AMD Ryzen 7 5800X3D Revisão: CPU de jogo melhor que o Core i9-12900K por US$120 a menos
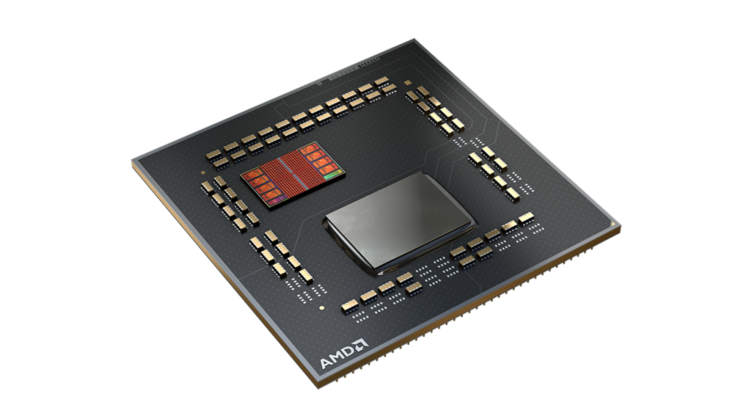
AMD finalmente fez a transição para um nova plataforma de soquete e chipset com o Ryzen 7000 mas a empresa ainda está procurando ordenhar o máximo fora do soquete AM4. AMD primeiro anunciado seu design 3D em V-cache baseado na tecnologia de embalagem 3DFabric da TSMC na Computex 2021, mostrando melhorias maciças no desempenho dos jogos a 1080p
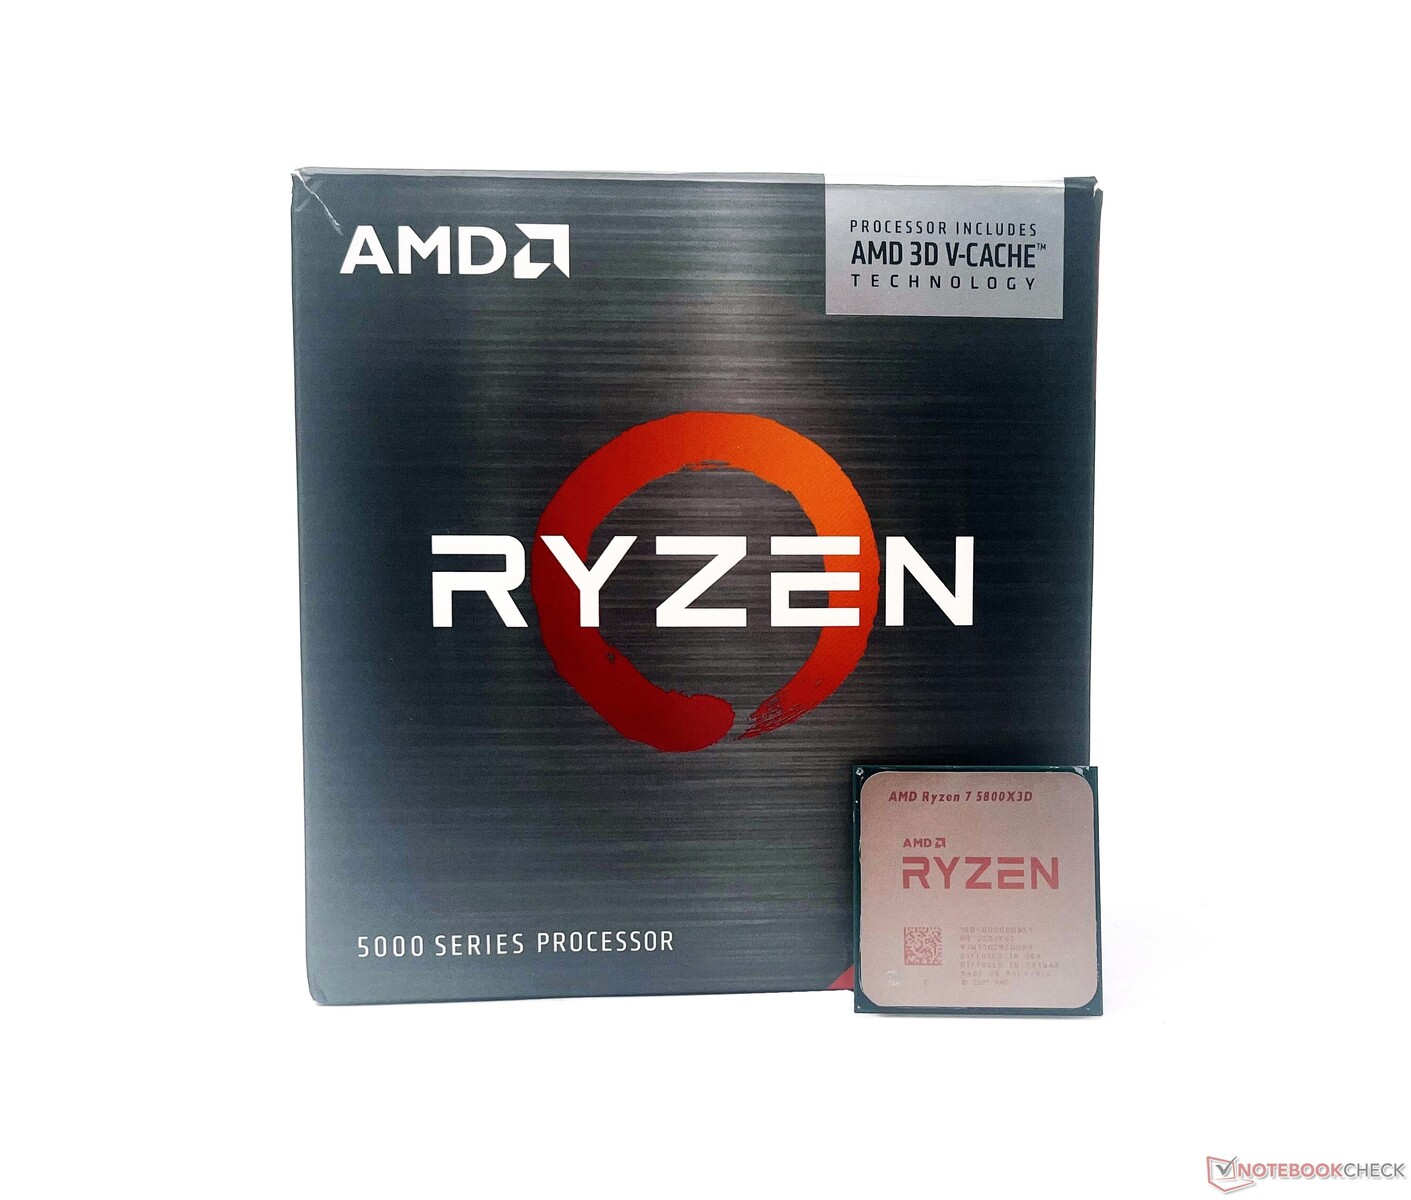
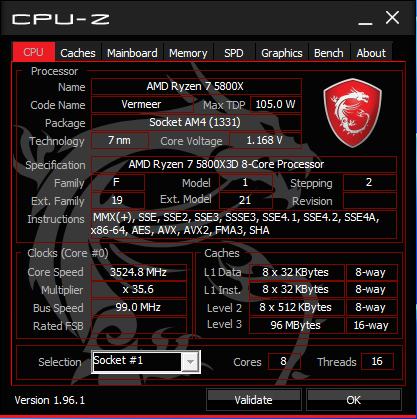
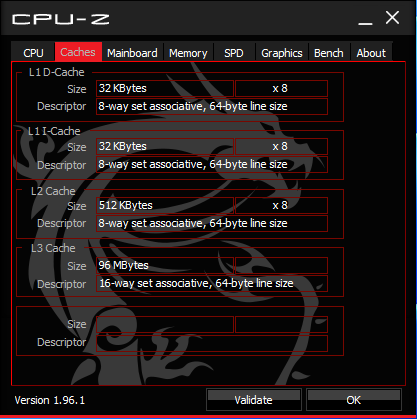
Avançar rapidamente para CES 2022, e AMD revelado o Ryzen 7 5800X3D - um processador de 8 núcleos de 16 fios de 105 W com 64 MB de V-Cache 3D adicionado aos 32 MB de cache 2D existente.
Embora a AMD tenha tido um home run com a linha Zen 3 Vermeer em sua maioria, a Intel rapidamente deu um salto com o Arquitetura do núcleo híbrido do Lago Alder liderada pelo Núcleo i9-12900K e mais tarde, o Núcleo i9-12900KS.
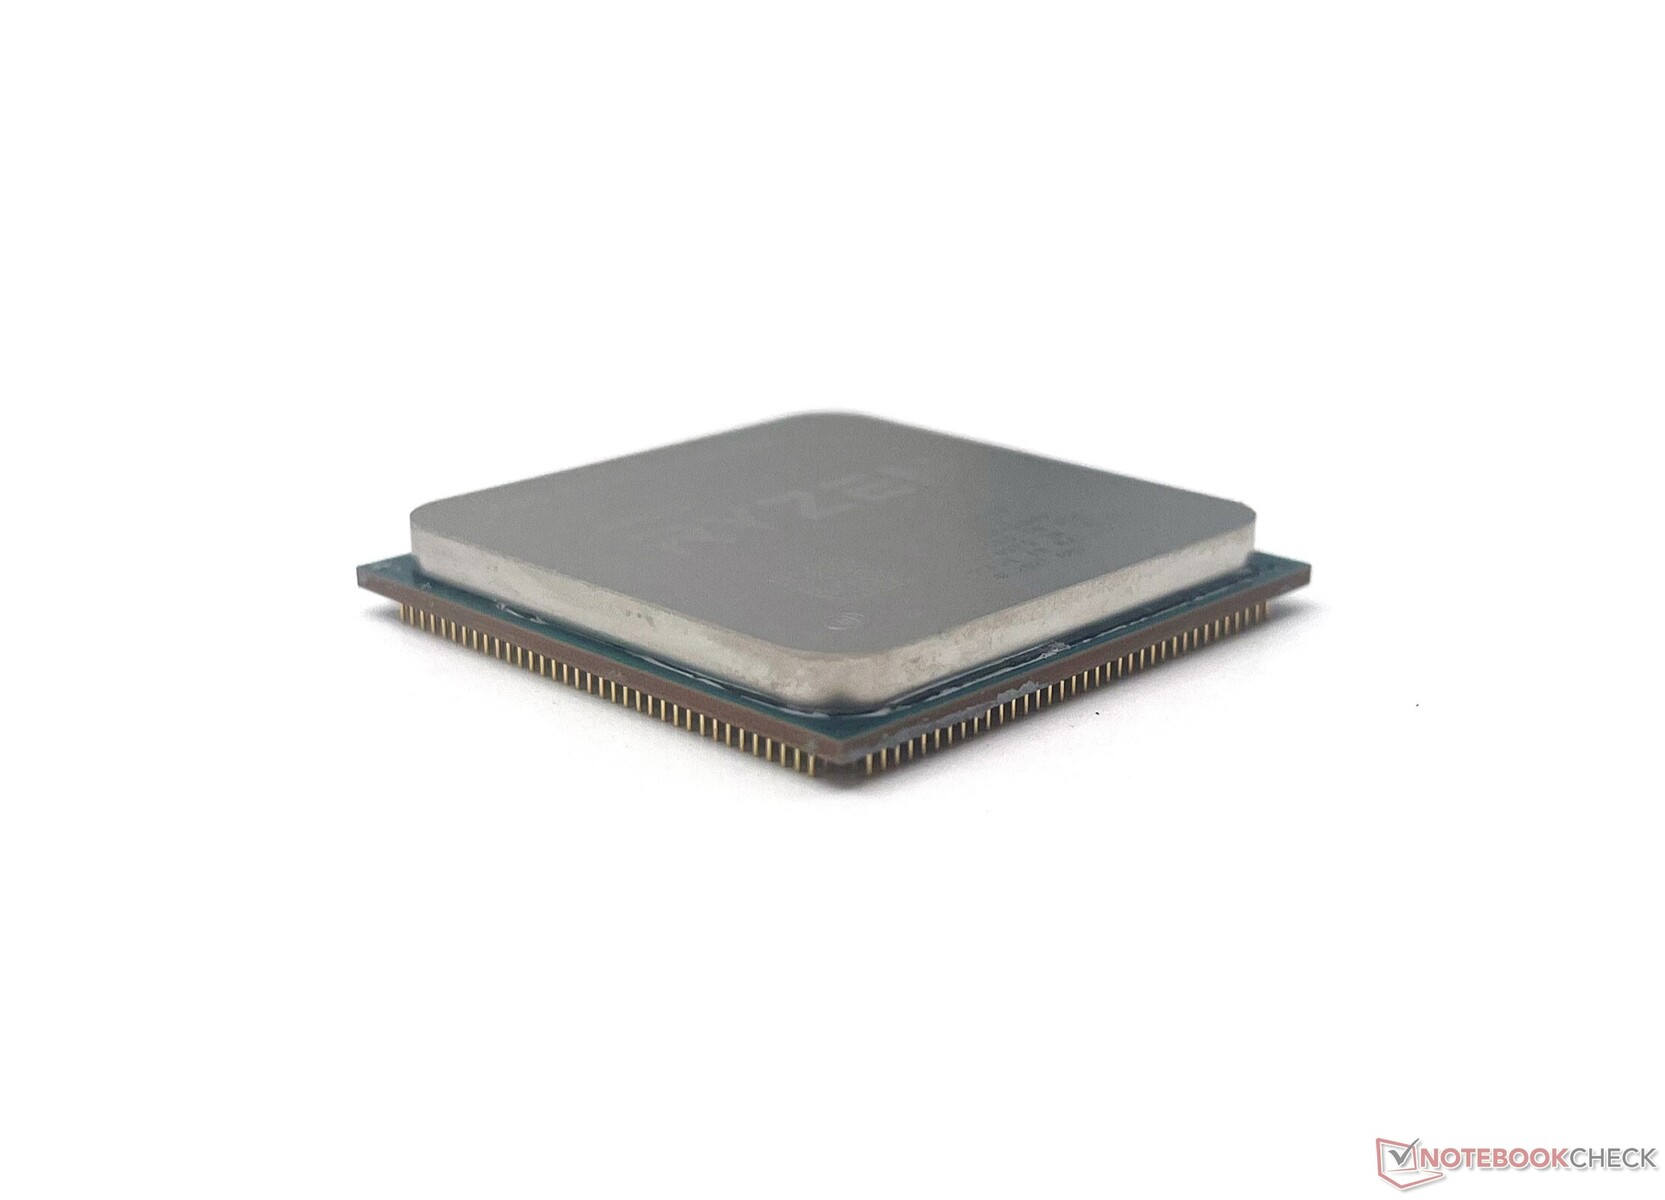
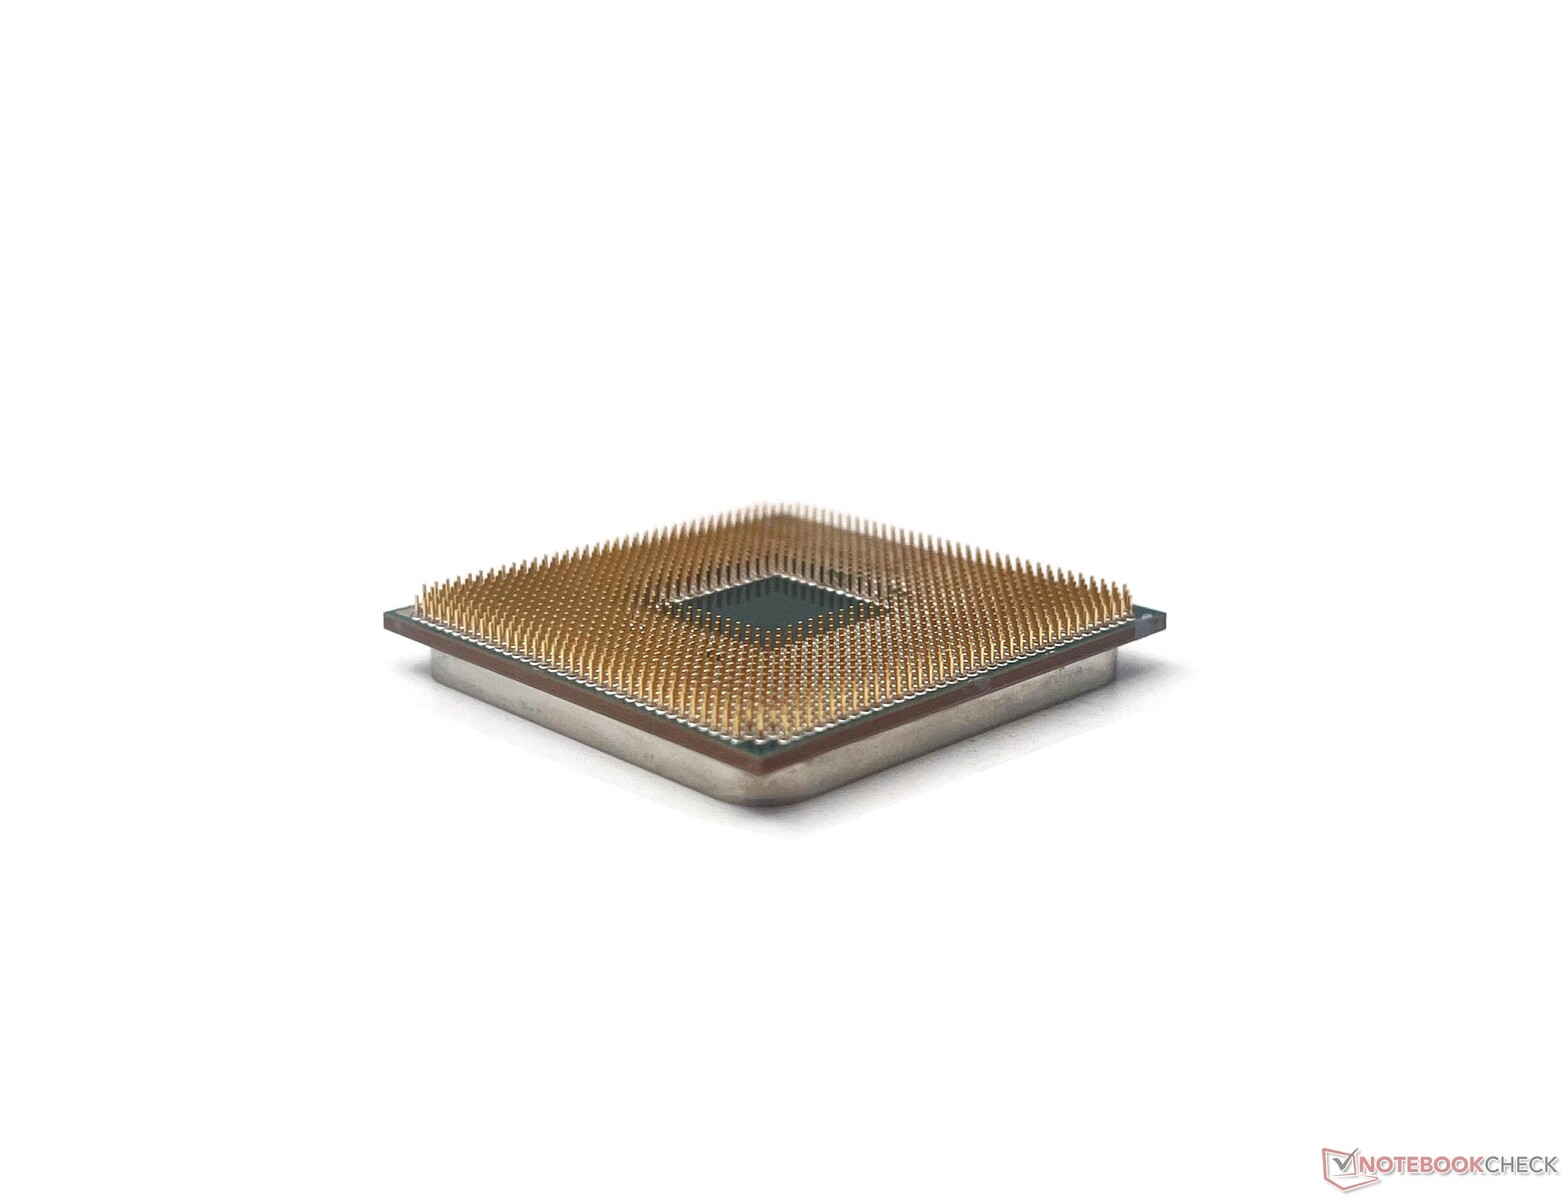
Apesar da nova tecnologia de cache, o Ryzen 7 5800X3D parece exatamente idêntico a outros processadores Zen 3, inclusive com a mesma altura em Z. Portanto, os resfriadores AM4 existentes funcionam muito bem com esta CPU.
Nesta revisão, damos uma olhada no AMD Ryzen 7 5800X3D, vemos como ele se acumula bem com a atual competição do Lago Alder da Intel, e se este é um investimento que você deve estar contemplando em 2022.
A linha de CPU desktop AMD Ryzen Zen 3 Vermeer
| SKU | Cores/Threads | Relógio de Base (GHz) | Relógio Turbo (GHz) | L3-Cache (MB) | TDP (W) | MSRP no Lançamento (US$) |
|---|---|---|---|---|---|---|
| Ryzen 9 5950X | 16/32 | 3.4 | 4.9 | 64 | 105 | 799 |
| Ryzen 9 5900X | 12/24 | 3.7 | 4.8 | 64 | 105 | 549 |
| Ryzen 7 5800X3D | 8/16 | 3.4 | 4.5 | 32+64 | 105 | 449 |
| Ryzen 7 5800X | 8/16 | 3.8 | 4.7 | 32 | 105 | 449 |
| Ryzen 7 5700X | 8/16 | 3.4 | 4.6 | 32 | 65 | 299 |
| Ryzen 5 5600X | 6/12 | 3.7 | 4.6 | 32 | 65 | 299 |
| Ryzen 5 5600 | 6/12 | 3.5 | 4.4 | 32 | 65 | 199 |
A bancada de teste: O Ryzen 7 5800X3D atende ao RTX 3090 Ti
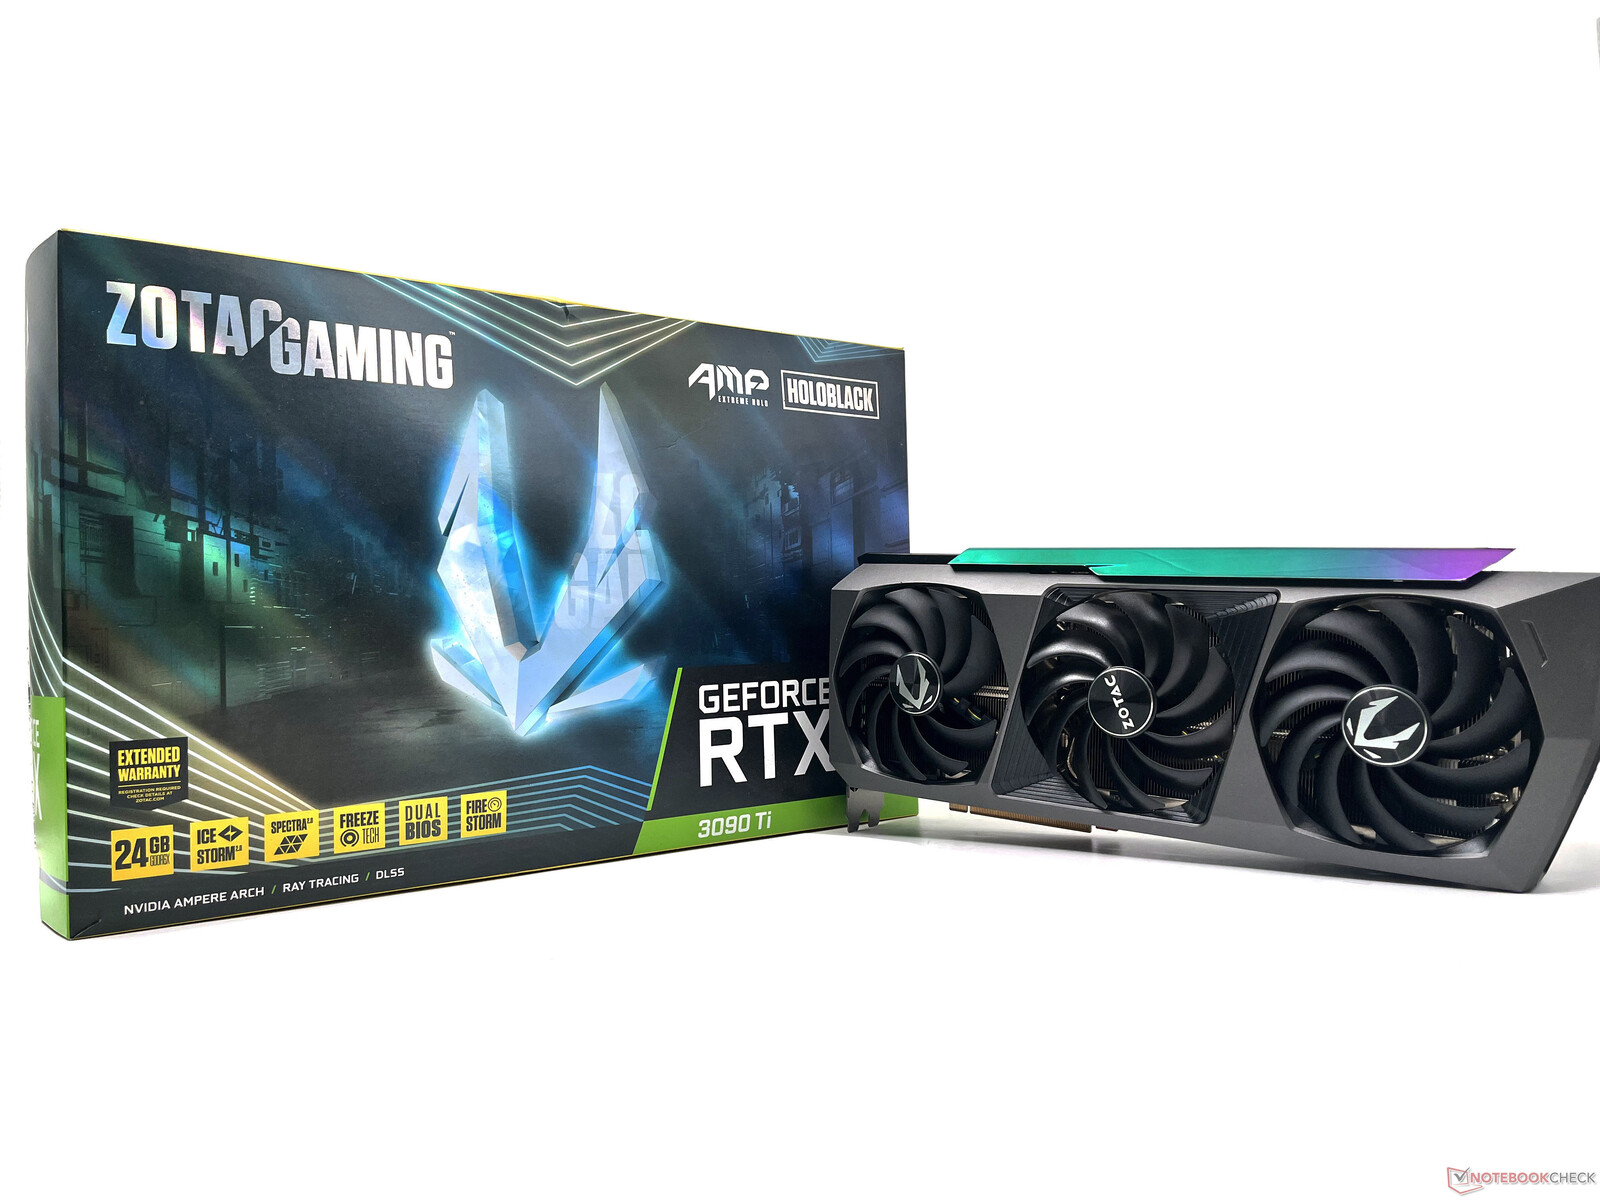
Nosso banco de testes é baseado no que tínhamos usado anteriormente para o Zotac Gaming GeForce RTX 3090 Ti AMP Extreme GPU Holo revisão. Isto inclui o seguinte:
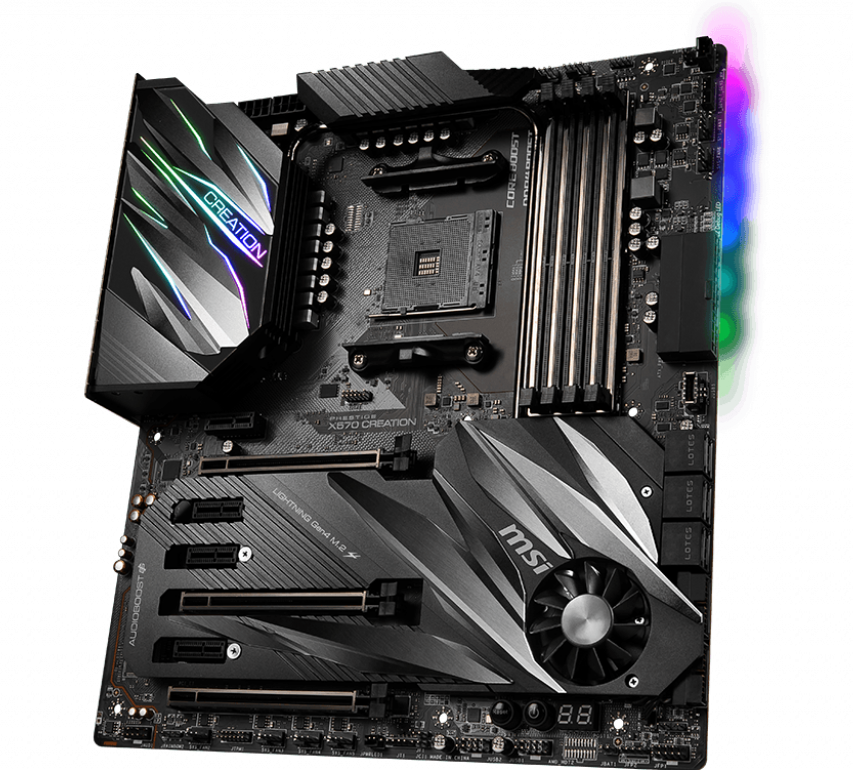
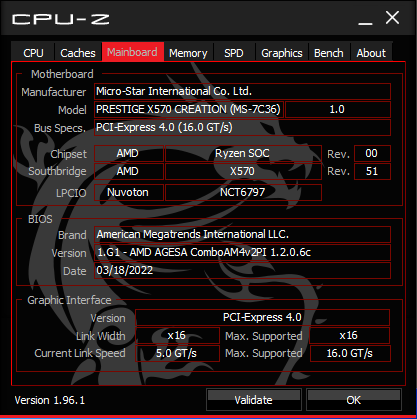
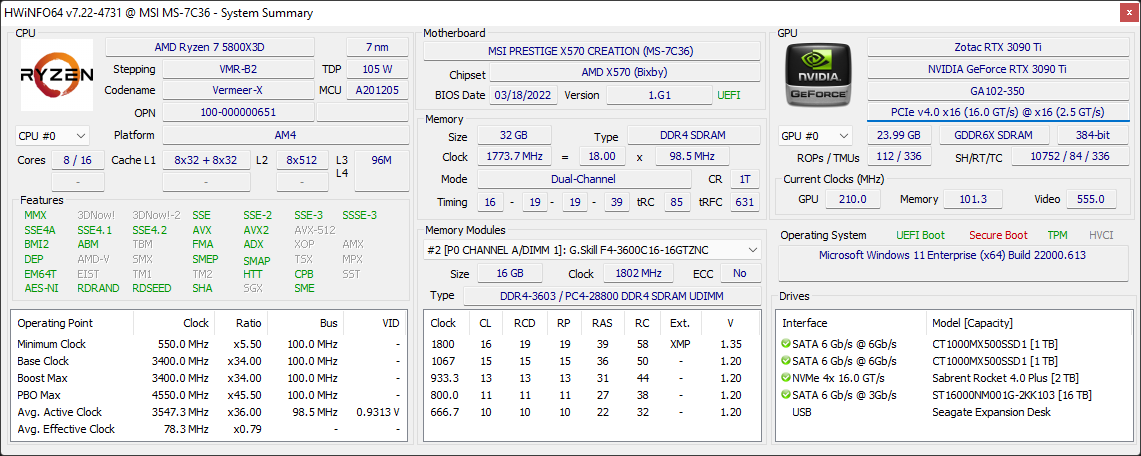
- MSI Prestige X570 Criação de placa-mãe com AGESA 1.2.0.6c
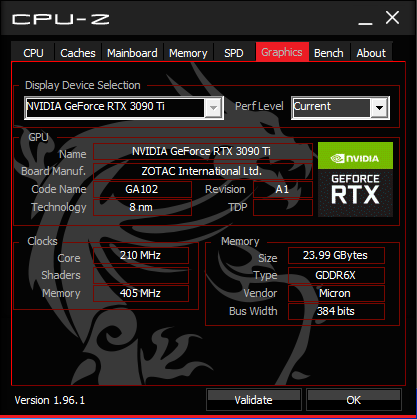
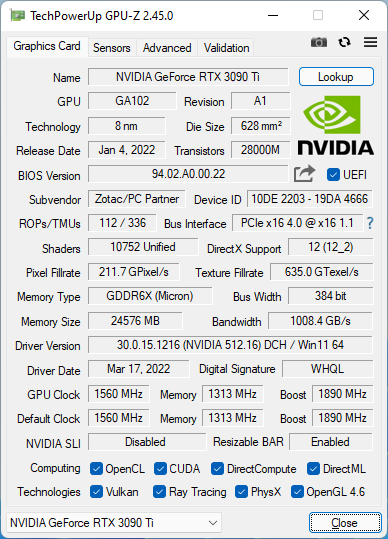
- Zotac Gaming GeForce RTX 3090 Ti AMP Extreme GPU Holo
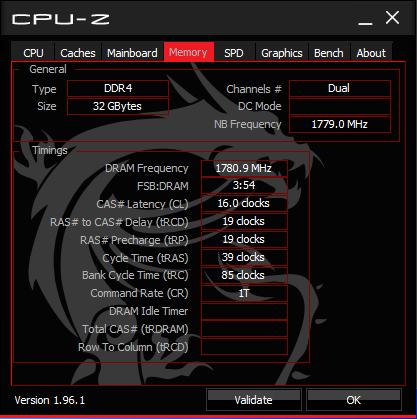
- 2x 16 GB G.SKILL Trident Z Neo DDR4-3600 RAM com temporizações 16-19-19-39
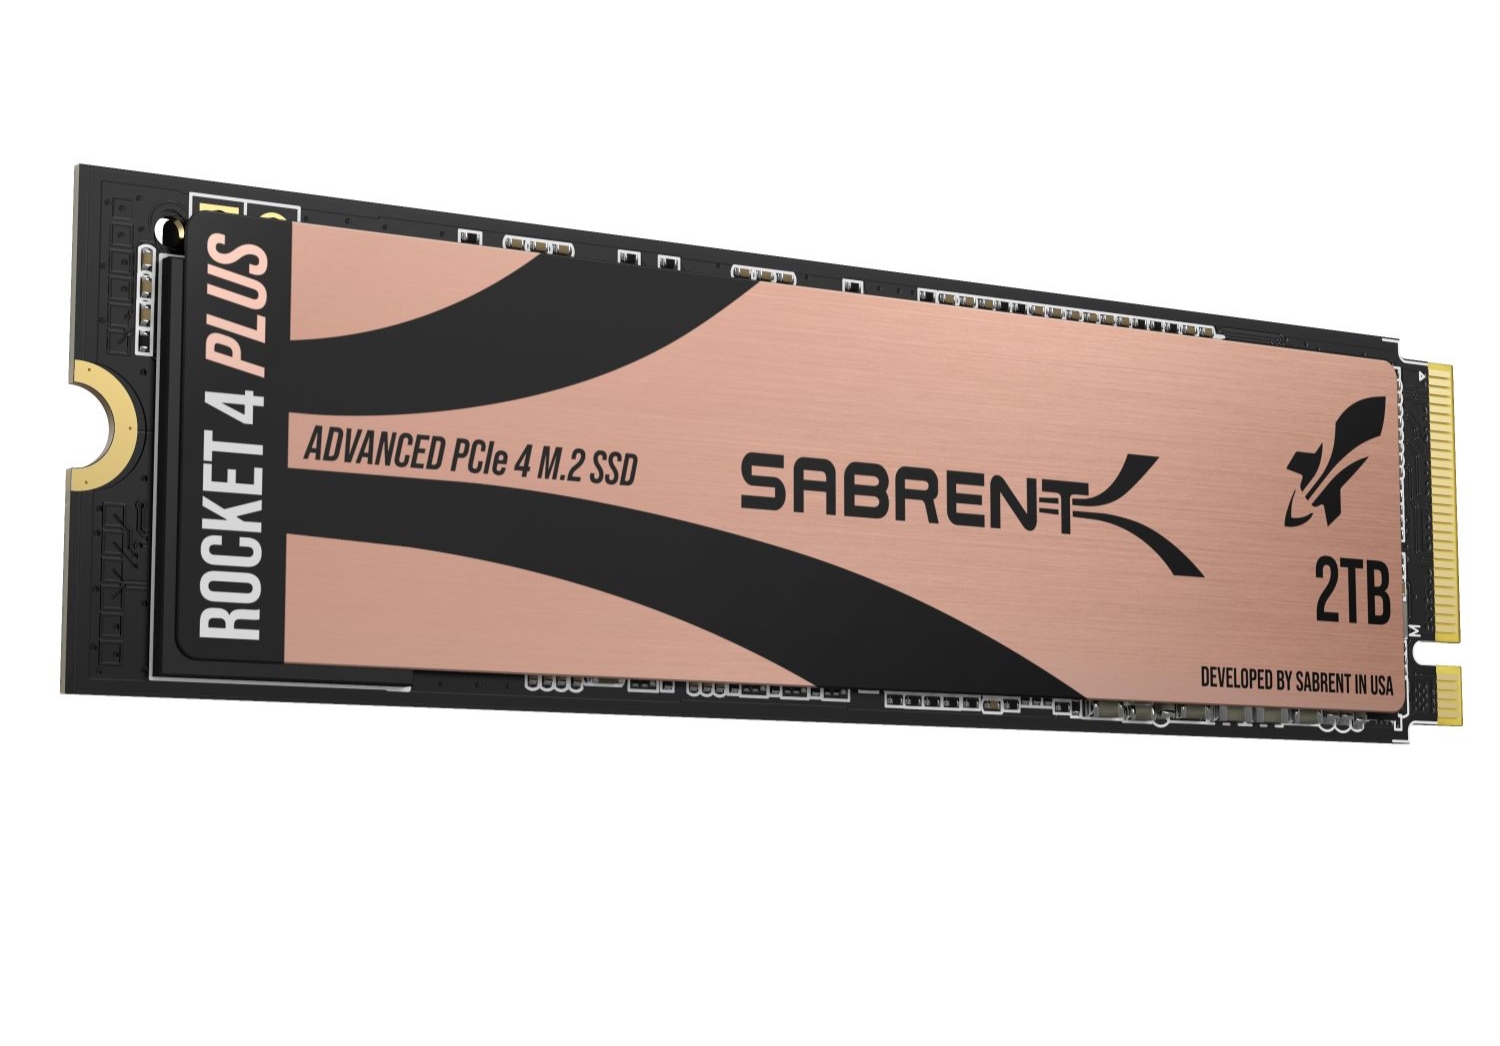
- 2 TB Sabrent Rocket 4 Plus Gen4 NVMe SSD
- 2x 1 TB SSDs MX500 SATA Crucial
- Thermaltake Toughpower 850 W mais Gold PSU
- Corsair iCUE H115i Elite Capellix AIO cooler
- Case Corsair iCUE 4000X RGB
- Gigabyte M28U 4K 144 Hz AMD FreeSync Premium Pro monitor
Gostaríamos de agradecer à AMD por fornecer a amostra de revisão Ryzen 7 5800X3D, Nvidia para a GPU Zotac RTX 3090 Ti, Sabrent para o Rocket 4 Plus Gen4 SSD, Corsair para o iCUE H115i Elite Capellix Cooler e caixa 4000X, e Gigabyte para o monitor de jogos M28U.
Padrões de referência sintéticos: Ryzen 7 5800X3D fica em segundo plano
O desempenho bruto da CPU não é definitivamente o forte do Ryzen 7 5800X3D. Isto se deve principalmente a um par de razões:
- O Ryzen 7 5800X3D é mais baixo - base 400 MHz mais baixa e 200 MHz mais baixa - do que o Ryzen 7 5800X
- Embora o 5800X3D suporte memória e overclock Infinity Fabric, o V-Cache 3D adicional evita qualquer forma de overclock do núcleo, incluindo Precision Boost Overdrive
Portanto, o desempenho multi-core no Cinebench R15, R20 e R23 é cerca de 6-10% mais lento em comparação com um Ryzen 7 5800X. Em um único núcleo, mesmo o Ryzen 5 5600X é mais rápido em cerca de 6% em comparação com o 5800X3D.
Uma tendência semelhante se reflete também em outros benchmarks de CPU sintética onde o Ryzen 7 5800X obtém uma vantagem confortável sobre o Ryzen 7 5800X3D, exceto para os testes de CPU wPrime, 3DMark 11 Physics, e 3DMark Time Spy.
O Intel Core i9-12900K, devido a sua configuração de 16 núcleos com 24 fios e um relógio de impulso de 5,1 GHz, mantém um avanço confortável em nossos testes sem quebrar um suor.
| Blender - v2.79 BMW27 CPU | |
| AMD Ryzen 5 5600X | |
| AMD Ryzen 7 5800X3D | |
| AMD Ryzen 7 5800X | |
| Intel Core i5-12600K | |
| AMD Ryzen 9 5900X | |
| Intel Core i9-12900K | |
| AMD Ryzen 9 5950X | |
| WinRAR - Result | |
| AMD Ryzen 7 5800X | |
| AMD Ryzen 7 5800X3D | |
| AMD Ryzen 9 5900X | |
| AMD Ryzen 5 5600X | |
| AMD Ryzen 9 5950X | |
| Intel Core i9-12900K | |
| Intel Core i5-12600K | |
| HWBOT x265 Benchmark v2.2 - 4k Preset | |
| AMD Ryzen 9 5950X | |
| Intel Core i5-12600K | |
| Intel Core i9-12900K | |
| AMD Ryzen 9 5900X | |
| AMD Ryzen 7 5800X | |
| AMD Ryzen 7 5800X3D | |
| AMD Ryzen 5 5600X | |
| R Benchmark 2.5 - Overall mean | |
| AMD Ryzen 7 5800X3D | |
| AMD Ryzen 5 5600X | |
| AMD Ryzen 9 5950X | |
| AMD Ryzen 9 5900X | |
| AMD Ryzen 7 5800X | |
| Intel Core i5-12600K | |
| Intel Core i9-12900K | |
| LibreOffice - 20 Documents To PDF | |
| Intel Core i5-12600K | |
| AMD Ryzen 7 5800X3D | |
| AMD Ryzen 9 5900X | |
| AMD Ryzen 9 5950X | |
| AMD Ryzen 5 5600X | |
| AMD Ryzen 7 5800X | |
| Intel Core i9-12900K | |
| 3DMark 11 - 1280x720 Performance Physics | |
| Intel Core i9-12900K | |
| AMD Ryzen 7 5800X3D | |
| AMD Ryzen 9 5950X | |
| Intel Core i5-12600K | |
| AMD Ryzen 9 5900X | |
| AMD Ryzen 7 5800X | |
| AMD Ryzen 5 5600X | |
* ... menor é melhor
O refrigerador Corsair H115i Elite Capellix AIO combinado com o radiador de 280 mm é capaz de fazer um bom trabalho para manter o Ryzen 7 5800X3D frio. Não notamos qualquer estrangulamento em nosso teste de loop multi-core Cinebench R15 sustentado.
Desempenho da aplicação: Sem grandes problemas na produtividade diária e certos fluxos de trabalho criativos
O Ryzen 7 5800X3D é capaz de lidar habilmente com tarefas diárias de produtividade, como evidenciado pelos resultados do PCMark 10. Sua classificação na parte inferior do gráfico pode ser atribuída a relógios mais baixos, mas vemos apenas um déficit de desempenho de cerca de 8% em comparação com o Ryzen 7 5800X.
Como não tínhamos um Titan RTX para esta comparação, tivemos que nos contentar com o RTX 3090 Ti como a GPU de escolha. Embora seja um cartão da classe Titan em papel, o RTX 3090 Ti utiliza drivers convencionais GeForce que levam a penalidades artificiais de desempenho em algumas aplicações profissionais.
No entanto, a combinação Ryzen 7 5800X3D e RTX 3090 Ti se presta a alguns bons resultados em certos subconjuntos dos testes SPECviewperf tais como 3ds Max, Maya, Showcase, e Medical.
| PCMark 10 Score | 7607 pontos | |
Ajuda | ||
3D e desempenho em jogos: Ryzen 7 5800X3D corre além do Core i9-12900K a 1080p
A AMD comercializa o Ryzen 7 5800X3D como um processador de jogos. Enquanto o 5800X3D luta claramente no desempenho da CPU bruta, as mesas giram quando se trata de aplicações para jogos. Vemos isso particularmente em resoluções mais baixas, como 1080p.
A combinação Ryzen 7 5800X3D+RTX 3090 Ti lidera claramente o pacote e até consegue vencer de forma convincente a configuração Core i9-12900K+Titan RTX em uma boa maioria de testes 3DMark e Unigine por uma margem significativa. Observe que o Ryzen 7 5800X3D ainda perde para as ofertas da Intel Alder Lake e para a maioria de seus primos Zen 3 em aspectos somente de CPU destes benchmarks, como mostrado anteriormente. O RTX 3090 Ti parece ter contribuído com seu músculo nestes testes, pois é claramente um cartão muito mais poderoso do que o Titan RTX que tínhamos usado em revisões anteriores.
Para uma análise mais detalhada dos resultados dos benchmarks 3D sintéticos, consulte nossa revisão do Zotac GeForce RTX 3090 Ti AMP Extreme Holo GPU.
| 3DMark 11 Performance | 49471 pontos | |
| 3DMark Ice Storm Standard Score | 233264 pontos | |
| 3DMark Cloud Gate Standard Score | 75753 pontos | |
| 3DMark Fire Strike Score | 36563 pontos | |
| 3DMark Fire Strike Extreme Score | 24198 pontos | |
| 3DMark Time Spy Score | 19241 pontos | |
Ajuda | ||
O Ryzen 7 5800X3D é o vencedor claro se você estiver procurando uma das CPUs de jogos mais rápidas disponíveis atualmente. Infelizmente, ainda não conseguimos obter uma amostra do Core i9-12900KS, portanto a comparação abaixo se limita ao Core i9-12900K e ao Núcleo i5-12600K do estábulo da Team Blue.
As resoluções a 1080p são as que mais se beneficiam com o aumento do cache, já que estas configurações são mais limitadas em relação aos 2K e acima. Assim, o Ryzen 7 5800X3D parece ser uma combinação ideal para o RTX 3090 Ti para empurrar o maior número possível de quadros com esta resolução. A elevação do Core i9-12900K pode ser de até 40% (Borderlands 3, 1080p Badass Quality) dependendo do jogo e das configurações de qualidade escolhidas.
| F1 2021 | |
| 1920x1080 Medium Preset AA:T AF:16x | |
| AMD Ryzen 7 5800X3D, NVIDIA GeForce RTX 3090 Ti | |
| AMD Ryzen 9 5900X, NVIDIA Titan RTX | |
| Intel Core i9-12900K, NVIDIA Titan RTX | |
| Intel Core i5-12600K, NVIDIA Titan RTX | |
| 1920x1080 High Preset AA:T AF:16x | |
| AMD Ryzen 7 5800X3D, NVIDIA GeForce RTX 3090 Ti | |
| AMD Ryzen 9 5900X, NVIDIA Titan RTX | |
| Intel Core i9-12900K, NVIDIA Titan RTX | |
| Intel Core i5-12600K, NVIDIA Titan RTX | |
| 1920x1080 Ultra High Preset + Raytracing AA:T AF:16x | |
| AMD Ryzen 7 5800X3D, NVIDIA GeForce RTX 3090 Ti | |
| AMD Ryzen 9 5900X, NVIDIA Titan RTX | |
| Intel Core i9-12900K, NVIDIA Titan RTX | |
| Intel Core i5-12600K, NVIDIA Titan RTX | |
| baixo | média | alto | ultra | QHD | 4K | |
|---|---|---|---|---|---|---|
| GTA V (2015) | 185.59 | 160.67 | 155.26 | 182.63 | ||
| The Witcher 3 (2015) | 394 | 193.4 | 172.9 | |||
| Dota 2 Reborn (2015) | 257.7 | 231.2 | 217.1 | 195.8 | 184.2 | |
| Final Fantasy XV Benchmark (2018) | 222 | 226 | 186.1 | 151.6 | 96.3 | |
| X-Plane 11.11 (2018) | 169.1 | 158.1 | 135.9 | 115.7 | ||
| Shadow of the Tomb Raider (2018) | 265 | 257 | 244 | 184 | 106 | |
| Metro Exodus (2019) | 213 | 175.2 | 145.9 | 125.3 | 84.3 | |
| Total War: Three Kingdoms (2019) | 342.6 | 248.9 | 176.6 | 117.9 | 59.9 | |
| Control (2019) | 240 | 209 | 142.5 | 73.9 | ||
| Borderlands 3 (2019) | 204 | 187.6 | 173.3 | 143.1 | 83.8 | |
| Mafia Definitive Edition (2020) | 240 | 231 | 173.9 | 99.2 | ||
| Watch Dogs Legion (2020) | 171.4 | 154.2 | 130.2 | 107.8 | 70.1 | |
| Assassin´s Creed Valhalla (2020) | 160 | 138 | 123 | 108 | 73 | |
| F1 2021 (2021) | 537 | 470 | 242 | 189.3 | 114.9 | |
| Far Cry 6 (2021) | 179 | 161.6 | 142 | 132.9 | 89.9 | |
| Call of Duty Vanguard (2021) | 195.5 | 207 | 191.2 | 149.9 | 93.7 | |
| Forza Horizon 5 (2021) | 231 | 200 | 188 | 127 | 114 | 89 |
| Rainbow Six Extraction (2022) | 411 | 347 | 315 | 290 | 208 | 116 |
| Dying Light 2 (2022) | 202 | 171.4 | 153 | 113.2 | 64.3 | |
| GRID Legends (2022) | 228 | 202 | 173.4 | 156.6 | 153.2 | 120.5 |
| Elden Ring (2022) | 60 | 60 | 60 | 60 | 60 | 60 |
| Cyberpunk 2077 1.6 (2022) | 219 | 201 | 172.8 | 151.8 | 103.9 | 53.3 |
| Ghostwire Tokyo (2022) | 263 | 260 | 261 | 261 | 210 | 113.2 |
| Tiny Tina's Wonderlands (2022) | 324 | 277 | 231 | 190.2 | 142.6 | 81.1 |
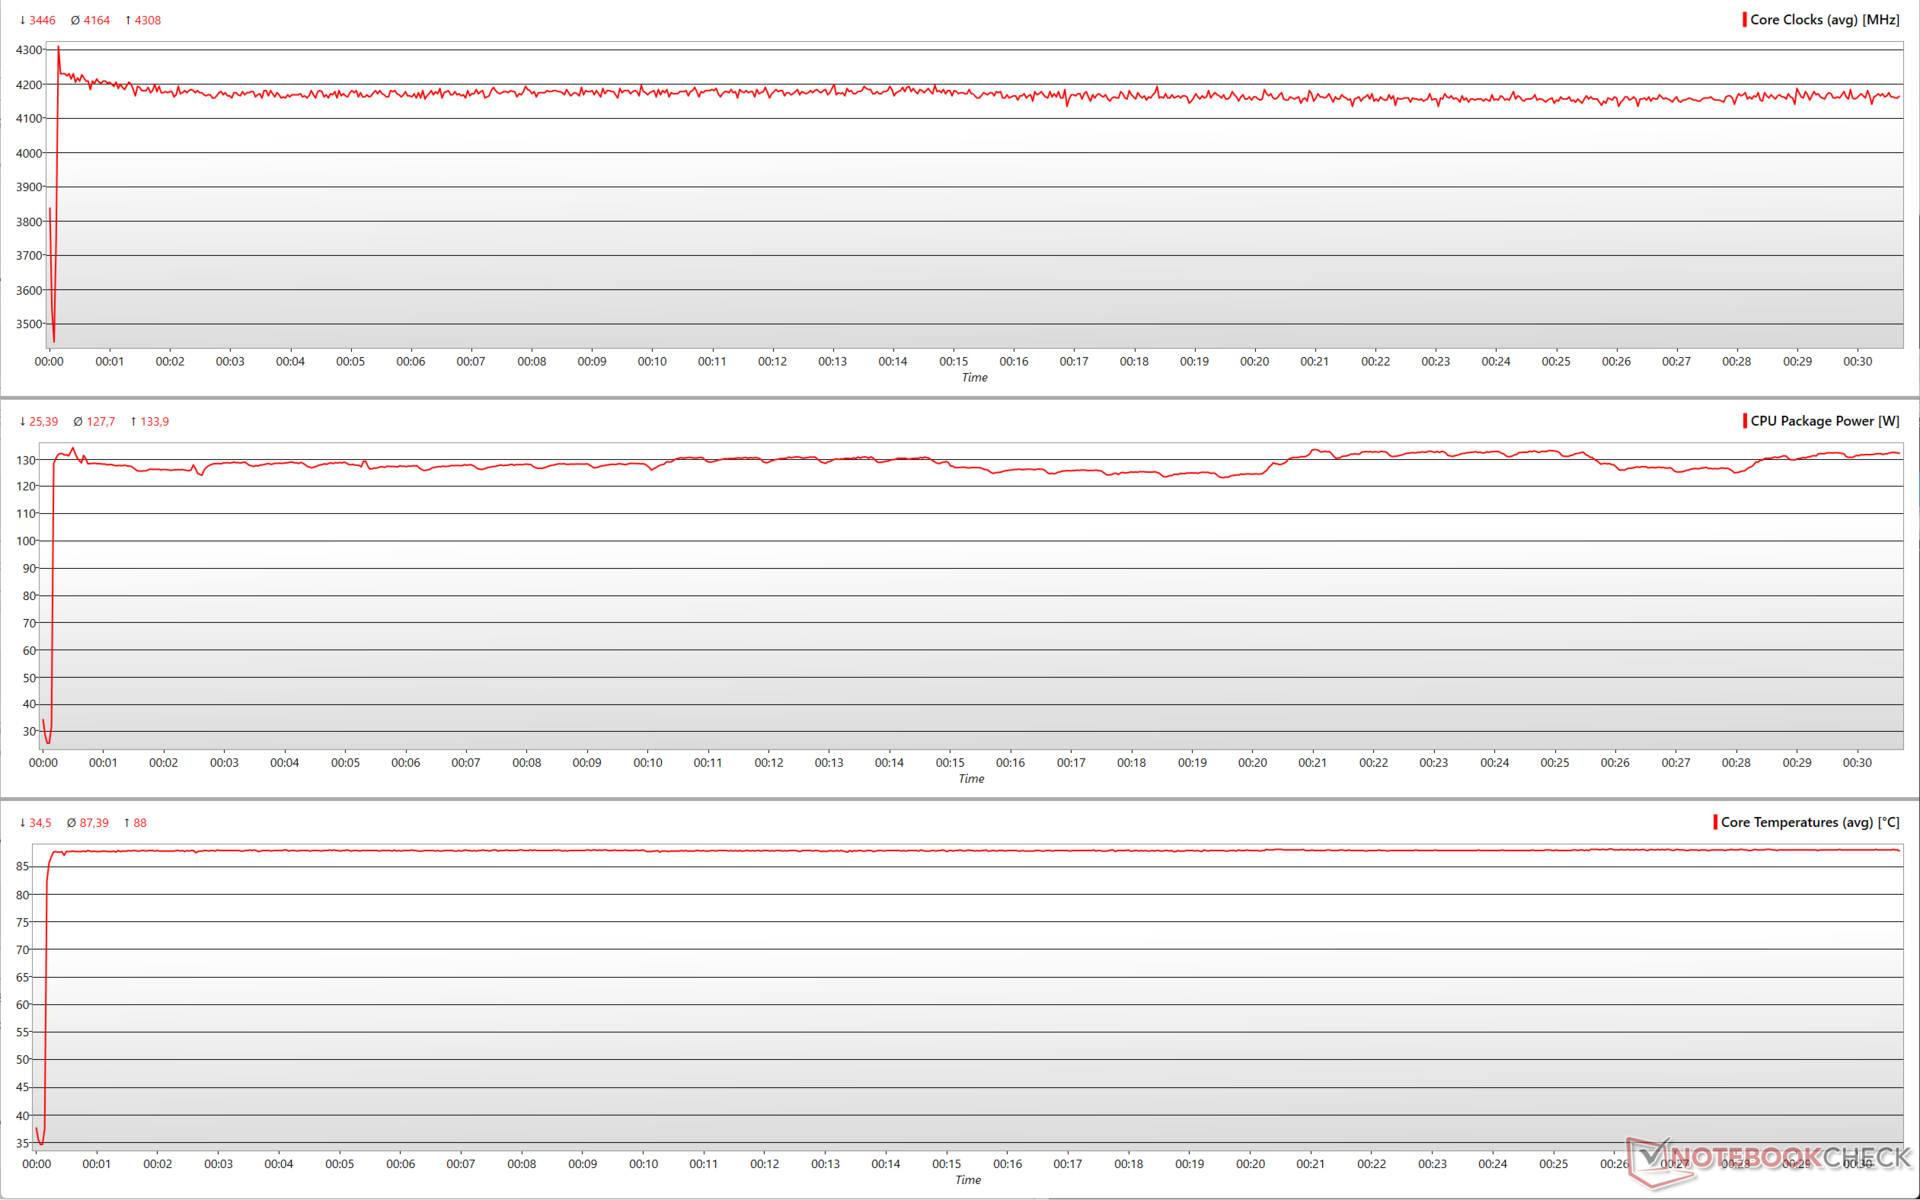
Teste de estresse e temperaturas: Sem problemas de estrangulamento
Enfatizando o Ryzen 7 5800X3D com Prime95, o pacote de CPU tem um custo de energia um pouco acima da marca de 130 W e as velocidades do relógio são bastante consistentes perto de 4,2 GHz. As temperaturas da CPU pairam próximo à marca de 90 °C sem estrangulamento.
Esta consistência no desempenho também foi vista anteriormente no teste de loop multi-core Cinebench R15 acima. Isto pode ser atribuído em parte ao Ryzen 7 5800X3D e também em parte ao excelente desempenho de resfriamento do refrigerador Corsair H115i Elite Capellix AIO.
Consumo de energia: Menos econômico que o Core i5-12600K apesar do desempenho inferior
Nosso sistema de teste consome cerca de 102 W em modo inativo com um total de cinco ventiladores de caixa (três ventiladores de caixa Corsair SP 120 mm e dois ventiladores de radiador Corsair ML 120 mm) e o resfriador Elite Capellix rodando no perfil Balanceado. Toda a iluminação RGB foi desligada.
O consumo de energia é mais ou menos semelhante ao Ryzen 9 5900X e cerca de 29% maior do que o Ryzen 5 5600X em Prime95 no local de estresse FFT. Cinebench R15 multi-core vê o Ryzen 7 5800X3D ser ligeiramente menos econômico do que o Núcleo i5-12600K mesmo que o chip da AMD apresente um déficit de desempenho de 6%. Um perfil semelhante é visto com o Cinebench R20 multi também, desta vez com uma diferença de desempenho ainda maior de 18% em comparação com o Core i5-12600K.
O Ryzen 7 5800X3D fica atrás do Núcleo i9-12900K em 26% no Cinebench R20 single-core, mas parece consumir um pouco mais de energia. Em geral, porém, o consumo total de energia do sistema com o Ryzen 7 5800X3D ainda está limitado a cerca da marca de 230 W, enquanto que o PC Core i9-12900K pode consumir quase 57% mais energia em testes de CPU de múltiplos núcleos.
Power Consumption: External Monitor
* ... menor é melhor
Pro
Contra
Veredicto: Somente para gamers e usuários do OG Zen
A AMD tem mantido no soquete AM4 por muito tempo. Mesmo com o lançamento da série Ryzen 7000 no soquete AM5, a empresa espera que o soquete mais antigo tenha um bom desempenho durante a maior parte do tempo. O Ryzen 7 5800X3D é mais um banco de ensaio para a AMD, aprendizagens das quais serão incorporadas em futuras iterações. Dito isto, o Ryzen 7 5800X3D claramente parece ser uma grande escolha se seu caso de uso primário for jogos, particularmente em resoluções mais baixas.
O uso de uma cache empilhada em 3D dá aos jogos um espaço de manobra significativo. No entanto, ele traz consigo várias armadilhas, incluindo não ser capaz de fazer overclock nos próprios núcleos e baixar os relógios de base/boost para garantir que o TDP não vá além de 105 W
o 3D V-cache é uma forma engenhosa de melhorar o desempenho dos jogos sem aumentar o TDP. Os jogadores acharão o 3D V-cache útil para empurrar quadros mais altos que o Core i9-12900K por cerca de US$120 a menos. Para todas as outras tarefas, os relógios mais baixos e a falta de overclocking provam ser grandes limitações.
O Ryzen 7 5800X3D sofre quando se trata de desempenho bruto da CPU quando comparado com seus irmãos da família Zen 3, e definitivamente perde para o Lago Alder Núcleo i5-12600K e Núcleo i9-12900K processadores. O lado negativo é que este déficit de desempenho não é acompanhado por um menor consumo de energia
Embora vejamos o Ryzen 7 5800X3D atrasado quando se trata do componente Físico dos benchmarks 3D sintéticos, o processador começa a mostrar seu valor nos componentes gráficos destes testes. O jogo a 1080p ou QHD é o melhor caso de uso para este processador. Juntamente com a GPU correta, o Ryzen 7 5800X3D pode empurrar quadros muito mais do que é possível com o Core i9-12900K.
Isto suscita a pergunta. Vale a pena atualizar esta CPU para?
O soquete AM4 é agora uma plataforma altamente estável. Ainda é cedo para o soquete AM5 e os usuários gostariam de esperar e ver como as novas CPUs Ryzen 7000 funcionariam nos testes do mundo real e também descobrir as melhores combinações de memória DDR5 possíveis antes de dar o mergulho.
Jogadores ainda em processadores Zen de geração mais antiga, como um Ryzen 7 2700Xpor exemplo, encontrará o Ryzen 7 5800X3D um upgrade digno e terá o prazer de embolsar a economia de US$120 em comparação com o Core i9-12900K, além de economizar em upgrades da placa mãe (assumindo que sua placa atual ainda ofereça uma entrega de energia decente). Entretanto, os criadores de conteúdo e aqueles que precisam de um melhor desempenho geral podem querer procurar outras opções, tais como o Ryzen 7 5800X para o mesmo MSRP de US$ 449.
O Core i5-12600K é uma barganha ainda melhor por apenas US$289 MSRP desde que o investimento adicional no ecossistema da Intel não seja uma restrição.
Preço e disponibilidade
Price comparison

