Revisão do Lenovo ThinkBook 16 G4+: Bom laptop multimídia com muita potência
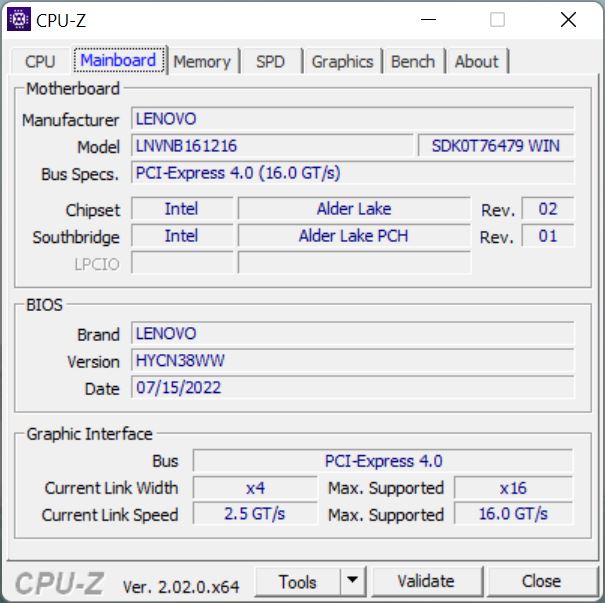
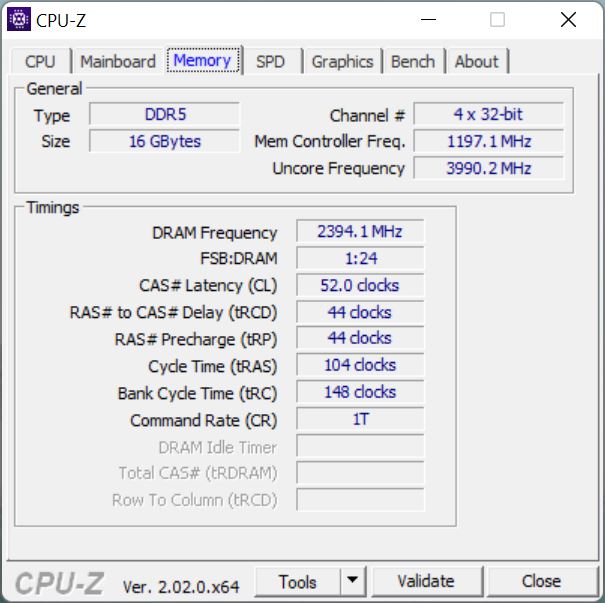
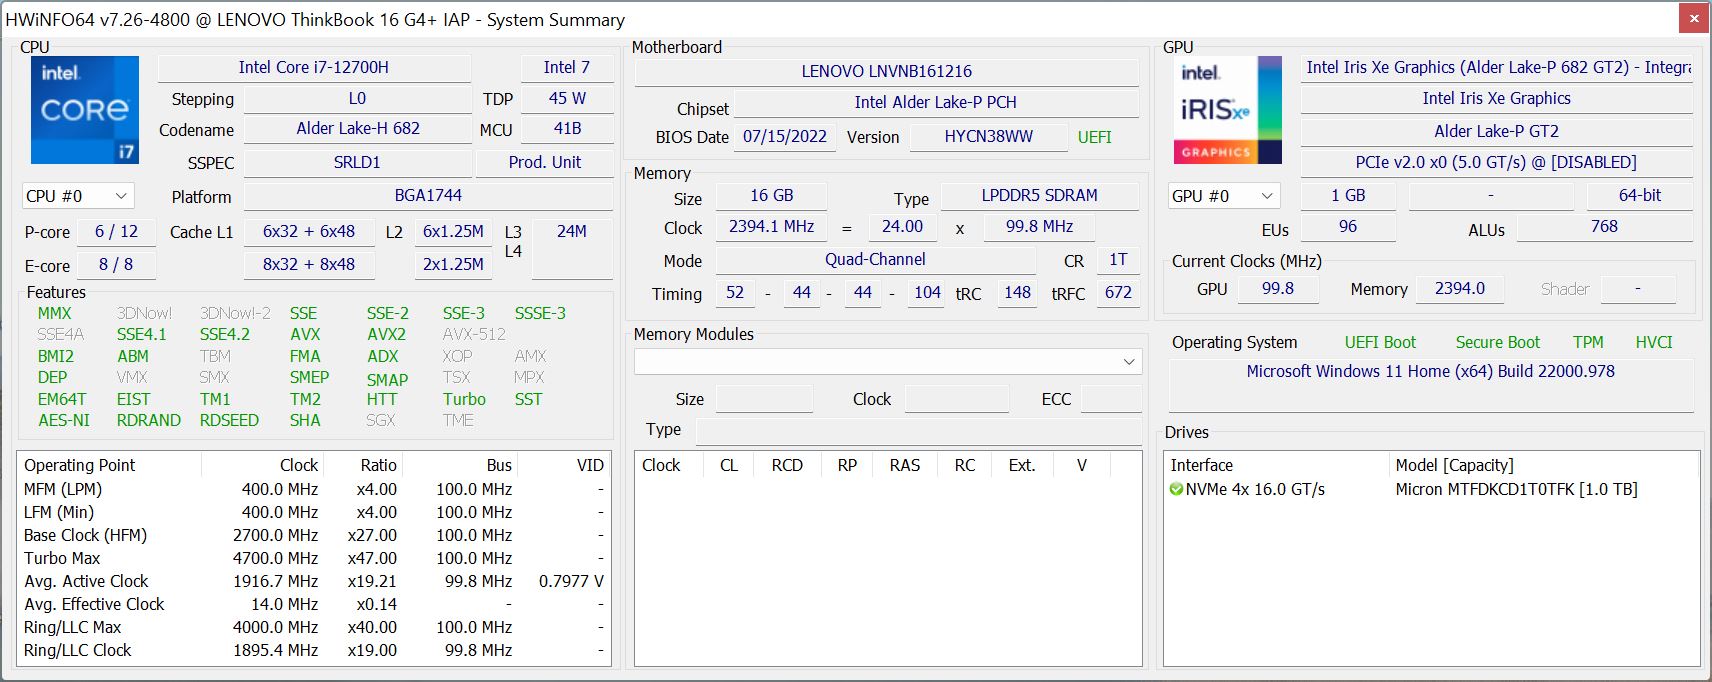
Com o ThinkBook 16 G4+, a Lenovo está introduzindo um caderno multimídia de 16 polegadas com componentes poderosos e muitas características modernas por um RRP de 1.200 Euros (~US$ 1.200). Além do mais recente processador Intel Core i7-12700H, há o dedicado GeForce RTX 2050 da Nvidia, bem como recursos modernos como Thunderbolt 4, Wi-Fi 6E ou PCIe 4.0. O display é um painel IPS WQHD mate e há um grande SSD de 1 TB, ao lado de 16 GB de RAM. Nossa amostra de revisão é um modelo de campus sem um sistema operacional.
Possíveis concorrentes em comparação
Avaliação | Data | Modelo | Peso | Altura | Size | Resolução | Preço |
|---|---|---|---|---|---|---|---|
| 88.4 % v7 (old) | 09/2022 | Lenovo ThinkBook 16 G4+ IAP i7-12700H, GeForce RTX 2050 Mobile | 1.8 kg | 16.5 mm | 16.00" | 2560x1600 | |
| 87.4 % v7 (old) | 08/2022 | Dell Inspiron 16 Plus 7620 i7-12700H, GeForce RTX 3050 Ti Laptop GPU | 2.1 kg | 18.99 mm | 16.00" | 3072x1920 | |
| 86.2 % v7 (old) | 07/2022 | Acer Swift X SFX16-51G-5388 i5-11320H, GeForce RTX 3050 4GB Laptop GPU | 1.8 kg | 18.9 mm | 16.10" | 1920x1080 | |
v (old) | 12/2021 | Asus Vivobook Pro 16X-M7600QE R9 5900HX, GeForce RTX 3050 Ti Laptop GPU | 1.9 kg | 19 mm | 16.10" | 3840x2400 | |
| 83.6 % v7 (old) | 07/2022 | Huawei MateBook D 16 2022 i7-12700H, Iris Xe G7 96EUs | 1.7 kg | 18.4 mm | 16.00" | 1920x1200 | |
| 79.8 % v7 (old) | 08/2022 | Samsung Galaxy Book2 15 i7-1260P, A350M | 1.6 kg | 15 mm | 15.60" | 1920x1080 |
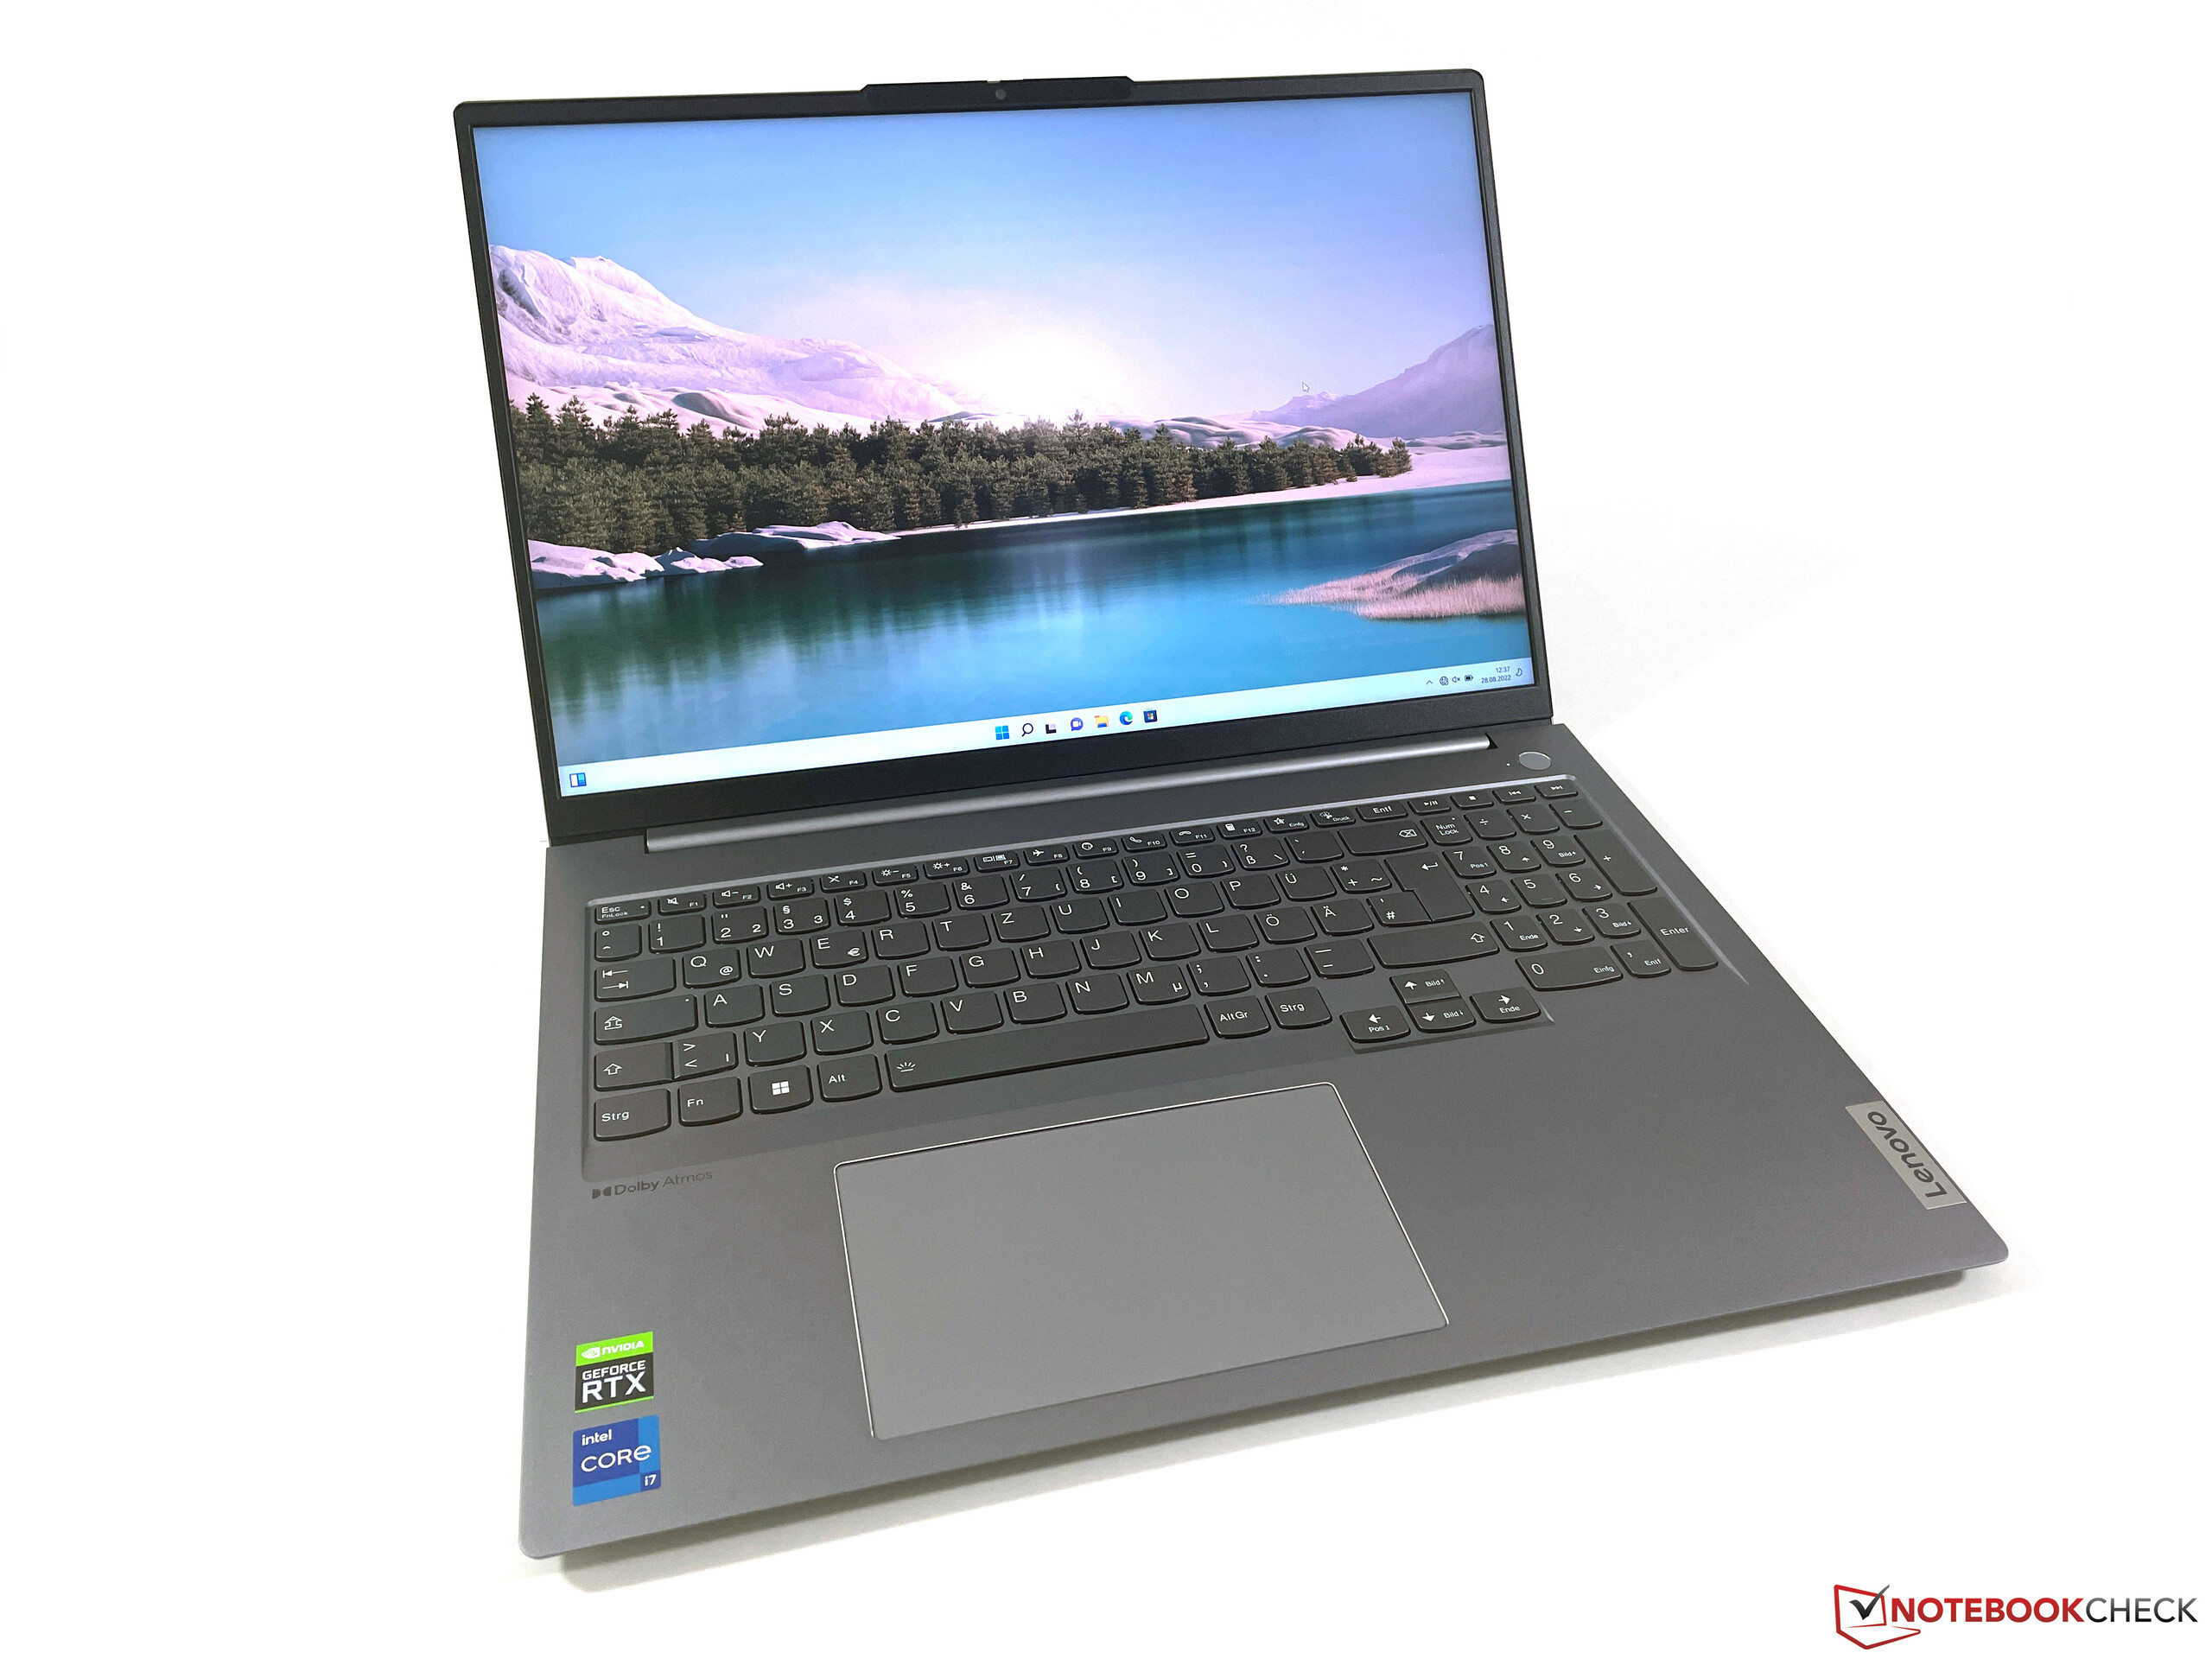
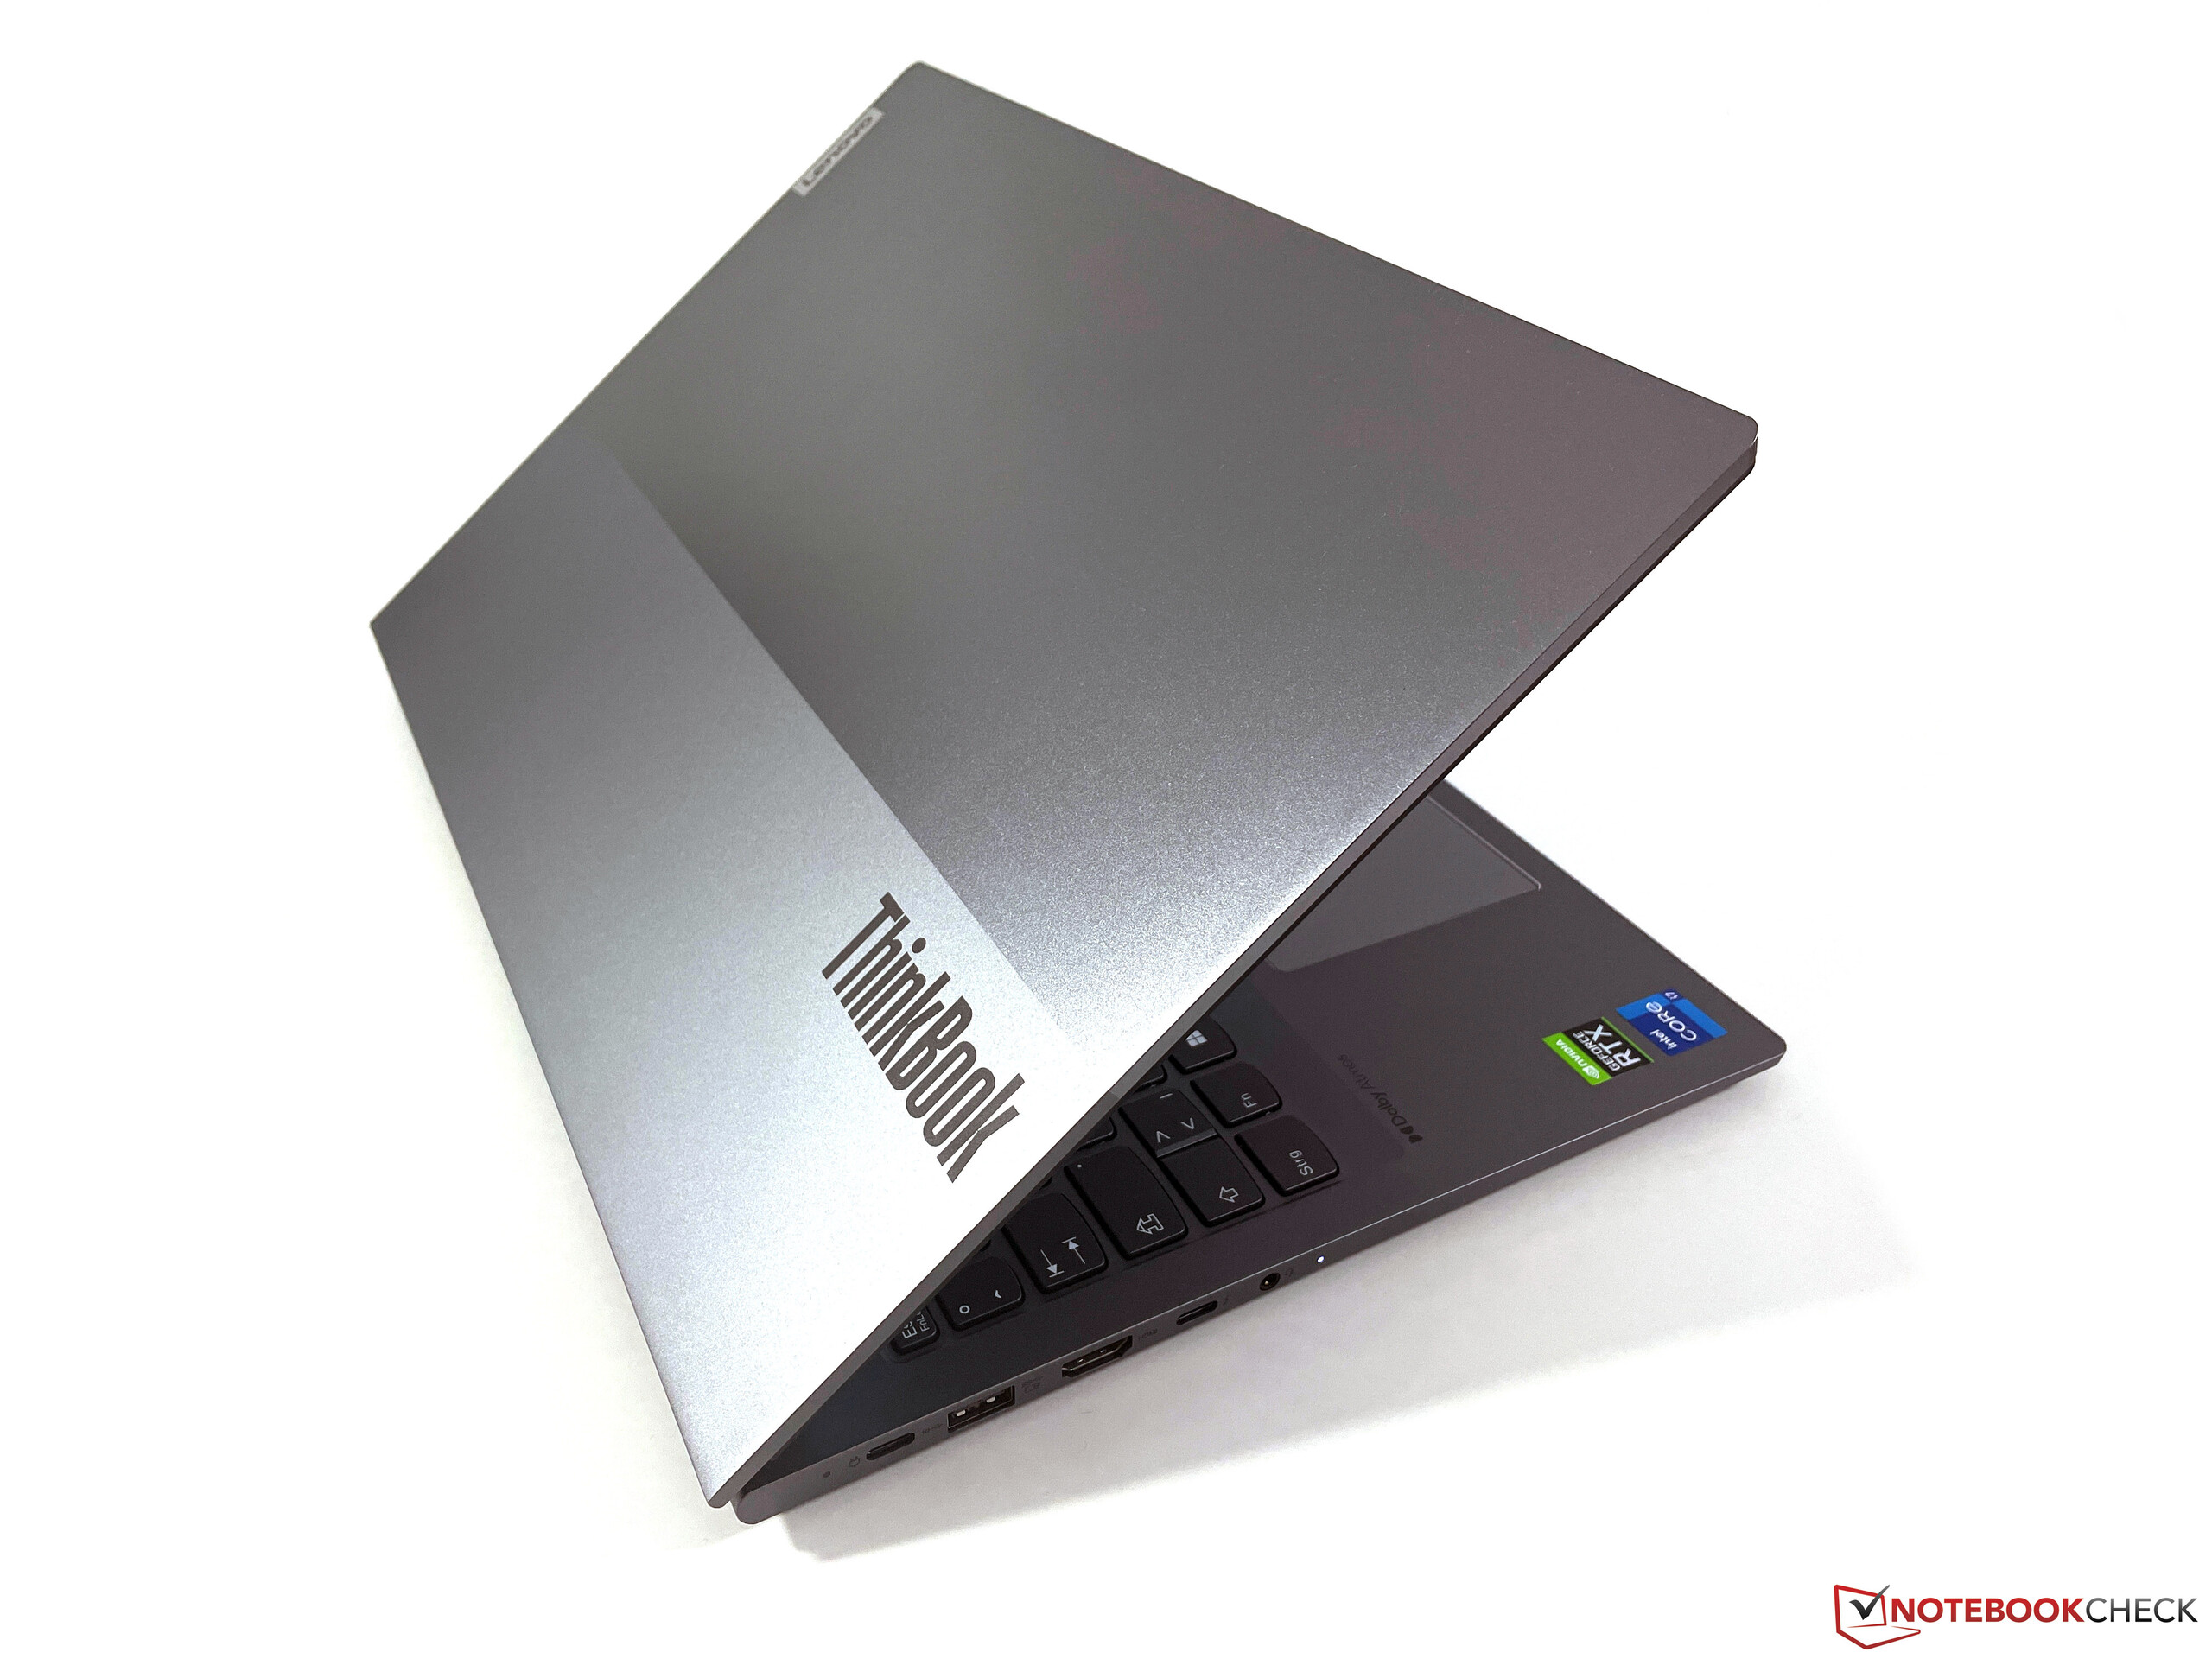
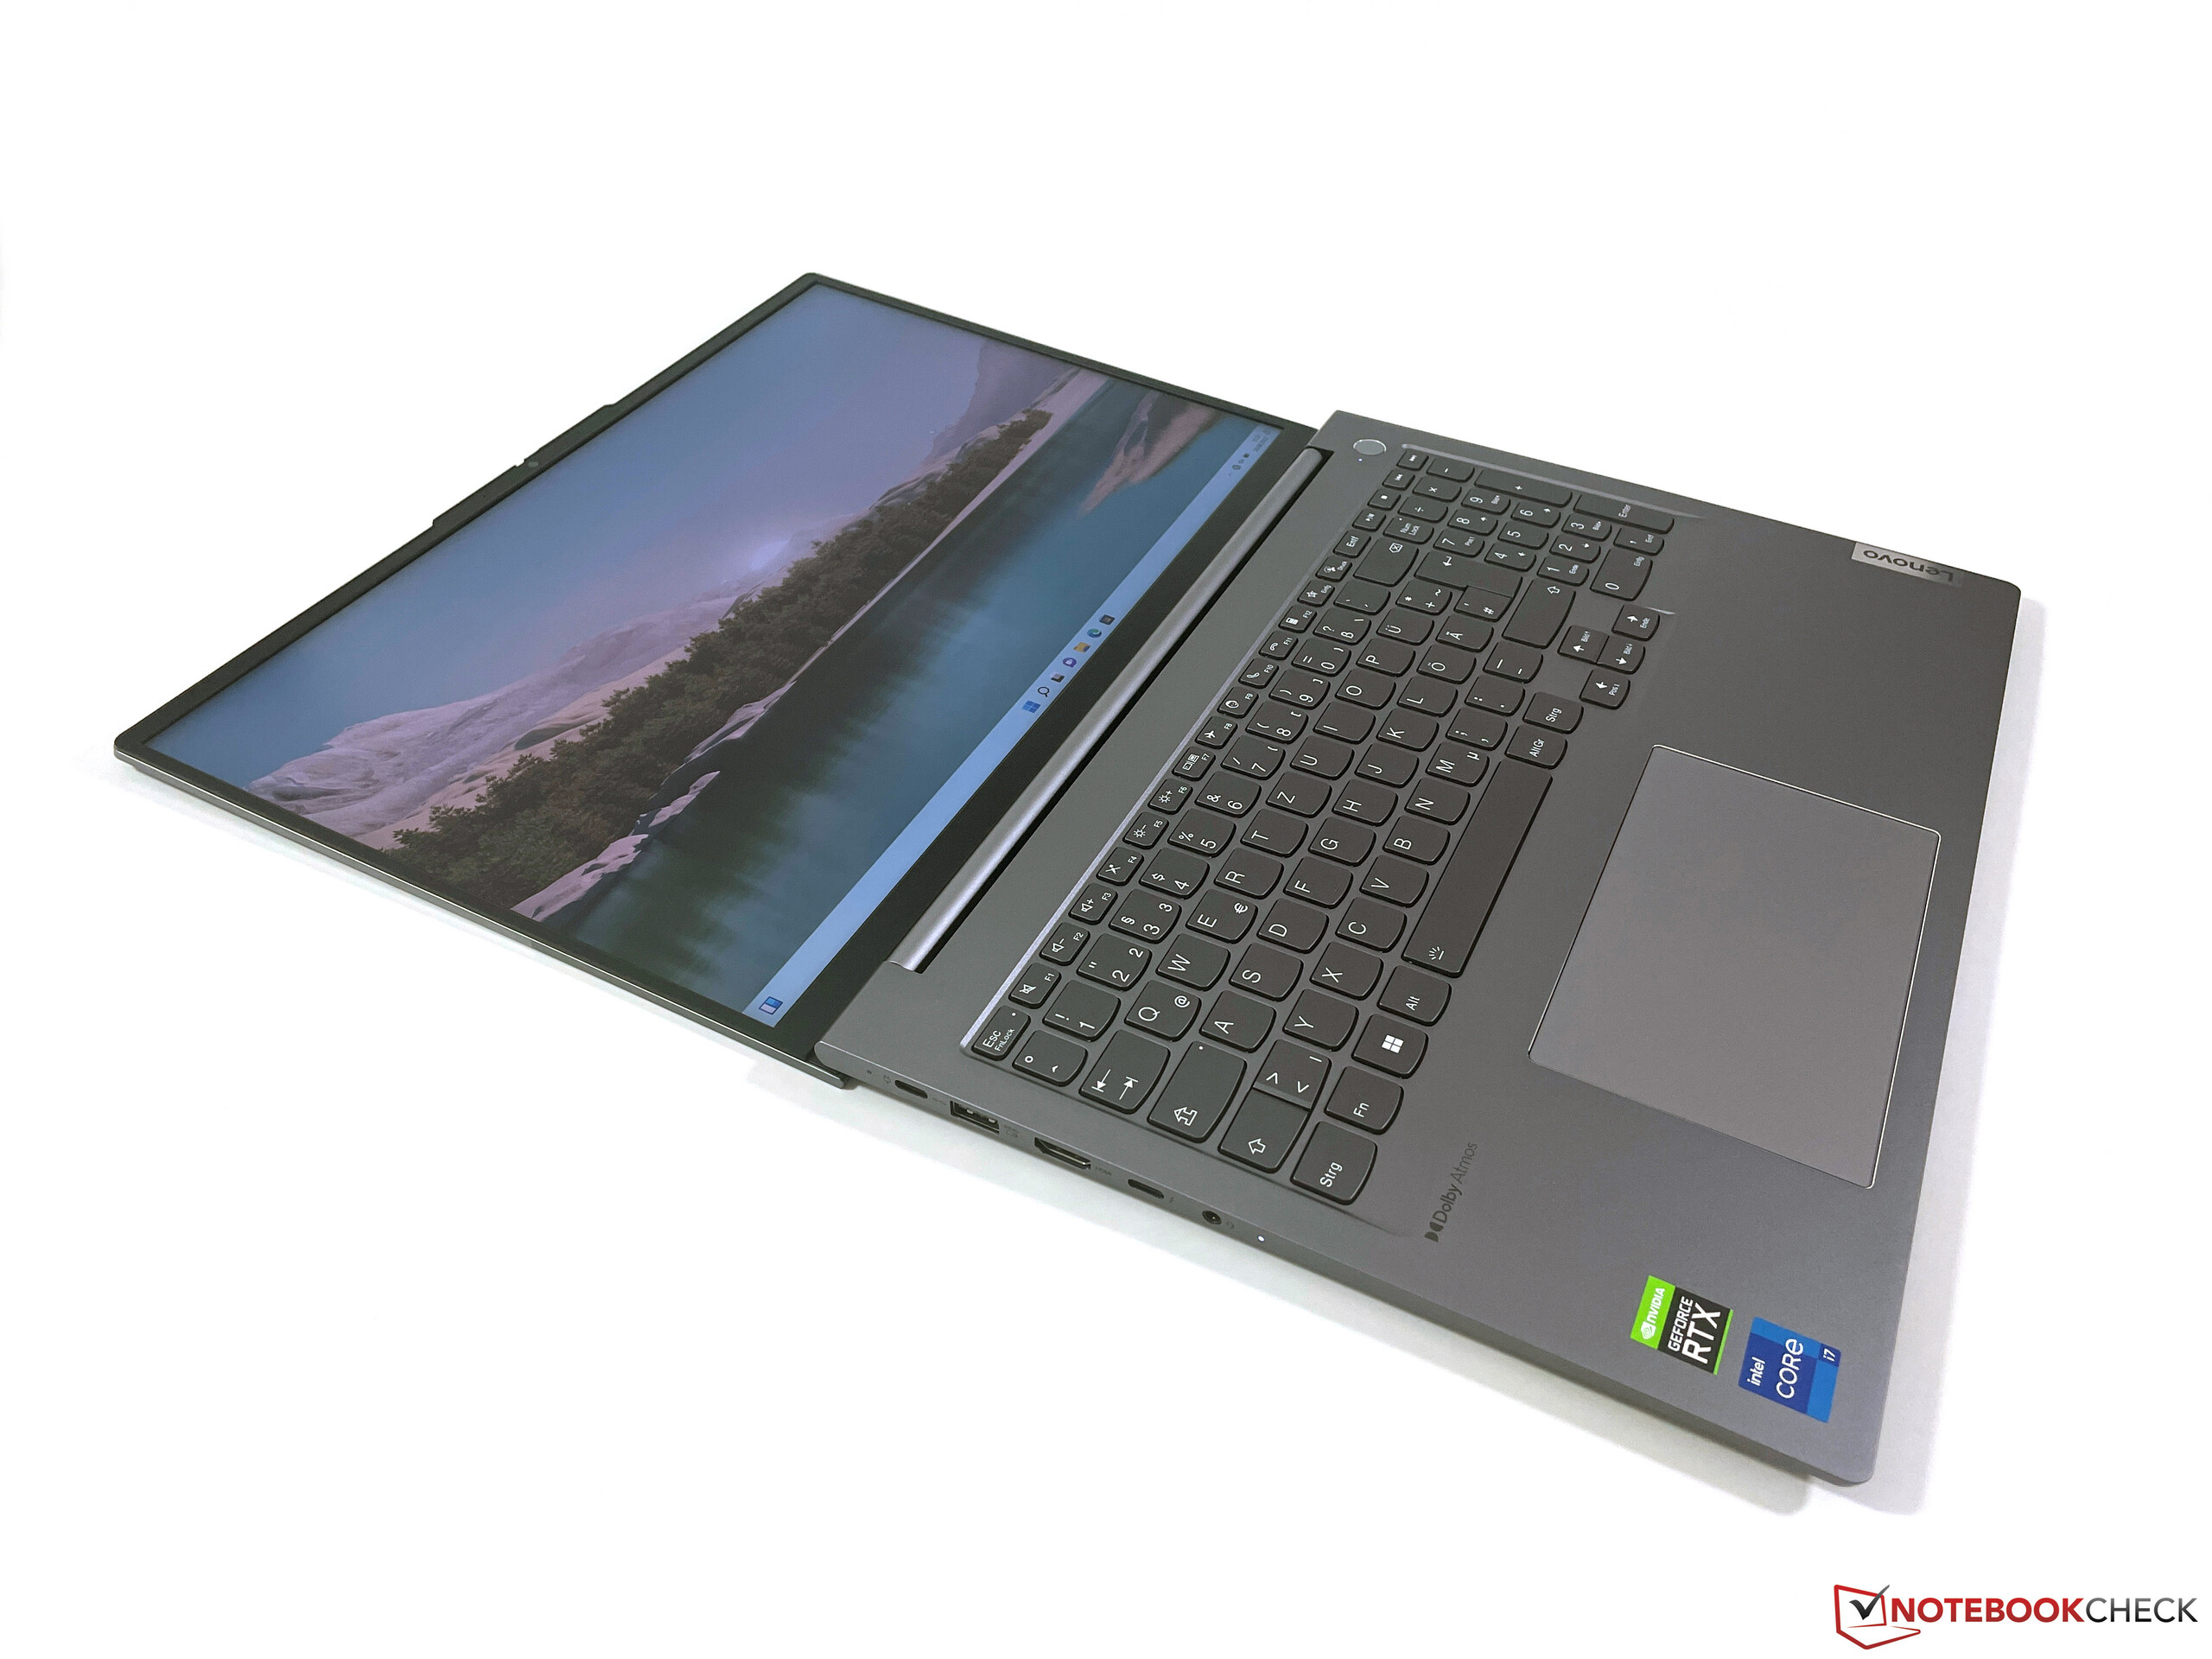
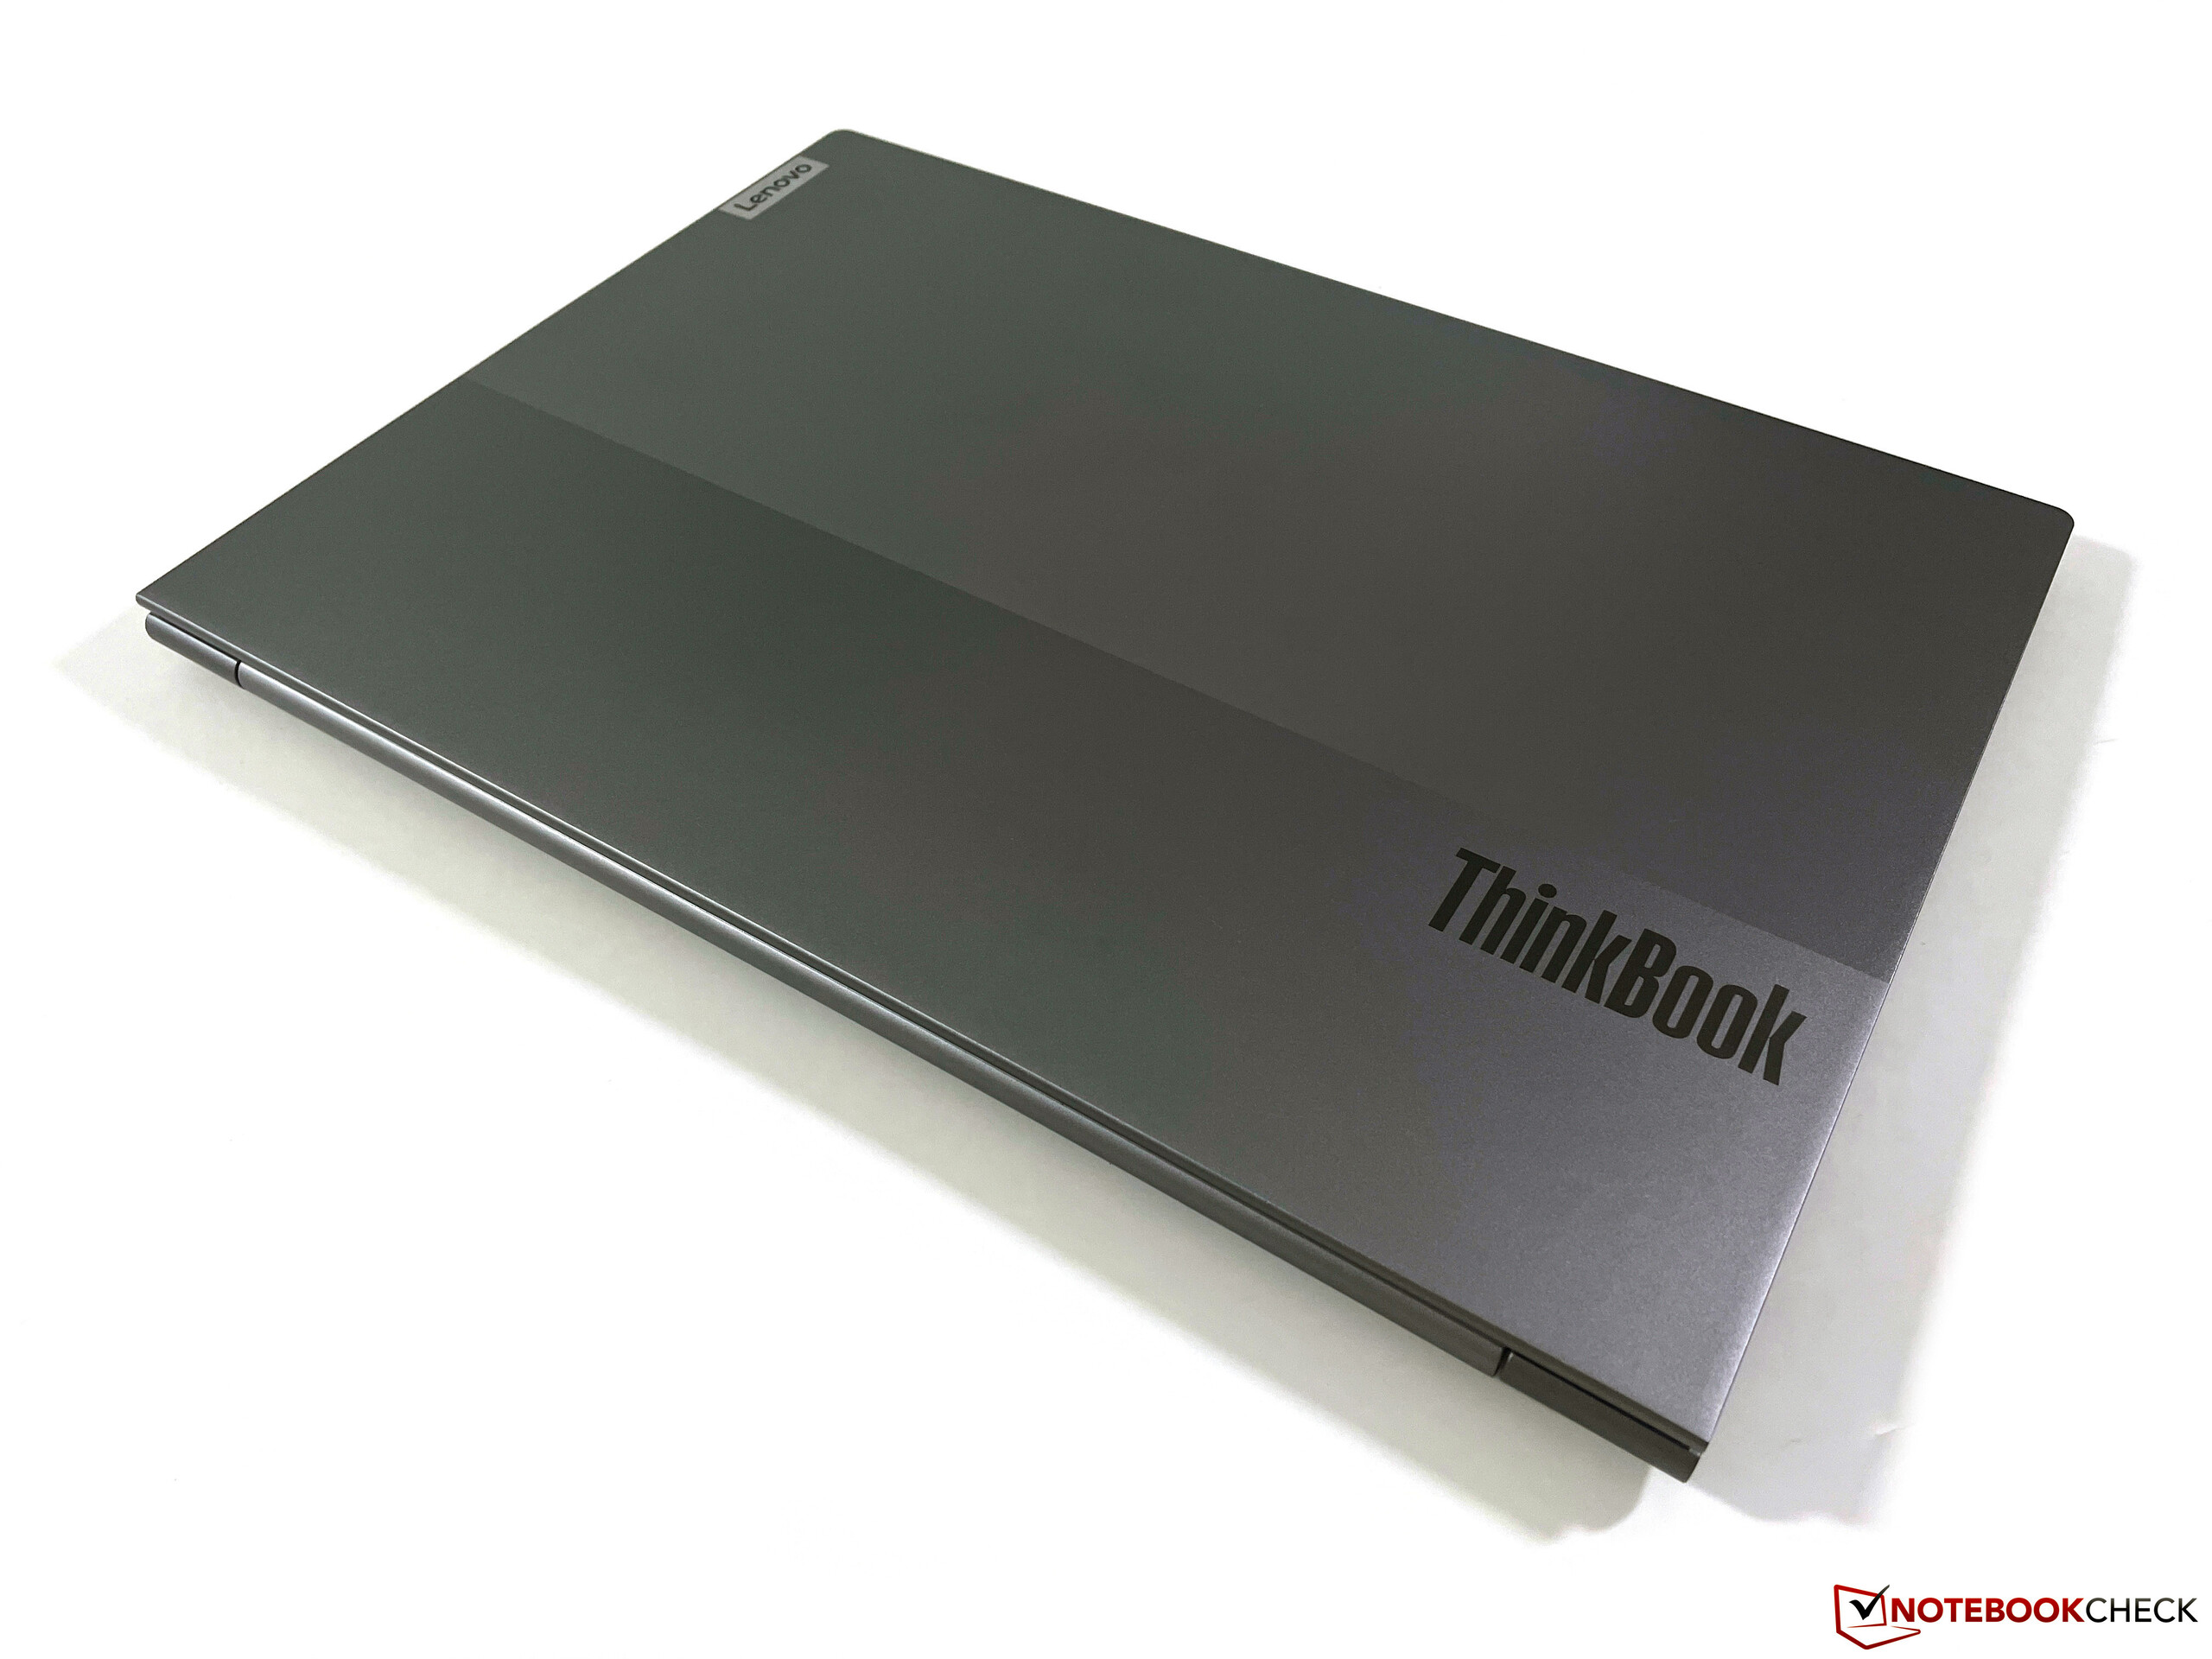
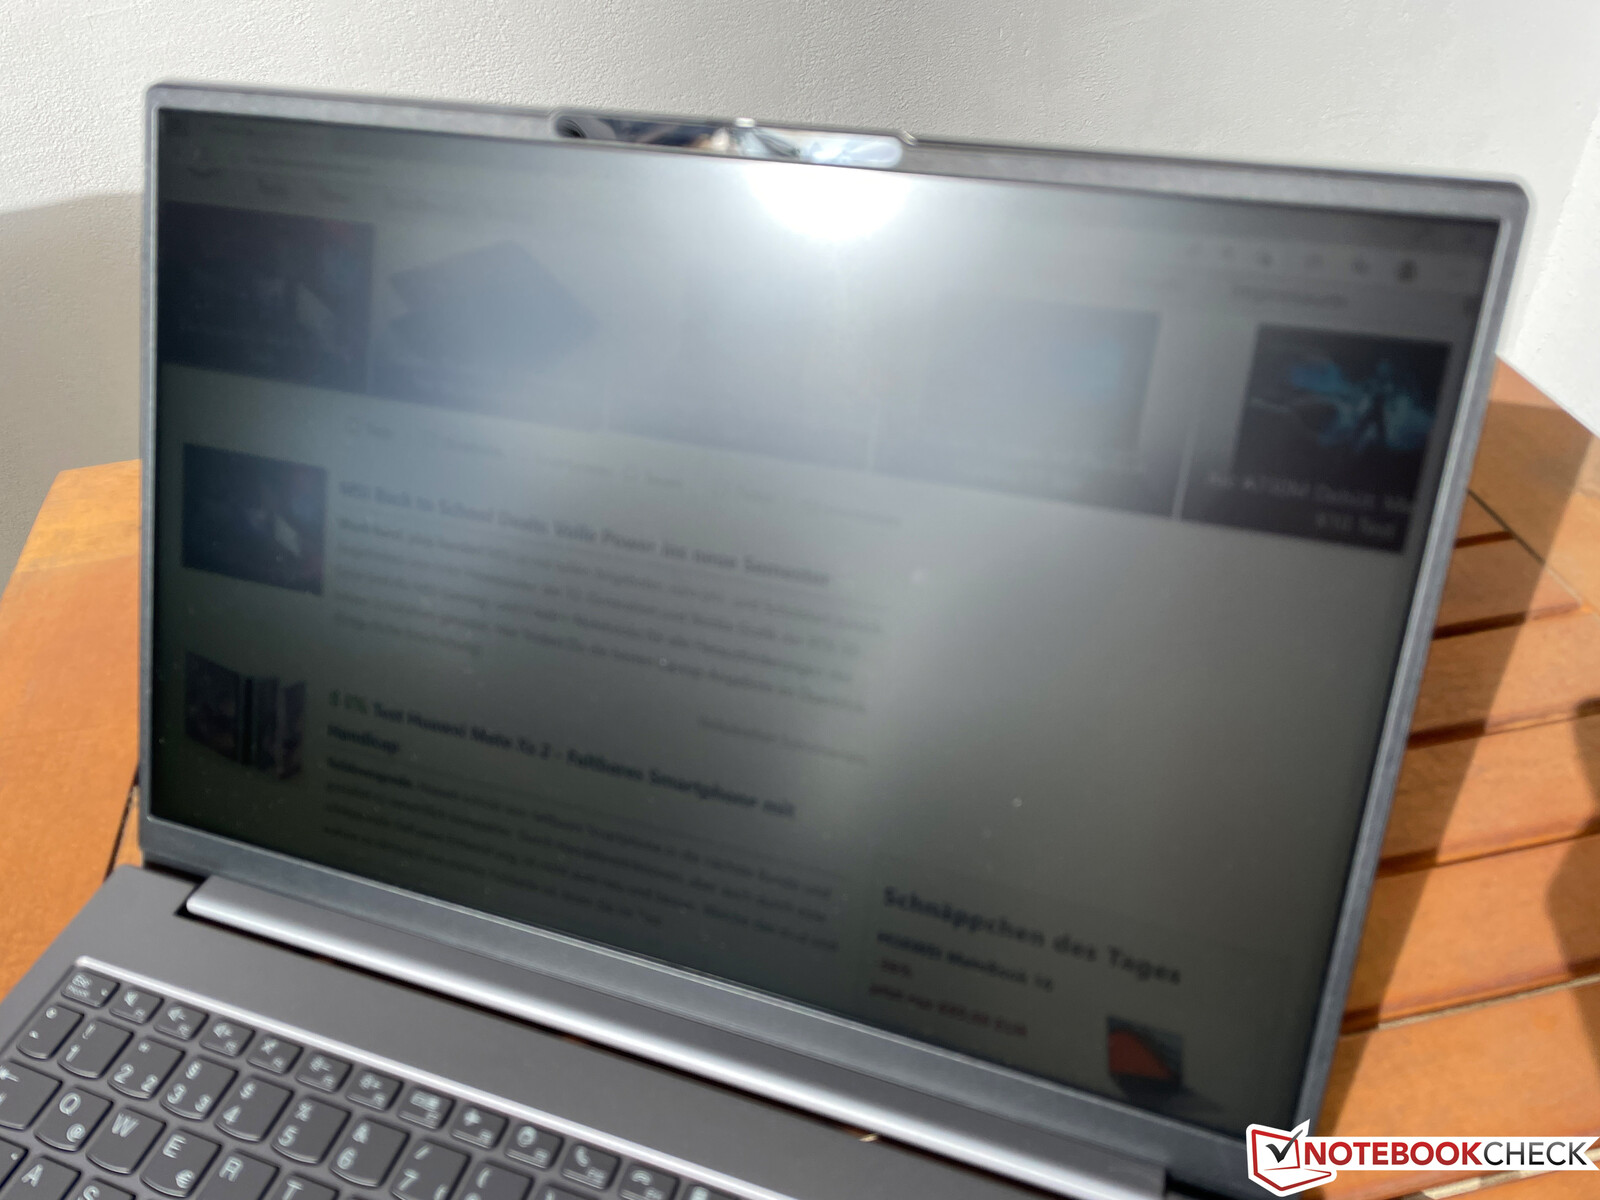
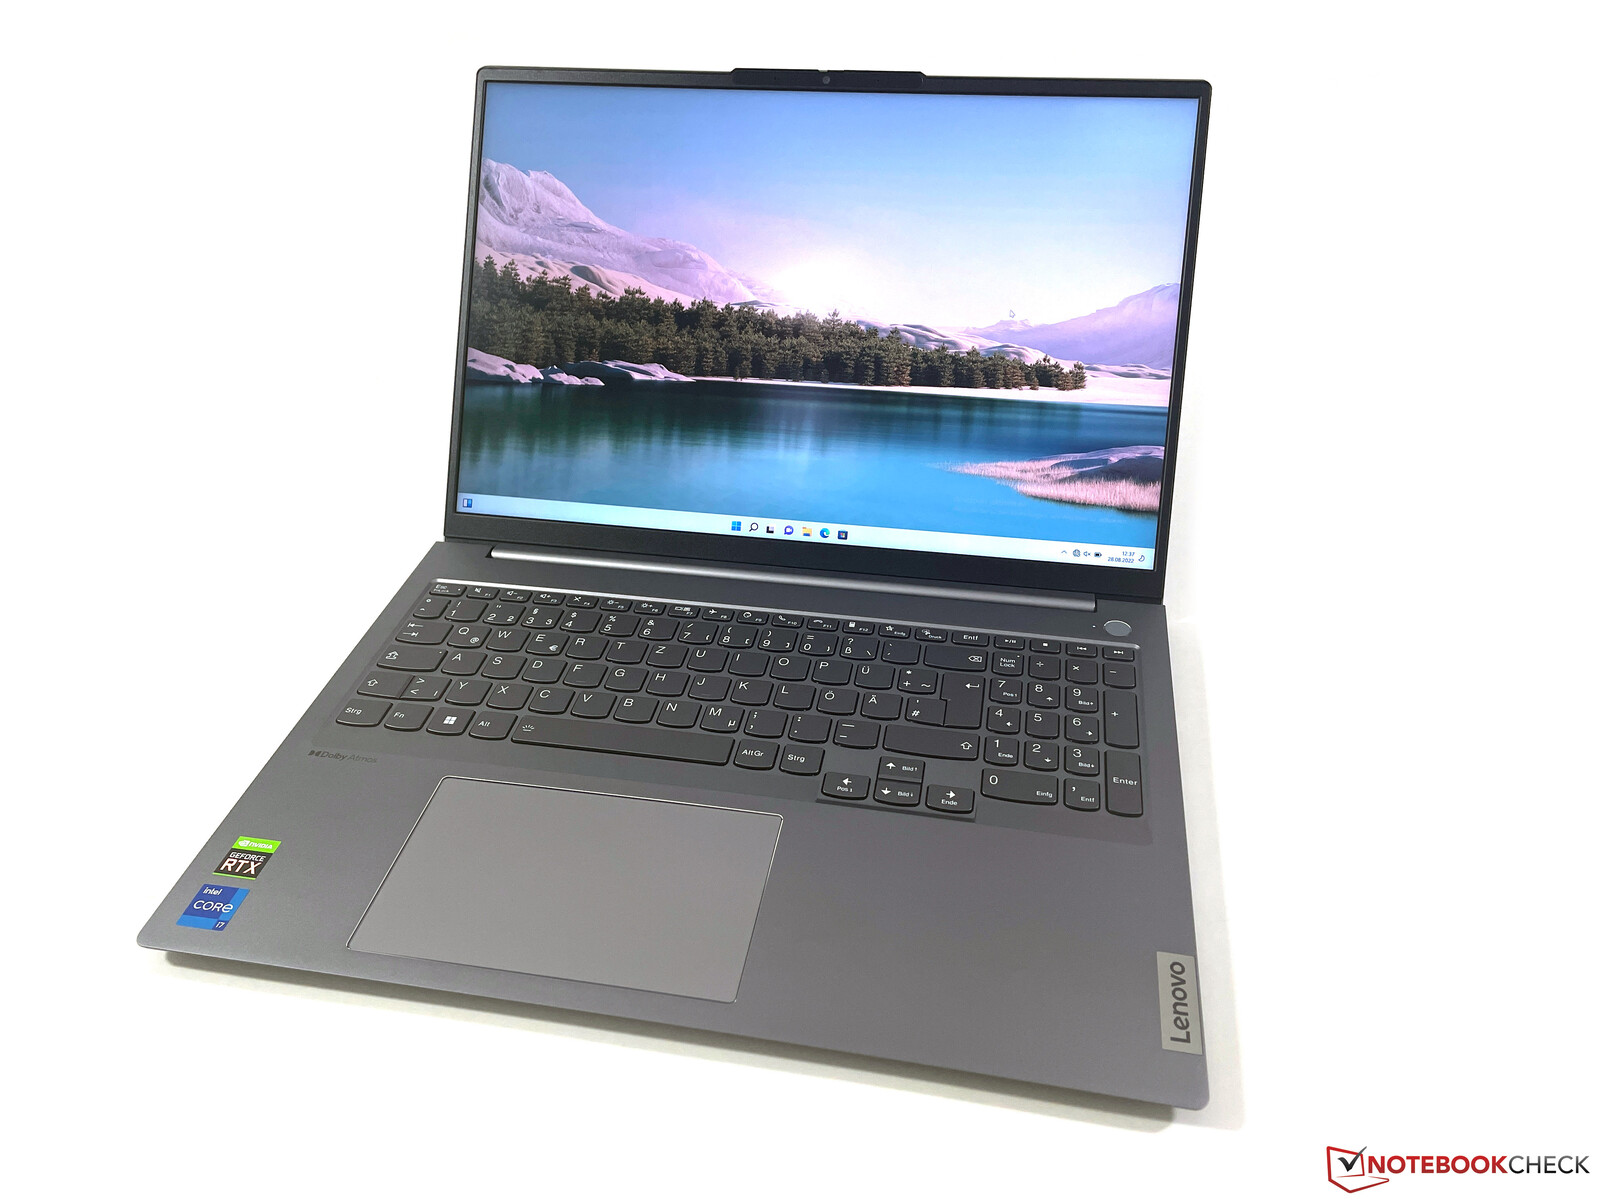
Case - A Lenovo faz uso do alumínio
A Lenovo utiliza principalmente alumínio para a caixa (isto é, a tampa e a unidade base) e as superfícies são jateadas tanto a jato de areia quanto anodizadas. As superfícies lisas são agradáveis e transmitem uma impressão de alta qualidade. As impressões digitais podem ser vistas com relativa rapidez, mas também podem ser removidas facilmente. Visualmente, a caixa de cor prata parece elegante e se encaixa bem em ambientes profissionais. O único acento visual é a tampa de dois tons de cinza com duas tonalidades diferentes.
Em termos de acabamento, o ThinkBook dá uma impressão fundamentalmente boa, mas ainda há espaço para melhorias. Conseguimos obter ruídos de rangidos silenciosos da unidade base e a área do teclado também pode ser pressionada para dentro. A tampa do display demonstra ser mais estável - não fomos capazes de trazer nenhum erro de imagem, mas o display se inclina claramente quando o ângulo de abertura é alterado. Um máximo de 180 graus é possível e as dobradiças estão bem ajustadas, já que a abertura com uma mão não apresenta problemas.
Com exceção doAcer Swift Xos dispositivos de 16 polegadas no campo de comparação são muito semelhantes em termos de tamanho. No entanto, o ThinkBook é um pouco mais fino que a maioria dos rivais, com apenas 1,65 cm. O peso é de 1,82 kg, não incluindo as 400 gramas adicionais para o adaptador de energia.
Equipamentos - ThinkBook com Thunderbolt 4
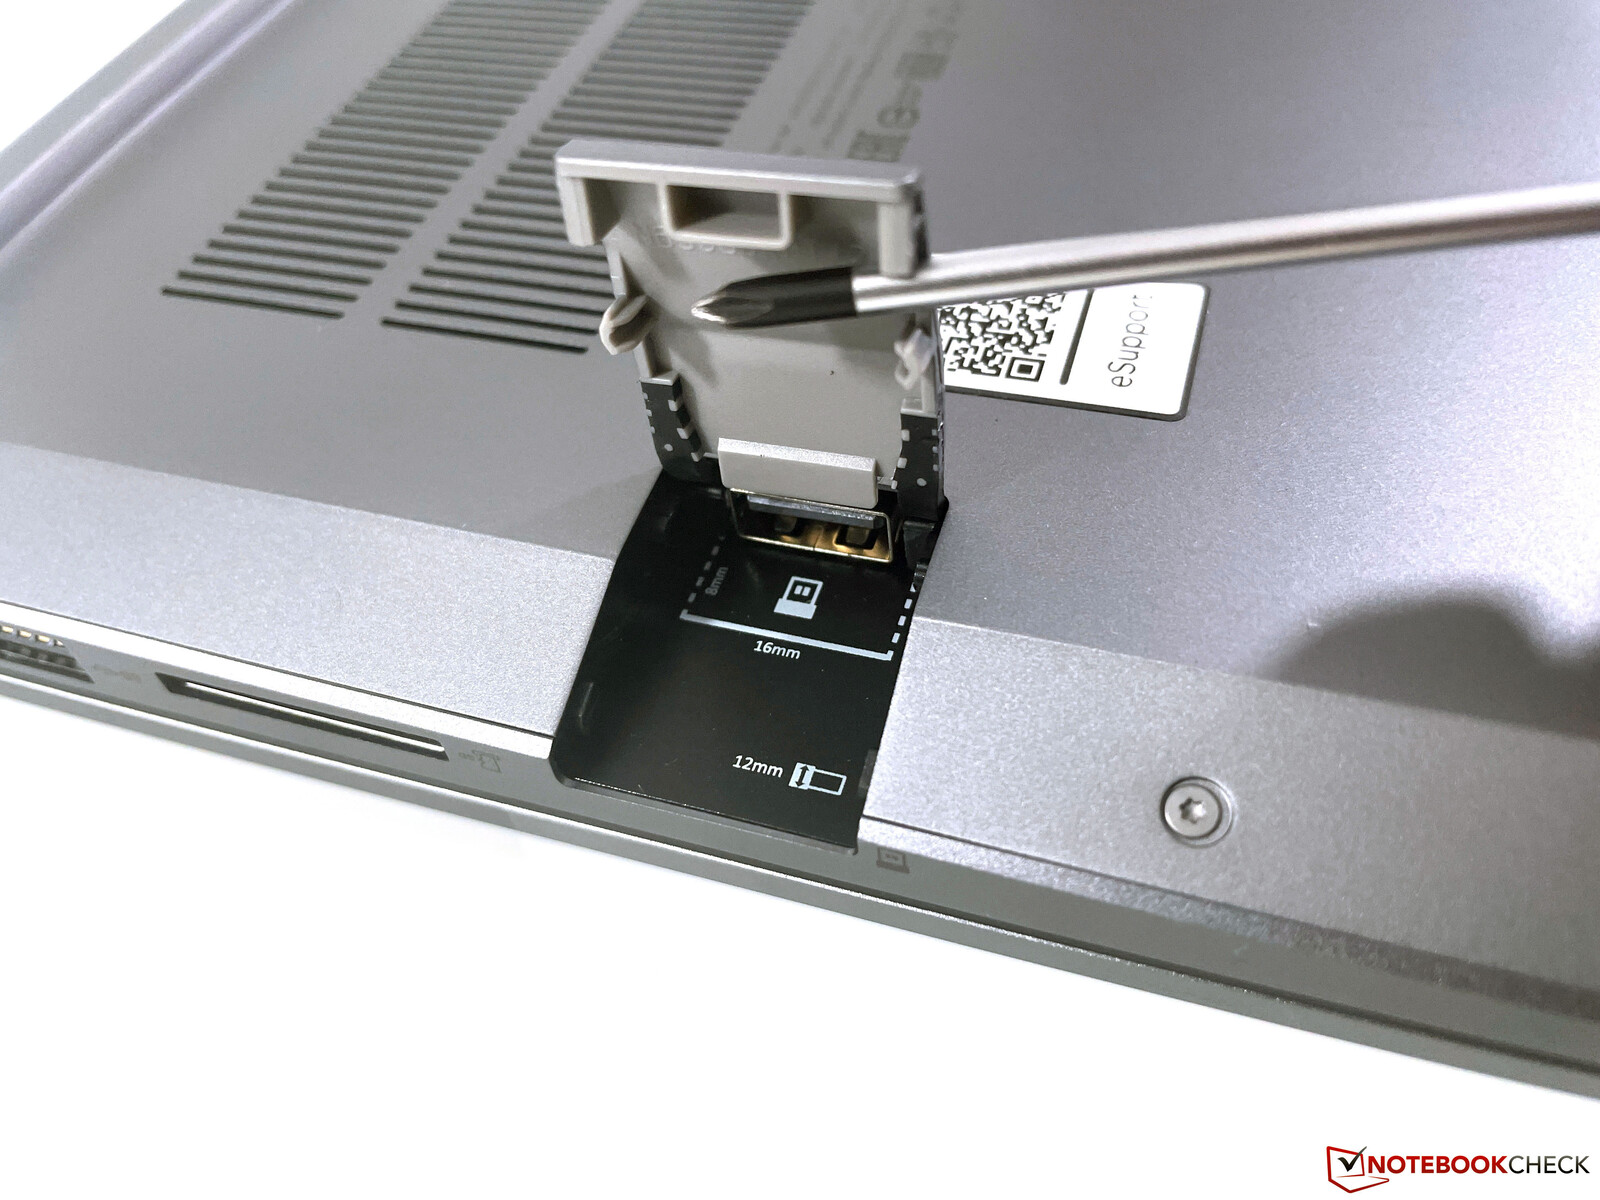
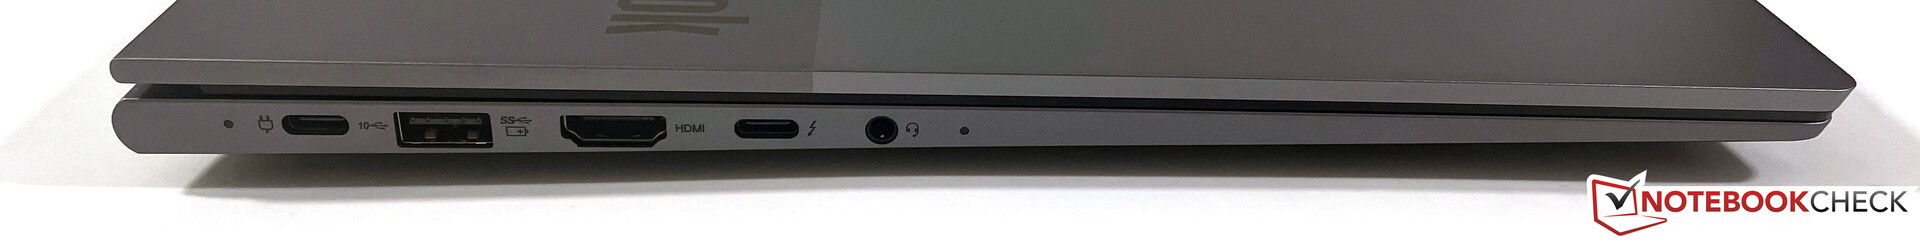
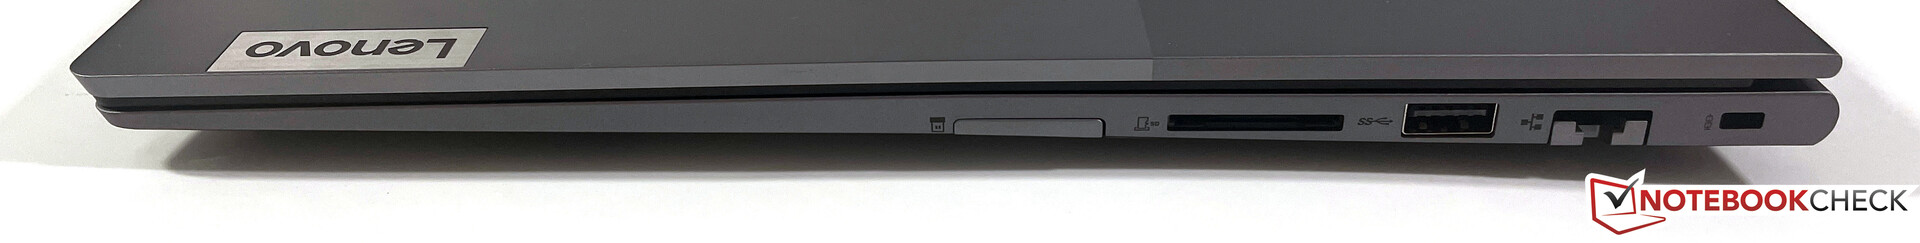
O ThinkBook 16 G4+ oferece praticamente todos os portos que você poderia querer. Além de uma porta Thunderbolt 4 moderna, há também portas USB-A regulares, uma saída HDMI completa e uma porta Gigabit Ethernet. Há até mesmo uma porta USB oculta sob uma aba no lado direito, que está em conformidade apenas com o padrão 2.0, mas é perfeita para dongles permanentemente conectados, como dispositivos de entrada externa.
Leitor de cartões SD
Há um leitor de cartões SD no lado direito que não acomoda totalmente os cartões de memória (eles se projetam em cerca de 2 cm). Medimos taxas de transferência de quase 90 MB/s através de nosso cartão de referência (Angelbird AV Pro V60 UHS-II), o que coloca o ThinkBook à frente dos concorrentes cujos leitores de cartão só funcionam via USB 2.0.
| SD Card Reader | |
| average JPG Copy Test (av. of 3 runs) | |
| Média da turma Multimedia (23 - 531, n=43, últimos 2 anos) | |
| Lenovo ThinkBook 16 G4+ IAP (Angelbird AV Pro V60) | |
| Asus Vivobook Pro 16X-M7600QE (AV Pro SD microSD 128 GB V60) | |
| Dell Inspiron 16 Plus 7620 (Toshiba Exceria Pro SDXC 64 GB UHS-II) | |
| Samsung Galaxy Book2 15 (Angelbird AV Pro V60) | |
| maximum AS SSD Seq Read Test (1GB) | |
| Média da turma Multimedia (27.9 - 1455, n=42, últimos 2 anos) | |
| Lenovo ThinkBook 16 G4+ IAP (Angelbird AV Pro V60) | |
| Asus Vivobook Pro 16X-M7600QE (AV Pro SD microSD 128 GB V60) | |
| Dell Inspiron 16 Plus 7620 (Toshiba Exceria Pro SDXC 64 GB UHS-II) | |
| Samsung Galaxy Book2 15 (Angelbird AV Pro V60) | |
Comunicação
Além do módulo Gigabit Ethernet (Intel I219-V), a Lenovo instala o muito moderno módulo Intel AX211E Wi-Fi 6E, que teoricamente suporta as mais recentes redes de 6 GHz. No entanto, não conseguimos nos conectar à rede de 6 GHz de nosso roteador de referência da Asus. No entanto, as taxas de transferência foram muito altas e estáveis na rede de 5 GHz, e é por isso que não há limitações reais na prática.
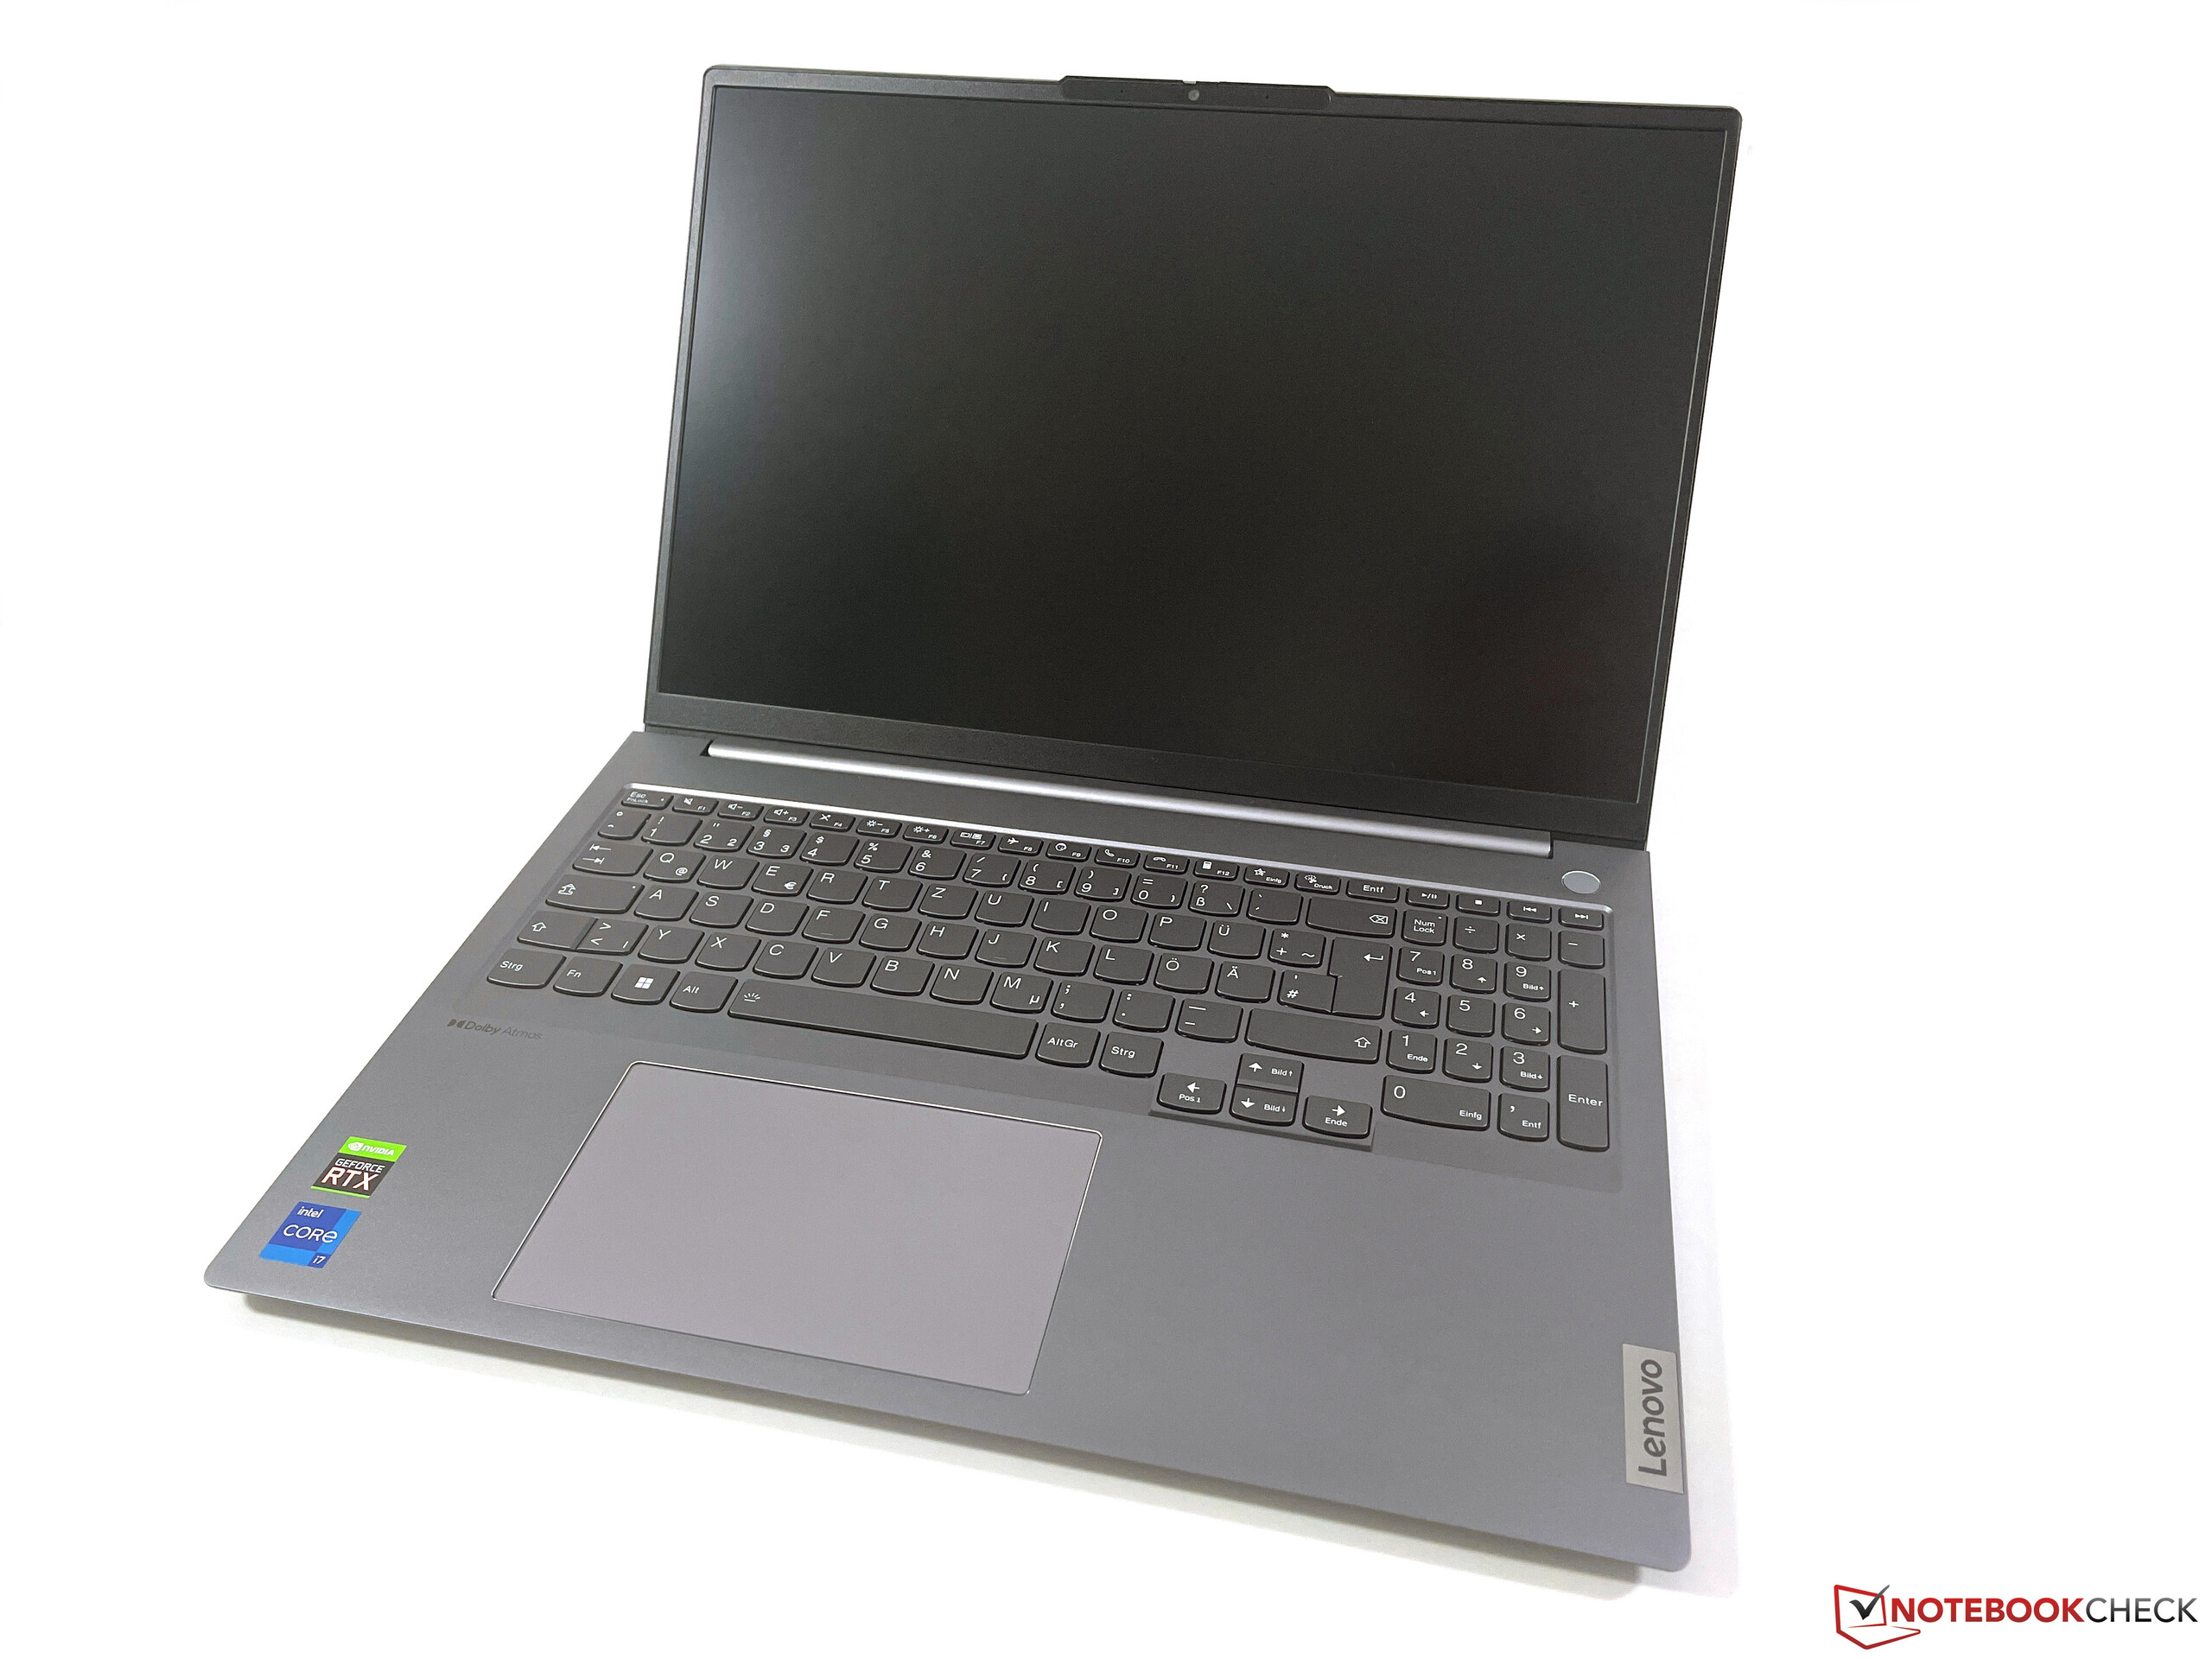
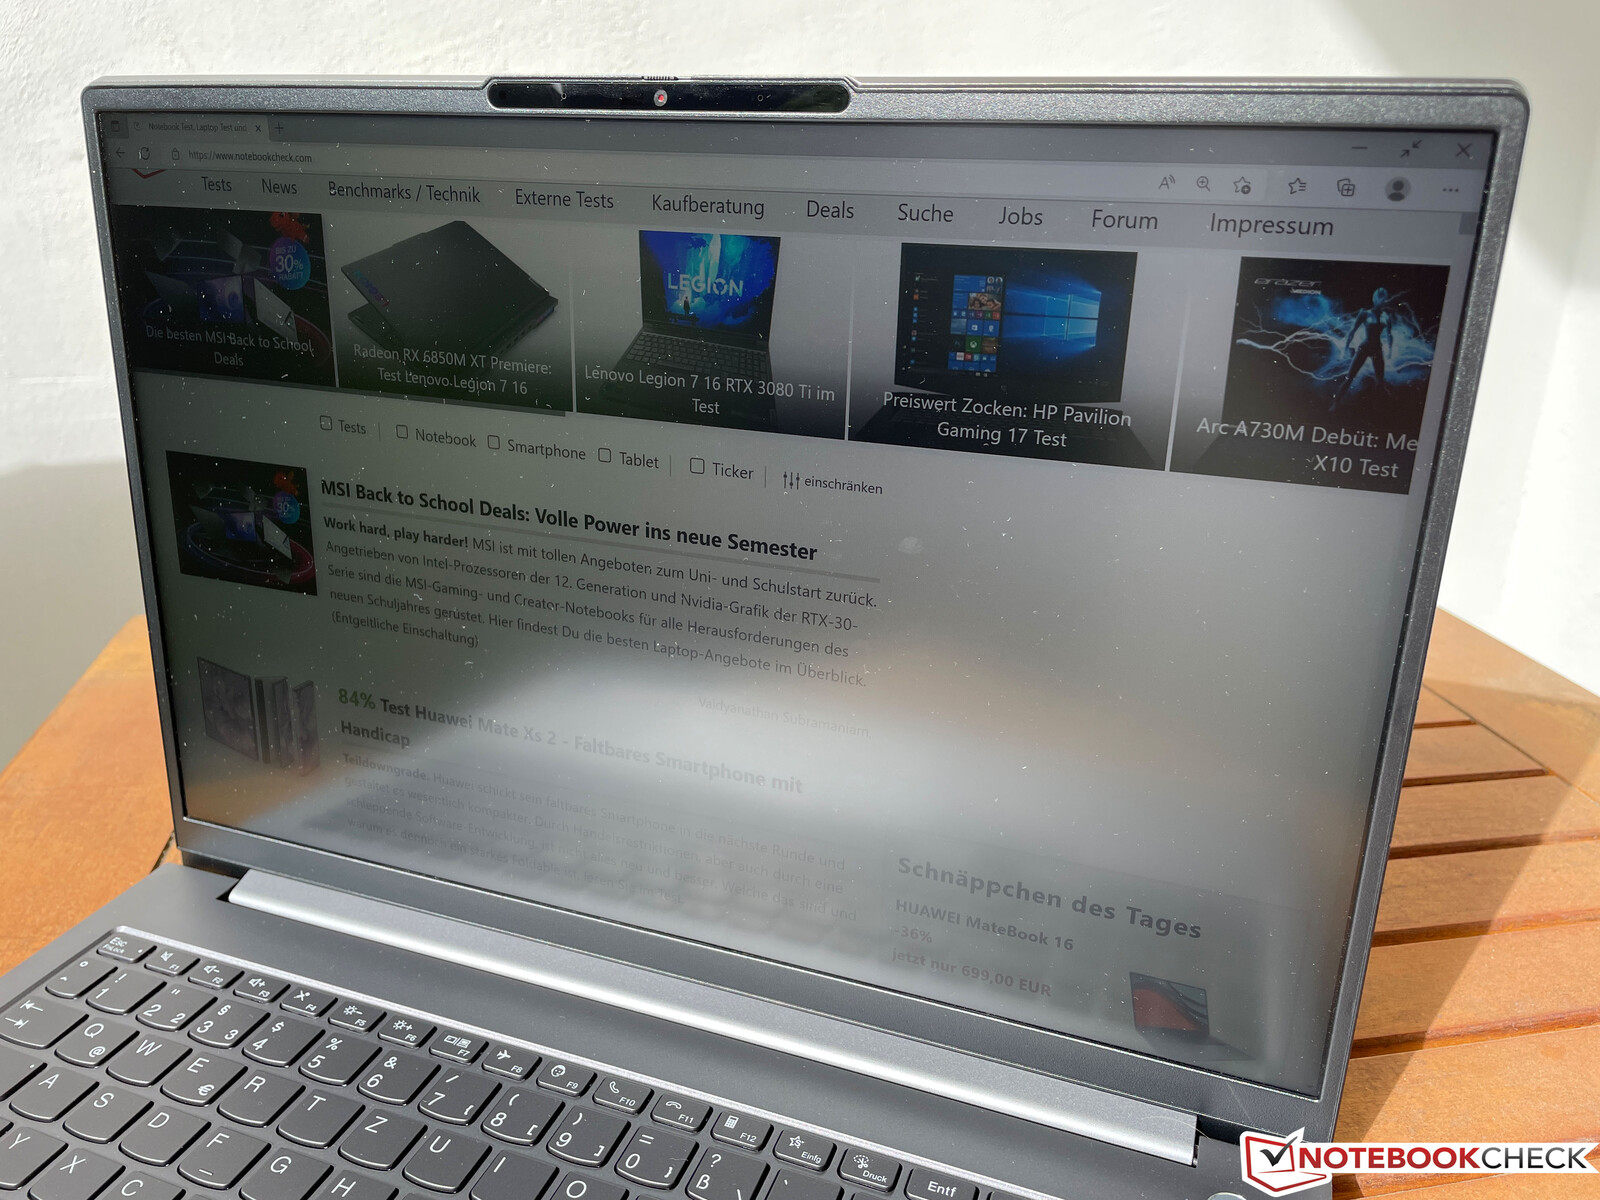
Webcam
O ThinkBook oferece uma webcam de 1080p com um obturador mecânico que fornece imagens melhores do que os módulos anteriores de 720p. Além disso, há uma câmera IR para reconhecimento facial via Windows Olá.


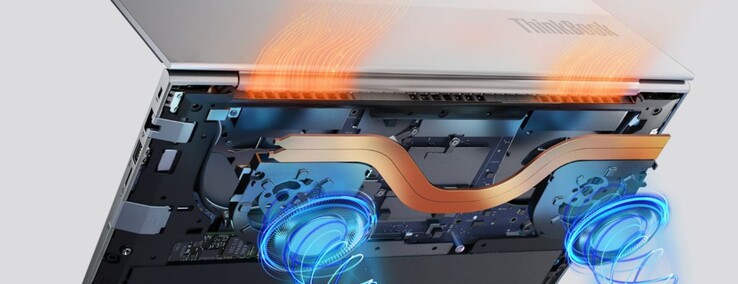
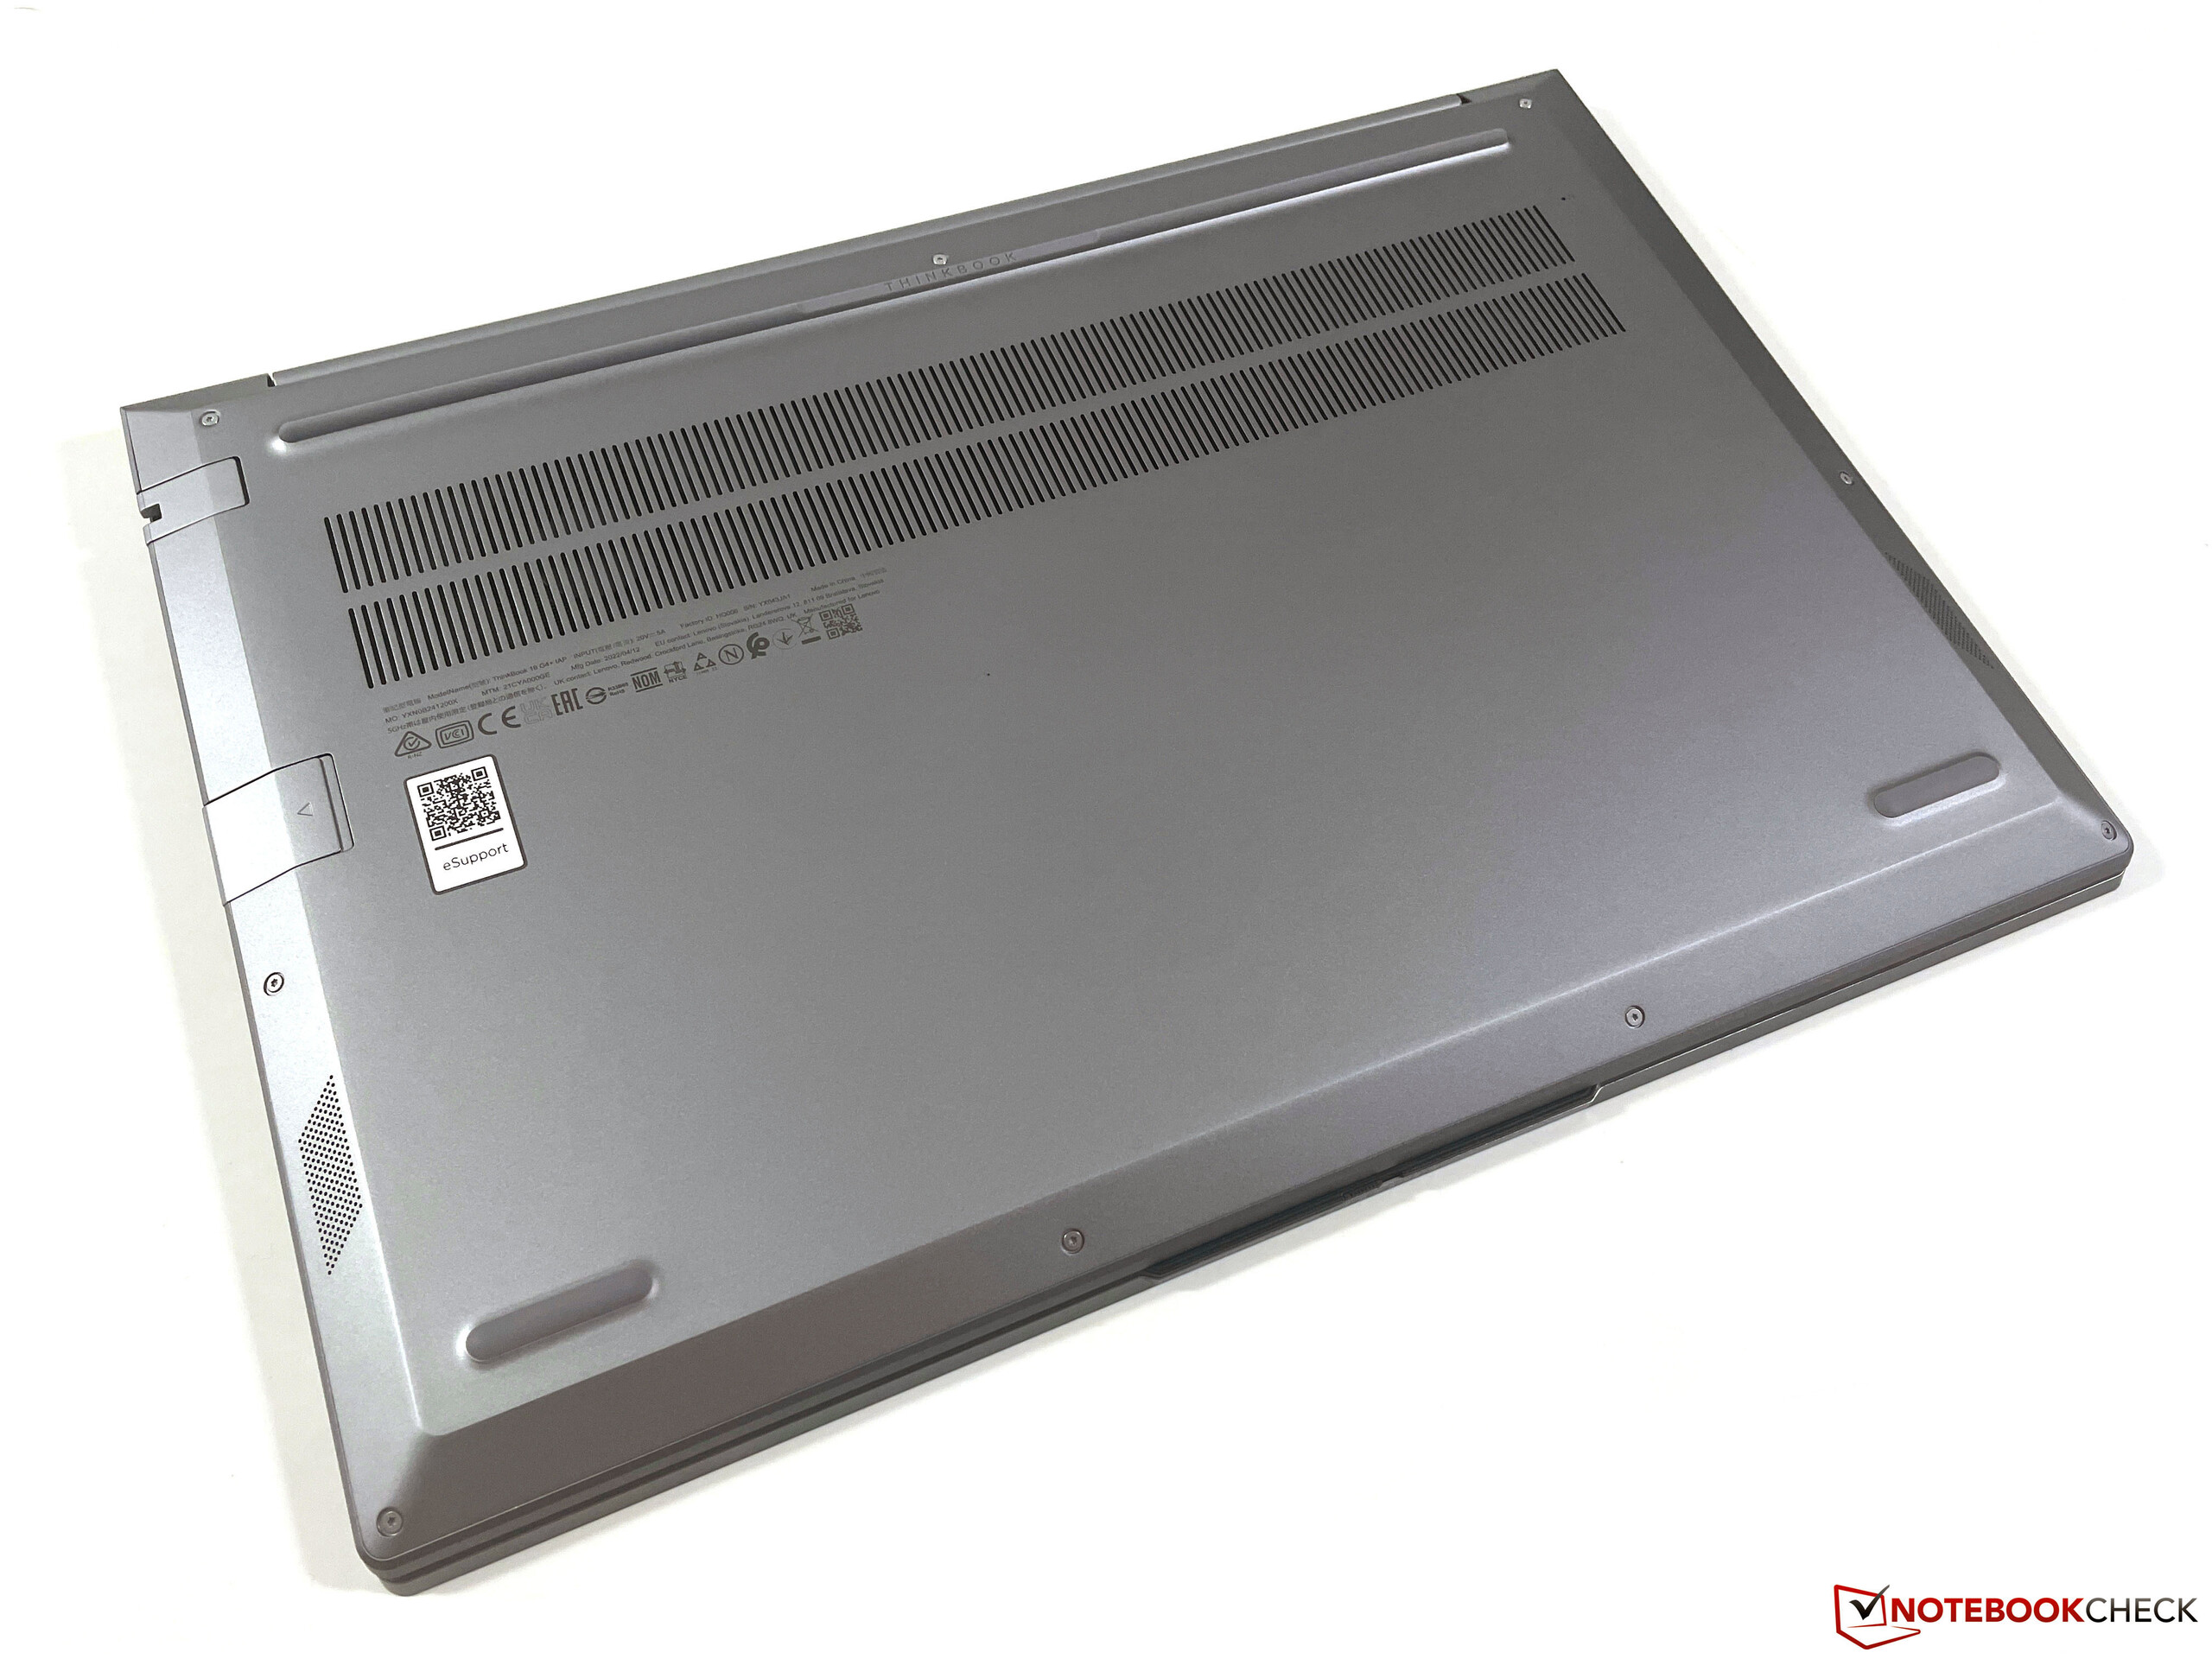
Manutenção
A placa de base é fixada com um total de 10 parafusos Torx (T5) e pode ser removida facilmente. Em seguida, é possível limpar os dois ventiladores e acessar os dois slots M.2-2280 para SSDs. O módulo WLAN é parcialmente colado, mas pode ser substituído, em princípio. Apenas a RAM é soldada e não pode ser atualizada.

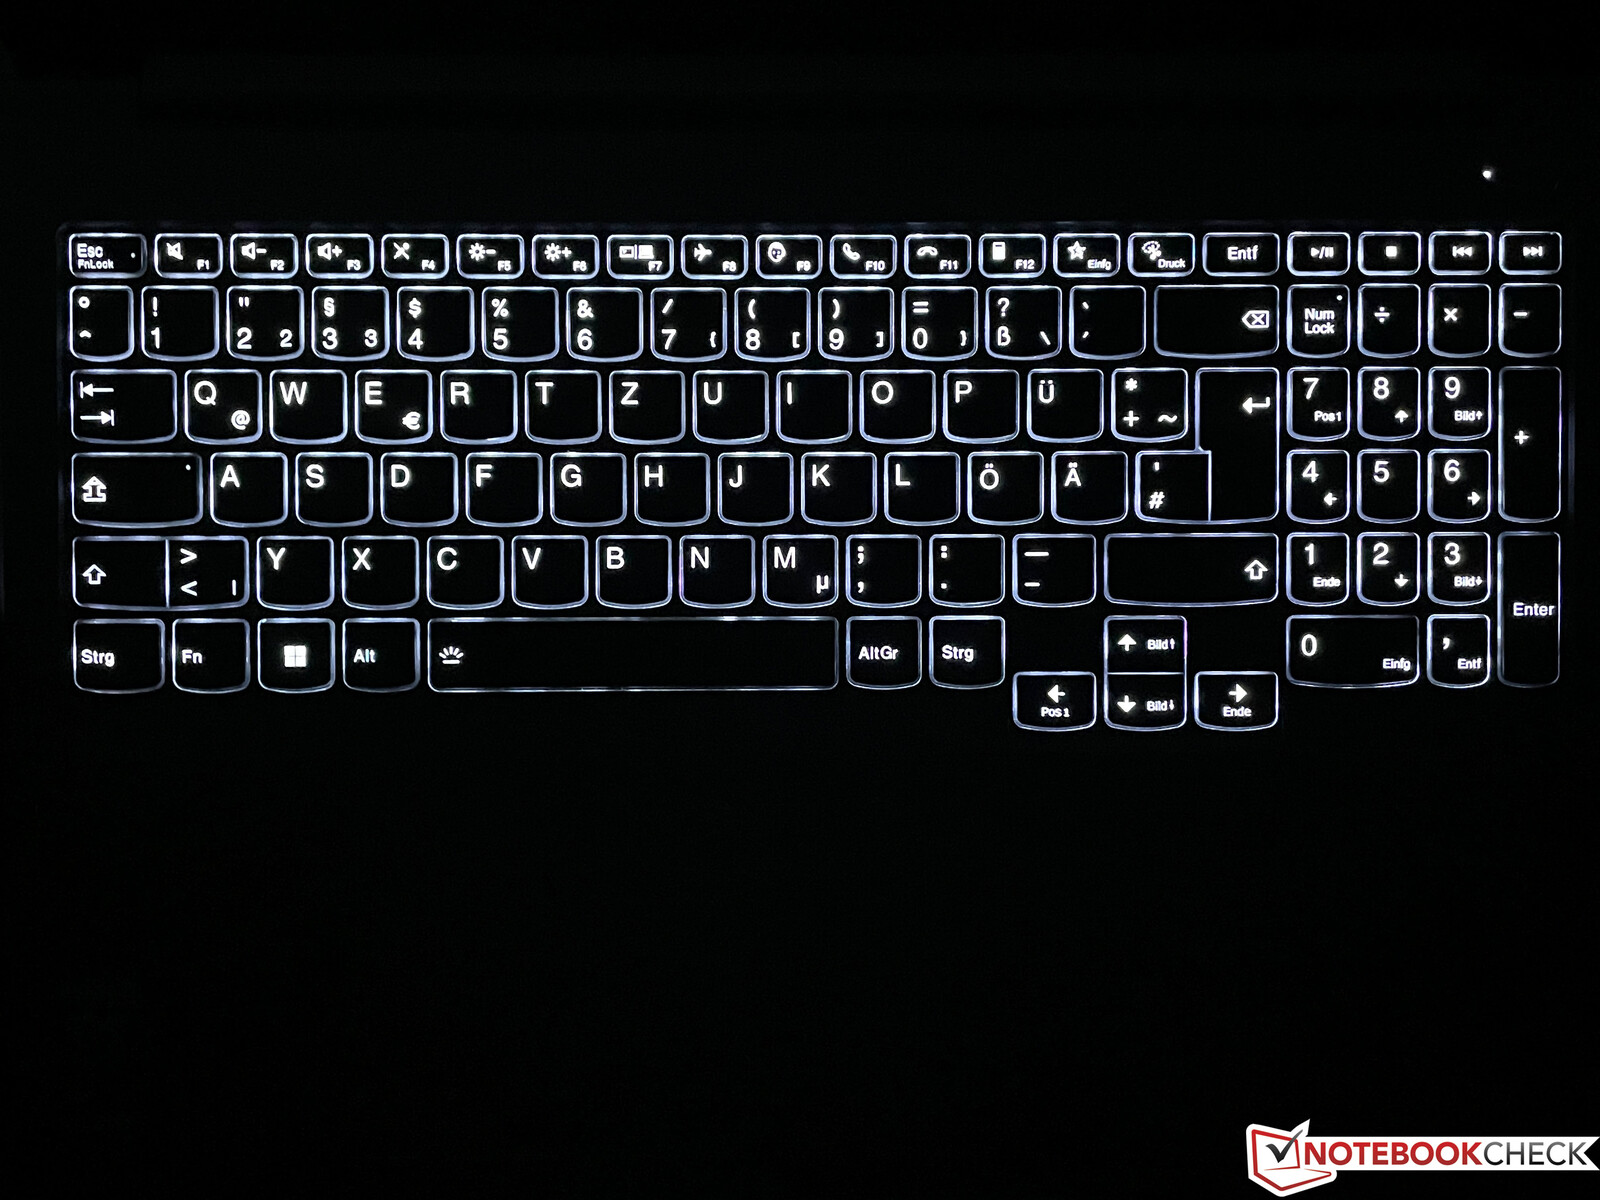
Dispositivos de entrada - Laptop multimídia com um teclado médio
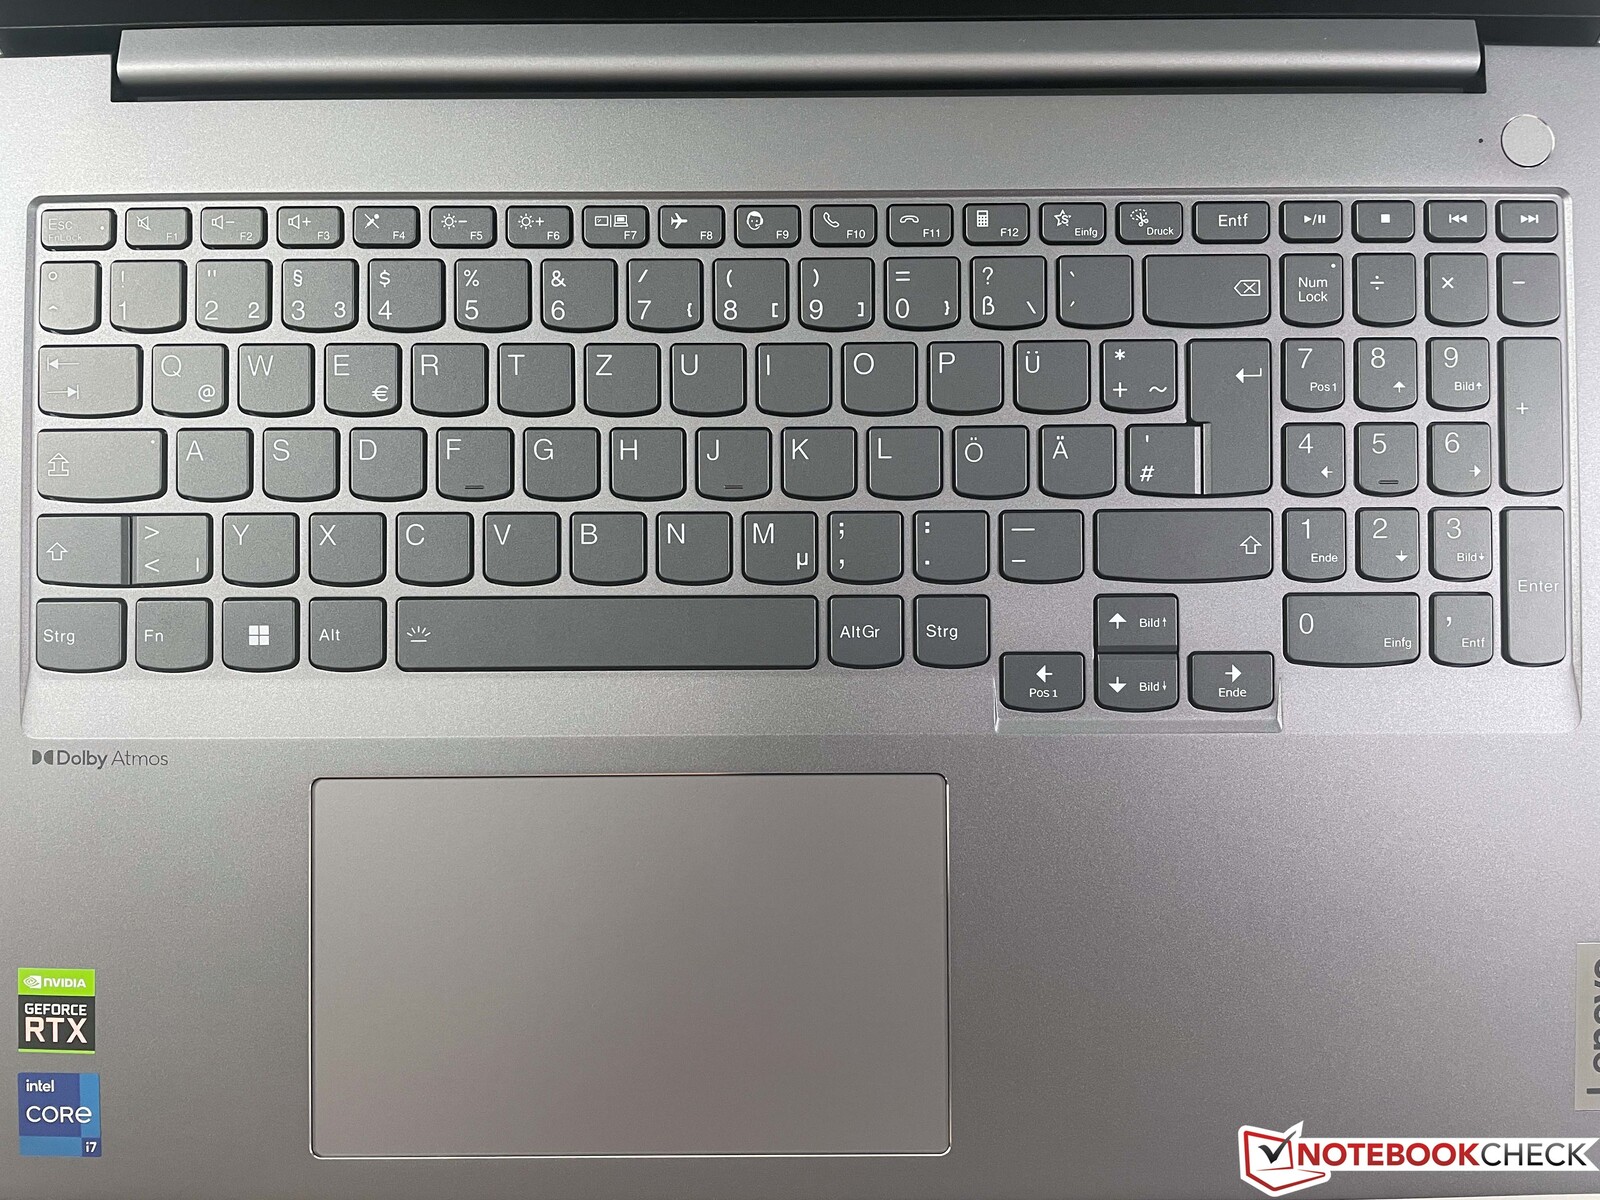
O teclado cinza escuro oferece uma retroiluminação branca de dois níveis bem como um teclado numérico dedicado no lado direito, embora as teclas sejam um pouco mais estreitas aqui. Em termos de digitação, o ThinkBook está mais na linha dos IdeaPads do fabricante do que dos ThinkPads. O percurso das chaves é bastante curto, mas pelo menos o feedback é muito preciso e as chaves também não chocalham. Em nossa opinião, a Lenovo desperdiça algum potencial aqui; há entradas mais confortáveis se você digitar freqüentemente textos muito longos. O botão de alimentação está localizado à direita acima do teclado e inclui um leitor de impressões digitais.
O ClickPad grande foi deslocado ligeiramente para a esquerda e, a 12 x 7,5 cm, oferece espaço suficiente para navegação com ponteiro, assim como gestos com até quatro dedos. Isto funciona muito bem graças ao padrão da Microsoft Precision e o teclado também não faz barulho. A metade inferior pode ser pressionada fisicamente, mas isto se caracteriza por ruídos de cliques altos e baratos, portanto você deve apenas tocar o pad (toque para clicar).
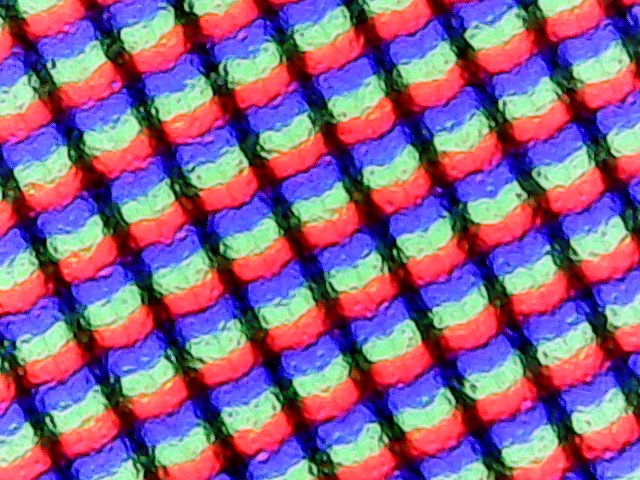
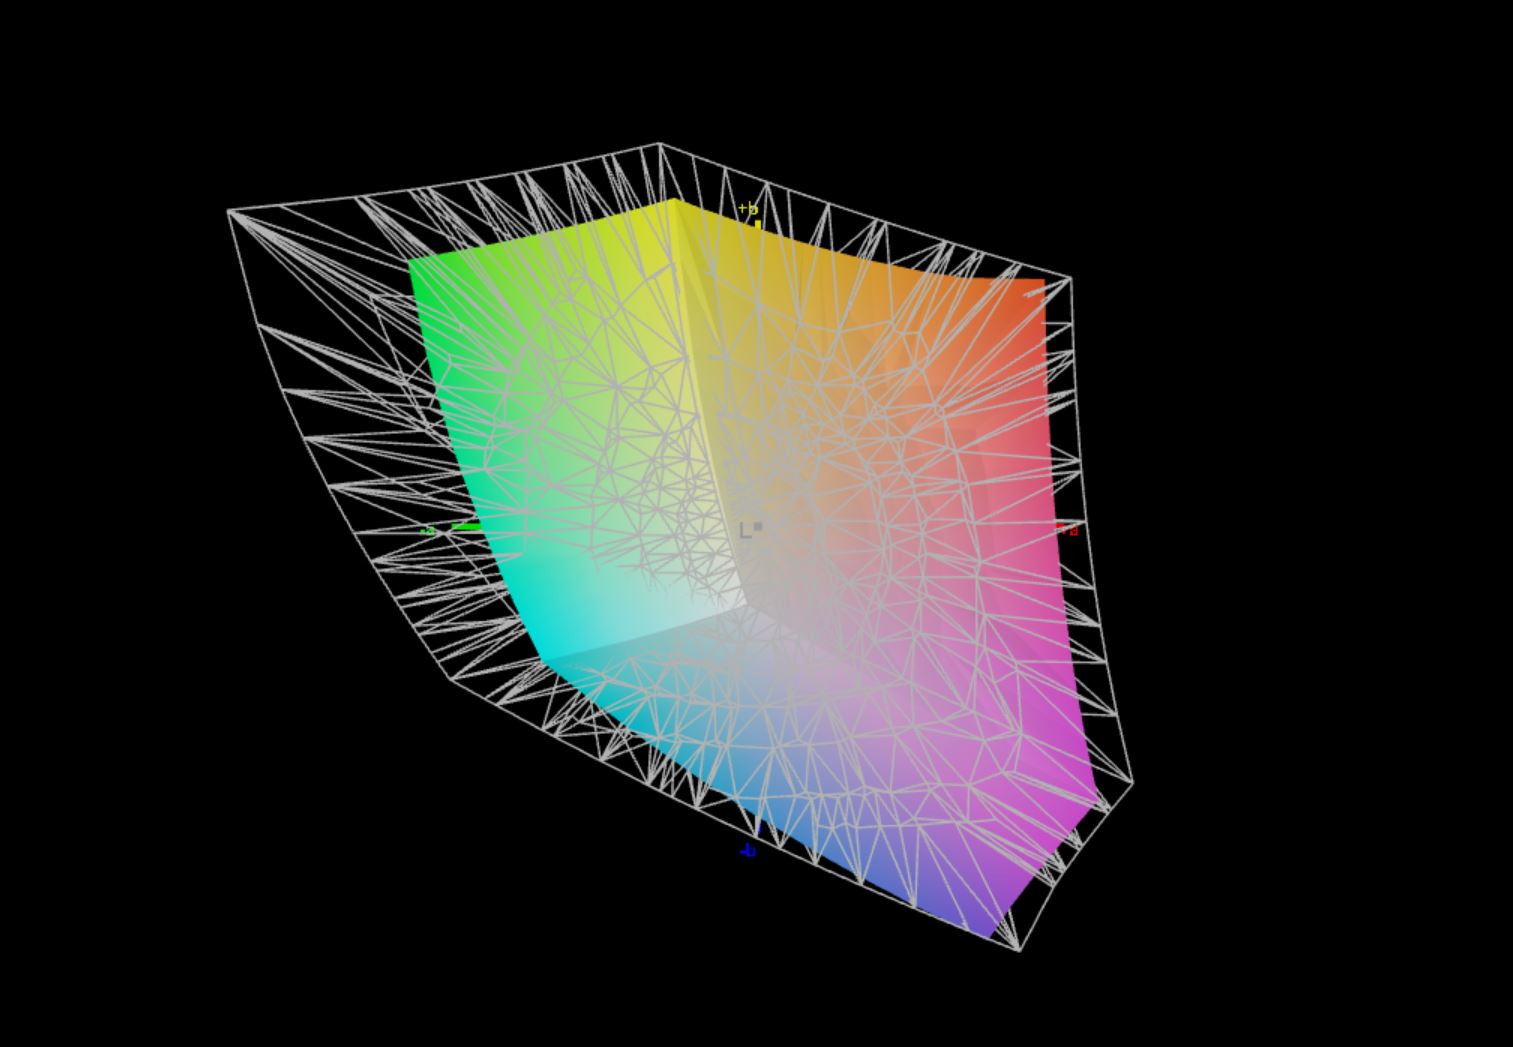
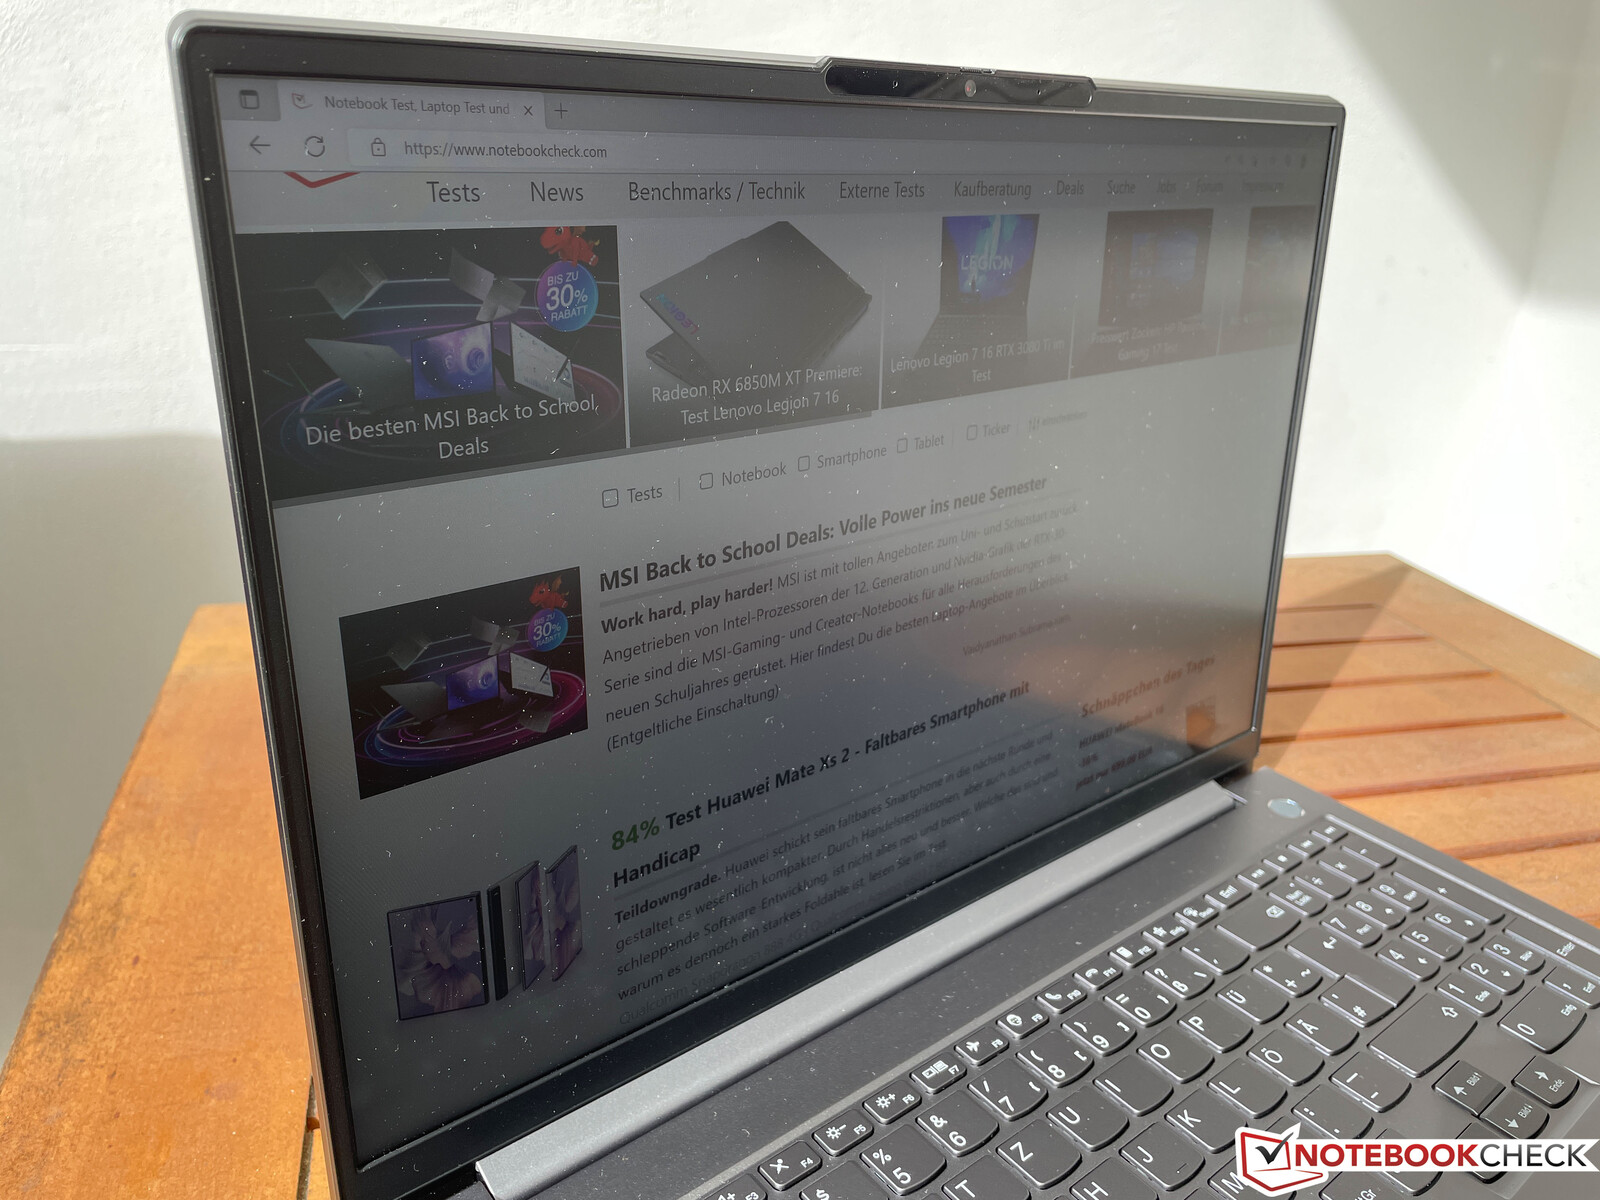
Display - Painel IPS Matte WQHD
A Lenovo equipa o ThinkBook 16 G4+ com um painel WQHD mate no formato 16:10, mas existem duas versões diferentes da tela IPS. Nossa amostra de revisão utiliza um painel de 60 Hz, mas de acordo com a folha de especificações, um modelo de 120 Hz com calibração de cor de fábrica também está disponível como opção.
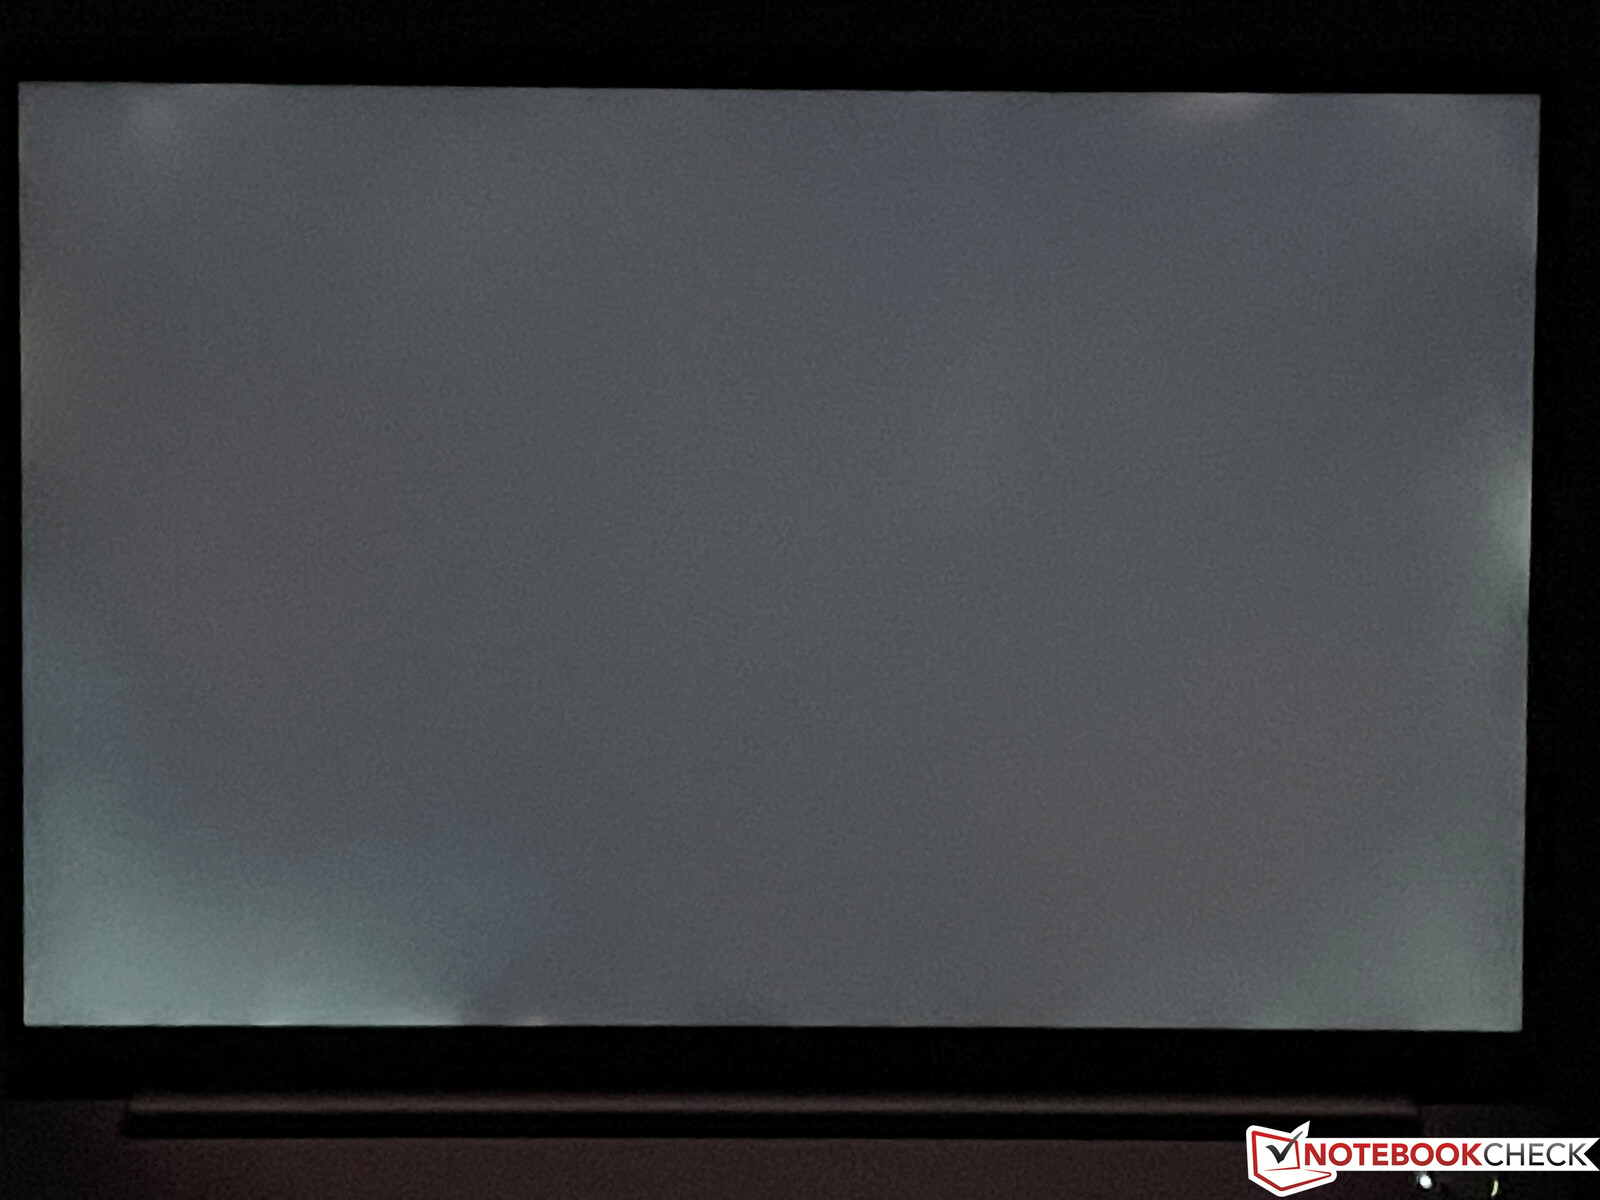
Nossa impressão subjetiva da imagem do painel fosco é muito boa. O conteúdo é exibido claramente, as cores são vivas e as áreas brilhantes não são granulosas. Determinamos uma relação de contraste muito boa de quase 1700:1 (valor em preto 0,23), o que certamente também contribui para a impressão da imagem viva. A Lenovo especifica um brilho de 350 cd/m², que nosso painel apenas supera. Não há cintilação PWM e os tempos de resposta são discretos, mas há halos claramente visíveis em fundos escuros com altos níveis de brilho. A estabilidade do ângulo de visão da tela IPS é muito boa, mas o conteúdo HDR não é suportado.
| |||||||||||||||||||||||||
iluminação: 91 %
iluminação com acumulador: 372 cd/m²
Contraste: 1613:1 (Preto: 0.23 cd/m²)
ΔE ColorChecker Calman: 2.6 | ∀{0.5-29.43 Ø4.73}
calibrated: 1.3
ΔE Greyscale Calman: 3.7 | ∀{0.09-98 Ø4.97}
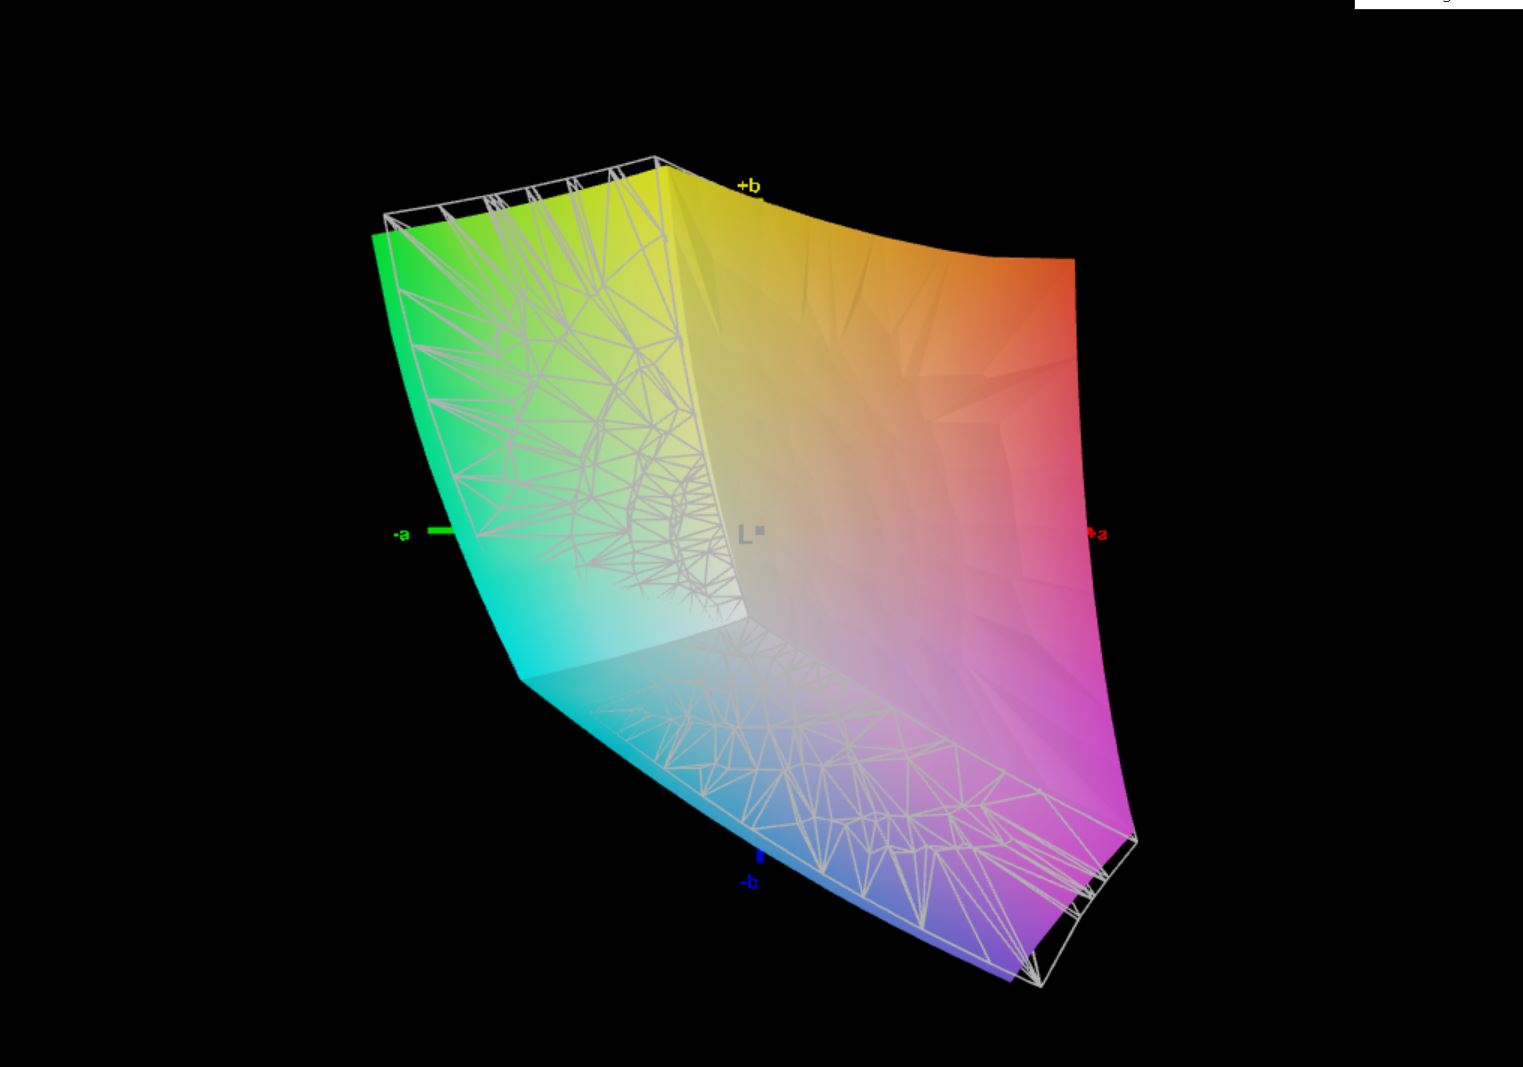
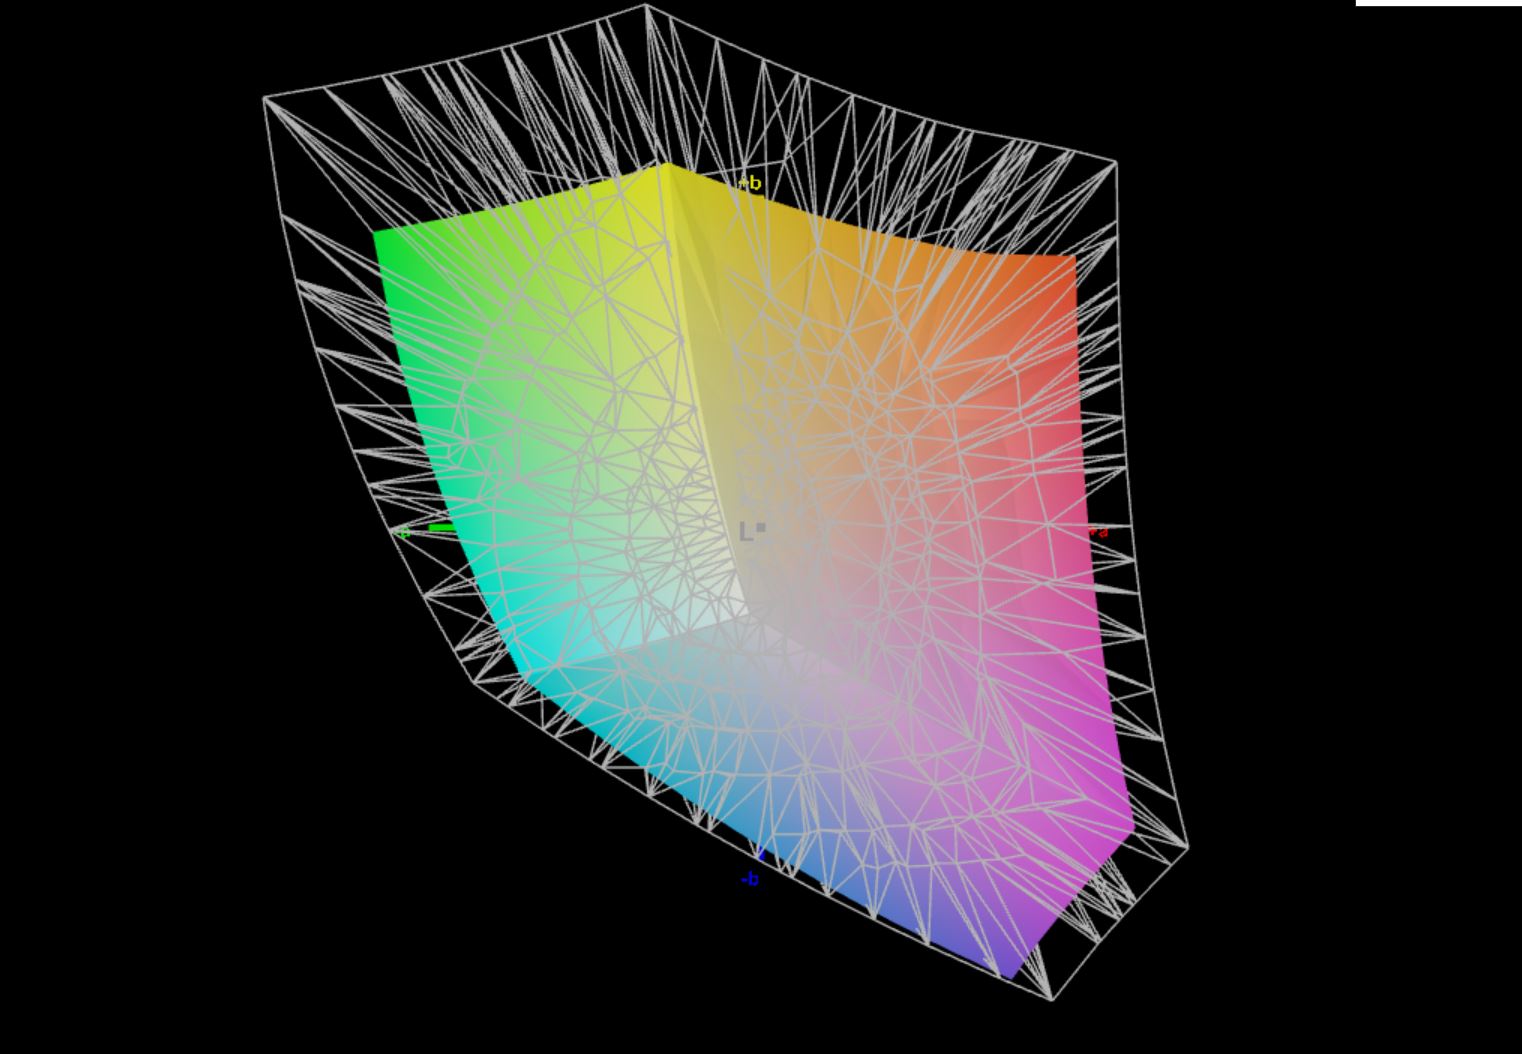
71.7% AdobeRGB 1998 (Argyll 3D)
97.5% sRGB (Argyll 3D)
69.6% Display P3 (Argyll 3D)
Gamma: 2.32
CCT: 7271 K
| Lenovo ThinkBook 16 G4+ IAP LEN160WQXGA, IPS, 2560x1600, 16" | Dell Inspiron 16 Plus 7620 BOE NE16N41, IPS, 3072x1920, 16" | Acer Swift X SFX16-51G-5388 Chi Mei N161HCA-EA3, , 1920x1080, 16.1" | Asus Vivobook Pro 16X-M7600QE Samsung ATNA60YV02-0, OLED, 3840x2400, 16.1" | Huawei MateBook D 16 2022 BOE NV160WUM-NH0, IPS, 1920x1200, 16" | Samsung Galaxy Book2 15 NE156FHM-NS0, IPS, 1920x1080, 15.6" | |
|---|---|---|---|---|---|---|
| Display | 2% | -5% | 27% | -4% | -27% | |
| Display P3 Coverage (%) | 69.6 | 70.8 2% | 65.1 -6% | 99.8 43% | 66.2 -5% | 49.6 -29% |
| sRGB Coverage (%) | 97.5 | 99.5 2% | 95.65 -2% | 100 3% | 96.4 -1% | 74.8 -23% |
| AdobeRGB 1998 Coverage (%) | 71.7 | 73.2 2% | 66.75 -7% | 96.9 35% | 68.3 -5% | 51.3 -28% |
| Response Times | -42% | -6% | 91% | -2% | -24% | |
| Response Time Grey 50% / Grey 80% * (ms) | 32.7 ? | 38 ? -16% | 30 ? 8% | 2 ? 94% | 30.5 ? 7% | 32.3 ? 1% |
| Response Time Black / White * (ms) | 16.8 ? | 28 ? -67% | 20 ? -19% | 2 ? 88% | 18.7 ? -11% | 25 ? -49% |
| PWM Frequency (Hz) | 60 ? | |||||
| Screen | 8% | 11% | 14% | -19% | -71% | |
| Brightness middle (cd/m²) | 371 | 288.9 -22% | 276 -26% | 392 6% | 319 -14% | 337 -9% |
| Brightness (cd/m²) | 357 | 276 -23% | 264 -26% | 396 11% | 317 -11% | 325 -9% |
| Brightness Distribution (%) | 91 | 92 1% | 85 -7% | 98 8% | 90 -1% | 89 -2% |
| Black Level * (cd/m²) | 0.23 | 0.26 -13% | 0.16 30% | 0.23 -0% | 0.4 -74% | |
| Contrast (:1) | 1613 | 1111 -31% | 1725 7% | 1387 -14% | 843 -48% | |
| Colorchecker dE 2000 * | 2.6 | 1.88 28% | 1.8 31% | 1.74 33% | 3.4 -31% | 4.7 -81% |
| Colorchecker dE 2000 max. * | 4.4 | 4.37 1% | 3.77 14% | 3.18 28% | 8.1 -84% | 15.7 -257% |
| Colorchecker dE 2000 calibrated * | 1.3 | 0.42 68% | 0.63 52% | 1.85 -42% | 0.8 38% | 2.8 -115% |
| Greyscale dE 2000 * | 3.7 | 1.4 62% | 2.76 25% | 1.77 52% | 5.7 -54% | 5.4 -46% |
| Gamma | 2.32 95% | 2.3 96% | 2.37 93% | 2.22 99% | 2.1 105% | 2.07 106% |
| CCT | 7271 89% | 6634 98% | 6564 99% | 6483 100% | 7433 87% | 7727 84% |
| Média Total (Programa/Configurações) | -11% /
-0% | 0% /
5% | 44% /
30% | -8% /
-13% | -41% /
-55% |
* ... menor é melhor
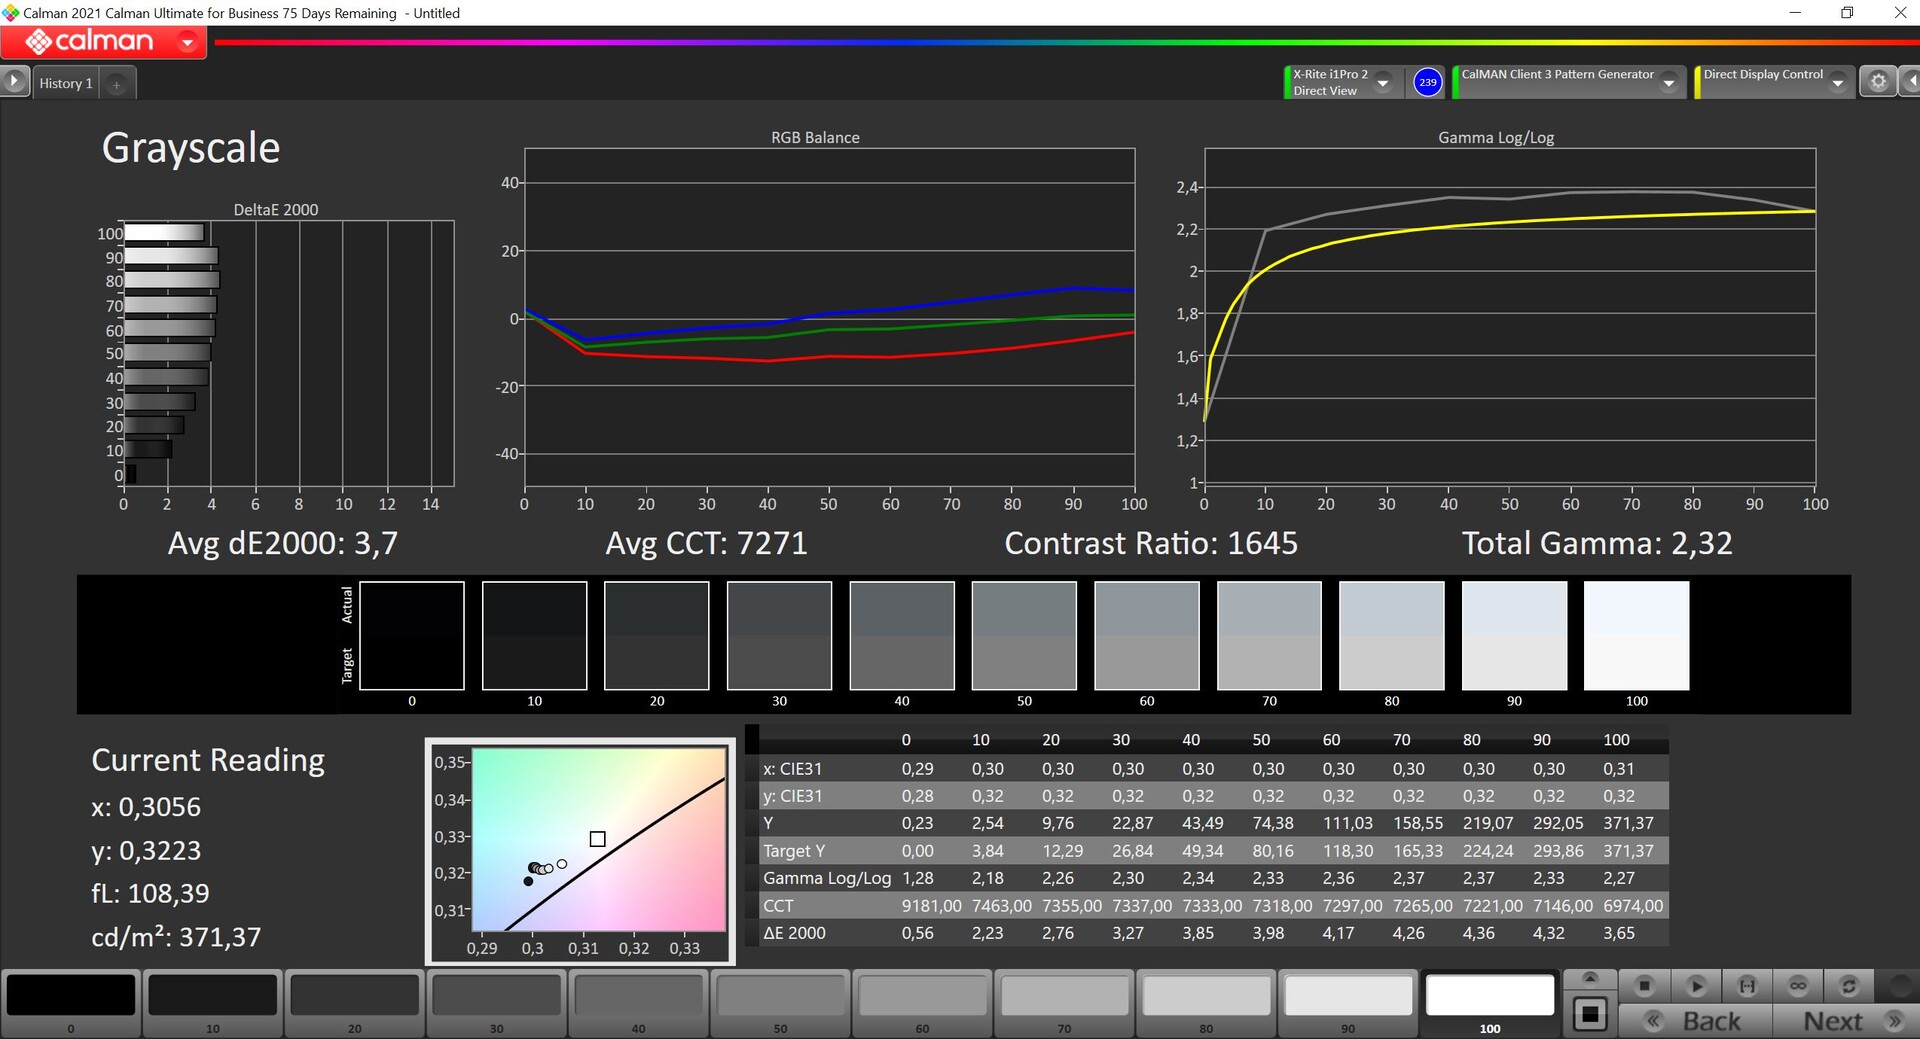
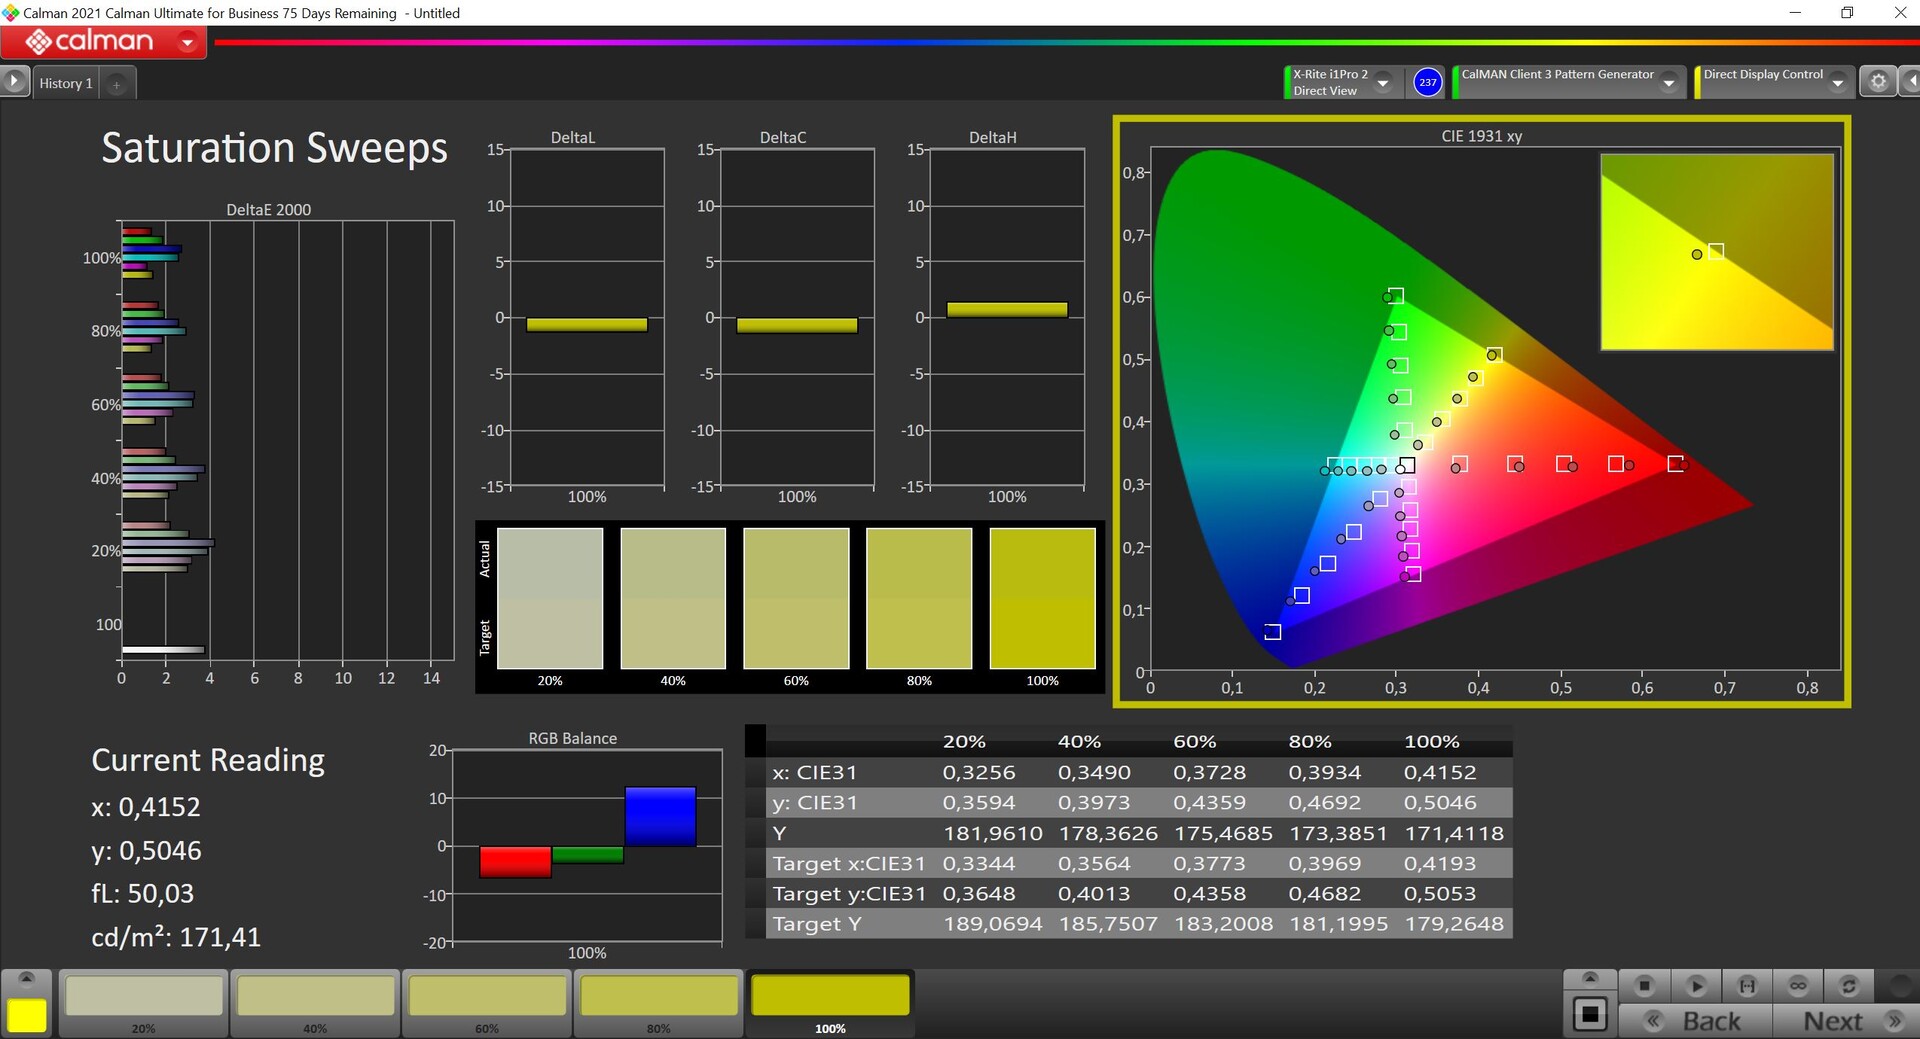
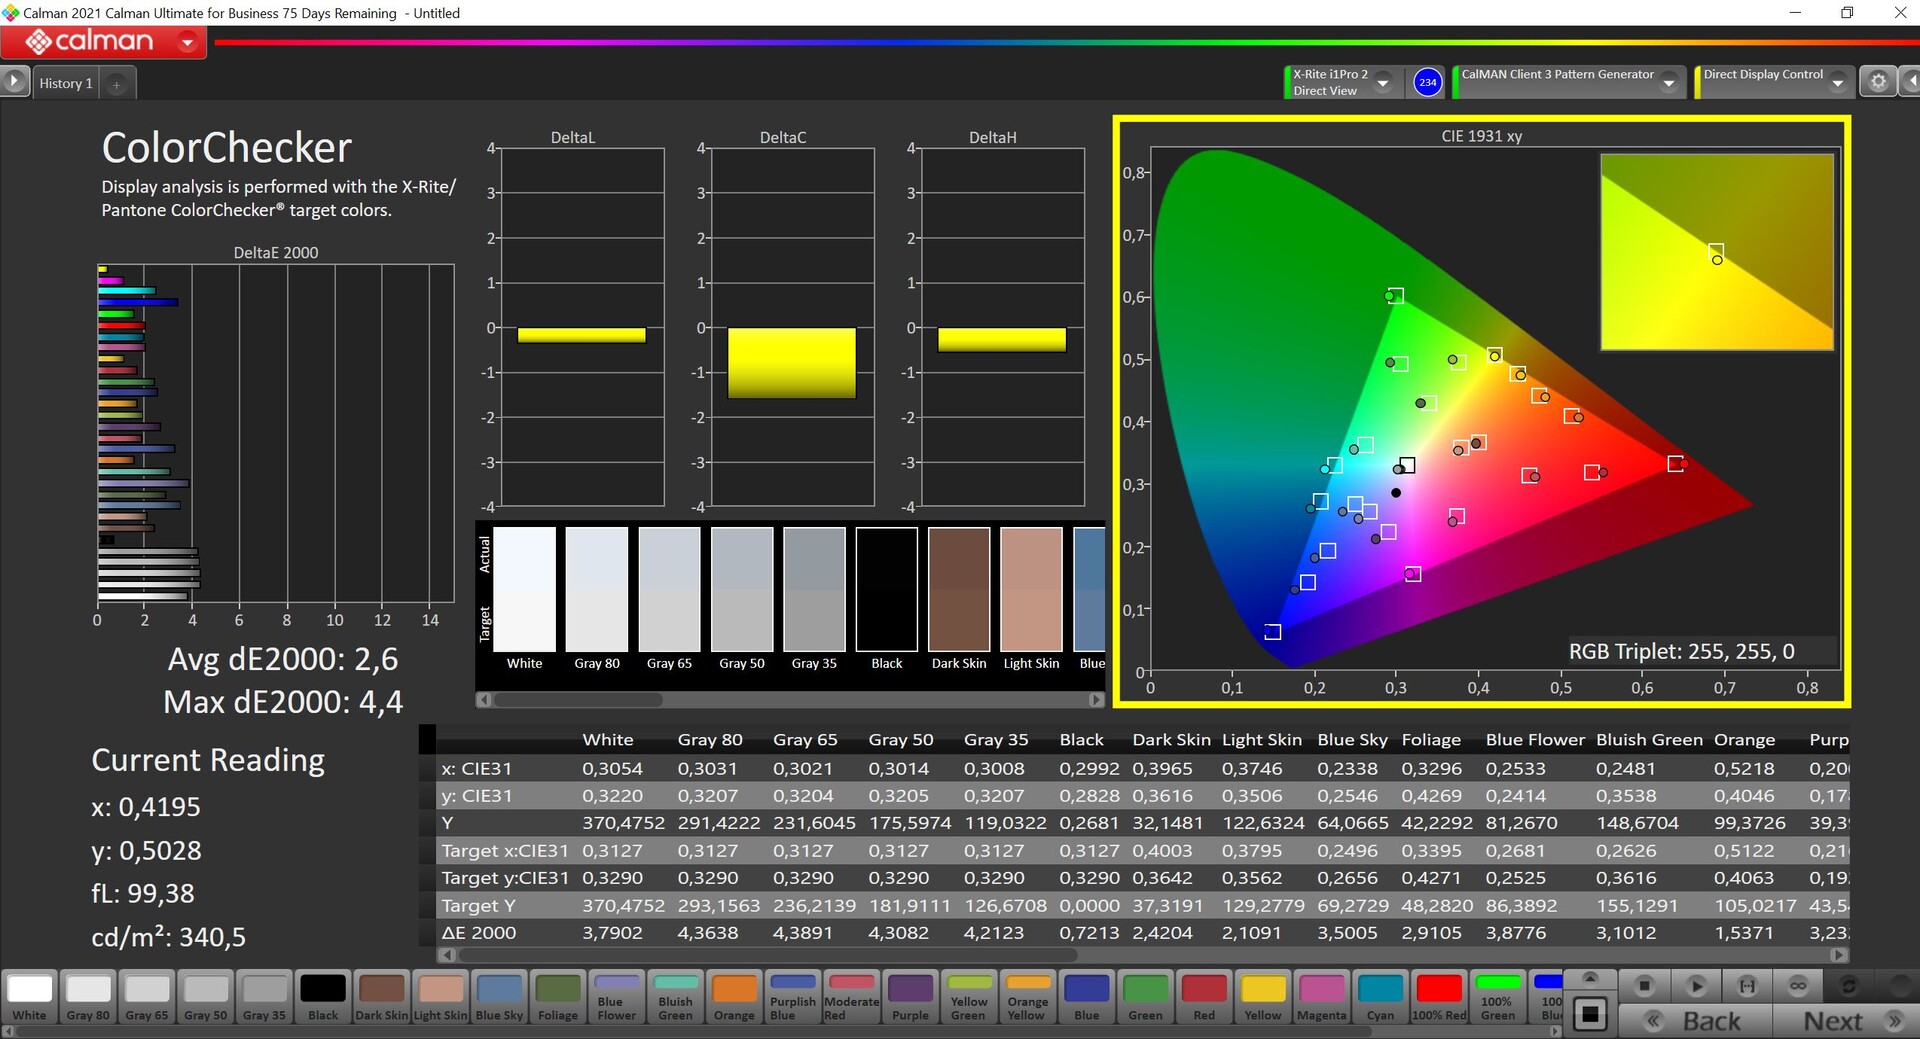
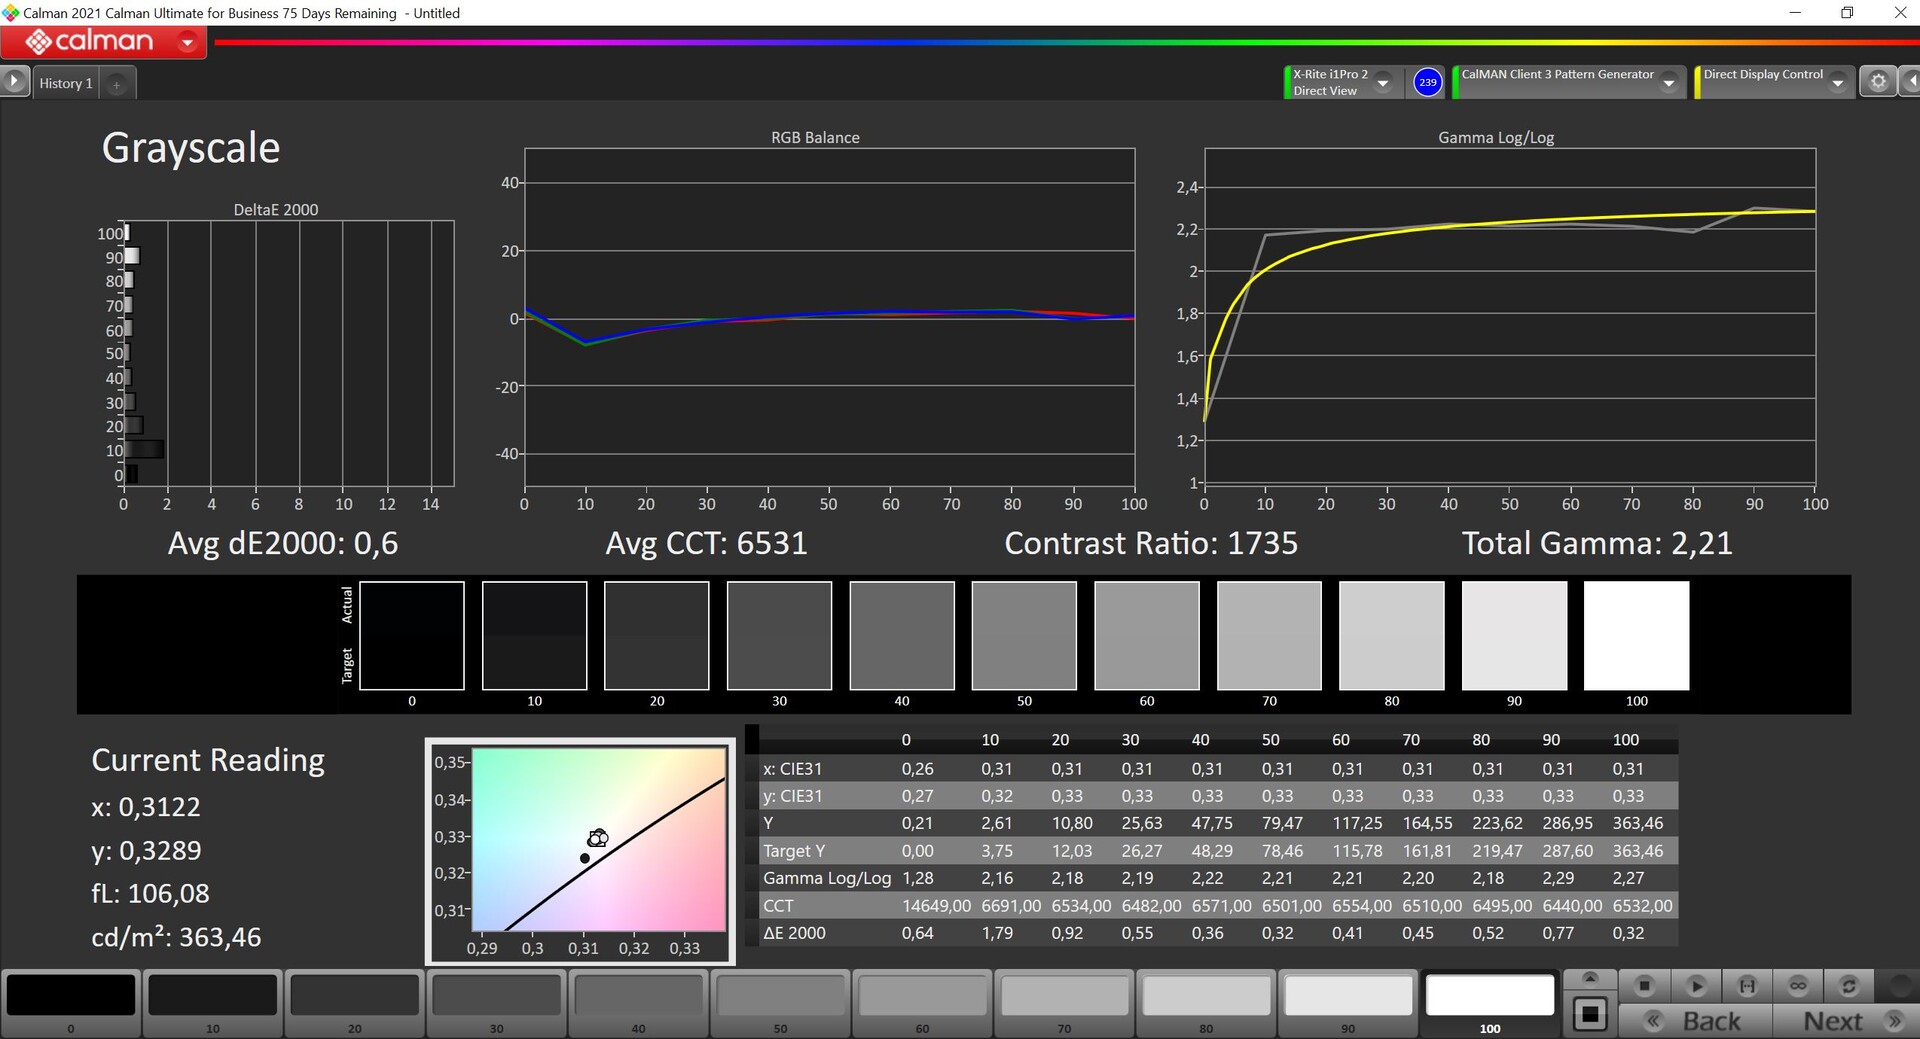
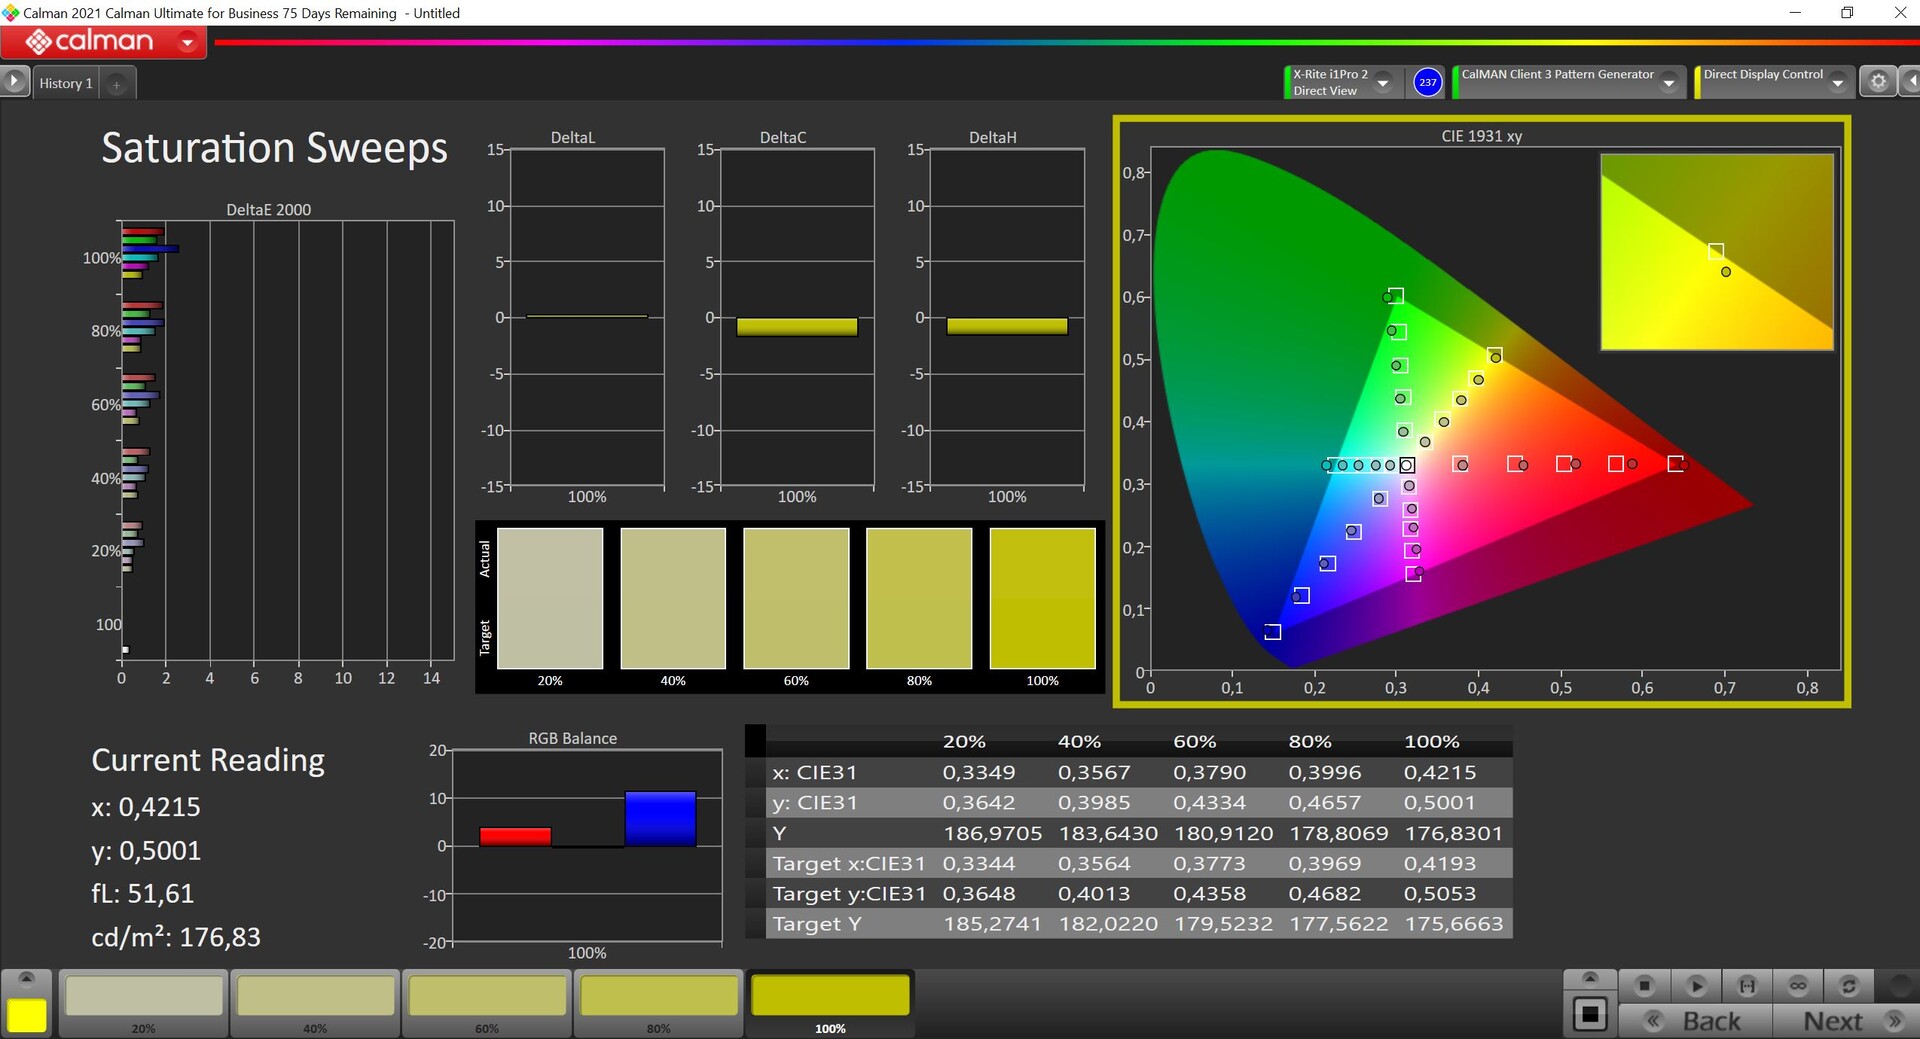
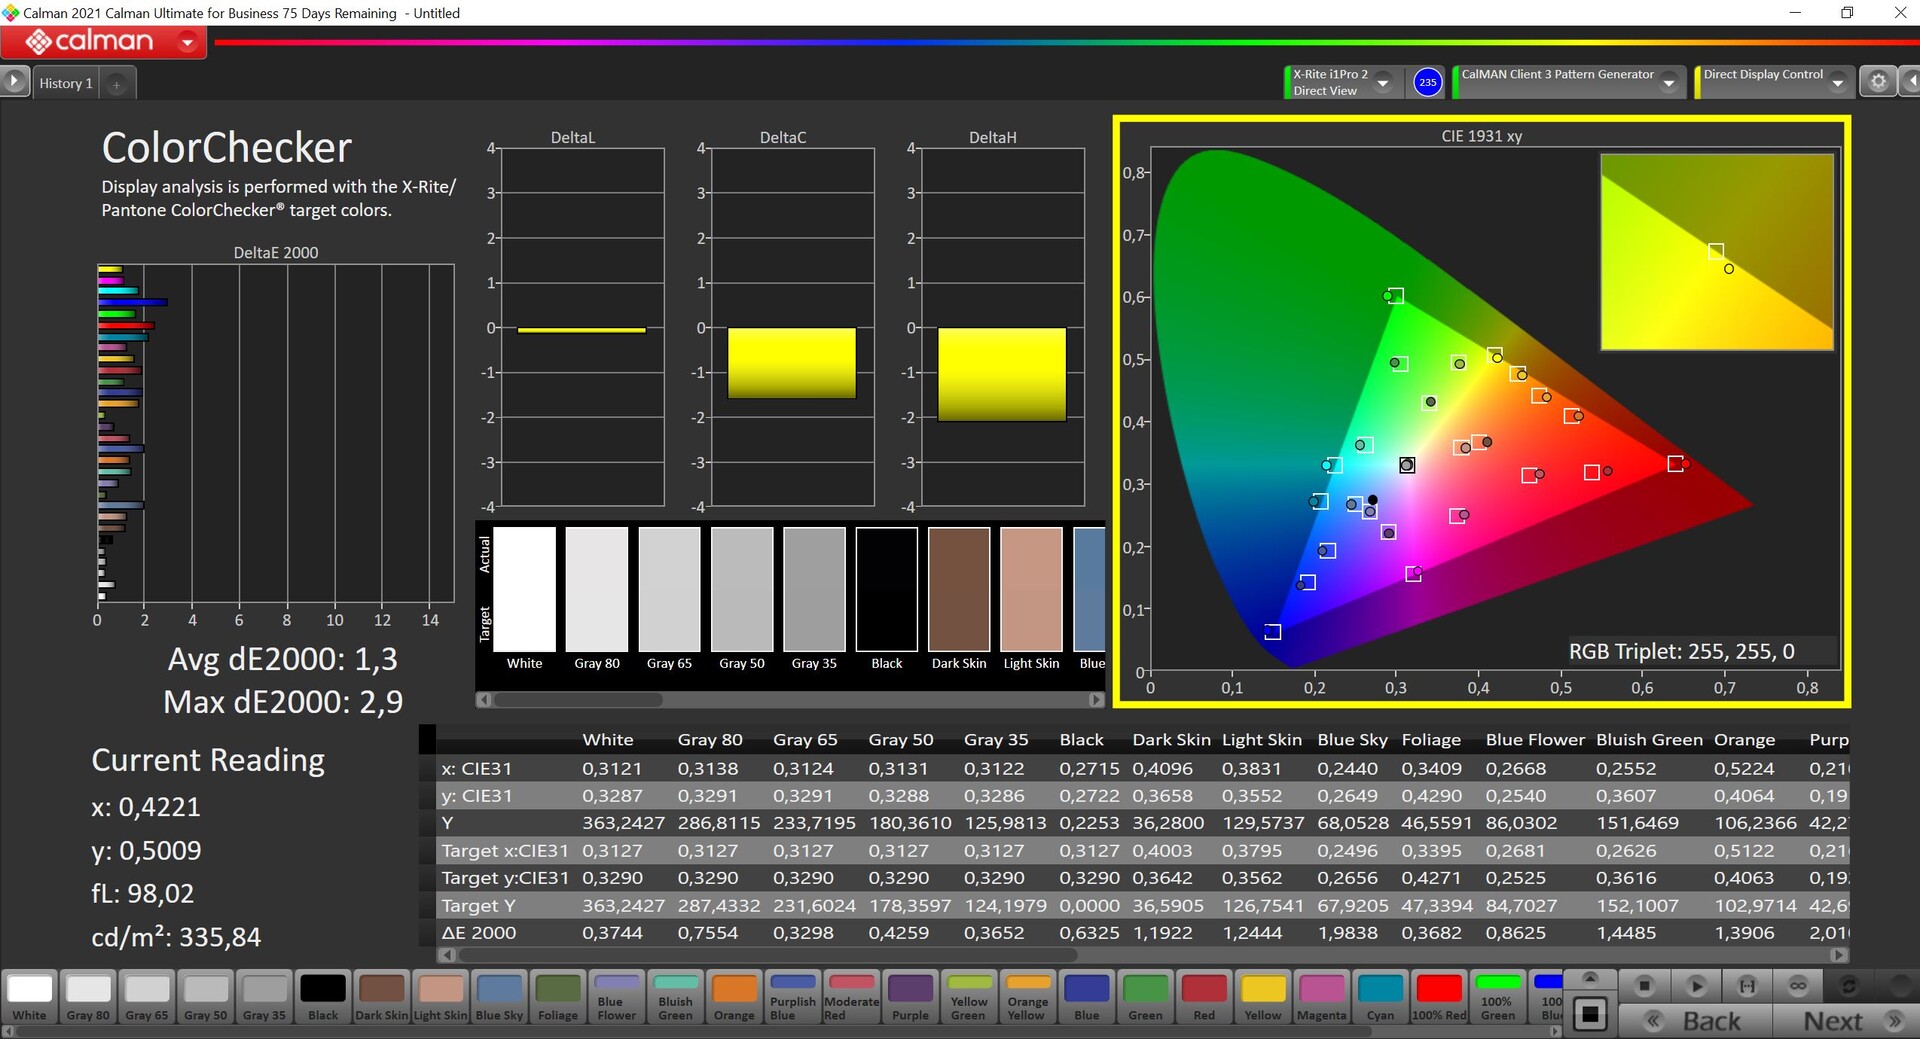
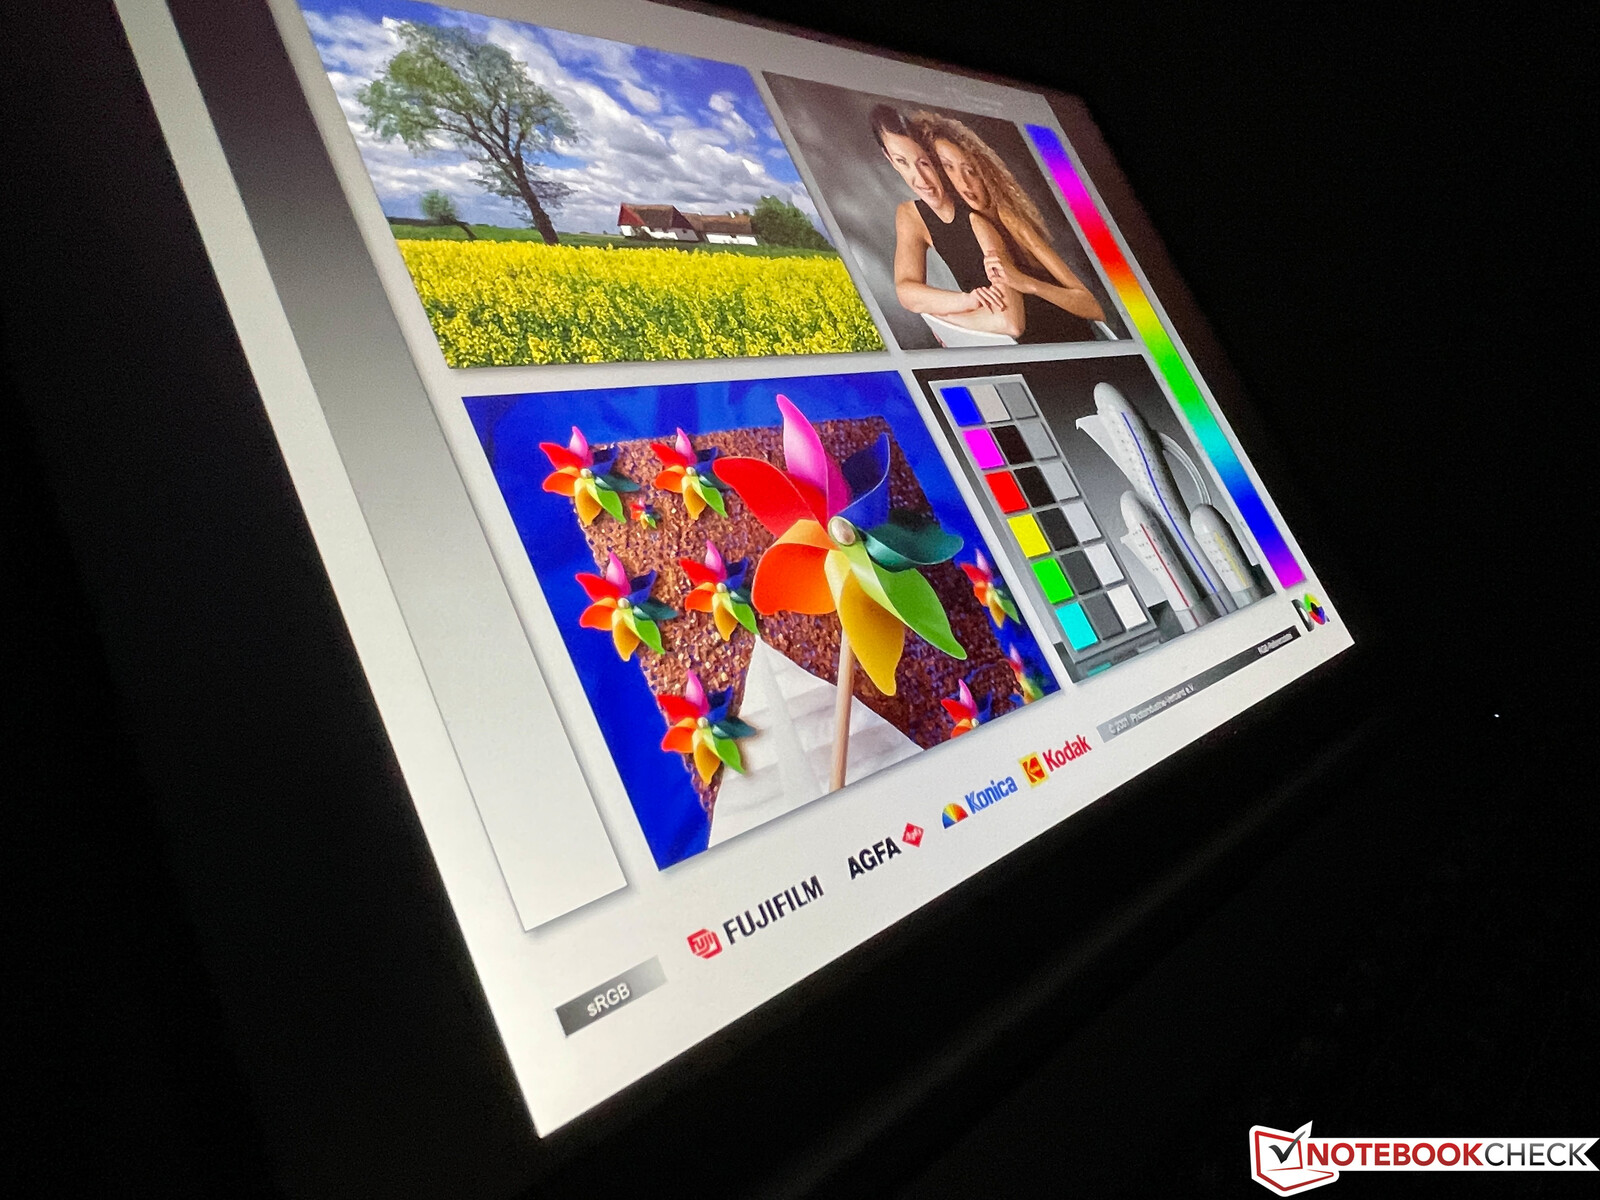
Nossa análise com o software profissional CalMAN (X-Rite i1 Pro 2) revela uma tonalidade ligeiramente azulada em conjunto com uma temperatura de cor que é ligeiramente fria demais. Por outro lado, os desvios da escala de cinza e também as cores em relação ao espaço de cor de referência sRGB já são bastante baixos. Se você não quiser editar imagens, não precisa necessariamente calibrar o painel, mas ainda há muito potencial aqui e depois de nossa calibração, os resultados são muito melhores e todas as cores estão abaixo do importante desvio DeltaE-2000 de 3. Juntamente com a cobertura quase completa do sRGB, a edição de imagem/vídeo também é possível
Exibir tempos de resposta
| ↔ Tempo de resposta preto para branco | ||
|---|---|---|
| 16.8 ms ... ascensão ↗ e queda ↘ combinadas | ↗ 6.4 ms ascensão | 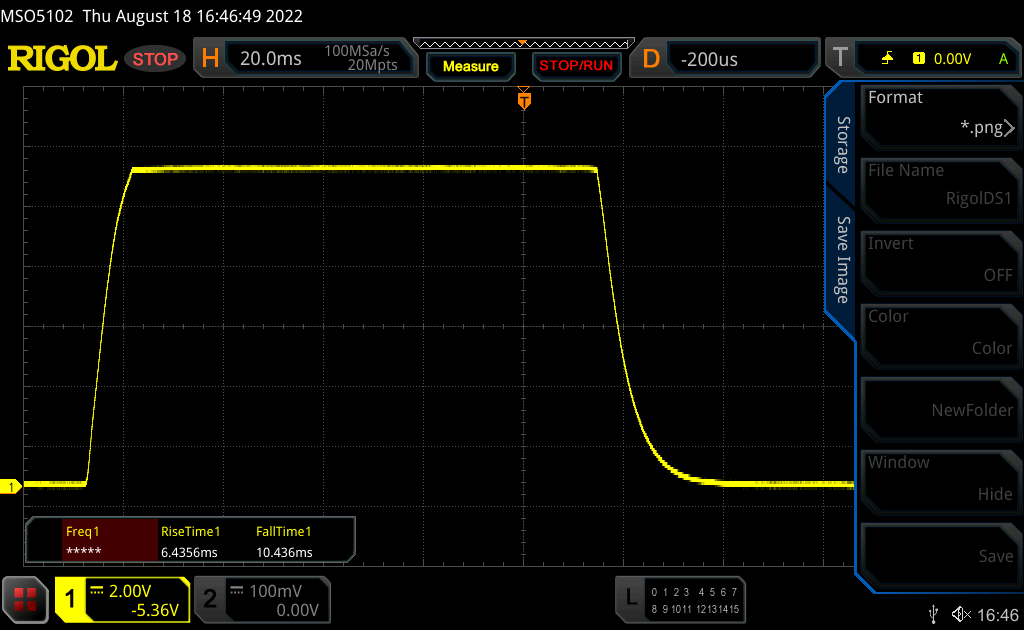 |
| ↘ 10.4 ms queda | ||
| A tela mostra boas taxas de resposta em nossos testes, mas pode ser muito lenta para jogadores competitivos. Em comparação, todos os dispositivos testados variam de 0.1 (mínimo) a 240 (máximo) ms. » 38 % de todos os dispositivos são melhores. Isso significa que o tempo de resposta medido é melhor que a média de todos os dispositivos testados (19.9 ms). | ||
| ↔ Tempo de resposta 50% cinza a 80% cinza | ||
| 32.7 ms ... ascensão ↗ e queda ↘ combinadas | ↗ 15.7 ms ascensão | 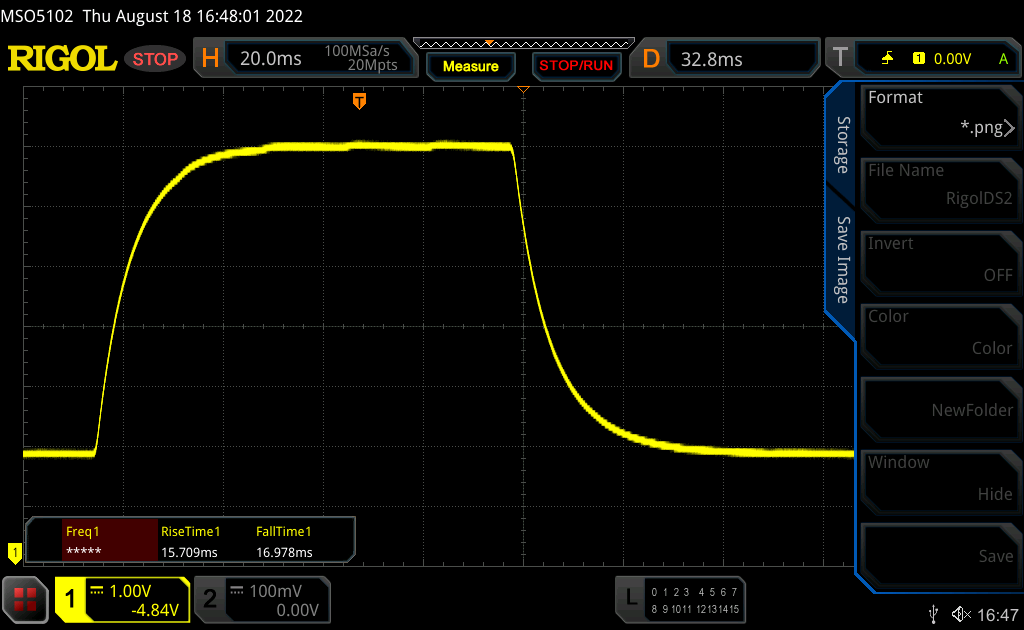 |
| ↘ 17 ms queda | ||
| A tela mostra taxas de resposta lentas em nossos testes e será insatisfatória para os jogadores. Em comparação, todos os dispositivos testados variam de 0.165 (mínimo) a 636 (máximo) ms. » 44 % de todos os dispositivos são melhores. Isso significa que o tempo de resposta medido é semelhante à média de todos os dispositivos testados (31.1 ms). | ||
Cintilação da tela / PWM (modulação por largura de pulso)
| Tela tremeluzindo / PWM não detectado | 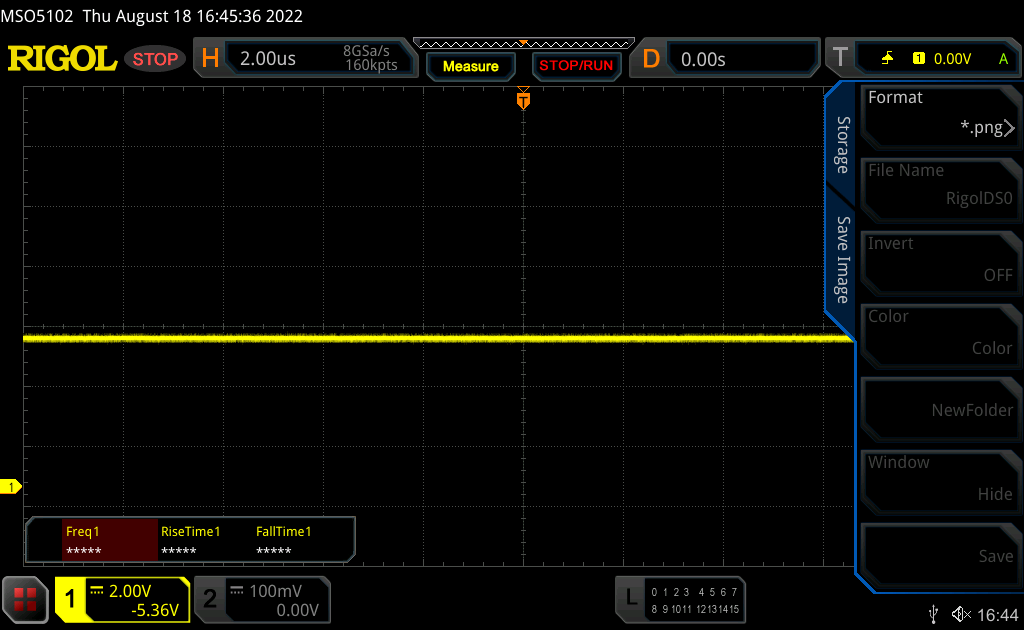 | ||
[pwm_comparison] Em comparação: 52 % de todos os dispositivos testados não usam PWM para escurecer a tela. Se PWM foi detectado, uma média de 7791 (mínimo: 5 - máximo: 343500) Hz foi medida. | |||
A superfície da tela mate ajuda ao ar livre, claro, e você pode trabalhar confortavelmente em dias nublados, mas a tela precisa ser um pouco mais brilhante em dias muito brilhantes.
Desempenho - Alder Lake & GeForce RTX
Condições de teste
Como de costume, a Lenovo oferece suas próprias configurações de energia que podem ser definidas tanto através do software Vantage pré-instalado quanto através da combinação de teclas Fn+P. Listamos os respectivos valores TDP/TGP para a CPU e GPU na tabela abaixo. Utilizamos a configuração de Alto Desempenho para testes.
| Modo de desempenho | Carga da CPU | Carga da GPU | Teste de estresse | Volume máximo do ventilador |
|---|---|---|---|---|
| Economia de bateria | 64 -> 20 watts | 20 watts | CPU: 20 wattsGPU : 20 watts |
30,5 dB(A) |
| Refrigeração inteligente | 72 -> 35 watts | 36 watts | CPU: 24 wattsGPU : 36 watts |
43,7 dB(A) |
| Alto desempenho | 80 -> 55 watts | 60 watts | CPU: 20 wattsGPU : 50 watts |
47 dB(A) |
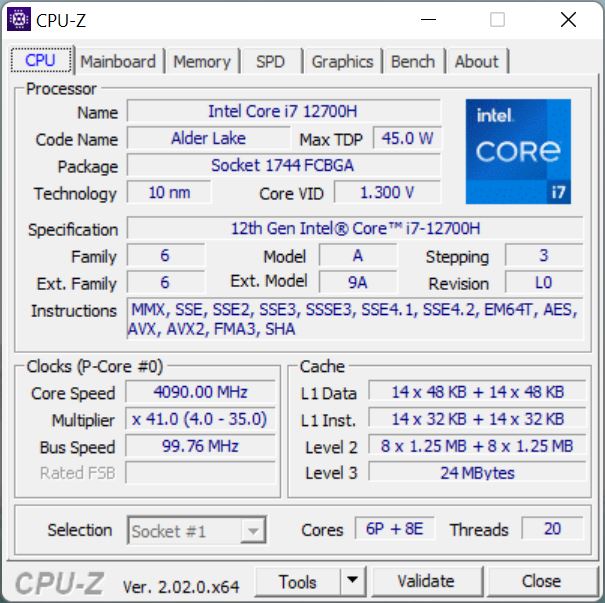
Processador
O Núcleo i7-12700Hé um processador rápido da atual geração Alder Lake da Intel que depende de uma arquitetura híbrida com 6 núcleos de desempenho rápido e 8 núcleos de eficiência. Graças aos altos limites de potência, o desempenho do ThinkBook 16 G4+ é muito bom e o desempenho da CPU é melhor do que o dos rivais. Mesmo sob carga sustentada, o processador permanece a 55 watts e proporciona bons resultados. Entretanto, o consumo máximo é limitado a 70 watts no modo de bateria e então rapidamente atinge 64 watts, razão pela qual o desempenho multi-core é ~12% menor quando não conectado à tomada. Mais referências de CPU estão disponíveis aqui.
Cinebench R15 Multi Sustained Load
Cinebench R23: Multi Core | Single Core
Cinebench R20: CPU (Multi Core) | CPU (Single Core)
Cinebench R15: CPU Multi 64Bit | CPU Single 64Bit
Blender: v2.79 BMW27 CPU
7-Zip 18.03: 7z b 4 | 7z b 4 -mmt1
Geekbench 5.5: Multi-Core | Single-Core
HWBOT x265 Benchmark v2.2: 4k Preset
LibreOffice : 20 Documents To PDF
R Benchmark 2.5: Overall mean
| CPU Performance rating | |
| Média da turma Multimedia | |
| Lenovo ThinkBook 16 G4+ IAP | |
| Média Intel Core i7-12700H | |
| Dell Inspiron 16 Plus 7620 | |
| Huawei MateBook D 16 2022 | |
| Asus Vivobook Pro 16X-M7600QE | |
| Samsung Galaxy Book2 15 | |
| Acer Swift X SFX16-51G-5388 | |
| Cinebench R23 / Multi Core | |
| Média da turma Multimedia (4861 - 33362, n=81, últimos 2 anos) | |
| Lenovo ThinkBook 16 G4+ IAP | |
| Média Intel Core i7-12700H (4032 - 19330, n=64) | |
| Dell Inspiron 16 Plus 7620 | |
| Asus Vivobook Pro 16X-M7600QE | |
| Asus Vivobook Pro 16X-M7600QE | |
| Huawei MateBook D 16 2022 | |
| Samsung Galaxy Book2 15 | |
| Acer Swift X SFX16-51G-5388 | |
| Cinebench R23 / Single Core | |
| Média da turma Multimedia (1128 - 2459, n=73, últimos 2 anos) | |
| Lenovo ThinkBook 16 G4+ IAP | |
| Huawei MateBook D 16 2022 | |
| Samsung Galaxy Book2 15 | |
| Dell Inspiron 16 Plus 7620 | |
| Média Intel Core i7-12700H (778 - 1826, n=63) | |
| Asus Vivobook Pro 16X-M7600QE | |
| Asus Vivobook Pro 16X-M7600QE | |
| Acer Swift X SFX16-51G-5388 | |
| Cinebench R20 / CPU (Multi Core) | |
| Média da turma Multimedia (1887 - 12912, n=64, últimos 2 anos) | |
| Lenovo ThinkBook 16 G4+ IAP | |
| Média Intel Core i7-12700H (1576 - 7407, n=64) | |
| Dell Inspiron 16 Plus 7620 | |
| Asus Vivobook Pro 16X-M7600QE | |
| Asus Vivobook Pro 16X-M7600QE | |
| Huawei MateBook D 16 2022 | |
| Samsung Galaxy Book2 15 | |
| Acer Swift X SFX16-51G-5388 | |
| Cinebench R20 / CPU (Single Core) | |
| Média da turma Multimedia (425 - 853, n=64, últimos 2 anos) | |
| Lenovo ThinkBook 16 G4+ IAP | |
| Samsung Galaxy Book2 15 | |
| Dell Inspiron 16 Plus 7620 | |
| Média Intel Core i7-12700H (300 - 704, n=64) | |
| Huawei MateBook D 16 2022 | |
| Asus Vivobook Pro 16X-M7600QE | |
| Asus Vivobook Pro 16X-M7600QE | |
| Acer Swift X SFX16-51G-5388 | |
| Cinebench R15 / CPU Multi 64Bit | |
| Média da turma Multimedia (856 - 5224, n=68, últimos 2 anos) | |
| Média Intel Core i7-12700H (1379 - 2916, n=70) | |
| Lenovo ThinkBook 16 G4+ IAP | |
| Dell Inspiron 16 Plus 7620 | |
| Huawei MateBook D 16 2022 | |
| Huawei MateBook D 16 2022 | |
| Asus Vivobook Pro 16X-M7600QE | |
| Asus Vivobook Pro 16X-M7600QE | |
| Samsung Galaxy Book2 15 | |
| Acer Swift X SFX16-51G-5388 | |
| Cinebench R15 / CPU Single 64Bit | |
| Média da turma Multimedia (184.8 - 326, n=66, últimos 2 anos) | |
| Lenovo ThinkBook 16 G4+ IAP | |
| Huawei MateBook D 16 2022 | |
| Dell Inspiron 16 Plus 7620 | |
| Média Intel Core i7-12700H (113 - 263, n=65) | |
| Samsung Galaxy Book2 15 | |
| Asus Vivobook Pro 16X-M7600QE | |
| Asus Vivobook Pro 16X-M7600QE | |
| Acer Swift X SFX16-51G-5388 | |
| Blender / v2.79 BMW27 CPU | |
| Acer Swift X SFX16-51G-5388 | |
| Samsung Galaxy Book2 15 | |
| Huawei MateBook D 16 2022 | |
| Asus Vivobook Pro 16X-M7600QE | |
| Asus Vivobook Pro 16X-M7600QE | |
| Média da turma Multimedia (100 - 557, n=65, últimos 2 anos) | |
| Dell Inspiron 16 Plus 7620 | |
| Média Intel Core i7-12700H (168 - 732, n=63) | |
| Lenovo ThinkBook 16 G4+ IAP | |
| 7-Zip 18.03 / 7z b 4 | |
| Lenovo ThinkBook 16 G4+ IAP | |
| Média Intel Core i7-12700H (22844 - 73067, n=63) | |
| Dell Inspiron 16 Plus 7620 | |
| Média da turma Multimedia (29095 - 130368, n=62, últimos 2 anos) | |
| Asus Vivobook Pro 16X-M7600QE | |
| Asus Vivobook Pro 16X-M7600QE | |
| Huawei MateBook D 16 2022 | |
| Samsung Galaxy Book2 15 | |
| Acer Swift X SFX16-51G-5388 | |
| 7-Zip 18.03 / 7z b 4 -mmt1 | |
| Média da turma Multimedia (3666 - 7545, n=63, últimos 2 anos) | |
| Asus Vivobook Pro 16X-M7600QE | |
| Asus Vivobook Pro 16X-M7600QE | |
| Huawei MateBook D 16 2022 | |
| Lenovo ThinkBook 16 G4+ IAP | |
| Média Intel Core i7-12700H (2743 - 5972, n=63) | |
| Dell Inspiron 16 Plus 7620 | |
| Samsung Galaxy Book2 15 | |
| Acer Swift X SFX16-51G-5388 | |
| Geekbench 5.5 / Multi-Core | |
| Média da turma Multimedia (4652 - 20422, n=62, últimos 2 anos) | |
| Lenovo ThinkBook 16 G4+ IAP | |
| Dell Inspiron 16 Plus 7620 | |
| Média Intel Core i7-12700H (5144 - 13745, n=64) | |
| Huawei MateBook D 16 2022 | |
| Asus Vivobook Pro 16X-M7600QE | |
| Asus Vivobook Pro 16X-M7600QE | |
| Samsung Galaxy Book2 15 | |
| Acer Swift X SFX16-51G-5388 | |
| Geekbench 5.5 / Single-Core | |
| Média da turma Multimedia (805 - 2974, n=62, últimos 2 anos) | |
| Huawei MateBook D 16 2022 | |
| Lenovo ThinkBook 16 G4+ IAP | |
| Samsung Galaxy Book2 15 | |
| Dell Inspiron 16 Plus 7620 | |
| Média Intel Core i7-12700H (803 - 1851, n=64) | |
| Asus Vivobook Pro 16X-M7600QE | |
| Asus Vivobook Pro 16X-M7600QE | |
| Acer Swift X SFX16-51G-5388 | |
| HWBOT x265 Benchmark v2.2 / 4k Preset | |
| Média da turma Multimedia (5.26 - 36.1, n=63, últimos 2 anos) | |
| Lenovo ThinkBook 16 G4+ IAP | |
| Média Intel Core i7-12700H (4.67 - 21.8, n=64) | |
| Dell Inspiron 16 Plus 7620 | |
| Asus Vivobook Pro 16X-M7600QE | |
| Asus Vivobook Pro 16X-M7600QE | |
| Huawei MateBook D 16 2022 | |
| Samsung Galaxy Book2 15 | |
| Acer Swift X SFX16-51G-5388 | |
| LibreOffice / 20 Documents To PDF | |
| Asus Vivobook Pro 16X-M7600QE | |
| Asus Vivobook Pro 16X-M7600QE | |
| Acer Swift X SFX16-51G-5388 | |
| Média da turma Multimedia (23.9 - 146.7, n=64, últimos 2 anos) | |
| Lenovo ThinkBook 16 G4+ IAP | |
| Dell Inspiron 16 Plus 7620 | |
| Média Intel Core i7-12700H (34.2 - 95.3, n=63) | |
| Samsung Galaxy Book2 15 | |
| Huawei MateBook D 16 2022 | |
| R Benchmark 2.5 / Overall mean | |
| Acer Swift X SFX16-51G-5388 | |
| Asus Vivobook Pro 16X-M7600QE | |
| Asus Vivobook Pro 16X-M7600QE | |
| Dell Inspiron 16 Plus 7620 | |
| Média Intel Core i7-12700H (0.4441 - 1.052, n=63) | |
| Samsung Galaxy Book2 15 | |
| Média da turma Multimedia (0.3604 - 0.947, n=63, últimos 2 anos) | |
| Lenovo ThinkBook 16 G4+ IAP | |
| Huawei MateBook D 16 2022 | |
* ... menor é melhor
AIDA64: FP32 Ray-Trace | FPU Julia | CPU SHA3 | CPU Queen | FPU SinJulia | FPU Mandel | CPU AES | CPU ZLib | FP64 Ray-Trace | CPU PhotoWorxx
| Performance rating | |
| Média da turma Multimedia | |
| Asus Vivobook Pro 16X-M7600QE | |
| Lenovo ThinkBook 16 G4+ IAP | |
| Dell Inspiron 16 Plus 7620 | |
| Média Intel Core i7-12700H | |
| Huawei MateBook D 16 2022 | |
| Samsung Galaxy Book2 15 | |
| Acer Swift X SFX16-51G-5388 | |
| AIDA64 / FP32 Ray-Trace | |
| Média da turma Multimedia (2214 - 50388, n=60, últimos 2 anos) | |
| Lenovo ThinkBook 16 G4+ IAP | |
| Asus Vivobook Pro 16X-M7600QE | |
| Asus Vivobook Pro 16X-M7600QE | |
| Dell Inspiron 16 Plus 7620 | |
| Huawei MateBook D 16 2022 | |
| Média Intel Core i7-12700H (2585 - 17957, n=64) | |
| Acer Swift X SFX16-51G-5388 | |
| Samsung Galaxy Book2 15 | |
| AIDA64 / FPU Julia | |
| Asus Vivobook Pro 16X-M7600QE | |
| Asus Vivobook Pro 16X-M7600QE | |
| Média da turma Multimedia (12867 - 201874, n=61, últimos 2 anos) | |
| Lenovo ThinkBook 16 G4+ IAP | |
| Dell Inspiron 16 Plus 7620 | |
| Huawei MateBook D 16 2022 | |
| Média Intel Core i7-12700H (12439 - 90760, n=64) | |
| Acer Swift X SFX16-51G-5388 | |
| Samsung Galaxy Book2 15 | |
| AIDA64 / CPU SHA3 | |
| Média da turma Multimedia (653 - 8623, n=61, últimos 2 anos) | |
| Lenovo ThinkBook 16 G4+ IAP | |
| Asus Vivobook Pro 16X-M7600QE | |
| Asus Vivobook Pro 16X-M7600QE | |
| Média Intel Core i7-12700H (833 - 4242, n=64) | |
| Dell Inspiron 16 Plus 7620 | |
| Huawei MateBook D 16 2022 | |
| Acer Swift X SFX16-51G-5388 | |
| Samsung Galaxy Book2 15 | |
| AIDA64 / CPU Queen | |
| Lenovo ThinkBook 16 G4+ IAP | |
| Asus Vivobook Pro 16X-M7600QE | |
| Asus Vivobook Pro 16X-M7600QE | |
| Média Intel Core i7-12700H (57923 - 103202, n=63) | |
| Huawei MateBook D 16 2022 | |
| Dell Inspiron 16 Plus 7620 | |
| Média da turma Multimedia (13483 - 181505, n=49, últimos 2 anos) | |
| Samsung Galaxy Book2 15 | |
| Acer Swift X SFX16-51G-5388 | |
| AIDA64 / FPU SinJulia | |
| Asus Vivobook Pro 16X-M7600QE | |
| Asus Vivobook Pro 16X-M7600QE | |
| Lenovo ThinkBook 16 G4+ IAP | |
| Média da turma Multimedia (1240 - 28794, n=61, últimos 2 anos) | |
| Média Intel Core i7-12700H (3249 - 9939, n=64) | |
| Dell Inspiron 16 Plus 7620 | |
| Huawei MateBook D 16 2022 | |
| Samsung Galaxy Book2 15 | |
| Acer Swift X SFX16-51G-5388 | |
| AIDA64 / FPU Mandel | |
| Asus Vivobook Pro 16X-M7600QE | |
| Asus Vivobook Pro 16X-M7600QE | |
| Média da turma Multimedia (6395 - 105740, n=60, últimos 2 anos) | |
| Lenovo ThinkBook 16 G4+ IAP | |
| Dell Inspiron 16 Plus 7620 | |
| Média Intel Core i7-12700H (7135 - 44760, n=64) | |
| Huawei MateBook D 16 2022 | |
| Acer Swift X SFX16-51G-5388 | |
| Samsung Galaxy Book2 15 | |
| AIDA64 / CPU AES | |
| Asus Vivobook Pro 16X-M7600QE | |
| Asus Vivobook Pro 16X-M7600QE | |
| Huawei MateBook D 16 2022 | |
| Média Intel Core i7-12700H (31839 - 144360, n=64) | |
| Lenovo ThinkBook 16 G4+ IAP | |
| Média da turma Multimedia (13243 - 126790, n=61, últimos 2 anos) | |
| Dell Inspiron 16 Plus 7620 | |
| Acer Swift X SFX16-51G-5388 | |
| Samsung Galaxy Book2 15 | |
| AIDA64 / CPU ZLib | |
| Lenovo ThinkBook 16 G4+ IAP | |
| Média da turma Multimedia (167.2 - 2022, n=61, últimos 2 anos) | |
| Dell Inspiron 16 Plus 7620 | |
| Média Intel Core i7-12700H (305 - 1171, n=64) | |
| Asus Vivobook Pro 16X-M7600QE | |
| Asus Vivobook Pro 16X-M7600QE | |
| Huawei MateBook D 16 2022 | |
| Samsung Galaxy Book2 15 | |
| Acer Swift X SFX16-51G-5388 | |
| AIDA64 / FP64 Ray-Trace | |
| Média da turma Multimedia (1014 - 26875, n=61, últimos 2 anos) | |
| Asus Vivobook Pro 16X-M7600QE | |
| Asus Vivobook Pro 16X-M7600QE | |
| Lenovo ThinkBook 16 G4+ IAP | |
| Dell Inspiron 16 Plus 7620 | |
| Média Intel Core i7-12700H (1437 - 9692, n=64) | |
| Huawei MateBook D 16 2022 | |
| Acer Swift X SFX16-51G-5388 | |
| Samsung Galaxy Book2 15 | |
| AIDA64 / CPU PhotoWorxx | |
| Média da turma Multimedia (12860 - 88154, n=61, últimos 2 anos) | |
| Samsung Galaxy Book2 15 | |
| Lenovo ThinkBook 16 G4+ IAP | |
| Huawei MateBook D 16 2022 | |
| Acer Swift X SFX16-51G-5388 | |
| Dell Inspiron 16 Plus 7620 | |
| Média Intel Core i7-12700H (12863 - 52207, n=64) | |
| Asus Vivobook Pro 16X-M7600QE | |
| Asus Vivobook Pro 16X-M7600QE | |
Desempenho do sistema
No uso diário, o ThinkBook 16 G4+ é um laptop extremamente responsivo e, dados os poderosos componentes, não se deve preocupar com gargalos de desempenho nos próximos anos. Não conseguimos executar o PCMark 10 sintético em nossa amostra de revisão porque ele sempre falhou apesar de várias reinstalações do programa e também dos drivers. Este foi o único problema que encontramos durante os testes e os resultados nos outros benchmarks são muito bons, como esperado.
WebXPRT 3: Overall
WebXPRT 4: Overall
Jetstream 2: 2.0 Total
Mozilla Kraken 1.1: Total
Octane V2: Total Score
LibreOffice : 20 Documents To PDF
| CrossMark / Overall | |
| Huawei MateBook D 16 2022 | |
| Média da turma Multimedia (866 - 2728, n=67, últimos 2 anos) | |
| Lenovo ThinkBook 16 G4+ IAP | |
| Média Intel Core i7-12700H, NVIDIA GeForce RTX 2050 Mobile (n=1) | |
| Dell Inspiron 16 Plus 7620 | |
| Acer Swift X SFX16-51G-5388 | |
| CrossMark / Productivity | |
| Huawei MateBook D 16 2022 | |
| Média da turma Multimedia (931 - 2489, n=67, últimos 2 anos) | |
| Lenovo ThinkBook 16 G4+ IAP | |
| Média Intel Core i7-12700H, NVIDIA GeForce RTX 2050 Mobile (n=1) | |
| Dell Inspiron 16 Plus 7620 | |
| Acer Swift X SFX16-51G-5388 | |
| CrossMark / Creativity | |
| Média da turma Multimedia (907 - 3465, n=67, últimos 2 anos) | |
| Huawei MateBook D 16 2022 | |
| Lenovo ThinkBook 16 G4+ IAP | |
| Média Intel Core i7-12700H, NVIDIA GeForce RTX 2050 Mobile (n=1) | |
| Dell Inspiron 16 Plus 7620 | |
| Acer Swift X SFX16-51G-5388 | |
| CrossMark / Responsiveness | |
| Huawei MateBook D 16 2022 | |
| Lenovo ThinkBook 16 G4+ IAP | |
| Média Intel Core i7-12700H, NVIDIA GeForce RTX 2050 Mobile (n=1) | |
| Dell Inspiron 16 Plus 7620 | |
| Média da turma Multimedia (605 - 2024, n=67, últimos 2 anos) | |
| Acer Swift X SFX16-51G-5388 | |
| WebXPRT 3 / Overall | |
| Média da turma Multimedia (136.4 - 596, n=70, últimos 2 anos) | |
| Huawei MateBook D 16 2022 | |
| Dell Inspiron 16 Plus 7620 | |
| Lenovo ThinkBook 16 G4+ IAP | |
| Média Intel Core i7-12700H, NVIDIA GeForce RTX 2050 Mobile (n=1) | |
| Asus Vivobook Pro 16X-M7600QE | |
| Samsung Galaxy Book2 15 | |
| Acer Swift X SFX16-51G-5388 | |
| WebXPRT 4 / Overall | |
| Média da turma Multimedia (167.3 - 402, n=71, últimos 2 anos) | |
| Huawei MateBook D 16 2022 | |
| Lenovo ThinkBook 16 G4+ IAP | |
| Média Intel Core i7-12700H, NVIDIA GeForce RTX 2050 Mobile (n=1) | |
| Dell Inspiron 16 Plus 7620 | |
| Samsung Galaxy Book2 15 | |
| Acer Swift X SFX16-51G-5388 | |
| Jetstream 2 / 2.0 Total | |
| Média da turma Multimedia (261 - 481, n=36, últimos 2 anos) | |
| Dell Inspiron 16 Plus 7620 | |
| Lenovo ThinkBook 16 G4+ IAP | |
| Média Intel Core i7-12700H, NVIDIA GeForce RTX 2050 Mobile (n=1) | |
| Huawei MateBook D 16 2022 | |
| Samsung Galaxy Book2 15 | |
| Acer Swift X SFX16-51G-5388 | |
| Mozilla Kraken 1.1 / Total | |
| Acer Swift X SFX16-51G-5388 | |
| Asus Vivobook Pro 16X-M7600QE | |
| Asus Vivobook Pro 16X-M7600QE | |
| Samsung Galaxy Book2 15 | |
| Dell Inspiron 16 Plus 7620 | |
| Huawei MateBook D 16 2022 | |
| Lenovo ThinkBook 16 G4+ IAP | |
| Média Intel Core i7-12700H, NVIDIA GeForce RTX 2050 Mobile (n=1) | |
| Média da turma Multimedia (228 - 835, n=74, últimos 2 anos) | |
| Octane V2 / Total Score | |
| Média da turma Multimedia (64079 - 153175, n=35, últimos 2 anos) | |
| Huawei MateBook D 16 2022 | |
| Lenovo ThinkBook 16 G4+ IAP | |
| Média Intel Core i7-12700H, NVIDIA GeForce RTX 2050 Mobile (n=1) | |
| Samsung Galaxy Book2 15 | |
| Acer Swift X SFX16-51G-5388 | |
| LibreOffice / 20 Documents To PDF | |
| Asus Vivobook Pro 16X-M7600QE | |
| Asus Vivobook Pro 16X-M7600QE | |
| Acer Swift X SFX16-51G-5388 | |
| Média da turma Multimedia (23.9 - 146.7, n=64, últimos 2 anos) | |
| Lenovo ThinkBook 16 G4+ IAP | |
| Média Intel Core i7-12700H, NVIDIA GeForce RTX 2050 Mobile (n=1) | |
| Dell Inspiron 16 Plus 7620 | |
| Samsung Galaxy Book2 15 | |
| Huawei MateBook D 16 2022 | |
* ... menor é melhor
» No benchmarks for this notebook found!
| AIDA64 / Memory Copy | |
| Média da turma Multimedia (21158 - 132135, n=61, últimos 2 anos) | |
| Lenovo ThinkBook 16 G4+ IAP | |
| Samsung Galaxy Book2 15 | |
| Huawei MateBook D 16 2022 | |
| Acer Swift X SFX16-51G-5388 | |
| Dell Inspiron 16 Plus 7620 | |
| Média Intel Core i7-12700H (25615 - 80511, n=64) | |
| Asus Vivobook Pro 16X-M7600QE | |
| Asus Vivobook Pro 16X-M7600QE | |
| AIDA64 / Memory Read | |
| Média da turma Multimedia (19699 - 174586, n=61, últimos 2 anos) | |
| Lenovo ThinkBook 16 G4+ IAP | |
| Dell Inspiron 16 Plus 7620 | |
| Samsung Galaxy Book2 15 | |
| Média Intel Core i7-12700H (25586 - 79442, n=64) | |
| Huawei MateBook D 16 2022 | |
| Acer Swift X SFX16-51G-5388 | |
| Asus Vivobook Pro 16X-M7600QE | |
| Asus Vivobook Pro 16X-M7600QE | |
| AIDA64 / Memory Write | |
| Média da turma Multimedia (17733 - 134998, n=61, últimos 2 anos) | |
| Samsung Galaxy Book2 15 | |
| Acer Swift X SFX16-51G-5388 | |
| Huawei MateBook D 16 2022 | |
| Lenovo ThinkBook 16 G4+ IAP | |
| Dell Inspiron 16 Plus 7620 | |
| Média Intel Core i7-12700H (23679 - 88660, n=64) | |
| Asus Vivobook Pro 16X-M7600QE | |
| Asus Vivobook Pro 16X-M7600QE | |
| AIDA64 / Memory Latency | |
| Média da turma Multimedia (7 - 535, n=60, últimos 2 anos) | |
| Acer Swift X SFX16-51G-5388 | |
| Lenovo ThinkBook 16 G4+ IAP | |
| Huawei MateBook D 16 2022 | |
| Dell Inspiron 16 Plus 7620 | |
| Média Intel Core i7-12700H (76.2 - 133.9, n=62) | |
| Asus Vivobook Pro 16X-M7600QE | |
| Asus Vivobook Pro 16X-M7600QE | |
| Samsung Galaxy Book2 15 | |
* ... menor é melhor
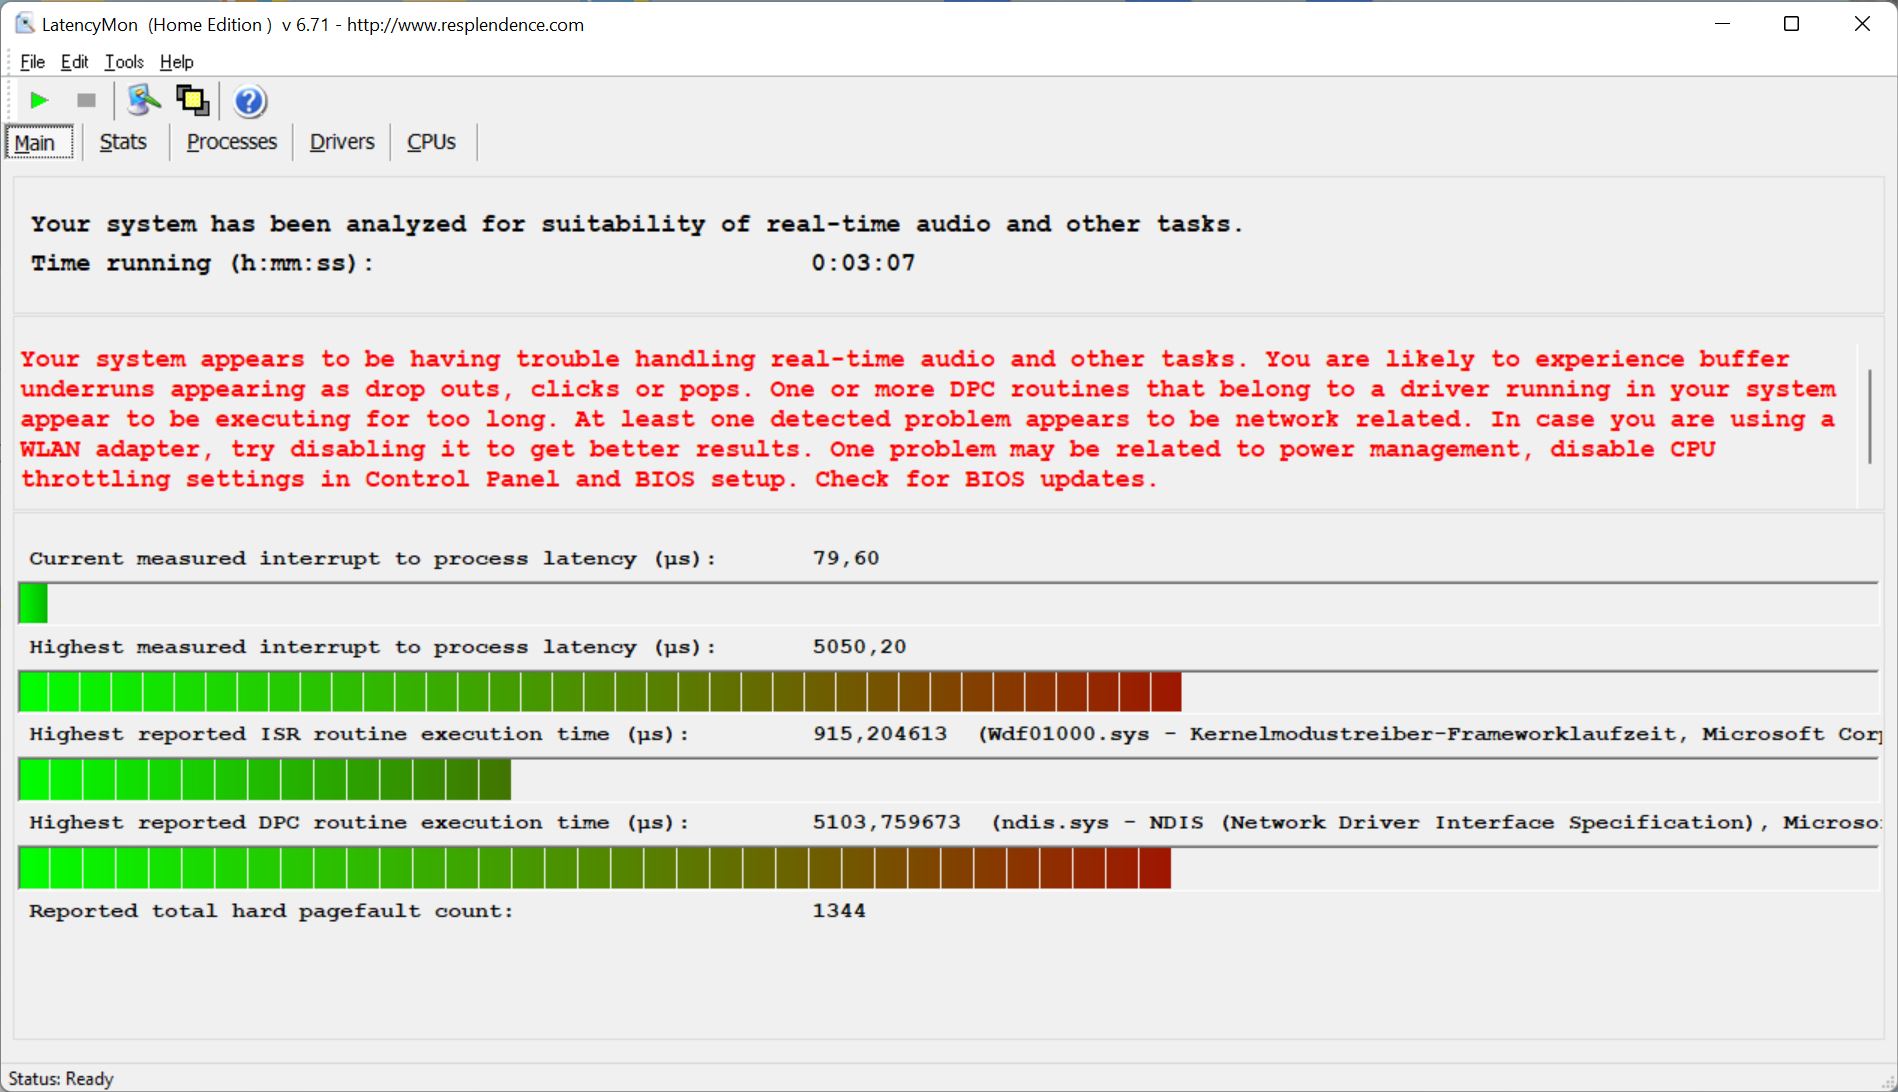
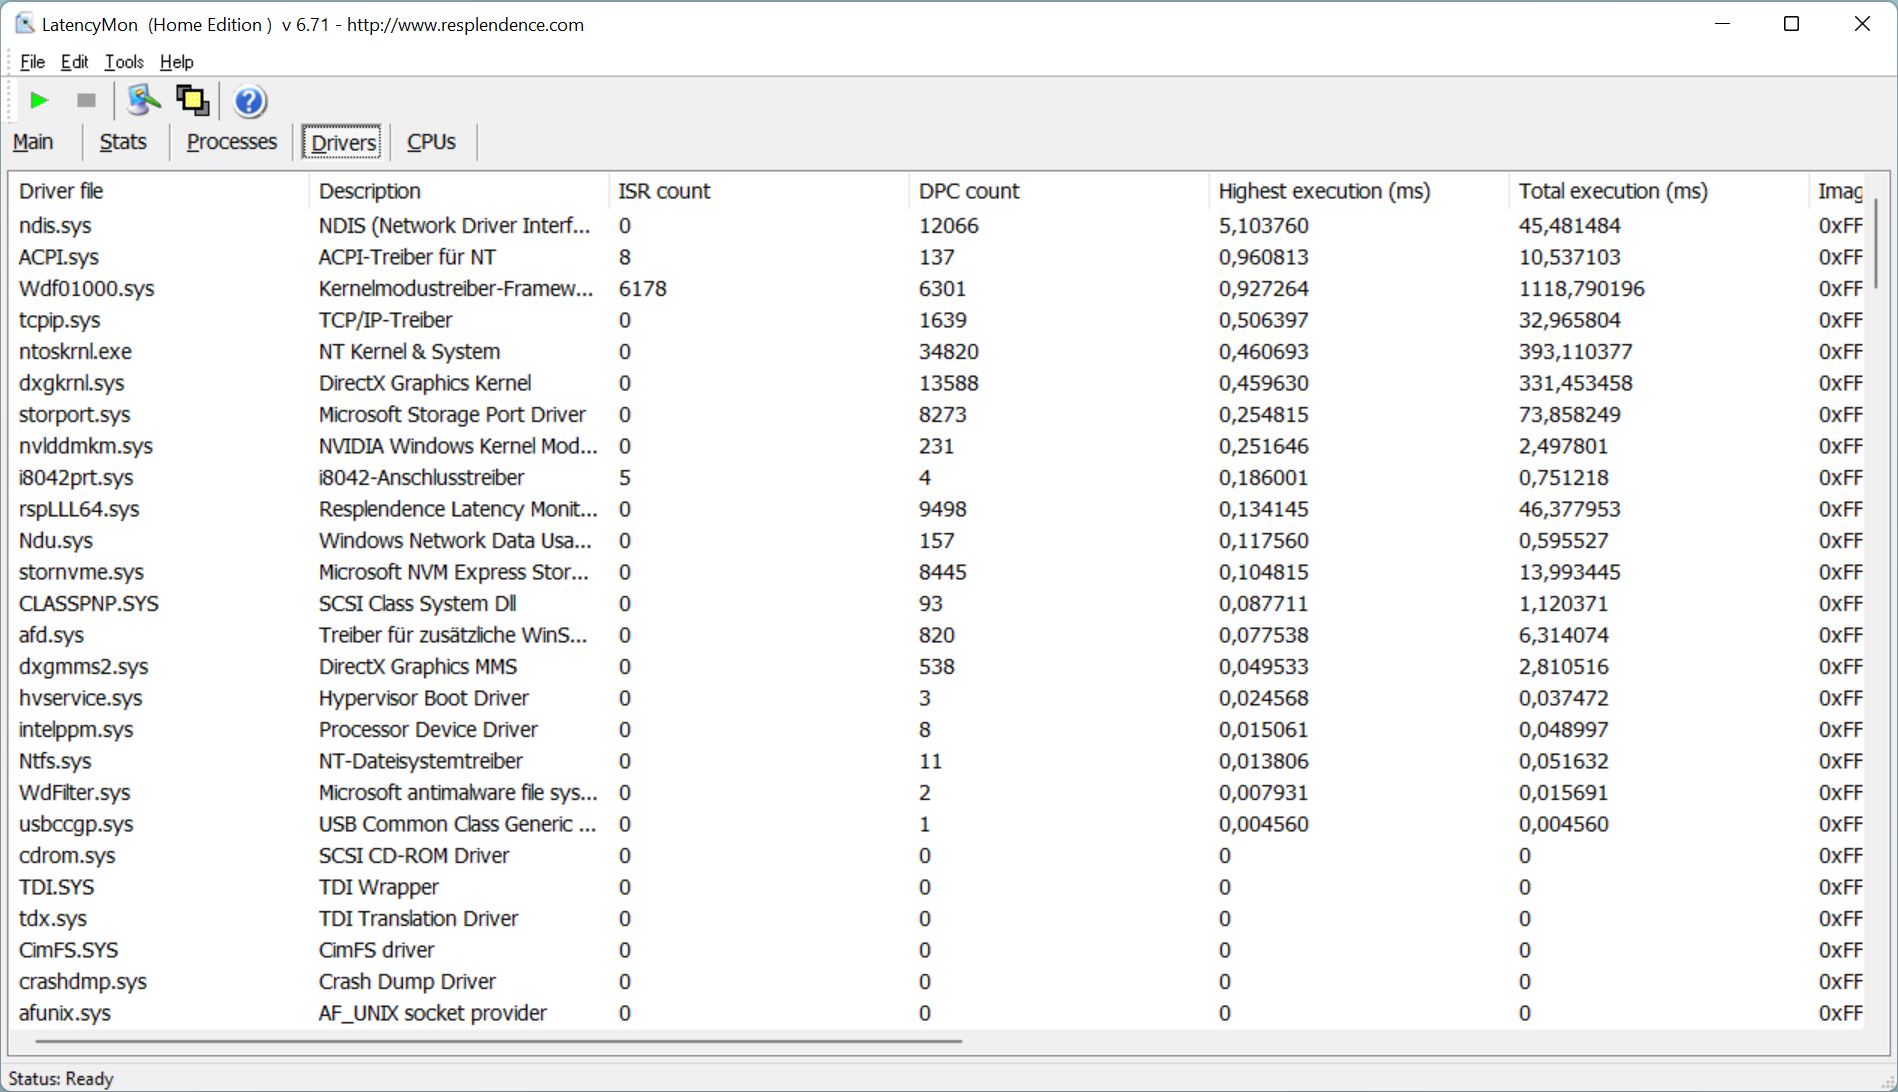
Latência do DPC
Em nosso teste de latência padronizado (navegação na web, reprodução 4K YouTube, carga de CPU), o ThinkBook 16 G4+ mostra severas limitações com a versão atual e, portanto, é inadequado para o uso de aplicações de áudio em tempo real.
| DPC Latencies / LatencyMon - interrupt to process latency (max), Web, Youtube, Prime95 | |
| Acer Swift X SFX16-51G-5388 | |
| Lenovo ThinkBook 16 G4+ IAP | |
| Asus Vivobook Pro 16X-M7600QE | |
| Dell Inspiron 16 Plus 7620 | |
| Samsung Galaxy Book2 15 | |
| Huawei MateBook D 16 2022 | |
* ... menor é melhor
Massenspeicher
O ThinkBook 16 G4+ oferece dois slots M.2-2280 para SSDs, um dos quais usa uma conexão rápida PCIe 4.0, o outro PCIe 3.0. Um Micron 2450 compacto (M.2-2242) está instalado em nossa amostra de revisão, que já é um SSD PCIe 4.0, mas este drive não é o mais rápido, já que o fabricante especifica uma taxa máxima de transferência de 3,6 GB/s. O resultado final é que você tem um SSD PCIe 4.0 com velocidade PCIe 3.0. No entanto, isto não apresenta restrições reais na prática e o desempenho permanece estável mesmo sob carga prolongada. O SSD oferece uma capacidade de 1 TB, sendo que 916 GB ainda está disponível após a primeira inicialização. Mais benchmarks de SSD estão disponíveisaqui.

* ... menor é melhor
Sustained Read Performance: DiskSpd Read Loop, Queue Depth 8
Placa Gráfica
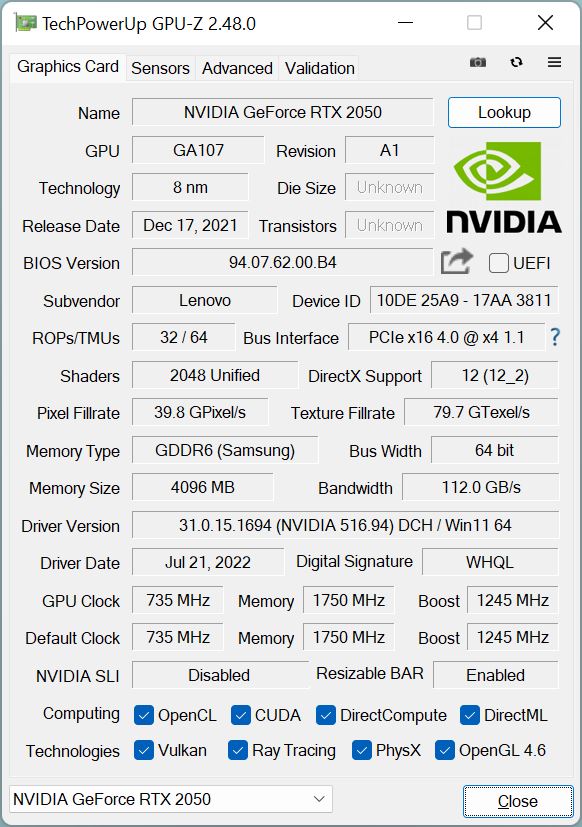
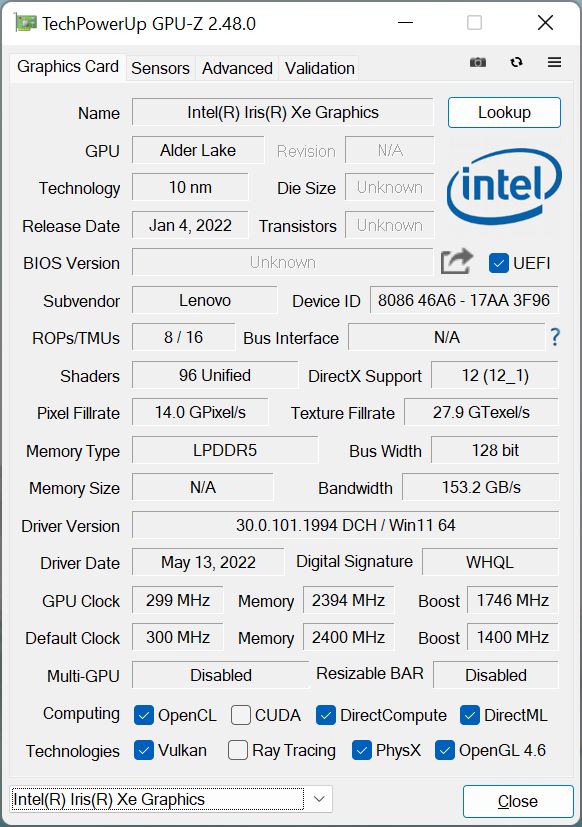
No uso diário, os cálculos gráficos são muitas vezes realizados pelos processadores integradosG7 Iris Xe Graphicsos dedicados Nvidia GeForce RTX 2050só se liga automaticamente sob carga mais alta. Em princípio, esta GPU é uma GeForce MX570mas também apoia a RayTracing e DLSS. O TGP está regulado para um máximo de 50 watts, sendo que outros 10 watts podem ser usados pelo processador. Observamos um relógio de núcleo máximo de 1.762 MHz.
Nos benchmarks sintéticos, o RTX 2050 normalmente está logo atrás do RTX 3050que funciona um pouco mais eficientemente. Além disso, a GPU é mais que duas vezes mais rápida do que a Iris Xe Graphics G7 em testes exigentes. Não há queda de desempenho sob carga prolongada, pois o exigente teste de estresse Time Spy é facilmente aprovado com 99,7%.
Entretanto, o consumo de energia da GPU é limitado a 30 watts no modo de bateria, o que leva a uma redução de desempenho de 15%. Mais referências de GPU estão disponíveis em nossoseção técnica.
| V-Ray 5 Benchmark - GPU CUDA | |
| Média da turma Multimedia (277 - 1482, n=7, últimos 2 anos) | |
| Acer Swift X SFX16-51G-5388 | |
| Média NVIDIA GeForce RTX 2050 Mobile (169 - 214, n=3) | |
* ... menor é melhor
| 3DMark Vantage P Result | 52669 pontos | |
| 3DMark 11 Performance | 15277 pontos | |
| 3DMark Cloud Gate Standard Score | 40781 pontos | |
| 3DMark Fire Strike Score | 9274 pontos | |
| 3DMark Time Spy Score | 4300 pontos | |
Ajuda | ||
Desempenho nos jogos
O desempenho do jogo doRTX 2050é bom, e o ThinkBook 16 G4+ está novamente atrás do RTX 3050 Ti e, em muitos casos, também o RTX 3050. Assim, muitos títulos podem ser jogados sem problemas em Full HD e com detalhes altos, e a resolução WQHD nativa também é possível em alguns casos. Uma redução nos detalhes em FHD é necessária apenas para títulos exigentes como o Cyberpoint 2077. Nosso loop Witcher 3 mostra que o desempenho não cai durante sessões de jogo mais longas. Mais benchmarks de jogos estão disponíveis aqui.
| The Witcher 3 | |
| 1920x1080 High Graphics & Postprocessing (Nvidia HairWorks Off) | |
| Dell Inspiron 16 Plus 7620 | |
| Média da turma Multimedia (22 - 224, n=13, últimos 2 anos) | |
| Lenovo ThinkBook 16 G4+ IAP | |
| Asus Vivobook Pro 16X-M7600QE | |
| Média NVIDIA GeForce RTX 2050 Mobile (46.7 - 78, n=8) | |
| Acer Swift X SFX16-51G-5388 | |
| Samsung Galaxy Book2 15 | |
| Huawei MateBook D 16 2022 | |
| 1920x1080 Ultra Graphics & Postprocessing (HBAO+) | |
| Dell Inspiron 16 Plus 7620 | |
| Média da turma Multimedia (11 - 121, n=13, últimos 2 anos) | |
| Asus Vivobook Pro 16X-M7600QE | |
| Lenovo ThinkBook 16 G4+ IAP | |
| Média NVIDIA GeForce RTX 2050 Mobile (24.3 - 39.6, n=9) | |
| Acer Swift X SFX16-51G-5388 | |
| Samsung Galaxy Book2 15 | |
| Huawei MateBook D 16 2022 | |
| Cyberpunk 2077 1.6 | |
| 1920x1080 High Preset | |
| Dell Inspiron 16 Plus 7620 | |
| Lenovo ThinkBook 16 G4+ IAP | |
| Média NVIDIA GeForce RTX 2050 Mobile (19.1 - 31, n=4) | |
| Samsung Galaxy Book2 15 | |
| 1920x1080 Ultra Preset | |
| Dell Inspiron 16 Plus 7620 | |
| Lenovo ThinkBook 16 G4+ IAP | |
| Média NVIDIA GeForce RTX 2050 Mobile (16.8 - 27.4, n=4) | |
| Samsung Galaxy Book2 15 | |
| F1 2021 | |
| 1920x1080 High Preset AA:T AF:16x | |
| Asus Vivobook Pro 16X-M7600QE | |
| Lenovo ThinkBook 16 G4+ IAP | |
| Média NVIDIA GeForce RTX 2050 Mobile (66.2 - 107.6, n=3) | |
| Samsung Galaxy Book2 15 | |
| Huawei MateBook D 16 2022 | |
| 1920x1080 Ultra High Preset + Raytracing AA:T AF:16x | |
| Asus Vivobook Pro 16X-M7600QE | |
| Média NVIDIA GeForce RTX 2050 Mobile (36.1 - 52.3, n=3) | |
| Lenovo ThinkBook 16 G4+ IAP | |
| Huawei MateBook D 16 2022 | |
| Samsung Galaxy Book2 15 | |
Witcher 3 FPS Chart
| baixo | média | alto | ultra | QHD | |
|---|---|---|---|---|---|
| GTA V (2015) | 179.1 | 175.3 | 108.1 | 52.9 | 37.3 |
| The Witcher 3 (2015) | 216 | 139 | 77 | 38.3 | |
| Dota 2 Reborn (2015) | 167.4 | 153.9 | 140 | 129.6 | |
| Final Fantasy XV Benchmark (2018) | 109.1 | 61 | 41.8 | 29 | |
| X-Plane 11.11 (2018) | 139.6 | 106.4 | 90.1 | ||
| Far Cry 5 (2018) | 118 | 68 | 62 | 60 | 39 |
| Strange Brigade (2018) | 196.9 | 86.8 | 71.5 | 63.1 | 46.5 |
| F1 2021 (2021) | 229 | 130.6 | 99.5 | 44.1 | 28.2 |
| Cyberpunk 2077 1.6 (2022) | 49 | 41 | 31 | 25 |
Emissões - O jogo requer fones de ouvido
Ruído
Quando ociosos ou sob carga baixa, os dois ventiladores quase sempre permanecem desativados, mesmo no modo de alto desempenho . Entretanto, eles atingem rapidamente a velocidade máxima sob cargas mais altas neste modo, correspondendo a um nível de ruído de 47 dB(A). Isto já é claramente audível e por isso recomendamos fones de ouvido quando estiver jogando. No modo de resfriamento inteligente , o laptop só é marginalmente mais silencioso a pouco menos de 44 dB(A) quando jogando. Se você não exigir muito desempenho, você pode mudar facilmente para o modo de economia de bateria, uma vez que os ventiladores raramente fazem efeito e são dificilmente audíveis, mas este modo dificilmente é adequado para jogos devido à redução de energia. Não foram detectados ruídos eletrônicos.
Barulho
| Ocioso |
| 24.2 / 24.2 / 24.2 dB |
| Carga |
| 47 / 47 dB |
 | ||
30 dB silencioso 40 dB(A) audível 50 dB(A) ruidosamente alto |
||
min: | ||
| Lenovo ThinkBook 16 G4+ IAP GeForce RTX 2050 Mobile, i7-12700H, Micron 2450 1TB MTFDKCD1T0TFK | Dell Inspiron 16 Plus 7620 GeForce RTX 3050 Ti Laptop GPU, i7-12700H, Kioxia BG5 KBG50ZNS512G | Acer Swift X SFX16-51G-5388 GeForce RTX 3050 4GB Laptop GPU, i5-11320H, Samsung PM991 MZVLQ512HBLU | Asus Vivobook Pro 16X-M7600QE GeForce RTX 3050 Ti Laptop GPU, R9 5900HX, SK Hynix HFM001TD3JX013N | Huawei MateBook D 16 2022 Iris Xe G7 96EUs, i7-12700H, Silicon Motion PCIe-8 SSD | Samsung Galaxy Book2 15 A350M, i7-1260P, Samsung PM991 MZVLQ512HBLU | |
|---|---|---|---|---|---|---|
| Noise | -6% | -3% | -5% | 2% | -4% | |
| desligado / ambiente * (dB) | 24.2 | 23.3 4% | 25.4 -5% | 26 -7% | 24.2 -0% | 24.3 -0% |
| Idle Minimum * (dB) | 24.2 | 25.7 -6% | 25.4 -5% | 27 -12% | 24.2 -0% | 24.3 -0% |
| Idle Average * (dB) | 24.2 | 26.1 -8% | 25.4 -5% | 27 -12% | 25.8 -7% | 24.3 -0% |
| Idle Maximum * (dB) | 24.2 | 30.6 -26% | 27.8 -15% | 27.5 -14% | 30.5 -26% | 29.8 -23% |
| Load Average * (dB) | 47 | 46.2 2% | 41 13% | 41.7 11% | 39.8 15% | 47.5 -1% |
| Witcher 3 ultra * (dB) | 47 | 49.2 -5% | 39.8 15% | 47.5 -1% | ||
| Load Maximum * (dB) | 47 | 49.4 -5% | 47 -0% | 45.3 4% | 39.8 15% | 47.5 -1% |
* ... menor é melhor
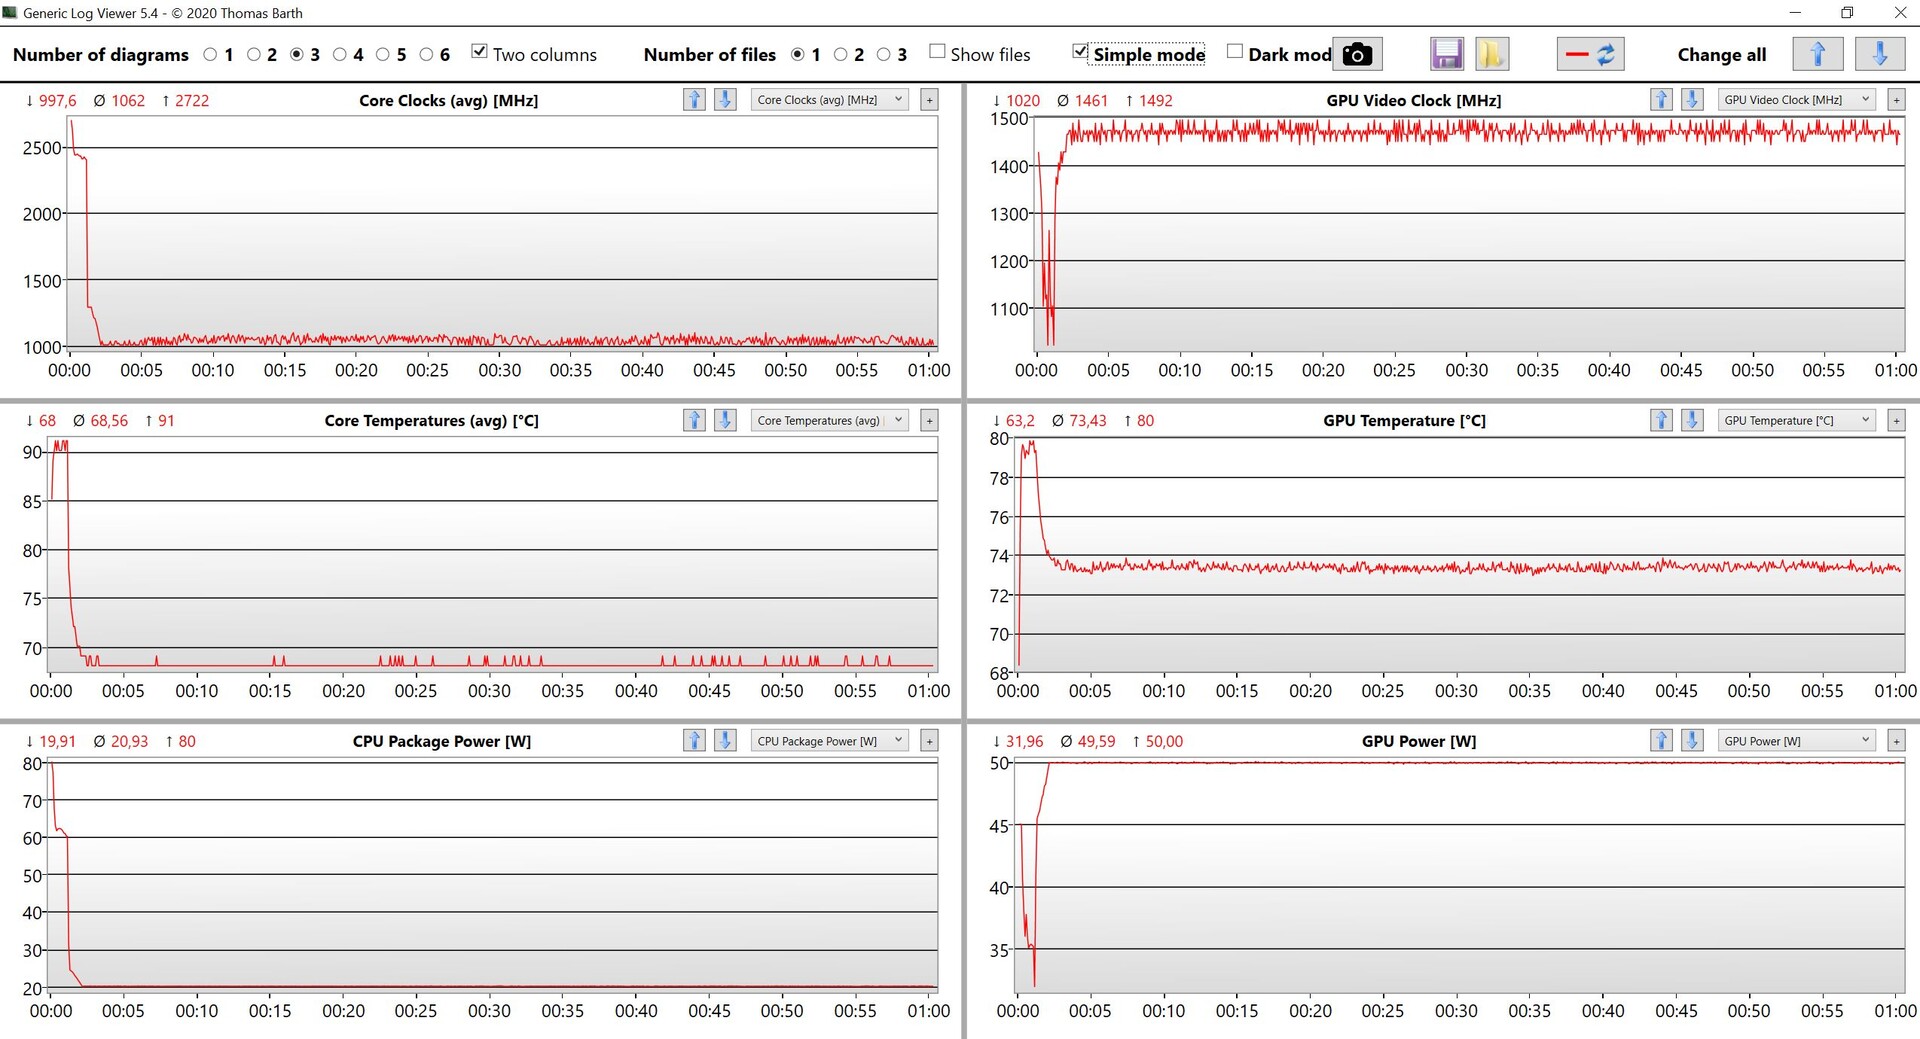
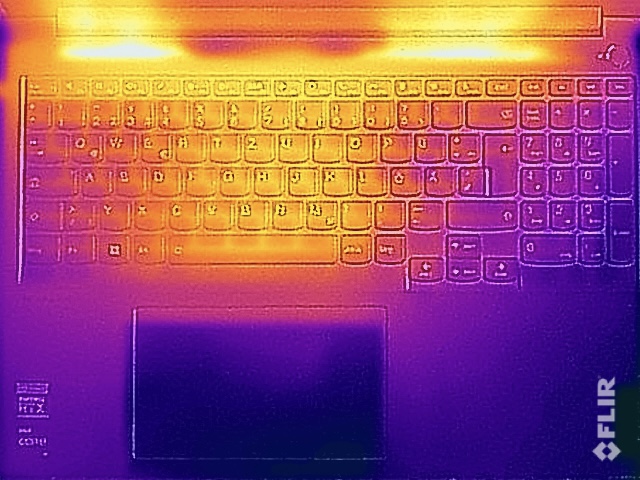
Temperatura
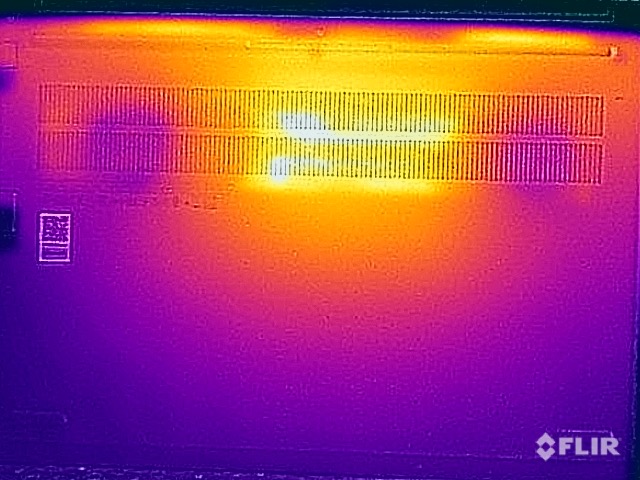
A caixa de alumínio não esquenta sob carga baixa. Só fica significativamente mais quente durante os jogos ou testes de estresse. No lado superior da unidade base, registramos cerca de 42 °C na área do meio/cima do teclado, o que também é perceptível ao digitar, mas não é desagradável. Na parte inferior, há um hotspot na área central traseira da caixa, onde medimos cerca de 50 °C. O contato direto da pele com superfícies metálicas deve ser evitado aqui.
Em testes de estresse, o processador começa na potência máxima e depois se estabiliza a 20 watts após alguns minutos, enquanto a placa gráfica se estabiliza a 50 watts e permanece neste nível. Portanto, a GPU é priorizada no modo High Performance, enquanto o processador pode consumir um pouco mais de energia no modo Intelligent Cooling (24/36 watts).
(±) A temperatura máxima no lado superior é 42.9 °C / 109 F, em comparação com a média de 36.8 °C / 98 F , variando de 21 a 71 °C para a classe Multimedia.
(-) A parte inferior aquece até um máximo de 50.6 °C / 123 F, em comparação com a média de 39.1 °C / 102 F
(+) Em uso inativo, a temperatura média para o lado superior é 25.3 °C / 78 F, em comparação com a média do dispositivo de 31.3 °C / ### class_avg_f### F.
(±) Jogando The Witcher 3, a temperatura média para o lado superior é 36.1 °C / 97 F, em comparação com a média do dispositivo de 31.3 °C / ## #class_avg_f### F.
(+) Os apoios para as mãos e o touchpad são mais frios que a temperatura da pele, com um máximo de 28.3 °C / 82.9 F e, portanto, são frios ao toque.
(±) A temperatura média da área do apoio para as mãos de dispositivos semelhantes foi 28.7 °C / 83.7 F (+0.4 °C / 0.8 F).
| Lenovo ThinkBook 16 G4+ IAP Intel Core i7-12700H, NVIDIA GeForce RTX 2050 Mobile | Dell Inspiron 16 Plus 7620 Intel Core i7-12700H, NVIDIA GeForce RTX 3050 Ti Laptop GPU | Acer Swift X SFX16-51G-5388 Intel Core i5-11320H, NVIDIA GeForce RTX 3050 4GB Laptop GPU | Asus Vivobook Pro 16X-M7600QE AMD Ryzen 9 5900HX, NVIDIA GeForce RTX 3050 Ti Laptop GPU | Huawei MateBook D 16 2022 Intel Core i7-12700H, Intel Iris Xe Graphics G7 96EUs | Samsung Galaxy Book2 15 Intel Core i7-1260P, Intel Arc A350M | |
|---|---|---|---|---|---|---|
| Heat | -7% | -13% | 3% | -3% | 1% | |
| Maximum Upper Side * (°C) | 42.9 | 46 -7% | 52.4 -22% | 39.4 8% | 41.8 3% | 44.6 -4% |
| Maximum Bottom * (°C) | 50.6 | 45.8 9% | 50 1% | 43.6 14% | 47.3 7% | 47.5 6% |
| Idle Upper Side * (°C) | 26 | 29.2 -12% | 30.3 -17% | 27.6 -6% | 28.3 -9% | 25.8 1% |
| Idle Bottom * (°C) | 26.5 | 31 -17% | 30.4 -15% | 27.5 -4% | 30.2 -14% | 26.1 2% |
* ... menor é melhor
Oradores
A Lenovo equipa o ThinkBook 16 G4+ com dois alto-falantes estéreo (2x 2 watts), que estão localizados na área frontal da unidade base e direcionam o som para baixo. Em termos de som, os módulos são médios e comparáveis aos do concorrente direto, os Dell Inspiron 16 Plusjá que ambos os modelos carecem de potência e baixo. Para música de fundo ou vídeos ocasionais, a qualidade do som é suficiente e é até muito boa para reprodução da fala (por exemplo, conferências), graças à reprodução linear dos agudos/alto. Entretanto, os alto-falantes externos ou fones de ouvido devem ser usados para jogos ou noites de cinema.
Lenovo ThinkBook 16 G4+ IAP análise de áudio
(±) | o volume do alto-falante é médio, mas bom (###valor### dB)
Graves 100 - 315Hz
(-) | quase nenhum baixo - em média 17.3% menor que a mediana
(±) | a linearidade dos graves é média (10.3% delta para a frequência anterior)
Médios 400 - 2.000 Hz
(+) | médios equilibrados - apenas 4.6% longe da mediana
(+) | médios são lineares (4.6% delta para frequência anterior)
Altos 2 - 16 kHz
(+) | agudos equilibrados - apenas 1.6% longe da mediana
(+) | os máximos são lineares (6.2% delta da frequência anterior)
Geral 100 - 16.000 Hz
(±) | a linearidade do som geral é média (15.7% diferença em relação à mediana)
Comparado com a mesma classe
» 39% de todos os dispositivos testados nesta classe foram melhores, 5% semelhantes, 56% piores
» O melhor teve um delta de 5%, a média foi 17%, o pior foi 45%
Comparado com todos os dispositivos testados
» 24% de todos os dispositivos testados foram melhores, 5% semelhantes, 71% piores
» O melhor teve um delta de 4%, a média foi 24%, o pior foi 134%
Dell Inspiron 16 Plus 7620 análise de áudio
(+) | os alto-falantes podem tocar relativamente alto (###valor### dB)
Graves 100 - 315Hz
(-) | quase nenhum baixo - em média 22.2% menor que a mediana
(±) | a linearidade dos graves é média (9.7% delta para a frequência anterior)
Médios 400 - 2.000 Hz
(+) | médios equilibrados - apenas 3.3% longe da mediana
(+) | médios são lineares (5.3% delta para frequência anterior)
Altos 2 - 16 kHz
(+) | agudos equilibrados - apenas 2.5% longe da mediana
(+) | os máximos são lineares (4.7% delta da frequência anterior)
Geral 100 - 16.000 Hz
(+) | o som geral é linear (13.4% diferença em relação à mediana)
Comparado com a mesma classe
» 28% de todos os dispositivos testados nesta classe foram melhores, 5% semelhantes, 68% piores
» O melhor teve um delta de 5%, a média foi 17%, o pior foi 45%
Comparado com todos os dispositivos testados
» 14% de todos os dispositivos testados foram melhores, 4% semelhantes, 83% piores
» O melhor teve um delta de 4%, a média foi 24%, o pior foi 134%
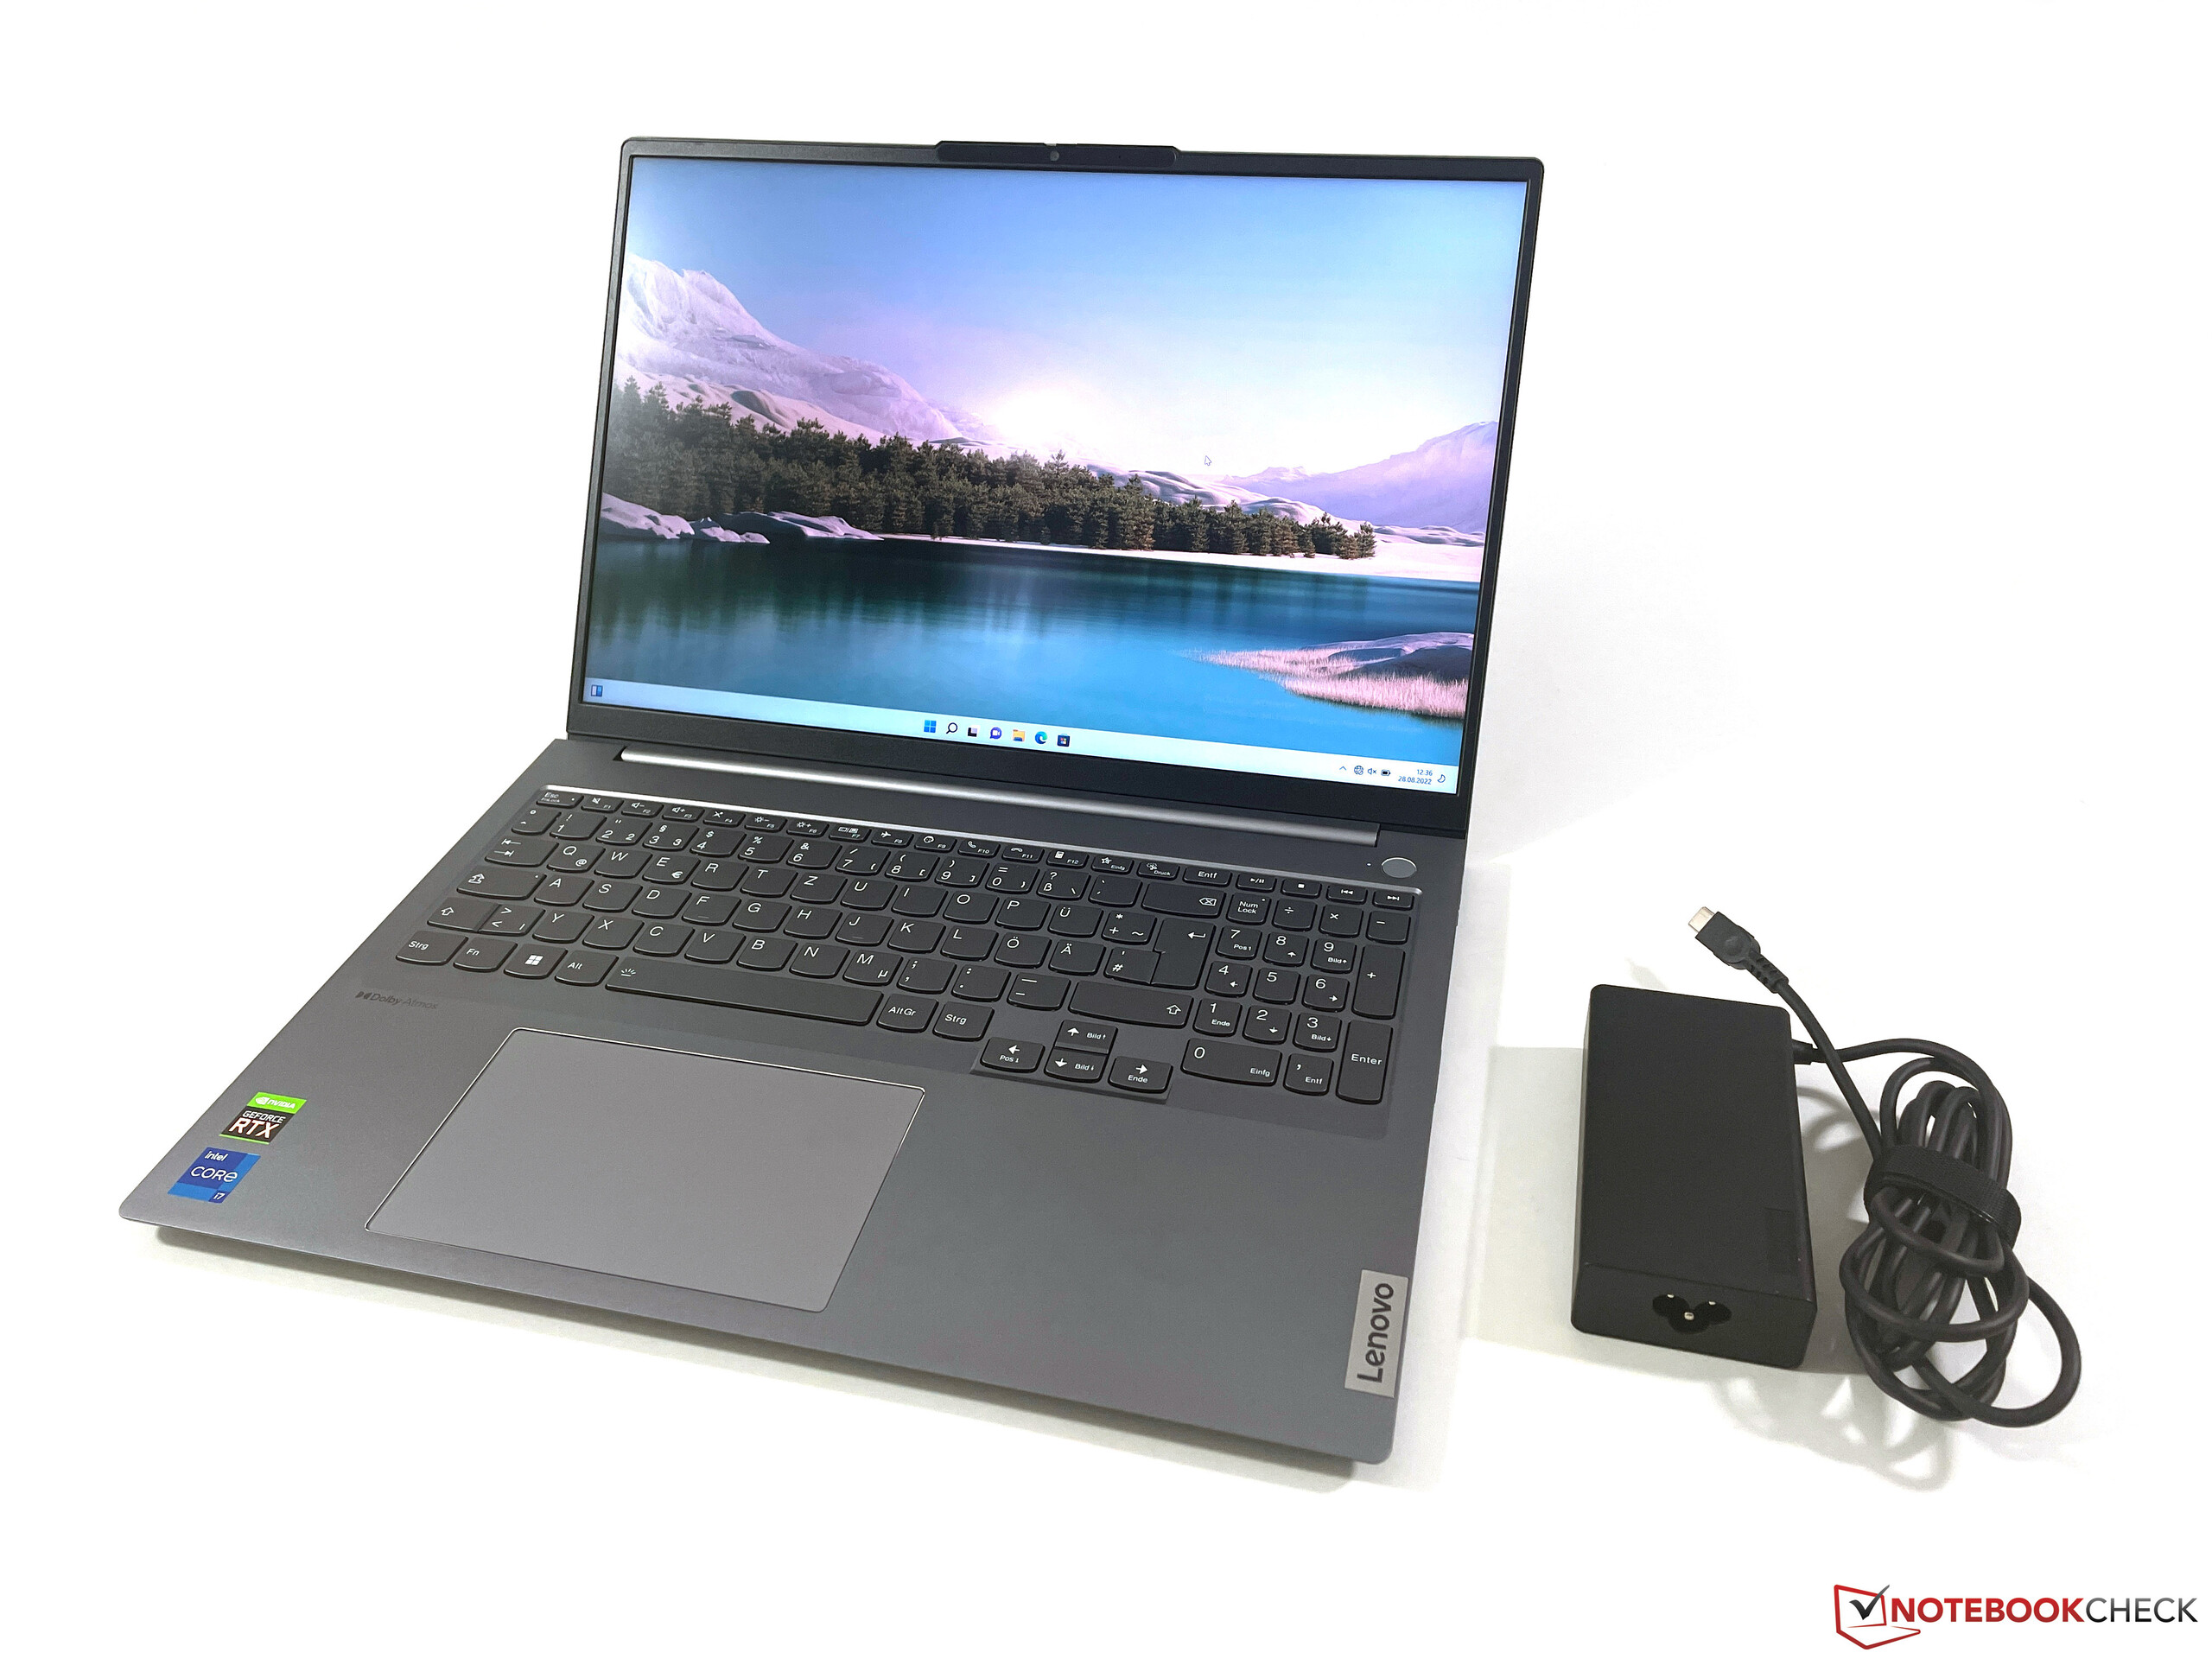
Gestão de energia - ThinkBook com resistência decente
Consumo de energia
Os valores de consumo ocioso do ThinkBook são perfeitamente aceitáveis em vista do grande painel WQHD com um máximo de ~12 watts. Entretanto, a fonte de alimentação de 100 watts incluída rapidamente se torna um fator limitador sob carga. Em casos extremos, a ferramenta HWiNFO produz um consumo total máximo de 162 watts no início do teste de estresse e, após a avaliação dos dados, vemos que também é necessário extrair até 70 watts da bateria por um curto período de tempo. A situação se estabiliza após alguns minutos, mas isto certamente não é favorável à vida útil da bateria se a bateria tiver que ser batida novamente e novamente sob carga.
| desligado | |
| Ocioso | |
| Carga |
|
Key:
min: | |
| Lenovo ThinkBook 16 G4+ IAP i7-12700H, GeForce RTX 2050 Mobile, Micron 2450 1TB MTFDKCD1T0TFK, IPS, 2560x1600, 16" | Dell Inspiron 16 Plus 7620 i7-12700H, GeForce RTX 3050 Ti Laptop GPU, Kioxia BG5 KBG50ZNS512G, IPS, 3072x1920, 16" | Acer Swift X SFX16-51G-5388 i5-11320H, GeForce RTX 3050 4GB Laptop GPU, Samsung PM991 MZVLQ512HBLU, , 1920x1080, 16.1" | Asus Vivobook Pro 16X-M7600QE R9 5900HX, GeForce RTX 3050 Ti Laptop GPU, SK Hynix HFM001TD3JX013N, OLED, 3840x2400, 16.1" | Huawei MateBook D 16 2022 i7-12700H, Iris Xe G7 96EUs, Silicon Motion PCIe-8 SSD, IPS, 1920x1200, 16" | Samsung Galaxy Book2 15 i7-1260P, A350M, Samsung PM991 MZVLQ512HBLU, IPS, 1920x1080, 15.6" | Média NVIDIA GeForce RTX 2050 Mobile | Média da turma Multimedia | |
|---|---|---|---|---|---|---|---|---|
| Power Consumption | -29% | 0% | -22% | 12% | 30% | 11% | 1% | |
| Idle Minimum * (Watt) | 5 | 6.8 -36% | 7 -40% | 8.2 -64% | 6.1 -22% | 4 20% | 5.11 ? -2% | 5.71 ? -14% |
| Idle Average * (Watt) | 11.2 | 9.6 14% | 10.1 10% | 16.2 -45% | 10.6 5% | 7.8 30% | 9.15 ? 18% | 10.1 ? 10% |
| Idle Maximum * (Watt) | 11.6 | 17 -47% | 15 -29% | 19.7 -70% | 11.5 1% | 8.5 27% | 11.2 ? 3% | 12.4 ? -7% |
| Load Average * (Watt) | 89.3 | 117.5 -32% | 63.3 29% | 65.8 26% | 65.5 27% | 59.1 34% | 70.6 ? 21% | 65 ? 27% |
| Witcher 3 ultra * (Watt) | 83 | 113.1 -36% | 63.3 24% | 65.6 21% | 61.2 26% | 56.7 32% | ||
| Load Maximum * (Watt) | 102 | 137.4 -35% | 94 8% | 104 -2% | 68.4 33% | 62.4 39% | 87.4 ? 14% | 112.2 ? -10% |
* ... menor é melhor
Power consumption Witcher 3 / Stress test
Power cosumption with an external monitor
Vida útil da bateria
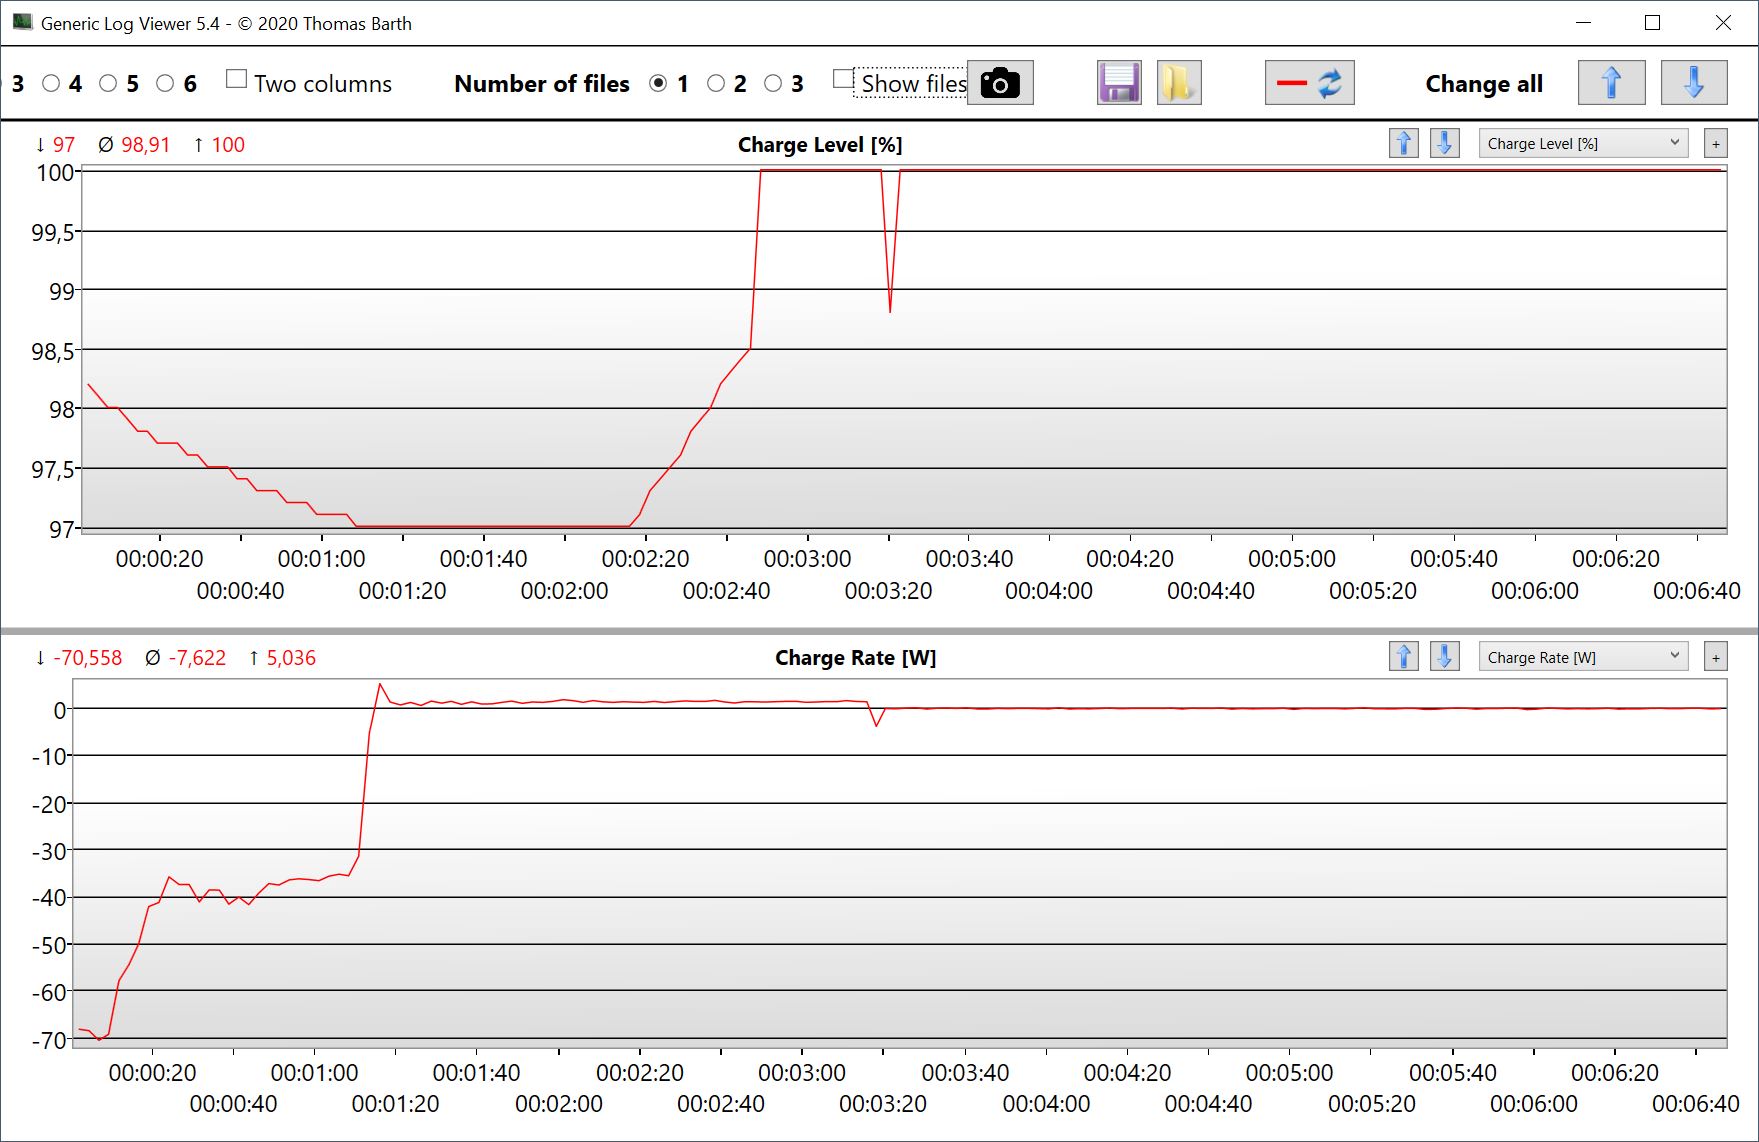
A bateria 71 Wh permite tempos de funcionamento decentes, já que nossa amostra de revisão durou entre 6:43 horas e 8:09 horas em testes WLAN, dependendo do brilho da tela. Um pouco mais de 12 horas é mesmo possível com reprodução de vídeo a 150 cd/m² (correspondente a 71% da luminosidade máxima). Esta grande diferença em relação ao teste WLAN mostra mais uma vez que as CPUs atuais do Lago Alder não funcionam de forma particularmente eficiente, mesmo sob carga de um só núcleo (isto é, quando se navega na Internet).
O processo completo de carga com o dispositivo ligado leva cerca de 100 minutos com uma curva de carga linear, mas há também uma opção de carga expressa que leva apenas 73 minutos (60% já está disponível após 28 minutos).
| Lenovo ThinkBook 16 G4+ IAP i7-12700H, GeForce RTX 2050 Mobile, 71 Wh | Dell Inspiron 16 Plus 7620 i7-12700H, GeForce RTX 3050 Ti Laptop GPU, 86 Wh | Acer Swift X SFX16-51G-5388 i5-11320H, GeForce RTX 3050 4GB Laptop GPU, 58.7 Wh | Asus Vivobook Pro 16X-M7600QE R9 5900HX, GeForce RTX 3050 Ti Laptop GPU, 96 Wh | Huawei MateBook D 16 2022 i7-12700H, Iris Xe G7 96EUs, 60 Wh | Samsung Galaxy Book2 15 i7-1260P, A350M, 54 Wh | Média da turma Multimedia | |
|---|---|---|---|---|---|---|---|
| Duração da bateria | -2% | -11% | 6% | -13% | -5% | 29% | |
| H.264 (h) | 12.6 | 8.4 -33% | 10.6 -16% | 16.4 ? 30% | |||
| WiFi v1.3 (h) | 8.2 | 9.6 17% | 8.1 -1% | 11.3 38% | 7.1 -13% | 8.2 0% | 12 ? 46% |
| Load (h) | 1.5 | 1.2 -20% | 1.5 0% | 1.1 -27% | 1.5 0% | 1.675 ? 12% |
Pro
Contra
Veredicto - O ThinkBook 16 G4+ é um laptop multimídia muito bom

O Lenovo ThinkBook 16 G4+ é um caderno multimídia muito sólido que tem poucos pontos de crítica, além do fraco fornecimento de energia durante os picos de carga. A unidade base poderia ser um pouco mais estável e a Lenovo também tem espaço para melhorias no teclado, mas estes pontos não nos impediriam de comprá-lo.
A grande tela IPS de 16 polegadas oferece muito boa qualidade de imagem livre de PWM e superfícies brilhantes não parecem granulosas apesar da superfície fosca. Embora faltem características adicionais, como HDR, uma taxa de atualização mais alta ou um espaço de cor estendido aqui, o painel é, no entanto, perfeitamente suficiente para seu propósito pretendido. Os valores de desempenho, graças à combinação de um Intel Core i7-12700H e um Nvidia GeForce RTX 2050são muito bons. Mesmo o jogo não é um problema com o ThinkBook.
No ThinkBook 16 G4+, a Lenovo oferece um excelente notebook multimídia que não tem pontos fracos importantes e impressiona com sua extensa conectividade, alto desempenho e boa exibição IPS no uso diário.
Dispositivos concorrentes, tais como o Dell Inspiron 16 Plus ou o Acer Swift Xoferecem GPUs um pouco mais rápidas e eficientes no RTX 3050 e RTX 3050 Timas lutar com exposições mais escuras. No geral, o ThinkBook 16 G4+ é um laptop muito sólido que, tudo considerado, está à frente de seus rivais.
Preço e Disponibilidade
A disponibilidade do ThinkBook 16 G4+ da Lenovo parece ser esparsa em todo o mundo. Por exemplo, o website oficial da Lenovo lista o laptop em França (1.079,00 euros), Itália (1.659,00 euros), Singapura (SG$1.504,07) e o Emirados Árabes Unidos.
Esta lista não é exaustiva. Os preços são a partir de 20.09.2022 e estão sujeitos a alterações
Lenovo ThinkBook 16 G4+ IAP
- 09/20/2022 v7 (old)
Andreas Osthoff
Price comparison

