Revisão Acer Swift X 16: RTX 3050 brilha em laptop multimídia
O Acer Swift X 16 difere basicamente doAcer Swift 3 (SF316)somente nas placas gráficas, sendo que a primeira utiliza Nvidia's GeForce RTX 3050o laptop multimídia é alimentado por um Núcleo i5-11320H ou um Núcleo i7-11390H CPU QuadCore - Tiger Lake Refrescar com um TDP de 35 watts. Nenhuma variante AMD está em oferta como seu irmãozinho, o Acer Swift X 14. A RAM é sempre uma solda de 16 GB de LPDDR4X-4266, enquanto o SSD PCIe 3.0 tem 512 GB.
De particular interesse para nossa revisão é se os padrões de desempenho de exibição e multimídia são adequadamente refletidos no preço de US$ 1.200. Afinal de contas, dispositivos concorrentes, tais como Inspiron 16 Plus da Dell, IdeaPad 5 Pro 16 da Lenovo e VivoBook Pro 16X da Asus não devem ser subestimados.
Possíveis concorrentes em comparação
Avaliação | Data | Modelo | Peso | Altura | Size | Resolução | Preço |
|---|---|---|---|---|---|---|---|
| 86.2 % v7 (old) | 07/2022 | Acer Swift X SFX16-51G-5388 i5-11320H, GeForce RTX 3050 4GB Laptop GPU | 1.8 kg | 18.9 mm | 16.10" | 1920x1080 | |
| 86.4 % v7 (old) | 10/2021 | Acer Swift 3 SF316-51 i7-11370H, Iris Xe G7 96EUs | 1.7 kg | 15.9 mm | 16.10" | 1920x1080 | |
| 85.6 % v7 (old) | 03/2022 | Acer Swift X SFX14-41G-R7F3 R5 5500U, GeForce GTX 1650 Mobile | 1.4 kg | 18.89 mm | 14.00" | 1920x1080 | |
| 86.1 % v7 (old) | 09/2021 | Lenovo IdeaPad 5 Pro 16ACH R7 5800H, GeForce GTX 1650 Mobile | 2 kg | 17.5 mm | 16.00" | 2560x1600 | |
| 86.7 % v7 (old) | 08/2021 | Dell Inspiron 16 Plus 7610 i7-11800H, GeForce RTX 3050 4GB Laptop GPU | 2 kg | 18.99 mm | 16.00" | 3072x1920 | |
v (old) | 12/2021 | Asus Vivobook Pro 16X-M7600QE R9 5900HX, GeForce RTX 3050 Ti Laptop GPU | 1.9 kg | 19 mm | 16.10" | 3840x2400 | |
| 86.5 % v7 (old) | 10/2021 | Huawei MateBook 16 R7 5800H R7 5800H, Vega 8 | 2 kg | 17.8 mm | 16.00" | 2520x1680 |
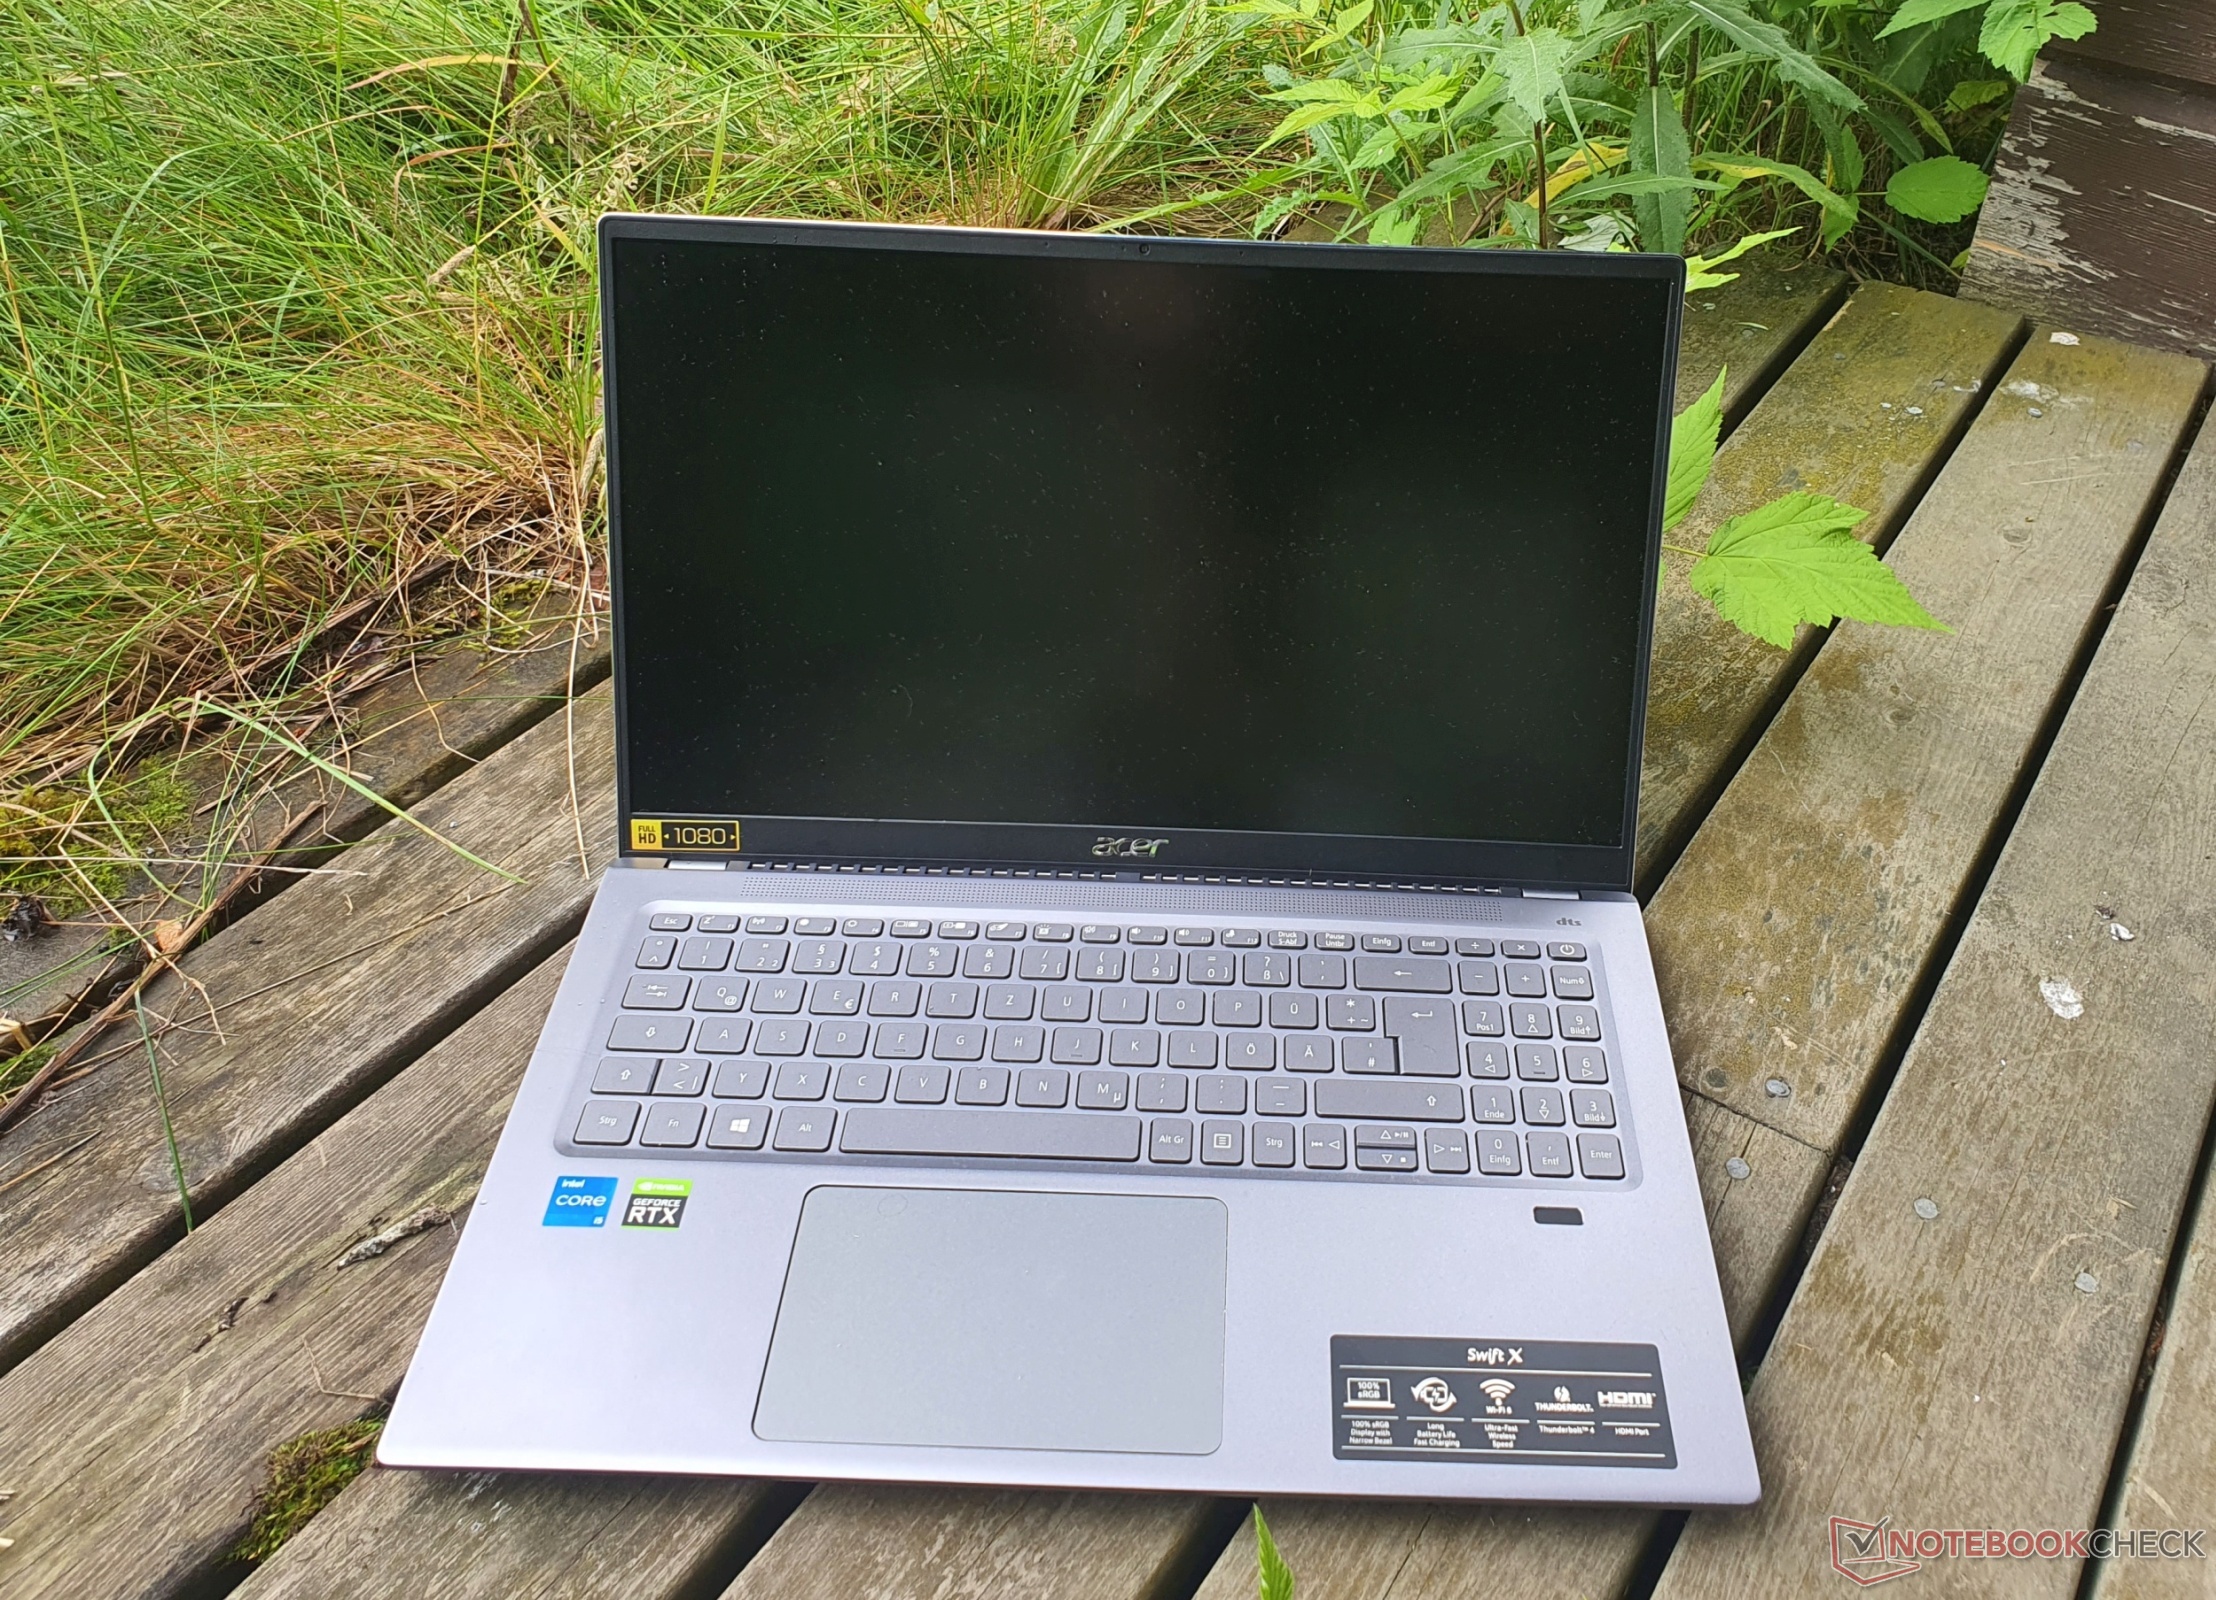
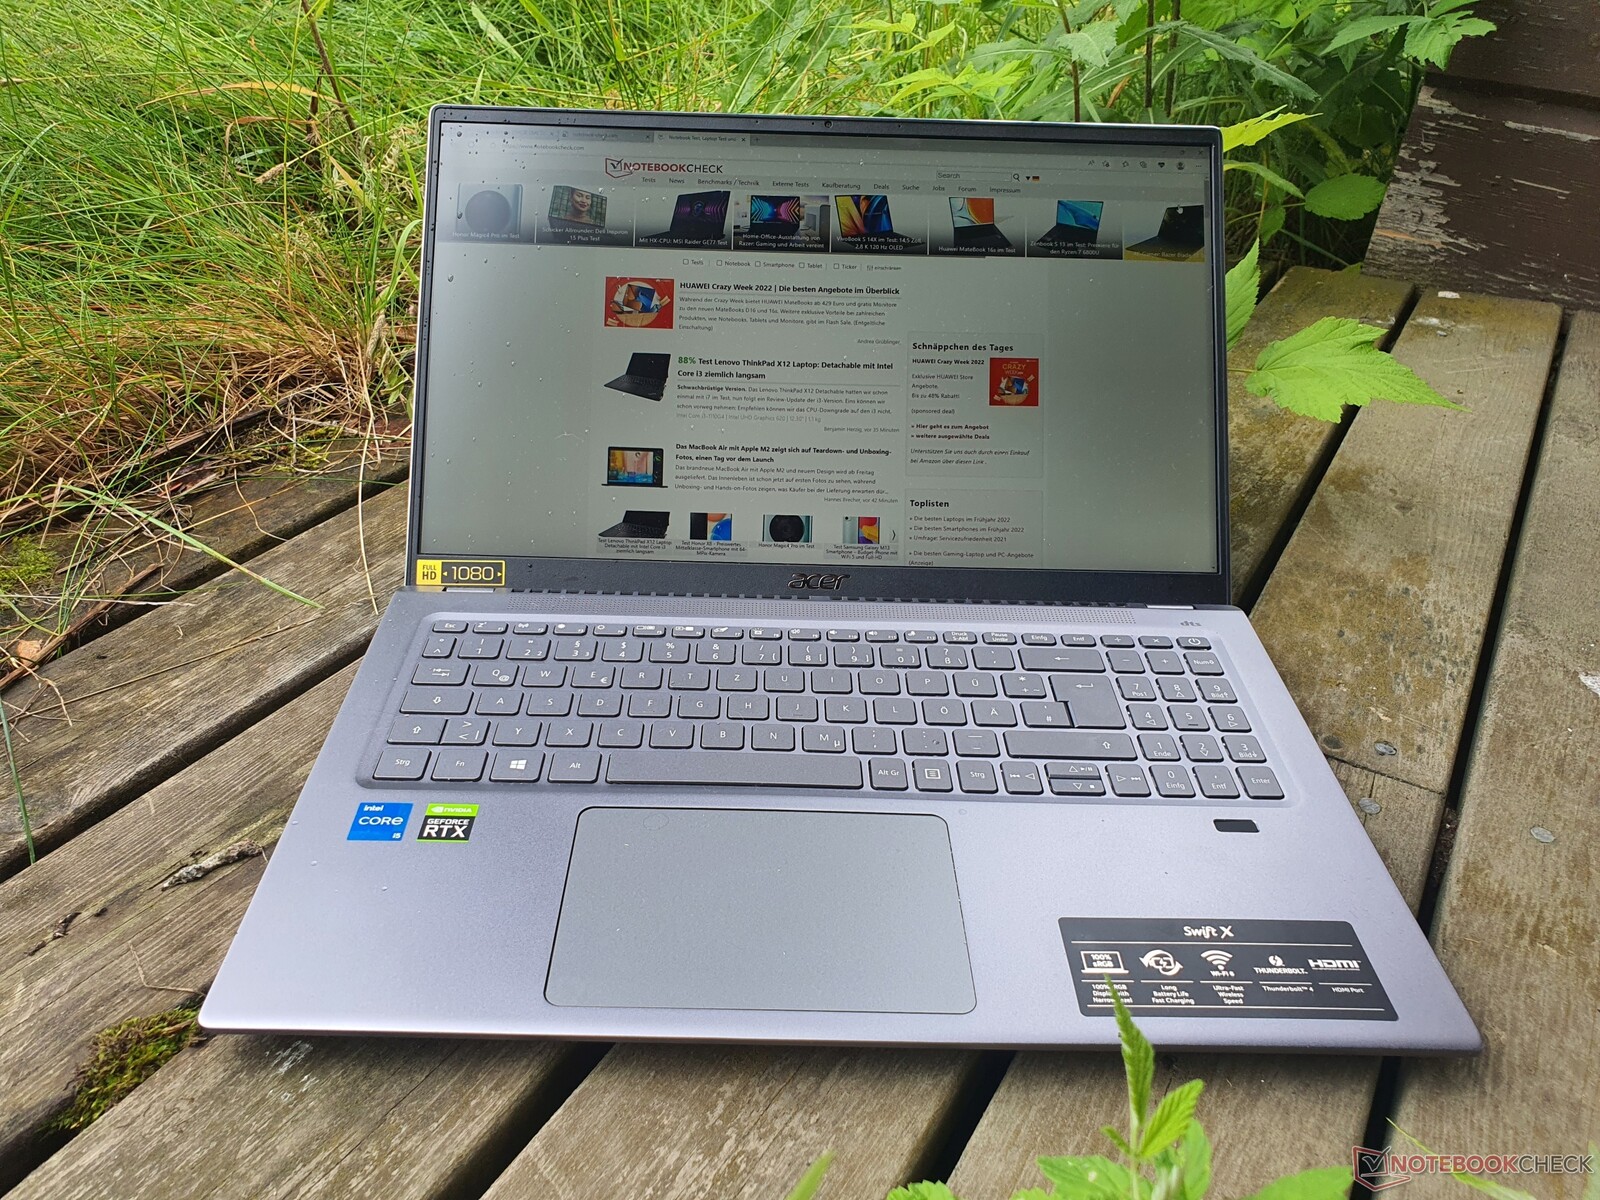
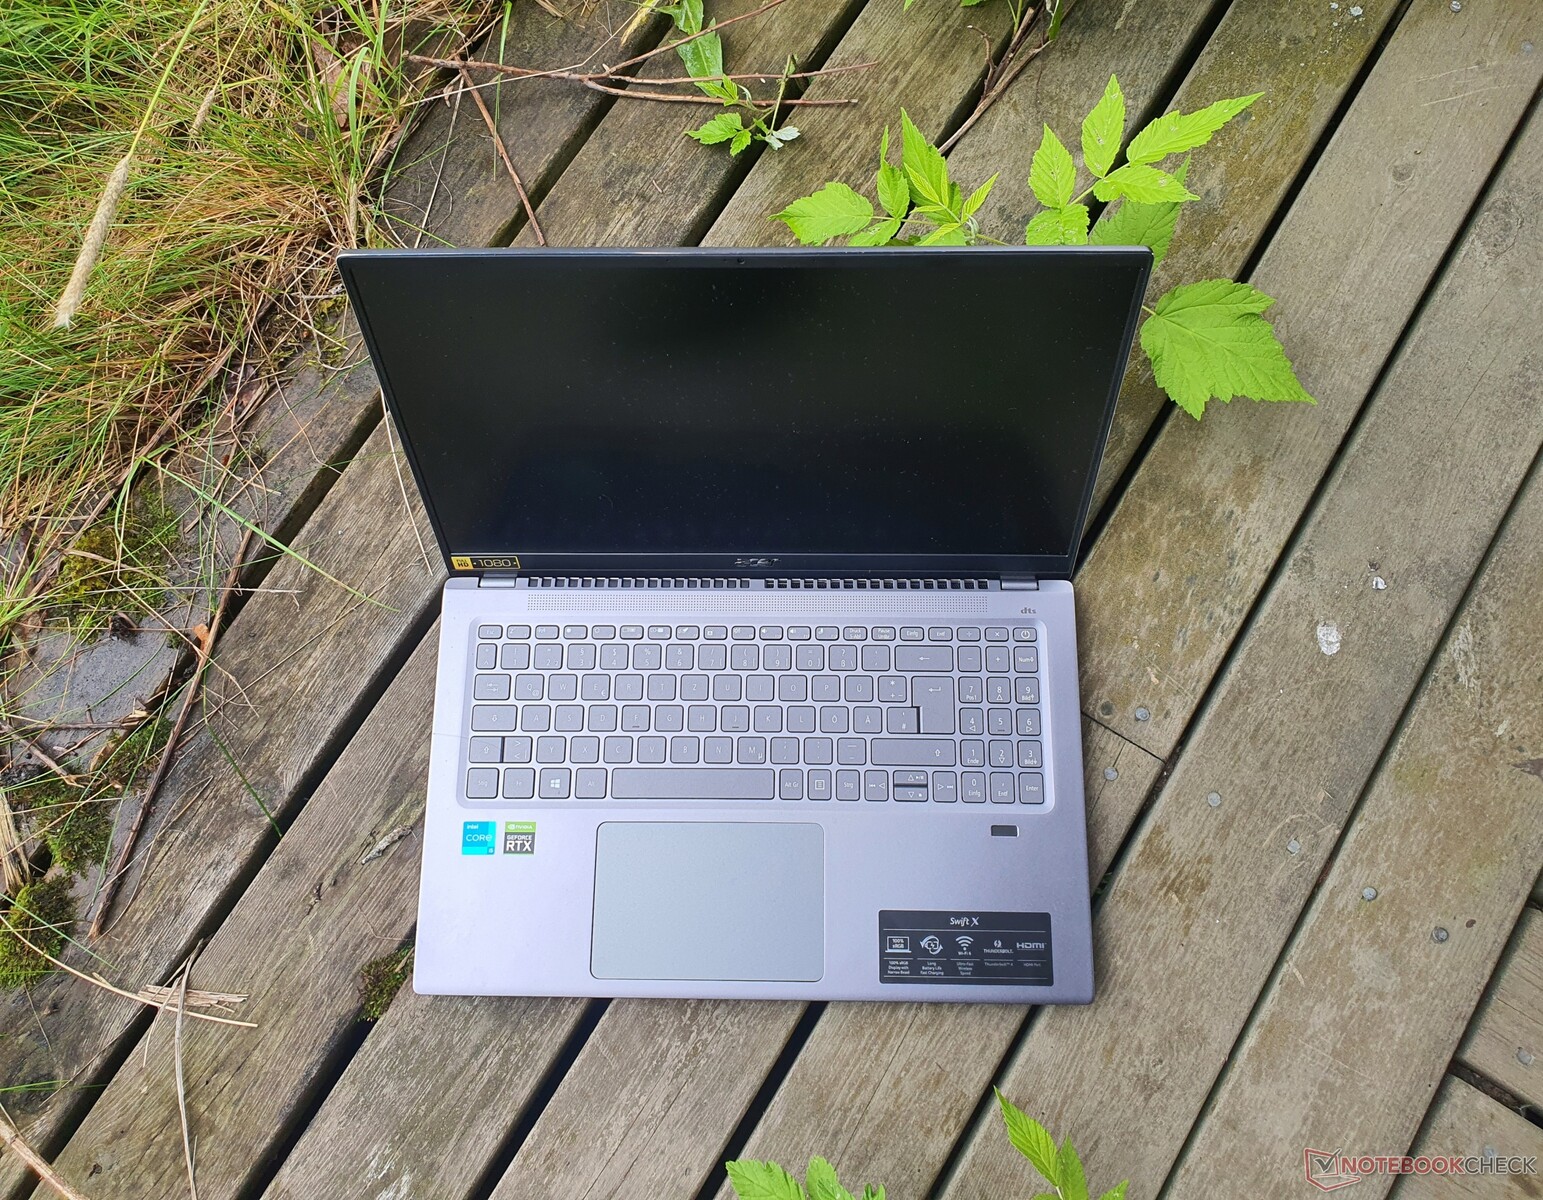
A caixa de alumínio dá estabilidade ao Acer Swift X 16
A caixa de alumínio cinzento-azulado e fosco tem um toque de alta qualidade e é bastante estável; há uma flexibilidade mínima no apoio de palma. As dobradiças são apertadas de modo que a tela só teima um pouco, mas permite a abertura com uma só mão ao mesmo tempo.
Entretanto, a tampa poderia ter sido um pouco mais resistente à torção e se sair menos bem sob determinadas aplicações de pressão. Mas isto dificilmente é um problema no uso diário. O acabamento não mostra nenhuma folga ou saliências e o ângulo máximo de abertura é de 130 graus relativamente pequeno.
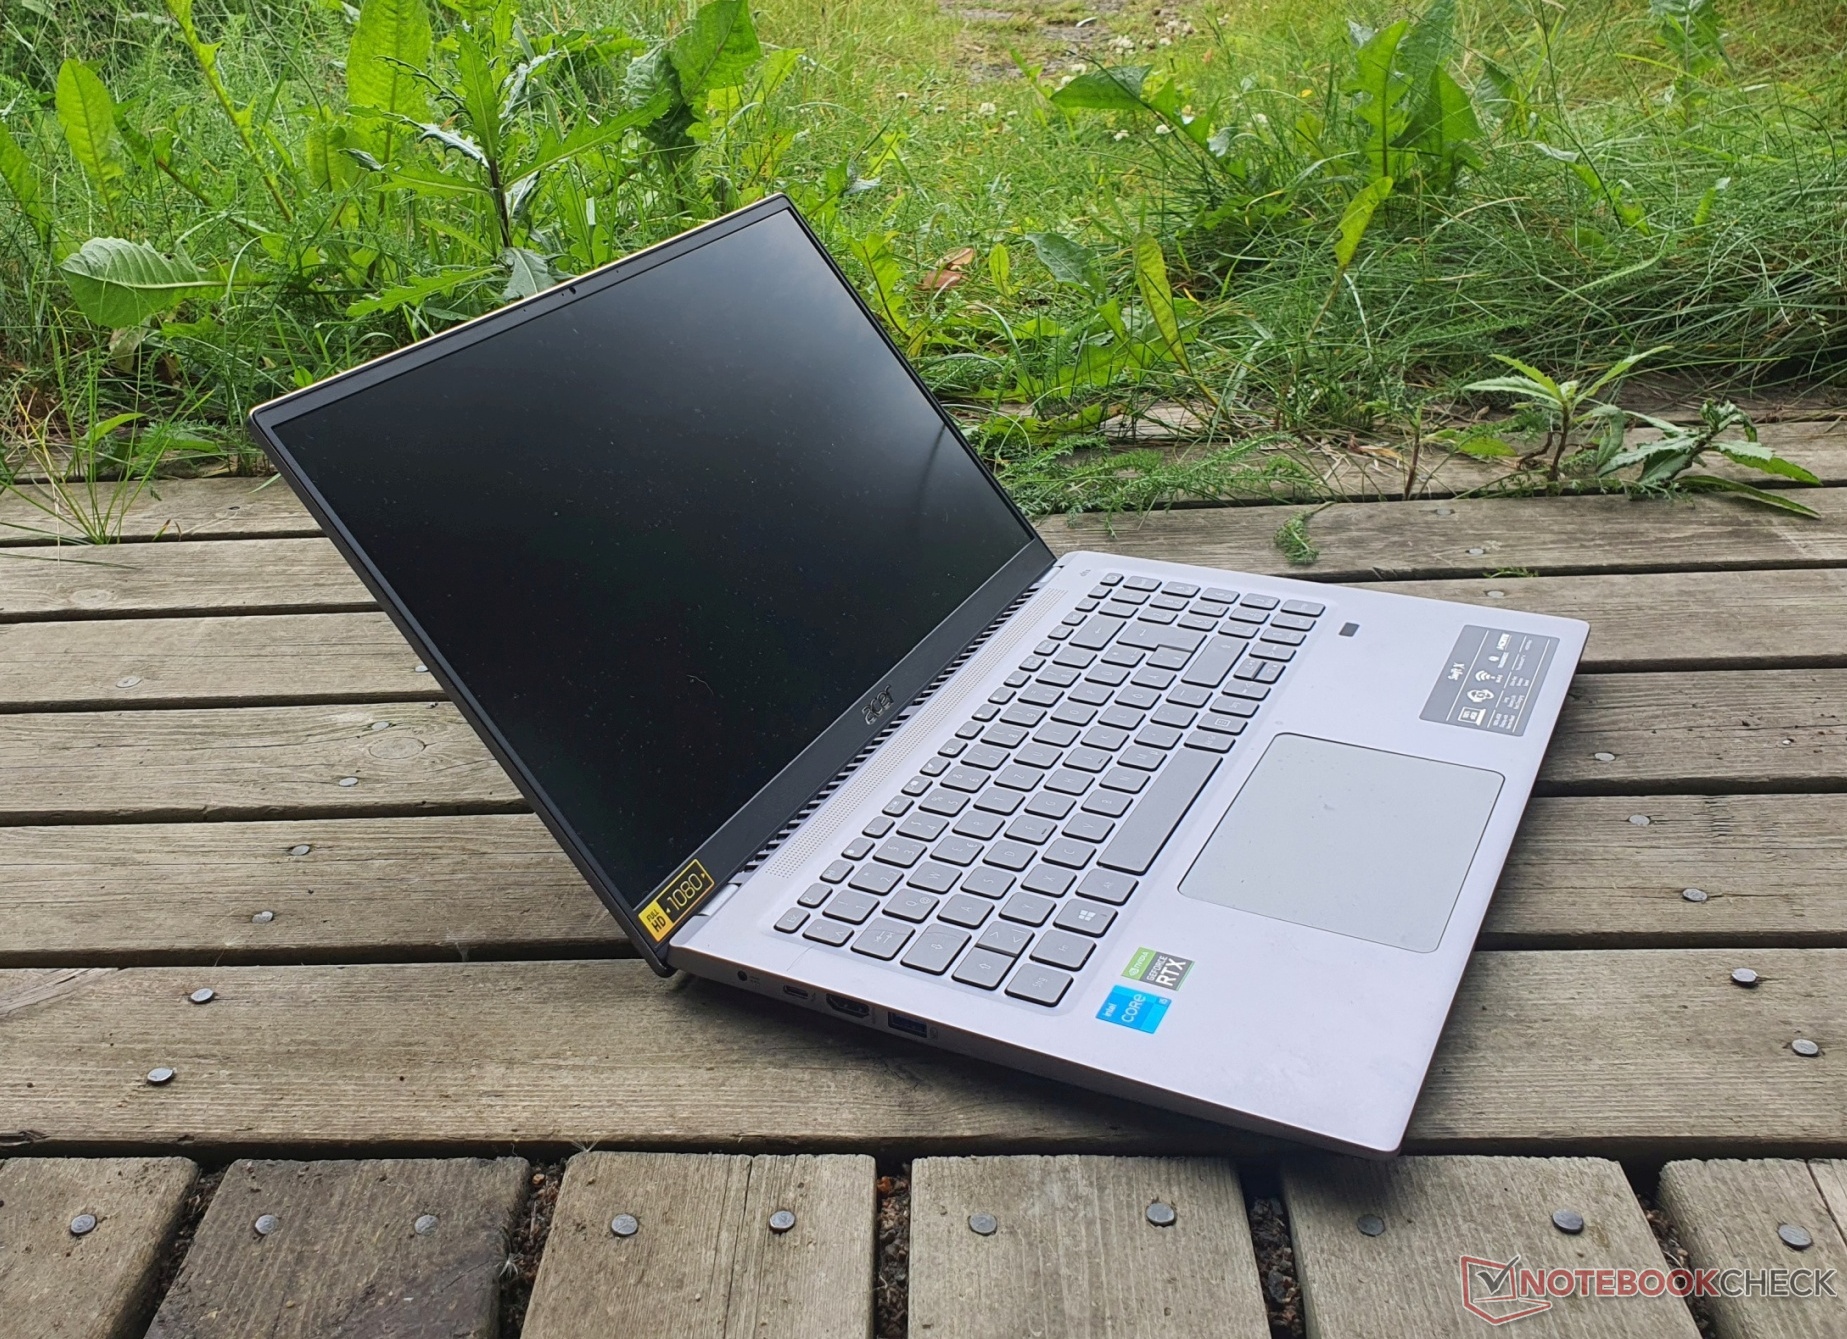
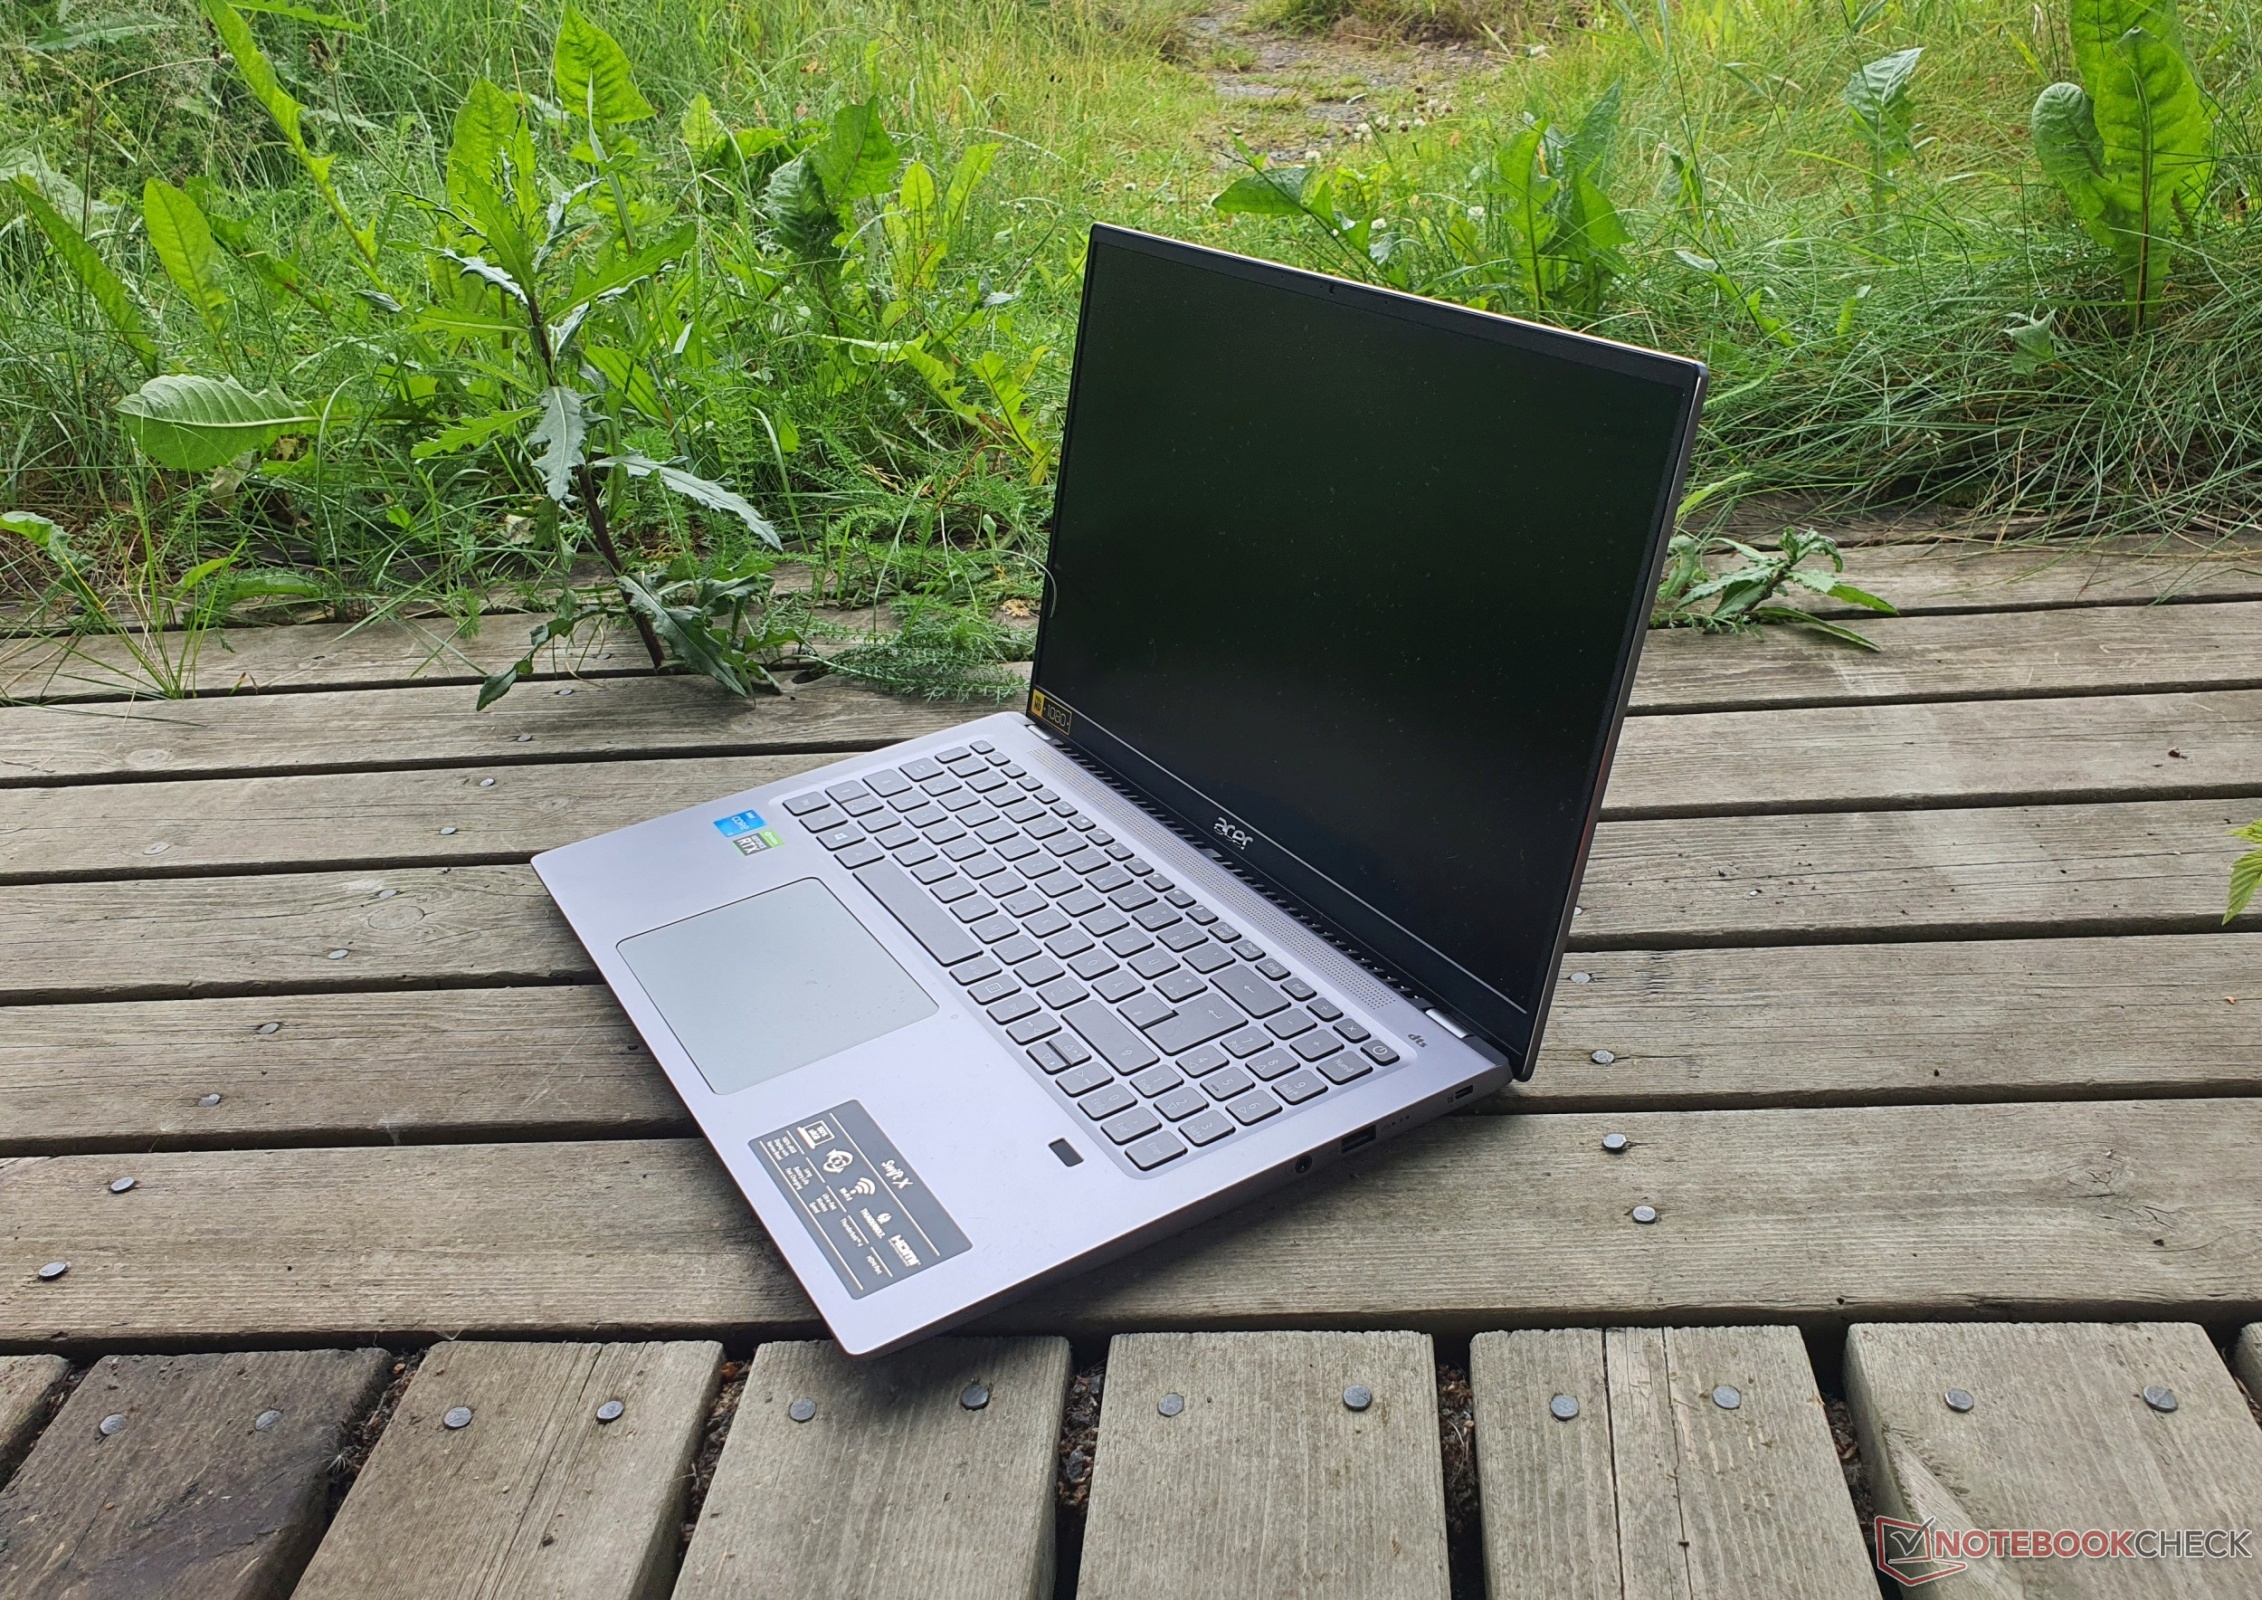
Devido à tela de 16,1 polegadas no formato 16:9, o Acer Swift X é ligeiramente mais longo, mas menos largo e comparativamente leve a 1,8 kg. O Swift 3 pesa cerca de 130 gramas a menos devido à falta de um dGPU. Todos os outros dispositivos de comparação oferecem uma tela de 16 polegadas no formato 16:10 e pesam cerca de 2 kg.
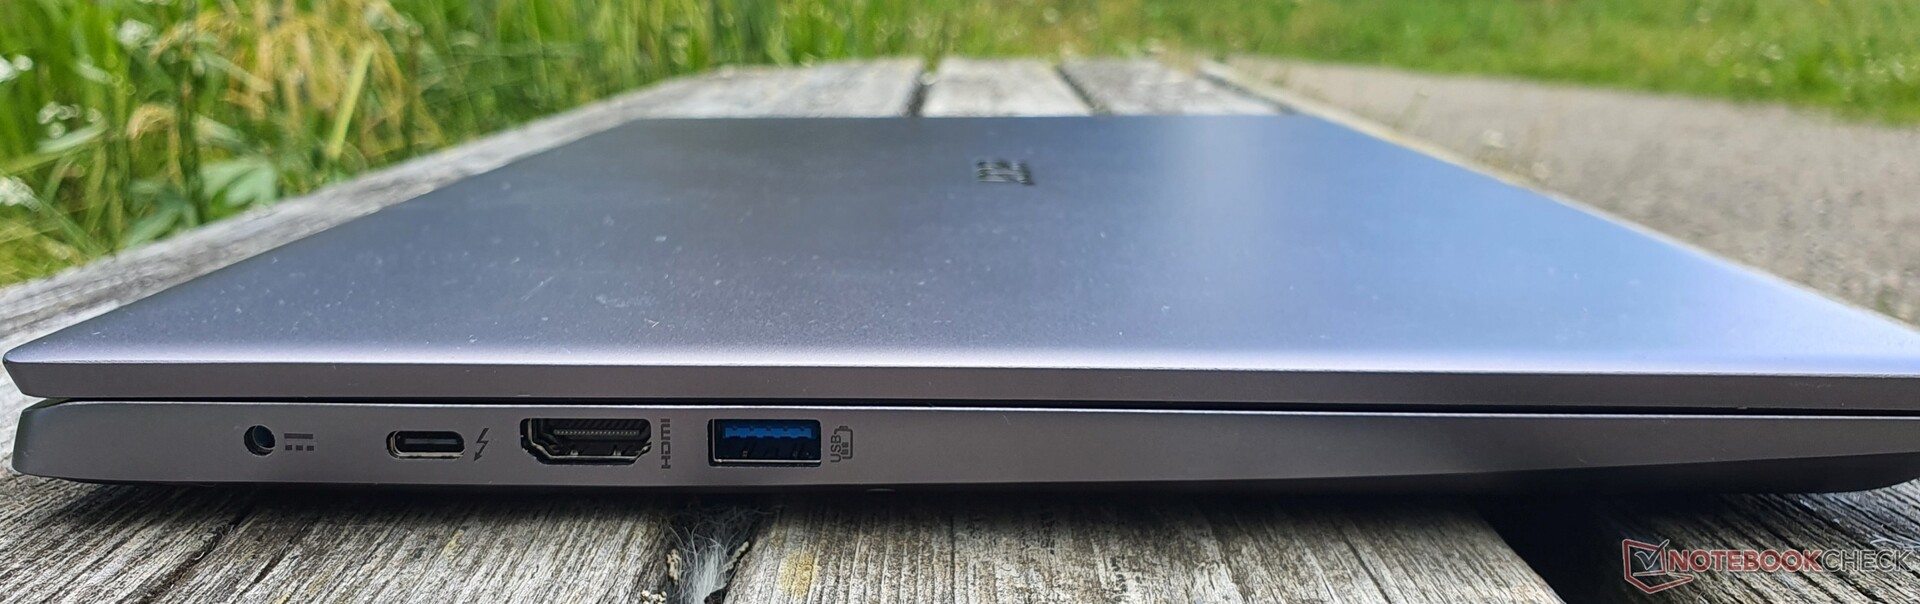
Equipamento: Acer é "Swift" com Thunderbolt 4
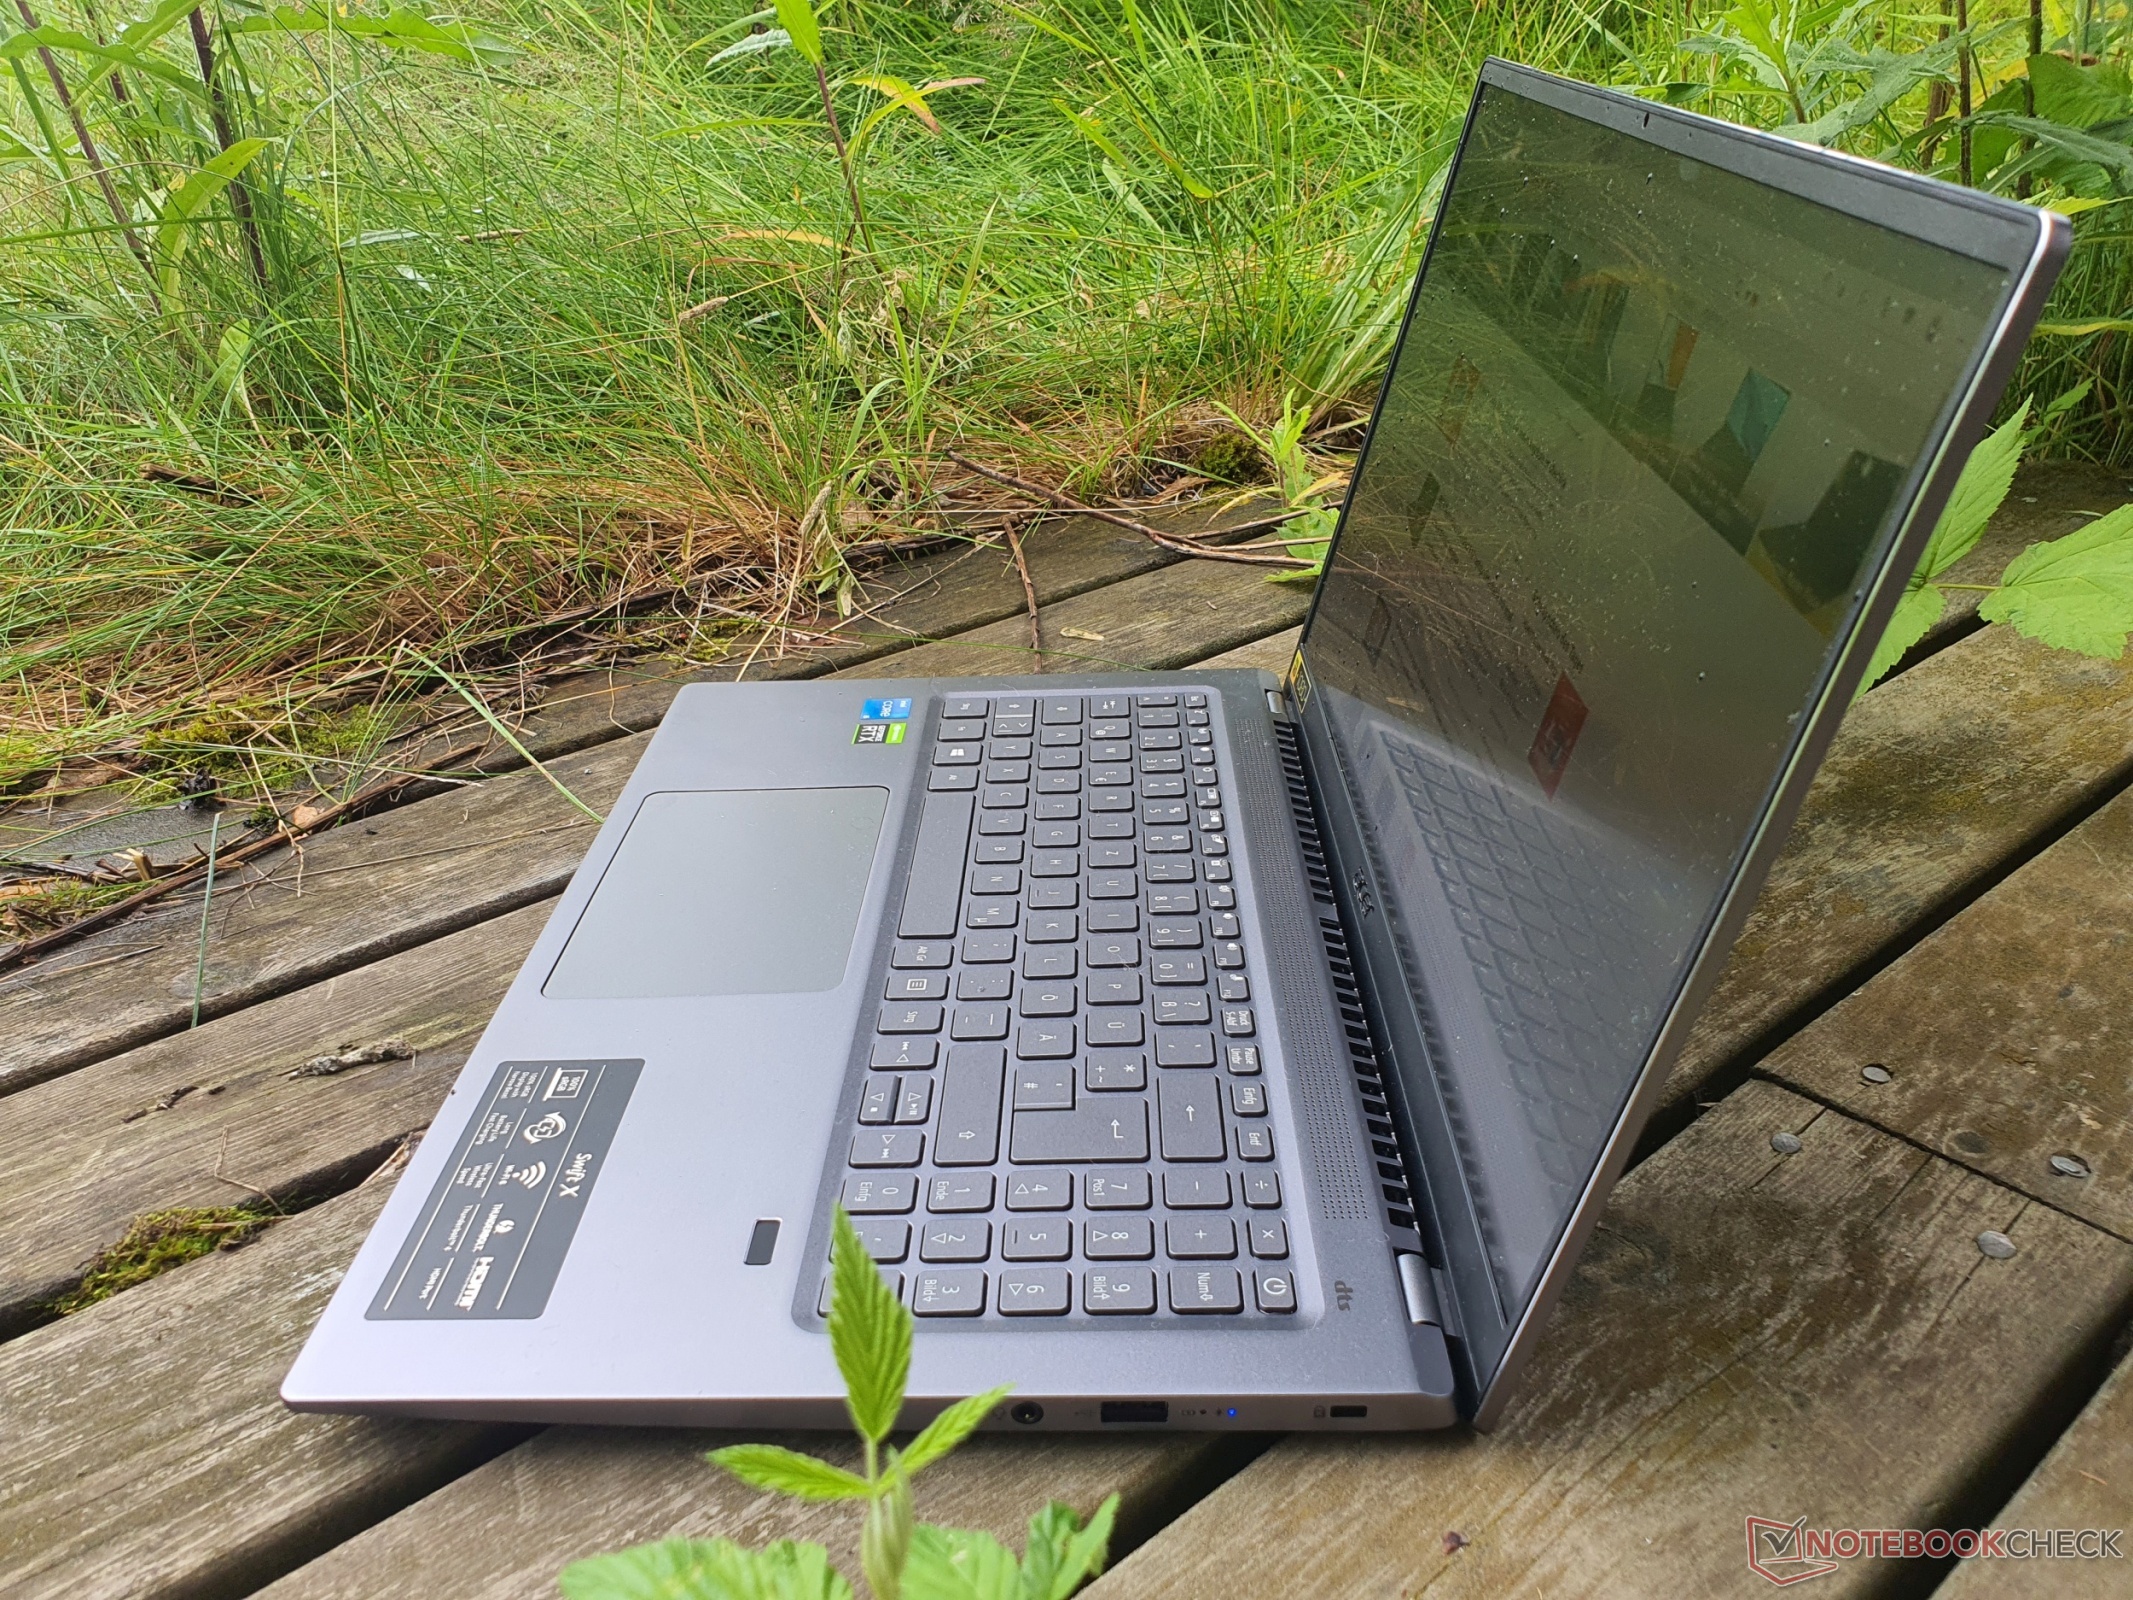
As portas no Acer Swift X estão todas suficientemente espaçadas de modo a não se bloquearem umas às outras. Uma porta HDMI 2.0 e DisplayPort 1.4 via Thunderbolt 4 estão disponíveis para displays externos.
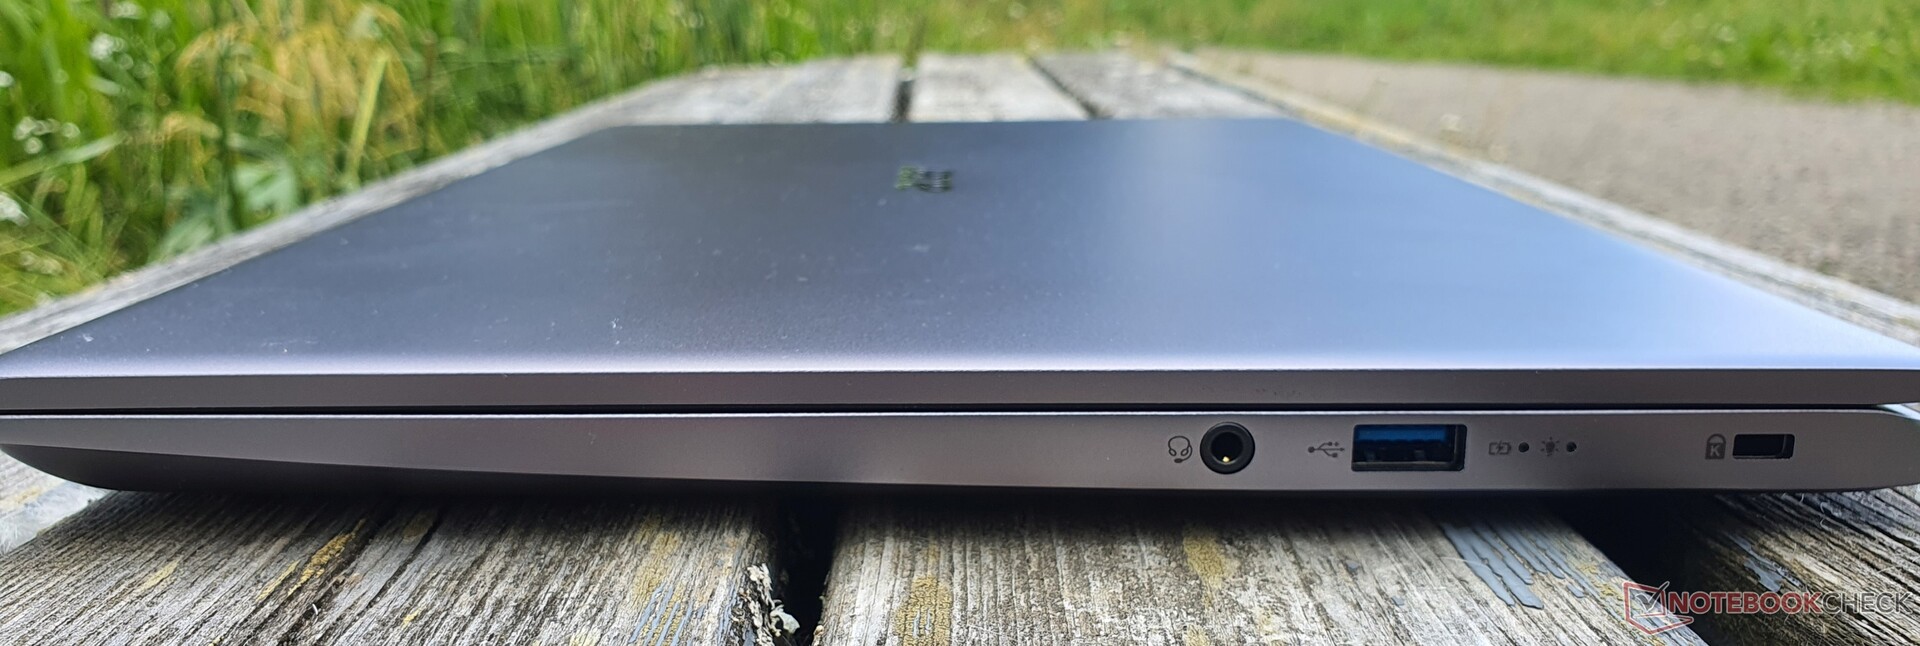
Há também duas portas USB-A 3.2 Gen1, uma de cada lado. Uma tomada de áudio e um dispositivo Kensington também estão disponíveis, mas nenhum leitor de cartão SD ou porta LAN. O carregamento é feito através de uma conexão proprietária ou USB-C.
Comunicação
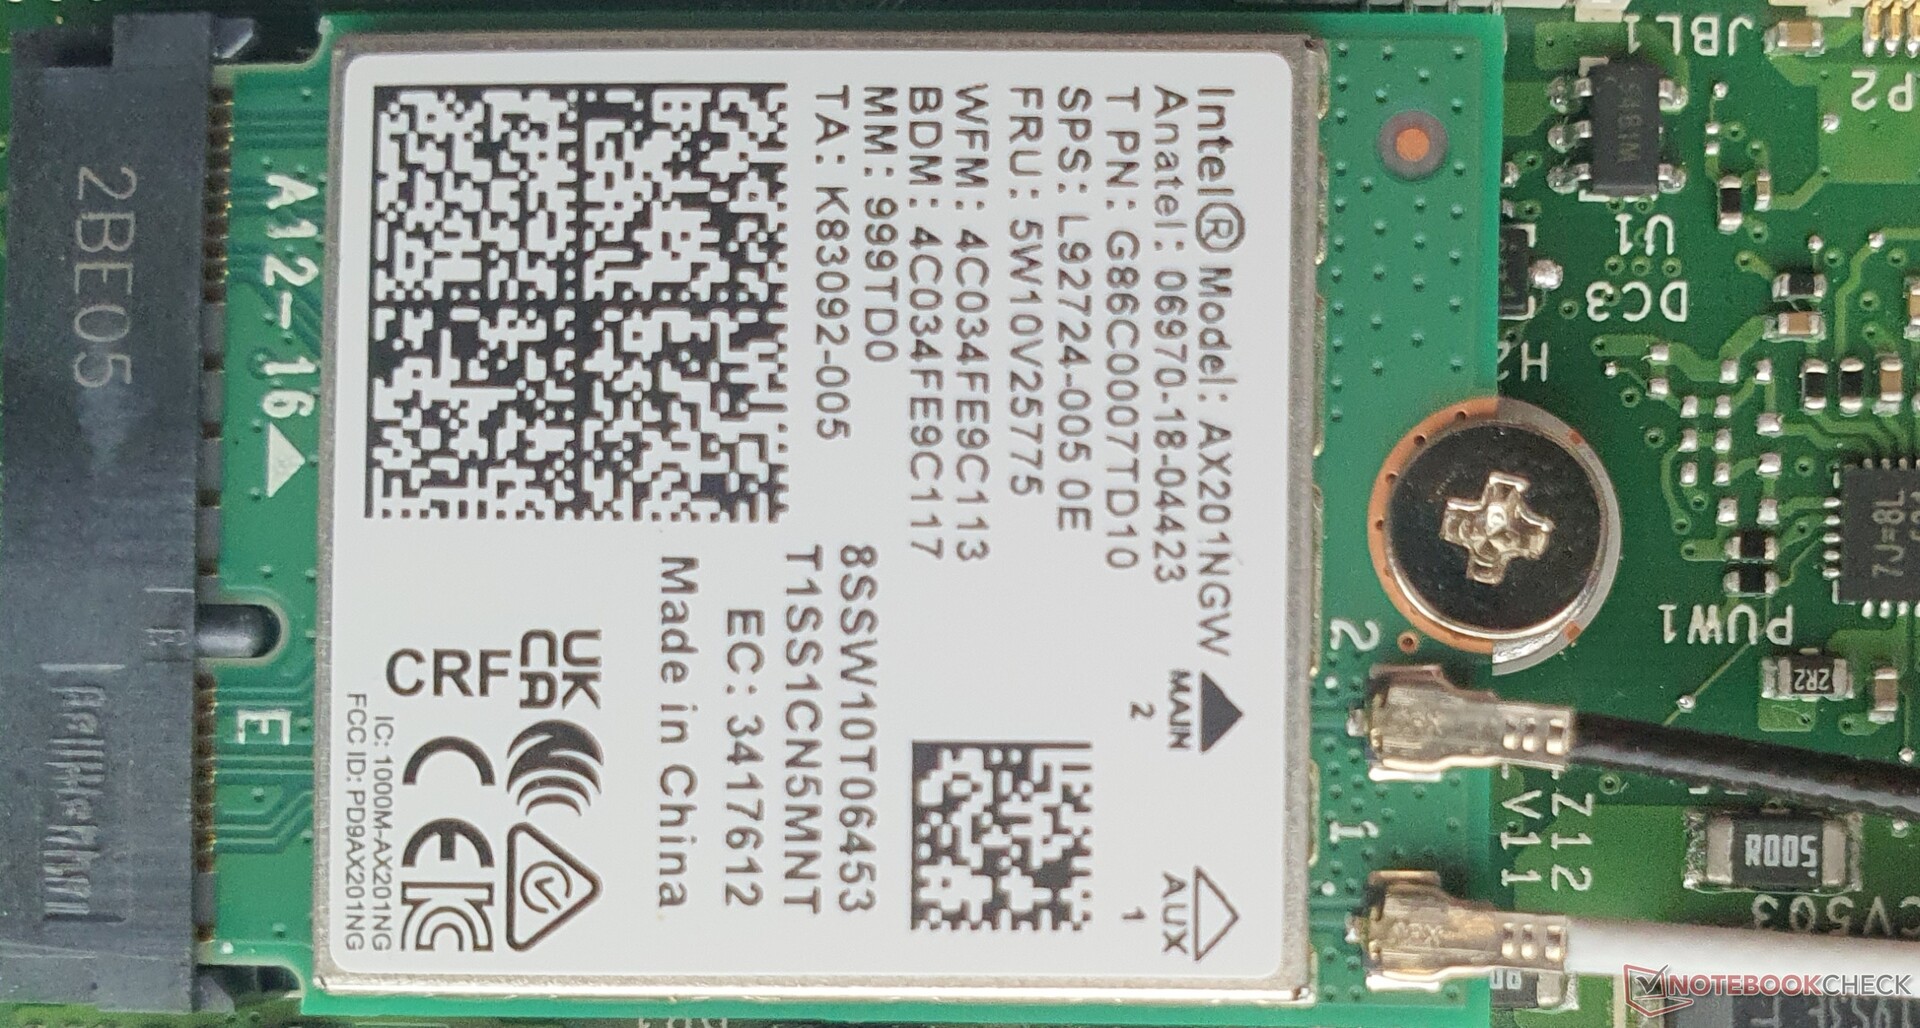
Graças ao módulo Intel AX201 WiFi 6 plugado, as velocidades de transferência estão a um nível muito bom. SomenteO Matebook de Huawei 16é um pouco mais rápido em termos de envio. O Bluetooth 5.0 está incluído, mas não há opções para WWAN e NFC.
Webcam

Como muitas vezes acontece, a qualidade da webcam integrada de 720p (1.280 x 720) deixa muito a desejar: a imagem é ruidosa, embaçada e desbotada. Os valores DeltaE (10,4 em média) proporcionam uma precisão de cor média, na melhor das hipóteses. Não há abertura da webcam ou IR para Windows Olá, mas há microfones de dois raios com redução de ruído.


Segurança
Além do chip de segurança TPM 2.0, há um dispositivo de trava Kensington (nano) e um leitor de impressões digitais que faz seu trabalho de forma rápida e confiável com um simples toque do dedo.
Acessórios

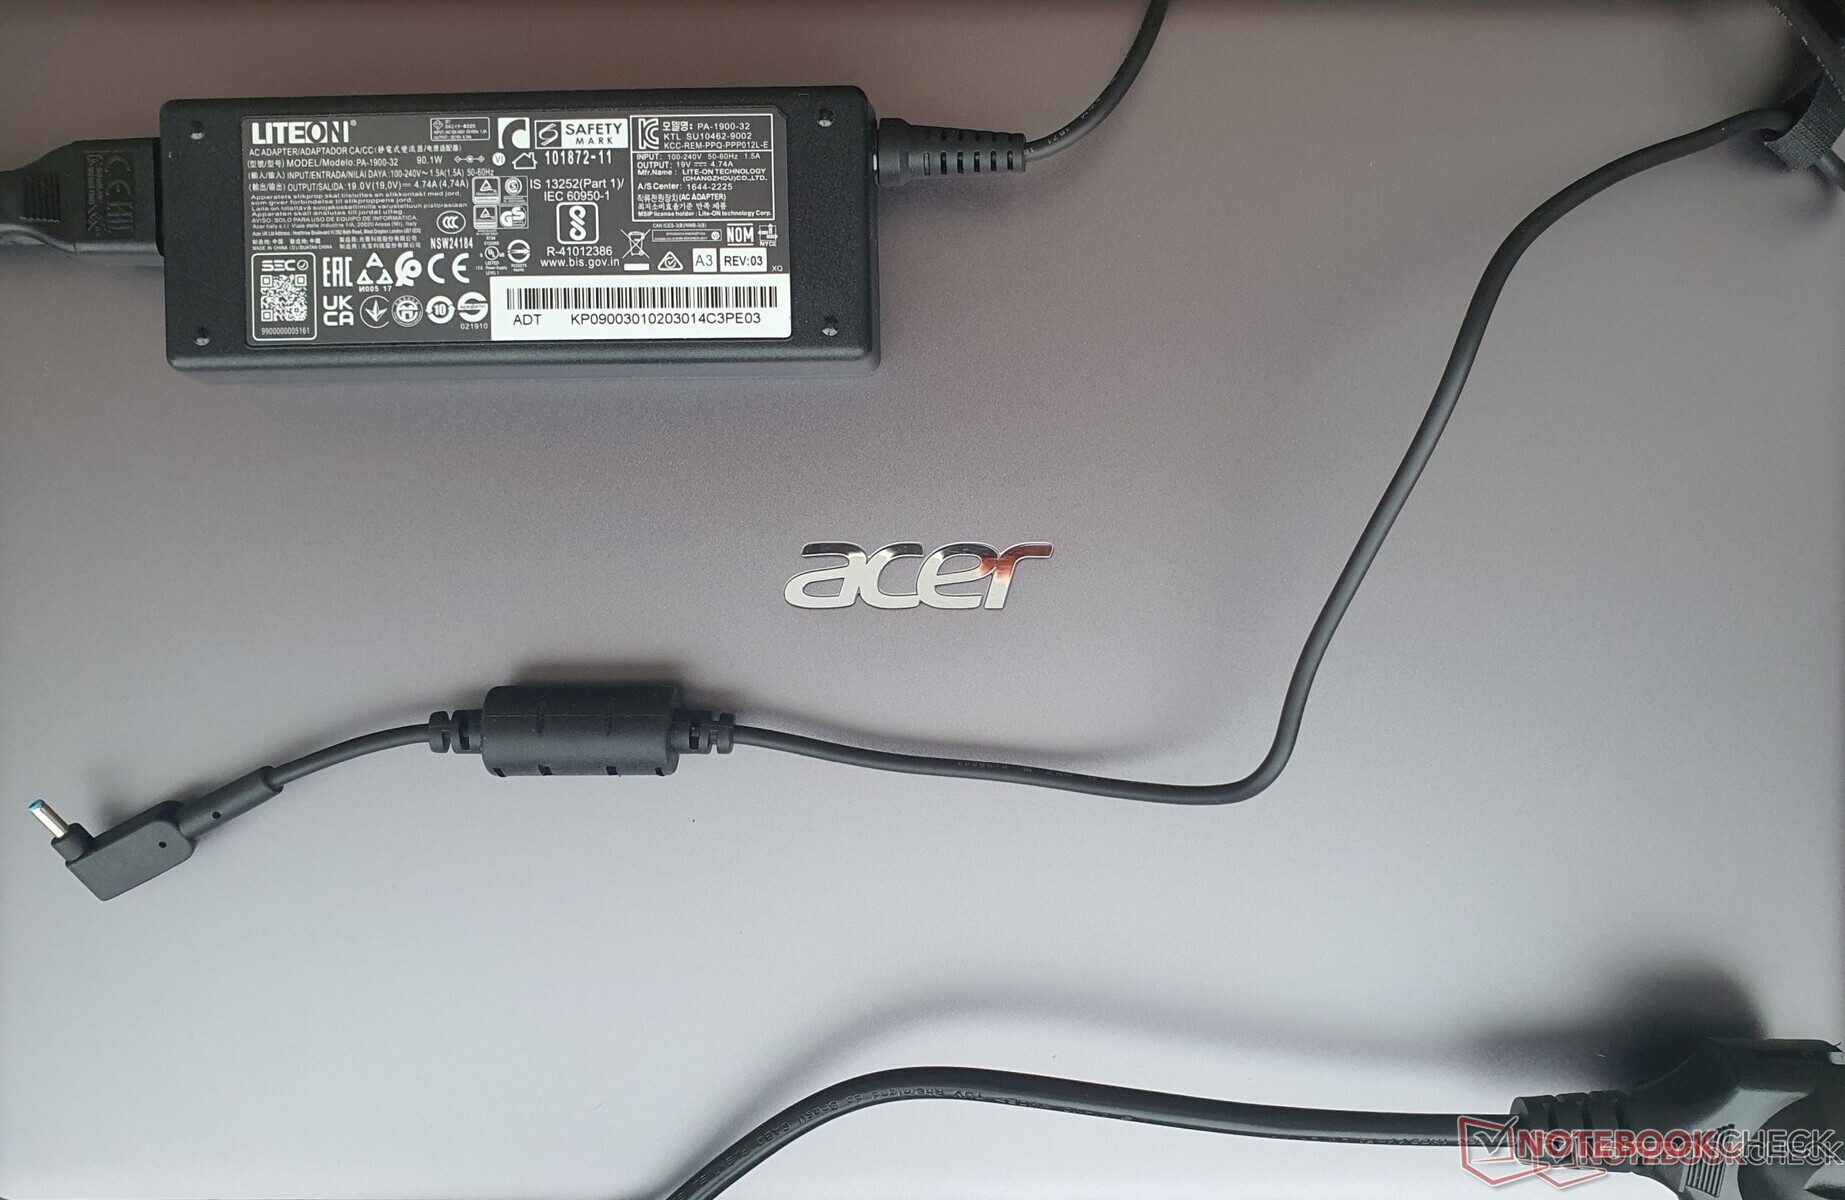
Nenhum acessório está incluído, exceto a fonte de alimentação de 90 watts da marca LiteON que é necessária para a GPU Nvidia. A Acer é colocada em embalagens ecológicas para o Swift X - muito pouco plástico é usado.
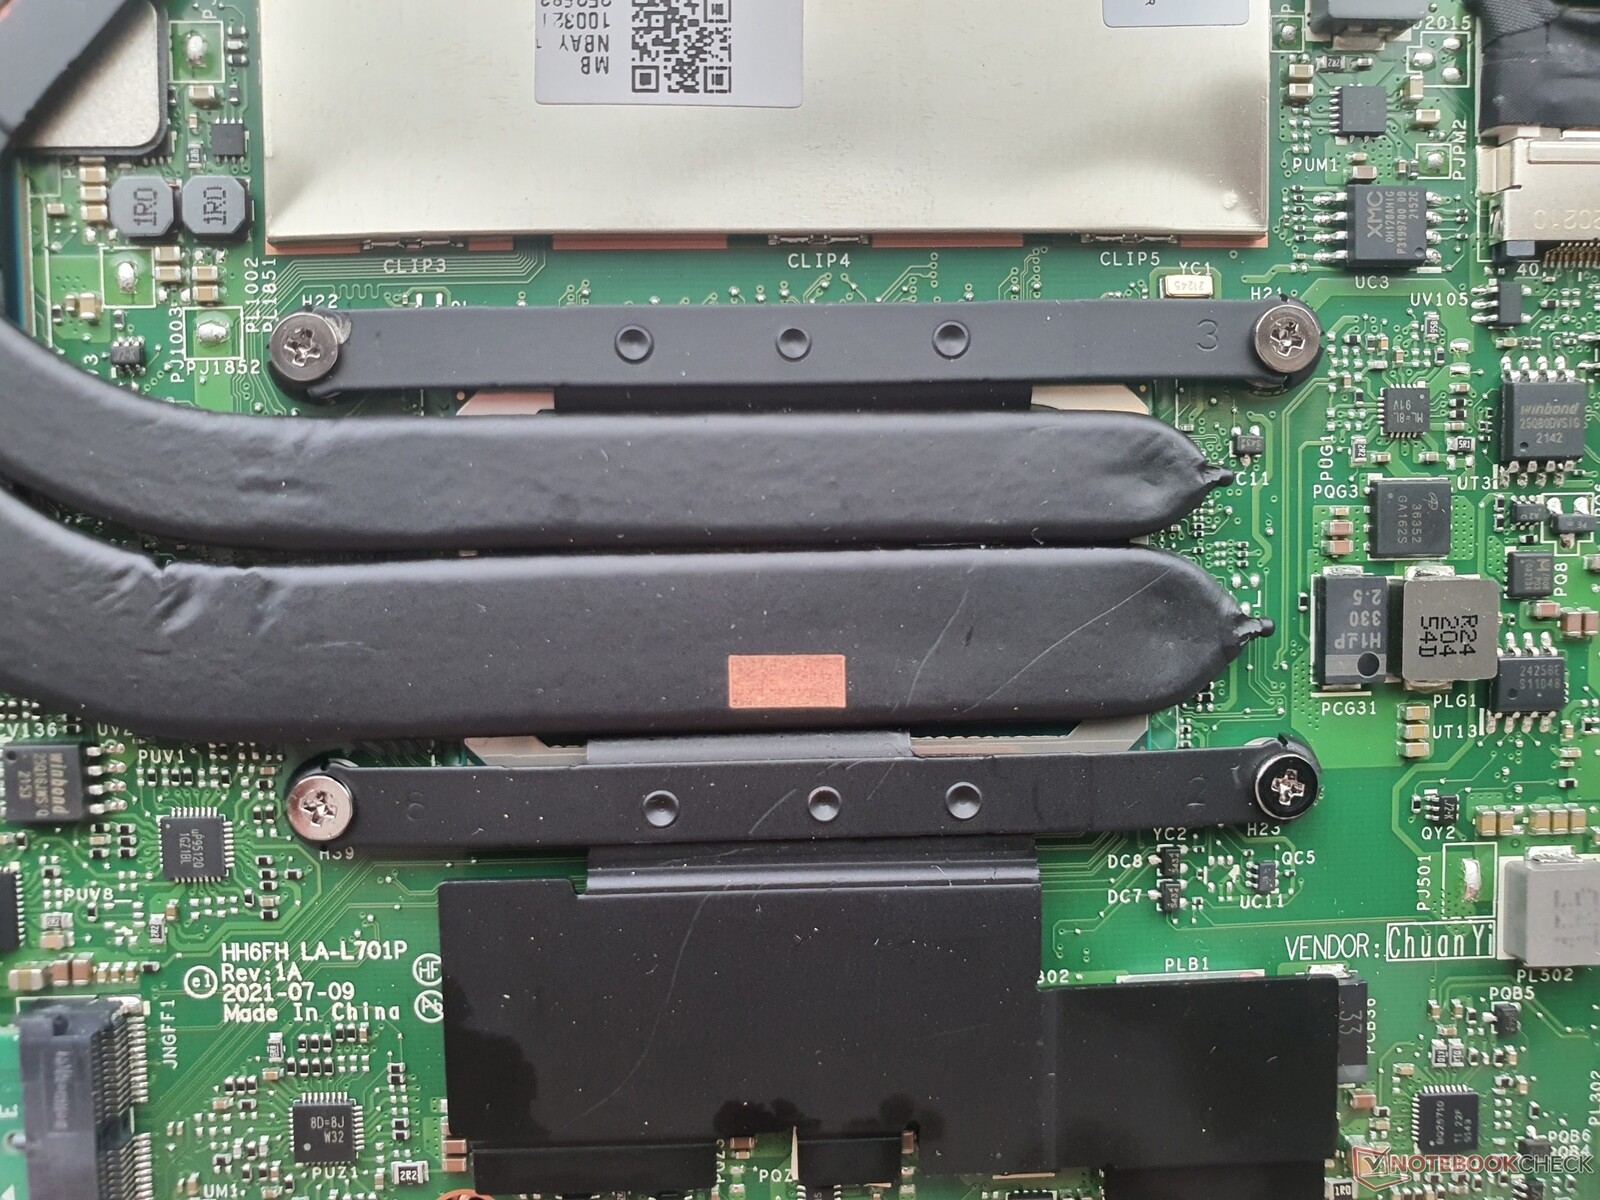
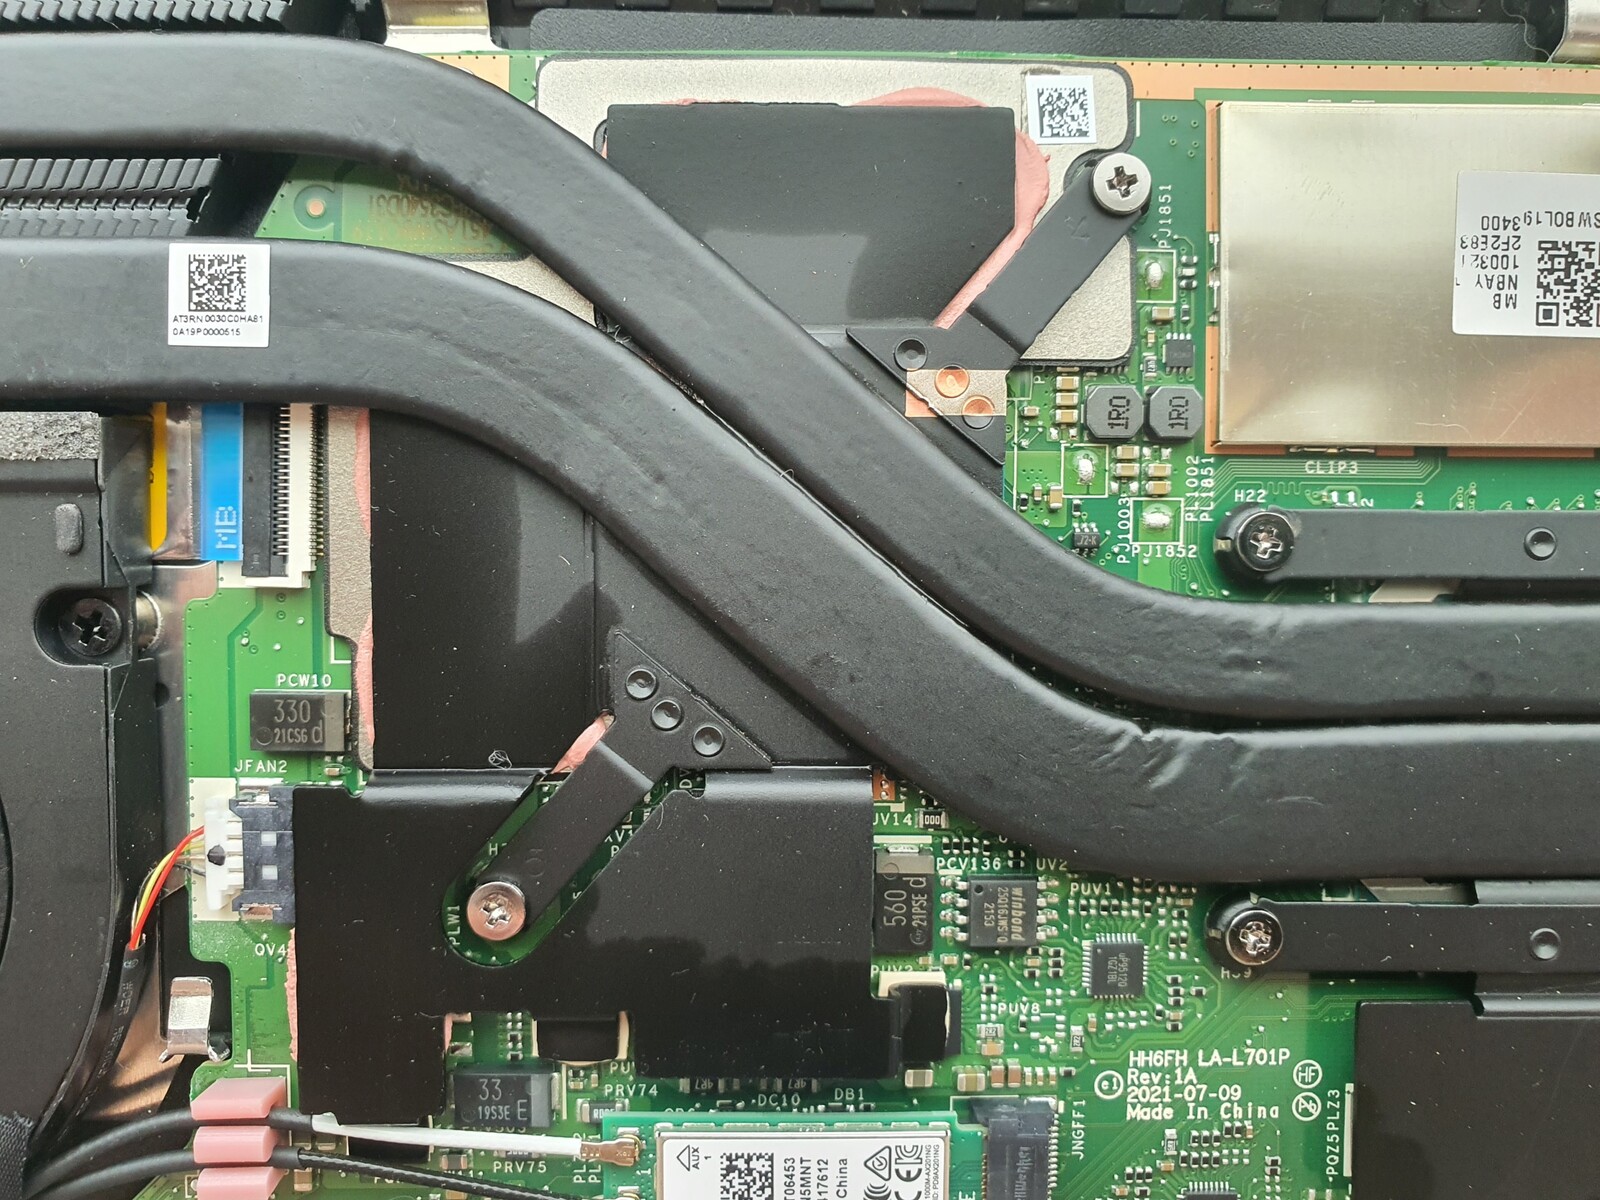
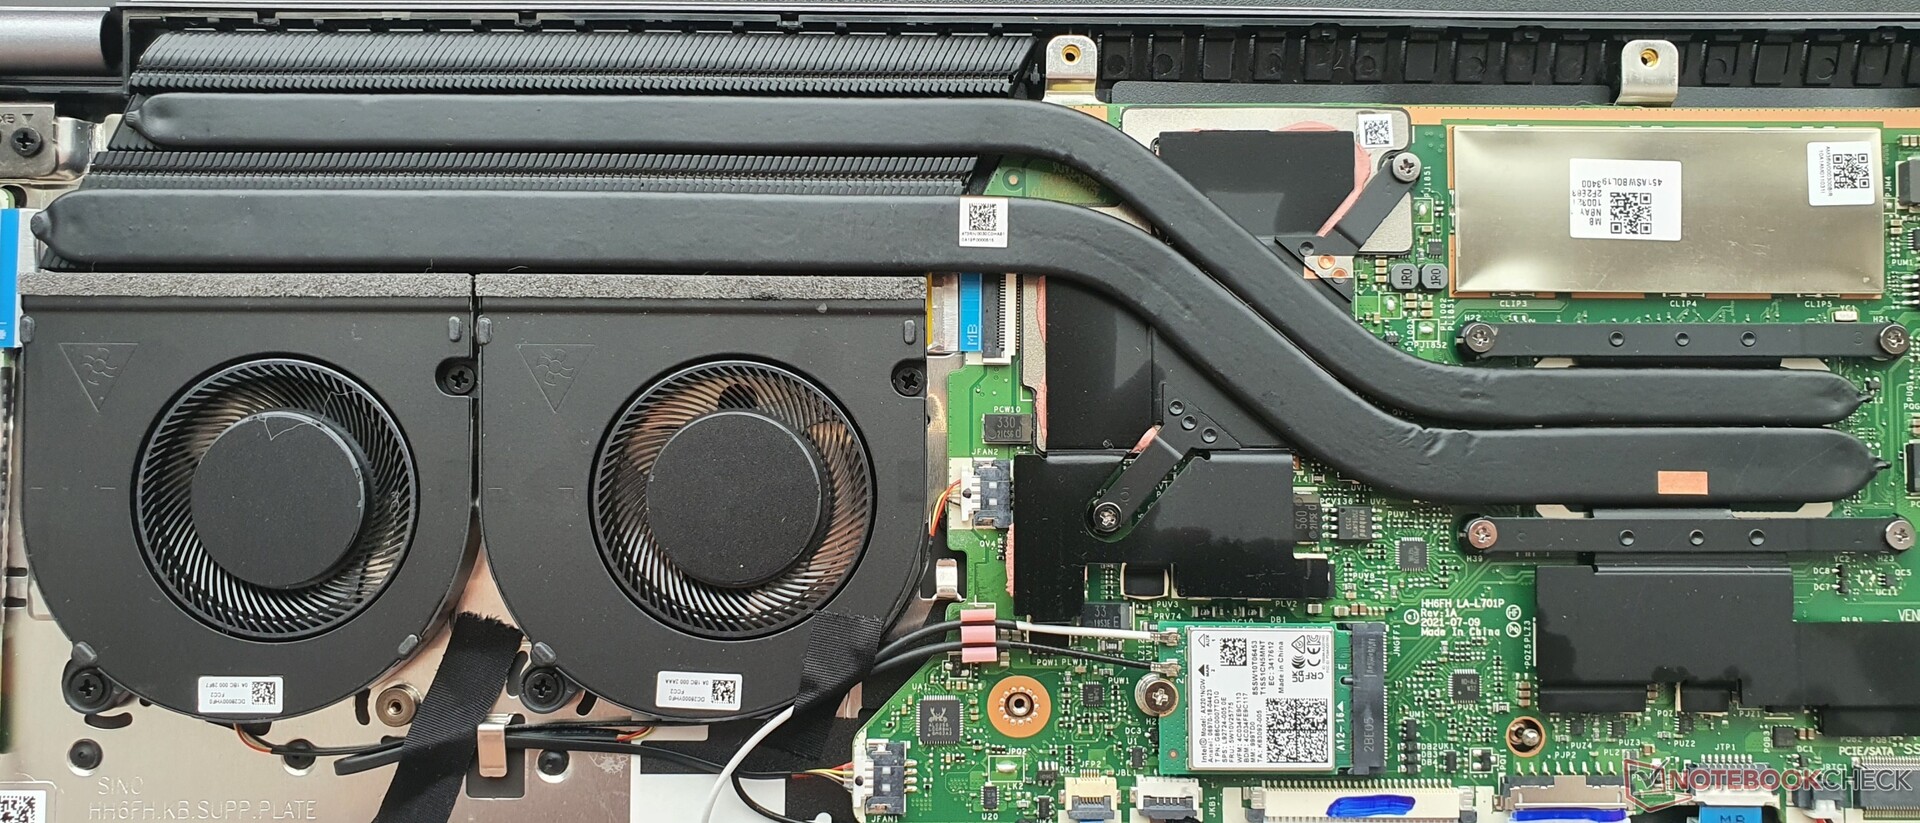
Manutenção
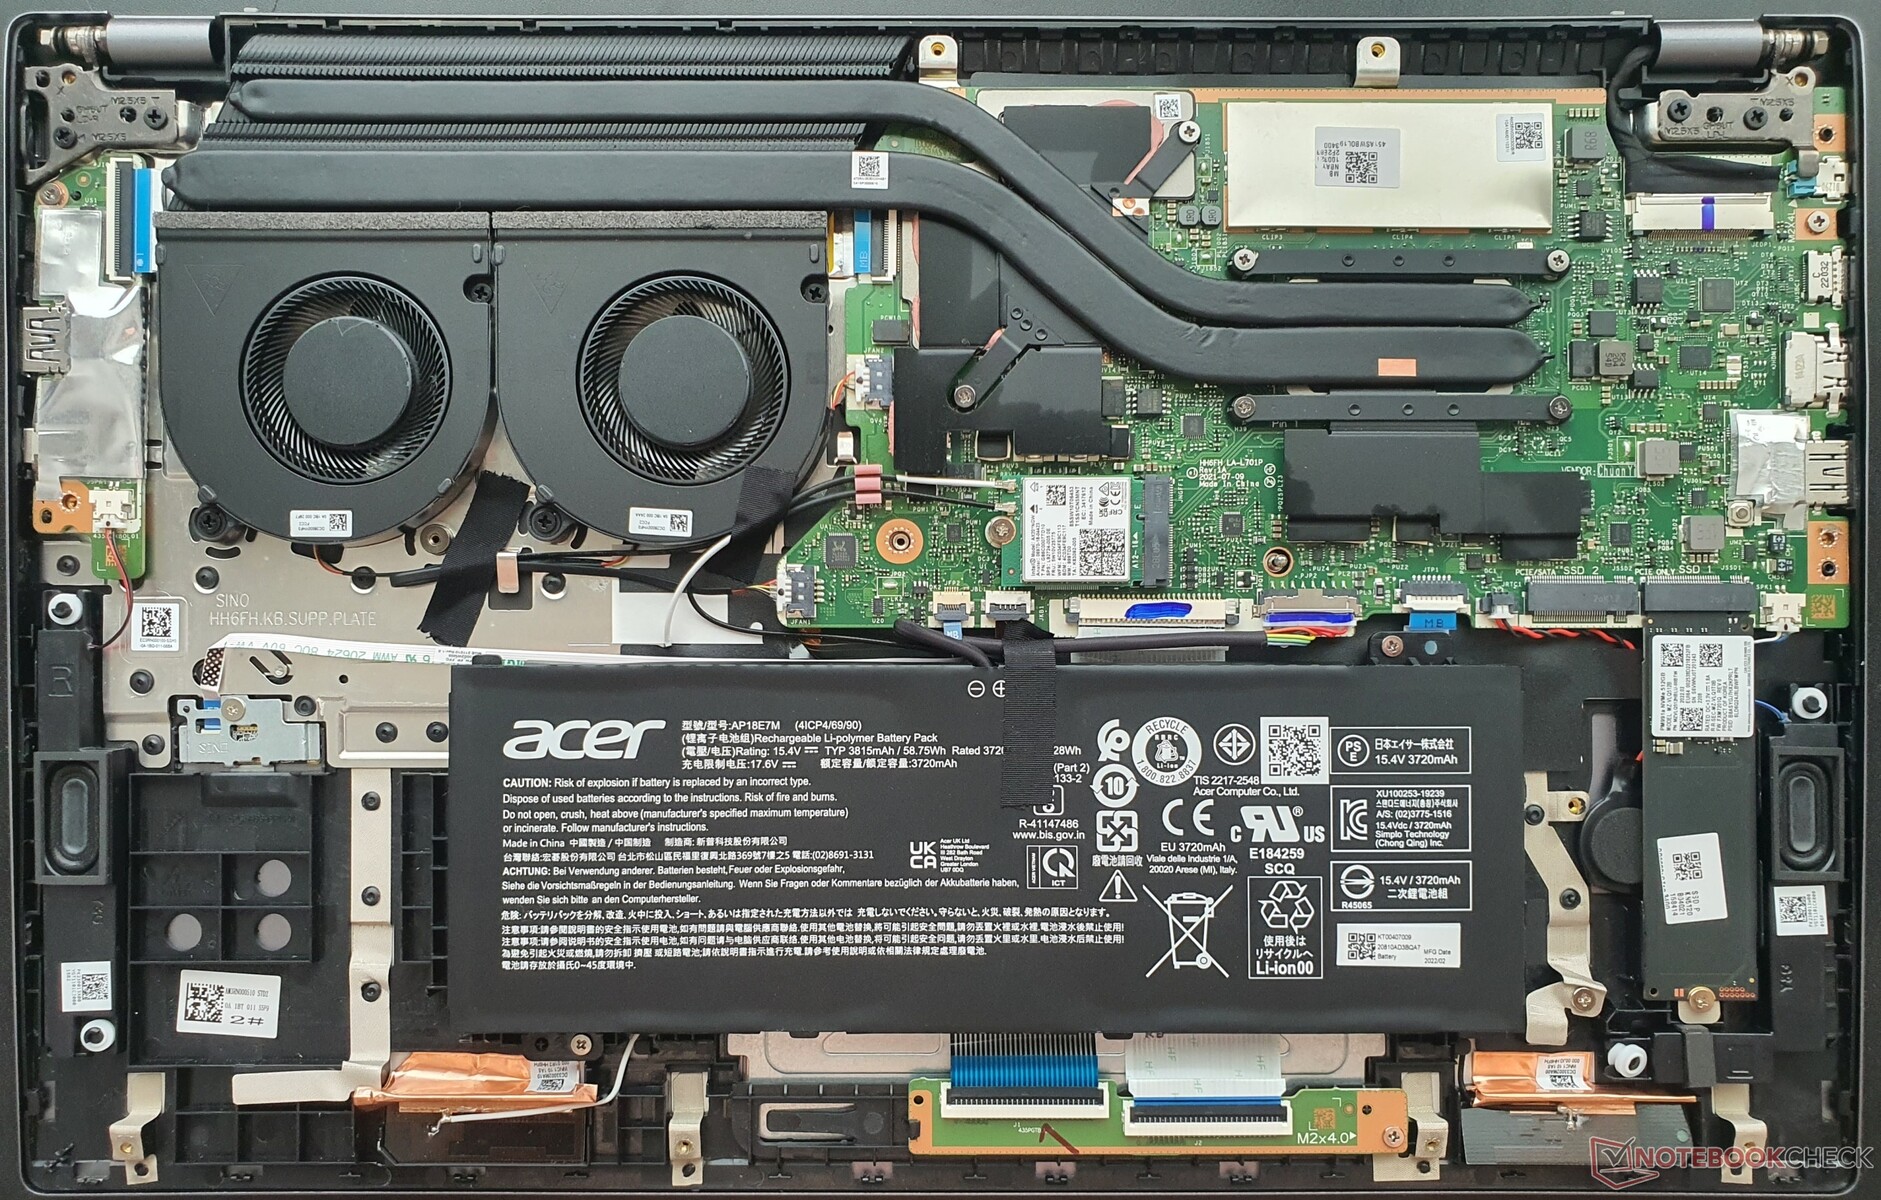
Após soltar 12 pequenos parafusos Torx, a placa base pode ser facilmente removida com a ajuda de uma espátula plástica plana. A RAM é completamente soldada, mas há duas ranhuras M.2-2280. O módulo WLAN e a bateria parafusada são substituíveis, e os ventiladores podem ser limpos.
Garantia
Na maioria dos países, a Acer oferece uma garantia limitada de 1 ano em seus laptops. Isto pode variar, portanto, certifique-se de verificar com seu fornecedor antes de comprar
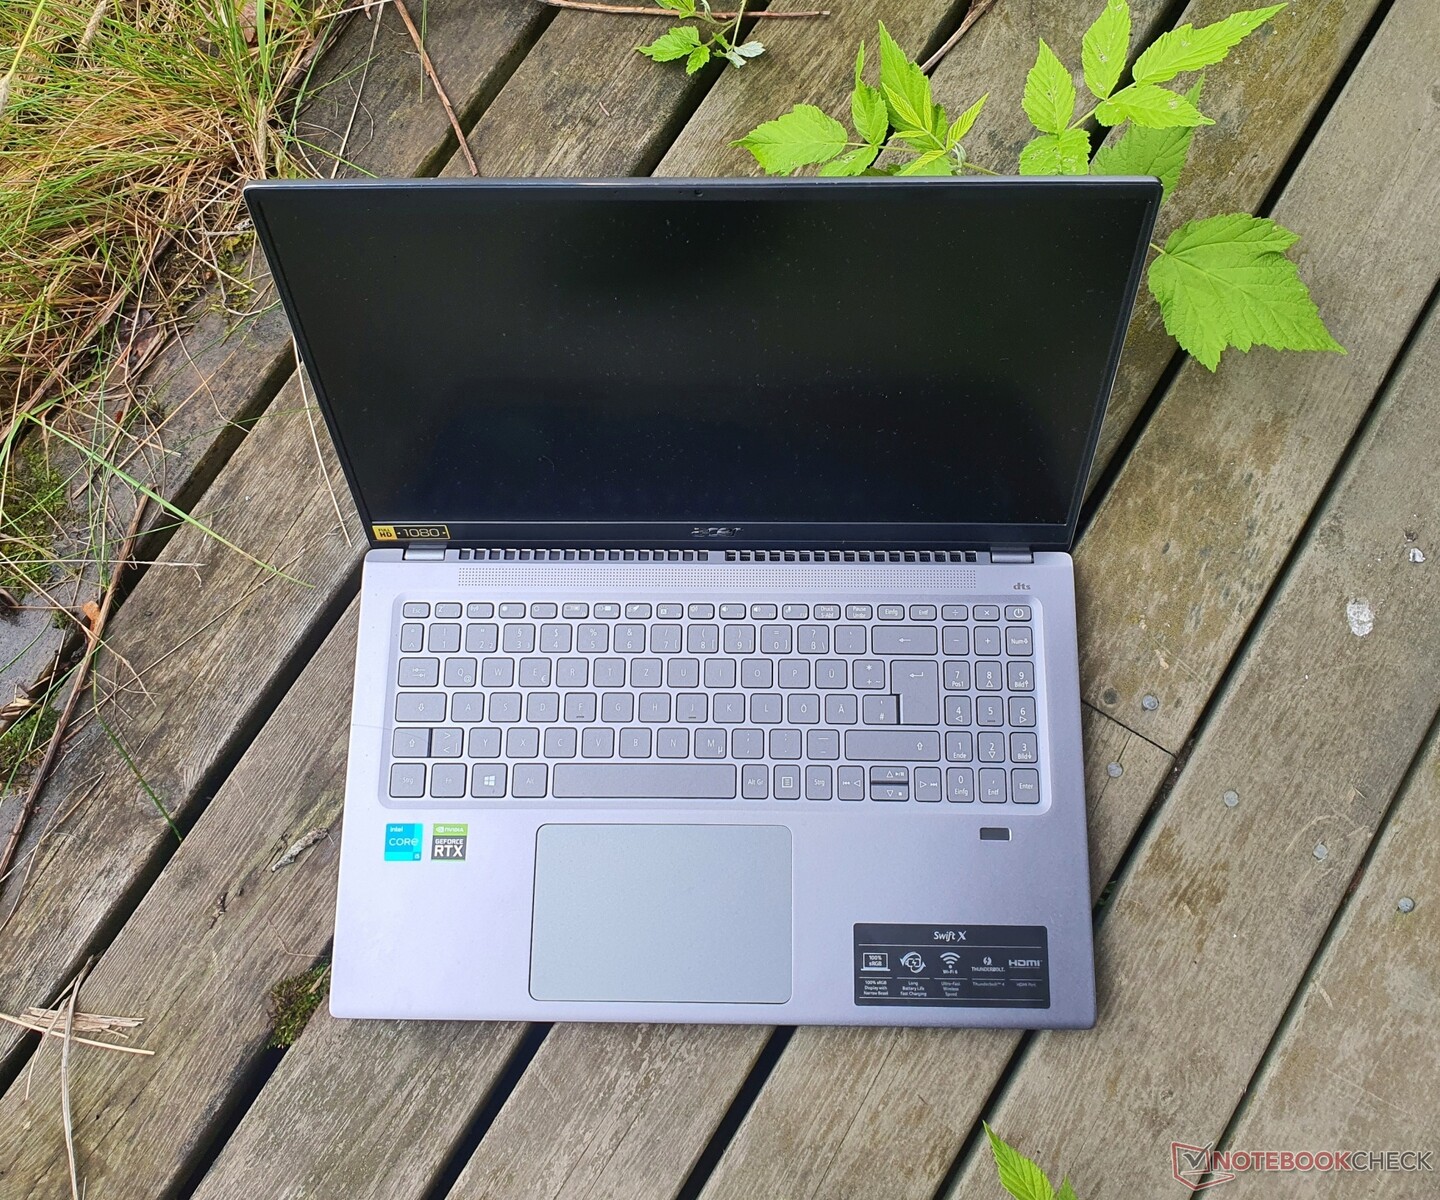
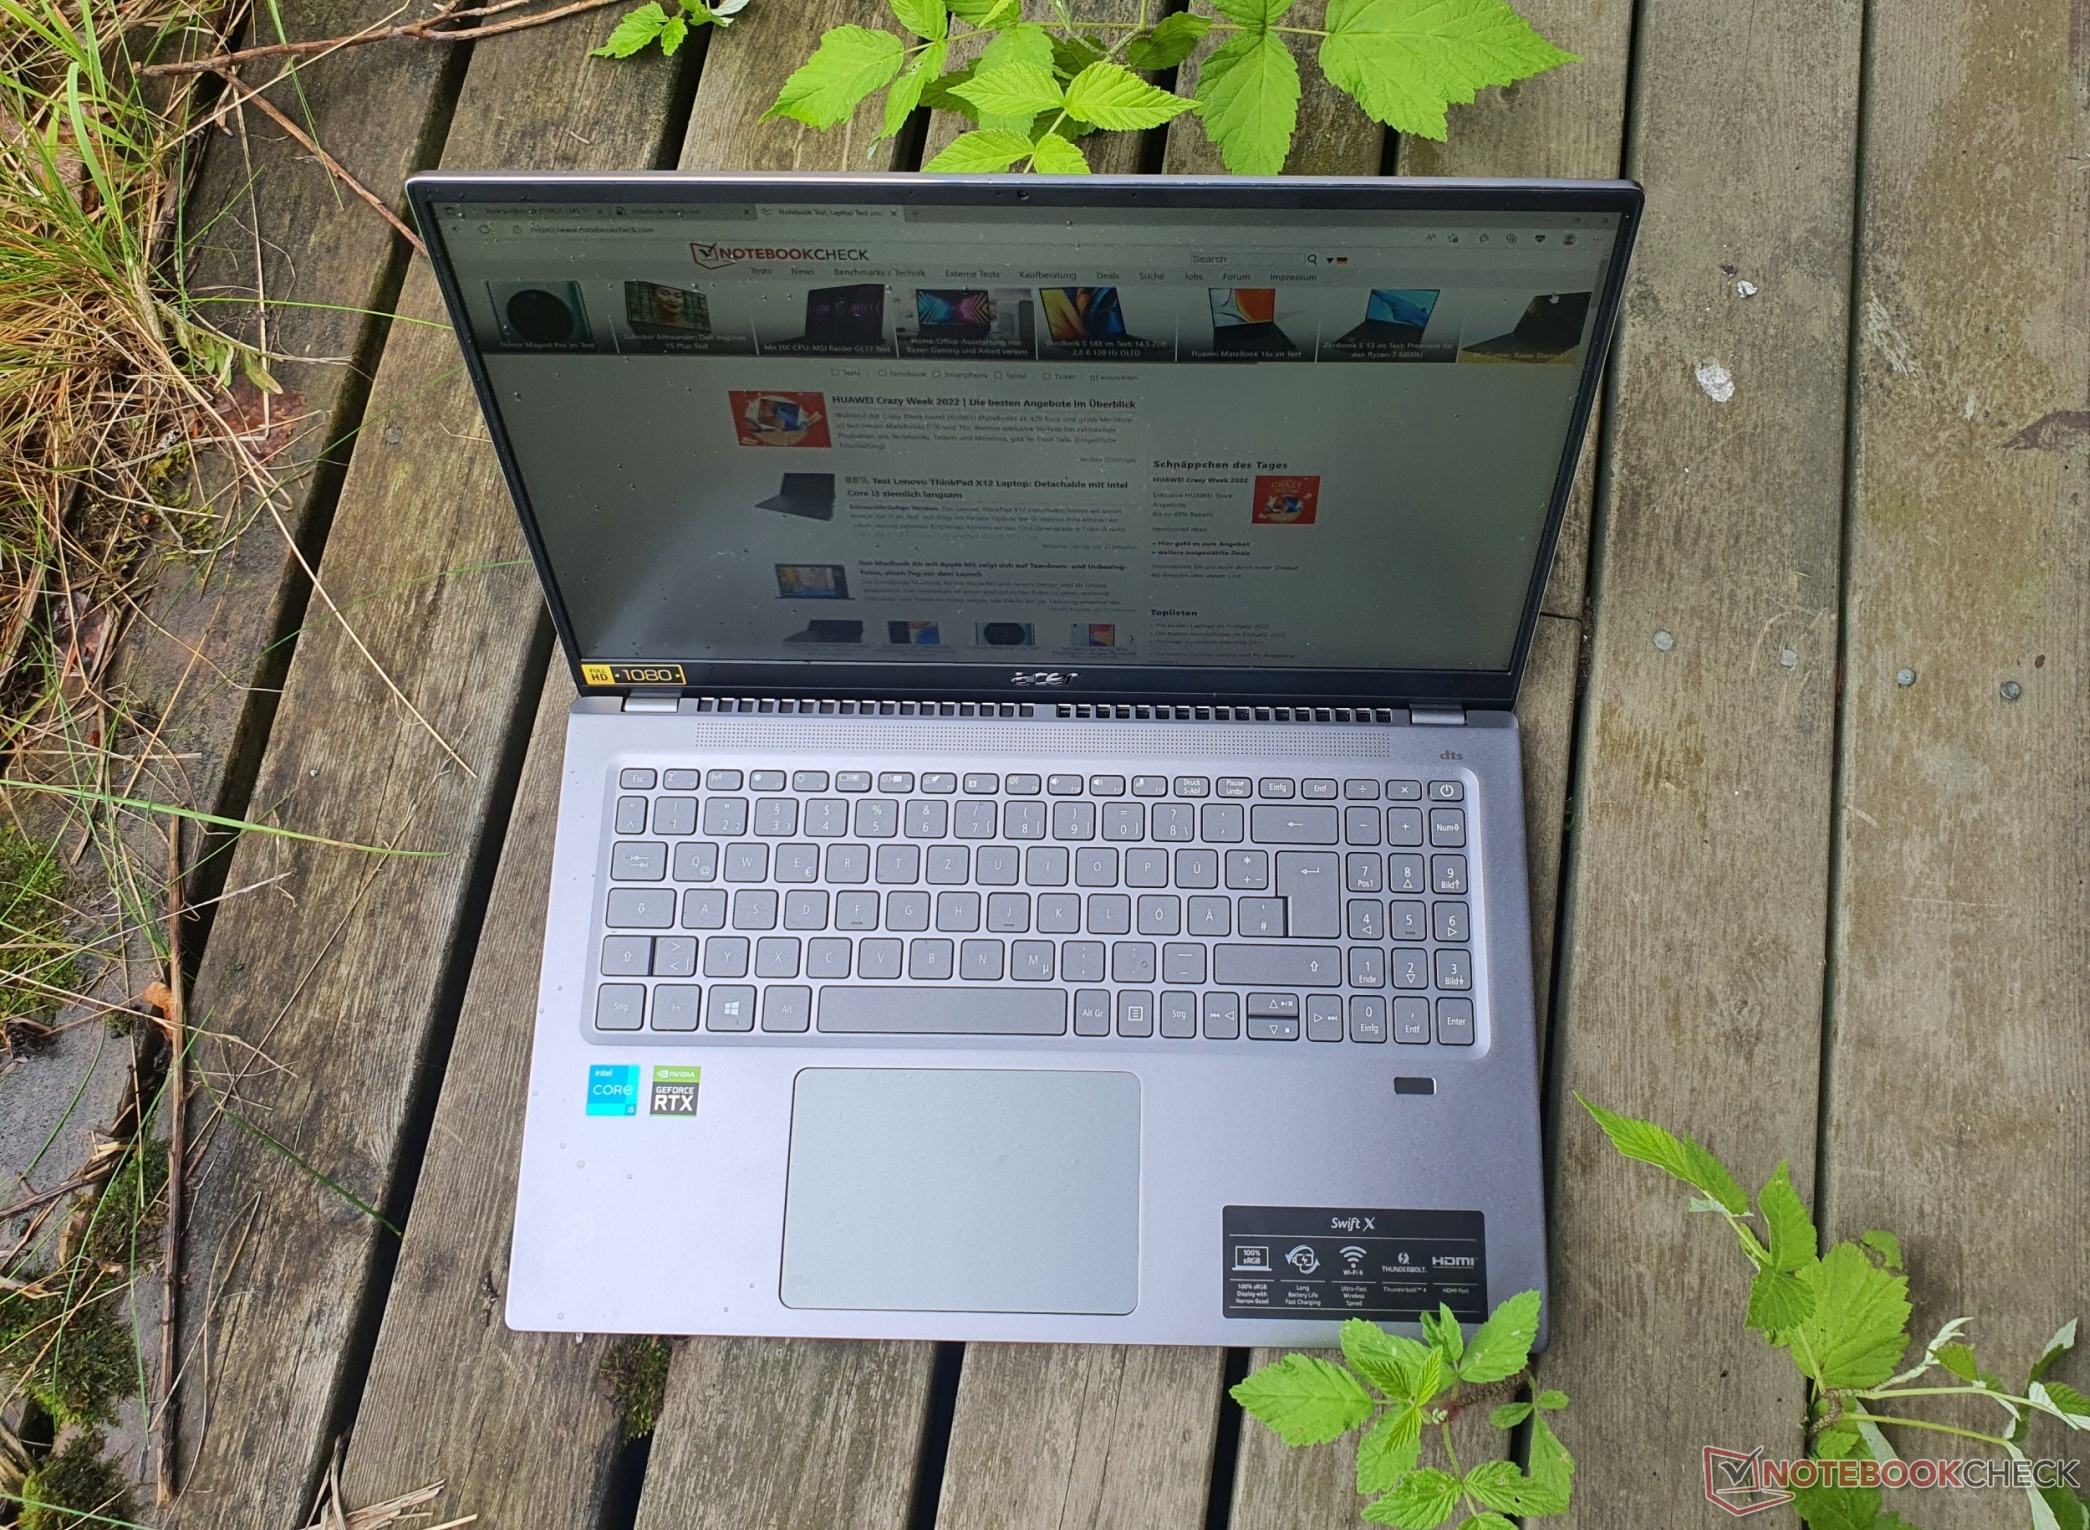
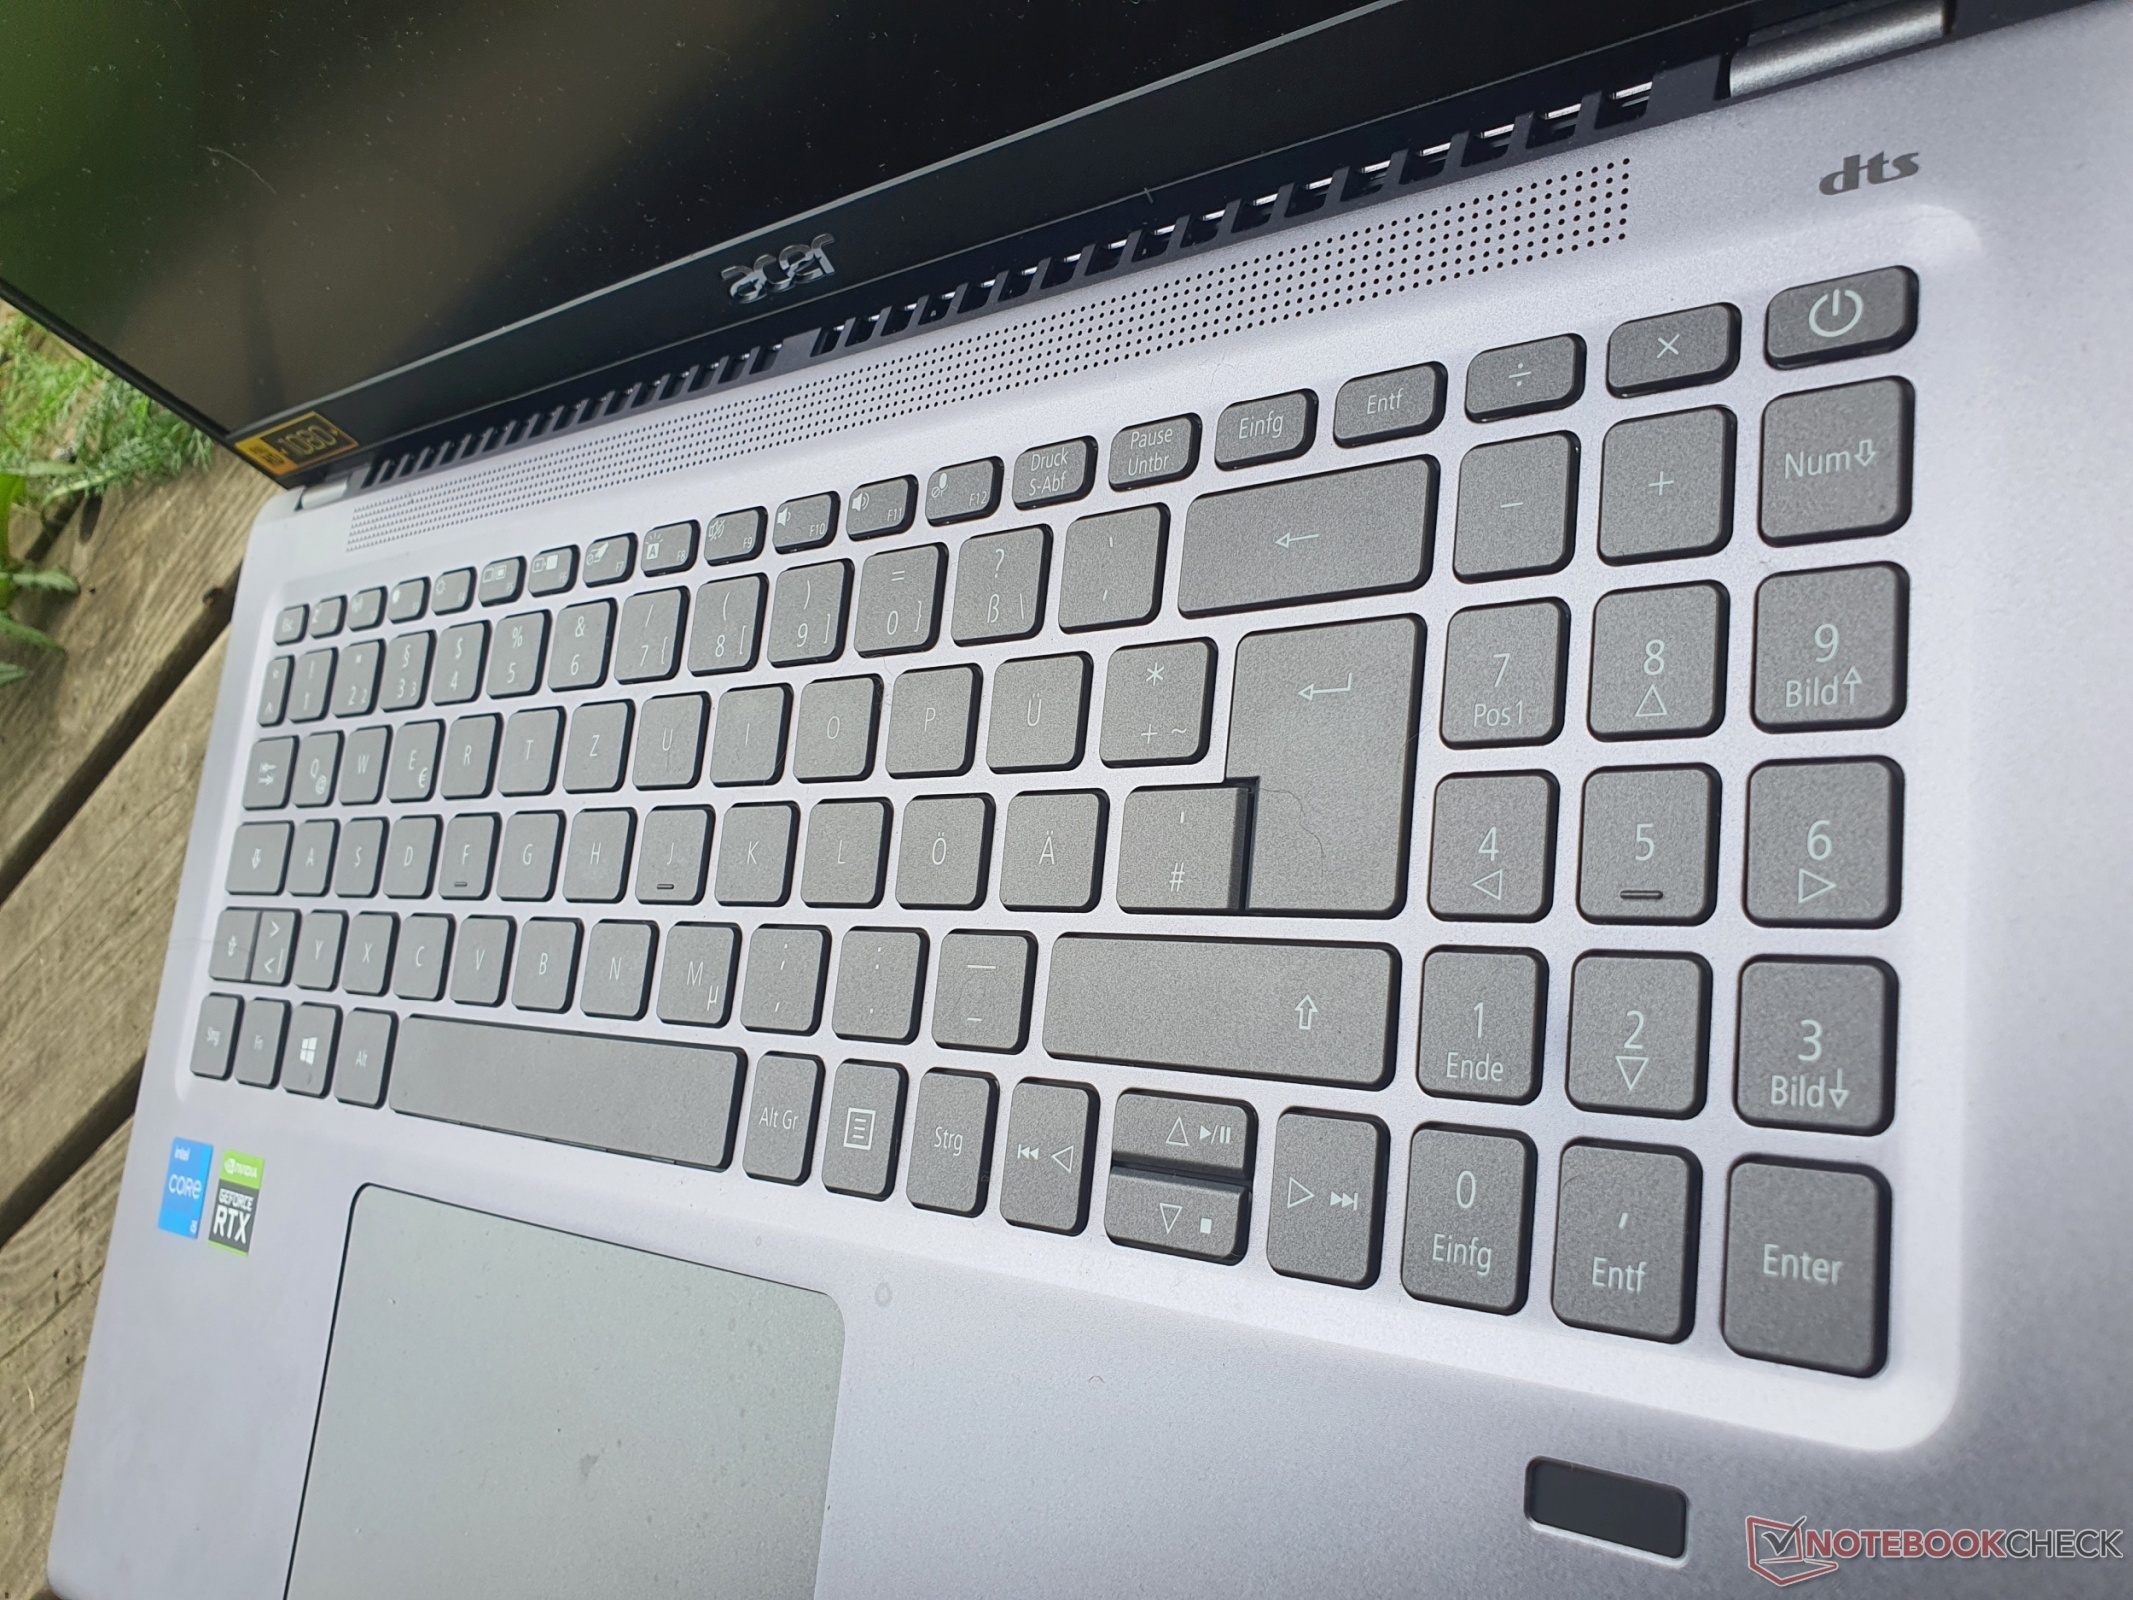
Dispositivos de entrada: Digitação rápida em teclado retroiluminado
Teclado
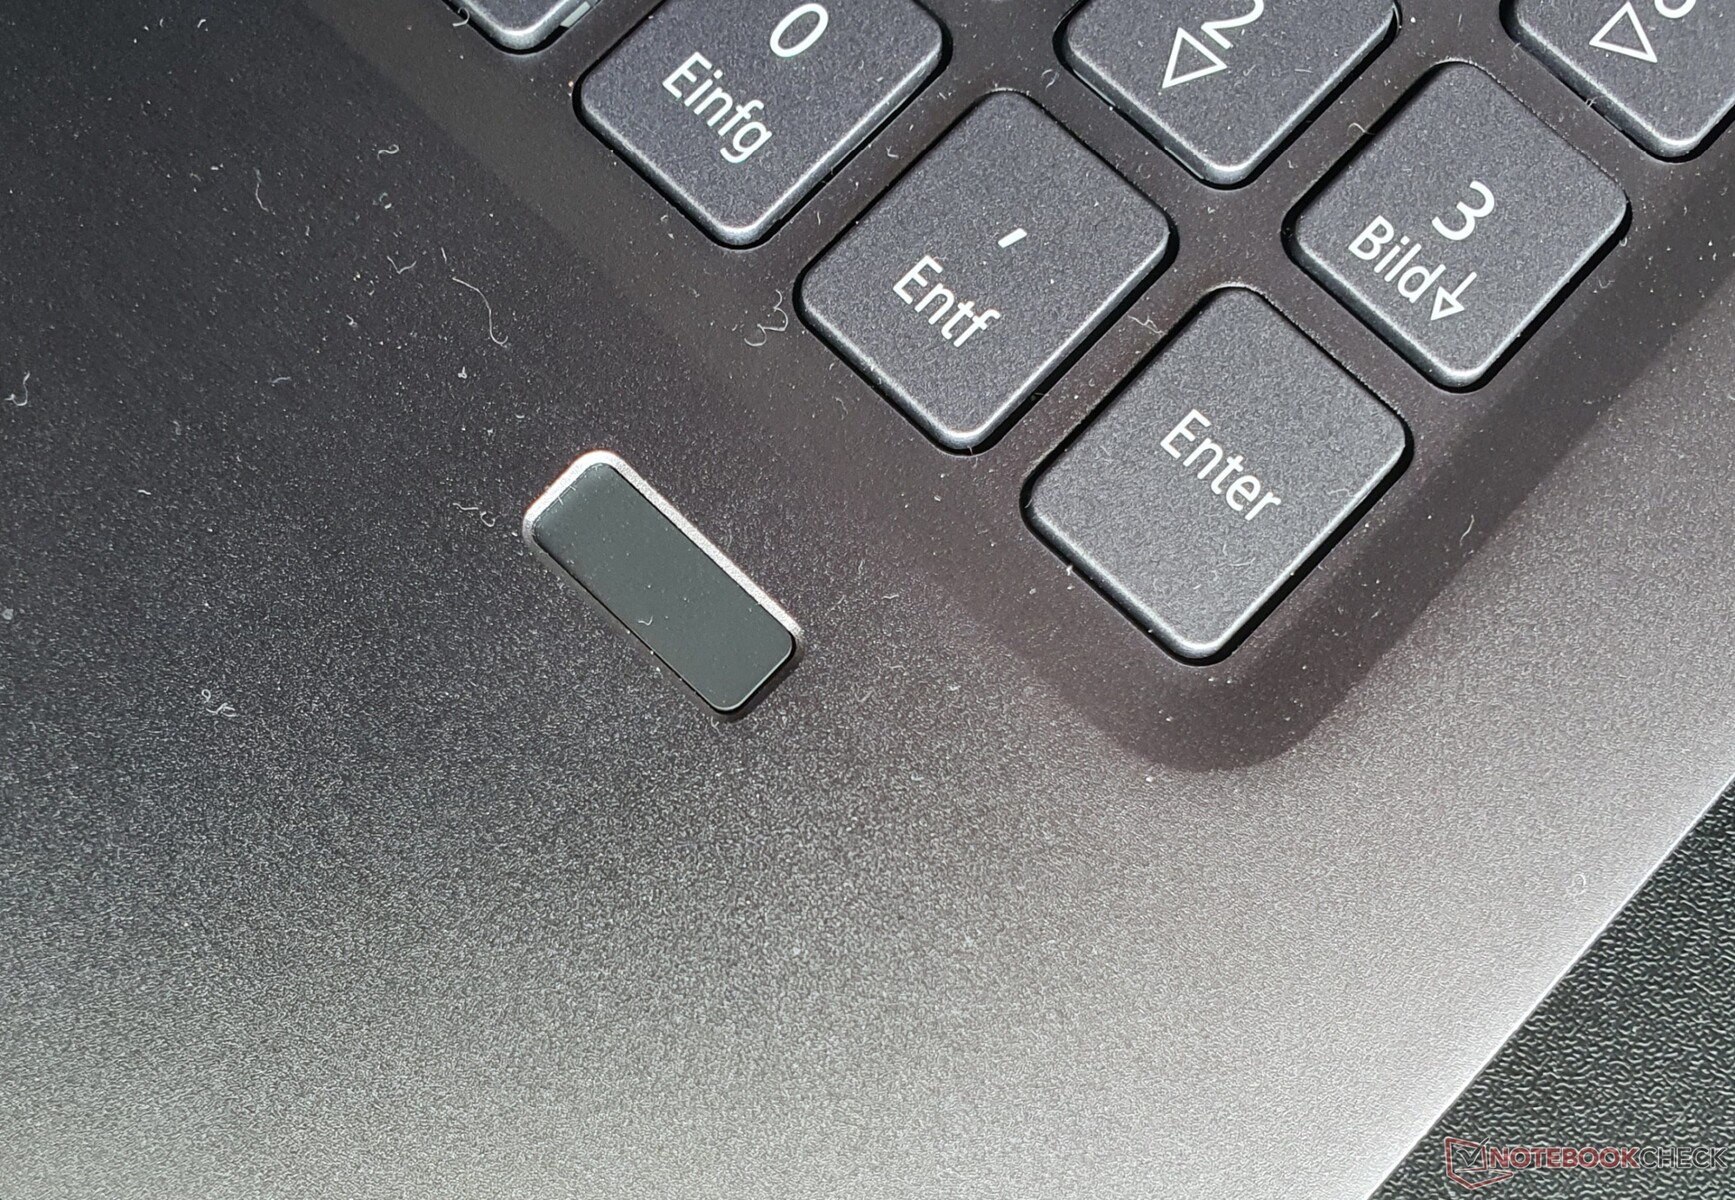
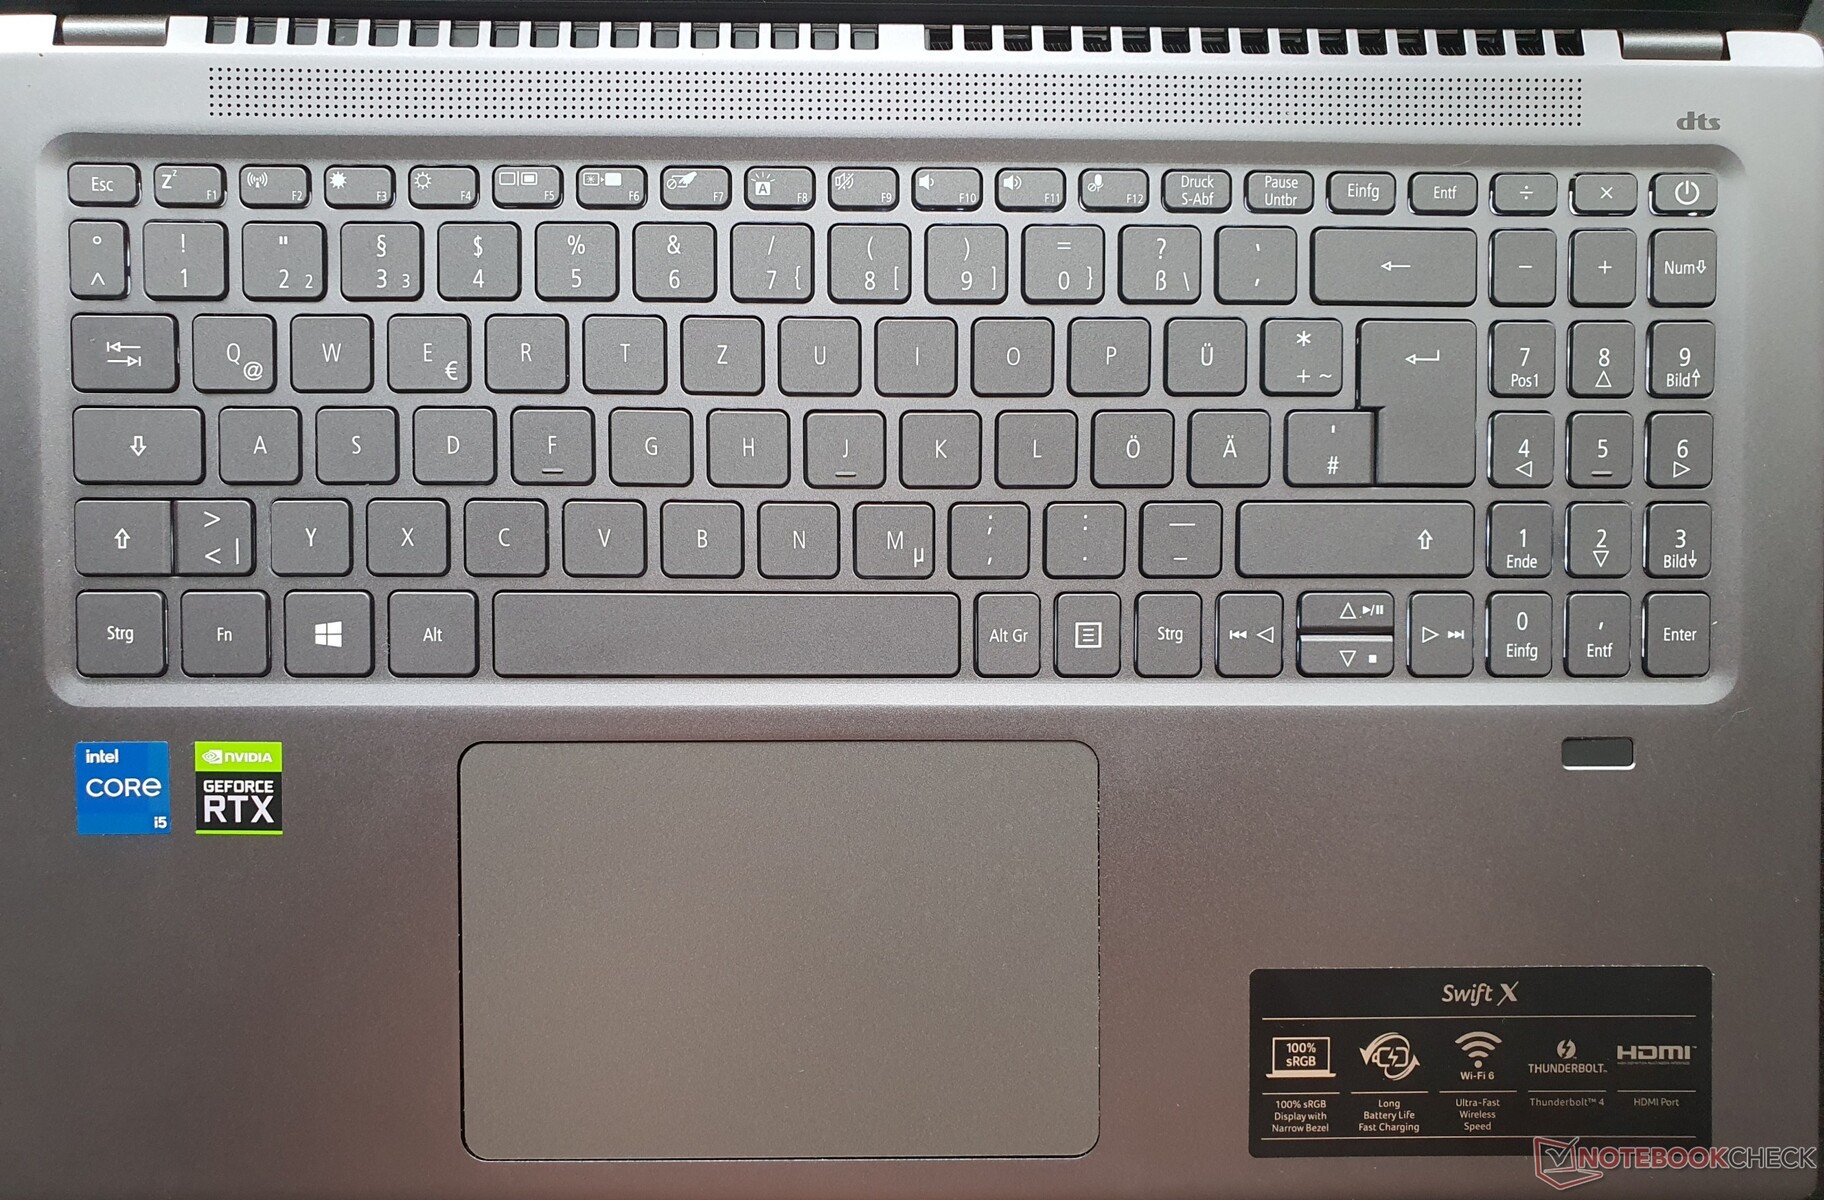
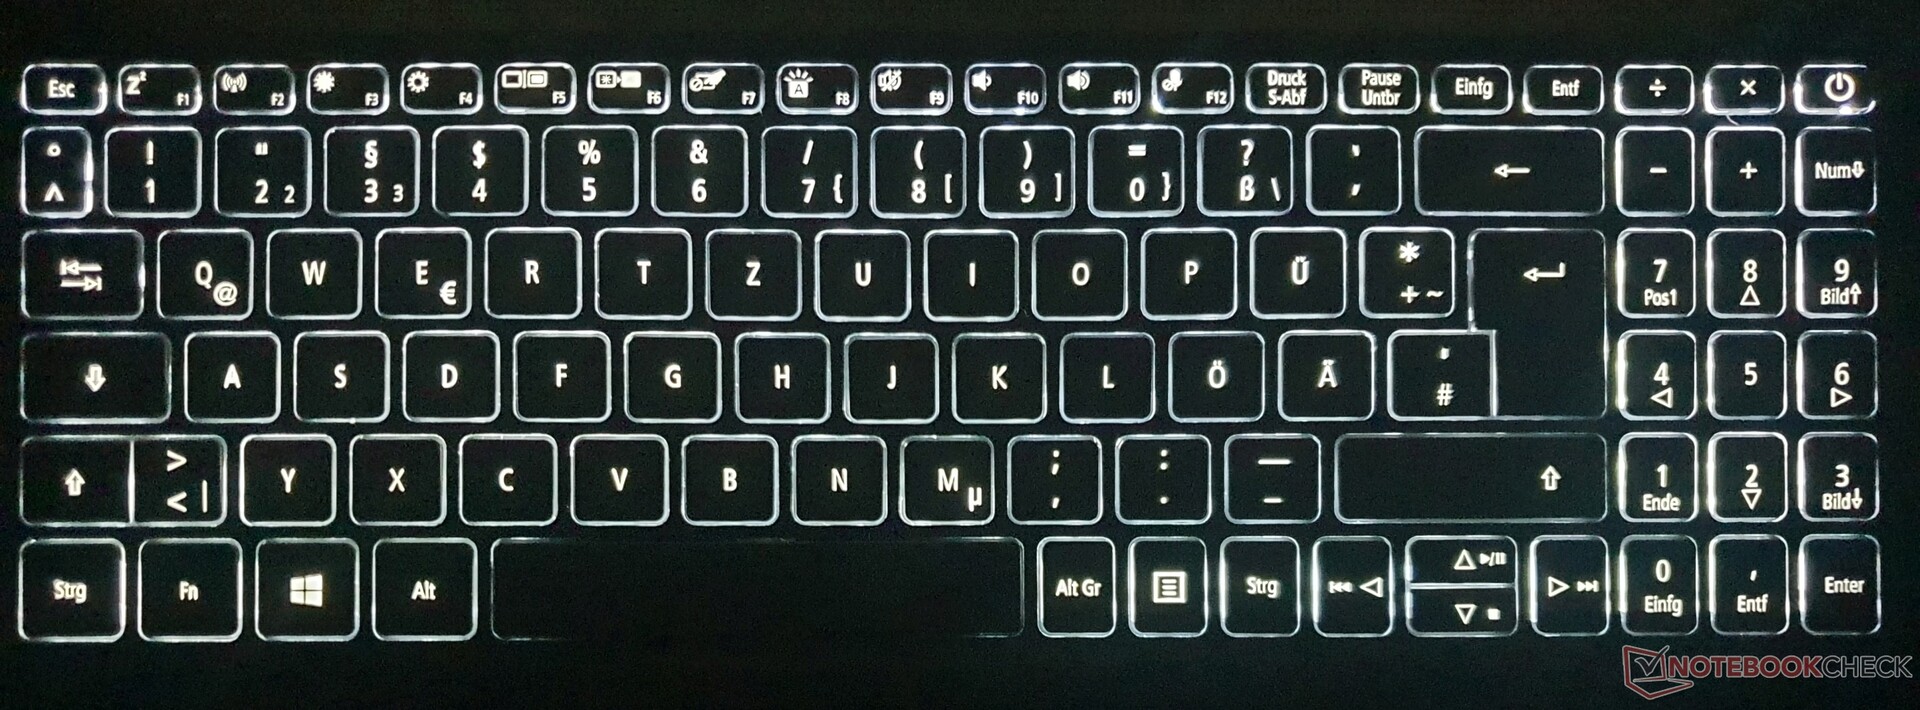
As teclas do Swift X são um pouco menores, especialmente a linha superior, o NumPad e as teclas de seta vertical. O curso das teclas é curto, o ponto de pressão é bem dosado e a resistência é clara. Em geral, a digitação rápida é possível no teclado Acer de um nível iluminado por trás, que também faz seu trabalho agradavelmente silenciosamente.
O layout é bom, com atribuições duplas para "Pos1/End" e algumas funções multimídia (reproduzir, pausar, rebobinar). O teclado cede ligeiramente sob pressão, mas isto não é um problema ao digitar.
Touchpad
O clickpad mede um grande 12,5 x 8 cm e deslizar o ponteiro do mouse é brincadeira de criança sobre a superfície lisa. Os botões integrados na área inferior do touchpad têm um curso curto, requerem mais força do que o normal para clicar e fornecer um feedback moderado (para o gosto do revisor)
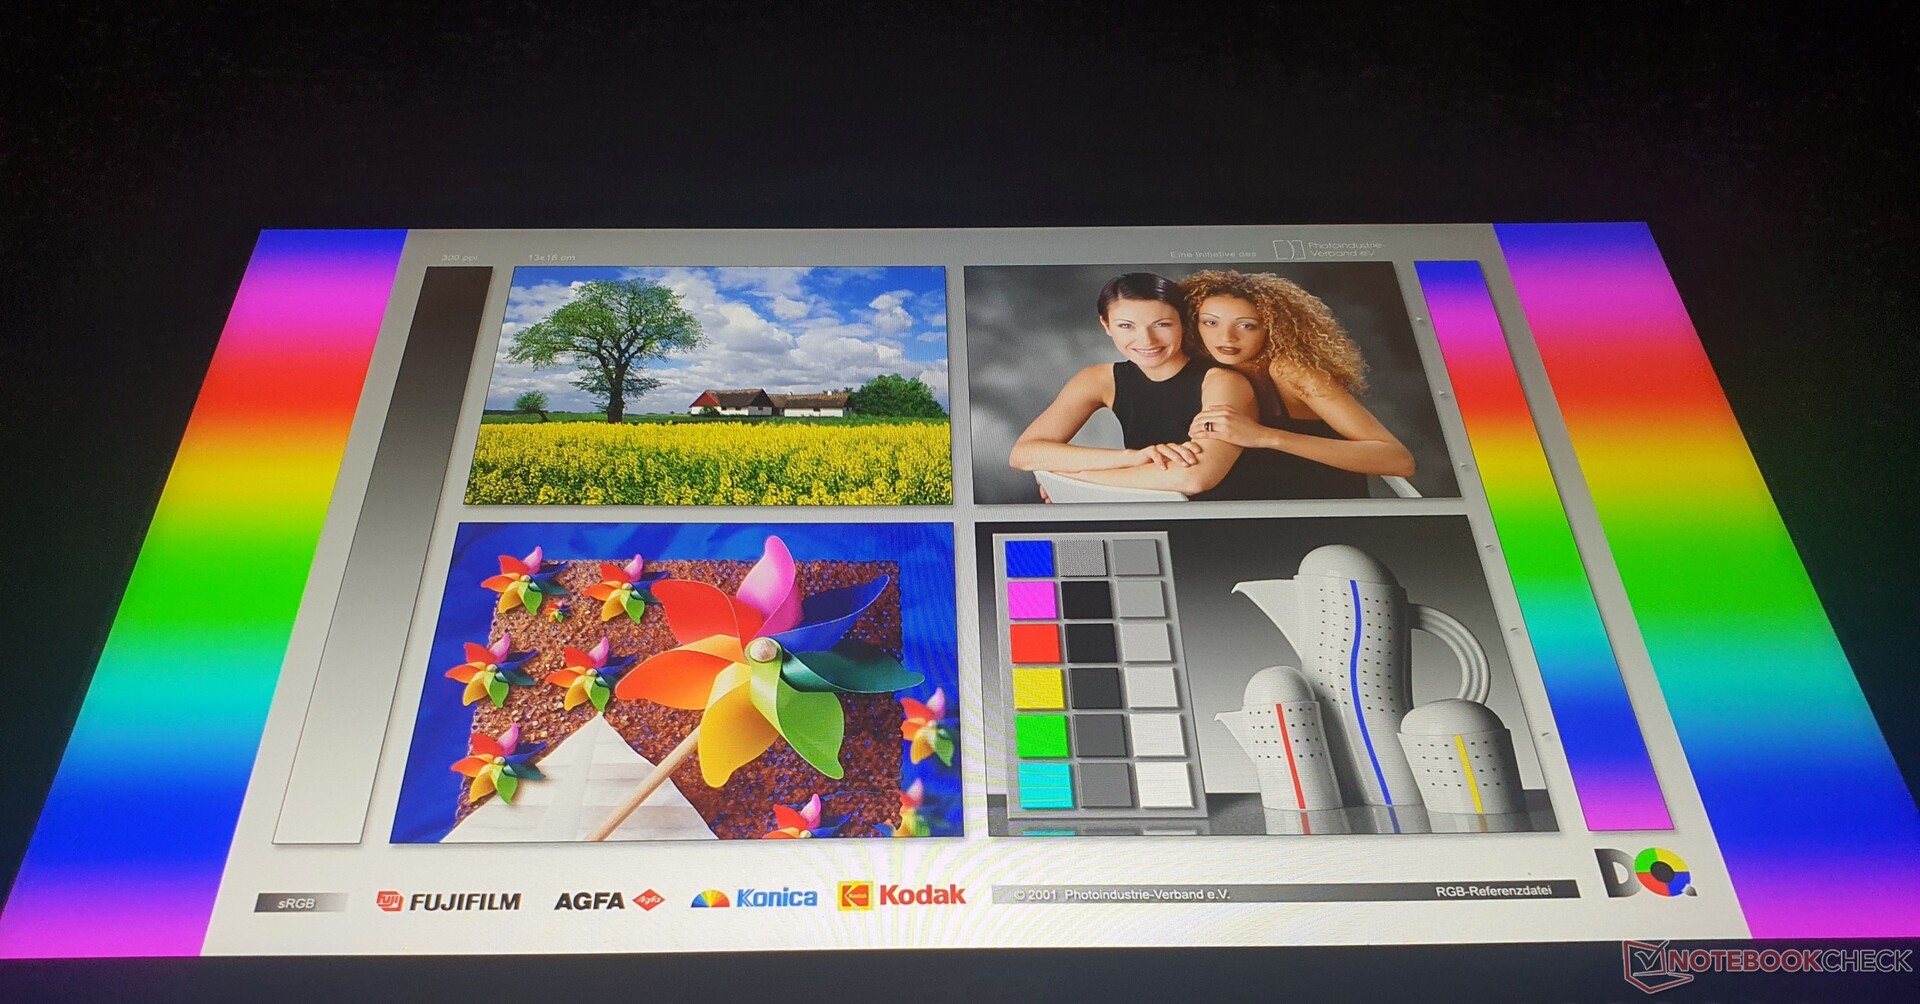
Mostrar: Acer promete 100% sRGB para o Swift X 16
A tela mate do Acer Swift X mede 16,1 polegadas, mas mantém o formato 16:9 (bom para mídia, menos adequado para tarefas de escritório), enquanto que a concorrência freqüentemente usa 16:10. A resolução de 1.920 x 1.080 pixels é fina em 16 polegadas, o que significa que a escala do Windows pode permanecer em 100% (nitidez de imagem ideal).
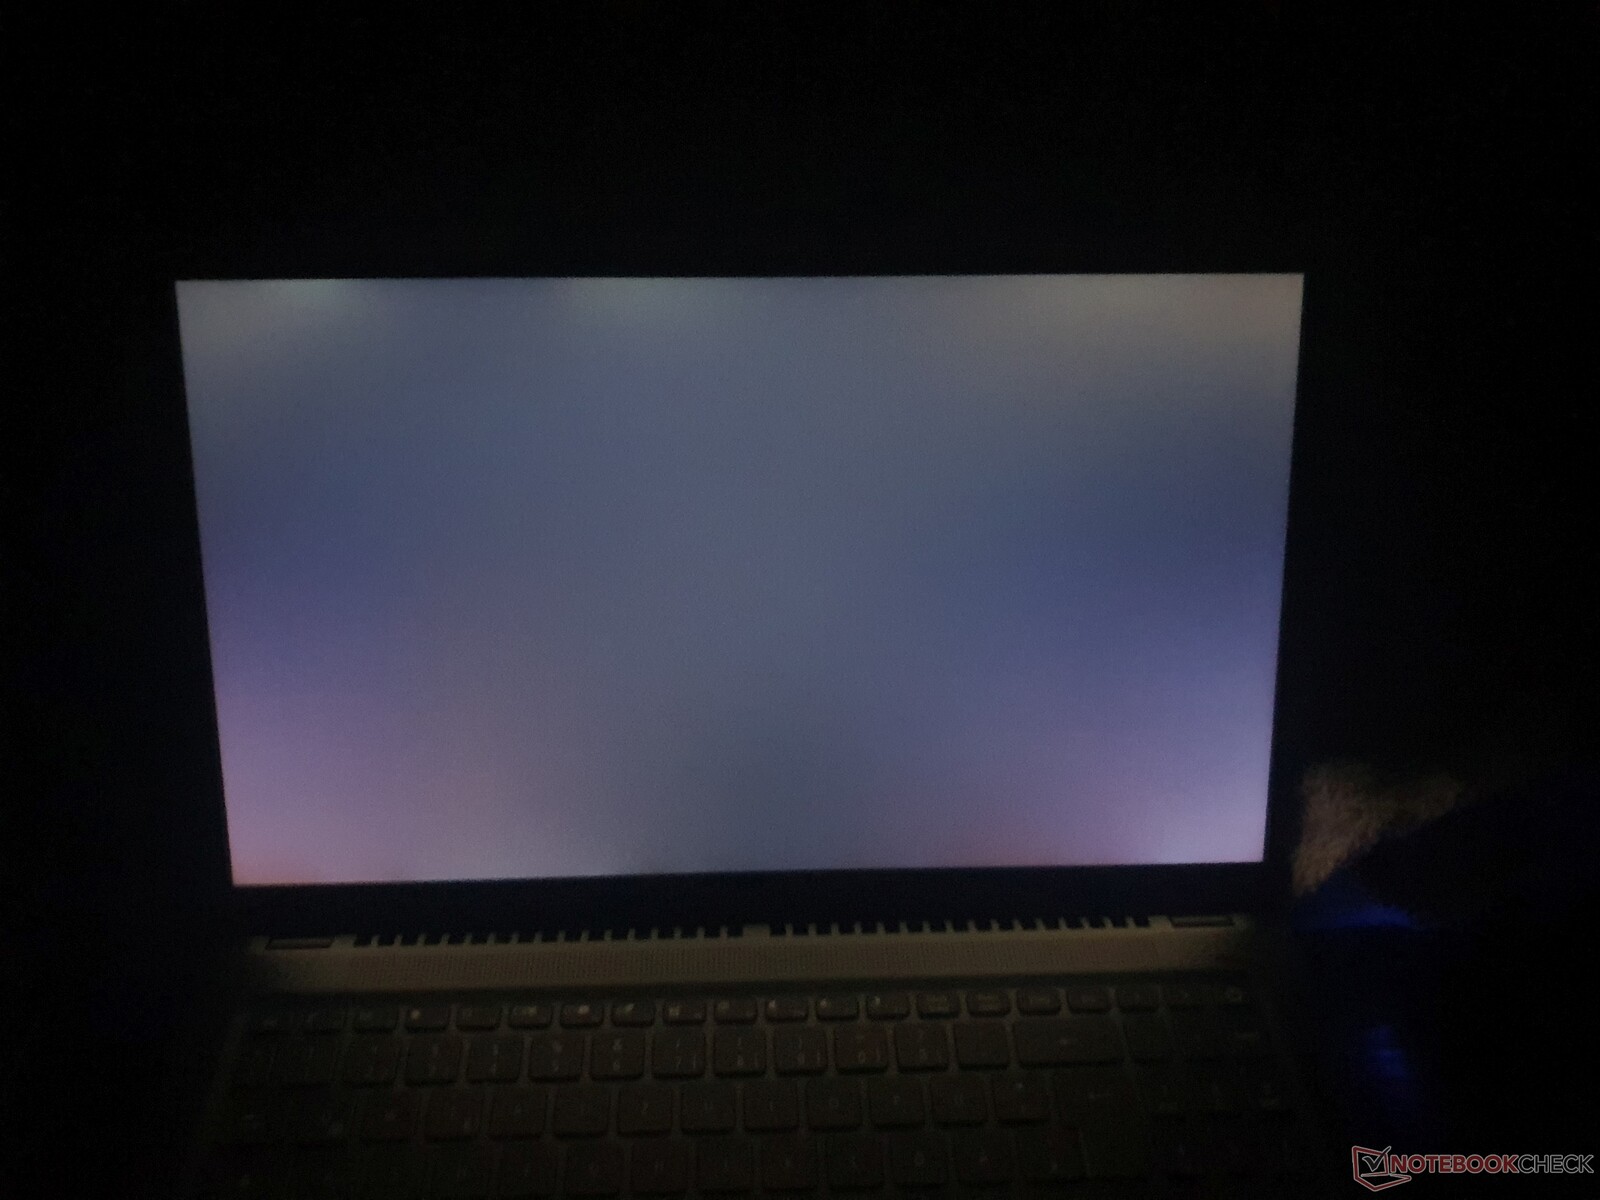
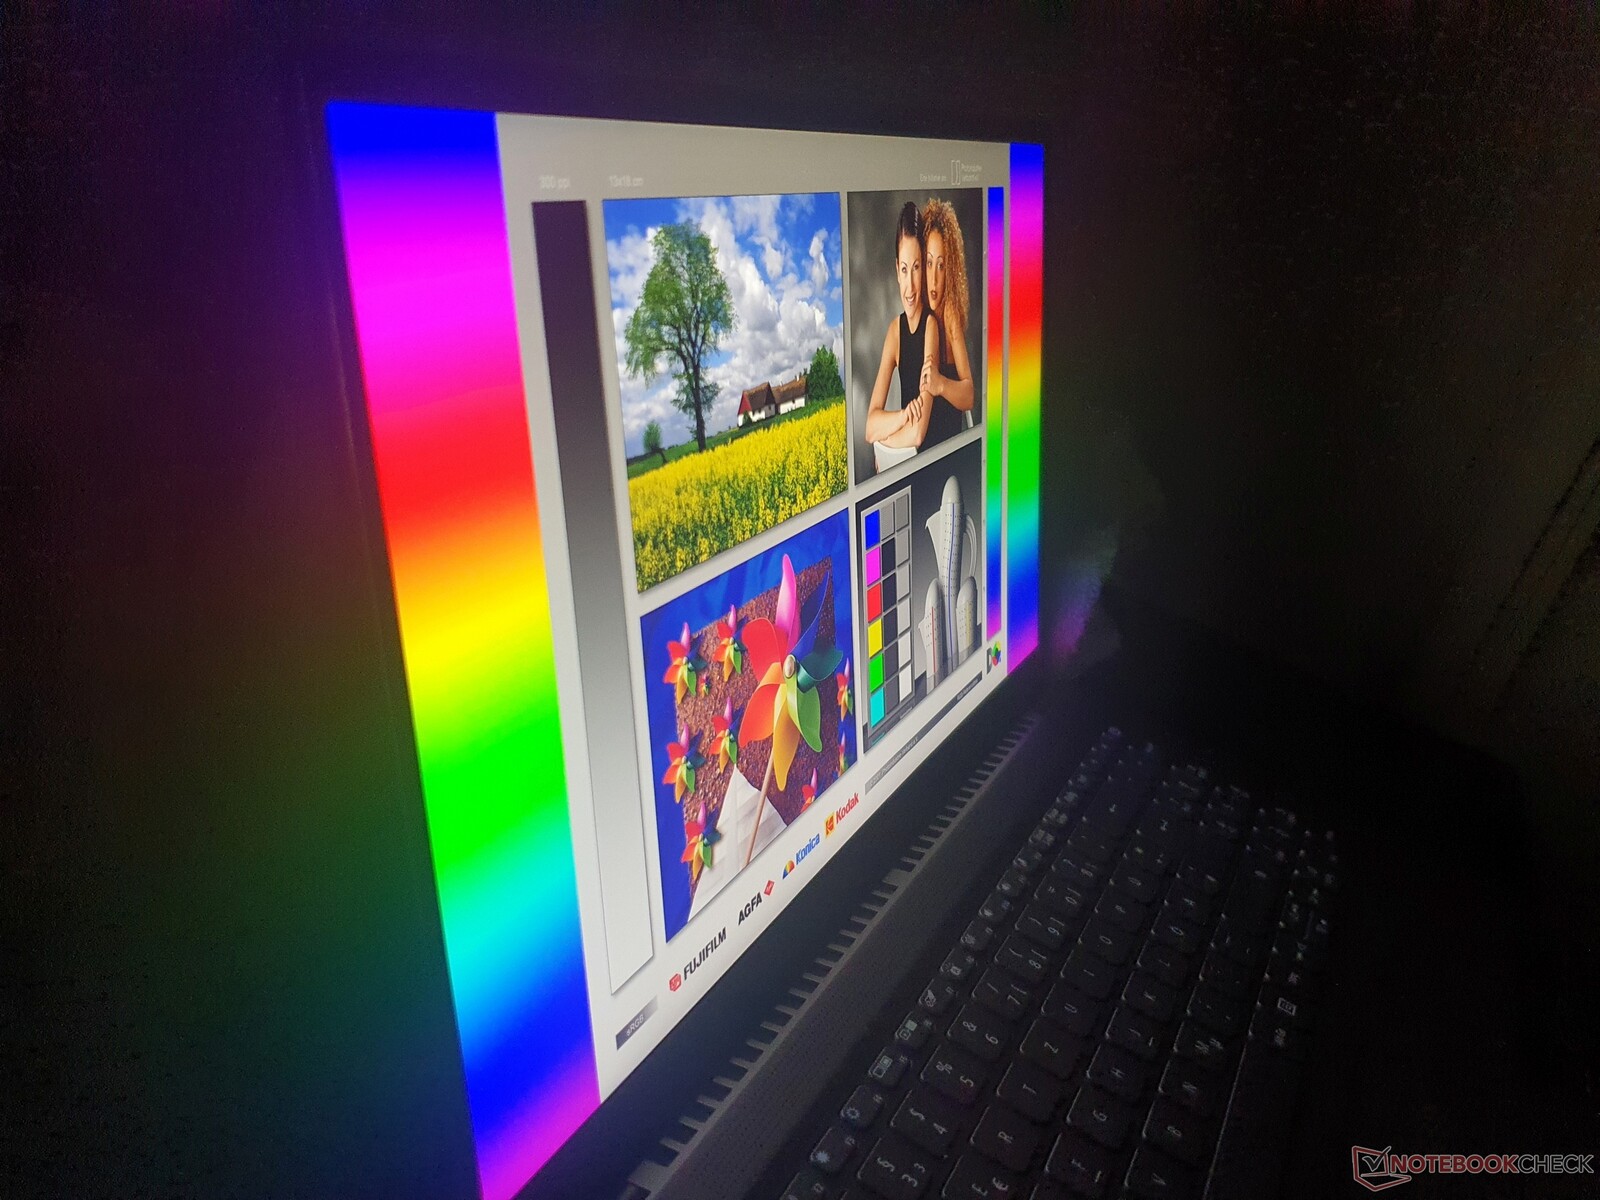
Uma desvantagem é o baixo brilho das 264 lêndeas medidas, o que é suficiente em ambientes internos, mas subótimo. Não há opções alternativas de exibição. Além disso, o brilho cai novamente no modo de bateria para apenas 180 lêndeas.
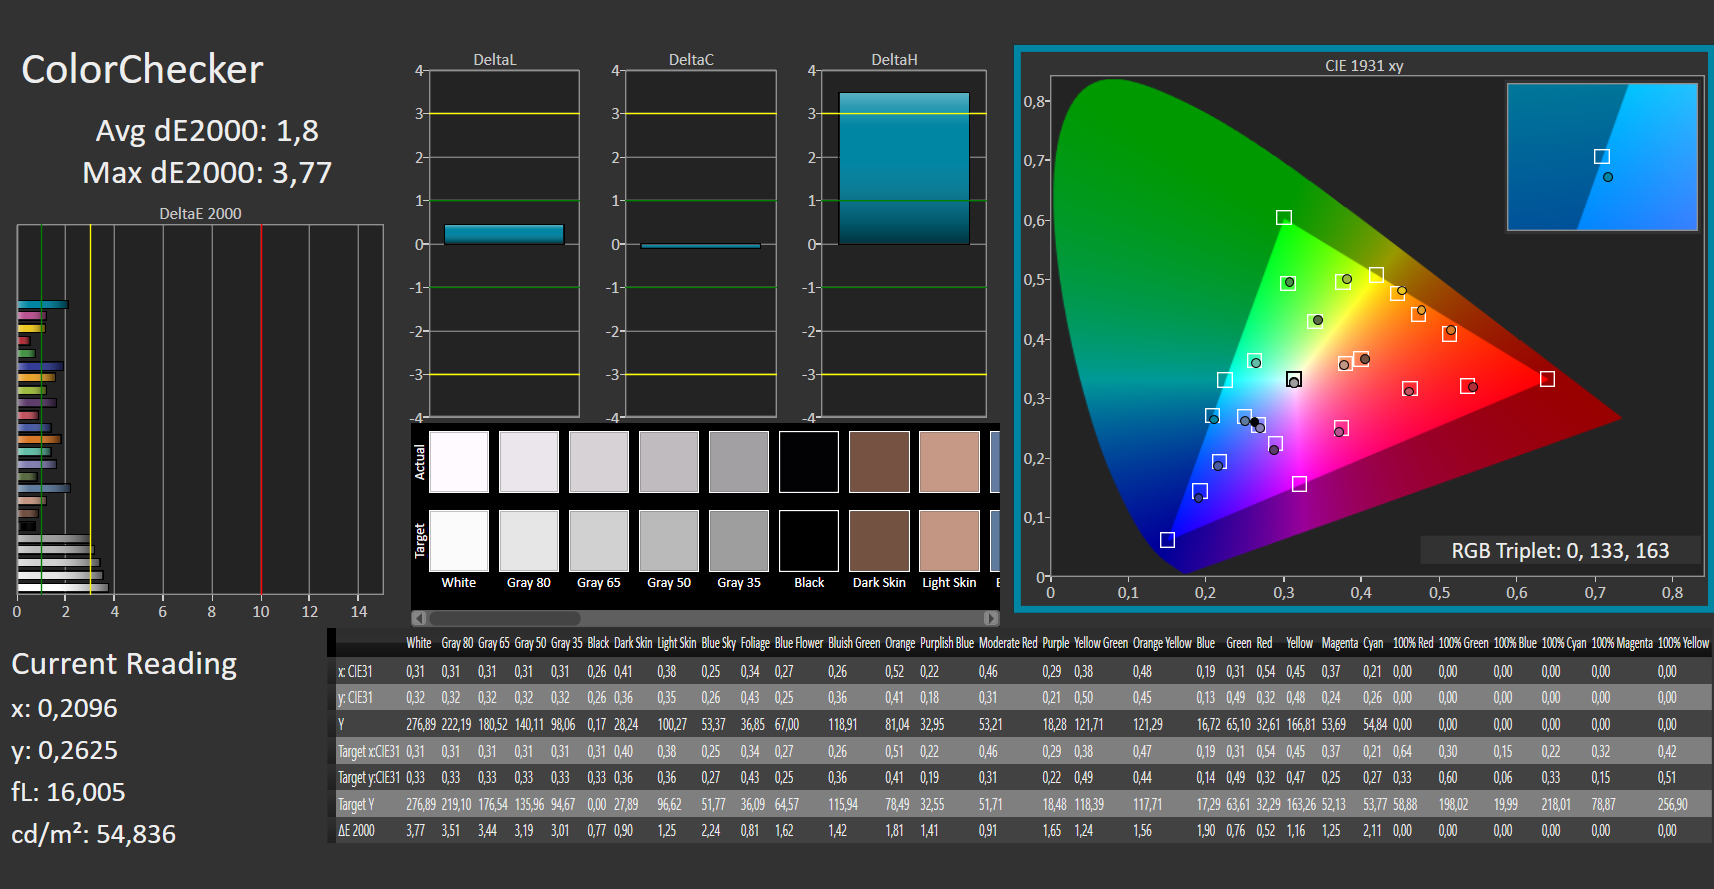
A relação de contraste (1.725:1) e o nível de preto (0,16 lêndeas) são muito bons para uma tela IPS e os baixos valores DeltaE resultam em uma representação de cores adequada. Os tempos de resposta do painel não são bons nem ruins, mas são suficientes para jogos casuais. Não foi detectada nenhuma cintilação de PWM.
O painel em si é fundamentalmente sólido, mas os laptops concorrentes em nosso quadro comparativo têm painéis consistentemente melhores com resoluções e valores de brilho mais altos. O Lenovo IdeaPad 5 Pro 16também tem uma taxa de atualização de 120 Hz, enquanto o Asus Vivobook Pro 16Xtem um painel OLED 4K.
| |||||||||||||||||||||||||
iluminação: 85 %
iluminação com acumulador: 180 cd/m²
Contraste: 1725:1 (Preto: 0.16 cd/m²)
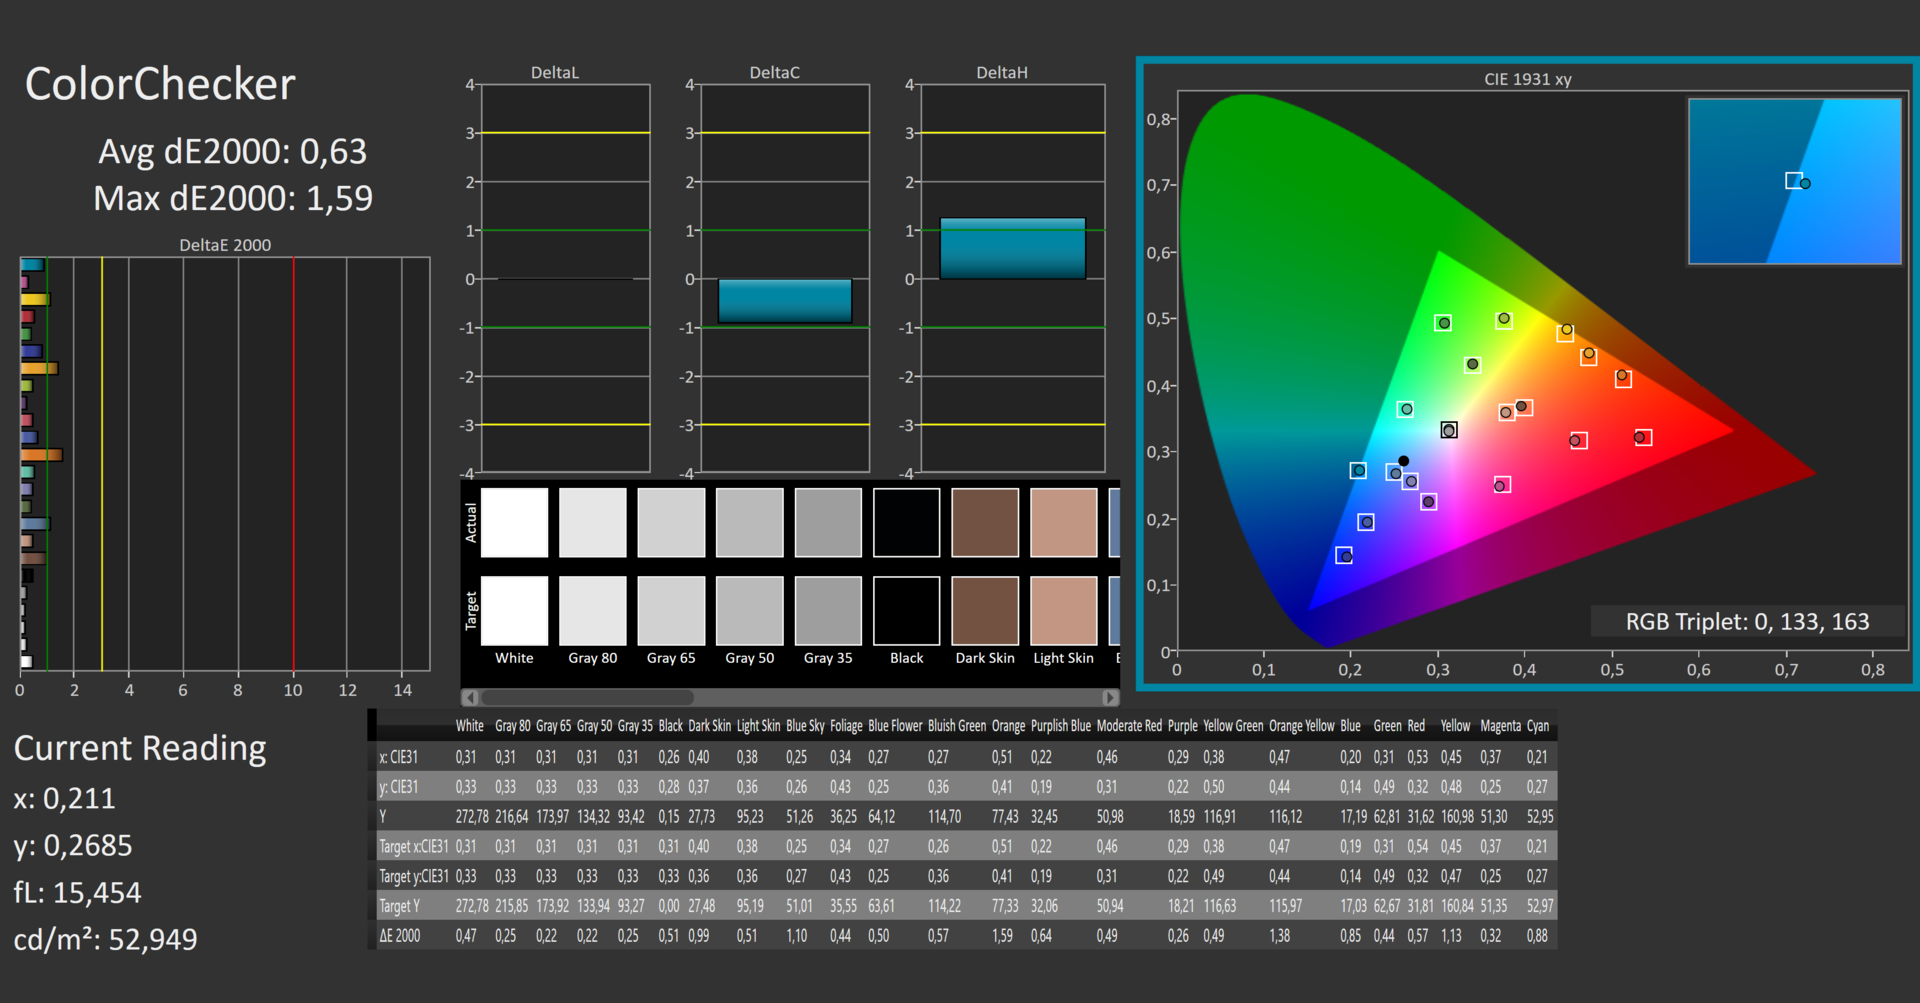
ΔE ColorChecker Calman: 1.8 | ∀{0.5-29.43 Ø4.71}
calibrated: 0.63
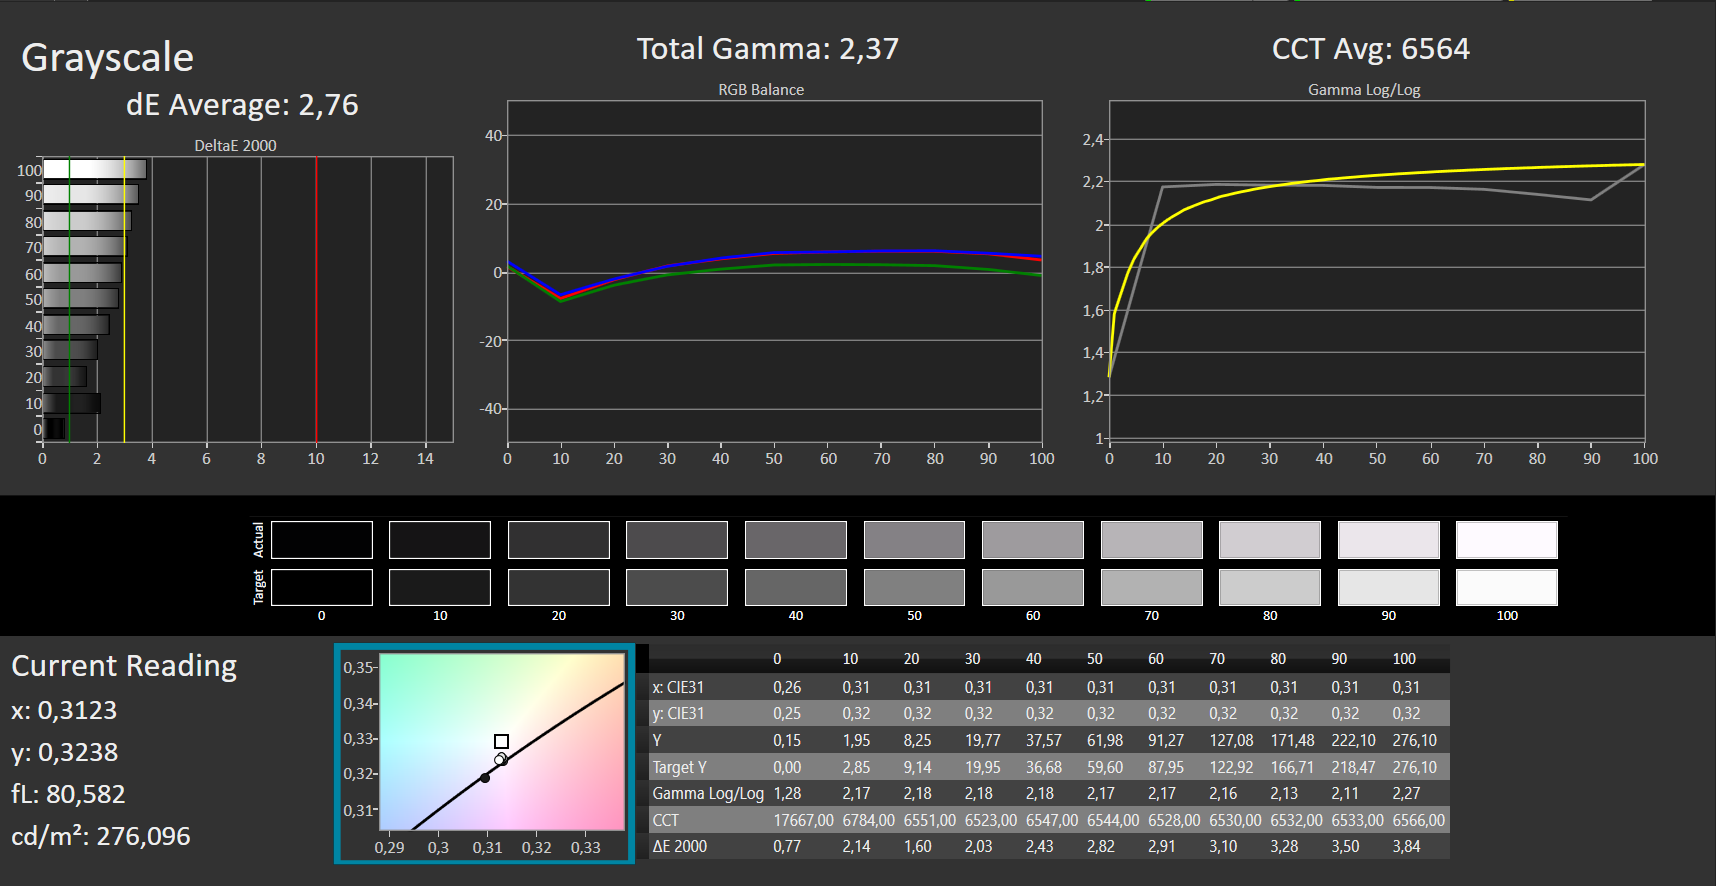
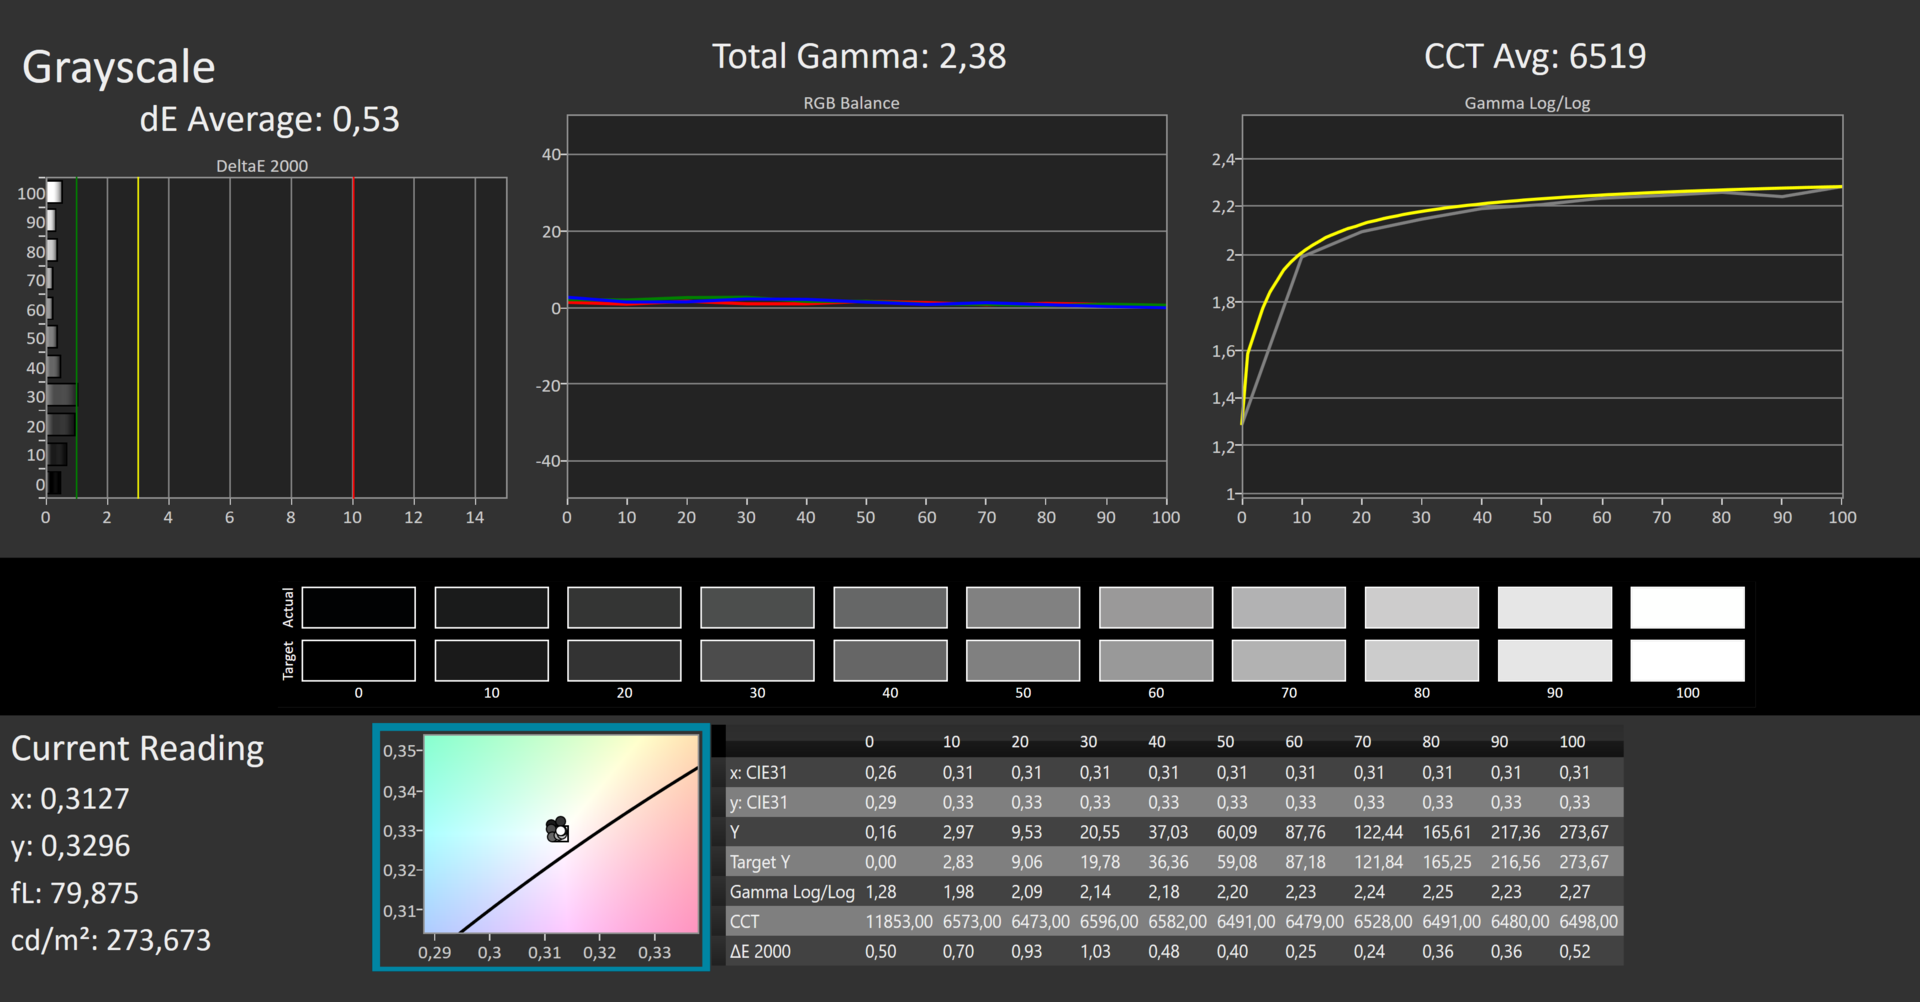
ΔE Greyscale Calman: 2.76 | ∀{0.09-98 Ø4.96}
66.75% AdobeRGB 1998 (Argyll 3D)
95.65% sRGB (Argyll 3D)
65.1% Display P3 (Argyll 3D)
Gamma: 2.37
CCT: 6564 K
| Acer Swift X SFX16-51G-5388 Chi Mei N161HCA-EA3, , 1920x1080, 16.1" | Acer Swift 3 SF316-51 Chi Mei CMN160B, IPS, 1920x1080, 16.1" | Lenovo IdeaPad 5 Pro 16ACH IPS LED, 2560x1600, 16" | Dell Inspiron 16 Plus 7610 AU Optronics B160QAN, IPS, 3072x1920, 16" | Asus Vivobook Pro 16X-M7600QE Samsung ATNA60YV02-0, OLED, 3840x2400, 16.1" | Huawei MateBook 16 R7 5800H BOE TV160DKT-NH0, , 2520x1680, 16" | |
|---|---|---|---|---|---|---|
| Display | 3% | 8% | 11% | 34% | -2% | |
| Display P3 Coverage (%) | 65.1 | 66.6 2% | 71 9% | 74.1 14% | 99.8 53% | 63.1 -3% |
| sRGB Coverage (%) | 95.65 | 99.5 4% | 99 4% | 99.4 4% | 100 5% | 94.9 -1% |
| AdobeRGB 1998 Coverage (%) | 66.75 | 68.5 3% | 73.3 10% | 75.8 14% | 96.9 45% | 65.1 -2% |
| Response Times | -4% | 51% | -74% | 92% | -35% | |
| Response Time Grey 50% / Grey 80% * (ms) | 30 ? | 32 ? -7% | 16.4 ? 45% | 49.2 ? -64% | 2 ? 93% | 41.2 ? -37% |
| Response Time Black / White * (ms) | 20 ? | 20 ? -0% | 8.8 ? 56% | 36.8 ? -84% | 2 ? 90% | 26.4 ? -32% |
| PWM Frequency (Hz) | 2500 ? | 24940 ? | 60 ? | |||
| Screen | 7% | -25% | -32% | -5% | 7% | |
| Brightness middle (cd/m²) | 276 | 304 10% | 395 43% | 296.8 8% | 392 42% | 357 29% |
| Brightness (cd/m²) | 264 | 284 8% | 375 42% | 292 11% | 396 50% | 349 32% |
| Brightness Distribution (%) | 85 | 88 4% | 90 6% | 87 2% | 98 15% | 93 9% |
| Black Level * (cd/m²) | 0.16 | 0.165 -3% | 0.32 -100% | 0.21 -31% | 0.21 -31% | |
| Contrast (:1) | 1725 | 1842 7% | 1234 -28% | 1413 -18% | 1700 -1% | |
| Colorchecker dE 2000 * | 1.8 | 1.44 20% | 2.6 -44% | 2.56 -42% | 1.74 3% | 1.6 11% |
| Colorchecker dE 2000 max. * | 3.77 | 3.62 4% | 5.4 -43% | 4.76 -26% | 3.18 16% | 3.9 -3% |
| Colorchecker dE 2000 calibrated * | 0.63 | 1.1 -75% | 1.86 -195% | 1.85 -194% | 0.6 5% | |
| Greyscale dE 2000 * | 2.76 | 2.6 6% | 3.4 -23% | 2.6 6% | 1.77 36% | 2.4 13% |
| Gamma | 2.37 93% | 2.41 91% | 2.12 104% | 2.07 106% | 2.22 99% | 2.14 103% |
| CCT | 6564 99% | 6527 100% | 6140 106% | 6628 98% | 6483 100% | 6728 97% |
| Color Space (Percent of AdobeRGB 1998) (%) | 68.5 | |||||
| Color Space (Percent of sRGB) (%) | 99.5 | |||||
| Média Total (Programa/Configurações) | 2% /
4% | 11% /
-7% | -32% /
-29% | 40% /
21% | -10% /
-1% |
* ... menor é melhor
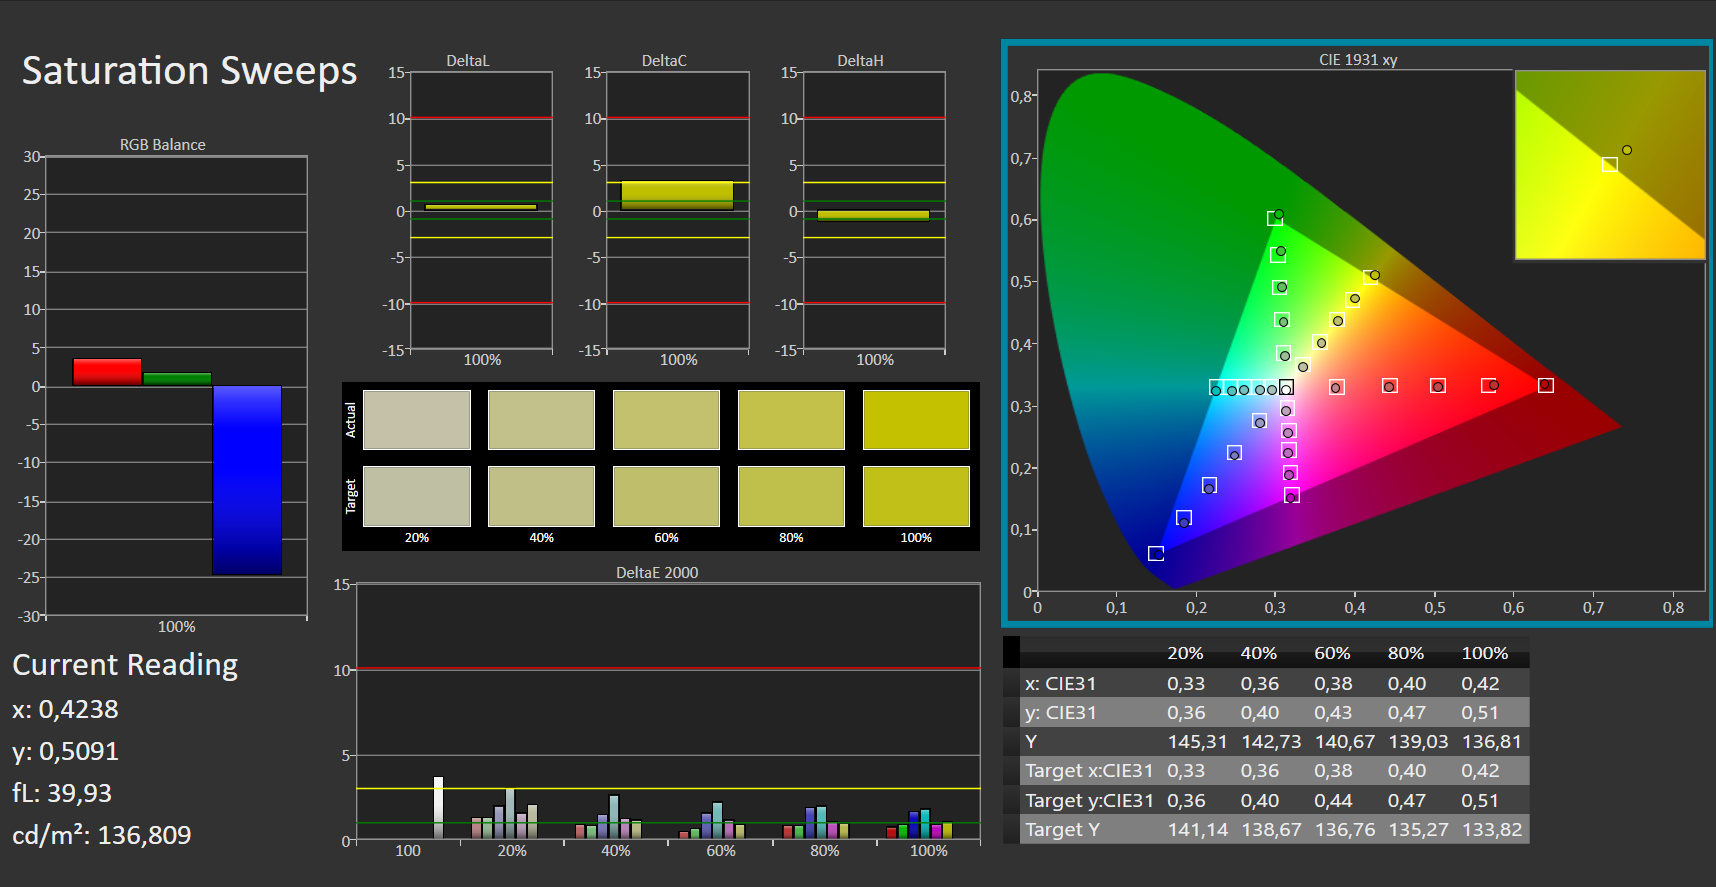
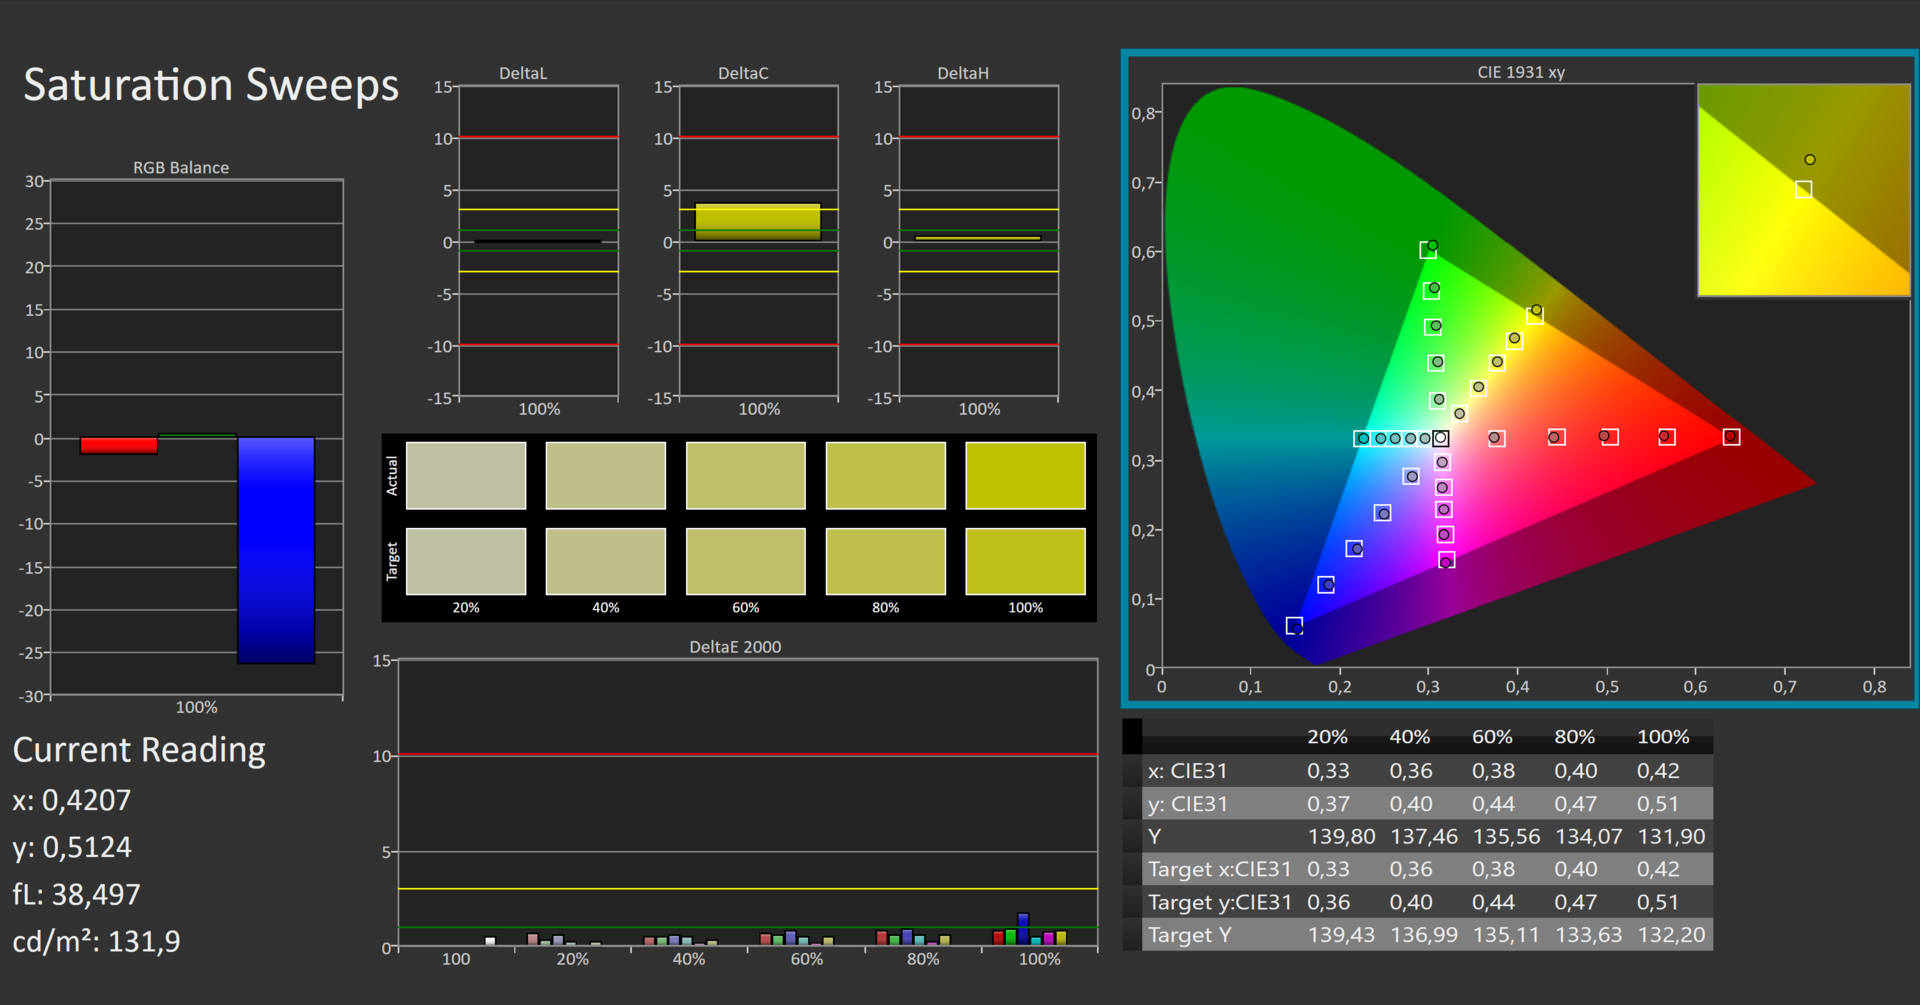
A Acer promete uma cobertura sRGB completa, o que é confirmado por nossa medida de 95,7%. Para os espaços de cor Adobe RGB e DCI-P3, registramos 66,8% e 65,1%, respectivamente. Isto torna possível a edição semi-profissional de imagens e vídeos
A tela já está bem calibrada ex works, mas conseguimos melhorar ainda mais os resultados. Como sempre, nosso perfil de cores ICC está disponível para download ao lado do gráfico de iluminação
Exibir tempos de resposta
| ↔ Tempo de resposta preto para branco | ||
|---|---|---|
| 20 ms ... ascensão ↗ e queda ↘ combinadas | ↗ 11 ms ascensão |  |
| ↘ 9 ms queda | ||
| A tela mostra boas taxas de resposta em nossos testes, mas pode ser muito lenta para jogadores competitivos. Em comparação, todos os dispositivos testados variam de 0.1 (mínimo) a 240 (máximo) ms. » 44 % de todos os dispositivos são melhores. Isso significa que o tempo de resposta medido é semelhante à média de todos os dispositivos testados (19.8 ms). | ||
| ↔ Tempo de resposta 50% cinza a 80% cinza | ||
| 30 ms ... ascensão ↗ e queda ↘ combinadas | ↗ 14 ms ascensão |  |
| ↘ 16 ms queda | ||
| A tela mostra taxas de resposta lentas em nossos testes e será insatisfatória para os jogadores. Em comparação, todos os dispositivos testados variam de 0.165 (mínimo) a 636 (máximo) ms. » 40 % de todos os dispositivos são melhores. Isso significa que o tempo de resposta medido é semelhante à média de todos os dispositivos testados (30.9 ms). | ||
Cintilação da tela / PWM (modulação por largura de pulso)
| Tela tremeluzindo / PWM não detectado |  | ||
[pwm_comparison] Em comparação: 52 % de todos os dispositivos testados não usam PWM para escurecer a tela. Se PWM foi detectado, uma média de 7741 (mínimo: 5 - máximo: 343500) Hz foi medida. | |||
Para uso externo, o Acer Swift X 16 só pode ser usado na sombra. Apesar de sua superfície fosca, a tela simplesmente não é brilhante o suficiente para resistir ao sol.

Desempenho: Swift X funciona bem, mas o SSD é estrangulado
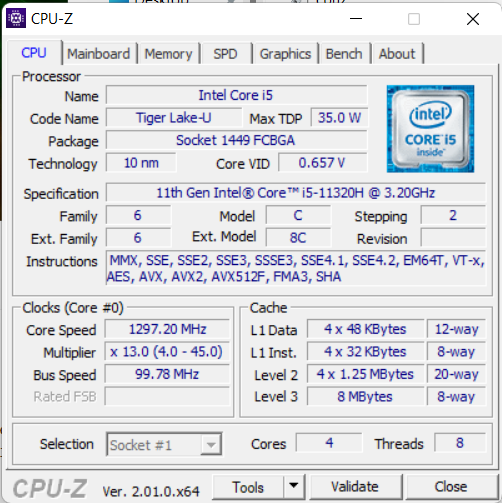
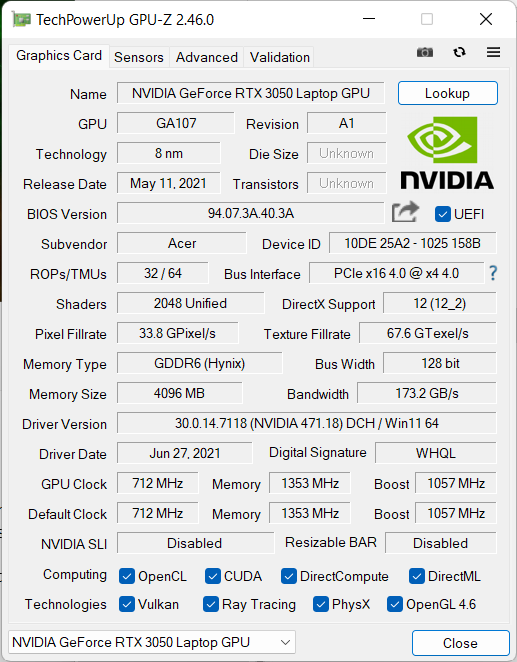
A Acer oferece exatamente duas opções de CPU para sua Swift X 16: Uma Intel Núcleo i5-11320H com 4,5 GHz Turbo (em nosso modelo) e um Núcleo i7-11390H com 5 GHz Turbo. Ambos são processadores quad-core.
O laptop geralmente vem com um Nvidia GeForce RTX 3050 e 16 GB de RAM LPDDR4X-4266 soldado. Quanto ao espaço de armazenamento, 512 GB de SSD (PCIe 3.0) é o padrão, embora um SDD de 1 TB seja oferecido em algumas configurações em outros países. Em geral, este nível de hardware é suficiente para fins multimídia, como edição de vídeo simples, edição de áudio ou jogos FHD, e para uso geral no escritório.
Condições de teste
Acer fornece três diferentes modos de potência que podem ser alternados através da combinação de teclas "Fn + F": "Silent", "Normal" e "Performance".
Estes influenciam diretamente o volume do ventilador e os limites de desempenho. Os ventiladores são assim significativamente mais silenciosos no modo Silencioso , e menos intrusivos no modo Normal (em relação ao modo Performance). O Turbo Boost não é afetado e o desempenho da CPU bruta é apenas ligeiramente reduzido no modo Silencioso - sob carga constante (6% de estrangulamento térmico). A GPU nunca é estrangulada, mas os 5 watts extras de "Dynamic Boost" só estão disponíveis no modo Performance .
A configuração mais silenciosa é obtida sob a opção Windows "Melhor economia de energia" + Modo silencioso da Acer. Nossos benchmarks foram conduzidos no modo Performance , enquanto os tempos de funcionamento da bateria (navegação na web e vídeo) foram determinados no modo Balanceado .
| TDP em Watt | TGP em Watt | kombiniert | |
|---|---|---|---|
| Modus Silent-Modus | 35 | 35 | 20+35 |
| Normal-Modus | 35 | 35 | 25+35 |
| Performance-Modus | 35 | 40 | 25+40 |
| Akkubetrieb | 25 | 30 | 15+30 |
| Win11: Beste Einsparung | 12,5 | 30 | 12,5+30 |
Processador
A Intel Núcleo i5-11320H é uma CPU quad-core com um TDP de 35 watts e um relógio de base de 3,2 GHz. Turbo é especificado como 4,5 GHz. A CPU é aproximadamente a mesma que a CPU Core i5-1155G7que pode ser configurado entre 15 e um máximo de 28 watts
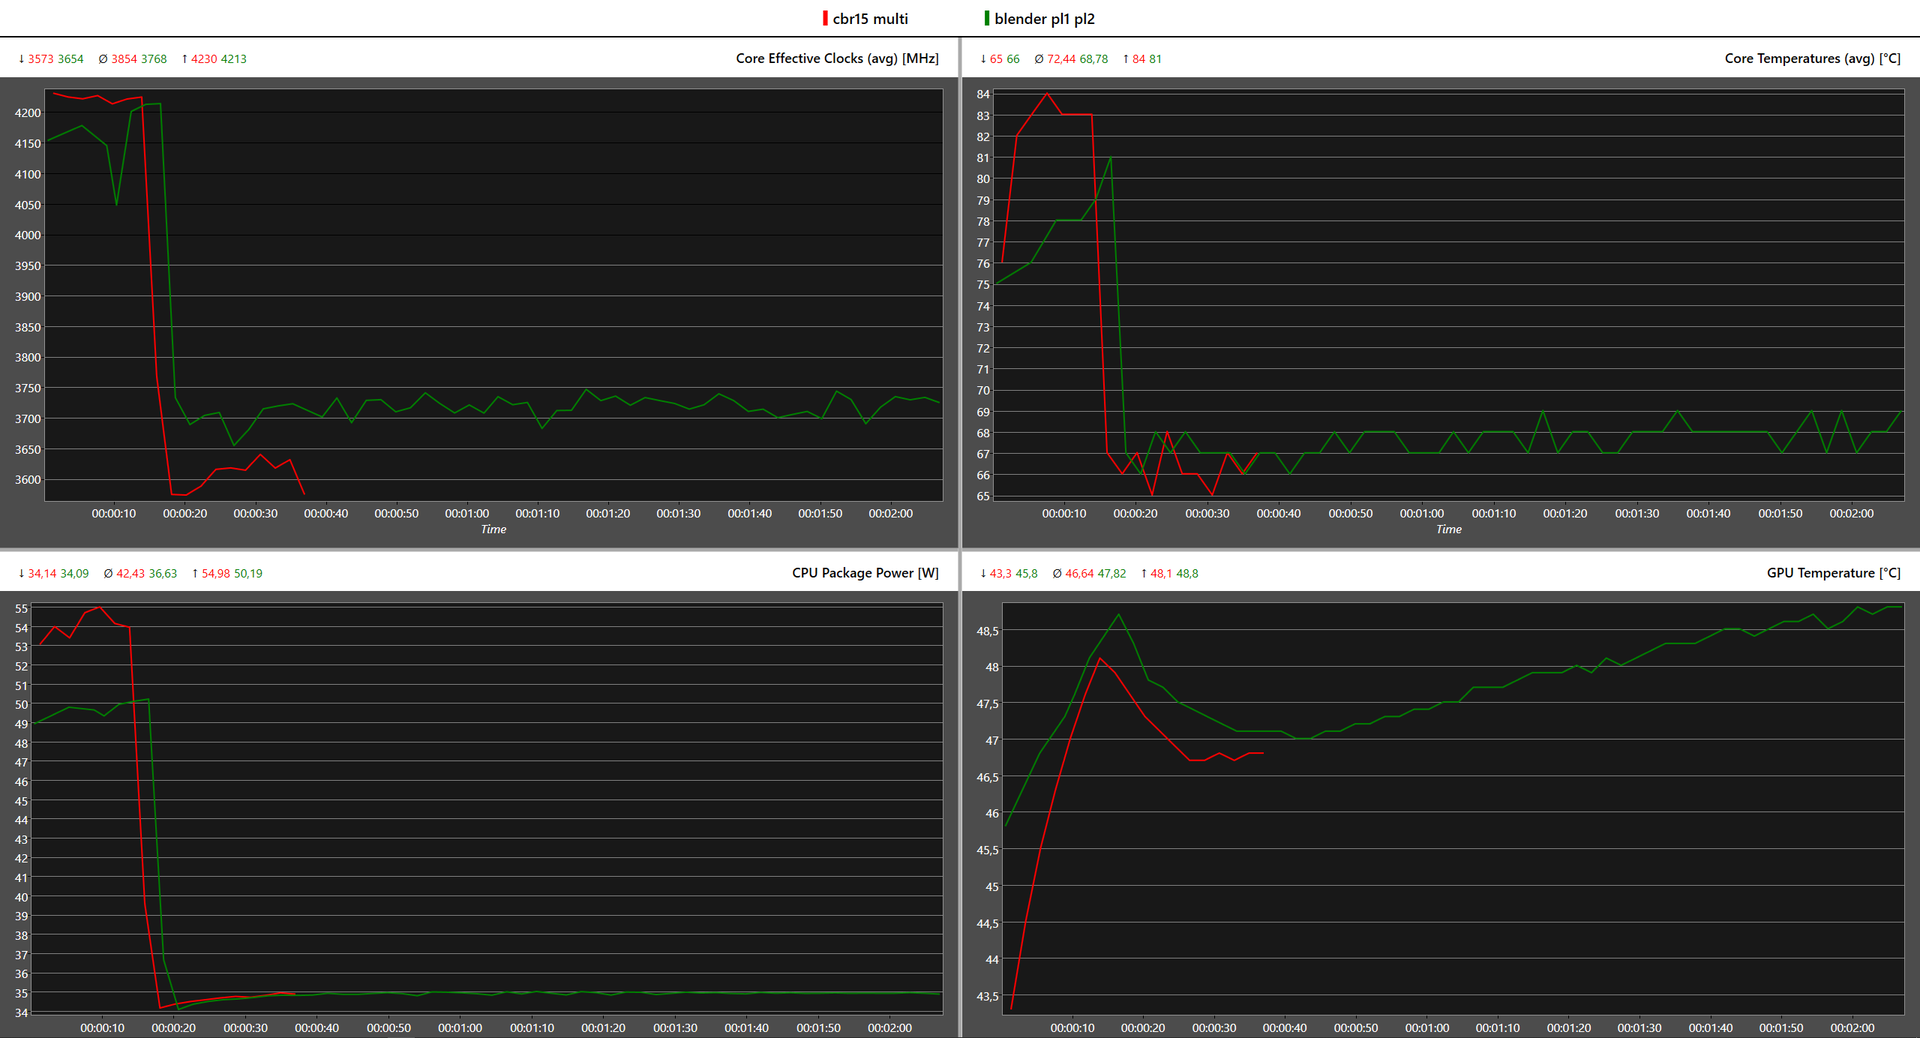
Sob Turbo, o processador Intel consome initualmente 55 watts a 4,15 GHz. O consumo de energia cai então permanentemente para os 35 watts especificados após menos de um minuto, de modo que o relógio base de 3,2 GHz entra em jogo
O Swift X traz a parte traseira no campo de comparação em termos de desempenho. No modo de bateria, a CPU ainda pode consumir 25 watts, mas o desempenho cai em ~25%.
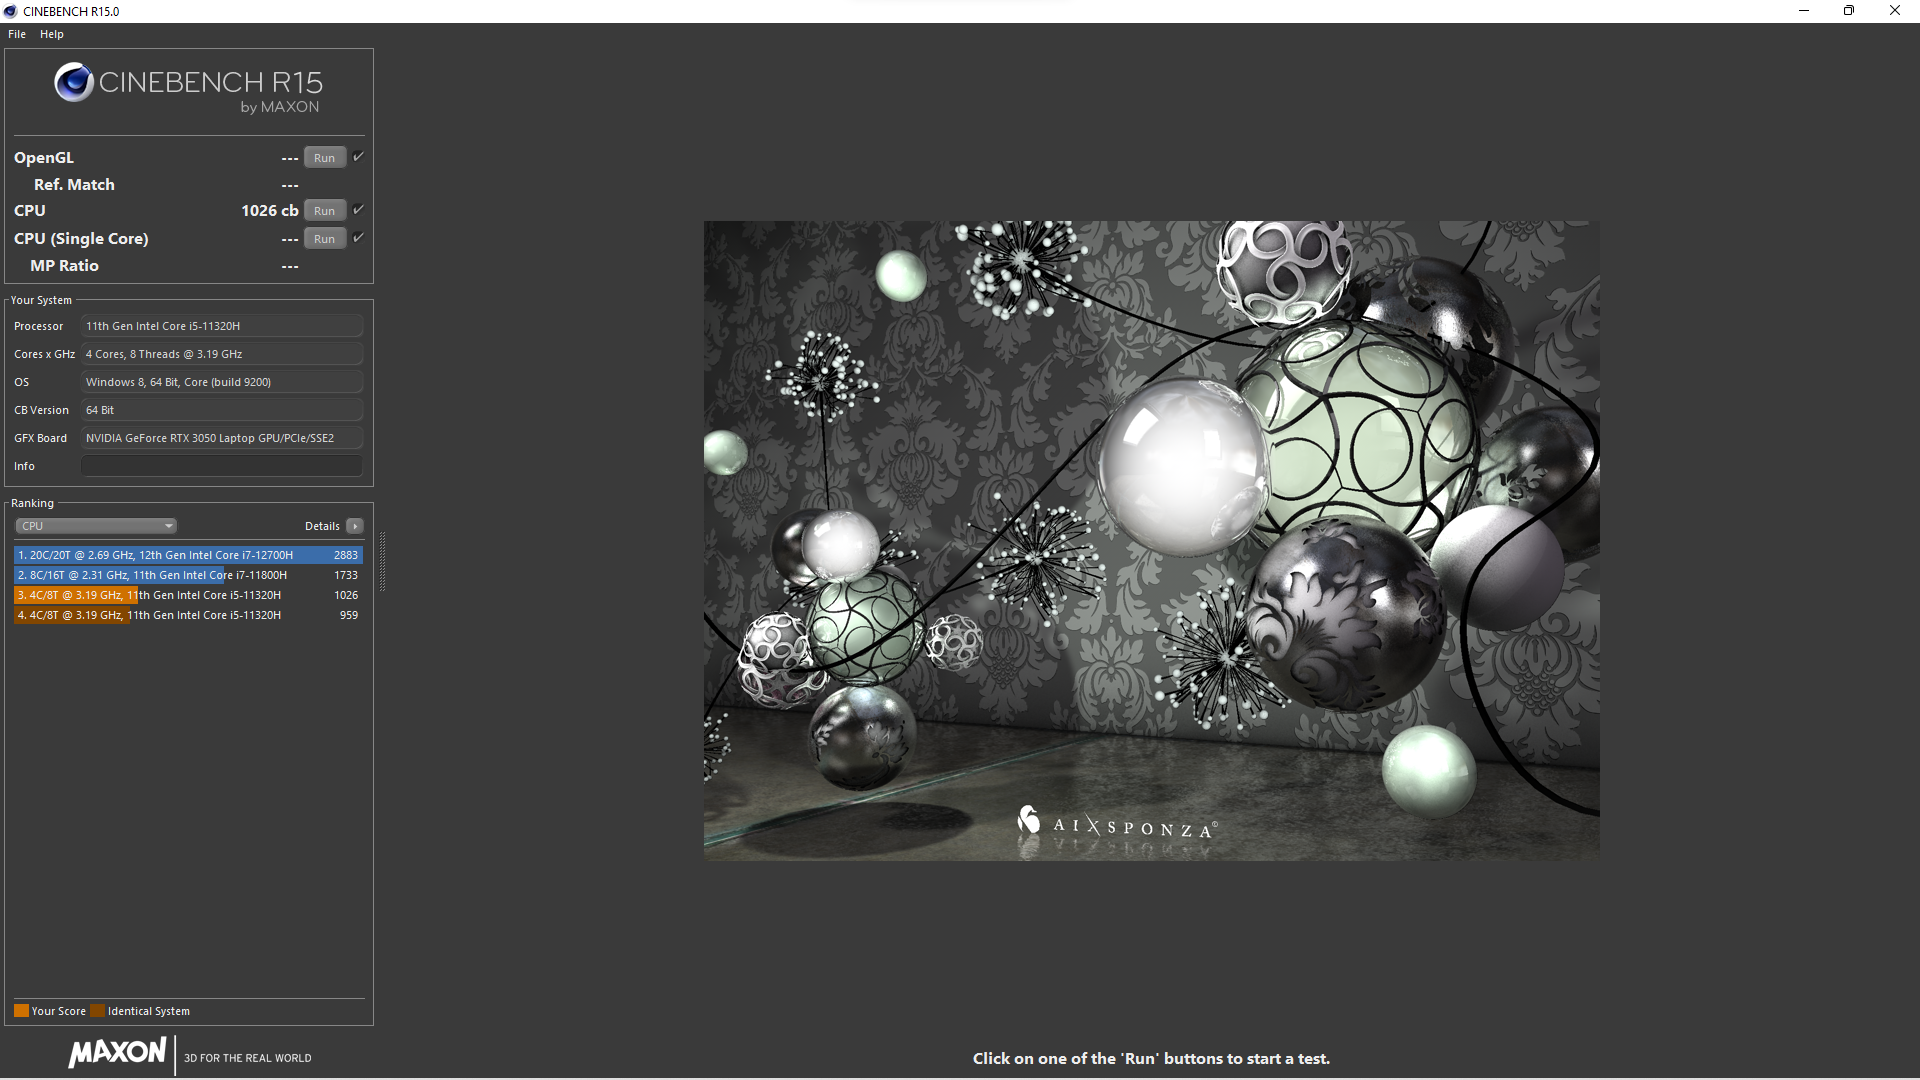

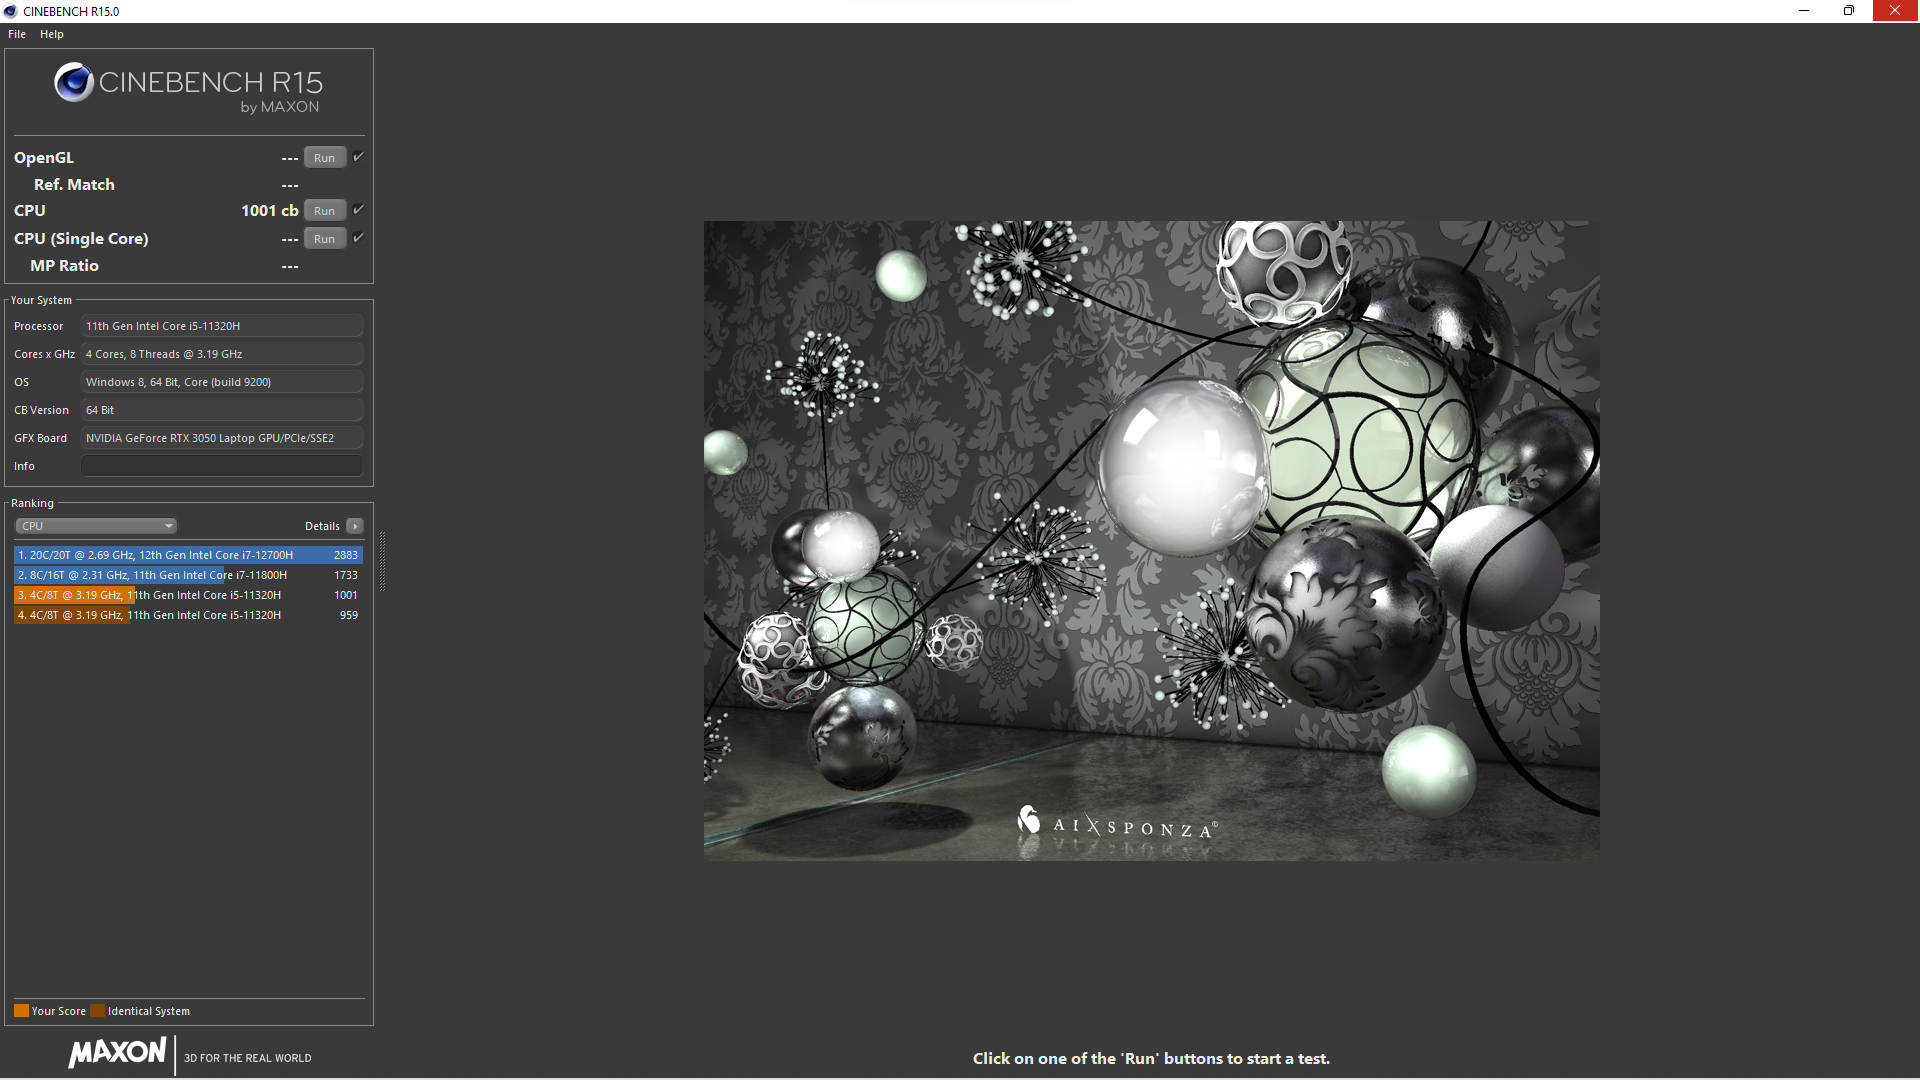
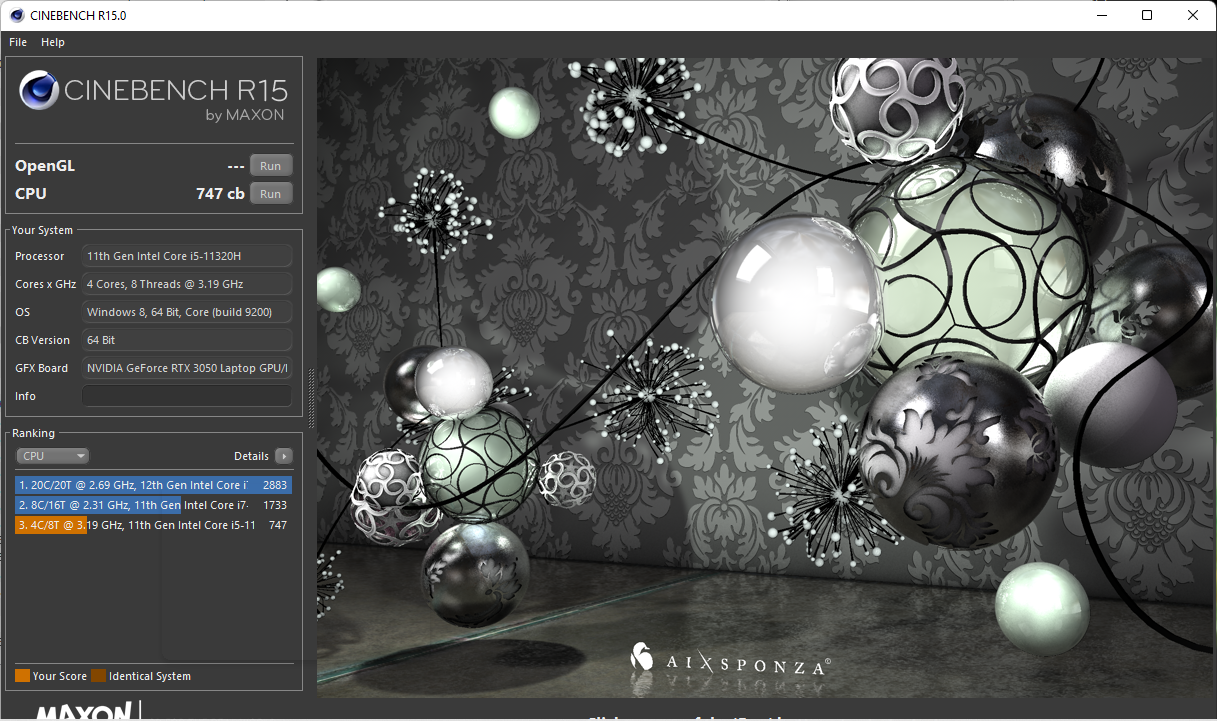
Cinebench R15 Multi Sustained Load
Cinebench R23: Multi Core | Single Core
Cinebench R20: CPU (Multi Core) | CPU (Single Core)
Cinebench R15: CPU Multi 64Bit | CPU Single 64Bit
Blender: v2.79 BMW27 CPU | v3.3 Classroom CPU | v3.3 Classroom CUDA
7-Zip 18.03: 7z b 4 | 7z b 4 -mmt1
Geekbench 5.5: Multi-Core | Single-Core | OpenCL Score
HWBOT x265 Benchmark v2.2: 4k Preset
LibreOffice : 20 Documents To PDF
R Benchmark 2.5: Overall mean
V-Ray 5 Benchmark: CPU | GPU CUDA
WebXPRT 3: Overall
WebXPRT 4: Overall
Mozilla Kraken 1.1: Total
Octane V2: Total Score
Jetstream 2: 2.0 Total
| CPU Performance rating | |
| Média da turma Multimedia | |
| Asus Vivobook Pro 16X-M7600QE -7! | |
| Lenovo IdeaPad 5 Pro 16ACH -7! | |
| Dell Inspiron 16 Plus 7610 -8! | |
| Acer Swift 3 SF316-51 -7! | |
| Acer Swift X SFX14-41G-R7F3 -7! | |
| Acer Swift X SFX16-51G-5388 | |
| Média Intel Core i5-11320H | |
| Cinebench R23 / Multi Core | |
| Média da turma Multimedia (4861 - 33362, n=65, últimos 2 anos) | |
| Asus Vivobook Pro 16X-M7600QE | |
| Asus Vivobook Pro 16X-M7600QE | |
| Lenovo IdeaPad 5 Pro 16ACH | |
| Dell Inspiron 16 Plus 7610 | |
| Acer Swift X SFX14-41G-R7F3 | |
| Acer Swift 3 SF316-51 | |
| Acer Swift X SFX16-51G-5388 | |
| Média Intel Core i5-11320H (5720 - 6051, n=4) | |
| Cinebench R23 / Single Core | |
| Média da turma Multimedia (1128 - 2459, n=64, últimos 2 anos) | |
| Acer Swift 3 SF316-51 | |
| Dell Inspiron 16 Plus 7610 | |
| Asus Vivobook Pro 16X-M7600QE | |
| Asus Vivobook Pro 16X-M7600QE | |
| Média Intel Core i5-11320H (1341 - 1467, n=4) | |
| Lenovo IdeaPad 5 Pro 16ACH | |
| Acer Swift X SFX16-51G-5388 | |
| Acer Swift X SFX14-41G-R7F3 | |
| Cinebench R20 / CPU (Multi Core) | |
| Média da turma Multimedia (1887 - 12912, n=56, últimos 2 anos) | |
| Asus Vivobook Pro 16X-M7600QE | |
| Asus Vivobook Pro 16X-M7600QE | |
| Lenovo IdeaPad 5 Pro 16ACH | |
| Dell Inspiron 16 Plus 7610 | |
| Acer Swift X SFX14-41G-R7F3 | |
| Acer Swift X SFX16-51G-5388 | |
| Acer Swift 3 SF316-51 | |
| Média Intel Core i5-11320H (2208 - 2349, n=4) | |
| Cinebench R20 / CPU (Single Core) | |
| Média da turma Multimedia (425 - 853, n=56, últimos 2 anos) | |
| Acer Swift 3 SF316-51 | |
| Dell Inspiron 16 Plus 7610 | |
| Asus Vivobook Pro 16X-M7600QE | |
| Asus Vivobook Pro 16X-M7600QE | |
| Média Intel Core i5-11320H (557 - 567, n=4) | |
| Acer Swift X SFX16-51G-5388 | |
| Lenovo IdeaPad 5 Pro 16ACH | |
| Acer Swift X SFX14-41G-R7F3 | |
| Cinebench R15 / CPU Multi 64Bit | |
| Média da turma Multimedia (856 - 5224, n=60, últimos 2 anos) | |
| Asus Vivobook Pro 16X-M7600QE | |
| Asus Vivobook Pro 16X-M7600QE | |
| Lenovo IdeaPad 5 Pro 16ACH | |
| Dell Inspiron 16 Plus 7610 | |
| Acer Swift X SFX14-41G-R7F3 | |
| Acer Swift X SFX16-51G-5388 | |
| Acer Swift 3 SF316-51 | |
| Média Intel Core i5-11320H (857 - 1019, n=4) | |
| Cinebench R15 / CPU Single 64Bit | |
| Média da turma Multimedia (184.8 - 326, n=58, últimos 2 anos) | |
| Asus Vivobook Pro 16X-M7600QE | |
| Asus Vivobook Pro 16X-M7600QE | |
| Acer Swift 3 SF316-51 | |
| Dell Inspiron 16 Plus 7610 | |
| Lenovo IdeaPad 5 Pro 16ACH | |
| Acer Swift X SFX16-51G-5388 | |
| Média Intel Core i5-11320H (212 - 215, n=4) | |
| Acer Swift X SFX14-41G-R7F3 | |
| Blender / v2.79 BMW27 CPU | |
| Média Intel Core i5-11320H (507 - 543, n=4) | |
| Acer Swift 3 SF316-51 | |
| Acer Swift X SFX16-51G-5388 | |
| Acer Swift X SFX14-41G-R7F3 | |
| Dell Inspiron 16 Plus 7610 | |
| Lenovo IdeaPad 5 Pro 16ACH | |
| Asus Vivobook Pro 16X-M7600QE | |
| Asus Vivobook Pro 16X-M7600QE | |
| Média da turma Multimedia (100 - 557, n=57, últimos 2 anos) | |
| Blender / v3.3 Classroom CPU | |
| Média Intel Core i5-11320H (937 - 1010, n=3) | |
| Acer Swift X SFX16-51G-5388 | |
| Média da turma Multimedia (134.5 - 1042, n=61, últimos 2 anos) | |
| Blender / v3.3 Classroom CUDA | |
| Acer Swift X SFX16-51G-5388 | |
| Média Intel Core i5-11320H (n=1) | |
| Média da turma Multimedia (20 - 186, n=21, últimos 2 anos) | |
| 7-Zip 18.03 / 7z b 4 | |
| Asus Vivobook Pro 16X-M7600QE | |
| Asus Vivobook Pro 16X-M7600QE | |
| Média da turma Multimedia (26062 - 130368, n=54, últimos 2 anos) | |
| Lenovo IdeaPad 5 Pro 16ACH | |
| Dell Inspiron 16 Plus 7610 | |
| Acer Swift X SFX14-41G-R7F3 | |
| Acer Swift 3 SF316-51 | |
| Média Intel Core i5-11320H (24718 - 26858, n=4) | |
| Acer Swift X SFX16-51G-5388 | |
| 7-Zip 18.03 / 7z b 4 -mmt1 | |
| Média da turma Multimedia (3666 - 7545, n=55, últimos 2 anos) | |
| Asus Vivobook Pro 16X-M7600QE | |
| Asus Vivobook Pro 16X-M7600QE | |
| Dell Inspiron 16 Plus 7610 | |
| Acer Swift 3 SF316-51 | |
| Lenovo IdeaPad 5 Pro 16ACH | |
| Média Intel Core i5-11320H (4813 - 5119, n=4) | |
| Acer Swift X SFX16-51G-5388 | |
| Acer Swift X SFX14-41G-R7F3 | |
| Geekbench 5.5 / Multi-Core | |
| Média da turma Multimedia (4652 - 20422, n=55, últimos 2 anos) | |
| Asus Vivobook Pro 16X-M7600QE | |
| Asus Vivobook Pro 16X-M7600QE | |
| Lenovo IdeaPad 5 Pro 16ACH | |
| Acer Swift 3 SF316-51 | |
| Acer Swift X SFX16-51G-5388 | |
| Acer Swift X SFX14-41G-R7F3 | |
| Média Intel Core i5-11320H (4927 - 5955, n=4) | |
| Geekbench 5.5 / Single-Core | |
| Média da turma Multimedia (805 - 2974, n=55, últimos 2 anos) | |
| Acer Swift 3 SF316-51 | |
| Asus Vivobook Pro 16X-M7600QE | |
| Asus Vivobook Pro 16X-M7600QE | |
| Média Intel Core i5-11320H (1453 - 1523, n=4) | |
| Acer Swift X SFX16-51G-5388 | |
| Lenovo IdeaPad 5 Pro 16ACH | |
| Acer Swift X SFX14-41G-R7F3 | |
| Geekbench 5.5 / OpenCL Score | |
| Média da turma Multimedia (11562 - 217159, n=55, últimos 2 anos) | |
| Asus Vivobook Pro 16X-M7600QE | |
| Asus Vivobook Pro 16X-M7600QE | |
| Acer Swift X SFX16-51G-5388 | |
| Lenovo IdeaPad 5 Pro 16ACH | |
| Acer Swift X SFX14-41G-R7F3 | |
| Média Intel Core i5-11320H (17641 - 50997, n=4) | |
| Acer Swift 3 SF316-51 | |
| HWBOT x265 Benchmark v2.2 / 4k Preset | |
| Média da turma Multimedia (5.26 - 36.1, n=55, últimos 2 anos) | |
| Asus Vivobook Pro 16X-M7600QE | |
| Asus Vivobook Pro 16X-M7600QE | |
| Lenovo IdeaPad 5 Pro 16ACH | |
| Dell Inspiron 16 Plus 7610 | |
| Acer Swift X SFX14-41G-R7F3 | |
| Acer Swift X SFX16-51G-5388 | |
| Acer Swift 3 SF316-51 | |
| Média Intel Core i5-11320H (7.25 - 7.91, n=4) | |
| LibreOffice / 20 Documents To PDF | |
| Asus Vivobook Pro 16X-M7600QE | |
| Asus Vivobook Pro 16X-M7600QE | |
| Acer Swift X SFX16-51G-5388 | |
| Média da turma Multimedia (23.9 - 146.7, n=56, últimos 2 anos) | |
| Média Intel Core i5-11320H (44 - 50, n=4) | |
| Lenovo IdeaPad 5 Pro 16ACH | |
| Dell Inspiron 16 Plus 7610 | |
| Acer Swift 3 SF316-51 | |
| R Benchmark 2.5 / Overall mean | |
| Acer Swift X SFX14-41G-R7F3 | |
| Média Intel Core i5-11320H (0.581 - 0.622, n=4) | |
| Acer Swift X SFX16-51G-5388 | |
| Dell Inspiron 16 Plus 7610 | |
| Acer Swift 3 SF316-51 | |
| Lenovo IdeaPad 5 Pro 16ACH | |
| Asus Vivobook Pro 16X-M7600QE | |
| Asus Vivobook Pro 16X-M7600QE | |
| Média da turma Multimedia (0.3604 - 0.947, n=55, últimos 2 anos) | |
| V-Ray 5 Benchmark / CPU | |
| Média da turma Multimedia (3126 - 14552, n=24, últimos 2 anos) | |
| Dell Inspiron 16 Plus 7610 | |
| Acer Swift X SFX16-51G-5388 | |
| Média Intel Core i5-11320H (3985 - 4415, n=4) | |
| V-Ray 5 Benchmark / GPU CUDA | |
| Média da turma Multimedia (335 - 1482, n=5, últimos 2 anos) | |
| Acer Swift X SFX16-51G-5388 | |
| Média Intel Core i5-11320H (99 - 374, n=2) | |
| WebXPRT 3 / Overall | |
| Média da turma Multimedia (136.4 - 596, n=62, últimos 2 anos) | |
| Asus Vivobook Pro 16X-M7600QE | |
| Lenovo IdeaPad 5 Pro 16ACH | |
| Acer Swift 3 SF316-51 | |
| Média Intel Core i5-11320H (243 - 269, n=4) | |
| Dell Inspiron 16 Plus 7610 | |
| Acer Swift X SFX16-51G-5388 | |
| Acer Swift X SFX14-41G-R7F3 | |
| WebXPRT 4 / Overall | |
| Média da turma Multimedia (167.3 - 402, n=64, últimos 2 anos) | |
| Média Intel Core i5-11320H (202 - 206, n=3) | |
| Acer Swift X SFX16-51G-5388 | |
| Mozilla Kraken 1.1 / Total | |
| Acer Swift X SFX14-41G-R7F3 | |
| Acer Swift X SFX16-51G-5388 | |
| Média Intel Core i5-11320H (662 - 680, n=4) | |
| Lenovo IdeaPad 5 Pro 16ACH | |
| Dell Inspiron 16 Plus 7610 | |
| Acer Swift 3 SF316-51 | |
| Asus Vivobook Pro 16X-M7600QE | |
| Asus Vivobook Pro 16X-M7600QE | |
| Média da turma Multimedia (228 - 835, n=65, últimos 2 anos) | |
| Octane V2 / Total Score | |
| Média da turma Multimedia (79641 - 153175, n=29, últimos 2 anos) | |
| Acer Swift X SFX16-51G-5388 | |
| Média Intel Core i5-11320H (n=1) | |
| Acer Swift X SFX14-41G-R7F3 | |
| Jetstream 2 / 2.0 Total | |
| Média da turma Multimedia (287 - 481, n=30, últimos 2 anos) | |
| Acer Swift X SFX16-51G-5388 | |
| Média Intel Core i5-11320H (174.3 - 208, n=3) | |
| Dell Inspiron 16 Plus 7610 | |
* ... menor é melhor
AIDA64: FP32 Ray-Trace | FPU Julia | CPU SHA3 | CPU Queen | FPU SinJulia | FPU Mandel | CPU AES | CPU ZLib | FP64 Ray-Trace | CPU PhotoWorxx
| Performance rating | |
| Média da turma Multimedia | |
| Asus Vivobook Pro 16X-M7600QE | |
| Lenovo IdeaPad 5 Pro 16ACH | |
| Acer Swift X SFX14-41G-R7F3 | |
| Média Intel Core i5-11320H | |
| Acer Swift X SFX16-51G-5388 | |
| Dell Inspiron 16 Plus 7610 -9! | |
| AIDA64 / FP32 Ray-Trace | |
| Média da turma Multimedia (2214 - 50388, n=53, últimos 2 anos) | |
| Asus Vivobook Pro 16X-M7600QE | |
| Asus Vivobook Pro 16X-M7600QE | |
| Lenovo IdeaPad 5 Pro 16ACH | |
| Acer Swift X SFX14-41G-R7F3 | |
| Média Intel Core i5-11320H (6369 - 7489, n=4) | |
| Acer Swift X SFX16-51G-5388 | |
| AIDA64 / FPU Julia | |
| Asus Vivobook Pro 16X-M7600QE | |
| Asus Vivobook Pro 16X-M7600QE | |
| Lenovo IdeaPad 5 Pro 16ACH | |
| Média da turma Multimedia (12867 - 201874, n=53, últimos 2 anos) | |
| Acer Swift X SFX14-41G-R7F3 | |
| Média Intel Core i5-11320H (27391 - 31637, n=4) | |
| Acer Swift X SFX16-51G-5388 | |
| AIDA64 / CPU SHA3 | |
| Média da turma Multimedia (626 - 8623, n=53, últimos 2 anos) | |
| Asus Vivobook Pro 16X-M7600QE | |
| Asus Vivobook Pro 16X-M7600QE | |
| Lenovo IdeaPad 5 Pro 16ACH | |
| Média Intel Core i5-11320H (1847 - 2099, n=4) | |
| Acer Swift X SFX16-51G-5388 | |
| Acer Swift X SFX14-41G-R7F3 | |
| AIDA64 / CPU Queen | |
| Asus Vivobook Pro 16X-M7600QE | |
| Asus Vivobook Pro 16X-M7600QE | |
| Lenovo IdeaPad 5 Pro 16ACH | |
| Média da turma Multimedia (13483 - 181505, n=40, últimos 2 anos) | |
| Acer Swift X SFX14-41G-R7F3 | |
| Média Intel Core i5-11320H (43565 - 52477, n=4) | |
| Acer Swift X SFX16-51G-5388 | |
| AIDA64 / FPU SinJulia | |
| Asus Vivobook Pro 16X-M7600QE | |
| Asus Vivobook Pro 16X-M7600QE | |
| Lenovo IdeaPad 5 Pro 16ACH | |
| Acer Swift X SFX14-41G-R7F3 | |
| Média da turma Multimedia (886 - 28794, n=53, últimos 2 anos) | |
| Média Intel Core i5-11320H (4381 - 5011, n=4) | |
| Acer Swift X SFX16-51G-5388 | |
| AIDA64 / FPU Mandel | |
| Asus Vivobook Pro 16X-M7600QE | |
| Asus Vivobook Pro 16X-M7600QE | |
| Lenovo IdeaPad 5 Pro 16ACH | |
| Média da turma Multimedia (6395 - 105740, n=53, últimos 2 anos) | |
| Acer Swift X SFX14-41G-R7F3 | |
| Média Intel Core i5-11320H (16659 - 18770, n=4) | |
| Acer Swift X SFX16-51G-5388 | |
| AIDA64 / CPU AES | |
| Asus Vivobook Pro 16X-M7600QE | |
| Asus Vivobook Pro 16X-M7600QE | |
| Lenovo IdeaPad 5 Pro 16ACH | |
| Média Intel Core i5-11320H (59851 - 76500, n=4) | |
| Média da turma Multimedia (8171 - 126790, n=53, últimos 2 anos) | |
| Acer Swift X SFX16-51G-5388 | |
| Acer Swift X SFX14-41G-R7F3 | |
| AIDA64 / CPU ZLib | |
| Média da turma Multimedia (143.8 - 2022, n=53, últimos 2 anos) | |
| Asus Vivobook Pro 16X-M7600QE | |
| Asus Vivobook Pro 16X-M7600QE | |
| Lenovo IdeaPad 5 Pro 16ACH | |
| Acer Swift X SFX14-41G-R7F3 | |
| Média Intel Core i5-11320H (330 - 410, n=4) | |
| Acer Swift X SFX16-51G-5388 | |
| Dell Inspiron 16 Plus 7610 | |
| AIDA64 / FP64 Ray-Trace | |
| Média da turma Multimedia (1014 - 26875, n=53, últimos 2 anos) | |
| Asus Vivobook Pro 16X-M7600QE | |
| Asus Vivobook Pro 16X-M7600QE | |
| Lenovo IdeaPad 5 Pro 16ACH | |
| Acer Swift X SFX14-41G-R7F3 | |
| Média Intel Core i5-11320H (3536 - 4021, n=4) | |
| Acer Swift X SFX16-51G-5388 | |
| AIDA64 / CPU PhotoWorxx | |
| Média da turma Multimedia (8187 - 88154, n=53, últimos 2 anos) | |
| Acer Swift X SFX16-51G-5388 | |
| Média Intel Core i5-11320H (25964 - 36644, n=4) | |
| Asus Vivobook Pro 16X-M7600QE | |
| Asus Vivobook Pro 16X-M7600QE | |
| Acer Swift X SFX14-41G-R7F3 | |
| Lenovo IdeaPad 5 Pro 16ACH | |
Desempenho do sistema
O sistema funciona muito rapidamente e sem atrasos, mesmo trabalhando com várias abas e reproduzindo um vídeo de 4K YouTube em segundo plano.
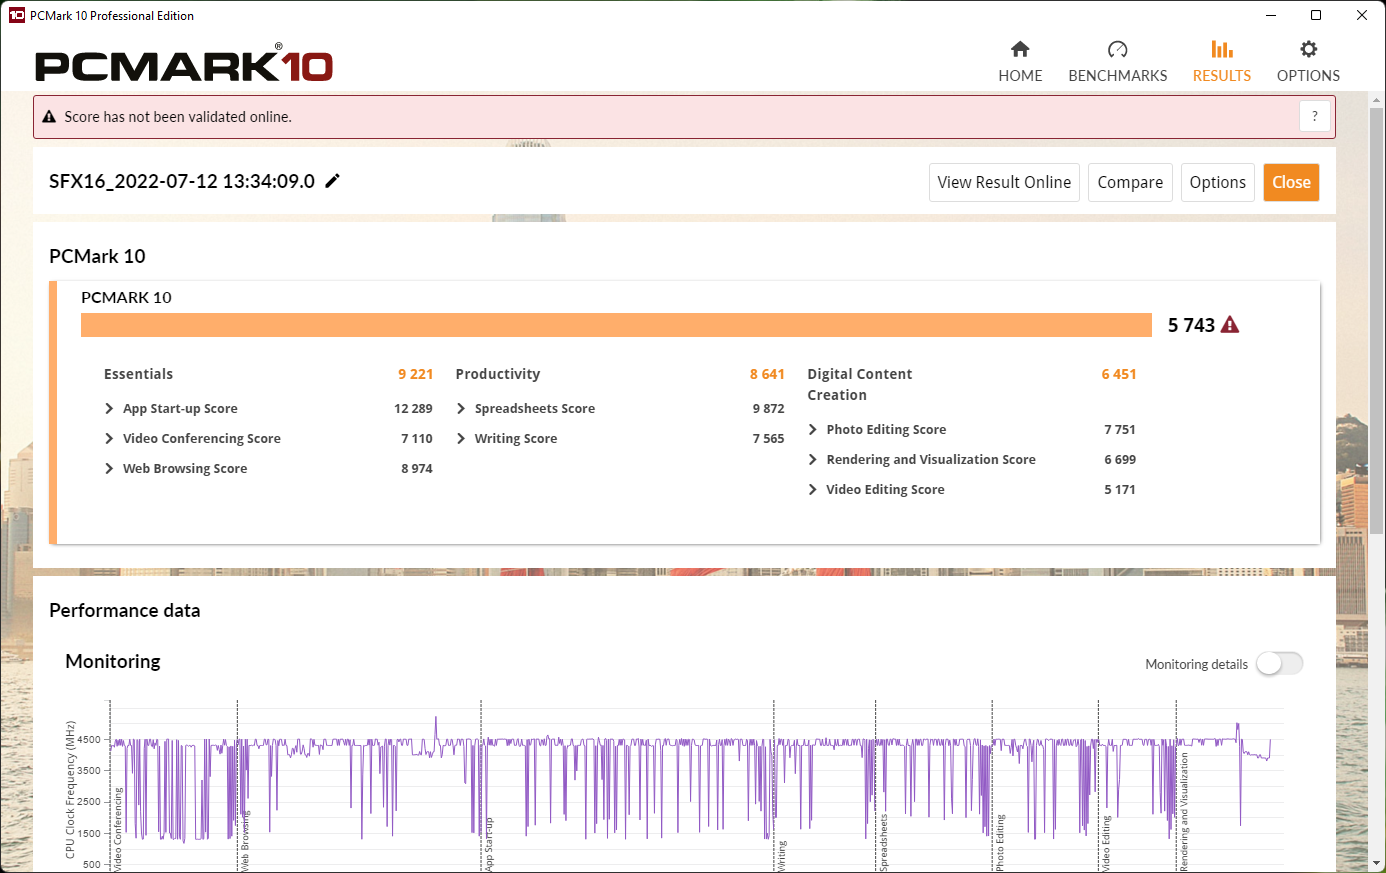
As notas do PCMark 10 estão relativamente próximas umas das outras em nosso campo de comparação. O Acer Swift X se destaca mais em termos de pontuação AIDA64/memória, provavelmente devido a sua rápida LPDDR4X RAM.
CrossMark: Overall | Productivity | Creativity | Responsiveness
| PCMark 10 / Score | |
| Média da turma Multimedia (4325 - 10386, n=51, últimos 2 anos) | |
| Asus Vivobook Pro 16X-M7600QE | |
| Dell Inspiron 16 Plus 7610 | |
| Lenovo IdeaPad 5 Pro 16ACH | |
| Acer Swift X SFX16-51G-5388 | |
| Média Intel Core i5-11320H, NVIDIA GeForce RTX 3050 4GB Laptop GPU (n=1) | |
| Acer Swift 3 SF316-51 | |
| Acer Swift X SFX14-41G-R7F3 | |
| PCMark 10 / Essentials | |
| Média da turma Multimedia (8025 - 11664, n=50, últimos 2 anos) | |
| Asus Vivobook Pro 16X-M7600QE | |
| Acer Swift 3 SF316-51 | |
| Lenovo IdeaPad 5 Pro 16ACH | |
| Dell Inspiron 16 Plus 7610 | |
| Acer Swift X SFX16-51G-5388 | |
| Média Intel Core i5-11320H, NVIDIA GeForce RTX 3050 4GB Laptop GPU (n=1) | |
| Acer Swift X SFX14-41G-R7F3 | |
| PCMark 10 / Productivity | |
| Média da turma Multimedia (7323 - 18233, n=50, últimos 2 anos) | |
| Asus Vivobook Pro 16X-M7600QE | |
| Acer Swift X SFX16-51G-5388 | |
| Média Intel Core i5-11320H, NVIDIA GeForce RTX 3050 4GB Laptop GPU (n=1) | |
| Dell Inspiron 16 Plus 7610 | |
| Lenovo IdeaPad 5 Pro 16ACH | |
| Acer Swift 3 SF316-51 | |
| Acer Swift X SFX14-41G-R7F3 | |
| PCMark 10 / Digital Content Creation | |
| Média da turma Multimedia (3651 - 16240, n=50, últimos 2 anos) | |
| Dell Inspiron 16 Plus 7610 | |
| Asus Vivobook Pro 16X-M7600QE | |
| Lenovo IdeaPad 5 Pro 16ACH | |
| Acer Swift X SFX16-51G-5388 | |
| Média Intel Core i5-11320H, NVIDIA GeForce RTX 3050 4GB Laptop GPU (n=1) | |
| Acer Swift 3 SF316-51 | |
| Acer Swift X SFX14-41G-R7F3 | |
| CrossMark / Overall | |
| Média da turma Multimedia (866 - 2728, n=59, últimos 2 anos) | |
| Acer Swift X SFX16-51G-5388 | |
| Média Intel Core i5-11320H, NVIDIA GeForce RTX 3050 4GB Laptop GPU (n=1) | |
| Acer Swift X SFX14-41G-R7F3 | |
| CrossMark / Productivity | |
| Média da turma Multimedia (931 - 2489, n=59, últimos 2 anos) | |
| Acer Swift X SFX16-51G-5388 | |
| Média Intel Core i5-11320H, NVIDIA GeForce RTX 3050 4GB Laptop GPU (n=1) | |
| Acer Swift X SFX14-41G-R7F3 | |
| CrossMark / Creativity | |
| Média da turma Multimedia (907 - 3465, n=59, últimos 2 anos) | |
| Acer Swift X SFX16-51G-5388 | |
| Média Intel Core i5-11320H, NVIDIA GeForce RTX 3050 4GB Laptop GPU (n=1) | |
| Acer Swift X SFX14-41G-R7F3 | |
| CrossMark / Responsiveness | |
| Média da turma Multimedia (605 - 2024, n=59, últimos 2 anos) | |
| Acer Swift X SFX16-51G-5388 | |
| Média Intel Core i5-11320H, NVIDIA GeForce RTX 3050 4GB Laptop GPU (n=1) | |
| Acer Swift X SFX14-41G-R7F3 | |
| PCMark 10 Score | 5743 pontos | |
Ajuda | ||
| AIDA64 / Memory Copy | |
| Média da turma Multimedia (11299 - 132135, n=53, últimos 2 anos) | |
| Acer Swift X SFX16-51G-5388 | |
| Média Intel Core i5-11320H (41106 - 55961, n=4) | |
| Lenovo IdeaPad 5 Pro 16ACH | |
| Huawei MateBook 16 R7 5800H | |
| Acer Swift X SFX14-41G-R7F3 | |
| AIDA64 / Memory Read | |
| Média da turma Multimedia (11624 - 174586, n=53, últimos 2 anos) | |
| Acer Swift X SFX16-51G-5388 | |
| Média Intel Core i5-11320H (46516 - 52799, n=4) | |
| Acer Swift X SFX14-41G-R7F3 | |
| Lenovo IdeaPad 5 Pro 16ACH | |
| Huawei MateBook 16 R7 5800H | |
| AIDA64 / Memory Write | |
| Média da turma Multimedia (11755 - 134998, n=53, últimos 2 anos) | |
| Acer Swift X SFX16-51G-5388 | |
| Média Intel Core i5-11320H (46760 - 63323, n=4) | |
| Acer Swift X SFX14-41G-R7F3 | |
| Huawei MateBook 16 R7 5800H | |
| Lenovo IdeaPad 5 Pro 16ACH | |
| AIDA64 / Memory Latency | |
| Média da turma Multimedia (7 - 535, n=52, últimos 2 anos) | |
| Acer Swift X SFX14-41G-R7F3 | |
| Acer Swift X SFX16-51G-5388 | |
| Média Intel Core i5-11320H (77.6 - 114.1, n=4) | |
| Huawei MateBook 16 R7 5800H | |
| Lenovo IdeaPad 5 Pro 16ACH | |
| Dell Inspiron 16 Plus 7610 | |
* ... menor é melhor
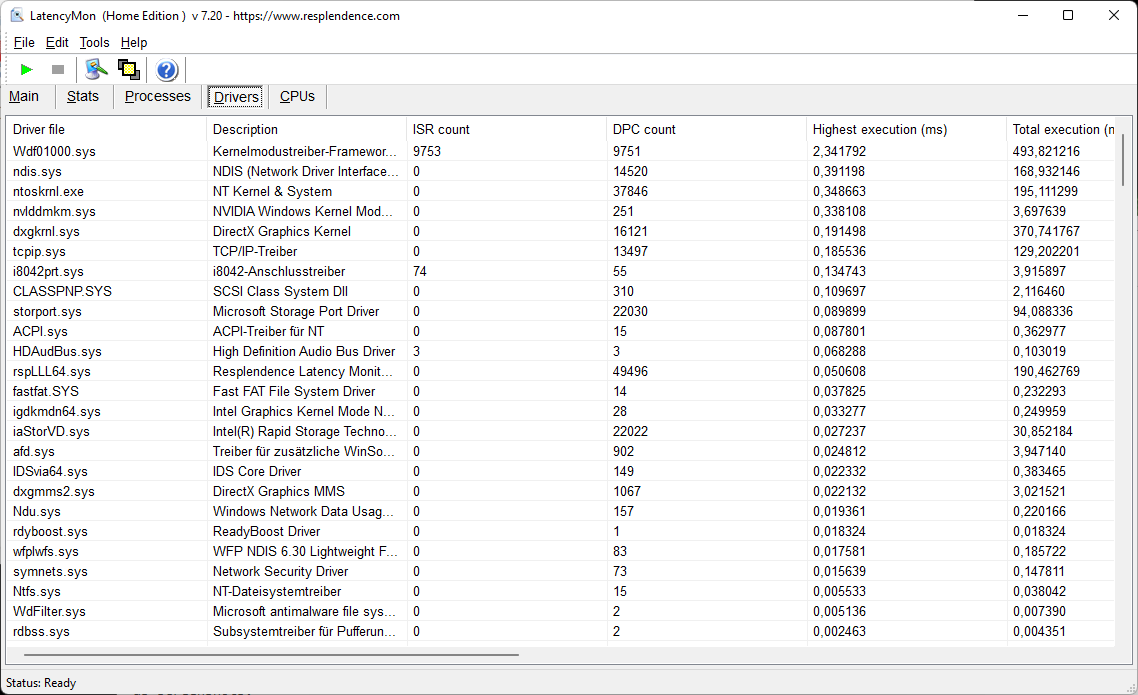
Latência do DPC
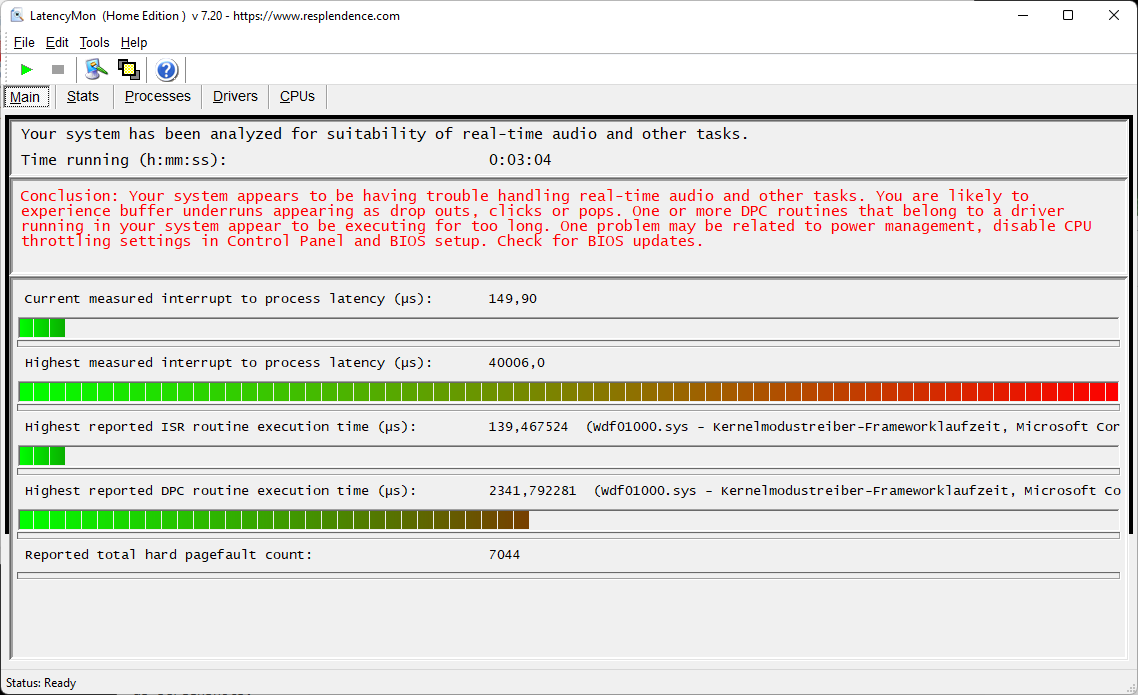
As latências do DPC são surpreendentemente altas, razão pela qual repetimos o teste várias vezes, mas com resultados muito semelhantes: 0.04 segundos de atraso é muito lento, de modo que as aplicações em tempo real (áudio/vídeo) não são recomendadas. A Acer deve melhorar isto urgentemente com uma atualização da BIOS.
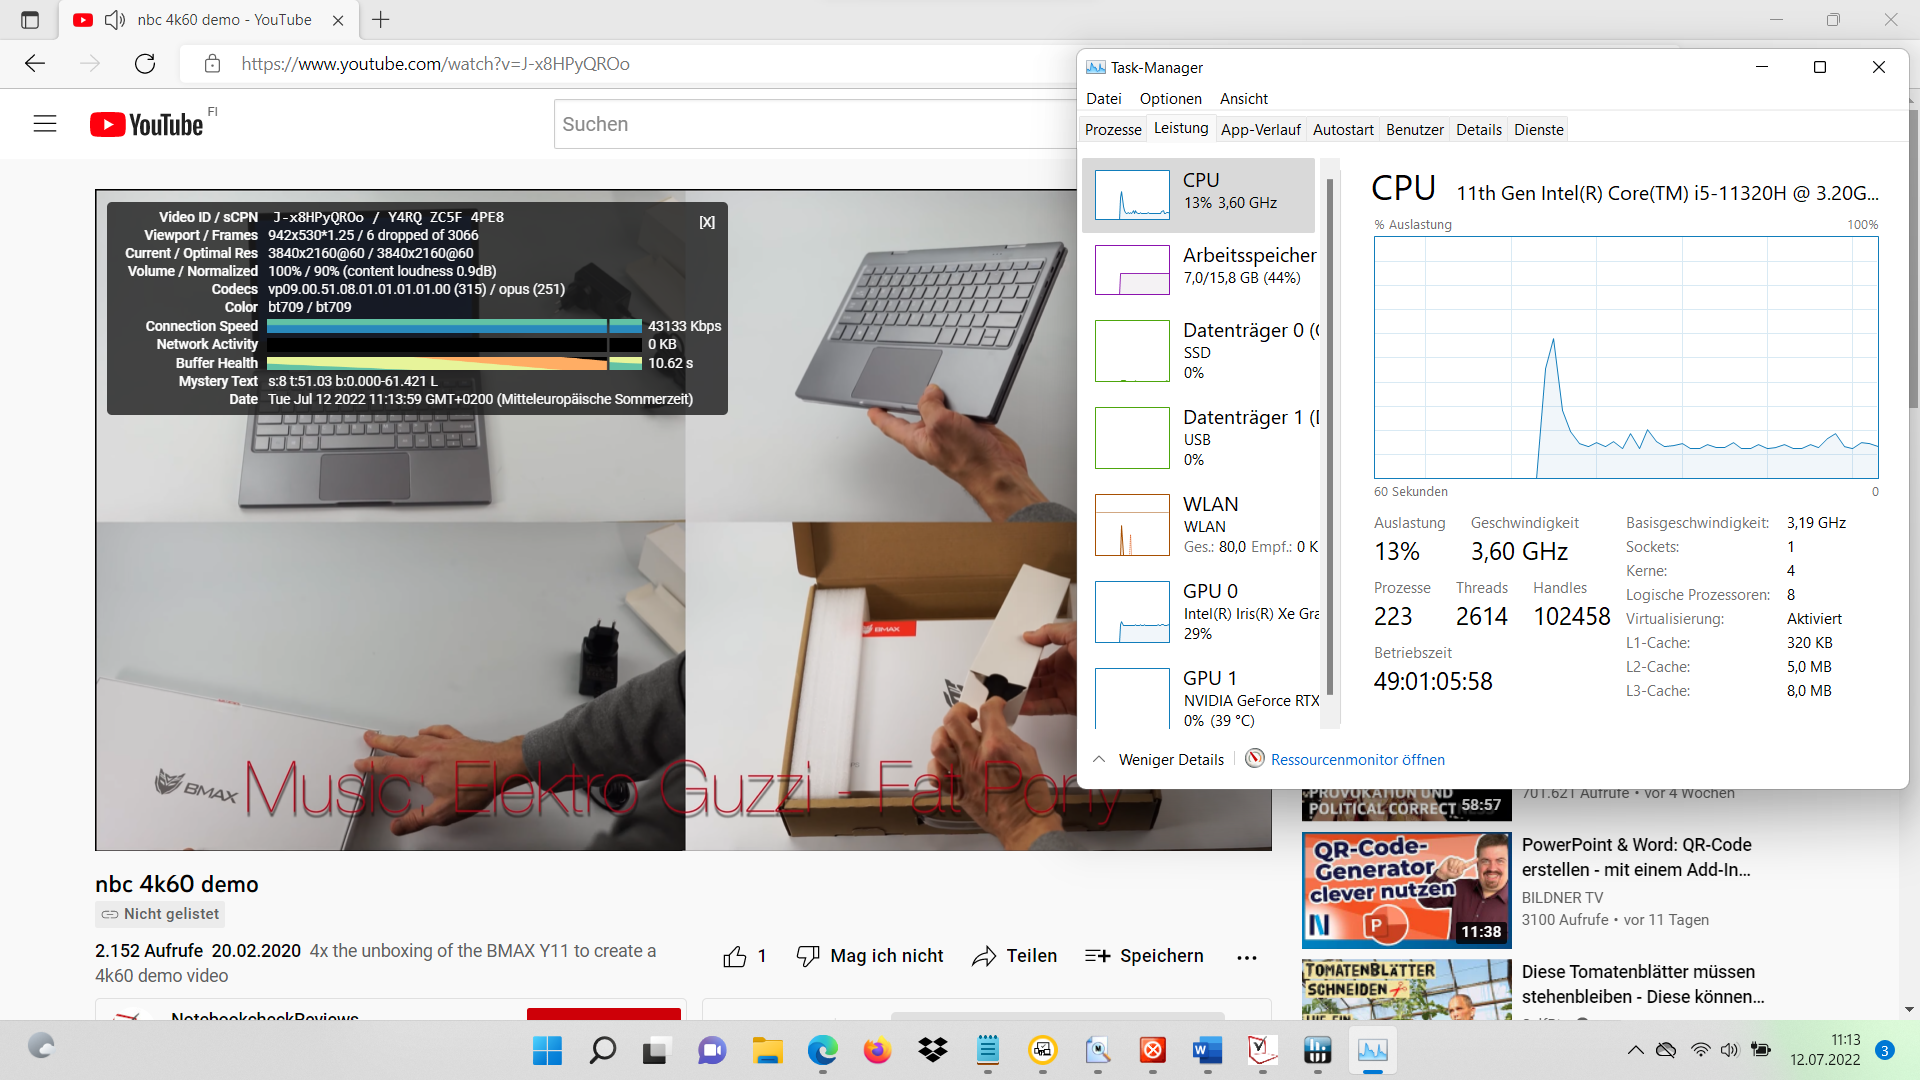
Como acontece com freqüência, a causa é o driver do módulo central. a reprodução do 4K YouTube causa uma carga de CPU de 13% e quase 30% para a GPU Intel.
| DPC Latencies / LatencyMon - interrupt to process latency (max), Web, Youtube, Prime95 | |
| Acer Swift X SFX16-51G-5388 | |
| Asus Vivobook Pro 16X-M7600QE | |
| Dell Inspiron 16 Plus 7610 | |
| Acer Swift X SFX14-41G-R7F3 | |
| Lenovo IdeaPad 5 Pro 16ACH | |
| Huawei MateBook 16 R7 5800H | |
| Acer Swift 3 SF316-51 | |
* ... menor é melhor
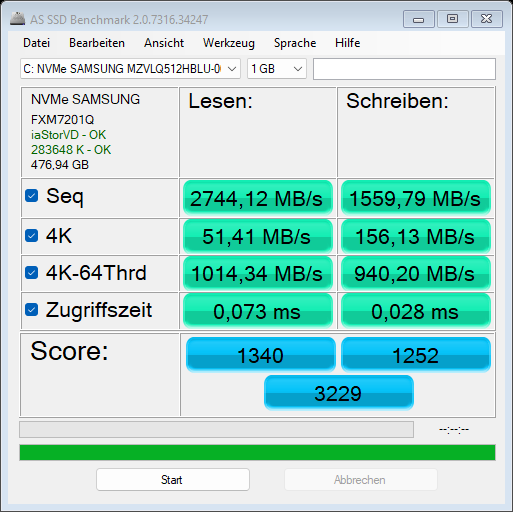
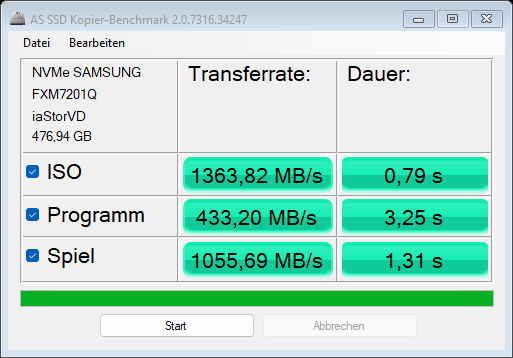
Dispositivos de armazenamento
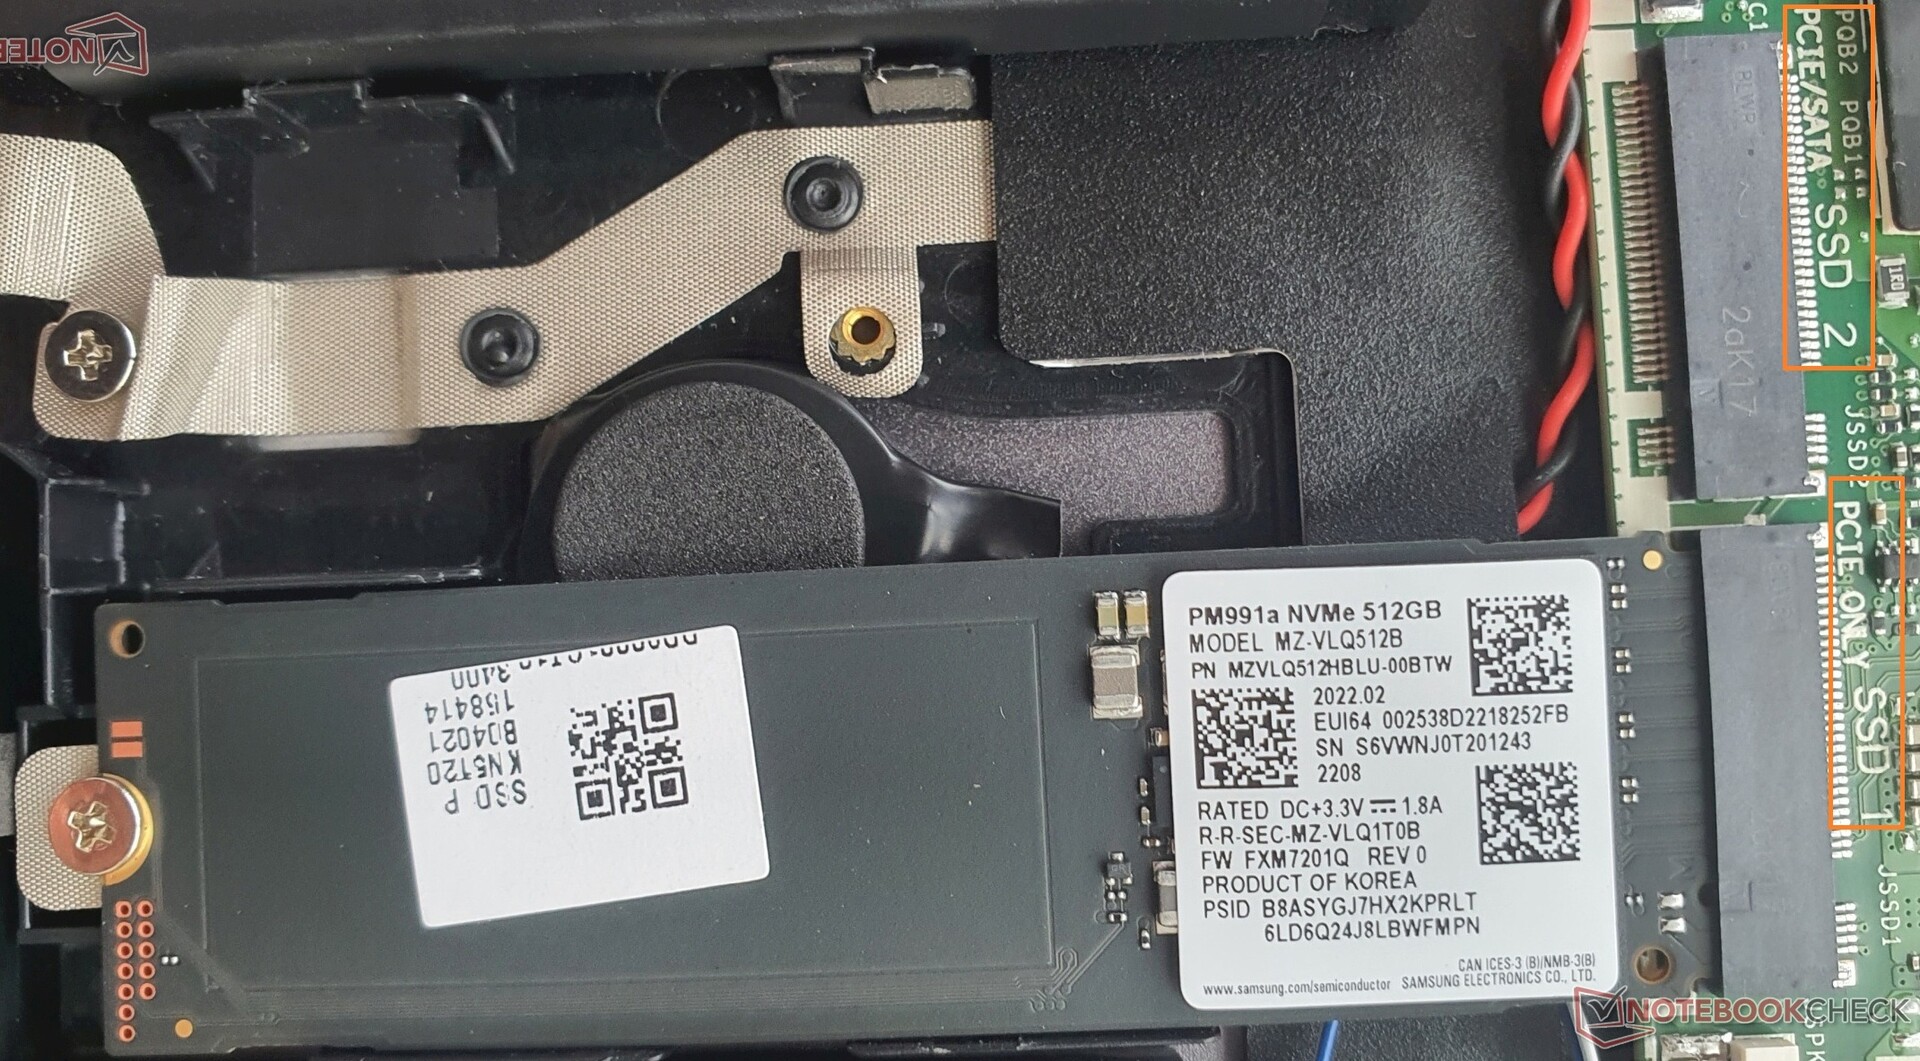
O SSD Samsung PM991 PCIe 3.0 SSD da Samsung mostra velocidades médias. Após alguns minutos, no entanto, ele cai ~40%, aparentemente devido ao superaquecimento. O Samsung PM991 também mostra este comportamento em alguns de nossos outros testes de portáteis e, portanto, não é específico para o Acer Swift X 16.
Em contraste com o Swift 3há um segundo slot M.2 para outro SSD.
| Acer Swift X SFX16-51G-5388 GeForce RTX 3050 4GB Laptop GPU, i5-11320H, Samsung PM991 MZVLQ512HBLU | Acer Swift 3 SF316-51 Iris Xe G7 96EUs, i7-11370H, Micron 2210 MTFDHBA512QFD | Acer Swift X SFX14-41G-R7F3 GeForce GTX 1650 Mobile, R5 5500U, WDC PC SN530 SDBPNPZ-1T00 | Lenovo IdeaPad 5 Pro 16ACH GeForce GTX 1650 Mobile, R7 5800H, Micron 2300 512GB MTFDHBA512TDV | Dell Inspiron 16 Plus 7610 GeForce RTX 3050 4GB Laptop GPU, i7-11800H, Kingston OM3PDP3512B | Asus Vivobook Pro 16X-M7600QE GeForce RTX 3050 Ti Laptop GPU, R9 5900HX, SK Hynix HFM001TD3JX013N | |
|---|---|---|---|---|---|---|
| AS SSD | -0% | -5% | -19% | -12% | 12% | |
| Seq Read (MB/s) | 2744.12 | 2015 -27% | 2091 -24% | 2643 -4% | 2077 -24% | 2913 6% |
| Seq Write (MB/s) | 1559.79 | 1055 -32% | 1856 19% | 1510 -3% | 778 -50% | 1806 16% |
| 4K Read (MB/s) | 51.41 | 73.9 44% | 27.51 -46% | 42.86 -17% | 49.6 -4% | 47.67 -7% |
| 4K Write (MB/s) | 156.13 | 223.2 43% | 116.3 -26% | 85.5 -45% | 236.1 51% | 101.5 -35% |
| 4K-64 Read (MB/s) | 1014.34 | 589 -42% | 812 -20% | 768 -24% | 801 -21% | 1382 36% |
| 4K-64 Write (MB/s) | 940.2 | 1029 9% | 1415 50% | 1983 111% | 942 0% | 2164 130% |
| Access Time Read * (ms) | 0.073 | 0.056 23% | 0.103 -41% | 0.06 18% | 0.044 40% | |
| Access Time Write * (ms) | 0.028 | 0.039 -39% | 0.033 -18% | 0.101 -261% | 0.073 -161% | 0.109 -289% |
| Score Read (Points) | 1340 | 865 -35% | 1048 -22% | 1075 -20% | 1059 -21% | 1720 28% |
| Score Write (Points) | 1252 | 1358 8% | 1717 37% | 2220 77% | 1256 0% | 2446 95% |
| Score Total (Points) | 3229 | 2644 -18% | 3292 2% | 3797 18% | 2804 -13% | 4995 55% |
| Copy ISO MB/s (MB/s) | 1363.82 | 1186 -13% | 1028 -25% | 2649 94% | ||
| Copy Program MB/s (MB/s) | 433.2 | 782 81% | 794 83% | 372.8 -14% | ||
| Copy Game MB/s (MB/s) | 1055.69 | 1028 -3% | 987 -7% | 1126 7% |
* ... menor é melhor
* ... menor é melhor
Sustained Performance Read: DiskSpd Read Loop, Queue Depth 8
Placa Gráfica


O Swift X 16 da Acer vem com umIntel Xe G7 (96EUs)iGPU e o Nvidia GeForce RTX 3050 na menor variante com um TGP de 35 watts + 5 watts de Dynamic Boost. Isto garante que novos jogos possam ser exibidos em Full HD com detalhes médios a altos e permite a reprodução de alguns vídeos
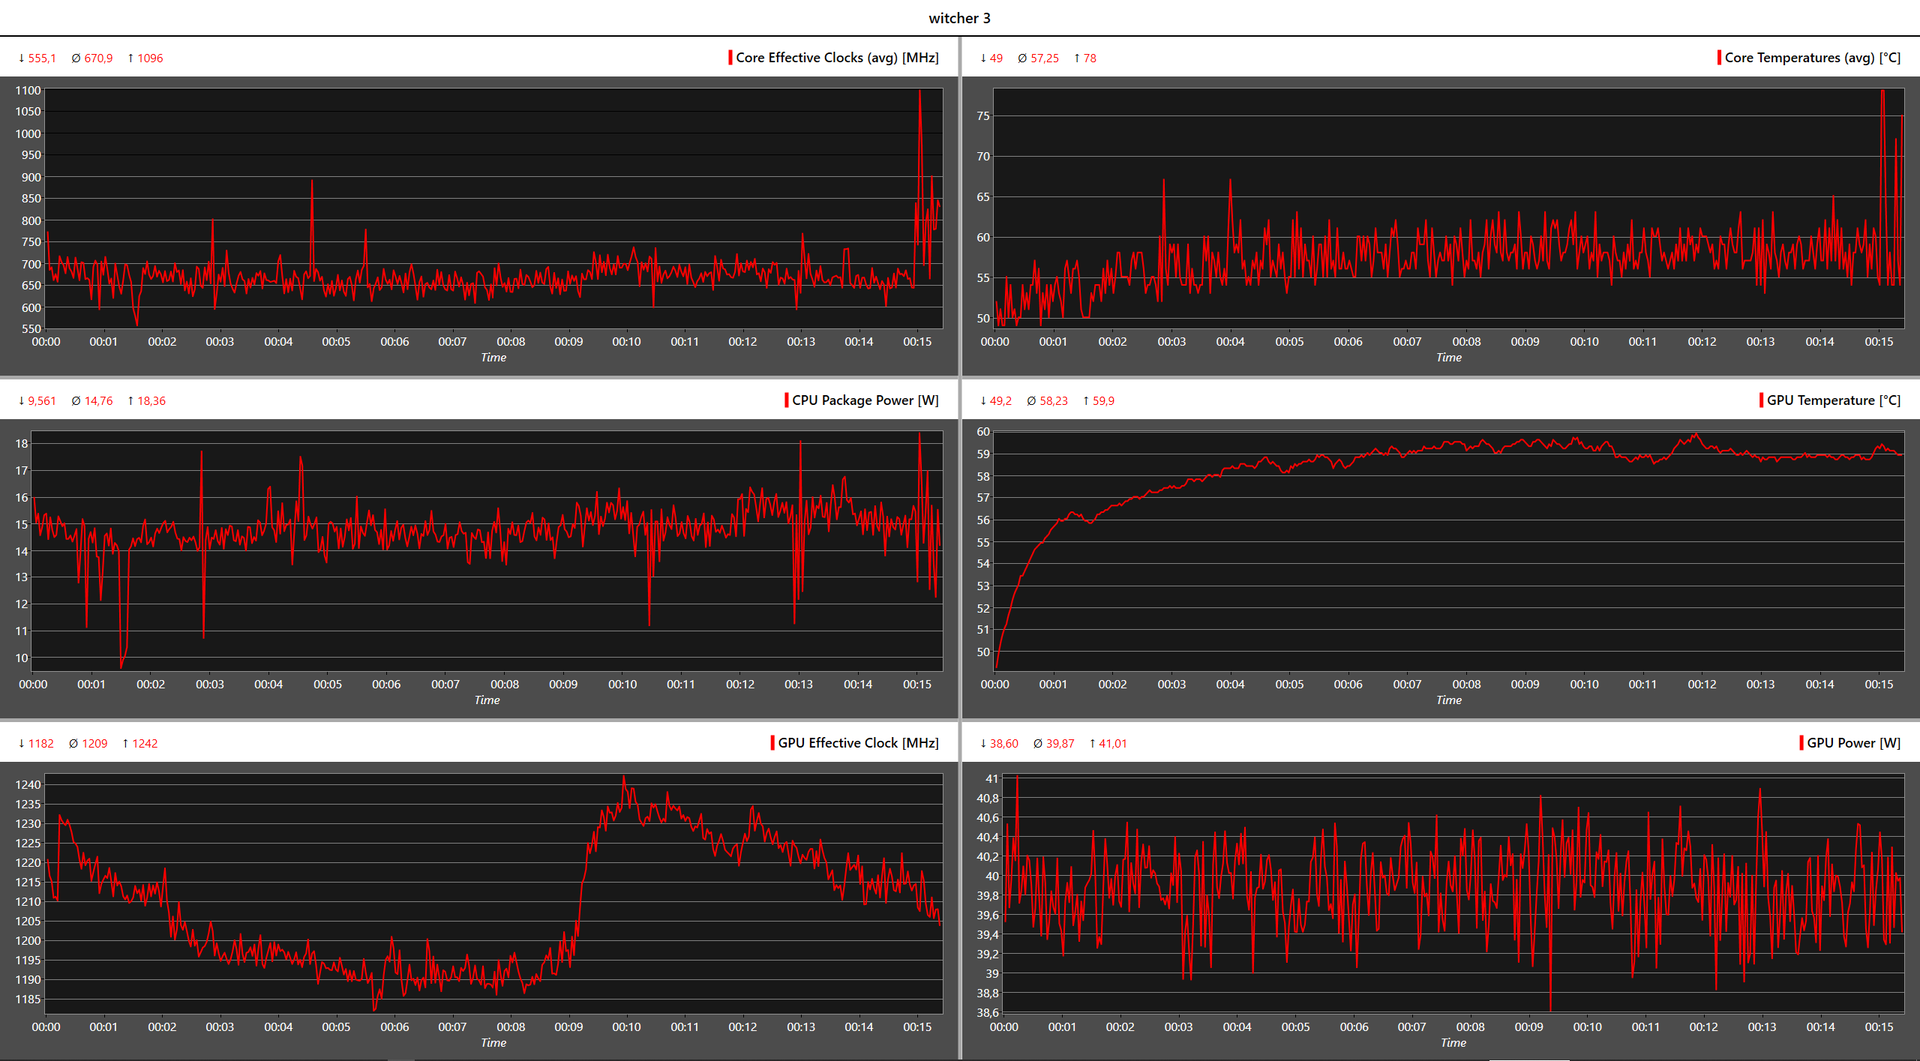
O relógio de impulso de 1.057 MHz é ultrapassado com uma média de 1.209 MHz, o que se deve ao Impulso Dinâmico. A temperatura da GPU nem sequer sobe a 60 °C.
Jogadores mais rápidos em nosso campo de comparação são apenas os Asus Vivobook Pro 16X (em ~20 %) e Dells Inspiron 16 Plus (em ~40 %), que permitem seu RTX 3050 um TGP superior (50 e 65 watts, respectivamente). O IdeaPad 5 Pro 16 com GTX 1650 pode ser superado em 10 a 25%, dependendo da referência/jogo.
No modo de bateria, a performance da GPU cai cerca de 15%.
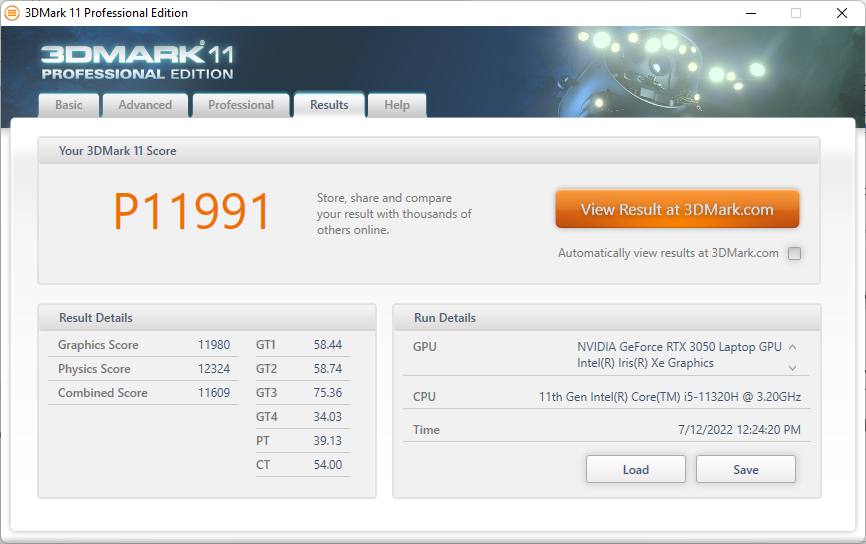
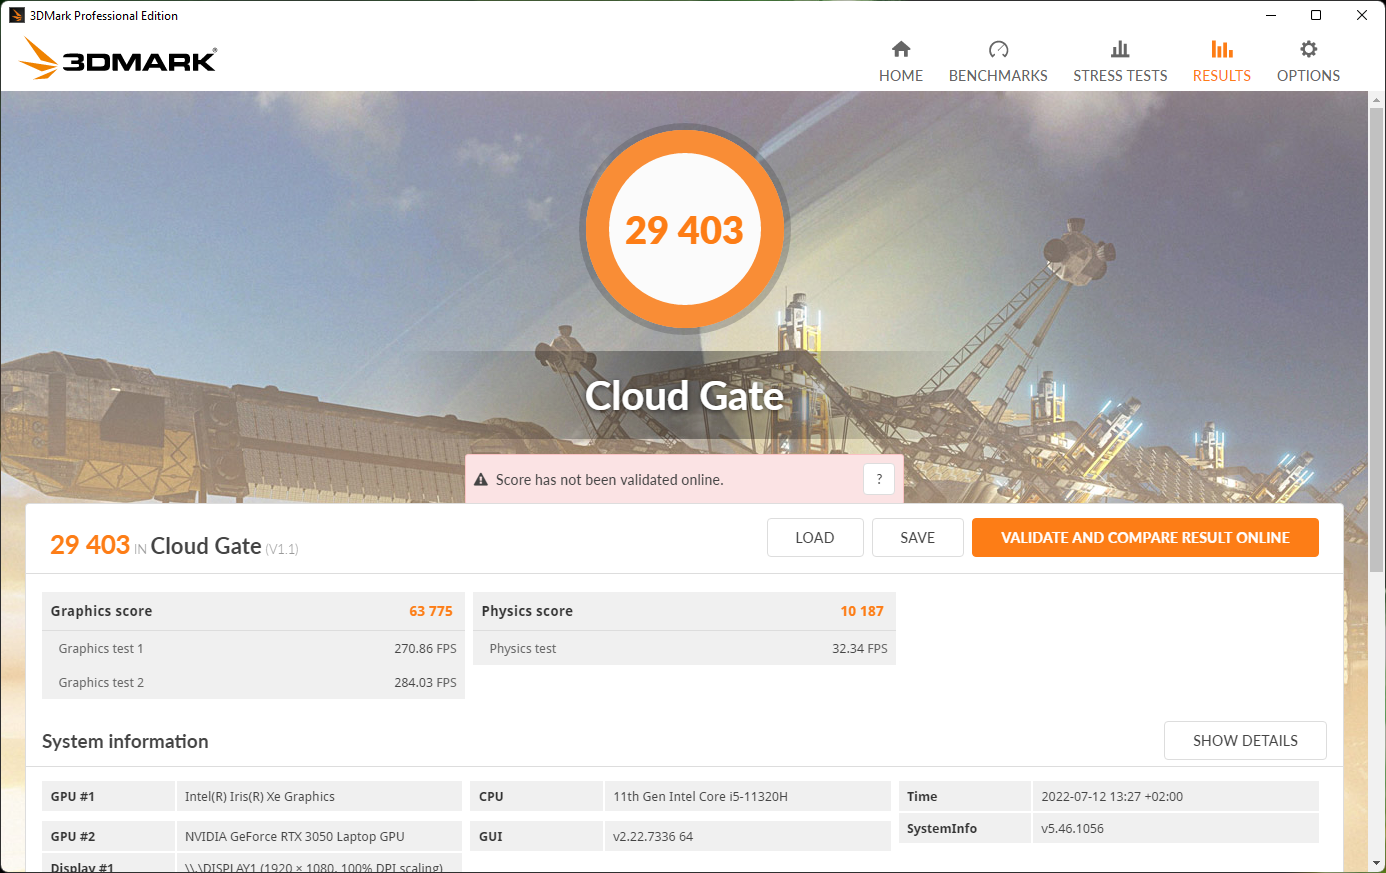
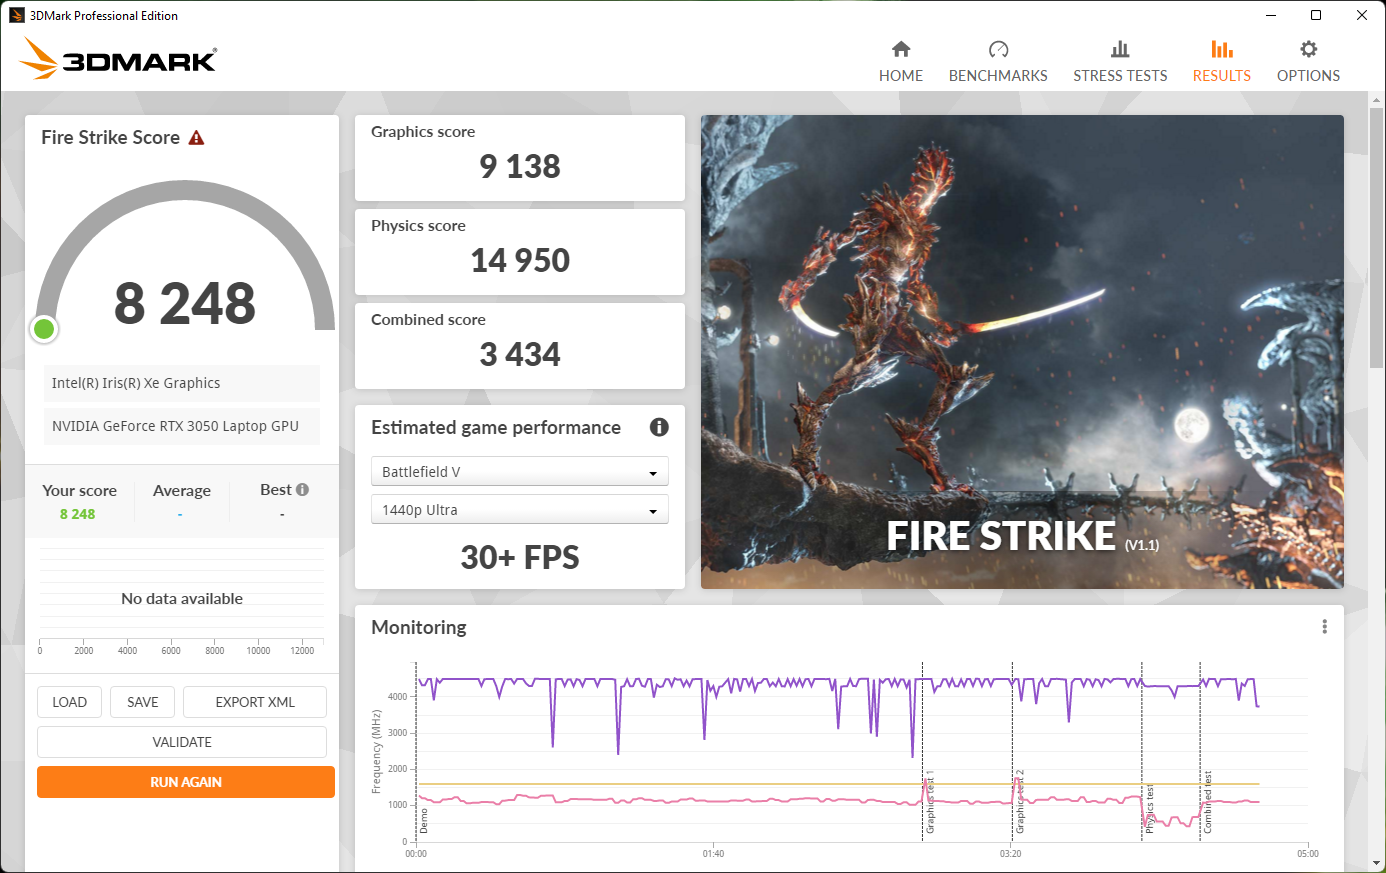
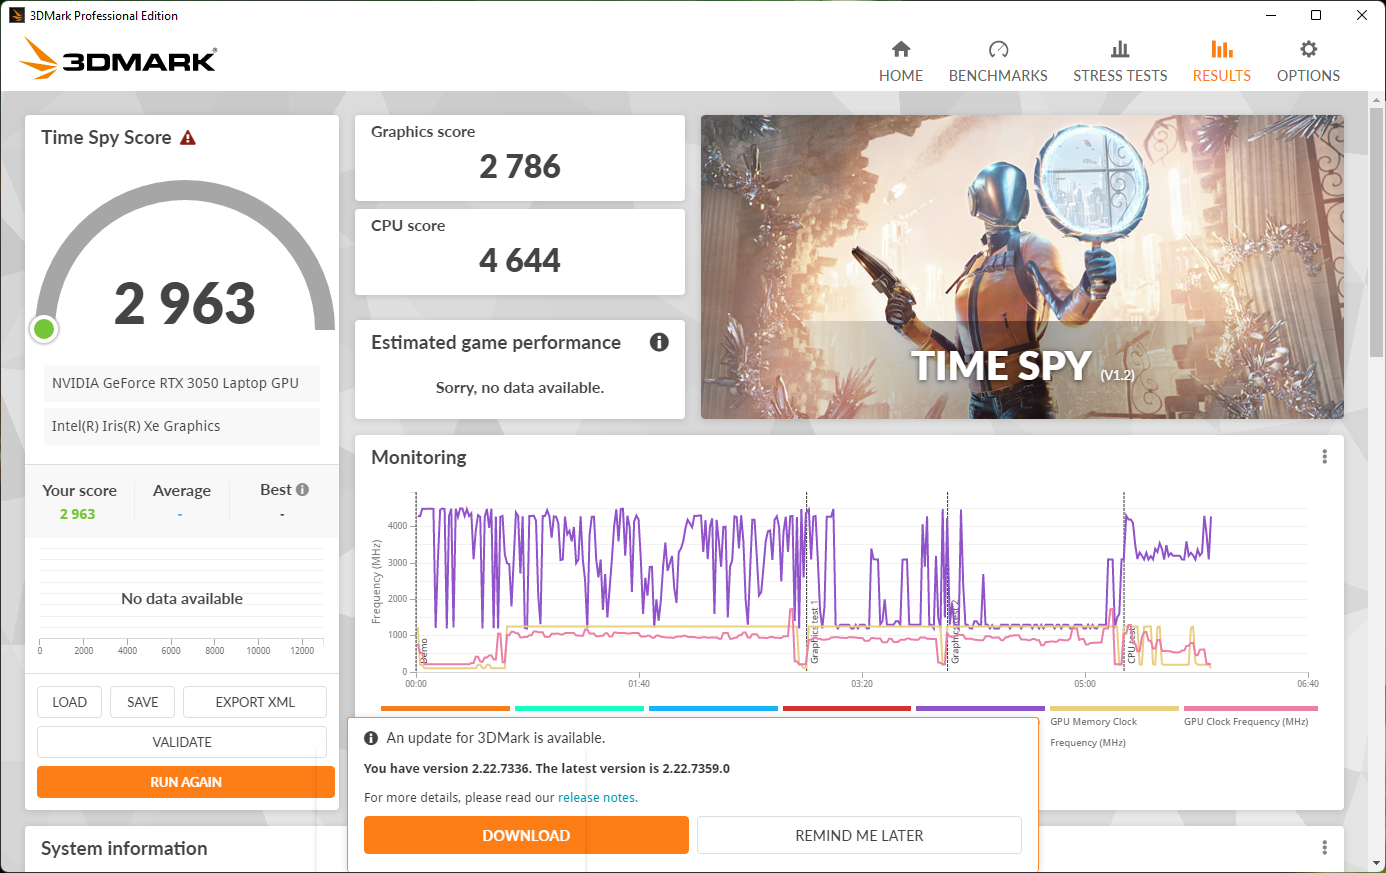
| 3DMark 11 Performance | 11991 pontos | |
| 3DMark Cloud Gate Standard Score | 29403 pontos | |
| 3DMark Fire Strike Score | 9249 pontos | |
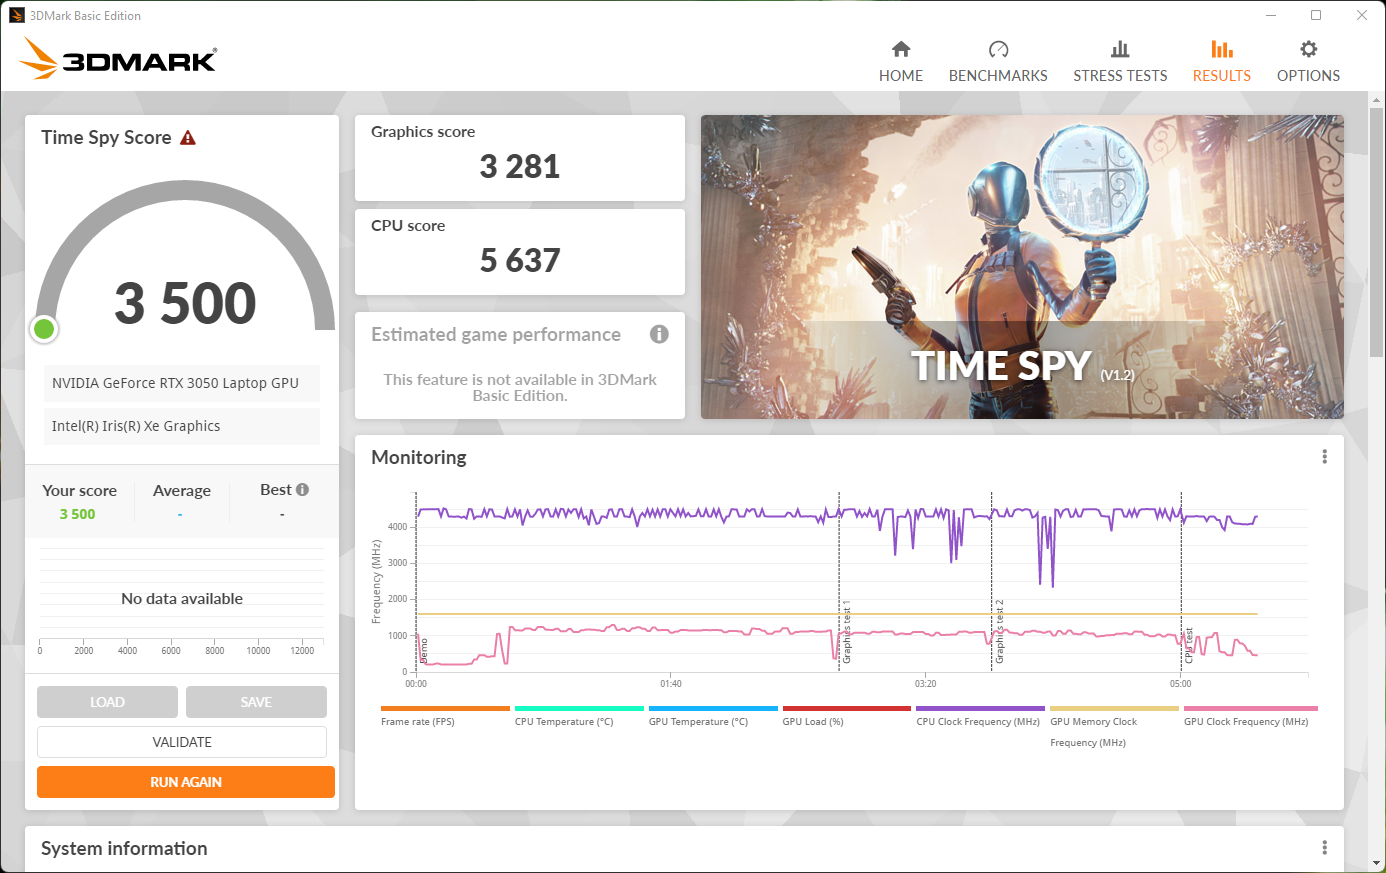
| 3DMark Time Spy Score | 3500 pontos | |
Ajuda | ||
| Ghostwire Tokyo - 1920x1080 High Settings | |
| Média NVIDIA GeForce RTX 3050 4GB Laptop GPU (55.7 - 79.7, n=3) | |
| Acer Swift X SFX16-51G-5388 | |
O teste de estresse de uma hora Wichter 3 mostra níveis de desempenho bastante estáveis com base na curva FPS
Witcher 3 FPS Chart
| baixo | média | alto | ultra | |
|---|---|---|---|---|
| GTA V (2015) | 170.4 | 163.1 | 99.2 | 48 |
| The Witcher 3 (2015) | 183.9 | 106.7 | 58.7 | 31.5 |
| Dota 2 Reborn (2015) | 138.6 | 122.7 | 119.4 | 116 |
| Final Fantasy XV Benchmark (2018) | 97.4 | 48.7 | 35.9 | |
| X-Plane 11.11 (2018) | 104.7 | 87 | 72.5 | |
| Far Cry 5 (2018) | 104 | 64 | 56 | 59 |
| Strange Brigade (2018) | 216 | 90.4 | 72.1 | 62.1 |
| Ghostwire Tokyo (2022) | 58.2 | 55.7 | 53.9 |
Emissões: Acer Swift X 16 com modo Silent
Ruído do sistema
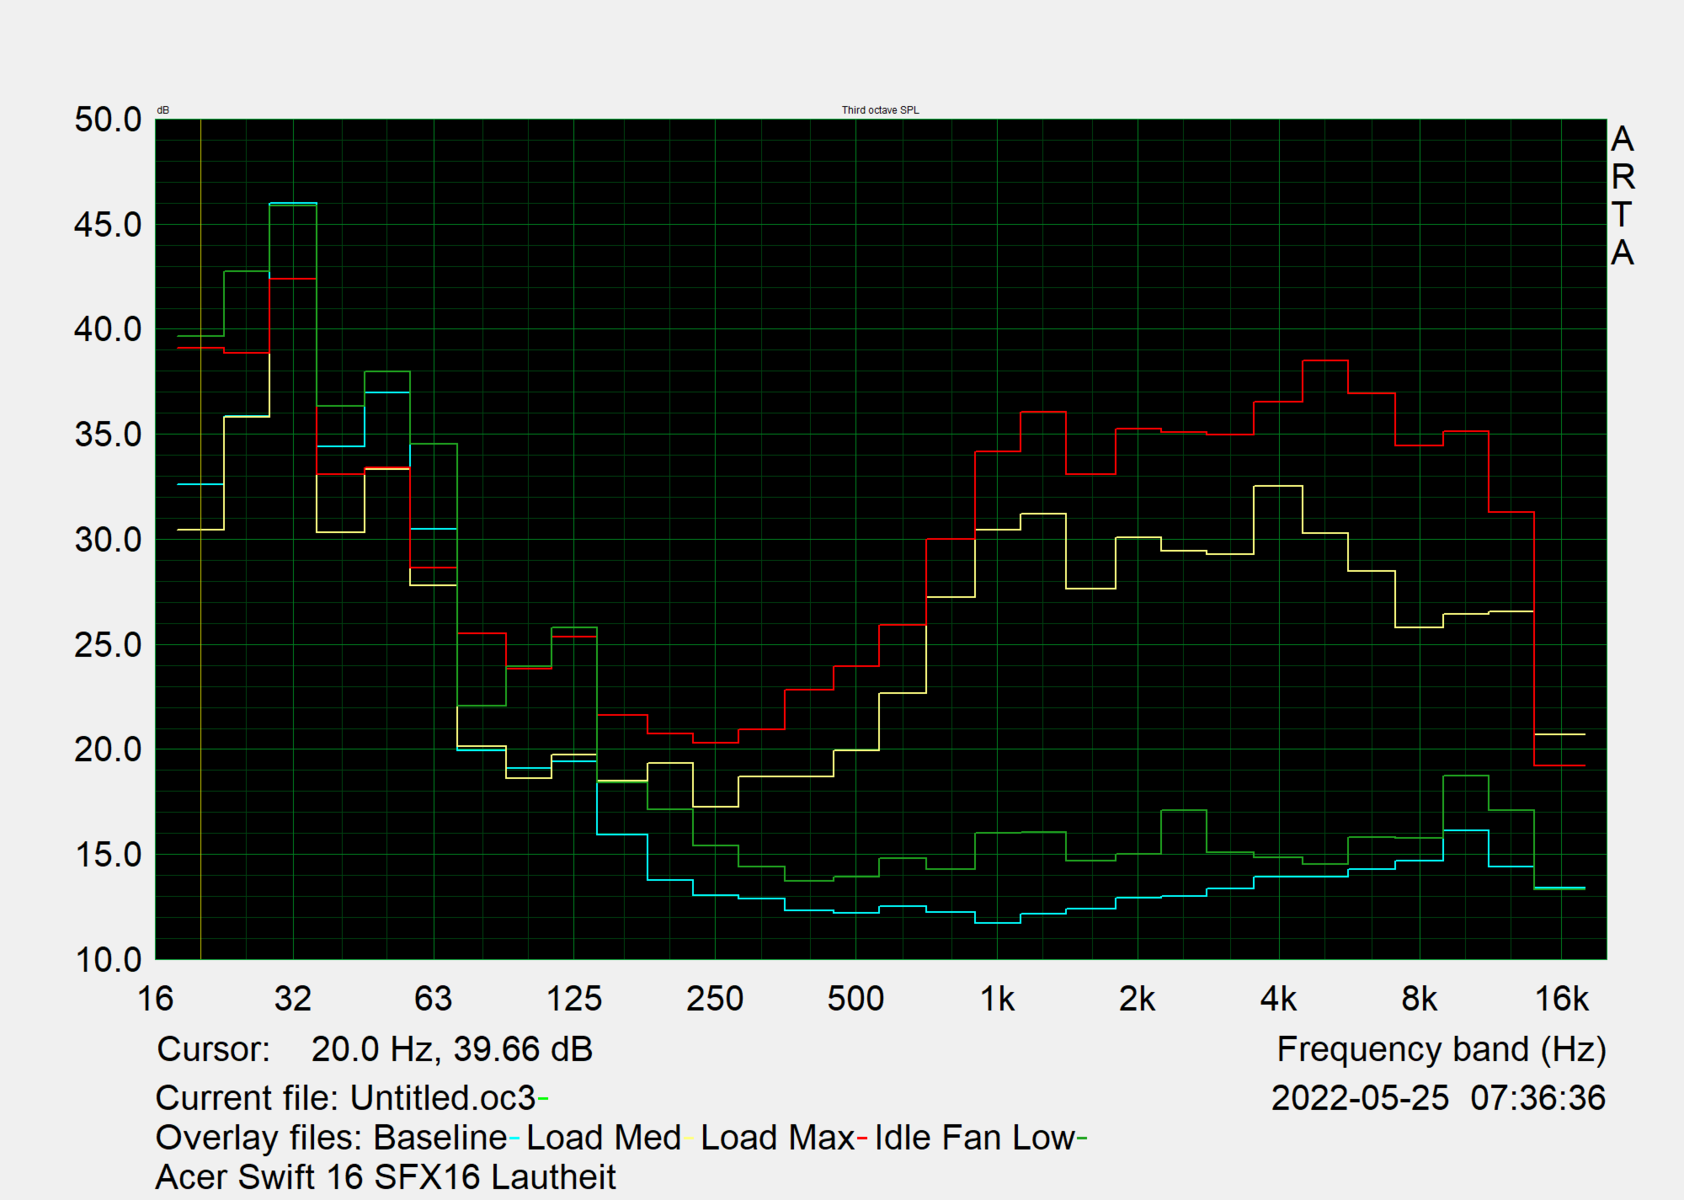
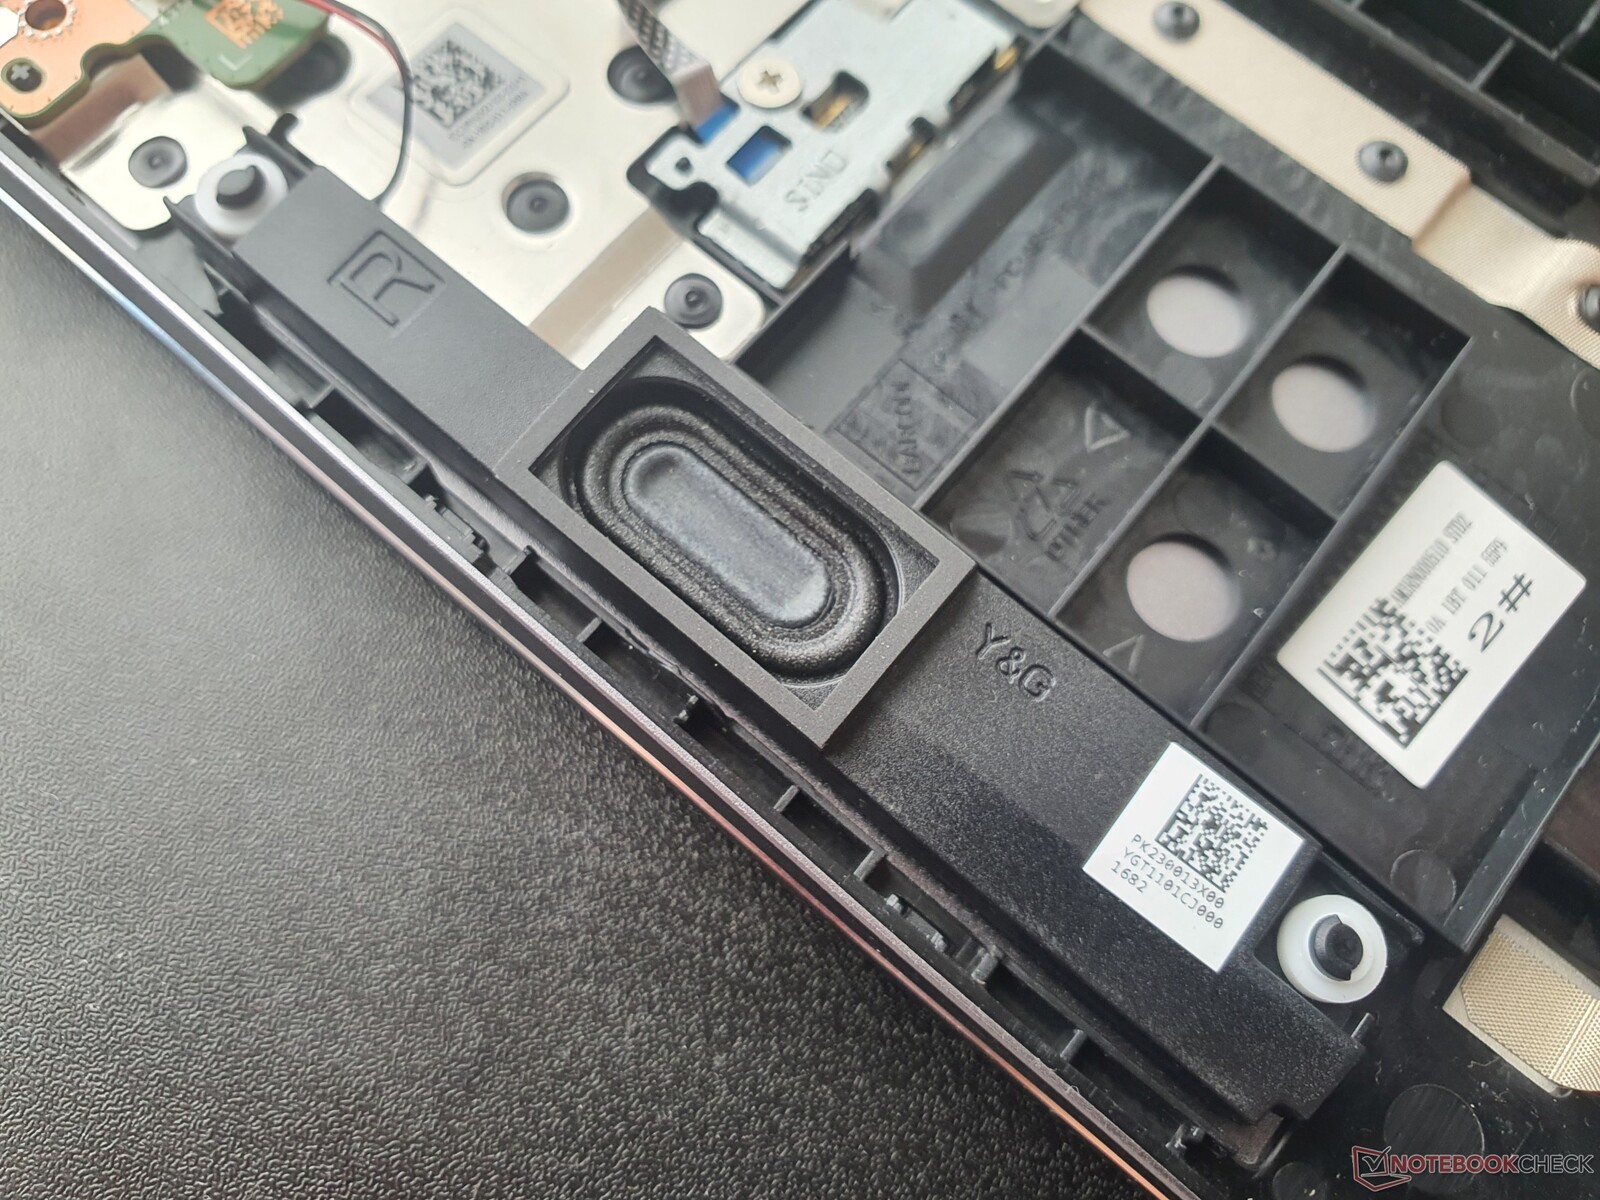
O Swift X 16 está equipado com dois ventiladores de tamanho médio e dois tubos de calor. Ao contrário dos Swift 3a CPU compartilha o sistema de resfriamento com uma GPU dedicada.
Como resultado, os ventiladores ficam mais altos sob carga, e o jogo também resulta em comportamento irregular dos ventiladores, mas em intervalos mais longos, de modo que não se destaca realmente. Embora 41 db(A) sob carga não seja silencioso, é significativamente menos irritante do que um portátil de jogos tradicional.
Os dispositivos de comparação com uma GPU dedicada estão aproximadamente no mesmo nível, mas a Dell Inspiron 16 Pluscom um TGP 55 W mais alto fica mais alto. O próprio modo Silent da Acer torna as coisas ainda mais silenciosas. Quando se navega na web, os ventiladores muitas vezes ficam parados; a uma velocidade de navegação um pouco mais rápida, há pequenas "rajadas" em volumes confortáveis
Barulho
| Ocioso |
| 25.4 / 25.4 / 27.8 dB |
| Carga |
| 41 / 47 dB |
 | ||
30 dB silencioso 40 dB(A) audível 50 dB(A) ruidosamente alto |
||
min: | ||
| Acer Swift X SFX16-51G-5388 GeForce RTX 3050 4GB Laptop GPU, i5-11320H, Samsung PM991 MZVLQ512HBLU | Acer Swift 3 SF316-51 Iris Xe G7 96EUs, i7-11370H, Micron 2210 MTFDHBA512QFD | Acer Swift X SFX14-41G-R7F3 GeForce GTX 1650 Mobile, R5 5500U, WDC PC SN530 SDBPNPZ-1T00 | Lenovo IdeaPad 5 Pro 16ACH GeForce GTX 1650 Mobile, R7 5800H, Micron 2300 512GB MTFDHBA512TDV | Dell Inspiron 16 Plus 7610 GeForce RTX 3050 4GB Laptop GPU, i7-11800H, Kingston OM3PDP3512B | Asus Vivobook Pro 16X-M7600QE GeForce RTX 3050 Ti Laptop GPU, R9 5900HX, SK Hynix HFM001TD3JX013N | Huawei MateBook 16 R7 5800H Vega 8, R7 5800H, Lite-On CA5-8D512 | |
|---|---|---|---|---|---|---|---|
| Noise | 5% | -1% | 3% | 0% | -2% | 7% | |
| desligado / ambiente * (dB) | 25.4 | 26 -2% | 26 -2% | 24.04 5% | 24.4 4% | 26 -2% | 24.8 2% |
| Idle Minimum * (dB) | 25.4 | 26 -2% | 26 -2% | 24.04 5% | 24.4 4% | 27 -6% | 24.8 2% |
| Idle Average * (dB) | 25.4 | 26 -2% | 27 -6% | 24.04 5% | 24.4 4% | 27 -6% | 24.8 2% |
| Idle Maximum * (dB) | 27.8 | 27.7 -0% | 27.4 1% | 24.04 14% | 24.4 12% | 27.5 1% | 26.7 4% |
| Load Average * (dB) | 41 | 32.7 20% | 42.2 -3% | 41.3 -1% | 48.3 -18% | 41.7 -2% | 32 22% |
| Load Maximum * (dB) | 47 | 39 17% | 44.3 6% | 52.93 -13% | 48.9 -4% | 45.3 4% | 42.4 10% |
| Witcher 3 ultra * (dB) | 49.21 | 48.9 | 32 |
* ... menor é melhor
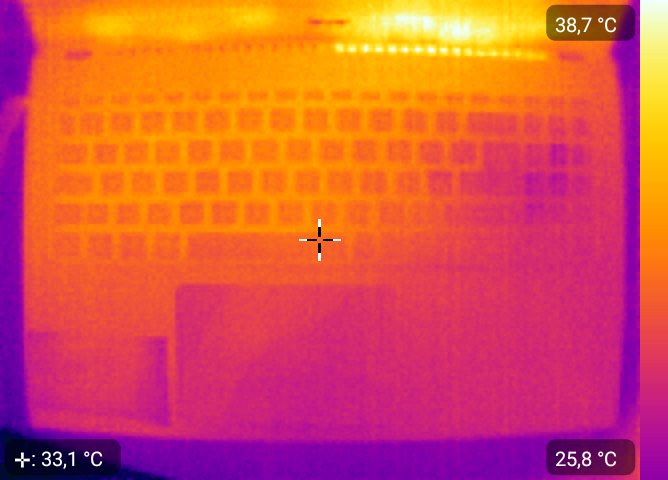
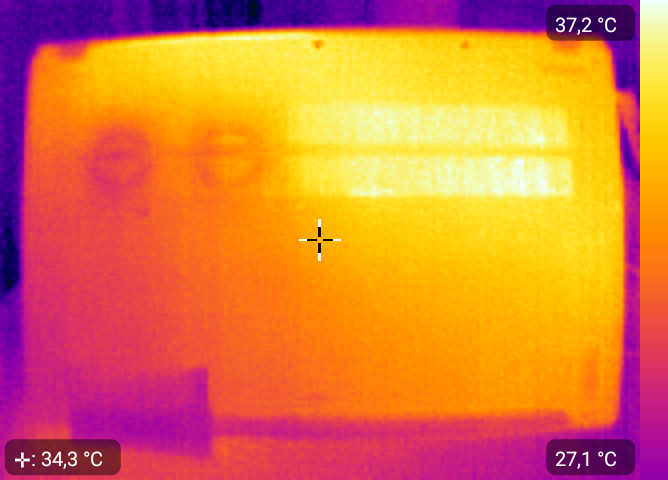
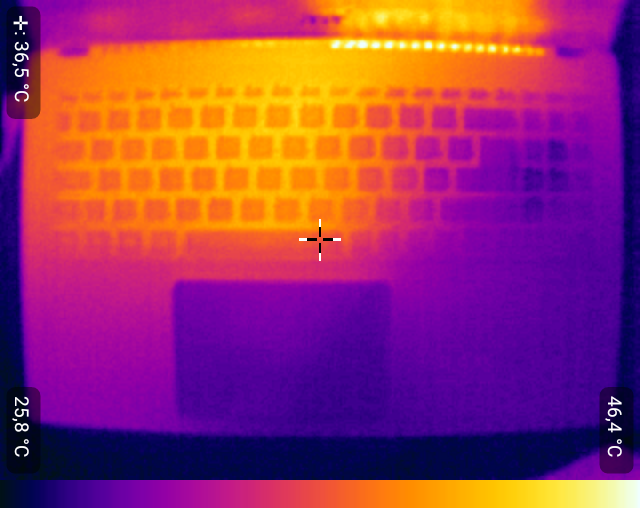
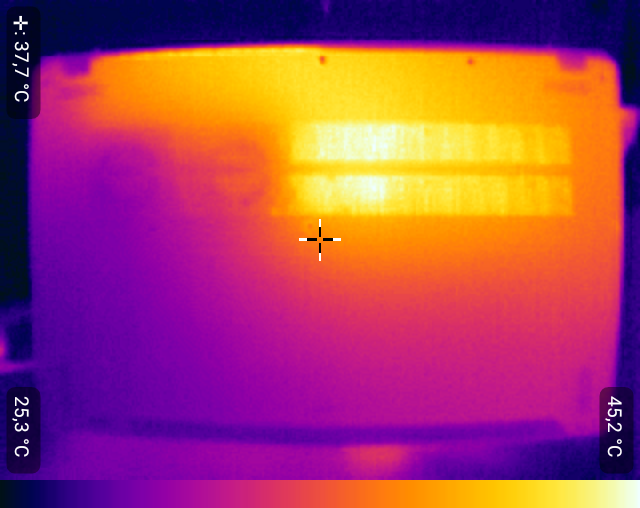
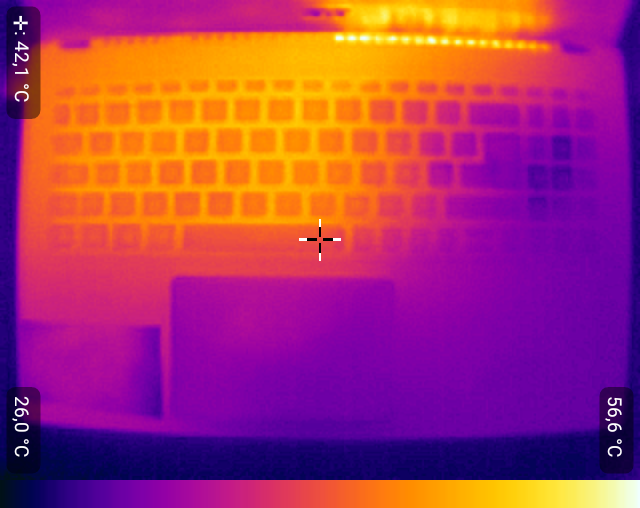
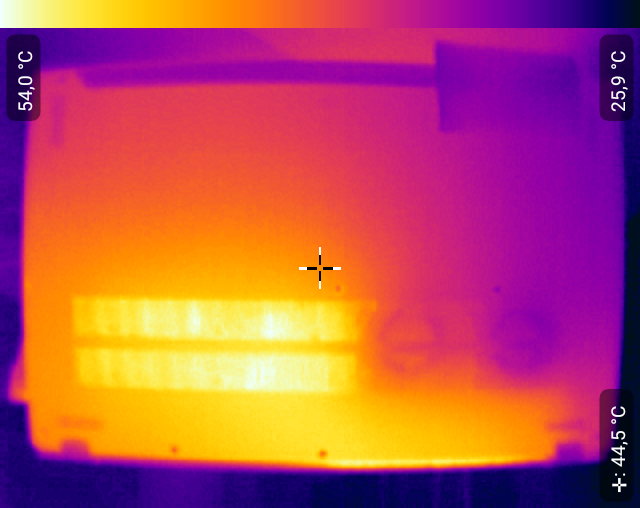
Temperatura
Quando se joga, as temperaturas permanecem dentro dos limites e nada fica visivelmente quente ou annyoing de forma alguma. Hotspots só ocorrem sob o teste de estresse combinado, especialmente acima do teclado. O Asus Vivobook Pro 16X permanece significativamente mais frio, apesar do RTX 3050enquanto a Dell's Inspiron 16 Plus aquece mais visivelmente.
(-) A temperatura máxima no lado superior é 52.4 °C / 126 F, em comparação com a média de 36.8 °C / 98 F , variando de 21 a 71 °C para a classe Multimedia.
(-) A parte inferior aquece até um máximo de 50 °C / 122 F, em comparação com a média de 39.1 °C / 102 F
(+) Em uso inativo, a temperatura média para o lado superior é 27.8 °C / 82 F, em comparação com a média do dispositivo de 31.3 °C / ### class_avg_f### F.
(±) Jogando The Witcher 3, a temperatura média para o lado superior é 32.8 °C / 91 F, em comparação com a média do dispositivo de 31.3 °C / ## #class_avg_f### F.
(±) Os apoios para as mãos e o touchpad podem ficar muito quentes ao toque, com um máximo de 39.2 °C / 102.6 F.
(-) A temperatura média da área do apoio para as mãos de dispositivos semelhantes foi 28.7 °C / 83.7 F (-10.5 °C / -18.9 F).
| Acer Swift X SFX16-51G-5388 Intel Core i5-11320H, NVIDIA GeForce RTX 3050 4GB Laptop GPU | Acer Swift 3 SF316-51 Intel Core i7-11370H, Intel Iris Xe Graphics G7 96EUs | Lenovo IdeaPad 5 Pro 16ACH AMD Ryzen 7 5800H, NVIDIA GeForce GTX 1650 Mobile | Dell Inspiron 16 Plus 7610 Intel Core i7-11800H, NVIDIA GeForce RTX 3050 4GB Laptop GPU | Asus Vivobook Pro 16X-M7600QE AMD Ryzen 9 5900HX, NVIDIA GeForce RTX 3050 Ti Laptop GPU | Huawei MateBook 16 R7 5800H AMD Ryzen 7 5800H, AMD Radeon RX Vega 8 (Ryzen 4000/5000) | |
|---|---|---|---|---|---|---|
| Heat | 7% | 4% | -6% | 14% | 13% | |
| Maximum Upper Side * (°C) | 52.4 | 40 24% | 51.9 1% | 46.4 11% | 39.4 25% | 40.2 23% |
| Maximum Bottom * (°C) | 50 | 47 6% | 51.5 -3% | 54.8 -10% | 43.6 13% | 49.7 1% |
| Idle Upper Side * (°C) | 30.3 | 30.1 1% | 27.2 10% | 31.4 -4% | 27.6 9% | 26.4 13% |
| Idle Bottom * (°C) | 30.4 | 31.6 -4% | 28.5 6% | 36.6 -20% | 27.5 10% | 26.4 13% |
* ... menor é melhor
Teste de estresse
Sob estresse puro da CPU, a Intel Núcleo i5-11320H relógios a 3 GHz (200 MHz abaixo do relógio de base) e atinge 73 °C.
Sob pura tensão dGPU, oRTX 3050 relógios a 700 MHz, o que corresponde a seu relógio de base. A carga combinada (FurMark + Prime95) reduz a CPU para 2,4 GHz, enquanto a GPU aciona apenas ligeiramente a 600 MHz. As temperaturas estão em torno de 75 °C e 65 °C, respectivamente. Um bom resultado.
O consumo combinado é de 25W (CPU) + 35W (GPU) = 60 watts. Nos jogos, isso equivale a 15W + 40W. No modo de bateria, 15W + 30W.
| Relógio CPU (GHz) | Relógio GPU (MHz) | Temperatura média da CPU (°C) | Temperatura média da GPU (°C) | PL1 (Watt) | TGP (Watt) | |
| System Idle | 0,04 | 200 | 29 | 34 | -- | -- |
| Prime95 Stress | 3 | 200 | 73 | 52 | 35 | -- |
| Prime95 + FurMark Stress | 2,4 | 600 | 75 | 66 | 25 | 40 |
| FurMark Stress | 0,1 | 700 | 48 | 56 | -- | 40 |
| Witcher 3 Estresse | 0,7 | 1200 | 60 | 59 | 15 | 40 |
| Witcher 3 @Akku | 0,7 | 1057 | 59 | 58 | 15 | 30 |
Oradores
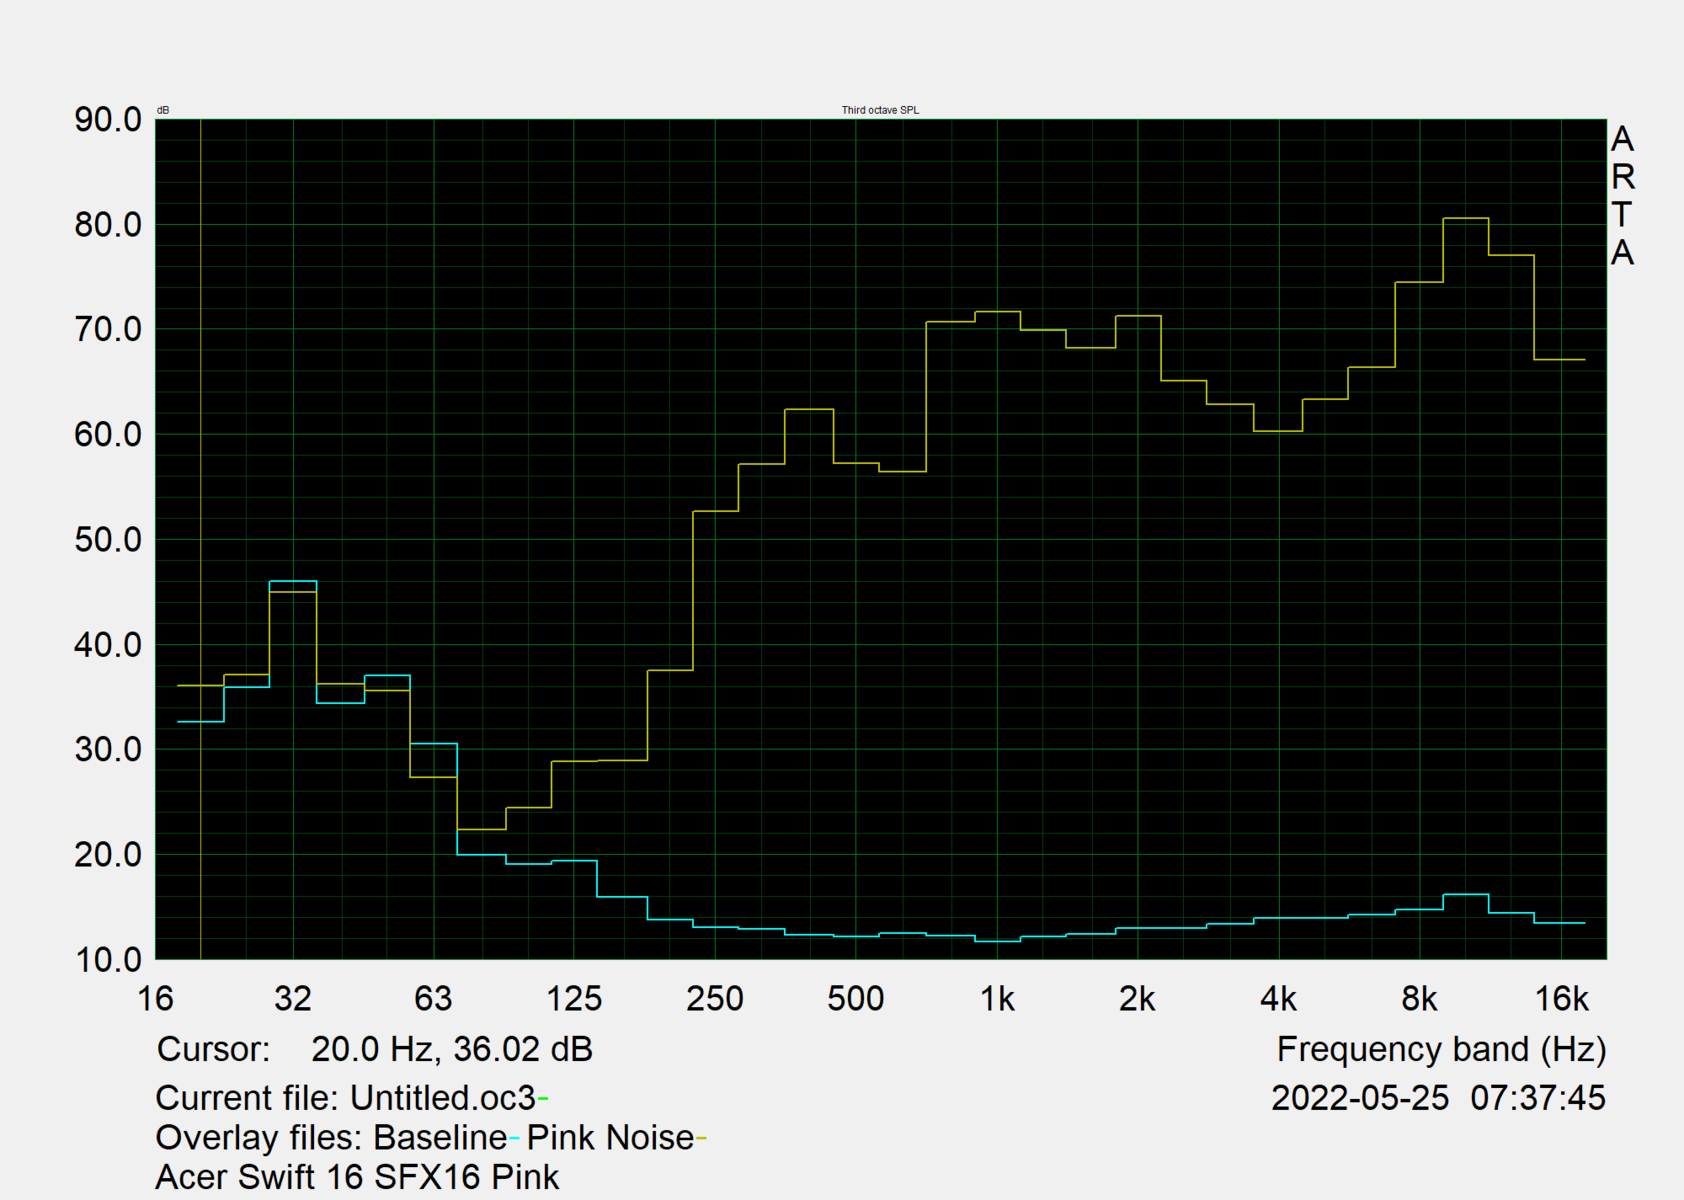
Os alto-falantes produzem um som de qualidade inferior, o que não deveria ser o caso de um laptop multimídia. Os sons são muito silenciosos, quase não há graves e até mesmo os médios e altos são reproduzidos apenas com precisão limitada.
O uso de periféricos de áudio externos através do conector de 3,5 mm ou Bluetooth é, portanto, recomendado.
Acer Swift X SFX16-51G-5388 análise de áudio
(±) | o volume do alto-falante é médio, mas bom (###valor### dB)
Graves 100 - 315Hz
(-) | quase nenhum baixo - em média 25% menor que a mediana
(±) | a linearidade dos graves é média (11.6% delta para a frequência anterior)
Médios 400 - 2.000 Hz
(±) | médios mais altos - em média 6.1% maior que a mediana
(±) | a linearidade dos médios é média (8.2% delta para frequência anterior)
Altos 2 - 16 kHz
(±) | máximos mais altos - em média 5.3% maior que a mediana
(±) | a linearidade dos máximos é média (8.9% delta para frequência anterior)
Geral 100 - 16.000 Hz
(±) | a linearidade do som geral é média (22.9% diferença em relação à mediana)
Comparado com a mesma classe
» 81% de todos os dispositivos testados nesta classe foram melhores, 5% semelhantes, 14% piores
» O melhor teve um delta de 5%, a média foi 17%, o pior foi 45%
Comparado com todos os dispositivos testados
» 68% de todos os dispositivos testados foram melhores, 6% semelhantes, 26% piores
» O melhor teve um delta de 4%, a média foi 23%, o pior foi 134%
Lenovo IdeaPad 5 Pro 16ACH análise de áudio
(-) | alto-falantes não muito altos (###valor### dB)
Graves 100 - 315Hz
(-) | quase nenhum baixo - em média 24.4% menor que a mediana
(±) | a linearidade dos graves é média (13.3% delta para a frequência anterior)
Médios 400 - 2.000 Hz
(+) | médios equilibrados - apenas 3.2% longe da mediana
(+) | médios são lineares (4.1% delta para frequência anterior)
Altos 2 - 16 kHz
(+) | agudos equilibrados - apenas 2% longe da mediana
(+) | os máximos são lineares (6.3% delta da frequência anterior)
Geral 100 - 16.000 Hz
(±) | a linearidade do som geral é média (22.5% diferença em relação à mediana)
Comparado com a mesma classe
» 80% de todos os dispositivos testados nesta classe foram melhores, 4% semelhantes, 16% piores
» O melhor teve um delta de 5%, a média foi 17%, o pior foi 45%
Comparado com todos os dispositivos testados
» 66% de todos os dispositivos testados foram melhores, 6% semelhantes, 28% piores
» O melhor teve um delta de 4%, a média foi 23%, o pior foi 134%
Gestão de energia: Swift X, como tantas vezes, no meio
Consumo de energia
O Swift X está sedento em standby, exigindo 3 watts completos. Os valores ociosos, por outro lado, são medíocres e aproximadamente no mesmo nível de nosso campo de comparação.
Sob carga, máquinas com uma CPU de 45 watts + TGP superior podem consumir significativamente mais energia - até 100 watts - o que beneficia o desempenho. O Swift X 16 da Acer extrai um máximo de 63 watts da rede elétrica. A fonte de alimentação é, portanto, suficientemente dimensionada a 90 watts.
| desligado | |
| Ocioso | |
| Carga |
|
Key:
min: | |
| Acer Swift X SFX16-51G-5388 i5-11320H, GeForce RTX 3050 4GB Laptop GPU, Samsung PM991 MZVLQ512HBLU, , 1920x1080, 16.1" | Acer Swift 3 SF316-51 i7-11370H, Iris Xe G7 96EUs, Micron 2210 MTFDHBA512QFD, IPS, 1920x1080, 16.1" | Acer Swift X SFX14-41G-R7F3 R5 5500U, GeForce GTX 1650 Mobile, WDC PC SN530 SDBPNPZ-1T00, IPS, 1920x1080, 14" | Lenovo IdeaPad 5 Pro 16ACH R7 5800H, GeForce GTX 1650 Mobile, Micron 2300 512GB MTFDHBA512TDV, IPS LED, 2560x1600, 16" | Dell Inspiron 16 Plus 7610 i7-11800H, GeForce RTX 3050 4GB Laptop GPU, Kingston OM3PDP3512B, IPS, 3072x1920, 16" | Asus Vivobook Pro 16X-M7600QE R9 5900HX, GeForce RTX 3050 Ti Laptop GPU, SK Hynix HFM001TD3JX013N, OLED, 3840x2400, 16.1" | Huawei MateBook 16 R7 5800H R7 5800H, Vega 8, Lite-On CA5-8D512, , 2520x1680, 16" | Média NVIDIA GeForce RTX 3050 4GB Laptop GPU | Média da turma Multimedia | |
|---|---|---|---|---|---|---|---|---|---|
| Power Consumption | 39% | 25% | -11% | -33% | -21% | 11% | -16% | 3% | |
| Idle Minimum * (Watt) | 7 | 4.8 31% | 3.4 51% | 5.7 19% | 7.7 -10% | 8.2 -17% | 4.6 34% | 7.17 ? -2% | 5.62 ? 20% |
| Idle Average * (Watt) | 10.1 | 7.4 27% | 6 41% | 9.3 8% | 10.7 -6% | 16.2 -60% | 10.5 -4% | 10.4 ? -3% | 10.2 ? -1% |
| Idle Maximum * (Watt) | 15 | 9 40% | 9.2 39% | 11 27% | 16.8 -12% | 19.7 -31% | 11.2 25% | 14.8 ? 1% | 12.5 ? 17% |
| Load Average * (Watt) | 63.3 | 34.9 45% | 57 10% | 83.4 -32% | 100.39 -59% | 65.8 -4% | 59.1 7% | 89.7 ? -42% | 65 ? -3% |
| Witcher 3 ultra * (Watt) | 63.3 | 34.9 45% | 57.3 9% | 94.4 -49% | 108 -71% | 65.6 -4% | 58.6 7% | ||
| Load Maximum * (Watt) | 94 | 51.4 45% | 93.6 -0% | 128.7 -37% | 129 -37% | 104 -11% | 98.3 -5% | 124.8 ? -33% | 111.9 ? -19% |
* ... menor é melhor
Power consumption Witcher 3 / Stress test
Power consumption with an external monitor
Vida útil da bateria
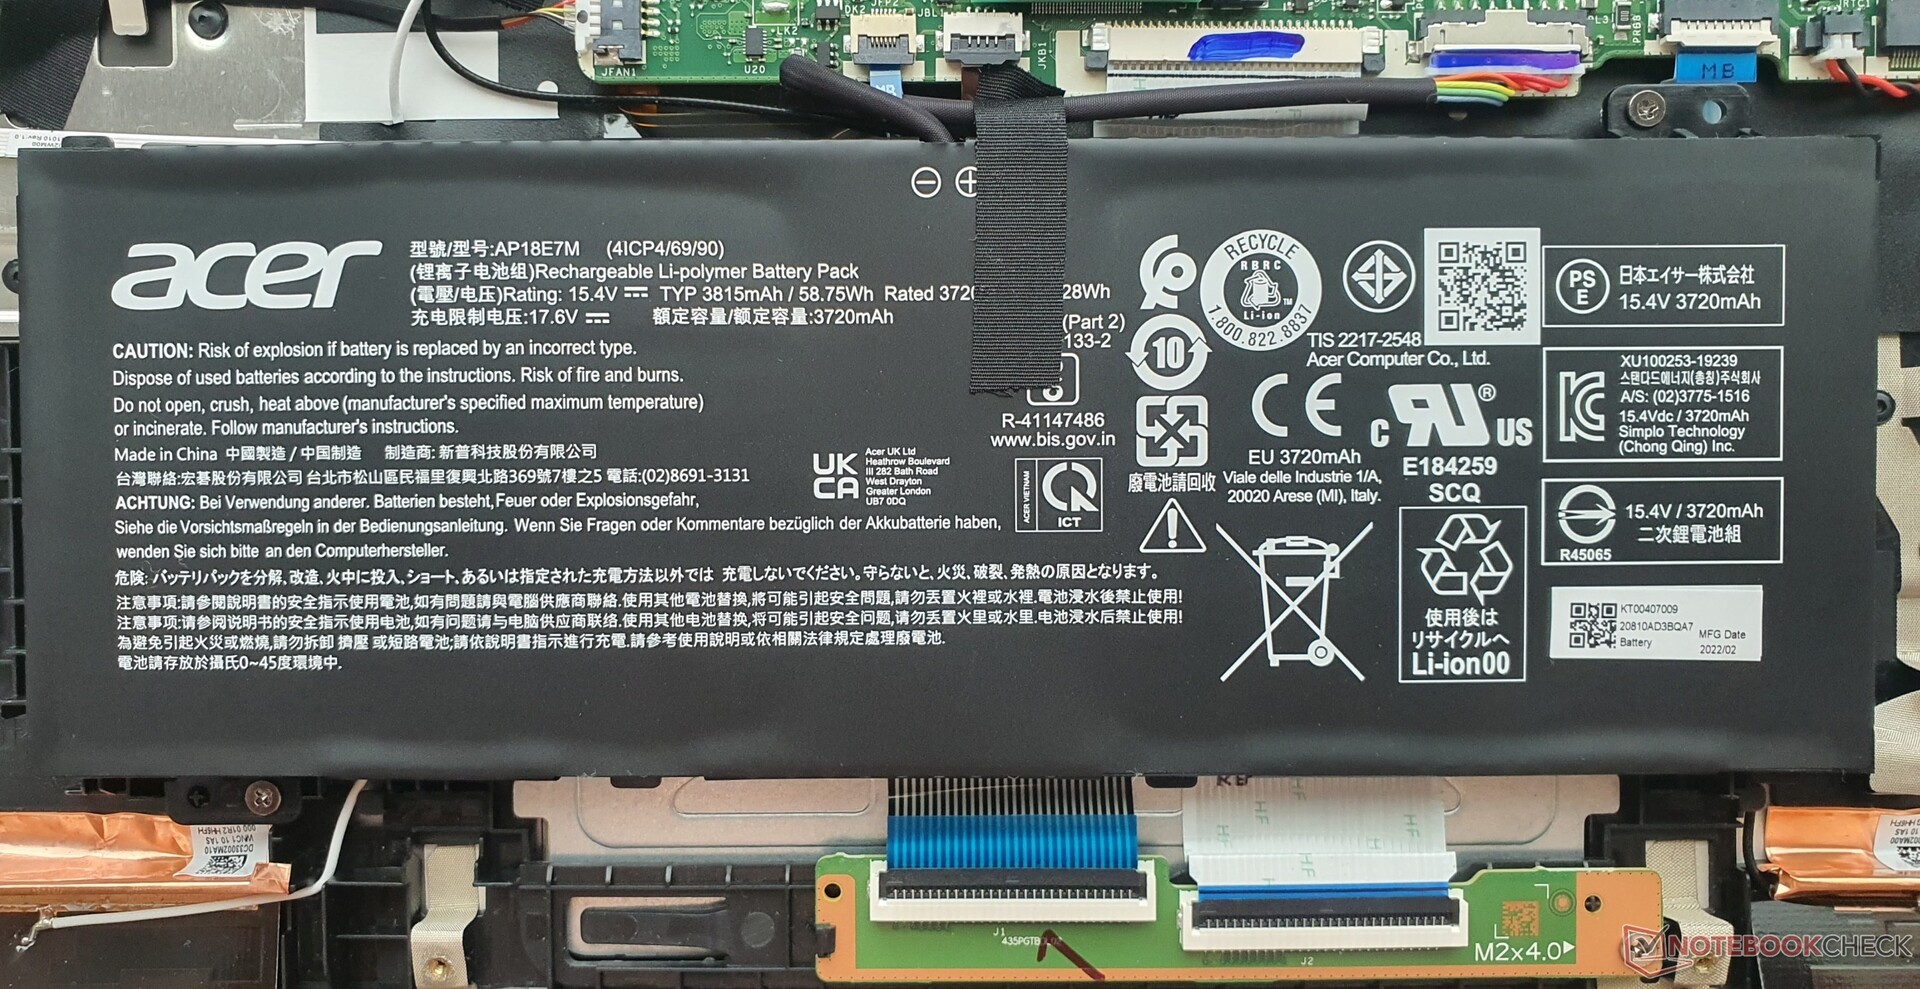
A duração da bateria de ~8 horas quando se navega na web a 150 lêndeas é aceitável, mas vem em último lugar em nosso campo de comparação. OSwift 3sem dGPU dura mais de uma hora e meia, e a Lenovo'sIdeaPad 5 Pro 16alcança um tempo de execução 50% maior.
| Acer Swift X SFX16-51G-5388 i5-11320H, GeForce RTX 3050 4GB Laptop GPU, 58.7 Wh | Acer Swift 3 SF316-51 i7-11370H, Iris Xe G7 96EUs, 56 Wh | Acer Swift X SFX14-41G-R7F3 R5 5500U, GeForce GTX 1650 Mobile, 58.7 Wh | Lenovo IdeaPad 5 Pro 16ACH R7 5800H, GeForce GTX 1650 Mobile, 75 Wh | Dell Inspiron 16 Plus 7610 i7-11800H, GeForce RTX 3050 4GB Laptop GPU, 86 Wh | Asus Vivobook Pro 16X-M7600QE R9 5900HX, GeForce RTX 3050 Ti Laptop GPU, 96 Wh | Média da turma Multimedia | |
|---|---|---|---|---|---|---|---|
| Duração da bateria | 19% | 19% | 31% | 71% | 7% | 50% | |
| H.264 (h) | 8.4 | 10.3 23% | 10.4 24% | 16.8 ? 100% | |||
| WiFi v1.3 (h) | 8.1 | 9.8 21% | 10.1 25% | 12.6 56% | 9.9 22% | 11.3 40% | 12.3 ? 52% |
| Gaming (h) | 1.1 | 1.533 ? 39% | |||||
| Load (h) | 1.5 | 1.7 13% | 1.7 13% | 1.7 13% | 3.3 120% | 1.1 -27% | 1.645 ? 10% |
| Reader / Idle (h) | 20.1 | 7.6 | 20.5 | 20.3 | 24.9 ? | ||
| Witcher 3 ultra (h) | 2.2 | 1.2 |
Pro
Contra
Veredicto: Acer Swift X 16 por US$ 1200 é simplesmente muito caro
O compacto Acer Swift X 16 é bastante leve a 1,8 kg e silencioso sob carga graças aos modos de potência bem implementados da Acer. Os dispositivos de entrada são bons, enquanto o Thunderbolt 4 melhora a conectividade, embora falte um leitor de cartões SD, bem como uma porta LAN
O desempenho gráfico do robusto híbrido de escritório multimídia é suficiente para jogos Full HD ou criação de conteúdo ocasional. Este último também se beneficia do espaço de cores de 95% sRGB da tela de 16 polegadas. Isto também é ideal para o prazer da mídia, mas um formato 16:10 seria mais vantajoso para o trabalho. Considerando o preço bastante alto, a Acer poderia ter instalado uma versão mais potente do GeForce RTX 3050.
Por US$ 1.200, você obtém um dispositivo de trabalho de alto desempenho, relativamente silencioso e compacto para tarefas multimídia. Infelizmente, o display de 16 polegadas é um pouco escuro demais e não acompanha a concorrência, também em termos de alto-falantes e duração da bateria.
Considerando que este é suposto ser um laptop multimídia, algumas coisas nos incomodam. Por exemplo, a tela muito escura, os alto-falantes ruins, a webcam e as altas latências DPC. Além disso, a RAM é soldada e a duração da bateria de 8 horas é medíocre para a classe do laptop.
O Vivobook Pro 16X de Asus oferece melhor desempenho em quase todas as áreas: visor OLED 4K mais brilhante, CPU AMD Ryzen HX, tempos de execução mais longos, melhores alto-falantes e desempenho gráfico (TGP mais alto). Também podemos fazer afirmações semelhantes sobre o Dell Inspiron 16 Plus e o muito mais barato Lenovo Ideapad 5 Pro 16.
Preço e Disponibilidade
Os leitores são aconselhados a verificar diretamente através do site da Acer na Internet a disponibilidade em seu país. Tenha em mente que a Acer oferece uma variedade de configurações do SFX16-51G que variam de local para local. Nos exemplos seguintes, as diferenças em relação ao nosso modelo revisado(SFX16-51G-5388: Intel Core i5-11320H, Nvidia GeForce RTX 3050, 16 GB RAM e 512 GB SSD) são destacadas em negrito:
US(Intel Core i7-11390H, Nvidia GeForce RTX 3050Ti, 16 GB de RAM e 512 GB de SSD)
UK(Intel Core i7-11390H, Nvidia GeForce RTX 3050Ti, 16 GB de RAM e 1 TB SSD)
Canadá( Intel Core i7-11370H, Intel Iris Xe Graphics, 16 GB RAM e 512 GB SDD)
Os preços são a partir de 18.07.2022. Para comparação, nosso dispositivo revisado tinha um preço de varejo de EUR 1.200 (US$ 1.200).
Acer Swift X SFX16-51G-5388
- 07/15/2022 v7 (old)
Marvin Gollor
Price comparison

