Revisão do MSI Pulse GL66: A i9-12900H está melhorando o laptop para jogos RTX-3060 ou apenas tornando-o mais caro?
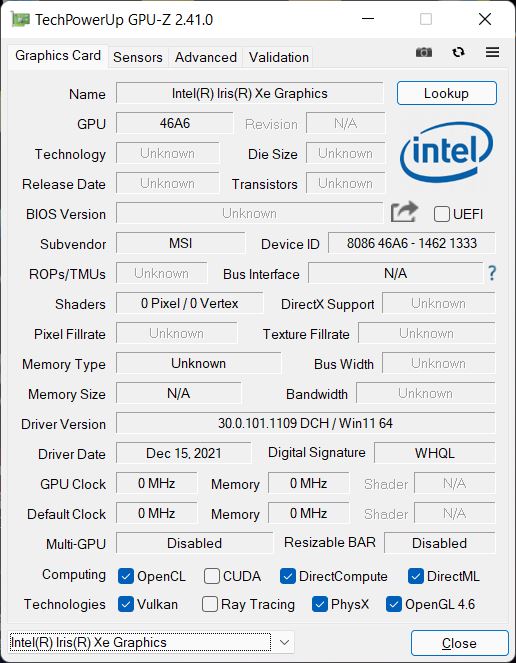
No ano passado, a série de jogos Pulse foi introduzida recentemente com os dois modelos GL66 e GL76, e este ano vem a atualização para Alder Lake. Como não testamos os dispositivos no ano passado, o teste desta série é novo para nós. Revisamos o GL66 de 15 polegadas em sua segunda iteração com umRTX 3060e Núcleo i9-12900Hque está disponível por cerca de 1.900 Euros (~$2057).
Já testamos a combinação de Alder Lake e RTX 3060 no Alienware x14 (14 polegadas) e Asus TUF Gaming F15como dispositivos de comparação adicionais, usamos outros laptops de 15 polegadas com a mesma GPU, tais como o Schenker XMG Apex 15oLenovo Legion S7e o Alienware m15 R5.
Possíveis concorrentes em comparação
Avaliação | Data | Modelo | Peso | Altura | Size | Resolução | Preço |
|---|---|---|---|---|---|---|---|
| 80.7 % v7 (old) | 04/2022 | MSI Pulse GL66 12UEK i9-12900H, GeForce RTX 3060 Laptop GPU | 2.3 kg | 25 mm | 15.60" | 1920x1080 | |
| 87.2 % v7 (old) | 03/2022 | Asus TUF Gaming F15 FX507ZM i7-12700H, GeForce RTX 3060 Laptop GPU | 2.1 kg | 24.95 mm | 15.60" | 1920x1080 | |
| 86.7 % v7 (old) | 03/2022 | Alienware x14 i7 RTX 3060 i7-12700H, GeForce RTX 3060 Laptop GPU | 1.8 kg | 14.5 mm | 14.00" | 1920x1080 | |
| 84.4 % v7 (old) | 11/2021 | Schenker XMG Apex 15 NH57E PS R7 5800H, GeForce RTX 3060 Laptop GPU | 2.1 kg | 29 mm | 15.60" | 1920x1080 | |
| 87.9 % v7 (old) | 11/2021 | Lenovo Legion S7 15ACH6 82K80030GE R9 5900HX, GeForce RTX 3060 Laptop GPU | 2 kg | 18.9 mm | 15.60" | 3840x2160 | |
| 84.7 % v7 (old) | 06/2021 | Alienware m15 R5 Ryzen Edition R7 5800H, GeForce RTX 3060 Laptop GPU | 2.5 kg | 22.85 mm | 15.60" | 1920x1080 |
Caso
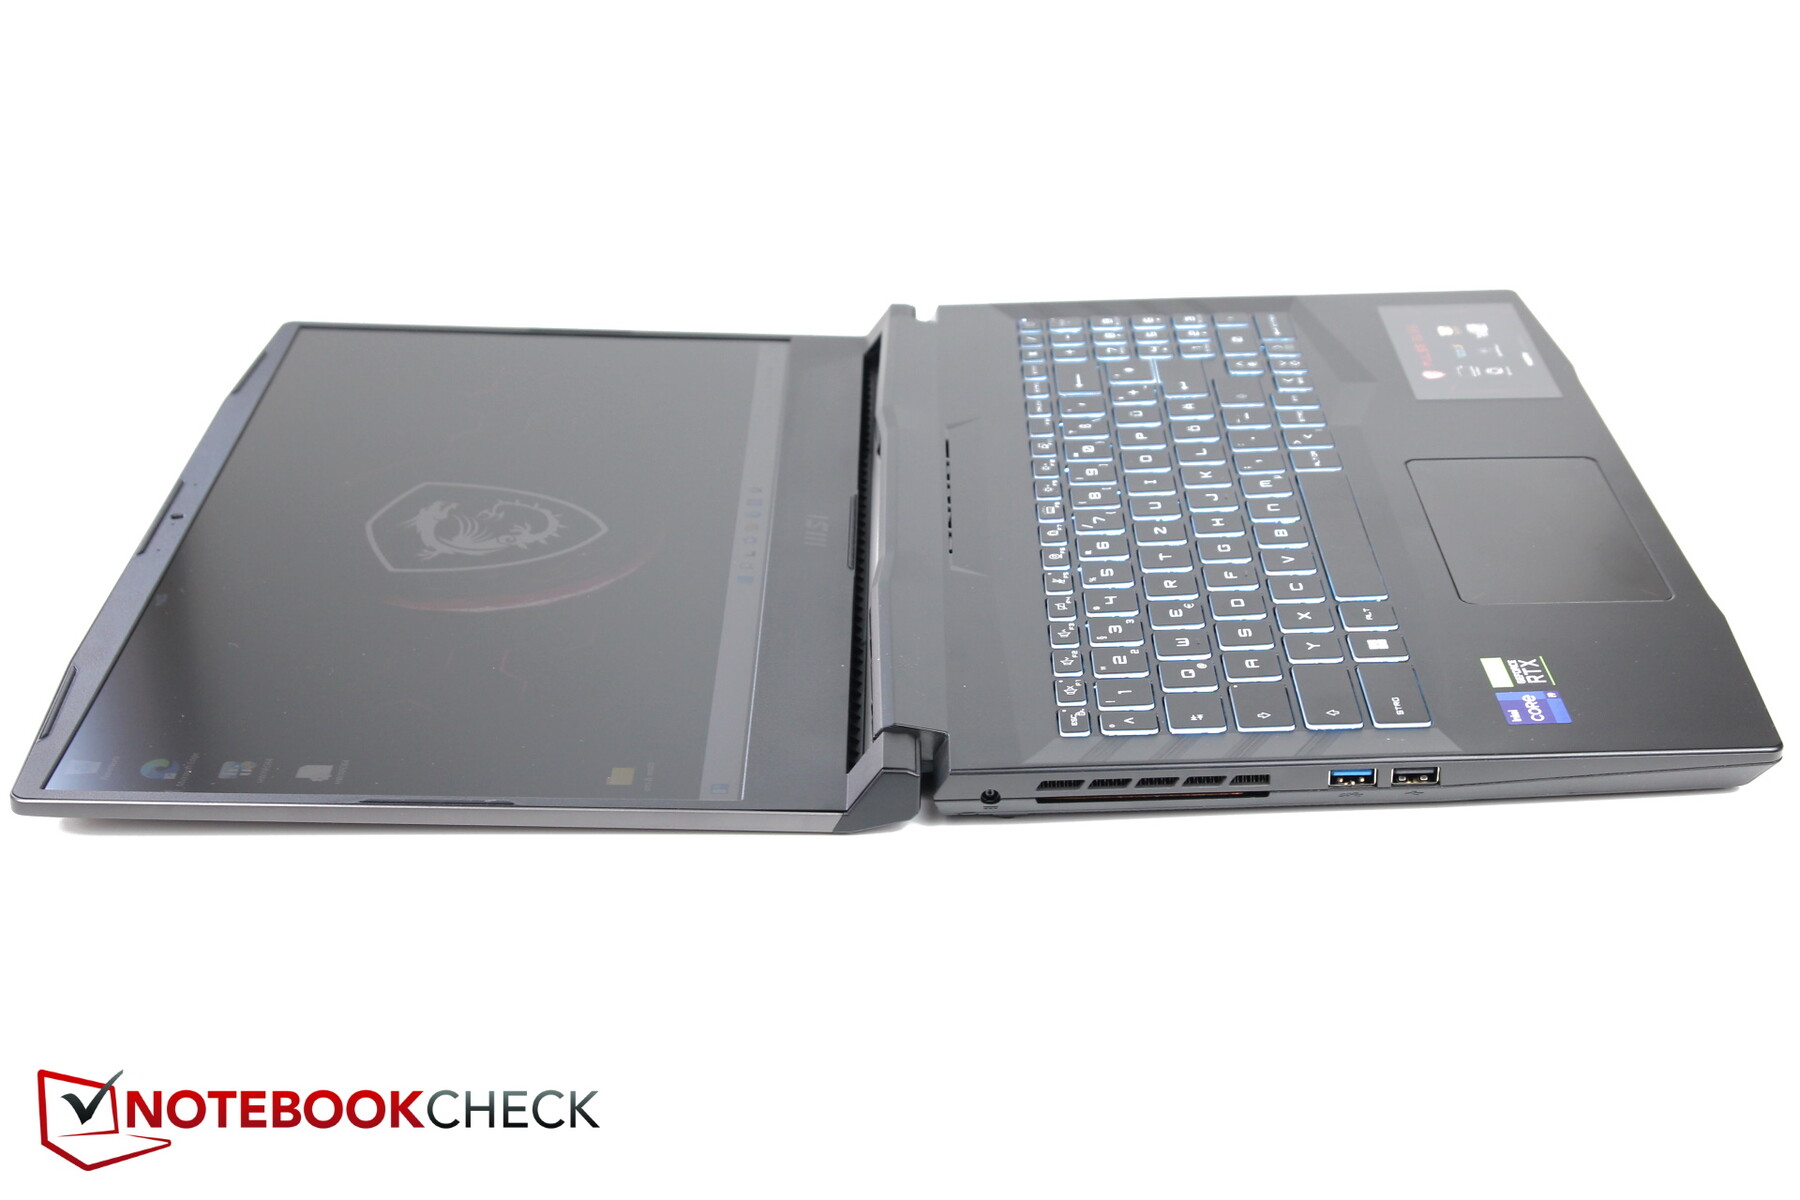
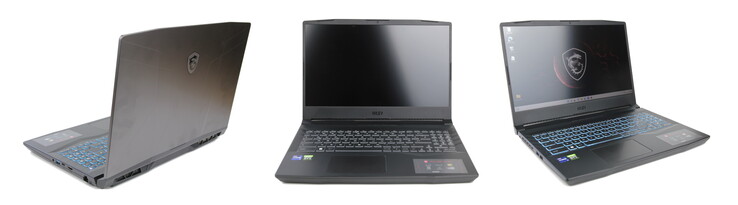
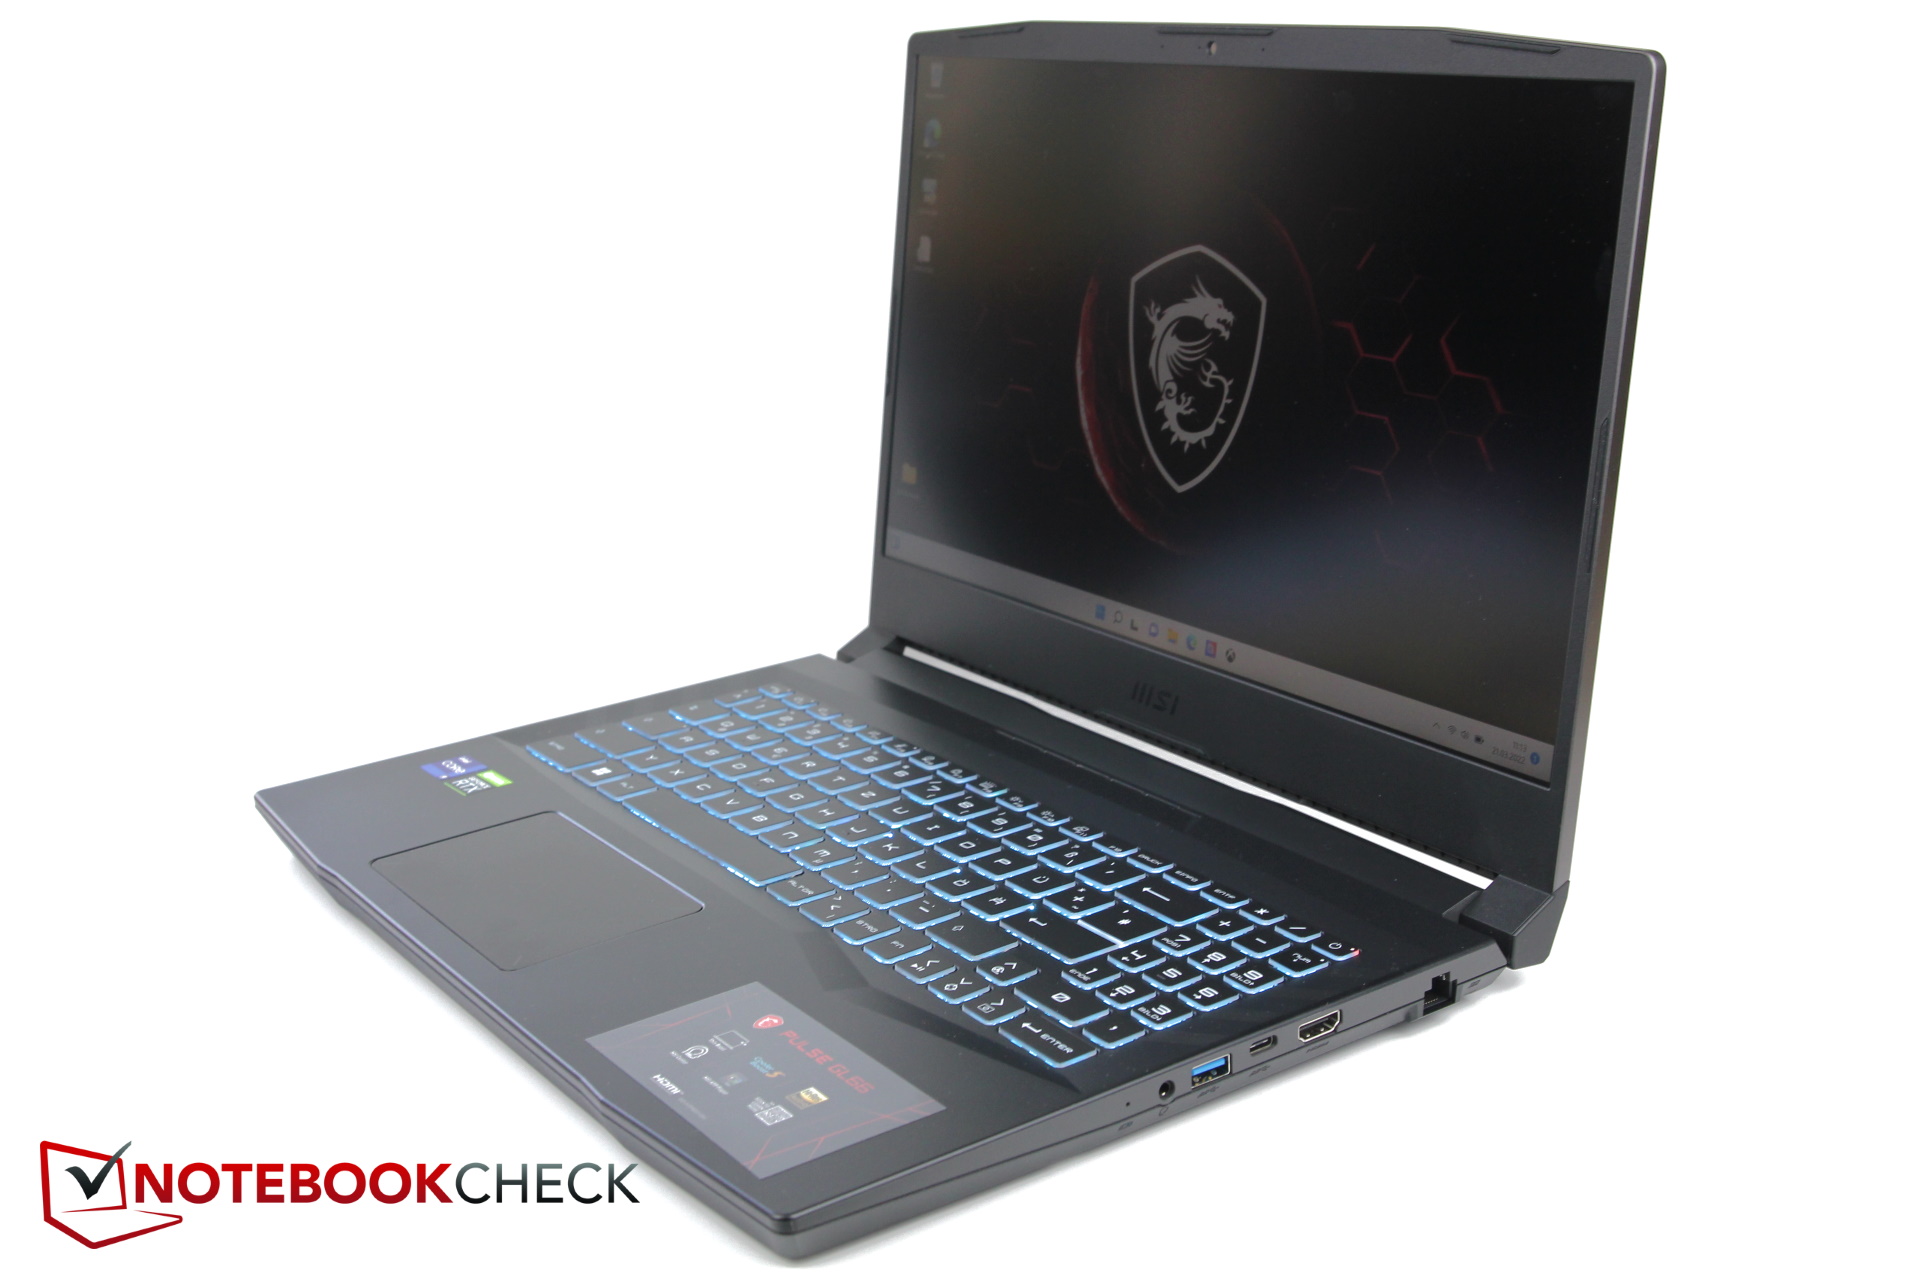
Somente a tampa do display do Pulse é feita de metal e o restante do laptop é feito de plástico. Isto torna a tampa bastante resistente ao empenamento. Seu ângulo máximo de abertura é de quase 180 graus. As duas dobradiças nas laterais fazem um bom trabalho, mas como devido à sua construção metálica a tampa não é particularmente leve, ela pode abrir completamente acidentalmente quando se move o laptop, particularmente se for aberta a mais de dois terços do caminho.
Um entalhe na base permite que você abra o laptop facilmente com uma mão. Embora a base também seja bastante estável, as tentativas de empenamento também podem produzir alguns ruídos crepitantes às vezes
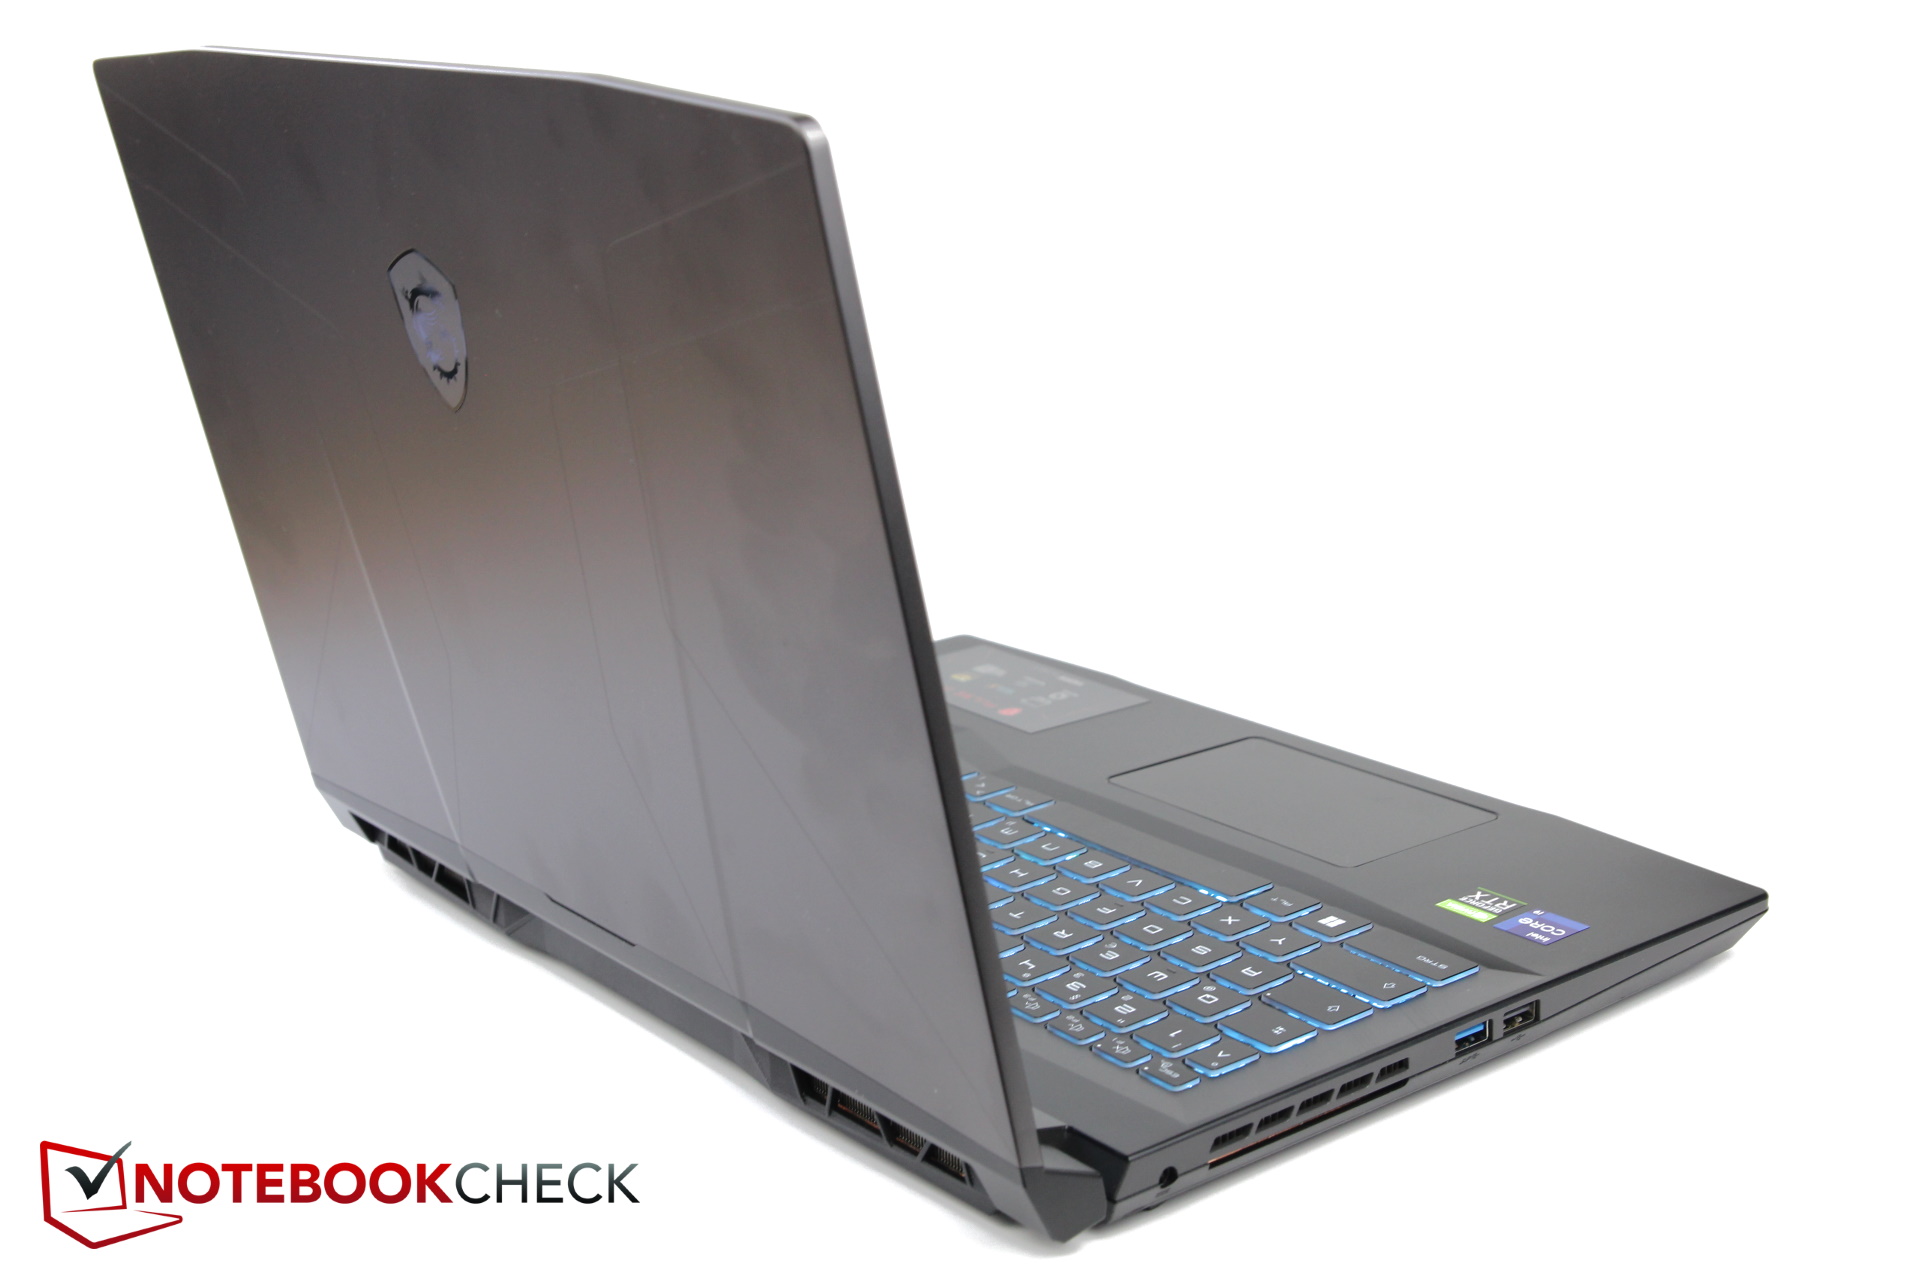
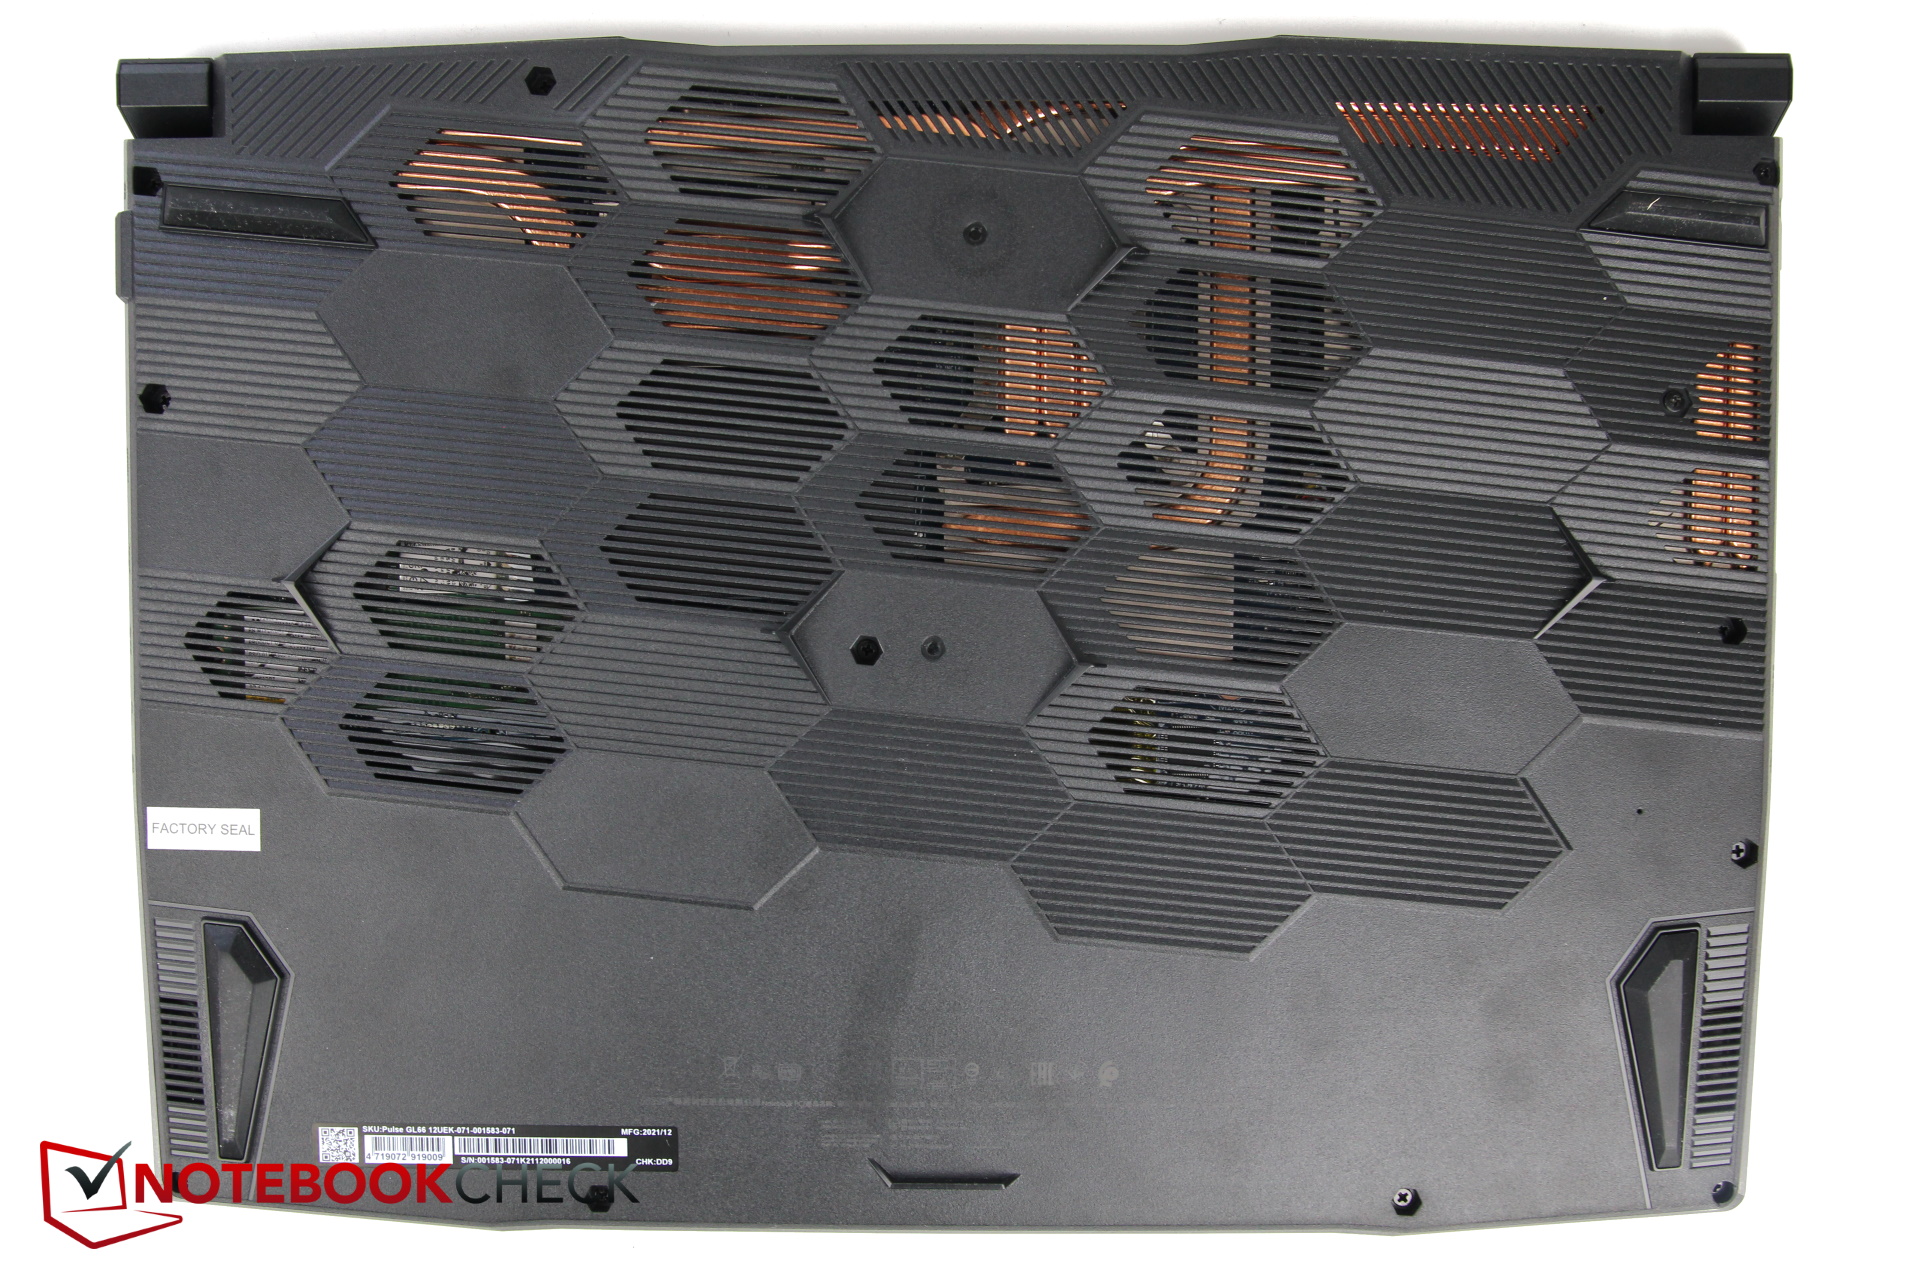
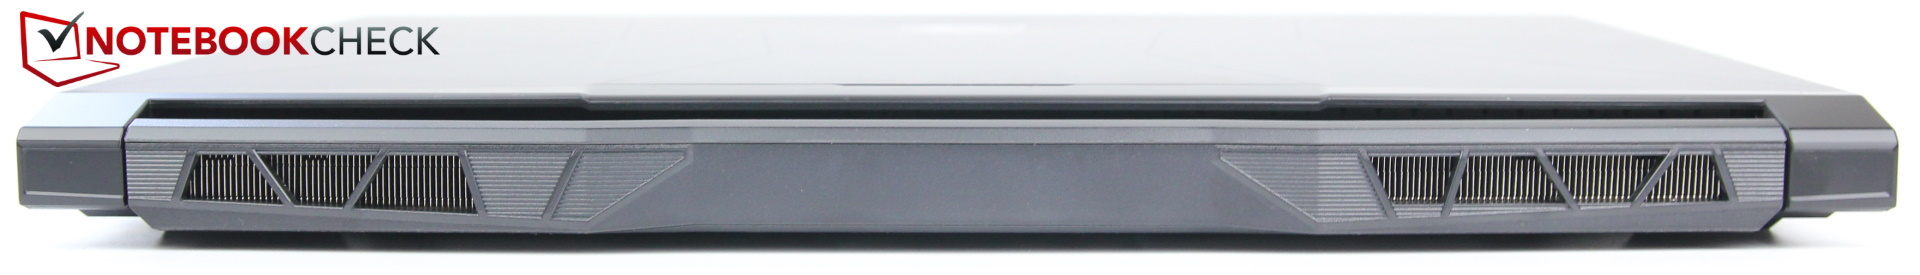
O teclado é ligeiramente recuado, de modo que os apoios da palma da mão são minimamente elevados. O fundo da caixa é feito de plástico fino e coberto por muitas estruturas grandes, tipo favo de mel, algumas das quais são ventiladores de ventilação. O ar de exaustão sai pela parte de trás e do lado esquerdo em direção à parte de trás.
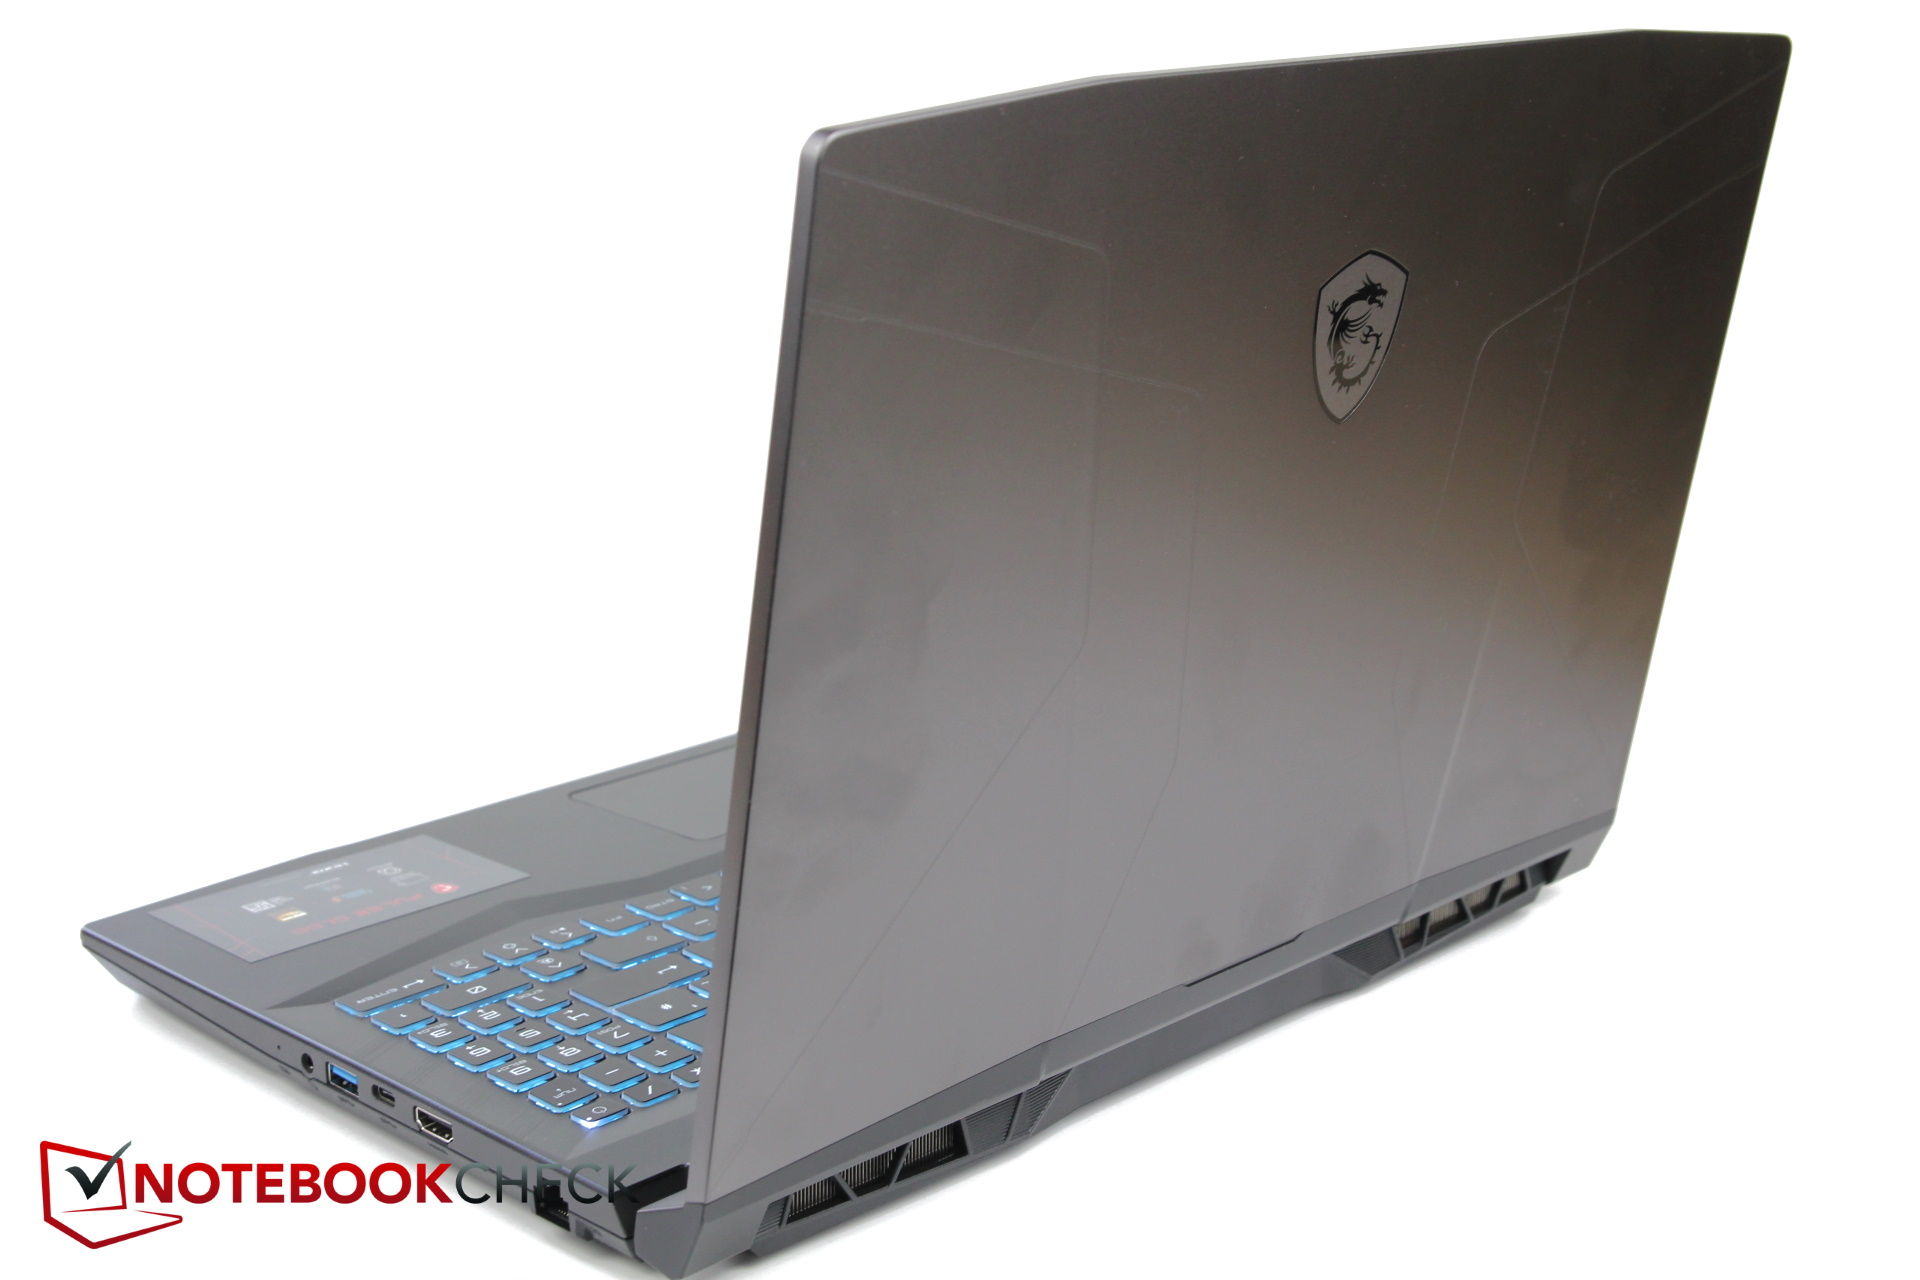
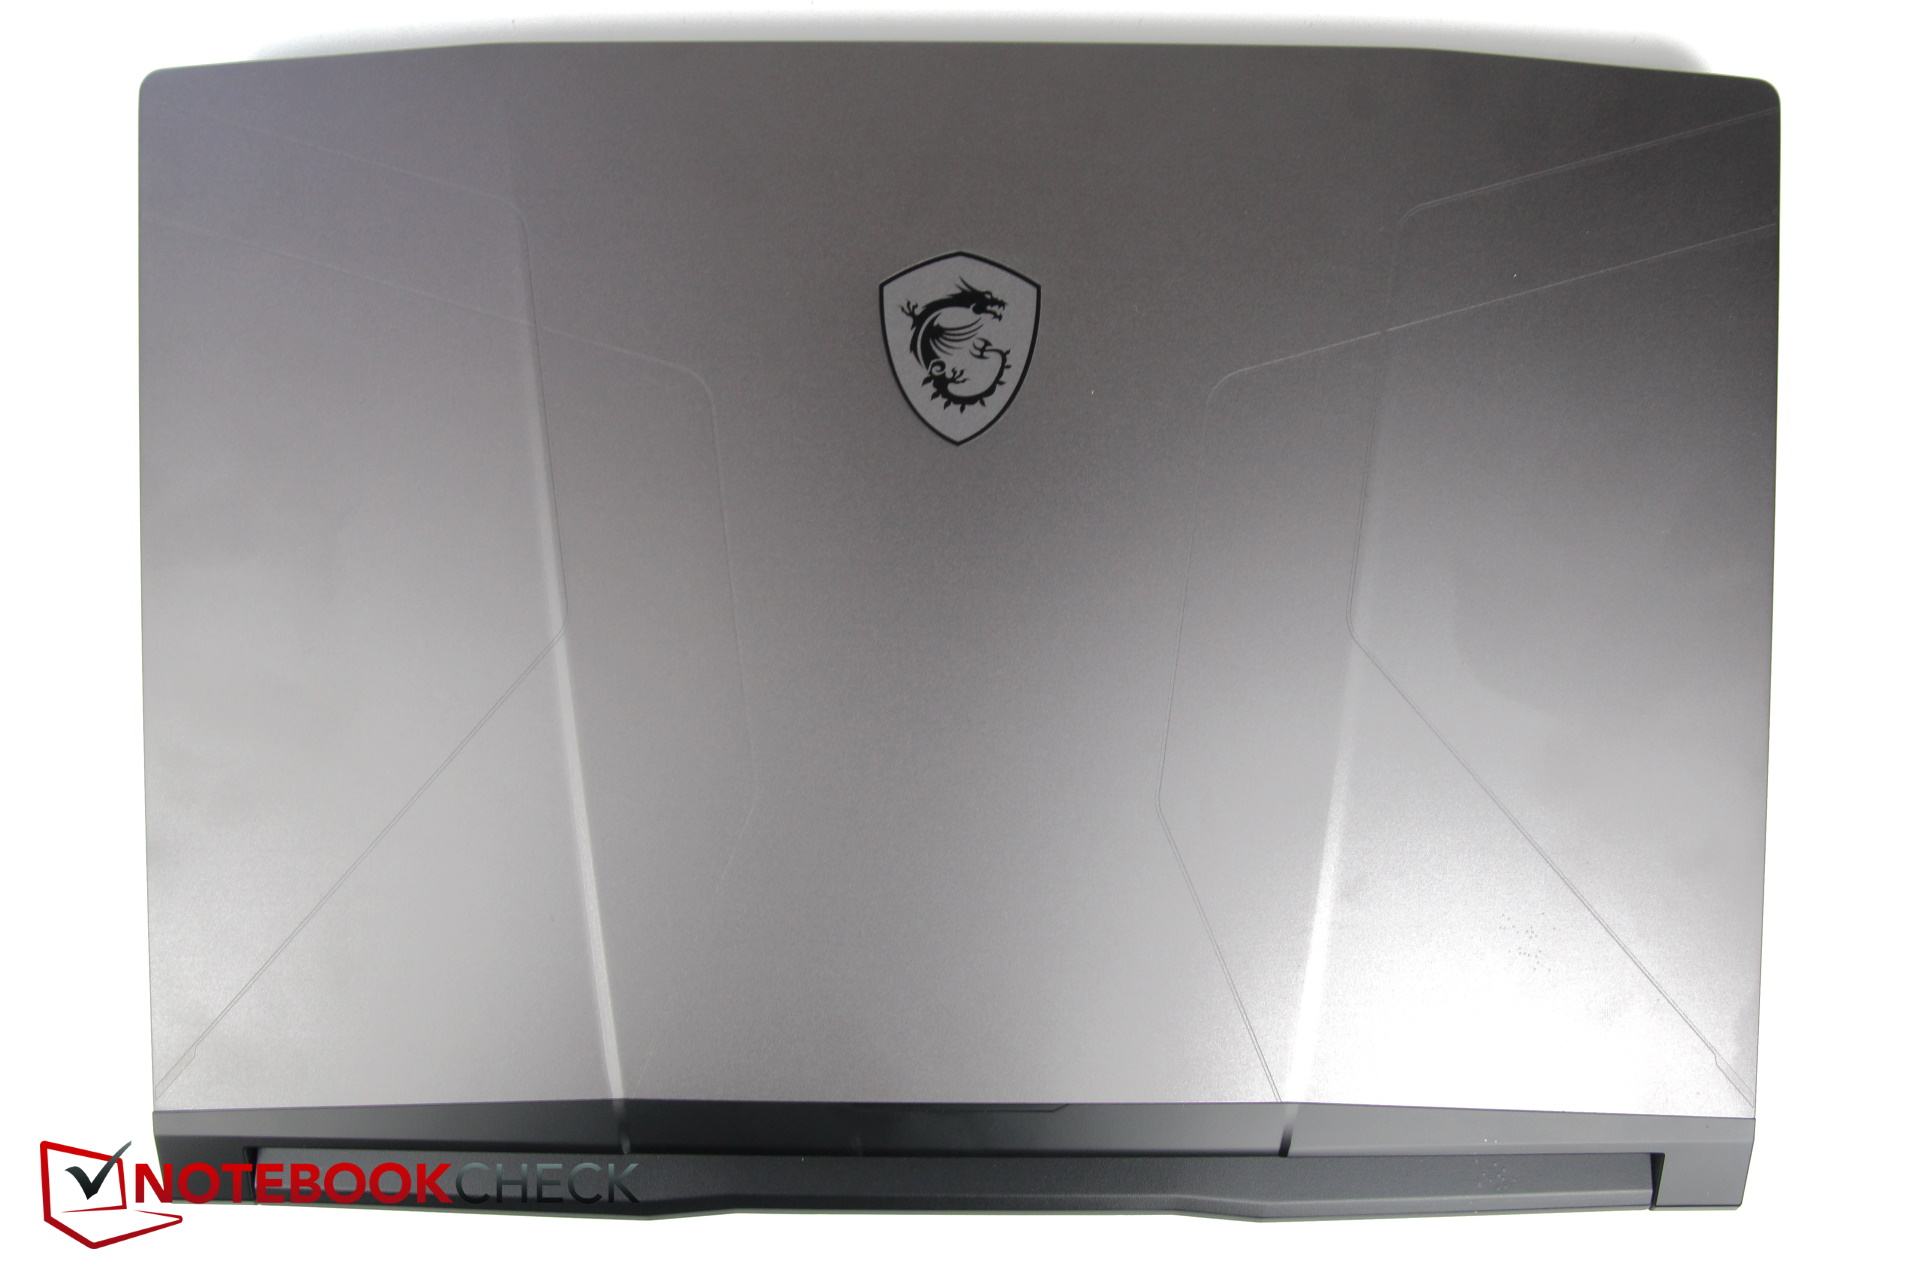
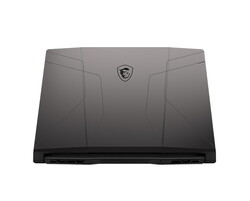
O design é direcionado para os jogadores sem ser excessivamente ornamentado. O topo cinza prateado exibe de forma proeminente o logotipo do escudo tipo Porsche com o dragão, e a base e o fundo são mantidos em um preto escuro. O acabamento parece ser bom, e não notamos nenhuma lacuna irregular.
Exceto para o Alienware m5 maior, a maioria dos laptops em nosso campo de testes tem aproximadamente o mesmo comprimento e largura. A espessura do MSI o coloca no meio do campo. Entretanto, a espessura especificada do MSI de 23,4 mm (~0,92 pol.) é mais provável que se refira ao lugar mais fino, e o laptop mede mais como 25 mm (~0,98 pol.) em direção à parte de trás.
O Legion S7 e o Alienware x14 mostram que os laptops para jogos também podem ser mais finos, mas tanto o XMG Apex quanto o TUG Gaming F15 são mais espessos. Em termos de peso, o MSI é um dos modelos mais pesados e somente o Alienware m5 é ainda mais pesado.
Equipamento
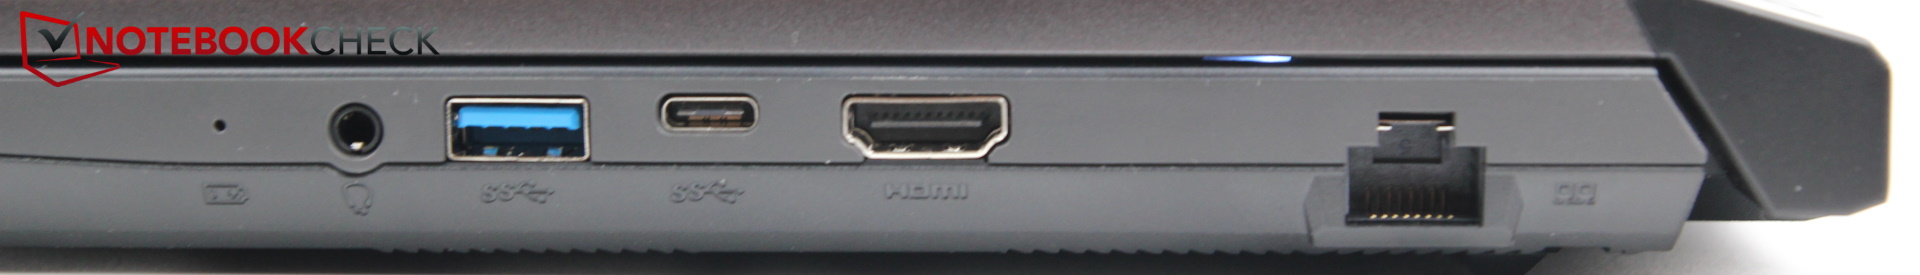
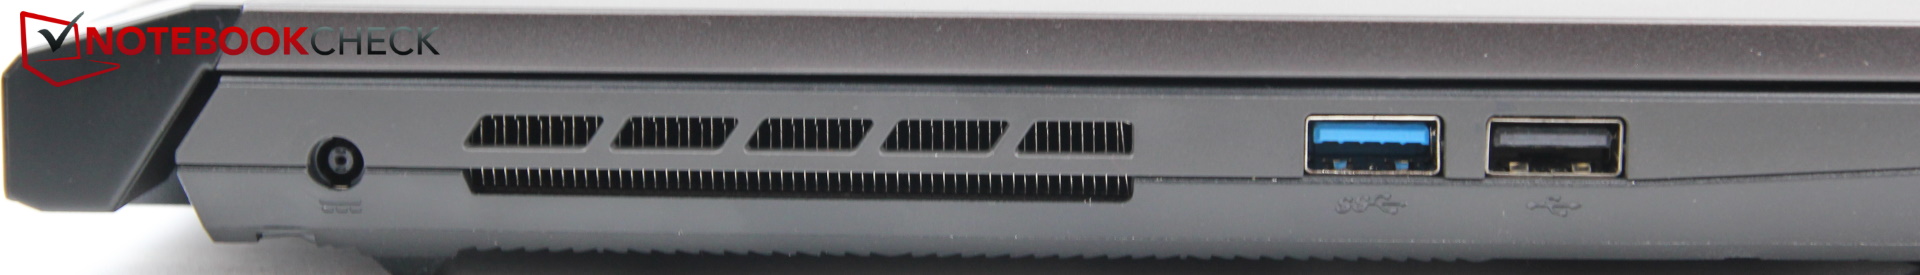
Apenas as conexões mais necessárias estão presentes, mas nada mais. Existem quatro portas USB no total, com uma delas no formato USB-C. Infelizmente, isso também é apenas 3.2 Gen 1, que é quase o mesmo que USB 3.0 (5Gb/s). Falta o Thunderbolt, assim como um leitor de cartões SD. Uma das três portas USB-A suporta até mesmo apenas a velocidade 2.0, que não está mais de acordo com os padrões atuais.
Mas o que é pior, é que a porta USB-C não funcionou corretamente. Nosso SSD externo em um estojo M.2 constantemente re-anuncia-se na porta USB-C. Enquanto a luz do SSD permanecia ligada consistentemente, o sistema operacional continuava registrando-o e desregistando-o continuamente. Um reinício também não ajudou, e tivemos que mudar para o uso de um adaptador USB-C para A. Depois disso, o problema não aconteceu mais. Encontramos o mesmo problema com o MSI Katana, mas o Asus TUF Gaming F17 ou ROG Strix Scar que também estamos testando ao mesmo tempo não teve o problema. Talvez nosso plugue USB-C não possa ser inserido suficientemente fundo nas portas MSI.
A distribuição das portas também é inferior à ideal. A maioria das portas está do lado direito, incluindo a porta HDMI com seus plugues potencialmente grandes e cabos rígidos. Isto é um incômodo para usuários destros. Além disso, as portas são colocadas bastante próximas umas das outras, particularmente as duas portas USB-A do lado esquerdo, que de outra forma estaria vazia de conexões.
Devemos também mencionar que a tomada não se encaixa muito bem. Durante nosso teste, aconteceu várias vezes que ela escapou pela metade do caminho sem que percebêssemos.
Comunicação
O Pulse se conecta à WLAN através de um módulo Intel AX201. Seu potencial não é totalmente utilizado, e as taxas de transferência estão na parte inferior de nossa comparação.
Webcam
É utilizada uma webcam padrão 720p. Durante anos, não houve realmente nenhuma atualização importante em muitos laptops nesta área, quer isto esteja relacionado ou não à escassez de Corona. Mas pelo menos os desvios de cor permanecem dentro dos limites.


Segurança
O Pulse não tem muito a oferecer aos puristas de segurança, e não há nem um sensor de impressão digital nem uma conexão Kensington. No entanto, o TPM 2.0 está, naturalmente, incluído.
Acessórios e Garantia
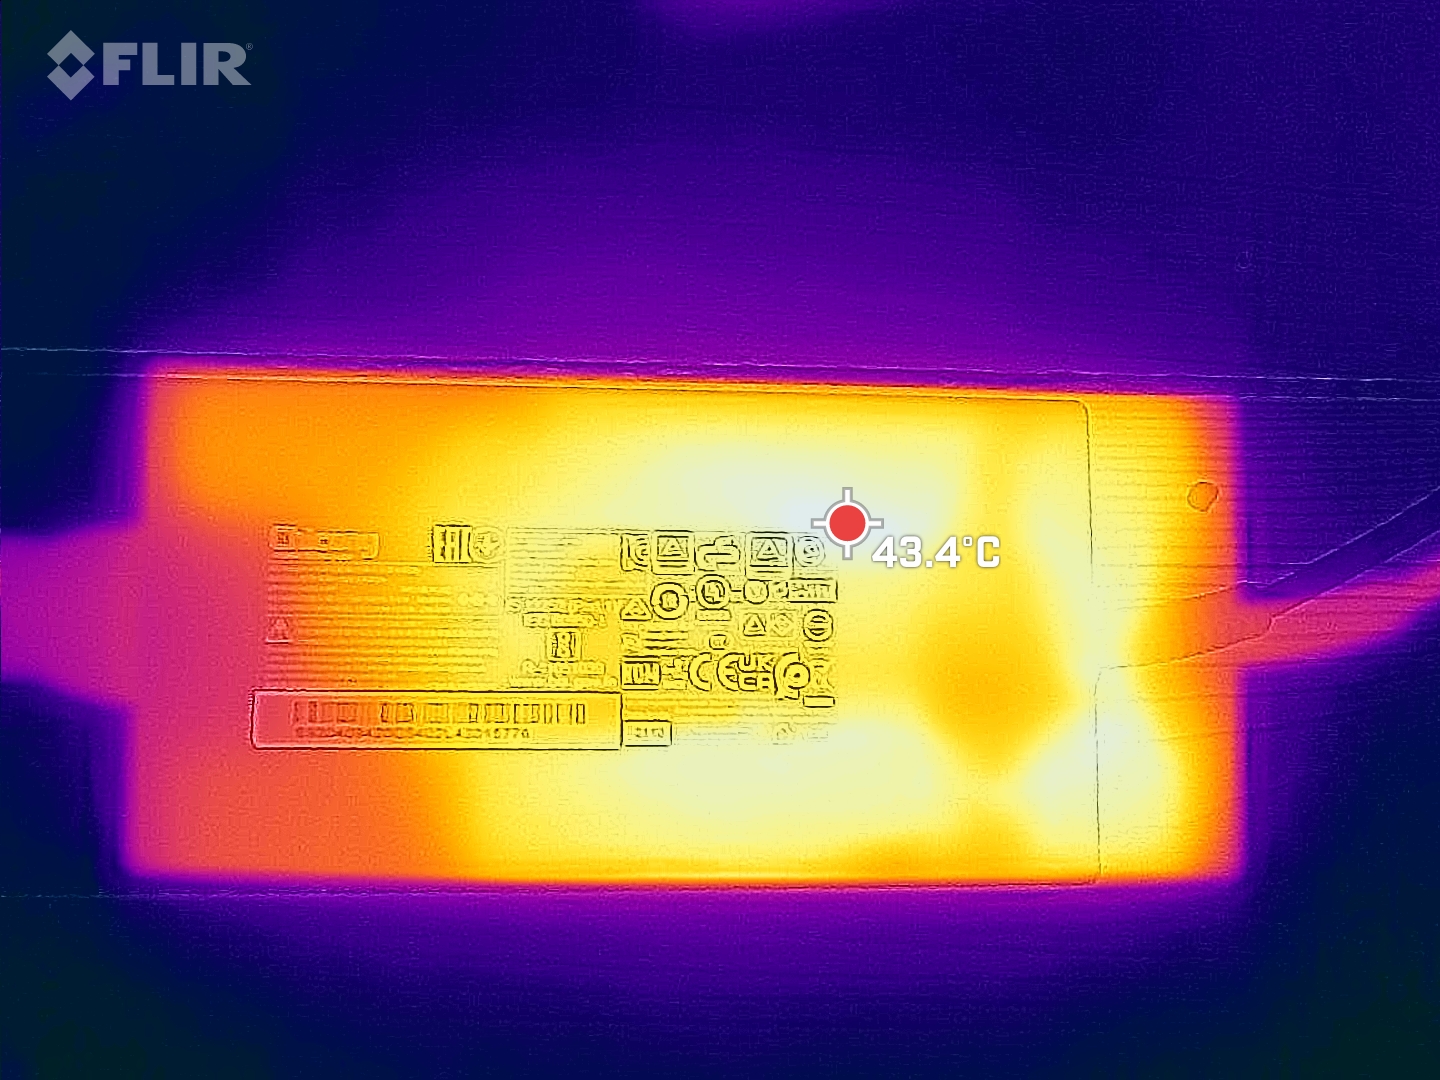
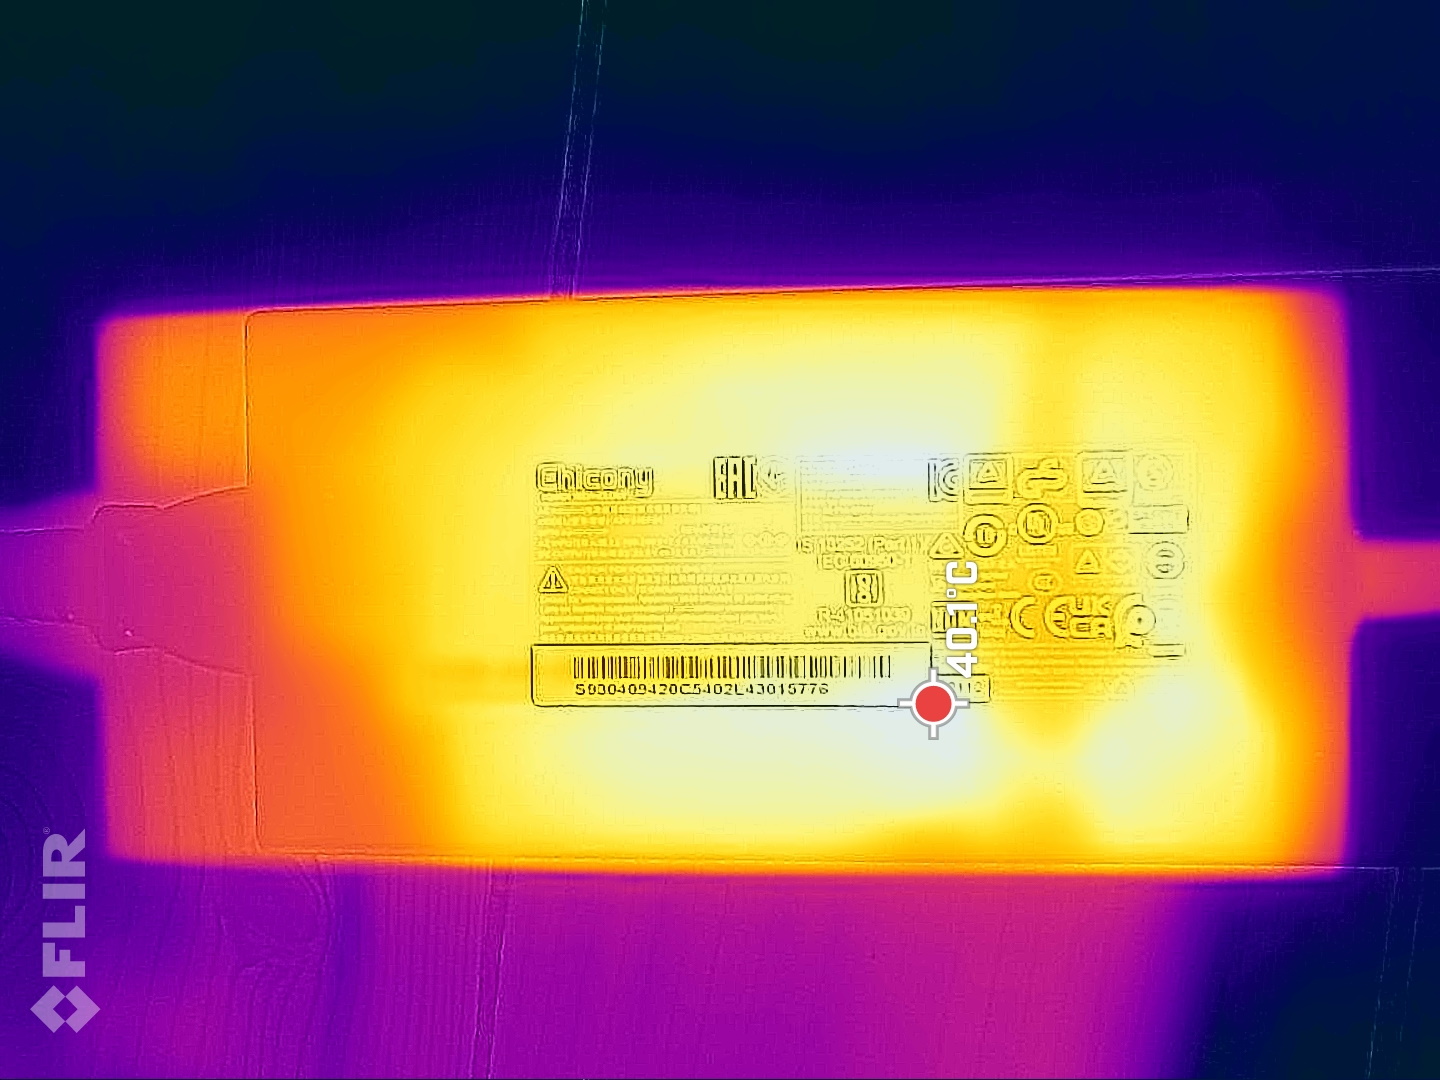
Além de alguns adesivos "legais" e a fonte de alimentação de 240 watts, a MSI não inclui mais nada que valha a pena mencionar com o laptop. A garantia cobre 24 meses de serviço de coleta e devolução.
Manutenção
A MSI esconde um dos parafusos atrás de um adesivo. Nossa unidade de teste é um emprestador fornecido pela loja Cyberport, por isso não quisemos danificar o selo do adesivo para abrir o dispositivo. Entretanto, de acordo com a MSI, o dispositivo também pode ser aberto pelo cliente para tarefas de manutenção. Desde que isto seja feito "profissionalmente", a garantia do dispositivo não deve ser afetada.
Dispositivos de entrada
Teclado
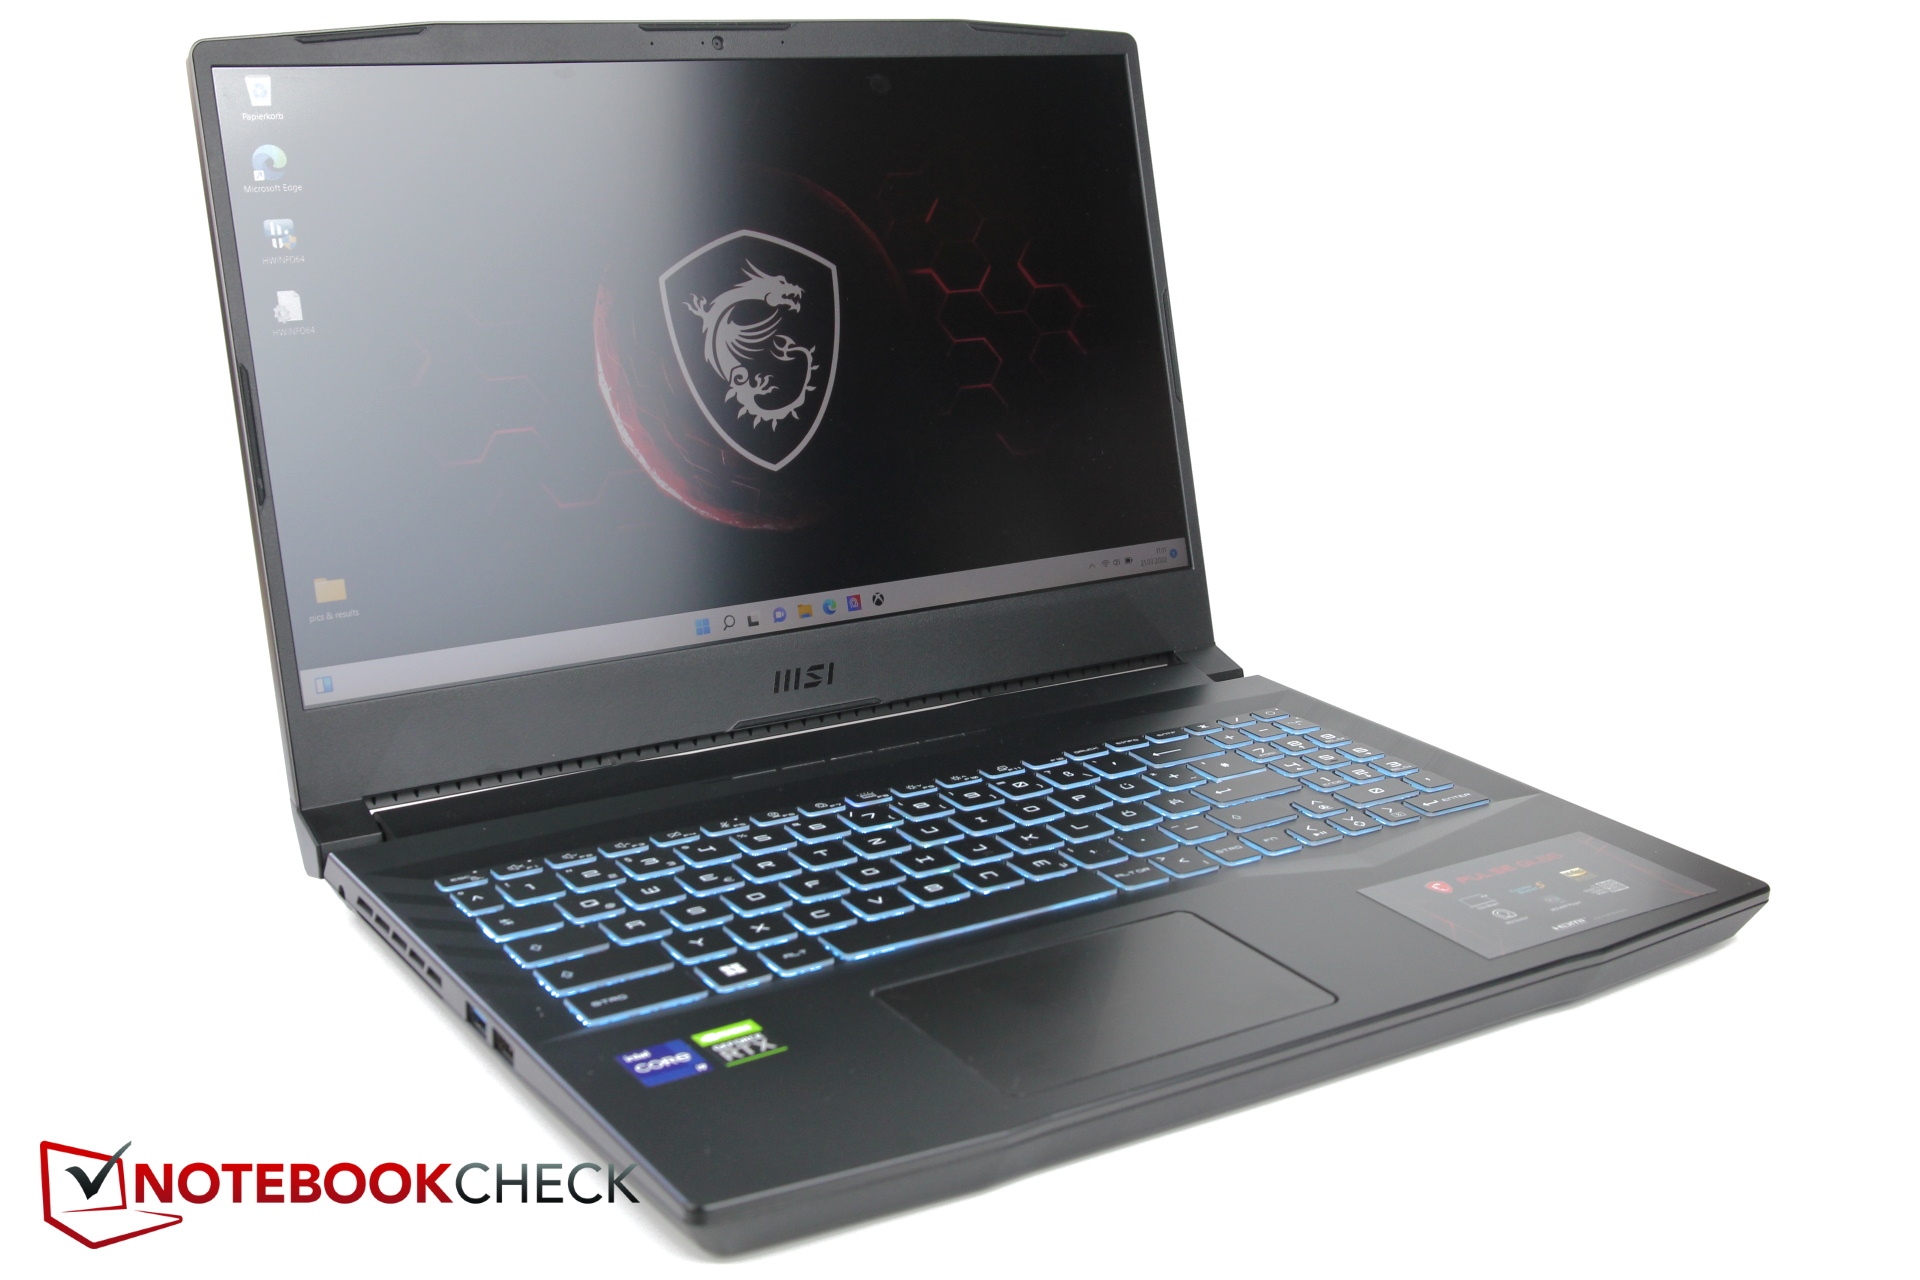
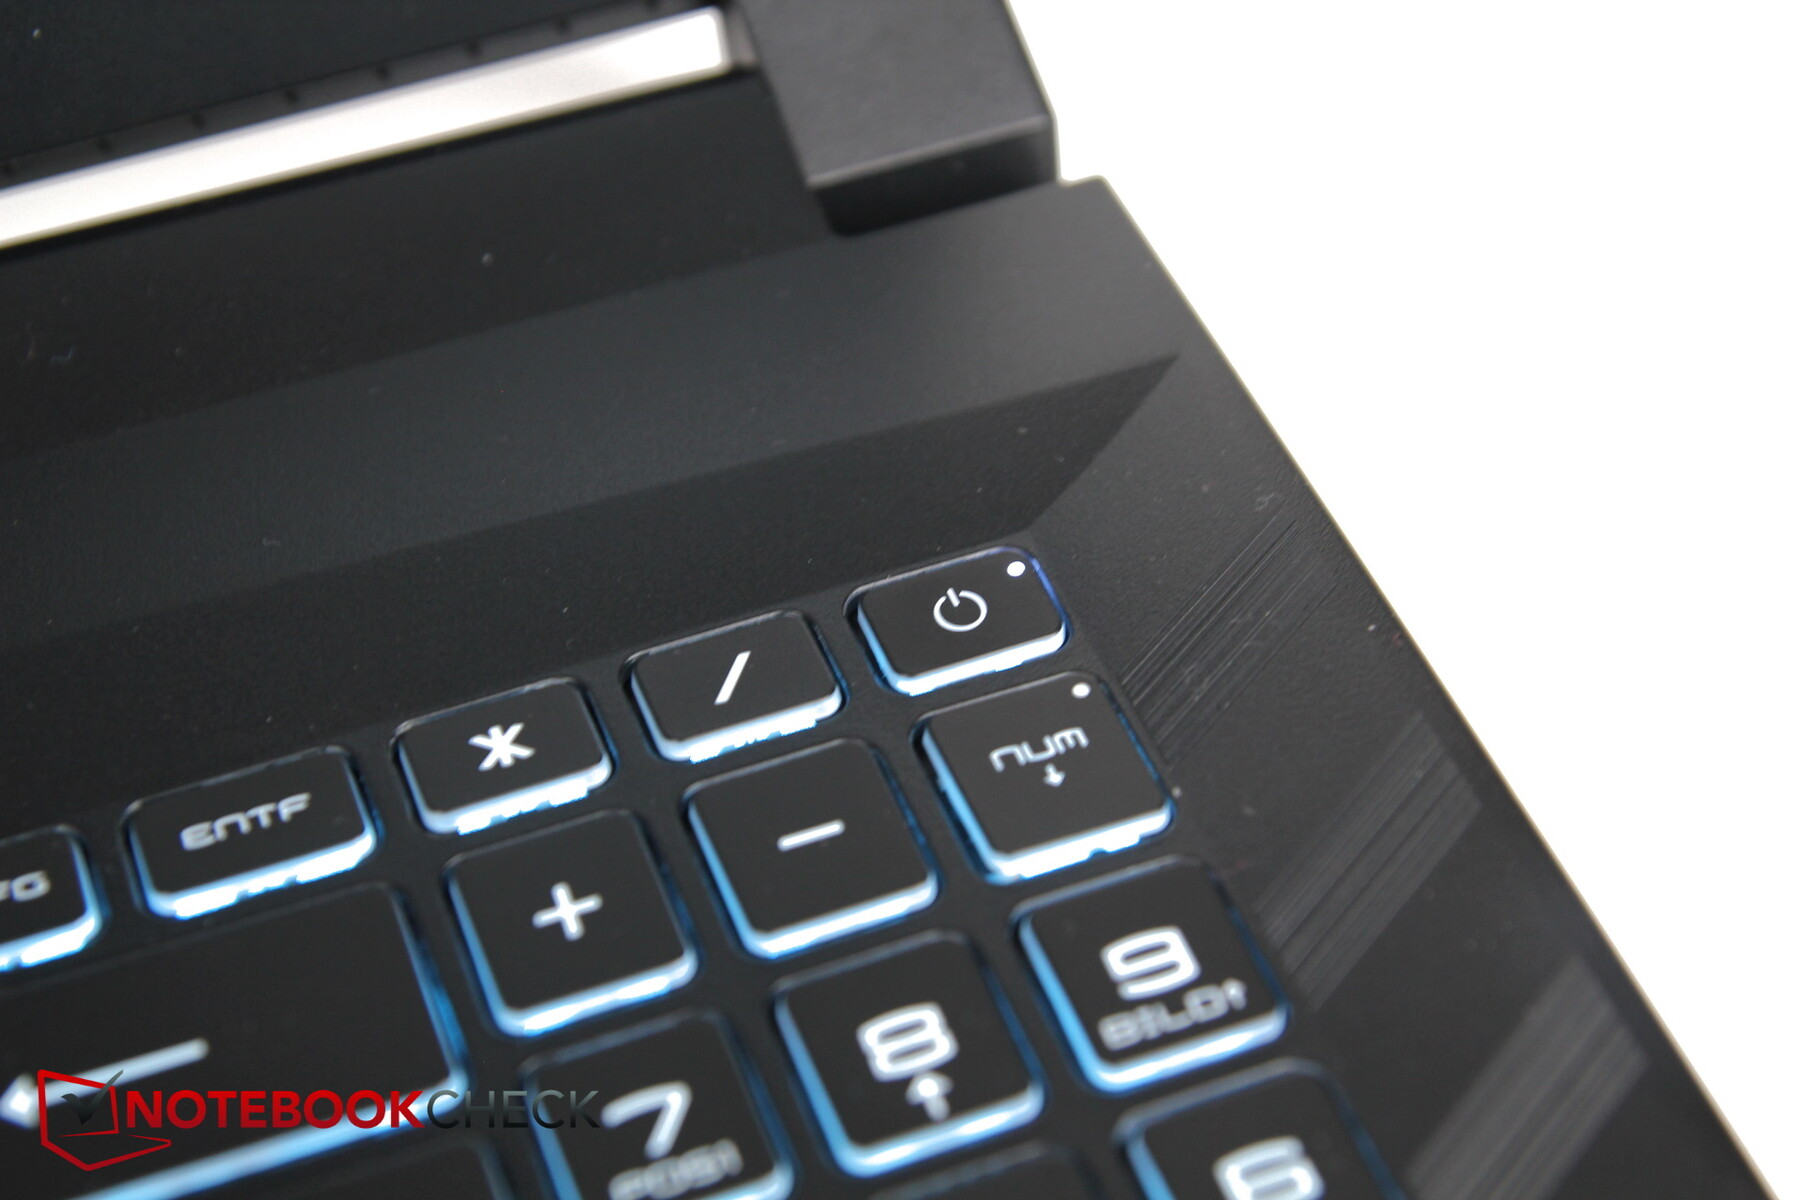
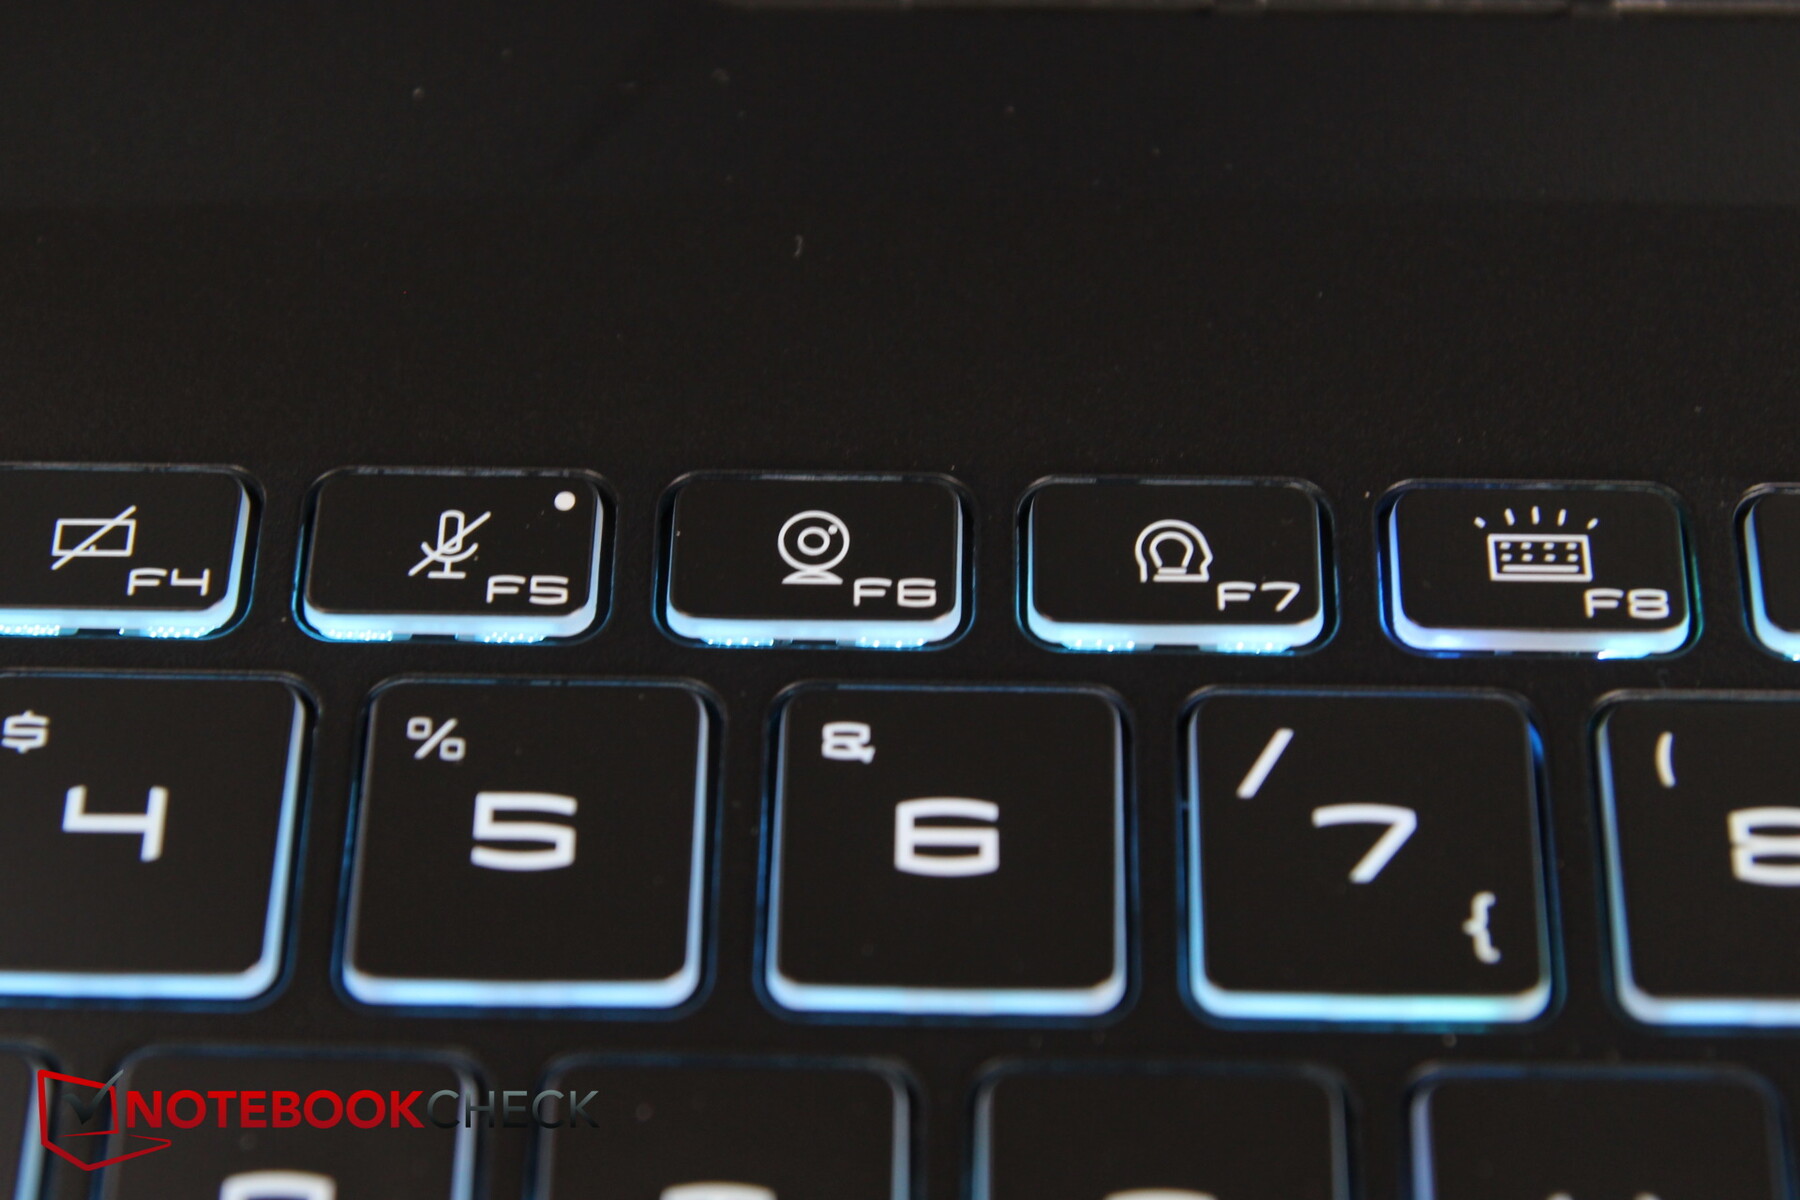
O teclado mostra uma grande semelhança com outros laptops MSI, tais como a série Katana. O layout parece bem arranjado, mas com suas teclas próximas umas das outras e algumas delas também muito pequenas, também parece um pouco abarrotado. Particularmente as chaves F e ainda mais o teclado numérico que é apertado ao lado delas se tornaram muito pequenos.
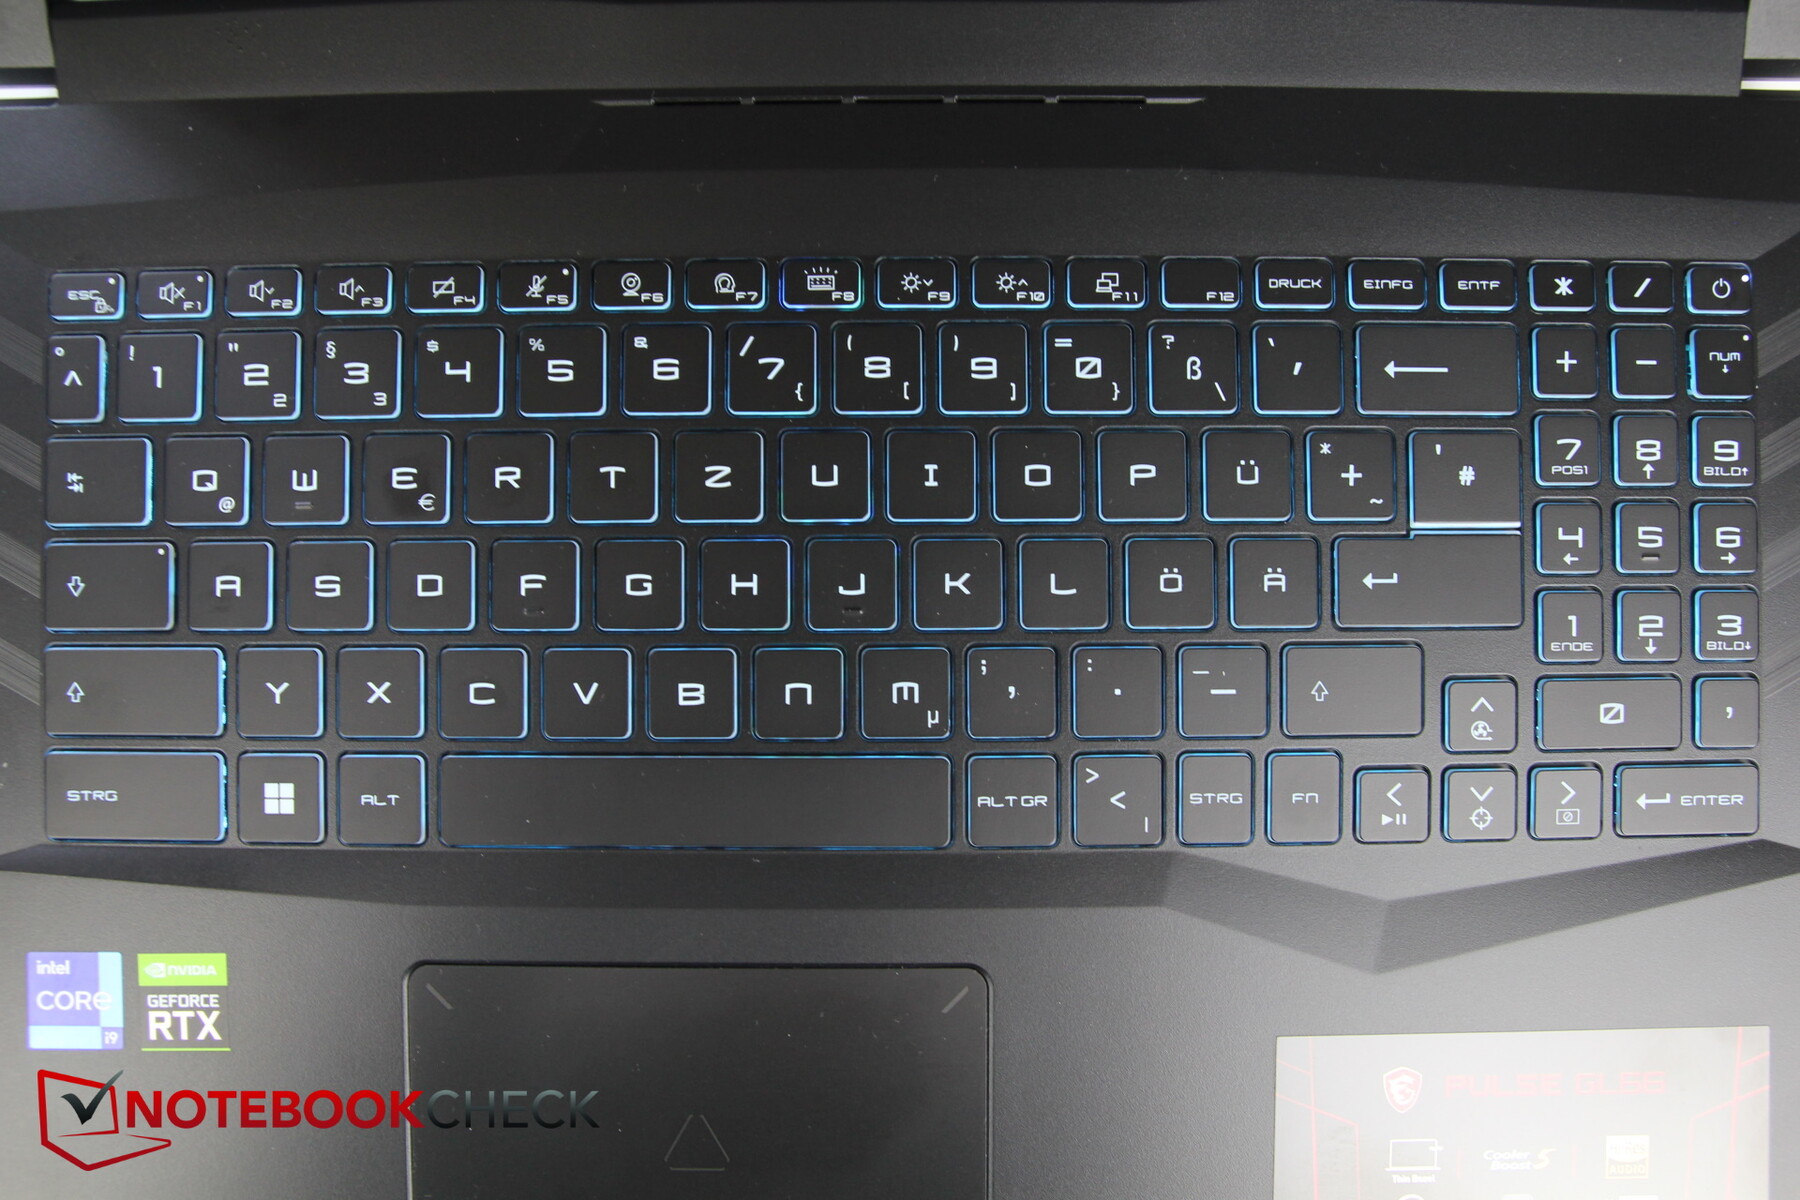
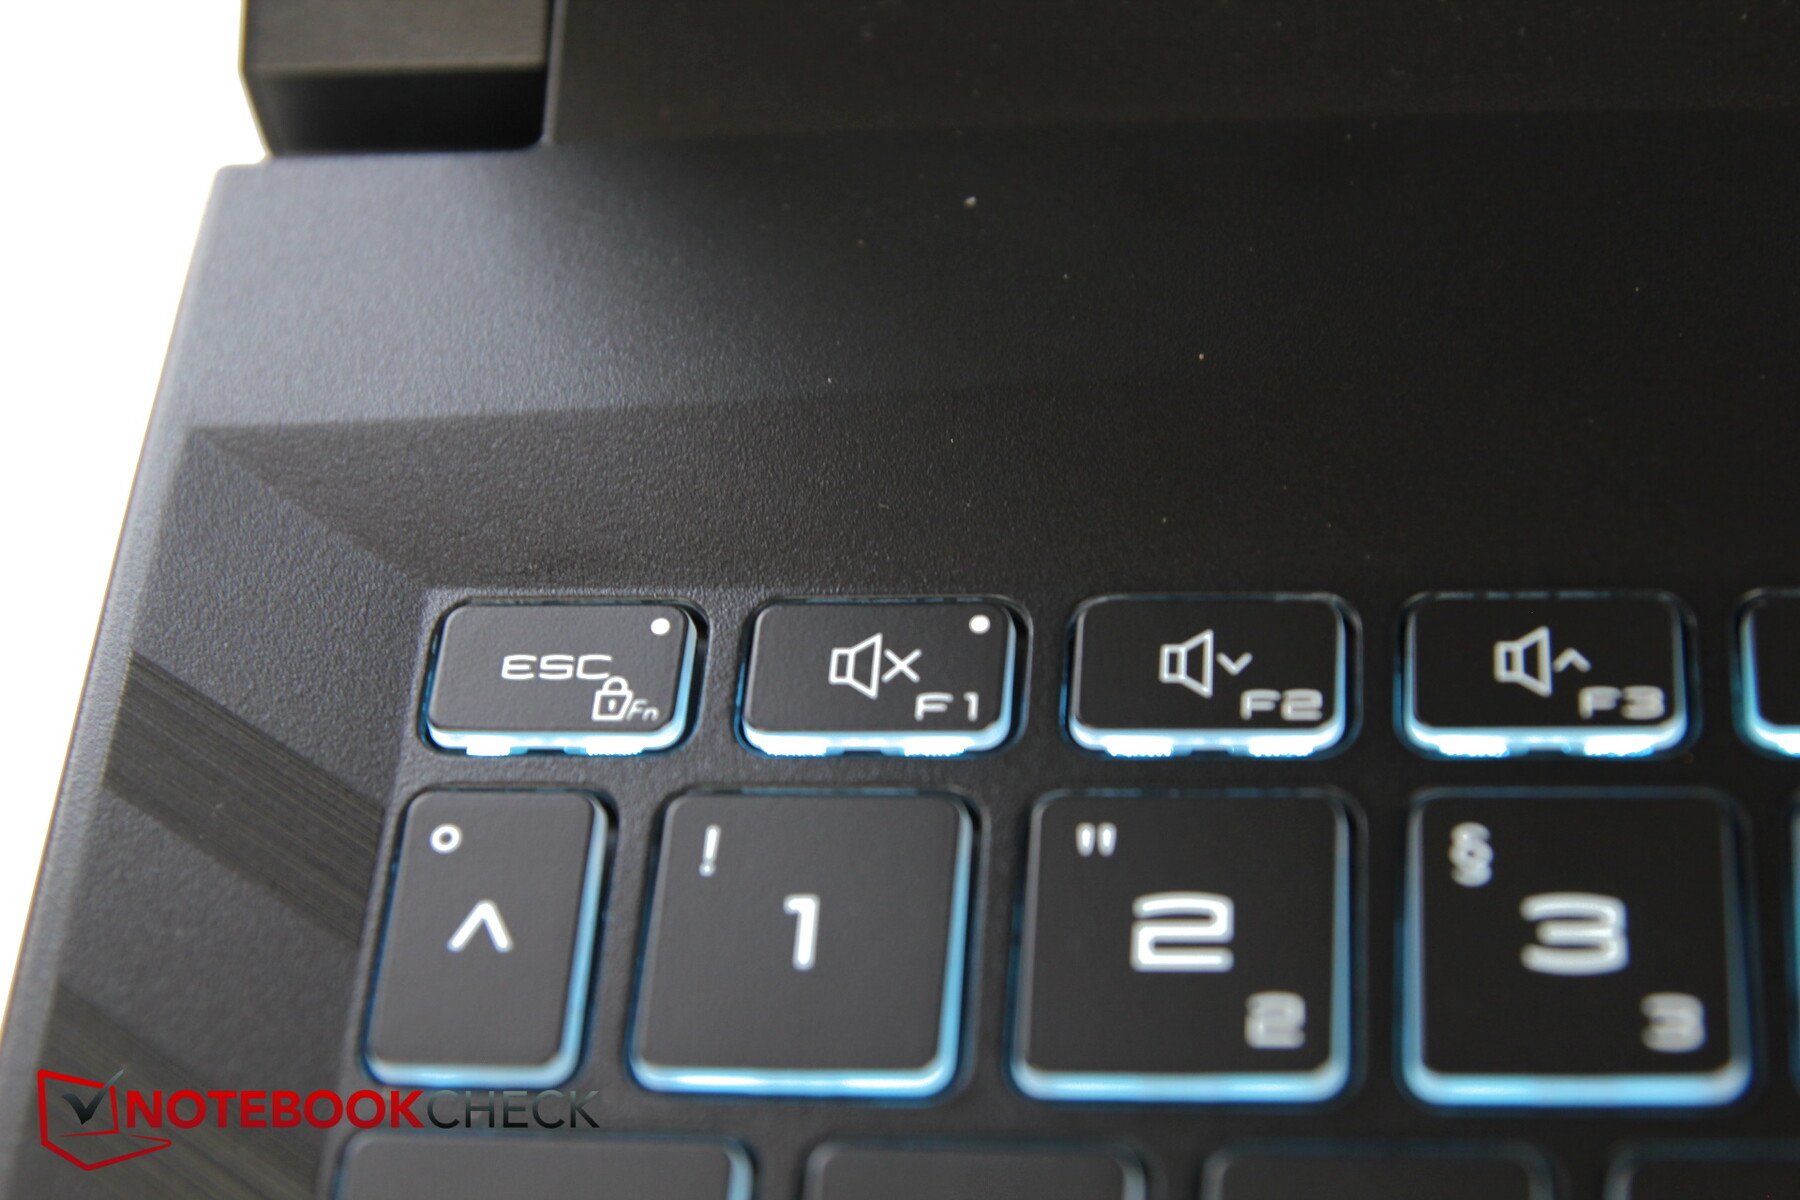
Como é típico da MSI, a chave Fn é colocada do lado direito em vez do lado esquerdo, mas ela pode mudar de função com a chave Windows do lado esquerdo. As teclas de seta também abrigam funções especiais como ligar o aumento do ventilador, desligar o visor ou sobrepor a retícula.
A rotulagem das teclas é fácil de ler e usa um estilo de fonte futurista que provavelmente deve atrair os jogadores.
Embora haja um curto curso, o feedback é bom, permitindo que você digite fácil e rapidamente. O teclado não se dobra irritantemente sob pressão, e o ruído de digitação é moderado.
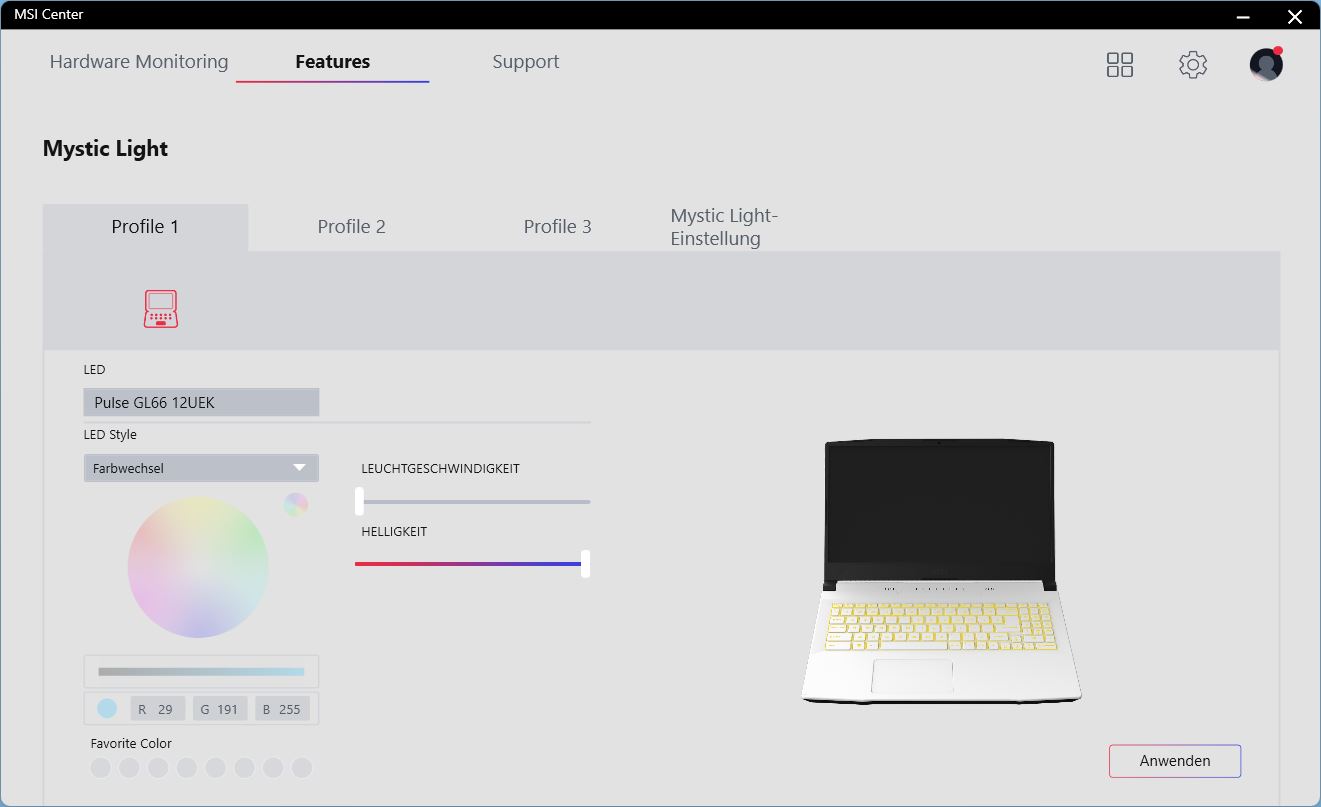
Embora haja uma iluminação de teclado, ela tem apenas uma única zona. Você pode ajustar a cor e muitas outras configurações no MSI Center.
Touchpad
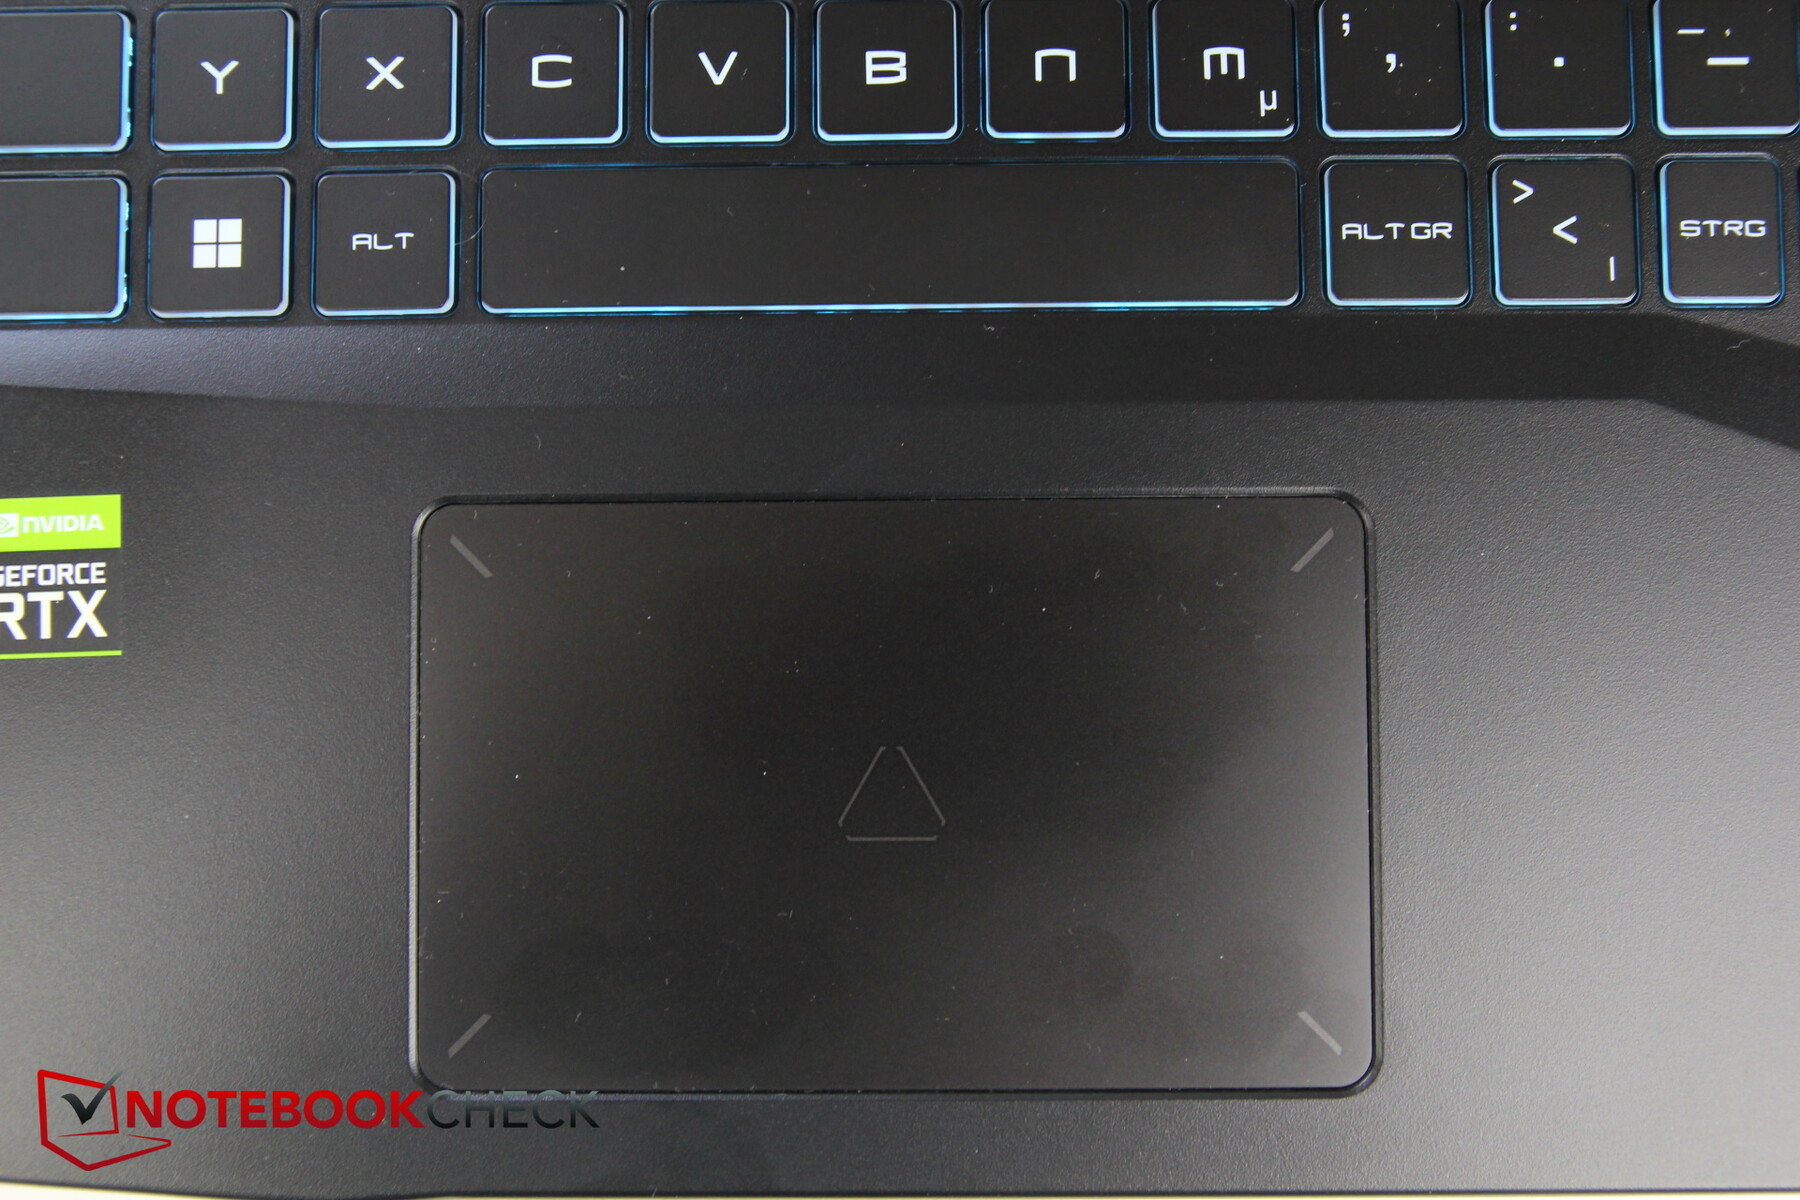
O touchpad não parece muito grande, com cerca de 10,5 x 6,5 cm (~4,1 x 2,6 pol.). Enquanto a superfície é lisa, os dedos já podem colar um pouco quando estão apenas ligeiramente molhados. As entradas multi-toque ainda funcionam muito bem.
As teclas integradas do mouse têm um ponto de pressão claro, muito curto e nítido. Elas são ligeiramente mais altas do que o teclado, mas não em uma extensão que seja particularmente irritante
Mostrar

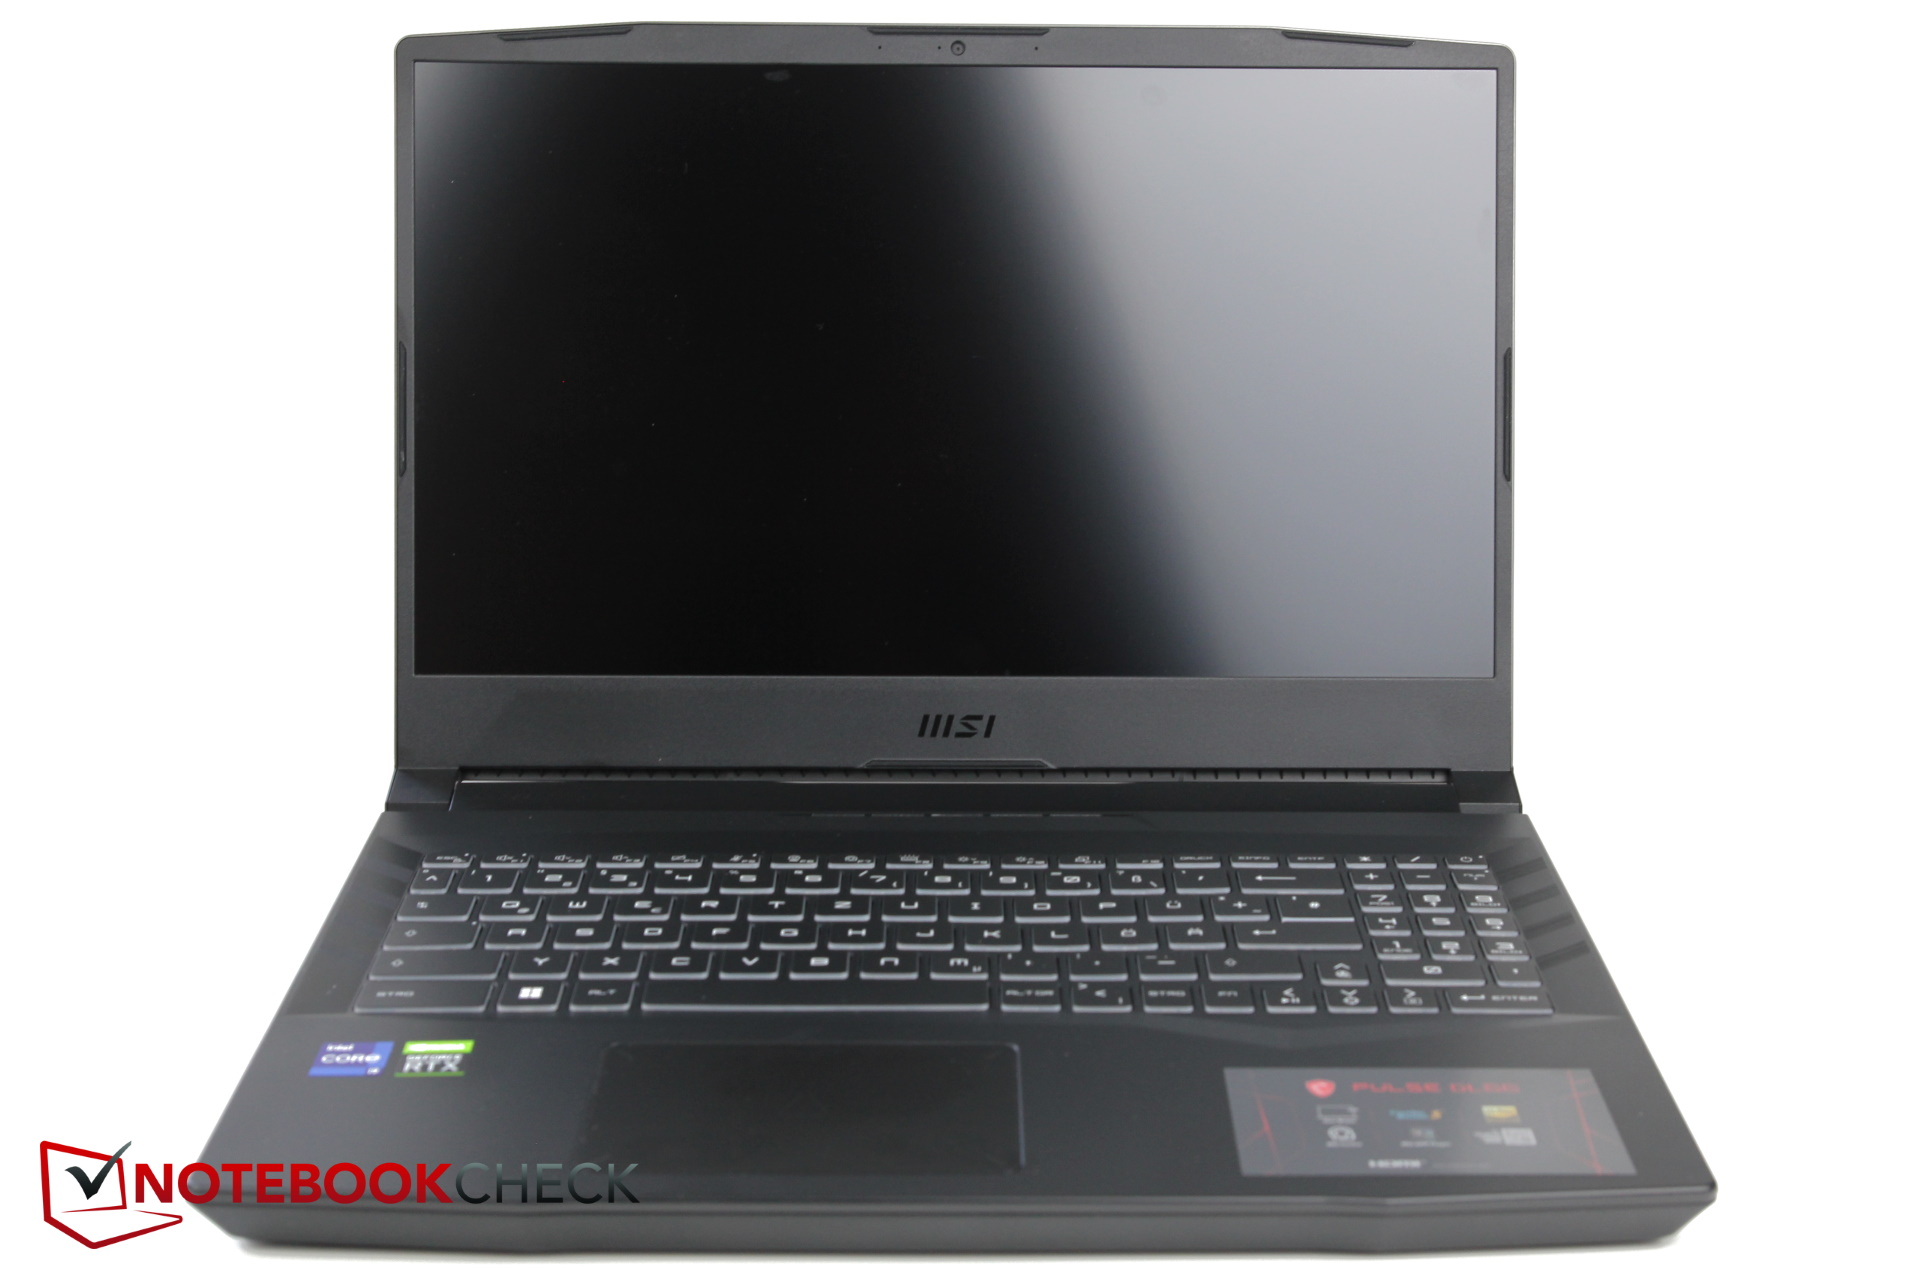
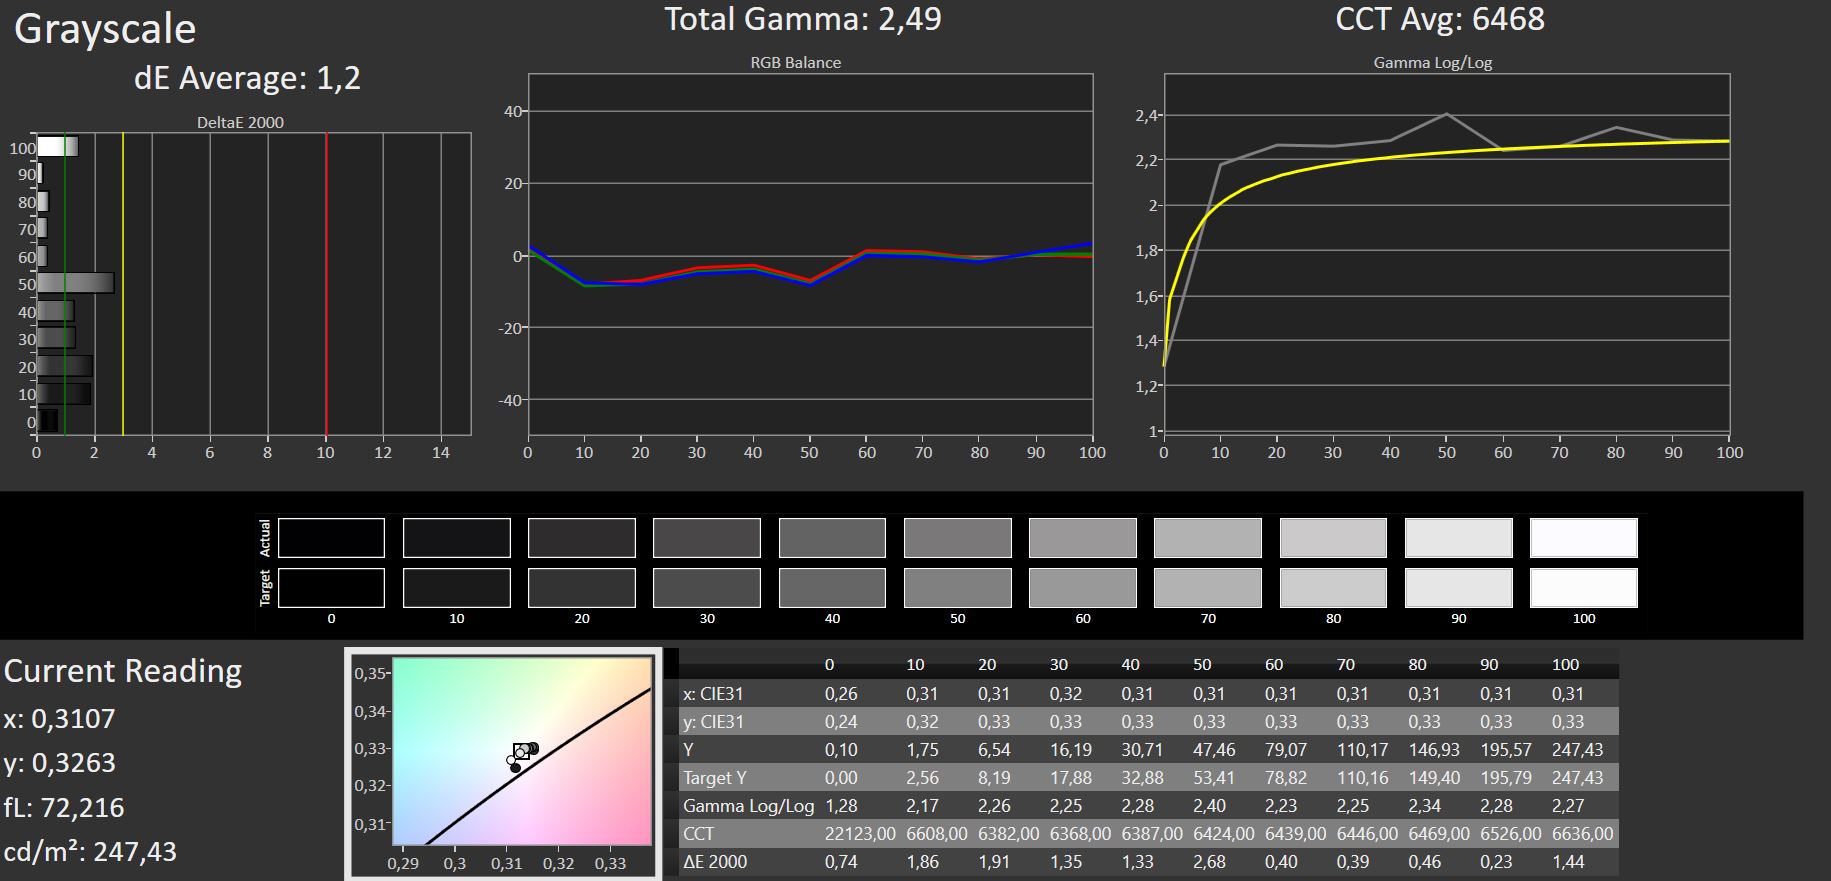
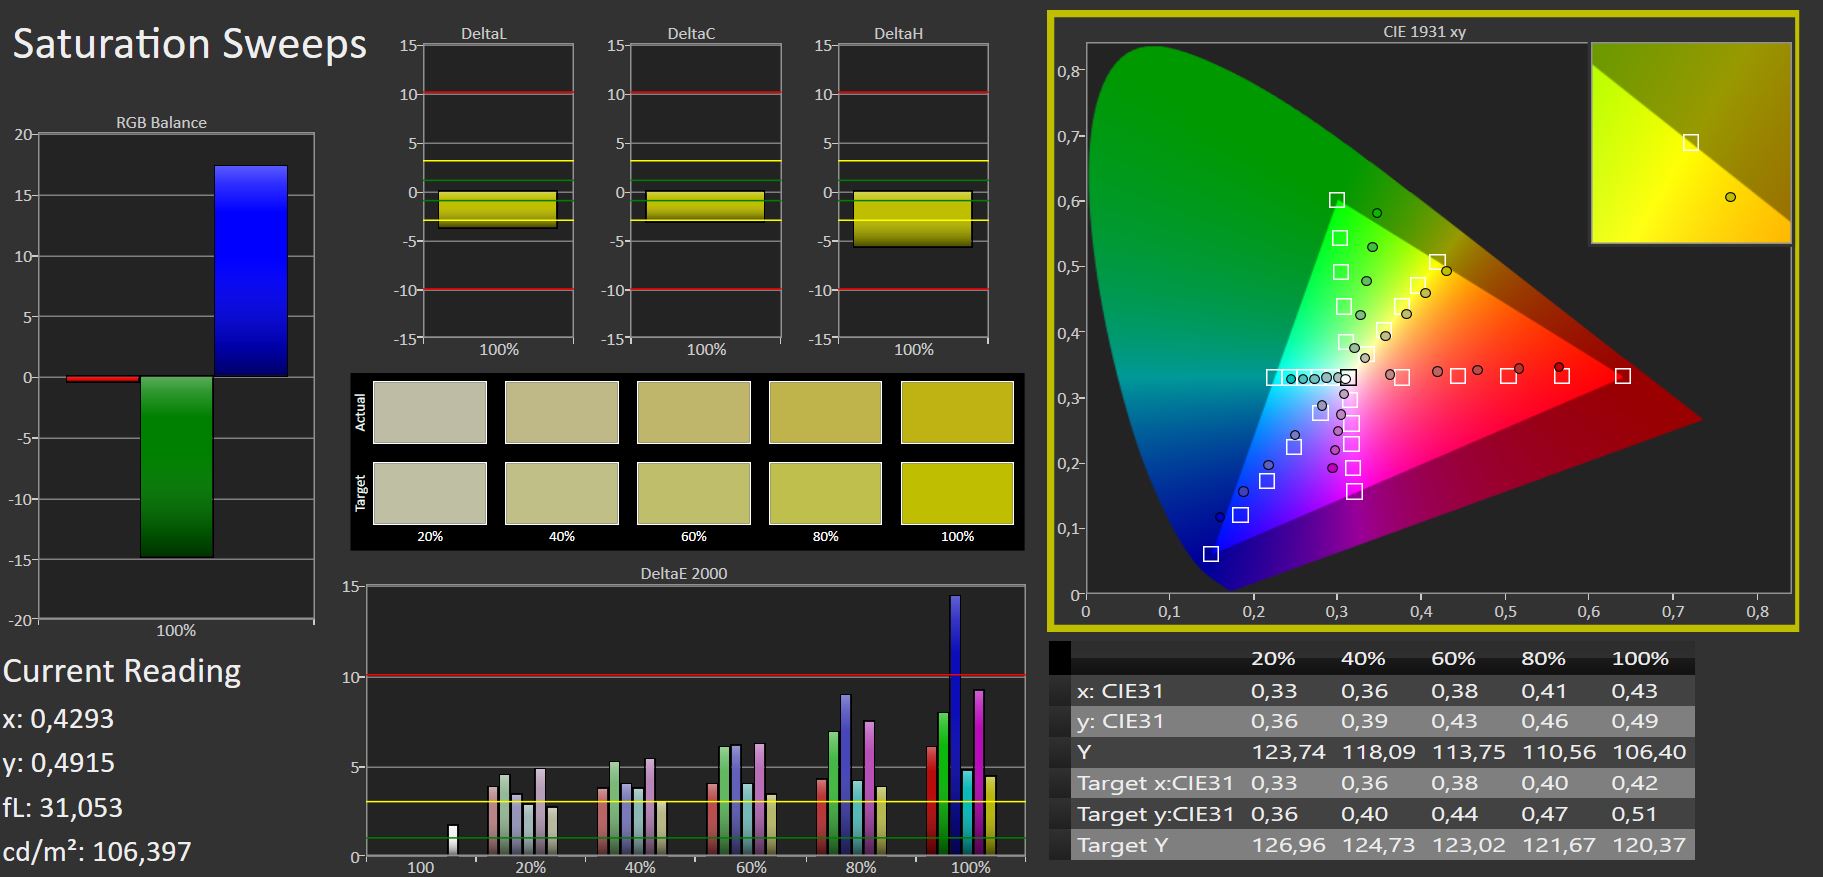
A MSI usa uma tela IPS Mate Full-HD com 144 Hz da AU Optronics. A MSI já utilizou este modelo no ano passado, por exemplo, no GF65 Fino. Uma grande desvantagem do painel é particularmente sua fraca luminosidade de menos de 250 lêndeas. A distribuição de luminosidade ainda está dentro de limites aceitáveis de 86%.
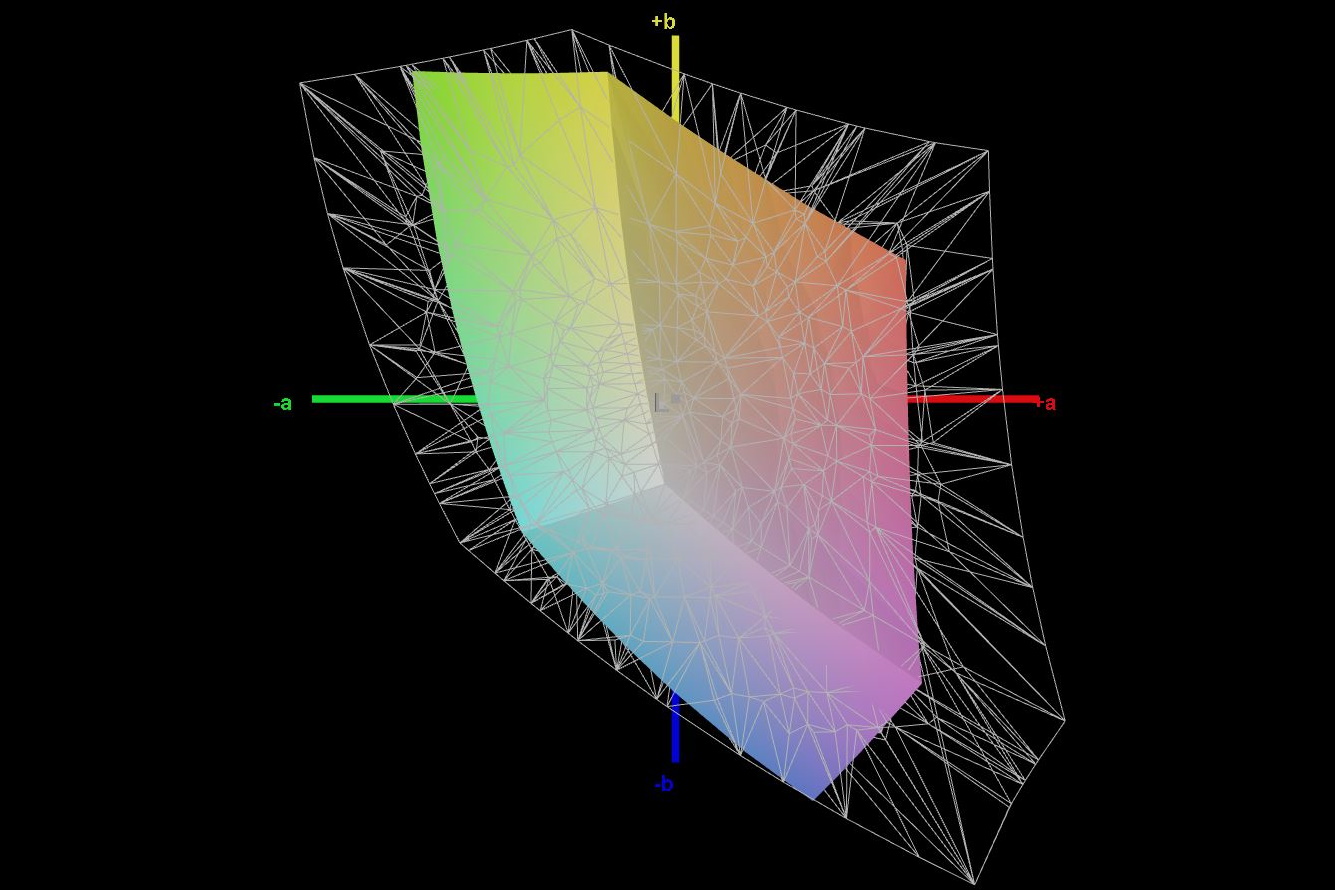
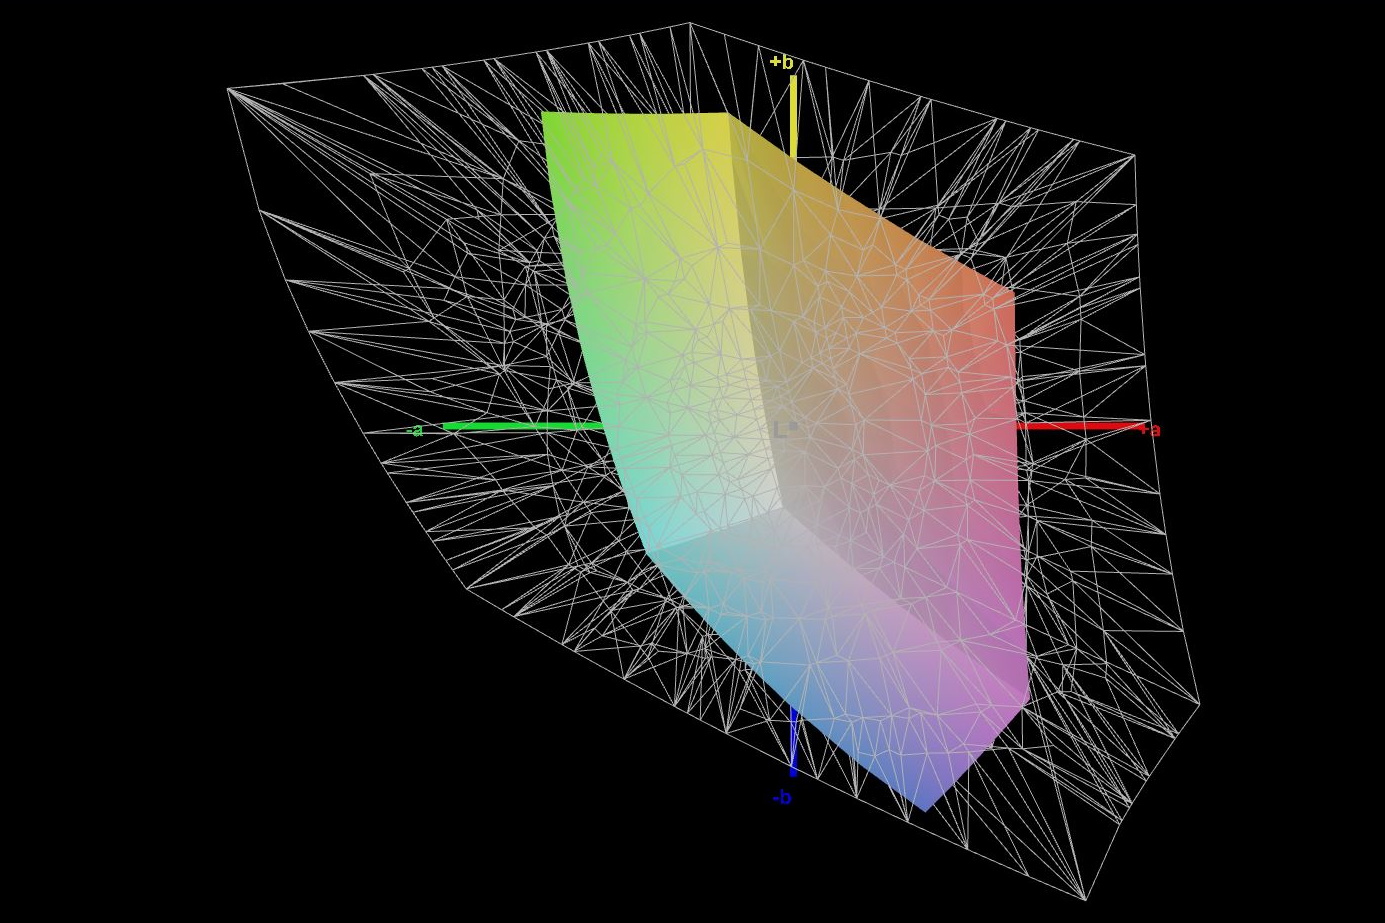
Pelo menos o valor negro é baixo e o contraste alto, mas com apenas 58% sRGB, a cobertura do espaço de cor se torna fraca. Os tempos de resposta também são bastante fracos para um laptop para jogos
Infelizmente, não parece que haja outras opções de exibição. Pelo menos o Pulse de 17 polegadas oferece um painel com 360 Hz, e espera-se que isso também seja mais brilhante.
Embora haja algum sangramento de tela na borda superior à esquerda, ele é quase imperceptível.
| |||||||||||||||||||||||||
iluminação: 86 %
iluminação com acumulador: 247 cd/m²
Contraste: 1908:1 (Preto: 0.13 cd/m²)
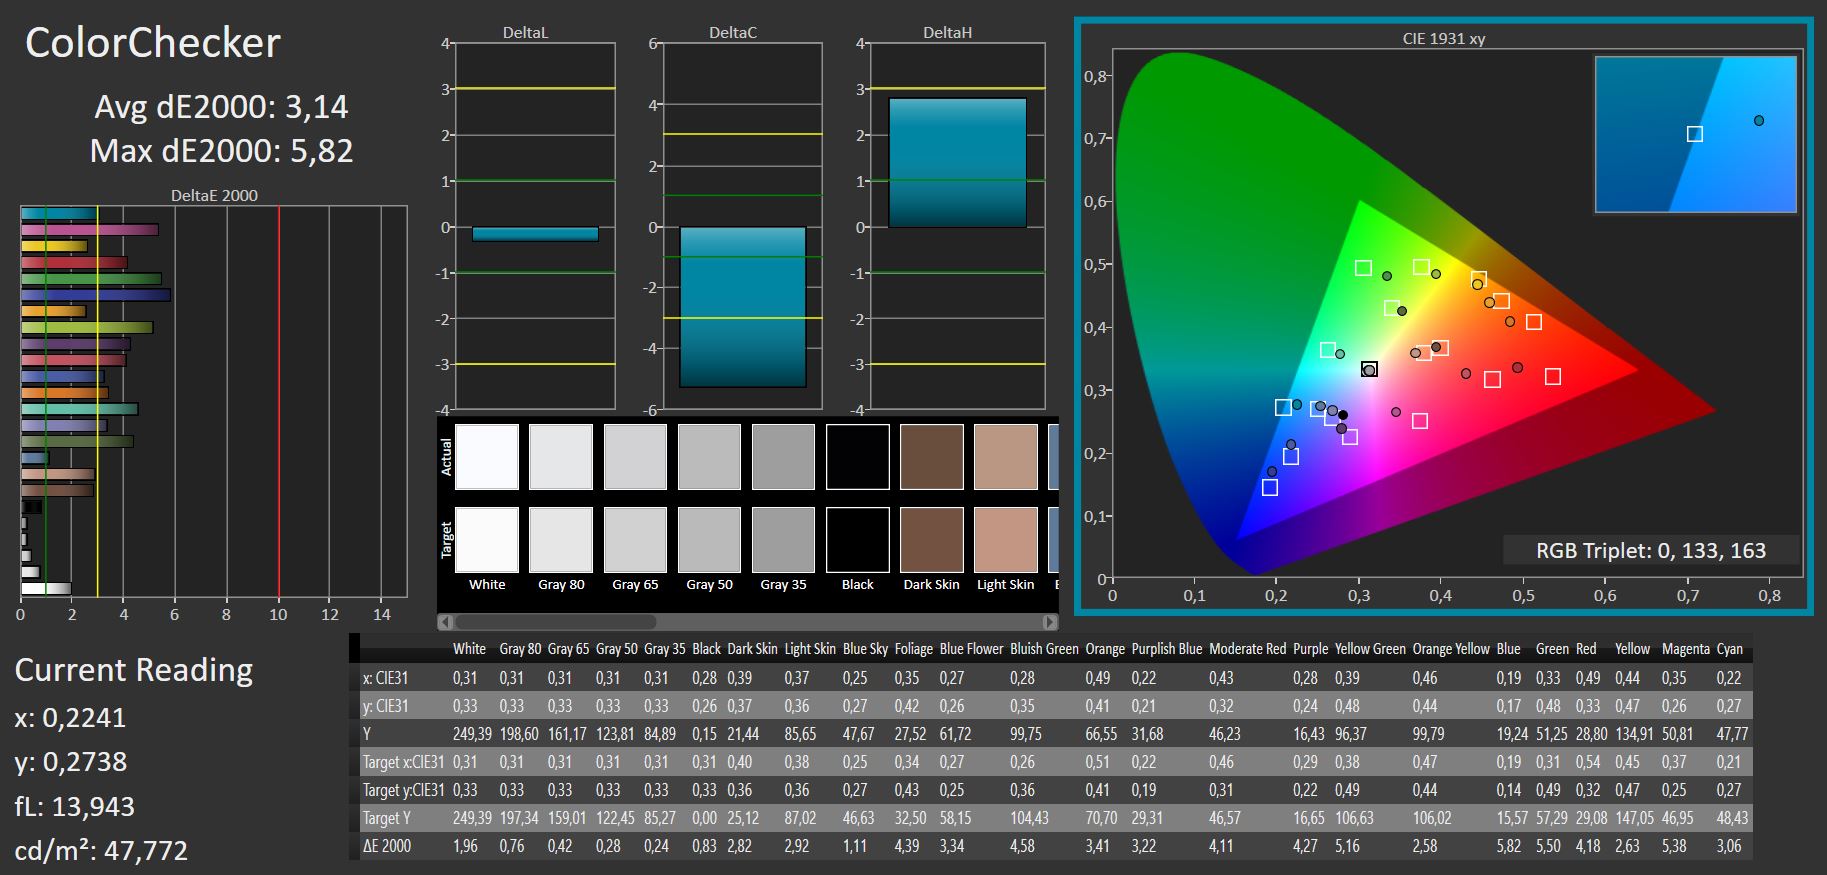
ΔE ColorChecker Calman: 3.14 | ∀{0.5-29.43 Ø4.71}
calibrated: 3.14
ΔE Greyscale Calman: 1.2 | ∀{0.09-98 Ø4.96}
40.3% AdobeRGB 1998 (Argyll 3D)
58.4% sRGB (Argyll 3D)
39% Display P3 (Argyll 3D)
Gamma: 2.49
CCT: 6468 K
| MSI Pulse GL66 12UEK AU Optronics B156HAN08.4 (AUOAF90), IPS, 1920x1080, 15.6" | Asus TUF Gaming F15 FX507ZM TL156VDXP0101, IPS, 1920x1080, 15.6" | Alienware x14 i7 RTX 3060 SHP154D, IPS, 1920x1080, 14" | Schenker XMG Apex 15 NH57E PS LG Philips LGD0625 (LP156WFG-SPB3), IPS, 1920x1080, 15.6" | Lenovo Legion S7 15ACH6 82K80030GE CSOT T3 MNF601EA1-6, IPS, 3840x2160, 15.6" | Alienware m15 R5 Ryzen Edition B156HAN, IPS, 1920x1080, 15.6" | |
|---|---|---|---|---|---|---|
| Display | 69% | 114% | 64% | 110% | ||
| Display P3 Coverage (%) | 39 | 66.4 70% | 99.6 155% | 64.5 65% | 85.2 118% | |
| sRGB Coverage (%) | 58.4 | 97 66% | 100 71% | 95.9 64% | 98.8 69% | |
| AdobeRGB 1998 Coverage (%) | 40.3 | 68.5 70% | 87.6 117% | 65.8 63% | 98.2 144% | |
| Response Times | 70% | 74% | 60% | 31% | 80% | |
| Response Time Grey 50% / Grey 80% * (ms) | 38.8 ? | 5.6 ? 86% | 9.6 ? 75% | 15 61% | 31.6 ? 19% | 4 ? 90% |
| Response Time Black / White * (ms) | 28 ? | 12.8 ? 54% | 7.6 ? 73% | 11.6 59% | 16 ? 43% | 8.4 ? 70% |
| PWM Frequency (Hz) | ||||||
| Screen | -3% | -24% | -40% | 30% | -12% | |
| Brightness middle (cd/m²) | 248 | 353.7 43% | 434 75% | 393 58% | 607 145% | 329 33% |
| Brightness (cd/m²) | 245 | 340 39% | 411 68% | 353 44% | 605 147% | 321 31% |
| Brightness Distribution (%) | 86 | 89 3% | 89 3% | 83 -3% | 93 8% | 92 7% |
| Black Level * (cd/m²) | 0.13 | 0.34 -162% | 0.25 -92% | 0.47 -262% | 0.41 -215% | 0.27 -108% |
| Contrast (:1) | 1908 | 1040 -45% | 1736 -9% | 836 -56% | 1480 -22% | 1219 -36% |
| Colorchecker dE 2000 * | 3.14 | 1.74 45% | 3 4% | 2.84 10% | 0.84 73% | 2.78 11% |
| Colorchecker dE 2000 max. * | 5.82 | 3.63 38% | 7.1 -22% | 7.15 -23% | 3.02 48% | 4.88 16% |
| Colorchecker dE 2000 calibrated * | 3.14 | 0.5 84% | 0.7 78% | 0.67 79% | 0.69 78% | 1.63 48% |
| Greyscale dE 2000 * | 1.2 | 2.1 -75% | 5.1 -325% | 3.73 -211% | 1.1 8% | 2.5 -108% |
| Gamma | 2.49 88% | 2.3 96% | 2.19 100% | 2.53 87% | 2.131 103% | 2.106 104% |
| CCT | 6468 100% | 6257 104% | 6204 105% | 7312 89% | 6648 98% | 6201 105% |
| Color Space (Percent of AdobeRGB 1998) (%) | 76 | |||||
| Color Space (Percent of sRGB) (%) | 99 | |||||
| Média Total (Programa/Configurações) | 45% /
23% | 55% /
19% | 28% /
-4% | 57% /
47% | 34% /
5% |
* ... menor é melhor
Pelo menos o painel já está bem calibrado no estado de entrega. O desvio na escala de cinza é de apenas 1,2. Assim, dificilmente se pode obter mais melhorias através de uma calibração manual.
Exibir tempos de resposta
| ↔ Tempo de resposta preto para branco | ||
|---|---|---|
| 28 ms ... ascensão ↗ e queda ↘ combinadas | ↗ 14.6 ms ascensão | 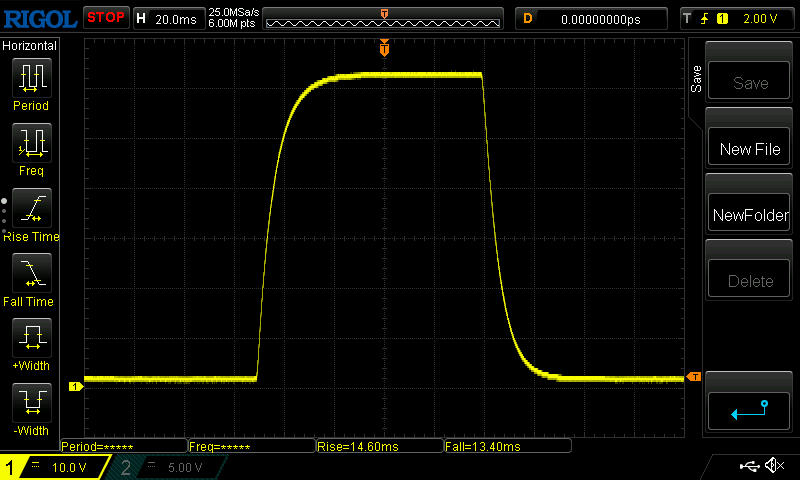 |
| ↘ 13.4 ms queda | ||
| A tela mostra taxas de resposta relativamente lentas em nossos testes e pode ser muito lenta para os jogadores. Em comparação, todos os dispositivos testados variam de 0.1 (mínimo) a 240 (máximo) ms. » 71 % de todos os dispositivos são melhores. Isso significa que o tempo de resposta medido é pior que a média de todos os dispositivos testados (19.8 ms). | ||
| ↔ Tempo de resposta 50% cinza a 80% cinza | ||
| 38.8 ms ... ascensão ↗ e queda ↘ combinadas | ↗ 18.2 ms ascensão | 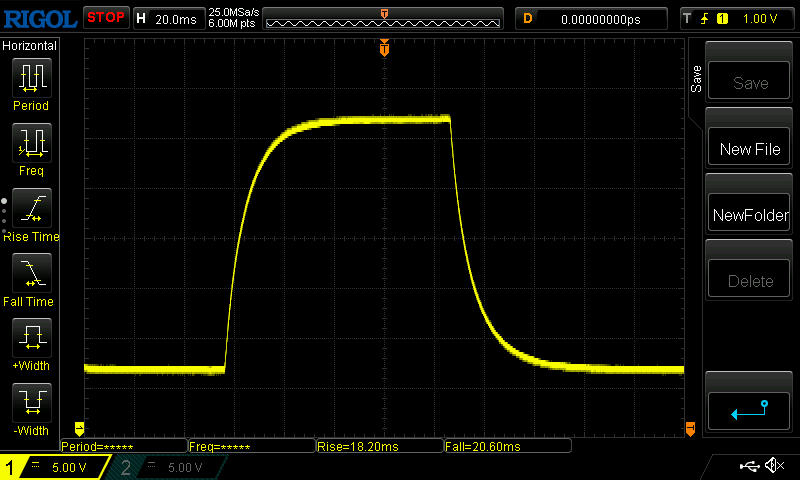 |
| ↘ 20.6 ms queda | ||
| A tela mostra taxas de resposta lentas em nossos testes e será insatisfatória para os jogadores. Em comparação, todos os dispositivos testados variam de 0.165 (mínimo) a 636 (máximo) ms. » 58 % de todos os dispositivos são melhores. Isso significa que o tempo de resposta medido é pior que a média de todos os dispositivos testados (31 ms). | ||
Cintilação da tela / PWM (modulação por largura de pulso)
| Tela tremeluzindo / PWM não detectado | 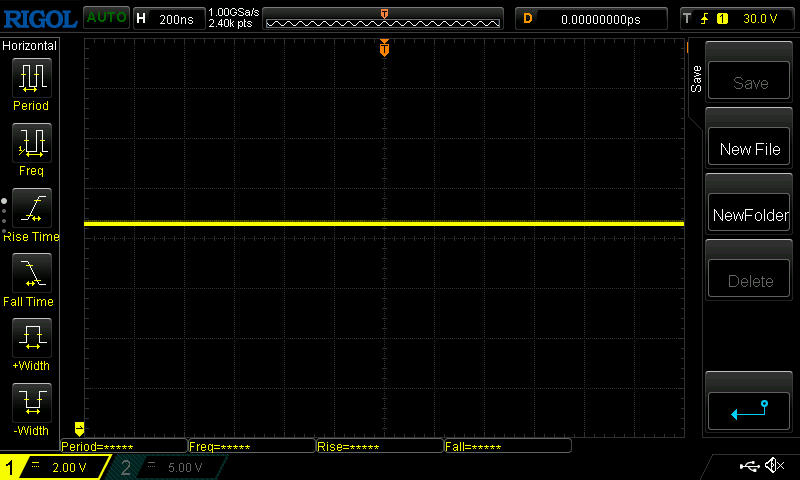 | ||
[pwm_comparison] Em comparação: 52 % de todos os dispositivos testados não usam PWM para escurecer a tela. Se PWM foi detectado, uma média de 7757 (mínimo: 5 - máximo: 343500) Hz foi medida. | |||
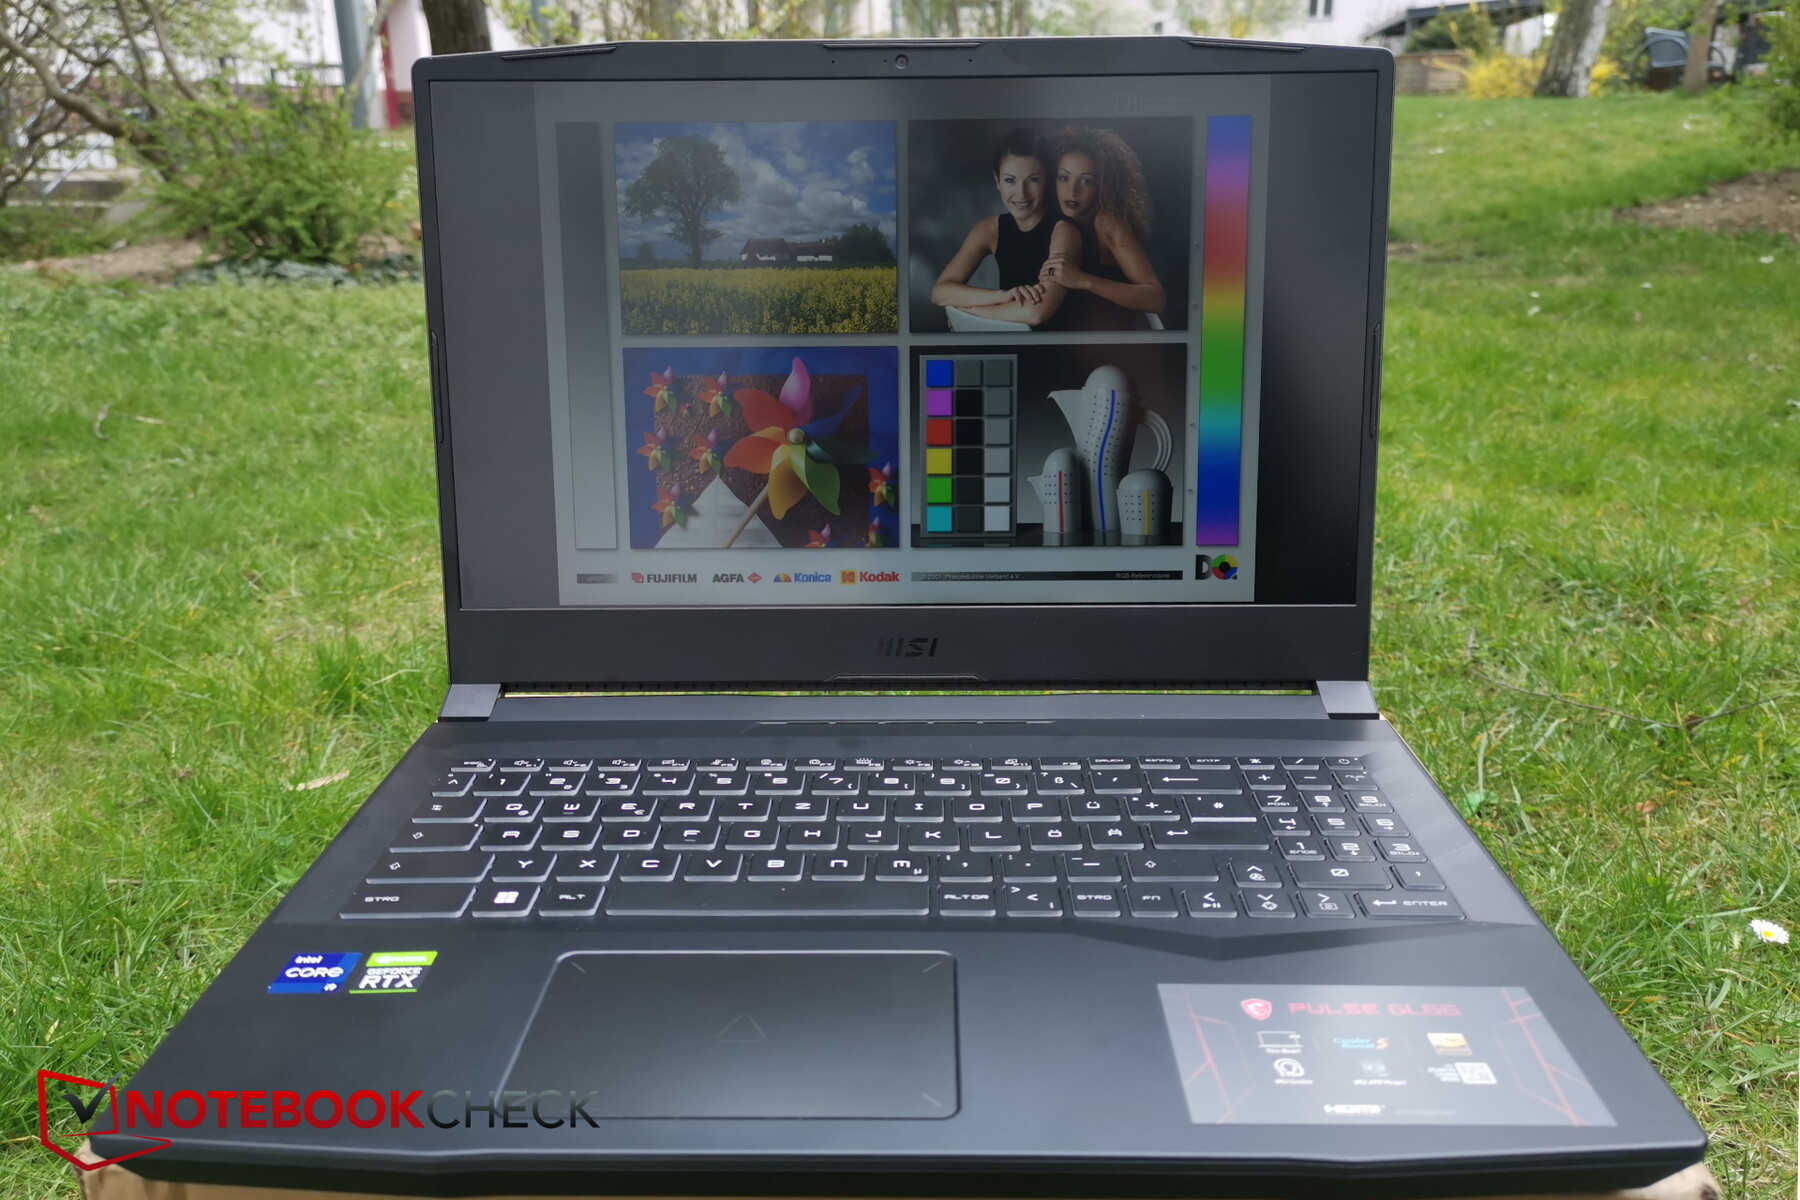
Ao ar livre, particularmente a baixa luminosidade tornará as coisas difíceis, portanto, a busca de ambientes menos brilhantes torna-se obrigatória.
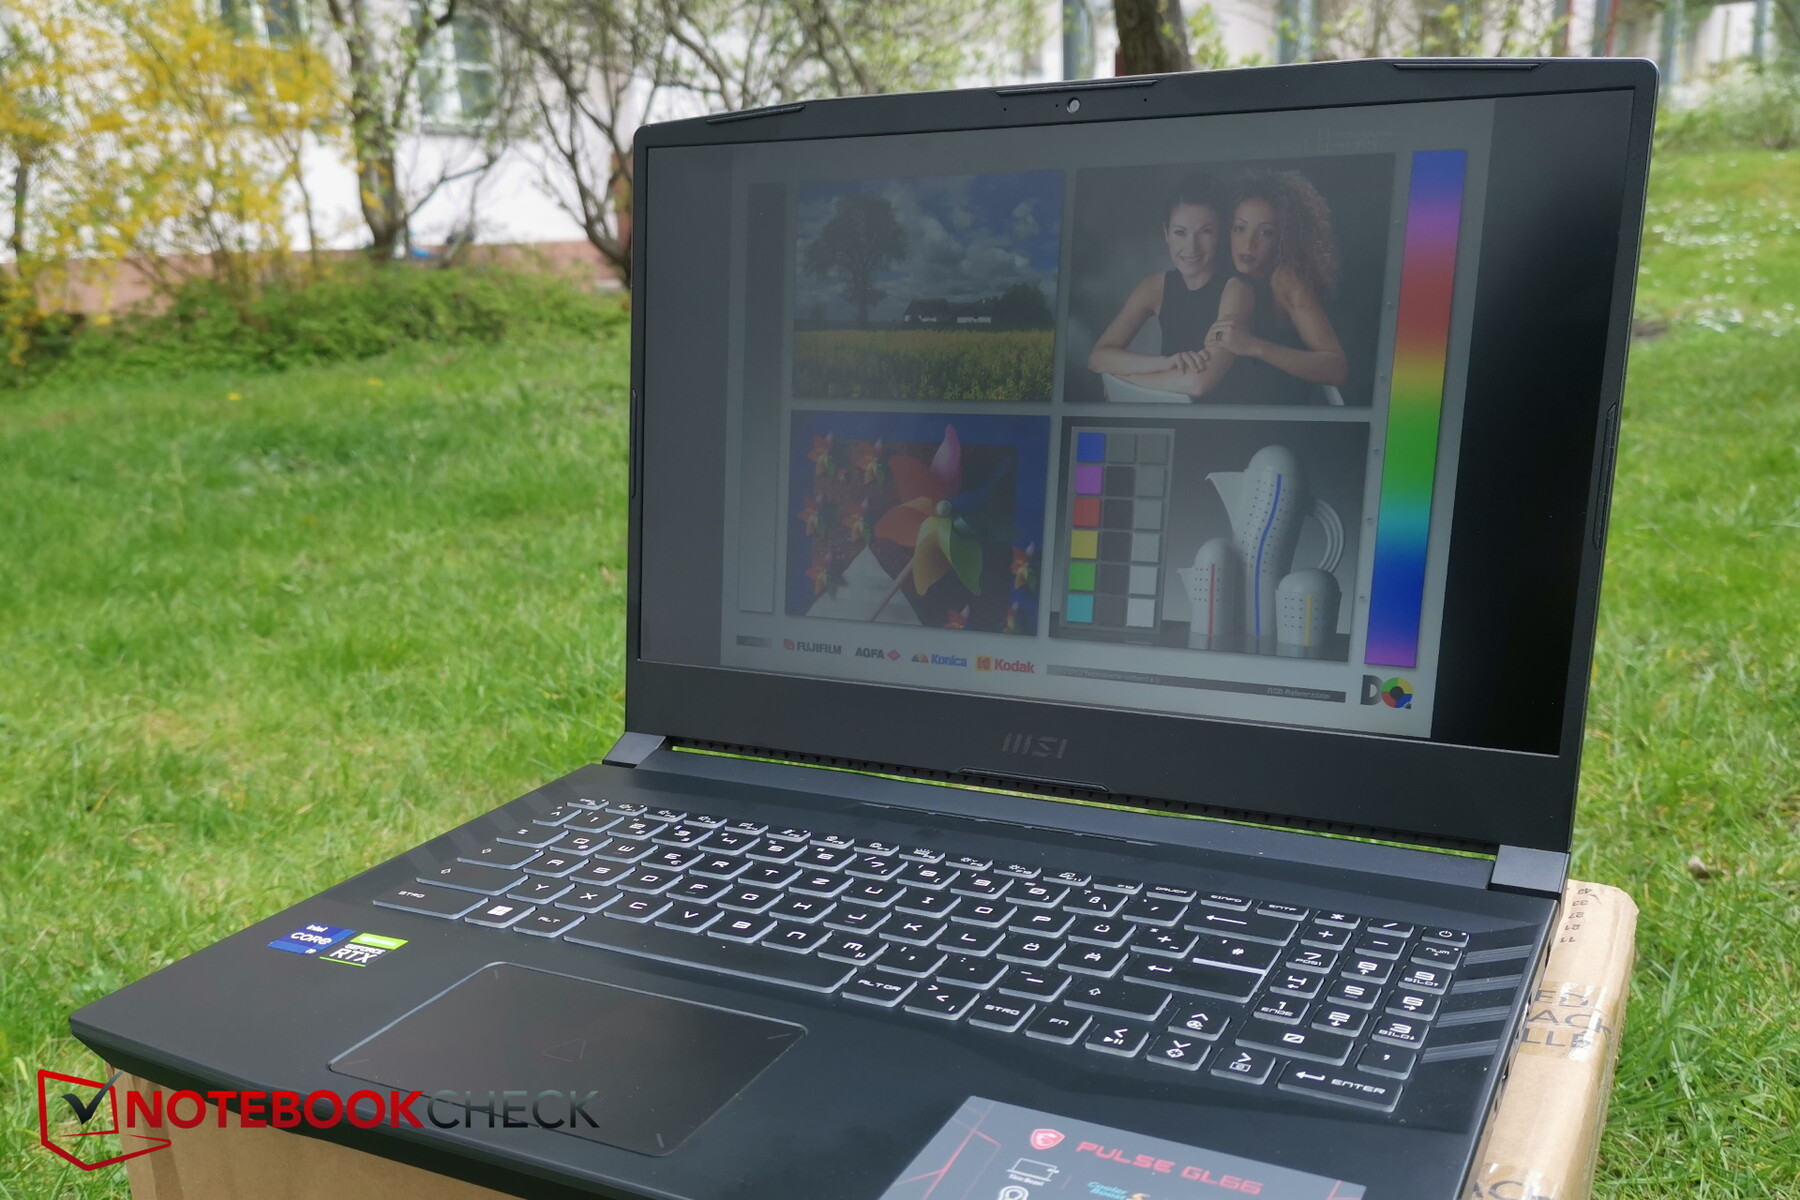
Mesmo que os displays IPS tenham geralmente ângulos de visão bastante estáveis, você ainda pode notar uma redução significativa no brilho ao olhar para nossa unidade de teste a partir de ângulos de visão extremos.

Desempenho
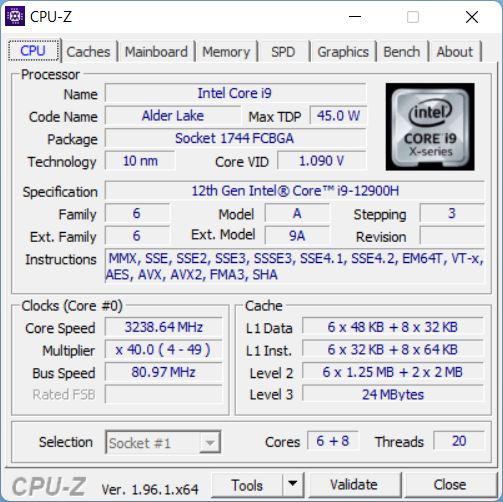
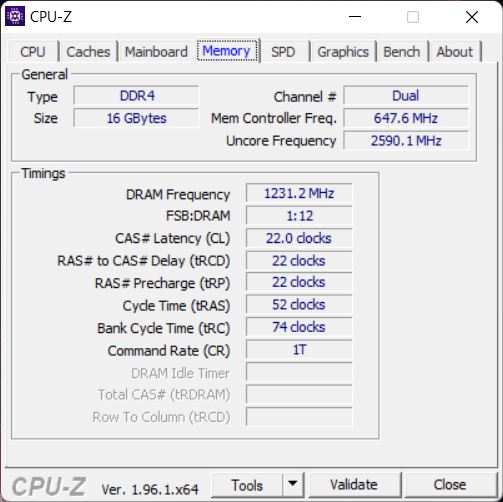
Com sua combinação de umIntel Core i9-12900He RTX 3060o Pulso é claramente voltado para os jogadores. Além disso, há 16 GB de RAM, com a MSI ainda usando DDR4-RAM aqui. Embora custe cerca de 1900 euros (~$2057), o dispositivo ainda pertence ao segmento médio inferior

Condições de teste
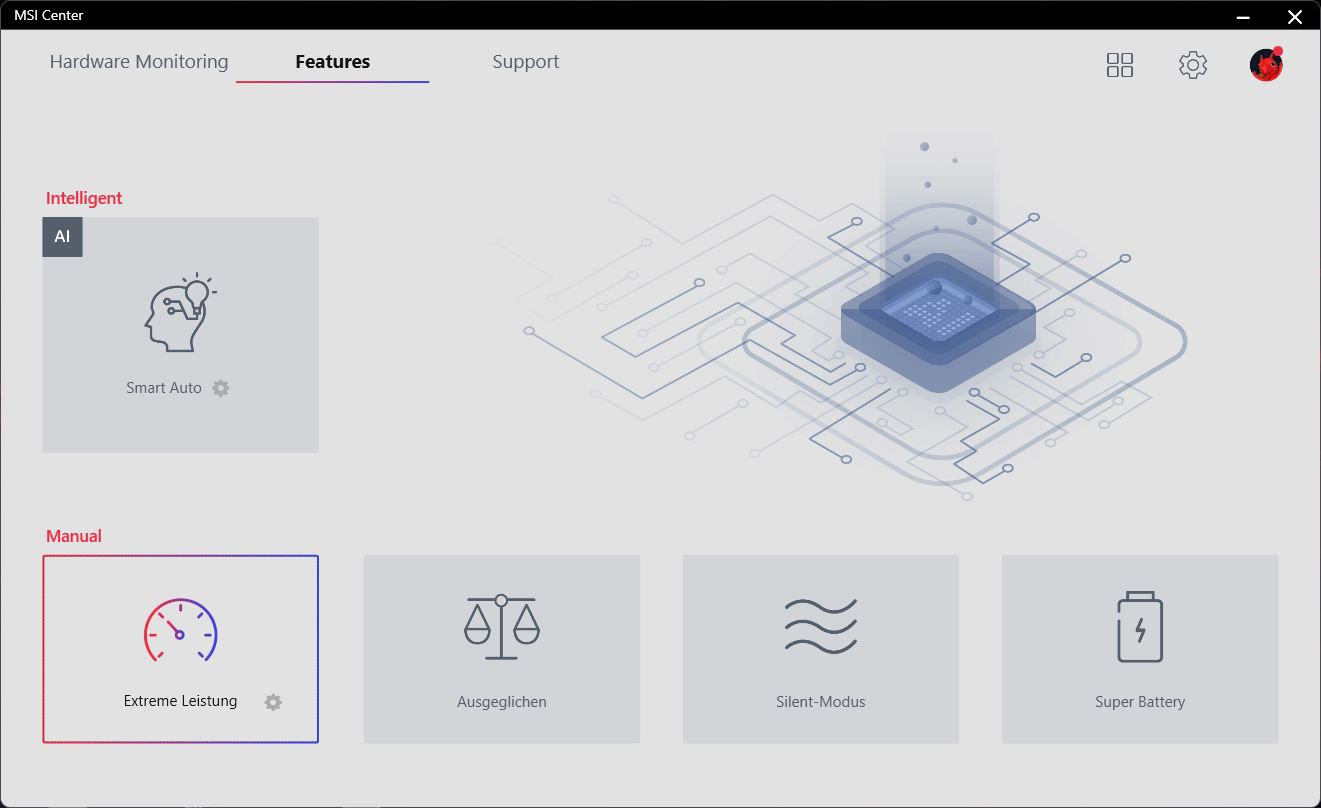
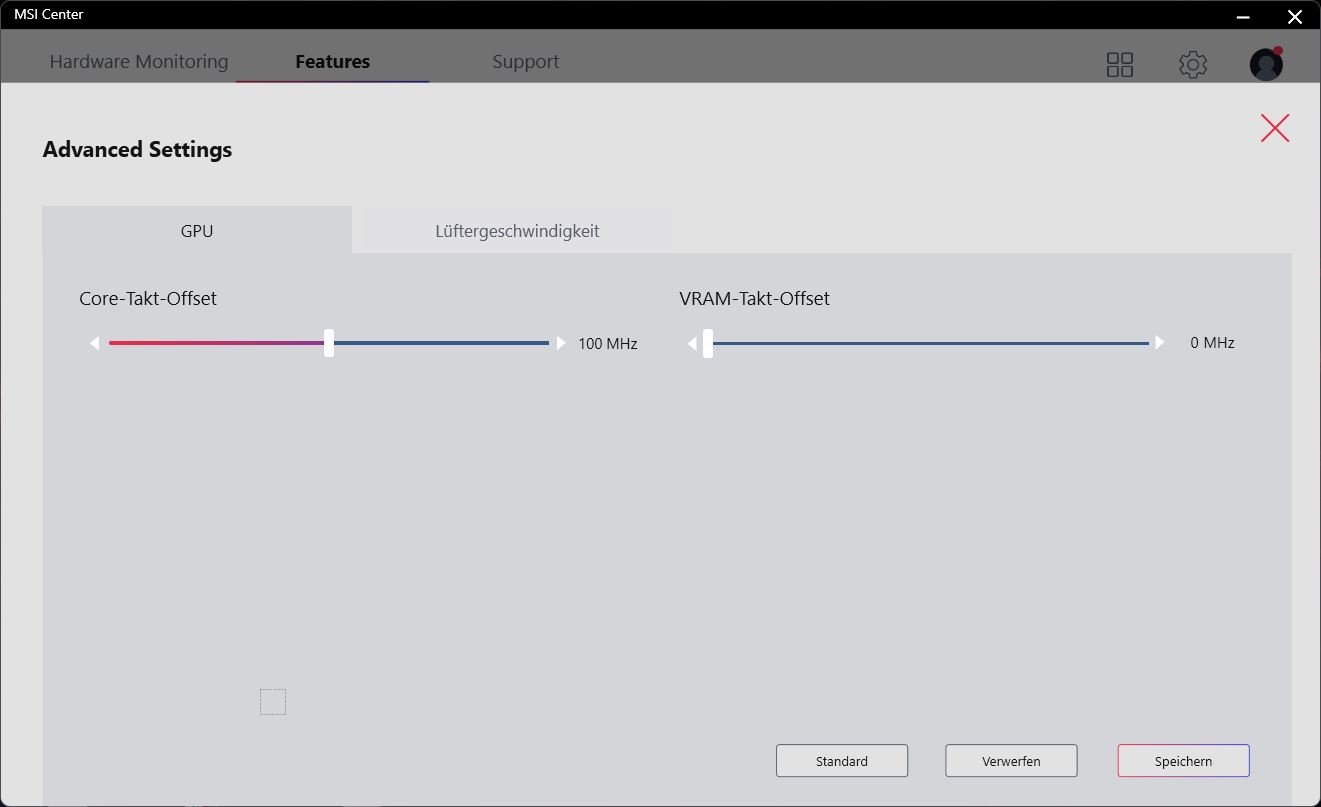
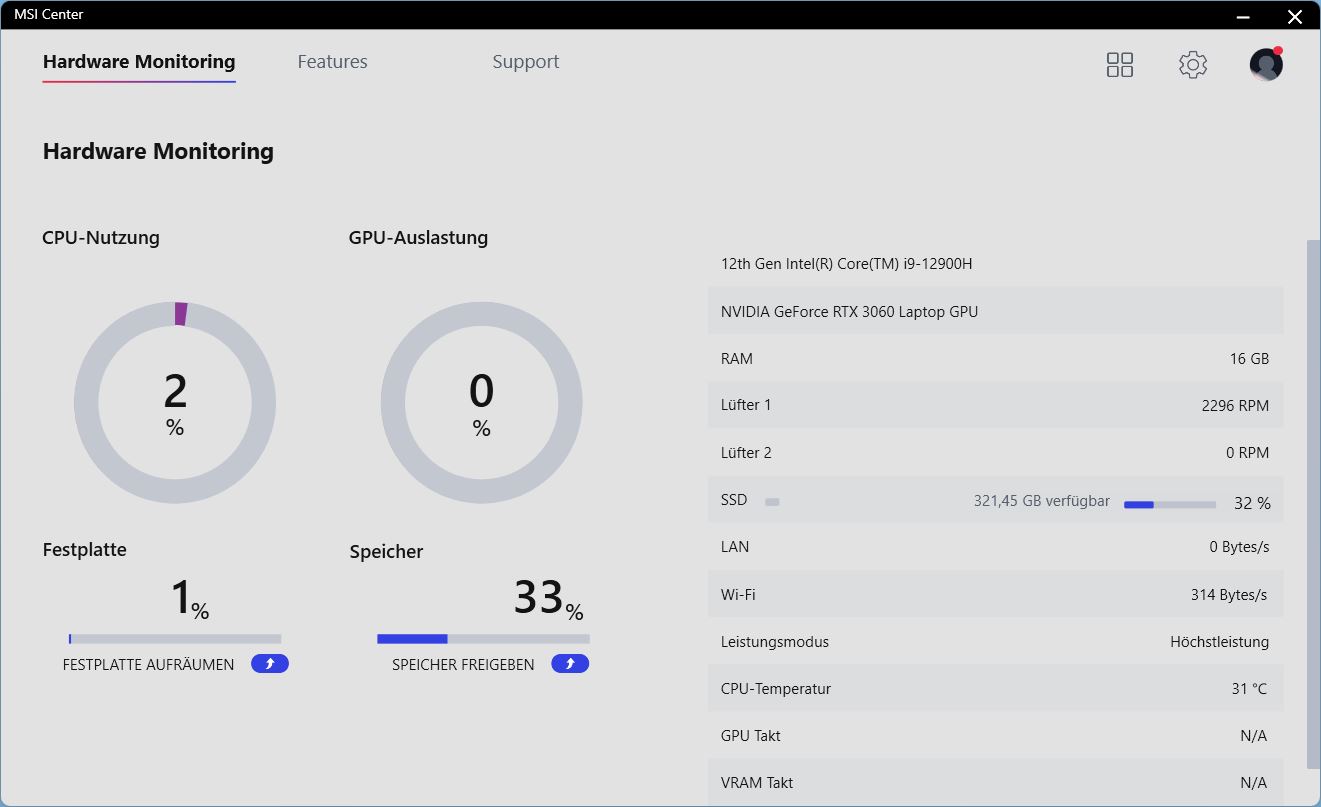
Para obter os melhores resultados de referência, selecionamos o modo "Extreme Performance" no software MSI. Nas Configurações Avançadas, usamos o Padrão.
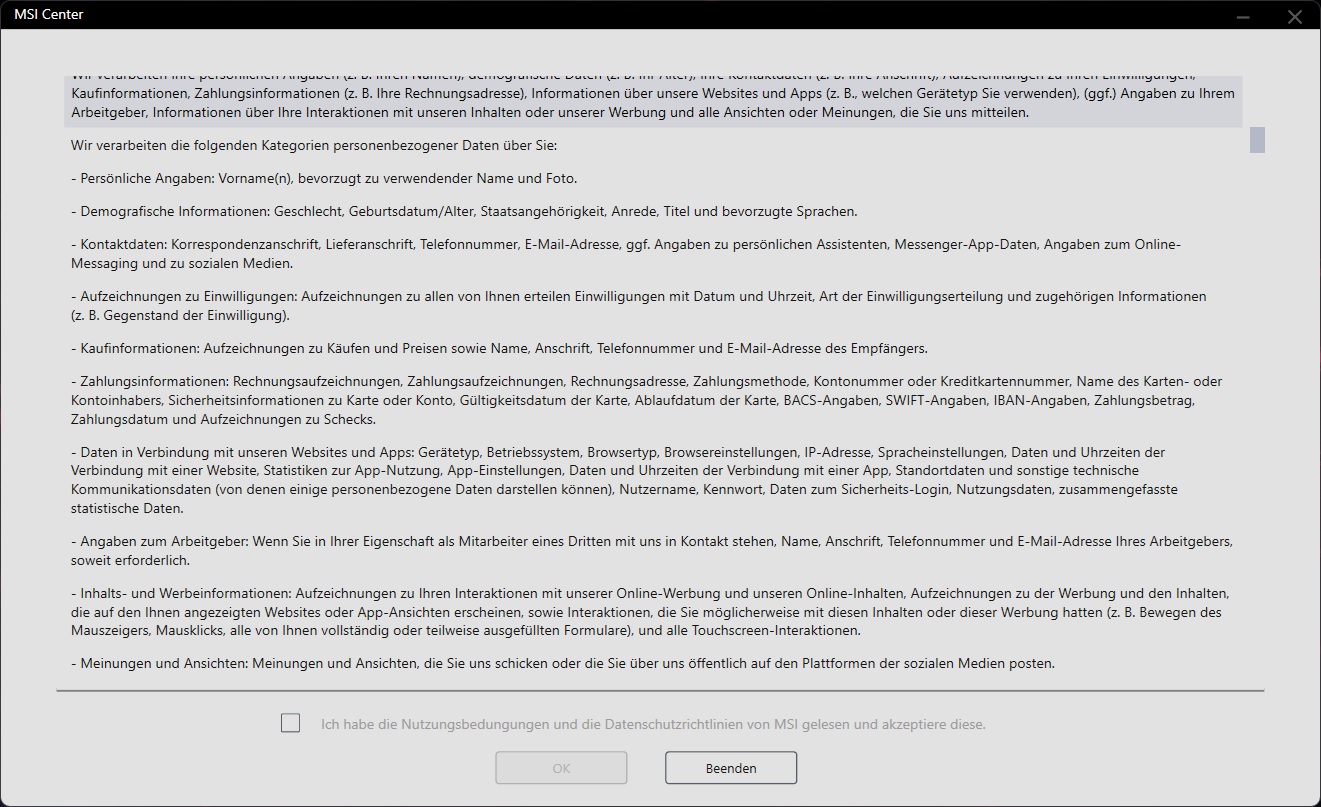
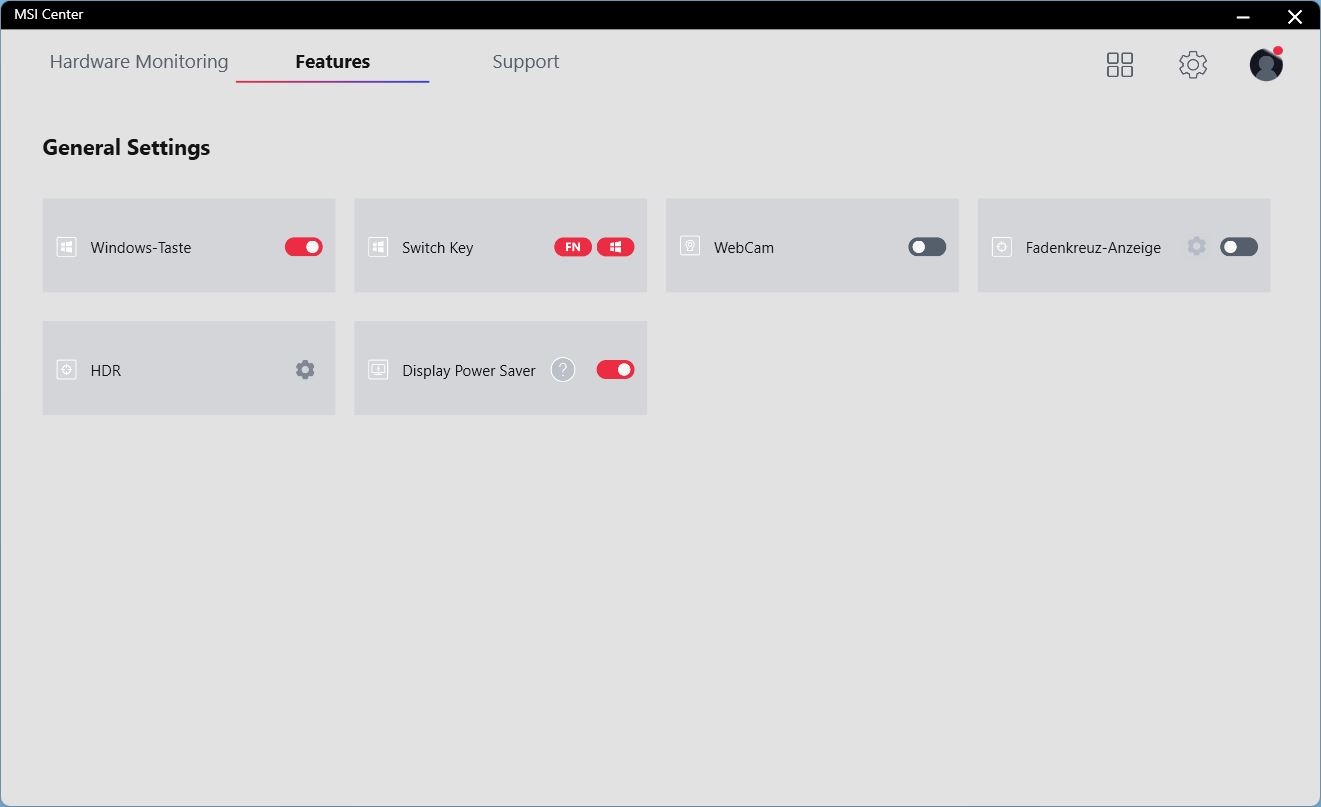
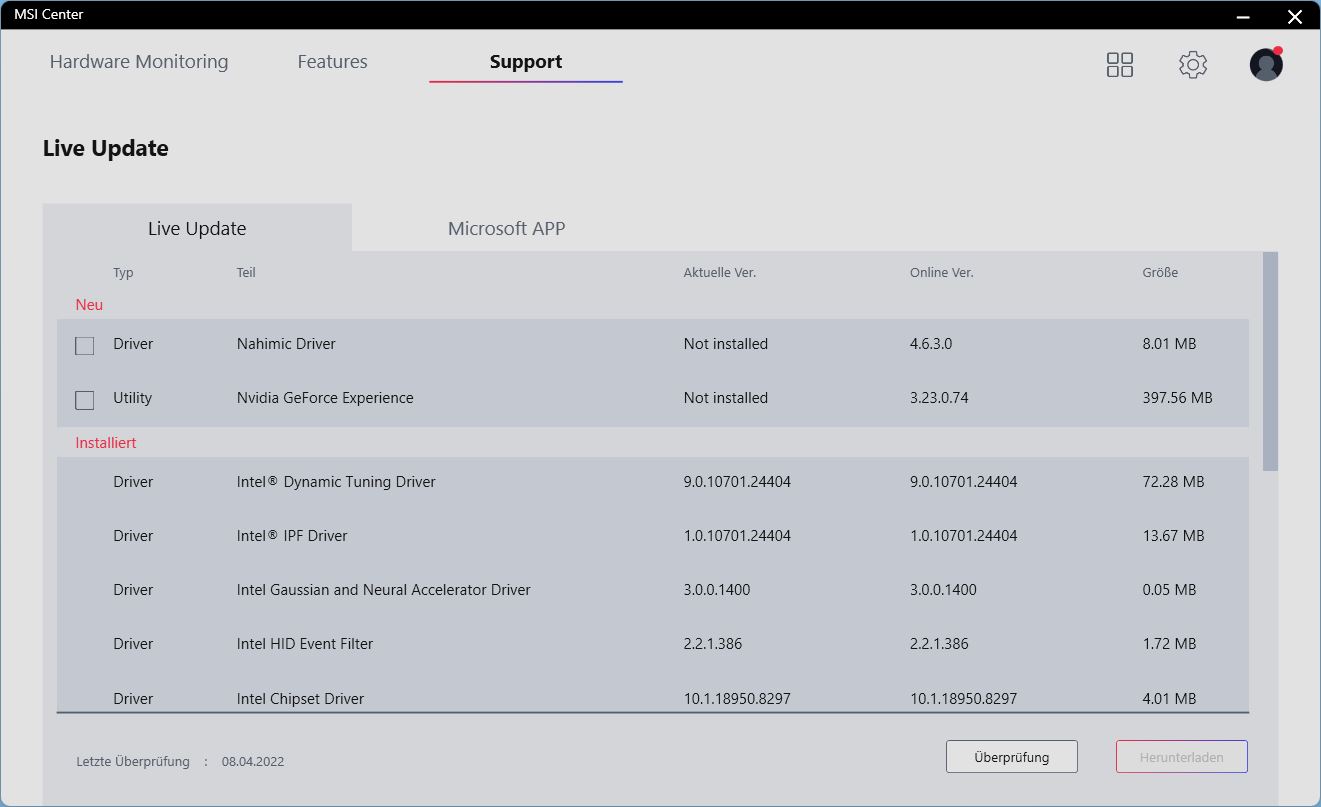
Os usuários devem se familiarizar com o MSI Center, pois além de configurar os perfis dos ventiladores, você também pode verificar o sistema para atualizações, configurar a iluminação do teclado e ajustar as configurações gerais e muitas mais aqui. É claro que o fabricante também reúne aqui alguns dados do usuário.
Processador
ONúcleo i9-12900Hé um dos principais modelos da atual série Alder Lake da Intel, portanto deve atender a todas as exigências dos jogadores. A CPU combina 6 núcleos de desempenho e 8 núcleos de eficiência e é capaz de operar com até 20 fios simultaneamente. A velocidade do relógio Turbo alcança até 5 GHz
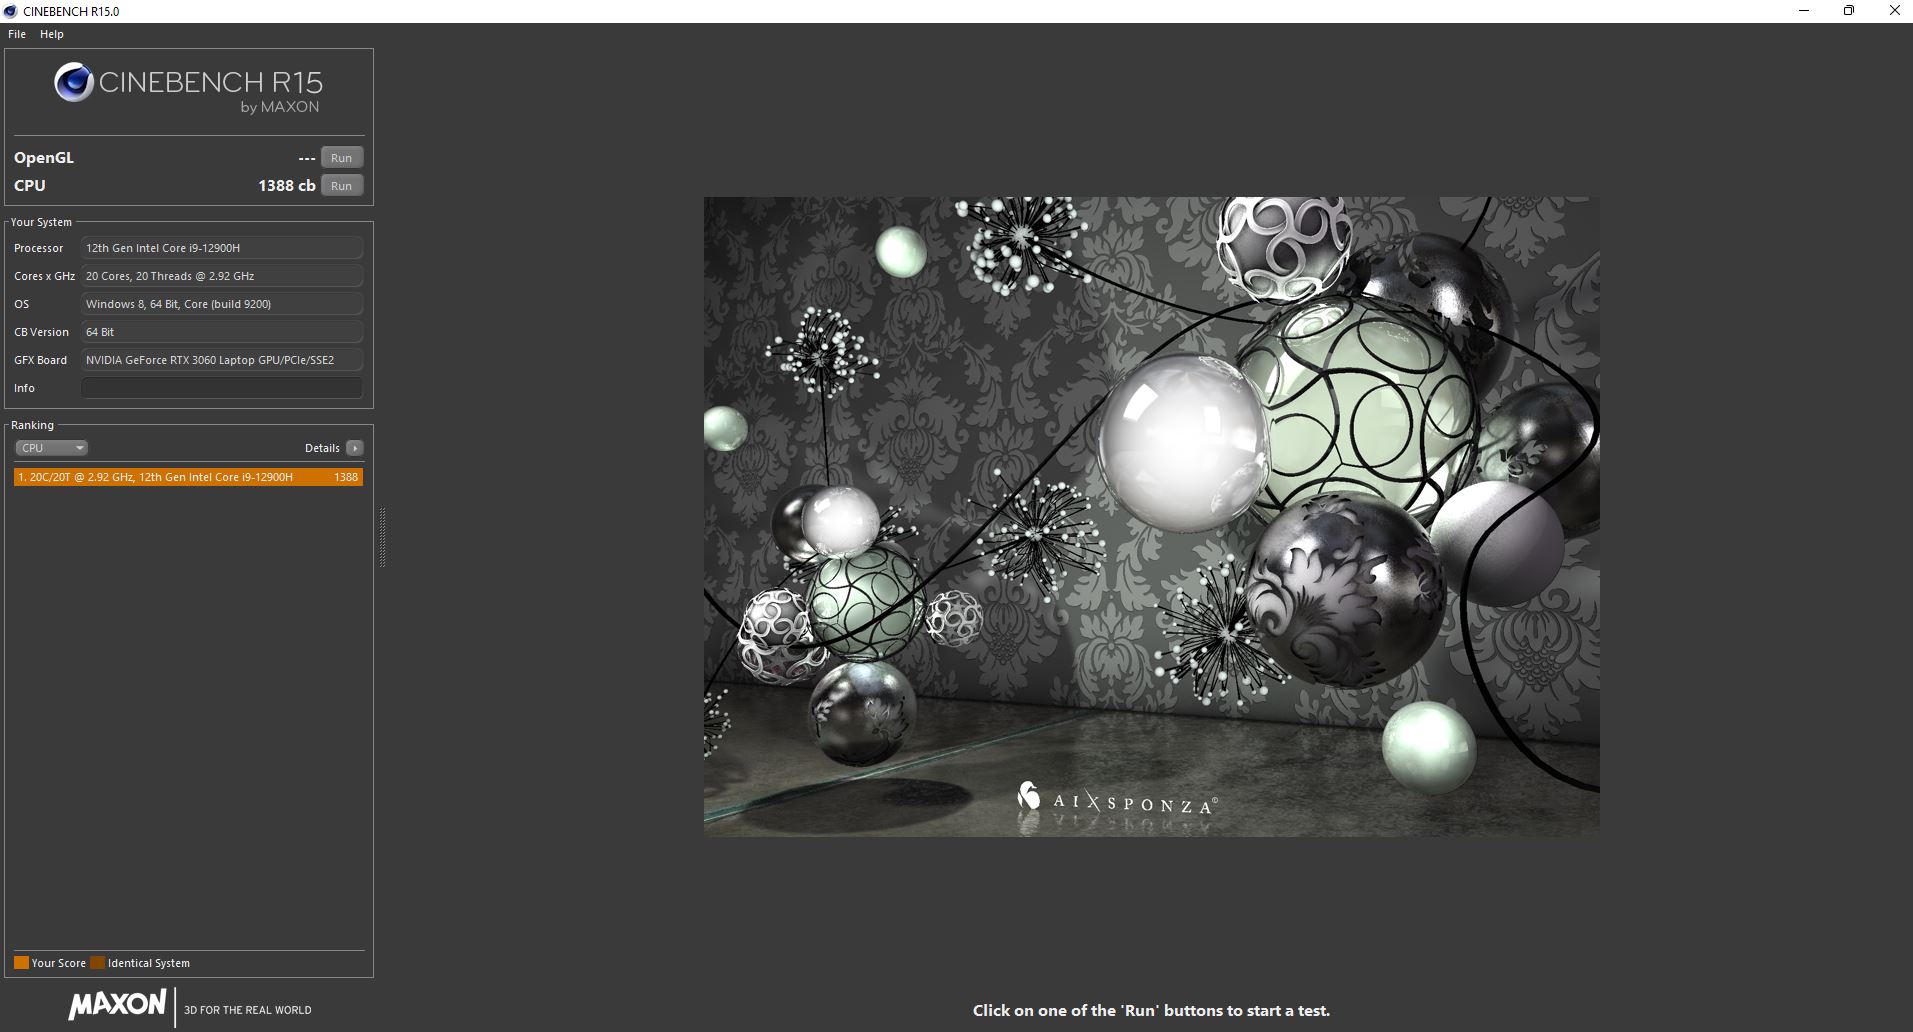
O desempenho no loop Cinebench é bom, e a CPU é capaz de bater a geração anterior com seus processadores AMD sem nenhum problema. Entretanto, a i9 no Pulse não é significativamente mais rápida do que a i7-12700H em alguns dos laptops concorrentes. Particularmente o Asus TUF F15tem um desempenho pelo menos ao nível dos olhos e em partes até ligeiramente mais rápido. A MSI poderia ter poupado a si mesma e a seus clientes o prêmio adicional para o significativamente mais caro i9-12900H. Por outro lado, o slim Alienware x14com a i7-12700H é cerca de 6 a 7 por cento mais lento.
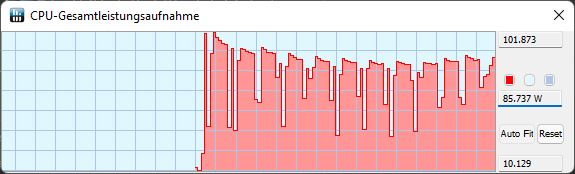
No início da primeira corrida, o TDP está a cerca de 100 watts, antes de começar a cair e finalmente a nivelar a 85 watts. No entanto, ele só raramente cai para os 45 watts nominais.
No funcionamento por bateria, o modo de desempenho extremo não está mais disponível e ele muda para o modo balanceado. No Cinebench, o desempenho cai 45% e atinge apenas 1388 pontos!
Cinebench R15 Multi Constant Load Test
Cinebench R23: Multi Core | Single Core
Cinebench R20: CPU (Multi Core) | CPU (Single Core)
Cinebench R15: CPU Multi 64Bit | CPU Single 64Bit
Blender: v2.79 BMW27 CPU
7-Zip 18.03: 7z b 4 | 7z b 4 -mmt1
Geekbench 5.5: Multi-Core | Single-Core
HWBOT x265 Benchmark v2.2: 4k Preset
LibreOffice : 20 Documents To PDF
R Benchmark 2.5: Overall mean
| CPU Performance rating | |
| Média da turma Gaming | |
| MSI Pulse GL66 12UEK | |
| Asus TUF Gaming F15 FX507ZM | |
| Alienware x14 i7 RTX 3060 | |
| Média Intel Core i9-12900H | |
| Schenker XMG Apex 15 NH57E PS | |
| Lenovo Legion S7 15ACH6 82K80030GE | |
| Alienware m15 R5 Ryzen Edition | |
| Cinebench R23 / Multi Core | |
| Média da turma Gaming (10488 - 42661, n=107, últimos 2 anos) | |
| Asus TUF Gaming F15 FX507ZM | |
| MSI Pulse GL66 12UEK | |
| Alienware x14 i7 RTX 3060 | |
| Média Intel Core i9-12900H (7359 - 19648, n=28) | |
| Lenovo Legion S7 15ACH6 82K80030GE | |
| Schenker XMG Apex 15 NH57E PS | |
| Alienware m15 R5 Ryzen Edition | |
| Cinebench R23 / Single Core | |
| Média da turma Gaming (1166 - 2415, n=107, últimos 2 anos) | |
| MSI Pulse GL66 12UEK | |
| Média Intel Core i9-12900H (1634 - 1930, n=28) | |
| Asus TUF Gaming F15 FX507ZM | |
| Alienware x14 i7 RTX 3060 | |
| Lenovo Legion S7 15ACH6 82K80030GE | |
| Alienware m15 R5 Ryzen Edition | |
| Schenker XMG Apex 15 NH57E PS | |
| Cinebench R20 / CPU (Multi Core) | |
| Média da turma Gaming (4029 - 16433, n=106, últimos 2 anos) | |
| Asus TUF Gaming F15 FX507ZM | |
| MSI Pulse GL66 12UEK | |
| Alienware x14 i7 RTX 3060 | |
| Média Intel Core i9-12900H (2681 - 7471, n=28) | |
| Lenovo Legion S7 15ACH6 82K80030GE | |
| Schenker XMG Apex 15 NH57E PS | |
| Alienware m15 R5 Ryzen Edition | |
| Cinebench R20 / CPU (Single Core) | |
| Média da turma Gaming (442 - 913, n=106, últimos 2 anos) | |
| MSI Pulse GL66 12UEK | |
| Média Intel Core i9-12900H (624 - 738, n=28) | |
| Alienware x14 i7 RTX 3060 | |
| Asus TUF Gaming F15 FX507ZM | |
| Lenovo Legion S7 15ACH6 82K80030GE | |
| Alienware m15 R5 Ryzen Edition | |
| Schenker XMG Apex 15 NH57E PS | |
| Cinebench R15 / CPU Multi 64Bit | |
| Média da turma Gaming (1578 - 6330, n=105, últimos 2 anos) | |
| Asus TUF Gaming F15 FX507ZM | |
| MSI Pulse GL66 12UEK | |
| Alienware x14 i7 RTX 3060 | |
| Média Intel Core i9-12900H (1395 - 3077, n=28) | |
| Lenovo Legion S7 15ACH6 82K80030GE | |
| Schenker XMG Apex 15 NH57E PS | |
| Alienware m15 R5 Ryzen Edition | |
| Cinebench R15 / CPU Single 64Bit | |
| Média da turma Gaming (188.8 - 350, n=106, últimos 2 anos) | |
| MSI Pulse GL66 12UEK | |
| Média Intel Core i9-12900H (235 - 277, n=29) | |
| Asus TUF Gaming F15 FX507ZM | |
| Alienware x14 i7 RTX 3060 | |
| Lenovo Legion S7 15ACH6 82K80030GE | |
| Alienware m15 R5 Ryzen Edition | |
| Schenker XMG Apex 15 NH57E PS | |
| Blender / v2.79 BMW27 CPU | |
| Alienware m15 R5 Ryzen Edition | |
| Schenker XMG Apex 15 NH57E PS | |
| Média Intel Core i9-12900H (160 - 451, n=28) | |
| Lenovo Legion S7 15ACH6 82K80030GE | |
| Alienware x14 i7 RTX 3060 | |
| MSI Pulse GL66 12UEK | |
| Asus TUF Gaming F15 FX507ZM | |
| Média da turma Gaming (79 - 330, n=104, últimos 2 anos) | |
| 7-Zip 18.03 / 7z b 4 | |
| Média da turma Gaming (33491 - 148086, n=105, últimos 2 anos) | |
| Asus TUF Gaming F15 FX507ZM | |
| Alienware x14 i7 RTX 3060 | |
| MSI Pulse GL66 12UEK | |
| Média Intel Core i9-12900H (34684 - 76677, n=28) | |
| Lenovo Legion S7 15ACH6 82K80030GE | |
| Schenker XMG Apex 15 NH57E PS | |
| Alienware m15 R5 Ryzen Edition | |
| 7-Zip 18.03 / 7z b 4 -mmt1 | |
| Média da turma Gaming (4199 - 7436, n=105, últimos 2 anos) | |
| MSI Pulse GL66 12UEK | |
| Média Intel Core i9-12900H (5302 - 6289, n=28) | |
| Lenovo Legion S7 15ACH6 82K80030GE | |
| Alienware x14 i7 RTX 3060 | |
| Alienware m15 R5 Ryzen Edition | |
| Schenker XMG Apex 15 NH57E PS | |
| Asus TUF Gaming F15 FX507ZM | |
| Geekbench 5.5 / Multi-Core | |
| Média da turma Gaming (6460 - 28263, n=105, últimos 2 anos) | |
| Alienware x14 i7 RTX 3060 | |
| Asus TUF Gaming F15 FX507ZM | |
| Média Intel Core i9-12900H (8519 - 14376, n=31) | |
| MSI Pulse GL66 12UEK | |
| Lenovo Legion S7 15ACH6 82K80030GE | |
| Schenker XMG Apex 15 NH57E PS | |
| Alienware m15 R5 Ryzen Edition | |
| Geekbench 5.5 / Single-Core | |
| Média da turma Gaming (986 - 2474, n=105, últimos 2 anos) | |
| MSI Pulse GL66 12UEK | |
| Média Intel Core i9-12900H (1631 - 1897, n=31) | |
| Alienware x14 i7 RTX 3060 | |
| Asus TUF Gaming F15 FX507ZM | |
| Lenovo Legion S7 15ACH6 82K80030GE | |
| Schenker XMG Apex 15 NH57E PS | |
| Alienware m15 R5 Ryzen Edition | |
| HWBOT x265 Benchmark v2.2 / 4k Preset | |
| Média da turma Gaming (11.5 - 44.4, n=105, últimos 2 anos) | |
| Asus TUF Gaming F15 FX507ZM | |
| MSI Pulse GL66 12UEK | |
| Alienware x14 i7 RTX 3060 | |
| Média Intel Core i9-12900H (8.05 - 22.5, n=28) | |
| Lenovo Legion S7 15ACH6 82K80030GE | |
| Schenker XMG Apex 15 NH57E PS | |
| Alienware m15 R5 Ryzen Edition | |
| LibreOffice / 20 Documents To PDF | |
| Lenovo Legion S7 15ACH6 82K80030GE | |
| Alienware m15 R5 Ryzen Edition | |
| Schenker XMG Apex 15 NH57E PS | |
| Asus TUF Gaming F15 FX507ZM | |
| Média da turma Gaming (33.2 - 88.8, n=105, últimos 2 anos) | |
| Média Intel Core i9-12900H (36.8 - 59.8, n=28) | |
| MSI Pulse GL66 12UEK | |
| Alienware x14 i7 RTX 3060 | |
| R Benchmark 2.5 / Overall mean | |
| Alienware m15 R5 Ryzen Edition | |
| Schenker XMG Apex 15 NH57E PS | |
| Lenovo Legion S7 15ACH6 82K80030GE | |
| Asus TUF Gaming F15 FX507ZM | |
| Alienware x14 i7 RTX 3060 | |
| Média Intel Core i9-12900H (0.4218 - 0.506, n=28) | |
| Média da turma Gaming (0.3439 - 0.759, n=106, últimos 2 anos) | |
| MSI Pulse GL66 12UEK | |
* ... menor é melhor
AIDA64: FP32 Ray-Trace | FPU Julia | CPU SHA3 | CPU Queen | FPU SinJulia | FPU Mandel | CPU AES | CPU ZLib | FP64 Ray-Trace | CPU PhotoWorxx
| Performance rating | |
| Média da turma Gaming | |
| Lenovo Legion S7 15ACH6 82K80030GE | |
| Schenker XMG Apex 15 NH57E PS | |
| Alienware m15 R5 Ryzen Edition | |
| Média Intel Core i9-12900H | |
| Alienware x14 i7 RTX 3060 | |
| MSI Pulse GL66 12UEK | |
| Asus TUF Gaming F15 FX507ZM | |
| AIDA64 / FP32 Ray-Trace | |
| Média da turma Gaming (10227 - 85542, n=105, últimos 2 anos) | |
| Lenovo Legion S7 15ACH6 82K80030GE | |
| Schenker XMG Apex 15 NH57E PS | |
| Alienware m15 R5 Ryzen Edition | |
| Média Intel Core i9-12900H (4074 - 18289, n=29) | |
| Asus TUF Gaming F15 FX507ZM | |
| MSI Pulse GL66 12UEK | |
| Alienware x14 i7 RTX 3060 | |
| AIDA64 / FPU Julia | |
| Média da turma Gaming (51376 - 238426, n=105, últimos 2 anos) | |
| Lenovo Legion S7 15ACH6 82K80030GE | |
| Schenker XMG Apex 15 NH57E PS | |
| Alienware m15 R5 Ryzen Edition | |
| Média Intel Core i9-12900H (22307 - 93236, n=29) | |
| Asus TUF Gaming F15 FX507ZM | |
| MSI Pulse GL66 12UEK | |
| Alienware x14 i7 RTX 3060 | |
| AIDA64 / CPU SHA3 | |
| Média da turma Gaming (2180 - 10115, n=105, últimos 2 anos) | |
| Lenovo Legion S7 15ACH6 82K80030GE | |
| Asus TUF Gaming F15 FX507ZM | |
| Schenker XMG Apex 15 NH57E PS | |
| MSI Pulse GL66 12UEK | |
| Alienware m15 R5 Ryzen Edition | |
| Média Intel Core i9-12900H (1378 - 4215, n=29) | |
| Alienware x14 i7 RTX 3060 | |
| AIDA64 / CPU Queen | |
| Média da turma Gaming (49785 - 173351, n=90, últimos 2 anos) | |
| MSI Pulse GL66 12UEK | |
| Lenovo Legion S7 15ACH6 82K80030GE | |
| Média Intel Core i9-12900H (78172 - 111241, n=28) | |
| Alienware x14 i7 RTX 3060 | |
| Asus TUF Gaming F15 FX507ZM | |
| Schenker XMG Apex 15 NH57E PS | |
| Alienware m15 R5 Ryzen Edition | |
| AIDA64 / FPU SinJulia | |
| Média da turma Gaming (4424 - 33636, n=105, últimos 2 anos) | |
| Lenovo Legion S7 15ACH6 82K80030GE | |
| Schenker XMG Apex 15 NH57E PS | |
| Alienware m15 R5 Ryzen Edition | |
| MSI Pulse GL66 12UEK | |
| Asus TUF Gaming F15 FX507ZM | |
| Alienware x14 i7 RTX 3060 | |
| Média Intel Core i9-12900H (5709 - 10410, n=29) | |
| AIDA64 / FPU Mandel | |
| Média da turma Gaming (25115 - 128721, n=105, últimos 2 anos) | |
| Lenovo Legion S7 15ACH6 82K80030GE | |
| Schenker XMG Apex 15 NH57E PS | |
| Alienware m15 R5 Ryzen Edition | |
| Média Intel Core i9-12900H (11257 - 45581, n=29) | |
| Asus TUF Gaming F15 FX507ZM | |
| MSI Pulse GL66 12UEK | |
| Alienware x14 i7 RTX 3060 | |
| AIDA64 / CPU AES | |
| Lenovo Legion S7 15ACH6 82K80030GE | |
| Schenker XMG Apex 15 NH57E PS | |
| Alienware m15 R5 Ryzen Edition | |
| Média da turma Gaming (39258 - 247074, n=105, últimos 2 anos) | |
| MSI Pulse GL66 12UEK | |
| Alienware x14 i7 RTX 3060 | |
| Média Intel Core i9-12900H (31935 - 151546, n=29) | |
| Asus TUF Gaming F15 FX507ZM | |
| AIDA64 / CPU ZLib | |
| Média da turma Gaming (574 - 2531, n=105, últimos 2 anos) | |
| Asus TUF Gaming F15 FX507ZM | |
| MSI Pulse GL66 12UEK | |
| Alienware x14 i7 RTX 3060 | |
| Média Intel Core i9-12900H (449 - 1193, n=29) | |
| Lenovo Legion S7 15ACH6 82K80030GE | |
| Schenker XMG Apex 15 NH57E PS | |
| Alienware m15 R5 Ryzen Edition | |
| AIDA64 / FP64 Ray-Trace | |
| Média da turma Gaming (5509 - 45446, n=105, últimos 2 anos) | |
| Lenovo Legion S7 15ACH6 82K80030GE | |
| Schenker XMG Apex 15 NH57E PS | |
| Alienware m15 R5 Ryzen Edition | |
| Média Intel Core i9-12900H (2235 - 10511, n=29) | |
| Asus TUF Gaming F15 FX507ZM | |
| MSI Pulse GL66 12UEK | |
| Alienware x14 i7 RTX 3060 | |
| AIDA64 / CPU PhotoWorxx | |
| Alienware x14 i7 RTX 3060 | |
| Média da turma Gaming (12271 - 89891, n=105, últimos 2 anos) | |
| Média Intel Core i9-12900H (20960 - 48269, n=30) | |
| Asus TUF Gaming F15 FX507ZM | |
| MSI Pulse GL66 12UEK | |
| Schenker XMG Apex 15 NH57E PS | |
| Lenovo Legion S7 15ACH6 82K80030GE | |
| Alienware m15 R5 Ryzen Edition | |
Desempenho do sistema
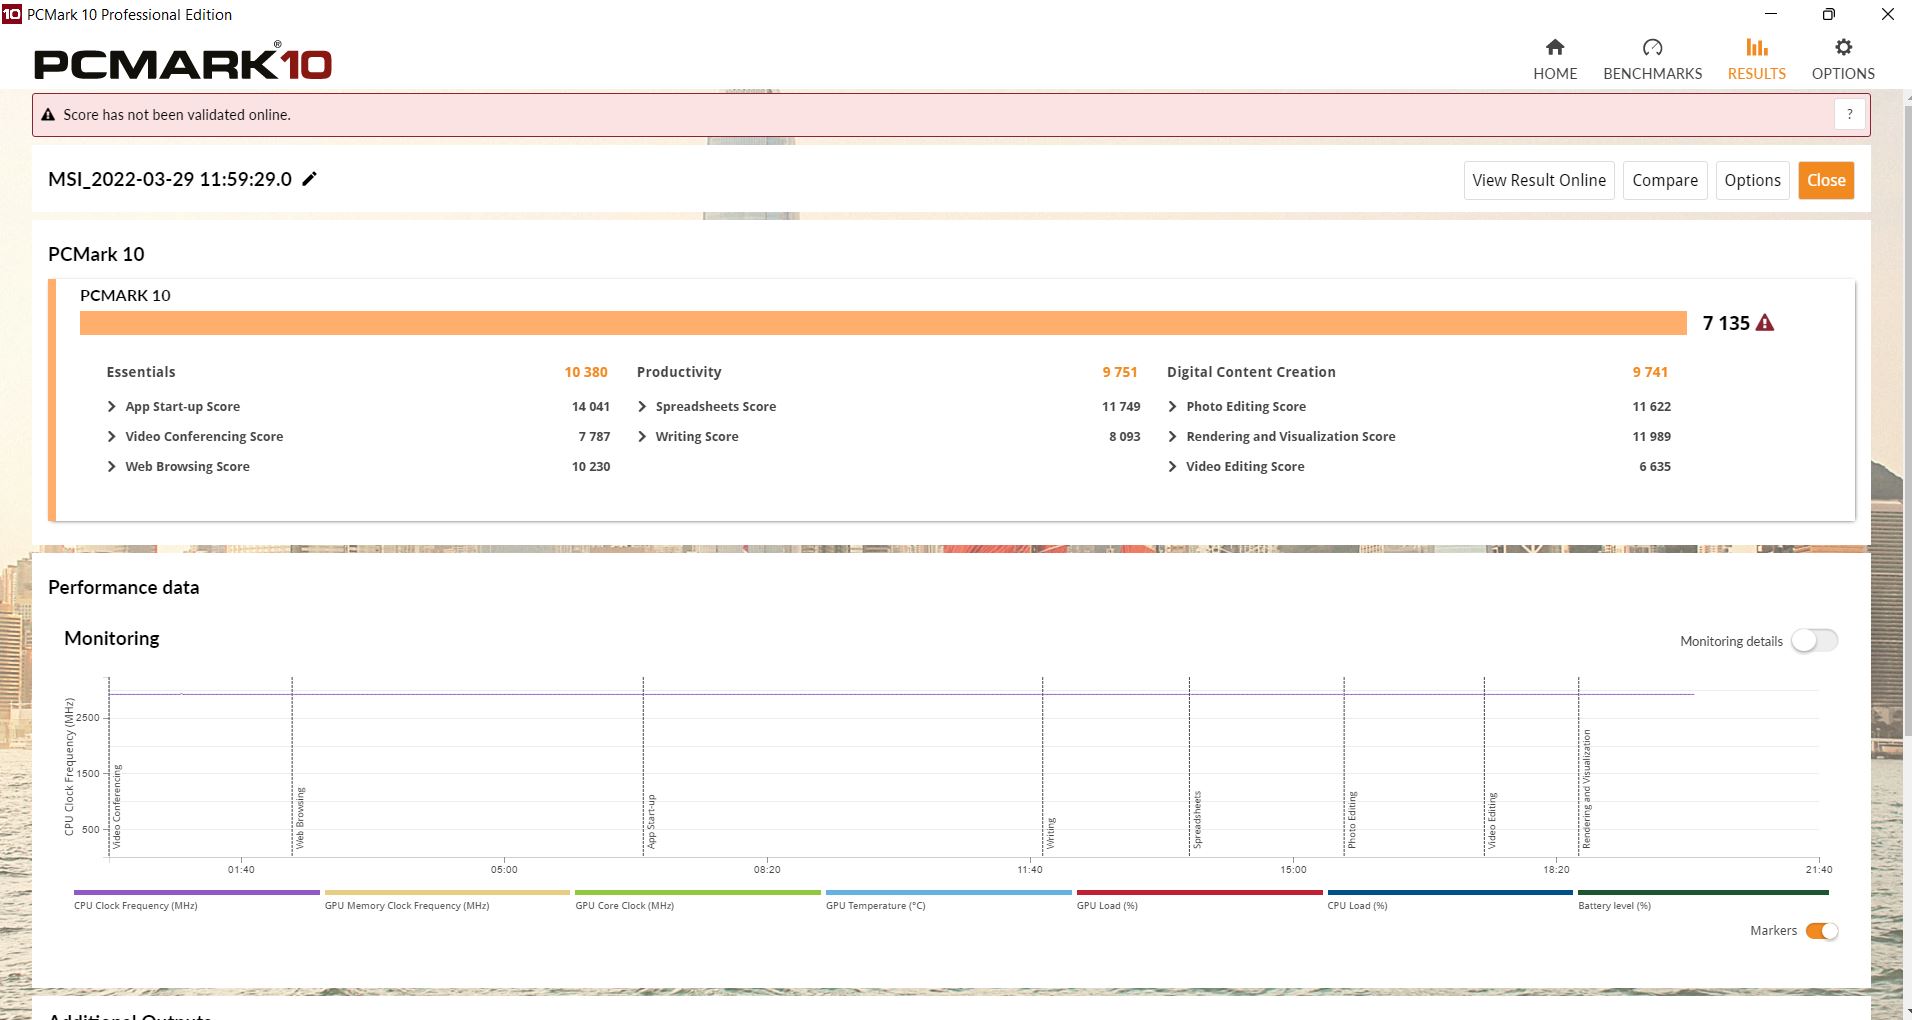
No benchmark PCMark 10 Productivity, o Pulse coloca em primeiro lugar, mas nas outras áreas, é ligeiramente ultrapassado pelo Asus TUF Gaming 15 e às vezes também pelo Alienware X14. Por outro lado, no CrossMark, nossa unidade de teste também termina à frente do X14.
CrossMark: Overall | Productivity | Creativity | Responsiveness
| PCMark 10 / Score | |
| Média da turma Gaming (5828 - 12414, n=93, últimos 2 anos) | |
| Média Intel Core i9-12900H, NVIDIA GeForce RTX 3060 Laptop GPU (7135 - 7861, n=4) | |
| Asus TUF Gaming F15 FX507ZM | |
| Alienware x14 i7 RTX 3060 | |
| MSI Pulse GL66 12UEK | |
| Schenker XMG Apex 15 NH57E PS | |
| Lenovo Legion S7 15ACH6 82K80030GE | |
| Alienware m15 R5 Ryzen Edition | |
| PCMark 10 / Essentials | |
| Média Intel Core i9-12900H, NVIDIA GeForce RTX 3060 Laptop GPU (10380 - 11198, n=4) | |
| Média da turma Gaming (8810 - 11935, n=97, últimos 2 anos) | |
| Asus TUF Gaming F15 FX507ZM | |
| MSI Pulse GL66 12UEK | |
| Alienware x14 i7 RTX 3060 | |
| Schenker XMG Apex 15 NH57E PS | |
| Lenovo Legion S7 15ACH6 82K80030GE | |
| Alienware m15 R5 Ryzen Edition | |
| PCMark 10 / Productivity | |
| Média da turma Gaming (6845 - 25323, n=95, últimos 2 anos) | |
| Média Intel Core i9-12900H, NVIDIA GeForce RTX 3060 Laptop GPU (9751 - 10486, n=4) | |
| MSI Pulse GL66 12UEK | |
| Alienware x14 i7 RTX 3060 | |
| Asus TUF Gaming F15 FX507ZM | |
| Alienware m15 R5 Ryzen Edition | |
| Lenovo Legion S7 15ACH6 82K80030GE | |
| Schenker XMG Apex 15 NH57E PS | |
| PCMark 10 / Digital Content Creation | |
| Média da turma Gaming (7602 - 19954, n=95, últimos 2 anos) | |
| Asus TUF Gaming F15 FX507ZM | |
| Média Intel Core i9-12900H, NVIDIA GeForce RTX 3060 Laptop GPU (9741 - 11226, n=4) | |
| Alienware x14 i7 RTX 3060 | |
| MSI Pulse GL66 12UEK | |
| Schenker XMG Apex 15 NH57E PS | |
| Lenovo Legion S7 15ACH6 82K80030GE | |
| Alienware m15 R5 Ryzen Edition | |
| CrossMark / Overall | |
| MSI Pulse GL66 12UEK | |
| Média da turma Gaming (1366 - 2409, n=94, últimos 2 anos) | |
| Média Intel Core i9-12900H, NVIDIA GeForce RTX 3060 Laptop GPU (1789 - 2096, n=4) | |
| Alienware x14 i7 RTX 3060 | |
| CrossMark / Productivity | |
| MSI Pulse GL66 12UEK | |
| Média Intel Core i9-12900H, NVIDIA GeForce RTX 3060 Laptop GPU (1677 - 2062, n=4) | |
| Média da turma Gaming (1386 - 2254, n=94, últimos 2 anos) | |
| Alienware x14 i7 RTX 3060 | |
| CrossMark / Creativity | |
| Média da turma Gaming (1343 - 2786, n=94, últimos 2 anos) | |
| Média Intel Core i9-12900H, NVIDIA GeForce RTX 3060 Laptop GPU (2032 - 2125, n=4) | |
| MSI Pulse GL66 12UEK | |
| Alienware x14 i7 RTX 3060 | |
| CrossMark / Responsiveness | |
| MSI Pulse GL66 12UEK | |
| Média Intel Core i9-12900H, NVIDIA GeForce RTX 3060 Laptop GPU (1486 - 2230, n=4) | |
| Alienware x14 i7 RTX 3060 | |
| Média da turma Gaming (1226 - 2334, n=94, últimos 2 anos) | |
| PCMark 10 Score | 7135 pontos | |
Ajuda | ||
| AIDA64 / Memory Copy | |
| Alienware x14 i7 RTX 3060 | |
| Média da turma Gaming (21750 - 129946, n=105, últimos 2 anos) | |
| Média Intel Core i9-12900H (34438 - 74264, n=29) | |
| Asus TUF Gaming F15 FX507ZM | |
| MSI Pulse GL66 12UEK | |
| Schenker XMG Apex 15 NH57E PS | |
| Lenovo Legion S7 15ACH6 82K80030GE | |
| Alienware m15 R5 Ryzen Edition | |
| AIDA64 / Memory Read | |
| Alienware x14 i7 RTX 3060 | |
| Média da turma Gaming (22956 - 118858, n=105, últimos 2 anos) | |
| Média Intel Core i9-12900H (36365 - 74642, n=29) | |
| Asus TUF Gaming F15 FX507ZM | |
| MSI Pulse GL66 12UEK | |
| Schenker XMG Apex 15 NH57E PS | |
| Lenovo Legion S7 15ACH6 82K80030GE | |
| Alienware m15 R5 Ryzen Edition | |
| AIDA64 / Memory Write | |
| Média da turma Gaming (22297 - 135096, n=105, últimos 2 anos) | |
| Alienware x14 i7 RTX 3060 | |
| Média Intel Core i9-12900H (32276 - 67858, n=29) | |
| Asus TUF Gaming F15 FX507ZM | |
| MSI Pulse GL66 12UEK | |
| Schenker XMG Apex 15 NH57E PS | |
| Lenovo Legion S7 15ACH6 82K80030GE | |
| Alienware m15 R5 Ryzen Edition | |
| AIDA64 / Memory Latency | |
| Alienware x14 i7 RTX 3060 | |
| Média da turma Gaming (75.3 - 259, n=105, últimos 2 anos) | |
| MSI Pulse GL66 12UEK | |
| Média Intel Core i9-12900H (74.7 - 118.1, n=28) | |
| Lenovo Legion S7 15ACH6 82K80030GE | |
| Alienware m15 R5 Ryzen Edition | |
| Schenker XMG Apex 15 NH57E PS | |
| Asus TUF Gaming F15 FX507ZM | |
* ... menor é melhor
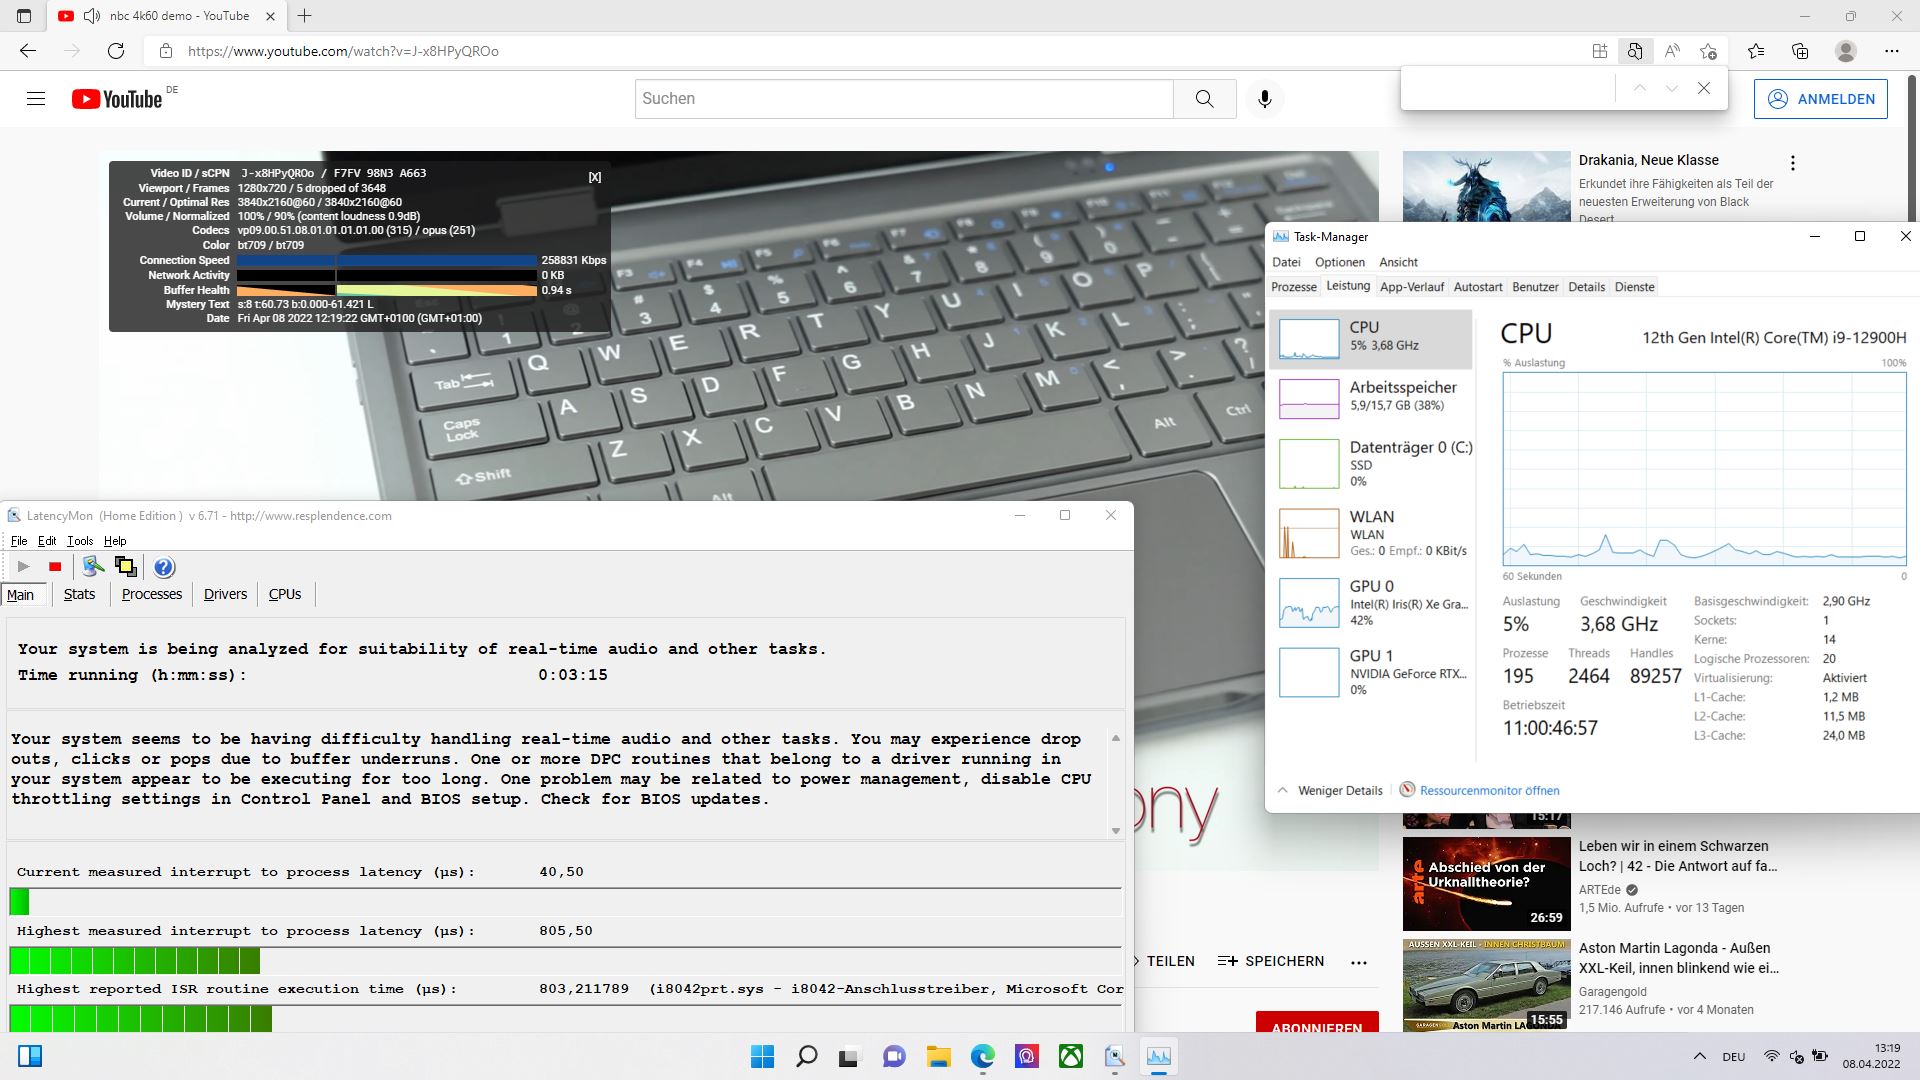
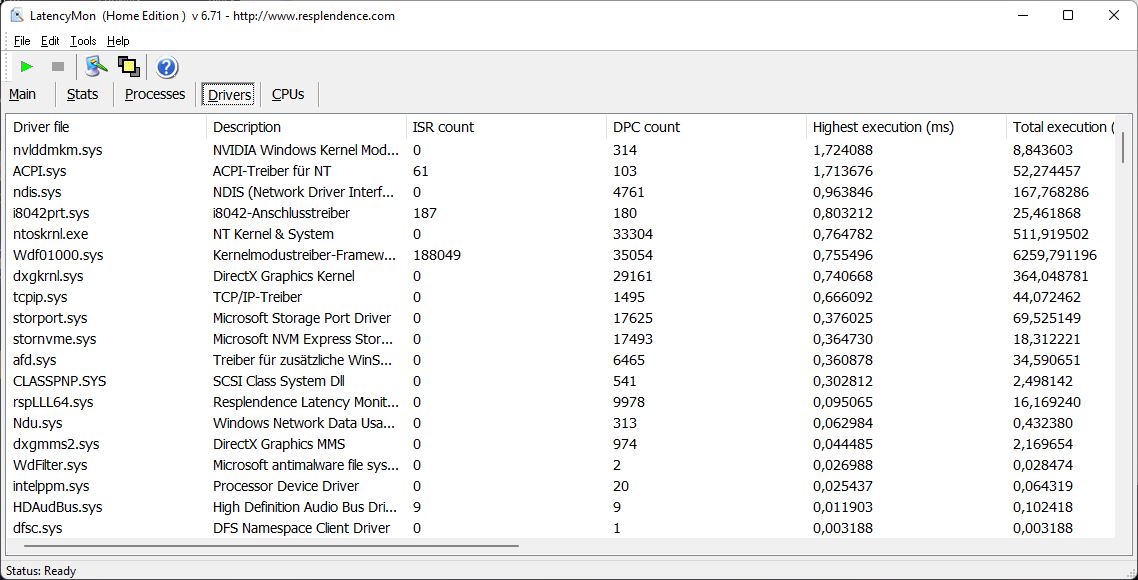
Latências DPC
Infelizmente, a LatencyMon já mostra alguns pequenos problemas ao abrir o navegador. A abertura de várias abas não mostra mais nenhum impacto. Há cinco quadros soltos ao reproduzir nosso vídeo de 4K/60 fps no YouTube. Um Prime95 de 10 segundos logo em seguida aumenta ainda mais o valor da latência.

| DPC Latencies / LatencyMon - interrupt to process latency (max), Web, Youtube, Prime95 | |
| Schenker XMG Apex 15 NH57E PS | |
| Alienware x14 i7 RTX 3060 | |
| MSI Pulse GL66 12UEK | |
| Asus TUF Gaming F15 FX507ZM | |
| Lenovo Legion S7 15ACH6 82K80030GE | |
| Alienware m15 R5 Ryzen Edition | |
* ... menor é melhor
Solução de armazenamento
A MSI utiliza um SSD NVMe 512-GB da Micron. Seu desempenho constante permanece muito uniforme e atinge cerca de 3000 MB/s em leitura e escrita seqüencial, o que é bom.

* ... menor é melhor
Constant Performance Reading: DiskSpd Read Loop, Queue Depth 8
Desempenho gráfico
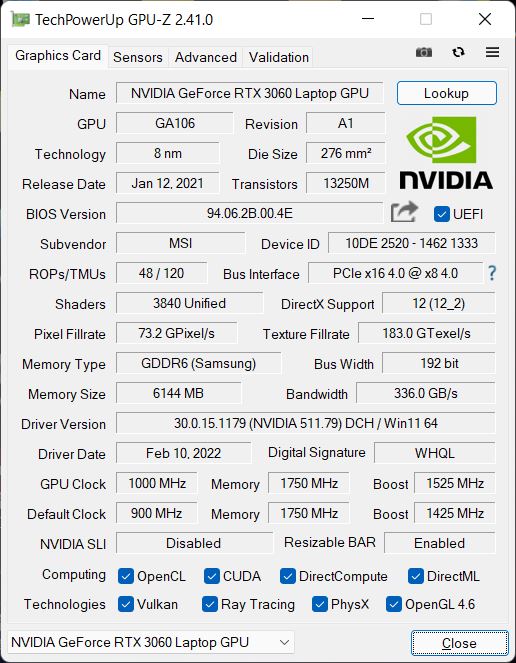
A Nvidia Geforce RTX 3060 com 6 GB de VRAM é usada como GPU. No entanto, em vez do máximo possível de 140 watts, só é capaz de usar até 105 watts, incluindo o Dynamic Boost. Isto pode levar a alguns concorrentes mais rápidos em termos de desempenho 3D puro.
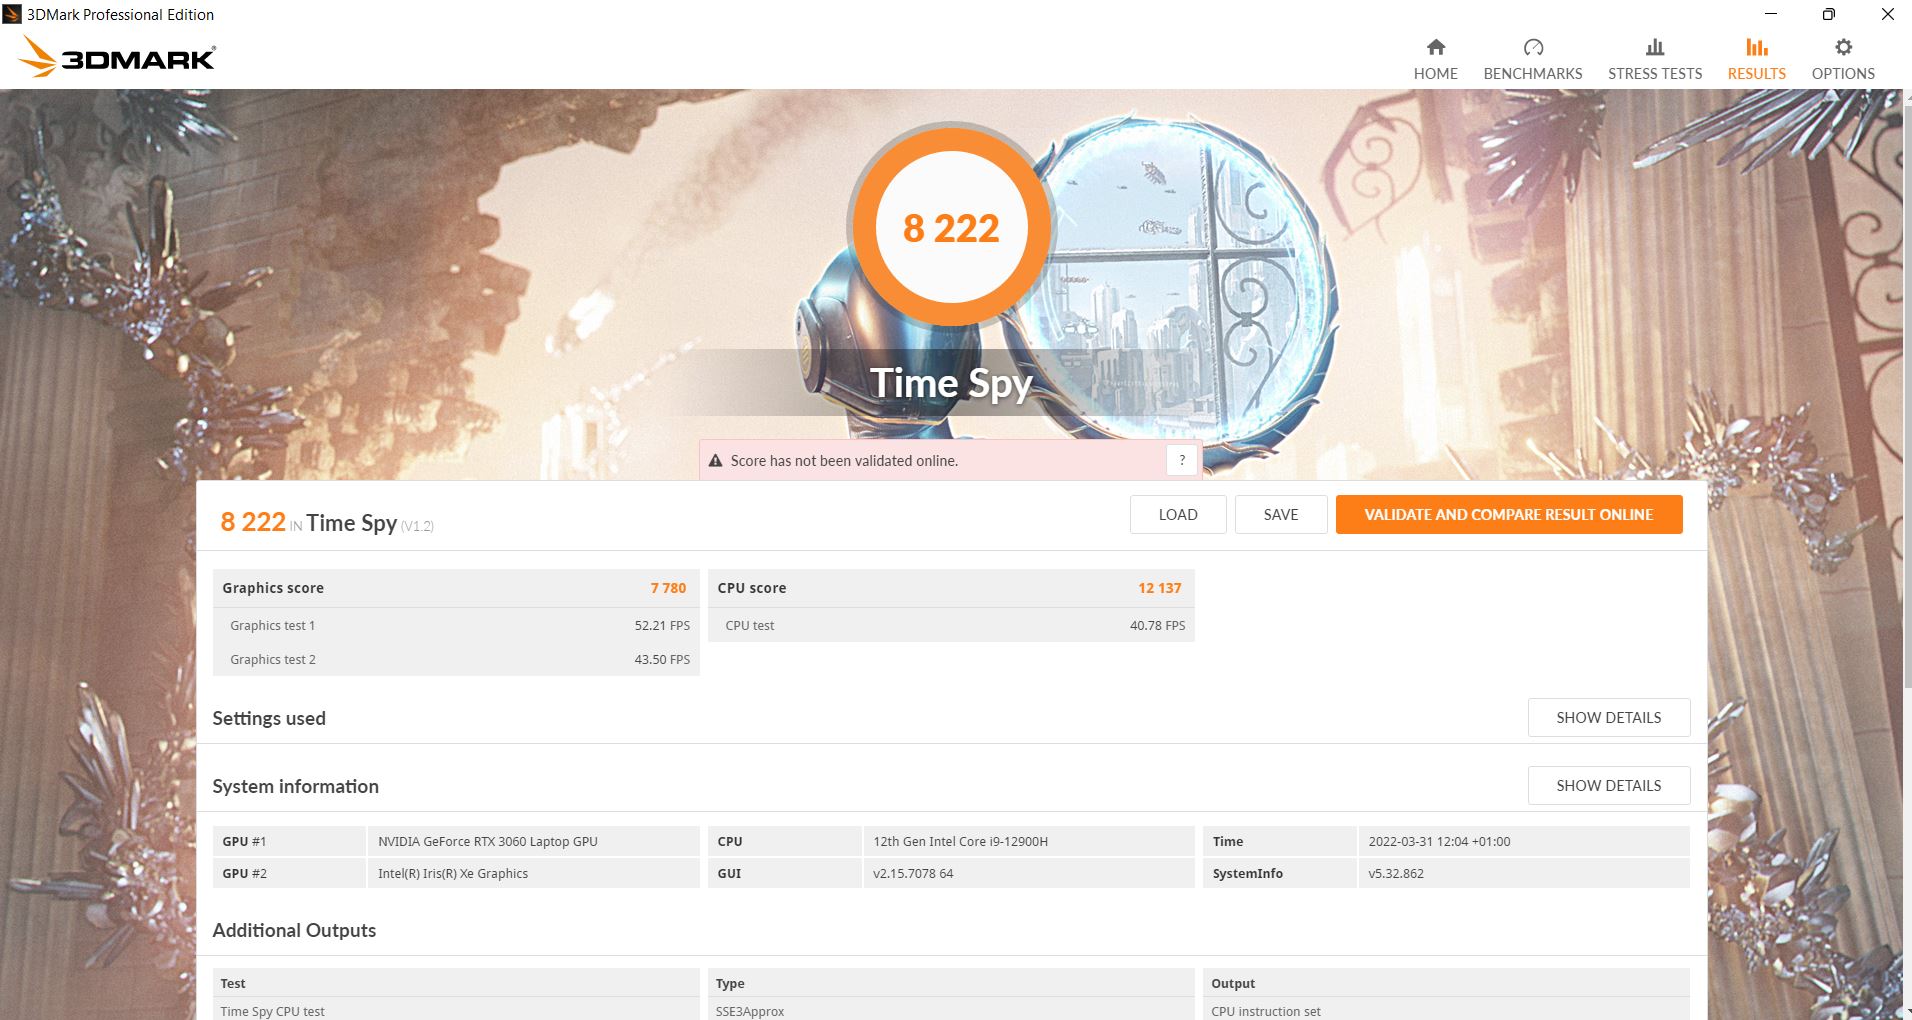
Nos testes sintéticos 3DMark, o Pulse é capaz de atingir os níveis esperados para uma média RTX 3060 nos testes Time Spy e Fire Strike. Vários concorrentes são mais rápidos, incluindo o Asus TUF Gaming F15, mas alguns também são ligeiramente mais lentos, como o Alienware X4. No entanto, a distância até os melhores jogadores é maior do que a distância até os mais baixos.
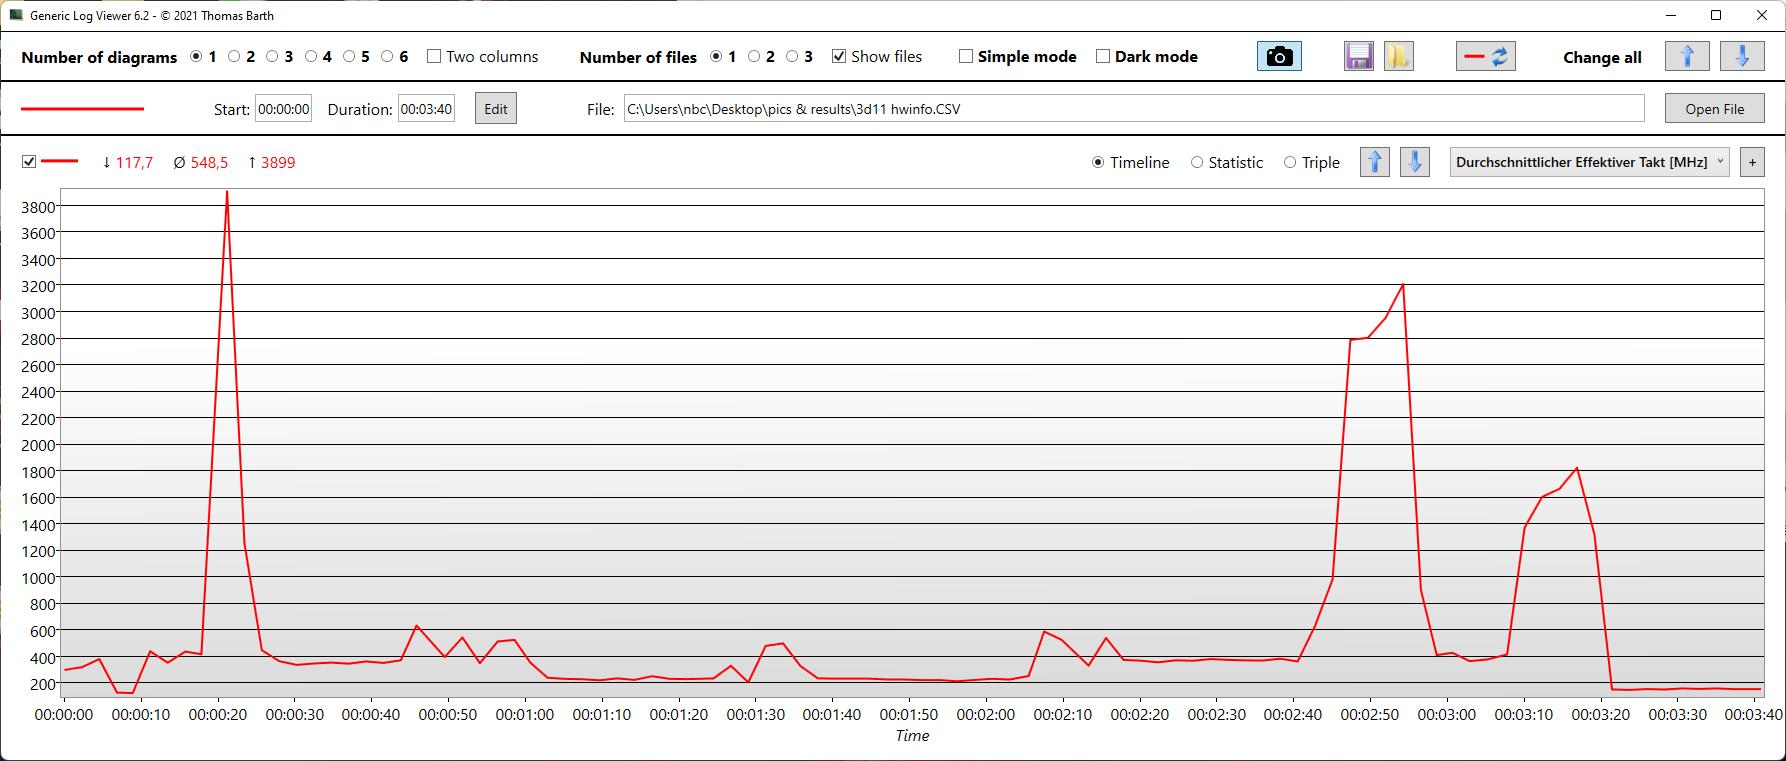
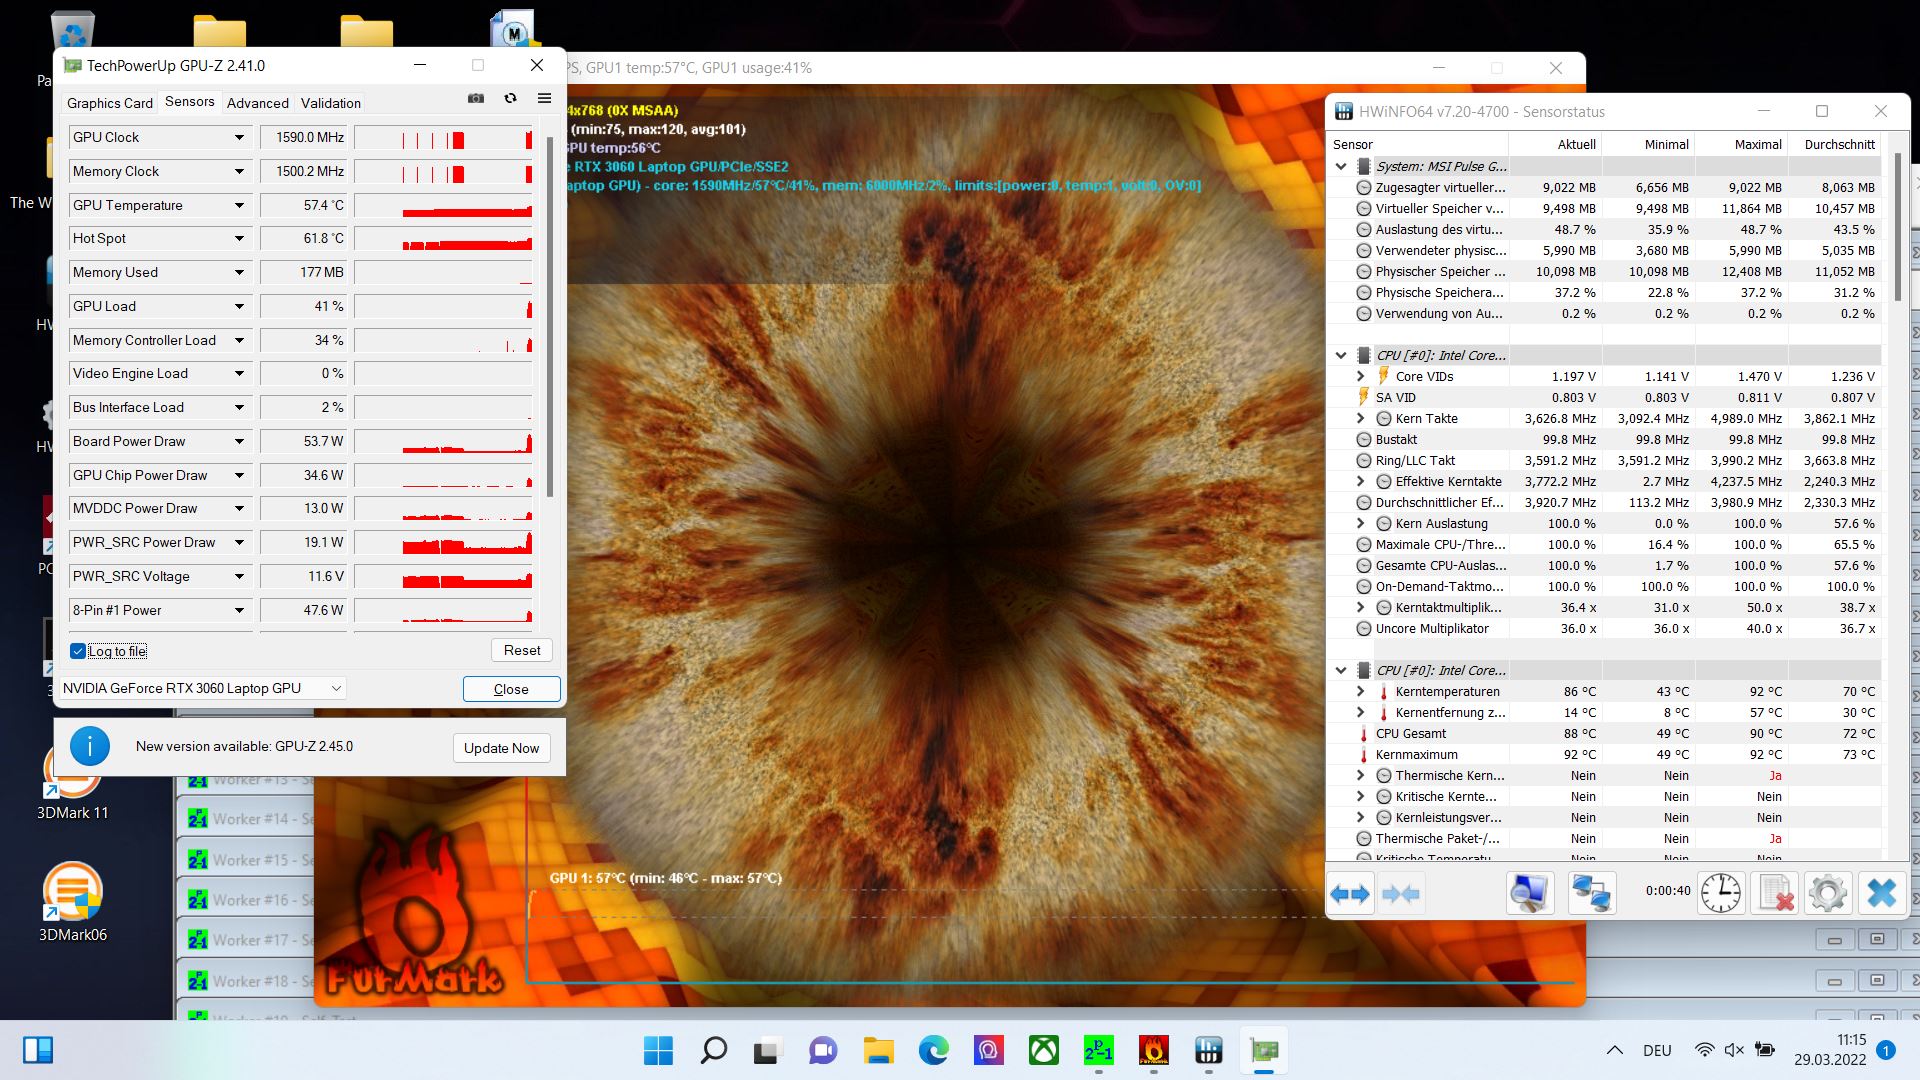
Por outro lado, o desempenho do laptop no 3DMark 11 é muito decepcionante. Mesmo depois de mais de 4 corridas incluindo algumas reinicializações no meio, o estranho resultado de nível inferior foi repetido. Um registro da HWinfo mostra que a velocidade do relógio da CPU é estranhamente baixa (veja o gráfico à direita). Observamos um comportamento semelhante no benchmark Cloud-Gate.
Na operação com bateria, a taxa de quadros cai de 75 fps para uma constante de 30 fps em
"The Witcher 3." Além disso, o sistema de resfriamento só é ativado muito tarde.
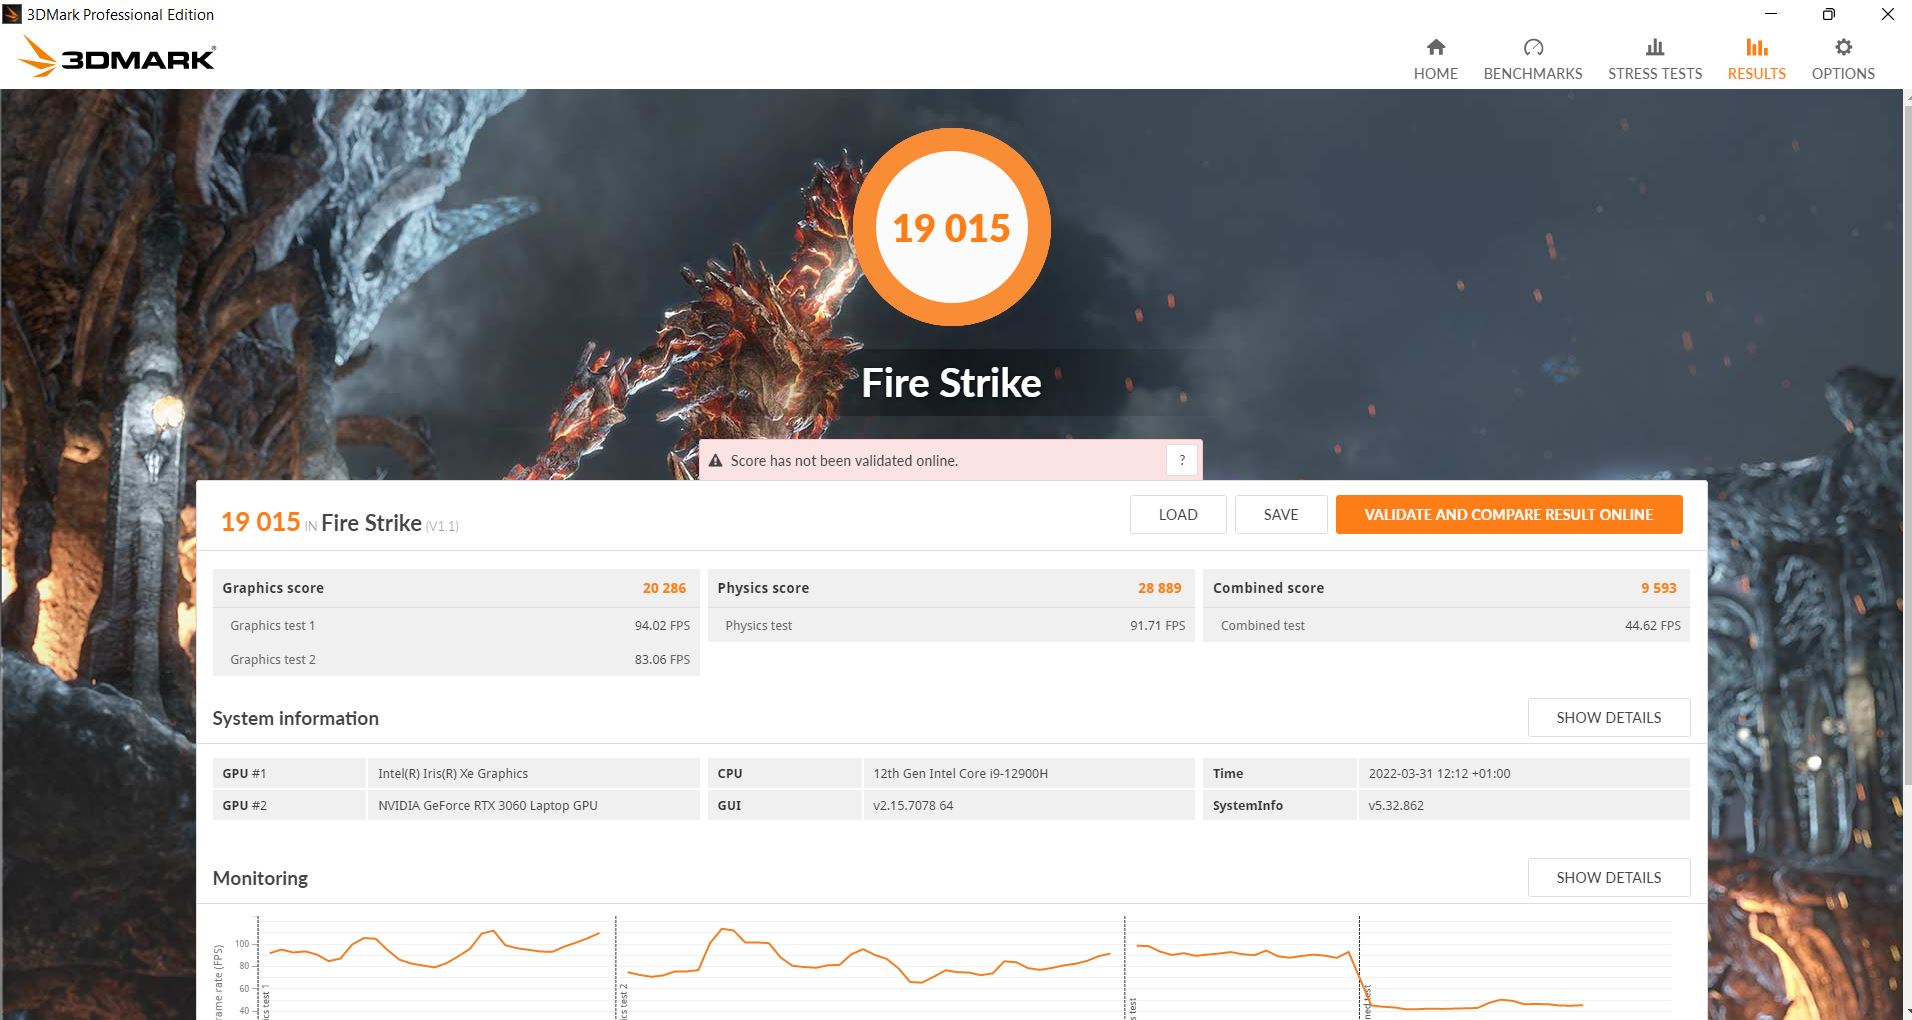
| 3DMark 11 Performance | 14164 pontos | |
| 3DMark Cloud Gate Standard Score | 28859 pontos | |
| 3DMark Fire Strike Score | 19015 pontos | |
| 3DMark Time Spy Score | 8222 pontos | |
Ajuda | ||
Desempenho nos jogos
o " Witcher 3" é executado em resolução nativa e em configurações Ultra em torno de 75 fps. Isto corresponde ao nível esperado, mas vários concorrentes, liderados pelo Asus TUF, ainda são mais rápidos. No"Cyberpunk 2077 1.5", o sistema atinge apenas em torno de 40 fps com as mesmas configurações. Embora isto ainda seja jogável suavemente, é insuficiente para efeitos de traçado de raio
Em"Far Cry 5" e em"X-Plane 11.11", o Pulse consegue até mesmo alcançar o segundo lugar atrás do Asus TUF. Apesar do TGP relativamente baixo, você pode jogar quase qualquer jogo suavemente em resolução nativa e com altos níveis de detalhes.
| Cyberpunk 2077 1.6 | |
| 1920x1080 Medium Preset | |
| Média NVIDIA GeForce RTX 3060 Laptop GPU (68 - 118, n=14) | |
| MSI Pulse GL66 12UEK | |
| Alienware x14 i7 RTX 3060 | |
| 1920x1080 High Preset | |
| Média NVIDIA GeForce RTX 3060 Laptop GPU (42.2 - 87.7, n=14) | |
| Alienware x14 i7 RTX 3060 | |
| MSI Pulse GL66 12UEK | |
| 1920x1080 Ultra Preset | |
| Alienware x14 i7 RTX 3060 | |
| Média NVIDIA GeForce RTX 3060 Laptop GPU (40 - 78.8, n=16) | |
| MSI Pulse GL66 12UEK | |
| 1920x1080 Ray Tracing Ultra Preset (DLSS off) | |
| Média NVIDIA GeForce RTX 3060 Laptop GPU (12.6 - 28.9, n=7) | |
| MSI Pulse GL66 12UEK | |
O Pulse não tem o Optimus avançado e também não há interruptor MUX no painel. Entretanto, a taxa de quadros do"The Witcher 3" ainda permanece bastante constante durante um período de uma hora.
The Witcher 3 FPS Chart
| baixo | média | alto | ultra | |
|---|---|---|---|---|
| The Witcher 3 (2015) | 368.5 | 247.2 | 139.6 | 78 |
| Dota 2 Reborn (2015) | 179 | 161 | 151 | 144 |
| X-Plane 11.11 (2018) | 142 | 123 | 100 | |
| Far Cry 5 (2018) | 168 | 128 | 120 | 112 |
| Cyberpunk 2077 1.6 (2022) | 88.1 | 87.1 | 42.2 | 40.7 |
Emissões
Emissões sonoras
Embora tenhamos a maioria dos benchmarks no modo Desempenho Extremo, a MSI recomenda o modo Equilibrado. No modo Extremo, os ventiladores começam até mesmo brevemente durante a operação ociosa, mas no modo Equilibrado eles permanecem silenciosos após 5 minutos do"The Witcher 3" durante a operação com bateria.
Mesmo que os ventiladores também possam ser ligados durante tarefas de trabalho regulares (como escrever esta revisão) no modo Equilibrado, eles então se espelham silenciosamente e são quase imperceptíveis.
No modo Extremo, apenas o Schenker Core fica mais alto sob carga. Quanto mais rápido o Asus TUF produz um nível de ruído semelhante.
Barulho
| Ocioso |
| 23 / 27 / 27 dB |
| Carga |
| 48.2 / 56.94 dB |
 | ||
30 dB silencioso 40 dB(A) audível 50 dB(A) ruidosamente alto |
||
min: | ||
| MSI Pulse GL66 12UEK GeForce RTX 3060 Laptop GPU, i9-12900H, Micron 2450 512GB MTFDKBA512TFK | Asus TUF Gaming F15 FX507ZM GeForce RTX 3060 Laptop GPU, i7-12700H, SK Hynix HFM001TD3JX013N | Alienware x14 i7 RTX 3060 GeForce RTX 3060 Laptop GPU, i7-12700H, WDC PC SN810 1TB | Schenker XMG Apex 15 NH57E PS GeForce RTX 3060 Laptop GPU, R7 5800H, Samsung SSD 980 500GB (MZ-V8V500BW) | Lenovo Legion S7 15ACH6 82K80030GE GeForce RTX 3060 Laptop GPU, R9 5900HX, Samsung PM981a MZVLB1T0HBLR | Alienware m15 R5 Ryzen Edition GeForce RTX 3060 Laptop GPU, R7 5800H, Toshiba KBG40ZNS512G NVMe | |
|---|---|---|---|---|---|---|
| Noise | 6% | 2% | 6% | -5% | 1% | |
| desligado / ambiente * (dB) | 23 | 23.2 -1% | 24.7 -7% | 23 -0% | 25 -9% | 24 -4% |
| Idle Minimum * (dB) | 23 | 23.6 -3% | 24.7 -7% | 23 -0% | 25 -9% | 24 -4% |
| Idle Average * (dB) | 27 | 23.6 13% | 24.7 9% | 23 15% | 30 -11% | 25 7% |
| Idle Maximum * (dB) | 27 | 25.4 6% | 30.9 -14% | 26.4 2% | 36 -33% | 35 -30% |
| Load Average * (dB) | 48.2 | 38 21% | 40 17% | 34.25 29% | 42 13% | 44 9% |
| Witcher 3 ultra * (dB) | 56.9 | 54.1 5% | 51.5 9% | 58.4 -3% | 53 7% | 48 16% |
| Load Maximum * (dB) | 56.94 | 57.2 -0% | 51.5 10% | 58.42 -3% | 54 5% | 50 12% |
* ... menor é melhor
Temperatura
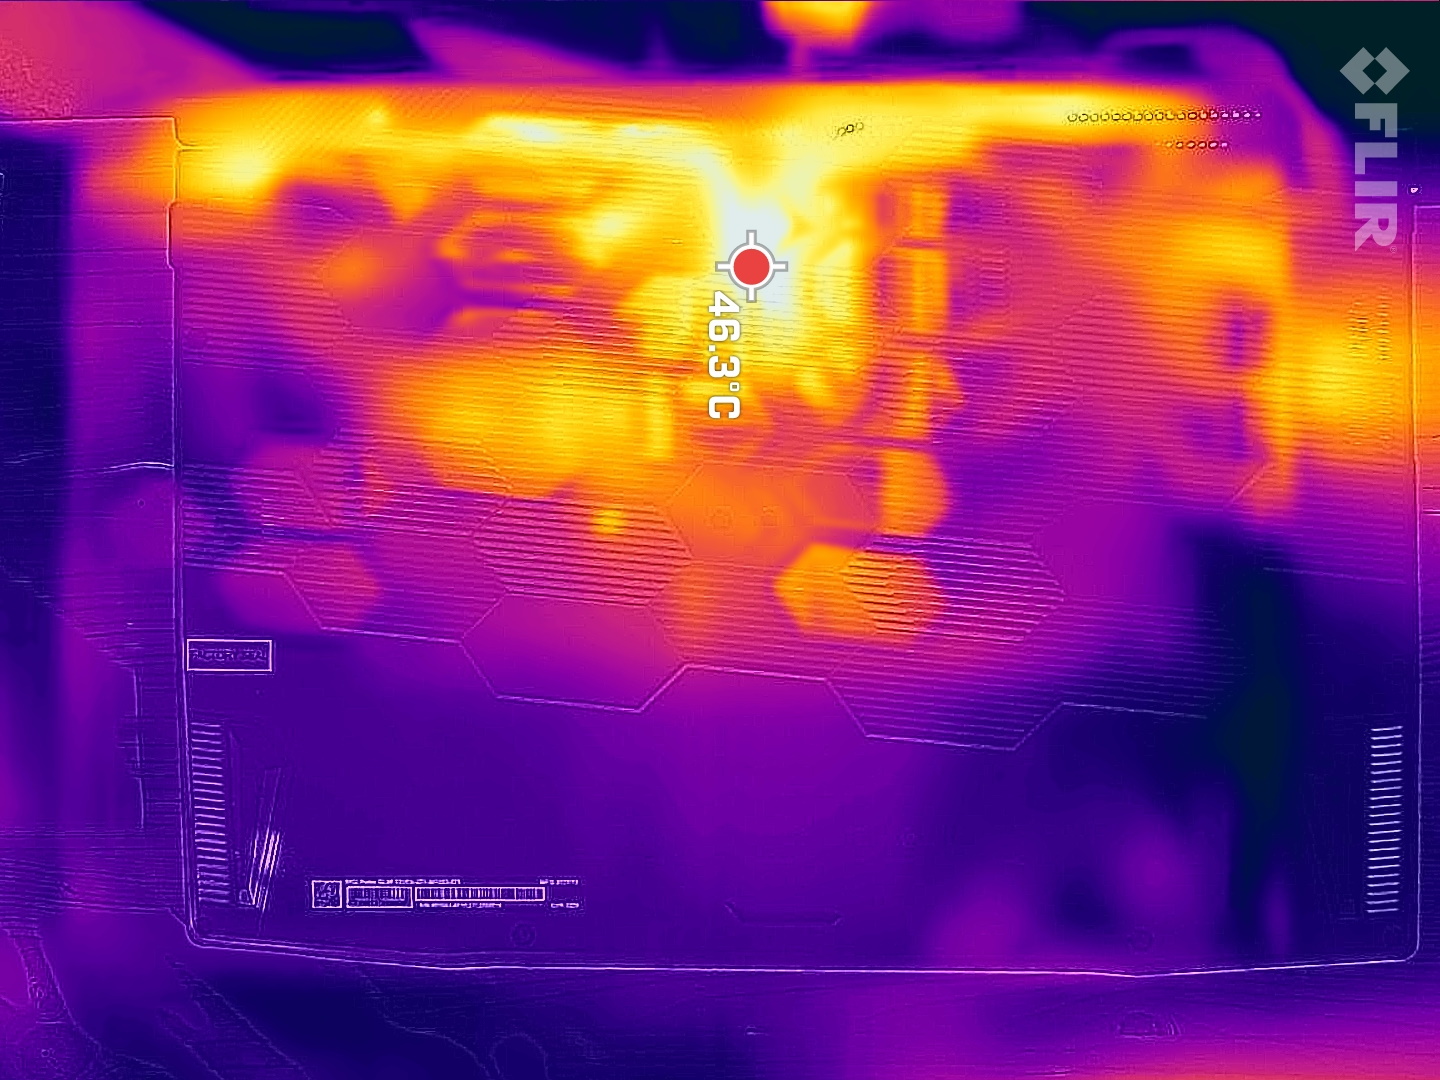
A cerca de 37 °C (99 °F) durante a operação ociosa, o laptop fica ligeiramente mais quente do que os concorrentes. Somente o Asus TUF aquece de forma semelhante aqui. Unter load, isto continua até 50 °C (122 °F), com vários concorrentes alcançando temperaturas semelhantes (Lenovo Legion S7) ou ficando ainda mais quente (Alienware m5).
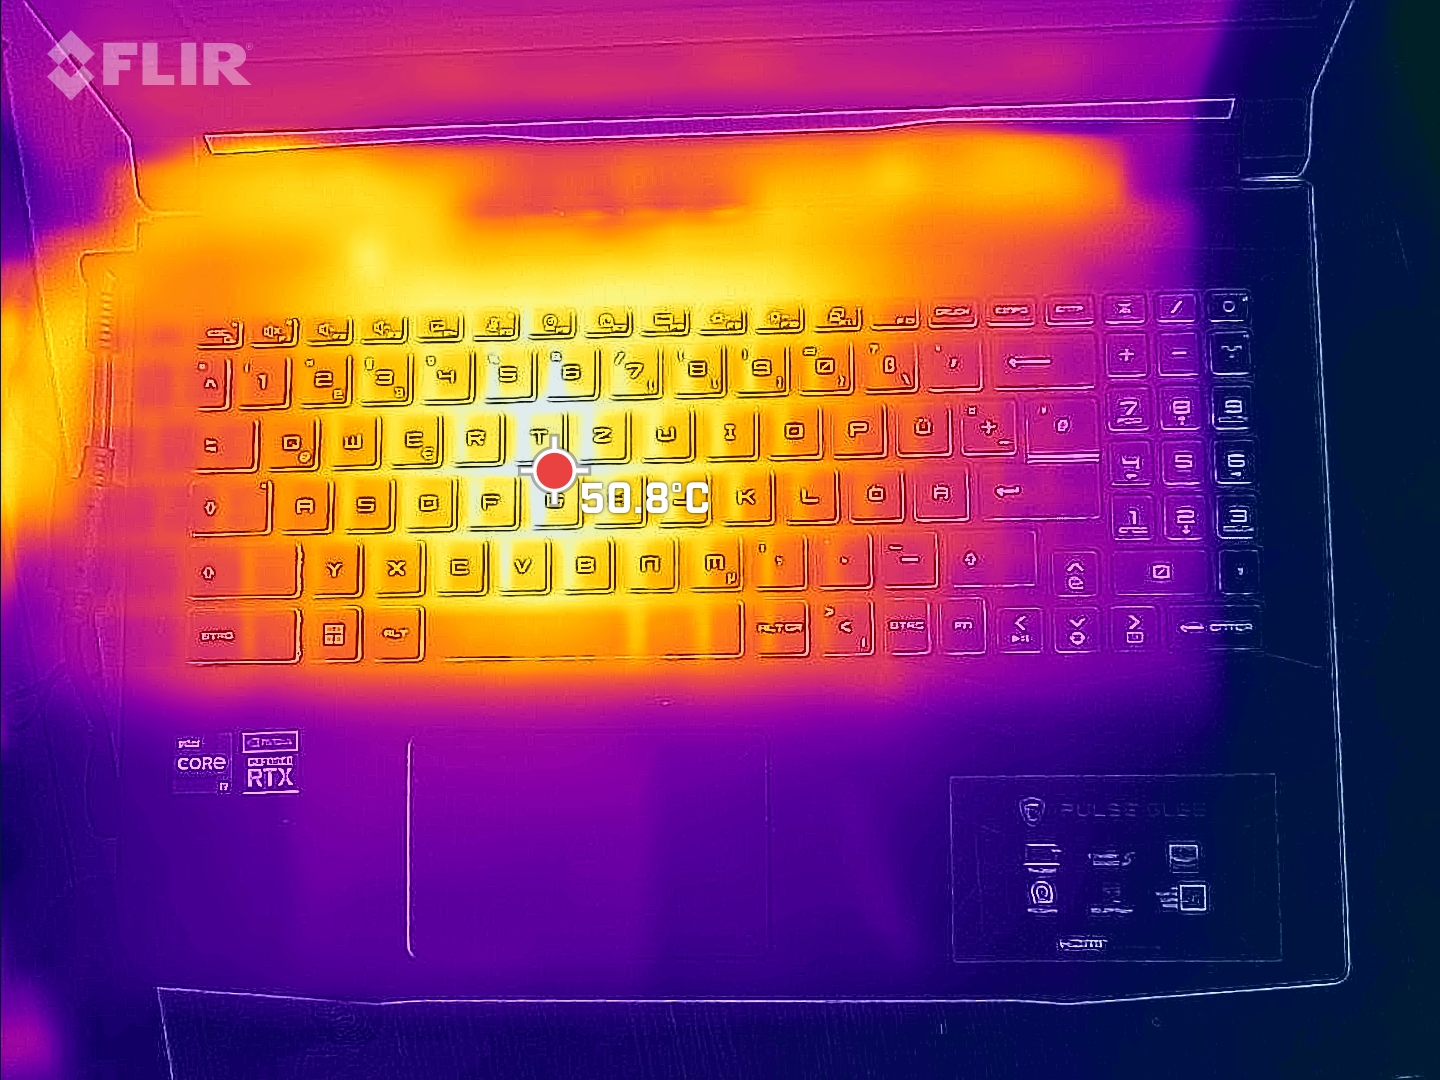
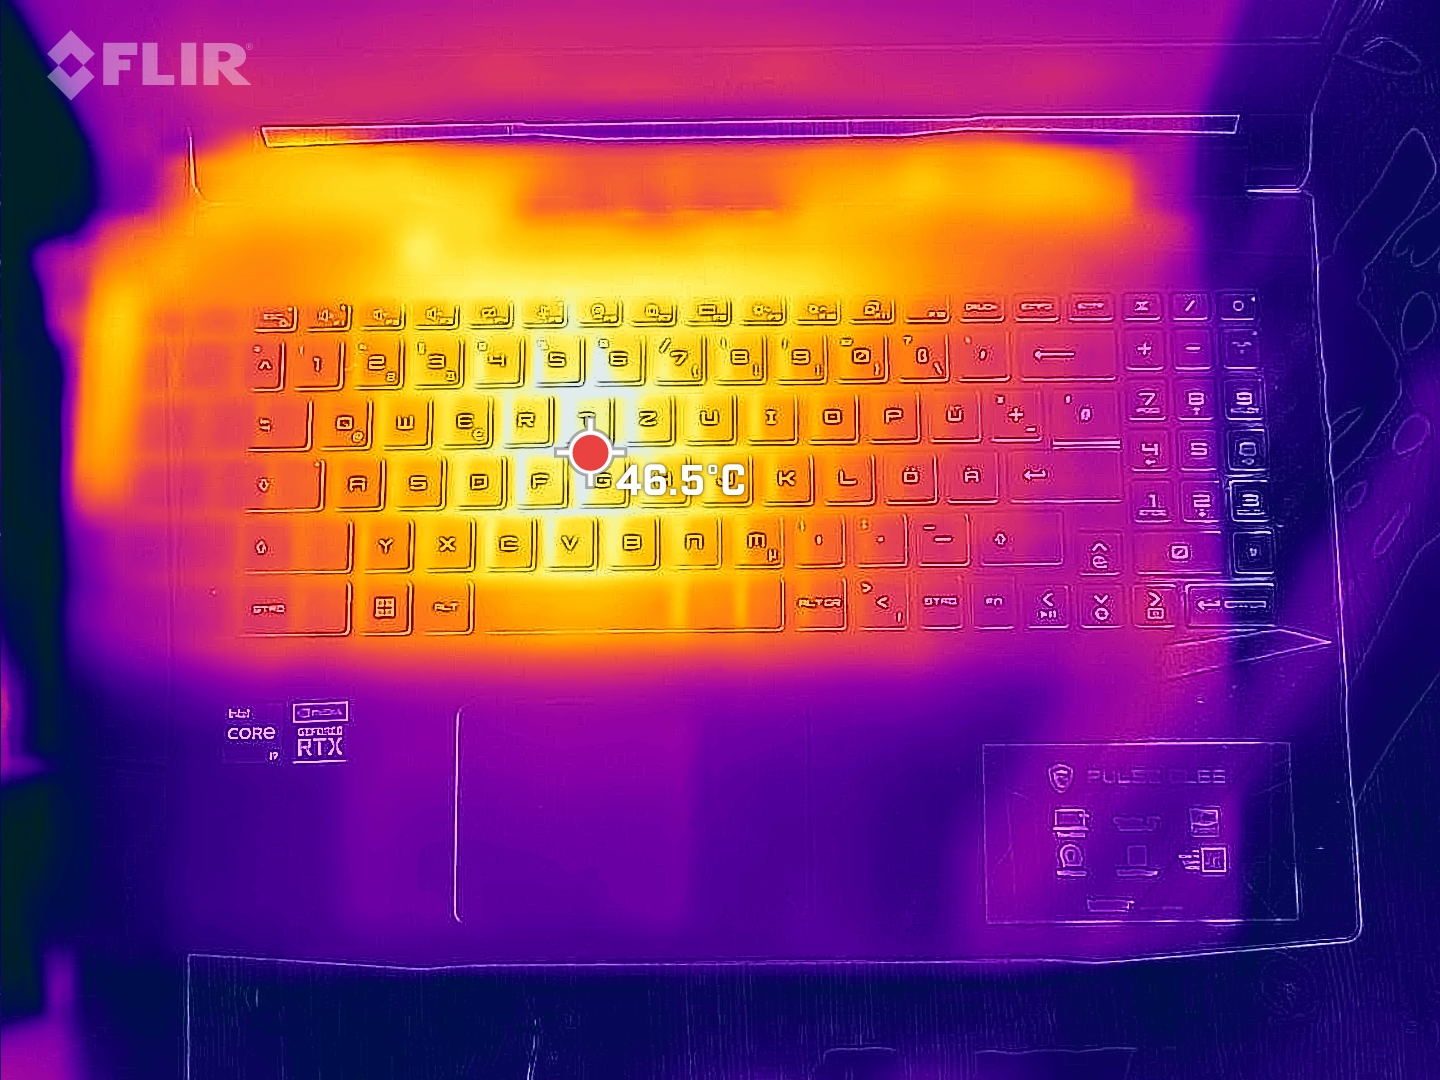
Felizmente, o descanso da palma permanece sempre frio. Os hotspots estão no centro ou mais próximos da tela.
(-) A temperatura máxima no lado superior é 50 °C / 122 F, em comparação com a média de 40.4 °C / 105 F , variando de 21.2 a 68.8 °C para a classe Gaming.
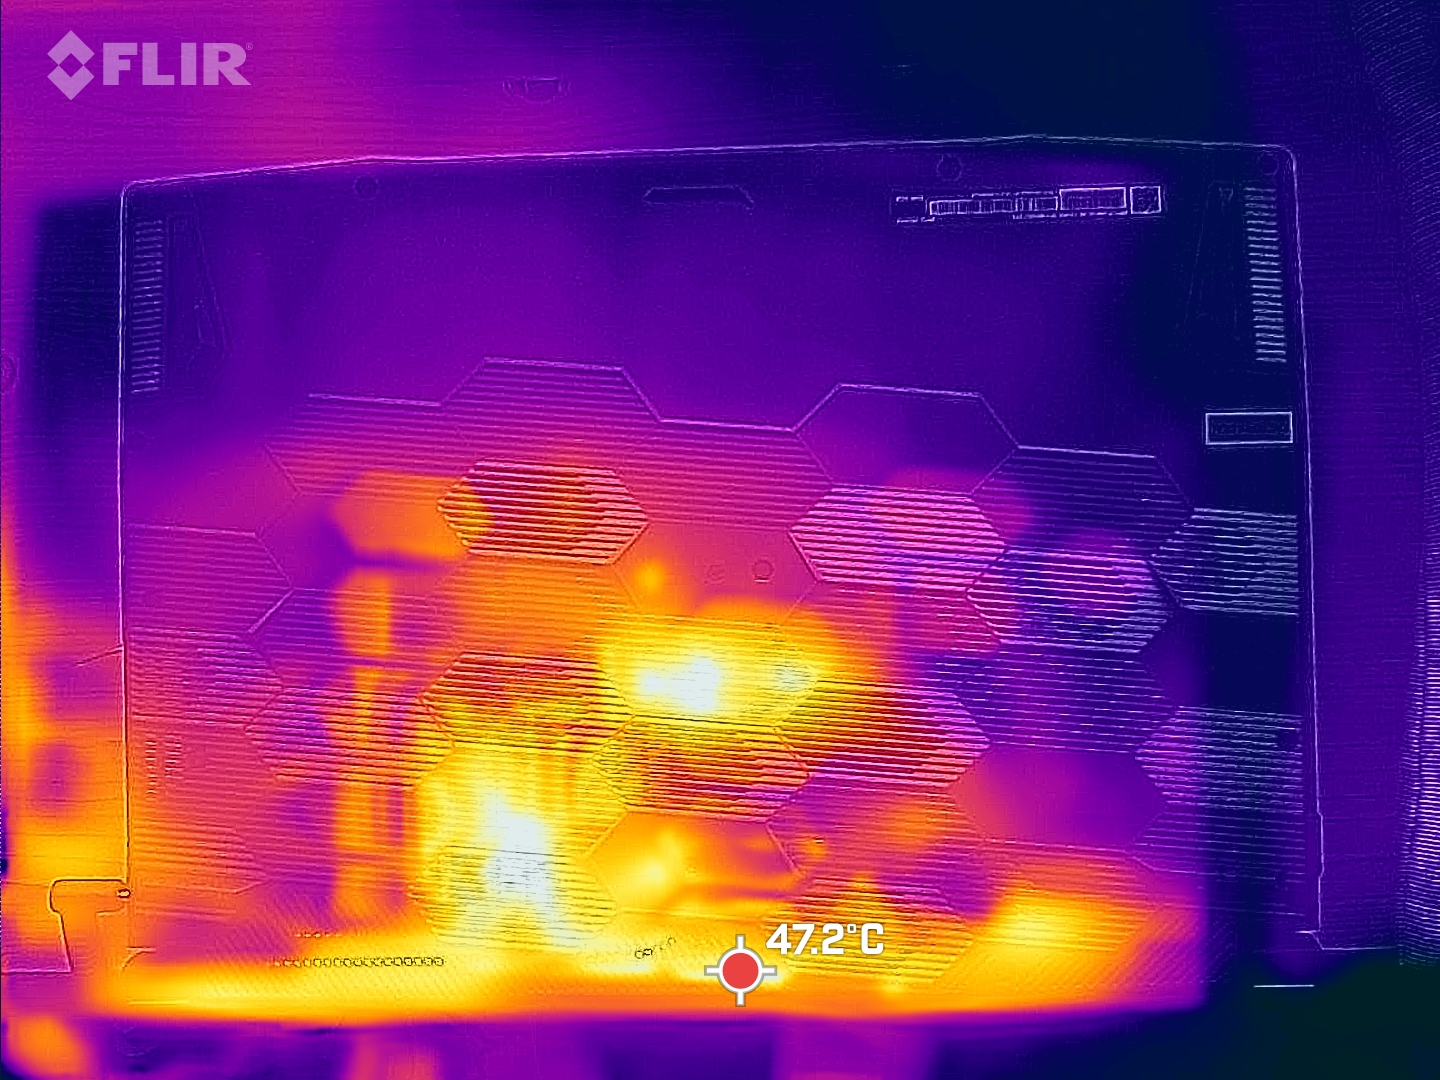
(-) A parte inferior aquece até um máximo de 47 °C / 117 F, em comparação com a média de 43.2 °C / 110 F
(+) Em uso inativo, a temperatura média para o lado superior é 30.8 °C / 87 F, em comparação com a média do dispositivo de 33.9 °C / ### class_avg_f### F.
(-) Jogando The Witcher 3, a temperatura média para o lado superior é 39.6 °C / 103 F, em comparação com a média do dispositivo de 33.9 °C / ## #class_avg_f### F.
(+) Os apoios para as mãos e o touchpad são mais frios que a temperatura da pele, com um máximo de 26 °C / 78.8 F e, portanto, são frios ao toque.
(+) A temperatura média da área do apoio para as mãos de dispositivos semelhantes foi 28.8 °C / 83.8 F (+2.8 °C / 5 F).
| MSI Pulse GL66 12UEK Intel Core i9-12900H, NVIDIA GeForce RTX 3060 Laptop GPU | Asus TUF Gaming F15 FX507ZM Intel Core i7-12700H, NVIDIA GeForce RTX 3060 Laptop GPU | Alienware x14 i7 RTX 3060 Intel Core i7-12700H, NVIDIA GeForce RTX 3060 Laptop GPU | Schenker XMG Apex 15 NH57E PS AMD Ryzen 7 5800H, NVIDIA GeForce RTX 3060 Laptop GPU | Lenovo Legion S7 15ACH6 82K80030GE AMD Ryzen 9 5900HX, NVIDIA GeForce RTX 3060 Laptop GPU | Alienware m15 R5 Ryzen Edition AMD Ryzen 7 5800H, NVIDIA GeForce RTX 3060 Laptop GPU | |
|---|---|---|---|---|---|---|
| Heat | -1% | 14% | 19% | 9% | -10% | |
| Maximum Upper Side * (°C) | 50 | 44.4 11% | 51.3 -3% | 36 28% | 49 2% | 62 -24% |
| Maximum Bottom * (°C) | 47 | 48.8 -4% | 44.4 6% | 38 19% | 50 -6% | 61 -30% |
| Idle Upper Side * (°C) | 36 | 37.8 -5% | 27.2 24% | 31 14% | 29 19% | 36 -0% |
| Idle Bottom * (°C) | 38 | 39.6 -4% | 26.6 30% | 33 13% | 30 21% | 33 13% |
* ... menor é melhor
Teste de estresse
No início de nosso teste de estresse, os núcleos inicialmente aceleram até 3,6 GHz, o que está longe do máximo de 5 GHz que é possível. Após o minuto inicial, a velocidade do relógio cai continuamente. Medimos apenas 2,9 GHz após 10 minutos e em torno de 2,3 GHz após uma hora. Isto significa que, apesar do modo Extreme Performance, a CPU é estrangulada aqui. Após uma hora, as temperaturas centrais ficam em torno de 80 °C (176 °F). Durante o teste, a temperatura máxima subiu para 97 °C (207 °F), razão pela qual a velocidade do relógio foi estrangulada
Vimos uma estranha queda de desempenho entre os minutos 12 e 20, talvez houvesse alguns outros processos que interferiram aqui.
A velocidade do relógio GPU é muito variável, variando entre cerca de 1,6 e 1,2 GHz dentro de uma hora, e as temperaturas estão em torno de 70 °C (158 °F). Há algumas quedas de desempenho maiores na velocidade do relógio da GPU e também na velocidade de armazenamento. Pelo menos esta última deve permanecer bastante constante, mas de acordo com o registro GPU-Z, ambos os valores caíram para 200 MHz no decorrer do teste.
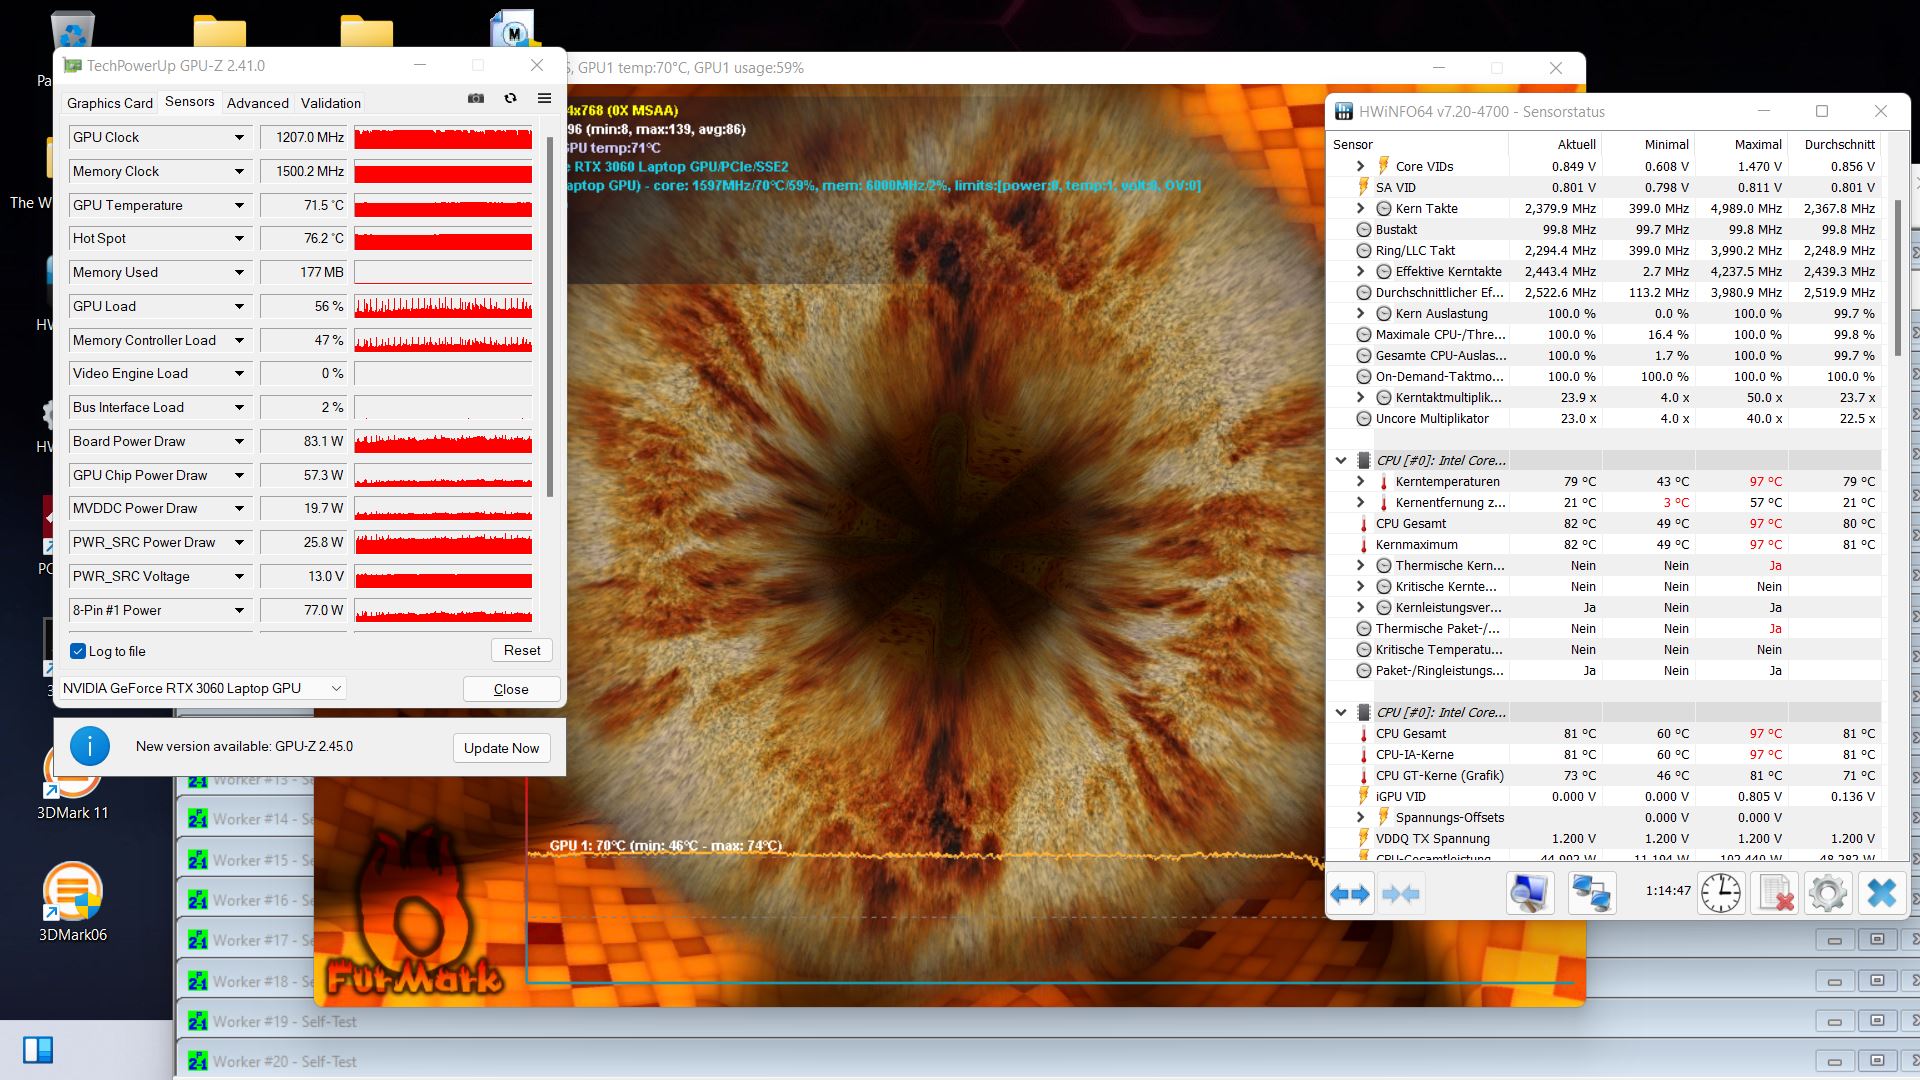
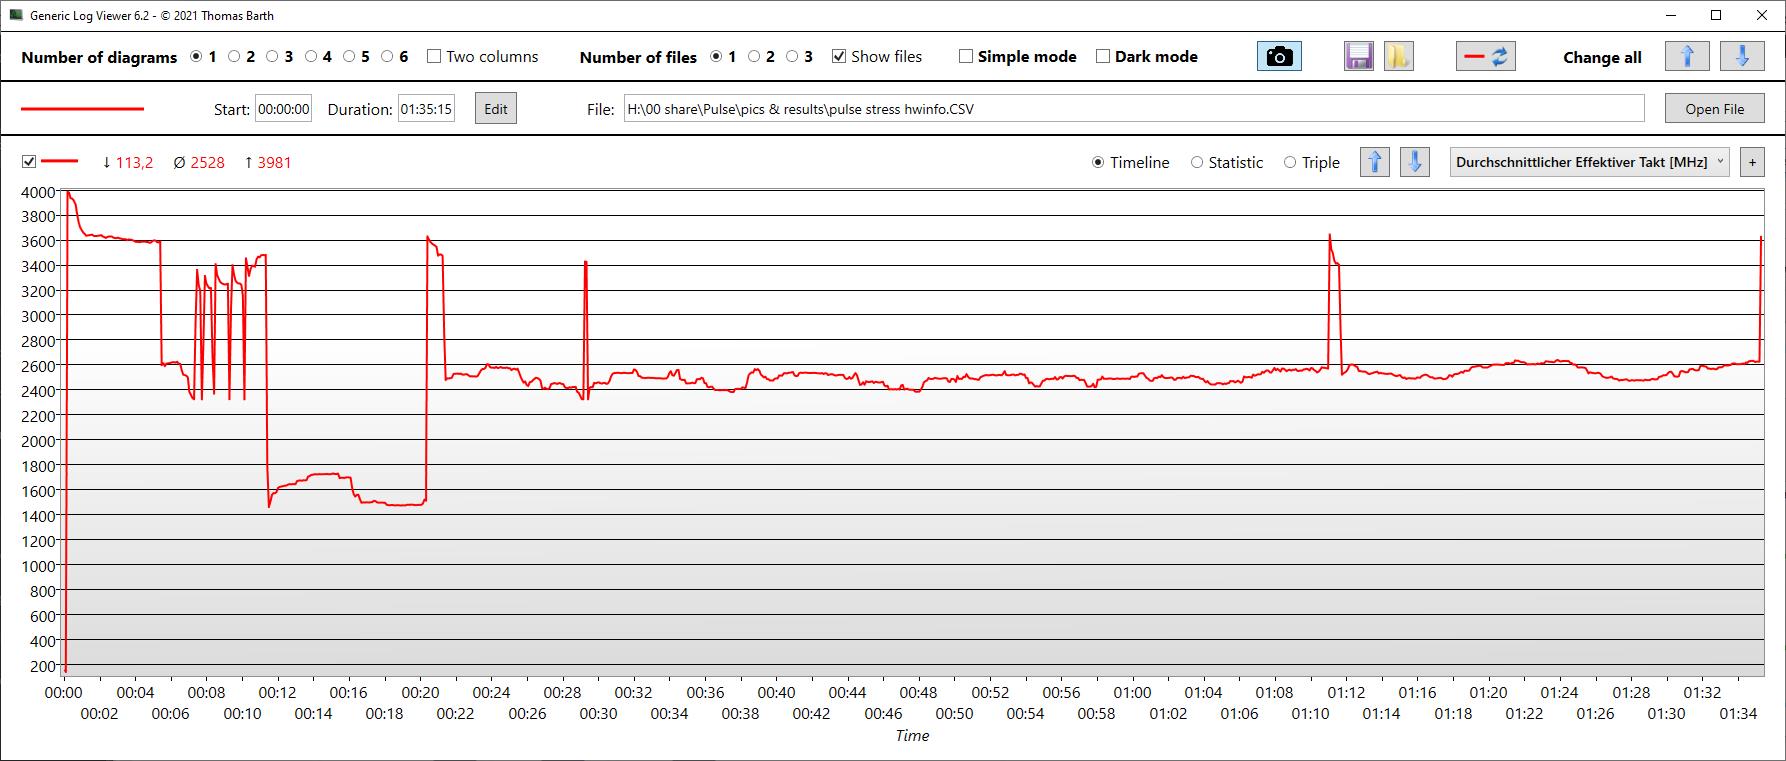
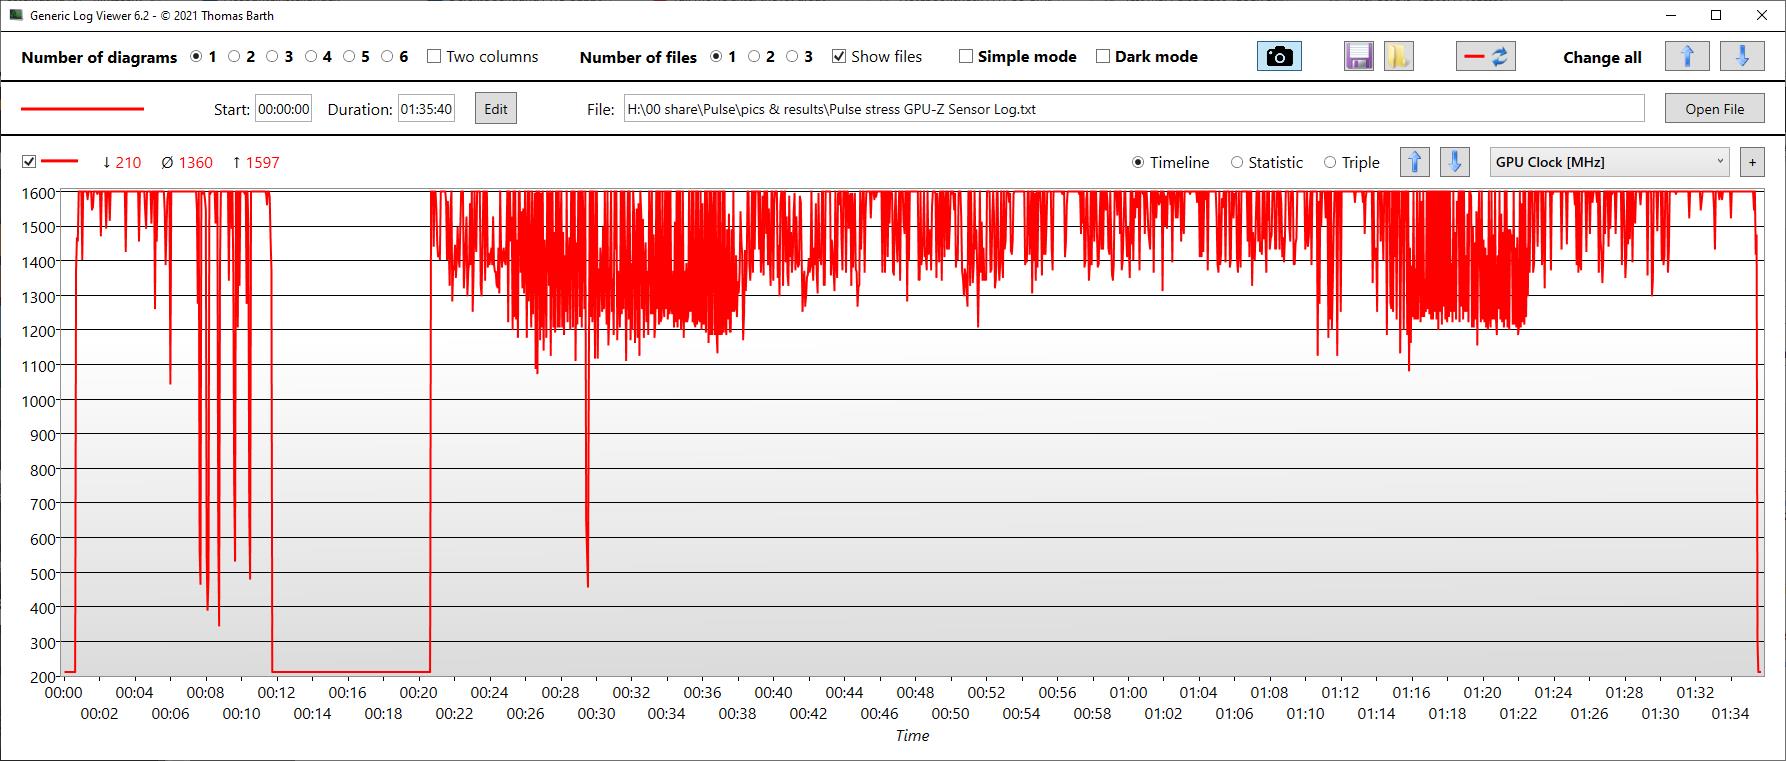
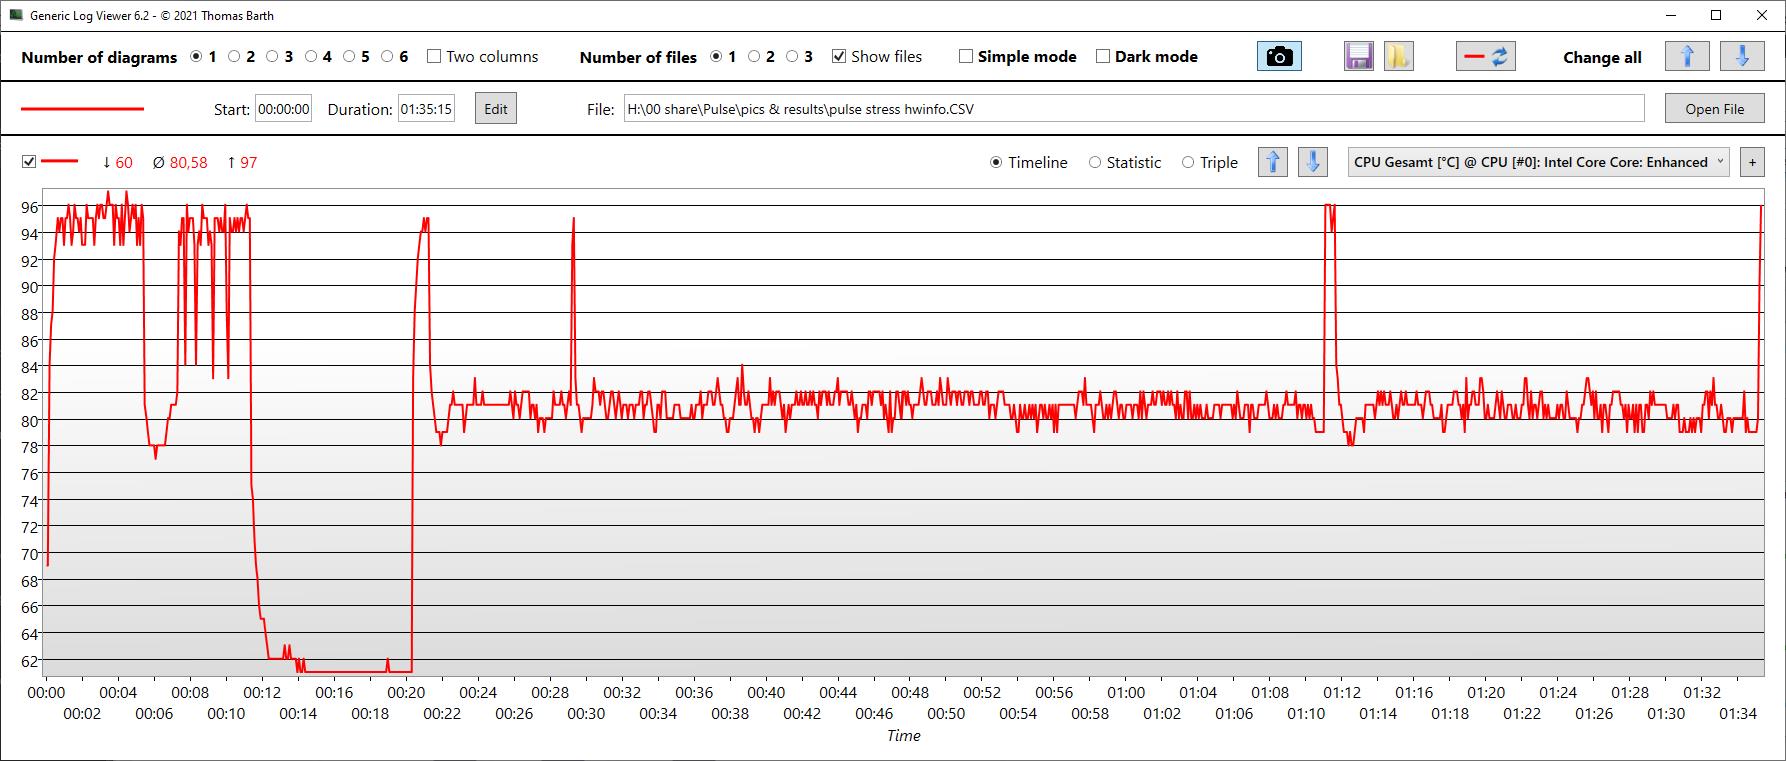
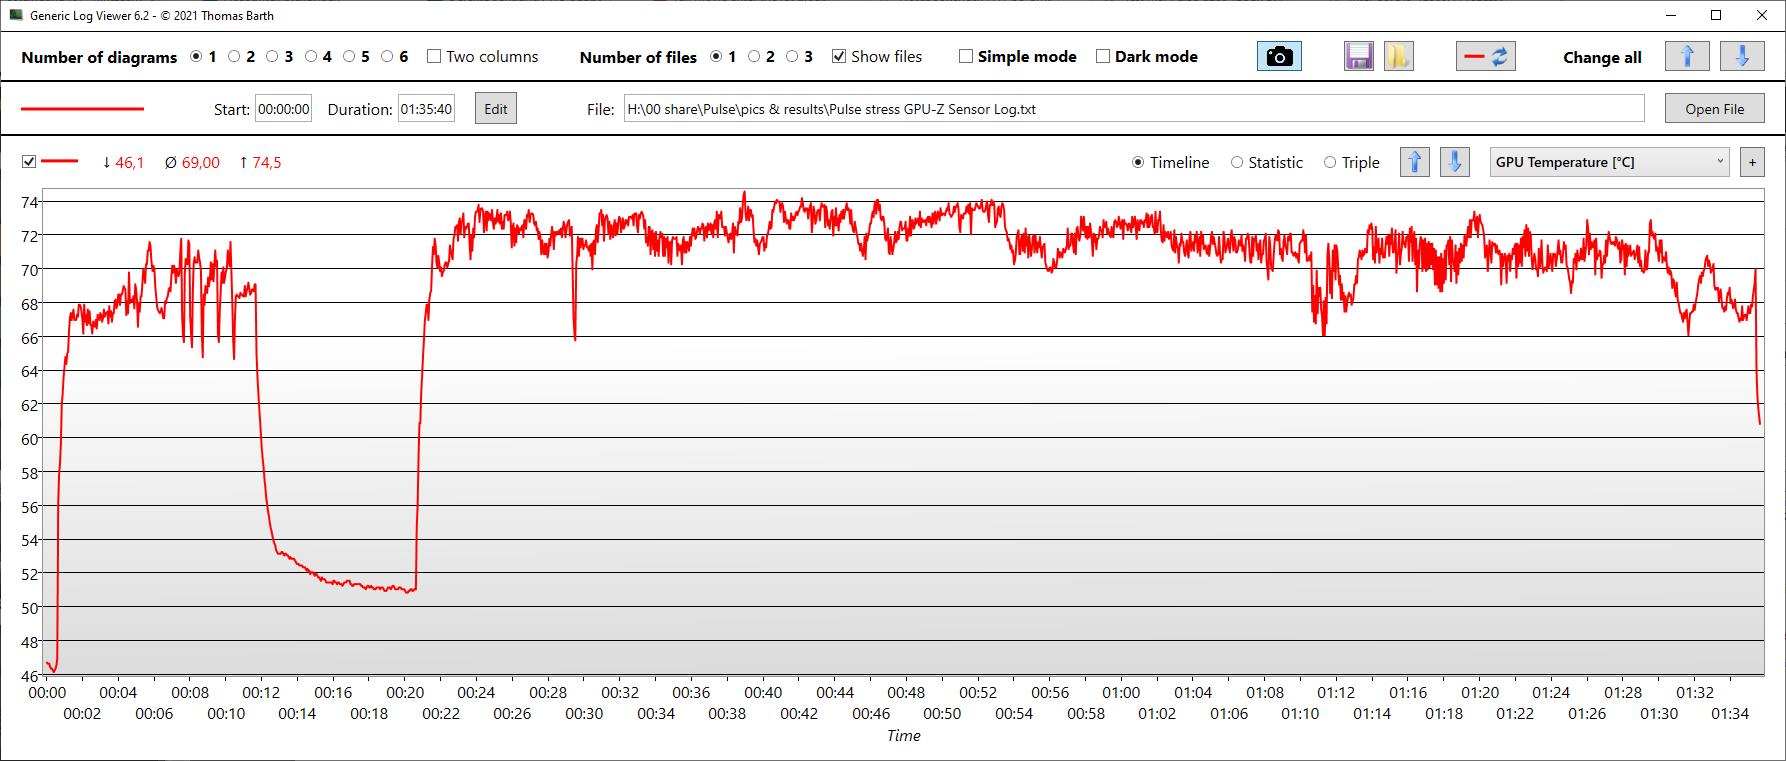
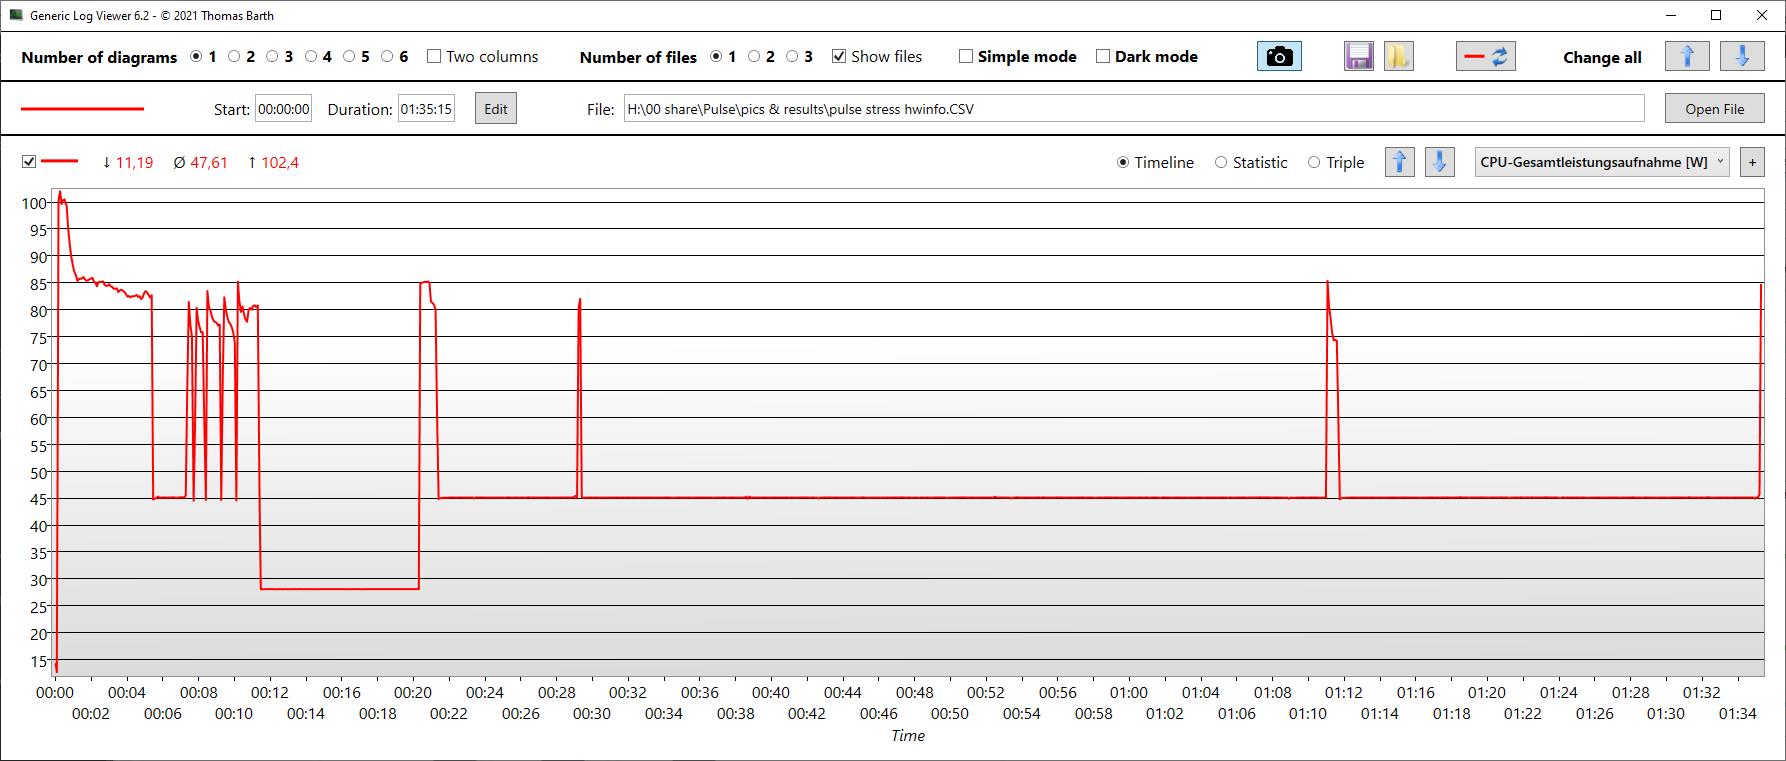
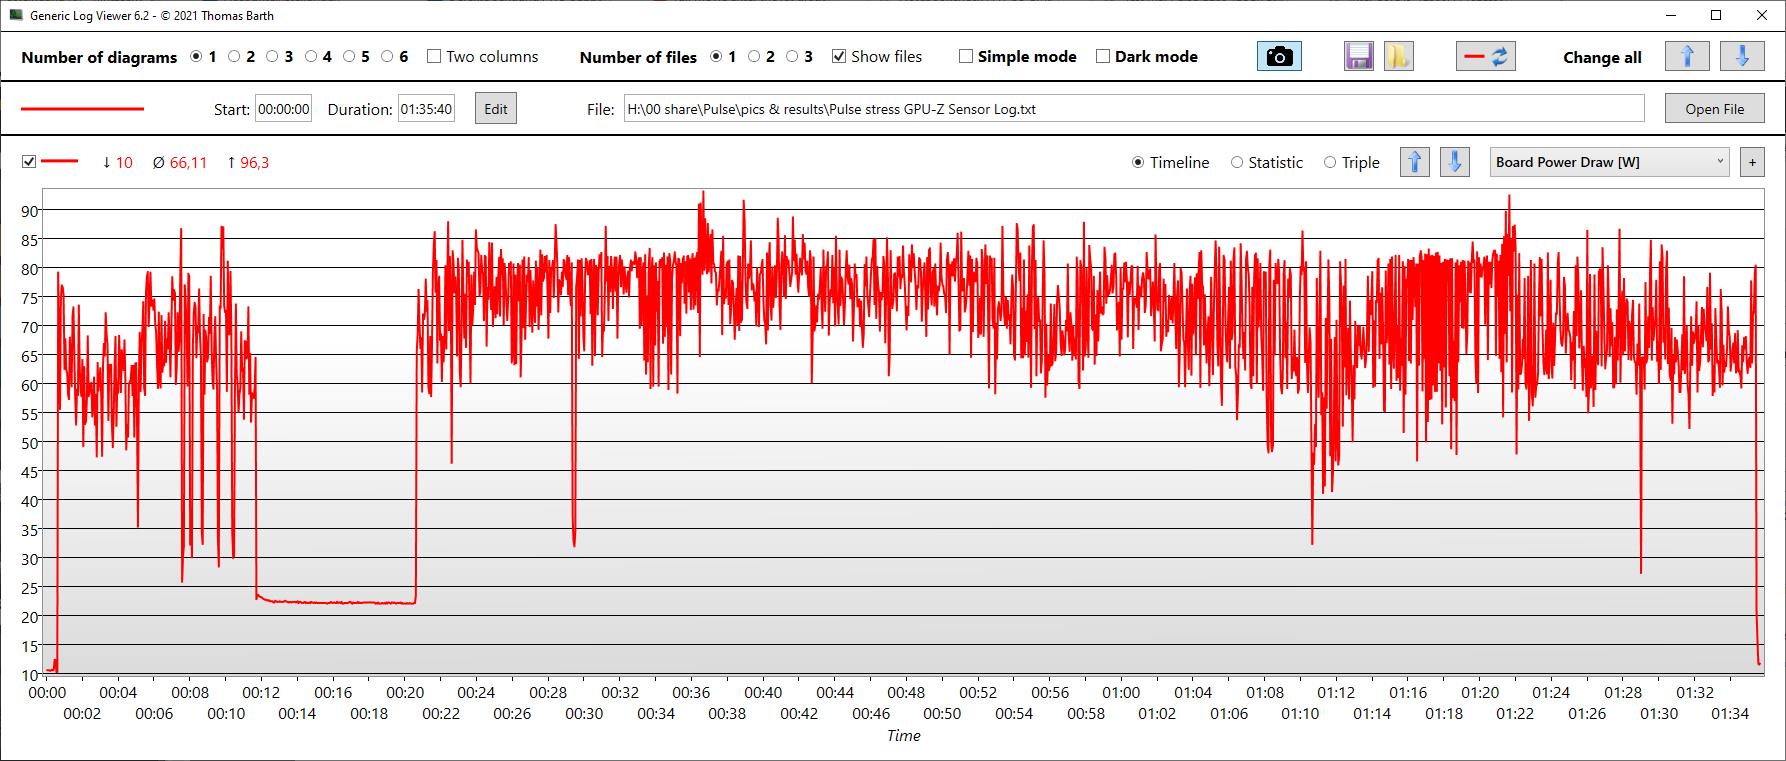
| Relógio CPU (GHz) | Relógio GPU (MHz) | Temperatura média da CPU (°C) | Temperatura média da GPU (°C) | |
| Prime95 + FurMark Stress | 2,5 | 1.360 | 81 | 69 |
Oradores
Os alto-falantes poderiam ser mais altos e claramente faltar alguns graves. Mas pelo menos os médios e altos são bastante equilibrados. Há uma porta de áudio combinada para conectar dispositivos de áudio analógicos externos.
MSI Pulse GL66 12UEK análise de áudio
(±) | o volume do alto-falante é médio, mas bom (###valor### dB)
Graves 100 - 315Hz
(-) | quase nenhum baixo - em média 16.2% menor que a mediana
(±) | a linearidade dos graves é média (10.4% delta para a frequência anterior)
Médios 400 - 2.000 Hz
(±) | médios mais altos - em média 7.6% maior que a mediana
(+) | médios são lineares (6.8% delta para frequência anterior)
Altos 2 - 16 kHz
(+) | agudos equilibrados - apenas 4.1% longe da mediana
(±) | a linearidade dos máximos é média (8.1% delta para frequência anterior)
Geral 100 - 16.000 Hz
(±) | a linearidade do som geral é média (18.8% diferença em relação à mediana)
Comparado com a mesma classe
» 62% de todos os dispositivos testados nesta classe foram melhores, 8% semelhantes, 30% piores
» O melhor teve um delta de 6%, a média foi 18%, o pior foi 132%
Comparado com todos os dispositivos testados
» 43% de todos os dispositivos testados foram melhores, 8% semelhantes, 49% piores
» O melhor teve um delta de 4%, a média foi 23%, o pior foi 134%
Asus TUF Gaming F15 FX507ZM análise de áudio
(±) | o volume do alto-falante é médio, mas bom (###valor### dB)
Graves 100 - 315Hz
(±) | graves reduzidos - em média 13.7% menor que a mediana
(±) | a linearidade dos graves é média (10.1% delta para a frequência anterior)
Médios 400 - 2.000 Hz
(±) | médios mais altos - em média 5.2% maior que a mediana
(+) | médios são lineares (4.9% delta para frequência anterior)
Altos 2 - 16 kHz
(+) | agudos equilibrados - apenas 4.1% longe da mediana
(±) | a linearidade dos máximos é média (8.6% delta para frequência anterior)
Geral 100 - 16.000 Hz
(±) | a linearidade do som geral é média (15.9% diferença em relação à mediana)
Comparado com a mesma classe
» 38% de todos os dispositivos testados nesta classe foram melhores, 7% semelhantes, 56% piores
» O melhor teve um delta de 6%, a média foi 18%, o pior foi 132%
Comparado com todos os dispositivos testados
» 25% de todos os dispositivos testados foram melhores, 5% semelhantes, 70% piores
» O melhor teve um delta de 4%, a média foi 23%, o pior foi 134%
Gerenciamento de energia
Consumo de energia
Durante a operação ociosa e especialmente também sob cargas médias (3DMark06), o consumo de energia é muito baixo. Durante o jogo, o consumo fica no meio do campo, mas pelo menos é também um dos dispositivos mais rápidos. Em nosso teste de estresse, o consumo é o mais alto, atingindo os mesmos níveis que o Asus TUF, que é realmente mais rápido. Entretanto, o consumo é baixo ou apropriado de modo geral.
| Ocioso | |
| Carga |
|
Key:
min: | |
| MSI Pulse GL66 12UEK i9-12900H, GeForce RTX 3060 Laptop GPU, Micron 2450 512GB MTFDKBA512TFK, IPS, 1920x1080, 15.6" | Asus TUF Gaming F15 FX507ZM i7-12700H, GeForce RTX 3060 Laptop GPU, SK Hynix HFM001TD3JX013N, IPS, 1920x1080, 15.6" | Alienware x14 i7 RTX 3060 i7-12700H, GeForce RTX 3060 Laptop GPU, WDC PC SN810 1TB, IPS, 1920x1080, 14" | Schenker XMG Apex 15 NH57E PS R7 5800H, GeForce RTX 3060 Laptop GPU, Samsung SSD 980 500GB (MZ-V8V500BW), IPS, 1920x1080, 15.6" | Lenovo Legion S7 15ACH6 82K80030GE R9 5900HX, GeForce RTX 3060 Laptop GPU, Samsung PM981a MZVLB1T0HBLR, IPS, 3840x2160, 15.6" | Alienware m15 R5 Ryzen Edition R7 5800H, GeForce RTX 3060 Laptop GPU, Toshiba KBG40ZNS512G NVMe, IPS, 1920x1080, 15.6" | Média NVIDIA GeForce RTX 3060 Laptop GPU | Média da turma Gaming | |
|---|---|---|---|---|---|---|---|---|
| Power Consumption | -33% | -7% | -36% | -43% | -52% | -45% | -69% | |
| Idle Minimum * (Watt) | 7 | 6.3 10% | 7.9 -13% | 10.5 -50% | 13 -86% | 11 -57% | 10.4 ? -49% | 13 ? -86% |
| Idle Average * (Watt) | 13 | 9.8 25% | 11.1 15% | 15 -15% | 16 -23% | 14 -8% | 14.5 ? -12% | 19 ? -46% |
| Idle Maximum * (Watt) | 13.7 | 26.5 -93% | 11.8 14% | 17 -24% | 23 -68% | 25 -82% | 21.4 ? -56% | 24.6 ? -80% |
| Load Average * (Watt) | 48.4 | 103.8 -114% | 107.4 -122% | 109 -125% | 95 -96% | 123 -154% | 109.3 ? -126% | 110.7 ? -129% |
| Witcher 3 ultra * (Watt) | 148 | 189 -28% | 111 25% | 186 -26% | 156 -5% | 176 -19% | ||
| Load Maximum * (Watt) | 244 | 241.9 1% | 140.4 42% | 186 24% | 191 22% | 226 7% | 206 ? 16% | 259 ? -6% |
* ... menor é melhor
Power Consumption The Witcher 3 / Stress Test
Power Consumption With External Monitor
Vida útil da bateria
A MSI usa uma bateria bastante pequena com apenas 53-Wh de capacidade, e a duração da bateria do laptop para jogos é correspondentemente baixa. Apenas o Schenker tem uma bateria igualmente pequena, mas todos os outros concorrentes têm uma capacidade de 80 (Alienware) ou mesmo 90-Wh (Asus TUF).
Isto significa que ele mal é suficiente para 4 horas de assistir a vídeos ou 4,5 horas de navegação em pleno (ou seja, bastante medíocre) brilho.
| MSI Pulse GL66 12UEK i9-12900H, GeForce RTX 3060 Laptop GPU, 53.5 Wh | Asus TUF Gaming F15 FX507ZM i7-12700H, GeForce RTX 3060 Laptop GPU, 90 Wh | Alienware x14 i7 RTX 3060 i7-12700H, GeForce RTX 3060 Laptop GPU, 80 Wh | Schenker XMG Apex 15 NH57E PS R7 5800H, GeForce RTX 3060 Laptop GPU, 49 Wh | Lenovo Legion S7 15ACH6 82K80030GE R9 5900HX, GeForce RTX 3060 Laptop GPU, 71 Wh | Alienware m15 R5 Ryzen Edition R7 5800H, GeForce RTX 3060 Laptop GPU, 86 Wh | Média da turma Gaming | |
|---|---|---|---|---|---|---|---|
| Duração da bateria | -42% | 39% | -6% | 26% | 34% | 44% | |
| H.264 (h) | 4 | 9.4 135% | 4.6 15% | 7.5 88% | 8.8 120% | 8.32 ? 108% | |
| Load (h) | 1.9 | 1.1 -42% | 0.8 -58% | 1.4 -26% | 1.2 -37% | 0.9 -53% | 1.502 ? -21% |
| Reader / Idle (h) | 15.8 | 14 | 14.7 | 8.27 ? | |||
| WiFi v1.3 (h) | 4.8 | 8.9 | 6.5 | 7 | 5.1 | 7.11 ? | |
| Witcher 3 ultra (h) | 0.8 | 1.6 |
Pro
Contra
Veredicto - Um grande potencial de melhoria
Embora o RTX 3060 só consiga usar 105 watts, ainda gostamos do desempenho do jogo, especialmente porque isto também torna o Pulse confortavelmente eficiente, mas não lento de forma alguma.
Nem a tela escura, com seus tempos de resposta toscos, nem o USB 2.0 ou a falta do Thunderbolt irão agradar aos verdadeiros jogadores. O uso de um selo adesivo de fábrica, que é pelo menos questionável, também não vai inspirar nenhum entusiasmo.
É óbvio que o laptop é realmente projetado para jogadores conscientes do preço, mesmo que o preço atual de cerca de 1.900 Euros (~$2.057) não o torne realmente um roubo. A MSI poderia ter baixado o preço sem problemas, se o fabricante tivesse usado um processador i7-12700H ou i7-12800H como a maioria dos concorrentes, ao invés do caro i9-12900H. A diferença de desempenho não é perceptível no Pulse e não justifica o prêmio de preço extra.
Com o Pulse GL66, a série de jogos bastante nova da MSI ainda revela alguns problemas de ajuste. A CPU cara não funciona em seu nível máximo e um modelo mais acessível teria baixado o preço do sistema para um nível mais apropriado.
Olhando para o desempenho, a Asus TUF Gaming F15 recomenda-se como uma alternativa. É mais rápido, oferece a melhor tela, e é ainda mais acessível a cerca de 1.600 euros (~$1.732). Custando aproximadamente o mesmo que o Pulse, a Lenovo Legion S7 também é capaz de brilhar com uma boa tela.
Preço e Disponibilidade
Nos EUA, várias configurações do Pulse GL66 12UEK com um i7-12700H estão disponíveis em Amazon a partir de $1549.
MSI Pulse GL66 12UEK
- 04/11/2022 v7 (old)
Christian Hintze
Price comparison

