MSI GF65 Thin 10UE Laptop Review: GeForce RTX 3060 em um orçamento
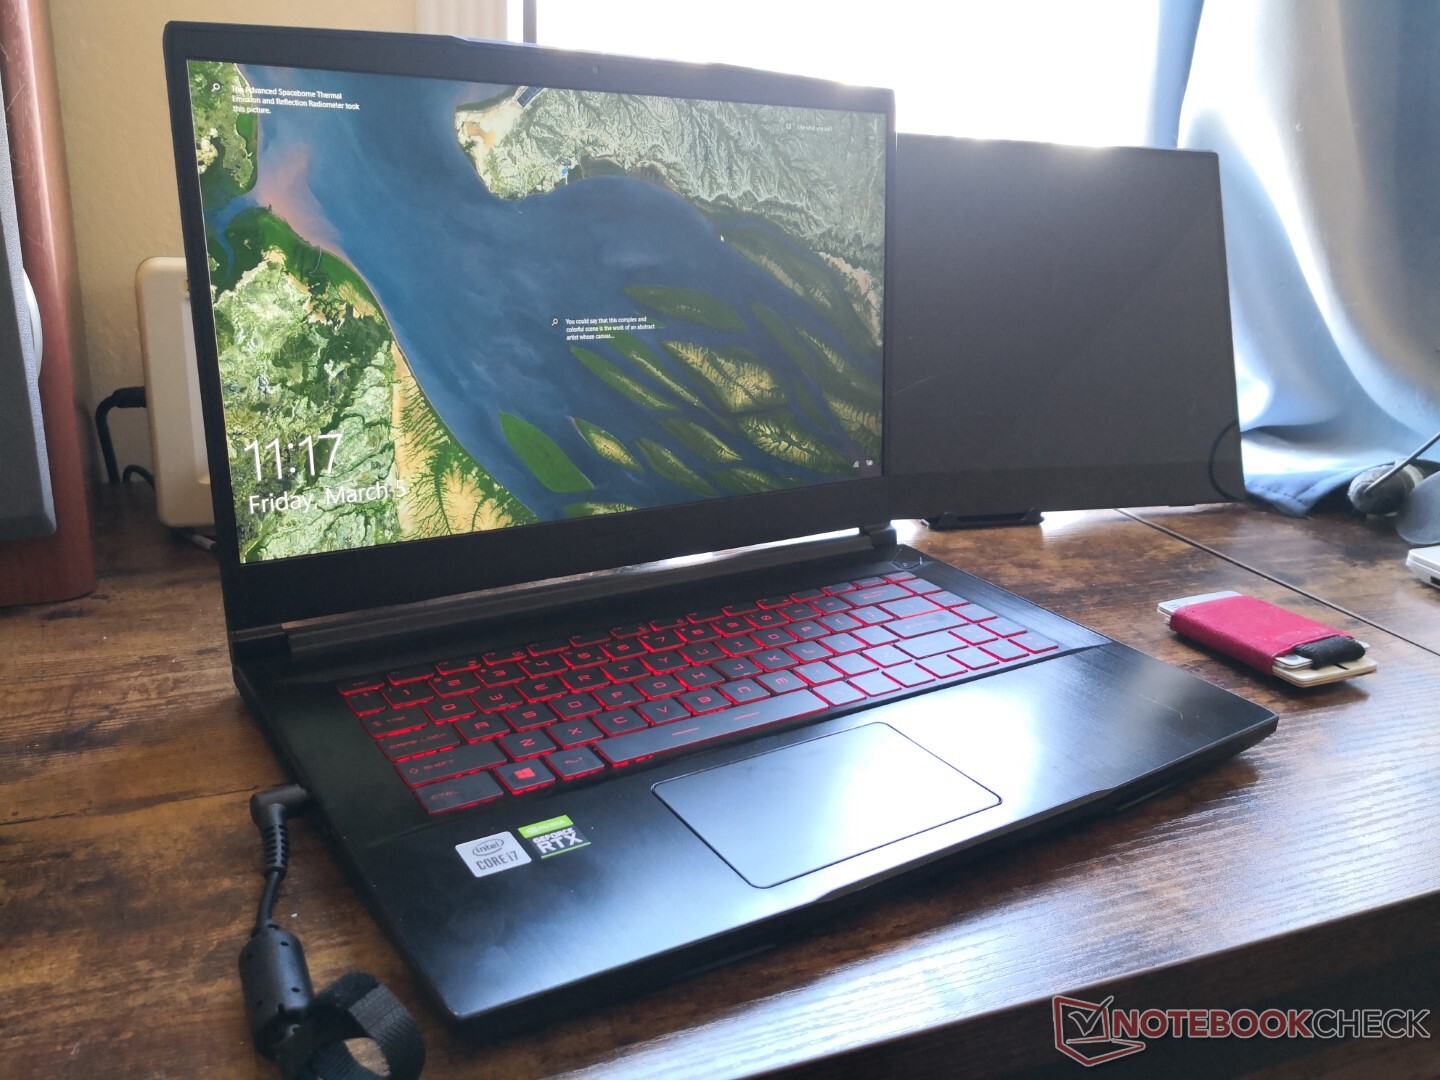
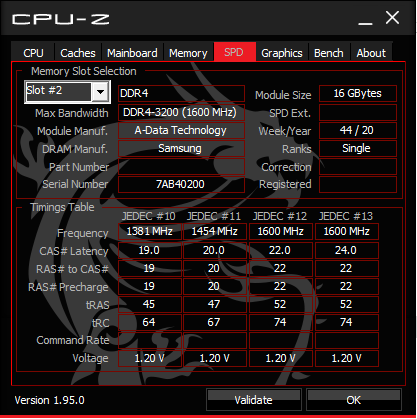
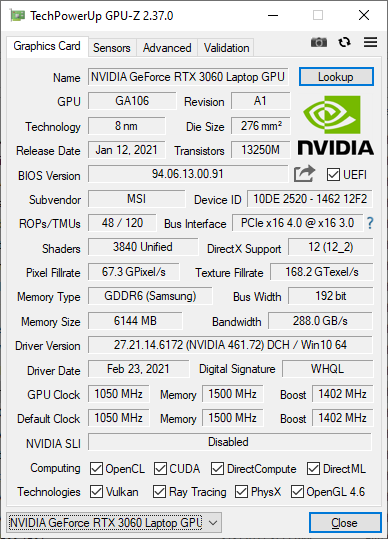
O MSI GF65 é um dos portáteis para jogos de 15,6 polegadas menos caros que você pode comprar com GeForce RTX 3060 gráficos. Nossa configuração de revisão vem com o Core i7-10750H da 10ª geração, já mencionado RTX 30 GPU, 32 GB de RAM, e 1 TB SSD Samsung por cerca de $1650 USD da CUKUSA. Entretanto, opções menores de RAM, armazenamento e Core i5 estão disponíveis por preços muito mais baixos a partir de $999.
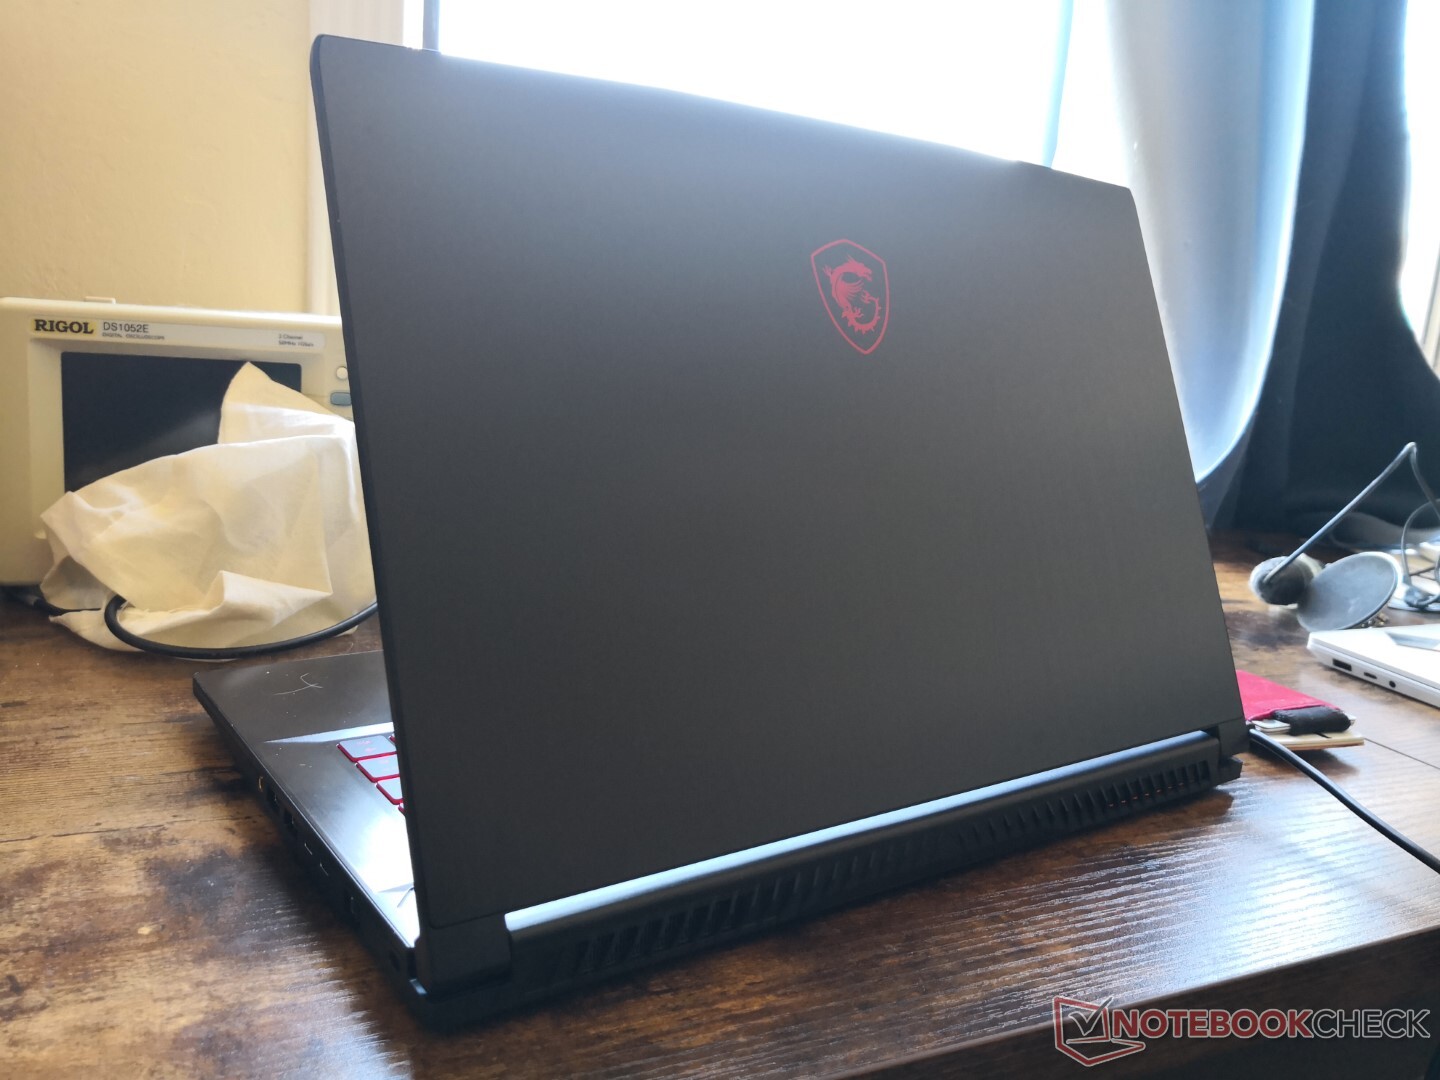
Externamente, o GF65 10UE tem o mesmo design de chassi que o GF65 9SD 2020 e muitos de nossos comentários existentes ainda se aplicam. Recomendamos verificar nossa revisão sobre a versão 2020 para saber mais sobre as características físicas do laptop.
A série MSI GF concorre com outros laptops para jogos de baixo custo como o Lenovo Legion 5, Dell G5, Acer Nitro 5, ou a série Asus TUF.
Mais análises da MSI:
potential competitors in comparison
Avaliação | Data | Modelo | Peso | Altura | Size | Resolução | Preço |
|---|---|---|---|---|---|---|---|
| 80.4 % v7 (old) | 03/2021 | MSI GF65 Thin 10UE i7-10750H, GeForce RTX 3060 Laptop GPU | 1.9 kg | 21.7 mm | 15.60" | 1920x1080 | |
| 85 % v7 (old) | 02/2021 | Asus ROG Strix G15 G513QR R9 5900HX, GeForce RTX 3070 Laptop GPU | 2.3 kg | 27.2 mm | 15.60" | 1920x1080 | |
| 84.9 % v7 (old) | 03/2021 | Schenker XMG Core 15 Ampere R7 4800H, GeForce RTX 3060 Laptop GPU | 2 kg | 22.9 mm | 15.60" | 2560x1440 | |
| 84 % v7 (old) | 02/2021 | MSI GS66 Stealth 10UG i7-10870H, GeForce RTX 3070 Laptop GPU | 2.1 kg | 19.8 mm | 15.60" | 1920x1080 | |
| 86.4 % v7 (old) | 02/2021 | Aorus 15G XC i7-10870H, GeForce RTX 3070 Laptop GPU | 2.1 kg | 23 mm | 15.60" | 1920x1080 | |
| 86.3 % v7 (old) | 12/2020 | Lenovo Legion 7 15IMH05-81YT001VGE i9-10980HK, GeForce RTX 2080 Super Max-Q | 2.4 kg | 19.9 mm | 15.60" | 1920x1080 |
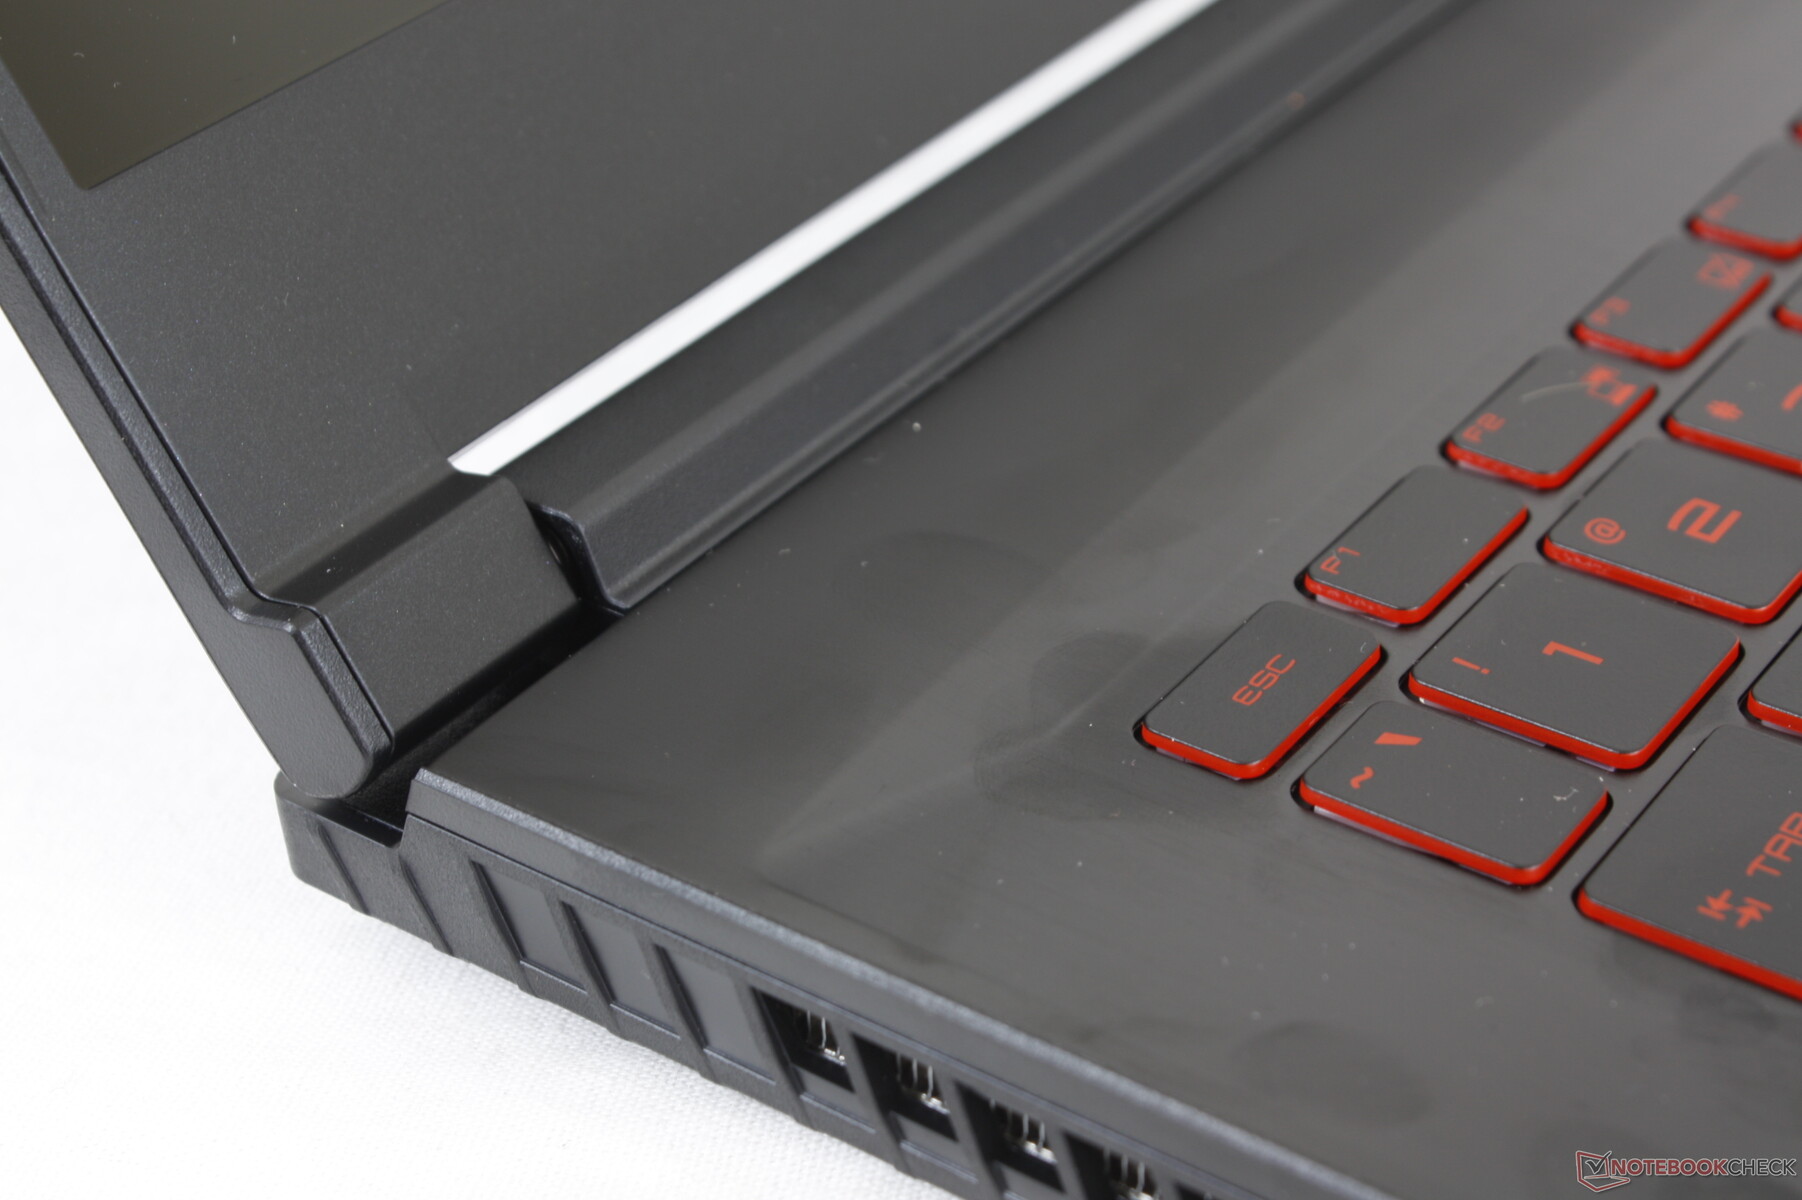
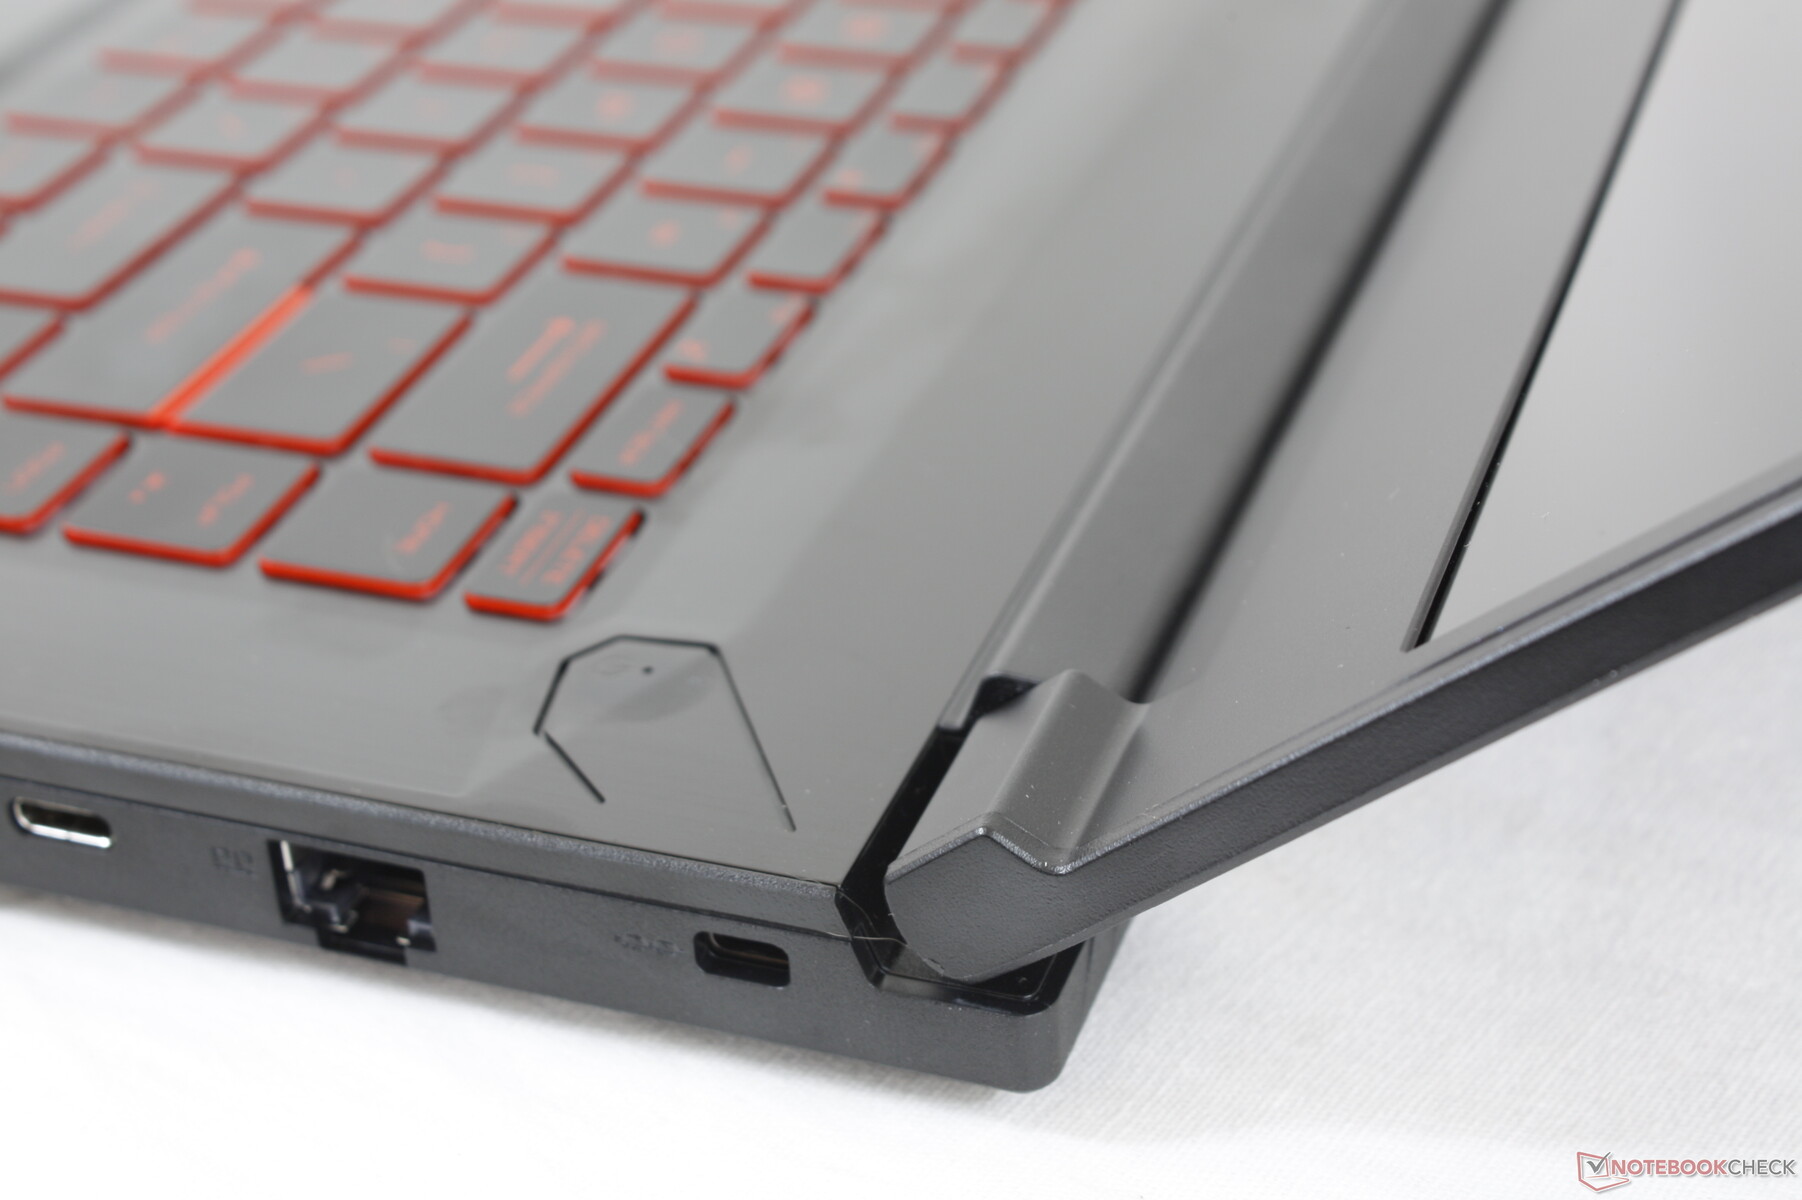
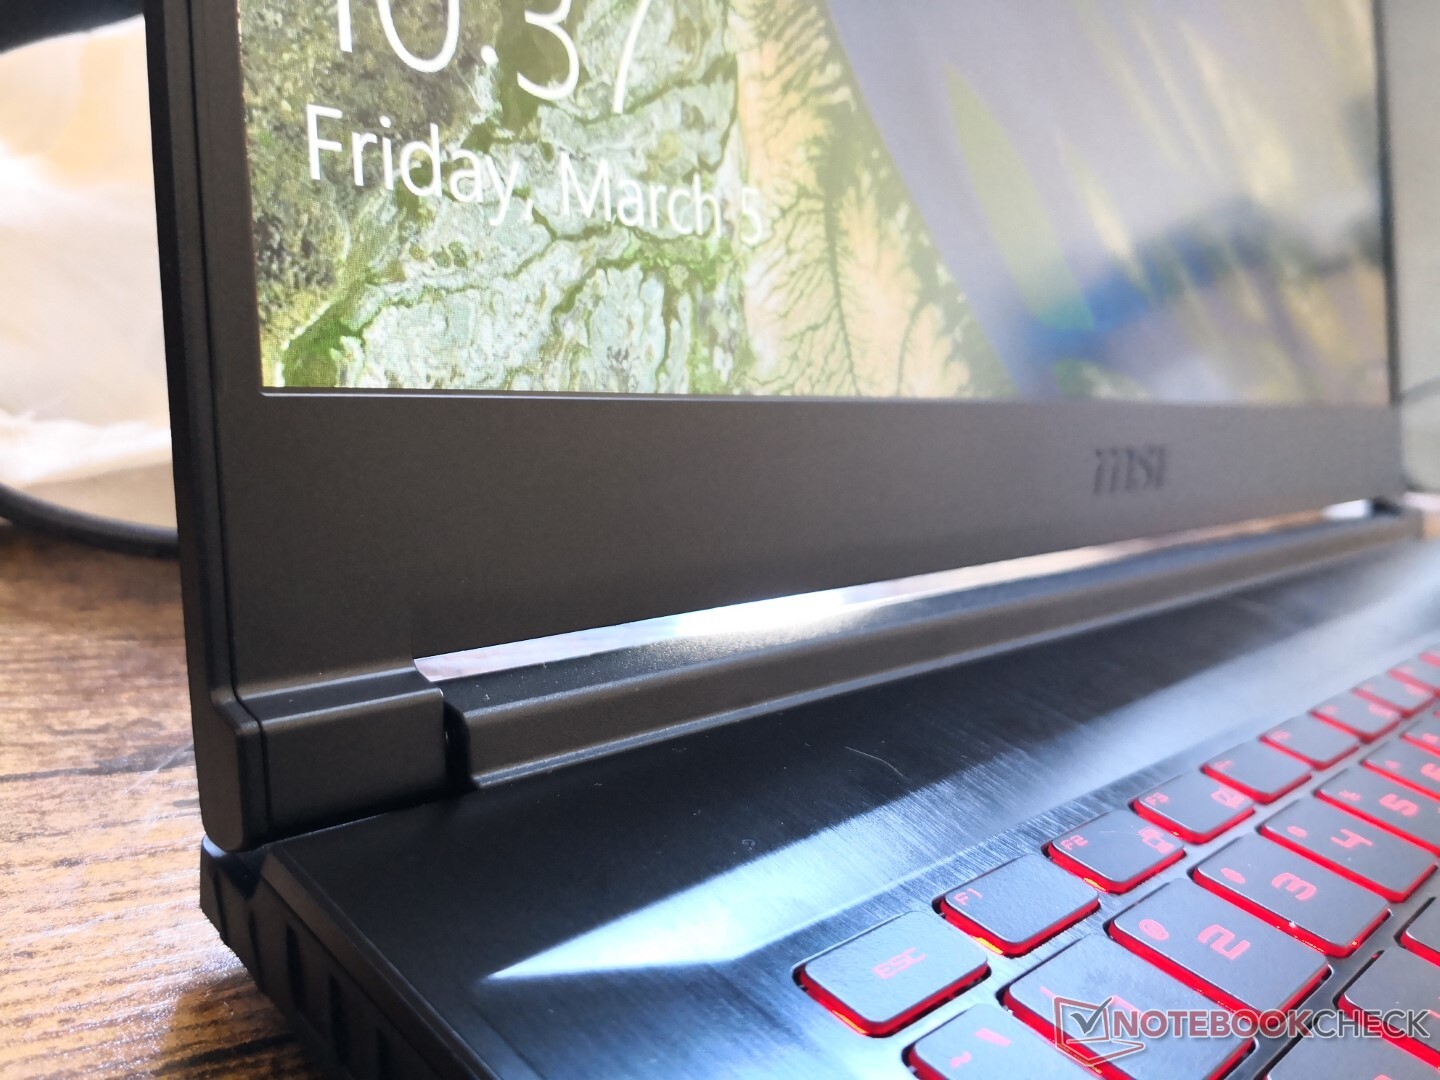
Caso
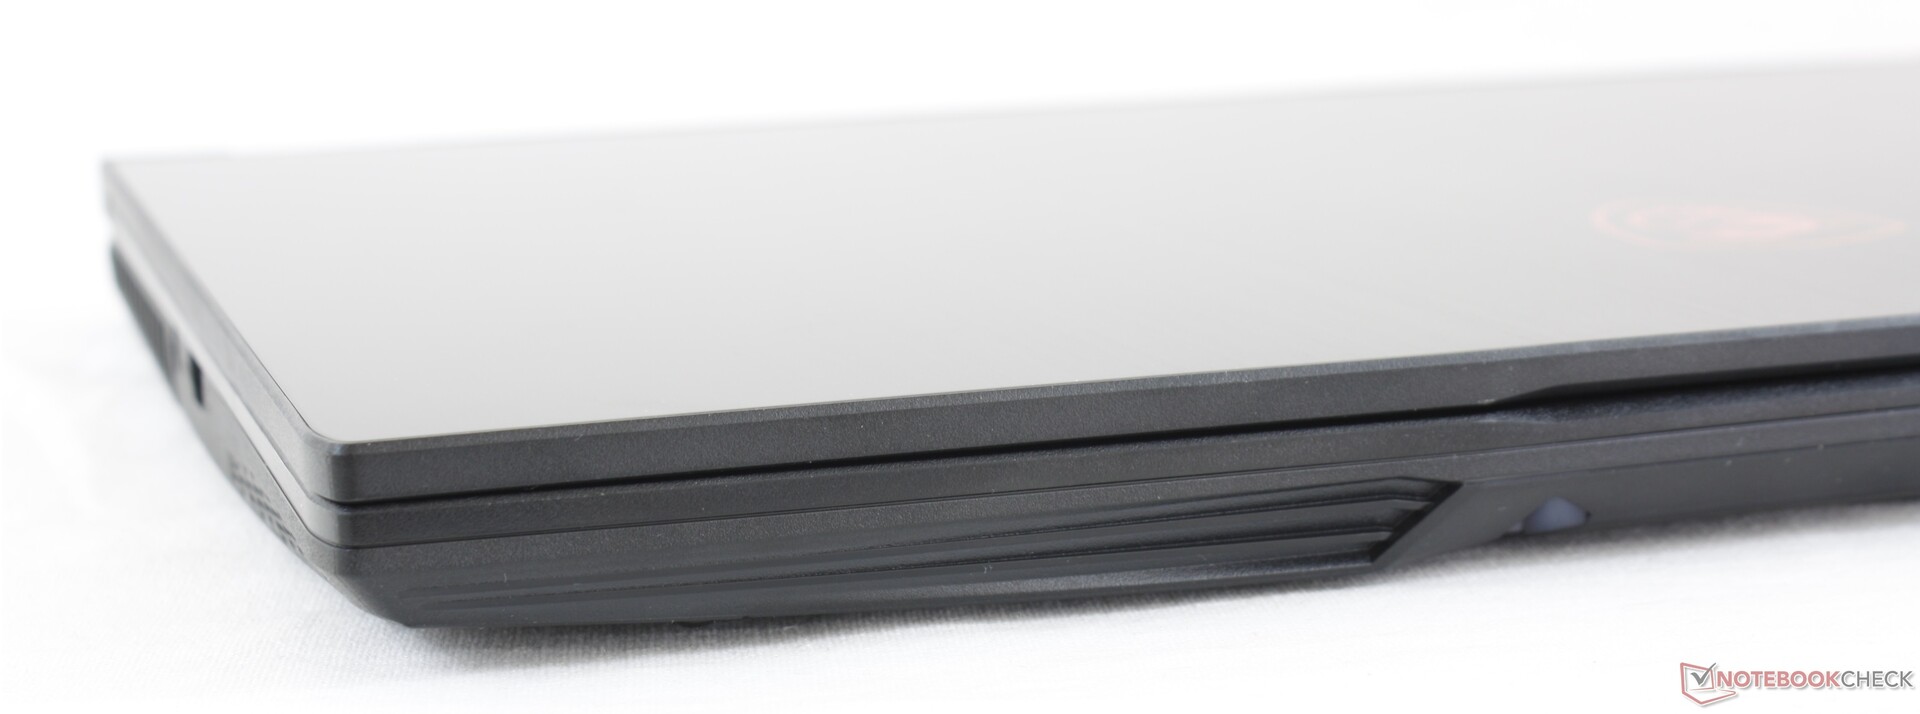
As superfícies parecem finas e empenam mais facilmente quando comparadas aos modelos mais sofisticados da série GE ou GT da MSI. O GF65 não se sente tão luxuoso como resultado, o que é de se esperar de um laptop de nível básico para jogos. Os modelos concorrentes Asus TUF, que são ligeiramente mais pesados, se sentem mais robustos.
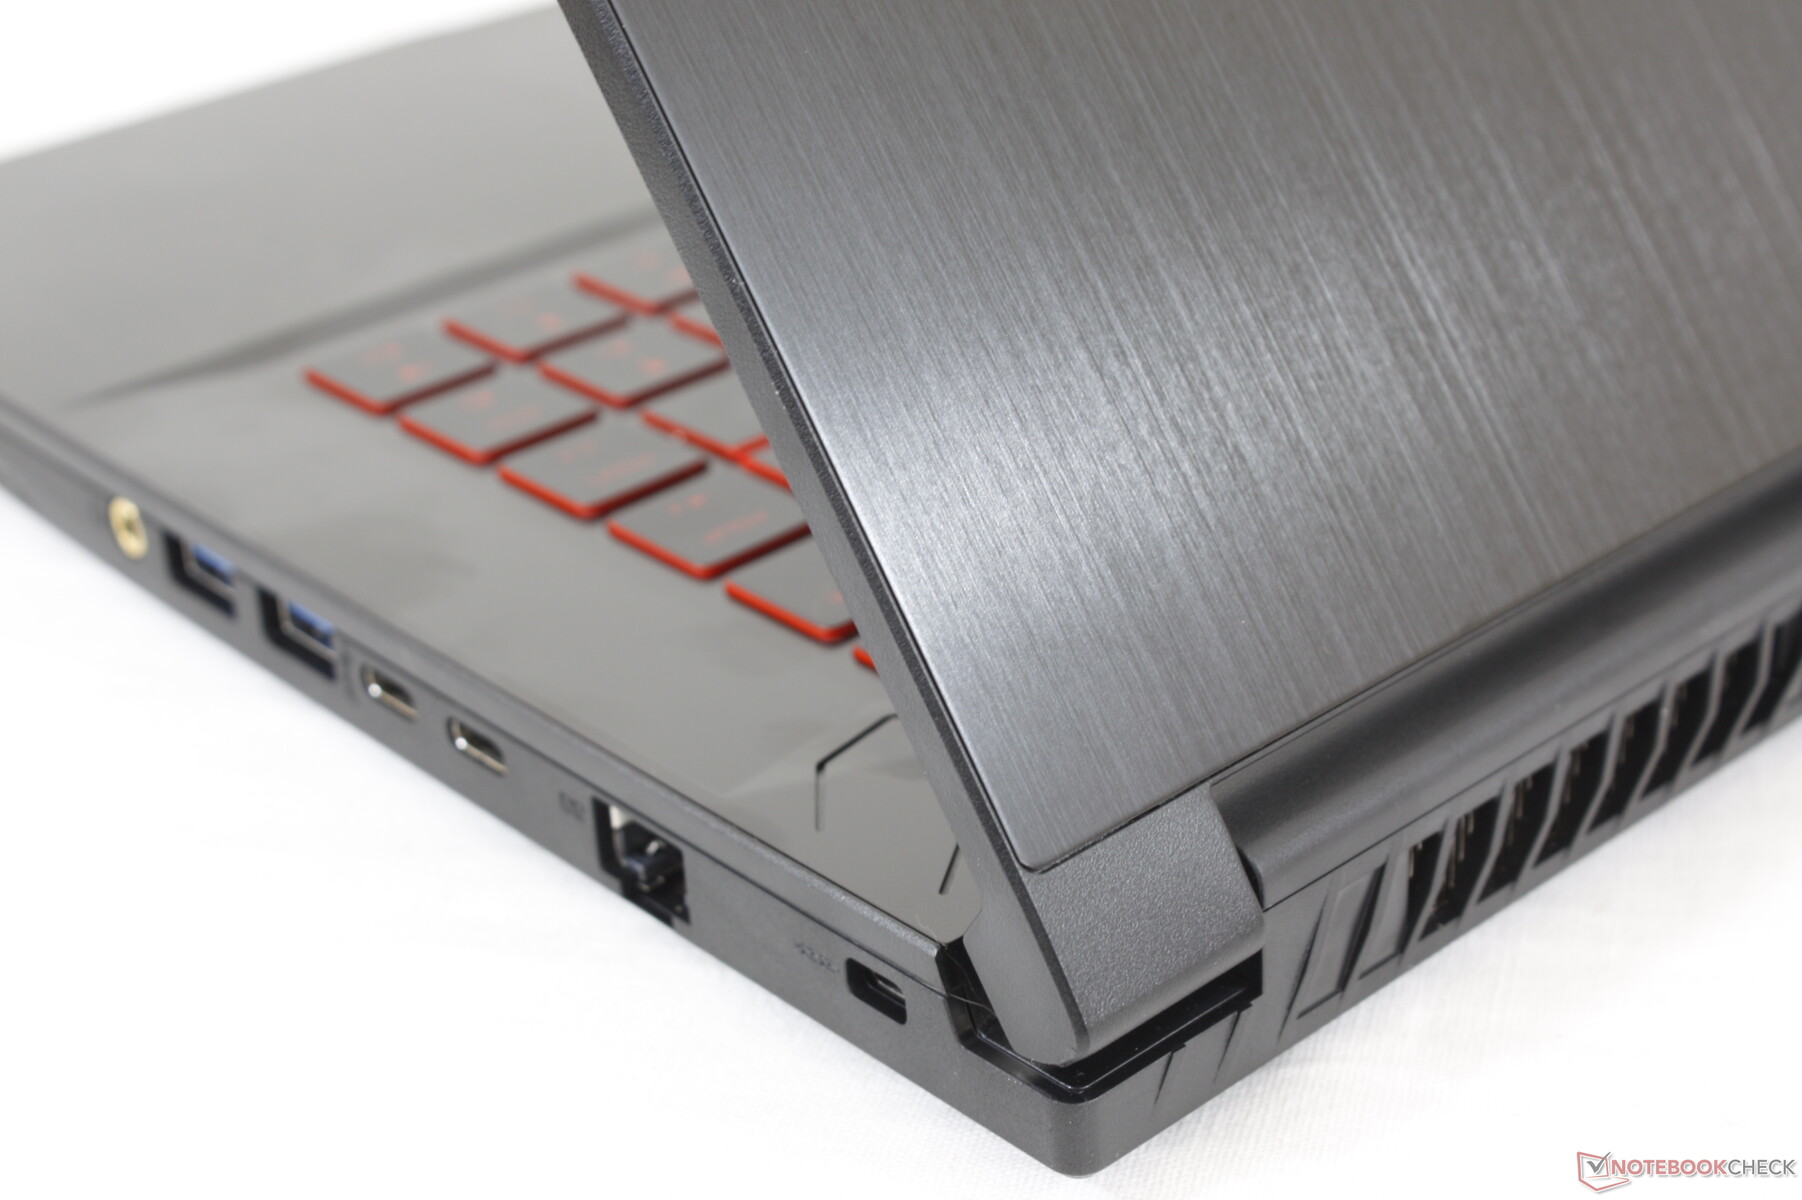
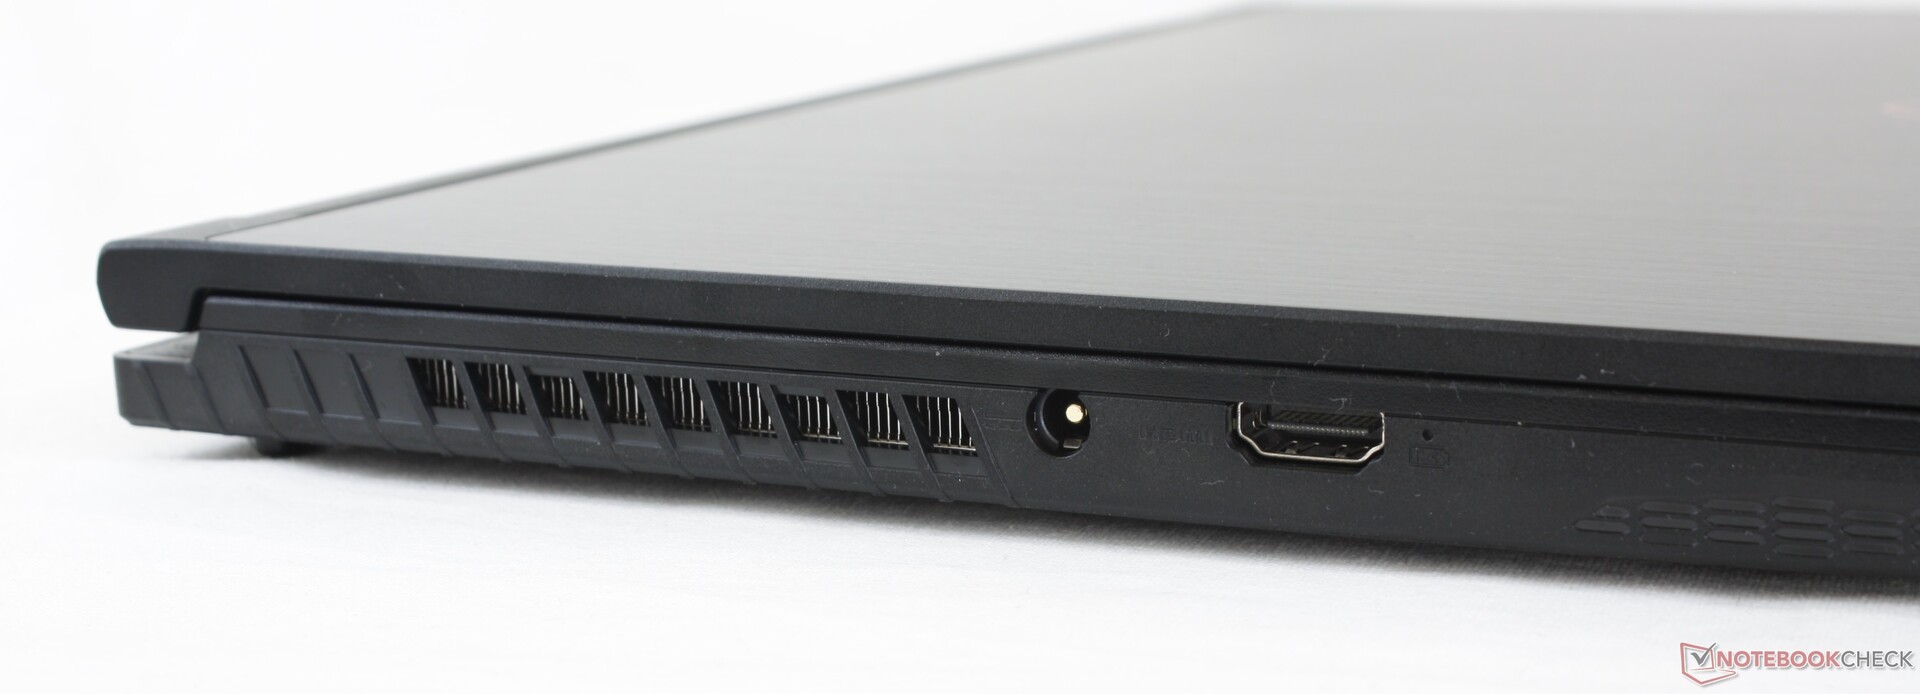
Conectividade
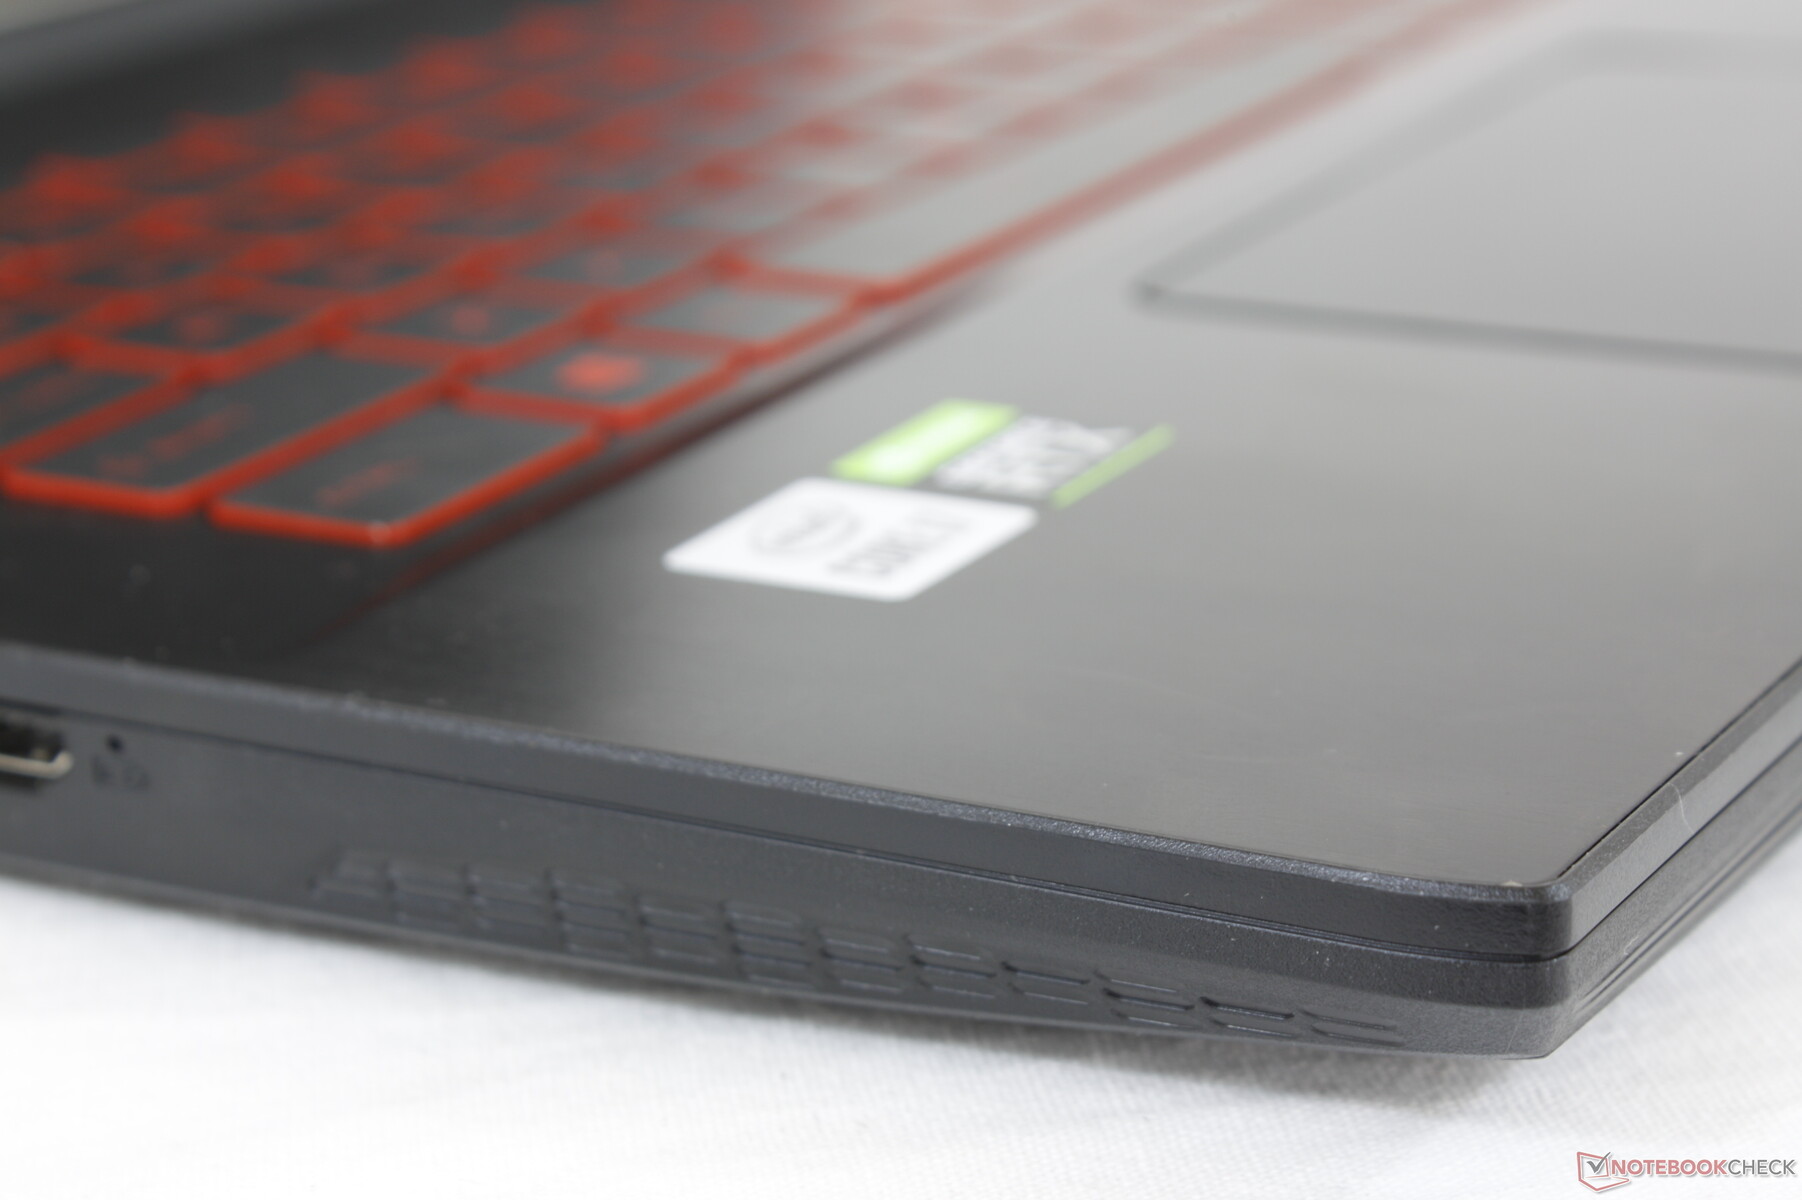
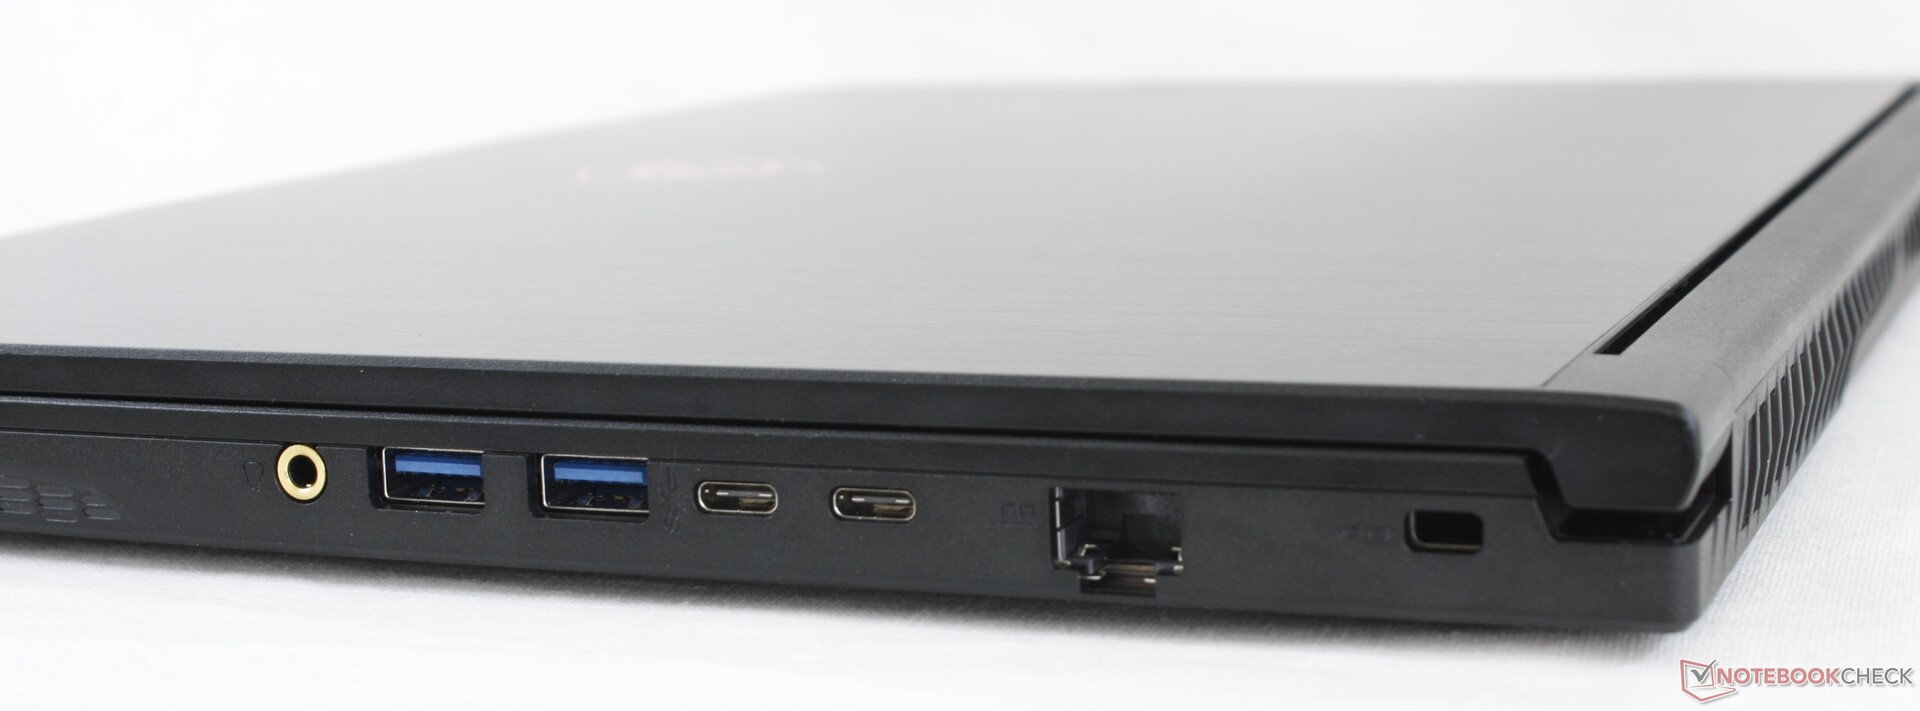
As opções de porta permanecem idênticas exceto por uma mudança notável: a porta HDMI 1.4 do GF65 9SD do ano passado foi atualizada para HDMI 2.0 para suporte total de monitor externo 4K60 FPS. Entretanto, as portas USB-C continuam a ser incompatíveis com os monitores externos.
Comunicação
Módulos embutidos de comunicação com e sem fio, soluções alternativas disponíveis (UMTS)?, Irregularidades (recepção de rádio)?
Webcam


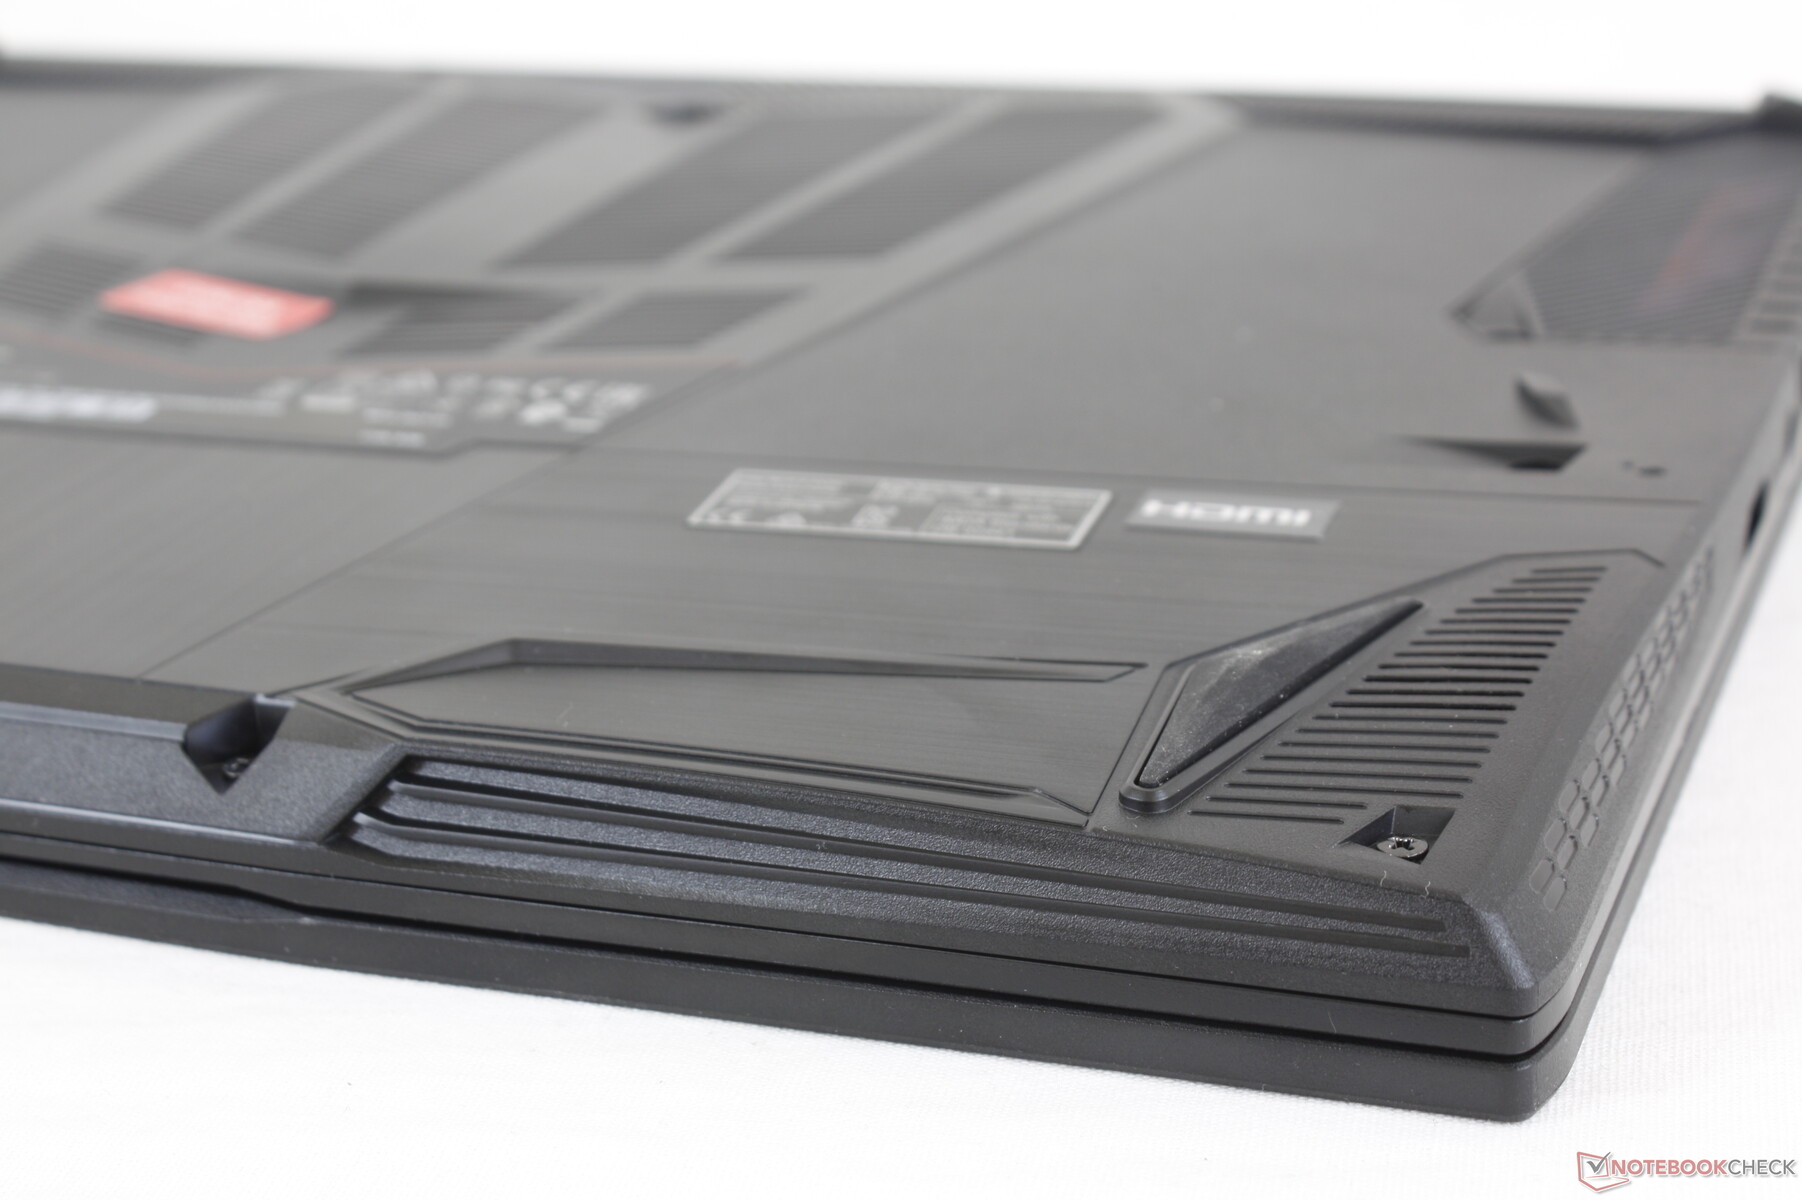
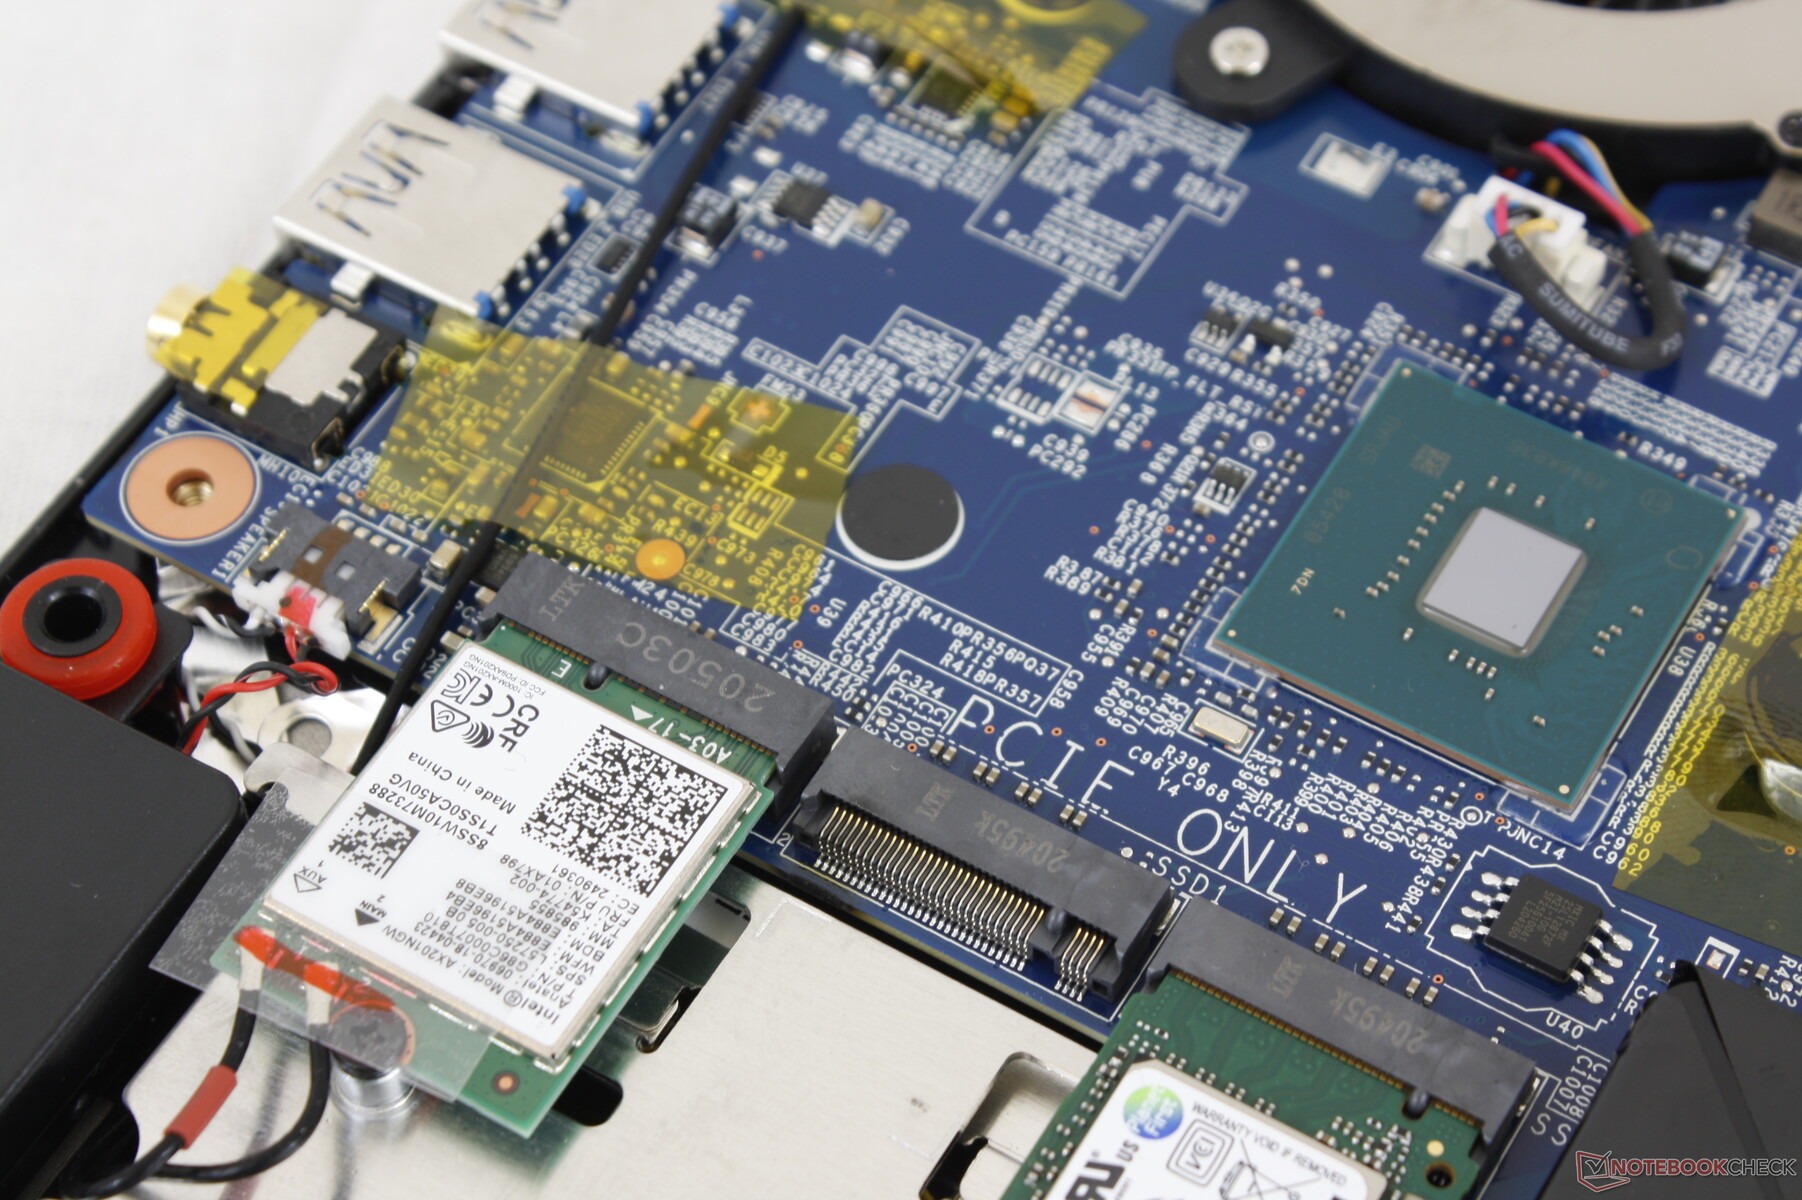
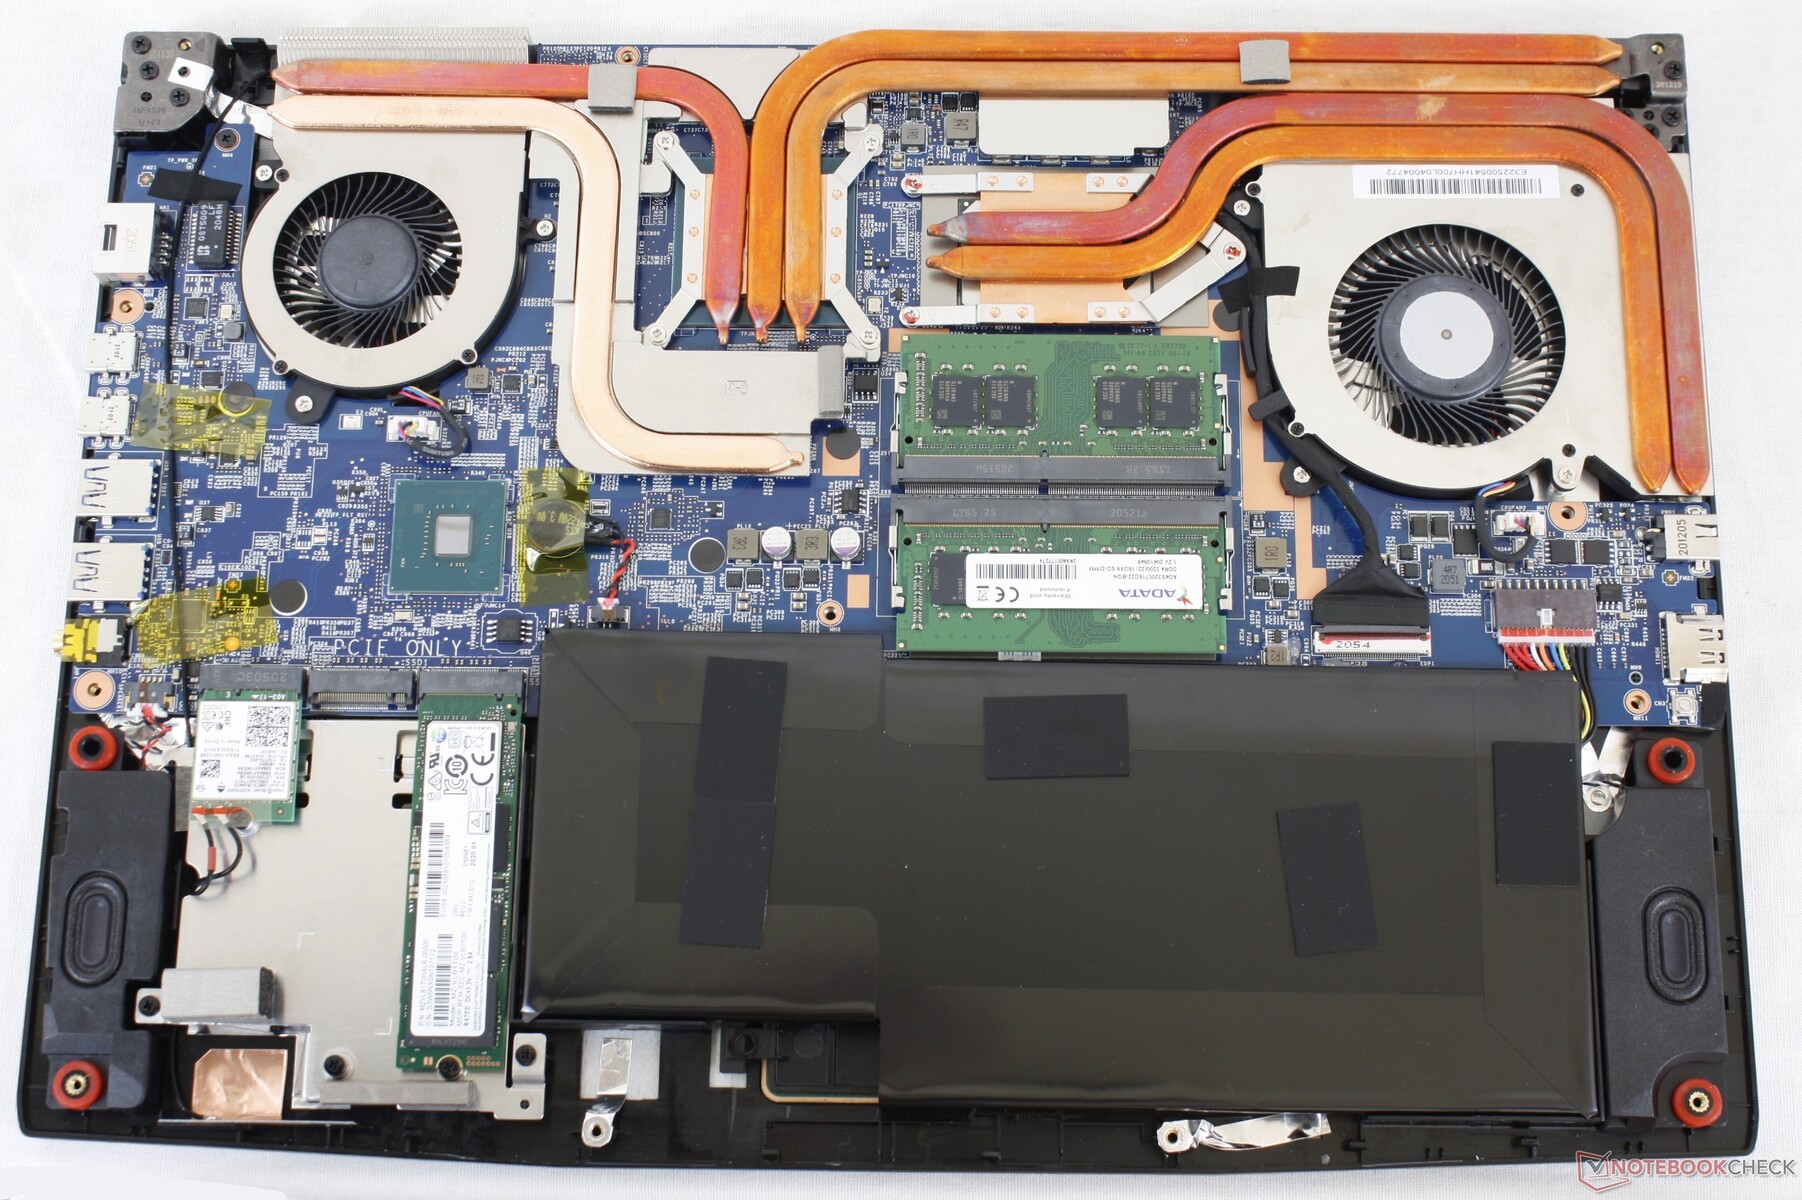
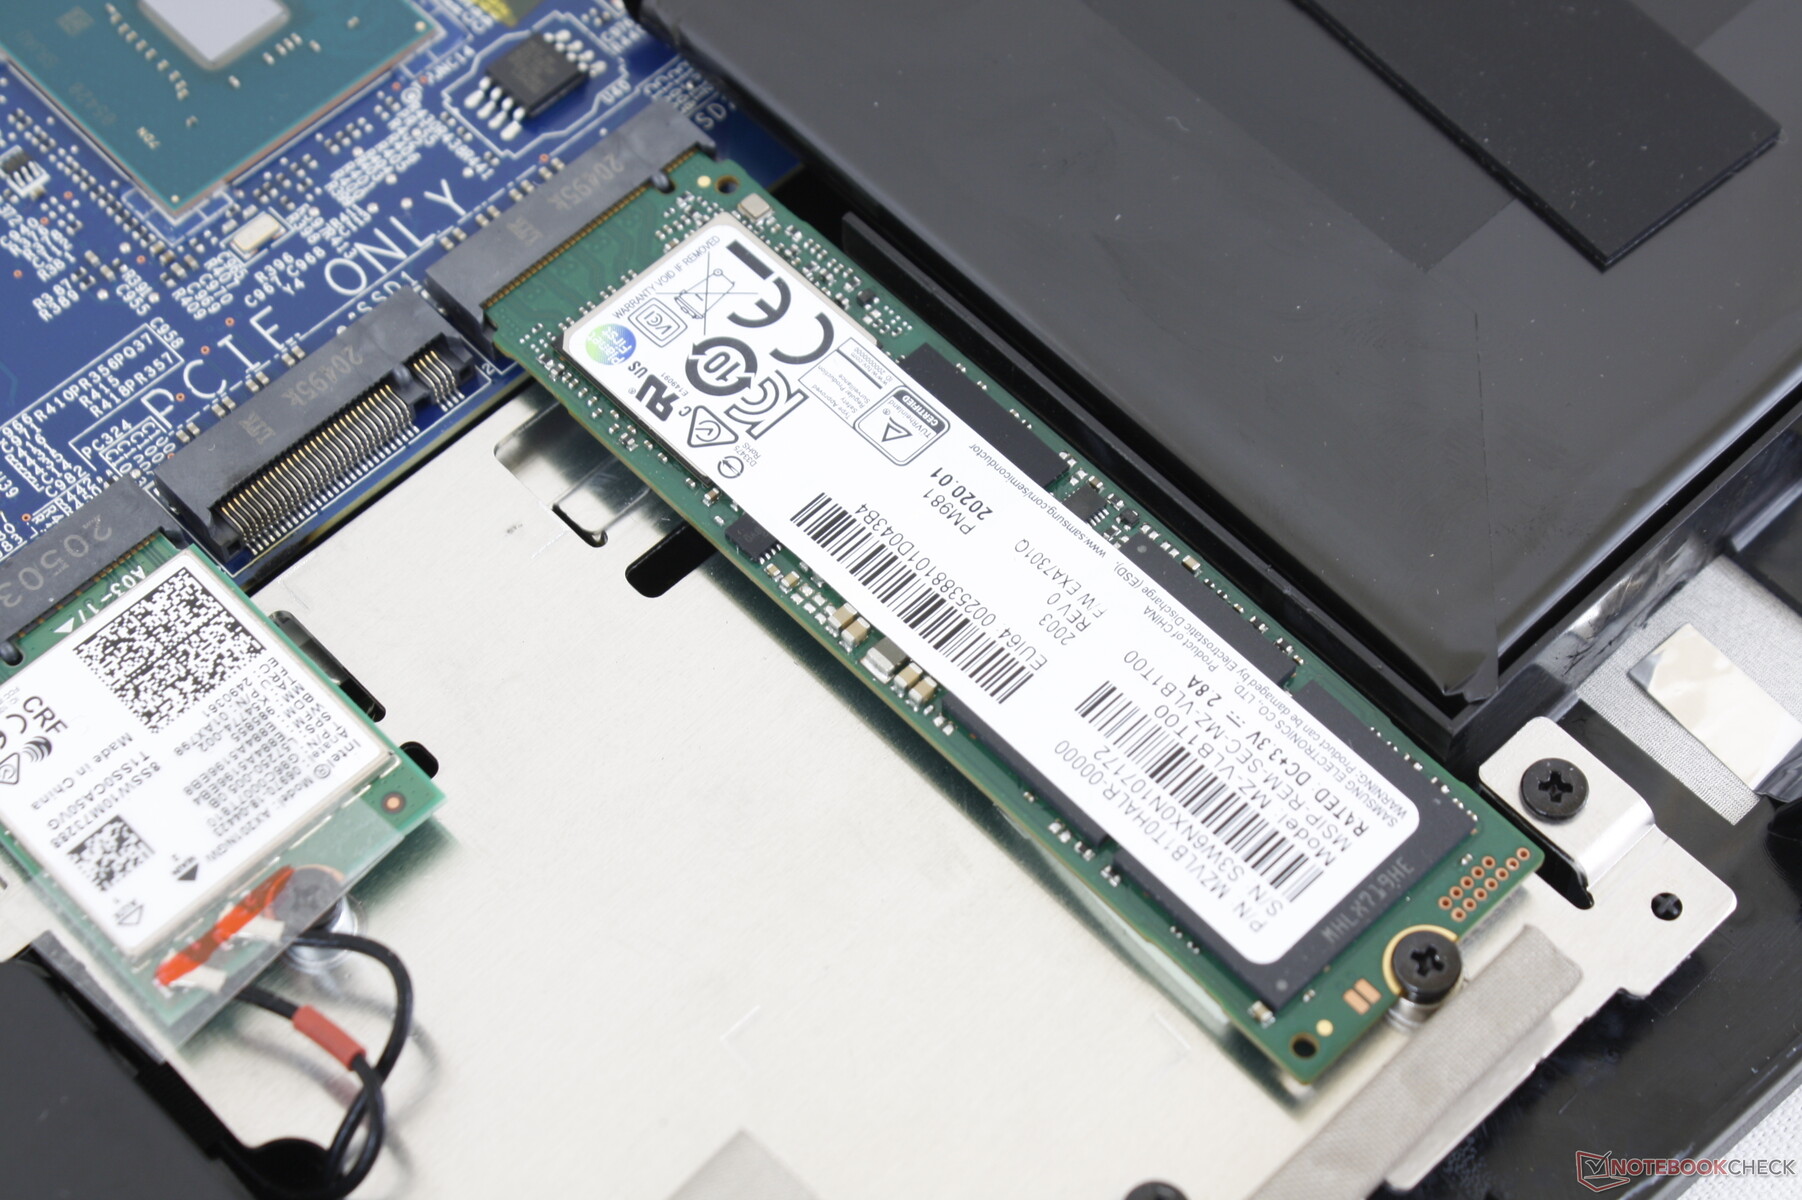
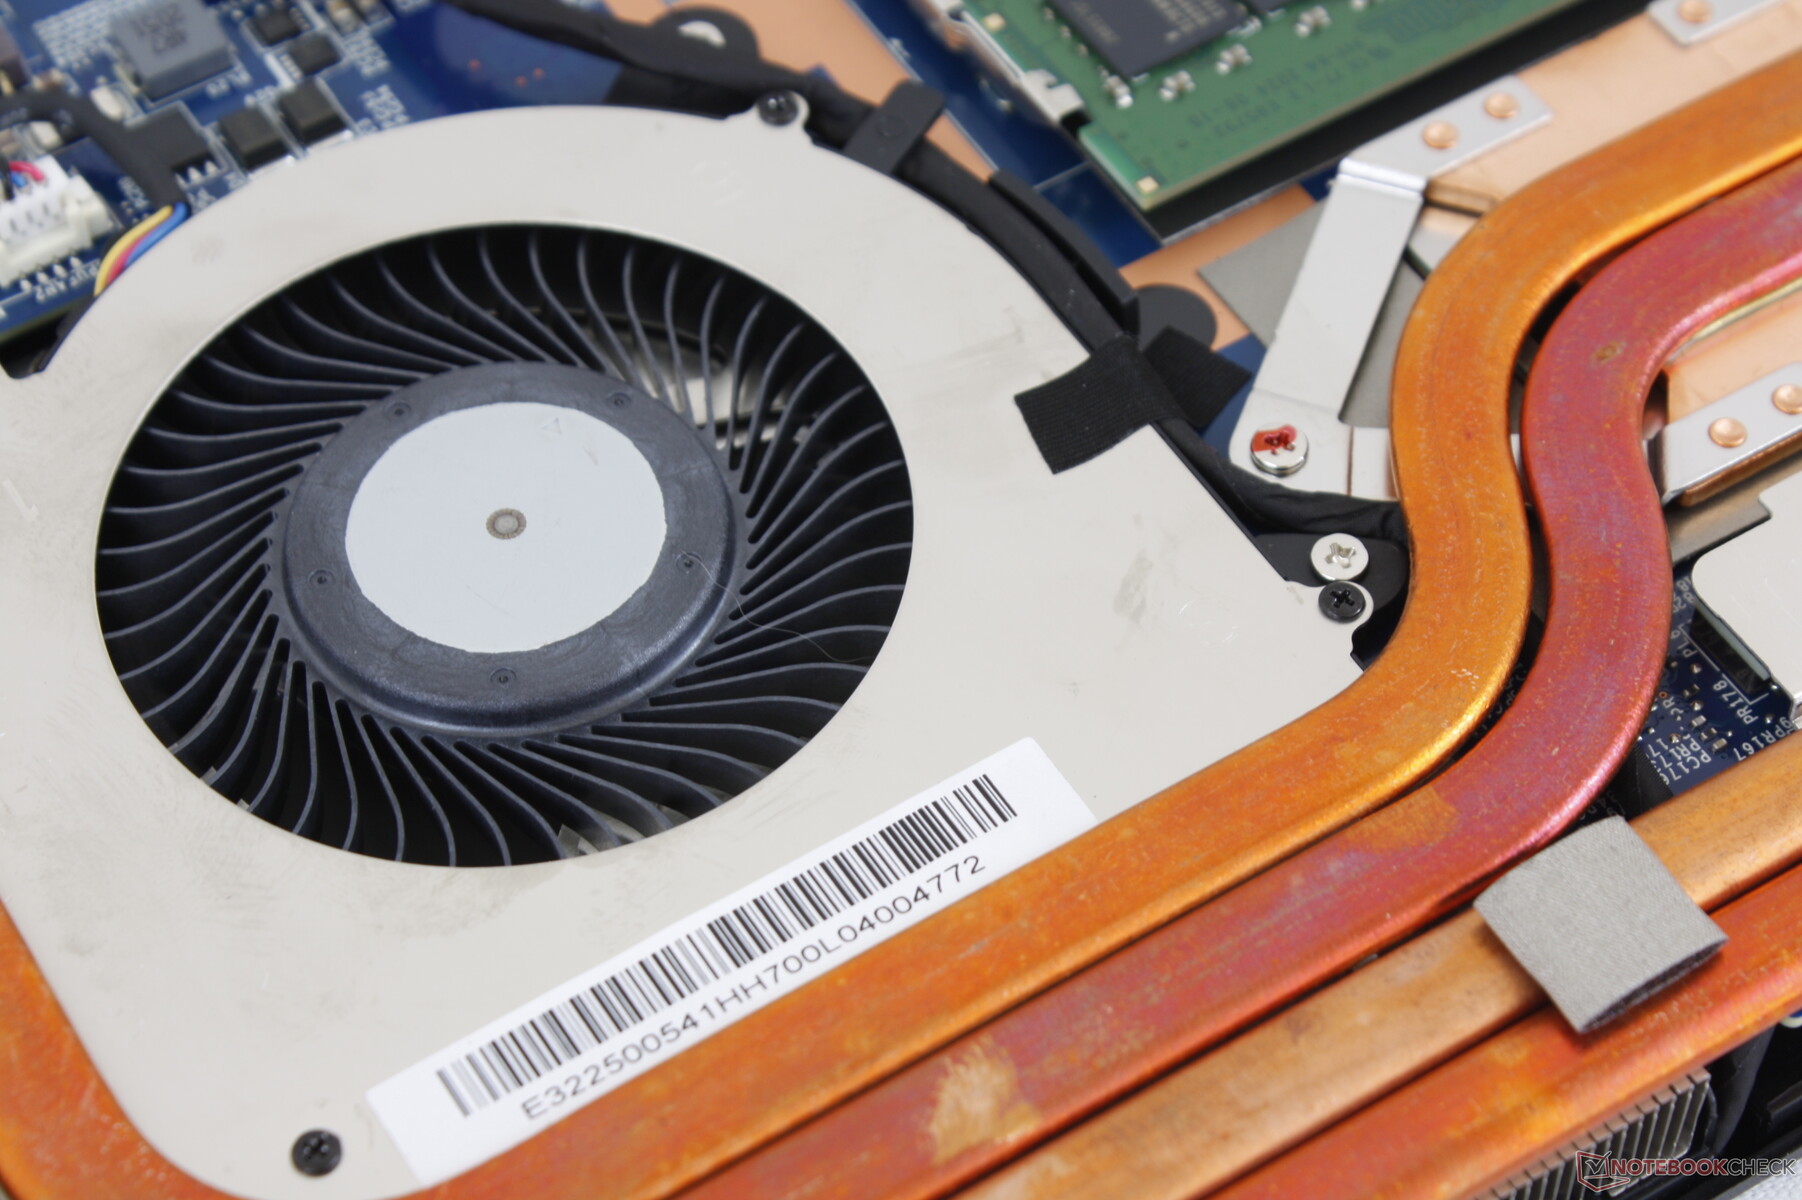
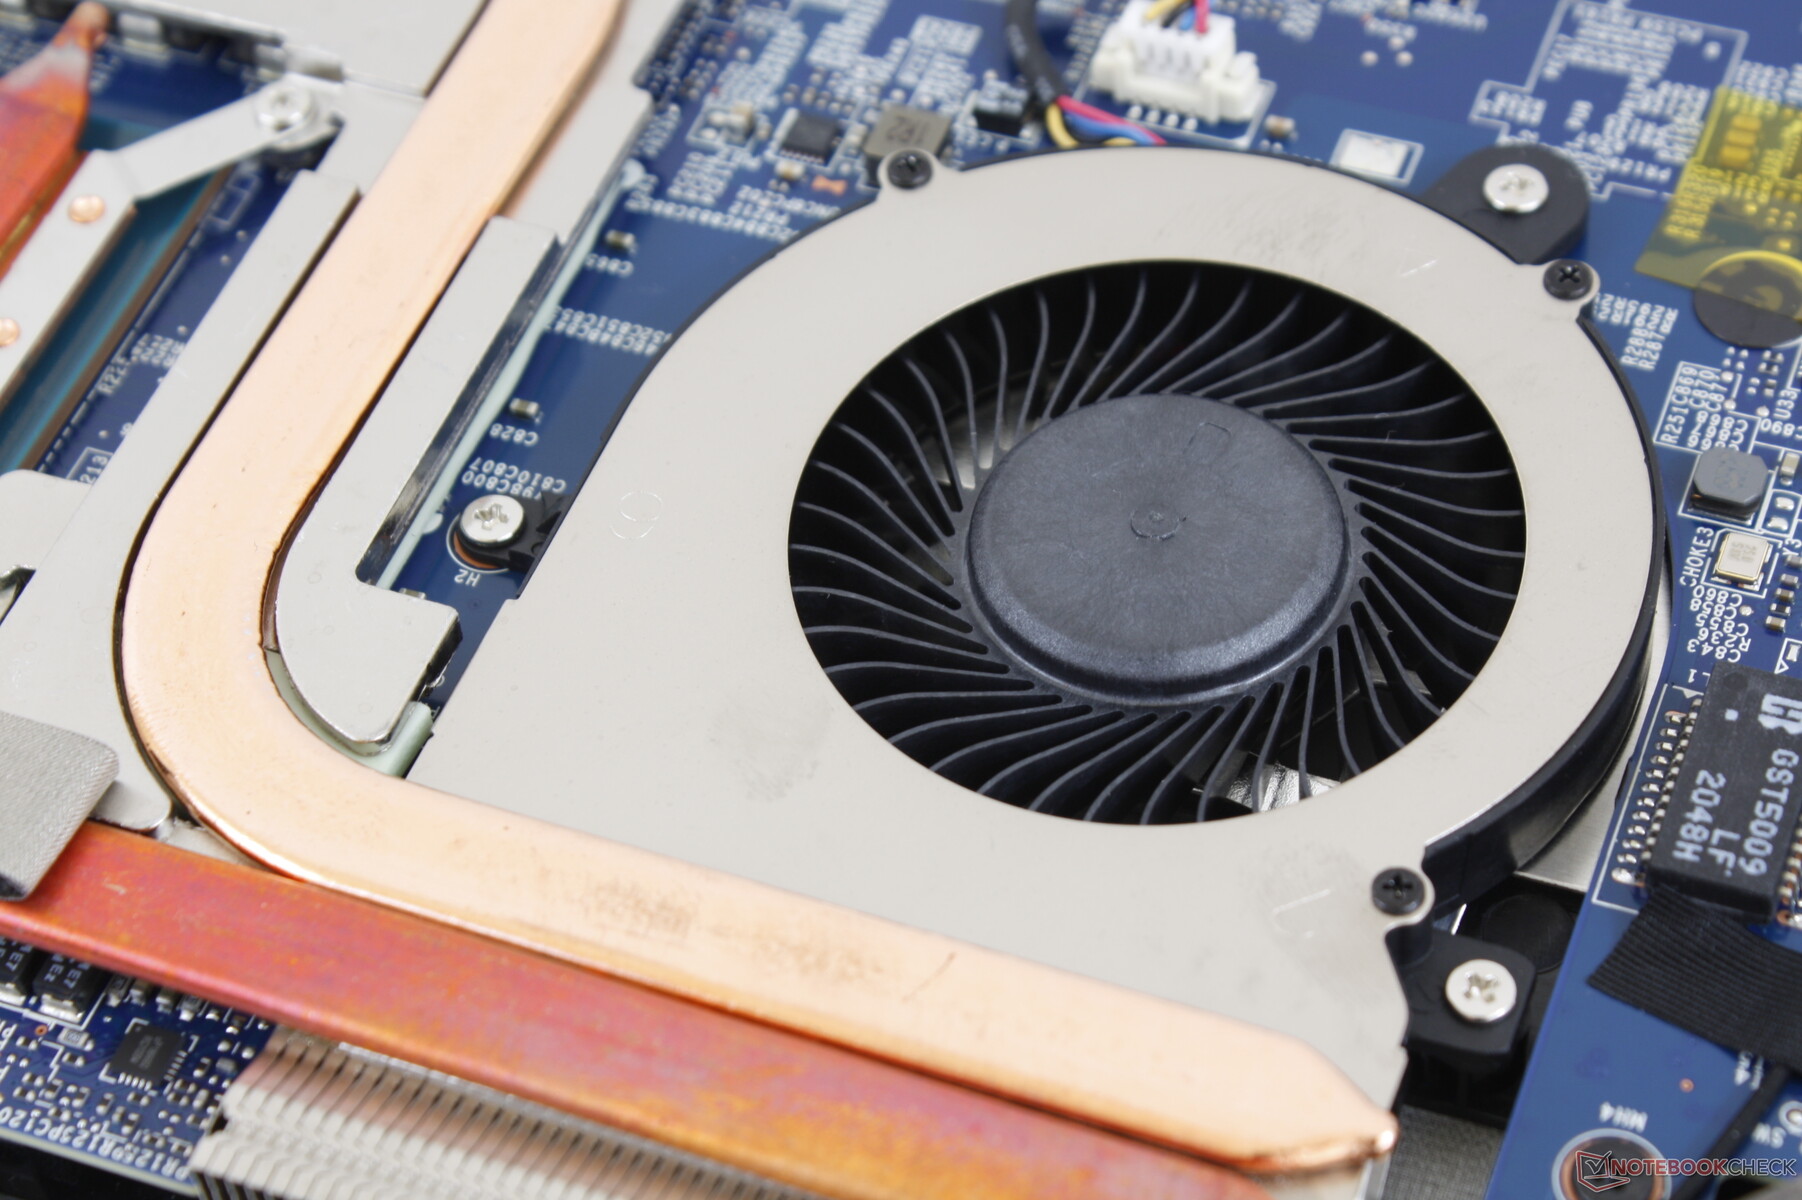
Manutenção
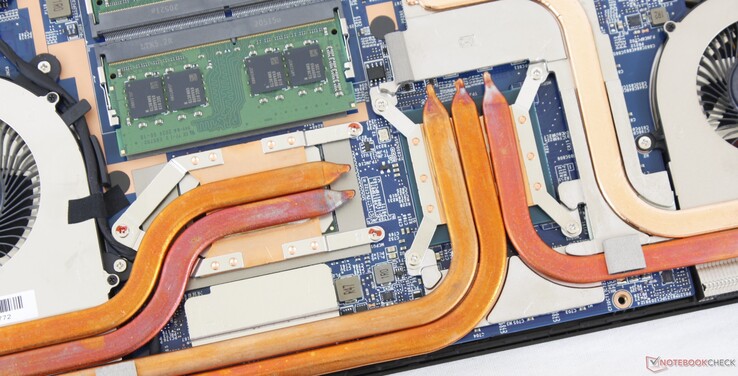
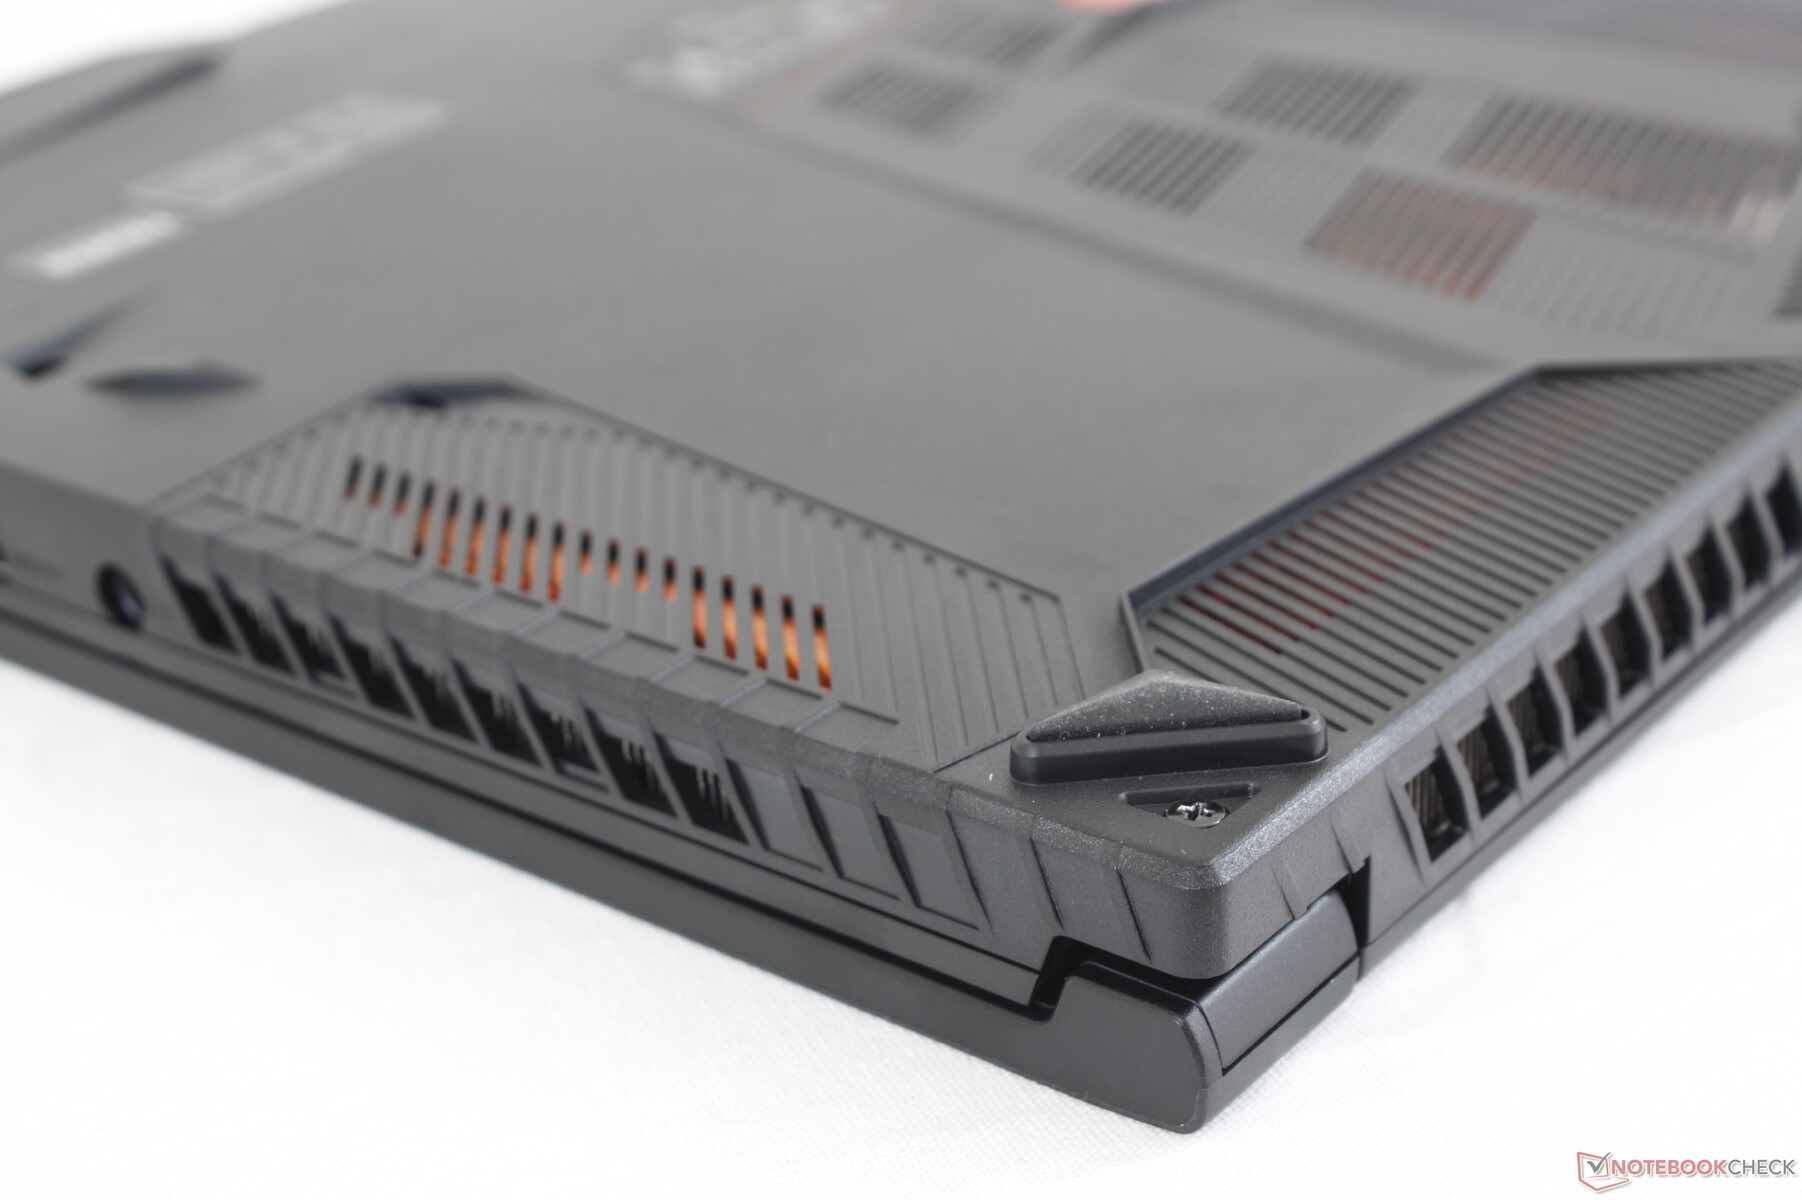
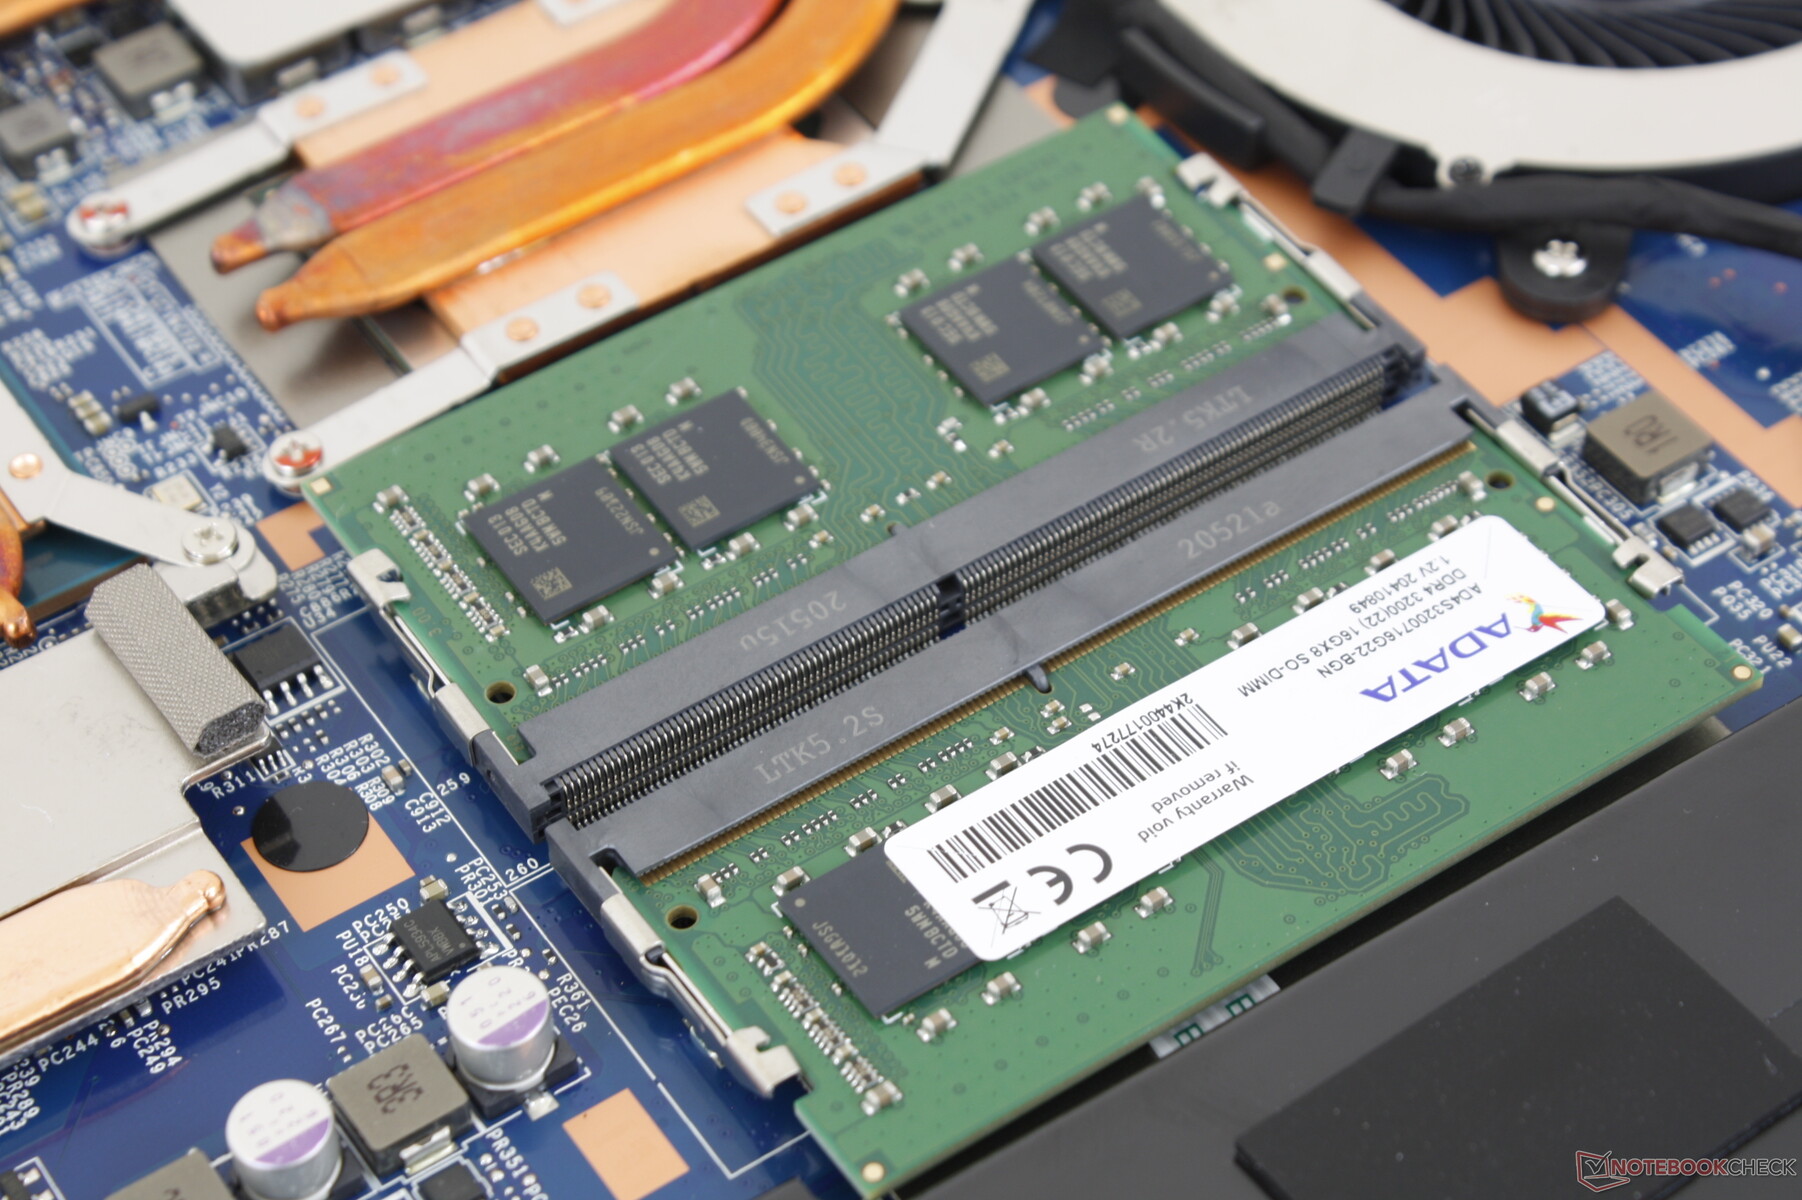
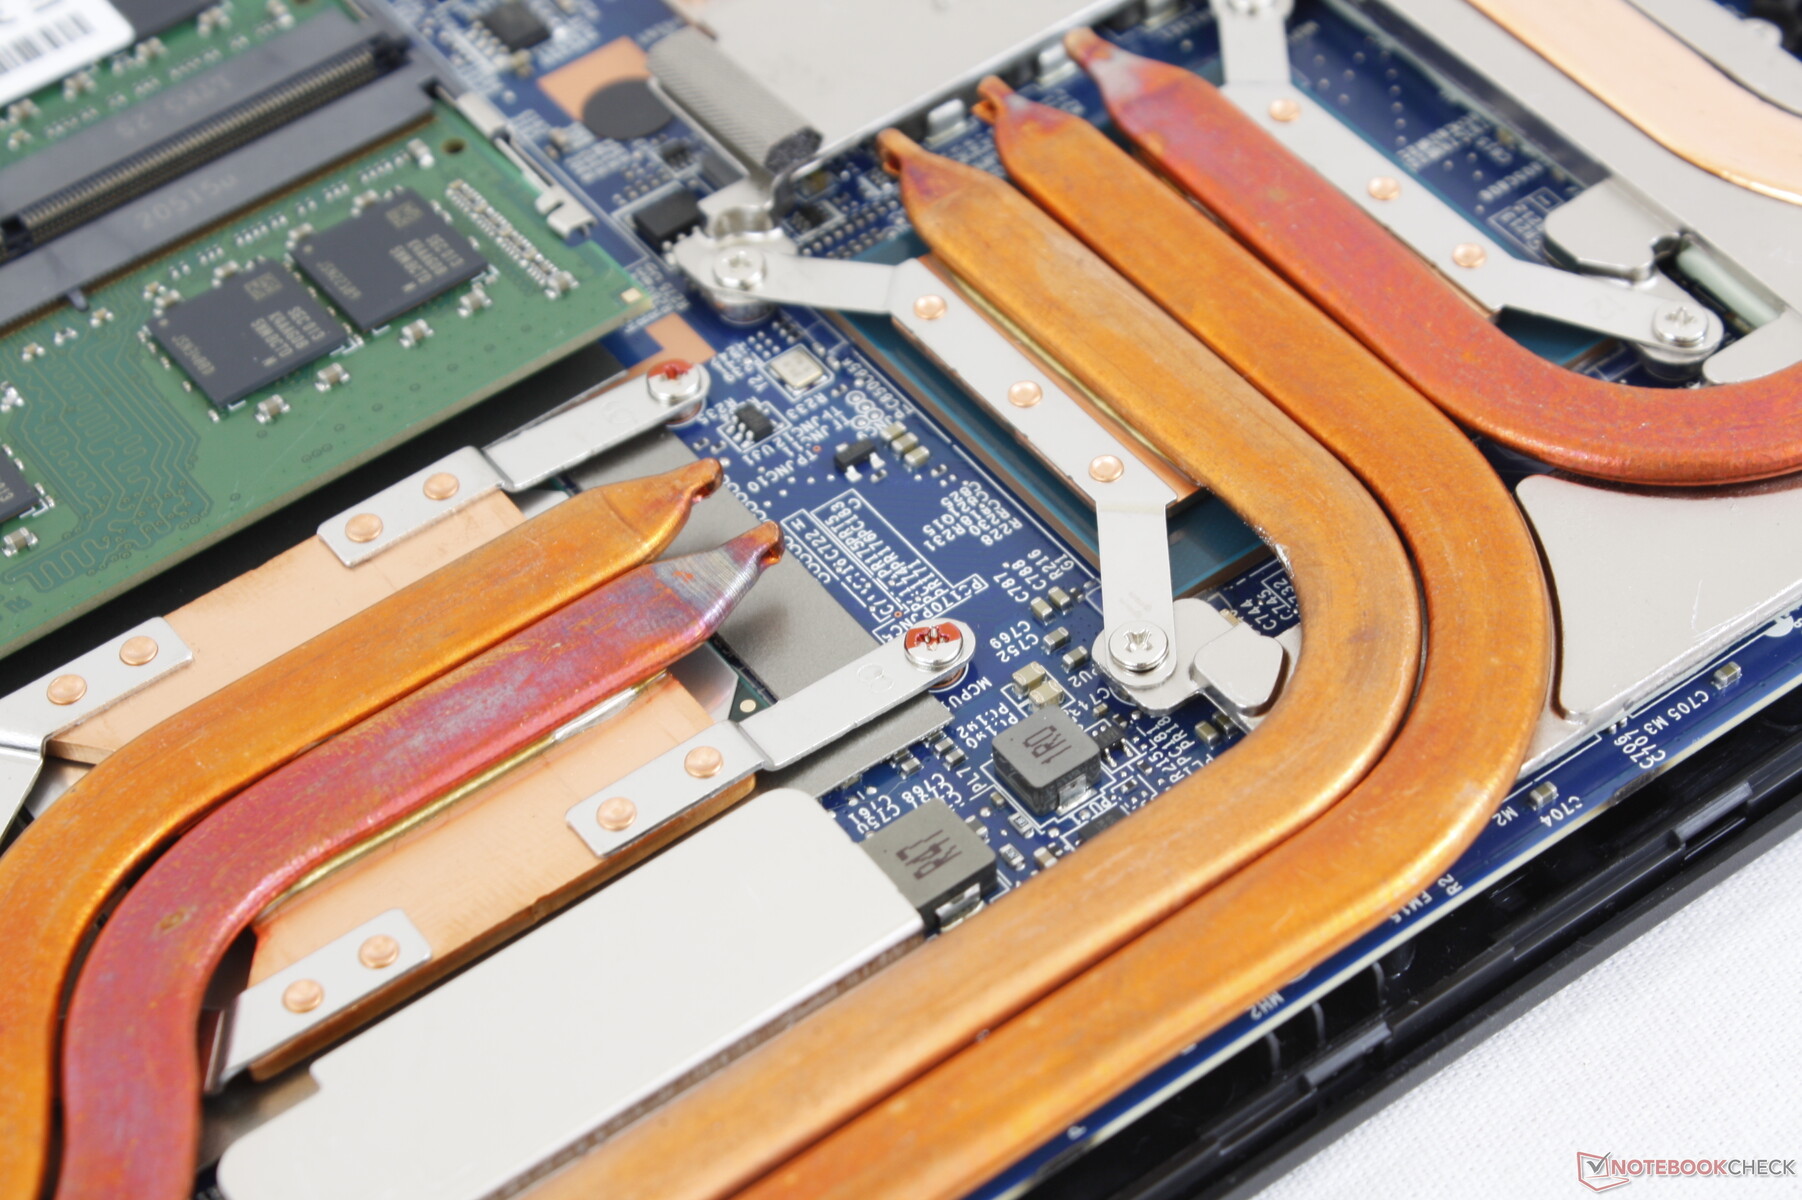
A manutenção requer apenas uma chave de fenda Philips para atualizações relativamente fáceis. Os proprietários devem ter cuidado ao remover o painel inferior, pois a tomada de áudio pode ficar presa ao longo da borda.
Acessórios e Garantia
Não há extras na caixa além do habitual adaptador AC e papelada. A garantia padrão limitada de um ano aplica-se enquanto quaisquer componentes instalados pela CUKUSA, como RAM ou armazenamento, terão cobertura de três anos em seu lugar.
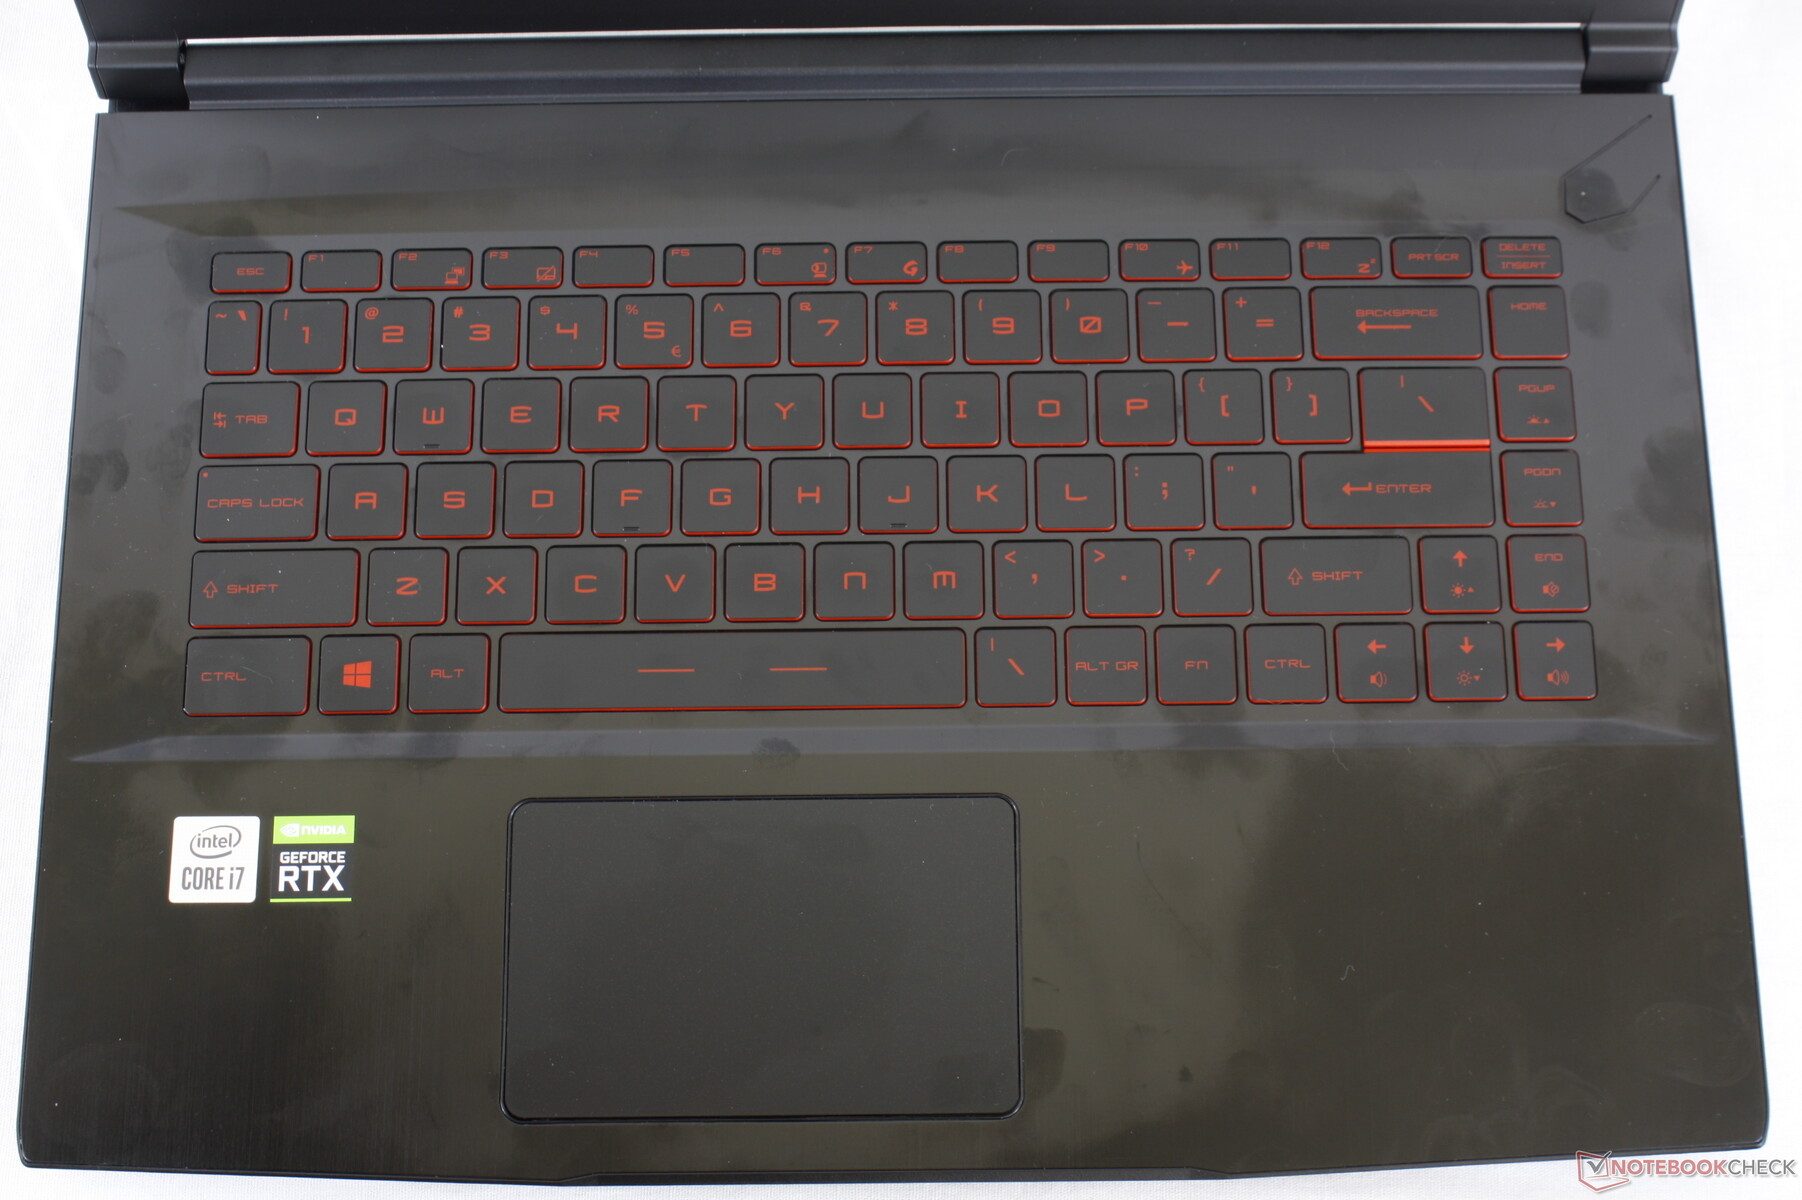
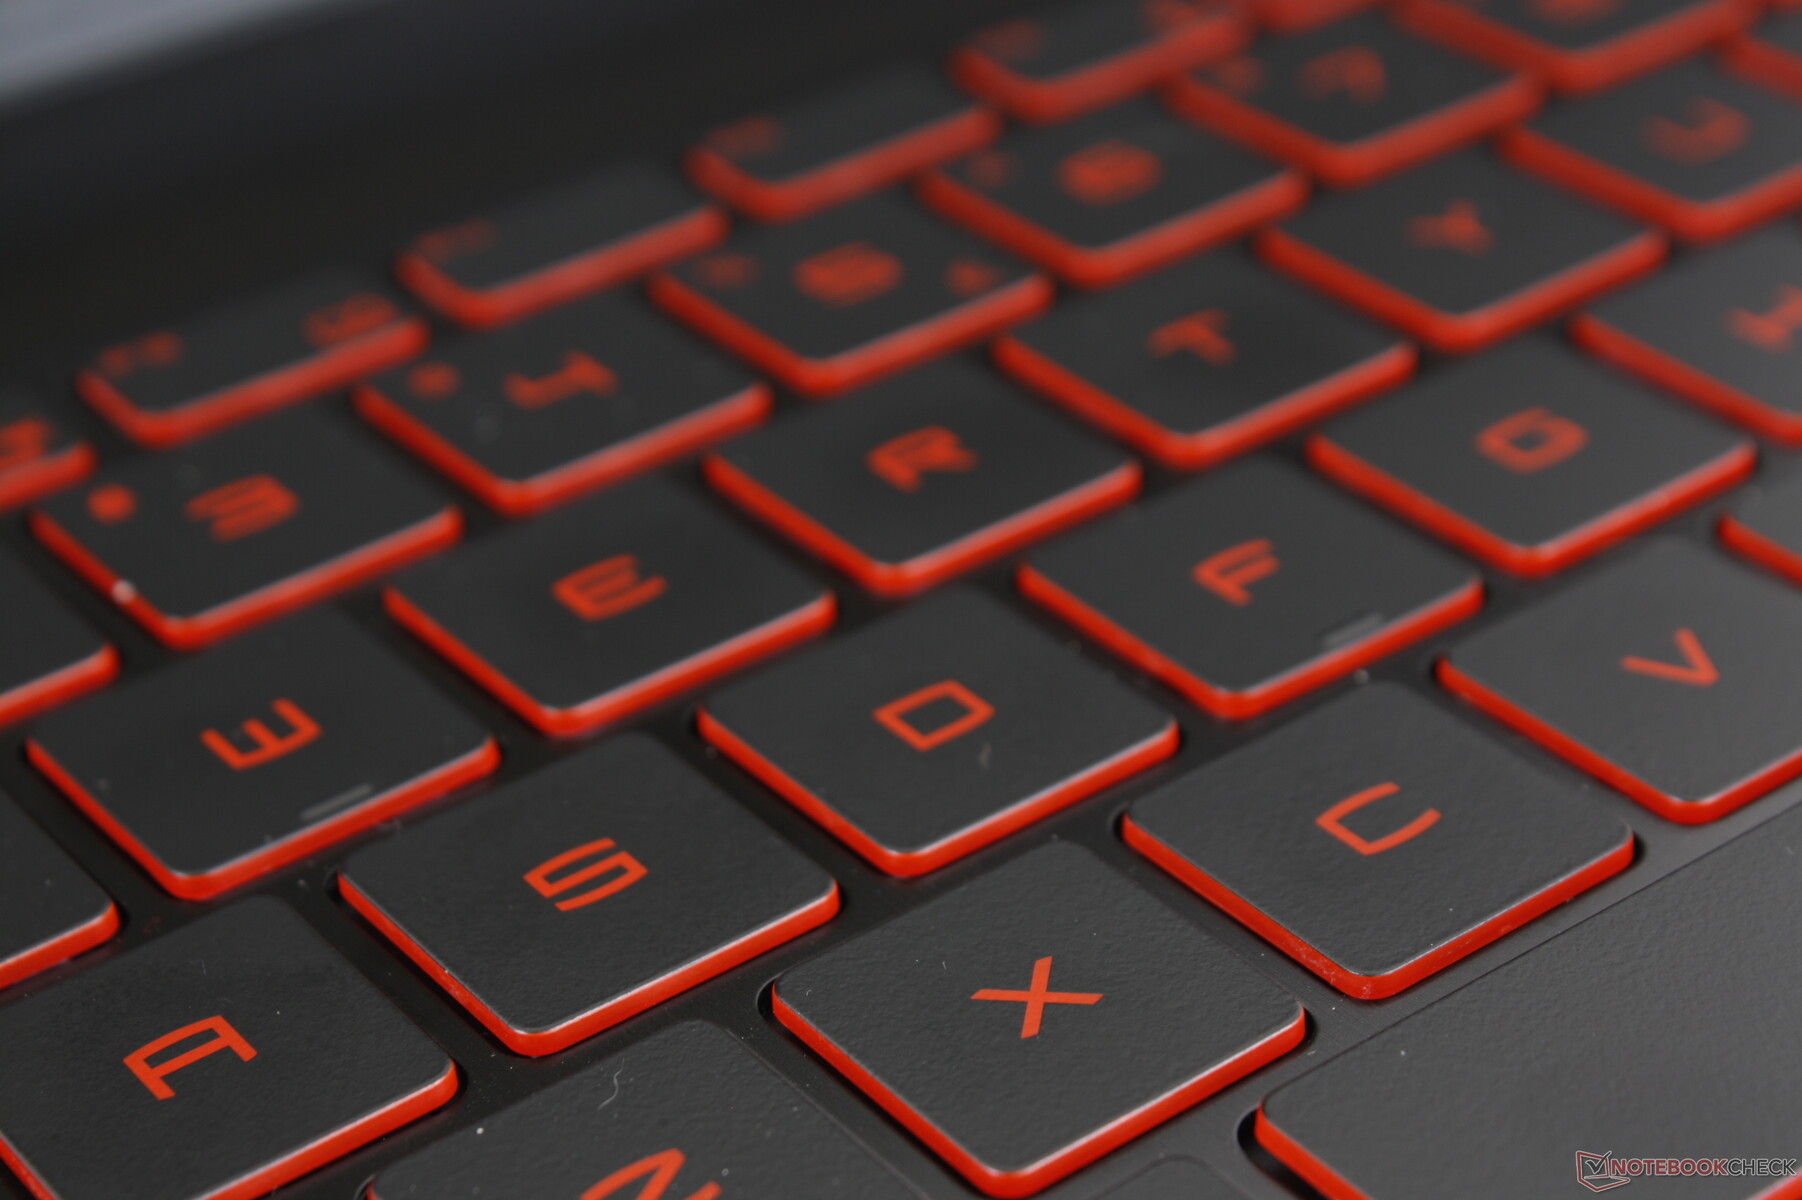
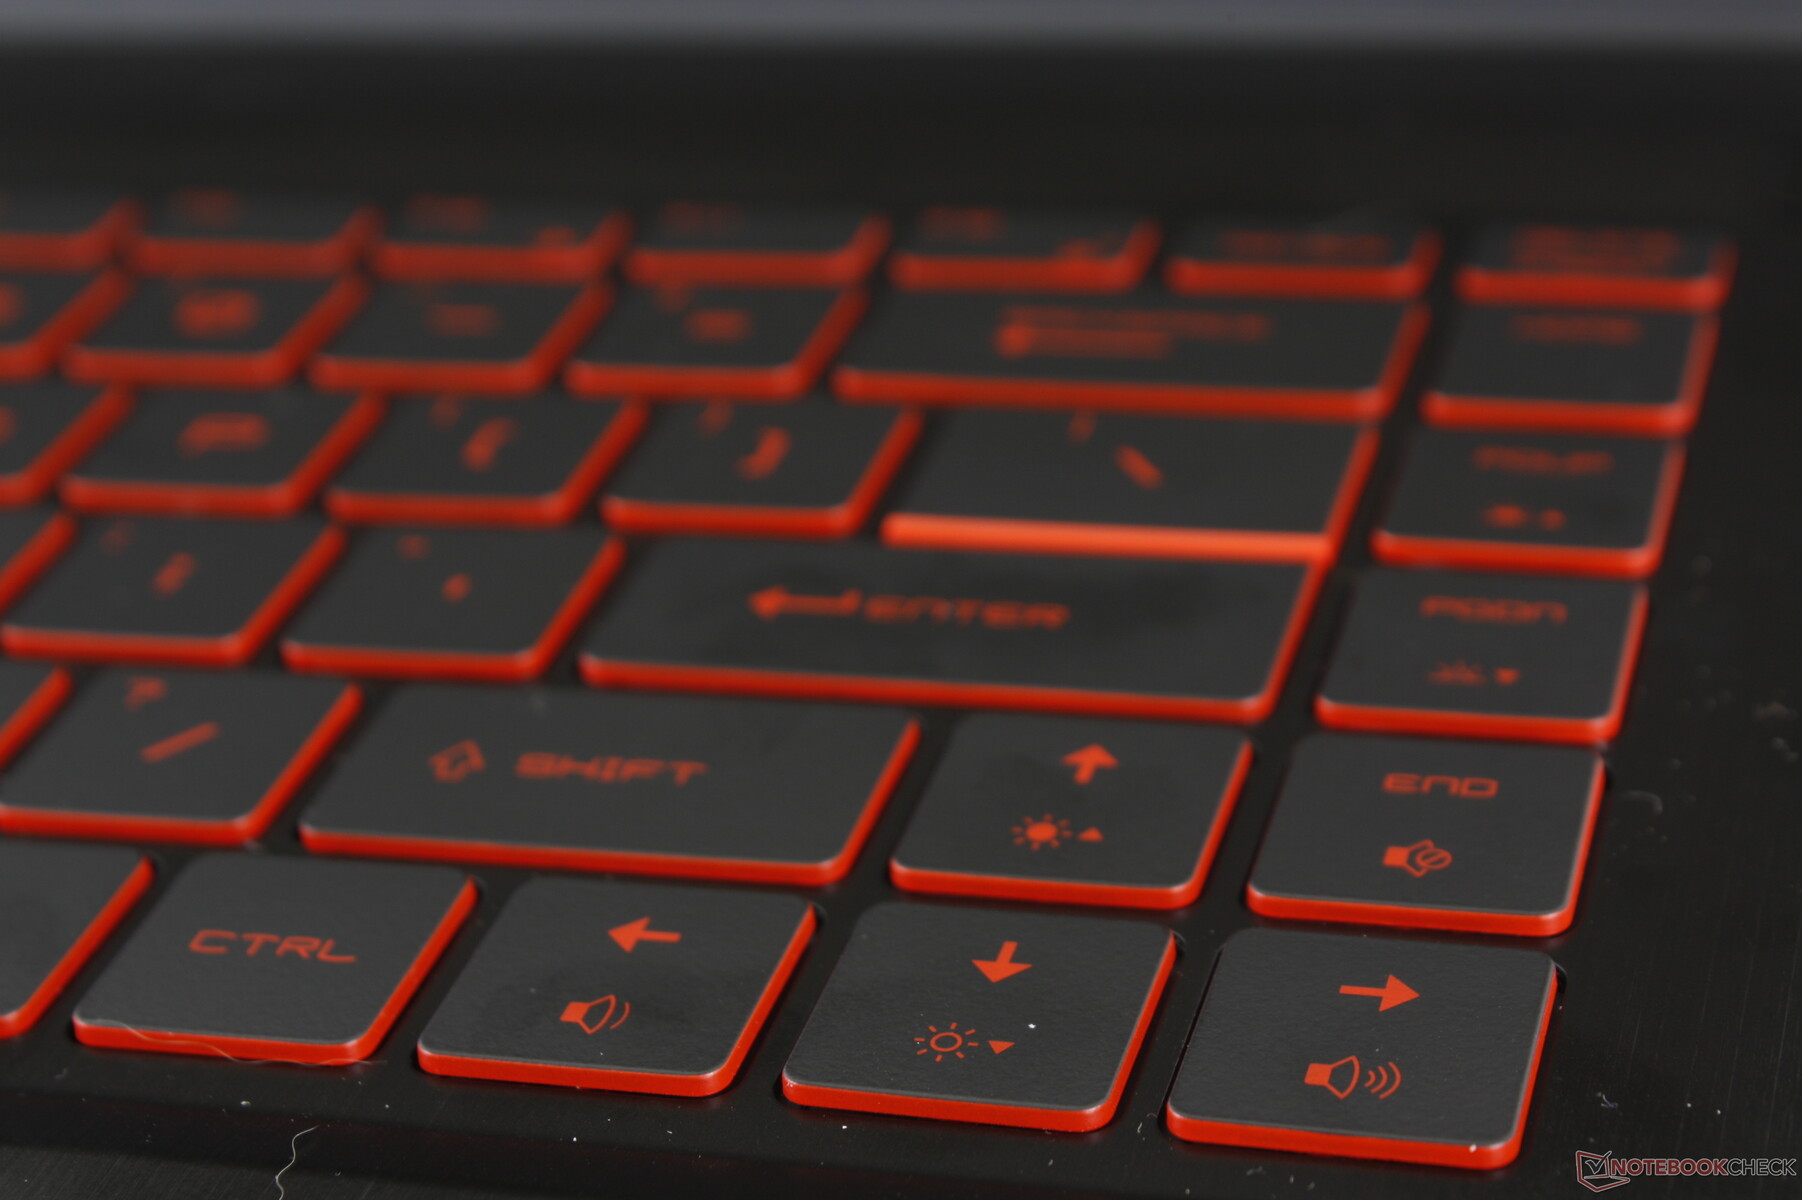
Dispositivos de entrada
Mostrar
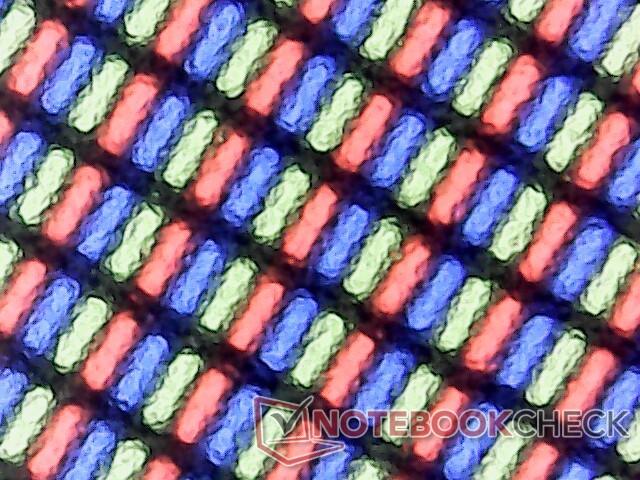
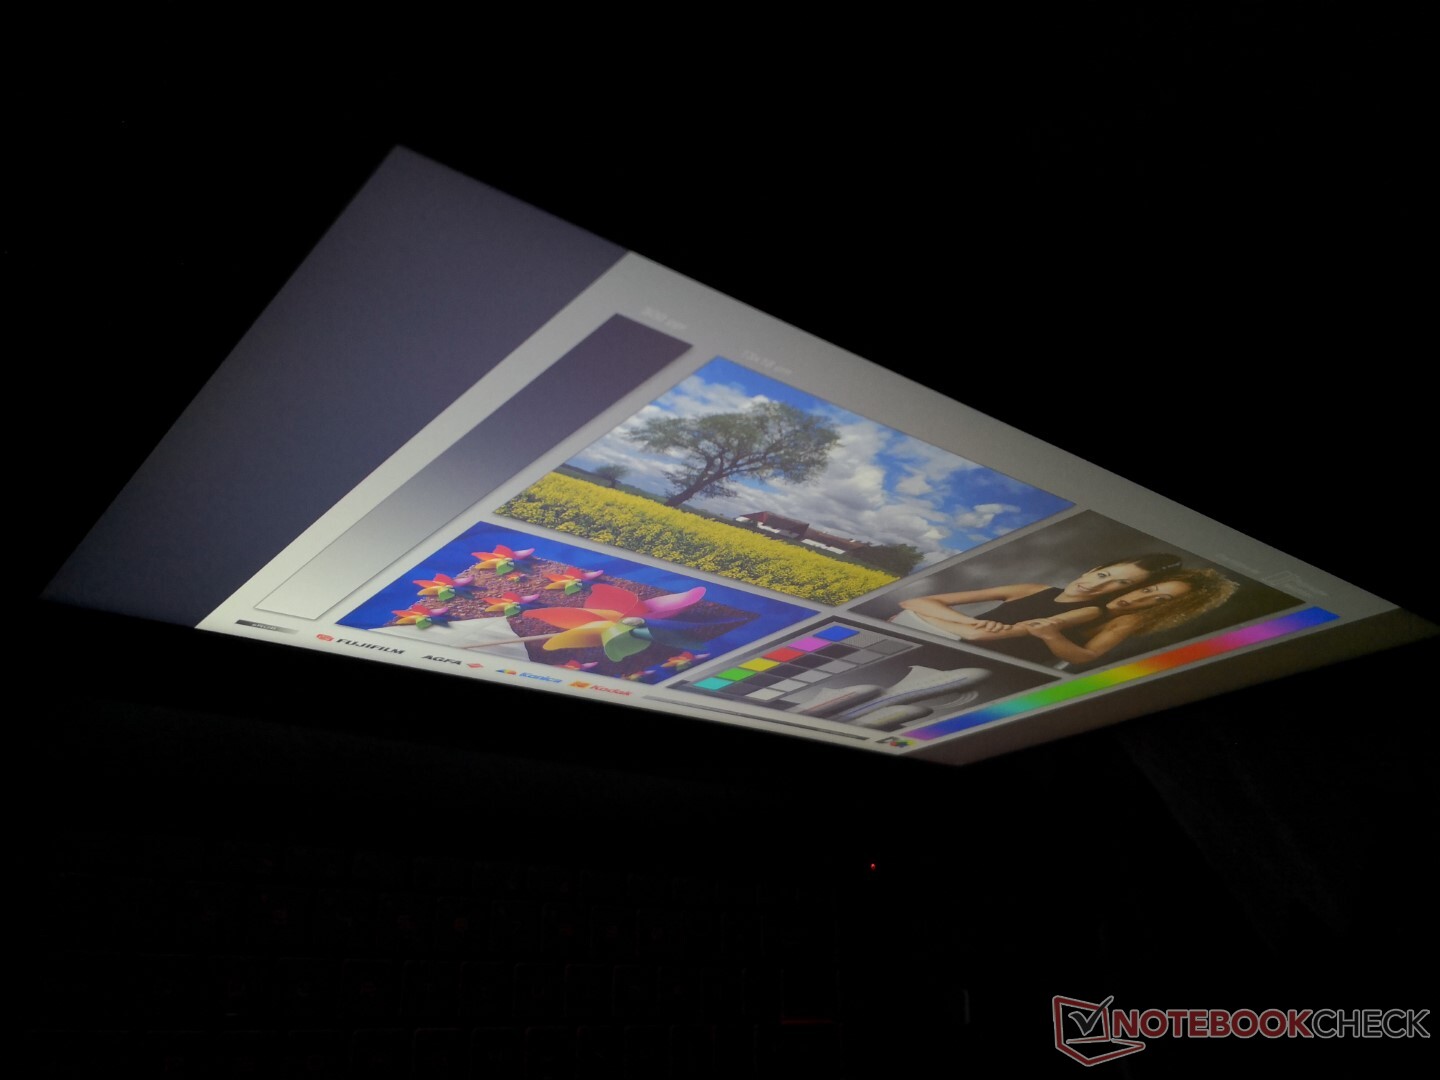
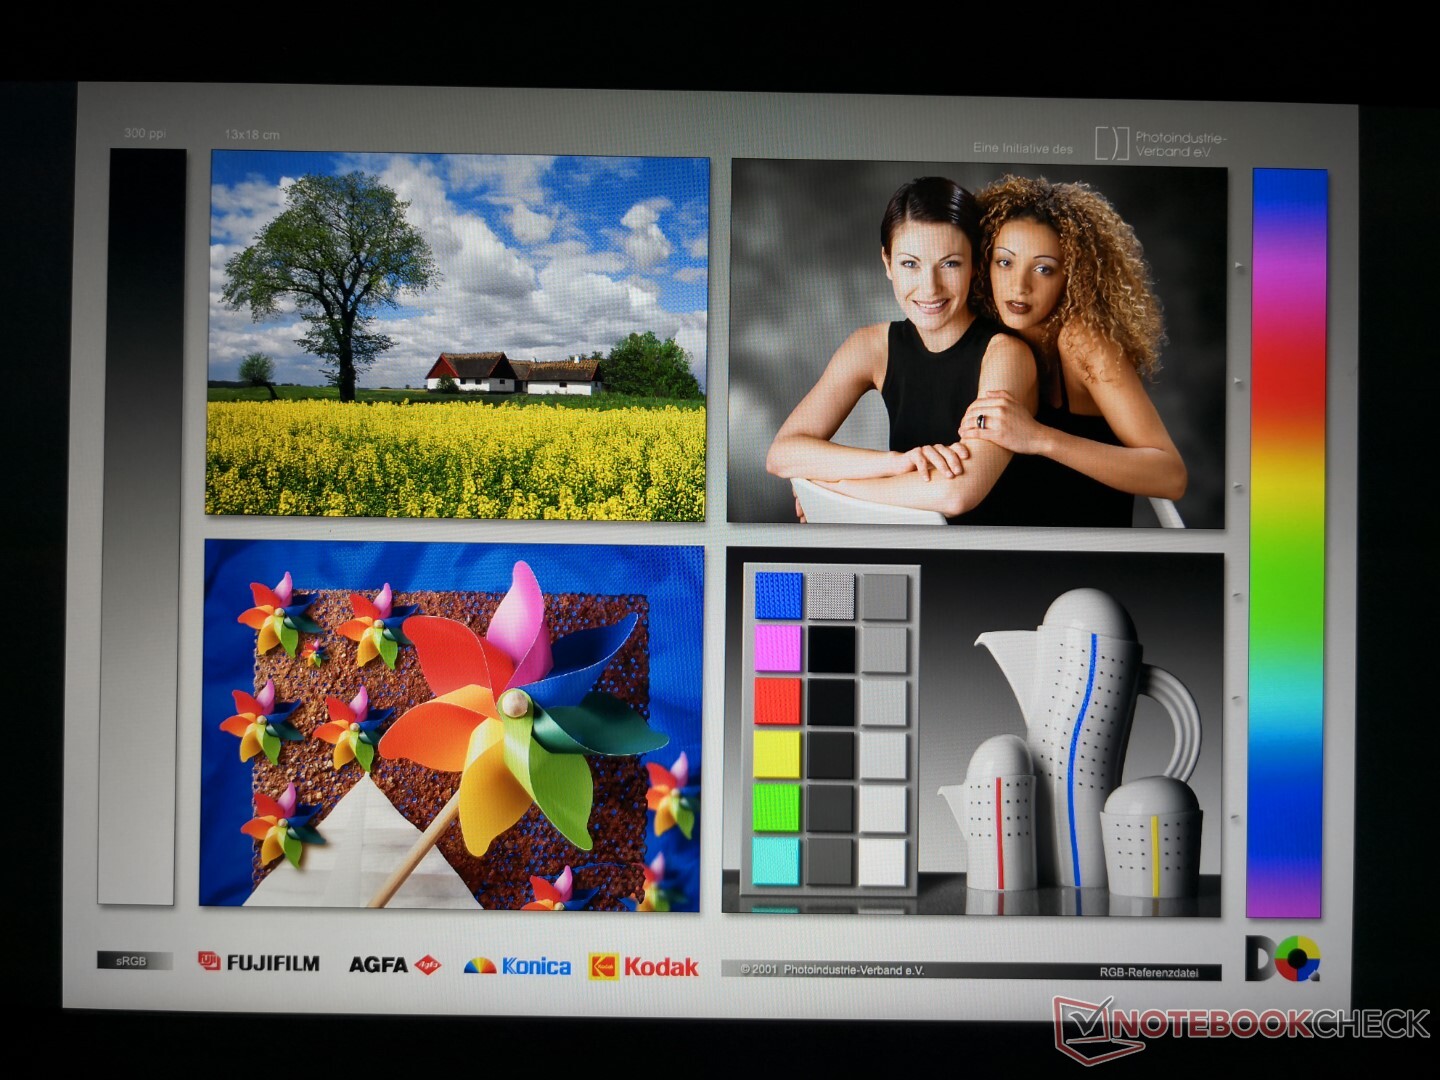
O GF65 10UE utiliza um painel AU Optronics diferente do antigo GF65 9SD (AUO B156HAN08.4 vs. AUO B156HAN13.0) com a principal diferença entre eles sendo a taxa de atualização (144 Hz vs. 120 Hz). Fora isso, os painéis são quase idênticos, incluindo seus tempos médios de resposta preto-branco e sua gama abaixo da média. O contraste é bastante alto em mais de 1000:1, mas a reprodução limitada das cores diminui esta vantagem.
Subjetivamente, o visor é amanteigado para jogos e uso geral - basta estar preparado para um pouco de fantasma e não espere que as cores apareçam.


| |||||||||||||||||||||||||
iluminação: 91 %
iluminação com acumulador: 266.5 cd/m²
Contraste: 1481:1 (Preto: 0.18 cd/m²)
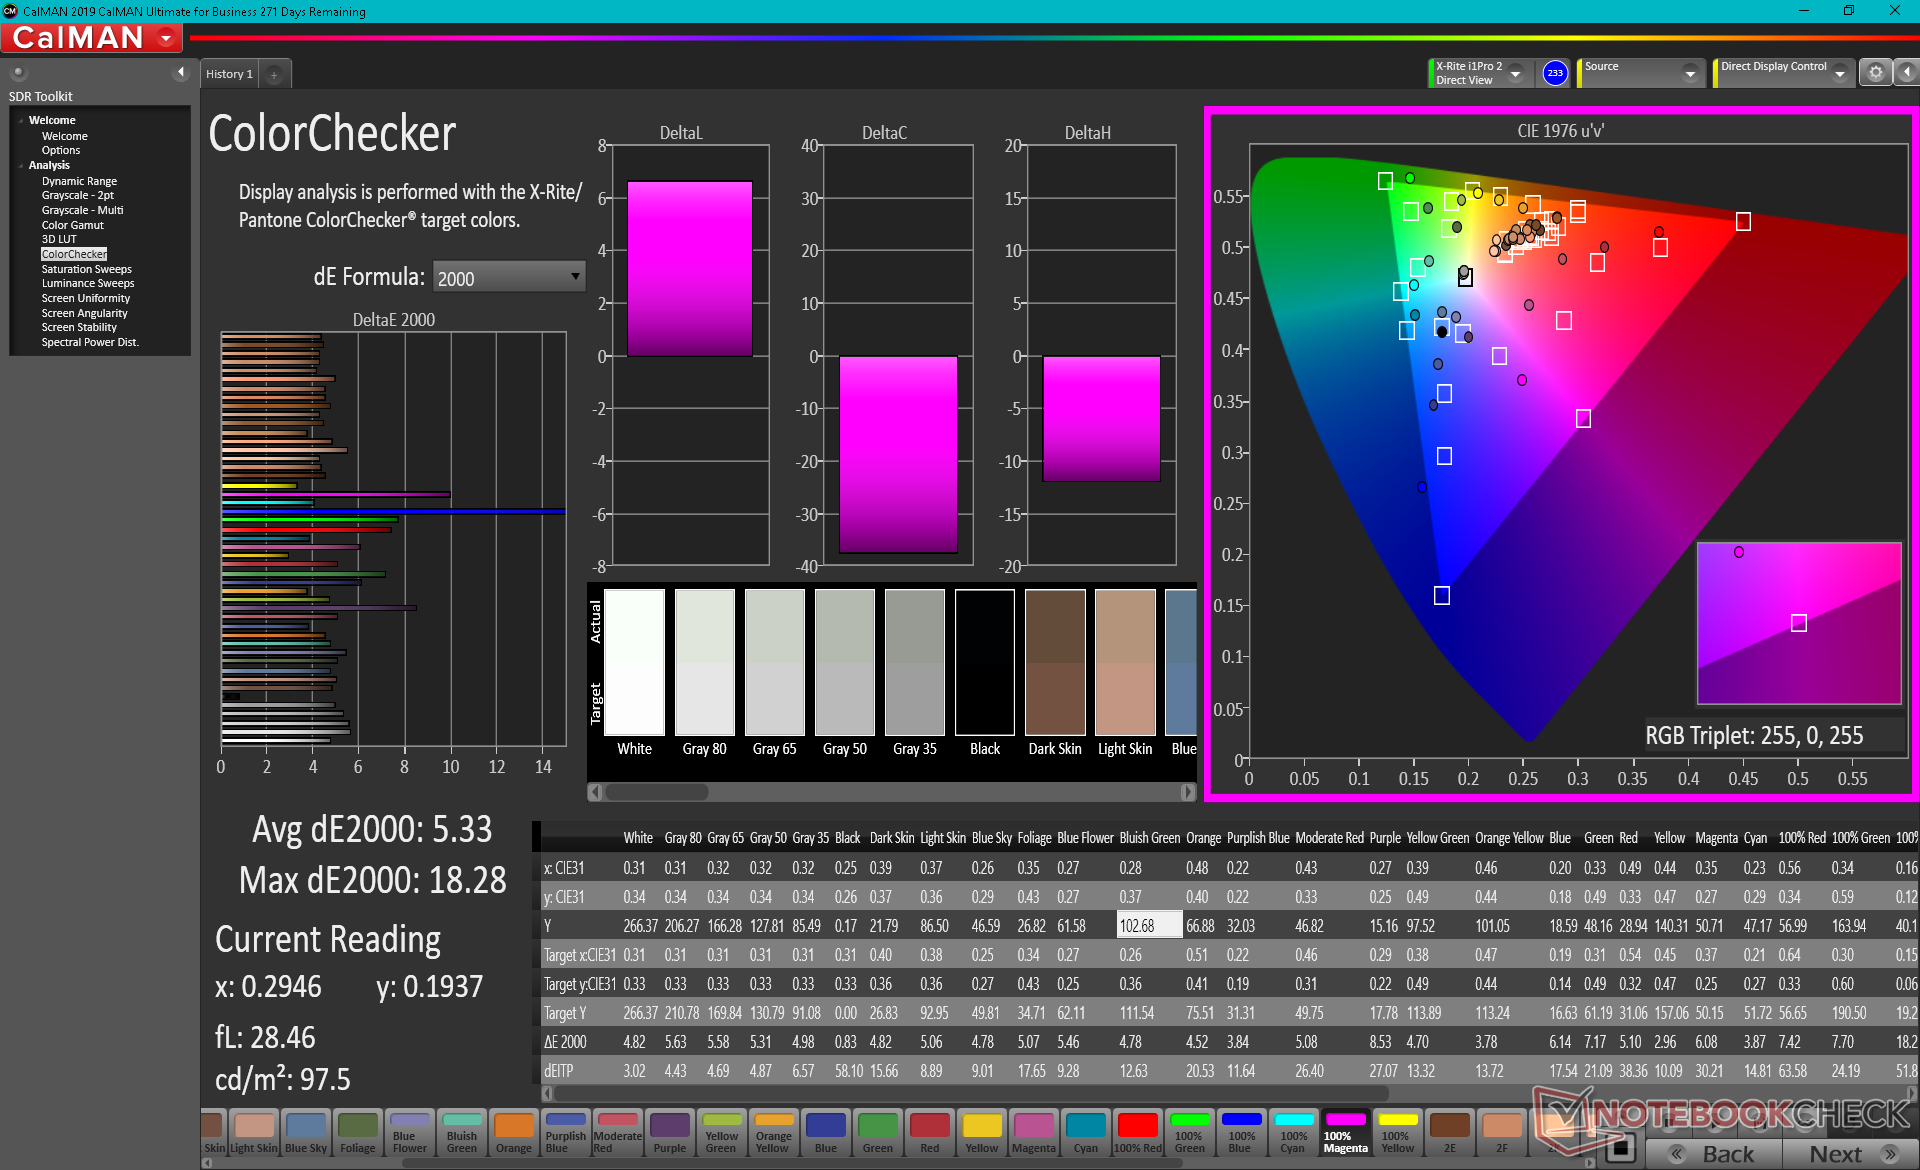
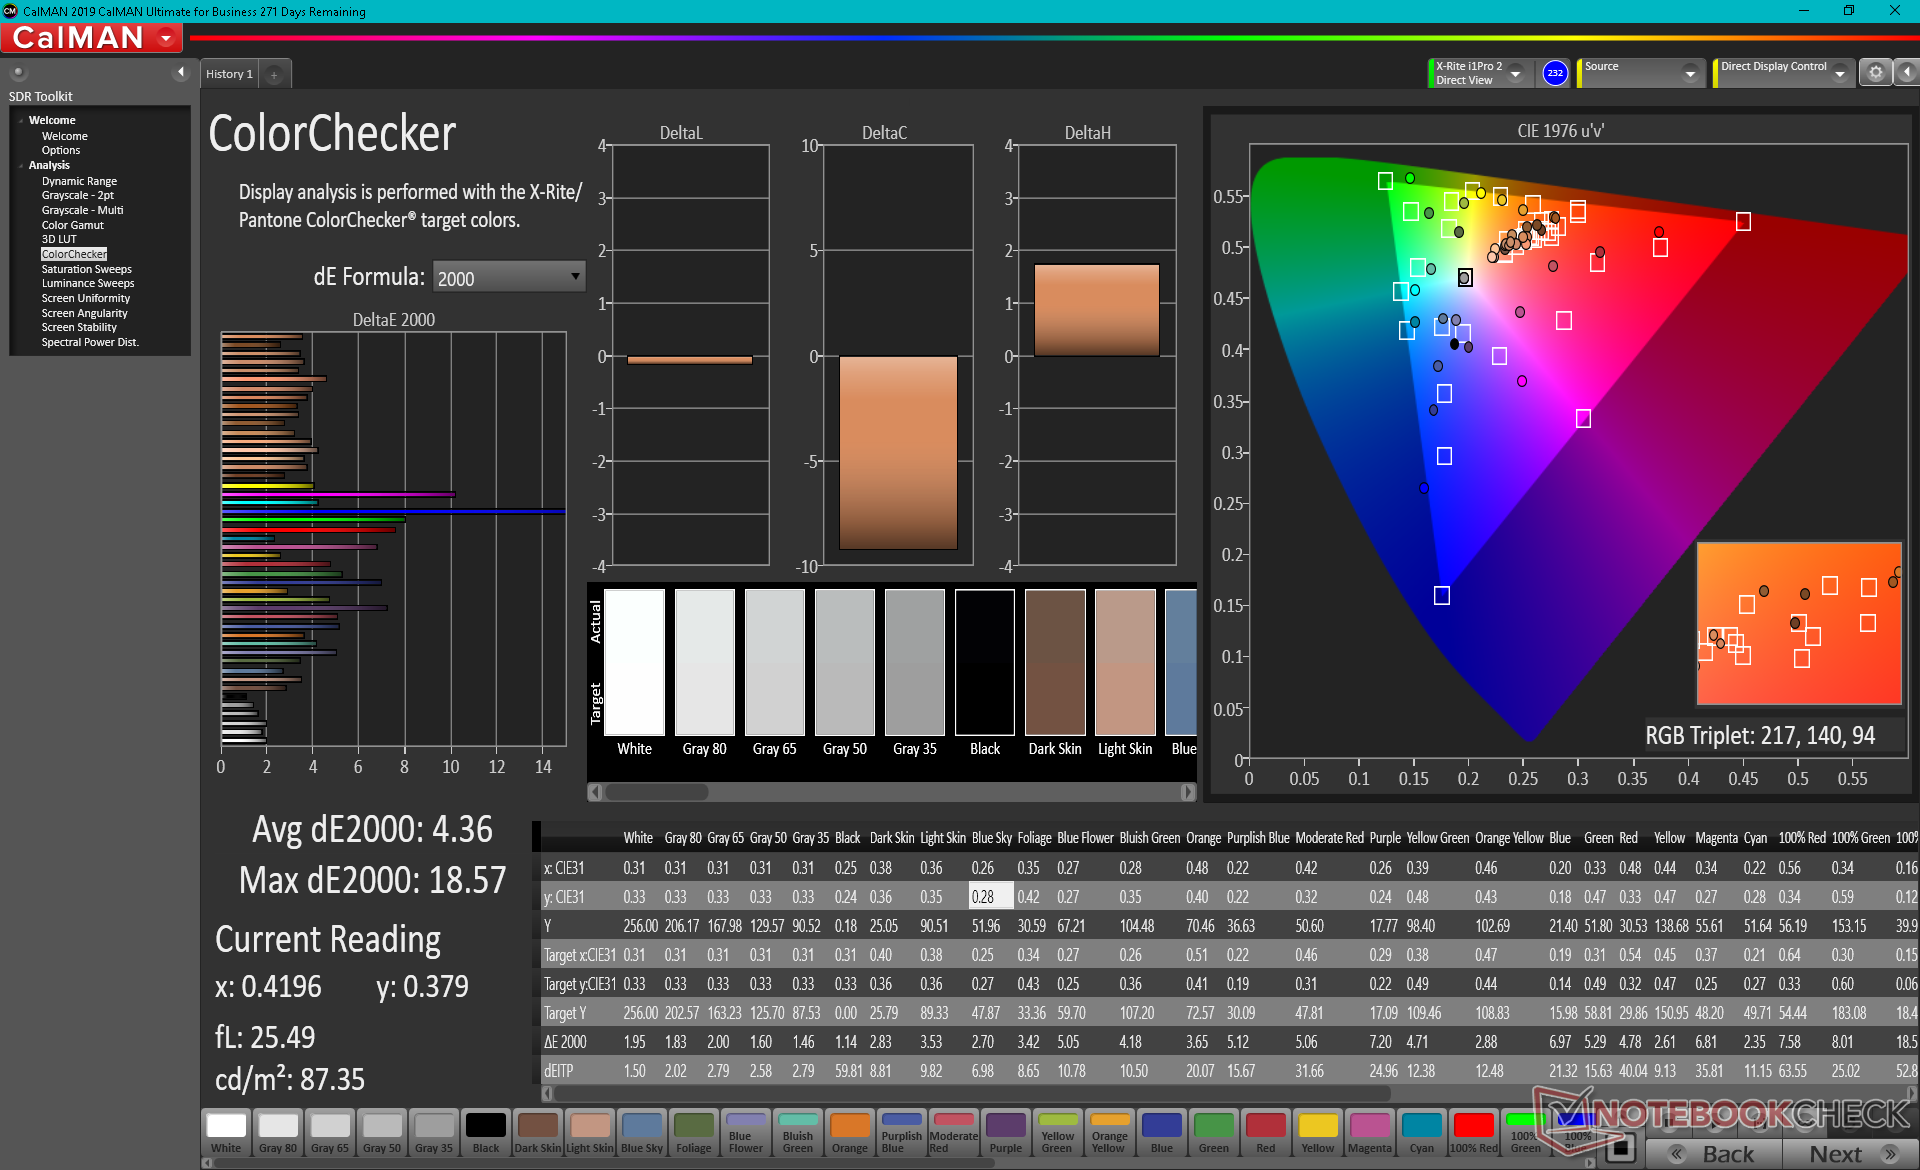
ΔE ColorChecker Calman: 5.33 | ∀{0.5-29.43 Ø4.71}
calibrated: 4.36
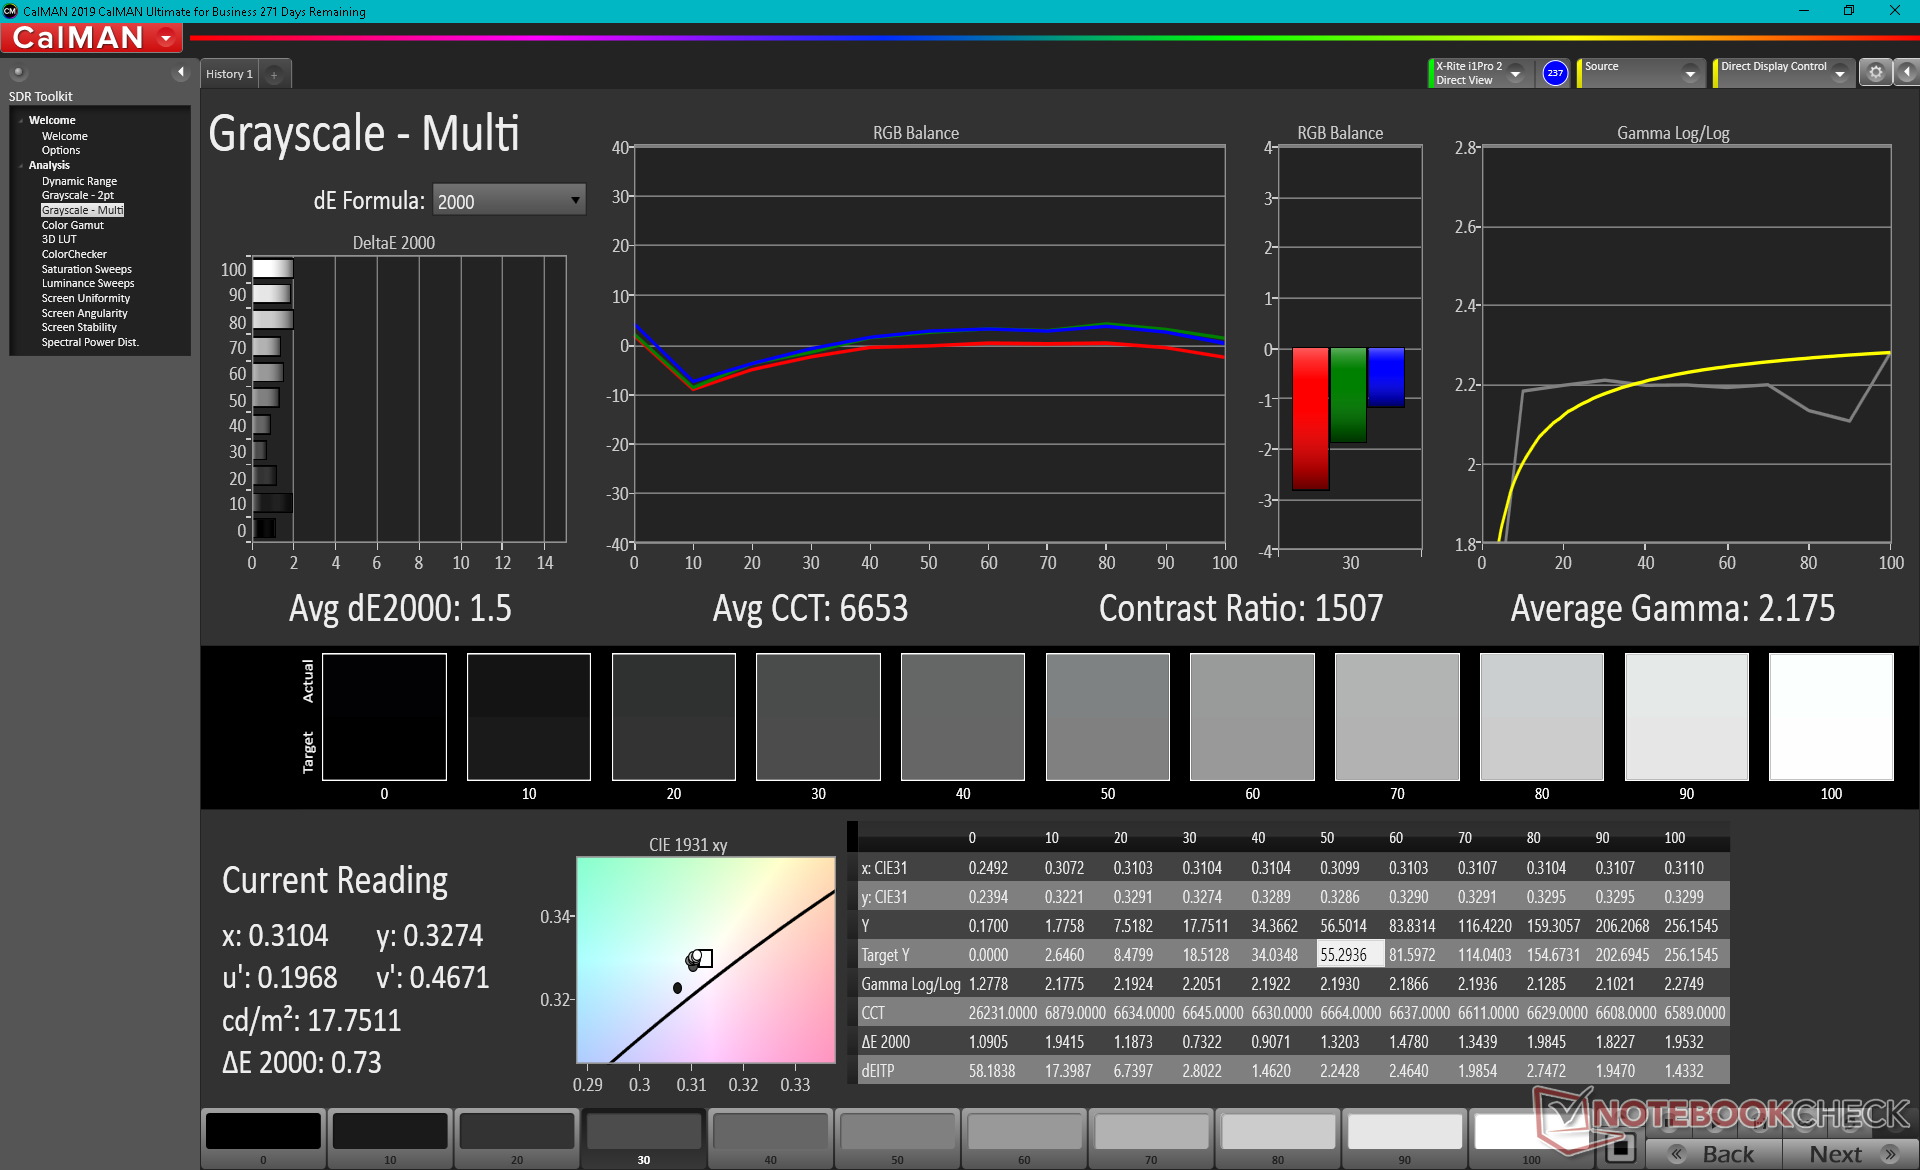
ΔE Greyscale Calman: 4.5 | ∀{0.09-98 Ø4.96}
55.8% sRGB (Argyll 1.6.3 3D)
35.6% AdobeRGB 1998 (Argyll 1.6.3 3D)
38.9% AdobeRGB 1998 (Argyll 3D)
56.3% sRGB (Argyll 3D)
37.65% Display P3 (Argyll 3D)
Gamma: 2.35
CCT: 6289 K
| MSI GF65 Thin 10UE AU Optronics B156HAN08.4, IPS, 15.6", 1920x1080 | Asus ROG Strix G15 G513QR LQ156M1JW25, IPS, 15.6", 1920x1080 | Schenker XMG Core 15 Ampere BOE CQ NE156QHM-NY2, IPS, 15.6", 2560x1440 | MSI GS66 Stealth 10UG AU Optronics B156HAN12.0, IPS, 15.6", 1920x1080 | Aorus 15G XC Sharp LQ156M1JW03, IPS, 15.6", 1920x1080 | Lenovo Legion 7 15IMH05-81YT001VGE AUO048E, IPS, 15.6", 1920x1080 | |
|---|---|---|---|---|---|---|
| Display | 74% | 81% | 78% | 73% | 82% | |
| Display P3 Coverage (%) | 37.65 | 67.7 80% | 69.8 85% | 67.7 80% | 65.6 74% | 70.3 87% |
| sRGB Coverage (%) | 56.3 | 94.3 67% | 98.8 75% | 98.4 75% | 97.5 73% | 99.4 77% |
| AdobeRGB 1998 Coverage (%) | 38.9 | 68.2 75% | 70.7 82% | 69.1 78% | 67.1 72% | 71.3 83% |
| Response Times | 75% | 64% | 62% | 72% | 77% | |
| Response Time Grey 50% / Grey 80% * (ms) | 36.8 ? | 8.2 ? 78% | 14.8 ? 60% | 14.4 ? 61% | 9.6 ? 74% | 8 ? 78% |
| Response Time Black / White * (ms) | 31.6 ? | 9.2 ? 71% | 10.4 ? 67% | 11.6 ? 63% | 9.6 ? 70% | 8 ? 75% |
| PWM Frequency (Hz) | 24040 ? | |||||
| Screen | 27% | 40% | 29% | 37% | 47% | |
| Brightness middle (cd/m²) | 266.5 | 308 16% | 347 30% | 259.5 -3% | 288 8% | 470 76% |
| Brightness (cd/m²) | 262 | 288 10% | 328 25% | 264 1% | 270 3% | 468 79% |
| Brightness Distribution (%) | 91 | 86 -5% | 89 -2% | 90 -1% | 89 -2% | 85 -7% |
| Black Level * (cd/m²) | 0.18 | 0.23 -28% | 0.27 -50% | 0.25 -39% | 0.25 -39% | 0.21 -17% |
| Contrast (:1) | 1481 | 1339 -10% | 1285 -13% | 1038 -30% | 1152 -22% | 2238 51% |
| Colorchecker dE 2000 * | 5.33 | 3.28 38% | 1.66 69% | 2.52 53% | 1.19 78% | 3.28 38% |
| Colorchecker dE 2000 max. * | 18.28 | 8.51 53% | 3.03 83% | 5.55 70% | 3.79 79% | 7.31 60% |
| Colorchecker dE 2000 calibrated * | 4.36 | 0.83 81% | 1.23 72% | 1.93 56% | 0.71 84% | 0.8 82% |
| Greyscale dE 2000 * | 4.5 | 5 -11% | 1.6 64% | 1.7 62% | 1.6 64% | 4.49 -0% |
| Gamma | 2.35 94% | 2.057 107% | 2.278 97% | 2.04 108% | 2.229 99% | 2.4 92% |
| CCT | 6289 103% | 7393 88% | 6430 101% | 6414 101% | 6539 99% | 7438 87% |
| Color Space (Percent of AdobeRGB 1998) (%) | 35.6 | 68 91% | 71 99% | 63.3 78% | 67 88% | 65 83% |
| Color Space (Percent of sRGB) (%) | 55.8 | 90 61% | 94 68% | 98.8 77% | 90 61% | 99 77% |
| Média Total (Programa/Configurações) | 59% /
42% | 62% /
51% | 56% /
43% | 61% /
48% | 69% /
58% |
* ... menor é melhor
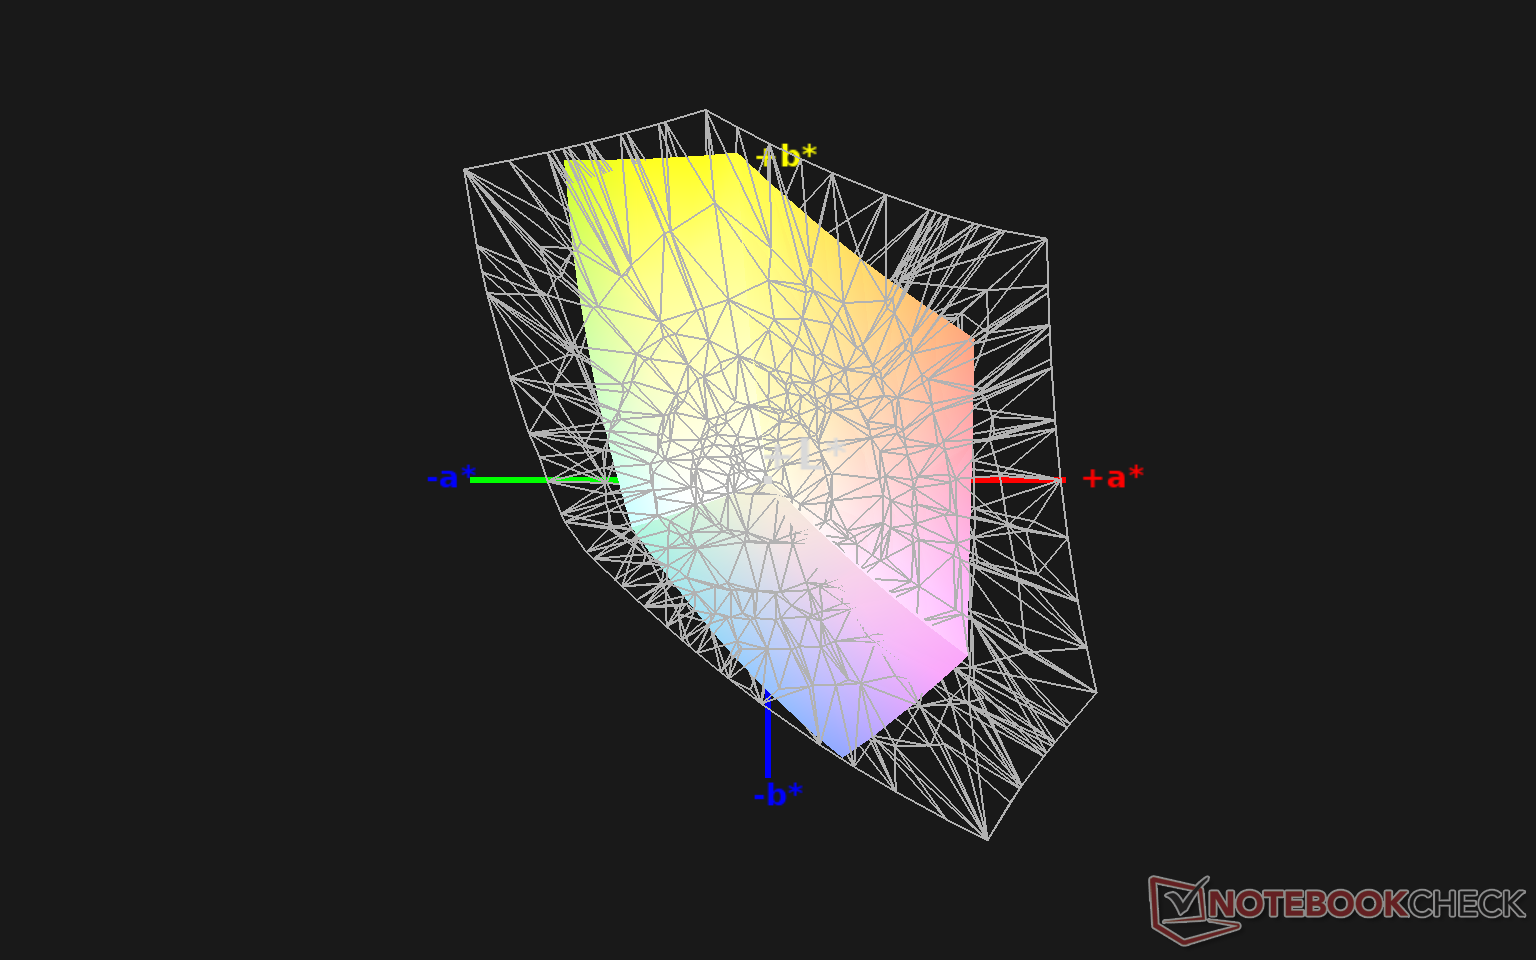
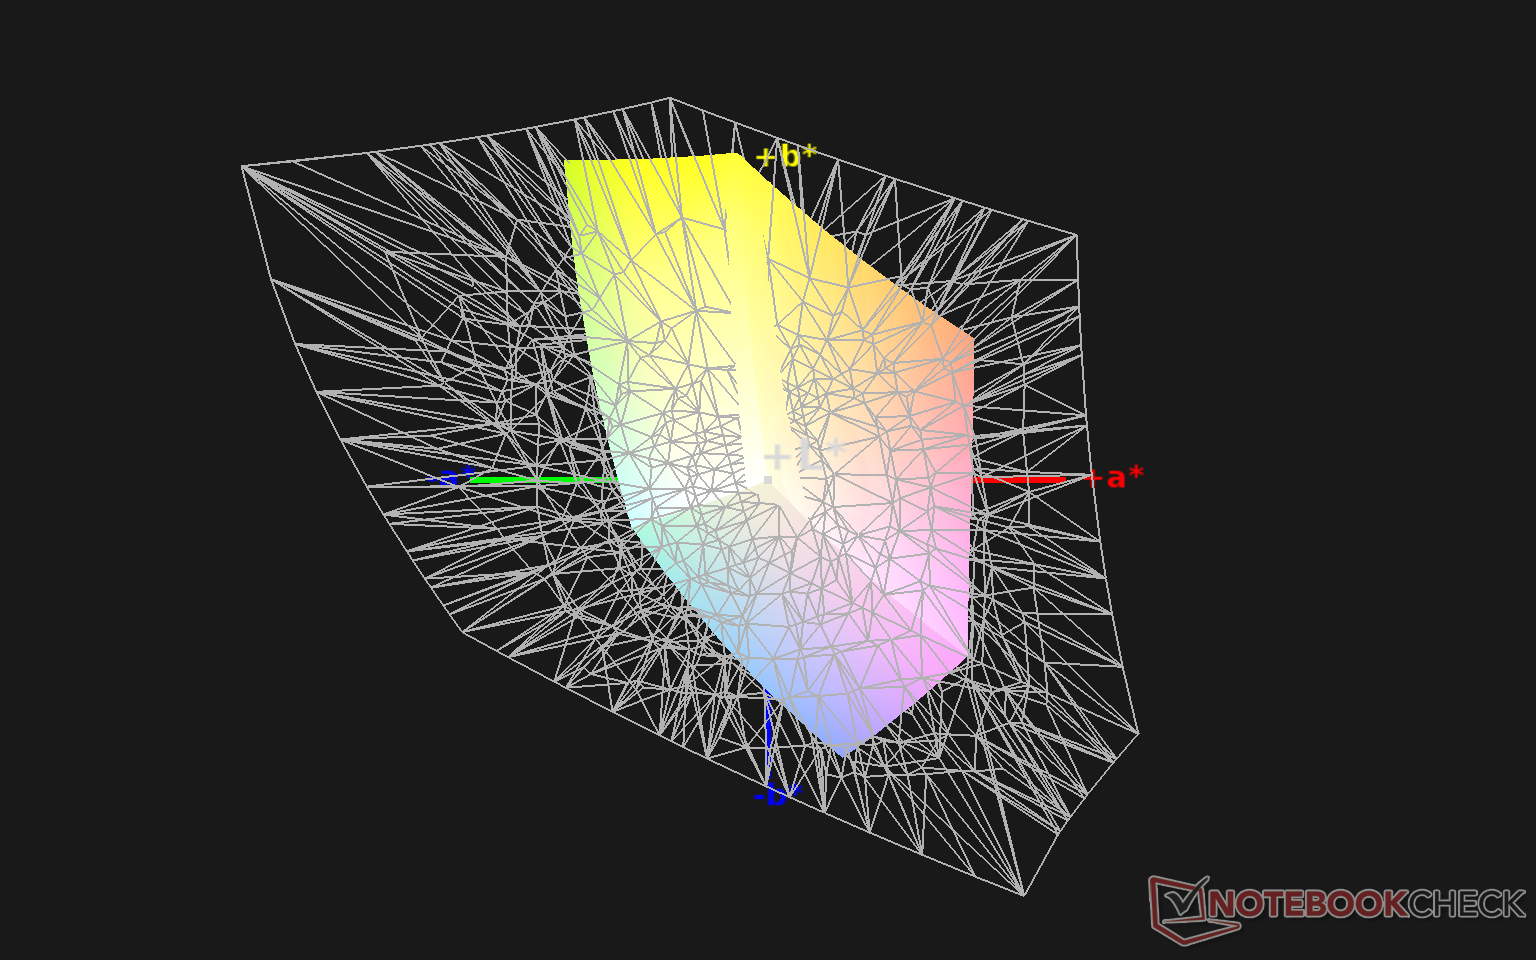
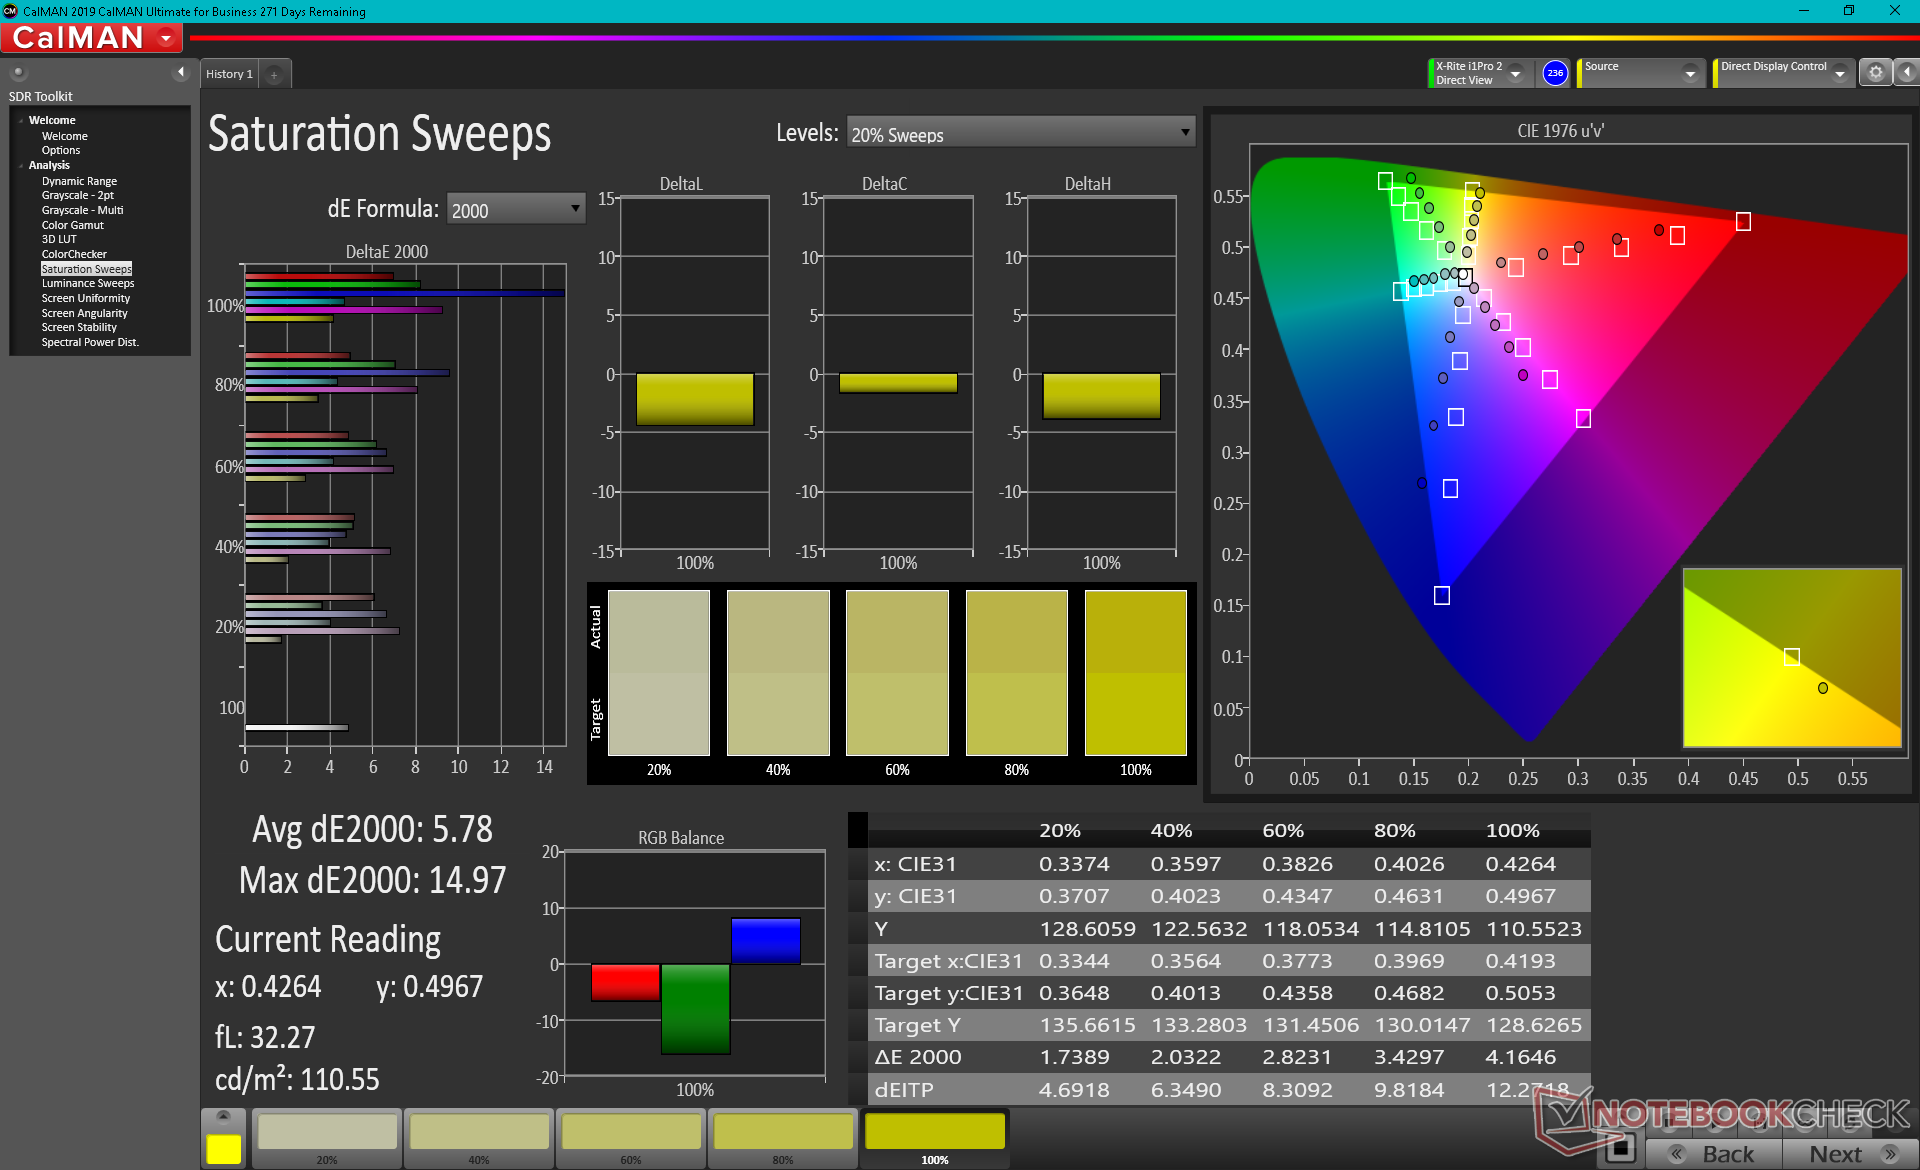
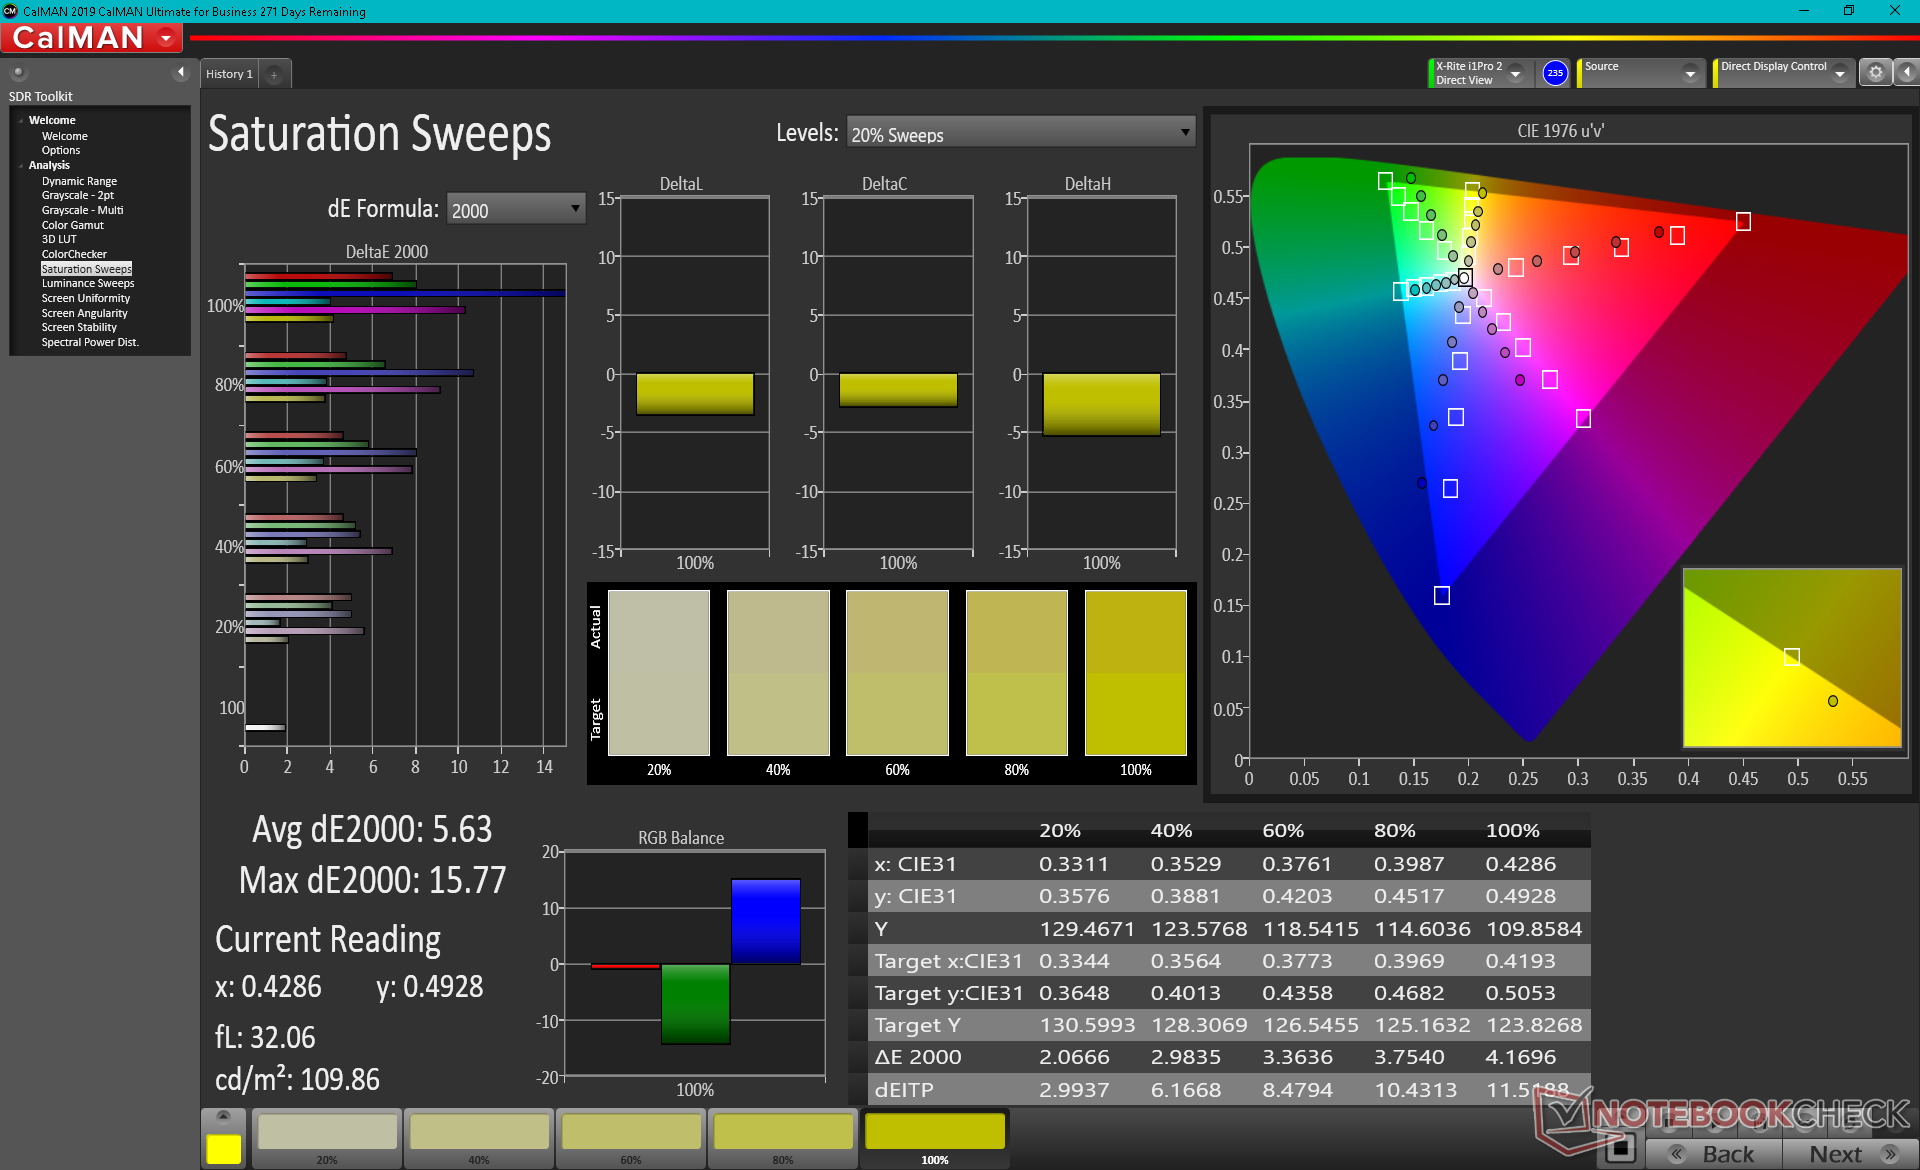
O espaço de cores cobre apenas 56% e 36% do sRGB e AdobeRGB, respectivamente, para ser indicativo de um painel de orçamento, apesar da alta taxa de atualização nativa de 144 Hz. A maioria dos Ultrabooks ou laptops de jogos de médio alcance ou melhores cobrem pelo menos 90 por cento do sRGB para cores mais profundas. As cores limitadas aqui não são um problema quando se trata de jogos, mas os editores gráficos vão querer evitar o uso deste painel.
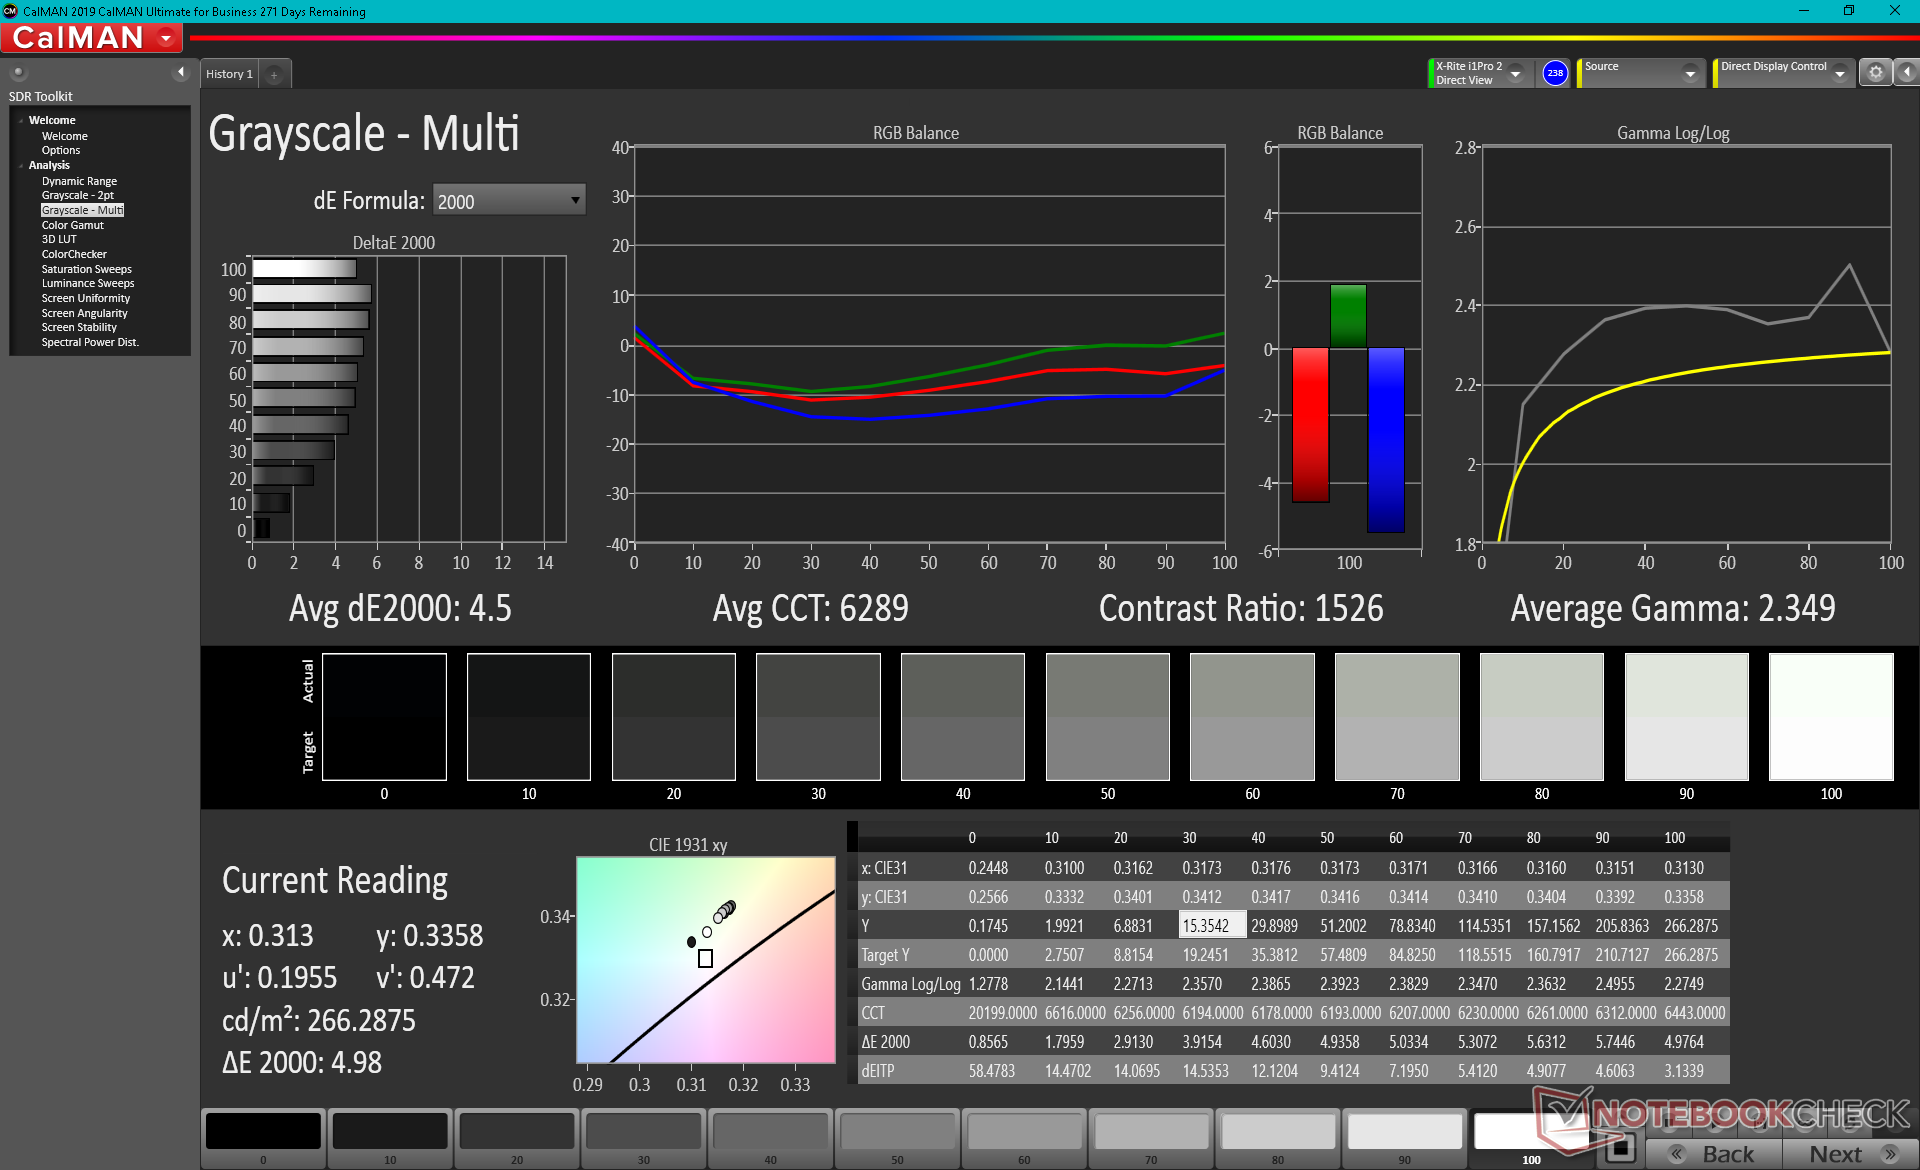
As medições do colorímetro X-Rite mostram uma temperatura de cor fora da caixa excessivamente quente que nossa própria calibração é capaz de fixar para níveis mais precisos de tons de cinza. A precisão da cor, no entanto, permanece abaixo da média, especialmente quando a níveis de saturação mais altos devido ao espaço de cor estreito mencionado acima. O azul em particular é representado de forma mais imprecisa do que qualquer outra cor testada por uma ampla margem.
Exibir tempos de resposta
| ↔ Tempo de resposta preto para branco | ||
|---|---|---|
| 31.6 ms ... ascensão ↗ e queda ↘ combinadas | ↗ 18.4 ms ascensão | 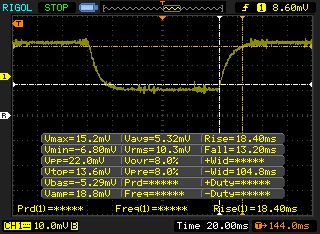 |
| ↘ 13.2 ms queda | ||
| A tela mostra taxas de resposta lentas em nossos testes e será insatisfatória para os jogadores. Em comparação, todos os dispositivos testados variam de 0.1 (mínimo) a 240 (máximo) ms. » 85 % de todos os dispositivos são melhores. Isso significa que o tempo de resposta medido é pior que a média de todos os dispositivos testados (19.8 ms). | ||
| ↔ Tempo de resposta 50% cinza a 80% cinza | ||
| 36.8 ms ... ascensão ↗ e queda ↘ combinadas | ↗ 19.2 ms ascensão | 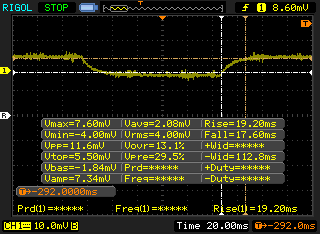 |
| ↘ 17.6 ms queda | ||
| A tela mostra taxas de resposta lentas em nossos testes e será insatisfatória para os jogadores. Em comparação, todos os dispositivos testados variam de 0.165 (mínimo) a 636 (máximo) ms. » 53 % de todos os dispositivos são melhores. Isso significa que o tempo de resposta medido é pior que a média de todos os dispositivos testados (31 ms). | ||
Cintilação da tela / PWM (modulação por largura de pulso)
| Tela tremeluzindo / PWM não detectado | 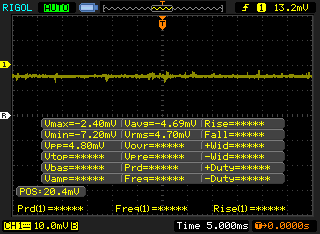 | ||
[pwm_comparison] Em comparação: 52 % de todos os dispositivos testados não usam PWM para escurecer a tela. Se PWM foi detectado, uma média de 7754 (mínimo: 5 - máximo: 343500) Hz foi medida. | |||
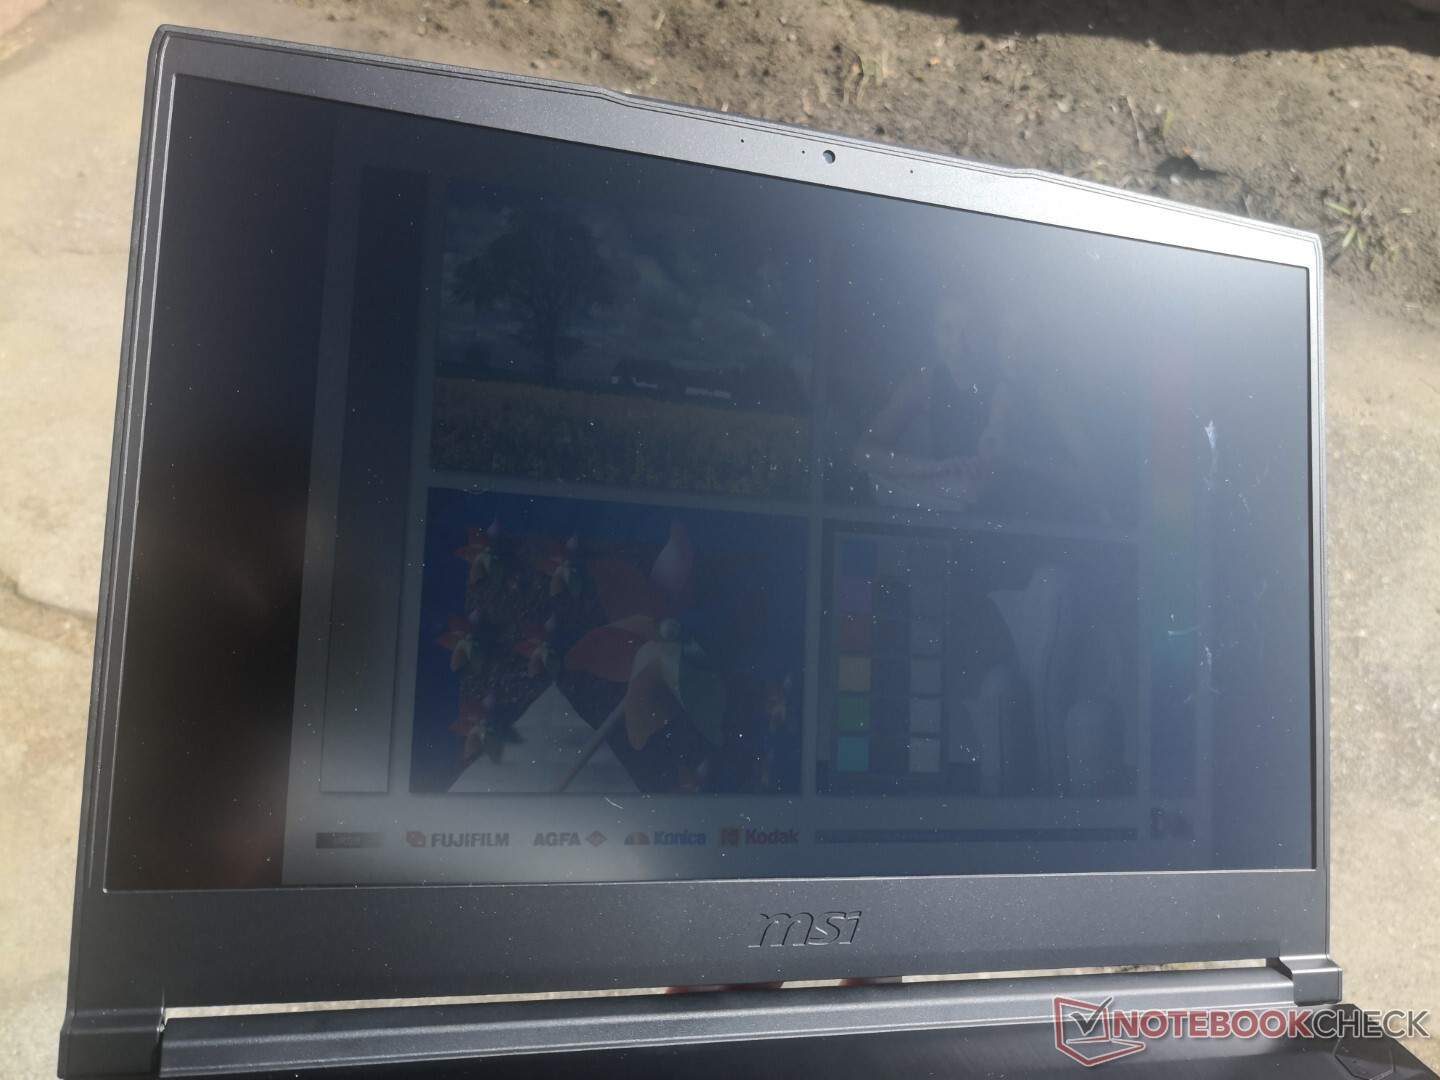
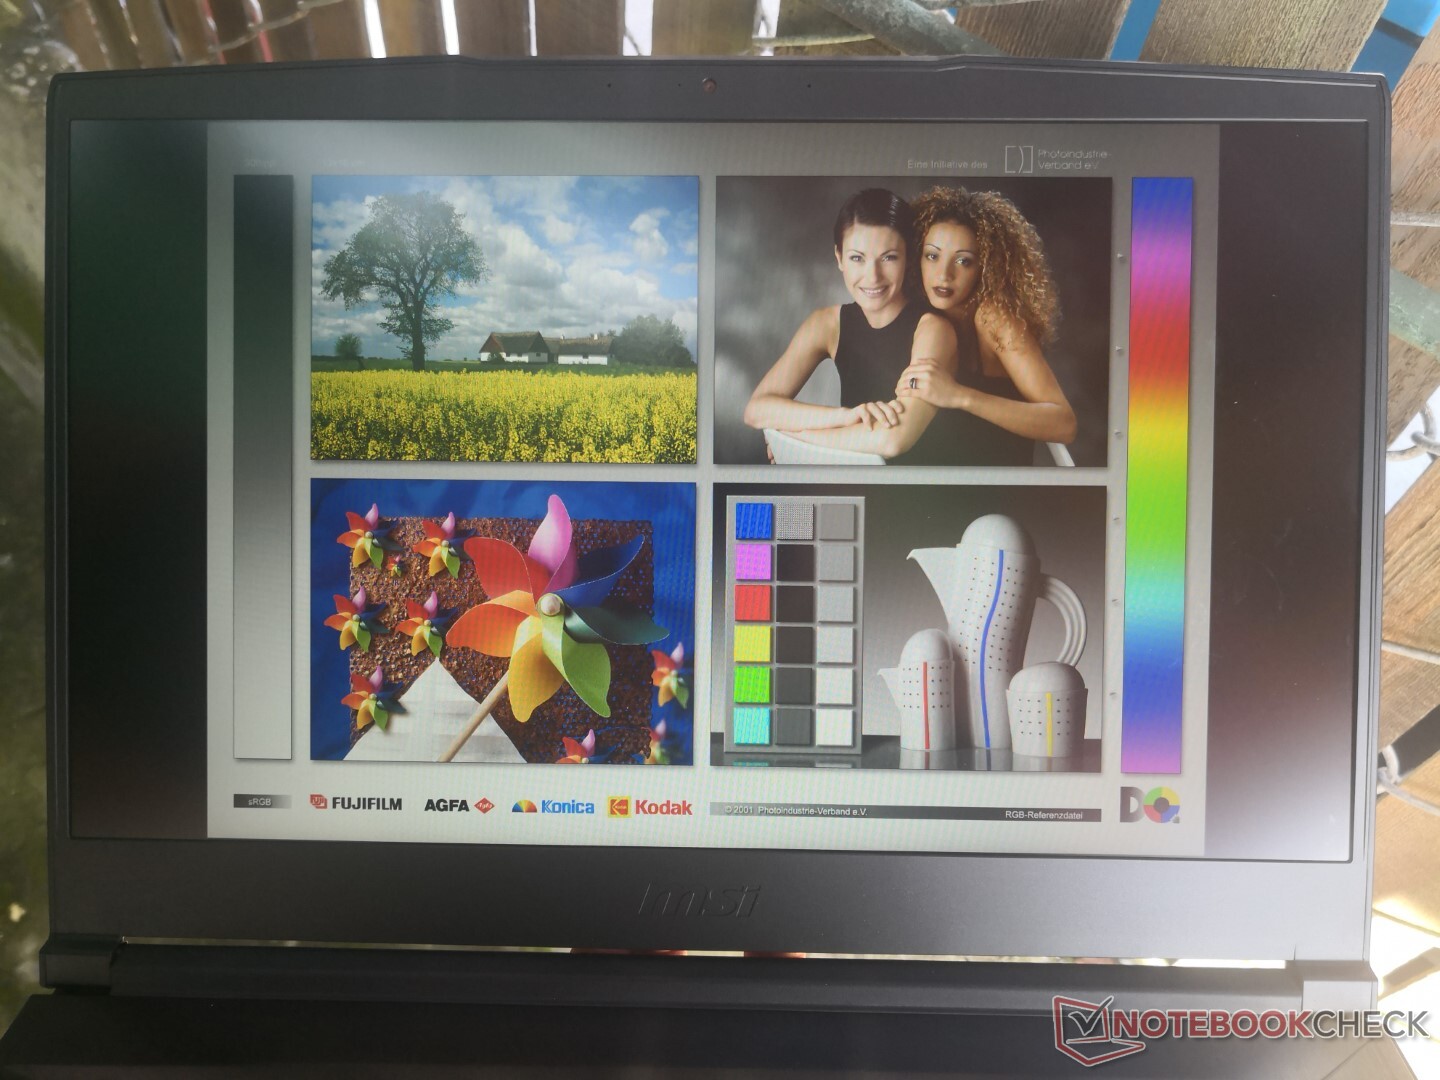
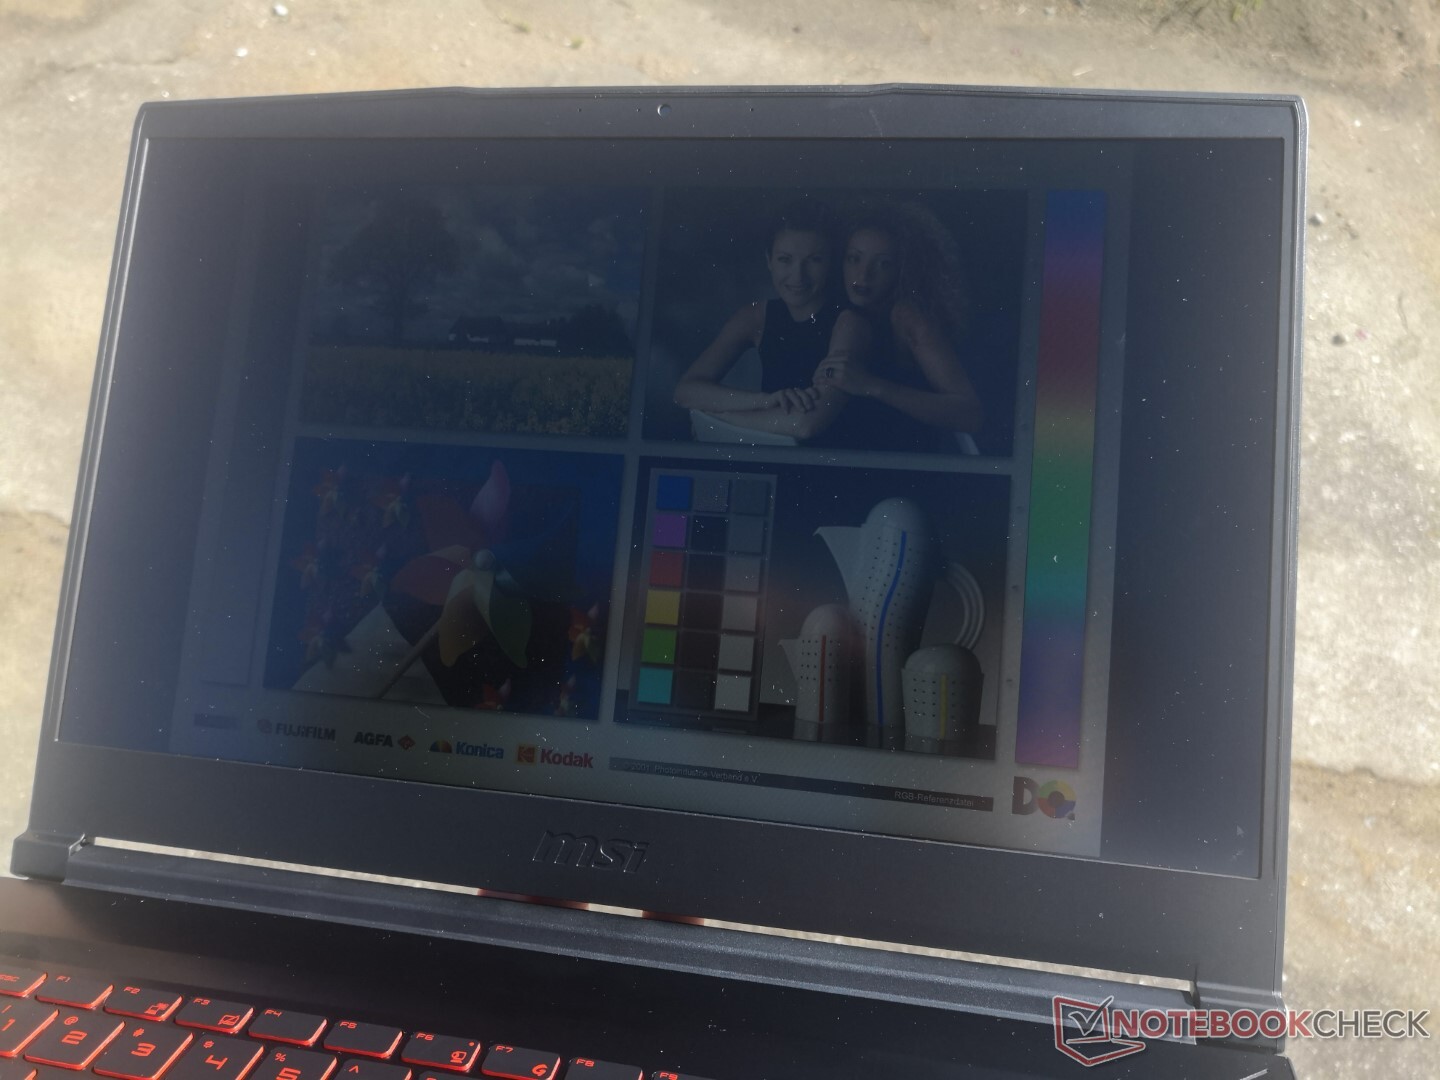
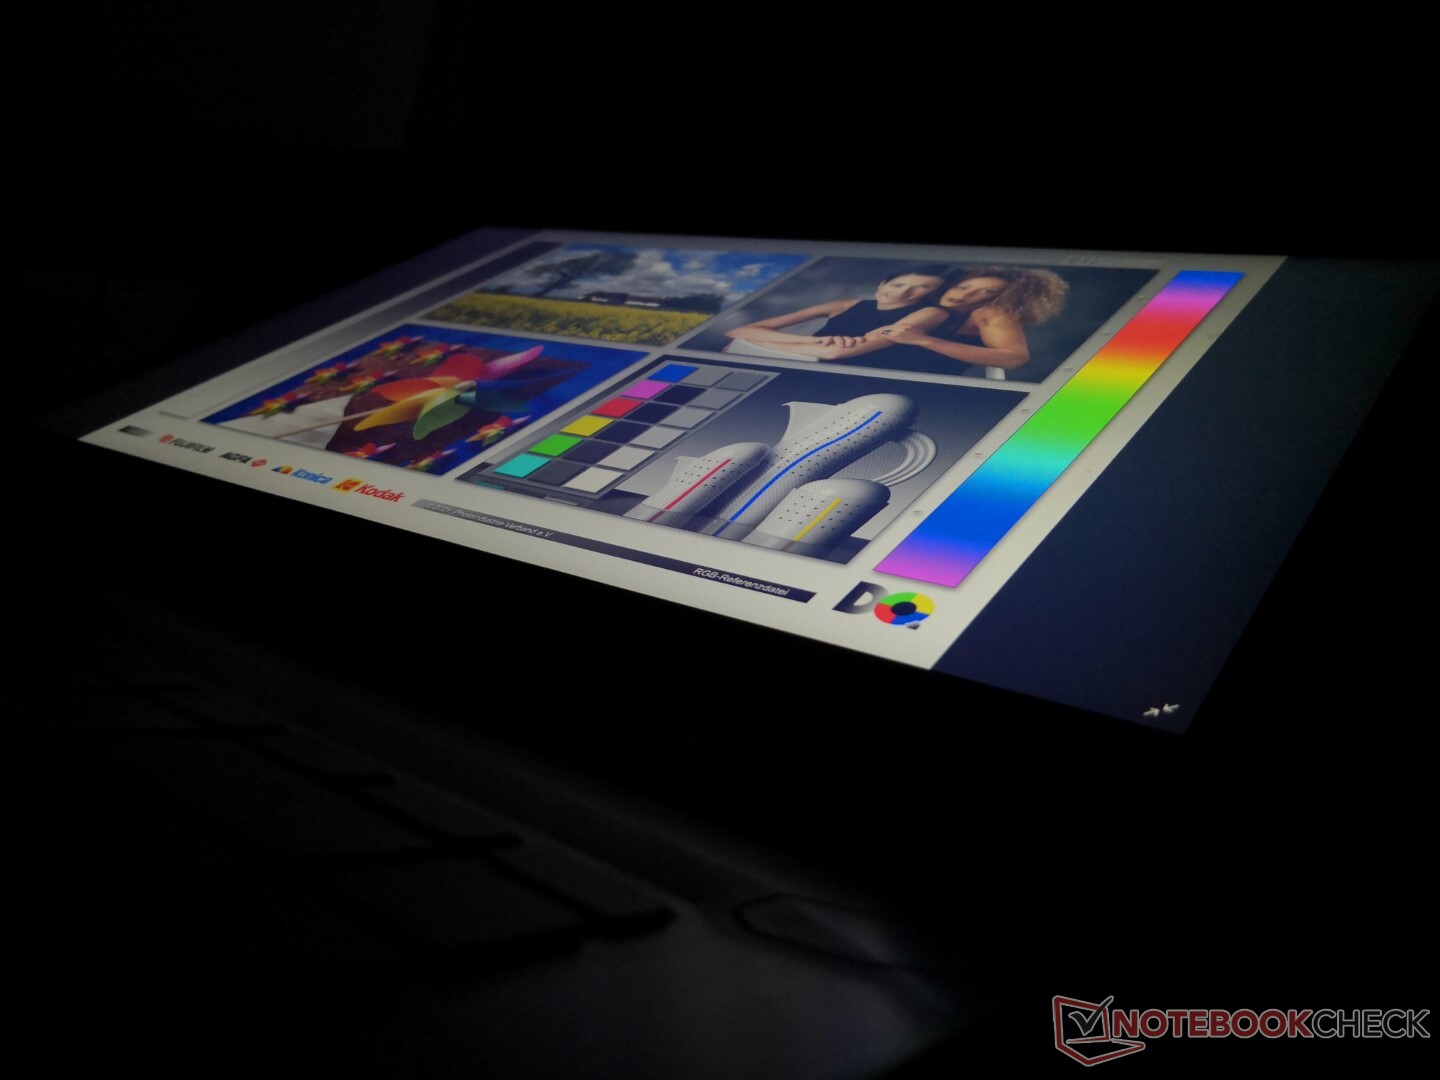
A visibilidade ao ar livre está abaixo da média, pois a tela não é mais brilhante ou mais fraca do que a saída do GF65 9SD. O brilho máximo é um pouco menor do que a maioria dos laptops para jogos onde 300 lêndeas ou mais é mais comum.
Desempenho
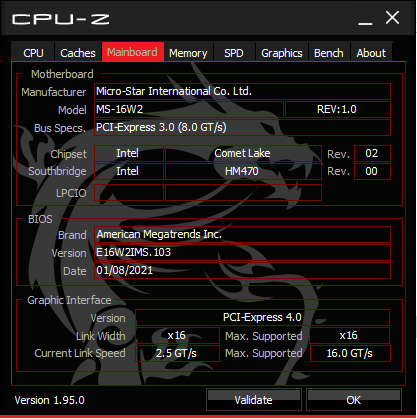
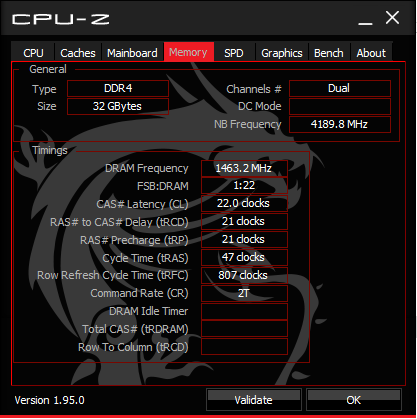
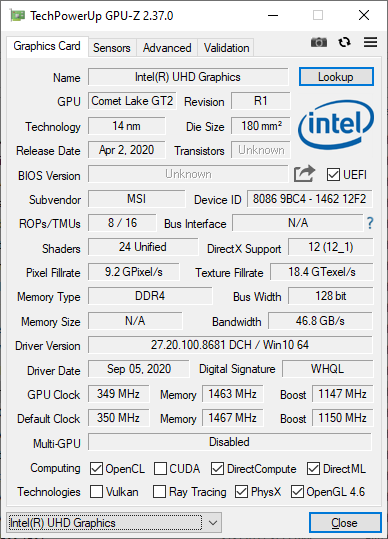
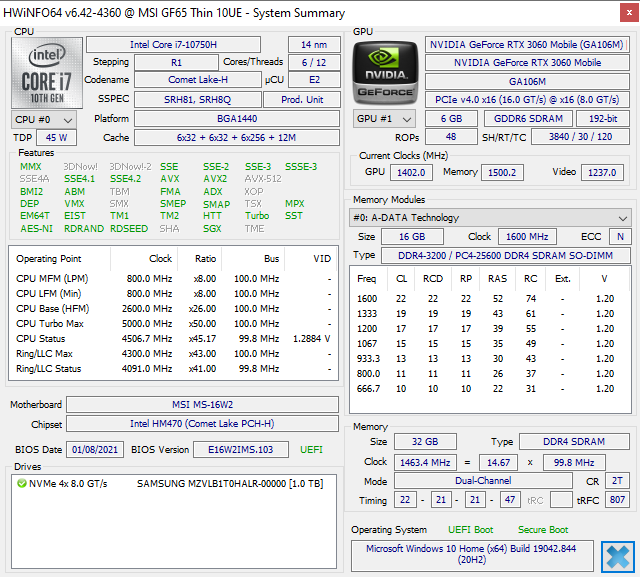
A MSI atualizou o display (120 Hz para 144 Hz) e a RAM (2666 MHz para 3200 MHz) do antigo GF65 9SD. A CPU e GPU foram atualizadas de Coffee Lake-H para Comet Lake-H e Nvidia Turing para Ampere, respectivamente.
As SKUs Lesser Core i5-10200H e i5-10500H também estão disponíveis, mas o display IPS 144 Hz e GeForce RTX 3060 permanecem fixos em todas as configurações a partir desta escrita.
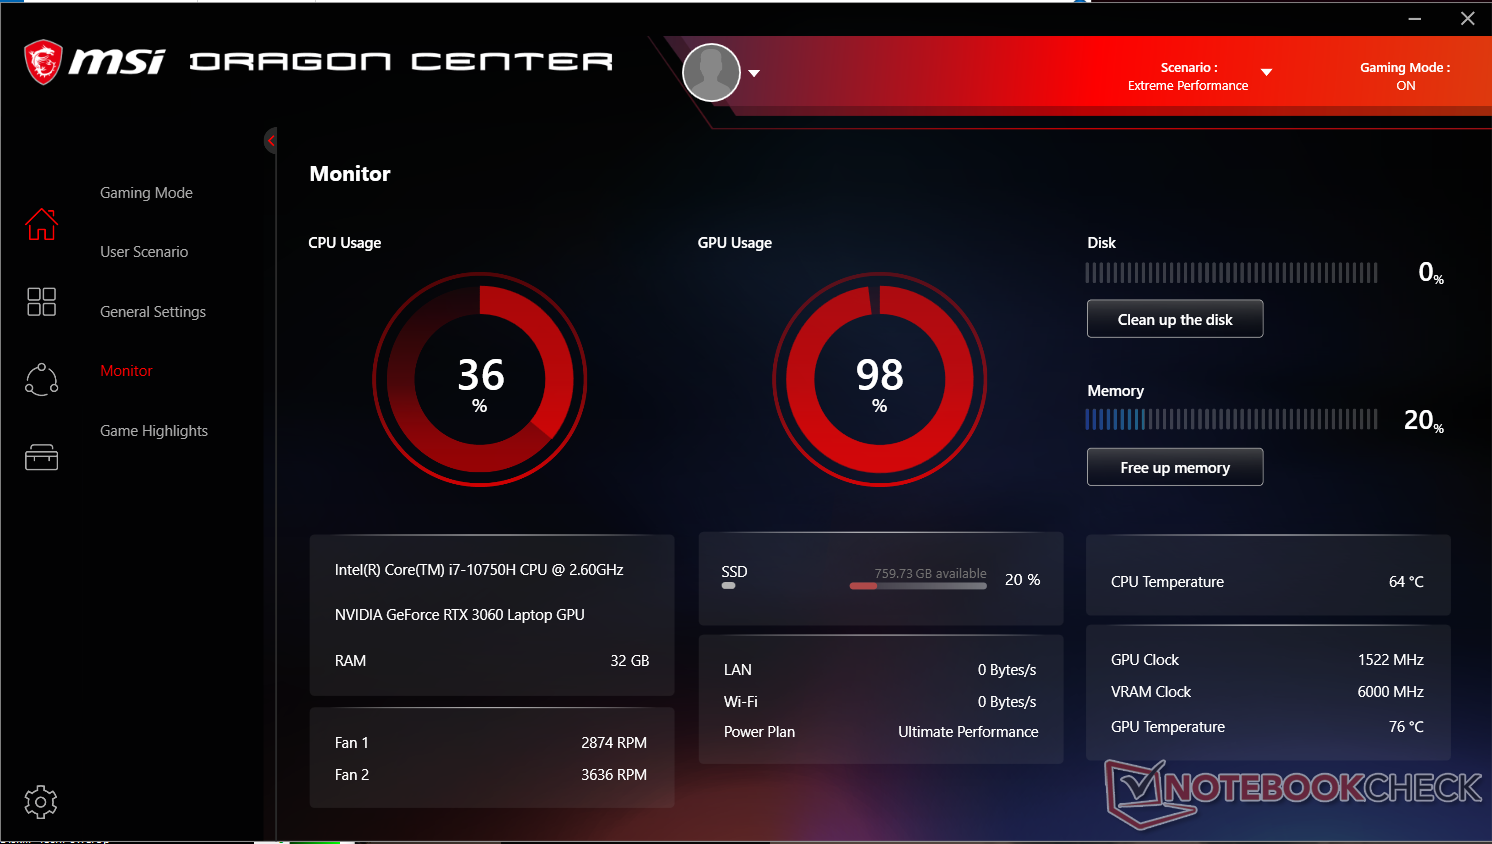
Tínhamos definido nosso sistema para o modo MSI Extreme Performance antes de executar quaisquer benchmarks de desempenho abaixo.
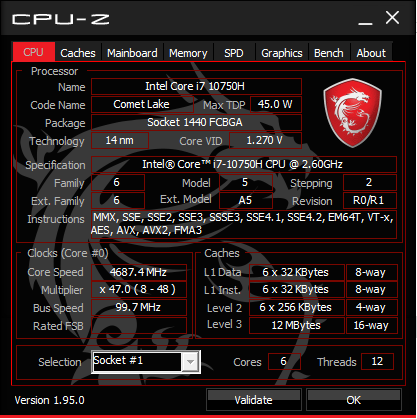
Processador
O desempenho da CPU de múltiplas roscas é mais lento que o Core i7-10750H médio em nosso banco de dados em cerca de 10 a 15 por cento. De fato, o Core i7-9750H mais antigo no Maingear Vector 15 é capaz de superar nosso MSI de forma consistente em alguns pontos percentuais em cargas multi-rosca. Para um desempenho superior, os usuários devem ativar o modo Cooler Boost (ou modo de ventilador máximo) como detalhado em nossa seção de Teste de Estresse abaixo.
Cinebench R15: CPU Multi 64Bit | CPU Single 64Bit
Blender: v2.79 BMW27 CPU
7-Zip 18.03: 7z b 4 -mmt1 | 7z b 4
Geekbench 5.5: Single-Core | Multi-Core
HWBOT x265 Benchmark v2.2: 4k Preset
LibreOffice : 20 Documents To PDF
R Benchmark 2.5: Overall mean
| Cinebench R20 / CPU (Multi Core) | |
| Schenker XMG Core 15 Ampere | |
| Asus Zephyrus G14 GA401IV | |
| Asus ROG Strix Scar 15 G532LWS | |
| Aorus 15P XC | |
| MSI GE65 Raider 9SF-049US | |
| HP Pavilion Gaming 15-ec1206ng | |
| Média Intel Core i7-10750H (1749 - 3325, n=43) | |
| Maingear Vector 15 | |
| MSI GF65 Thin 10UE | |
| Gateway Creator Series 15.6 GWTN156-3BK | |
| MSI GF63 Thin 9SC | |
| Cinebench R20 / CPU (Single Core) | |
| Asus Zephyrus G14 GA401IV | |
| Asus ROG Strix Scar 15 G532LWS | |
| Schenker XMG Core 15 Ampere | |
| MSI GF65 Thin 10UE | |
| MSI GE65 Raider 9SF-049US | |
| Aorus 15P XC | |
| Média Intel Core i7-10750H (431 - 504, n=43) | |
| Gateway Creator Series 15.6 GWTN156-3BK | |
| HP Pavilion Gaming 15-ec1206ng | |
| Maingear Vector 15 | |
| MSI GF63 Thin 9SC | |
| Cinebench R15 / CPU Multi 64Bit | |
| Schenker XMG Core 15 Ampere | |
| Asus Zephyrus G14 GA401IV | |
| Asus ROG Strix Scar 15 G532LWS | |
| Aorus 15P XC | |
| MSI GE65 Raider 9SF-049US | |
| HP Pavilion Gaming 15-ec1206ng | |
| Maingear Vector 15 | |
| Média Intel Core i7-10750H (804 - 1418, n=50) | |
| MSI GF65 Thin 10UE | |
| Gateway Creator Series 15.6 GWTN156-3BK | |
| MSI GF63 Thin 9SC | |
| Cinebench R15 / CPU Single 64Bit | |
| Asus ROG Strix Scar 15 G532LWS | |
| MSI GF65 Thin 10UE | |
| Aorus 15P XC | |
| MSI GE65 Raider 9SF-049US | |
| Média Intel Core i7-10750H (184 - 213, n=45) | |
| Asus Zephyrus G14 GA401IV | |
| Schenker XMG Core 15 Ampere | |
| Maingear Vector 15 | |
| Gateway Creator Series 15.6 GWTN156-3BK | |
| HP Pavilion Gaming 15-ec1206ng | |
| MSI GF63 Thin 9SC | |
| Blender / v2.79 BMW27 CPU | |
| Gateway Creator Series 15.6 GWTN156-3BK | |
| MSI GF65 Thin 10UE | |
| Média Intel Core i7-10750H (322 - 587, n=43) | |
| HP Pavilion Gaming 15-ec1206ng | |
| Asus Zephyrus G14 GA401IV | |
| Aorus 15P XC | |
| Asus ROG Strix Scar 15 G532LWS | |
| Schenker XMG Core 15 Ampere | |
| 7-Zip 18.03 / 7z b 4 -mmt1 | |
| Asus ROG Strix Scar 15 G532LWS | |
| Aorus 15P XC | |
| MSI GF65 Thin 10UE | |
| Média Intel Core i7-10750H (4504 - 5470, n=43) | |
| Schenker XMG Core 15 Ampere | |
| Asus Zephyrus G14 GA401IV | |
| Gateway Creator Series 15.6 GWTN156-3BK | |
| HP Pavilion Gaming 15-ec1206ng | |
| 7-Zip 18.03 / 7z b 4 | |
| Schenker XMG Core 15 Ampere | |
| Asus Zephyrus G14 GA401IV | |
| Asus ROG Strix Scar 15 G532LWS | |
| Aorus 15P XC | |
| HP Pavilion Gaming 15-ec1206ng | |
| Média Intel Core i7-10750H (26040 - 37345, n=43) | |
| MSI GF65 Thin 10UE | |
| Gateway Creator Series 15.6 GWTN156-3BK | |
| Geekbench 5.5 / Single-Core | |
| Asus ROG Strix Scar 15 G532LWS | |
| MSI GF65 Thin 10UE | |
| Aorus 15P XC | |
| Média Intel Core i7-10750H (1114 - 1333, n=43) | |
| Asus Zephyrus G14 GA401IV | |
| Schenker XMG Core 15 Ampere | |
| HP Pavilion Gaming 15-ec1206ng | |
| Gateway Creator Series 15.6 GWTN156-3BK | |
| Geekbench 5.5 / Multi-Core | |
| Asus ROG Strix Scar 15 G532LWS | |
| Schenker XMG Core 15 Ampere | |
| Aorus 15P XC | |
| Asus Zephyrus G14 GA401IV | |
| MSI GF65 Thin 10UE | |
| Média Intel Core i7-10750H (4443 - 6674, n=43) | |
| HP Pavilion Gaming 15-ec1206ng | |
| Gateway Creator Series 15.6 GWTN156-3BK | |
| HWBOT x265 Benchmark v2.2 / 4k Preset | |
| Schenker XMG Core 15 Ampere | |
| Asus ROG Strix Scar 15 G532LWS | |
| Aorus 15P XC | |
| Asus Zephyrus G14 GA401IV | |
| HP Pavilion Gaming 15-ec1206ng | |
| Média Intel Core i7-10750H (5.54 - 11.6, n=43) | |
| MSI GF65 Thin 10UE | |
| Gateway Creator Series 15.6 GWTN156-3BK | |
| LibreOffice / 20 Documents To PDF | |
| HP Pavilion Gaming 15-ec1206ng | |
| Schenker XMG Core 15 Ampere | |
| Gateway Creator Series 15.6 GWTN156-3BK | |
| Aorus 15P XC | |
| Média Intel Core i7-10750H (43.1 - 99.2, n=43) | |
| Asus ROG Strix Scar 15 G532LWS | |
| MSI GF65 Thin 10UE | |
| R Benchmark 2.5 / Overall mean | |
| Gateway Creator Series 15.6 GWTN156-3BK | |
| Média Intel Core i7-10750H (0.578 - 0.708, n=42) | |
| HP Pavilion Gaming 15-ec1206ng | |
| MSI GF65 Thin 10UE | |
| Aorus 15P XC | |
| Schenker XMG Core 15 Ampere | |
| Asus ROG Strix Scar 15 G532LWS | |
* ... menor é melhor
Desempenho do sistema
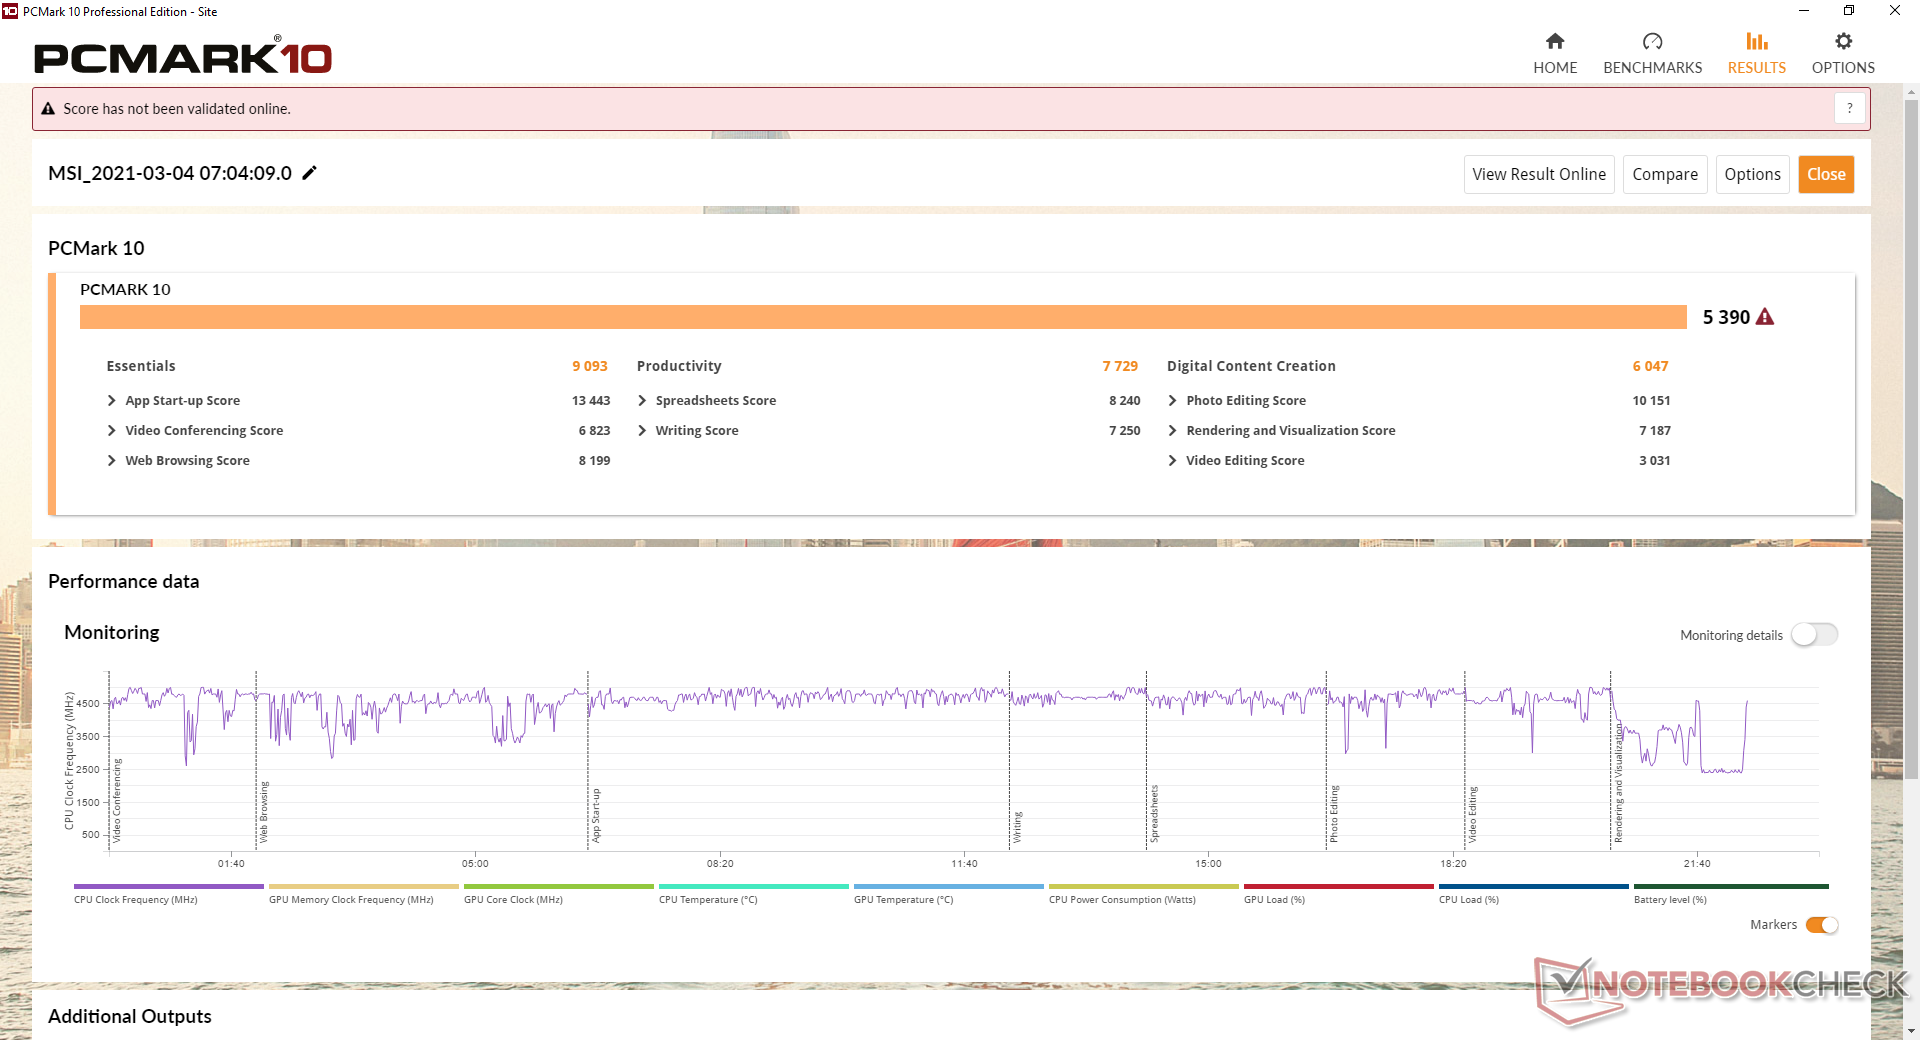
| PCMark 10 Score | 5390 pontos | |
Ajuda | ||
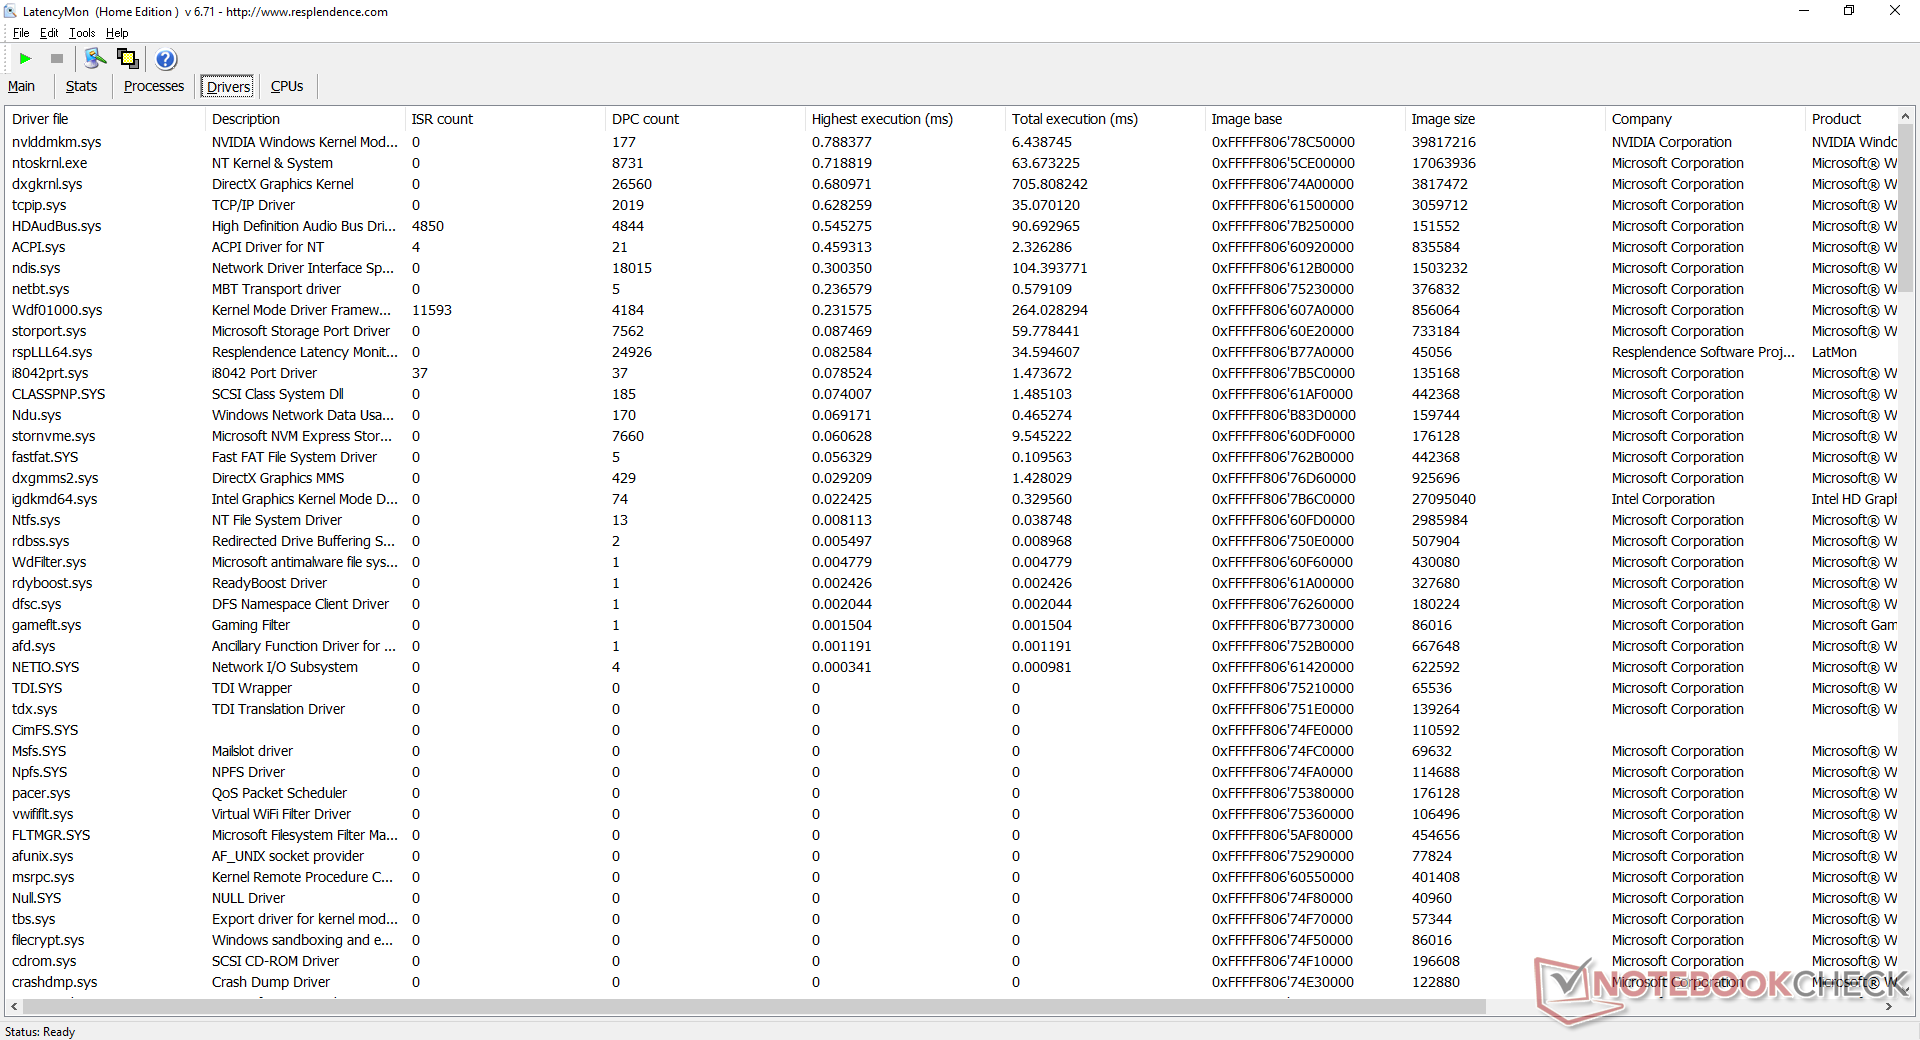
Latência do DPC
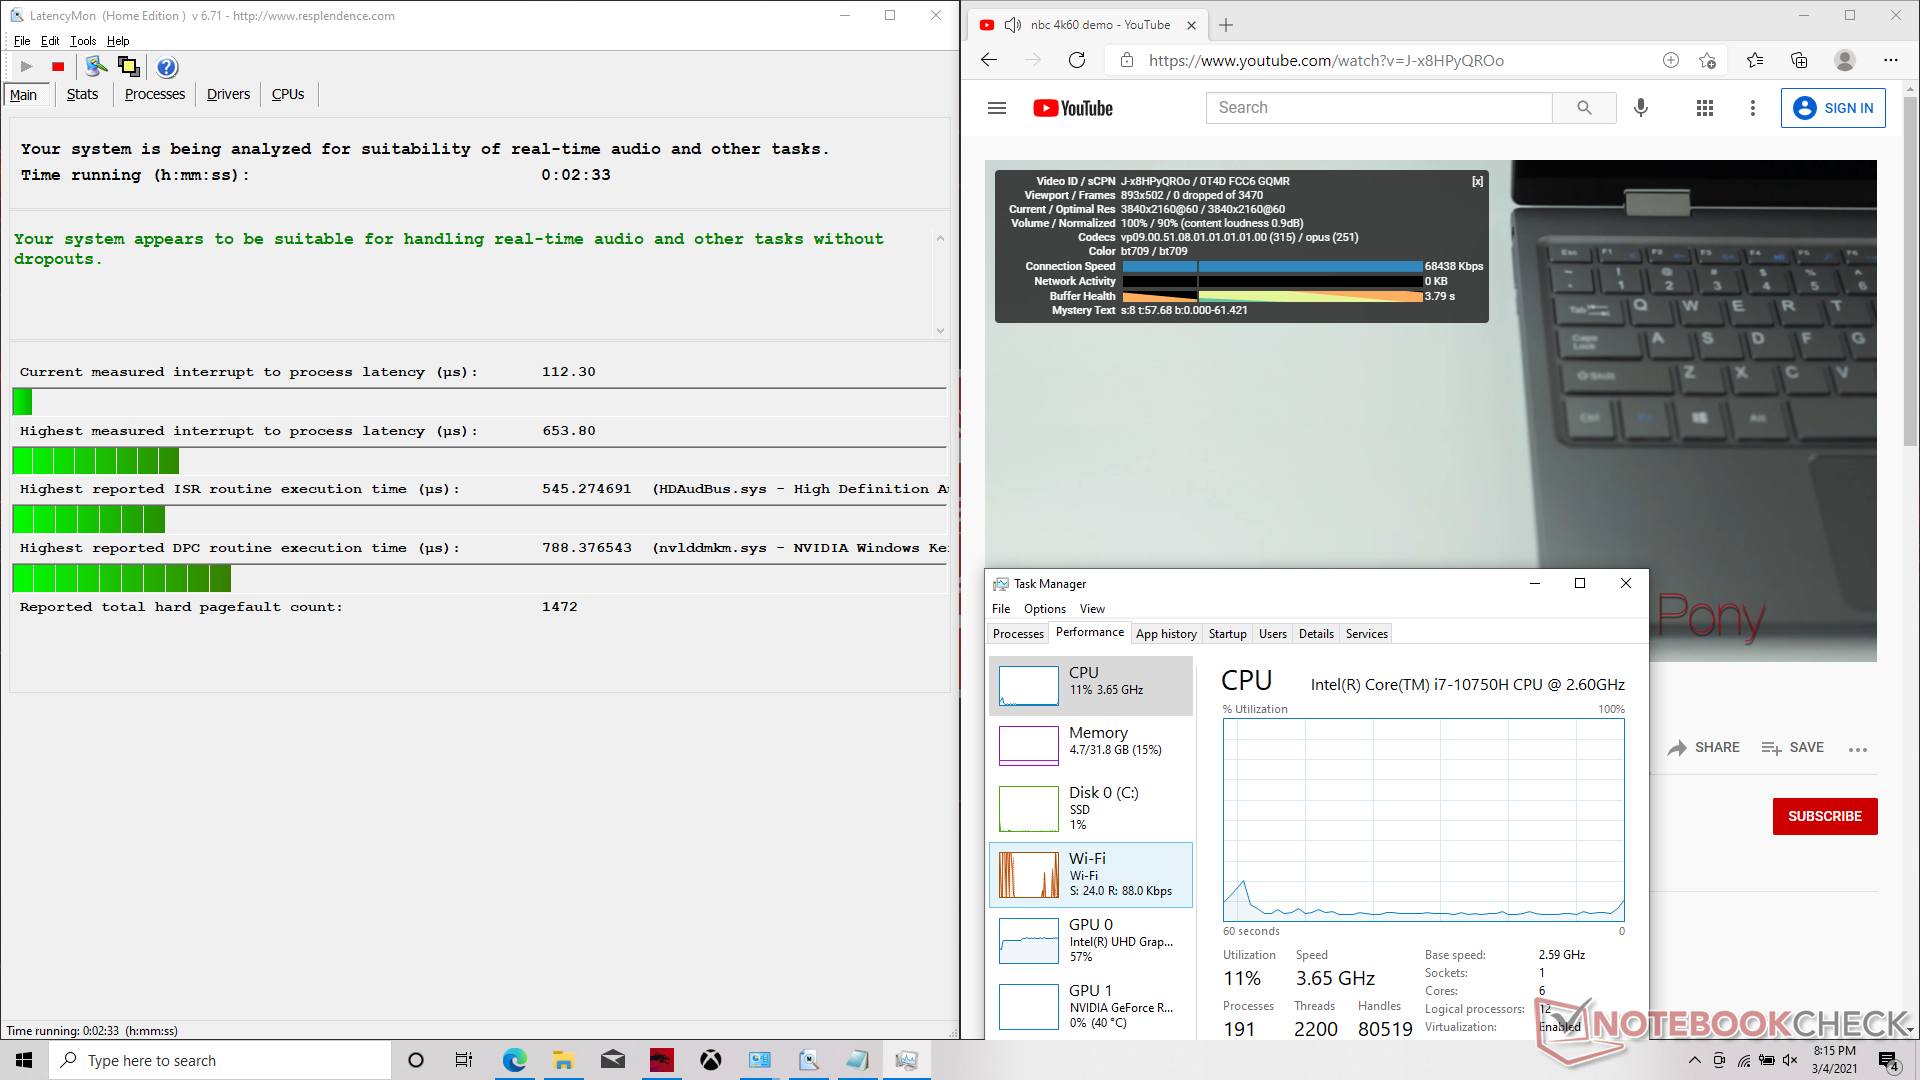
LatencyMon não mostra problemas de latência DPC ao abrir várias abas do navegador em nossa página inicial e também não deixa cair frames ao reproduzir conteúdo 4K60 no YouTube.
| DPC Latencies / LatencyMon - interrupt to process latency (max), Web, Youtube, Prime95 | |
| Aorus 15G XC | |
| Lenovo Legion 7 15IMH05-81YT001VGE | |
| MSI GF65 Thin 10UE | |
| MSI GS66 Stealth 10UG | |
| Schenker XMG Core 15 Ampere | |
| Asus ROG Strix G15 G513QR | |
* ... menor é melhor
Dispositivos de armazenamento
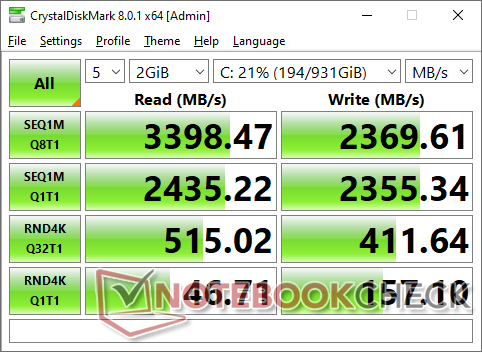
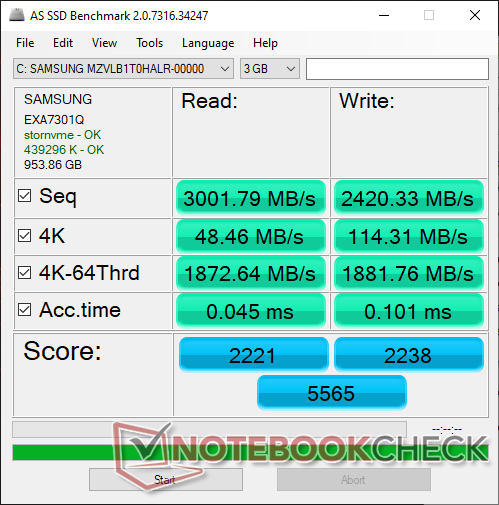
Nossa unidade vem com um Samsung PM981 NVMe SSD de 1 TB, mas outros vendedores provavelmente terão algo diferente, dependendo da capacidade e do preço desejado. Somos capazes de alcançar e manter a velocidade teórica de leitura seqüencial de 3200 MB/s do drive, como mostrado pelo nosso teste de loop DiskSpd abaixo.
| MSI GF65 Thin 10UE Samsung SSD PM981 MZVLB1T0HALR | Asus ROG Strix G15 G513QR SK Hynix HFM001TD3JX013N | Schenker XMG Core 15 Ampere Samsung SSD 970 EVO Plus 1TB | MSI GS66 Stealth 10UG WDC PC SN730 SDBPNTY-1T00 | Lenovo Legion 7 15IMH05-81YT001VGE 2x Samsung PM981a MZVLB1T0HBLR (RAID 0) | |
|---|---|---|---|---|---|
| AS SSD | -7% | 10% | -4% | -7% | |
| Seq Read (MB/s) | 3002 | 2881 -4% | 2829 -6% | 2198 -27% | 3088 3% |
| Seq Write (MB/s) | 2420 | 1570 -35% | 2646 9% | 2596 7% | 2561 6% |
| 4K Read (MB/s) | 48.46 | 52.4 8% | 54.8 13% | 43.81 -10% | 43.01 -11% |
| 4K Write (MB/s) | 114.3 | 124 8% | 179.1 57% | 115.5 1% | 102 -11% |
| 4K-64 Read (MB/s) | 1873 | 1334 -29% | 1734 -7% | 1692 -10% | 1549 -17% |
| 4K-64 Write (MB/s) | 1882 | 2189 16% | 2396 27% | 2162 15% | 1378 -27% |
| Access Time Read * (ms) | 0.045 | 0.055 -22% | 0.033 27% | 0.056 -24% | 0.051 -13% |
| Access Time Write * (ms) | 0.101 | 0.03 70% | 0.021 79% | 0.098 3% | 0.037 63% |
| Score Read (Points) | 2221 | 1675 -25% | 2072 -7% | 1956 -12% | 1901 -14% |
| Score Write (Points) | 2238 | 2470 10% | 2839 27% | 2537 13% | 1737 -22% |
| Score Total (Points) | 5565 | 4943 -11% | 5965 7% | 5513 -1% | 4583 -18% |
| Copy ISO MB/s (MB/s) | 2421 | 1277 -47% | 2119 -12% | 2236 -8% | 2684 11% |
| Copy Program MB/s (MB/s) | 705 | 575 -18% | 406.1 -42% | 690 -2% | 544 -23% |
| Copy Game MB/s (MB/s) | 1490 | 1272 -15% | 1086 -27% | 1546 4% | 1116 -25% |
| CrystalDiskMark 5.2 / 6 | 14% | 4% | 8% | ||
| Write 4K (MB/s) | 157.3 | 139.1 -12% | 163.1 4% | 110.4 -30% | |
| Read 4K (MB/s) | 46.69 | 47.59 2% | 48.97 5% | 55.1 18% | |
| Write Seq (MB/s) | 2389 | 2917 22% | 2607 9% | ||
| Read Seq (MB/s) | 2196 | 2586 18% | 2316 5% | ||
| Write 4K Q32T1 (MB/s) | 407.6 | 511 25% | 338 -17% | 466.6 14% | |
| Read 4K Q32T1 (MB/s) | 519 | 571 10% | 475.6 -8% | 517 0% | |
| Write Seq Q32T1 (MB/s) | 2401 | 3263 36% | 3090 29% | 3424 43% | |
| Read Seq Q32T1 (MB/s) | 3344 | 3567 7% | 3421 2% | 3519 5% | |
| Write 4K Q8T8 (MB/s) | 1496 | ||||
| Read 4K Q8T8 (MB/s) | 1597 | ||||
| Média Total (Programa/Configurações) | -7% /
-7% | 12% /
12% | 0% /
-1% | 1% /
-2% |
* ... menor é melhor

Disk Throttling: DiskSpd Read Loop, Queue Depth 8
Desempenho da GPU
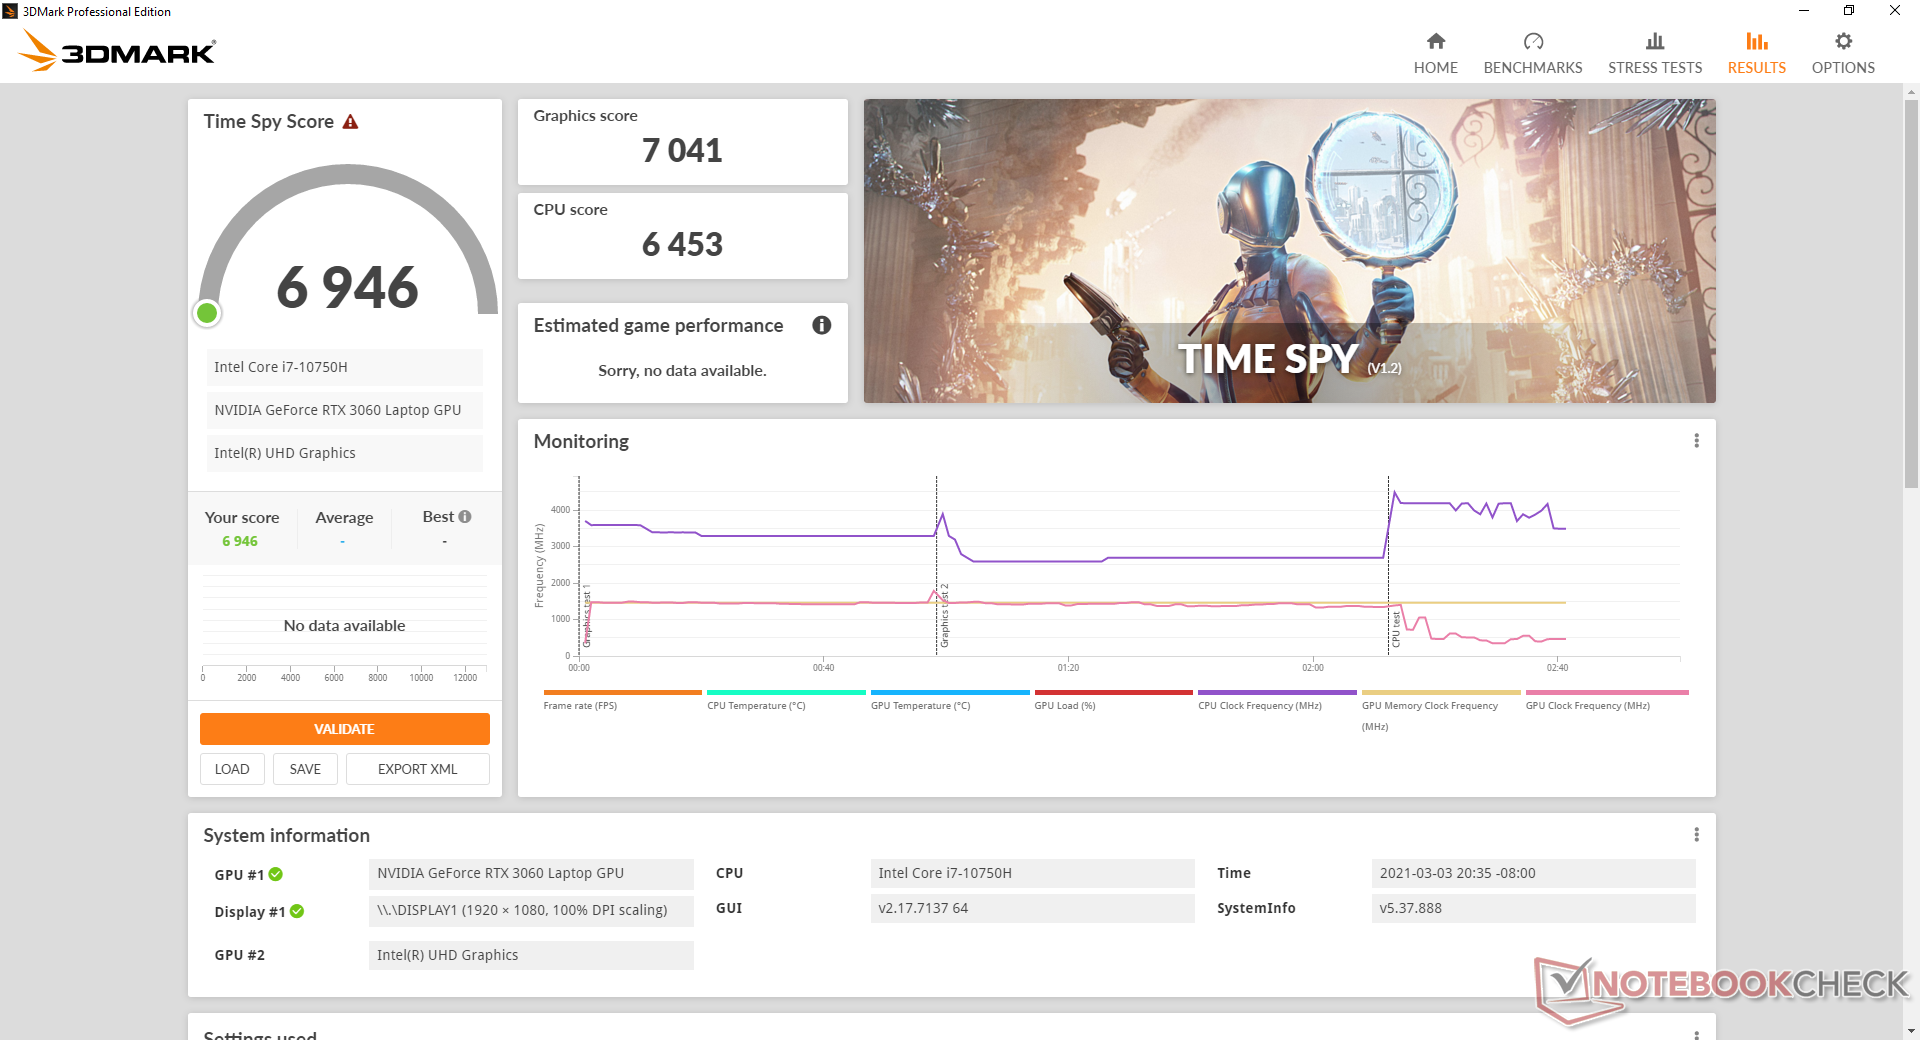
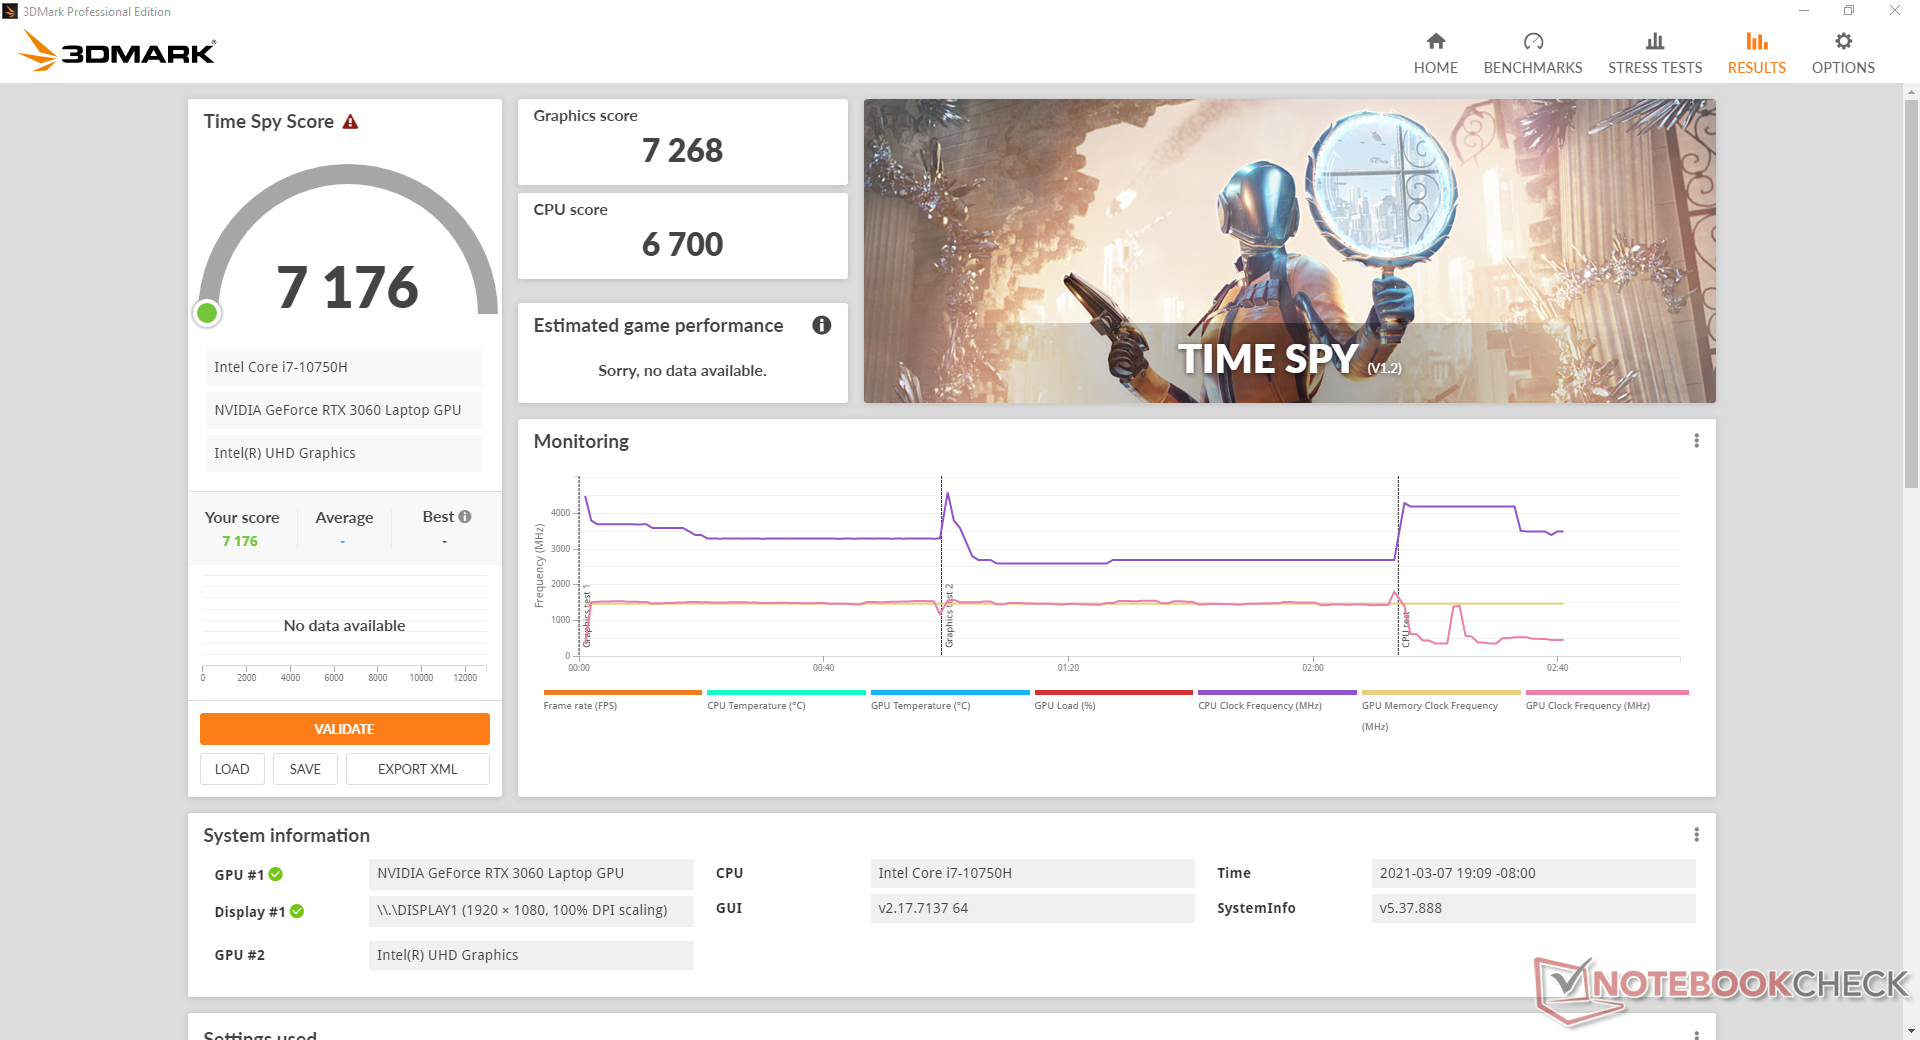
Dos quatro laptops que testamos até agora com o móvel GeForce RTX 3060, nosso MSI GF65 é o mais lento do grupo em cerca de 15% de acordo com os 3DMark benchmarks. O desempenho bruto ainda está acima do móvel RTX 2060, embora apenas em cerca de 15%. Os proprietários de Os laptops GeForce RTX 2070 ainda desfrutarão de um desempenho gráfico ligeiramente mais rápido do que este laptop RTX 3060.
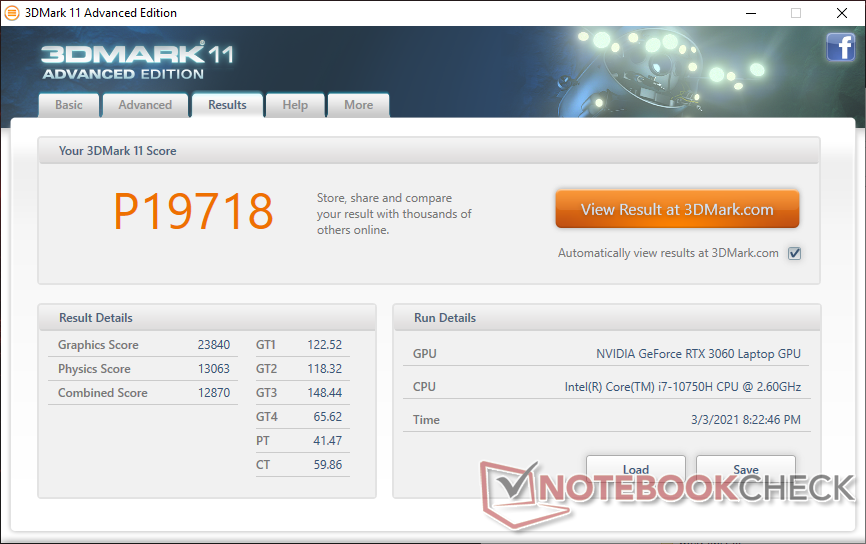
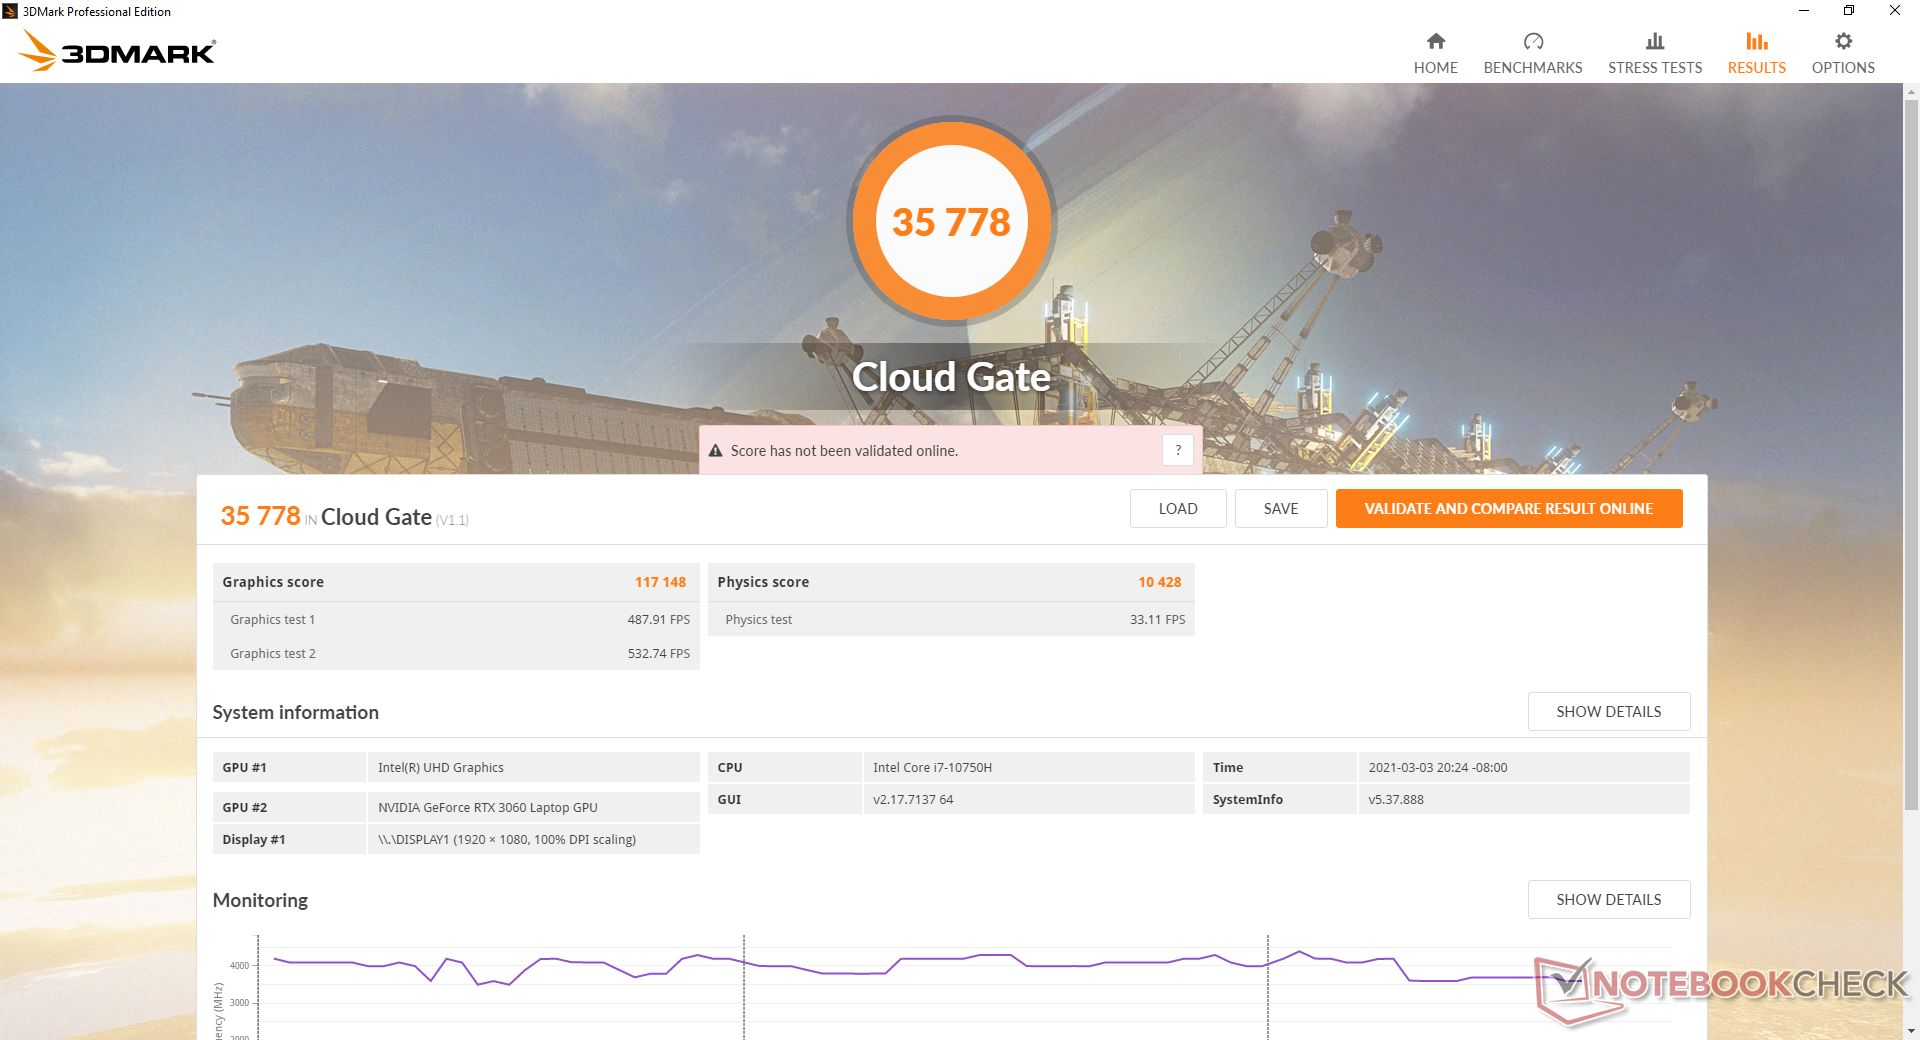
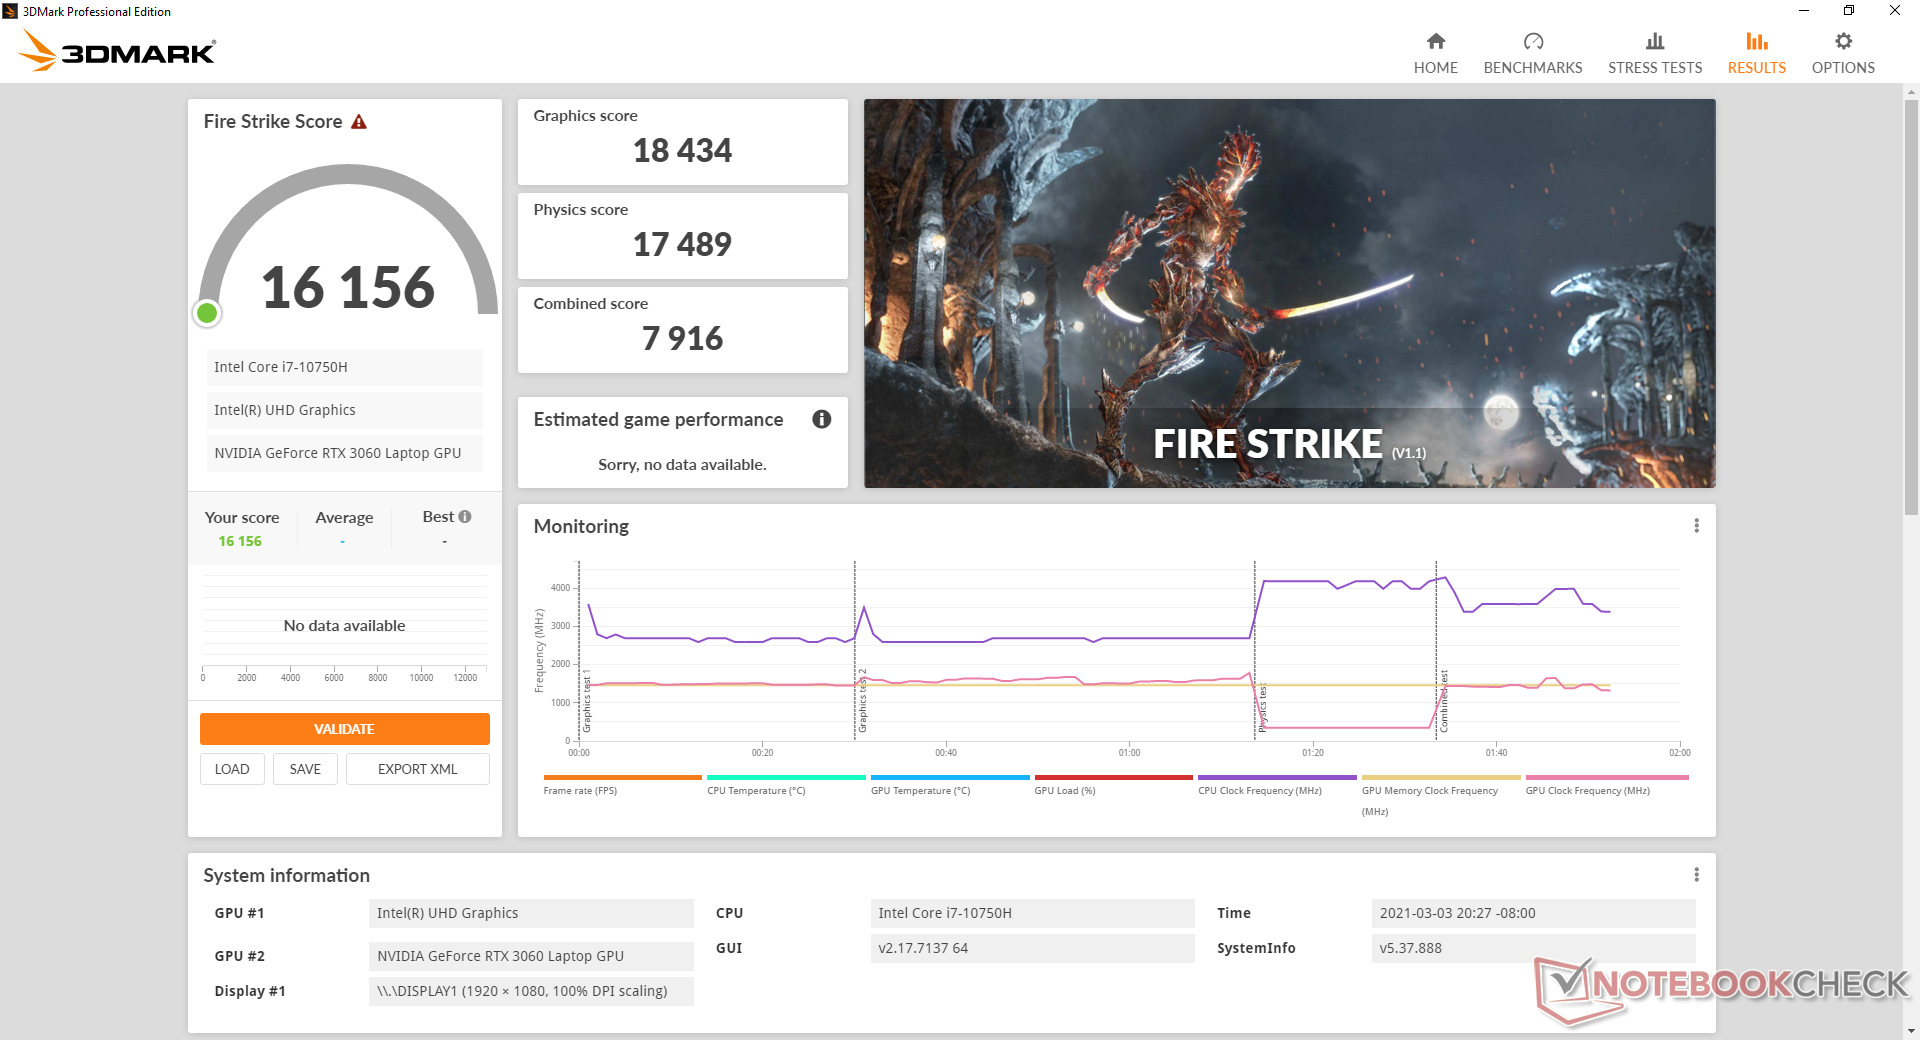
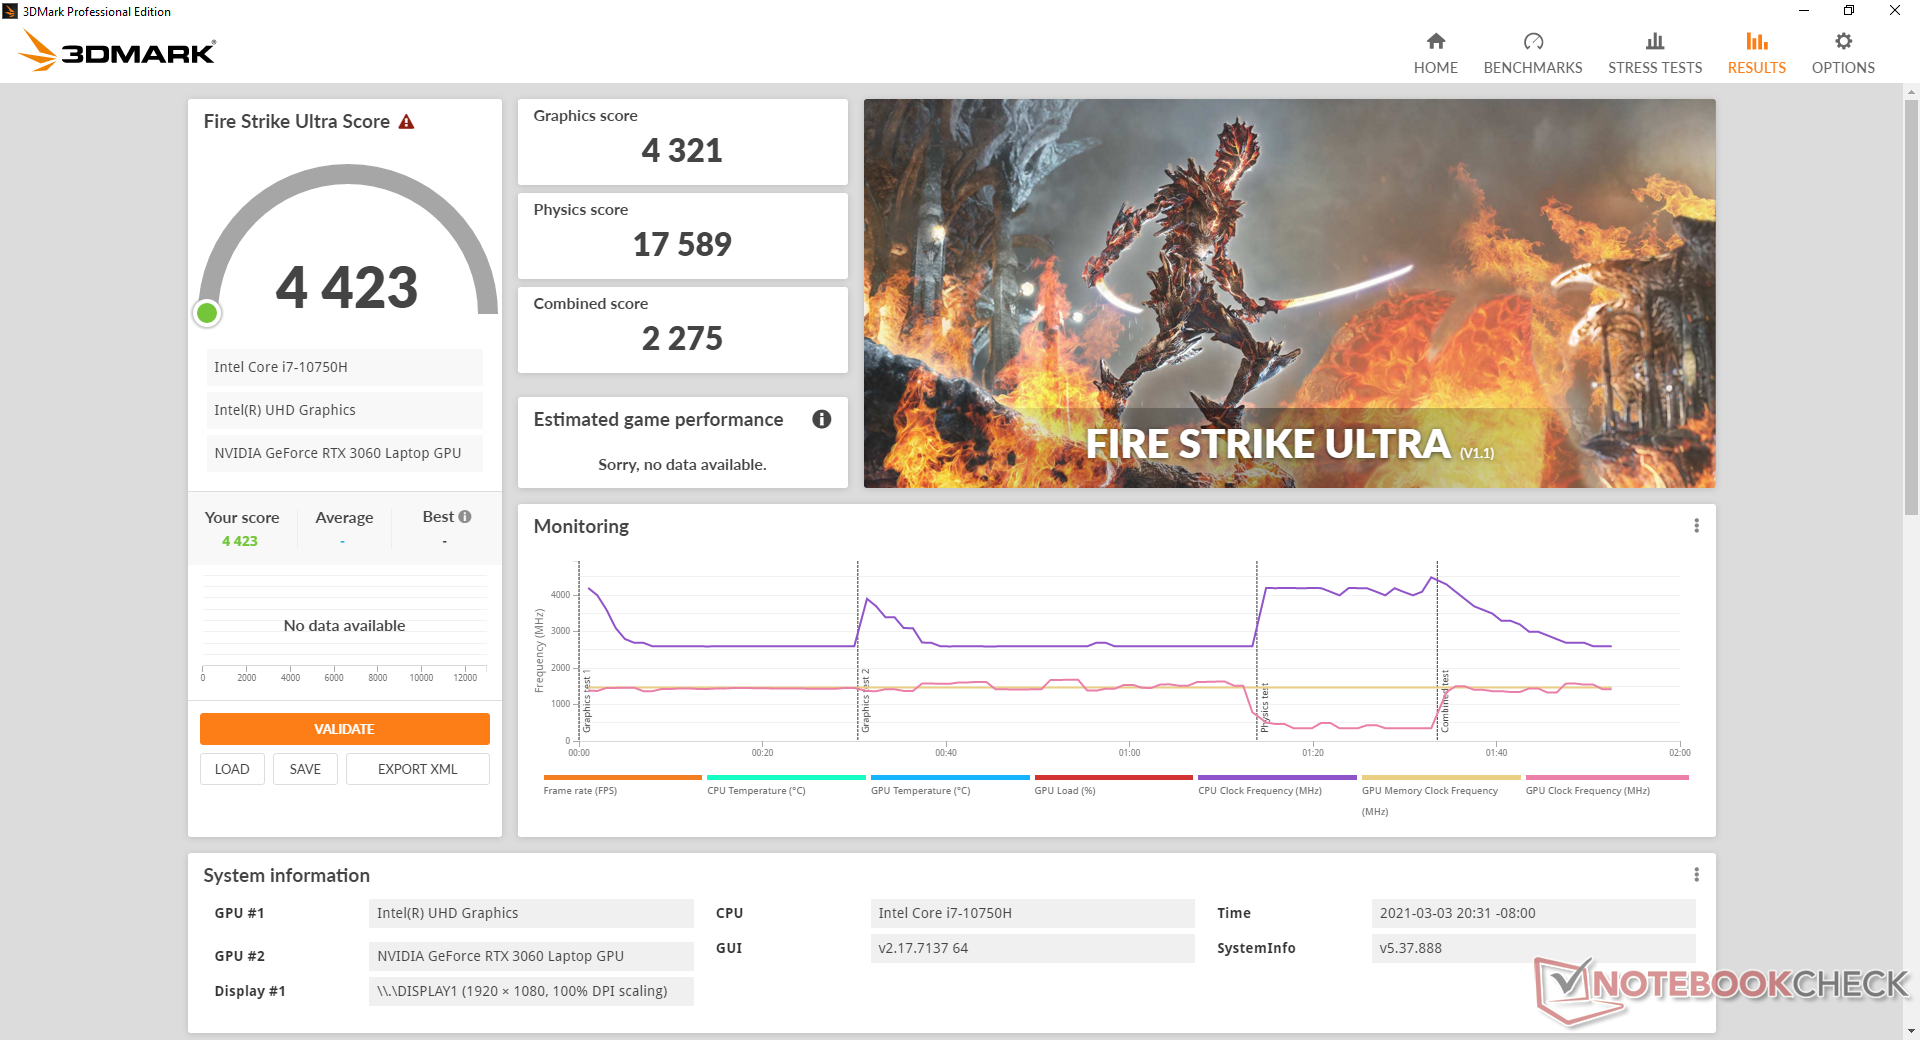
| 3DMark 11 Performance | 19718 pontos | |
| 3DMark Cloud Gate Standard Score | 35778 pontos | |
| 3DMark Fire Strike Score | 16156 pontos | |
| 3DMark Time Spy Score | 6946 pontos | |
Ajuda | ||
| Dota 2 Reborn - 3840x2160 ultra (3/3) best looking | |
| MSI GF65 Thin 10UE | |
| Média NVIDIA GeForce RTX 3060 Laptop GPU (46.9 - 107, n=11) | |
| baixo | média | alto | ultra | QHD | 4K | |
|---|---|---|---|---|---|---|
| GTA V (2015) | 164 | 152 | 120 | 69.2 | ||
| The Witcher 3 (2015) | 294 | 223.2 | 134.2 | 68.7 | ||
| Dota 2 Reborn (2015) | 125 | 116 | 109 | 90.7 | 94.9 | |
| Final Fantasy XV Benchmark (2018) | 124 | 89.8 | 70.3 | 53.6 | 30.7 | |
| X-Plane 11.11 (2018) | 83.6 | 73 | 62.2 | 62.3 | ||
| Far Cry 5 (2018) | 131 | 108 | 103 | 97 | ||
| Strange Brigade (2018) | 269 | 172 | 138 | 121 |
Emissions
Ruído do sistema
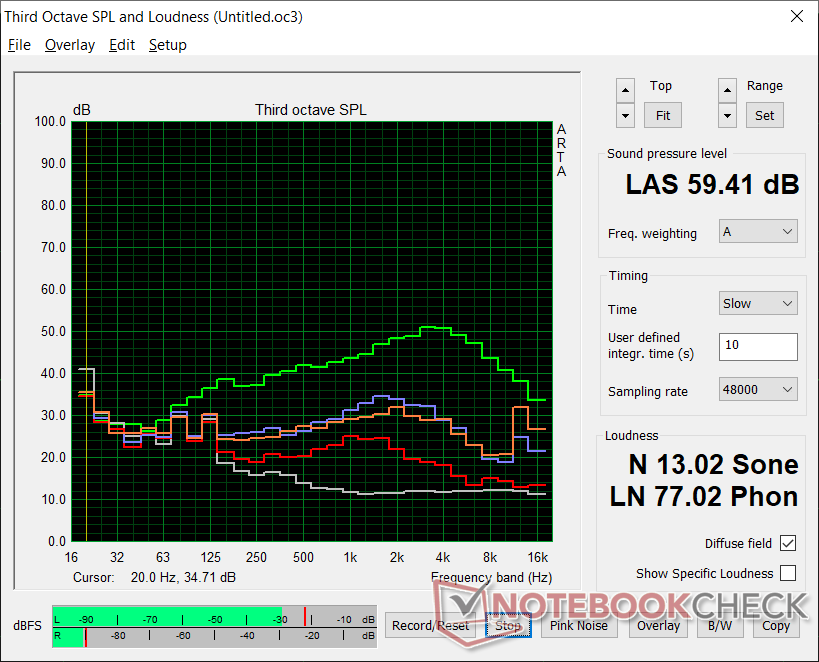
Quando conectado a uma tomada, o ruído do ventilador estará sempre presente não importando o ajuste, mesmo quando ajustado para o modo "Silencioso" da MSI. Os ventiladores só ficarão verdadeiramente silenciosos se estiverem funcionando com bateria. Caso contrário, os ventiladores serão sempre audíveis a 33 dB(A) durante atividades de baixa potência como navegação na web ou transmissão de vídeo, o que pode ser um pouco irritante.
O ruído dos ventiladores quando jogando no modo de desempenho extremo oscilará em torno da faixa baixa de 40 dB(A) para ser mais silencioso do que o que observamos no GF65 9SD. Entretanto, isto pode aumentar mais durante a jogabilidade, dependendo da carga da CPU. A ativação do modo Cooler Boost fará com que o ruído do ventilador suba até 59 dB(A).
| MSI GF65 Thin 10UE GeForce RTX 3060 Laptop GPU, i7-10750H, Samsung SSD PM981 MZVLB1T0HALR | Asus ROG Strix G15 G513QR GeForce RTX 3070 Laptop GPU, R9 5900HX, SK Hynix HFM001TD3JX013N | Schenker XMG Core 15 Ampere GeForce RTX 3060 Laptop GPU, R7 4800H, Samsung SSD 970 EVO Plus 1TB | MSI GS66 Stealth 10UG GeForce RTX 3070 Laptop GPU, i7-10870H, WDC PC SN730 SDBPNTY-1T00 | Aorus 15G XC GeForce RTX 3070 Laptop GPU, i7-10870H, ESR512GTLCG-EAC-4 | Lenovo Legion 7 15IMH05-81YT001VGE GeForce RTX 2080 Super Max-Q, i9-10980HK, 2x Samsung PM981a MZVLB1T0HBLR (RAID 0) | MSI GF65 9SD GeForce GTX 1660 Ti Mobile, i7-9750H, Kingston RBUSNS8154P3512GJ | |
|---|---|---|---|---|---|---|---|
| Noise | 4% | 6% | -5% | 4% | 8% | -6% | |
| desligado / ambiente * (dB) | 24.7 | 24 3% | 24 3% | 26.2 -6% | 25 -1% | 24.4 1% | 28.7 -16% |
| Idle Minimum * (dB) | 33.1 | 25 24% | 26 21% | 34 -3% | 29 12% | 24.4 26% | 33.3 -1% |
| Idle Average * (dB) | 33.1 | 31 6% | 28 15% | 34 -3% | 30 9% | 24.4 26% | 33.9 -2% |
| Idle Maximum * (dB) | 33.1 | 33 -0% | 30 9% | 34 -3% | 31 6% | 24.4 26% | 33.9 -2% |
| Load Average * (dB) | 42.7 | 45 -5% | 42 2% | 47.2 -11% | 41 4% | 49.3 -15% | 41 4% |
| Witcher 3 ultra * (dB) | 40.6 | 48 -18% | 50 -23% | 46.3 -14% | 47 -16% | 54 -33% | 49.5 -22% |
| Load Maximum * (dB) | 59.4 | 50 16% | 52 12% | 58.2 2% | 51 14% | 46.6 22% | 59.5 -0% |
* ... menor é melhor
Barulho
| Ocioso |
| 33.1 / 33.1 / 33.1 dB |
| Carga |
| 42.7 / 59.4 dB |
 | ||
30 dB silencioso 40 dB(A) audível 50 dB(A) ruidosamente alto |
||
min: | ||
Temperatura
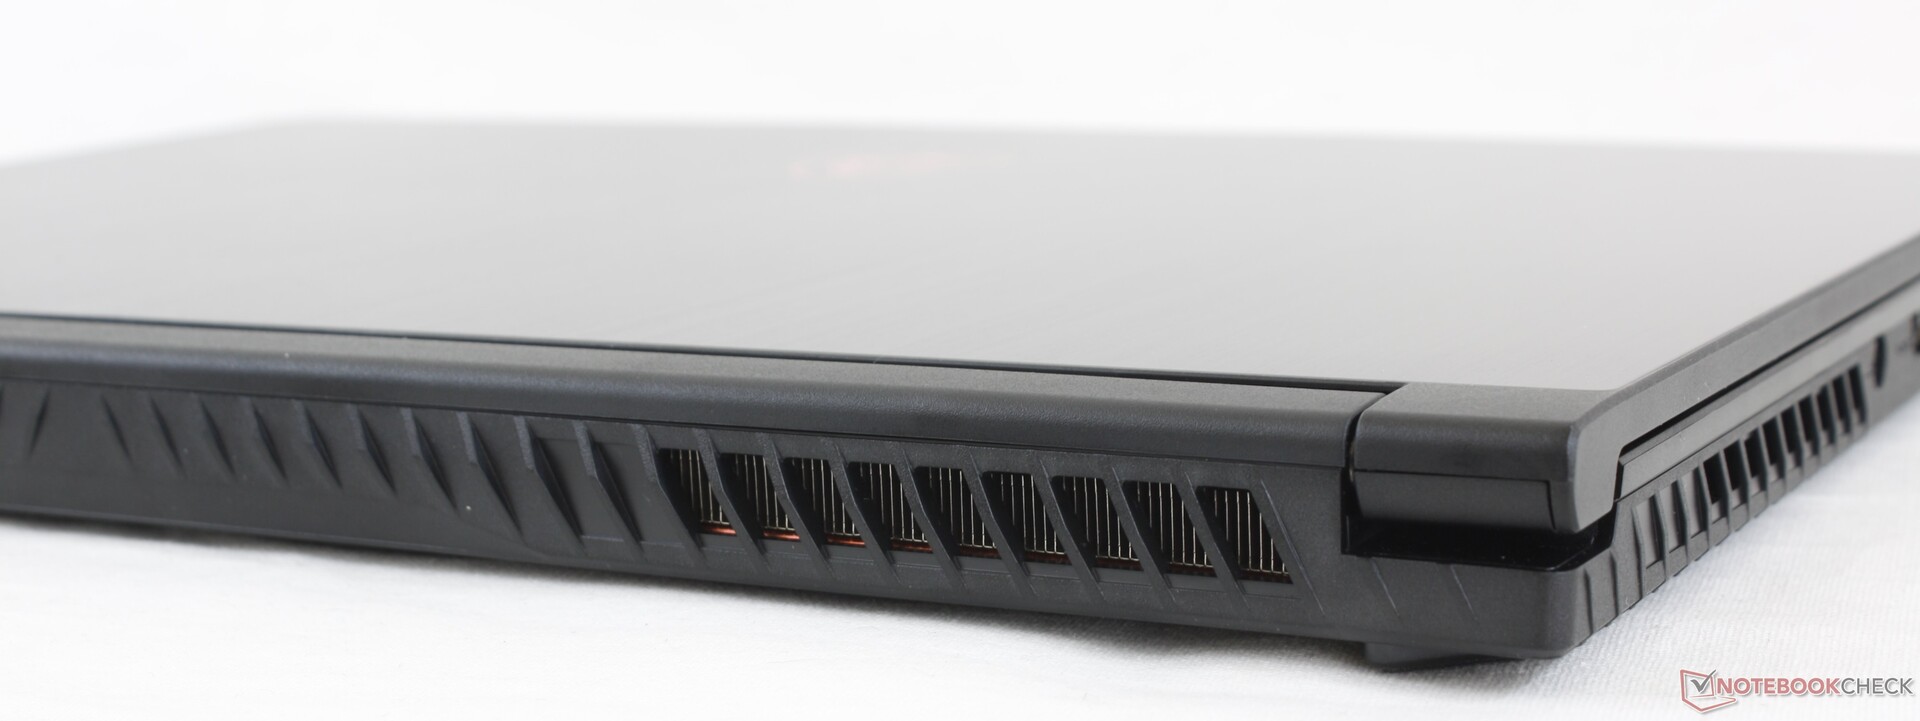
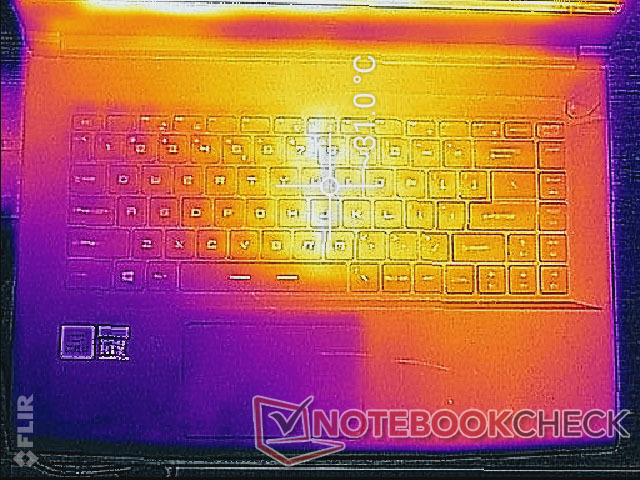
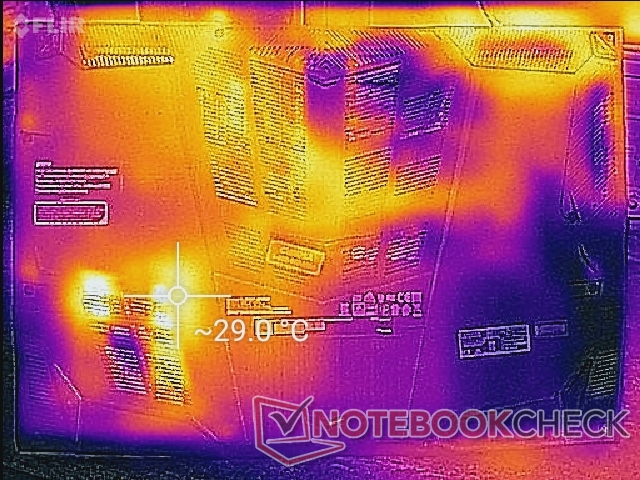
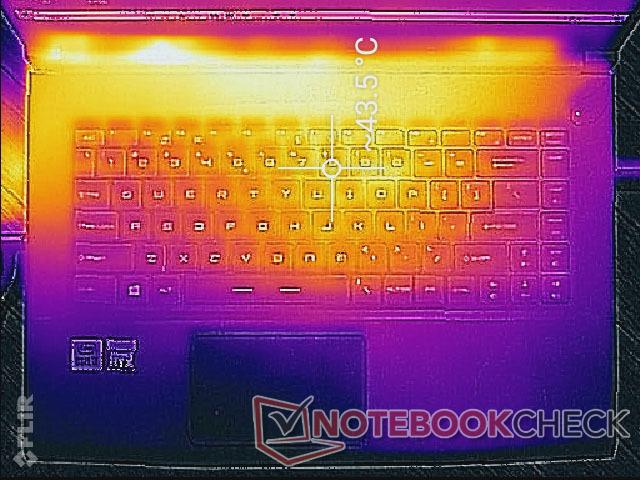
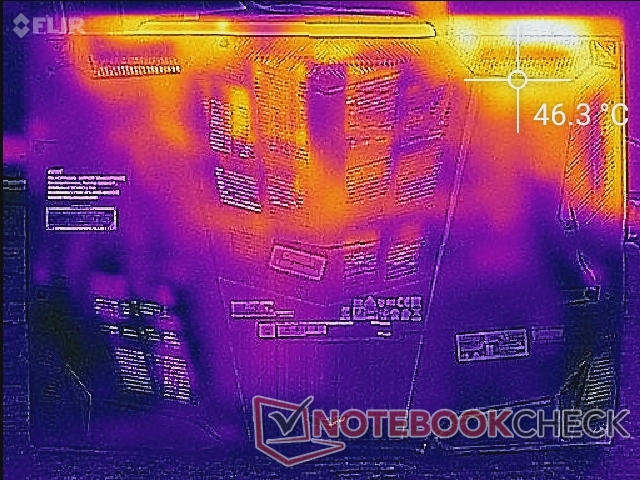
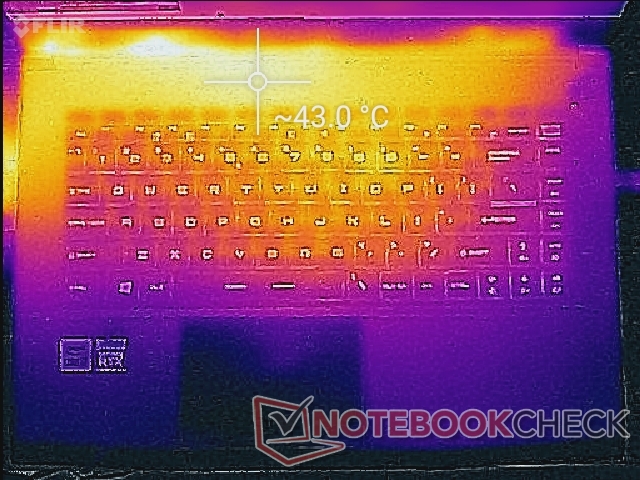
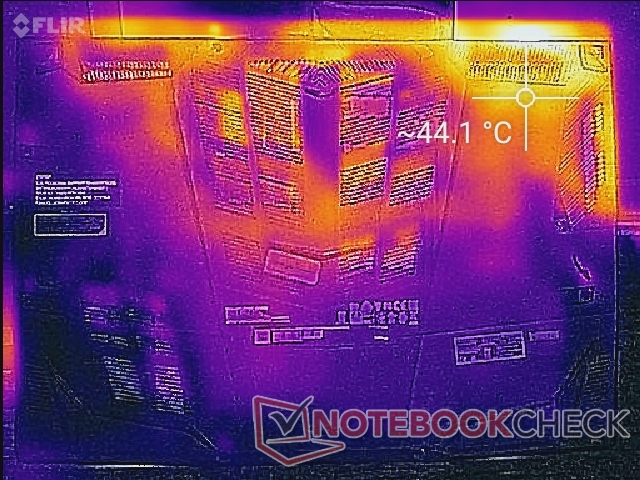
As temperaturas superficiais são as mais quentes em direção aos quadrantes traseiros, longe das teclas WASD e das setas. Os pontos quentes podem ser tão quentes quanto 44 C quando se joga, o que está muito próximo do que gravamos no GF65 9SD mais antigo. A maior parte da superfície inferior permanece relativamente fria quando se joga.
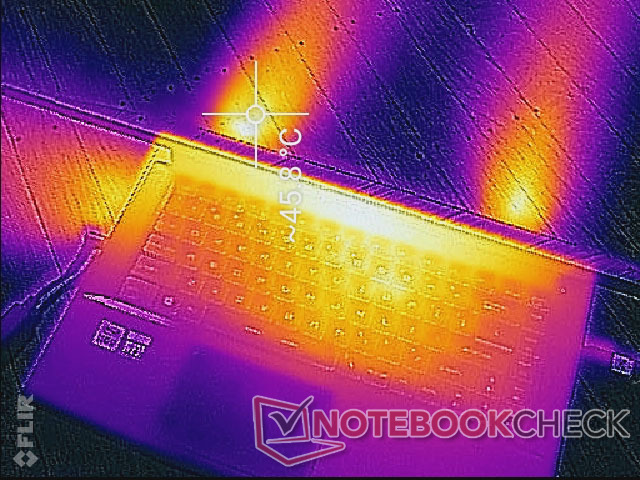
(±) A temperatura máxima no lado superior é 43.4 °C / 110 F, em comparação com a média de 40.4 °C / 105 F , variando de 21.2 a 68.8 °C para a classe Gaming.
(±) A parte inferior aquece até um máximo de 41.8 °C / 107 F, em comparação com a média de 43.2 °C / 110 F
(+) Em uso inativo, a temperatura média para o lado superior é 27.6 °C / 82 F, em comparação com a média do dispositivo de 33.9 °C / ### class_avg_f### F.
(±) Jogando The Witcher 3, a temperatura média para o lado superior é 33.9 °C / 93 F, em comparação com a média do dispositivo de 33.9 °C / ## #class_avg_f### F.
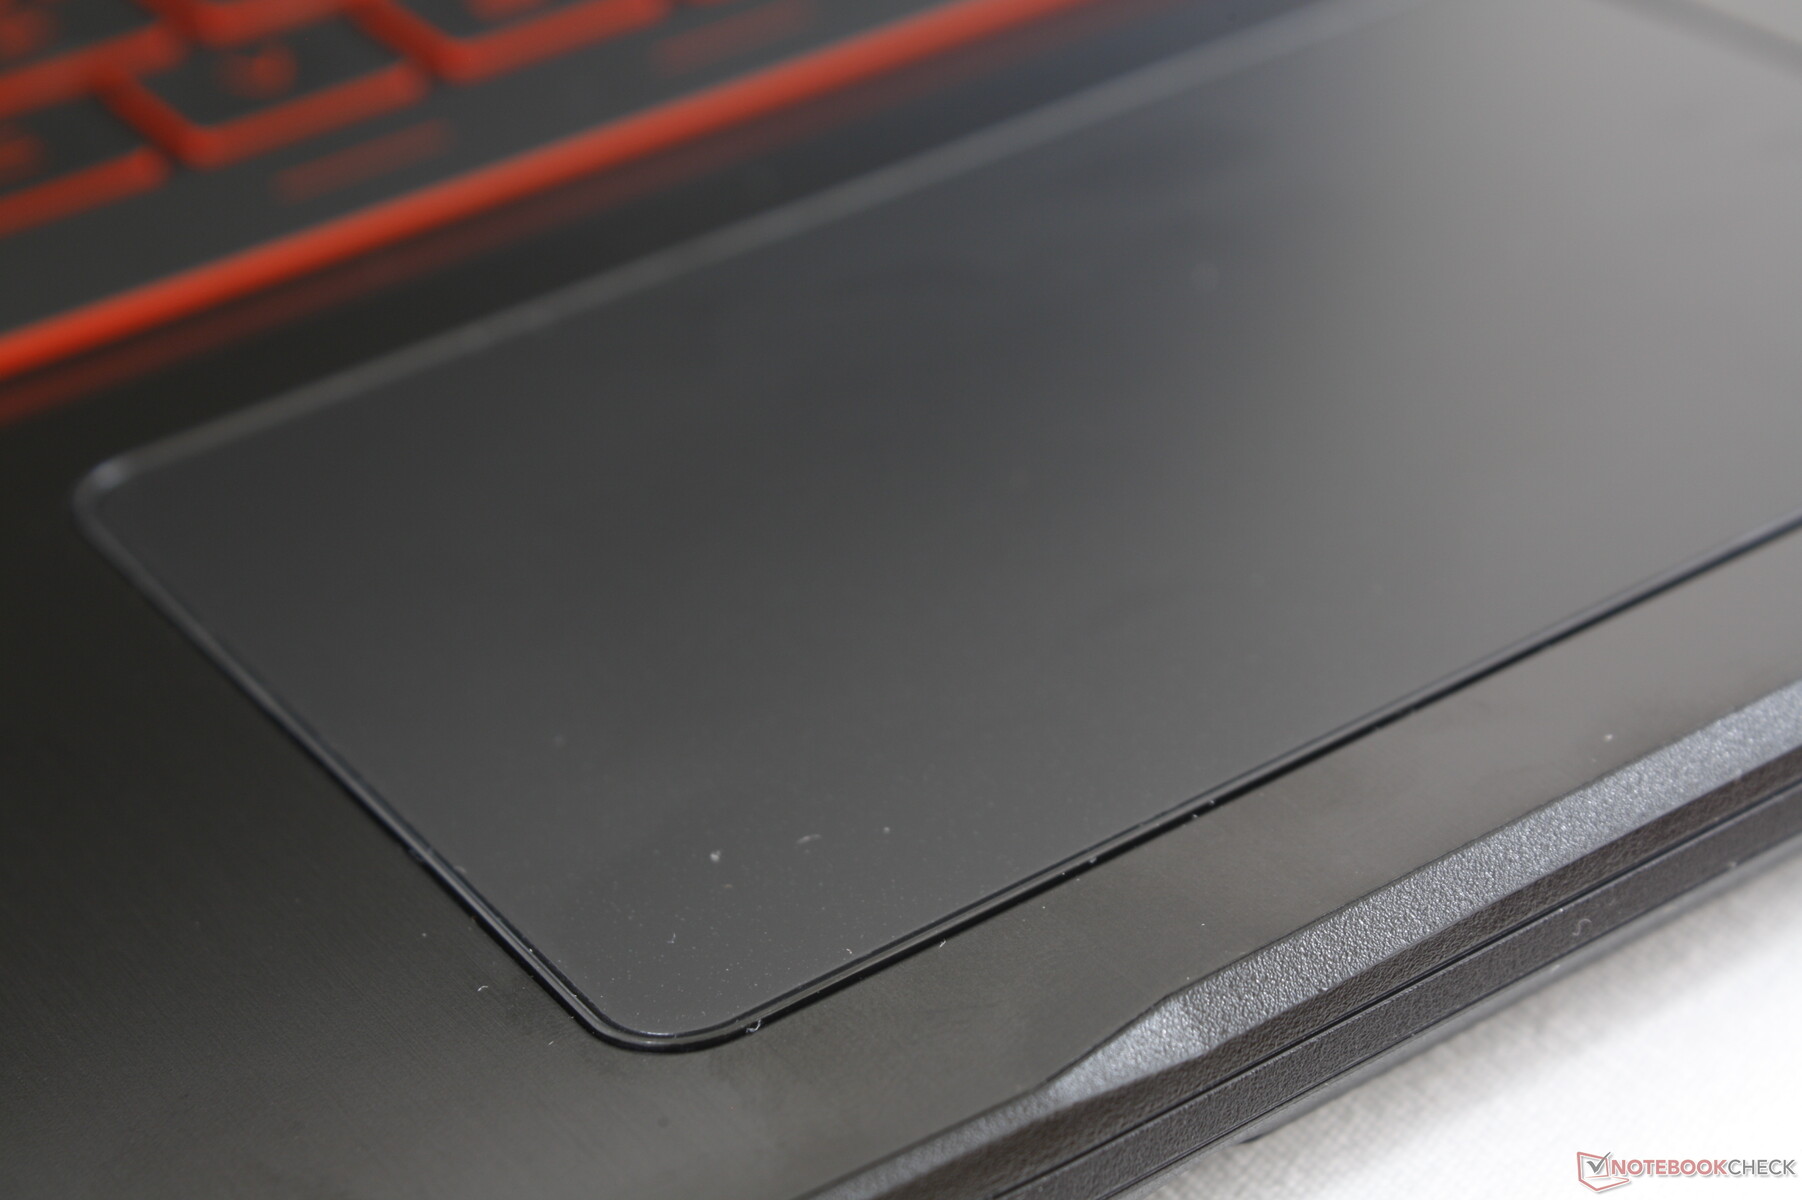
(+) Os apoios para as mãos e o touchpad são mais frios que a temperatura da pele, com um máximo de 27.4 °C / 81.3 F e, portanto, são frios ao toque.
(±) A temperatura média da área do apoio para as mãos de dispositivos semelhantes foi 28.8 °C / 83.8 F (+1.4 °C / 2.5 F).
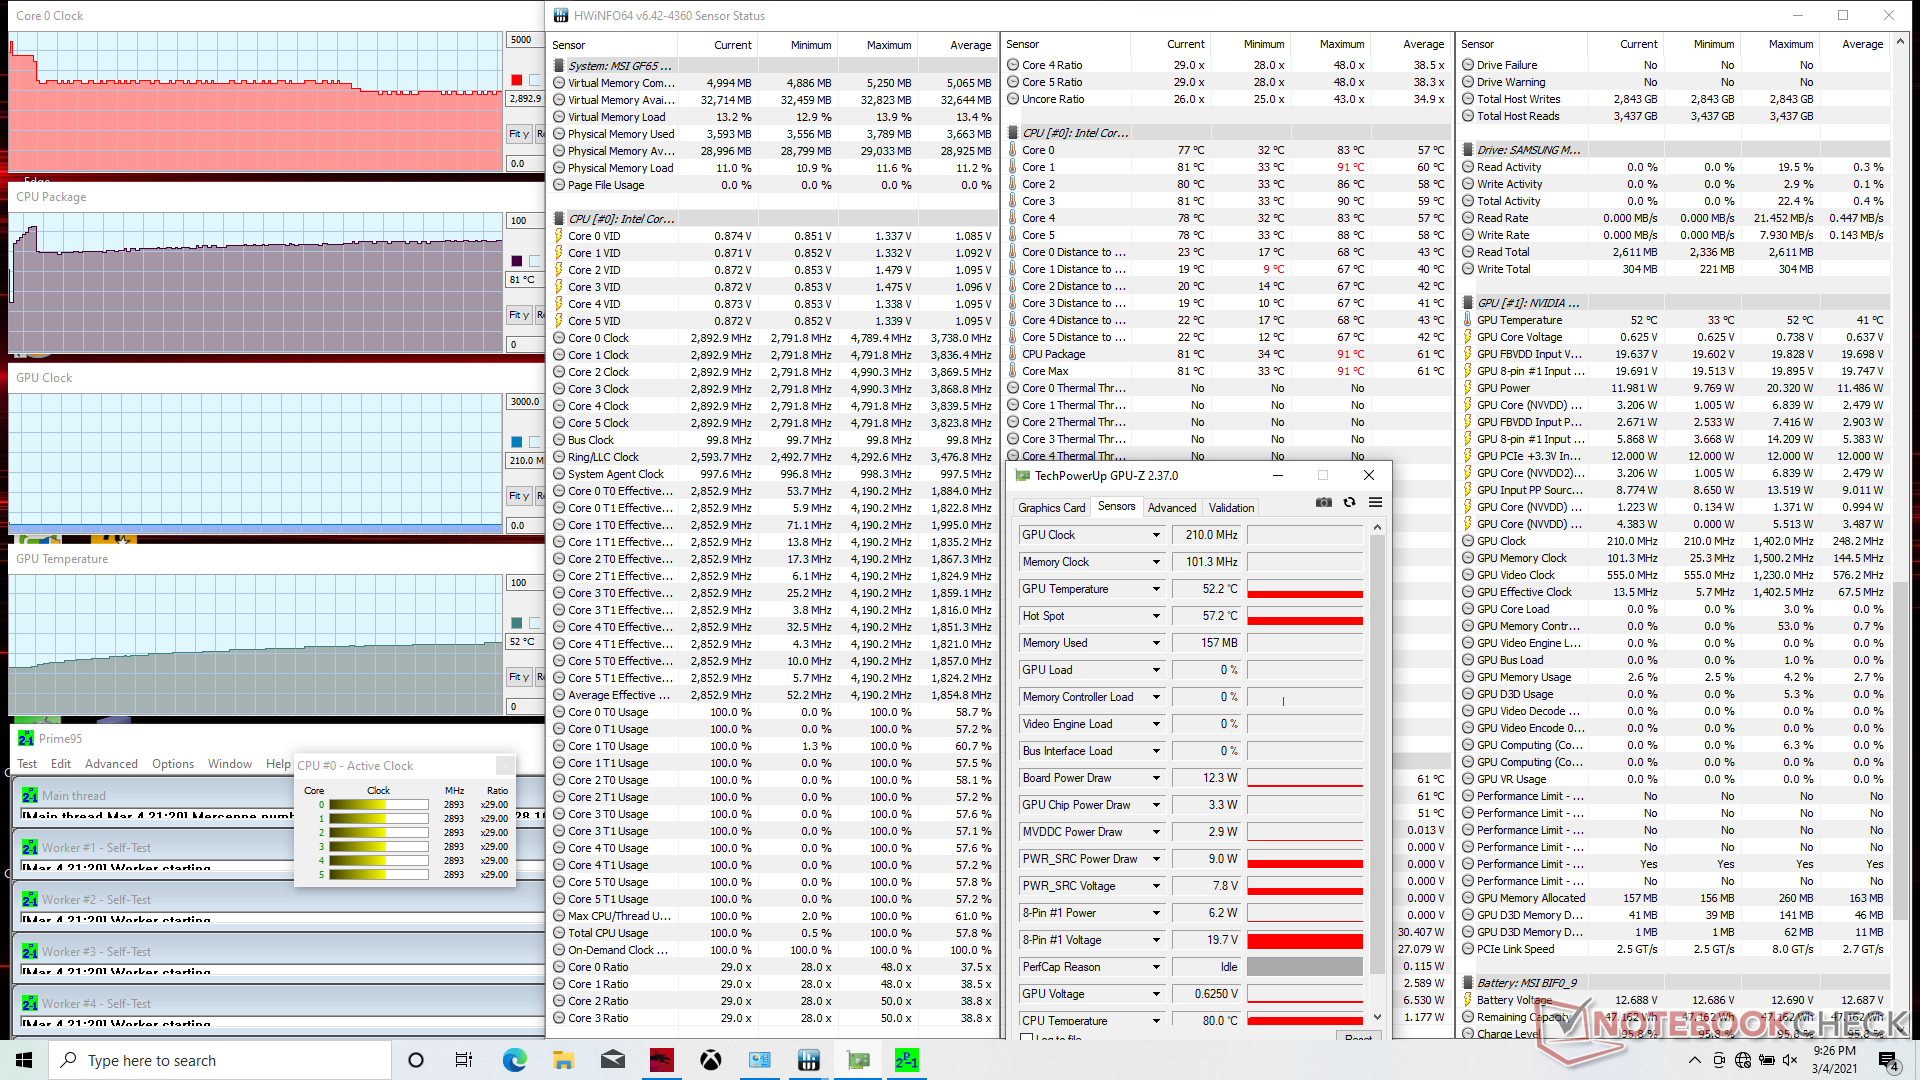
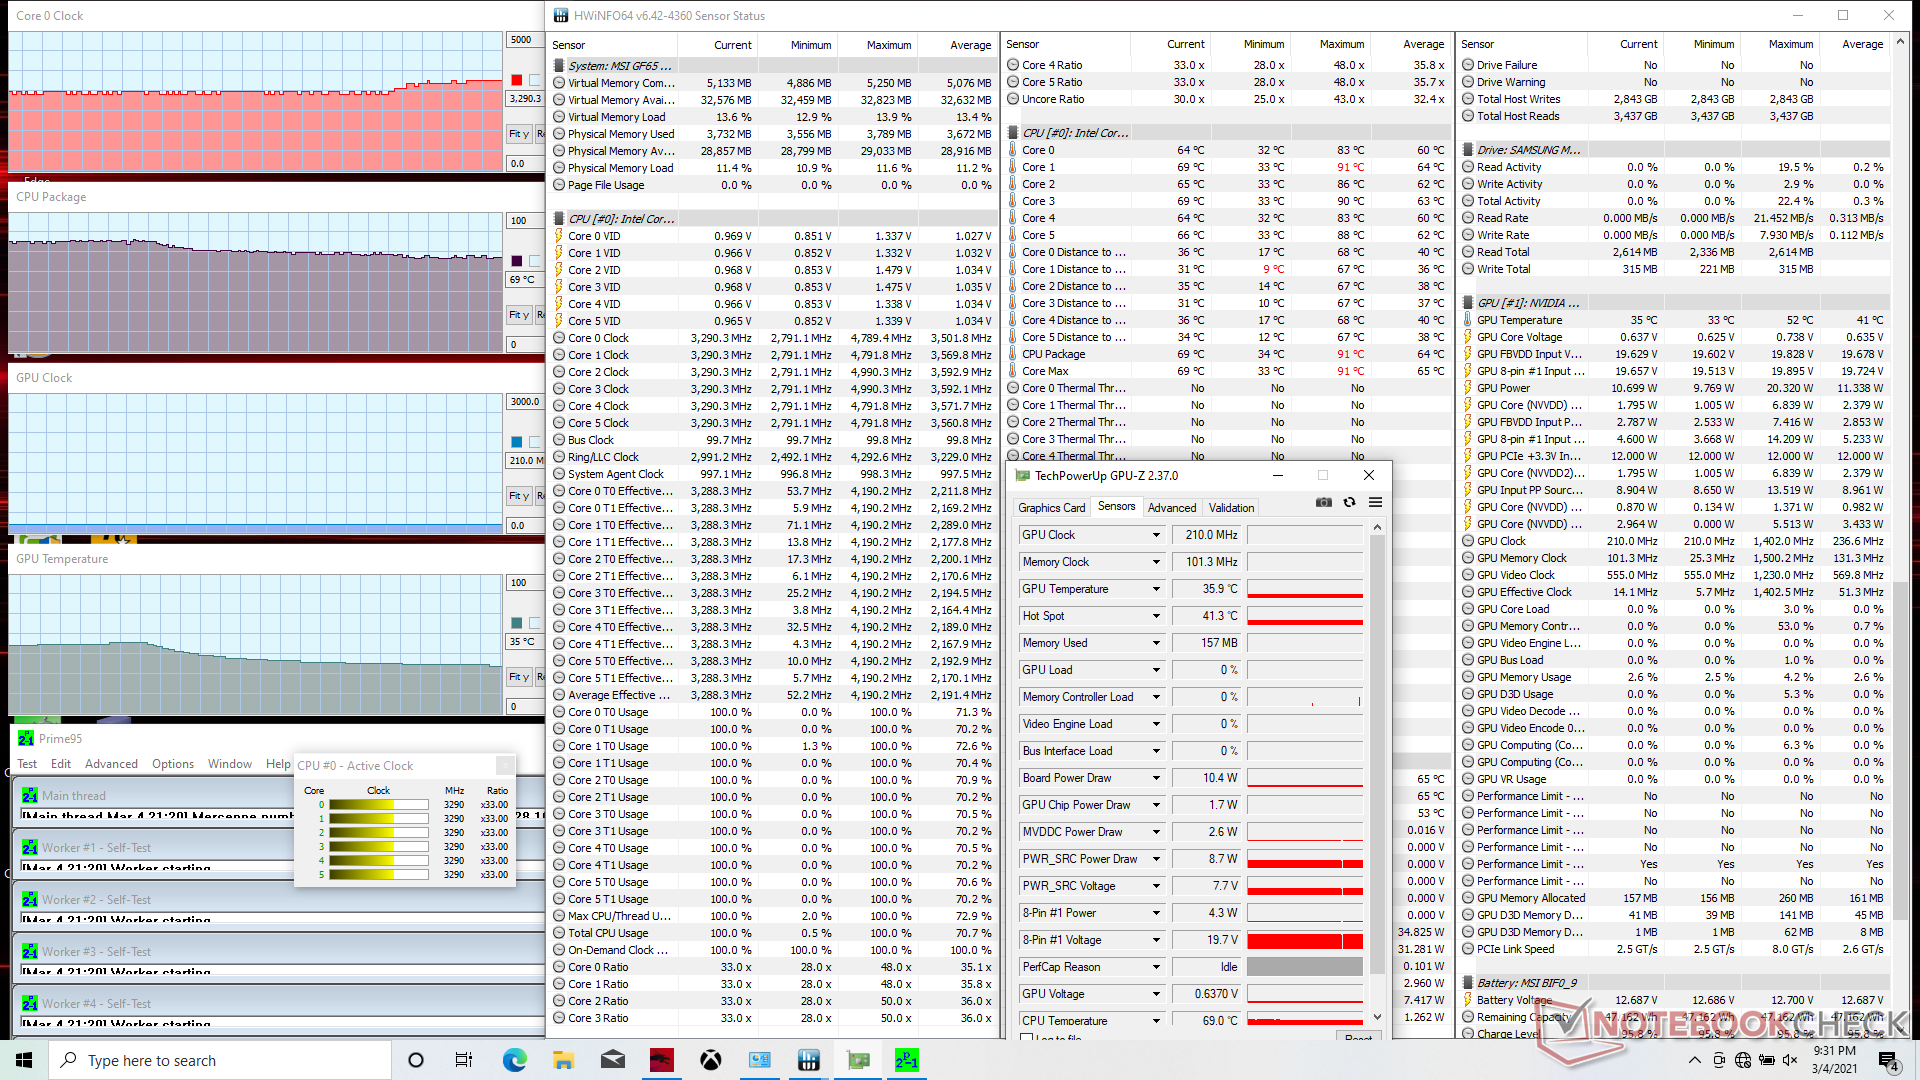
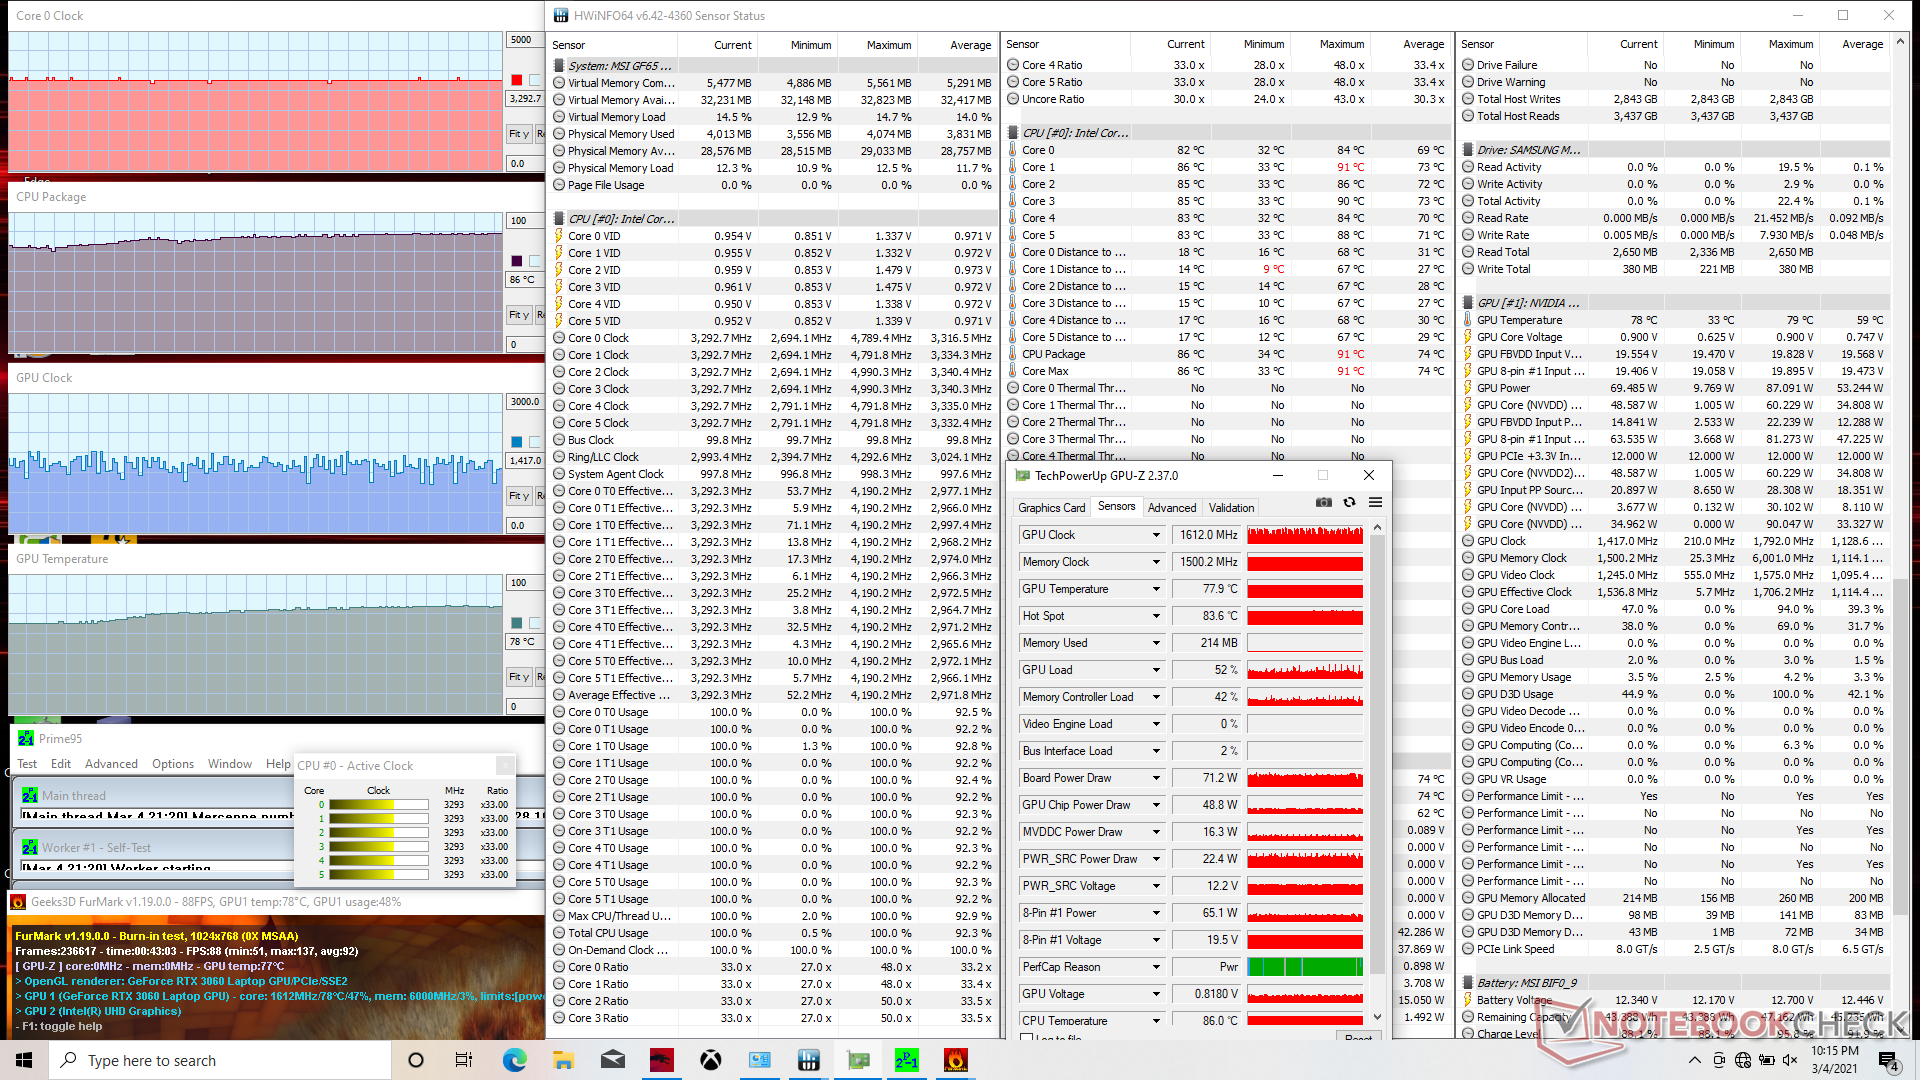
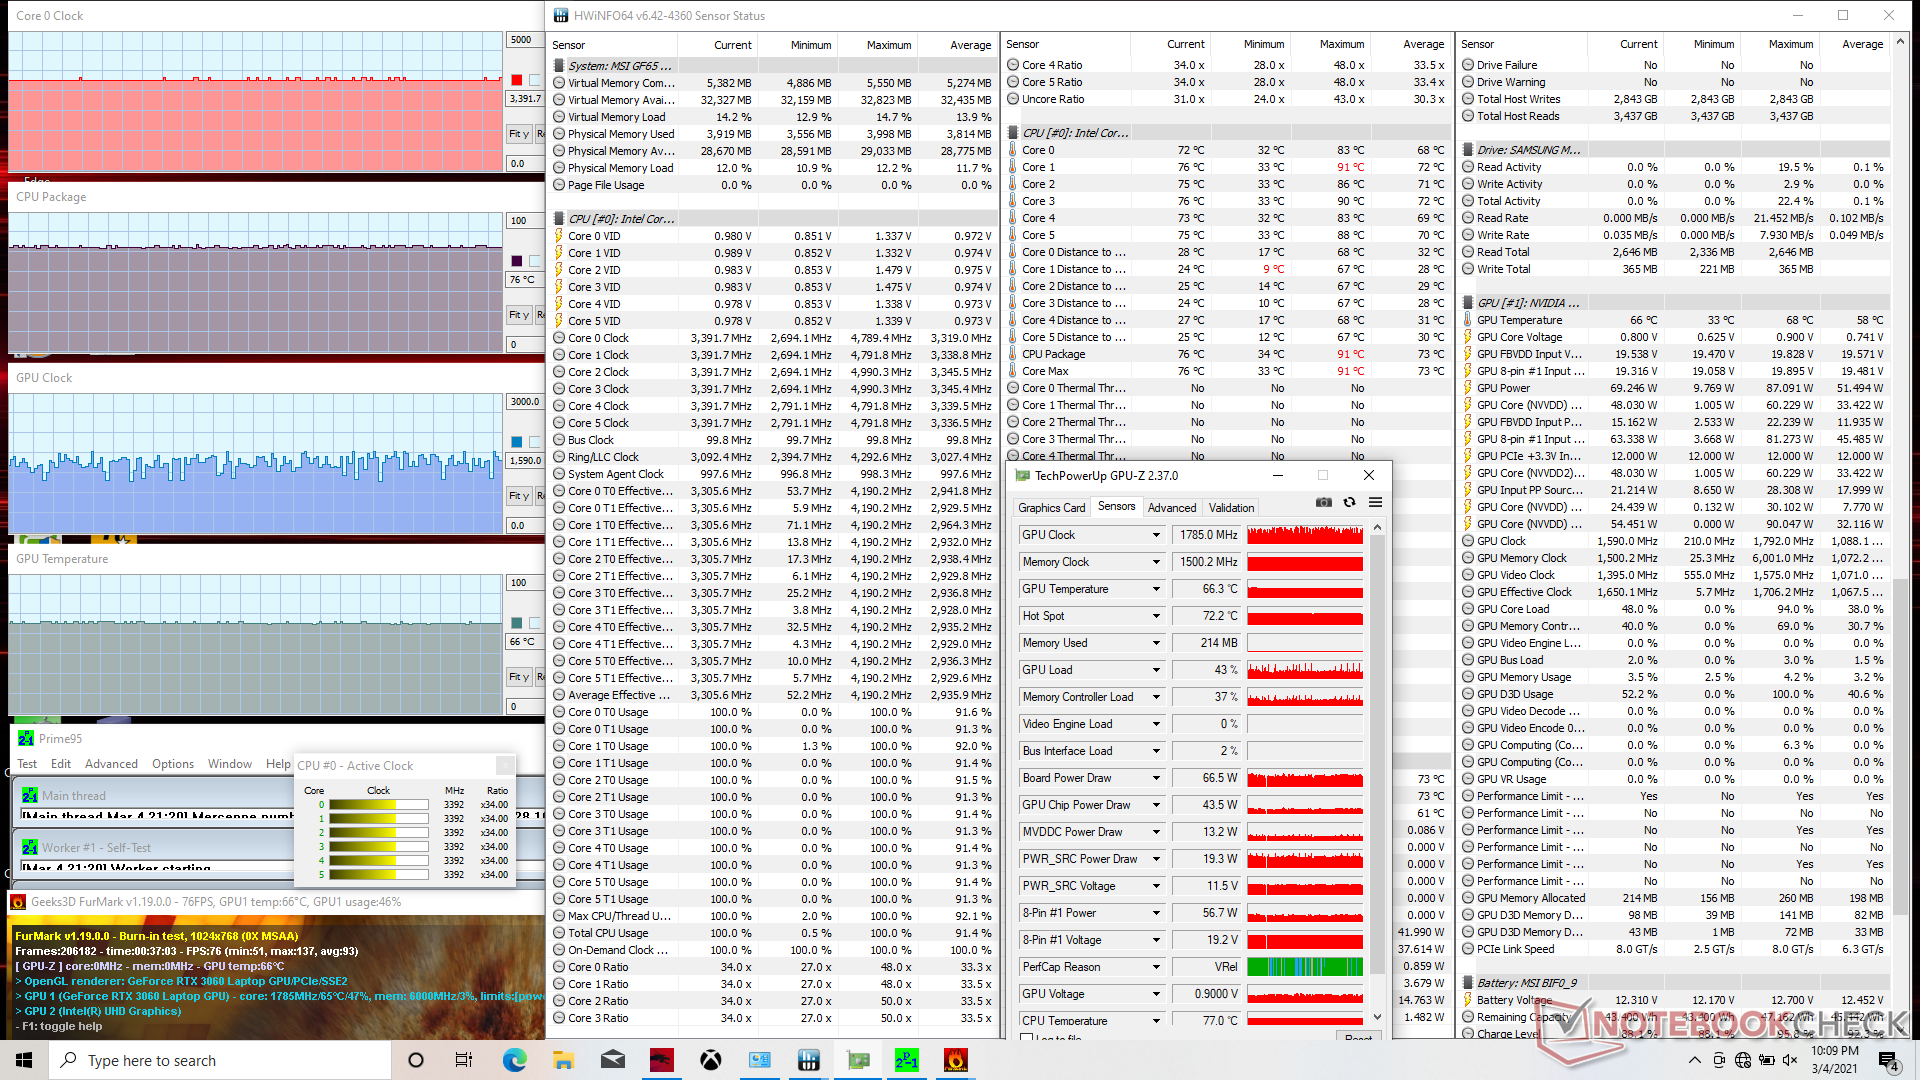
Teste de estresse
Ao executar Prime95 no modo Extreme Performance, as taxas de relógio da CPU alcançariam 4,2 GHz por apenas os primeiros segundos até atingir uma temperatura central de 91 C. As taxas de relógio e a temperatura cairiam então continuamente e se estabilizariam em 2,8 GHz e 72 C, respectivamente. Se o Cooler Boost for ativado, as taxas de relógio e a temperatura aumentarão para 3,3 GHz e diminuirão para 69 C, respectivamente
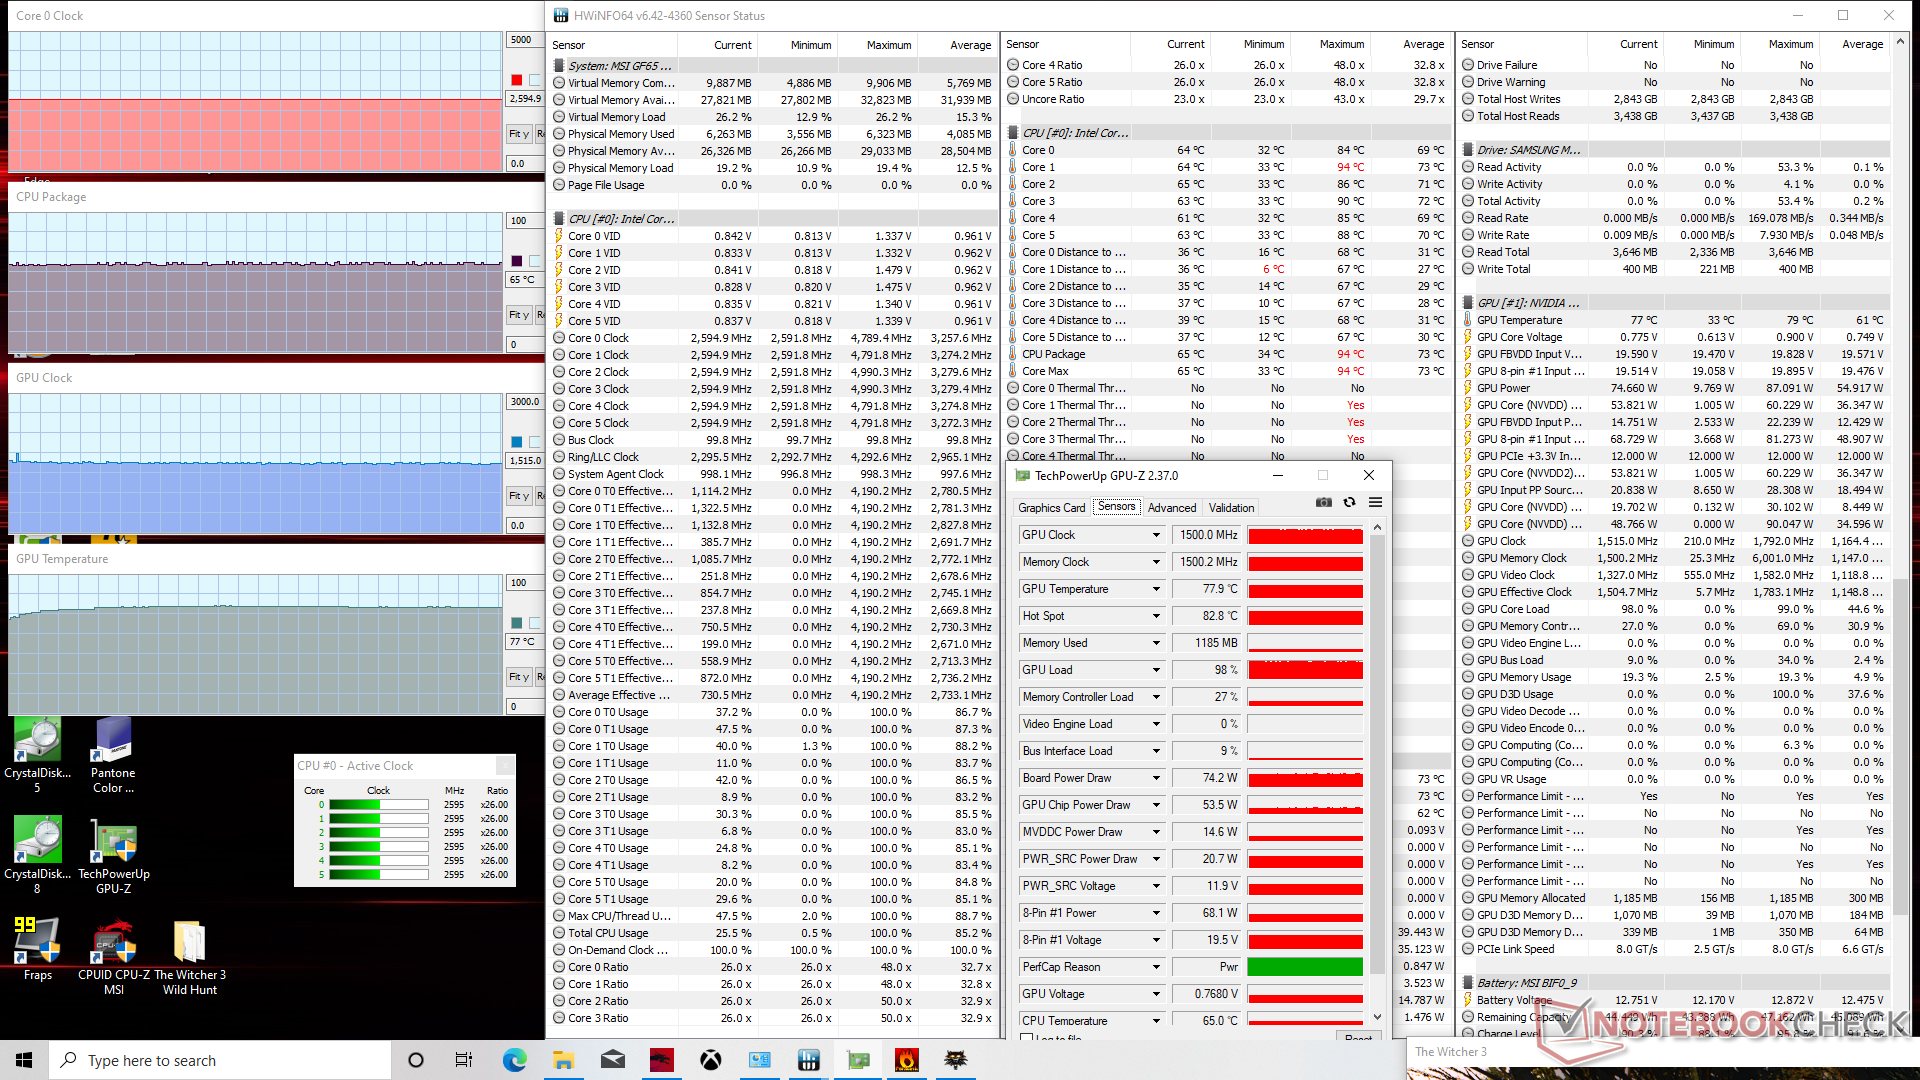
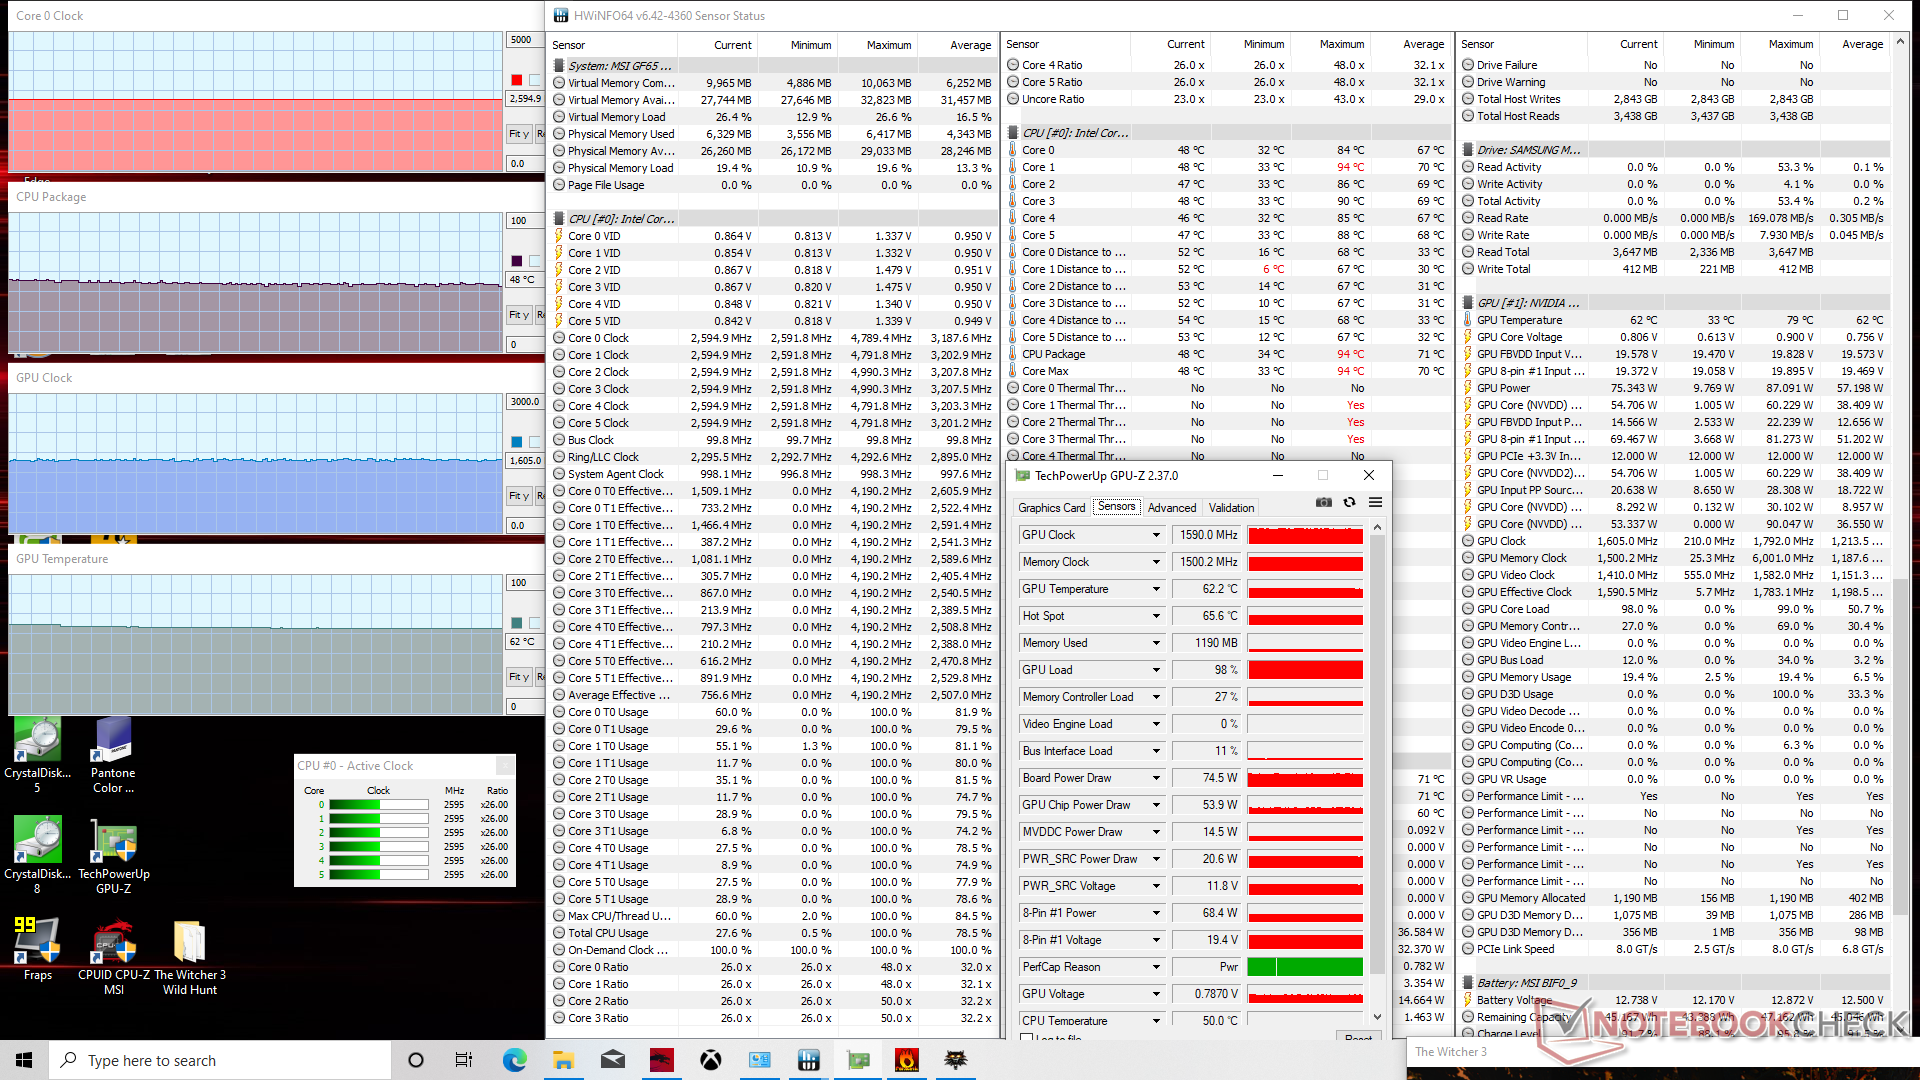
Rodando Witcher 3 faz com que a CPU e GPU se estabilizem em 65 C e 77 C, respectivamente, que são faixas relativamente frias para um laptop para jogos. A ativação do Cooler Boost reduziria ainda mais as temperaturas da CPU e da GPU para apenas 48 C e 62 C, respectivamente, enquanto que a média dos relógios da GPU se elevaria ligeiramente de 1515 MHz para 1590 MHz. O recurso Cooler Boost não é, portanto, vital para jogos, mas pode ser útil para aqueles que desejam o máximo desempenho do Turbo Boost da CPU fora de seus sistemas GF65
Funcionando com energia de bateria irá limitar a performance. Um Fire Strike executado com baterias retornaria pontuações de Física e Gráficos de 10559 e 12438 pontos, respectivamente, em comparação com 17489 e 18434 pontos quando em rede.

| RelógioCPU (GHz) | RelógioGPU (MHz) | Temperaturamédiada CPU (°C) | Temperaturamédiada GPU (°C) | |
| System Idle | -- | --34 | 33 | |
| Prime95 Stress (Cooler Boost off) | 2.8 - 2.9 | -81 | 52 | |
| Prime95 Stress (Cooler Boost on) | 3.3 | ----69 | 35 | |
| Witcher 3 Stress (Cooler Boost off) | 2.6 | 1515 | 65 | 77 |
| Witcher 3 Stress (Cooler Boost on) | 2.6 | 1590 | 48 | 62 |
| Prime95 + FurMark Stress (Cooler Boost off) | 3.3 | 1612 | 86 | 78 |
| Prime95 + FurMark Stress (Cooler Boost on) | 3.3 | 1785 | 76 | 66 |
Oradores


MSI GF65 Thin 10UE análise de áudio
(±) | o volume do alto-falante é médio, mas bom (###valor### dB)
Graves 100 - 315Hz
(-) | quase nenhum baixo - em média 19.6% menor que a mediana
(-) | graves não são lineares (16.1% delta para frequência anterior)
Médios 400 - 2.000 Hz
(+) | médios equilibrados - apenas 3.2% longe da mediana
(±) | a linearidade dos médios é média (7.6% delta para frequência anterior)
Altos 2 - 16 kHz
(+) | agudos equilibrados - apenas 3.6% longe da mediana
(±) | a linearidade dos máximos é média (8.6% delta para frequência anterior)
Geral 100 - 16.000 Hz
(±) | a linearidade do som geral é média (17.9% diferença em relação à mediana)
Comparado com a mesma classe
» 55% de todos os dispositivos testados nesta classe foram melhores, 9% semelhantes, 37% piores
» O melhor teve um delta de 6%, a média foi 18%, o pior foi 132%
Comparado com todos os dispositivos testados
» 37% de todos os dispositivos testados foram melhores, 8% semelhantes, 55% piores
» O melhor teve um delta de 4%, a média foi 23%, o pior foi 134%
Apple MacBook 12 (Early 2016) 1.1 GHz análise de áudio
(+) | os alto-falantes podem tocar relativamente alto (###valor### dB)
Graves 100 - 315Hz
(±) | graves reduzidos - em média 11.3% menor que a mediana
(±) | a linearidade dos graves é média (14.2% delta para a frequência anterior)
Médios 400 - 2.000 Hz
(+) | médios equilibrados - apenas 2.4% longe da mediana
(+) | médios são lineares (5.5% delta para frequência anterior)
Altos 2 - 16 kHz
(+) | agudos equilibrados - apenas 2% longe da mediana
(+) | os máximos são lineares (4.5% delta da frequência anterior)
Geral 100 - 16.000 Hz
(+) | o som geral é linear (10.2% diferença em relação à mediana)
Comparado com a mesma classe
» 7% de todos os dispositivos testados nesta classe foram melhores, 2% semelhantes, 90% piores
» O melhor teve um delta de 5%, a média foi 18%, o pior foi 53%
Comparado com todos os dispositivos testados
» 5% de todos os dispositivos testados foram melhores, 1% semelhantes, 94% piores
» O melhor teve um delta de 4%, a média foi 23%, o pior foi 134%
Energy Management
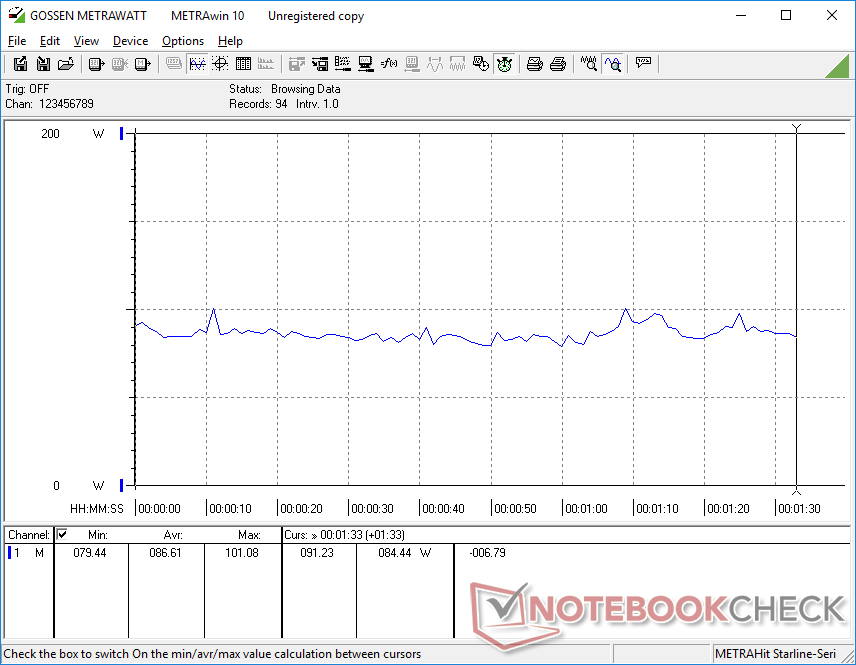
Consumo de energia
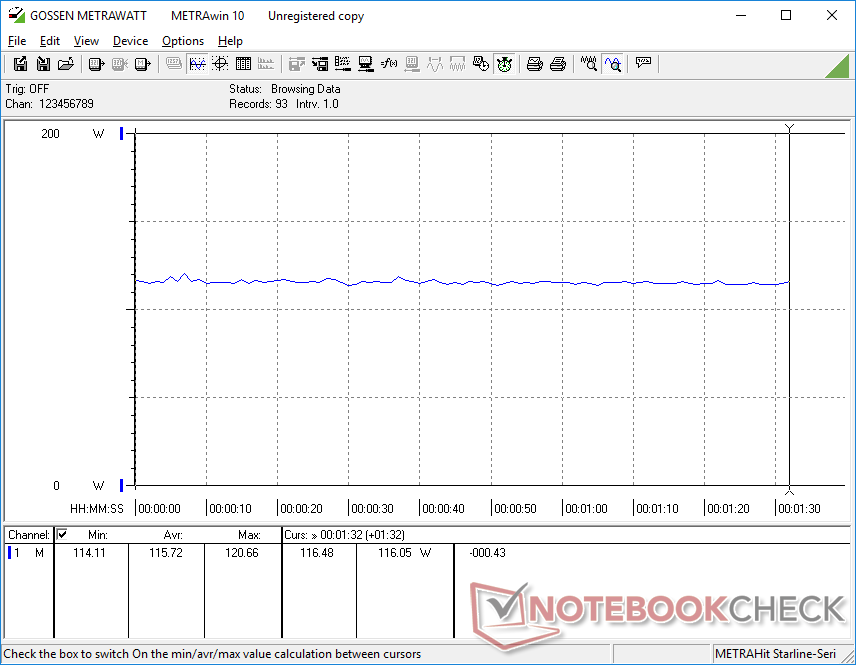
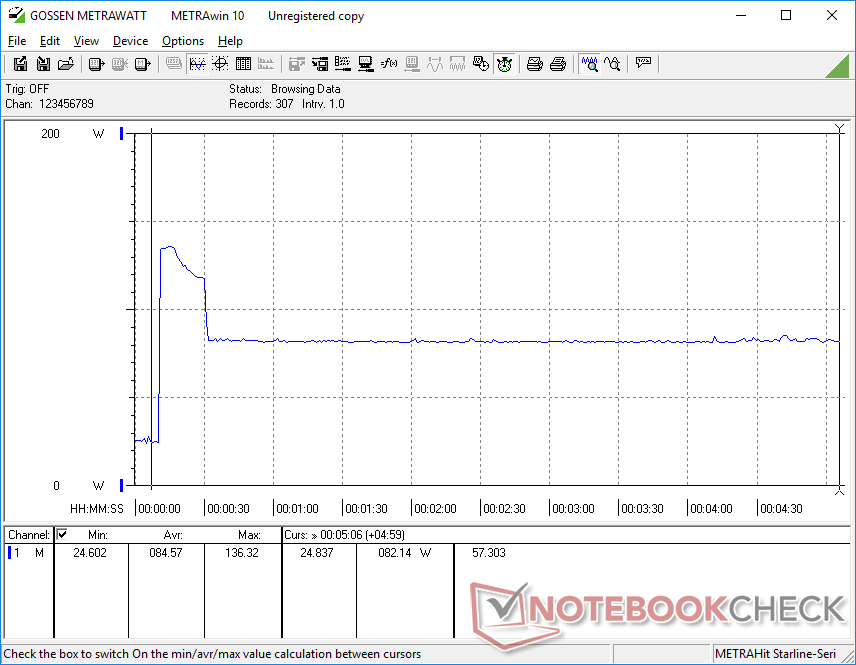
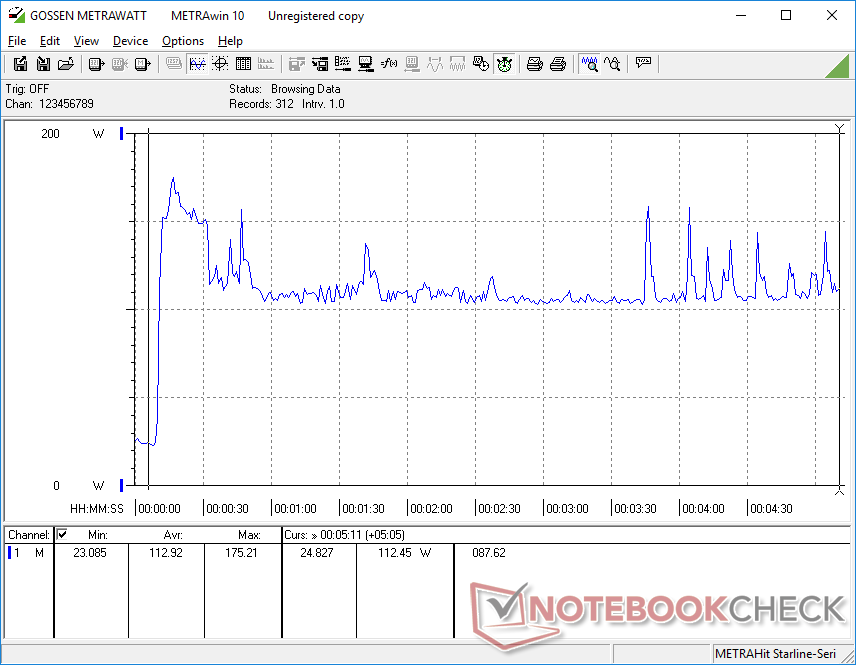
O sistema consome um pouco menos de energia do que no antigo GF65 9SD. Em funcionamento Witcher 3 exige cerca de 116 W em comparação com 134 W no modelo mais antigo, embora nosso RTX 3060 seja capaz de fornecer um aumento de 15% na potência gráfica bruta sobre o GTX 1660 Ti. O Schenker XMG Core 15 com a mesma GPU RTX 3060 consome significativamente mais energia do que nossa MSI provavelmente porque visa valores TGP mais altos e outras diferenças de processador.
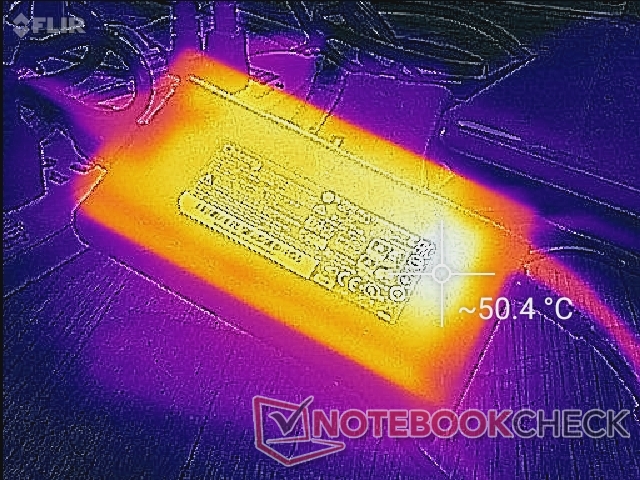
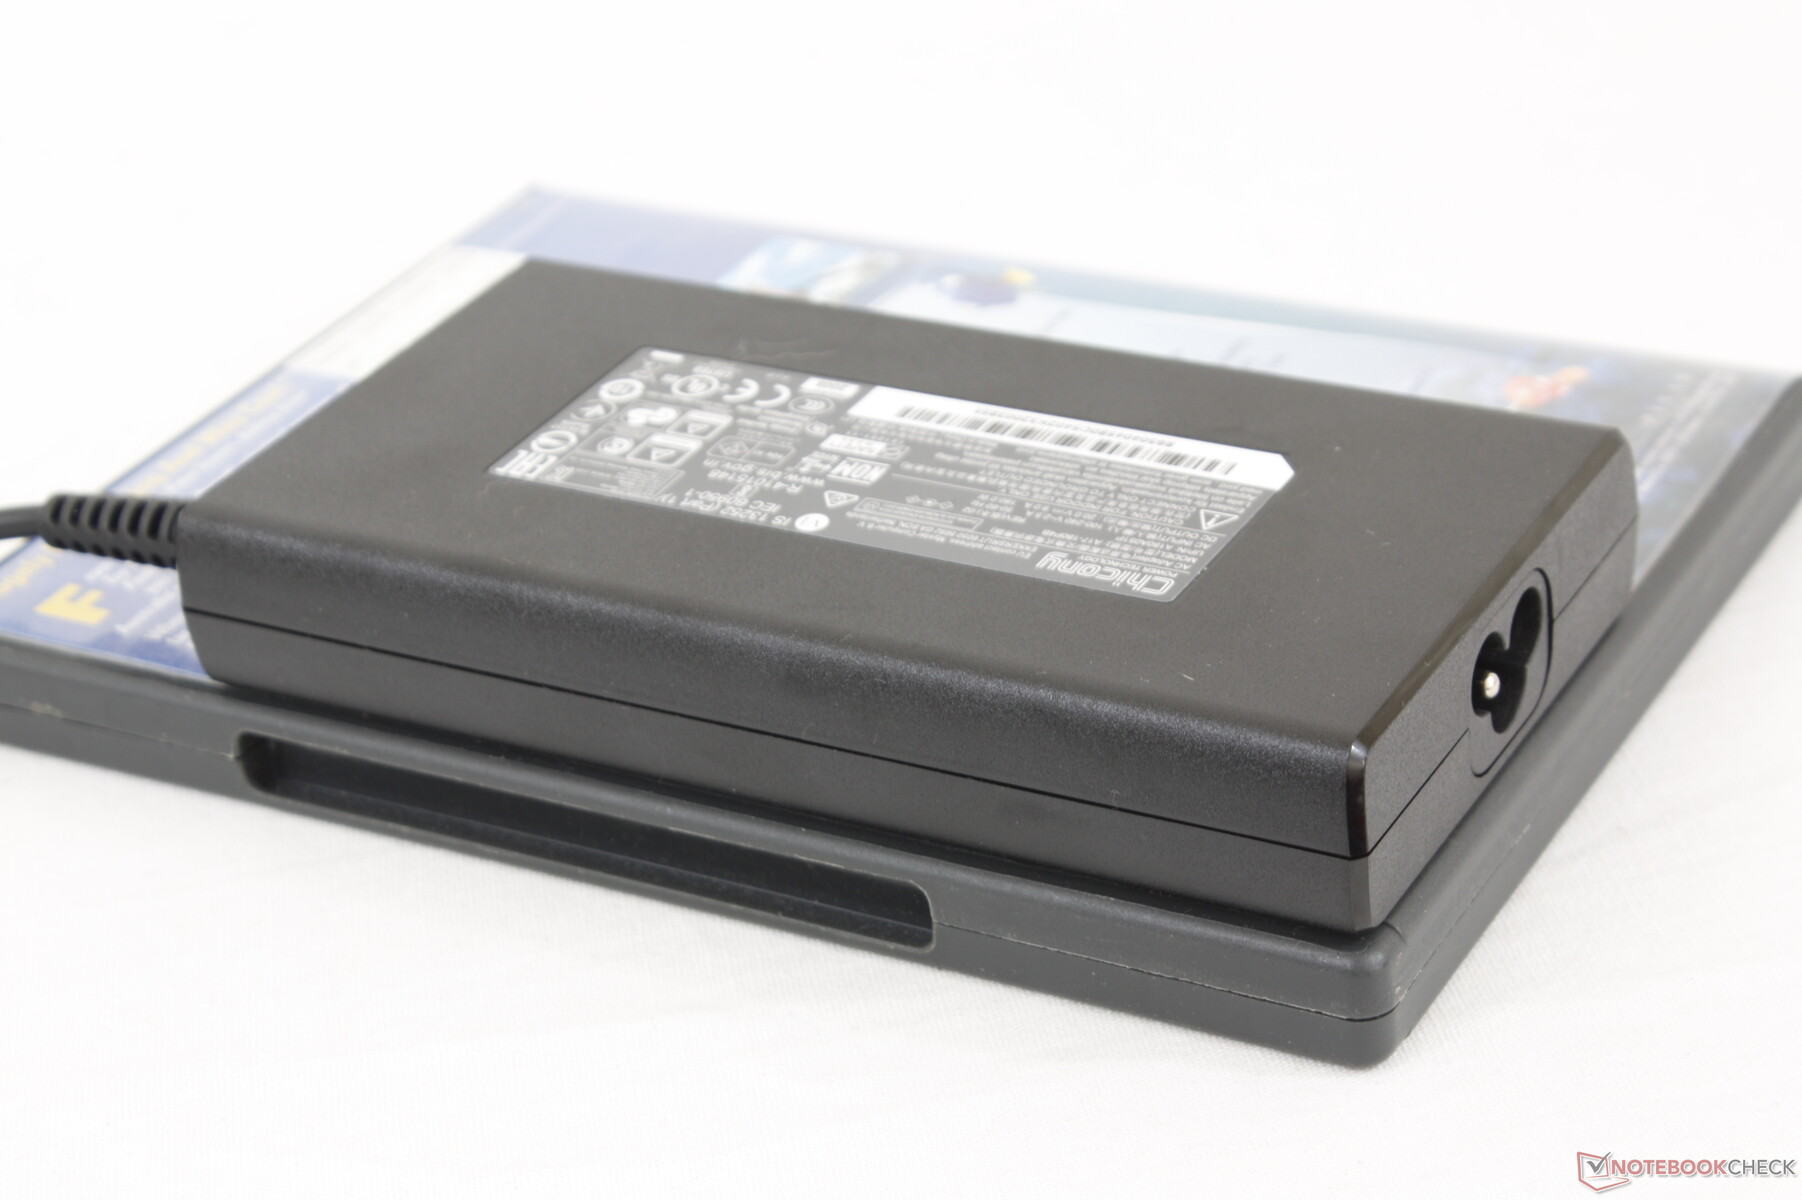
Somos capazes de medir um consumo máximo de 175,2 W W a partir do pequeno (~14,4 x 7,5 x 2,3 cm) adaptador CA de 180 W ao executar simultaneamente Prime95 e FurMark. A carga da bateria diminui significativamente quando se trabalha com cargas extremas e pode até parar, o que é o que observamos durante nosso teste de estresse acima.
| desligado | |
| Ocioso | |
| Carga |
|
Key:
min: | |
| MSI GF65 Thin 10UE i7-10750H, GeForce RTX 3060 Laptop GPU, Samsung SSD PM981 MZVLB1T0HALR, IPS, 1920x1080, 15.6" | Asus ROG Strix G15 G513QR R9 5900HX, GeForce RTX 3070 Laptop GPU, SK Hynix HFM001TD3JX013N, IPS, 1920x1080, 15.6" | Schenker XMG Core 15 Ampere R7 4800H, GeForce RTX 3060 Laptop GPU, Samsung SSD 970 EVO Plus 1TB, IPS, 2560x1440, 15.6" | Aorus 15G XC i7-10870H, GeForce RTX 3070 Laptop GPU, ESR512GTLCG-EAC-4, IPS, 1920x1080, 15.6" | Lenovo Legion 7 15IMH05-81YT001VGE i9-10980HK, GeForce RTX 2080 Super Max-Q, 2x Samsung PM981a MZVLB1T0HBLR (RAID 0), IPS, 1920x1080, 15.6" | MSI GF65 9SD i7-9750H, GeForce GTX 1660 Ti Mobile, Kingston RBUSNS8154P3512GJ, IPS, 1920x1080, 15.6" | |
|---|---|---|---|---|---|---|
| Power Consumption | -27% | -35% | -48% | -24% | -17% | |
| Idle Minimum * (Watt) | 5.4 | 4 26% | 11 -104% | 13 -141% | 9 -67% | 9.5 -76% |
| Idle Average * (Watt) | 12.8 | 9 30% | 14 -9% | 16 -25% | 12.6 2% | 12.4 3% |
| Idle Maximum * (Watt) | 19.5 | 36 -85% | 20 -3% | 30 -54% | 17 13% | 22 -13% |
| Load Average * (Watt) | 86.6 | 130 -50% | 94 -9% | 92 -6% | 115 -33% | 80.8 7% |
| Witcher 3 ultra * (Watt) | 115.7 | 174 -50% | 167 -44% | 154 -33% | 159 -37% | 133.9 -16% |
| Load Maximum * (Watt) | 175.2 | 227 -30% | 251 -43% | 223 -27% | 216 -23% | 187.1 -7% |
* ... menor é melhor
Vida útil da bateria
Os tempos de funcionamento são em média de cerca de 4,5 horas de uso da WLAN no mundo real quando no perfil de potência balanceada. Os resultados não são tão diferentes do GF65 do ano passado, pois a capacidade da bateria não mudou.
O carregamento da capacidade vazia para a plena leva um pouco mais de duas horas. O sistema não pode ser recarregado via USB-C.
| MSI GF65 Thin 10UE i7-10750H, GeForce RTX 3060 Laptop GPU, 51 Wh | Asus ROG Strix G15 G513QR R9 5900HX, GeForce RTX 3070 Laptop GPU, 90 Wh | Schenker XMG Core 15 Ampere R7 4800H, GeForce RTX 3060 Laptop GPU, 62 Wh | MSI GS66 Stealth 10UG i7-10870H, GeForce RTX 3070 Laptop GPU, 99.9 Wh | Aorus 15G XC i7-10870H, GeForce RTX 3070 Laptop GPU, 99 Wh | Lenovo Legion 7 15IMH05-81YT001VGE i9-10980HK, GeForce RTX 2080 Super Max-Q, 80 Wh | MSI GF65 9SD i7-9750H, GeForce GTX 1660 Ti Mobile, 51 Wh | |
|---|---|---|---|---|---|---|---|
| Duração da bateria | 58% | 2% | 50% | 44% | 1% | 11% | |
| Reader / Idle (h) | 11.1 | 7.8 -30% | 10.8 -3% | 9.6 -14% | |||
| WiFi v1.3 (h) | 4.6 | 7.4 61% | 5.8 26% | 7.1 54% | 6.3 37% | 3.4 -26% | 5.1 11% |
| Load (h) | 1.1 | 1.7 55% | 1.2 9% | 2.2 100% | 2.3 109% | 1.4 27% |
Pro
Contra
Veredicto

O móvel GeForce RTX 3060 opera sob uma ampla faixa TGP entre 60 W e 115 W. Os fabricantes de laptops são livres para atingir os valores TGP que desejarem dentro dessa faixa, o que significa que metas TGP mais altas terão um desempenho superior. Isto também significa que alguns laptops com o TGP podem preferir marginalmente mais lentos do que outros, mesmo que venham equipados com o mesmo GPU
O MSI GF65 10UE é um laptop RTX 3060 relativamente barato e, talvez não coincidentemente, ele também vem com uma GPU RTX 3060 mais lenta do que a média. Outros laptops que testamos até agora com a mesma GPU são cerca de 10 a 15 por cento mais rápidos. O desempenho da CPU também é ligeiramente mais lento do que a média, a menos que os usuários decidam ativar o modo Cooler Boost. Cores, tempos de resposta preto-branco, Thunderbolt e DisplayPort são ou médios ou completamente omitidos.
Jogadores que querem maximizar o desempenho por dólar sem sacrificar a RAM ou a capacidade de atualização SSD acharão o leve MSI GF65 atraente. Para um desempenho bruto superior, a maioria dos outros laptops para jogos com o mesmo GeForce RTX 3060 pode executá-lo mais rapidamente.
A facilidade de manutenção, alta taxa de atualização da tela e temperaturas centrais relativamente baixas quando os jogos ainda são alguns de nossos aspectos favoritos do GF65. Mesmo assim, os potenciais compradores devem estar cientes das características que estarão perdendo.
Preço e disponibilidade
Nossa configuração exata está atualmente disponível na Amazon por $1649 USD. Uma configuração com apenas 8 GB de RAM e 512 GB de armazenamento também está disponível por $1299 USD.
MSI GF65 Thin 10UE
- 03/08/2021 v7 (old)
Allen Ngo
Price comparison

