Revisão do laptop HP Envy 17: GeForce GPU toca em uma elegante tela de 4K do laptop multimídia
A série de modelos Envy da HP significa laptops potentes para profissionais criativos móveis. Nesta série, o fabricante oferece modelos a partir de modelos compactos de 13,3 até grandes tamanhos de 17,3 polegadas. O HP Envy 17-cr0079ng é posicionado na extremidade superior, trazendo uma grande tela UHD de 17,3 polegadas nesta versão do modelo.
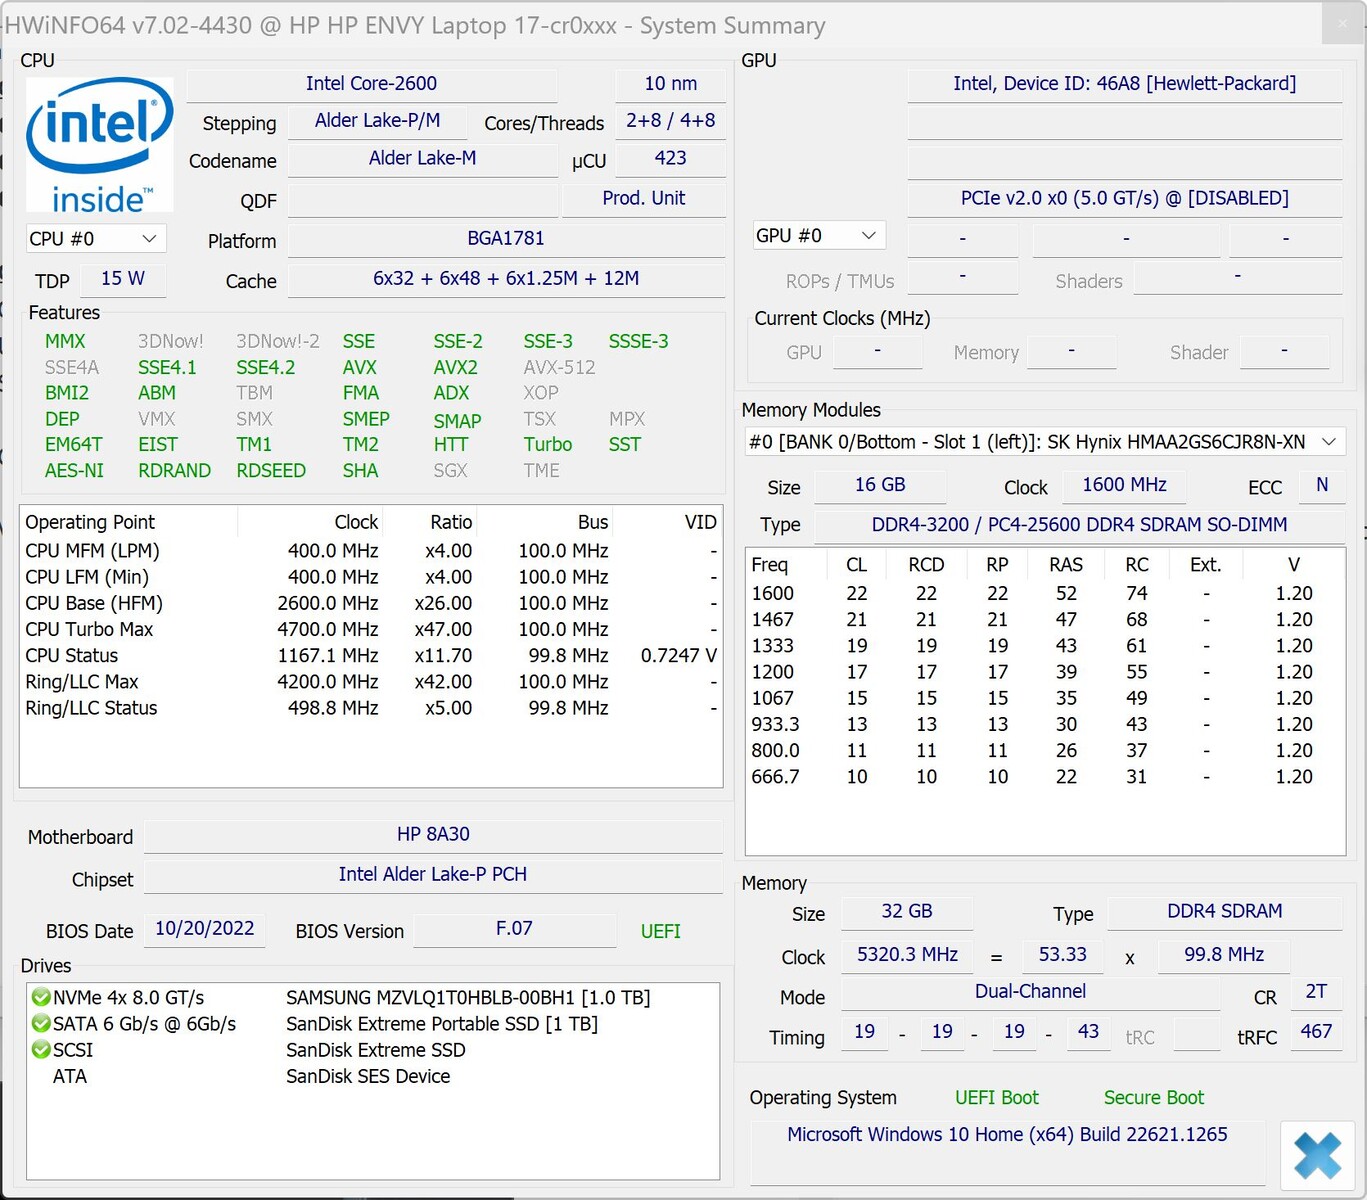
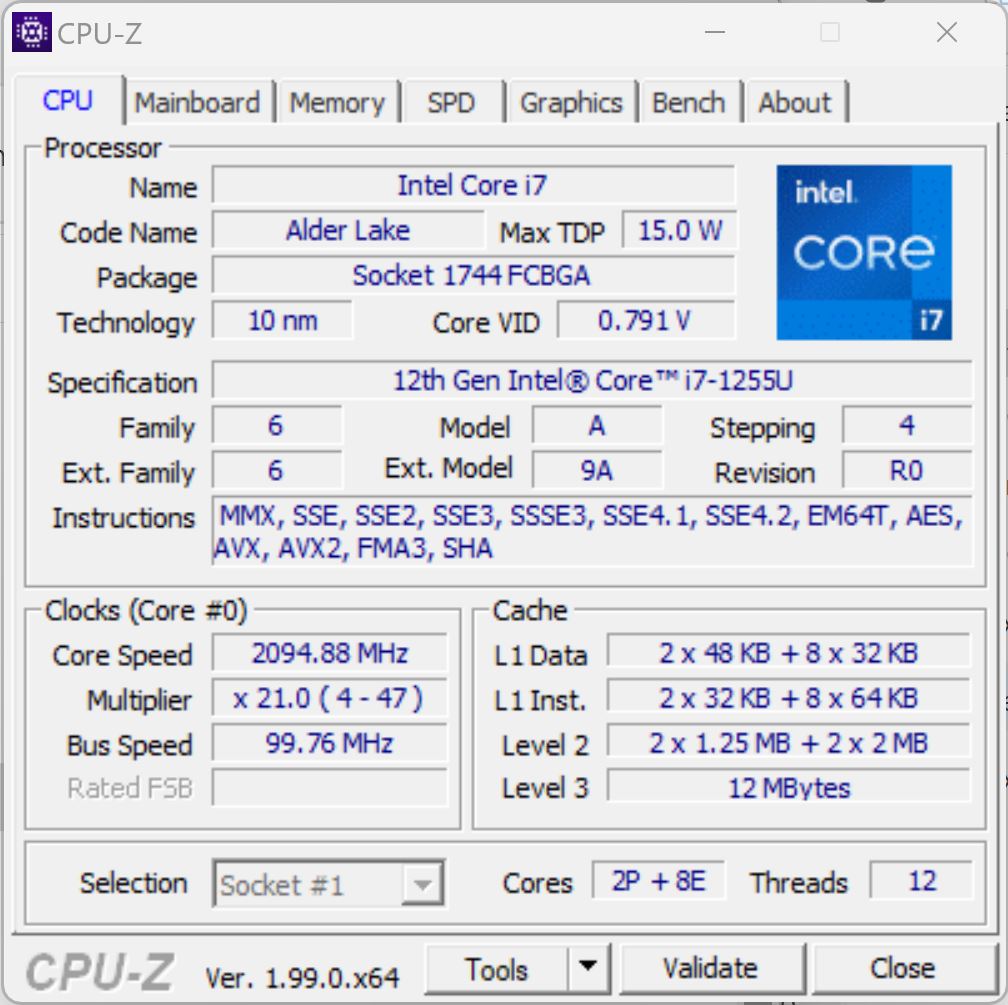
Sob o capô, a HP Envy 17-cr0079ng é capaz de oferecer também alguns bons equipamentos: A HP utiliza o Intel Core i7-1255Uprocessador da 12ª geração (Lago Alder), combinando isto com um processador dedicado Nvidia GeForce RTX 2050 Laptop gPU de faixa média inferior com 4 GB GDDR6, 32 GB DDR4 de memória de trabalho, e um SSD grande de 1 TB. Junto com uma bateria de 55-Wh, isto resulta em um laptop de ~2,5 kg (~5,5 lb) de 17 polegadas que agora tem que se provar em nosso teste.
Em nossa revisão, o Envy 17 tem que competir contra outros laptops com o Core i7-1255U, tais como o mais compacto HP ProBook 450 G9 6A180EAe também a mesma solução gráfica, tal como o Acer Aspire 5 A515-57G-53N8e o de 17 polegadas LG Gram 17campeão de enduro.
Possíveis concorrentes em comparação
Avaliação | Data | Modelo | Peso | Altura | Size | Resolução | Preço |
|---|---|---|---|---|---|---|---|
| 86.3 % v7 (old) | 04/2023 | HP Envy 17-cr0079ng i7-1255U, GeForce RTX 2050 Mobile | 2.6 kg | 19.6 mm | 17.30" | 3840x2160 | |
| 85 % v7 (old) | 08/2022 | HP ProBook 450 G9 6A180EA i7-1255U, Iris Xe G7 96EUs | 1.7 kg | 19.9 mm | 15.60" | 1920x1080 | |
| 86.4 % v7 (old) | 03/2023 | LG Gram 17Z90Q-E.AD78G i7-1260P, GeForce RTX 2050 Mobile | 1.4 kg | 17.8 mm | 17.00" | 2560x1600 | |
| 80.7 % v7 (old) | 09/2022 | Acer Aspire 5 A515-57G-53N8 i5-1240P, GeForce RTX 2050 Mobile | 1.8 kg | 18 mm | 15.60" | 1920x1080 | |
| 89.3 % v7 (old) | 06/2022 | Dell XPS 17 9720 i7-12700H, GeForce RTX 3050 4GB Laptop GPU | 2.5 kg | 19.5 mm | 17.00" | 3840x2400 | |
| 79.4 % v7 (old) | 03/2023 | Lenovo IdeaPad 3 17ABA7 R5 5625U, Vega 7 | 2 kg | 19.9 mm | 17.30" | 1920x1080 |
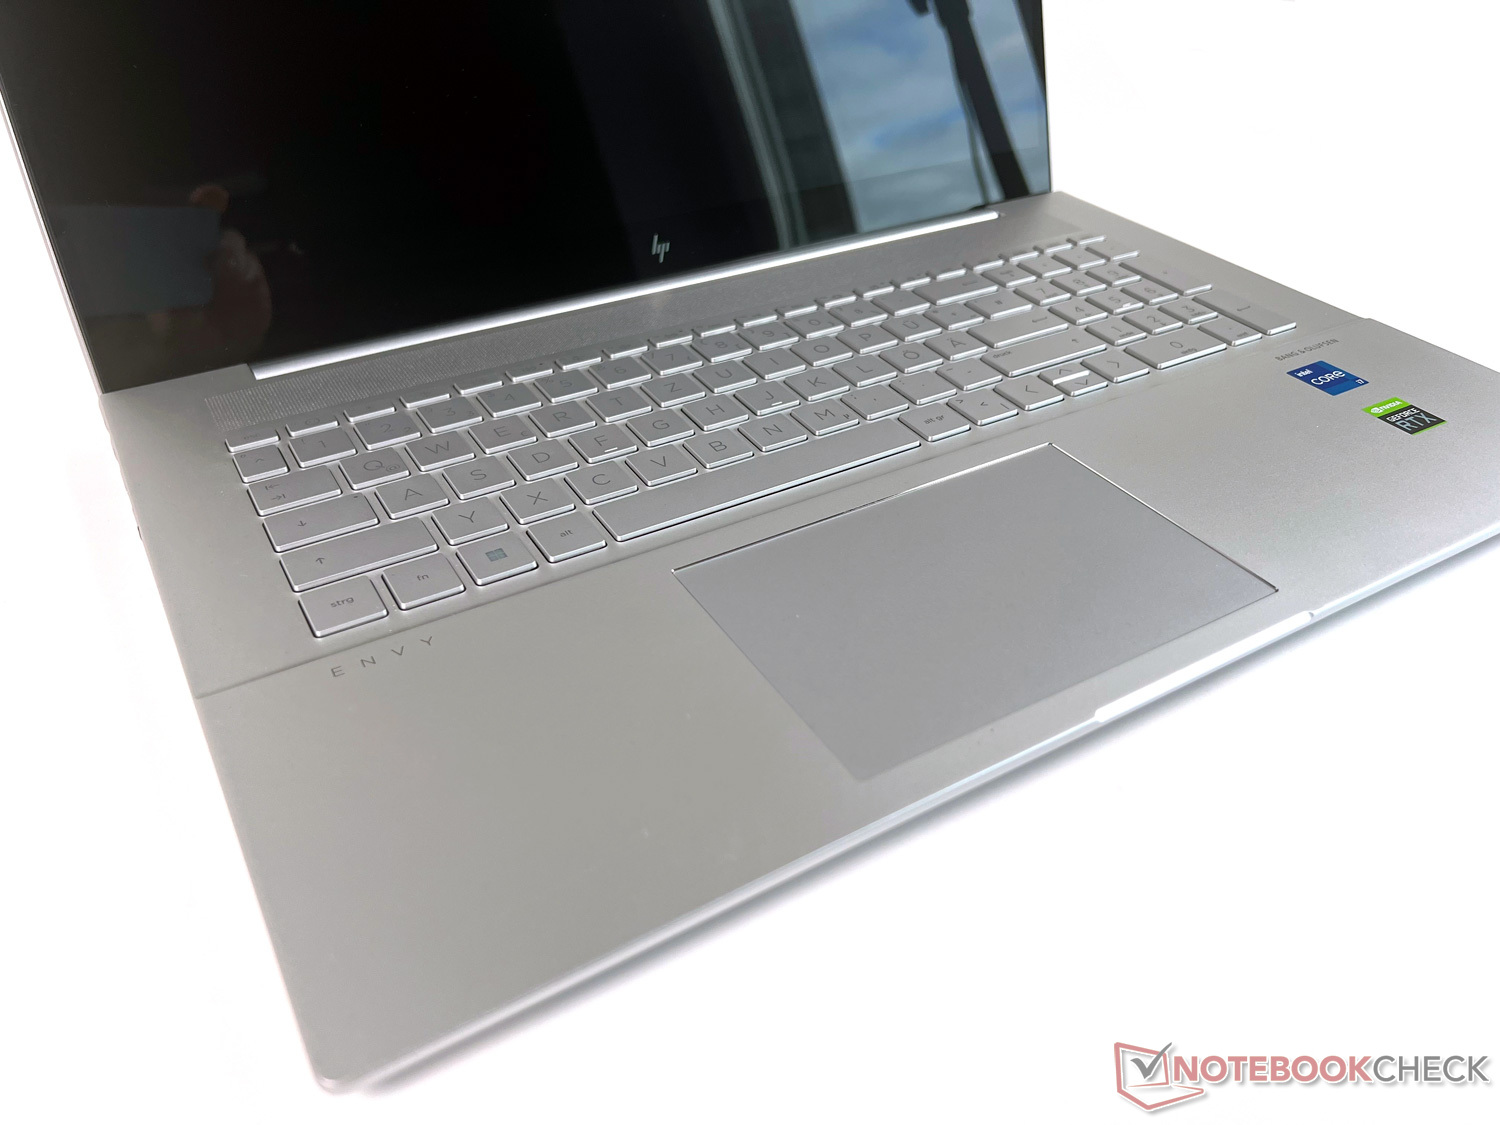
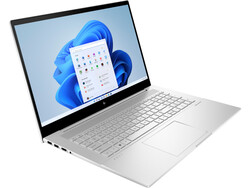
Estojo: Elegante e simples na cor prata
A HP Envy 17 se apresenta em um design simples na cor prata. Embora a maior parte do estojo seja feita de plástico, ele oferece uma impressão de alta qualidade com bom acabamento. A dobradiça larga mantém o grande visor bastante apertado, de modo que você tem que usar ambas as mãos para abrir o laptop.
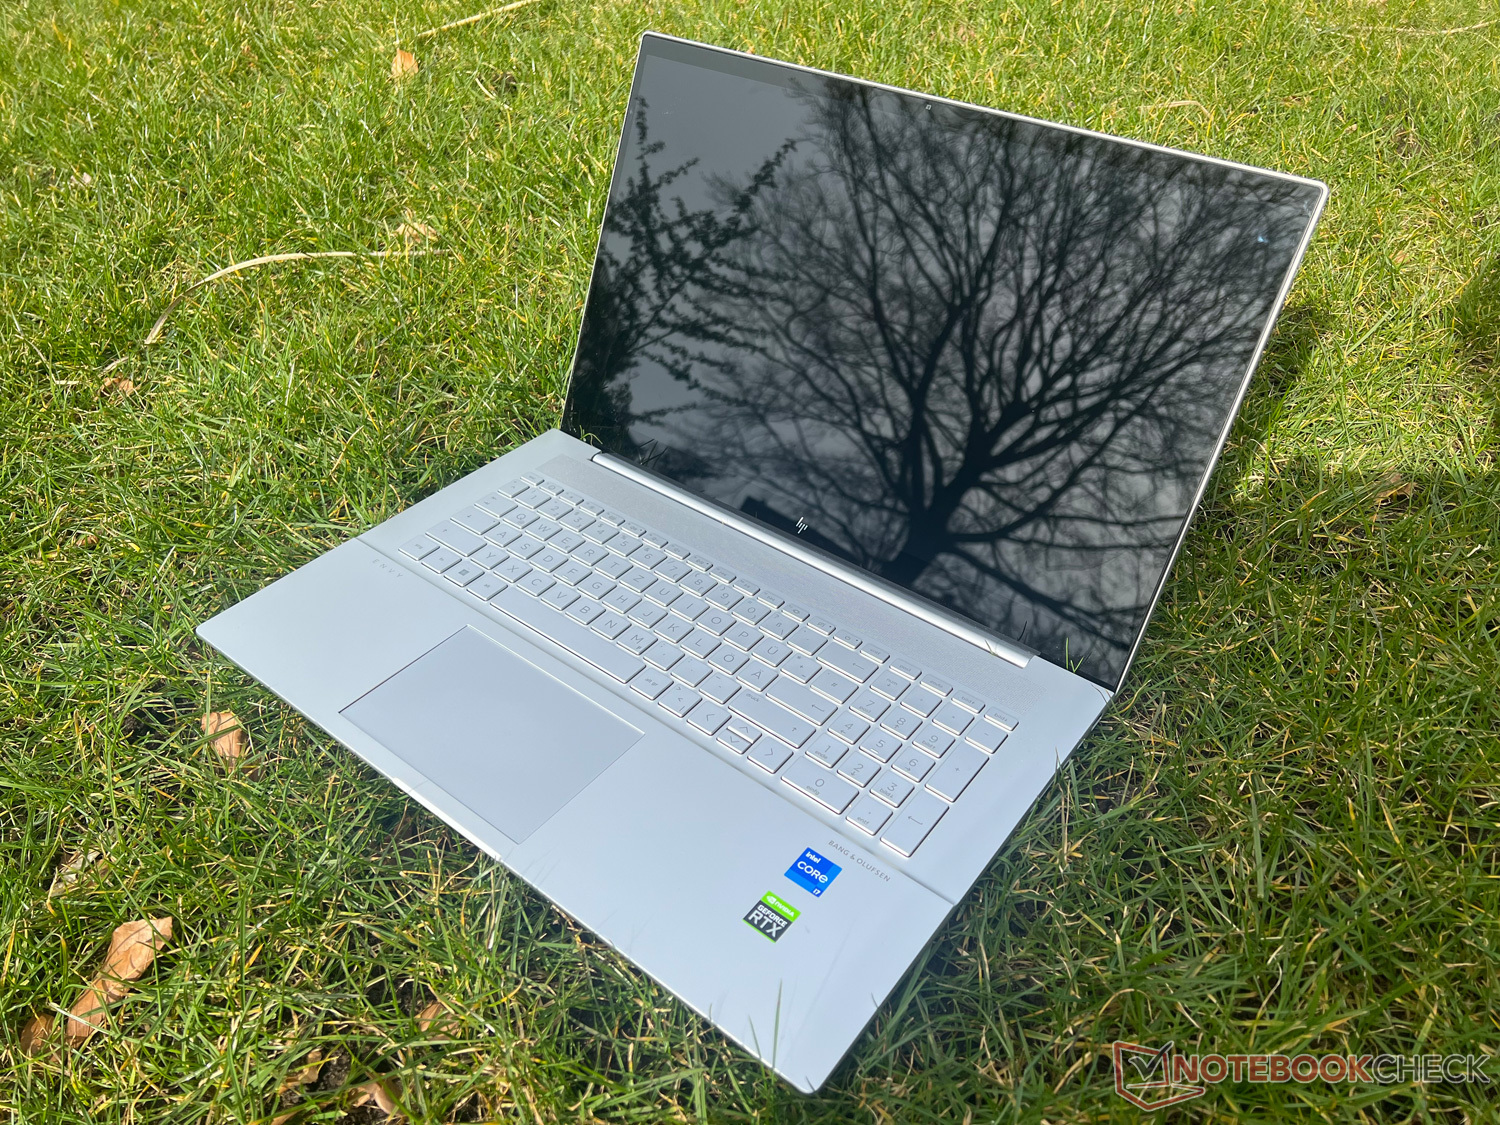
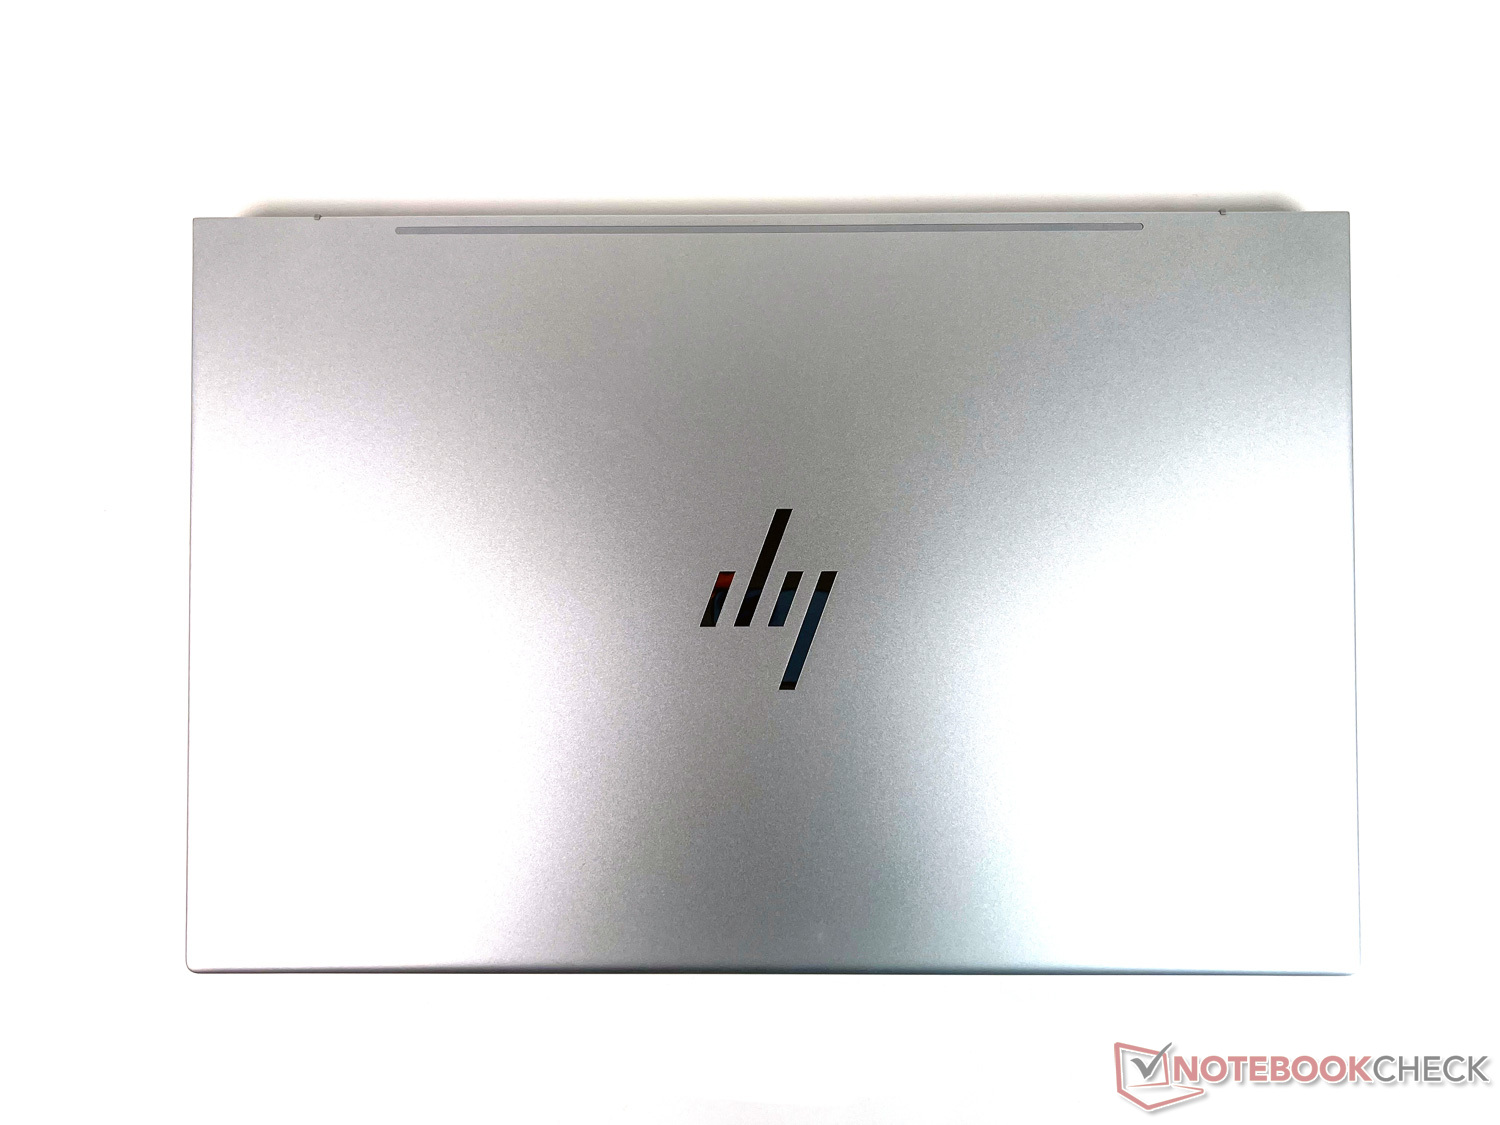
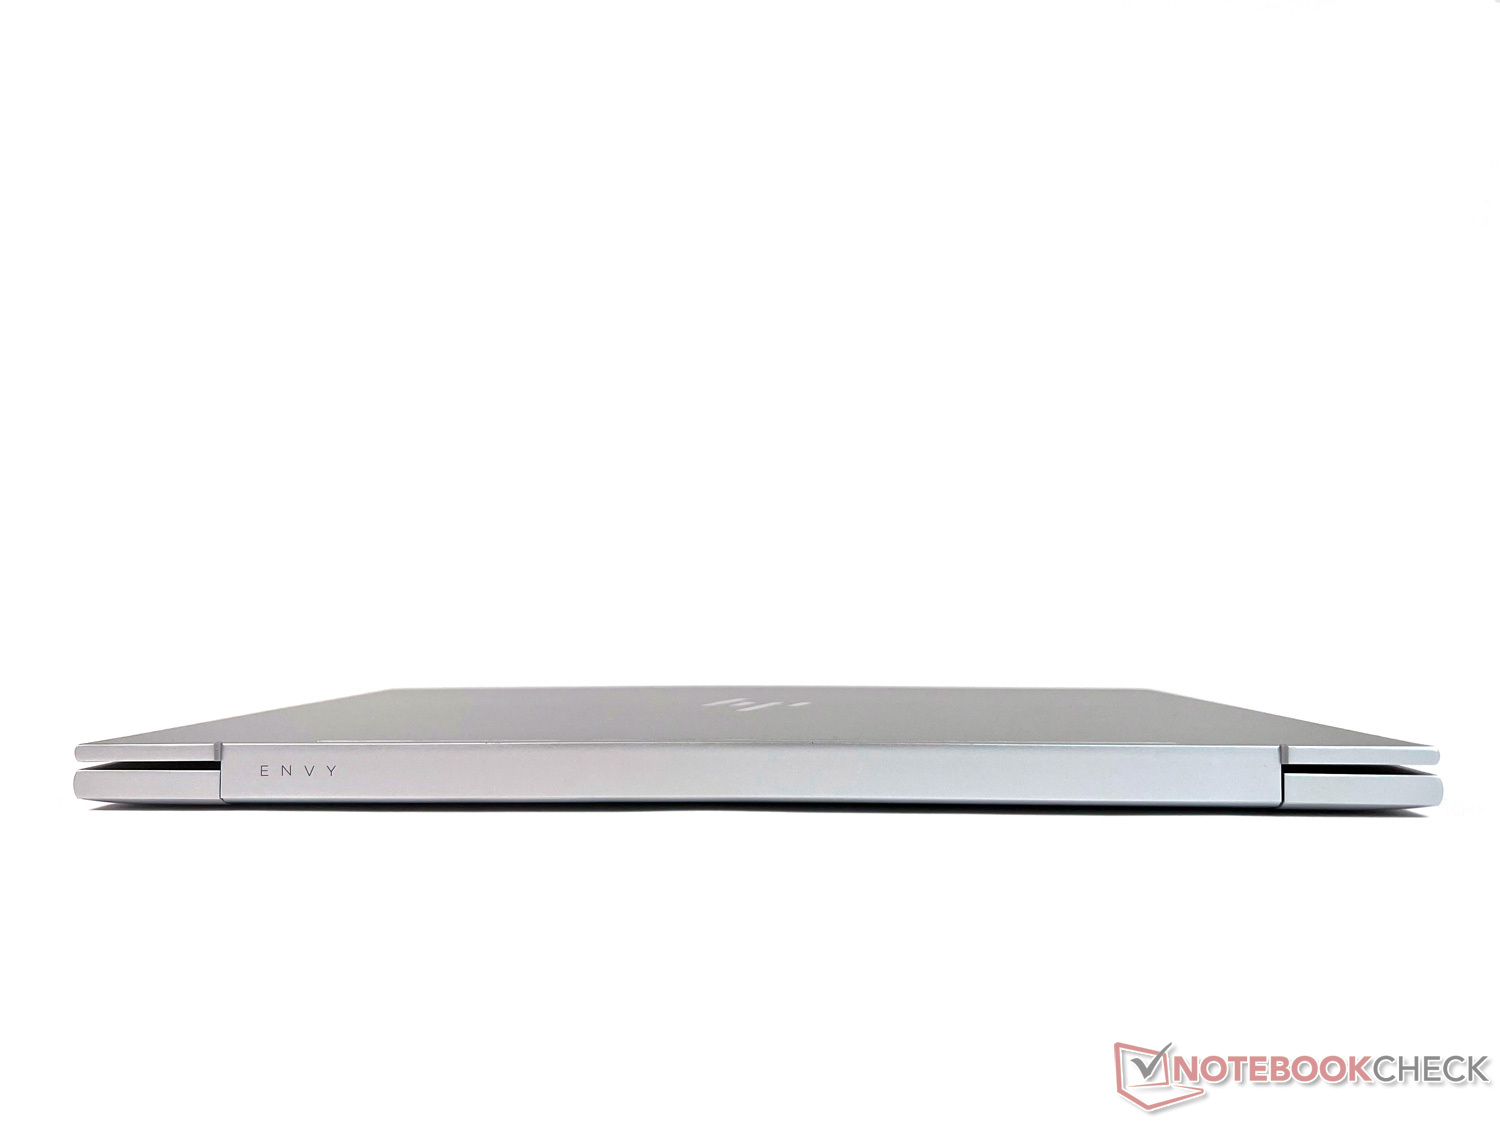
Como um laptop de 17 polegadas, o HP Envy 17 não é, naturalmente, muito compacto. Mas, graças às luneis finas da tela, particularmente do lado esquerdo e direito, o tamanho total permanece dentro dos limites. Em comparação com os outros dispositivos grandes de 17 polegadas, ele se coloca no meio do campo de teste.
O peso de ~2,5 kg (~5,5 lb) mais 500g (~1,1 lb) para o carregador tem um impacto no uso móvel. Uma grande diagonal do mostrador exige seu devido. Entretanto, mesmo com esse tamanho, os laptops podem até ser mais leves, como mostram os concorrentes. Nossa unidade de teste é um dos modelos mais pesados aqui, o que é um ponto negativo para o uso móvel.
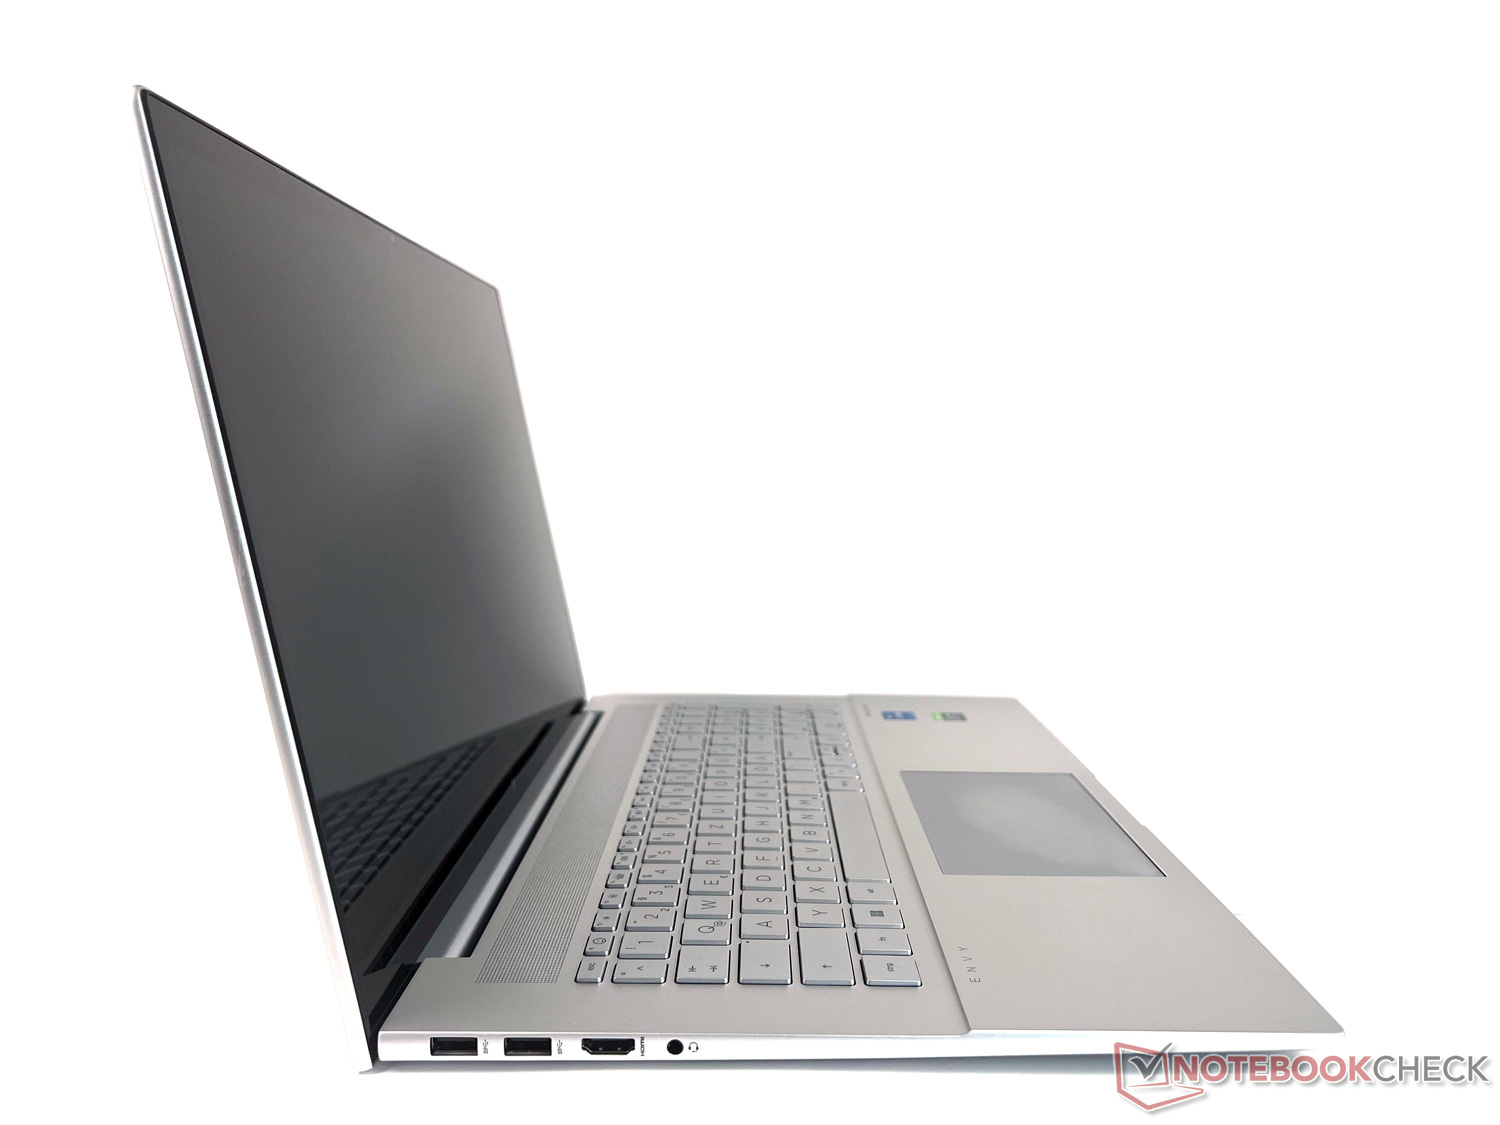
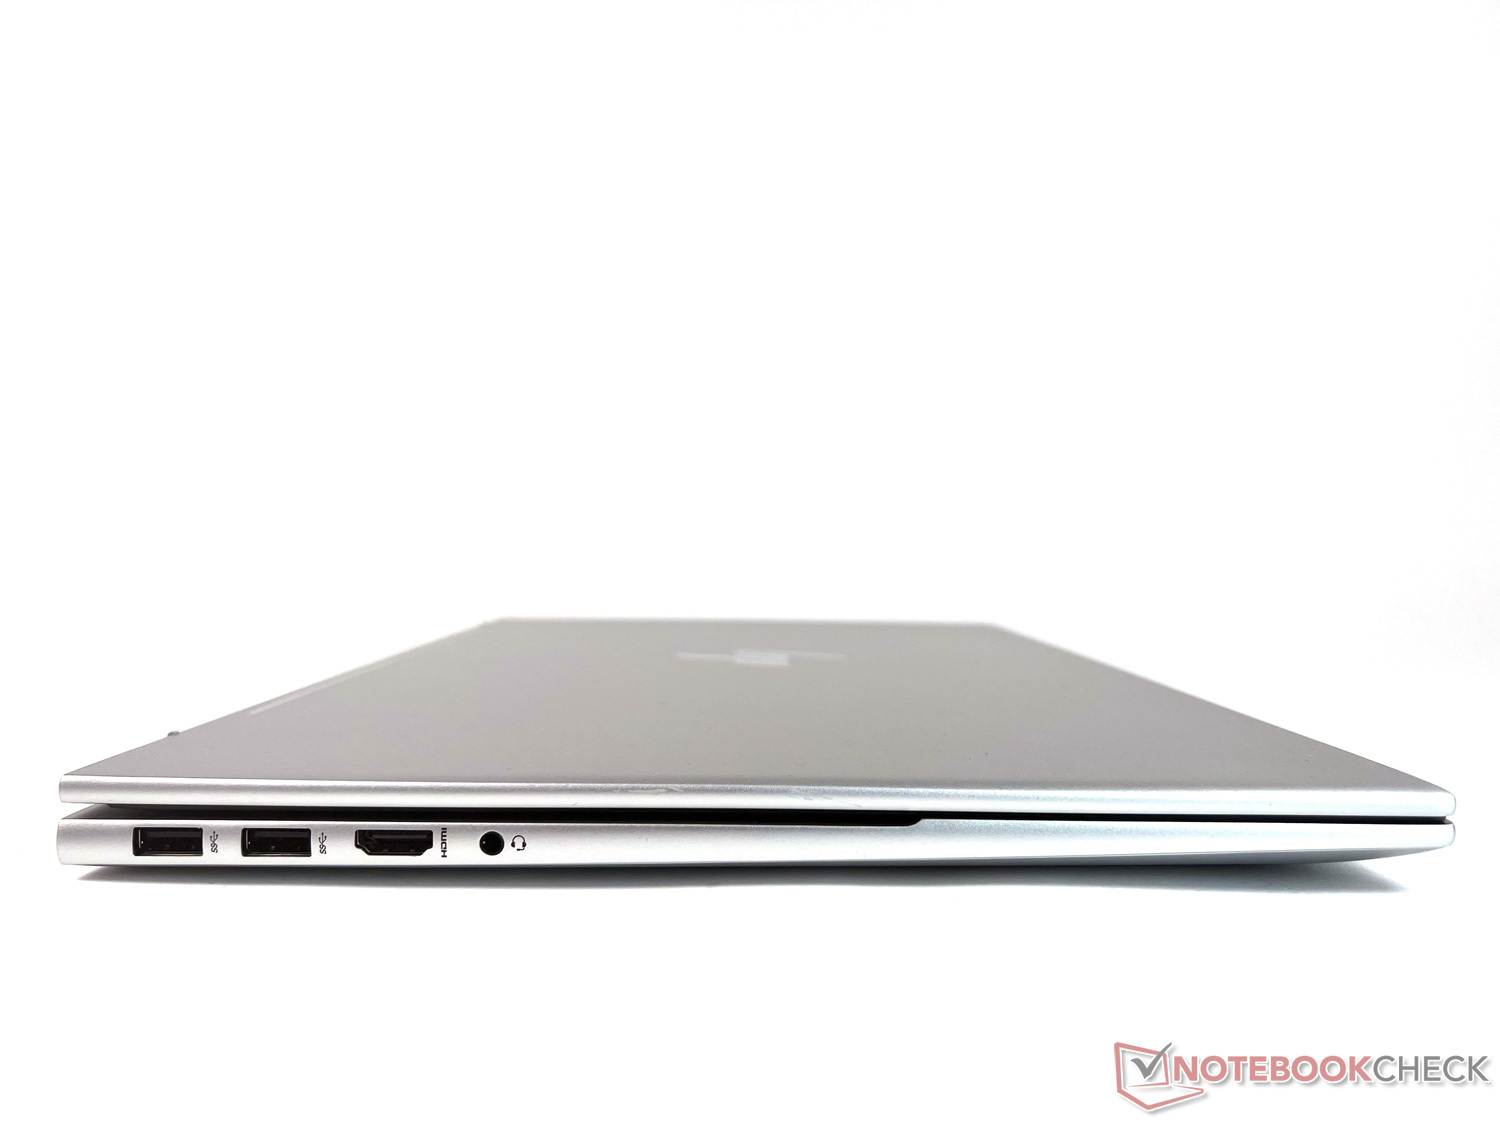
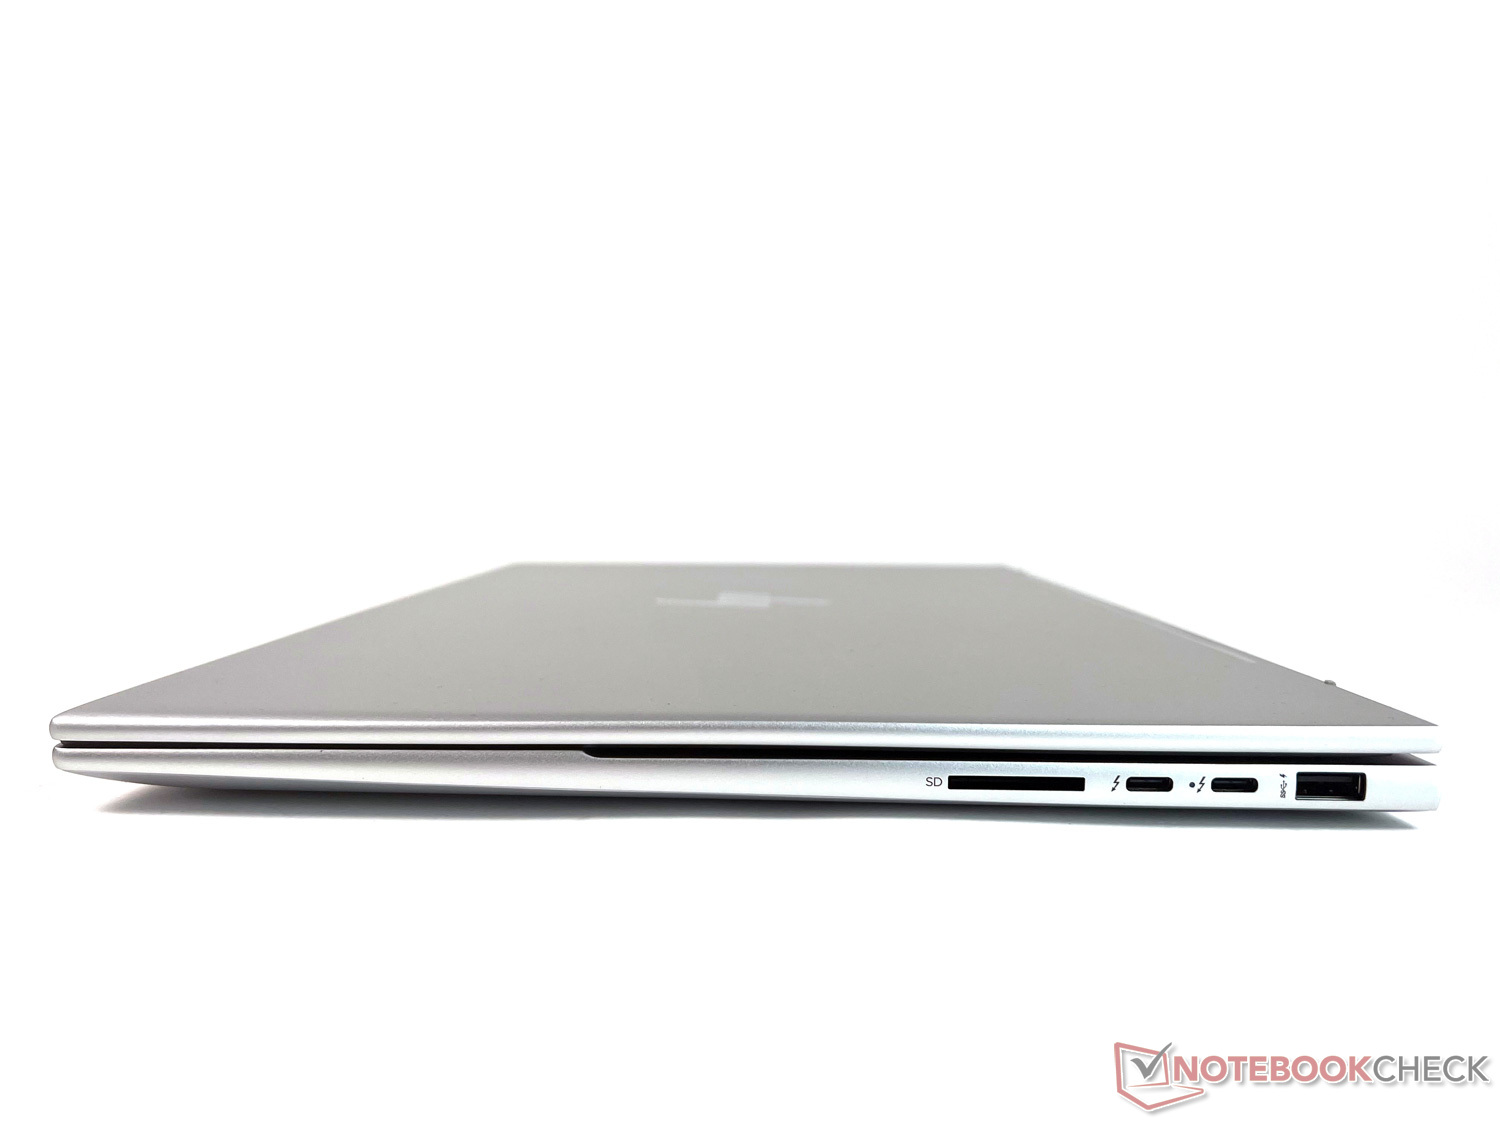
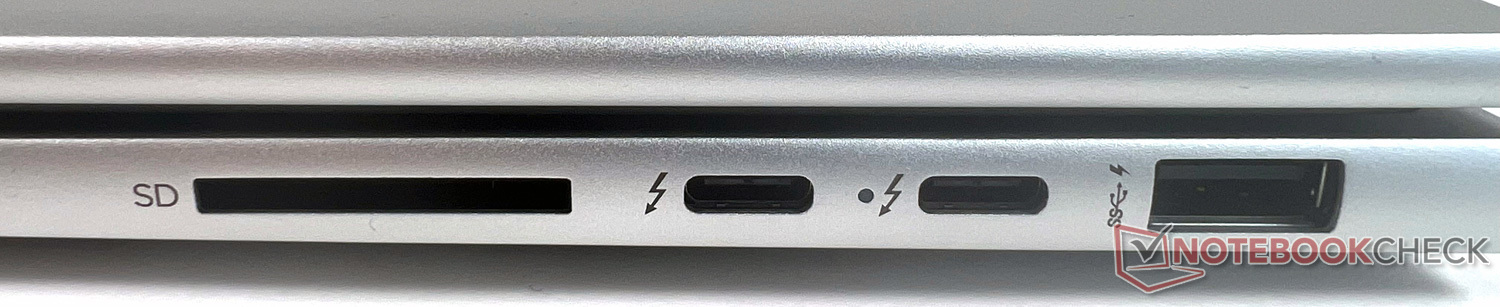
Equipamento: Laptop multimídia com 2x Thunderbolt 4
O Envy 17 oferece um extenso equipamento portuário, com exceção de um porto LAN. Estão incluídas duas portas Thunderbolt 4 com USB 4 Tipo C para transferência de dados até 40 Gbit/s, carregamento, e DisplayPort 1.4, com ambas as portas posicionadas no lado direito. Em algumas situações, seria mais desejável distribuí-las por ambos os lados. Uma das portas Thunderbolt é usada pelo carregador incluído para fornecer a energia.
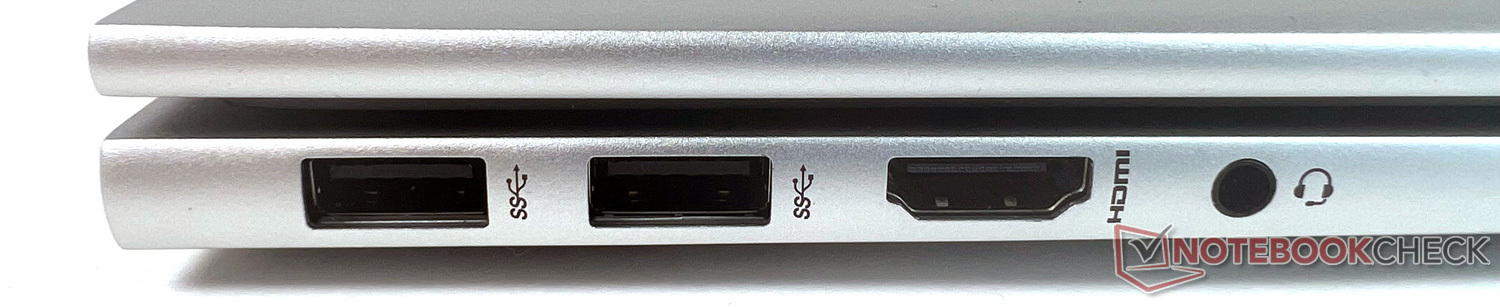
No lado esquerdo, uma porta HDMI-2.1 permite a conexão de um monitor externo, alternativamente à conexão DisplayPort. Três portas USB-A adicionais distribuídas por ambos os lados são suficientes, e há também um leitor de cartões SD. Todas as conexões são de fácil acesso.
Leitor de cartões SD
O leitor de cartões SD integrado não é um dos representantes mais rápidos de seu tipo. Em nossas medidas usando nosso cartão de referência AV PRO microSD 128 GB V60, ele sempre se coloca em último lugar, mas a distância atrás da maioria dos concorrentes não é muito grande. Entretanto, aqueles que muitas vezes precisam copiar grandes quantidades de dados de um cartão de armazenamento ainda serão melhor atendidos por outros dispositivos.
| SD Card Reader | |
| average JPG Copy Test (av. of 3 runs) | |
| Dell XPS 17 9720 (Toshiba Exceria Pro SDXC 64 GB UHS-II) | |
| Média da turma Multimedia (23 - 531, n=37, últimos 2 anos) | |
| Lenovo IdeaPad 3 17ABA7 (AV Pro SD microSD 128 GB V60) | |
| LG Gram 17Z90Q-E.AD78G (AV Pro SD microSD 128 GB V60) | |
| HP Envy 17-cr0079ng (AV Pro SD microSD 128 GB V60) | |
| maximum AS SSD Seq Read Test (1GB) | |
| Média da turma Multimedia (37.3 - 1455, n=36, últimos 2 anos) | |
| Dell XPS 17 9720 (Toshiba Exceria Pro SDXC 64 GB UHS-II) | |
| LG Gram 17Z90Q-E.AD78G (AV Pro SD microSD 128 GB V60) | |
| Lenovo IdeaPad 3 17ABA7 (AV Pro SD microSD 128 GB V60) | |
| HP Envy 17-cr0079ng (AV Pro SD microSD 128 GB V60) | |
Comunicação
O módulo Wi-Fi 6E AX211 da Intel utilizado aqui garante uma conexão WLAN rápida que quase se mantém constante ao longo do tempo. Nossas medidas estão ao nível da média para este módulo WLAN. Uma conexão de rede cabeada na forma de uma porta LAN ou uma conexão móvel não está disponível.
Webcam
A câmera infravermelha HP True Vision é colocada no centro da moldura do visor superior. Ela oferece supressão temporária de ruído e um microfone digital integrado de dois raios. Com 5 MP, sua resolução é bastante alta, e também pode ser usada para Windows Olá. Embora a qualidade da imagem seja boa, ela tem uma leve tonalidade vermelha. Comparado aos concorrentes em nosso teste, ele tem o segundo menor desvio de cor com um sólido ∆E de 8. Isto é absolutamente suficiente para chamadas de vídeo profissionais ou privadas.
Um belo truque: o obturador de privacidade não é aberto e fechado manualmente através do botão deslizante, mas através de teclas no teclado. Além disso, uma pequena luz ao lado da câmera indica quando esta é ativada.


Segurança
Além da proteção da privacidade da câmera, a HP Envy 17 também suporta o módulo de plataforma confiável (firmware TPM). Não há Kensington Lock ou sensor de impressões digitais, mas o Windows Hello é suportado para desbloqueio via reconhecimento facial.
Acessórios
A HP inclui um poderoso carregador USB-C de 90 watts com ou sem laptop. Opcionalmente, a HP também oferece uma série de acessórios, mas eles não são projetados especificamente para este laptop.
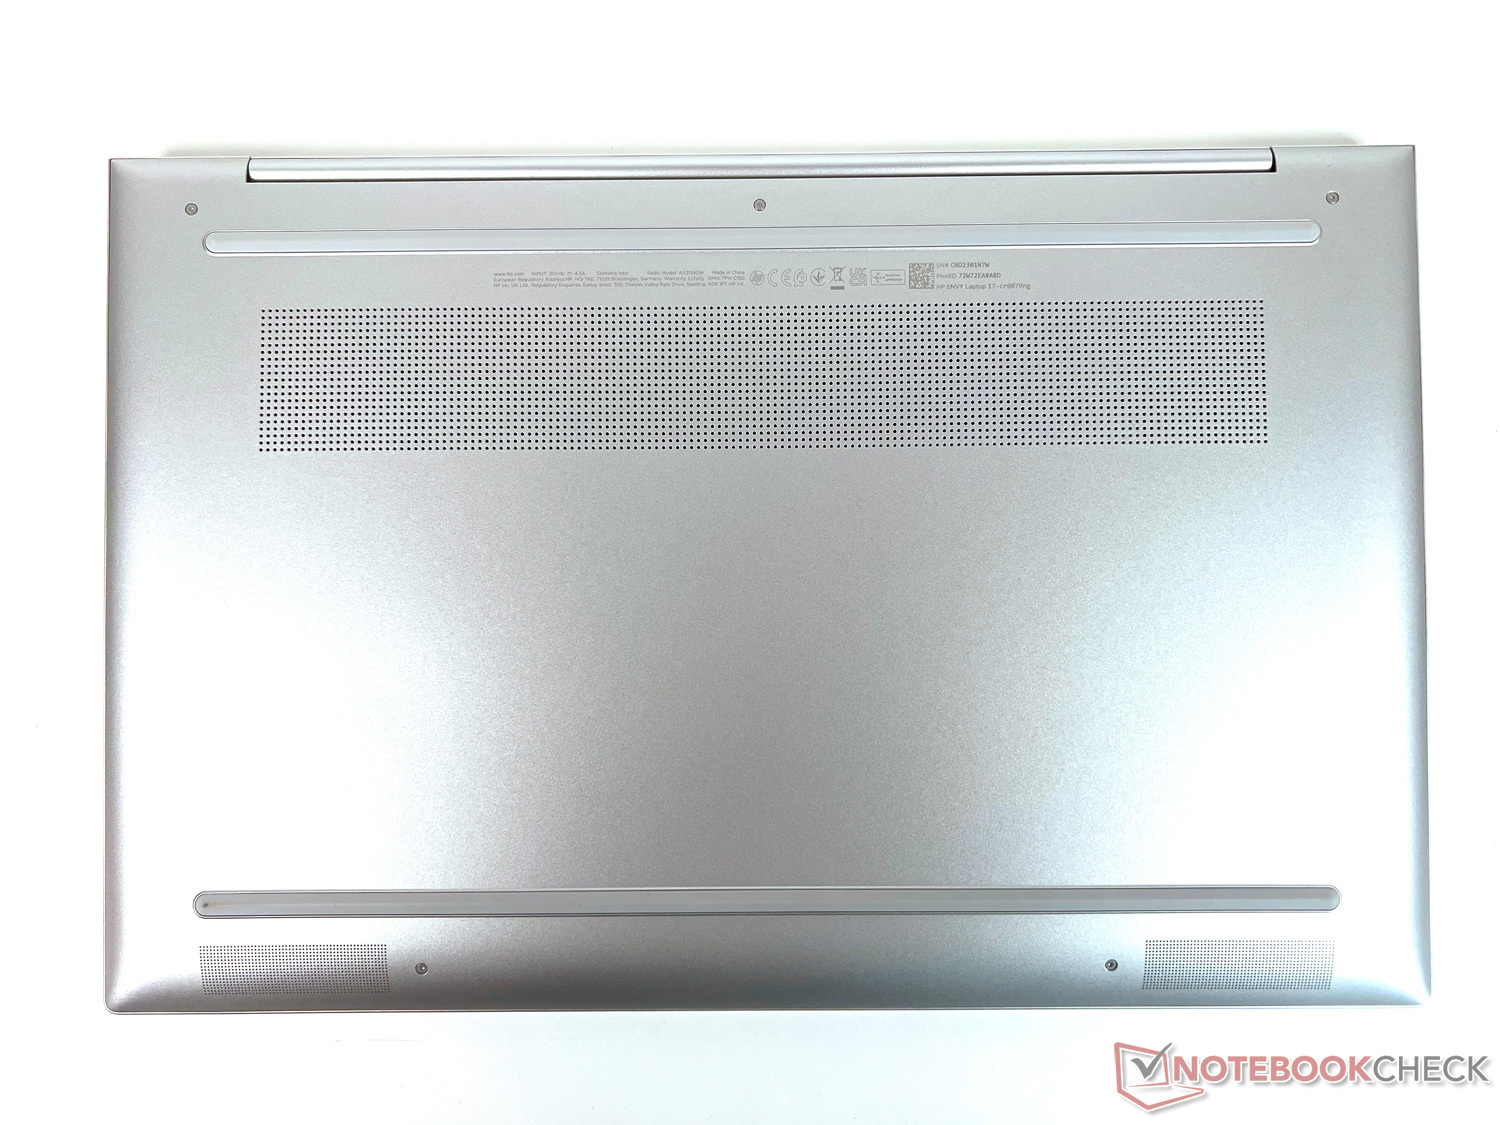
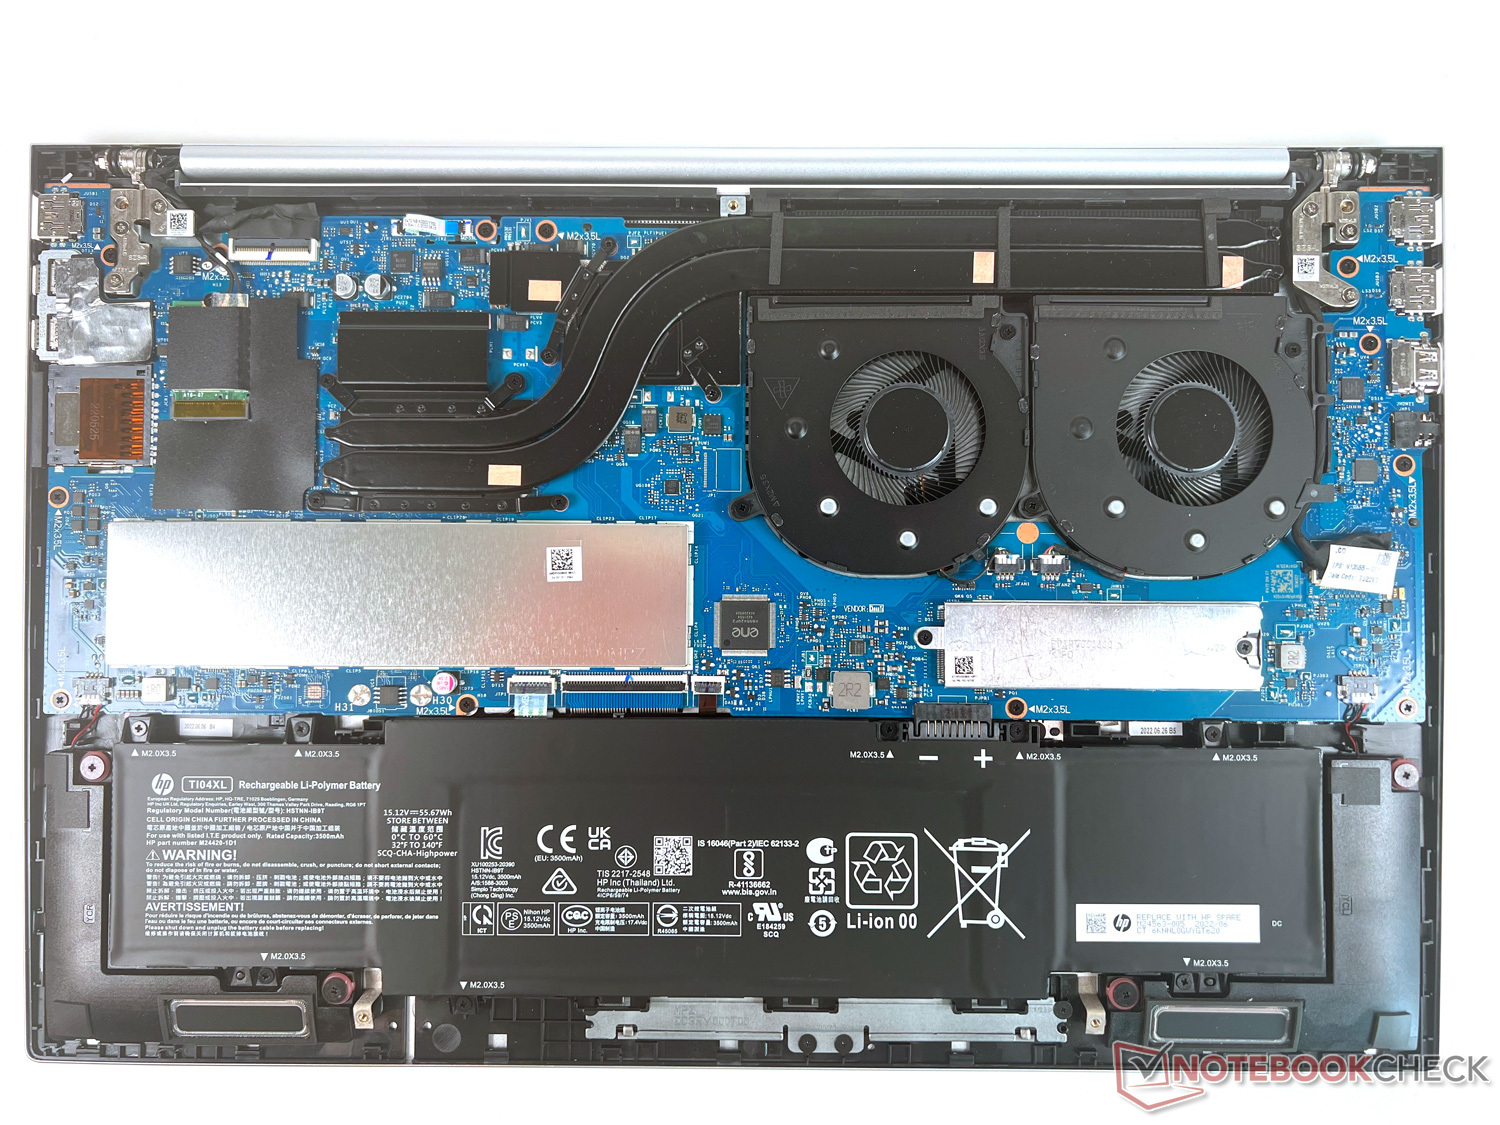
Manutenção
O acesso ao interior é bloqueado por cinco minúsculos parafusos Torx. Uma vez obtido o acesso, dificilmente lhe é oferecida qualquer oportunidade de manutenção. Não há slots gratuitos para expansão de armazenamento, mas considerando que já oferece 32 GB de RAM, isto não deve ser muito difícil de aceitar. A bateria, o M.2 SSD, e o módulo Wi-Fi podem ser substituídos.
Garantia
Na Alemanha, a HP oferece uma garantia de 2 anos do fabricante para peças e mão-de-obra.
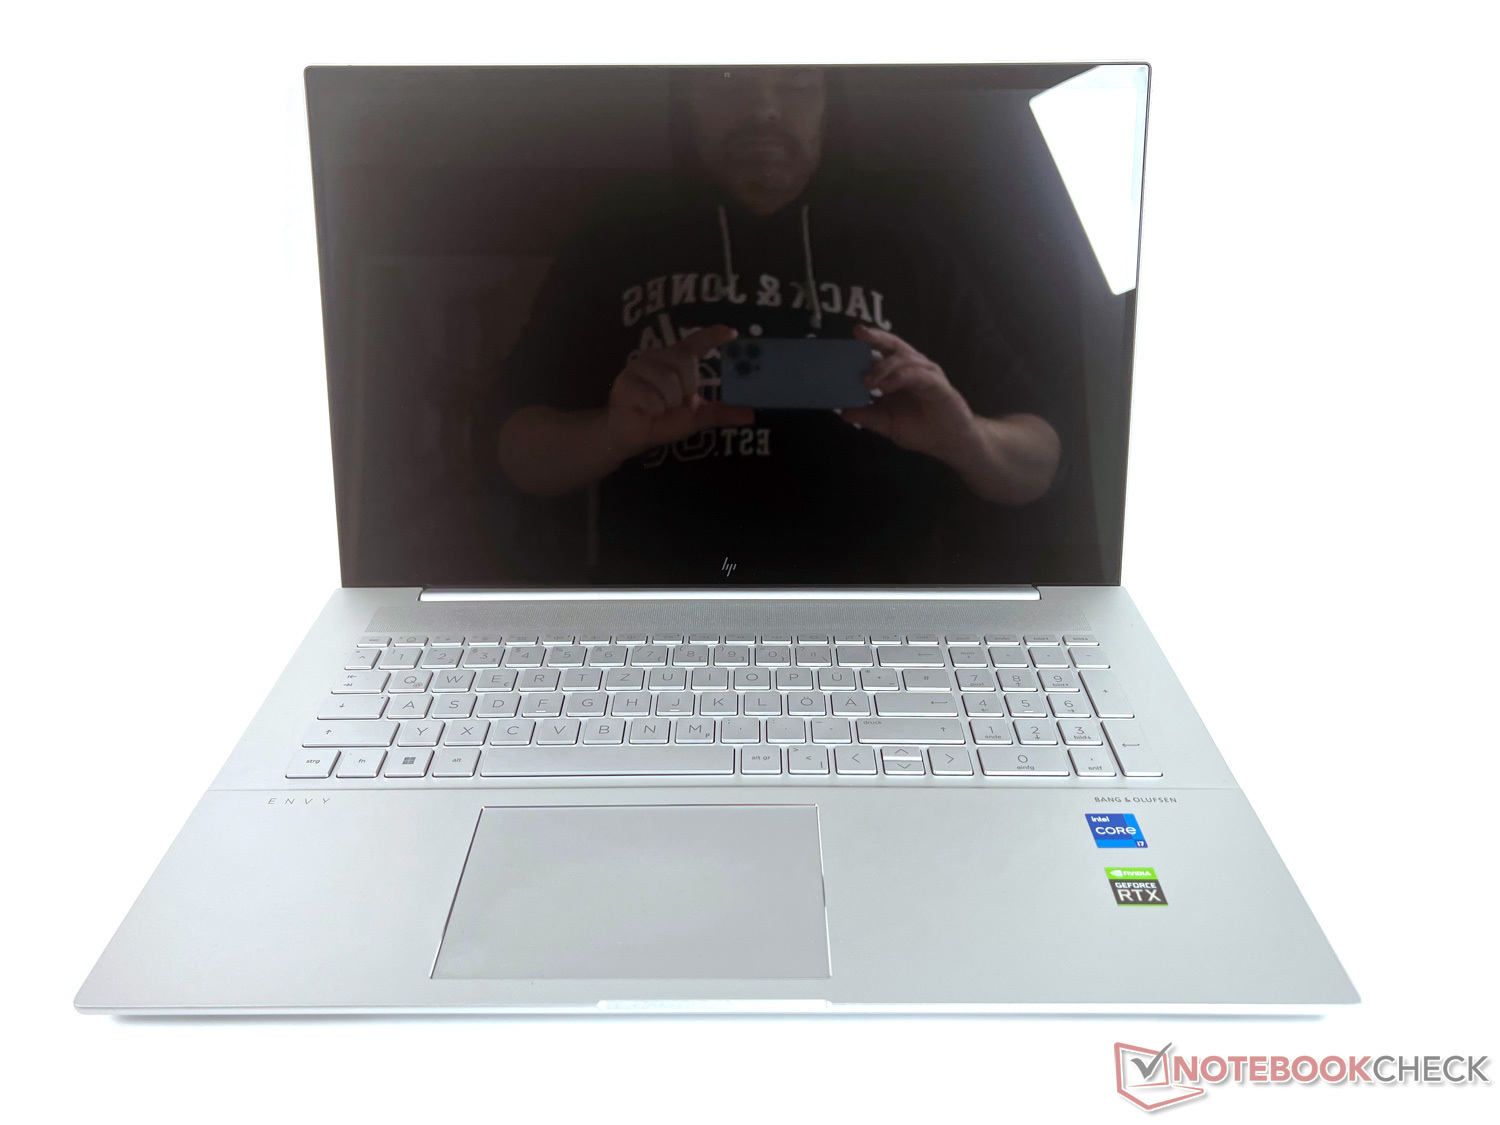
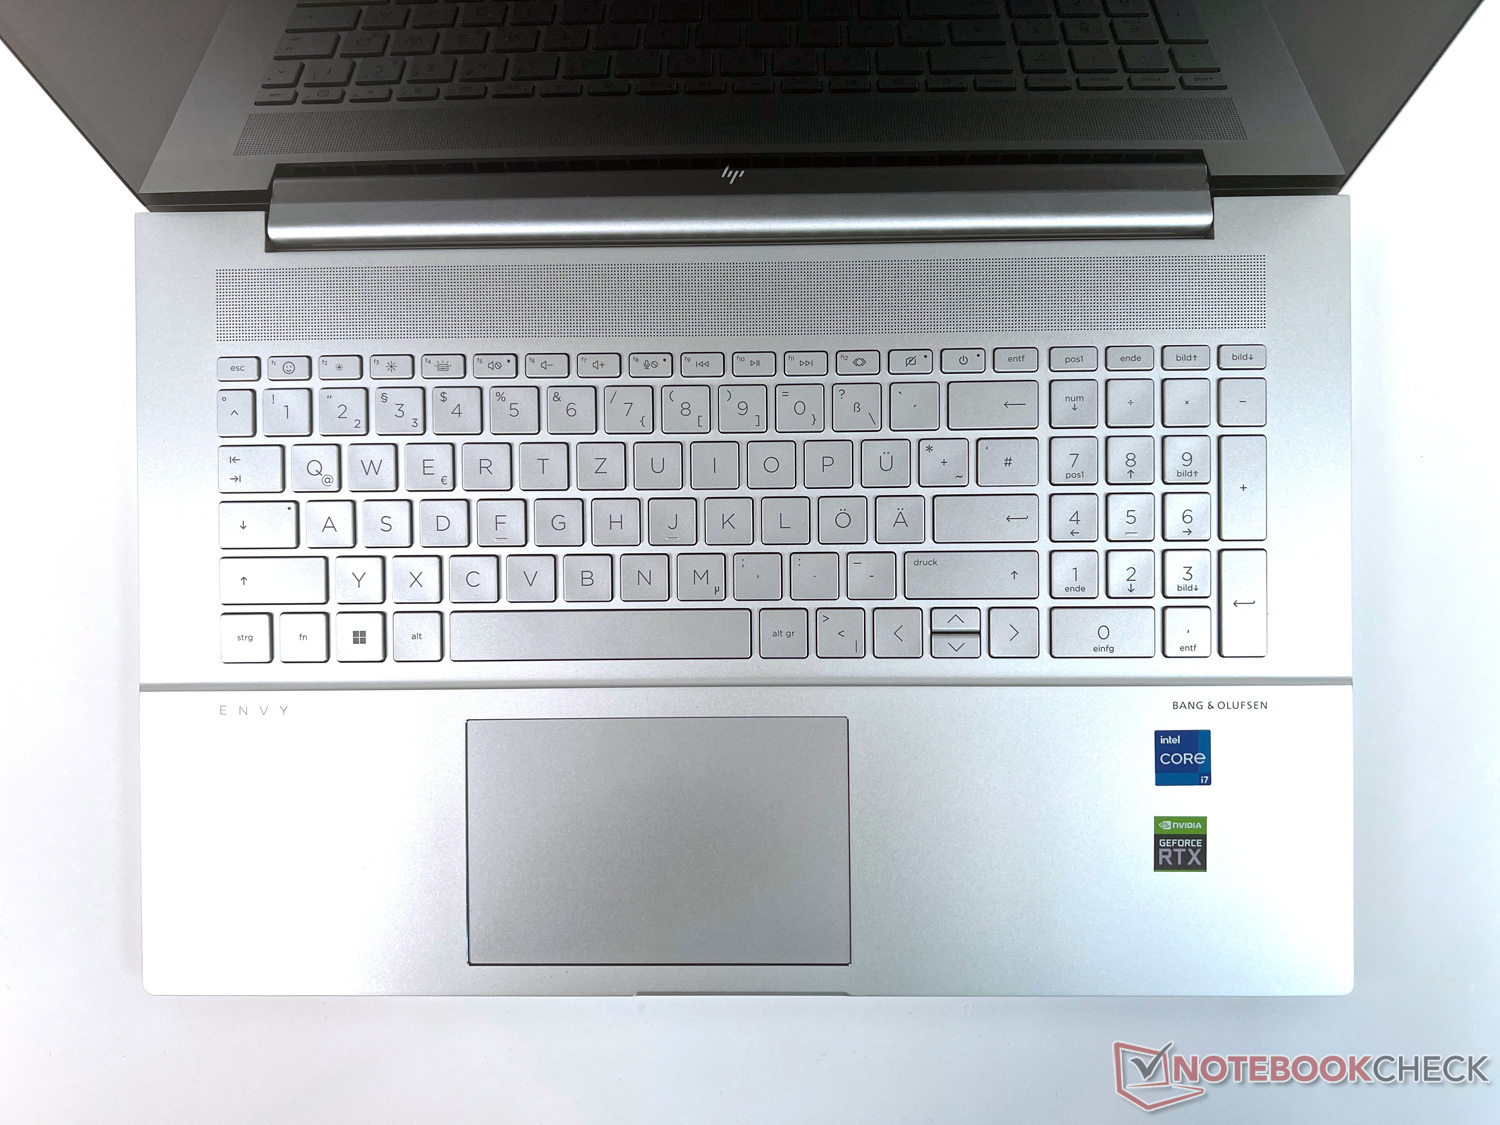
Dispositivos de entrada: O grande teclado não dá motivo para reclamações
Um display de 17,3 polegadas na diagonal também significa que há muito espaço para o teclado. Além de cerca de 3 cm (~1,2 pol.) nas bordas, a HP utiliza este espaço para um teclado suficientemente grande junto com um numpad na lateral.
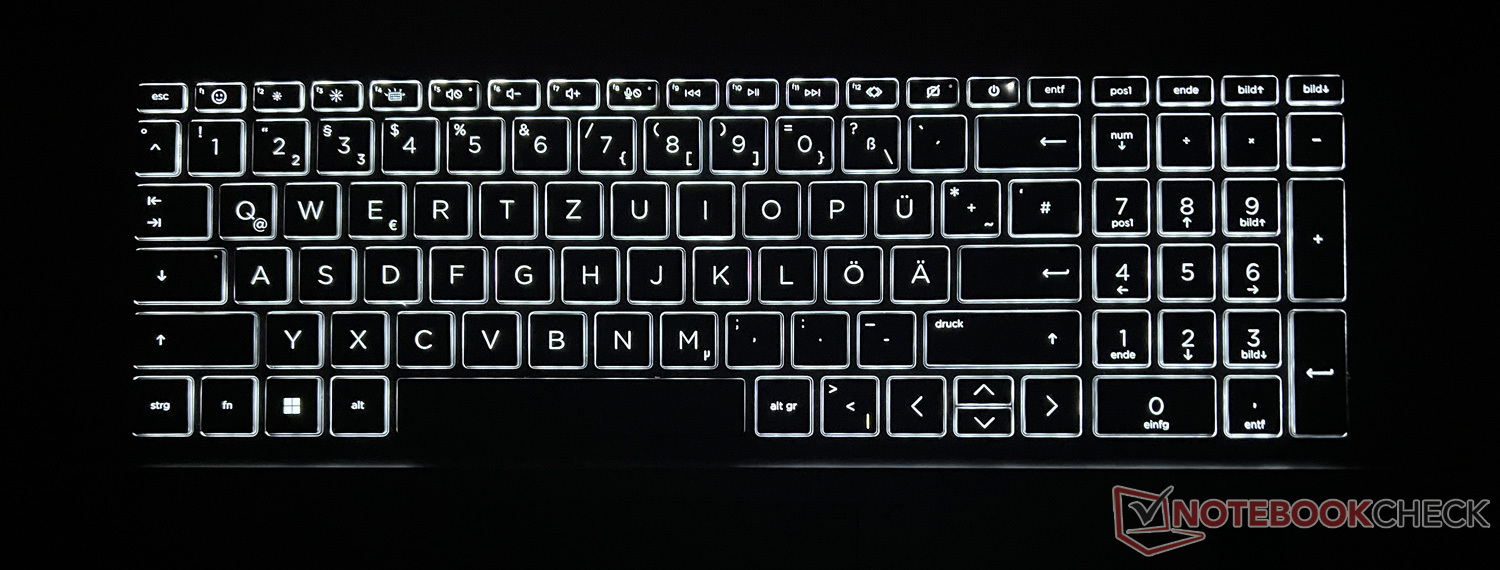
Teclado
Com cerca de 1,7 x 1,7 cm (~0,67 in), as teclas são suficientemente grandes, e com um forno de chave de cerca de 2 mm (~0,08 in), o teclado oferece uma experiência de digitação confortável. O fabricante ocupa as teclas F1 a F12 com como funções adicionais habituais, por exemplo para controlar a iluminação do teclado em três etapas, o volume, o brilho do visor ou o obturador da câmera que já mencionamos. No lado direito está a tecla de alimentação para ligar o dispositivo.
O teclado numérico é conveniente especialmente para a entrada de números. A iluminação do teclado garante uma iluminação uniforme das teclas e uma boa legibilidade das etiquetas.
Touchpad
O touchpad é colocado abaixo do teclado ligeiramente à esquerda do centro. Em torno de 12,5 x 8 cm (~4,9 x 3,15 pol.), não temos nenhum motivo de reclamação sobre o tamanho nem sobre a háptica, graças à superfície lisa. Os cliques à esquerda são possíveis em quase toda a superfície do touchpad, e além do canto inferior direito, também os cliques à direita. Não há separação táctil das áreas, mas na operação diária você não notará que isto está faltando.
A resposta às entradas é rápida e sem nenhum problema. Gestos multi-toque como rolagem com dois dedos ou zoom in e out são suportados.
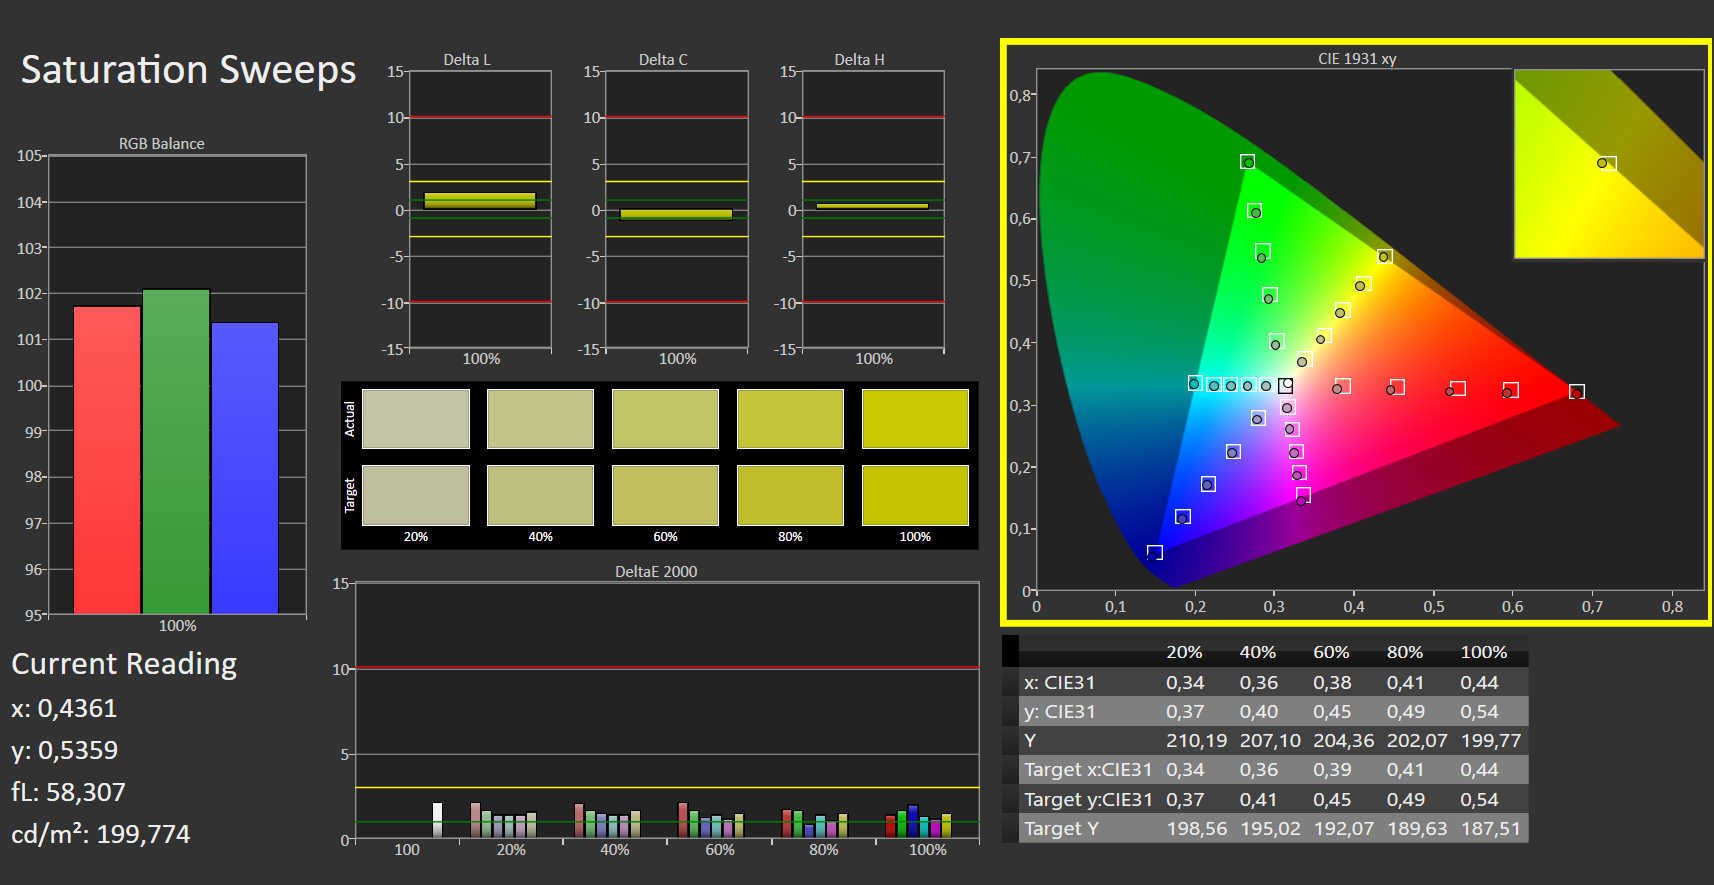
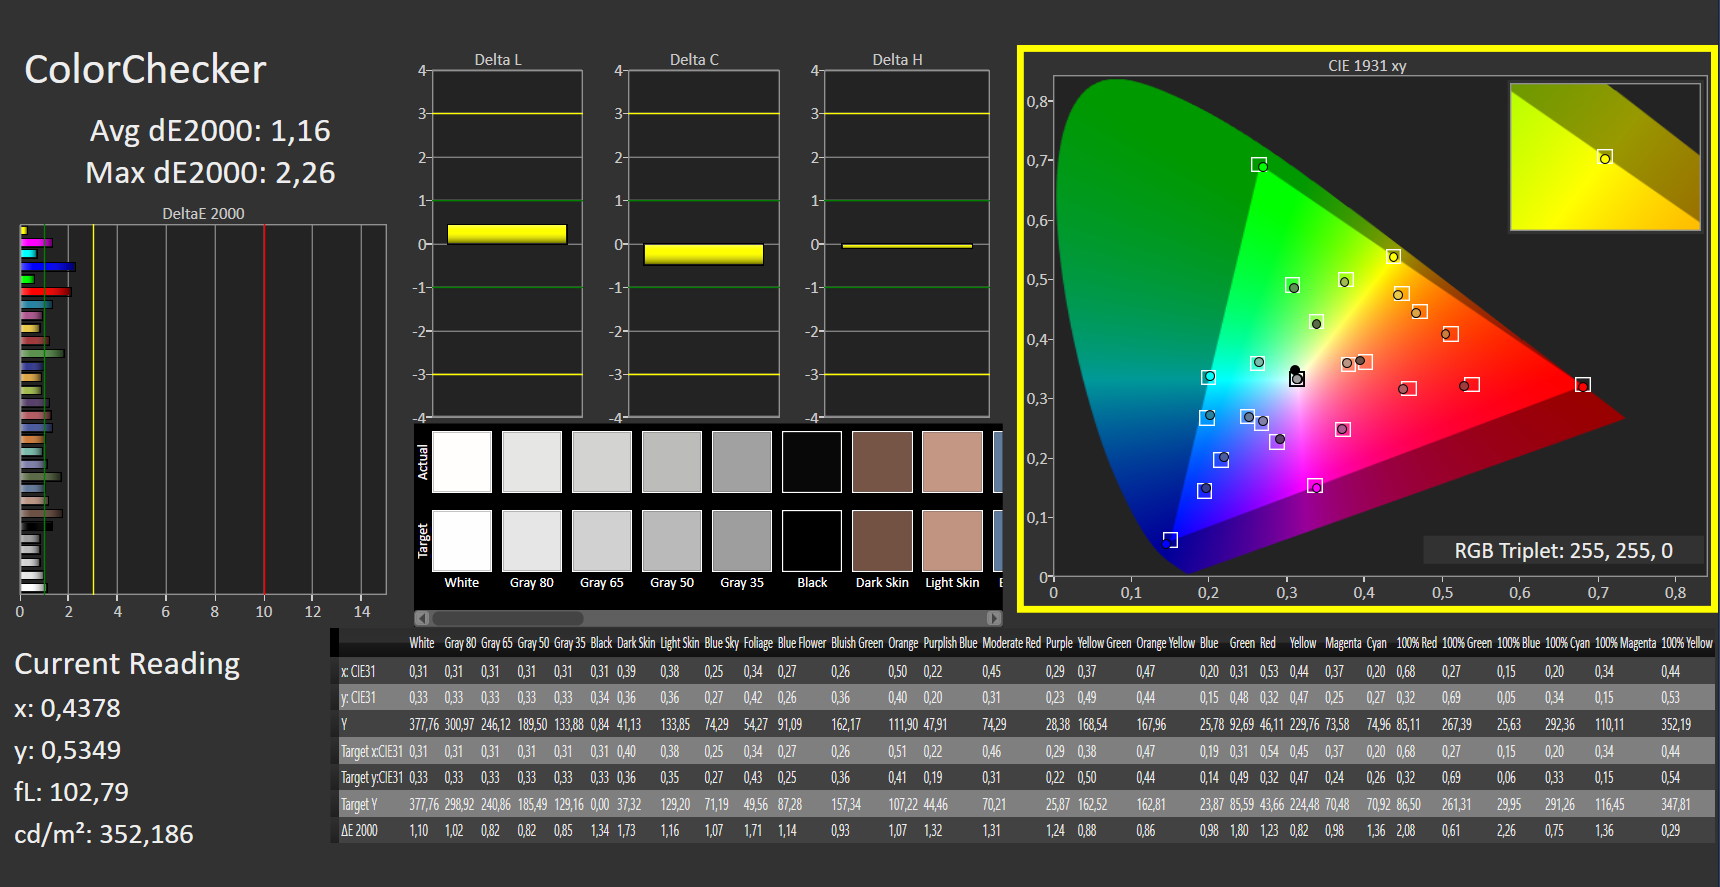
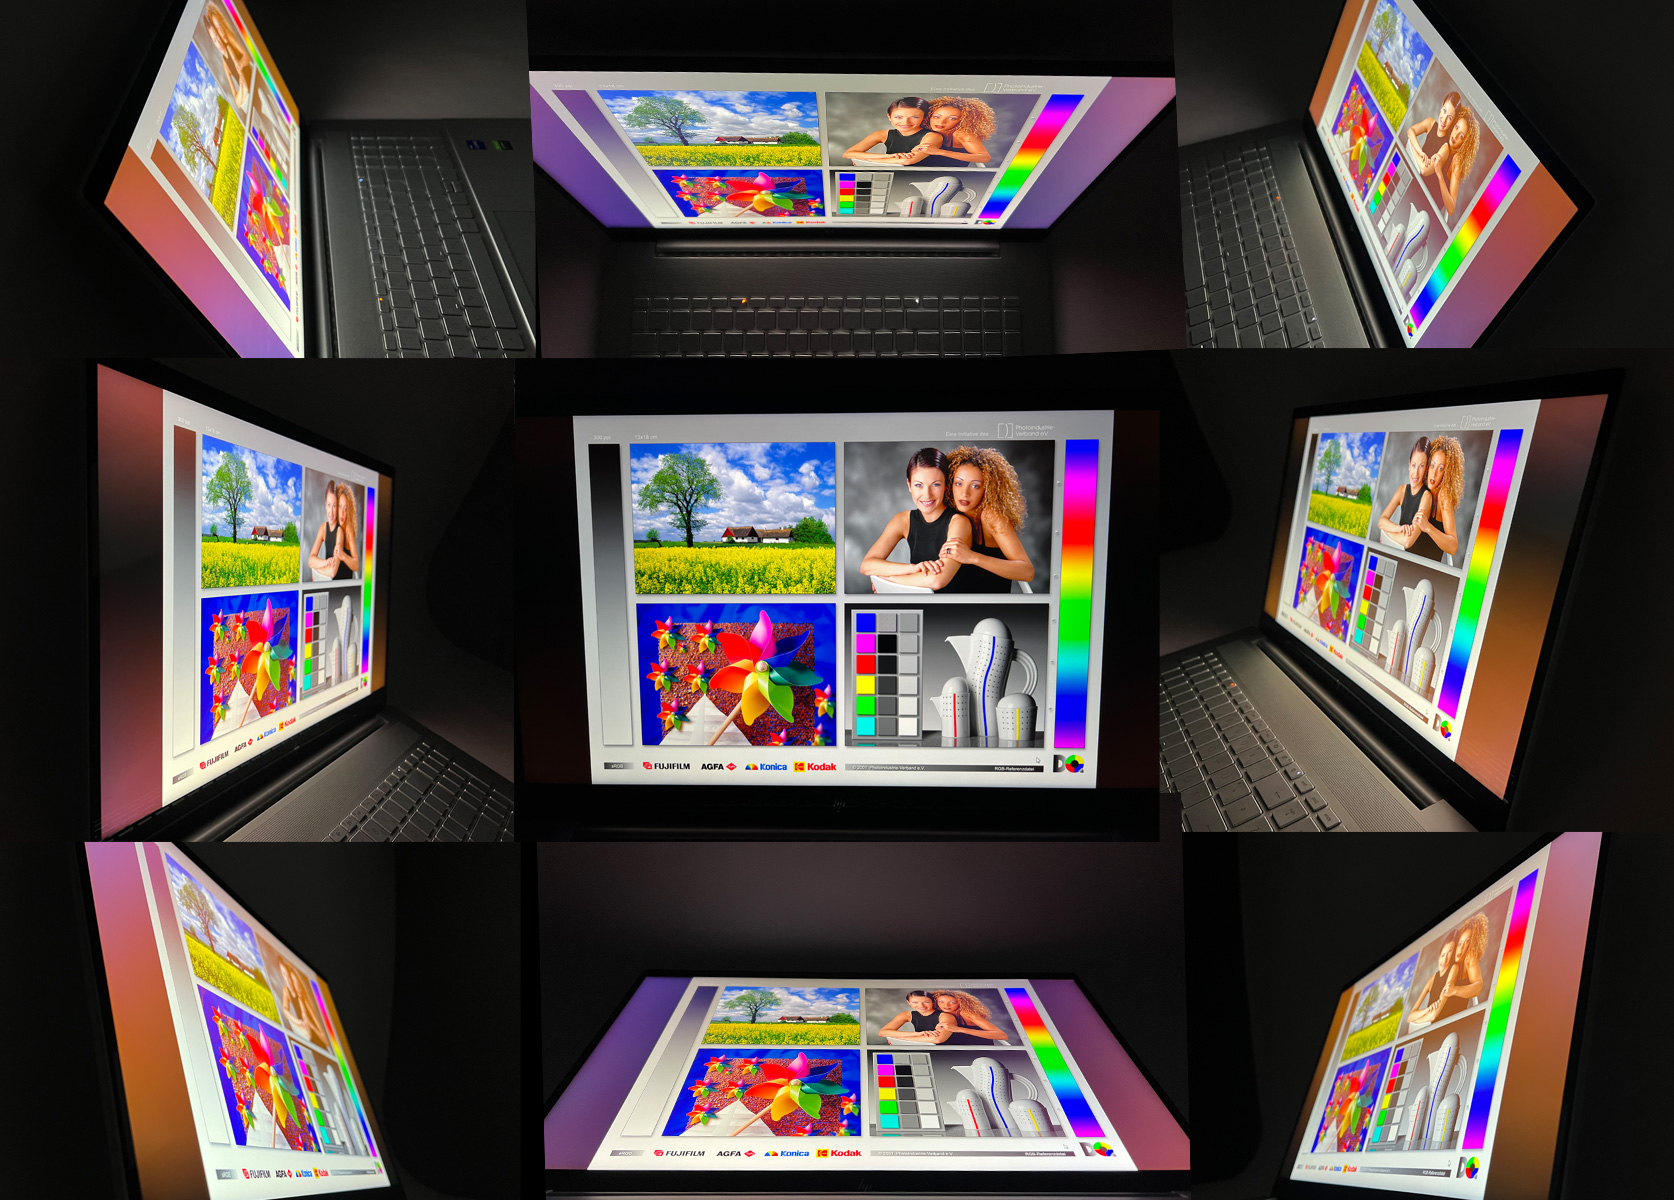
Mostrar: Alta resolução e boa, mas muito reflexiva

A HP equipou o Envy 17-cr0079ng com um grande painel IPS de 17,3 polegadas de alta resolução 4K da BOE com 3,840 x 2,160 pixels, 60 Hz, e tempos de resposta curtos. Alternativamente, você também pode escolher versões com um display FHD nesta série de modelos.
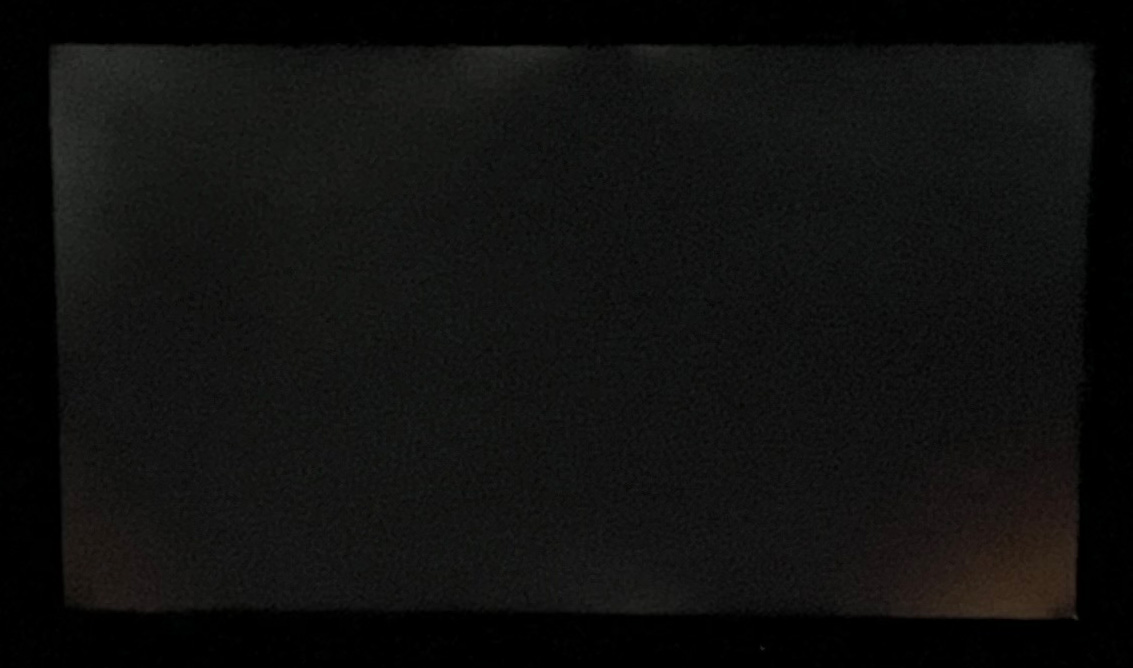
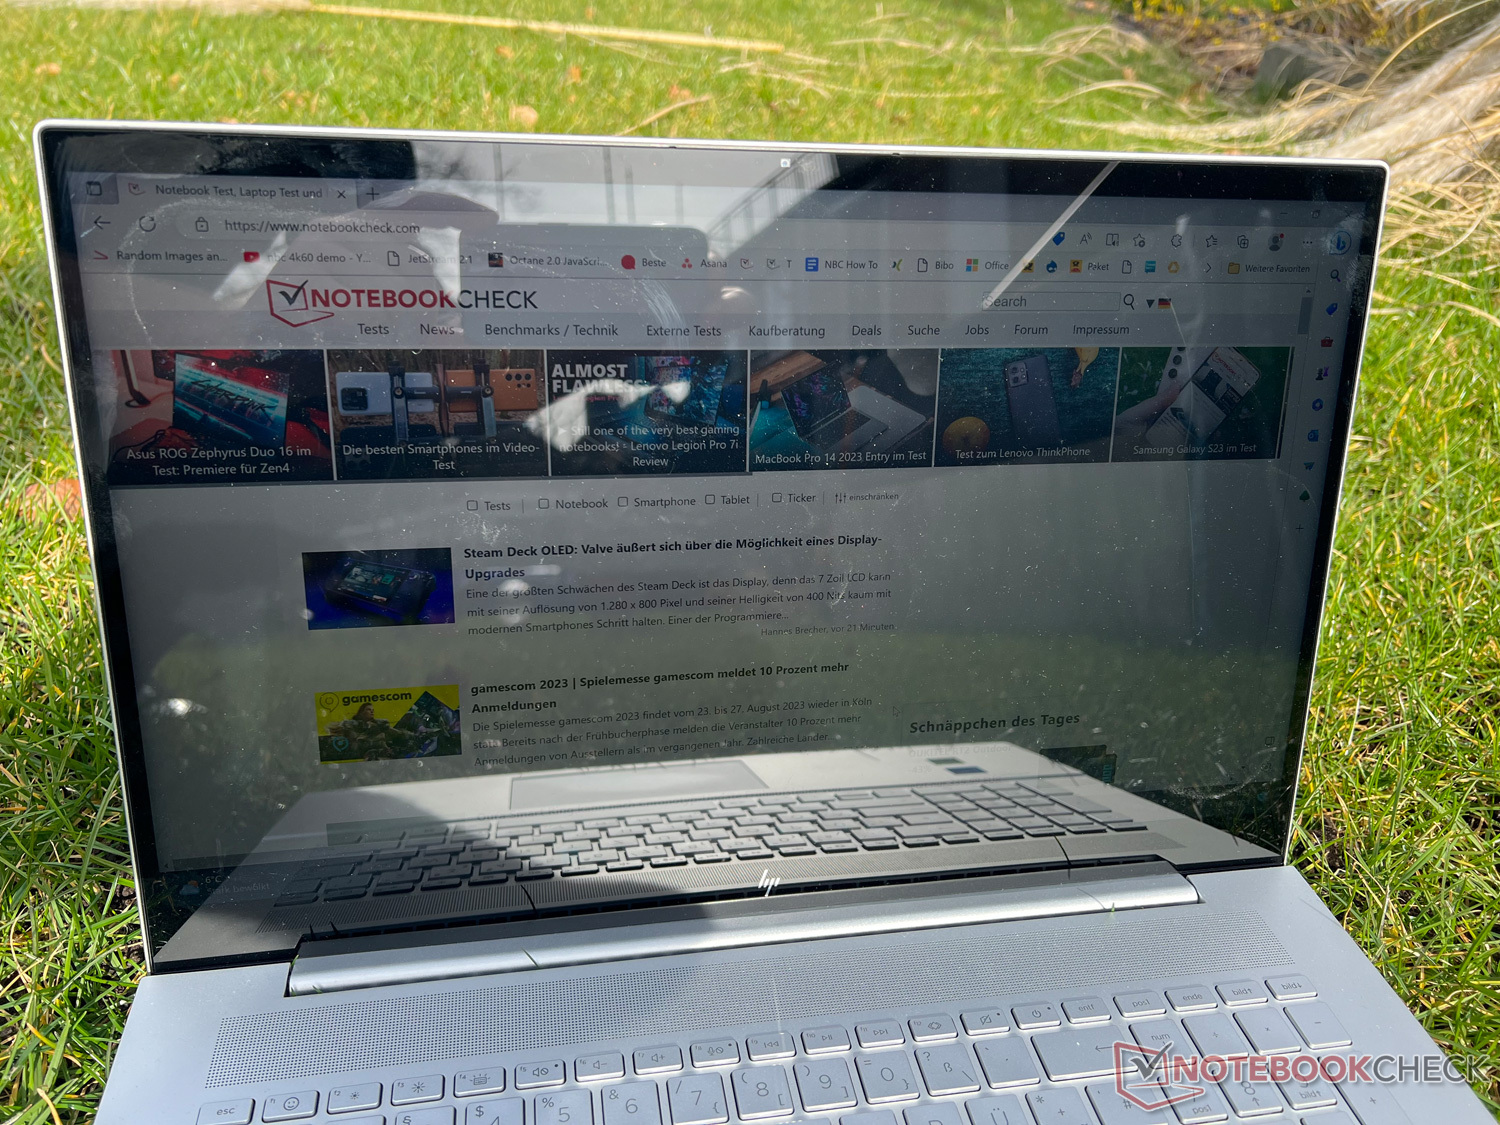
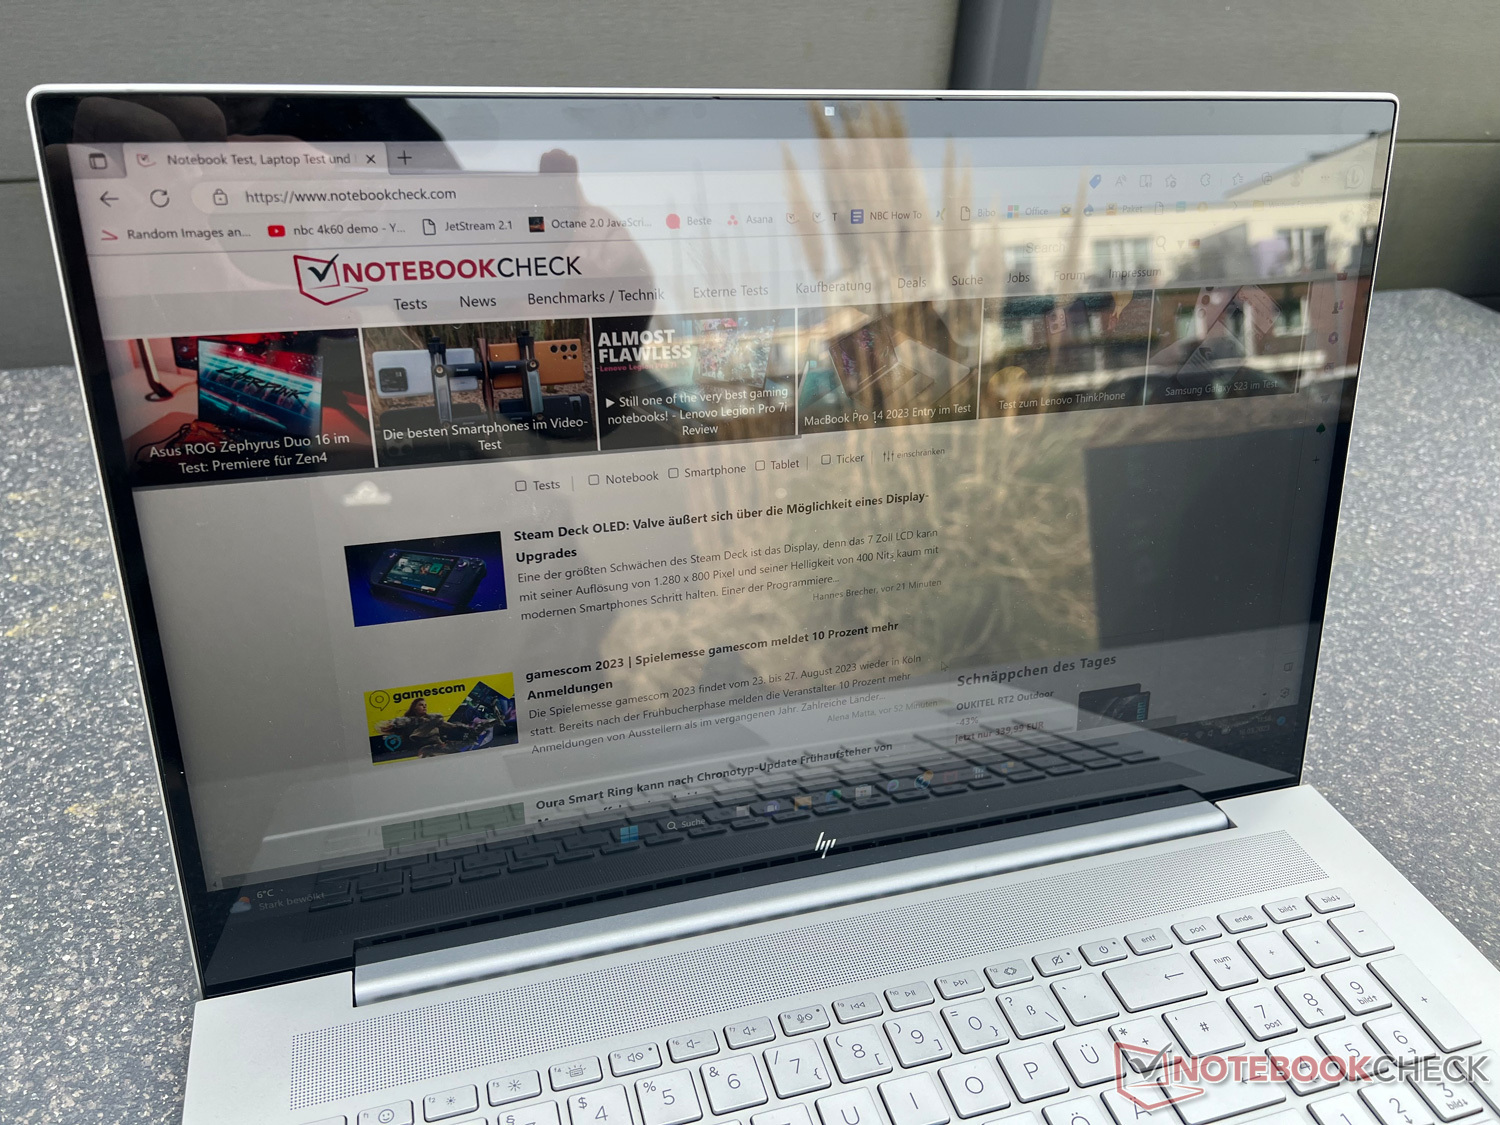
O fabricante promete um brilho de tela de 400 Nits, que pode confirmar em nossas medidas de teste em alguns pontos e também quase em média em toda a área. Em nosso campo de comparação, nossa unidade de teste oferece um dos displays mais brilhantes, mas infelizmente isso não ajuda na utilização ao ar livre, uma vez que o fabricante decidiu usar uma versão refletiva. Mesmo que pareça ótimo, ele também cria reflexos fortes, tornando o conteúdo dificilmente reconhecível ao ar livre (veja as fotos abaixo). Em ambientes internos, isto funciona melhor, mas você ainda obtém reflexos irritantes de fontes de luz, como lâmpadas ou janelas.
Em termos de valor negro e contraste, a HP Envy 17 é superada pela maioria de nossos concorrentes. Em nosso campo de comparação, o visor produz um dos melhores resultados gerais, mas também sofre de um leve turvamento e um sangramento significativo de luz de fundo, o que significa que você pode ver alguns pontos mais claros na iluminação de fundo nas bordas quando o conteúdo escuro é exibido.
| |||||||||||||||||||||||||
iluminação: 86 %
iluminação com acumulador: 390 cd/m²
Contraste: 987:1 (Preto: 0.395 cd/m²)
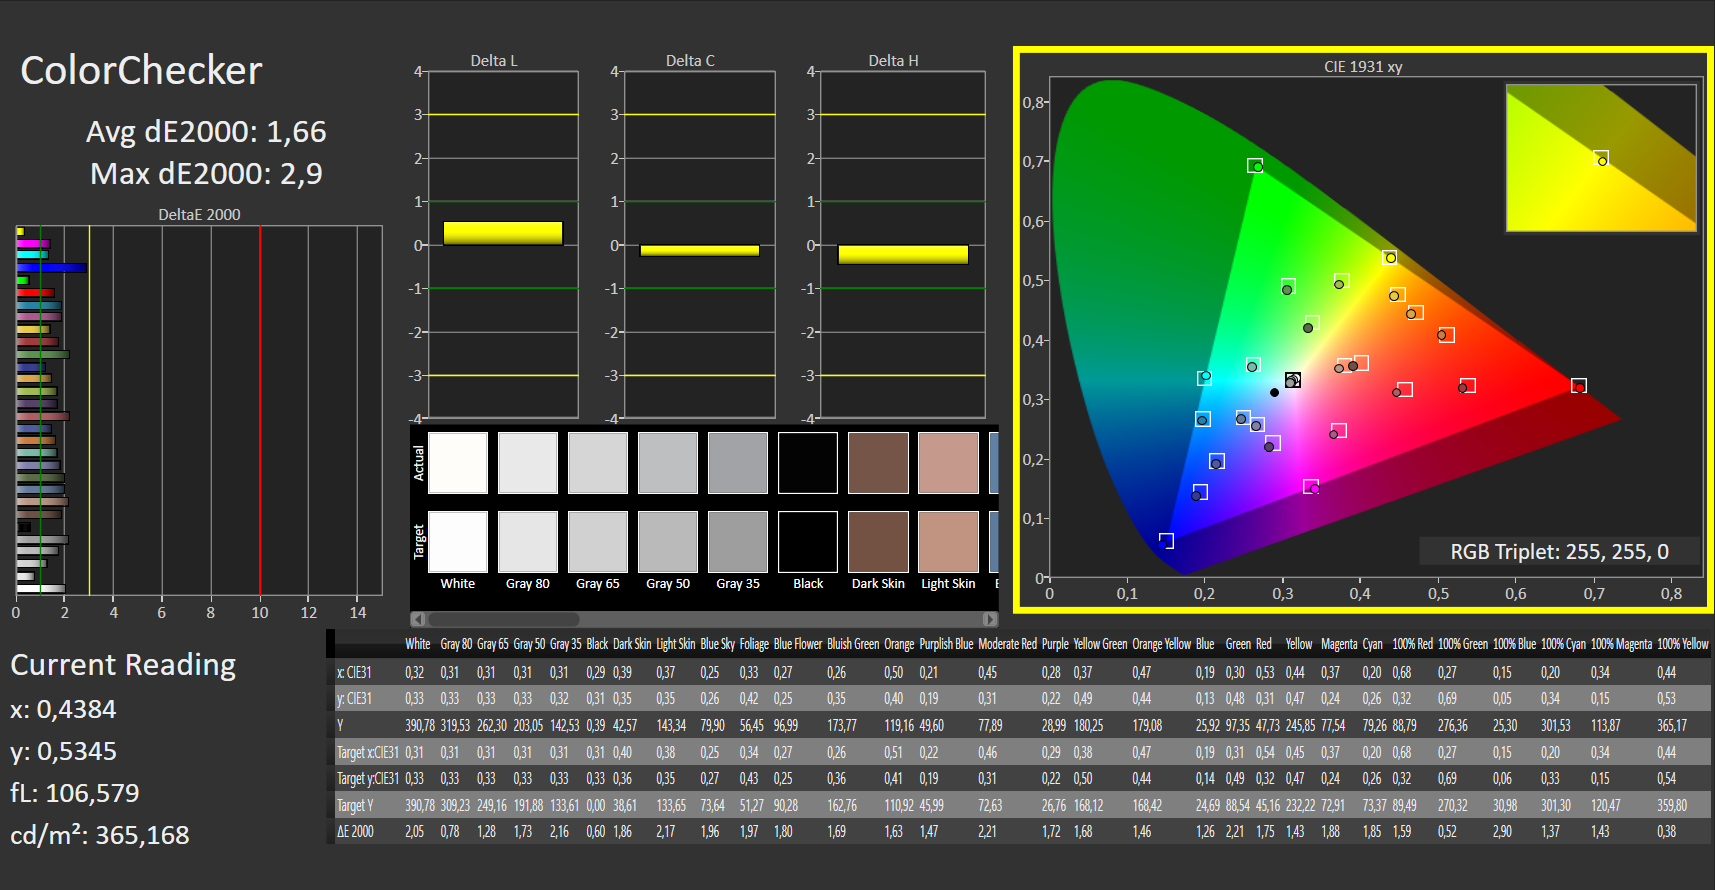
ΔE ColorChecker Calman: 1.66 | ∀{0.5-29.43 Ø4.71}
calibrated: 1.16
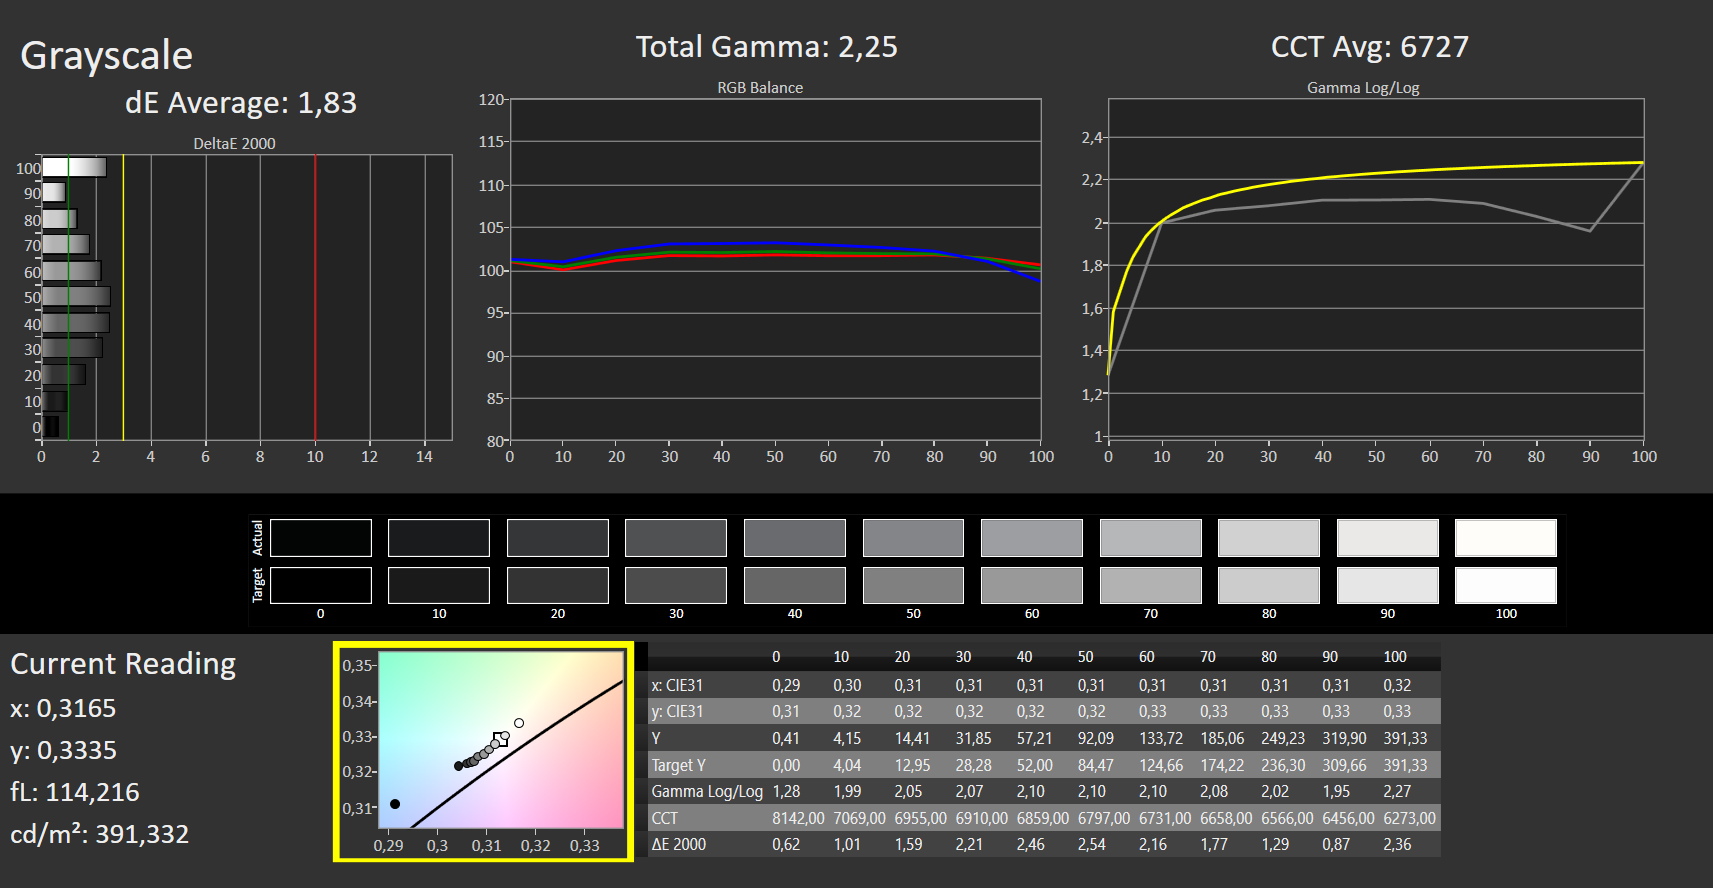
ΔE Greyscale Calman: 1.83 | ∀{0.09-98 Ø4.96}
87.03% AdobeRGB 1998 (Argyll 3D)
100% sRGB (Argyll 3D)
98.31% Display P3 (Argyll 3D)
Gamma: 2.25
CCT: 6727 K
| HP Envy 17-cr0079ng BOE0A66, IPS, 3840x2160, 17.3" | HP ProBook 450 G9 6A180EA Chi Mei CMN1512, , 1920x1080, 15.6" | LG Gram 17Z90Q-E.AD78G LG Display LP170WQ1-SPF2, IPS, 2560x1600, 17" | Acer Aspire 5 A515-57G-53N8 CMN N156HCA-EAB, IPS, 1920x1080, 15.6" | Dell XPS 17 9720 Sharp LQ170R1, IPS, 3840x2400, 17" | Lenovo IdeaPad 3 17ABA7 Lenovo LEN173FHD, IPS, 1920x1080, 17.3" | |
|---|---|---|---|---|---|---|
| Display | -47% | -4% | -47% | 4% | -22% | |
| Display P3 Coverage (%) | 98.31 | 42.76 -57% | 92.2 -6% | 43.3 -56% | 94.8 -4% | 67.8 -31% |
| sRGB Coverage (%) | 100 | 63.9 -36% | 98.66 -1% | 65 -35% | 100 0% | 88.9 -11% |
| AdobeRGB 1998 Coverage (%) | 87.03 | 44.2 -49% | 82.98 -5% | 44.8 -49% | 100 15% | 65 -25% |
| Response Times | -1443% | -1086% | -1855% | -2763% | -443% | |
| Response Time Grey 50% / Grey 80% * (ms) | 1 | 28 ? -2700% | 22 ? -2100% | 35.6 ? -3460% | 53.2 ? -5220% | 10 ? -900% |
| Response Time Black / White * (ms) | 7 ? | 20 ? -186% | 12 ? -71% | 24.5 ? -250% | 28.4 ? -306% | 6 ? 14% |
| PWM Frequency (Hz) | 17990 ? | |||||
| Screen | -124% | -36% | -97% | -17% | -109% | |
| Brightness middle (cd/m²) | 390 | 234 -40% | 391 0% | 250 -36% | 438 12% | 353 -9% |
| Brightness (cd/m²) | 385 | 218 -43% | 358 -7% | 234 -39% | 411 7% | 307 -20% |
| Brightness Distribution (%) | 86 | 85 -1% | 84 -2% | 79 -8% | 86 0% | 78 -9% |
| Black Level * (cd/m²) | 0.395 | 0.17 57% | 0.29 27% | 0.19 52% | 0.27 32% | 0.775 -96% |
| Contrast (:1) | 987 | 1376 39% | 1348 37% | 1316 33% | 1622 64% | 455 -54% |
| Colorchecker dE 2000 * | 1.66 | 5.04 -204% | 3.52 -112% | 3.94 -137% | 2.5 -51% | 5.48 -230% |
| Colorchecker dE 2000 max. * | 2.9 | 18.04 -522% | 6.06 -109% | 16.73 -477% | 6.3 -117% | 10.13 -249% |
| Colorchecker dE 2000 calibrated * | 1.16 | 4.13 -256% | 1.43 -23% | 3.09 -166% | 0.8 31% | 2.44 -110% |
| Greyscale dE 2000 * | 1.83 | 4.43 -142% | 4.27 -133% | 3.6 -97% | 4.2 -130% | 5.56 -204% |
| Gamma | 2.25 98% | 2.41 91% | 2.3 96% | 2.081 106% | 2.22 99% | 2.43 91% |
| CCT | 6727 97% | 6350 102% | 7203 90% | 6476 100% | 7034 92% | 7582 86% |
| Média Total (Programa/Configurações) | -538% /
-296% | -375% /
-179% | -666% /
-338% | -925% /
-405% | -191% /
-138% |
* ... menor é melhor
Em comparação com os outros candidatos de teste, a cobertura do espaço de cor é boa. O painel cobre 100% do menor espaço de cor sRGB. Com um bom 98% do P3 e 87% do espaço de cor AdobeRGB, ele atinge bons valores mas ainda assim não seria a escolha perfeita para designers gráficos.
O dispositivo também oferece uma boa reprodução de núcleos em comparação com os concorrentes, como mostram as medidas baixas do Delta E. Os valores que já estão bastante equilibrados no estado de entrega podem ser ainda melhorados por uma calibração.


Exibir tempos de resposta
| ↔ Tempo de resposta preto para branco | ||
|---|---|---|
| 7 ms ... ascensão ↗ e queda ↘ combinadas | ↗ 1 ms ascensão |  |
| ↘ 6 ms queda | ||
| A tela mostra taxas de resposta muito rápidas em nossos testes e deve ser muito adequada para jogos em ritmo acelerado. Em comparação, todos os dispositivos testados variam de 0.1 (mínimo) a 240 (máximo) ms. » 21 % de todos os dispositivos são melhores. Isso significa que o tempo de resposta medido é melhor que a média de todos os dispositivos testados (19.8 ms). | ||
| ↔ Tempo de resposta 50% cinza a 80% cinza | ||
| 1 ms ... ascensão ↗ e queda ↘ combinadas | ↗ 0 ms ascensão |  |
| ↘ 0 ms queda | ||
| A tela mostra taxas de resposta muito rápidas em nossos testes e deve ser muito adequada para jogos em ritmo acelerado. Em comparação, todos os dispositivos testados variam de 0.165 (mínimo) a 636 (máximo) ms. » 4 % de todos os dispositivos são melhores. Isso significa que o tempo de resposta medido é melhor que a média de todos os dispositivos testados (31 ms). | ||
Cintilação da tela / PWM (modulação por largura de pulso)
| Tela tremeluzindo / PWM não detectado |  | ||
[pwm_comparison] Em comparação: 52 % de todos os dispositivos testados não usam PWM para escurecer a tela. Se PWM foi detectado, uma média de 7754 (mínimo: 5 - máximo: 343500) Hz foi medida. | |||
O visor reflexivo cria alguns problemas ao utilizá-lo ao ar livre. A tela IPS oferece uma boa estabilidade do ângulo de visão que é típica deste tipo de painel.
Desempenho: Com GeForce RTX 2050 também adequado para jogos
Em nossa configuração de teste cr0079ng (72W72EA), a HP Envy 17 está equipada com o Núcleo i7-1255Uda 12ª geração de processadores da Intel (Alder Lake U). O fabricante combina isto com um adicional de 32 GB de RAM DDR4 3200 MHz (2x 16 GB) e um grande SSD 1-TB PCIe NVMe M.2 SSD. Dependendo das exigências, o processador dedicado Nvidia GeForce RTX 2050 Laptop GPU com GDDR6 de 4 GB ou o Intel Iris Xe Graphics interno lida com a saída gráfica.
Alternativamente, a HP também oferece o Envy 17 em muitas outras configurações, por exemplo, com menos memória RAM e armazenamento ou CPUs diferentes, como a Intel Core i5-1235U ou Núcleo i7-1260P.
Condições de teste
Com o Centro de Comando, a HP oferece sua própria ferramenta, permitindo que você escolha entre os modos de desempenho "Balanceado", "Performance" e "Frio", bem como um modo "Economia de Energia" na operação com bateria, ou você também pode selecionar um modo automático "Ajuste Inteligente". Para nossos benchmarks, geralmente escolhemos o modo HP "Performance" junto com a configuração Windows "Best Performance".
| Modo Performance" | Modo "Ajuste Inteligente" | Modo "Cool | |
|---|---|---|---|
| Limite de potência 1 | 18 Watt | 15 Watt | 10 Watt |
| Limite de potência 2 | 51 Watt | 46 Watt | 15 Watt |
Processador
O Núcleo i7-1255Uusado aqui vem da 12ª geração de processadores da Intel (Alder Lake) e é projetado para laptops de alta tecnologia. O processador de dez núcleos consiste em dois núcleos de desempenho e oito núcleos de eficiência, resultando em doze roscas devido à hyperthreading dos núcleos P. A velocidade do relógio varia entre 1,7 e 4,7 GHz.
Nos benchmarks de CPU durante nossos testes, o HP Envy 17 oferece principalmente resultados muito bons, geralmente posicionando-se acima da média para a CPU e os concorrentes com a mesma CPU. Em nosso teste de carga constante, o desempenho também está disponível constantemente. Na operação com bateria, o desempenho é reduzido em cerca de 70%.
Cinebench R15 Multi Constant Load Test
Cinebench R23: Multi Core | Single Core
Cinebench R20: CPU (Multi Core) | CPU (Single Core)
Cinebench R15: CPU Multi 64Bit | CPU Single 64Bit
Blender: v2.79 BMW27 CPU
7-Zip 18.03: 7z b 4 | 7z b 4 -mmt1
Geekbench 5.5: Multi-Core | Single-Core
HWBOT x265 Benchmark v2.2: 4k Preset
LibreOffice : 20 Documents To PDF
R Benchmark 2.5: Overall mean
| CPU Performance rating | |
| Média da turma Multimedia | |
| Dell XPS 17 9720 | |
| Acer Aspire 5 A515-57G-53N8 | |
| HP Envy 17-cr0079ng | |
| LG Gram 17Z90Q-E.AD78G | |
| Média Intel Core i7-1255U | |
| Lenovo IdeaPad 3 17ABA7 | |
| HP ProBook 450 G9 6A180EA | |
| HP Envy 17-cg | |
| Cinebench R23 / Multi Core | |
| Média da turma Multimedia (4861 - 33362, n=74, últimos 2 anos) | |
| Dell XPS 17 9720 | |
| Acer Aspire 5 A515-57G-53N8 | |
| HP Envy 17-cr0079ng | |
| LG Gram 17Z90Q-E.AD78G | |
| LG Gram 17Z90Q-E.AD78G | |
| Lenovo IdeaPad 3 17ABA7 | |
| Média Intel Core i7-1255U (5269 - 9628, n=11) | |
| HP ProBook 450 G9 6A180EA | |
| HP Envy 17-cg | |
| Cinebench R23 / Single Core | |
| Média da turma Multimedia (1128 - 2459, n=66, últimos 2 anos) | |
| Dell XPS 17 9720 | |
| Acer Aspire 5 A515-57G-53N8 | |
| Média Intel Core i7-1255U (1408 - 1775, n=11) | |
| LG Gram 17Z90Q-E.AD78G | |
| HP Envy 17-cr0079ng | |
| HP ProBook 450 G9 6A180EA | |
| Lenovo IdeaPad 3 17ABA7 | |
| HP Envy 17-cg | |
| Cinebench R20 / CPU (Multi Core) | |
| Média da turma Multimedia (1887 - 12912, n=57, últimos 2 anos) | |
| Dell XPS 17 9720 | |
| Acer Aspire 5 A515-57G-53N8 | |
| HP Envy 17-cr0079ng | |
| Lenovo IdeaPad 3 17ABA7 | |
| LG Gram 17Z90Q-E.AD78G | |
| Média Intel Core i7-1255U (2095 - 3702, n=11) | |
| HP ProBook 450 G9 6A180EA | |
| HP Envy 17-cg | |
| Cinebench R20 / CPU (Single Core) | |
| Média da turma Multimedia (425 - 853, n=57, últimos 2 anos) | |
| Dell XPS 17 9720 | |
| Acer Aspire 5 A515-57G-53N8 | |
| Média Intel Core i7-1255U (550 - 682, n=11) | |
| HP Envy 17-cr0079ng | |
| LG Gram 17Z90Q-E.AD78G | |
| HP ProBook 450 G9 6A180EA | |
| Lenovo IdeaPad 3 17ABA7 | |
| HP Envy 17-cg | |
| Cinebench R15 / CPU Multi 64Bit | |
| Dell XPS 17 9720 | |
| Dell XPS 17 9720 | |
| Média da turma Multimedia (856 - 5224, n=61, últimos 2 anos) | |
| Acer Aspire 5 A515-57G-53N8 | |
| LG Gram 17Z90Q-E.AD78G | |
| Lenovo IdeaPad 3 17ABA7 | |
| HP Envy 17-cr0079ng | |
| Média Intel Core i7-1255U (919 - 1577, n=11) | |
| HP ProBook 450 G9 6A180EA | |
| HP Envy 17-cg | |
| Cinebench R15 / CPU Single 64Bit | |
| Média da turma Multimedia (184.8 - 326, n=59, últimos 2 anos) | |
| Dell XPS 17 9720 | |
| HP Envy 17-cr0079ng | |
| Acer Aspire 5 A515-57G-53N8 | |
| Média Intel Core i7-1255U (161 - 251, n=12) | |
| Lenovo IdeaPad 3 17ABA7 | |
| LG Gram 17Z90Q-E.AD78G | |
| HP ProBook 450 G9 6A180EA | |
| HP Envy 17-cg | |
| Blender / v2.79 BMW27 CPU | |
| HP ProBook 450 G9 6A180EA | |
| HP Envy 17-cg | |
| HP Envy 17-cr0079ng | |
| Média Intel Core i7-1255U (372 - 601, n=11) | |
| LG Gram 17Z90Q-E.AD78G | |
| Acer Aspire 5 A515-57G-53N8 | |
| Lenovo IdeaPad 3 17ABA7 | |
| Média da turma Multimedia (100 - 557, n=58, últimos 2 anos) | |
| Dell XPS 17 9720 | |
| 7-Zip 18.03 / 7z b 4 | |
| Dell XPS 17 9720 | |
| Média da turma Multimedia (26062 - 130368, n=55, últimos 2 anos) | |
| Acer Aspire 5 A515-57G-53N8 | |
| LG Gram 17Z90Q-E.AD78G | |
| HP Envy 17-cr0079ng | |
| Lenovo IdeaPad 3 17ABA7 | |
| Média Intel Core i7-1255U (24126 - 37365, n=11) | |
| HP ProBook 450 G9 6A180EA | |
| HP Envy 17-cg | |
| 7-Zip 18.03 / 7z b 4 -mmt1 | |
| Média da turma Multimedia (3666 - 7545, n=56, últimos 2 anos) | |
| Dell XPS 17 9720 | |
| HP Envy 17-cr0079ng | |
| Média Intel Core i7-1255U (5059 - 5529, n=11) | |
| Lenovo IdeaPad 3 17ABA7 | |
| HP ProBook 450 G9 6A180EA | |
| Acer Aspire 5 A515-57G-53N8 | |
| LG Gram 17Z90Q-E.AD78G | |
| HP Envy 17-cg | |
| Geekbench 5.5 / Multi-Core | |
| Dell XPS 17 9720 | |
| Média da turma Multimedia (4652 - 20422, n=56, últimos 2 anos) | |
| Acer Aspire 5 A515-57G-53N8 | |
| LG Gram 17Z90Q-E.AD78G | |
| HP Envy 17-cr0079ng | |
| Média Intel Core i7-1255U (4463 - 8821, n=12) | |
| HP ProBook 450 G9 6A180EA | |
| Lenovo IdeaPad 3 17ABA7 | |
| HP Envy 17-cg | |
| Geekbench 5.5 / Single-Core | |
| Média da turma Multimedia (805 - 2974, n=56, últimos 2 anos) | |
| Dell XPS 17 9720 | |
| HP Envy 17-cr0079ng | |
| HP ProBook 450 G9 6A180EA | |
| Média Intel Core i7-1255U (1560 - 1712, n=12) | |
| Acer Aspire 5 A515-57G-53N8 | |
| LG Gram 17Z90Q-E.AD78G | |
| HP Envy 17-cg | |
| Lenovo IdeaPad 3 17ABA7 | |
| HWBOT x265 Benchmark v2.2 / 4k Preset | |
| Média da turma Multimedia (5.26 - 36.1, n=56, últimos 2 anos) | |
| Dell XPS 17 9720 | |
| Acer Aspire 5 A515-57G-53N8 | |
| HP Envy 17-cr0079ng | |
| LG Gram 17Z90Q-E.AD78G | |
| Lenovo IdeaPad 3 17ABA7 | |
| Média Intel Core i7-1255U (6.31 - 10.1, n=11) | |
| HP ProBook 450 G9 6A180EA | |
| HP Envy 17-cg | |
| LibreOffice / 20 Documents To PDF | |
| LG Gram 17Z90Q-E.AD78G | |
| Acer Aspire 5 A515-57G-53N8 | |
| HP Envy 17-cg | |
| Lenovo IdeaPad 3 17ABA7 | |
| HP ProBook 450 G9 6A180EA | |
| Média da turma Multimedia (23.9 - 146.7, n=57, últimos 2 anos) | |
| Média Intel Core i7-1255U (35.6 - 52.5, n=11) | |
| HP Envy 17-cr0079ng | |
| Dell XPS 17 9720 | |
| R Benchmark 2.5 / Overall mean | |
| HP Envy 17-cg | |
| Lenovo IdeaPad 3 17ABA7 | |
| HP ProBook 450 G9 6A180EA | |
| LG Gram 17Z90Q-E.AD78G | |
| Média Intel Core i7-1255U (0.4688 - 0.558, n=11) | |
| Acer Aspire 5 A515-57G-53N8 | |
| HP Envy 17-cr0079ng | |
| Média da turma Multimedia (0.3604 - 0.947, n=56, últimos 2 anos) | |
| Dell XPS 17 9720 | |
* ... menor é melhor
AIDA64: FP32 Ray-Trace | FPU Julia | CPU SHA3 | CPU Queen | FPU SinJulia | FPU Mandel | CPU AES | CPU ZLib | FP64 Ray-Trace | CPU PhotoWorxx
| Performance rating | |
| Média da turma Multimedia | |
| Lenovo IdeaPad 3 17ABA7 | |
| Dell XPS 17 9720 | |
| HP Envy 17-cr0079ng | |
| Acer Aspire 5 A515-57G-53N8 | |
| Média Intel Core i7-1255U | |
| LG Gram 17Z90Q-E.AD78G | |
| HP ProBook 450 G9 6A180EA | |
| HP Envy 17-cg -9! | |
| AIDA64 / FP32 Ray-Trace | |
| Média da turma Multimedia (2214 - 50388, n=53, últimos 2 anos) | |
| Lenovo IdeaPad 3 17ABA7 | |
| HP Envy 17-cr0079ng | |
| Dell XPS 17 9720 | |
| Média Intel Core i7-1255U (4313 - 8127, n=11) | |
| Acer Aspire 5 A515-57G-53N8 | |
| HP ProBook 450 G9 6A180EA | |
| LG Gram 17Z90Q-E.AD78G | |
| AIDA64 / FPU Julia | |
| Média da turma Multimedia (12867 - 201874, n=54, últimos 2 anos) | |
| Lenovo IdeaPad 3 17ABA7 | |
| HP Envy 17-cr0079ng | |
| Média Intel Core i7-1255U (19813 - 41353, n=11) | |
| Dell XPS 17 9720 | |
| Acer Aspire 5 A515-57G-53N8 | |
| HP ProBook 450 G9 6A180EA | |
| LG Gram 17Z90Q-E.AD78G | |
| AIDA64 / CPU SHA3 | |
| Média da turma Multimedia (626 - 8623, n=54, últimos 2 anos) | |
| Dell XPS 17 9720 | |
| Lenovo IdeaPad 3 17ABA7 | |
| HP Envy 17-cr0079ng | |
| Média Intel Core i7-1255U (1325 - 2135, n=11) | |
| Acer Aspire 5 A515-57G-53N8 | |
| LG Gram 17Z90Q-E.AD78G | |
| HP ProBook 450 G9 6A180EA | |
| AIDA64 / CPU Queen | |
| Dell XPS 17 9720 | |
| Acer Aspire 5 A515-57G-53N8 | |
| Lenovo IdeaPad 3 17ABA7 | |
| Média da turma Multimedia (13483 - 181505, n=41, últimos 2 anos) | |
| LG Gram 17Z90Q-E.AD78G | |
| HP Envy 17-cr0079ng | |
| Média Intel Core i7-1255U (61375 - 65892, n=11) | |
| HP ProBook 450 G9 6A180EA | |
| AIDA64 / FPU SinJulia | |
| Lenovo IdeaPad 3 17ABA7 | |
| Média da turma Multimedia (886 - 28794, n=54, últimos 2 anos) | |
| Dell XPS 17 9720 | |
| Acer Aspire 5 A515-57G-53N8 | |
| LG Gram 17Z90Q-E.AD78G | |
| HP Envy 17-cr0079ng | |
| Média Intel Core i7-1255U (3577 - 5095, n=11) | |
| HP ProBook 450 G9 6A180EA | |
| AIDA64 / FPU Mandel | |
| Média da turma Multimedia (6395 - 105740, n=53, últimos 2 anos) | |
| Lenovo IdeaPad 3 17ABA7 | |
| HP Envy 17-cr0079ng | |
| Dell XPS 17 9720 | |
| Média Intel Core i7-1255U (11759 - 20187, n=11) | |
| Acer Aspire 5 A515-57G-53N8 | |
| LG Gram 17Z90Q-E.AD78G | |
| HP ProBook 450 G9 6A180EA | |
| AIDA64 / CPU AES | |
| Lenovo IdeaPad 3 17ABA7 | |
| Dell XPS 17 9720 | |
| Média da turma Multimedia (8171 - 126790, n=54, últimos 2 anos) | |
| HP Envy 17-cr0079ng | |
| Média Intel Core i7-1255U (27900 - 67458, n=11) | |
| Acer Aspire 5 A515-57G-53N8 | |
| LG Gram 17Z90Q-E.AD78G | |
| HP ProBook 450 G9 6A180EA | |
| AIDA64 / CPU ZLib | |
| Média da turma Multimedia (143.8 - 2022, n=54, últimos 2 anos) | |
| Dell XPS 17 9720 | |
| Acer Aspire 5 A515-57G-53N8 | |
| HP Envy 17-cr0079ng | |
| LG Gram 17Z90Q-E.AD78G | |
| Lenovo IdeaPad 3 17ABA7 | |
| Média Intel Core i7-1255U (393 - 640, n=11) | |
| HP ProBook 450 G9 6A180EA | |
| HP Envy 17-cg | |
| AIDA64 / FP64 Ray-Trace | |
| Média da turma Multimedia (1014 - 26875, n=54, últimos 2 anos) | |
| Lenovo IdeaPad 3 17ABA7 | |
| HP Envy 17-cr0079ng | |
| Dell XPS 17 9720 | |
| Média Intel Core i7-1255U (2474 - 4400, n=11) | |
| Acer Aspire 5 A515-57G-53N8 | |
| LG Gram 17Z90Q-E.AD78G | |
| HP ProBook 450 G9 6A180EA | |
| AIDA64 / CPU PhotoWorxx | |
| Média da turma Multimedia (8187 - 88154, n=54, últimos 2 anos) | |
| Dell XPS 17 9720 | |
| LG Gram 17Z90Q-E.AD78G | |
| Média Intel Core i7-1255U (13899 - 44054, n=11) | |
| HP Envy 17-cr0079ng | |
| Acer Aspire 5 A515-57G-53N8 | |
| HP ProBook 450 G9 6A180EA | |
| Lenovo IdeaPad 3 17ABA7 | |
Desempenho do sistema
Na operação prática, o hardware utilizado aqui proporciona mais do que um sólido desempenho. Em benchmarks como o PCMark 10, o laptop é capaz de acompanhar bem o topo do campo e, em sua maioria, só é superado pelos dois laptops que são equipados com hardware mais potente. Aqueles que querem ainda mais desempenho são ainda mais bem servidos pelo Intel Core i7-12700H nãoDell XPS 17 9720por exemplo.
Por algumas razões estranhas, o teste Creative Benchmark do PCMark 8 foi sempre interrompido no meio com o hardware e a configuração do driver de nossa unidade de teste. Portanto, deixamos de fora desta referência.
CrossMark: Overall | Productivity | Creativity | Responsiveness
| PCMark 10 / Score | |
| Média da turma Multimedia (4325 - 10386, n=52, últimos 2 anos) | |
| Dell XPS 17 9720 | |
| LG Gram 17Z90Q-E.AD78G | |
| HP Envy 17-cr0079ng | |
| Média Intel Core i7-1255U, NVIDIA GeForce RTX 2050 Mobile (n=1) | |
| Acer Aspire 5 A515-57G-53N8 | |
| Lenovo IdeaPad 3 17ABA7 | |
| HP Envy 17-cg | |
| HP ProBook 450 G9 6A180EA | |
| PCMark 10 / Essentials | |
| Média da turma Multimedia (8025 - 11664, n=51, últimos 2 anos) | |
| Lenovo IdeaPad 3 17ABA7 | |
| Dell XPS 17 9720 | |
| HP Envy 17-cr0079ng | |
| Média Intel Core i7-1255U, NVIDIA GeForce RTX 2050 Mobile (n=1) | |
| LG Gram 17Z90Q-E.AD78G | |
| HP ProBook 450 G9 6A180EA | |
| Acer Aspire 5 A515-57G-53N8 | |
| HP Envy 17-cg | |
| PCMark 10 / Productivity | |
| Média da turma Multimedia (7323 - 18233, n=51, últimos 2 anos) | |
| LG Gram 17Z90Q-E.AD78G | |
| Dell XPS 17 9720 | |
| Lenovo IdeaPad 3 17ABA7 | |
| HP Envy 17-cr0079ng | |
| Média Intel Core i7-1255U, NVIDIA GeForce RTX 2050 Mobile (n=1) | |
| HP Envy 17-cg | |
| Acer Aspire 5 A515-57G-53N8 | |
| HP ProBook 450 G9 6A180EA | |
| PCMark 10 / Digital Content Creation | |
| Média da turma Multimedia (3651 - 16240, n=51, últimos 2 anos) | |
| Dell XPS 17 9720 | |
| LG Gram 17Z90Q-E.AD78G | |
| HP Envy 17-cr0079ng | |
| Média Intel Core i7-1255U, NVIDIA GeForce RTX 2050 Mobile (n=1) | |
| Acer Aspire 5 A515-57G-53N8 | |
| HP Envy 17-cg | |
| Lenovo IdeaPad 3 17ABA7 | |
| HP ProBook 450 G9 6A180EA | |
| CrossMark / Overall | |
| Média da turma Multimedia (866 - 2728, n=60, últimos 2 anos) | |
| Dell XPS 17 9720 | |
| LG Gram 17Z90Q-E.AD78G | |
| HP Envy 17-cr0079ng | |
| Média Intel Core i7-1255U, NVIDIA GeForce RTX 2050 Mobile (n=1) | |
| HP ProBook 450 G9 6A180EA | |
| Lenovo IdeaPad 3 17ABA7 | |
| CrossMark / Productivity | |
| Média da turma Multimedia (931 - 2489, n=60, últimos 2 anos) | |
| Dell XPS 17 9720 | |
| LG Gram 17Z90Q-E.AD78G | |
| HP Envy 17-cr0079ng | |
| Média Intel Core i7-1255U, NVIDIA GeForce RTX 2050 Mobile (n=1) | |
| HP ProBook 450 G9 6A180EA | |
| Lenovo IdeaPad 3 17ABA7 | |
| CrossMark / Creativity | |
| Média da turma Multimedia (907 - 3465, n=60, últimos 2 anos) | |
| Dell XPS 17 9720 | |
| LG Gram 17Z90Q-E.AD78G | |
| HP Envy 17-cr0079ng | |
| Média Intel Core i7-1255U, NVIDIA GeForce RTX 2050 Mobile (n=1) | |
| HP ProBook 450 G9 6A180EA | |
| Lenovo IdeaPad 3 17ABA7 | |
| CrossMark / Responsiveness | |
| Dell XPS 17 9720 | |
| Média da turma Multimedia (605 - 2024, n=60, últimos 2 anos) | |
| LG Gram 17Z90Q-E.AD78G | |
| HP Envy 17-cr0079ng | |
| Média Intel Core i7-1255U, NVIDIA GeForce RTX 2050 Mobile (n=1) | |
| Lenovo IdeaPad 3 17ABA7 | |
| HP ProBook 450 G9 6A180EA | |
| PCMark 8 Home Score Accelerated v2 | 5469 pontos | |
| PCMark 8 Work Score Accelerated v2 | 5812 pontos | |
| PCMark 10 Score | 6351 pontos | |
Ajuda | ||
| AIDA64 / Memory Copy | |
| Média da turma Multimedia (11299 - 132135, n=54, últimos 2 anos) | |
| LG Gram 17Z90Q-E.AD78G | |
| Dell XPS 17 9720 | |
| Média Intel Core i7-1255U (22846 - 67017, n=11) | |
| HP Envy 17-cr0079ng | |
| Acer Aspire 5 A515-57G-53N8 | |
| HP ProBook 450 G9 6A180EA | |
| Lenovo IdeaPad 3 17ABA7 | |
| AIDA64 / Memory Read | |
| Média da turma Multimedia (11624 - 174586, n=54, últimos 2 anos) | |
| LG Gram 17Z90Q-E.AD78G | |
| Dell XPS 17 9720 | |
| Média Intel Core i7-1255U (22877 - 67398, n=11) | |
| HP Envy 17-cr0079ng | |
| Acer Aspire 5 A515-57G-53N8 | |
| HP ProBook 450 G9 6A180EA | |
| Lenovo IdeaPad 3 17ABA7 | |
| AIDA64 / Memory Write | |
| Média da turma Multimedia (11755 - 134998, n=54, últimos 2 anos) | |
| Dell XPS 17 9720 | |
| LG Gram 17Z90Q-E.AD78G | |
| Média Intel Core i7-1255U (22883 - 65839, n=11) | |
| HP Envy 17-cr0079ng | |
| Acer Aspire 5 A515-57G-53N8 | |
| HP ProBook 450 G9 6A180EA | |
| Lenovo IdeaPad 3 17ABA7 | |
| AIDA64 / Memory Latency | |
| Média da turma Multimedia (7 - 535, n=53, últimos 2 anos) | |
| LG Gram 17Z90Q-E.AD78G | |
| Dell XPS 17 9720 | |
| Lenovo IdeaPad 3 17ABA7 | |
| Média Intel Core i7-1255U (76 - 163.2, n=11) | |
| HP ProBook 450 G9 6A180EA | |
| HP Envy 17-cr0079ng | |
| HP Envy 17-cg | |
* ... menor é melhor
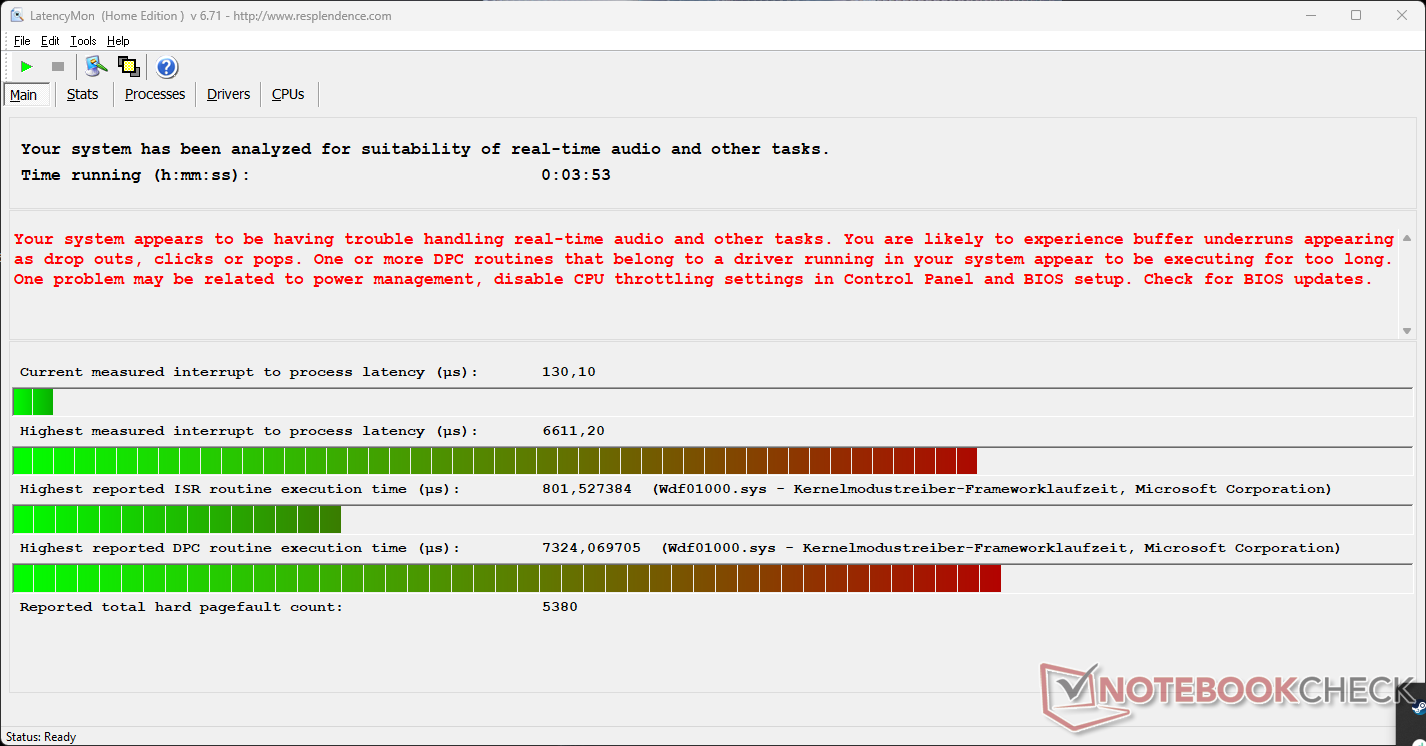
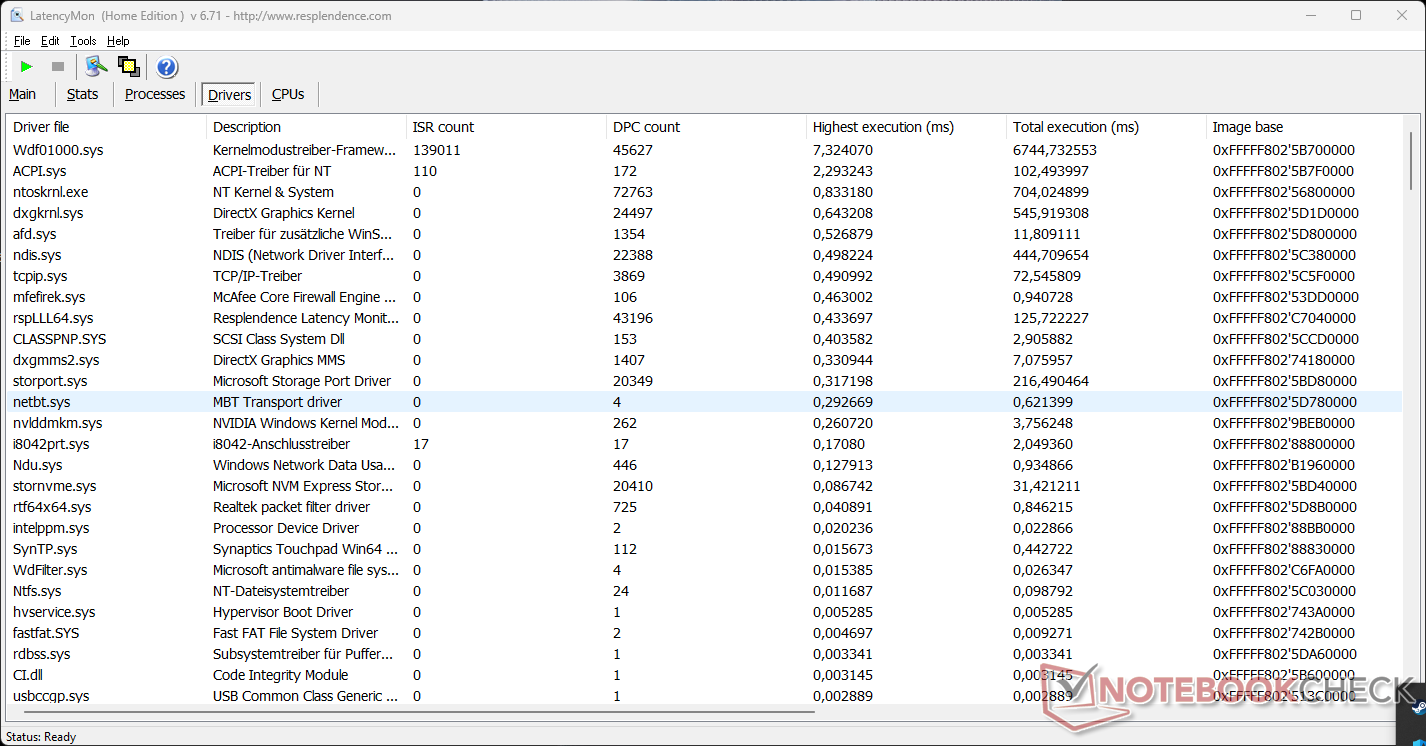
Latências DPC
Nossa unidade de teste mostra latências relativamente altas de DPC. Embora isto possa ser uma indicação de que alguns problemas podem ocorrer com o processamento de áudio e vídeo em tempo real, como sempre, este também é apenas um instantâneo da configuração atual do driver.
| DPC Latencies / LatencyMon - interrupt to process latency (max), Web, Youtube, Prime95 | |
| HP ProBook 450 G9 6A180EA | |
| HP Envy 17-cr0079ng | |
| LG Gram 17Z90Q-E.AD78G | |
| HP Envy 17-cg | |
| Acer Aspire 5 A515-57G-53N8 | |
| Lenovo IdeaPad 3 17ABA7 | |
| Dell XPS 17 9720 | |
* ... menor é melhor
Solução de armazenamento
O SSD 1-TB da Samsung não tem um desempenho particularmente bom em nossas medições de teste. Não só fica atrás da maioria dos outros concorrentes, mas também abaixo do nível médio para o SSD. A HP não fez nenhum favor a si mesma com esta escolha, mas você ainda não notaria nenhuma limitação durante a operação diária. Pelo menos os valores permanecem quase idênticos no desempenho constante, sem começar a ser asfixiados.

* ... menor é melhor
Disk Throttling: DiskSpd Read Loop, Queue Depth 8
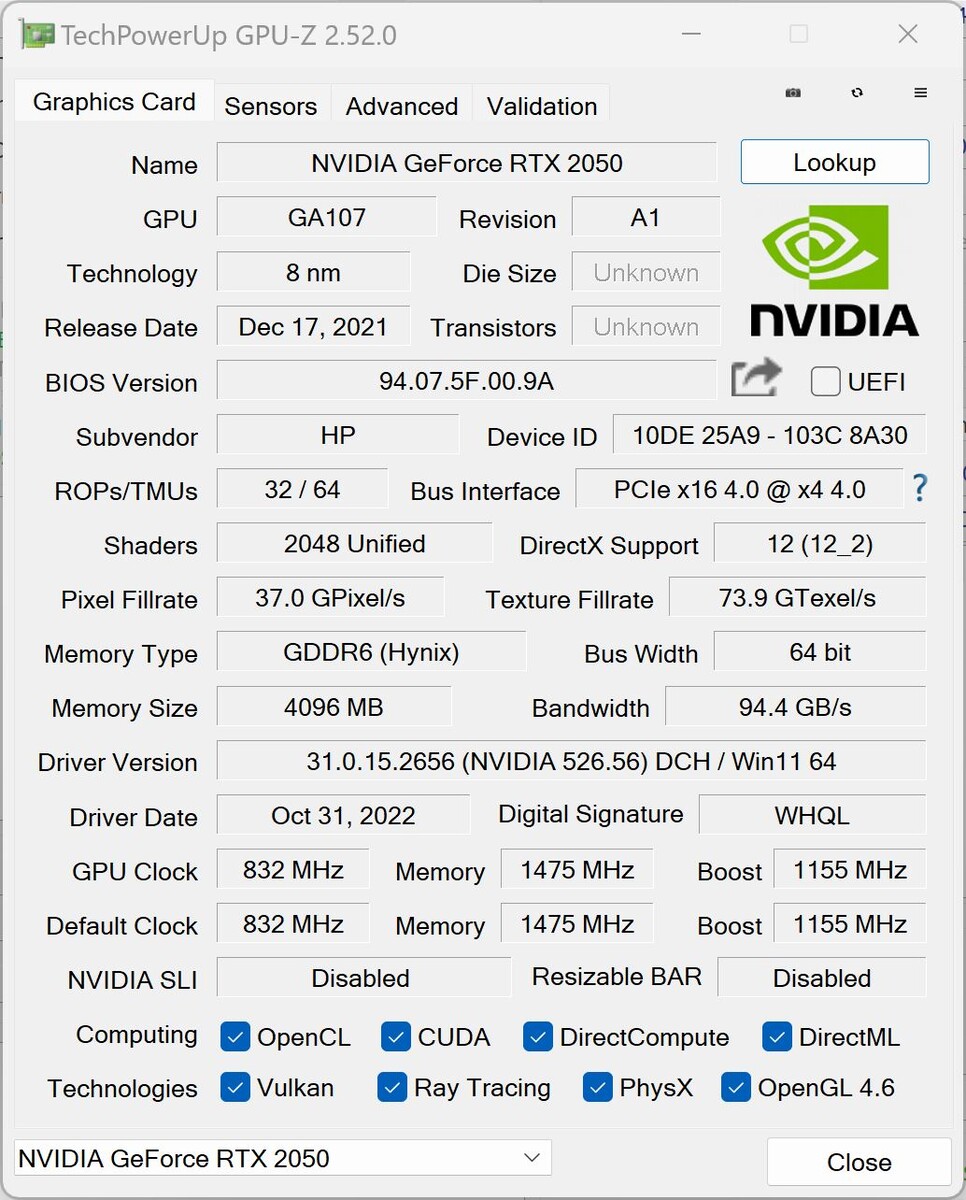
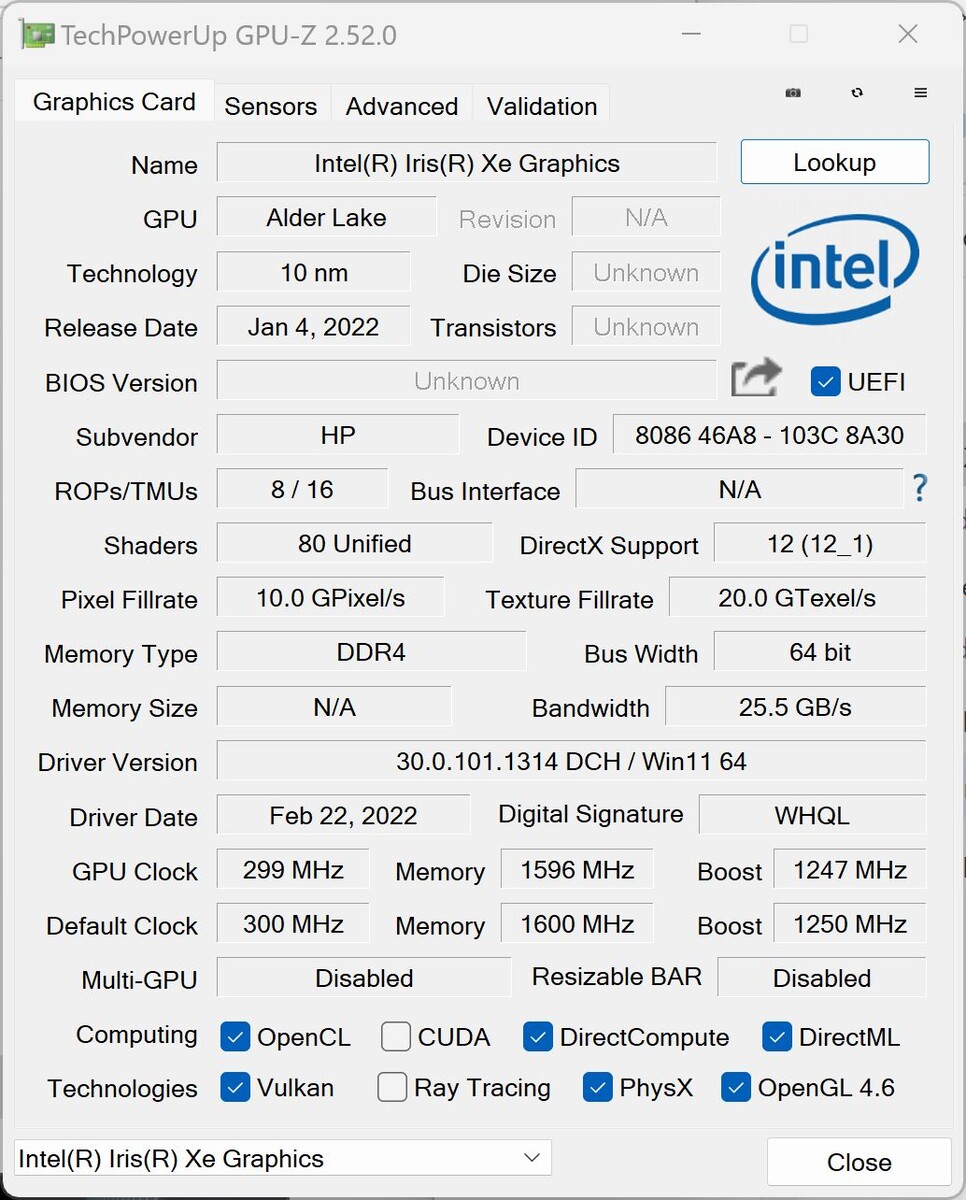
Placa Gráfica
Enquanto a Intel Iris Xe Graphics iGPU lida com as tarefas gráficas menos exigentes, com maiores exigências o Nvidia GeForce RTX 2050 Laptop A GPU é ativada. Com isto, uma solução gráfica dedicada da gama média inferior está a bordo. No entanto, a GPU também vem de 2021, portanto não é mais uma galinha de primavera. A placa gráfica é equipada com 4 GB de armazenamento gráfico GDDR6 e funciona a uma velocidade de relógio de até 1,477 MHz. Ela é incapaz de acompanhar o GeForce RTX 4050que foi recentemente introduzida pela Nvidia, o que a deixa muito para trás.
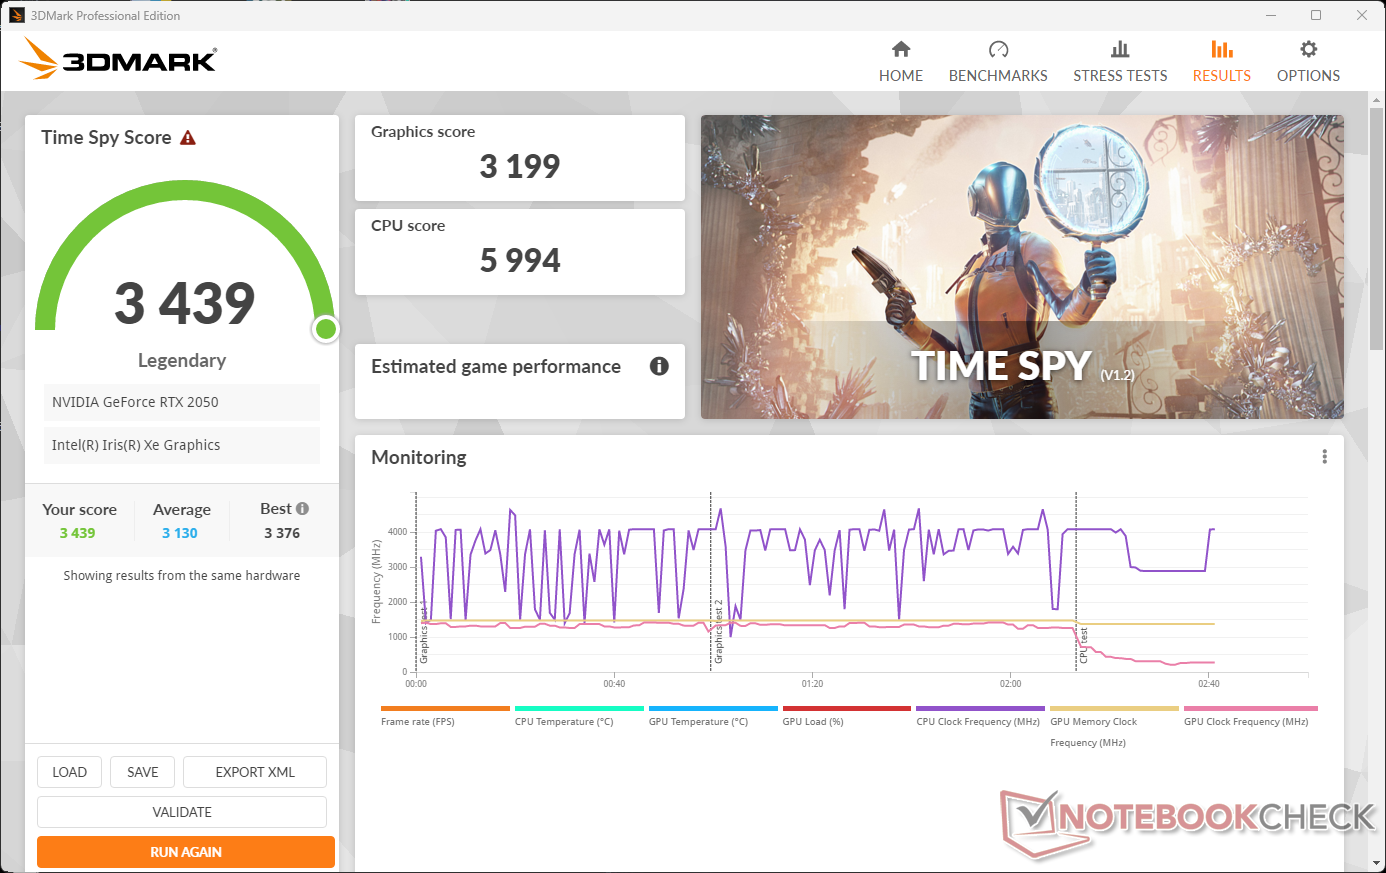
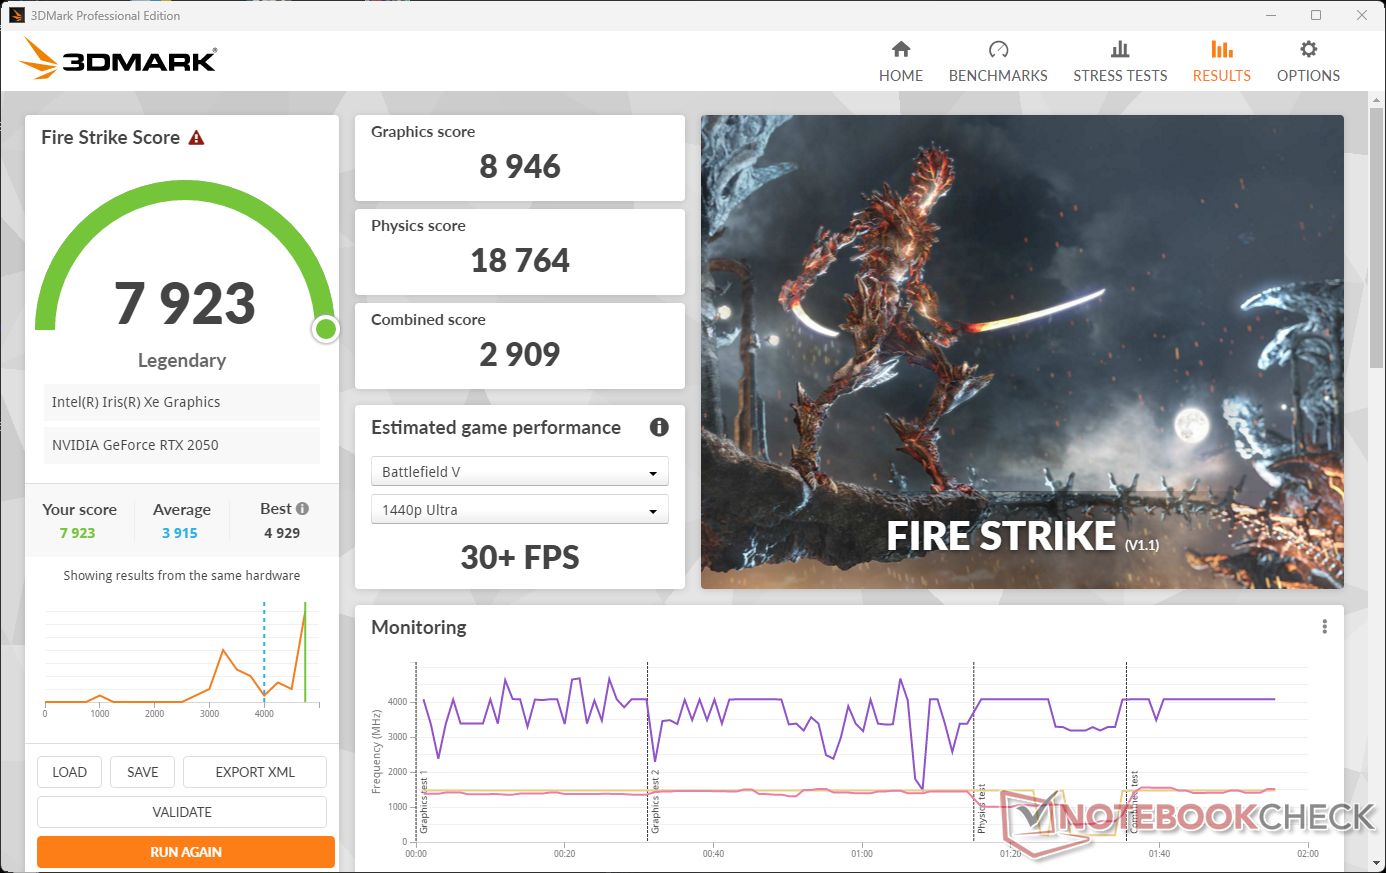
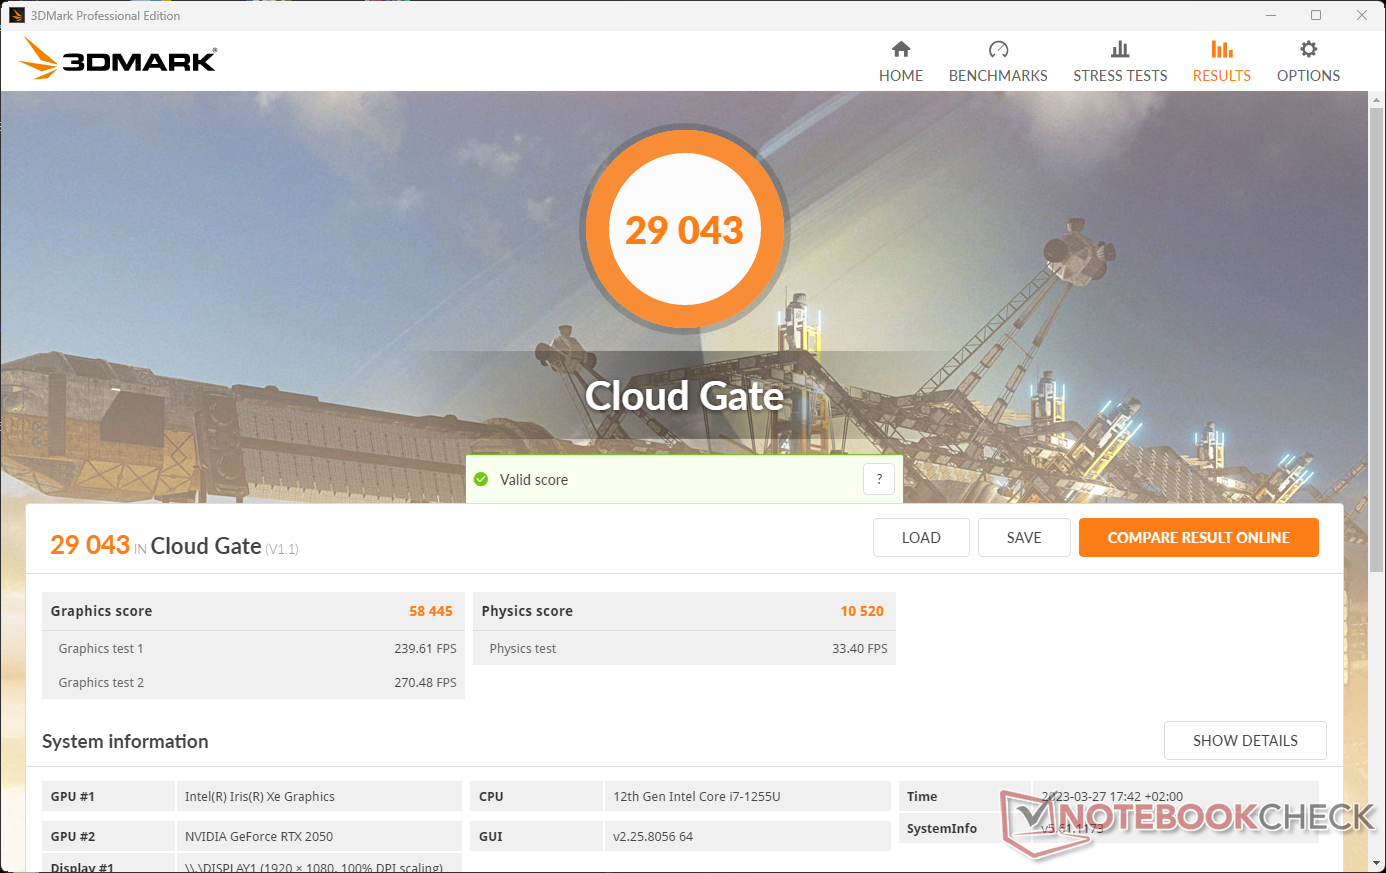
Nos gráficos de referência, a HP Envy 17-cr0079ng atinge valores sólidos em nosso teste. Mesmo permanecendo em partes abaixo da média desta solução gráfica, eles estão sempre acima dos valores dos LG Gram 17Z90Qcampeão de enduro e ao nível do Acer Aspire 5 A515que estão ambos equipados com o mesmo dGPU.
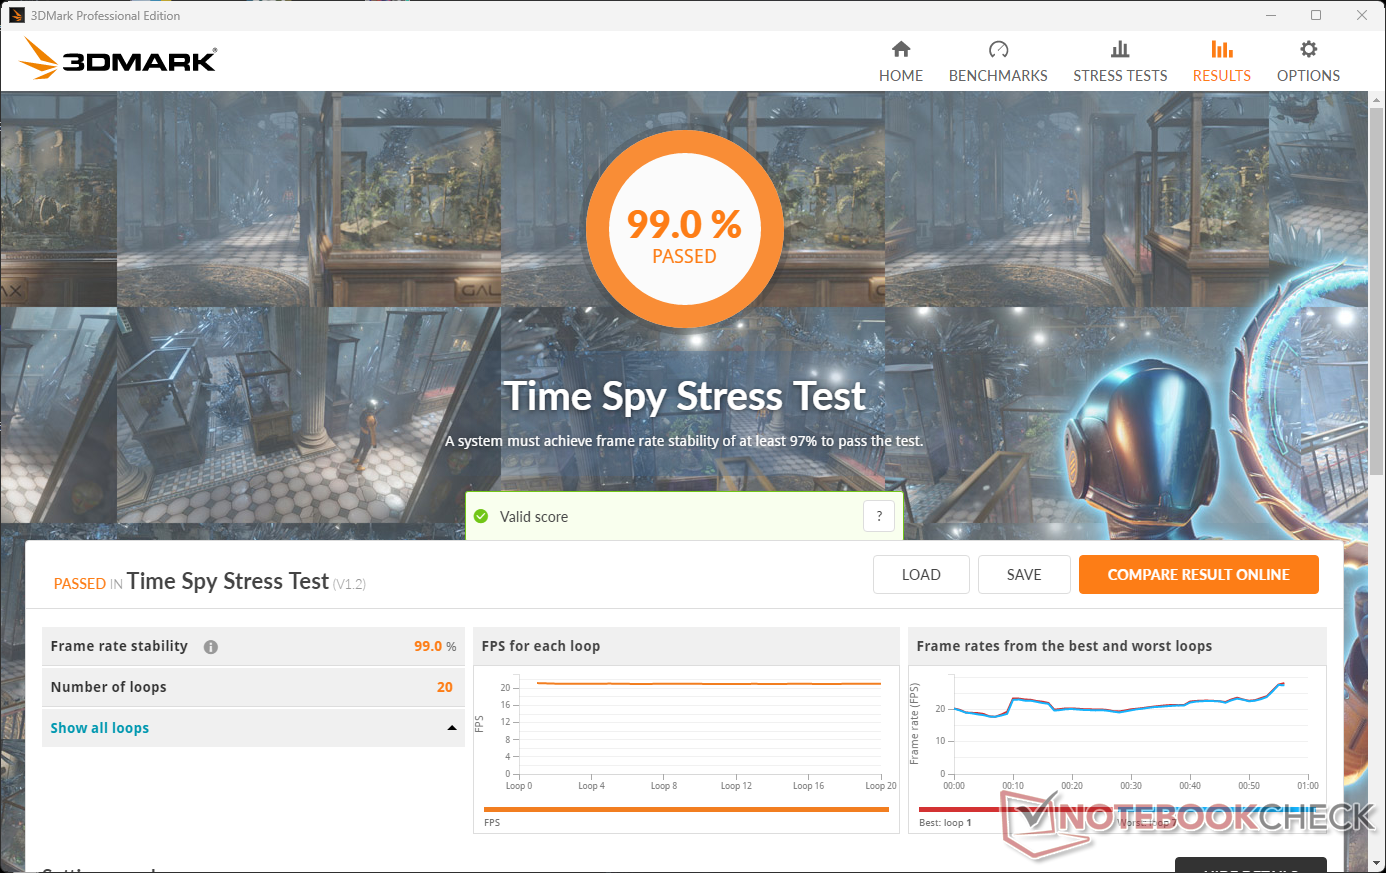
Na operação de rede, o desempenho gráfico permanece constante ao longo do tempo, como mostra o teste de esforço do 3DMark (resultado: 99%). Em operação com bateria, o laptop ainda atinge 80 a 90%, dependendo do benchmark (3DMark 11: 11.017 pontos gráficos).
| 3DMark 11 Performance | 12472 pontos | |
| 3DMark Cloud Gate Standard Score | 29043 pontos | |
| 3DMark Fire Strike Score | 7923 pontos | |
| 3DMark Time Spy Score | 3439 pontos | |
Ajuda | ||
* ... menor é melhor
Desempenho nos jogos
Para uma rodada cultivada de jogos com o laptop multimídia HP Envy 17, a solução gráfica dedicada é facilmente suficiente. A maioria dos jogos que escolhemos para nosso teste funciona sem problemas em configurações gráficas altas ou muitas vezes até mesmo máximas na resolução FHD. Entretanto, uma GPU dificilmente permitirá que você desfrute da resolução total de 4K da tela.
Um aborrecimento: Usando o modo "Performance" no Centro de Comando HP, muitos jogos foram minimizados ao alterar a resolução da tela, e nós não conseguimos continuar com eles depois, ou eles até mesmo falharam completamente. Não conseguimos resolver este problema durante nossos testes da HP Envy 17. Portanto, algumas das medidas do jogo só foram realizadas usando o modo "Ajuste Inteligente", onde o problema não ocorreu.
| The Witcher 3 - 1920x1080 Ultra Graphics & Postprocessing (HBAO+) | |
| MSI Katana 15 B12VEK | |
| Média da turma Multimedia (11 - 121, n=7, últimos 2 anos) | |
| Dell XPS 17 9720 | |
| LG Gram 17Z90Q-E.AD78G | |
| HP Envy 17-cr0079ng | |
| Acer Aspire 5 A515-57G-53N8 | |
| HP ProBook 450 G9 6A180EA | |
| Lenovo IdeaPad 3 17ABA7 | |
| GTA V - 1920x1080 Highest AA:4xMSAA + FX AF:16x | |
| MSI Katana 15 B12VEK | |
| Dell XPS 17 9720 | |
| Média da turma Multimedia (7.92 - 141.6, n=55, últimos 2 anos) | |
| HP Envy 17-cr0079ng | |
| Acer Aspire 5 A515-57G-53N8 | |
| LG Gram 17Z90Q-E.AD78G | |
| Lenovo IdeaPad 3 17ABA7 | |
| Final Fantasy XV Benchmark - 1920x1080 High Quality | |
| MSI Katana 15 B12VEK | |
| Média da turma Multimedia (7.61 - 144.4, n=57, últimos 2 anos) | |
| Dell XPS 17 9720 | |
| HP Envy 17-cr0079ng | |
| Acer Aspire 5 A515-57G-53N8 | |
| LG Gram 17Z90Q-E.AD78G | |
| HP ProBook 450 G9 6A180EA | |
| Lenovo IdeaPad 3 17ABA7 | |
| Strange Brigade - 1920x1080 ultra AA:ultra AF:16 | |
| MSI Katana 15 B12VEK | |
| Média da turma Multimedia (13.3 - 303, n=57, últimos 2 anos) | |
| Dell XPS 17 9720 | |
| HP Envy 17-cr0079ng | |
| LG Gram 17Z90Q-E.AD78G | |
| HP ProBook 450 G9 6A180EA | |
| Lenovo IdeaPad 3 17ABA7 | |
| Dota 2 Reborn - 1920x1080 ultra (3/3) best looking | |
| Dell XPS 17 9720 | |
| MSI Katana 15 B12VEK | |
| HP Envy 17-cr0079ng | |
| Média da turma Multimedia (29 - 179.9, n=59, últimos 2 anos) | |
| Acer Aspire 5 A515-57G-53N8 | |
| LG Gram 17Z90Q-E.AD78G | |
| HP ProBook 450 G9 6A180EA | |
| Lenovo IdeaPad 3 17ABA7 | |
Em nosso "O teste de carga constante Witcher 3", a taxa de estrutura permanece em um nível constante, e não medimos nenhuma queda.
The Witcher 3 FPS Chart
| baixo | média | alto | ultra | QHD | 4K | |
|---|---|---|---|---|---|---|
| GTA V (2015) | 150.7 | 139.3 | 90.2 | 44.8 | ||
| The Witcher 3 (2015) | 175.7 | 106.4 | 58.2 | 33.4 | ||
| Dota 2 Reborn (2015) | 140.9 | 125.8 | 119.5 | 112.6 | 54.8 | |
| Final Fantasy XV Benchmark (2018) | 90.5 | 49 | 35 | 25 | 13.4 | |
| X-Plane 11.11 (2018) | 97.8 | 83.9 | 68.1 | 51.7 | ||
| Far Cry 5 (2018) | 107 | 59 | 53 | 49 | 35 | 18 |
| Strange Brigade (2018) | 170.8 | 74.2 | 60.9 | 53.3 | ||
| Monster Hunter Stories 2 (2021) | 94.4 | 91.2 | 89.7 | 72.5 | ||
| F1 2021 (2021) | 190.7 | 105.6 | 66.2 | 36.1 | 27 | 11 |
| GRID Legends (2022) | 100.6 | 80.8 | 67.9 | 49.5 | 39.4 | 23.3 |
| F1 22 (2022) | 167.7 | 106.6 | 92.7 | 59 | 12 | |
| Dead Space Remake (2023) | 30.8 | 25.8 | 20.4 | 17.8 | 7.4 |
Emissões: Baixo, baixo, onde está o baixo...
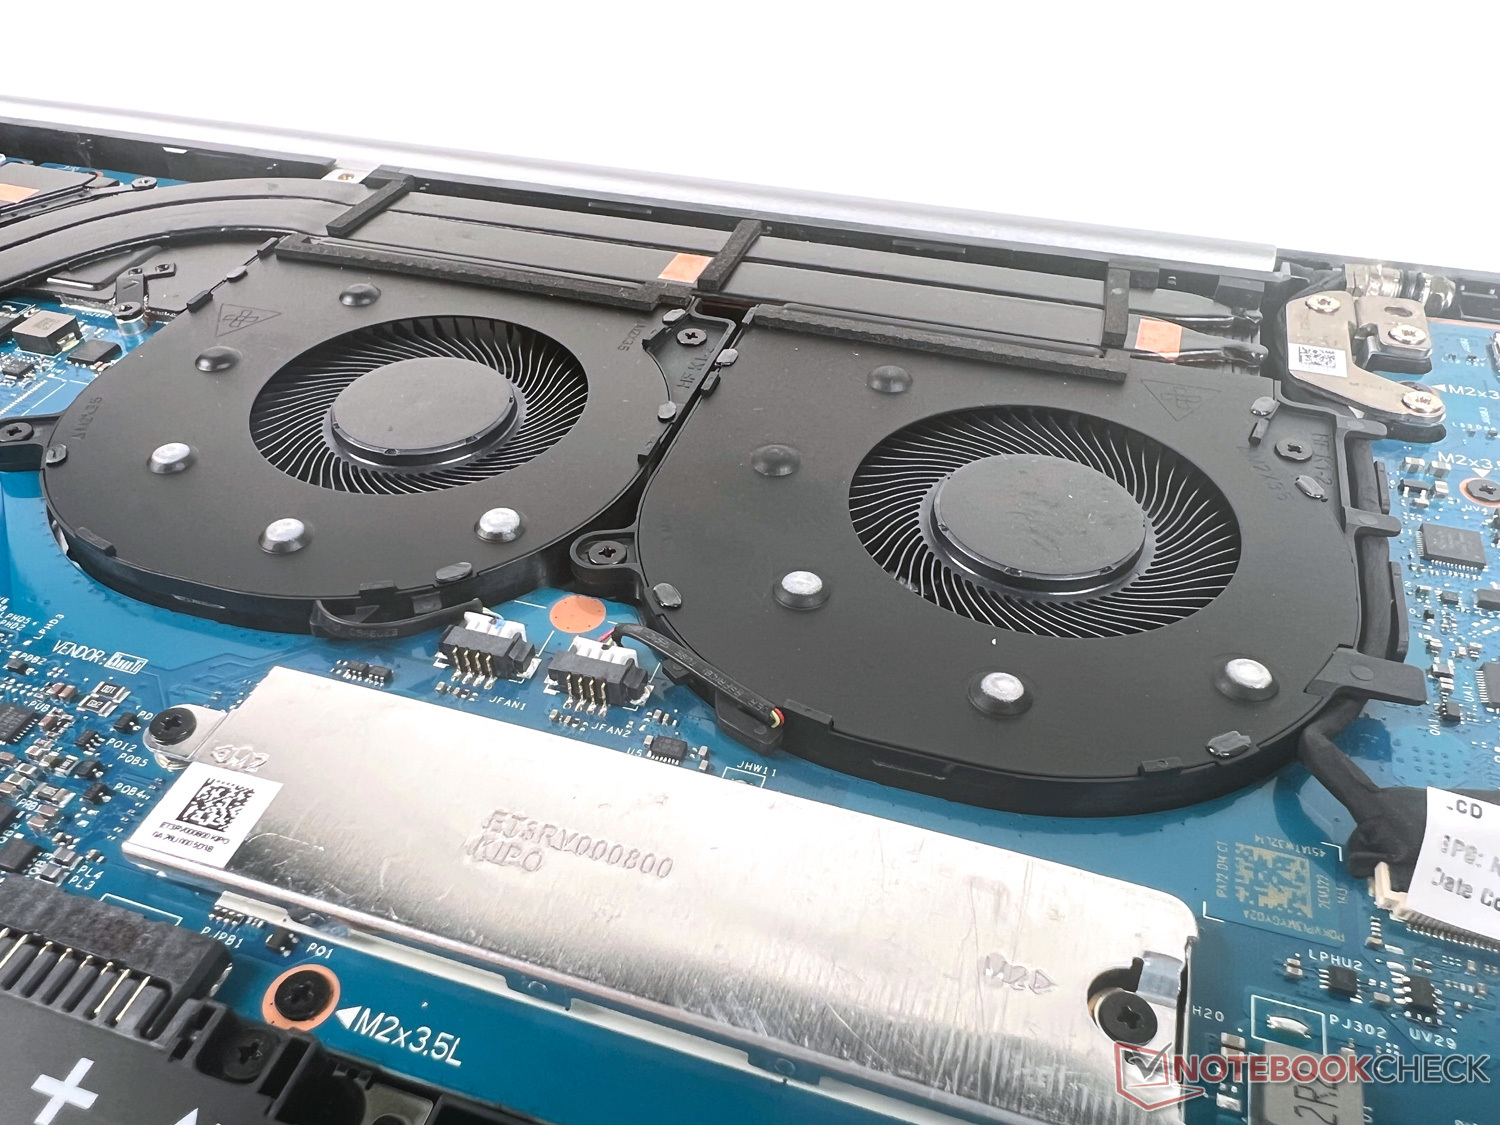
Níveis de ruídos
Durante a operação ociosa e sob carga baixa, a HP Envy 17 não é audível. Sob algumas exigências leves, os dois ventiladores para CPU e GPU ronronam constantemente, sem serem particularmente irritantes. Por outro lado, se você desafiar o hardware incorporado (por exemplo, durante os jogos), o dispositivo atinge um nível de ruído de até 48 dB. O modo "Ajuste Inteligente" quase não traz nenhuma vantagem em termos de ruído quando a carga é ligeiramente reduzida.
Nossa unidade de teste não produz nenhum outro barulho irritante.
Barulho
| Ocioso |
| 28.5 / 28.5 / 29.7 dB |
| Carga |
| 39.5 / 48 dB |
 | ||
30 dB silencioso 40 dB(A) audível 50 dB(A) ruidosamente alto |
||
min: | ||
| HP Envy 17-cr0079ng GeForce RTX 2050 Mobile, i7-1255U, Samsung PM991a MZVLQ1T0HBLB | HP ProBook 450 G9 6A180EA Iris Xe G7 96EUs, i7-1255U, SK Hynix HFM512GD3JX013N | LG Gram 17Z90Q-E.AD78G GeForce RTX 2050 Mobile, i7-1260P, Samsung PM9A1 MZVL21T0HCLR | Acer Aspire 5 A515-57G-53N8 GeForce RTX 2050 Mobile, i5-1240P, Micron 2450 512GB MTFDKBA512TFK | Dell XPS 17 9720 GeForce RTX 3050 4GB Laptop GPU, i7-12700H, Micron 3400 MTFDKBA512TFH 512GB | Lenovo IdeaPad 3 17ABA7 Vega 7, R5 5625U, Intel SSDPEKNW512GZL | |
|---|---|---|---|---|---|---|
| Noise | 19% | -3% | -0% | 8% | -5% | |
| desligado / ambiente * (dB) | 26.5 | 25.5 4% | 26 2% | 25 6% | 24 9% | 26 2% |
| Idle Minimum * (dB) | 28.5 | 25.5 11% | 28 2% | 25 12% | 24 16% | 26 9% |
| Idle Average * (dB) | 28.5 | 25.5 11% | 28 2% | 29 -2% | 24 16% | 30.8 -8% |
| Idle Maximum * (dB) | 29.7 | 25.5 14% | 28.8 3% | 31 -4% | 24 19% | 33.4 -12% |
| Load Average * (dB) | 39.5 | 28 29% | 49.3 -25% | 46 -16% | 43.9 -11% | 47.6 -21% |
| Load Maximum * (dB) | 48 | 27.7 42% | 49.1 -2% | 47 2% | 48.4 -1% | 47.5 1% |
| Witcher 3 ultra * (dB) | 42 | 48.4 |
* ... menor é melhor
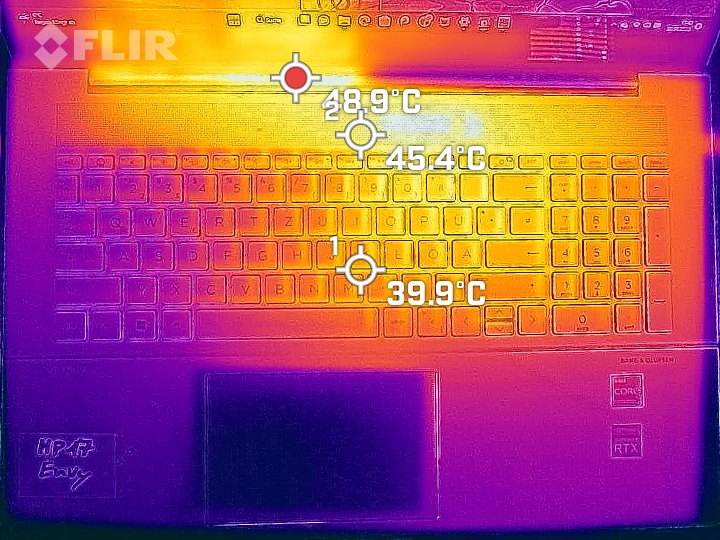
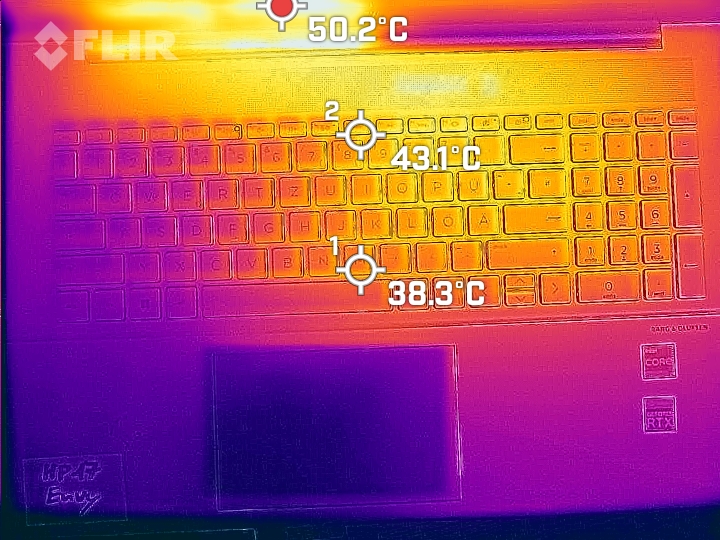
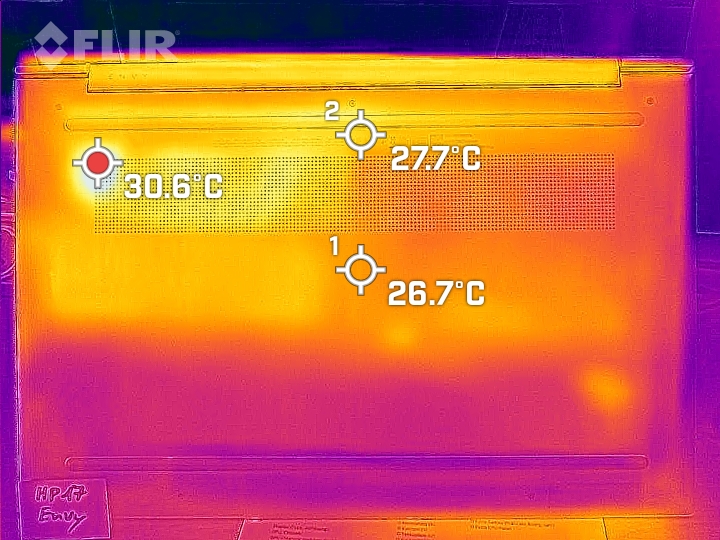
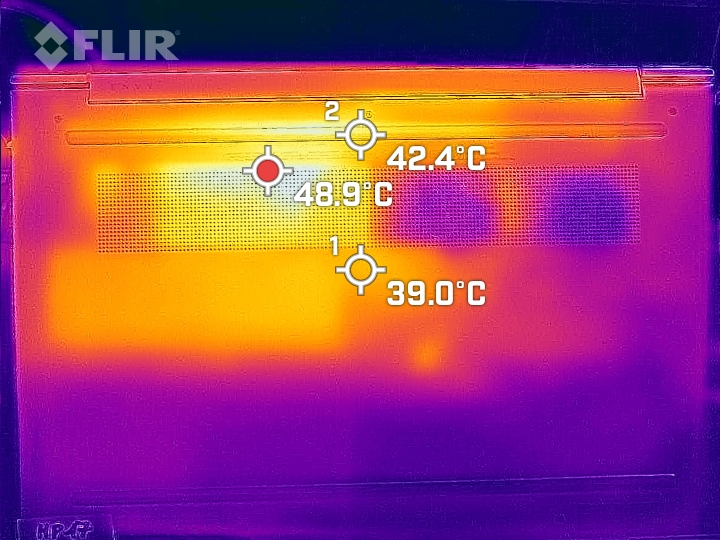
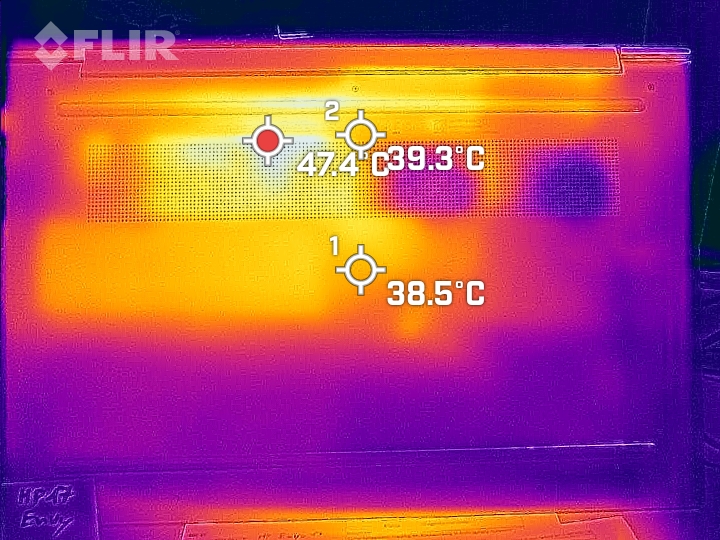
Temperatura
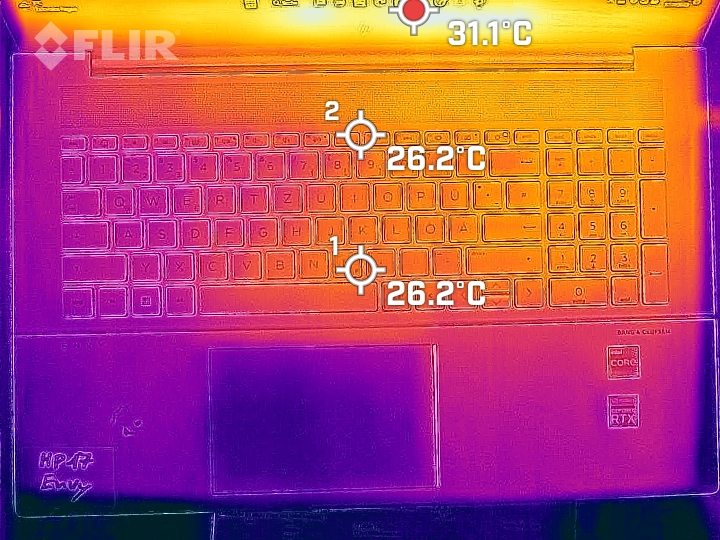
Durante a operação ociosa, o laptop quase não fica mais quente do que a temperatura ambiente. Sob carga, um hotspot se desenvolve no centro em frente ao display, que depois se expande em direção ao teclado, atingindo temperaturas próximas à marca de 50°C (122°F). Embora este aquecimento seja perceptível durante a digitação, ele não se torna muito desconfortável.
(-) A temperatura máxima no lado superior é 47.1 °C / 117 F, em comparação com a média de 36.8 °C / 98 F , variando de 21 a 71 °C para a classe Multimedia.
(±) A parte inferior aquece até um máximo de 43.8 °C / 111 F, em comparação com a média de 39.1 °C / 102 F
(+) Em uso inativo, a temperatura média para o lado superior é 23.9 °C / 75 F, em comparação com a média do dispositivo de 31.3 °C / ### class_avg_f### F.
(±) Jogando The Witcher 3, a temperatura média para o lado superior é 34.5 °C / 94 F, em comparação com a média do dispositivo de 31.3 °C / ## #class_avg_f### F.
(+) Os apoios para as mãos e o touchpad são mais frios que a temperatura da pele, com um máximo de 31.7 °C / 89.1 F e, portanto, são frios ao toque.
(-) A temperatura média da área do apoio para as mãos de dispositivos semelhantes foi 28.7 °C / 83.7 F (-3 °C / -5.4 F).
| HP Envy 17-cr0079ng Intel Core i7-1255U, NVIDIA GeForce RTX 2050 Mobile | HP ProBook 450 G9 6A180EA Intel Core i7-1255U, Intel Iris Xe Graphics G7 96EUs | LG Gram 17Z90Q-E.AD78G Intel Core i7-1260P, NVIDIA GeForce RTX 2050 Mobile | Acer Aspire 5 A515-57G-53N8 Intel Core i5-1240P, NVIDIA GeForce RTX 2050 Mobile | Dell XPS 17 9720 Intel Core i7-12700H, NVIDIA GeForce RTX 3050 4GB Laptop GPU | Lenovo IdeaPad 3 17ABA7 AMD Ryzen 5 5625U, AMD Radeon RX Vega 7 | Média da turma Multimedia | |
|---|---|---|---|---|---|---|---|
| Heat | -14% | -9% | -2% | -3% | 1% | -0% | |
| Maximum Upper Side * (°C) | 47.1 | 40.5 14% | 50.3 -7% | 43 9% | 49.5 -5% | 43.1 8% | 41.1 ? 13% |
| Maximum Bottom * (°C) | 43.8 | 47.6 -9% | 52.5 -20% | 48 -10% | 38.4 12% | 43.6 -0% | 43.6 ? -0% |
| Idle Upper Side * (°C) | 25.2 | 32.6 -29% | 26.9 -7% | 26 -3% | 28 -11% | 25.1 -0% | 26.9 ? -7% |
| Idle Bottom * (°C) | 25.9 | 34.2 -32% | 26.5 -2% | 27 -4% | 27.8 -7% | 27 -4% | 27.8 ? -7% |
* ... menor é melhor
Teste de estresse
Em nosso teste de estresse com Prime95 e Furmark desafiando o hardware por pelo menos uma hora, a CPU e a GPU mantêm um resultado constante sem maiores quedas durante o teste. Uma CPU fica a uma média de 71 °C (160 °F) e cerca de 1,65 GHz, o que é ligeiramente inferior à velocidade básica do relógio de 1,7 GHz. Entretanto, isto não tem nenhum impacto no funcionamento diário. Uma GPU consome 35 watts, funcionando a cerca de 1,1 GHz com temperaturas em torno de 75 °C (167 °F).
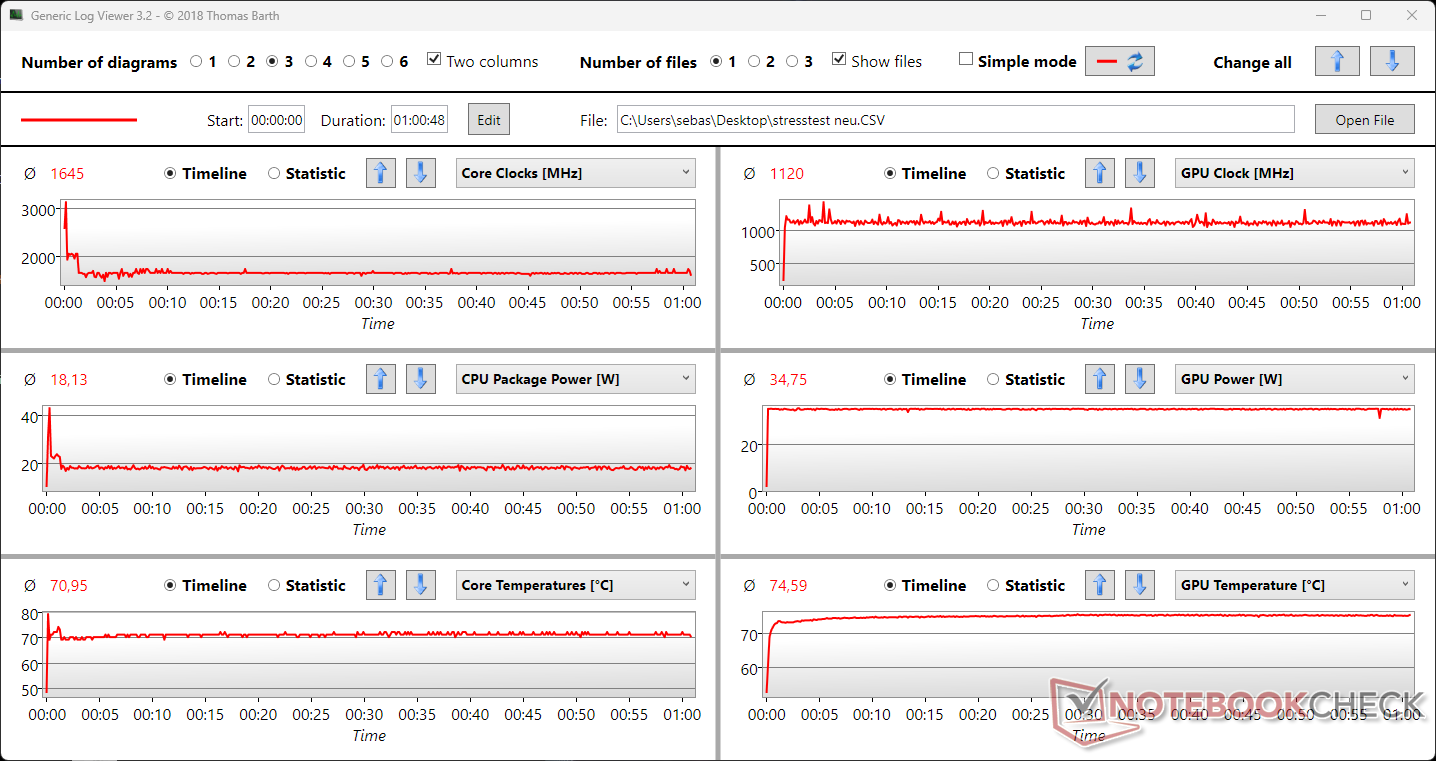
| Relógio CPU (GHz) | Relógio GPU (MHz) | Temperatura média da CPU (°C) | Temperatura média da GPU (°C) | |
| Sistema ocioso | 2.0 | 0 | 49 | 55 |
| Prime95, Stress | 2.5 | 0 | 68 | 55 |
| Prime95 + FurMark, Stress | 1.65 | 1.1 | 71 | 75 |
| O Witcher 3, Stress | 3.3 | 1.3 | 65 | 71 |
Oradores
Os alto-falantes estéreo da Bang & Olufsen podem tocar relativamente alto e oferecer médias e altas equilibradas. No entanto, o baixo está faltando quase completamente. No geral, nossa unidade de teste coloca na metade inferior o campo multimídia em termos de reprodução de áudio. Particularmente para música ou jogos, recomendamos conectar fones de ouvido ou um fone de ouvido através da porta de áudio de 3,5 mm.
HP Envy 17-cr0079ng análise de áudio
(+) | os alto-falantes podem tocar relativamente alto (###valor### dB)
Graves 100 - 315Hz
(-) | quase nenhum baixo - em média 17.6% menor que a mediana
(±) | a linearidade dos graves é média (12.4% delta para a frequência anterior)
Médios 400 - 2.000 Hz
(+) | médios equilibrados - apenas 2.5% longe da mediana
(+) | médios são lineares (3.6% delta para frequência anterior)
Altos 2 - 16 kHz
(±) | máximos mais altos - em média 10.1% maior que a mediana
(+) | os máximos são lineares (4.2% delta da frequência anterior)
Geral 100 - 16.000 Hz
(±) | a linearidade do som geral é média (18.3% diferença em relação à mediana)
Comparado com a mesma classe
» 56% de todos os dispositivos testados nesta classe foram melhores, 7% semelhantes, 38% piores
» O melhor teve um delta de 5%, a média foi 17%, o pior foi 45%
Comparado com todos os dispositivos testados
» 40% de todos os dispositivos testados foram melhores, 8% semelhantes, 52% piores
» O melhor teve um delta de 4%, a média foi 23%, o pior foi 134%
Apple MacBook Pro 16 2021 M1 Pro análise de áudio
(+) | os alto-falantes podem tocar relativamente alto (###valor### dB)
Graves 100 - 315Hz
(+) | bons graves - apenas 3.8% longe da mediana
(+) | o baixo é linear (5.2% delta para a frequência anterior)
Médios 400 - 2.000 Hz
(+) | médios equilibrados - apenas 1.3% longe da mediana
(+) | médios são lineares (2.1% delta para frequência anterior)
Altos 2 - 16 kHz
(+) | agudos equilibrados - apenas 1.9% longe da mediana
(+) | os máximos são lineares (2.7% delta da frequência anterior)
Geral 100 - 16.000 Hz
(+) | o som geral é linear (4.6% diferença em relação à mediana)
Comparado com a mesma classe
» 0% de todos os dispositivos testados nesta classe foram melhores, 0% semelhantes, 100% piores
» O melhor teve um delta de 5%, a média foi 17%, o pior foi 45%
Comparado com todos os dispositivos testados
» 0% de todos os dispositivos testados foram melhores, 0% semelhantes, 100% piores
» O melhor teve um delta de 4%, a média foi 23%, o pior foi 134%
Gerenciamento de energia: A HP Envy 17 não é uma campeã de enduro
Consumo de energia
A HP Envy 17-cr0079ng não é muito eficiente. Em comparação com a LG Gram 17com o mesmo display diagonal e dGPU, assim como a maioria dos outros modelos de comparação, consome mais energia do carregador, que a 90 W é suficientemente grande para um consumo de energia de cerca de 70 W. Somente sob carga de pico absoluto, o consumo atinge apenas um pouco mais alto a 93 W.
| desligado | |
| Ocioso | |
| Carga |
|
Key:
min: | |
| HP Envy 17-cr0079ng i7-1255U, GeForce RTX 2050 Mobile, Samsung PM991a MZVLQ1T0HBLB, IPS, 3840x2160, 17.3" | HP ProBook 450 G9 6A180EA i7-1255U, Iris Xe G7 96EUs, SK Hynix HFM512GD3JX013N, , 1920x1080, 15.6" | LG Gram 17Z90Q-E.AD78G i7-1260P, GeForce RTX 2050 Mobile, Samsung PM9A1 MZVL21T0HCLR, IPS, 2560x1600, 17" | Acer Aspire 5 A515-57G-53N8 i5-1240P, GeForce RTX 2050 Mobile, Micron 2450 512GB MTFDKBA512TFK, IPS, 1920x1080, 15.6" | Dell XPS 17 9720 i7-12700H, GeForce RTX 3050 4GB Laptop GPU, Micron 3400 MTFDKBA512TFH 512GB, IPS, 3840x2400, 17" | Lenovo IdeaPad 3 17ABA7 R5 5625U, Vega 7, Intel SSDPEKNW512GZL, IPS, 1920x1080, 17.3" | Média NVIDIA GeForce RTX 2050 Mobile | Média da turma Multimedia | |
|---|---|---|---|---|---|---|---|---|
| Power Consumption | 47% | 31% | 26% | -35% | 42% | 18% | 10% | |
| Idle Minimum * (Watt) | 5.8 | 4.5 22% | 4.1 29% | 4 31% | 7.8 -34% | 5.1 12% | 5.11 ? 12% | 5.66 ? 2% |
| Idle Average * (Watt) | 14.3 | 7.3 49% | 9.8 31% | 8 44% | 15.1 -6% | 8.3 42% | 9.15 ? 36% | 10.2 ? 29% |
| Idle Maximum * (Watt) | 18.4 | 8.1 56% | 12 35% | 13 29% | 17 8% | 9.6 48% | 11.2 ? 39% | 12.5 ? 32% |
| Load Average * (Watt) | 70 | 32.8 53% | 49.3 30% | 62 11% | 114 -63% | 33.6 52% | 70.6 ? -1% | 65.2 ? 7% |
| Witcher 3 ultra * (Watt) | 69.4 | 32 54% | 49.3 29% | 60 14% | 115.2 -66% | 33.3 52% | ||
| Load Maximum * (Watt) | 93 | 47 49% | 66 29% | 70 25% | 135.6 -46% | 51.9 44% | 87.4 ? 6% | 113.5 ? -22% |
* ... menor é melhor
Power Consumption The Witcher 3 / Stress Test
Power Consumption with External Monitor
Vida útil da bateria
A HP equipou nossa unidade de teste Envy 17 com uma bateria de 55-Wh. Com isto, ela é ligeiramente maior do que a da maioria dos outros dispositivos de comparação. Somente o campeão de resistência LG Gram 17 e o laptop de energia Dell XPS 17 têm baterias significativamente maiores.
Entretanto, o tamanho da bateria só se reflete em um sentido limitado na vida útil da bateria de nossa unidade de teste. No campo de comparação, nosso dispositivo é o último, o que provavelmente se deve principalmente à tela de 4K de alta resolução e bastante brilhante. Sob carga, a bateria se esgota após apenas cerca de 90 minutos, e enquanto navegamos ou assistimos a vídeos, os valores não convidam realmente algum entusiasmo nem com cerca de 4,5 e 5,5 horas, respectivamente.
| HP Envy 17-cr0079ng i7-1255U, GeForce RTX 2050 Mobile, 55 Wh | HP ProBook 450 G9 6A180EA i7-1255U, Iris Xe G7 96EUs, 51 Wh | LG Gram 17Z90Q-E.AD78G i7-1260P, GeForce RTX 2050 Mobile, 90 Wh | Acer Aspire 5 A515-57G-53N8 i5-1240P, GeForce RTX 2050 Mobile, 50 Wh | Dell XPS 17 9720 i7-12700H, GeForce RTX 3050 4GB Laptop GPU, 97 Wh | Lenovo IdeaPad 3 17ABA7 R5 5625U, Vega 7, 38 Wh | Média da turma Multimedia | |
|---|---|---|---|---|---|---|---|
| Duração da bateria | 111% | 124% | 19% | 58% | 45% | 125% | |
| H.264 (h) | 5.5 | 11.2 104% | 17.1 ? 211% | ||||
| WiFi v1.3 (h) | 4.7 | 10.1 115% | 14.5 209% | 7.1 51% | 9.2 96% | 6.8 45% | 12.2 ? 160% |
| Load (h) | 1.6 | 3.3 106% | 2.2 38% | 1.4 -13% | 1.2 -25% | 1.664 ? 4% | |
| Witcher 3 ultra (h) | 2.7 | 1.7 | |||||
| Reader / Idle (h) | 15.8 | 24.9 ? |
Pro
Contra
Veredicto: O HP Envy 17 é um bom allrounder com poucos destaques
Em nosso teste, a HP Envy 17-cr0079ng se apresenta como um laptop multimídia equilibrado. Graças ao seu sólido desempenho de CPU e ao nível de entrada dedicado GeForce, ele também pode ser usado para jogar videogames, desde que as demandas não sejam muito altas. Aqueles que procuram mais podem encontrá-lo no Dell XPS 17 por exemplo.
Um dos destaques deve ser realmente a tela grande e brilhante com uma resolução UHD. Graças ao seu design de alto brilho, ele também parece muito bom, mas isso acaba sendo um problema com reflexos de luz ou ao ar livre.
O laptop também mostra alguns pontos fracos na vida útil da bateria, por isso não é um companheiro ideal para uso ao ar livre ou móvel. Aqueles que querem poder trabalhar o máximo de tempo possível longe da tomada devem definitivamente escolher outro laptop, como o extremamente duradouroLG Gram 17.
No geral, a HP Envy 17 pontua em nosso teste com mais pontos fortes do que fracos, mas é incapaz de realmente se destacar em qualquer área. Ela oferece uma boa mistura para multimídia, jogos e Office, mas também custa um preço elevado a um MSRP de quase 2.000 Euros (~$2.210). Outros dispositivos oferecem mais pelo dinheiro aqui, tais como o Acer Aspire 5 A515-57Gcom o mesmo dGPU mas sem 4K display custando apenas a metade, ou o mais caro ainda, mas também mais potente e globalmente mais "perfeito" Dell XPS 17.
Preço e Disponibilidade
O HP Envy 17 está disponível em muitas configurações da HP a partir de $699,99. Um modelo com uma configuração quase similar à nossa unidade de teste (Intel Core i7-1260P em vez de i7-1255U, 32 GB de RAM, 1-TB SSD, display QHD) mas sem a placa gráfica dedicada está disponível por US$ 1309,99, e outra configuração com a placa gráfica mas com menos RAM e uma tela FHD menor custa US$ 1049,99.
HP Envy 17-cr0079ng
- 03/28/2023 v7 (old)
Marcus Schwarten
Transparência
A seleção dos dispositivos a serem analisados é feita pela nossa equipe editorial. A amostra de teste foi fornecida ao autor como empréstimo pelo fabricante ou varejista para fins desta revisão. O credor não teve influência nesta revisão, nem o fabricante recebeu uma cópia desta revisão antes da publicação. Não houve obrigação de publicar esta revisão. Como empresa de mídia independente, a Notebookcheck não está sujeita à autoridade de fabricantes, varejistas ou editores.
É assim que o Notebookcheck está testando
Todos os anos, o Notebookcheck analisa de forma independente centenas de laptops e smartphones usando procedimentos padronizados para garantir que todos os resultados sejam comparáveis. Desenvolvemos continuamente nossos métodos de teste há cerca de 20 anos e definimos padrões da indústria no processo. Em nossos laboratórios de teste, equipamentos de medição de alta qualidade são utilizados por técnicos e editores experientes. Esses testes envolvem um processo de validação em vários estágios. Nosso complexo sistema de classificação é baseado em centenas de medições e benchmarks bem fundamentados, o que mantém a objetividade.Price comparison

