Revisão do laptop MSI Katana 15: Jogador de orçamento com RTX 4050 e CPU Alder Lake
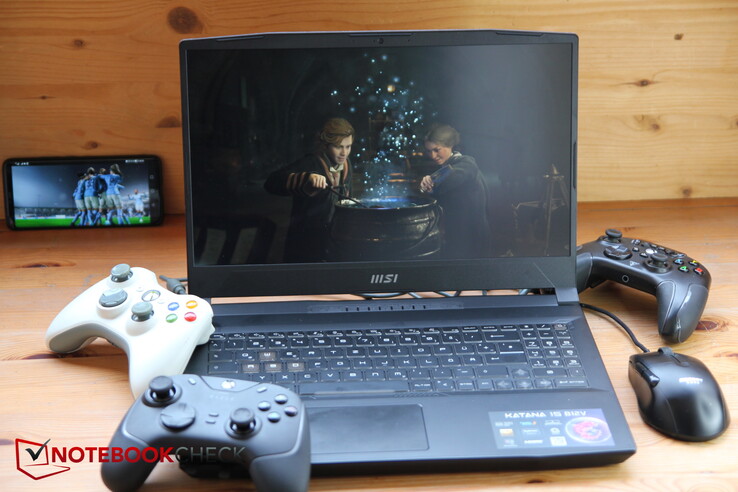
A MSI tem uma linha de laptops que visualmente parecem muito semelhantes. No ano passado, revisamos o quase-predecessor de 15,6 polegadas, oMSI Katana GF66 12UGSmas o Pulso GL66ou MSI Sword também batem a mesma nota visual. Nossa configuração atual de revisão é interessante porque a MSI decidiu combinar um processador "antigo" Alder Lake com um novo RTX 4050 a fim de possivelmente estar entre os primeiros a lançar um laptop para jogos com um cartão RTX 40xx. A designação é Katana 15 B12, enquanto o Katana 15 B13 já tem um Intel Gen13 e um RTX 40xx. Vamos ver como as duas gerações de CPU/GPU se comparam em nosso modelo B12.
Como o Katana 15 é um dos primeiros laptops com um RTX 4050 a ser revisto, voltamos em grande parte para a geração anterior de jogadores de nível básico a médio com oRTX 3060para comparação. Estes incluem o Lenovo Legion 5o Schenker XMG Core 15o MSI Pulso GL66 e o Asus TUF Gaming F15o predecessor também está incluído para comparação, mas os leitores devem notar que ele foi equipado com o mais forte RTX 3070 Ti.
Possíveis concorrentes em comparação
Avaliação | Data | Modelo | Peso | Altura | Size | Resolução | Preço |
|---|---|---|---|---|---|---|---|
| 82.9 % v7 (old) | 03/2023 | MSI Katana 15 B12VEK i7-12650H, GeForce RTX 4050 Laptop GPU | 2.3 kg | 24.9 mm | 15.60" | 1920x1080 | |
| 80.3 % v7 (old) | 06/2022 | MSI Katana GF66 12UGS i7-12700H, GeForce RTX 3070 Ti Laptop GPU | 2.3 kg | 27.5 mm | 15.60" | 1920x1080 | |
| 80.7 % v7 (old) | 04/2022 | MSI Pulse GL66 12UEK i9-12900H, GeForce RTX 3060 Laptop GPU | 2.3 kg | 25 mm | 15.60" | 1920x1080 | |
| 87.5 % v7 (old) | 11/2022 | Lenovo Legion 5 15IAH7H 82RB i7-12700H, GeForce RTX 3060 Laptop GPU | 2.4 kg | 19.99 mm | 15.60" | 1920x1080 | |
| 87.2 % v7 (old) | 03/2022 | Asus TUF Gaming F15 FX507ZM i7-12700H, GeForce RTX 3060 Laptop GPU | 2.1 kg | 24.95 mm | 15.60" | 1920x1080 | |
| 87.9 % v7 (old) | 01/2023 | Schenker XMG Core 15 (M22) R7 6800H, GeForce RTX 3060 Laptop GPU | 2.1 kg | 23 mm | 15.60" | 2560x1440 |
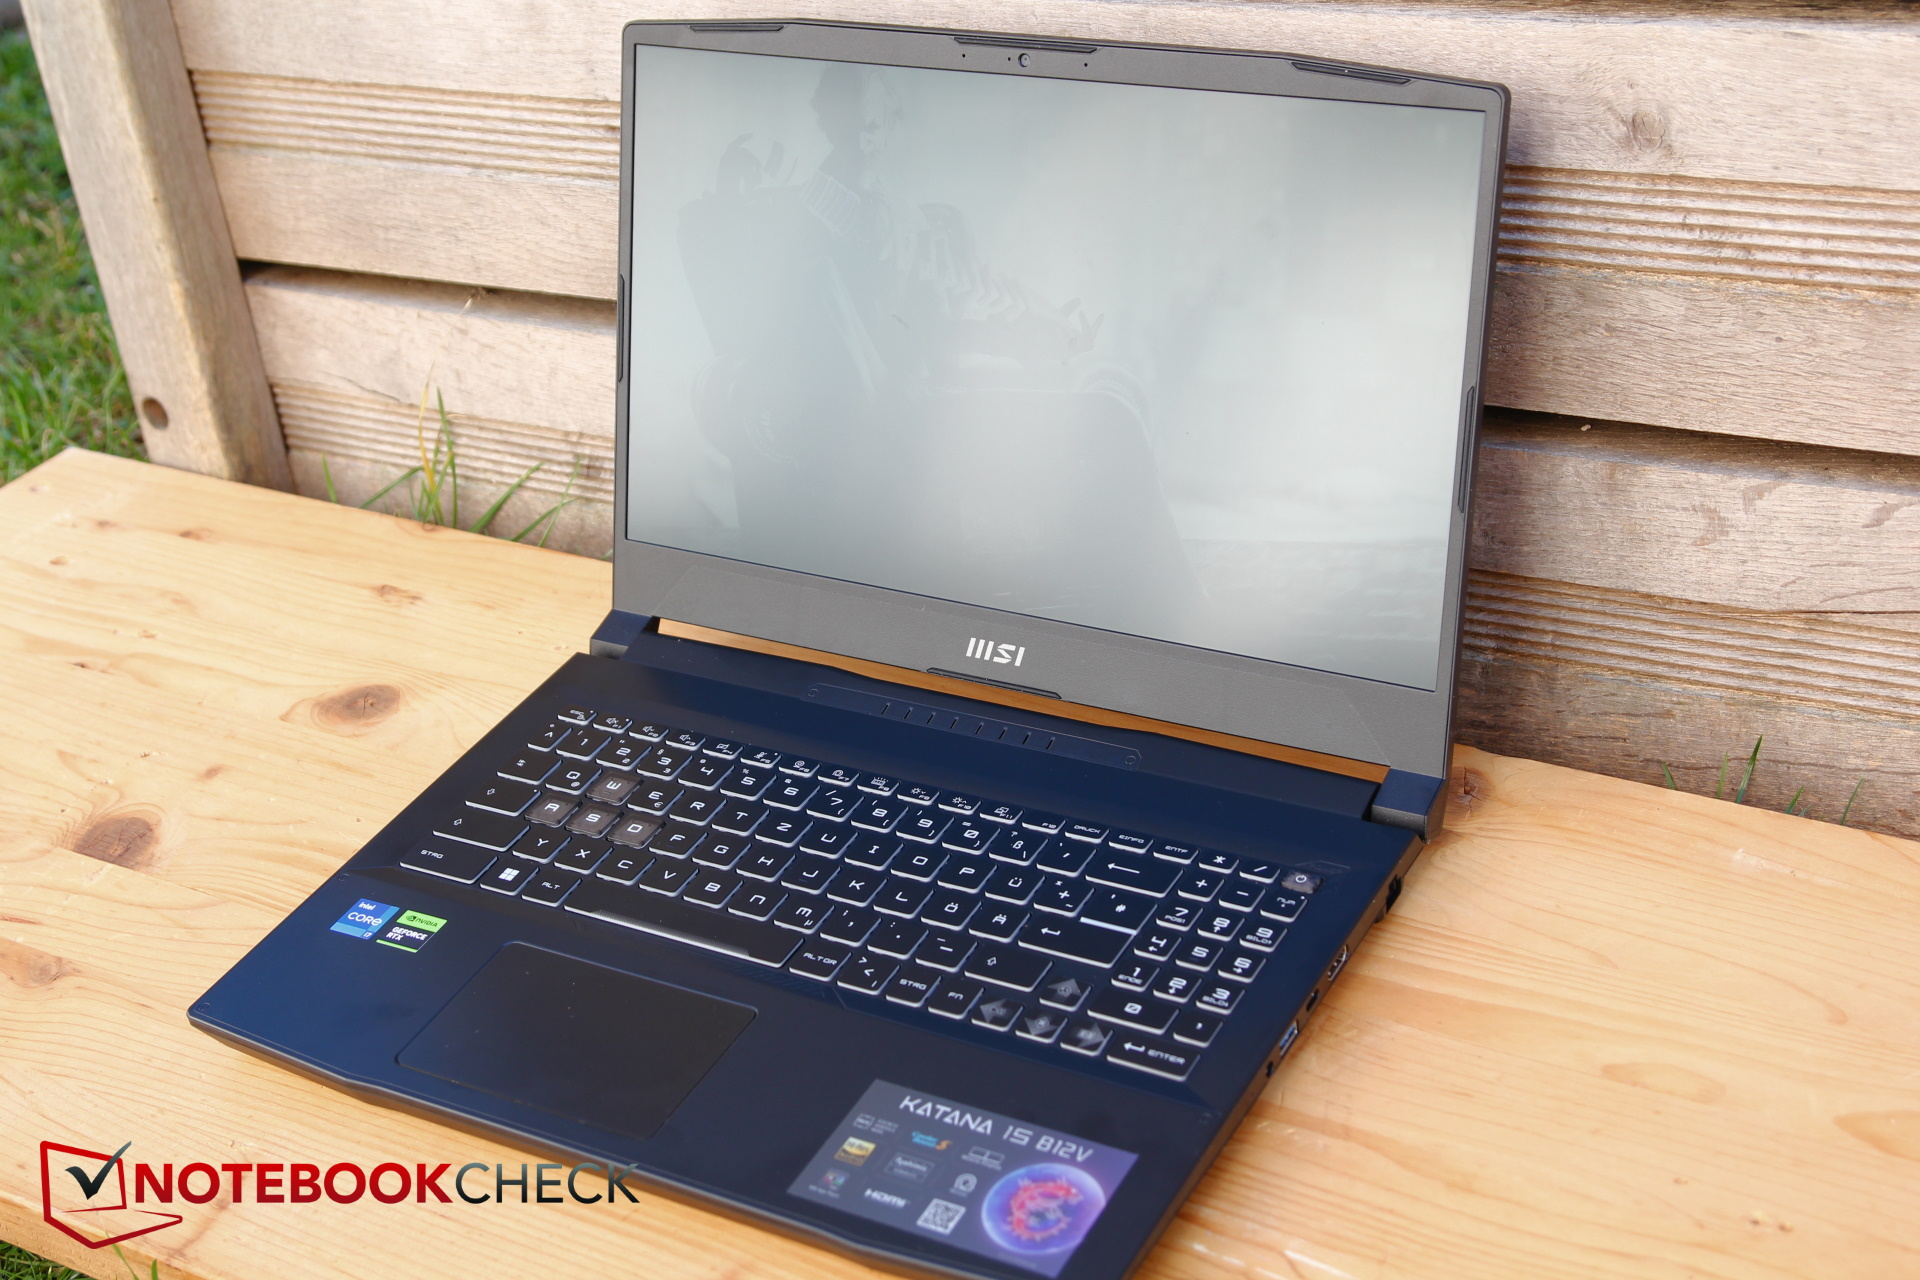
Estojo - Plástico Katana
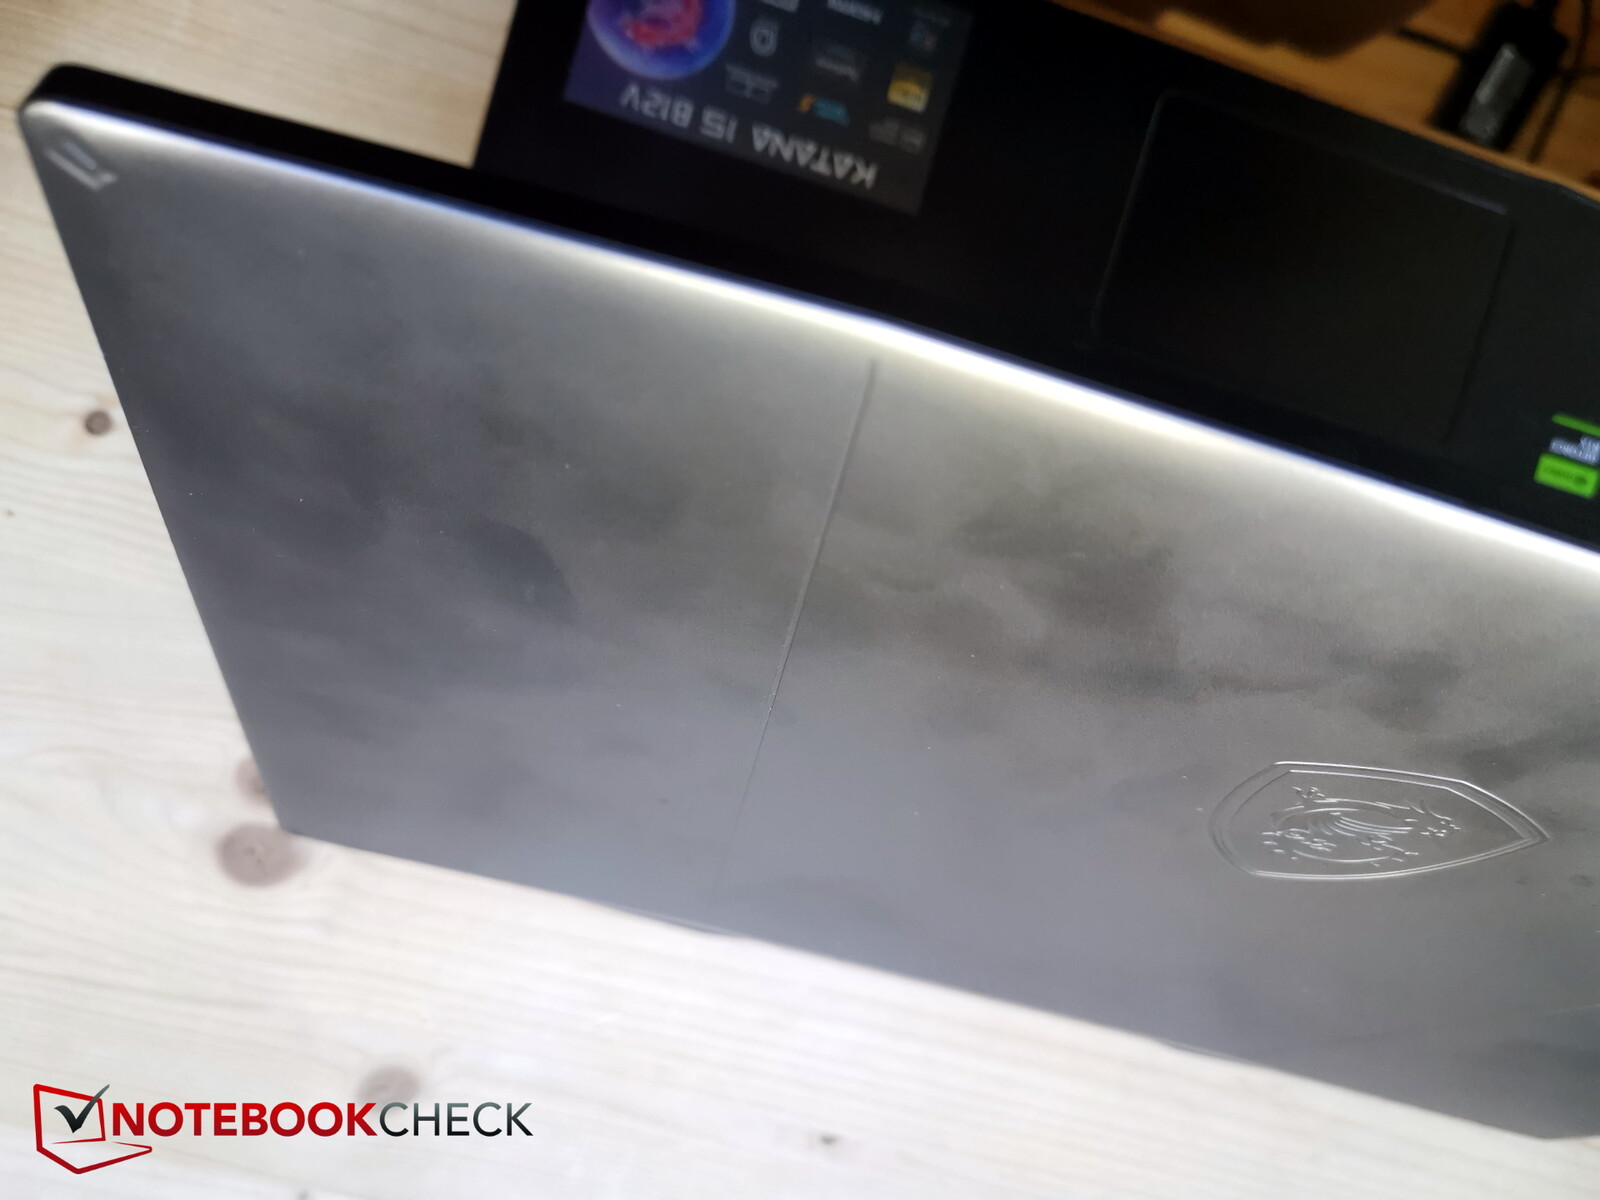
A caixa do Katana 15 é feita inteiramente de plástico, mesmo que os materiais da superfície lisa da tampa do display e da base apareçam quase como metal. As laterais agora mostram um padrão preto e cinza. Infelizmente, o estojo também se mostra muito suscetível a impressões digitais
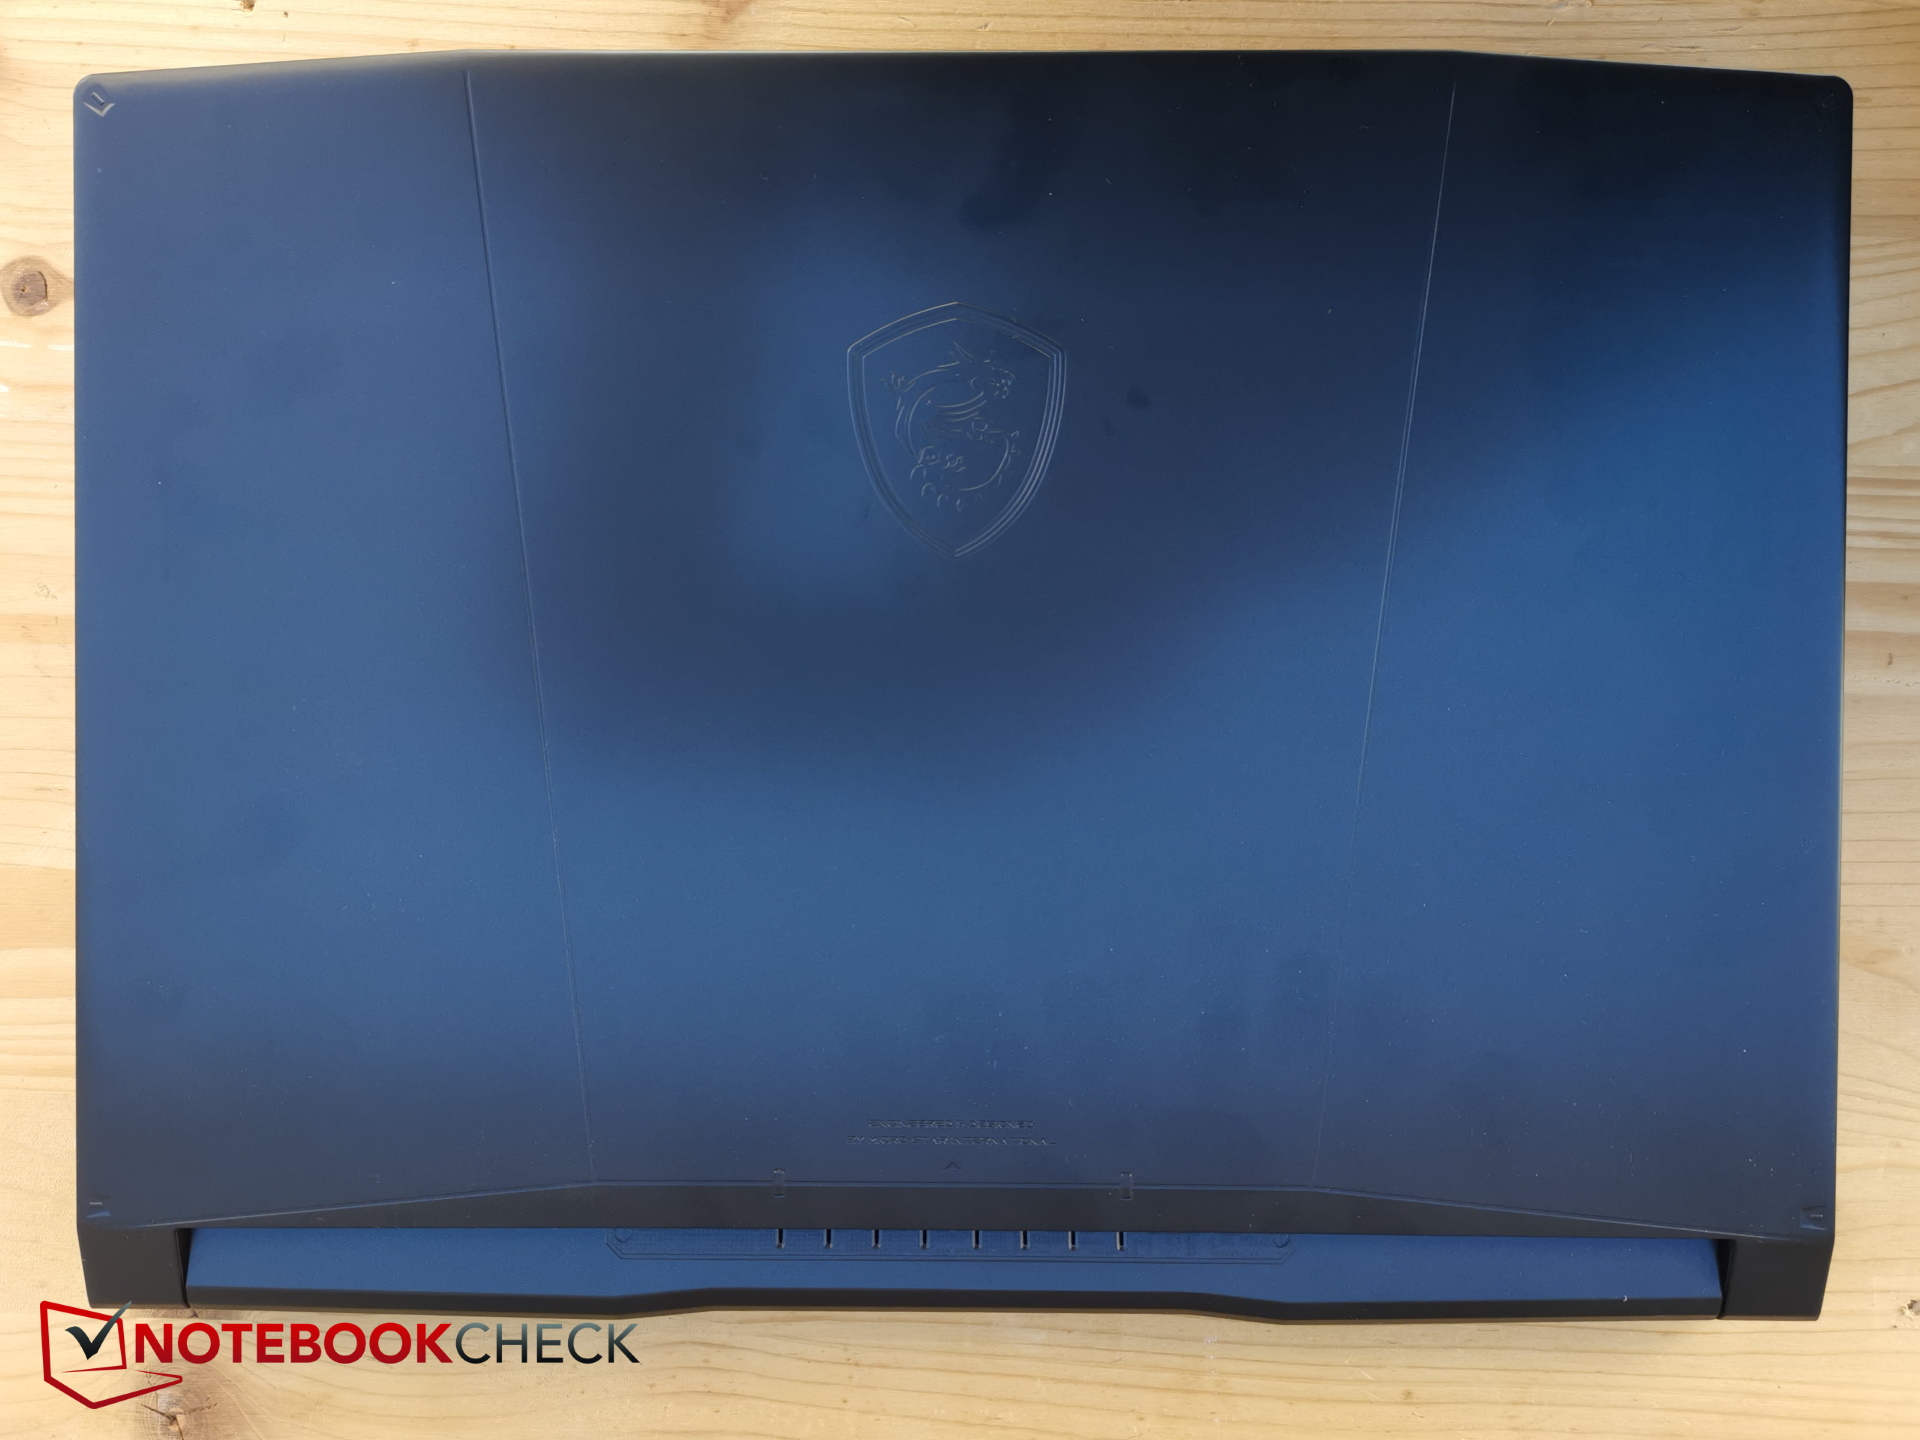
O ângulo de abertura é de 180 graus. Ao lado da logomarca, algumas linhas e cortes decoram a superfície preta brilhante da tampa. O mostrador vacila por mais tempo do que o habitual após a abertura ou ajuste do ângulo
A parte inferior é feita de plástico mais macio. A base é relativamente resistente à torção, mas emite alguns sons de rachadura. Ao contrário, a tampa é muito mais fácil de dobrar e emite um som de ranger. As bordas do visor são estreitas nas laterais, mas bastante largas na parte superior e inferior, pelos padrões atuais.
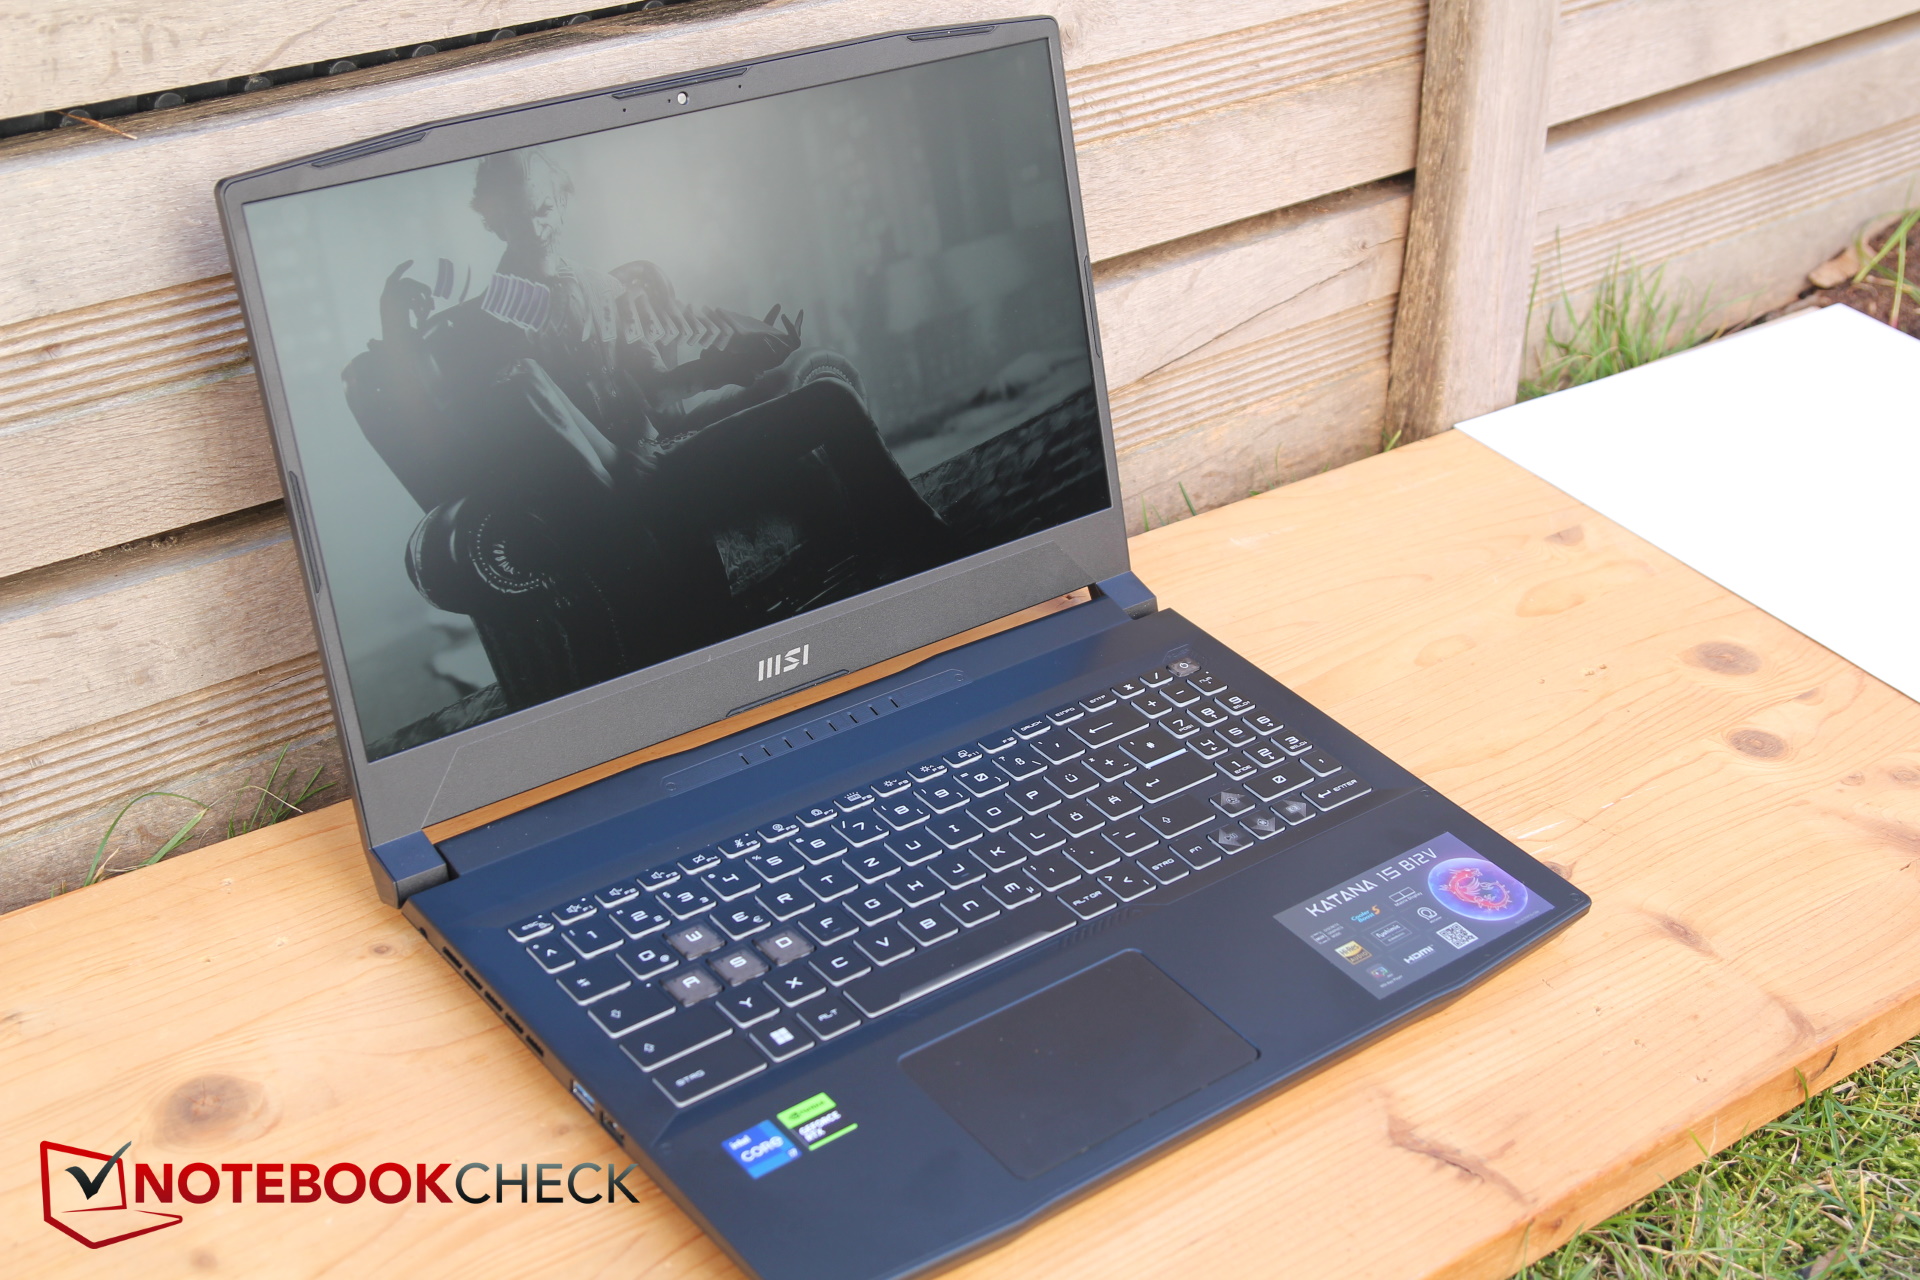
O Katana 15 2023 é ligeiramente mais fino que o do ano passado Katana GF66e herda as dimensões e o peso do Pulso GL66o Legion 5 é novamente ainda mais fino, mas o Core 15 também, embora minimamente.
Equipamentos - Última geração
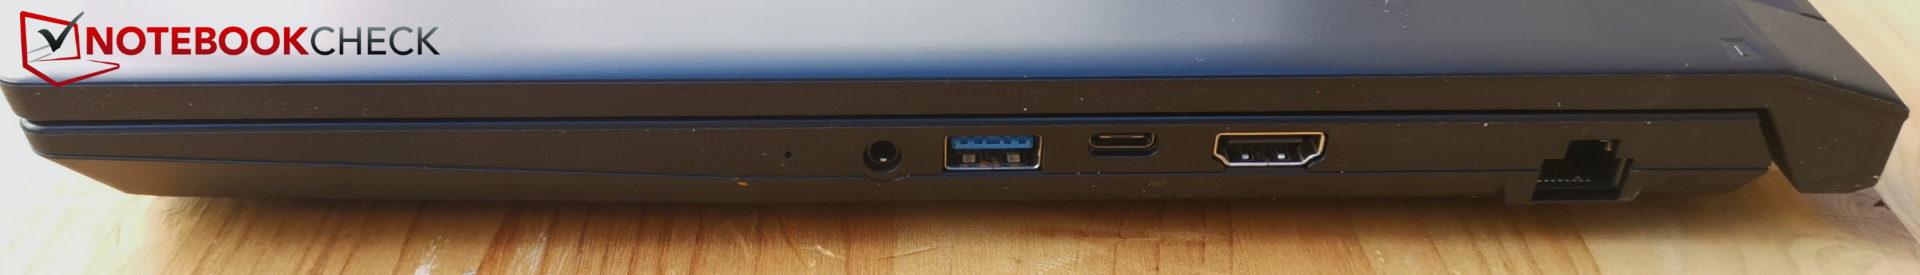
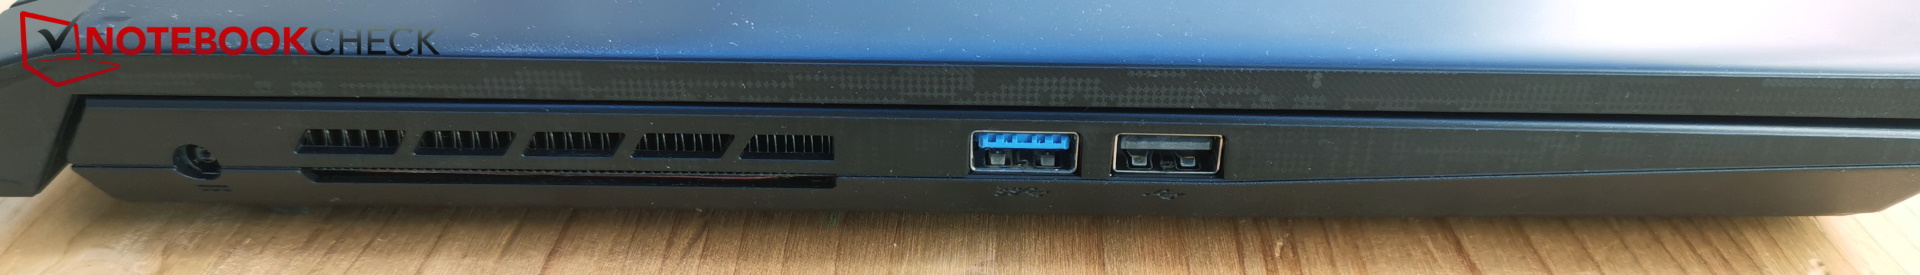
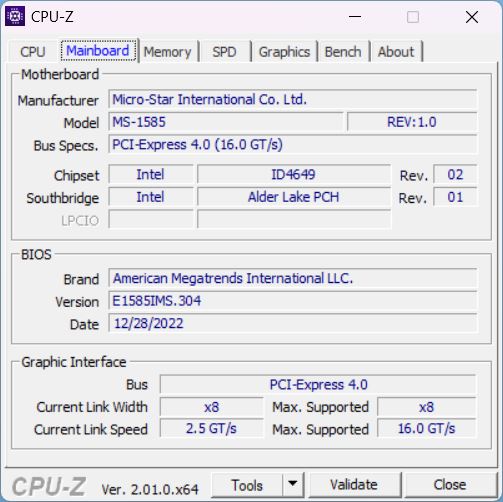
A disposição das portas é a mesma para todos os três modelos MSI. Na verdade, uma das três portas USB-A ainda é do tipo 2.0, que não pertence realmente à era atual. O mesmo se aplica a um slot USB-C, que não suporta Thunderbolt e oferece apenas velocidade 3.0.
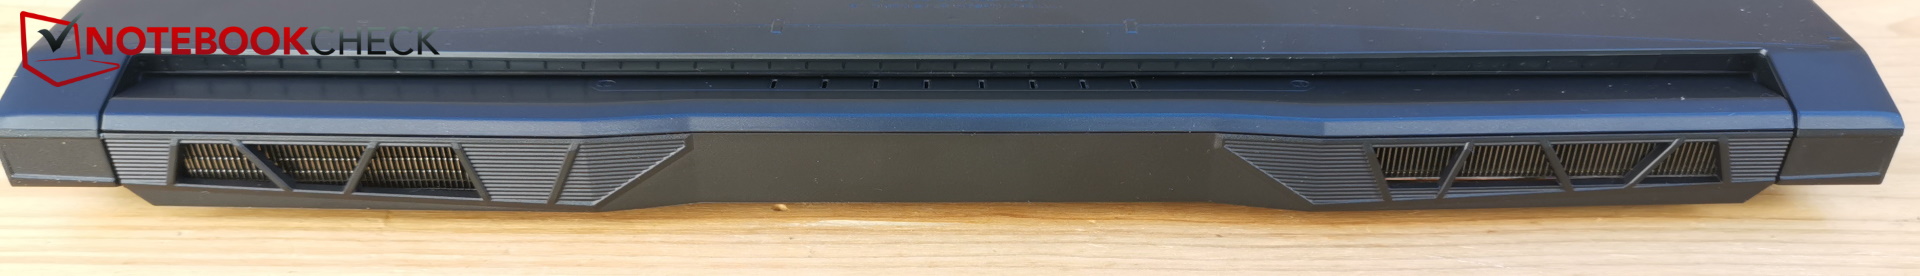
Falta um leitor SD, mas pelo menos LAN e HDMI estão a bordo. A tomada do fone de ouvido está excepcionalmente localizada no lado direito, assim como a porta HDMI, o que pode interferir com a mão do mouse. Apesar do espaço suficiente, não há portas na parte de trás.
Comunicação
A MSI instalou o módulo Intel Wi-Fi 6 AX201 WLAN, que ainda não suporta Wi-Fi 6E, portanto, a conexão com a rede de 6 GHz não é possível atualmente. Mas ele opera na faixa de 5 GHz (e, claro, 2,4 GHz) e isto ainda é bastante rápido.
Webcam
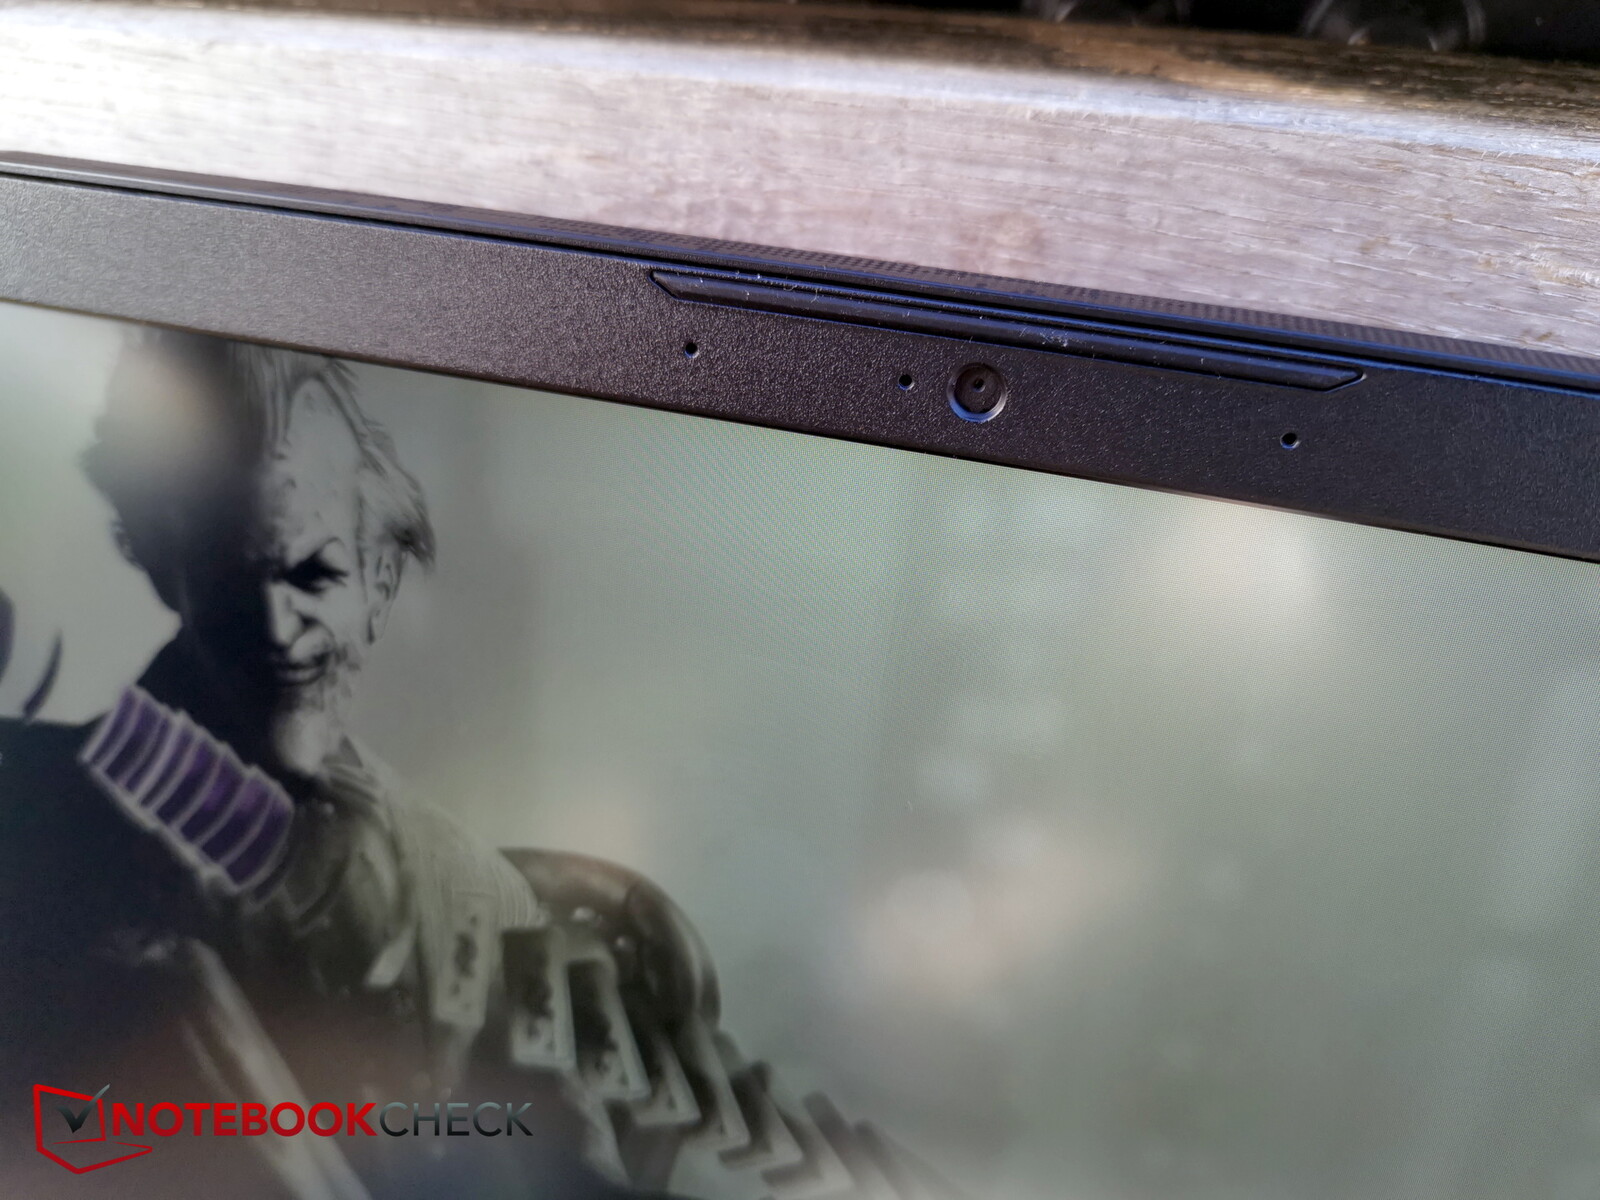
A webcam também é do último gênero com sua resolução de 720p. Mesmo a mais nova B13 ainda tem uma câmera de 720p. Esta pode ser ligada e desligada via fn+F6.
Os desvios de cor são geralmente bastante altos e a qualidade da imagem é bastante subótima.


Segurança
O TPM está a bordo, caso contrário, falta um slot Kensington. Também não há nenhum sensor de impressão digital disponível.
Acessórios e Garantia
Os laptops baratos geralmente não vêm com extras. Este também é o caso do Katana 15.
A MSI oferece uma garantia de 24 meses e um serviço de coleta e devolução está incluído.
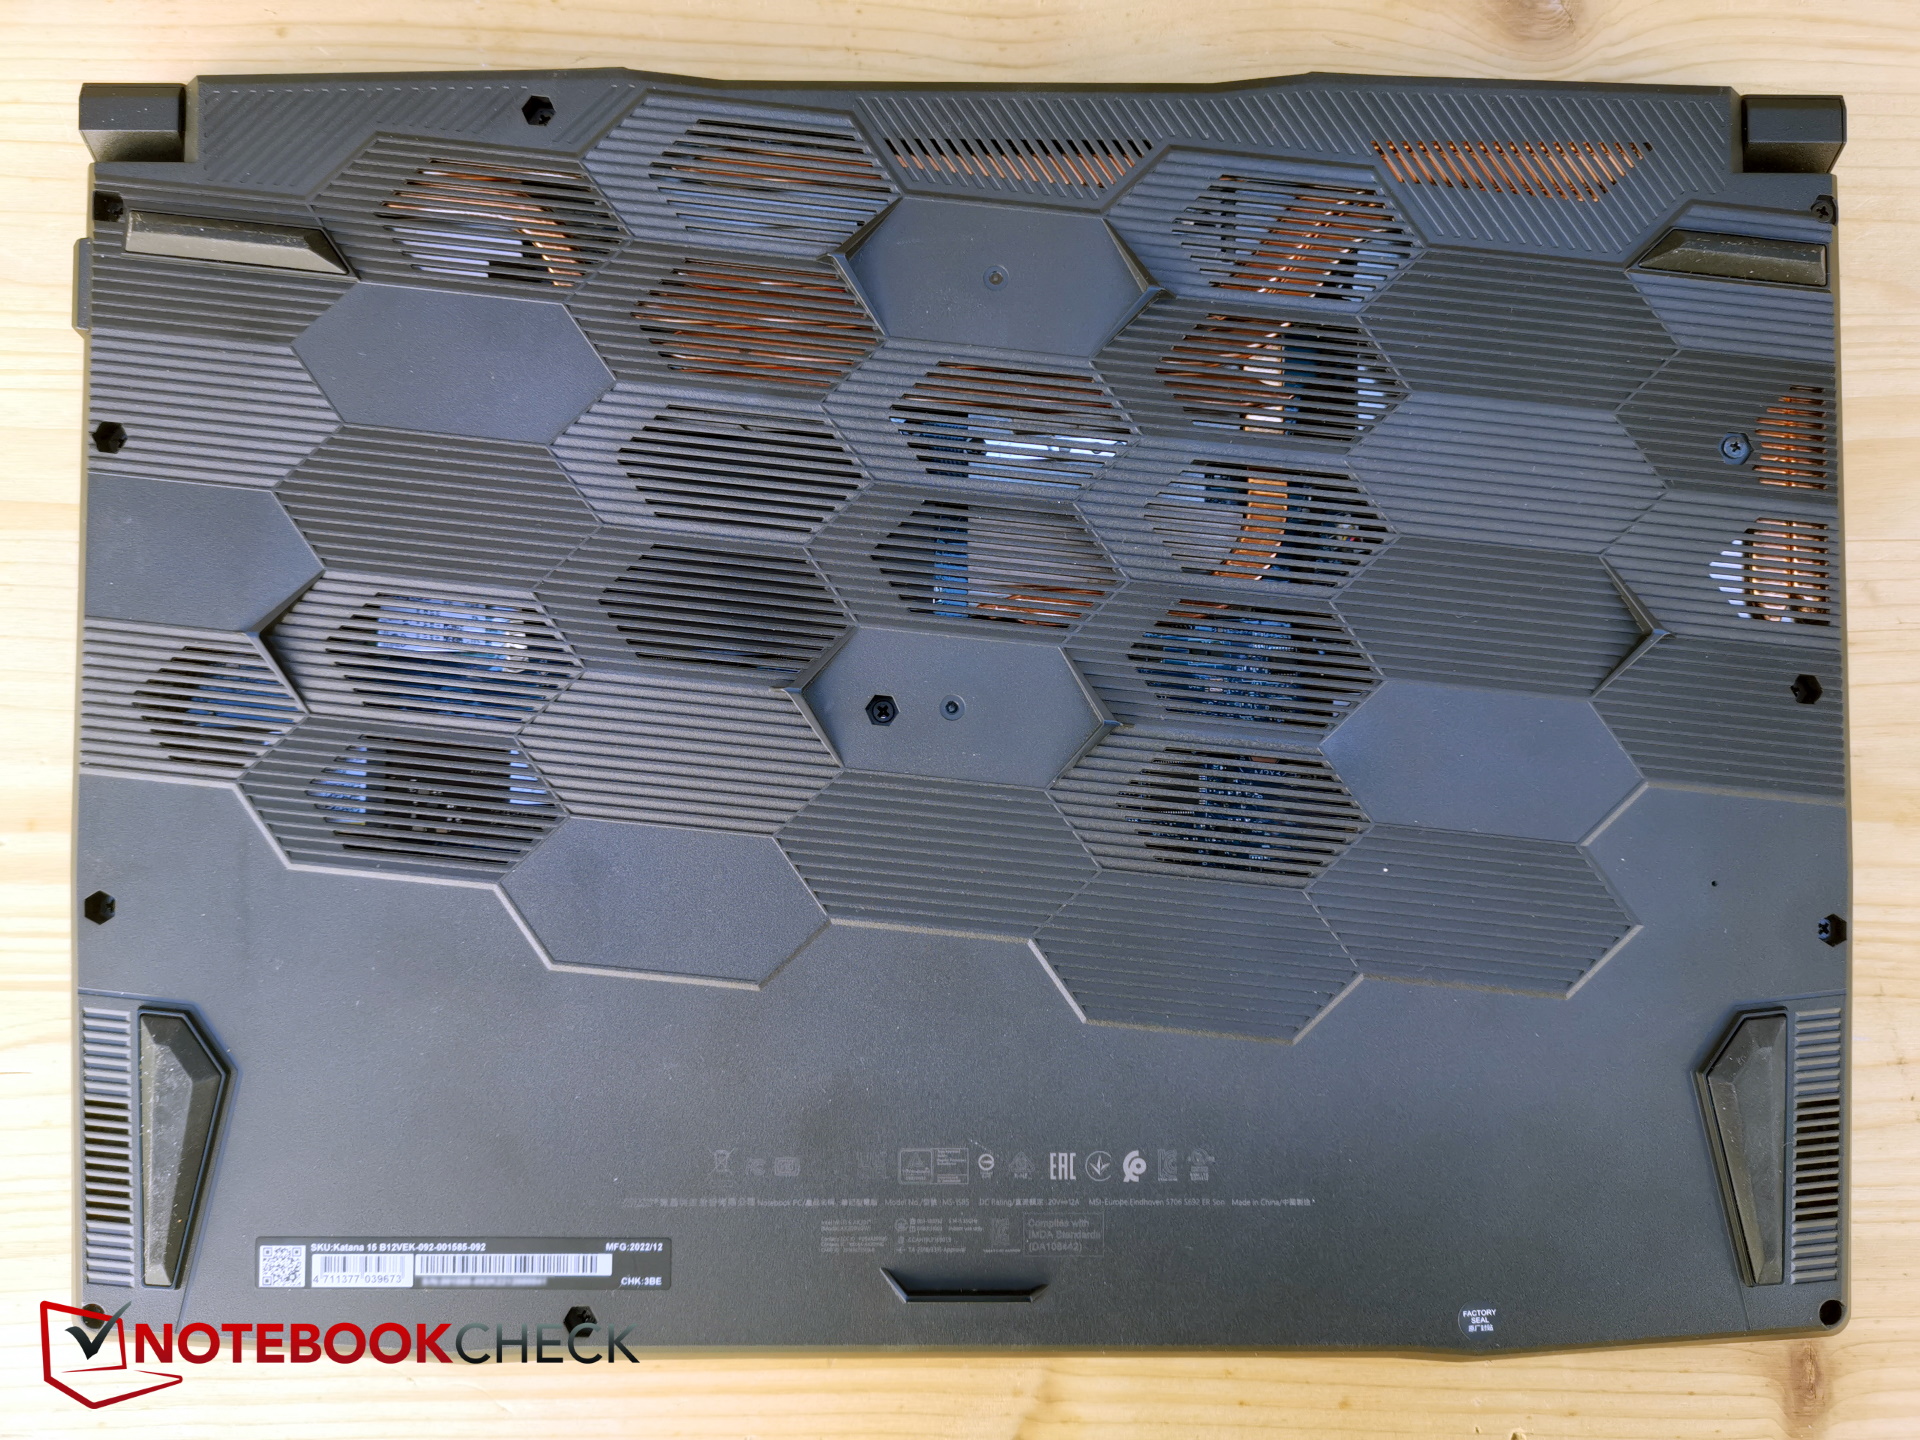
Manutenção
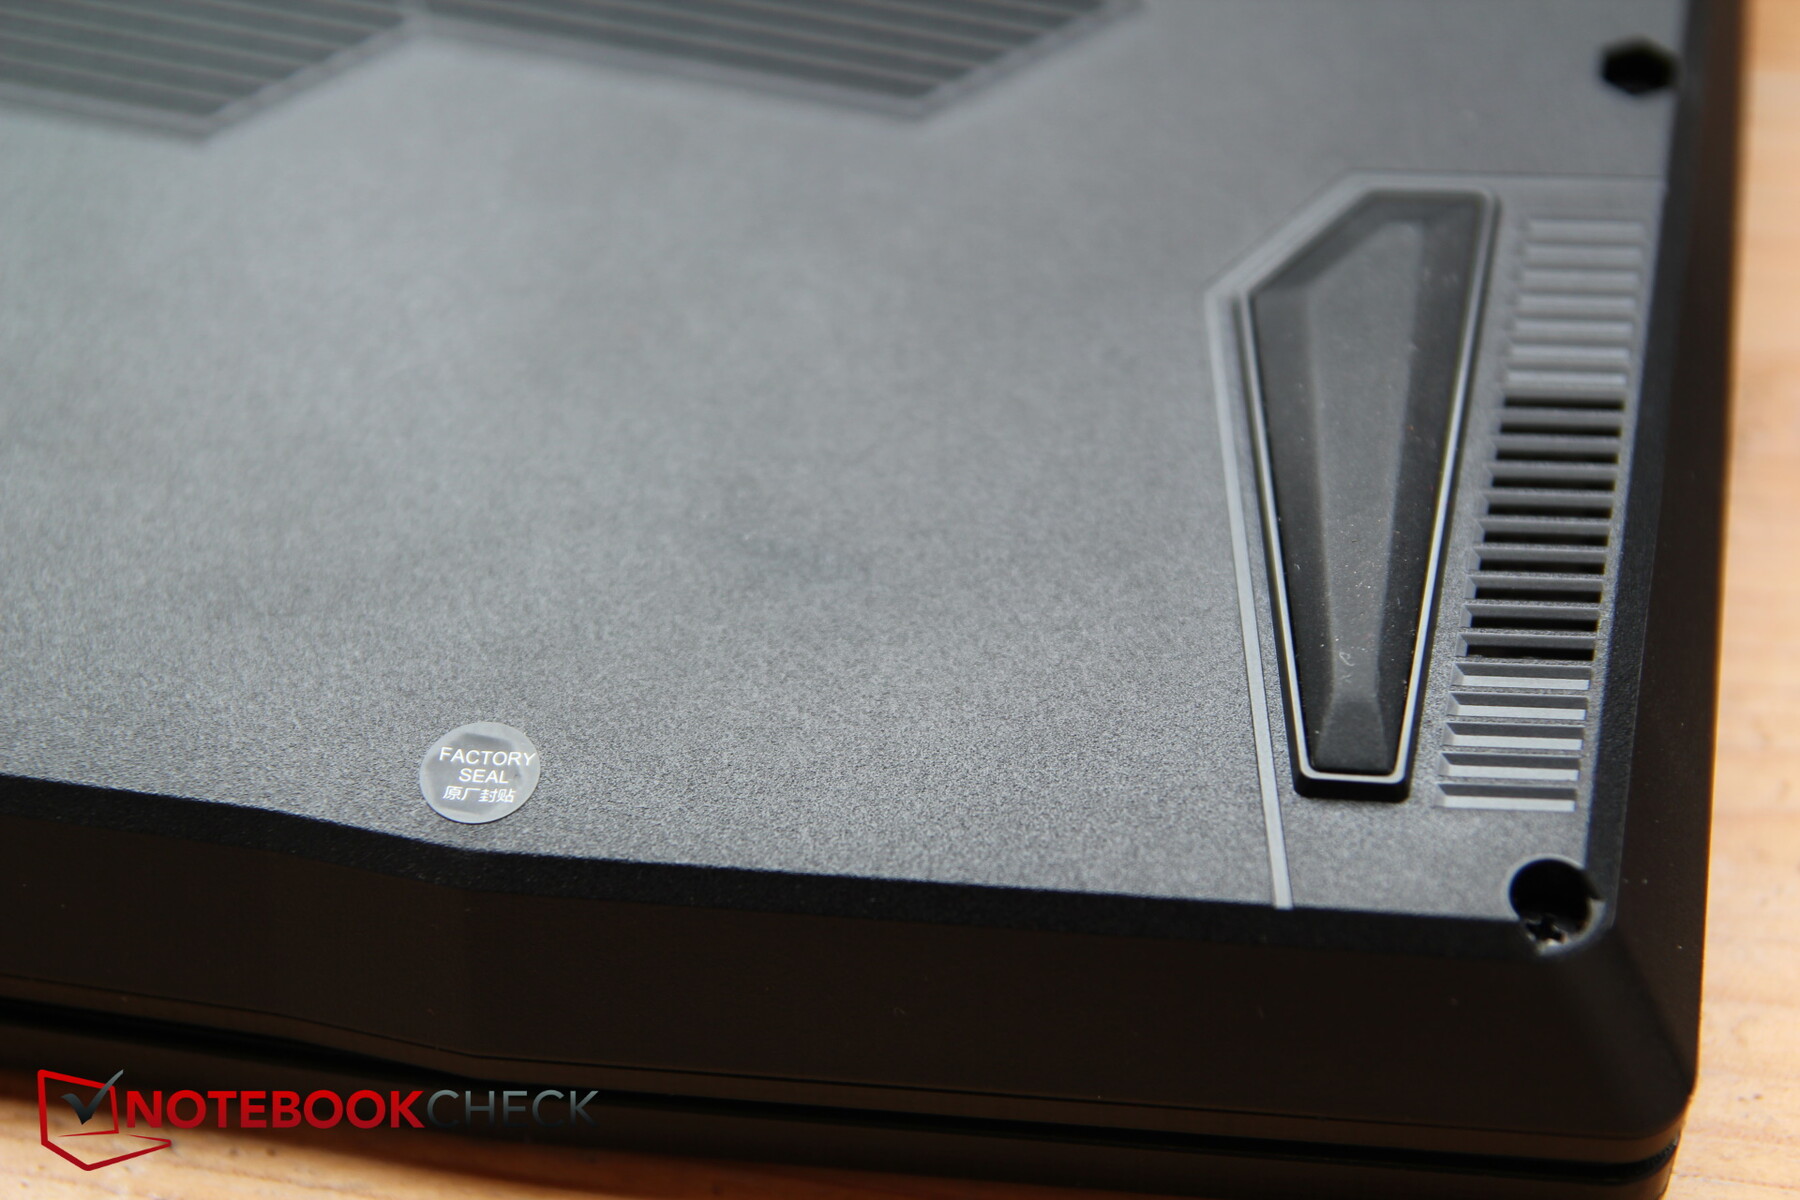
Infelizmente, a MSI usa um adesivo de vedação para determinar se os próprios usuários já abriram o dispositivo. Como nosso modelo de teste vem do Cyberport, nos abstivemos de abri-lo para não danificar o dispositivo para nosso emprestador.
De acordo com a MSI, o dispositivo também pode ser aberto pelo proprietário para fins de manutenção. Enquanto isto for feito "profissionalmente", a garantia do dispositivo permanece inalterada.
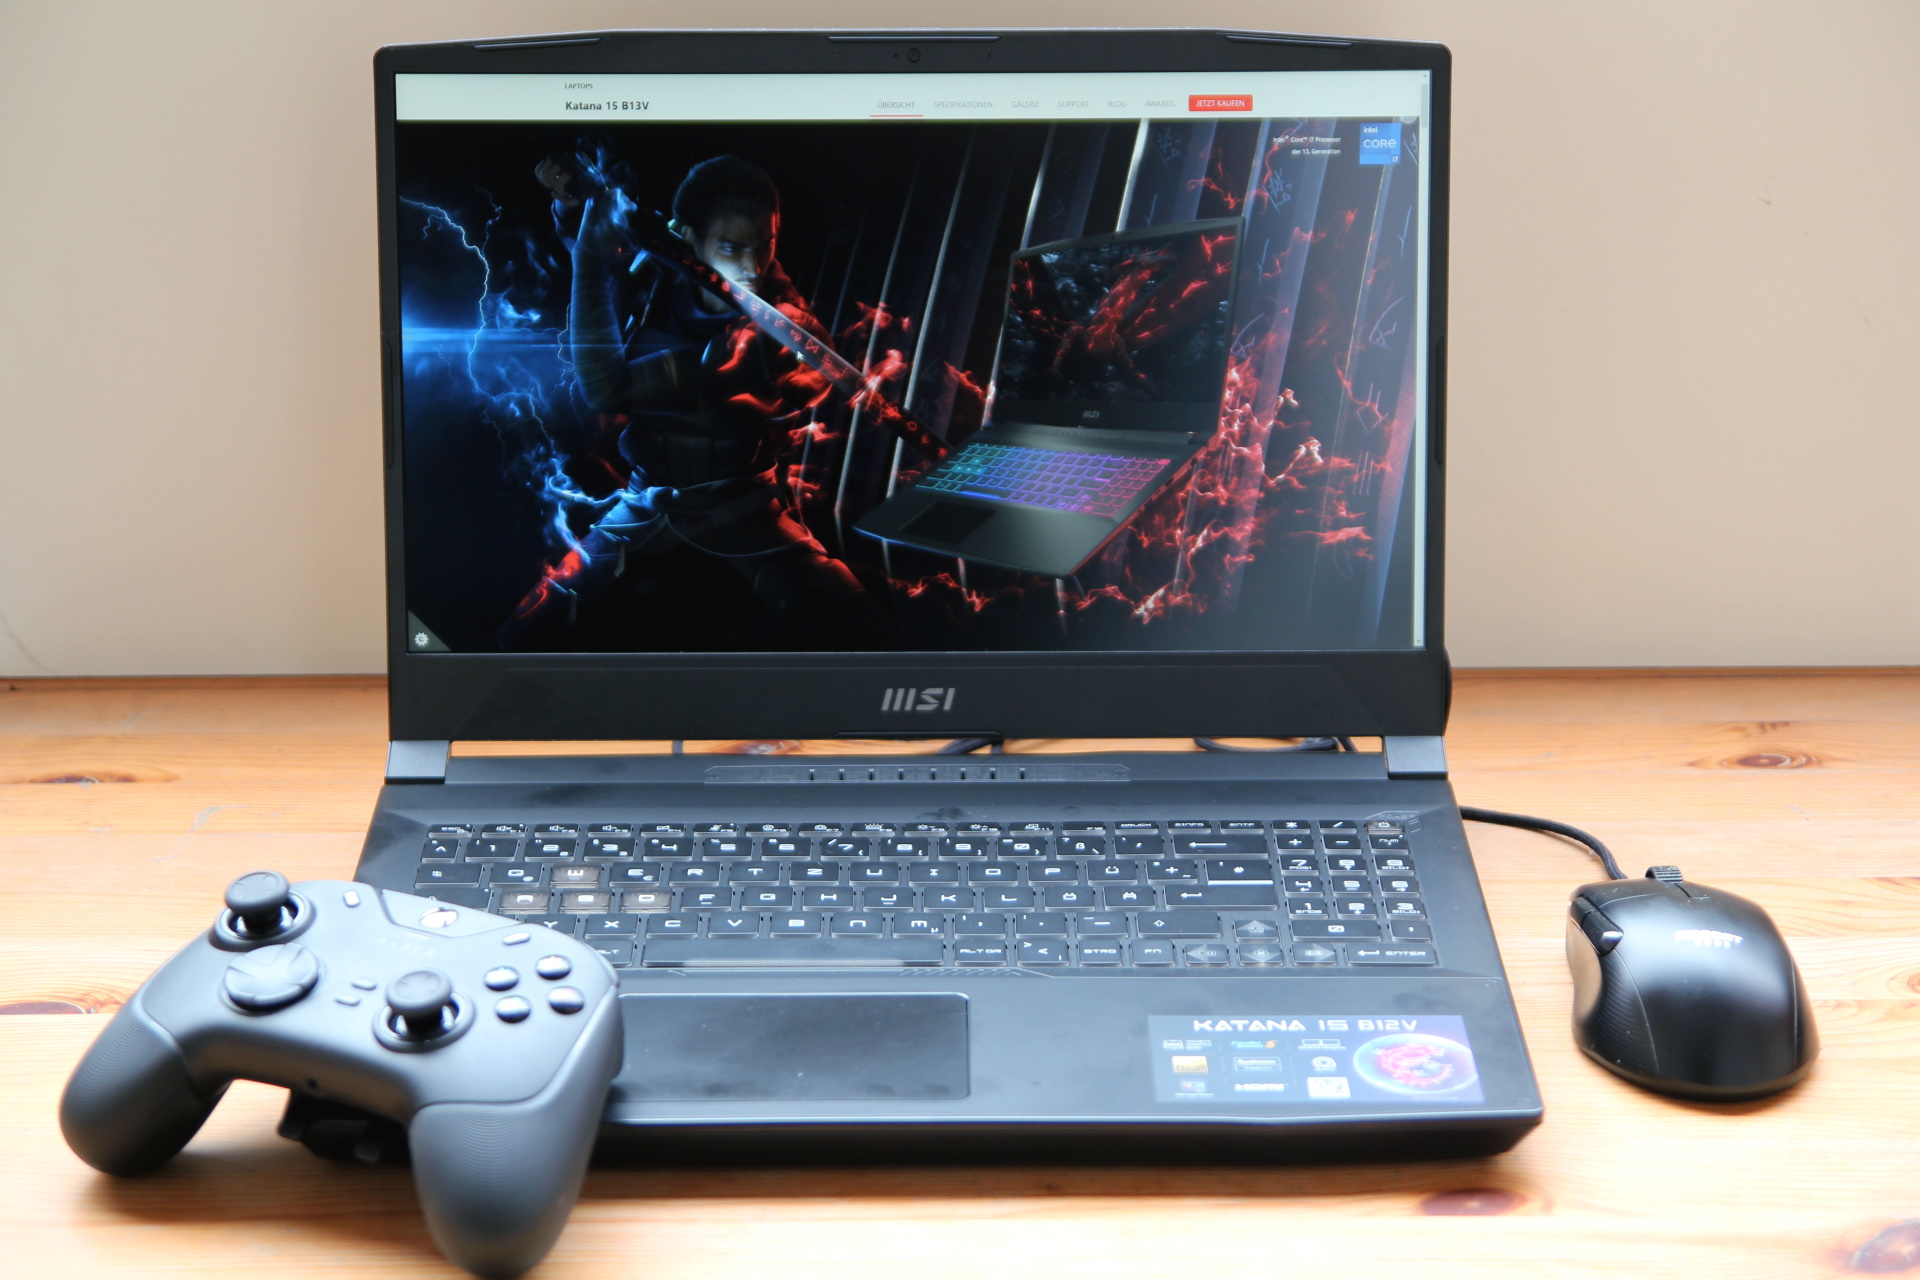
Dispositivos de entrada - Teclado decente, pequeno touchpad
Teclado
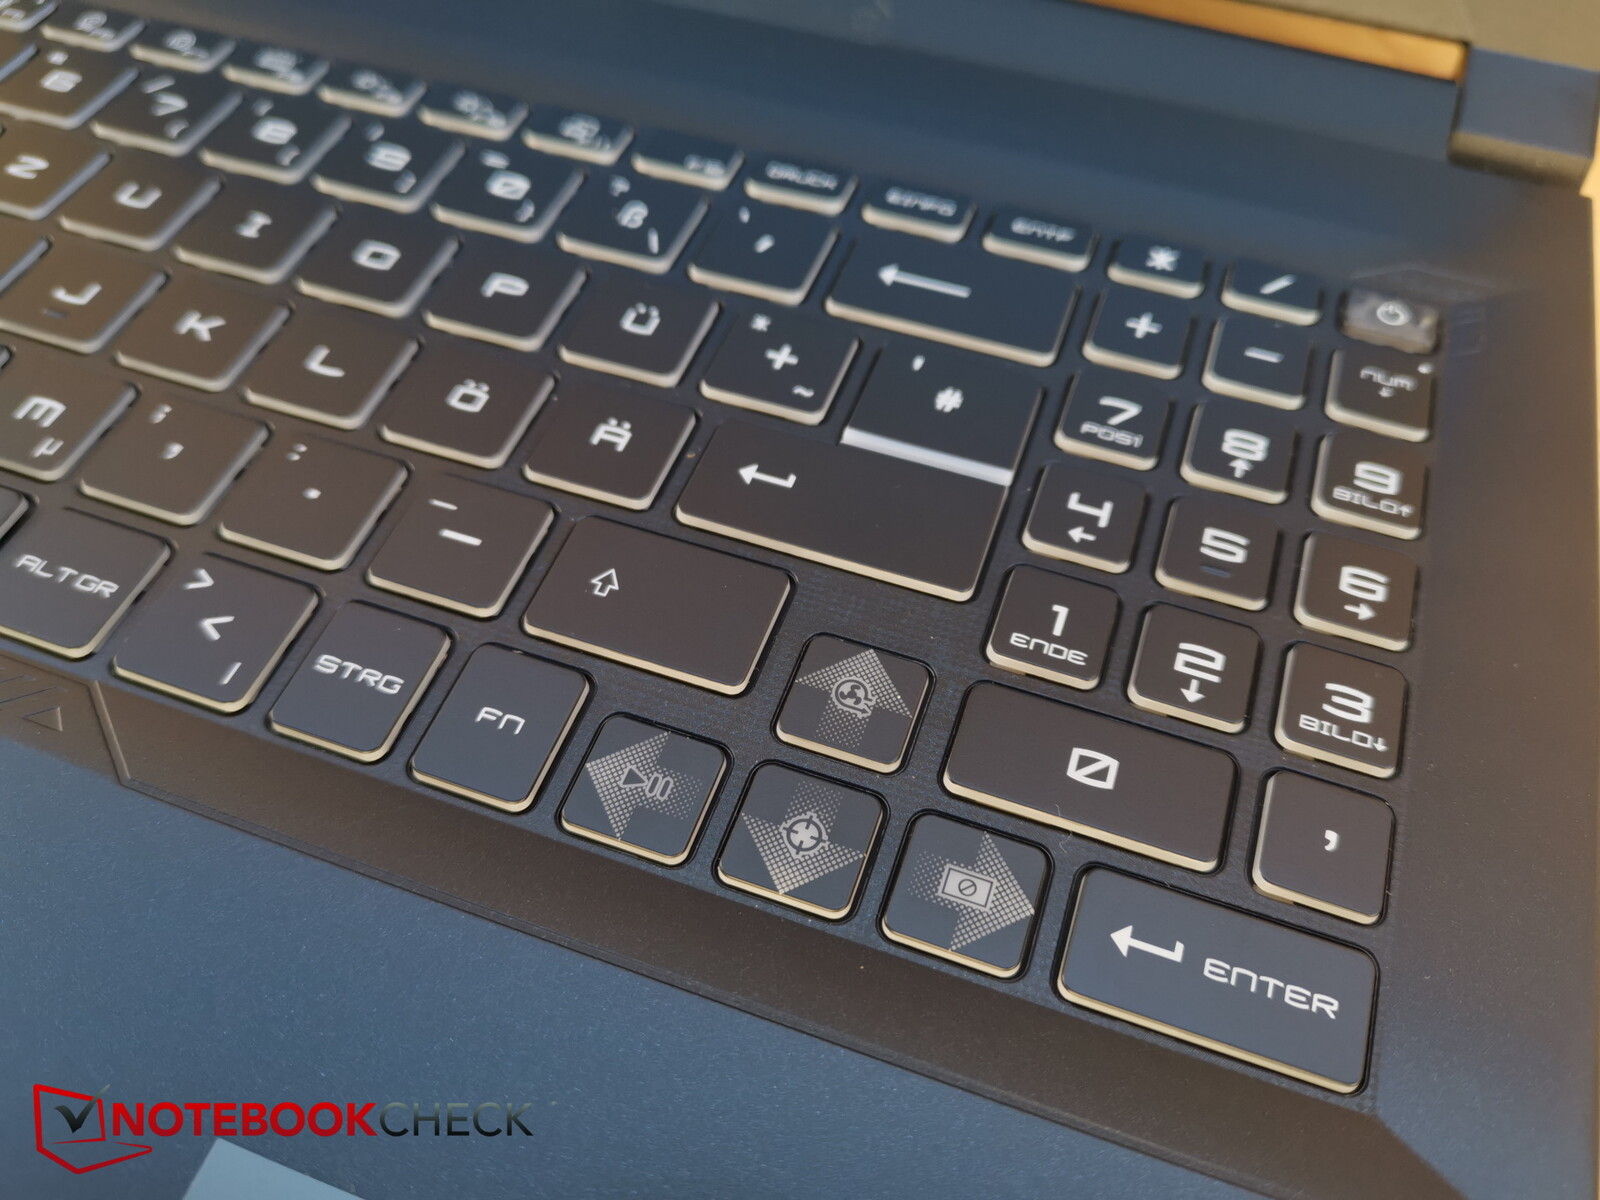
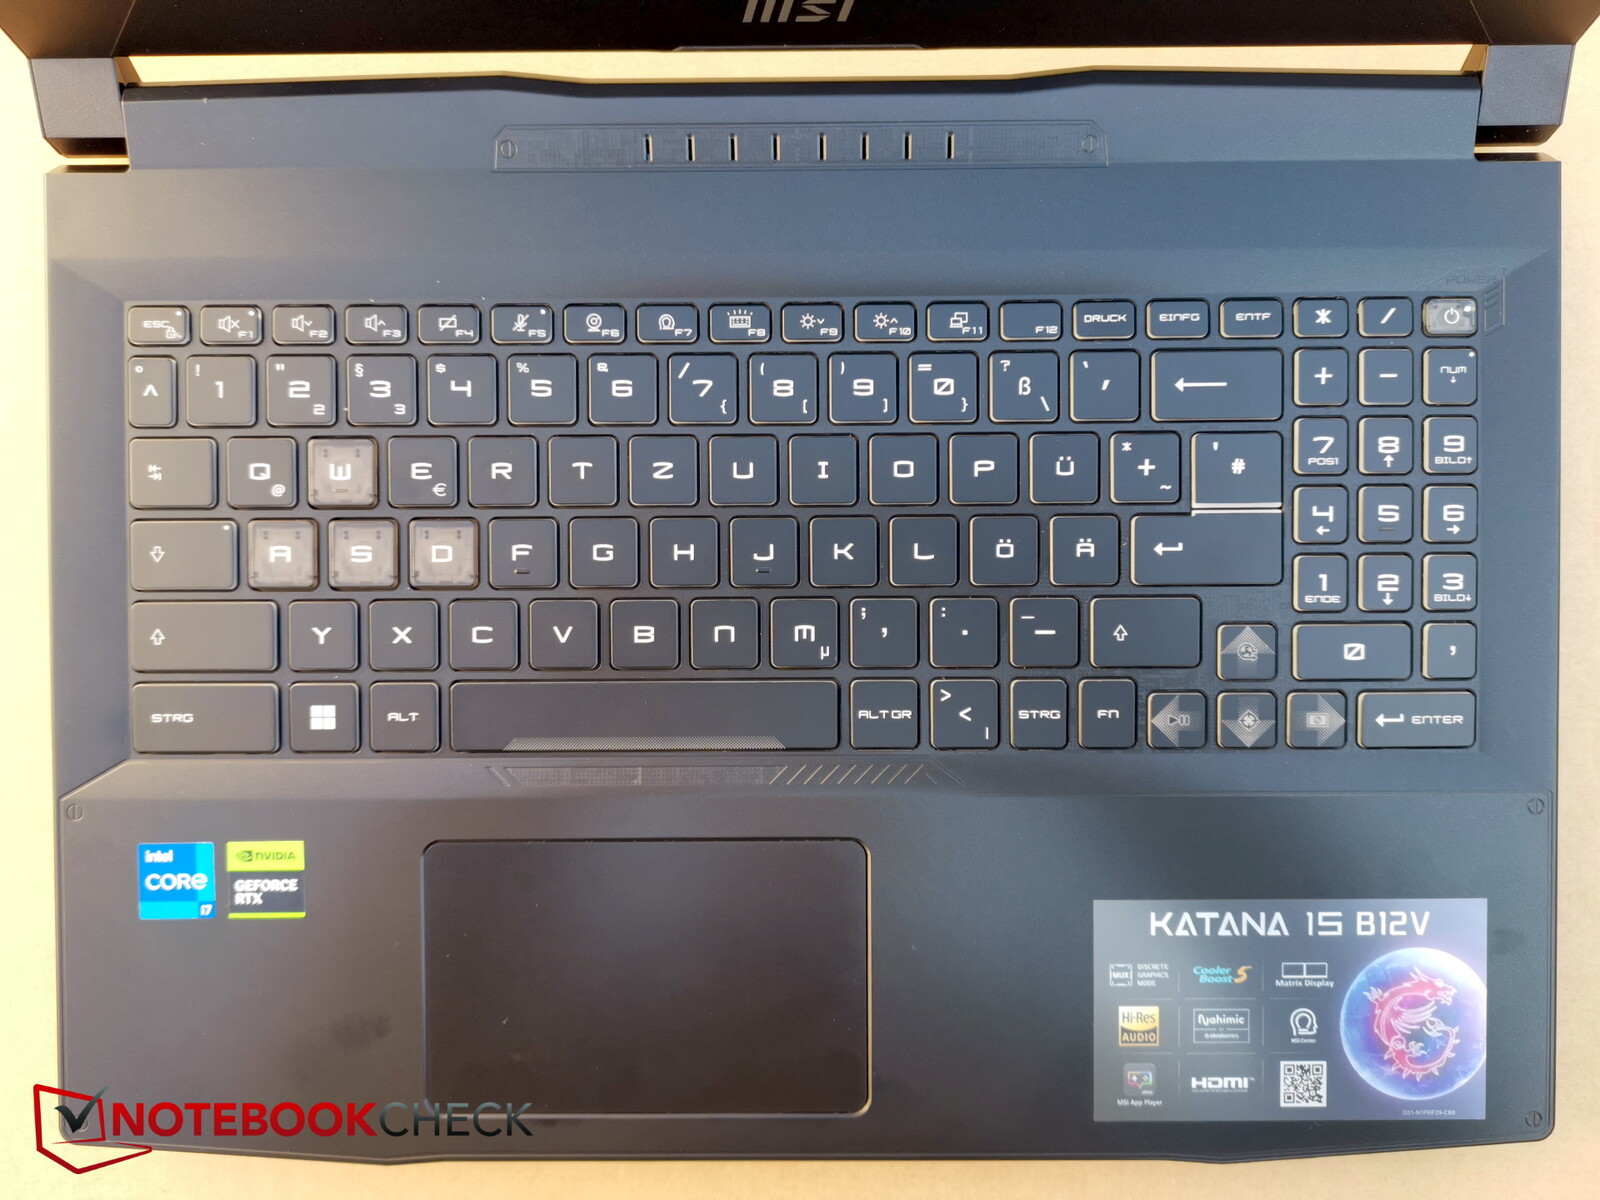
O layout é muito semelhante para todos os modelos Katana: parece muito arrumado, mas o numpad do lado direito parece mal espremido, mas pelo menos existe um.
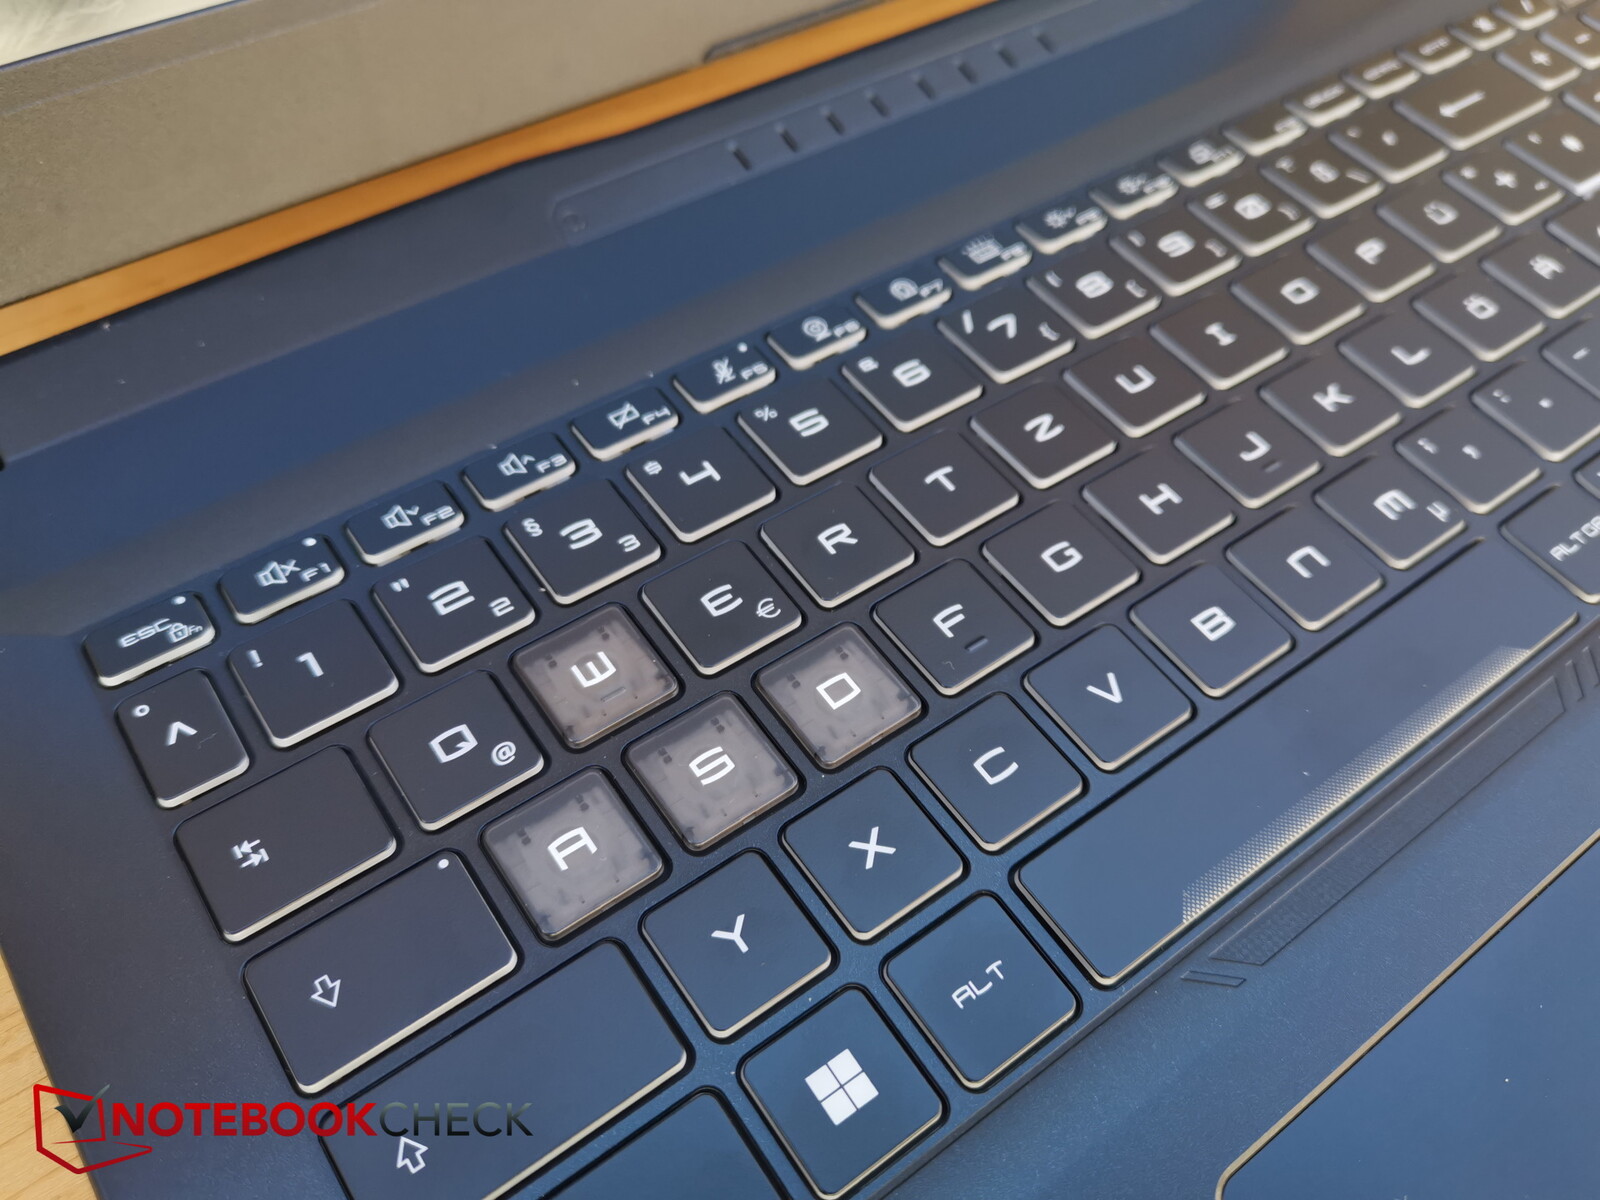
As teclas de seta no meio não são reduzidas pela metade em altura, como é freqüentemente o caso, mas são um pouco menores em comprimento e altura. As teclas WASD são transparentes e, portanto, se destacam em cores. As teclas F e especiais também são muito pequenas.
Infelizmente, a MSI mudou novamente a chave fn para o lado direito da barra de espaço, o que requer que alguns se acostumem. É estranho porque a MSI continua a seguir seu próprio caminho. Se necessário, você pode trocar as funções das teclas fn e Windows, mas então você tem o mesmo problema com a tecla Windows, que está do lado direito em vez da tecla fn.
A viagem da chave é bastante curta, mas o feedback é claramente perceptível, de modo que a digitação é bastante rápida. O ruído da tecla é moderado, e a base permanece estável e não se dobra ao digitar.
A retroiluminação do teclado oferece quatro zonas, cada uma com quatro níveis de luminosidade ajustável.
Touchpad
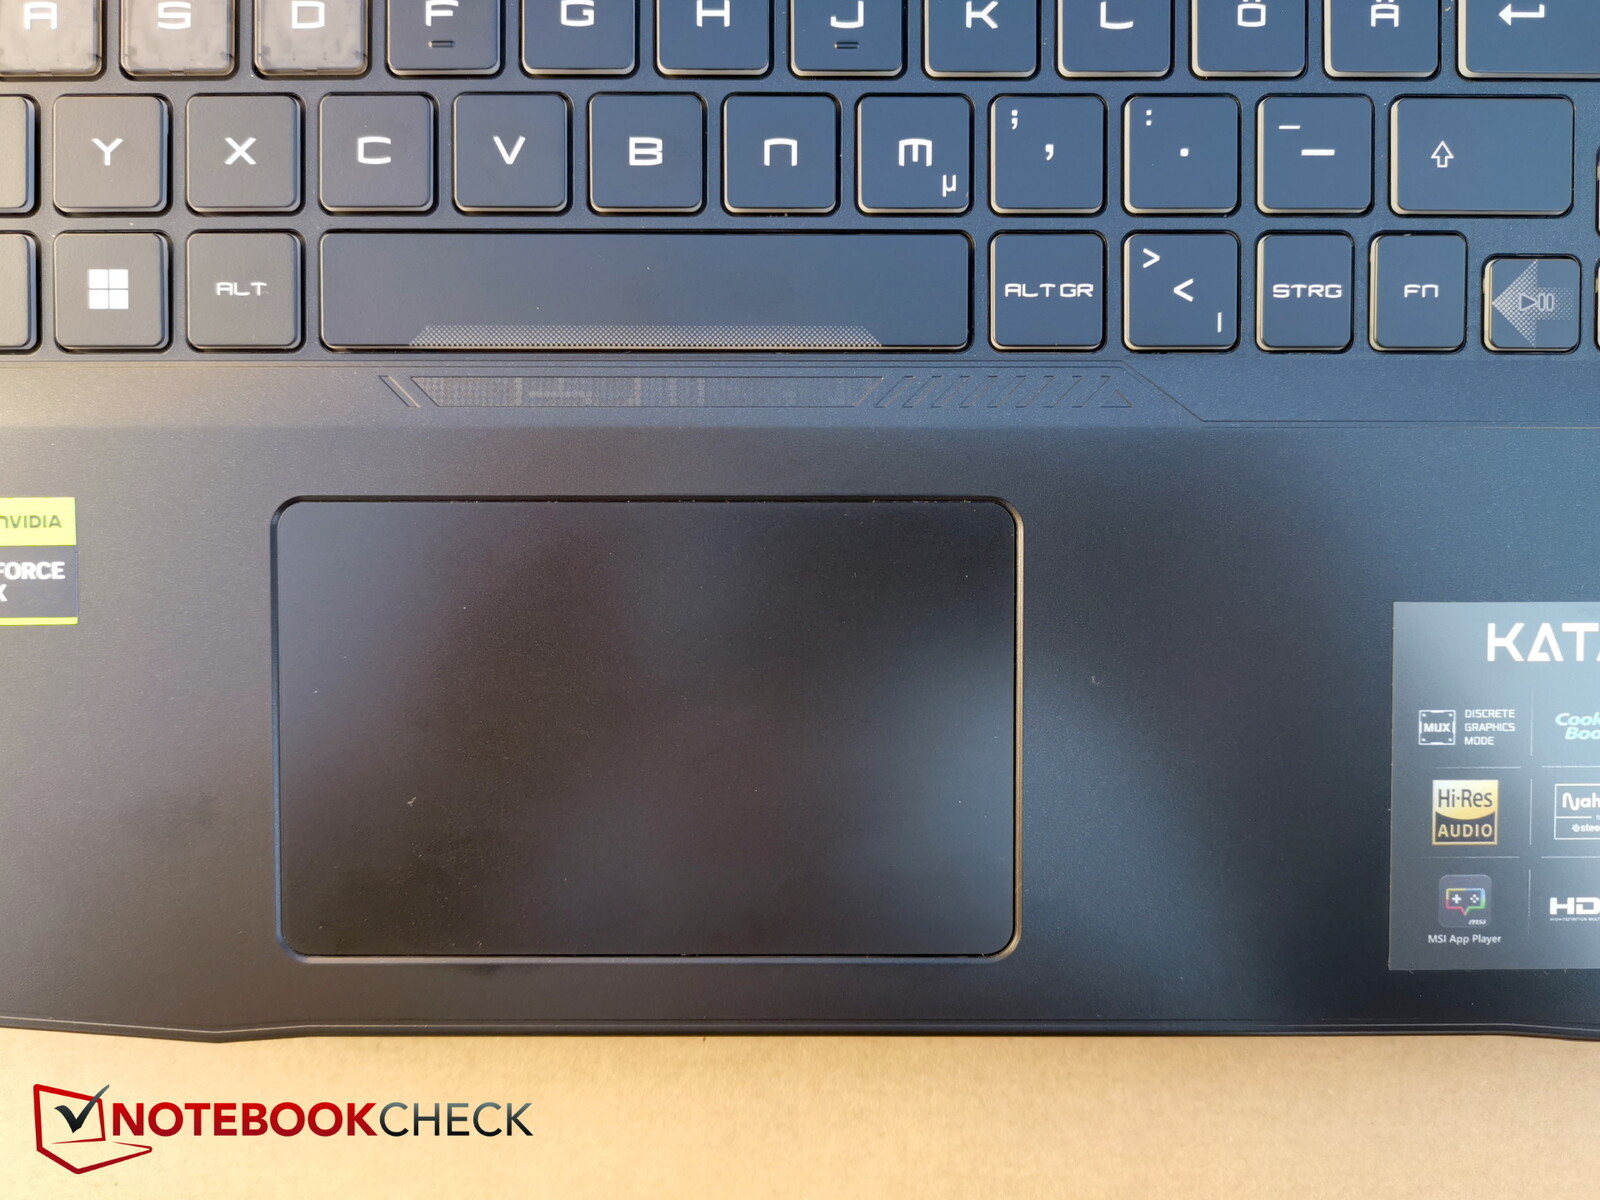
O Katana 15 tem o que parece ser um dos menores touchpads do mercado. Parece um pouco retro. Claro, os jogadores geralmente conectam um mouse de qualquer forma, mas um touchpad maior é simplesmente mais confortável para uso em movimento
O touchpad fica logo abaixo da barra de espaço e, portanto, muito à esquerda no layout. Uma colocação um pouco mais central teria sido mais vantajosa
Os cliques das teclas integradas são um pouco mais altos e não parecem ser de alta qualidade, mas reagem de forma confiável e precisa.
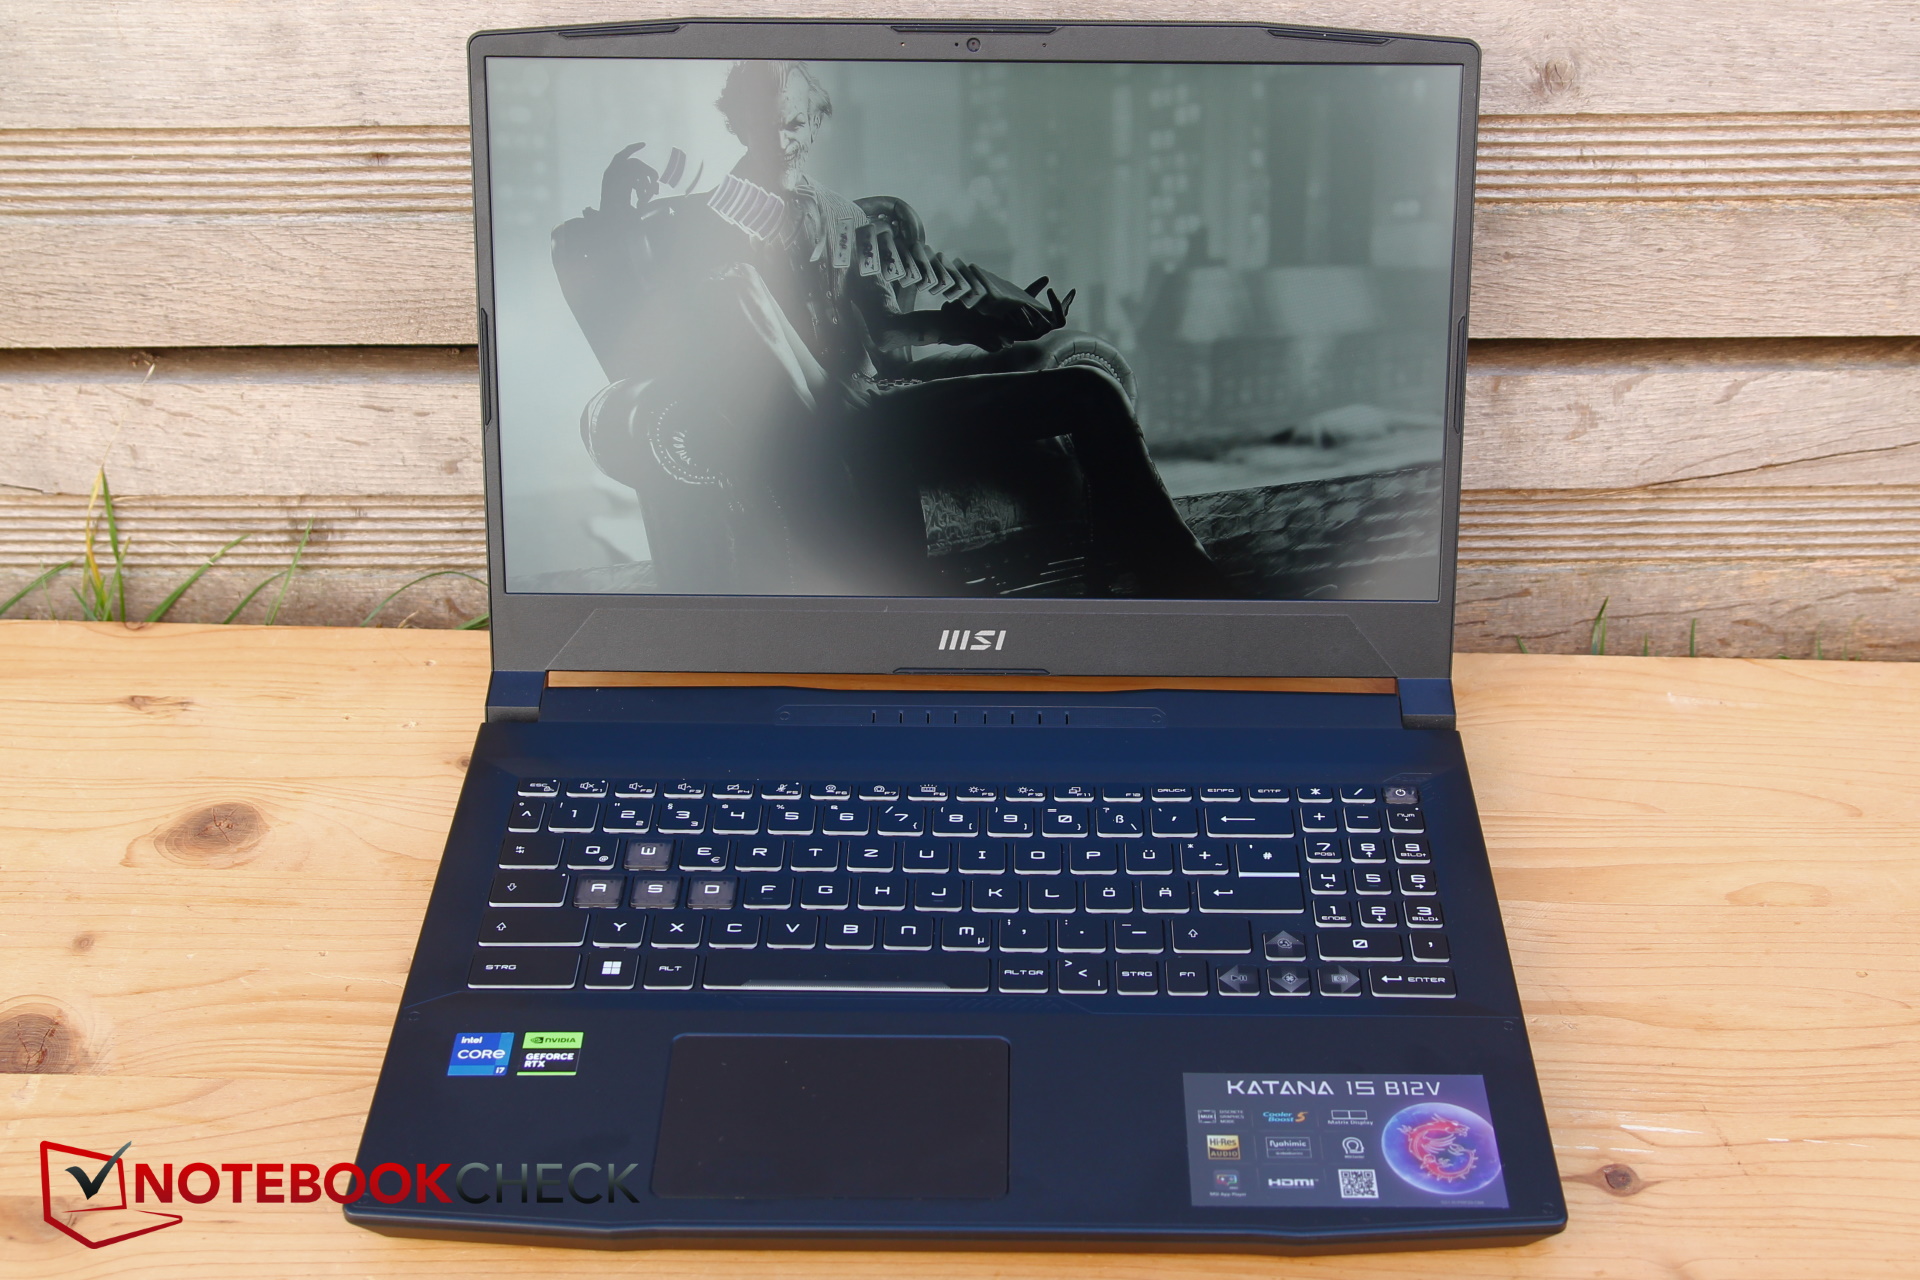
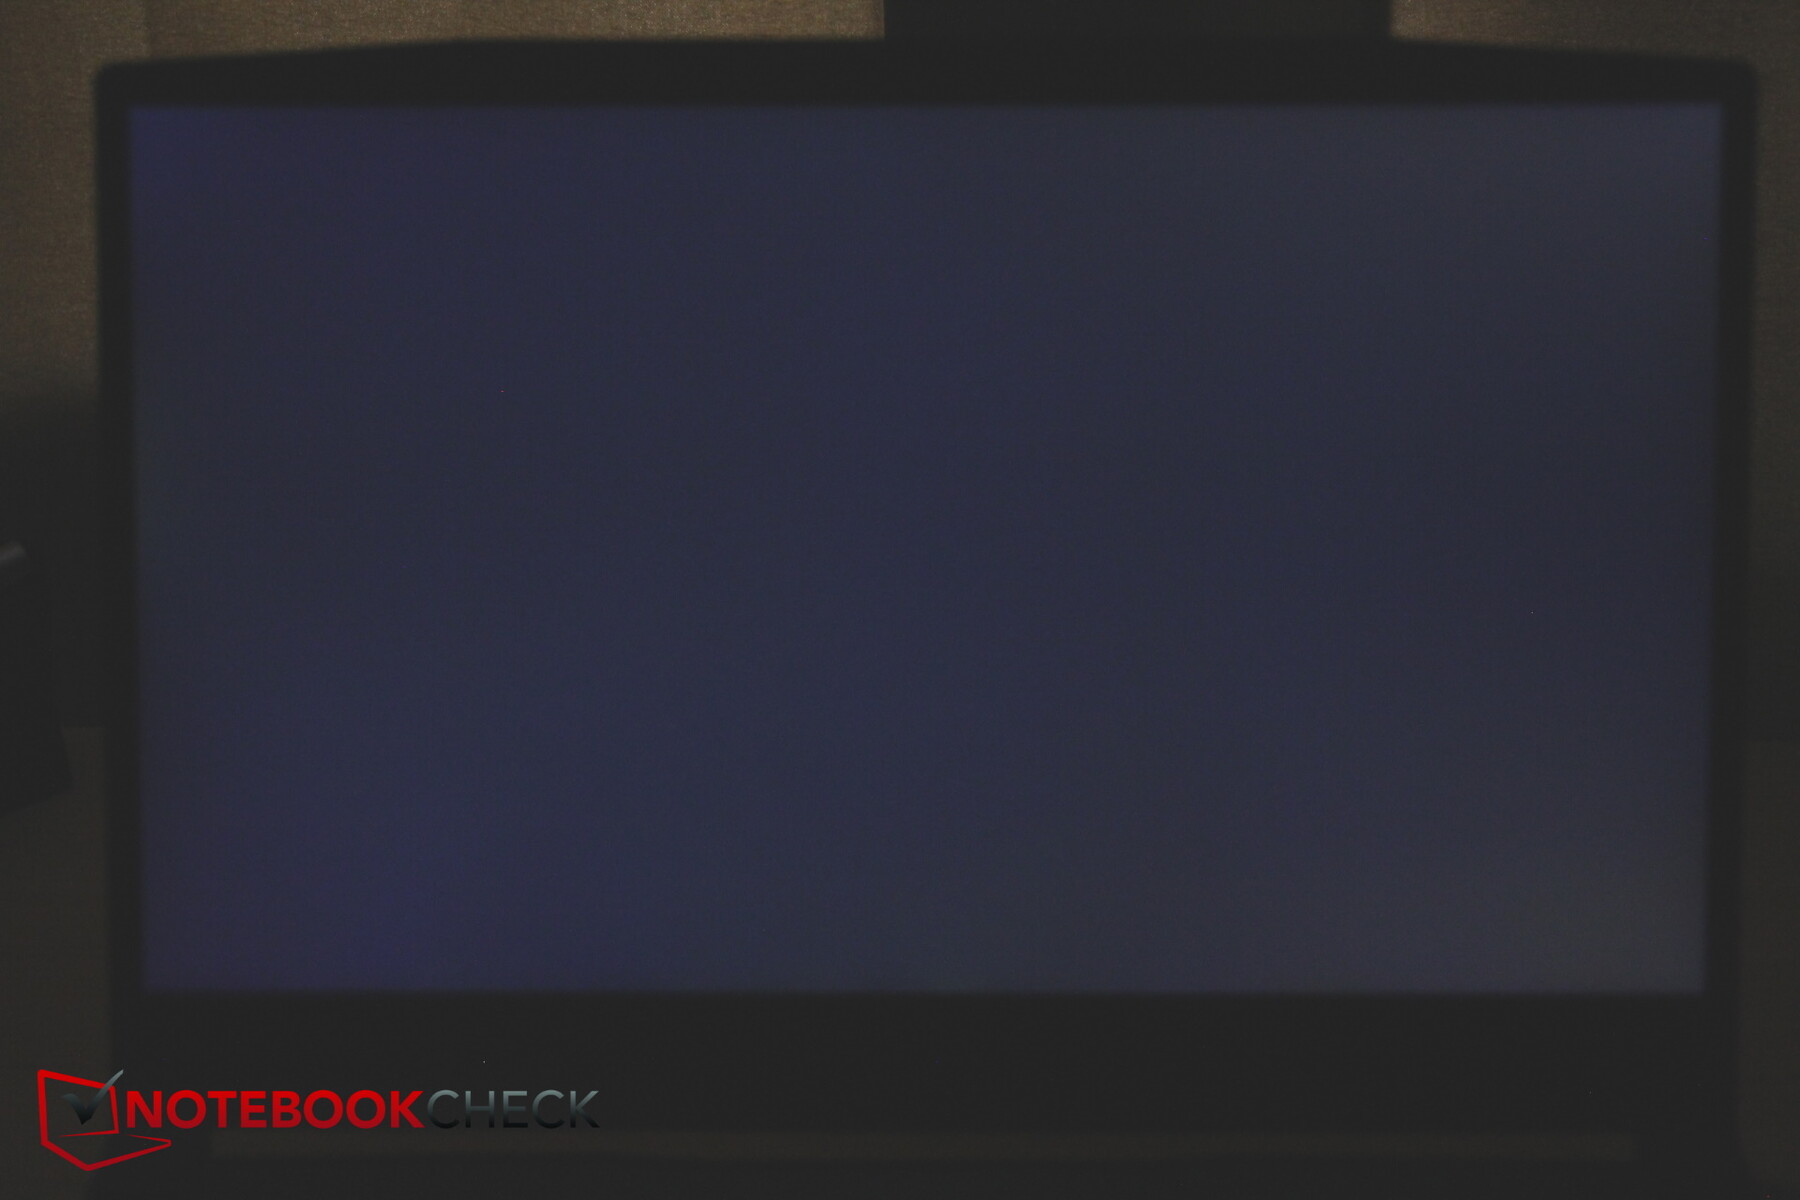
Mostrador - 250 lêndeas e 57% sRGB são valores orçamentários
A MSI continua usando uma tela Full HD para os Katana, enquanto muitos concorrentes já usam QHD e superiores. Isto não é necessariamente um problema, pois a resolução e os 144 Hz devem se encaixar bem com o RTX 4050. Até agora, também não parece haver nenhuma opção alternativa de display para o B13. Em última análise, é o mesmo painel do Katana GF66 e do Pulse GL66.
Infelizmente, o brilho médio de 258 lêndeas está bastante abaixo da média atualmente, uma vez que a maioria dos laptops da concorrência oferece displays mais brilhantes. Pelo menos a iluminação de 92 por cento é bastante uniforme, e o brilho diminui um pouco em direção à parte inferior direita
Os tempos de resposta são bastante abaixo do ideal para um jogador medíocre. Pelo menos o PWM não é um problema em nosso modelo. O sangramento da tela é apenas leve e não perceptível na maioria das situações.
| |||||||||||||||||||||||||
iluminação: 92 %
iluminação com acumulador: 257 cd/m²
Contraste: 1374:1 (Preto: 0.19 cd/m²)
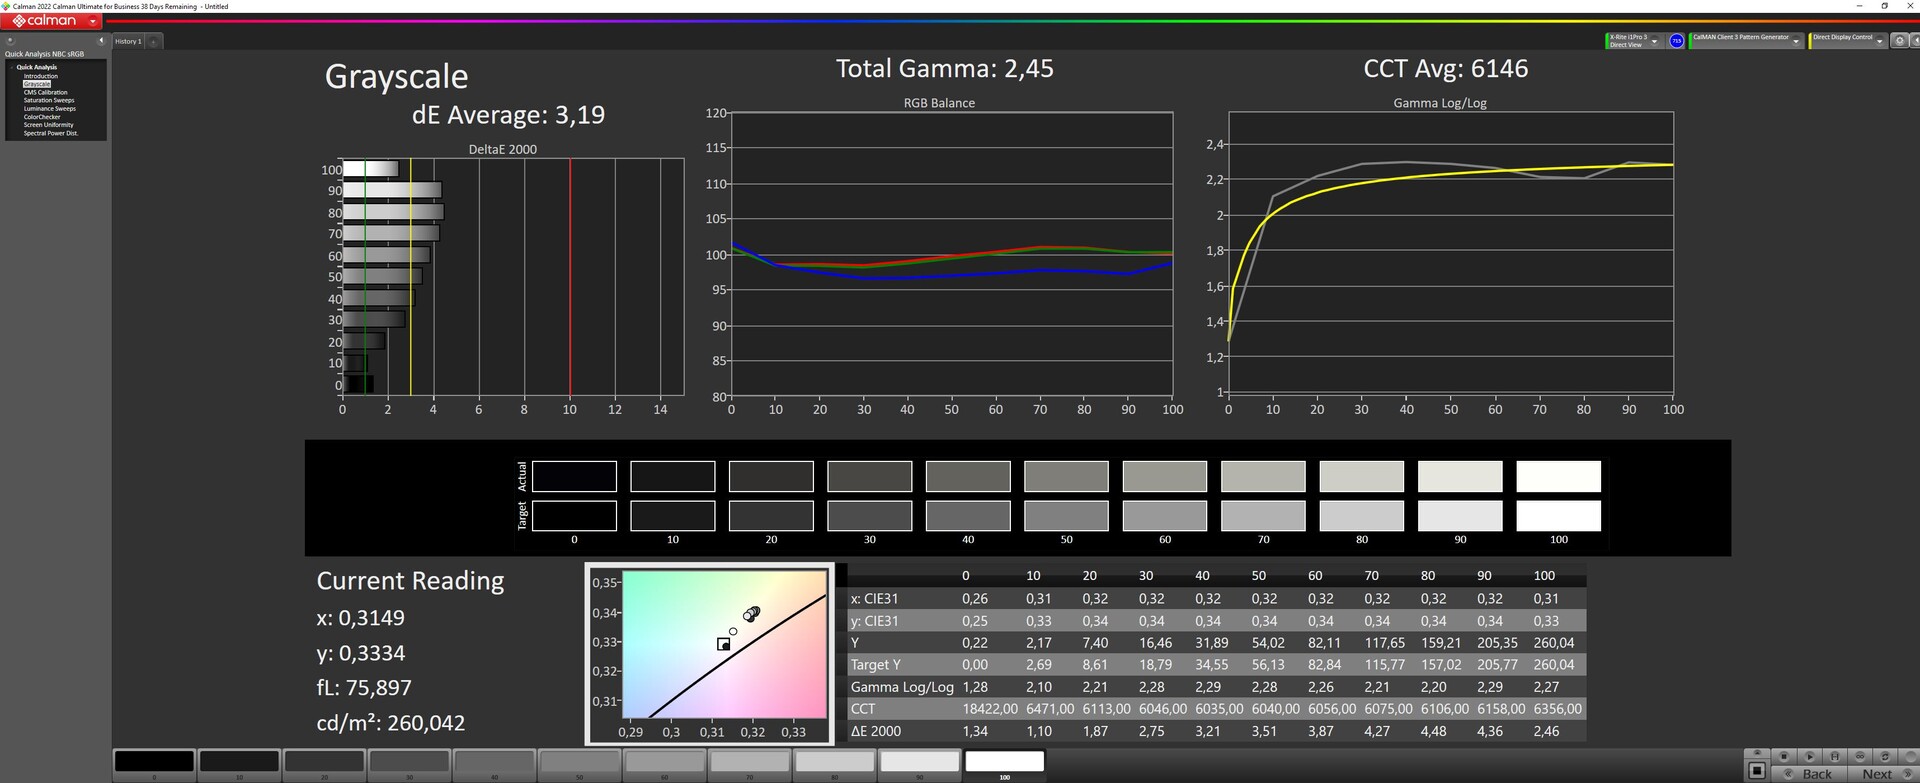
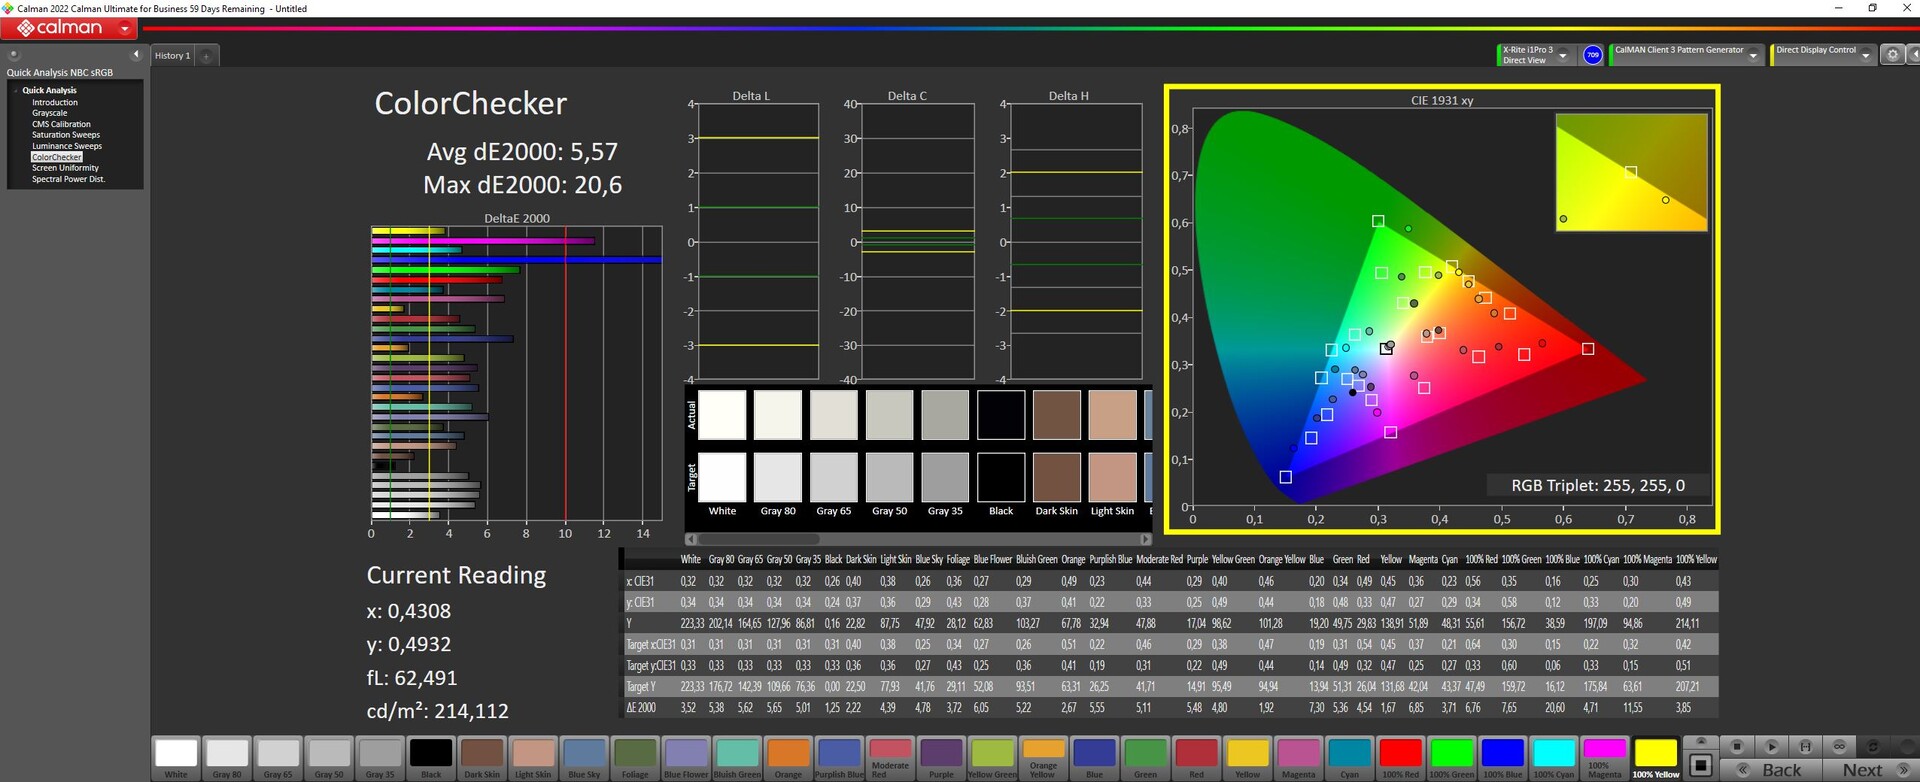
ΔE ColorChecker Calman: 5.57 | ∀{0.5-29.43 Ø4.72}
calibrated: 4.63
ΔE Greyscale Calman: 3.19 | ∀{0.09-98 Ø4.97}
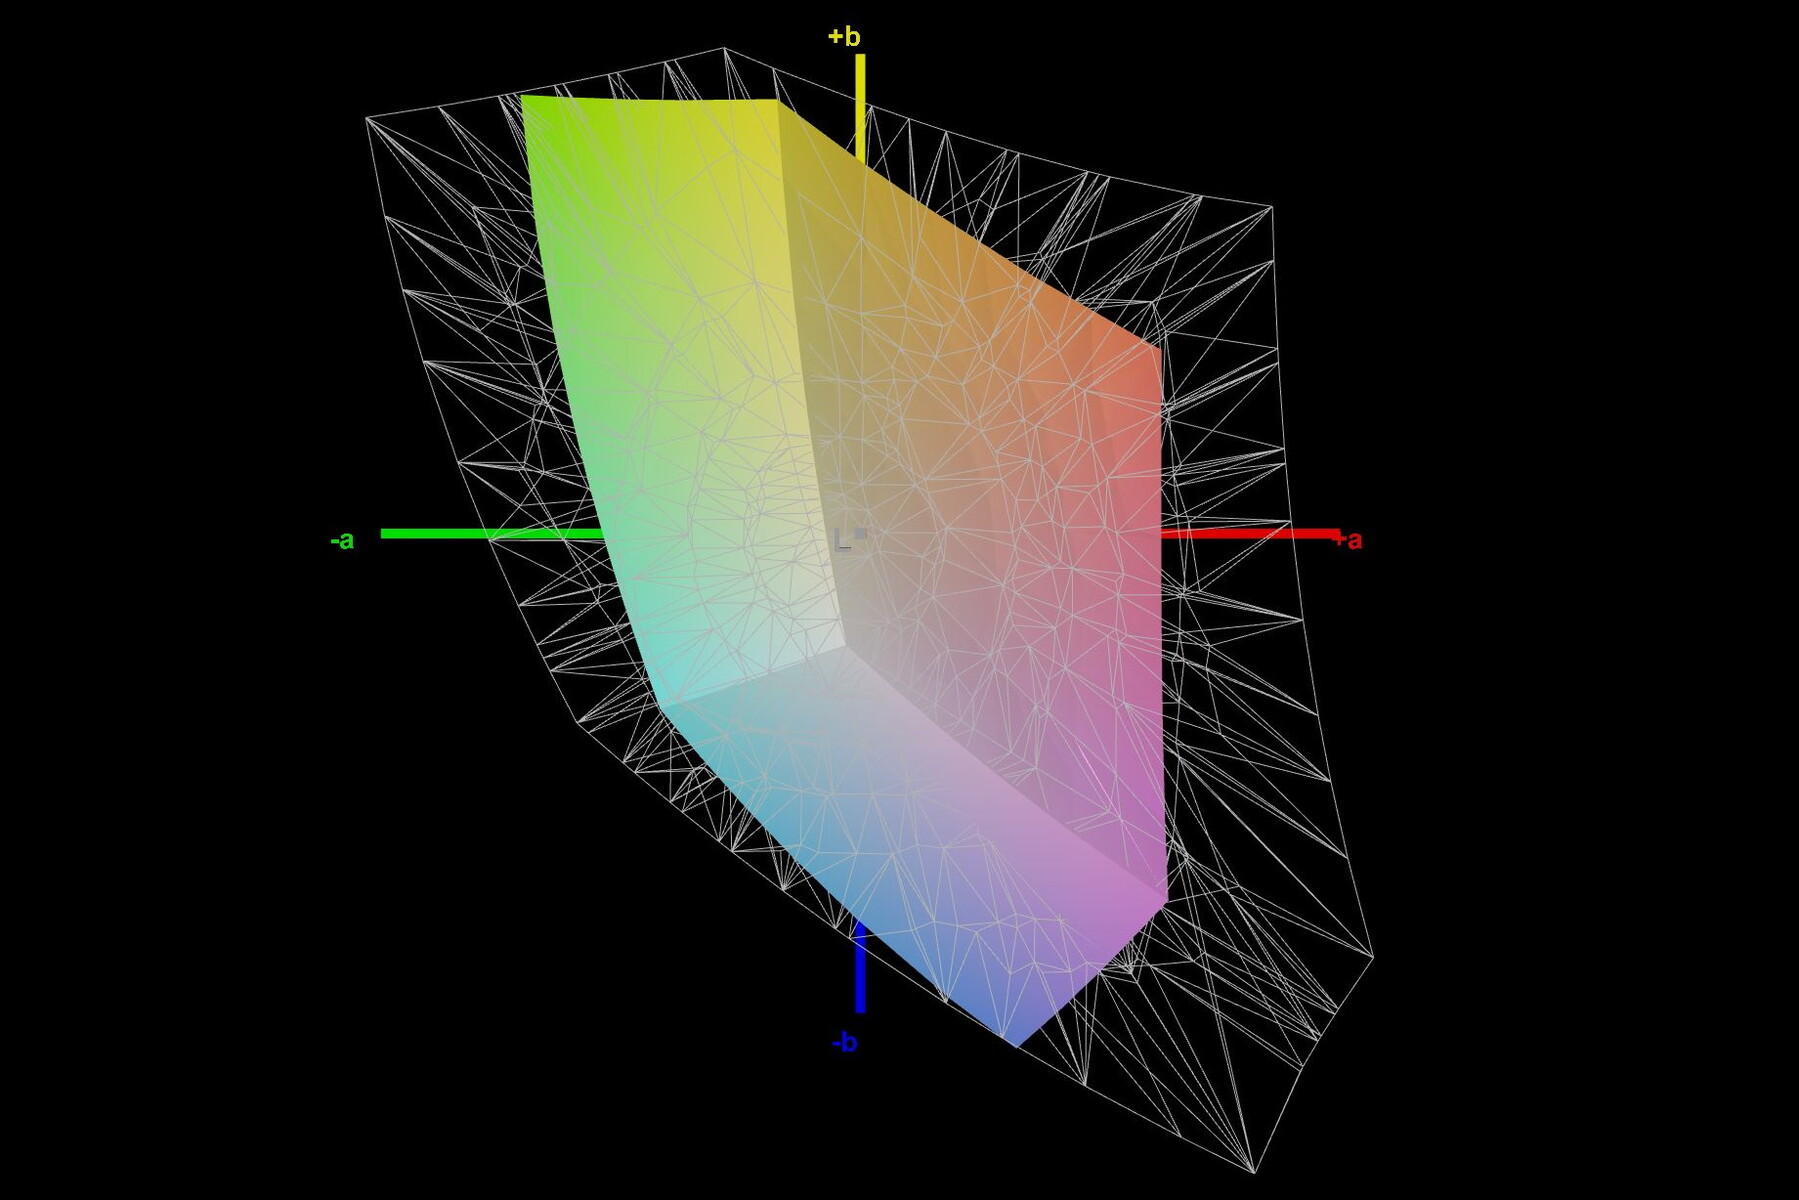
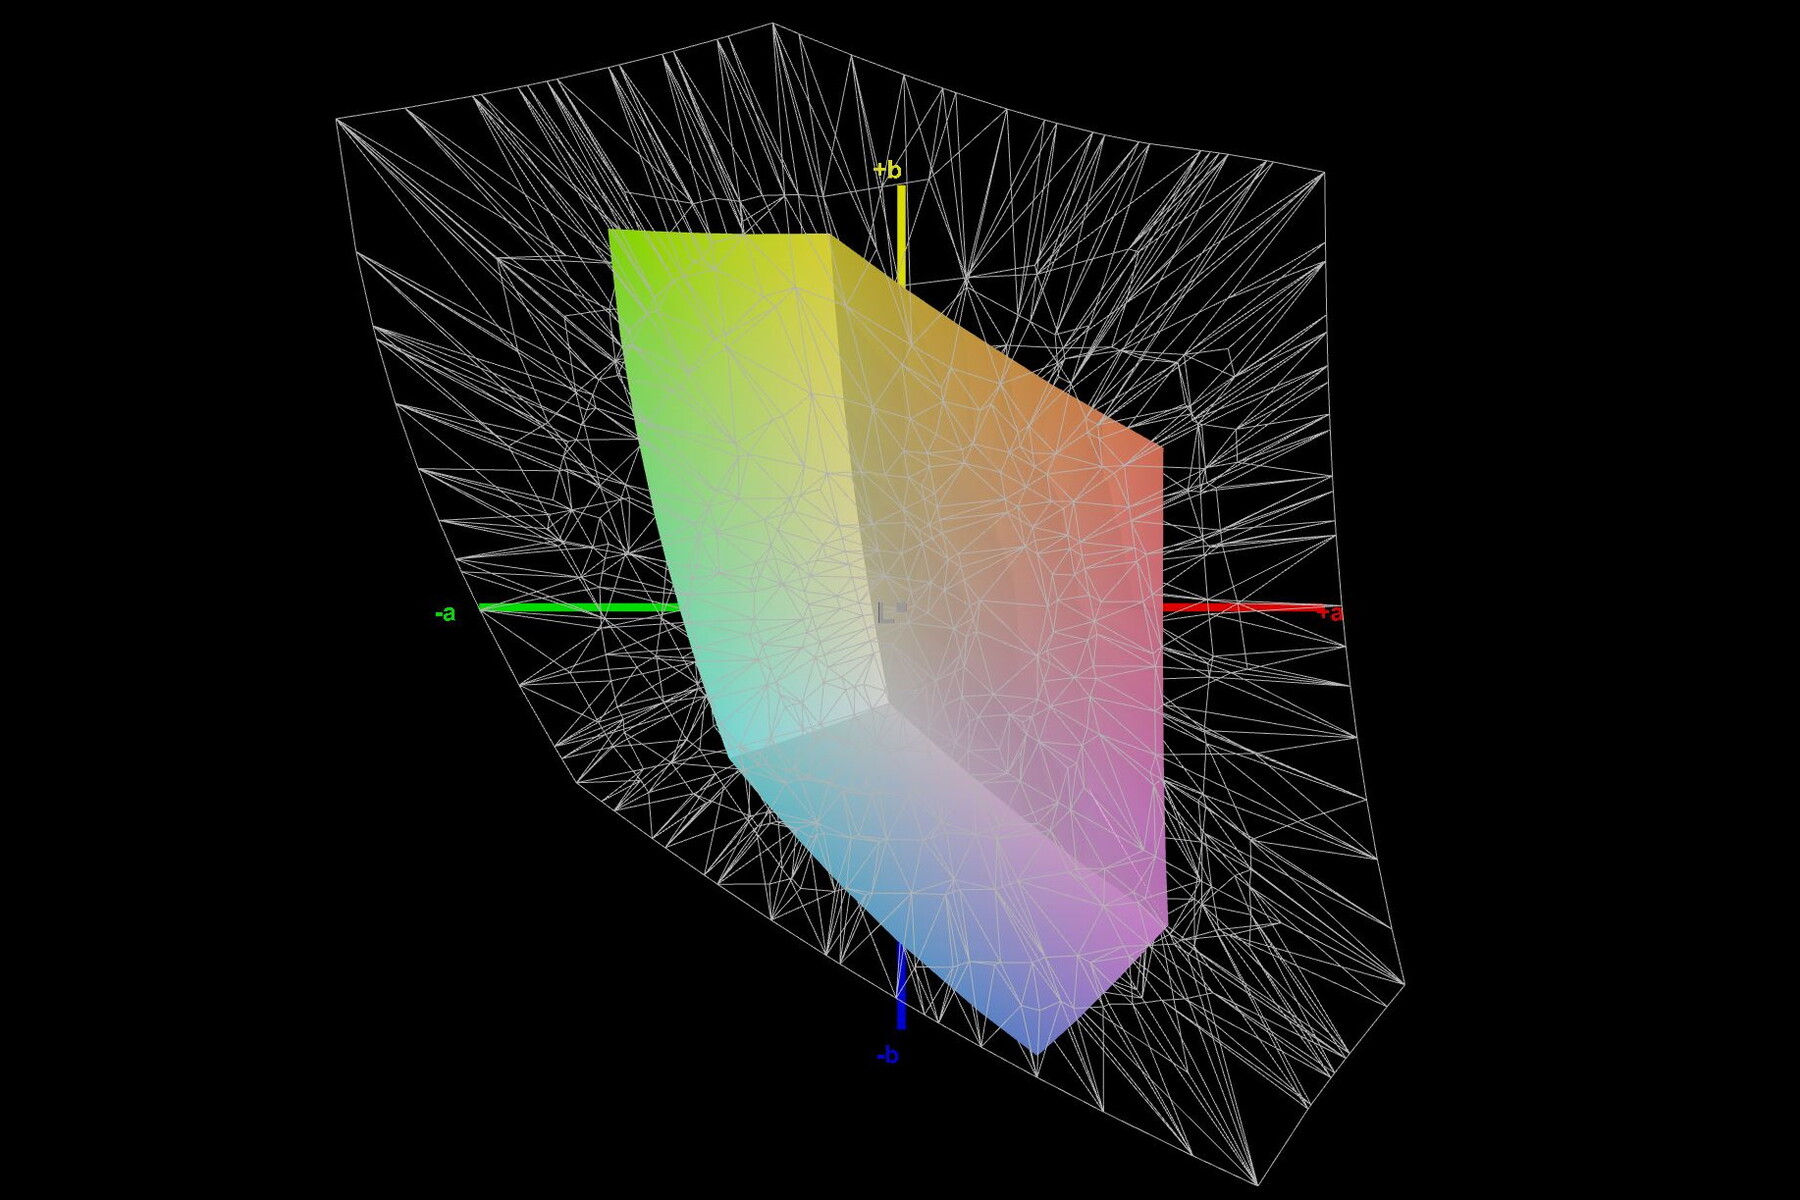
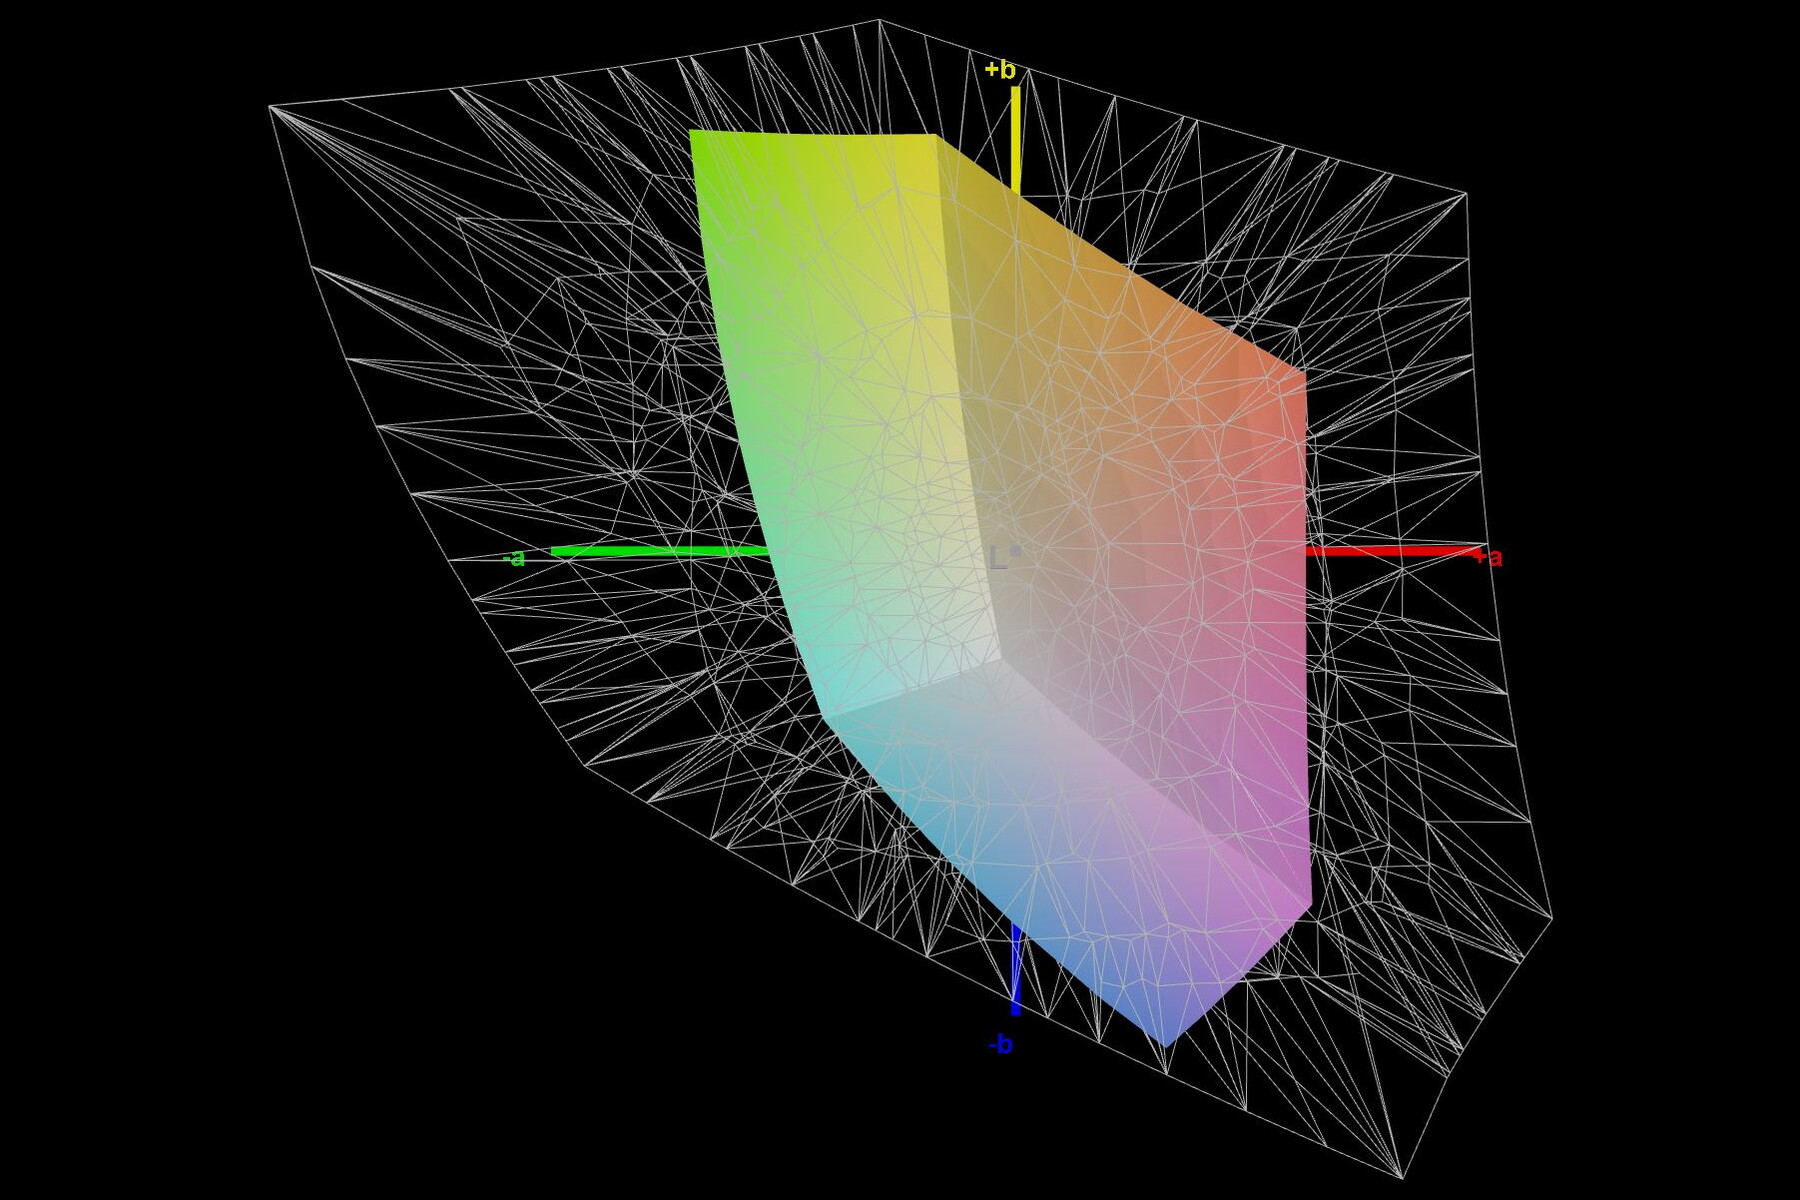
39.3% AdobeRGB 1998 (Argyll 3D)
56.8% sRGB (Argyll 3D)
38.1% Display P3 (Argyll 3D)
Gamma: 2.45
CCT: 6146 K
| MSI Katana 15 B12VEK AUOAF90 (B156HAN08.4), IPS, 1920x1080, 15.6" | MSI Katana GF66 12UGS AU Optronics AUOAF90, IPS, 1920x1080, 15.6" | MSI Pulse GL66 12UEK AU Optronics B156HAN08.4 (AUOAF90), IPS, 1920x1080, 15.6" | Lenovo Legion 5 15IAH7H 82RB CSOT MNF601CA1-3, IPS, 1920x1080, 15.6" | Asus TUF Gaming F15 FX507ZM TL156VDXP0101, IPS, 1920x1080, 15.6" | Schenker XMG Core 15 (M22) CSOT MNF601CA1-1, IPS, 2560x1440, 15.6" | |
|---|---|---|---|---|---|---|
| Display | 3% | 3% | 78% | 73% | 78% | |
| Display P3 Coverage (%) | 38.1 | 39.1 3% | 39 2% | 69.1 81% | 66.4 74% | 68.8 81% |
| sRGB Coverage (%) | 56.8 | 58.3 3% | 58.4 3% | 99.5 75% | 97 71% | 99.3 75% |
| AdobeRGB 1998 Coverage (%) | 39.3 | 40.4 3% | 40.3 3% | 70 78% | 68.5 74% | 69.9 78% |
| Response Times | -5% | -2% | 59% | 69% | 66% | |
| Response Time Grey 50% / Grey 80% * (ms) | 38.8 ? | 40 ? -3% | 38.8 ? -0% | 14.8 ? 62% | 5.6 ? 86% | 16 ? 59% |
| Response Time Black / White * (ms) | 26.8 ? | 28.4 ? -6% | 28 ? -4% | 12 ? 55% | 12.8 ? 52% | 7.6 ? 72% |
| PWM Frequency (Hz) | ||||||
| Screen | 1% | 29% | 1% | 26% | 15% | |
| Brightness middle (cd/m²) | 261 | 227 -13% | 248 -5% | 363.5 39% | 353.7 36% | 378 45% |
| Brightness (cd/m²) | 258 | 225 -13% | 245 -5% | 350 36% | 340 32% | 371 44% |
| Brightness Distribution (%) | 92 | 90 -2% | 86 -7% | 89 -3% | 89 -3% | 93 1% |
| Black Level * (cd/m²) | 0.19 | 0.21 -11% | 0.13 32% | 0.39 -105% | 0.34 -79% | 0.33 -74% |
| Contrast (:1) | 1374 | 1081 -21% | 1908 39% | 932 -32% | 1040 -24% | 1145 -17% |
| Colorchecker dE 2000 * | 5.57 | 4.19 25% | 3.14 44% | 3.68 34% | 1.74 69% | 2.84 49% |
| Colorchecker dE 2000 max. * | 20.6 | 17.45 15% | 5.82 72% | 8.92 57% | 3.63 82% | 5.51 73% |
| Colorchecker dE 2000 calibrated * | 4.63 | 3.81 18% | 3.14 32% | 0.53 89% | 0.5 89% | 2.75 41% |
| Greyscale dE 2000 * | 3.19 | 2.7 15% | 1.2 62% | 6.5 -104% | 2.1 34% | 4.08 -28% |
| Gamma | 2.45 90% | 2.208 100% | 2.49 88% | 2.2 100% | 2.3 96% | 2.4 92% |
| CCT | 6146 106% | 6176 105% | 6468 100% | 5995 108% | 6257 104% | 5841 111% |
| Média Total (Programa/Configurações) | -0% /
1% | 10% /
19% | 46% /
26% | 56% /
42% | 53% /
36% |
* ... menor é melhor
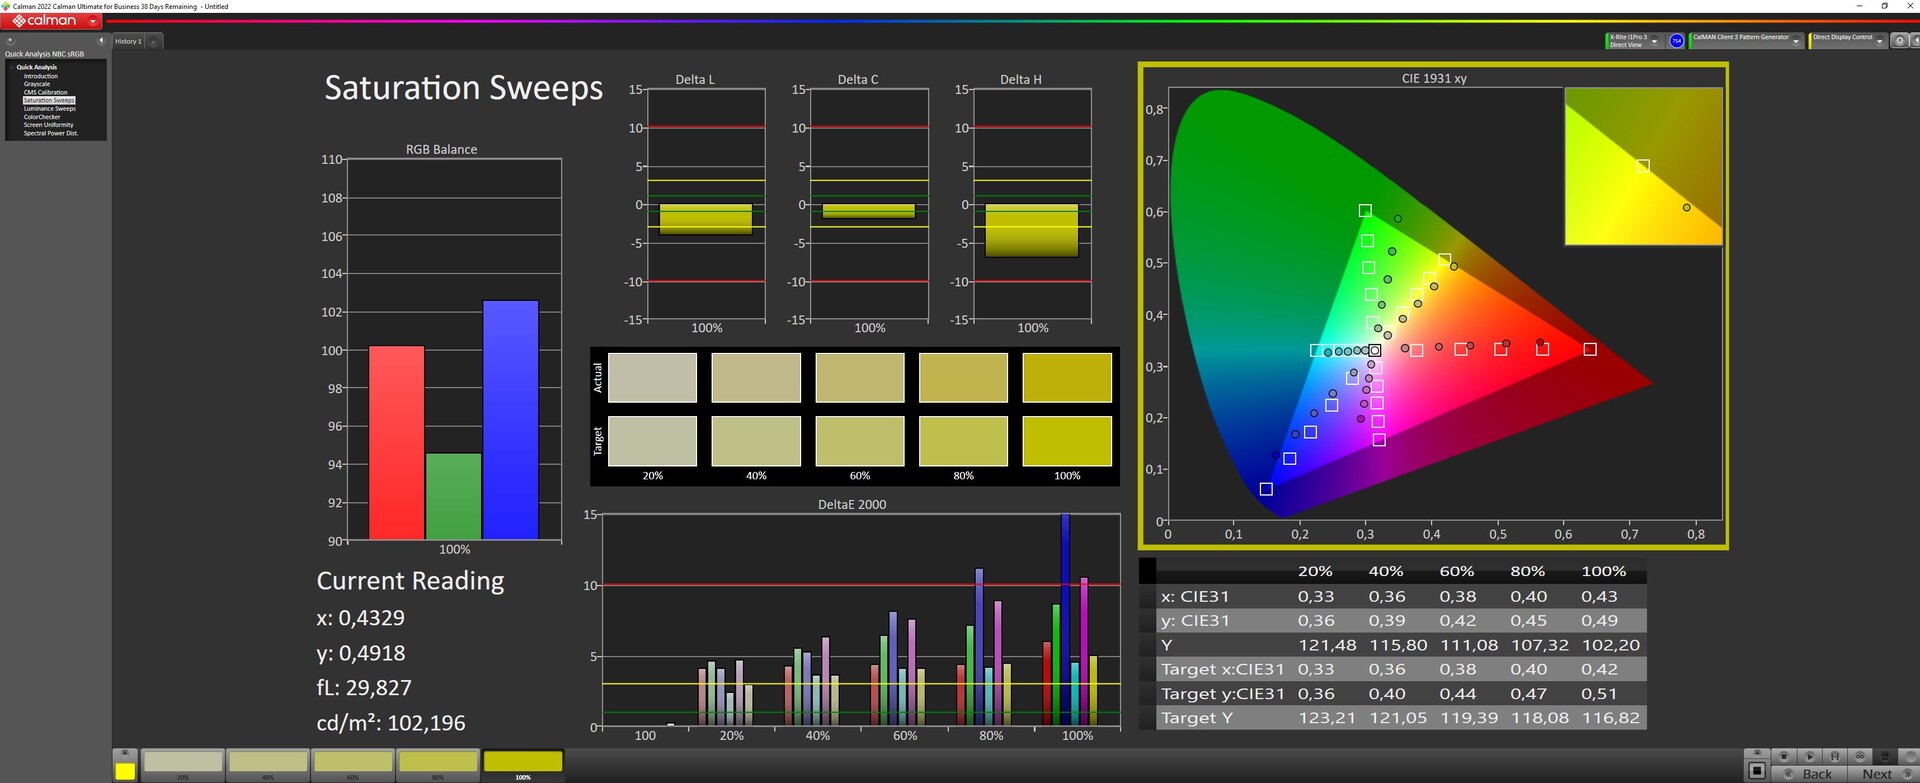
O fabricante não fornece nenhuma informação sobre a cobertura do espaço de cor. Medimos pouco menos de 57% em sRGB e cerca de 39% em AdobeRGB e DisplayP3. Também aqui, o caráter orçamentário do Katana 15 é evidente; a concorrência oferece maior cobertura do espaço de cores.
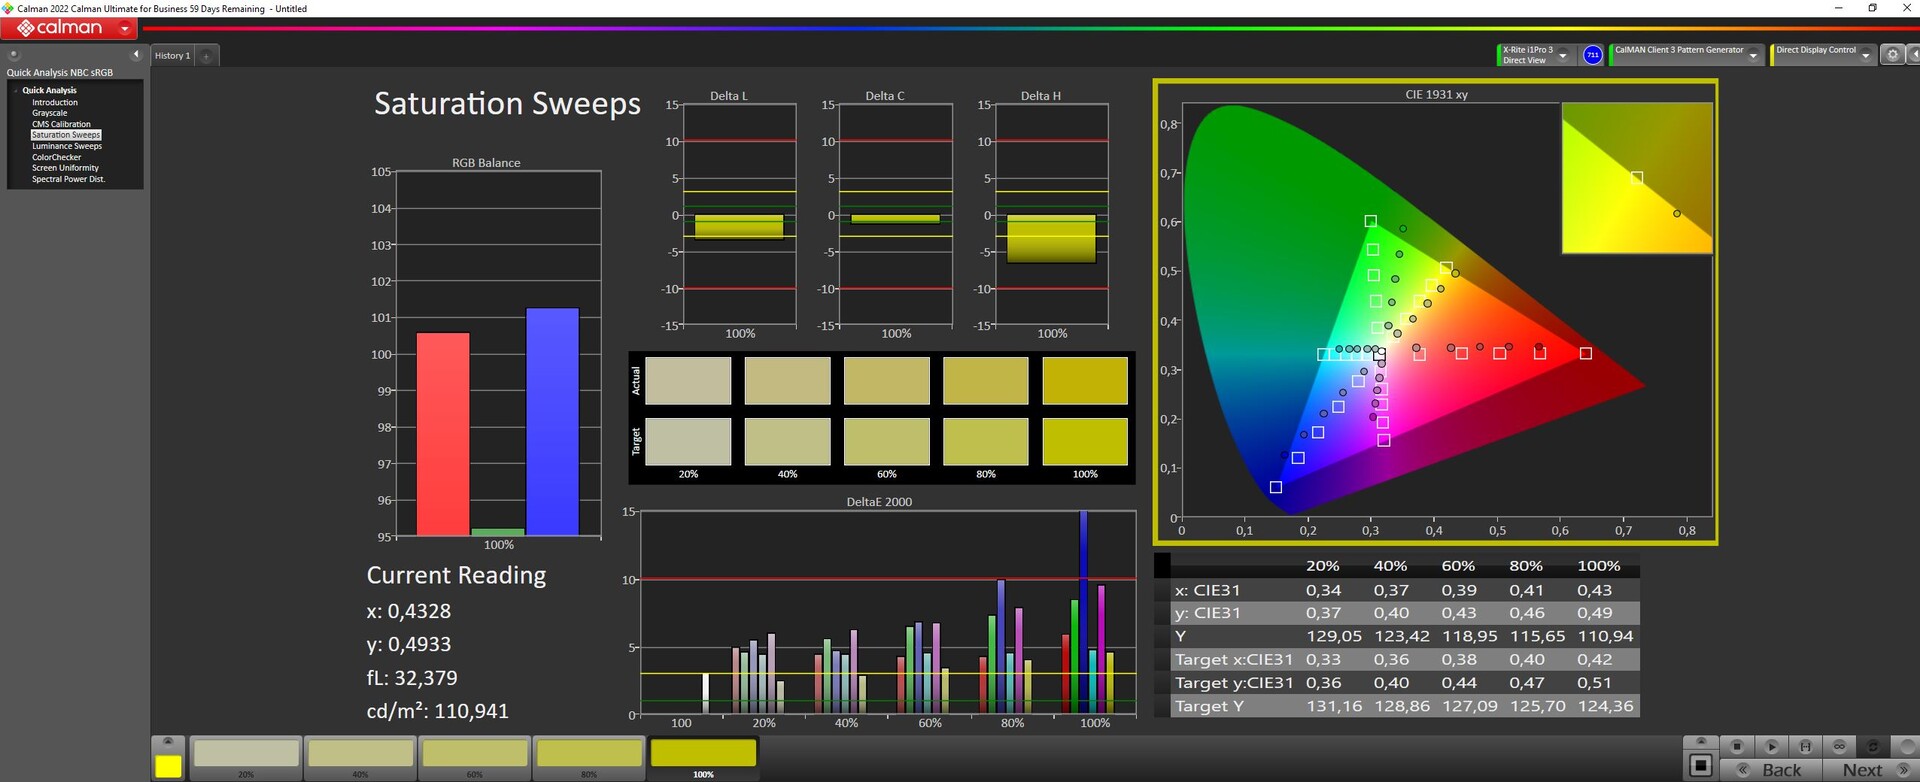
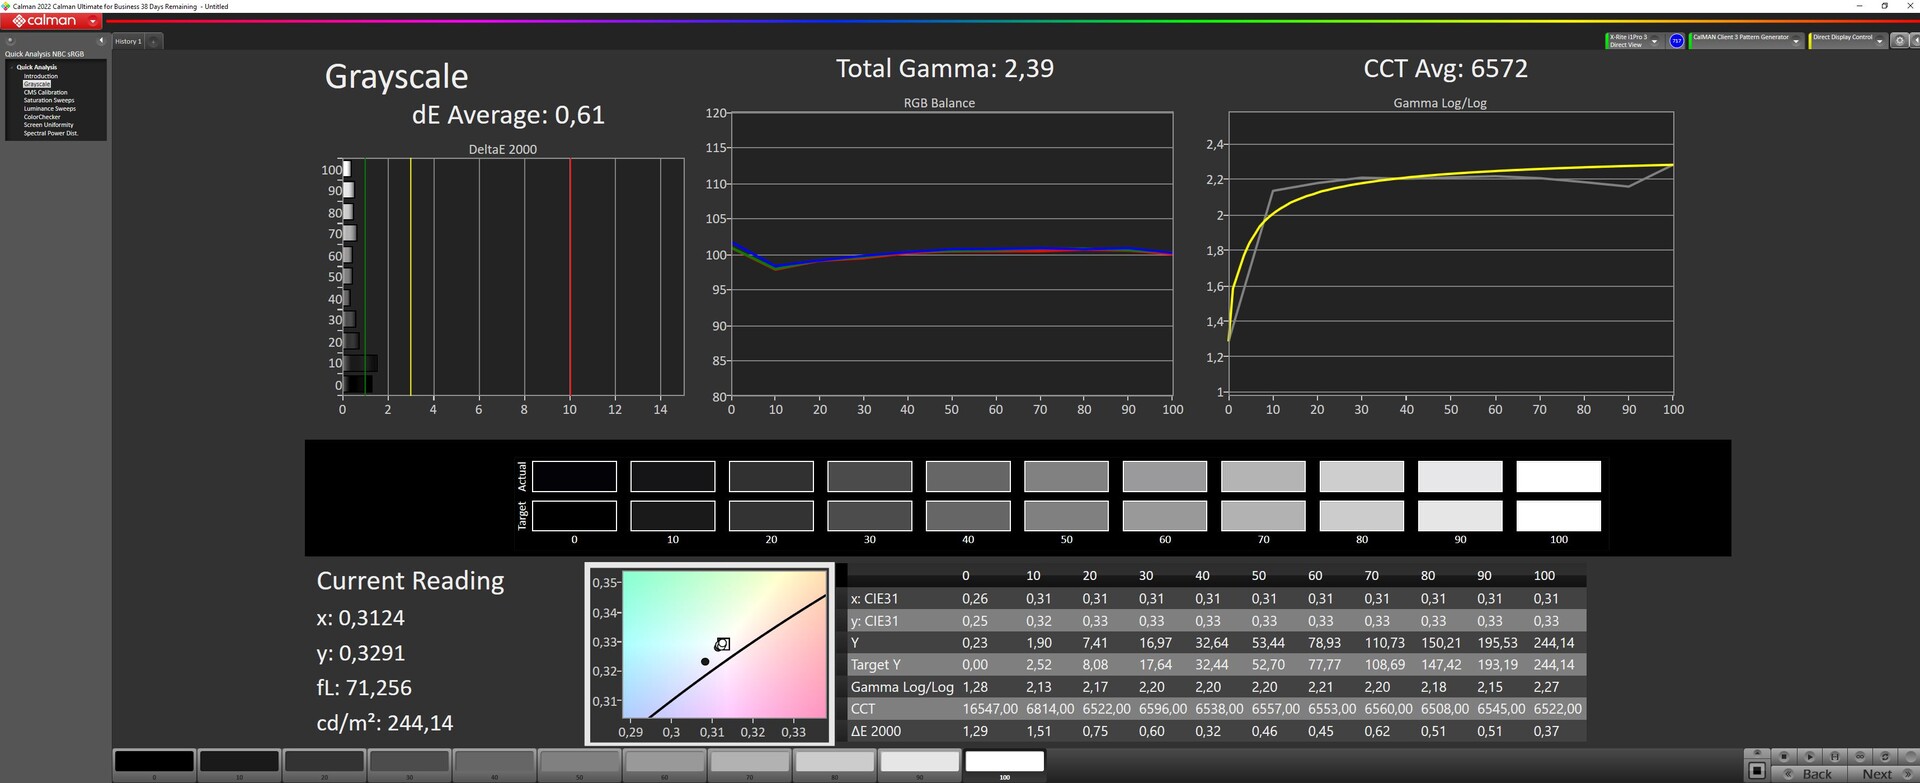
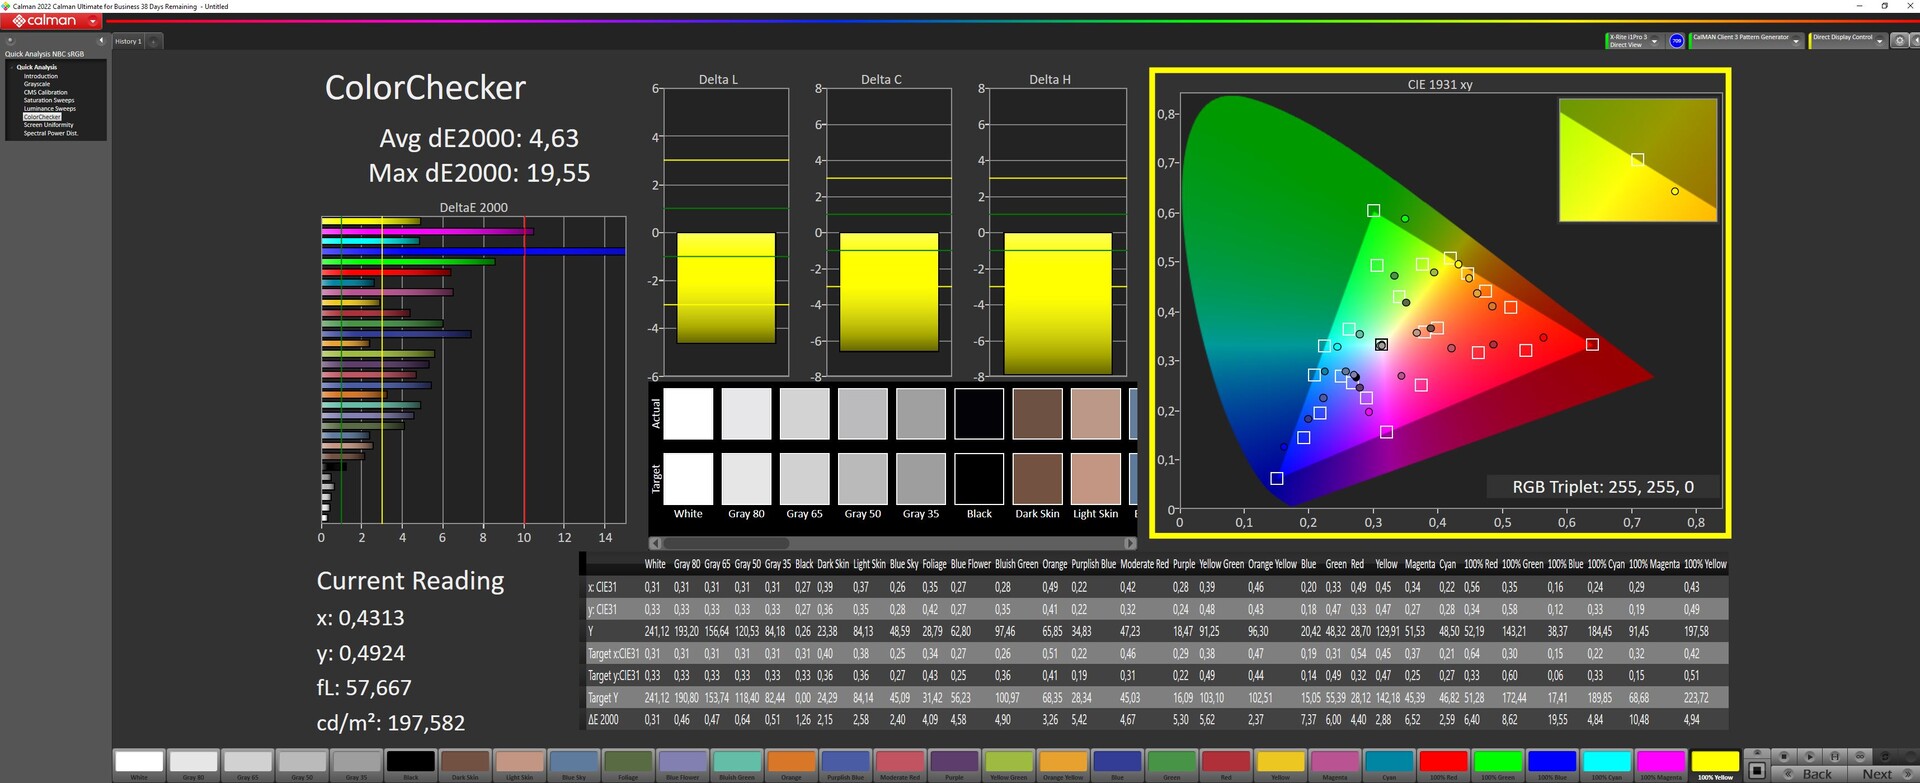
O display não é tão bem ajustado ex fábrica. Aqui só medimos em relação ao padrão sRGB. A redução da luminosidade baixa apenas ligeiramente o valor DeltaE para os níveis de cinza, mas ainda assim ele permanece um pouco abaixo de 3. Entretanto, o Calman ColorChecker mostra altos desvios de cor.
A calibração manual minimiza os desvios de escala de cinza para um bom 0,61, mas o valor DeltaE do ColorChecker de 4,63 permanece muito alto. O visor não parece ser capaz de mais. Nosso perfil de cor de icc calibrado pode ser baixado acima.
Exibir tempos de resposta
| ↔ Tempo de resposta preto para branco | ||
|---|---|---|
| 26.8 ms ... ascensão ↗ e queda ↘ combinadas | ↗ 14.2 ms ascensão | 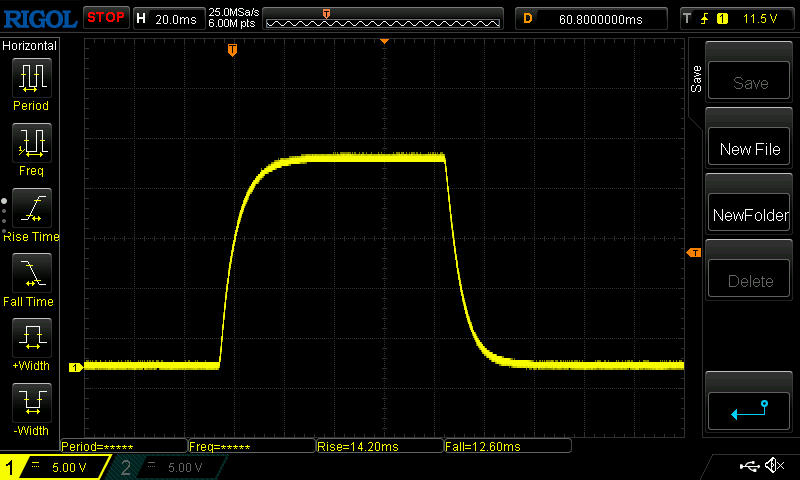 |
| ↘ 12.6 ms queda | ||
| A tela mostra taxas de resposta relativamente lentas em nossos testes e pode ser muito lenta para os jogadores. Em comparação, todos os dispositivos testados variam de 0.1 (mínimo) a 240 (máximo) ms. » 67 % de todos os dispositivos são melhores. Isso significa que o tempo de resposta medido é pior que a média de todos os dispositivos testados (19.8 ms). | ||
| ↔ Tempo de resposta 50% cinza a 80% cinza | ||
| 38.8 ms ... ascensão ↗ e queda ↘ combinadas | ↗ 18.6 ms ascensão | 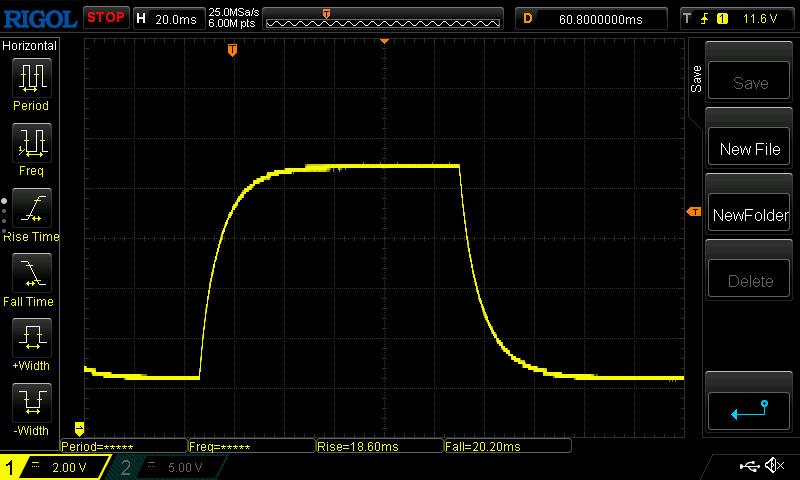 |
| ↘ 20.2 ms queda | ||
| A tela mostra taxas de resposta lentas em nossos testes e será insatisfatória para os jogadores. Em comparação, todos os dispositivos testados variam de 0.165 (mínimo) a 636 (máximo) ms. » 58 % de todos os dispositivos são melhores. Isso significa que o tempo de resposta medido é pior que a média de todos os dispositivos testados (31 ms). | ||
Cintilação da tela / PWM (modulação por largura de pulso)
| Tela tremeluzindo / PWM não detectado | 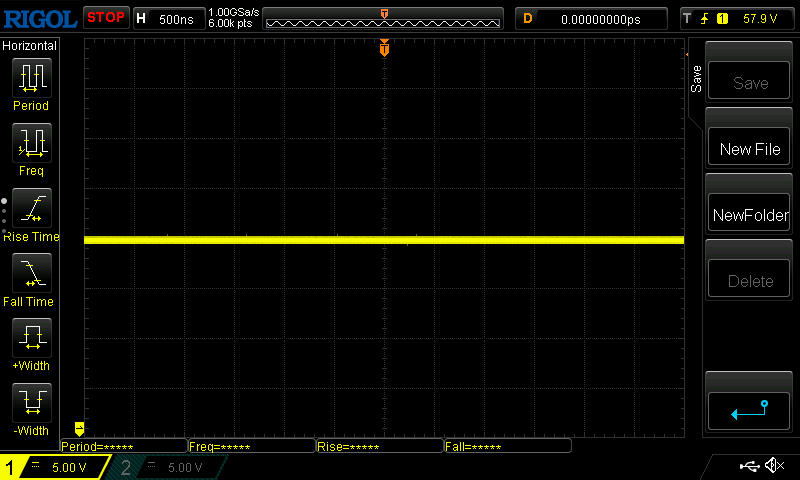 | ||
[pwm_comparison] Em comparação: 52 % de todos os dispositivos testados não usam PWM para escurecer a tela. Se PWM foi detectado, uma média de 7769 (mínimo: 5 - máximo: 343500) Hz foi medida. | |||
A superfície fosca filtra os reflexos agressivos ao ar livre. Entretanto, o brilho fraco do painel exige definitivamente um lugar à sombra.
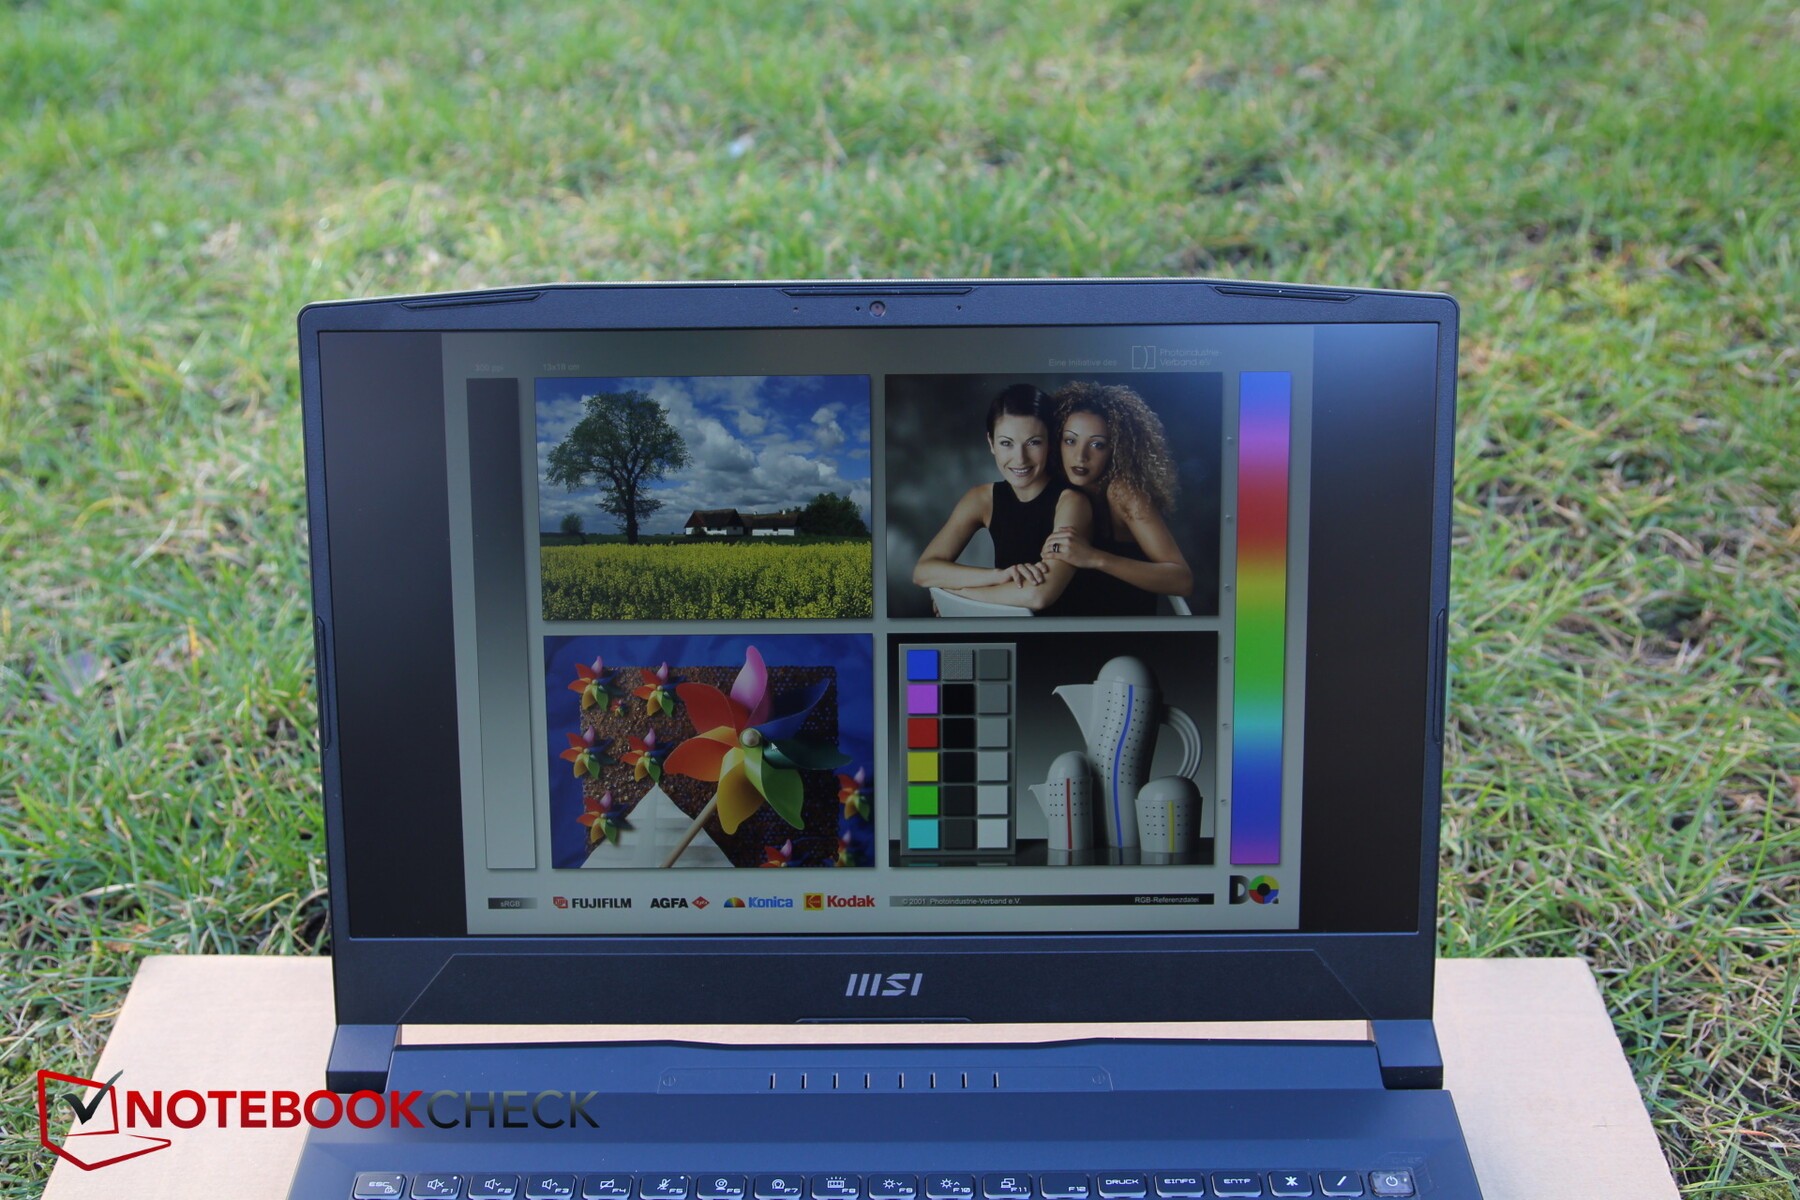
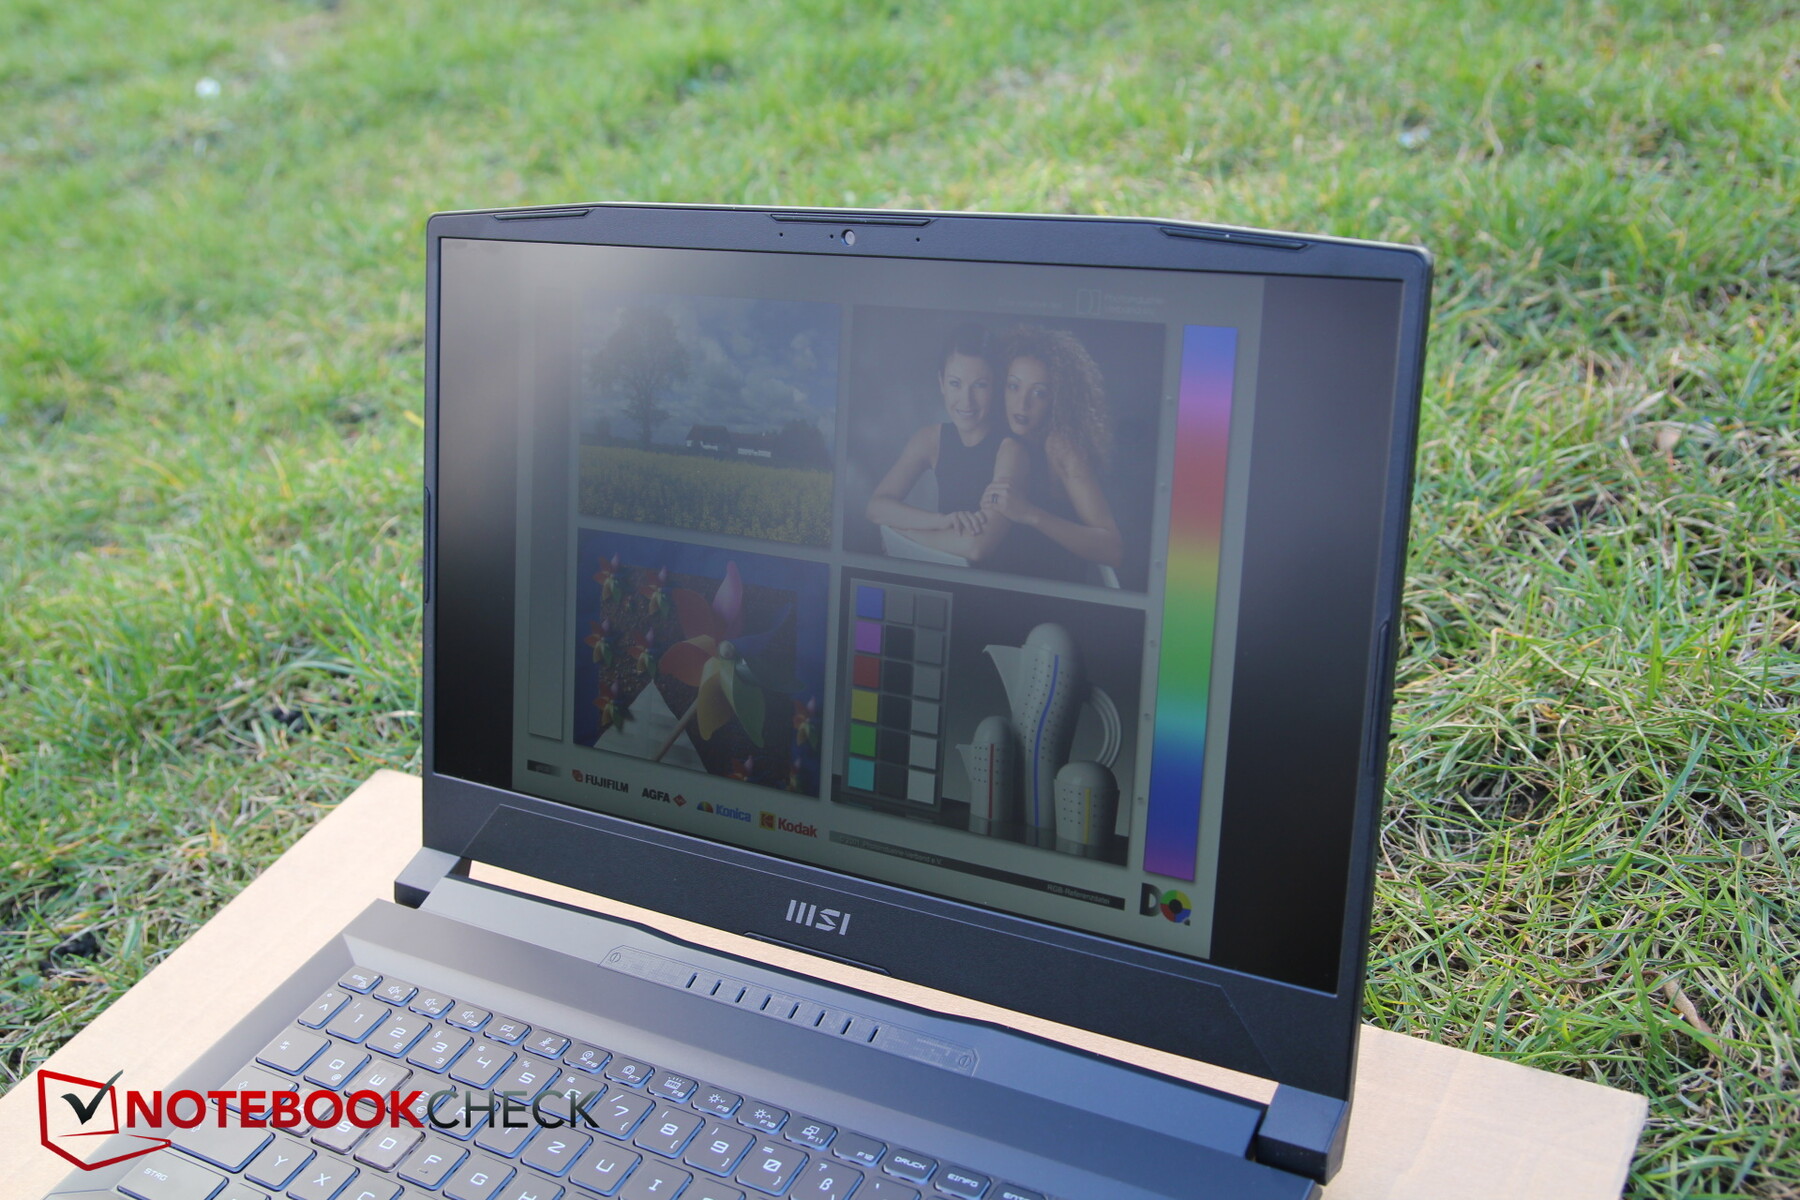
A estabilidade do ângulo de visão é boa. Uma queda no brilho só é visível em ângulos de visão extremos.

Desempenho - Katana 15 no nível de RTX 3060
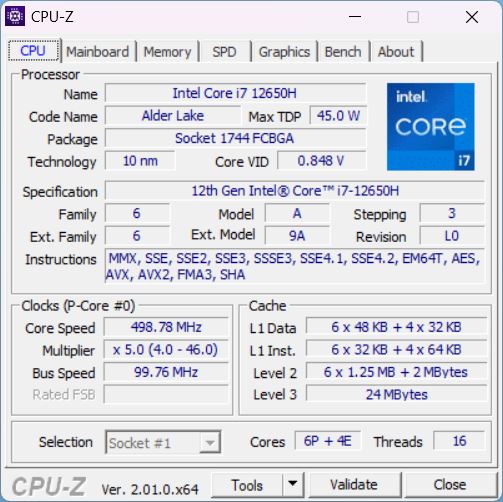
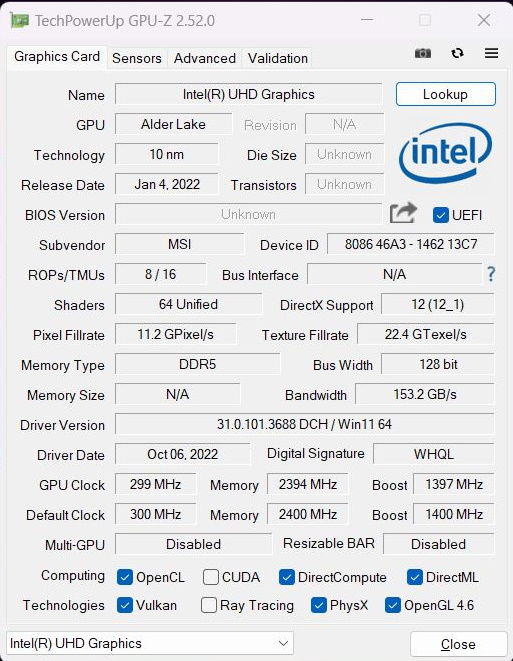
O MSI Katana 15 é anunciado como um laptop para jogos, e embora seuNúcleo i7-12650Hpertence à série Alder Lake do ano passado, definitivamente faz parte do segmento alto inferior.
A CPU é combinada com umNvidia RTX 4050o cartão de nível básico entre os novos modelos RTX 40xx. Na Katana, ela pode consumir até 105 W. 16 GB de RAM é o padrão (mais baixo) para um jogador hoje em dia.
Condições de teste
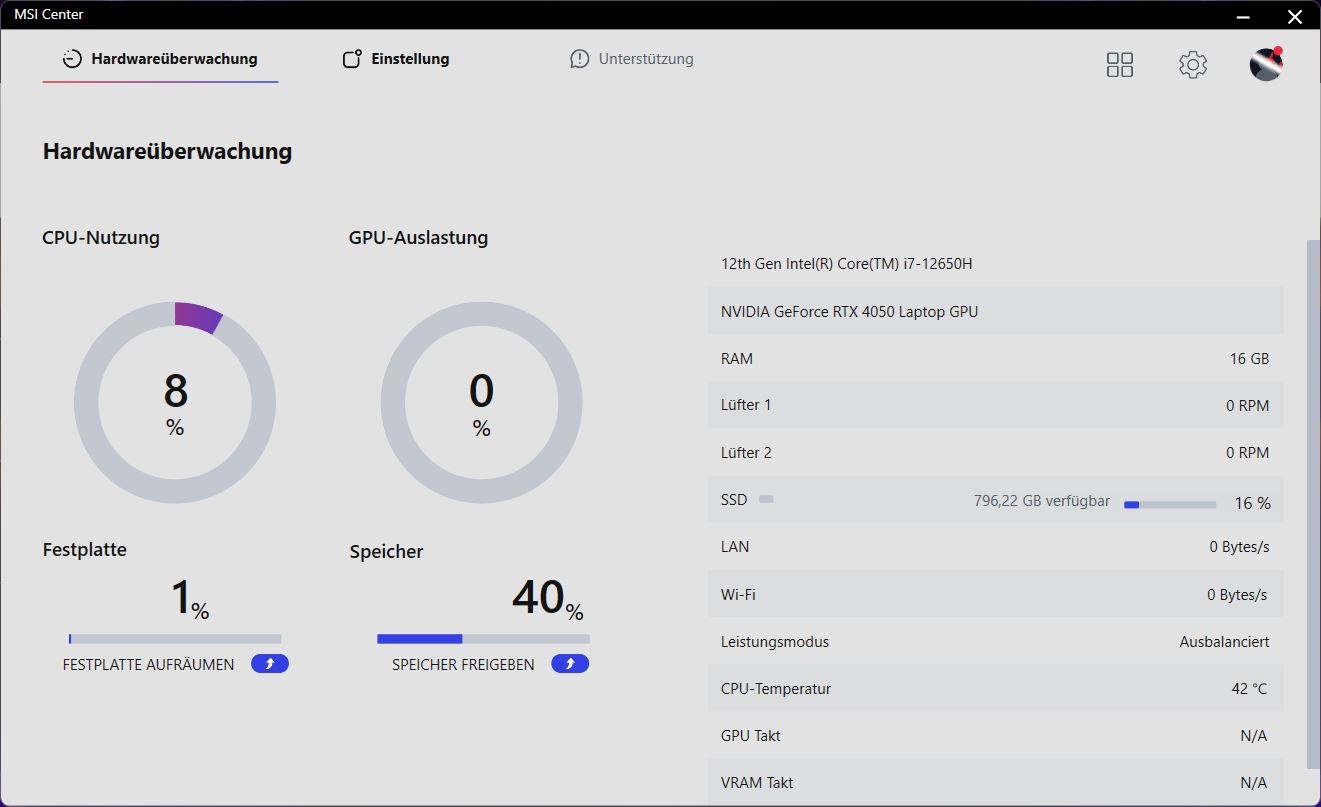
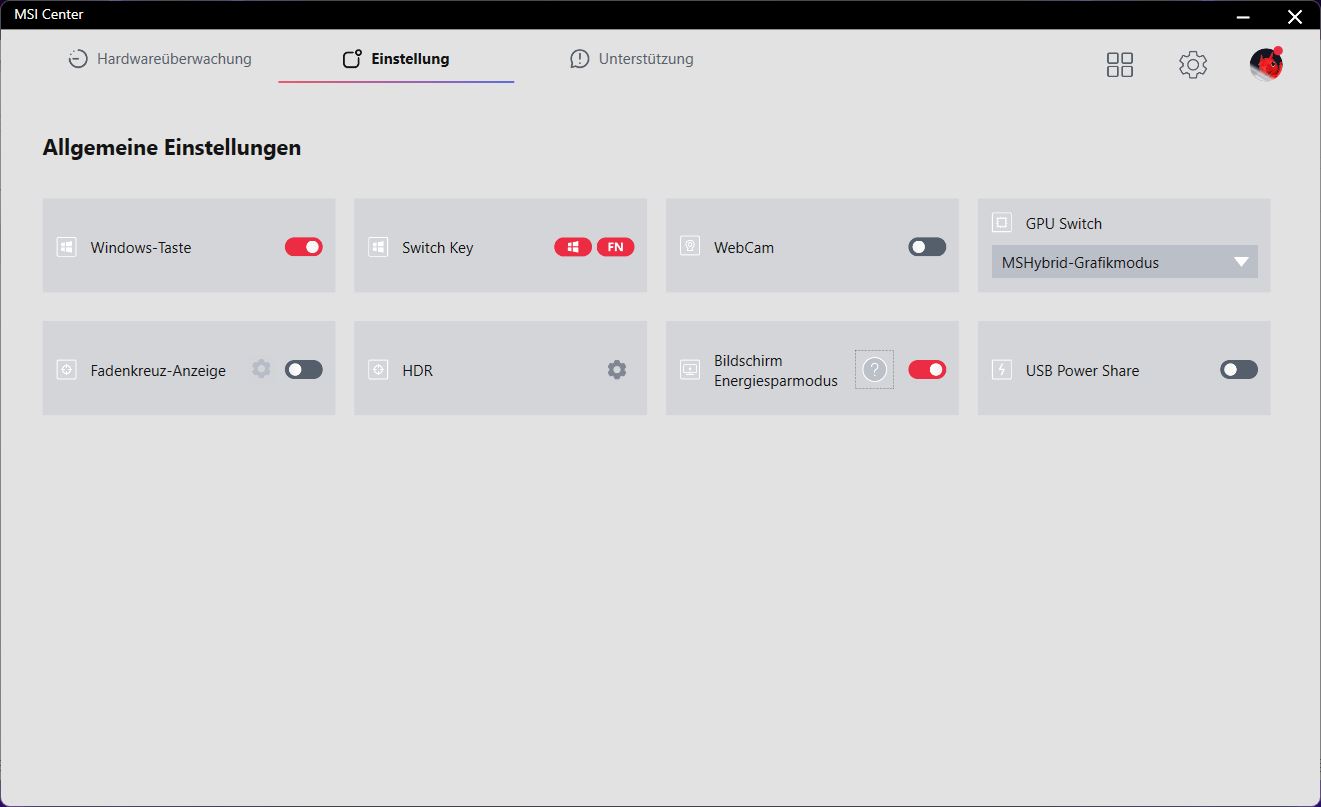
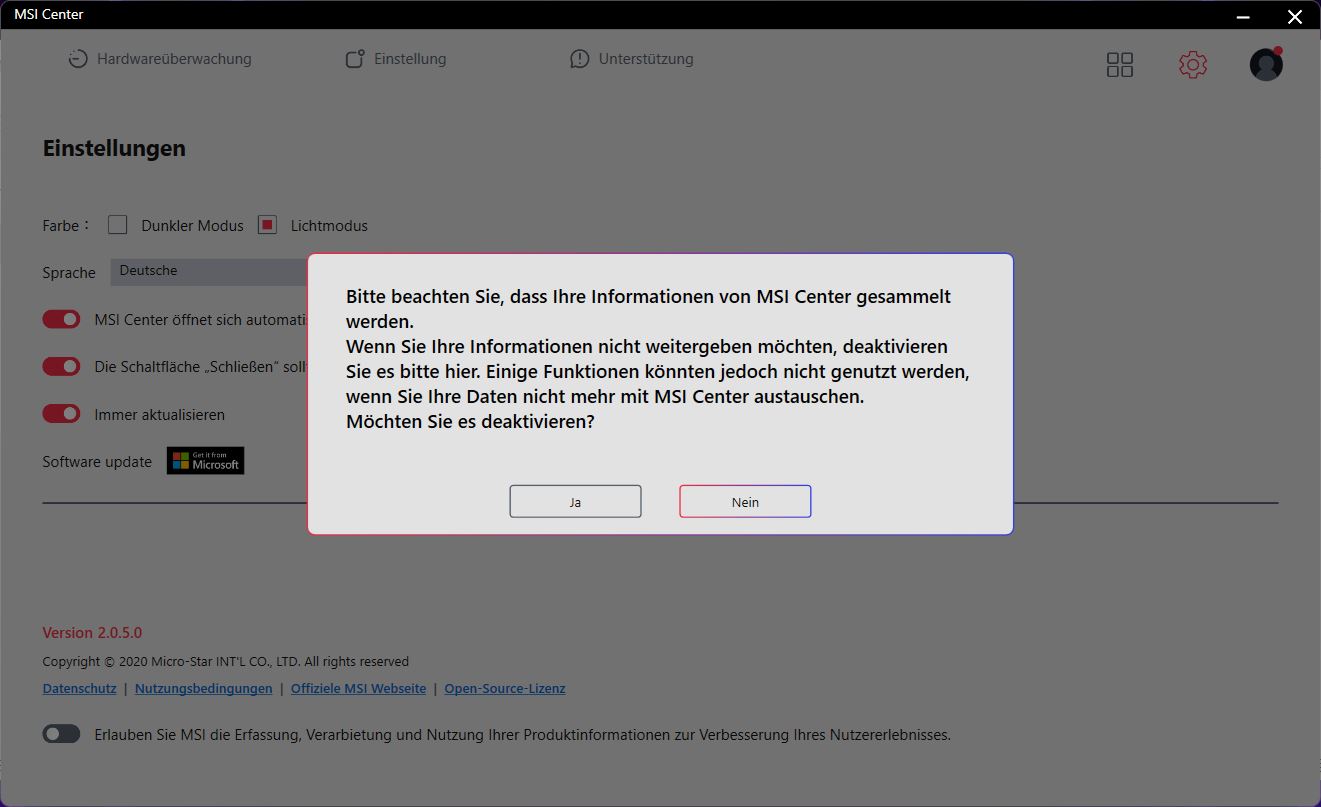
O MSI Center é o centro de controle, que o fabricante utiliza para coletar vários tipos de dados, é claro. Entre outras coisas, as configurações de desempenho são ajustadas aqui. O modo AI é predefinido por padrão aqui, o que ajusta automaticamente os valores de desempenho dependendo da carga aplicada. Depositamos nossa confiança na competência da IA e executamos todos os benchmarks neste modo.
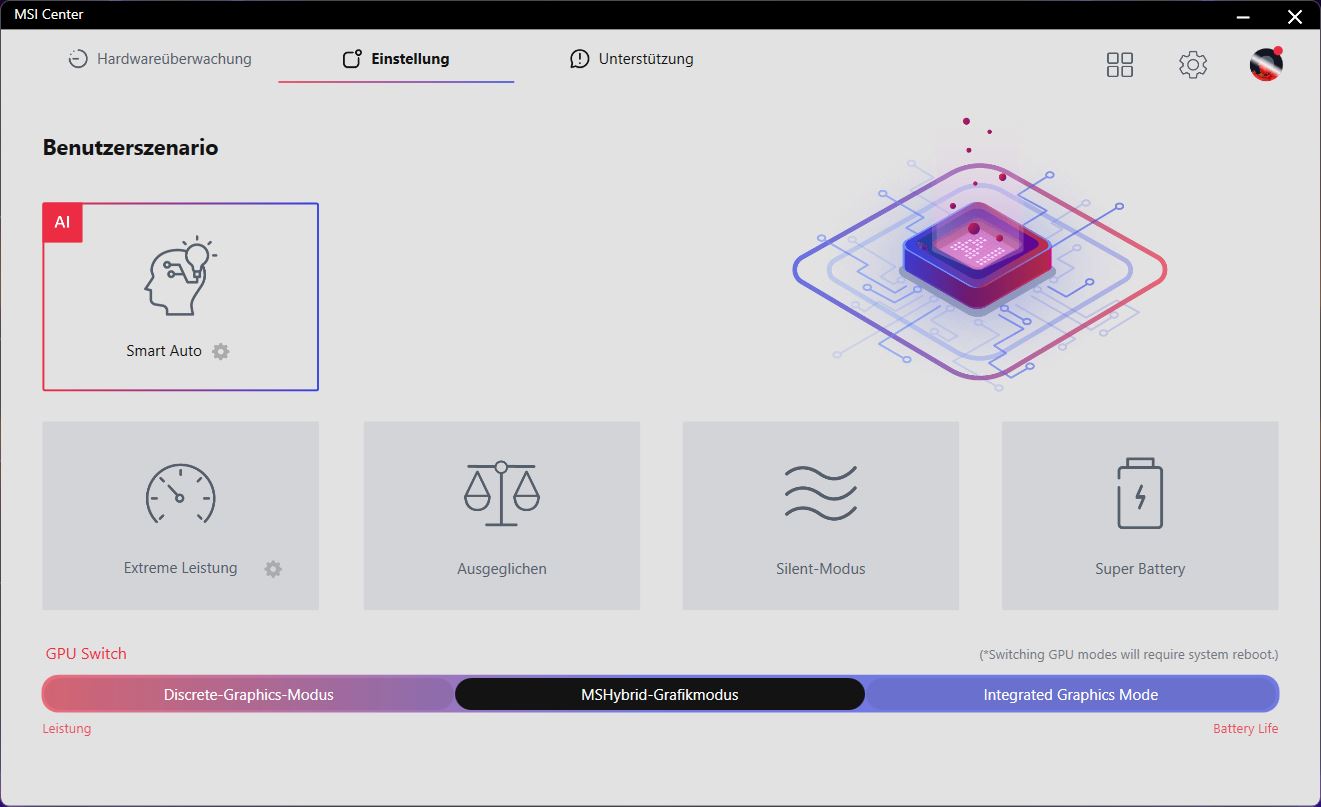
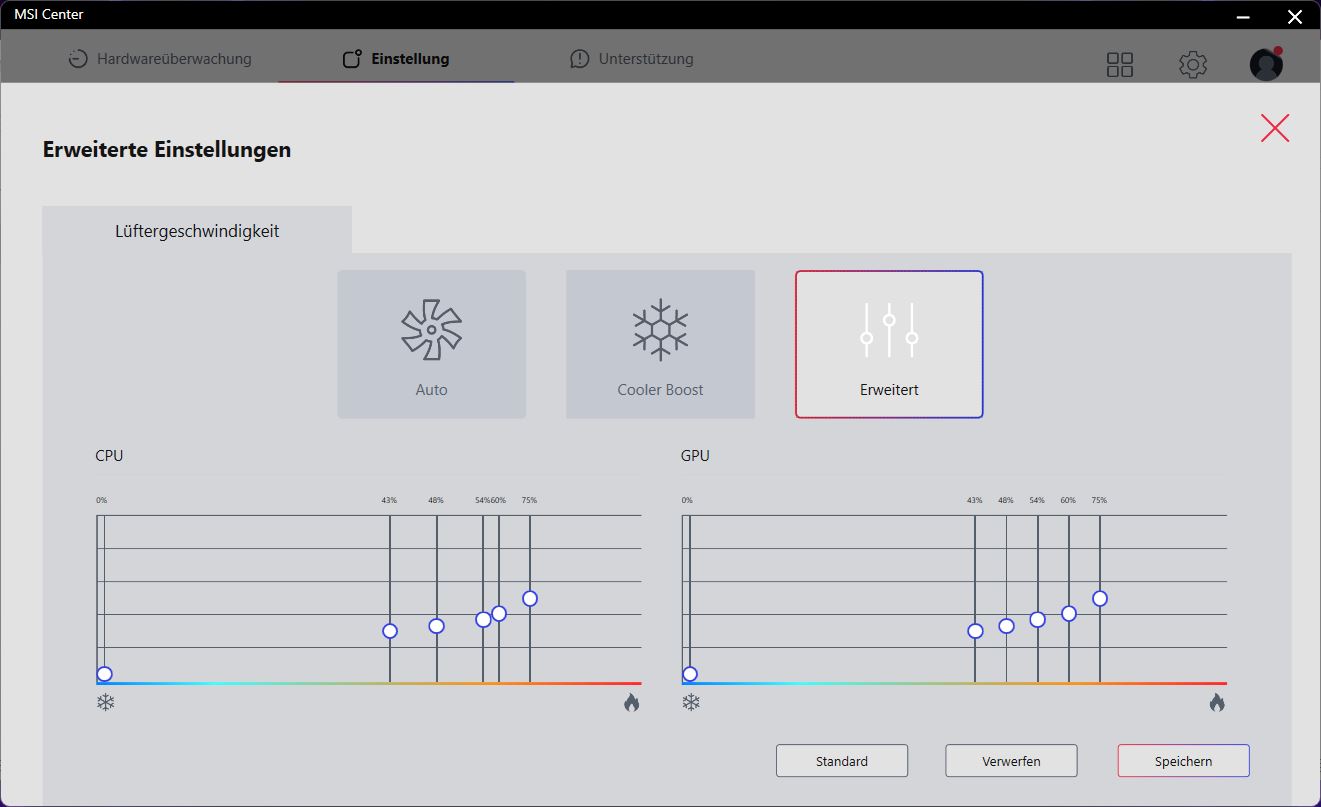
Além do desempenho, outras configurações podem ser ajustadas no MSI Center. Por exemplo, você troca as funções das teclas fn e Windows, ajusta manualmente as curvas do ventilador no modo de Desempenho Extremo, ou alterna iGPU e dGPU. A ferramenta tem problemas com determinadas resoluções
Na maioria das vezes, o modo híbrido GPU foi ativado no MSI Center, que muda automaticamente entre o iGPU e o dGPU. No entanto, isto não funcionou de forma confiável em nossos benchmarks. Por exemplo, tivemos que ativar manualmente o dGPU para Blender porque o teste só funcionava automaticamente com o iGPU e produzia resultados muito ruins.
Processador
Em contraste com o comumente usadoi7-12700Ho i7-12650H tem apenas 4 dos núcleos 8 E, mas os 6 P núcleos são os mesmos. Este último relógio até 4,7 GHz. A CPU pertence à parte inferior de alta qualidade da última geração Intel. Alternativamente, agora há também o Katana 15 B13 com uma CPU Gen13 da Intel, cujo preço provavelmente será mais alto.
No loop Cinebench, observamos uma pequena queda no desempenho durante as duas primeiras corridas. Em seguida, o desempenho é em grande parte constante, mas não excessivamente alto em geral. Nossa Katana está em desvantagem em relação à concorrência com a i7-12700H, e também é superada pelos Ryzen 7 6800H.
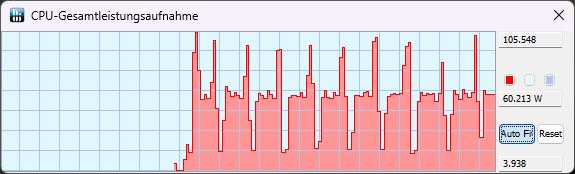
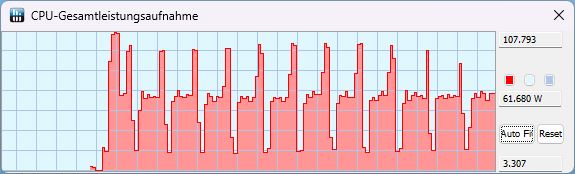
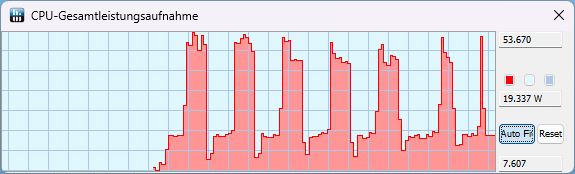
O TDP permanece quase o mesmo tanto no modo KI quanto no modo Extremo: medimos cerca de 105 W no início e no final de uma corrida, respectivamente, e o consumo de energia cai para 60 W no decorrer da corrida. No modo de bateria, o pico é de apenas 53 W, caso contrário, apenas 19 W está disponível
Em geral, o desempenho da CPU está no nível esperado, mas o desempenho do núcleo único da Katana é um pouco mais fraco.
Cinebench R15 Multi Sustained Load
Cinebench R23: Multi Core | Single Core
Cinebench R20: CPU (Multi Core) | CPU (Single Core)
Cinebench R15: CPU Multi 64Bit | CPU Single 64Bit
Blender: v2.79 BMW27 CPU
7-Zip 18.03: 7z b 4 | 7z b 4 -mmt1
Geekbench 5.5: Multi-Core | Single-Core
HWBOT x265 Benchmark v2.2: 4k Preset
LibreOffice : 20 Documents To PDF
R Benchmark 2.5: Overall mean
| CPU Performance rating | |
| Média da turma Gaming | |
| Lenovo Legion 5 15IAH7H 82RB | |
| MSI Pulse GL66 12UEK | |
| Asus TUF Gaming F15 FX507ZM | |
| MSI Katana GF66 12UGS | |
| MSI Katana 15 B12VEK | |
| Schenker XMG Core 15 (M22) | |
| Média Intel Core i7-12650H | |
| Cinebench R23 / Multi Core | |
| Média da turma Gaming (10488 - 40970, n=110, últimos 2 anos) | |
| Lenovo Legion 5 15IAH7H 82RB | |
| Asus TUF Gaming F15 FX507ZM | |
| MSI Pulse GL66 12UEK | |
| MSI Katana GF66 12UGS | |
| MSI Katana 15 B12VEK | |
| Schenker XMG Core 15 (M22) | |
| Média Intel Core i7-12650H (5362 - 15537, n=14) | |
| Cinebench R23 / Single Core | |
| Média da turma Gaming (1166 - 2356, n=110, últimos 2 anos) | |
| MSI Pulse GL66 12UEK | |
| MSI Katana GF66 12UGS | |
| Lenovo Legion 5 15IAH7H 82RB | |
| Asus TUF Gaming F15 FX507ZM | |
| Média Intel Core i7-12650H (1428 - 1808, n=14) | |
| MSI Katana 15 B12VEK | |
| Schenker XMG Core 15 (M22) | |
| Cinebench R20 / CPU (Multi Core) | |
| Média da turma Gaming (4029 - 16108, n=109, últimos 2 anos) | |
| Lenovo Legion 5 15IAH7H 82RB | |
| Asus TUF Gaming F15 FX507ZM | |
| MSI Pulse GL66 12UEK | |
| MSI Katana GF66 12UGS | |
| MSI Katana 15 B12VEK | |
| Schenker XMG Core 15 (M22) | |
| Média Intel Core i7-12650H (2106 - 6009, n=14) | |
| Cinebench R20 / CPU (Single Core) | |
| Média da turma Gaming (442 - 895, n=109, últimos 2 anos) | |
| MSI Pulse GL66 12UEK | |
| MSI Katana GF66 12UGS | |
| Lenovo Legion 5 15IAH7H 82RB | |
| Asus TUF Gaming F15 FX507ZM | |
| Média Intel Core i7-12650H (552 - 696, n=14) | |
| MSI Katana 15 B12VEK | |
| Schenker XMG Core 15 (M22) | |
| Cinebench R15 / CPU Multi 64Bit | |
| Média da turma Gaming (1578 - 6271, n=108, últimos 2 anos) | |
| Lenovo Legion 5 15IAH7H 82RB | |
| Asus TUF Gaming F15 FX507ZM | |
| MSI Pulse GL66 12UEK | |
| MSI Katana GF66 12UGS | |
| MSI Katana GF66 12UGS | |
| Schenker XMG Core 15 (M22) | |
| MSI Katana 15 B12VEK | |
| Média Intel Core i7-12650H (753 - 2253, n=14) | |
| Cinebench R15 / CPU Single 64Bit | |
| Média da turma Gaming (188.8 - 343, n=109, últimos 2 anos) | |
| MSI Pulse GL66 12UEK | |
| MSI Katana GF66 12UGS | |
| MSI Katana GF66 12UGS | |
| Lenovo Legion 5 15IAH7H 82RB | |
| Asus TUF Gaming F15 FX507ZM | |
| Schenker XMG Core 15 (M22) | |
| MSI Katana 15 B12VEK | |
| Média Intel Core i7-12650H (206 - 261, n=14) | |
| Blender / v2.79 BMW27 CPU | |
| Média Intel Core i7-12650H (222 - 553, n=15) | |
| MSI Katana GF66 12UGS | |
| MSI Katana 15 B12VEK | |
| Schenker XMG Core 15 (M22) | |
| MSI Pulse GL66 12UEK | |
| Asus TUF Gaming F15 FX507ZM | |
| Lenovo Legion 5 15IAH7H 82RB | |
| Média da turma Gaming (80 - 330, n=107, últimos 2 anos) | |
| 7-Zip 18.03 / 7z b 4 | |
| Média da turma Gaming (33491 - 148086, n=108, últimos 2 anos) | |
| Lenovo Legion 5 15IAH7H 82RB | |
| Asus TUF Gaming F15 FX507ZM | |
| MSI Pulse GL66 12UEK | |
| Schenker XMG Core 15 (M22) | |
| MSI Katana 15 B12VEK | |
| MSI Katana GF66 12UGS | |
| Média Intel Core i7-12650H (27053 - 59034, n=14) | |
| 7-Zip 18.03 / 7z b 4 -mmt1 | |
| Média da turma Gaming (4199 - 7436, n=108, últimos 2 anos) | |
| MSI Pulse GL66 12UEK | |
| MSI Katana GF66 12UGS | |
| Lenovo Legion 5 15IAH7H 82RB | |
| Schenker XMG Core 15 (M22) | |
| Média Intel Core i7-12650H (5265 - 6116, n=14) | |
| MSI Katana 15 B12VEK | |
| Asus TUF Gaming F15 FX507ZM | |
| Geekbench 5.5 / Multi-Core | |
| Média da turma Gaming (6460 - 27010, n=108, últimos 2 anos) | |
| Lenovo Legion 5 15IAH7H 82RB | |
| Asus TUF Gaming F15 FX507ZM | |
| MSI Pulse GL66 12UEK | |
| MSI Katana GF66 12UGS | |
| MSI Katana 15 B12VEK | |
| Schenker XMG Core 15 (M22) | |
| Média Intel Core i7-12650H (6478 - 11284, n=16) | |
| Geekbench 5.5 / Single-Core | |
| Média da turma Gaming (986 - 2474, n=108, últimos 2 anos) | |
| MSI Pulse GL66 12UEK | |
| MSI Katana GF66 12UGS | |
| Lenovo Legion 5 15IAH7H 82RB | |
| Asus TUF Gaming F15 FX507ZM | |
| Média Intel Core i7-12650H (1590 - 1797, n=16) | |
| MSI Katana 15 B12VEK | |
| Schenker XMG Core 15 (M22) | |
| HWBOT x265 Benchmark v2.2 / 4k Preset | |
| Média da turma Gaming (11.5 - 44.3, n=108, últimos 2 anos) | |
| Lenovo Legion 5 15IAH7H 82RB | |
| Asus TUF Gaming F15 FX507ZM | |
| MSI Pulse GL66 12UEK | |
| Schenker XMG Core 15 (M22) | |
| MSI Katana 15 B12VEK | |
| Média Intel Core i7-12650H (6.62 - 17.4, n=16) | |
| MSI Katana GF66 12UGS | |
| LibreOffice / 20 Documents To PDF | |
| Schenker XMG Core 15 (M22) | |
| Asus TUF Gaming F15 FX507ZM | |
| Média da turma Gaming (19 - 88.8, n=108, últimos 2 anos) | |
| MSI Katana 15 B12VEK | |
| Média Intel Core i7-12650H (35.1 - 58.5, n=14) | |
| MSI Pulse GL66 12UEK | |
| Lenovo Legion 5 15IAH7H 82RB | |
| MSI Katana GF66 12UGS | |
| R Benchmark 2.5 / Overall mean | |
| MSI Katana 15 B12VEK | |
| Schenker XMG Core 15 (M22) | |
| Média Intel Core i7-12650H (0.4584 - 0.515, n=14) | |
| Asus TUF Gaming F15 FX507ZM | |
| Lenovo Legion 5 15IAH7H 82RB | |
| MSI Katana GF66 12UGS | |
| Média da turma Gaming (0.3439 - 0.759, n=109, últimos 2 anos) | |
| MSI Pulse GL66 12UEK | |
* ... menor é melhor
AIDA64: FP32 Ray-Trace | FPU Julia | CPU SHA3 | CPU Queen | FPU SinJulia | FPU Mandel | CPU AES | CPU ZLib | FP64 Ray-Trace | CPU PhotoWorxx
| Performance rating | |
| Média da turma Gaming | |
| Lenovo Legion 5 15IAH7H 82RB | |
| Schenker XMG Core 15 (M22) | |
| MSI Katana 15 B12VEK | |
| MSI Pulse GL66 12UEK | |
| Asus TUF Gaming F15 FX507ZM | |
| MSI Katana GF66 12UGS | |
| Média Intel Core i7-12650H | |
| AIDA64 / FP32 Ray-Trace | |
| Média da turma Gaming (10227 - 85542, n=107, últimos 2 anos) | |
| Lenovo Legion 5 15IAH7H 82RB | |
| Schenker XMG Core 15 (M22) | |
| MSI Katana 15 B12VEK | |
| Média Intel Core i7-12650H (5422 - 15620, n=14) | |
| Asus TUF Gaming F15 FX507ZM | |
| MSI Pulse GL66 12UEK | |
| MSI Katana GF66 12UGS | |
| AIDA64 / FPU Julia | |
| Média da turma Gaming (51376 - 238426, n=107, últimos 2 anos) | |
| Schenker XMG Core 15 (M22) | |
| Lenovo Legion 5 15IAH7H 82RB | |
| MSI Katana 15 B12VEK | |
| Média Intel Core i7-12650H (26386 - 76434, n=14) | |
| Asus TUF Gaming F15 FX507ZM | |
| MSI Pulse GL66 12UEK | |
| MSI Katana GF66 12UGS | |
| AIDA64 / CPU SHA3 | |
| Média da turma Gaming (2180 - 9817, n=107, últimos 2 anos) | |
| Lenovo Legion 5 15IAH7H 82RB | |
| Schenker XMG Core 15 (M22) | |
| Asus TUF Gaming F15 FX507ZM | |
| MSI Katana 15 B12VEK | |
| MSI Pulse GL66 12UEK | |
| MSI Katana GF66 12UGS | |
| Média Intel Core i7-12650H (1479 - 3244, n=14) | |
| AIDA64 / CPU Queen | |
| Média da turma Gaming (49785 - 173351, n=95, últimos 2 anos) | |
| MSI Pulse GL66 12UEK | |
| Lenovo Legion 5 15IAH7H 82RB | |
| MSI Katana GF66 12UGS | |
| Asus TUF Gaming F15 FX507ZM | |
| Schenker XMG Core 15 (M22) | |
| MSI Katana 15 B12VEK | |
| Média Intel Core i7-12650H (59278 - 89537, n=14) | |
| AIDA64 / FPU SinJulia | |
| Média da turma Gaming (4424 - 33636, n=107, últimos 2 anos) | |
| Schenker XMG Core 15 (M22) | |
| Lenovo Legion 5 15IAH7H 82RB | |
| MSI Pulse GL66 12UEK | |
| Asus TUF Gaming F15 FX507ZM | |
| MSI Katana GF66 12UGS | |
| MSI Katana 15 B12VEK | |
| Média Intel Core i7-12650H (4690 - 8726, n=14) | |
| AIDA64 / FPU Mandel | |
| Média da turma Gaming (25115 - 128721, n=107, últimos 2 anos) | |
| Schenker XMG Core 15 (M22) | |
| Lenovo Legion 5 15IAH7H 82RB | |
| MSI Katana 15 B12VEK | |
| Média Intel Core i7-12650H (15001 - 37738, n=14) | |
| Asus TUF Gaming F15 FX507ZM | |
| MSI Pulse GL66 12UEK | |
| MSI Katana GF66 12UGS | |
| AIDA64 / CPU AES | |
| Lenovo Legion 5 15IAH7H 82RB | |
| Média da turma Gaming (39258 - 247074, n=107, últimos 2 anos) | |
| MSI Pulse GL66 12UEK | |
| MSI Katana GF66 12UGS | |
| Schenker XMG Core 15 (M22) | |
| MSI Katana 15 B12VEK | |
| Asus TUF Gaming F15 FX507ZM | |
| Média Intel Core i7-12650H (32702 - 92530, n=14) | |
| AIDA64 / CPU ZLib | |
| Média da turma Gaming (574 - 2531, n=107, últimos 2 anos) | |
| Asus TUF Gaming F15 FX507ZM | |
| Lenovo Legion 5 15IAH7H 82RB | |
| MSI Pulse GL66 12UEK | |
| MSI Katana GF66 12UGS | |
| Schenker XMG Core 15 (M22) | |
| MSI Katana 15 B12VEK | |
| Média Intel Core i7-12650H (443 - 891, n=14) | |
| AIDA64 / FP64 Ray-Trace | |
| Média da turma Gaming (5509 - 45446, n=107, últimos 2 anos) | |
| Lenovo Legion 5 15IAH7H 82RB | |
| Schenker XMG Core 15 (M22) | |
| MSI Katana 15 B12VEK | |
| Média Intel Core i7-12650H (3096 - 8448, n=14) | |
| Asus TUF Gaming F15 FX507ZM | |
| MSI Pulse GL66 12UEK | |
| MSI Katana GF66 12UGS | |
| AIDA64 / CPU PhotoWorxx | |
| Média da turma Gaming (12271 - 89891, n=107, últimos 2 anos) | |
| MSI Katana 15 B12VEK | |
| Lenovo Legion 5 15IAH7H 82RB | |
| Asus TUF Gaming F15 FX507ZM | |
| Média Intel Core i7-12650H (22046 - 44164, n=14) | |
| Schenker XMG Core 15 (M22) | |
| MSI Katana GF66 12UGS | |
| MSI Pulse GL66 12UEK | |
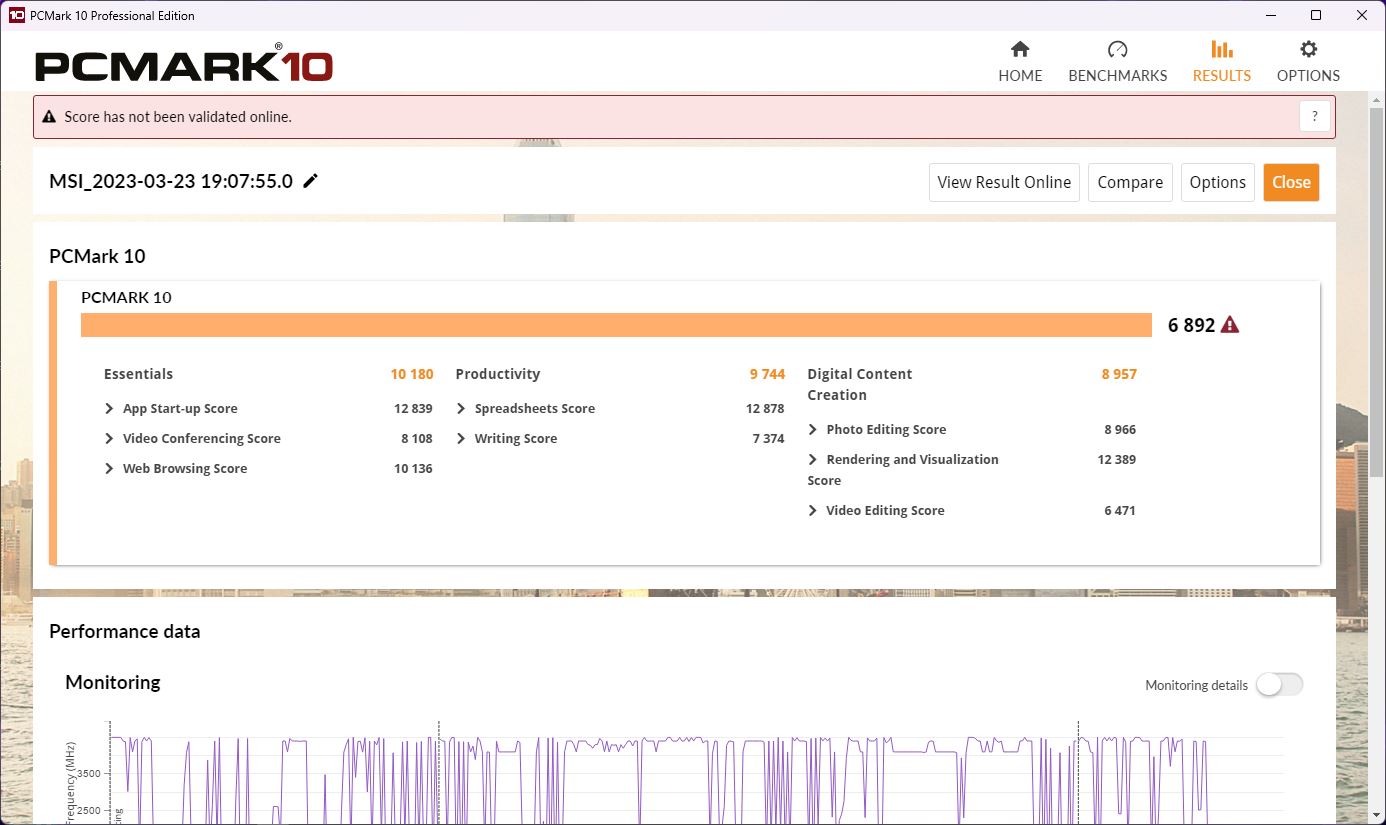
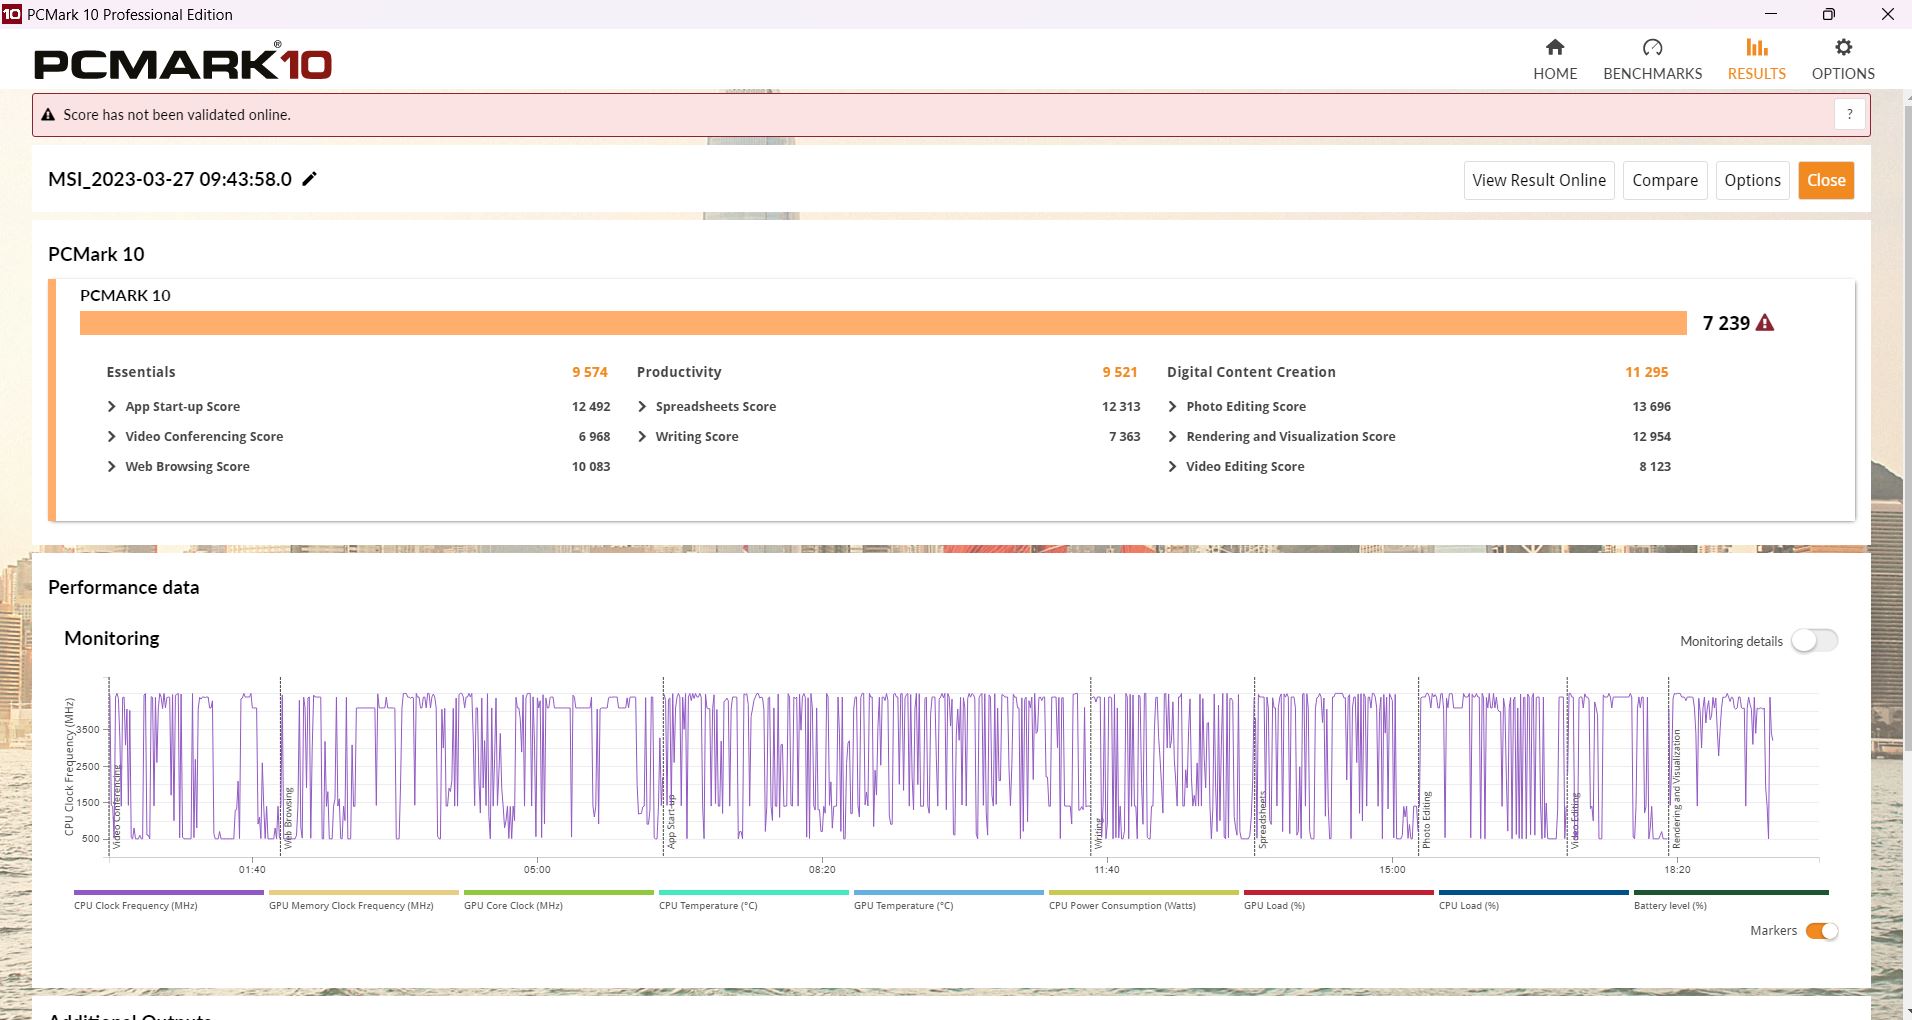
Desempenho do sistema
Sem surpresas, os Katana não podem se diferenciar de seus modelos irmãos.GF66 ou GL66 em termos de desempenho do sistema também. Em comparação, ele atinge uma pontuação um pouco mais baixa. A pontuação é melhor com o dGPU ativado manualmente, mas não em todos os sub-testes.
CrossMark: Overall | Productivity | Creativity | Responsiveness
| PCMark 10 / Score | |
| Média da turma Gaming (5828 - 11574, n=95, últimos 2 anos) | |
| Lenovo Legion 5 15IAH7H 82RB | |
| MSI Katana GF66 12UGS | |
| Asus TUF Gaming F15 FX507ZM | |
| Schenker XMG Core 15 (M22) | |
| MSI Pulse GL66 12UEK | |
| MSI Katana 15 B12VEK | |
| Média Intel Core i7-12650H, NVIDIA GeForce RTX 4050 Laptop GPU (n=1) | |
| PCMark 10 / Essentials | |
| Lenovo Legion 5 15IAH7H 82RB | |
| Schenker XMG Core 15 (M22) | |
| Média da turma Gaming (8810 - 12600, n=99, últimos 2 anos) | |
| Asus TUF Gaming F15 FX507ZM | |
| MSI Pulse GL66 12UEK | |
| MSI Katana GF66 12UGS | |
| MSI Katana 15 B12VEK | |
| Média Intel Core i7-12650H, NVIDIA GeForce RTX 4050 Laptop GPU (n=1) | |
| PCMark 10 / Productivity | |
| Média da turma Gaming (6845 - 21327, n=97, últimos 2 anos) | |
| Lenovo Legion 5 15IAH7H 82RB | |
| MSI Katana GF66 12UGS | |
| MSI Pulse GL66 12UEK | |
| MSI Katana 15 B12VEK | |
| Média Intel Core i7-12650H, NVIDIA GeForce RTX 4050 Laptop GPU (n=1) | |
| Schenker XMG Core 15 (M22) | |
| Asus TUF Gaming F15 FX507ZM | |
| PCMark 10 / Digital Content Creation | |
| Média da turma Gaming (7602 - 19657, n=97, últimos 2 anos) | |
| Lenovo Legion 5 15IAH7H 82RB | |
| Asus TUF Gaming F15 FX507ZM | |
| MSI Katana GF66 12UGS | |
| Schenker XMG Core 15 (M22) | |
| MSI Pulse GL66 12UEK | |
| MSI Katana 15 B12VEK | |
| Média Intel Core i7-12650H, NVIDIA GeForce RTX 4050 Laptop GPU (n=1) | |
| CrossMark / Overall | |
| MSI Pulse GL66 12UEK | |
| Lenovo Legion 5 15IAH7H 82RB | |
| Média da turma Gaming (1366 - 2409, n=95, últimos 2 anos) | |
| MSI Katana GF66 12UGS | |
| MSI Katana 15 B12VEK | |
| Média Intel Core i7-12650H, NVIDIA GeForce RTX 4050 Laptop GPU (n=1) | |
| Schenker XMG Core 15 (M22) | |
| CrossMark / Productivity | |
| MSI Pulse GL66 12UEK | |
| Lenovo Legion 5 15IAH7H 82RB | |
| MSI Katana GF66 12UGS | |
| Média da turma Gaming (1386 - 2254, n=95, últimos 2 anos) | |
| MSI Katana 15 B12VEK | |
| Média Intel Core i7-12650H, NVIDIA GeForce RTX 4050 Laptop GPU (n=1) | |
| Schenker XMG Core 15 (M22) | |
| CrossMark / Creativity | |
| Média da turma Gaming (1343 - 2729, n=95, últimos 2 anos) | |
| MSI Pulse GL66 12UEK | |
| Lenovo Legion 5 15IAH7H 82RB | |
| MSI Katana GF66 12UGS | |
| MSI Katana 15 B12VEK | |
| Média Intel Core i7-12650H, NVIDIA GeForce RTX 4050 Laptop GPU (n=1) | |
| Schenker XMG Core 15 (M22) | |
| CrossMark / Responsiveness | |
| MSI Pulse GL66 12UEK | |
| Lenovo Legion 5 15IAH7H 82RB | |
| MSI Katana GF66 12UGS | |
| Média da turma Gaming (1226 - 2334, n=95, últimos 2 anos) | |
| MSI Katana 15 B12VEK | |
| Média Intel Core i7-12650H, NVIDIA GeForce RTX 4050 Laptop GPU (n=1) | |
| Schenker XMG Core 15 (M22) | |
| PCMark 10 Score | 6892 pontos | |
Ajuda | ||
| AIDA64 / Memory Copy | |
| Média da turma Gaming (21750 - 129946, n=107, últimos 2 anos) | |
| MSI Katana 15 B12VEK | |
| Asus TUF Gaming F15 FX507ZM | |
| Lenovo Legion 5 15IAH7H 82RB | |
| Média Intel Core i7-12650H (43261 - 69735, n=14) | |
| Schenker XMG Core 15 (M22) | |
| MSI Katana GF66 12UGS | |
| MSI Pulse GL66 12UEK | |
| AIDA64 / Memory Read | |
| Média da turma Gaming (22956 - 118858, n=107, últimos 2 anos) | |
| MSI Katana 15 B12VEK | |
| Lenovo Legion 5 15IAH7H 82RB | |
| Asus TUF Gaming F15 FX507ZM | |
| Média Intel Core i7-12650H (47313 - 67412, n=14) | |
| Schenker XMG Core 15 (M22) | |
| MSI Pulse GL66 12UEK | |
| MSI Katana GF66 12UGS | |
| AIDA64 / Memory Write | |
| Média da turma Gaming (22297 - 135096, n=107, últimos 2 anos) | |
| Lenovo Legion 5 15IAH7H 82RB | |
| Asus TUF Gaming F15 FX507ZM | |
| MSI Katana 15 B12VEK | |
| Schenker XMG Core 15 (M22) | |
| Média Intel Core i7-12650H (45617 - 59361, n=14) | |
| MSI Katana GF66 12UGS | |
| MSI Pulse GL66 12UEK | |
| AIDA64 / Memory Latency | |
| Média da turma Gaming (75.3 - 259, n=107, últimos 2 anos) | |
| Lenovo Legion 5 15IAH7H 82RB | |
| MSI Katana GF66 12UGS | |
| MSI Katana 15 B12VEK | |
| MSI Pulse GL66 12UEK | |
| Schenker XMG Core 15 (M22) | |
| Média Intel Core i7-12650H (71.6 - 103.9, n=14) | |
| Asus TUF Gaming F15 FX507ZM | |
* ... menor é melhor
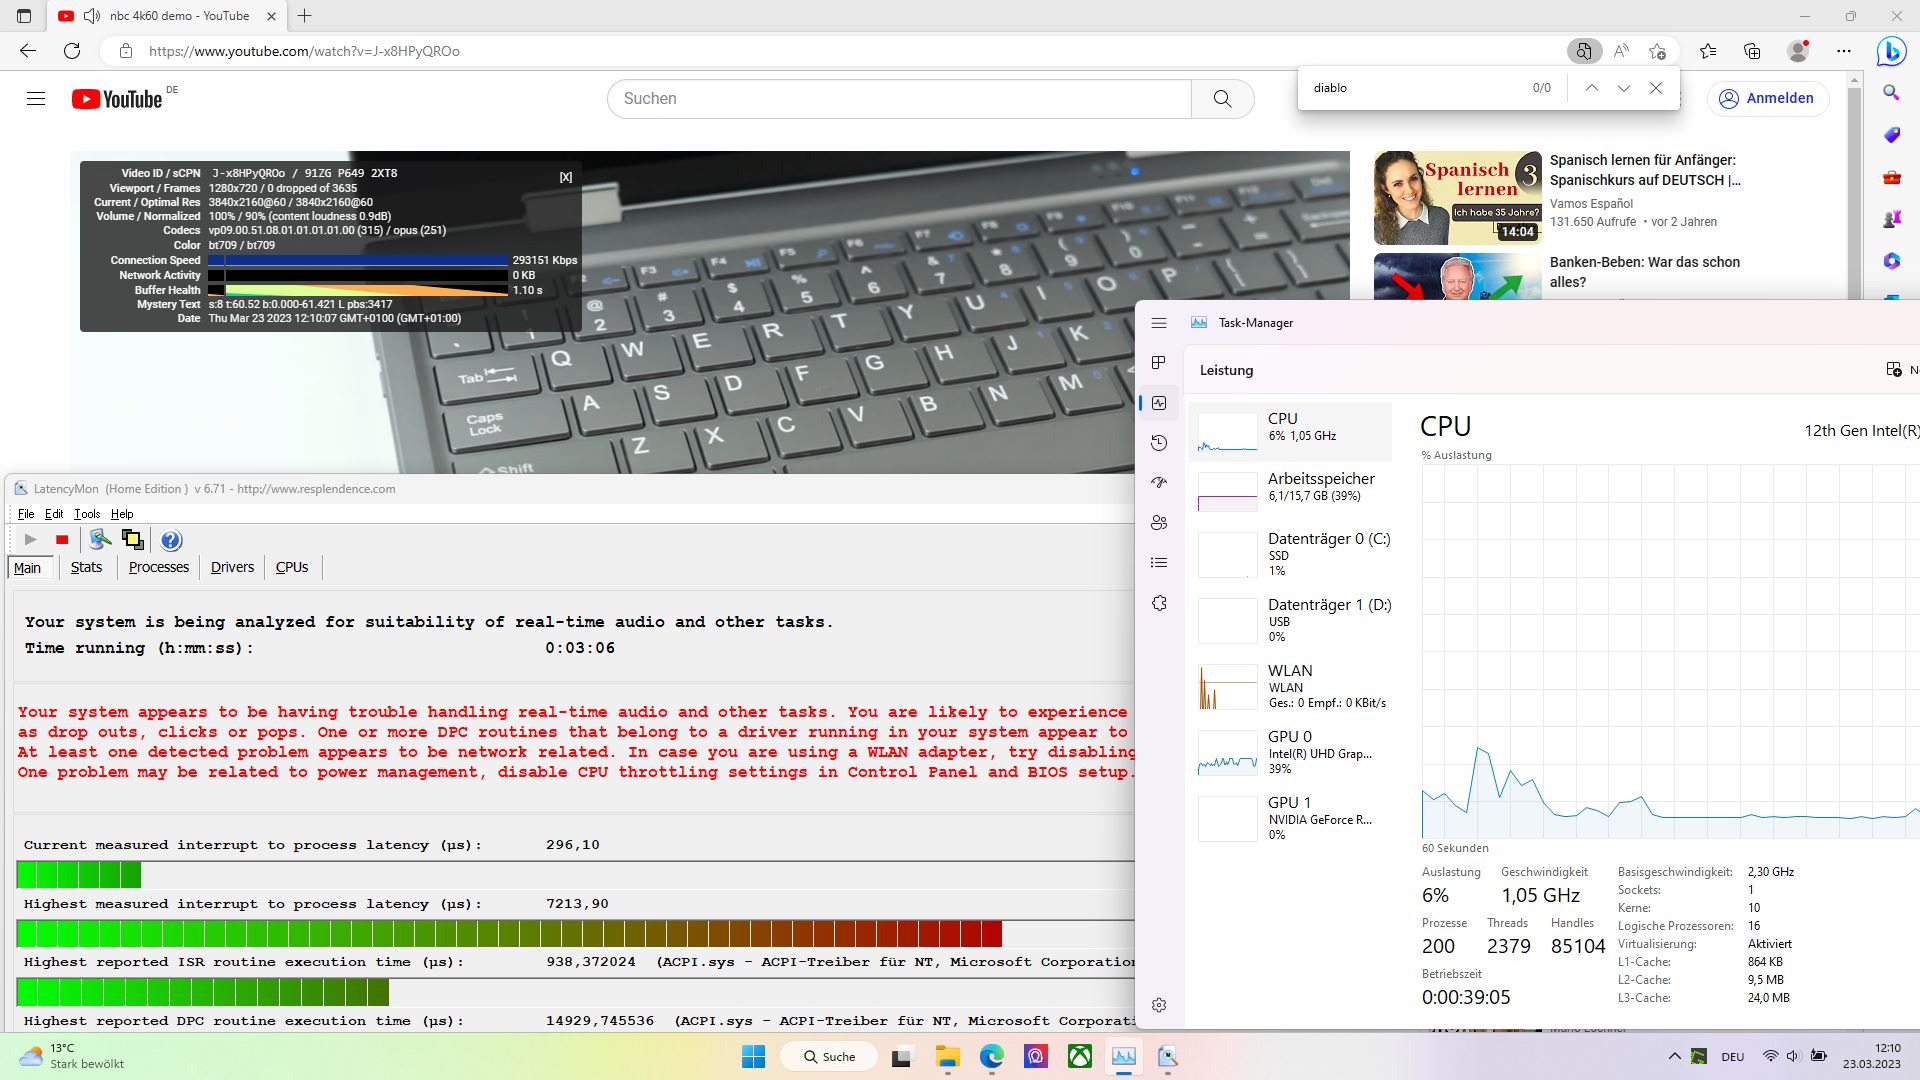
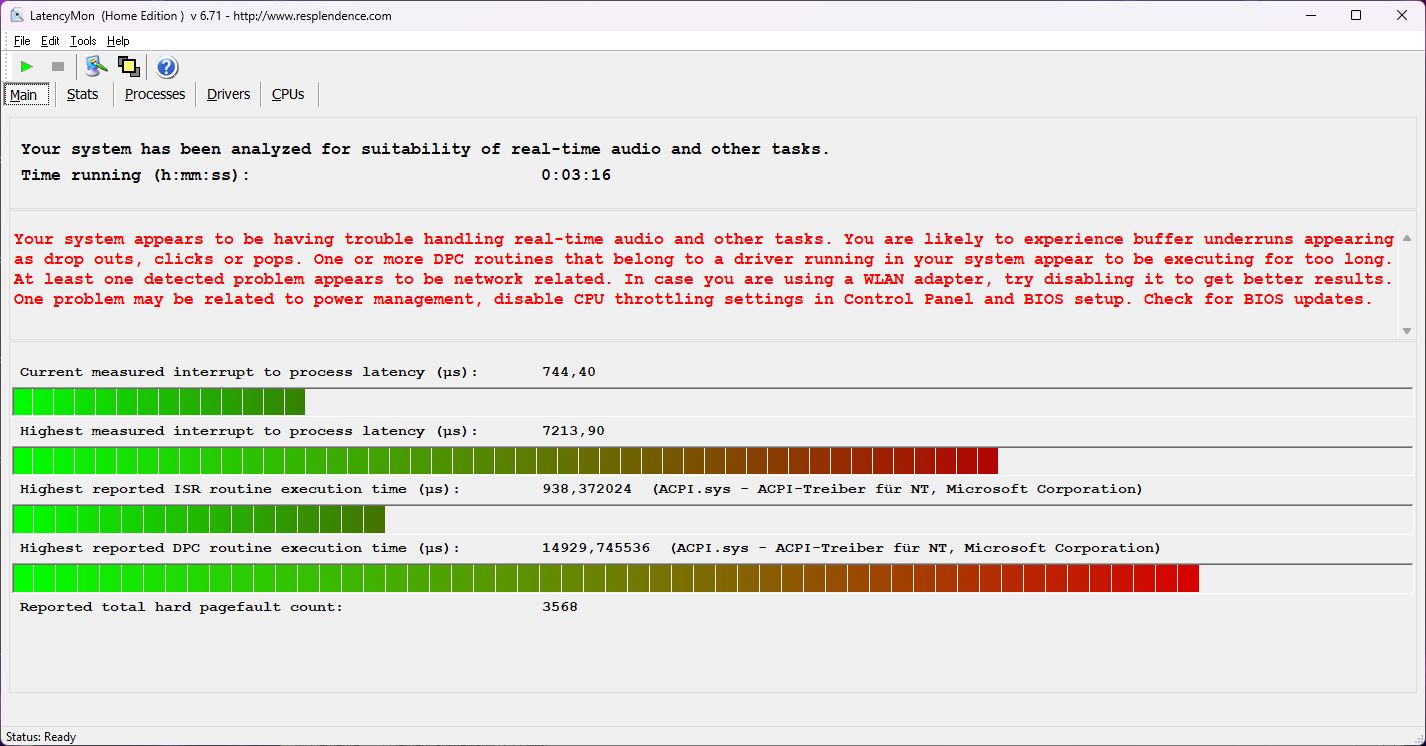
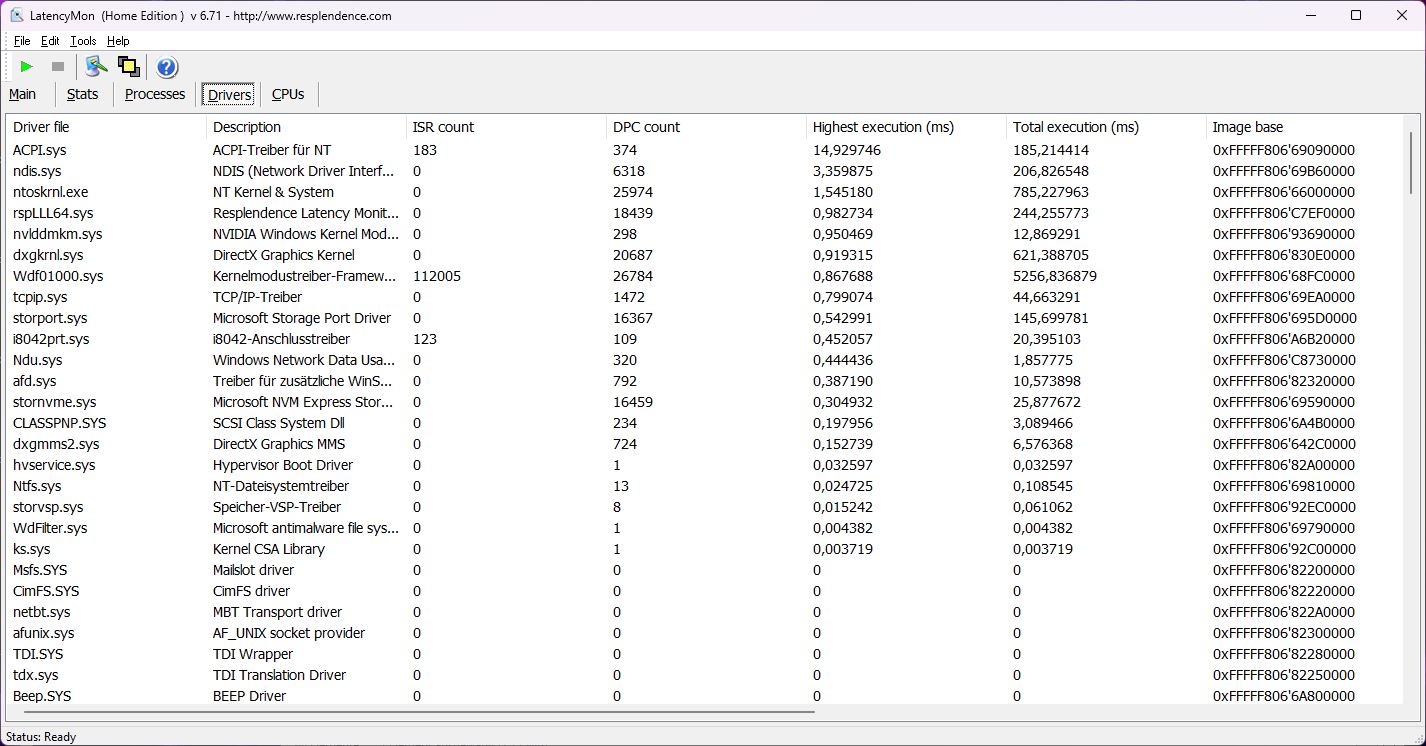
Latência do DPC
Atualmente, os drivers Nvidia para notebooks com um cartão RTX 40xx ainda têm latências muito altas sob LatencyMon e nossa Katana não é exceção. As primeiras latências ocorrem imediatamente após o início da ferramenta. A abertura de várias abas do navegador e a reprodução de nosso vídeo de 4K/60 fps no YouTube aumenta acentuadamente o valor. Mas não houve saltos de quadros.
| DPC Latencies / LatencyMon - interrupt to process latency (max), Web, Youtube, Prime95 | |
| MSI Katana 15 B12VEK | |
| Schenker XMG Core 15 (M22) | |
| MSI Pulse GL66 12UEK | |
| Lenovo Legion 5 15IAH7H 82RB | |
| Asus TUF Gaming F15 FX507ZM | |
| MSI Katana GF66 12UGS | |
* ... menor é melhor
Dispositivos de armazenamento
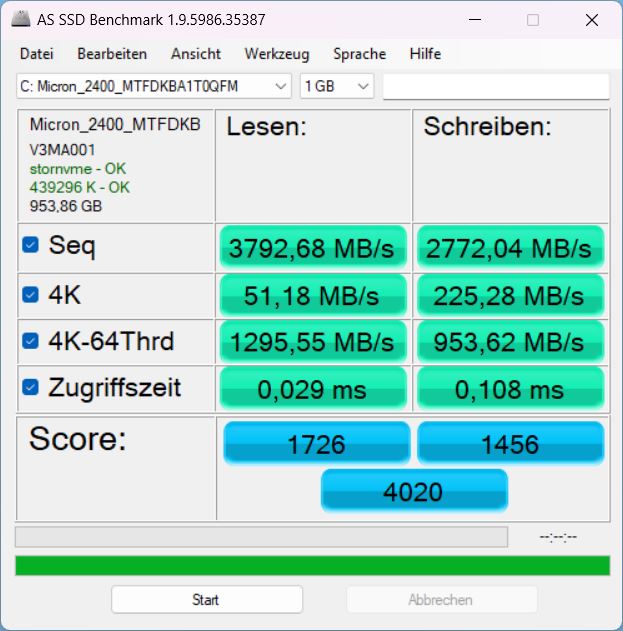
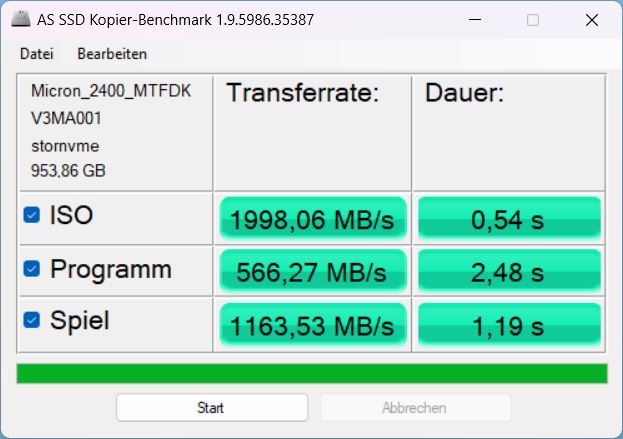
Um SSD 1 TB PCIe 4.0 x4 NVMe da Micron serve como o principal dispositivo de armazenamento. Na Katana, ele não explora plenamente seu potencial de desempenho e fica bem atrás dos modelos Micron 2450 noKatana GF66 ou o Pulso GL66.
Pelo menos seu desempenho é relativamente constante, só diminuindo minimamente após longos períodos de tempo. Você pode encontrar mais informações sobre o modelo em nosso Lista de bestsellers de SSD.

* ... menor é melhor
Sustained Read Performance: DiskSpd Read Loop, Queue Depth 8
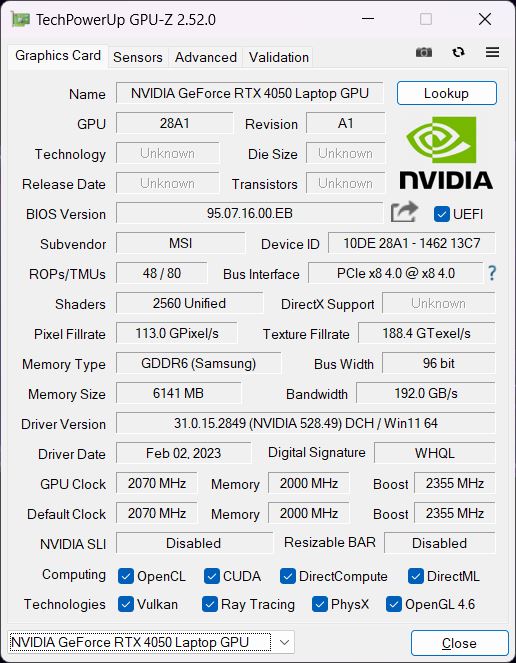
Placa Gráfica
O Nvidia Geforce RTX 4050é o cartão de entrada da nova geração RTX 40xx. Seu desempenho deve estar aproximadamente no mesmo nível de uma geração mais antiga RTX 3060dependendo do TGP selecionado (aqui 105 W), embora atual os padrões de referência sugerem que o cartão dificilmente se beneficia de mais de 100 W.
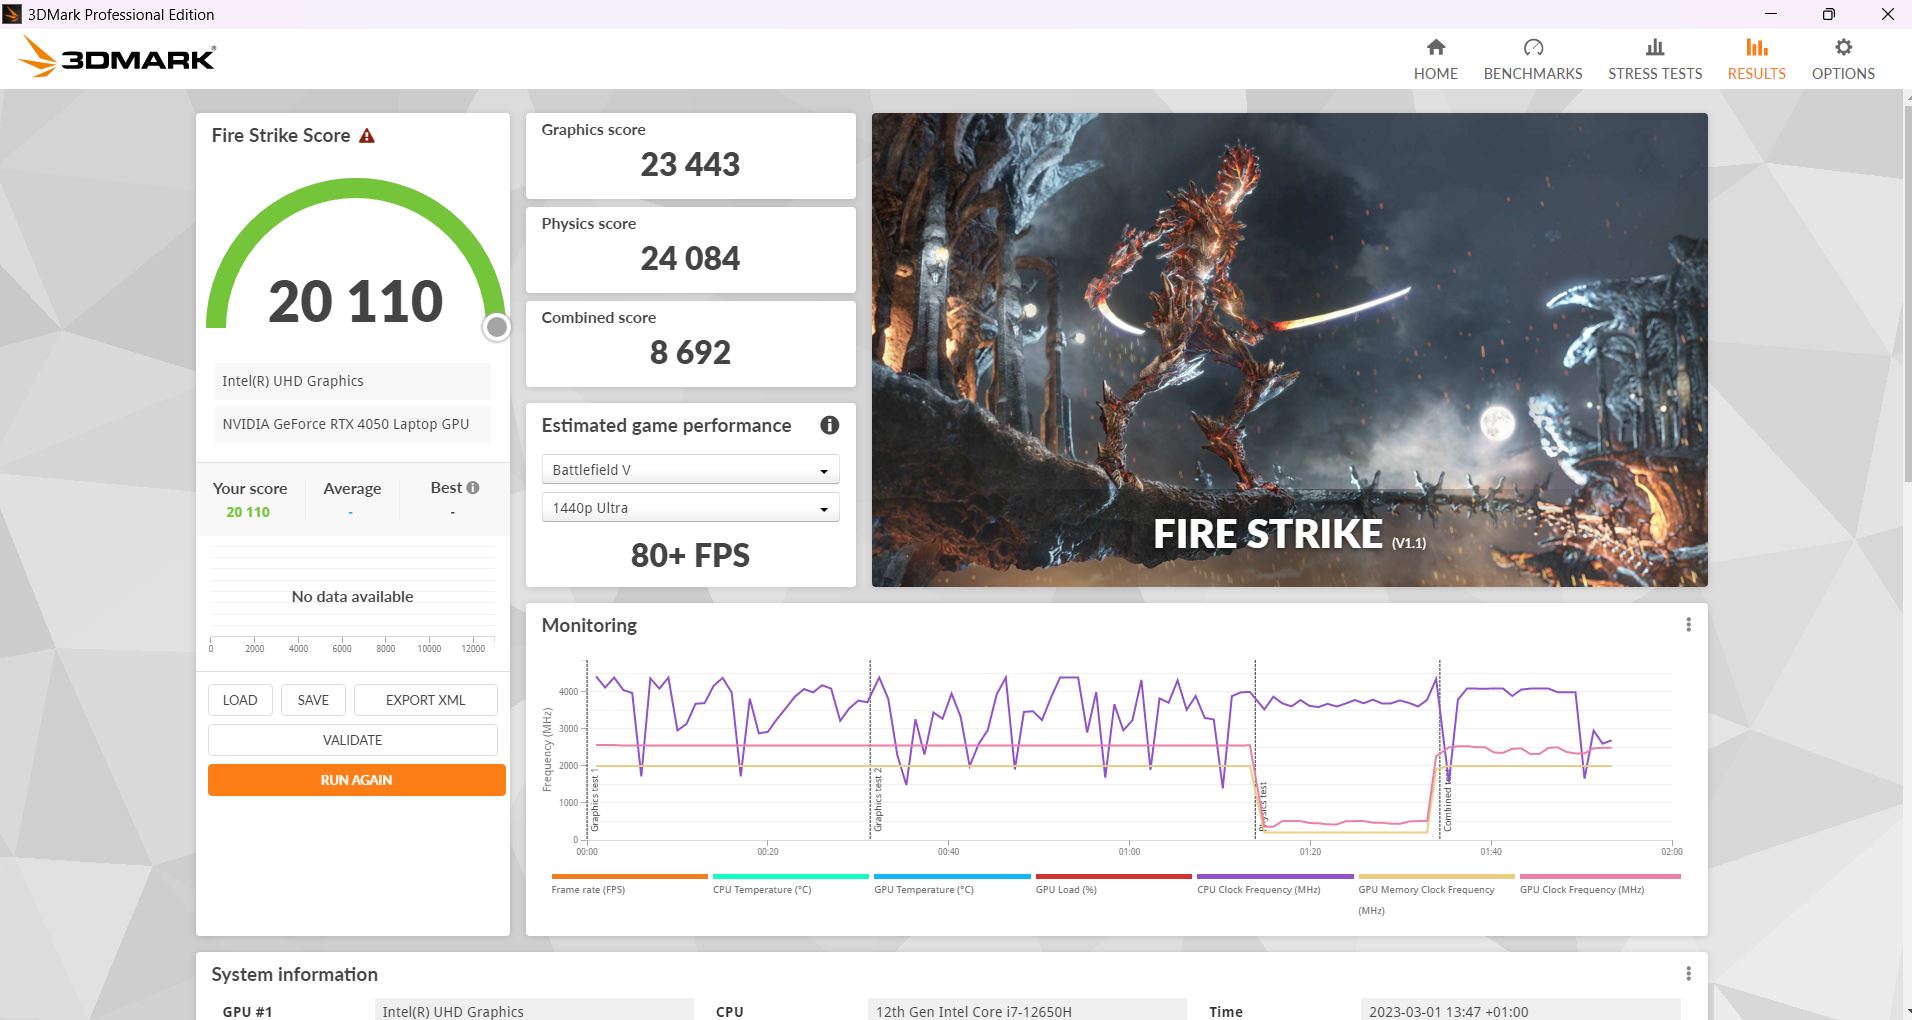
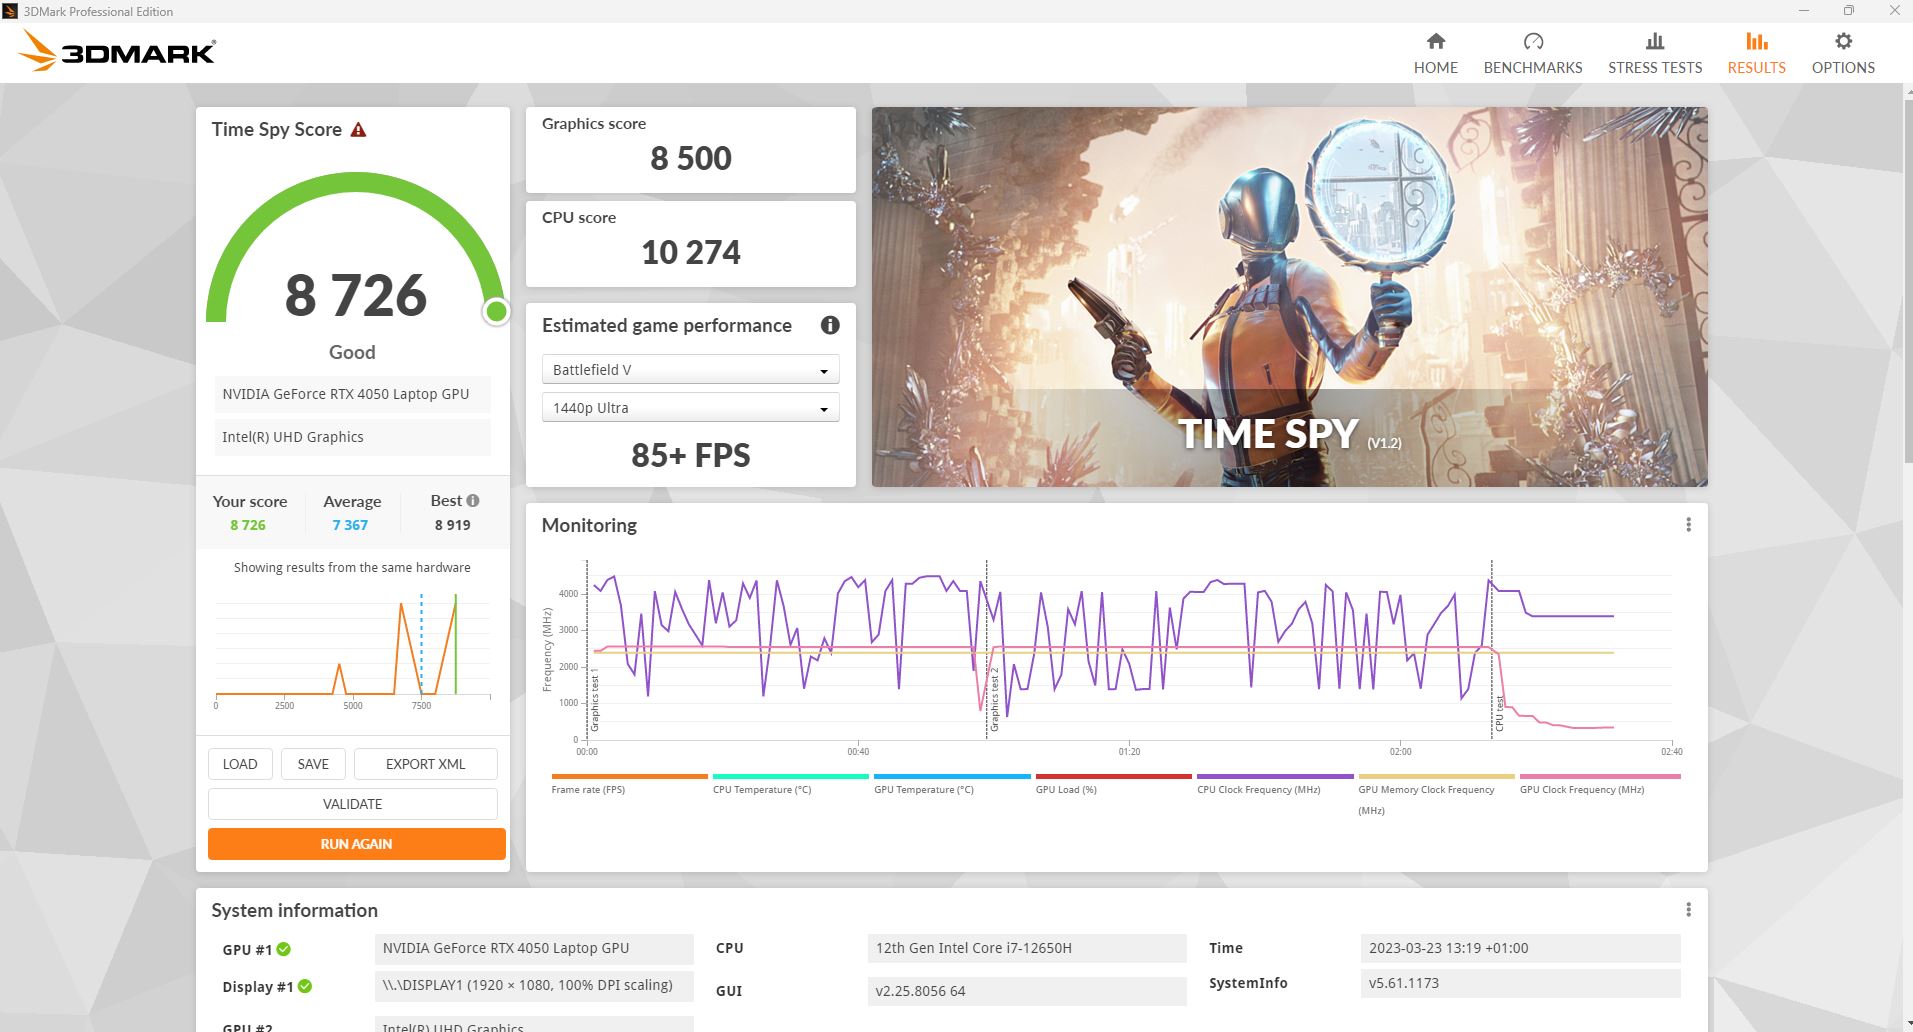
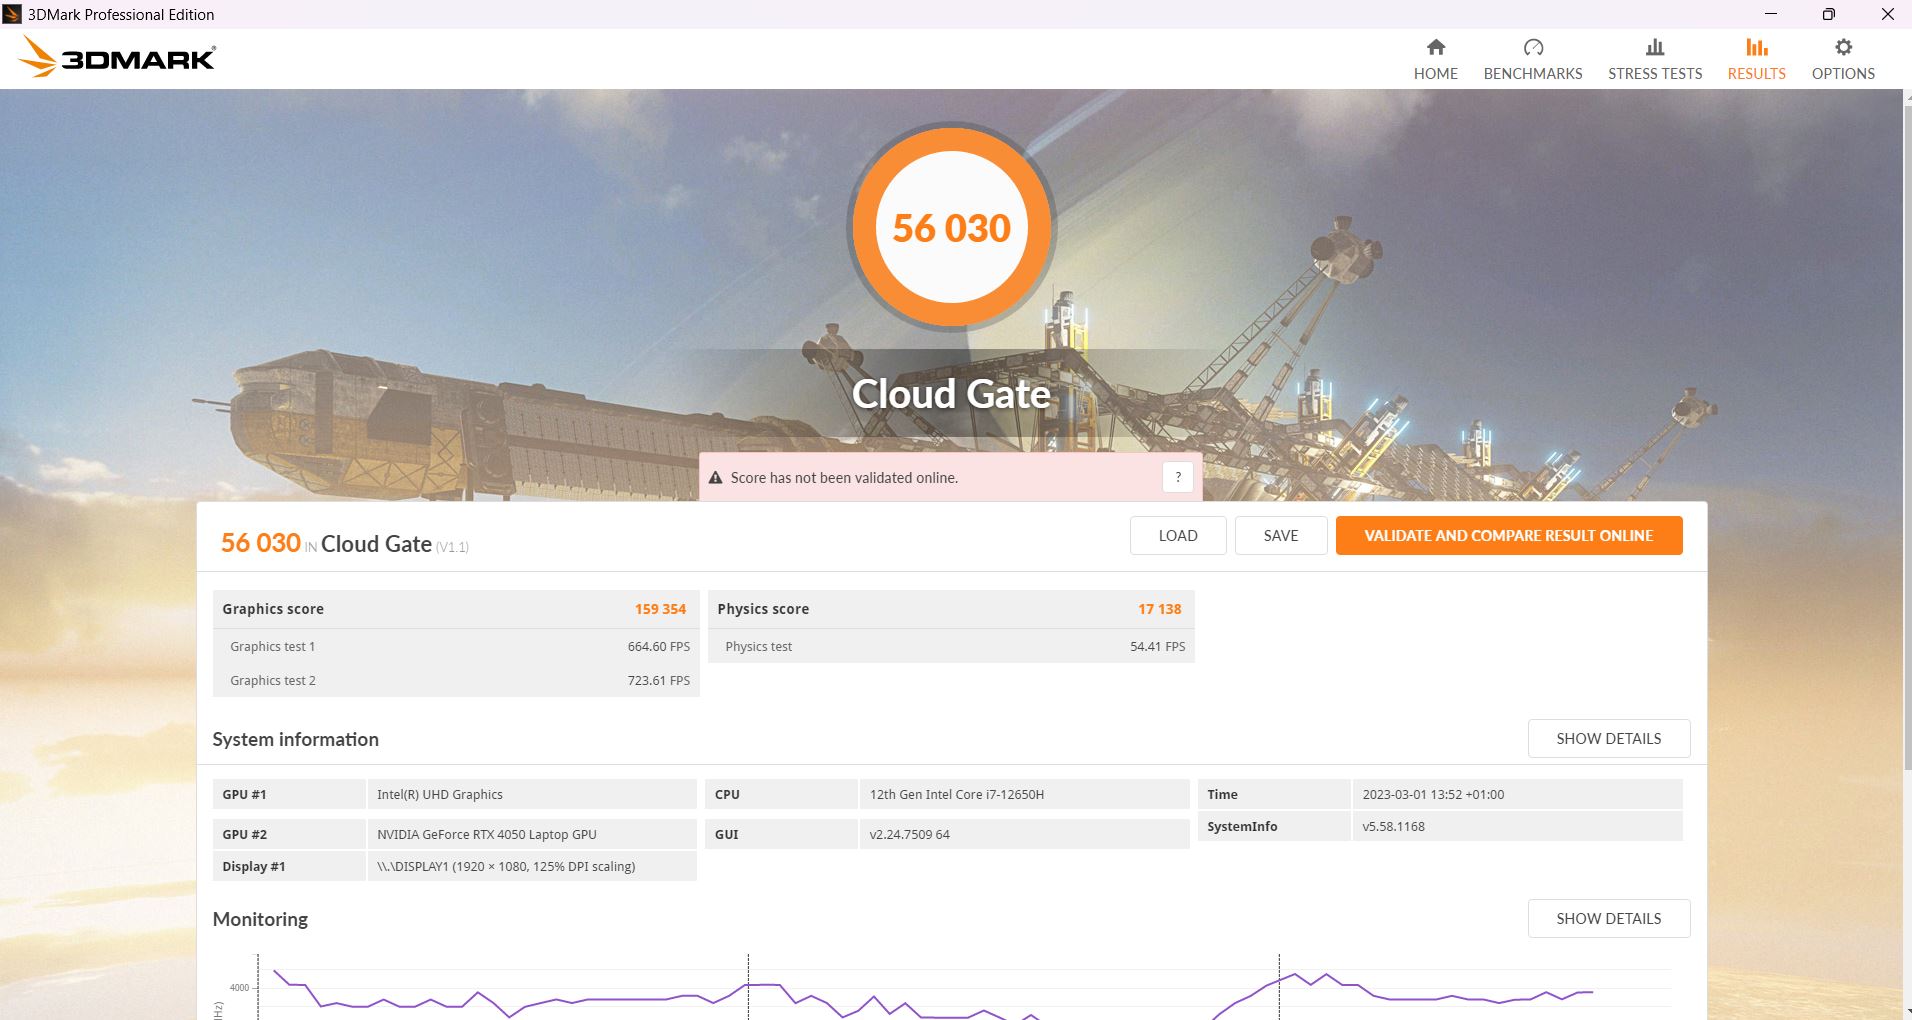
Nos 3DMarks sintéticos, a GPU tem um desempenho praticamente no nível esperado e está um pouco à frente da concorrência do ano passado com o RTX 3060. OKatana GF66 com o RTX 3070 Tiestá apenas cerca de 10 por cento à frente.
Longe do soquete, é claro, o desempenho sofre. Em outro Fire Strike rodam em modo de bateria, os Katana só alcançaram 14.446 pontos gráficos em vez dos 23.443 pontos quando plugados.
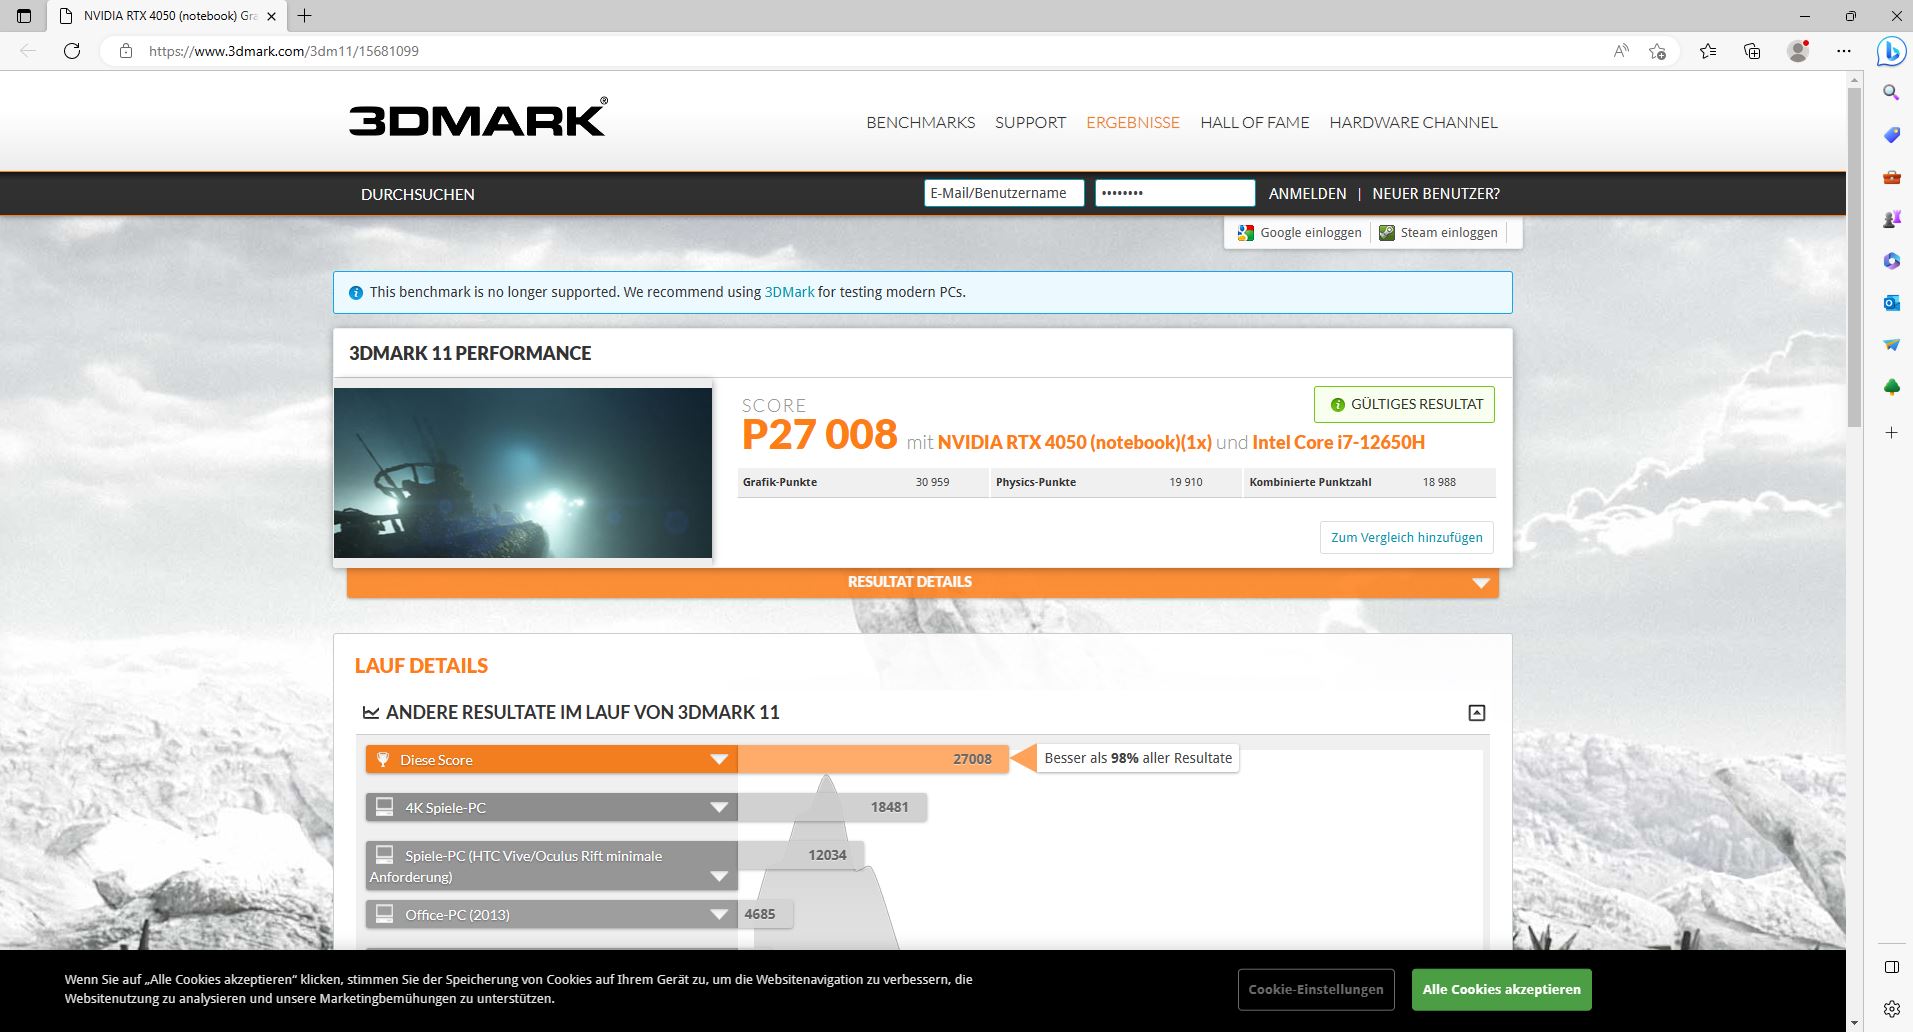
| 3DMark 11 Performance | 27008 pontos | |
| 3DMark Cloud Gate Standard Score | 56030 pontos | |
| 3DMark Fire Strike Score | 20110 pontos | |
| 3DMark Time Spy Score | 8726 pontos | |
Ajuda | ||
* ... menor é melhor
Desempenho nos jogos
Nos padrões de jogo, o Katana 15 tende a assumir uma posição mais baixa em comparação com a concorrência direta. Somente oXMG Core 15 com seu RTX 3060é ligeiramente mais lento, enquanto o Pulso GL66 com um RTX 3060 é mais ou menos tão rápido. O é o mais rápido Legion 5 em particular, também com um RTX 3060, é visivelmente mais rápido.
Em Far Cry 5, por outro lado, a Katana está até ligeiramente à frente da concorrência. Portanto, também depende muito do jogo que se joga.
| Performance rating - Percent | |
| Média da turma Gaming | |
| Lenovo Legion 5 15IAH7H 82RB | |
| MSI Pulse GL66 12UEK -3! | |
| Asus TUF Gaming F15 FX507ZM | |
| MSI Katana GF66 12UGS | |
| MSI Katana 15 B12VEK | |
| Schenker XMG Core 15 (M22) | |
| The Witcher 3 - 1920x1080 Ultra Graphics & Postprocessing (HBAO+) | |
| Média da turma Gaming (95 - 240, n=8, últimos 2 anos) | |
| MSI Katana GF66 12UGS | |
| Asus TUF Gaming F15 FX507ZM | |
| Lenovo Legion 5 15IAH7H 82RB | |
| MSI Katana 15 B12VEK | |
| Schenker XMG Core 15 (M22) | |
| MSI Pulse GL66 12UEK | |
| GTA V - 1920x1080 Highest AA:4xMSAA + FX AF:16x | |
| Média da turma Gaming (48.3 - 186.9, n=98, últimos 2 anos) | |
| Lenovo Legion 5 15IAH7H 82RB | |
| MSI Katana GF66 12UGS | |
| Asus TUF Gaming F15 FX507ZM | |
| Schenker XMG Core 15 (M22) | |
| MSI Katana 15 B12VEK | |
| Final Fantasy XV Benchmark - 1920x1080 High Quality | |
| Média da turma Gaming (41 - 215, n=99, últimos 2 anos) | |
| Lenovo Legion 5 15IAH7H 82RB | |
| Asus TUF Gaming F15 FX507ZM | |
| Schenker XMG Core 15 (M22) | |
| MSI Katana GF66 12UGS | |
| MSI Katana 15 B12VEK | |
| Strange Brigade - 1920x1080 ultra AA:ultra AF:16 | |
| Média da turma Gaming (76.3 - 456, n=89, últimos 2 anos) | |
| MSI Katana GF66 12UGS | |
| Lenovo Legion 5 15IAH7H 82RB | |
| Asus TUF Gaming F15 FX507ZM | |
| Schenker XMG Core 15 (M22) | |
| MSI Katana 15 B12VEK | |
| Dota 2 Reborn - 1920x1080 ultra (3/3) best looking | |
| Lenovo Legion 5 15IAH7H 82RB | |
| Média da turma Gaming (84.8 - 248, n=110, últimos 2 anos) | |
| Asus TUF Gaming F15 FX507ZM | |
| MSI Pulse GL66 12UEK | |
| MSI Katana 15 B12VEK | |
| MSI Katana GF66 12UGS | |
| Schenker XMG Core 15 (M22) | |
Um interruptor MUX está disponível, o que lhe permite escolher entre o iGPU ou o dGPU no MSI Center, o que sempre envolve um reinício.
A taxa de quadros Witcher 3 permanece estável dentro das flutuações habituais (ciclo dia/noite no jogo). Mas os laptops concorrentes são freqüentemente um pouco mais rápidos, mesmo aqueles com o RTX 3060.
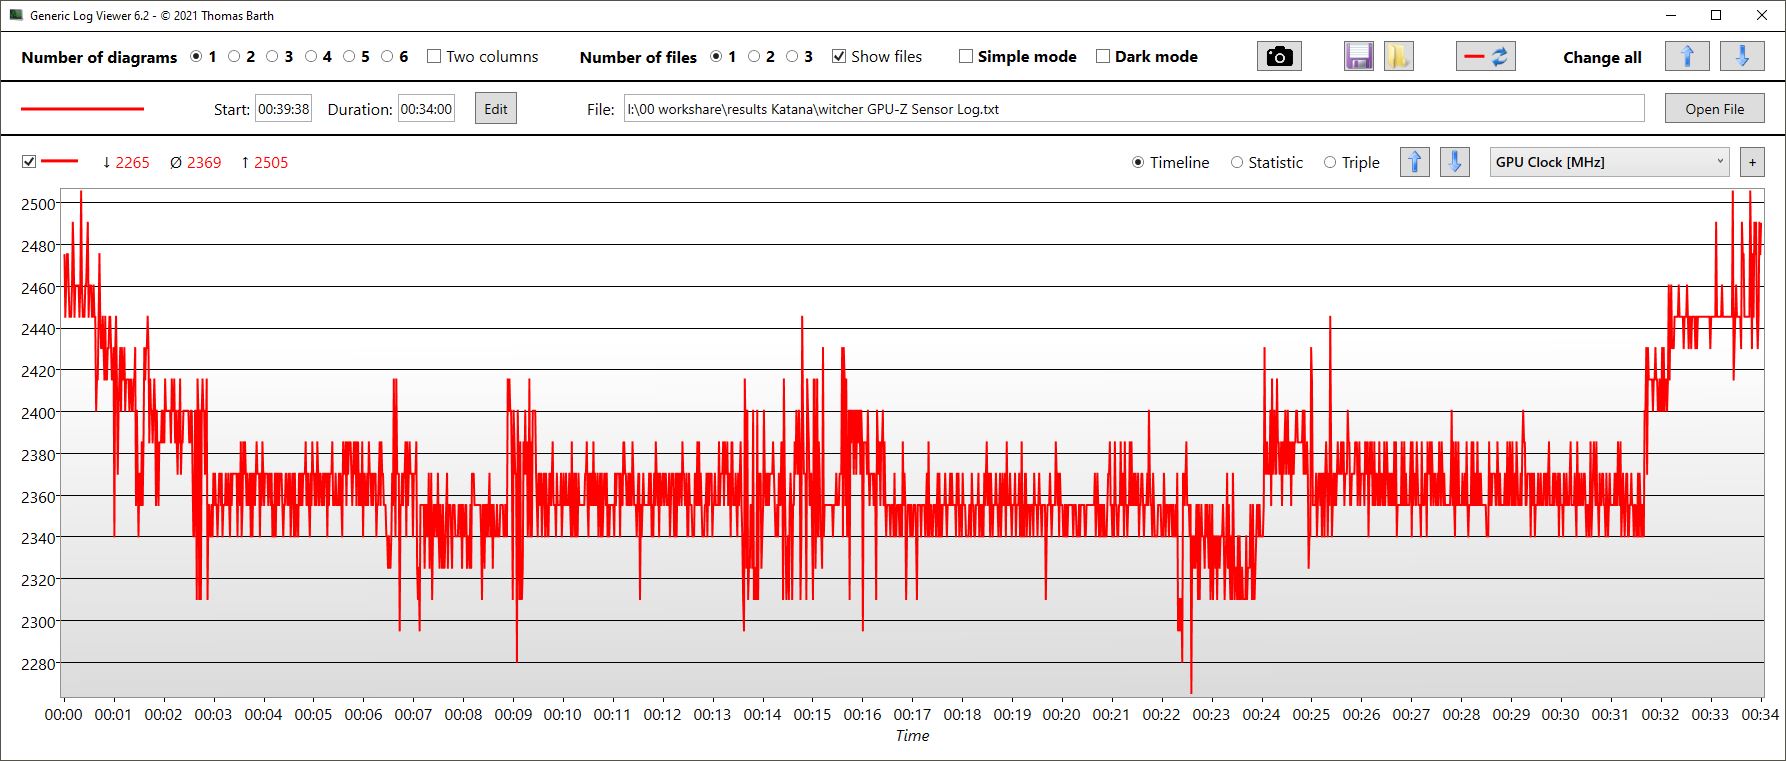
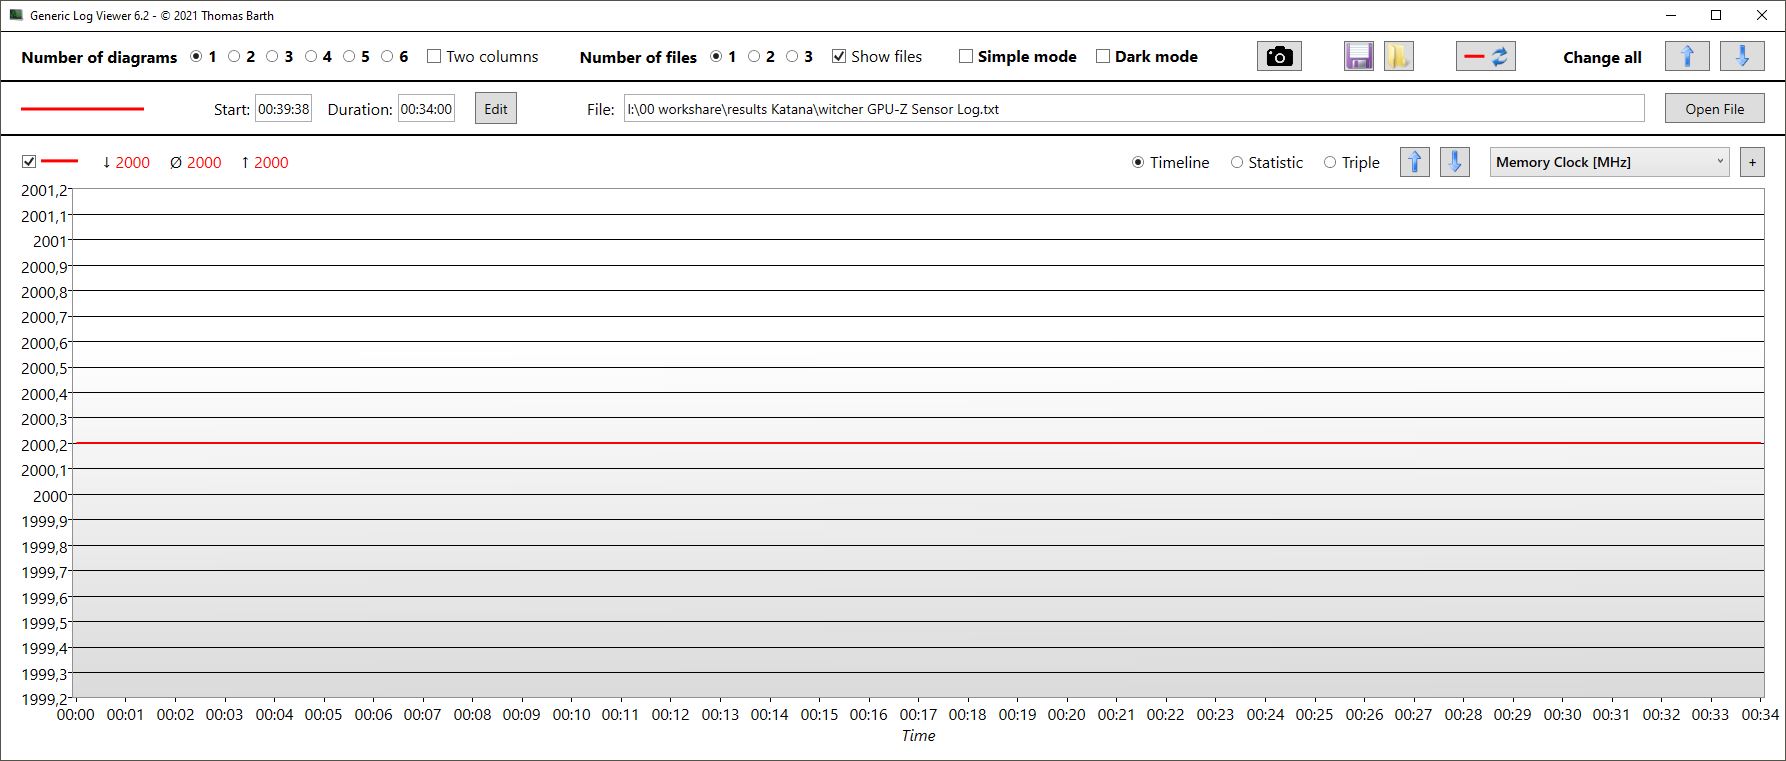
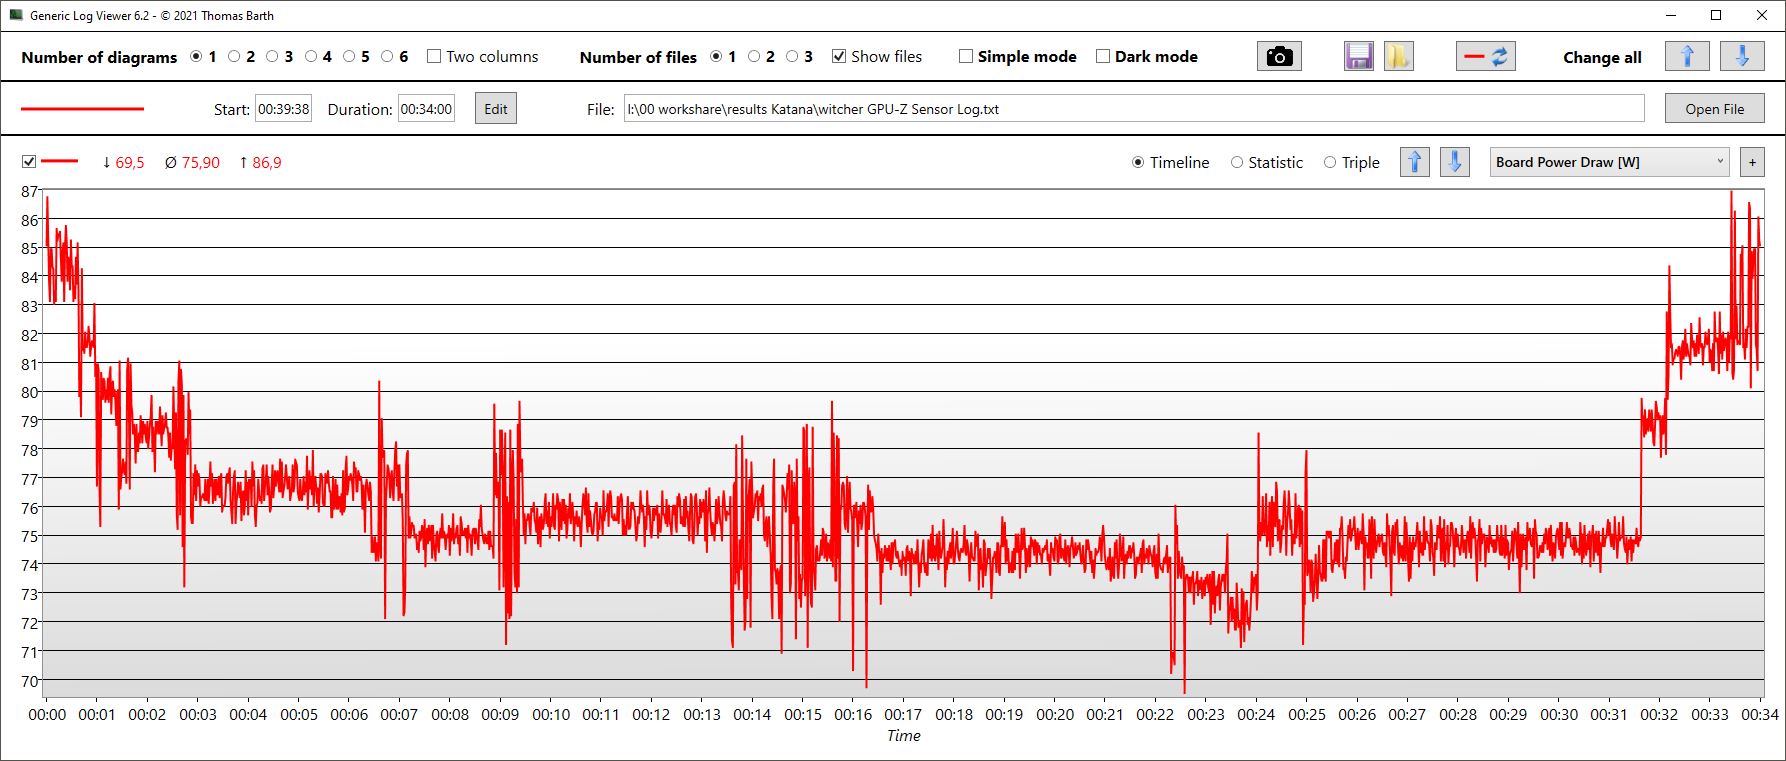
A taxa de clock da GPU é bastante estável em 2,4 GHz, e o relógio de memória também é constante em 2 GHz. As temperaturas da GPU não excedem 76 °C e a média gira em torno de 75 °C. O consumo de energia de 76 W, em média, está longe dos 105 W especificados.
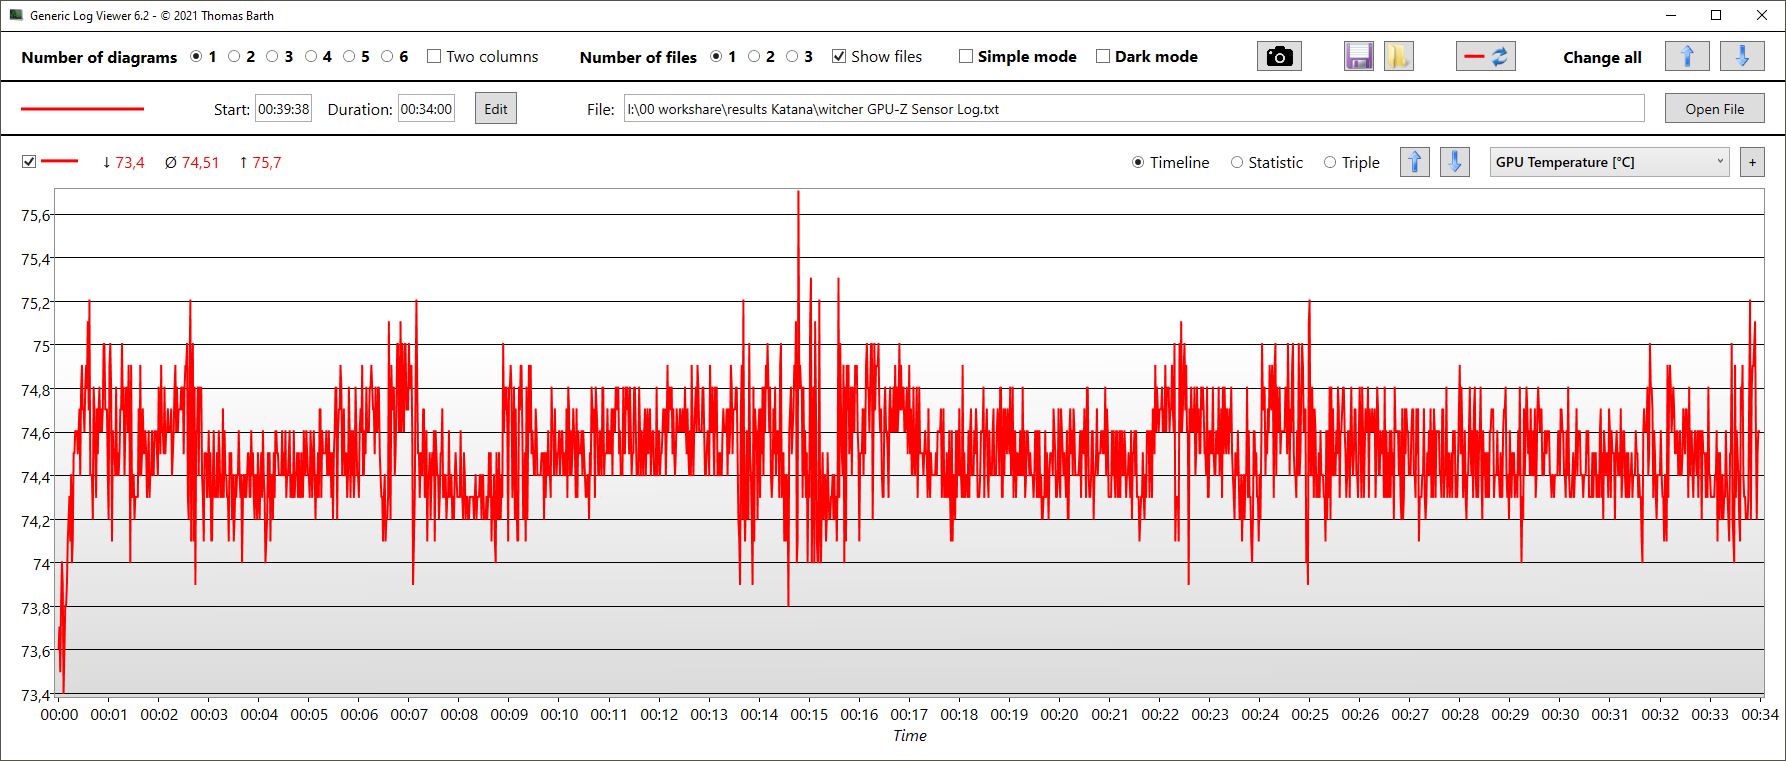
Witcher 3 FPS Chart
| baixo | média | alto | ultra | |
|---|---|---|---|---|
| GTA V (2015) | 183.5 | 176.6 | 172.7 | 92.2 |
| The Witcher 3 (2015) | 395 | 293 | 161 | 83 |
| Dota 2 Reborn (2015) | 175.1 | 158.1 | 150.5 | 142.5 |
| Final Fantasy XV Benchmark (2018) | 188 | 120.7 | 82.8 | |
| X-Plane 11.11 (2018) | 139.9 | 122.4 | 97 | |
| Far Cry 5 (2018) | 170 | 135 | 126 | 119 |
| Strange Brigade (2018) | 214 | 173 | 148.7 | |
| Dying Light 2 (2022) | 122.1 | 75.2 | 62.4 |
Emissões - Na tranqüilidade está o poder da espada
Ruído
Quando ociosos na área de trabalho, os ventiladores são em sua maioria silenciosos, mesmo no modo Extreme Performance, o que é incomum. E mesmo no 3DMark06, os ventiladores começam a funcionar relativamente tarde e atingem apenas 37,7 dB no final do primeiro cenário de referência. Somente os Legion 5é mais silencioso, o Asus TUF Gaming é igualmente silenciosa, enquanto os modelos irmãos e o Núcleo XMG são mais barulhentos.
O desenvolvimento de ruído moderado também é evidente nos jogos (modo AI), e o Katana só se torna barulhento durante o estresse combinado CPU/GPU.
Barulho
| Ocioso |
| 24 / 24 / 24 dB |
| Carga |
| 37.71 / 54.55 dB |
 | ||
30 dB silencioso 40 dB(A) audível 50 dB(A) ruidosamente alto |
||
min: | ||
| MSI Katana 15 B12VEK GeForce RTX 4050 Laptop GPU, i7-12650H, Micron 2400 MTFDKBA1T0QFM | MSI Katana GF66 12UGS GeForce RTX 3070 Ti Laptop GPU, i7-12700H, Micron 2450 1TB MTFDKBA1T0TFK | MSI Pulse GL66 12UEK GeForce RTX 3060 Laptop GPU, i9-12900H, Micron 2450 512GB MTFDKBA512TFK | Lenovo Legion 5 15IAH7H 82RB GeForce RTX 3060 Laptop GPU, i7-12700H | Asus TUF Gaming F15 FX507ZM GeForce RTX 3060 Laptop GPU, i7-12700H, SK Hynix HFM001TD3JX013N | Schenker XMG Core 15 (M22) GeForce RTX 3060 Laptop GPU, R7 6800H, Samsung SSD 980 Pro 1TB MZ-V8P1T0BW | |
|---|---|---|---|---|---|---|
| Noise | -9% | -11% | 1% | -3% | -2% | |
| desligado / ambiente * (dB) | 24 | 26 -8% | 23 4% | 23.3 3% | 23.2 3% | 23 4% |
| Idle Minimum * (dB) | 24 | 27 -13% | 23 4% | 23.5 2% | 23.6 2% | 23 4% |
| Idle Average * (dB) | 24 | 28 -17% | 27 -13% | 23.5 2% | 23.6 2% | 23 4% |
| Idle Maximum * (dB) | 24 | 31 -29% | 27 -13% | 26.8 -12% | 25.4 -6% | 23 4% |
| Load Average * (dB) | 37.71 | 44 -17% | 48.2 -28% | 29.3 22% | 38 -1% | 42.41 -12% |
| Witcher 3 ultra * (dB) | 45.75 | 44 4% | 56.9 -24% | 51.4 -12% | 54.1 -18% | 54.71 -20% |
| Load Maximum * (dB) | 54.55 | 45 18% | 56.94 -4% | 53 3% | 57.2 -5% | 55.05 -1% |
* ... menor é melhor
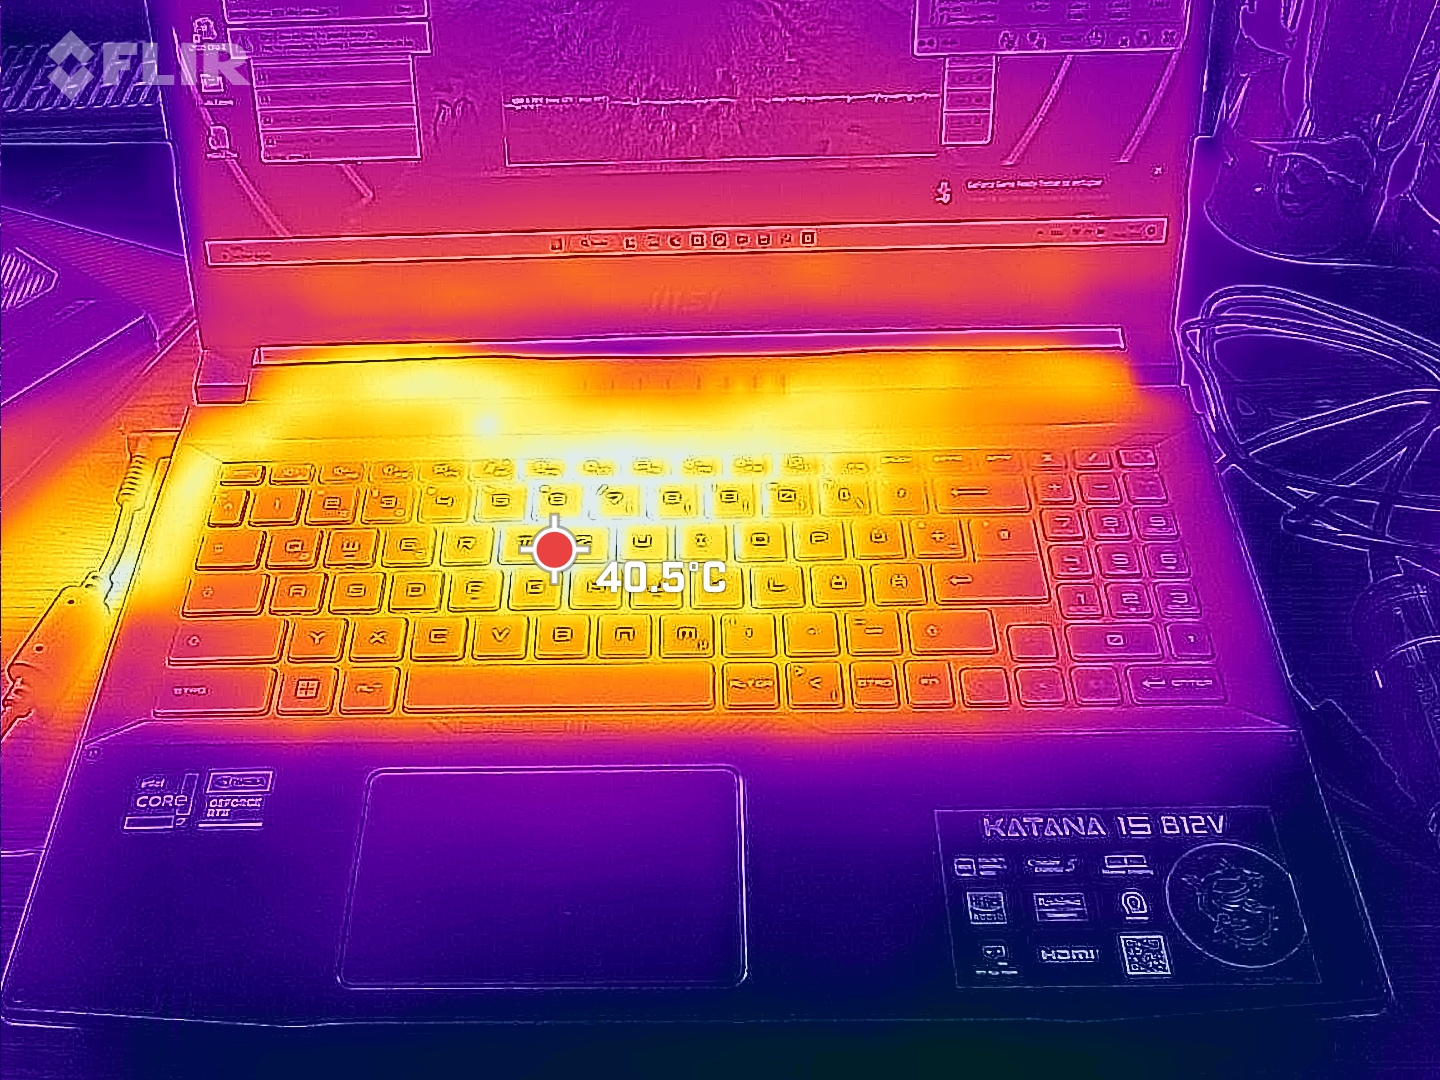
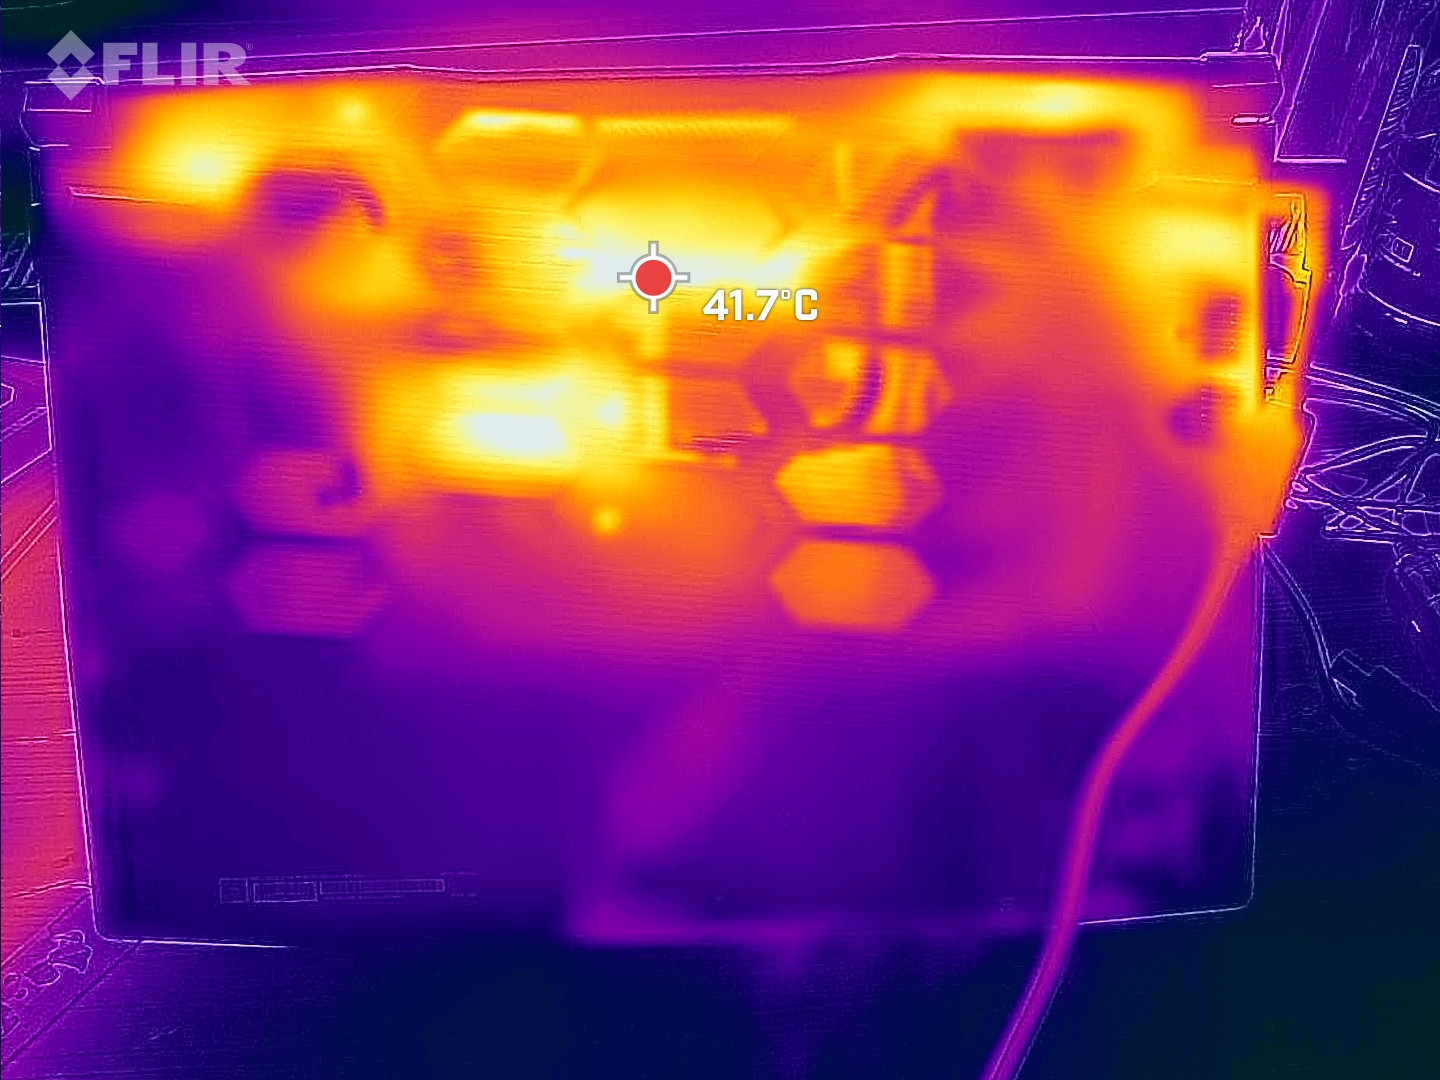
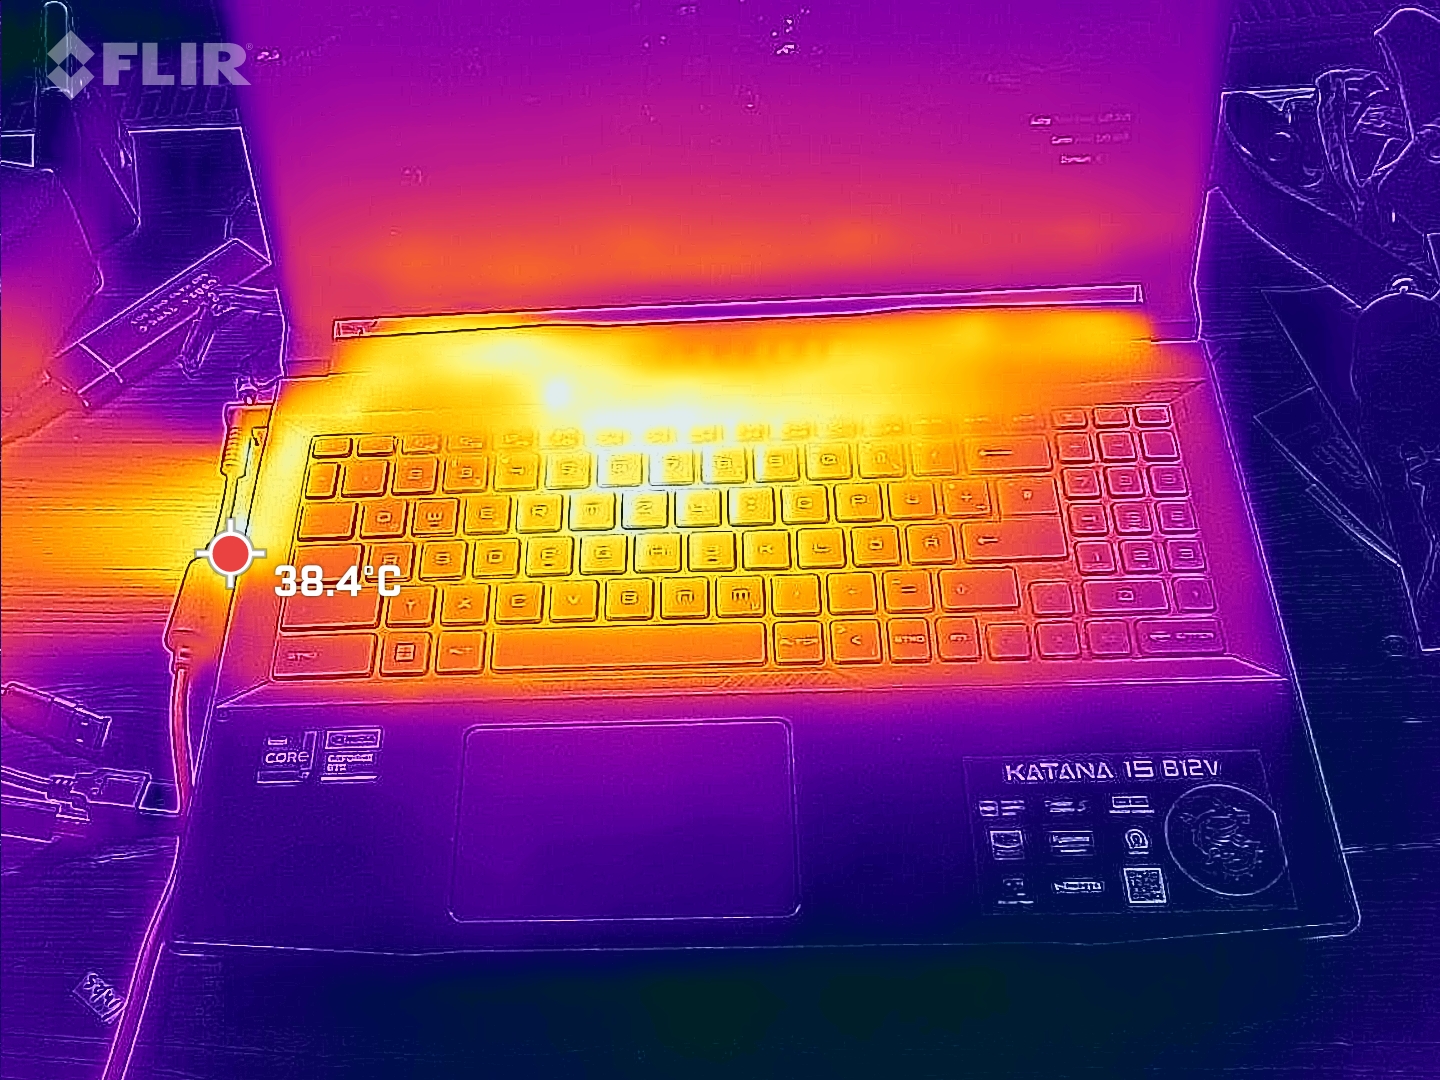
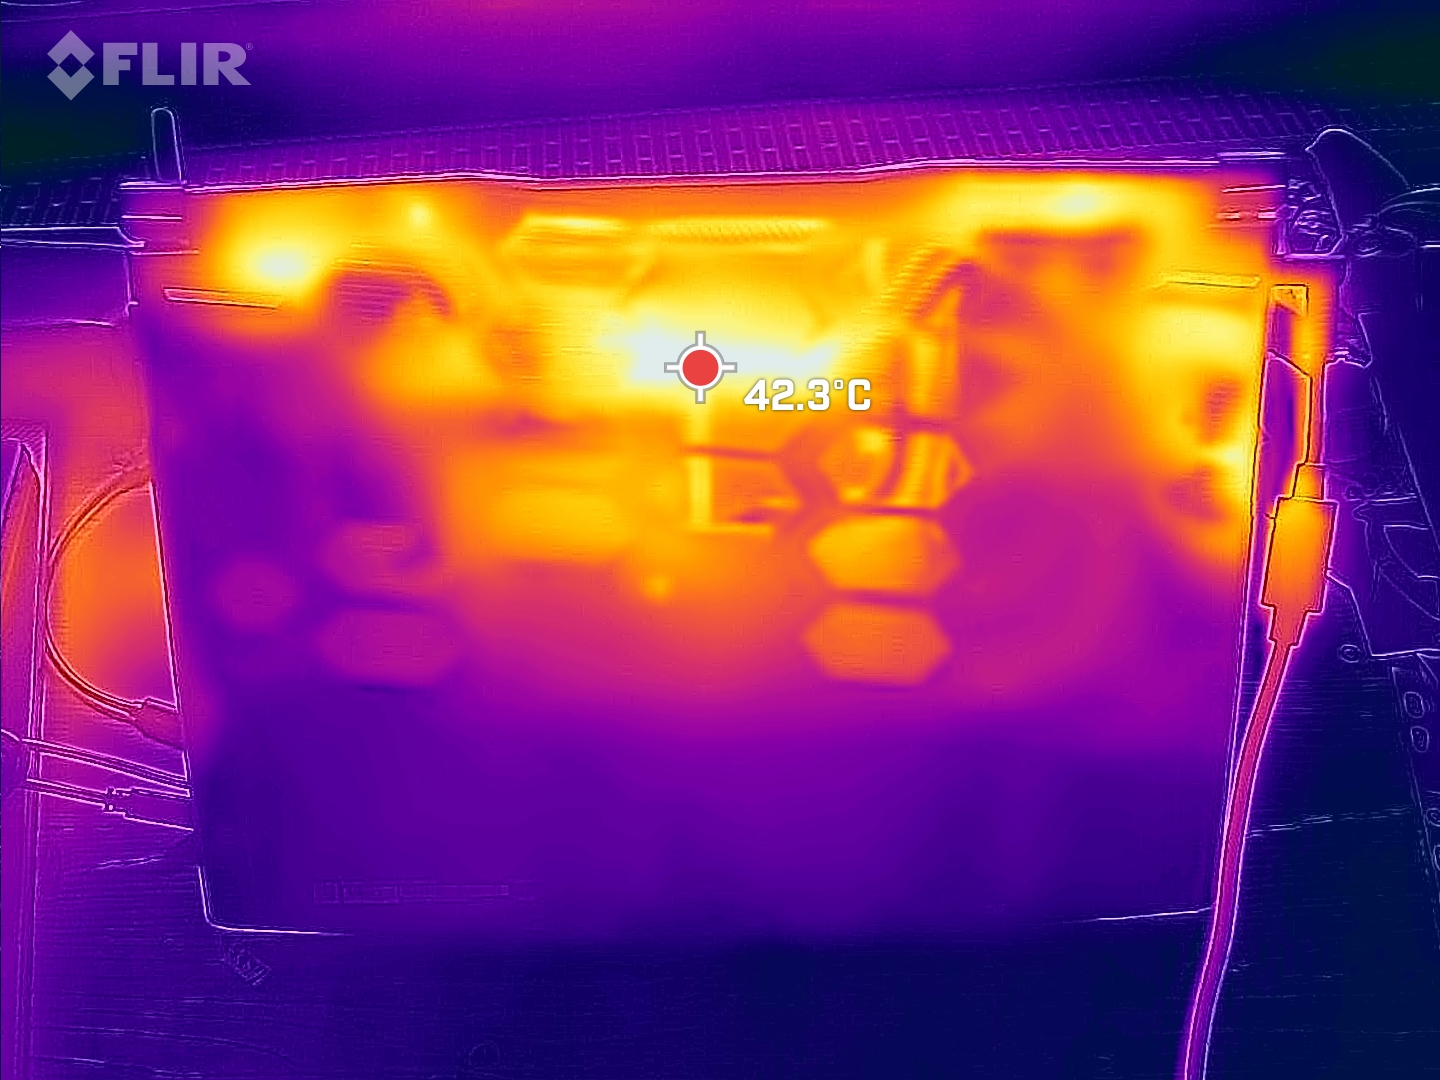
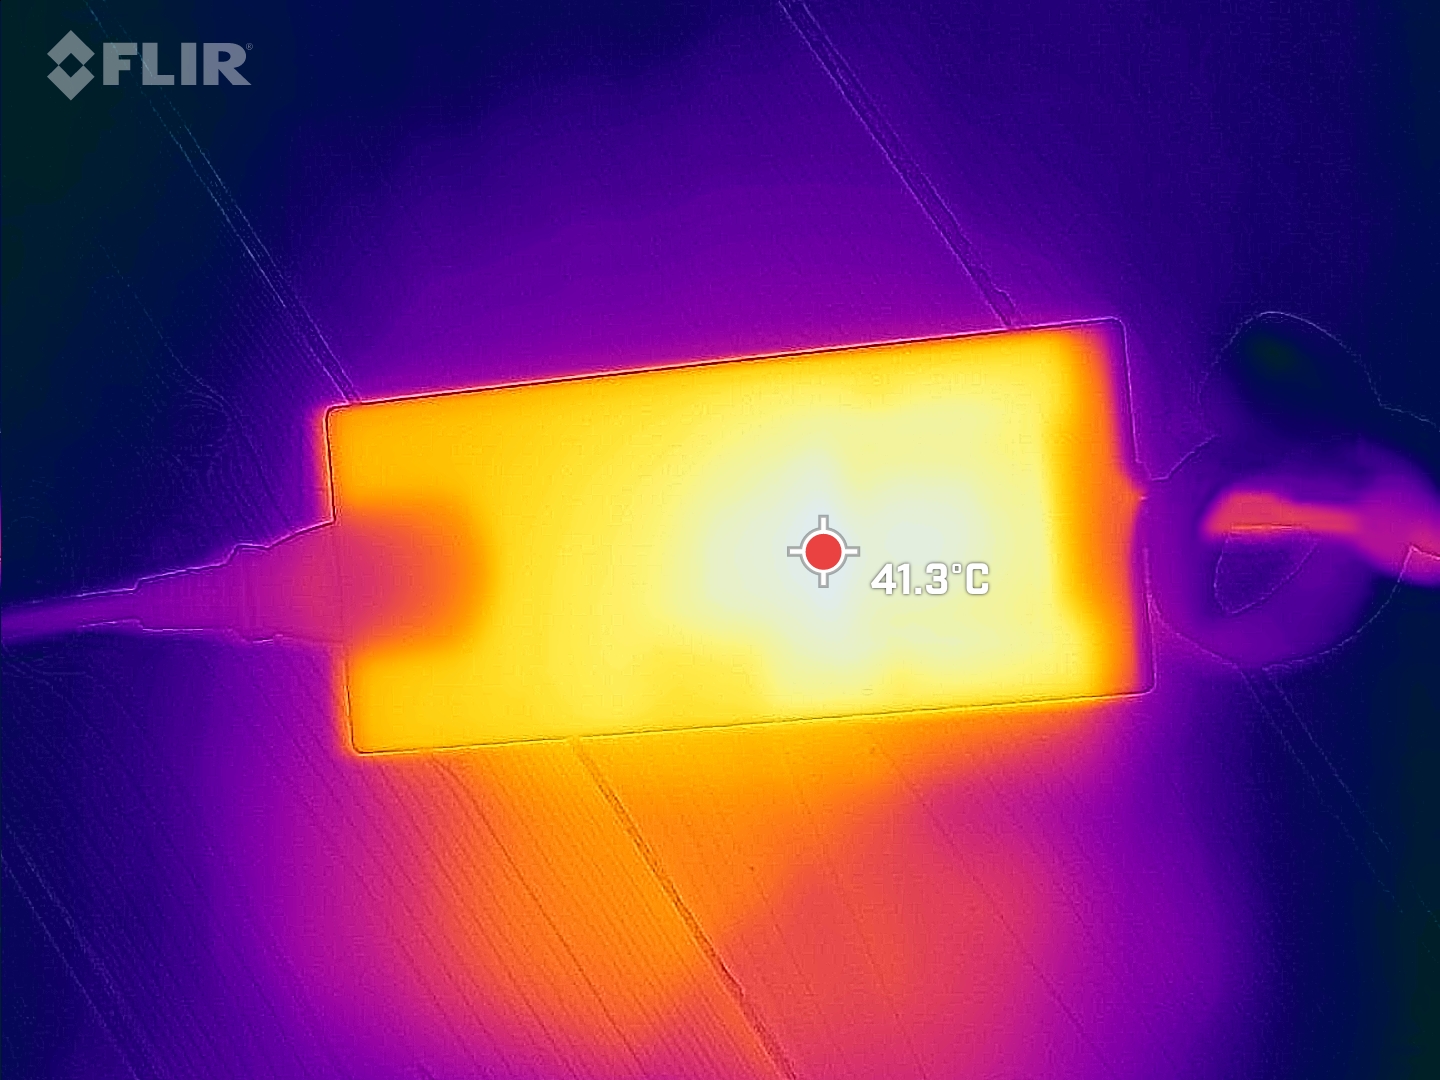
Temperatura
Os pontos quentes estão a pouco menos de 50 °C no centro, em direção à parte de trás. Os apoios das palmas permanecem sempre frios, mas as chaves WASD podem aquecer um pouco desconfortavelmente sob forte estresse.
(-) A temperatura máxima no lado superior é 47 °C / 117 F, em comparação com a média de 40.4 °C / 105 F , variando de 21.2 a 68.8 °C para a classe Gaming.
(-) A parte inferior aquece até um máximo de 48 °C / 118 F, em comparação com a média de 43.2 °C / 110 F
(+) Em uso inativo, a temperatura média para o lado superior é 29 °C / 84 F, em comparação com a média do dispositivo de 33.9 °C / ### class_avg_f### F.
(±) Jogando The Witcher 3, a temperatura média para o lado superior é 35 °C / 95 F, em comparação com a média do dispositivo de 33.9 °C / ## #class_avg_f### F.
(+) Os apoios para as mãos e o touchpad são mais frios que a temperatura da pele, com um máximo de 23 °C / 73.4 F e, portanto, são frios ao toque.
(+) A temperatura média da área do apoio para as mãos de dispositivos semelhantes foi 28.8 °C / 83.8 F (+5.8 °C / 10.4 F).
| MSI Katana 15 B12VEK Intel Core i7-12650H, NVIDIA GeForce RTX 4050 Laptop GPU | MSI Katana GF66 12UGS Intel Core i7-12700H, NVIDIA GeForce RTX 3070 Ti Laptop GPU | MSI Pulse GL66 12UEK Intel Core i9-12900H, NVIDIA GeForce RTX 3060 Laptop GPU | Lenovo Legion 5 15IAH7H 82RB Intel Core i7-12700H, NVIDIA GeForce RTX 3060 Laptop GPU | Asus TUF Gaming F15 FX507ZM Intel Core i7-12700H, NVIDIA GeForce RTX 3060 Laptop GPU | Schenker XMG Core 15 (M22) AMD Ryzen 7 6800H, NVIDIA GeForce RTX 3060 Laptop GPU | |
|---|---|---|---|---|---|---|
| Heat | -17% | -2% | 16% | -2% | 6% | |
| Maximum Upper Side * (°C) | 47 | 61 -30% | 50 -6% | 37.8 20% | 44.4 6% | 48 -2% |
| Maximum Bottom * (°C) | 48 | 55 -15% | 47 2% | 51 -6% | 48.8 -2% | 51 -6% |
| Idle Upper Side * (°C) | 35 | 43 -23% | 36 -3% | 25.8 26% | 37.8 -8% | 28 20% |
| Idle Bottom * (°C) | 38 | 38 -0% | 38 -0% | 28.8 24% | 39.6 -4% | 33 13% |
* ... menor é melhor
Teste de estresse
Os núcleos começam nosso teste de estresse em 3,1 GHz muito brevemente. Após alguns segundos, as temperaturas dos núcleos sobem até 89 °C, após o que as taxas do relógio caem e atingem uma média estável de 2,5 GHz. O consumo médio de energia é de 50 W. As temperaturas se estabilizam em torno de 82 °C
O relógio da GPU flutua entre 2 e 2,5 GHz. São atingidas temperaturas médias de 75 °C, enquanto o consumo de energia elétrica é de apenas cerca de 62 W.
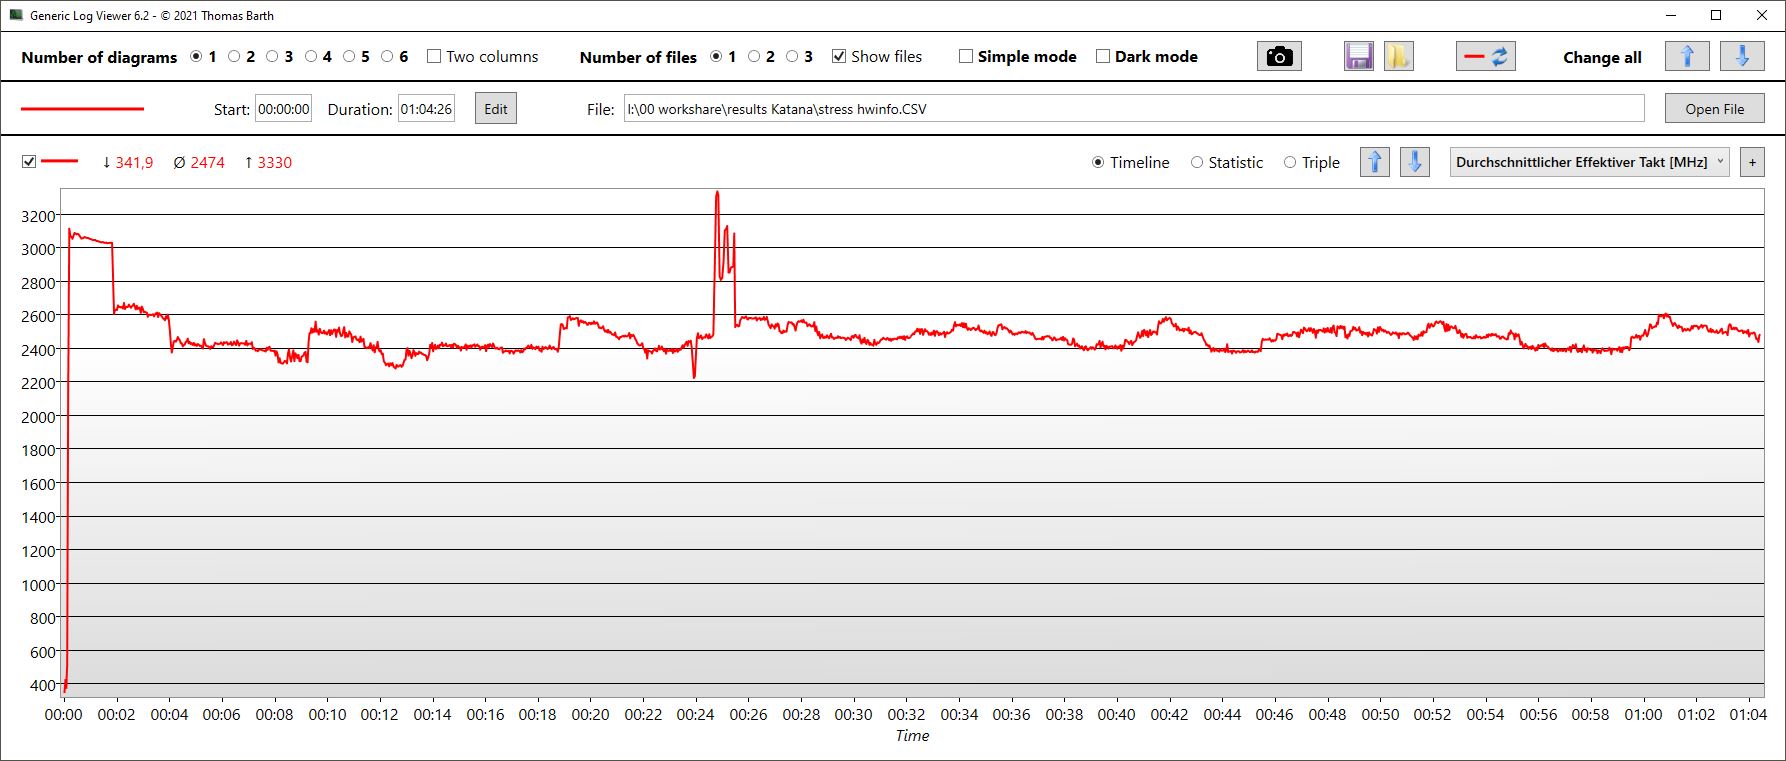
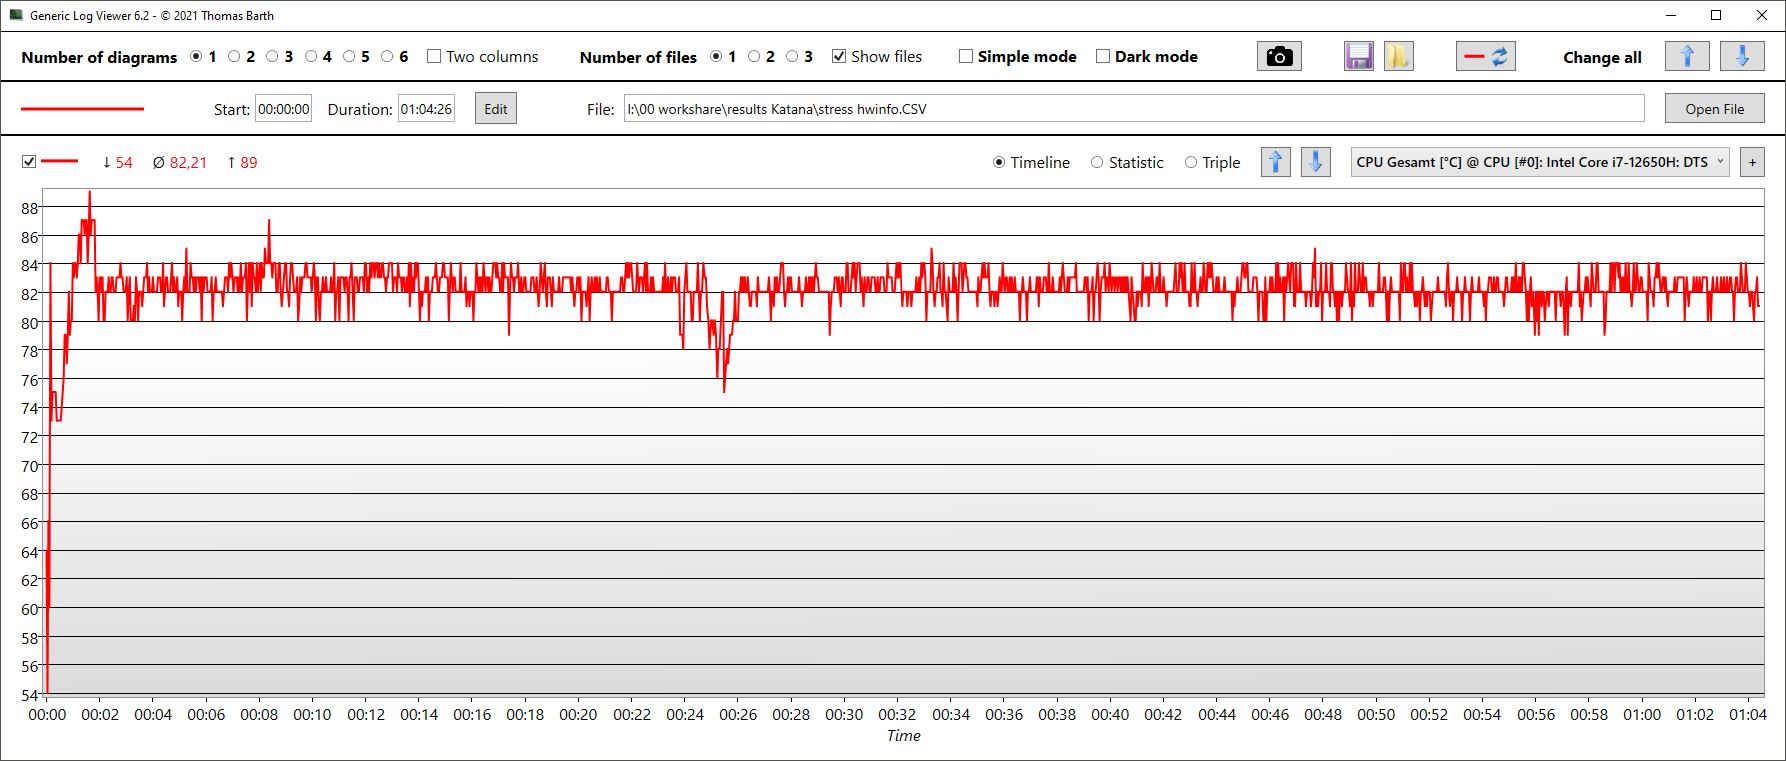
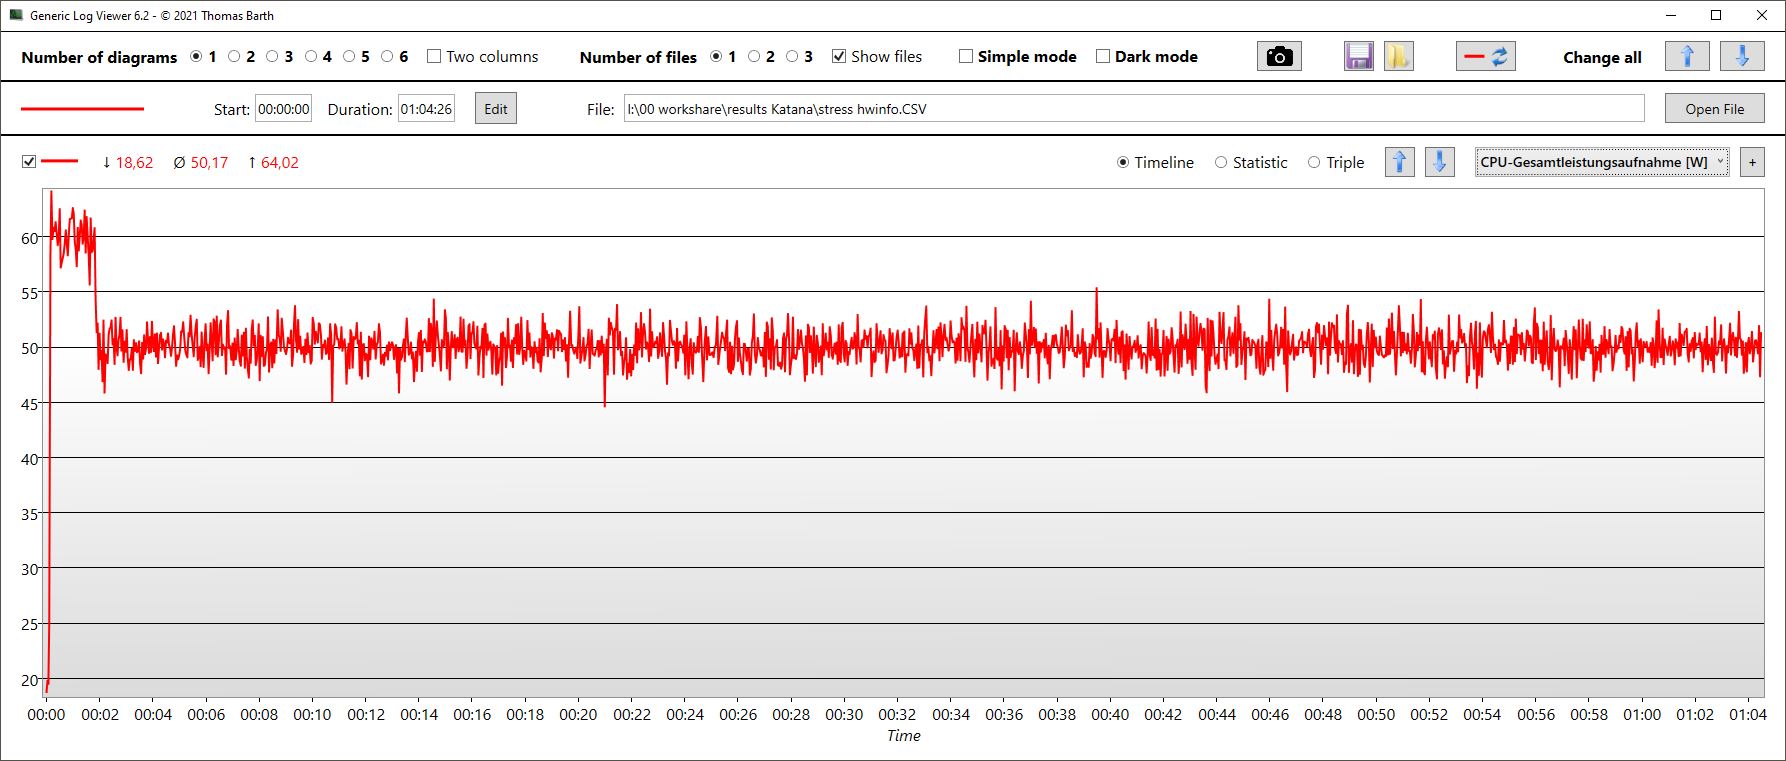
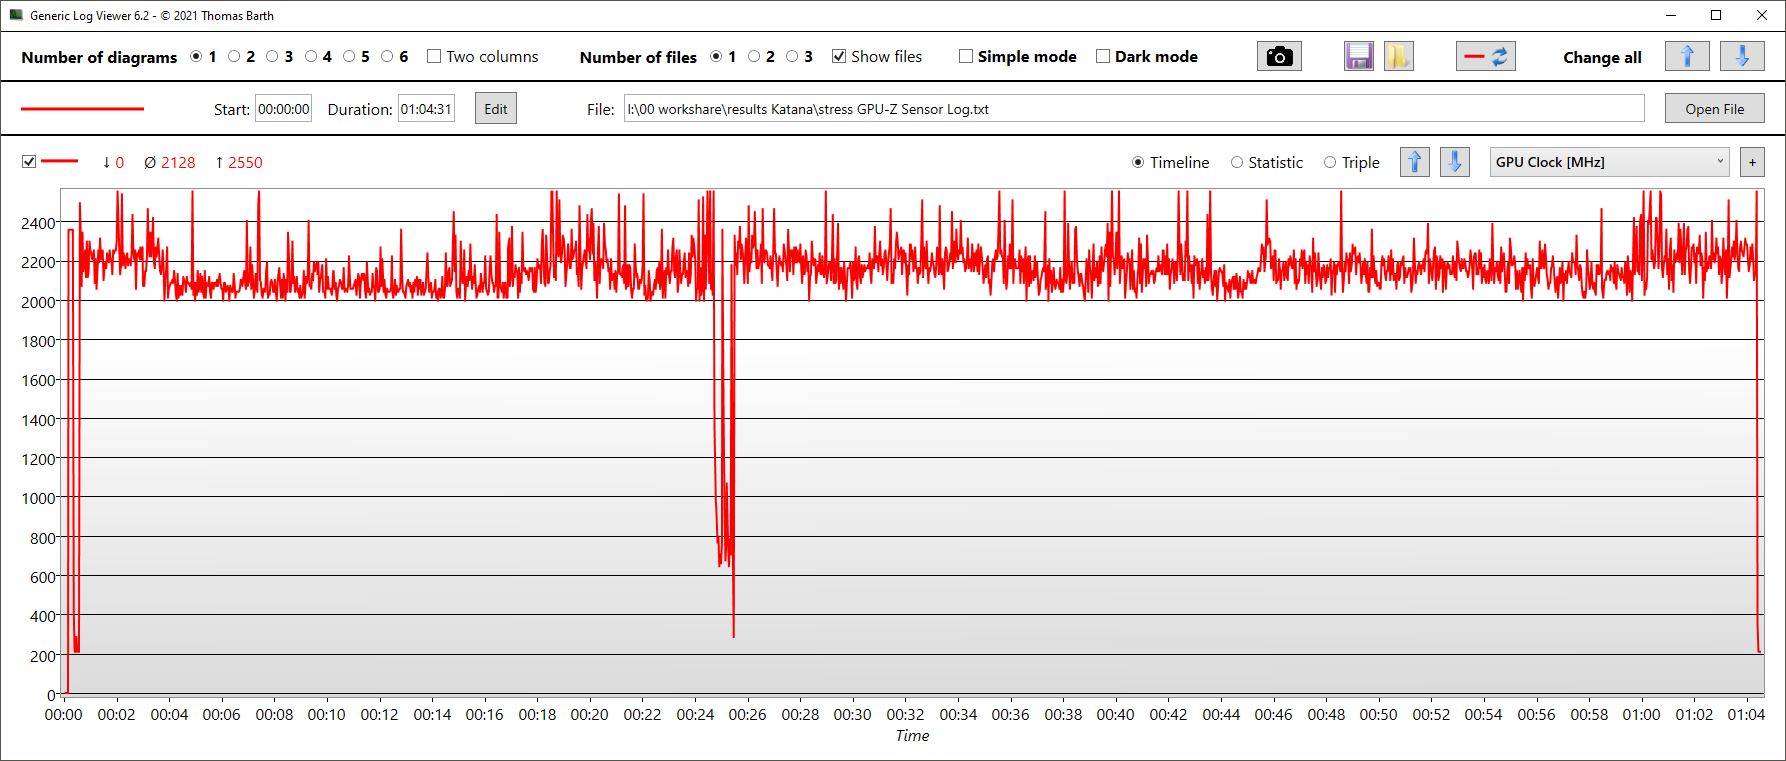
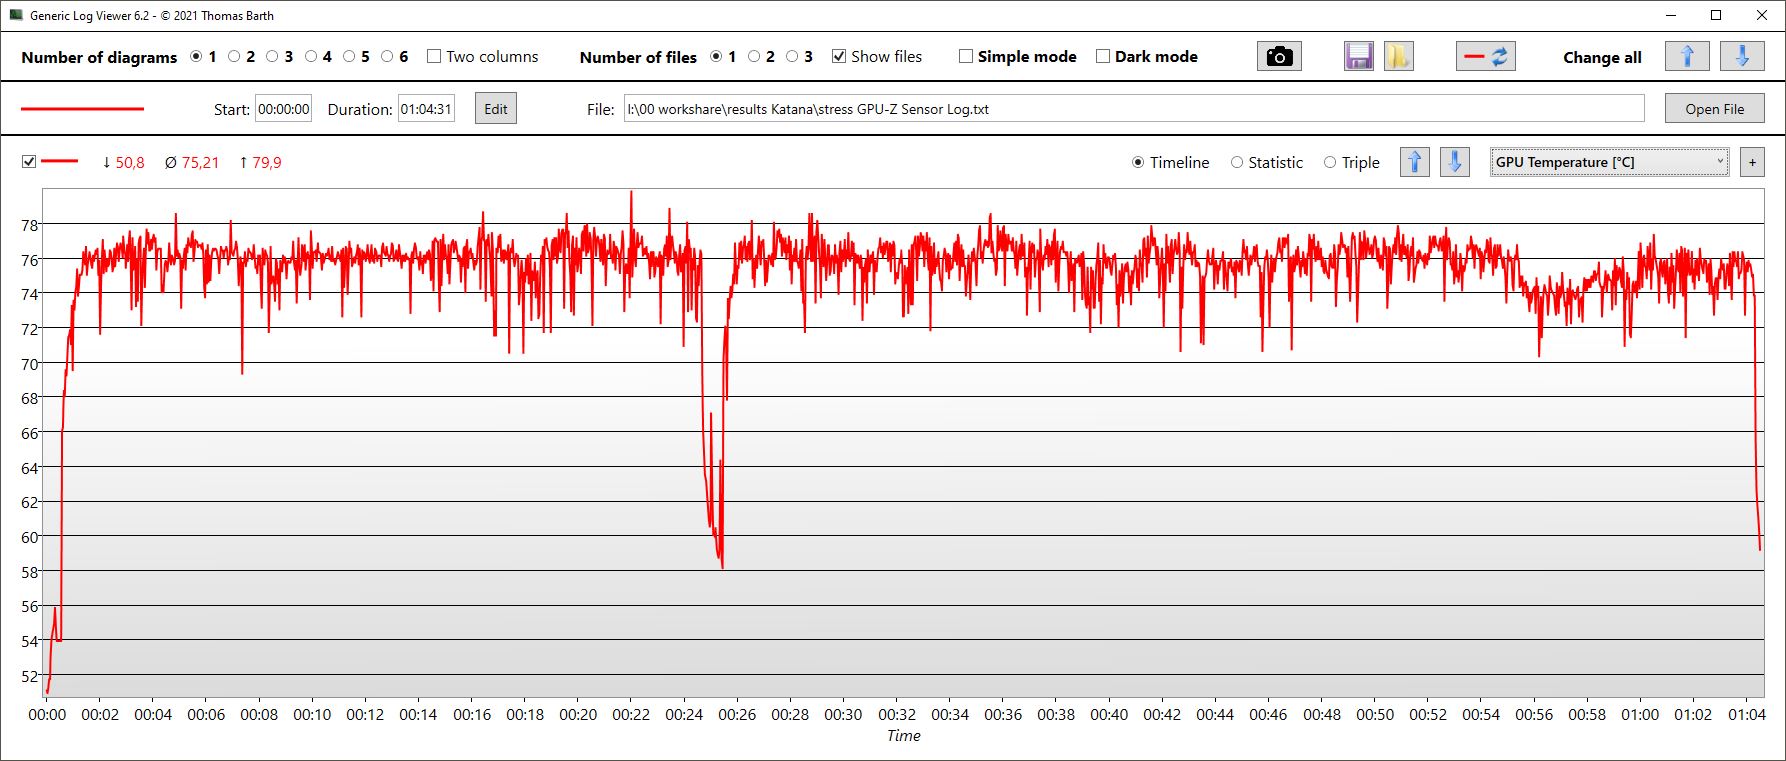
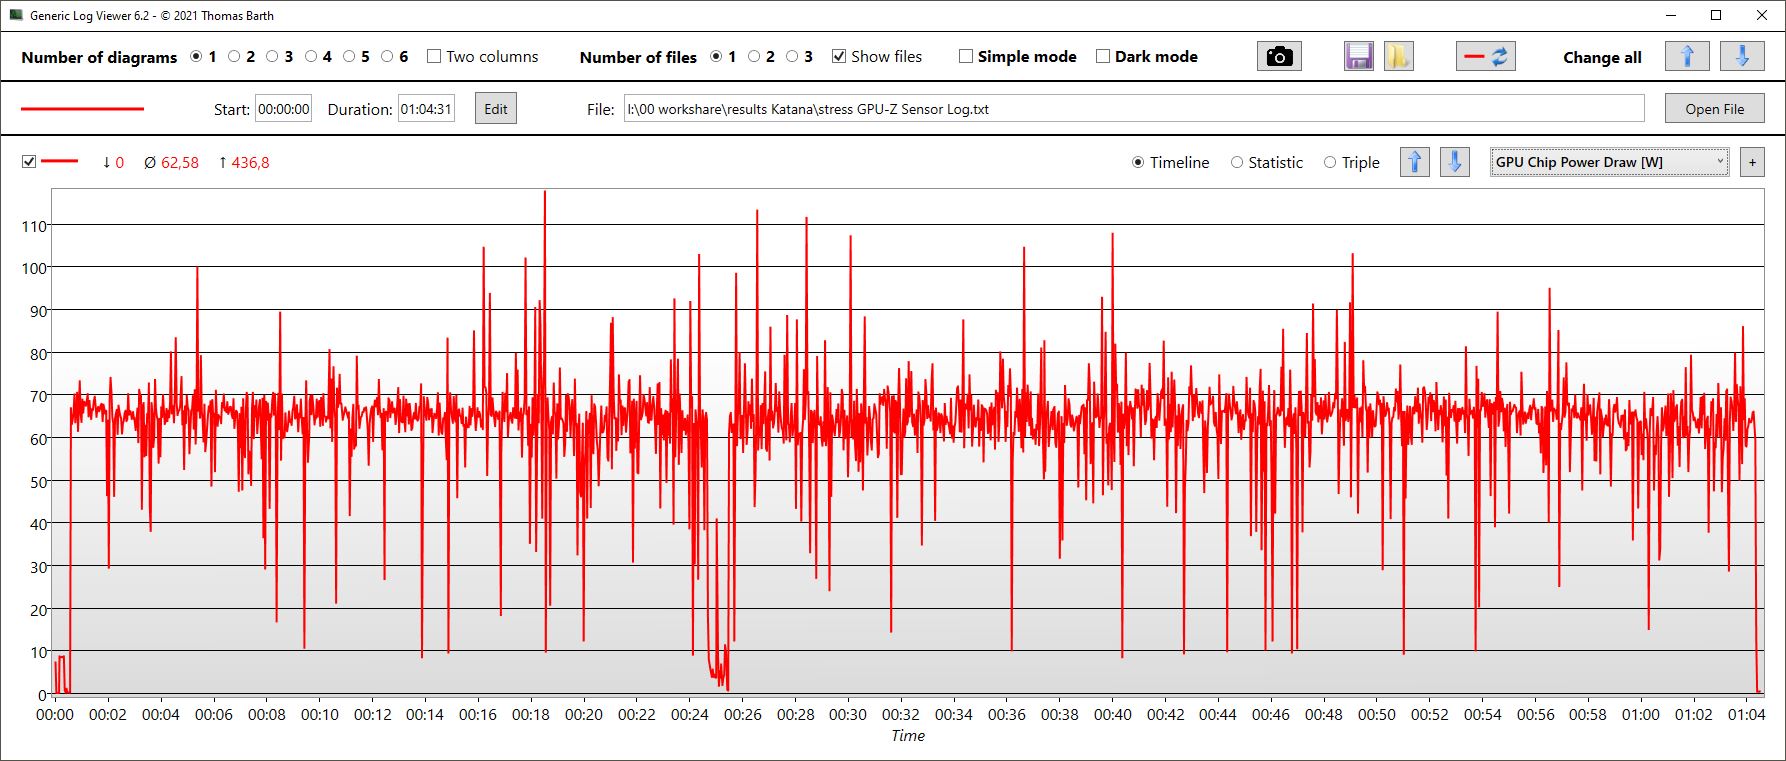
| Relógio CPU (GHz) | Relógio GPU (MHz) | Temperatura média da CPU (°C) | Temperatura média da GPU (°C) | |
| Prime95 + FurMark Stress | 2,5 | 2.121 | 82 | 75 |
| Witcher 3 Stress | 0.6 | 2.400 | 75 | 75 |
Oradores
Os alto-falantes estereofônicos oferecem médias e altas equilibradas, mas quase nenhum baixo e volume médio, na melhor das hipóteses. A tomada de fone de ouvido é ideal para dispositivos analógicos.
MSI Katana 15 B12VEK análise de áudio
(±) | o volume do alto-falante é médio, mas bom (###valor### dB)
Graves 100 - 315Hz
(-) | quase nenhum baixo - em média 21.5% menor que a mediana
(±) | a linearidade dos graves é média (8.8% delta para a frequência anterior)
Médios 400 - 2.000 Hz
(+) | médios equilibrados - apenas 4.1% longe da mediana
(+) | médios são lineares (4.8% delta para frequência anterior)
Altos 2 - 16 kHz
(+) | agudos equilibrados - apenas 2.3% longe da mediana
(+) | os máximos são lineares (4% delta da frequência anterior)
Geral 100 - 16.000 Hz
(±) | a linearidade do som geral é média (17.3% diferença em relação à mediana)
Comparado com a mesma classe
» 47% de todos os dispositivos testados nesta classe foram melhores, 12% semelhantes, 41% piores
» O melhor teve um delta de 6%, a média foi 18%, o pior foi 132%
Comparado com todos os dispositivos testados
» 32% de todos os dispositivos testados foram melhores, 8% semelhantes, 59% piores
» O melhor teve um delta de 4%, a média foi 24%, o pior foi 134%
Lenovo Legion 5 15IAH7H 82RB análise de áudio
(+) | os alto-falantes podem tocar relativamente alto (###valor### dB)
Graves 100 - 315Hz
(-) | quase nenhum baixo - em média 28.2% menor que a mediana
(±) | a linearidade dos graves é média (12.9% delta para a frequência anterior)
Médios 400 - 2.000 Hz
(±) | médios mais altos - em média 5.7% maior que a mediana
(±) | a linearidade dos médios é média (7.4% delta para frequência anterior)
Altos 2 - 16 kHz
(+) | agudos equilibrados - apenas 3.3% longe da mediana
(+) | os máximos são lineares (6.4% delta da frequência anterior)
Geral 100 - 16.000 Hz
(±) | a linearidade do som geral é média (23.6% diferença em relação à mediana)
Comparado com a mesma classe
» 86% de todos os dispositivos testados nesta classe foram melhores, 4% semelhantes, 10% piores
» O melhor teve um delta de 6%, a média foi 18%, o pior foi 132%
Comparado com todos os dispositivos testados
» 71% de todos os dispositivos testados foram melhores, 6% semelhantes, 23% piores
» O melhor teve um delta de 4%, a média foi 24%, o pior foi 134%
Gerenciamento de energia - Eficiente RTX 4050 na MSI Katana
Consumo de energia
Em termos de consumo de energia, o novo Katana 15 é mais econômico do que a concorrência com uma GPU de última geração. Nosso modelo de teste tem boas taxas enquanto ocioso, e permanece assim mesmo quando se joga ou sob forte estresse. Embora o desempenho 3D também seja ligeiramente menor, a diferença no consumo é muito maior do que a diferença no desempenho.
Por exemplo, tanto o Legion 5 quanto o XMG Core 15 até o Asus TUF Gaming F15 consomem quase 50% mais quando jogando com Witcher 3 do que nosso Katana 15! Mas o Katana GF66 com seu RTX 3070 Ti também consome apenas 16% a mais em jogos.
Medimos um consumo máximo a curto prazo de até 189 W. A fonte de alimentação padrão Chicony, que foi projetada para 240 W, deve ser capaz de lidar muito bem com isso.
| desligado | |
| Ocioso | |
| Carga |
|
Key:
min: | |
| MSI Katana 15 B12VEK i7-12650H, GeForce RTX 4050 Laptop GPU, Micron 2400 MTFDKBA1T0QFM, IPS, 1920x1080, 15.6" | MSI Katana GF66 12UGS i7-12700H, GeForce RTX 3070 Ti Laptop GPU, Micron 2450 1TB MTFDKBA1T0TFK, IPS, 1920x1080, 15.6" | MSI Pulse GL66 12UEK i9-12900H, GeForce RTX 3060 Laptop GPU, Micron 2450 512GB MTFDKBA512TFK, IPS, 1920x1080, 15.6" | Lenovo Legion 5 15IAH7H 82RB i7-12700H, GeForce RTX 3060 Laptop GPU, , IPS, 1920x1080, 15.6" | Asus TUF Gaming F15 FX507ZM i7-12700H, GeForce RTX 3060 Laptop GPU, SK Hynix HFM001TD3JX013N, IPS, 1920x1080, 15.6" | Schenker XMG Core 15 (M22) R7 6800H, GeForce RTX 3060 Laptop GPU, Samsung SSD 980 Pro 1TB MZ-V8P1T0BW, IPS, 2560x1440, 15.6" | Média NVIDIA GeForce RTX 4050 Laptop GPU | Média da turma Gaming | |
|---|---|---|---|---|---|---|---|---|
| Power Consumption | -26% | -6% | -121% | -34% | -34% | -30% | -64% | |
| Idle Minimum * (Watt) | 8.5 | 9 -6% | 7 18% | 19.8 -133% | 6.3 26% | 11.8 -39% | 9.95 ? -17% | 13.2 ? -55% |
| Idle Average * (Watt) | 10.2 | 13 -27% | 13 -27% | 26.2 -157% | 9.8 4% | 14.7 -44% | 15.8 ? -55% | 18.9 ? -85% |
| Idle Maximum * (Watt) | 11.3 | 20 -77% | 13.7 -21% | 48.2 -327% | 26.5 -135% | 15 -33% | 20.1 ? -78% | 24.5 ? -117% |
| Load Average * (Watt) | 84 | 100 -19% | 48.4 42% | 102.9 -23% | 103.8 -24% | 100 -19% | 88 ? -5% | 108.8 ? -30% |
| Witcher 3 ultra * (Watt) | 128 | 149 -16% | 148 -16% | 186.7 -46% | 189 -48% | 184 -44% | ||
| Load Maximum * (Watt) | 189 | 212 -12% | 244 -29% | 268 -42% | 241.9 -28% | 237 -25% | 176.3 ? 7% | 254 ? -34% |
* ... menor é melhor
Power Consumption Witcher 3 / Stresstest
Power Consumption with an External Monitor
Vida útil da bateria
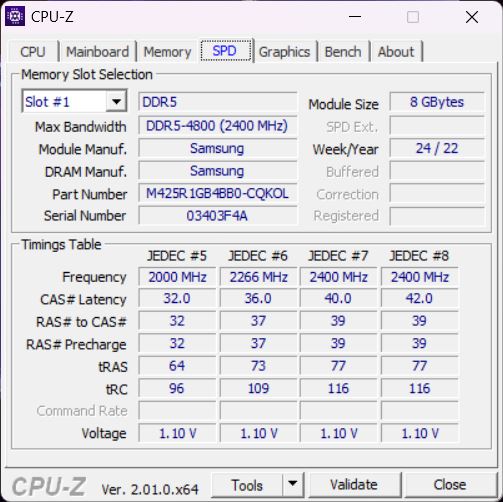
Onde mais os laptops de orçamento economizam dinheiro? Correto, a bateria. O modelo no Katana 15 tem apenas 53 Wh, que é padrão no Katana ou Pulse. O resto da concorrência tem baterias que vão de 62 a 90 Wh. Assim, os tempos de funcionamento são bastante medíocres, apesar da eficiência energética comparativamente boa.
Uma noite de filme pode ser planejada para cerca de 4 horas e 20 minutos. Nosso teste WLAN produz resultados significativamente diferentes, dependendo do modo selecionado. No modo balanceado com brilho máximo (258 nits), a bateria dura apenas 2 horas e 20 minutos. Em Power Saver a 150 nits, por outro lado, medimos aproximadamente o mesmo tempo que no teste de vídeo.
| MSI Katana 15 B12VEK i7-12650H, GeForce RTX 4050 Laptop GPU, 53.5 Wh | MSI Katana GF66 12UGS i7-12700H, GeForce RTX 3070 Ti Laptop GPU, 52 Wh | MSI Pulse GL66 12UEK i9-12900H, GeForce RTX 3060 Laptop GPU, 53.5 Wh | Lenovo Legion 5 15IAH7H 82RB i7-12700H, GeForce RTX 3060 Laptop GPU, 80 Wh | Asus TUF Gaming F15 FX507ZM i7-12700H, GeForce RTX 3060 Laptop GPU, 90 Wh | Schenker XMG Core 15 (M22) R7 6800H, GeForce RTX 3060 Laptop GPU, 62 Wh | Média da turma Gaming | |
|---|---|---|---|---|---|---|---|
| Duração da bateria | -26% | 9% | -6% | -8% | 27% | 49% | |
| H.264 (h) | 4.4 | 4 -9% | 8.28 ? 88% | ||||
| WiFi v1.3 (h) | 4.3 | 2.4 -44% | 5 16% | 4.8 12% | 7.8 81% | 6.96 ? 62% | |
| Load (h) | 1.5 | 1.4 -7% | 1.9 27% | 1.1 -27% | 1.1 -27% | 1.1 -27% | 1.47 ? -2% |
| Reader / Idle (h) | 8.1 | 15.8 | 8.71 ? |
Pro
Contra
Veredicto - Orçamento RTX 4050 ainda é muito caro

A MSI Katana 15 B12 combina uma CPU Gen12 com um RTX 4050o que na verdade não é uma má idéia para um jogador de orçamento. A CPU é tudo menos ruim e a GPU no Katana 15 prova ser significativamente mais eficiente do que os modelos do ano passado.
No entanto, nosso principal ponto de crítica para os jogadores do orçamento é o preço: enquanto você pode obter laptops com RTX 3060 a partir de cerca de US$800, você paga um total de US$1.499,99 aqui! As vantagens da eficiência do RTX 4050 não justificam este prêmio de preço. Mais ainda, uma vez que quase todos os outros componentes do Katana 15 são claramente de classe econômica, desde as portas parcialmente desatualizadas até o visor Full HD bastante escuro e a bateria comparativamente pequena. Além disso, o desempenho do laptop tende a ficar atrás da maioria dos jogadores do RTX 3060 e o RTX 4050 falha claramente sua meta TGP de 105.
A MSI Katana 15 B12 combina uma boa CPU de última geração com uma RTX 4050 atual, mas não consegue estabelecer um preço que seja razoável para os muitos componentes do orçamento. No momento, o Katana 15 é simplesmente muito caro.
Afinal de contas, há muitas alternativas. Se você quer mais desempenho e menos componentes do orçamento a preços ainda mais baixos, sua melhor aposta é o Lenovo Legion 5 com seu RTX 3060. Mas a maioria dos outros jogadores RTX 3060 também deveriam ser mais baratos, melhor equipados e, em sua maioria, mais rápidos.
Preço e Disponibilidade
Na loja oficial da MSI US webstore, a Katana 15 B12VGK-082 tem um preço de $1.499,99. Os compradores interessados (dependendo do local) podem encontrar o mesmo modelo a preços mais baratos em outros revendedores, como a Amazon.
MSI Katana 15 B12VEK
- 03/28/2023 v7 (old)
Christian Hintze
Transparência
A seleção dos dispositivos a serem analisados é feita pela nossa equipe editorial. A amostra de teste foi fornecida ao autor como empréstimo pelo fabricante ou varejista para fins desta revisão. O credor não teve influência nesta revisão, nem o fabricante recebeu uma cópia desta revisão antes da publicação. Não houve obrigação de publicar esta revisão. Como empresa de mídia independente, a Notebookcheck não está sujeita à autoridade de fabricantes, varejistas ou editores.
É assim que o Notebookcheck está testando
Todos os anos, o Notebookcheck analisa de forma independente centenas de laptops e smartphones usando procedimentos padronizados para garantir que todos os resultados sejam comparáveis. Desenvolvemos continuamente nossos métodos de teste há cerca de 20 anos e definimos padrões da indústria no processo. Em nossos laboratórios de teste, equipamentos de medição de alta qualidade são utilizados por técnicos e editores experientes. Esses testes envolvem um processo de validação em vários estágios. Nosso complexo sistema de classificação é baseado em centenas de medições e benchmarks bem fundamentados, o que mantém a objetividade.Price comparison

