Análises para Intel Core i7-1260P processador
Análise do Geekom Mini IT12: O concorrente do Intel NUC com um Intel Core i7-1260P funciona muito silenciosamente!
O Geekom Mini IT12 é uma alternativa interessante aos conhecidos modelos Intel NUC. O fabricante taiwanês optou por um SoC Intel Alder Lake móvel. Nesta análise, analisamos mais de perto o que esse minicomputador pode oferecer e se ele está à altura do líder da categoria, a Intel. Graças à sua porta Thunderbolt, também pudemos dar uma olhada no seu desempenho em jogos usando uma GPU externa.
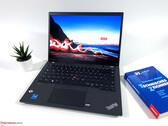
Intel Core i7-1260P, Iris Xe G7 96EUs, 572 gLenovo ThinkPad T14 G3 review - Laptop comercial é pior com Intel e Nvidia
Após já termos testado o ThinkPad T14 G3 com o processador AMD, agora damos uma olhada na versão com um Intel Core i7-1260P e dedicado GeForce MX550. Qual configuração oferece um desempenho superior e maior vida útil da bateria? E a GPU GeForce vale a pena em comparação com a rápida Radeon 680M iGPU?
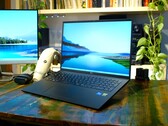
Intel Core i7-1260P, NVIDIA GeForce MX550, 14", 1.5 kgAsus ExpertBook B5 Flip OLED em revisão: laptop 2 em 1 com Stylus Ativo e bons tempos de execução
O carro-chefe do B5 Flip é uma grande tela OLED touchscreen de 16 polegadas, mate, em formato 16:10 (3.840 x 2.400 pixels). Com a GPU Arc-A350M da Intel, um núcleo gráfico de entrada relativamente novo, até agora raramente encontrado, está a bordo.
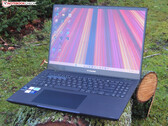
Intel Core i7-1260P, A350M, 16", 1.8 kgRevisão LG Gram 17 - Um laptop super leve de 17 polegadas com um modesto dGPU
O Nvidia GeForce RTX 2050-equipado, 2022 LG Gram 17 pesa apenas 57 gramas a mais do que sua contraparte - um dispositivo que vem sem uma placa gráfica dedicada. Além disso, o laptop oferece um Intel Core i7 de 12ª geração e 32GB de RAM. Apesar de ter hardware mais potente, a bateria oferecida aqui dura mais do que seus predecessores.
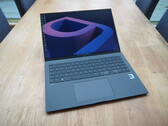
Intel Core i7-1260P, NVIDIA GeForce RTX 2050 Mobile, 17", 1.4 kgLG Gram 16 (2022) Revisão do notebook: Dispositivo leve com problemas de estabilidade
A versão 2021 da LG Gram 16 recebeu de nós uma boa classificação no ano passado. Como parte de sua atualização de 2022, a LG lidou com um de nossos principais pontos de crítica: a exibição reflexiva. Descubra o que mais há de novo em nossa revisão detalhada.
Intel Core i7-1260P, Iris Xe G7 96EUs, 16", 1.2 kgLenovo ThinkPad X1 Carbon G10 21CB00DCGE: Intel Iris Xe Graphics G7 96EUs, 14.00", 1.2 kg
ánalise » Lenovo ThinkPad X1 Carbono G10 30th Anniversary Laptop review: Edição OLED com edições de resistência
Intel NUC 12 Pro Kit NUC12WSKi7: Intel Iris Xe Graphics G7 96EUs, 0.5 kg
ánalise » Intel NUC 12 Pro Kit - Wall Street Canyon em revisão: Mini PC avançado com Intel Core i7-1260P para alta versatilidade
Acer Swift X SFX16-52G-77RX: Intel Arc A370M, 16.00", 1.8 kg
ánalise » Revisão Acer Swift X 16 (2022): laptop de 16 polegadas com atualizações poderosas
Lenovo Yoga Slim 7 Carbon 13IAP7-82U9005FGE: Intel Iris Xe Graphics G7 96EUs, 13.30", 1 kg
ánalise » Revisão do laptop Lenovo Yoga Slim 7i Carbon 13 - poderoso laptop ultraportátil com menos de 1 kg
Asus ExpertBook B2 Flip B2502FBA-N80141X: Intel Iris Xe Graphics G7 96EUs, 15.60", 1.9 kg
ánalise » Asus ExpertBook B2 Flip em revisão: caderno 2 em 1 com tela sensível ao toque AntiGlare e modem 5G
Huawei MateBook X Pro 2022: Intel Iris Xe Graphics G7 96EUs, 14.20", 1.3 kg
ánalise » Revisão do laptop Huawei MateBook X Pro 2022: MacBook Air concorrente pontua com a melhor tela IPS
Samsung Galaxy Book2 15: Intel Arc A350M, 15.60", 1.6 kg
ánalise » Samsung Galaxy Book2 15 review - O laptop multimídia com Arc A350M não impressiona
Dynabook Portégé X40-K: Intel Iris Xe Graphics G7 96EUs, 14.00", 1.5 kg
ánalise » Revisão Dynabook Portégé X40-K: Portátil Premium com um display de orçamento
Lenovo Yoga 7 16IAP7: Intel Iris Xe Graphics G7 96EUs, 16.00", 2 kg
ánalise » Revisão da Lenovo Yoga 7 16 Gen 7: Massivo laptop conversível de 16 polegadas
Framework Laptop 13.5 12th Gen Intel: Intel Iris Xe Graphics G7 96EUs, 13.50", 1.3 kg
ánalise » Framework Laptop 13.5 Intel 12th gen review: Como a superfície da Microsoft, mas na verdade reparável
Dell XPS 13 Plus 9320 4K: Intel Iris Xe Graphics G7 96EUs, 13.40", 1.2 kg
ánalise » Dell XPS 13 Plus 9320 Laptop Review - O XPS 13 agora tem uma barra de toque
Lenovo IdeaCentre AIO 3 24IAP7: NVIDIA GeForce MX550, 23.80", 6.8 kg
ánalise » Batalha das GPUs de nível básico - Nvidia GeForce MX550 & Intel Arc A350M Review
MSI Summit E14 Flip Evo A12MT: Intel Iris Xe Graphics G7 96EUs, 14.00", 1.6 kg
ánalise » MSI Summit E14 Flip Evo A12M revisão conversível: Uma alternativa legítima à HP, Dell ou Lenovo
GPD Win Max 2: Intel Iris Xe Graphics G7 96EUs, 10.10", 1 kg
ánalise » GPD Win Max 2 revisão PC de jogos portáteis: Intel Core i7-1260P ou AMD Ryzen 7 6800U?
Dell Inspiron 16 7620 2-in-1: Intel Iris Xe Graphics G7 96EUs, 16.00", 2.1 kg
ánalise » Dell Inspiron 16 7620 Revisão 2 em 1 conversível: Chassi em Mylar e alumínio
Samsung Galaxy Book2 Pro 360 13 NP930QED-KA3DE: Intel Iris Xe Graphics G7 96EUs, 13.30", 1 kg
ánalise » Samsung Galaxy Book2 Pro 360 13 em revisão: Laptop leve 2 em 1 com entrada stylus e visor OLED
Lenovo Yoga 9i 14 2022 i7-1260P: Intel Iris Xe Graphics G7 96EUs, 14.00", 1.4 kg
ánalise » Lenovo Yoga 9i 14 2022 Portátil - High-End conversível com 4K-OLED em revisão
Lenovo Yoga 9 14IAP7 82LU0001US: Intel Iris Xe Graphics G7 96EUs, 14.00", 1.4 kg
ánalise » Estreia do Intel Core i7-1260P: Lenovo Yoga 9 14IAP7 revisão de conversível
MSI Summit E14 Evo A12M, i7-1260P: Intel Iris Xe Graphics G7 96EUs, 14.00", 1.6 kg
ánalise externa » MSI Summit E14 Evo A12M, i7-1260P
Asus ExpertBook B7 Flip B7402FBA: Intel Iris Xe Graphics G7 96EUs, 14.00", 1.5 kg
ánalise externa » Asus ExpertBook B7 Flip B7402FBA
Lenovo Yoga Slim 6 14IAP8: Intel Iris Xe Graphics G7 96EUs, 14.00", 1.3 kg
ánalise externa » Lenovo Yoga Slim 6 14IAP8
Lenovo ThinkPad P14s G3, i7-1260P T550: NVIDIA T550 Laptop GPU, 14.00", 1.2 kg
ánalise externa » Lenovo ThinkPad P14s G3, i7-1260P T550
LG Gram 17Z90Q-E.AD78G: NVIDIA GeForce RTX 2050 Mobile, 17.00", 1.4 kg
ánalise externa » LG Gram 17Z90Q-E.AD78G
Lenovo ThinkPad E15 G4, i7-1260P: Intel Iris Xe Graphics G7 96EUs, 15.60", 1.7 kg
ánalise externa » Lenovo ThinkPad E15 G4, i7-1260P
Lenovo ThinkPad X1 Nano G2, i7-1260P: Intel Iris Xe Graphics G7 96EUs, 13.00", 1 kg
ánalise externa » Lenovo ThinkPad X1 Nano G2, i7-1260P
Lenovo ThinkPad X13 G3, i7-1260P: Intel Iris Xe Graphics G7 96EUs, 13.30", 1.3 kg
ánalise externa » Lenovo ThinkPad X13 G3, i7-1260P
Asus ExpertBook B5 B5602CBA, i7-1260P: Intel Iris Xe Graphics G7 96EUs, 16.00", 1.5 kg
ánalise externa » Asus ExpertBook B5 B5602CBA, i7-1260P
HP Envy x360 15-es2026nr: Intel Iris Xe Graphics G7 96EUs, 15.60", 1.7 kg
ánalise externa » HP Envy x360 15-es2026nr
LG UltraPC 17, i7-1260P RTX 3050 Ti: NVIDIA GeForce RTX 3050 Ti Laptop GPU, 17.00", 2 kg
ánalise externa » LG UltraPC 17, i7-1260P RTX 3050 Ti
Lenovo ThinkPad T14s G3-21BR00G0GE: Intel Iris Xe Graphics G7 96EUs, 14.00", 1.2 kg
ánalise externa » Lenovo ThinkPad T14s G3-21BR00G0GE
LG Gram 14Z90Q, i7-1260P: Intel Iris Xe Graphics G7 96EUs, 14.00", 1 kg
ánalise externa » LG Gram 14Z90Q, i7-1260P
HP Envy x360 15-ew0871nd: Intel Iris Xe Graphics G7 96EUs, 15.60", 1.7 kg
ánalise externa » HP Envy x360 15-ew0871nd
HP Spectre x360 16-f1180ng: Intel Arc A370M, 16.00", 2 kg
ánalise externa » HP Spectre x360 16-f1180ng
Asus ExpertBook B5 Flip B5402F, i7-1260P: Intel Iris Xe Graphics G7 96EUs, 14.00", 1.3 kg
ánalise externa » Asus ExpertBook B5 Flip B5402F, i7-1260P
Asus ExpertBook B2 Flip B2502FBA-N80141X: Intel Iris Xe Graphics G7 96EUs, 15.60", 1.9 kg
ánalise externa » Asus ExpertBook B2 Flip B2502FBA-N80141X
Dynabook Portégé X30L-K-108: Intel Iris Xe Graphics G7 96EUs, 13.30", 0.9 kg
ánalise externa » Dynabook Portégé X30L-K-108
LG Gram 16 2-in-1 2022 16T90Q, i7-1260P: Intel Iris Xe Graphics G7 96EUs, 16.00", 1.5 kg
ánalise externa » LG Gram 16 2-in-1 2022 16T90Q, i7-1260P
Lenovo ThinkPad T14 G3 21AH00HXGE: Intel Iris Xe Graphics G7 96EUs, 14.00", 1.3 kg
ánalise externa » Lenovo ThinkPad T14 G3 21AH00HXGE
Lenovo Yoga 9 14IAP7 82LU0001US: Intel Iris Xe Graphics G7 96EUs, 14.00", 1.4 kg
ánalise externa » Lenovo Yoga 9 14IAP7 82LU0001US
Acer Swift 5 SF514-56T-706S: Intel Iris Xe Graphics G7 96EUs, 14.00", 1.2 kg
ánalise externa » Acer Swift 5 SF514-56T-706S
Lenovo Ideapad 5 Pro 14IAP7, i7-1260P RTX 2050: NVIDIA GeForce RTX 2050 Mobile, 14.00", 1.4 kg
ánalise externa » Lenovo Ideapad 5 Pro 14IAP7, i7-1260P RTX 2050
Asus ZenBook S 13 Flip UP5302ZA, i7-1260P: Intel Iris Xe Graphics G7 96EUs, 13.30", 1.1 kg
ánalise externa » Asus ZenBook S 13 Flip UP5302ZA, i7-1260P
Dynabook Tecra A40-K-101: Intel Iris Xe Graphics G7 96EUs, 14.00", 1.5 kg
ánalise externa » Dynabook Tecra A40-K-101
MSI Prestige 14 A12UC-006: NVIDIA GeForce RTX 3050 4GB Laptop GPU, 14.00", 1.3 kg
ánalise externa » MSI Prestige 14 A12UC-006
Lenovo Ideapad 5 Pro 14IAP7, i7-1260P: Intel Iris Xe Graphics G7 96EUs, 14.00", 1.4 kg
ánalise externa » Lenovo Ideapad 5 Pro 14IAP7, i7-1260P
Lenovo Yoga 7 14IAL7-82QE003FGE: Intel Iris Xe Graphics G7 96EUs, 14.00", 1.4 kg
ánalise externa » Lenovo Yoga 7 14IAL7-82QE003FGE
LG Gram 16Z90Q: Intel Iris Xe Graphics G7 96EUs, 16.00", 1.2 kg
ánalise externa » LG Gram 16Z90Q
Dynabook Portégé X30W-K-11E: Intel Iris Xe Graphics G7 96EUs, 13.30", 1 kg
ánalise externa » Dynabook Portégé X30W-K-11E
Lenovo Yoga Slim 7 Carbon 13IAP7-82U9005FGE: Intel Iris Xe Graphics G7 96EUs, 13.30", 1 kg
ánalise externa » Lenovo Yoga Slim 7 Carbon 13IAP7-82U9005FGE
Dynabook Portégé X30L-K-122: Intel Iris Xe Graphics G7 96EUs, 13.30", 0.9 kg
ánalise externa » Dynabook Portégé X30L-K-122
Acer Swift X SFX16-52G-77RX: Intel Arc A370M, 16.00", 1.8 kg
ánalise externa » Acer Swift X SFX16-52G-77RX
Dynabook Portégé X40-K: Intel Iris Xe Graphics G7 96EUs, 14.00", 1.5 kg
ánalise externa » Dynabook Portégé X40-K
HP Pavilion 15-eg2000: Intel Iris Xe Graphics G7 96EUs, 15.60", 1.7 kg
ánalise externa » HP Pavilion 15-eg2000
Lenovo Yoga 7 16IAP7: Intel Iris Xe Graphics G7 96EUs, 16.00", 2 kg
ánalise externa » Lenovo Yoga 7 16IAP7
Acer Swift 5 SF514-56T-797T: Intel Iris Xe Graphics G7 96EUs, 14.00", 1.2 kg
ánalise externa » Acer Swift 5 SF514-56T-797T
LG Gram 17 2022, i7-1260P: Intel Iris Xe Graphics G7 96EUs, 17.00", 1.4 kg
ánalise externa » LG Gram 17 2022, i7-1260P
Lenovo ThinkPad X1 Carbon G10-21CB00B9GE: Intel Iris Xe Graphics G7 96EUs, 14.00", 1.1 kg
ánalise externa » Lenovo ThinkPad X1 Carbon G10-21CB00B9GE
Acer Aspire 5 A515-57G-705U: NVIDIA GeForce RTX 2050 Mobile, 15.60", 1.8 kg
ánalise externa » Acer Aspire 5 A515-57G-705U
One Netbook T1: Intel Iris Xe Graphics G7 96EUs, 13.00", 1 kg
ánalise externa » One Netbook T1
Dell Vostro 16 5620, i7-1260P MX570: NVIDIA GeForce MX570, 16.00", 1.9 kg
ánalise externa » Dell Vostro 16 5620, i7-1260P MX570
Huawei MateBook X Pro 2022: Intel Iris Xe Graphics G7 96EUs, 14.20", 1.3 kg
ánalise externa » Huawei MateBook X Pro 2022
Dell Inspiron 16 7620 2-in-1: Intel Iris Xe Graphics G7 96EUs, 16.00", 2.1 kg
ánalise externa » Dell Inspiron 16 7620 2-in-1
Acer Swift 5 SF514-56T-7173: Intel Iris Xe Graphics G7 96EUs, 14.00", 1.2 kg
ánalise externa » Acer Swift 5 SF514-56T-7173
LG Gram 16Z90Q 2022: Intel Iris Xe Graphics G7 96EUs, 16.00", 1.3 kg
ánalise externa » LG Gram 16Z90Q 2022
Acer Swift 3 SF314-512-78H2: Intel Iris Xe Graphics G7 96EUs, 14.00", 1.3 kg
ánalise externa » Acer Swift 3 SF314-512-78H2
MSI Summit E14 Flip Evo A12MT: Intel Iris Xe Graphics G7 96EUs, 14.00", 1.6 kg
ánalise externa » MSI Summit E14 Flip Evo A12MT
MSI Summit E16 Flip A12UDT-006: NVIDIA GeForce RTX 3050 Ti Laptop GPU, 16.00", 1.9 kg
ánalise externa » MSI Summit E14 Flip Evo A12MT-016
HP Envy x360 15t-ew000: Intel Iris Xe Graphics G7 96EUs, 15.60", 1.7 kg
ánalise externa » HP Envy x360 15t-ew000
Acer Spin 5 SP514-51N-70LZ: Intel Iris Xe Graphics G7 96EUs, 14.00", 1.3 kg
ánalise externa » Acer Spin 5 SP514-51N-70LZ
Samsung Galaxy Book2 Pro 15, i7-1260P: Intel Iris Xe Graphics G7 96EUs, 15.60", 1.1 kg
ánalise externa » Samsung Galaxy Book2 Pro 15, i7-1246P
Lenovo ThinkPad X1 Yoga G7 21CD006YGE: Intel Iris Xe Graphics G7 96EUs, 14.00", 1.4 kg
ánalise externa » Lenovo ThinkPad X1 Yoga G7 21CD006YGE
HP Envy 17-cr0474ng: Intel Iris Xe Graphics G7 96EUs, 17.30", 2.5 kg
ánalise externa » HP Envy 17-cr0474ng
Lenovo Yoga Slim 7 Carbon 13IAP7-82U9002JUK: Intel Iris Xe Graphics G7 96EUs, 13.30", 1 kg
ánalise externa » Lenovo Yoga Slim 7 Carbon 13IAP7-82U9002JUK
Dell XPS 13 Plus 9320 4K: Intel Iris Xe Graphics G7 96EUs, 13.40", 1.2 kg
ánalise externa » Dell XPS 13 Plus 9320 4K
Dell XPS 13 Plus 9320, i7-1260P FHD: Intel Iris Xe Graphics G7 96EUs, 13.40", 1.3 kg
ánalise externa » Dell XPS 13 9320, i7-1260P
Samsung Galaxy Book2 Pro 360 15 NP950QED-KA3DE: Intel Iris Xe Graphics G7 96EUs, 15.60", 1.4 kg
ánalise externa » Samsung Galaxy Book2 Pro 360 15 NP950QED-KA3DE
Asus Zenbook 14 UX3402, i7-1260P: Intel Iris Xe Graphics G7 96EUs, 14.00", 1.4 kg
ánalise externa » Asus Zenbook 14 UX3402, i7-1260P
Acer Swift X SFX14-51G-79RJ: NVIDIA GeForce RTX 3050 Ti Laptop GPU, 14.00", 1.4 kg
ánalise externa » Acer Swift X SFX14-51G-79RJ
Samsung Galaxy Book2 Pro 360 13 NP930QED-KA3DE: Intel Iris Xe Graphics G7 96EUs, 13.30", 1 kg
ánalise externa » Samsung Galaxy Book2 Pro 360 13 NP930QED-KA3DE
Lenovo Yoga 9i 14 2022 i7-1260P: Intel Iris Xe Graphics G7 96EUs, 14.00", 1.4 kg
ánalise externa » Lenovo Yoga 9i 14 2022 i7-1260P
LG Gram 17Z90Q-E.AD78G: NVIDIA GeForce RTX 2050 Mobile, 17.00", 1.4 kg
» Teste de longa duração do LG Gram 17: Dois anos com o gigante leve
GPD Win Max 2: Intel Iris Xe Graphics G7 96EUs, 10.10", 1 kg
» GPD revela o preço do Pocket 4: Laptop ultraportátil com tecnologia AMD em breve
Huawei MateBook X Pro 2022: Intel Iris Xe Graphics G7 96EUs, 14.20", 1.3 kg
» O Huawei MateBook X Pro é um dos melhores laptops Intel Evo, mas a falta de opções de manutenção impede uma melhor classificação
Lenovo Yoga 7 16IAP7: Intel Iris Xe Graphics G7 96EUs, 16.00", 2 kg
» Lenovo Yoga 7i 16 IAP7 2 em 1 agora enviado com gráficos Intel Arc A370M por $1400 USD
Dell XPS 13 Plus 9320 4K: Intel Iris Xe Graphics G7 96EUs, 13.40", 1.2 kg
» O novo XPS 13 Plus da Dell poderia ser um laptop realmente bom, mas há algumas decisões questionáveis de design
Lenovo Yoga 9i 14 2022 i7-1260P: Intel Iris Xe Graphics G7 96EUs, 14.00", 1.4 kg
» O novo Yoga 9i 14 com o 4K OLED é atualmente o melhor conversível da Lenovo
Lenovo Yoga 9 14IAP7 82LU0001US: Intel Iris Xe Graphics G7 96EUs, 14.00", 1.4 kg
» Nossos primeiros resultados do Core i7-1260P estão dentro e são melhores que o AMD Zen 3... na maioria das vezes