Deutsch
 English
 Español
 Français
 Italiano
 Nederlands
 Polski
 Português
 Русский
 Türkçe
 Svenska
 Chinese
 Magyar
Breve Análise do Portátil Alienware 17 R5 (i7-8750H, GTX 1070, QHD)
| |||||||||||||||||||||||||
iluminação: 86 %
iluminação com acumulador: 398 cd/m²
Contraste: 780:1 (Preto: 0.51 cd/m²)
ΔE Color 5.45 | 0.5-29.43 Ø5, calibrated: 2.56
ΔE Greyscale 5.4 | 0.57-98 Ø5.3
86% sRGB (Argyll 1.6.3 3D)
56% AdobeRGB 1998 (Argyll 1.6.3 3D)
62.9% AdobeRGB 1998 (Argyll 2.2.0 3D)
86.1% sRGB (Argyll 2.2.0 3D)
63.4% Display P3 (Argyll 2.2.0 3D)
Gamma: 2.4
| Alienware 17 R5 JYWWF_B173QTN (AUO1496), TN, 2560x1440 | Alienware 17 R4 TN LED, 2560x1440 | Acer Predator Helios 500 PH517-51-79BY AUO_B173HAN03, IPS, 1920x1080 | MSI GE73 8RF-008 Raider RGB Chi Mei N173HHE-G32 (CMN1747), TN WLED, 1920x1080 | HP Omen 17t-3AW55AV_1 AU Optronics AUO309D, IPS, 1920x1080 | |
|---|---|---|---|---|---|
| Display | -4% | 4% | 32% | 4% | |
| Display P3 Coverage | 63.4 | 61.2 -3% | 64.4 2% | 90.8 43% | 65.4 3% |
| sRGB Coverage | 86.1 | 82.9 -4% | 91.3 6% | 99.9 16% | 90 5% |
| AdobeRGB 1998 Coverage | 62.9 | 60.5 -4% | 65.6 4% | 85.8 36% | 65.8 5% |
| Response Times | -79% | -9% | -81% | -26% | |
| Response Time Grey 50% / Grey 80% * | 20.8 ? | 30 ? -44% | 14 ? 33% | 28 ? -35% | 17.6 ? 15% |
| Response Time Black / White * | 6 ? | 12.8 ? -113% | 9 ? -50% | 13.6 ? -127% | 10 ? -67% |
| PWM Frequency | 25000 ? | ||||
| Screen | -3% | -5% | 20% | 11% | |
| Brightness middle | 398 | 402.3 1% | 335 -16% | 273 -31% | 343.6 -14% |
| Brightness | 367 | 372 1% | 300 -18% | 273 -26% | 320 -13% |
| Brightness Distribution | 86 | 86 0% | 82 -5% | 90 5% | 87 1% |
| Black Level * | 0.51 | 0.62 -22% | 0.7 -37% | 0.26 49% | 0.34 33% |
| Contrast | 780 | 649 -17% | 479 -39% | 1050 35% | 1011 30% |
| Colorchecker dE 2000 * | 5.45 | 5.6 -3% | 4.99 8% | 3.52 35% | 3.74 31% |
| Colorchecker dE 2000 max. * | 10.36 | 9.8 5% | 9.32 10% | 6.34 39% | 5.33 49% |
| Colorchecker dE 2000 calibrated * | 2.56 | 1.93 25% | 2.09 18% | 3.49 -36% | |
| Greyscale dE 2000 * | 5.4 | 4.7 13% | 5.2 4% | 3.11 42% | 3.7 31% |
| Gamma | 2.4 92% | 2.14 103% | 2.49 88% | 2.43 91% | 2.36 93% |
| CCT | 7453 87% | 7519 86% | 7719 84% | 6999 93% | 6388 102% |
| Color Space (Percent of AdobeRGB 1998) | 56 | 53.7 -4% | 59 5% | 76 36% | 58 4% |
| Color Space (Percent of sRGB) | 86 | 82.2 -4% | 91 6% | 100 16% | 90 5% |
| Total Average (Program / Settings) | -29% /
-13% | -3% /
-4% | -10% /
9% | -4% /
5% |
* ... smaller is better
Display Response Times
| ↔ Response Time Black to White | ||
|---|---|---|
| 6 ms ... rise ↗ and fall ↘ combined | ↗ 4 ms rise | 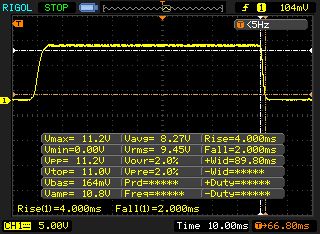 |
| ↘ 2 ms fall | ||
| The screen shows very fast response rates in our tests and should be very well suited for fast-paced gaming. In comparison, all tested devices range from 0.1 (minimum) to 240 (maximum) ms. » 13 % of all devices are better. This means that the measured response time is better than the average of all tested devices (21.5 ms). | ||
| ↔ Response Time 50% Grey to 80% Grey | ||
| 20.8 ms ... rise ↗ and fall ↘ combined | ↗ 11.6 ms rise | 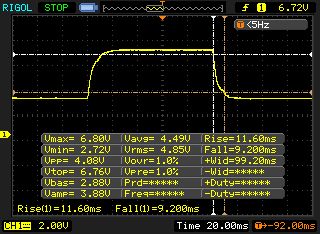 |
| ↘ 9.2 ms fall | ||
| The screen shows good response rates in our tests, but may be too slow for competitive gamers. In comparison, all tested devices range from 0.2 (minimum) to 636 (maximum) ms. » 28 % of all devices are better. This means that the measured response time is better than the average of all tested devices (33.7 ms). | ||
Screen Flickering / PWM (Pulse-Width Modulation)
| Screen flickering / PWM not detected | 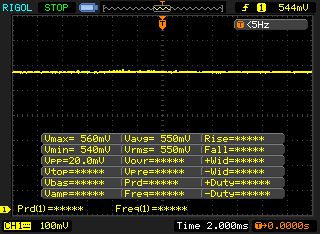 | ||
In comparison: 53 % of all tested devices do not use PWM to dim the display. If PWM was detected, an average of 17908 (minimum: 5 - maximum: 3846000) Hz was measured. | |||

| Alienware 17 R5 SK hynix PC401 HFS256GD9TNG | Alienware 17 R4 SK Hynix PC300 NVMe 512 GB | Acer Predator Helios 500 PH517-51-79BY SK hynix SSD Canvas SC300 HFS256GD9MNE-6200A | MSI GE73 8RF-008 Raider RGB Toshiba HG6 THNSNJ256G8NY | HP Omen 17t-3AW55AV_1 Samsung SSD PM981 MZVLB512HAJQ | |
|---|---|---|---|---|---|
| AS SSD | 1% | 3% | -67% | 47% | |
| Seq Read | 2203 | 1752 -20% | 972 -56% | 511 -77% | 1473 -33% |
| Seq Write | 559 | 735 31% | 838 50% | 425.7 -24% | 1962 251% |
| 4K Read | 38.74 | 35.61 -8% | 38.57 0% | 14.07 -64% | 31.66 -18% |
| 4K Write | 92.7 | 113.4 22% | 80.7 -13% | 38.34 -59% | 84.4 -9% |
| Access Time Read * | 0.091 | 0.042 54% | 0.235 -158% | 0.071 22% | |
| Access Time Write * | 0.065 | 0.123 -89% | 0.054 17% | 0.097 -49% | 0.047 28% |
| Score Read | 706 | 831 18% | 859 22% | 417 -41% | 1304 85% |
* ... smaller is better

| 3DMark 11 - 1280x720 Performance GPU | |
| Average of class Gaming (1029 - 72070, n=231, last 2 years) | |
| Alienware 17 R4 | |
| Alienware 17 R5 | |
| MSI GE73 8RF-008 Raider RGB | |
| HP Omen 17t-3AW55AV_1 | |
| 3DMark 11 Performance | 18741 pontos | |
| 3DMark Cloud Gate Standard Score | 32992 pontos | |
| 3DMark Fire Strike Score | 15457 pontos | |
| 3DMark Time Spy Score | 5640 pontos | |
Ajuda | ||
| F1 2018 - 2560x1440 Ultra High Preset AA:T AF:16x | |
| Alienware 17 R5 | |
| The Crew 2 - 2560x1440 Ultra Preset | |
| Alienware 17 R5 | |
| Need for Speed Payback - 2560x1440 Ultra Preset | |
| Alienware 17 R5 | |
| Assassin´s Creed Origins - 2560x1440 Ultra High Preset | |
| Alienware 17 R5 | |
| Destiny 2 - 2560x1440 Highest Preset AA:SM AF:16x | |
| Alienware 17 R5 | |
| baixo | média | alto | ultra | QHD | |
| The Witcher 3 (2015) | 109 | 60.8 | |||
| FIFA 18 (2017) | 326 | 319 | |||
| Destiny 2 (2017) | 142 | 119 | 82.4 | ||
| Assassin´s Creed Origins (2017) | 77 | 67 | 54 | ||
| Need for Speed Payback (2017) | 114 | 108 | 81.3 | ||
| The Crew 2 (2018) | 60 | 60 | 60 | ||
| F1 2018 (2018) | 117 | 84 | 68 |
Barulho
| Ocioso |
| 32 / 33 / 34 dB |
| HDD |
| 33 dB |
| Carga |
| 43 / 51 dB |
 | ||
30 dB silencioso 40 dB(A) audível 50 dB(A) ruidosamente alto |
||
min: | ||
| Alienware 17 R5 i7-8750H, GeForce GTX 1070 Mobile | Alienware 17 R4 i7-7820HK, GeForce GTX 1080 Mobile | Acer Predator Helios 500 PH517-51-79BY i7-8750H, GeForce GTX 1070 Mobile | MSI GE73 8RF-008 Raider RGB i7-8750H, GeForce GTX 1070 Mobile | HP Omen 17t-3AW55AV_1 i7-8750H, GeForce GTX 1070 Mobile | Average of class Gaming | |
|---|---|---|---|---|---|---|
| Noise | -4% | 3% | 0% | 5% | 10% | |
| off / environment * | 30 | 28.2 6% | 30.4 -1% | 30 -0% | 27.8 7% | 24.1 ? 20% |
| Idle Minimum * | 32 | 35.6 -11% | 31.2 2% | 32 -0% | 31.1 3% | 25.6 ? 20% |
| Idle Average * | 33 | 35.6 -8% | 35.3 -7% | 33 -0% | 31.1 6% | 27.4 ? 17% |
| Idle Maximum * | 34 | 35.7 -5% | 35.3 -4% | 34 -0% | 35 -3% | 30.8 ? 9% |
| Load Average * | 43 | 50.2 -17% | 44.4 -3% | 41 5% | 42 2% | 43.1 ? -0% |
| Witcher 3 ultra * | 51 | 50.2 2% | 41 20% | 50 2% | 44.5 13% | |
| Load Maximum * | 51 | 50.2 2% | 45.2 11% | 54 -6% | 46.5 9% | 53.5 ? -5% |
* ... smaller is better
(-) The maximum temperature on the upper side is 46 °C / 115 F, compared to the average of 40.4 °C / 105 F, ranging from 21.2 to 68.8 °C for the class Gaming.
(-) The bottom heats up to a maximum of 58 °C / 136 F, compared to the average of 43.2 °C / 110 F
(±) In idle usage, the average temperature for the upper side is 34.9 °C / 95 F, compared to the device average of 33.8 °C / 93 F.
(±) Playing The Witcher 3, the average temperature for the upper side is 37.4 °C / 99 F, compared to the device average of 33.8 °C / 93 F.
(+) The palmrests and touchpad are reaching skin temperature as a maximum (32 °C / 89.6 F) and are therefore not hot.
(-) The average temperature of the palmrest area of similar devices was 28.9 °C / 84 F (-3.1 °C / -5.6 F).
| Alienware 17 R5 i7-8750H, GeForce GTX 1070 Mobile | Alienware 17 R4 i7-7820HK, GeForce GTX 1080 Mobile | Acer Predator Helios 500 PH517-51-79BY i7-8750H, GeForce GTX 1070 Mobile | MSI GE73 8RF-008 Raider RGB i7-8750H, GeForce GTX 1070 Mobile | HP Omen 17t-3AW55AV_1 i7-8750H, GeForce GTX 1070 Mobile | Average of class Gaming | |
|---|---|---|---|---|---|---|
| Heat | 13% | 21% | 13% | 11% | 14% | |
| Maximum Upper Side * | 46 | 49.6 -8% | 42.6 7% | 47 -2% | 44.2 4% | 46 ? -0% |
| Maximum Bottom * | 58 | 56 3% | 37.2 36% | 49 16% | 55.8 4% | 49.4 ? 15% |
| Idle Upper Side * | 40 | 29.6 26% | 33.6 16% | 32 20% | 31.6 21% | 31.4 ? 21% |
| Idle Bottom * | 41 | 29.2 29% | 31 24% | 34 17% | 35 15% | 32.5 ? 21% |
* ... smaller is better
Alienware 17 R5 audio analysis
(+) | speakers can play relatively loud (89 dB)
Bass 100 - 315 Hz
(±) | reduced bass - on average 9.8% lower than median
(±) | linearity of bass is average (10.1% delta to prev. frequency)
Mids 400 - 2000 Hz
(+) | balanced mids - only 2.4% away from median
(+) | mids are linear (3.1% delta to prev. frequency)
Highs 2 - 16 kHz
(+) | balanced highs - only 4.2% away from median
(+) | highs are linear (5.6% delta to prev. frequency)
Overall 100 - 16.000 Hz
(+) | overall sound is linear (9.5% difference to median)
Compared to same class
» 3% of all tested devices in this class were better, 1% similar, 96% worse
» The best had a delta of 6%, average was 18%, worst was 132%
Compared to all devices tested
» 3% of all tested devices were better, 1% similar, 97% worse
» The best had a delta of 4%, average was 25%, worst was 134%
Alienware 17 R4 audio analysis
(±) | speaker loudness is average but good (75 dB)
Bass 100 - 315 Hz
(-) | nearly no bass - on average 15.3% lower than median
(±) | linearity of bass is average (9.6% delta to prev. frequency)
Mids 400 - 2000 Hz
(±) | higher mids - on average 5.5% higher than median
(±) | linearity of mids is average (8.9% delta to prev. frequency)
Highs 2 - 16 kHz
(±) | higher highs - on average 5.1% higher than median
(±) | linearity of highs is average (9.7% delta to prev. frequency)
Overall 100 - 16.000 Hz
(±) | linearity of overall sound is average (22.4% difference to median)
Compared to same class
» 77% of all tested devices in this class were better, 6% similar, 16% worse
» The best had a delta of 6%, average was 18%, worst was 132%
Compared to all devices tested
» 60% of all tested devices were better, 6% similar, 33% worse
» The best had a delta of 4%, average was 25%, worst was 134%
| desligado | |
| Ocioso | |
| Carga |
|
| Alienware 17 R5 i7-8750H, GeForce GTX 1070 Mobile | Alienware 17 R4 i7-7820HK, GeForce GTX 1080 Mobile | Acer Predator Helios 500 PH517-51-79BY i7-8750H, GeForce GTX 1070 Mobile | MSI GE73 8RF-008 Raider RGB i7-8750H, GeForce GTX 1070 Mobile | HP Omen 17t-3AW55AV_1 i7-8750H, GeForce GTX 1070 Mobile | Average of class Gaming | |
|---|---|---|---|---|---|---|
| Power Consumption | -13% | 6% | 21% | 20% | 22% | |
| Idle Minimum * | 28 | 37.5 -34% | 20.4 27% | 15 46% | 17.8 36% | 13.9 ? 50% |
| Idle Average * | 32 | 37.6 -18% | 26.5 17% | 20 37% | 24.7 23% | 19.2 ? 40% |
| Idle Maximum * | 37 | 37.6 -2% | 37 -0% | 26 30% | 29.6 20% | 27 ? 27% |
| Load Average * | 112 | 122.4 -9% | 129 -15% | 97 13% | 110 2% | 111.4 ? 1% |
| Witcher 3 ultra * | 192 | 180.3 6% | 186 3% | 186 3% | 167.8 13% | |
| Load Maximum * | 231 | 277.4 -20% | 216 6% | 239 -3% | 178.6 23% | 251 ? -9% |
* ... smaller is better
| Alienware 17 R5 i7-8750H, GeForce GTX 1070 Mobile, 99 Wh | Alienware 17 R4 i7-7820HK, GeForce GTX 1080 Mobile, 99 Wh | Acer Predator Helios 500 PH517-51-79BY i7-8750H, GeForce GTX 1070 Mobile, 72 Wh | MSI GE73 8RF-008 Raider RGB i7-8750H, GeForce GTX 1070 Mobile, 51 Wh | HP Omen 17t-3AW55AV_1 i7-8750H, GeForce GTX 1070 Mobile, 86 Wh | Average of class Gaming | |
|---|---|---|---|---|---|---|
| Battery Runtime | -2% | 4% | -14% | 23% | 68% | |
| Reader / Idle | 268 | 276 3% | 253 -6% | 303 13% | 268 0% | 543 ? 103% |
| WiFi v1.3 | 218 | 181 -17% | 174 -20% | 186 -15% | 253 16% | 367 ? 68% |
| Load | 64 | 69 8% | 88 38% | 38 -41% | 97 52% | 84.3 ? 32% |
| Witcher 3 ultra | 66 | 80.6 ? | ||||
| H.264 | 193 | 400 ? |
Pro
Contra
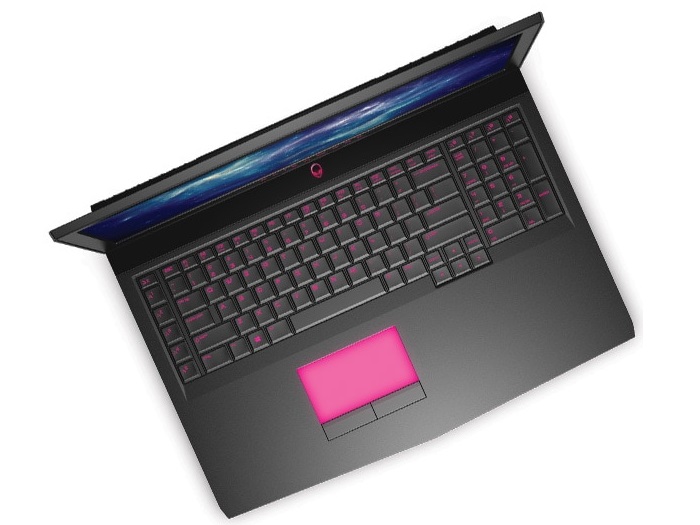
Aqueles que procuram um portátil de gama alta e sofisticado, com bons dispositivos de entrada, conexões modernas e muitas opções de iluminação devem ficar satisfeitos com o Alienware 17 R5.
Além de alguns detalhes menores, a carcaça de 17 polegadas é capaz de convencer, contanto que você possa aceitar sua grossura e peso. A baixa duração da bateria também diminui a mobilidade. Para o sucessor, desejaríamos também de um melhor controle do ventilador, já que os ventiladores aceleram desnecessariamente durante a operação 3D.
Há também coisas boas e ruins na tela QHD opcional, que é muito brilhante e também oferece um tempo de resposta muito rápido, por um lado, mas sofre de um valor de preto medíocre e ângulos de visão limitados pelo outro lado. Além disso, o desempenho Turbo da CPU também poderia ser melhor. Durante a carga multi-core, o Core i7-8750H utiliza apenas o overclocking de forma limitada.
No geral, ainda é suficiente para uma posição em nossa lista dos Top 10 dos jogos. Mas o domínio anterior dos portáteis Alienware foi quebrado.
Alienware 17 R5
-
09/06/2018 v6(old)
Florian Glaser
Pricecompare