Breve Análise do Portátil HP Omen 17t (i7-8750H, GTX 1070)
| SD Card Reader | |
| average JPG Copy Test (av. of 3 runs) | |
| Aorus X9 DT (Toshiba Exceria Pro SDXC 64 GB UHS-II) | |
| Eurocom Q8 (Toshiba Exceria Pro SDXC 64 GB UHS-II) | |
| Média da turma Gaming (20.9 - 210, n=54, últimos 2 anos) | |
| HP Omen 17t-3AW55AV_1 (Toshiba Exceria Pro SDXC 64 GB UHS-II) | |
| Acer Predator 17 G9-793-70PJ (Toshiba Exceria Pro SDXC 64 GB UHS-II) | |
| Asus G752VS-BA338T (Toshiba Exceria Pro SDXC 64 GB UHS-II) | |
| MSI GE73 8RF-008 Raider RGB (Toshiba Exceria Pro SDXC 64 GB UHS-II) | |
| maximum AS SSD Seq Read Test (1GB) | |
| Aorus X9 DT (Toshiba Exceria Pro SDXC 64 GB UHS-II) | |
| Eurocom Q8 (Toshiba Exceria Pro SDXC 64 GB UHS-II) | |
| Média da turma Gaming (25.5 - 261, n=51, últimos 2 anos) | |
| Acer Predator 17 G9-793-70PJ (Toshiba Exceria Pro SDXC 64 GB UHS-II) | |
| Asus G752VS-BA338T (Toshiba Exceria Pro SDXC 64 GB UHS-II) | |
| HP Omen 17t-3AW55AV_1 (Toshiba Exceria Pro SDXC 64 GB UHS-II) | |
| MSI GE73 8RF-008 Raider RGB (Toshiba Exceria Pro SDXC 64 GB UHS-II) | |
| |||||||||||||||||||||||||
iluminação: 87 %
iluminação com acumulador: 343.6 cd/m²
Contraste: 1011:1 (Preto: 0.34 cd/m²)
ΔE ColorChecker Calman: 3.74 | ∀{0.5-29.43 Ø4.71}
calibrated: 3.49
ΔE Greyscale Calman: 3.7 | ∀{0.09-98 Ø4.96}
90% sRGB (Argyll 1.6.3 3D)
58% AdobeRGB 1998 (Argyll 1.6.3 3D)
65.8% AdobeRGB 1998 (Argyll 3D)
90% sRGB (Argyll 3D)
65.4% Display P3 (Argyll 3D)
Gamma: 2.36
CCT: 6388 K
| HP Omen 17t-3AW55AV_1 AU Optronics AUO309D, IPS, 17.3", 1920x1080 | Alienware 17 R4 TN LED, 17.3", 2560x1440 | Acer Predator 17 G9-793-70PJ AU Optronics B173ZAN01.0 (AUO109B), IPS, 17.3", 3840x2160 | Asus G752VS-BA338T AU Optronics B173HAN01.1 (AUO119D), IPS, 17.3", 1920x1080 | Eurocom Q8 AU Optronics B173QTN01.0, Dell P/N WJGD4, TN LED, 17.3", 2560x1440 | EVGA SC17 GTX 1070 Sharp LQ173D1JW31, IPS, 17.3", 3840x2160 | MSI GE73 8RF-008 Raider RGB Chi Mei N173HHE-G32 (CMN1747), TN WLED, 17.3", 1920x1080 | Aorus X9 DT AUO B173HAN03.0 (AUO309D), IPS, 17.3", 1920x1080 | MSI GT75 8RG-090 Titan CMN N173HHE-G32 (CMN1747), TN, 17.3", 1920x1080 | |
|---|---|---|---|---|---|---|---|---|---|
| Display | -7% | 31% | -4% | -10% | 31% | 27% | 2% | 27% | |
| Display P3 Coverage (%) | 65.4 | 61.2 -6% | 86.4 32% | 61.6 -6% | 58.7 -10% | 87.3 33% | 90.8 39% | 66.8 2% | 90.9 39% |
| sRGB Coverage (%) | 90 | 82.9 -8% | 99.9 11% | 90.3 0% | 81 -10% | 100 11% | 99.9 11% | 92.1 2% | 100 11% |
| AdobeRGB 1998 Coverage (%) | 65.8 | 60.5 -8% | 99.1 51% | 62.8 -5% | 58.9 -10% | 98.8 50% | 85.8 30% | 67.3 2% | 86.2 31% |
| Response Times | -49% | -170% | -133% | -7% | -206% | -48% | -13% | 50% | |
| Response Time Grey 50% / Grey 80% * (ms) | 17.6 ? | 30 ? -70% | 50 ? -184% | 36 ? -105% | 21.6 ? -23% | 45.6 ? -159% | 28 ? -59% | 18.4 ? -5% | 8 ? 55% |
| Response Time Black / White * (ms) | 10 ? | 12.8 ? -28% | 25.6 ? -156% | 26 ? -160% | 9 ? 10% | 35.2 ? -252% | 13.6 ? -36% | 12 ? -20% | 5.6 ? 44% |
| PWM Frequency (Hz) | 1042 ? | 25000 ? | 26000 ? | ||||||
| Screen | -26% | 5% | -27% | -69% | -1% | 7% | 19% | 17% | |
| Brightness middle (cd/m²) | 343.6 | 402.3 17% | 343 0% | 307 -11% | 367.9 7% | 399.1 16% | 273 -21% | 280 -19% | 240 -30% |
| Brightness (cd/m²) | 320 | 372 16% | 328 2% | 300 -6% | 346 8% | 360 13% | 273 -15% | 262 -18% | 248 -22% |
| Brightness Distribution (%) | 87 | 86 -1% | 84 -3% | 88 1% | 84 -3% | 81 -7% | 90 3% | 86 -1% | 83 -5% |
| Black Level * (cd/m²) | 0.34 | 0.62 -82% | 0.29 15% | 0.32 6% | 0.55 -62% | 0.4 -18% | 0.26 24% | 0.22 35% | 0.22 35% |
| Contrast (:1) | 1011 | 649 -36% | 1183 17% | 959 -5% | 669 -34% | 998 -1% | 1050 4% | 1273 26% | 1091 8% |
| Colorchecker dE 2000 * | 3.74 | 5.6 -50% | 4.01 -7% | 5.53 -48% | 9.86 -164% | 4.78 -28% | 3.52 6% | 1.78 52% | 2.14 43% |
| Colorchecker dE 2000 max. * | 5.33 | 9.8 -84% | 6.03 -13% | 11.54 -117% | 17.56 -229% | 7.65 -44% | 6.34 -19% | 3.91 27% | 5.04 5% |
| Colorchecker dE 2000 calibrated * | 3.49 | 4.43 -27% | 2.09 40% | 1.54 56% | |||||
| Greyscale dE 2000 * | 3.7 | 4.7 -27% | 4.7 -27% | 7 -89% | 12.4 -235% | 3.8 -3% | 3.11 16% | 0.74 80% | 1.62 56% |
| Gamma | 2.36 93% | 2.14 103% | 2.4 92% | 2.48 89% | 2.09 105% | 2.03 108% | 2.43 91% | 2.43 91% | 2.28 96% |
| CCT | 6388 102% | 7519 86% | 6451 101% | 8103 80% | 11064 59% | 7288 89% | 6999 93% | 6494 100% | 6846 95% |
| Color Space (Percent of AdobeRGB 1998) (%) | 58 | 53.7 -7% | 88 52% | 58 0% | 52.5 -9% | 86.9 50% | 76 31% | 60 3% | 77 33% |
| Color Space (Percent of sRGB) (%) | 90 | 82.2 -9% | 100 11% | 90 0% | 80.5 -11% | 100 11% | 100 11% | 92 2% | 100 11% |
| Média Total (Programa/Configurações) | -27% /
-26% | -45% /
-13% | -55% /
-36% | -29% /
-50% | -59% /
-22% | -5% /
4% | 3% /
11% | 31% /
23% |
* ... menor é melhor
Exibir tempos de resposta
| ↔ Tempo de resposta preto para branco | ||
|---|---|---|
| 10 ms ... ascensão ↗ e queda ↘ combinadas | ↗ 4.8 ms ascensão | 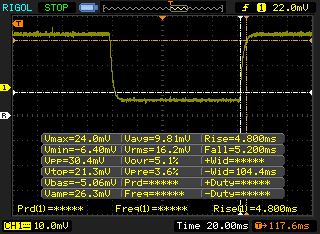 |
| ↘ 5.2 ms queda | ||
| A tela mostra boas taxas de resposta em nossos testes, mas pode ser muito lenta para jogadores competitivos. Em comparação, todos os dispositivos testados variam de 0.1 (mínimo) a 240 (máximo) ms. » 27 % de todos os dispositivos são melhores. Isso significa que o tempo de resposta medido é melhor que a média de todos os dispositivos testados (19.8 ms). | ||
| ↔ Tempo de resposta 50% cinza a 80% cinza | ||
| 17.6 ms ... ascensão ↗ e queda ↘ combinadas | ↗ 10 ms ascensão | 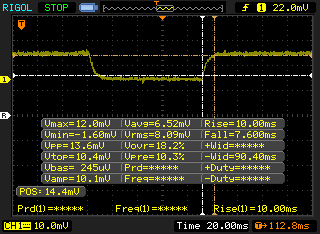 |
| ↘ 7.6 ms queda | ||
| A tela mostra boas taxas de resposta em nossos testes, mas pode ser muito lenta para jogadores competitivos. Em comparação, todos os dispositivos testados variam de 0.165 (mínimo) a 636 (máximo) ms. » 32 % de todos os dispositivos são melhores. Isso significa que o tempo de resposta medido é melhor que a média de todos os dispositivos testados (30.9 ms). | ||
Cintilação da tela / PWM (modulação por largura de pulso)
| Tela tremeluzindo / PWM não detectado | 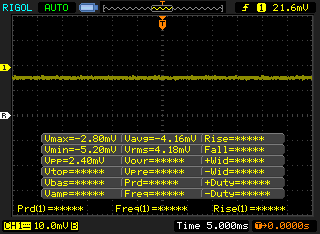 | ||
[pwm_comparison] Em comparação: 52 % de todos os dispositivos testados não usam PWM para escurecer a tela. Se PWM foi detectado, uma média de 7744 (mínimo: 5 - máximo: 343500) Hz foi medida. | |||
| wPrime 2.10 - 1024m | |
| Asus ROG Strix GL702ZC-GC204T | |
| HP Omen X 17-ap0xx | |
| Média Intel Core i7-8750H (125.5 - 180.5, n=6) | |
| HP Omen 17t-3AW55AV_1 | |
| Média da turma Gaming (33 - 210, n=6, últimos 2 anos) | |
* ... menor é melhor
| PCMark 8 Home Score Accelerated v2 | 5557 pontos | |
| PCMark 8 Creative Score Accelerated v2 | 8378 pontos | |
| PCMark 8 Work Score Accelerated v2 | 5968 pontos | |
| PCMark 10 Score | 5939 pontos | |
Ajuda | ||
| HP Omen 17t-3AW55AV_1 Samsung SSD PM981 MZVLB512HAJQ | Alienware 17 R4 SK Hynix PC300 NVMe 512 GB | EVGA SC17 GTX 1070 Samsung SM951 MZVPV256 m.2 | Acer Predator 17 G9-793-70PJ Toshiba NVMe THNSN5512GPU7 | Asus G752VS-BA338T Samsung SM961 MZVKW512HMJP m.2 PCI-e | Eurocom Q8 Samsung SSD 960 Pro 512 GB m.2 | MSI GE73 8RF-008 Raider RGB Toshiba HG6 THNSNJ256G8NY | Aorus X9 DT Transcend TS1TMTE850 | Média Samsung SSD PM981 MZVLB512HAJQ | |
|---|---|---|---|---|---|---|---|---|---|
| AS SSD | -29% | -4% | -6% | 17% | 12% | -84% | -22% | 8% | |
| Copy Game MB/s (MB/s) | 875 | 574 -34% | 1034 18% | 1217 39% | 958 9% | 295.5 -66% | 1057 ? 21% | ||
| Copy Program MB/s (MB/s) | 481.1 | 446.1 -7% | 470 -2% | 445.1 -7% | 406.7 -15% | 192.9 -60% | 454 ? -6% | ||
| Copy ISO MB/s (MB/s) | 1080 | 1227 14% | 1337 24% | 2145 99% | 1596 48% | 412.5 -62% | 1755 ? 63% | ||
| Score Total (Points) | 4142 | 2072 -50% | 2328 -44% | 2547 -39% | 3056 -26% | 3840 -7% | 881 -79% | 2145 -48% | 3966 ? -4% |
| Score Write (Points) | 2147 | 858 -60% | 487 -77% | 890 -59% | 1480 -31% | 1579 -26% | 254 -88% | 916 -57% | 1780 ? -17% |
| Score Read (Points) | 1304 | 831 -36% | 1238 -5% | 1112 -15% | 1077 -17% | 1515 16% | 417 -68% | 828 -37% | 1451 ? 11% |
| Access Time Write * (ms) | 0.047 | 0.123 -162% | 0.033 30% | 0.033 30% | 0.027 43% | 0.035 26% | 0.097 -106% | 0.038 19% | 0.08337 ? -77% |
| Access Time Read * (ms) | 0.071 | 0.042 41% | 0.049 31% | 0.052 27% | 0.058 18% | 0.043 39% | 0.235 -231% | 0.042 41% | 0.05092 ? 28% |
| 4K-64 Write (MB/s) | 1866 | 671 -64% | 260.9 -86% | 646 -65% | 1185 -36% | 1285 -31% | 172.7 -91% | 715 -62% | 1504 ? -19% |
| 4K-64 Read (MB/s) | 1125 | 620 -45% | 999 -11% | 851 -24% | 744 -34% | 1232 10% | 351.4 -69% | 654 -42% | 1203 ? 7% |
| 4K Write (MB/s) | 84.4 | 113.4 34% | 112.1 33% | 120.8 43% | 138.9 65% | 107.9 28% | 38.34 -55% | 98.9 17% | 112 ? 33% |
| 4K Read (MB/s) | 31.66 | 35.61 12% | 45.64 44% | 37.51 18% | 49.71 57% | 35.57 12% | 14.07 -56% | 22.23 -30% | 50.5 ? 60% |
| Seq Write (MB/s) | 1962 | 735 -63% | 1144 -42% | 1230 -37% | 1554 -21% | 1869 -5% | 425.7 -78% | 1019 -48% | 1637 ? -17% |
| Seq Read (MB/s) | 1473 | 1752 19% | 1934 31% | 2237 52% | 2824 92% | 2481 68% | 511 -65% | 1518 3% | 1976 ? 34% |
* ... menor é melhor

| 3DMark 11 | |
| 1280x720 Performance GPU | |
| Média da turma Gaming (21841 - 80022, n=103, últimos 2 anos) | |
| Aorus X9 DT | |
| Média NVIDIA GeForce GTX 1070 Mobile (13760 - 25604, n=58) | |
| HP Omen 17t-3AW55AV_1 | |
| MSI GS73 Stealth 8RF-011 | |
| Asus ROG Strix GL702ZC-GC204T | |
| Schenker XMG Neo 15 | |
| HP Spectre x360 15-ch000 | |
| HP Omen 15-dc0001ng | |
| 1280x720 Performance Combined | |
| Média da turma Gaming (10258 - 30851, n=103, últimos 2 anos) | |
| Aorus X9 DT | |
| HP Omen 17t-3AW55AV_1 | |
| MSI GS73 Stealth 8RF-011 | |
| Schenker XMG Neo 15 | |
| Média NVIDIA GeForce GTX 1070 Mobile (7137 - 12565, n=58) | |
| HP Spectre x360 15-ch000 | |
| Asus ROG Strix GL702ZC-GC204T | |
| HP Omen 15-dc0001ng | |
| 3DMark | |
| 1280x720 Cloud Gate Standard Graphics | |
| Média da turma Gaming (86886 - 223650, n=60, últimos 2 anos) | |
| Aorus X9 DT | |
| HP Omen 17t-3AW55AV_1 | |
| Média NVIDIA GeForce GTX 1070 Mobile (64973 - 125922, n=51) | |
| MSI GS73 Stealth 8RF-011 | |
| Schenker XMG Neo 15 | |
| Asus ROG Strix GL702ZC-GC204T | |
| HP Omen 15-dc0001ng | |
| HP Spectre x360 15-ch000 | |
| 1920x1080 Fire Strike Graphics | |
| Média da turma Gaming (18629 - 62849, n=112, últimos 2 anos) | |
| Aorus X9 DT | |
| Média NVIDIA GeForce GTX 1070 Mobile (15718 - 19059, n=56) | |
| HP Omen 17t-3AW55AV_1 | |
| MSI GS73 Stealth 8RF-011 | |
| Schenker XMG Neo 15 | |
| Asus ROG Strix GL702ZC-GC204T | |
| HP Omen 15-dc0001ng | |
| HP Spectre x360 15-ch000 | |
| 3DMark 11 Performance | 17921 pontos | |
| 3DMark Cloud Gate Standard Score | 37519 pontos | |
| 3DMark Fire Strike Score | 14335 pontos | |
Ajuda | ||
| The Witcher 3 | |
| 1920x1080 High Graphics & Postprocessing (Nvidia HairWorks Off) | |
| Média da turma Gaming (341 - 404, n=2, últimos 2 anos) | |
| Aorus X9 DT | |
| Asus G752VS-BA338T | |
| MSI GE73 8RF-008 Raider RGB | |
| Média NVIDIA GeForce GTX 1070 Mobile (83 - 123, n=30) | |
| Acer Predator 17 G9-793-70PJ | |
| HP Omen 17t-3AW55AV_1 | |
| 1920x1080 Ultra Graphics & Postprocessing (HBAO+) | |
| Média da turma Gaming (104.7 - 240, n=7, últimos 2 anos) | |
| Alienware 17 R4 | |
| Aorus X9 DT | |
| HP Omen X 17-ap0xx | |
| MSI GE73 8RF-008 Raider RGB | |
| Asus G752VS-BA338T | |
| Acer Predator 17 G9-793-70PJ | |
| Média NVIDIA GeForce GTX 1070 Mobile (48.2 - 68.4, n=41) | |
| HP Omen 17t-3AW55AV_1 | |
| Eurocom Q8 | |
| Rise of the Tomb Raider | |
| 1920x1080 High Preset AA:FX AF:4x | |
| Asus G752VS-BA338T | |
| Média NVIDIA GeForce GTX 1070 Mobile (83.2 - 118.8, n=18) | |
| HP Omen 17t-3AW55AV_1 | |
| 1920x1080 Very High Preset AA:FX AF:16x | |
| Alienware 17 R4 | |
| HP Omen X 17-ap0xx | |
| Asus G752VS-BA338T | |
| EVGA SC17 GTX 1070 | |
| Média NVIDIA GeForce GTX 1070 Mobile (79.1 - 102.5, n=25) | |
| HP Omen 17t-3AW55AV_1 | |
| baixo | média | alto | ultra | 4K | |
|---|---|---|---|---|---|
| The Witcher 3 (2015) | 268 | 191 | 83 | 57 | |
| Rise of the Tomb Raider (2016) | 253 | 174 | 103 | 87 | |
| Rocket League (2017) | 250 | 250 | 231 | 173 | |
| Middle-earth: Shadow of War (2017) | 186 | 127 | 98 | 76 | |
| Final Fantasy XV Benchmark (2018) | 140 | 82 | 63 |
Barulho
| Ocioso |
| 31.1 / 31.1 / 35 dB |
| Carga |
| 42 / 46.5 dB |
 | ||
30 dB silencioso 40 dB(A) audível 50 dB(A) ruidosamente alto |
||
min: | ||
| HP Omen 17t-3AW55AV_1 GeForce GTX 1070 Mobile, i7-8750H, Samsung SSD PM981 MZVLB512HAJQ | Alienware 17 R4 GeForce GTX 1080 Mobile, i7-7820HK, SK Hynix PC300 NVMe 512 GB | EVGA SC17 GTX 1070 GeForce GTX 1070 Mobile, 6820HK, Samsung SM951 MZVPV256 m.2 | Acer Predator 17 G9-793-70PJ GeForce GTX 1070 Mobile, i7-7700HQ, Toshiba NVMe THNSN5512GPU7 | Asus G752VS-BA338T GeForce GTX 1070 Mobile, i7-7700HQ, Samsung SM961 MZVKW512HMJP m.2 PCI-e | Eurocom Q8 GeForce GTX 1070 Mobile, i9-8950HK, Samsung SSD 960 Pro 512 GB m.2 | MSI GE73 8RF-008 Raider RGB GeForce GTX 1070 Mobile, i7-8750H, Toshiba HG6 THNSNJ256G8NY | Aorus X9 DT GeForce GTX 1080 Mobile, i9-8950HK, Transcend TS1TMTE850 | |
|---|---|---|---|---|---|---|---|---|
| Noise | -10% | -7% | -6% | -2% | -3% | -6% | -21% | |
| desligado / ambiente * (dB) | 27.8 | 28.2 -1% | 29.2 -5% | 31 -12% | 30 -8% | 28 -1% | 30 -8% | 30 -8% |
| Idle Minimum * (dB) | 31.1 | 35.6 -14% | 33.9 -9% | 32 -3% | 30 4% | 28.2 9% | 32 -3% | 36 -16% |
| Idle Average * (dB) | 31.1 | 35.6 -14% | 33.9 -9% | 35 -13% | 32 -3% | 31.8 -2% | 33 -6% | 37 -19% |
| Idle Maximum * (dB) | 35 | 35.7 -2% | 33.9 3% | 38 -9% | 36 -3% | 36.3 -4% | 34 3% | 43 -23% |
| Load Average * (dB) | 42 | 50.2 -20% | 43.8 -4% | 42 -0% | 43 -2% | 46.7 -11% | 41 2% | 50 -19% |
| Witcher 3 ultra * (dB) | 44.5 | 50.2 -13% | 44 1% | 43 3% | 46.9 -5% | 50 -12% | 57 -28% | |
| Load Maximum * (dB) | 46.5 | 50.2 -8% | 53.4 -15% | 50 -8% | 49 -5% | 49.7 -7% | 54 -16% | 61 -31% |
* ... menor é melhor
(±) A temperatura máxima no lado superior é 44.2 °C / 112 F, em comparação com a média de 40.4 °C / 105 F , variando de 21.2 a 68.8 °C para a classe Gaming.
(-) A parte inferior aquece até um máximo de 55.8 °C / 132 F, em comparação com a média de 43.2 °C / 110 F
(+) Em uso inativo, a temperatura média para o lado superior é 28.5 °C / 83 F, em comparação com a média do dispositivo de 33.9 °C / ### class_avg_f### F.
(±) Jogando The Witcher 3, a temperatura média para o lado superior é 32.9 °C / 91 F, em comparação com a média do dispositivo de 33.9 °C / ## #class_avg_f### F.
(+) Os apoios para as mãos e o touchpad são mais frios que a temperatura da pele, com um máximo de 28.2 °C / 82.8 F e, portanto, são frios ao toque.
(±) A temperatura média da área do apoio para as mãos de dispositivos semelhantes foi 28.8 °C / 83.8 F (+0.6 °C / 1 F).
| HP Omen 17t-3AW55AV_1 GeForce GTX 1070 Mobile, i7-8750H, Samsung SSD PM981 MZVLB512HAJQ | Alienware 17 R4 GeForce GTX 1080 Mobile, i7-7820HK, SK Hynix PC300 NVMe 512 GB | EVGA SC17 GTX 1070 GeForce GTX 1070 Mobile, 6820HK, Samsung SM951 MZVPV256 m.2 | Acer Predator 17 G9-793-70PJ GeForce GTX 1070 Mobile, i7-7700HQ, Toshiba NVMe THNSN5512GPU7 | Asus G752VS-BA338T GeForce GTX 1070 Mobile, i7-7700HQ, Samsung SM961 MZVKW512HMJP m.2 PCI-e | Eurocom Q8 GeForce GTX 1070 Mobile, i9-8950HK, Samsung SSD 960 Pro 512 GB m.2 | MSI GE73 8RF-008 Raider RGB GeForce GTX 1070 Mobile, i7-8750H, Toshiba HG6 THNSNJ256G8NY | Aorus X9 DT GeForce GTX 1080 Mobile, i9-8950HK, Transcend TS1TMTE850 | |
|---|---|---|---|---|---|---|---|---|
| Heat | 3% | 7% | 19% | 17% | 5% | 2% | 9% | |
| Maximum Upper Side * (°C) | 44.2 | 49.6 -12% | 47.6 -8% | 39.1 12% | 41 7% | 43.4 2% | 47 -6% | 43 3% |
| Maximum Bottom * (°C) | 55.8 | 56 -0% | 53.2 5% | 42.1 25% | 39.3 30% | 44 21% | 49 12% | 55 1% |
| Idle Upper Side * (°C) | 31.6 | 29.6 6% | 28.2 11% | 27.9 12% | 28.8 9% | 32.8 -4% | 32 -1% | 27 15% |
| Idle Bottom * (°C) | 35 | 29.2 17% | 28.6 18% | 26.1 25% | 27.3 22% | 34.2 2% | 34 3% | 29 17% |
* ... menor é melhor
HP Omen 17t-3AW55AV_1 análise de áudio
(±) | o volume do alto-falante é médio, mas bom (###valor### dB)
Graves 100 - 315Hz
(-) | quase nenhum baixo - em média 17.6% menor que a mediana
(±) | a linearidade dos graves é média (14.3% delta para a frequência anterior)
Médios 400 - 2.000 Hz
(+) | médios equilibrados - apenas 2% longe da mediana
(+) | médios são lineares (5.2% delta para frequência anterior)
Altos 2 - 16 kHz
(+) | agudos equilibrados - apenas 2.4% longe da mediana
(+) | os máximos são lineares (6.5% delta da frequência anterior)
Geral 100 - 16.000 Hz
(±) | a linearidade do som geral é média (16% diferença em relação à mediana)
Comparado com a mesma classe
» 39% de todos os dispositivos testados nesta classe foram melhores, 6% semelhantes, 55% piores
» O melhor teve um delta de 6%, a média foi 18%, o pior foi 132%
Comparado com todos os dispositivos testados
» 25% de todos os dispositivos testados foram melhores, 5% semelhantes, 69% piores
» O melhor teve um delta de 4%, a média foi 23%, o pior foi 134%
MSI GE73 8RF-008 Raider RGB análise de áudio
(+) | os alto-falantes podem tocar relativamente alto (###valor### dB)
Graves 100 - 315Hz
(±) | graves reduzidos - em média 7% menor que a mediana
(±) | a linearidade dos graves é média (8.1% delta para a frequência anterior)
Médios 400 - 2.000 Hz
(+) | médios equilibrados - apenas 4.8% longe da mediana
(±) | a linearidade dos médios é média (7.1% delta para frequência anterior)
Altos 2 - 16 kHz
(+) | agudos equilibrados - apenas 3.6% longe da mediana
(+) | os máximos são lineares (4.6% delta da frequência anterior)
Geral 100 - 16.000 Hz
(+) | o som geral é linear (10.2% diferença em relação à mediana)
Comparado com a mesma classe
» 5% de todos os dispositivos testados nesta classe foram melhores, 2% semelhantes, 93% piores
» O melhor teve um delta de 6%, a média foi 18%, o pior foi 132%
Comparado com todos os dispositivos testados
» 5% de todos os dispositivos testados foram melhores, 1% semelhantes, 94% piores
» O melhor teve um delta de 4%, a média foi 23%, o pior foi 134%
| desligado | |
| Ocioso | |
| Carga |
|
Key:
min: | |
| HP Omen 17t-3AW55AV_1 i7-8750H, GeForce GTX 1070 Mobile, Samsung SSD PM981 MZVLB512HAJQ, IPS, 1920x1080, 17.3" | EVGA SC17 GTX 1070 6820HK, GeForce GTX 1070 Mobile, Samsung SM951 MZVPV256 m.2, IPS, 3840x2160, 17.3" | Acer Predator 17 G9-793-70PJ i7-7700HQ, GeForce GTX 1070 Mobile, Toshiba NVMe THNSN5512GPU7, IPS, 3840x2160, 17.3" | Asus G752VS-BA338T i7-7700HQ, GeForce GTX 1070 Mobile, Samsung SM961 MZVKW512HMJP m.2 PCI-e, IPS, 1920x1080, 17.3" | Eurocom Q8 i9-8950HK, GeForce GTX 1070 Mobile, Samsung SSD 960 Pro 512 GB m.2, TN LED, 2560x1440, 17.3" | MSI GE73 8RF-008 Raider RGB i7-8750H, GeForce GTX 1070 Mobile, Toshiba HG6 THNSNJ256G8NY, TN WLED, 1920x1080, 17.3" | Alienware 17 R4 i7-7820HK, GeForce GTX 1080 Mobile, SK Hynix PC300 NVMe 512 GB, TN LED, 2560x1440, 17.3" | HP Omen X 17-ap0xx i7-7820HK, GeForce GTX 1080 Mobile, Samsung PM961 MZVLW256HEHP, IPS, 1920x1080, 17.3" | |
|---|---|---|---|---|---|---|---|---|
| Power Consumption | -37% | -19% | -4% | -10% | 2% | -44% | -8% | |
| Idle Minimum * (Watt) | 17.8 | 27.3 -53% | 23 -29% | 21 -18% | 26.3 -48% | 15 16% | 37.5 -111% | 21.6 -21% |
| Idle Average * (Watt) | 24.7 | 34.9 -41% | 33 -34% | 27 -9% | 29 -17% | 20 19% | 37.6 -52% | 26.4 -7% |
| Idle Maximum * (Watt) | 29.6 | 37.6 -27% | 40 -35% | 32 -8% | 32.3 -9% | 26 12% | 37.6 -27% | 26.6 10% |
| Load Average * (Watt) | 110 | 164.4 -49% | 94 15% | 86 22% | 82.4 25% | 97 12% | 122.4 -11% | 95.6 13% |
| Witcher 3 ultra * (Watt) | 167.8 | 177 -5% | 165 2% | 192 -14% | 186 -11% | 180.3 -7% | 221.7 -32% | |
| Load Maximum * (Watt) | 178.6 | 202.5 -13% | 228 -28% | 206 -15% | 170.2 5% | 239 -34% | 277.4 -55% | 199.6 -12% |
* ... menor é melhor
| HP Omen 17t-3AW55AV_1 i7-8750H, GeForce GTX 1070 Mobile, 86 Wh | EVGA SC17 GTX 1070 6820HK, GeForce GTX 1070 Mobile, 74.48 Wh | Acer Predator 17 G9-793-70PJ i7-7700HQ, GeForce GTX 1070 Mobile, 88 Wh | Asus G752VS-BA338T i7-7700HQ, GeForce GTX 1070 Mobile, 90 Wh | Eurocom Q8 i9-8950HK, GeForce GTX 1070 Mobile, 66 Wh | MSI GE73 8RF-008 Raider RGB i7-8750H, GeForce GTX 1070 Mobile, 51 Wh | Alienware 17 R4 i7-7820HK, GeForce GTX 1080 Mobile, 99 Wh | HP Omen X 17-ap0xx i7-7820HK, GeForce GTX 1080 Mobile, 99 Wh | Aorus X9 DT i9-8950HK, GeForce GTX 1080 Mobile, 94.24 Wh | |
|---|---|---|---|---|---|---|---|---|---|
| Duração da bateria | -30% | 0% | 27% | -38% | -25% | -17% | 29% | -17% | |
| Reader / Idle (h) | 4.5 | 4 -11% | 5.4 20% | 7.4 64% | 5.1 13% | 4.6 2% | 5.8 29% | 4.2 -7% | |
| WiFi v1.3 (h) | 4.2 | 2.7 -36% | 3.6 -14% | 4.9 17% | 2.6 -38% | 3.1 -26% | 3 -29% | 5.6 33% | 3.2 -24% |
| Load (h) | 1.6 | 0.9 -44% | 1.5 -6% | 1.6 0% | 0.6 -63% | 1.2 -25% | 2 25% | 1.3 -19% |
Pro
Contra

A história do Omen 17t é de equilíbrio. Os componentes da máquina complementam-se bem, resultando em um excelente pacote com pouco espaço para reclamações. A tela é brilhante com boa reprodução de cores. A poderosa CPU e GPU estão bem ajustadas para jogos em Full HD. O teclado e a qualidade de construção são excelentes e a seleção de portas é ampla. Para completar, o gerenciamento de calor e do ruído do ventilador estão acima da média para esta categoria.
O recurso de destaque aqui é o painel de 144 Hz. As telas de alta taxa de atualização, que eram comumente relegados a portáteis caros no passado, estão lentamente se infiltrando em dispositivos de preço mais baixo, e o Omen 17t é um excelente exemplo da qualidade que pode ser obtida a esse preço. Embora o Omen 17t não seja, de modo algum, um "portátil econômico", seu preço é mais agressivo do que a maioria de seus concorrentes, especialmente aqueles que exibem uma tela com taxa de atualização alta.
O Omen 17t tem algumas fraquezas. Em particular, a duração da bateria é fraca (devido à falta de Optimus) e os alto-falantes são repugnantes (graças ao ruído desagradável em volumes mais altos). Além disso, a unidade de inicialização PM981 da Samsung exibe um comportamento estranho, mas isso pode ser específico da nossa unidade. A HP também errou ao não usar o espaço adicional disponibilizado pela remoção da unidade óptica. No entanto, todas essas desvantagens não são críticas para um portátil de jogos.
Em suma, o HP Omen 17t é um pacote bem construído que ter sido cuidadosamente projetado. A tela de 144 Hz é um bom recurso nesta faixa de preço, e os componentes internos são (principalmente) capazes de aproveitar a maior taxa de atualização e o G-Sync. O Omen 17t é um bom exemplo de um portátil de jogos "poli funcional, mestre de alguns", e seu preço competitivo faz com que valha a pena considerá-lo.
HP Omen 17t-3AW55AV_1
- 08/21/2018 v6 (old)
Sam Medley
Price comparison
