 Deutsch
 English
 Español
 Français
 Italiano
 Nederlands
 Polski
 Português
 Русский
 Türkçe
 Svenska
 Chinese
 Magyar
Breve Análise do Workstation Fujitsu Celsius H760


| SD Card Reader | |
| average JPG Copy Test (av. of 3 runs) | |
| Fujitsu Celsius H760 | |
| maximum AS SSD Seq Read Test (1GB) | |
| Fujitsu Celsius H760 | |
| Networking | |
| WiFi Speed Client 1m | |
| WiFi Speed Server 1m |
| |||||||||||||||||||||||||
iluminação: 82 %
iluminação com acumulador: 342 cd/m²
Contraste: 1003:1 (Preto: 0.34 cd/m²)
ΔE Color 3.8 | 0.5-29.43 Ø5
ΔE Greyscale 2 | 0.57-98 Ø5.3
88% sRGB (Calman 2D)
82.2% sRGB (Argyll 1.6.3 3D)
54% AdobeRGB 1998 (Argyll 1.6.3 3D)
60.3% AdobeRGB 1998 (Argyll 2.2.0 3D)
82.4% sRGB (Argyll 2.2.0 3D)
63.9% Display P3 (Argyll 2.2.0 3D)
Gamma: 2.17
| Fujitsu Celsius H760 LGD046F LP156WF6-SPP1, , 1920x1080, 15.60 | HP ZBook 15 G3 Samsung SDC5344, , 1920x1080, 15.60 | Lenovo ThinkPad P50 LP156WF6-SPK1, , 1920x1080, 15.60 | Dell Precision 7510 (4K IGZO) Sharp LQ156D1, , 3840x2160, 15.60 | |
|---|---|---|---|---|
| Display | 12% | -34% | 40% | |
| Display P3 Coverage | 63.9 | 66.8 5% | 39.13 -39% | 86.2 35% |
| sRGB Coverage | 82.4 | 95.5 16% | 58.5 -29% | 99.7 21% |
| AdobeRGB 1998 Coverage | 60.3 | 69 14% | 40.45 -33% | 99 64% |
| Response Times | -40% | -11% | -6% | |
| Response Time Grey 50% / Grey 80% * | 38 ? | 54 ? -42% | 46 ? -21% | 40.4 ? -6% |
| Response Time Black / White * | 26 ? | 35.6 ? -37% | 26 ? -0% | 27.6 ? -6% |
| PWM Frequency | 198 ? | 198.4 ? | ||
| Screen | -29% | -18% | 4% | |
| Brightness middle | 341 | 306 -10% | 263 -23% | 279.2 -18% |
| Brightness | 310 | 289 -7% | 236 -24% | 271 -13% |
| Brightness Distribution | 82 | 85 4% | 78 -5% | 83 1% |
| Black Level * | 0.34 | 0.34 -0% | 0.34 -0% | 0.266 22% |
| Contrast | 1003 | 900 -10% | 774 -23% | 1050 5% |
| Colorchecker dE 2000 * | 3.8 | 5.1 -34% | 2.35 38% | 4.14 -9% |
| Colorchecker dE 2000 max. * | 10.8 | 9.9 8% | 6.56 39% | |
| Greyscale dE 2000 * | 2 | 7.4 -270% | 3.33 -67% | 3.26 -63% |
| Gamma | 2.17 101% | 2.37 93% | 2.38 92% | 2.19 100% |
| CCT | 6581 99% | 7263 89% | 6917 94% | 6375 102% |
| Color Space (Percent of AdobeRGB 1998) | 54 | 63 17% | 37 -31% | 85.68 59% |
| Color Space (Percent of sRGB) | 82.2 | 95 16% | 58 -29% | 99.72 21% |
| Total Average (Program / Settings) | -19% /
-22% | -21% /
-20% | 13% /
10% |
* ... smaller is better
Display Response Times
| ↔ Response Time Black to White | ||
|---|---|---|
| 26 ms ... rise ↗ and fall ↘ combined | ↗ 7 ms rise | 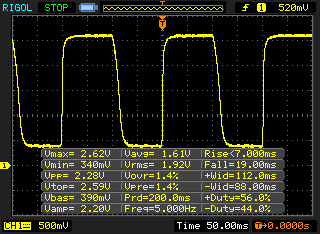 |
| ↘ 19 ms fall | ||
| The screen shows relatively slow response rates in our tests and may be too slow for gamers. In comparison, all tested devices range from 0.1 (minimum) to 240 (maximum) ms. » 57 % of all devices are better. This means that the measured response time is worse than the average of all tested devices (21.5 ms). | ||
| ↔ Response Time 50% Grey to 80% Grey | ||
| 38 ms ... rise ↗ and fall ↘ combined | ↗ 15 ms rise | 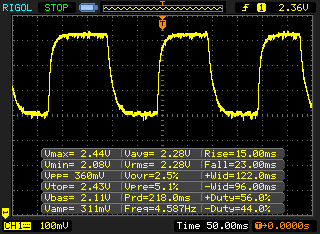 |
| ↘ 23 ms fall | ||
| The screen shows slow response rates in our tests and will be unsatisfactory for gamers. In comparison, all tested devices range from 0.2 (minimum) to 636 (maximum) ms. » 49 % of all devices are better. This means that the measured response time is worse than the average of all tested devices (33.7 ms). | ||
Screen Flickering / PWM (Pulse-Width Modulation)
| Screen flickering / PWM not detected | 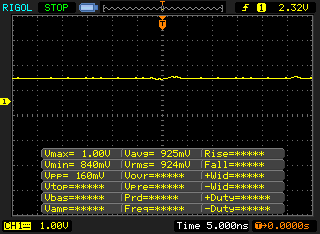 | ||
In comparison: 53 % of all tested devices do not use PWM to dim the display. If PWM was detected, an average of 17900 (minimum: 5 - maximum: 3846000) Hz was measured. | |||
| Cinebench R15 | |
| CPU Single 64Bit | |
| MSI WS60-6QJE316H11 | |
| Fujitsu Celsius H760 | |
| Lenovo ThinkPad P50 | |
| HP ZBook Studio G3 | |
| Dell Precision 3510 | |
| CPU Multi 64Bit | |
| Lenovo ThinkPad P50 | |
| Fujitsu Celsius H760 | |
| HP ZBook Studio G3 | |
| MSI WS60-6QJE316H11 | |
| Dell Precision 3510 | |
| Cinebench R11.5 | |
| CPU Single 64Bit | |
| Fujitsu Celsius H760 | |
| MSI WS60-6QJE316H11 | |
| Lenovo ThinkPad P50 | |
| HP ZBook Studio G3 | |
| Dell Precision 3510 | |
| CPU Multi 64Bit | |
| Lenovo ThinkPad P50 | |
| Fujitsu Celsius H760 | |
| HP ZBook Studio G3 | |
| MSI WS60-6QJE316H11 | |
| Dell Precision 3510 | |
| PCMark 8 | |
| Home Score Accelerated v2 | |
| Fujitsu Celsius H760 | |
| Lenovo ThinkPad P50 | |
| Dell Precision 7510 (4K IGZO) | |
| HP ZBook 15 G3 | |
| Creative Score Accelerated v2 | |
| Dell Precision 7510 (4K IGZO) | |
| HP ZBook 15 G3 | |
| Fujitsu Celsius H760 | |
| Lenovo ThinkPad P50 | |
| Work Score Accelerated v2 | |
| Fujitsu Celsius H760 | |
| HP ZBook 15 G3 | |
| Lenovo ThinkPad P50 | |
| Dell Precision 7510 (4K IGZO) | |
| Fujitsu Celsius H760 Samsung SM951 MZVPV512 m.2 PCI-e | Dell Precision 7510 (4K IGZO) Samsung SSD SM951a 512GB M.2 PCIe 3.0 x4 NVMe (MZVKV512) | Lenovo ThinkPad P50 Samsung SSD PM871 MZNLN256HCHP | HP ZBook Studio G3 Samsung SM951 MZVPV512HDGL m.2 PCI-e | Dell Precision 5510 SK hynix SC920 512 GB | MSI WS60 6QJ-535VPL 2x Plextor PX512M6GV-2280 (RAID 0) | |
|---|---|---|---|---|---|---|
| AS SSD | 3% | -69% | -10% | -515% | -48% | |
| Copy Game MB/s | 978 | 1045 7% | 206.7 -79% | 1104 13% | 349 -64% | |
| Copy Program MB/s | 571 | 480.1 -16% | 171.3 -70% | 593 4% | 221 -61% | |
| Copy ISO MB/s | 1325 | 1391 5% | 269.3 -80% | 1280 -3% | 387 -71% | |
| Access Time Read * | 0.036 | 0.036 -0% | 0.058 -61% | 0.046 -28% | 0.111 -208% | 0.054 -50% |
| Access Time Write * | 0.018 | 0.025 -39% | 0.038 -111% | 0.025 -39% | 0.74 -4011% | 0.041 -128% |
| 4K-64 Read | 801 | 1067 33% | 381.2 -52% | 1050 31% | 327 -59% | 437.1 -45% |
| 4K-64 Write | 285 | 375.7 32% | 258.3 -9% | 230.6 -19% | 257 -10% | 375.8 32% |
| Seq Read | 1916 | 1953 2% | 515 -73% | 1713 -11% | 474 -75% | 880 -54% |
| Seq Write | 1492 | 1484 -1% | 272.8 -82% | 947 -37% | 389 -74% | 821 -45% |
* ... smaller is better

| 3DMark | |
| 1280x720 Cloud Gate Standard Graphics | |
| Lenovo ThinkPad P50 | |
| Fujitsu Celsius H760 | |
| HP ZBook 15 G3 | |
| Dell Precision 7510 (4K IGZO) | |
| 1920x1080 Fire Strike Graphics | |
| Dell Precision 7510 (4K IGZO) | |
| Lenovo ThinkPad P50 | |
| HP ZBook 15 G3 | |
| Fujitsu Celsius H760 | |
| LuxMark v2.0 64Bit | |
| Sala GPUs-only | |
| HP ZBook 15 G3 | |
| Lenovo ThinkPad P50 | |
| Fujitsu Celsius H760 | |
| Room GPUs-only | |
| HP ZBook 15 G3 | |
| Lenovo ThinkPad P50 | |
| Fujitsu Celsius H760 | |
| Cinebench R11.5 - OpenGL 64Bit | |
| Fujitsu Celsius H760 | |
| HP ZBook 15 G3 | |
| Dell Precision 7510 (4K IGZO) | |
| Lenovo ThinkPad P50 | |
| 3DMark Ice Storm Standard Score | 90607 pontos | |
| 3DMark Cloud Gate Standard Score | 18192 pontos | |
| 3DMark Fire Strike Score | 3794 pontos | |
Ajuda | ||
| baixo | média | alto | ultra | |
| Metro: Last Light (2013) | 118.9 | 94.8 | 55.3 | 29.5 |
| Dirt Rally (2015) | 272 | 136 | 76 | 33 |
| The Witcher 3 (2015) | 68 | 49 | 22 | 15 |
Barulho
| Ocioso |
| 29 / 29 / 29 dB |
| HDD |
| 29 dB |
| Carga |
| 43.1 / 49.2 dB |
 | ||
30 dB silencioso 40 dB(A) audível 50 dB(A) ruidosamente alto |
||
min: | ||
(+) The maximum temperature on the upper side is 38.5 °C / 101 F, compared to the average of 38.1 °C / 101 F, ranging from 22.2 to 69.8 °C for the class Workstation.
(±) The bottom heats up to a maximum of 42.8 °C / 109 F, compared to the average of 41.3 °C / 106 F
(+) In idle usage, the average temperature for the upper side is 30 °C / 86 F, compared to the device average of 32 °C / 90 F.
(+) The palmrests and touchpad are reaching skin temperature as a maximum (32.1 °C / 89.8 F) and are therefore not hot.
(-) The average temperature of the palmrest area of similar devices was 27.8 °C / 82 F (-4.3 °C / -7.8 F).
| desligado | |
| Ocioso | |
| Carga |
|
| Fujitsu Celsius H760 E3-1505M v5, Quadro M2000M, Samsung SM951 MZVPV512 m.2 PCI-e, IPS LED, 1920x1080, 15.60 | Dell Precision 7510 (4K IGZO) E3-1535M v5, Quadro M2000M, Samsung SSD SM951a 512GB M.2 PCIe 3.0 x4 NVMe (MZVKV512), IGZO IPS, 3840x2160, 15.60 | HP ZBook 15 G3 E3-1505M v5, Quadro M2000M, Samsung SM951 MZVPV512HDGL m.2 PCI-e, UWVA-IPS, 1920x1080, 15.60 | Lenovo ThinkPad P50 6820HQ, Quadro M2000M, Samsung SSD PM871 MZNLN256HCHP, IPS, 1920x1080, 15.60 | Dell Precision 3510 6700HQ, FirePro W5130M, Samsung SM951 MZVPV256HDGL m.2 PCI-e, TN LED, 1366x768, 15.60 | |
|---|---|---|---|---|---|
| Power Consumption | -103% | 5% | 21% | 36% | |
| Idle Minimum * | 7.7 | 23.9 -210% | 5.7 26% | 5.6 27% | 4.2 45% |
| Idle Average * | 11.8 | 28.9 -145% | 12.2 -3% | 8.6 27% | 6.5 45% |
| Idle Maximum * | 12.9 | 30 -133% | 12.6 2% | 9.3 28% | 7.1 45% |
| Load Average * | 90.2 | 95.2 -6% | 83.1 8% | 89.5 1% | 74.6 17% |
| Load Maximum * | 130.8 | 157.1 -20% | 138.2 -6% | 105 20% | 92.2 30% |
* ... smaller is better
| Fujitsu Celsius H760 E3-1505M v5, Quadro M2000M, 72 Wh | Dell Precision 7510 (4K IGZO) E3-1535M v5, Quadro M2000M, 91 Wh | HP ZBook 15 G3 E3-1505M v5, Quadro M2000M, 90 Wh | Lenovo ThinkPad P50 6820HQ, Quadro M2000M, 90 Wh | Dell Precision 3510 6700HQ, FirePro W5130M, 84 Wh | |
|---|---|---|---|---|---|
| Battery Runtime | -38% | 33% | 52% | 79% | |
| Reader / Idle | 557 | 268 -52% | 822 48% | 860 54% | 1168 110% |
| H.264 | 273 | 449 64% | 533 95% | 605 122% | |
| WiFi v1.3 | 333 | 239 -28% | 386 16% | 498 50% | 591 77% |
| Load | 106 | 70 -34% | 110 4% | 113 7% | 111 5% |
Pro
Contra
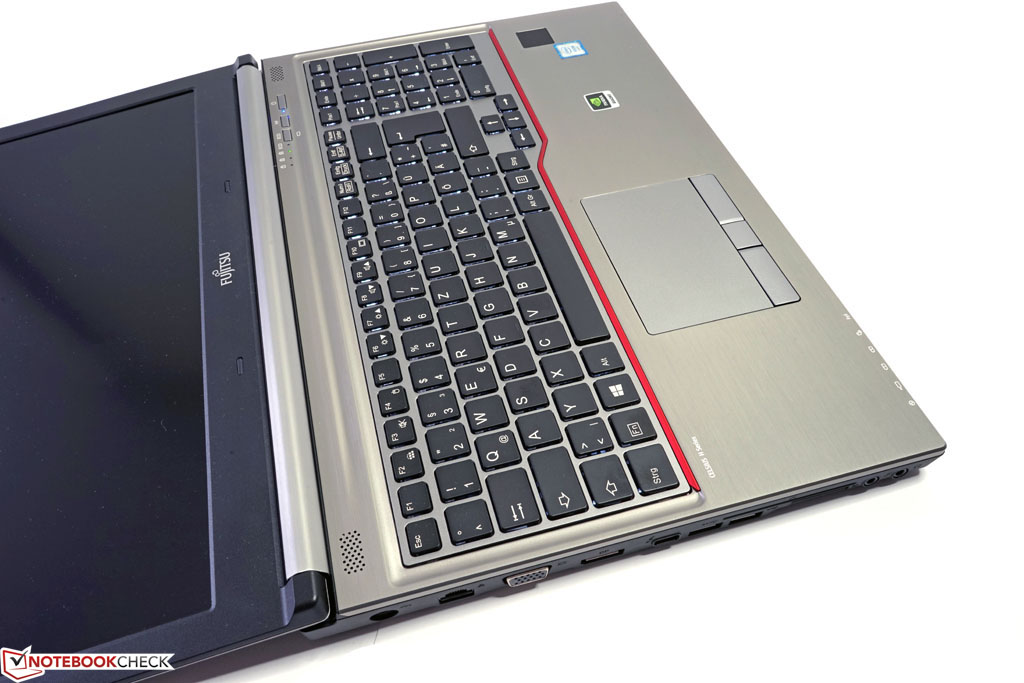
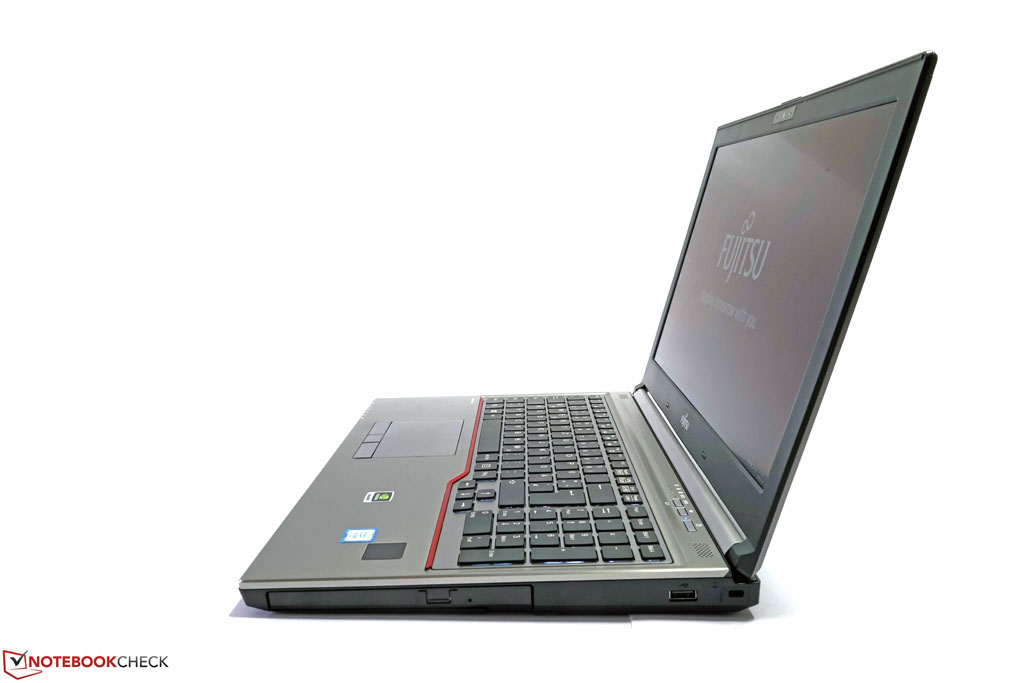
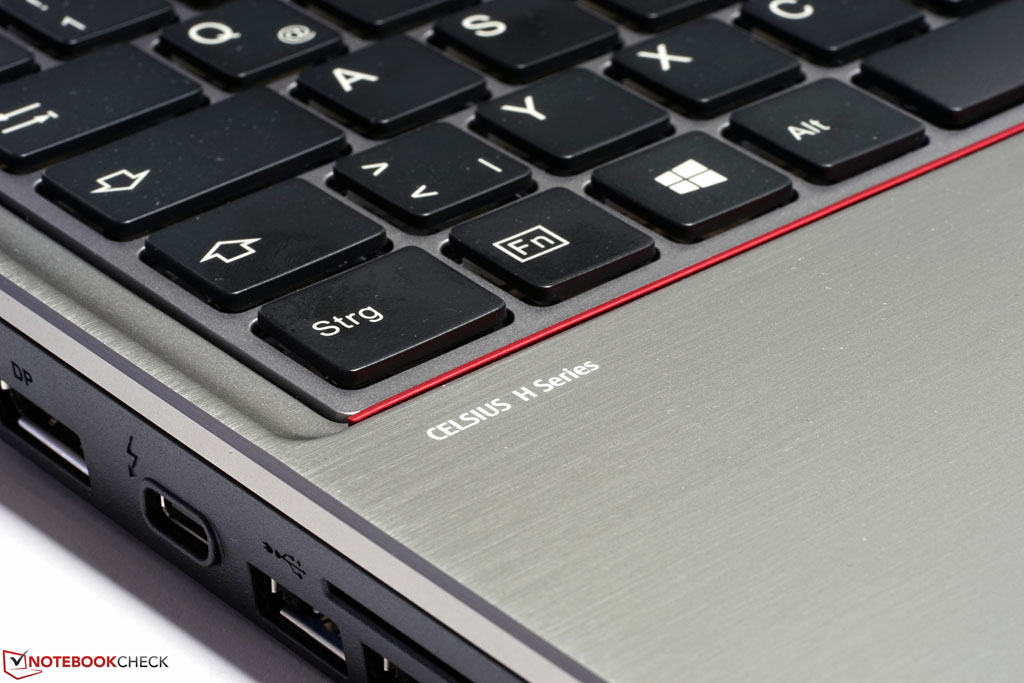
O Fujitsu Celsius H760 é um avanço lógico do anterior Celsius H740 e convence em quase todas as seções. O chassi é rígido, bem construído, e o design também não é tão ruim.
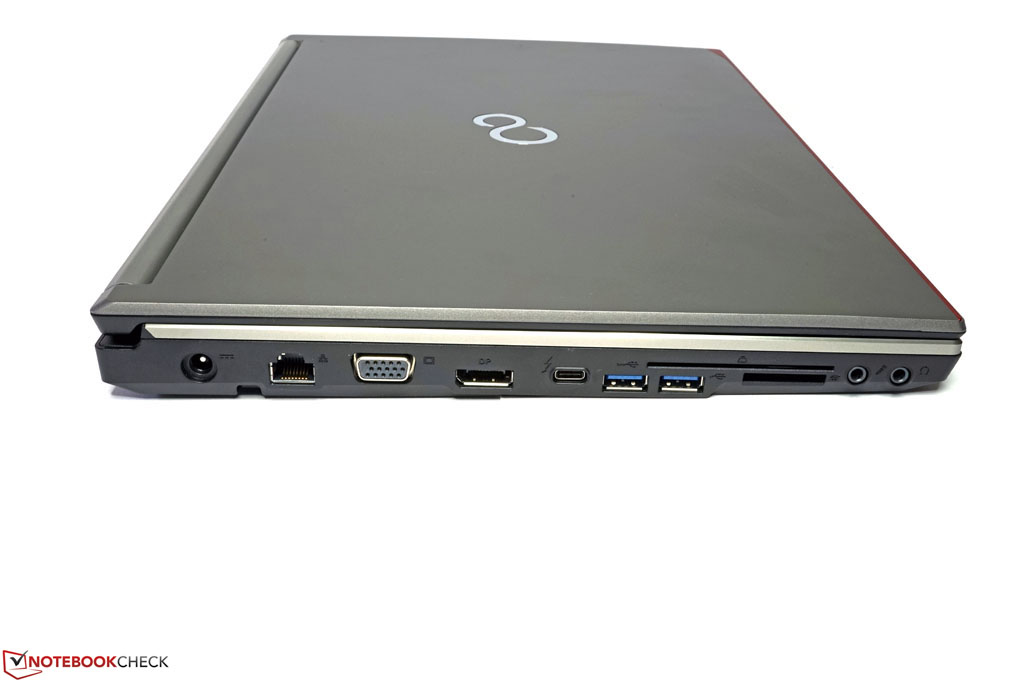
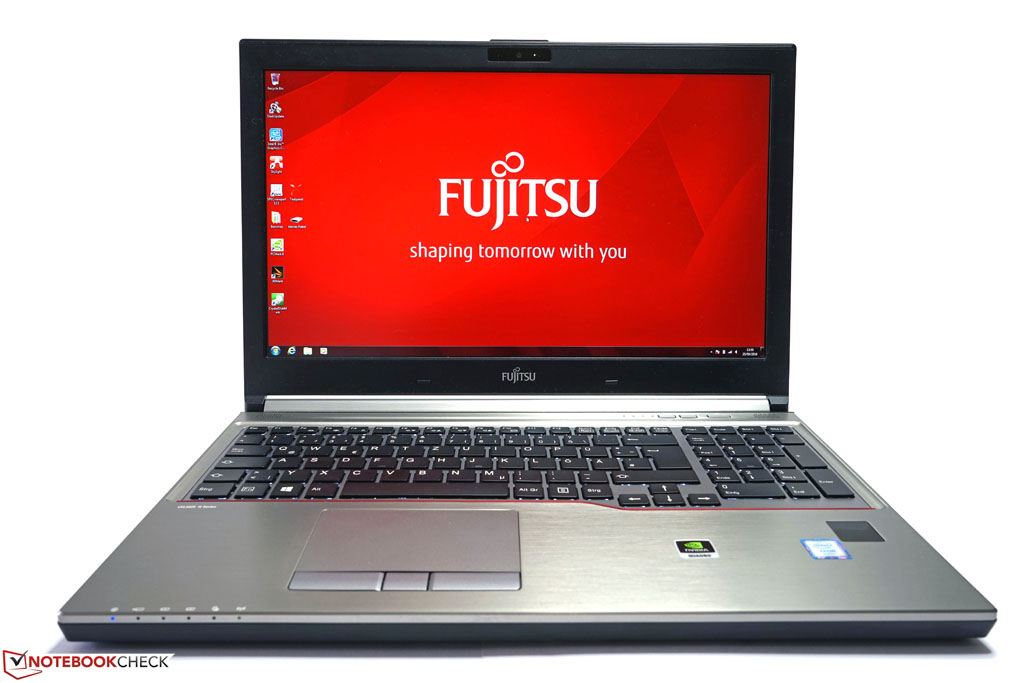
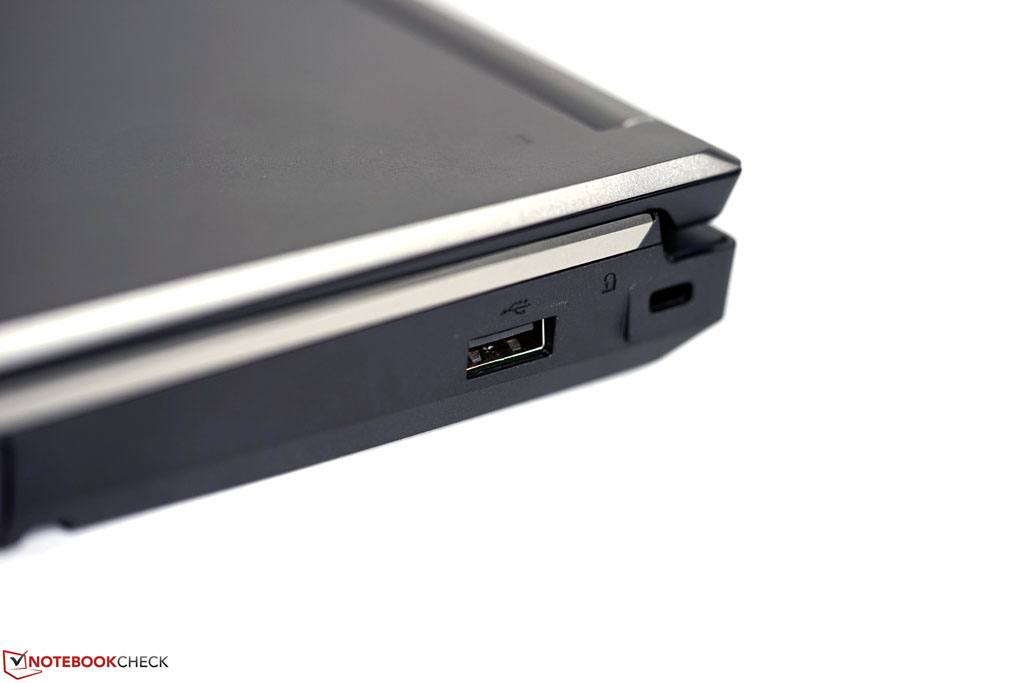
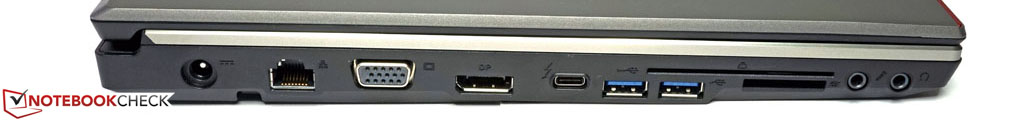
Sob o capô, gostamos das portas atualizadas, as configurações flexíveis e o nível de desempenho adequado.
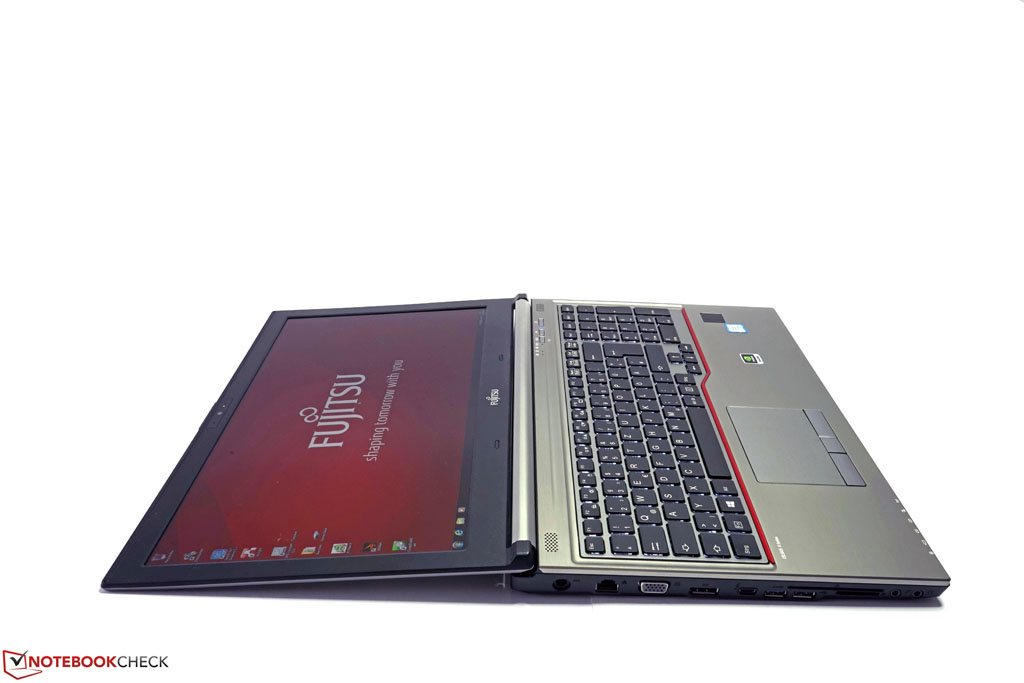
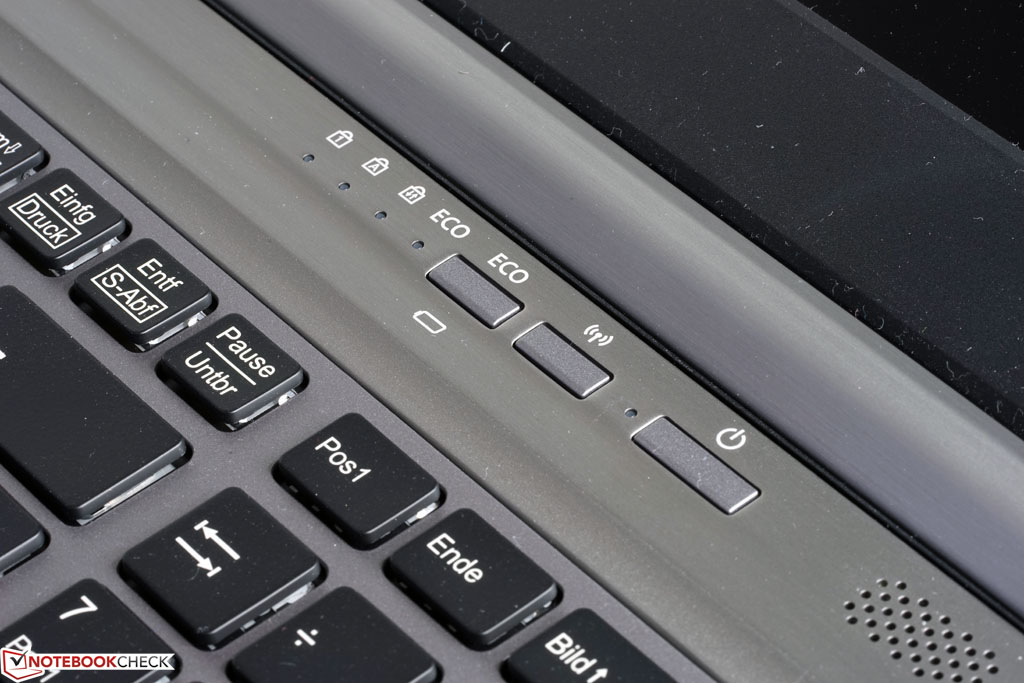
Que você não tenha que renunciar a quaisquer recursos tipicamente empresarial com esta ferramenta poderosa, é claro, é uma questão não dita neste segmento exclusivo de workstations. Um conjunto completo de recursos de segurança, bons dispositivos de entrada e a garantia opcional e opções de serviços completam a impressão geral muito boa.
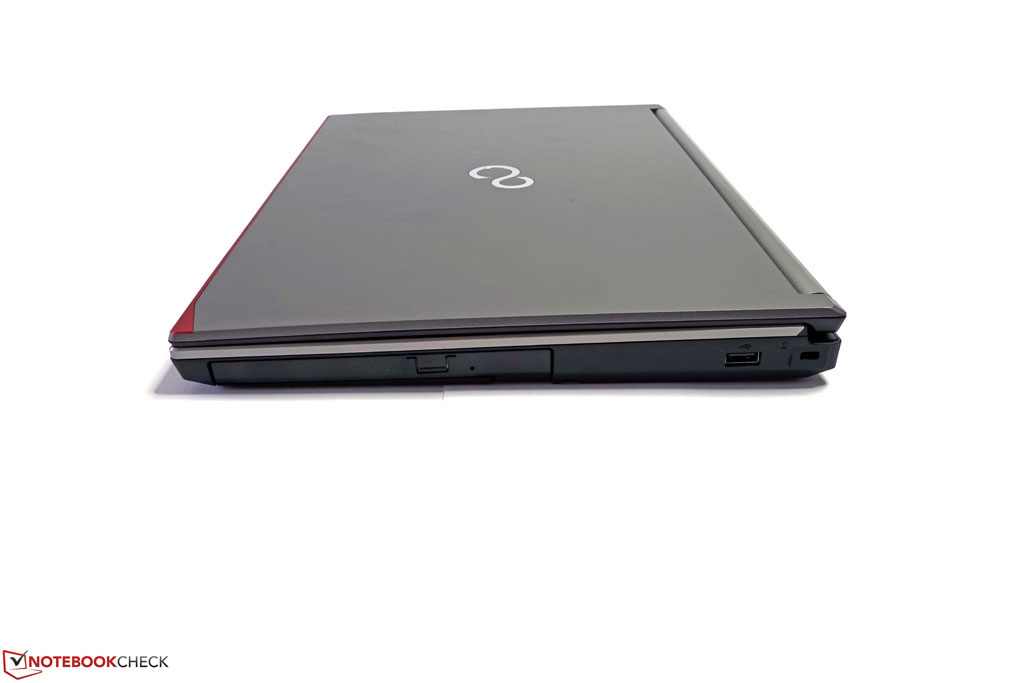
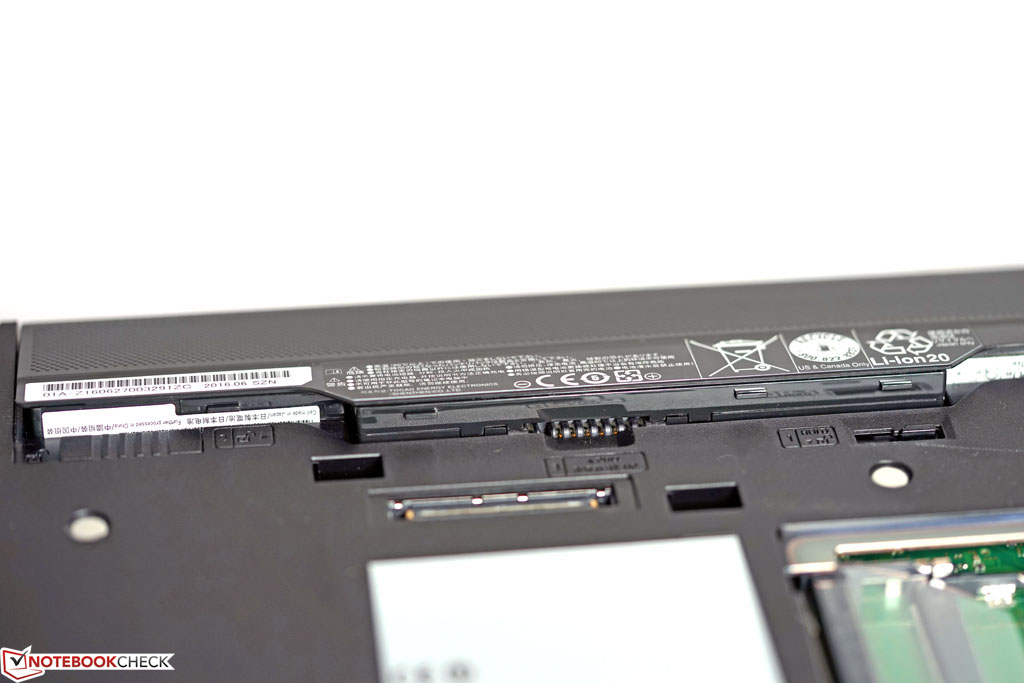
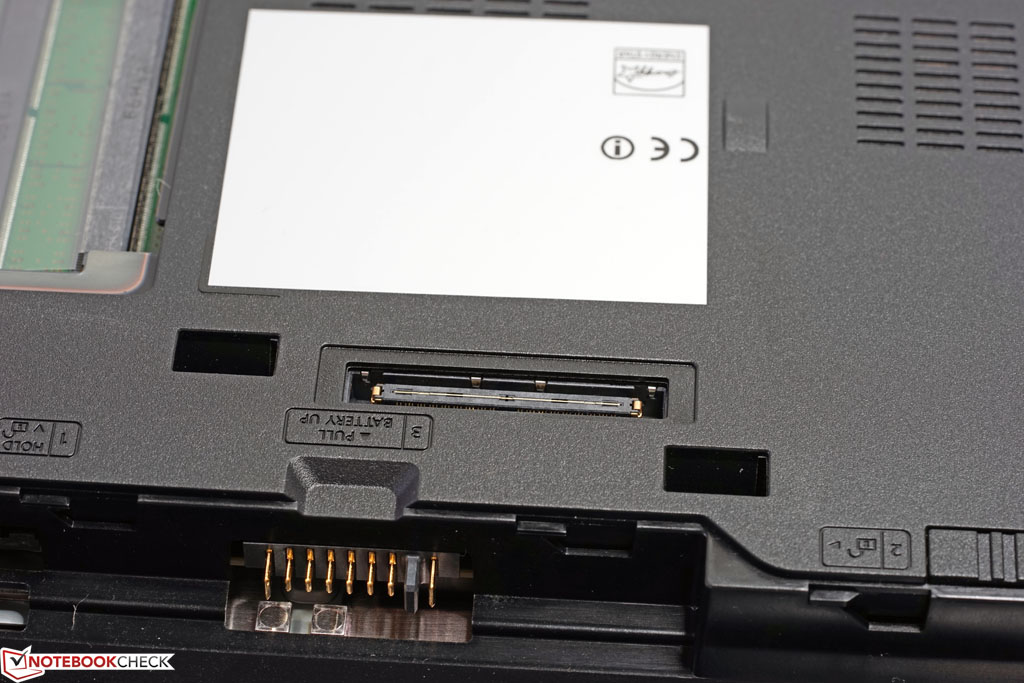
A pequena, mas importante cereja no topo do bolo é a baia modular integrada. Graças aos módulos correspondentes, você recebe mais flexibilidade, o que pode fazer uma importante diferença em comparação com alguns dos rivais.
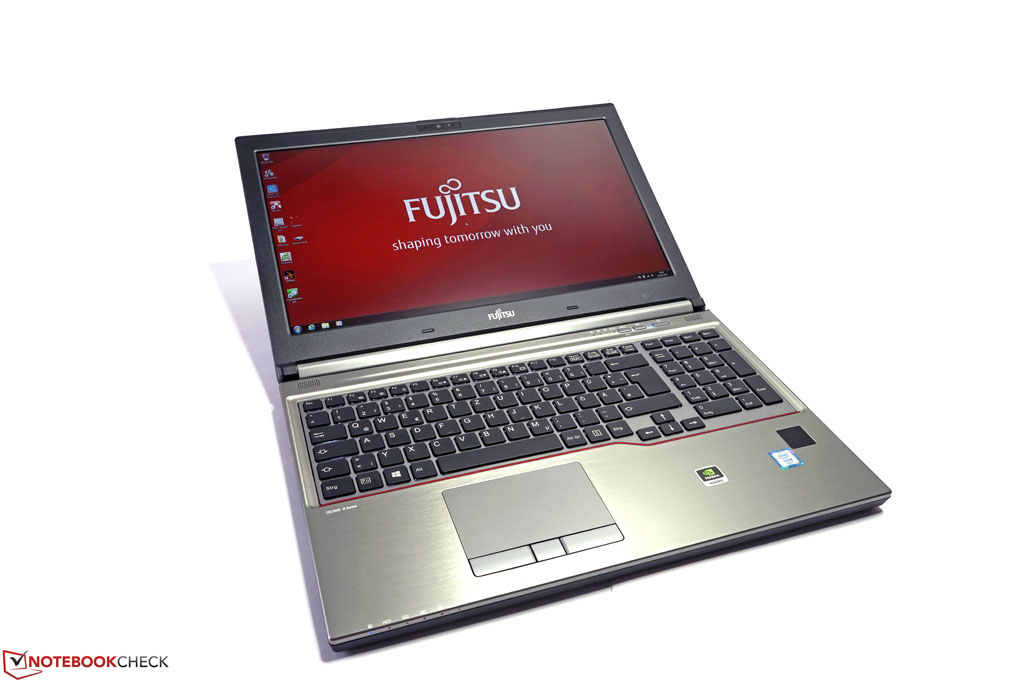
Embora você poderia viver com uma webcam de qualidade média, o alto ruído sob carga máxima e o afogamento do desempenho utilizando a energia da bateria, a tela Full HD testada provavelmente será o maior problema. É uma boa tela IPS com amplos ângulos de visão, mas não combina muito com esta categoria cara de aparelhos. A gama de cores, precisão de cores e a grade notória afetam o bom desempenho e evitam o uso em cenários profissionais onde são precisas cores precisas.
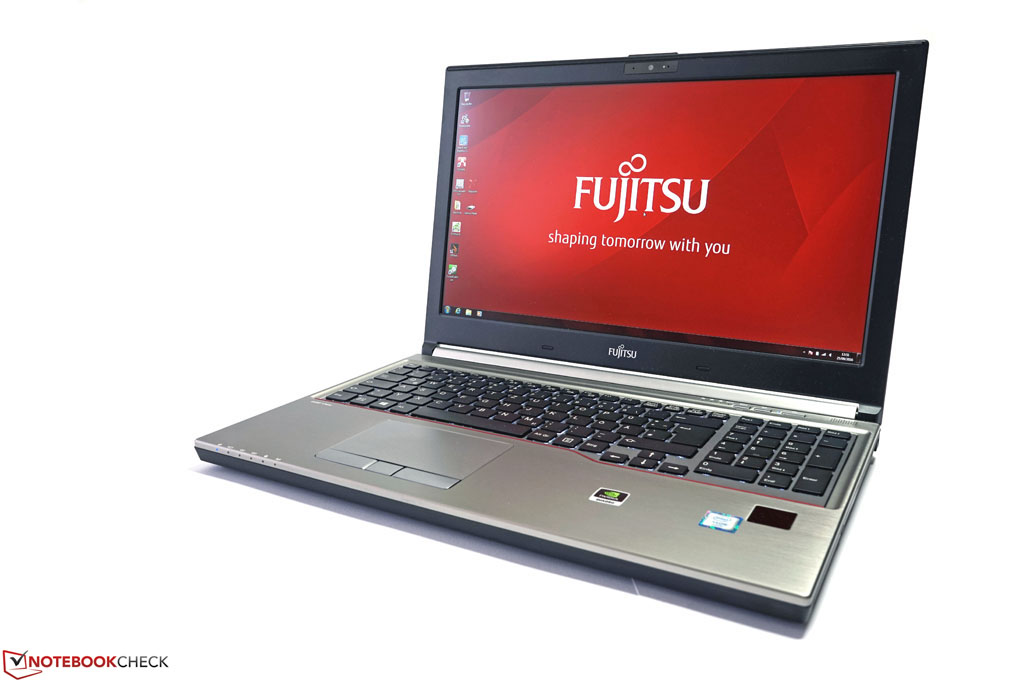
Em resumo, os workstations móveis Fujitsu Celsius H760 são uma bela alternativa para concorrentes similares, e também pode ser um pacote com preço atraente, dependendo da configuração.
Fujitsu Celsius H760
-
10/12/2016 v5.1(old)
Tobias Winkler
Pricecompare
