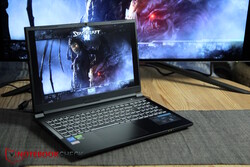
Análise do laptop Medion Erazer Crawler E40: Gamer acessível com bom desempenho RTX 4050

O Medion Erazer Crawler E40 substitui o E30 (com Intel Gen12 e RTX 30xx) e traz a série para o estado atual da arte com Intel Gen 13 e RTX 4050. Esse laptop para jogos de nível básico custa atualmente pouco menos de ~US$ 1100.
Concorrendo com outros laptops para jogos econômicos, o Medion Erazer Crawler E40 enfrenta rivais como o Lenovo LOQ 15e o Asus TUF Gaming A15o XMG Apex 15ou o MSI Katana 15.
A Medion engloba vários modelos sob a marca "Erazer", o que torna difícil manter o controle de todos eles. Enquanto outros fabricantes organizam séries nas quais combinam diferentes configurações em um mesmo gabinete, a Medion parece acreditar que cada configuração justifica um novo nome de série. O Erazer Crawler E40 está disponível apenas nessa configuração específica e, portanto, é vendido apenas como esse modelo. Não há opções em relação à CPU, GPU ou tela.
Outros modelos Medion Erazer que testamos anteriormente incluem:
Possíveis concorrentes em comparação
Avaliação | Data | Modelo | Peso | Altura | Size | Resolução | Preço |
|---|---|---|---|---|---|---|---|
| 85.4 % v7 (old) | 12/2023 | Medion Erazer Crawler E40 - MD 62518 i5-13500H, GeForce RTX 4050 Laptop GPU | 2.3 kg | 28 mm | 15.60" | 1920x1080 | |
| 85.9 % v7 (old) | 10/2023 | Lenovo LOQ 15IRH8 Core i7 i7-13620H, GeForce RTX 4050 Laptop GPU | 2.4 kg | 25.2 mm | 15.60" | 2560x1440 | |
| 86.3 % v7 (old) | 06/2023 | Asus TUF A15 FA507 R7 7735HS, GeForce RTX 4050 Laptop GPU | 2.2 kg | 24.9 mm | 15.60" | 1920x1080 | |
| 86.2 % v7 (old) | 10/2023 | Schenker XMG Apex 15 (Late 23) R7 7840HS, GeForce RTX 4050 Laptop GPU | 2.2 kg | 26.7 mm | 15.60" | 2560x1440 | |
| 82.9 % v7 (old) | 03/2023 | MSI Katana 15 B12VEK i7-12650H, GeForce RTX 4050 Laptop GPU | 2.3 kg | 24.9 mm | 15.60" | 1920x1080 |
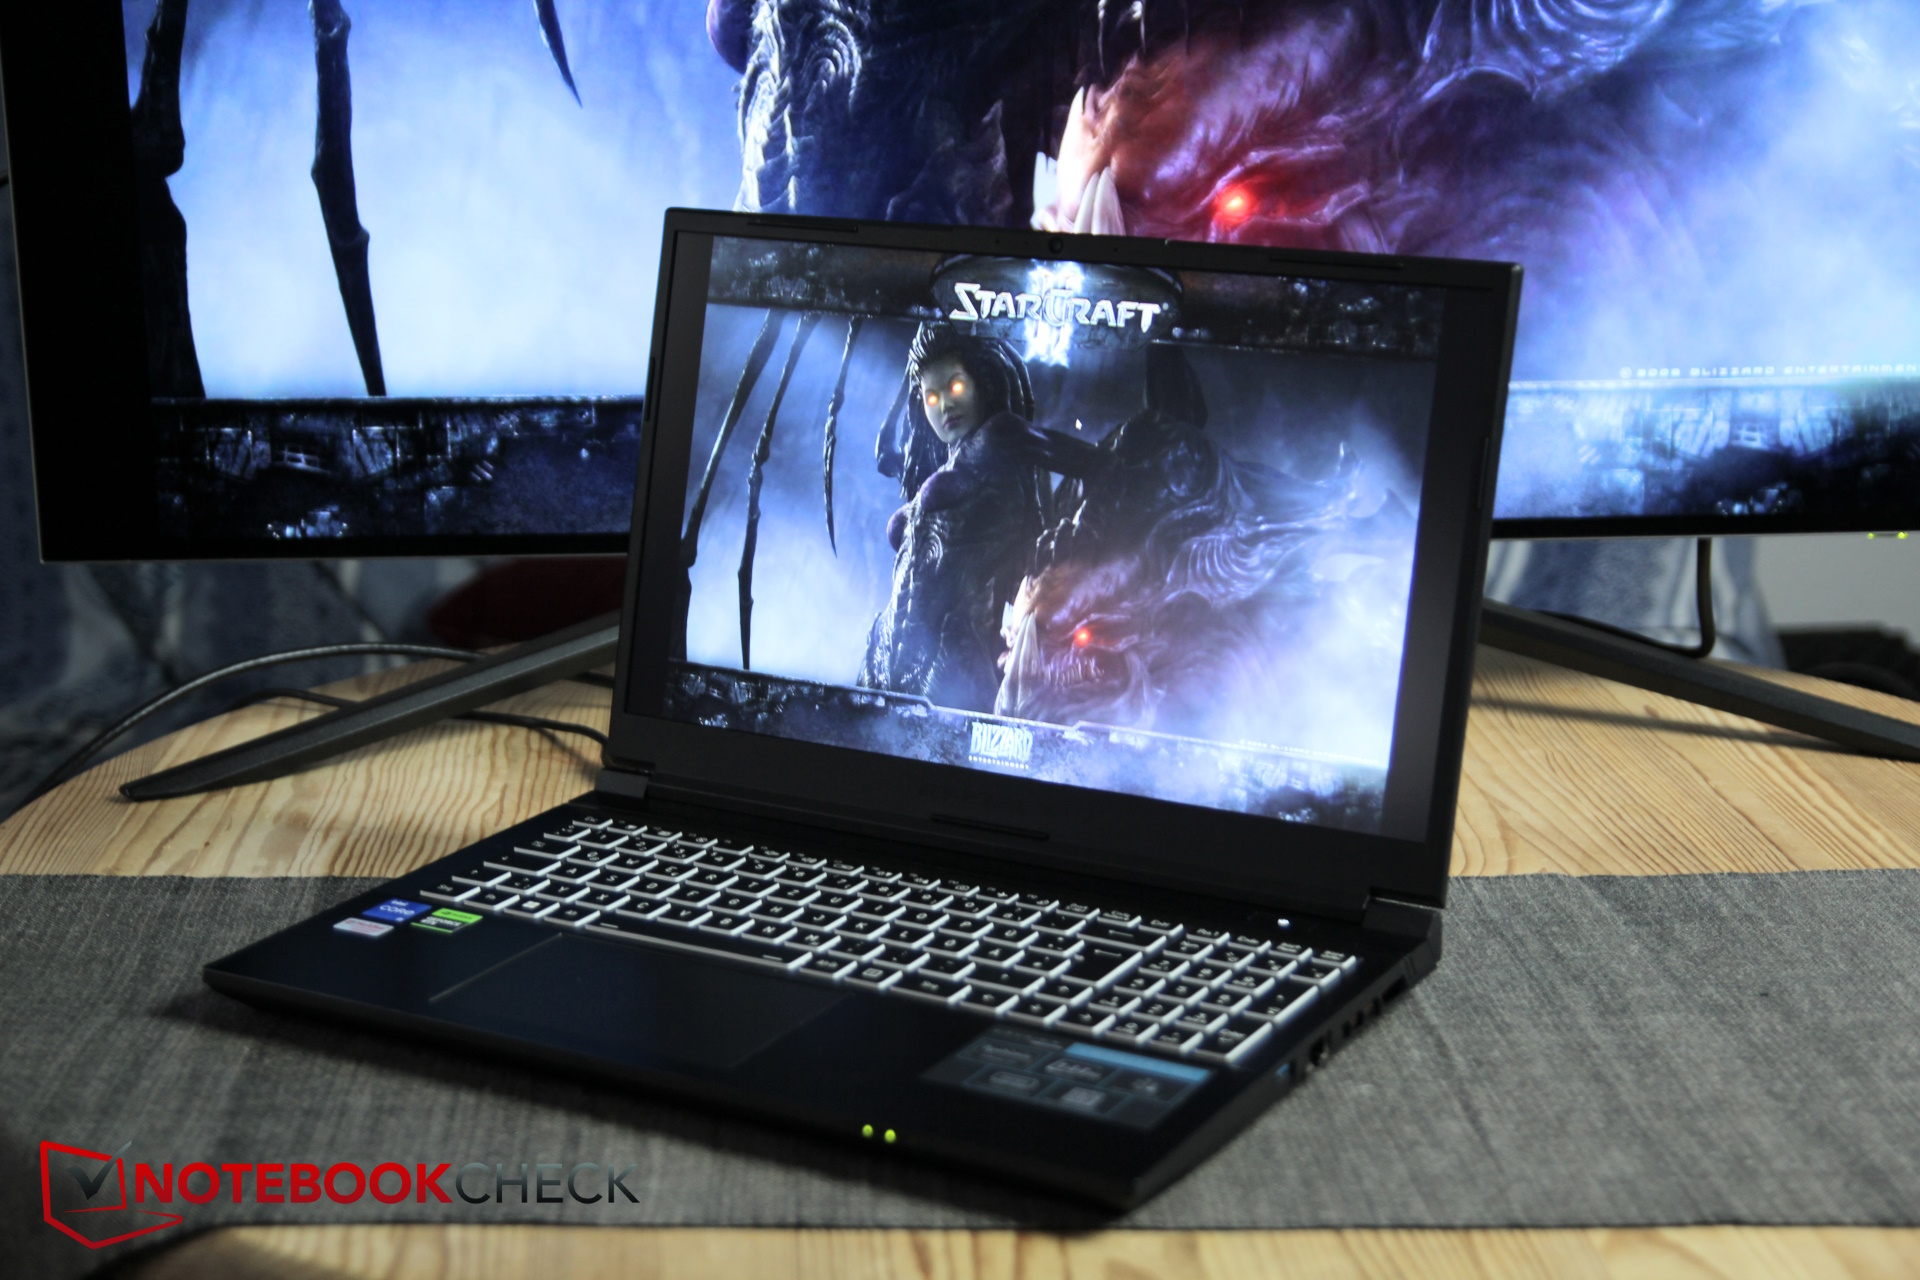
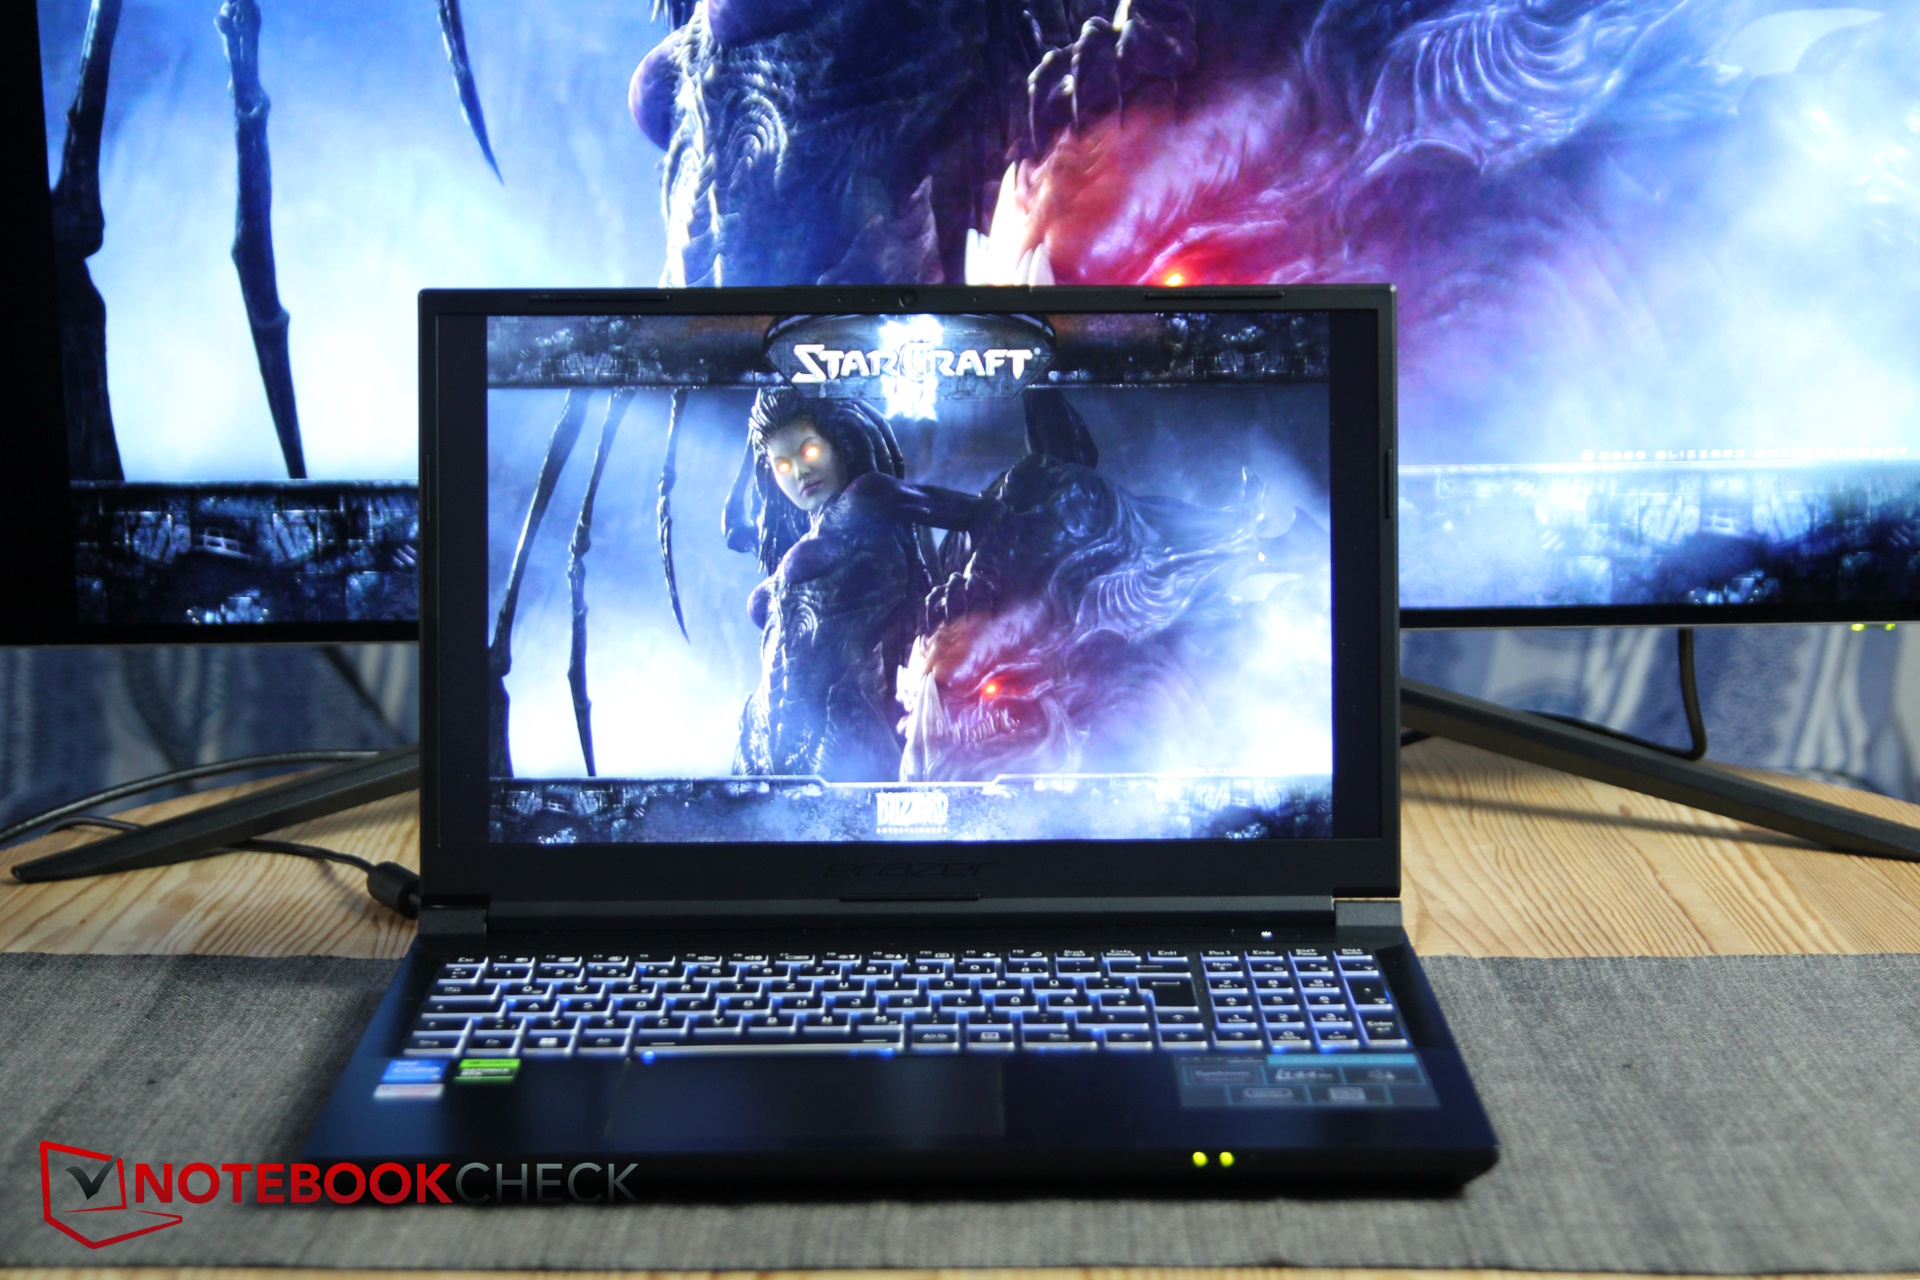
Case e conectividade - Crawler E40 em um acabamento de plástico escovado
A tampa e a base da tela são feitas de plástico robusto que se assemelha muito ao alumínio, dando-lhe uma aparência intencional. As bordas da tela e a parte inferior do laptop são feitas de plástico macio. Tanto a tampa lisa quanto a base são propensas a atrair impressões digitais.
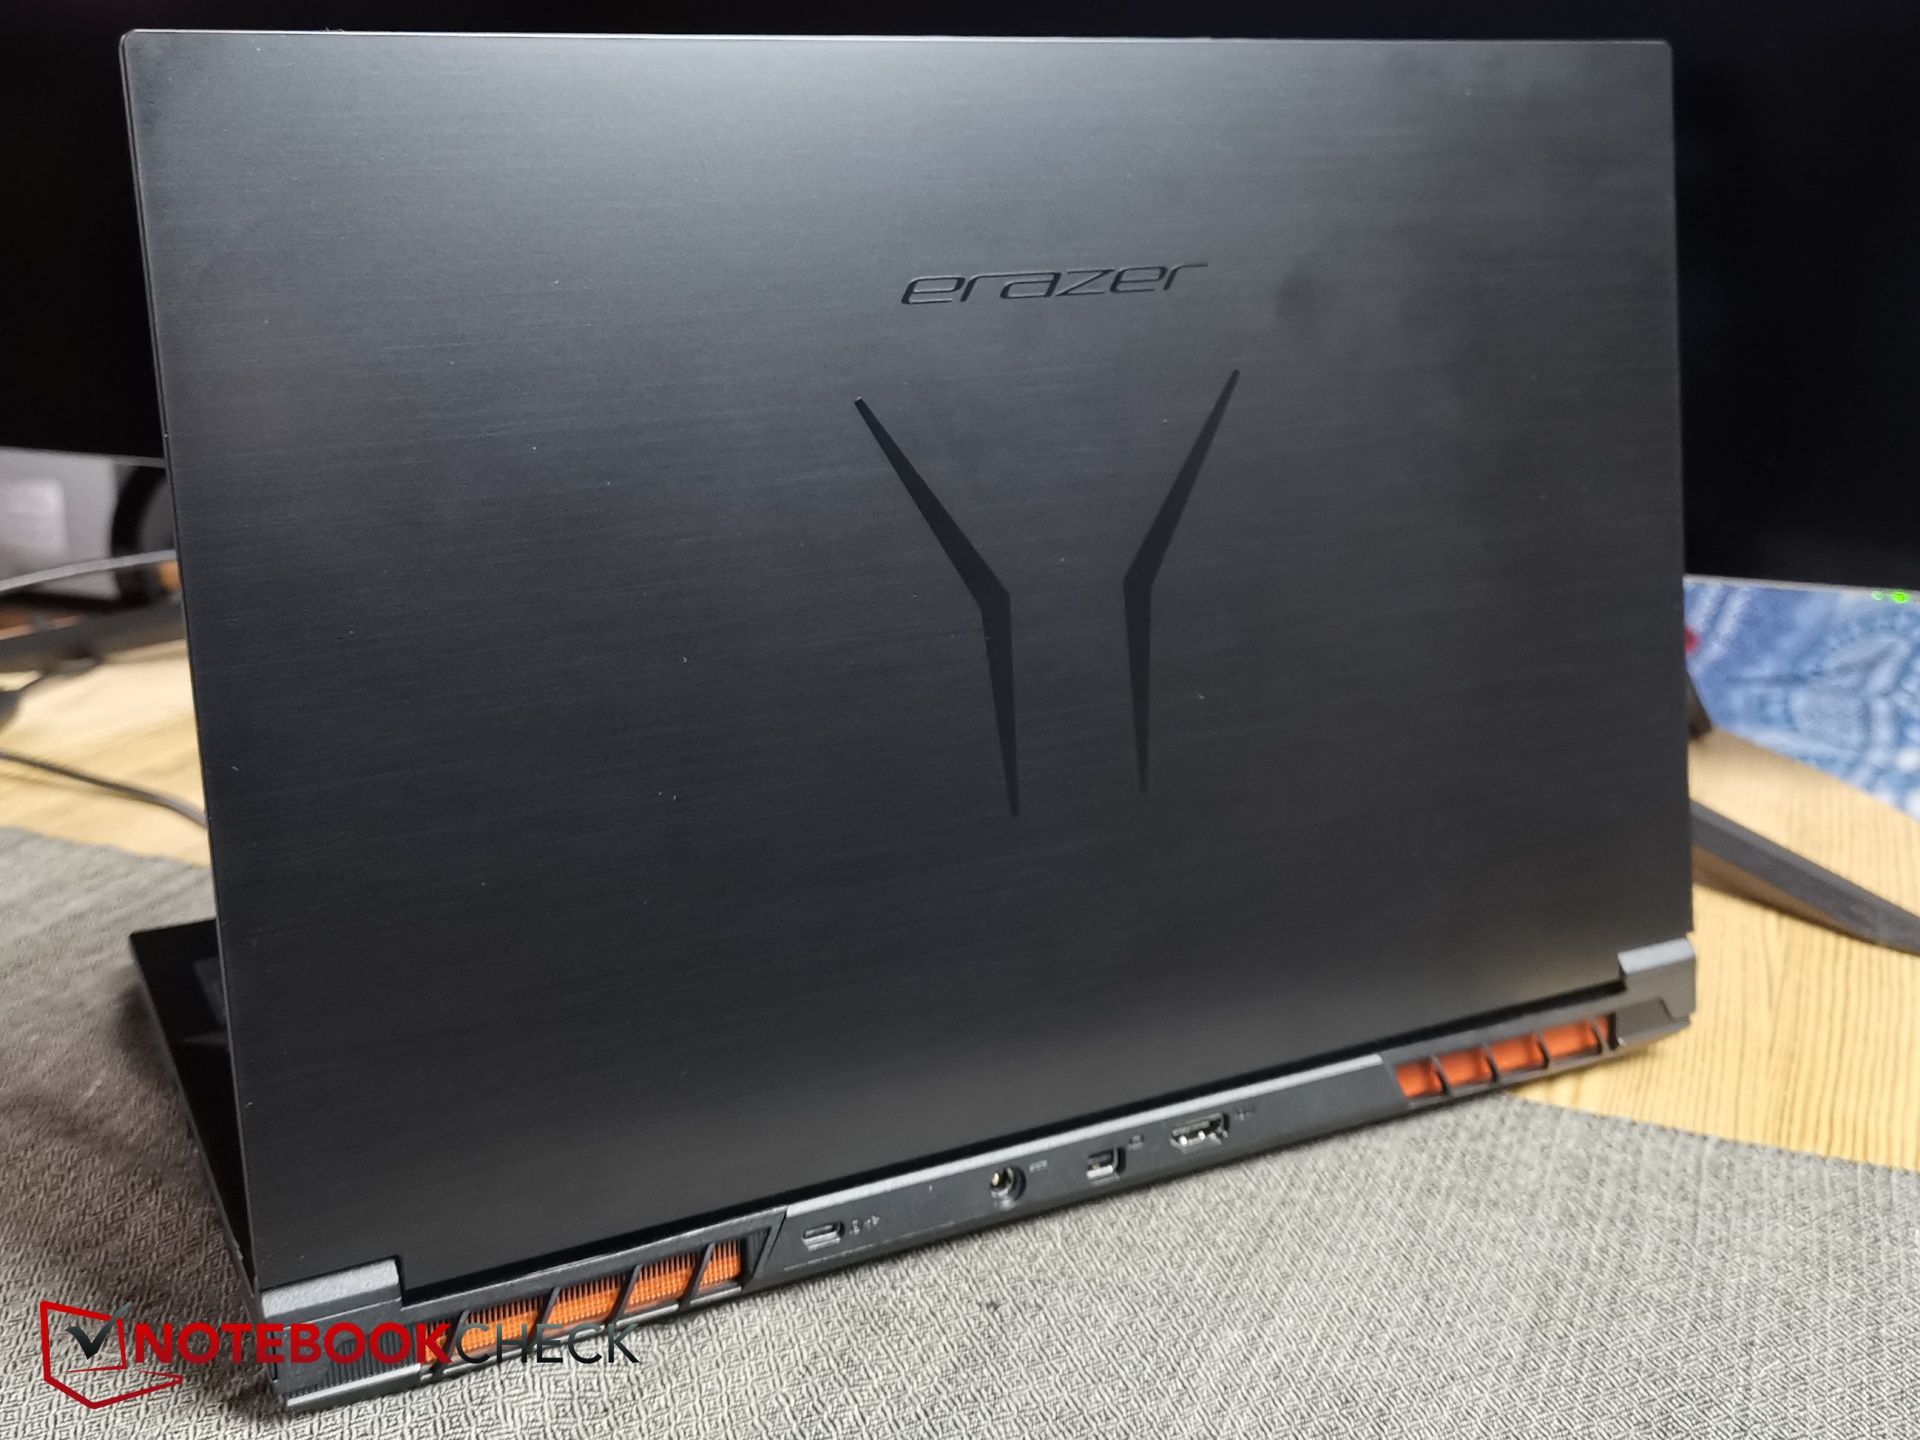
Com um design totalmente preto, incluindo o logotipo da Erazer na tampa, o laptop tem uma estética relativamente simples. A base apresenta um alto nível de resistência à torção, enquanto a tampa, embora menos, parece notavelmente "macia" e flexiona consideravelmente quando é torcida, com a tela lidando com isso estoicamente. O acabamento geral é de bom padrão e não há lacunas visíveis.
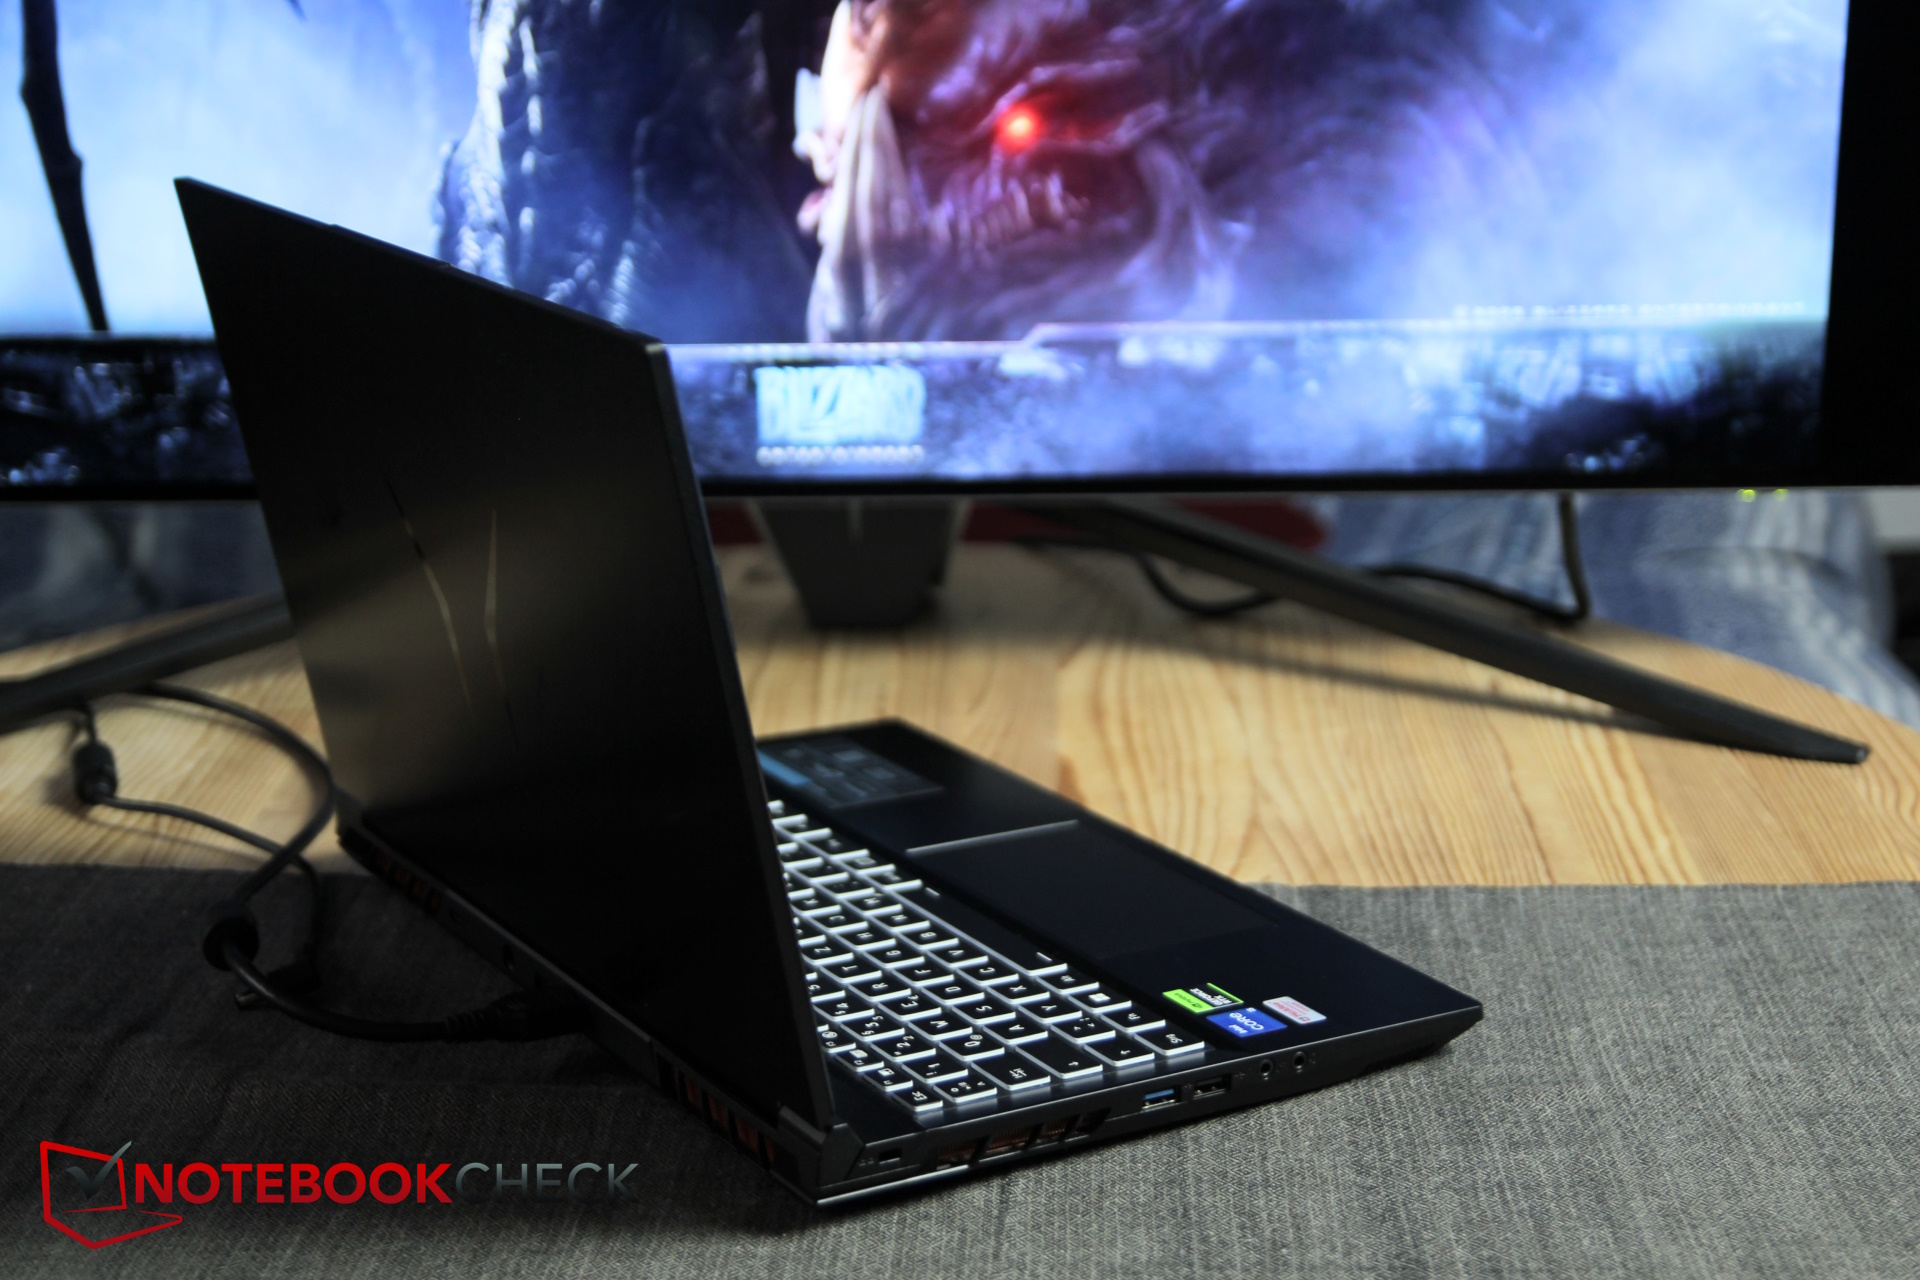
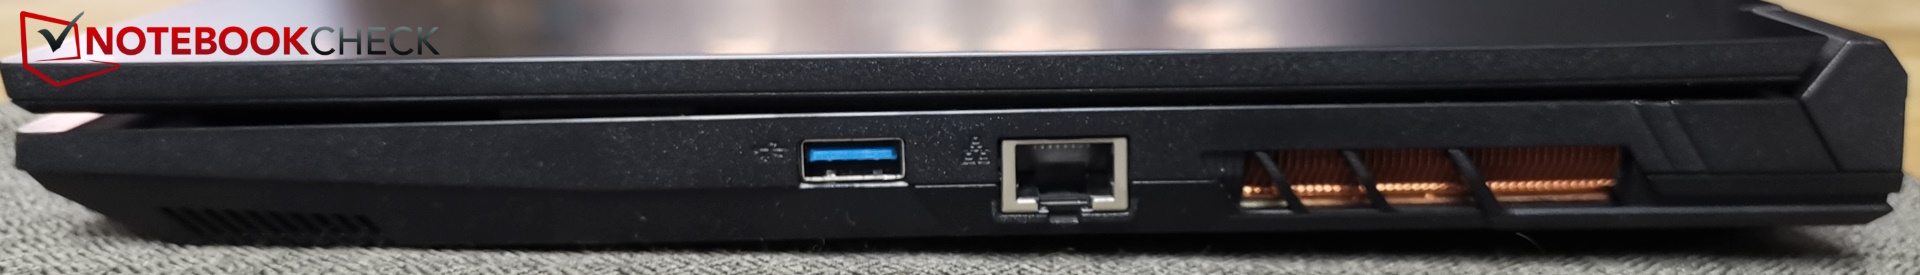
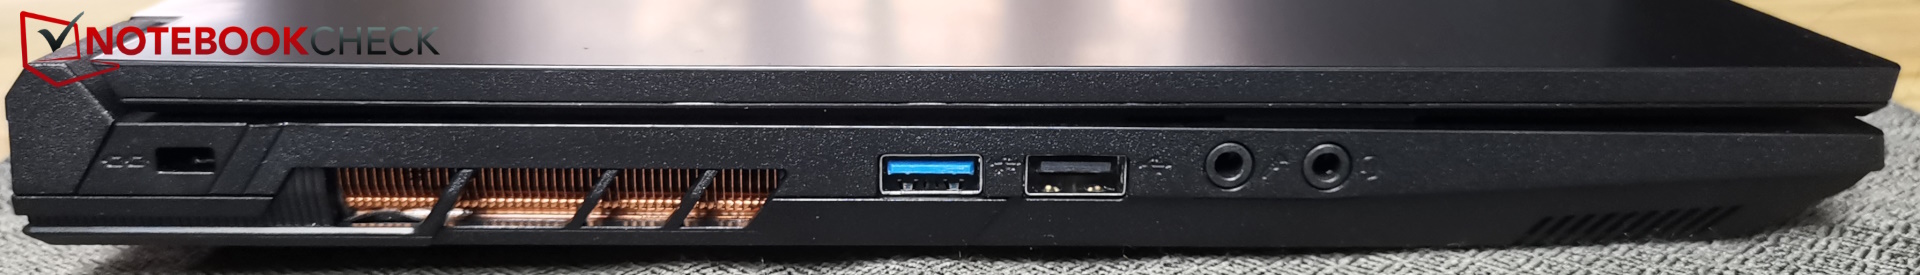
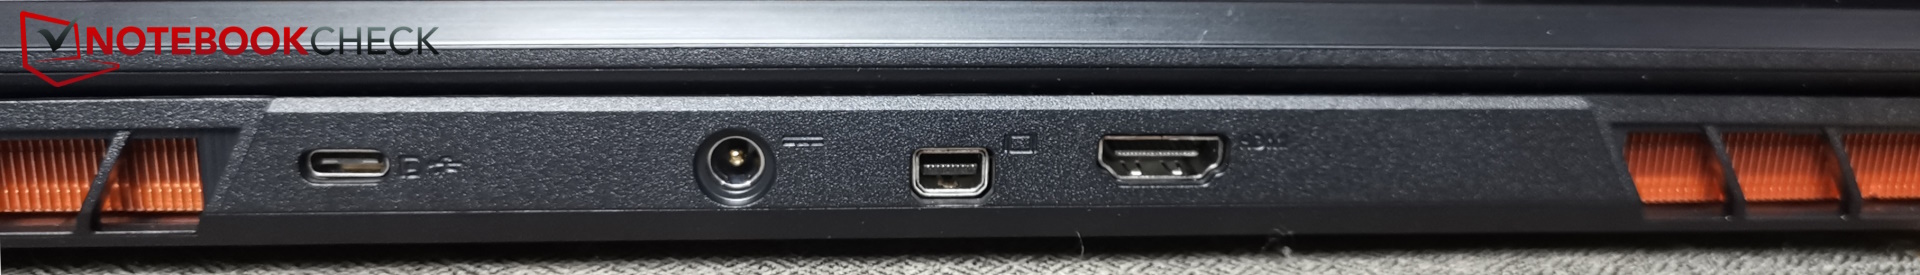
Conexões - Sem Thunderbolt, mas com USB 2.0
Apesar de contar com uma CPU Intel, o E40 não tem suporte para Thunderbolt. Ele inclui USB-C com uma velocidade de 10 Gb/s. Entretanto, ele também incorpora uma porta USB-A 2.0 desatualizada, que poderia ser atualizada para uma alternativa mais rápida. Notavelmente, não há leitor de cartão presente.


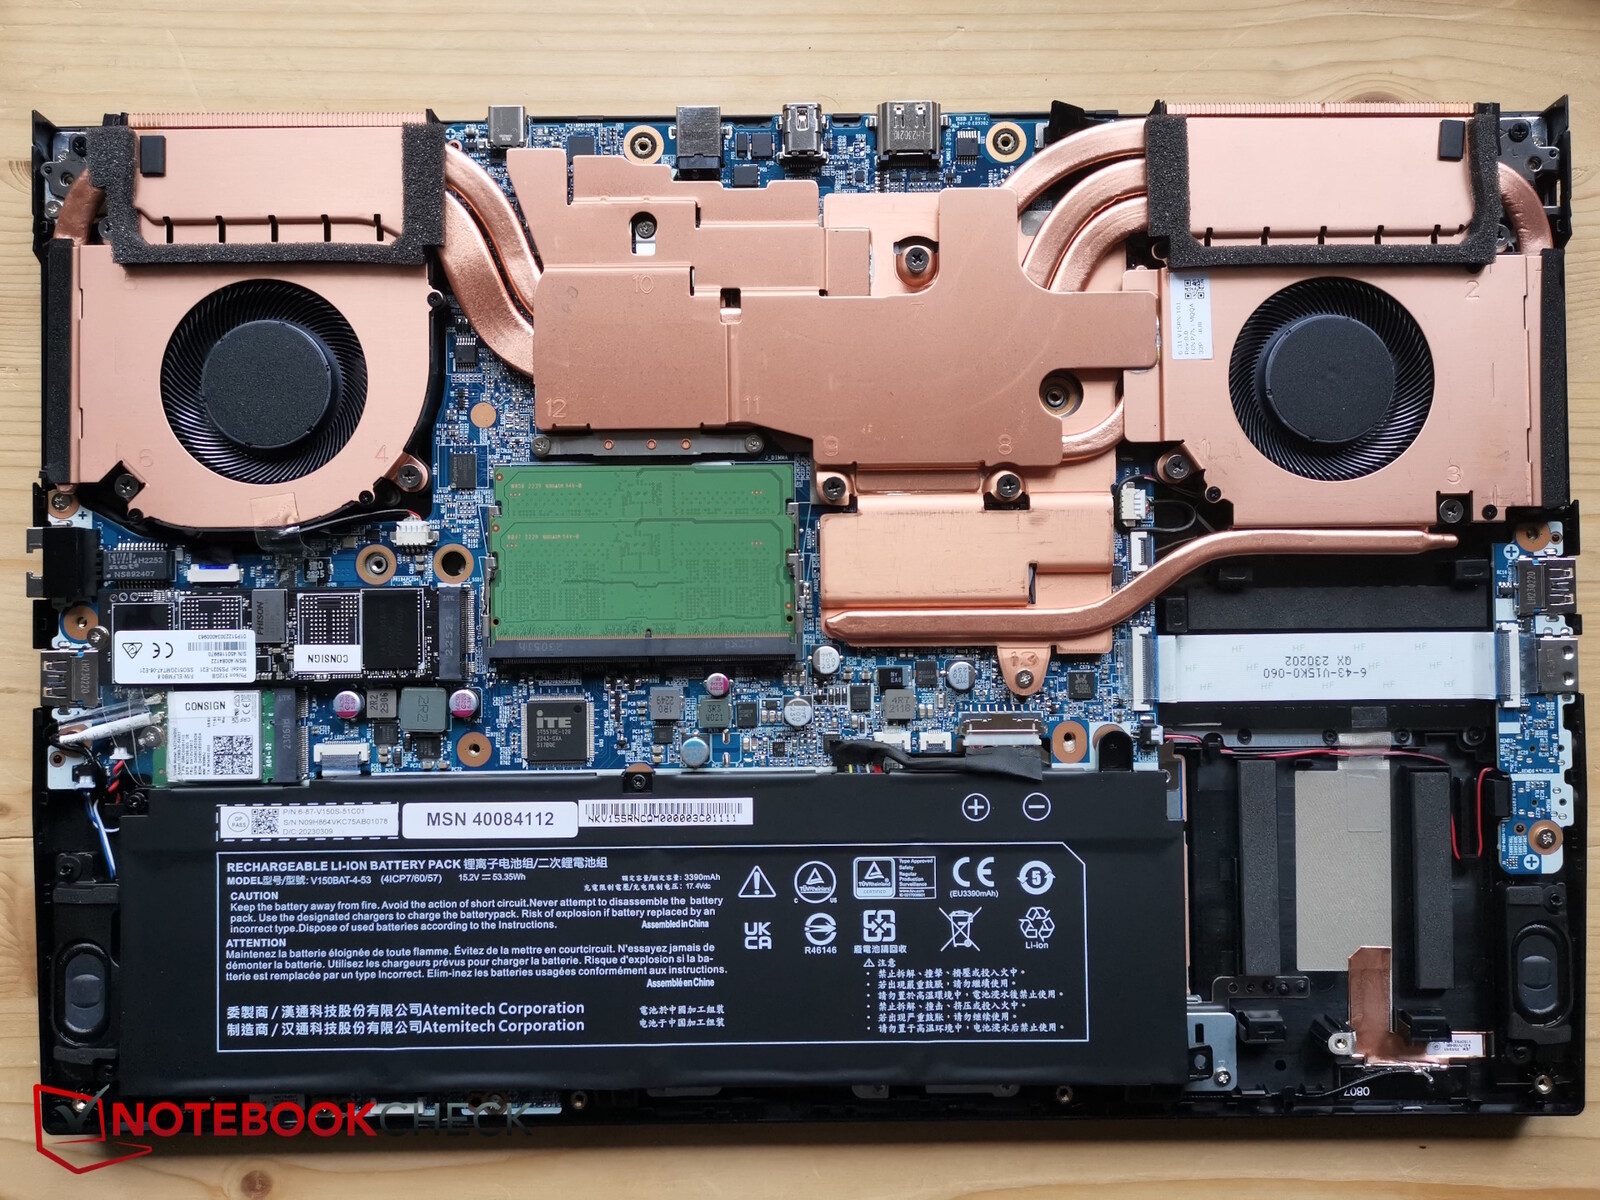
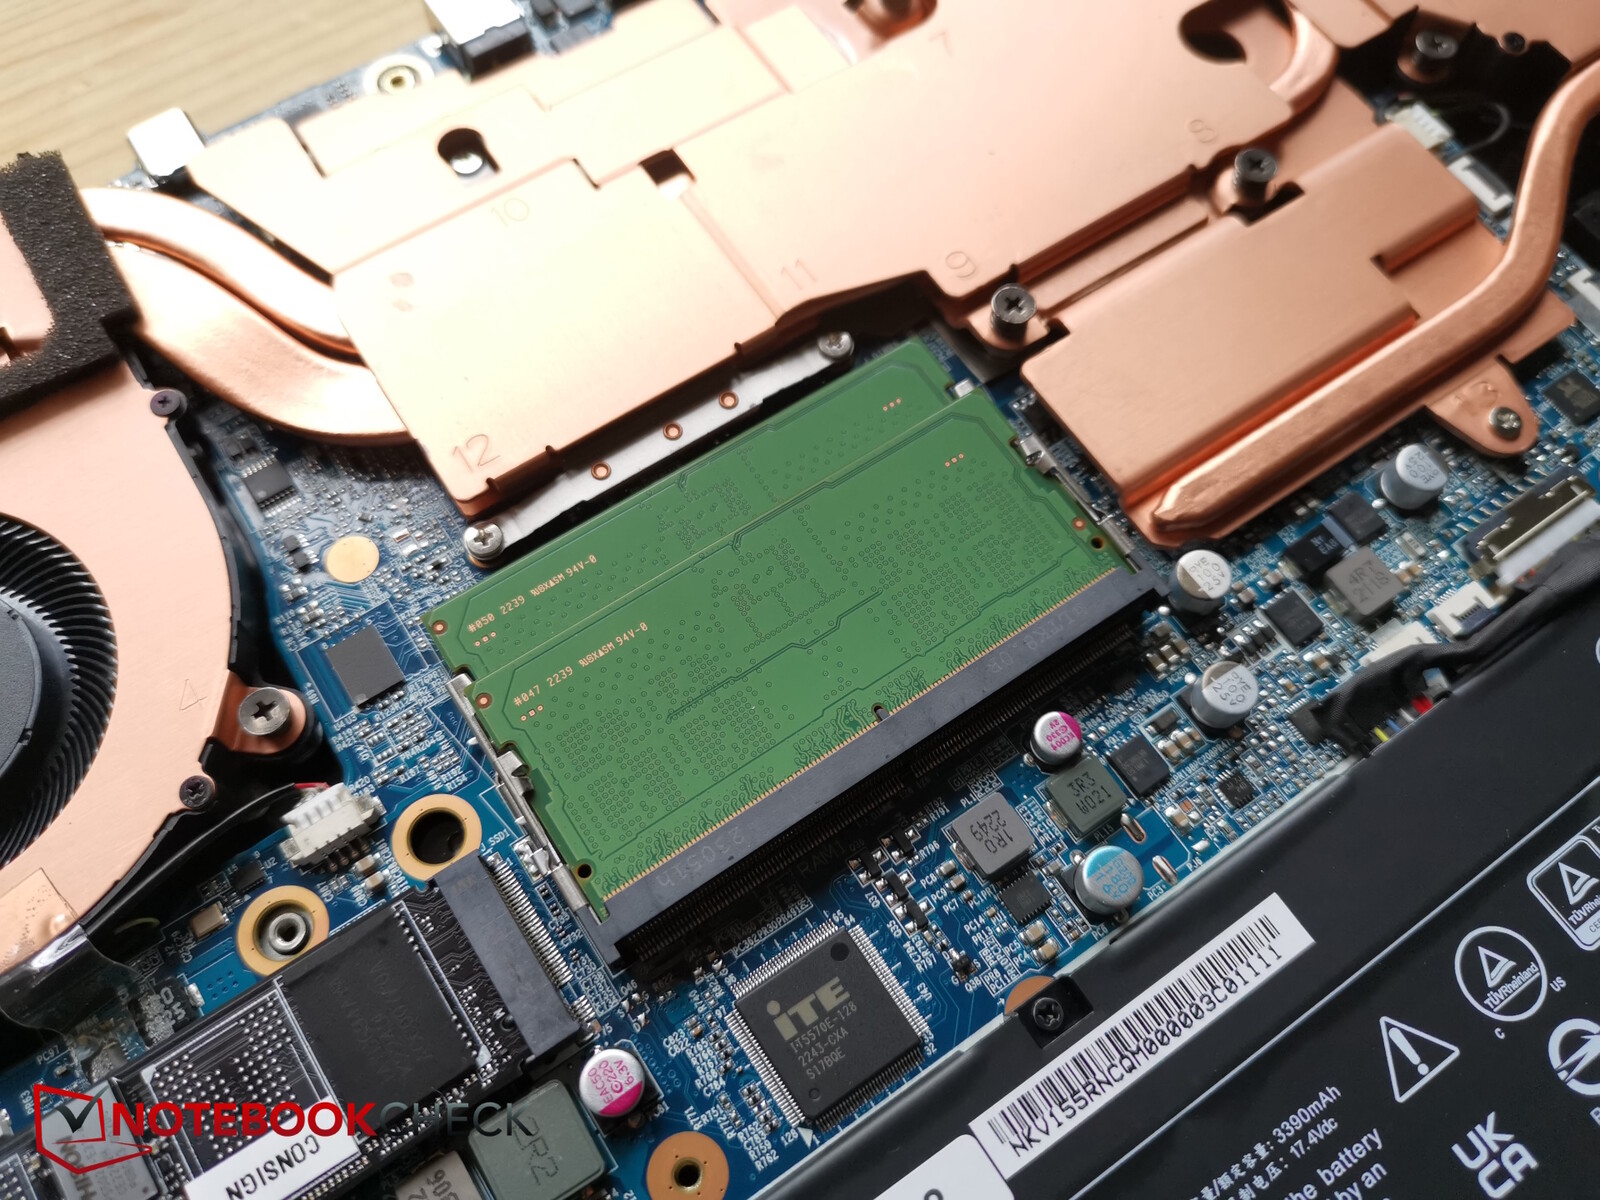
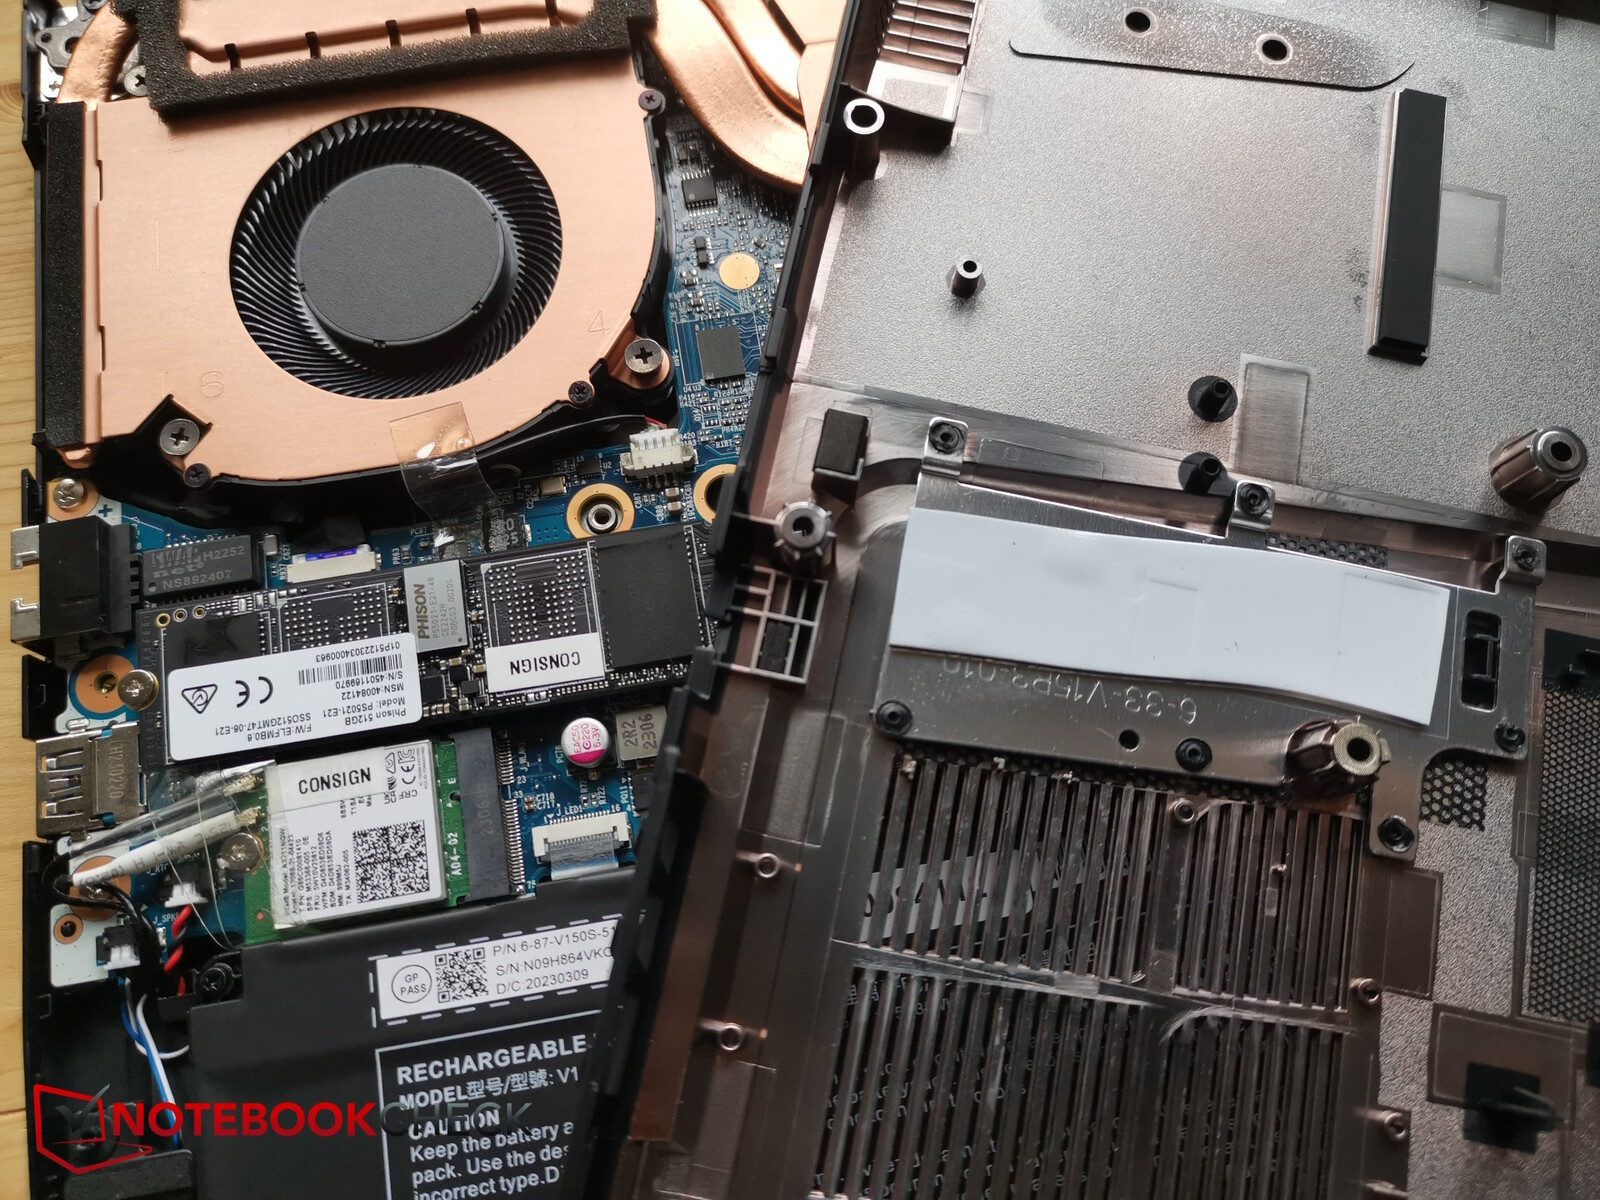
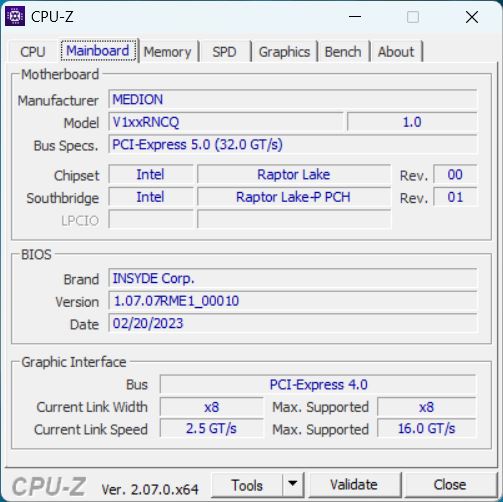
Manutenção
Para acessar os componentes internos, é necessário remover 14 parafusos Phillips do mesmo tamanho. A placa de base plástica pode então ser facilmente removida. Na parte inferior, o senhor encontrará um sistema de resfriamento com bastante cobre, uma bateria parafusada, dois slots de RAM, o SSD resfriado por duas almofadas e o módulo WiFi substituível.
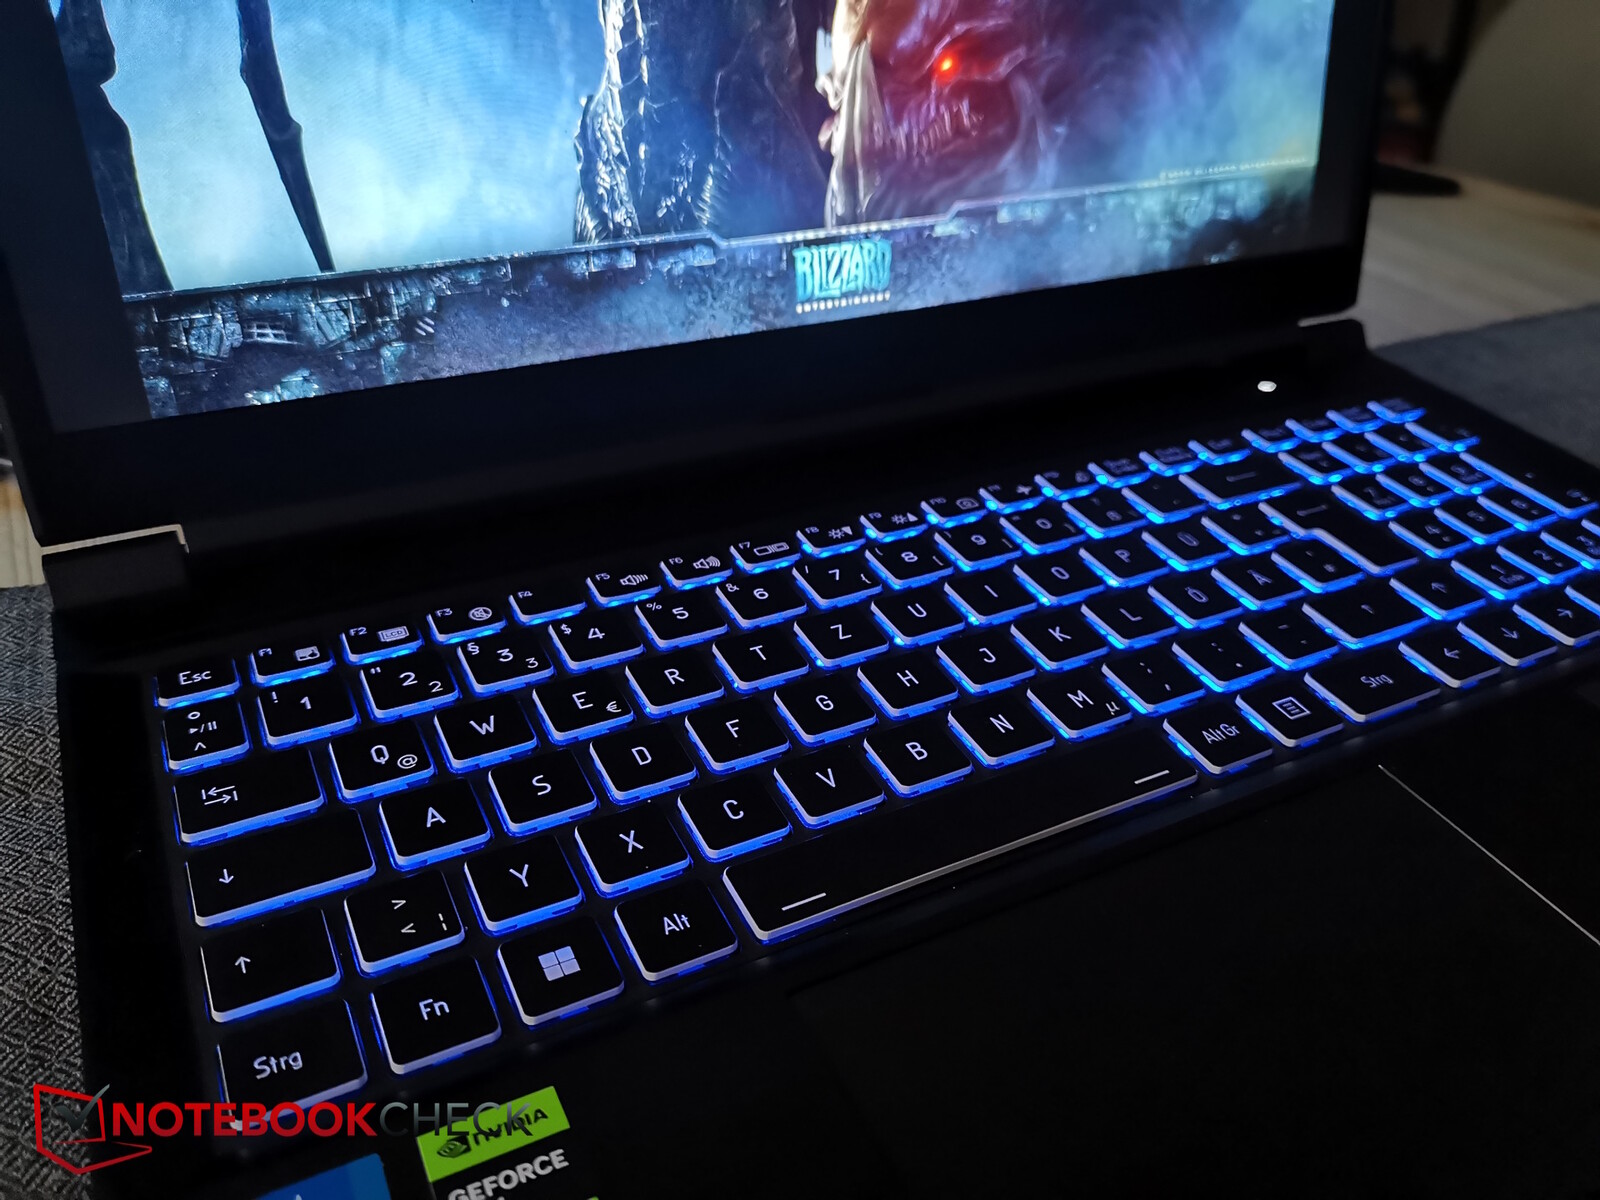
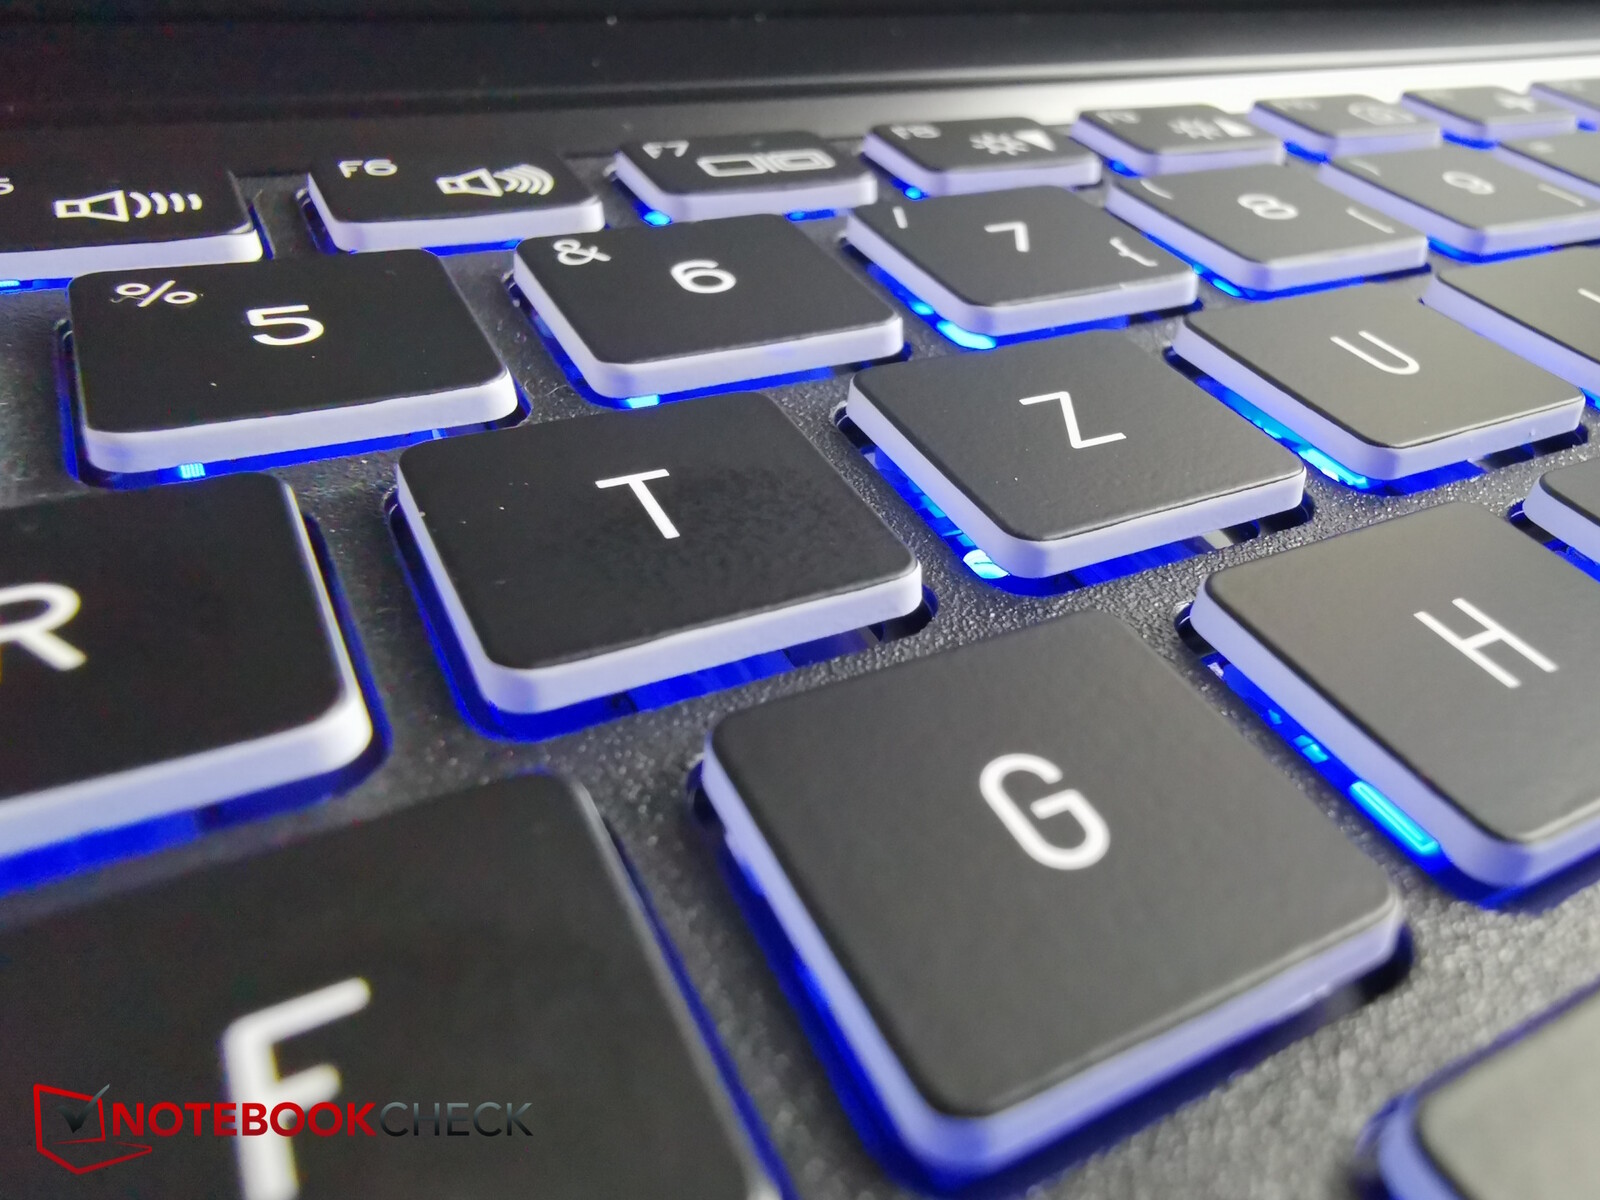
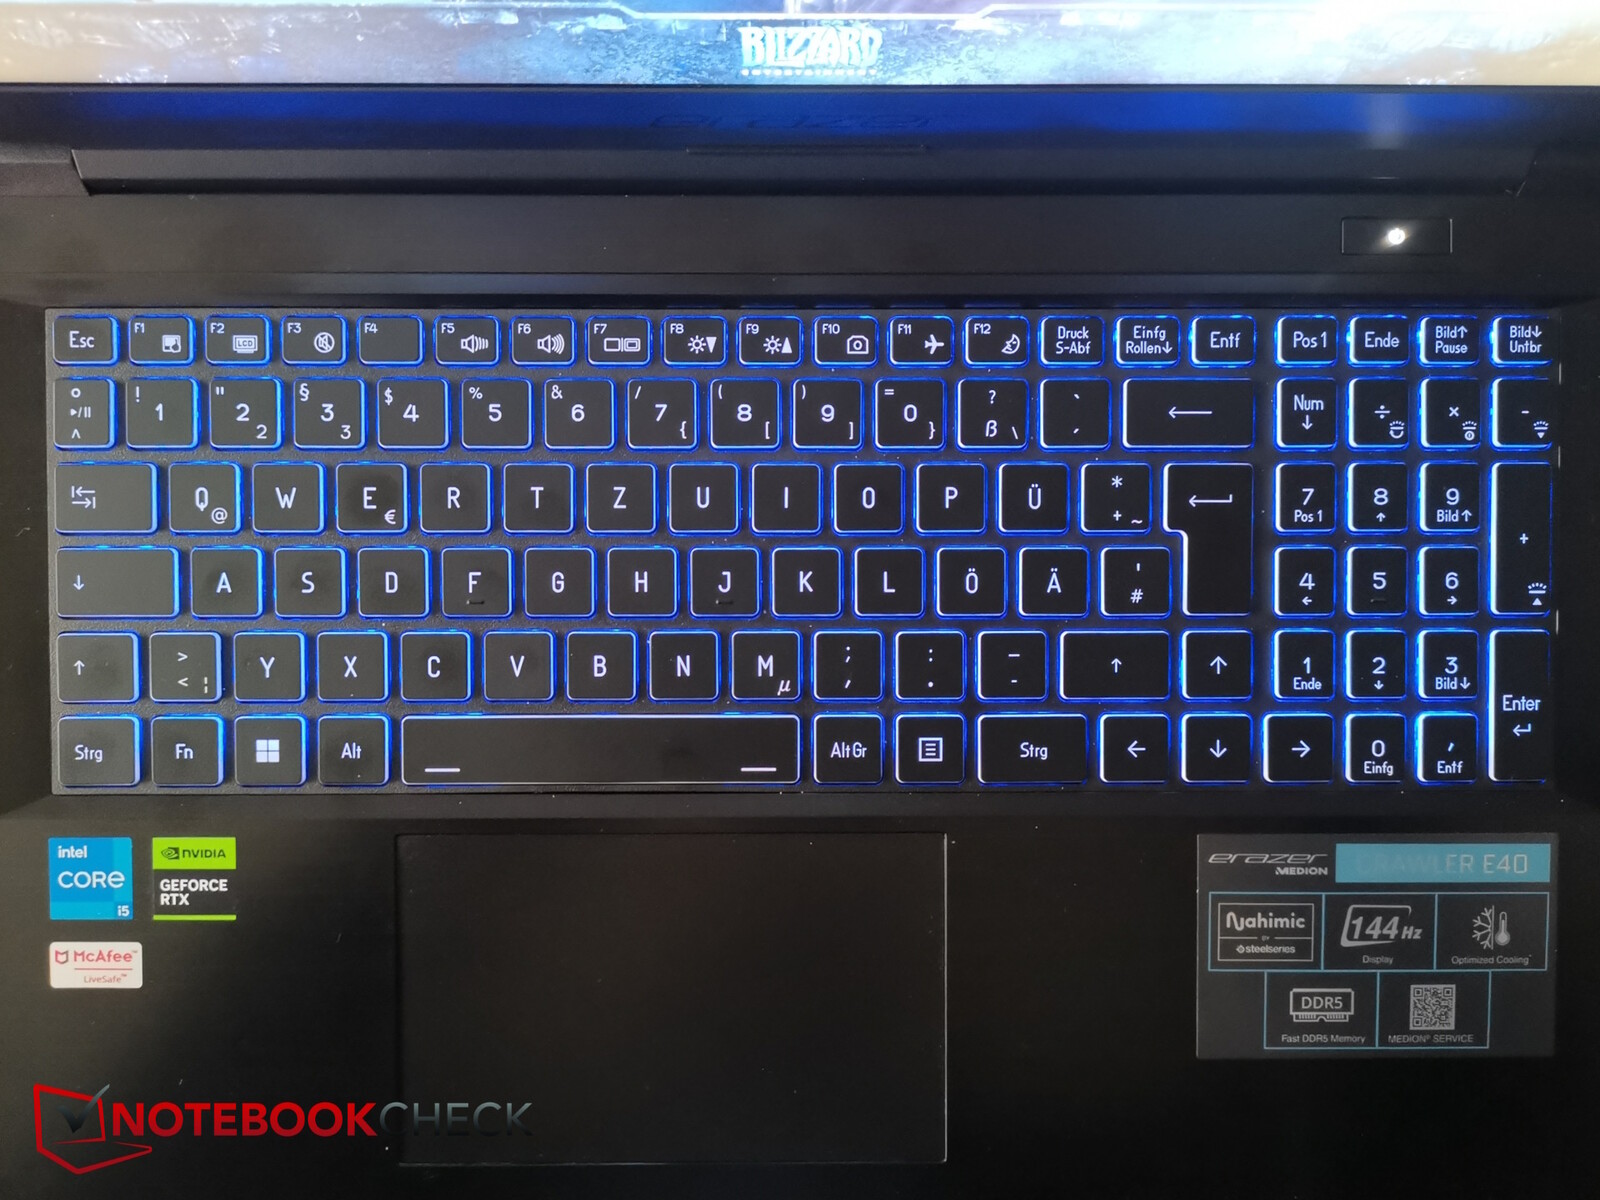
Dispositivos de entrada - Sólido no geral
O layout do teclado, como o de outros dispositivos da Medion analisados este ano, é bastante limpo. As teclas, no entanto, são bem pequenas (1,4 cm), mas estão bem espaçadas. À direita, há um teclado numérico com teclas ainda menores.
O deslocamento das teclas é médio e o feedback é um pouco suave. No entanto, é fácil e rápido digitar nele.
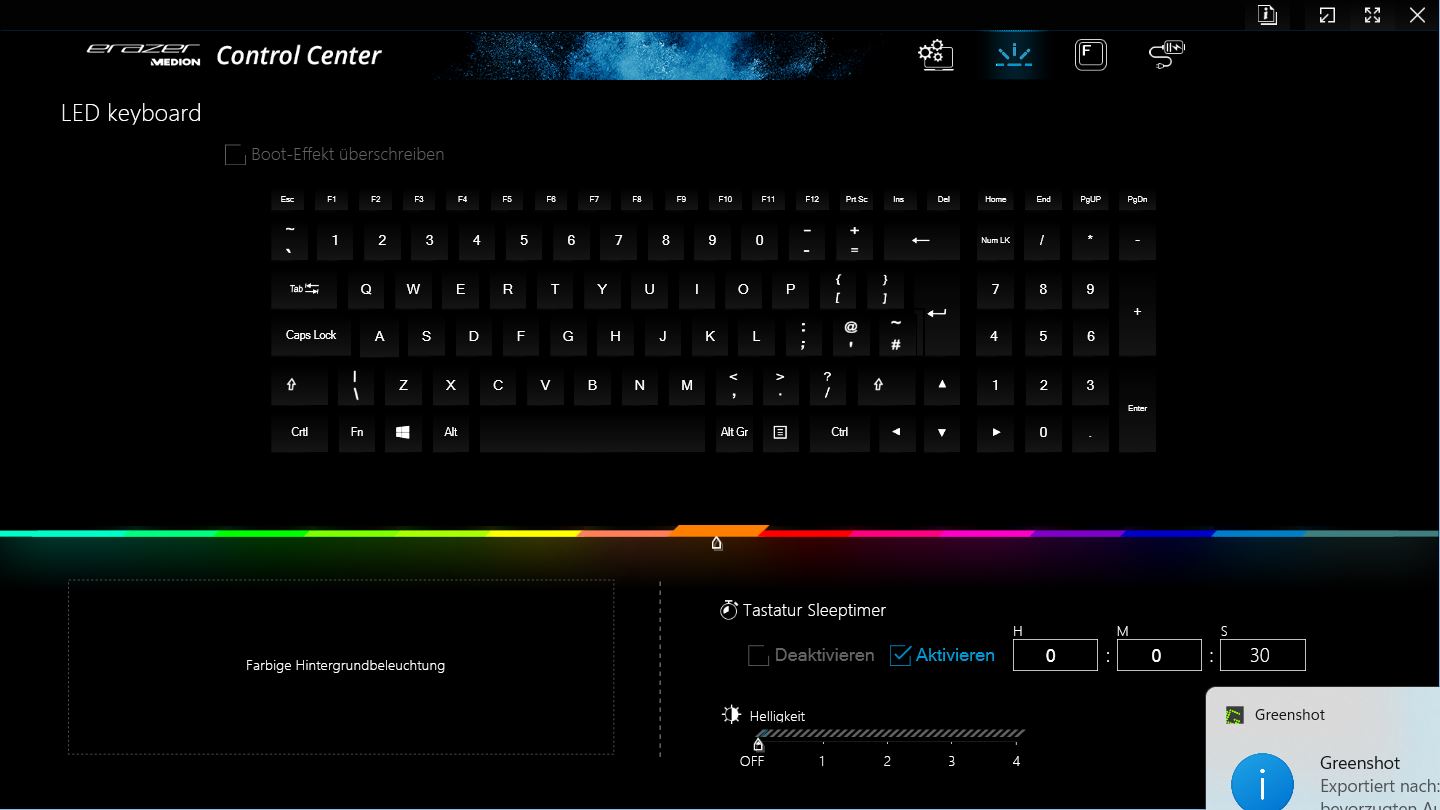
A iluminação de fundo RGB de dois estágios, que pode ser configurada por meio do Control Center (várias cores) e controlada por teclas especiais, ajuda em ambientes escuros. Mas é apenas uma zona.
O touchpad (aprox. 12,1 x 7,3 cm) é ligeiramente deslocado para a esquerda para ficar o mais central possível sob as outras teclas devido ao teclado numérico. A superfície é escorregadia, mas os ruídos de clique não exatamente silenciosos parecem um pouco baratos.
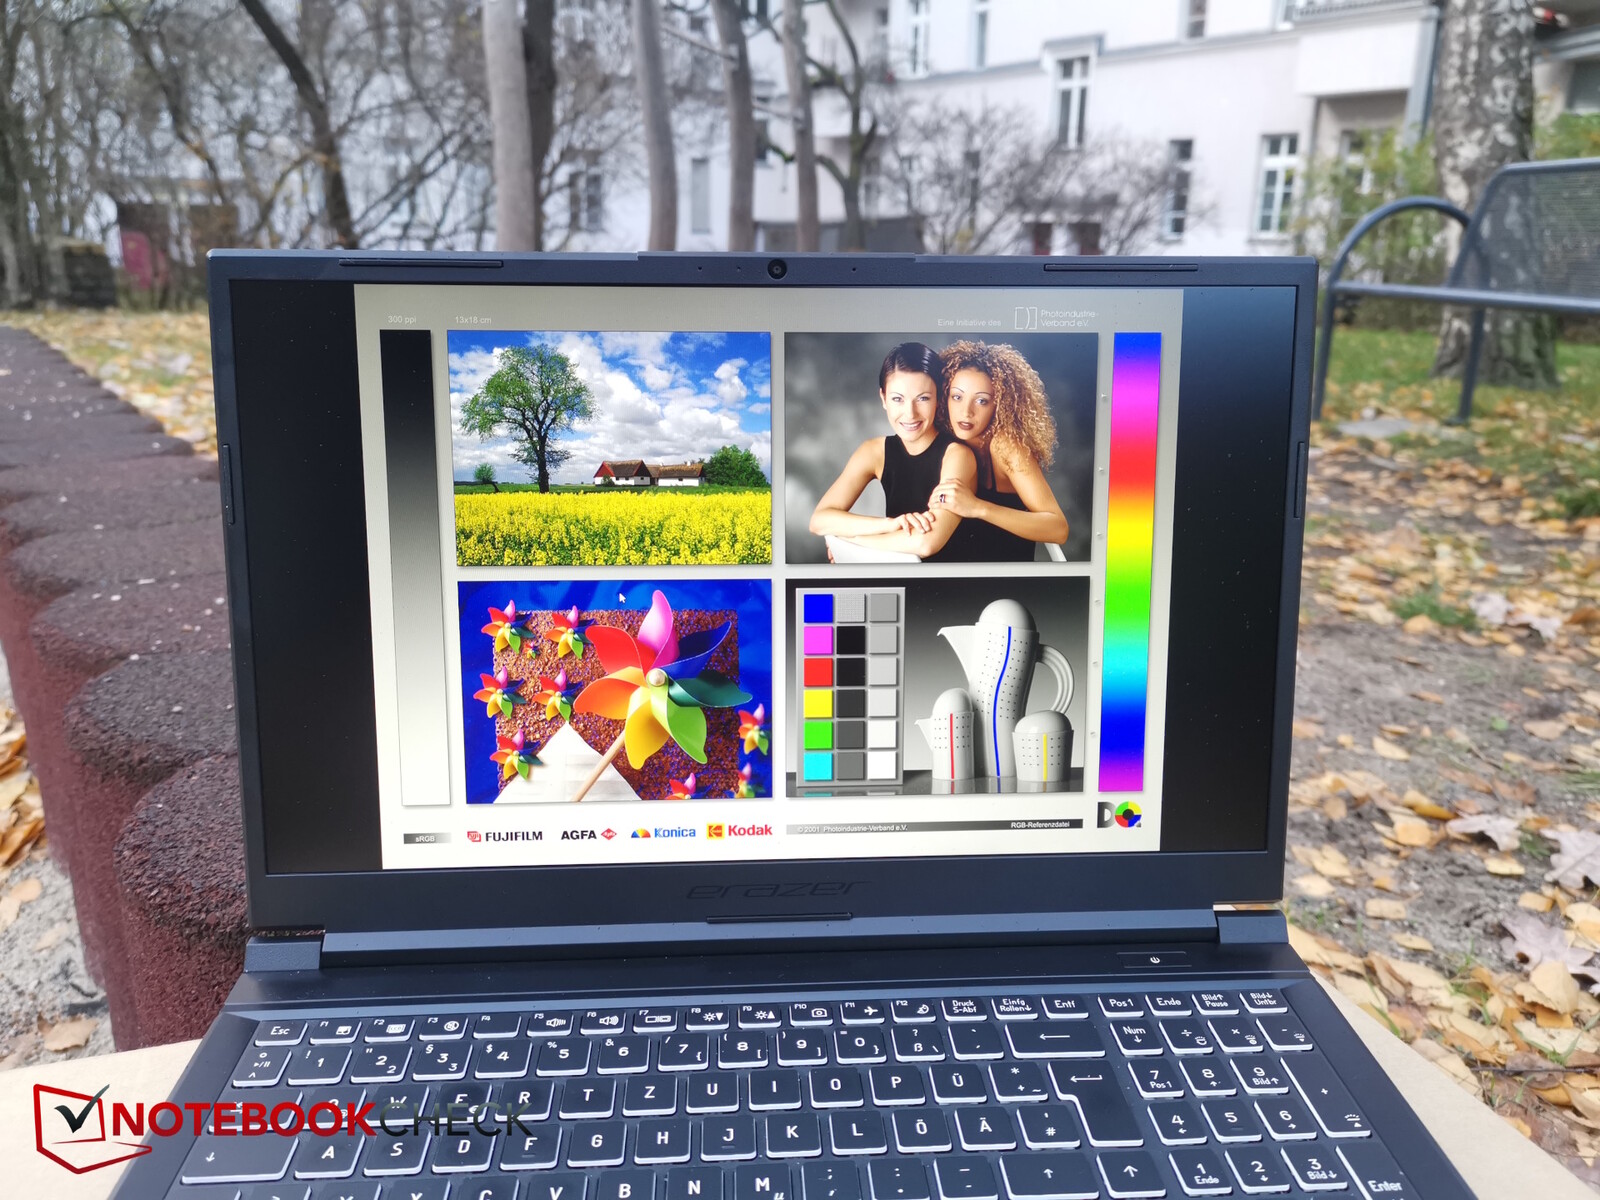
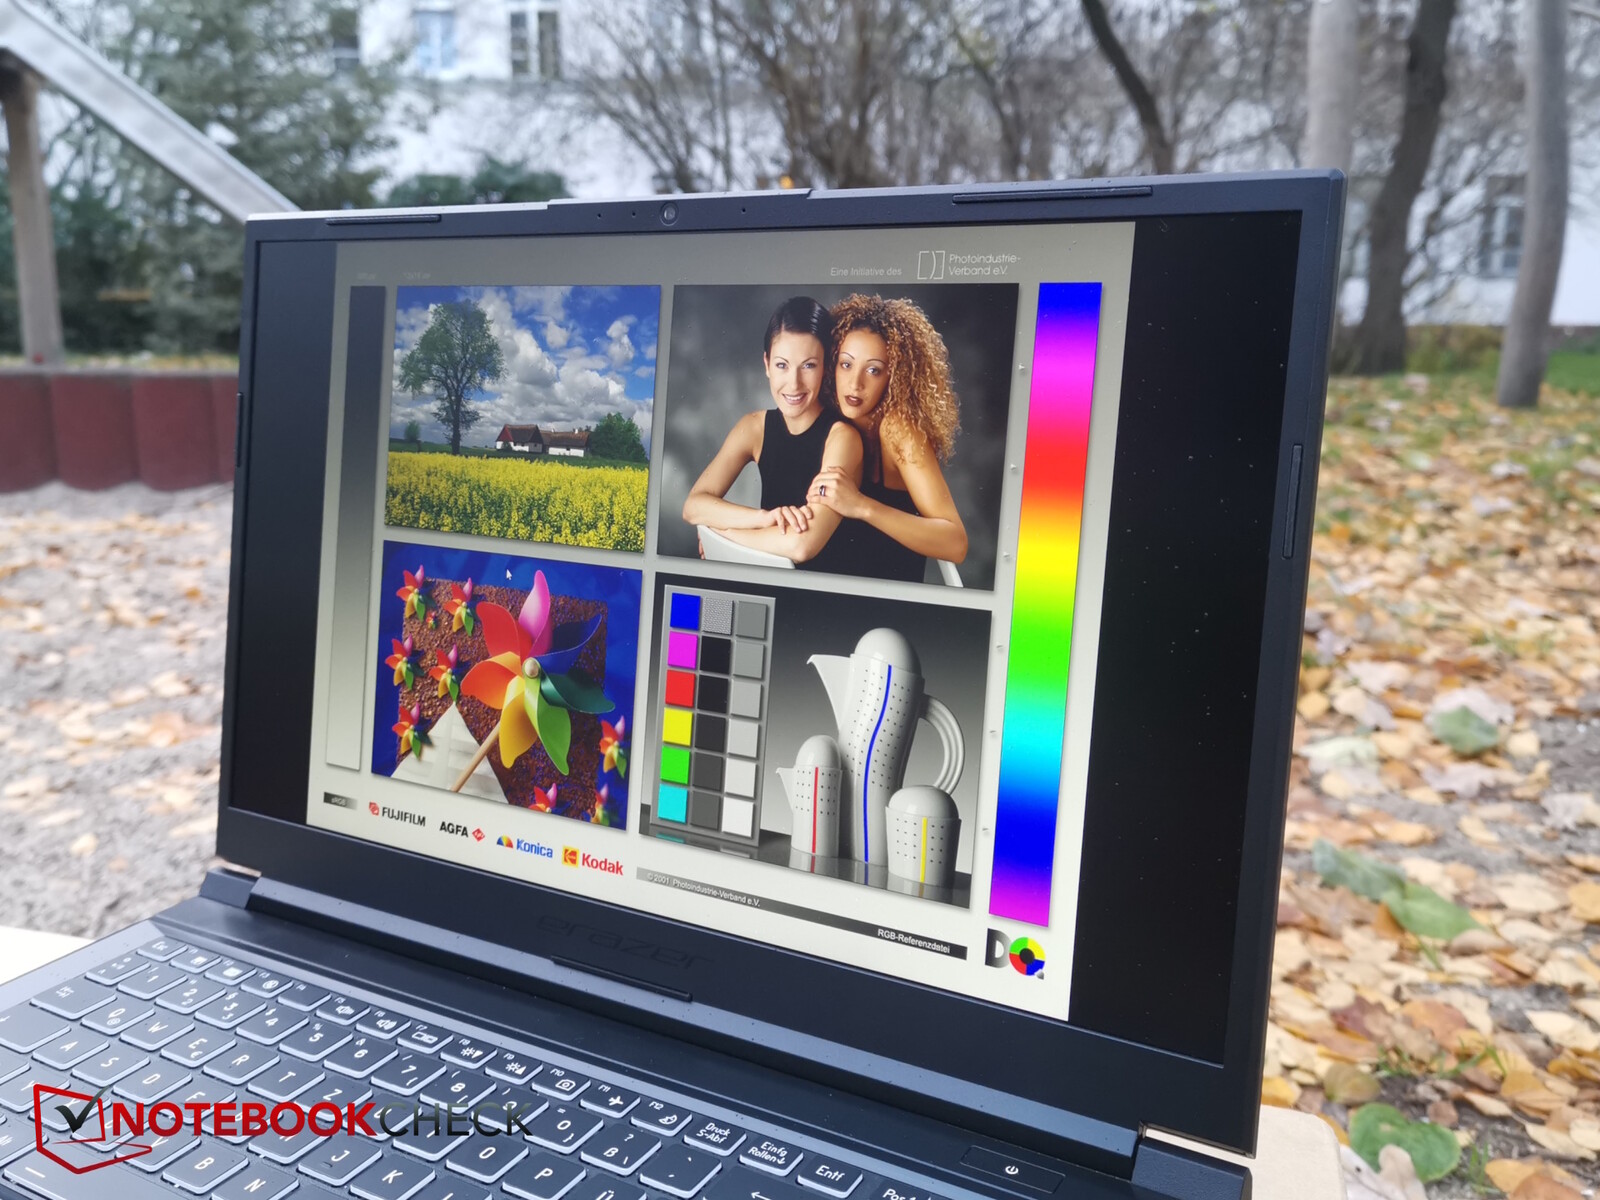
Display - Um velho conhecido de 2019
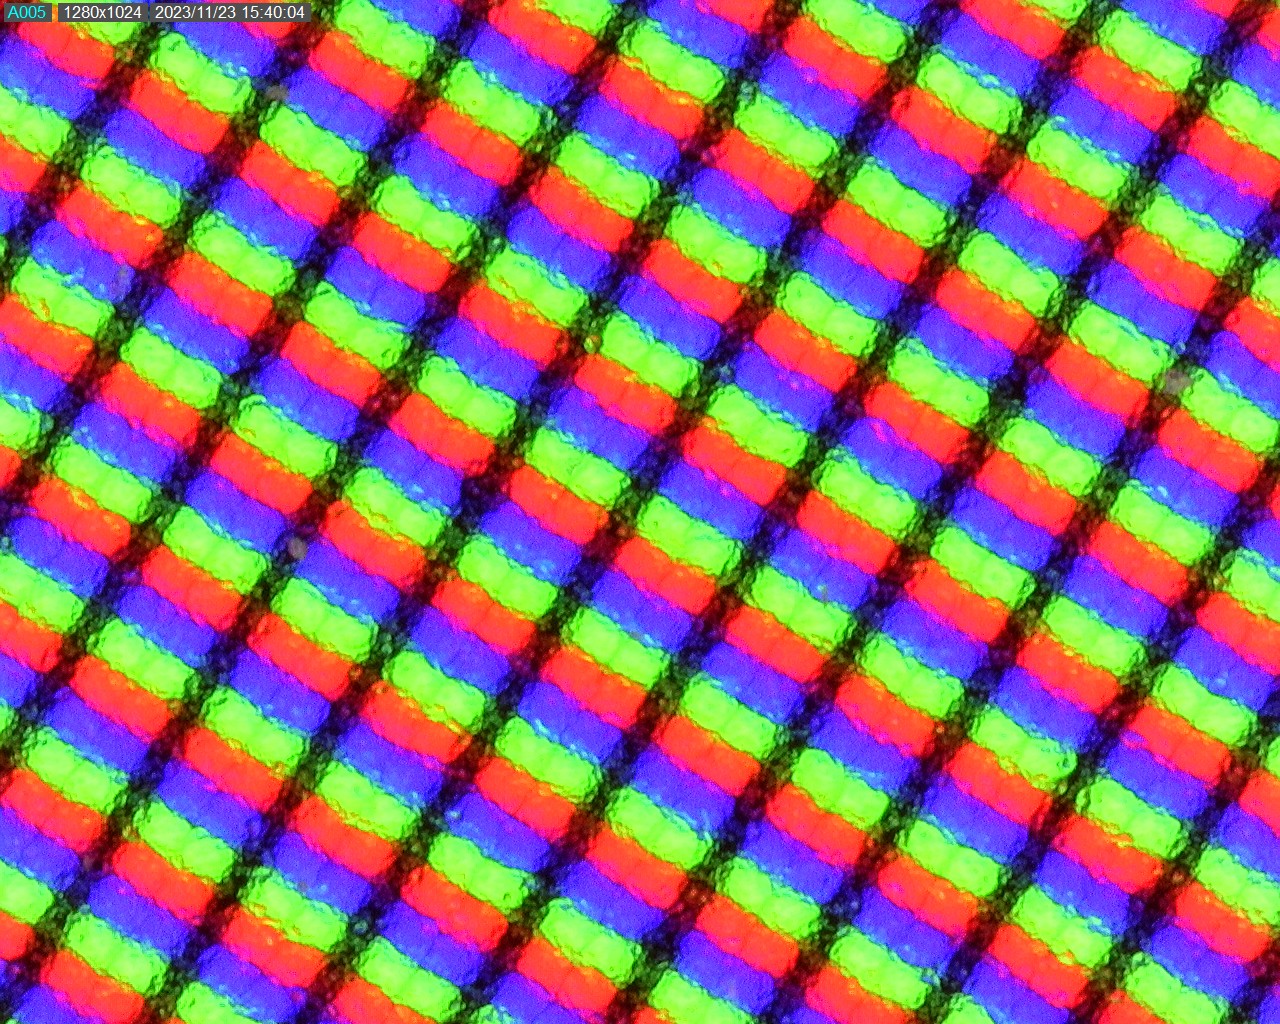
O Medion Erazer Crawler E40 apresenta uma tela familiar, que já foi usada em vários laptops anteriormente. A tela IPS Full HD fosca com uma taxa de atualização de 144 Hz não é a mais recente, tendo sido usada no XMG Fusion 15 em 2019.
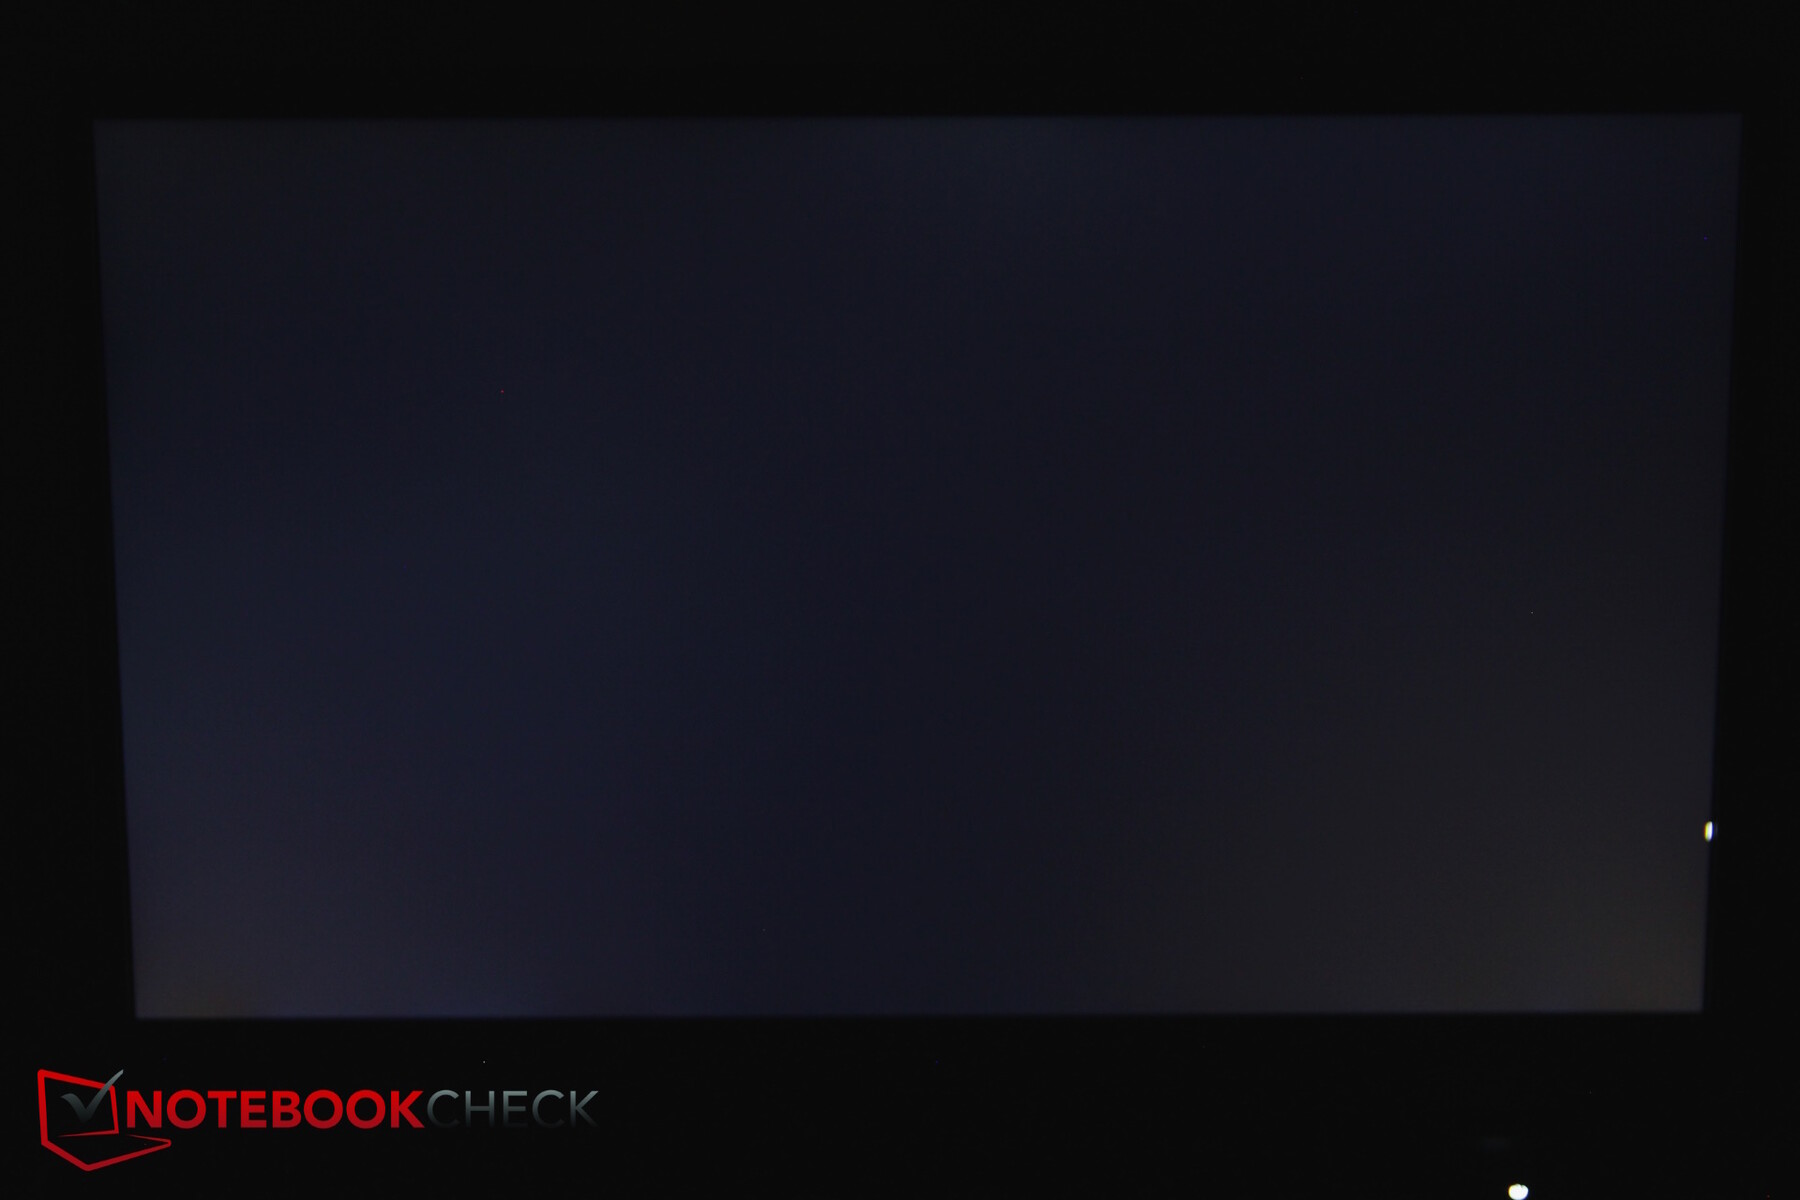
O brilho médio da tela de 350 nits é aceitável, embora o contraste seja um pouco comprometido pelo fraco valor de preto.
Os tempos de resposta são decentes para um laptop para jogos e há uma leve presença de sangramento da luz de fundo.
| |||||||||||||||||||||||||
iluminação: 91 %
iluminação com acumulador: 356 cd/m²
Contraste: 847:1 (Preto: 0.43 cd/m²)
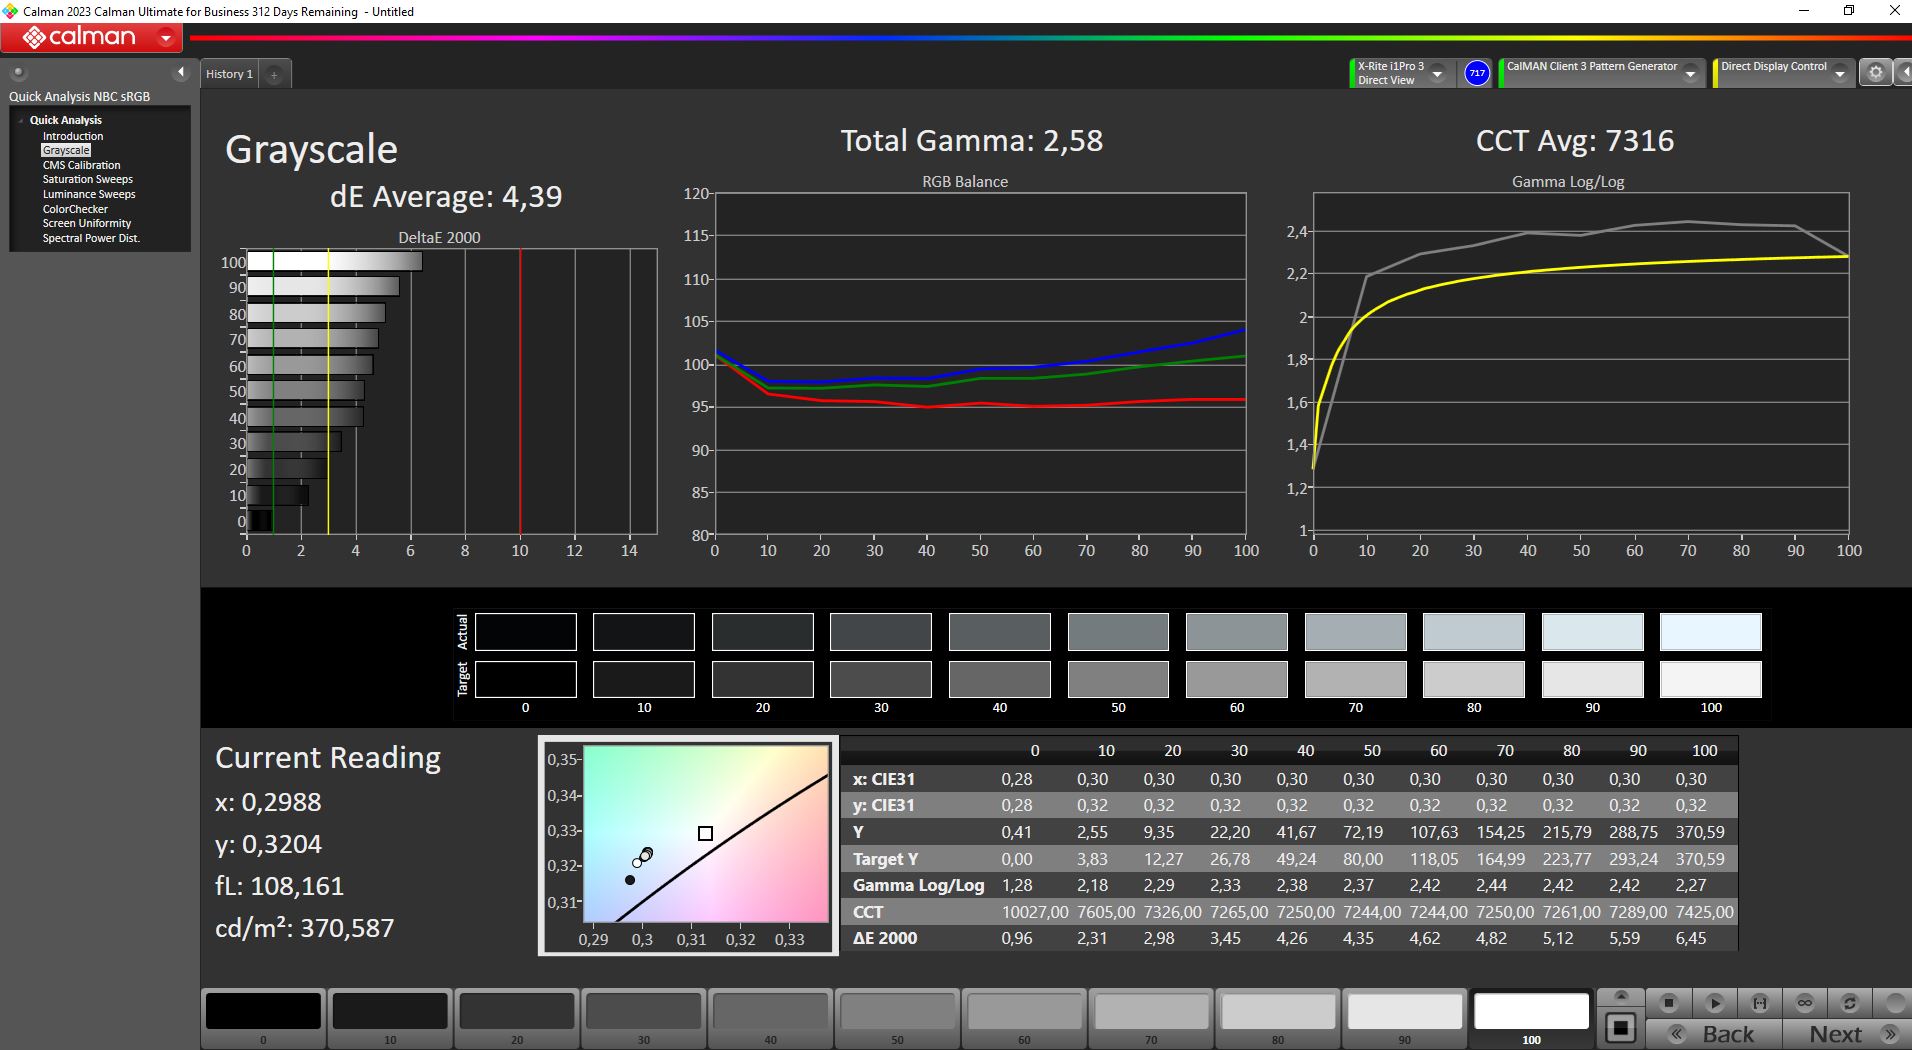
ΔE ColorChecker Calman: 3.98 | ∀{0.5-29.43 Ø4.71}
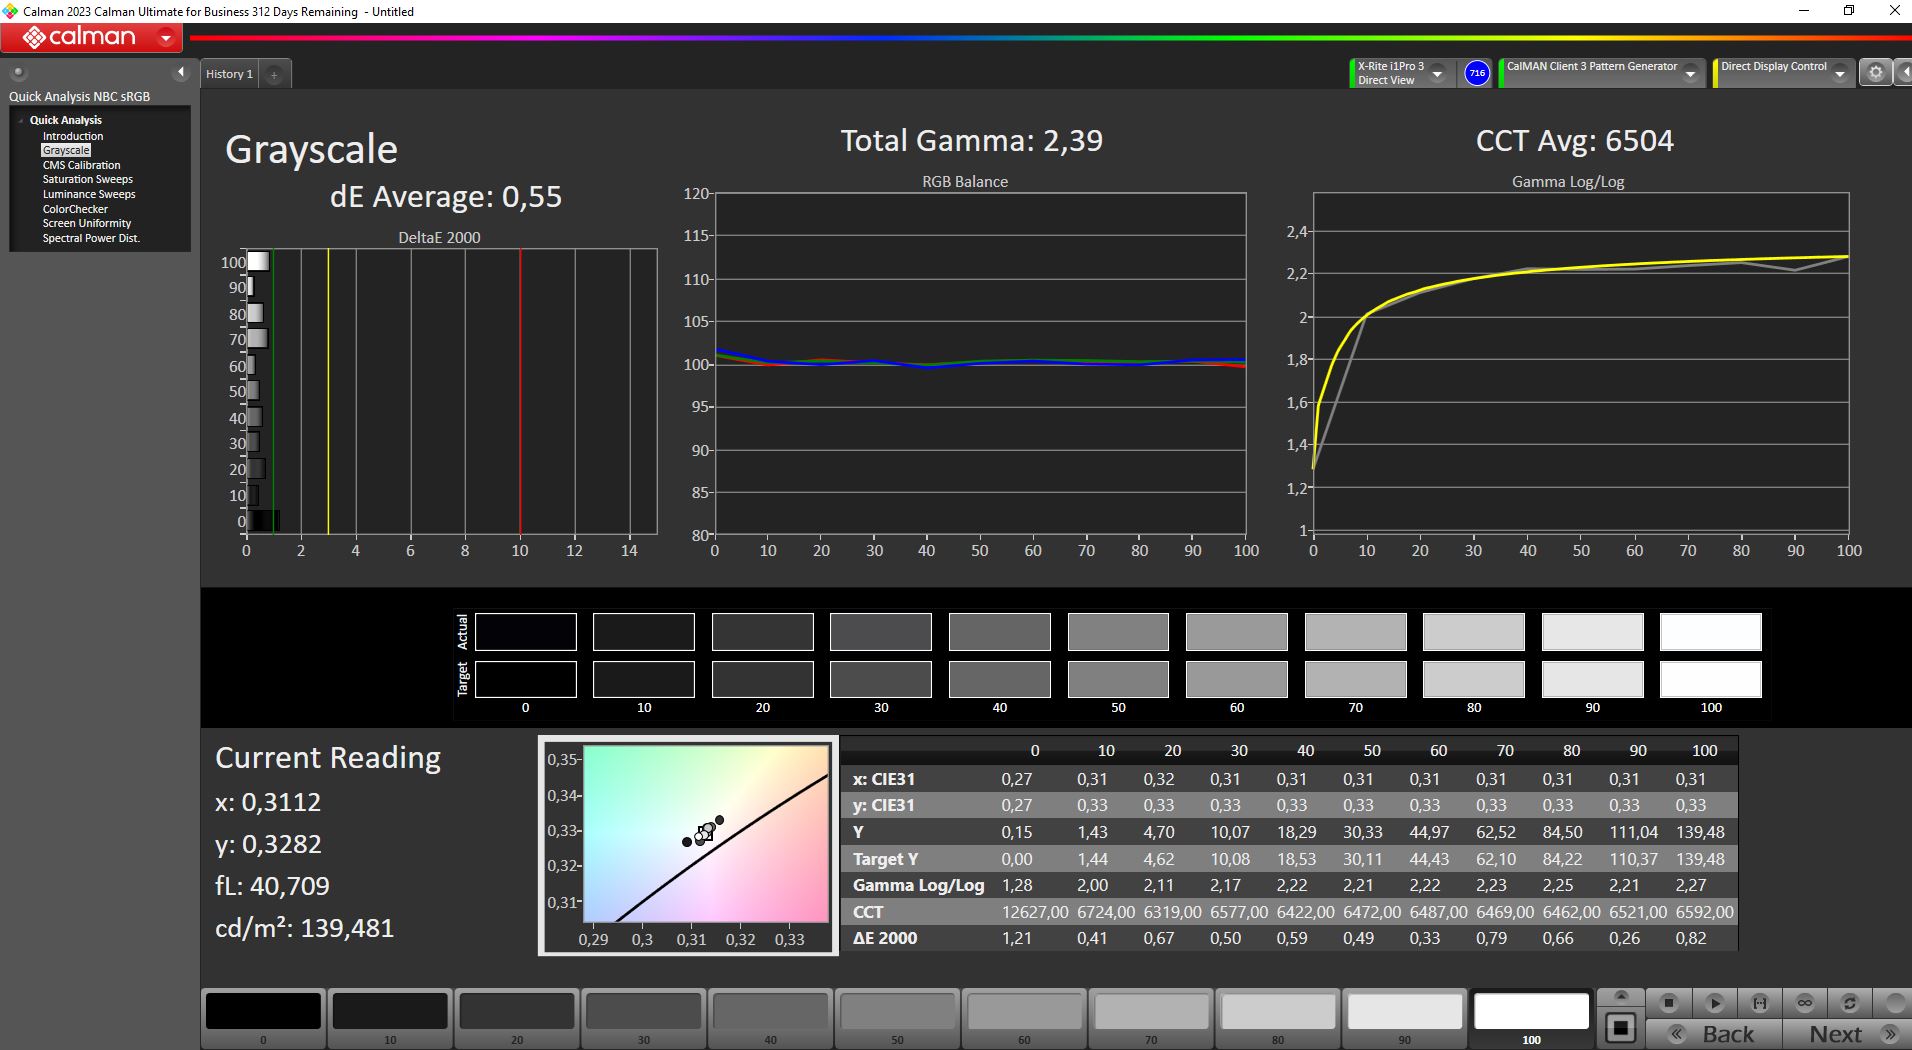
calibrated: 1.36
ΔE Greyscale Calman: 4.39 | ∀{0.09-98 Ø4.96}
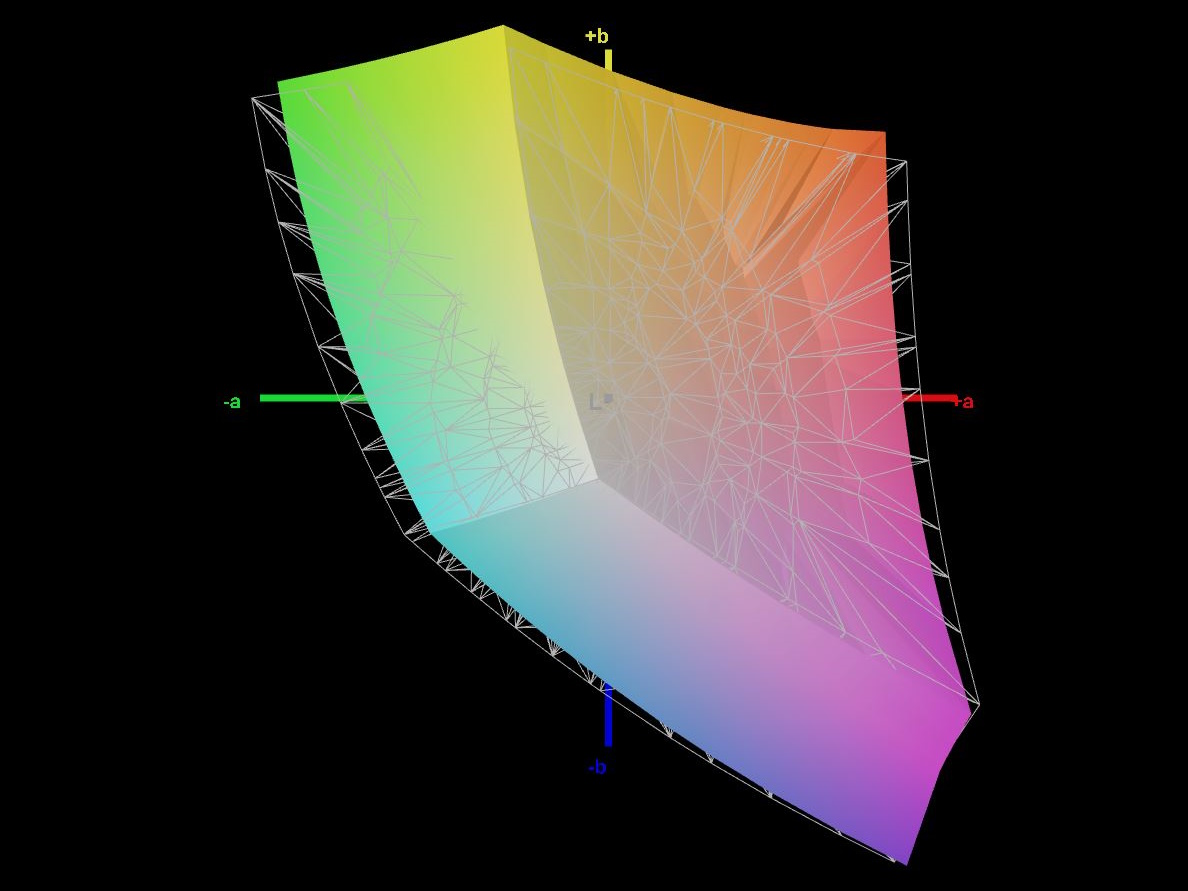
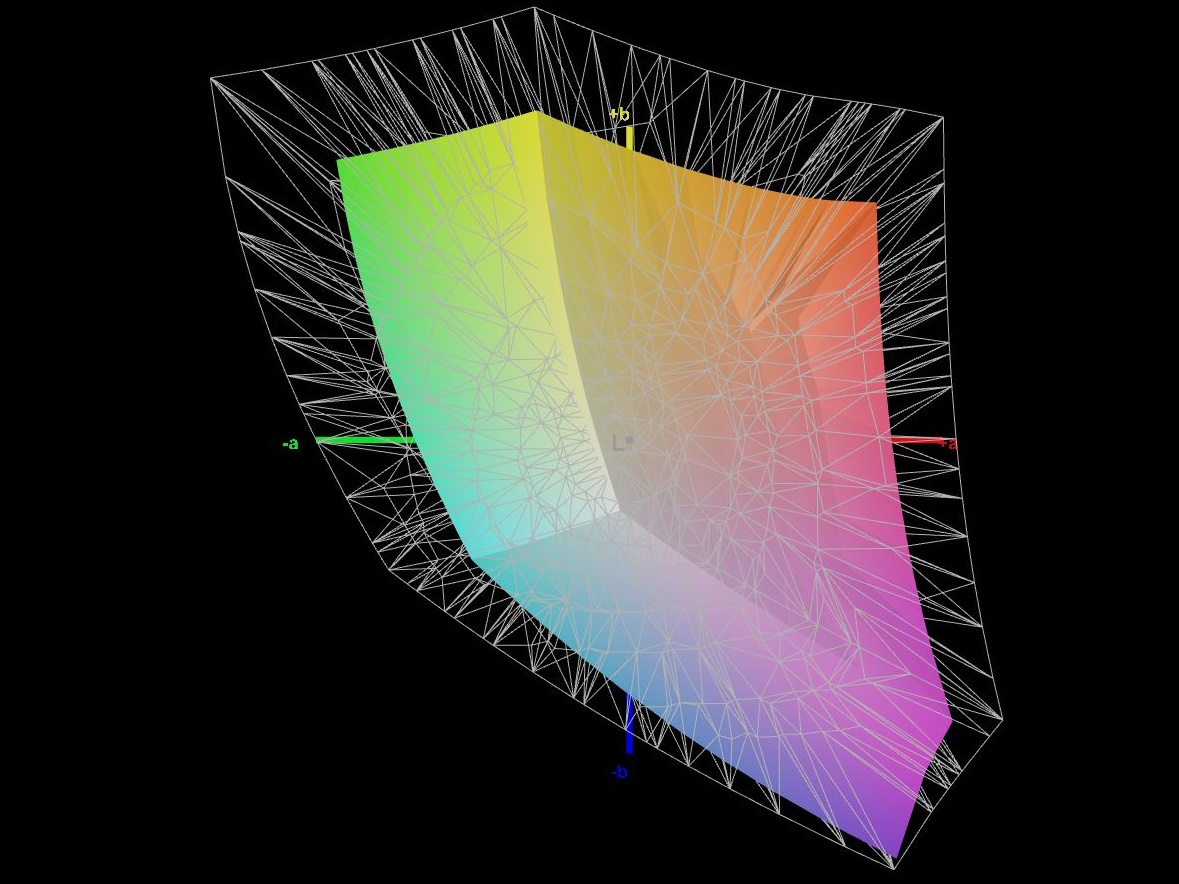
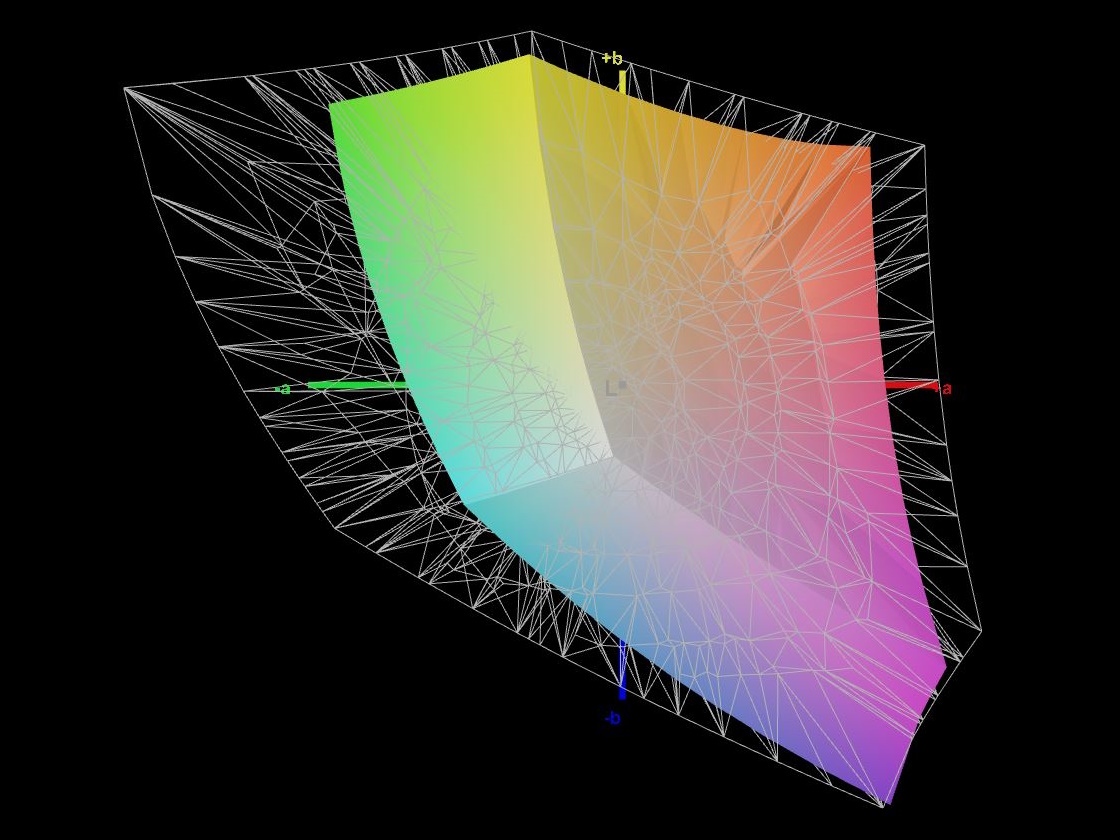
63.2% AdobeRGB 1998 (Argyll 3D)
89.7% sRGB (Argyll 3D)
61.4% Display P3 (Argyll 3D)
Gamma: 2.58
CCT: 7316 K
| Medion Erazer Crawler E40 - MD 62518 BOE HF NV156FHM-N4G, IPS, 1920x1080, 15.6" | Lenovo LOQ 15IRH8 Core i7 BOE CQ NE156QHM-NY4, IPS, 2560x1440, 15.6" | Asus TUF A15 FA507 N156HMA-GA1, IPS, 1920x1080, 15.6" | Schenker XMG Apex 15 (Late 23) BOE CQ NE156QHM-NY2, IPS, 2560x1440, 15.6" | MSI Katana 15 B12VEK AUOAF90 (B156HAN08.4), IPS, 1920x1080, 15.6" | |
|---|---|---|---|---|---|
| Display | 8% | 6% | 9% | -38% | |
| Display P3 Coverage (%) | 61.4 | 66.3 8% | 64.9 6% | 67.5 10% | 38.1 -38% |
| sRGB Coverage (%) | 89.7 | 96.6 8% | 96.5 8% | 97.6 9% | 56.8 -37% |
| AdobeRGB 1998 Coverage (%) | 63.2 | 67.7 7% | 66.6 5% | 68.9 9% | 39.3 -38% |
| Response Times | 25% | -199% | -29% | -282% | |
| Response Time Grey 50% / Grey 80% * (ms) | 8 ? | 5 ? 37% | 30.4 ? -280% | 13.2 ? -65% | 38.8 ? -385% |
| Response Time Black / White * (ms) | 9.6 ? | 8.41 ? 12% | 20.8 ? -117% | 8.8 ? 8% | 26.8 ? -179% |
| PWM Frequency (Hz) | |||||
| Screen | 3% | 32% | 12% | -46% | |
| Brightness middle (cd/m²) | 364 | 373 2% | 288 -21% | 336 -8% | 261 -28% |
| Brightness (cd/m²) | 351 | 365 4% | 271 -23% | 307 -13% | 258 -26% |
| Brightness Distribution (%) | 91 | 90 -1% | 91 0% | 77 -15% | 92 1% |
| Black Level * (cd/m²) | 0.43 | 0.33 23% | 0.17 60% | 0.38 12% | 0.19 56% |
| Contrast (:1) | 847 | 1130 33% | 1694 100% | 884 4% | 1374 62% |
| Colorchecker dE 2000 * | 3.98 | 4.19 -5% | 1.9 52% | 1.96 51% | 5.57 -40% |
| Colorchecker dE 2000 max. * | 6.38 | 8.47 -33% | 3.3 48% | 5.07 21% | 20.6 -223% |
| Colorchecker dE 2000 calibrated * | 1.36 | 1.07 21% | 0.9 34% | 1.27 7% | 4.63 -240% |
| Greyscale dE 2000 * | 4.39 | 5 -14% | 2.7 38% | 2.3 48% | 3.19 27% |
| Gamma | 2.58 85% | 1.93 114% | 2.32 95% | 2.017 109% | 2.45 90% |
| CCT | 7316 89% | 7520 86% | 6535 99% | 6644 98% | 6146 106% |
| Média Total (Programa/Configurações) | 12% /
7% | -54% /
-6% | -3% /
6% | -122% /
-78% |
* ... menor é melhor
O desempenho imediato do monitor é abaixo do ideal, com valores DeltaE para cores e escala de cinza bem acima da meta, e o nível de preto é excessivamente alto. Entretanto, a calibração do painel e a redução do brilho melhoram significativamente a qualidade da tela. Após a calibração, os valores DeltaE são reduzidos a um louvável 0,55 para escala de cinza e 1,36 para ColorChecker.
O senhor pode fazer o download gratuito do nosso perfil de cores calibrado acima.
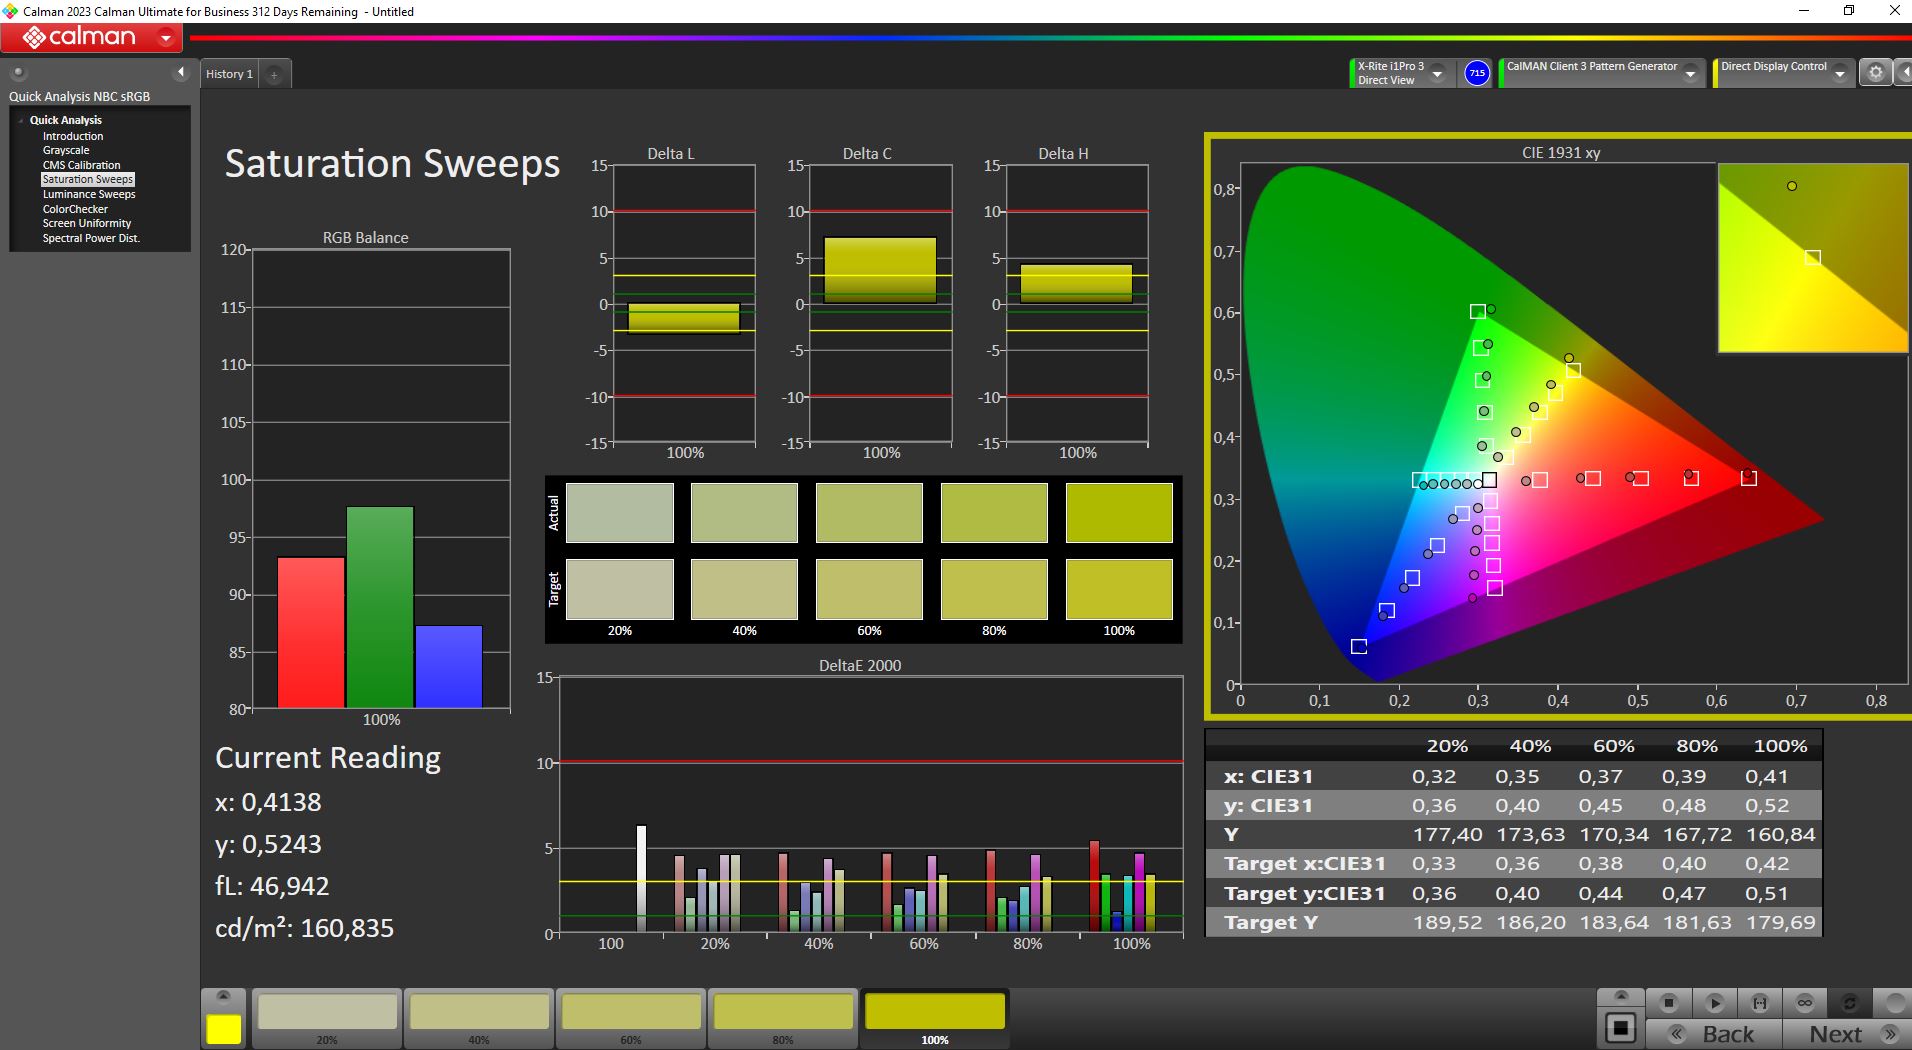
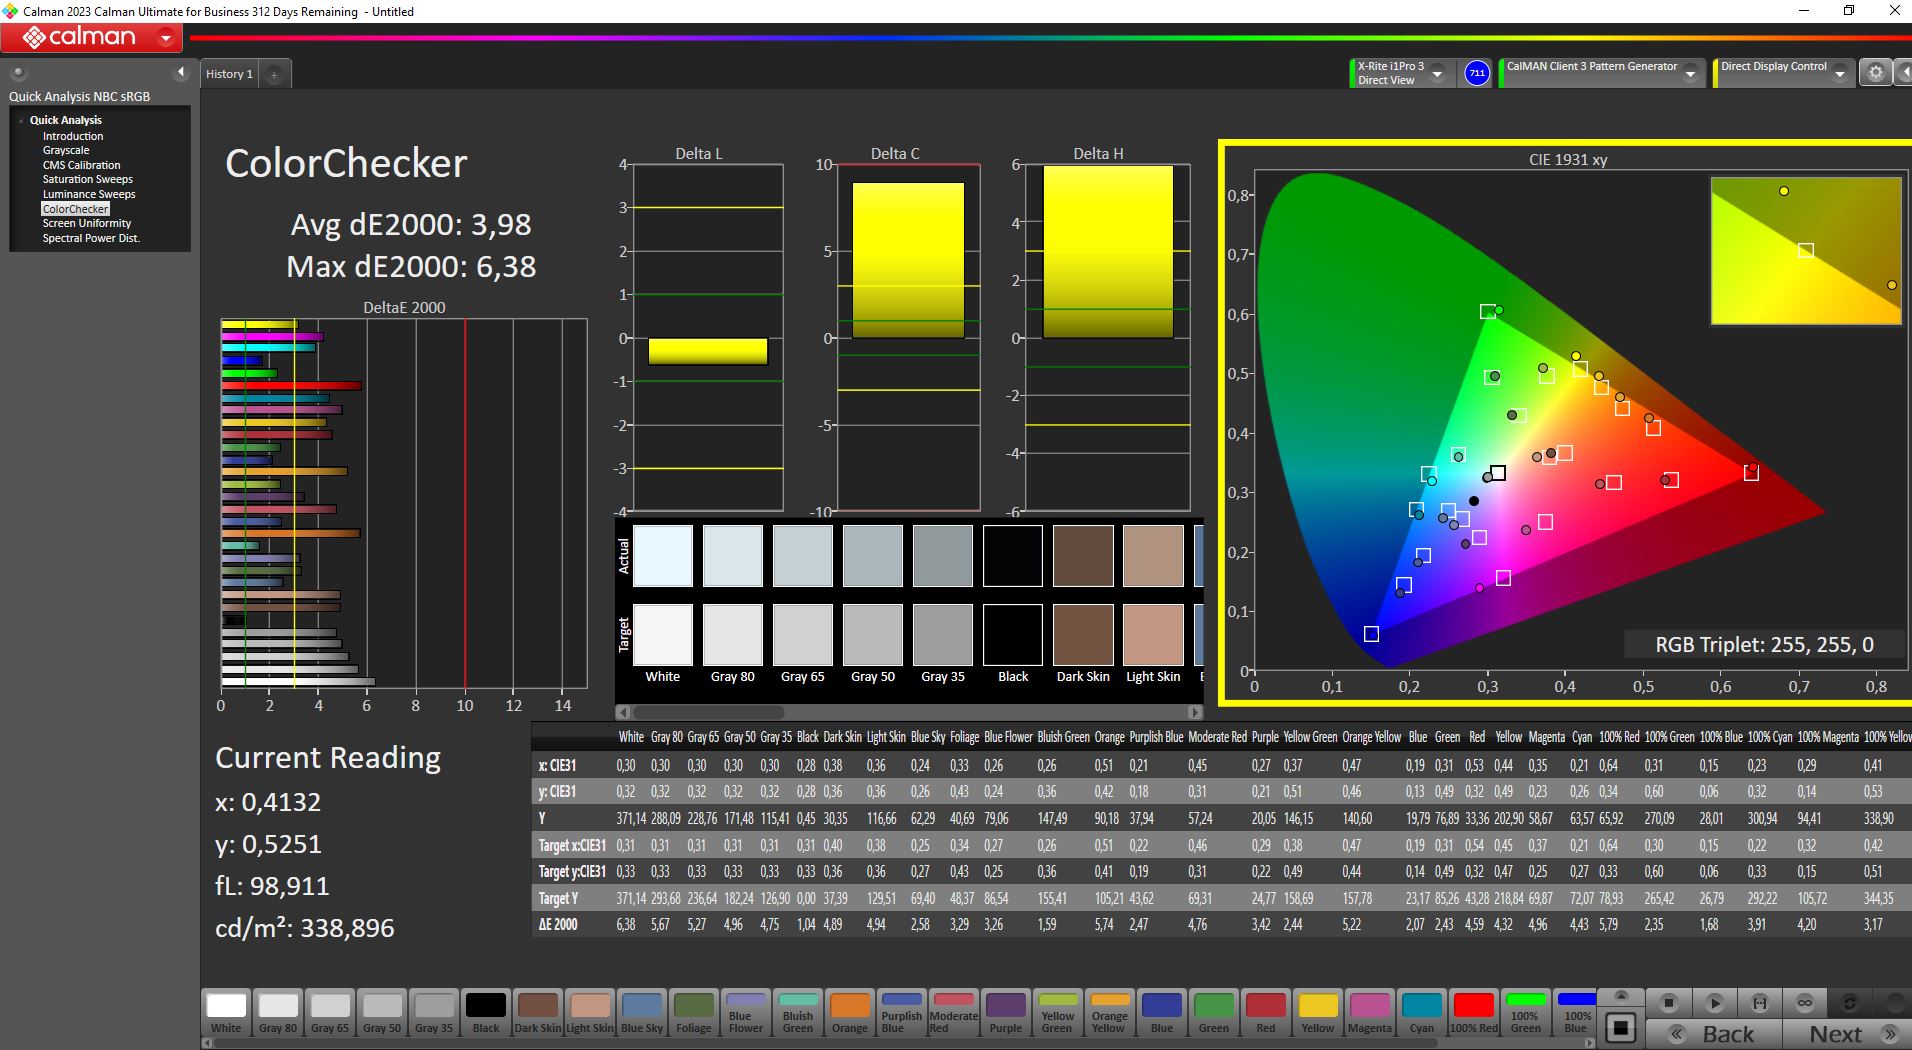
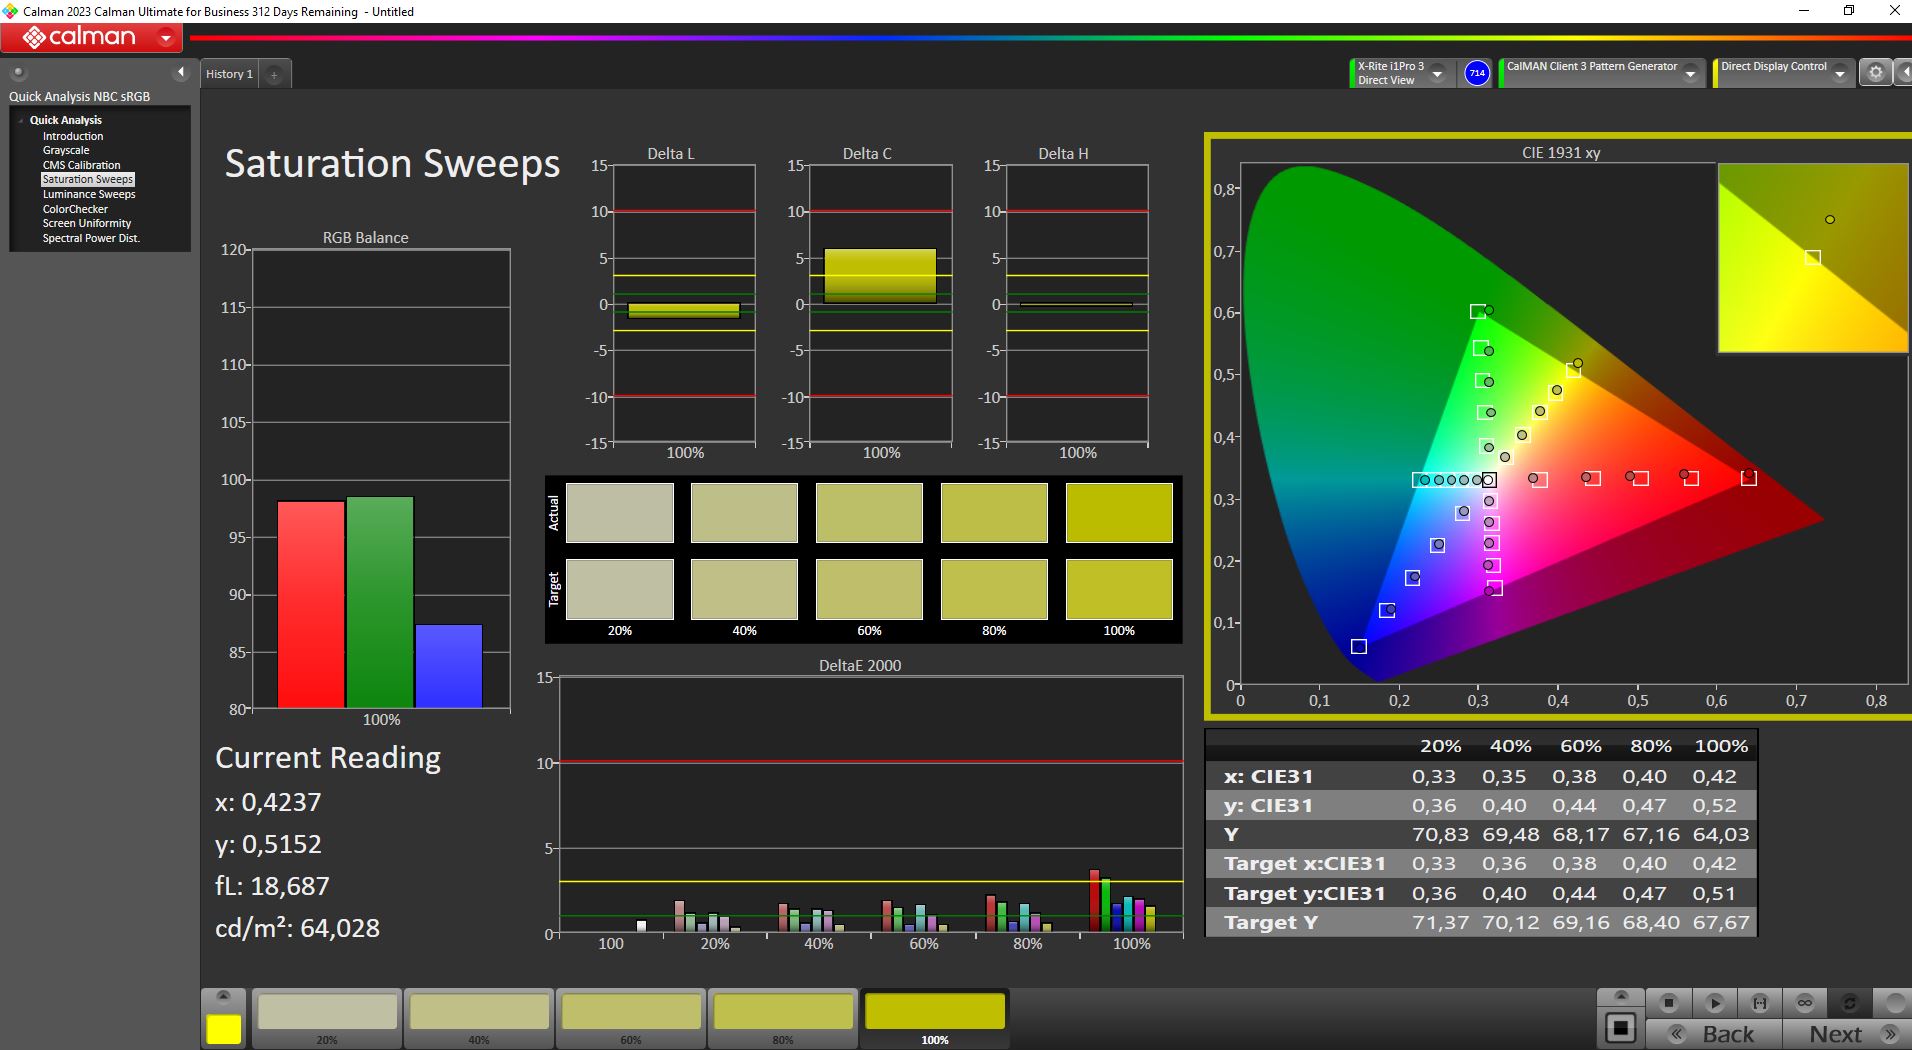
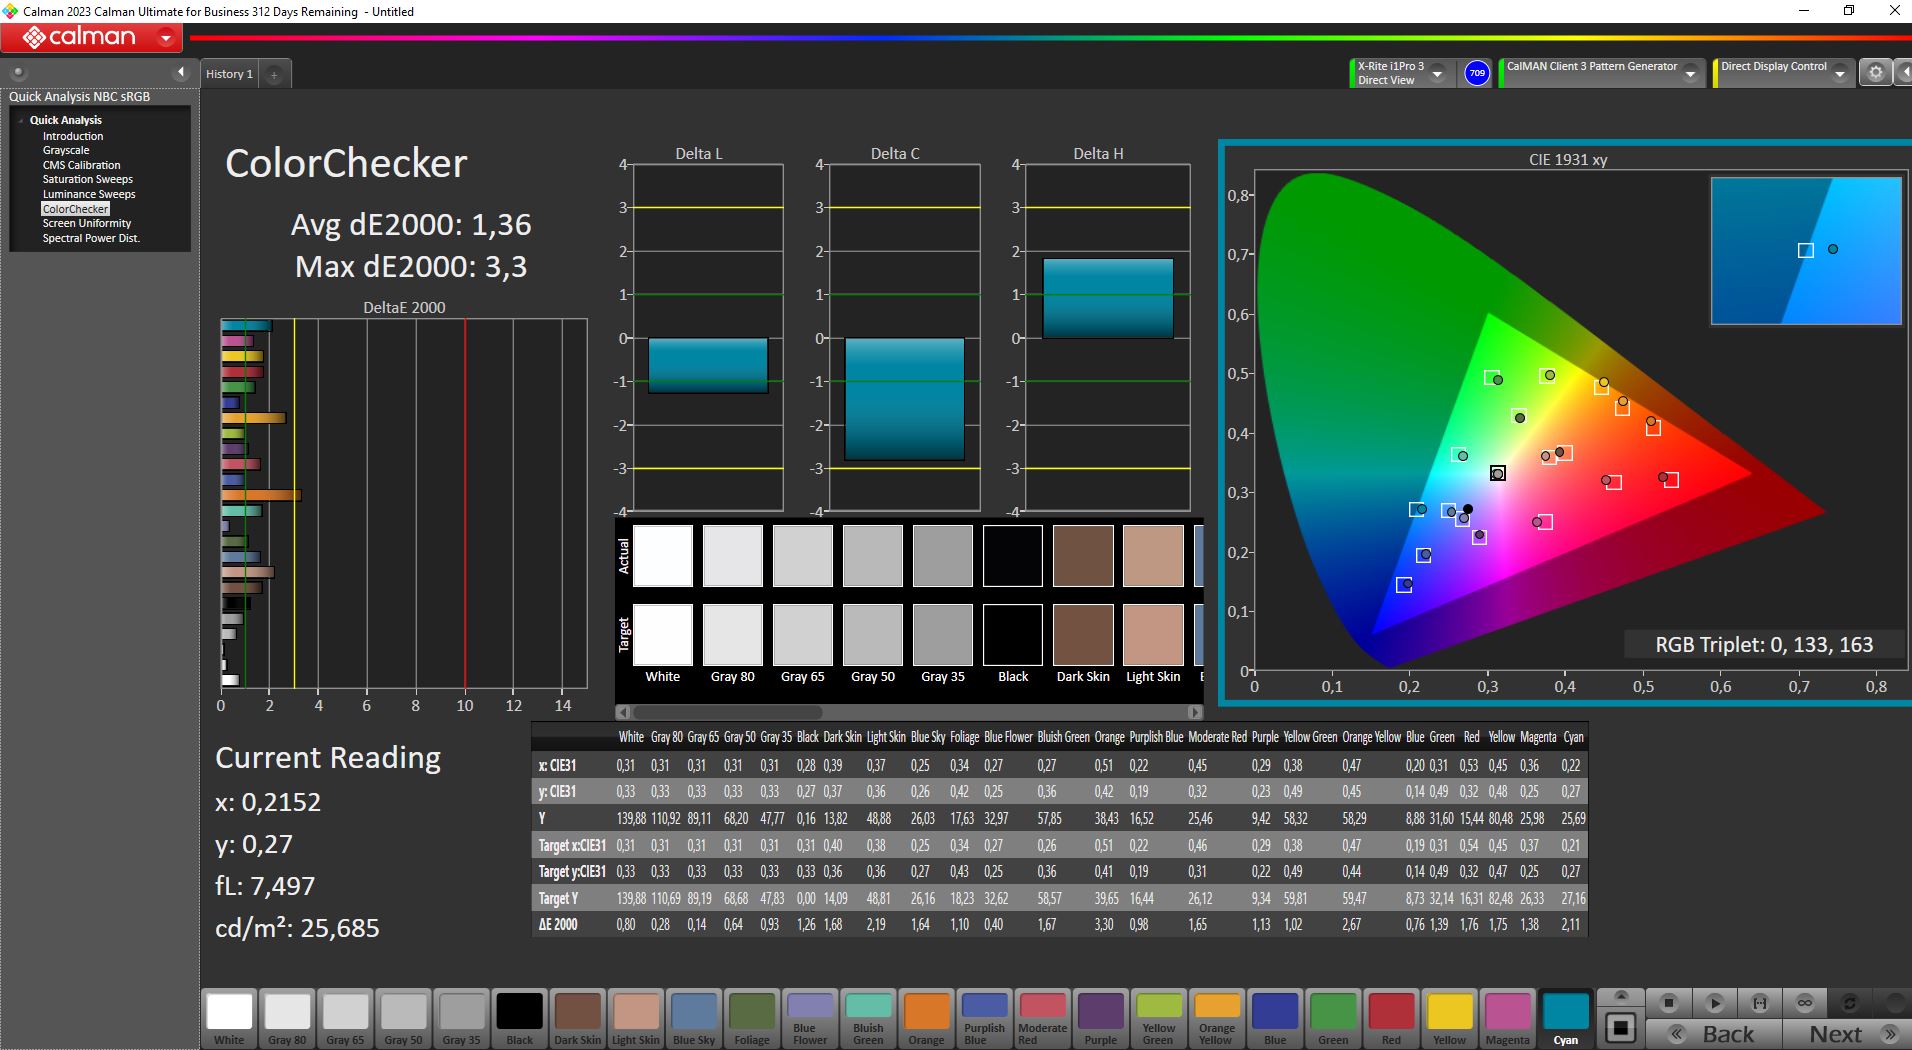
O painel mais antigo apresenta pontos fracos claros em termos de cobertura do espaço de cores, com cobertura de apenas 90% do sRGB, na melhor das hipóteses. Apesar dos bons valores DeltaE, o painel pode ser menos adequado para criadores de conteúdo.
Exibir tempos de resposta
| ↔ Tempo de resposta preto para branco | ||
|---|---|---|
| 9.6 ms ... ascensão ↗ e queda ↘ combinadas | ↗ 5.4 ms ascensão | 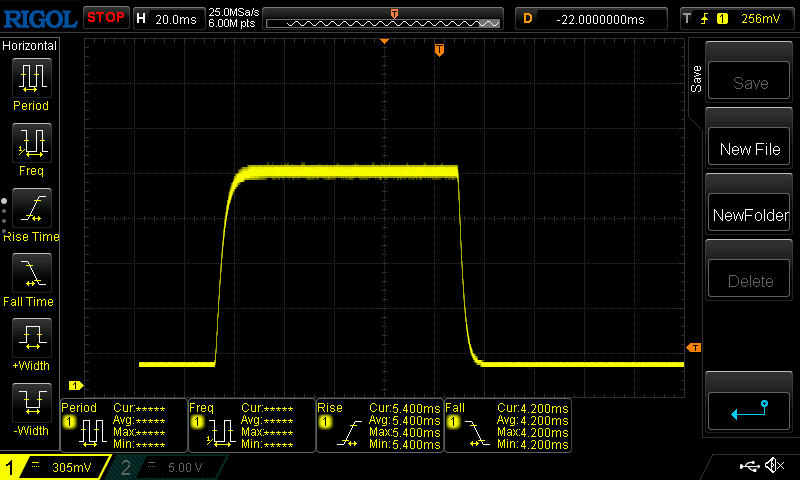 |
| ↘ 4.2 ms queda | ||
| A tela mostra taxas de resposta rápidas em nossos testes e deve ser adequada para jogos. Em comparação, todos os dispositivos testados variam de 0.1 (mínimo) a 240 (máximo) ms. » 26 % de todos os dispositivos são melhores. Isso significa que o tempo de resposta medido é melhor que a média de todos os dispositivos testados (19.8 ms). | ||
| ↔ Tempo de resposta 50% cinza a 80% cinza | ||
| 8 ms ... ascensão ↗ e queda ↘ combinadas | ↗ 3.8 ms ascensão | 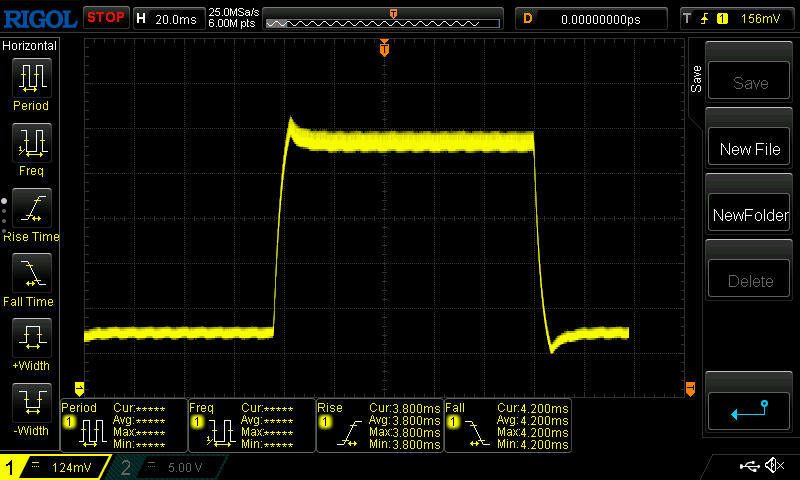 |
| ↘ 4.2 ms queda | ||
| A tela mostra taxas de resposta rápidas em nossos testes e deve ser adequada para jogos. Em comparação, todos os dispositivos testados variam de 0.165 (mínimo) a 636 (máximo) ms. » 21 % de todos os dispositivos são melhores. Isso significa que o tempo de resposta medido é melhor que a média de todos os dispositivos testados (30.9 ms). | ||
Cintilação da tela / PWM (modulação por largura de pulso)
| Tela tremeluzindo / PWM não detectado | 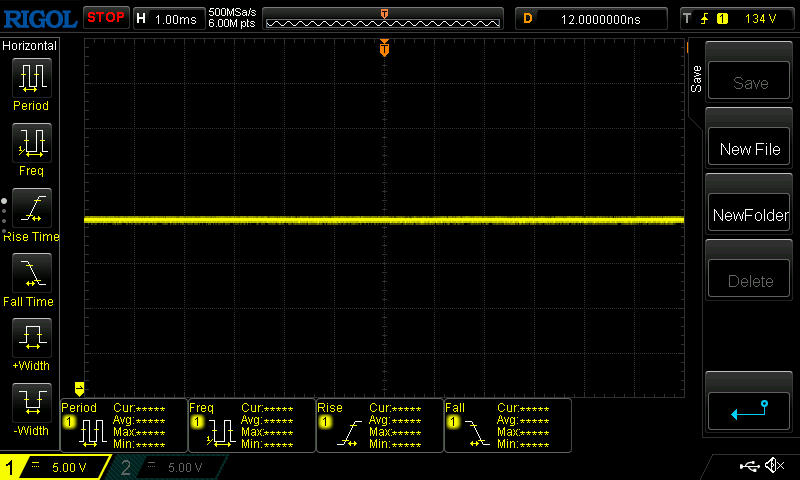 | ||
[pwm_comparison] Em comparação: 52 % de todos os dispositivos testados não usam PWM para escurecer a tela. Se PWM foi detectado, uma média de 7744 (mínimo: 5 - máximo: 343500) Hz foi medida. | |||
A superfície fosca, juntamente com o brilho de 350 nits, garante que trabalhar ao ar livre, pelo menos em um local com sombra, não seja um desafio.

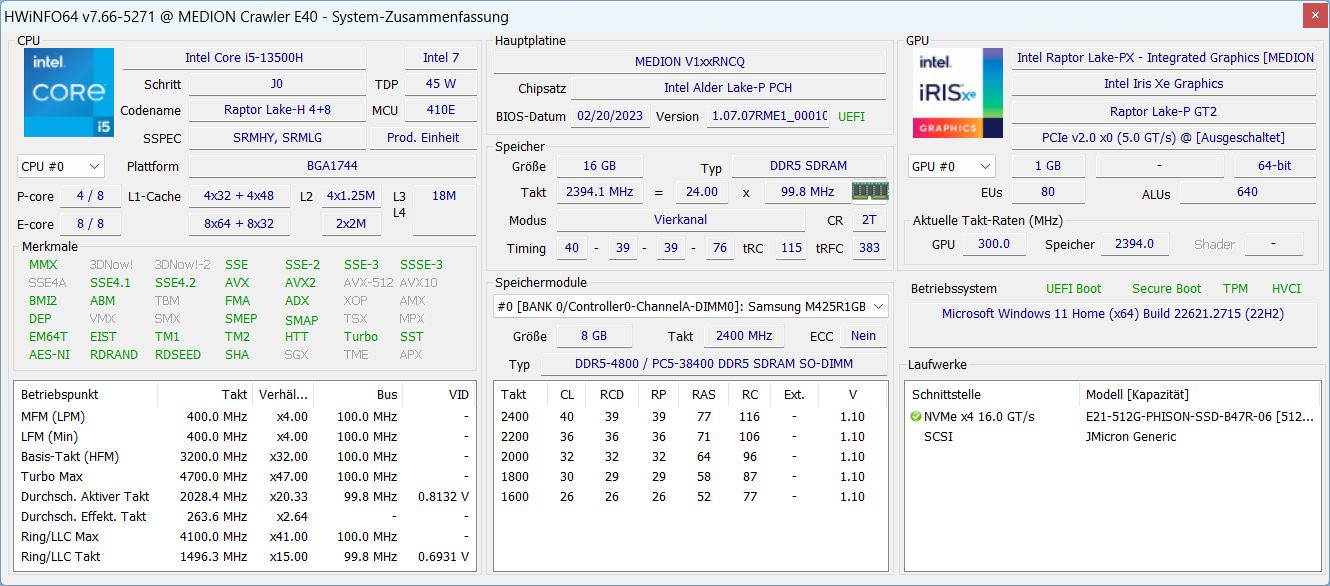
Desempenho - Uma boa combinação de i5-13500H e RTX 4050
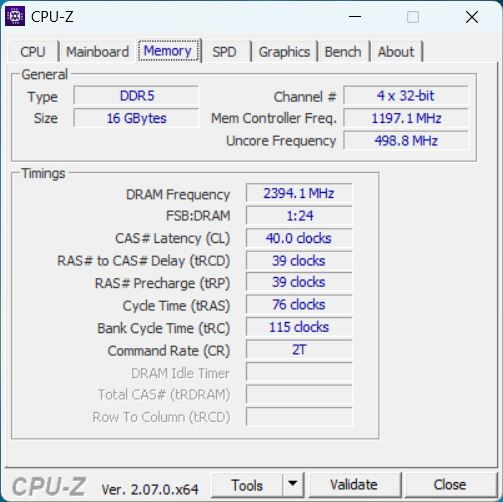
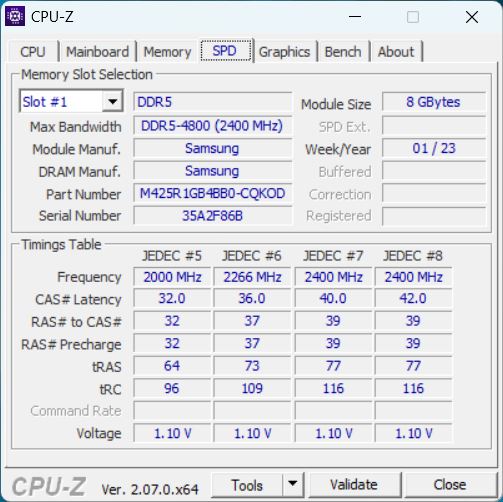
Com o Crawler, temos um laptop para jogos de nível básico, conforme indicado pela Nvidia GeForce RTX 4050 e o Intel Core i5-13500Hambos são variantes de orçamento sólidas entre os componentes para jogos. Há também 16 GB de RAM DDR5-4800 moderna e um SSD NVMe com 512 GB, e o espaço de armazenamento também é mais uma opção econômica.
Isso torna o laptop adequado para qualquer pessoa que não precise necessariamente jogar todos os jogos atuais com o máximo de detalhes. Para muitos jogos, no entanto, o desempenho na resolução nativa de 1080p deve ser suficiente para detalhes elevados. Os criadores de conteúdo também podem se interessar pelo desempenho e pelo design simples, mas é provável que a tela seja um critério de arrasar para o trabalho criativo real (imagens, vídeos).
Condições de teste
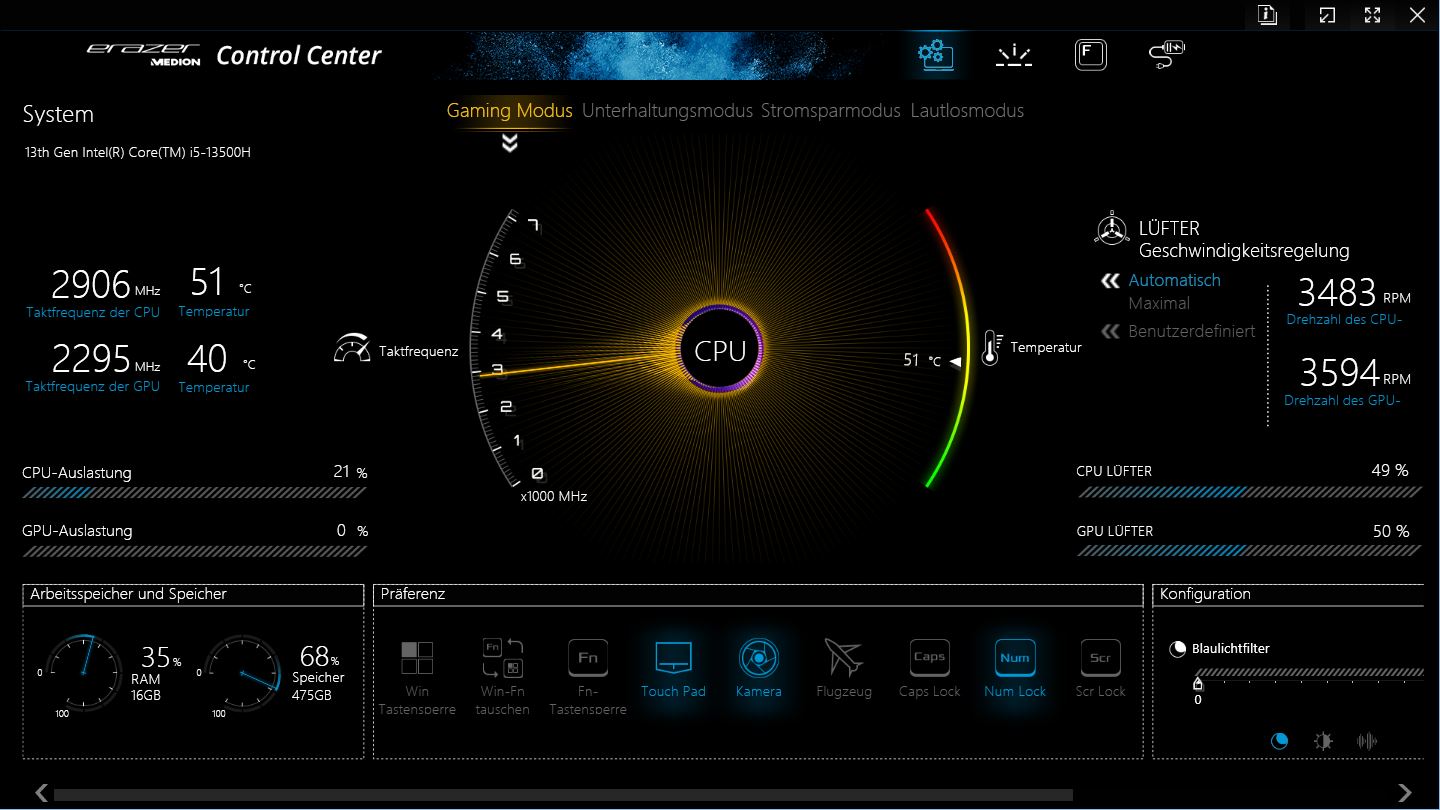
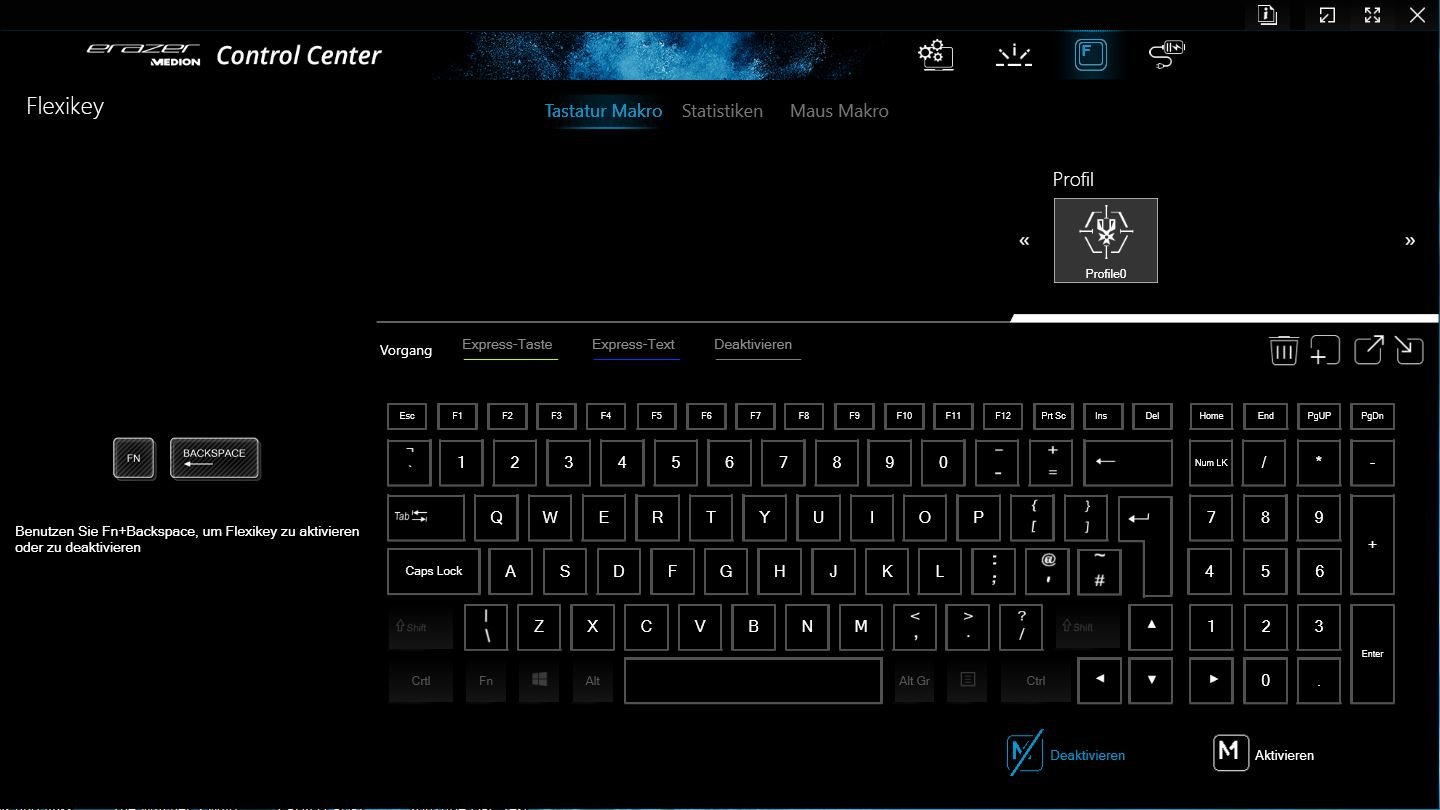
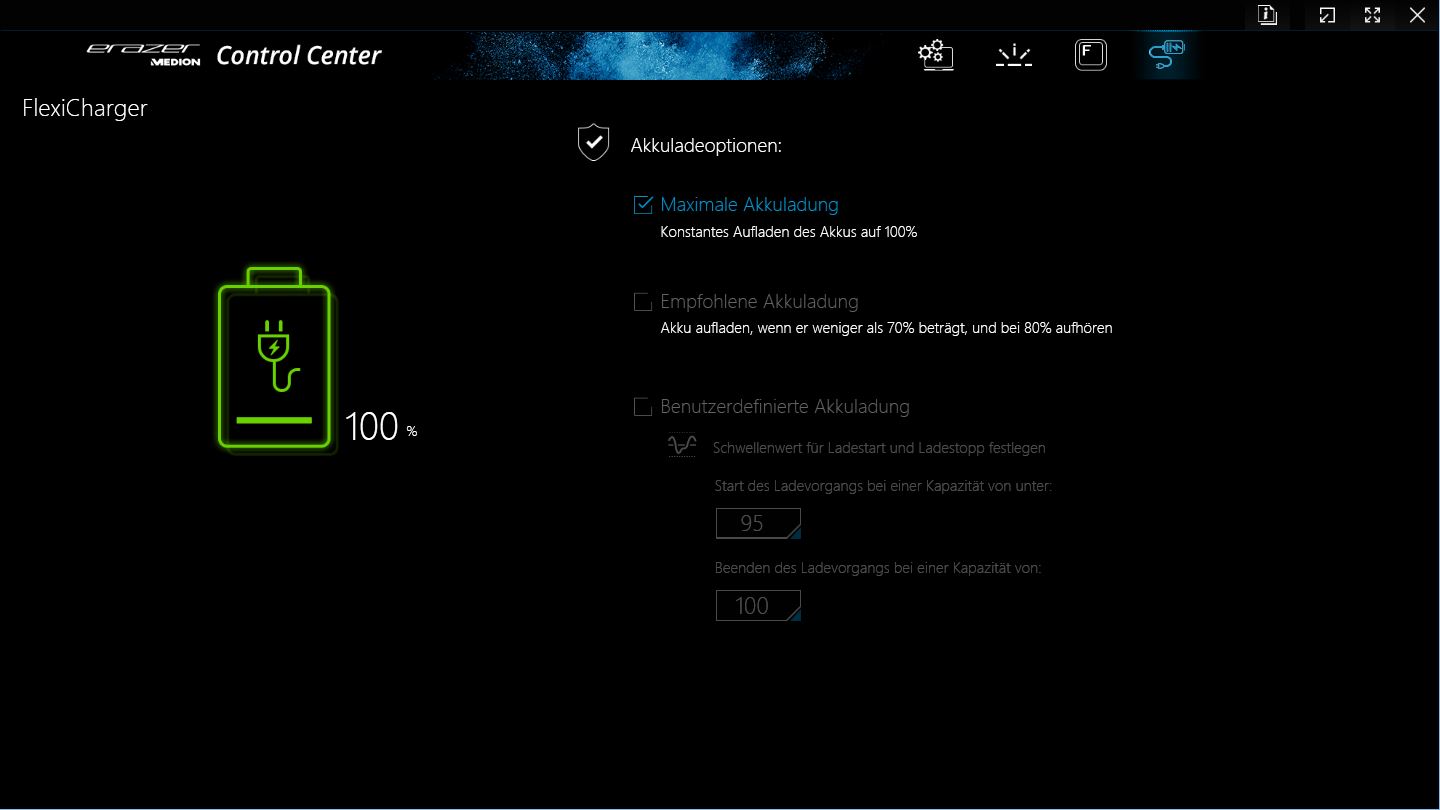
A Medion pré-instalou um Centro de Controle genérico no Crawler E40, que contém perfis de desempenho, iluminação do teclado e outras configurações. O aplicativo não é particularmente rápido e, muitas vezes, só processa as entradas com um pequeno atraso.
Na tela principal, também é um pouco irritante ter que rolar até o canto inferior direito para acessar o interruptor da GPU (MSHybrid vs. dGPU, é necessário reiniciar), por exemplo, que poderia ser projetado de forma mais clara com um pouco de esforço.
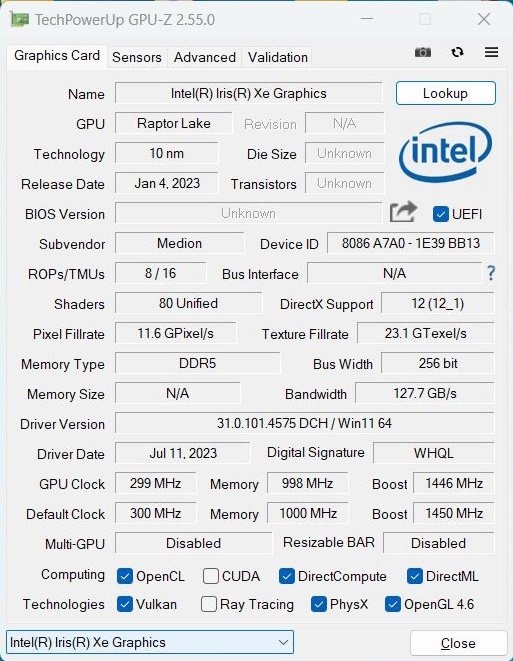
Usamos o modo de jogo para os benchmarks de desempenho e o modo de economia de energia para os testes de bateria, já que a dGPU é desativada aqui e a GPU integrada assume o controle.
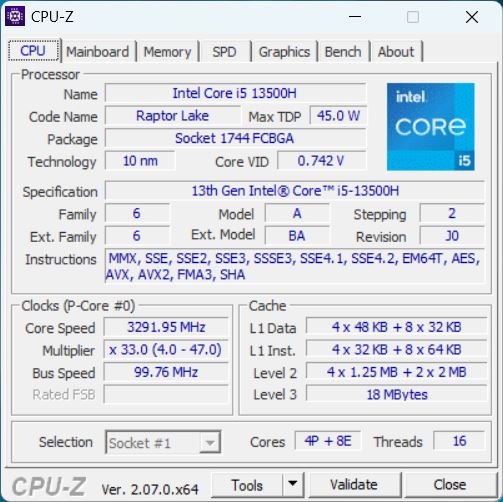
Processador
O Intel Core i5-13500H é uma CPU de médio porte da atual série Raptor Lake-H (Intel Gen13). Ele tem 4 dos 6 núcleos P possíveis e 8 núcleos E. Juntos, eles têm 12 núcleos e 16 threads (somente os núcleos P suportam hyperthreading). O clock base do E é de 1,9 GHz, os núcleos P podem atingir individualmente até 4,7 GHz e, juntos, até 4,6 GHz.
A propósito, existe um Medion Erazer Crawler E50 com Intel Gen 12 i5-12450H. O esquema de nomenclatura da Medion é realmente muito opaco e pode enganar os compradores, portanto, tenha cuidado ao comprar!
Em nossos benchmarks, a CPU apresentou bom desempenho e está praticamente no mesmo nível de um i5-13500 médio de nosso banco de dados.
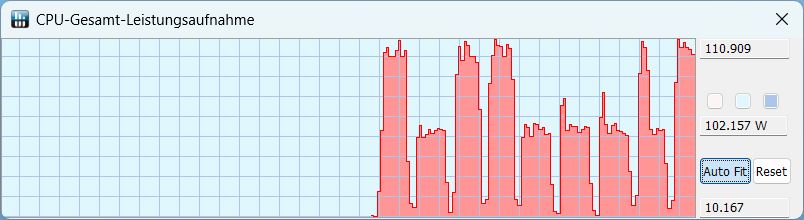
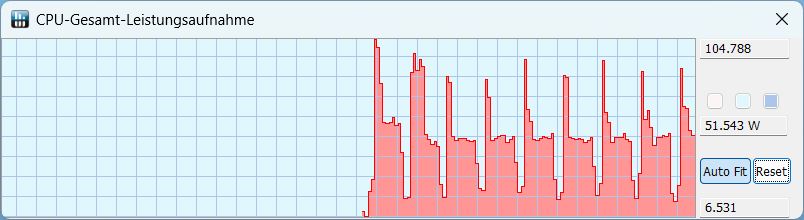
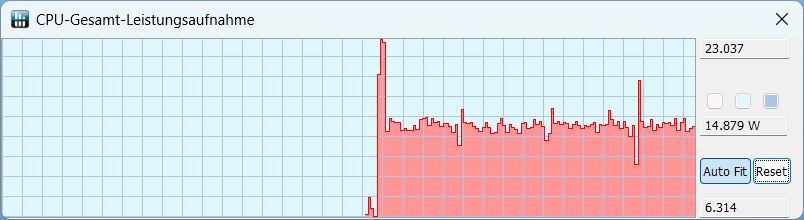
Durante o loop do Cinebench R15, o processador mostra um desempenho muito consistente desde o início, sem nenhuma queda após as primeiras execuções. A tabela abaixo mostra o comportamento nos vários modos de desempenho, incluindo o modo de bateria.
| Modo/Valor | Pontuação do Cinebench R15 | Consumo de energia da CPU Faixa | Consumo de energia da CPU típico |
|---|---|---|---|
| Jogos | 2.331 | 60 - 110 W | 105 |
| Entretenimento | 2.135 | 50-105 | 51 |
| Silencioso | 835 | 15-23 | 15 |
| Bateria | 1.065 | 19-21 | 21 |
Cinebench R15 Multi Loop
Cinebench R23: Multi Core | Single Core
Cinebench R20: CPU (Multi Core) | CPU (Single Core)
Cinebench R15: CPU Multi 64Bit | CPU Single 64Bit
Blender: v2.79 BMW27 CPU
7-Zip 18.03: 7z b 4 | 7z b 4 -mmt1
Geekbench 5.5: Multi-Core | Single-Core
HWBOT x265 Benchmark v2.2: 4k Preset
LibreOffice : 20 Documents To PDF
R Benchmark 2.5: Overall mean
| CPU Performance rating | |
| Média da turma Gaming | |
| Schenker XMG Apex 15 (Late 23) | |
| Lenovo LOQ 15IRH8 Core i7 | |
| MSI Katana 15 B12VEK | |
| Medion Erazer Crawler E40 - MD 62518 | |
| Média Intel Core i5-13500H | |
| Asus TUF A15 FA507 | |
| Cinebench R23 / Multi Core | |
| Média da turma Gaming (10488 - 42661, n=104, últimos 2 anos) | |
| Schenker XMG Apex 15 (Late 23) | |
| MSI Katana 15 B12VEK | |
| Lenovo LOQ 15IRH8 Core i7 | |
| Média Intel Core i5-13500H (13542 - 16335, n=5) | |
| Medion Erazer Crawler E40 - MD 62518 | |
| Asus TUF A15 FA507 | |
| Cinebench R23 / Single Core | |
| Média da turma Gaming (1601 - 2415, n=104, últimos 2 anos) | |
| Lenovo LOQ 15IRH8 Core i7 | |
| Medion Erazer Crawler E40 - MD 62518 | |
| Schenker XMG Apex 15 (Late 23) | |
| Média Intel Core i5-13500H (1704 - 1799, n=5) | |
| MSI Katana 15 B12VEK | |
| Asus TUF A15 FA507 | |
| Cinebench R20 / CPU (Multi Core) | |
| Média da turma Gaming (4029 - 16433, n=103, últimos 2 anos) | |
| Schenker XMG Apex 15 (Late 23) | |
| MSI Katana 15 B12VEK | |
| Lenovo LOQ 15IRH8 Core i7 | |
| Média Intel Core i5-13500H (5108 - 6212, n=5) | |
| Asus TUF A15 FA507 | |
| Medion Erazer Crawler E40 - MD 62518 | |
| Cinebench R20 / CPU (Single Core) | |
| Média da turma Gaming (622 - 913, n=103, últimos 2 anos) | |
| Lenovo LOQ 15IRH8 Core i7 | |
| Schenker XMG Apex 15 (Late 23) | |
| Medion Erazer Crawler E40 - MD 62518 | |
| Média Intel Core i5-13500H (655 - 687, n=5) | |
| MSI Katana 15 B12VEK | |
| Asus TUF A15 FA507 | |
| Cinebench R15 / CPU Multi 64Bit | |
| Média da turma Gaming (1578 - 6330, n=102, últimos 2 anos) | |
| Schenker XMG Apex 15 (Late 23) | |
| Medion Erazer Crawler E40 - MD 62518 | |
| Média Intel Core i5-13500H (2234 - 2475, n=5) | |
| Lenovo LOQ 15IRH8 Core i7 | |
| Asus TUF A15 FA507 | |
| MSI Katana 15 B12VEK | |
| Cinebench R15 / CPU Single 64Bit | |
| Média da turma Gaming (188.8 - 350, n=103, últimos 2 anos) | |
| Schenker XMG Apex 15 (Late 23) | |
| Lenovo LOQ 15IRH8 Core i7 | |
| Média Intel Core i5-13500H (243 - 261, n=5) | |
| Asus TUF A15 FA507 | |
| Medion Erazer Crawler E40 - MD 62518 | |
| MSI Katana 15 B12VEK | |
| Blender / v2.79 BMW27 CPU | |
| Lenovo LOQ 15IRH8 Core i7 | |
| Média Intel Core i5-13500H (205 - 263, n=6) | |
| MSI Katana 15 B12VEK | |
| Asus TUF A15 FA507 | |
| Medion Erazer Crawler E40 - MD 62518 | |
| Schenker XMG Apex 15 (Late 23) | |
| Média da turma Gaming (79 - 330, n=101, últimos 2 anos) | |
| 7-Zip 18.03 / 7z b 4 | |
| Média da turma Gaming (33491 - 148086, n=102, últimos 2 anos) | |
| Schenker XMG Apex 15 (Late 23) | |
| Asus TUF A15 FA507 | |
| MSI Katana 15 B12VEK | |
| Medion Erazer Crawler E40 - MD 62518 | |
| Lenovo LOQ 15IRH8 Core i7 | |
| Média Intel Core i5-13500H (50846 - 58567, n=6) | |
| 7-Zip 18.03 / 7z b 4 -mmt1 | |
| Schenker XMG Apex 15 (Late 23) | |
| Média da turma Gaming (4824 - 7436, n=102, últimos 2 anos) | |
| Lenovo LOQ 15IRH8 Core i7 | |
| Asus TUF A15 FA507 | |
| Média Intel Core i5-13500H (5500 - 5885, n=6) | |
| MSI Katana 15 B12VEK | |
| Medion Erazer Crawler E40 - MD 62518 | |
| Geekbench 5.5 / Multi-Core | |
| Média da turma Gaming (6460 - 28263, n=102, últimos 2 anos) | |
| Schenker XMG Apex 15 (Late 23) | |
| Lenovo LOQ 15IRH8 Core i7 | |
| MSI Katana 15 B12VEK | |
| Medion Erazer Crawler E40 - MD 62518 | |
| Média Intel Core i5-13500H (9312 - 11465, n=5) | |
| Asus TUF A15 FA507 | |
| Geekbench 5.5 / Single-Core | |
| Média da turma Gaming (1403 - 2474, n=102, últimos 2 anos) | |
| Schenker XMG Apex 15 (Late 23) | |
| Lenovo LOQ 15IRH8 Core i7 | |
| Média Intel Core i5-13500H (1674 - 1762, n=5) | |
| Medion Erazer Crawler E40 - MD 62518 | |
| MSI Katana 15 B12VEK | |
| Asus TUF A15 FA507 | |
| HWBOT x265 Benchmark v2.2 / 4k Preset | |
| Média da turma Gaming (11.5 - 44.4, n=102, últimos 2 anos) | |
| Schenker XMG Apex 15 (Late 23) | |
| Medion Erazer Crawler E40 - MD 62518 | |
| MSI Katana 15 B12VEK | |
| Asus TUF A15 FA507 | |
| Lenovo LOQ 15IRH8 Core i7 | |
| Média Intel Core i5-13500H (14.4 - 17.9, n=6) | |
| LibreOffice / 20 Documents To PDF | |
| Medion Erazer Crawler E40 - MD 62518 | |
| Média Intel Core i5-13500H (44 - 65.5, n=5) | |
| Asus TUF A15 FA507 | |
| Média da turma Gaming (33.2 - 88.8, n=102, últimos 2 anos) | |
| MSI Katana 15 B12VEK | |
| Schenker XMG Apex 15 (Late 23) | |
| Lenovo LOQ 15IRH8 Core i7 | |
| R Benchmark 2.5 / Overall mean | |
| Asus TUF A15 FA507 | |
| MSI Katana 15 B12VEK | |
| Média Intel Core i5-13500H (0.471 - 0.51, n=6) | |
| Medion Erazer Crawler E40 - MD 62518 | |
| Lenovo LOQ 15IRH8 Core i7 | |
| Schenker XMG Apex 15 (Late 23) | |
| Média da turma Gaming (0.3439 - 0.59, n=102, últimos 2 anos) | |
* ... menor é melhor
AIDA64: FP32 Ray-Trace | FPU Julia | CPU SHA3 | CPU Queen | FPU SinJulia | FPU Mandel | CPU AES | CPU ZLib | FP64 Ray-Trace | CPU PhotoWorxx
| Performance rating | |
| Média da turma Gaming | |
| Schenker XMG Apex 15 (Late 23) | |
| Asus TUF A15 FA507 | |
| MSI Katana 15 B12VEK | |
| Medion Erazer Crawler E40 - MD 62518 | |
| Média Intel Core i5-13500H | |
| Lenovo LOQ 15IRH8 Core i7 | |
| AIDA64 / FP32 Ray-Trace | |
| Média da turma Gaming (10227 - 85542, n=102, últimos 2 anos) | |
| Schenker XMG Apex 15 (Late 23) | |
| Asus TUF A15 FA507 | |
| MSI Katana 15 B12VEK | |
| Medion Erazer Crawler E40 - MD 62518 | |
| Média Intel Core i5-13500H (11081 - 15390, n=6) | |
| Lenovo LOQ 15IRH8 Core i7 | |
| AIDA64 / FPU Julia | |
| Média da turma Gaming (51376 - 372155, n=102, últimos 2 anos) | |
| Schenker XMG Apex 15 (Late 23) | |
| Asus TUF A15 FA507 | |
| MSI Katana 15 B12VEK | |
| Medion Erazer Crawler E40 - MD 62518 | |
| Média Intel Core i5-13500H (56813 - 74251, n=6) | |
| Lenovo LOQ 15IRH8 Core i7 | |
| AIDA64 / CPU SHA3 | |
| Média da turma Gaming (2180 - 10115, n=102, últimos 2 anos) | |
| Schenker XMG Apex 15 (Late 23) | |
| Medion Erazer Crawler E40 - MD 62518 | |
| Asus TUF A15 FA507 | |
| MSI Katana 15 B12VEK | |
| Média Intel Core i5-13500H (2621 - 3623, n=6) | |
| Lenovo LOQ 15IRH8 Core i7 | |
| AIDA64 / CPU Queen | |
| Média da turma Gaming (49785 - 173351, n=86, últimos 2 anos) | |
| Schenker XMG Apex 15 (Late 23) | |
| Asus TUF A15 FA507 | |
| MSI Katana 15 B12VEK | |
| Medion Erazer Crawler E40 - MD 62518 | |
| Média Intel Core i5-13500H (77835 - 85727, n=6) | |
| Lenovo LOQ 15IRH8 Core i7 | |
| AIDA64 / FPU SinJulia | |
| Schenker XMG Apex 15 (Late 23) | |
| Média da turma Gaming (4424 - 33636, n=102, últimos 2 anos) | |
| Asus TUF A15 FA507 | |
| MSI Katana 15 B12VEK | |
| Medion Erazer Crawler E40 - MD 62518 | |
| Média Intel Core i5-13500H (7249 - 8086, n=6) | |
| Lenovo LOQ 15IRH8 Core i7 | |
| AIDA64 / FPU Mandel | |
| Média da turma Gaming (25115 - 196829, n=102, últimos 2 anos) | |
| Schenker XMG Apex 15 (Late 23) | |
| Asus TUF A15 FA507 | |
| MSI Katana 15 B12VEK | |
| Medion Erazer Crawler E40 - MD 62518 | |
| Média Intel Core i5-13500H (27820 - 38336, n=6) | |
| Lenovo LOQ 15IRH8 Core i7 | |
| AIDA64 / CPU AES | |
| Schenker XMG Apex 15 (Late 23) | |
| Média da turma Gaming (39258 - 247074, n=102, últimos 2 anos) | |
| Média Intel Core i5-13500H (62657 - 120493, n=6) | |
| MSI Katana 15 B12VEK | |
| Asus TUF A15 FA507 | |
| Medion Erazer Crawler E40 - MD 62518 | |
| Lenovo LOQ 15IRH8 Core i7 | |
| AIDA64 / CPU ZLib | |
| Média da turma Gaming (574 - 2531, n=102, últimos 2 anos) | |
| Schenker XMG Apex 15 (Late 23) | |
| Medion Erazer Crawler E40 - MD 62518 | |
| Média Intel Core i5-13500H (782 - 992, n=6) | |
| MSI Katana 15 B12VEK | |
| Lenovo LOQ 15IRH8 Core i7 | |
| Asus TUF A15 FA507 | |
| AIDA64 / FP64 Ray-Trace | |
| Média da turma Gaming (5509 - 45446, n=102, últimos 2 anos) | |
| Schenker XMG Apex 15 (Late 23) | |
| Asus TUF A15 FA507 | |
| MSI Katana 15 B12VEK | |
| Medion Erazer Crawler E40 - MD 62518 | |
| Média Intel Core i5-13500H (5955 - 8495, n=6) | |
| Lenovo LOQ 15IRH8 Core i7 | |
| AIDA64 / CPU PhotoWorxx | |
| Média da turma Gaming (12271 - 89891, n=102, últimos 2 anos) | |
| MSI Katana 15 B12VEK | |
| Medion Erazer Crawler E40 - MD 62518 | |
| Schenker XMG Apex 15 (Late 23) | |
| Lenovo LOQ 15IRH8 Core i7 | |
| Média Intel Core i5-13500H (20212 - 37618, n=6) | |
| Asus TUF A15 FA507 | |
Desempenho do sistema
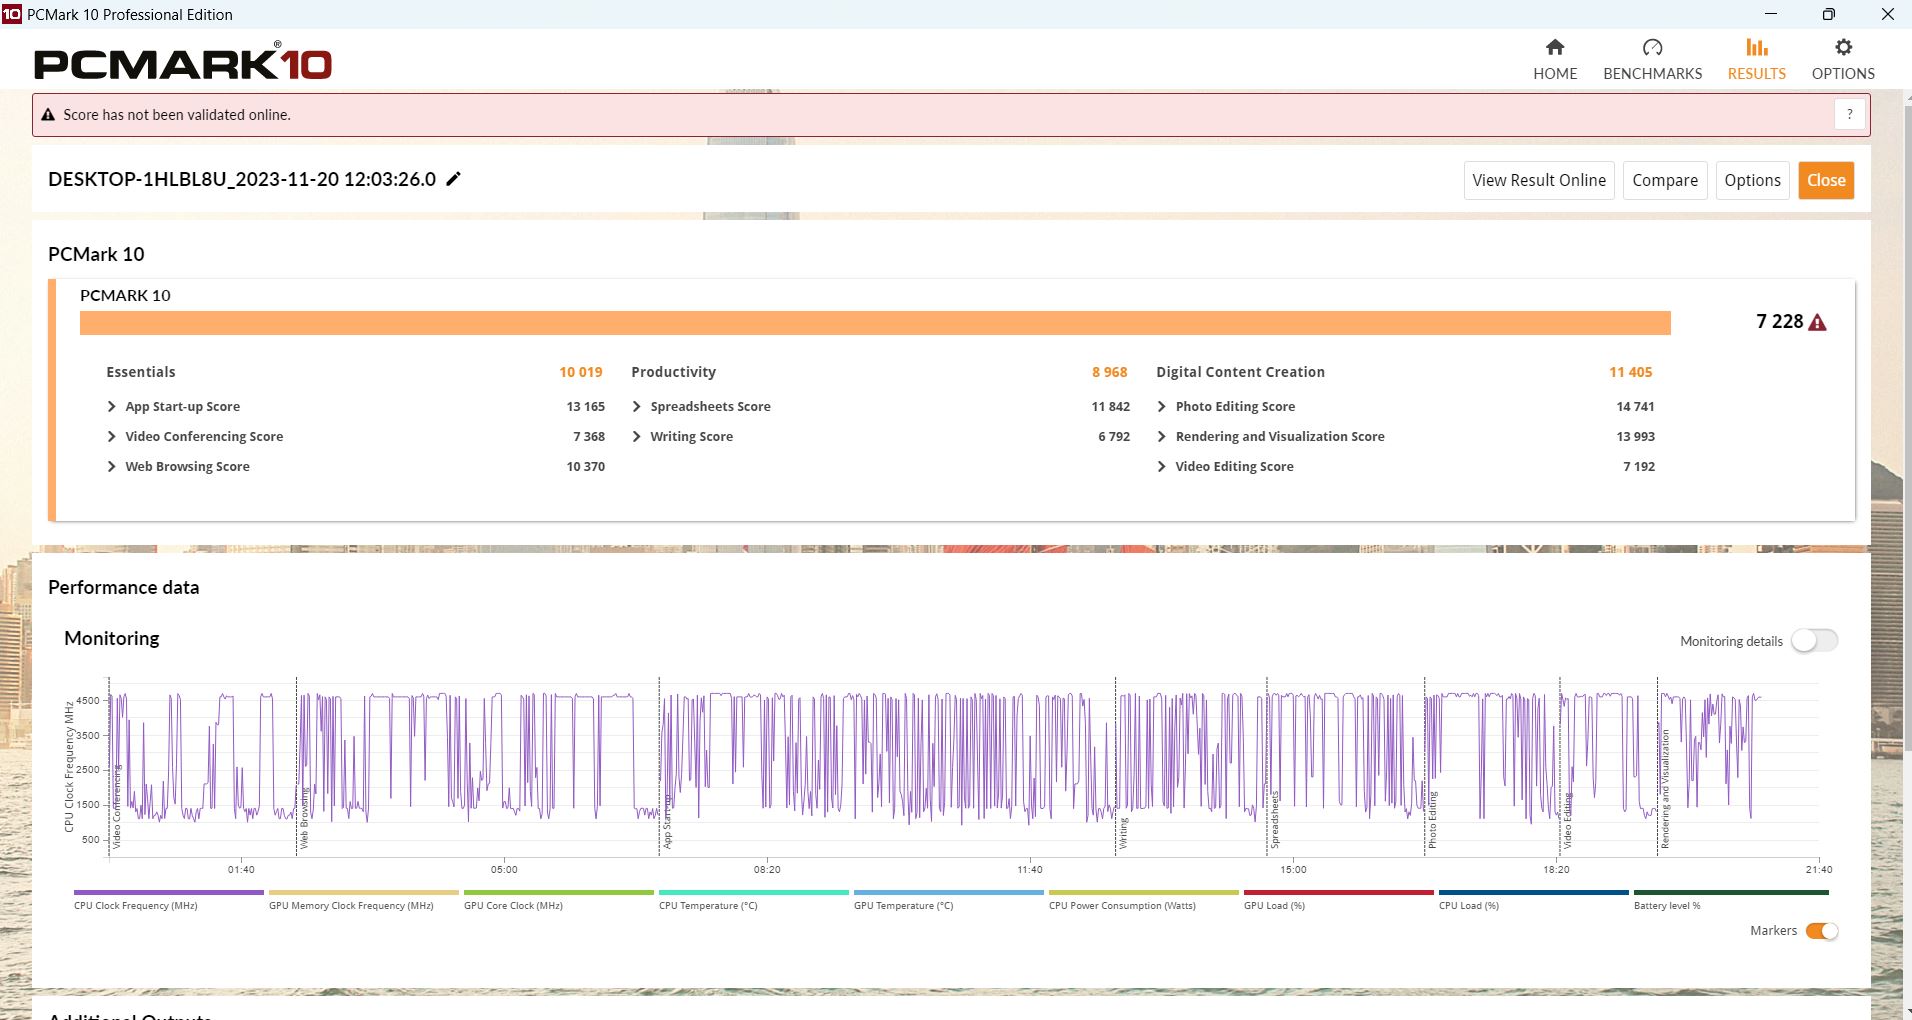
No PCMark 10, o XMG Apex 15 e o Lenovo LOQ 15 estão ligeiramente à frente, especialmente em Produtividade e Essenciais. O Crawler é igual na criação de conteúdo digital. Apenas o LOQ 15 é ligeiramente mais rápido no Crossmark.
CrossMark: Overall | Productivity | Creativity | Responsiveness
| PCMark 10 / Score | |
| Média da turma Gaming (5828 - 12414, n=93, últimos 2 anos) | |
| Schenker XMG Apex 15 (Late 23) | |
| Lenovo LOQ 15IRH8 Core i7 | |
| Medion Erazer Crawler E40 - MD 62518 | |
| Asus TUF A15 FA507 | |
| Média Intel Core i5-13500H, NVIDIA GeForce RTX 4050 Laptop GPU (6812 - 7228, n=2) | |
| MSI Katana 15 B12VEK | |
| PCMark 10 / Essentials | |
| Lenovo LOQ 15IRH8 Core i7 | |
| Schenker XMG Apex 15 (Late 23) | |
| Média da turma Gaming (8810 - 11935, n=97, últimos 2 anos) | |
| Asus TUF A15 FA507 | |
| MSI Katana 15 B12VEK | |
| Medion Erazer Crawler E40 - MD 62518 | |
| Média Intel Core i5-13500H, NVIDIA GeForce RTX 4050 Laptop GPU (9521 - 10019, n=2) | |
| PCMark 10 / Productivity | |
| Média da turma Gaming (6845 - 25323, n=95, últimos 2 anos) | |
| Schenker XMG Apex 15 (Late 23) | |
| MSI Katana 15 B12VEK | |
| Lenovo LOQ 15IRH8 Core i7 | |
| Asus TUF A15 FA507 | |
| Medion Erazer Crawler E40 - MD 62518 | |
| Média Intel Core i5-13500H, NVIDIA GeForce RTX 4050 Laptop GPU (8890 - 8968, n=2) | |
| PCMark 10 / Digital Content Creation | |
| Média da turma Gaming (7602 - 19954, n=95, últimos 2 anos) | |
| Lenovo LOQ 15IRH8 Core i7 | |
| Schenker XMG Apex 15 (Late 23) | |
| Medion Erazer Crawler E40 - MD 62518 | |
| Média Intel Core i5-13500H, NVIDIA GeForce RTX 4050 Laptop GPU (10134 - 11405, n=2) | |
| Asus TUF A15 FA507 | |
| MSI Katana 15 B12VEK | |
| CrossMark / Overall | |
| Média da turma Gaming (1366 - 2409, n=94, últimos 2 anos) | |
| Lenovo LOQ 15IRH8 Core i7 | |
| Medion Erazer Crawler E40 - MD 62518 | |
| Média Intel Core i5-13500H, NVIDIA GeForce RTX 4050 Laptop GPU (n=1) | |
| Schenker XMG Apex 15 (Late 23) | |
| MSI Katana 15 B12VEK | |
| Asus TUF A15 FA507 | |
| CrossMark / Productivity | |
| Média da turma Gaming (1386 - 2254, n=94, últimos 2 anos) | |
| Lenovo LOQ 15IRH8 Core i7 | |
| Medion Erazer Crawler E40 - MD 62518 | |
| Média Intel Core i5-13500H, NVIDIA GeForce RTX 4050 Laptop GPU (n=1) | |
| Schenker XMG Apex 15 (Late 23) | |
| MSI Katana 15 B12VEK | |
| Asus TUF A15 FA507 | |
| CrossMark / Creativity | |
| Média da turma Gaming (1343 - 2786, n=94, últimos 2 anos) | |
| Lenovo LOQ 15IRH8 Core i7 | |
| Schenker XMG Apex 15 (Late 23) | |
| Medion Erazer Crawler E40 - MD 62518 | |
| Média Intel Core i5-13500H, NVIDIA GeForce RTX 4050 Laptop GPU (n=1) | |
| MSI Katana 15 B12VEK | |
| Asus TUF A15 FA507 | |
| CrossMark / Responsiveness | |
| Lenovo LOQ 15IRH8 Core i7 | |
| Medion Erazer Crawler E40 - MD 62518 | |
| Média Intel Core i5-13500H, NVIDIA GeForce RTX 4050 Laptop GPU (n=1) | |
| Média da turma Gaming (1226 - 2334, n=94, últimos 2 anos) | |
| MSI Katana 15 B12VEK | |
| Schenker XMG Apex 15 (Late 23) | |
| Asus TUF A15 FA507 | |
| PCMark 10 Score | 7228 pontos | |
Ajuda | ||
| AIDA64 / Memory Copy | |
| Média da turma Gaming (21750 - 129946, n=102, últimos 2 anos) | |
| Schenker XMG Apex 15 (Late 23) | |
| Medion Erazer Crawler E40 - MD 62518 | |
| MSI Katana 15 B12VEK | |
| Lenovo LOQ 15IRH8 Core i7 | |
| Média Intel Core i5-13500H (36916 - 57830, n=6) | |
| Asus TUF A15 FA507 | |
| AIDA64 / Memory Read | |
| Média da turma Gaming (22956 - 118858, n=102, últimos 2 anos) | |
| MSI Katana 15 B12VEK | |
| Medion Erazer Crawler E40 - MD 62518 | |
| Lenovo LOQ 15IRH8 Core i7 | |
| Schenker XMG Apex 15 (Late 23) | |
| Média Intel Core i5-13500H (41676 - 65633, n=6) | |
| Asus TUF A15 FA507 | |
| AIDA64 / Memory Write | |
| Schenker XMG Apex 15 (Late 23) | |
| Média da turma Gaming (22297 - 135096, n=102, últimos 2 anos) | |
| Medion Erazer Crawler E40 - MD 62518 | |
| MSI Katana 15 B12VEK | |
| Asus TUF A15 FA507 | |
| Lenovo LOQ 15IRH8 Core i7 | |
| Média Intel Core i5-13500H (36826 - 60523, n=6) | |
| AIDA64 / Memory Latency | |
| Lenovo LOQ 15IRH8 Core i7 | |
| Média da turma Gaming (75.3 - 165.4, n=102, últimos 2 anos) | |
| Medion Erazer Crawler E40 - MD 62518 | |
| MSI Katana 15 B12VEK | |
| Média Intel Core i5-13500H (86.2 - 96.1, n=6) | |
| Schenker XMG Apex 15 (Late 23) | |
| Asus TUF A15 FA507 | |
* ... menor é melhor
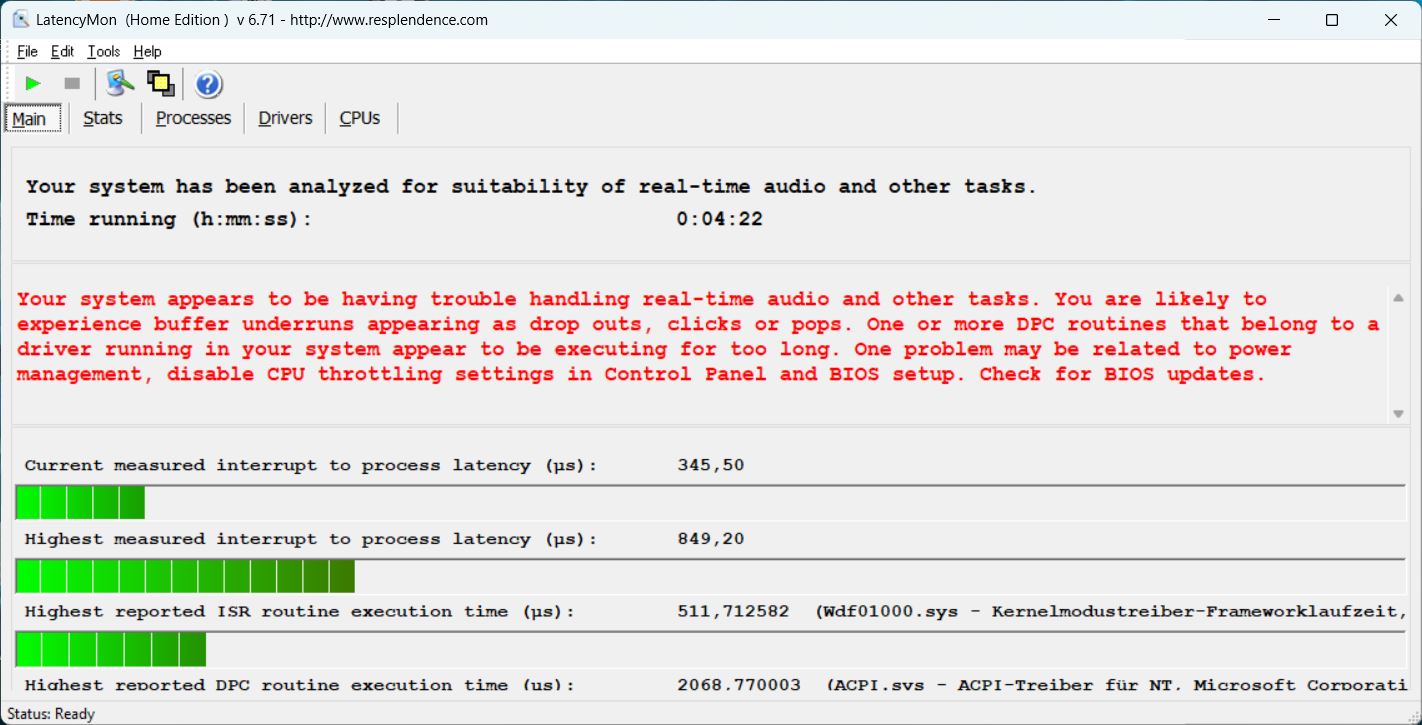
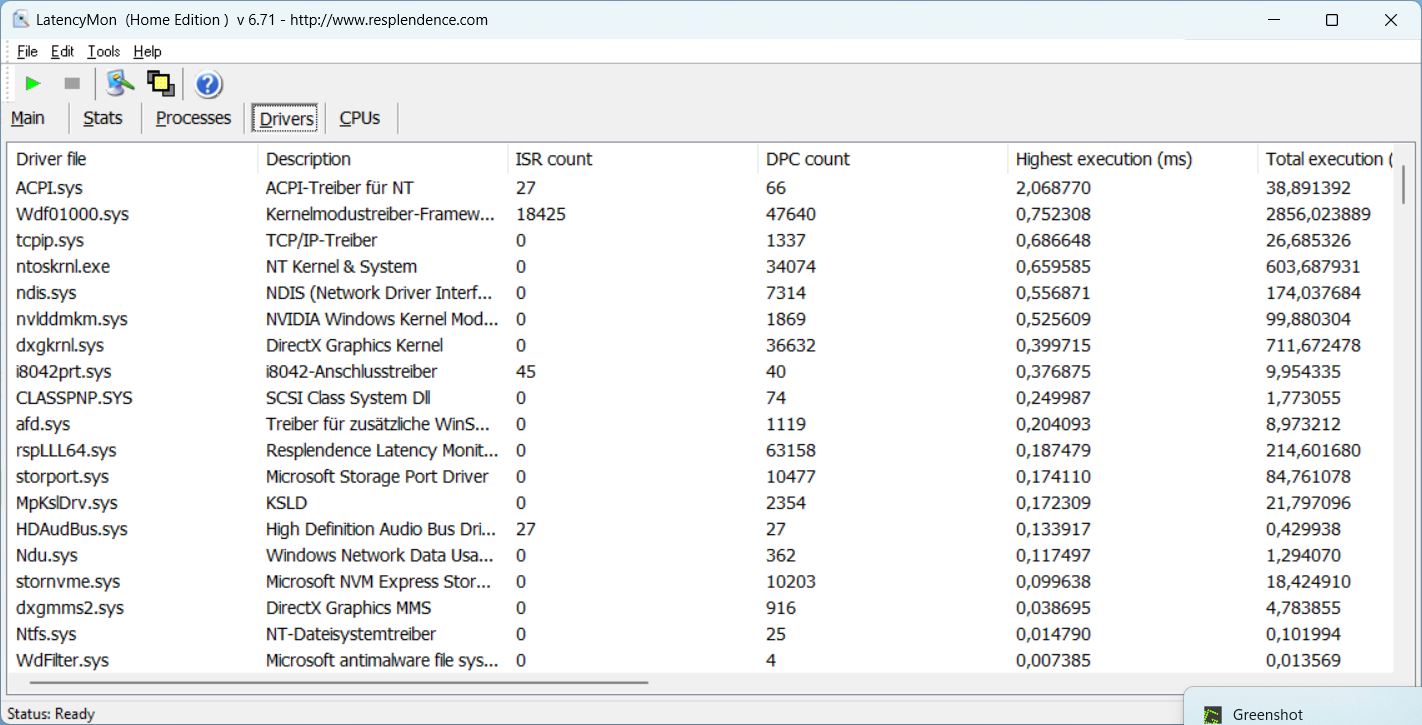
Latência DPC
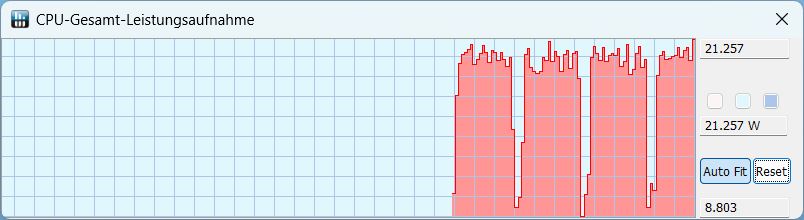
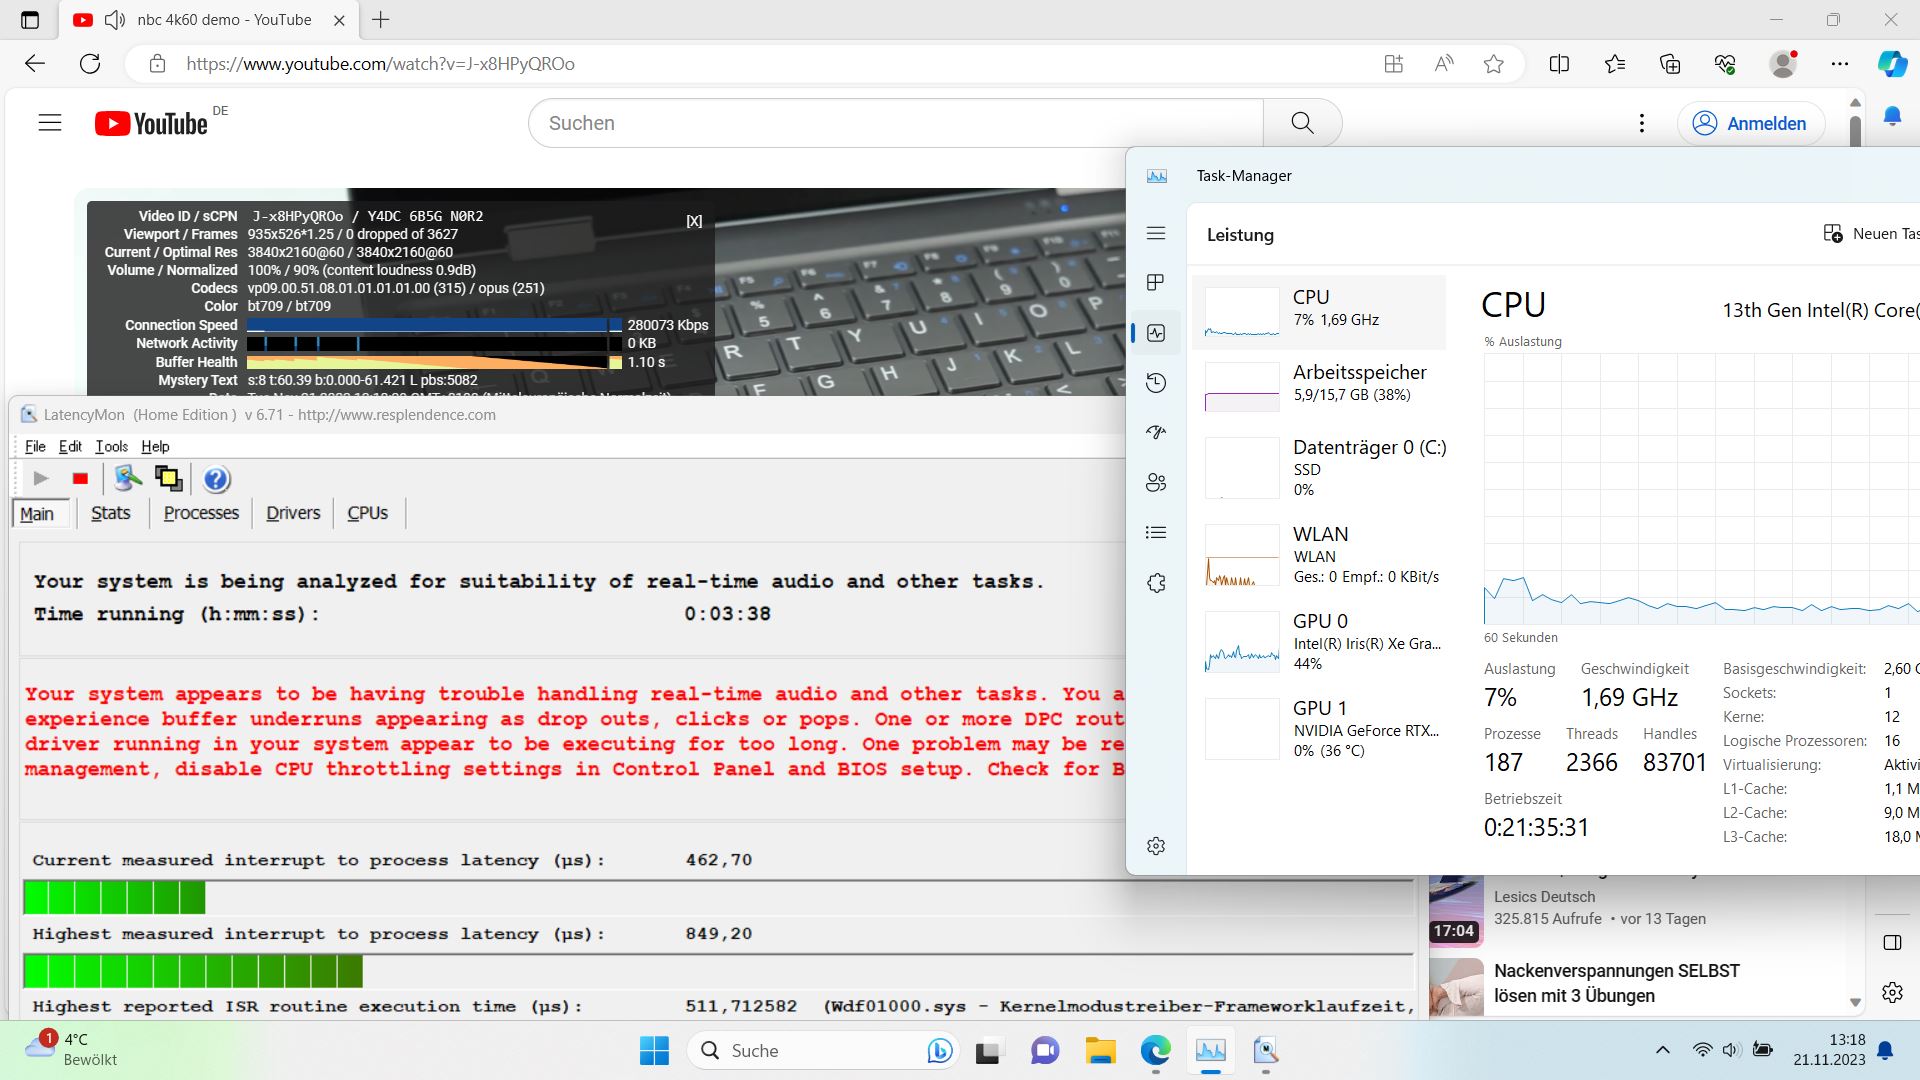
Não há problemas ao abrir o navegador ou várias guias. No entanto, o LatencyMon detecta alguns problemas ao reproduzir nosso vídeo do YouTube em 4K/60 fps. Pelo menos ele é reproduzido sem nenhuma queda de quadros. O valor da latência aumenta ligeiramente no Prime95.
| DPC Latencies / LatencyMon - interrupt to process latency (max), Web, Youtube, Prime95 | |
| MSI Katana 15 B12VEK | |
| Medion Erazer Crawler E40 - MD 62518 | |
| Lenovo LOQ 15IRH8 Core i7 | |
| Schenker XMG Apex 15 (Late 23) | |
* ... menor é melhor
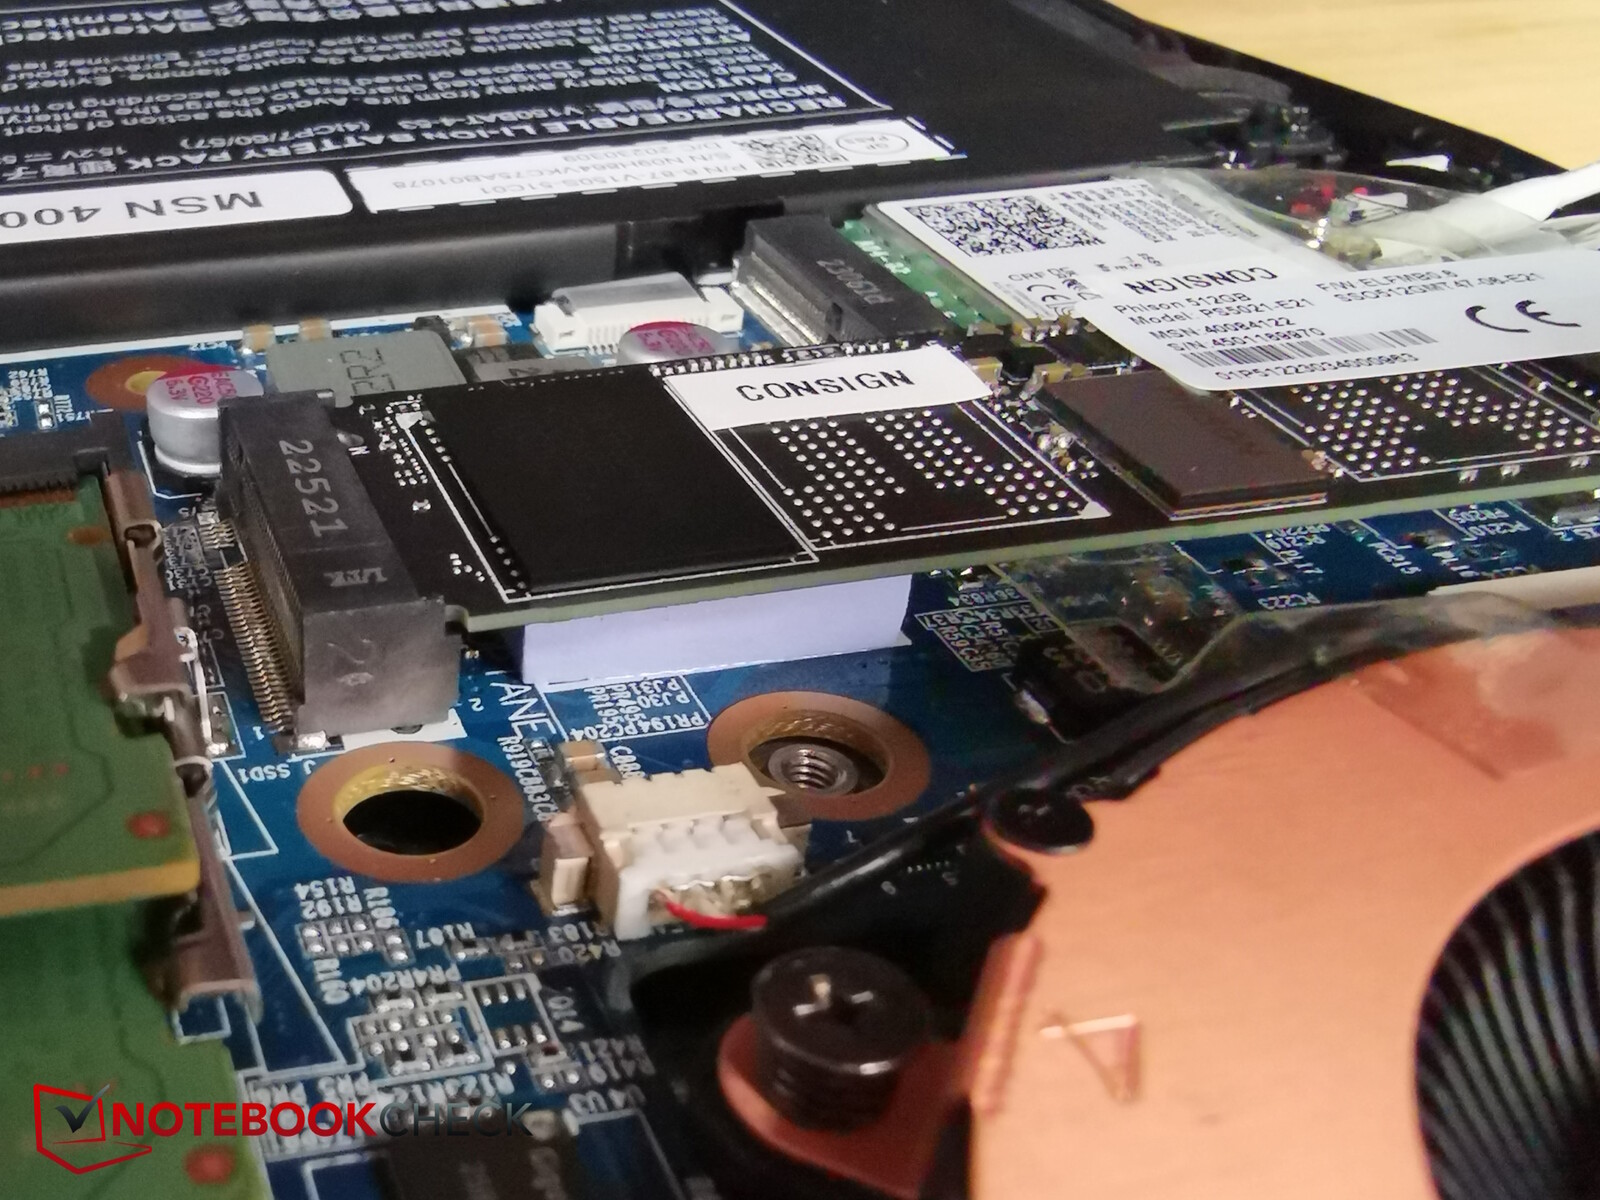
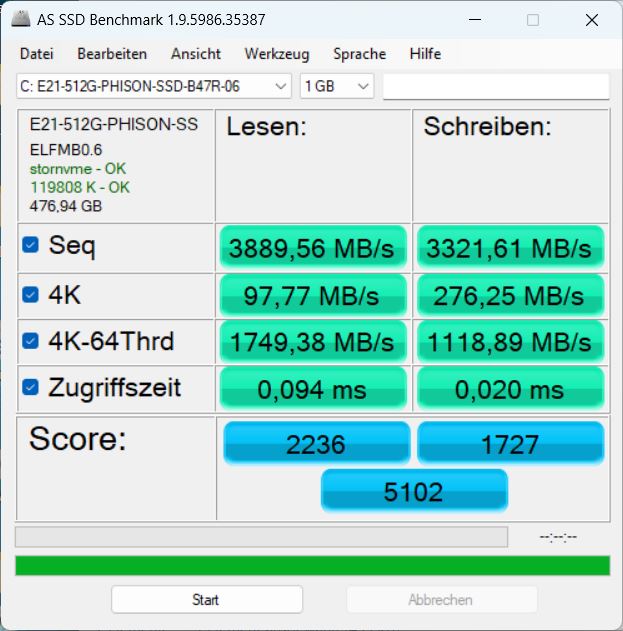
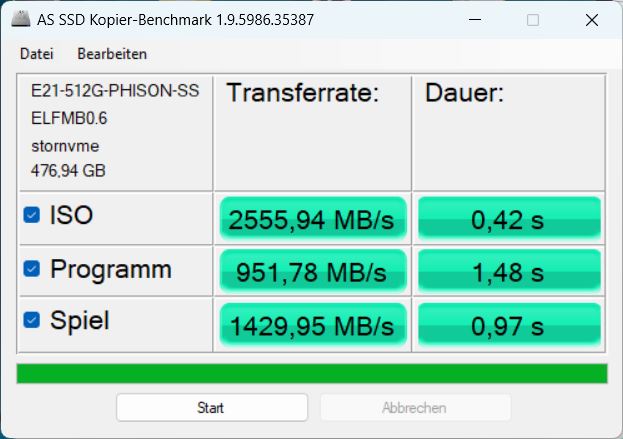
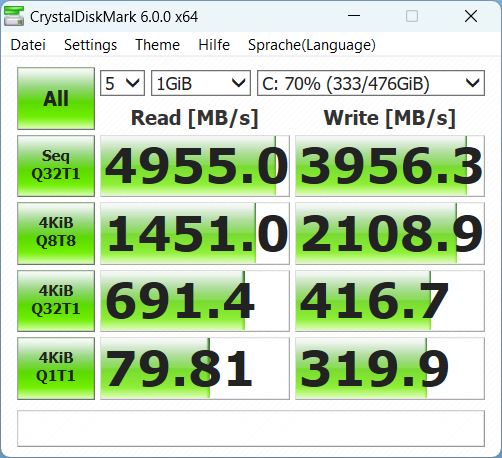
Dispositivos de armazenamento
A Medion usa um SSD NVMe de 512 GB da Phison. Embora isso não chegue perto da velocidade do Samsung 990 Pro no XMG Apex 15, ele supera o armazenamento dos outros três concorrentes e seu desempenho também é muito consistente por um longo período de tempo. Há mais comparações de SSDs em nossa lista dos melhores SSDs.

* ... menor é melhor
Continuous power read: DiskSpd Read Loop, Queue Depth 8
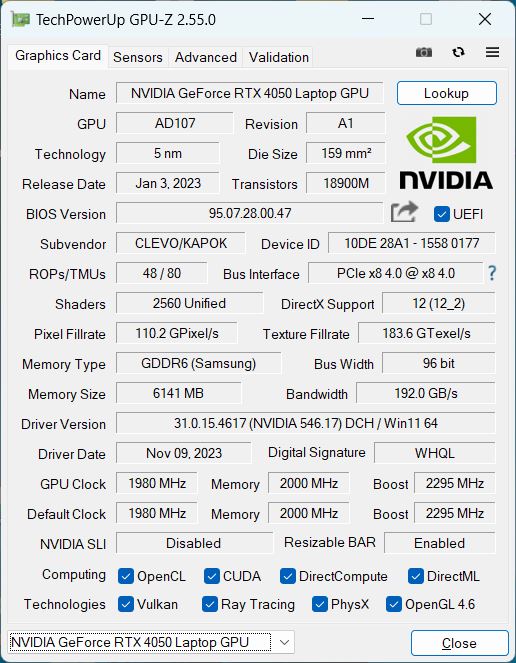
Placa de vídeo
Em nosso rastreador E40, um RTX 4050 com uma classificação de potência máxima de 100 W está instalado.
O E40 tem um desempenho muito bom nos benchmarks 3DMark, está um pouco acima de uma RTX 4050 média e no mesmo nível do XMG Apex 15 e do MSI Katana 15, que também são fortes nessa categoria.
No modo de bateria, o desempenho 3D em Fire Strike cai em 70%.
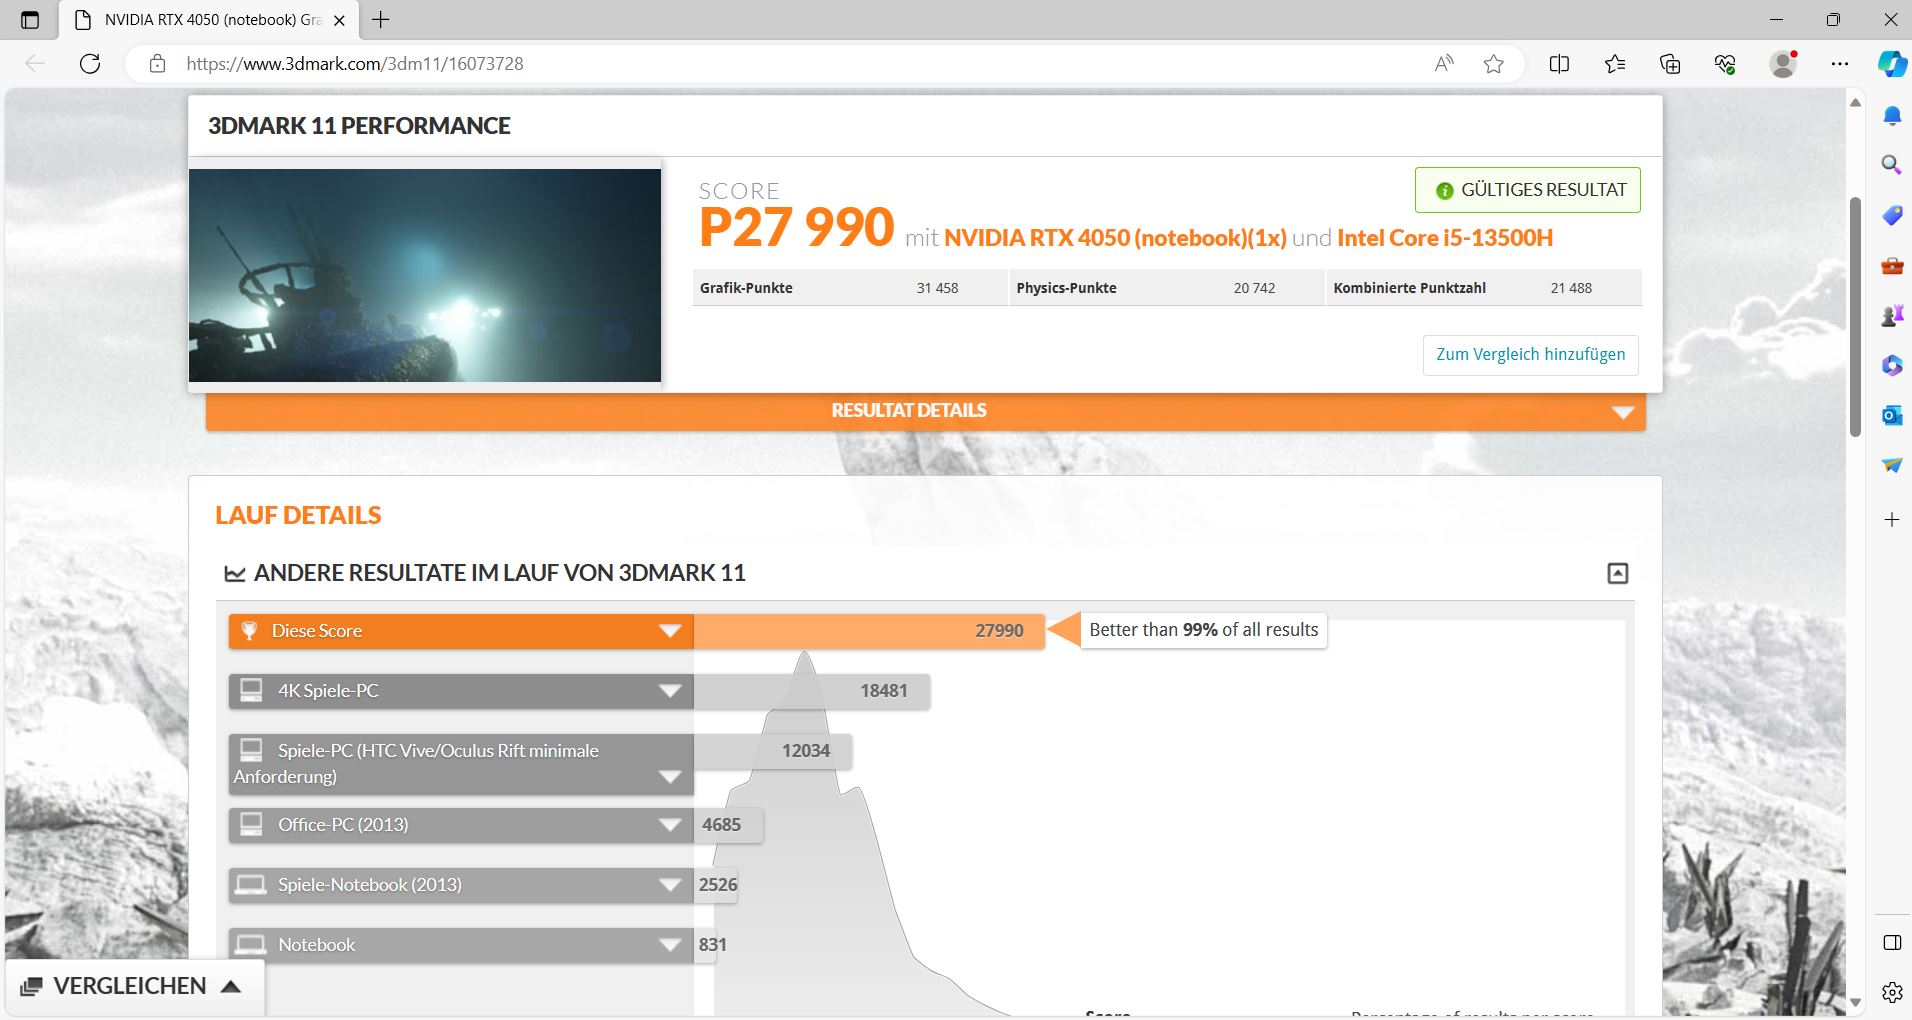
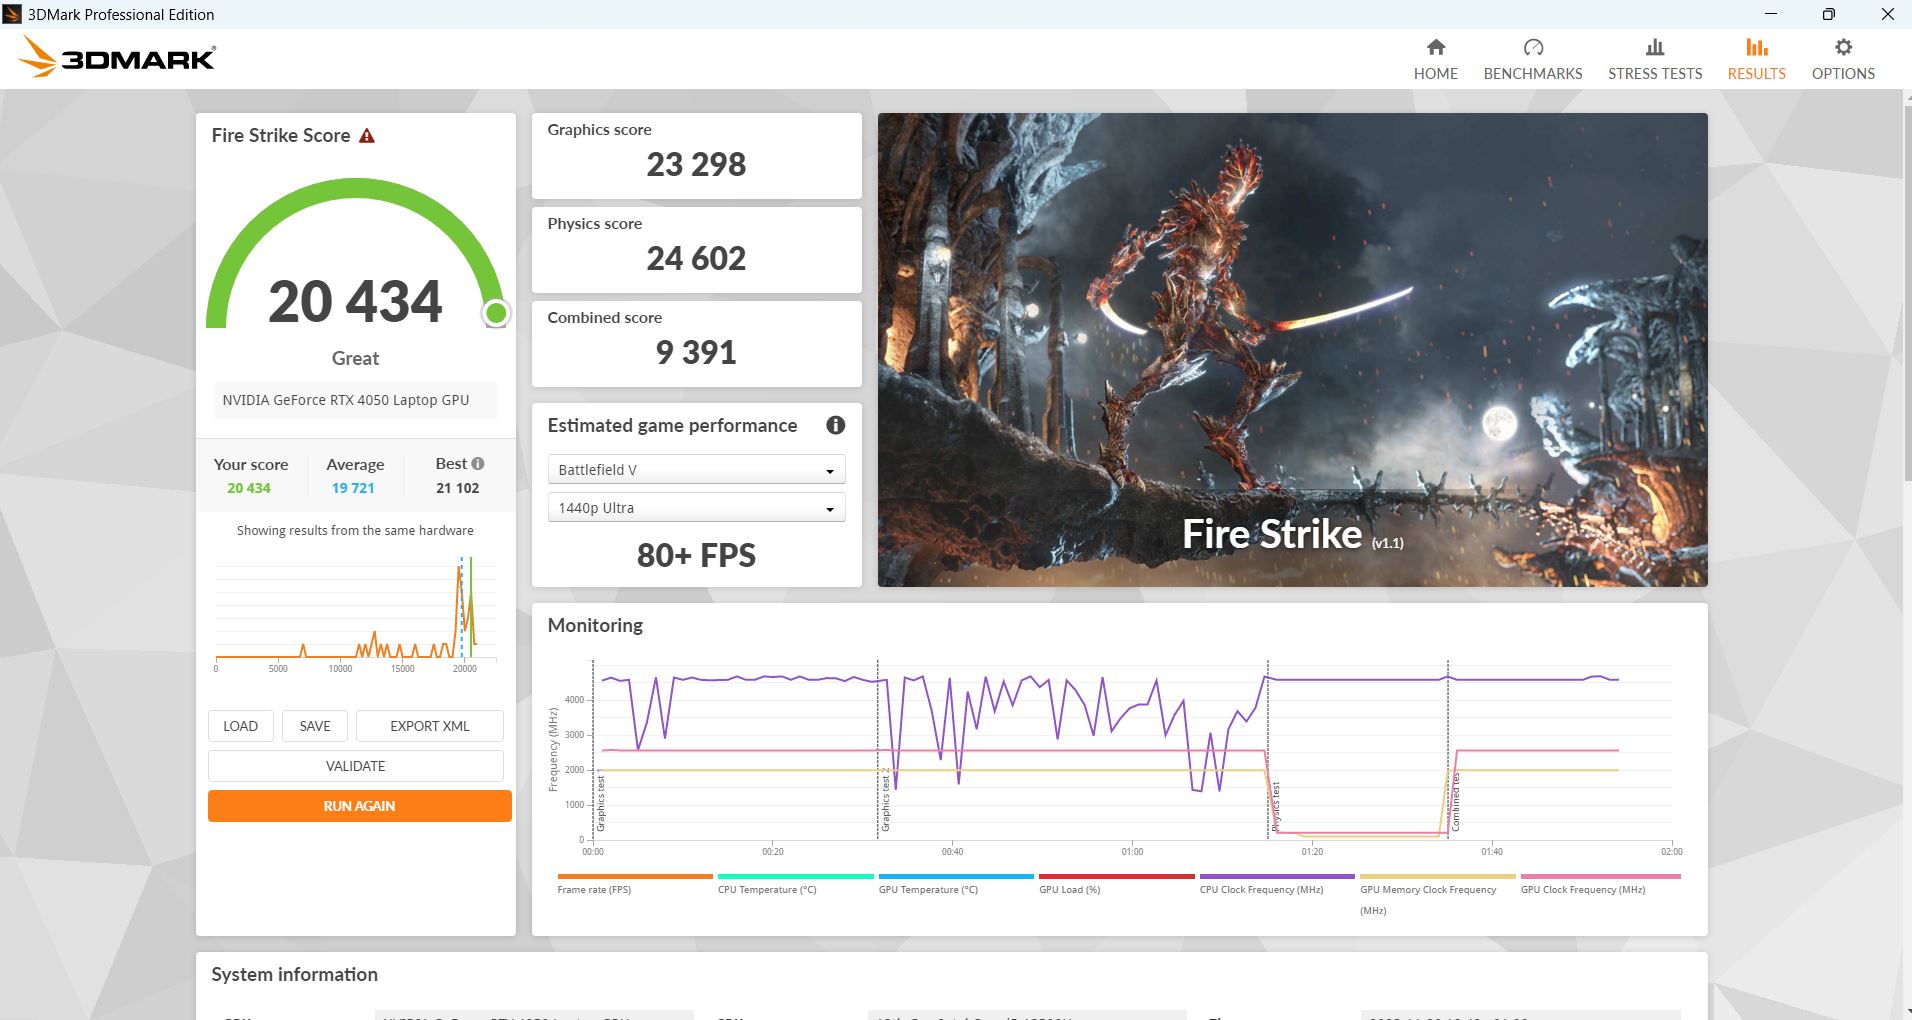
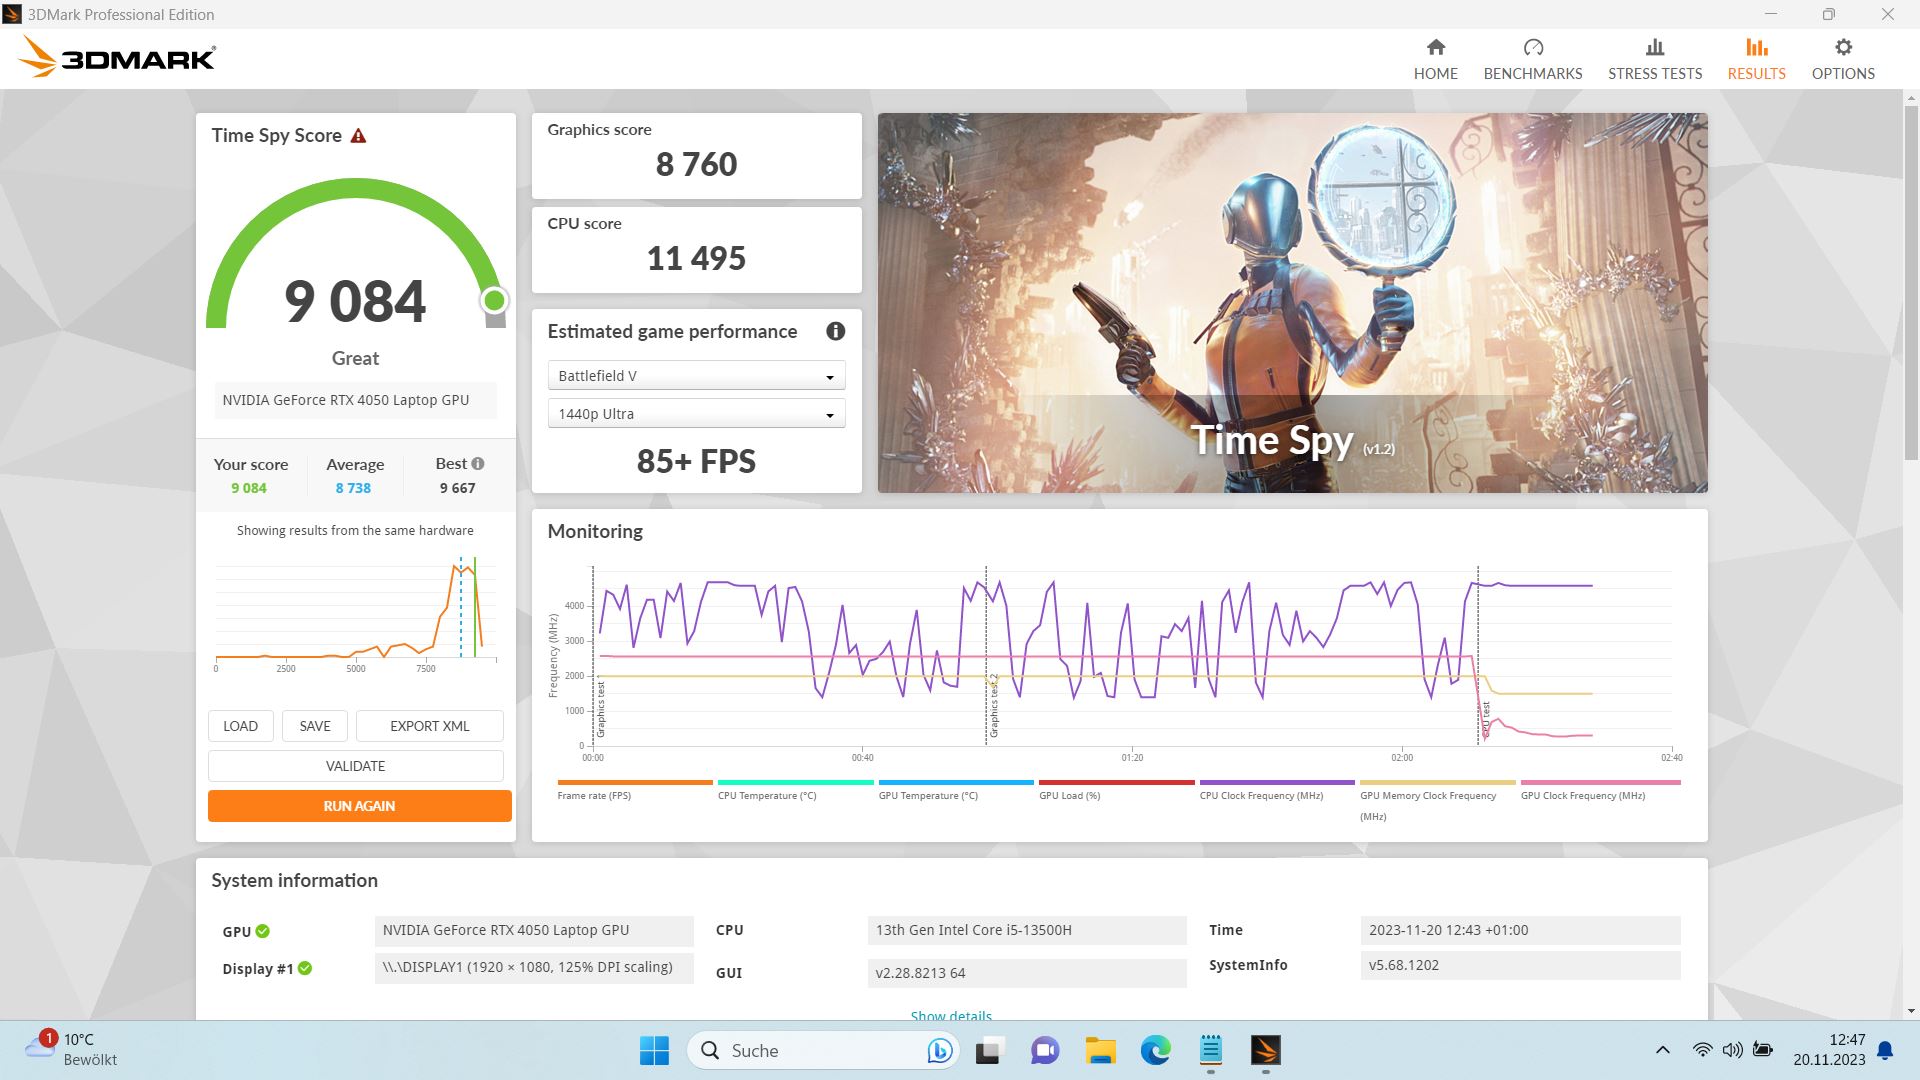
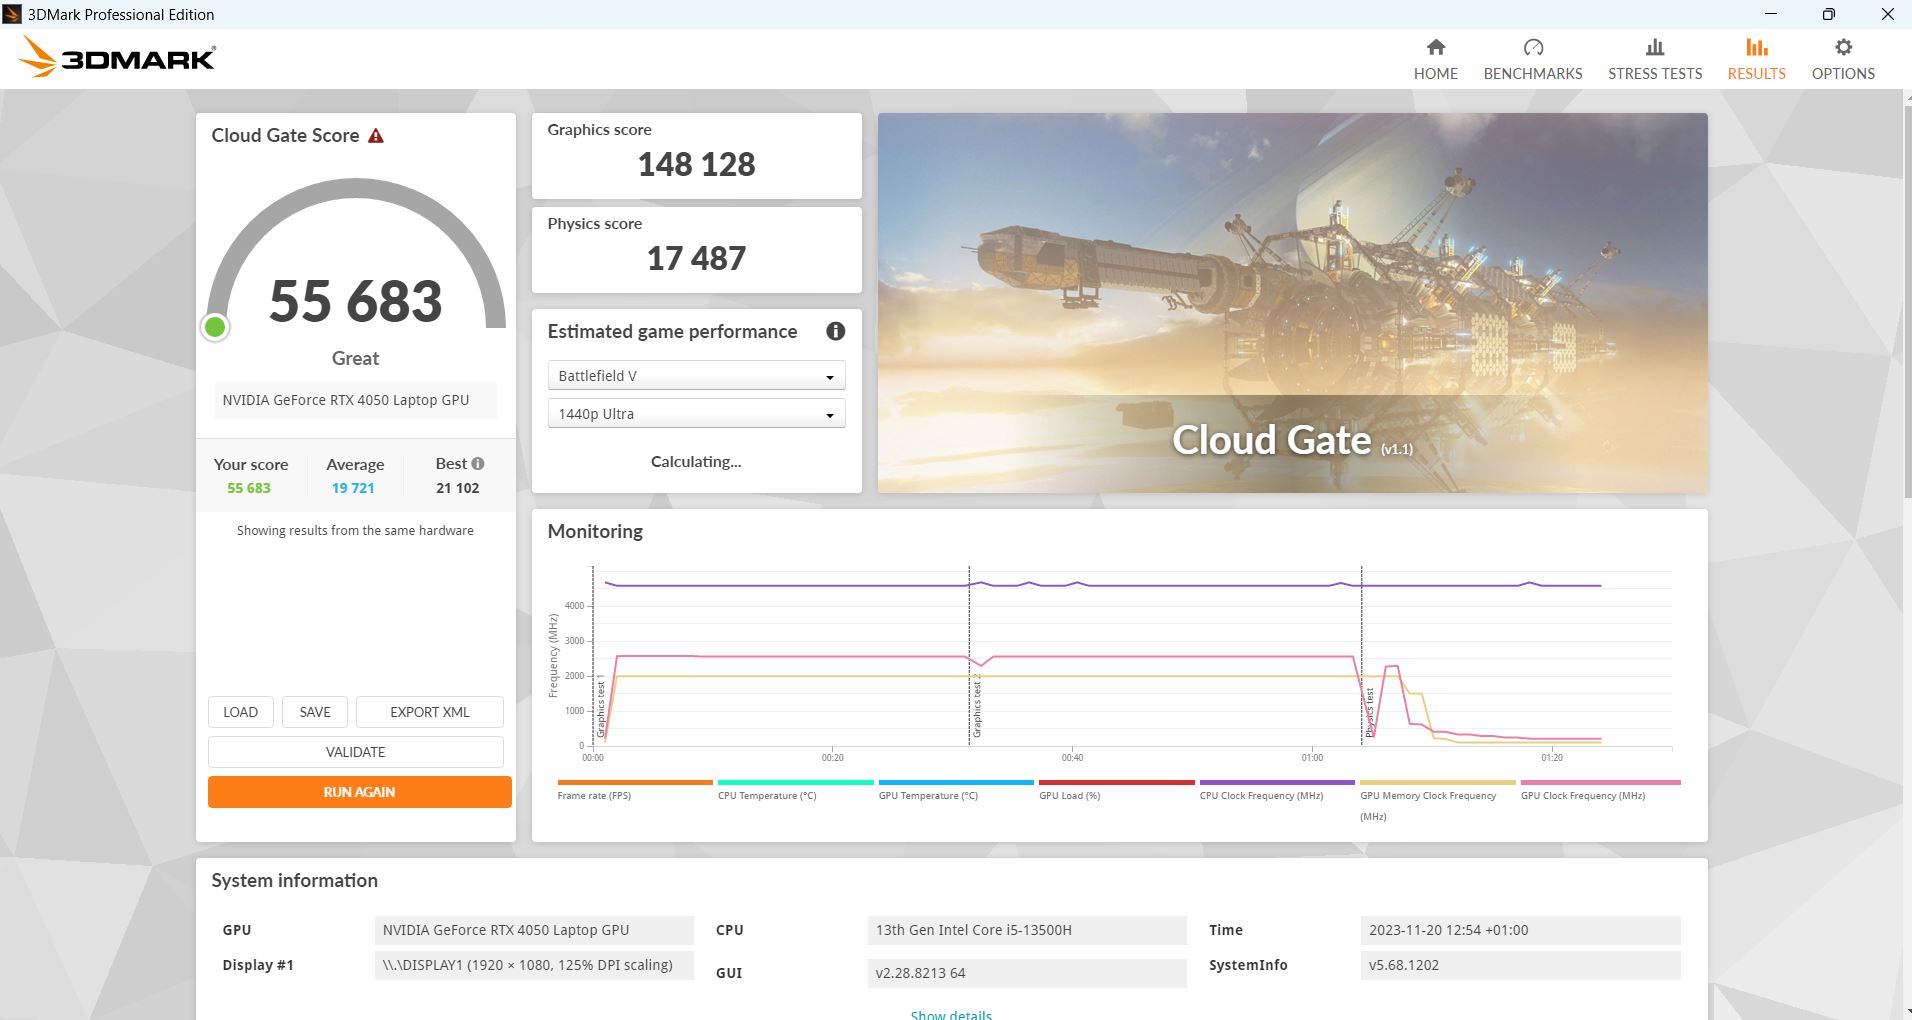
| 3DMark 11 Performance | 27990 pontos | |
| 3DMark Cloud Gate Standard Score | 55683 pontos | |
| 3DMark Fire Strike Score | 20434 pontos | |
| 3DMark Time Spy Score | 9084 pontos | |
Ajuda | ||
* ... menor é melhor
Jogos
Em nossos dados de registro para Witcher 3 (veja as capturas de tela abaixo), é possível ver que o clock da GPU e o consumo de energia nos modos de entretenimento e silencioso são quase exatamente os mesmos e apenas ligeiramente inferiores aos do modo de jogo. Da mesma forma, as taxas de quadros praticamente não diferem. A única diferença entre os modos é o comportamento da ventoinha, que leva a um desenvolvimento diferente do volume e da temperatura. No modo silencioso, a GPU fica mais quente do que nos outros modos. No modo de jogo, a taxa de quadros do Witcher 3 é muito constante.
Em comparação com a concorrência, o E40 tem um bom desempenho. Ele ocupa o primeiro lugar em Far Cry 5, em particular. Em Witcher 3, por outro lado, ele está em último lugar, mas as diferenças são muito pequenas. No resultado geral dos jogos, a concorrência está muito próxima, o LOQ 15 é um pouco melhor que o nosso crawler, o Katana 15 é praticamente o mesmo e o Apex 15 e, especialmente, o Asus TUF A15 são mais fracos.
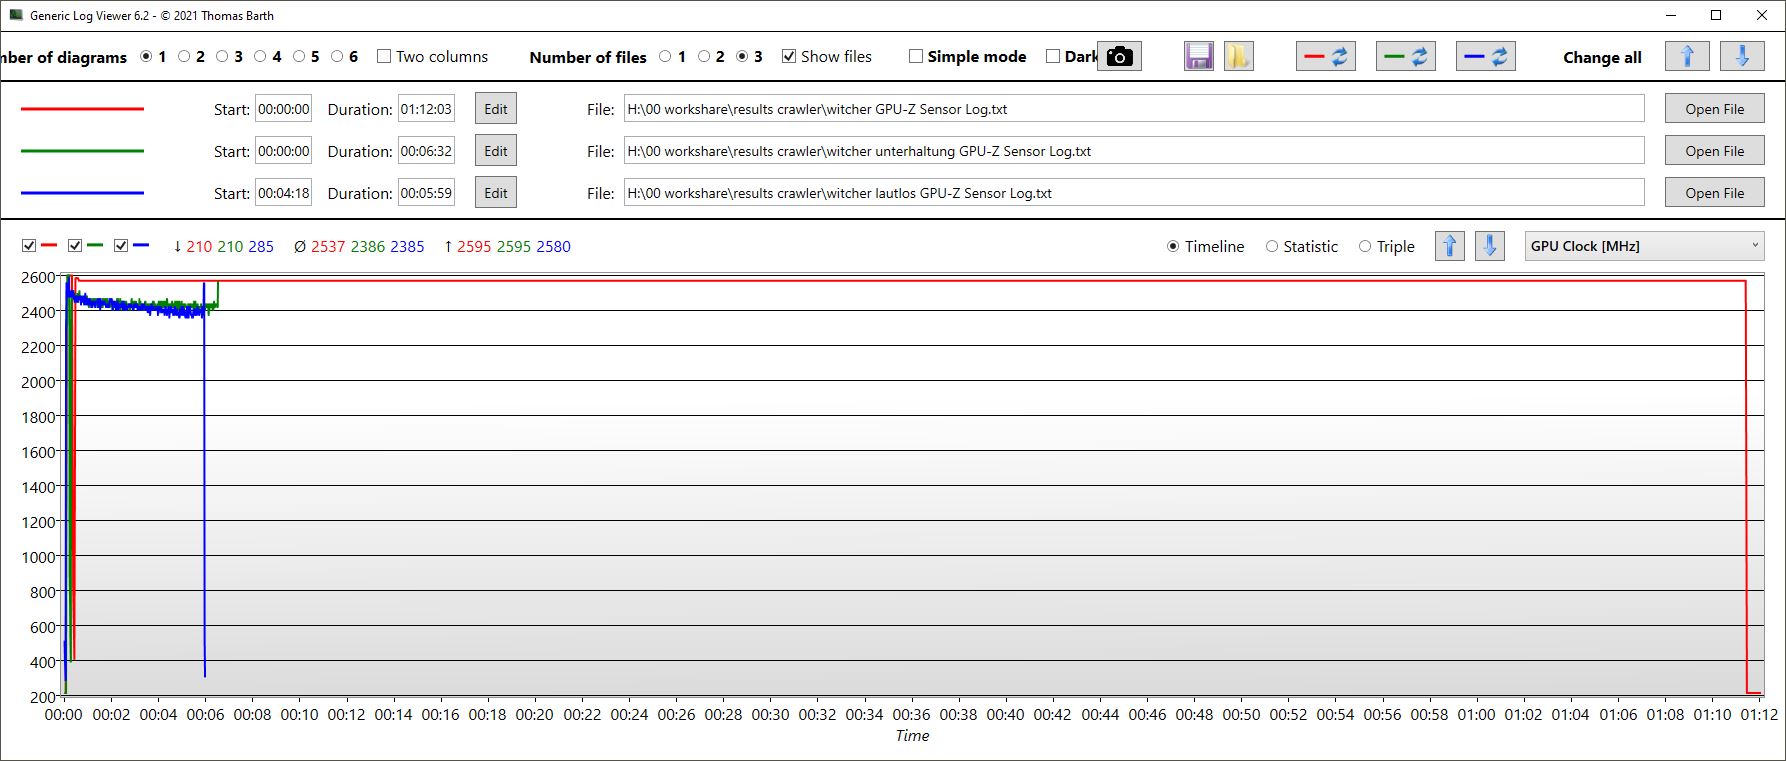
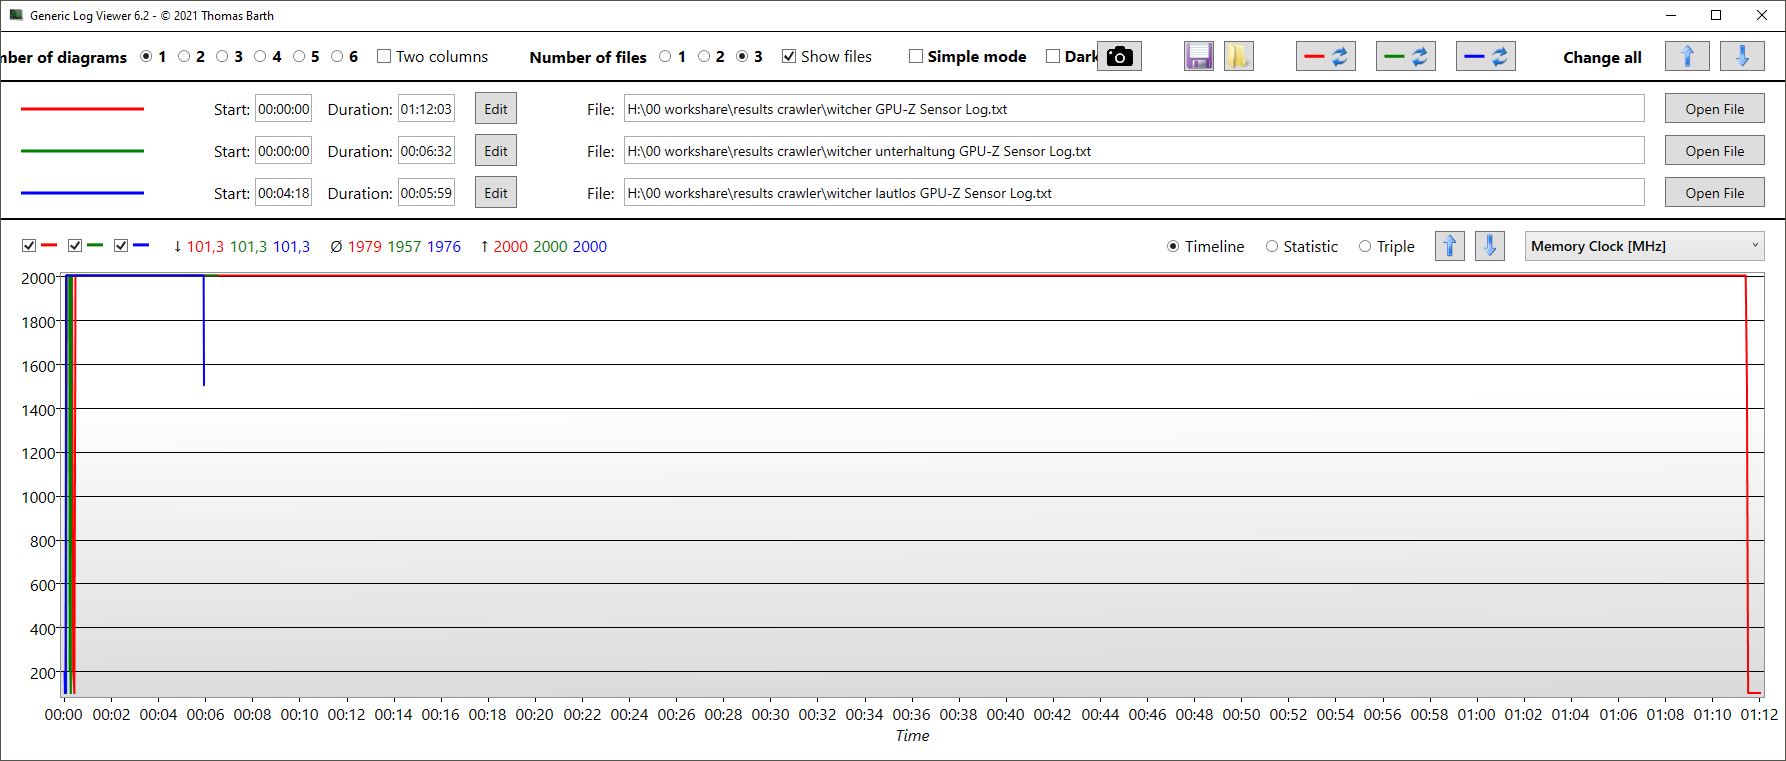
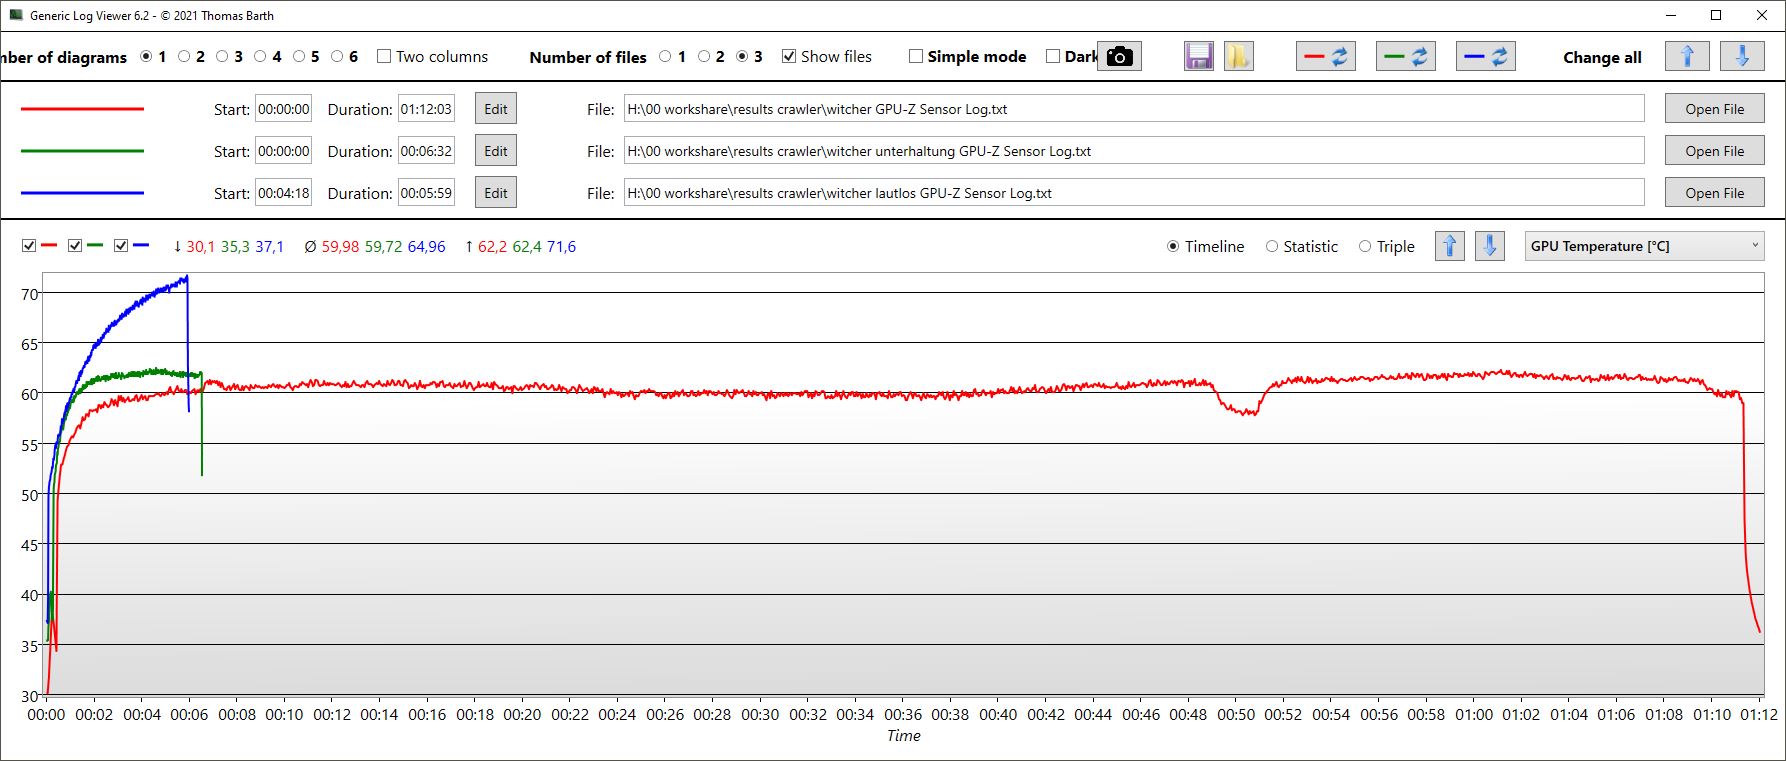
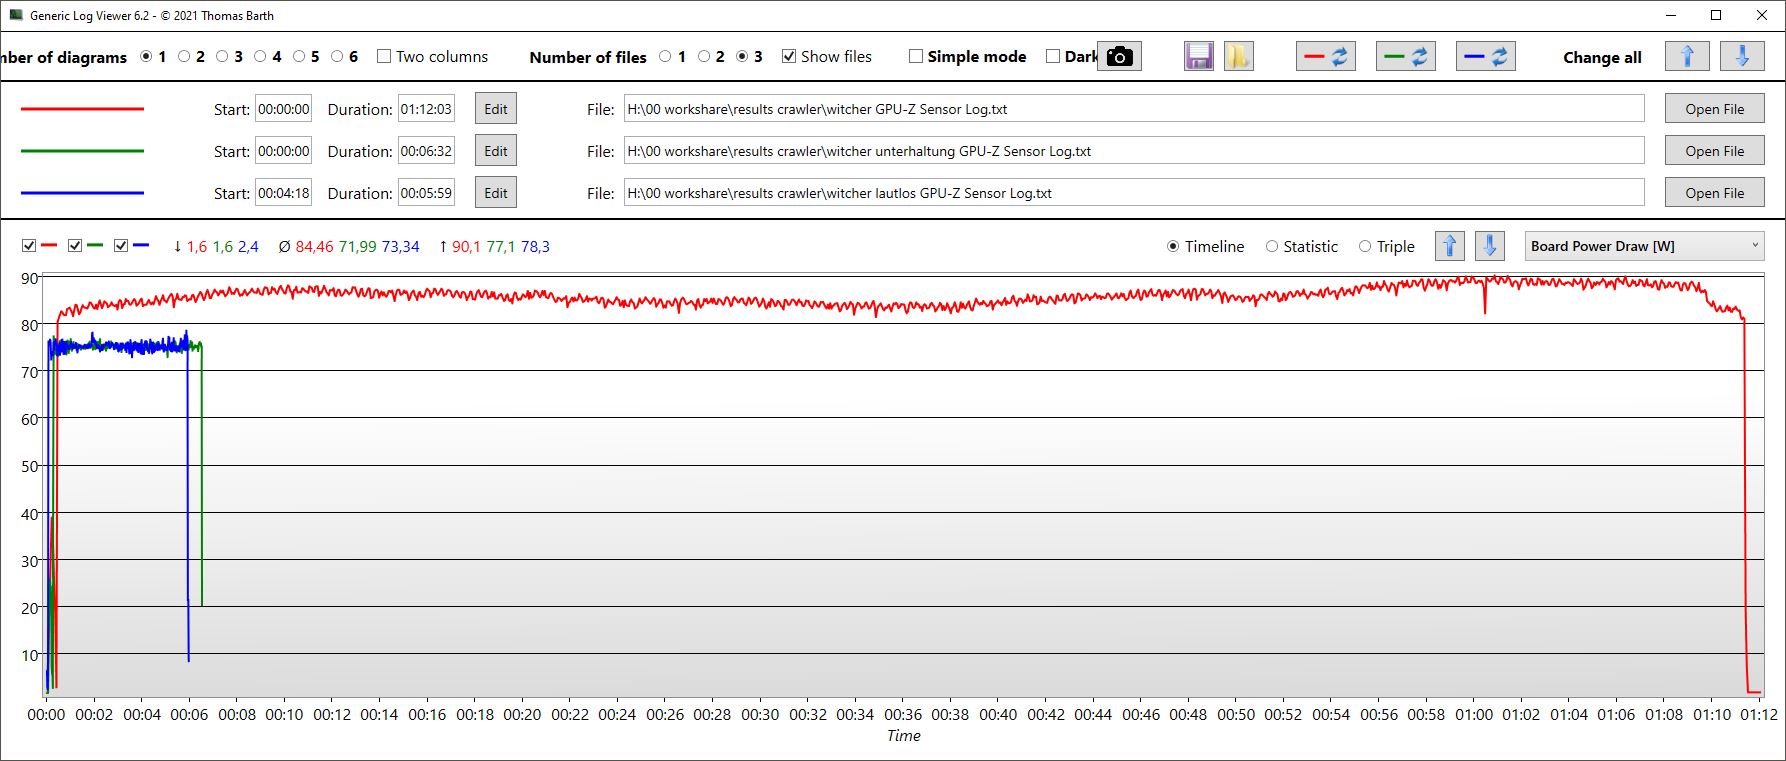
| Modo/Witcher 3 Medição da GPU | FPS médio | Relógio da GPU | Relógio da memória | Temperatura média | Consumo de energia |
|---|---|---|---|---|---|
| Jogos | 79,5 | 2.595 MHz | 2.000 MHz | 60 °C | 85 W |
| Entretenimento | 77 | 2.400 MHz | 2.000 MHz | aprox. 62 °C | 72 W |
| Silencioso | 78 | 2.400 MHz | 2.000 MHz | aprox. 75 °C | 73 W |
| Performance rating - Percent | |
| Média da turma Gaming | |
| Lenovo LOQ 15IRH8 Core i7 | |
| Medion Erazer Crawler E40 - MD 62518 | |
| MSI Katana 15 B12VEK | |
| Schenker XMG Apex 15 (Late 23) -1! | |
| Asus TUF A15 FA507 | |
| The Witcher 3 - 1920x1080 Ultra Graphics & Postprocessing (HBAO+) | |
| Média da turma Gaming (104.7 - 240, n=7, últimos 2 anos) | |
| Lenovo LOQ 15IRH8 Core i7 | |
| Schenker XMG Apex 15 (Late 23) | |
| MSI Katana 15 B12VEK | |
| Asus TUF A15 FA507 | |
| Medion Erazer Crawler E40 - MD 62518 | |
| GTA V - 1920x1080 Highest AA:4xMSAA + FX AF:16x | |
| Média da turma Gaming (67.1 - 186.9, n=90, últimos 2 anos) | |
| Medion Erazer Crawler E40 - MD 62518 | |
| Lenovo LOQ 15IRH8 Core i7 | |
| MSI Katana 15 B12VEK | |
| Asus TUF A15 FA507 | |
| Final Fantasy XV Benchmark - 1920x1080 High Quality | |
| Média da turma Gaming (64.2 - 215, n=91, últimos 2 anos) | |
| Schenker XMG Apex 15 (Late 23) | |
| Medion Erazer Crawler E40 - MD 62518 | |
| Lenovo LOQ 15IRH8 Core i7 | |
| MSI Katana 15 B12VEK | |
| Asus TUF A15 FA507 | |
| Strange Brigade - 1920x1080 ultra AA:ultra AF:16 | |
| Média da turma Gaming (113.6 - 458, n=83, últimos 2 anos) | |
| Lenovo LOQ 15IRH8 Core i7 | |
| MSI Katana 15 B12VEK | |
| Schenker XMG Apex 15 (Late 23) | |
| Asus TUF A15 FA507 | |
| Medion Erazer Crawler E40 - MD 62518 | |
| Dota 2 Reborn - 1920x1080 ultra (3/3) best looking | |
| Lenovo LOQ 15IRH8 Core i7 | |
| Média da turma Gaming (84.8 - 252, n=104, últimos 2 anos) | |
| MSI Katana 15 B12VEK | |
| Medion Erazer Crawler E40 - MD 62518 | |
| Schenker XMG Apex 15 (Late 23) | |
| Asus TUF A15 FA507 | |
| X-Plane 11.11 - 1920x1080 high (fps_test=3) | |
| Lenovo LOQ 15IRH8 Core i7 | |
| Média da turma Gaming (55.5 - 148.5, n=106, últimos 2 anos) | |
| Medion Erazer Crawler E40 - MD 62518 | |
| MSI Katana 15 B12VEK | |
| Schenker XMG Apex 15 (Late 23) | |
| Asus TUF A15 FA507 | |
Witcher 3 FPS chart
| baixo | média | alto | ultra | |
|---|---|---|---|---|
| GTA V (2015) | 182.2 | 176.4 | 169.1 | 97.7 |
| The Witcher 3 (2015) | 369 | 283 | 170 | 81 |
| Dota 2 Reborn (2015) | 162.7 | 152.7 | 147.9 | 140.2 |
| Final Fantasy XV Benchmark (2018) | 183.5 | 122.9 | 84.6 | |
| X-Plane 11.11 (2018) | 128.5 | 121.8 | 98.6 | |
| Far Cry 5 (2018) | 146 | 140 | 133 | 124 |
| Strange Brigade (2018) | 391 | 205 | 167.6 | 146.9 |
Emissões e energia - Sistema de resfriamento agressivo e barulhento
Ruído do sistema
O Crawler não é, de forma alguma, um aparelho silencioso. Em comparação com a concorrência, ele é o jogador mais barulhento, medimos até 56 dB no teste de estresse e ainda mais de 51 dB em Witcher 3, a concorrência geralmente fica bem abaixo de 50 dB aqui. O mesmo se aplica a uma execução do 3DMark06: Enquanto outros notebooks permanecem completamente silenciosos aqui em fases e só deixam as ventoinhas girarem bem baixinho na segunda metade do teste, elas já giram a 50 dB no E40.
O sistema de resfriamento é muito agressivo e barulhento para nós. Como os senhores poderão ver na próxima seção, as temperaturas são tão baixas que ventiladores mais silenciosos seriam facilmente possíveis aqui. Recomendamos que o senhor jogue no modo de entretenimento ou até mesmo no modo silencioso.
Pelo menos no modo ocioso, o E40 geralmente permanece silencioso; somente quando os processos em segundo plano geram mais carga do que o desejado no modo ocioso é que as ventoinhas são ligadas. Mas mesmo que o Crawler E40 tenha sido exposto a uma carga mais longa, as ventoinhas não se acalmam completamente. Mesmo no modo silencioso, as ventoinhas não se desligam em um futuro próximo.
| Modo/Witcher 3 medição | Volume | Consumo do sistema |
|---|---|---|
| Jogos | 51,46 dB | 155 W |
| Entretenimento | 48,21 | 139 W |
| Silencioso | 31,37 dB | 117 W |
Barulho
| Ocioso |
| 23 / 23 / 28.02 dB |
| Carga |
| 50.21 / 56.79 dB |
 | ||
30 dB silencioso 40 dB(A) audível 50 dB(A) ruidosamente alto |
||
min: | ||
| Medion Erazer Crawler E40 - MD 62518 GeForce RTX 4050 Laptop GPU, i5-13500H, Phison PS5021-E21 512GB | Lenovo LOQ 15IRH8 Core i7 GeForce RTX 4050 Laptop GPU, i7-13620H, Kioxia BG5 KBG50ZNT512G | Asus TUF A15 FA507 GeForce RTX 4050 Laptop GPU, R7 7735HS, Micron 2400 MTFDKBA512QFM | Schenker XMG Apex 15 (Late 23) GeForce RTX 4050 Laptop GPU, R7 7840HS, Samsung 990 Pro 1 TB | MSI Katana 15 B12VEK GeForce RTX 4050 Laptop GPU, i7-12650H, Micron 2400 MTFDKBA1T0QFM | |
|---|---|---|---|---|---|
| Noise | -5% | 14% | -2% | 6% | |
| desligado / ambiente * (dB) | 23 | 23.69 -3% | 23.3 -1% | 24 -4% | 24 -4% |
| Idle Minimum * (dB) | 23 | 29.03 -26% | 23.3 -1% | 25 -9% | 24 -4% |
| Idle Average * (dB) | 23 | 29.03 -26% | 23.3 -1% | 29 -26% | 24 -4% |
| Idle Maximum * (dB) | 28.02 | 29.03 -4% | 23.3 17% | 33 -18% | 24 14% |
| Load Average * (dB) | 50.21 | 48.7 3% | 29.6 41% | 36 28% | 37.71 25% |
| Witcher 3 ultra * (dB) | 51.46 | 48.5 6% | 43 16% | 48 7% | 45.75 11% |
| Load Maximum * (dB) | 56.79 | 48.7 14% | 43 24% | 53 7% | 54.55 4% |
* ... menor é melhor
Temperatura
Graças ao sistema de resfriamento agressivo, as temperaturas da superfície são quase surpreendentemente baixas. Mesmo sob carga máxima, elas mal ultrapassam 96,8 °F no modo de jogo (temperatura ambiente de 64,4 °F). Ainda há muito espaço para um sistema de resfriamento mais silencioso aqui.
(+) A temperatura máxima no lado superior é 36 °C / 97 F, em comparação com a média de 40.4 °C / 105 F , variando de 21.2 a 68.8 °C para a classe Gaming.
(+) A parte inferior aquece até um máximo de 36 °C / 97 F, em comparação com a média de 43.2 °C / 110 F
(+) Em uso inativo, a temperatura média para o lado superior é 23.7 °C / 75 F, em comparação com a média do dispositivo de 33.9 °C / ### class_avg_f### F.
(+) Jogando The Witcher 3, a temperatura média para o lado superior é 27.4 °C / 81 F, em comparação com a média do dispositivo de 33.9 °C / ## #class_avg_f### F.
(+) Os apoios para as mãos e o touchpad são mais frios que a temperatura da pele, com um máximo de 24 °C / 75.2 F e, portanto, são frios ao toque.
(+) A temperatura média da área do apoio para as mãos de dispositivos semelhantes foi 28.8 °C / 83.8 F (+4.8 °C / 8.6 F).
| Medion Erazer Crawler E40 - MD 62518 Intel Core i5-13500H, NVIDIA GeForce RTX 4050 Laptop GPU | Lenovo LOQ 15IRH8 Core i7 Intel Core i7-13620H, NVIDIA GeForce RTX 4050 Laptop GPU | Asus TUF A15 FA507 AMD Ryzen 7 7735HS, NVIDIA GeForce RTX 4050 Laptop GPU | Schenker XMG Apex 15 (Late 23) AMD Ryzen 7 7840HS, NVIDIA GeForce RTX 4050 Laptop GPU | MSI Katana 15 B12VEK Intel Core i7-12650H, NVIDIA GeForce RTX 4050 Laptop GPU | |
|---|---|---|---|---|---|
| Heat | -40% | -17% | -31% | -35% | |
| Maximum Upper Side * (°C) | 36 | 46.4 -29% | 48.9 -36% | 52 -44% | 47 -31% |
| Maximum Bottom * (°C) | 36 | 59.2 -64% | 44.6 -24% | 47 -31% | 48 -33% |
| Idle Upper Side * (°C) | 26 | 34.4 -32% | 27.1 -4% | 33 -27% | 35 -35% |
| Idle Bottom * (°C) | 27 | 36.2 -34% | 27.5 -2% | 33 -22% | 38 -41% |
* ... menor é melhor
Alto-falantes
Os alto-falantes estéreo estão localizados nos cantos dianteiros e irradiam para baixo. Os agudos são equilibrados, mas quase não há graves. Recomendamos conectar fones de ouvido por meio da saída jack.
Medion Erazer Crawler E40 - MD 62518 análise de áudio
(±) | o volume do alto-falante é médio, mas bom (###valor### dB)
Graves 100 - 315Hz
(-) | quase nenhum baixo - em média 32.7% menor que a mediana
(±) | a linearidade dos graves é média (11% delta para a frequência anterior)
Médios 400 - 2.000 Hz
(+) | médios equilibrados - apenas 4.6% longe da mediana
(±) | a linearidade dos médios é média (7.1% delta para frequência anterior)
Altos 2 - 16 kHz
(+) | agudos equilibrados - apenas 3.1% longe da mediana
(+) | os máximos são lineares (5.7% delta da frequência anterior)
Geral 100 - 16.000 Hz
(±) | a linearidade do som geral é média (21.8% diferença em relação à mediana)
Comparado com a mesma classe
» 78% de todos os dispositivos testados nesta classe foram melhores, 6% semelhantes, 16% piores
» O melhor teve um delta de 6%, a média foi 18%, o pior foi 132%
Comparado com todos os dispositivos testados
» 62% de todos os dispositivos testados foram melhores, 7% semelhantes, 31% piores
» O melhor teve um delta de 4%, a média foi 23%, o pior foi 134%
Lenovo LOQ 15IRH8 Core i7 análise de áudio
(±) | o volume do alto-falante é médio, mas bom (###valor### dB)
Graves 100 - 315Hz
(-) | quase nenhum baixo - em média 18.6% menor que a mediana
(±) | a linearidade dos graves é média (10.2% delta para a frequência anterior)
Médios 400 - 2.000 Hz
(+) | médios equilibrados - apenas 2.2% longe da mediana
(+) | médios são lineares (3.1% delta para frequência anterior)
Altos 2 - 16 kHz
(+) | agudos equilibrados - apenas 2.3% longe da mediana
(+) | os máximos são lineares (4.4% delta da frequência anterior)
Geral 100 - 16.000 Hz
(+) | o som geral é linear (13.7% diferença em relação à mediana)
Comparado com a mesma classe
» 21% de todos os dispositivos testados nesta classe foram melhores, 7% semelhantes, 72% piores
» O melhor teve um delta de 6%, a média foi 18%, o pior foi 132%
Comparado com todos os dispositivos testados
» 15% de todos os dispositivos testados foram melhores, 4% semelhantes, 81% piores
» O melhor teve um delta de 4%, a média foi 23%, o pior foi 134%
Consumo de energia
O consumo de energia é um pouco alto no modo inativo e no teste de estresse, mas não se destaca. Sob carga normal, o consumo está bem dentro da média da concorrência. Em jogos, ele está no mesmo nível do Lenovo LOQ 15, mas é mais alto do que os outros concorrentes.
Medimos um consumo máximo temporário de 202,5 W durante nosso teste de estresse simultâneo de CPU e GPU. A fonte de alimentação de 230 W da LiteOn não deve ter nenhum problema aqui.
| desligado | |
| Ocioso | |
| Carga |
|
Key:
min: | |
| Medion Erazer Crawler E40 - MD 62518 GeForce RTX 4050 Laptop GPU, i5-13500H, Phison PS5021-E21 512GB | Lenovo LOQ 15IRH8 Core i7 GeForce RTX 4050 Laptop GPU, i7-13620H, Kioxia BG5 KBG50ZNT512G | Asus TUF A15 FA507 GeForce RTX 4050 Laptop GPU, R7 7735HS, Micron 2400 MTFDKBA512QFM | Schenker XMG Apex 15 (Late 23) GeForce RTX 4050 Laptop GPU, R7 7840HS, Samsung 990 Pro 1 TB | MSI Katana 15 B12VEK GeForce RTX 4050 Laptop GPU, i7-12650H, Micron 2400 MTFDKBA1T0QFM | |
|---|---|---|---|---|---|
| Power Consumption | 1% | 23% | 15% | 18% | |
| Idle 150cd/m2 * (Watt) | 15.3 | 9.48 38% | 10.8 29% | 9.8 36% | |
| 3DMark06 Return To Proxycon * (Watt) | 88 | 94.5 -7% | 84 5% | ||
| Witcher 3 ultra * (Watt) | 155 | 154.4 -0% | 136.6 12% | 136.5 12% | 128 17% |
| 1280x720 Prime95 28.10 and Furmark 1.25 * (Watt) | 190 | 169.2 11% | 156.7 18% | 181 5% | 165 13% |
* ... menor é melhor
Power consumption Witcher 3 / stress test
Power consumption with external monitor
Duração da bateria
A Medion usa uma bateria de 54 Wh. Apenas o MSI Katana tem uma bateria similarmente pequena, mas ainda assim dura um pouco mais em todos os testes. O restante da concorrência tem baterias de pelo menos 60 Wh, sendo que o Asus TUF A15 tem até mesmo uma bateria de 90 Wh. Em resumo: o Medion tem a menor duração em uma comparação direta. Em nosso teste de vídeo ou de navegação com brilho reduzido, o laptop atinge uma duração de cerca de 4 horas, o que não é nada animador.
| Medion Erazer Crawler E40 - MD 62518 i5-13500H, GeForce RTX 4050 Laptop GPU, 54 Wh | Lenovo LOQ 15IRH8 Core i7 i7-13620H, GeForce RTX 4050 Laptop GPU, 60 Wh | Asus TUF A15 FA507 R7 7735HS, GeForce RTX 4050 Laptop GPU, 90 Wh | Schenker XMG Apex 15 (Late 23) R7 7840HS, GeForce RTX 4050 Laptop GPU, 62.32 Wh | MSI Katana 15 B12VEK i7-12650H, GeForce RTX 4050 Laptop GPU, 53.5 Wh | Média da turma Gaming | |
|---|---|---|---|---|---|---|
| Duração da bateria | 50% | 130% | 73% | 14% | 70% | |
| H.264 (h) | 3.9 | 6.1 56% | 12.5 221% | 8.3 113% | 4.4 13% | 8.27 ? 112% |
| WiFi v1.3 (h) | 4.1 | 5.9 44% | 11.7 185% | 7.1 73% | 4.3 5% | 7.08 ? 73% |
| Load (h) | 1.2 | 1 -17% | 1.6 33% | 1.5 25% | 1.496 ? 25% | |
| Reader / Idle (h) | 8.4 | 7.84 ? |
Pro
Contra
Veredicto - Jogador econômico com desvantagens, mas com bom desempenho
Por cerca de US$ 1.300, o Medion Crawler E40 oferece uma opção econômica para um notebook para jogos com uma RTX 4050. Embora ele se enquadre na faixa de orçamento, há modelos ainda mais baratos disponíveis, o que leva a uma análise mais detalhada da relação preço-desempenho. O Crawler E40 revela suas origens econômicas com recursos como o i5-13500H em vez do i7-13700H, uma tela de 2019, uma webcam de 720p e um slot USB 2.0, entre outros aspectos. Consequentemente, ele pode não atender às expectativas dos gamers com altas exigências. No entanto, o desempenho da CPU e da GPU é louvável, e o SSD tem um bom desempenho. A tela, embora não seja a mais recente, é suficientemente brilhante com 350 nits, responsiva e oferece uma taxa de atualização de 144 Hz, mesmo que não cubra totalmente os espaços de cores típicos.
Embora existam alguns pontos de crítica, muitos deles são aceitáveis em um laptop econômico. Por outro lado, a duração da bateria notavelmente fraca e o sistema de resfriamento excessivamente barulhento são preocupações mais relevantes. A otimização do software poderia resolver o problema do sistema de resfriamento, pois parece haver espaço para melhorias devido às baixas temperaturas.
Em resumo, o Medion Crawler E40 é um laptop para jogos econômico com alguns compromissos, mas o desempenho de seus componentes é louvável. As principais críticas estão no sistema de resfriamento barulhento e agressivo, bem como na fraca duração da bateria.
Cada um dos concorrentes discutidos no teste tem seus méritos, e as diferenças entre eles são relativamente pequenas. O Asus TUF A15, embora ofereça um desempenho um pouco mais fraco, destaca-se por sua impressionante duração da bateria. Se uma bateria de longa duração com desempenho comparável for uma prioridade e o senhor estiver disposto a gastar um pouco mais, o Lenovo LOQ 15 pode ser uma escolha adequada, apesar de ter algumas desvantagens. É essencial observar que não há um vencedor claro, especialmente considerando que o XMG Apex 15 tem um preço quase ~US$550 mais alto.
Preço e disponibilidade
O Medion Erazer Crawler E40 custa cerca de ~US$ 1.300 diretamente no site Medion.
Medion Erazer Crawler E40 - MD 62518
- 11/28/2023 v7 (old)
Christian Hintze
Transparência
A seleção dos dispositivos a serem analisados é feita pela nossa equipe editorial. A amostra de teste foi fornecida ao autor como empréstimo pelo fabricante ou varejista para fins desta revisão. O credor não teve influência nesta revisão, nem o fabricante recebeu uma cópia desta revisão antes da publicação. Não houve obrigação de publicar esta revisão. Como empresa de mídia independente, a Notebookcheck não está sujeita à autoridade de fabricantes, varejistas ou editores.
É assim que o Notebookcheck está testando
Todos os anos, o Notebookcheck analisa de forma independente centenas de laptops e smartphones usando procedimentos padronizados para garantir que todos os resultados sejam comparáveis. Desenvolvemos continuamente nossos métodos de teste há cerca de 20 anos e definimos padrões da indústria no processo. Em nossos laboratórios de teste, equipamentos de medição de alta qualidade são utilizados por técnicos e editores experientes. Esses testes envolvem um processo de validação em vários estágios. Nosso complexo sistema de classificação é baseado em centenas de medições e benchmarks bem fundamentados, o que mantém a objetividade.Price comparison

