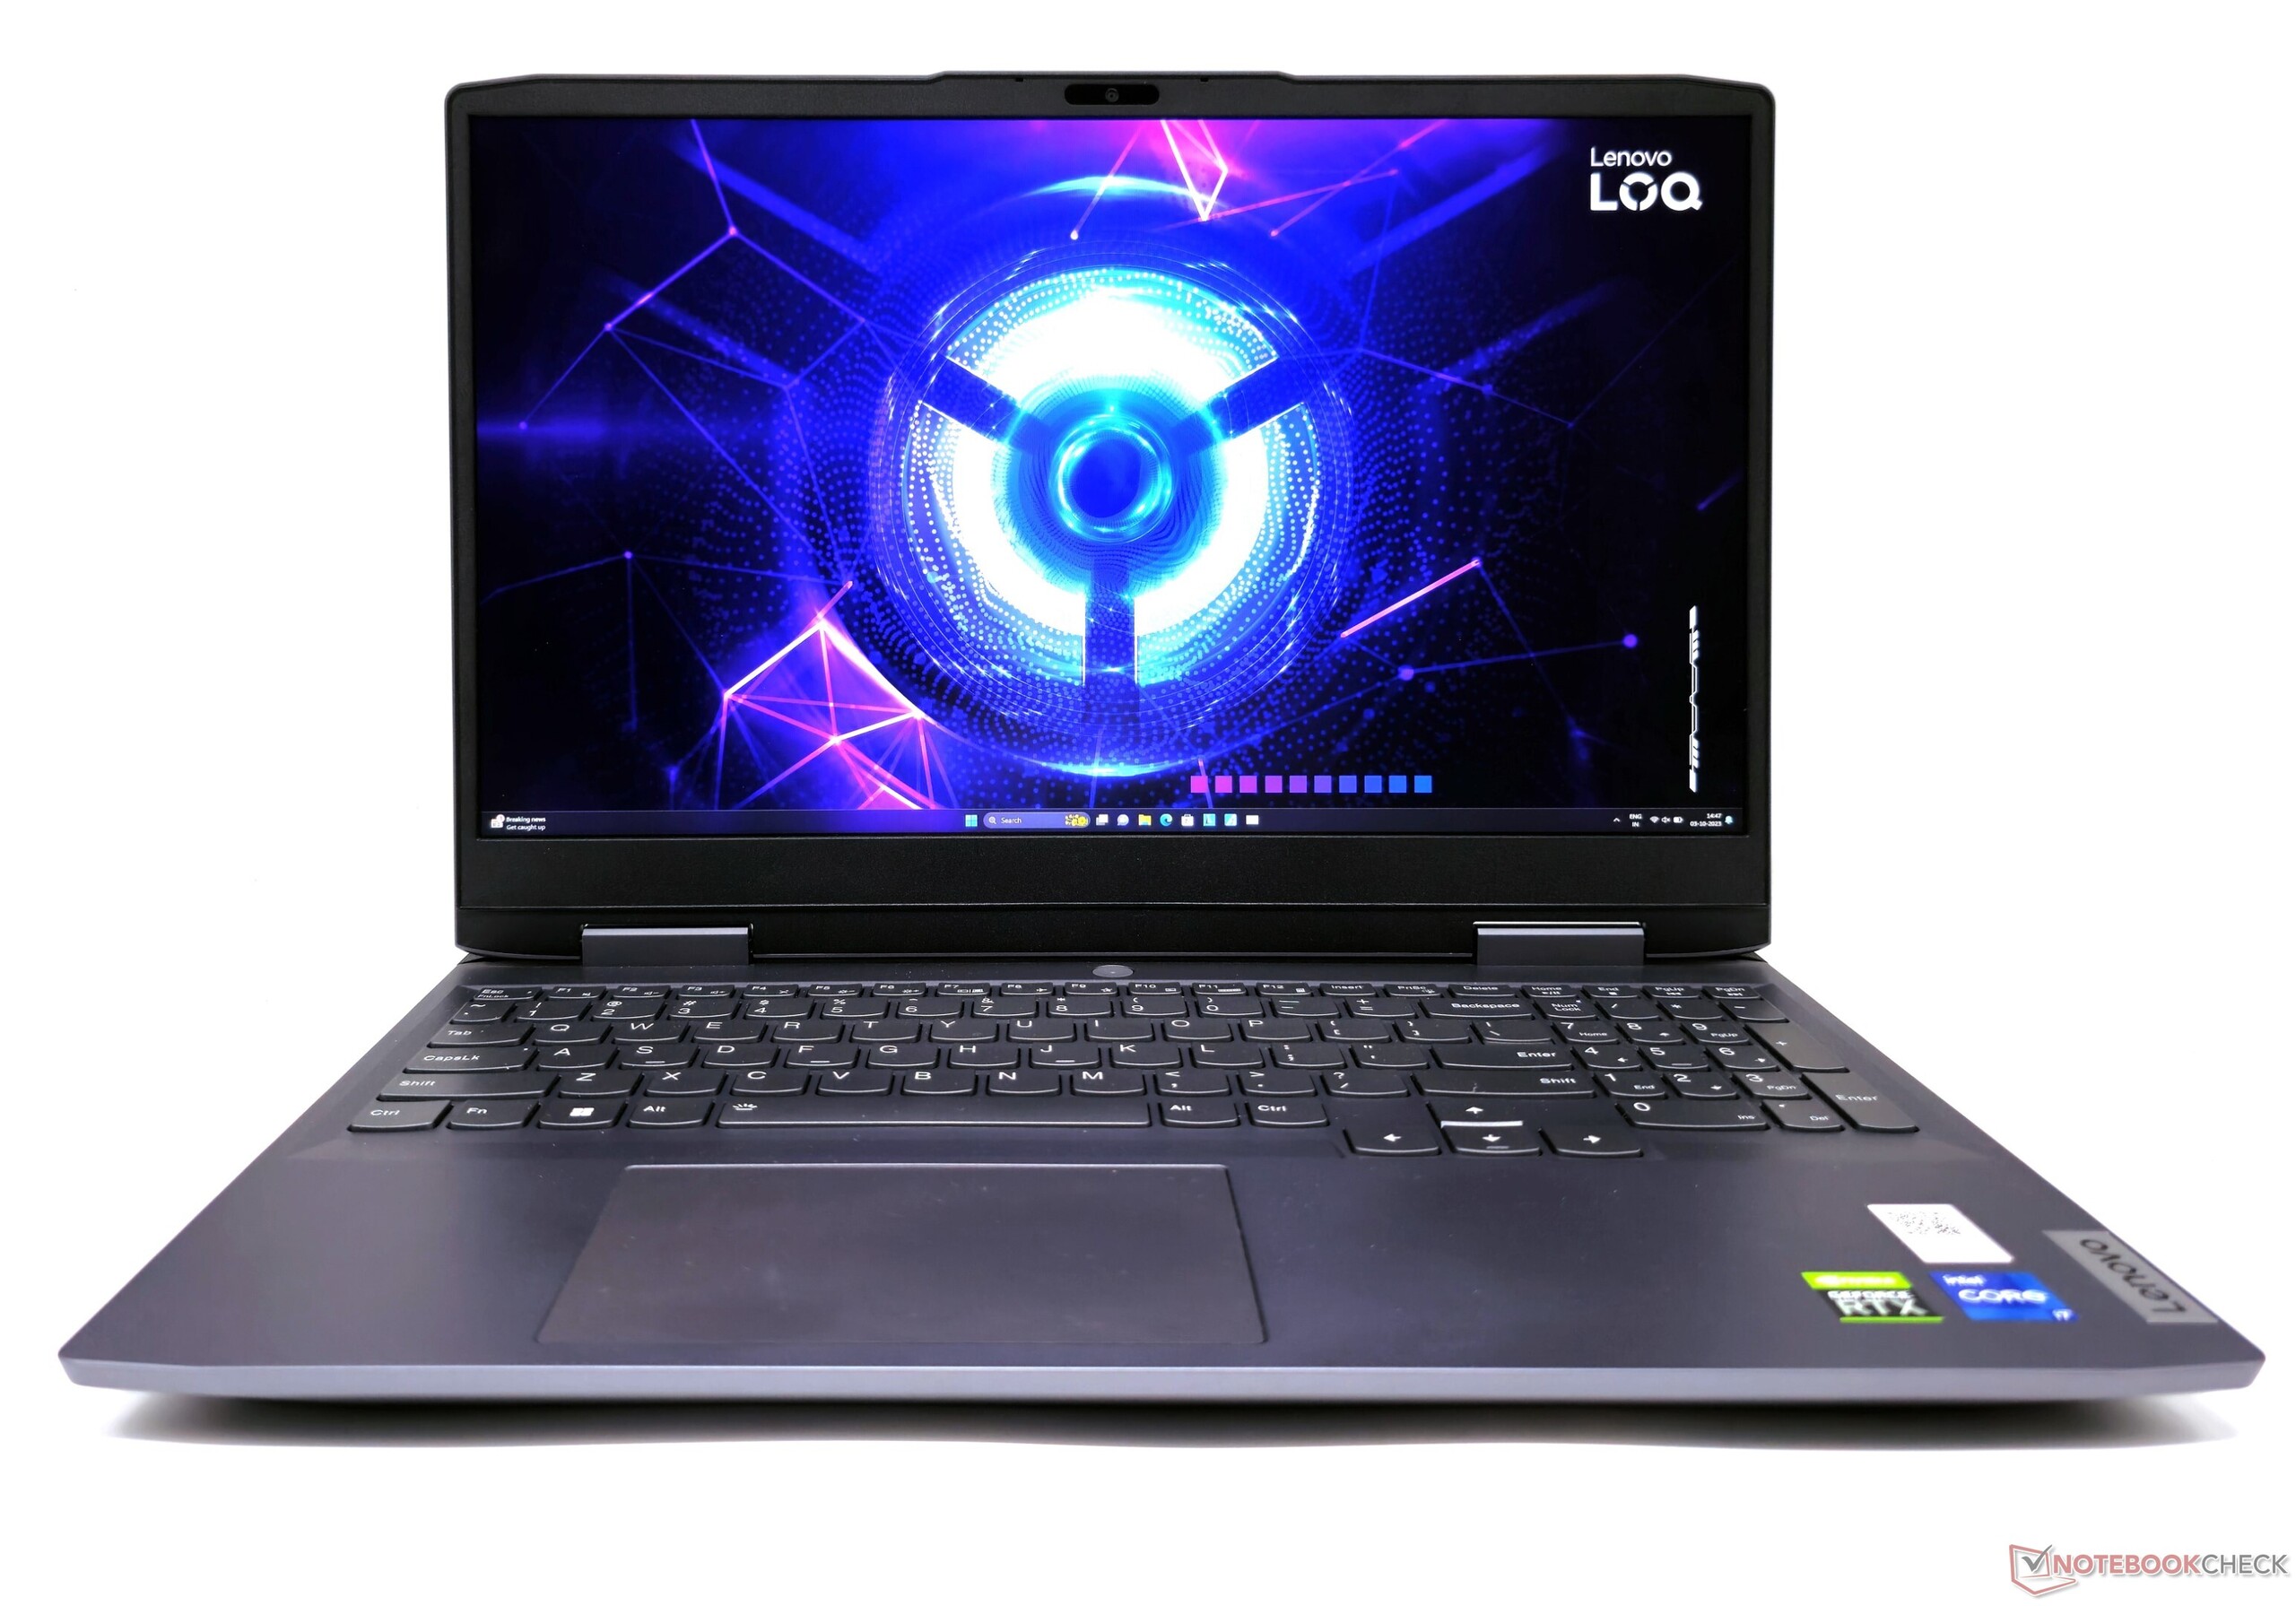
Análise do Lenovo LOQ 15 Core i7: Alternativa econômica para o Legion que levanta um dilema entre Intel e AMD

A série LOQ da Lenovo é voltada para jogadores de nível básico e econômico, semelhante às linhas Dell G Series, HP Victus, Asus TUF, MSI Katana e Acer Nitro. Recentemente, analisamos o LOQ 15APH8 com umAMD Ryzen 7 7840HSeGPU para laptop Nvidia RTX 4050. O LOQ 16IRH8 também combinou silício Intel e Nvidia, combinando um Core i7-13620H com RTX 4060 com gráficos RTX 4060.
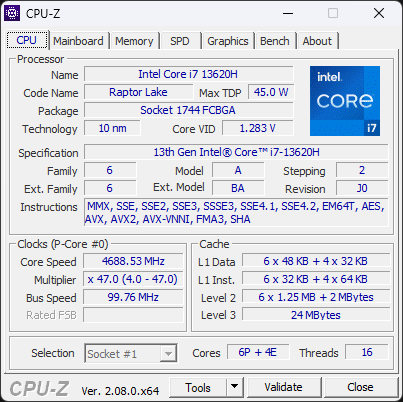
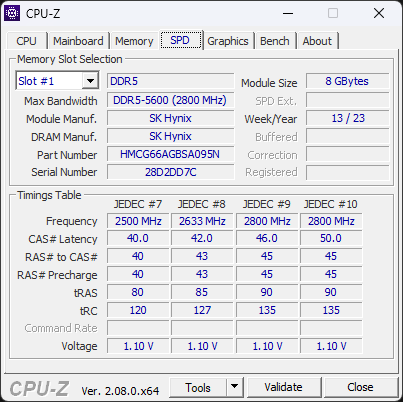
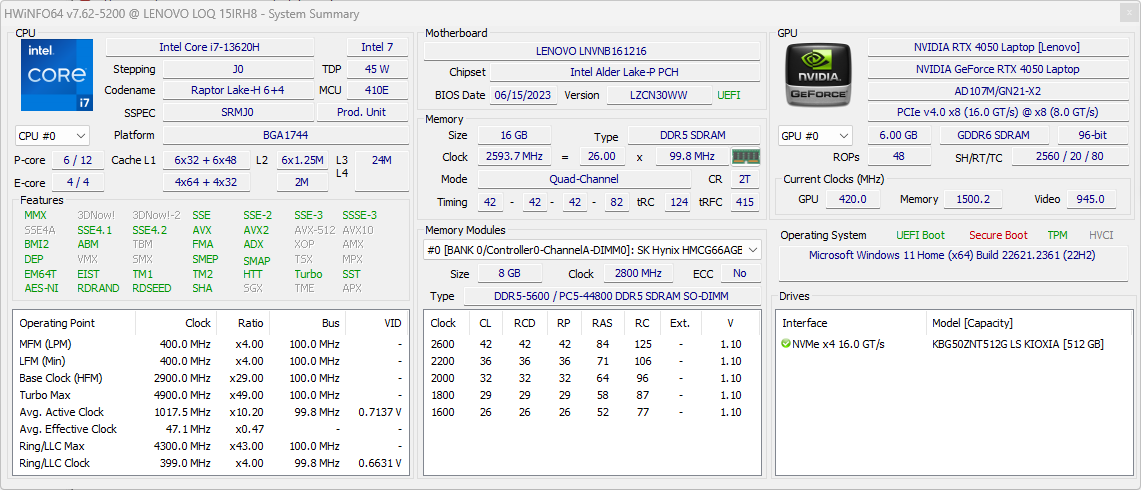
Agora, em nossos laboratórios, está o LOQ 15IRH8 de 15 polegadas, equipado com o Core i7-13620H e RTX 4050. Nosso modelo de teste também veio equipado com 16 GB de memória DDR5-5200, um SSD PCIe Gen4 NVMe de 512 GB e uma tela QHD G-Sync de 165 Hz.
Essa configuração de médio porte superior custa ₹ 1.01.988 (US$ 1.224) na Índia, enquanto a variante de 1080p 144 Hz pode ser adquirida por ₹ 97.790 (US$ 1.050).
Possíveis concorrentes em comparação
Avaliação | Data | Modelo | Peso | Altura | Size | Resolução | Preço |
|---|---|---|---|---|---|---|---|
| 85.9 % v7 (old) | 10/2023 | Lenovo LOQ 15IRH8 Core i7 i7-13620H, GeForce RTX 4050 Laptop GPU | 2.4 kg | 25.2 mm | 15.60" | 2560x1440 | |
| 87.3 % v7 (old) | 09/2023 | Lenovo LOQ 16IRH8 i7-13620H, GeForce RTX 4060 Laptop GPU | 2.7 kg | 25.9 mm | 16.00" | 2560x1600 | |
| 85.7 % v7 (old) | 07/2023 | Lenovo LOQ 15APH8 R7 7840HS, GeForce RTX 4050 Laptop GPU | 2.5 kg | 25.2 mm | 15.60" | 1920x1080 | |
| 82.1 % v7 (old) | 02/2023 | MSI Katana 17 B13VFK i7-13620H, GeForce RTX 4060 Laptop GPU | 2.8 kg | 25.2 mm | 17.30" | 1920x1080 | |
| 89 % v7 (old) | 08/2023 | Lenovo Legion Pro 5 16ARX8 (R5 7645HX, RTX 4050) R5 7645HX, GeForce RTX 4050 Laptop GPU | 2.5 kg | 27.3 mm | 16.00" | 2560x1600 | |
| 85.1 % v7 (old) | 09/2023 | HP Victus 16-r0077ng i7-13700H, GeForce RTX 4070 Laptop GPU | 2.4 kg | 24 mm | 16.10" | 1920x1080 | |
| 84.2 % v7 (old) | 06/2023 | Dell G15 5530 i7-13650HX, GeForce RTX 4060 Laptop GPU | 3 kg | 26.95 mm | 15.60" | 1920x1080 | |
| 86.9 % v7 (old) | 06/2023 | Asus TUF Gaming A16 FA617XS R9 7940HS, Radeon RX 7600S | 2.2 kg | 22.1 mm | 16.00" | 1920x1200 |
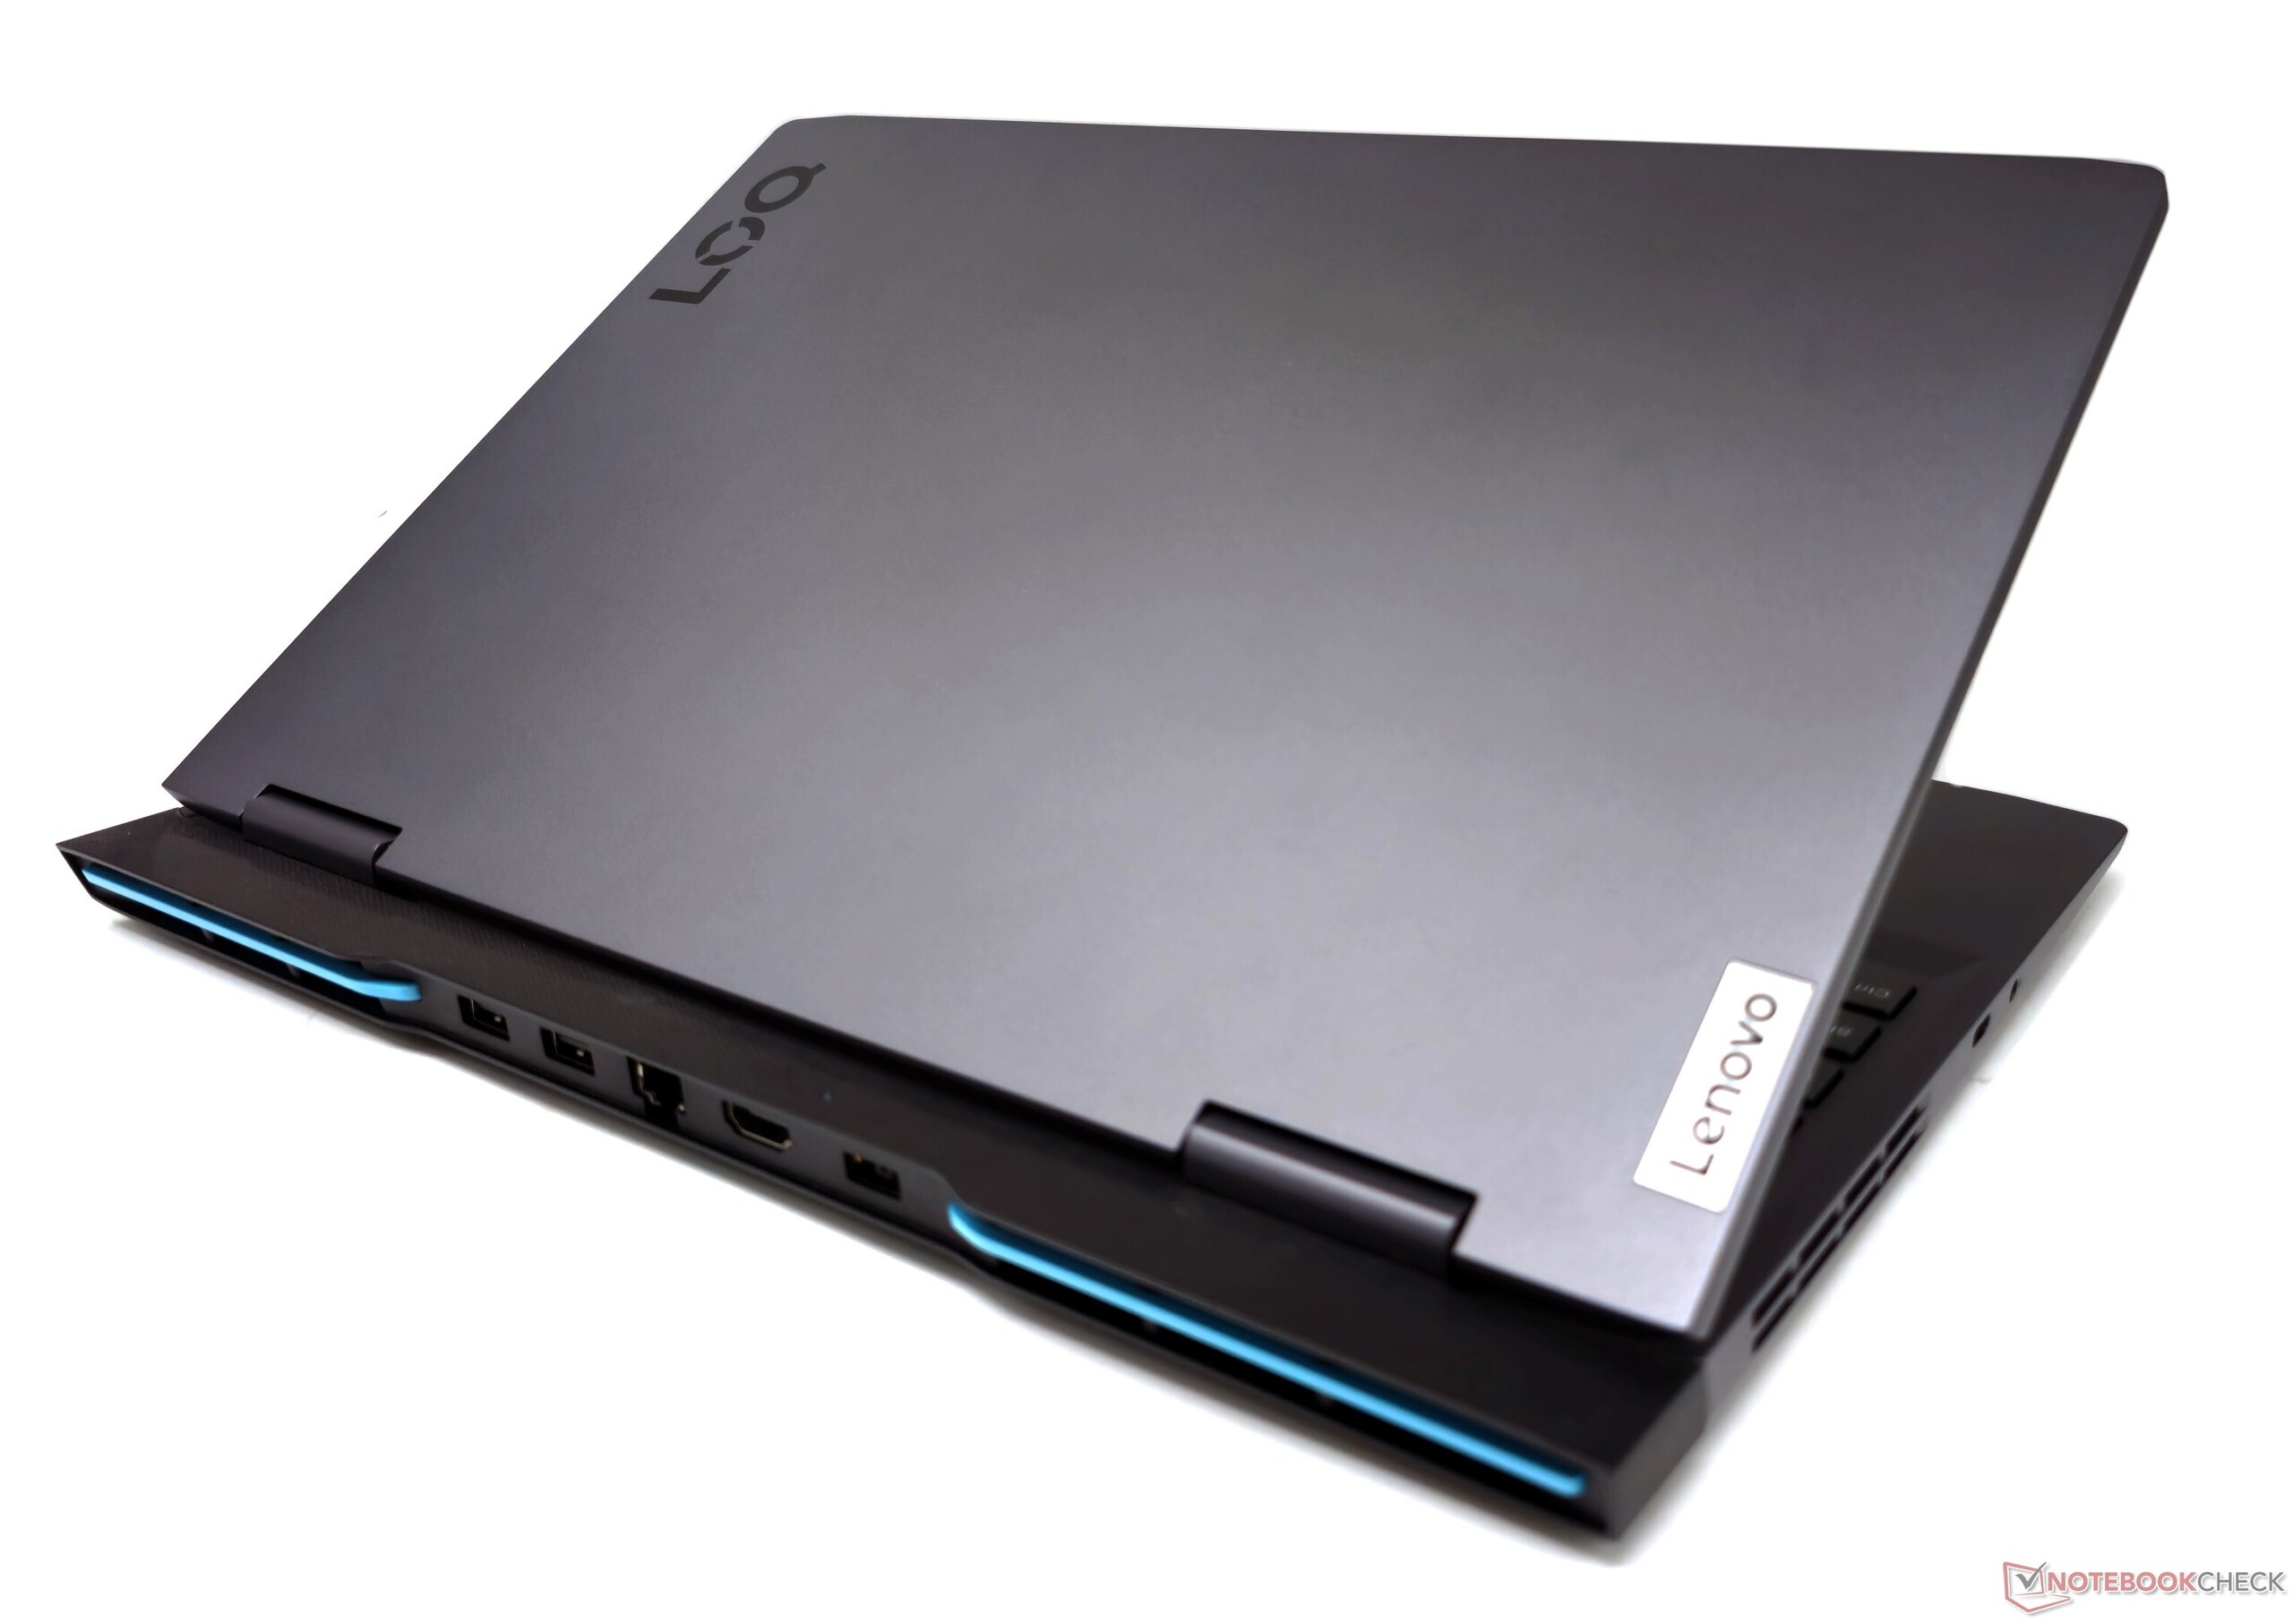
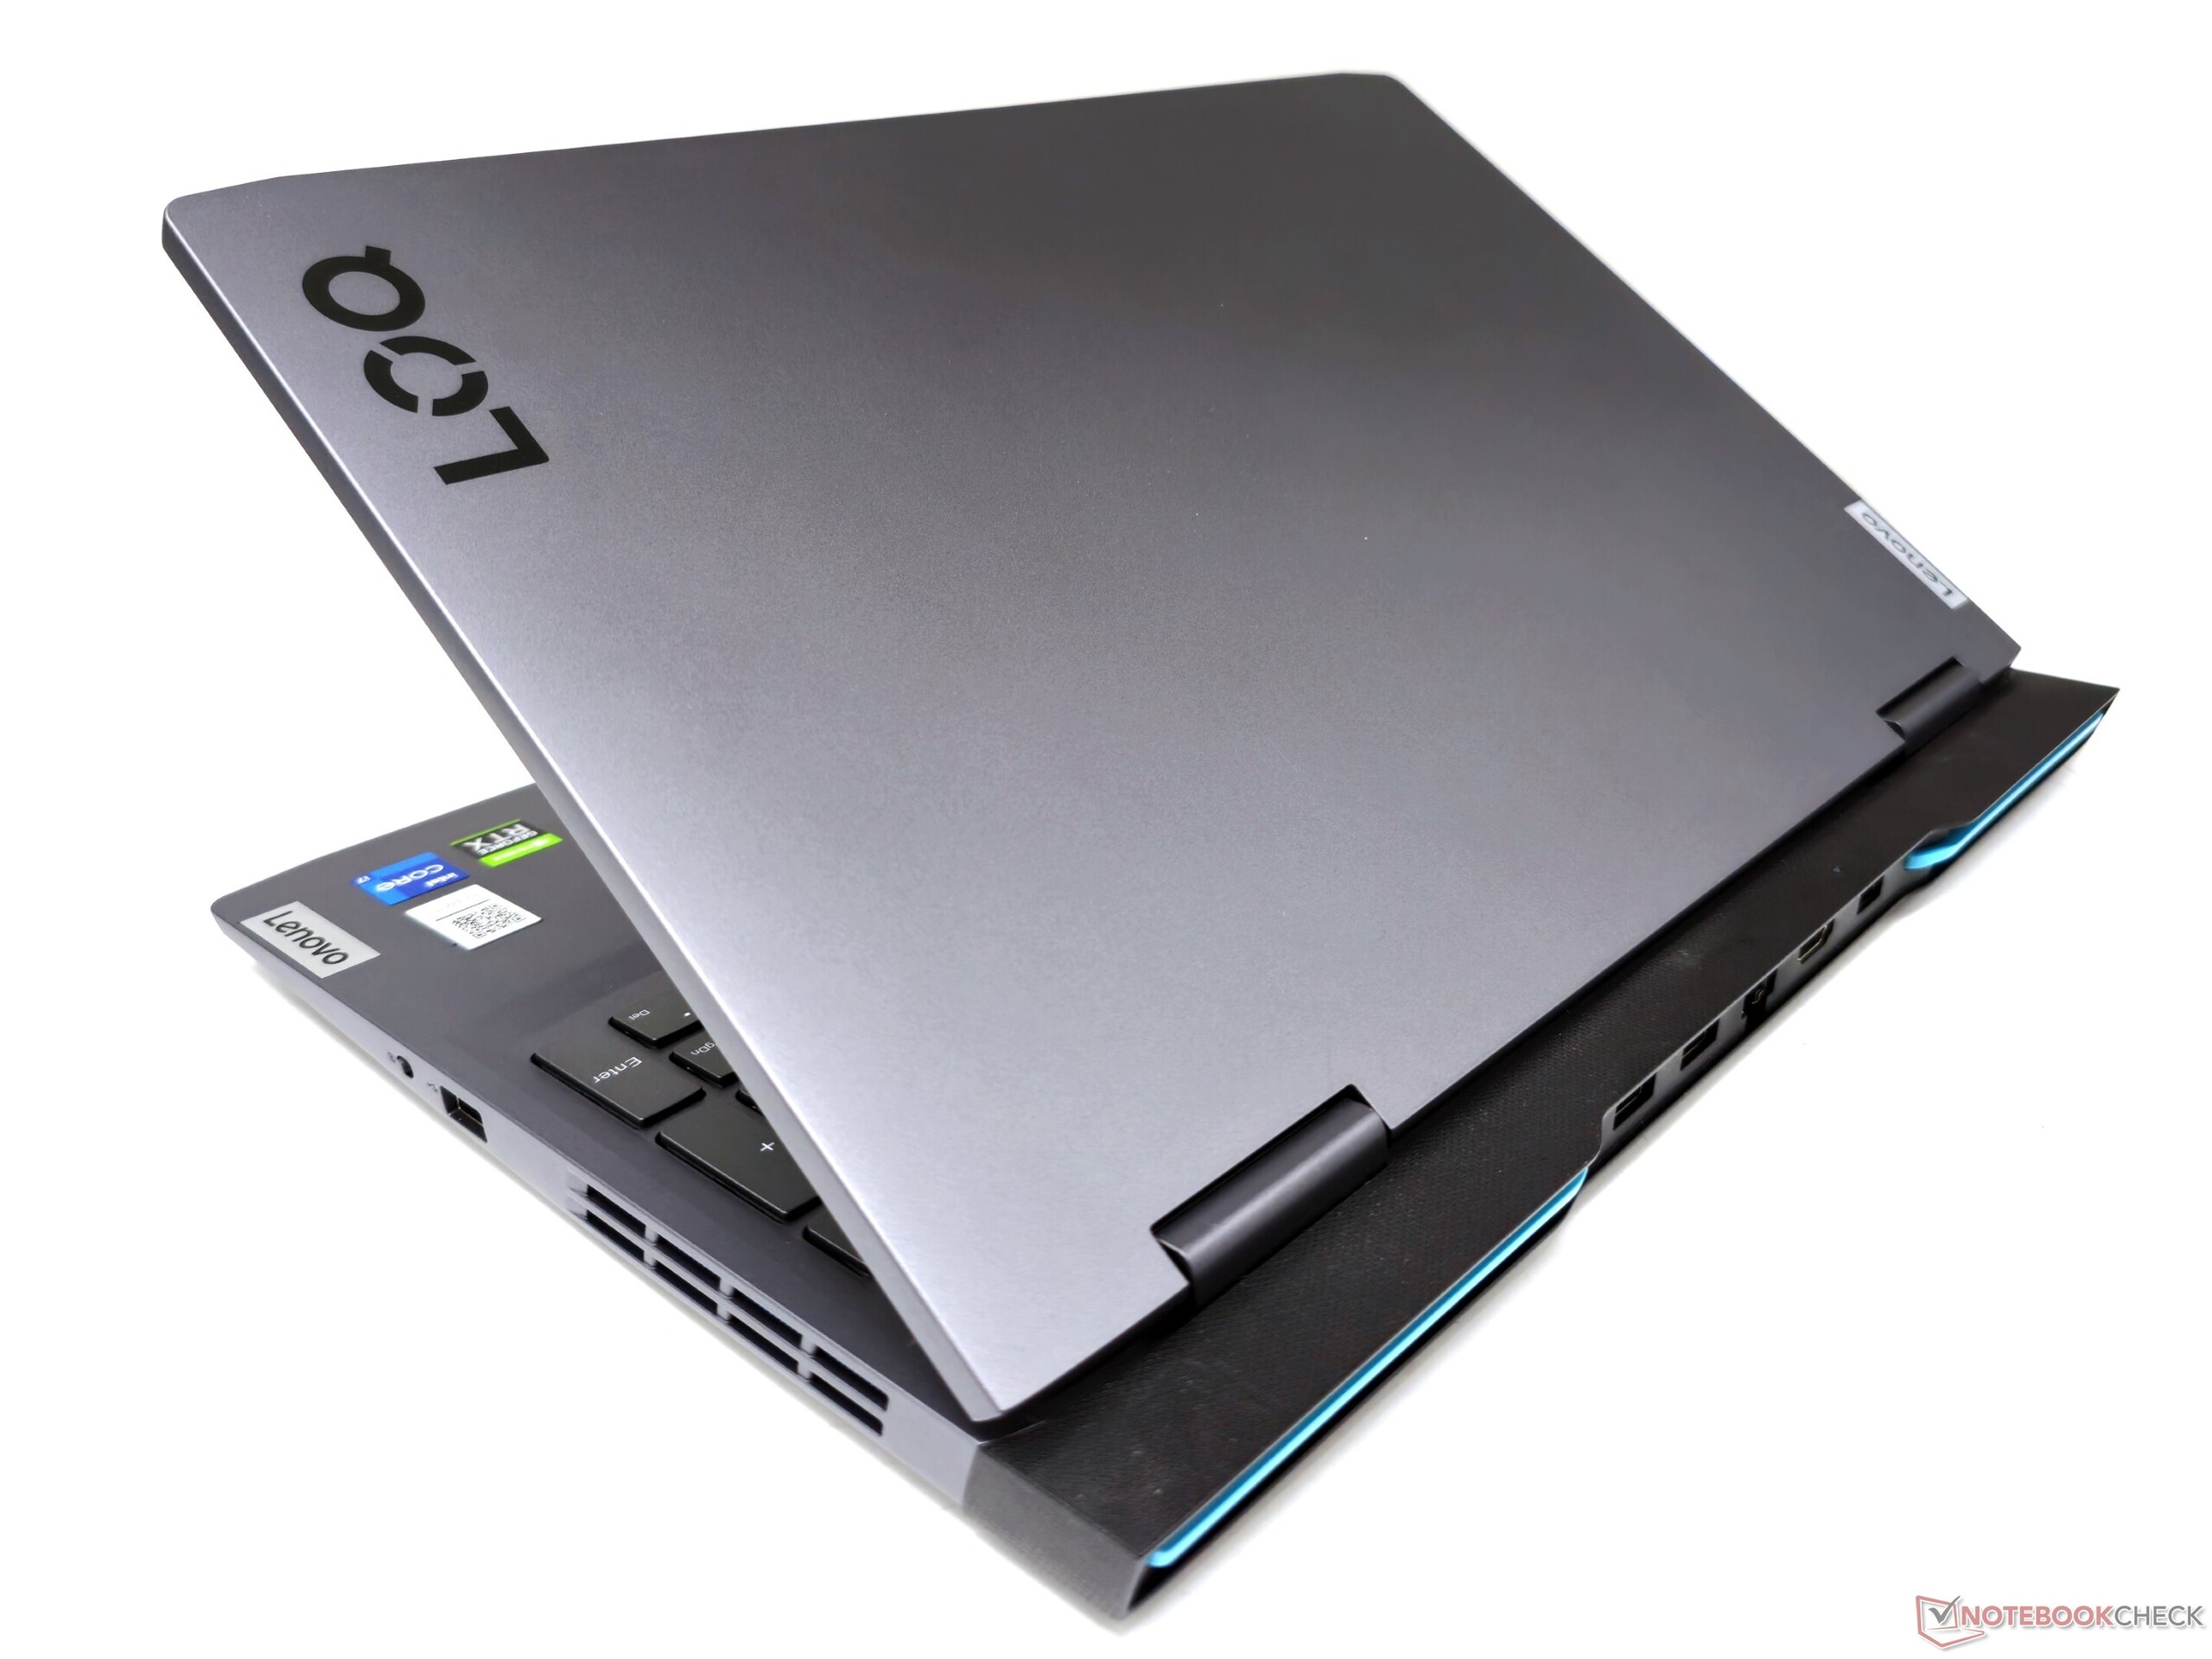
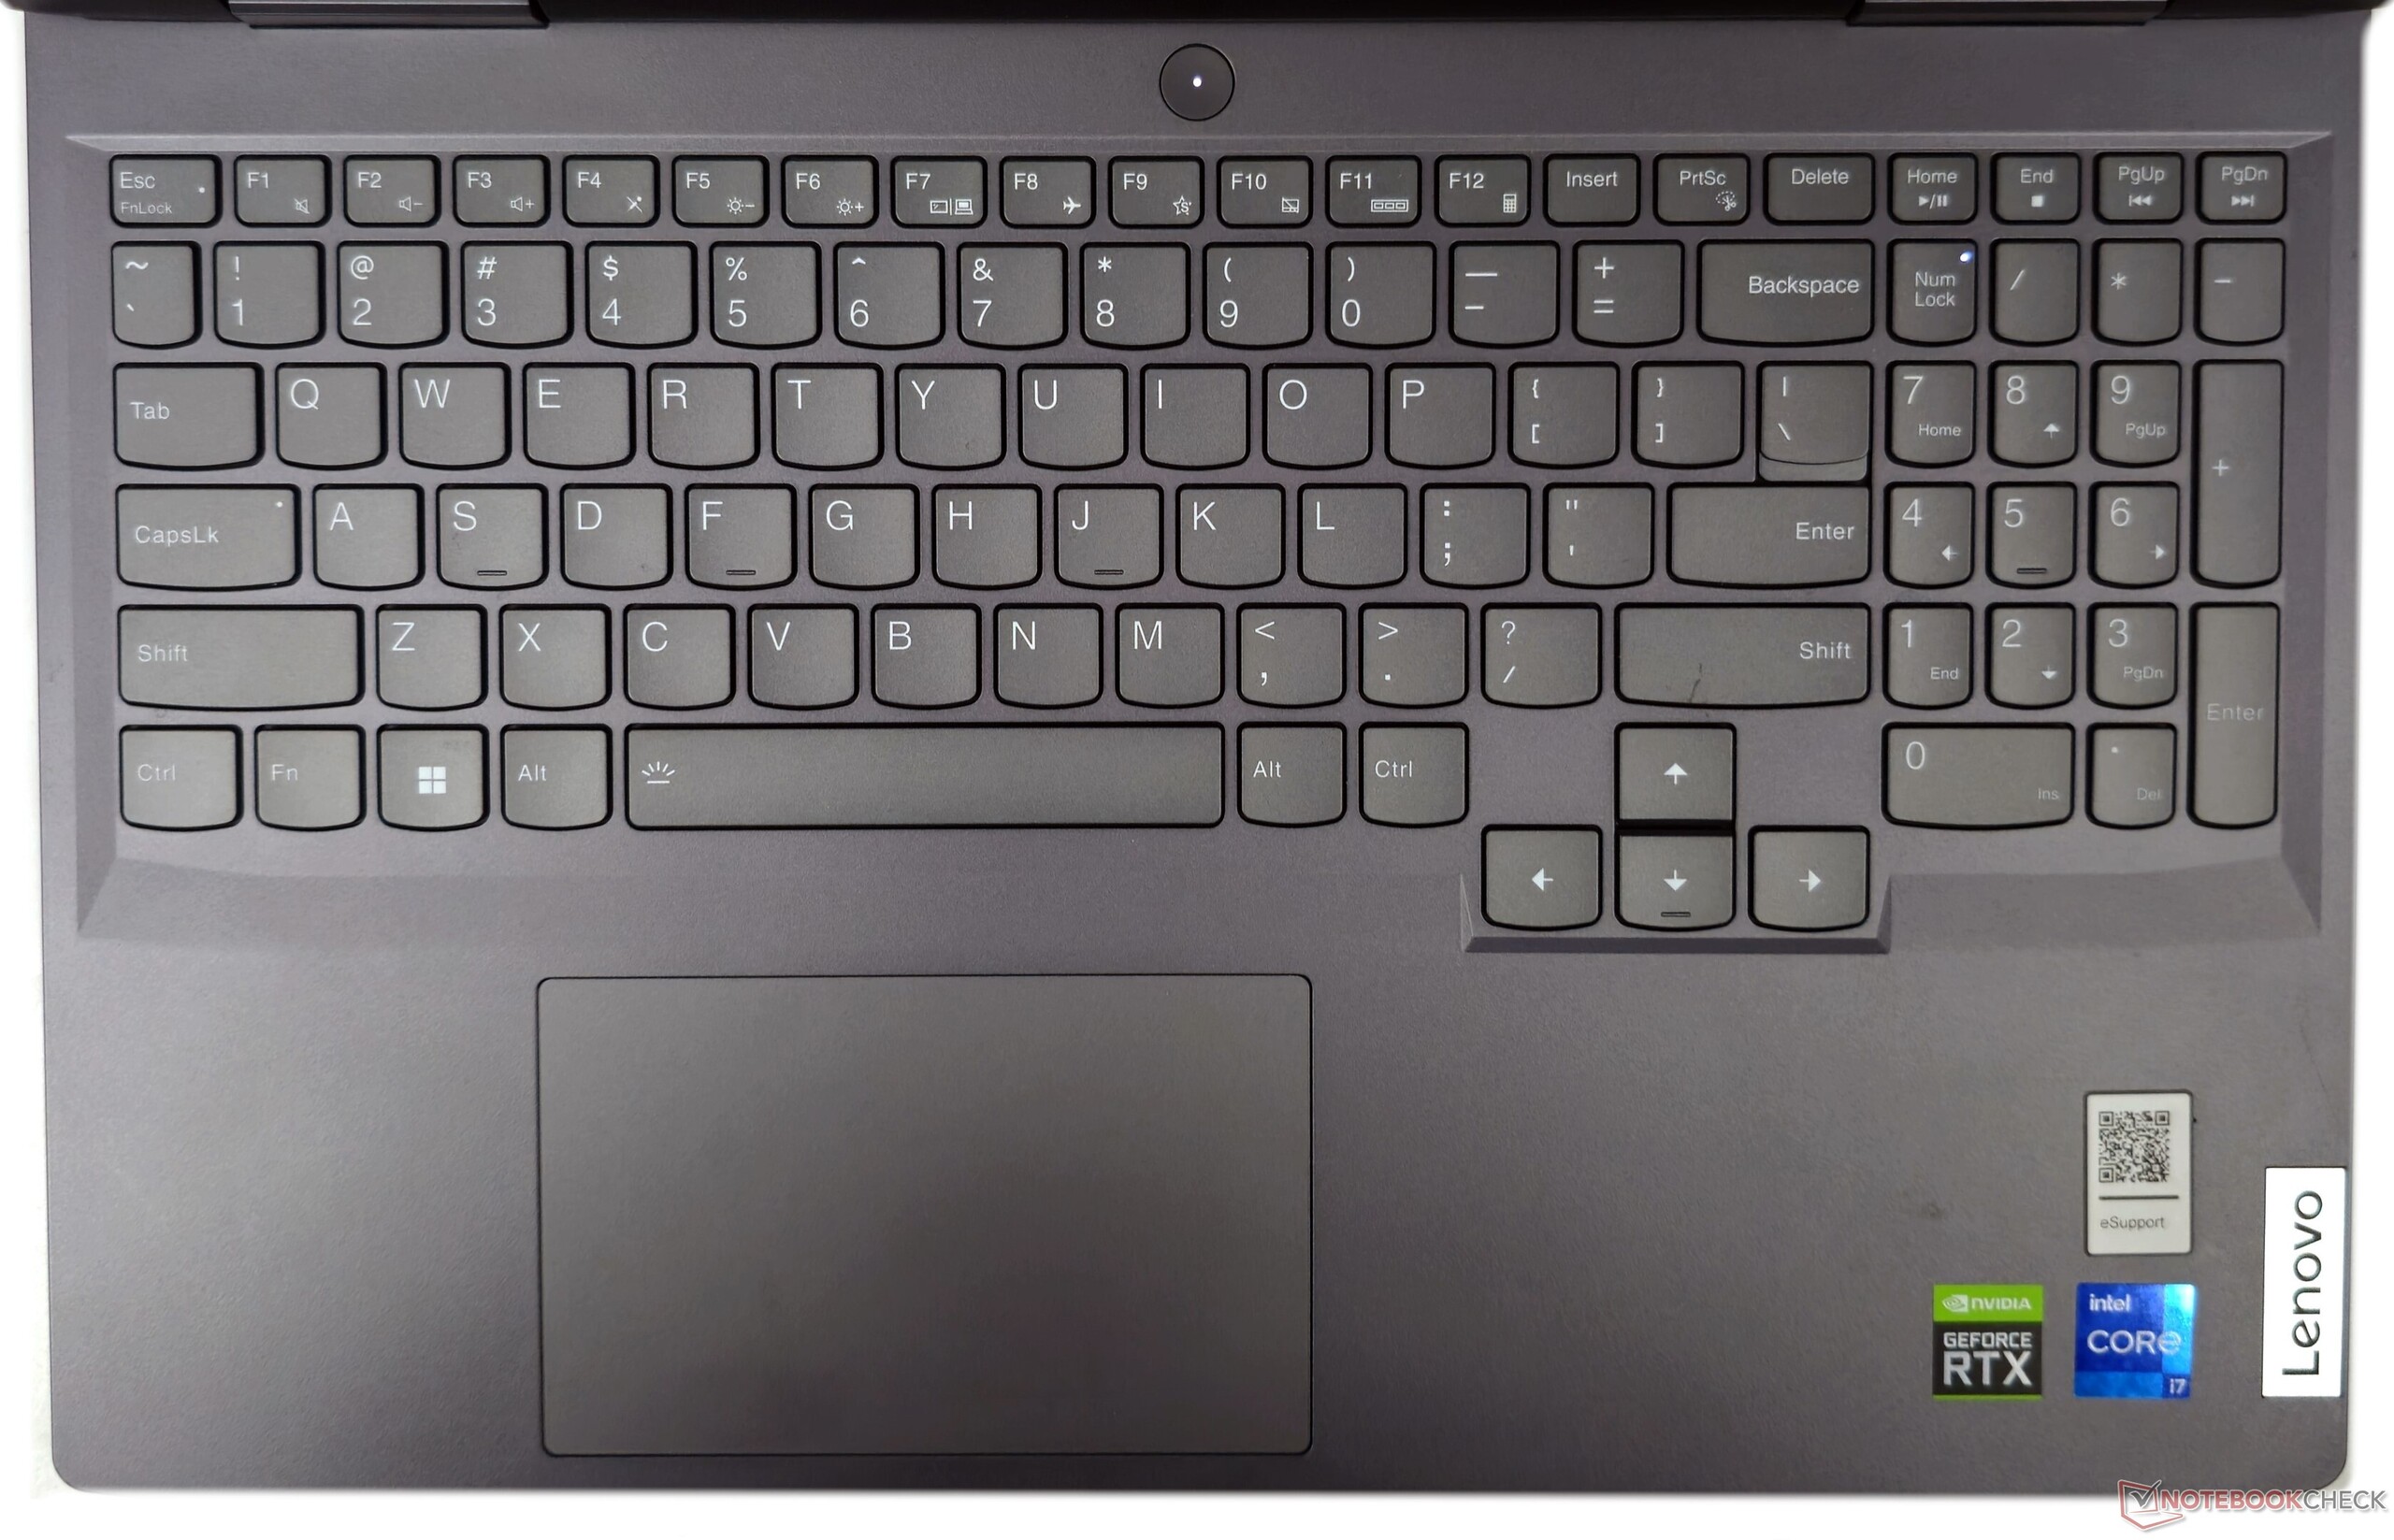
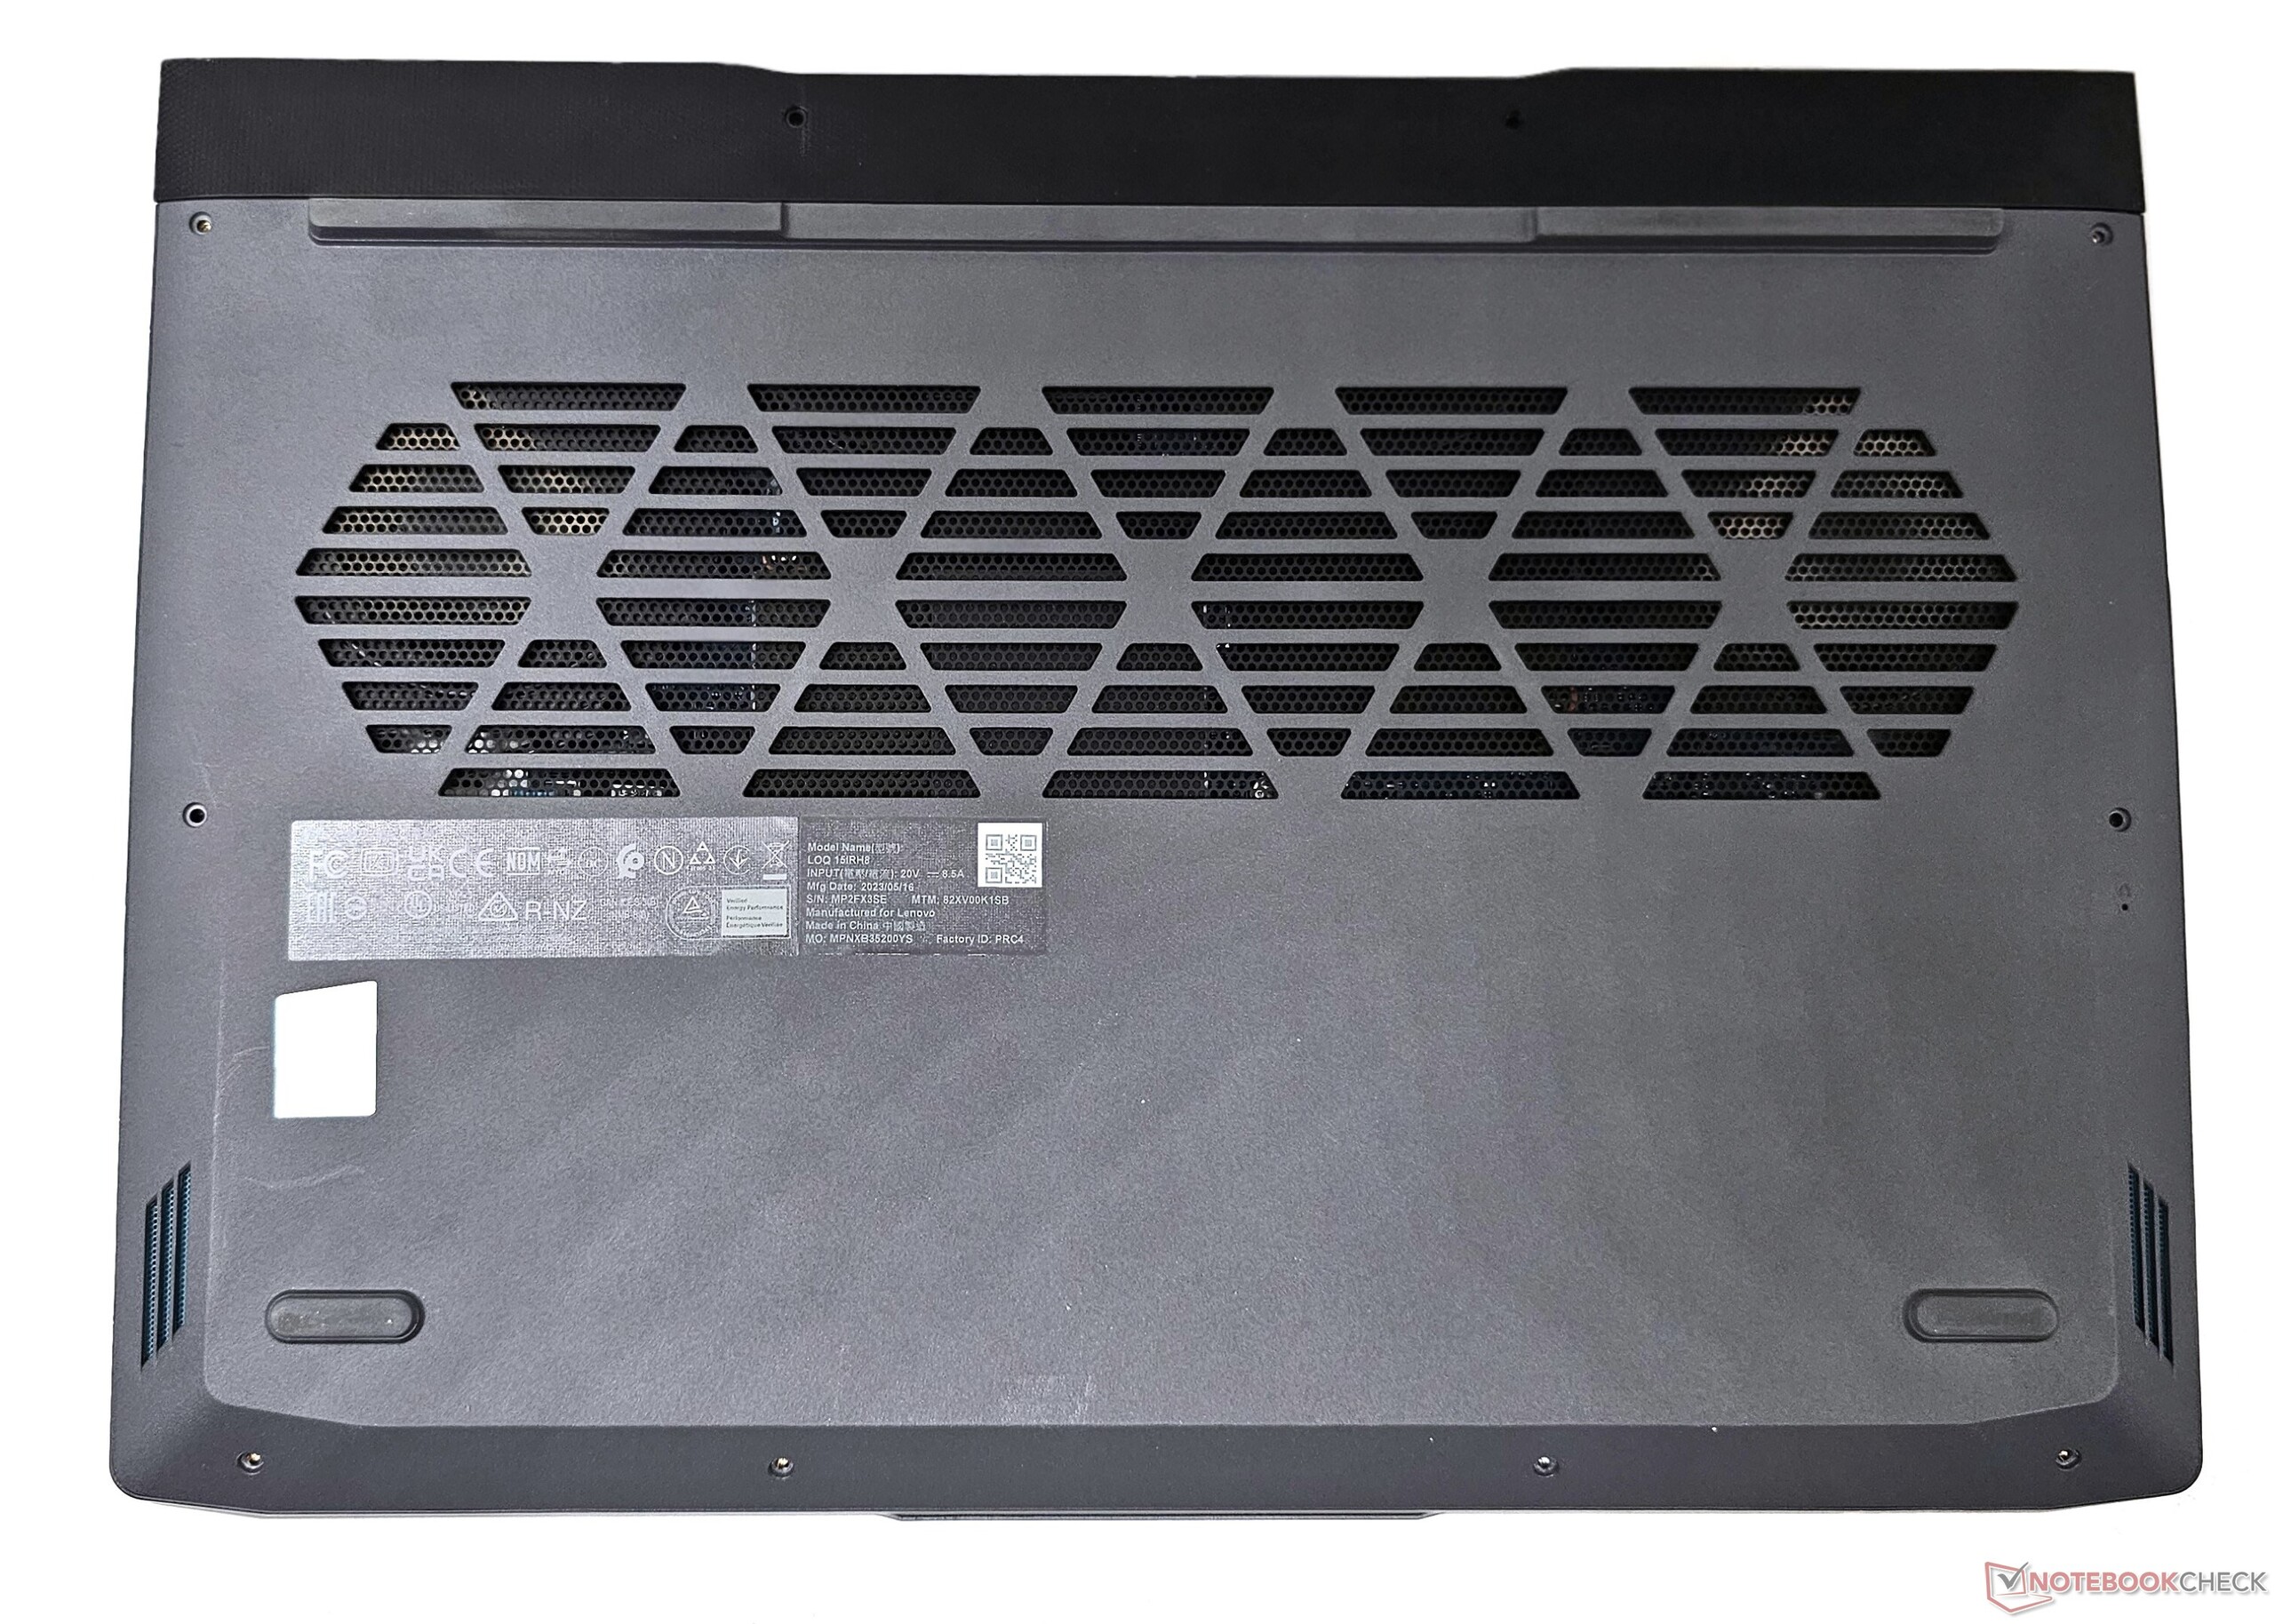
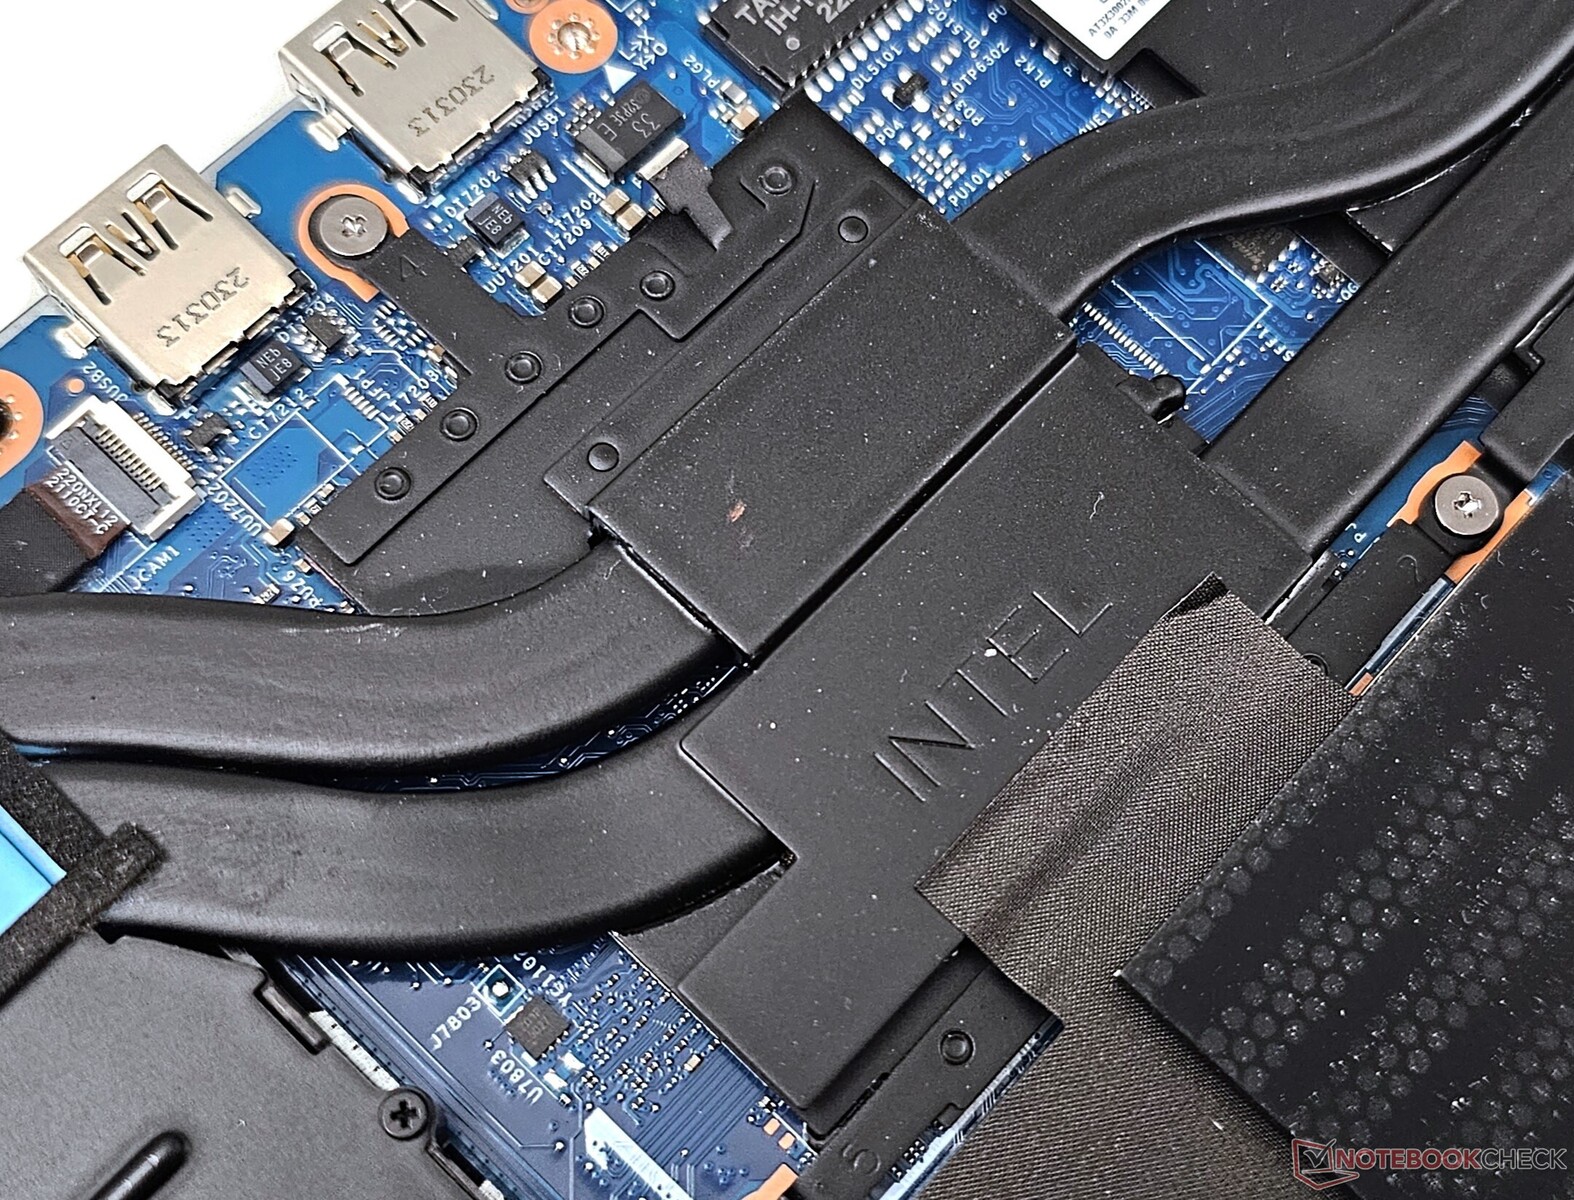
Chassi e dispositivos de entrada: A mesma construção plástica da variante AMD
Para obter mais detalhes sobre o chassi, a manutenção e os dispositivos de entrada do Lenovo LOQ 15IRH8, consulte nossa Análise do LOQ 15APH8- Esses aspectos são idênticos entre os notebooks LOQ da Lenovo baseados em Intel e AMD.
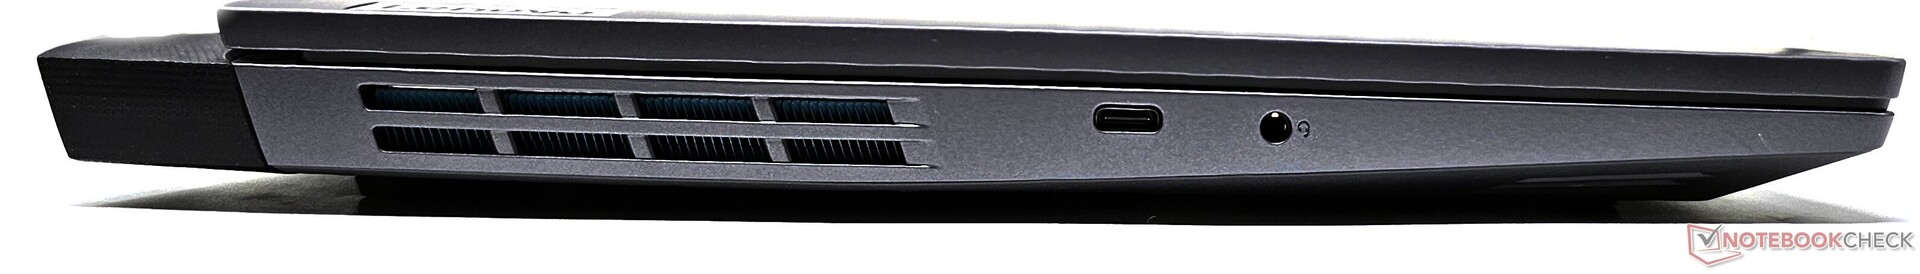
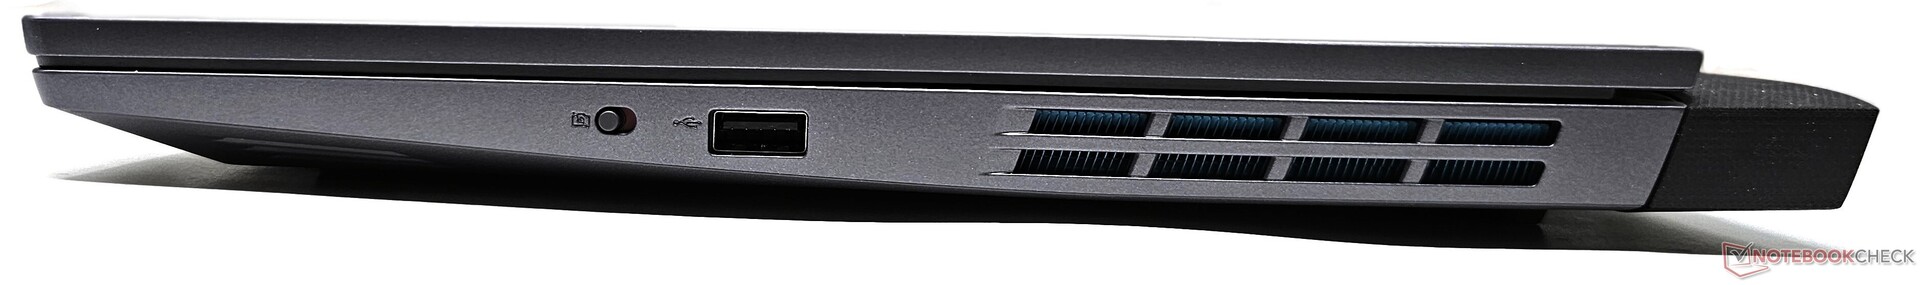
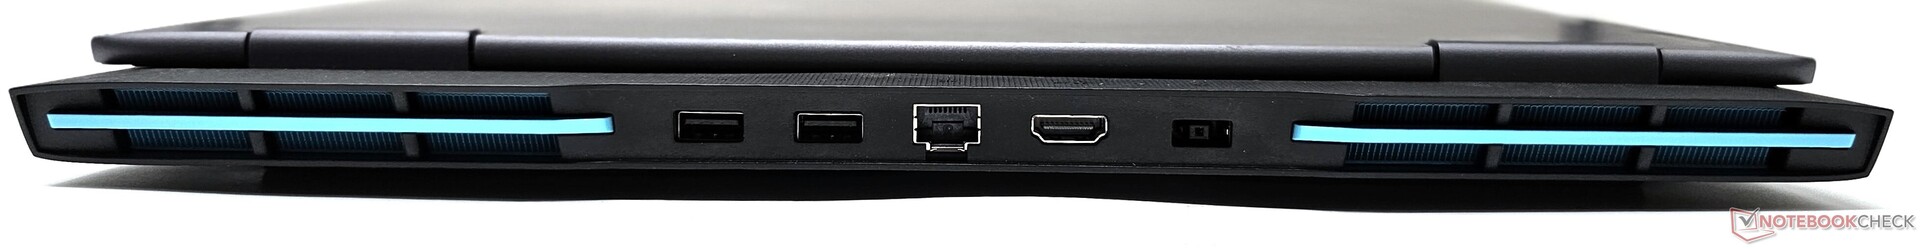
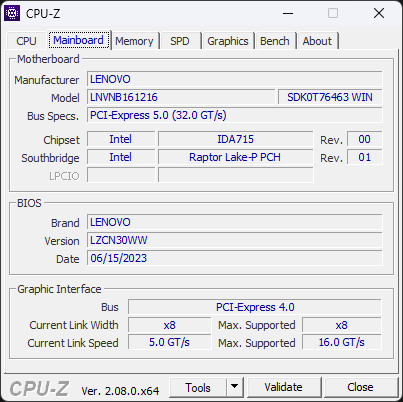
Conectividade: Fornecimento de energia USB-C de 140 W, mas sem Thunderbolt 4
A seleção e o posicionamento das portas são exatamente os mesmos do LOQ 16 baseado em Intel. Ao contrário do LOQ 15APH8, que usa uma porta USB 2.0 entre outras portas USB 3.2, as variantes da Intel padronizam totalmente a conectividade USB 3.2.
De acordo com a Lenovo, a única porta USB 3.2 Gen2 Type-C é capaz de fornecer 140 W de potência. Não há opção de USB4 ou Thunderbolt 4 disponível.
Comunicação
O desempenho sem fio está dentro do esperado para um módulo Realtek Wi-Fi 6. Os testes de transmissão e recepção mostraram uma taxa de transferência estável quando testados com nosso roteador de referência Asus ROG Rapture GT-AXE11000.
| Networking / iperf3 transmit AXE11000 | |
| Lenovo Legion Pro 5 16ARX8 (R5 7645HX, RTX 4050) | |
| Dell G15 5530 | |
| MSI Katana 17 B13VFK | |
| Média da turma Gaming (560 - 1862, n=88, últimos 2 anos) | |
| Lenovo LOQ 15IRH8 Core i7 | |
| Lenovo LOQ 15APH8 | |
| Média Realtek RTL8852BE (536 - 943, n=71) | |
| Asus TUF Gaming A16 FA617XS | |
| Lenovo LOQ 16IRH8 | |
| HP Victus 16-r0077ng | |
| Networking / iperf3 receive AXE11000 | |
| MSI Katana 17 B13VFK | |
| Lenovo Legion Pro 5 16ARX8 (R5 7645HX, RTX 4050) | |
| Dell G15 5530 | |
| Média da turma Gaming (680 - 1745, n=88, últimos 2 anos) | |
| Lenovo LOQ 15IRH8 Core i7 | |
| Asus TUF Gaming A16 FA617XS | |
| Média Realtek RTL8852BE (455 - 985, n=72) | |
| Lenovo LOQ 16IRH8 | |
| Lenovo LOQ 15APH8 | |
| HP Victus 16-r0077ng | |
Webcam
A webcam de 1080p apresenta altos desvios em todas as cores, exceto no branco. A qualidade da imagem ainda é útil para chamadas de vídeo com boa iluminação ambiente. Um interruptor eletrônico do obturador da câmera é fornecido no lado direito do dispositivo.


Garantia
Na Índia, a Lenovo oferece uma garantia padrão de um ano no local para o LOQ 15. Além disso, os compradores podem optar por várias opções de atualização de garantia e proteção contra danos acidentais diretamente da Lenovo.
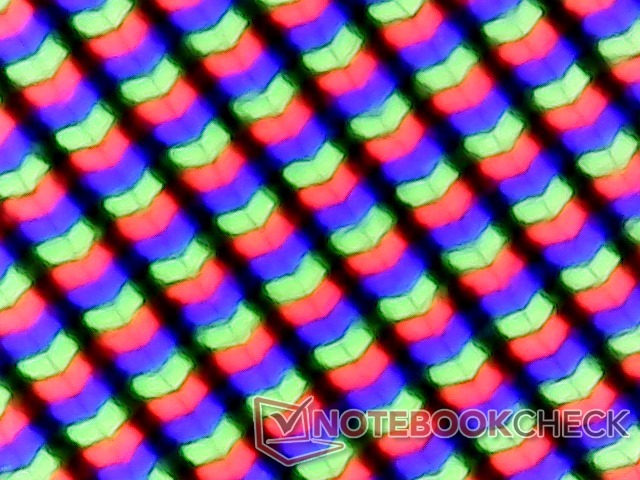
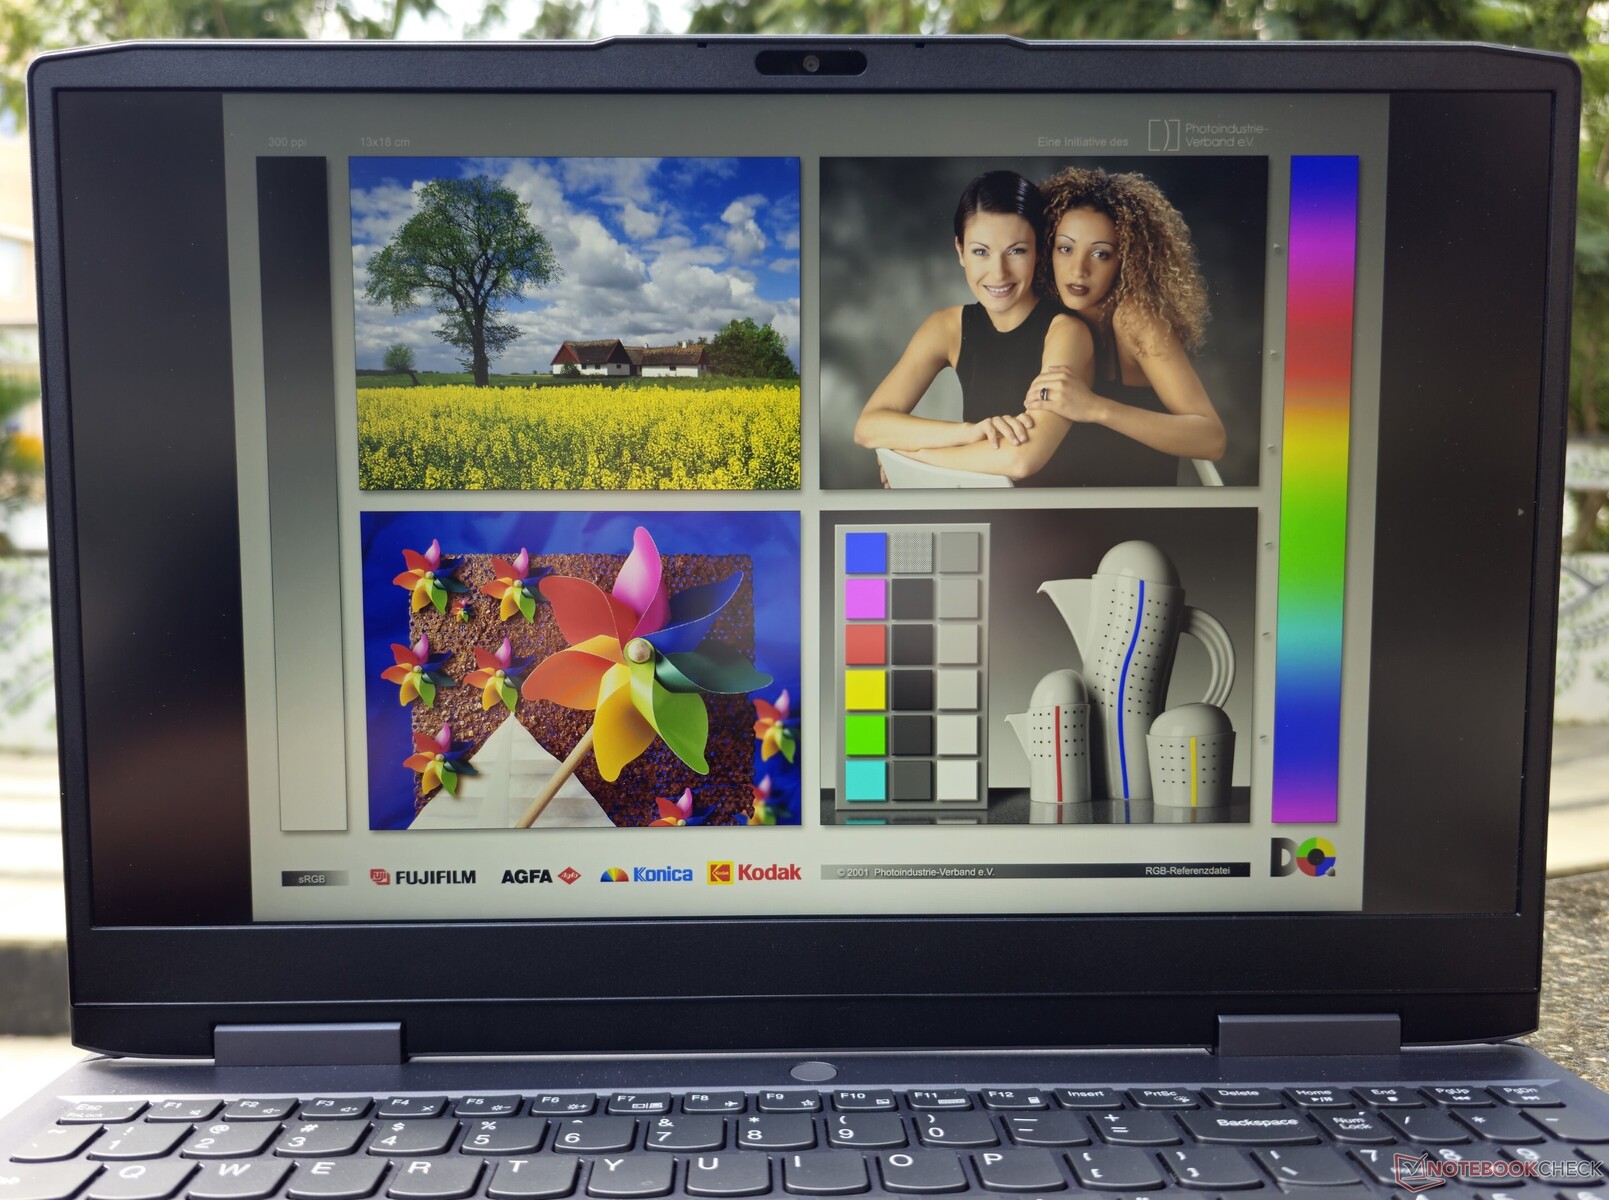
Tela: o painel QHD G-Sync de 165 Hz apresenta uma opção de atualização significativa
Nossa unidade LOQ 15 veio equipada com um painel BOE QHD com uma taxa de atualização de 165 Hz. O painel suporta Nvidia G-Sync no modo de GPU discreta. A Lenovo classifica o brilho em 350 nits, mas registramos até 383 nits no ponto mais brilhante da tela.
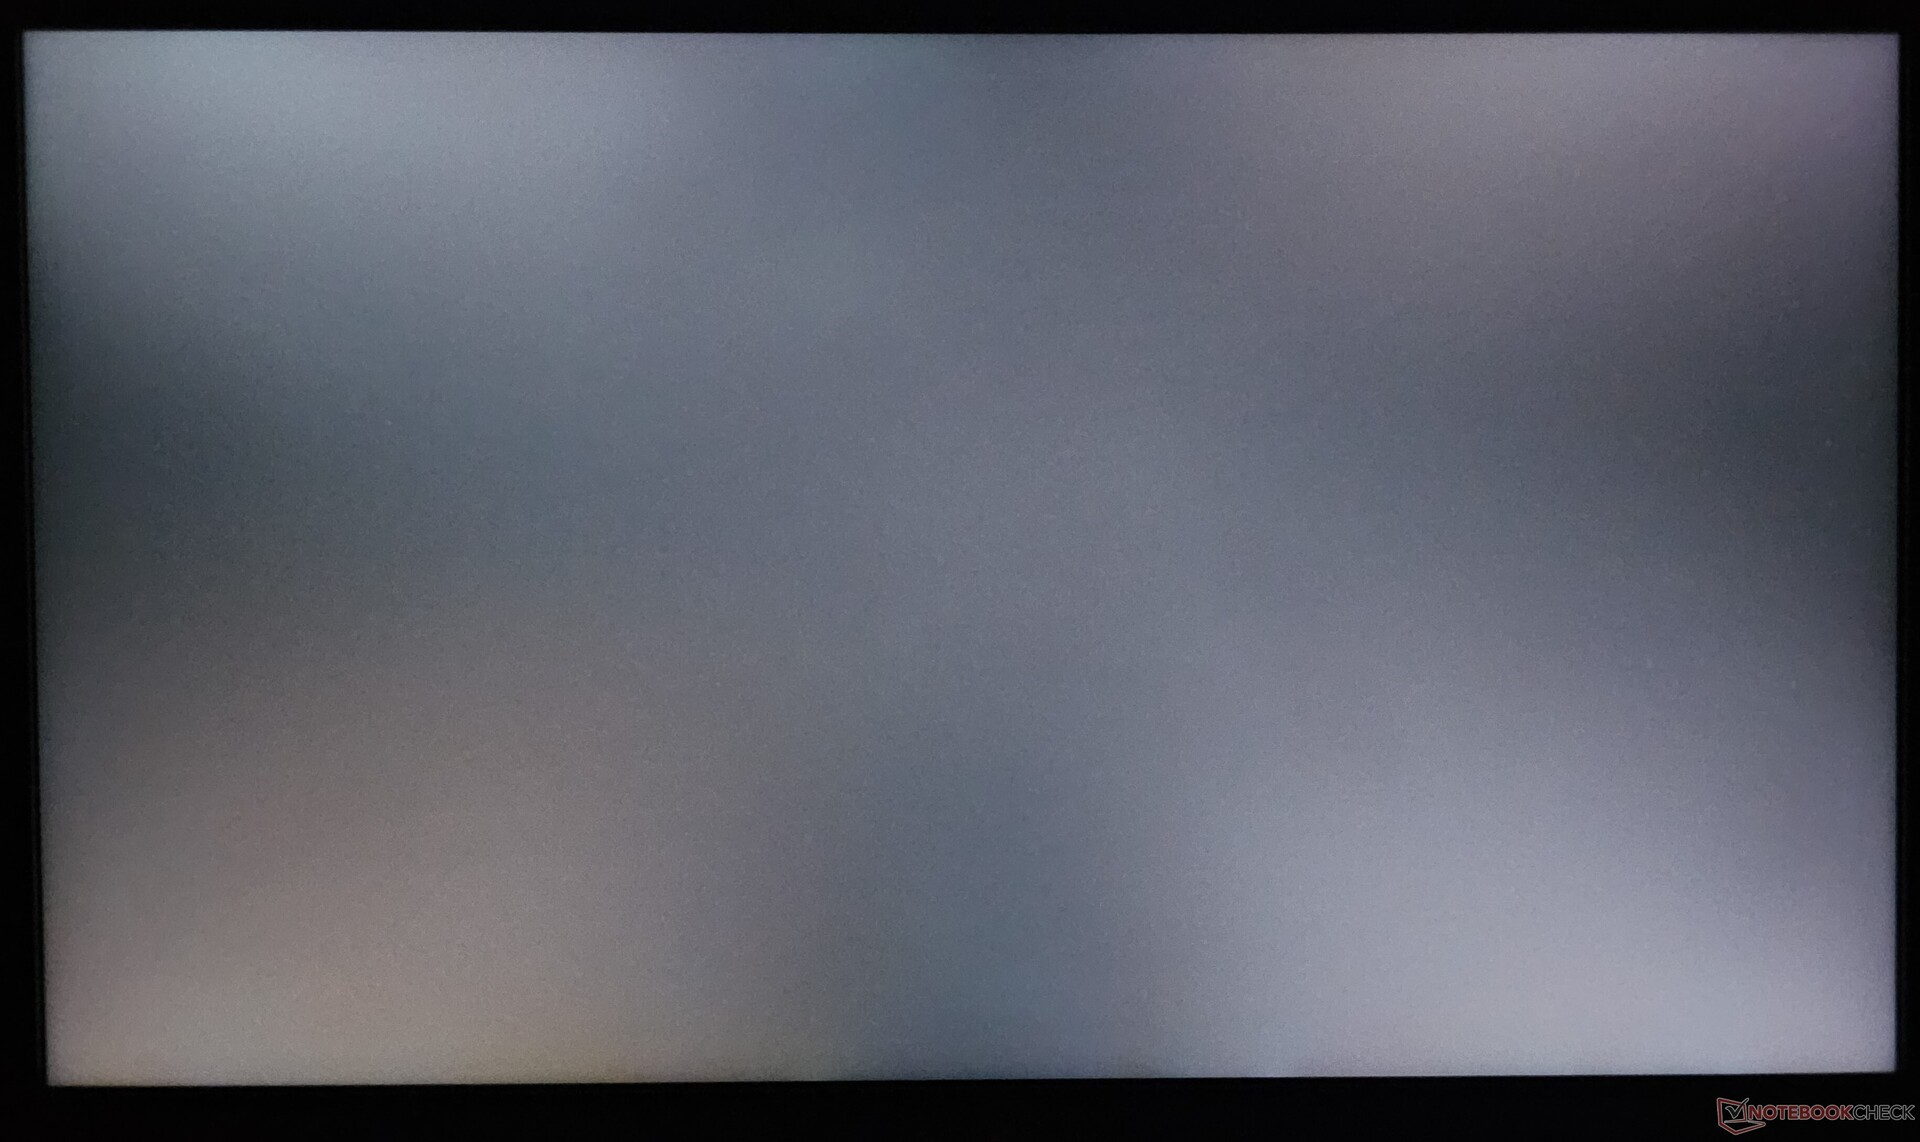
Há um sangramento da luz de fundo nos cantos, mas a uniformidade geral do brilho é boa, 90%. Os níveis de preto e a taxa de contraste superam o desempenho do painel QHD+ fabricado pela AUO no LOQ 16IRH8.
| |||||||||||||||||||||||||
iluminação: 90 %
iluminação com acumulador: 372 cd/m²
Contraste: 1130:1 (Preto: 0.33 cd/m²)
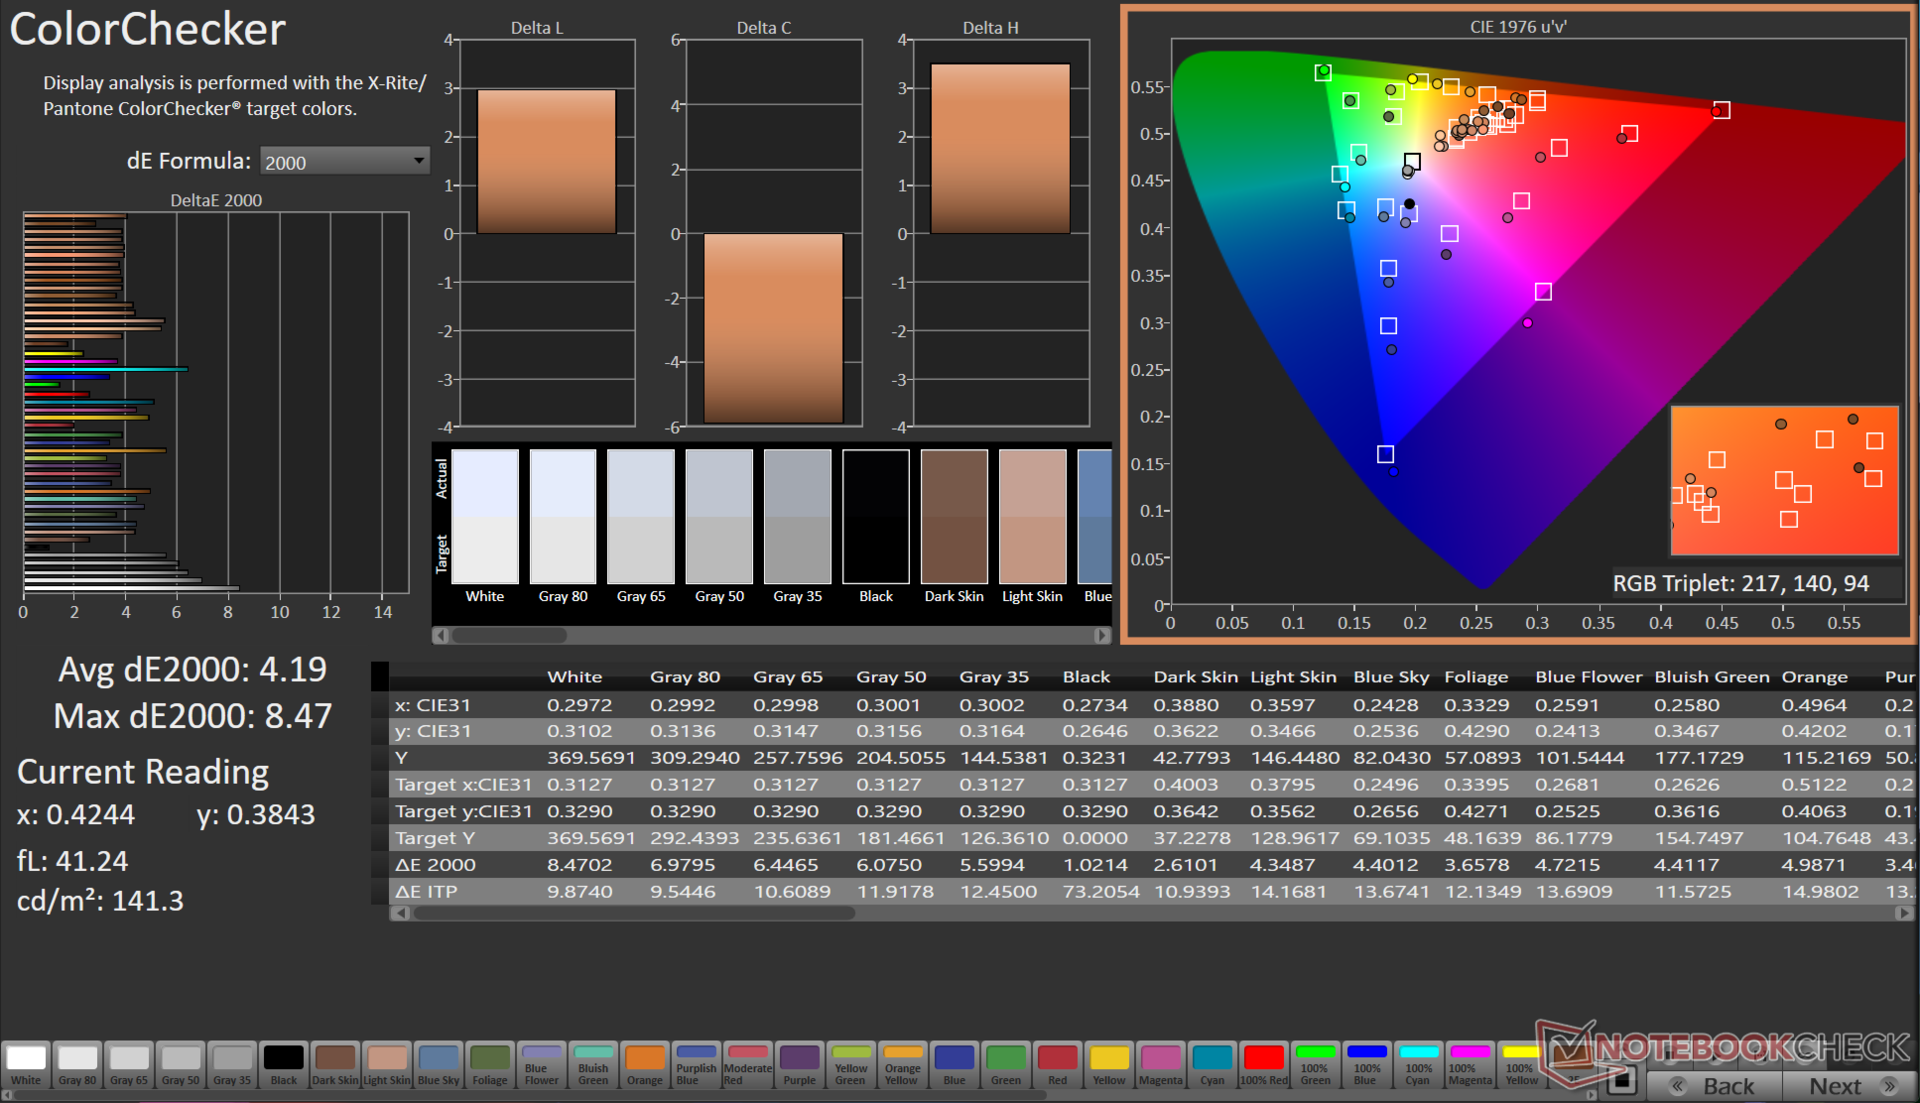
ΔE ColorChecker Calman: 4.19 | ∀{0.5-29.43 Ø4.71}
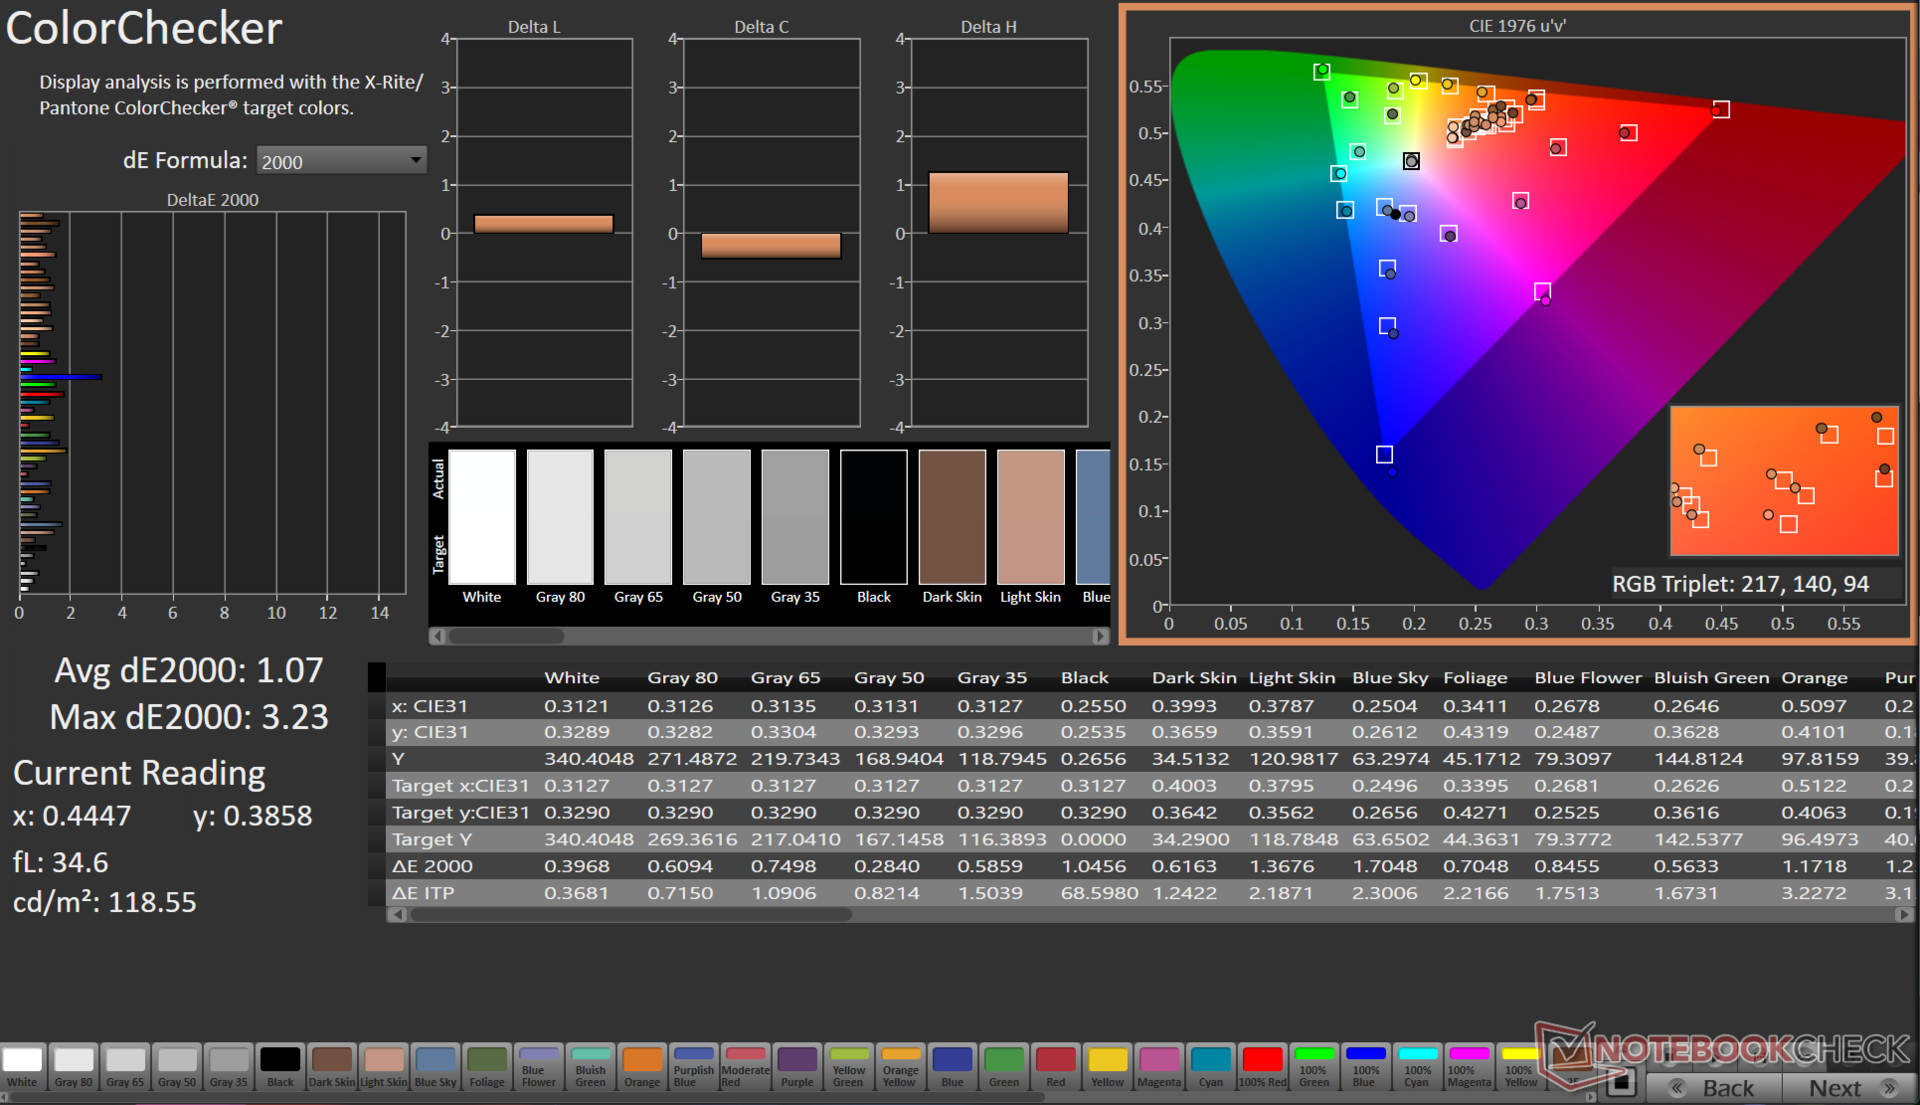
calibrated: 1.07
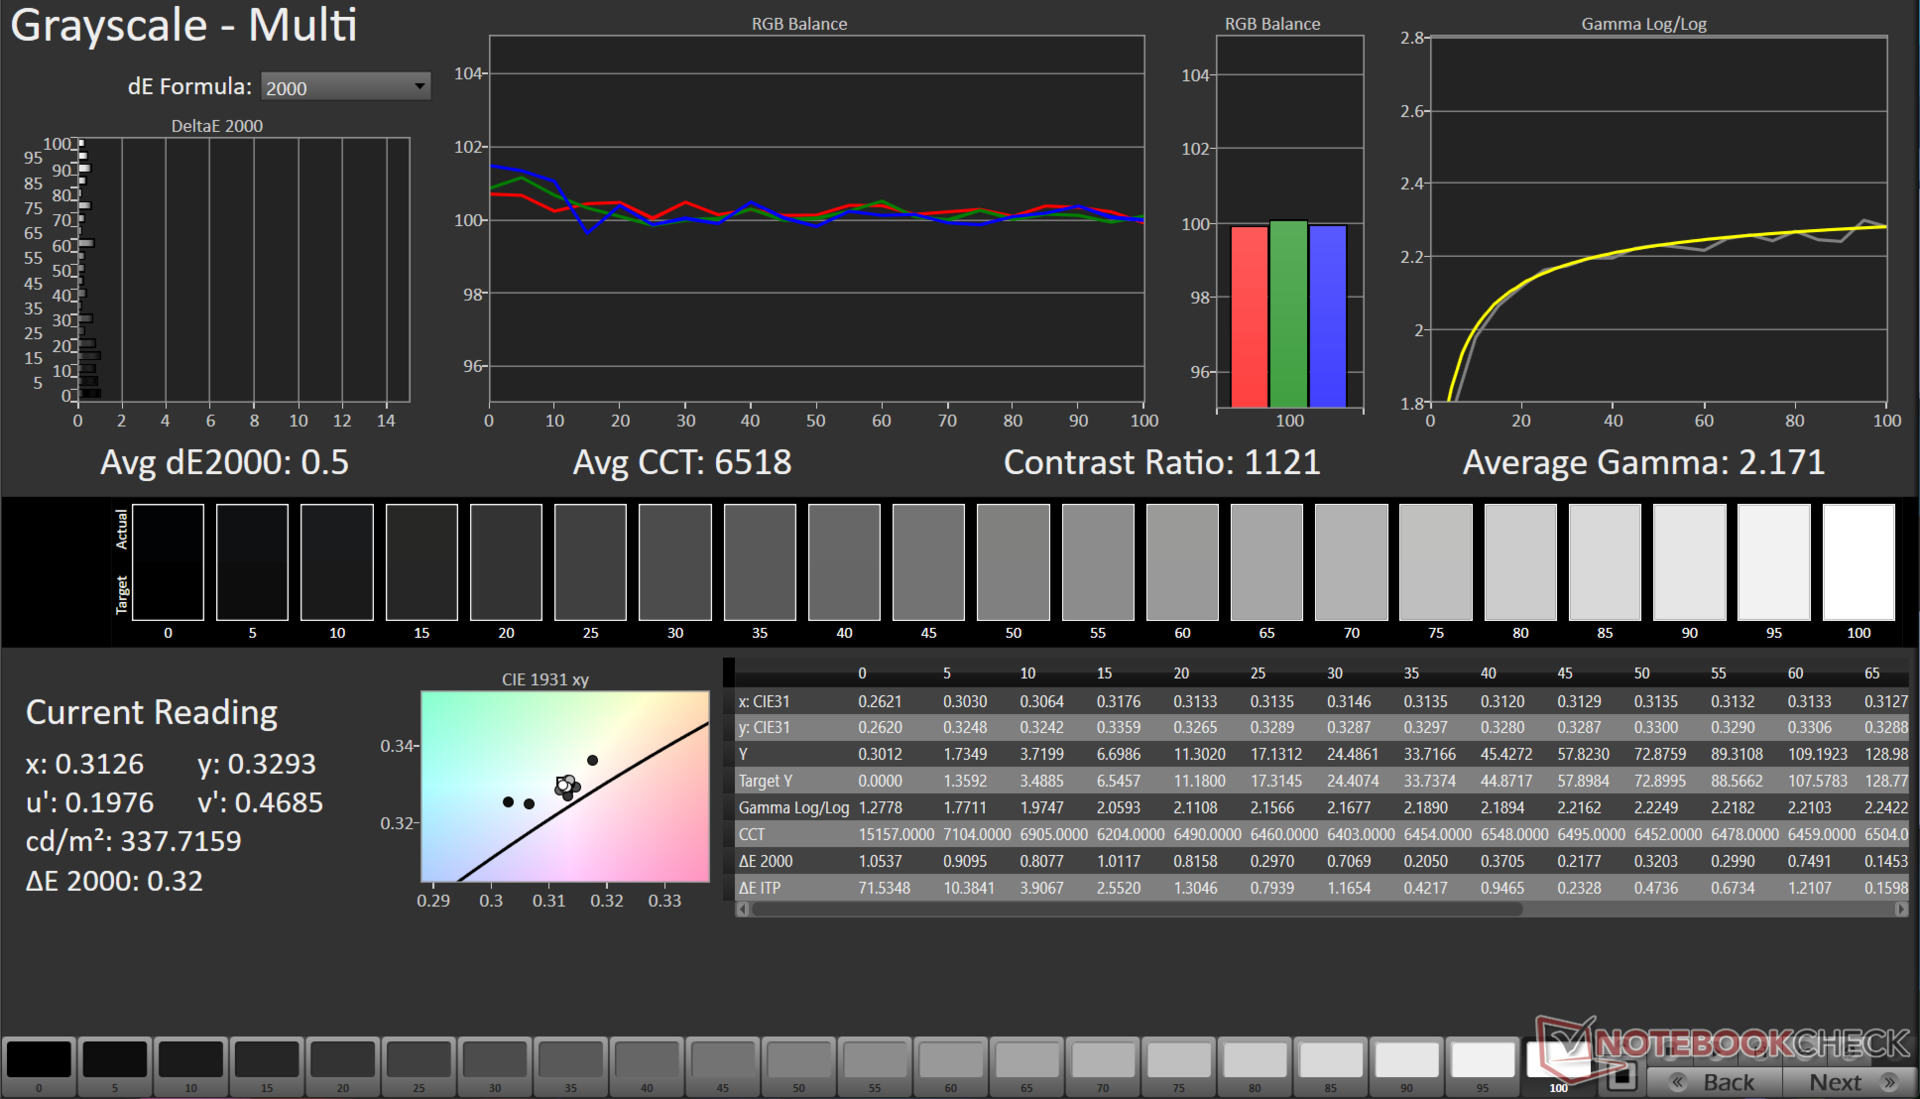
ΔE Greyscale Calman: 5 | ∀{0.09-98 Ø4.96}
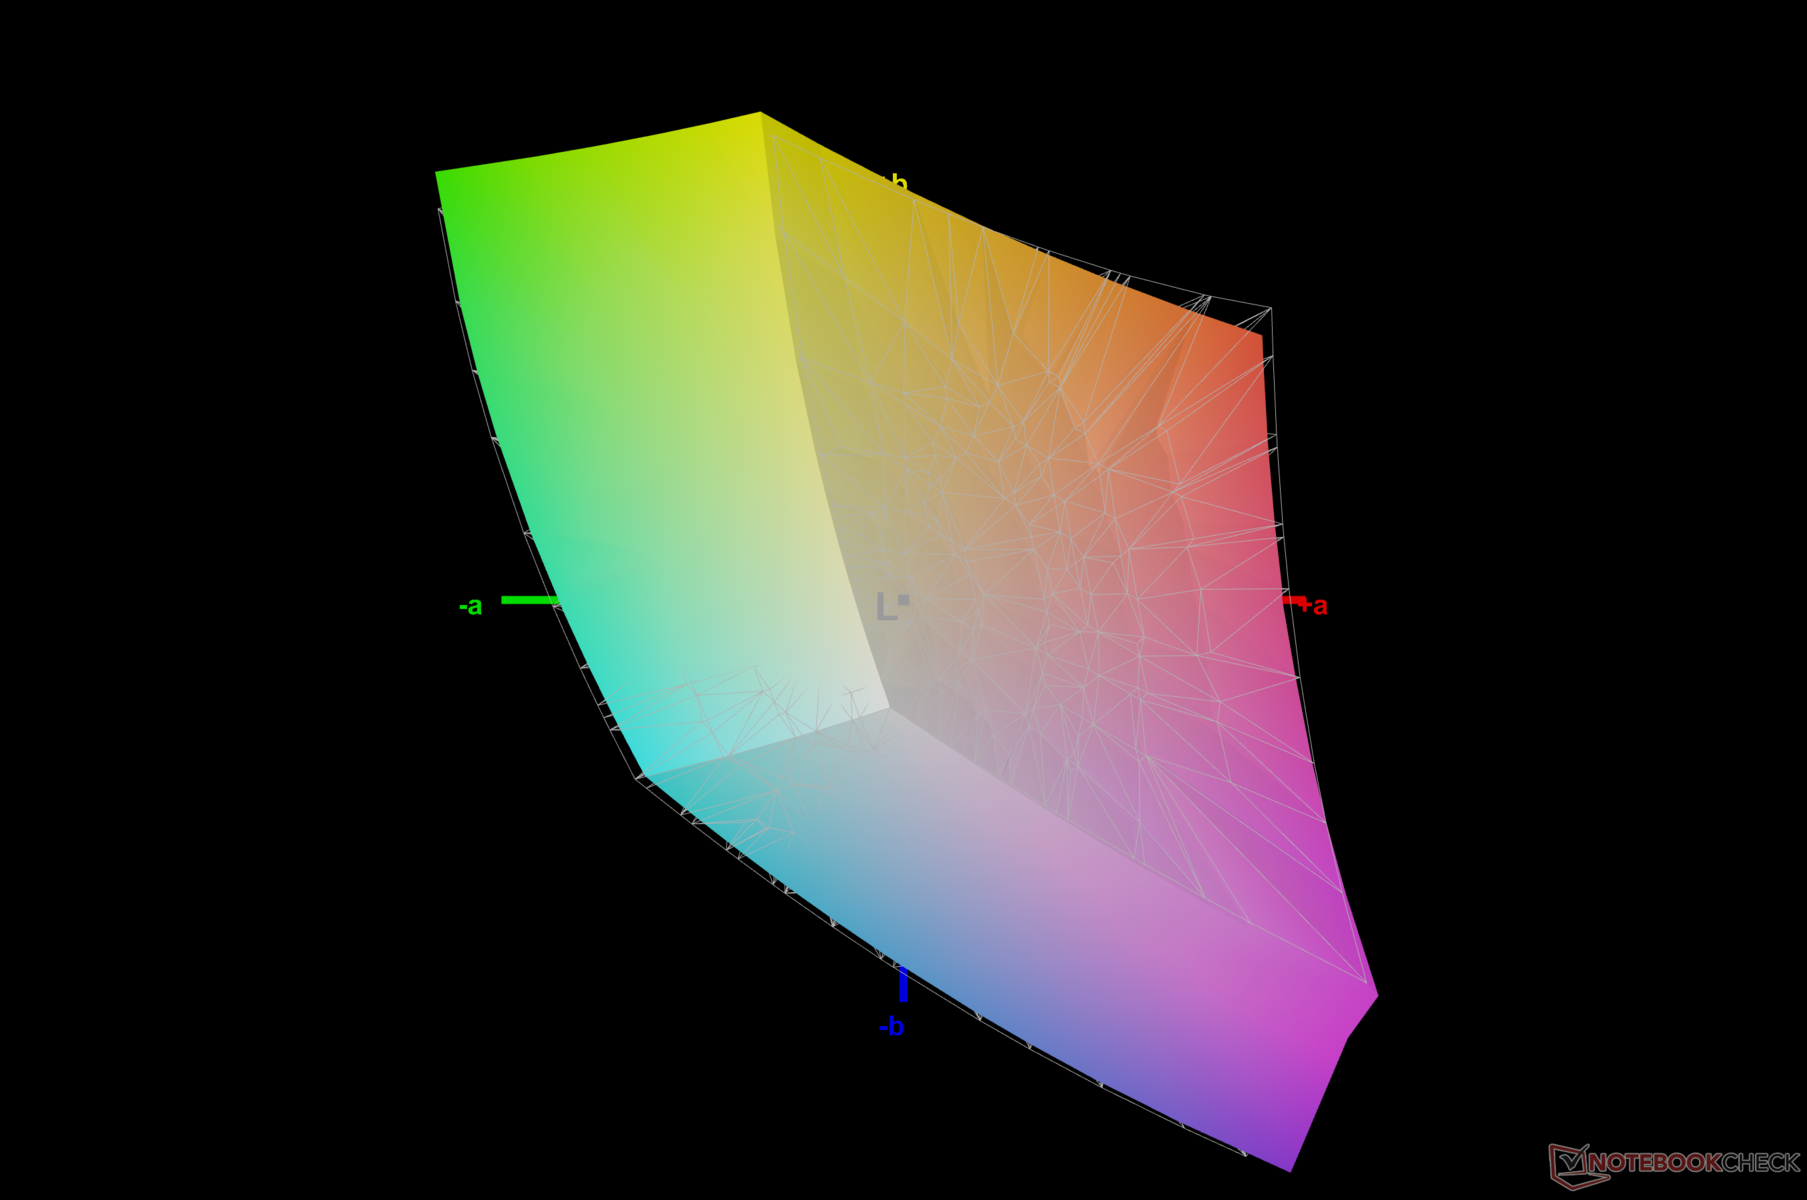
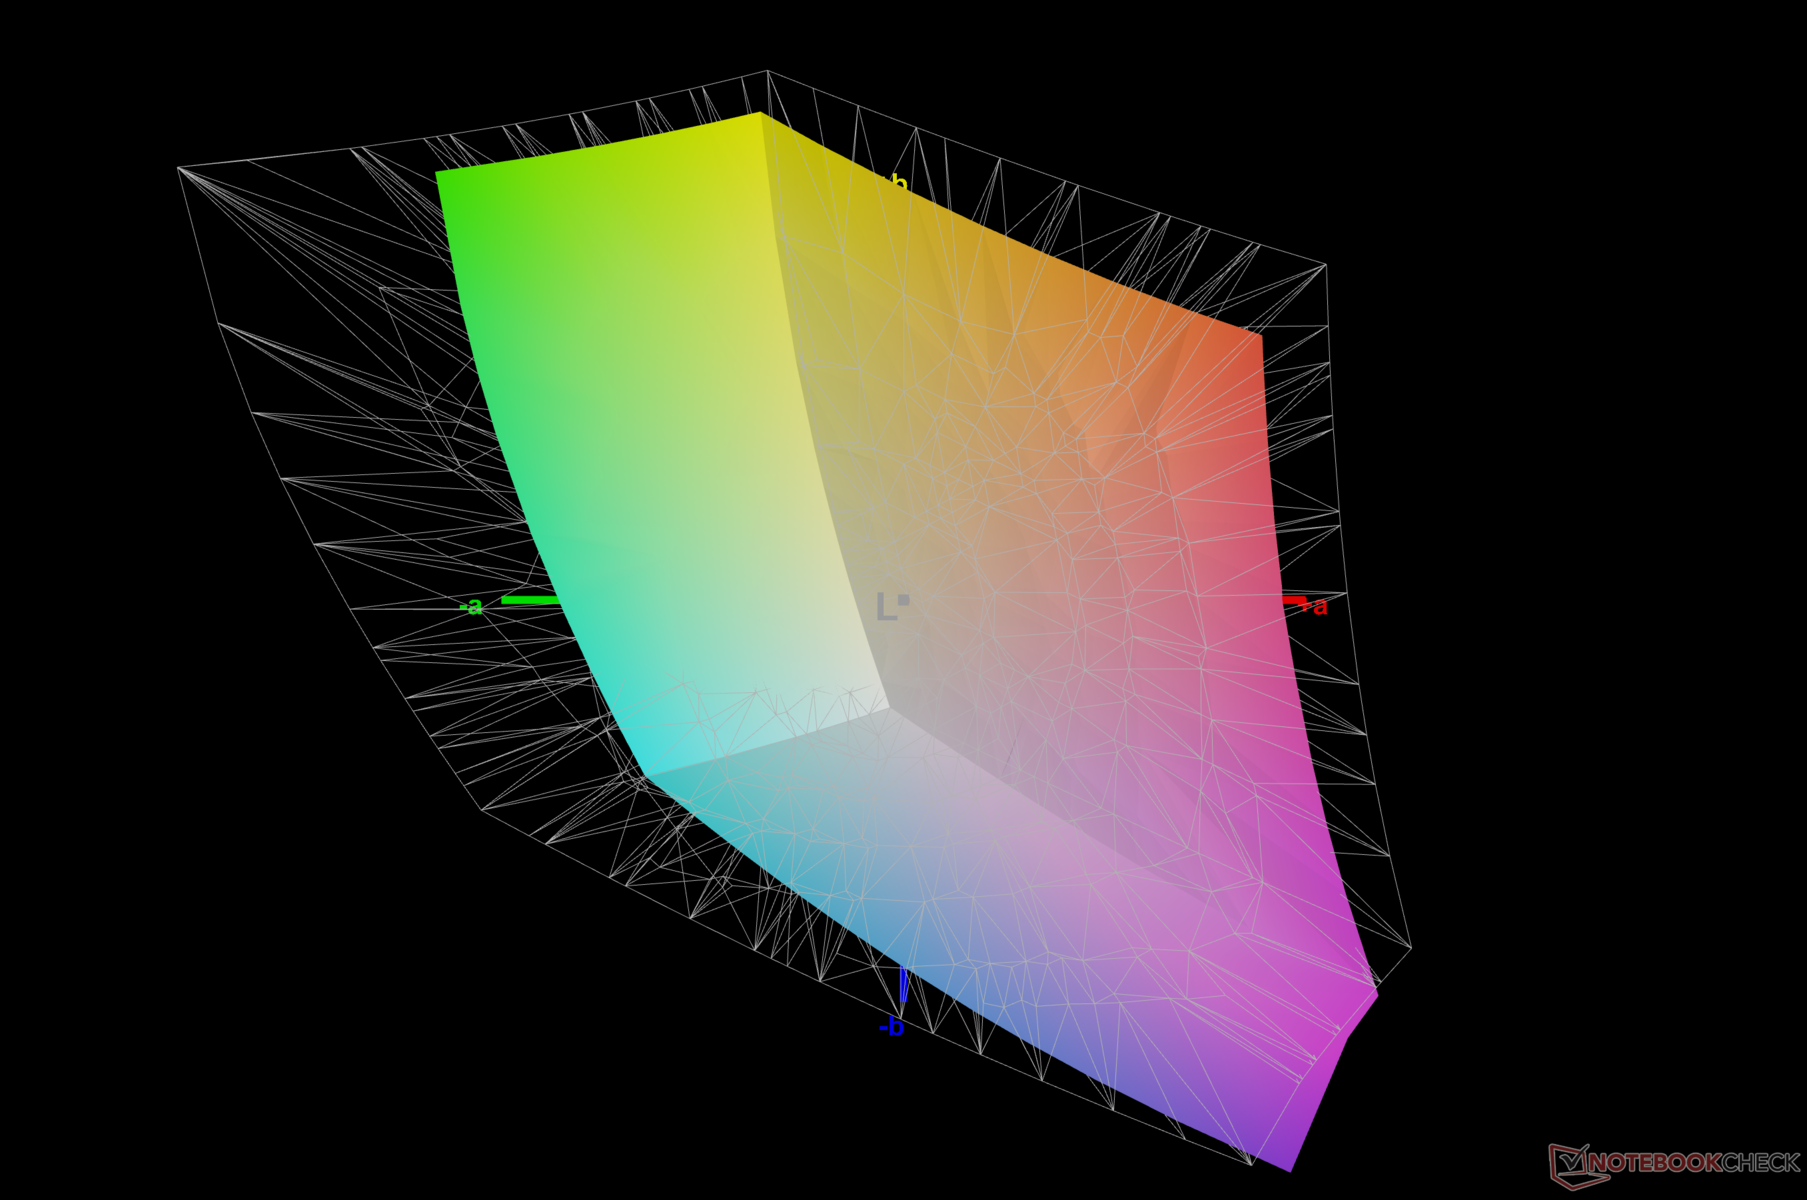
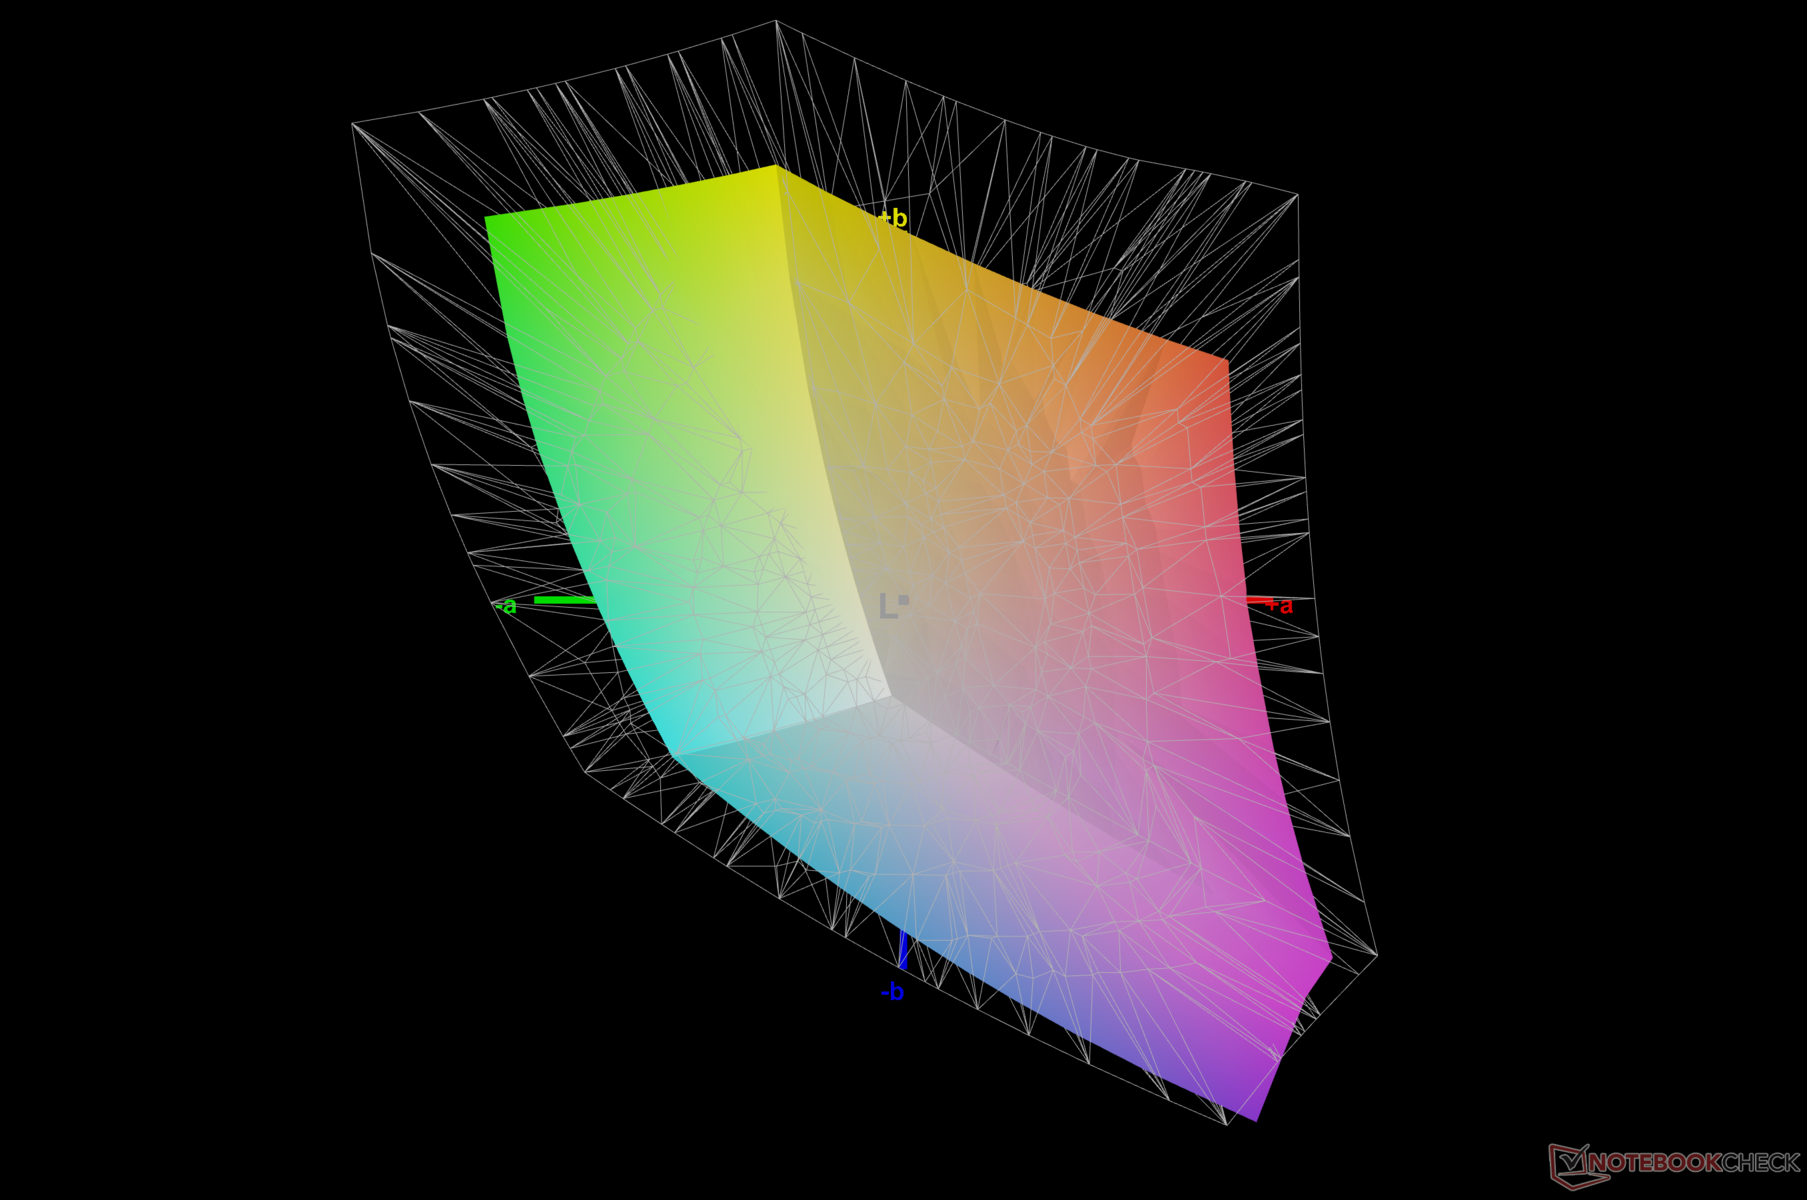
67.7% AdobeRGB 1998 (Argyll 3D)
96.6% sRGB (Argyll 3D)
66.3% Display P3 (Argyll 3D)
Gamma: 1.93
CCT: 7520 K
| Lenovo LOQ 15IRH8 Core i7 BOE CQ NE156QHM-NY4, IPS, 2560x1440, 15.6" | Lenovo LOQ 16IRH8 AUOC1A5 (B160QAN03.L), IPS, 2560x1600, 16" | Lenovo LOQ 15APH8 BOE NJ NE156FHM-NX3, IPS, 1920x1080, 15.6" | MSI Katana 17 B13VFK B173HAN04.9, IPS LED, 1920x1080, 17.3" | Lenovo Legion Pro 5 16ARX8 (R5 7645HX, RTX 4050) CSOT T3 MNG007DA2-2, IPS, 2560x1600, 16" | HP Victus 16-r0077ng CMN162D, IPS, 1920x1080, 16.1" | Dell G15 5530 AUO B156HAN, IPS, 1920x1080, 15.6" | Asus TUF Gaming A16 FA617XS BOE NE160WUM-NX2, IPS, 1920x1200, 16" | |
|---|---|---|---|---|---|---|---|---|
| Display | 5% | -39% | -38% | 6% | 1% | 7% | 3% | |
| Display P3 Coverage (%) | 66.3 | 70.5 6% | 40.2 -39% | 40.8 -38% | 71.6 8% | 66.7 1% | 73.1 10% | 69.3 5% |
| sRGB Coverage (%) | 96.6 | 98.9 2% | 60.2 -38% | 61 -37% | 99.8 3% | 98 1% | 98.4 2% | 97.3 1% |
| AdobeRGB 1998 Coverage (%) | 67.7 | 72.6 7% | 41.5 -39% | 42.2 -38% | 72.9 8% | 69 2% | 74.4 10% | 70.7 4% |
| Response Times | -16% | -473% | -385% | -51% | -82% | 34% | -116% | |
| Response Time Grey 50% / Grey 80% * (ms) | 5 ? | 7.2 ? -44% | 42.7 ? -754% | 33 ? -560% | 12 ? -140% | 13.3 ? -166% | 3.39 ? 32% | 15.6 ? -212% |
| Response Time Black / White * (ms) | 8.41 ? | 7.4 ? 12% | 24.5 ? -191% | 26 ? -209% | 5.2 ? 38% | 8.2 ? 2% | 5.35 ? 36% | 10 ? -19% |
| PWM Frequency (Hz) | 21620 ? | |||||||
| Screen | 17% | -17% | -46% | 20% | 23% | -5% | 20% | |
| Brightness middle (cd/m²) | 373 | 407 9% | 346.2 -7% | 267 -28% | 543 46% | 308 -17% | 320 -14% | 301 -19% |
| Brightness (cd/m²) | 365 | 369 1% | 329 -10% | 256 -30% | 516 41% | 285 -22% | 316 -13% | 294 -19% |
| Brightness Distribution (%) | 90 | 85 -6% | 81 -10% | 93 3% | 87 -3% | 85 -6% | 94 4% | 94 4% |
| Black Level * (cd/m²) | 0.33 | 0.45 -36% | 0.31 6% | 0.21 36% | 0.58 -76% | 0.25 24% | 0.21 36% | 0.21 36% |
| Contrast (:1) | 1130 | 904 -20% | 1117 -1% | 1271 12% | 936 -17% | 1232 9% | 1524 35% | 1433 27% |
| Colorchecker dE 2000 * | 4.19 | 1.43 66% | 4.19 -0% | 4.7 -12% | 1.35 68% | 1.3 69% | 4.55 -9% | 1.79 57% |
| Colorchecker dE 2000 max. * | 8.47 | 3.58 58% | 19.19 -127% | 20.4 -141% | 3.22 62% | 2.76 67% | 9.83 -16% | 3.48 59% |
| Colorchecker dE 2000 calibrated * | 1.07 | 1.07 -0% | 1.66 -55% | 4.5 -321% | 1.31 -22% | 0.92 14% | 1.51 -41% | 1.2 -12% |
| Greyscale dE 2000 * | 5 | 1.13 77% | 2.6 48% | 1.5 70% | 1.03 79% | 1.7 66% | 6.2 -24% | 2.5 50% |
| Gamma | 1.93 114% | 2.5 88% | 2.19 100% | 2.12 104% | 2.38 92% | 2.167 102% | 2.07 106% | 2.265 97% |
| CCT | 7520 86% | 6526 100% | 6749 96% | 6552 99% | 6452 101% | 6767 96% | 6479 100% | 6157 106% |
| Média Total (Programa/Configurações) | 2% /
9% | -176% /
-87% | -156% /
-92% | -8% /
7% | -19% /
3% | 12% /
3% | -31% /
-3% |
* ... menor é melhor
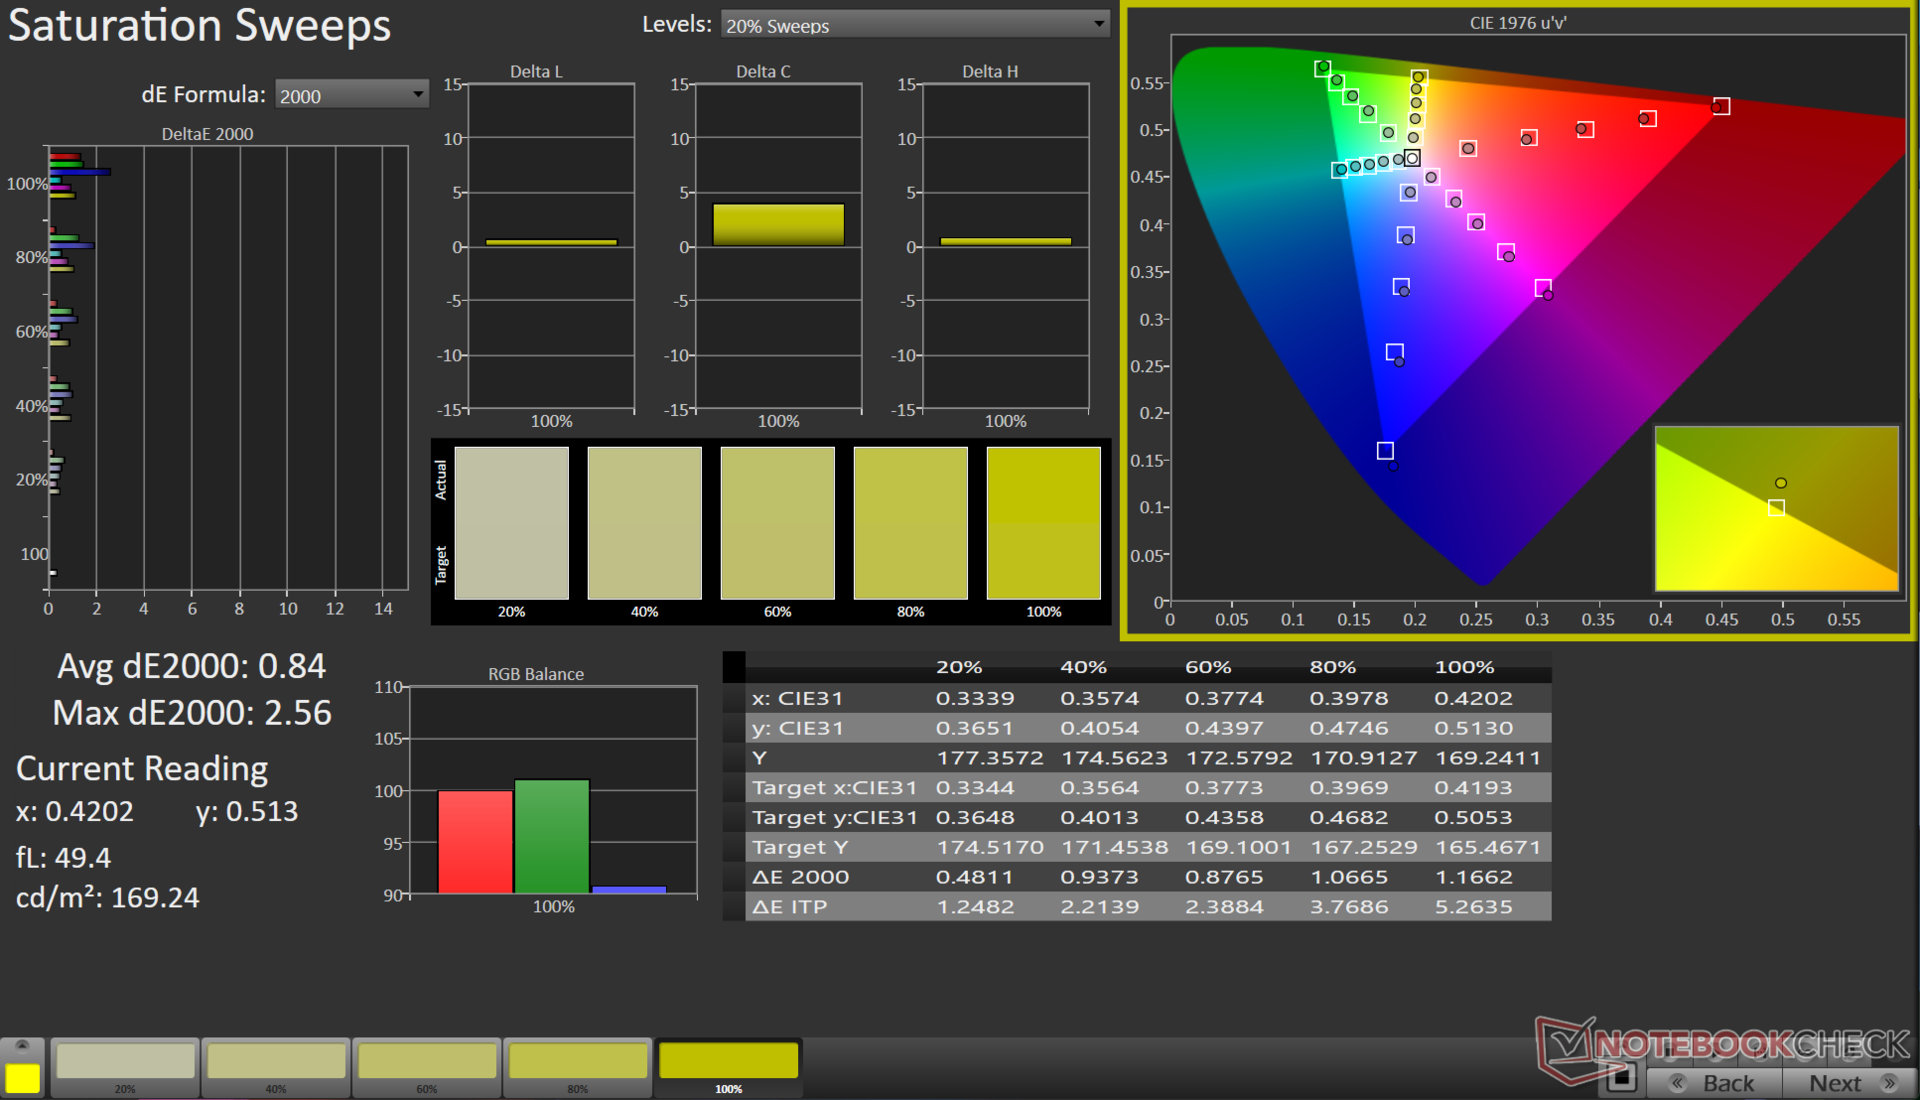
A tela cobre quase 97% da gama de cores sRGB, o que deve ser bom o suficiente para a maioria dos jogos e conteúdo da Web. No entanto, a cobertura Adobe RGB e Display P3 é apenas medíocre.
Dito isso, o painel QHD do LOQ 15IRH8 tem características de cor muito melhores em comparação com o painel de 1080p e 144 Hz do LOQ 15APH8 com tecnologia AMD.
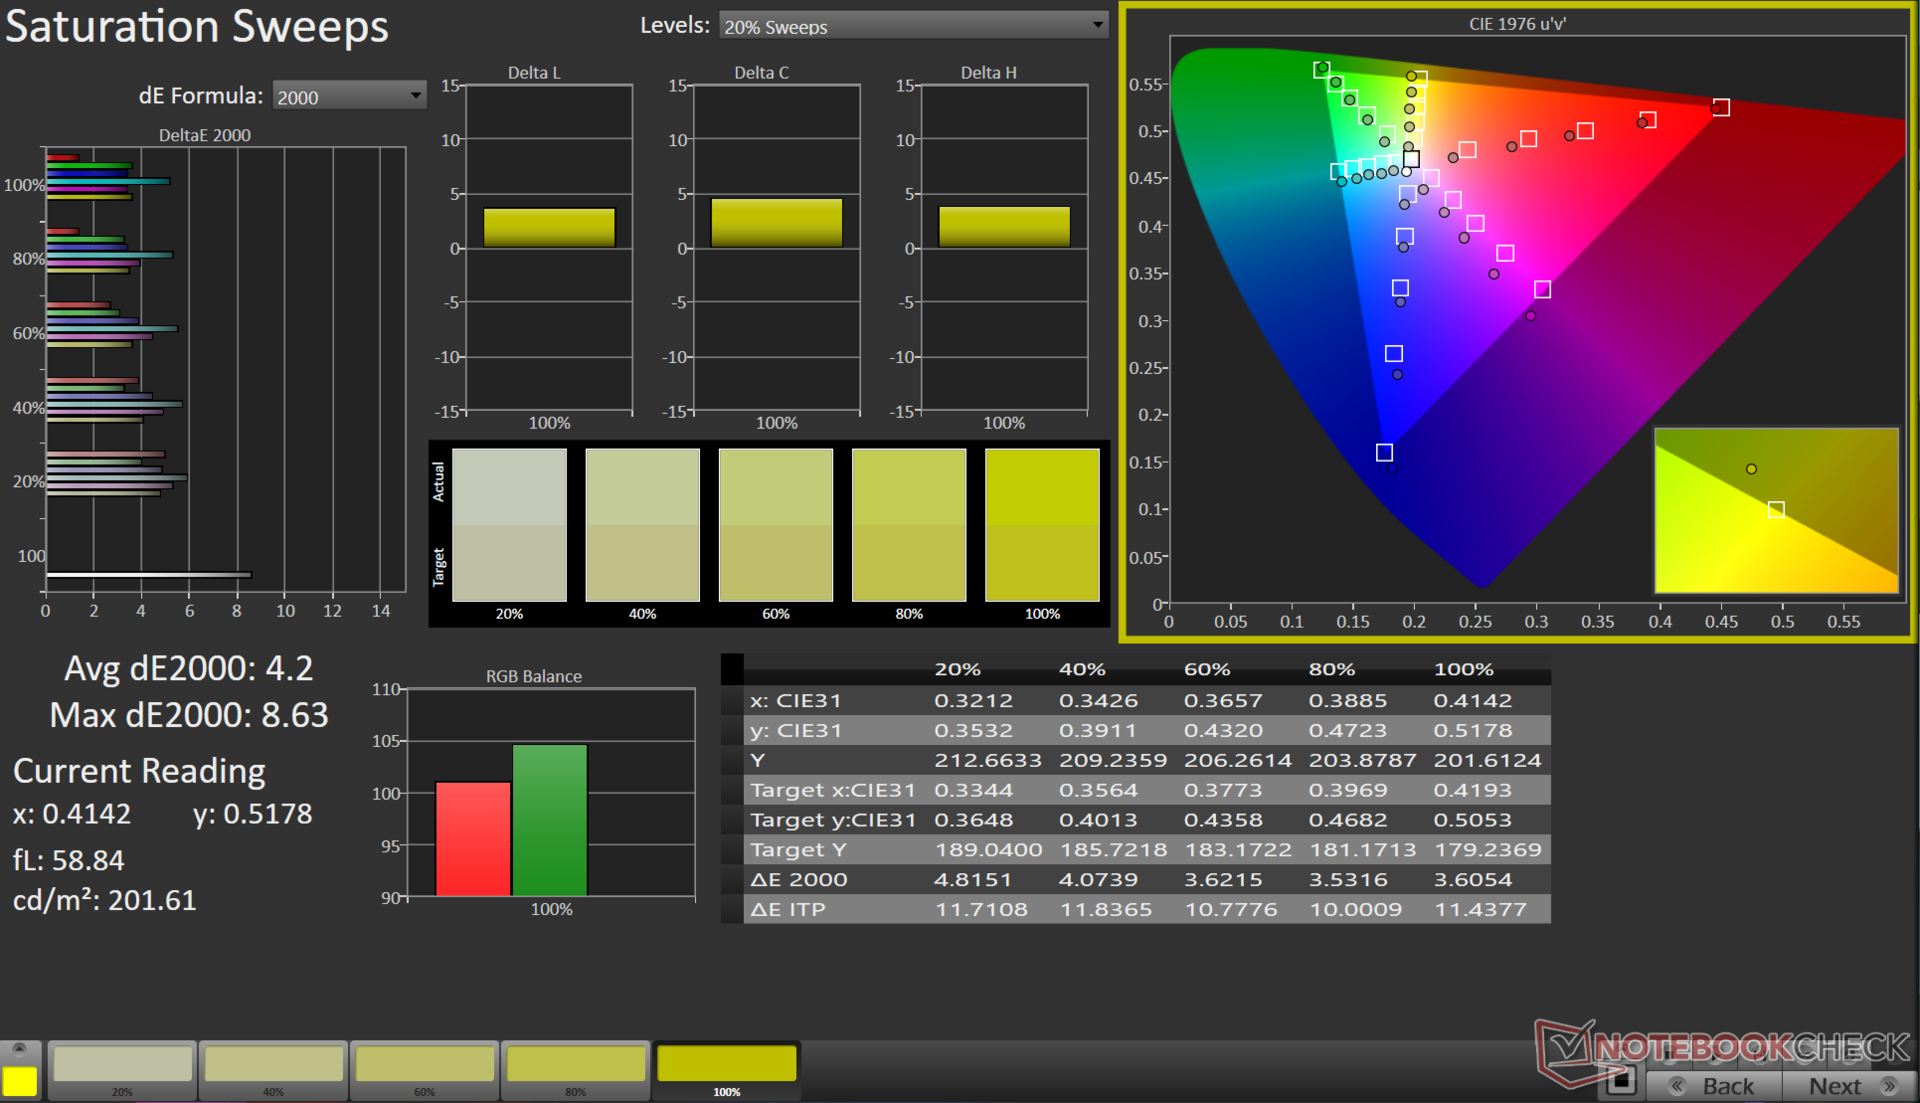
As cores que saem da caixa mostram grandes desvios, mas nossa rotina de calibração usando o espectrofotômetro X-Rite i1Basic Pro 3 e o software Calman Ultimate da Portrait Displays mostra melhorias significativas nos valores de escala de cinza e ColorChecker Delta E.
O painel ainda tem problemas para reproduzir com precisão a parte 100% azul do espectro.
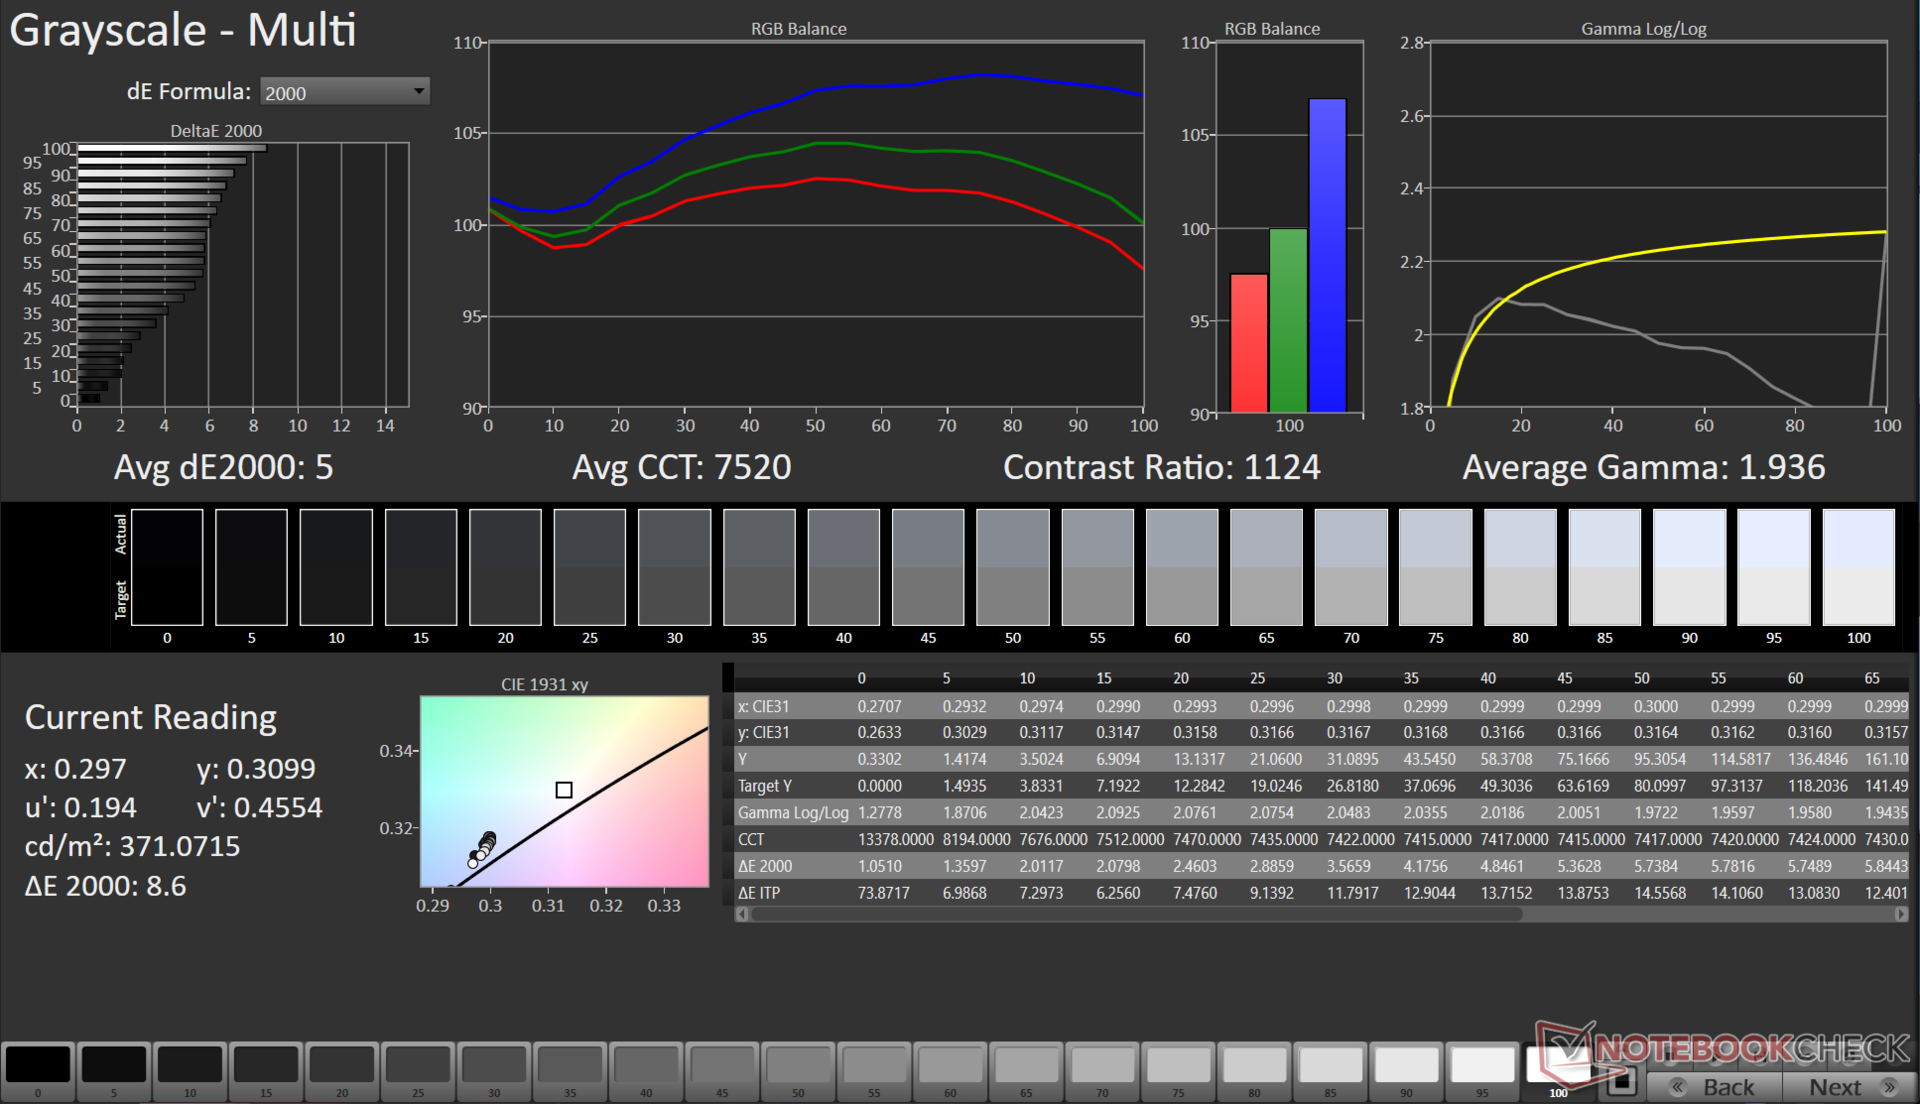
Nosso arquivo ICC calibrado pode ser baixado no link acima.
Exibir tempos de resposta
| ↔ Tempo de resposta preto para branco | ||
|---|---|---|
| 8.41 ms ... ascensão ↗ e queda ↘ combinadas | ↗ 3.96 ms ascensão | 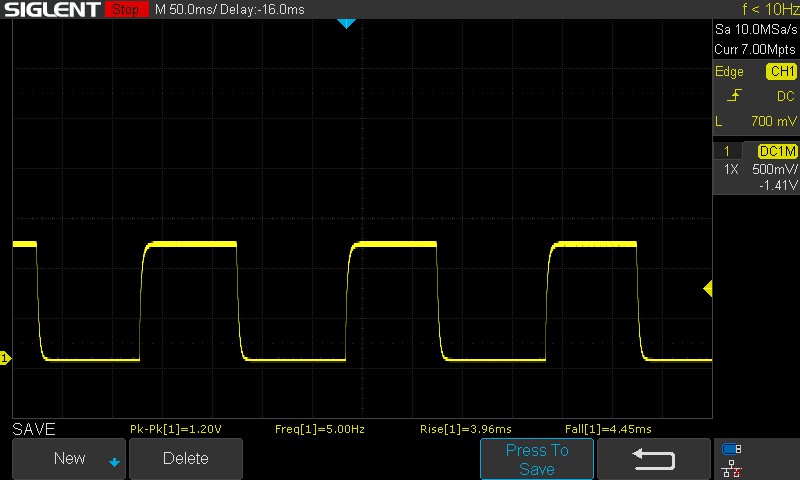 |
| ↘ 4.45 ms queda | ||
| A tela mostra taxas de resposta rápidas em nossos testes e deve ser adequada para jogos. Em comparação, todos os dispositivos testados variam de 0.1 (mínimo) a 240 (máximo) ms. » 24 % de todos os dispositivos são melhores. Isso significa que o tempo de resposta medido é melhor que a média de todos os dispositivos testados (19.8 ms). | ||
| ↔ Tempo de resposta 50% cinza a 80% cinza | ||
| 5 ms ... ascensão ↗ e queda ↘ combinadas | ↗ 2.16 ms ascensão | 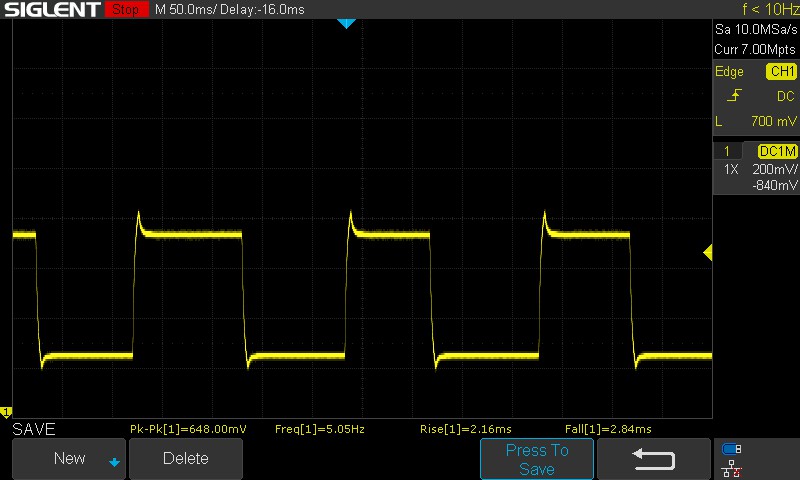 |
| ↘ 2.84 ms queda | ||
| A tela mostra taxas de resposta muito rápidas em nossos testes e deve ser muito adequada para jogos em ritmo acelerado. Em comparação, todos os dispositivos testados variam de 0.165 (mínimo) a 636 (máximo) ms. » 17 % de todos os dispositivos são melhores. Isso significa que o tempo de resposta medido é melhor que a média de todos os dispositivos testados (31 ms). | ||
Os tempos de resposta são uma grande melhoria em relação ao painel de 1080p do LOQ 15APH8. O painel usa overdrive por padrão, o que ajuda nas transições rápidas de 5 ms de 50% de cinza para 80% de cinza. A desativação do overdrive no aplicativo Lenovo Vantage aumenta o tempo de resposta combinado de 50% de cinza para 80% de cinza para 11 ms.
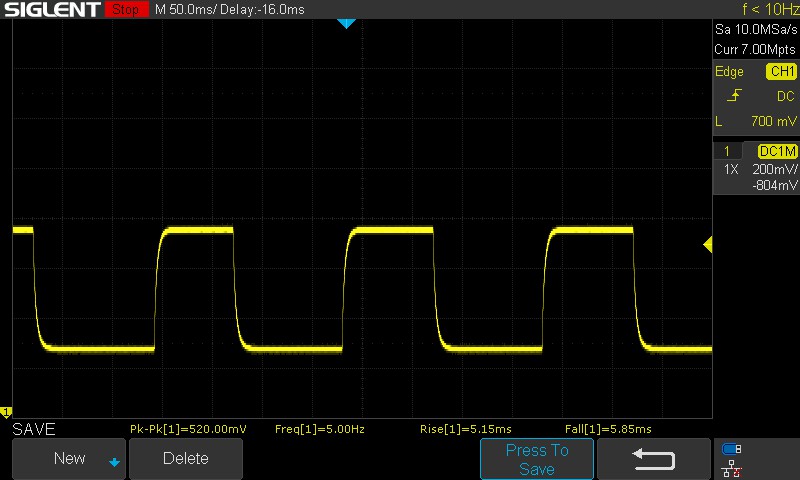
O painel não apresenta cintilação PWM em todos os níveis de brilho testados. Para obter mais informações, consulte nosso artigo "Por que o PWM é uma dor de cabeça" e também nossa Tabela de classificação de PWM para uma comparação do PWM medido em todos os dispositivos analisados.
Cintilação da tela / PWM (modulação por largura de pulso)
| Tela tremeluzindo / PWM não detectado | ≤ 100 % configuração de brilho | 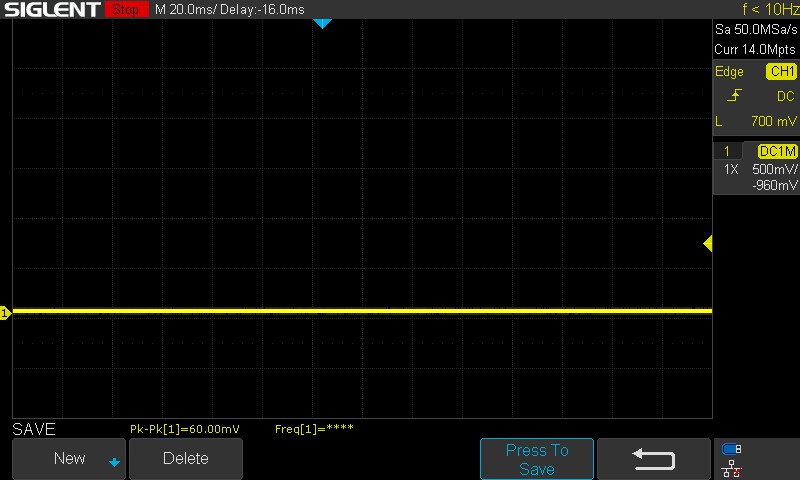 | |
[pwm_comparison] Em comparação: 52 % de todos os dispositivos testados não usam PWM para escurecer a tela. Se PWM foi detectado, uma média de 7757 (mínimo: 5 - máximo: 343500) Hz foi medida. | |||
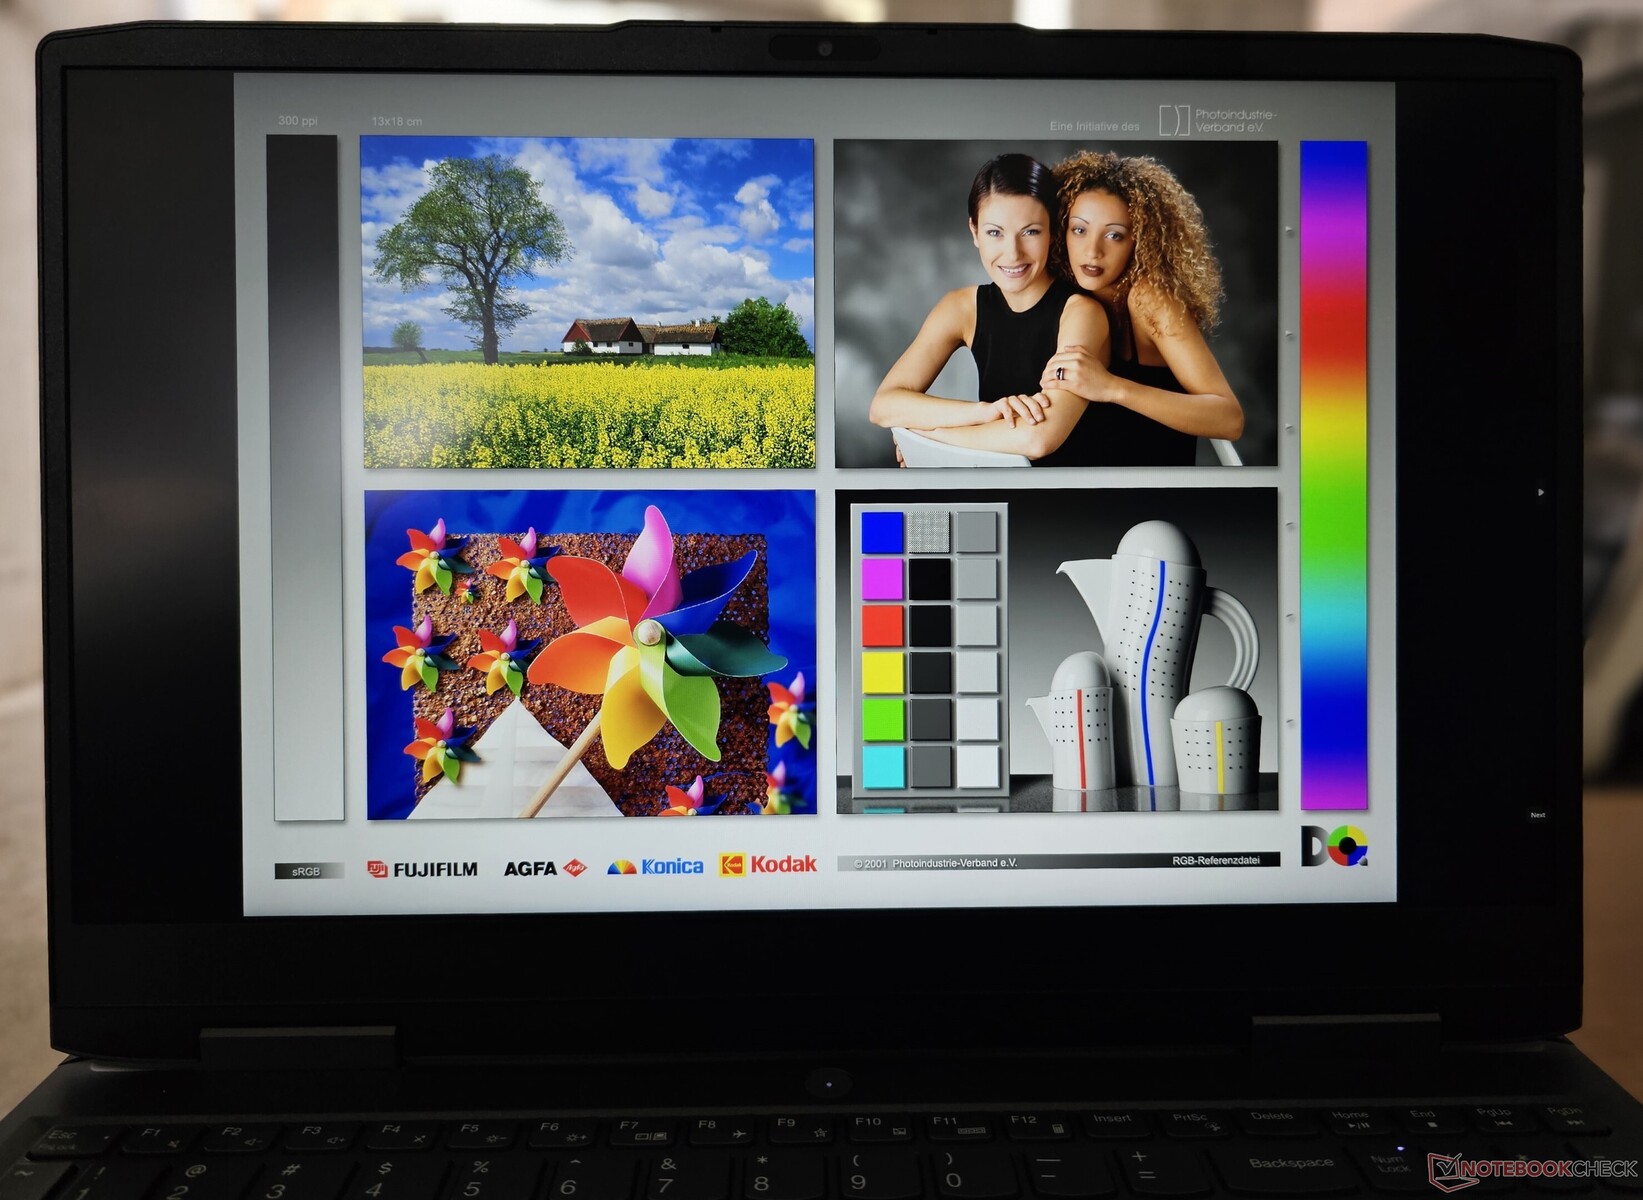
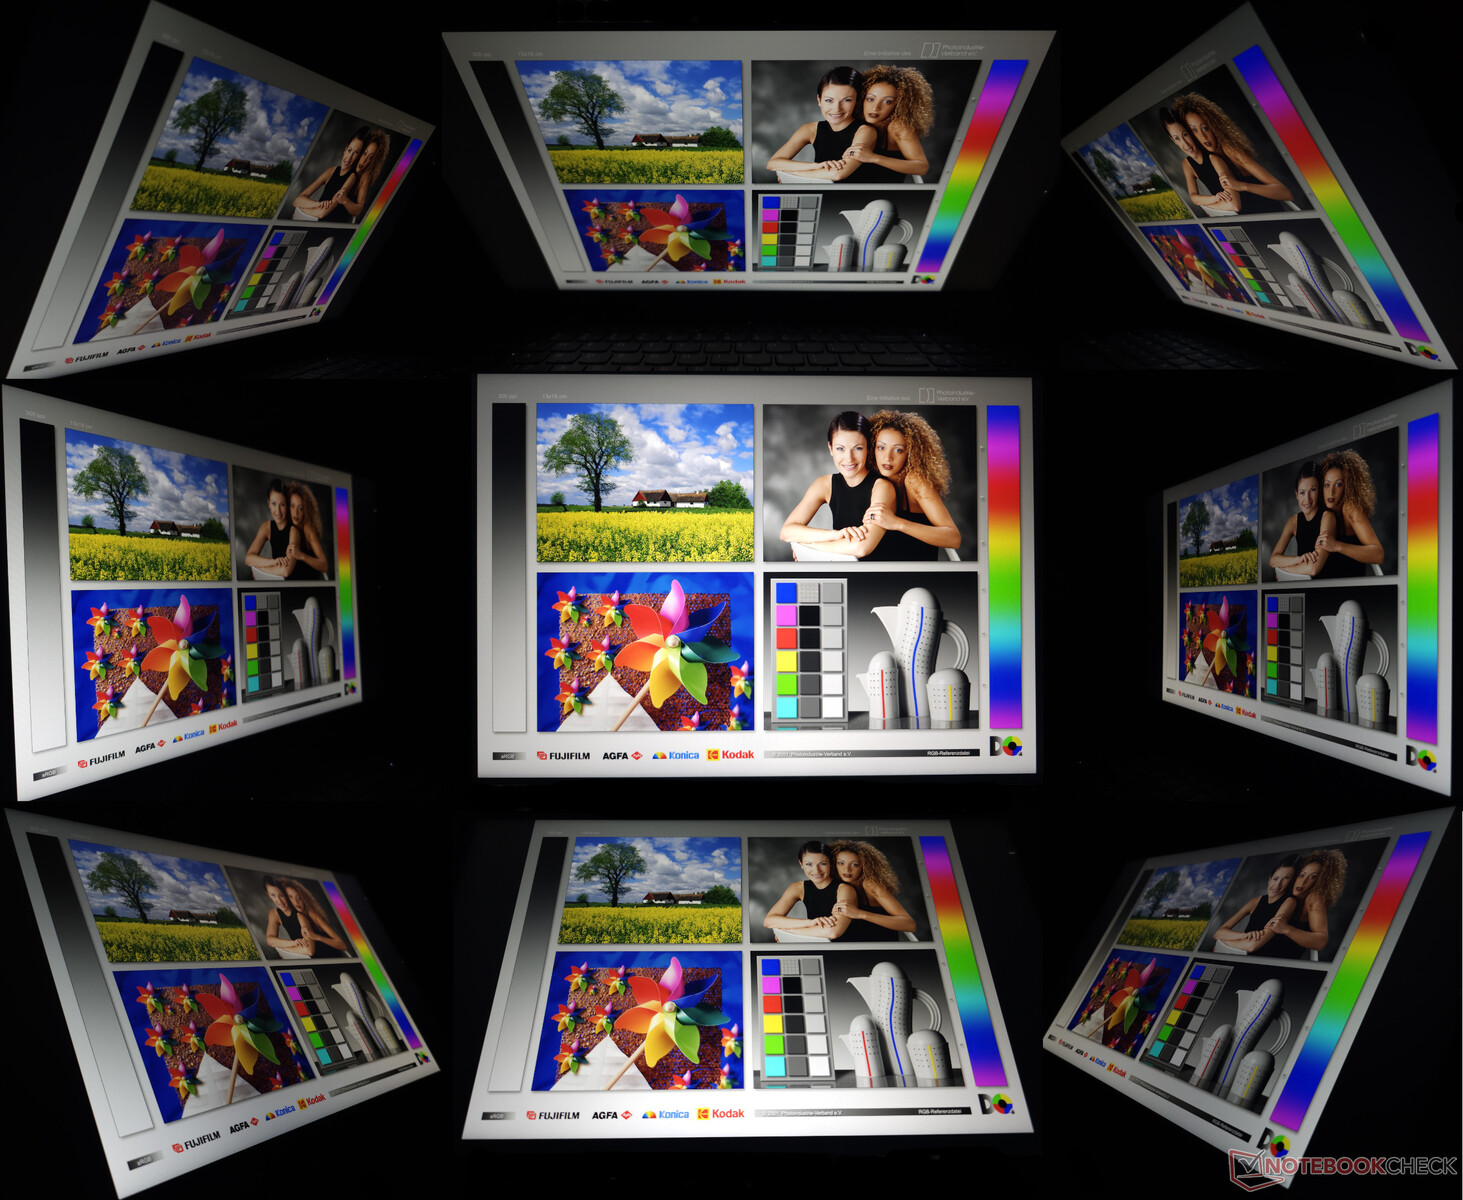
A visibilidade em ambientes externos é boa para uso geral, embora dias ensolarados e particularmente brilhantes possam ser insuportáveis para o painel de 350 nits. Os ângulos de visão são relativamente estáveis, com perda mínima de brilho e cor nos extremos.
Desempenho: O Core i7-13620H tem dificuldade em fazer um show estável
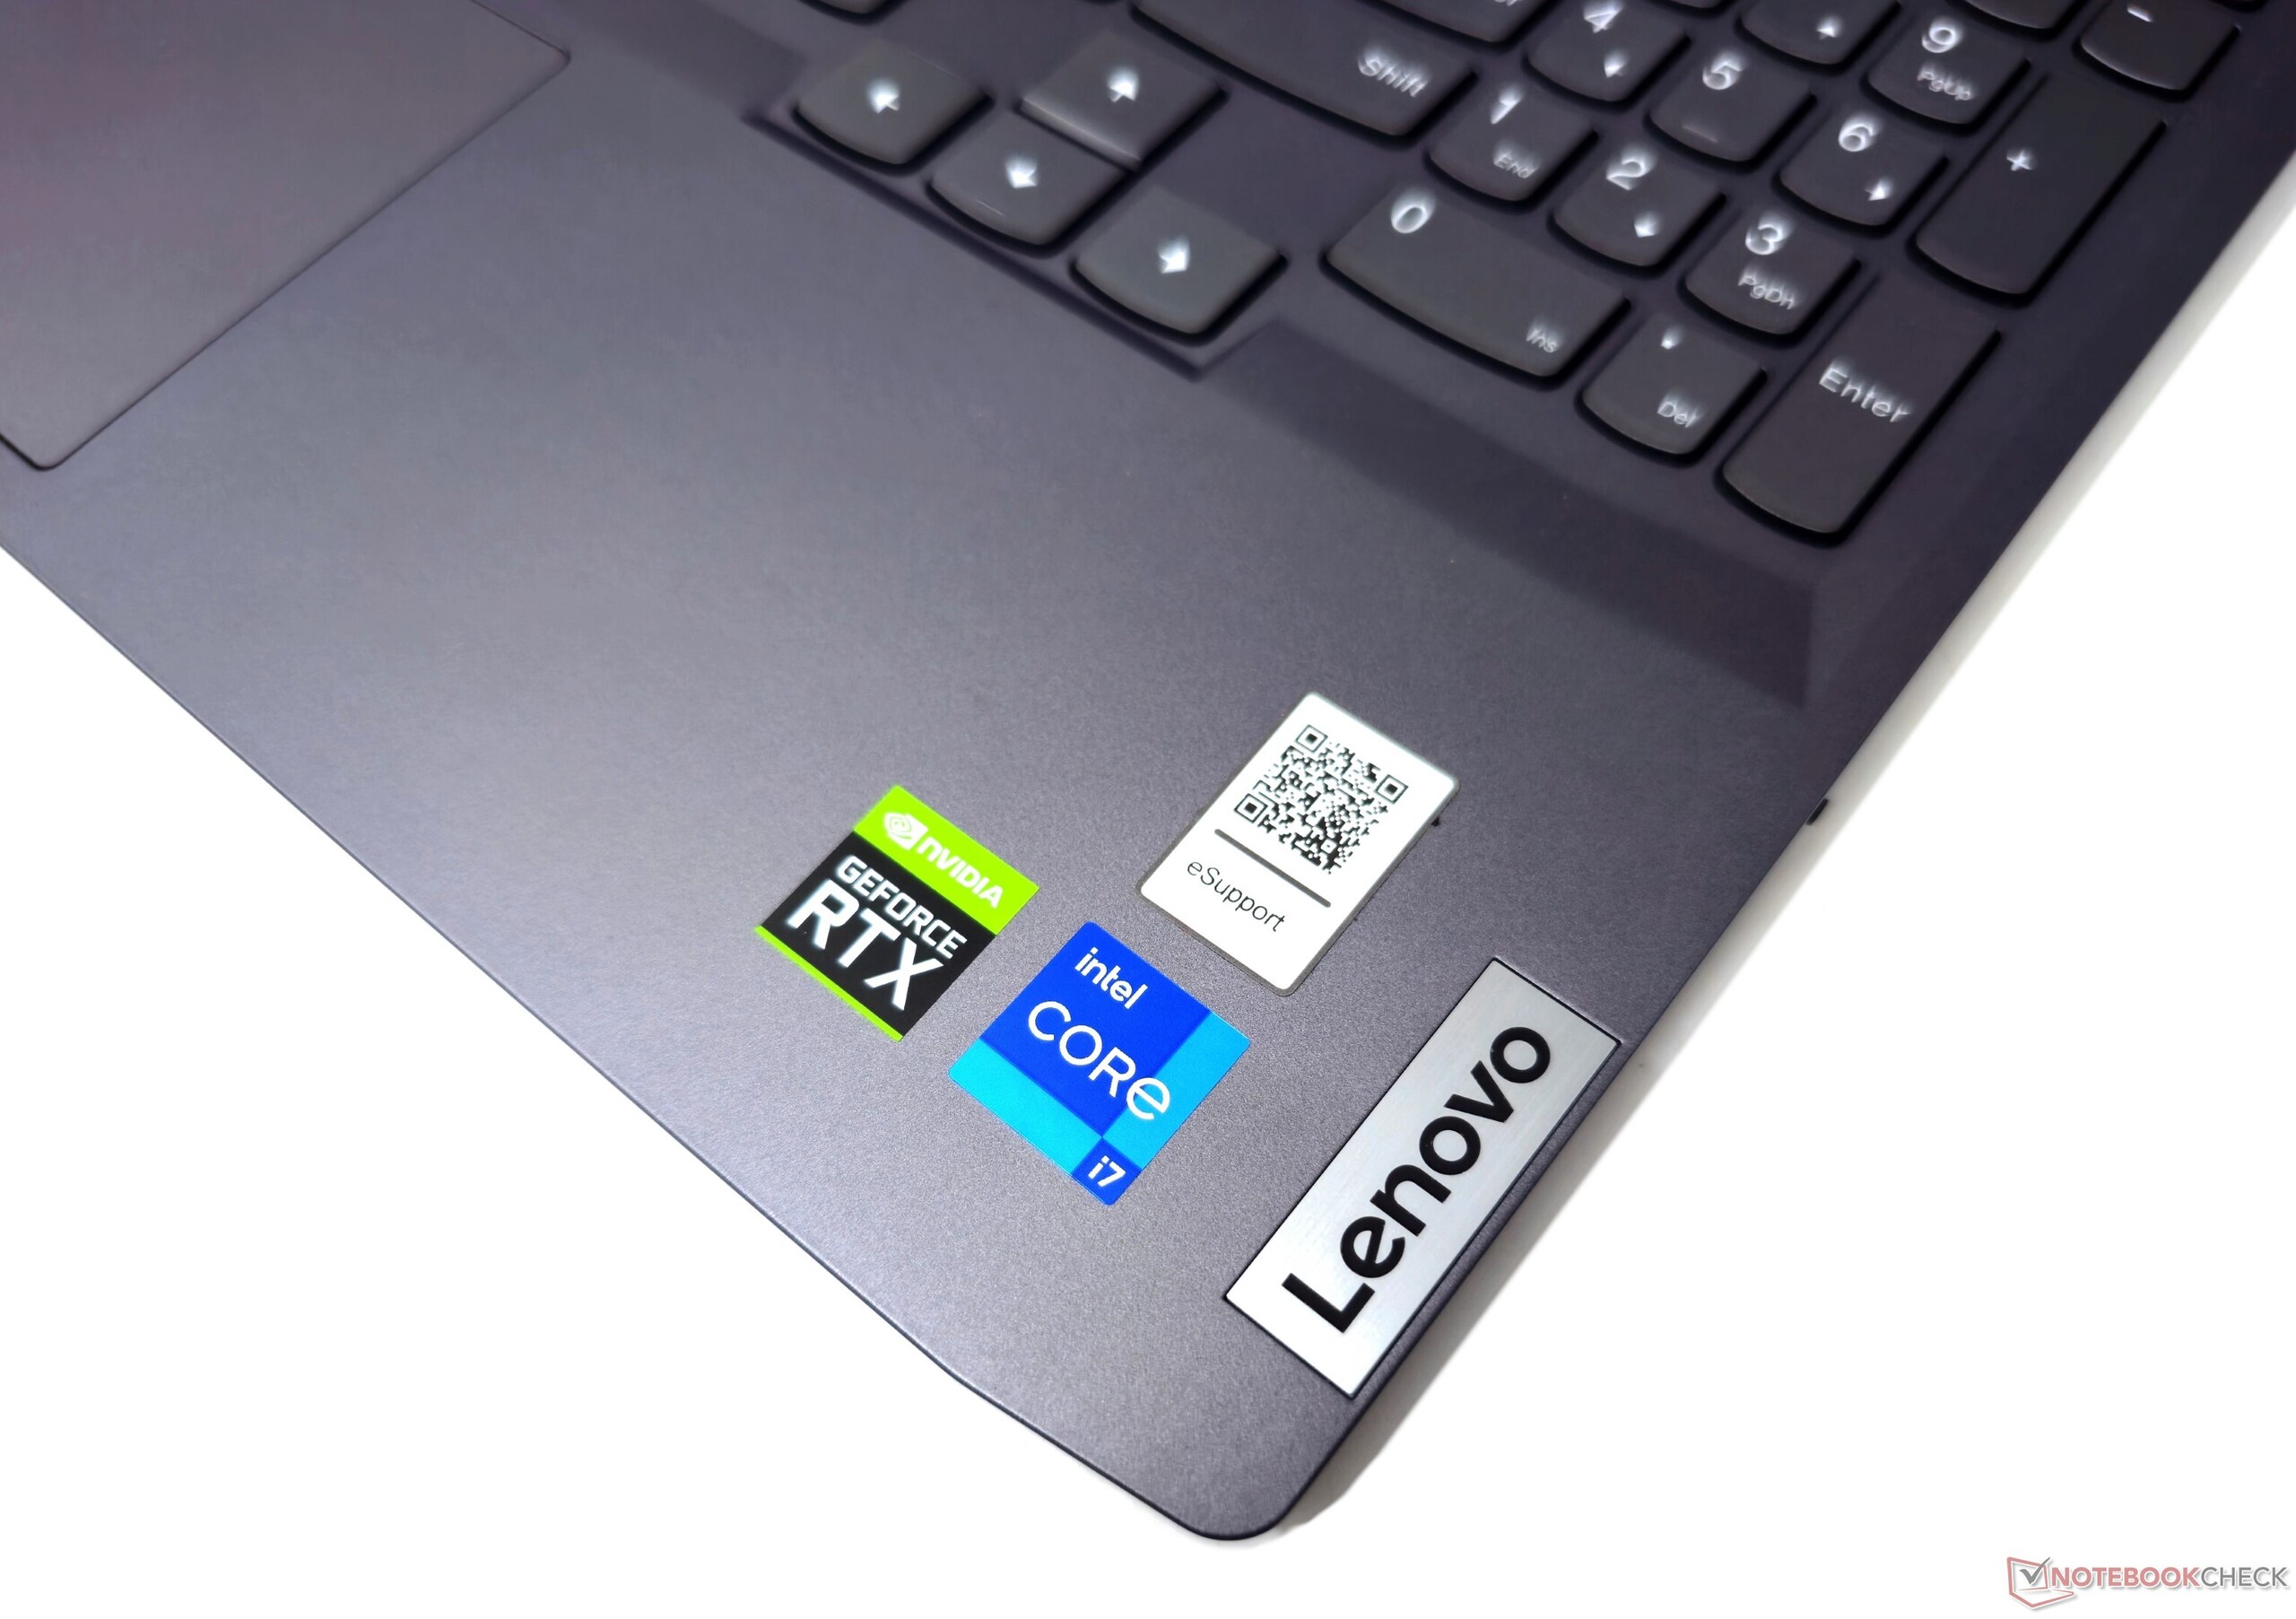
Na Índia, a Lenovo oferece várias opções de configuração do LOQ 15 com processadores Intel e AMD. Os modelos baseados em Intel oferecem uma escolha entre o Core i5-12450H e Core i7-13620H Enquanto as variantes da AMD apresentam os processadores Ryzen 5 7640HS ou Ryzen 7 7840HS. Para gráficos, os clientes podem selecionar versões para laptop da RTX 2050, RTX 3050, RTX 4050ou RTX 4060 GPUs.
Para o mercado dos EUA, a Lenovo configura o LOQ 15 com o Core i7-13700H emparelhado com a RTX 4050 ou o Core i5-13420H juntamente com a RTX 2050.
Condições de teste
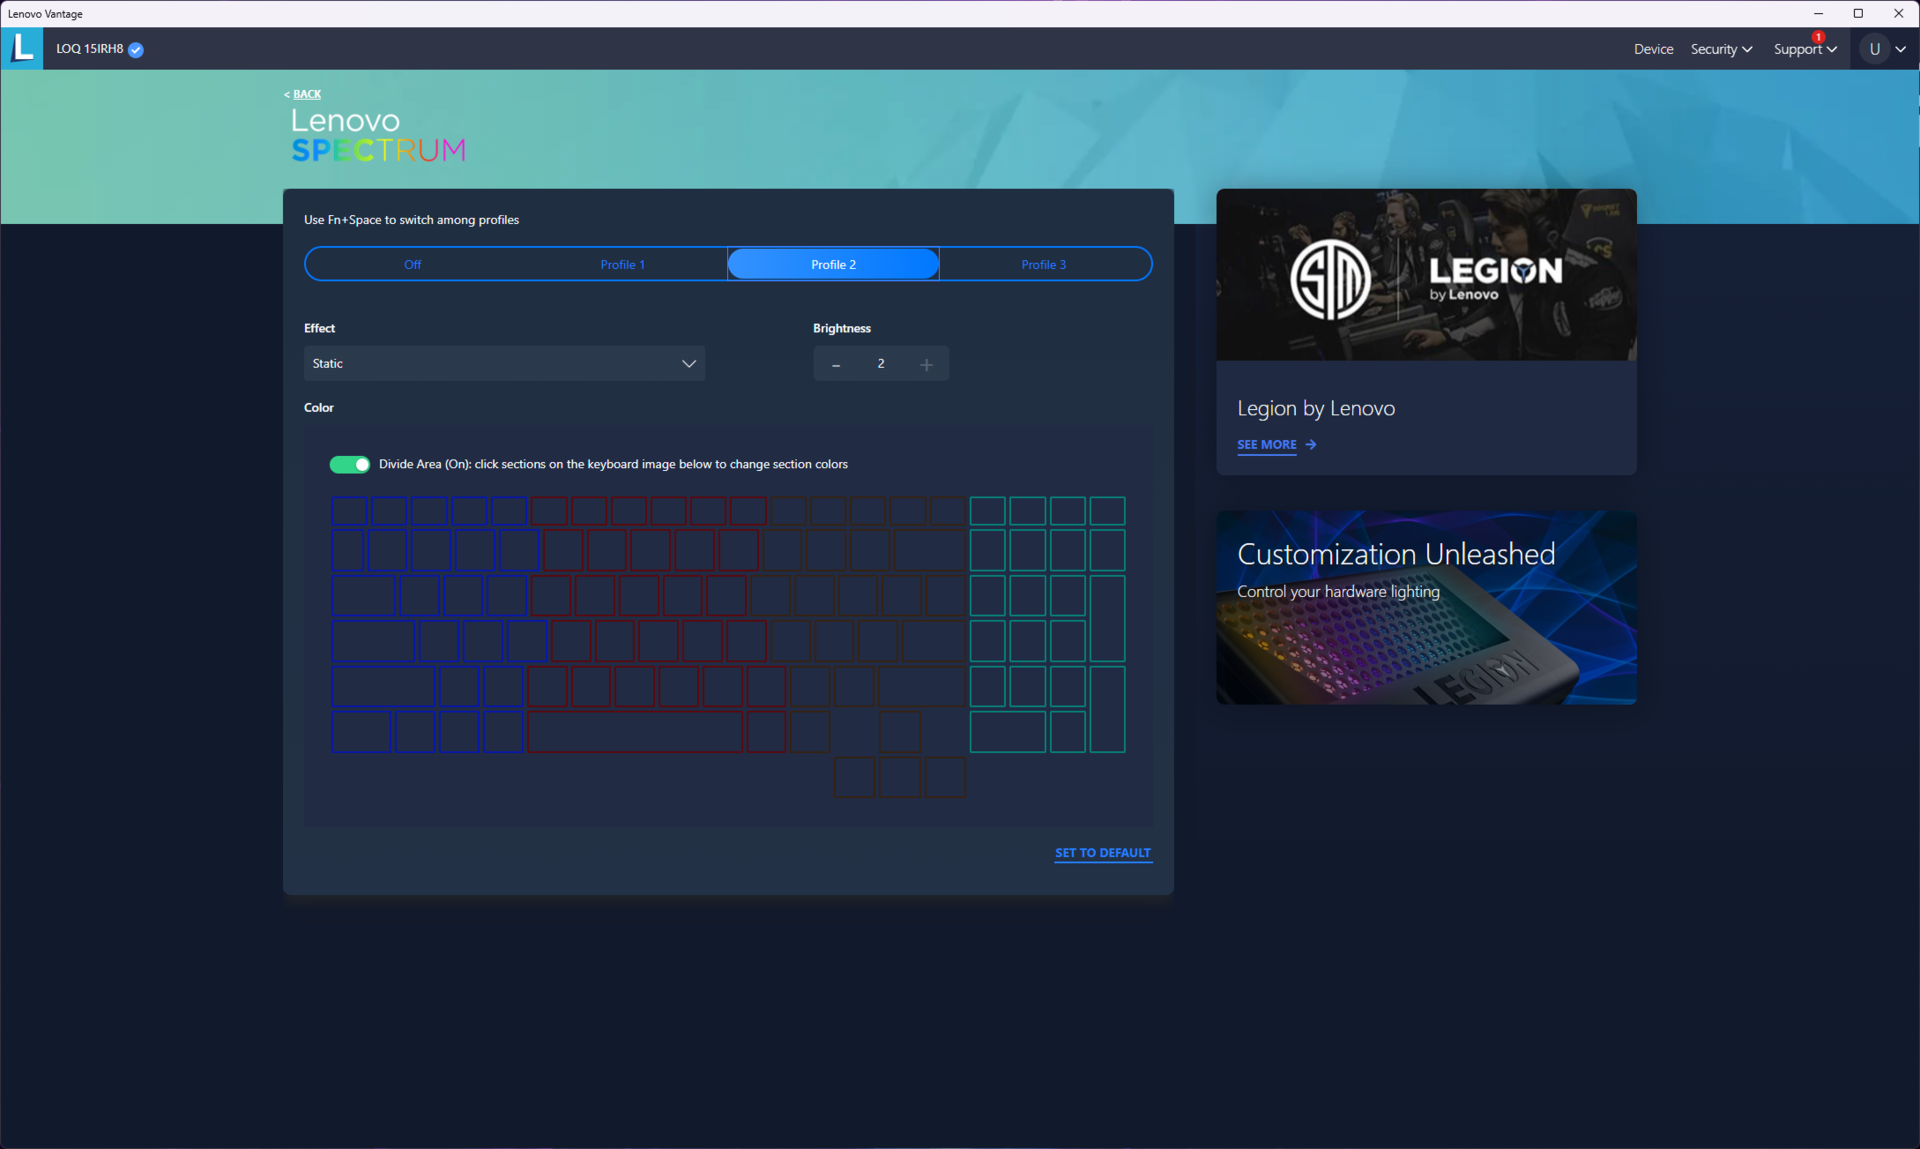
O Lenovo Vantage permite alterar facilmente os perfis de energia, os efeitos RGB e outras propriedades do LOQ 15. O aplicativo também permite que usuários experientes definam seus próprios limites de energia da CPU, duração, TDP da GPU, GPU para CPU Dynamic Boost e limites de temperatura, conforme desejado.
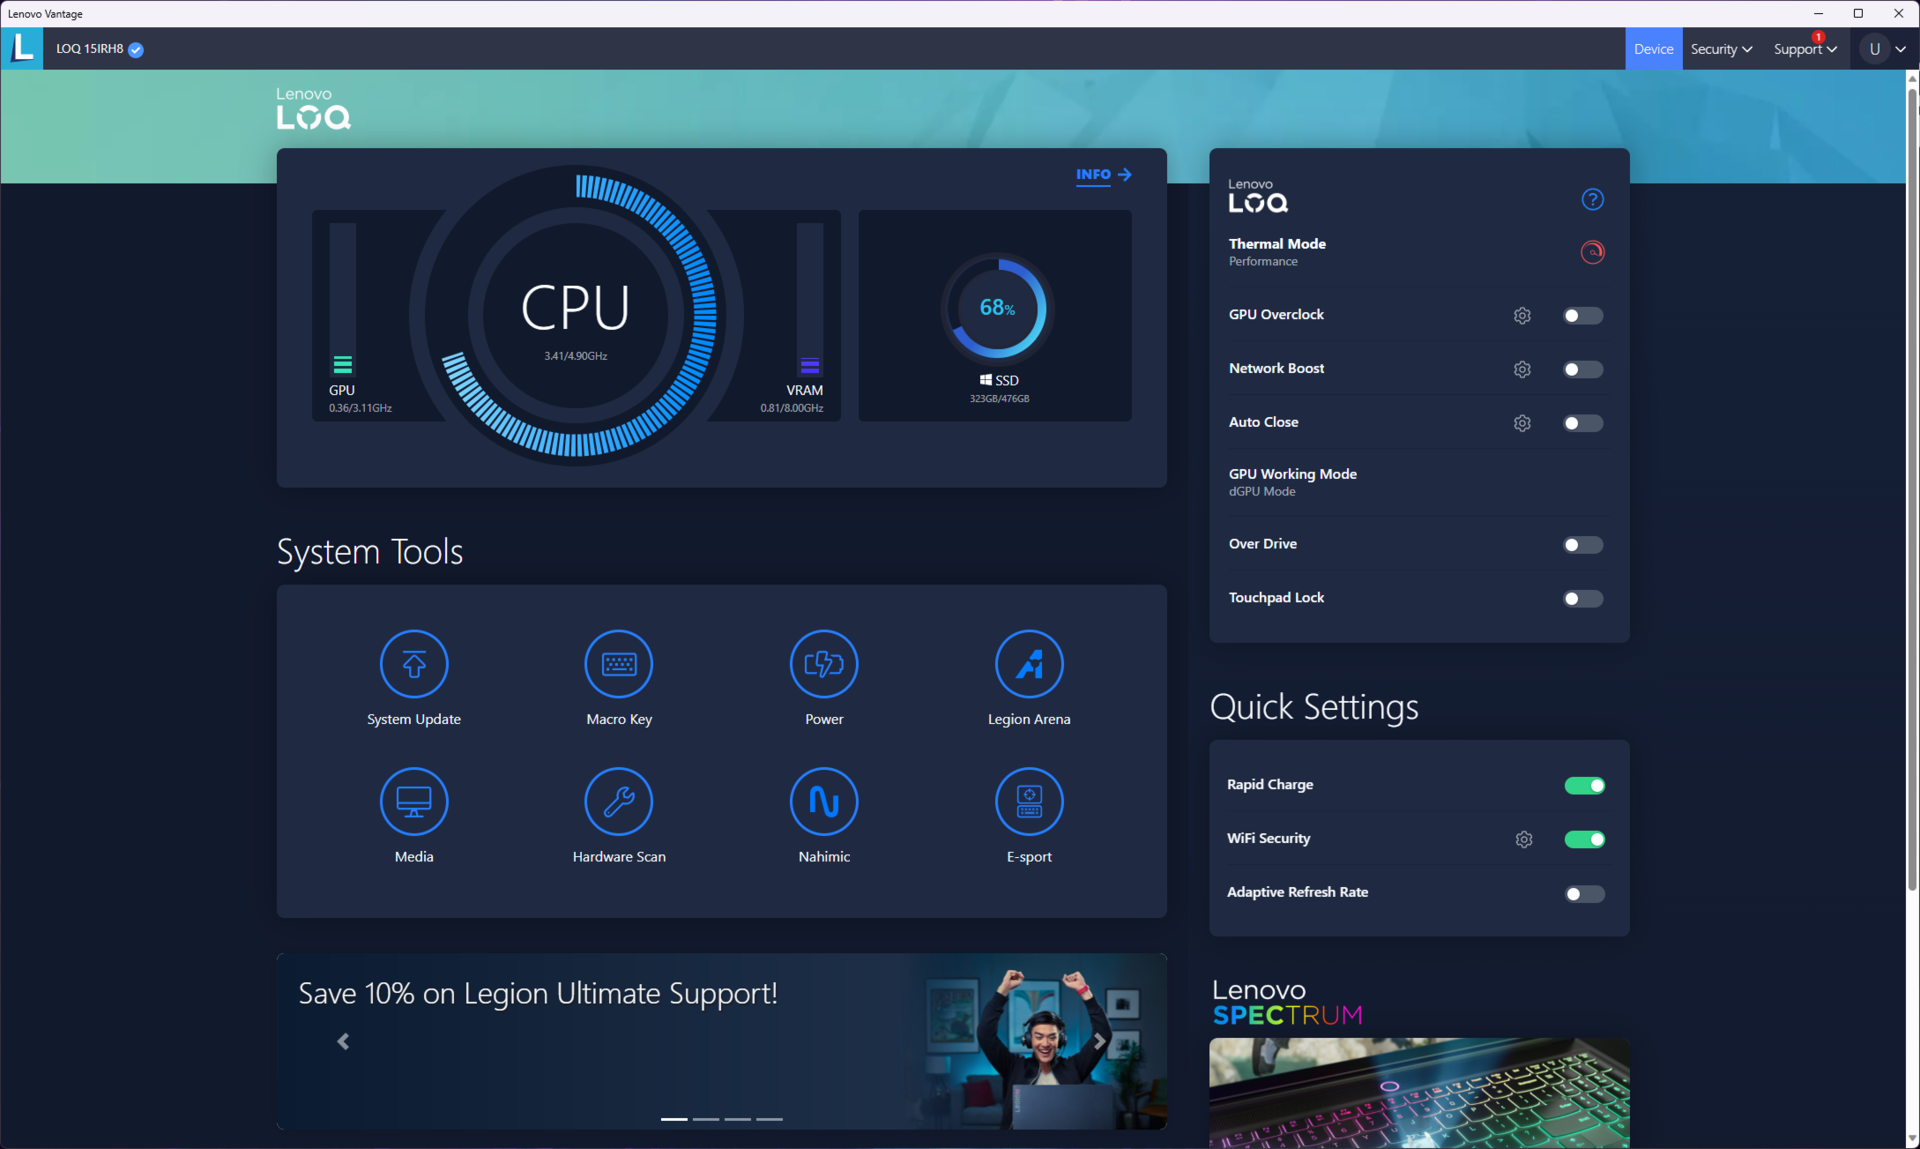
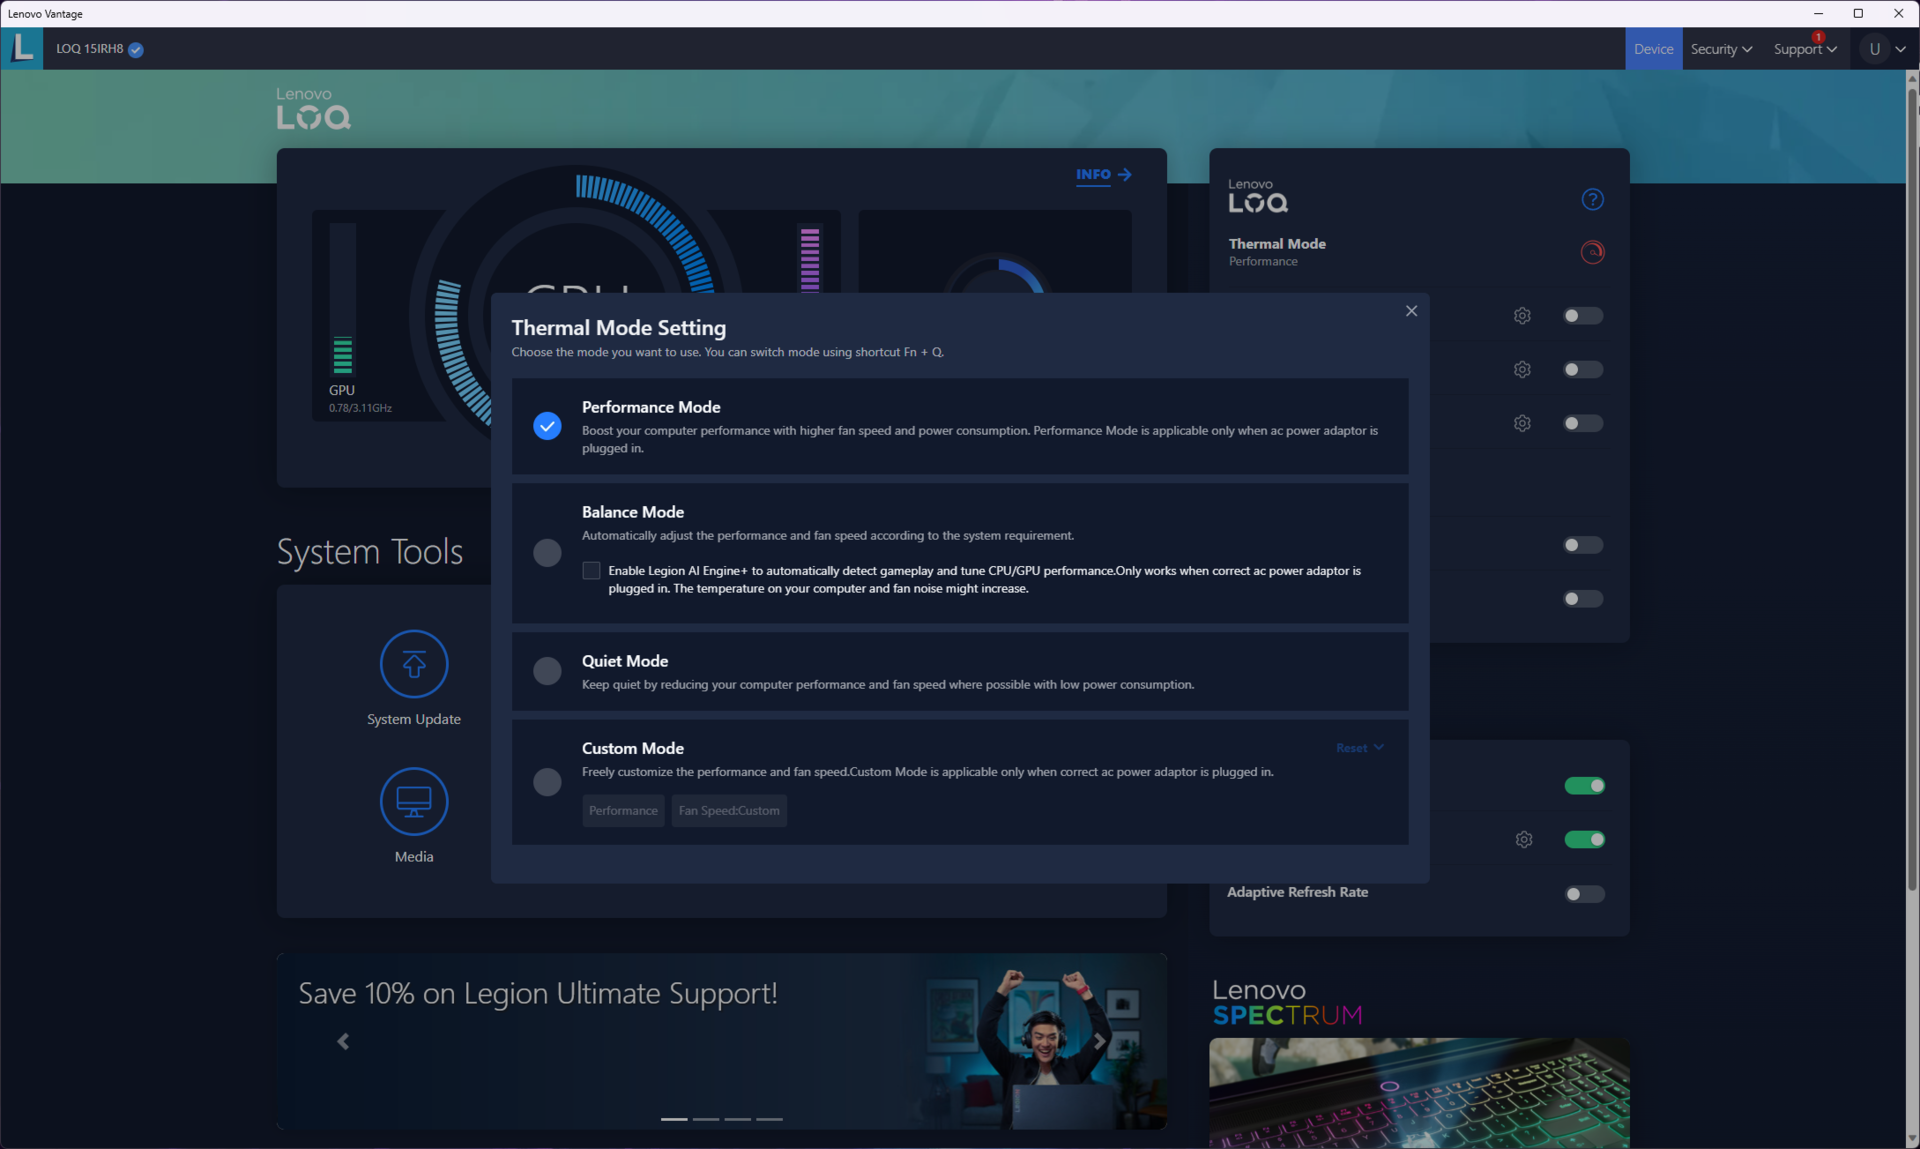
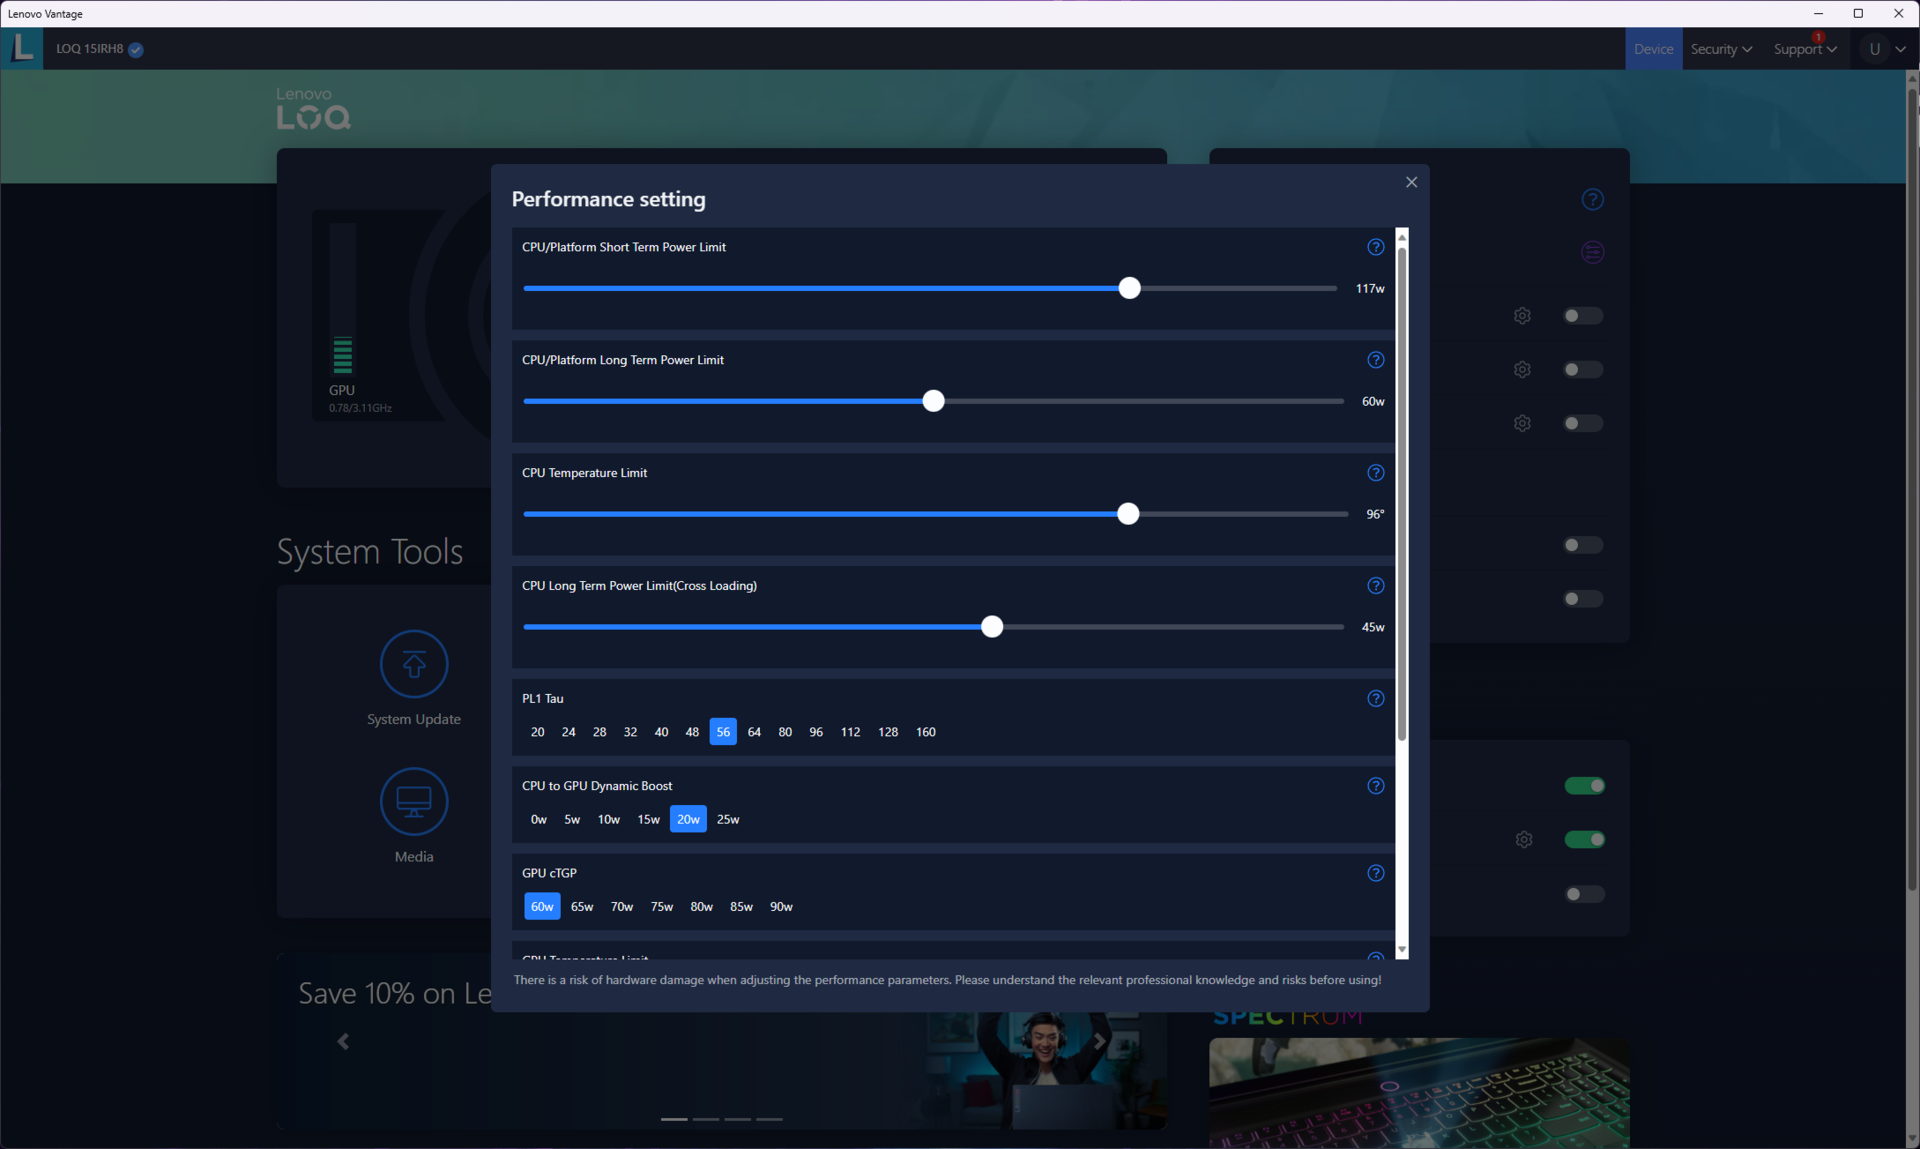
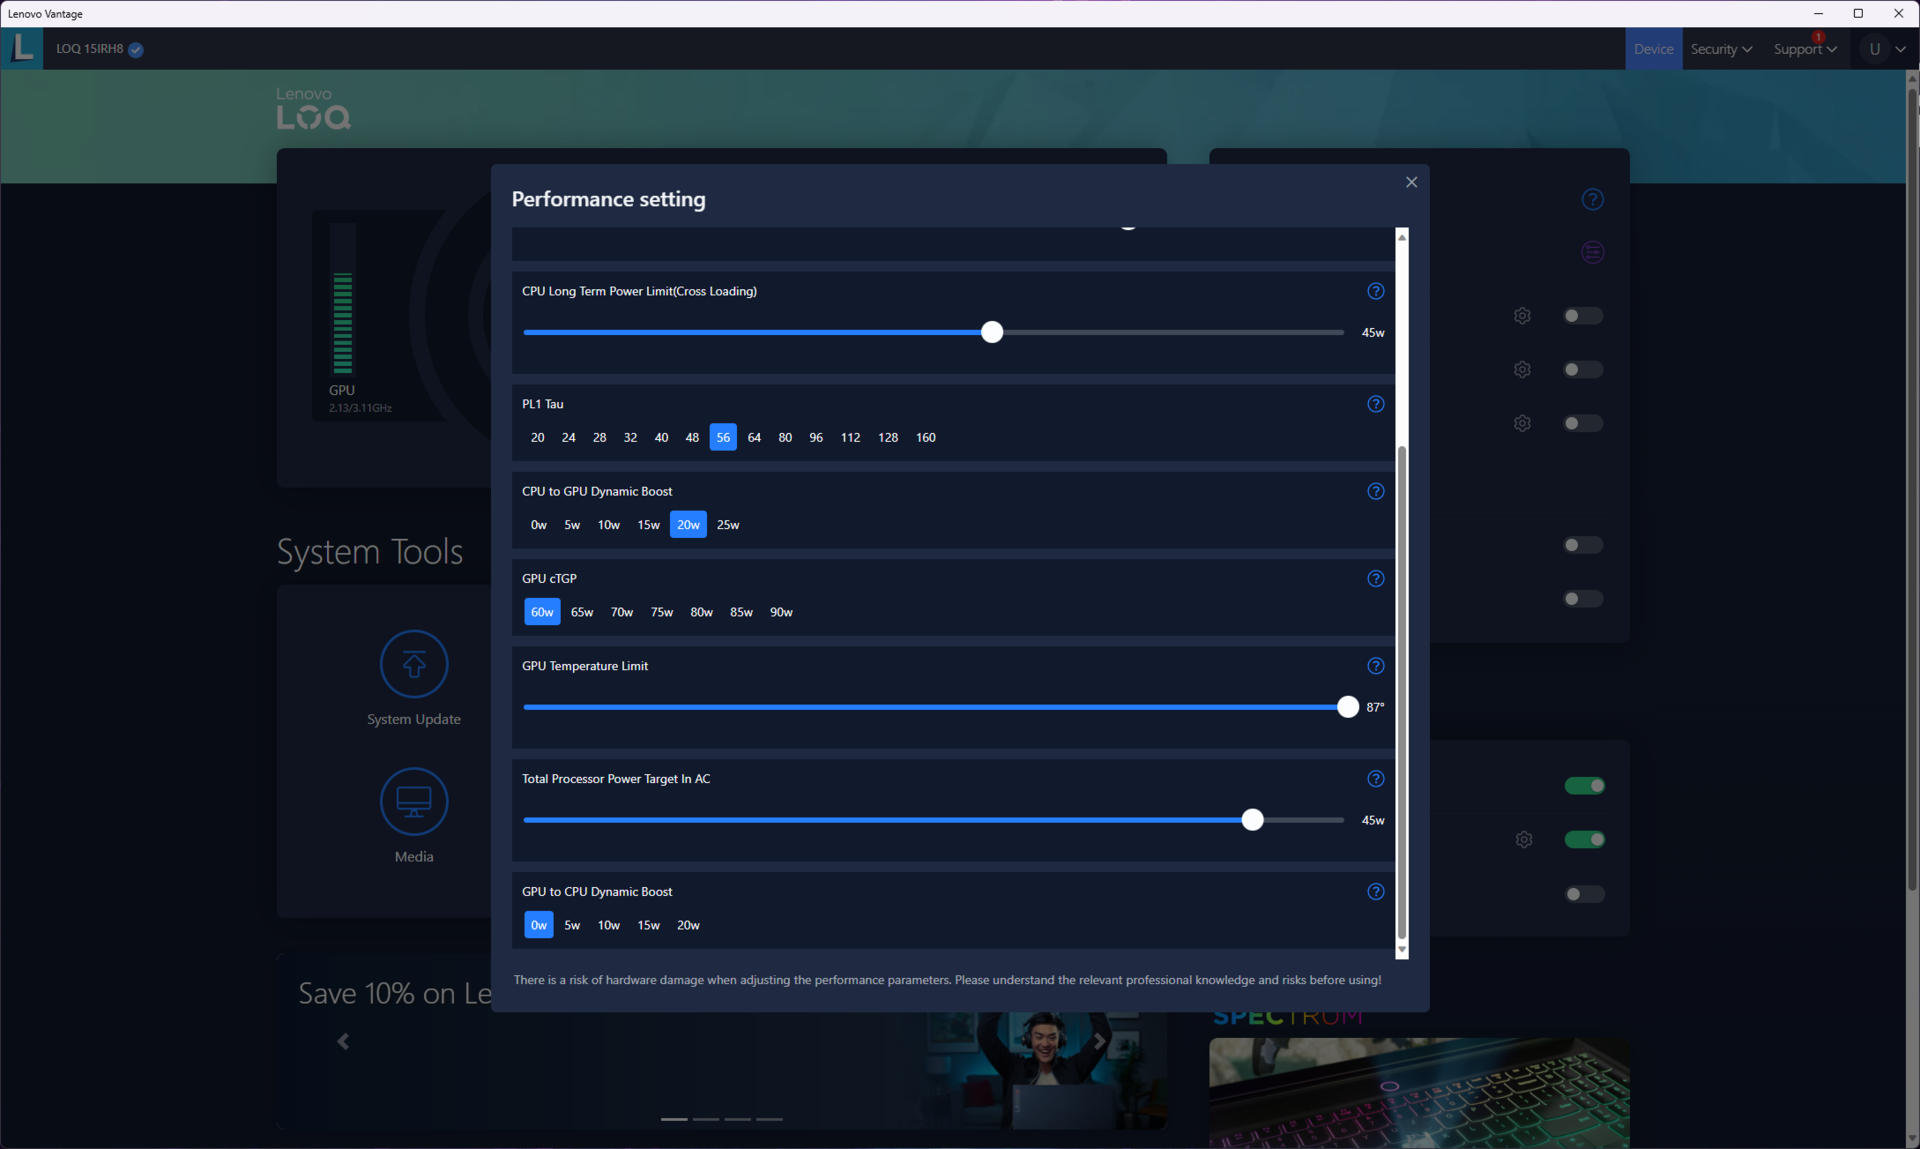
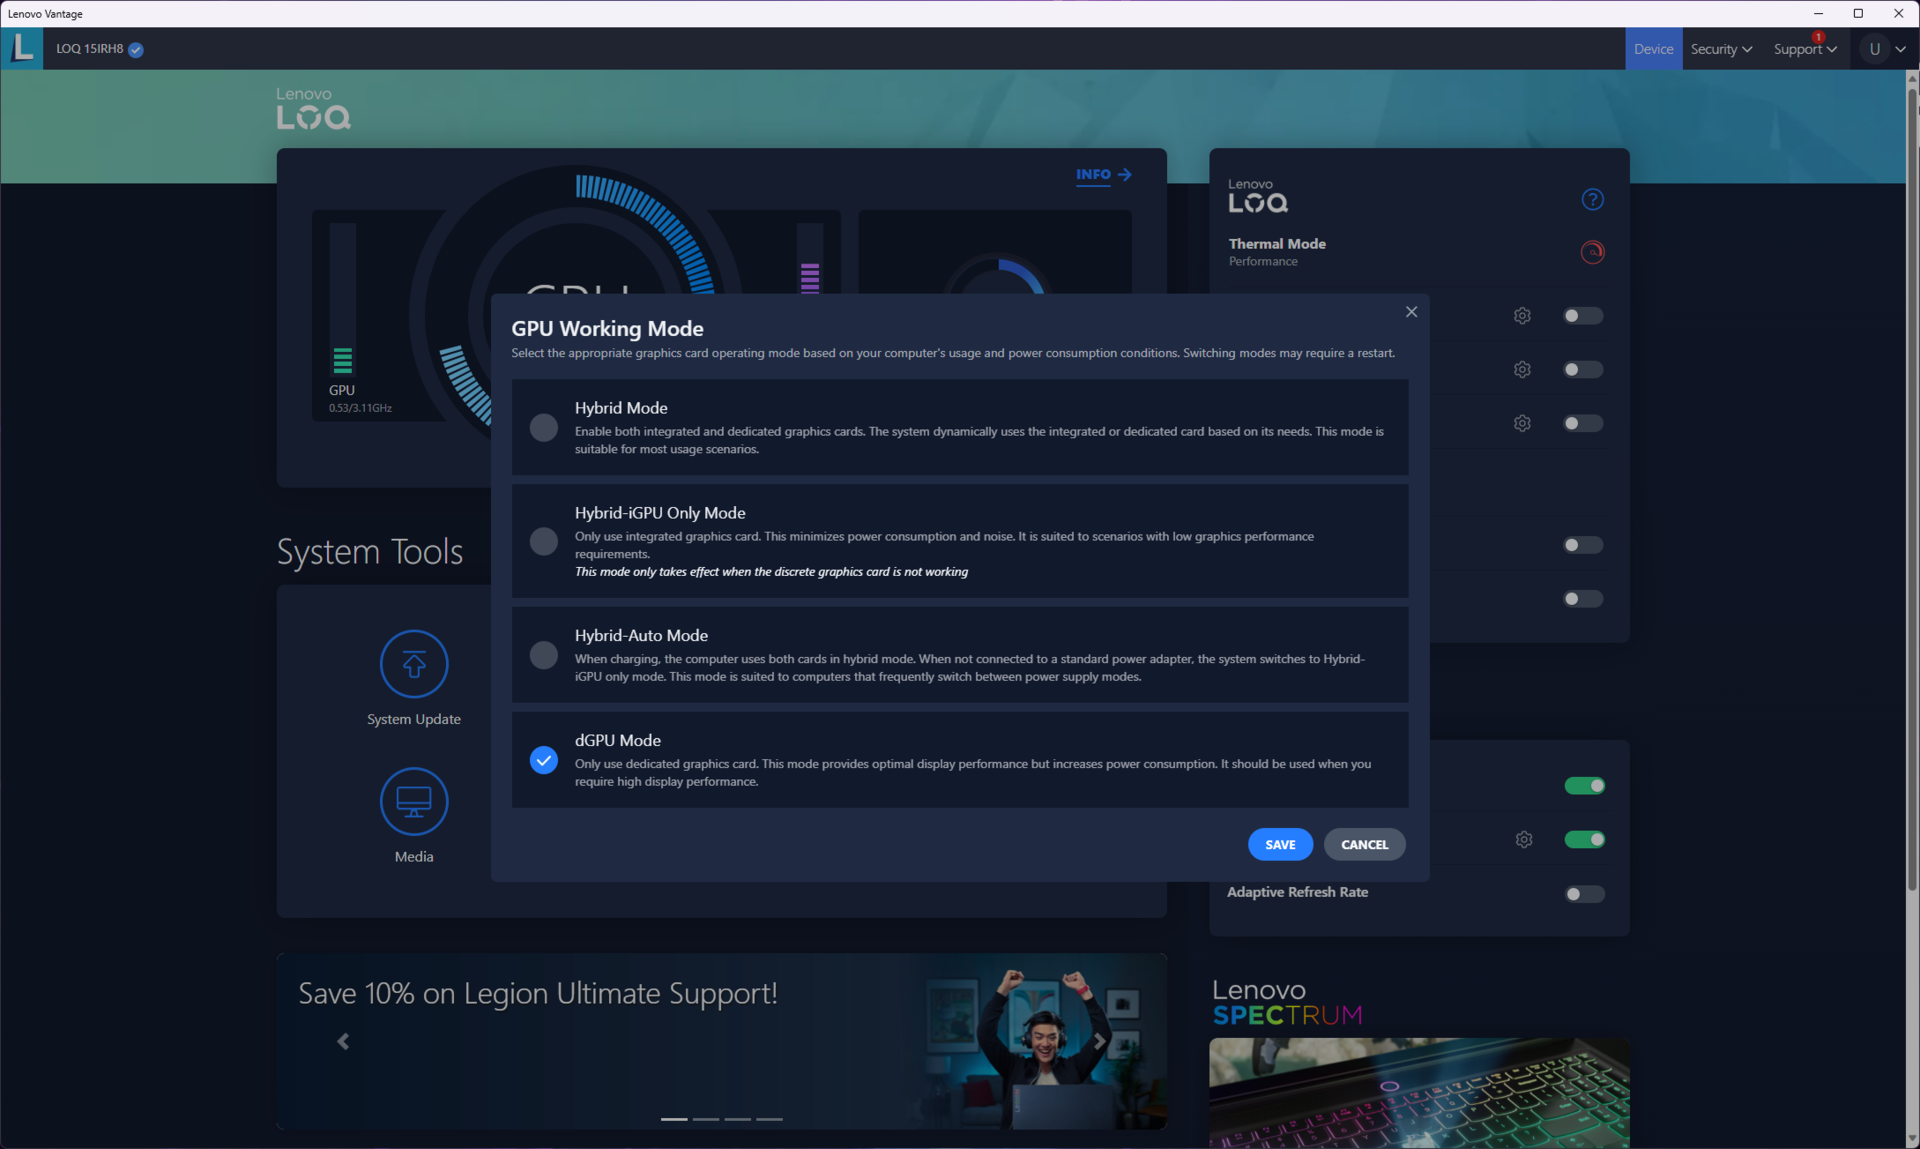
A tabela abaixo mostra como os perfis de energia padrão afetam o PL1 e o PL2 do processador. Em nossos testes, usamos o perfil Performance e ativamos o modo dGPU para permitir que o Core i7-13620H e a RTX 4050 exercitassem totalmente seus músculos. Os testes de bateria foram executados no perfil Quiet com a GPU definida para o modo Hybrid.
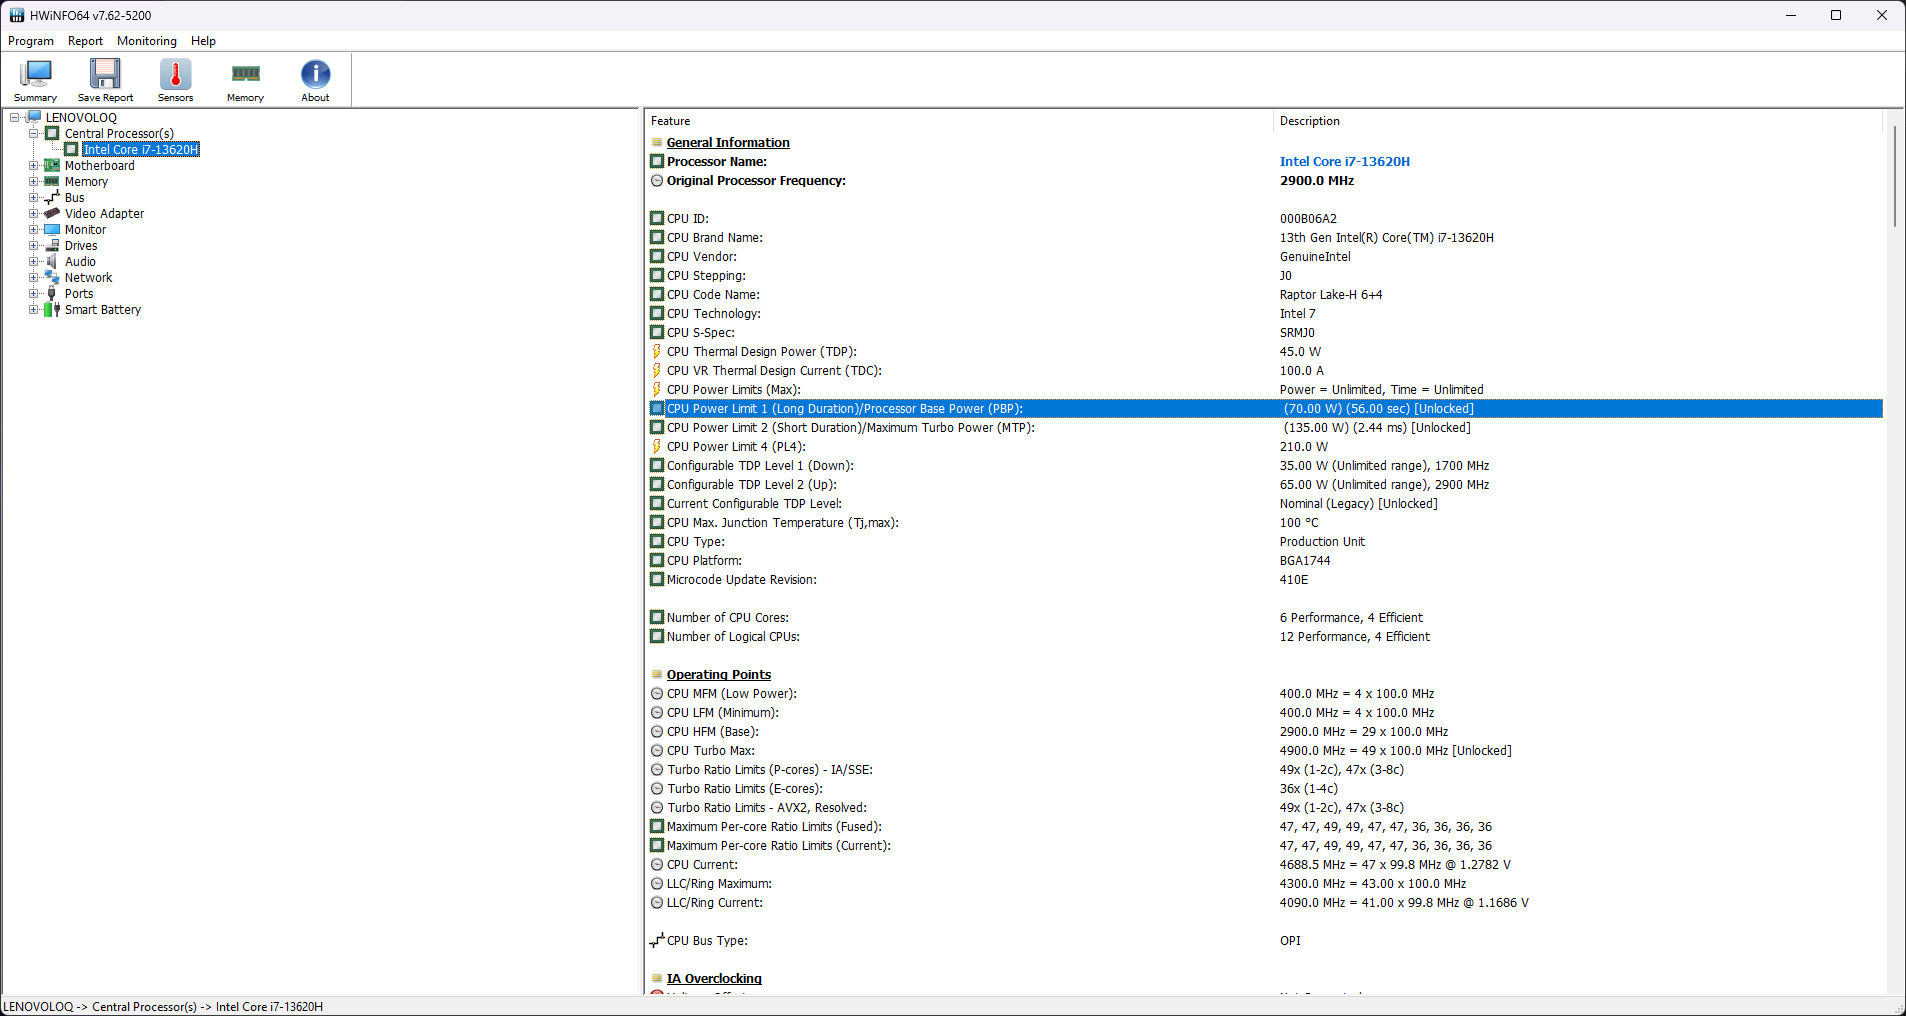
| Modo de desempenho | PL1 (PBP) / Tau | PL2 (MTP) / Tau | PL4 | Cinebench R15 Multi score | Cinebench R15 Multi score (30 loops) |
|---|---|---|---|---|---|
| Silencioso | 45 W / 56 s | 55 W / 2,44 ms | 210 W | 1.879 (-17,98%) | 1.412 (-26,34%) |
| Equilíbrio | 60 W / 56 s | 117 W / 2,44 ms | 210 W | 2.178 (-4,93%) | 1.657 (-13,56%) |
| Desempenho | 70 W / 56 s | 135 W / 2,44 ms | 210 W | 2.291 (100%) | 1.917 (100%) |
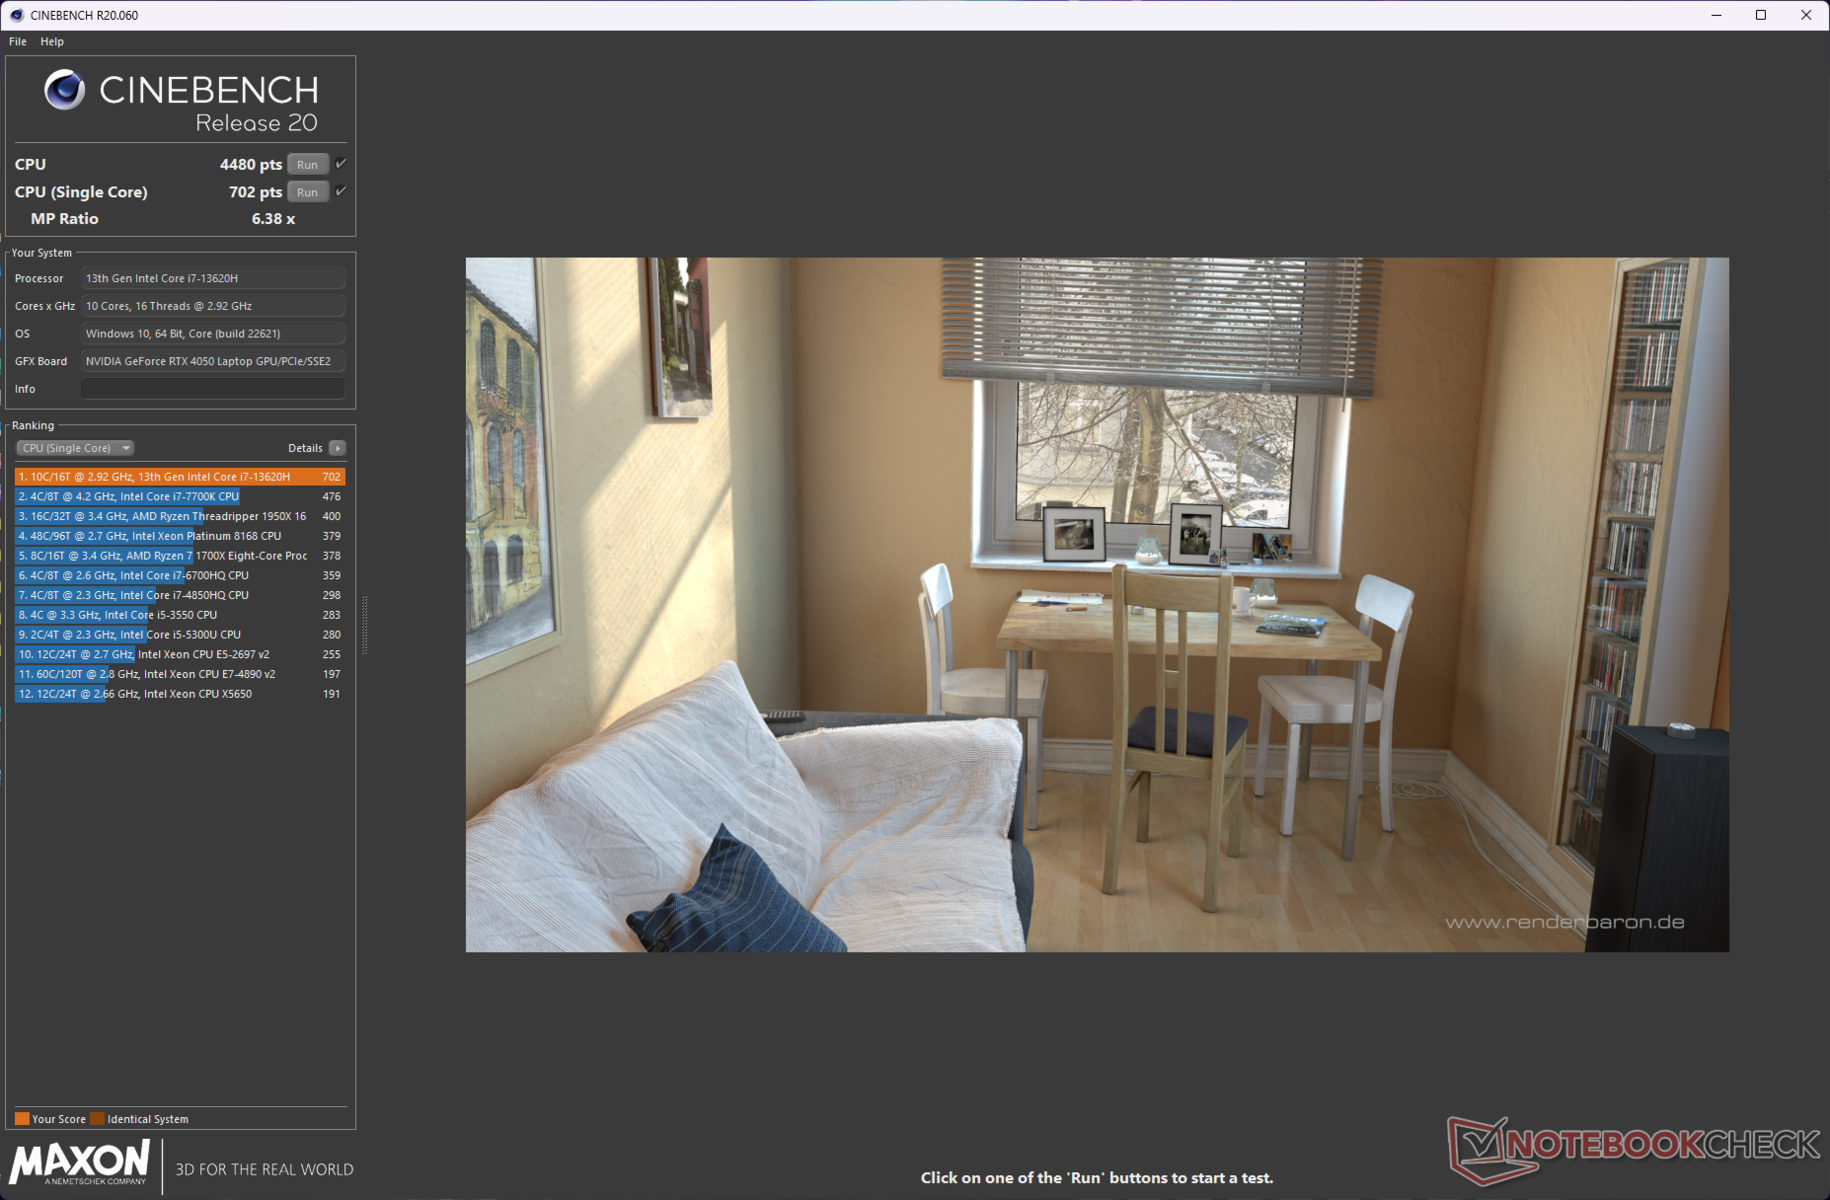
Processador
O Core i7-13620H do LOQ 15IRH8 fica atrás do LOQ 15APH8 equipado com Ryzen 7 7840HS em até 16% nos testes de vários núcleos do Cinebench, apesar de apresentar o mesmo número de threads, provavelmente devido aos clocks mais altos do último. No entanto, vemos uma inversão de papéis no Geekbench multi-core. O chip Intel também apresenta um bom desempenho na maioria dos benchmarks de núcleo único.
O chassi e o resfriamento do LOQ 15IRH8 parecem estar tendo problemas para sustentar adequadamente um teste de loop de vários núcleos do Cinebench R15. O Core i7-13620H encontra um lugar melhor no LOQ 16IRH8, onde o desempenho do processador é muito estável.
Cinebench R15 Multi Loop
Cinebench R23: Multi Core | Single Core
Cinebench R20: CPU (Multi Core) | CPU (Single Core)
Cinebench R15: CPU Multi 64Bit | CPU Single 64Bit
Blender: v2.79 BMW27 CPU
7-Zip 18.03: 7z b 4 | 7z b 4 -mmt1
Geekbench 5.5: Multi-Core | Single-Core
HWBOT x265 Benchmark v2.2: 4k Preset
LibreOffice : 20 Documents To PDF
R Benchmark 2.5: Overall mean
| CPU Performance rating | |
| Média da turma Gaming | |
| Dell G15 5530 | |
| Asus TUF Gaming A16 FA617XS | |
| Lenovo LOQ 15APH8 | |
| Lenovo LOQ 16IRH8 | |
| Lenovo Legion Pro 5 16ARX8 (R5 7645HX, RTX 4050) | |
| Lenovo LOQ 15IRH8 Core i7 | |
| MSI Katana 17 B13VFK | |
| Média Intel Core i7-13620H | |
| HP Victus 16-r0077ng | |
| Cinebench R23 / Multi Core | |
| Média da turma Gaming (10488 - 42661, n=107, últimos 2 anos) | |
| Dell G15 5530 | |
| Lenovo LOQ 15APH8 | |
| Asus TUF Gaming A16 FA617XS | |
| MSI Katana 17 B13VFK | |
| HP Victus 16-r0077ng | |
| Lenovo LOQ 16IRH8 | |
| Lenovo LOQ 15IRH8 Core i7 | |
| Média Intel Core i7-13620H (10819 - 15496, n=7) | |
| Lenovo Legion Pro 5 16ARX8 (R5 7645HX, RTX 4050) | |
| Cinebench R23 / Single Core | |
| Média da turma Gaming (1166 - 2415, n=107, últimos 2 anos) | |
| Lenovo LOQ 16IRH8 | |
| Lenovo LOQ 15IRH8 Core i7 | |
| Dell G15 5530 | |
| Média Intel Core i7-13620H (1716 - 1871, n=7) | |
| Lenovo Legion Pro 5 16ARX8 (R5 7645HX, RTX 4050) | |
| MSI Katana 17 B13VFK | |
| Asus TUF Gaming A16 FA617XS | |
| Lenovo LOQ 15APH8 | |
| HP Victus 16-r0077ng | |
| Cinebench R20 / CPU (Multi Core) | |
| Média da turma Gaming (4029 - 16433, n=106, últimos 2 anos) | |
| Dell G15 5530 | |
| Lenovo LOQ 15APH8 | |
| Asus TUF Gaming A16 FA617XS | |
| MSI Katana 17 B13VFK | |
| HP Victus 16-r0077ng | |
| Lenovo LOQ 15IRH8 Core i7 | |
| Lenovo LOQ 16IRH8 | |
| Lenovo Legion Pro 5 16ARX8 (R5 7645HX, RTX 4050) | |
| Média Intel Core i7-13620H (4214 - 5905, n=7) | |
| Cinebench R20 / CPU (Single Core) | |
| Média da turma Gaming (442 - 913, n=106, últimos 2 anos) | |
| Lenovo LOQ 15IRH8 Core i7 | |
| Dell G15 5530 | |
| Lenovo LOQ 16IRH8 | |
| Asus TUF Gaming A16 FA617XS | |
| Lenovo Legion Pro 5 16ARX8 (R5 7645HX, RTX 4050) | |
| Média Intel Core i7-13620H (657 - 719, n=7) | |
| Lenovo LOQ 15APH8 | |
| MSI Katana 17 B13VFK | |
| HP Victus 16-r0077ng | |
| Cinebench R15 / CPU Multi 64Bit | |
| Média da turma Gaming (1578 - 6330, n=105, últimos 2 anos) | |
| Dell G15 5530 | |
| Lenovo LOQ 15APH8 | |
| Asus TUF Gaming A16 FA617XS | |
| Lenovo LOQ 16IRH8 | |
| MSI Katana 17 B13VFK | |
| HP Victus 16-r0077ng | |
| Lenovo LOQ 15IRH8 Core i7 | |
| Lenovo Legion Pro 5 16ARX8 (R5 7645HX, RTX 4050) | |
| Média Intel Core i7-13620H (1681 - 2492, n=7) | |
| Cinebench R15 / CPU Single 64Bit | |
| Média da turma Gaming (188.8 - 350, n=106, últimos 2 anos) | |
| Lenovo Legion Pro 5 16ARX8 (R5 7645HX, RTX 4050) | |
| Asus TUF Gaming A16 FA617XS | |
| Lenovo LOQ 15APH8 | |
| Dell G15 5530 | |
| Lenovo LOQ 16IRH8 | |
| Lenovo LOQ 15IRH8 Core i7 | |
| Média Intel Core i7-13620H (250 - 269, n=7) | |
| MSI Katana 17 B13VFK | |
| HP Victus 16-r0077ng | |
| Blender / v2.79 BMW27 CPU | |
| Lenovo LOQ 15IRH8 Core i7 | |
| Média Intel Core i7-13620H (215 - 297, n=7) | |
| Lenovo Legion Pro 5 16ARX8 (R5 7645HX, RTX 4050) | |
| Lenovo LOQ 16IRH8 | |
| MSI Katana 17 B13VFK | |
| HP Victus 16-r0077ng | |
| Asus TUF Gaming A16 FA617XS | |
| Lenovo LOQ 15APH8 | |
| Dell G15 5530 | |
| Média da turma Gaming (79 - 330, n=104, últimos 2 anos) | |
| 7-Zip 18.03 / 7z b 4 | |
| Média da turma Gaming (33491 - 148086, n=105, últimos 2 anos) | |
| Dell G15 5530 | |
| Asus TUF Gaming A16 FA617XS | |
| HP Victus 16-r0077ng | |
| MSI Katana 17 B13VFK | |
| Lenovo Legion Pro 5 16ARX8 (R5 7645HX, RTX 4050) | |
| Lenovo LOQ 15APH8 | |
| Lenovo LOQ 16IRH8 | |
| Lenovo LOQ 15IRH8 Core i7 | |
| Média Intel Core i7-13620H (45092 - 62324, n=7) | |
| 7-Zip 18.03 / 7z b 4 -mmt1 | |
| Lenovo Legion Pro 5 16ARX8 (R5 7645HX, RTX 4050) | |
| Asus TUF Gaming A16 FA617XS | |
| Média da turma Gaming (4199 - 7436, n=105, últimos 2 anos) | |
| Lenovo LOQ 15APH8 | |
| Média Intel Core i7-13620H (5648 - 6326, n=7) | |
| Lenovo LOQ 15IRH8 Core i7 | |
| Lenovo LOQ 16IRH8 | |
| Dell G15 5530 | |
| MSI Katana 17 B13VFK | |
| HP Victus 16-r0077ng | |
| Geekbench 5.5 / Multi-Core | |
| Média da turma Gaming (6460 - 28263, n=105, últimos 2 anos) | |
| Dell G15 5530 | |
| Lenovo LOQ 16IRH8 | |
| Asus TUF Gaming A16 FA617XS | |
| HP Victus 16-r0077ng | |
| Lenovo LOQ 15IRH8 Core i7 | |
| MSI Katana 17 B13VFK | |
| Média Intel Core i7-13620H (8112 - 12223, n=7) | |
| Lenovo Legion Pro 5 16ARX8 (R5 7645HX, RTX 4050) | |
| Lenovo LOQ 15APH8 | |
| Geekbench 5.5 / Single-Core | |
| Média da turma Gaming (986 - 2474, n=105, últimos 2 anos) | |
| Asus TUF Gaming A16 FA617XS | |
| Lenovo Legion Pro 5 16ARX8 (R5 7645HX, RTX 4050) | |
| Lenovo LOQ 15IRH8 Core i7 | |
| Dell G15 5530 | |
| Lenovo LOQ 15APH8 | |
| Lenovo LOQ 16IRH8 | |
| Média Intel Core i7-13620H (1703 - 1865, n=7) | |
| MSI Katana 17 B13VFK | |
| HP Victus 16-r0077ng | |
| HWBOT x265 Benchmark v2.2 / 4k Preset | |
| Média da turma Gaming (11.5 - 44.4, n=105, últimos 2 anos) | |
| Dell G15 5530 | |
| Asus TUF Gaming A16 FA617XS | |
| Lenovo Legion Pro 5 16ARX8 (R5 7645HX, RTX 4050) | |
| Lenovo LOQ 15APH8 | |
| MSI Katana 17 B13VFK | |
| Lenovo LOQ 16IRH8 | |
| Lenovo LOQ 15IRH8 Core i7 | |
| HP Victus 16-r0077ng | |
| Média Intel Core i7-13620H (12.2 - 17.7, n=7) | |
| LibreOffice / 20 Documents To PDF | |
| HP Victus 16-r0077ng | |
| MSI Katana 17 B13VFK | |
| Lenovo Legion Pro 5 16ARX8 (R5 7645HX, RTX 4050) | |
| Média Intel Core i7-13620H (41.5 - 78.9, n=7) | |
| Média da turma Gaming (33.2 - 88.8, n=105, últimos 2 anos) | |
| Dell G15 5530 | |
| Lenovo LOQ 16IRH8 | |
| Lenovo LOQ 15IRH8 Core i7 | |
| Asus TUF Gaming A16 FA617XS | |
| Lenovo LOQ 15APH8 | |
| R Benchmark 2.5 / Overall mean | |
| HP Victus 16-r0077ng | |
| Média Intel Core i7-13620H (0.4438 - 0.4762, n=7) | |
| Lenovo LOQ 15IRH8 Core i7 | |
| Lenovo LOQ 15APH8 | |
| Lenovo LOQ 16IRH8 | |
| MSI Katana 17 B13VFK | |
| Lenovo Legion Pro 5 16ARX8 (R5 7645HX, RTX 4050) | |
| Média da turma Gaming (0.3439 - 0.759, n=106, últimos 2 anos) | |
| Dell G15 5530 | |
| Asus TUF Gaming A16 FA617XS | |
* ... menor é melhor
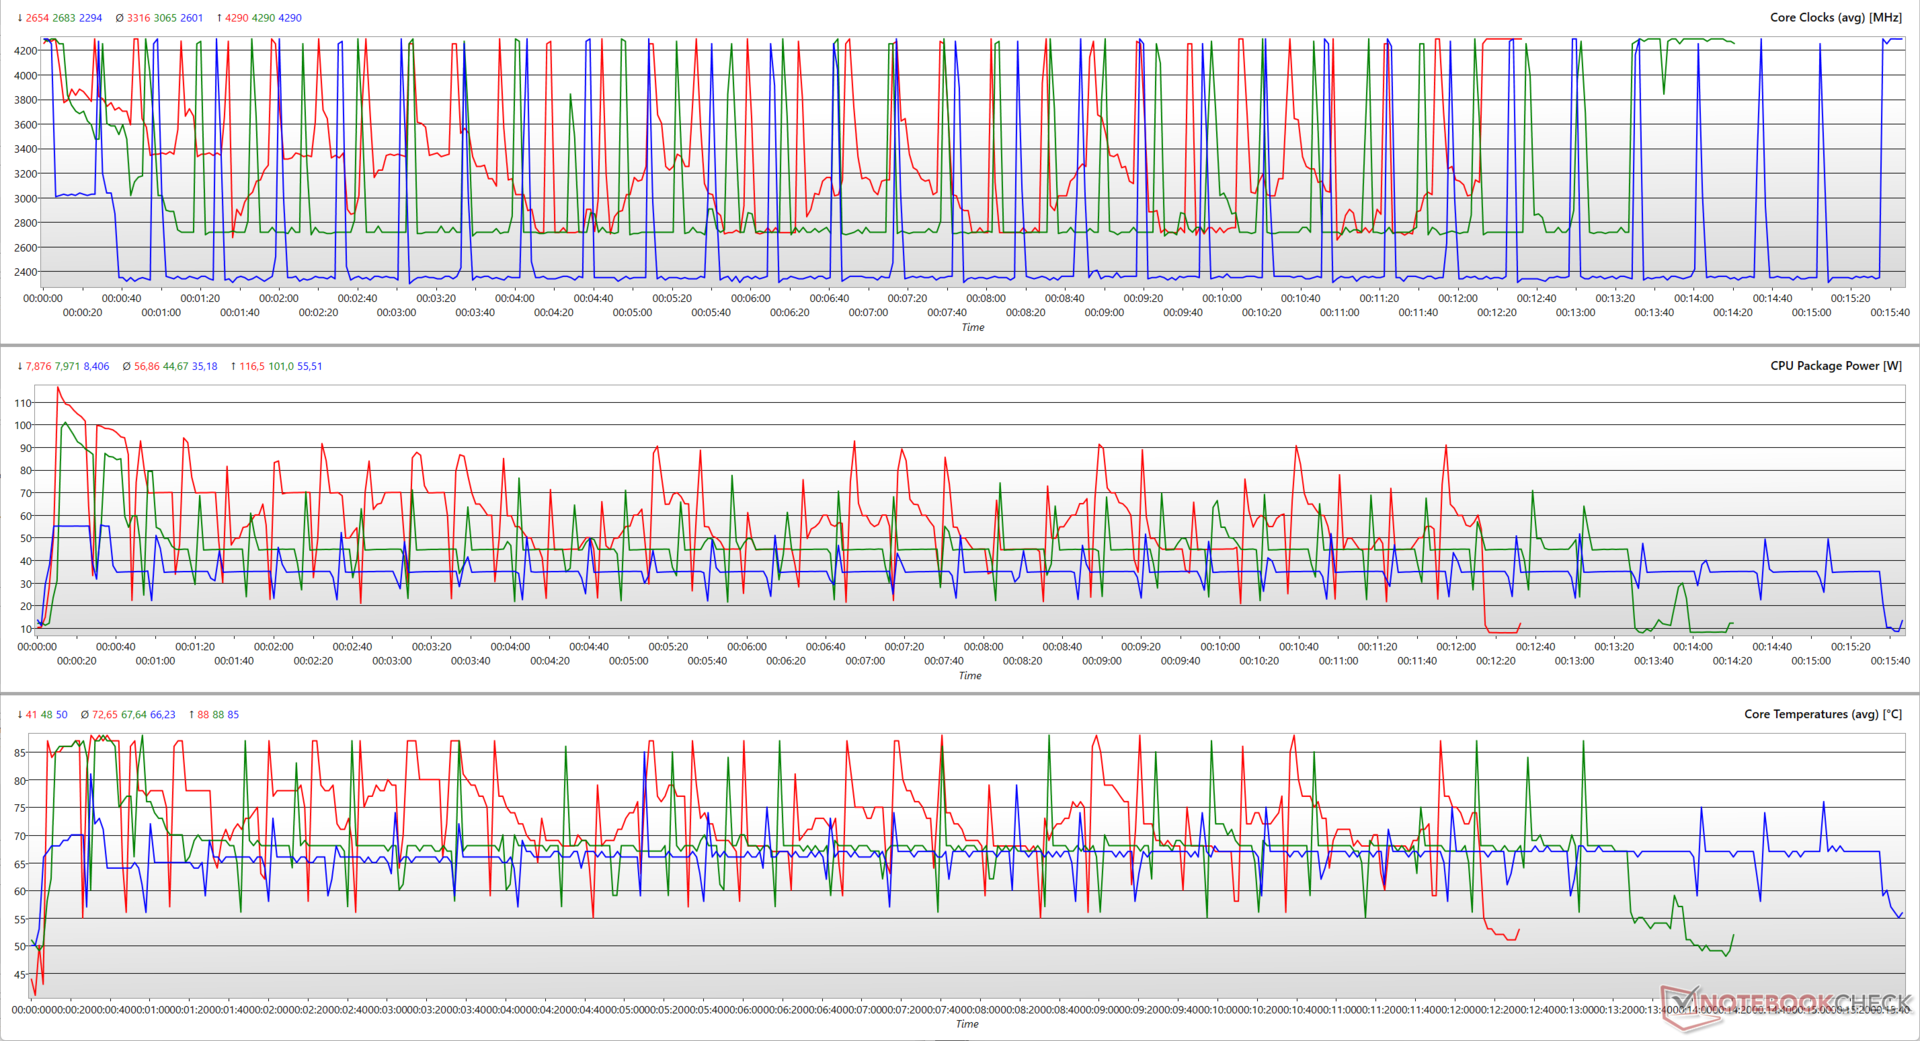
Uma análise do teste de loop de vários núcleos Cinebench R15 mostra como os perfis de energia incorporados influenciam vários parâmetros da CPU.
Embora o modo Desempenho deva permitir que o processador utilize até 135 W PL2, vemos que ele só atinge o máximo em 116,5 W. O modo Equilíbrio também parece se contentar com uma potência de pacote menor do que a possível (101 W vs. 117 W), mas aqui vemos uma execução mais estável em comparação com o modo Desempenho.
É possível que o sistema de resfriamento do LOQ 15IRH8 esteja com dificuldades sempre que o limite de energia ultrapassa 116 W, o que explica o baixo desempenho sustentado nesse benchmark.
As pontuações de vários núcleos do Cinebench R20 caem 23% com a energia da bateria, embora o desempenho de um único núcleo sofra apenas um pequeno impacto.
AIDA64: FP32 Ray-Trace | FPU Julia | CPU SHA3 | CPU Queen | FPU SinJulia | FPU Mandel | CPU AES | CPU ZLib | FP64 Ray-Trace | CPU PhotoWorxx
| Performance rating | |
| Média da turma Gaming | |
| Asus TUF Gaming A16 FA617XS | |
| Lenovo LOQ 15APH8 | |
| Dell G15 5530 | |
| Lenovo Legion Pro 5 16ARX8 (R5 7645HX, RTX 4050) | |
| HP Victus 16-r0077ng | |
| MSI Katana 17 B13VFK | |
| Lenovo LOQ 16IRH8 | |
| Lenovo LOQ 15IRH8 Core i7 | |
| Média Intel Core i7-13620H | |
| AIDA64 / FP32 Ray-Trace | |
| Média da turma Gaming (10227 - 85542, n=105, últimos 2 anos) | |
| Lenovo LOQ 15APH8 | |
| Asus TUF Gaming A16 FA617XS | |
| Lenovo Legion Pro 5 16ARX8 (R5 7645HX, RTX 4050) | |
| Dell G15 5530 | |
| HP Victus 16-r0077ng | |
| MSI Katana 17 B13VFK | |
| Lenovo LOQ 16IRH8 | |
| Média Intel Core i7-13620H (10779 - 13601, n=7) | |
| Lenovo LOQ 15IRH8 Core i7 | |
| AIDA64 / FPU Julia | |
| Média da turma Gaming (51376 - 238426, n=105, últimos 2 anos) | |
| Lenovo LOQ 15APH8 | |
| Asus TUF Gaming A16 FA617XS | |
| Lenovo Legion Pro 5 16ARX8 (R5 7645HX, RTX 4050) | |
| Dell G15 5530 | |
| HP Victus 16-r0077ng | |
| MSI Katana 17 B13VFK | |
| Lenovo LOQ 16IRH8 | |
| Lenovo LOQ 15IRH8 Core i7 | |
| Média Intel Core i7-13620H (54287 - 67187, n=7) | |
| AIDA64 / CPU SHA3 | |
| Média da turma Gaming (2180 - 10115, n=105, últimos 2 anos) | |
| Lenovo LOQ 15APH8 | |
| Asus TUF Gaming A16 FA617XS | |
| Dell G15 5530 | |
| Lenovo Legion Pro 5 16ARX8 (R5 7645HX, RTX 4050) | |
| HP Victus 16-r0077ng | |
| MSI Katana 17 B13VFK | |
| Lenovo LOQ 16IRH8 | |
| Média Intel Core i7-13620H (2327 - 2773, n=7) | |
| Lenovo LOQ 15IRH8 Core i7 | |
| AIDA64 / CPU Queen | |
| Asus TUF Gaming A16 FA617XS | |
| Lenovo LOQ 15APH8 | |
| Média da turma Gaming (49785 - 173351, n=90, últimos 2 anos) | |
| Dell G15 5530 | |
| Lenovo Legion Pro 5 16ARX8 (R5 7645HX, RTX 4050) | |
| HP Victus 16-r0077ng | |
| Lenovo LOQ 15IRH8 Core i7 | |
| Lenovo LOQ 16IRH8 | |
| MSI Katana 17 B13VFK | |
| Média Intel Core i7-13620H (66885 - 78867, n=7) | |
| AIDA64 / FPU SinJulia | |
| Asus TUF Gaming A16 FA617XS | |
| Lenovo LOQ 15APH8 | |
| Média da turma Gaming (4424 - 33636, n=105, últimos 2 anos) | |
| Lenovo Legion Pro 5 16ARX8 (R5 7645HX, RTX 4050) | |
| Dell G15 5530 | |
| HP Victus 16-r0077ng | |
| MSI Katana 17 B13VFK | |
| Lenovo LOQ 16IRH8 | |
| Média Intel Core i7-13620H (6737 - 8421, n=7) | |
| Lenovo LOQ 15IRH8 Core i7 | |
| AIDA64 / FPU Mandel | |
| Média da turma Gaming (25115 - 128721, n=105, últimos 2 anos) | |
| Lenovo LOQ 15APH8 | |
| Asus TUF Gaming A16 FA617XS | |
| Lenovo Legion Pro 5 16ARX8 (R5 7645HX, RTX 4050) | |
| Dell G15 5530 | |
| HP Victus 16-r0077ng | |
| MSI Katana 17 B13VFK | |
| Lenovo LOQ 16IRH8 | |
| Lenovo LOQ 15IRH8 Core i7 | |
| Média Intel Core i7-13620H (27242 - 32787, n=7) | |
| AIDA64 / CPU AES | |
| Média da turma Gaming (39258 - 247074, n=105, últimos 2 anos) | |
| Asus TUF Gaming A16 FA617XS | |
| Dell G15 5530 | |
| Lenovo LOQ 15APH8 | |
| HP Victus 16-r0077ng | |
| Média Intel Core i7-13620H (48646 - 85895, n=7) | |
| MSI Katana 17 B13VFK | |
| Lenovo LOQ 16IRH8 | |
| Lenovo Legion Pro 5 16ARX8 (R5 7645HX, RTX 4050) | |
| Lenovo LOQ 15IRH8 Core i7 | |
| AIDA64 / CPU ZLib | |
| Média da turma Gaming (574 - 2531, n=105, últimos 2 anos) | |
| Dell G15 5530 | |
| Lenovo LOQ 15APH8 | |
| Asus TUF Gaming A16 FA617XS | |
| HP Victus 16-r0077ng | |
| Lenovo Legion Pro 5 16ARX8 (R5 7645HX, RTX 4050) | |
| Lenovo LOQ 16IRH8 | |
| MSI Katana 17 B13VFK | |
| Média Intel Core i7-13620H (688 - 835, n=7) | |
| Lenovo LOQ 15IRH8 Core i7 | |
| AIDA64 / FP64 Ray-Trace | |
| Média da turma Gaming (5509 - 45446, n=105, últimos 2 anos) | |
| Lenovo LOQ 15APH8 | |
| Asus TUF Gaming A16 FA617XS | |
| Lenovo Legion Pro 5 16ARX8 (R5 7645HX, RTX 4050) | |
| Dell G15 5530 | |
| HP Victus 16-r0077ng | |
| MSI Katana 17 B13VFK | |
| Lenovo LOQ 16IRH8 | |
| Média Intel Core i7-13620H (5919 - 7364, n=7) | |
| Lenovo LOQ 15IRH8 Core i7 | |
| AIDA64 / CPU PhotoWorxx | |
| Média da turma Gaming (12271 - 89891, n=105, últimos 2 anos) | |
| HP Victus 16-r0077ng | |
| Dell G15 5530 | |
| MSI Katana 17 B13VFK | |
| Lenovo LOQ 15IRH8 Core i7 | |
| Lenovo LOQ 16IRH8 | |
| Asus TUF Gaming A16 FA617XS | |
| Lenovo Legion Pro 5 16ARX8 (R5 7645HX, RTX 4050) | |
| Média Intel Core i7-13620H (19421 - 34544, n=7) | |
| Lenovo LOQ 15APH8 | |
Confira nosso site dedicado Intel Core i7-13620H para obter mais informações e comparações de desempenho.
Desempenho do sistema
O LOQ 15IRH8 lidera seu primo LOQ 15APH8 baseado em AMD em 19% no CrossMark geral, mas esses dois dispositivos estão praticamente empatados no PCMark. Não observamos nenhum soluço no desempenho diário do sistema durante as tarefas de produtividade ou de jogos.
CrossMark: Overall | Productivity | Creativity | Responsiveness
AIDA64: Memory Copy | Memory Read | Memory Write | Memory Latency
| PCMark 10 / Score | |
| Média da turma Gaming (5828 - 12414, n=93, últimos 2 anos) | |
| Lenovo Legion Pro 5 16ARX8 (R5 7645HX, RTX 4050) | |
| Asus TUF Gaming A16 FA617XS | |
| Lenovo LOQ 15APH8 | |
| Lenovo LOQ 15IRH8 Core i7 | |
| Média Intel Core i7-13620H, NVIDIA GeForce RTX 4050 Laptop GPU (n=1) | |
| MSI Katana 17 B13VFK | |
| HP Victus 16-r0077ng | |
| Dell G15 5530 | |
| Lenovo LOQ 16IRH8 | |
| PCMark 10 / Essentials | |
| Lenovo Legion Pro 5 16ARX8 (R5 7645HX, RTX 4050) | |
| Dell G15 5530 | |
| Lenovo LOQ 15IRH8 Core i7 | |
| Média Intel Core i7-13620H, NVIDIA GeForce RTX 4050 Laptop GPU (n=1) | |
| Asus TUF Gaming A16 FA617XS | |
| MSI Katana 17 B13VFK | |
| HP Victus 16-r0077ng | |
| Média da turma Gaming (8810 - 11935, n=97, últimos 2 anos) | |
| Lenovo LOQ 15APH8 | |
| Lenovo LOQ 16IRH8 | |
| PCMark 10 / Productivity | |
| Média da turma Gaming (6845 - 25323, n=95, últimos 2 anos) | |
| Lenovo Legion Pro 5 16ARX8 (R5 7645HX, RTX 4050) | |
| Asus TUF Gaming A16 FA617XS | |
| Dell G15 5530 | |
| Lenovo LOQ 15APH8 | |
| Lenovo LOQ 15IRH8 Core i7 | |
| Média Intel Core i7-13620H, NVIDIA GeForce RTX 4050 Laptop GPU (n=1) | |
| MSI Katana 17 B13VFK | |
| HP Victus 16-r0077ng | |
| Lenovo LOQ 16IRH8 | |
| PCMark 10 / Digital Content Creation | |
| Média da turma Gaming (7602 - 19954, n=95, últimos 2 anos) | |
| Asus TUF Gaming A16 FA617XS | |
| Lenovo LOQ 15APH8 | |
| Lenovo LOQ 15IRH8 Core i7 | |
| Média Intel Core i7-13620H, NVIDIA GeForce RTX 4050 Laptop GPU (n=1) | |
| Lenovo Legion Pro 5 16ARX8 (R5 7645HX, RTX 4050) | |
| HP Victus 16-r0077ng | |
| MSI Katana 17 B13VFK | |
| Lenovo LOQ 16IRH8 | |
| Dell G15 5530 | |
| CrossMark / Overall | |
| Média da turma Gaming (1366 - 2409, n=94, últimos 2 anos) | |
| Lenovo LOQ 16IRH8 | |
| Lenovo Legion Pro 5 16ARX8 (R5 7645HX, RTX 4050) | |
| Lenovo LOQ 15IRH8 Core i7 | |
| Média Intel Core i7-13620H, NVIDIA GeForce RTX 4050 Laptop GPU (n=1) | |
| MSI Katana 17 B13VFK | |
| Dell G15 5530 | |
| Asus TUF Gaming A16 FA617XS | |
| Lenovo LOQ 15APH8 | |
| CrossMark / Productivity | |
| Lenovo Legion Pro 5 16ARX8 (R5 7645HX, RTX 4050) | |
| Lenovo LOQ 16IRH8 | |
| Média da turma Gaming (1386 - 2254, n=94, últimos 2 anos) | |
| Lenovo LOQ 15IRH8 Core i7 | |
| Média Intel Core i7-13620H, NVIDIA GeForce RTX 4050 Laptop GPU (n=1) | |
| MSI Katana 17 B13VFK | |
| Dell G15 5530 | |
| Asus TUF Gaming A16 FA617XS | |
| Lenovo LOQ 15APH8 | |
| CrossMark / Creativity | |
| Média da turma Gaming (1343 - 2786, n=94, últimos 2 anos) | |
| Dell G15 5530 | |
| Lenovo LOQ 16IRH8 | |
| Lenovo Legion Pro 5 16ARX8 (R5 7645HX, RTX 4050) | |
| MSI Katana 17 B13VFK | |
| Lenovo LOQ 15IRH8 Core i7 | |
| Média Intel Core i7-13620H, NVIDIA GeForce RTX 4050 Laptop GPU (n=1) | |
| Asus TUF Gaming A16 FA617XS | |
| Lenovo LOQ 15APH8 | |
| CrossMark / Responsiveness | |
| Lenovo LOQ 16IRH8 | |
| Lenovo Legion Pro 5 16ARX8 (R5 7645HX, RTX 4050) | |
| Lenovo LOQ 15IRH8 Core i7 | |
| Média Intel Core i7-13620H, NVIDIA GeForce RTX 4050 Laptop GPU (n=1) | |
| MSI Katana 17 B13VFK | |
| Média da turma Gaming (1226 - 2334, n=94, últimos 2 anos) | |
| Dell G15 5530 | |
| Asus TUF Gaming A16 FA617XS | |
| Lenovo LOQ 15APH8 | |
| AIDA64 / Memory Copy | |
| Média da turma Gaming (21750 - 129946, n=105, últimos 2 anos) | |
| HP Victus 16-r0077ng | |
| Asus TUF Gaming A16 FA617XS | |
| Dell G15 5530 | |
| Lenovo LOQ 15IRH8 Core i7 | |
| Média Intel Core i7-13620H, NVIDIA GeForce RTX 4050 Laptop GPU (n=1) | |
| Lenovo LOQ 16IRH8 | |
| MSI Katana 17 B13VFK | |
| Lenovo Legion Pro 5 16ARX8 (R5 7645HX, RTX 4050) | |
| Lenovo LOQ 15APH8 | |
| AIDA64 / Memory Read | |
| Média da turma Gaming (22956 - 118858, n=105, últimos 2 anos) | |
| HP Victus 16-r0077ng | |
| Dell G15 5530 | |
| Lenovo LOQ 16IRH8 | |
| Lenovo LOQ 15IRH8 Core i7 | |
| Média Intel Core i7-13620H, NVIDIA GeForce RTX 4050 Laptop GPU (n=1) | |
| MSI Katana 17 B13VFK | |
| Asus TUF Gaming A16 FA617XS | |
| Lenovo Legion Pro 5 16ARX8 (R5 7645HX, RTX 4050) | |
| Lenovo LOQ 15APH8 | |
| AIDA64 / Memory Write | |
| Média da turma Gaming (22297 - 135096, n=105, últimos 2 anos) | |
| Asus TUF Gaming A16 FA617XS | |
| HP Victus 16-r0077ng | |
| Dell G15 5530 | |
| Lenovo LOQ 15IRH8 Core i7 | |
| Média Intel Core i7-13620H, NVIDIA GeForce RTX 4050 Laptop GPU (n=1) | |
| Lenovo LOQ 16IRH8 | |
| Lenovo Legion Pro 5 16ARX8 (R5 7645HX, RTX 4050) | |
| MSI Katana 17 B13VFK | |
| Lenovo LOQ 15APH8 | |
| AIDA64 / Memory Latency | |
| Lenovo LOQ 15IRH8 Core i7 | |
| Média Intel Core i7-13620H, NVIDIA GeForce RTX 4050 Laptop GPU (n=1) | |
| Lenovo LOQ 16IRH8 | |
| Média da turma Gaming (75.3 - 259, n=105, últimos 2 anos) | |
| MSI Katana 17 B13VFK | |
| Lenovo LOQ 15APH8 | |
| HP Victus 16-r0077ng | |
| Dell G15 5530 | |
| Asus TUF Gaming A16 FA617XS | |
| Lenovo Legion Pro 5 16ARX8 (R5 7645HX, RTX 4050) | |
* ... menor é melhor
| PCMark 8 Home Score Accelerated v2 | 5795 pontos | |
| PCMark 8 Work Score Accelerated v2 | 6177 pontos | |
| PCMark 10 Score | 7656 pontos | |
Ajuda | ||
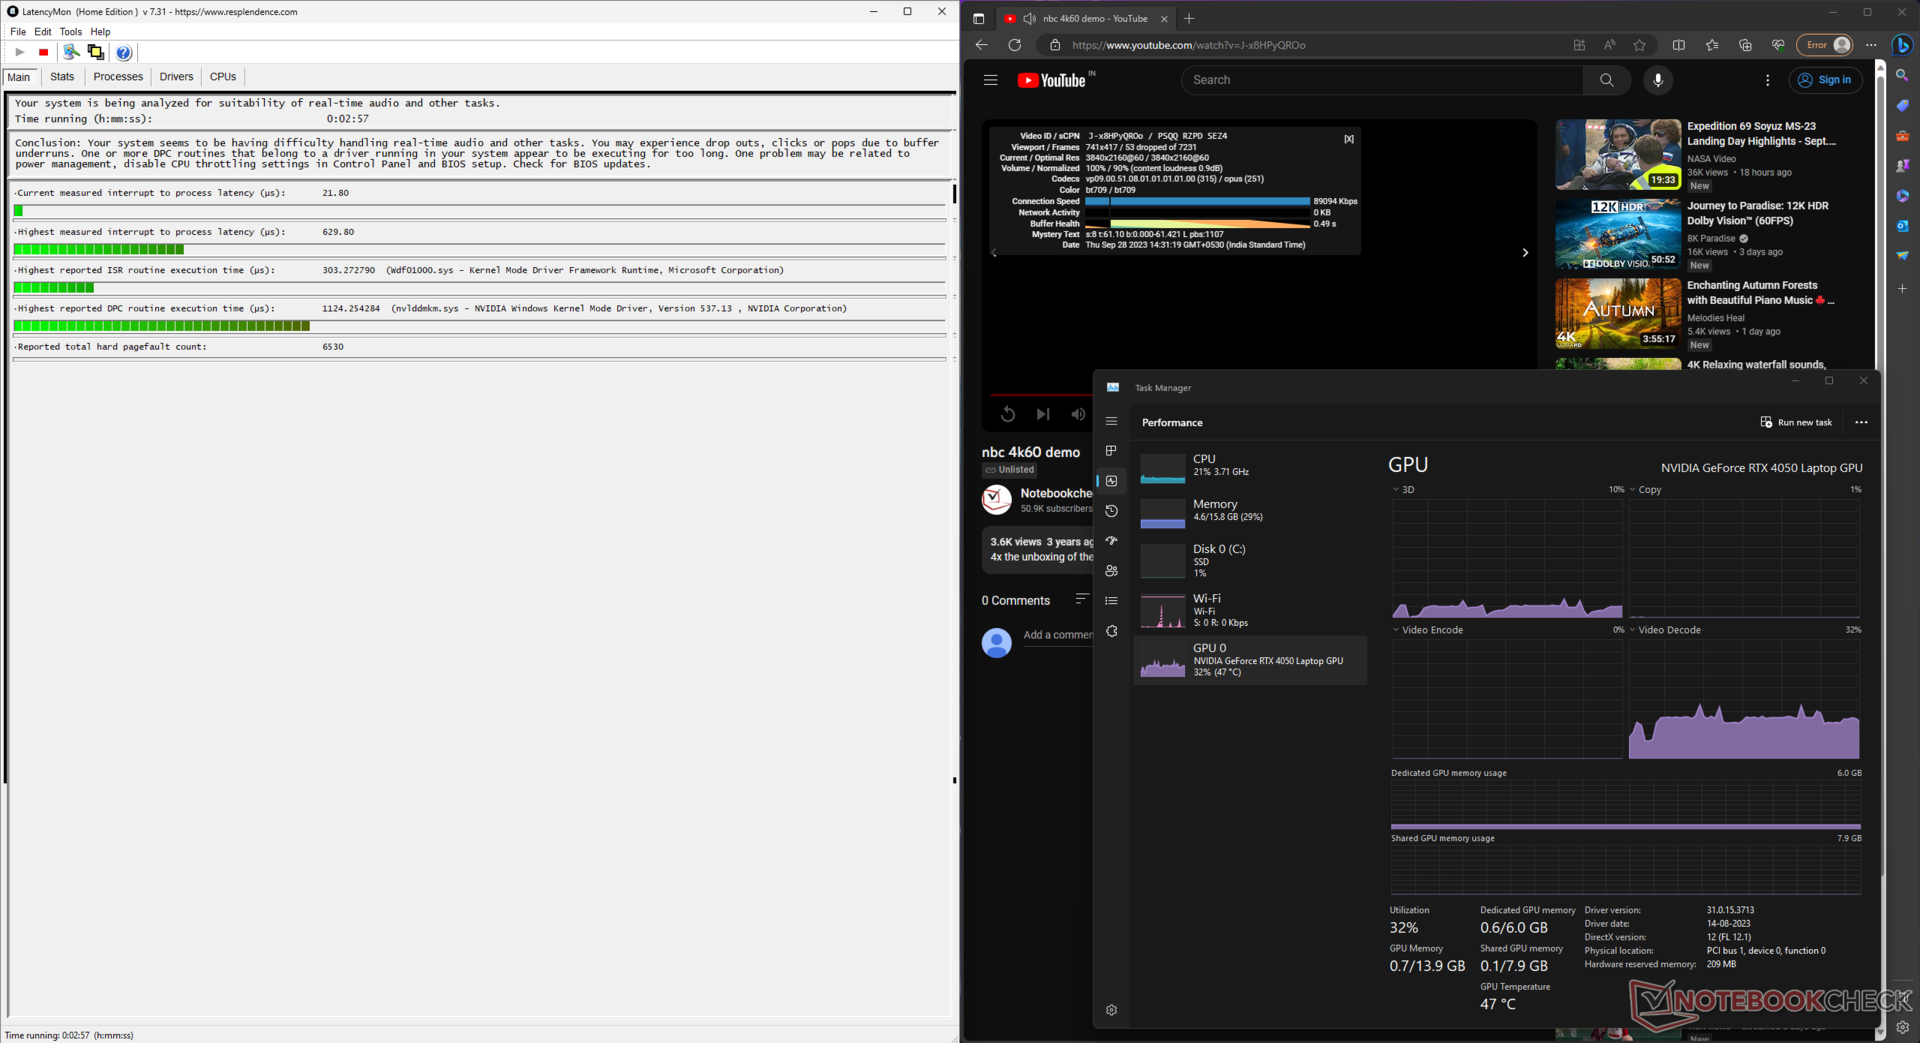
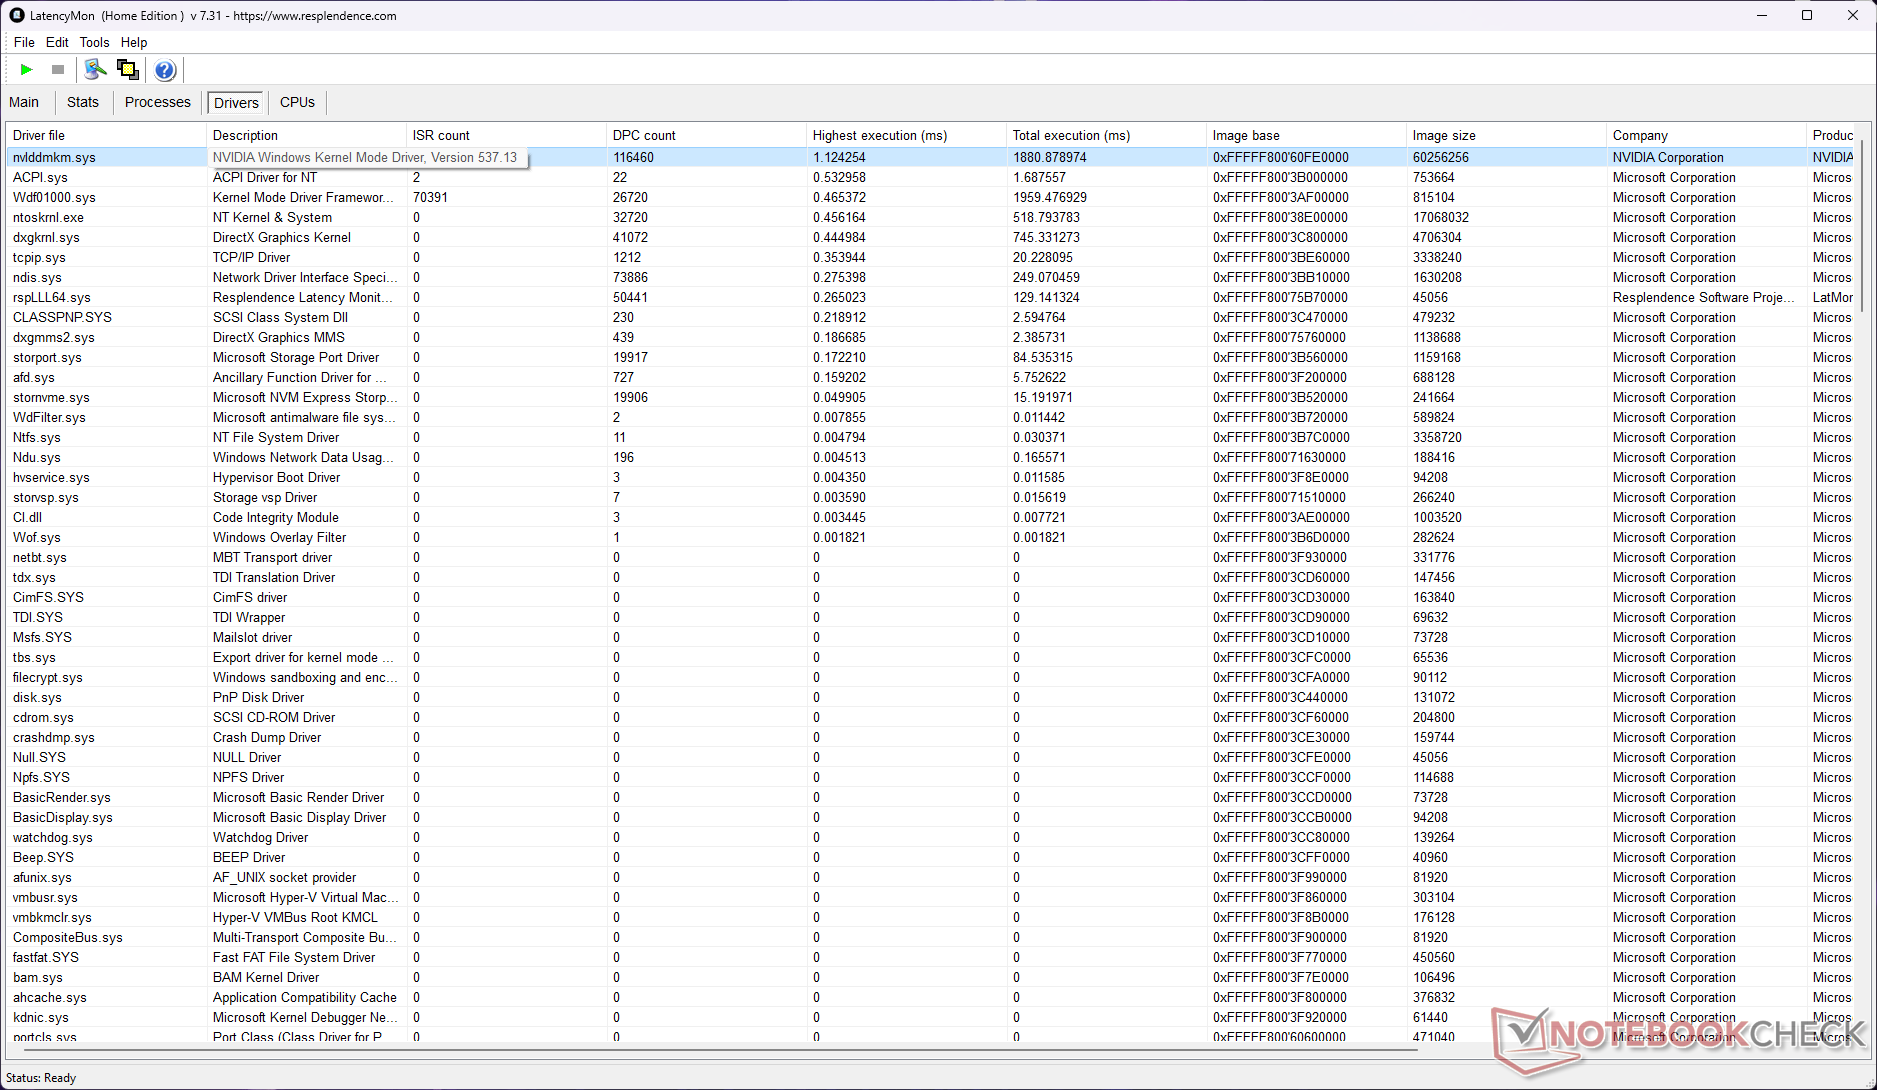
Latência DPC
A latência DPC é um pouco mais alta, mas o LOQ 15 Core i7 se sai muito melhor em comparação com seus pares no teste.
| DPC Latencies / LatencyMon - interrupt to process latency (max), Web, Youtube, Prime95 | |
| Dell G15 5530 | |
| MSI Katana 17 B13VFK | |
| HP Victus 16-r0077ng | |
| Lenovo LOQ 15APH8 | |
| Lenovo LOQ 16IRH8 | |
| Asus TUF Gaming A16 FA617XS | |
| Lenovo Legion Pro 5 16ARX8 (R5 7645HX, RTX 4050) | |
| Lenovo LOQ 15IRH8 Core i7 | |
* ... menor é melhor
Nosso Classificação de latência do DPC oferece uma visão geral da latência medida nos dispositivos analisados.
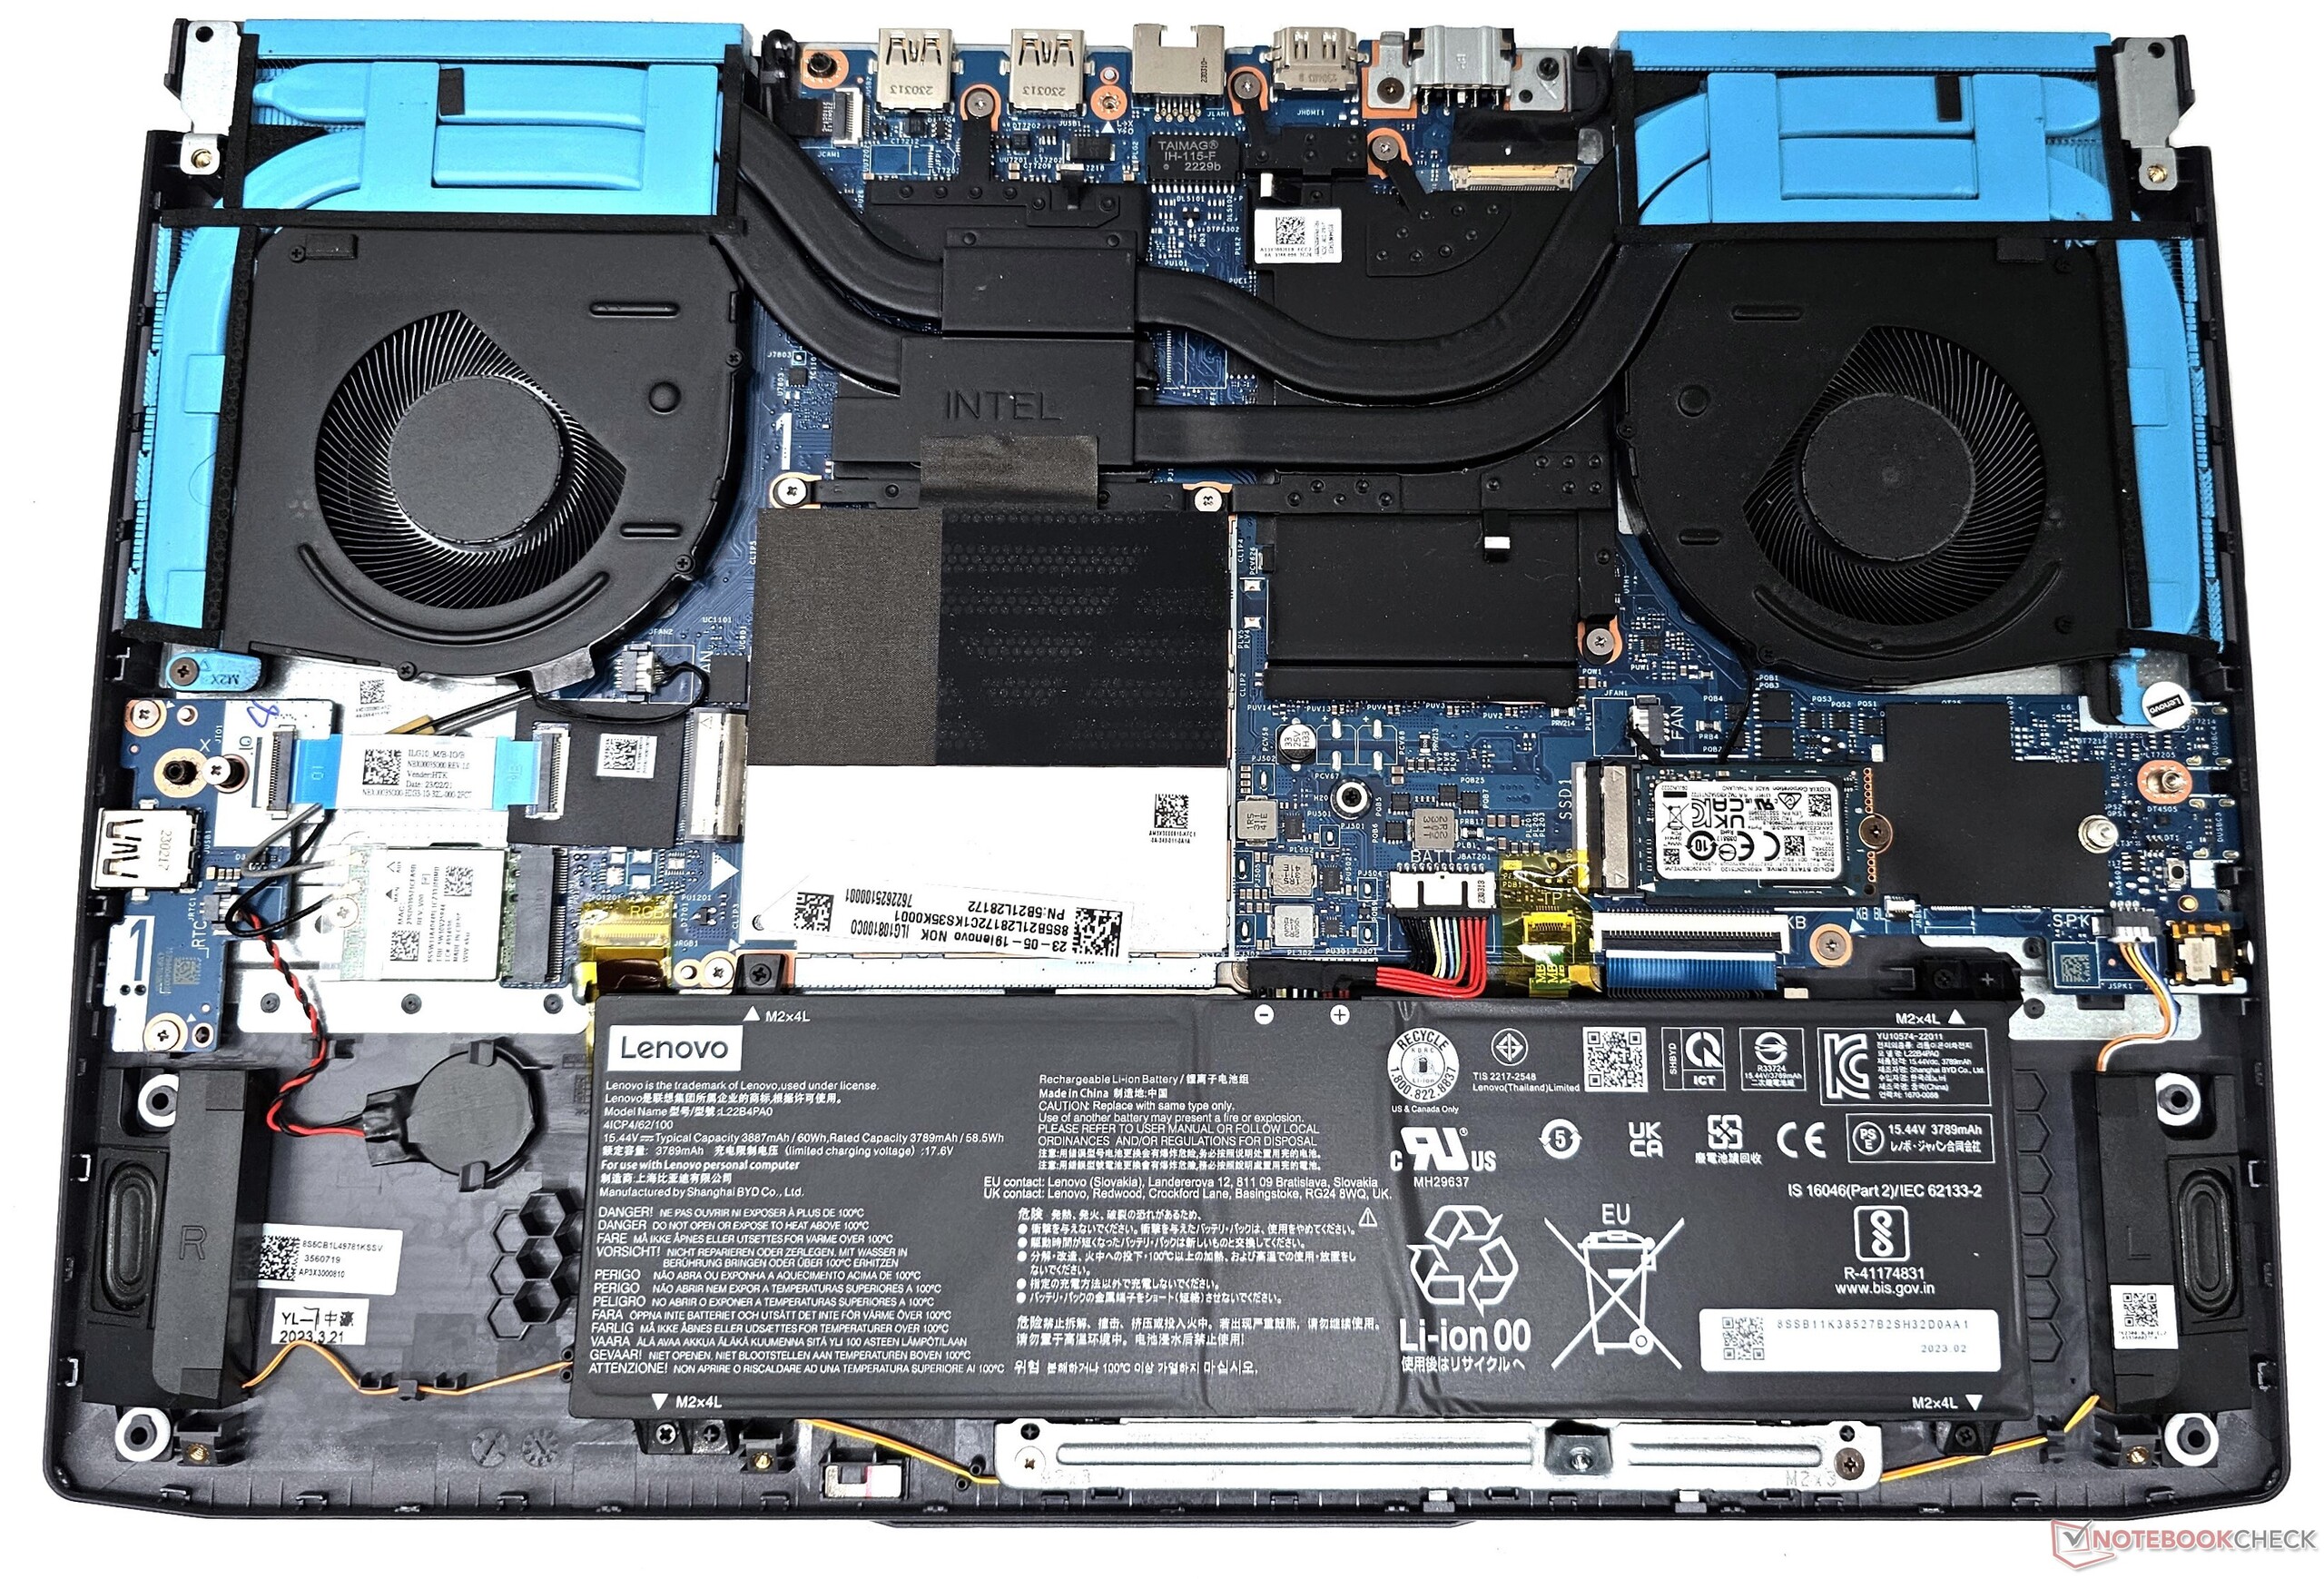
Dispositivos de armazenamento
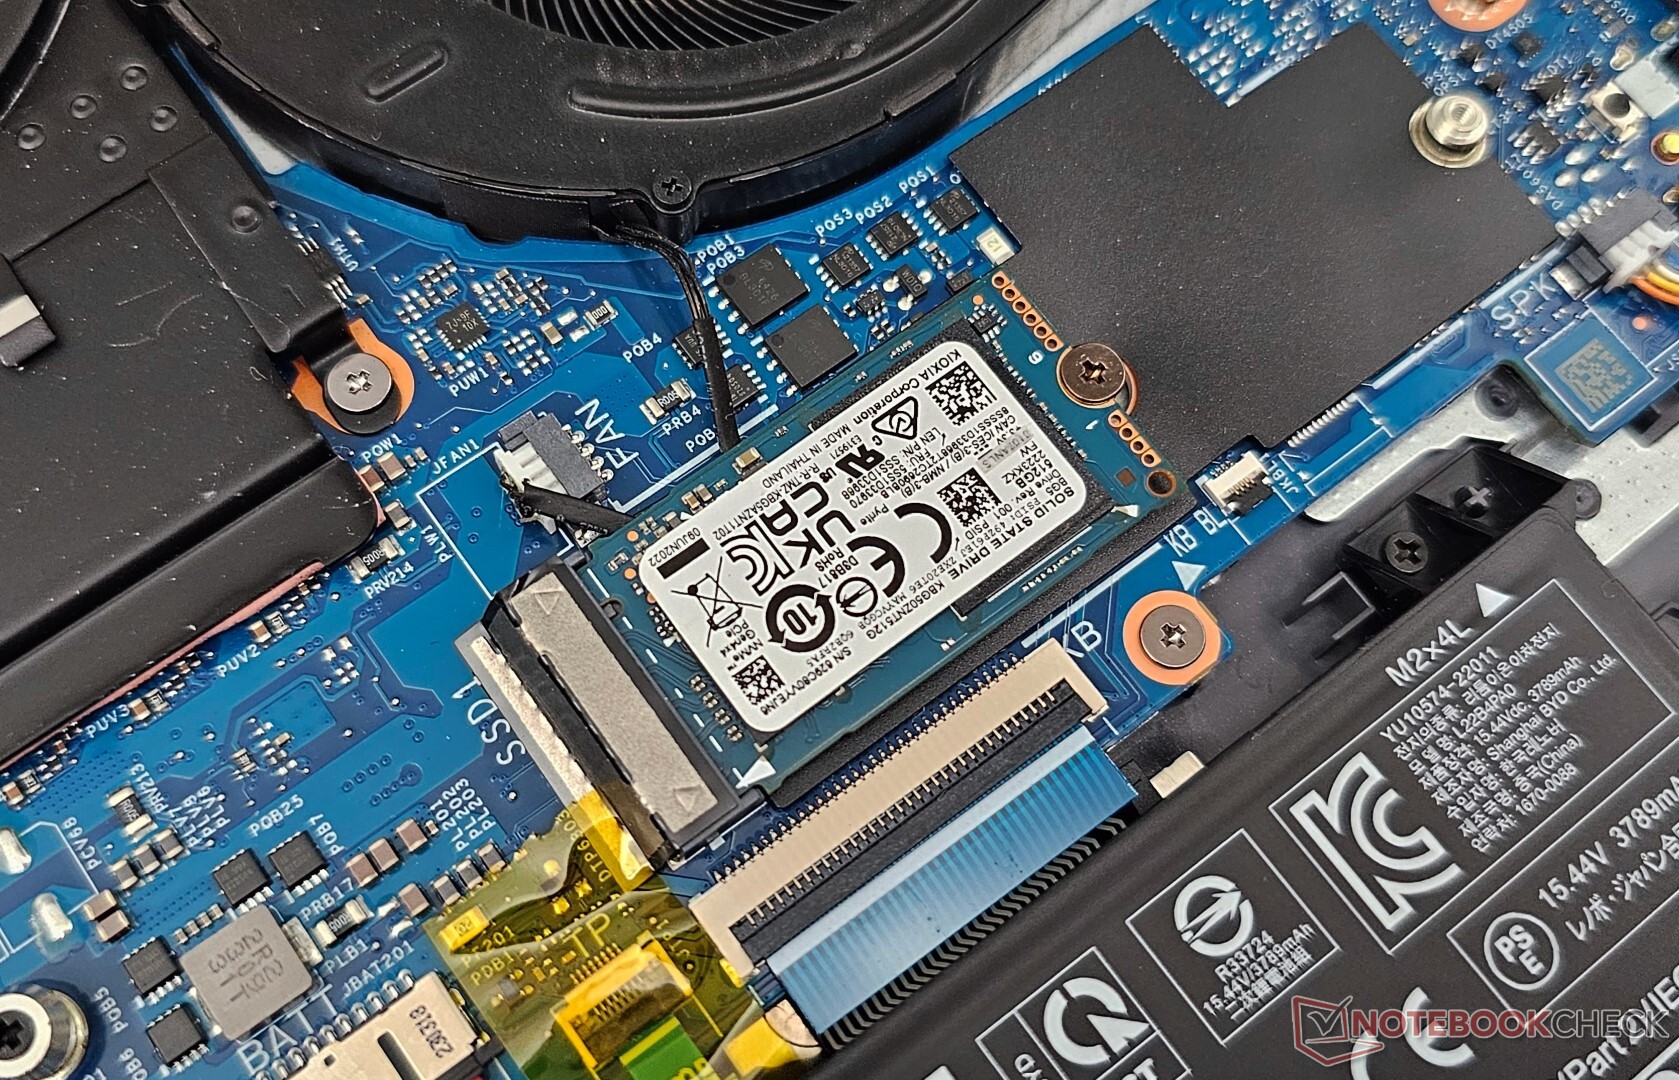
Nossa unidade LOQ 15IRH8 veio equipada com um SSD Kioxia 512 GB M.2 2230 PCIe Gen4 NVMe. O senhor pode substituí-lo por uma unidade M.2280 de maior capacidade, se necessário. Há também um slot M.2 2280 gratuito disponível para expansão do armazenamento.
O desempenho geral da unidade fica atrás da unidade Kioxia de 1 TB encontrada no HP Victus 16. A SSD também tem dificuldades para manter uma velocidade de leitura consistente, pois observamos quedas de desempenho após a 25ª execução em nosso teste de loop de leitura DiskSpd com uma profundidade de fila de 8.

* ... menor é melhor
Disk Throttling: DiskSpd Read Loop, Queue Depth 8
Mais informações e comparações de desempenho podem ser obtidas em nossos Benchmarks de HDD e SSD página.
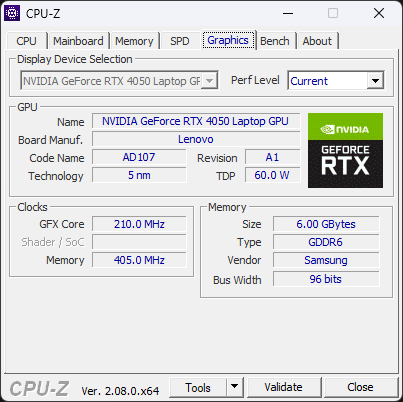
Desempenho da GPU
A GPU para laptop RTX 4050 no LOQ 15IRH8 é classificada com um TGP de 95 W, mas tem espaço para utilizar mais energia durante o estresse. Vemos que a mesma GPU no LOQ 15APH8 é cerca de 6% mais rápida nos testes cumulativos do 3DMark.
É interessante notar que esse RTX 4050 de 95 W está apenas um pouco atrás da variante de 140 W do Lenovo Legion Pro 5. No entanto, o último compensa esse déficit no benchmark Blender CUDA.
| 3DMark 11 Performance | 27474 pontos | |
| 3DMark Ice Storm Standard Score | 229274 pontos | |
| 3DMark Cloud Gate Standard Score | 49040 pontos | |
| 3DMark Fire Strike Score | 19230 pontos | |
| 3DMark Fire Strike Extreme Score | 9873 pontos | |
| 3DMark Time Spy Score | 8701 pontos | |
Ajuda | ||
| Blender / v3.3 Classroom OPTIX/RTX | |
| Média NVIDIA GeForce RTX 4050 Laptop GPU (25 - 37, n=40) | |
| Lenovo Legion Pro 5 16ARX8 (R5 7645HX, RTX 4050) | |
| Lenovo LOQ 15IRH8 Core i7 | |
| MSI Katana 17 B13VFK | |
| Lenovo LOQ 15APH8 | |
| HP Victus 16-r0077ng | |
| Lenovo LOQ 16IRH8 | |
| Dell G15 5530 | |
| Média da turma Gaming (9 - 32, n=106, últimos 2 anos) | |
| Blender / v3.3 Classroom CUDA | |
| Média NVIDIA GeForce RTX 4050 Laptop GPU (47 - 68, n=39) | |
| Lenovo LOQ 15IRH8 Core i7 | |
| Lenovo LOQ 15APH8 | |
| Lenovo Legion Pro 5 16ARX8 (R5 7645HX, RTX 4050) | |
| MSI Katana 17 B13VFK | |
| Lenovo LOQ 16IRH8 | |
| Dell G15 5530 | |
| HP Victus 16-r0077ng | |
| Média da turma Gaming (15 - 228, n=106, últimos 2 anos) | |
| Blender / v3.3 Classroom CPU | |
| Lenovo LOQ 15IRH8 Core i7 | |
| Média NVIDIA GeForce RTX 4050 Laptop GPU (243 - 907, n=40) | |
| Lenovo LOQ 16IRH8 | |
| HP Victus 16-r0077ng | |
| Lenovo Legion Pro 5 16ARX8 (R5 7645HX, RTX 4050) | |
| MSI Katana 17 B13VFK | |
| Asus TUF Gaming A16 FA617XS | |
| Lenovo LOQ 15APH8 | |
| Dell G15 5530 | |
| Média da turma Gaming (122 - 565, n=102, últimos 2 anos) | |
* ... menor é melhor
Desempenho em jogos
Tendências semelhantes também são observadas nos benchmarks de jogos. O RTX 4050 de 95 W do LOQ 15 e o RTX 4050 de 140 W do Legion Pro 5 apresentaram um desempenho quase idêntico nos testes cumulativos de jogos em 1080p Ultra, mas a potência mais alta do último permite uma vantagem perceptível em QHD Ultra.
O LOQ 15IRH8 é essencialmente uma máquina para jogos em 1080p Ultra. É possível obter taxas de quadros jogáveis em QHD Ultra em títulos um pouco mais antigos. Os jogadores que desejam obter mais quadros em QHD ou 4K terão que inevitavelmente usar tecnologias de aumento de escala como AMD FSR, Nvidia DLSS ou Intel XeSS, dependendo do título.
| The Witcher 3 - 1920x1080 Ultra Graphics & Postprocessing (HBAO+) | |
| Média da turma Gaming (104.7 - 240, n=7, últimos 2 anos) | |
| HP Victus 16-r0077ng | |
| MSI Katana 17 B13VFK | |
| Dell G15 5530 | |
| Lenovo LOQ 16IRH8 | |
| Asus TUF Gaming A16 FA617XS | |
| Lenovo Legion Pro 5 16ARX8 (R5 7645HX, RTX 4050) | |
| Lenovo LOQ 15IRH8 Core i7 | |
| Lenovo LOQ 15APH8 | |
| The Witcher 3 - 2560x1440 Ultra Graphics & Postprocessing (HBAO+) | |
| Média da turma Gaming (130 - 199.1, n=5, últimos 2 anos) | |
| Lenovo LOQ 16IRH8 | |
| Lenovo LOQ 15IRH8 Core i7 | |
| Média NVIDIA GeForce RTX 4050 Laptop GPU (39 - 61.3, n=8) | |
| Cyberpunk 2077 1.6 | |
| 1920x1080 Ultra Preset | |
| Dell G15 5530 | |
| MSI Katana 17 B13VFK | |
| Lenovo LOQ 15APH8 | |
| Lenovo LOQ 15IRH8 Core i7 | |
| Média NVIDIA GeForce RTX 4050 Laptop GPU (44.4 - 79.4, n=14) | |
| 2560x1440 Ultra Preset | |
| MSI Katana 17 B13VFK | |
| Lenovo LOQ 15IRH8 Core i7 | |
| Média NVIDIA GeForce RTX 4050 Laptop GPU (27.2 - 43.1, n=10) | |
| 1920x1080 Ray Tracing Ultra Preset (DLSS off) | |
| Dell G15 5530 | |
| Média NVIDIA GeForce RTX 4050 Laptop GPU (15.8 - 65.6, n=5) | |
| MSI Katana 17 B13VFK | |
| Lenovo LOQ 15IRH8 Core i7 | |
| F1 22 | |
| 1920x1080 Ultra High Preset AA:T AF:16x | |
| Média da turma Gaming (40.1 - 121.2, n=4, últimos 2 anos) | |
| Dell G15 5530 | |
| MSI Katana 17 B13VFK | |
| Lenovo LOQ 15IRH8 Core i7 | |
| Asus TUF Gaming A16 FA617XS | |
| Média NVIDIA GeForce RTX 4050 Laptop GPU (10.9 - 56.4, n=24) | |
| 2560x1440 Ultra High Preset AA:T AF:16x | |
| Média da turma Gaming (42 - 77.8, n=3, últimos 2 anos) | |
| MSI Katana 17 B13VFK | |
| Lenovo LOQ 15IRH8 Core i7 | |
| Média NVIDIA GeForce RTX 4050 Laptop GPU (6.58 - 34, n=14) | |
| F1 23 | |
| 1920x1080 Ultra High Preset AA:T AF:16x | |
| Lenovo Legion Pro 5 16ARX8 (R5 7645HX, RTX 4050) | |
| Lenovo LOQ 15IRH8 Core i7 | |
| Média NVIDIA GeForce RTX 4050 Laptop GPU (25.7 - 60.8, n=14) | |
| 2560x1440 Ultra High Preset AA:T AF:16x | |
| Lenovo Legion Pro 5 16ARX8 (R5 7645HX, RTX 4050) | |
| Lenovo LOQ 15IRH8 Core i7 | |
| Média NVIDIA GeForce RTX 4050 Laptop GPU (16.7 - 40.8, n=11) | |
O gráfico Witcher 3 FPS
Embora o desempenho sustentado da CPU do LOQ 15 (ou a falta dele) seja motivo de preocupação, o resfriamento do laptop parece adequado para a GPU RTX 4050 Laptop, conforme evidenciado pelas taxas de quadros relativamente estáveis em The Witcher 3 a 1080p Ultra.
| baixo | média | alto | ultra | QHD | |
|---|---|---|---|---|---|
| GTA V (2015) | 185.9 | 179.7 | 168.9 | 93.2 | 66 |
| The Witcher 3 (2015) | 390 | 286 | 167.6 | 85.6 | 61.3 |
| Dota 2 Reborn (2015) | 196.3 | 178.3 | 171.1 | 162.2 | |
| Final Fantasy XV Benchmark (2018) | 192.9 | 121.2 | 84 | 60.9 | |
| X-Plane 11.11 (2018) | 159.9 | 139.8 | 110.2 | ||
| Far Cry 5 (2018) | 156 | 135 | 128 | 121 | 83 |
| Strange Brigade (2018) | 475 | 211 | 171.8 | 149.2 | 95.5 |
| Cyberpunk 2077 1.6 (2022) | 103.3 | 85.5 | 72.9 | 67.8 | 41 |
| F1 22 (2022) | 233 | 224 | 172.3 | 55 | 33.9 |
| F1 23 (2023) | 228 | 222 | 158.4 | 44.1 | 34.1 |
Emissões: Altas temperaturas de superfície sob carga
Ruído do sistema
O ruído da ventoinha do LOQ 15IRH8 durante o modo inativo é muito semelhante ao que vimos com a variante AMD do LOQ 15, mas as ventoinhas deste último são cerca de 7% mais altas sob carga total. A Lenovo limitou os níveis de ruído da ventoinha a determinados limites, dependendo do perfil de energia selecionado, como pode ser visto na tabela abaixo.
O modo Desempenho fica um pouco abaixo da marca de 50 dB(A) sob carga. Embora o modo Silencioso resulte em um impacto significativo no desempenho da CPU, os jogos ainda devem ser comparativamente mais fáceis em relação ao perfil de Desempenho.
Barulho
| Ocioso |
| 29.03 / 29.03 / 29.03 dB |
| Carga |
| 48.7 / 48.7 dB |
 | ||
30 dB silencioso 40 dB(A) audível 50 dB(A) ruidosamente alto |
||
min: | ||
| Modo de desempenho | Idle dB(A) | Load average dB(A) | Load maximum dB(A) | The Witcher 3 1080p Ultra dB(A) |
|---|---|---|---|---|
| Silencioso | 25.28 | 33.09 | 36.07 | 36.69 / 78 fps |
| Equilíbrio | 25.28 | 40.40 | 45.15 | 45.42 / 83 fps |
| Desempenho | 29.03 | 48.72 | 48.71 | 48.52 / 85 fps |
| Lenovo LOQ 15IRH8 Core i7 i7-13620H, GeForce RTX 4050 Laptop GPU | Lenovo LOQ 16IRH8 i7-13620H, GeForce RTX 4060 Laptop GPU | Lenovo LOQ 15APH8 R7 7840HS, GeForce RTX 4050 Laptop GPU | MSI Katana 17 B13VFK i7-13620H, GeForce RTX 4060 Laptop GPU | Lenovo Legion Pro 5 16ARX8 (R5 7645HX, RTX 4050) R5 7645HX, GeForce RTX 4050 Laptop GPU | HP Victus 16-r0077ng i7-13700H, GeForce RTX 4070 Laptop GPU | Dell G15 5530 i7-13650HX, GeForce RTX 4060 Laptop GPU | Asus TUF Gaming A16 FA617XS R9 7940HS, Radeon RX 7600S | |
|---|---|---|---|---|---|---|---|---|
| Noise | 3% | 9% | -6% | 14% | 2% | 12% | 3% | |
| desligado / ambiente * (dB) | 23.69 | 23 3% | 23.1 2% | 24.5 -3% | 23 3% | 25 -6% | 20.41 14% | 25 -6% |
| Idle Minimum * (dB) | 29.03 | 23 21% | 23.1 20% | 24.5 16% | 23 21% | 28 4% | 26.85 8% | 25 14% |
| Idle Average * (dB) | 29.03 | 23 21% | 23.1 20% | 24.5 16% | 23 21% | 29 -0% | 26.85 8% | 26 10% |
| Idle Maximum * (dB) | 29.03 | 27.66 5% | 25.2 13% | 40 -38% | 24.42 16% | 30 -3% | 26.85 8% | 28 4% |
| Load Average * (dB) | 48.7 | 53.62 -10% | 44.3 9% | 48.3 1% | 34.94 28% | 43 12% | 27.65 43% | 43 12% |
| Witcher 3 ultra * (dB) | 48.5 | 53.5 -10% | 45.8 6% | 56 -15% | 43.79 10% | 46 5% | 47.9 1% | 51 -5% |
| Load Maximum * (dB) | 48.7 | 53.5 -10% | 52 -7% | 59.1 -21% | 50 -3% | 48 1% | 47.86 2% | 53 -9% |
* ... menor é melhor
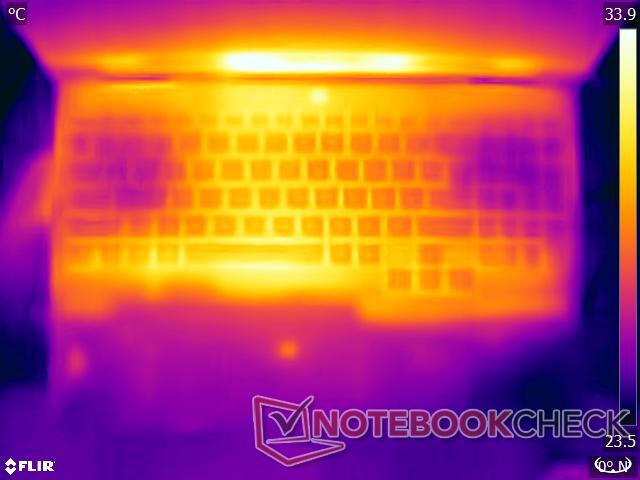
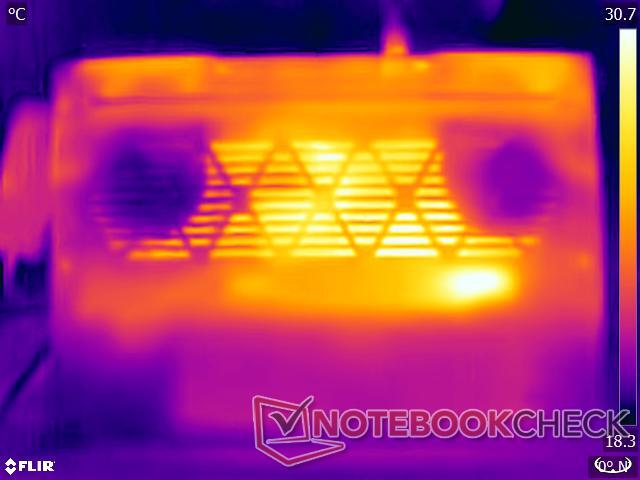
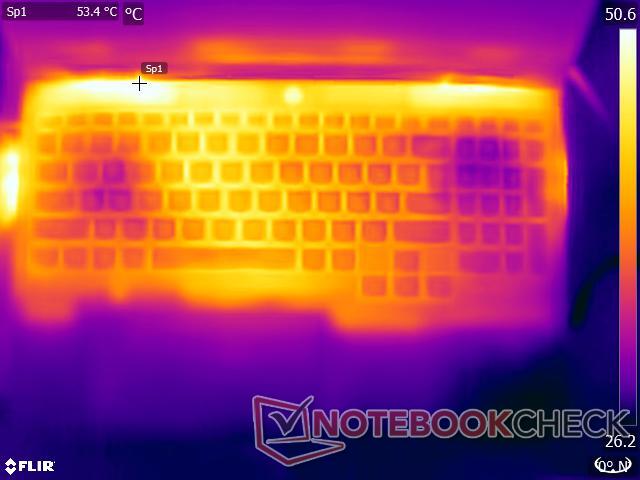
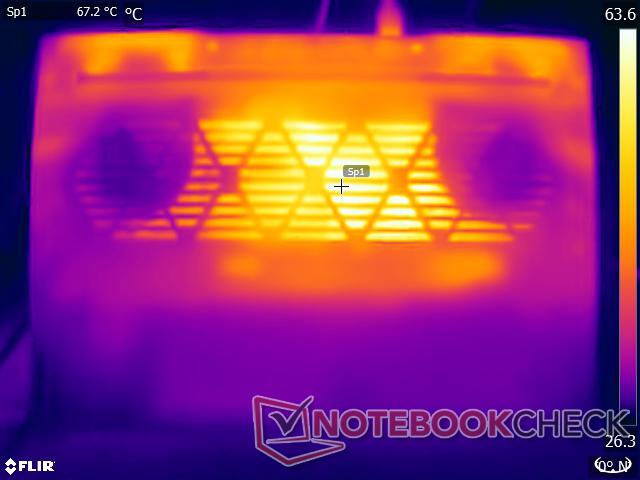
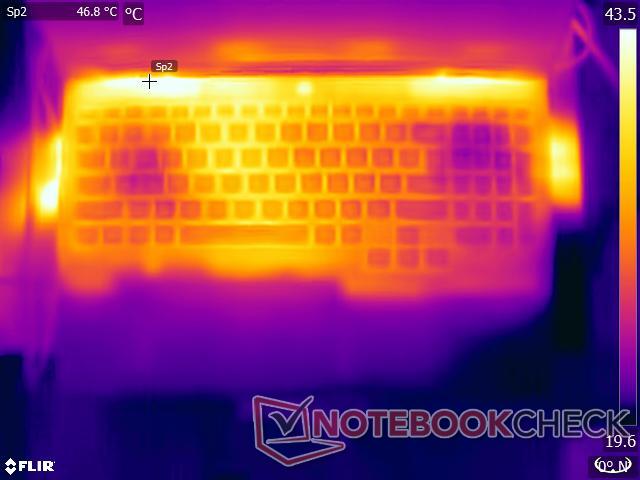
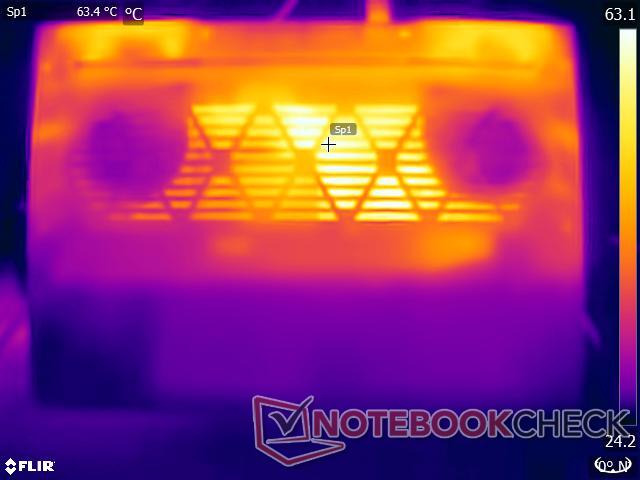
Temperatura
As temperaturas da superfície durante o estresse no perfil de desempenho podem ficar bastante quentes, especialmente na parte inferior do chassi. Embora nossos testes de estresse representem cenários extremos, não recomendamos usar esse dispositivo no colo para nada além de uso leve.
(-) A temperatura máxima no lado superior é 46.4 °C / 116 F, em comparação com a média de 40.4 °C / 105 F , variando de 21.2 a 68.8 °C para a classe Gaming.
(-) A parte inferior aquece até um máximo de 59.2 °C / 139 F, em comparação com a média de 43.2 °C / 110 F
(±) Em uso inativo, a temperatura média para o lado superior é 32.7 °C / 91 F, em comparação com a média do dispositivo de 33.9 °C / ### class_avg_f### F.
(-) Jogando The Witcher 3, a temperatura média para o lado superior é 39.4 °C / 103 F, em comparação com a média do dispositivo de 33.9 °C / ## #class_avg_f### F.
(+) Os apoios para as mãos e o touchpad estão atingindo a temperatura máxima da pele (34 °C / 93.2 F) e, portanto, não estão quentes.
(-) A temperatura média da área do apoio para as mãos de dispositivos semelhantes foi 28.8 °C / 83.8 F (-5.2 °C / -9.4 F).
| Lenovo LOQ 15IRH8 Core i7 Intel Core i7-13620H, NVIDIA GeForce RTX 4050 Laptop GPU | Lenovo LOQ 16IRH8 Intel Core i7-13620H, NVIDIA GeForce RTX 4060 Laptop GPU | Lenovo LOQ 15APH8 AMD Ryzen 7 7840HS, NVIDIA GeForce RTX 4050 Laptop GPU | MSI Katana 17 B13VFK Intel Core i7-13620H, NVIDIA GeForce RTX 4060 Laptop GPU | Lenovo Legion Pro 5 16ARX8 (R5 7645HX, RTX 4050) AMD Ryzen 5 7645HX, NVIDIA GeForce RTX 4050 Laptop GPU | HP Victus 16-r0077ng Intel Core i7-13700H, NVIDIA GeForce RTX 4070 Laptop GPU | Dell G15 5530 Intel Core i7-13650HX, NVIDIA GeForce RTX 4060 Laptop GPU | Asus TUF Gaming A16 FA617XS AMD Ryzen 9 7940HS, AMD Radeon RX 7600S | |
|---|---|---|---|---|---|---|---|---|
| Heat | 10% | 13% | 11% | 1% | 3% | -3% | 9% | |
| Maximum Upper Side * (°C) | 46.4 | 48 -3% | 44.4 4% | 41.6 10% | 45 3% | 51 -10% | 54 -16% | 53 -14% |
| Maximum Bottom * (°C) | 59.2 | 59 -0% | 52 12% | 43.1 27% | 54 9% | 54 9% | 62.2 -5% | 48 19% |
| Idle Upper Side * (°C) | 34.4 | 28 19% | 28 19% | 32 7% | 36 -5% | 37 -8% | 33.4 3% | 30 13% |
| Idle Bottom * (°C) | 36.2 | 28 23% | 29.6 18% | 35.8 1% | 38 -5% | 29 20% | 33.4 8% | 30 17% |
* ... menor é melhor
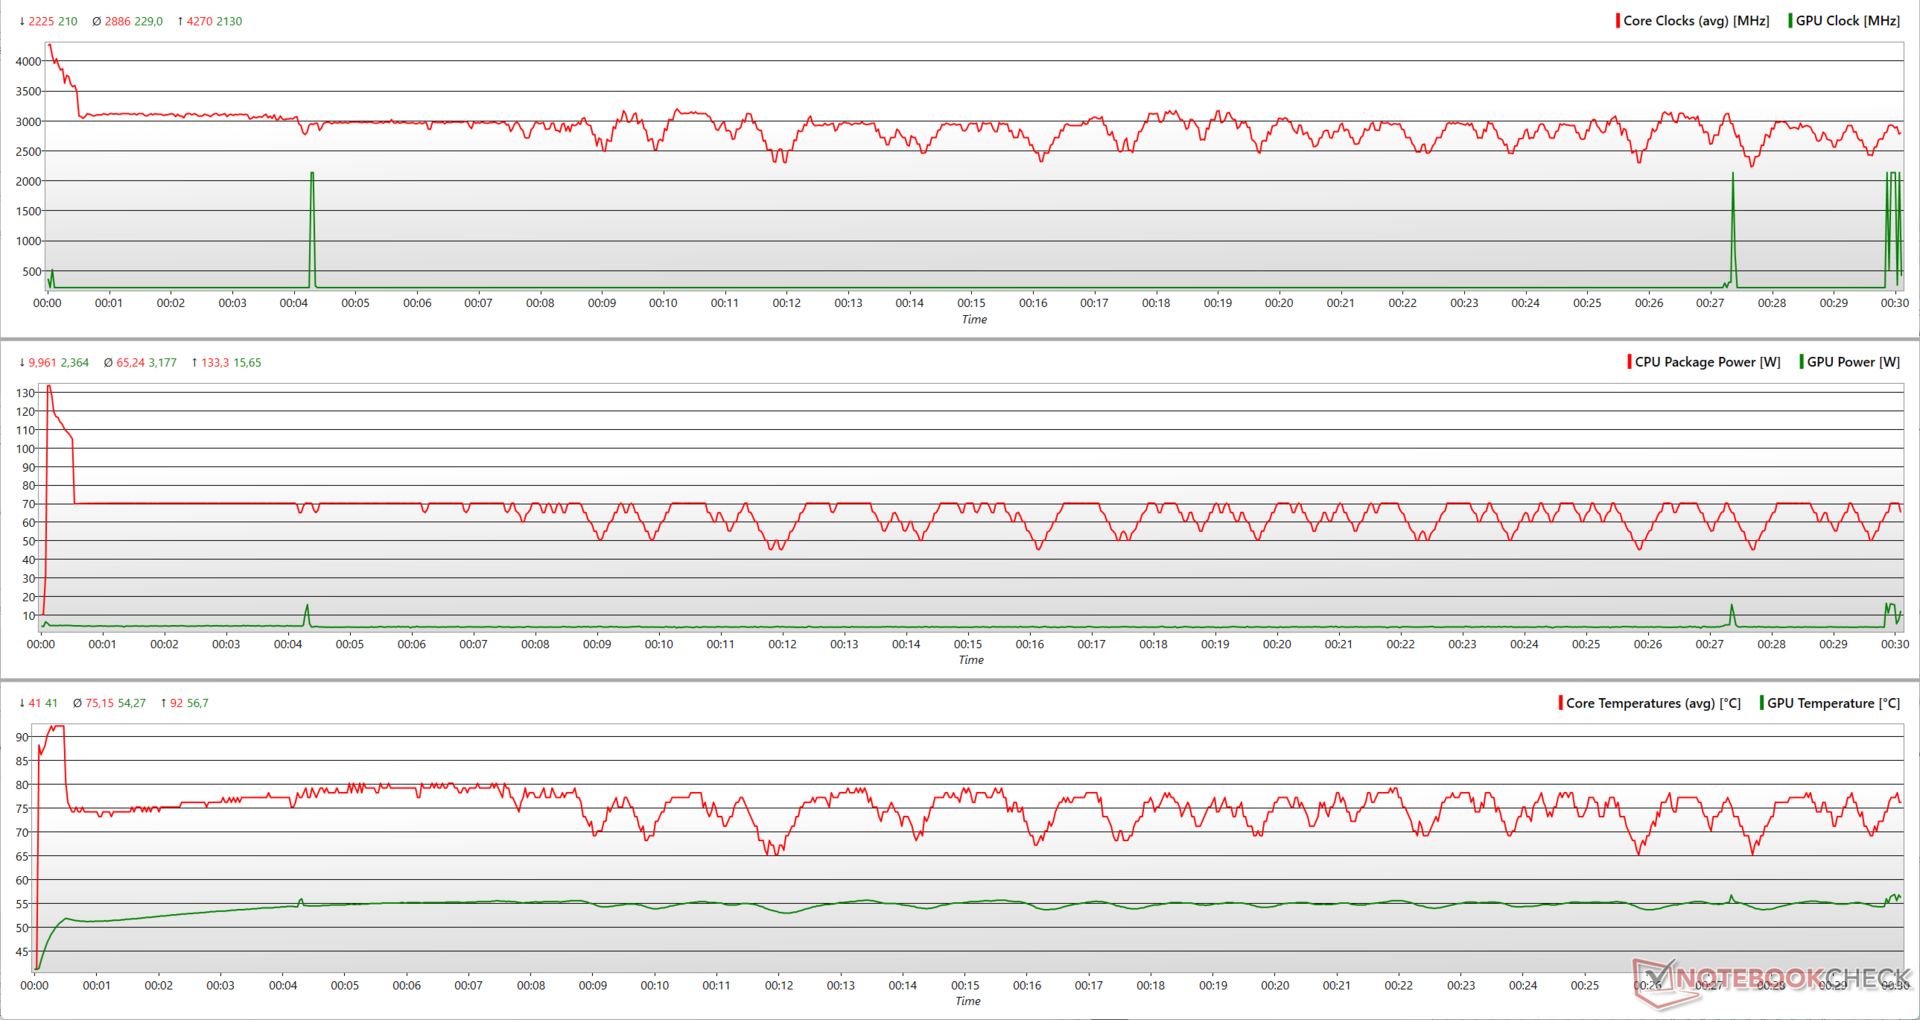
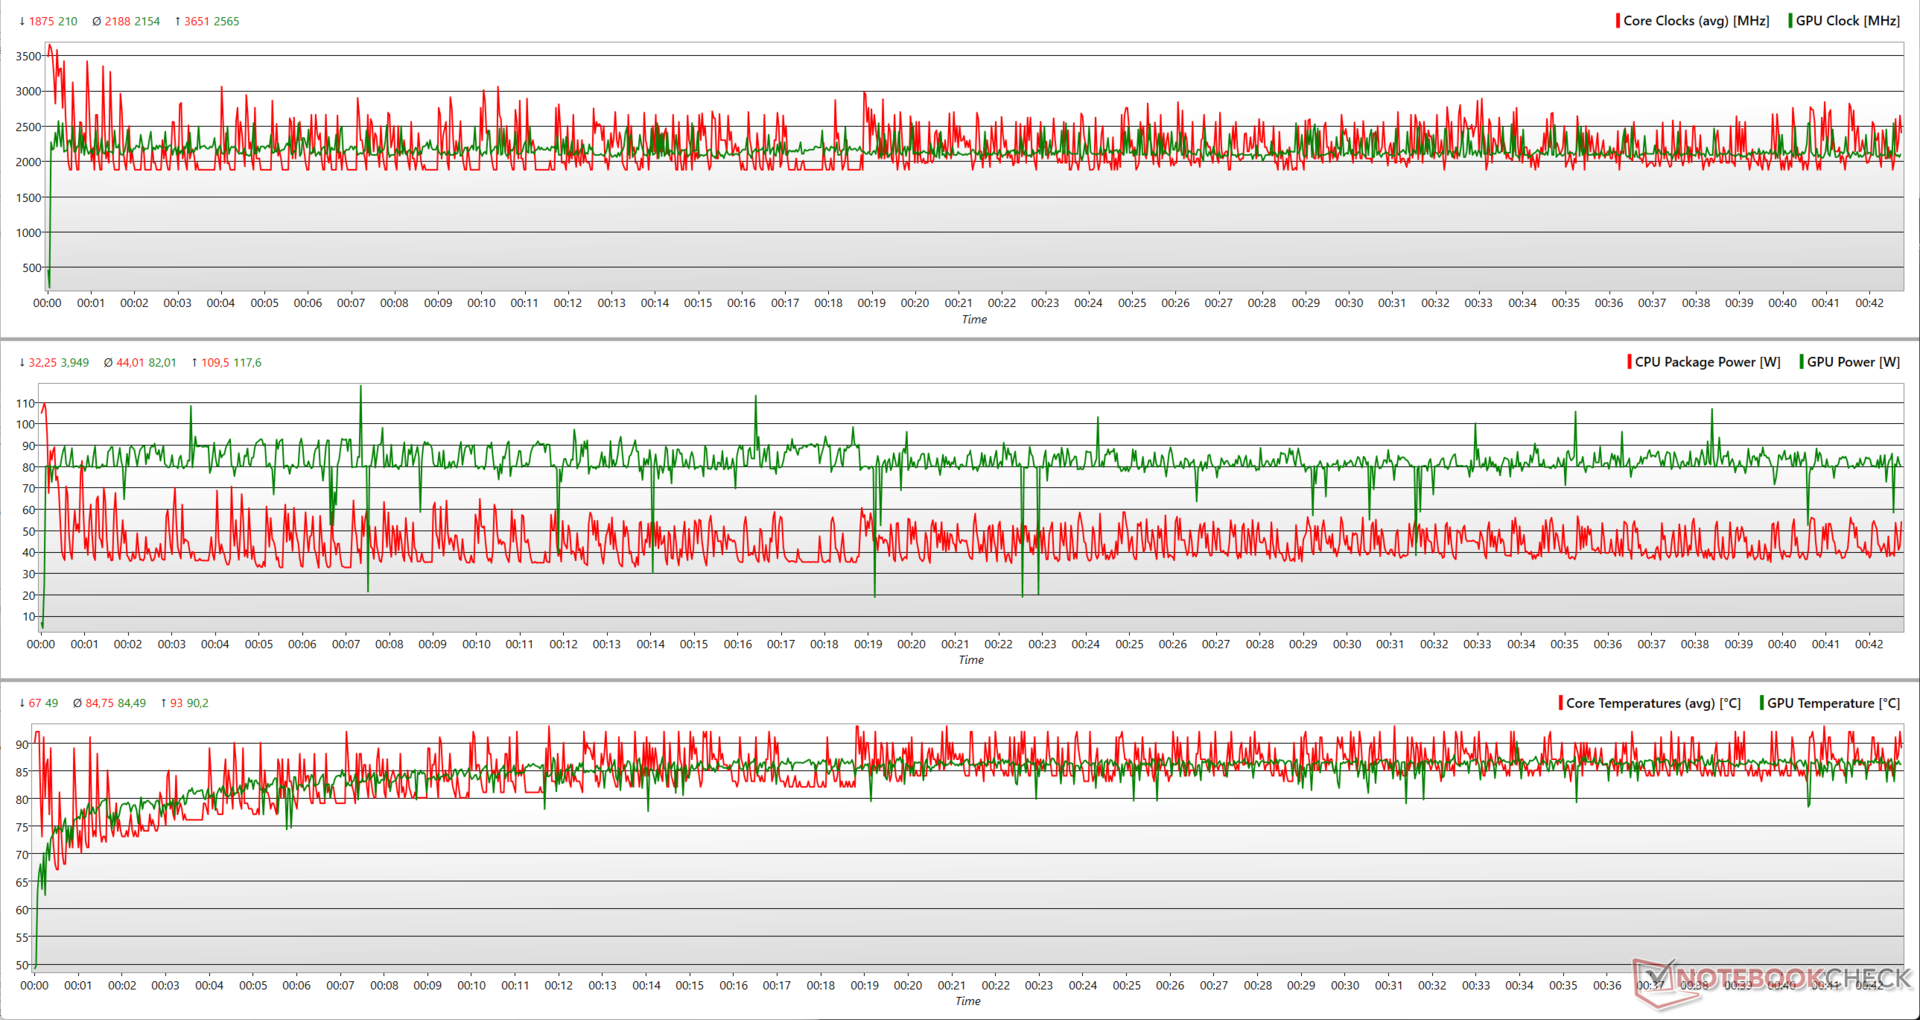
Teste de estresse
Ao contrário do que vimos anteriormente com o teste de loop de vários núcleos do Cinebench R15, ao estressar o LOQ 15 com grandes FFTs in-place do Prime95, o Core i7-13620H finalmente consegue atingir 133 W com um clock máximo de 4,27 GHz.
Um estresse combinado do Prime95 e do FurMark indica que o RTX 4050 pode utilizar até 117 W com um clock máximo de 2.565 MHz. O Core i7-13620H precisa lidar com um pico de aumento de 3,6 GHz, pois precisa compartilhar o espaço térmico e de energia com o RTX 4050.
| Teste de estresse | CPU Clock (GHz) | GPU Clock (MHz) | Temperatura média da CPU (°C) | Temperatura média da GPU (°C) |
| Sistema ocioso | 4.3 | 210 | 37 | 38.4 |
| Prime95 | 4.8 | 210 | 75 | 54.2 |
| Prime95 + FurMark | 3.2 | 2,220 | 77 | 79.7 |
| O Witcher 3 1080p Ultra | 4.8 | 2.535 | 76 | 80.5 |
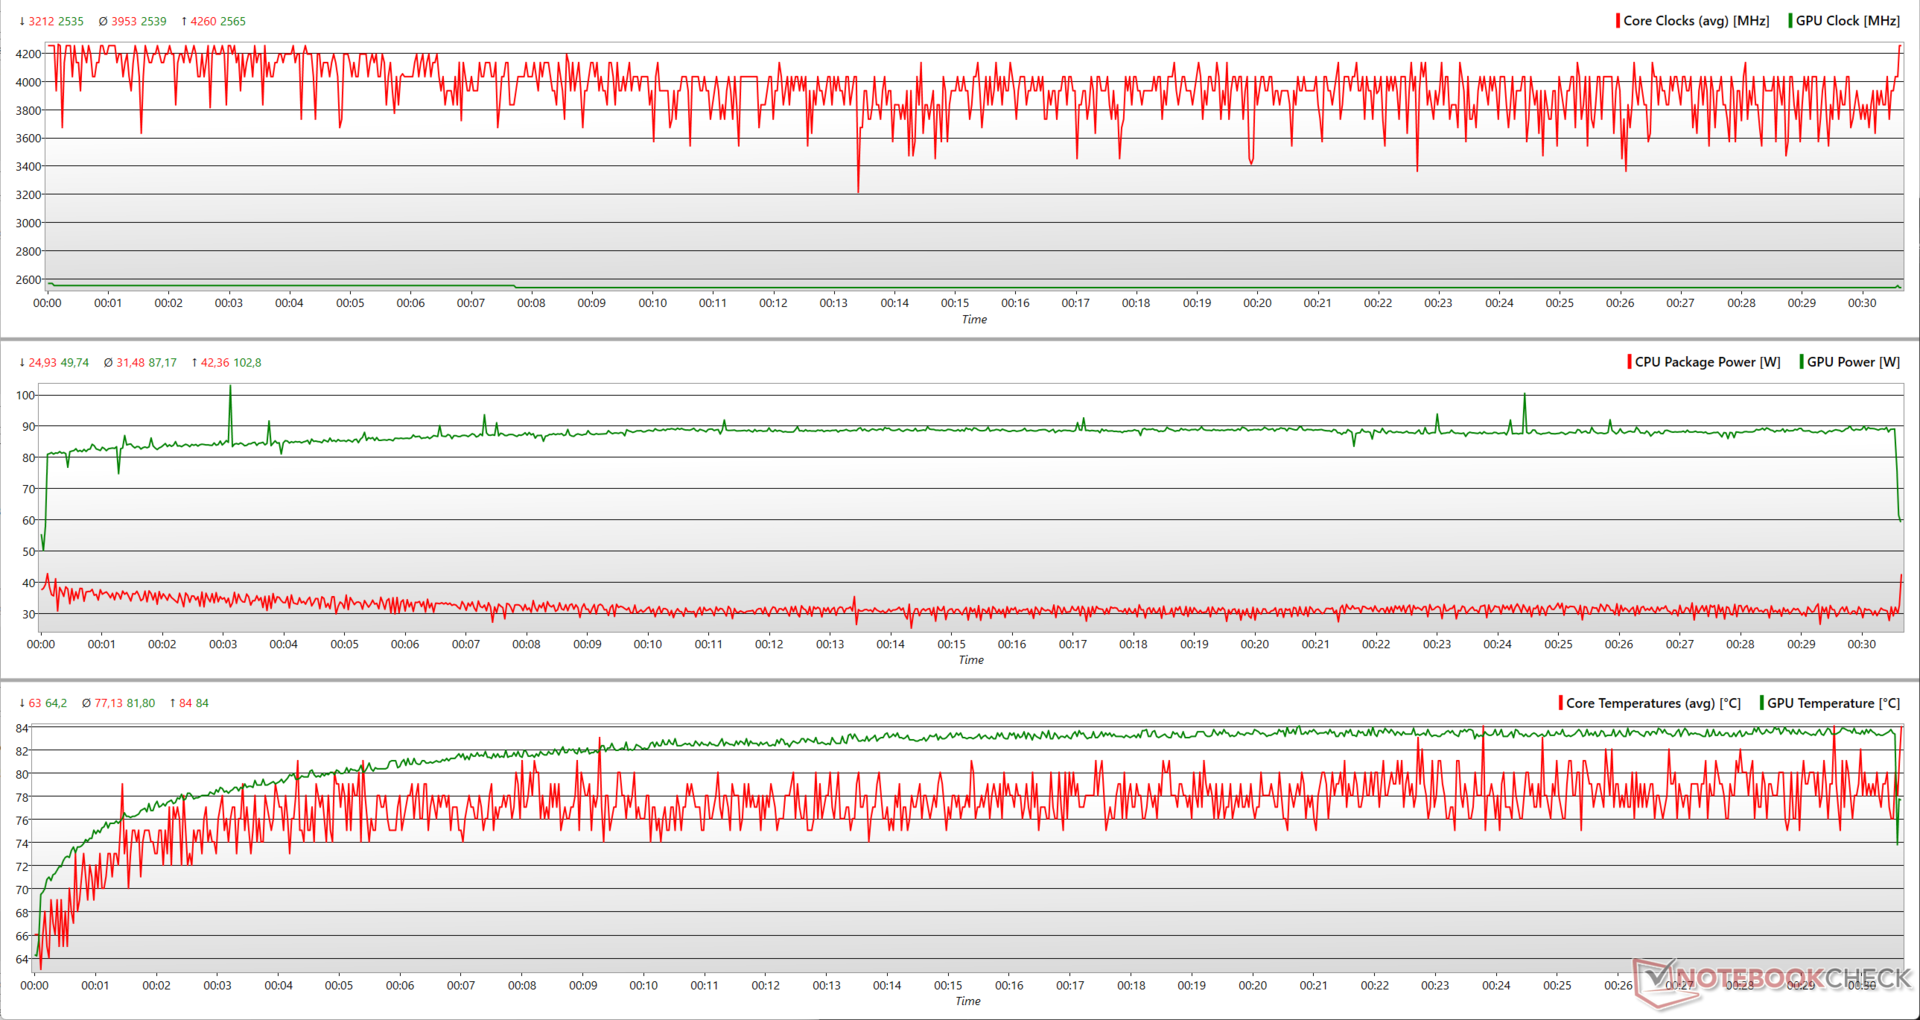
No teste de estresse Witcher 3 1080p Ultra, a RTX 4050 é capaz de atingir o mesmo clock de 2.565 MHz, mas com um TGP máximo muito menor de 103 W. Isso dá algum espaço para o Core i7-13620H utilizar até 42 W para um aumento máximo de 4,26 GHz.
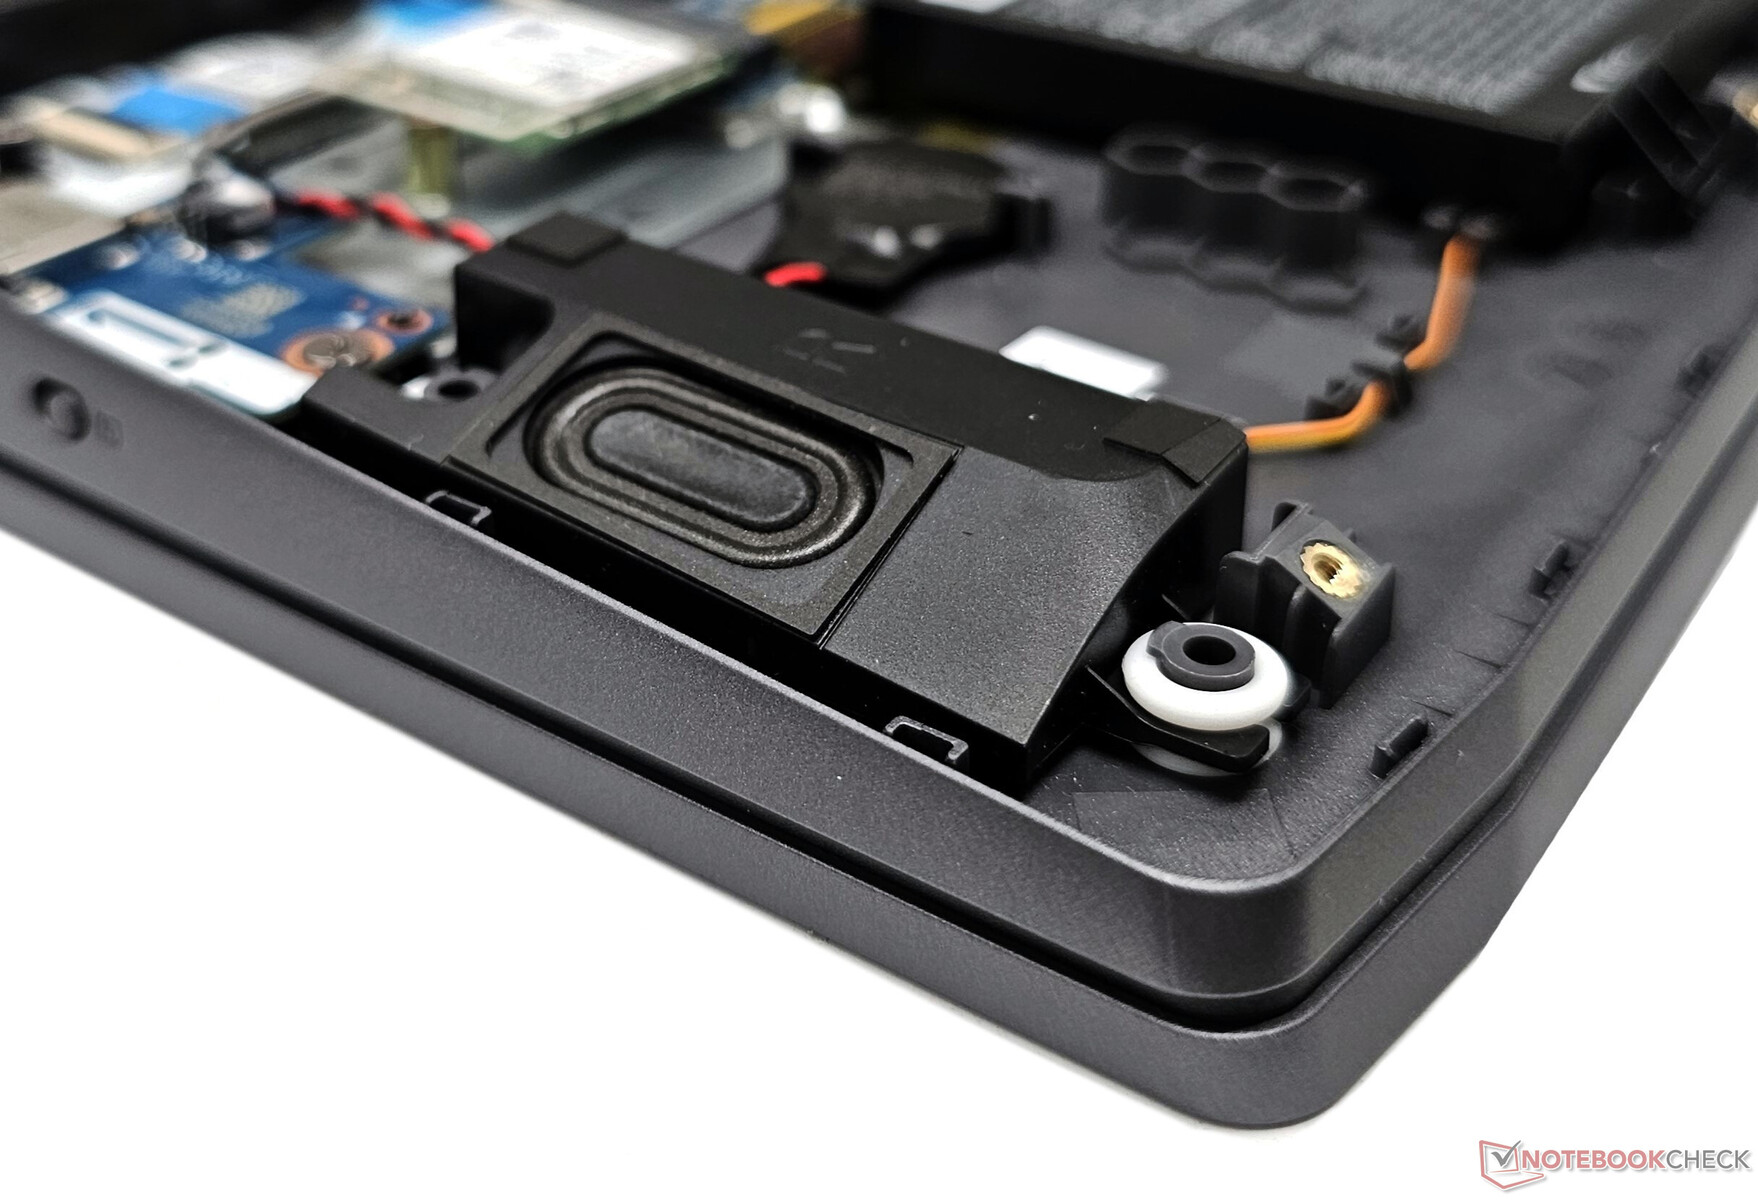
Alto-falantes
Os alto-falantes do LOQ 15IRH8 têm um volume decente. Os graves não são muito profundos, mas os médios e agudos são reproduzidos adequadamente. Os usuários podem obter uma saída de áudio melhor por meio de alto-falantes com fio ou Bluetooth 5.2.
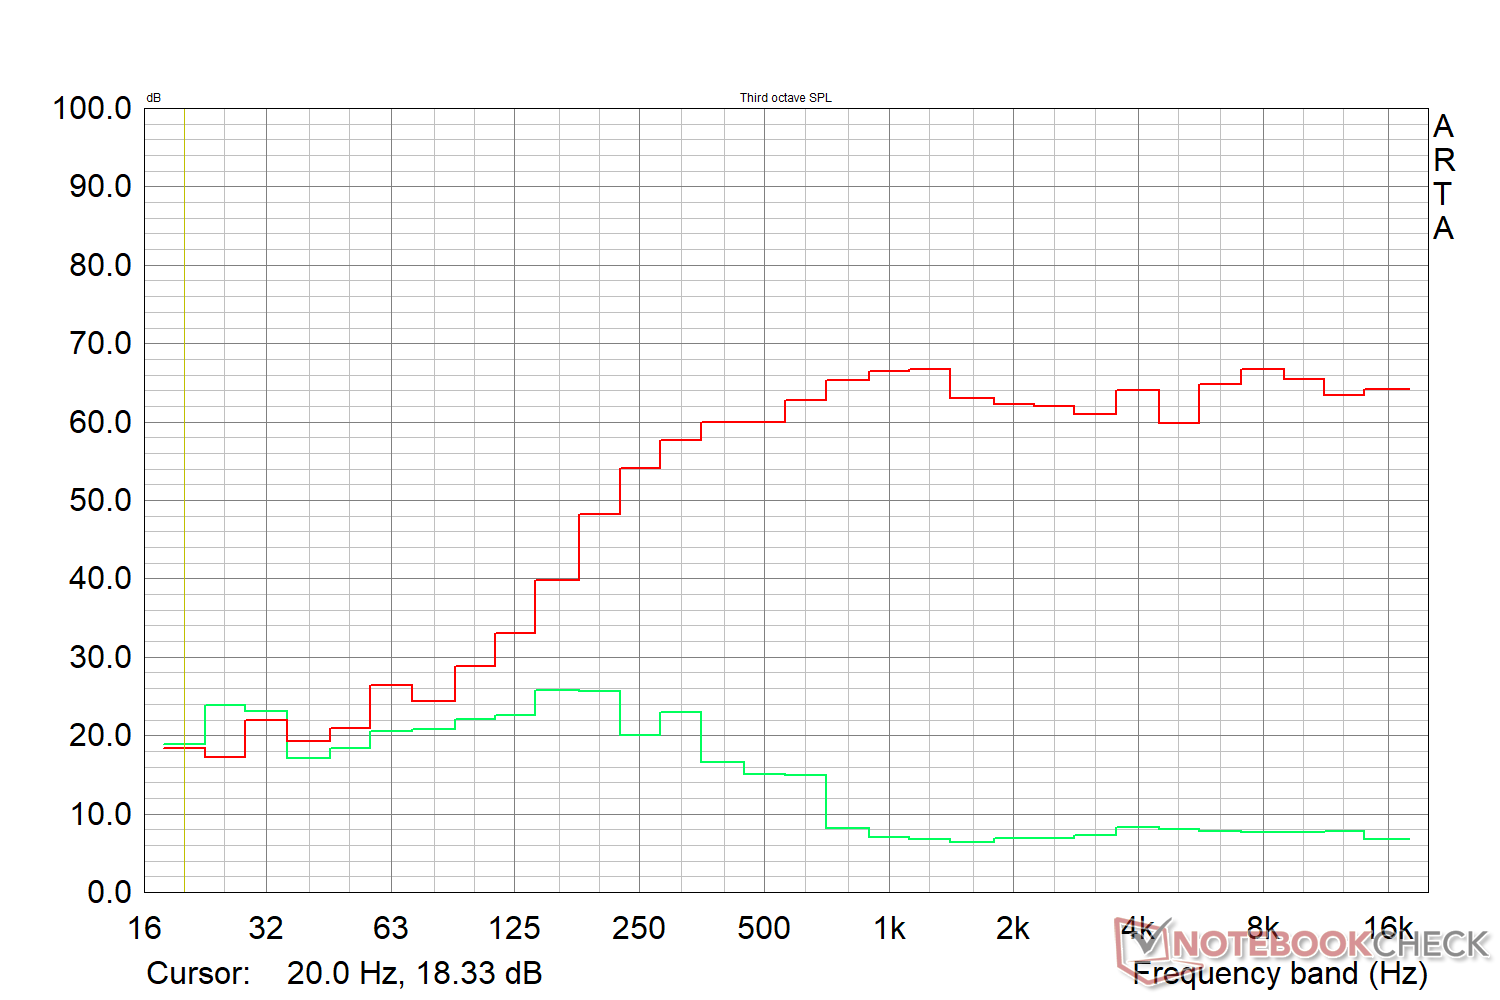
Lenovo LOQ 15IRH8 Core i7 análise de áudio
(±) | o volume do alto-falante é médio, mas bom (###valor### dB)
Graves 100 - 315Hz
(-) | quase nenhum baixo - em média 18.6% menor que a mediana
(±) | a linearidade dos graves é média (10.2% delta para a frequência anterior)
Médios 400 - 2.000 Hz
(+) | médios equilibrados - apenas 2.2% longe da mediana
(+) | médios são lineares (3.1% delta para frequência anterior)
Altos 2 - 16 kHz
(+) | agudos equilibrados - apenas 2.3% longe da mediana
(+) | os máximos são lineares (4.4% delta da frequência anterior)
Geral 100 - 16.000 Hz
(+) | o som geral é linear (13.7% diferença em relação à mediana)
Comparado com a mesma classe
» 21% de todos os dispositivos testados nesta classe foram melhores, 7% semelhantes, 72% piores
» O melhor teve um delta de 6%, a média foi 18%, o pior foi 132%
Comparado com todos os dispositivos testados
» 15% de todos os dispositivos testados foram melhores, 4% semelhantes, 81% piores
» O melhor teve um delta de 4%, a média foi 23%, o pior foi 134%
Apple MacBook Pro 16 2021 M1 Pro análise de áudio
(+) | os alto-falantes podem tocar relativamente alto (###valor### dB)
Graves 100 - 315Hz
(+) | bons graves - apenas 3.8% longe da mediana
(+) | o baixo é linear (5.2% delta para a frequência anterior)
Médios 400 - 2.000 Hz
(+) | médios equilibrados - apenas 1.3% longe da mediana
(+) | médios são lineares (2.1% delta para frequência anterior)
Altos 2 - 16 kHz
(+) | agudos equilibrados - apenas 1.9% longe da mediana
(+) | os máximos são lineares (2.7% delta da frequência anterior)
Geral 100 - 16.000 Hz
(+) | o som geral é linear (4.6% diferença em relação à mediana)
Comparado com a mesma classe
» 0% de todos os dispositivos testados nesta classe foram melhores, 0% semelhantes, 100% piores
» O melhor teve um delta de 5%, a média foi 17%, o pior foi 45%
Comparado com todos os dispositivos testados
» 0% de todos os dispositivos testados foram melhores, 0% semelhantes, 100% piores
» O melhor teve um delta de 4%, a média foi 23%, o pior foi 134%
Gerenciamento de energia: A variante AMD parece ser mais econômica
Consumo de energia
O consumo de energia sob carga é geralmente mais baixo em comparação com a concorrência. Apesar das diferenças de exibição, o LOQ 15APH8 com Ryzen 7 7840HS é cerca de 18% mais econômico no consumo geral de energia do que nossa unidade LOQ 15IRH8 baseada em Intel.
A unidade totalmente AMD Asus TUF Gaming A16 é o mais econômico em geral, mas o consumo de carga está dentro da faixa comparável do LOQ 15IRH8. O consumo de energia sob carga máxima excede a classificação de 170 W do carregador fornecido.
| desligado | |
| Ocioso | |
| Carga |
|
Key:
min: | |
| Lenovo LOQ 15IRH8 Core i7 i7-13620H, GeForce RTX 4050 Laptop GPU, IPS, 2560x1440, 15.6" | Lenovo LOQ 16IRH8 i7-13620H, GeForce RTX 4060 Laptop GPU, IPS, 2560x1600, 16" | Lenovo LOQ 15APH8 R7 7840HS, GeForce RTX 4050 Laptop GPU, IPS, 1920x1080, 15.6" | MSI Katana 17 B13VFK i7-13620H, GeForce RTX 4060 Laptop GPU, IPS LED, 1920x1080, 17.3" | Lenovo Legion Pro 5 16ARX8 (R5 7645HX, RTX 4050) R5 7645HX, GeForce RTX 4050 Laptop GPU, IPS, 2560x1600, 16" | HP Victus 16-r0077ng i7-13700H, GeForce RTX 4070 Laptop GPU, IPS, 1920x1080, 16.1" | Dell G15 5530 i7-13650HX, GeForce RTX 4060 Laptop GPU, IPS, 1920x1080, 15.6" | Asus TUF Gaming A16 FA617XS R9 7940HS, Radeon RX 7600S, IPS, 1920x1200, 16" | Média NVIDIA GeForce RTX 4050 Laptop GPU | Média da turma Gaming | |
|---|---|---|---|---|---|---|---|---|---|---|
| Power Consumption | 6% | 18% | 19% | 15% | 20% | 12% | 31% | 25% | 2% | |
| Idle Minimum * (Watt) | 18.52 | 17.2 7% | 15 19% | 12.2 34% | 13 30% | 8 57% | 8.4 55% | 7 62% | 9.95 ? 46% | 13 ? 30% |
| Idle Average * (Watt) | 22.54 | 19.3 14% | 17.7 21% | 14.9 34% | 17.4 23% | 13 42% | 14.98 34% | 10 56% | 15.8 ? 30% | 19 ? 16% |
| Idle Maximum * (Watt) | 29.79 | 21.2 29% | 21.5 28% | 15.8 47% | 21.8 27% | 22 26% | 15.56 48% | 15 50% | 20.1 ? 33% | 24.6 ? 17% |
| Load Average * (Watt) | 94.5 | 90 5% | 73.5 22% | 85.22 10% | 96.4 -2% | 86 9% | 96.8 -2% | 86 9% | 88 ? 7% | 110.7 ? -17% |
| Witcher 3 ultra * (Watt) | 154.4 | 168 -9% | 138.6 10% | 151.1 2% | 125 19% | 141.8 8% | 186 -20% | 160.6 -4% | ||
| Load Maximum * (Watt) | 190.4 | 211 -11% | 176.5 7% | 212.8 -12% | 204 -7% | 233 -22% | 271.42 -43% | 172 10% | 176.3 ? 7% | 259 ? -36% |
* ... menor é melhor
Power Consumption: The Witcher 3 / Stress test
Power Consumption: External Monitor
Duração da bateria
O tempo de duração da bateria é semelhante ao que observamos com o LOQ 16IRH8. Os ganhos de consumo de energia do LOQ 15APH8 se traduzem em uma duração de bateria 25% maior em comparação com o LOQ 15IRH8.
O adaptador de energia de 170 W fornecido suporta o carregamento rápido Rapid Charge, que pode ser ativado no aplicativo Lenovo Vantage. Isso permite que o dispositivo seja carregado de zero a 100% em aproximadamente 45 minutos.
| Lenovo LOQ 15IRH8 Core i7 i7-13620H, GeForce RTX 4050 Laptop GPU, 60 Wh | Lenovo LOQ 16IRH8 i7-13620H, GeForce RTX 4060 Laptop GPU, 80 Wh | Lenovo LOQ 15APH8 R7 7840HS, GeForce RTX 4050 Laptop GPU, 60 Wh | MSI Katana 17 B13VFK i7-13620H, GeForce RTX 4060 Laptop GPU, 53.5 Wh | Lenovo Legion Pro 5 16ARX8 (R5 7645HX, RTX 4050) R5 7645HX, GeForce RTX 4050 Laptop GPU, 80 Wh | HP Victus 16-r0077ng i7-13700H, GeForce RTX 4070 Laptop GPU, 83 Wh | Dell G15 5530 i7-13650HX, GeForce RTX 4060 Laptop GPU, 86 Wh | Asus TUF Gaming A16 FA617XS R9 7940HS, Radeon RX 7600S, 90 Wh | Média da turma Gaming | |
|---|---|---|---|---|---|---|---|---|---|
| Duração da bateria | 6% | 25% | -51% | -8% | 20% | 11% | 107% | 29% | |
| H.264 (h) | 6.1 | 6.4 5% | 5.4 -11% | 6.8 11% | 12.4 103% | 8.32 ? 36% | |||
| WiFi v1.3 (h) | 5.9 | 6.3 7% | 7.4 25% | 2.9 -51% | 5.6 -5% | 7.1 20% | 6.5 10% | 12.4 110% | 7.11 ? 21% |
| Load (h) | 1.5 | 1.1 | 1 | 0.8 | 0.9 | 1.502 ? | |||
| Reader / Idle (h) | 9.8 | 20.3 | 8.27 ? | ||||||
| Witcher 3 ultra (h) | 0.8 | 0.8 |
Pro
Contra
Veredicto: Jogos em 1080p Ultra que não custam caro
O LOQ 15 Core i7 apresenta uma tela QHD G-Sync de 165 Hz e uma webcam de 1080p, apesar de seu baixo custo. O painel QHD impressiona especialmente com cores e tempos de resposta significativamente melhores do que a opção FHD de 144 Hz.
A qualidade de construção, compreensivelmente, é prejudicada pela grande quantidade de plástico. Um aspecto mais preocupante é que o Core i7-13620H do LOQ 15IRH8 tem dificuldade para sustentar seu desempenho, ao contrário do que vimos com o AMD Ryzen 7 7840HS baseado no LOQ 15APH8 ou mesmo o LOQ 16IRH8.
No entanto, o desempenho é adequado para jogos tranquilos em 1080p, graças ao processador Intel i7-13620H e à placa de vídeo RTX 4050, que pode utilizar mais do que seu TGP nominal.
O Lenovo LOQ 15 Core i7 preenche a maioria dos requisitos e merece ser levado em consideração se o senhor estiver procurando um notebook capaz de jogar em 1080p por volta da marca de US$ 1.200 ou ₹ 1.00,00. Entretanto, as expectativas precisam ser moderadas com relação à qualidade de construção e às emissões de calor."
Outra área em que o LOQ 15 baseado em Intel decepciona é em termos de emissões de calor. Por outro lado, os níveis de ruído da ventoinha são gerenciáveis e é possível jogar adequadamente a 1080p, mesmo em perfis de energia mais baixos.
A escolha entre as SKUs do LOQ 15 com tecnologia Intel e AMD se resume a prioridades. A versão Intel oferece melhor desempenho em jogos a 1080p e menor ruído da ventoinha sob carga. Mas a variante da AMD tem uma vantagem no desempenho geral da CPU, funciona mais frio, é mais eficiente em termos de energia e tem melhor duração da bateria.
Dito isso, ambas as variantes do LOQ 15 apresentam um bom custo-benefício em comparação com o Legion Pro 5 16. Laptops como o HP Victus 16 e o MSI Katana 17 apresentam um desempenho visivelmente melhor nos gráficos, mas seus preços não parecem ser compatíveis com o hardware oferecido em relação ao LOQ 15.
Preço e disponibilidade
O LOQ 15 Core i7 custa a partir de ₹97.790 para a variante FHD 144 Hz e pode ser adquirido diretamente no site Lenovo India. No momento, o site não lista a disponibilidade da variante QHD testada.
A Amazon Índia não tem a maioria das variantes do LOQ 15 em estoque atualmente, exceto o LOQ 16IRH8 com um Core i7-13700H e RTX 4060 que está listado em ₹2,25,766.
ALenovo US também tem uma série de LOQ 15s de 13ª geração da Intel com várias opções de GPU da Nvidia. A Best Buy está oferecendo um LOQ 15 equipado com o Core i5-13420H e gráficos RTX 3050 por US$ 650. A Amazon US tem uma variante com uma RTX 4050 por US$ 1.227. Uma opção Ryzen 7 7840HS com RTX 4050 também está disponível na Best Buy por US$ 1.240.
Lenovo LOQ 15IRH8 Core i7
- 10/13/2023 v7 (old)
Vaidyanathan Subramaniam
Transparência
A seleção dos dispositivos a serem analisados é feita pela nossa equipe editorial. A amostra de teste foi fornecida ao autor como empréstimo pelo fabricante ou varejista para fins desta revisão. O credor não teve influência nesta revisão, nem o fabricante recebeu uma cópia desta revisão antes da publicação. Não houve obrigação de publicar esta revisão. Como empresa de mídia independente, a Notebookcheck não está sujeita à autoridade de fabricantes, varejistas ou editores.
É assim que o Notebookcheck está testando
Todos os anos, o Notebookcheck analisa de forma independente centenas de laptops e smartphones usando procedimentos padronizados para garantir que todos os resultados sejam comparáveis. Desenvolvemos continuamente nossos métodos de teste há cerca de 20 anos e definimos padrões da indústria no processo. Em nossos laboratórios de teste, equipamentos de medição de alta qualidade são utilizados por técnicos e editores experientes. Esses testes envolvem um processo de validação em vários estágios. Nosso complexo sistema de classificação é baseado em centenas de medições e benchmarks bem fundamentados, o que mantém a objetividade.Price comparison

