Veredicto
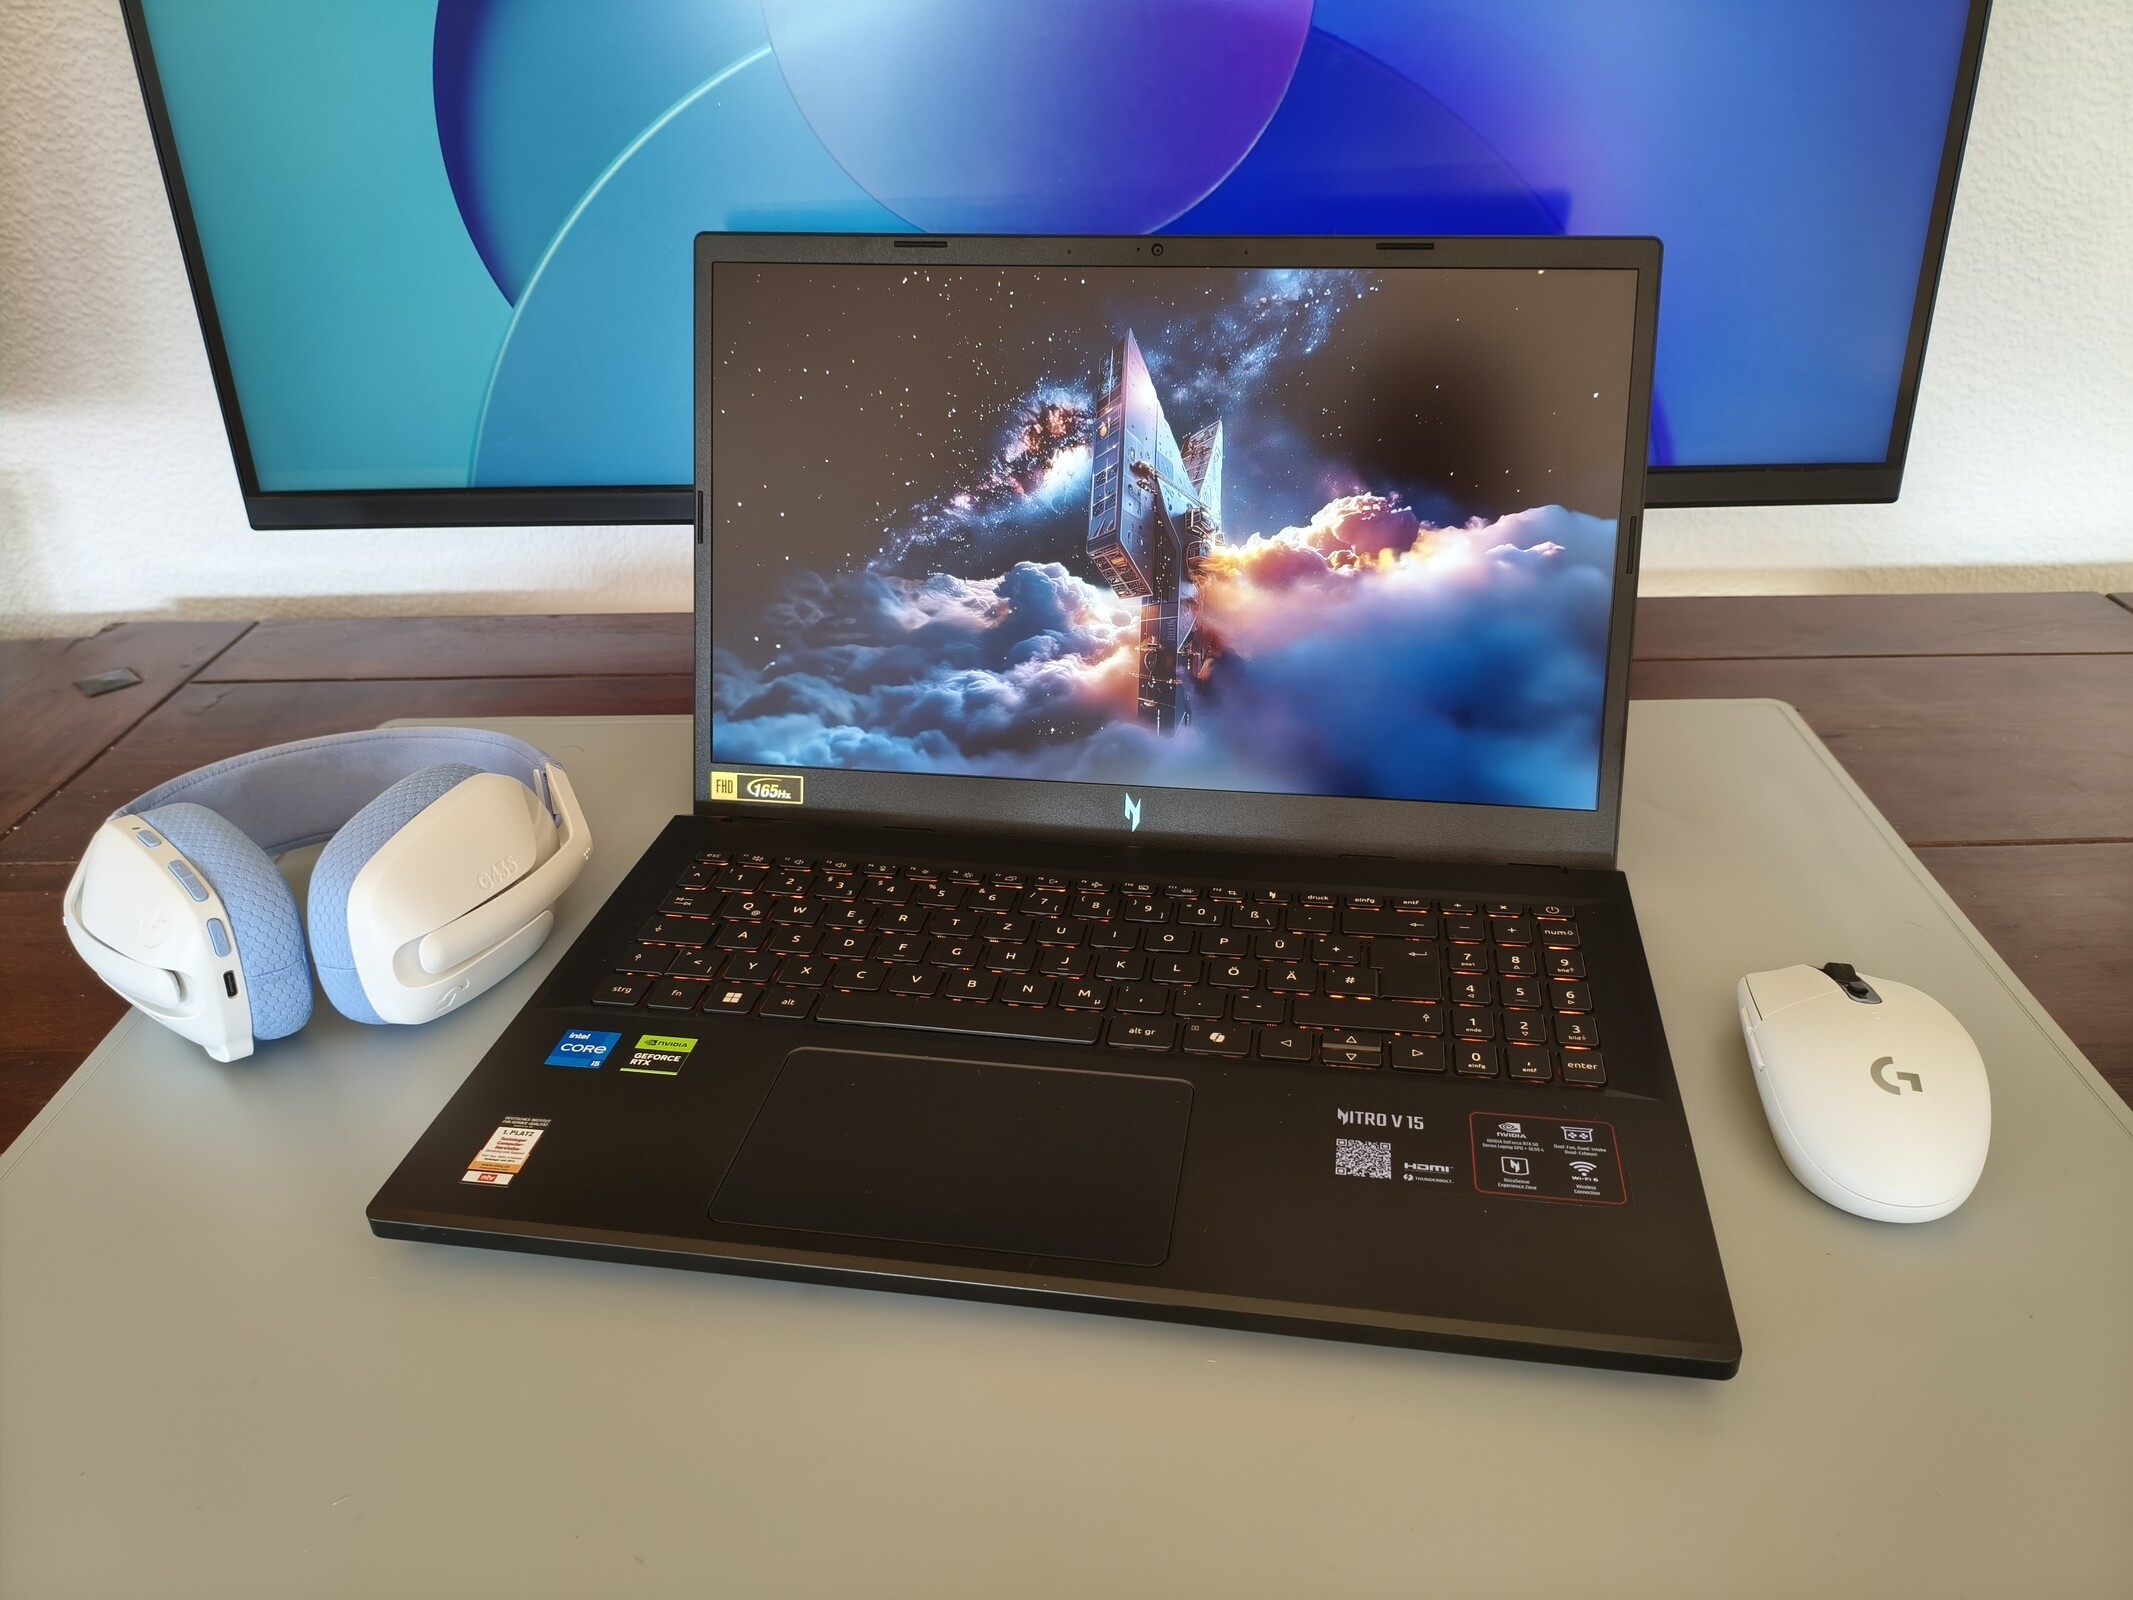
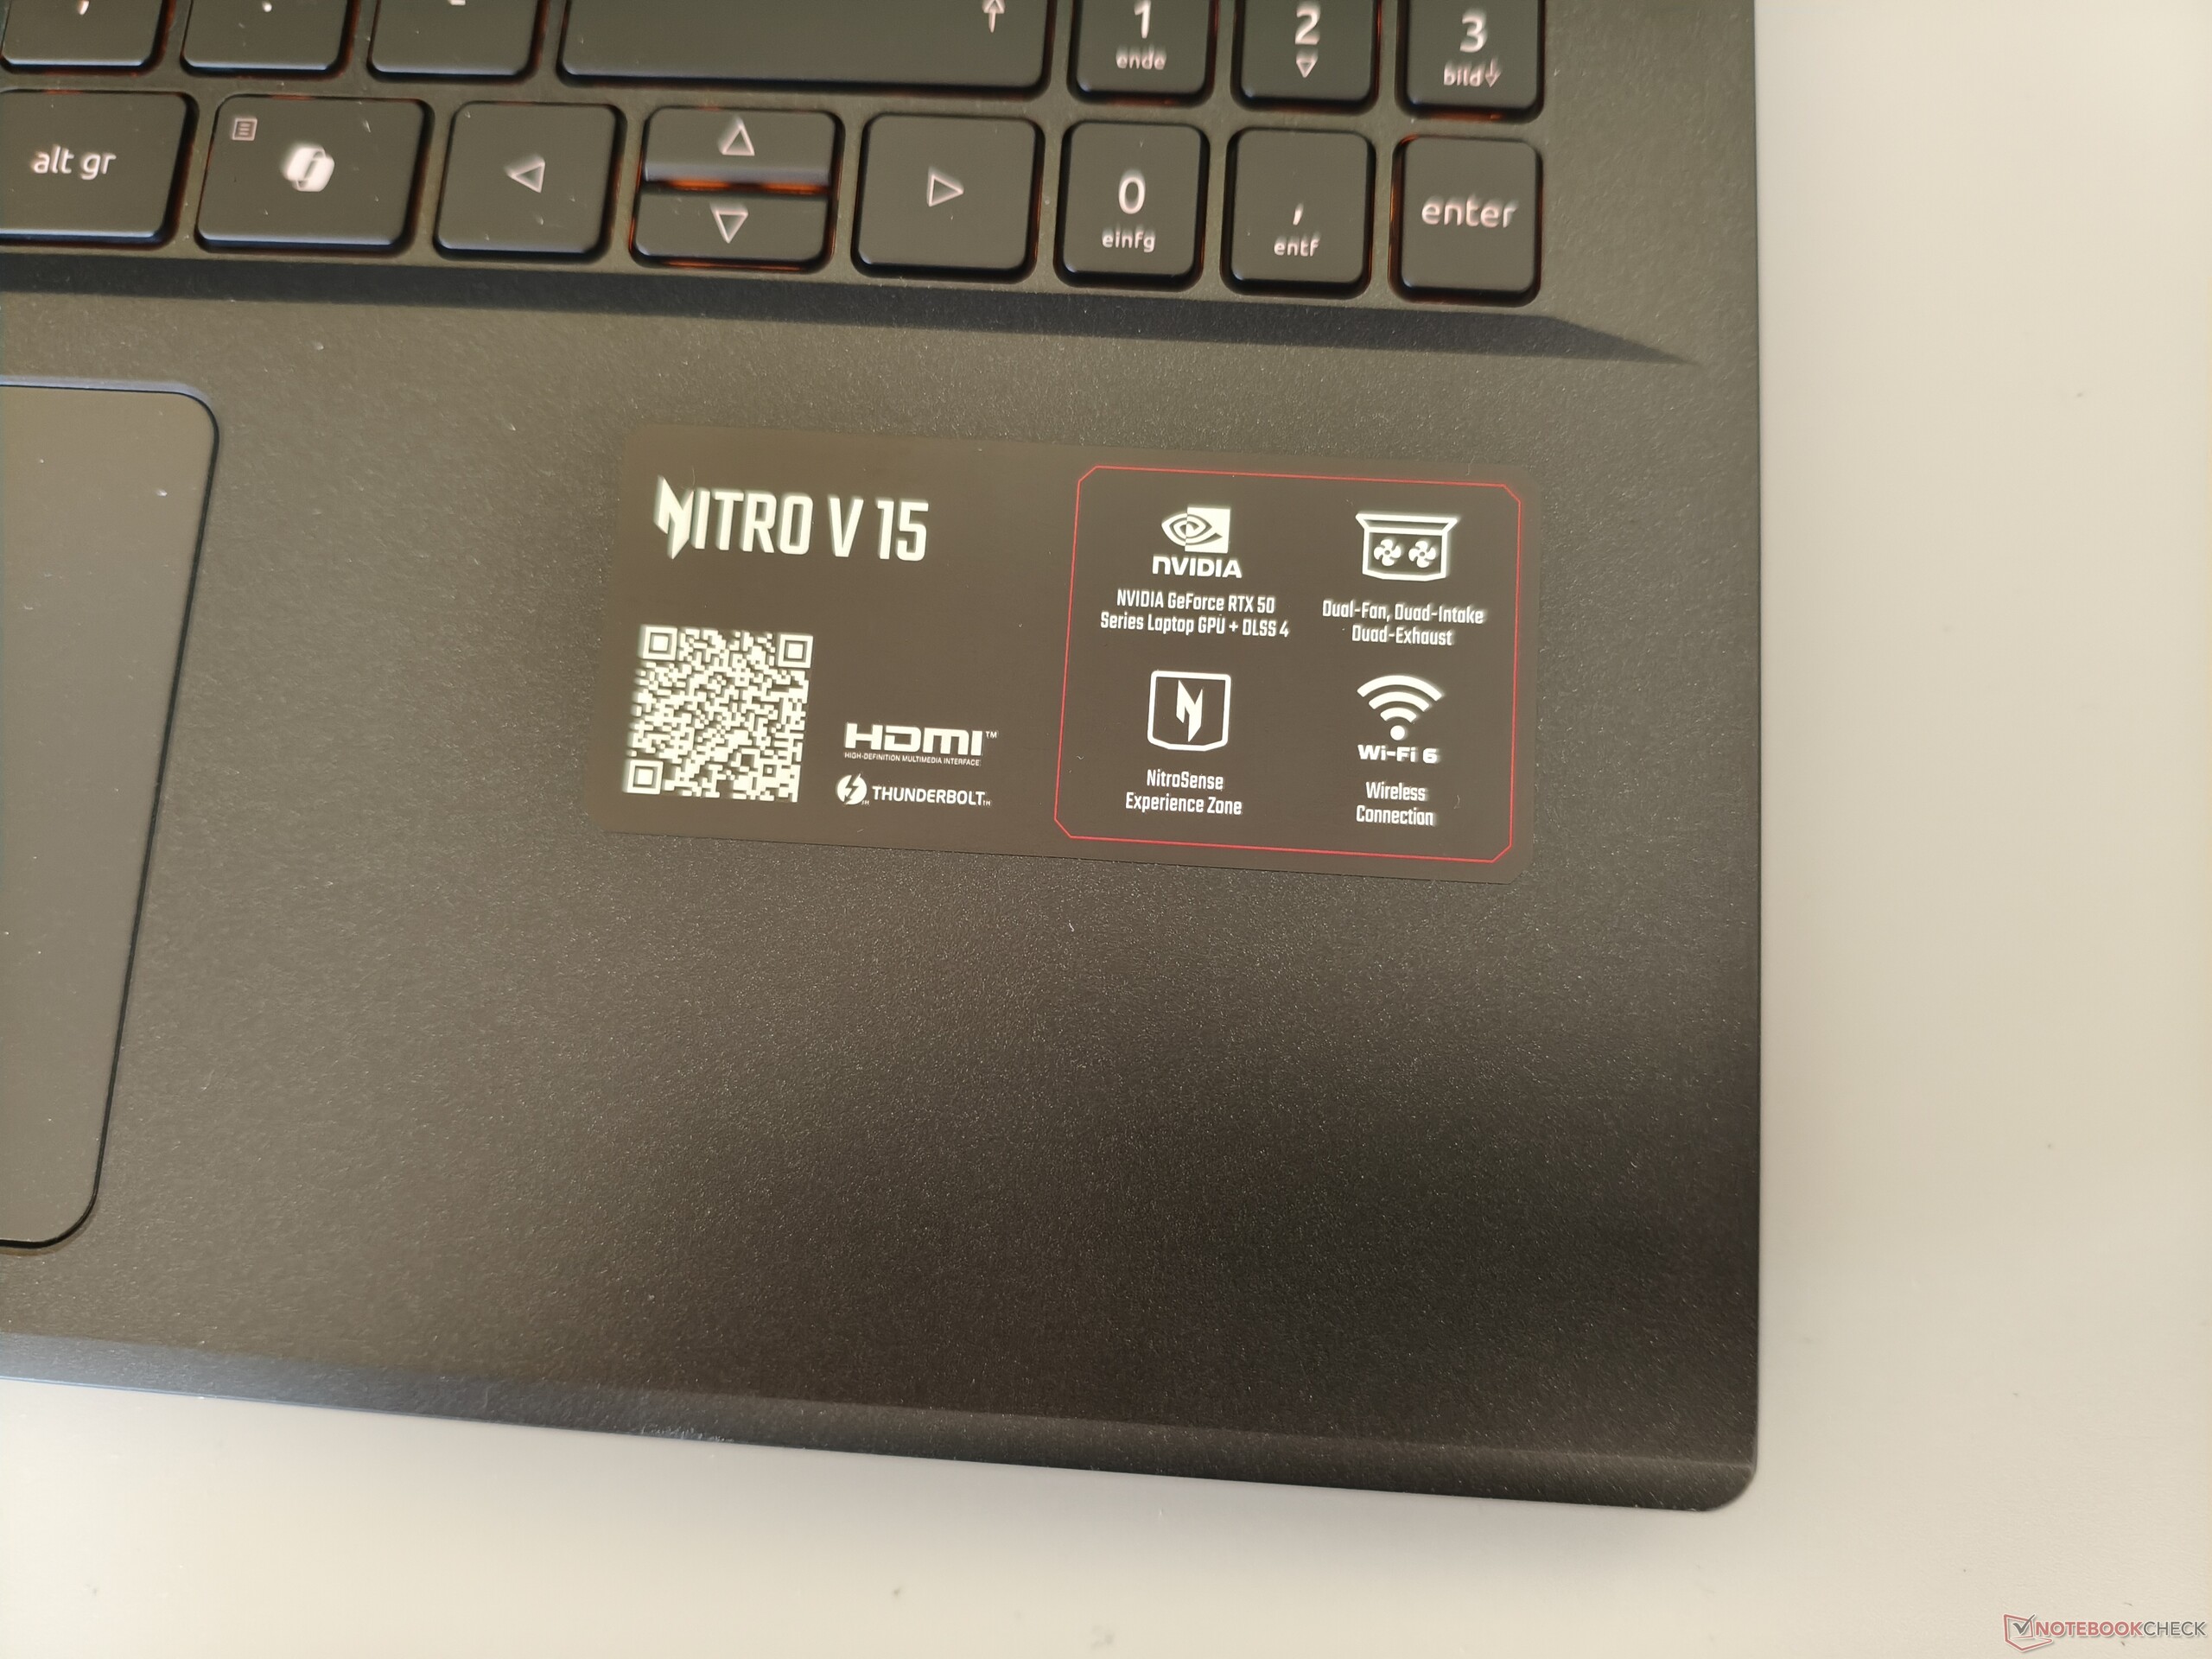
Atualmente, o Nitro V 15 está sendo vendido no varejo por pouco mais de 1.000 euros. Os compradores sem grandes expectativas receberão um laptop para jogos capaz, que pode não atingir os níveis máximos de desempenho, mas que, além da gama limitada de cores da tela, não comete nenhum erro grave. Começando pelo chassi, que apresenta uma atraente tampa texturizada, o dispositivo também oferece dispositivos de entrada decentes e uma sólida seleção de portas, incluindo a Thunderbolt 4.
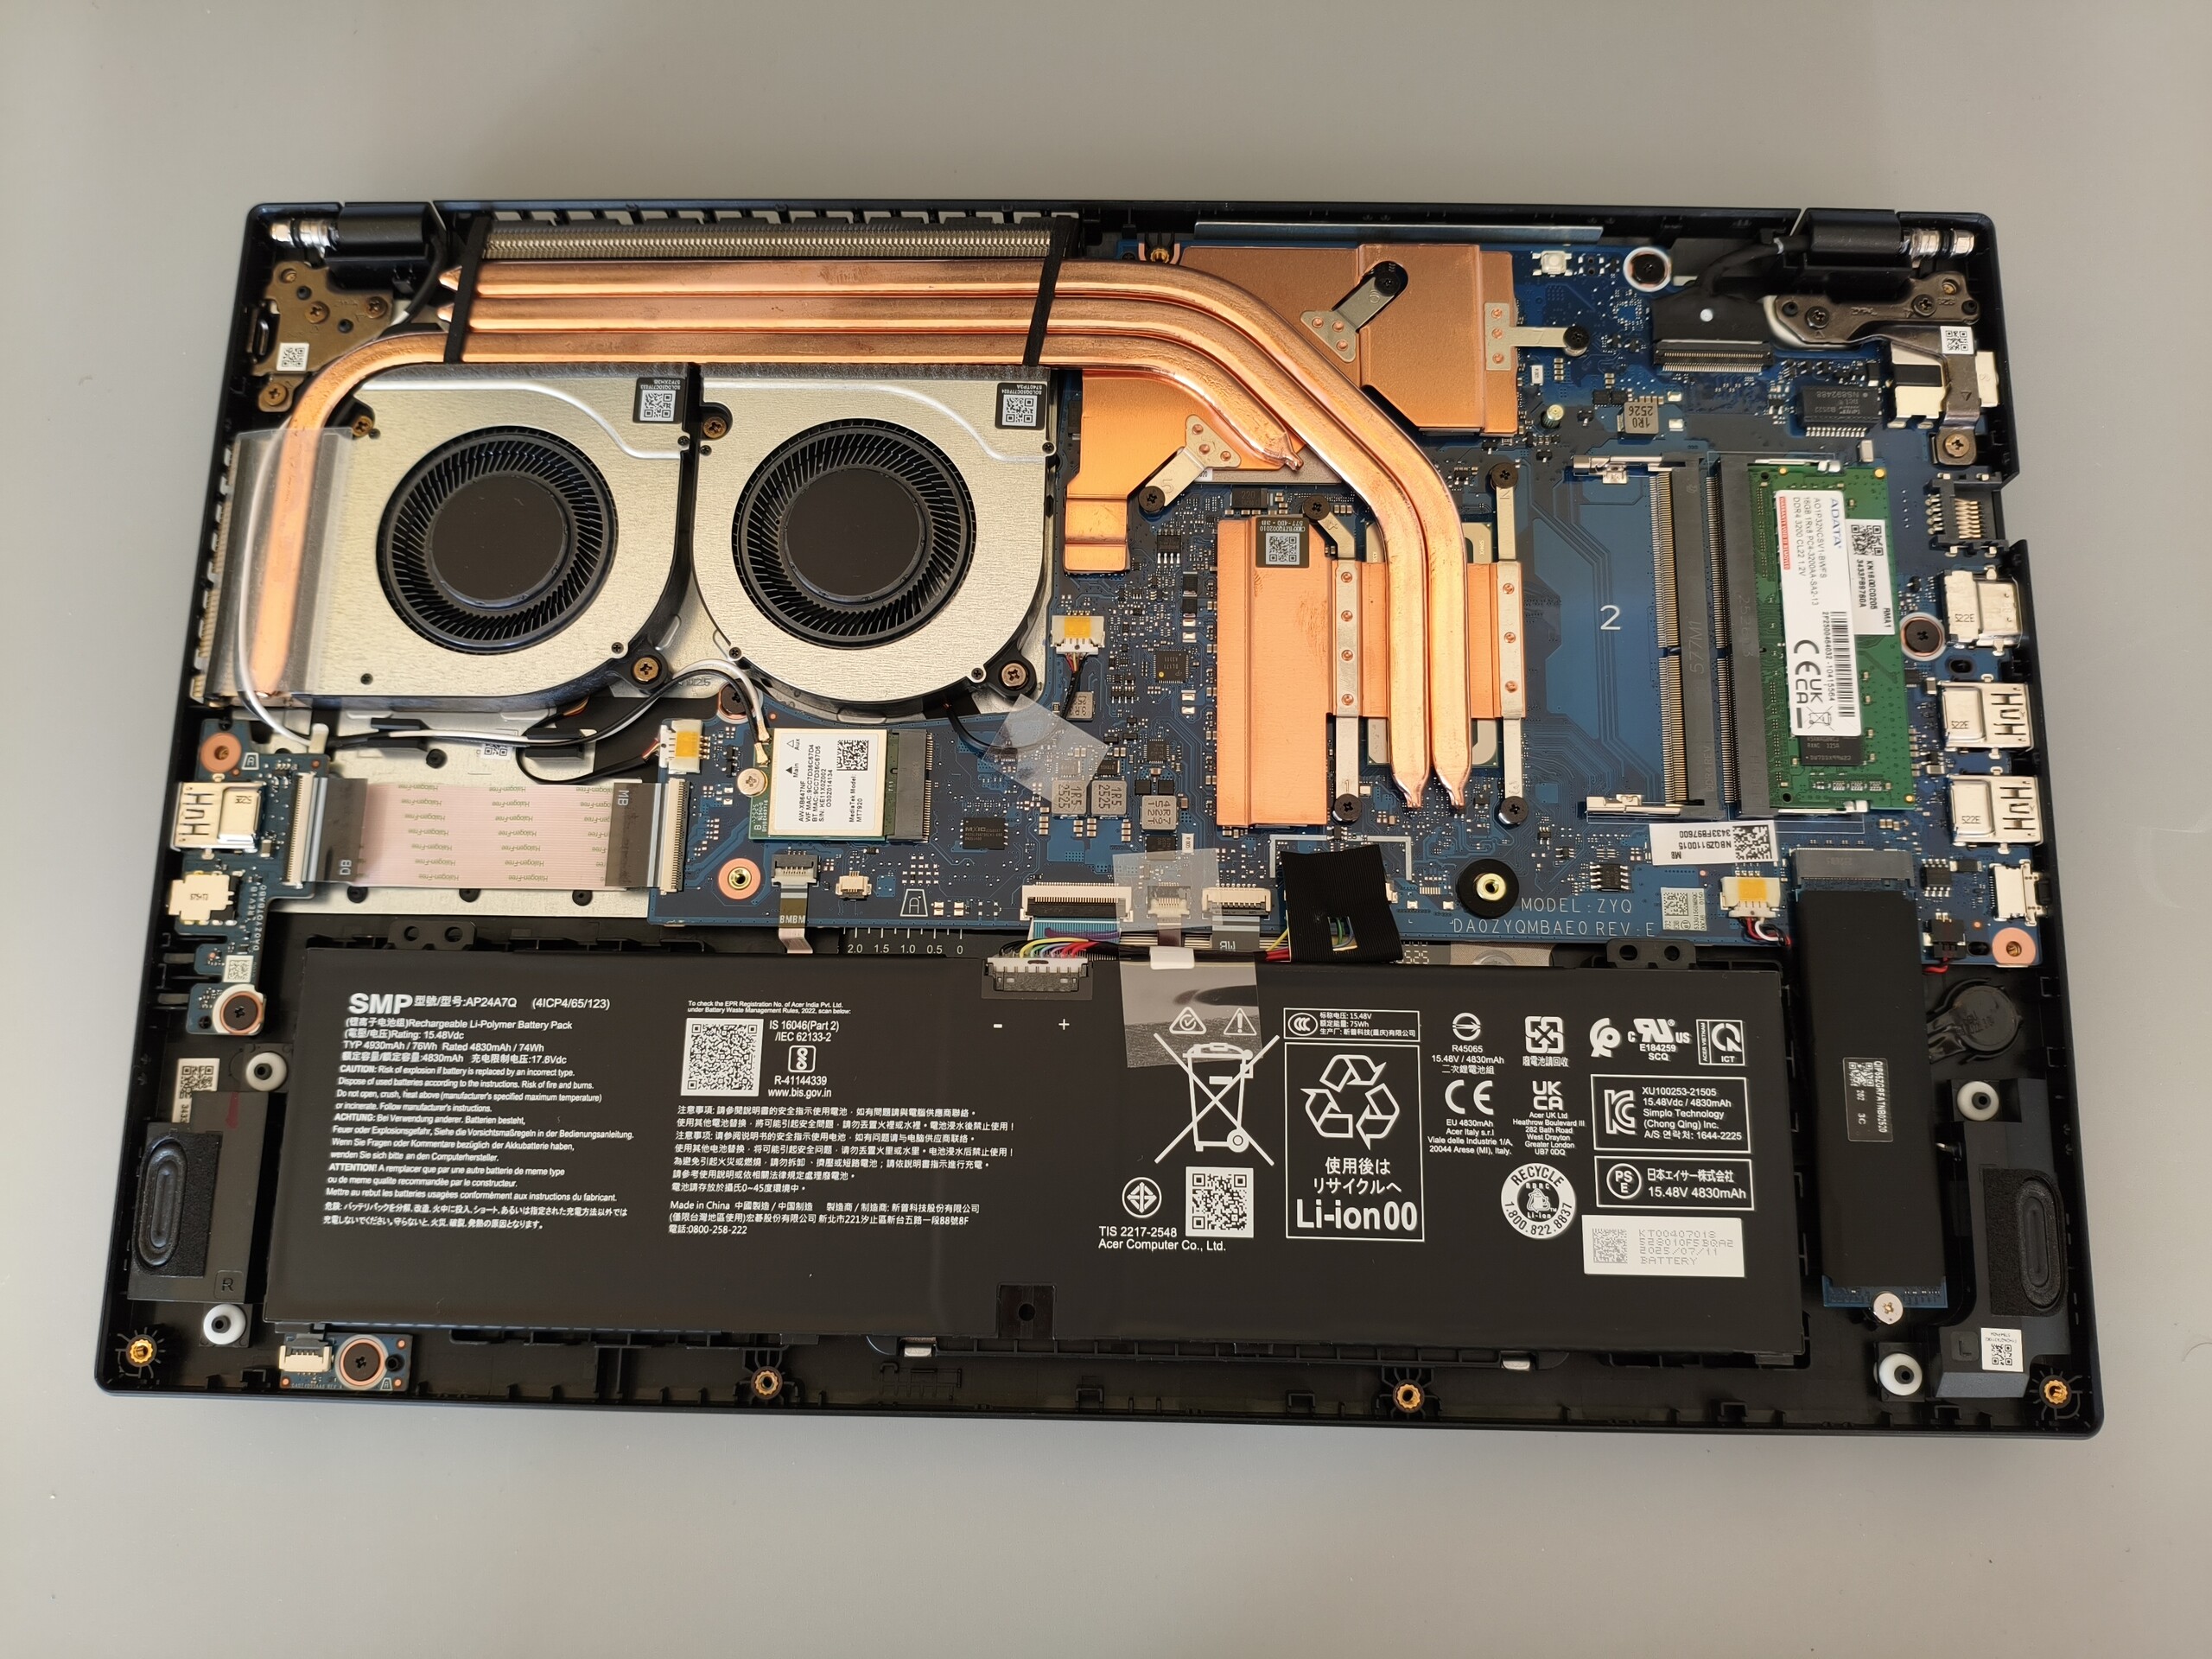
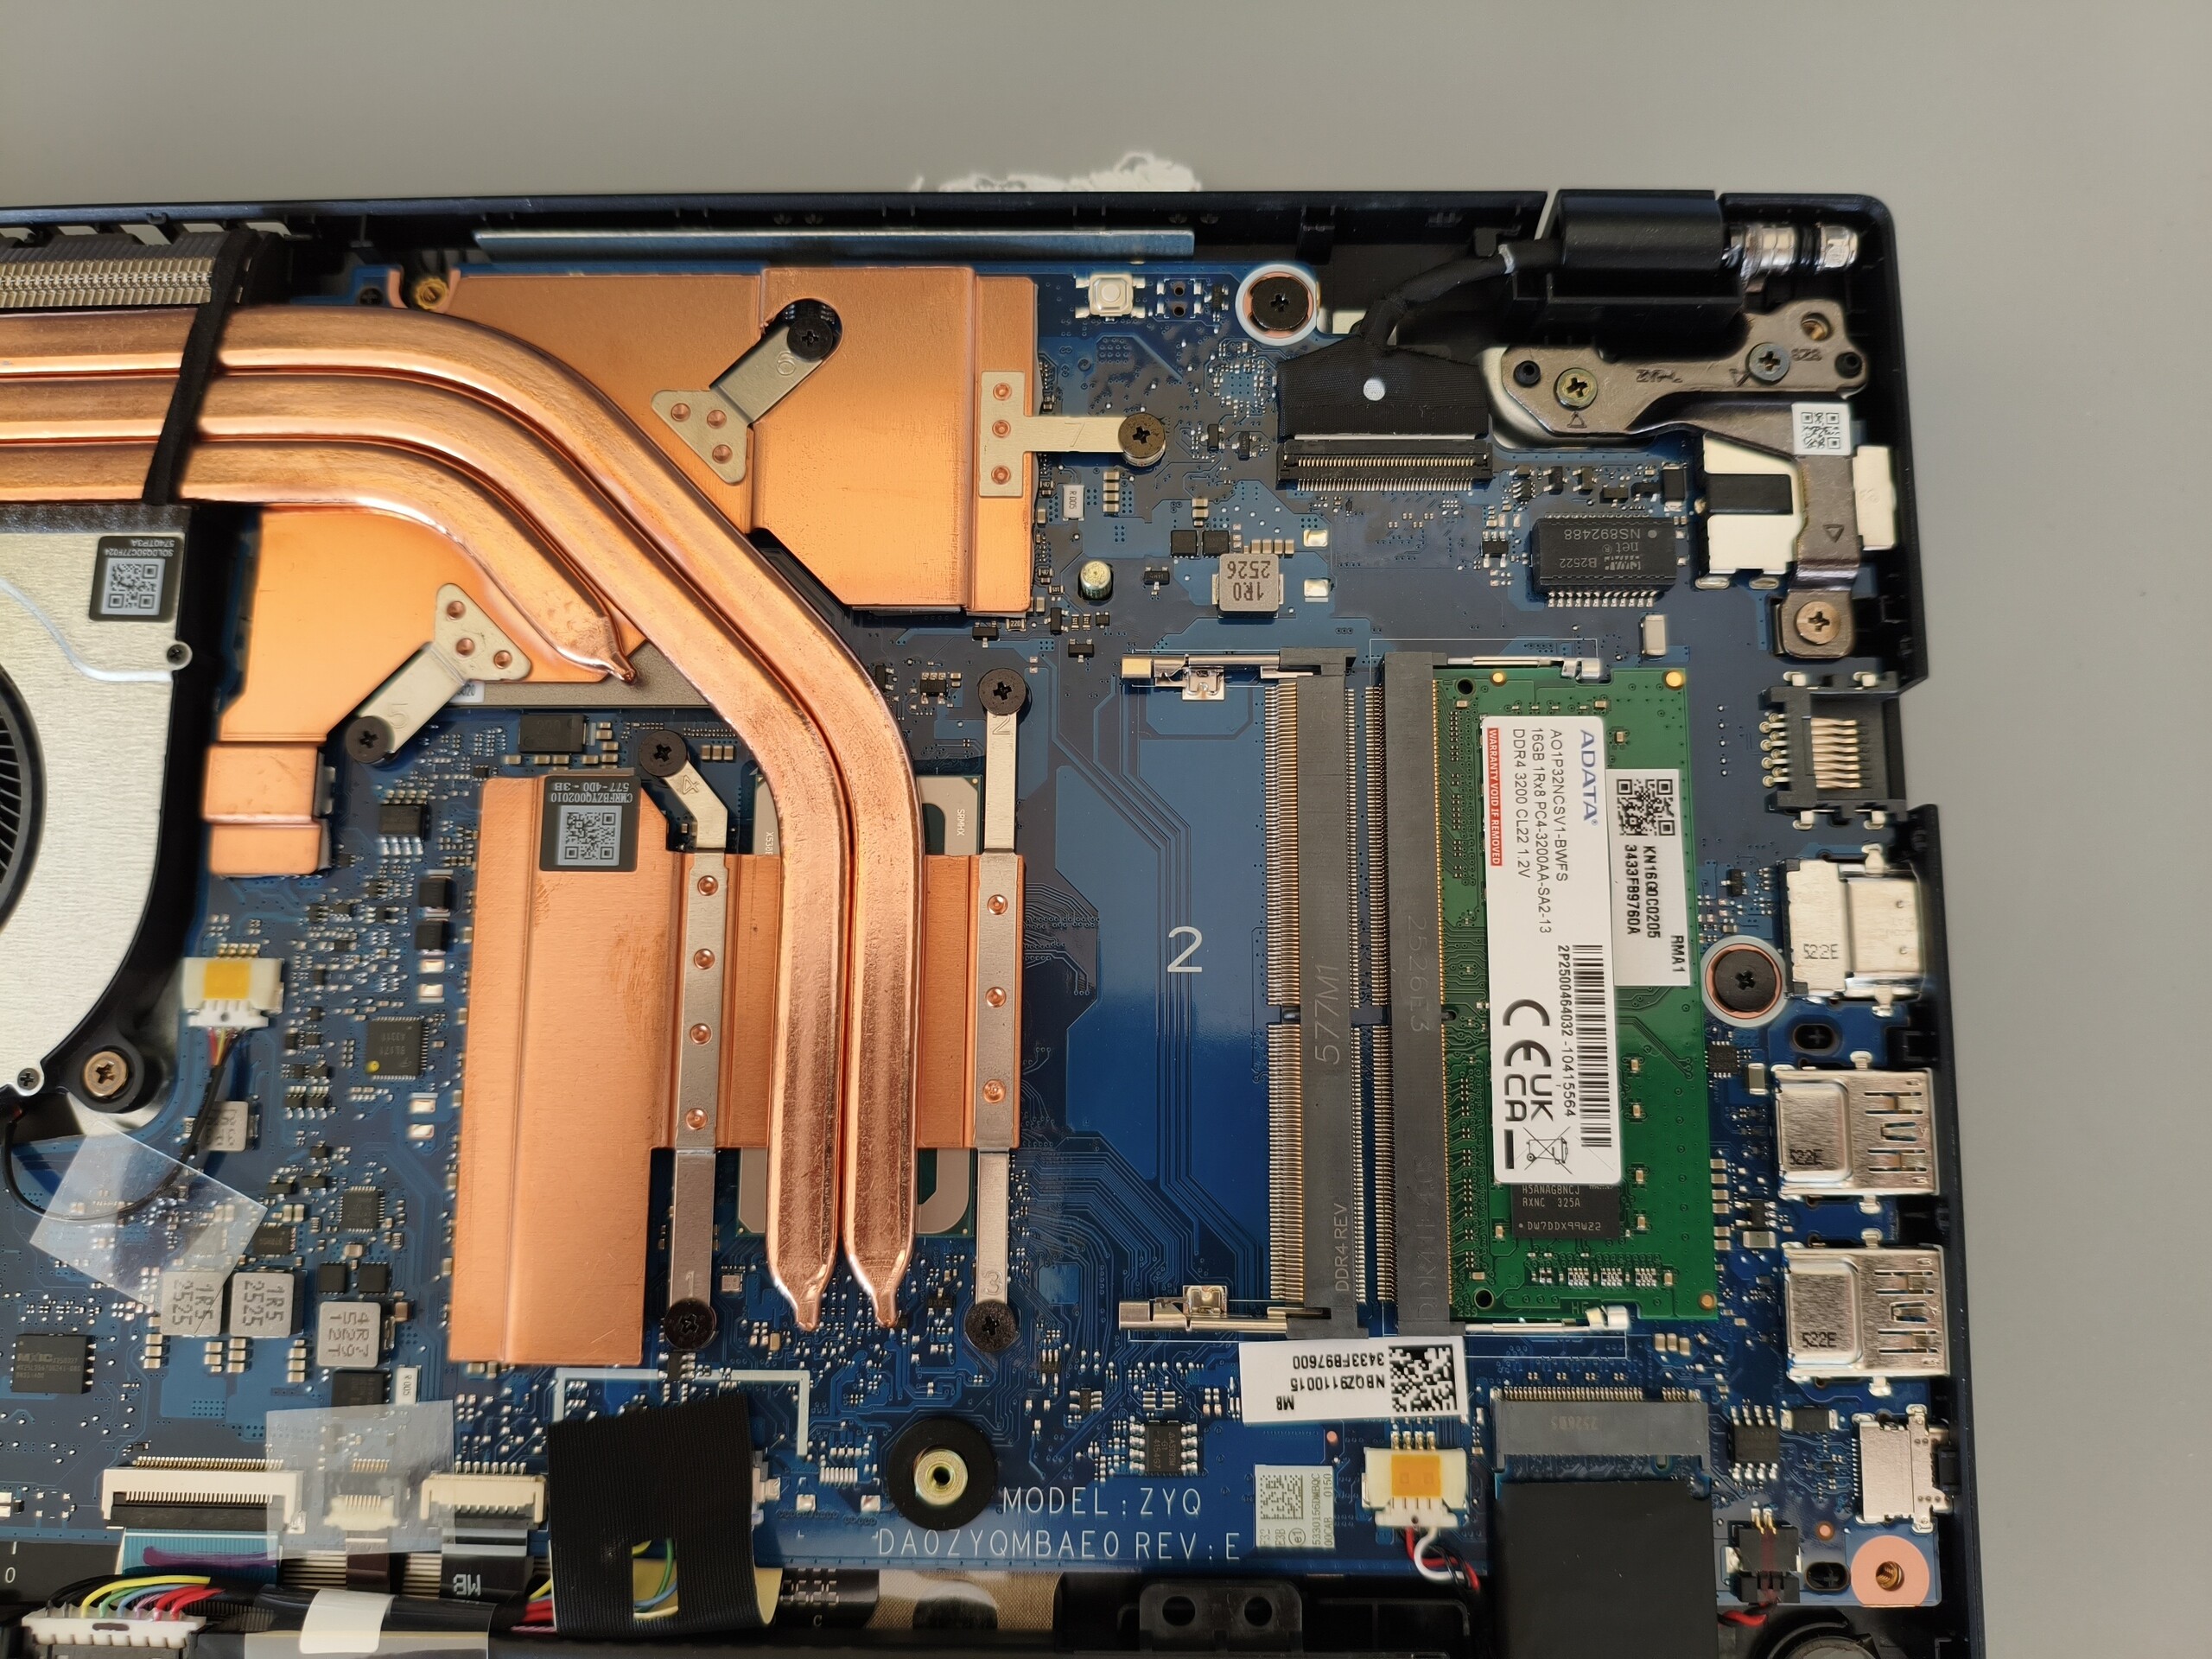
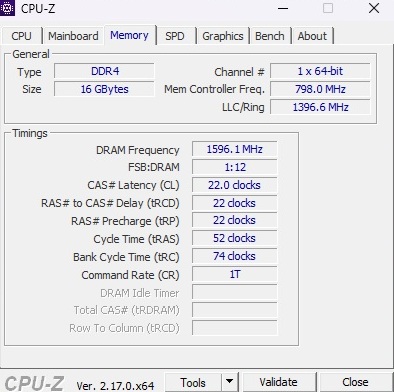
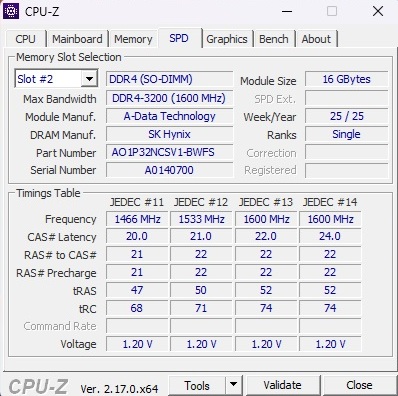
Como a RAM (2x 8 GB DDR4) e o SSD (1 TB M.2) não são soldados, a memória e o armazenamento podem ser atualizados, se necessário. Infelizmente, o desempenho em jogos é um pouco prejudicado, pois o Core i5-13420H e a RTX 5050 não conseguem realizar totalmente seu potencial nessa configuração. De modo geral, o laptop de 15 polegadas por pouco não recebe a classificação "Bom".
Outros notebooks nessa classe de preço e desempenho que vale a pena considerar incluem o MSI Cyborg 15e o HP Victus 15 e o Lenovo LOQ 15.
Pro
Contra
Preço e disponibilidade
O Acer Nitro V 15 ANV15-52-50S2 testado está disponível em vários varejistas on-line por preços a partir de cerca de 1.050 euros (por exemplo, em Notebooksbilliger). Os preços e a disponibilidade podem variar de acordo com a região.
- $72.31HPDELGB Replacement for Acer Nitro V 15 N23Q22 ANV15-51-73B9 Gaming ANV15-51 ANV15-51-51H9 LCD Non-Touch Screen Display Panel 15.6" FHD 144HZ 40 pin
- $95.58KrystalPix Replacement LCD for Acer Nitro V ANV15-52 ANV15-52-76NK Gaming 165hz Display 15.6" FHD LCD LED Screen 40 pins Non-Touch Panel New
- $74.58KrystalPix Replacement LCD for Acer Nitro V Gaming ANV15-52-50B1 LCD LED Screen 15.6" FHD 1920x1080 40pins Non-Touch Display New
Especificações
Caso
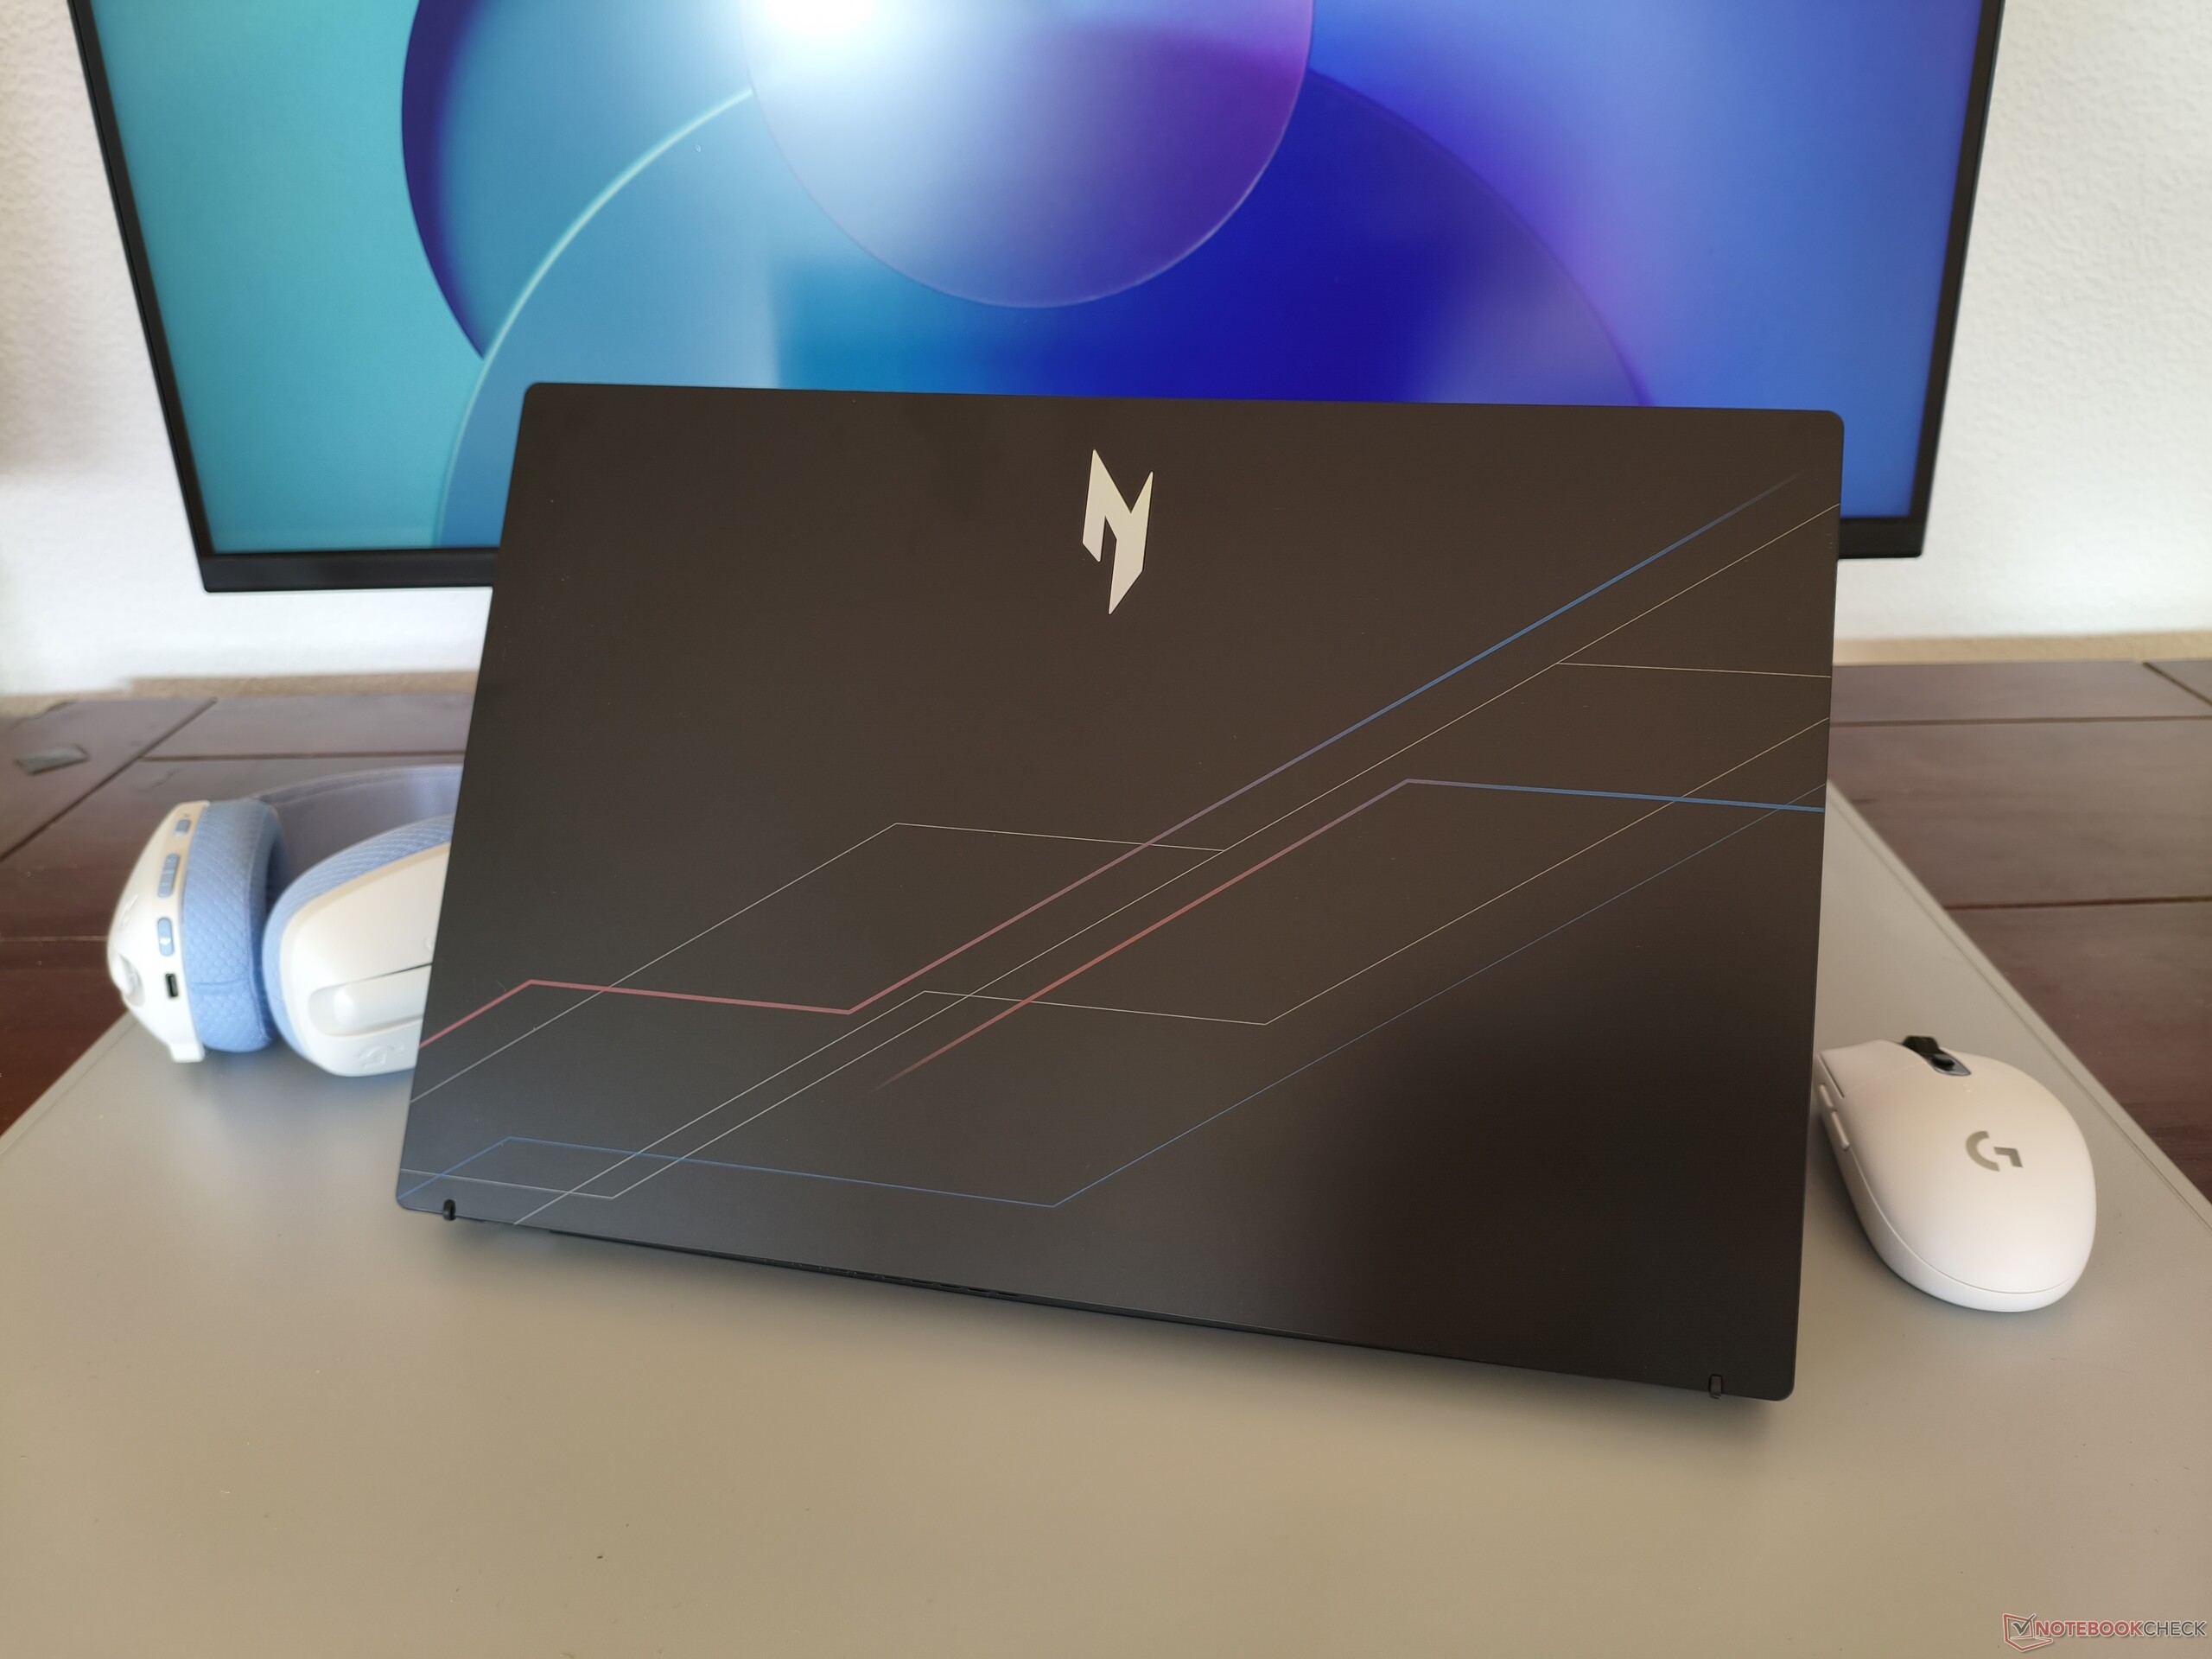
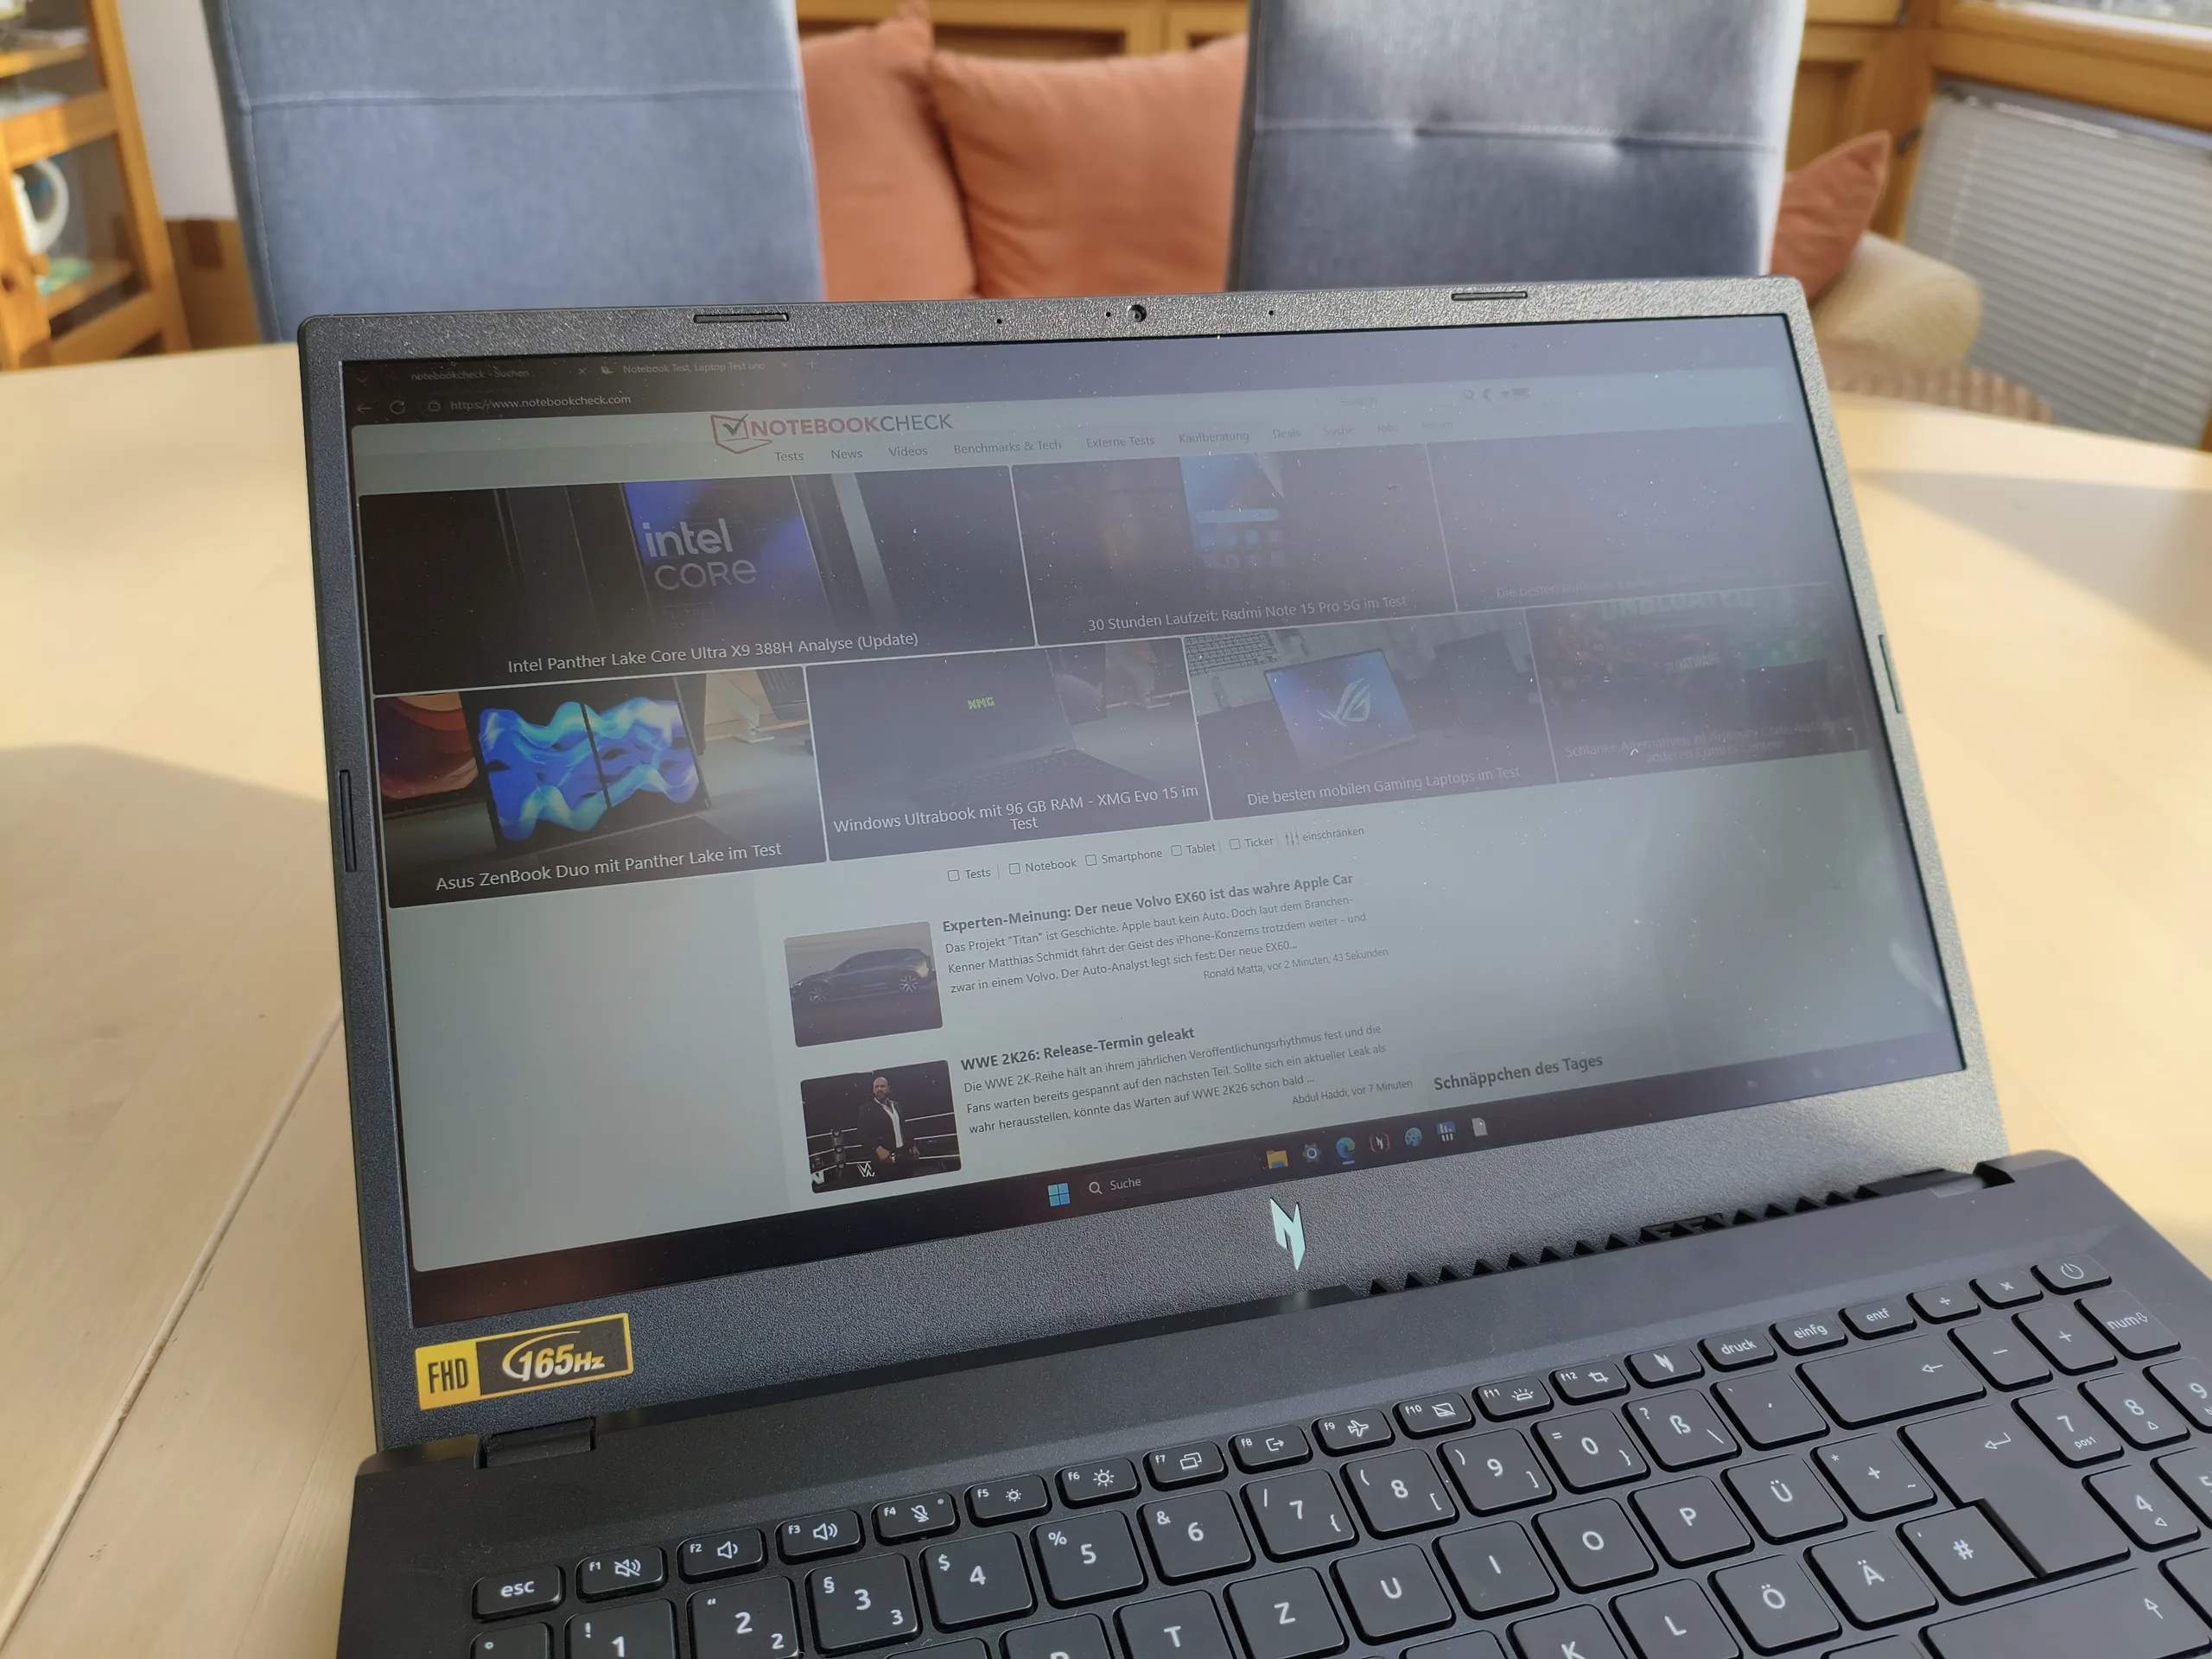
A Acer utiliza um chassi totalmente de plástico que é, em sua maioria, bem acabado, embora algumas áreas apresentem uma flexão perceptível. As dobradiças parecem um pouco frouxas e permitem que a tela se abra em um ângulo máximo de aproximadamente 145°. Pesando 2,1 kg, o laptop se iguala ao seu antecessor em termos de peso, enquanto o design geral permanece semelhante, mas não totalmente inalterado.

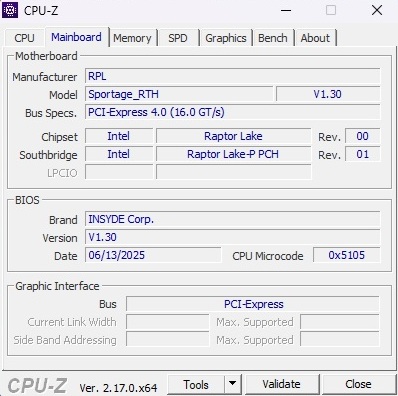
Conectividade
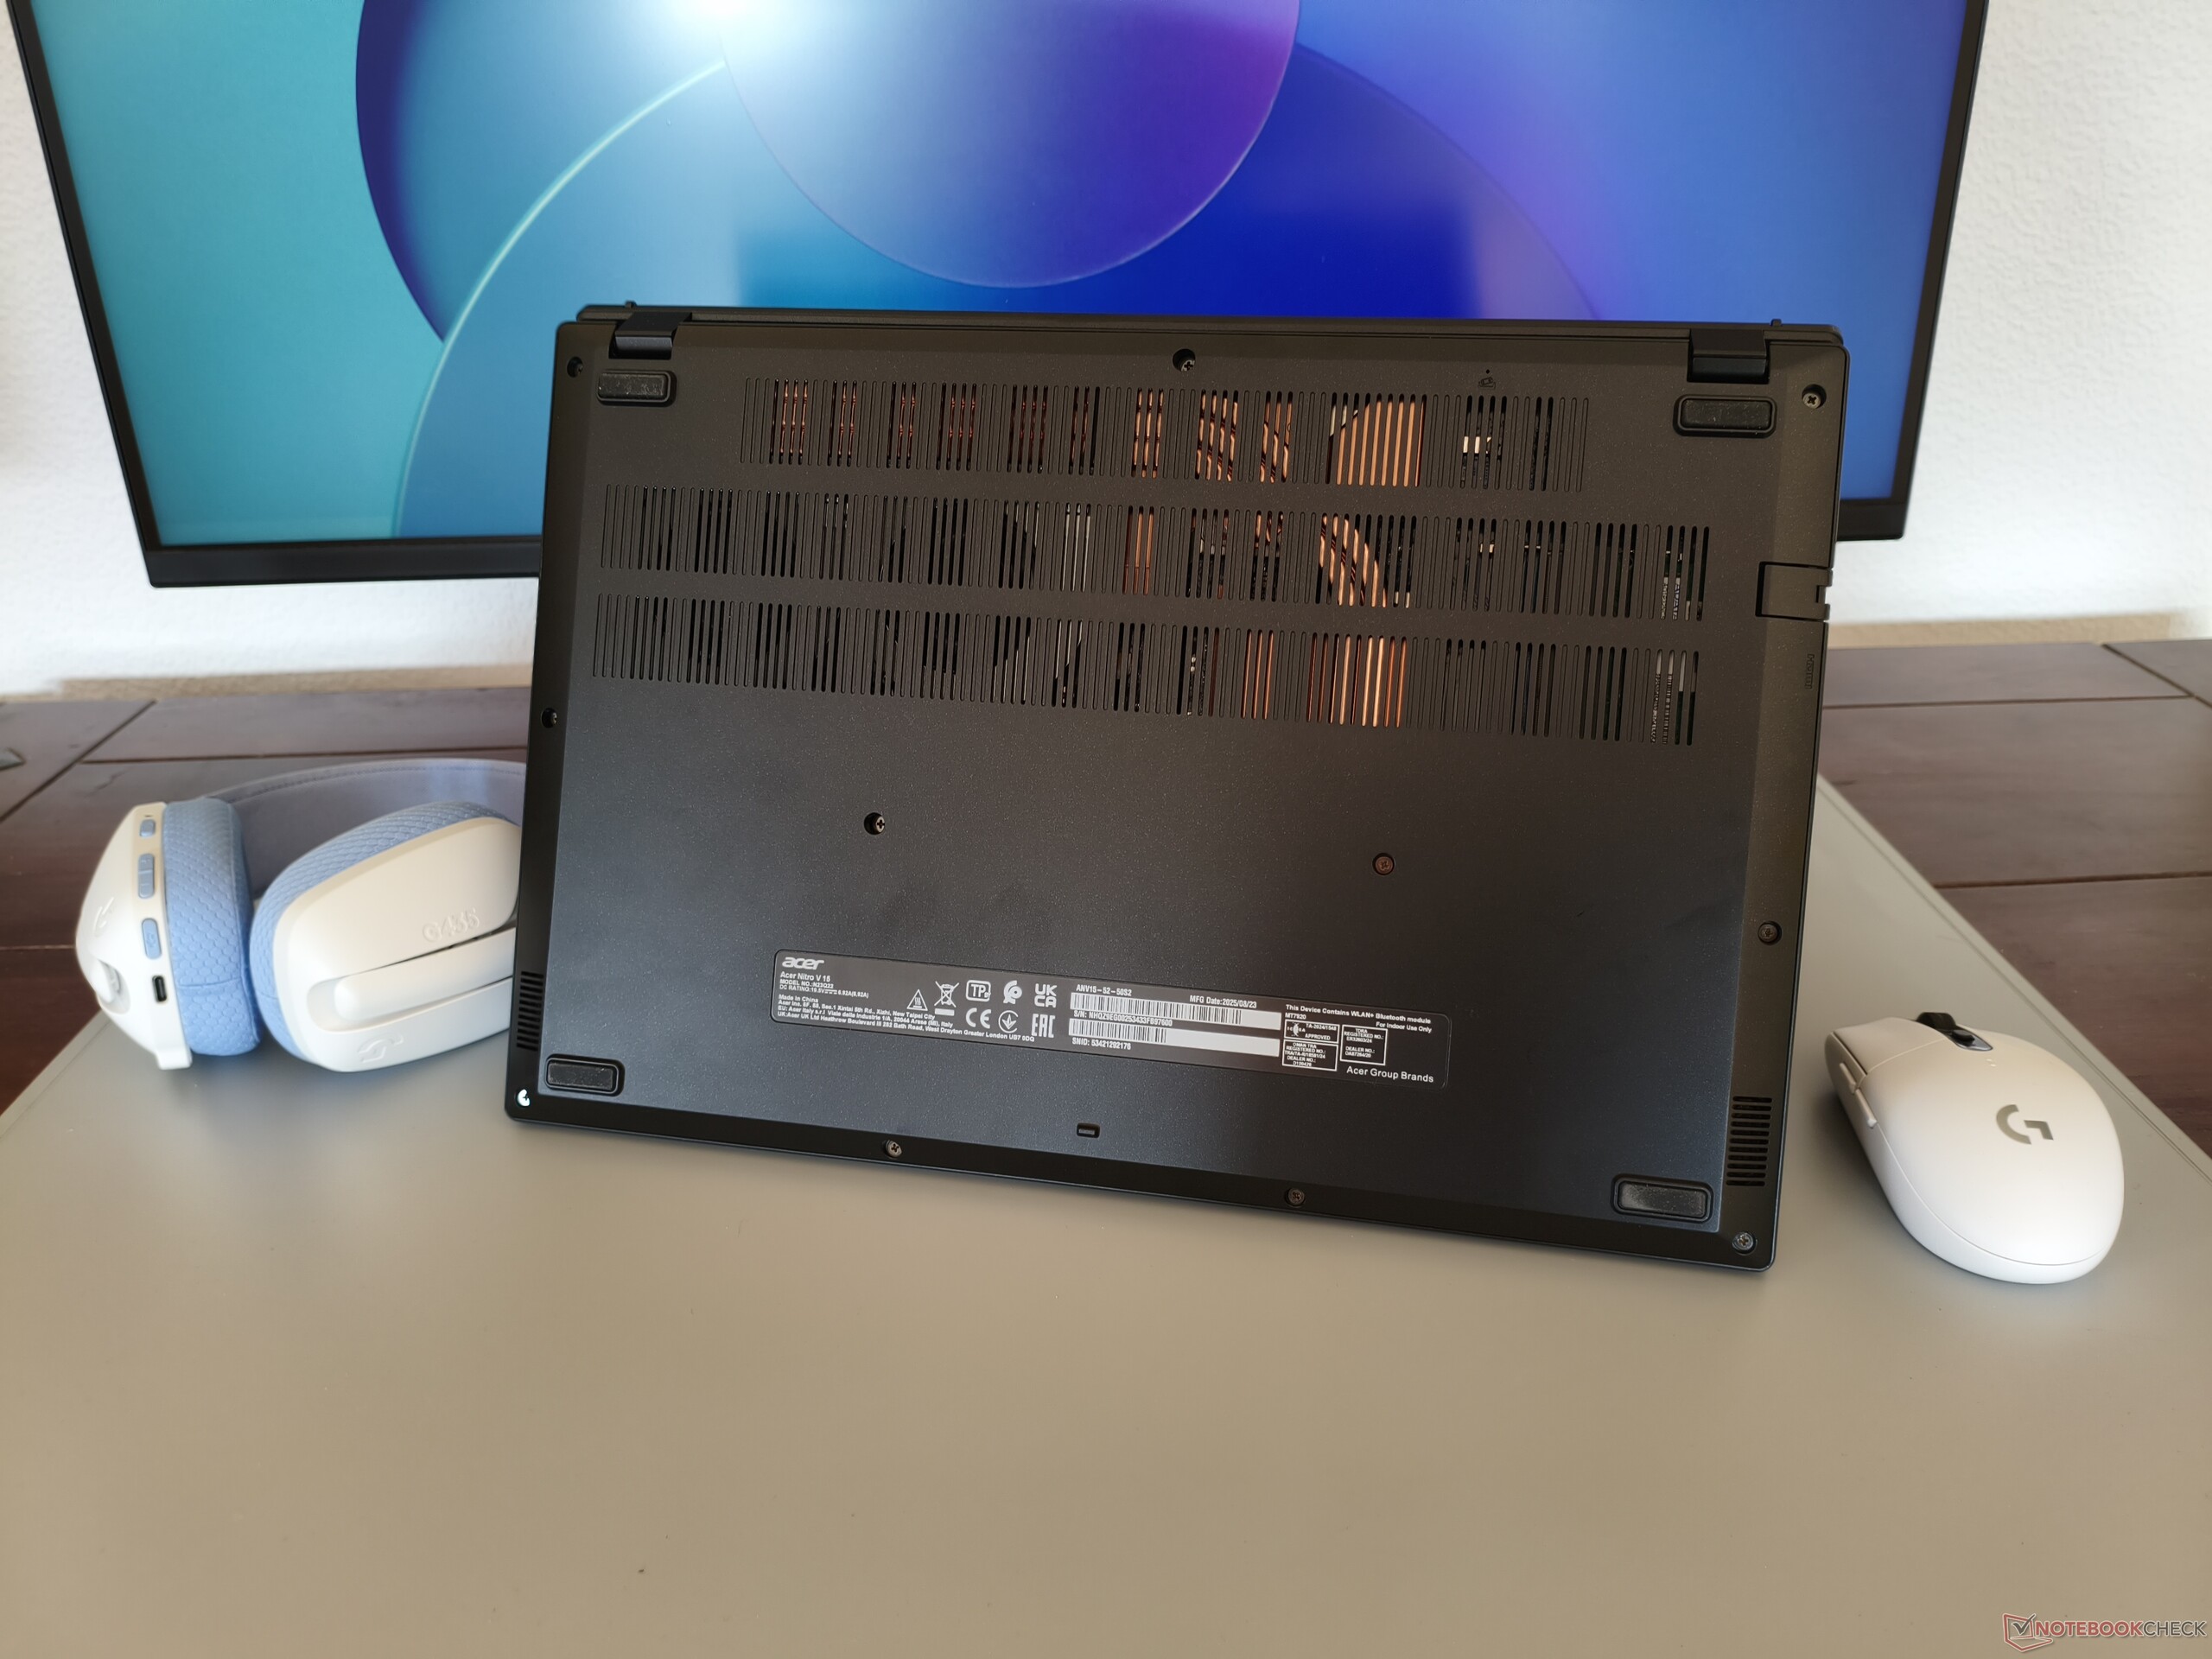
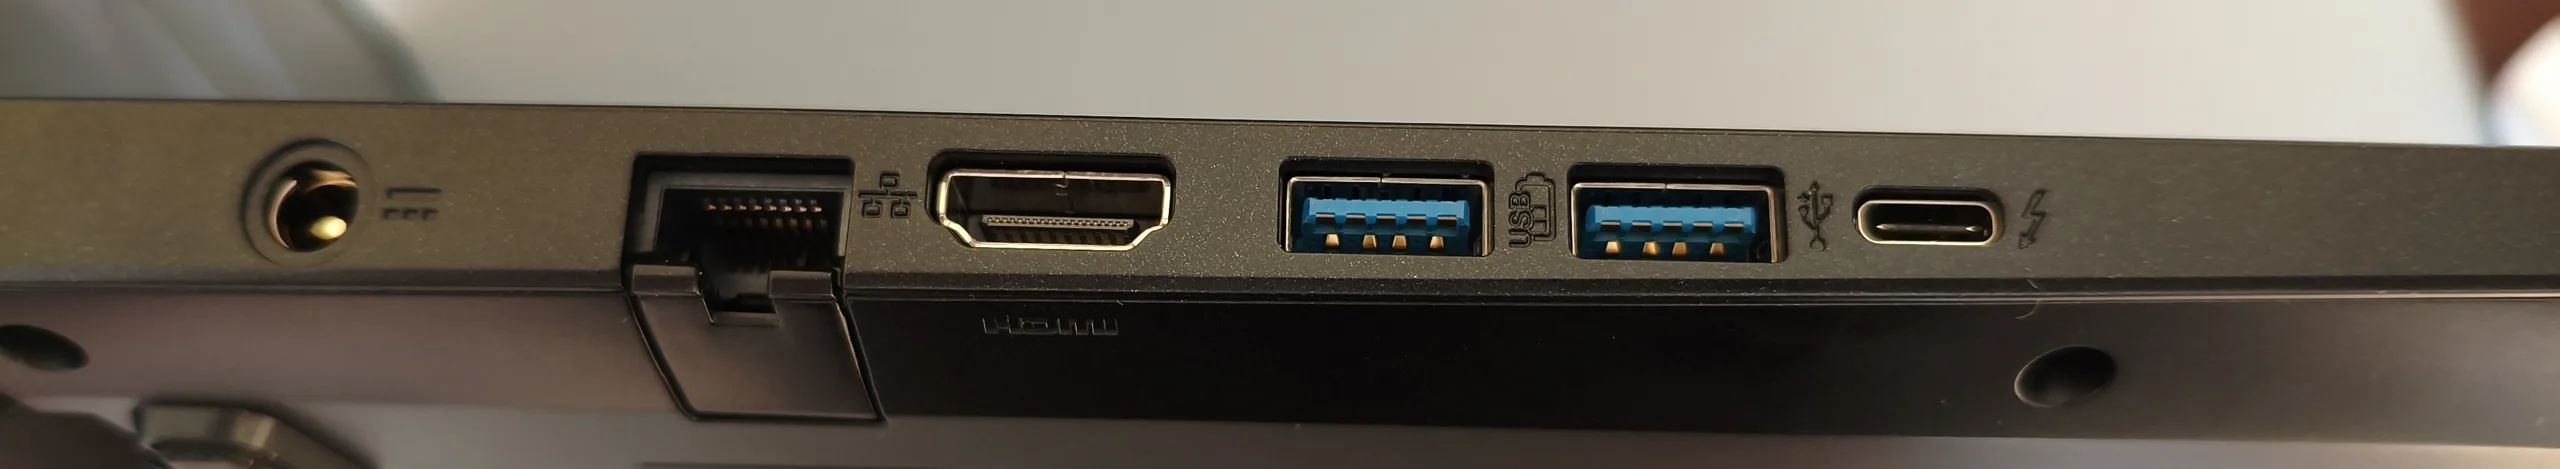
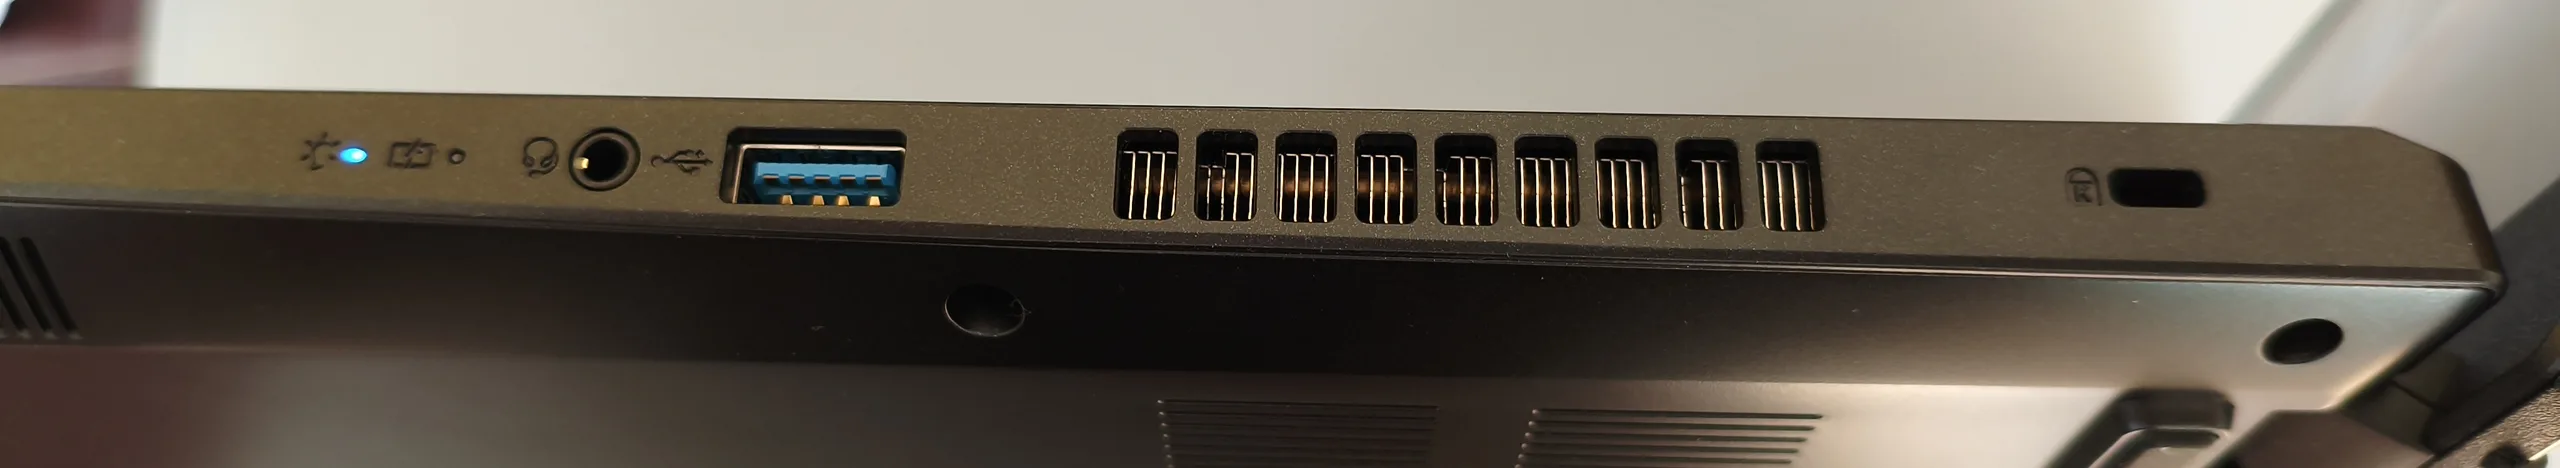
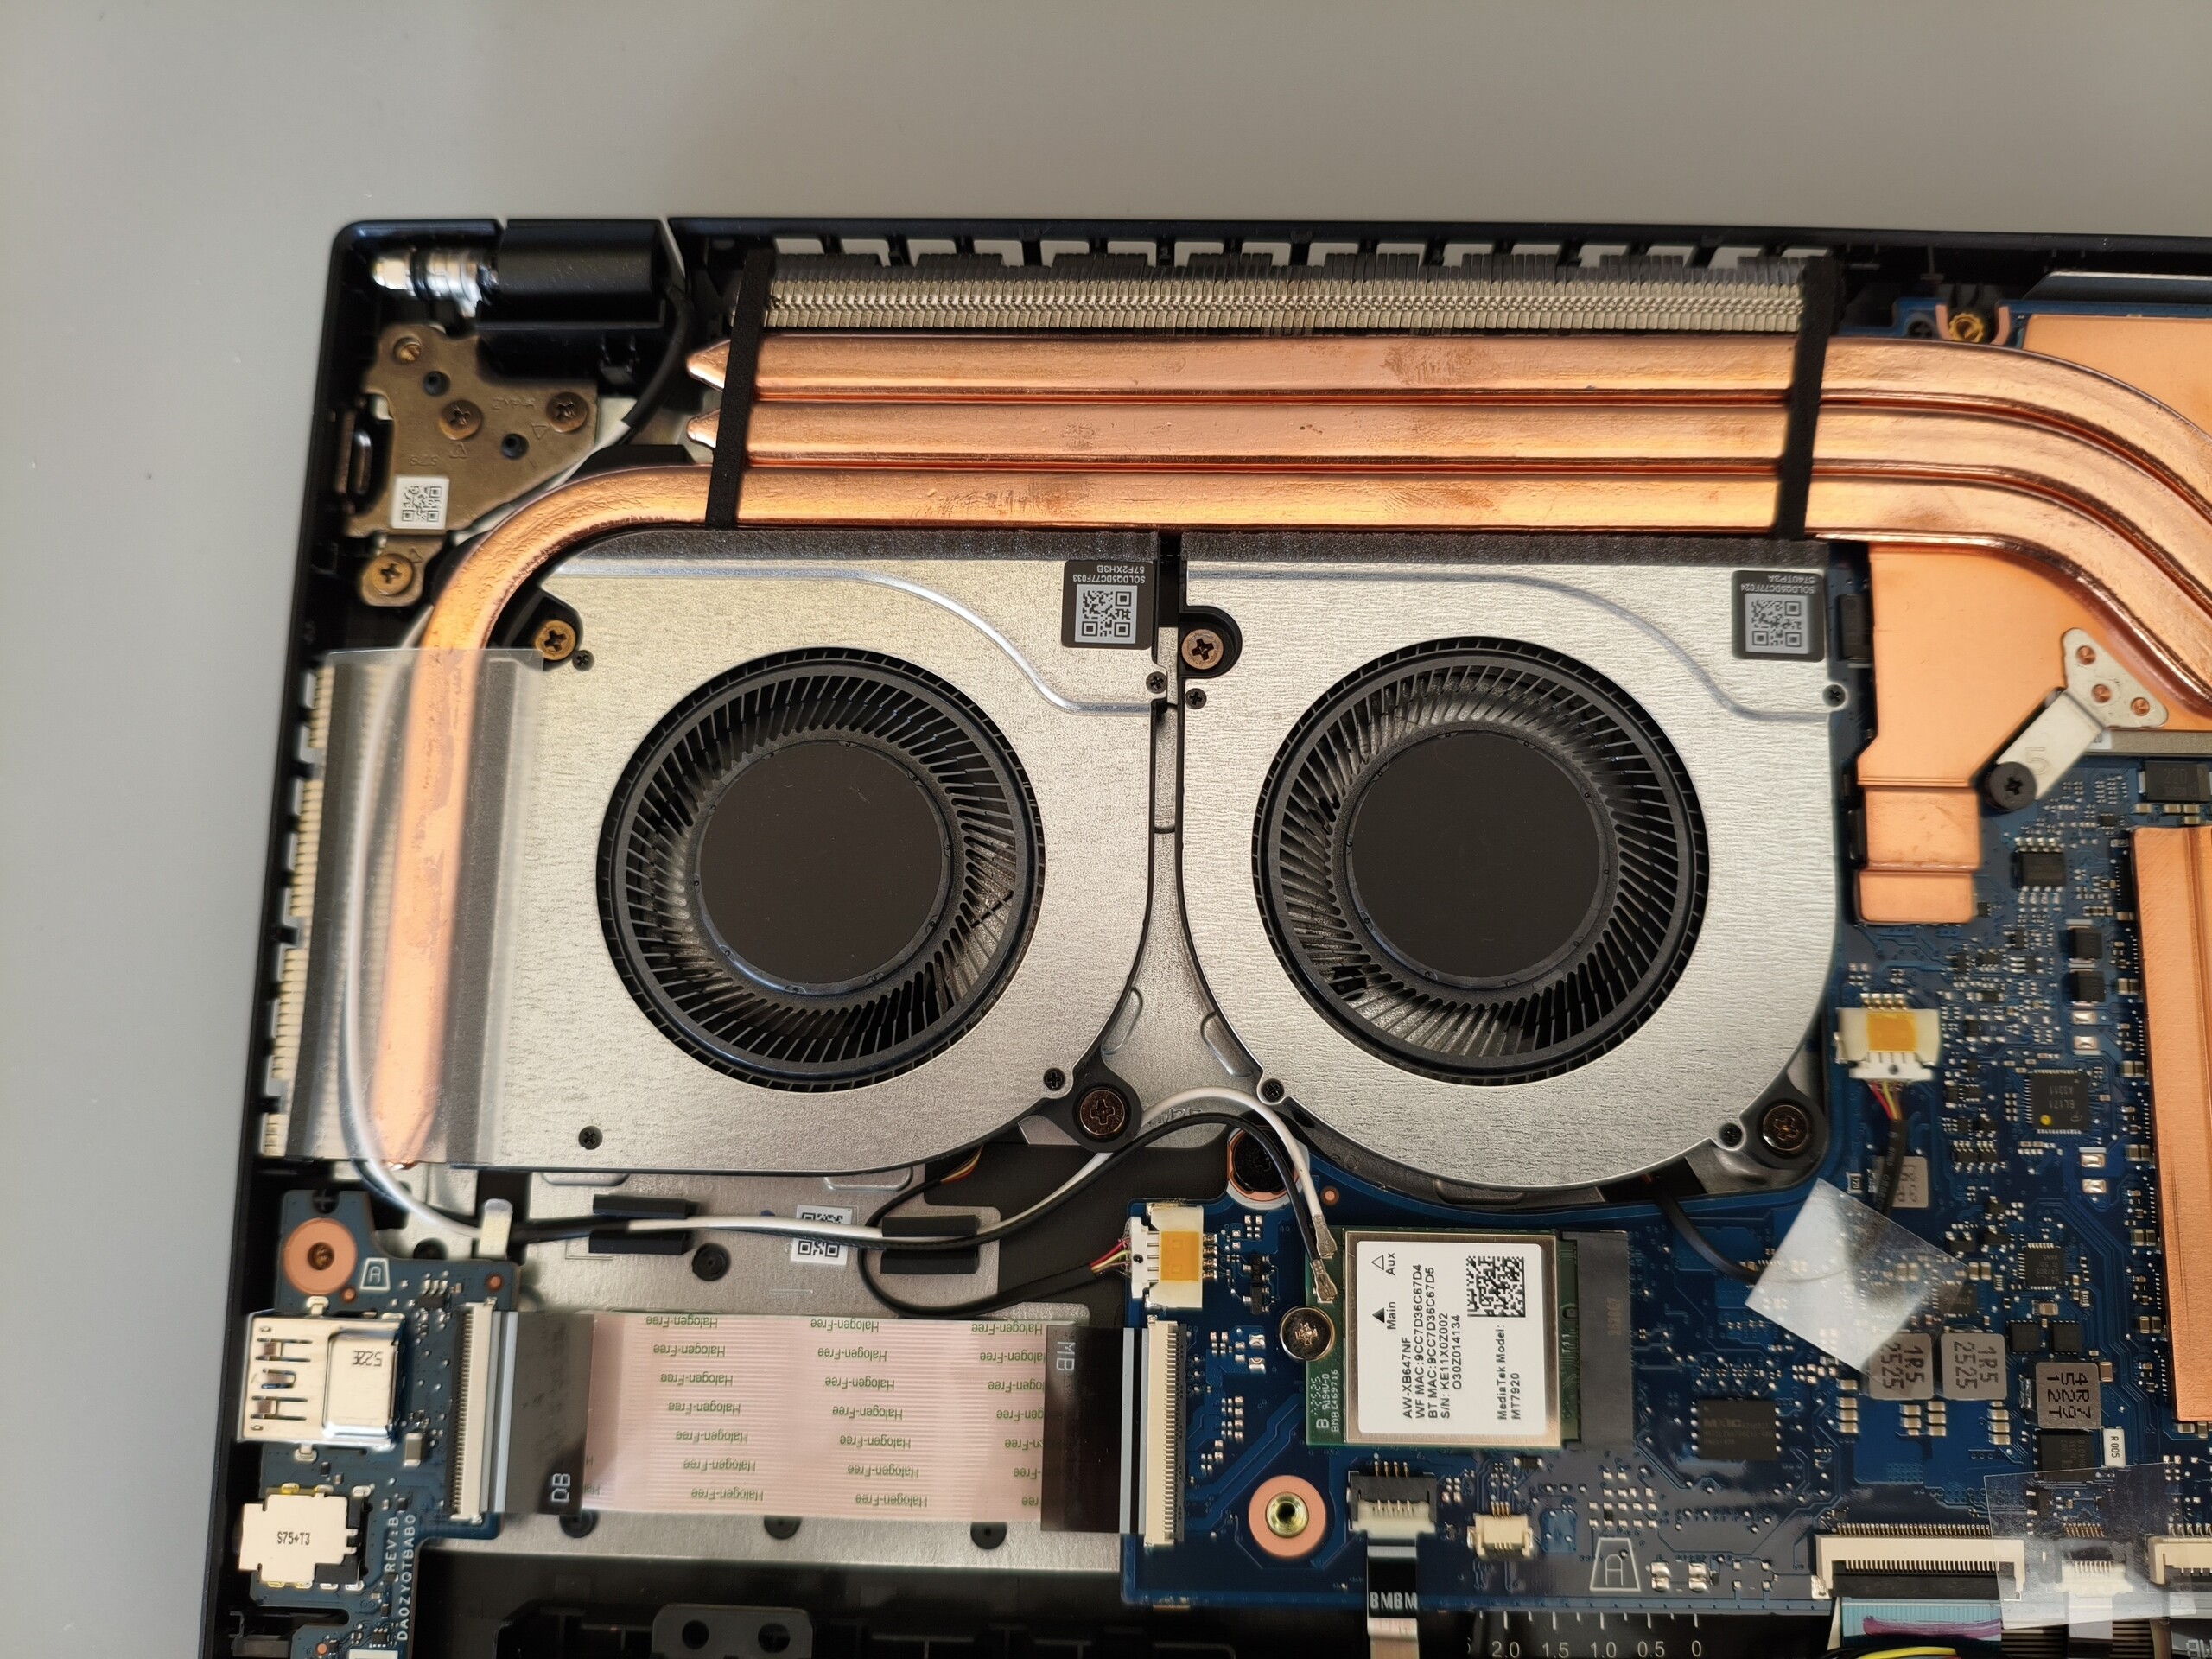
Além da ausência de um leitor de cartão, a seleção de portas deixa pouco espaço para críticas. A porta Gigabit LAN, a saída HDMI e o conector de áudio de 3,5 mm são complementados por três portas USB-A e um conector Thunderbolt 4. Um slot de trava Kensington também está incluído. O módulo Wi-Fi 6E oferece um desempenho mediano e a webcam, um tanto fraca, produz resultados igualmente inexpressivos. Para acessar os componentes internos, é necessário remover 11 parafusos Phillips. As imagens do interior podem ser encontradas mais abaixo.
Comunicação
Webcam


Manutenção
Dispositivos de entrada
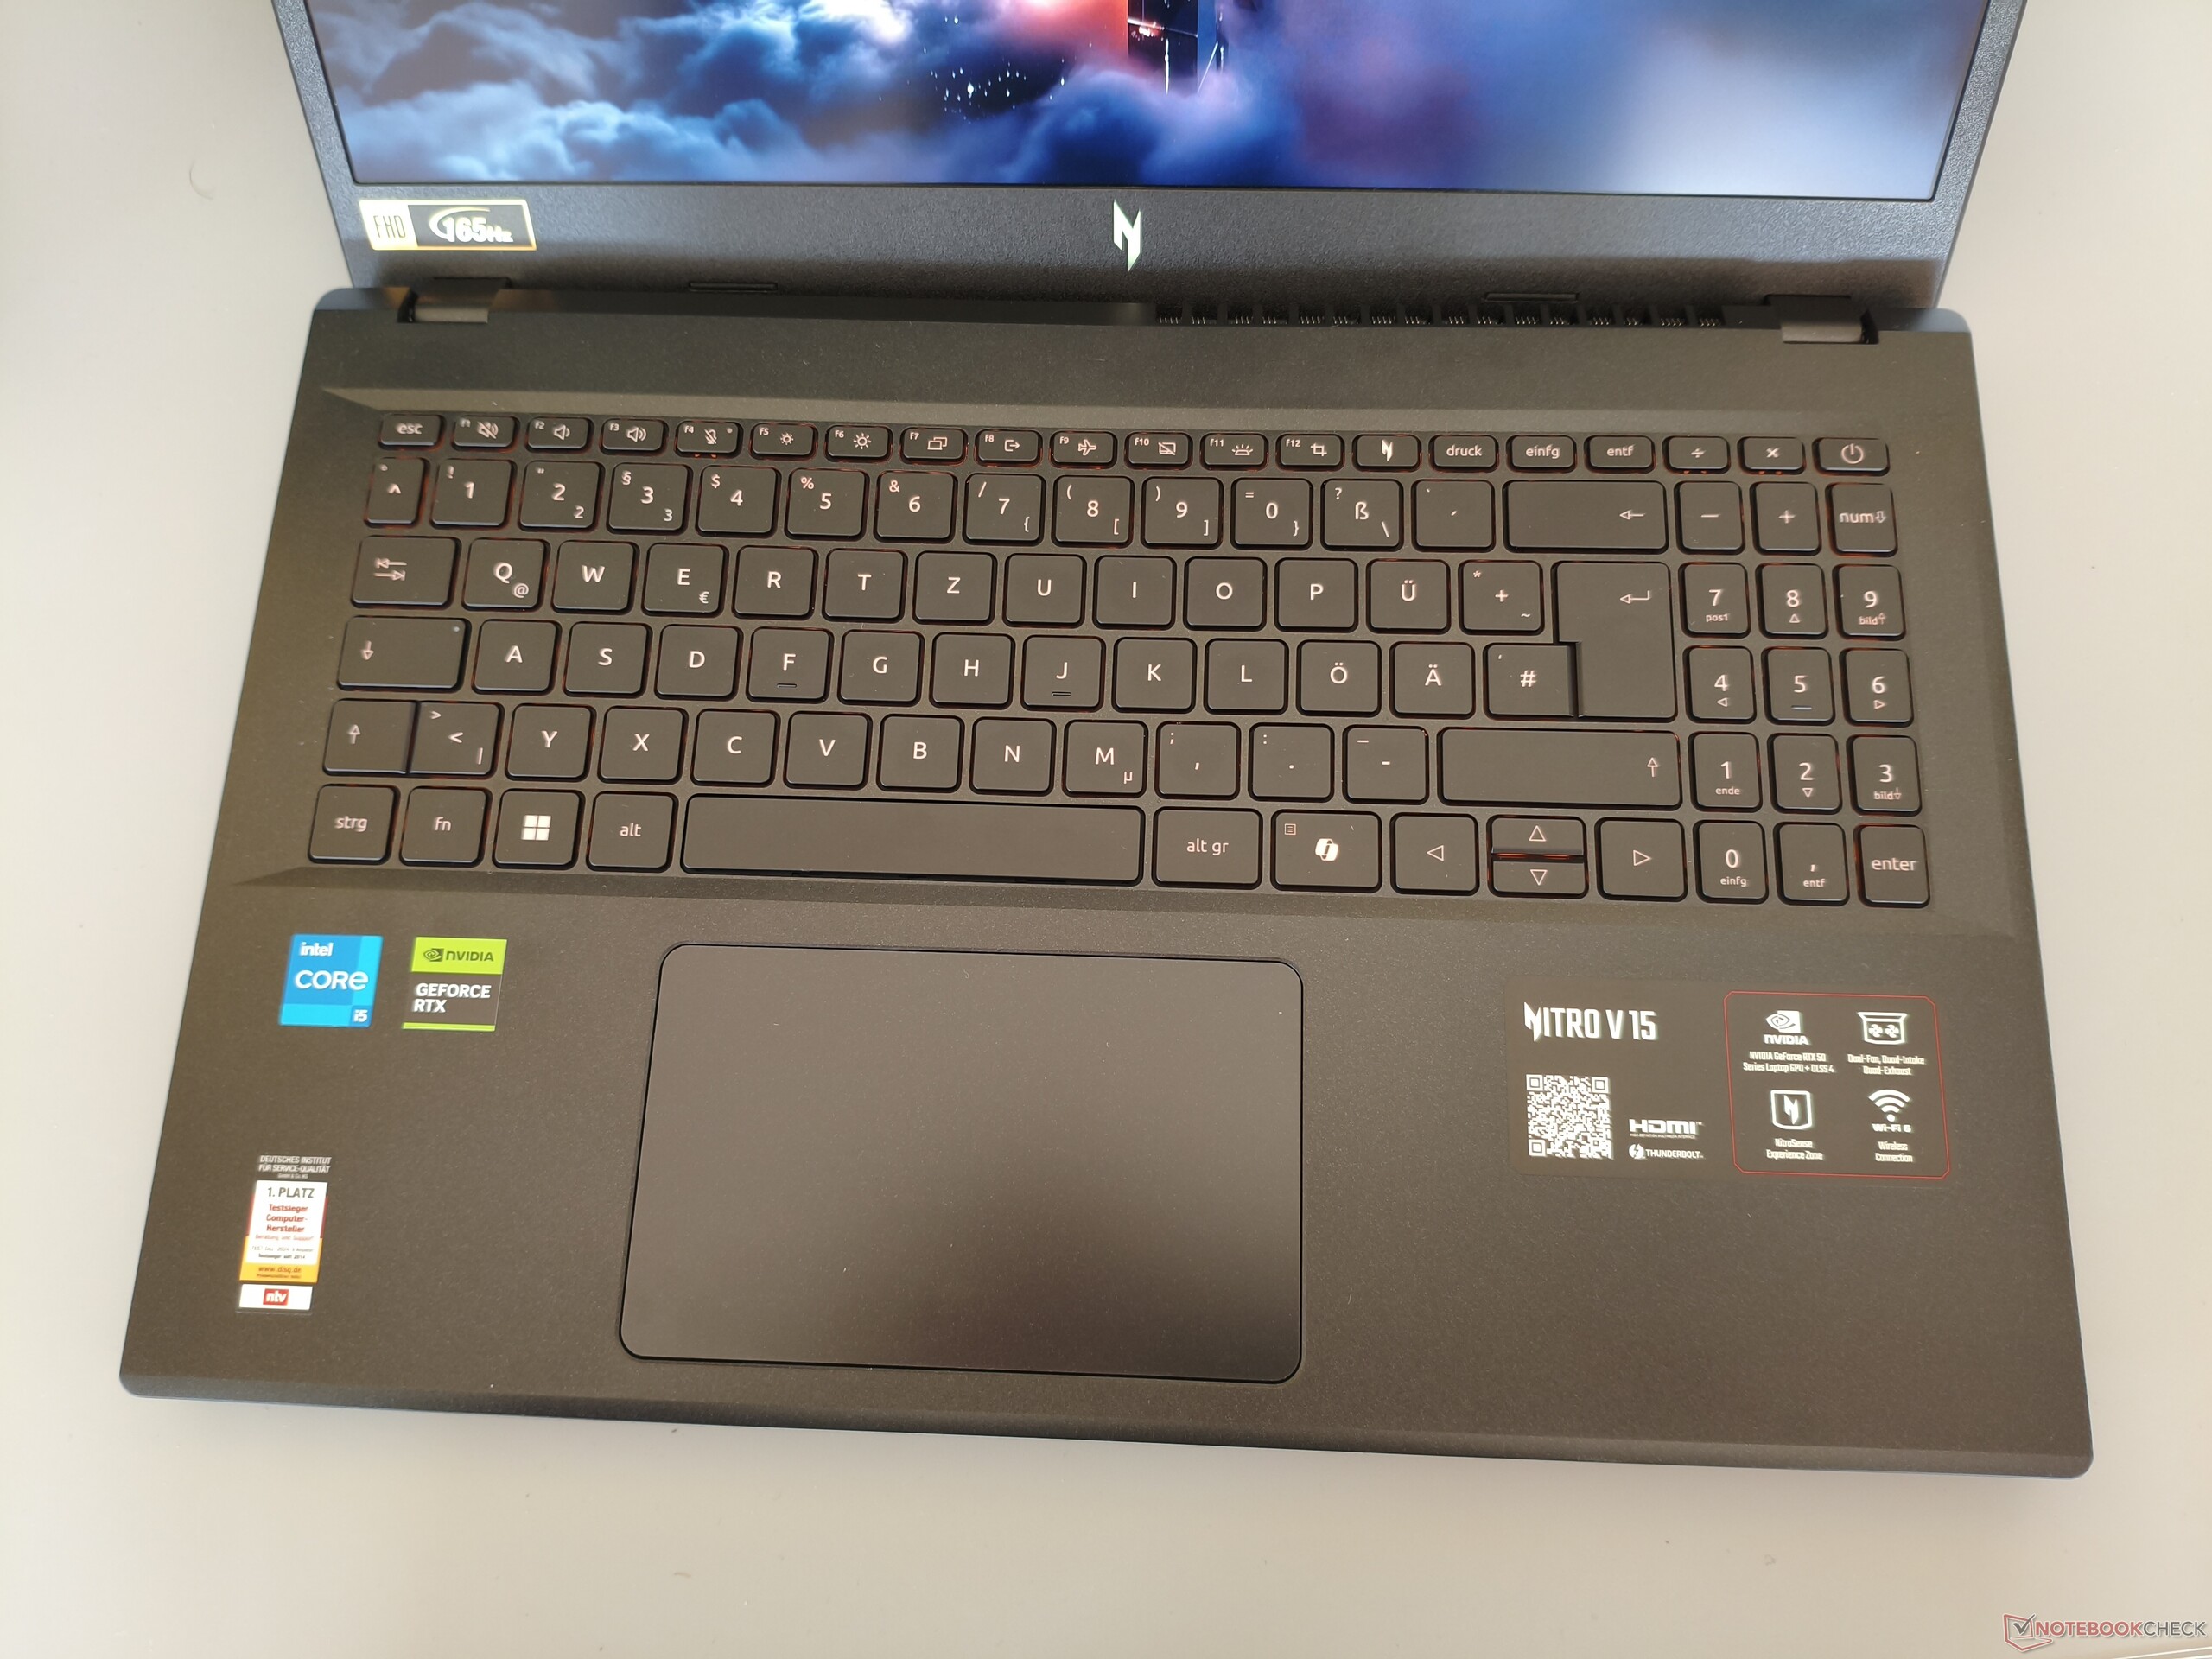
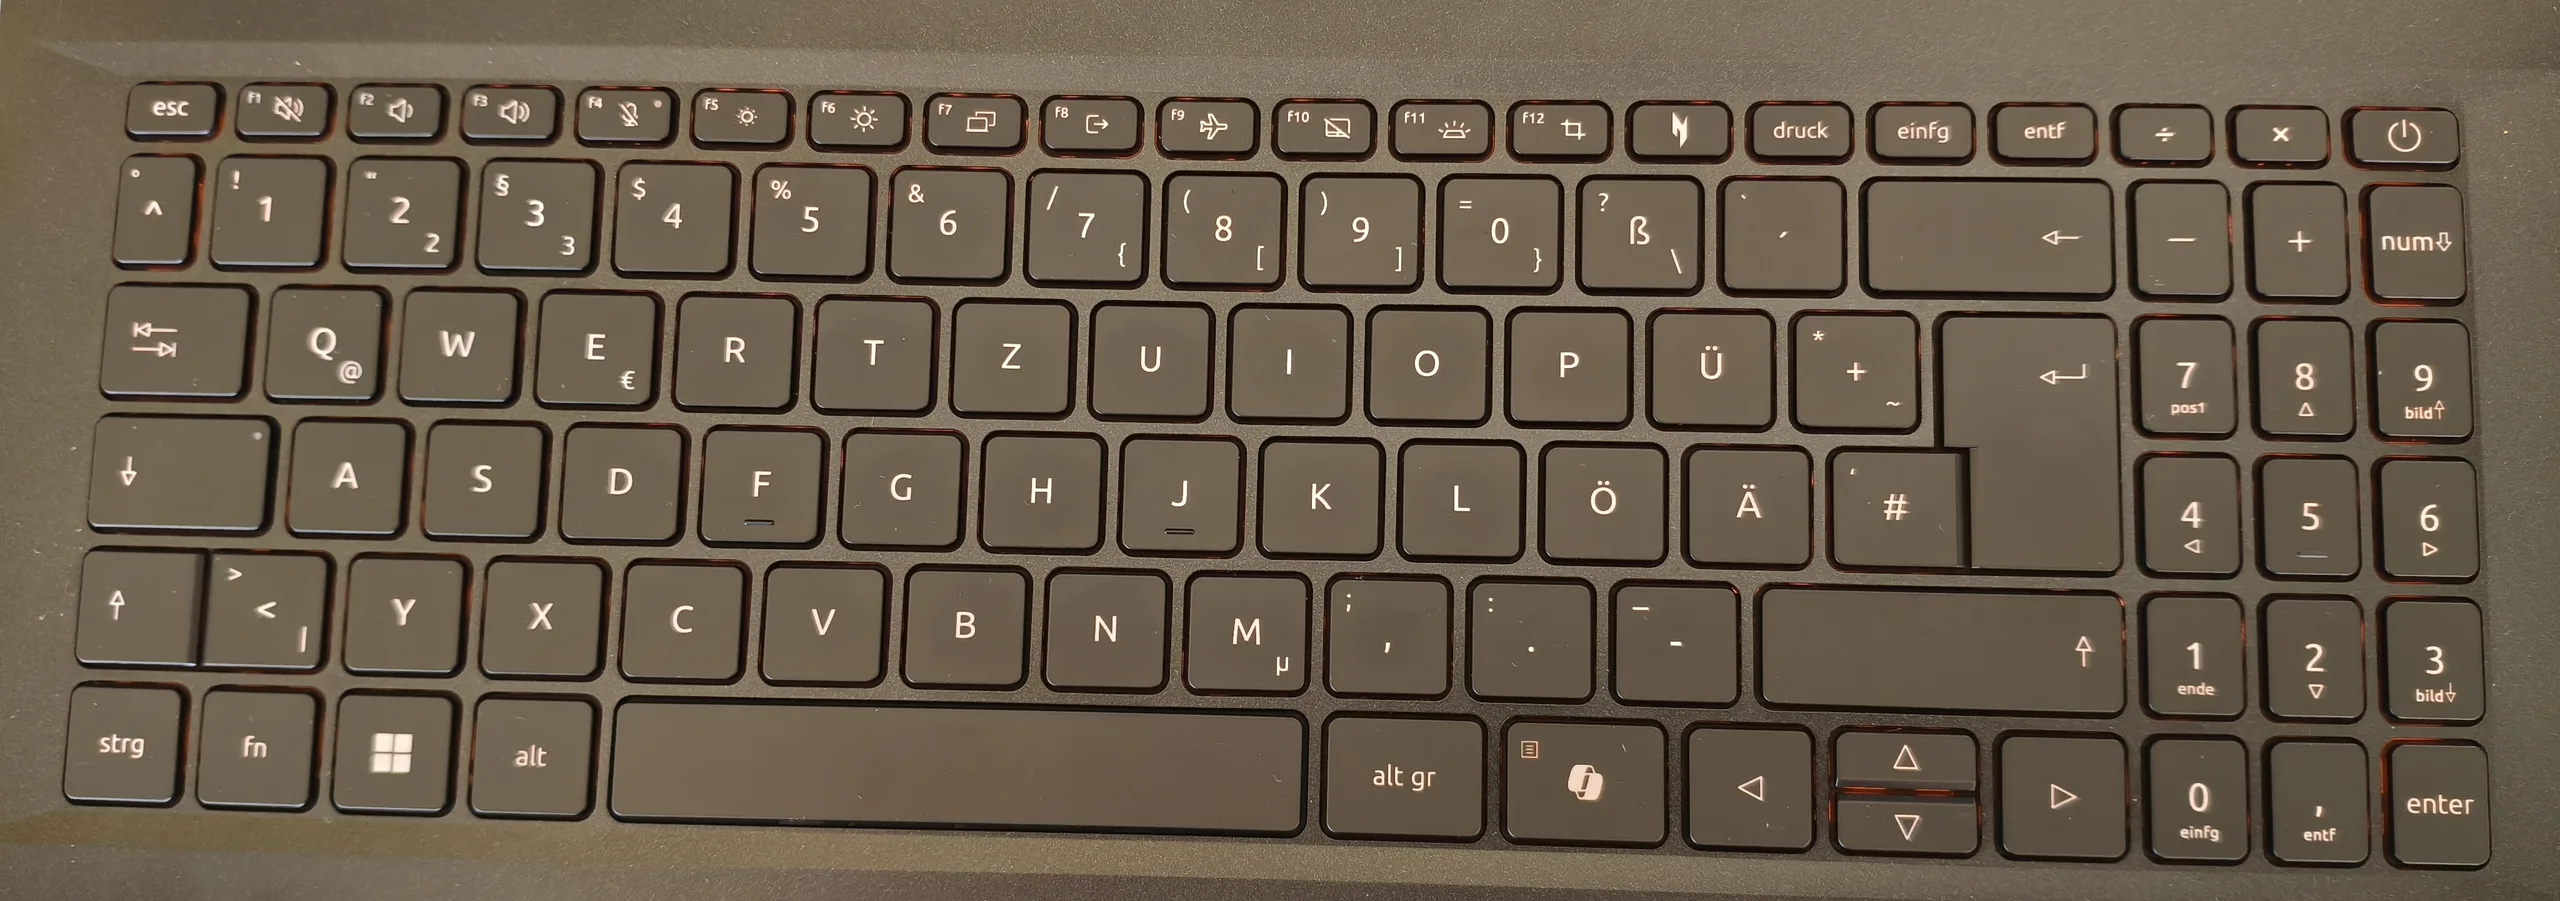
Não ficamos totalmente satisfeitos com o layout do teclado. Os pontos de crítica incluem o teclado numérico de três colunas em vez de um layout completo de quatro colunas, bem como as teclas de seta centrais bastante pequenas. A experiência de digitação é típica de um teclado com cúpula de borracha e, portanto, nada particularmente notável. Também é possível melhorar a iluminação de fundo. A iluminação laranja não é especialmente brilhante, mesmo em sua configuração mais alta. Como ponto positivo, o laptop de 15 polegadas apresenta um touchpad razoavelmente grande, medindo 12,6 x 7,8 cm, embora pareça um pouco irregular quando clicado.
Tela
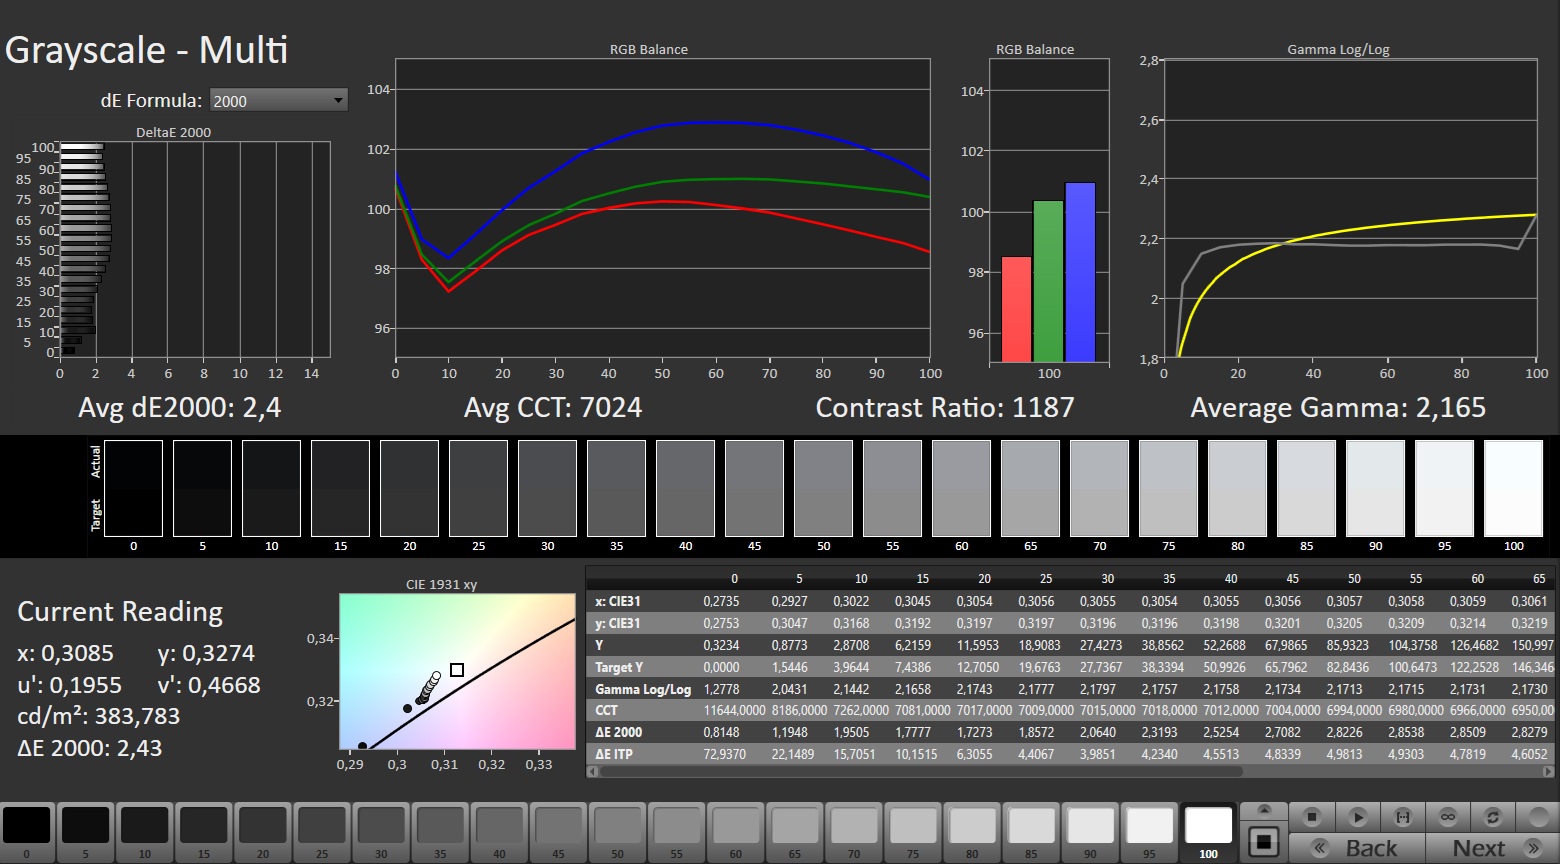
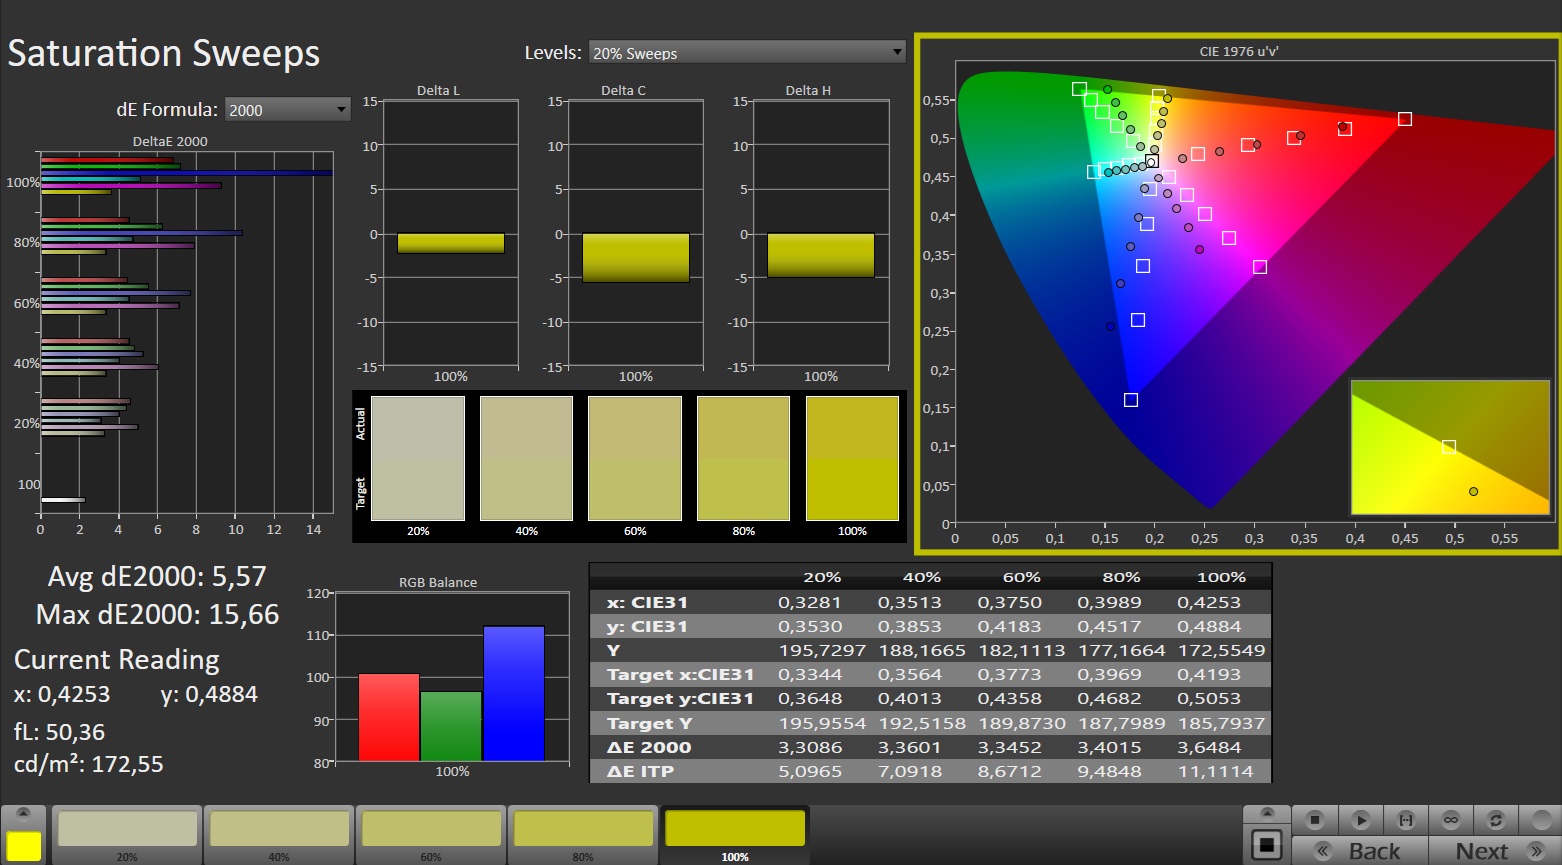
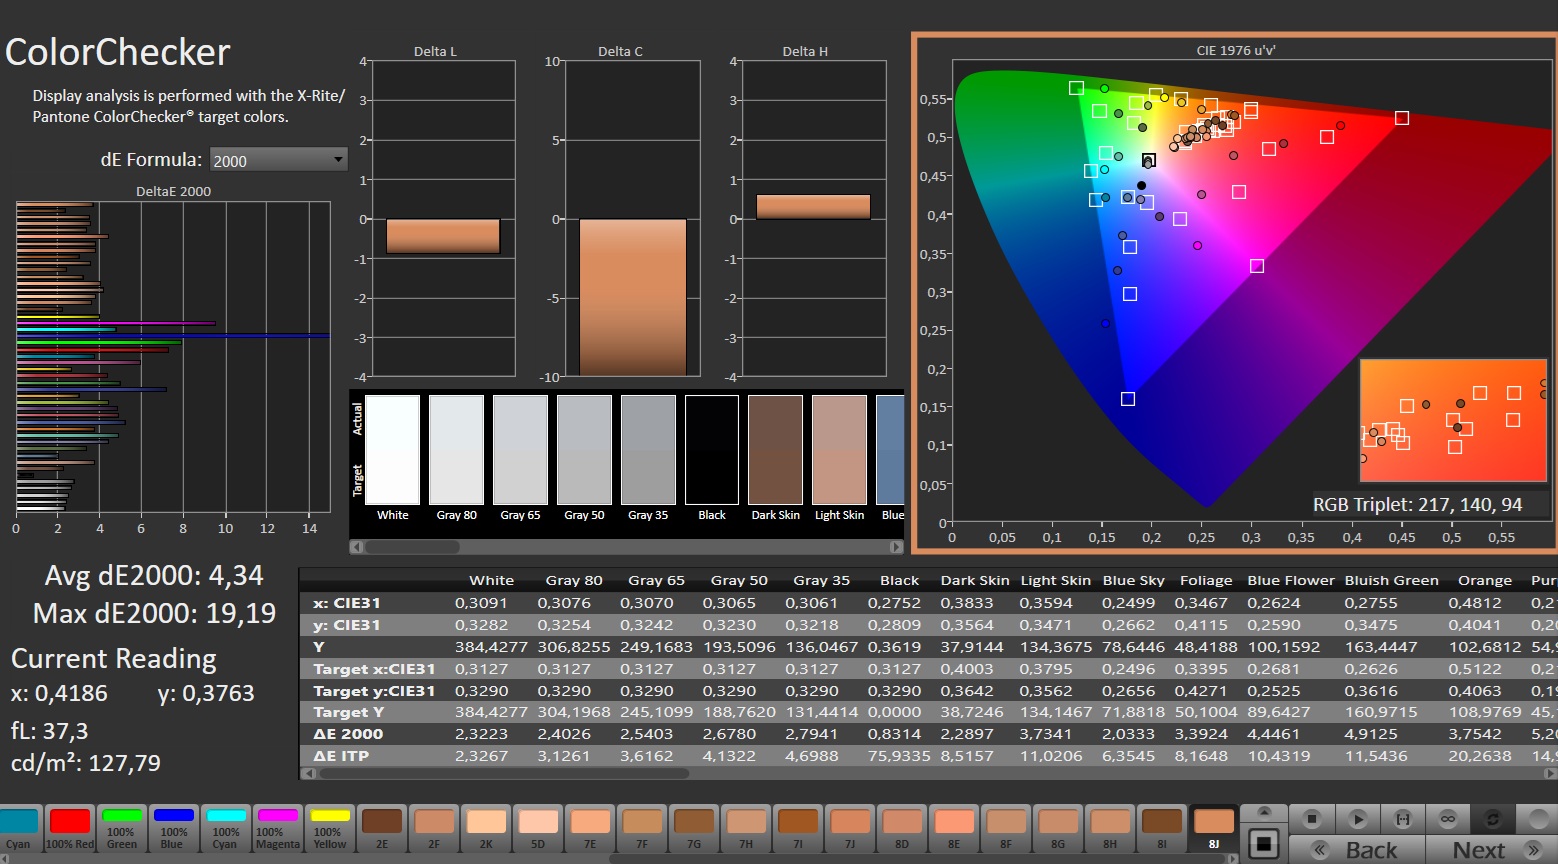
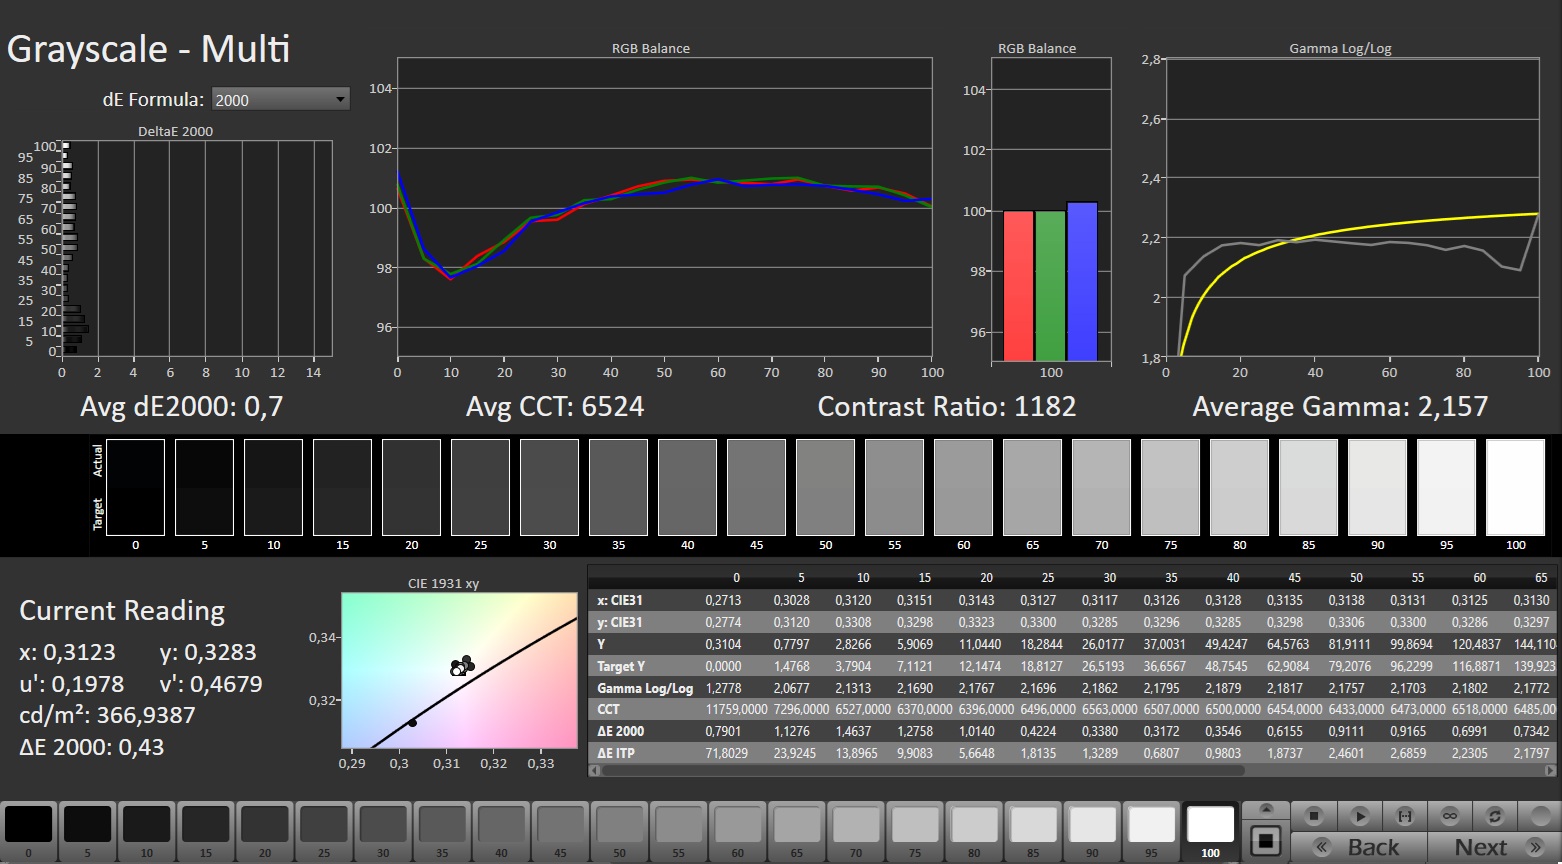
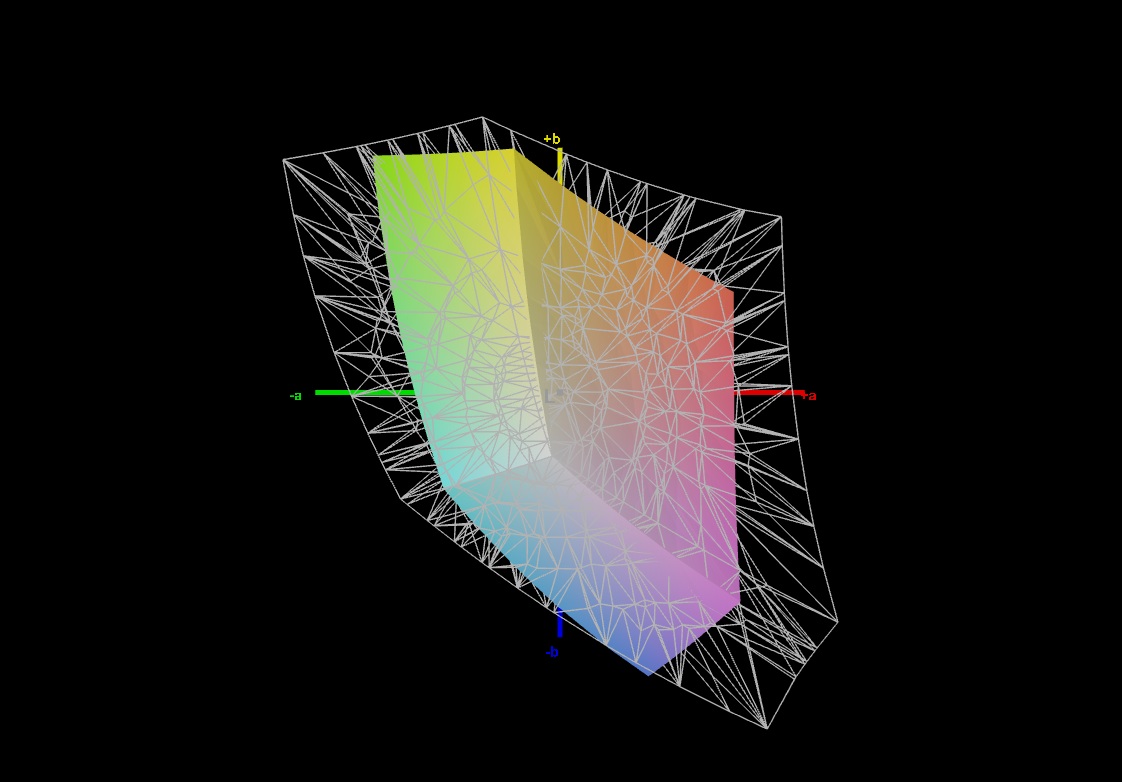
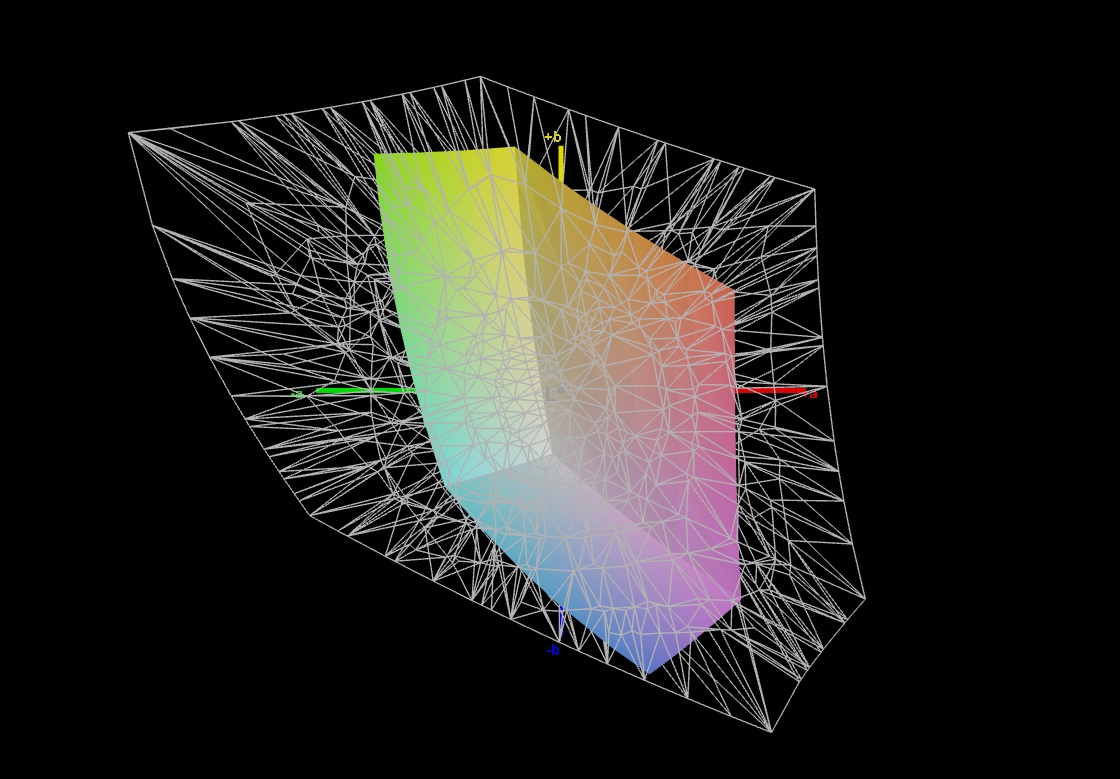
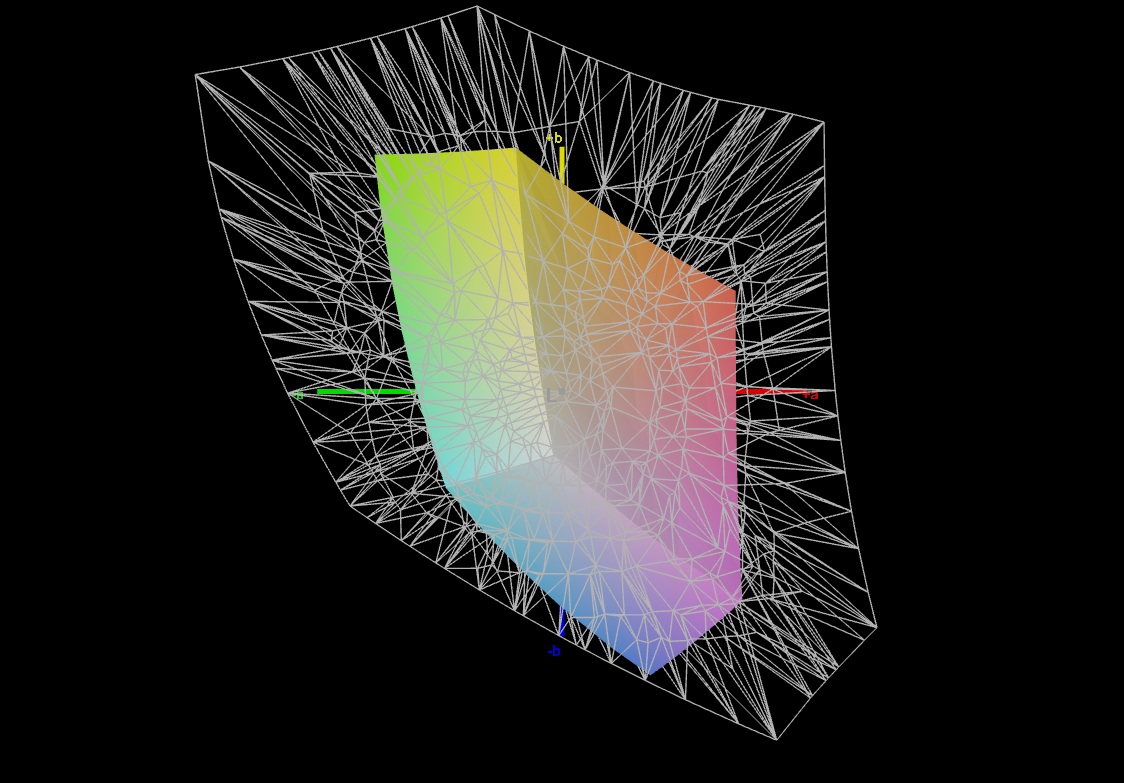
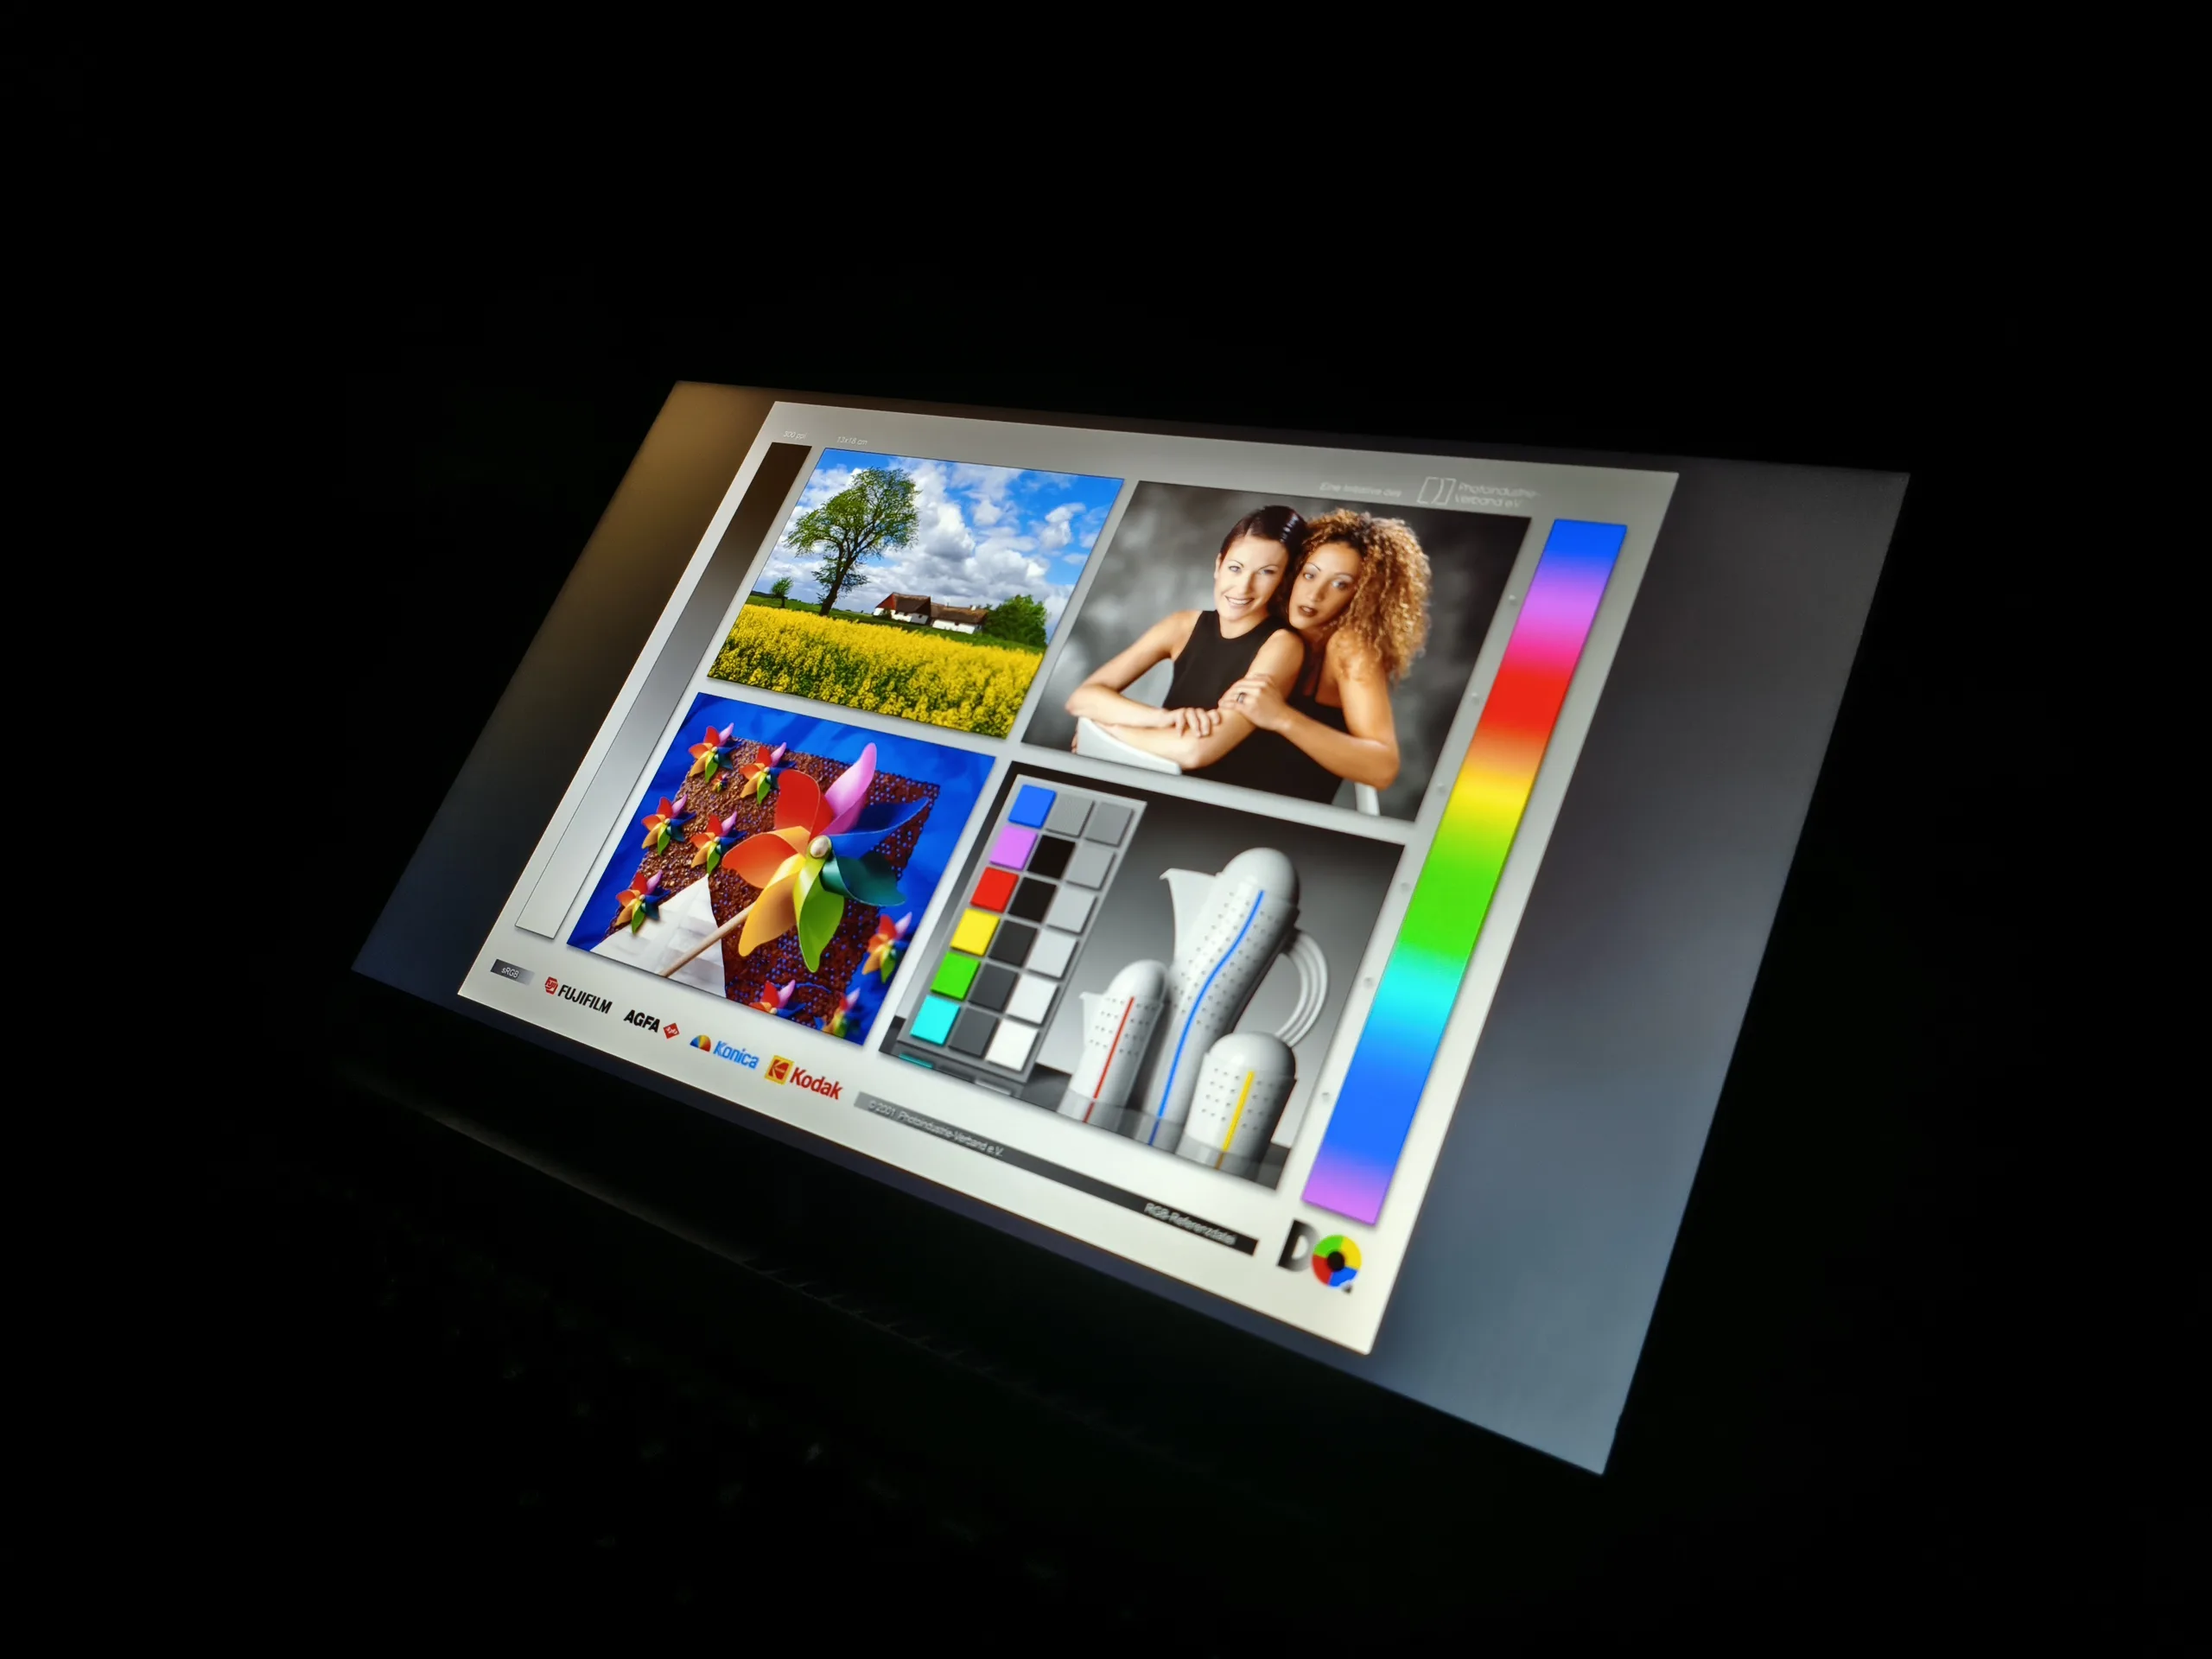
Infelizmente, a cobertura limitada de cores continua sendo um problema para laptops para jogos mais acessíveis, mesmo em 2026. Da mesma forma que o Cyborg 15 e o Victus 15, o Nitro V 15 fica abaixo da marca de 70% sRGB, resultando em uma imagem bastante pálida. O veredito sobre o brilho é mais positivo. Embora a média de 347 cd/m² não seja um destaque, a maioria dos concorrentes fica abaixo desse valor. Os valores restantes são típicos de um painel IPS, seja um nível de preto de 0,31 cd/m² ou uma relação de contraste de 1.232:1. O mesmo se aplica em grande parte aos ângulos de visualização.
| |||||||||||||||||||||||||
iluminação: 86 %
iluminação com acumulador: 382 cd/m²
Contraste: 1232:1 (Preto: 0.31 cd/m²)
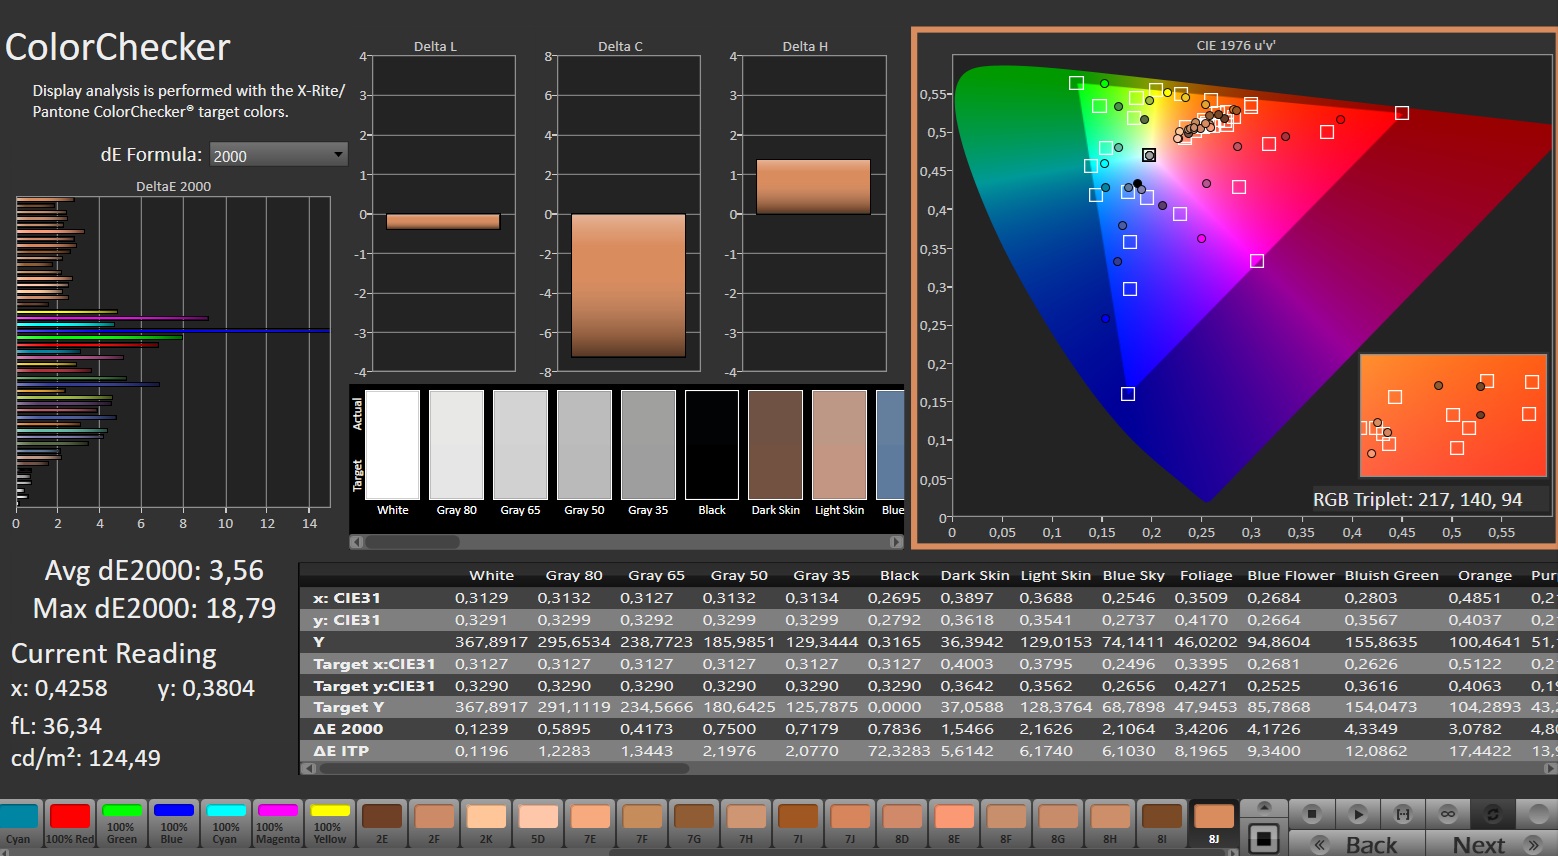
ΔE ColorChecker Calman: 4.34 | ∀{0.5-29.43 Ø4.72}
calibrated: 3.56
ΔE Greyscale Calman: 2.4 | ∀{0.09-98 Ø4.97}
41.6% AdobeRGB 1998 (Argyll 3D)
60.3% sRGB (Argyll 3D)
40.3% Display P3 (Argyll 3D)
Gamma: 2.165
CCT: 7024 K
| Acer Nitro V 15 ANV15-52-50S2 BOEhydis NE156FHM-NXA, IPS, 1920x1080, 15.6", 165 Hz | Acer Nitro V 15 ANV15-51-582S LG LP156WFJ-SPB4 (LGD0742), IPS, 1920x1080, 15.6", 144 Hz | HP Victus 15-fa2160ng CMN1560, IPS, 1920x1080, 15.6", 144 Hz | MSI Cyborg 15 B2RWEKG CMN N156HRA-EA1, IPS, 1920x1080, 15.6", 144 Hz | Lenovo LOQ 15AHP10 CSOT MNF601BA1-4, IPS, 1920x1080, 15.6", 144 Hz | Lenovo Legion 5 15AHP G10 LEN151WQXGA, OLED, 2560x1600, 15.1", 165 Hz | |
|---|---|---|---|---|---|---|
| Display | -0% | -1% | 8% | 66% | 117% | |
| Display P3 Coverage (%) | 40.3 | 40 -1% | 43 7% | 43.4 8% | 67.3 67% | 99.9 148% |
| sRGB Coverage (%) | 60.3 | 60 0% | 64.3 7% | 64.8 7% | 99.2 65% | 100 66% |
| AdobeRGB 1998 Coverage (%) | 41.6 | 41.4 0% | 34.7 -17% | 44.9 8% | 69.1 66% | 98.3 136% |
| Response Times | -6% | 16% | 17% | 6% | 99% | |
| Response Time Grey 50% / Grey 80% * (ms) | 39 ? | 34.2 ? 12% | 28.6 ? 27% | 27.6 ? 29% | 33.9 ? 13% | 0.42 ? 99% |
| Response Time Black / White * (ms) | 20.8 ? | 25.8 ? -24% | 20 ? 4% | 20 ? 4% | 21.2 ? -2% | 0.4 ? 98% |
| PWM Frequency (Hz) | 1152 ? | |||||
| PWM Amplitude * (%) | 11 | |||||
| Screen | -23% | -6% | -2% | 31% | 50% | |
| Brightness middle (cd/m²) | 382 | 292 -24% | 324 -15% | 286 -25% | 318 -17% | 492 29% |
| Brightness (cd/m²) | 347 | 263 -24% | 303 -13% | 272 -22% | 300 -14% | 495 43% |
| Brightness Distribution (%) | 86 | 80 -7% | 87 1% | 87 1% | 89 3% | 92 7% |
| Black Level * (cd/m²) | 0.31 | 0.25 19% | 0.26 16% | 0.17 45% | 0.2 35% | |
| Contrast (:1) | 1232 | 1168 -5% | 1246 1% | 1682 37% | 1590 29% | |
| Colorchecker dE 2000 * | 4.34 | 7.15 -65% | 4.7 -8% | 4.61 -6% | 1.33 69% | 0.9 79% |
| Colorchecker dE 2000 max. * | 19.19 | 15.51 19% | 18.19 5% | 19.59 -2% | 4.42 77% | 1.8 91% |
| Colorchecker dE 2000 calibrated * | 3.56 | 4.13 -16% | 2.93 18% | 2.99 16% | 0.94 74% | |
| Greyscale dE 2000 * | 2.4 | 4.9 -104% | 3.9 -63% | 3.9 -63% | 1.9 21% | 1.2 50% |
| Gamma | 2.165 102% | 2.014 109% | 2.21 100% | 2.236 98% | 2.187 101% | 2.16 102% |
| CCT | 7024 93% | 7178 91% | 7541 86% | 6792 96% | 6678 97% | 6291 103% |
| Média Total (Programa/Configurações) | -10% /
-16% | 3% /
-2% | 8% /
3% | 34% /
35% | 89% /
77% |
* ... menor é melhor

Exibir tempos de resposta
| ↔ Tempo de resposta preto para branco | ||
|---|---|---|
| 20.8 ms ... ascensão ↗ e queda ↘ combinadas | ↗ 10 ms ascensão | 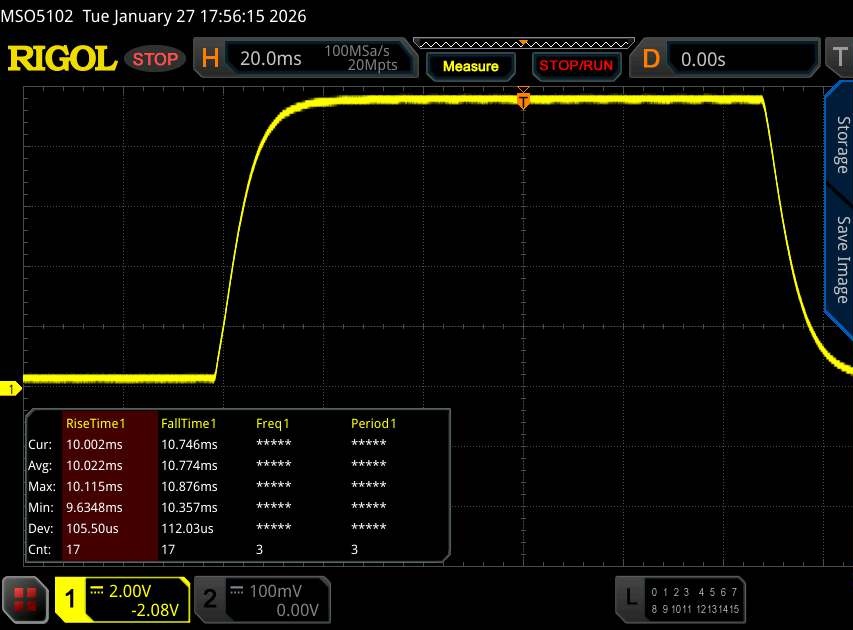 |
| ↘ 10.8 ms queda | ||
| A tela mostra boas taxas de resposta em nossos testes, mas pode ser muito lenta para jogadores competitivos. Em comparação, todos os dispositivos testados variam de 0.1 (mínimo) a 240 (máximo) ms. » 46 % de todos os dispositivos são melhores. Isso significa que o tempo de resposta medido é semelhante à média de todos os dispositivos testados (19.8 ms). | ||
| ↔ Tempo de resposta 50% cinza a 80% cinza | ||
| 39 ms ... ascensão ↗ e queda ↘ combinadas | ↗ 17.6 ms ascensão | 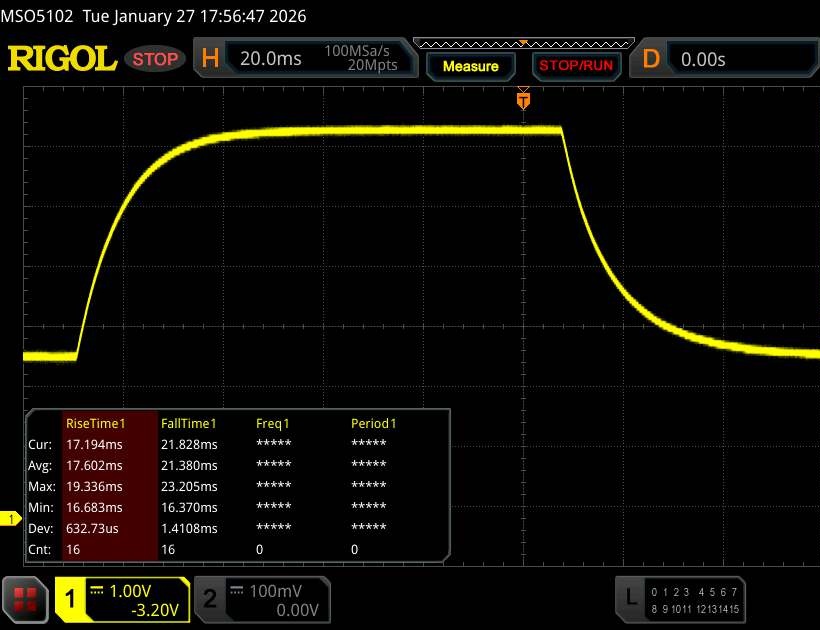 |
| ↘ 21.4 ms queda | ||
| A tela mostra taxas de resposta lentas em nossos testes e será insatisfatória para os jogadores. Em comparação, todos os dispositivos testados variam de 0.165 (mínimo) a 636 (máximo) ms. » 59 % de todos os dispositivos são melhores. Isso significa que o tempo de resposta medido é pior que a média de todos os dispositivos testados (31 ms). | ||
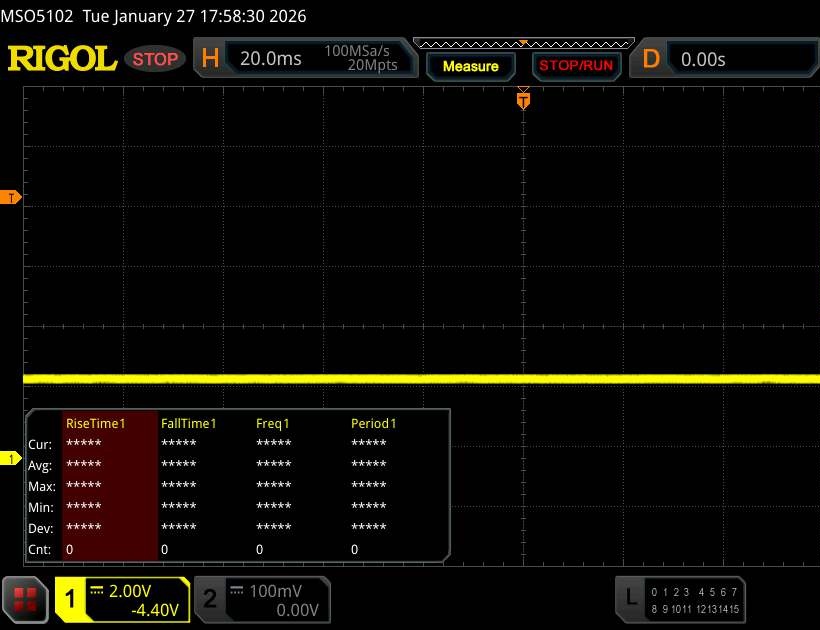
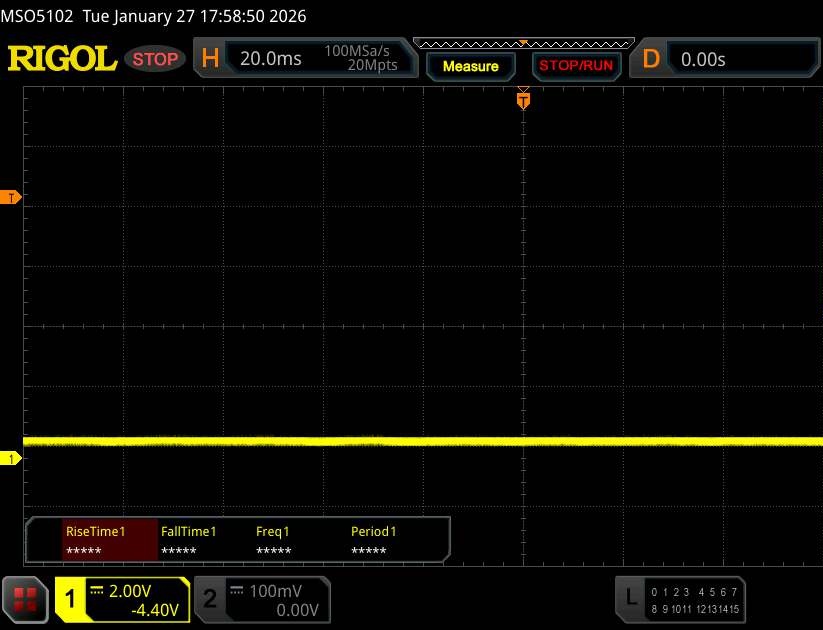
Cintilação da tela / PWM (modulação por largura de pulso)
| Tela tremeluzindo / PWM não detectado |  | ||
[pwm_comparison] Em comparação: 52 % de todos os dispositivos testados não usam PWM para escurecer a tela. Se PWM foi detectado, uma média de 7772 (mínimo: 5 - máximo: 343500) Hz foi medida. | |||
Desempenho
O Nitro V 15 pertence ao segmento de médio porte, embora o desempenho em algumas áreas tenda a se inclinar mais para o nível básico. Os compradores dispostos a gastar um pouco mais também podem optar por configurações com uma CPU mais rápida (Core i7-13620H) ou uma GPU mais potente (GeForce GPU para laptop RTX 5060).
Condições de teste
O utilitário NitroSense oferece quatro modos de operação, cujas diferenças podem ser encontradas na tabela abaixo. Todas as nossas medições foram feitas no modo Performance, com exceção do teste de bateria, que foi realizado no modo Balanced.
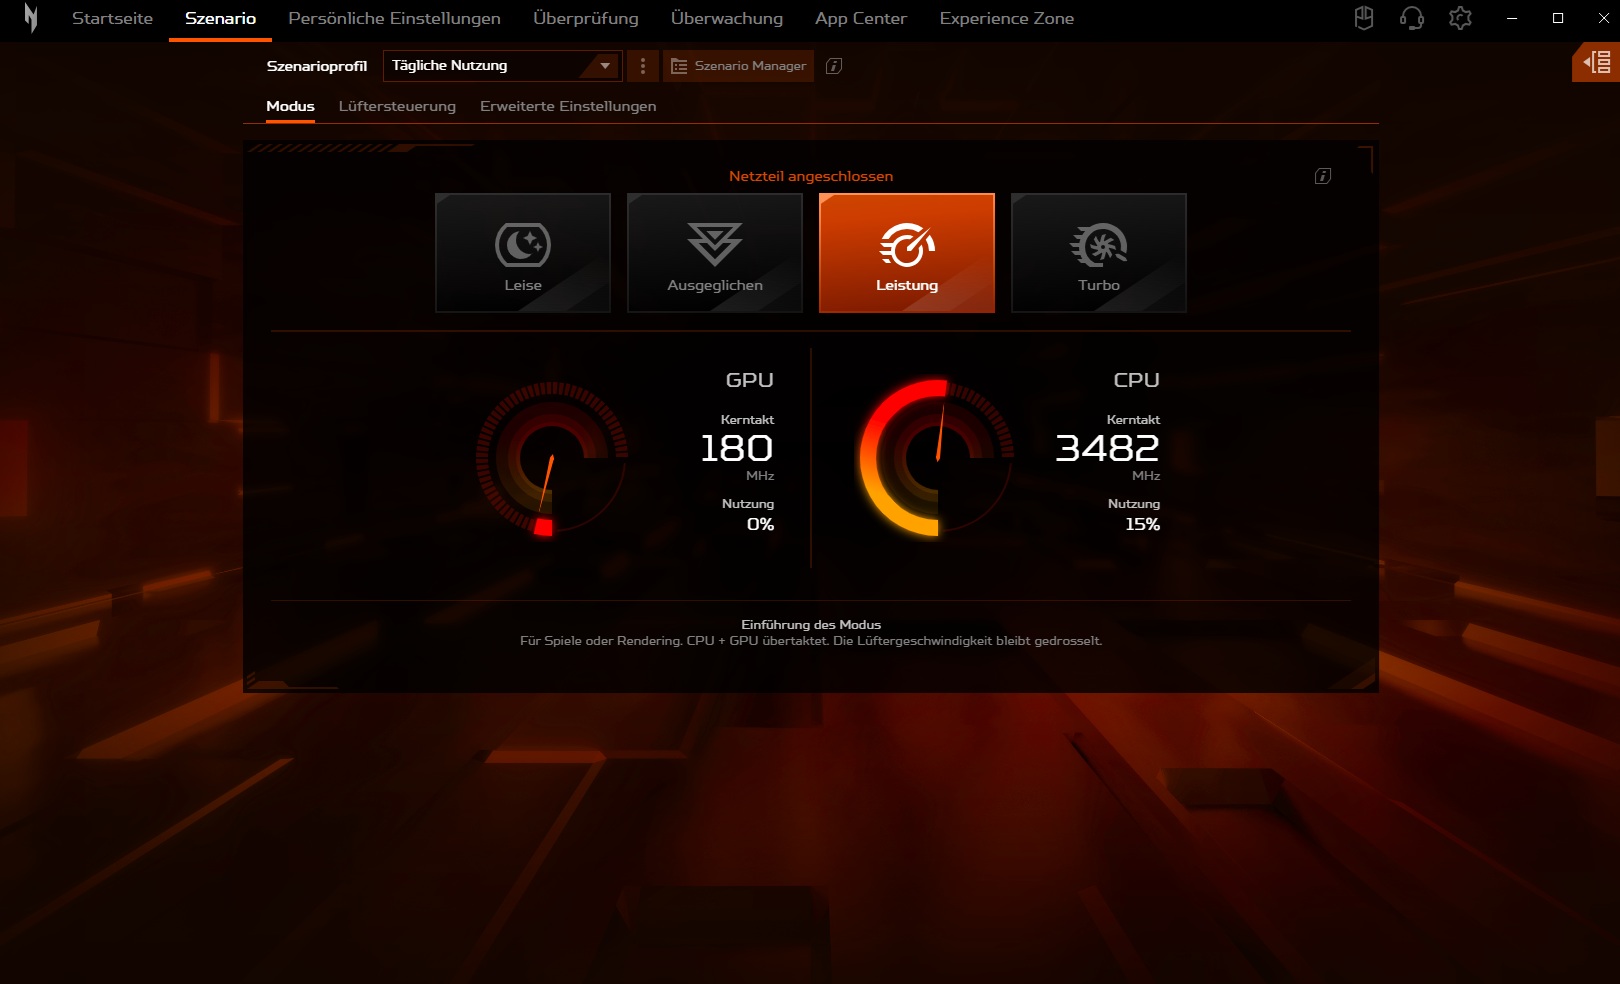
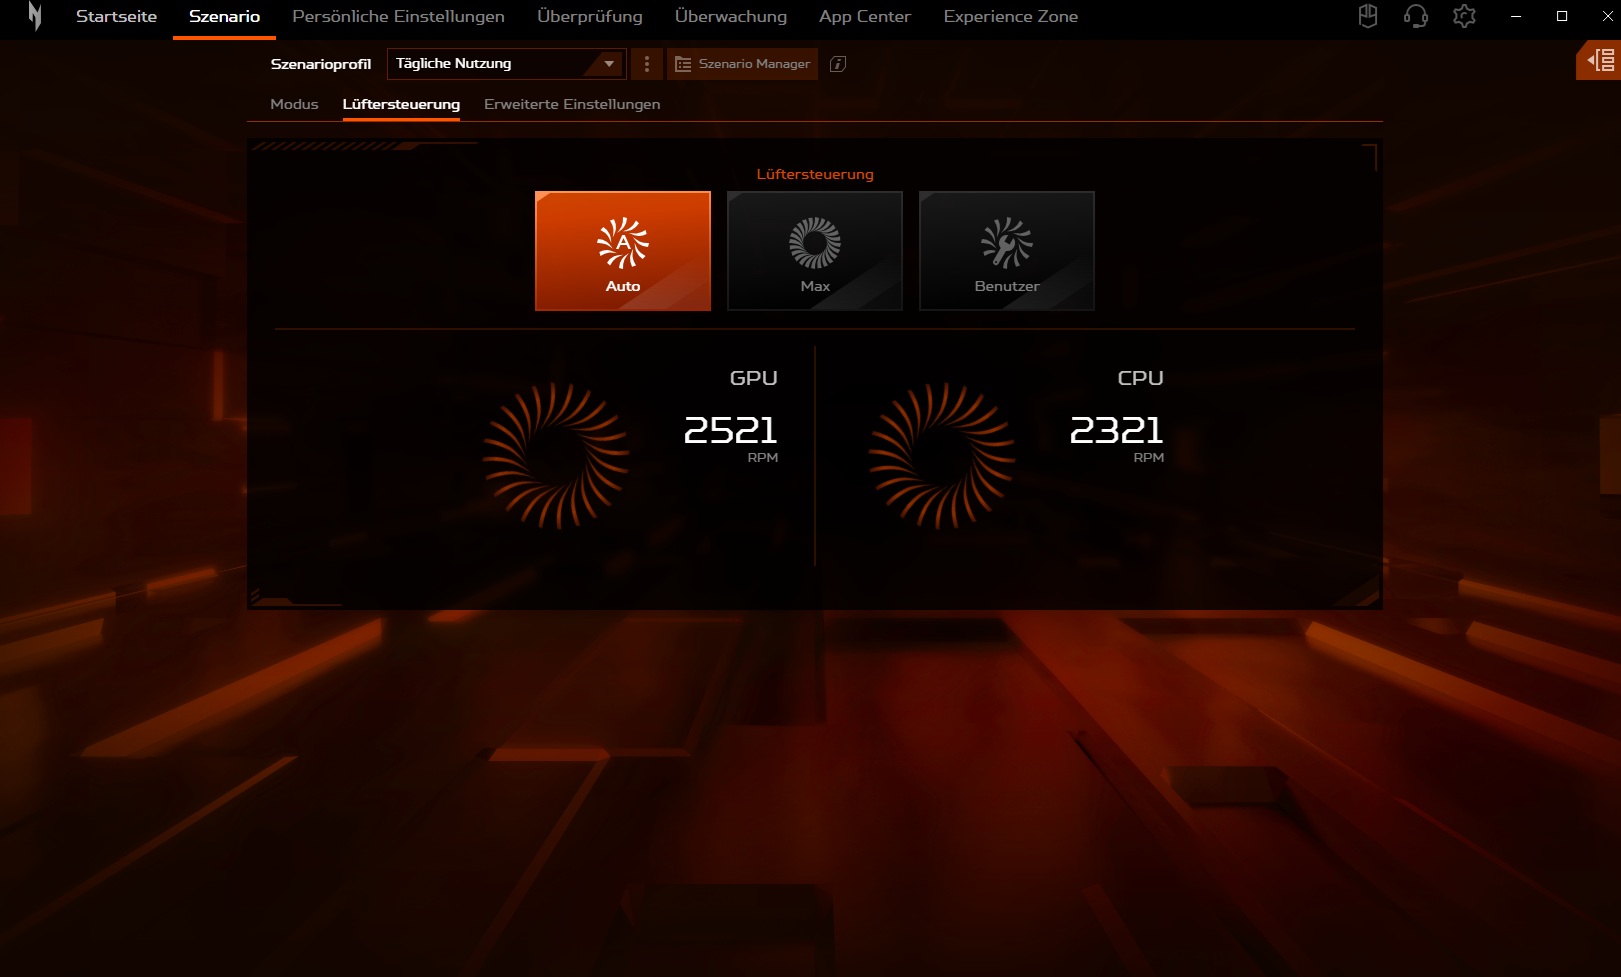
| Modo | Silencioso | Balanceado | Desempenho | Turbo |
| Ruído do Cyberpunk 2077 | 33 dB(A) | 45 dB(A) | 52 dB(A) | 55 dB(A) |
| Taxa de quadros do Cyberpunk 2077 (FHD/Ultra) | 45,1 fps | 59 fps | 61,3 fps | 63 fps |
| Consumo de energia da GPU | ~50 W | ~60 W | ~70 W | ~75 W |
| CPU PL1 | 16 W | 45 W | 50 W | 55 W |
| CPU PL2 | 64 W | 115 W | 115 W | 115 W |
| Pontuação multi-core do Cinebench R15 | 934 pontos | 1769 pontos | 1775 pontos | 1782 pontos |
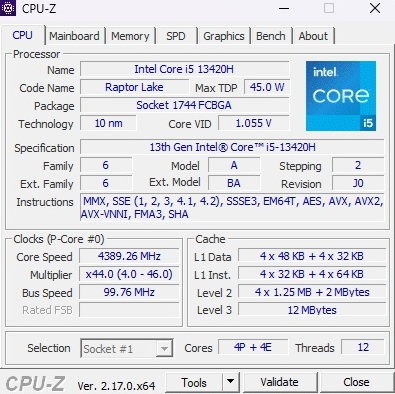
Processador
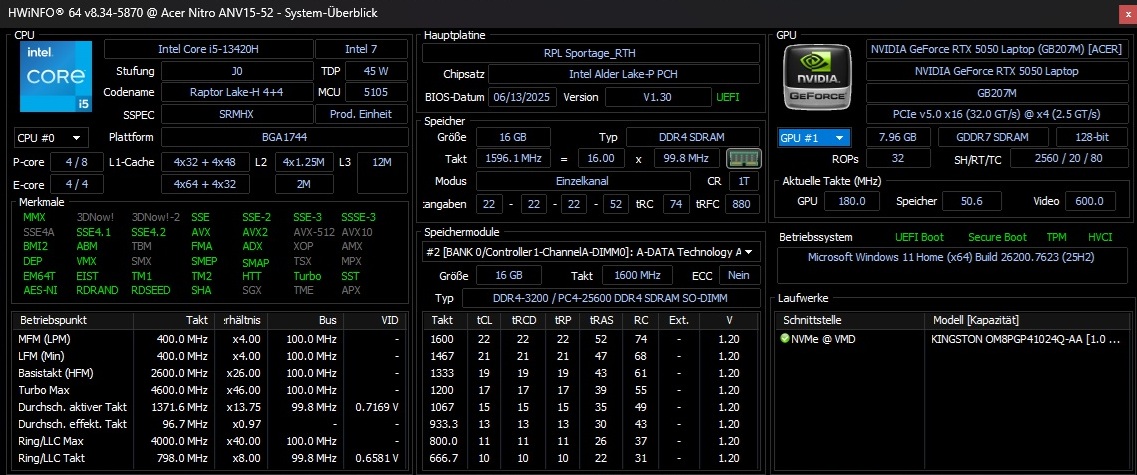
O processador instalado Core i5-13420H instalado é um modelo não mais particularmente novo da geração Raptor Lake da Intel. Ele apresenta quatro núcleos de desempenho (com Hyper-Threading) e quatro núcleos de eficiência (sem Hyper-Threading), permitindo até 12 threads simultâneos.
Os benchmarks da CPU não revelaram irregularidades. O desempenho permanece estável e está em linha com outros dispositivos equipados com o i5-13420H. É possível encontrar um desempenho superior em modelos concorrentes baseados em processadores AMD, como o Ryzen 7 250 e Ryzen 7 260.
Teste de resistência de vários núcleos do Cinebench R15
* ... menor é melhor
AIDA64: FP32 Ray-Trace | FPU Julia | CPU SHA3 | CPU Queen | FPU SinJulia | FPU Mandel | CPU AES | CPU ZLib | FP64 Ray-Trace | CPU PhotoWorxx
| Performance rating | |
| Média da turma Gaming | |
| Lenovo Legion 5 15AHP G10 | |
| Lenovo LOQ 15AHP10 | |
| MSI Cyborg 15 B2RWEKG | |
| Acer Nitro V 15 ANV15-51-582S | |
| Acer Nitro V 15 ANV15-52-50S2 | |
| Média Intel Core i5-13420H | |
| HP Victus 15-fa2160ng | |
| AIDA64 / FP32 Ray-Trace | |
| Média da turma Gaming (10227 - 85542, n=108, últimos 2 anos) | |
| Lenovo Legion 5 15AHP G10 | |
| Lenovo LOQ 15AHP10 | |
| Acer Nitro V 15 ANV15-52-50S2 | |
| MSI Cyborg 15 B2RWEKG | |
| Acer Nitro V 15 ANV15-51-582S | |
| Média Intel Core i5-13420H (7922 - 12134, n=5) | |
| HP Victus 15-fa2160ng | |
| AIDA64 / FPU Julia | |
| Média da turma Gaming (51376 - 238426, n=108, últimos 2 anos) | |
| Lenovo Legion 5 15AHP G10 | |
| Lenovo LOQ 15AHP10 | |
| Acer Nitro V 15 ANV15-51-582S | |
| Acer Nitro V 15 ANV15-52-50S2 | |
| MSI Cyborg 15 B2RWEKG | |
| Média Intel Core i5-13420H (40587 - 59715, n=5) | |
| HP Victus 15-fa2160ng | |
| AIDA64 / CPU SHA3 | |
| Média da turma Gaming (2180 - 9817, n=108, últimos 2 anos) | |
| Lenovo Legion 5 15AHP G10 | |
| Lenovo LOQ 15AHP10 | |
| Acer Nitro V 15 ANV15-51-582S | |
| Acer Nitro V 15 ANV15-52-50S2 | |
| HP Victus 15-fa2160ng | |
| MSI Cyborg 15 B2RWEKG | |
| Média Intel Core i5-13420H (1724 - 2634, n=5) | |
| AIDA64 / CPU Queen | |
| Lenovo Legion 5 15AHP G10 | |
| Média da turma Gaming (49785 - 173351, n=96, últimos 2 anos) | |
| Lenovo LOQ 15AHP10 | |
| MSI Cyborg 15 B2RWEKG | |
| Média Intel Core i5-13420H (69803 - 74956, n=5) | |
| Acer Nitro V 15 ANV15-51-582S | |
| Acer Nitro V 15 ANV15-52-50S2 | |
| HP Victus 15-fa2160ng | |
| AIDA64 / FPU SinJulia | |
| Lenovo Legion 5 15AHP G10 | |
| Lenovo LOQ 15AHP10 | |
| Média da turma Gaming (4424 - 33636, n=108, últimos 2 anos) | |
| MSI Cyborg 15 B2RWEKG | |
| Acer Nitro V 15 ANV15-52-50S2 | |
| Acer Nitro V 15 ANV15-51-582S | |
| HP Victus 15-fa2160ng | |
| Média Intel Core i5-13420H (5485 - 6644, n=5) | |
| AIDA64 / FPU Mandel | |
| Média da turma Gaming (25115 - 128721, n=108, últimos 2 anos) | |
| Lenovo Legion 5 15AHP G10 | |
| Lenovo LOQ 15AHP10 | |
| Acer Nitro V 15 ANV15-52-50S2 | |
| MSI Cyborg 15 B2RWEKG | |
| Acer Nitro V 15 ANV15-51-582S | |
| Média Intel Core i5-13420H (19684 - 30163, n=5) | |
| HP Victus 15-fa2160ng | |
| AIDA64 / CPU AES | |
| Média da turma Gaming (39258 - 247074, n=108, últimos 2 anos) | |
| Acer Nitro V 15 ANV15-51-582S | |
| Lenovo Legion 5 15AHP G10 | |
| Lenovo LOQ 15AHP10 | |
| Média Intel Core i5-13420H (35531 - 93100, n=5) | |
| MSI Cyborg 15 B2RWEKG | |
| Acer Nitro V 15 ANV15-52-50S2 | |
| HP Victus 15-fa2160ng | |
| AIDA64 / CPU ZLib | |
| Média da turma Gaming (574 - 2531, n=108, últimos 2 anos) | |
| Lenovo Legion 5 15AHP G10 | |
| Lenovo LOQ 15AHP10 | |
| Acer Nitro V 15 ANV15-52-50S2 | |
| Acer Nitro V 15 ANV15-51-582S | |
| HP Victus 15-fa2160ng | |
| MSI Cyborg 15 B2RWEKG | |
| Média Intel Core i5-13420H (509 - 746, n=5) | |
| AIDA64 / FP64 Ray-Trace | |
| Média da turma Gaming (5509 - 45446, n=108, últimos 2 anos) | |
| Lenovo Legion 5 15AHP G10 | |
| Lenovo LOQ 15AHP10 | |
| Acer Nitro V 15 ANV15-52-50S2 | |
| MSI Cyborg 15 B2RWEKG | |
| Acer Nitro V 15 ANV15-51-582S | |
| Média Intel Core i5-13420H (4283 - 6627, n=5) | |
| HP Victus 15-fa2160ng | |
| AIDA64 / CPU PhotoWorxx | |
| Média da turma Gaming (12271 - 89891, n=108, últimos 2 anos) | |
| Lenovo Legion 5 15AHP G10 | |
| MSI Cyborg 15 B2RWEKG | |
| Acer Nitro V 15 ANV15-51-582S | |
| Lenovo LOQ 15AHP10 | |
| HP Victus 15-fa2160ng | |
| Média Intel Core i5-13420H (12330 - 37044, n=5) | |
| Acer Nitro V 15 ANV15-52-50S2 | |
Desempenho do sistema
O desempenho geral do sistema não é digno de nota e coloca o Nitro V 15 no meio do campo de comparação. Somente o desempenho da memória se mostra um pouco abaixo do esperado.
PCMark 10: Productivity | Digital Content Creation
CrossMark: Overall | Productivity | Creativity | Responsiveness
WebXPRT 3: Overall
WebXPRT 4: Overall
Mozilla Kraken 1.1: Total
| Performance rating | |
| Média da turma Gaming | |
| Lenovo Legion 5 15AHP G10 | |
| Lenovo LOQ 15AHP10 -2! | |
| MSI Cyborg 15 B2RWEKG | |
| Acer Nitro V 15 ANV15-52-50S2 | |
| Média Intel Core i5-13420H, NVIDIA GeForce RTX 5050 Laptop | |
| Acer Nitro V 15 ANV15-51-582S -4! | |
| HP Victus 15-fa2160ng | |
| PCMark 10 / Productivity | |
| MSI Cyborg 15 B2RWEKG | |
| Acer Nitro V 15 ANV15-52-50S2 | |
| Média da turma Gaming (6845 - 21327, n=98, últimos 2 anos) | |
| Lenovo Legion 5 15AHP G10 | |
| Lenovo LOQ 15AHP10 | |
| Média Intel Core i5-13420H, NVIDIA GeForce RTX 5050 Laptop (6845 - 10967, n=2) | |
| Acer Nitro V 15 ANV15-51-582S | |
| HP Victus 15-fa2160ng | |
| PCMark 10 / Digital Content Creation | |
| Média da turma Gaming (7602 - 19657, n=98, últimos 2 anos) | |
| Lenovo Legion 5 15AHP G10 | |
| Lenovo LOQ 15AHP10 | |
| Acer Nitro V 15 ANV15-51-582S | |
| HP Victus 15-fa2160ng | |
| Média Intel Core i5-13420H, NVIDIA GeForce RTX 5050 Laptop (8618 - 8879, n=2) | |
| Acer Nitro V 15 ANV15-52-50S2 | |
| MSI Cyborg 15 B2RWEKG | |
| CrossMark / Overall | |
| Média da turma Gaming (1366 - 2409, n=96, últimos 2 anos) | |
| Lenovo Legion 5 15AHP G10 | |
| Lenovo LOQ 15AHP10 | |
| MSI Cyborg 15 B2RWEKG | |
| Acer Nitro V 15 ANV15-52-50S2 | |
| Média Intel Core i5-13420H, NVIDIA GeForce RTX 5050 Laptop (1366 - 1381, n=2) | |
| HP Victus 15-fa2160ng | |
| CrossMark / Productivity | |
| Média da turma Gaming (1386 - 2254, n=96, últimos 2 anos) | |
| Lenovo LOQ 15AHP10 | |
| Lenovo Legion 5 15AHP G10 | |
| MSI Cyborg 15 B2RWEKG | |
| Acer Nitro V 15 ANV15-52-50S2 | |
| Média Intel Core i5-13420H, NVIDIA GeForce RTX 5050 Laptop (1386 - 1426, n=2) | |
| HP Victus 15-fa2160ng | |
| CrossMark / Creativity | |
| Média da turma Gaming (1343 - 2729, n=96, últimos 2 anos) | |
| Lenovo Legion 5 15AHP G10 | |
| MSI Cyborg 15 B2RWEKG | |
| Lenovo LOQ 15AHP10 | |
| HP Victus 15-fa2160ng | |
| Média Intel Core i5-13420H, NVIDIA GeForce RTX 5050 Laptop (1343 - 1387, n=2) | |
| Acer Nitro V 15 ANV15-52-50S2 | |
| CrossMark / Responsiveness | |
| Média da turma Gaming (1226 - 2334, n=96, últimos 2 anos) | |
| Lenovo LOQ 15AHP10 | |
| Lenovo Legion 5 15AHP G10 | |
| MSI Cyborg 15 B2RWEKG | |
| Acer Nitro V 15 ANV15-52-50S2 | |
| Média Intel Core i5-13420H, NVIDIA GeForce RTX 5050 Laptop (1249 - 1364, n=2) | |
| HP Victus 15-fa2160ng | |
| WebXPRT 3 / Overall | |
| Média da turma Gaming (220 - 532, n=101, últimos 2 anos) | |
| Lenovo Legion 5 15AHP G10 | |
| Acer Nitro V 15 ANV15-51-582S | |
| MSI Cyborg 15 B2RWEKG | |
| HP Victus 15-fa2160ng | |
| Média Intel Core i5-13420H, NVIDIA GeForce RTX 5050 Laptop (242 - 247, n=2) | |
| Acer Nitro V 15 ANV15-52-50S2 | |
| WebXPRT 4 / Overall | |
| Média da turma Gaming (165 - 354, n=101, últimos 2 anos) | |
| Lenovo Legion 5 15AHP G10 | |
| MSI Cyborg 15 B2RWEKG | |
| Acer Nitro V 15 ANV15-51-582S | |
| HP Victus 15-fa2160ng | |
| Média Intel Core i5-13420H, NVIDIA GeForce RTX 5050 Laptop (220 - 226, n=2) | |
| Acer Nitro V 15 ANV15-52-50S2 | |
| Mozilla Kraken 1.1 / Total | |
| Acer Nitro V 15 ANV15-52-50S2 | |
| Média Intel Core i5-13420H, NVIDIA GeForce RTX 5050 Laptop (577 - 586, n=2) | |
| HP Victus 15-fa2160ng | |
| Acer Nitro V 15 ANV15-51-582S | |
| MSI Cyborg 15 B2RWEKG | |
| Lenovo LOQ 15AHP10 | |
| Lenovo Legion 5 15AHP G10 | |
| Média da turma Gaming (391 - 590, n=106, últimos 2 anos) | |
* ... menor é melhor
| AIDA64 / Memory Copy | |
| Média da turma Gaming (21750 - 129946, n=108, últimos 2 anos) | |
| Lenovo Legion 5 15AHP G10 | |
| MSI Cyborg 15 B2RWEKG | |
| Acer Nitro V 15 ANV15-51-582S | |
| Lenovo LOQ 15AHP10 | |
| Média Intel Core i5-13420H (22003 - 59609, n=5) | |
| HP Victus 15-fa2160ng | |
| Acer Nitro V 15 ANV15-52-50S2 | |
| AIDA64 / Memory Read | |
| Média da turma Gaming (22956 - 118858, n=108, últimos 2 anos) | |
| MSI Cyborg 15 B2RWEKG | |
| Lenovo Legion 5 15AHP G10 | |
| Acer Nitro V 15 ANV15-51-582S | |
| Média Intel Core i5-13420H (23499 - 68085, n=5) | |
| HP Victus 15-fa2160ng | |
| Lenovo LOQ 15AHP10 | |
| Acer Nitro V 15 ANV15-52-50S2 | |
| AIDA64 / Memory Write | |
| Lenovo Legion 5 15AHP G10 | |
| Média da turma Gaming (22297 - 135096, n=108, últimos 2 anos) | |
| MSI Cyborg 15 B2RWEKG | |
| Lenovo LOQ 15AHP10 | |
| Acer Nitro V 15 ANV15-51-582S | |
| Média Intel Core i5-13420H (21429 - 62529, n=5) | |
| HP Victus 15-fa2160ng | |
| Acer Nitro V 15 ANV15-52-50S2 | |
| AIDA64 / Memory Latency | |
| Média da turma Gaming (75.3 - 259, n=108, últimos 2 anos) | |
| HP Victus 15-fa2160ng | |
| MSI Cyborg 15 B2RWEKG | |
| Acer Nitro V 15 ANV15-52-50S2 | |
| Lenovo LOQ 15AHP10 | |
| Média Intel Core i5-13420H (90.2 - 103.6, n=5) | |
| Lenovo Legion 5 15AHP G10 | |
| Acer Nitro V 15 ANV15-51-582S | |
* ... menor é melhor
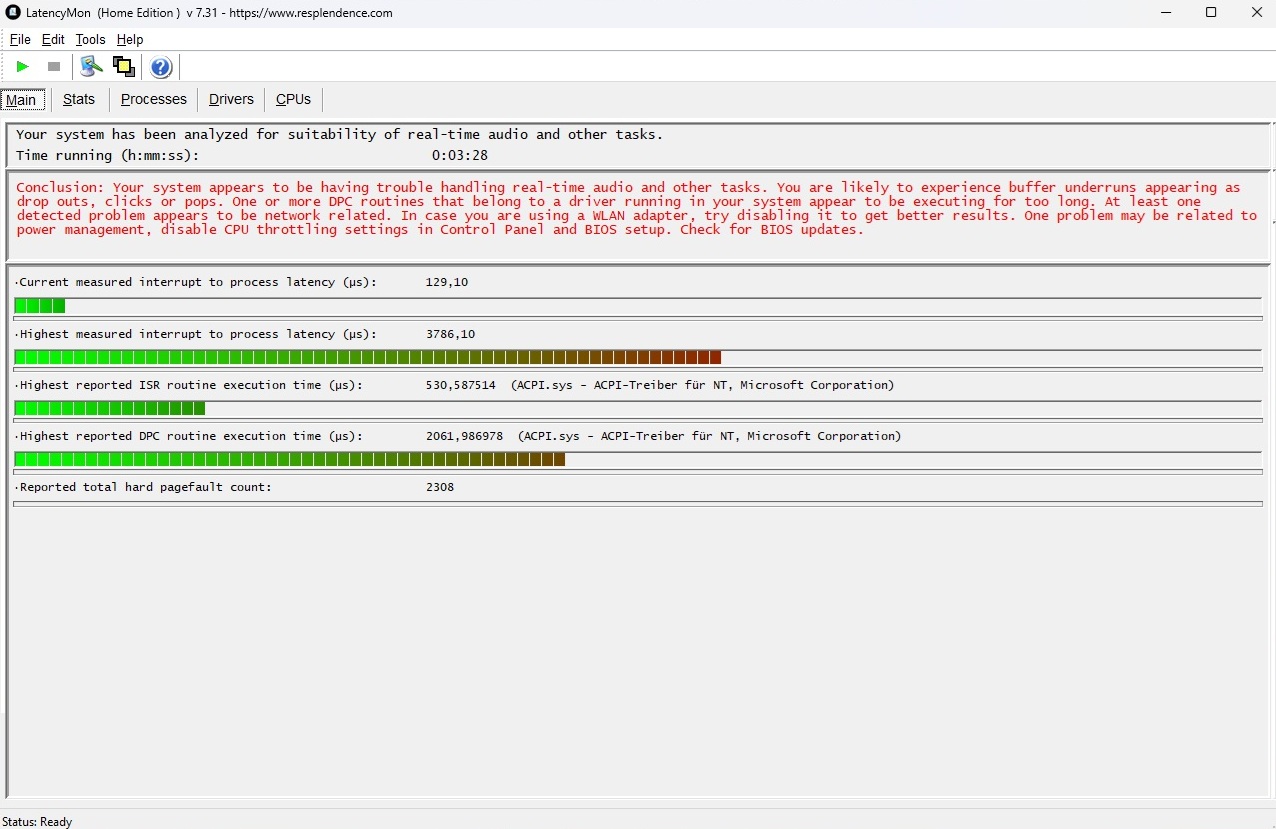
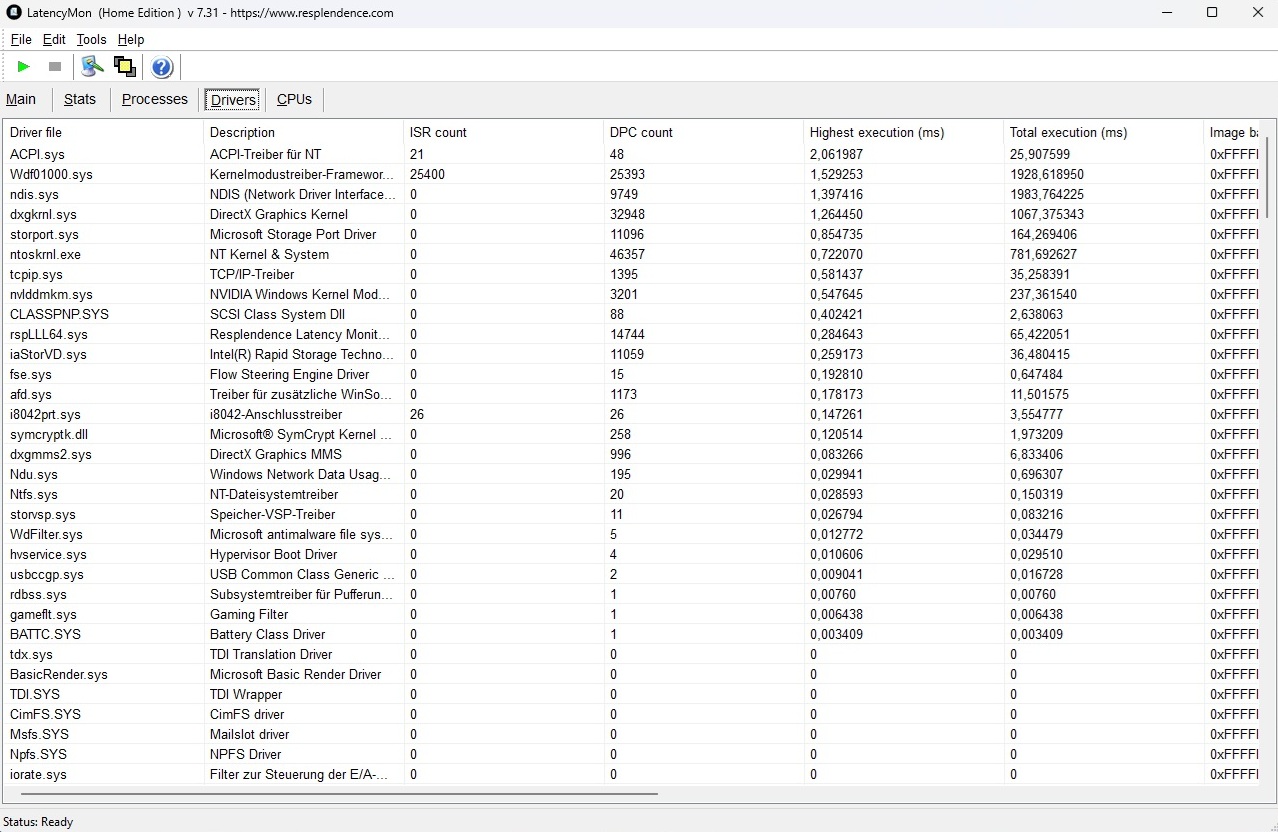
Latências de DPC
Os resultados de latência são igualmente modestos em relação aos do Cyborg 15 testado recentemente. O antecessor obteve valores significativamente mais baixos (ou seja, melhores) nesse aspecto.
| DPC Latencies / LatencyMon - interrupt to process latency (max), Web, Youtube, Prime95 | |
| MSI Cyborg 15 B2RWEKG | |
| Acer Nitro V 15 ANV15-52-50S2 | |
| HP Victus 15-fa2160ng | |
| Lenovo Legion 5 15AHP G10 | |
| Lenovo LOQ 15AHP10 | |
| Acer Nitro V 15 ANV15-51-582S | |
* ... menor é melhor
Armazenamento
Infelizmente, o SSD de 1 TB da Kingston sofre com quedas de desempenho sob carga contínua. No entanto, esse problema não é exclusivo do Nitro V 15 e também afeta vários concorrentes, incluindo o Lenovo LOQ 15.

* ... menor é melhor
Desempenho de leitura sustentado: Loop de leitura do DiskSpd (profundidade de fila 8)
Desempenho da GPU
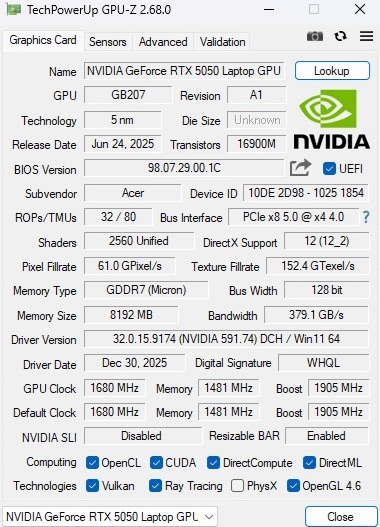
Graças ao seu sólido TGP máximo de 75 watts, a GeForce RTX 5050 oferece desempenho em linha com a média registrada anteriormente para essa GPU. No entanto, a diferença em relação à antecessora RTX 4050 do antecessor, permanece bastante modesta.
| 3DMark 11 Performance | 21647 pontos | |
| 3DMark Fire Strike Score | 20647 pontos | |
| 3DMark Time Spy Score | 8449 pontos | |
Ajuda | ||
* ... menor é melhor
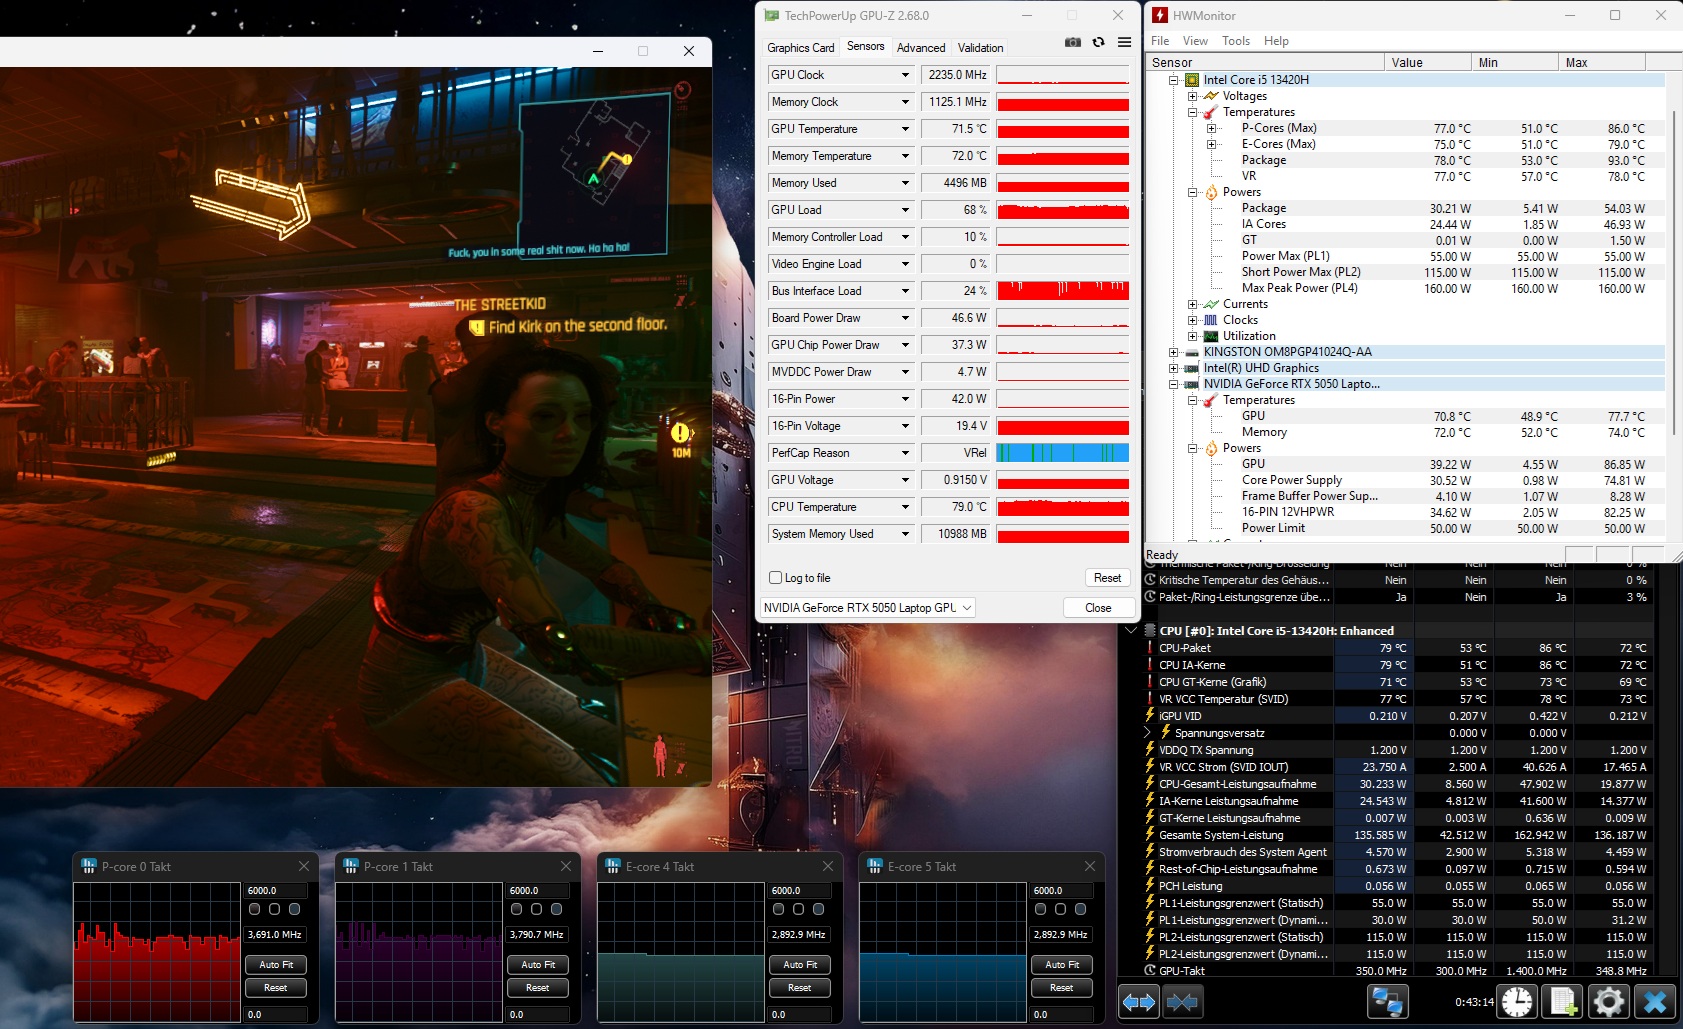
Desempenho em jogos
Os jogos mais antigos ou menos exigentes geralmente funcionam sem problemas na resolução nativa de 1.920 x 1.080, mesmo com as configurações máximas. No entanto, com títulos atuais ou mais exigentes, apenas as configurações médias ou altas costumam ser o limite prático se forem desejadas taxas de quadros acima de 40 FPS. O aumento de escala pode ser usado como alternativa, se necessário.
Com o DLSS definido para o modo Quality, por exemplo, Until Dawn alcançou 44 FPS na predefinição Ultra em vez de 36 FPS. Como de costume, taxas de quadros ainda mais altas podem ser alcançadas por meio da geração de quadros.
| Cyberpunk 2077 - 1920x1080 Ultra Preset (FSR off) | |
| Média da turma Gaming (17.7 - 169.9, n=119, últimos 2 anos) | |
| Lenovo Legion 5 15AHP G10 | |
| Lenovo LOQ 15AHP10 | |
| HP Victus 15-fa2160ng | |
| Média NVIDIA GeForce RTX 5050 Laptop (55.3 - 76.9, n=10) | |
| Acer Nitro V 15 ANV15-52-50S2 | |
| MSI Cyborg 15 B2RWEKG | |
| baixo | média | alto | ultra | |
|---|---|---|---|---|
| Dota 2 Reborn (2015) | 86.3 | 92.1 | 86.5 | |
| X-Plane 11.11 (2018) | 71.9 | 67.1 | ||
| Strange Brigade (2018) | 185 | 164.8 | 154.6 | |
| Baldur's Gate 3 (2023) | 89.2 | 70.9 | 68.1 | |
| Cyberpunk 2077 (2023) | 77.5 | 67.8 | 61.3 | |
| Until Dawn (2024) | 53.3 | 47.6 | 36.4 | |
| ARC Raiders (2025) | 81 | 68.7 | 49.2 |
| ARC Raiders | |
| 1920x1080 Epic Preset + Epic Raytracing AA:TSR | |
| Média da turma Gaming (43.5 - 98.6, n=11, últimos 2 anos) | |
| Média NVIDIA GeForce RTX 5050 Laptop (43.5 - 58.2, n=4) | |
| Acer Nitro V 15 ANV15-52-50S2 | |
| MSI Cyborg 15 B2RWEKG | |
| 1920x1080 High Preset AA:TSR | |
| Média da turma Gaming (64.5 - 144.4, n=11, últimos 2 anos) | |
| Média NVIDIA GeForce RTX 5050 Laptop (64.5 - 85.9, n=4) | |
| Acer Nitro V 15 ANV15-52-50S2 | |
| MSI Cyborg 15 B2RWEKG | |
Gráfico de Ultra FPS do Cyberpunk 2077
Emissões
Emissões de ruído
Sob carga, o Acer Nitro V 15 fica um pouco mais alto do que a maioria dos concorrentes, com 48 a 54 dB(A). Usuários mais sensíveis podem, é claro, selecionar um modo de operação diferente. No Cyberpunk 2077a mudança para o modo Balanced reduz o nível de ruído de 52 para 45 dB(A) sem sacrificar muito o desempenho.
Barulho
| Ocioso |
| 28 / 29 / 33 dB |
| Carga |
| 48 / 54 dB |
 | ||
30 dB silencioso 40 dB(A) audível 50 dB(A) ruidosamente alto |
||
min: | ||
| Acer Nitro V 15 ANV15-52-50S2 i5-13420H, GeForce RTX 5050 Laptop | Acer Nitro V 15 ANV15-51-582S i5-13420H, GeForce RTX 4050 Laptop GPU | HP Victus 15-fa2160ng i5-13420H, GeForce RTX 5050 Laptop | MSI Cyborg 15 B2RWEKG Core 7 240H, GeForce RTX 5050 Laptop | Lenovo LOQ 15AHP10 R7 250, GeForce RTX 5060 Laptop | Lenovo Legion 5 15AHP G10 R7 260, GeForce RTX 5060 Laptop | |
|---|---|---|---|---|---|---|
| Noise | 3% | 7% | 6% | -23% | 10% | |
| desligado / ambiente * (dB) | 24 | 25 -4% | 24 -0% | 24 -0% | 25 -4% | 25.5 -6% |
| Idle Minimum * (dB) | 28 | 25 11% | 28 -0% | 25 11% | 43 -54% | 25.5 9% |
| Idle Average * (dB) | 29 | 29 -0% | 29 -0% | 28 3% | 45 -55% | 25.5 12% |
| Idle Maximum * (dB) | 33 | 30 9% | 30 9% | 33 -0% | 48 -45% | 26.9 18% |
| Load Average * (dB) | 48 | 49 -2% | 40 17% | 44 8% | 53 -10% | 34.6 28% |
| Cyberpunk 2077 ultra * (dB) | 52 | 46 12% | 45 13% | 51 2% | 50.1 4% | |
| Load Maximum * (dB) | 54 | 51 6% | 48 11% | 50 7% | 53 2% | 50.1 7% |
| Witcher 3 ultra * (dB) | 49 |
* ... menor é melhor
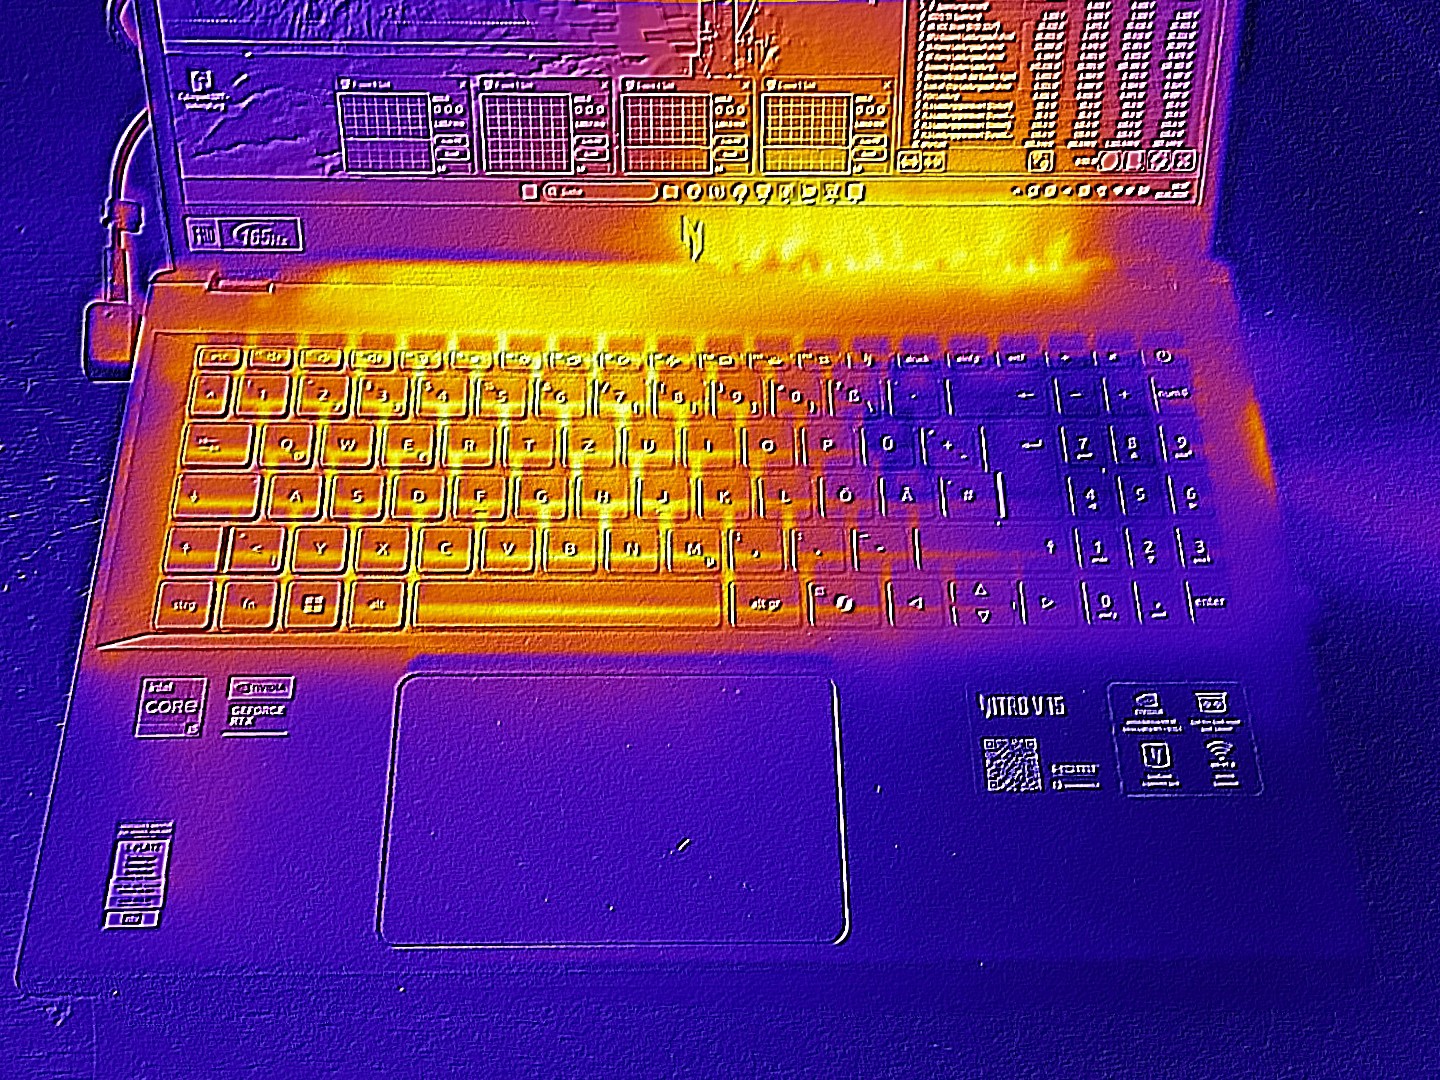
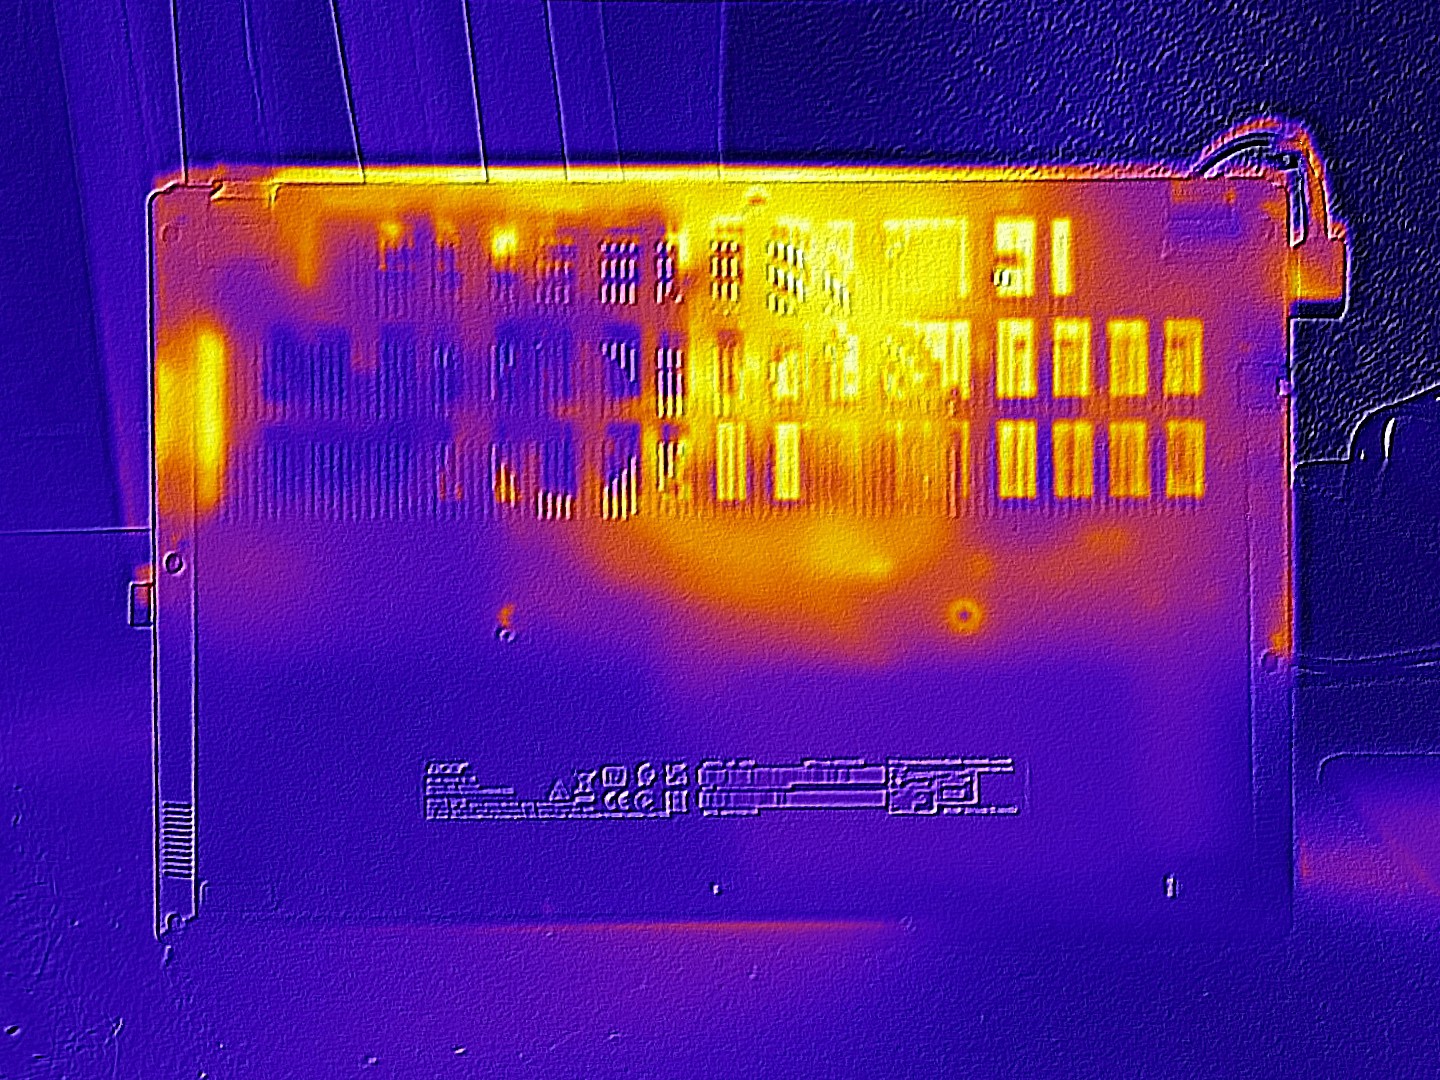
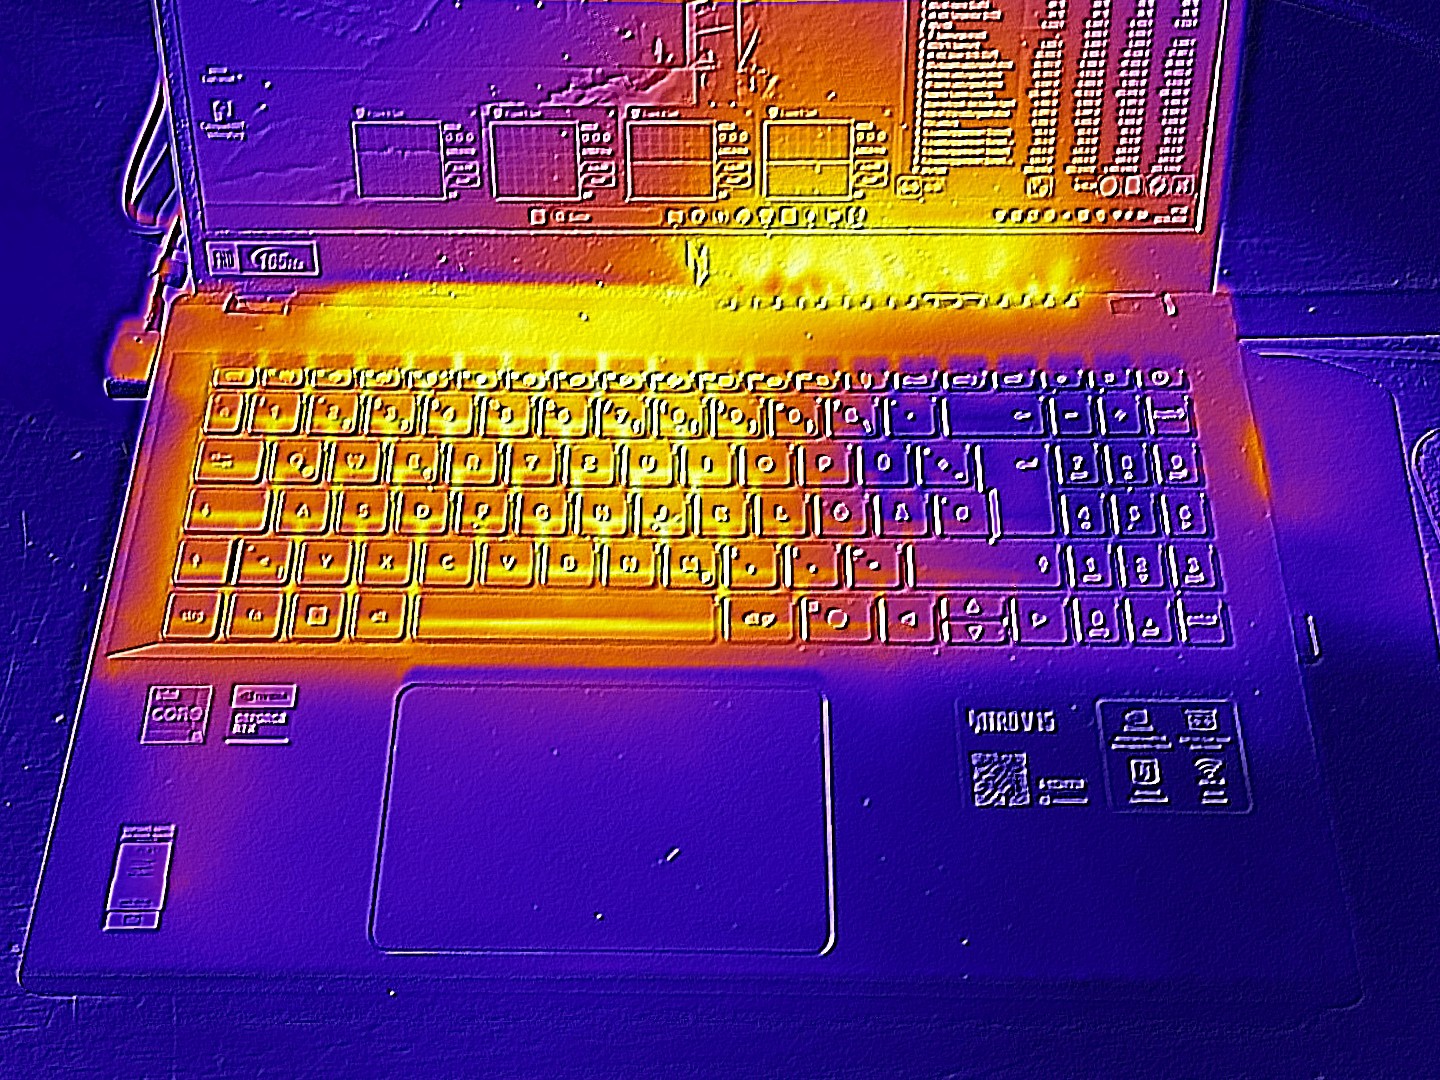
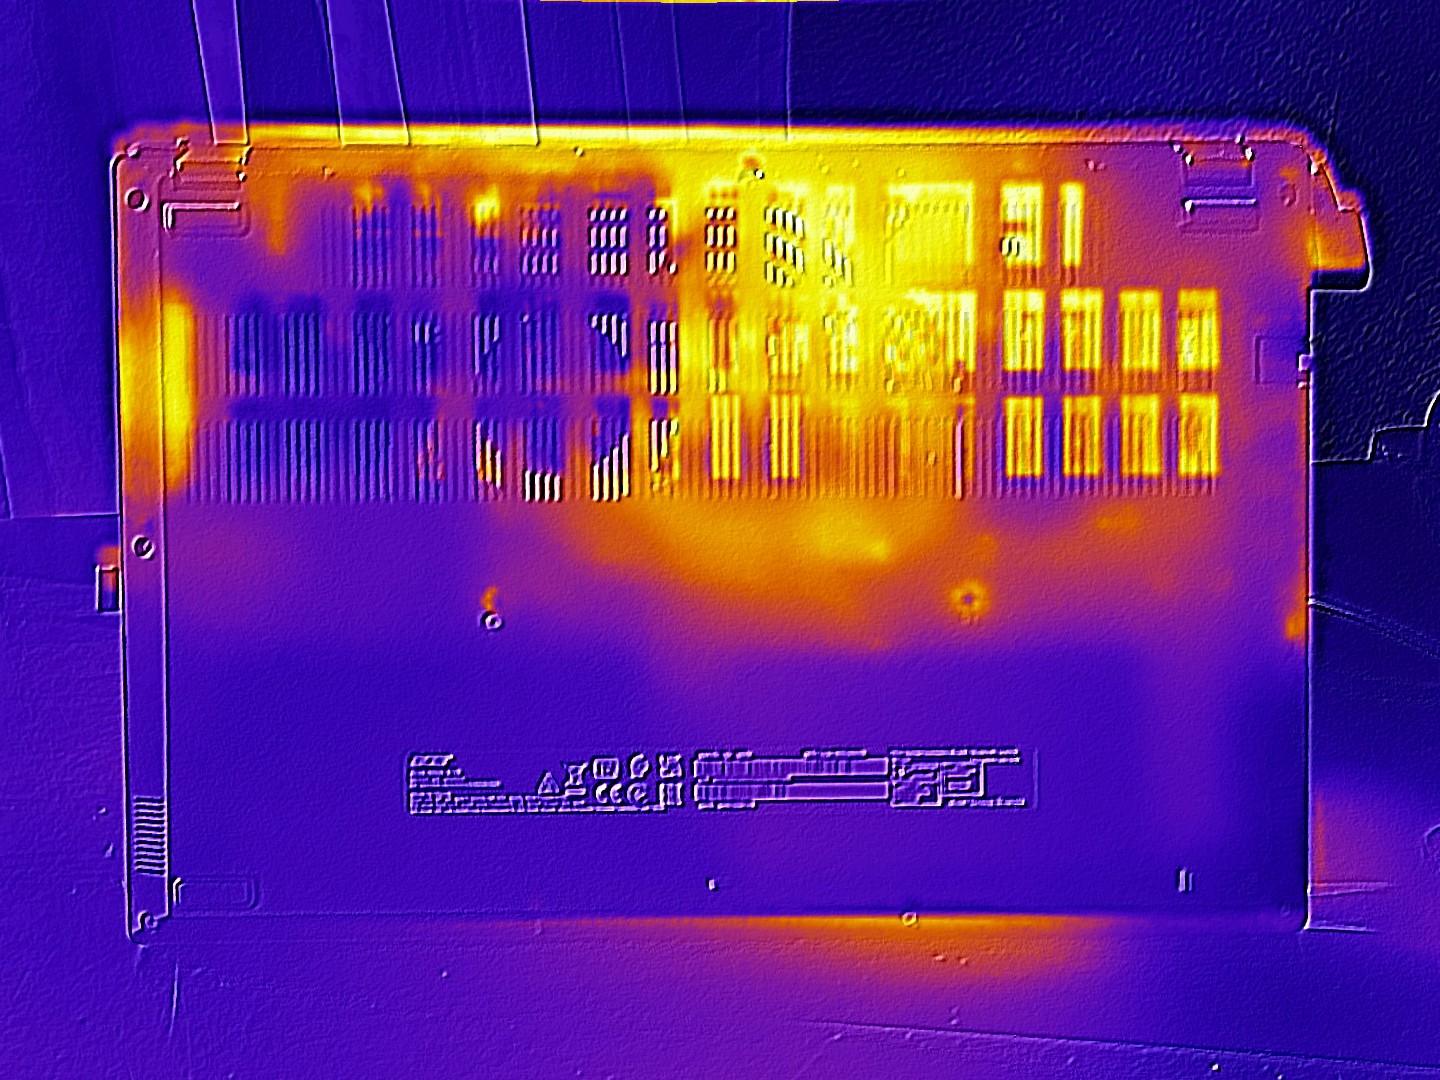
Temperatura
As temperaturas estão de acordo com as expectativas para um laptop RTX 5050. Em operação inativa, o chassi permanece agradavelmente frio.
(-) A temperatura máxima no lado superior é 46 °C / 115 F, em comparação com a média de 40.4 °C / 105 F , variando de 21.2 a 68.8 °C para a classe Gaming.
(-) A parte inferior aquece até um máximo de 49 °C / 120 F, em comparação com a média de 43.2 °C / 110 F
(+) Em uso inativo, a temperatura média para o lado superior é 25.8 °C / 78 F, em comparação com a média do dispositivo de 33.9 °C / ### class_avg_f### F.
(±) 3: The average temperature for the upper side is 37.8 °C / 100 F, compared to the average of 33.9 °C / 93 F for the class Gaming.
(+) Os apoios para as mãos e o touchpad são mais frios que a temperatura da pele, com um máximo de 31 °C / 87.8 F e, portanto, são frios ao toque.
(-) A temperatura média da área do apoio para as mãos de dispositivos semelhantes foi 28.8 °C / 83.8 F (-2.2 °C / -4 F).
| Acer Nitro V 15 ANV15-52-50S2 i5-13420H, GeForce RTX 5050 Laptop | Acer Nitro V 15 ANV15-51-582S i5-13420H, GeForce RTX 4050 Laptop GPU | HP Victus 15-fa2160ng i5-13420H, GeForce RTX 5050 Laptop | MSI Cyborg 15 B2RWEKG Core 7 240H, GeForce RTX 5050 Laptop | Lenovo LOQ 15AHP10 R7 250, GeForce RTX 5060 Laptop | Lenovo Legion 5 15AHP G10 R7 260, GeForce RTX 5060 Laptop | |
|---|---|---|---|---|---|---|
| Heat | 3% | -2% | -12% | -9% | 1% | |
| Maximum Upper Side * (°C) | 46 | 46 -0% | 43 7% | 46 -0% | 49 -7% | 42.2 8% |
| Maximum Bottom * (°C) | 49 | 48 2% | 43 12% | 45 8% | 58 -18% | 51.7 -6% |
| Idle Upper Side * (°C) | 28 | 27 4% | 37 -32% | 36 -29% | 32 -14% | 28.5 -2% |
| Idle Bottom * (°C) | 30 | 28 7% | 28 7% | 38 -27% | 29 3% | 29.2 3% |
* ... menor é melhor
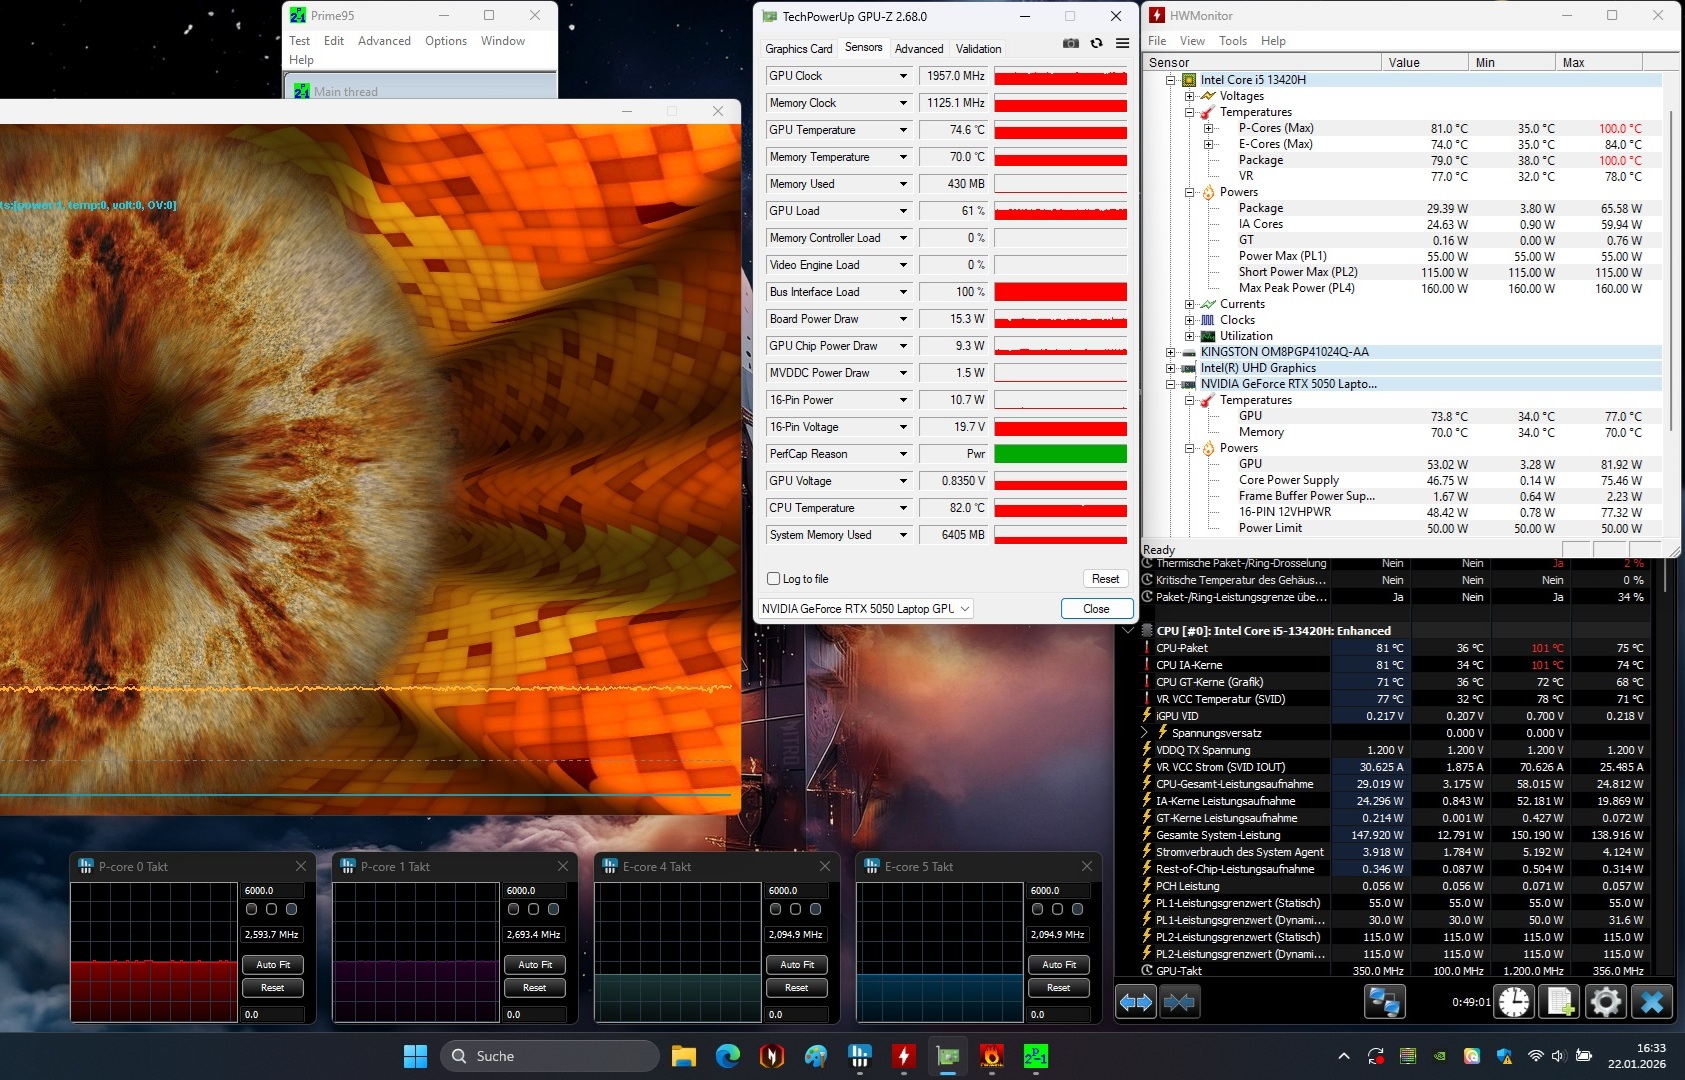
Teste de estresse
Nosso teste de estresse usando as ferramentas FurMark e Prime95 levou a GPU a cerca de 75 °C, enquanto a CPU se estabilizou em aproximadamente 80 °C após um curto período.
Alto-falante
A qualidade do som está na faixa intermediária. Como acontece com a maioria dos notebooks, os graves, em particular, deixam muito a desejar.
Acer Nitro V 15 ANV15-52-50S2 análise de áudio
(+) | os alto-falantes podem tocar relativamente alto (###valor### dB)
Graves 100 - 315Hz
(-) | quase nenhum baixo - em média 27.5% menor que a mediana
(-) | graves não são lineares (15% delta para frequência anterior)
Médios 400 - 2.000 Hz
(+) | médios equilibrados - apenas 4.7% longe da mediana
(+) | médios são lineares (4.4% delta para frequência anterior)
Altos 2 - 16 kHz
(+) | agudos equilibrados - apenas 2% longe da mediana
(+) | os máximos são lineares (4.5% delta da frequência anterior)
Geral 100 - 16.000 Hz
(±) | a linearidade do som geral é média (17.9% diferença em relação à mediana)
Comparado com a mesma classe
» 54% de todos os dispositivos testados nesta classe foram melhores, 9% semelhantes, 37% piores
» O melhor teve um delta de 6%, a média foi 18%, o pior foi 132%
Comparado com todos os dispositivos testados
» 37% de todos os dispositivos testados foram melhores, 8% semelhantes, 55% piores
» O melhor teve um delta de 4%, a média foi 24%, o pior foi 134%
HP Victus 15-fa2160ng análise de áudio
(+) | os alto-falantes podem tocar relativamente alto (###valor### dB)
Graves 100 - 315Hz
(-) | quase nenhum baixo - em média 23.8% menor que a mediana
(±) | a linearidade dos graves é média (12% delta para a frequência anterior)
Médios 400 - 2.000 Hz
(+) | médios equilibrados - apenas 2.1% longe da mediana
(+) | médios são lineares (4% delta para frequência anterior)
Altos 2 - 16 kHz
(±) | máximos mais altos - em média 5.5% maior que a mediana
(+) | os máximos são lineares (4.5% delta da frequência anterior)
Geral 100 - 16.000 Hz
(±) | a linearidade do som geral é média (17.8% diferença em relação à mediana)
Comparado com a mesma classe
» 53% de todos os dispositivos testados nesta classe foram melhores, 10% semelhantes, 37% piores
» O melhor teve um delta de 6%, a média foi 18%, o pior foi 132%
Comparado com todos os dispositivos testados
» 36% de todos os dispositivos testados foram melhores, 8% semelhantes, 56% piores
» O melhor teve um delta de 4%, a média foi 24%, o pior foi 134%
Gerenciamento de energia
consumo de energia
Com uma média de 18 watts, o requisito de energia no modo inativo poderia ser menor. Sob carga, o dispositivo de 15 polegadas consome entre 66 e 119 watts, de modo que a fonte de alimentação de 135 watts incluída não é sobrecarregada.
| desligado | |
| Ocioso | |
| Carga |
|
Key:
min: | |
| Acer Nitro V 15 ANV15-52-50S2 i5-13420H, GeForce RTX 5050 Laptop | Acer Nitro V 15 ANV15-51-582S i5-13420H, GeForce RTX 4050 Laptop GPU | HP Victus 15-fa2160ng i5-13420H, GeForce RTX 5050 Laptop | MSI Cyborg 15 B2RWEKG Core 7 240H, GeForce RTX 5050 Laptop | Lenovo LOQ 15AHP10 R7 250, GeForce RTX 5060 Laptop | Lenovo Legion 5 15AHP G10 R7 260, GeForce RTX 5060 Laptop | Média da turma Gaming | |
|---|---|---|---|---|---|---|---|
| Power Consumption | 26% | 2% | 4% | -28% | -10% | -37% | |
| Idle Minimum * (Watt) | 16.8 | 7 58% | 7.9 53% | 14.9 11% | 20 -19% | 6.9 59% | 13.1 ? 22% |
| Idle Average * (Watt) | 17.6 | 8 55% | 9.2 48% | 16.3 7% | 20.7 -18% | 10.7 39% | 18.8 ? -7% |
| Idle Maximum * (Watt) | 19.8 | 11 44% | 13.5 32% | 22.2 -12% | 22.7 -15% | 11.3 43% | 24.4 ? -23% |
| Load Average * (Watt) | 66 | 76 -15% | 78 -18% | 72 -9% | 71 -8% | 69.7 -6% | 108.5 ? -64% |
| Cyberpunk 2077 ultra * (Watt) | 106.5 | 128.4 -21% | 90.3 15% | 153.1 -44% | 162.6 -53% | ||
| Cyberpunk 2077 ultra external monitor * (Watt) | 105 | 126.7 -21% | 89.6 15% | 151.1 -44% | 165 -57% | ||
| Load Maximum * (Watt) | 119 | 136 -14% | 187 -57% | 117 2% | 172 -45% | 233.6 -96% | 254 ? -113% |
| Witcher 3 ultra * (Watt) | 98.2 |
* ... menor é melhor
consumo de energia Cyberpunk / Teste de estresse
consumo de energia com monitor externo
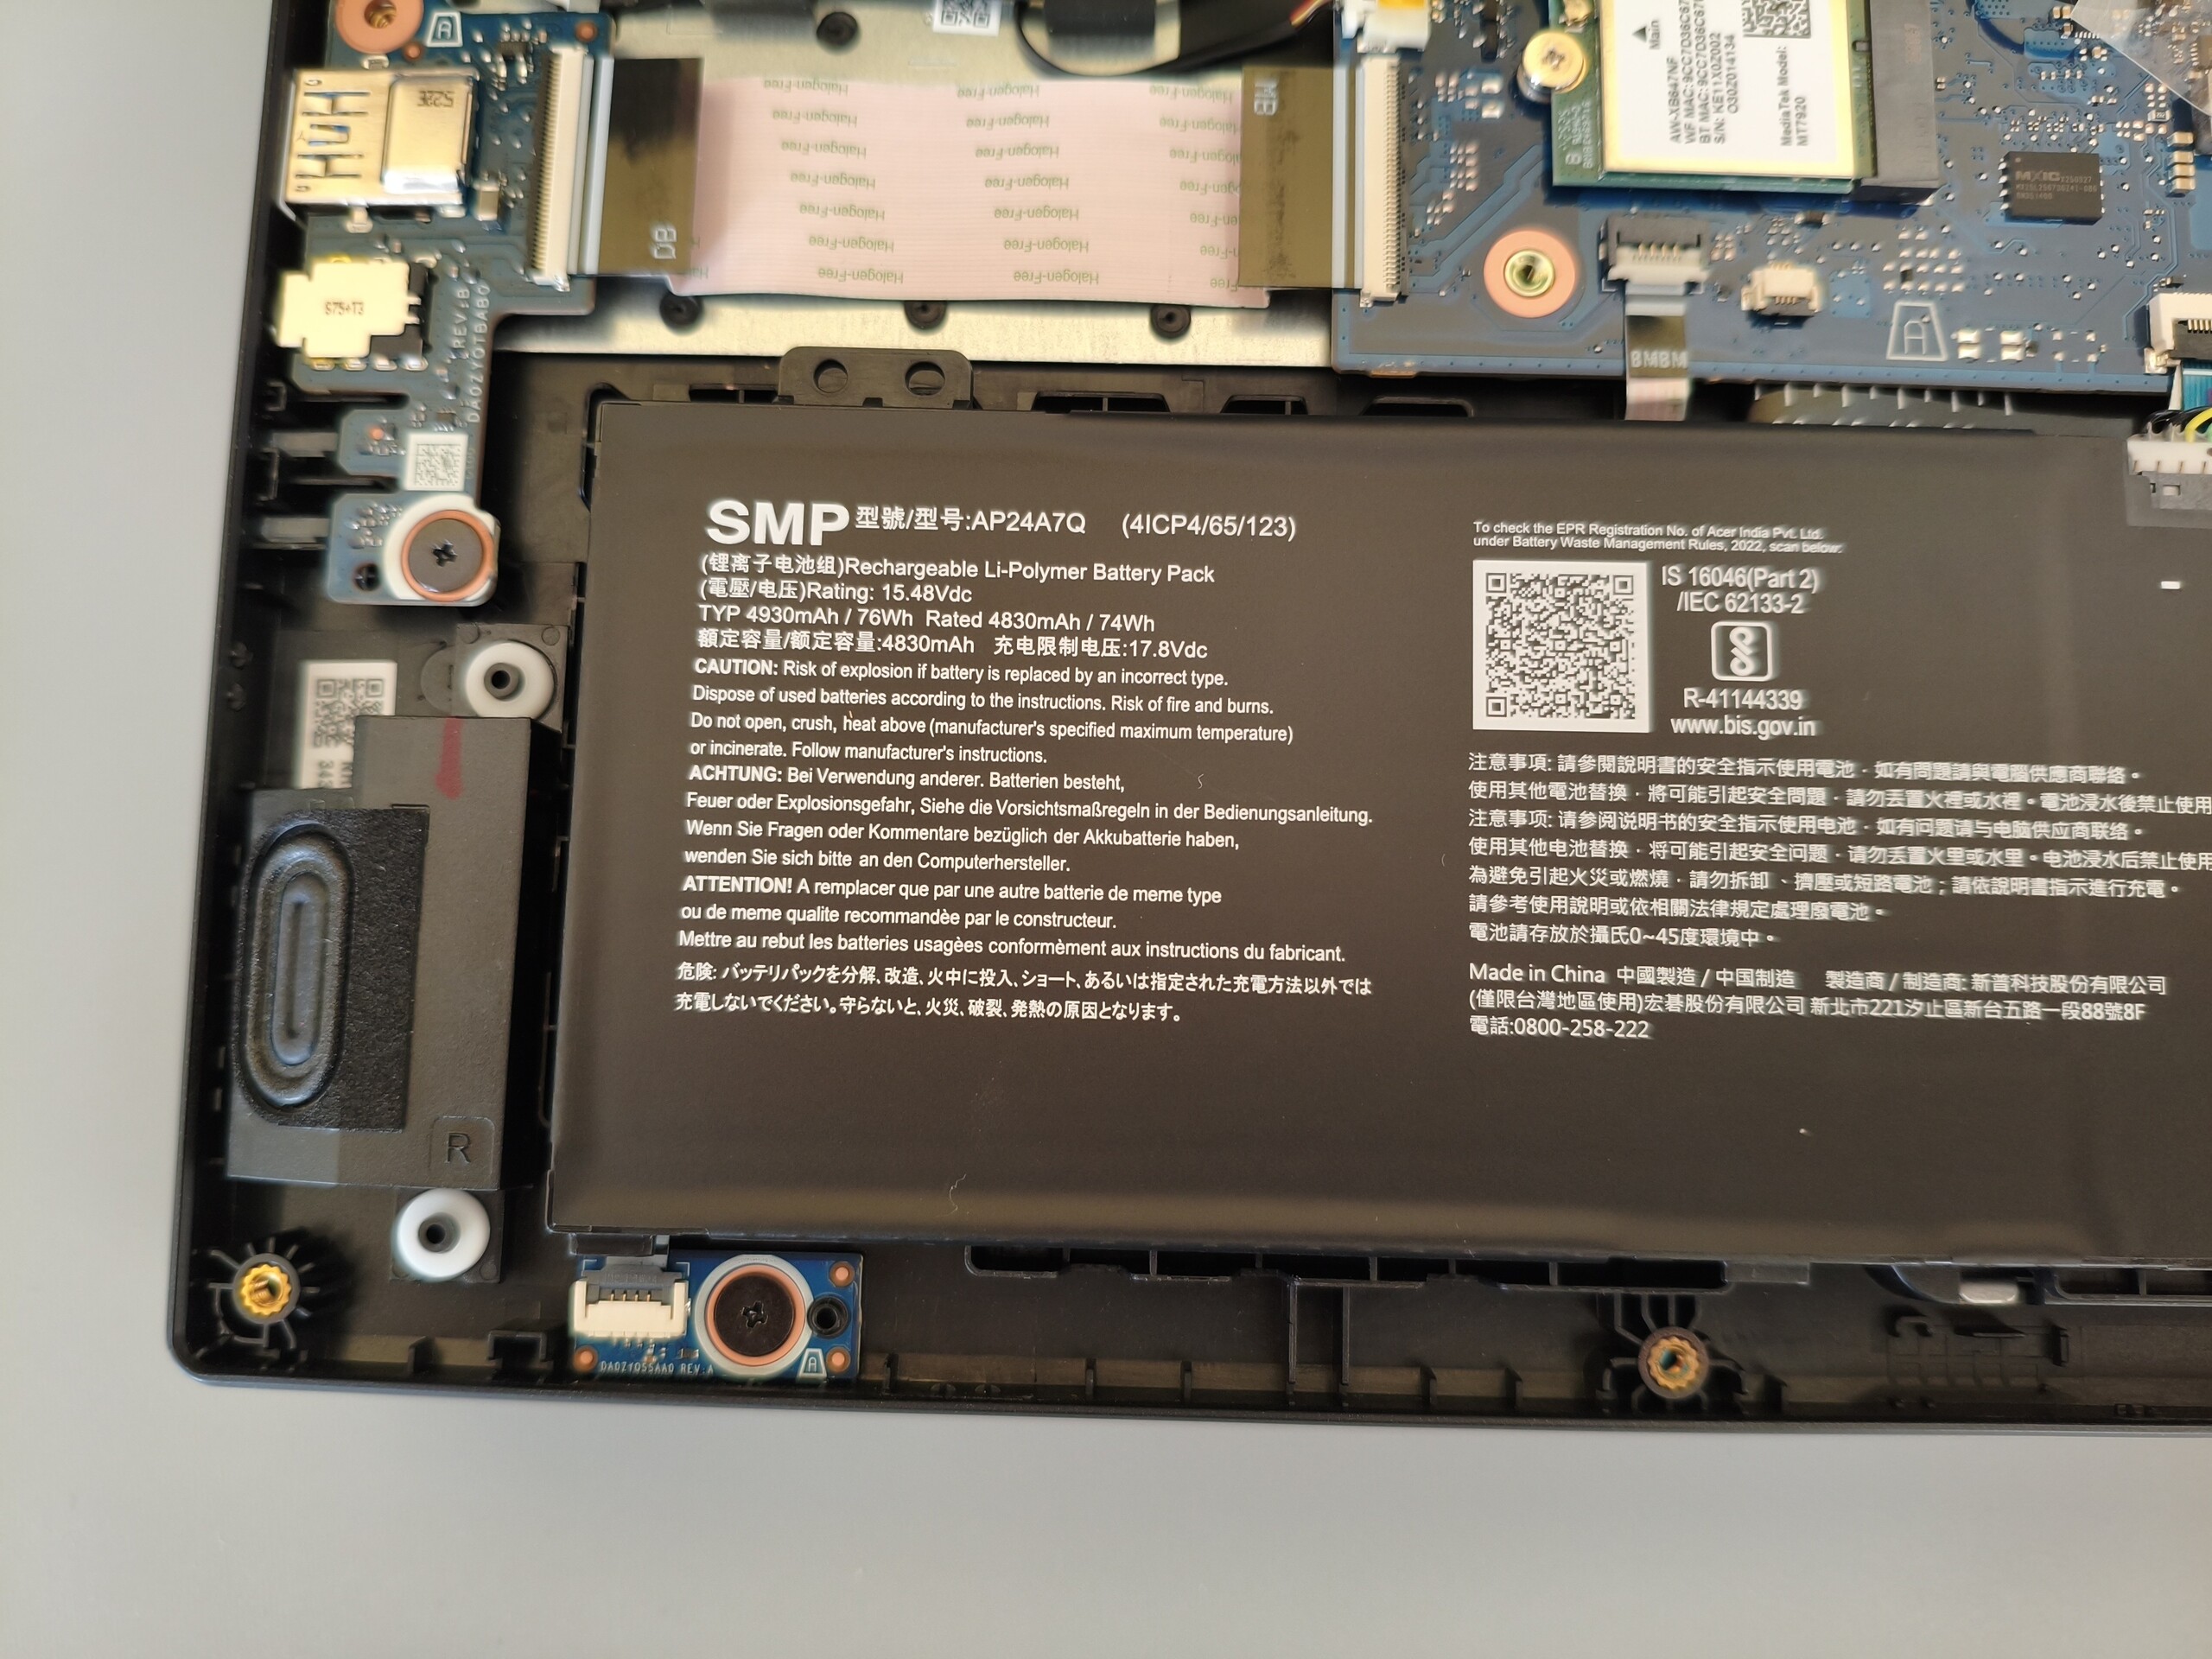
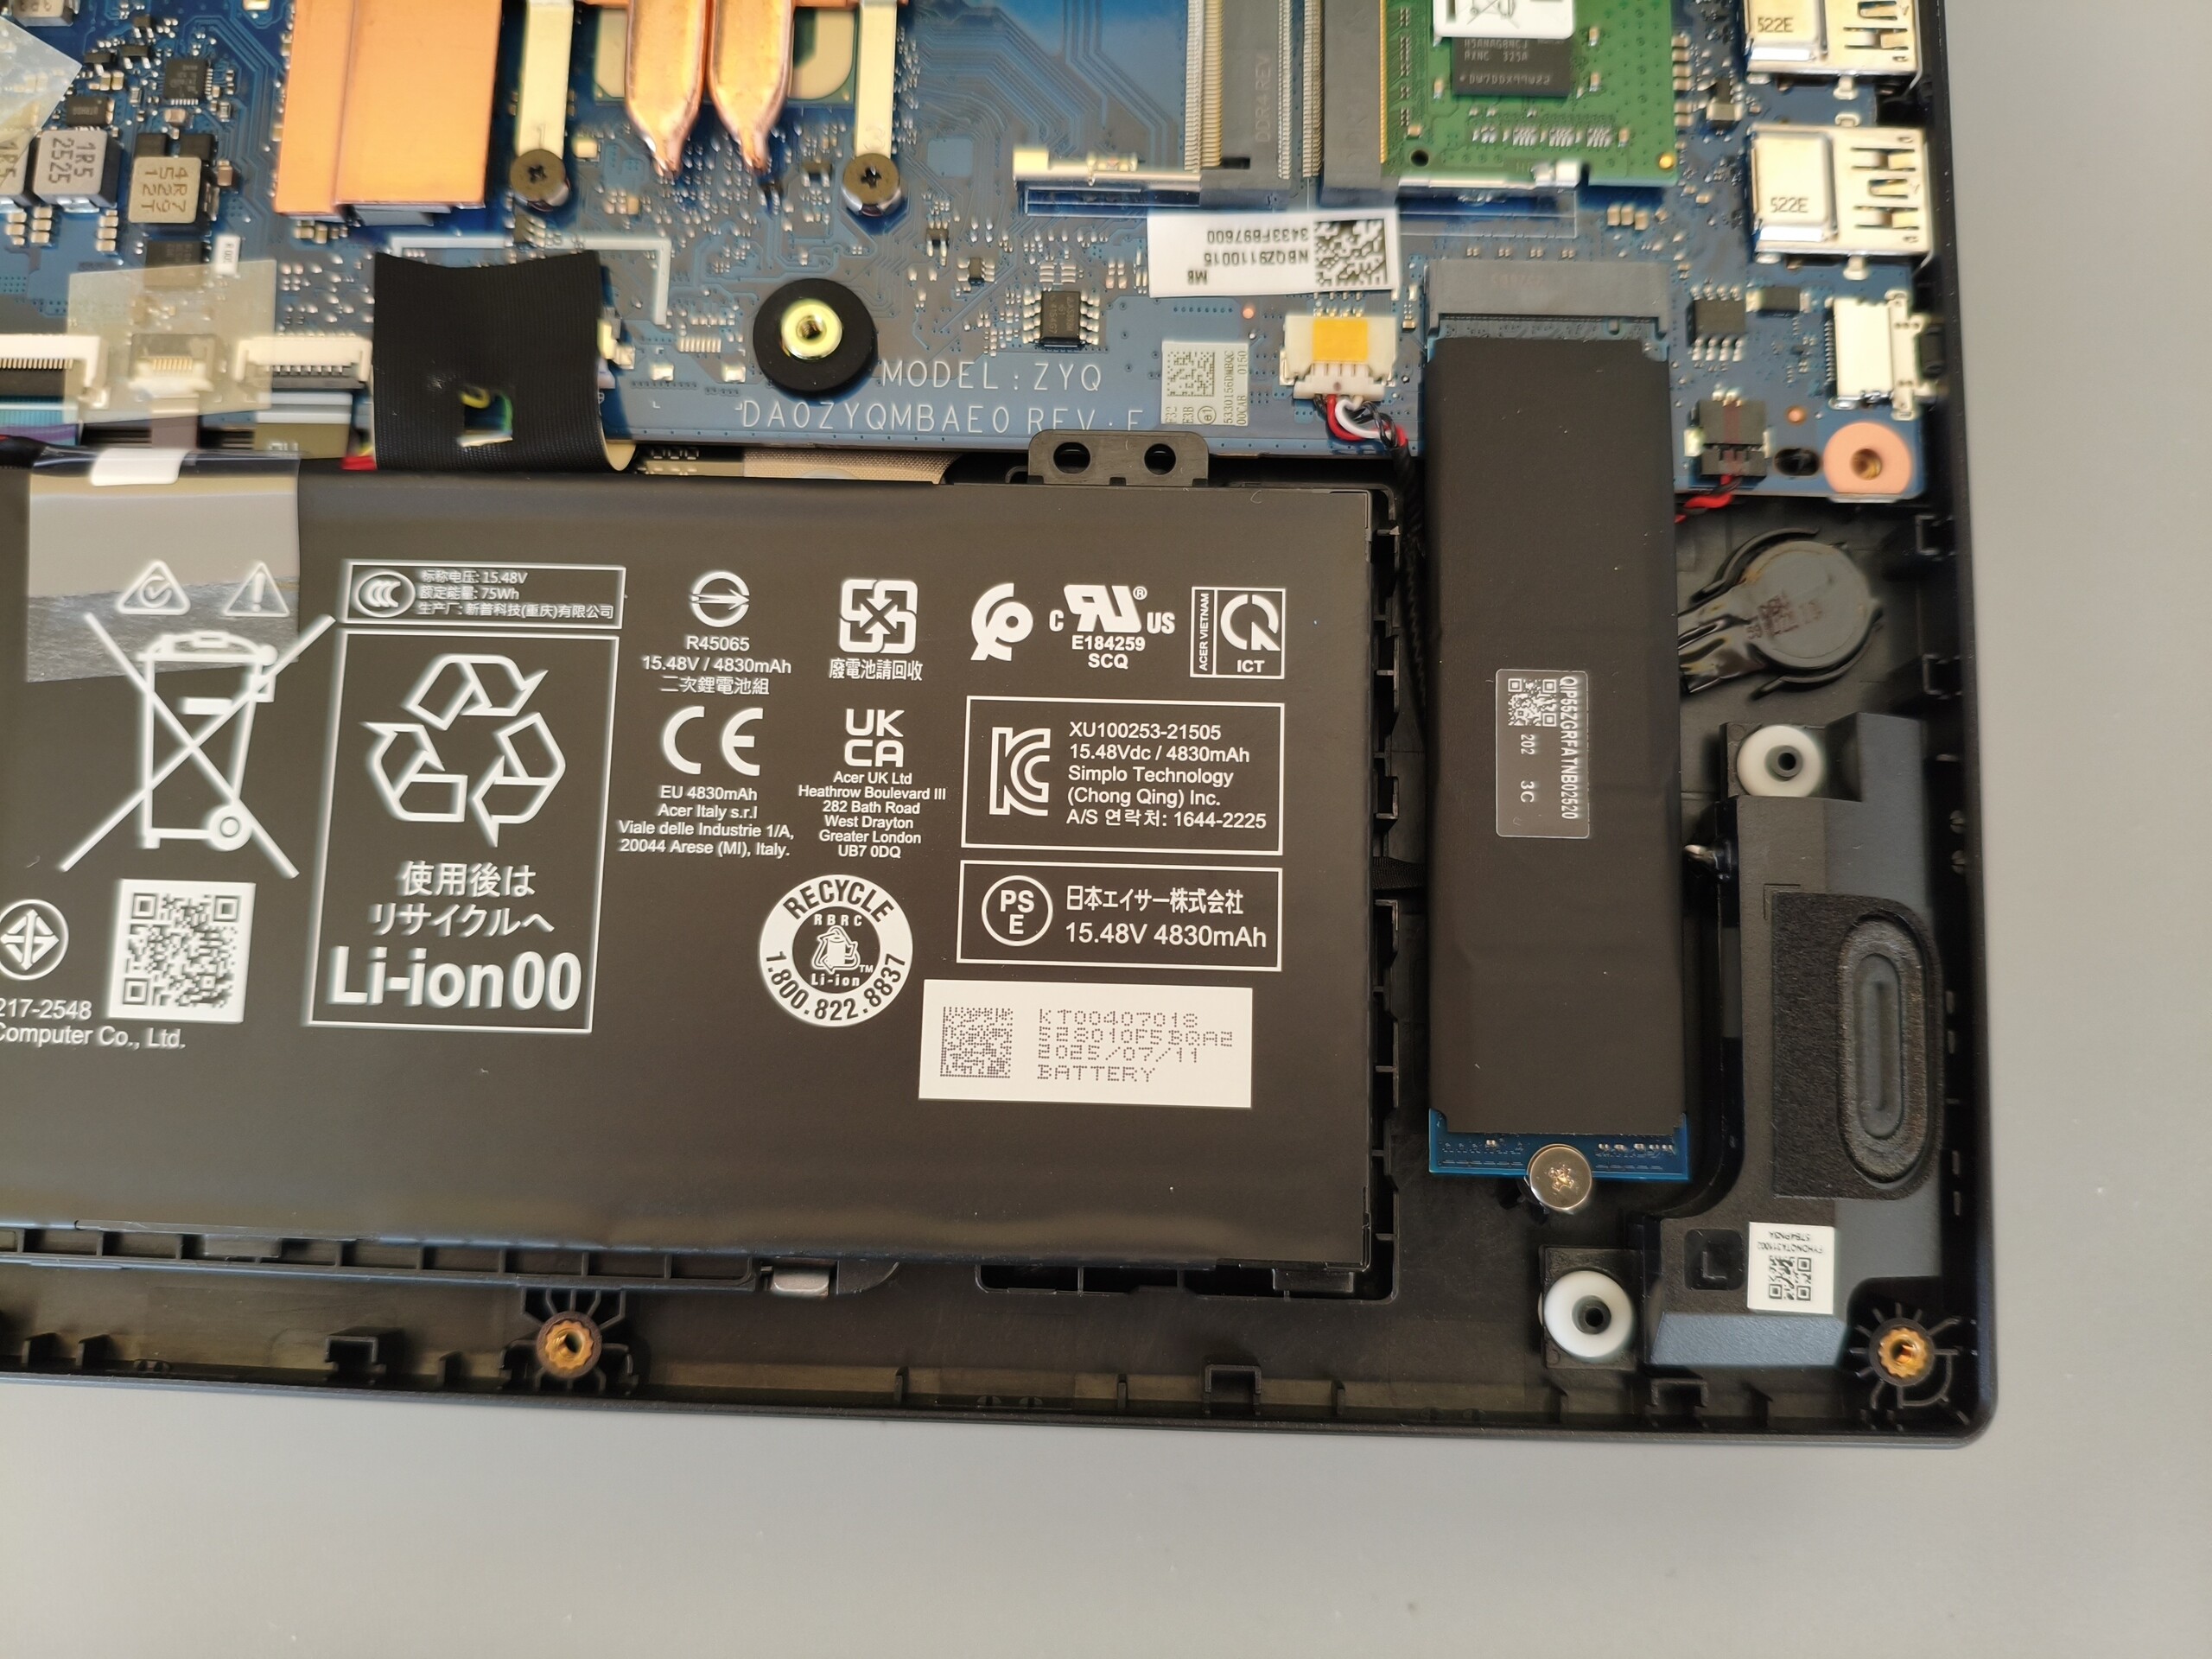
Duração da bateria
Embora a capacidade da bateria tenha aumentado significativamente de 57 para 76 Wh, a duração da bateria é pior do que a do antecessor. Em nosso teste de Wi-Fi com o brilho reduzido para 150 cd/m², o dispositivo conseguiu apenas cerca de 5,5 horas, o que ainda é aceitável em comparação com a concorrência.
| Acer Nitro V 15 ANV15-52-50S2 i5-13420H, GeForce RTX 5050 Laptop, 76 Wh | Acer Nitro V 15 ANV15-51-582S i5-13420H, GeForce RTX 4050 Laptop GPU, 57 Wh | HP Victus 15-fa2160ng i5-13420H, GeForce RTX 5050 Laptop, 70 Wh | MSI Cyborg 15 B2RWEKG Core 7 240H, GeForce RTX 5050 Laptop, 55.2 Wh | Lenovo LOQ 15AHP10 R7 250, GeForce RTX 5060 Laptop, 60 Wh | Lenovo Legion 5 15AHP G10 R7 260, GeForce RTX 5060 Laptop, 80 Wh | Média da turma Gaming | |
|---|---|---|---|---|---|---|---|
| Duração da bateria | 71% | -22% | -2% | -18% | 76% | 27% | |
| WiFi v1.3 (h) | 5.5 | 9.4 71% | 4.3 -22% | 5.4 -2% | 4.5 -18% | 9.7 76% | 6.98 ? 27% |
| Reader / Idle (h) | 21.5 | 6.9 | 8.71 ? | ||||
| Load (h) | 1.7 | 1.3 | 1.2 | 1.47 ? | |||
| H.264 (h) | 11.5 | 8.26 ? | |||||
| Cyberpunk 2077 ultra 150cd (h) | 0.9 |
Avaliação geral do Notebookcheck
Com uma gama de cores mais ampla, o Nitro V 15 seria um rival digno do Lenovo LOQ 15. No entanto, da forma como está, ele só atinge o nível do HP Victus 15 e do MSI Cyborg 15que têm preços semelhantes, em torno de 1.000 euros, mas oferecem resultados gerais ligeiramente melhores.
Acer Nitro V 15 ANV15-52-50S2
- 01/29/2026 v8
Florian Glaser
 Total Sustainability Score:
 Visão geral das alternativas possíveis
Imagem | Modelo / Análises | Preço | Peso | Altura | Tela |
|---|---|---|---|---|---|
1. 73.7%  | Acer Nitro V 15 ANV15-52-50S2 Intel Core i5-13420H ⎘ NVIDIA GeForce RTX 5050 Laptop ⎘ 16 GB Memória, 1024 GB SSD | Amazon: Preço de tabela: 1049 EUR | 2.1 kg | 23.5 mm | 15.60" 1920x1080 141 PPI IPS |
2. 82.8% v7 (old)  | Acer Nitro V 15 ANV15-51-582S Intel Core i5-13420H ⎘ NVIDIA GeForce RTX 4050 Laptop GPU ⎘ 16 GB Memória, 512 GB SSD | Amazon: 1. $72.31 HPDELGB Replacement for Acer... 2. $72.95 LCDBros Screen for Acer Nitr... 3. $136.34 Replacement Display, Compati... Preço de tabela: 900 EUR | 2.1 kg | 23.5 mm | 15.60" 1920x1080 141 PPI IPS |
3. 75.8%  | HP Victus 15-fa2160ng Intel Core i5-13420H ⎘ NVIDIA GeForce RTX 5050 Laptop ⎘ 24 GB Memória, 512 GB SSD | Amazon: Preço de tabela: 1000 EUR | 2.4 kg | 23.5 mm | 15.60" 1920x1080 141 PPI IPS |
4. 75.2%  | MSI Cyborg 15 B2RWEKG Intel Core 7 240H ⎘ NVIDIA GeForce RTX 5050 Laptop ⎘ 16 GB Memória, 512 GB SSD | Amazon: Preço de tabela: 1099 EUR | 2.2 kg | 23.2 mm | 15.60" 1920x1080 141 PPI IPS |
5. 77.5%  | Lenovo LOQ 15AHP10 AMD Ryzen 7 250 ⎘ NVIDIA GeForce RTX 5060 Laptop ⎘ 16 GB Memória, 1024 GB SSD | Amazon: | 2.4 kg | 24 mm | 15.60" 1920x1080 141 PPI IPS |
6. 87.2%  | Lenovo Legion 5 15AHP G10 AMD Ryzen 7 260 ⎘ NVIDIA GeForce RTX 5060 Laptop ⎘ 32 GB Memória, 1024 GB SSD | Amazon: Preço de tabela: 1449€ | 1.9 kg | 21.5 mm | 15.10" 2560x1600 200 PPI OLED |
Transparência
A seleção dos dispositivos a serem analisados é feita pela nossa equipe editorial. A amostra de teste foi fornecida ao autor como empréstimo pelo fabricante ou varejista para fins desta revisão. O credor não teve influência nesta revisão, nem o fabricante recebeu uma cópia desta revisão antes da publicação. Não houve obrigação de publicar esta revisão. Como empresa de mídia independente, a Notebookcheck não está sujeita à autoridade de fabricantes, varejistas ou editores.
É assim que o Notebookcheck está testando
Todos os anos, o Notebookcheck analisa de forma independente centenas de laptops e smartphones usando procedimentos padronizados para garantir que todos os resultados sejam comparáveis. Desenvolvemos continuamente nossos métodos de teste há cerca de 20 anos e definimos padrões da indústria no processo. Em nossos laboratórios de teste, equipamentos de medição de alta qualidade são utilizados por técnicos e editores experientes. Esses testes envolvem um processo de validação em vários estágios. Nosso complexo sistema de classificação é baseado em centenas de medições e benchmarks bem fundamentados, o que mantém a objetividade.