Análise do Aorus 15 BSF: O laptop para jogos QHD com uma RTX 4070 e ótimos tempos de execução
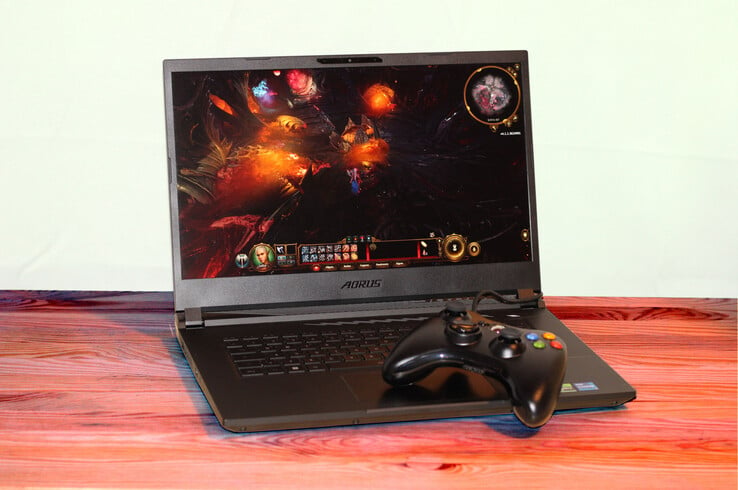
O Aorus 15 BSF da Gigabyte é um laptop para jogos de 15,6 polegadas de médio porte que conta com hardware atualizado: Raptor Lake, Ada Lovelace, DDR5, PCIe 4. O pacote completo está disponível por cerca de US$ 1.700. Os concorrentes incluem oHP Omen Transcend 16, MSI Pulse 17 B13VGK, Lenovo Legion Slim 7i 16 Gen 8, Acer Nitro 16 AN16-41e oAsus TUF Gaming A16 FA617XS.
Possíveis concorrentes em comparação
Avaliação | Data | Modelo | Peso | Altura | Size | Resolução | Preço |
|---|---|---|---|---|---|---|---|
| 85.7 % v7 (old) | 08/2023 | Aorus 15 BSF i7-13700H, GeForce RTX 4070 Laptop GPU | 2.4 kg | 20.9 mm | 15.60" | 2560x1440 | |
| 87.9 % v7 (old) | 08/2023 | HP Omen Transcend 16 i9-13900HX, GeForce RTX 4070 Laptop GPU | 2.3 kg | 19.8 mm | 16.00" | 2560x1600 | |
| 86.3 % v7 (old) | 07/2023 | MSI Pulse 17 B13VGK i7-13700H, GeForce RTX 4070 Laptop GPU | 2.7 kg | 27.2 mm | 17.30" | 1920x1080 | |
| 90 % v7 (old) | 07/2023 | Lenovo Legion Slim 7i 16 Gen 8 i9-13900H, GeForce RTX 4070 Laptop GPU | 2.1 kg | 19.9 mm | 16.00" | 2560x1600 | |
| 88.1 % v7 (old) | 06/2023 | Acer Nitro 16 AN16-41 R7 7735HS, GeForce RTX 4070 Laptop GPU | 2.7 kg | 27.9 mm | 16.00" | 2560x1600 | |
| 86.9 % v7 (old) | 06/2023 | Asus TUF Gaming A16 FA617XS R9 7940HS, Radeon RX 7600S | 2.2 kg | 22.1 mm | 16.00" | 1920x1200 |
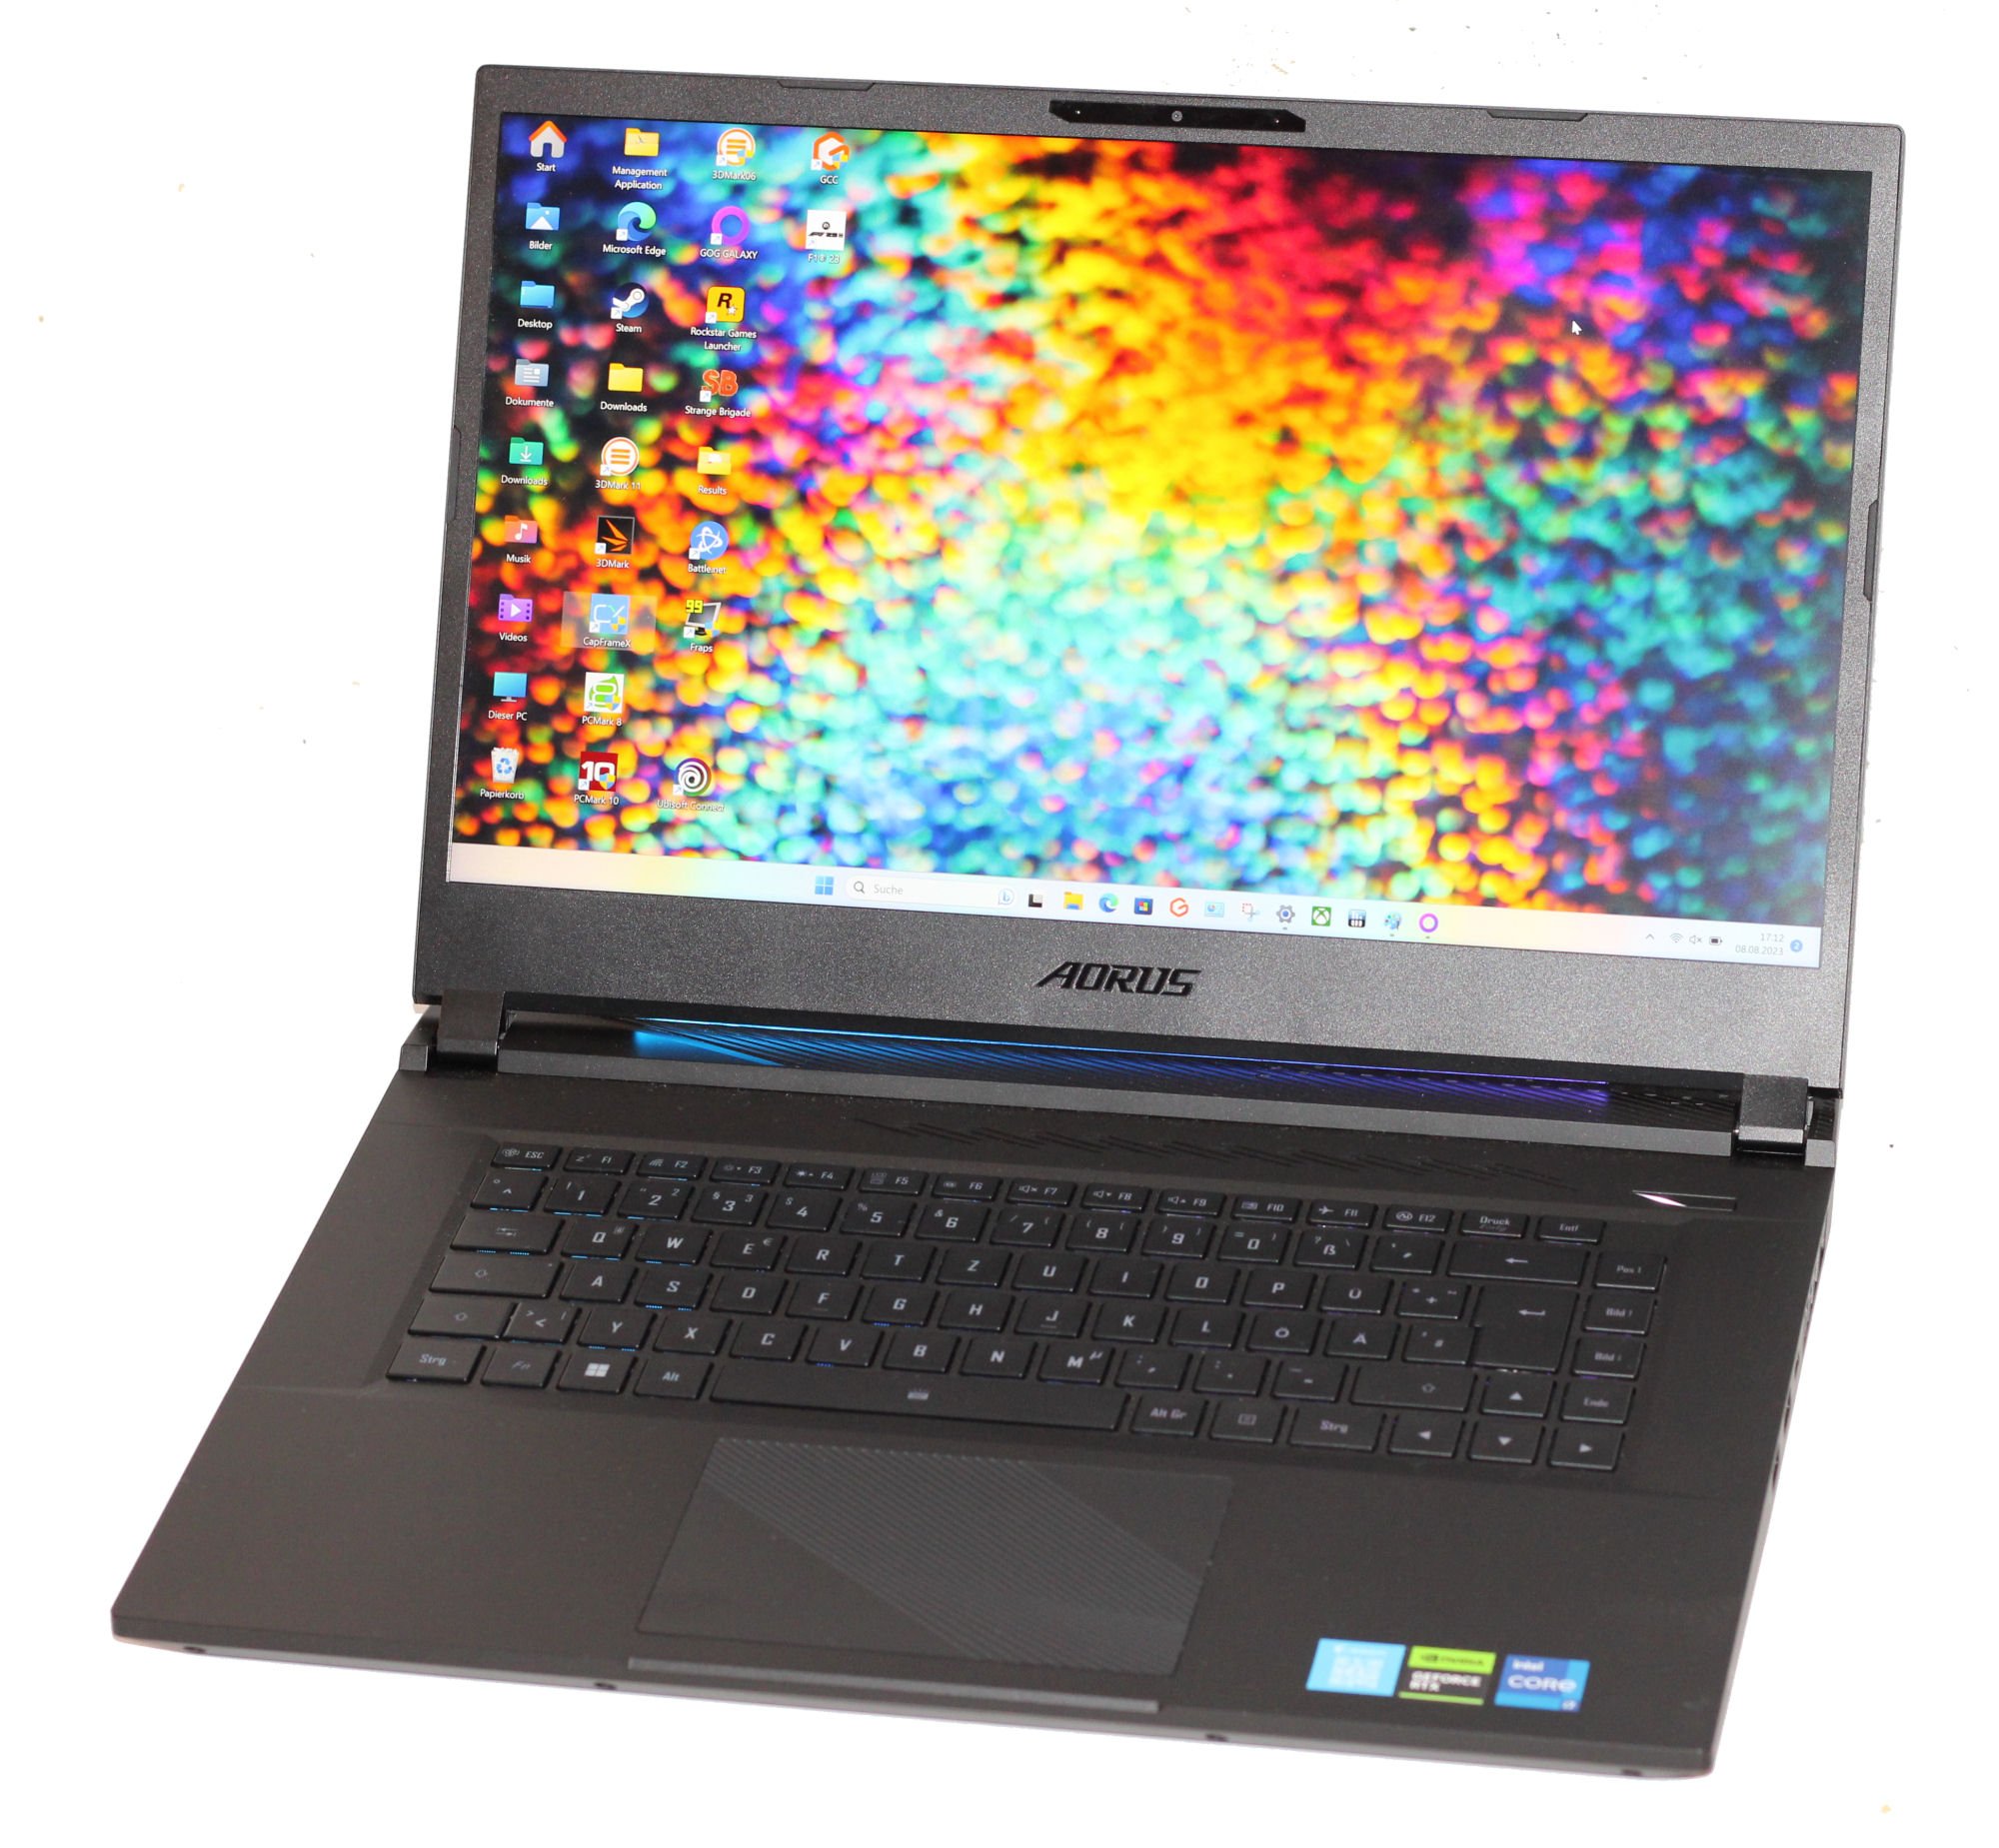
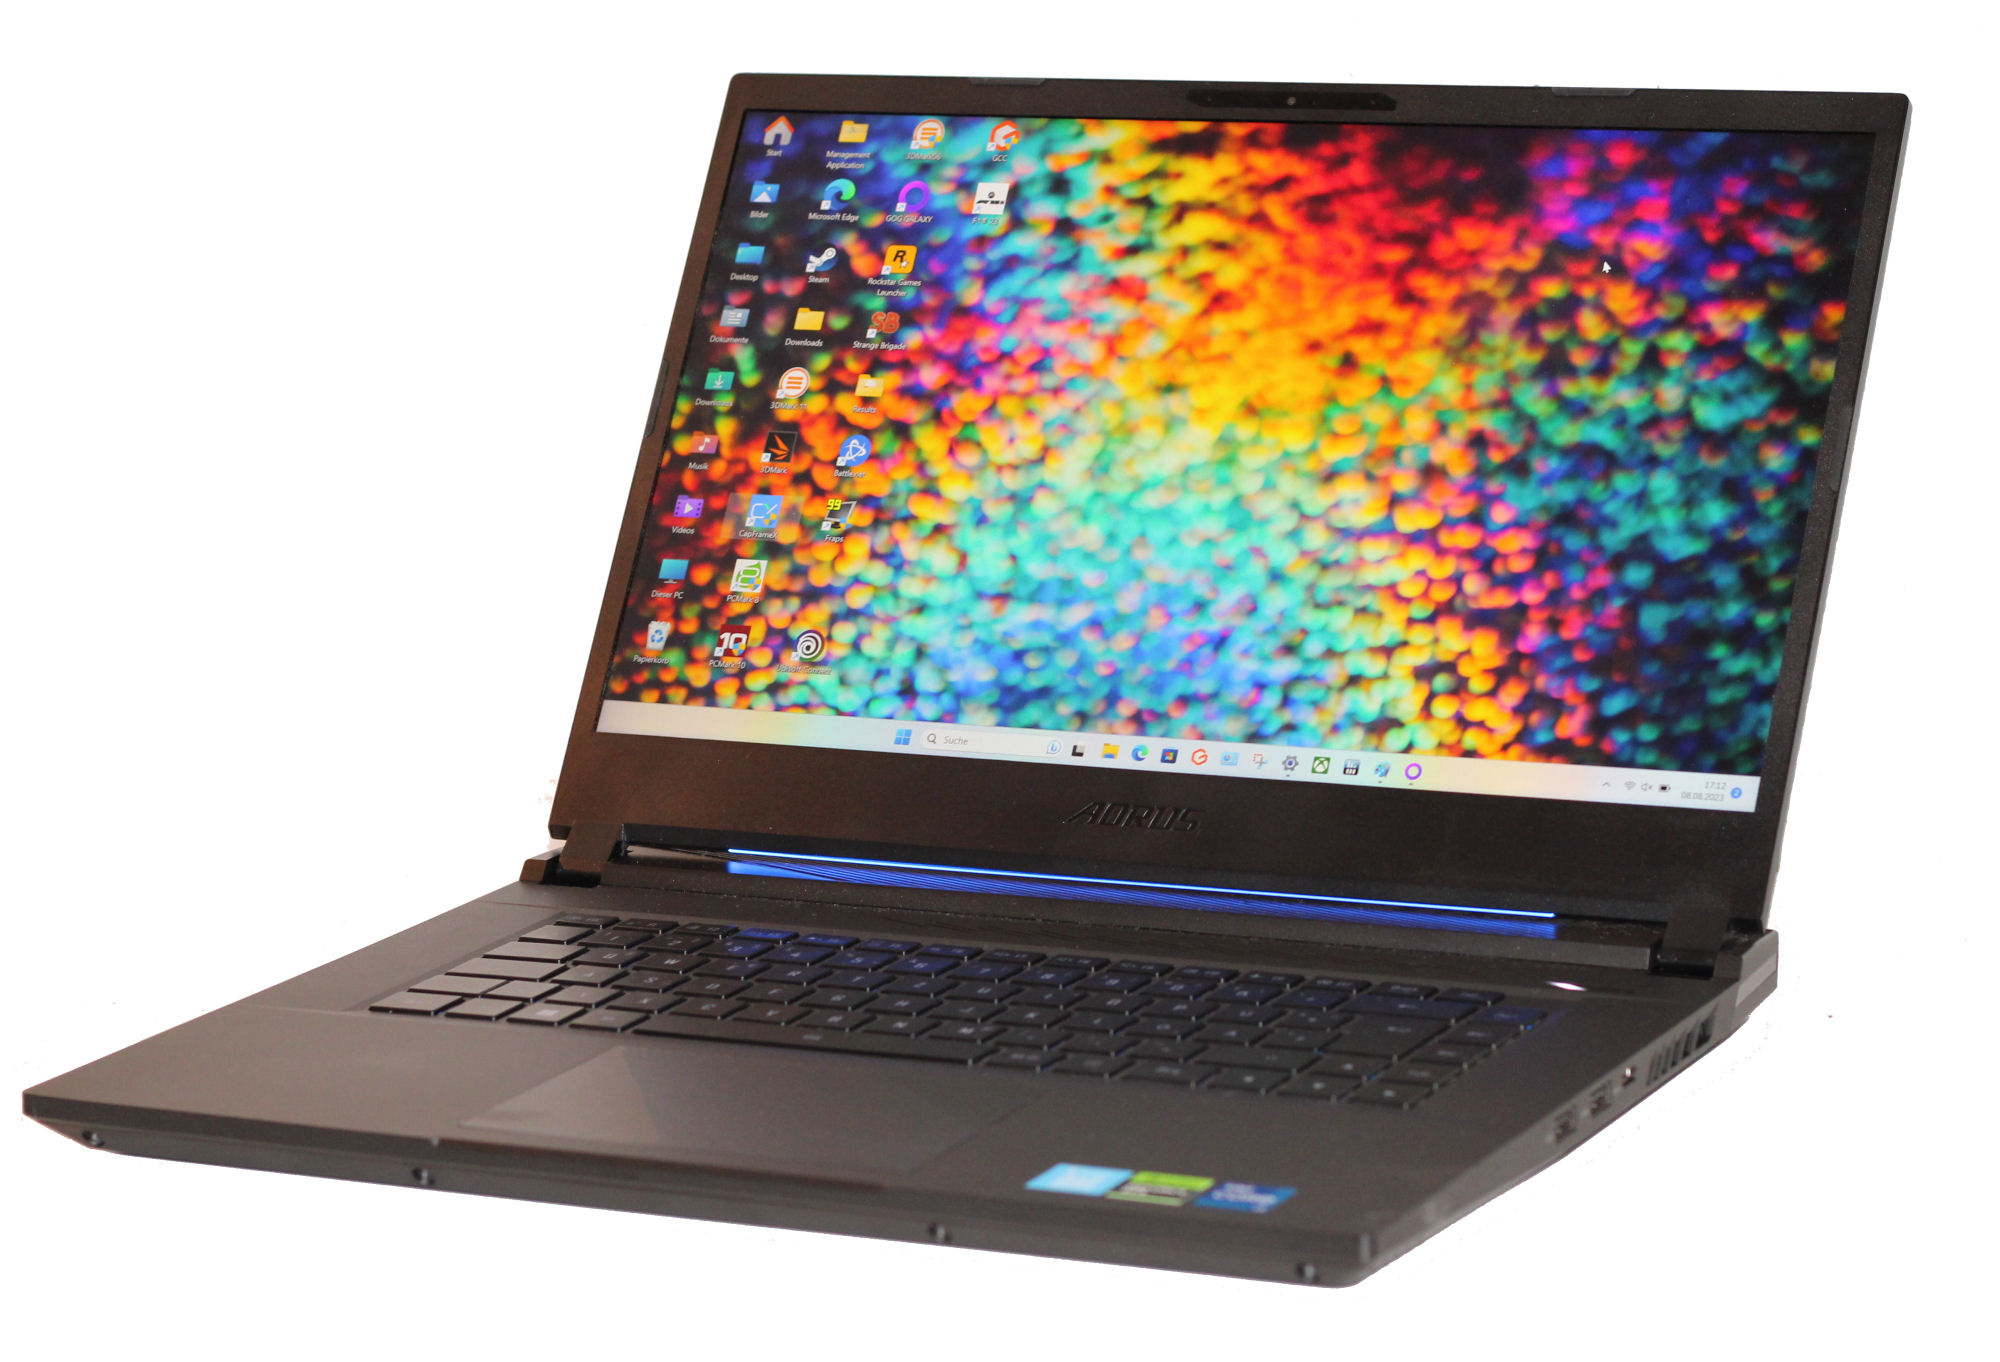
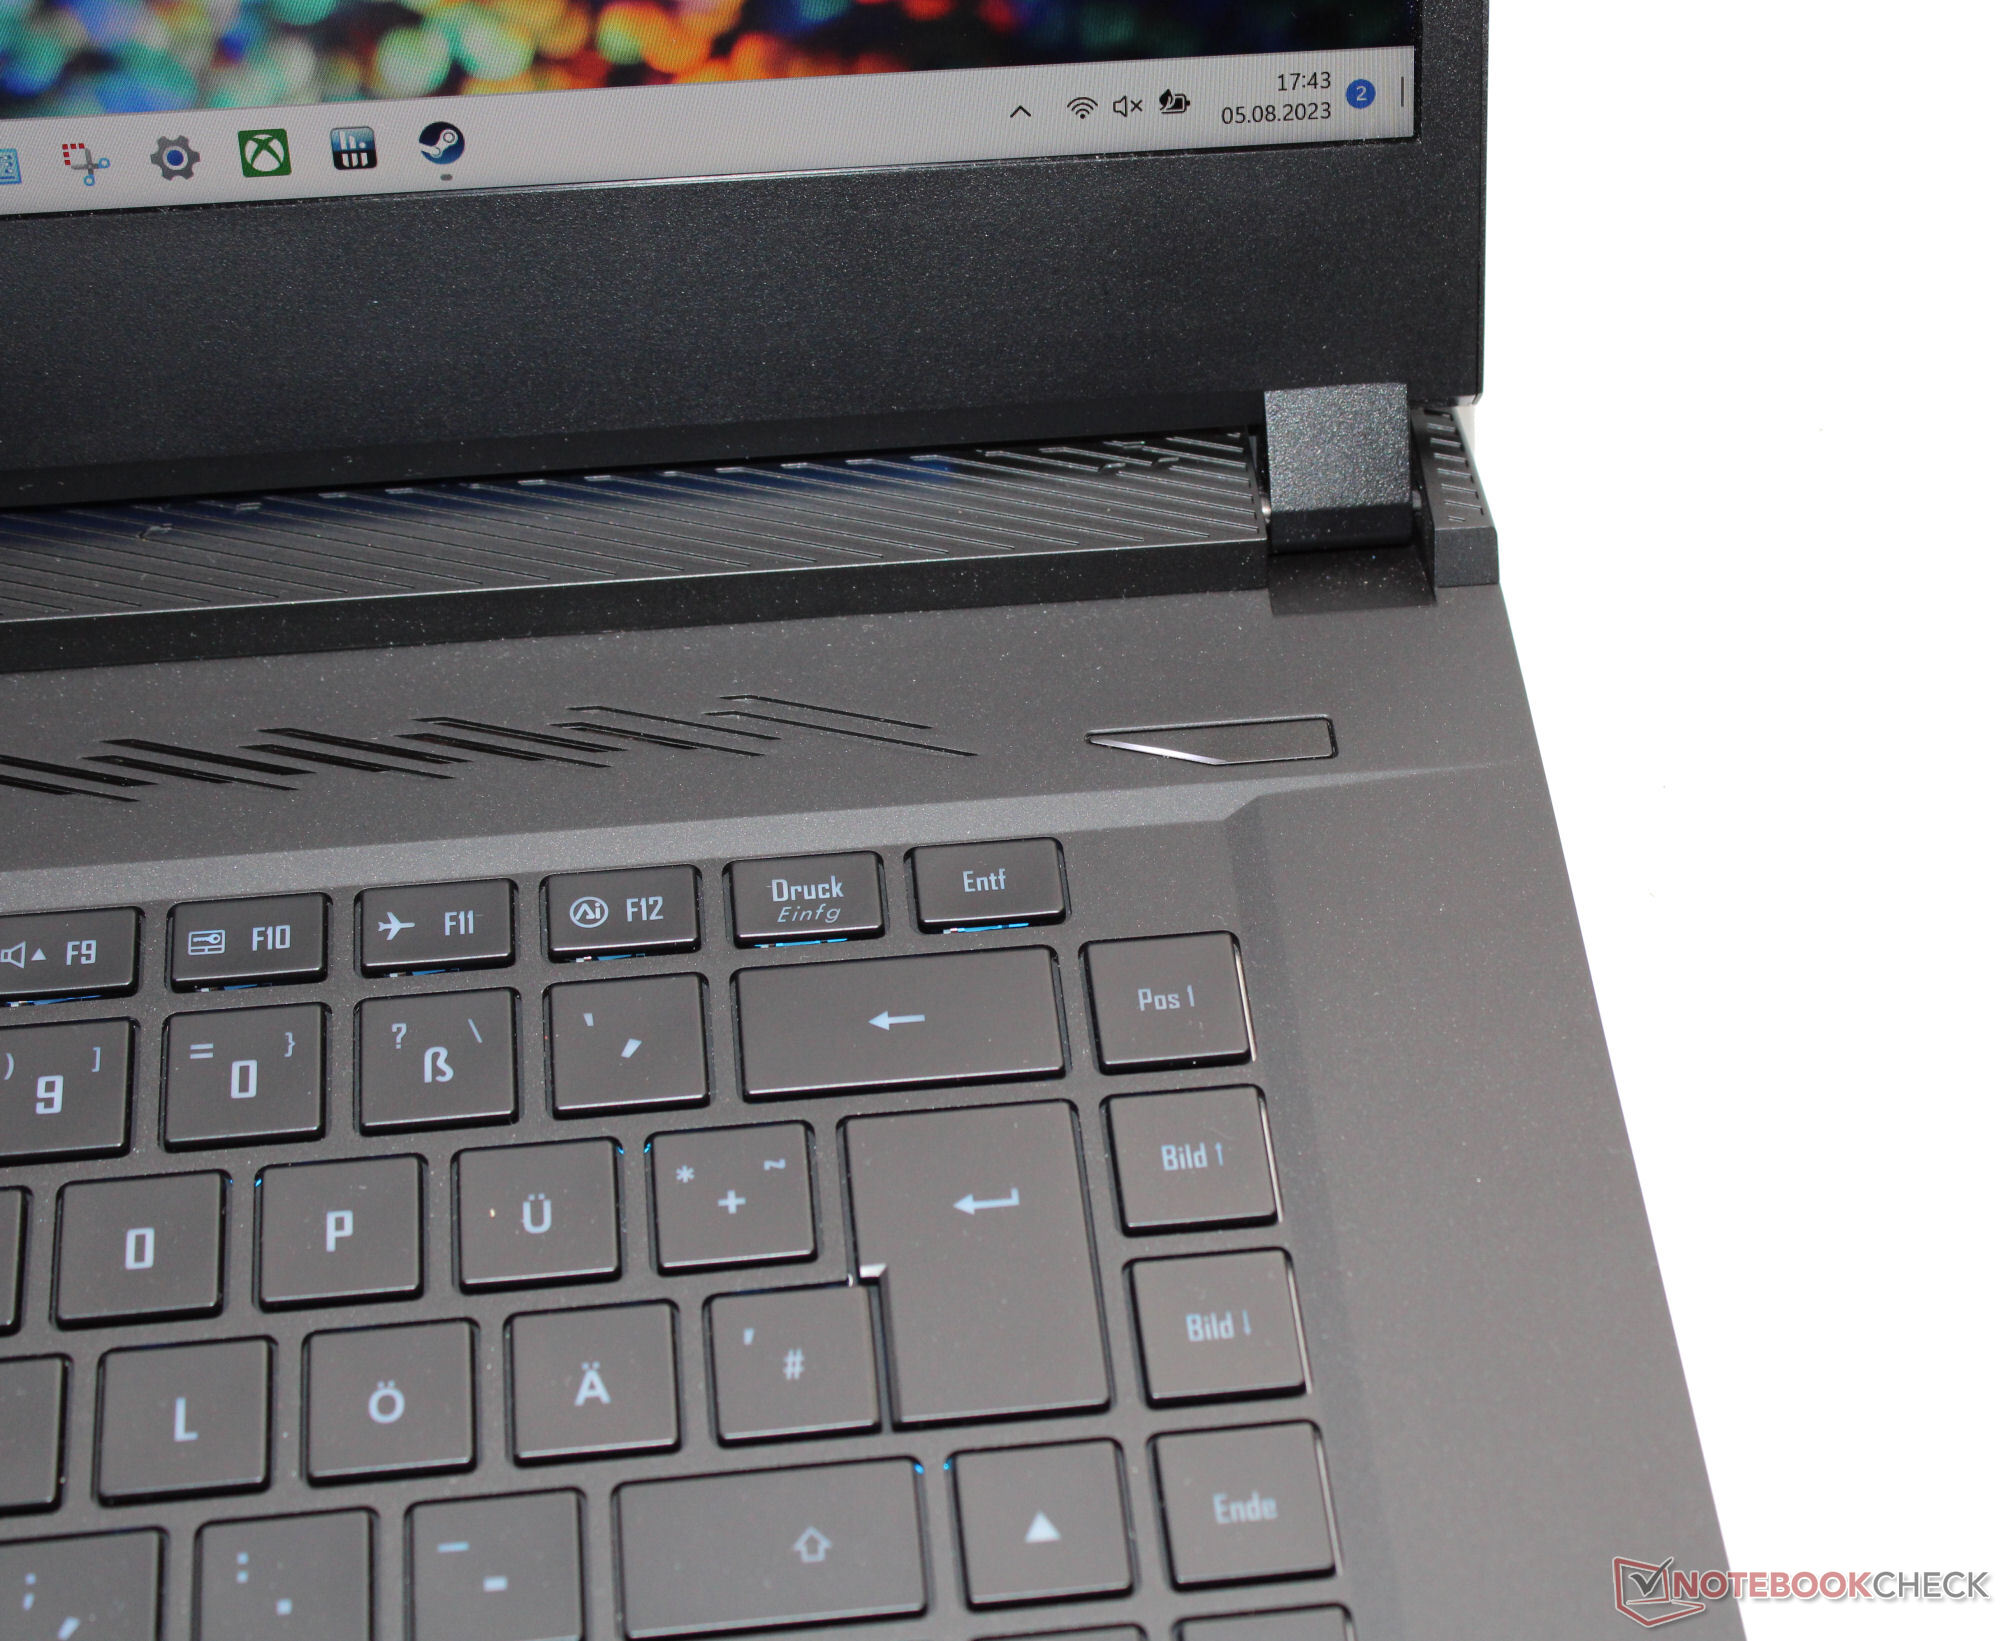
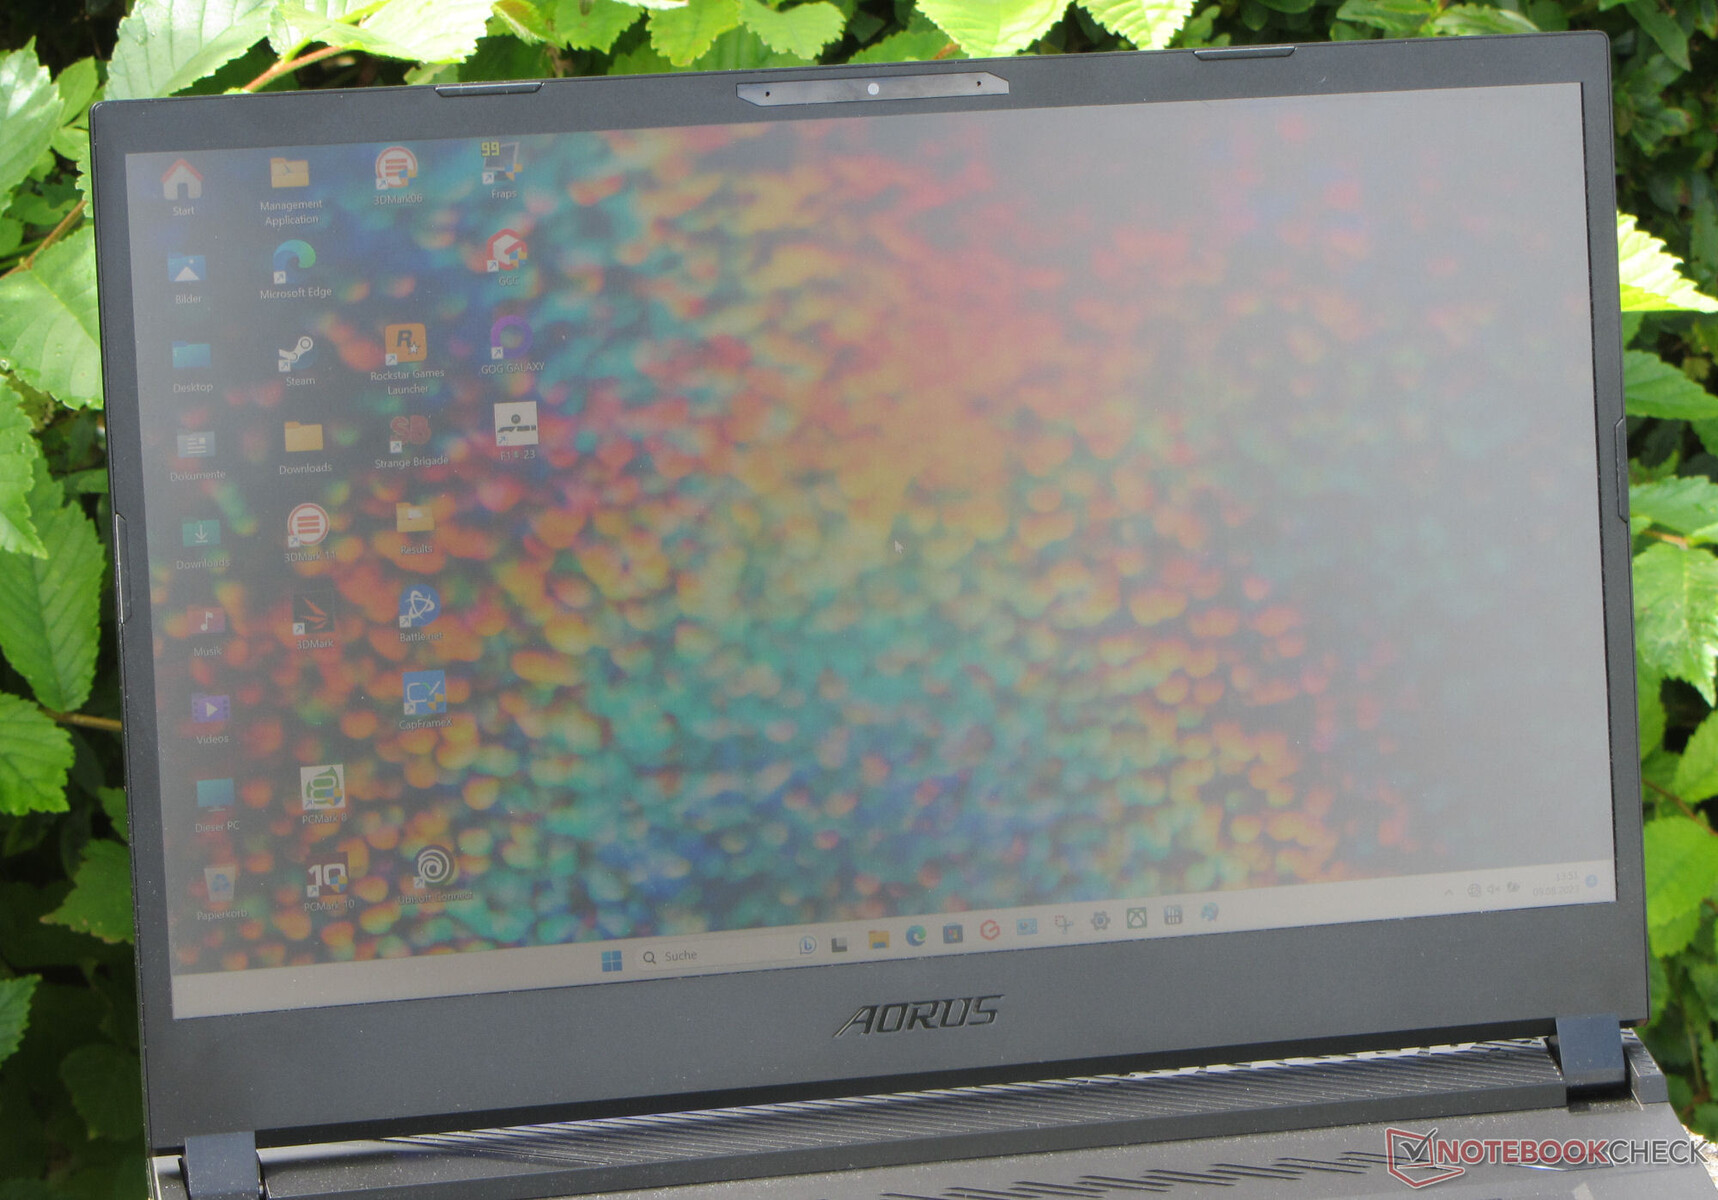
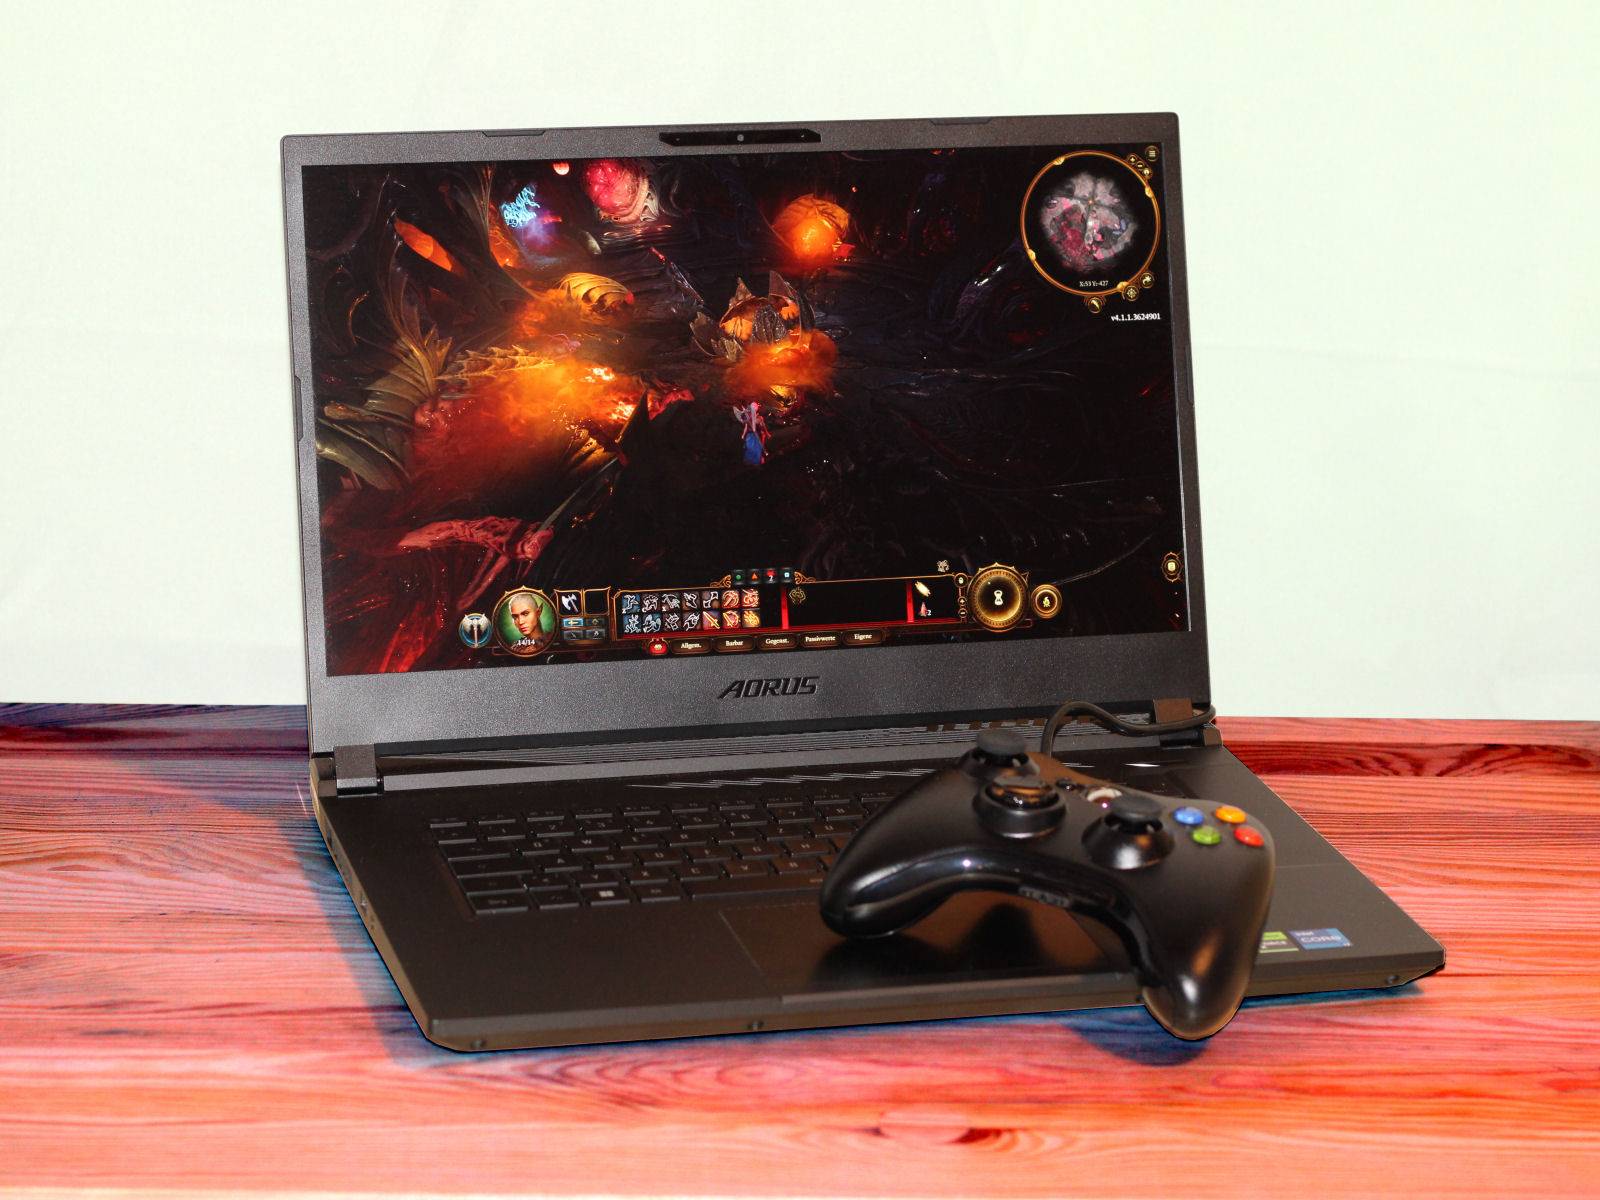
Gabinete - A Gigabyte alojou a tecnologia em um gabinete de metal
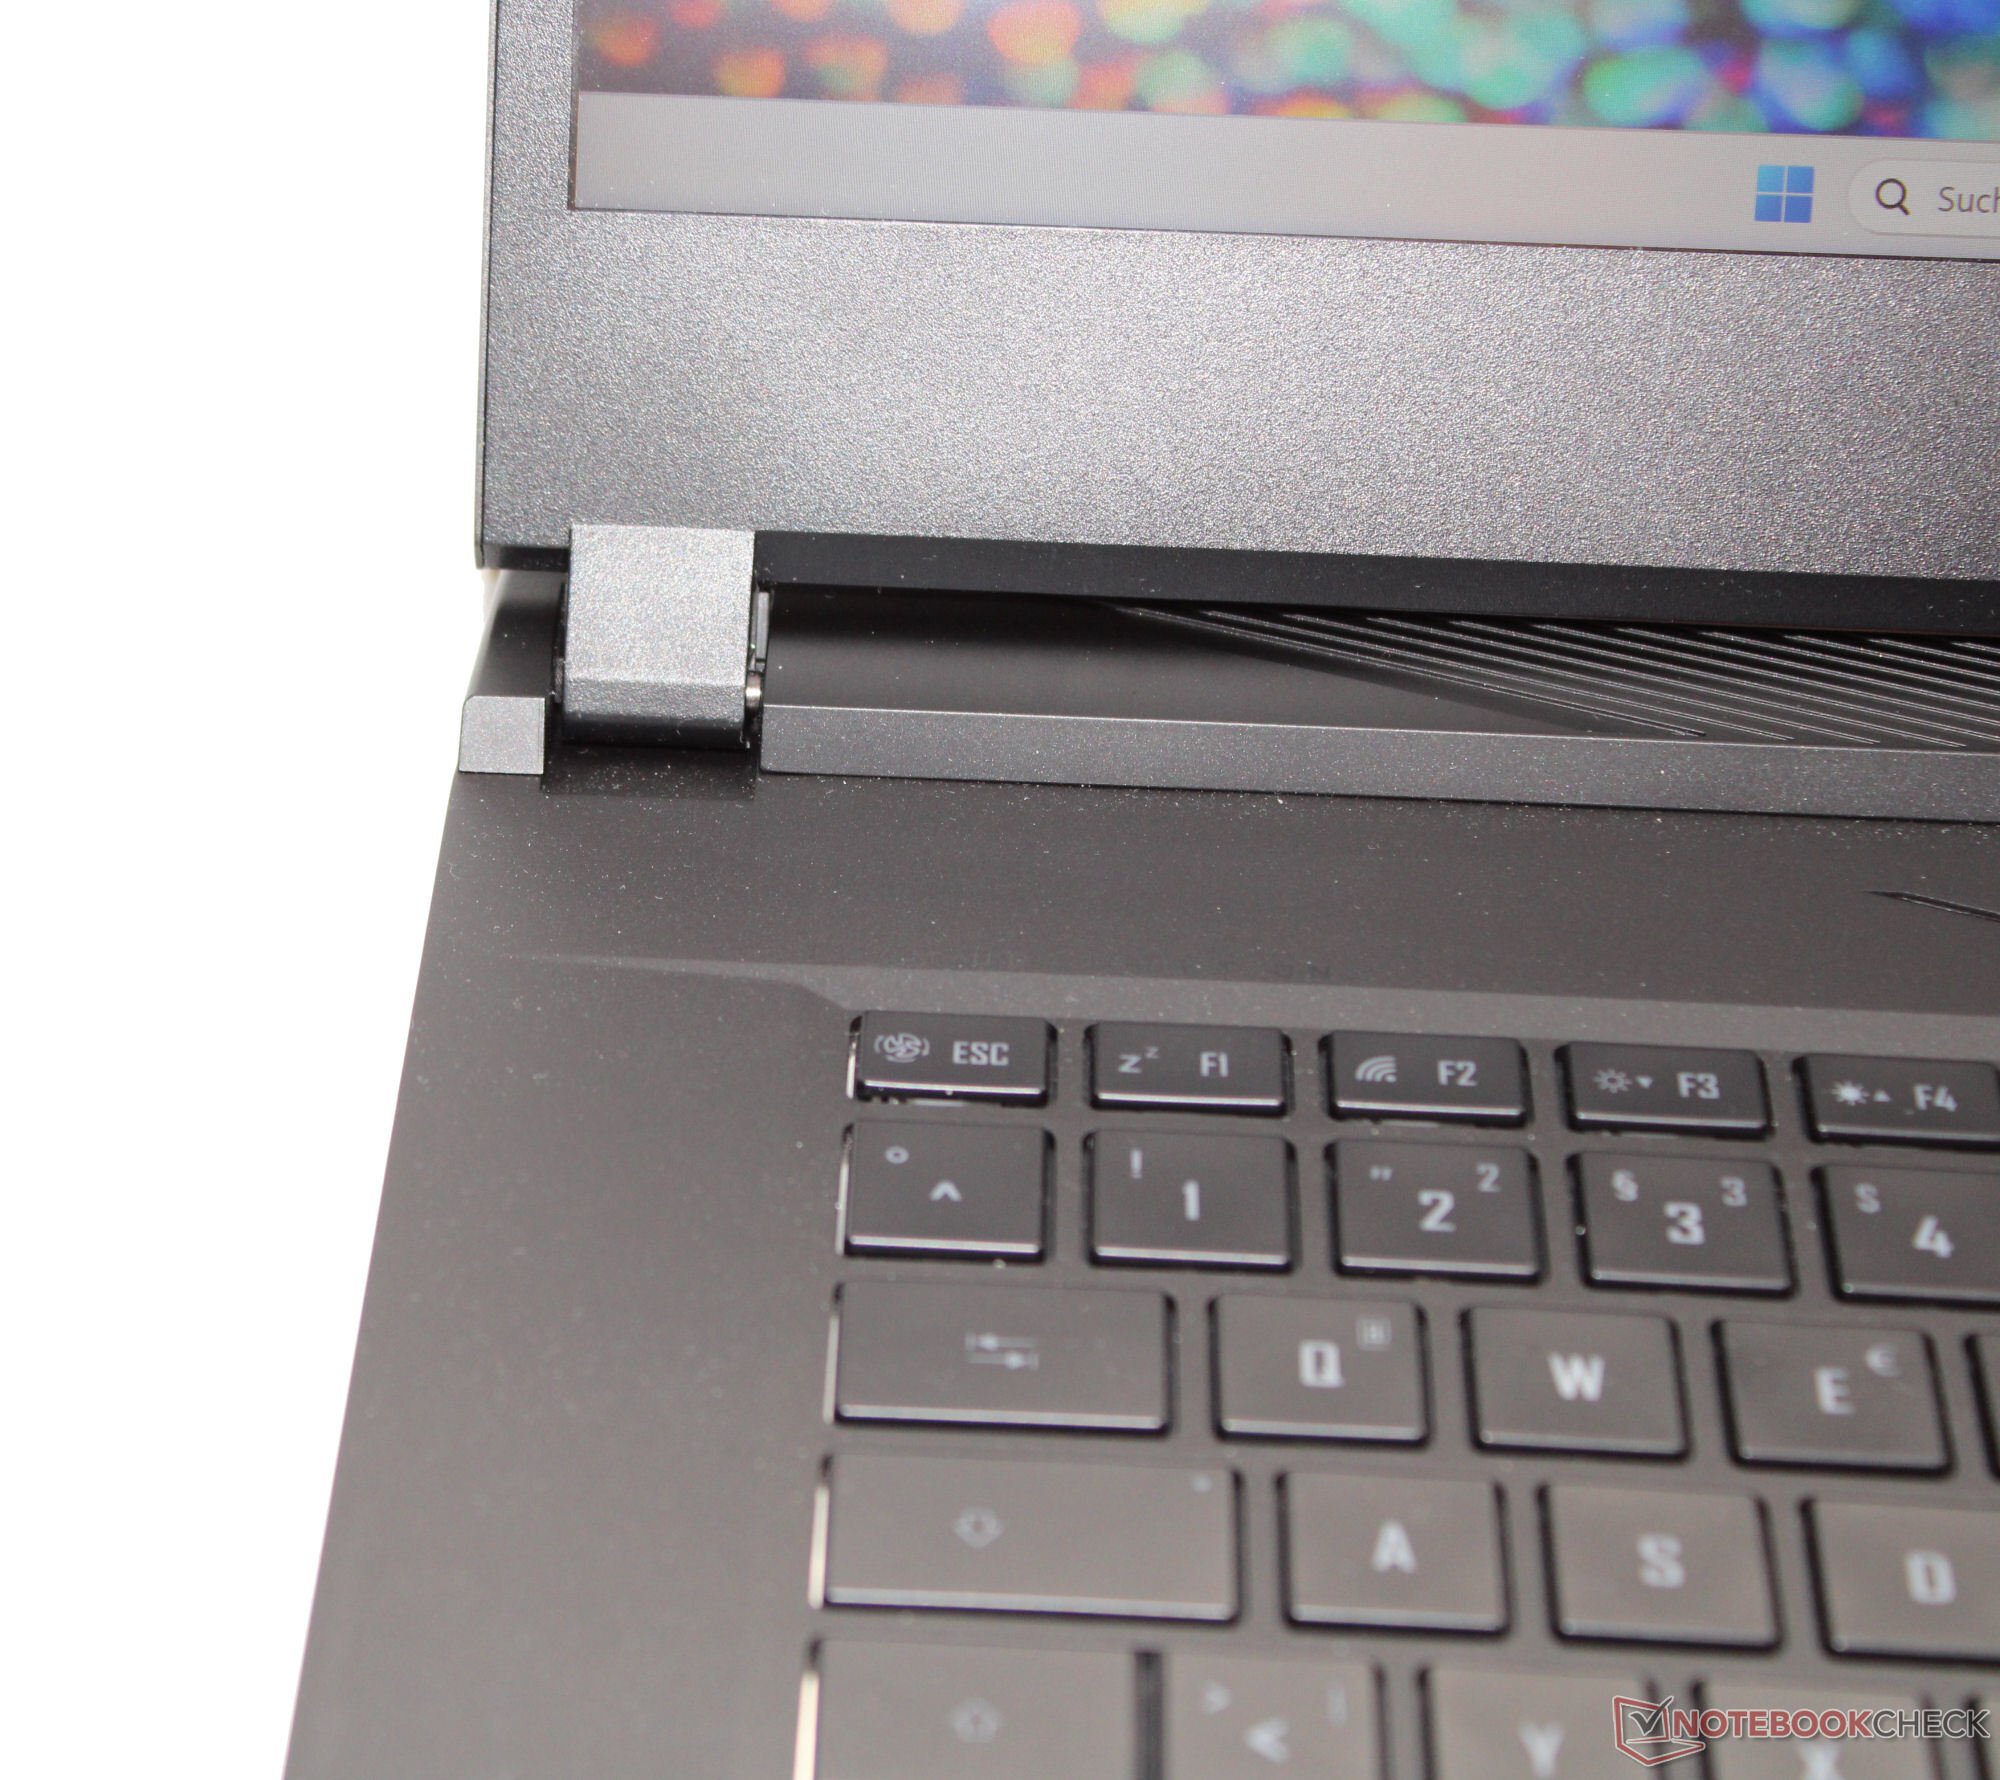
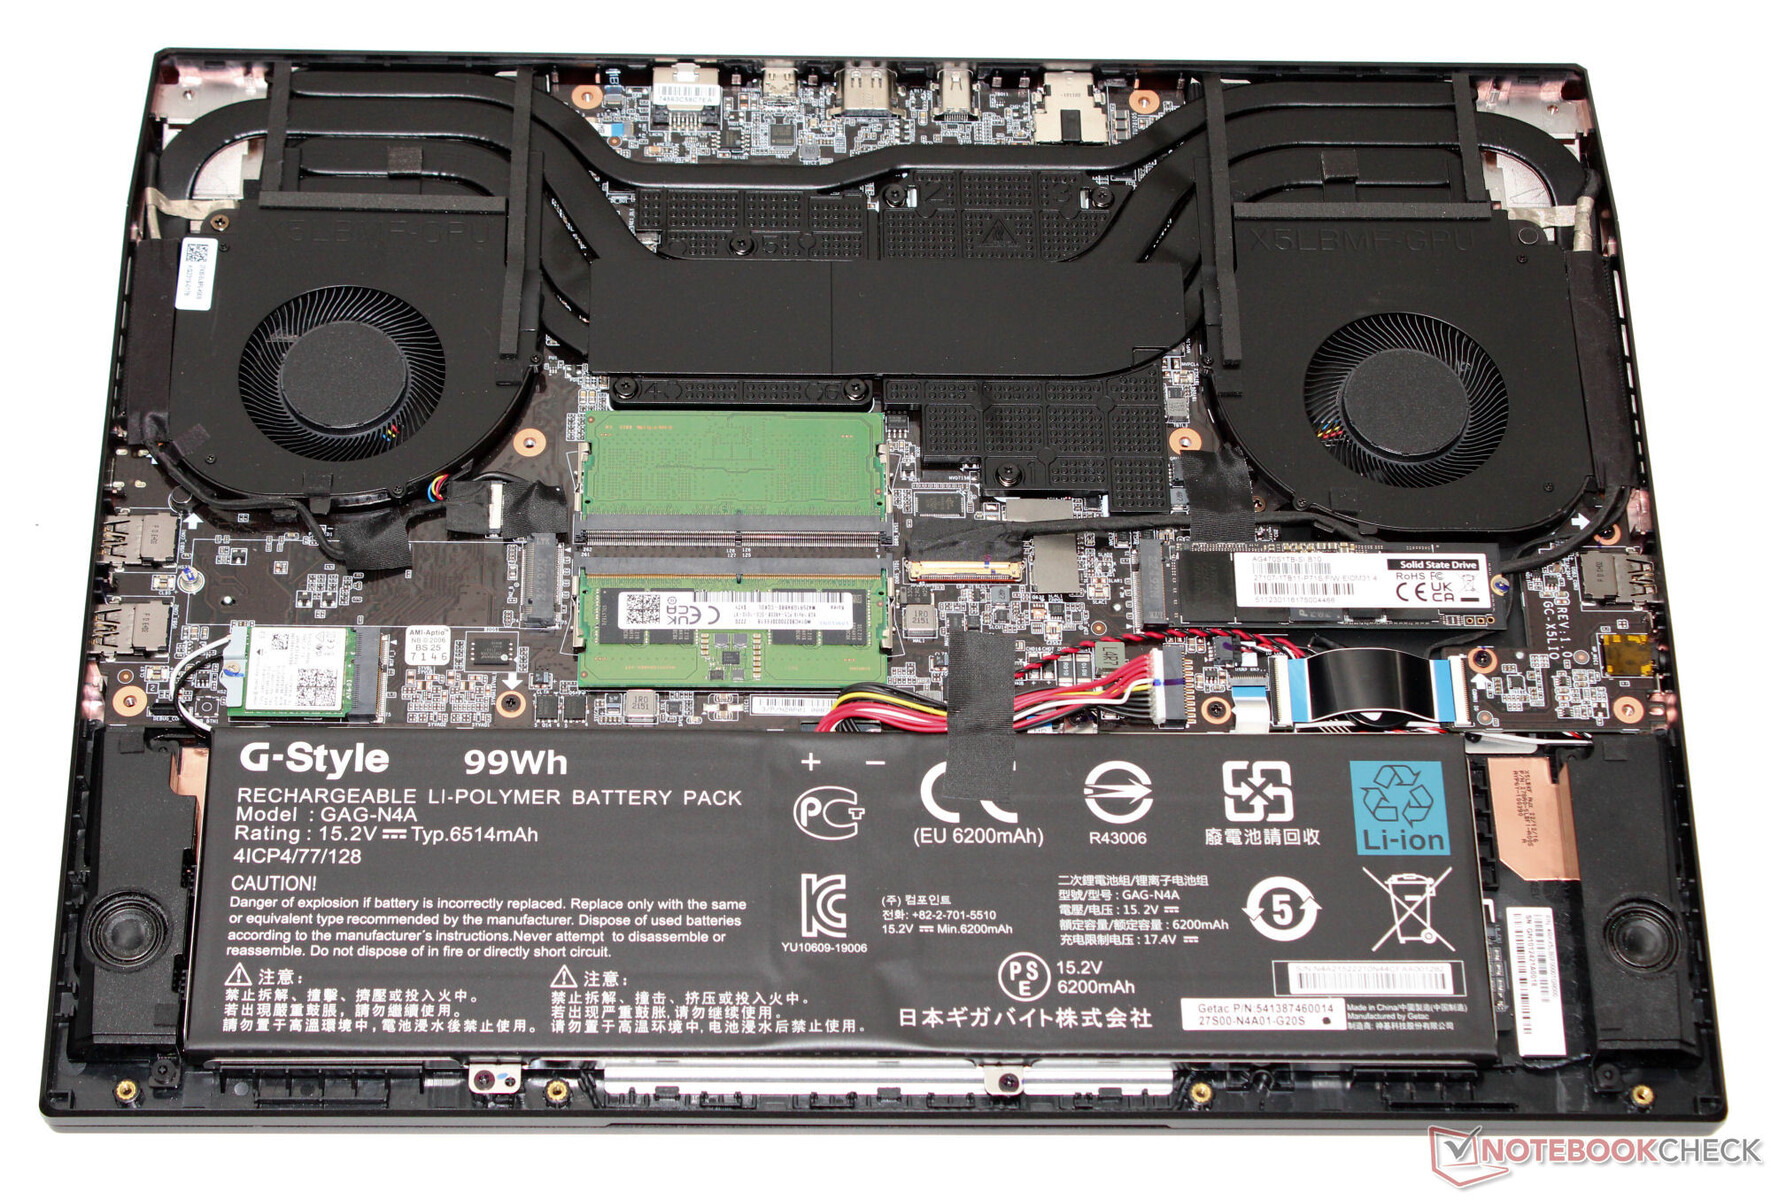
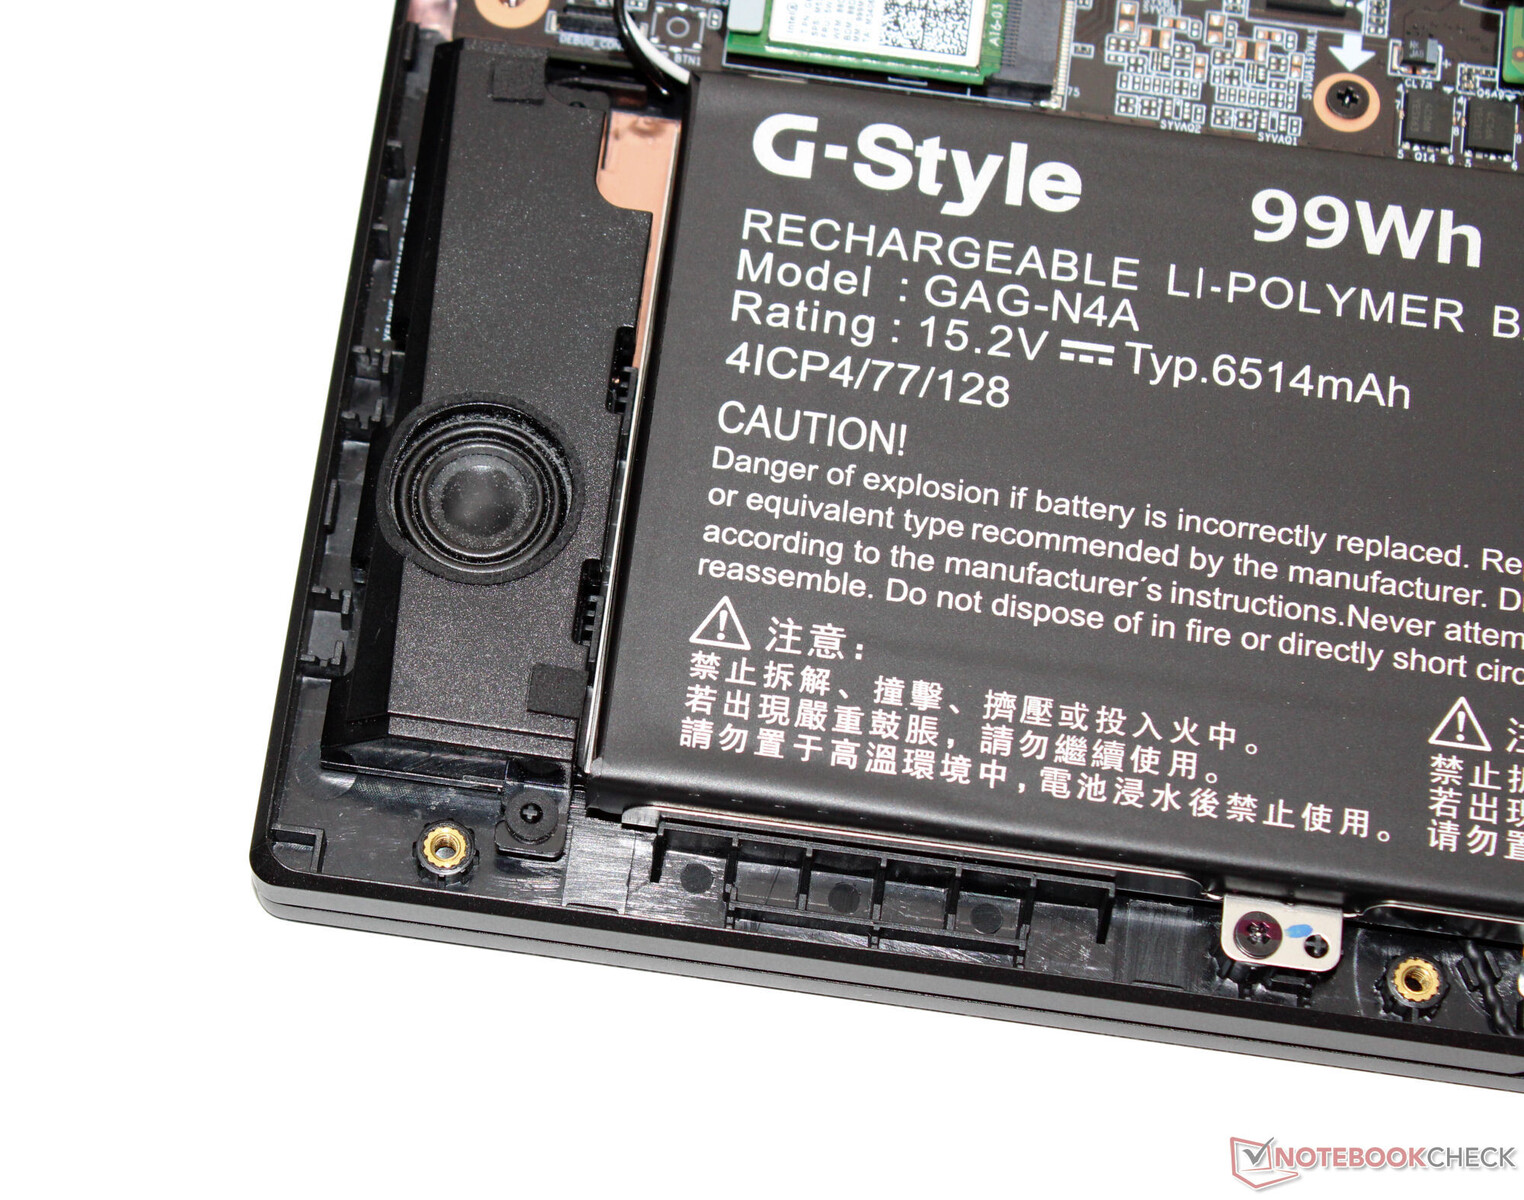
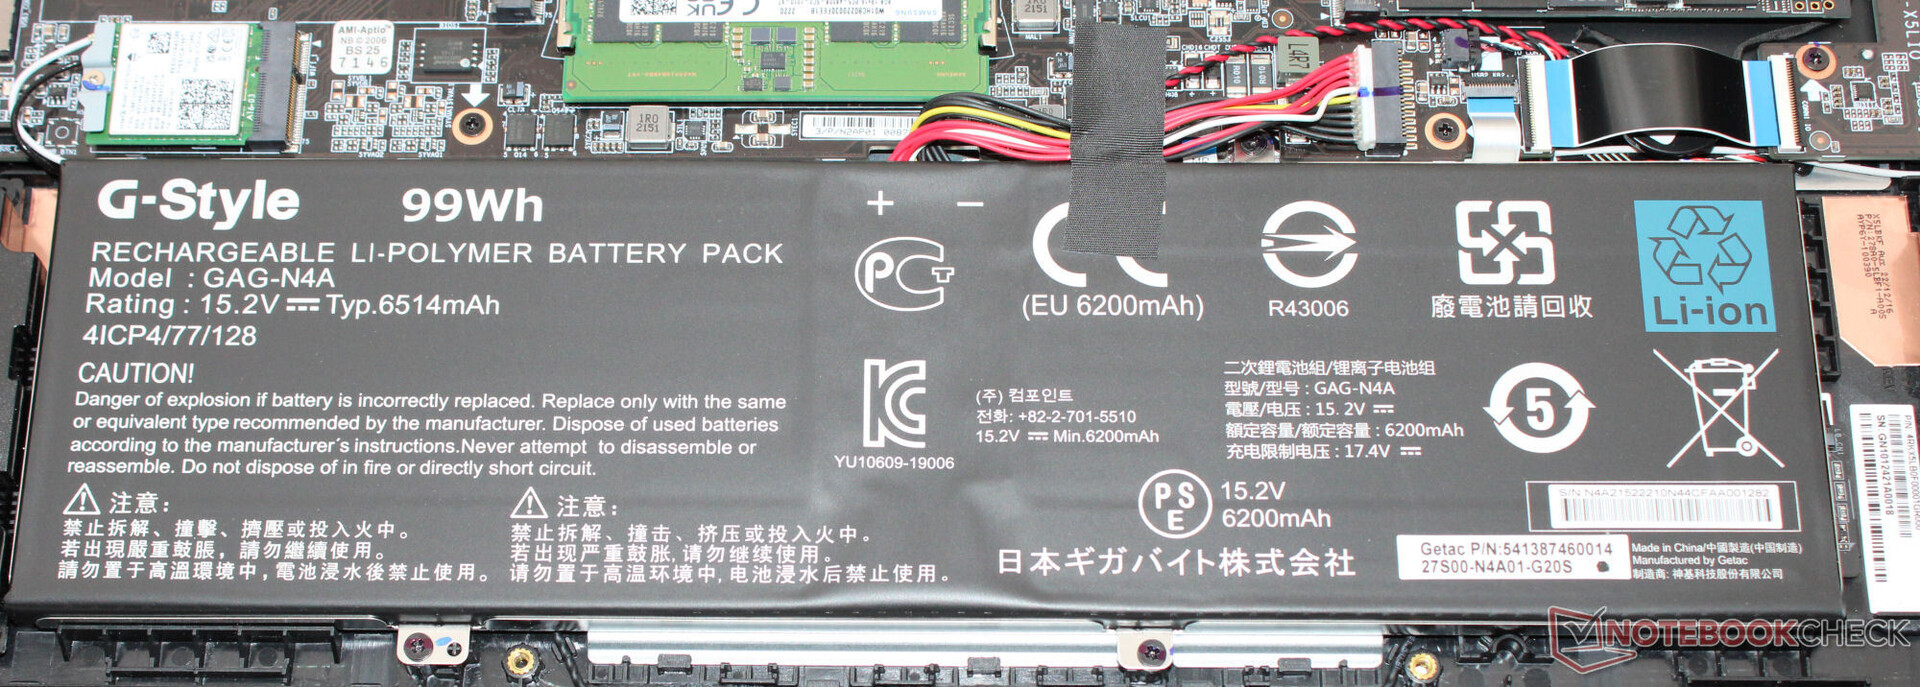
A Gigabyte optou por um gabinete de metal preto com superfícies lisas e foscas. O laptop não apresenta nenhum recurso de design extrovertido. Uma faixa de LED fixada na parte frontal inferior da tampa (quando o laptop está aberto) dá um pouco de cor ao dispositivo, juntamente com o teclado iluminado. A bateria (aparafusada, não colada) e o restante das entranhas do laptop podem ser acessados após a remoção da parte inferior do gabinete.
O laptop não parece ter nenhuma falha de design ou construção. Todos os espaços estão alinhados e não há excesso de material visível. A unidade de base pode ser levemente torcida, e a tampa mais ainda. Apesar disso: Pressionar a parte de trás não resulta em nenhuma mudança na imagem. As dobradiças mantêm a tampa firmemente na posição e seu ângulo máximo de abertura é de cerca de 130 graus. É possível abrir o dispositivo com uma mão.
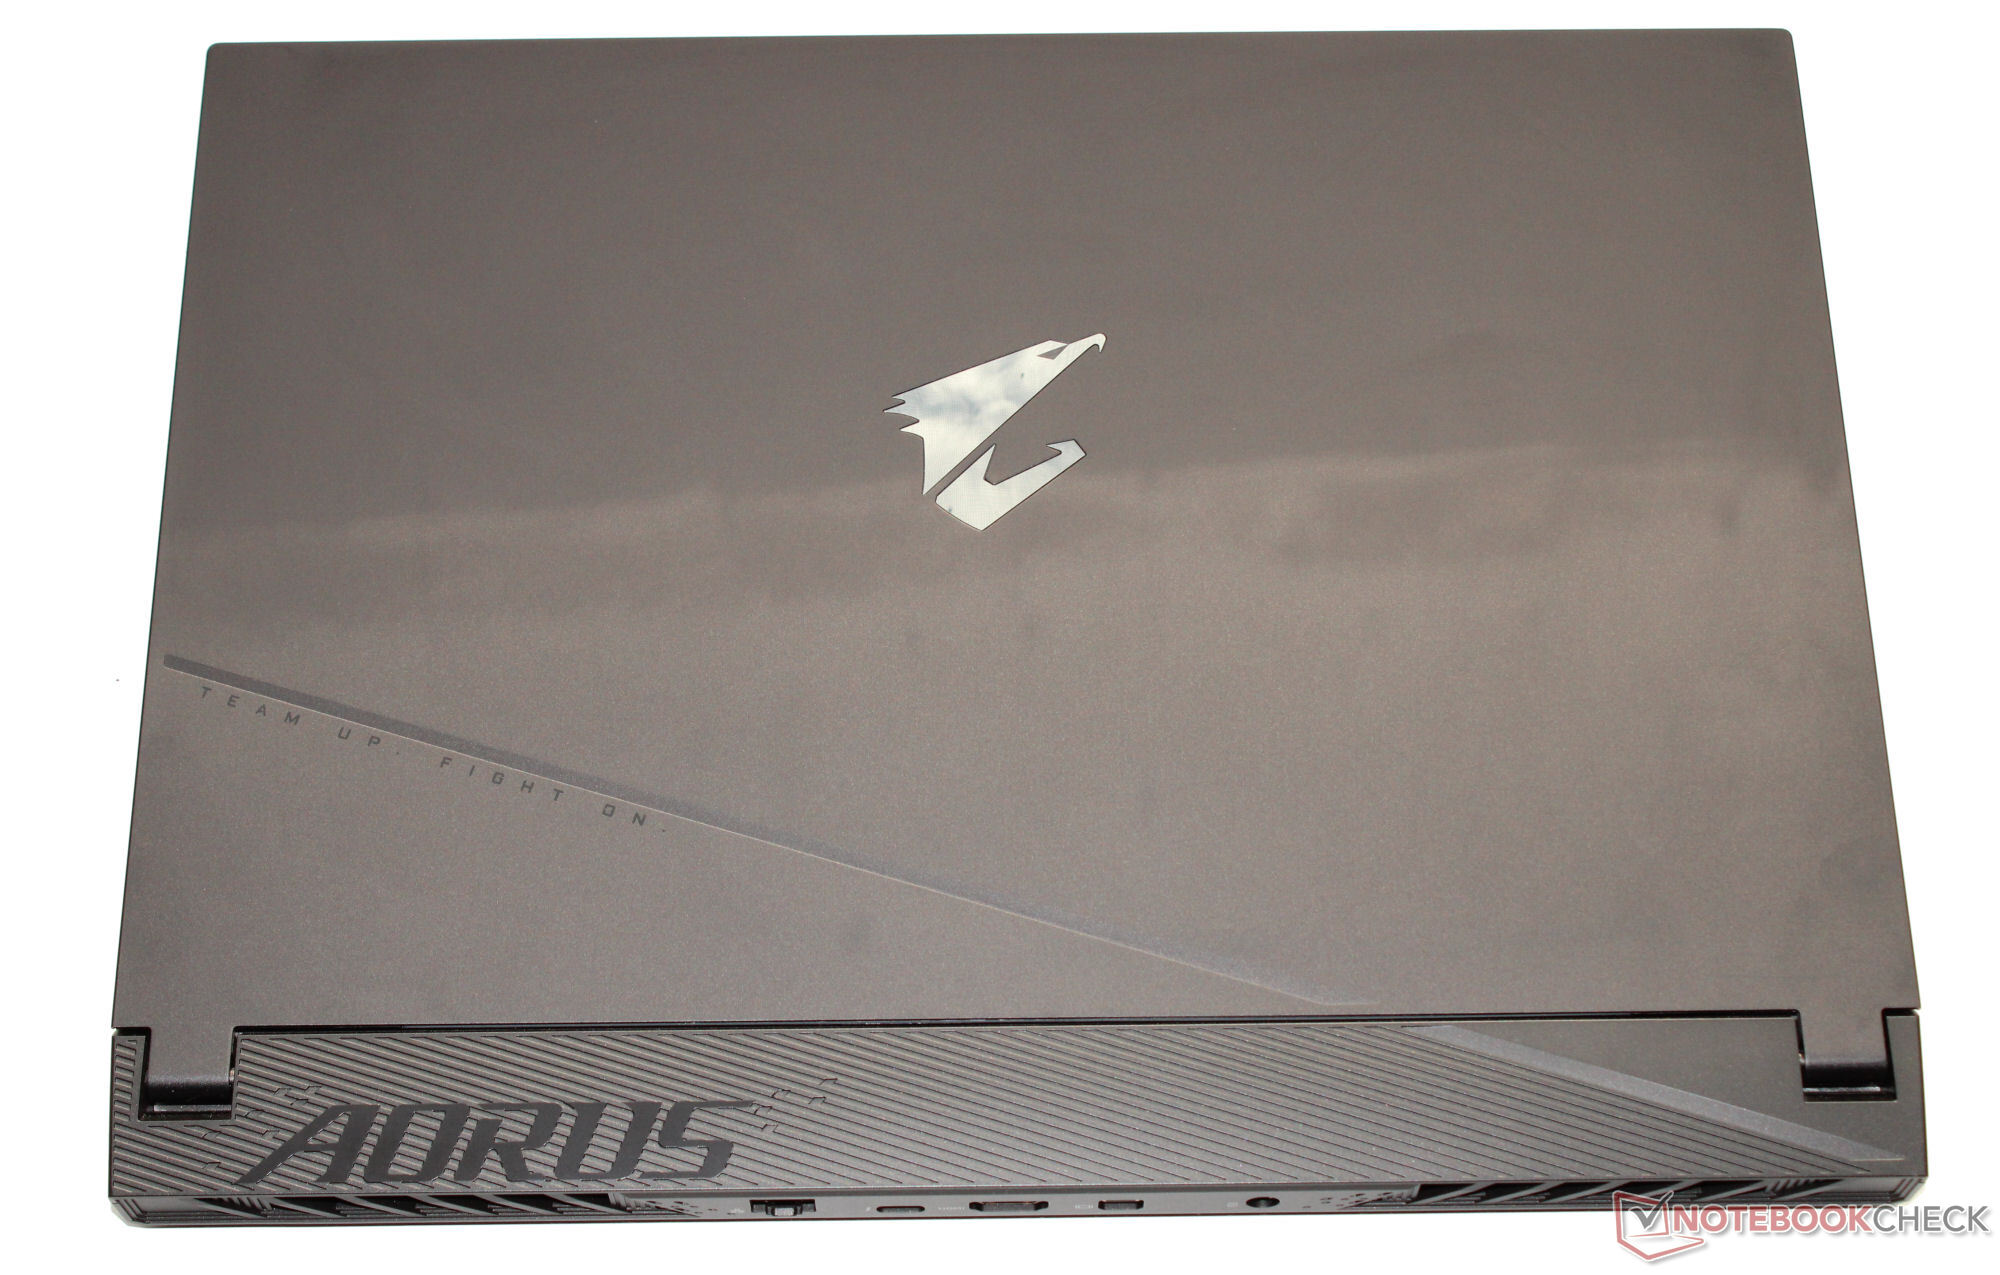
No campo de comparação, o Aorus 15 é um dos maiores laptops em termos de espaço ocupado. Seu peso é aproximadamente médio.
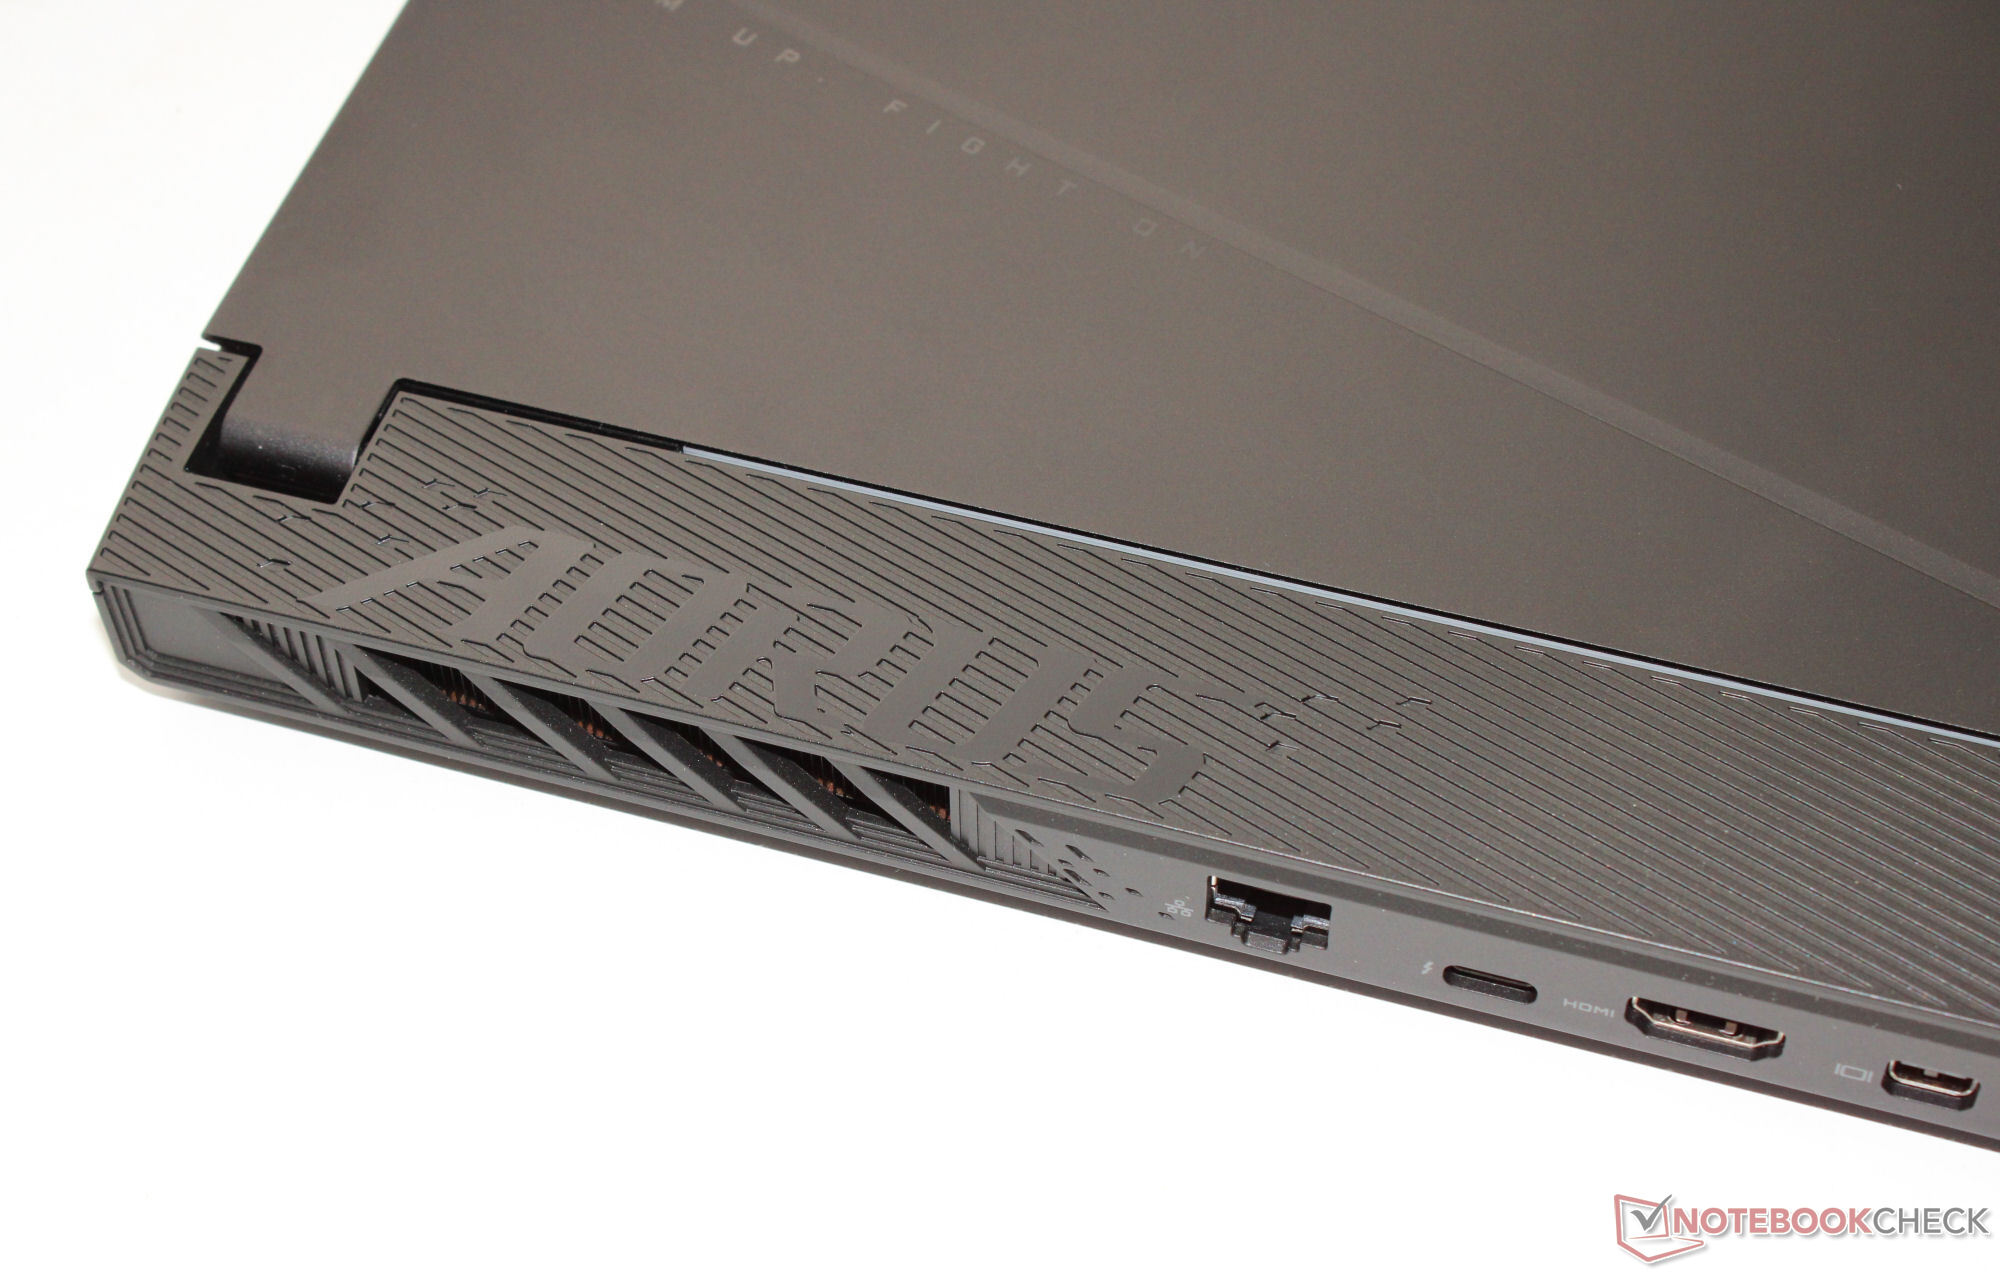
Conectividade - Thunderbolt 4 incluído
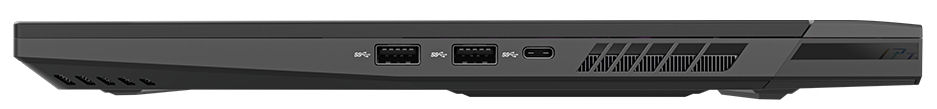
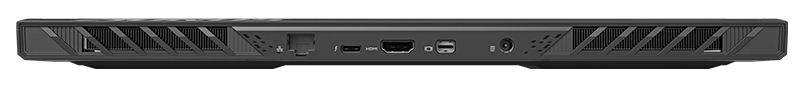
O Aorus possui três portas USB-A (2x USB 3.2 Gen 2, 1x USB 3.2 Gen 1) e duas conexões USB-C (1x Thunderbolt 4, 1x USB 3.2 Gen 2). A porta TB4 suporta Power Delivery, mas não pode emitir um sinal DisplayPort. Isso significa que ele tem um total de duas saídas de vídeo, ou seja, uma porta HDMI (2.1) e uma Mini DisplayPort dedicada (1.4). O laptop não tem um leitor de cartão SD.
As saídas de vídeo, a conexão de energia e a porta Gigabit Ethernet estão localizadas na parte traseira do dispositivo, o que significa que todos os cabos saem pela parte traseira e provavelmente não atrapalharão seu caminho.

Comunicação
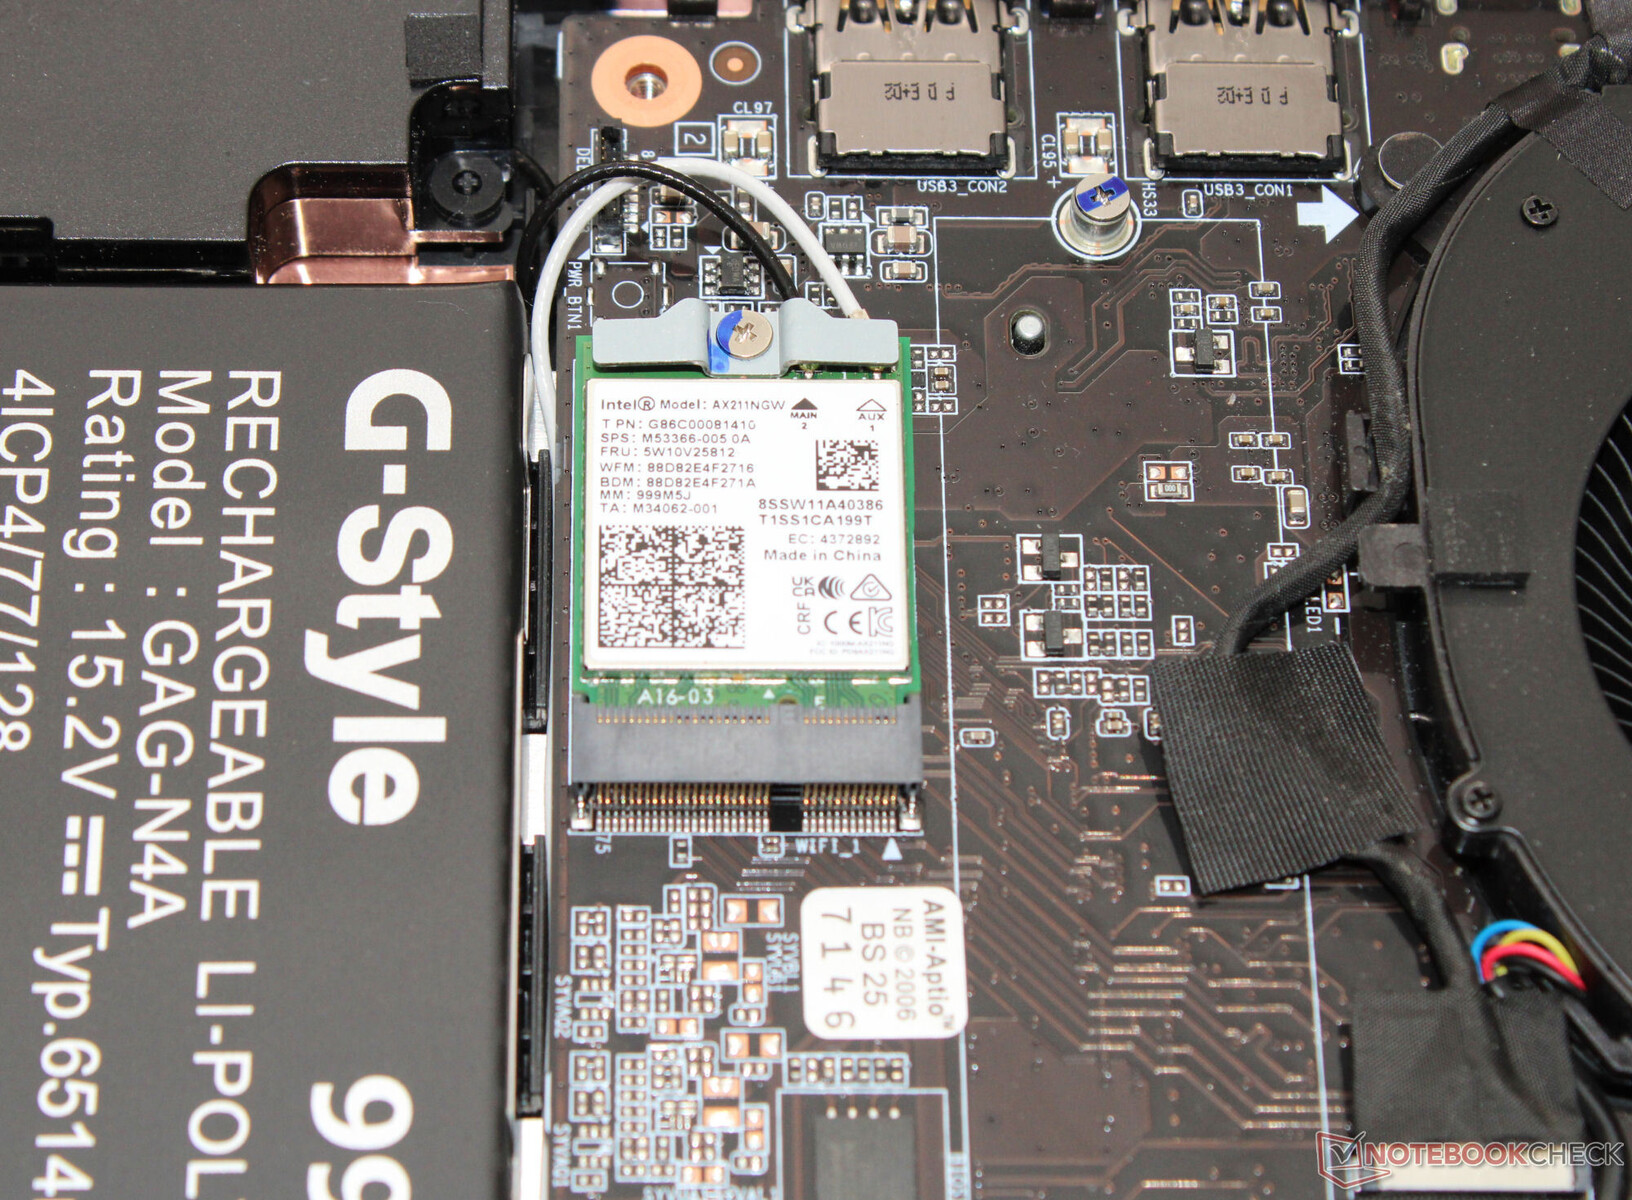
Em condições ideais (sem dispositivos WLAN nas proximidades, curta distância entre o laptop e o PC servidor), o laptop atinge excelentes taxas de dados WiFi. O dispositivo usa um chip WiFi 6E (Intel AX211). As conexões com fio são feitas por um controlador (RTL8125; 2,5 GBit) da Realtek.
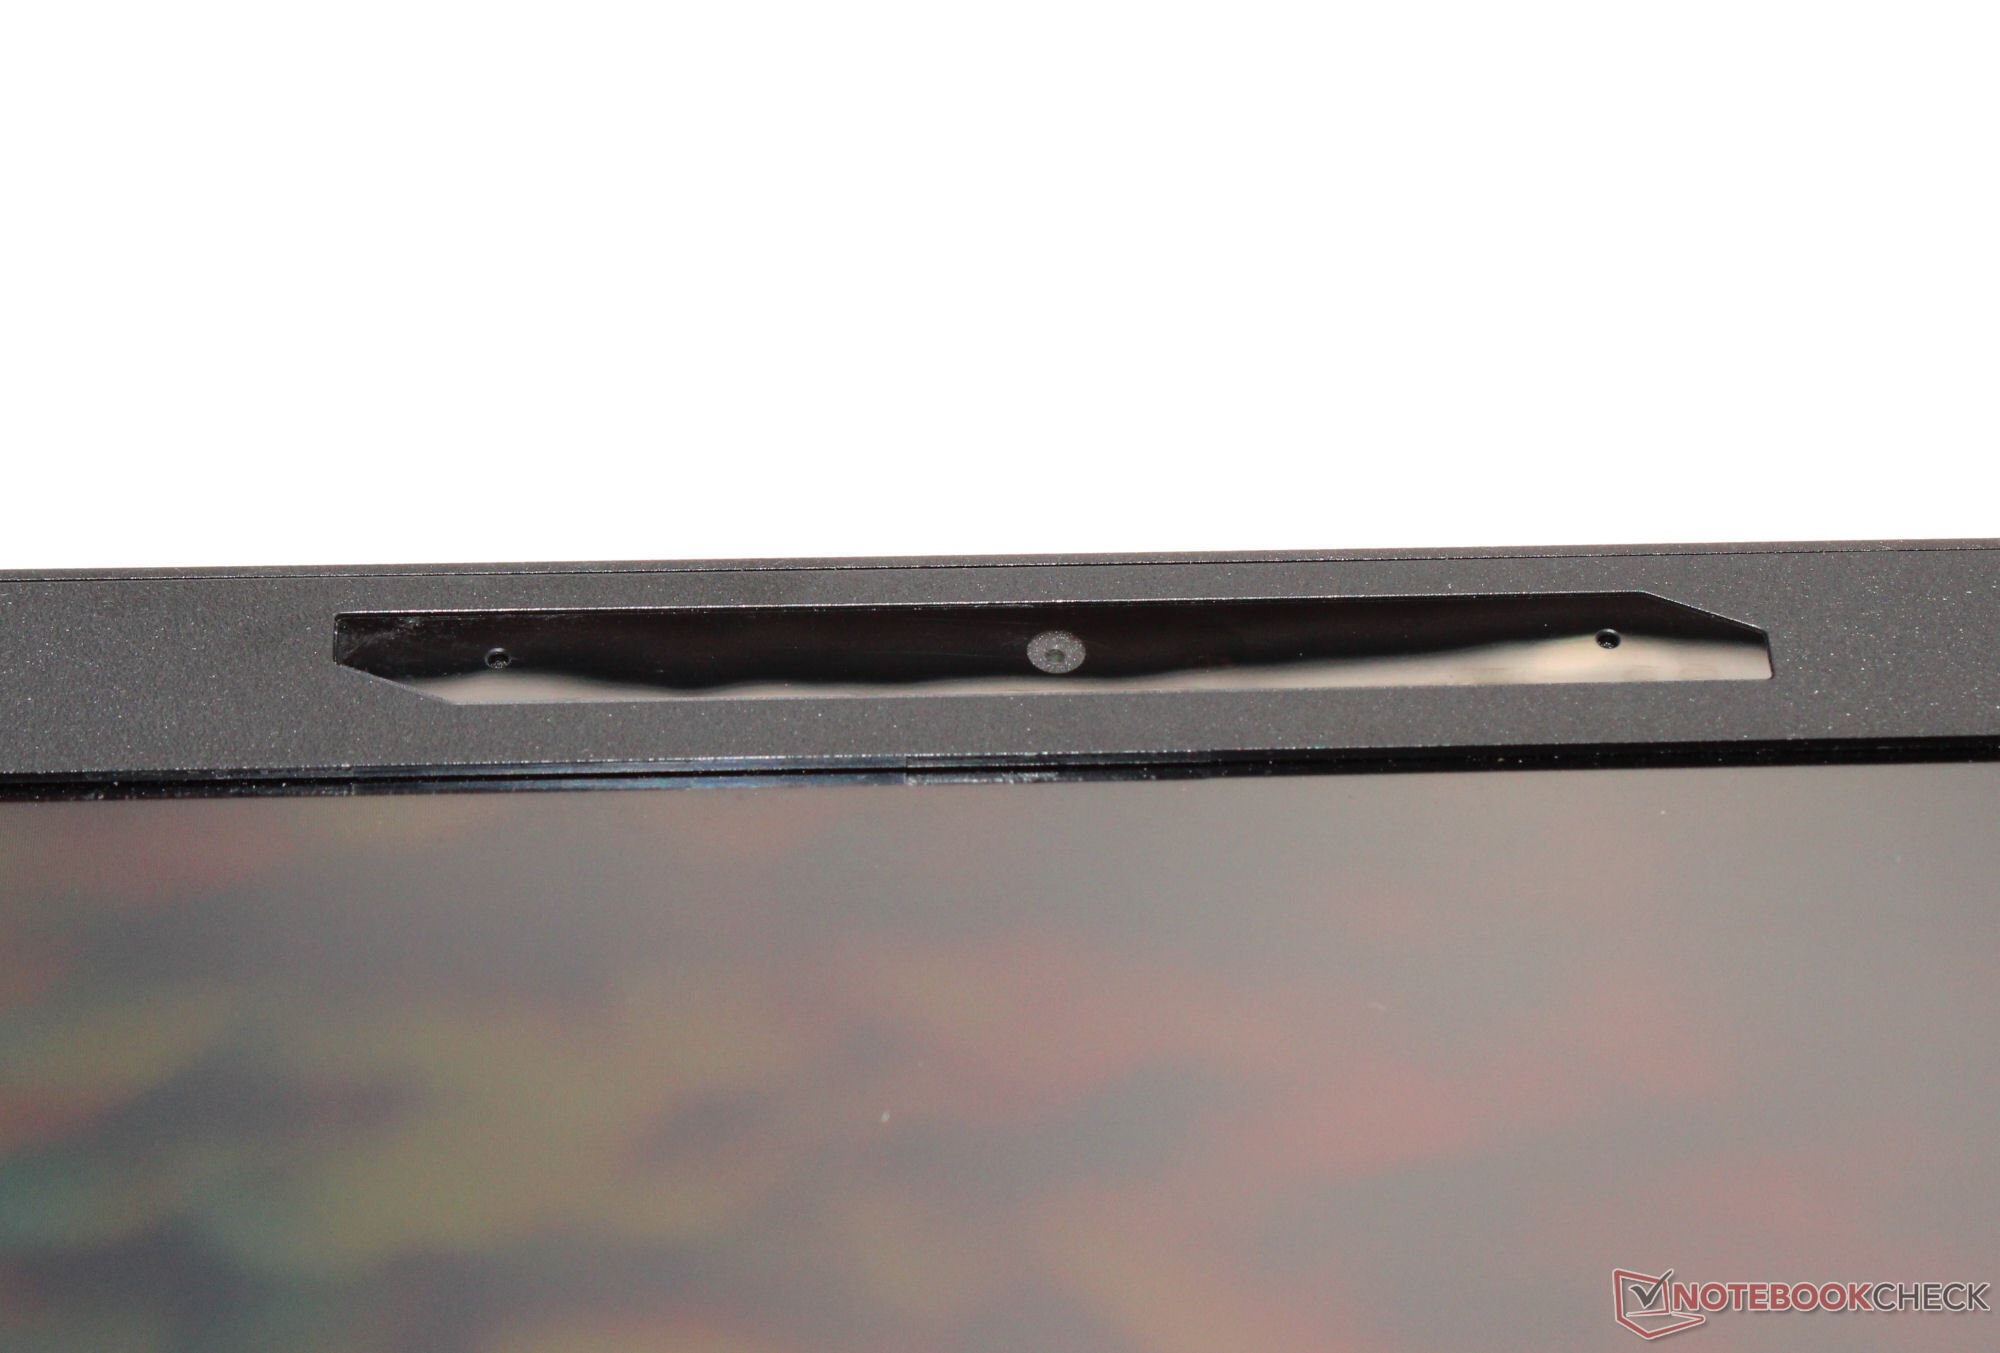
Webcam
A qualidade de sua webcam (2,1 MP, máx. 1.920 x 1.080 pixels) não difere da concorrência. Ele não possui uma tampa mecânica.


Acessórios
Além dos documentos habituais (guia de início rápido e informações sobre garantia), o laptop não vem com nenhum acessório adicional.
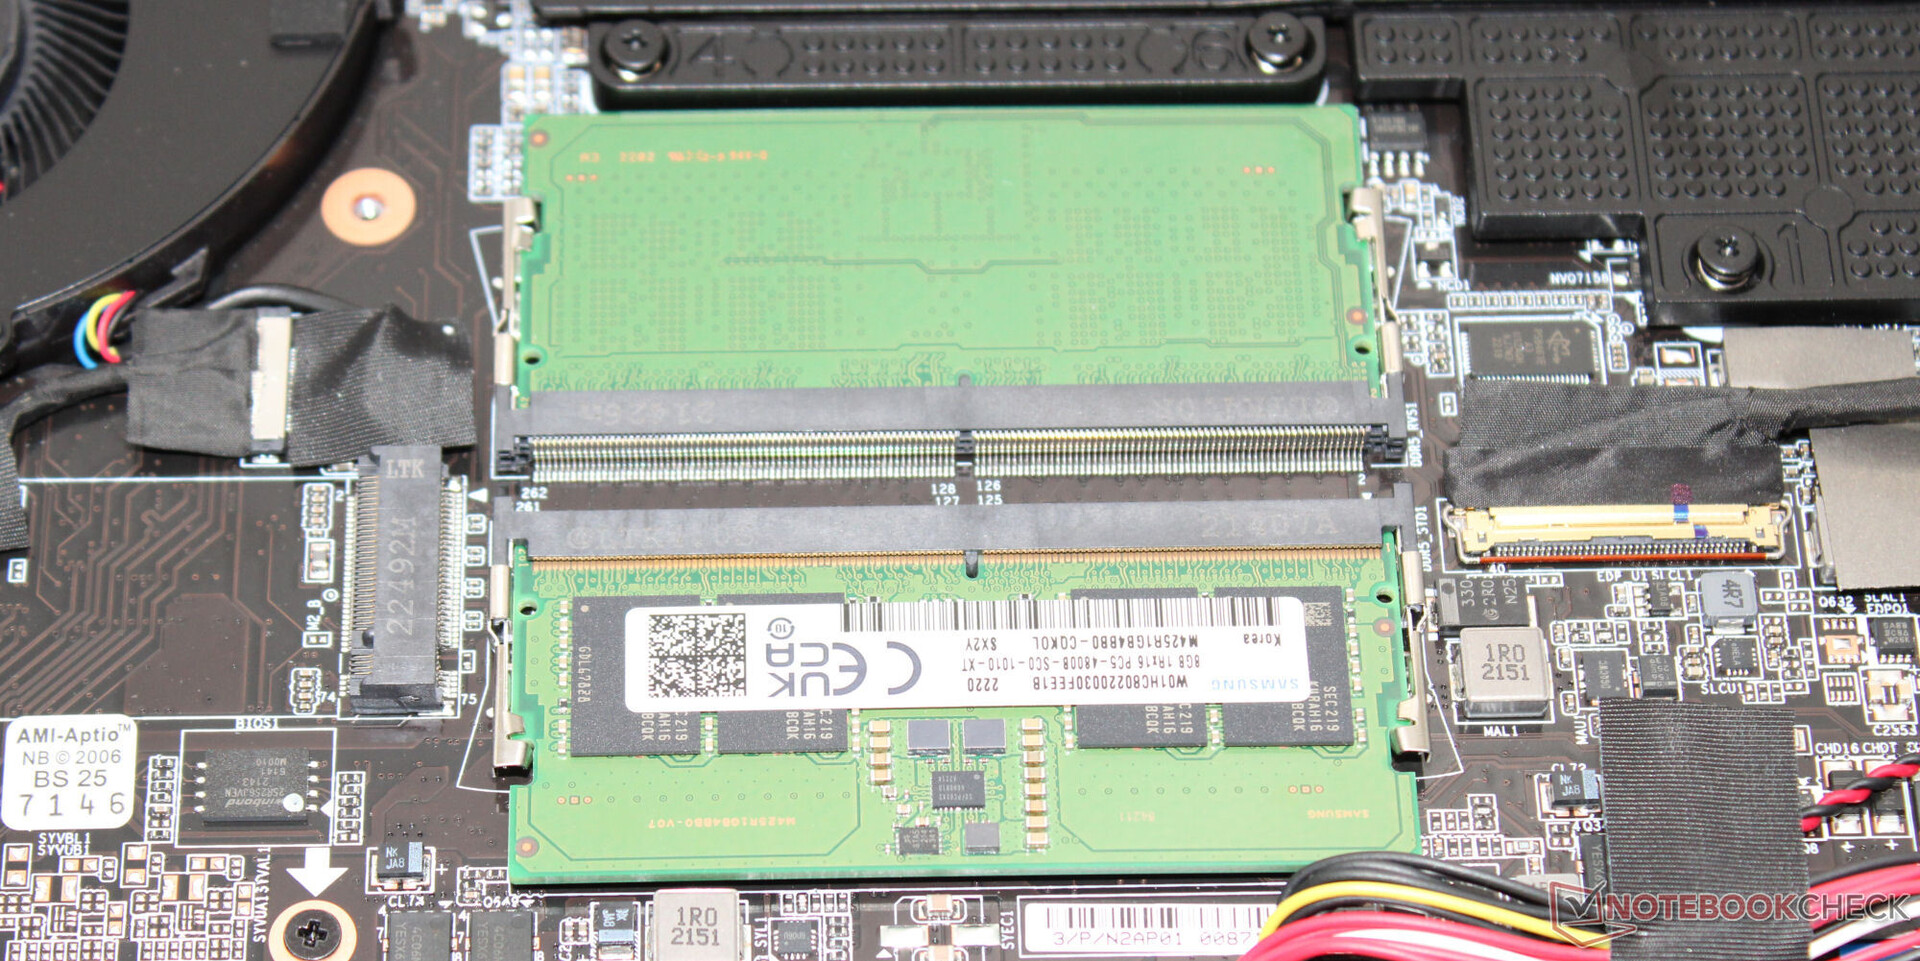
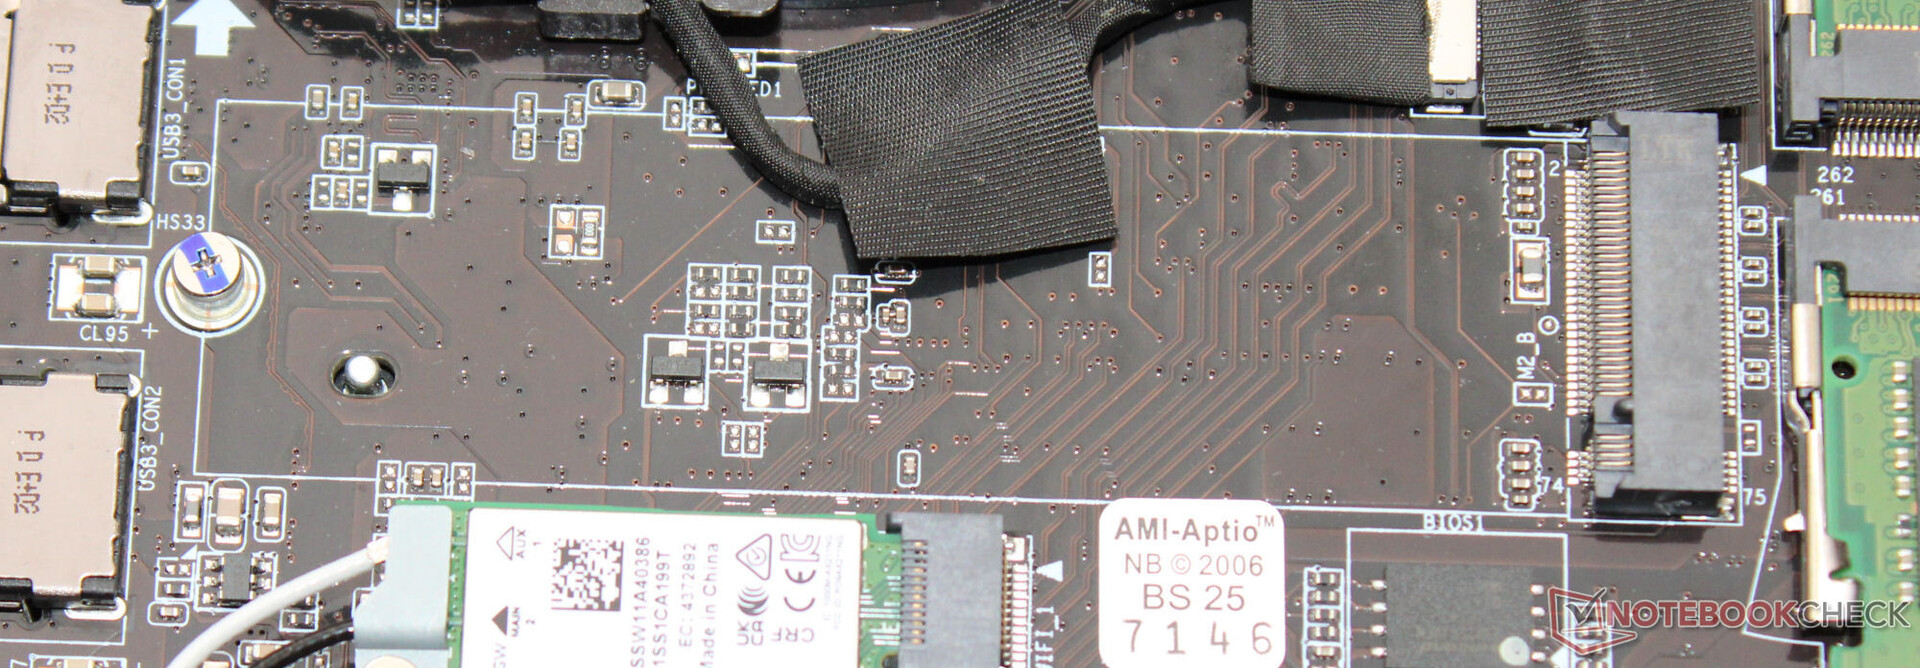
Manutenção
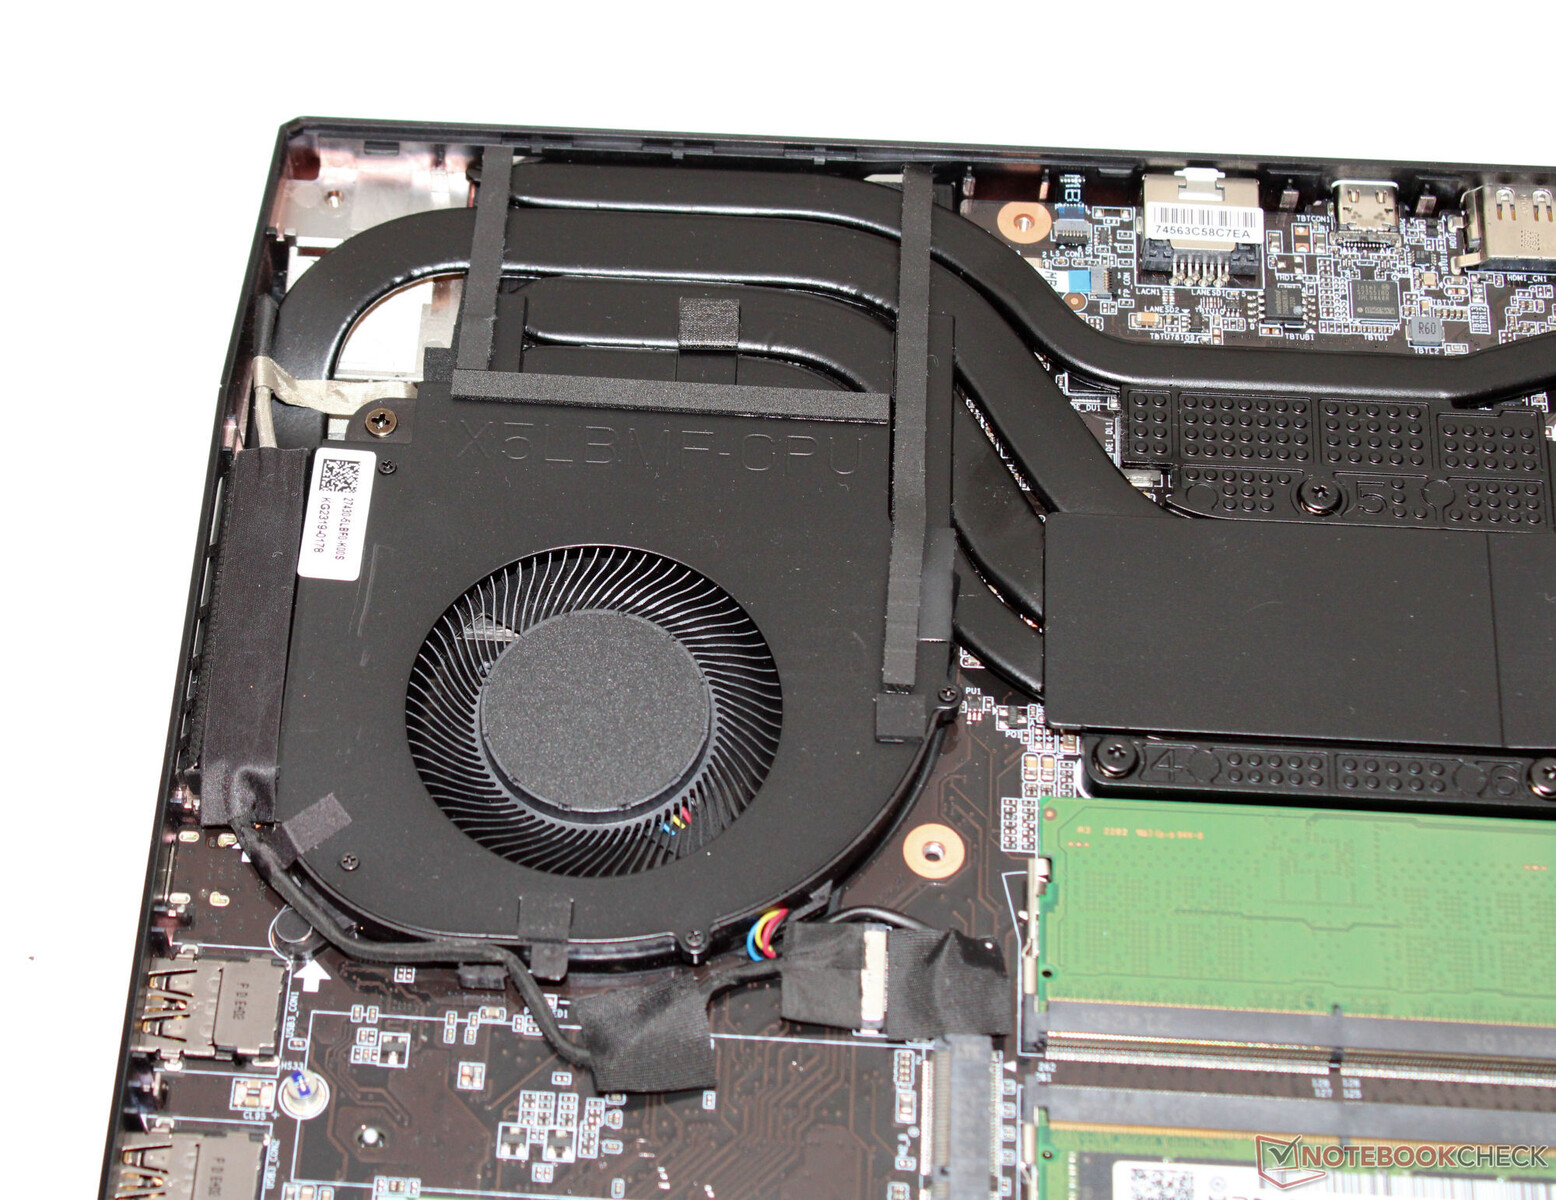
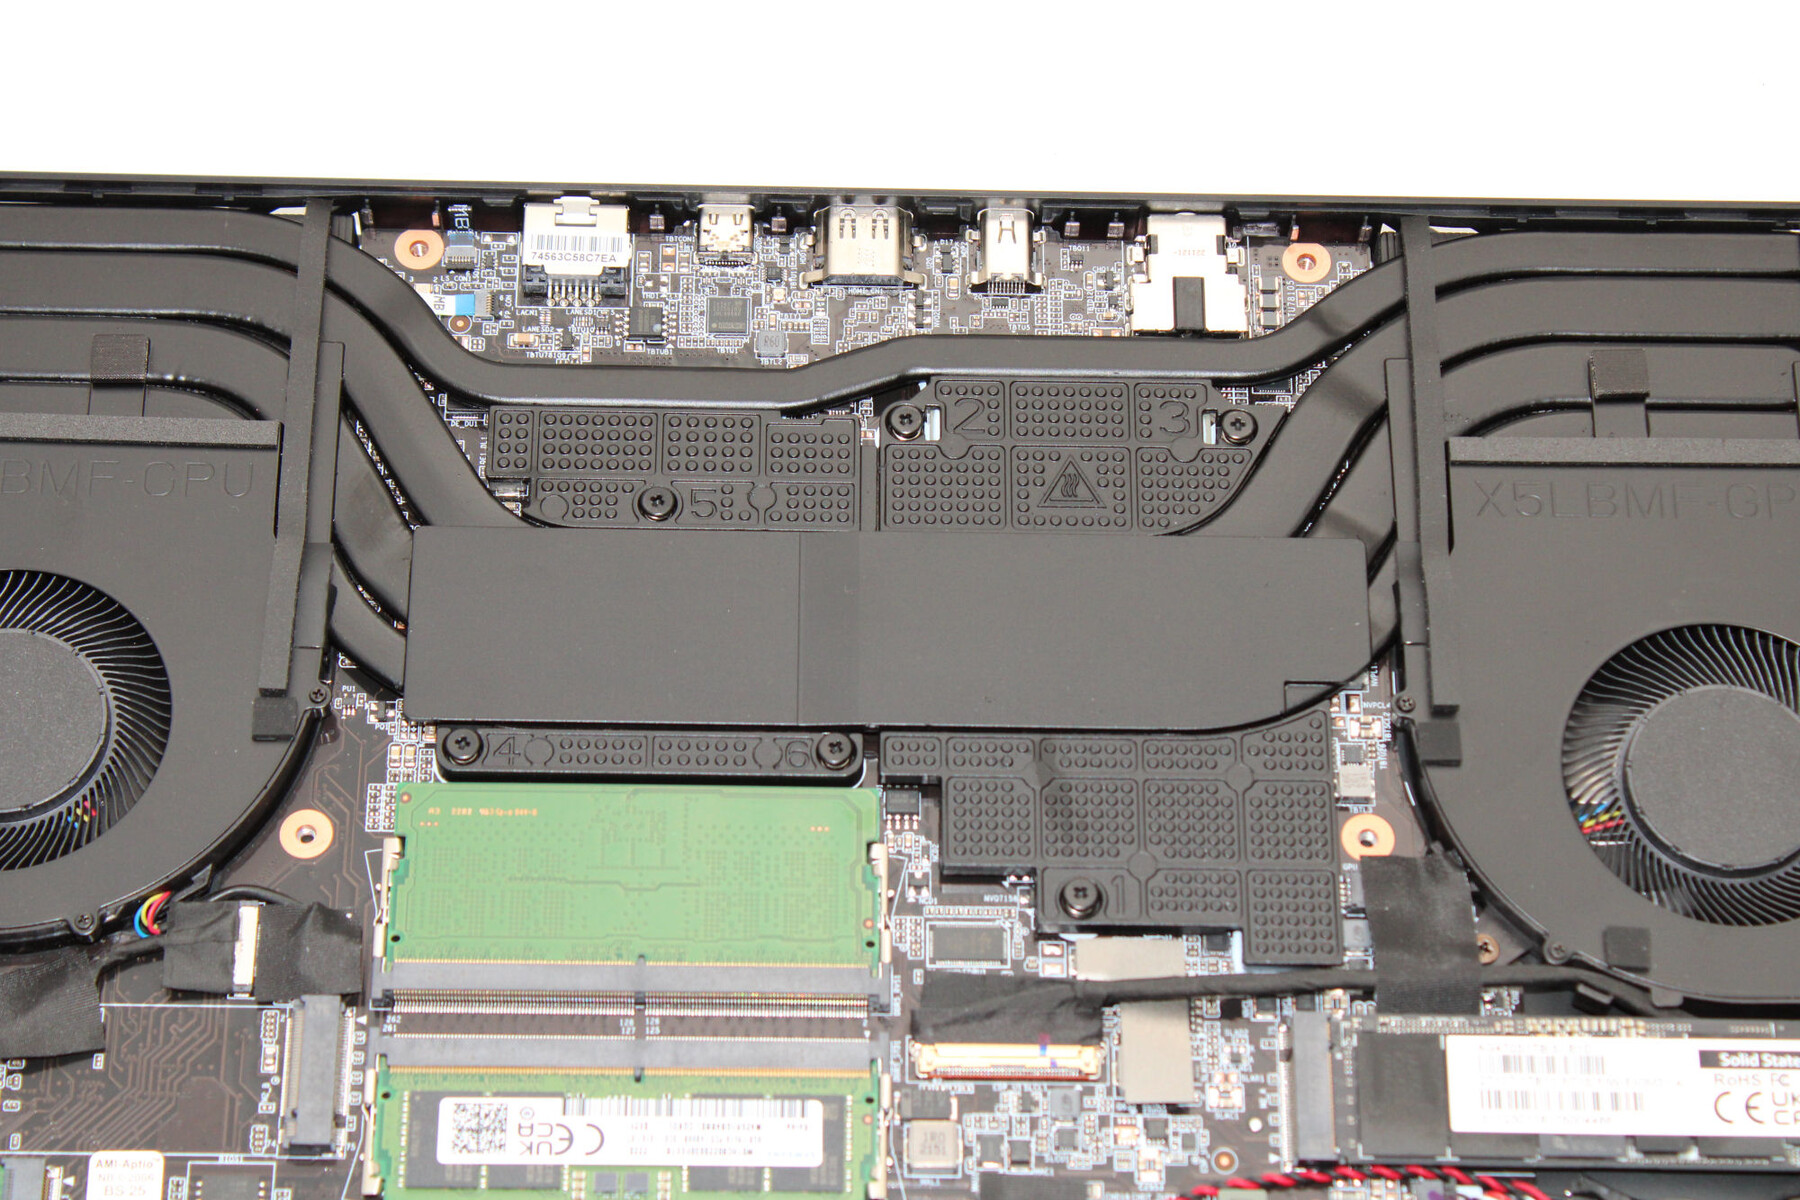
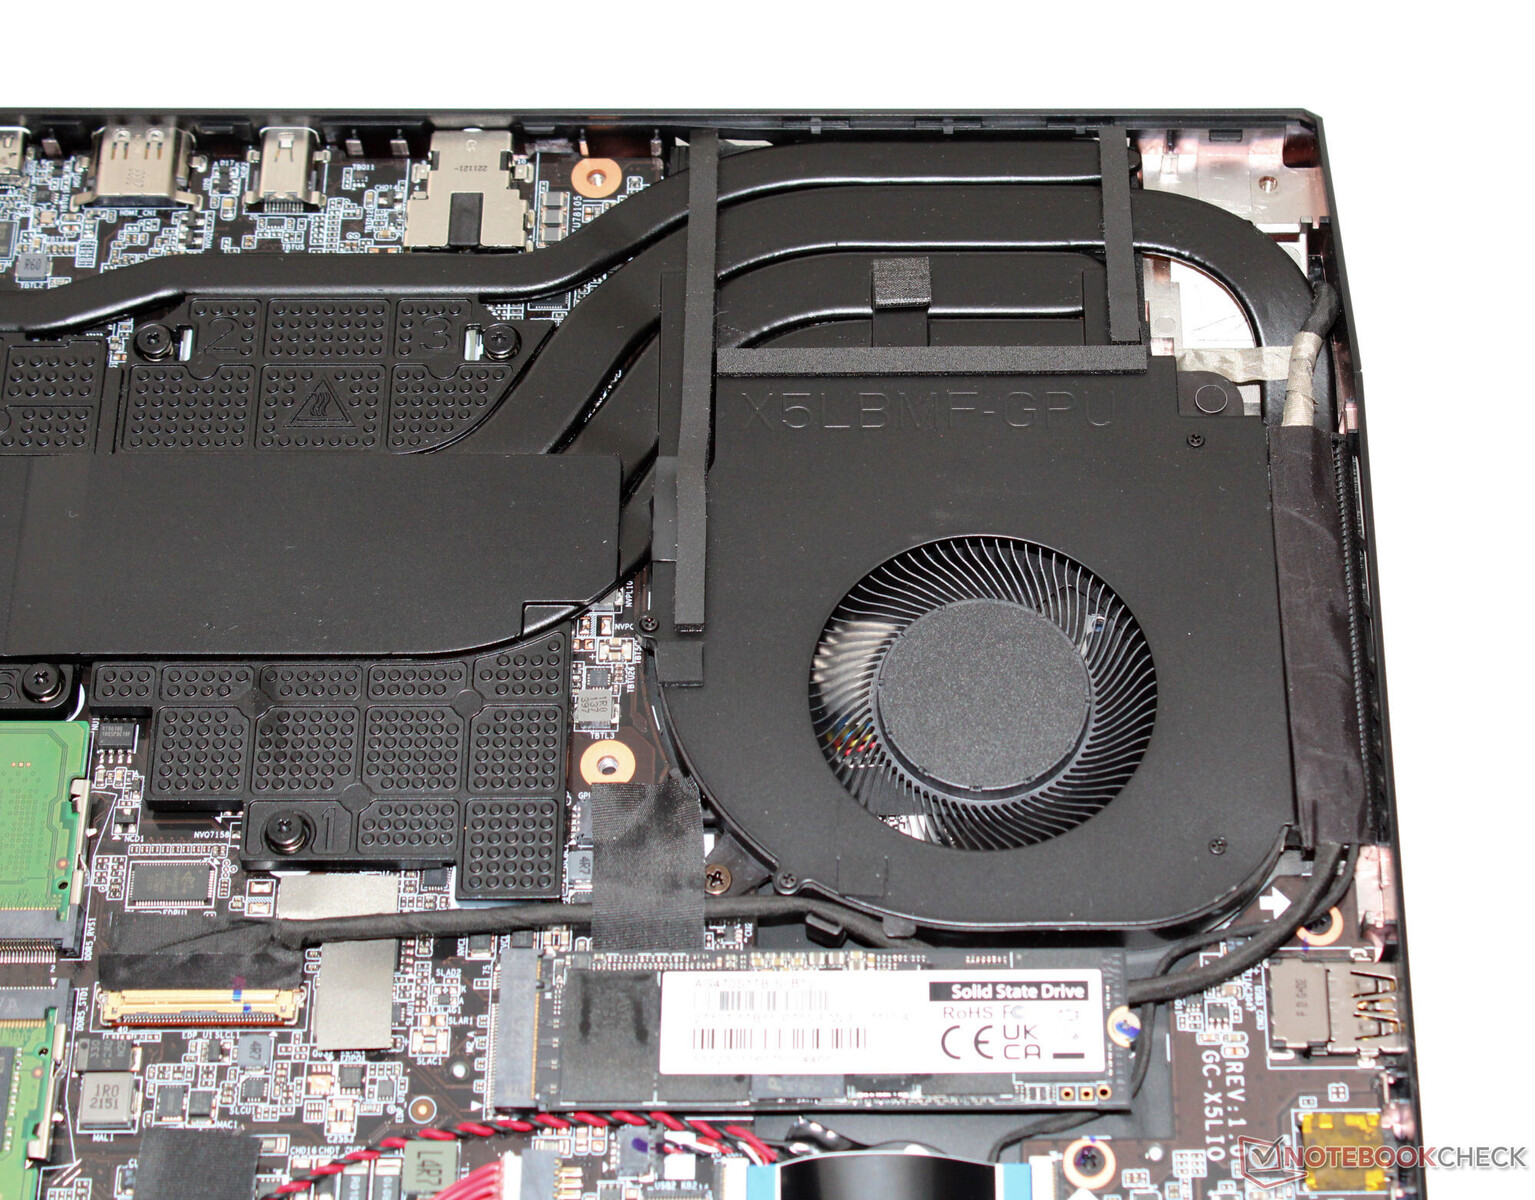
Depois de remover todos os parafusos na parte inferior do dispositivo, a seção inferior do gabinete pode ser removida com a ajuda de uma espátula ou de um plectro. Em seguida, é possível acessar os slots de RAM (ambos ocupados), o SSD (PCIe 4, M.2 2280), o segundo slot M.2 2280 (PCIe 4, M.2 2280), a bateria do BIOS, o módulo WLAN, os ventiladores, os alto-falantes e a bateria.
Garantia
O laptop Gigabyte de 15,6 polegadas vem com garantia de um ano. Não é possível estendê-la.
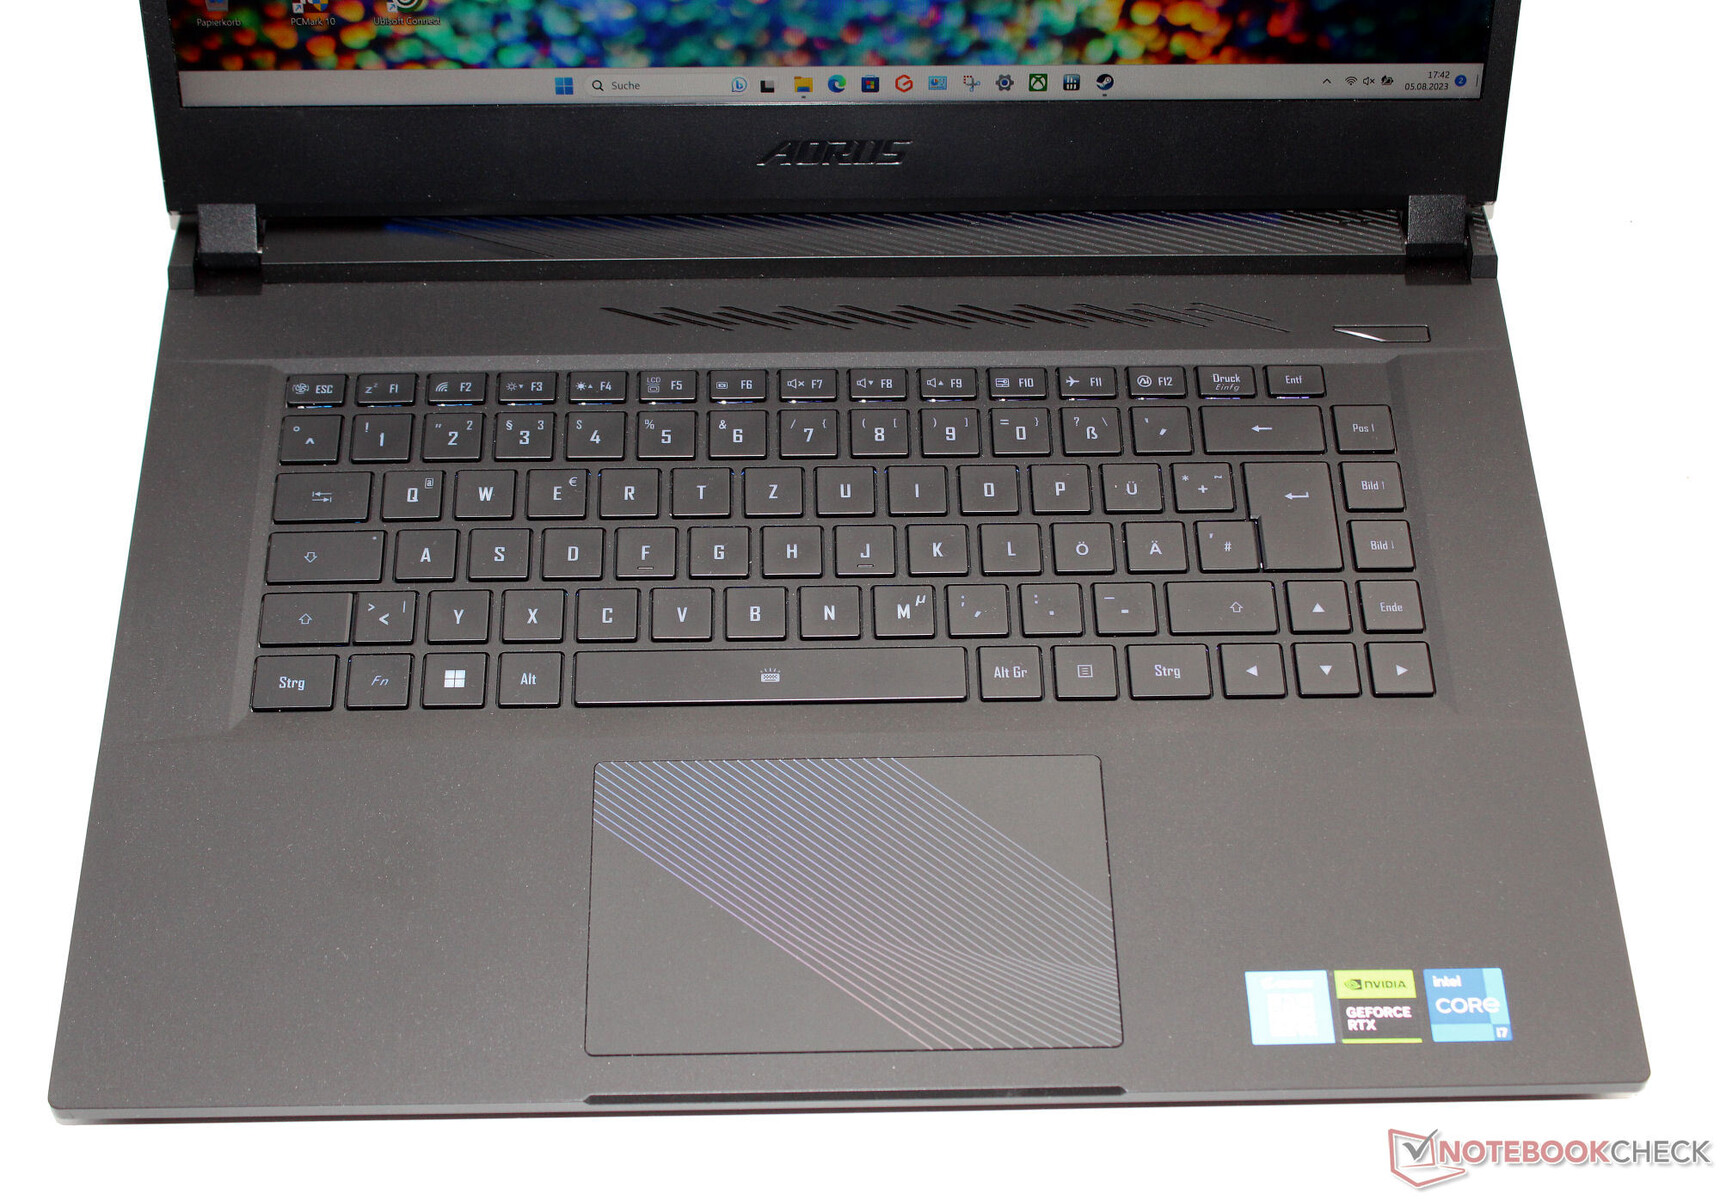
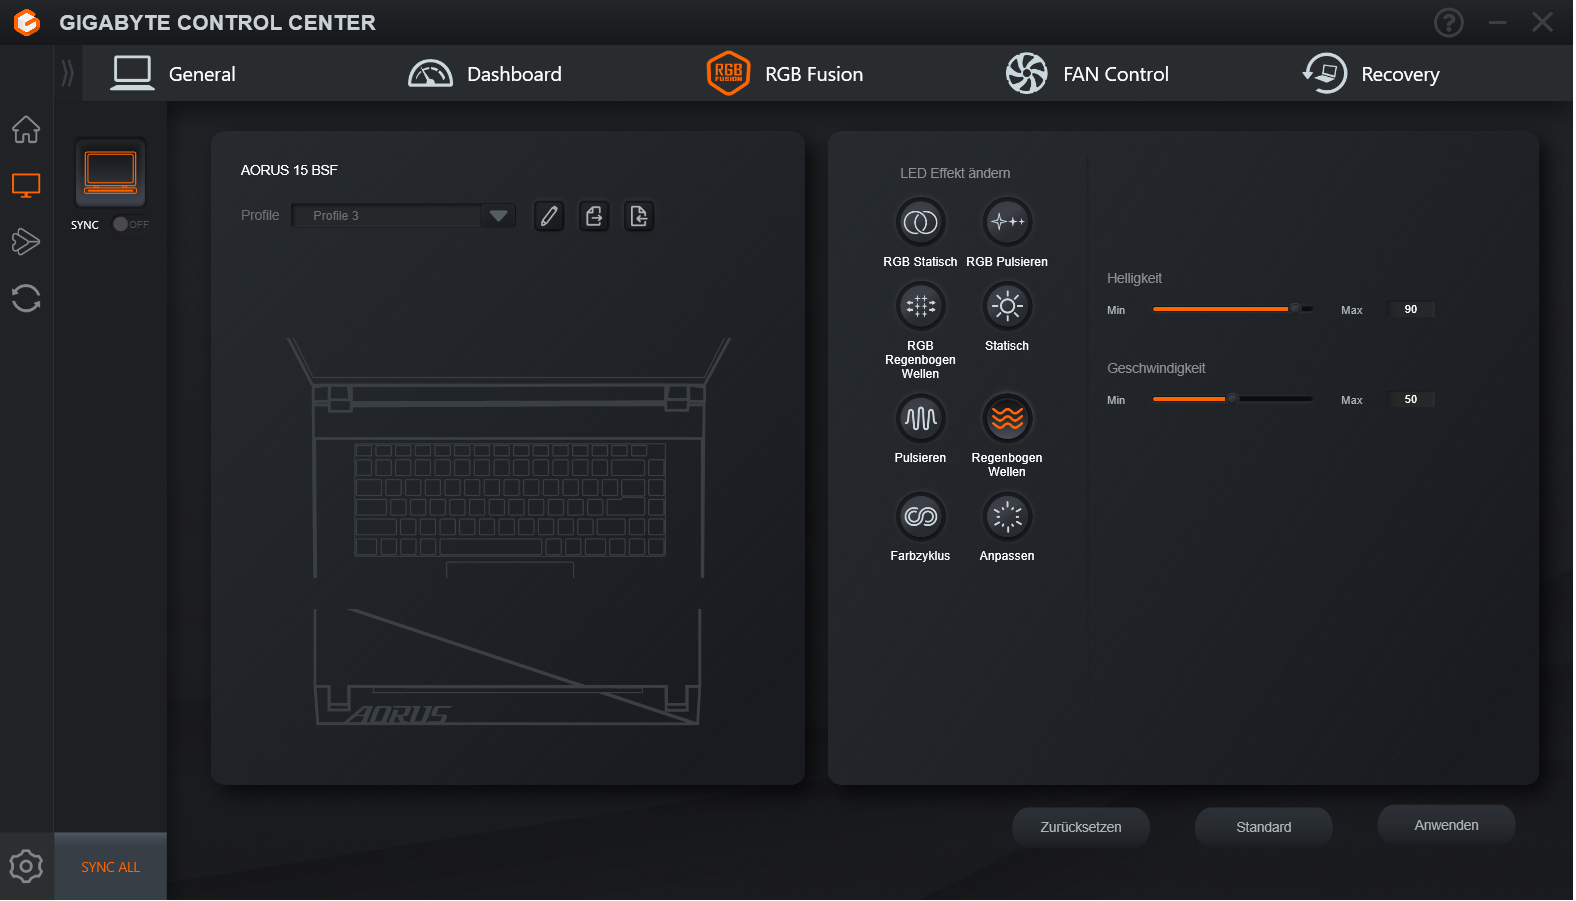
Dispositivos de entrada - O laptop para jogos com iluminação RGB
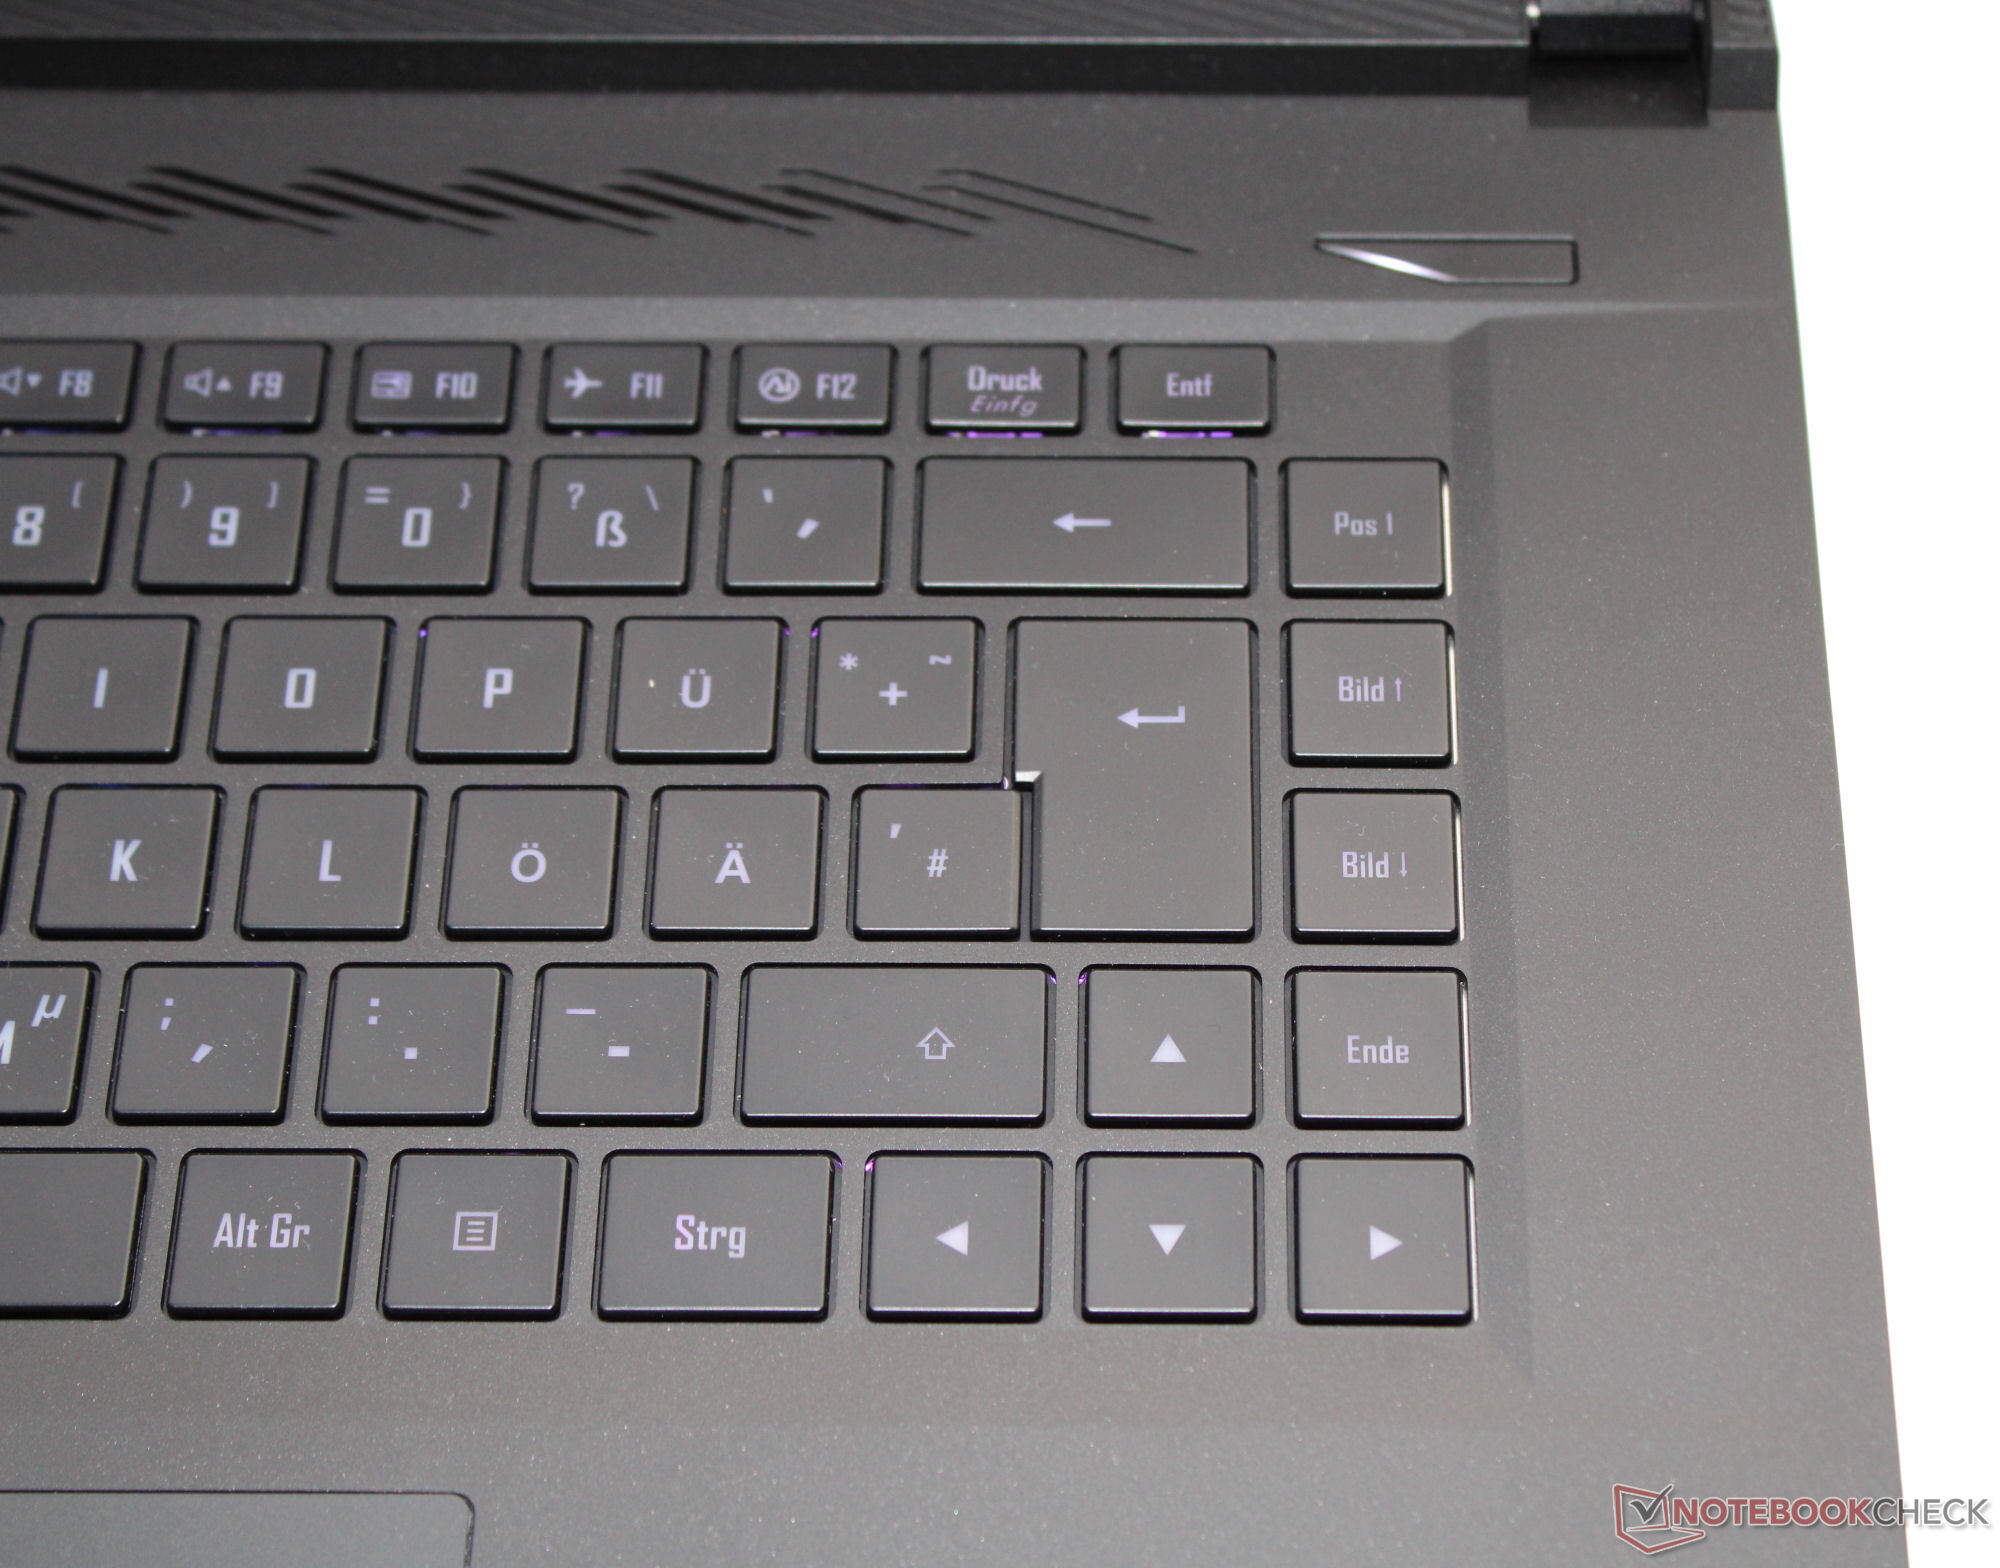
Teclado
As teclas lisas do teclado chiclet iluminado têm uma elevação média e um ponto de pressão claro. A resistência das teclas é boa - durante a digitação, elas têm uma pequena folga, mas isso não deve ser muito incômodo. Ponto positivo: As quatro teclas de seta têm tamanho regular. Em suma, este é um bom teclado para uso diário.
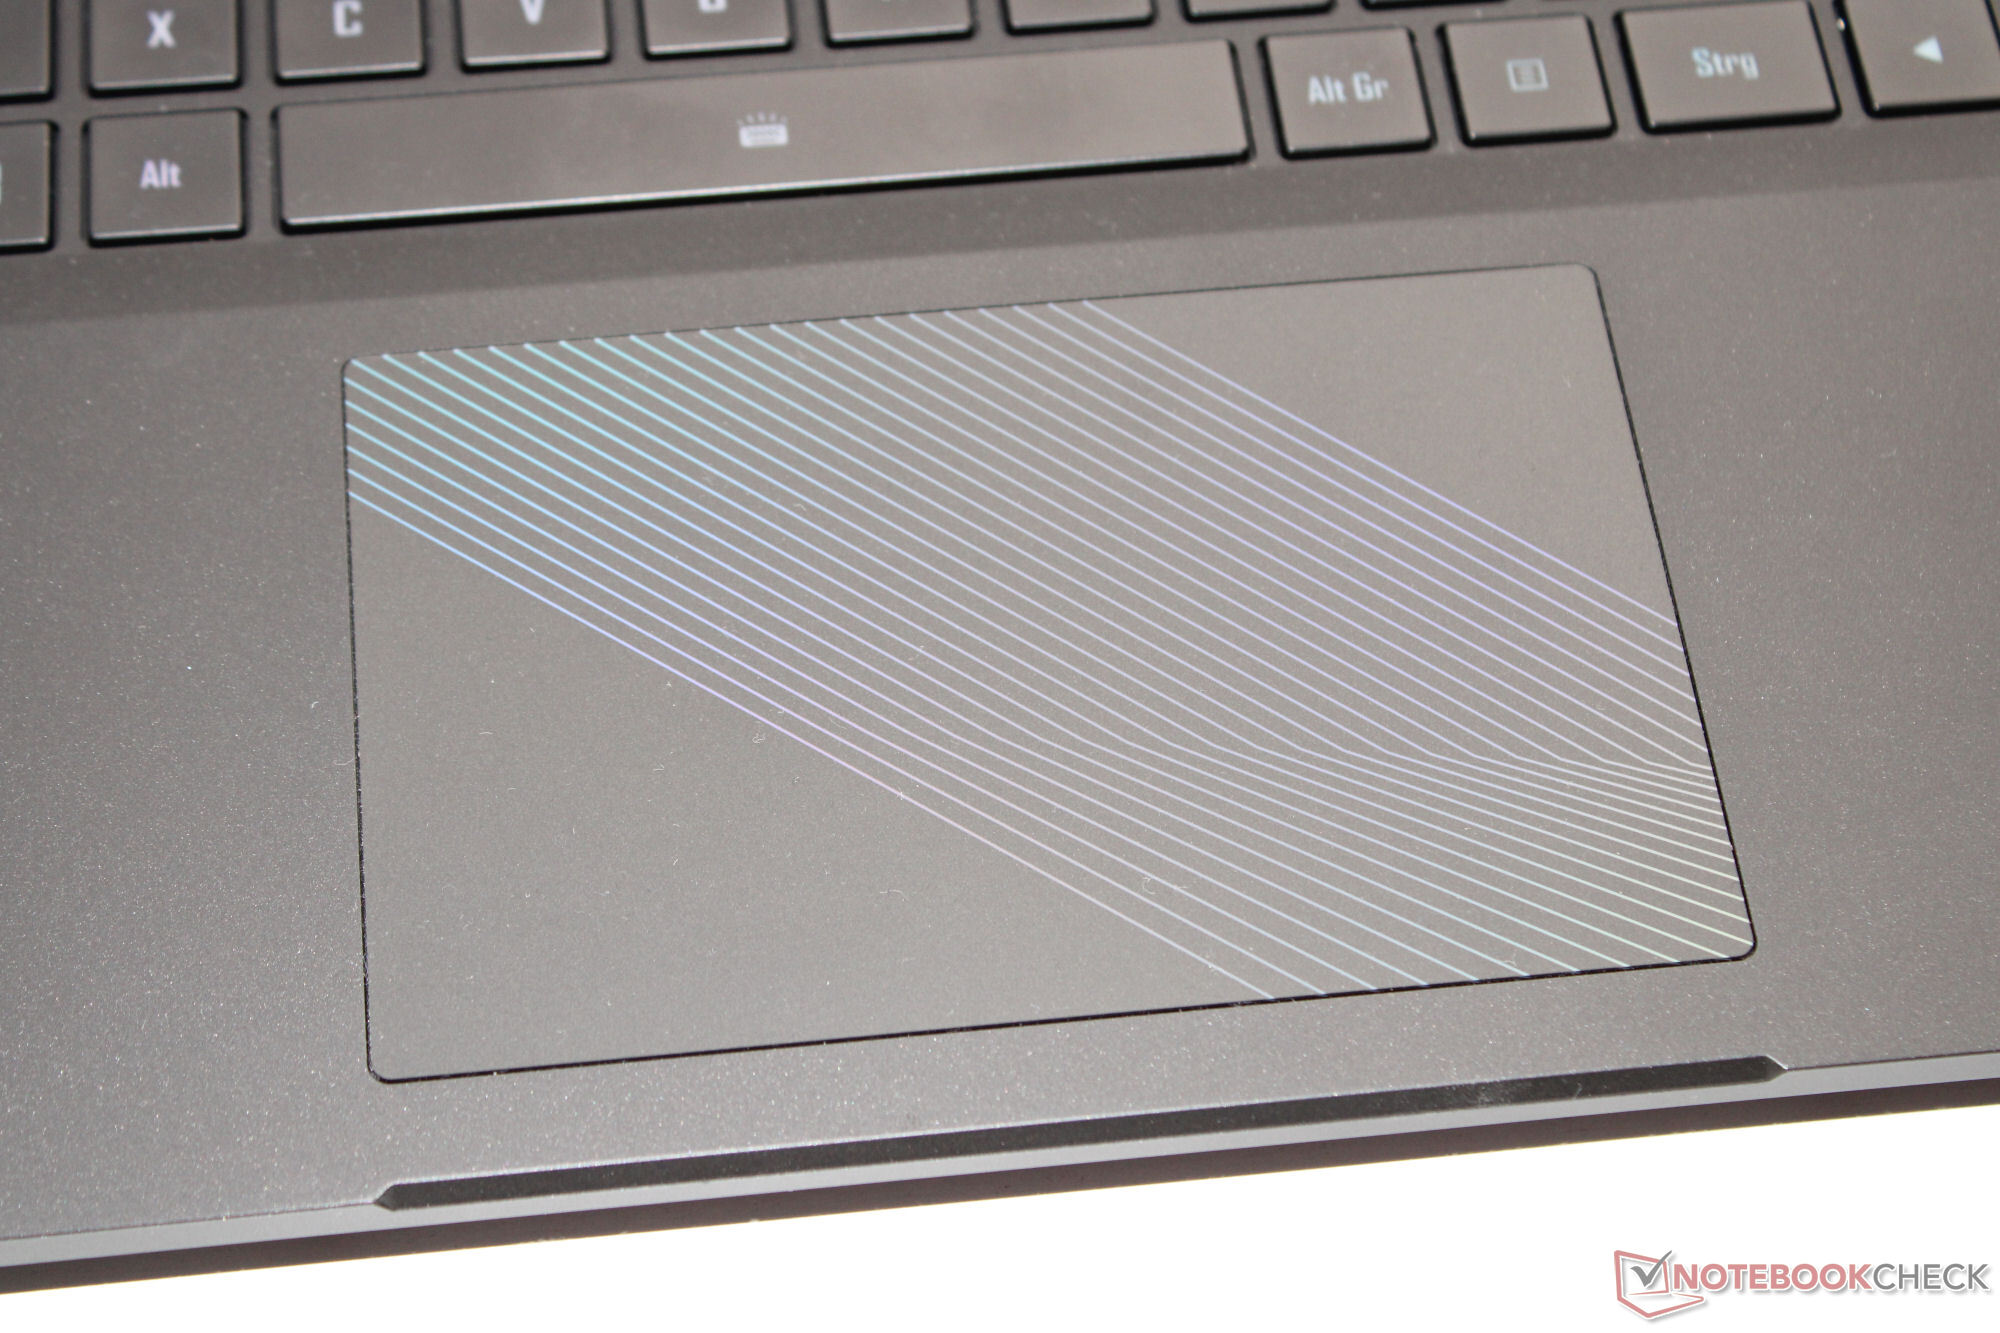
Touchpad
Um click pad (12,1 x 7,6 cm) funciona como substituto do mouse e os dedos deslizam bem sobre a superfície lisa. Ele tem uma elevação curta e um ponto de pressão claro.
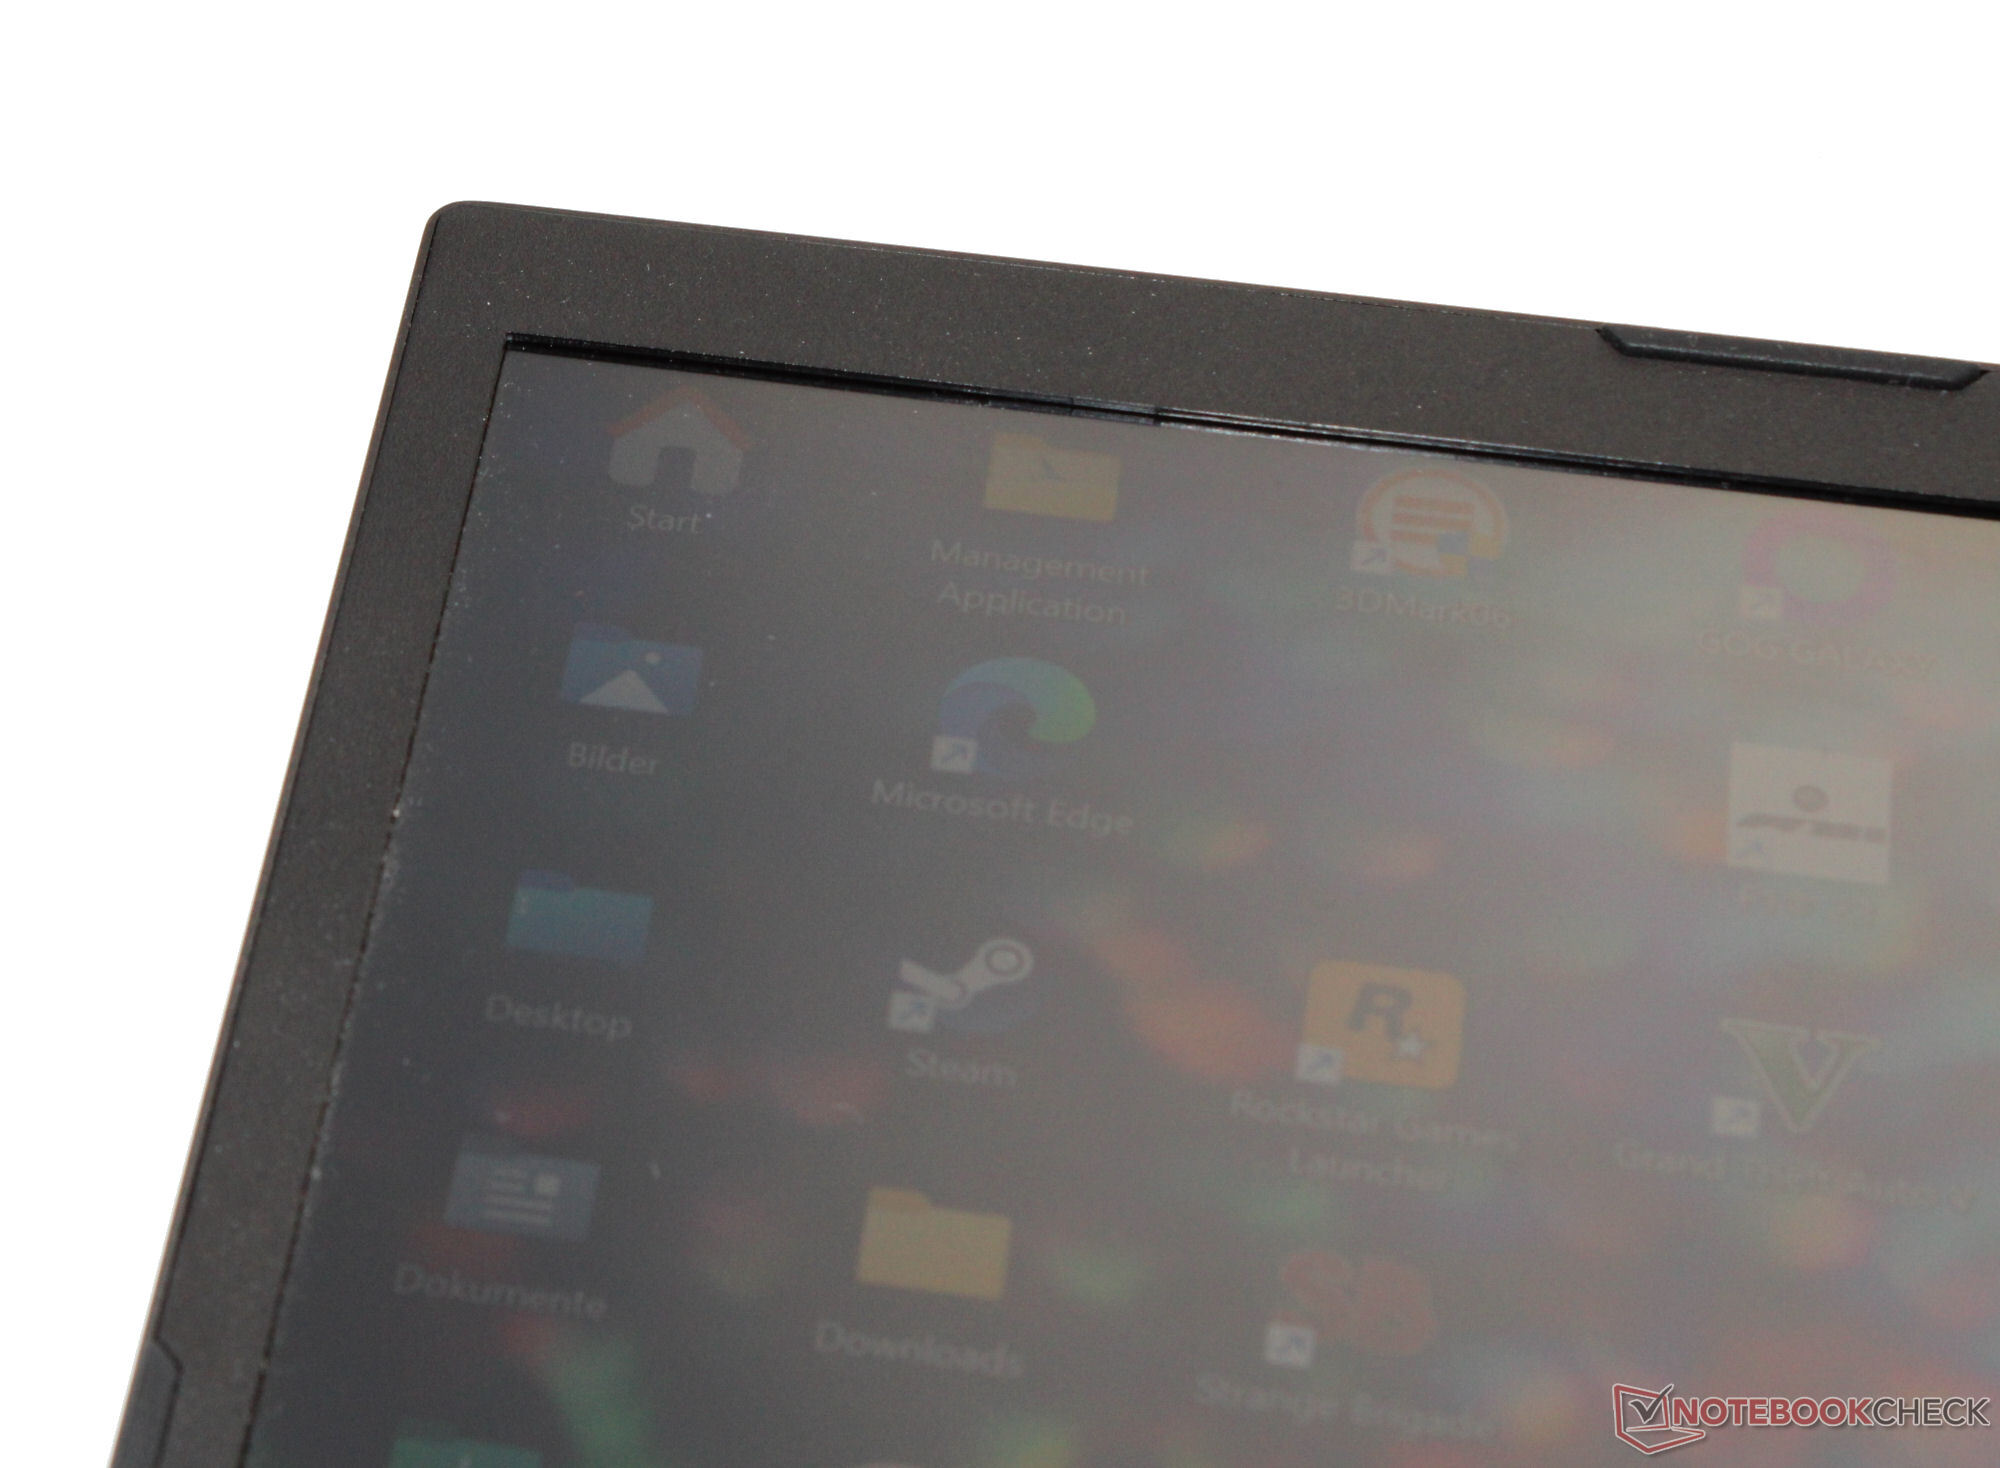
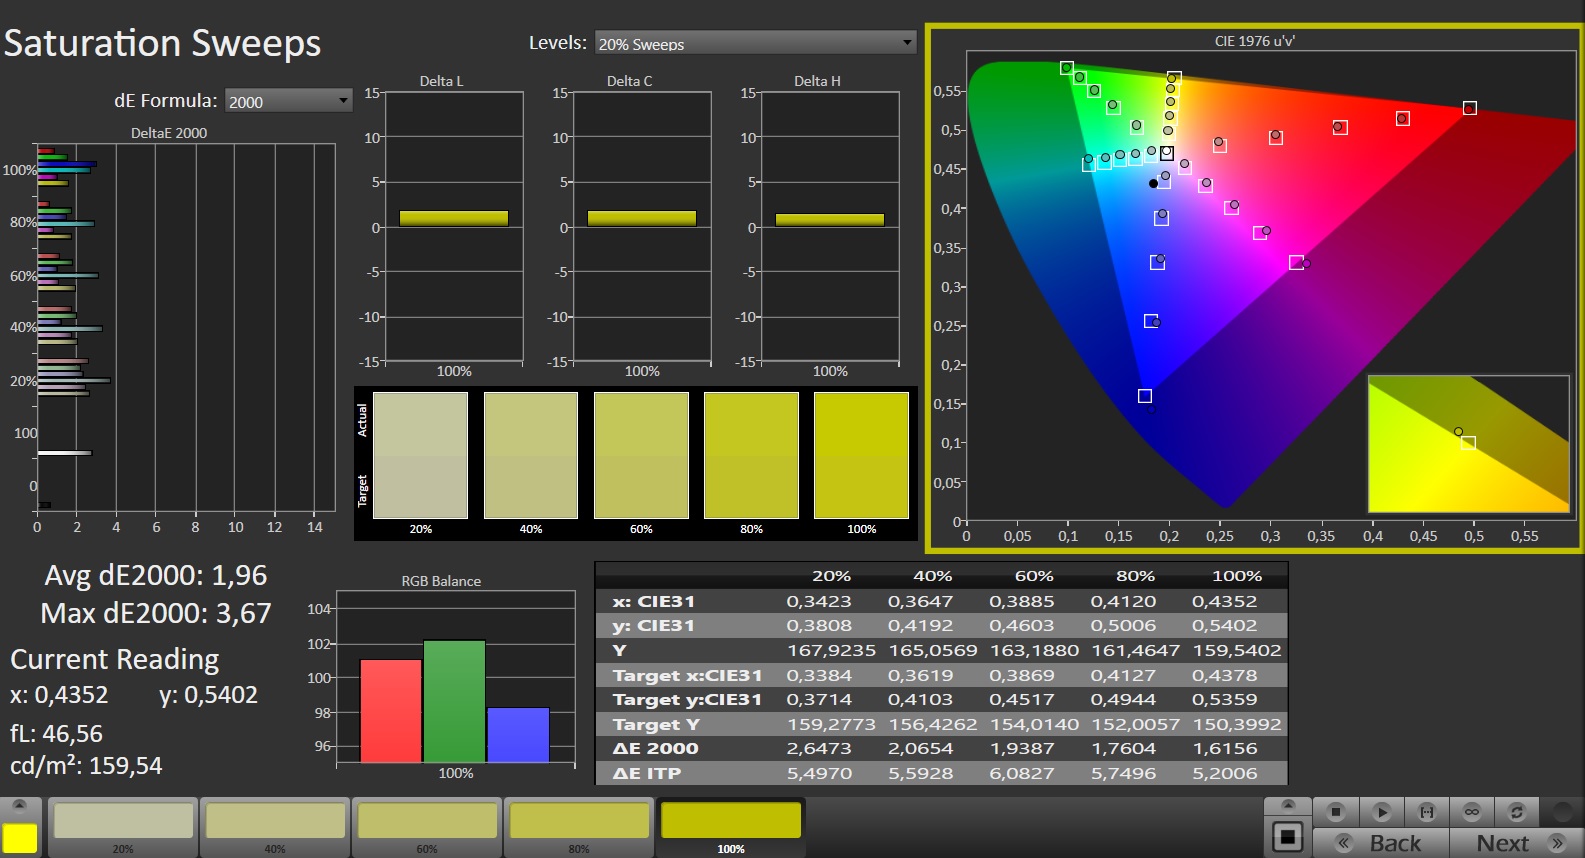
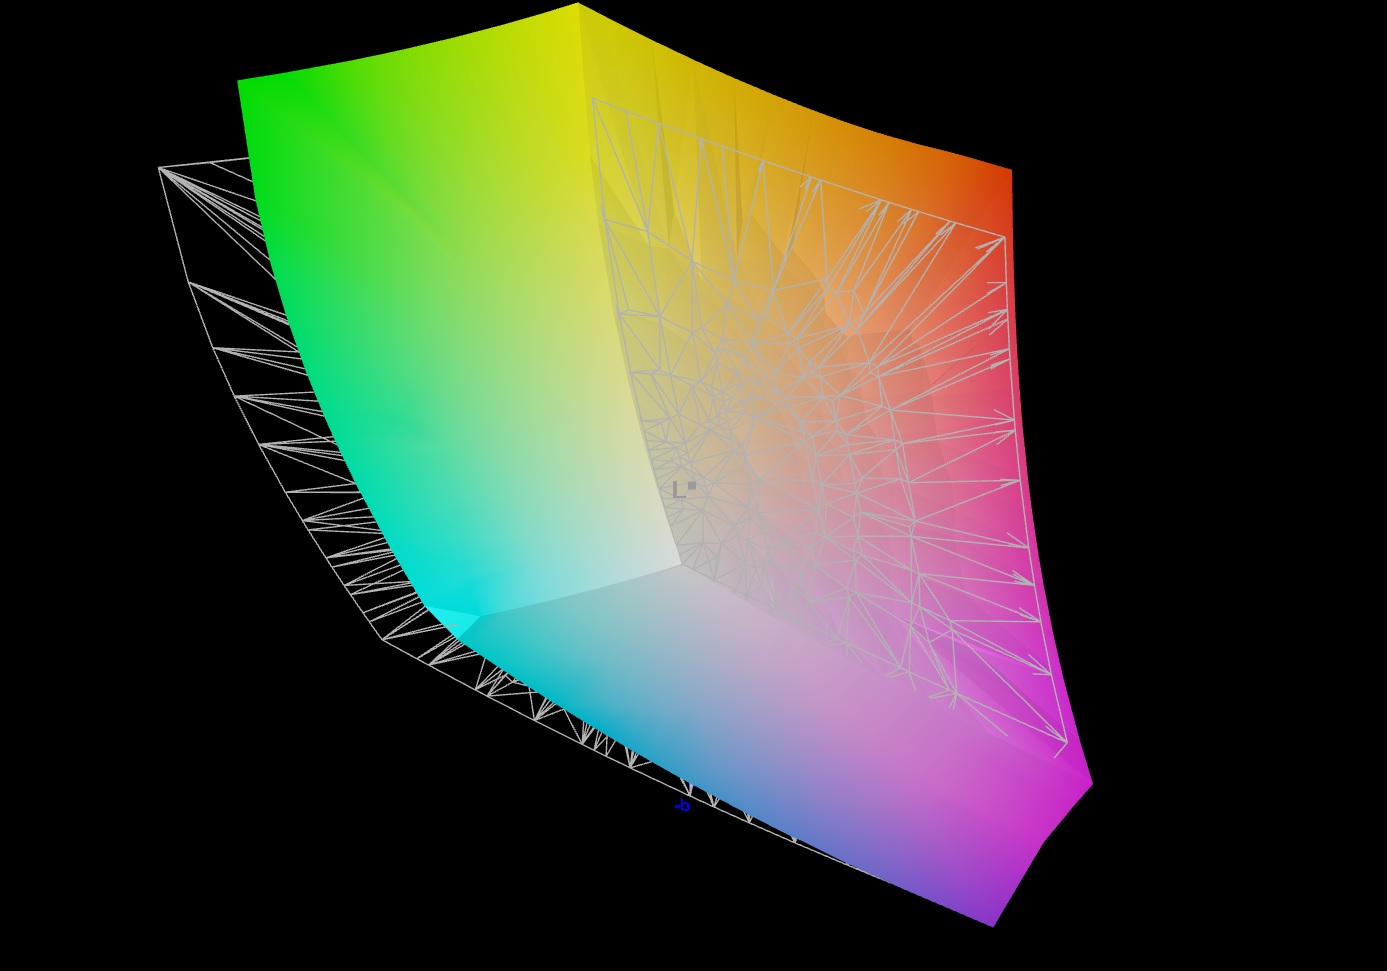
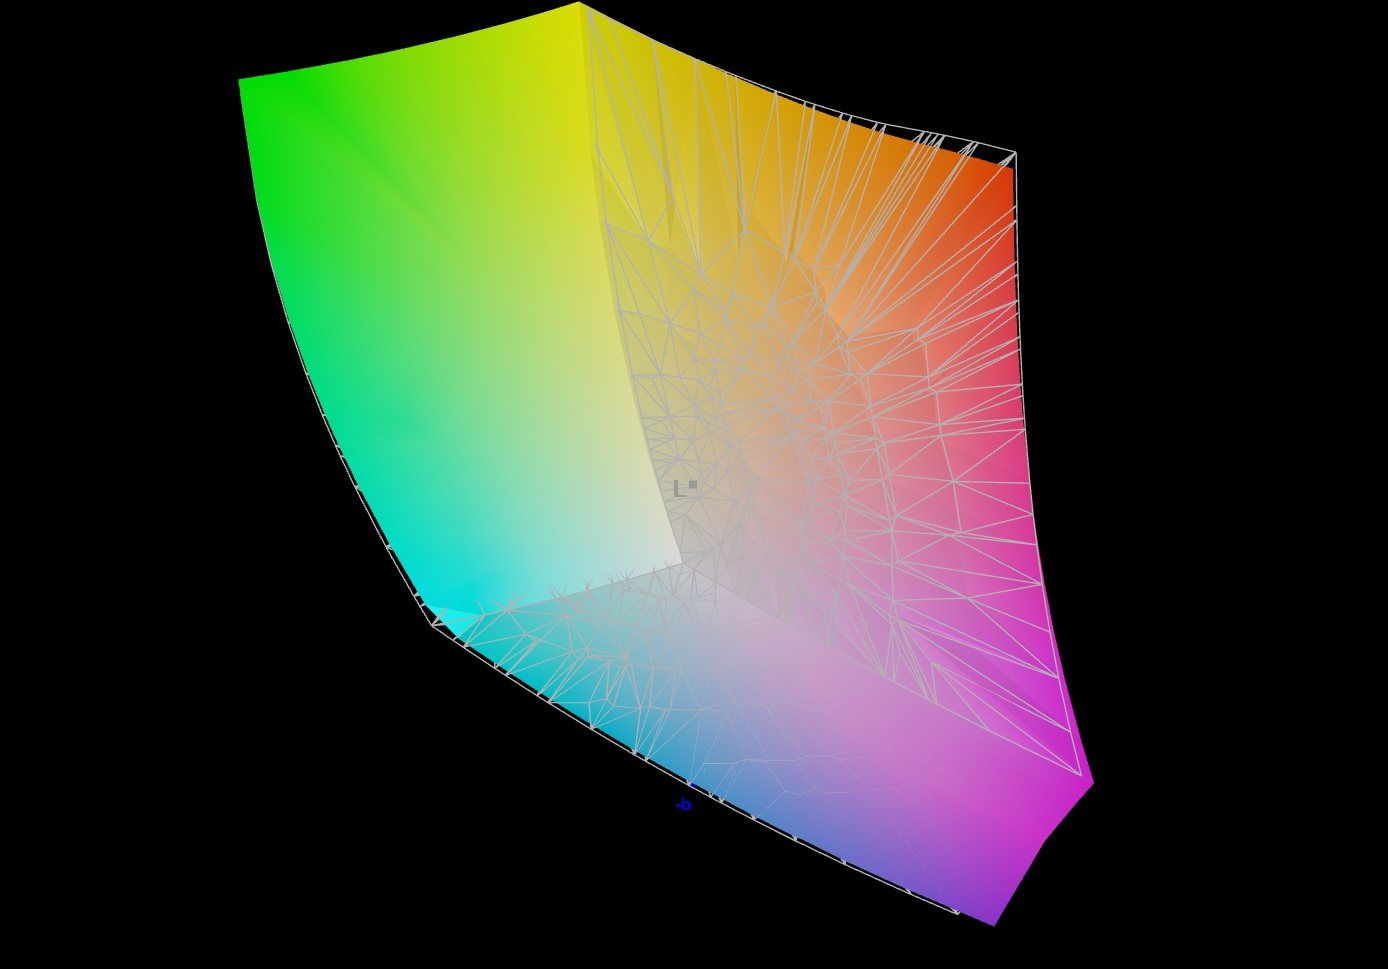
Tela - Um painel QHD com cobertura DCI-P3
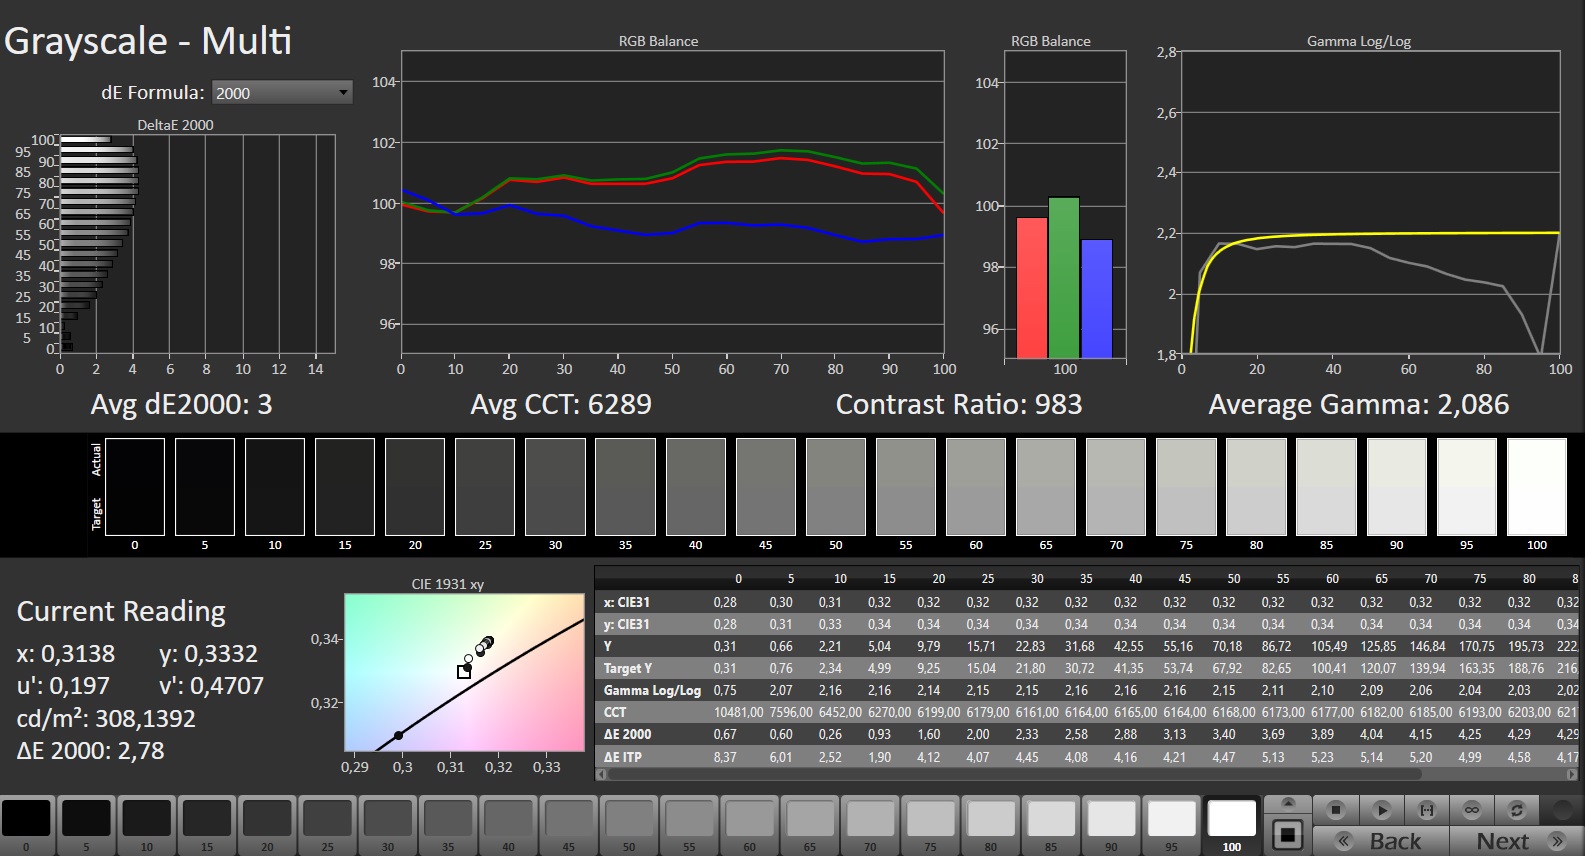
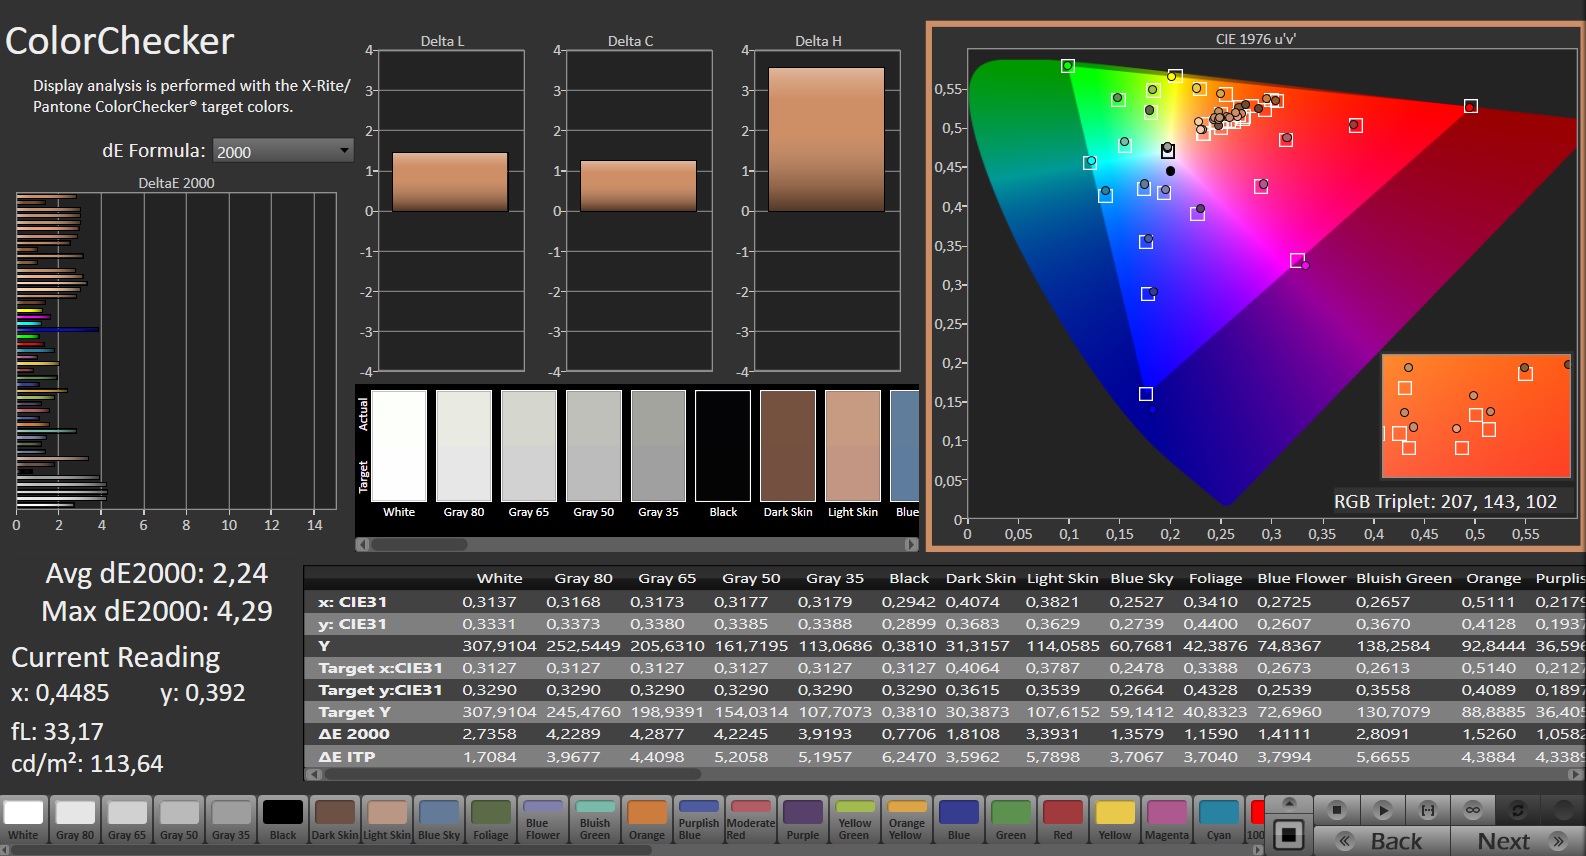
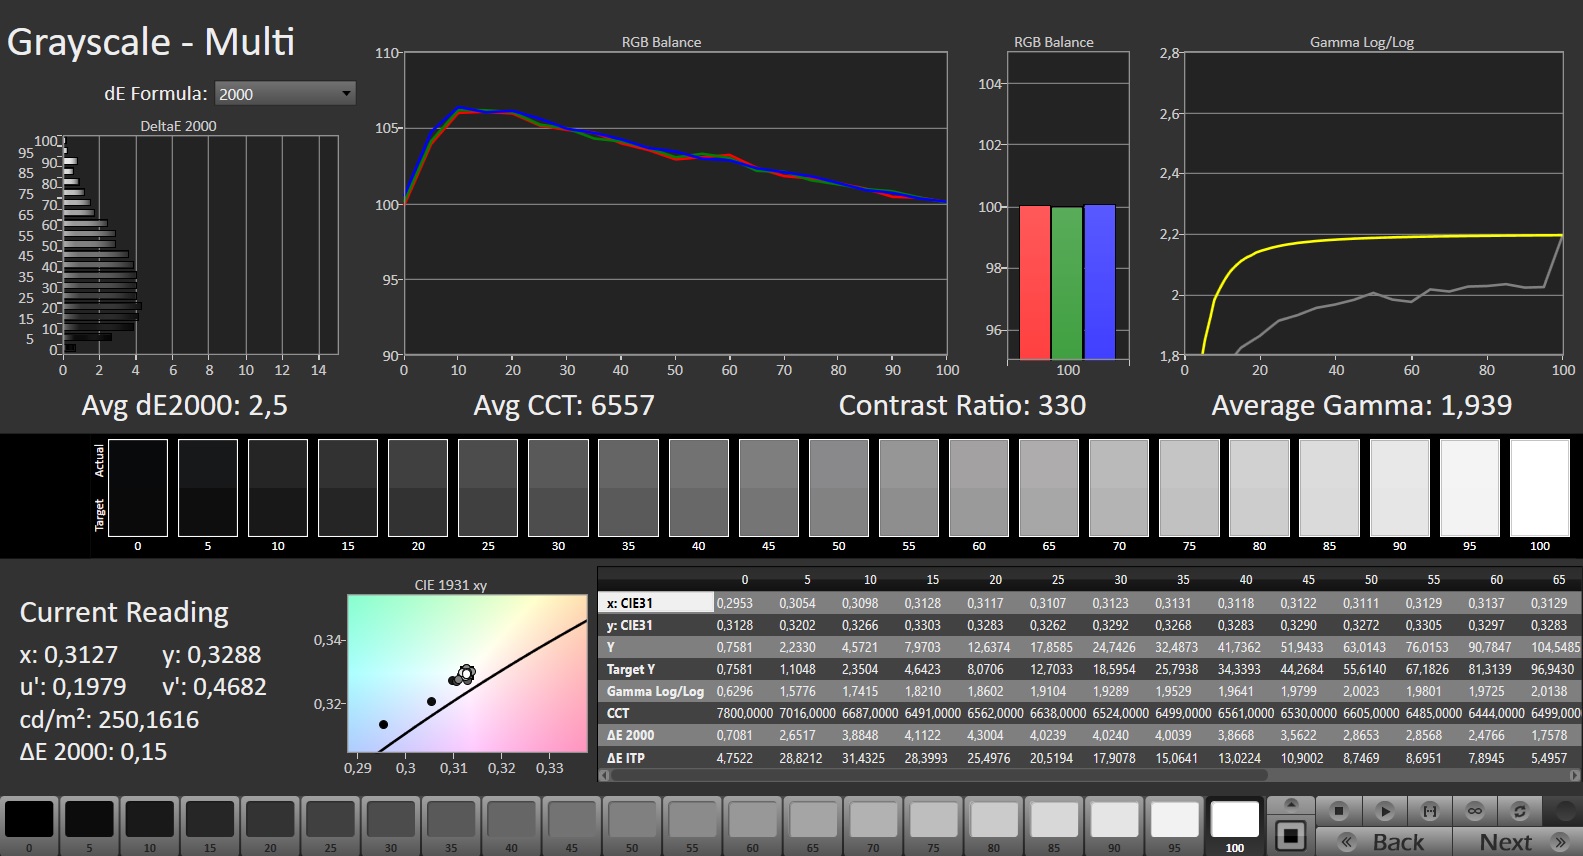
A tela de 165 Hz de reação rápida ganha pontos graças à sua superfície fosca e à ausência de cintilação PWM. A tela de 15,6 polegadas (2.560 x 1.440 pixels, IPS), que tem uma proporção de 16:9, alcançou níveis de brilho e contraste que não atingiram suas respectivas metas (> 300 cd/m² e 1.000:1).
| |||||||||||||||||||||||||
iluminação: 82 %
iluminação com acumulador: 299 cd/m²
Contraste: 965:1 (Preto: 0.31 cd/m²)
ΔE ColorChecker Calman: 2.24 | ∀{0.5-29.43 Ø4.71}
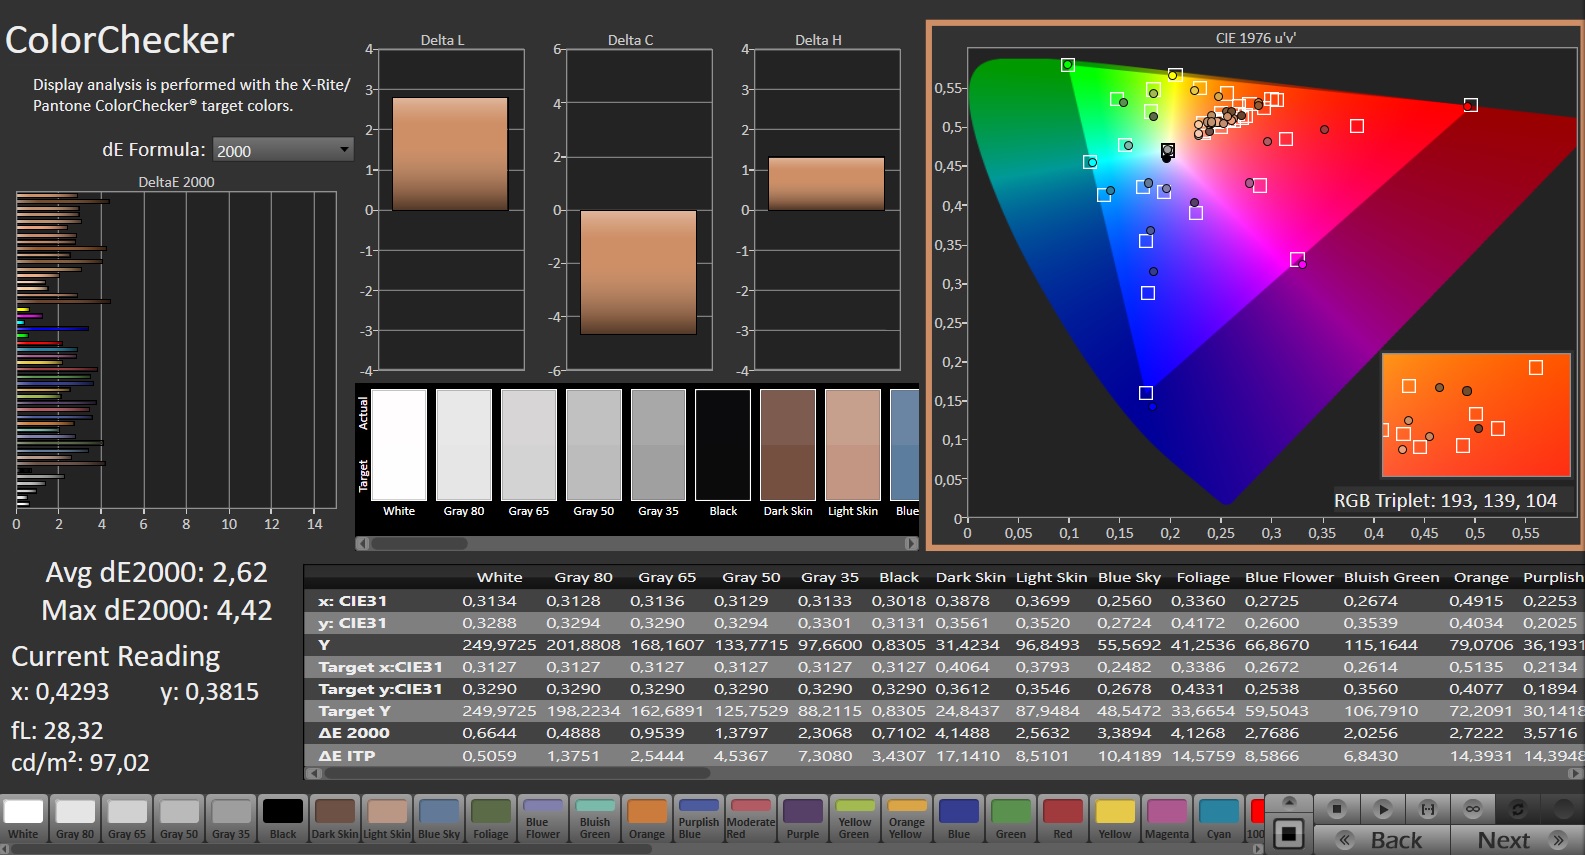
calibrated: 2.62
ΔE Greyscale Calman: 3 | ∀{0.09-98 Ø4.96}
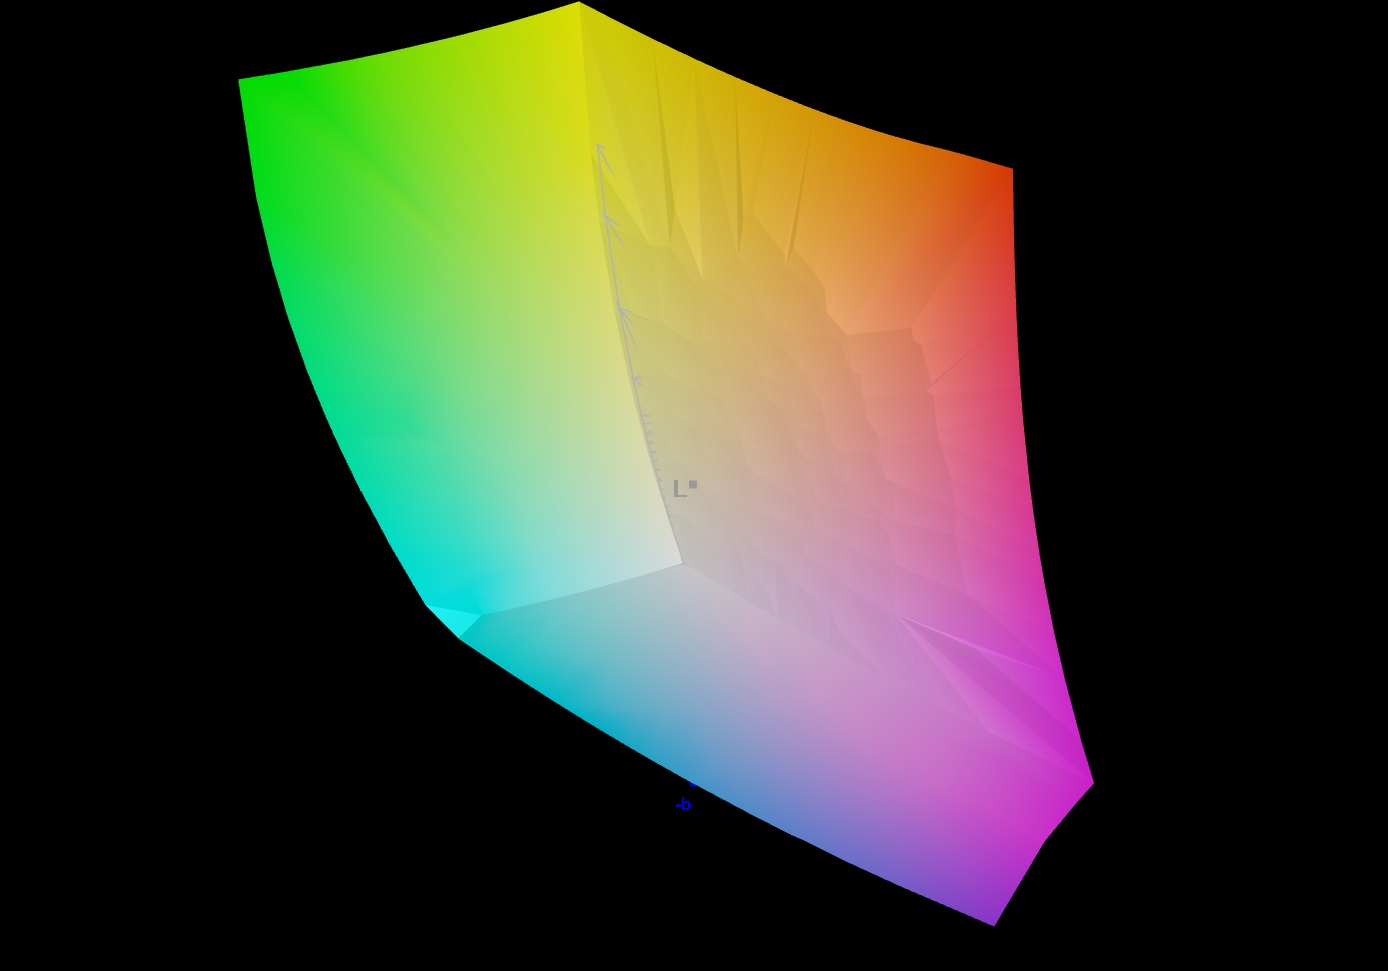
85.7% AdobeRGB 1998 (Argyll 3D)
99.9% sRGB (Argyll 3D)
98.2% Display P3 (Argyll 3D)
Gamma: 2.086
CCT: 6289 K
| Aorus 15 BSF Sharp LQ156T1JW05, IPS, 2560x1440, 15.6" | HP Omen Transcend 16 AUOA3A6, Mini-LED, 2560x1600, 16" | MSI Pulse 17 B13VGK AU Optronics B173HAN04.9, IPS, 1920x1080, 17.3" | Lenovo Legion Slim 7i 16 Gen 8 CSOT T3 MNG007DA2-3, IPS, 2560x1600, 16" | Acer Nitro 16 AN16-41 BOE CQ NE16QDM-NY1, IPS, 2560x1600, 16" | Asus TUF Gaming A16 FA617XS BOE NE160WUM-NX2, IPS, 1920x1200, 16" | |
|---|---|---|---|---|---|---|
| Display | 1% | -52% | -15% | -17% | -17% | |
| Display P3 Coverage (%) | 98.2 | 99.2 1% | 38.4 -61% | 70.4 -28% | 67.9 -31% | 69.3 -29% |
| sRGB Coverage (%) | 99.9 | 100 0% | 57.5 -42% | 99.4 -1% | 99.1 -1% | 97.3 -3% |
| AdobeRGB 1998 Coverage (%) | 85.7 | 87.6 2% | 39.7 -54% | 72.5 -15% | 69.9 -18% | 70.7 -18% |
| Response Times | -219% | -207% | -17% | 16% | -41% | |
| Response Time Grey 50% / Grey 80% * (ms) | 11.3 ? | 26.4 ? -134% | 31.2 ? -176% | 12 ? -6% | 11 ? 3% | 15.6 ? -38% |
| Response Time Black / White * (ms) | 7 ? | 28.2 ? -303% | 23.6 ? -237% | 8.9 ? -27% | 5 ? 29% | 10 ? -43% |
| PWM Frequency (Hz) | 3506 ? | |||||
| Screen | 234% | -42% | 22% | 25% | 23% | |
| Brightness middle (cd/m²) | 299 | 791.1 165% | 254 -15% | 474.6 59% | 520 74% | 301 1% |
| Brightness (cd/m²) | 282 | 800 184% | 250 -11% | 445 58% | 494 75% | 294 4% |
| Brightness Distribution (%) | 82 | 95 16% | 91 11% | 86 5% | 91 11% | 94 15% |
| Black Level * (cd/m²) | 0.31 | 0.04 87% | 0.14 55% | 0.39 -26% | 0.39 -26% | 0.21 32% |
| Contrast (:1) | 965 | 19778 1950% | 1814 88% | 1217 26% | 1333 38% | 1433 48% |
| Colorchecker dE 2000 * | 2.24 | 4.37 -95% | 4.52 -102% | 2.12 5% | 1.94 13% | 1.79 20% |
| Colorchecker dE 2000 max. * | 4.29 | 10.39 -142% | 21.22 -395% | 4.73 -10% | 5.62 -31% | 3.48 19% |
| Colorchecker dE 2000 calibrated * | 2.62 | 1.04 60% | 4.52 -73% | 0.57 78% | 0.74 72% | 1.2 54% |
| Greyscale dE 2000 * | 3 | 6.5 -117% | 1 67% | 2.8 7% | 2.94 2% | 2.5 17% |
| Gamma | 2.086 105% | 2.28 96% | 2.44 90% | 2.22 99% | 2.37 93% | 2.265 97% |
| CCT | 6289 103% | 6000 108% | 6502 100% | 6542 99% | 6443 101% | 6157 106% |
| Média Total (Programa/Configurações) | 5% /
120% | -100% /
-68% | -3% /
9% | 8% /
15% | -12% /
6% |
* ... menor é melhor
O monitor já apresentava uma boa representação de cores em seu estado de entrega: Com um desvio de 2,24, sua meta foi atingida (DeltaE < 3). A calibração não resultou em nenhuma diferença perceptível. A precisão das cores está presente: O painel pode representar completamente os espaços de cores sRGB e DCI-P3 e 86% do espaço Adobe RGB pode ser representado.

Exibir tempos de resposta
| ↔ Tempo de resposta preto para branco | ||
|---|---|---|
| 7 ms ... ascensão ↗ e queda ↘ combinadas | ↗ 3.4 ms ascensão | 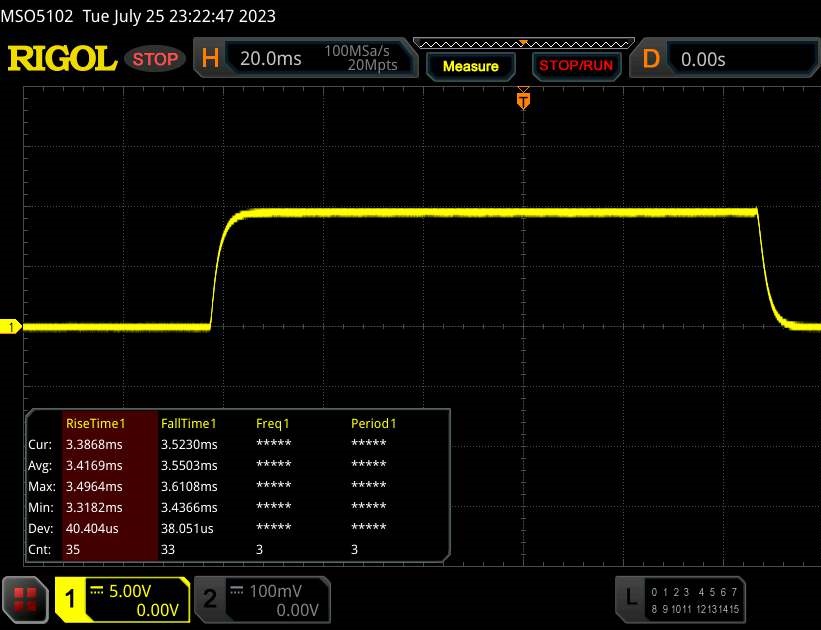 |
| ↘ 3.6 ms queda | ||
| A tela mostra taxas de resposta muito rápidas em nossos testes e deve ser muito adequada para jogos em ritmo acelerado. Em comparação, todos os dispositivos testados variam de 0.1 (mínimo) a 240 (máximo) ms. » 21 % de todos os dispositivos são melhores. Isso significa que o tempo de resposta medido é melhor que a média de todos os dispositivos testados (19.8 ms). | ||
| ↔ Tempo de resposta 50% cinza a 80% cinza | ||
| 11.3 ms ... ascensão ↗ e queda ↘ combinadas | ↗ 5.2 ms ascensão | 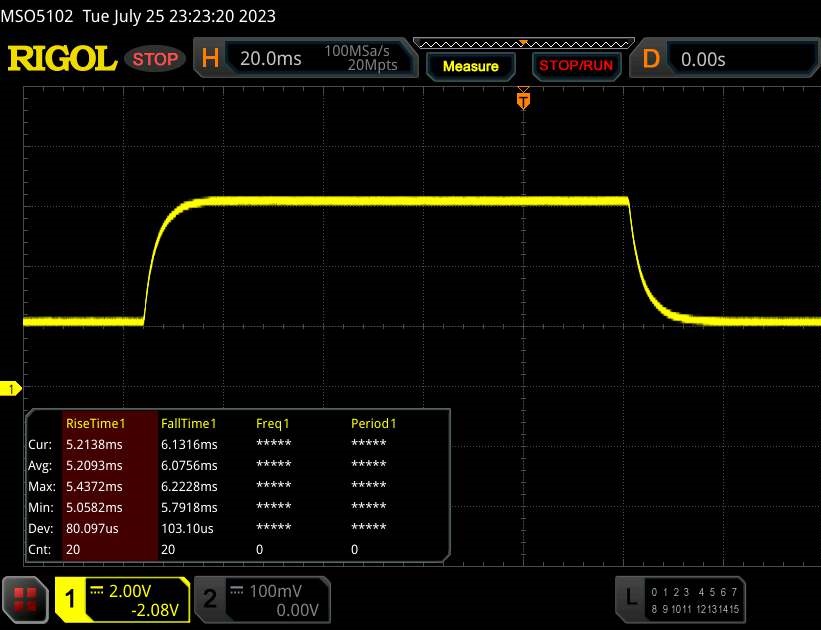 |
| ↘ 6.1 ms queda | ||
| A tela mostra boas taxas de resposta em nossos testes, mas pode ser muito lenta para jogadores competitivos. Em comparação, todos os dispositivos testados variam de 0.165 (mínimo) a 636 (máximo) ms. » 25 % de todos os dispositivos são melhores. Isso significa que o tempo de resposta medido é melhor que a média de todos os dispositivos testados (31 ms). | ||
Cintilação da tela / PWM (modulação por largura de pulso)
| Tela tremeluzindo / PWM não detectado |  | ||
[pwm_comparison] Em comparação: 52 % de todos os dispositivos testados não usam PWM para escurecer a tela. Se PWM foi detectado, uma média de 7754 (mínimo: 5 - máximo: 343500) Hz foi medida. | |||
O painel IPS estável com ângulo de visão pode ser lido de qualquer posição. Na área externa, é possível ler a partir da tela se o sol não estiver brilhando muito forte.

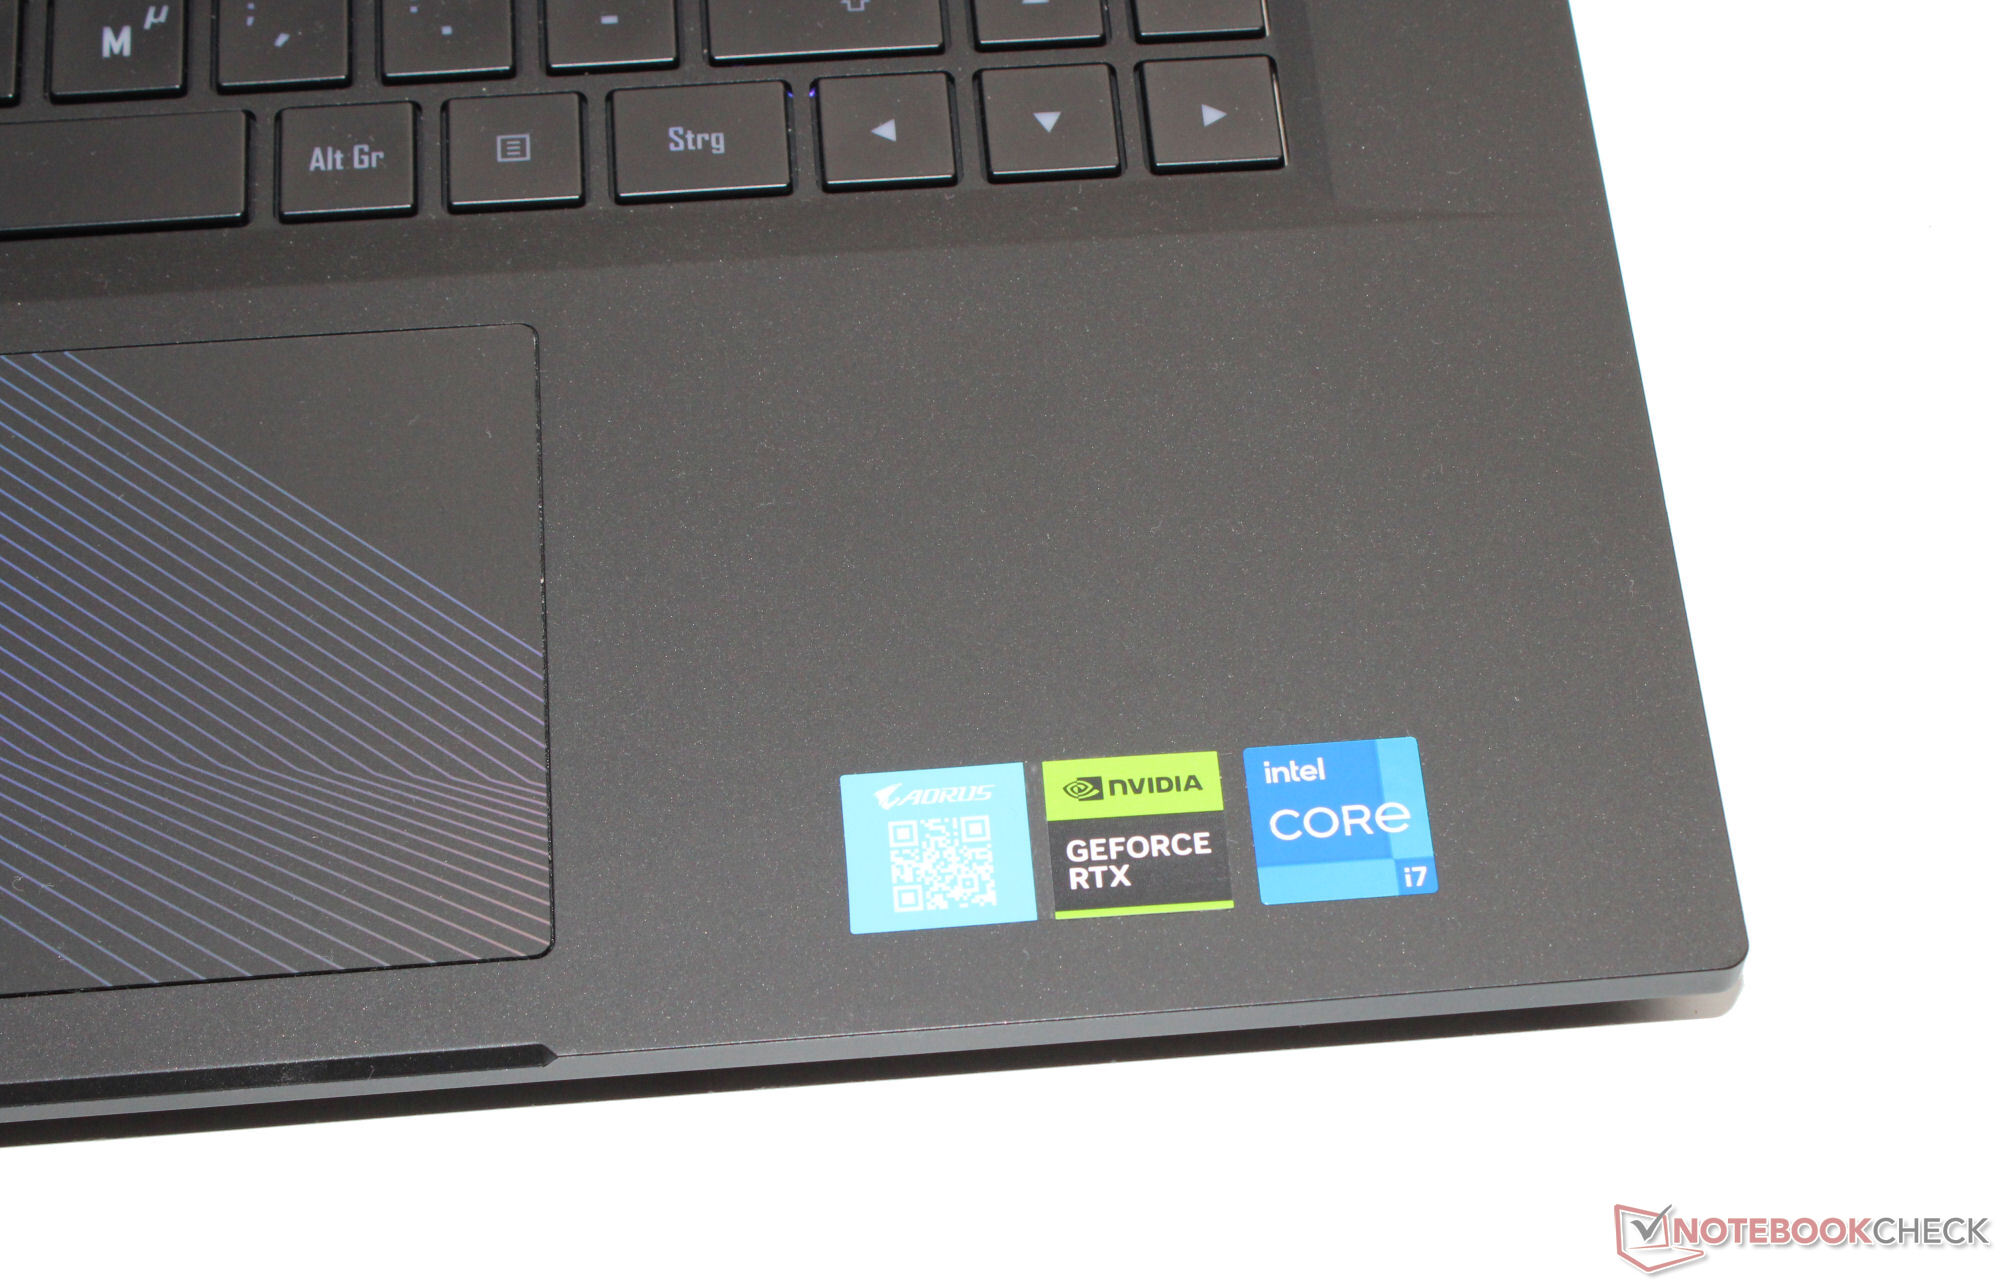
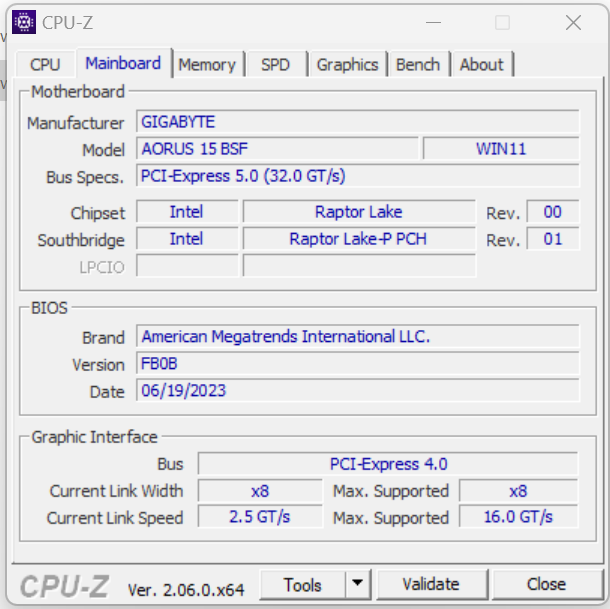
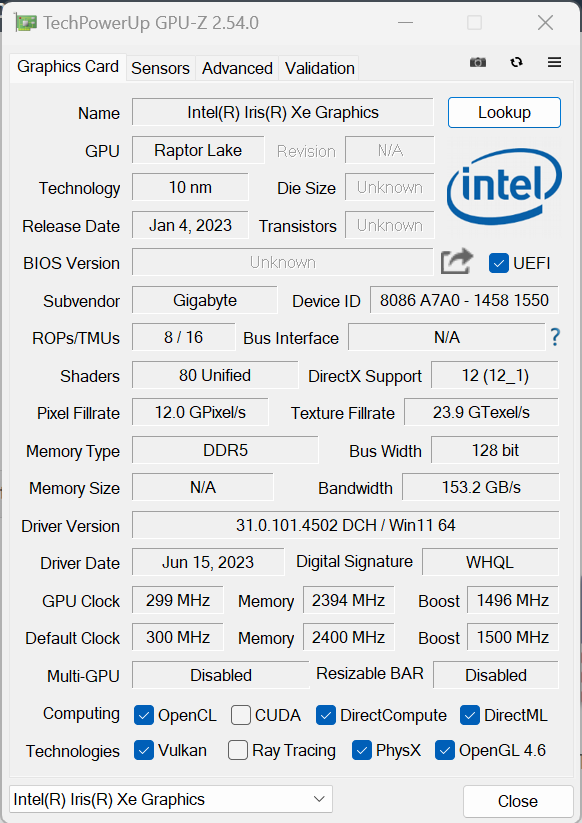
Desempenho - Raptor Lake e Ada Lovelace alimentam o computador Gigabyte
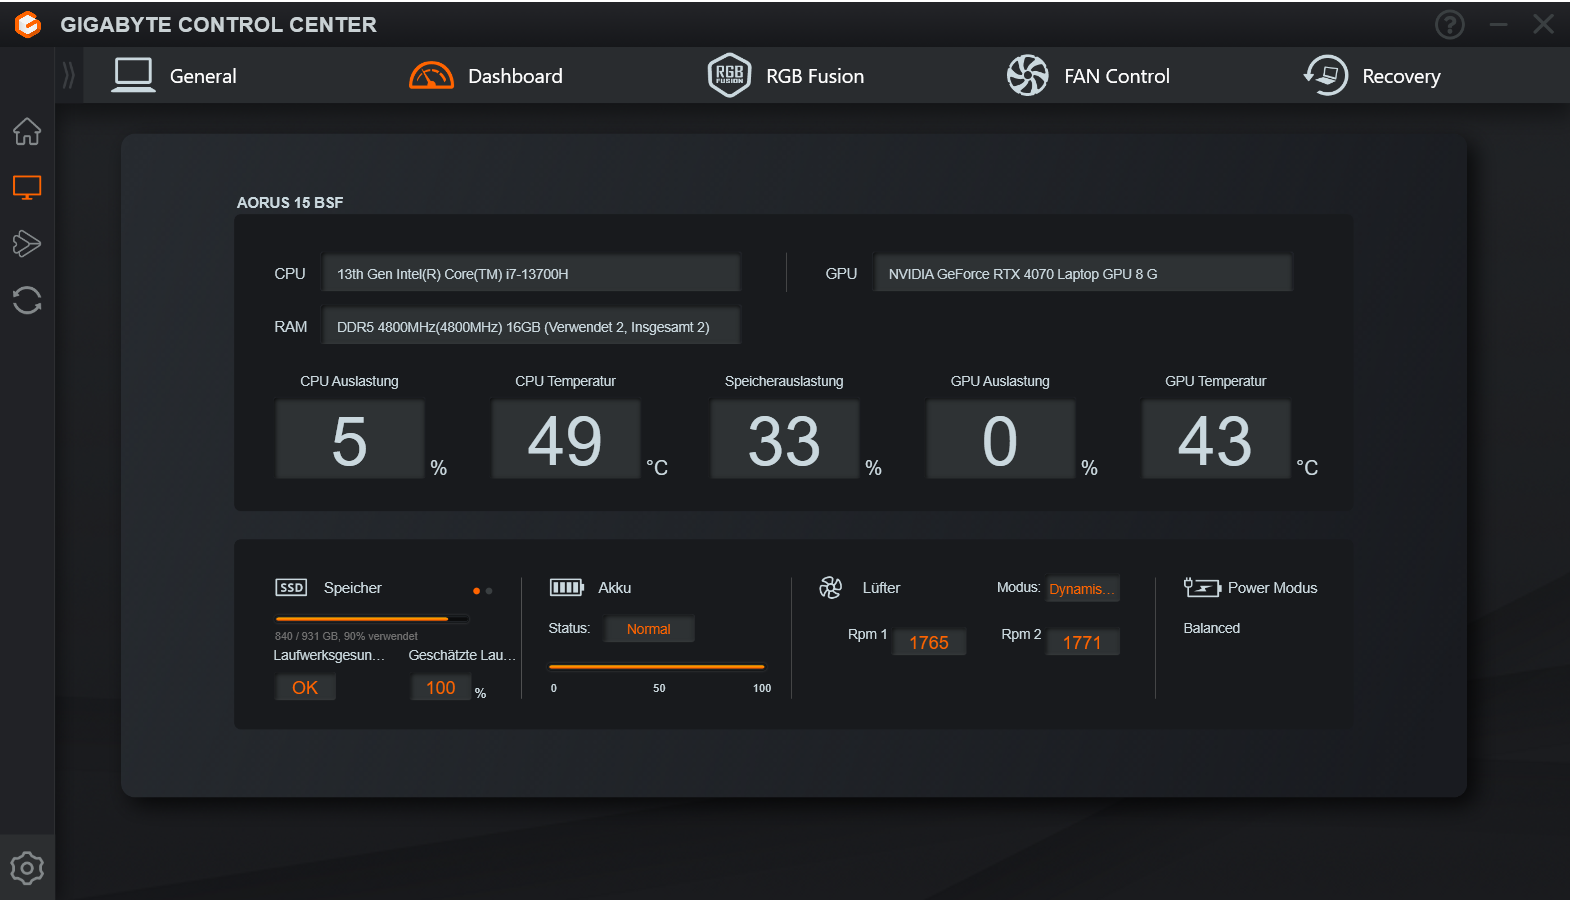
O Aorus 15 BSF é um dos laptops para jogos de médio porte mais potentes e também pode ser usado em diferentes áreas. O desempenho necessário é fornecido pelo Raptor Lake e Ada Lovelace. O dispositivo atual pode ser encontrado por cerca de US$ 1.700.
Condições de teste
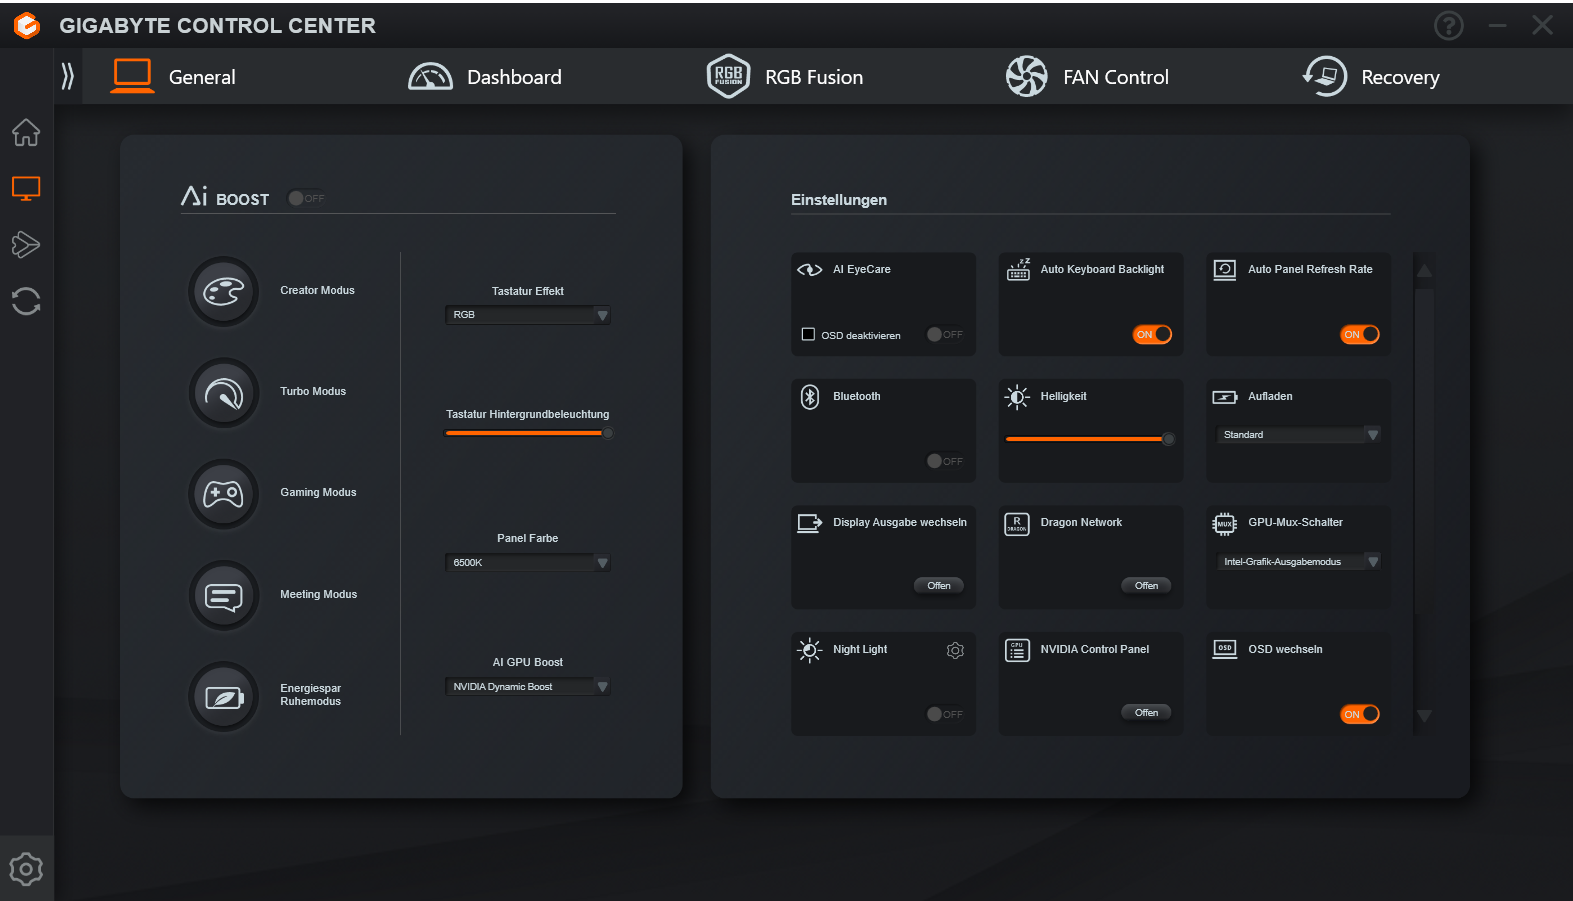
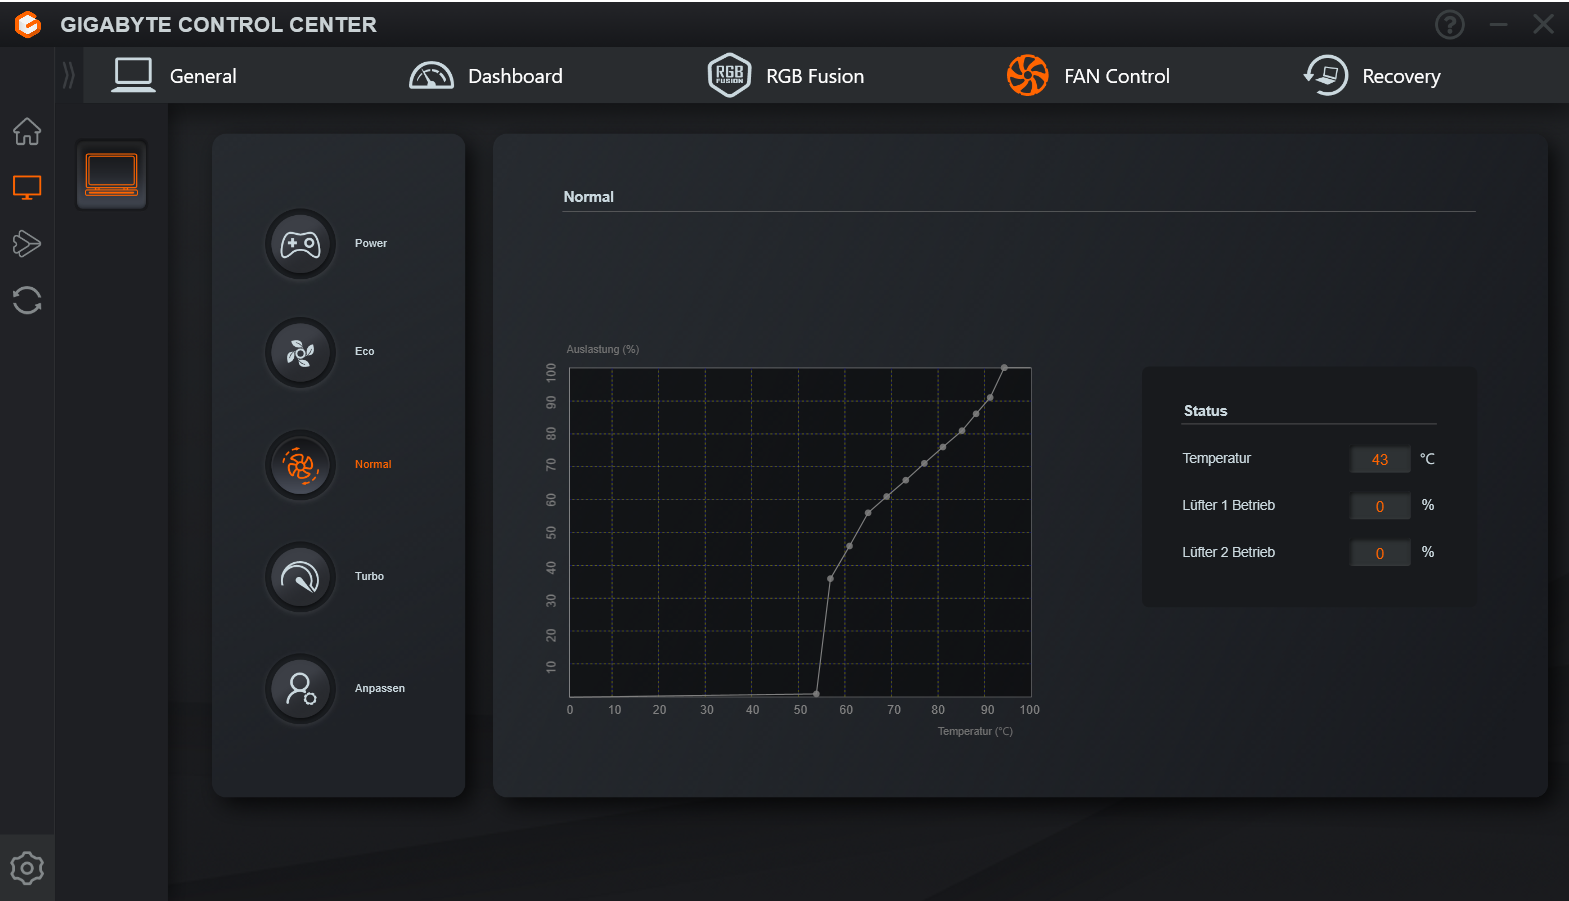
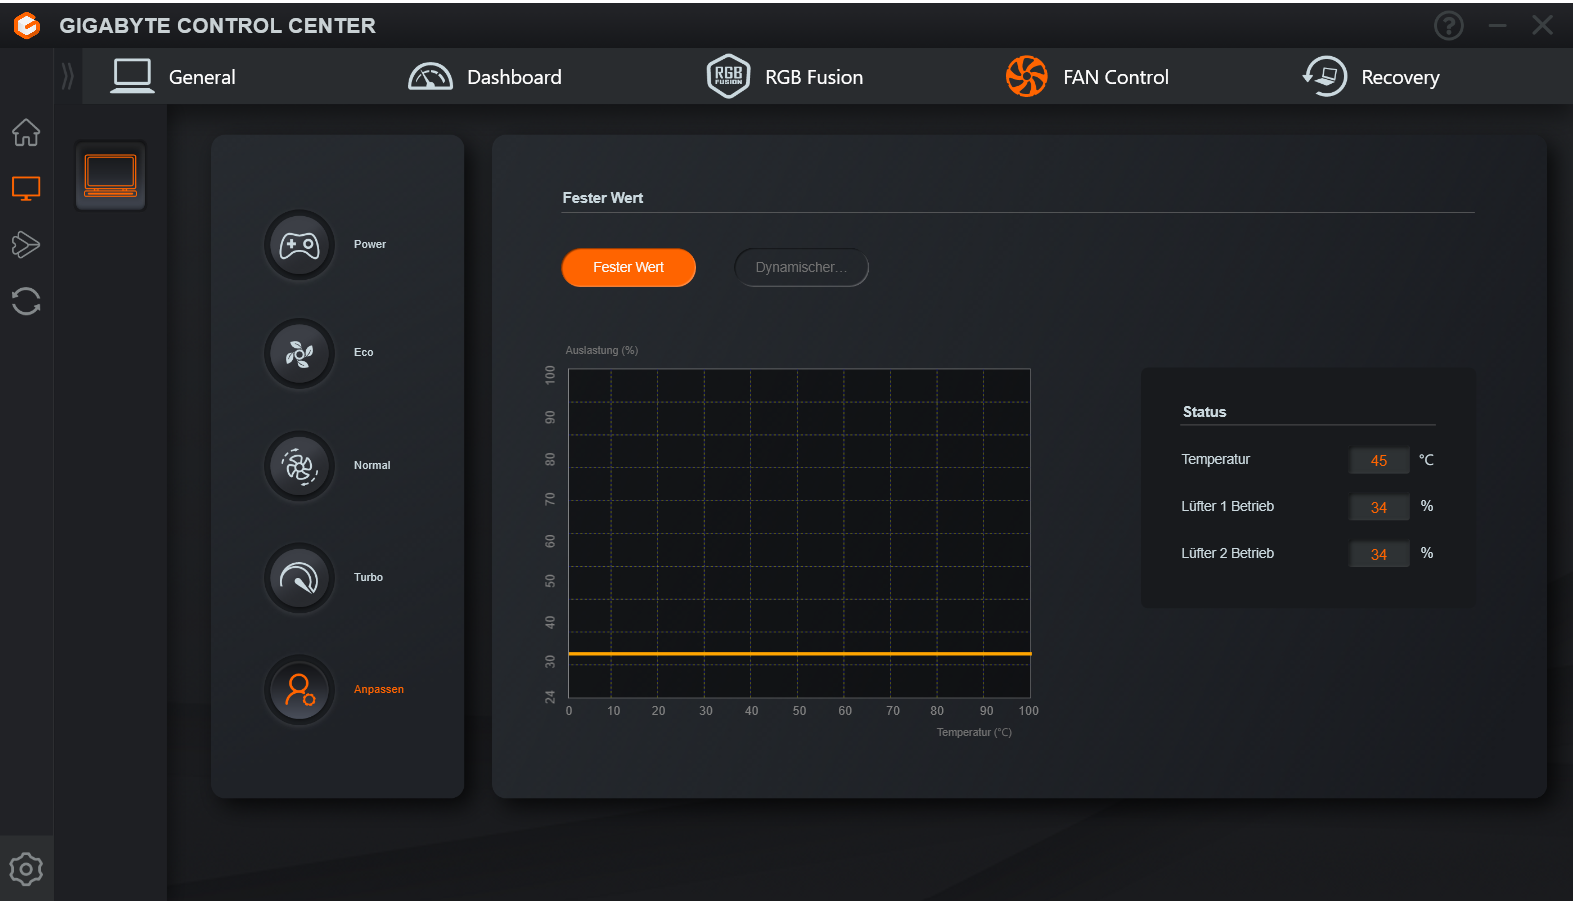
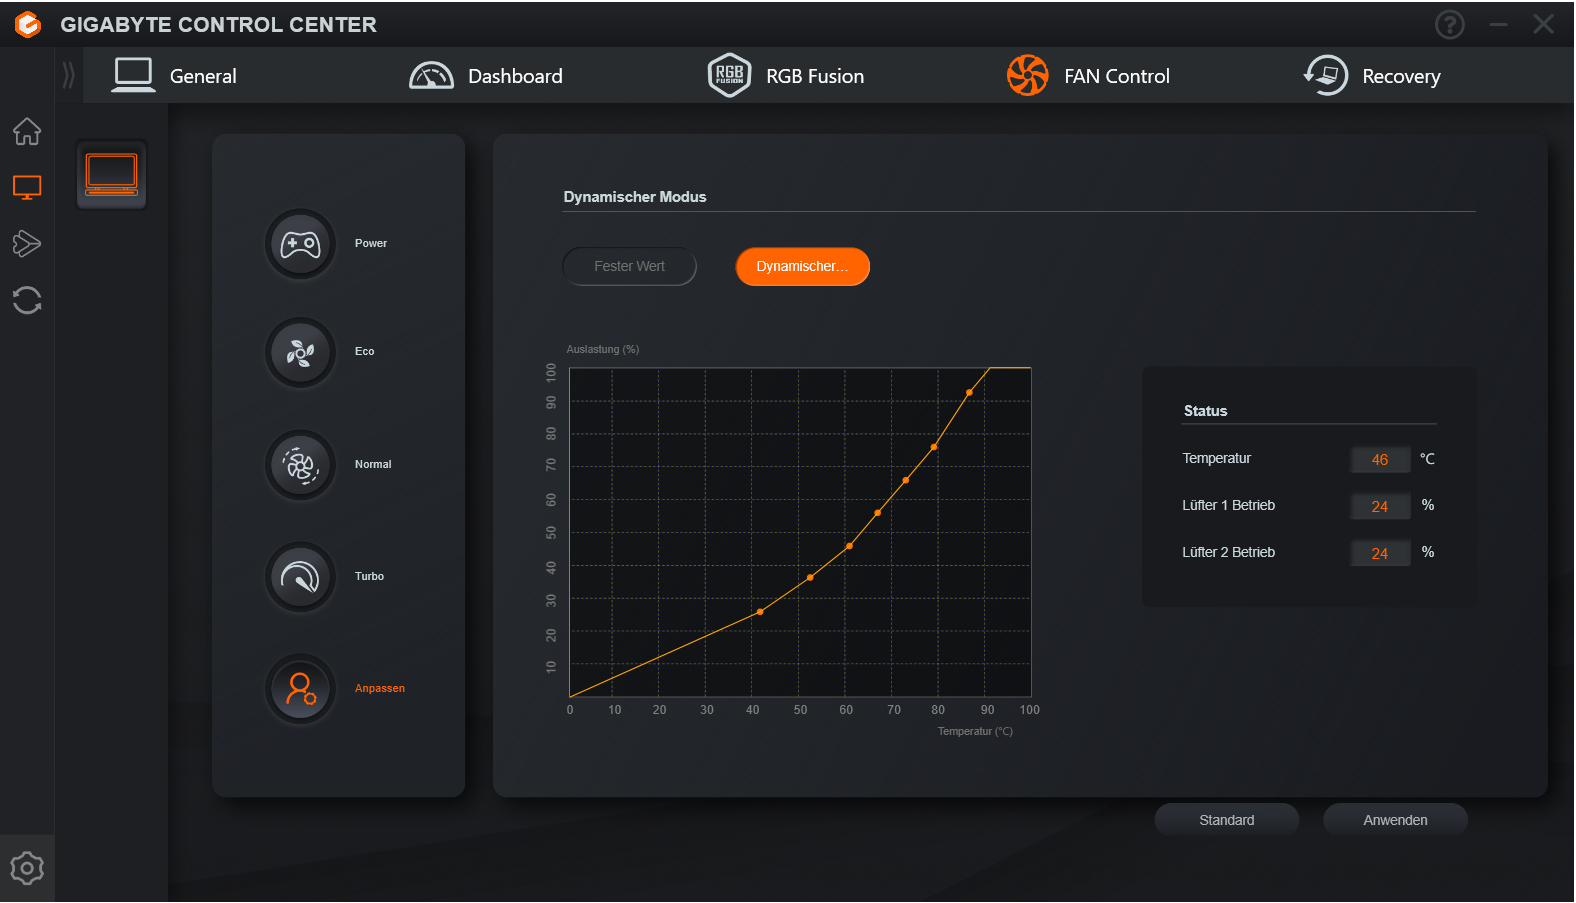
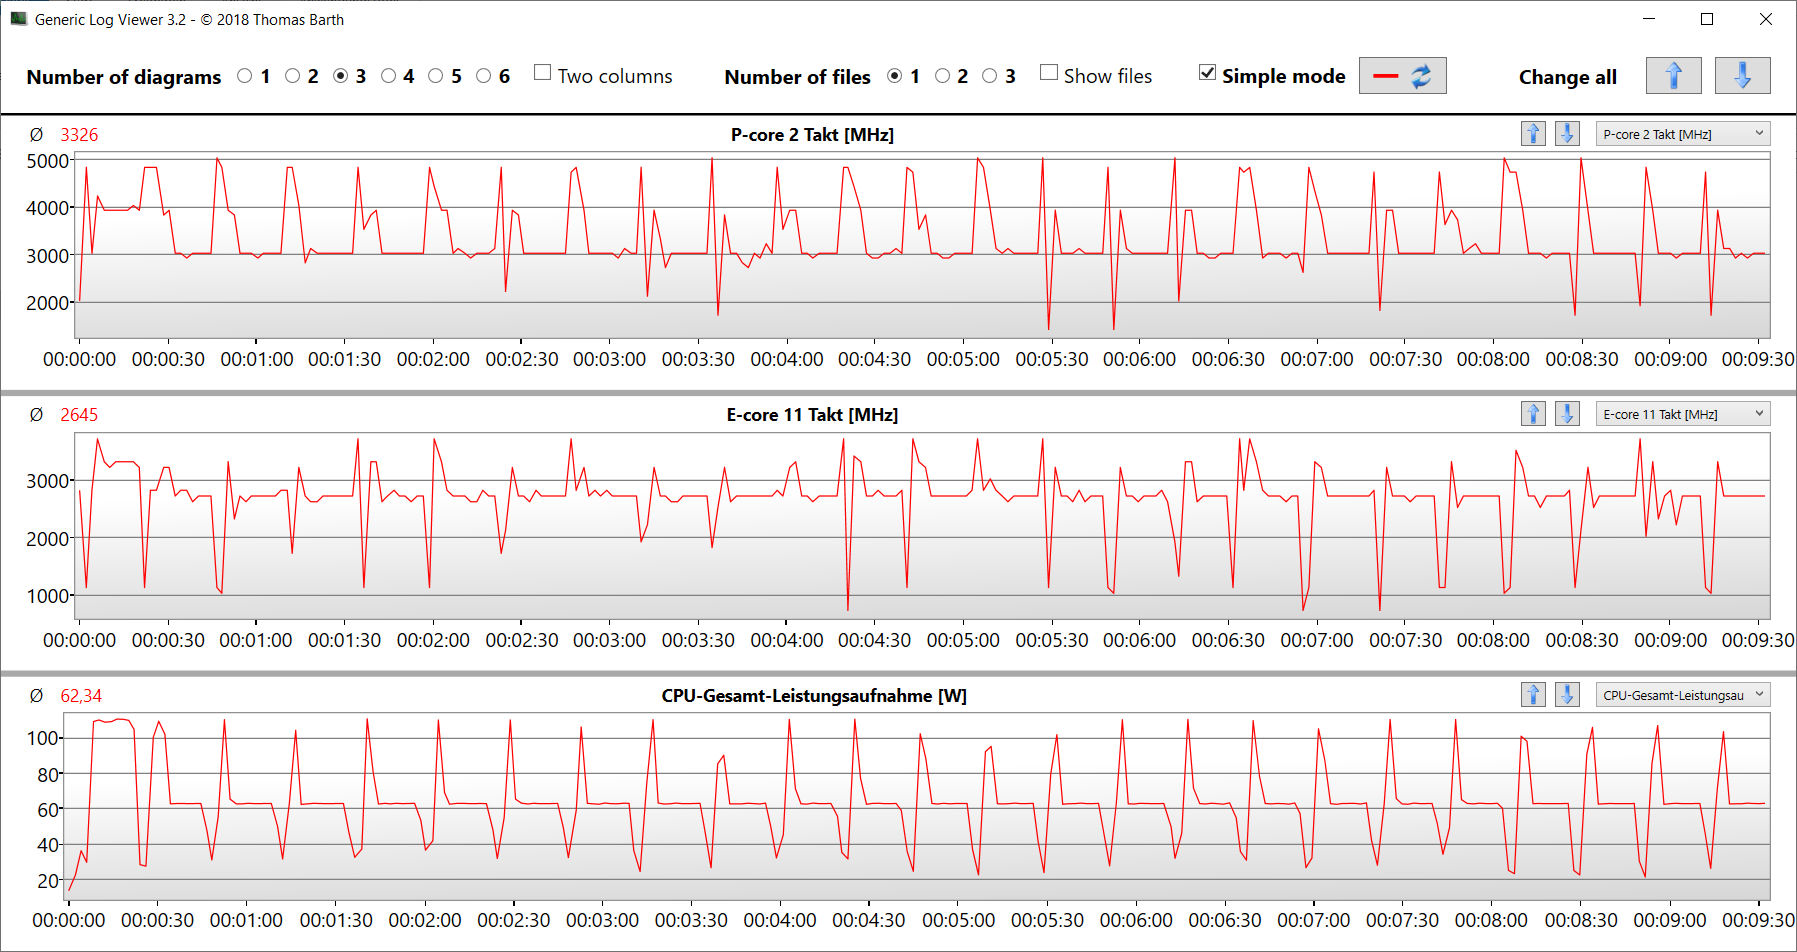
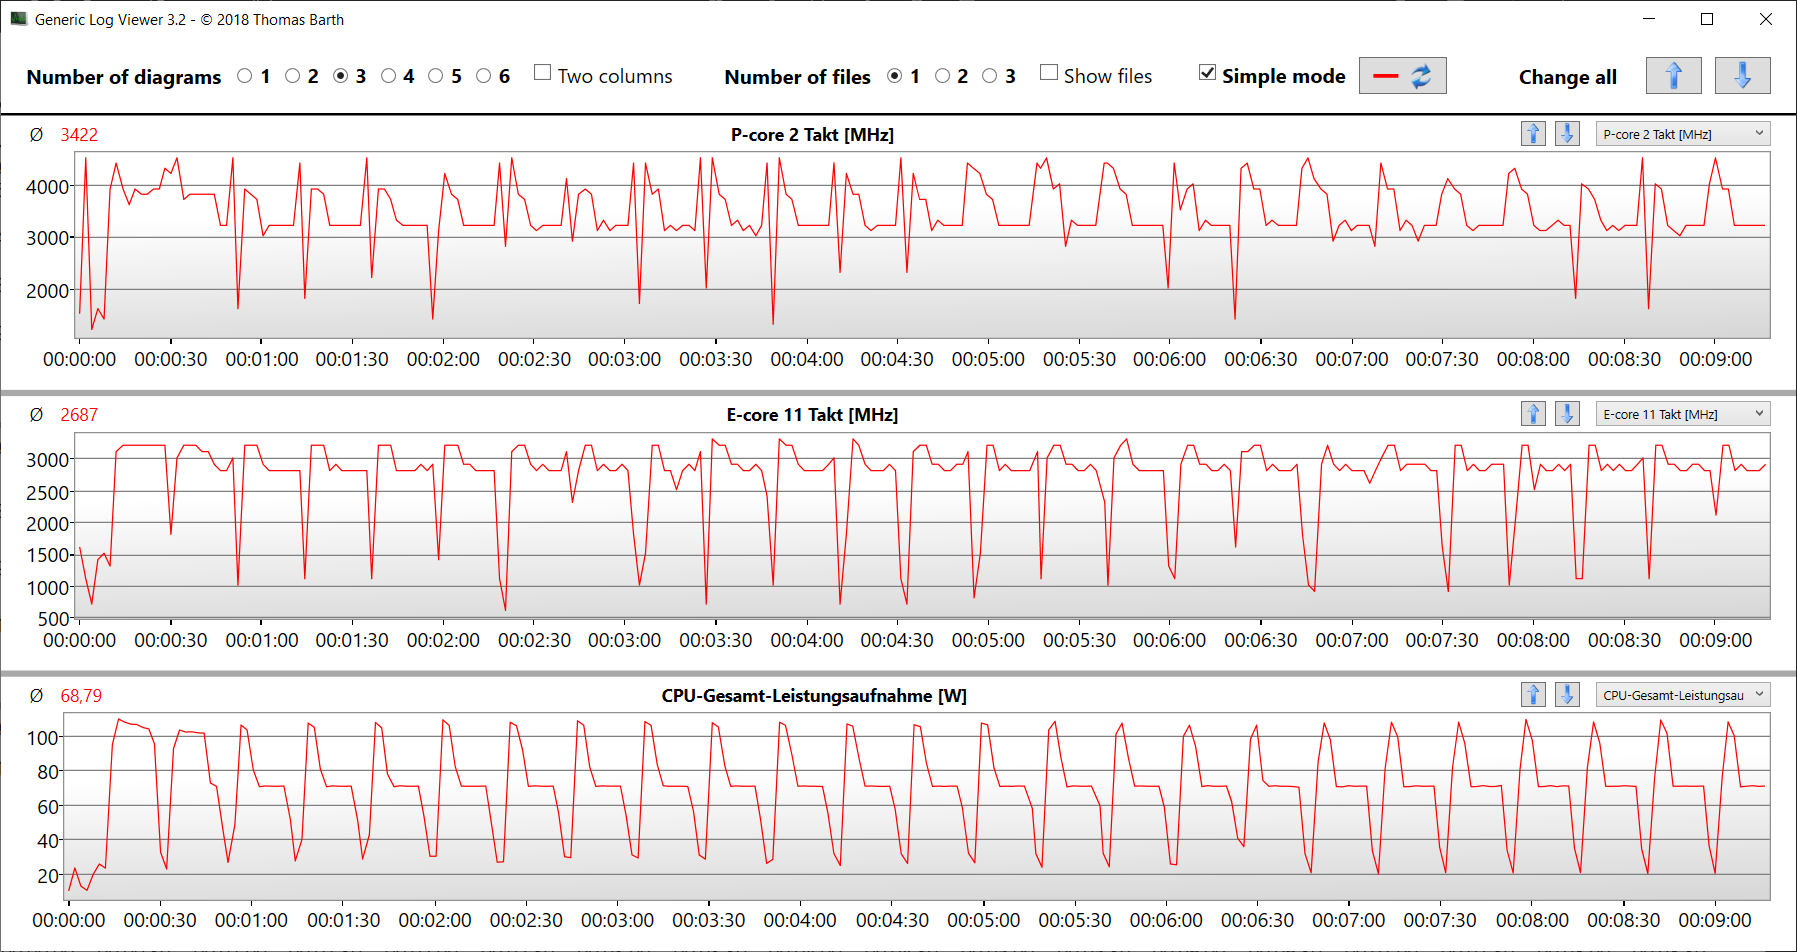
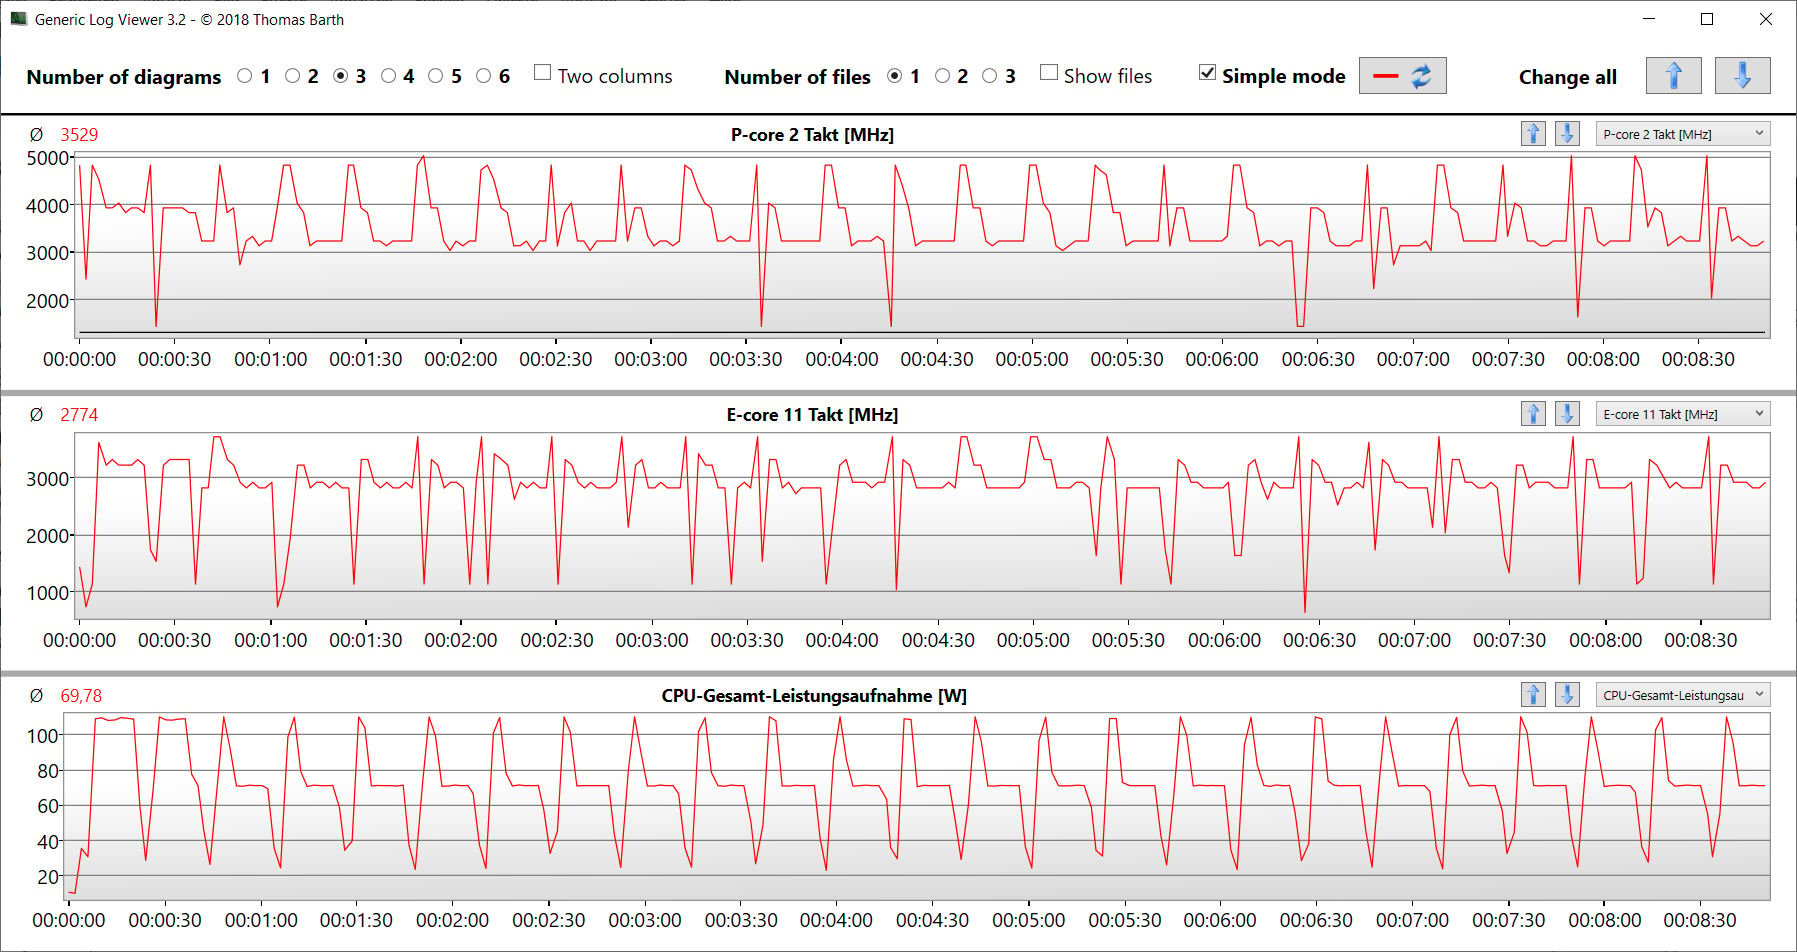
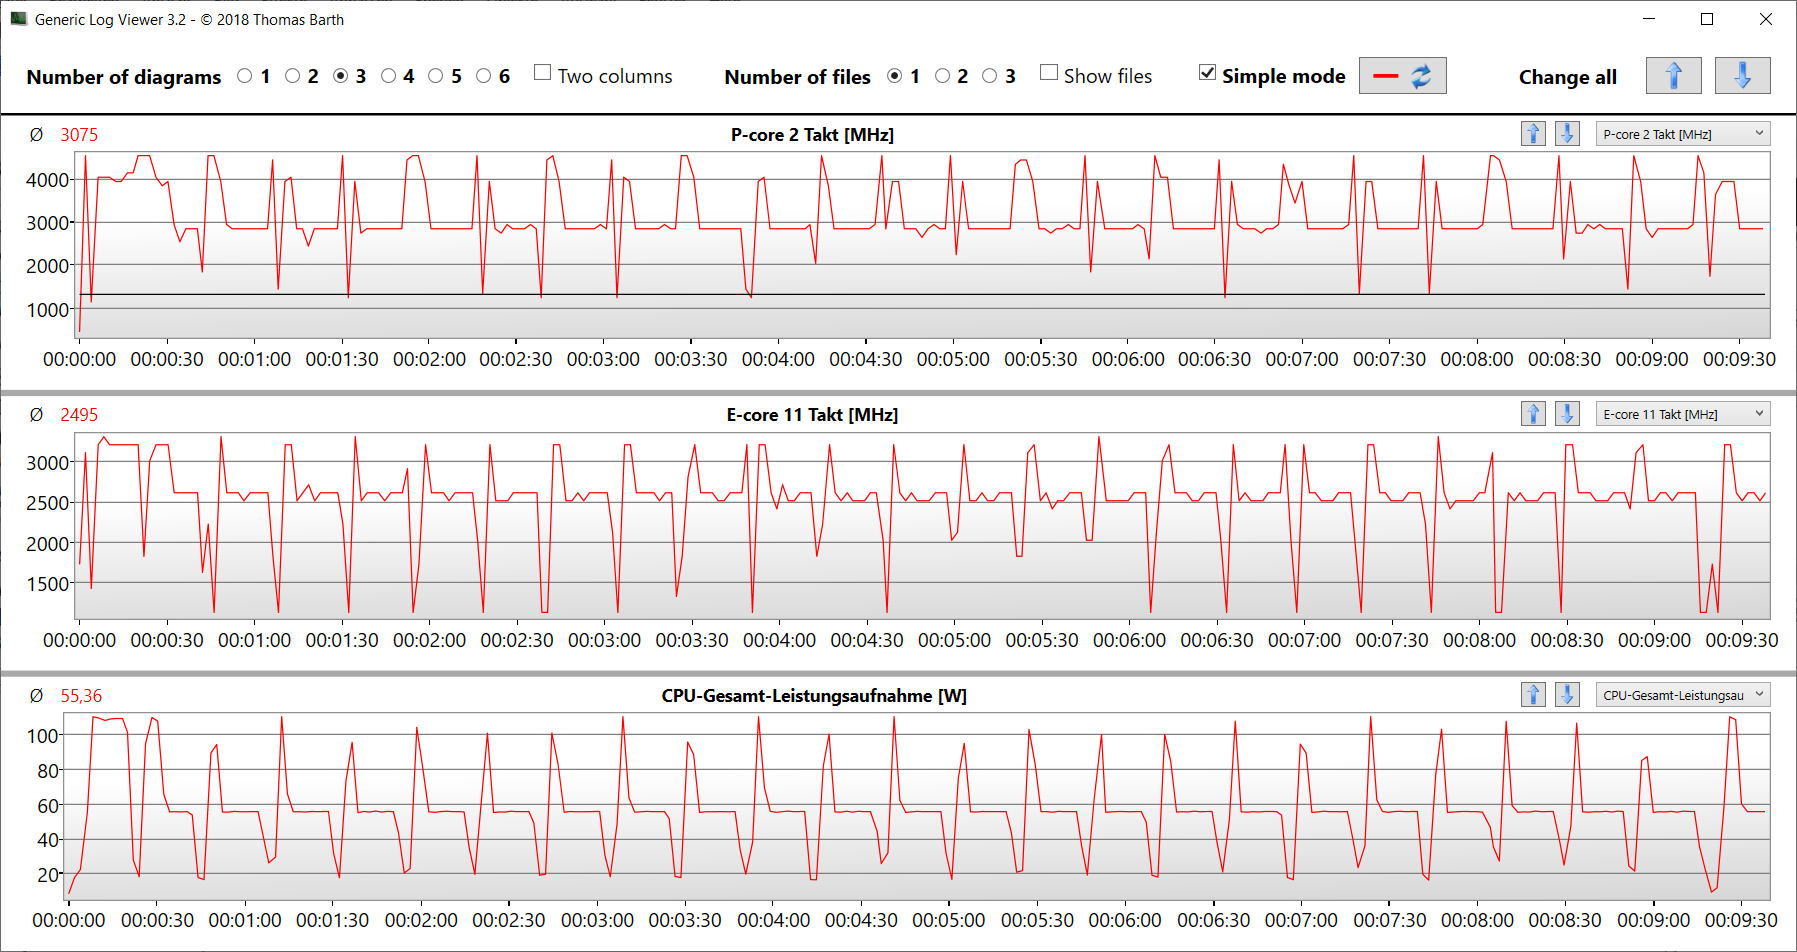
O centro de controle do computador (Gigabyte Control Center) oferece uma função AI Boost de nível superior que usamos além dos modos de desempenho típicos (consulte a tabela). Posteriormente, o Control Center selecionou o perfil apropriado - "Gaming Mode" e "Creator Mode" para os benchmarks, "Energy Saving Sleep Mode" para os testes de bateria.
| AI Boost | Creator | Turbo | Gaming | Meeting | Modo de suspensão com economia de energia | |
|---|---|---|---|---|---|---|
| Limite de energia 1 (HWInfo) | 55-70 watts | 70 watts | 70 watts | 55 watts | 27 watts | 27 watts |
| Limite de energia 2 (HWInfo) | 115 watts | 115 watts | 115 watts | 115 watts | 45 watts | 45 watts |
| Ruído (Witcher 3) | 53 dB(A) | 52 dB(A) | 55 dB(A) | 53 dB(A) | 46 dB(A) | 46 dB(A) |
| Desempenho (Witcher 3) | 118 fps | 118 fps | 118 fps | 118 fps | 118 fps | 118 fps |
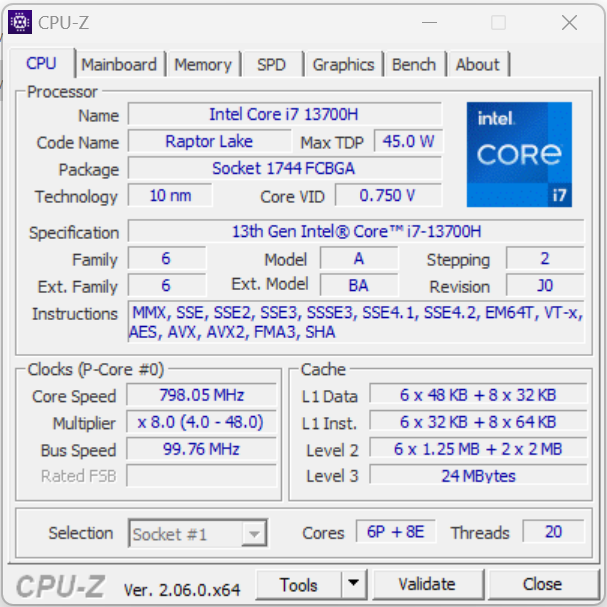
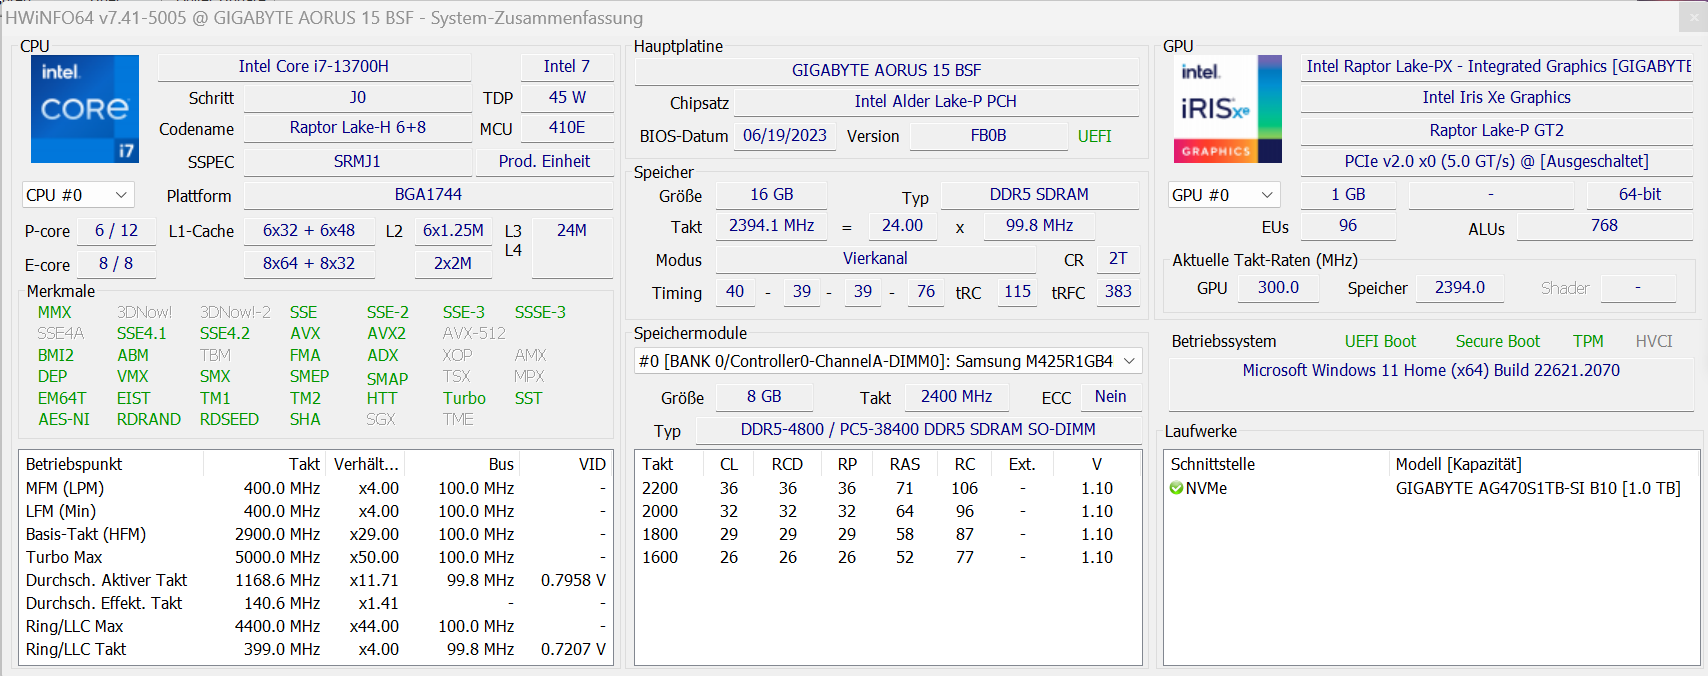
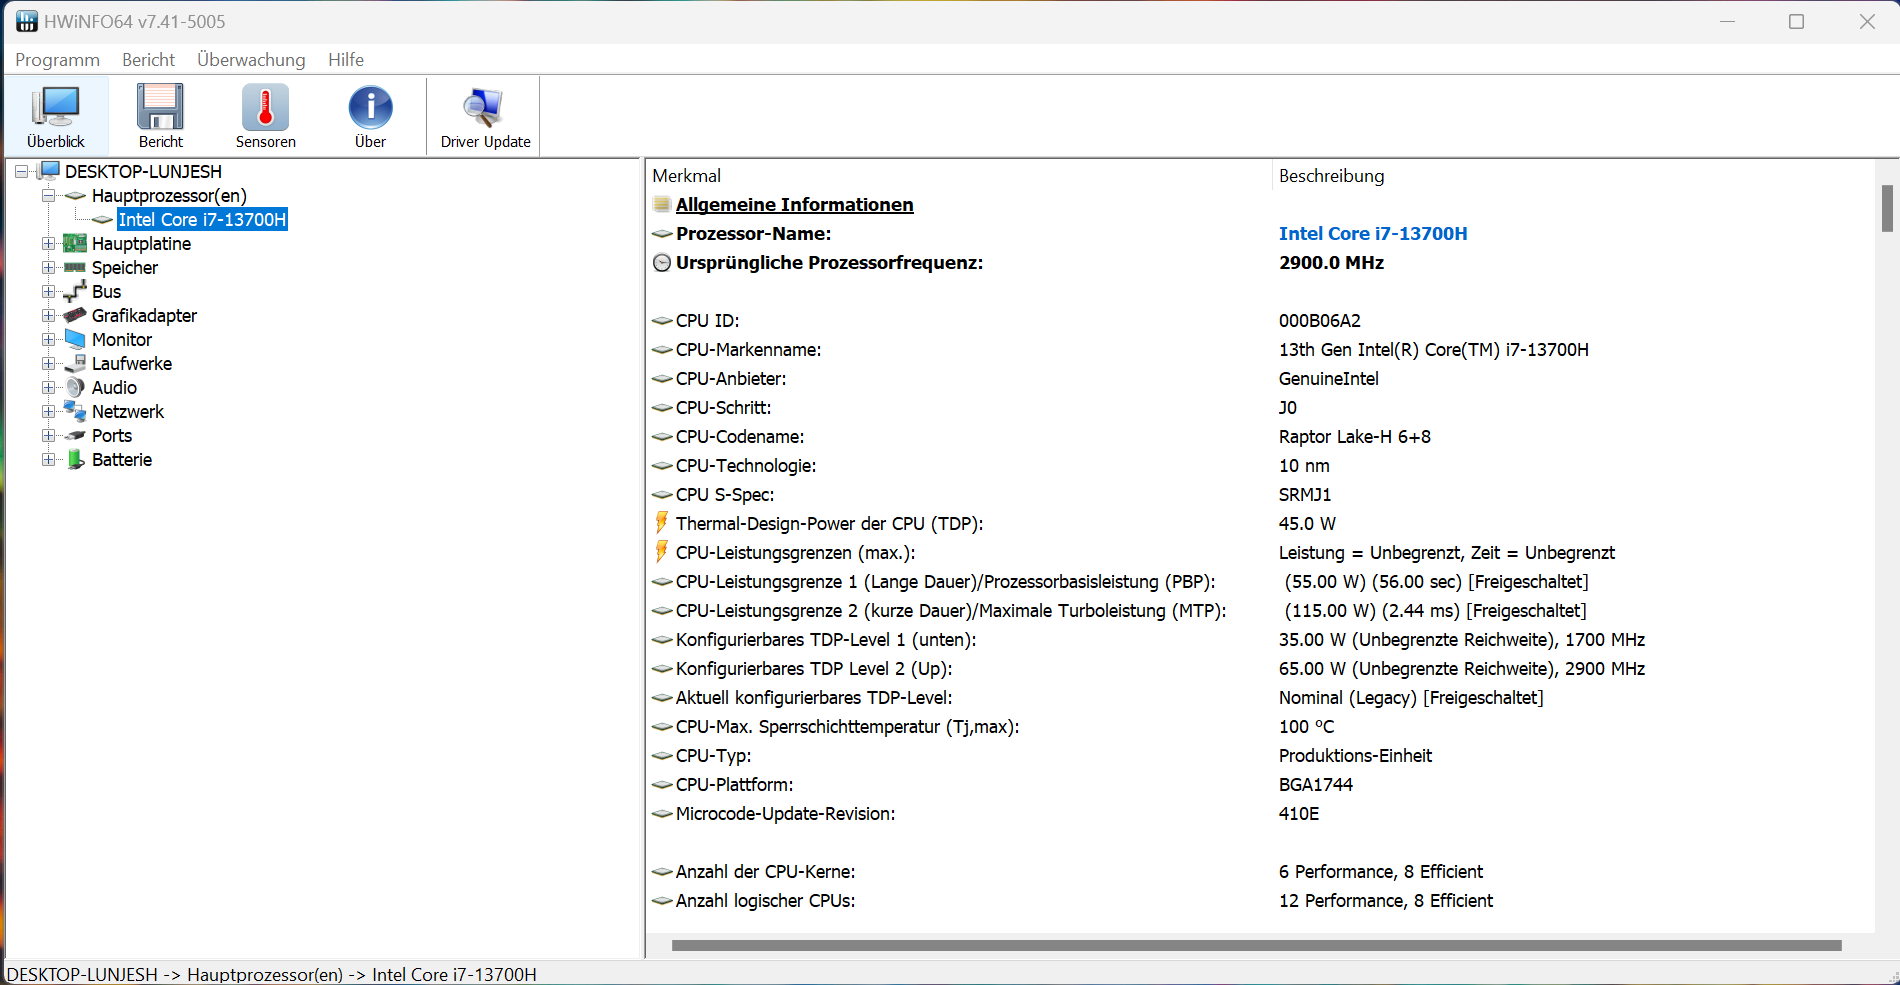
Processador
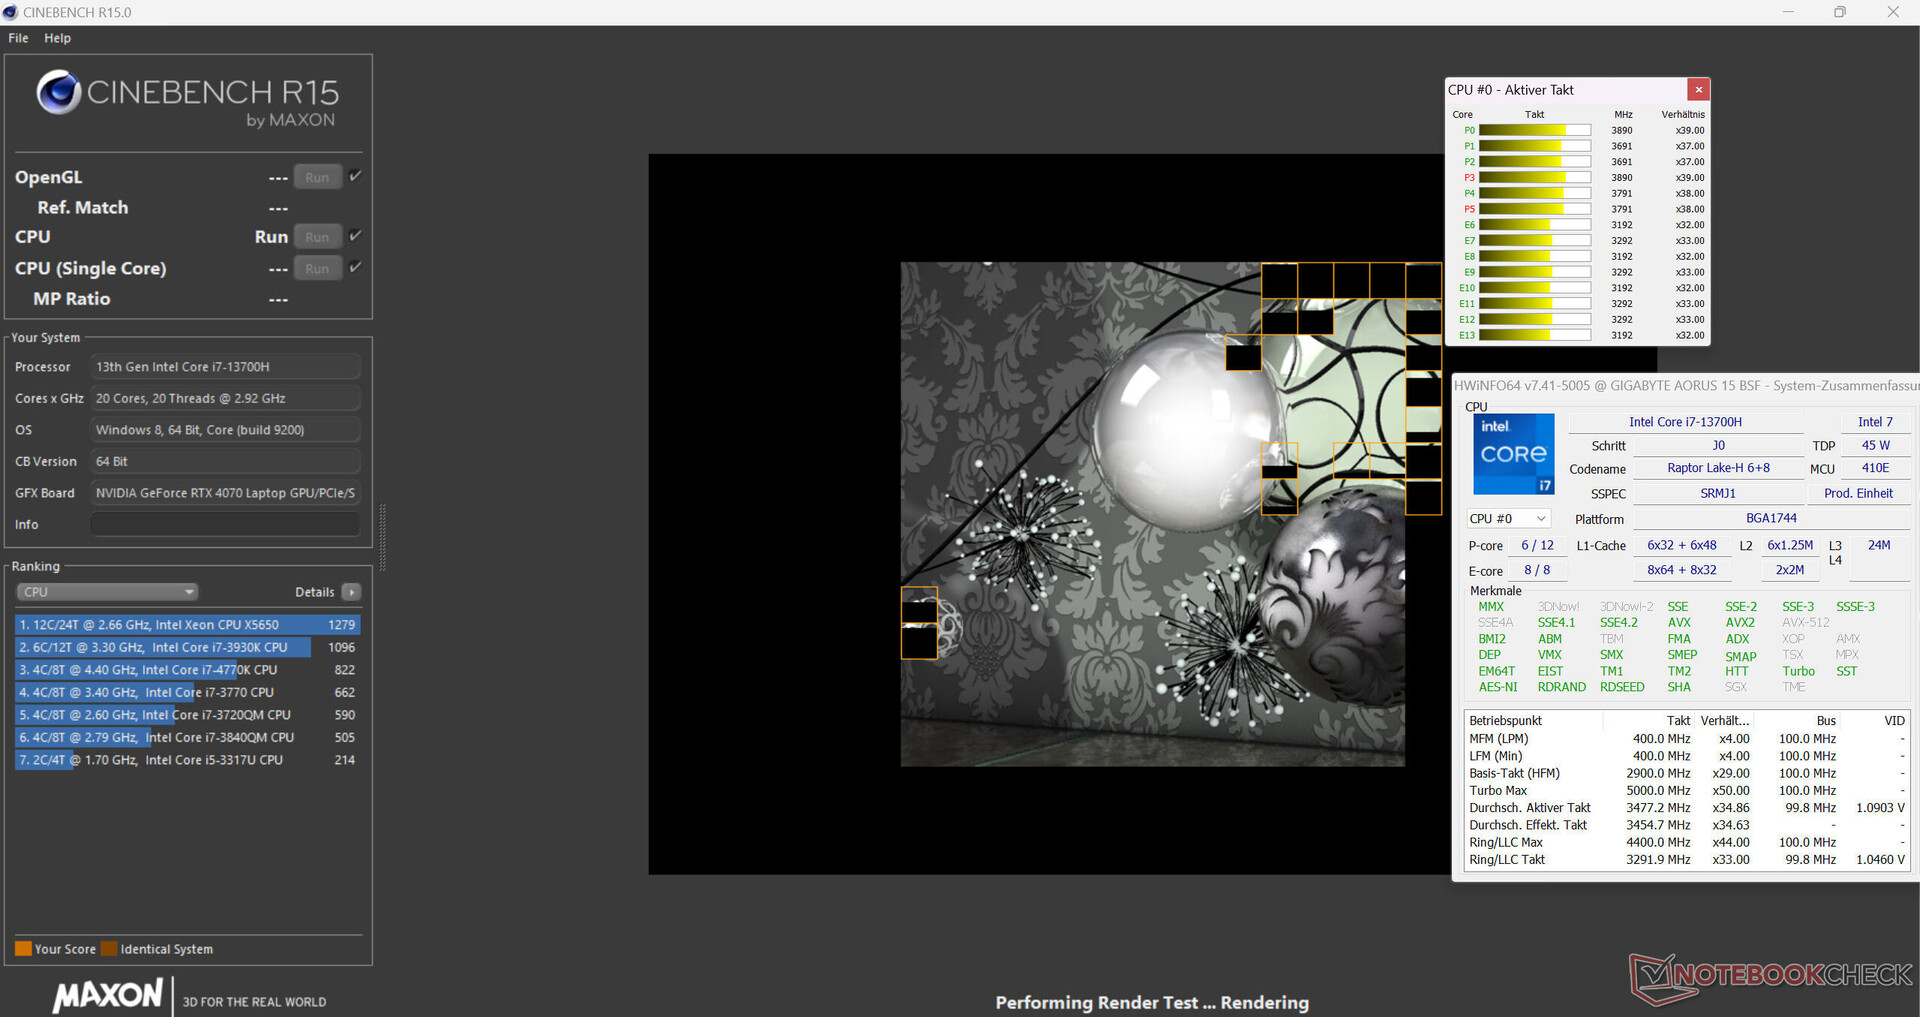
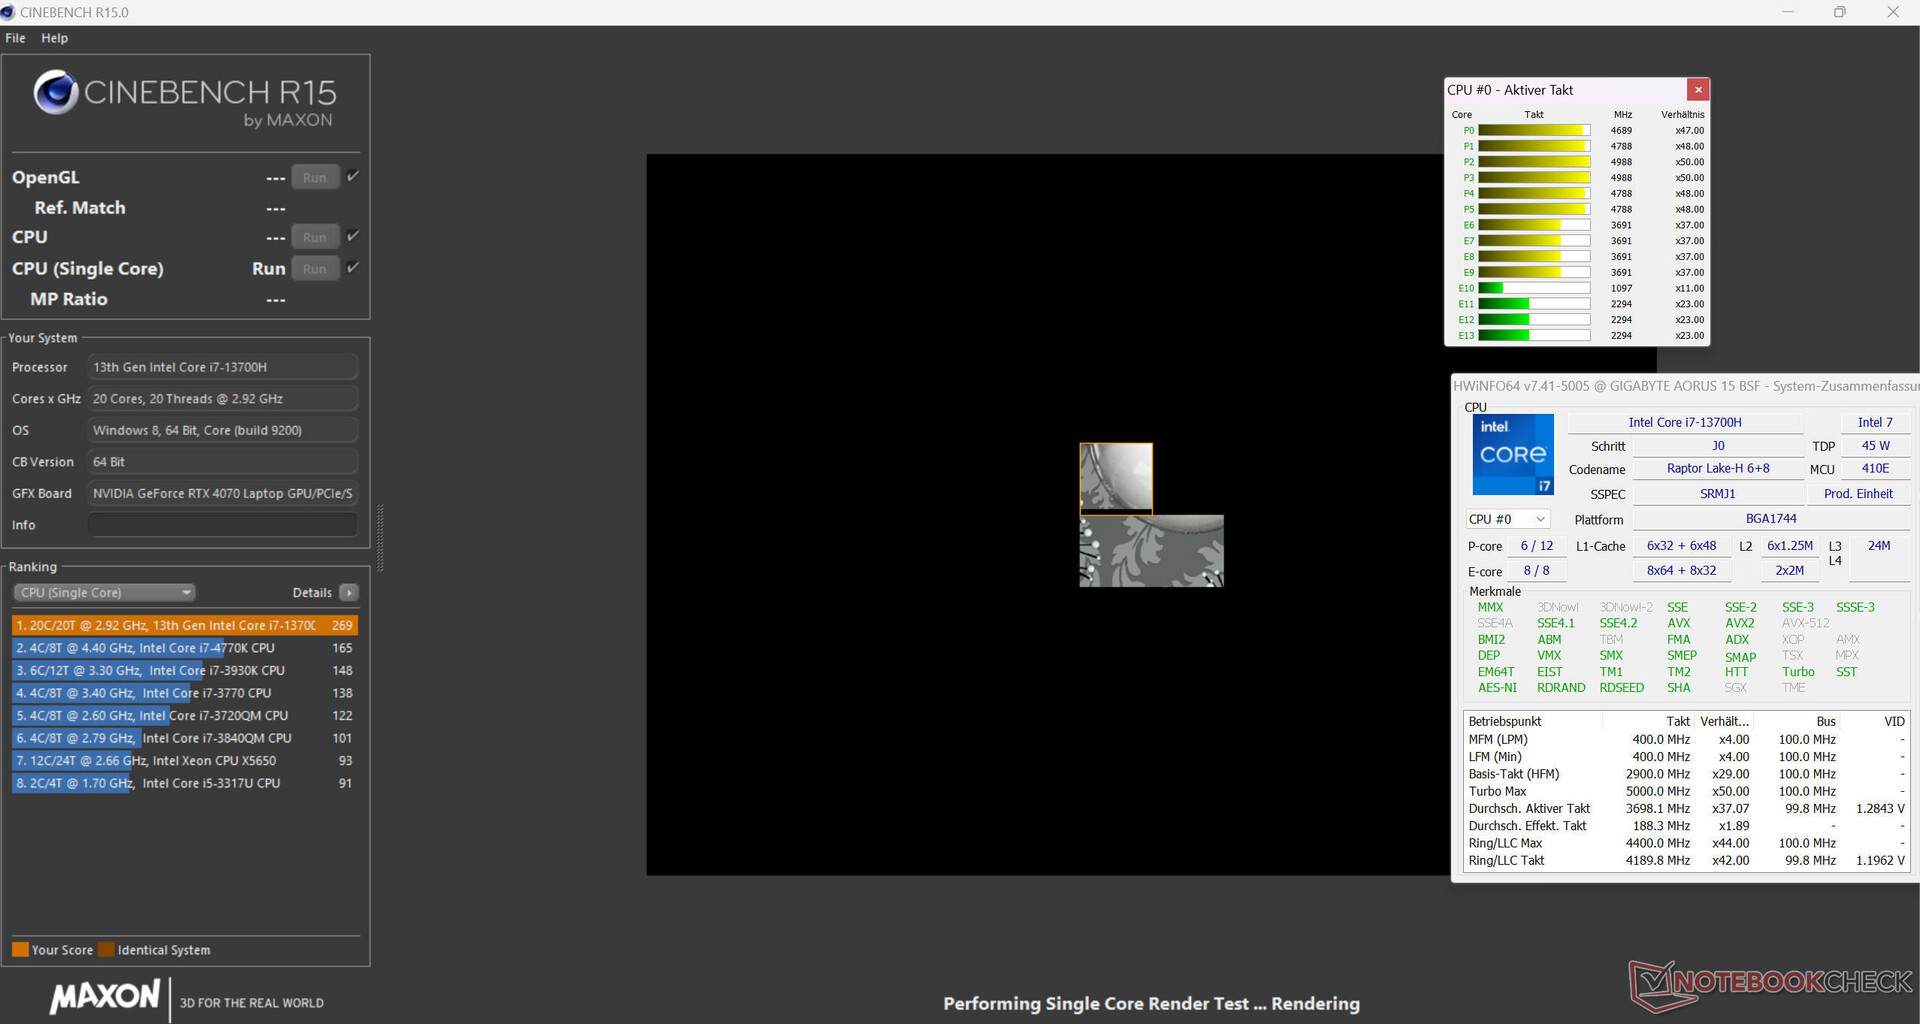
OCore-i7-13700H(Raptor Lake) consiste em oito núcleos de eficiência (sem hyper threading, 1,8 - 3,7 GHz) e seis núcleos de desempenho (hyper threading, 2,4 - 5 GHz). No total, isso soma 20 núcleos lógicos de CPU.
Os resultados de benchmark do laptop quando conectado à energia estavam acima da média da CPU. Com o uso da bateria, o desempenho mais relevante do single-thread (163 pontos) caiu de forma semelhante ao desempenho do multi-thread (1.614 pontos).
O teste de loop do CB15 confirmou que o turbo da CPU estava sendo usado permanentemente, embora a taxa de clock tenha caído um pouco após a primeira execução, independentemente do perfil usado. o "Turbo" afetou o nível de desempenho total mais alto.
Cinebench R15 Multi continuous test
* ... menor é melhor
AIDA64: FP32 Ray-Trace | FPU Julia | CPU SHA3 | CPU Queen | FPU SinJulia | FPU Mandel | CPU AES | CPU ZLib | FP64 Ray-Trace | CPU PhotoWorxx
| Performance rating | |
| Média da turma Gaming | |
| HP Omen Transcend 16 | |
| Asus TUF Gaming A16 FA617XS | |
| MSI Pulse 17 B13VGK | |
| Lenovo Legion Slim 7i 16 Gen 8 | |
| Acer Nitro 16 AN16-41 | |
| Aorus 15 BSF | |
| Média Intel Core i7-13700H | |
| AIDA64 / FP32 Ray-Trace | |
| Média da turma Gaming (10227 - 85542, n=105, últimos 2 anos) | |
| Asus TUF Gaming A16 FA617XS | |
| HP Omen Transcend 16 | |
| MSI Pulse 17 B13VGK | |
| Lenovo Legion Slim 7i 16 Gen 8 | |
| Acer Nitro 16 AN16-41 | |
| Média Intel Core i7-13700H (4986 - 18908, n=29) | |
| Aorus 15 BSF | |
| AIDA64 / FPU Julia | |
| Média da turma Gaming (51376 - 238426, n=105, últimos 2 anos) | |
| Asus TUF Gaming A16 FA617XS | |
| HP Omen Transcend 16 | |
| Acer Nitro 16 AN16-41 | |
| MSI Pulse 17 B13VGK | |
| Lenovo Legion Slim 7i 16 Gen 8 | |
| Média Intel Core i7-13700H (25360 - 92359, n=29) | |
| Aorus 15 BSF | |
| AIDA64 / CPU SHA3 | |
| Média da turma Gaming (2180 - 10115, n=105, últimos 2 anos) | |
| HP Omen Transcend 16 | |
| Asus TUF Gaming A16 FA617XS | |
| MSI Pulse 17 B13VGK | |
| Lenovo Legion Slim 7i 16 Gen 8 | |
| Acer Nitro 16 AN16-41 | |
| Aorus 15 BSF | |
| Média Intel Core i7-13700H (1339 - 4224, n=29) | |
| AIDA64 / CPU Queen | |
| HP Omen Transcend 16 | |
| Asus TUF Gaming A16 FA617XS | |
| Lenovo Legion Slim 7i 16 Gen 8 | |
| Média da turma Gaming (49785 - 173351, n=90, últimos 2 anos) | |
| Acer Nitro 16 AN16-41 | |
| Aorus 15 BSF | |
| MSI Pulse 17 B13VGK | |
| Média Intel Core i7-13700H (59324 - 107159, n=29) | |
| AIDA64 / FPU SinJulia | |
| Asus TUF Gaming A16 FA617XS | |
| Média da turma Gaming (4424 - 33636, n=105, últimos 2 anos) | |
| HP Omen Transcend 16 | |
| Acer Nitro 16 AN16-41 | |
| Lenovo Legion Slim 7i 16 Gen 8 | |
| MSI Pulse 17 B13VGK | |
| Aorus 15 BSF | |
| Média Intel Core i7-13700H (4800 - 11050, n=29) | |
| AIDA64 / FPU Mandel | |
| Média da turma Gaming (25115 - 128721, n=105, últimos 2 anos) | |
| Asus TUF Gaming A16 FA617XS | |
| HP Omen Transcend 16 | |
| Acer Nitro 16 AN16-41 | |
| MSI Pulse 17 B13VGK | |
| Lenovo Legion Slim 7i 16 Gen 8 | |
| Média Intel Core i7-13700H (12321 - 45118, n=29) | |
| Aorus 15 BSF | |
| AIDA64 / CPU AES | |
| Aorus 15 BSF | |
| HP Omen Transcend 16 | |
| Média da turma Gaming (39258 - 247074, n=105, últimos 2 anos) | |
| Asus TUF Gaming A16 FA617XS | |
| MSI Pulse 17 B13VGK | |
| Lenovo Legion Slim 7i 16 Gen 8 | |
| Média Intel Core i7-13700H (28769 - 151254, n=29) | |
| Acer Nitro 16 AN16-41 | |
| AIDA64 / CPU ZLib | |
| HP Omen Transcend 16 | |
| Média da turma Gaming (574 - 2531, n=105, últimos 2 anos) | |
| Lenovo Legion Slim 7i 16 Gen 8 | |
| MSI Pulse 17 B13VGK | |
| Asus TUF Gaming A16 FA617XS | |
| Média Intel Core i7-13700H (389 - 1215, n=29) | |
| Aorus 15 BSF | |
| Acer Nitro 16 AN16-41 | |
| AIDA64 / FP64 Ray-Trace | |
| Média da turma Gaming (5509 - 45446, n=105, últimos 2 anos) | |
| Asus TUF Gaming A16 FA617XS | |
| HP Omen Transcend 16 | |
| MSI Pulse 17 B13VGK | |
| Lenovo Legion Slim 7i 16 Gen 8 | |
| Acer Nitro 16 AN16-41 | |
| Média Intel Core i7-13700H (2540 - 10135, n=29) | |
| Aorus 15 BSF | |
| AIDA64 / CPU PhotoWorxx | |
| HP Omen Transcend 16 | |
| Média da turma Gaming (12271 - 89891, n=105, últimos 2 anos) | |
| Média Intel Core i7-13700H (12872 - 52727, n=29) | |
| MSI Pulse 17 B13VGK | |
| Aorus 15 BSF | |
| Asus TUF Gaming A16 FA617XS | |
| Acer Nitro 16 AN16-41 | |
| Lenovo Legion Slim 7i 16 Gen 8 | |
Desempenho do sistema
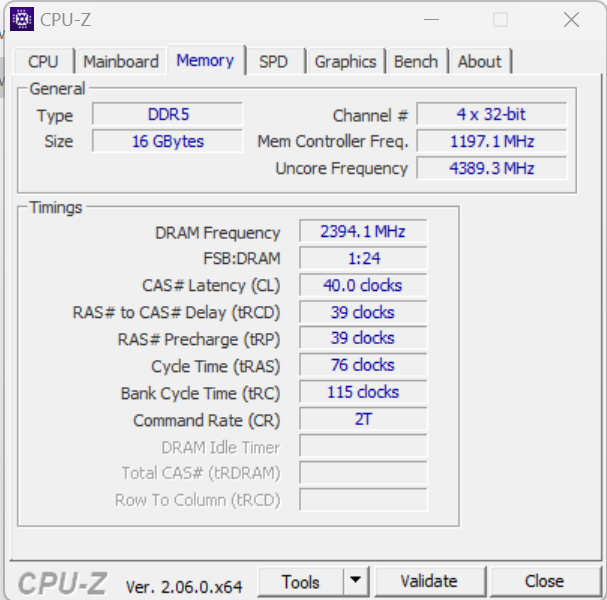
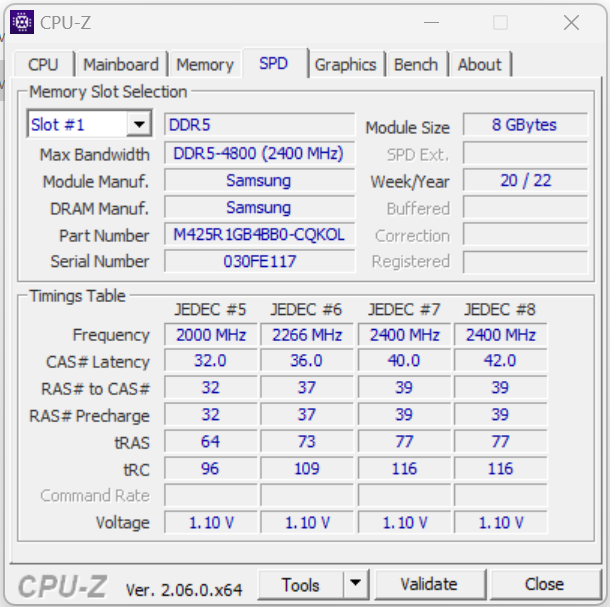
O sistema de funcionamento suave não perde nenhum desempenho de computação. A renderização e os jogos não são problemas para o laptop. As taxas de transferência da RAM estavam em um nível médio para a RAM DDR5 4800.
CrossMark: Overall | Productivity | Creativity | Responsiveness
| PCMark 10 / Score | |
| Lenovo Legion Slim 7i 16 Gen 8 | |
| Média da turma Gaming (5828 - 12414, n=93, últimos 2 anos) | |
| HP Omen Transcend 16 | |
| Asus TUF Gaming A16 FA617XS | |
| MSI Pulse 17 B13VGK | |
| Média Intel Core i7-13700H, NVIDIA GeForce RTX 4070 Laptop GPU (7158 - 7956, n=8) | |
| Aorus 15 BSF | |
| Acer Nitro 16 AN16-41 | |
| PCMark 10 / Essentials | |
| Lenovo Legion Slim 7i 16 Gen 8 | |
| HP Omen Transcend 16 | |
| Asus TUF Gaming A16 FA617XS | |
| Aorus 15 BSF | |
| Média Intel Core i7-13700H, NVIDIA GeForce RTX 4070 Laptop GPU (10252 - 11449, n=8) | |
| Média da turma Gaming (8810 - 11935, n=97, últimos 2 anos) | |
| Acer Nitro 16 AN16-41 | |
| MSI Pulse 17 B13VGK | |
| PCMark 10 / Productivity | |
| Média da turma Gaming (6845 - 25323, n=95, últimos 2 anos) | |
| Lenovo Legion Slim 7i 16 Gen 8 | |
| MSI Pulse 17 B13VGK | |
| Asus TUF Gaming A16 FA617XS | |
| HP Omen Transcend 16 | |
| Média Intel Core i7-13700H, NVIDIA GeForce RTX 4070 Laptop GPU (8501 - 10769, n=8) | |
| Acer Nitro 16 AN16-41 | |
| Aorus 15 BSF | |
| PCMark 10 / Digital Content Creation | |
| Média da turma Gaming (7602 - 19954, n=95, últimos 2 anos) | |
| Lenovo Legion Slim 7i 16 Gen 8 | |
| HP Omen Transcend 16 | |
| Asus TUF Gaming A16 FA617XS | |
| MSI Pulse 17 B13VGK | |
| Média Intel Core i7-13700H, NVIDIA GeForce RTX 4070 Laptop GPU (10358 - 12908, n=8) | |
| Aorus 15 BSF | |
| Acer Nitro 16 AN16-41 | |
| CrossMark / Overall | |
| Aorus 15 BSF | |
| Média da turma Gaming (1366 - 2409, n=94, últimos 2 anos) | |
| Lenovo Legion Slim 7i 16 Gen 8 | |
| HP Omen Transcend 16 | |
| MSI Pulse 17 B13VGK | |
| Média Intel Core i7-13700H, NVIDIA GeForce RTX 4070 Laptop GPU (1768 - 2073, n=6) | |
| Asus TUF Gaming A16 FA617XS | |
| Acer Nitro 16 AN16-41 | |
| CrossMark / Productivity | |
| Aorus 15 BSF | |
| Lenovo Legion Slim 7i 16 Gen 8 | |
| Média da turma Gaming (1386 - 2254, n=94, últimos 2 anos) | |
| HP Omen Transcend 16 | |
| MSI Pulse 17 B13VGK | |
| Média Intel Core i7-13700H, NVIDIA GeForce RTX 4070 Laptop GPU (1645 - 2006, n=6) | |
| Asus TUF Gaming A16 FA617XS | |
| Acer Nitro 16 AN16-41 | |
| CrossMark / Creativity | |
| HP Omen Transcend 16 | |
| Média da turma Gaming (1343 - 2786, n=94, últimos 2 anos) | |
| Aorus 15 BSF | |
| Lenovo Legion Slim 7i 16 Gen 8 | |
| MSI Pulse 17 B13VGK | |
| Média Intel Core i7-13700H, NVIDIA GeForce RTX 4070 Laptop GPU (1936 - 2137, n=6) | |
| Asus TUF Gaming A16 FA617XS | |
| Acer Nitro 16 AN16-41 | |
| CrossMark / Responsiveness | |
| Aorus 15 BSF | |
| Lenovo Legion Slim 7i 16 Gen 8 | |
| MSI Pulse 17 B13VGK | |
| Média Intel Core i7-13700H, NVIDIA GeForce RTX 4070 Laptop GPU (1451 - 2202, n=6) | |
| Média da turma Gaming (1226 - 2334, n=94, últimos 2 anos) | |
| HP Omen Transcend 16 | |
| Asus TUF Gaming A16 FA617XS | |
| Acer Nitro 16 AN16-41 | |
| PCMark 10 Score | 7309 pontos | |
Ajuda | ||
| AIDA64 / Memory Copy | |
| HP Omen Transcend 16 | |
| Média da turma Gaming (21750 - 129946, n=105, últimos 2 anos) | |
| Média Intel Core i7-13700H (24334 - 78081, n=29) | |
| MSI Pulse 17 B13VGK | |
| Aorus 15 BSF | |
| Asus TUF Gaming A16 FA617XS | |
| Acer Nitro 16 AN16-41 | |
| Lenovo Legion Slim 7i 16 Gen 8 | |
| AIDA64 / Memory Read | |
| HP Omen Transcend 16 | |
| Média da turma Gaming (22956 - 118858, n=105, últimos 2 anos) | |
| MSI Pulse 17 B13VGK | |
| Aorus 15 BSF | |
| Média Intel Core i7-13700H (23681 - 79656, n=29) | |
| Asus TUF Gaming A16 FA617XS | |
| Acer Nitro 16 AN16-41 | |
| Lenovo Legion Slim 7i 16 Gen 8 | |
| AIDA64 / Memory Write | |
| Aorus 15 BSF | |
| Média da turma Gaming (22297 - 135096, n=105, últimos 2 anos) | |
| HP Omen Transcend 16 | |
| Asus TUF Gaming A16 FA617XS | |
| Média Intel Core i7-13700H (22986 - 99898, n=29) | |
| MSI Pulse 17 B13VGK | |
| Acer Nitro 16 AN16-41 | |
| Lenovo Legion Slim 7i 16 Gen 8 | |
| AIDA64 / Memory Latency | |
| Média da turma Gaming (75.3 - 259, n=105, últimos 2 anos) | |
| MSI Pulse 17 B13VGK | |
| Média Intel Core i7-13700H (82.4 - 136.8, n=29) | |
| Acer Nitro 16 AN16-41 | |
| Aorus 15 BSF | |
| Asus TUF Gaming A16 FA617XS | |
| HP Omen Transcend 16 | |
| Lenovo Legion Slim 7i 16 Gen 8 | |
* ... menor é melhor
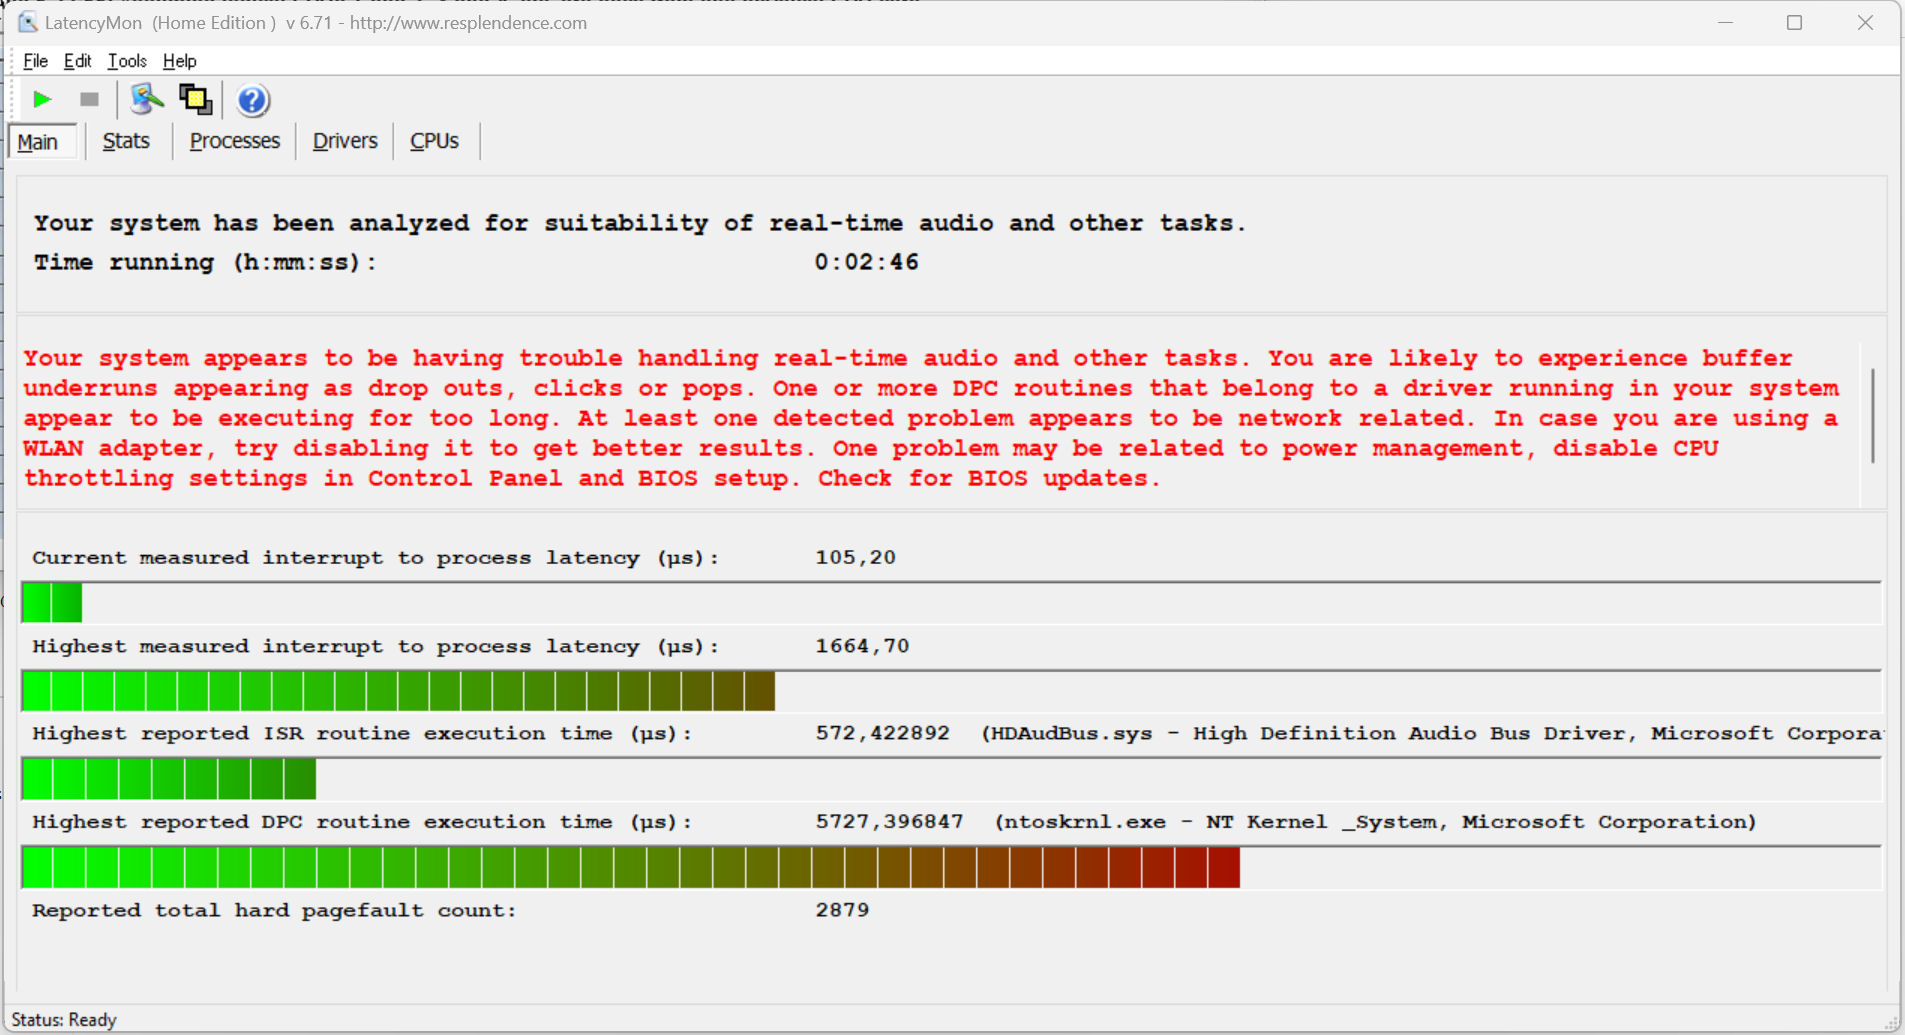
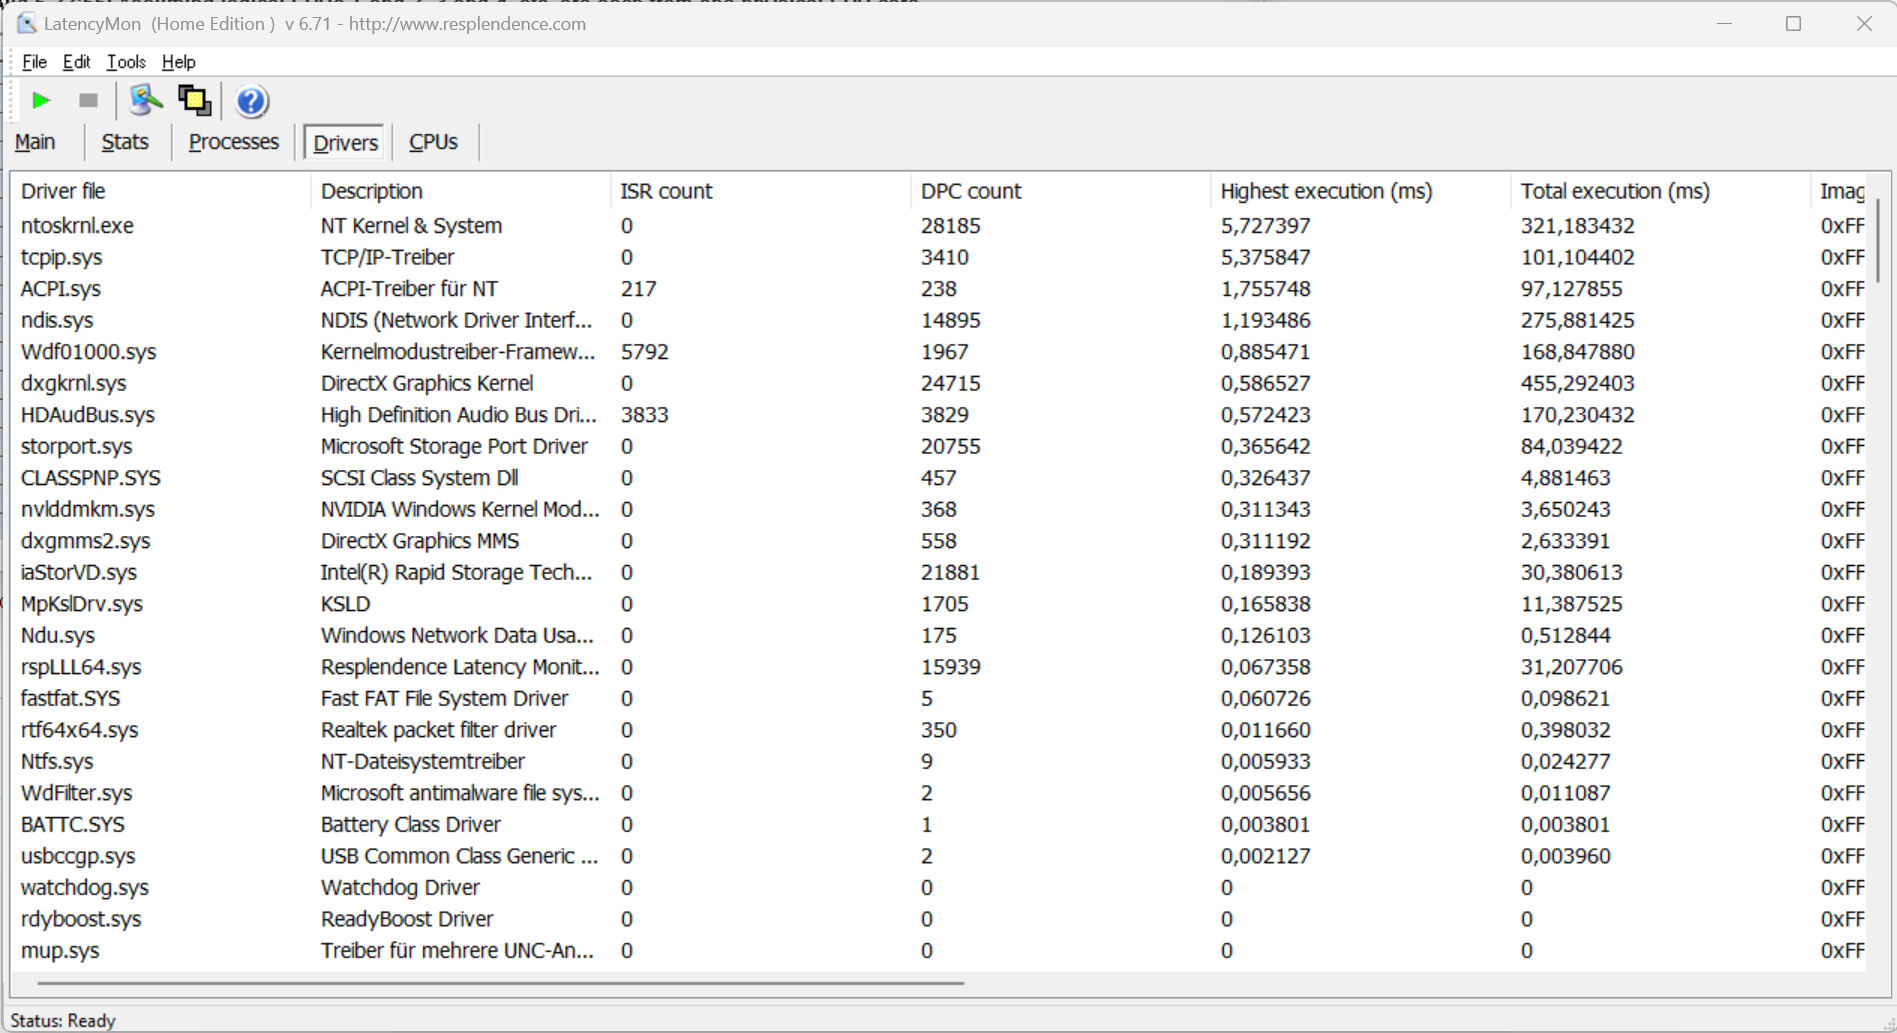
Latência DPC
O teste padronizado do monitor de latência (navegação na Web, reprodução de vídeo 4k, alta carga do Prime95) revelou algumas anomalias. O sistema não parece ser adequado para edição de vídeo e áudio em tempo real. Futuras atualizações de software podem levar a melhorias ou até mesmo a degradações.
| DPC Latencies / LatencyMon - interrupt to process latency (max), Web, Youtube, Prime95 | |
| Lenovo Legion Slim 7i 16 Gen 8 | |
| Aorus 15 BSF | |
| HP Omen Transcend 16 | |
| Acer Nitro 16 AN16-41 | |
| Asus TUF Gaming A16 FA617XS | |
| MSI Pulse 17 B13VGK | |
* ... menor é melhor
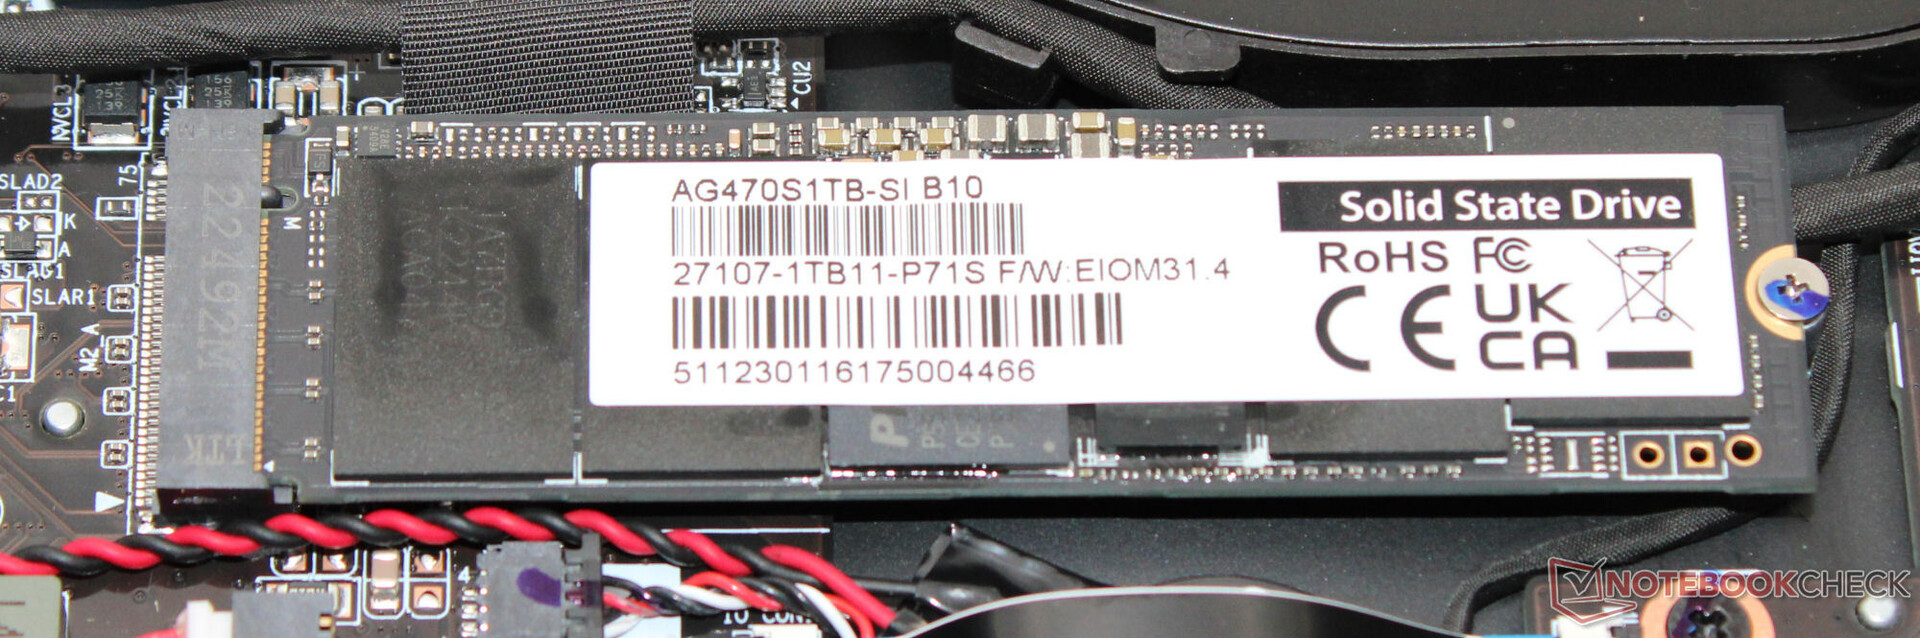
Dispositivos de armazenamento
O laptop está equipado com um SSD de 1 TB (PCIe 4, M.2 2280) da Gigabyte, que apresentou taxas de dados muito boas. Positivo: Não notamos nenhum estrangulamento relacionado à temperatura. O dispositivo tem espaço para mais um SSD.

* ... menor é melhor
Reading continuous performance: DiskSpd Read Loop, Queue Depth 8
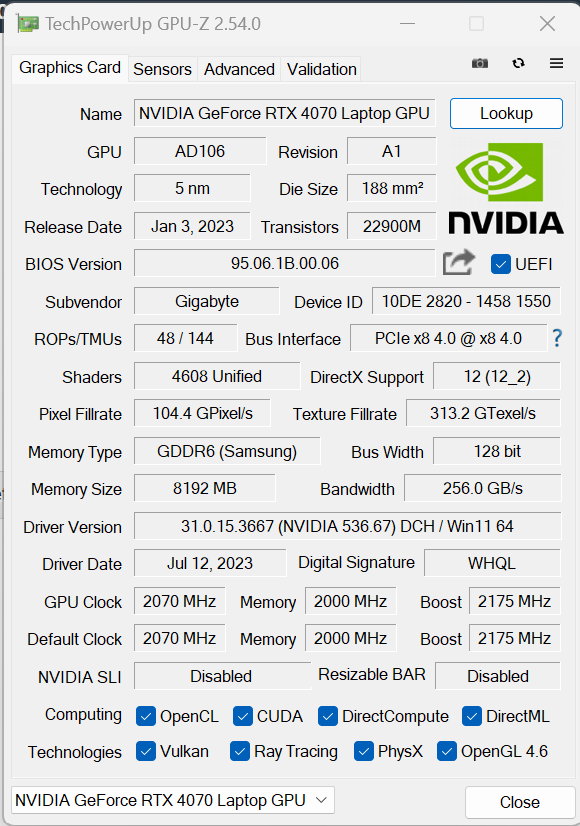
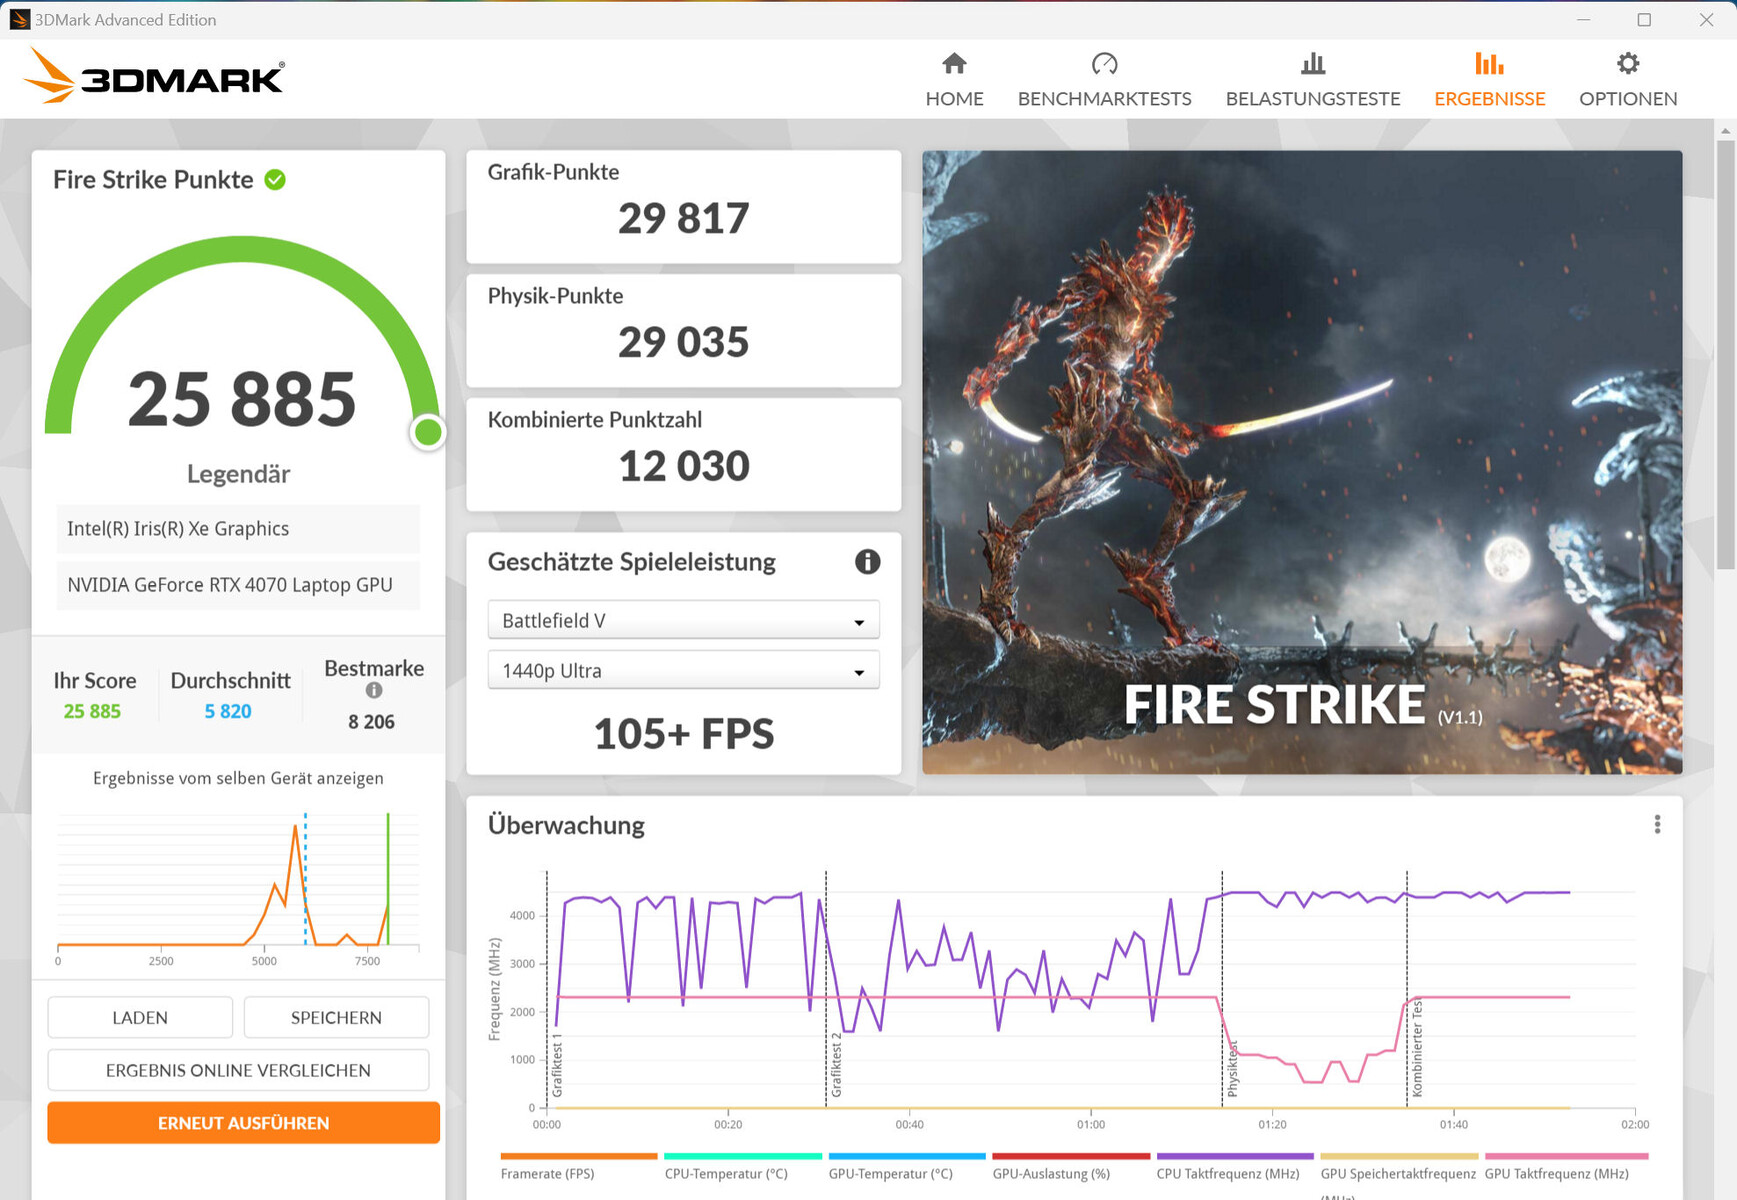
Placa de vídeo
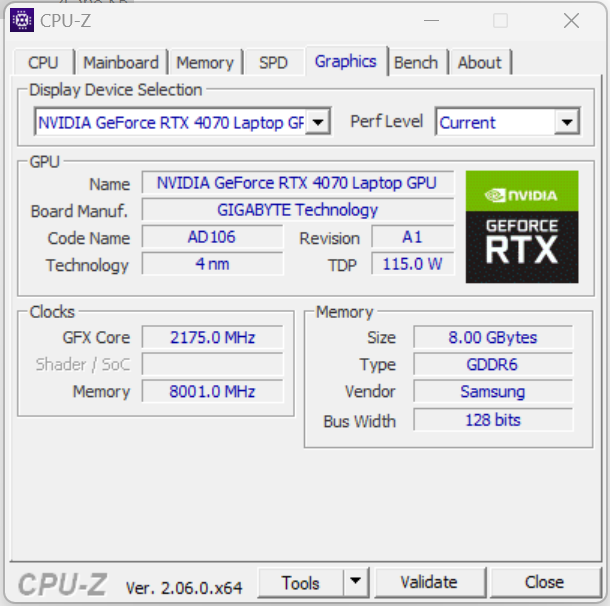
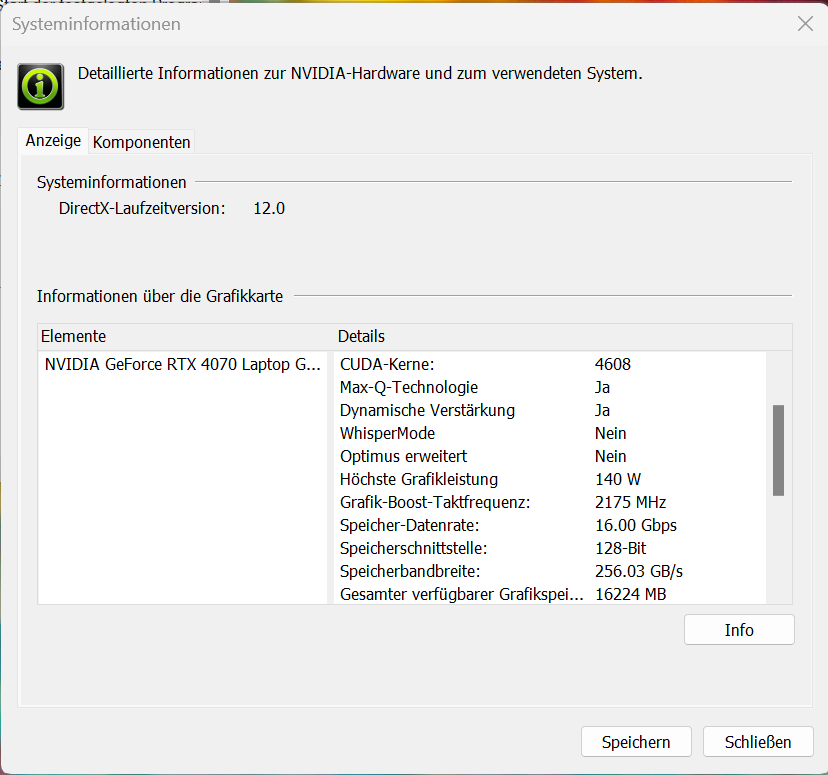
AGeForce RTX 4070apresenta 4.608 shaders, memória GDDR6 rápida (embora apenas 8.192 MB) e um barramento de 128 bits de largura. A Gigabyte lhe deu um TGP máximo de 140 watts (115 watts + 25 watts) - mais não é possível. De acordo com o teste Witcher 3 teste, o TGP completo não é aproveitado.
Seus resultados de benchmark ficaram acima da média da RTX 4070 anterior. O uso do modo dGPU não levou a nenhuma melhoria. A alteração entre o modo Optimus ("modo de saída de gráficos Intel") e o modo dGPU ("modo de saída de gráficos Nvidia") pode ser feita por meio do Centro de Controle (geral -> interruptor GPU MUX). Sempre é necessário reiniciar o laptop. A Gigabyte depende de uma chave MUX - o Advanced Optimus não é suportado.

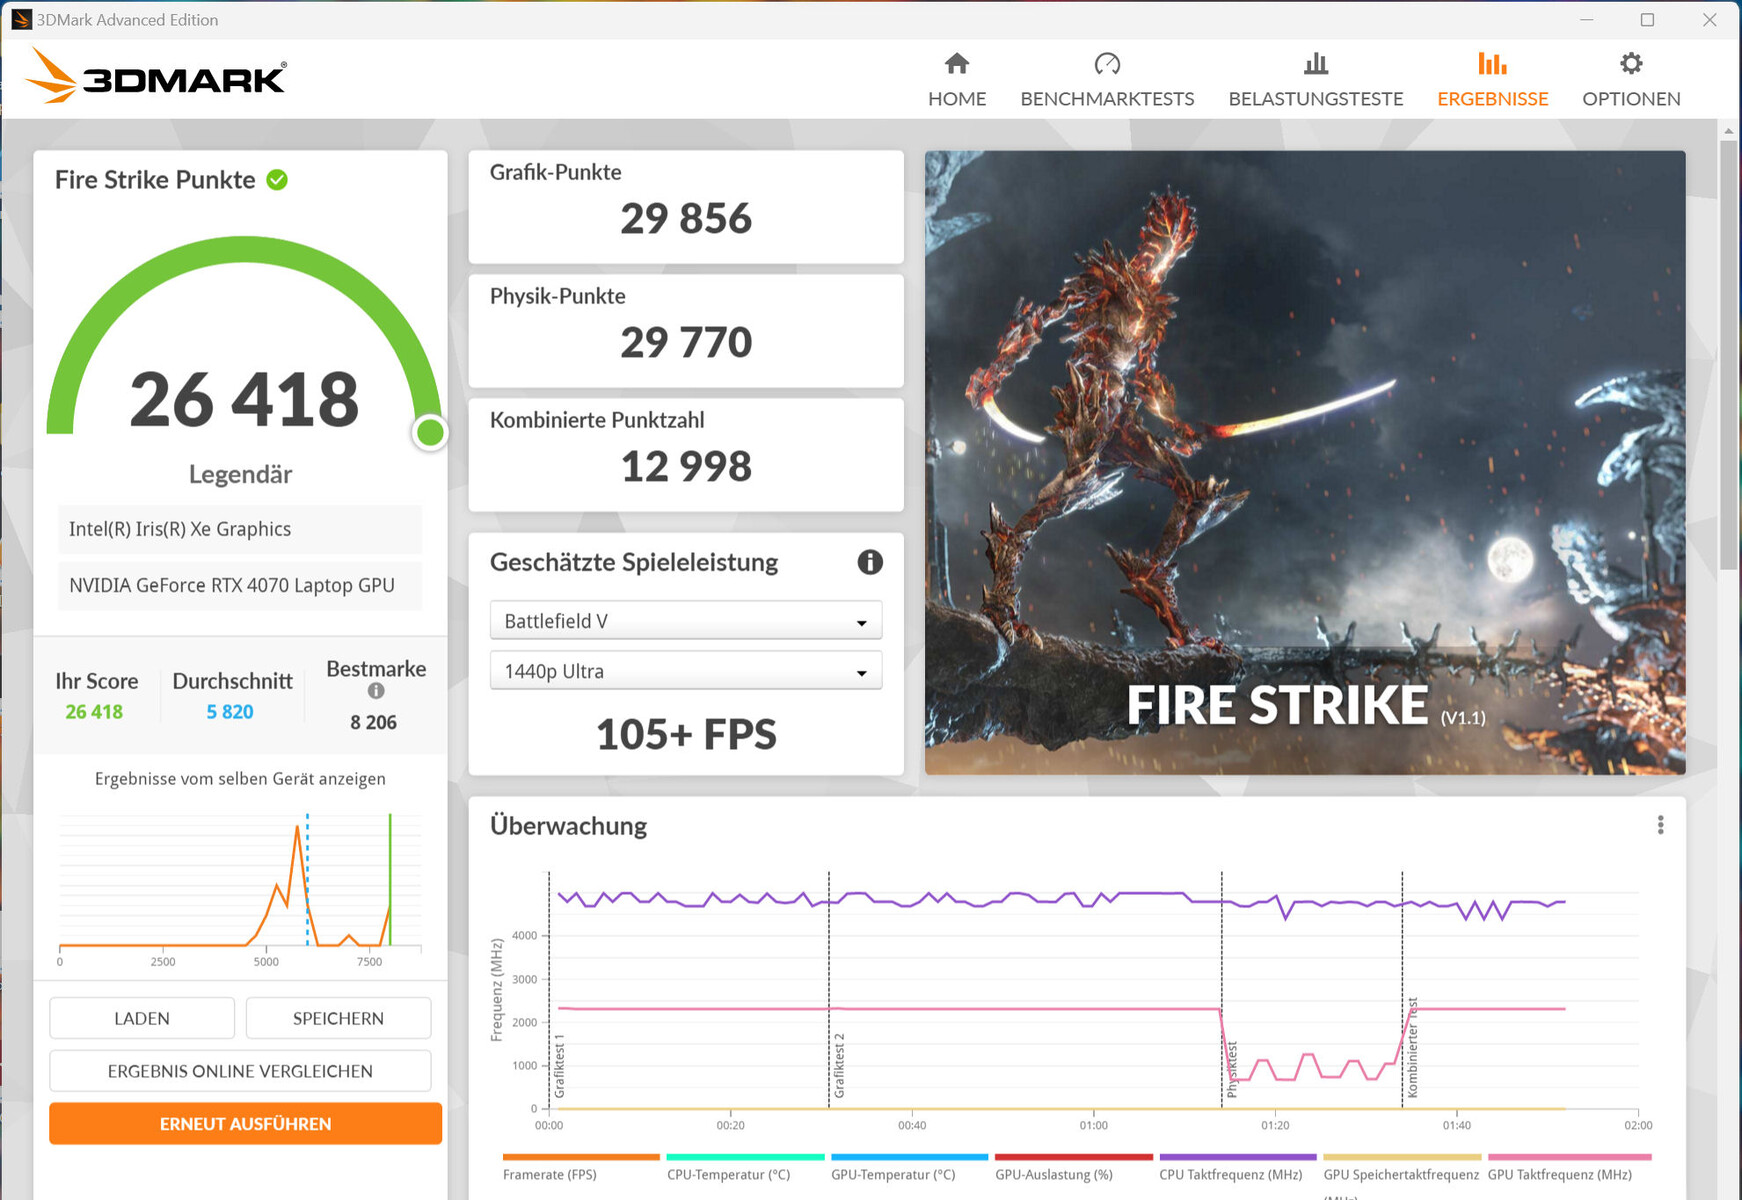
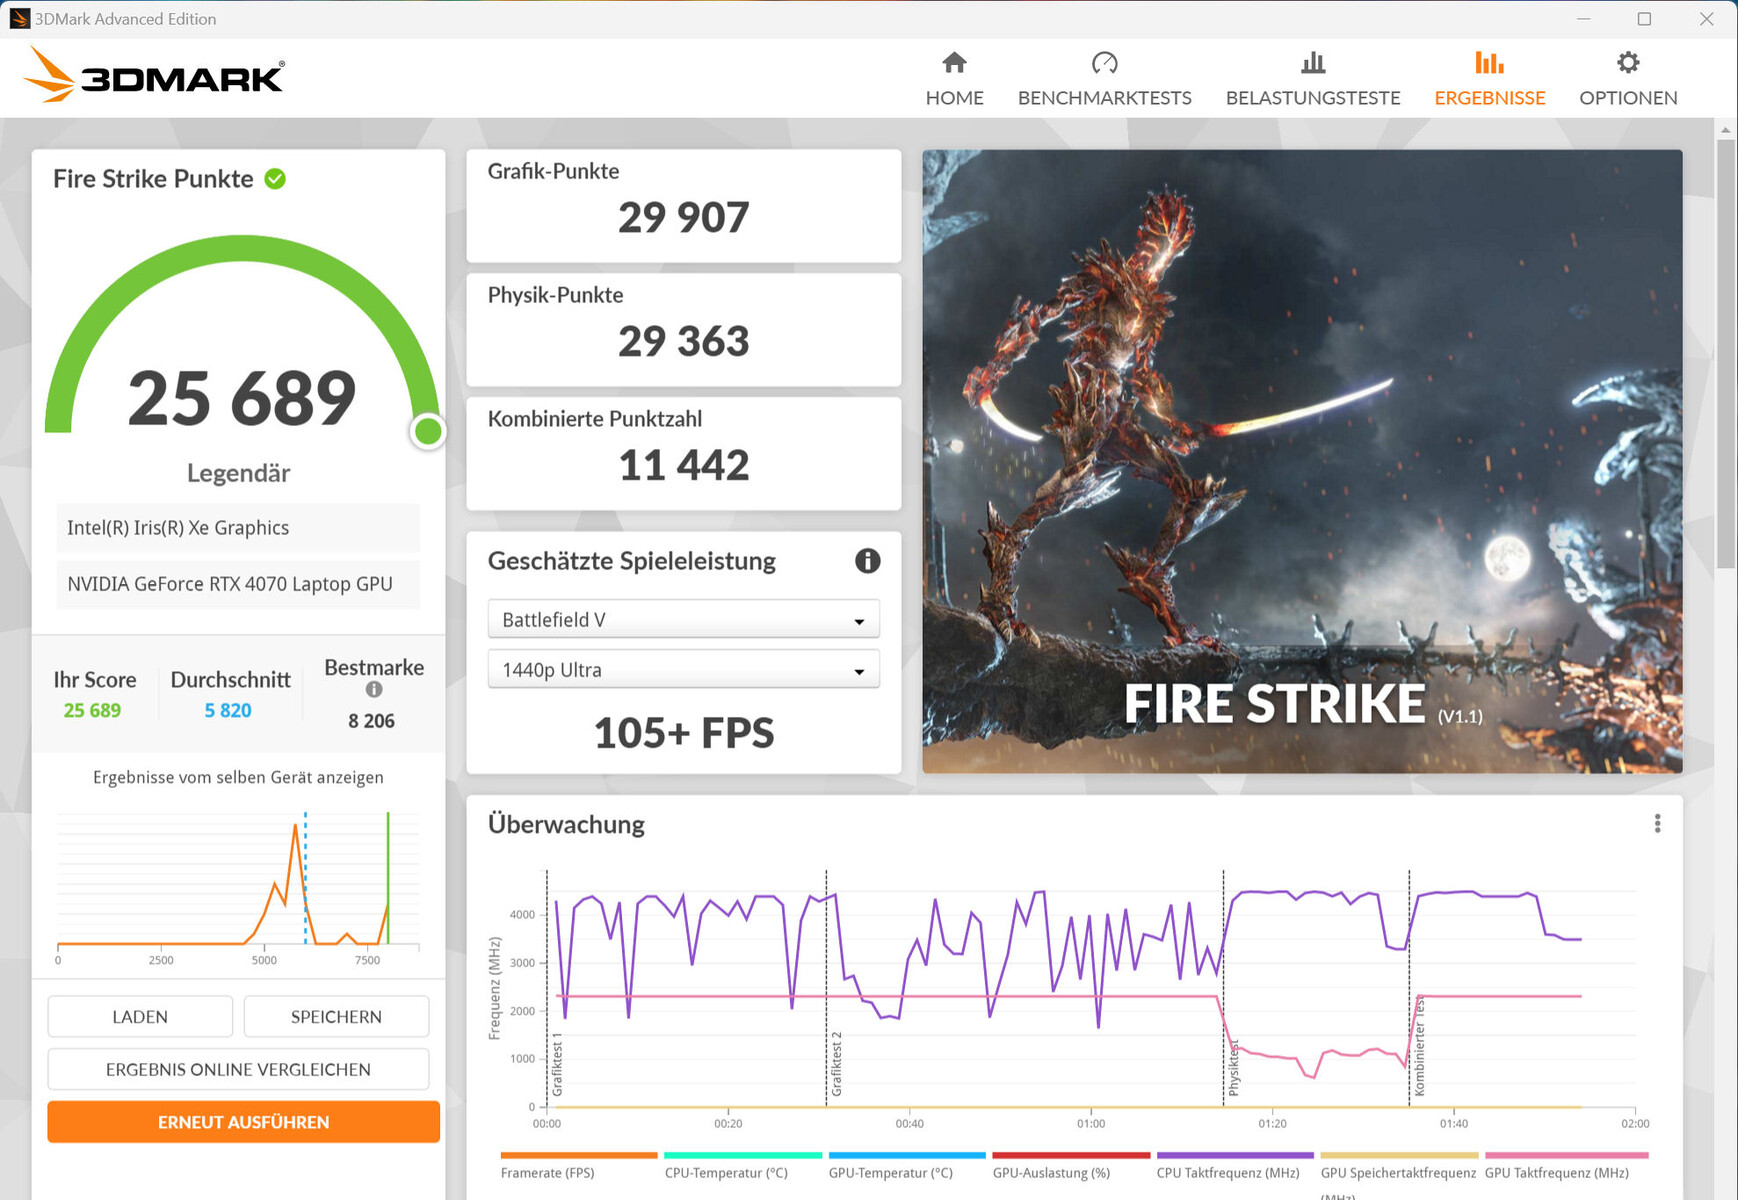
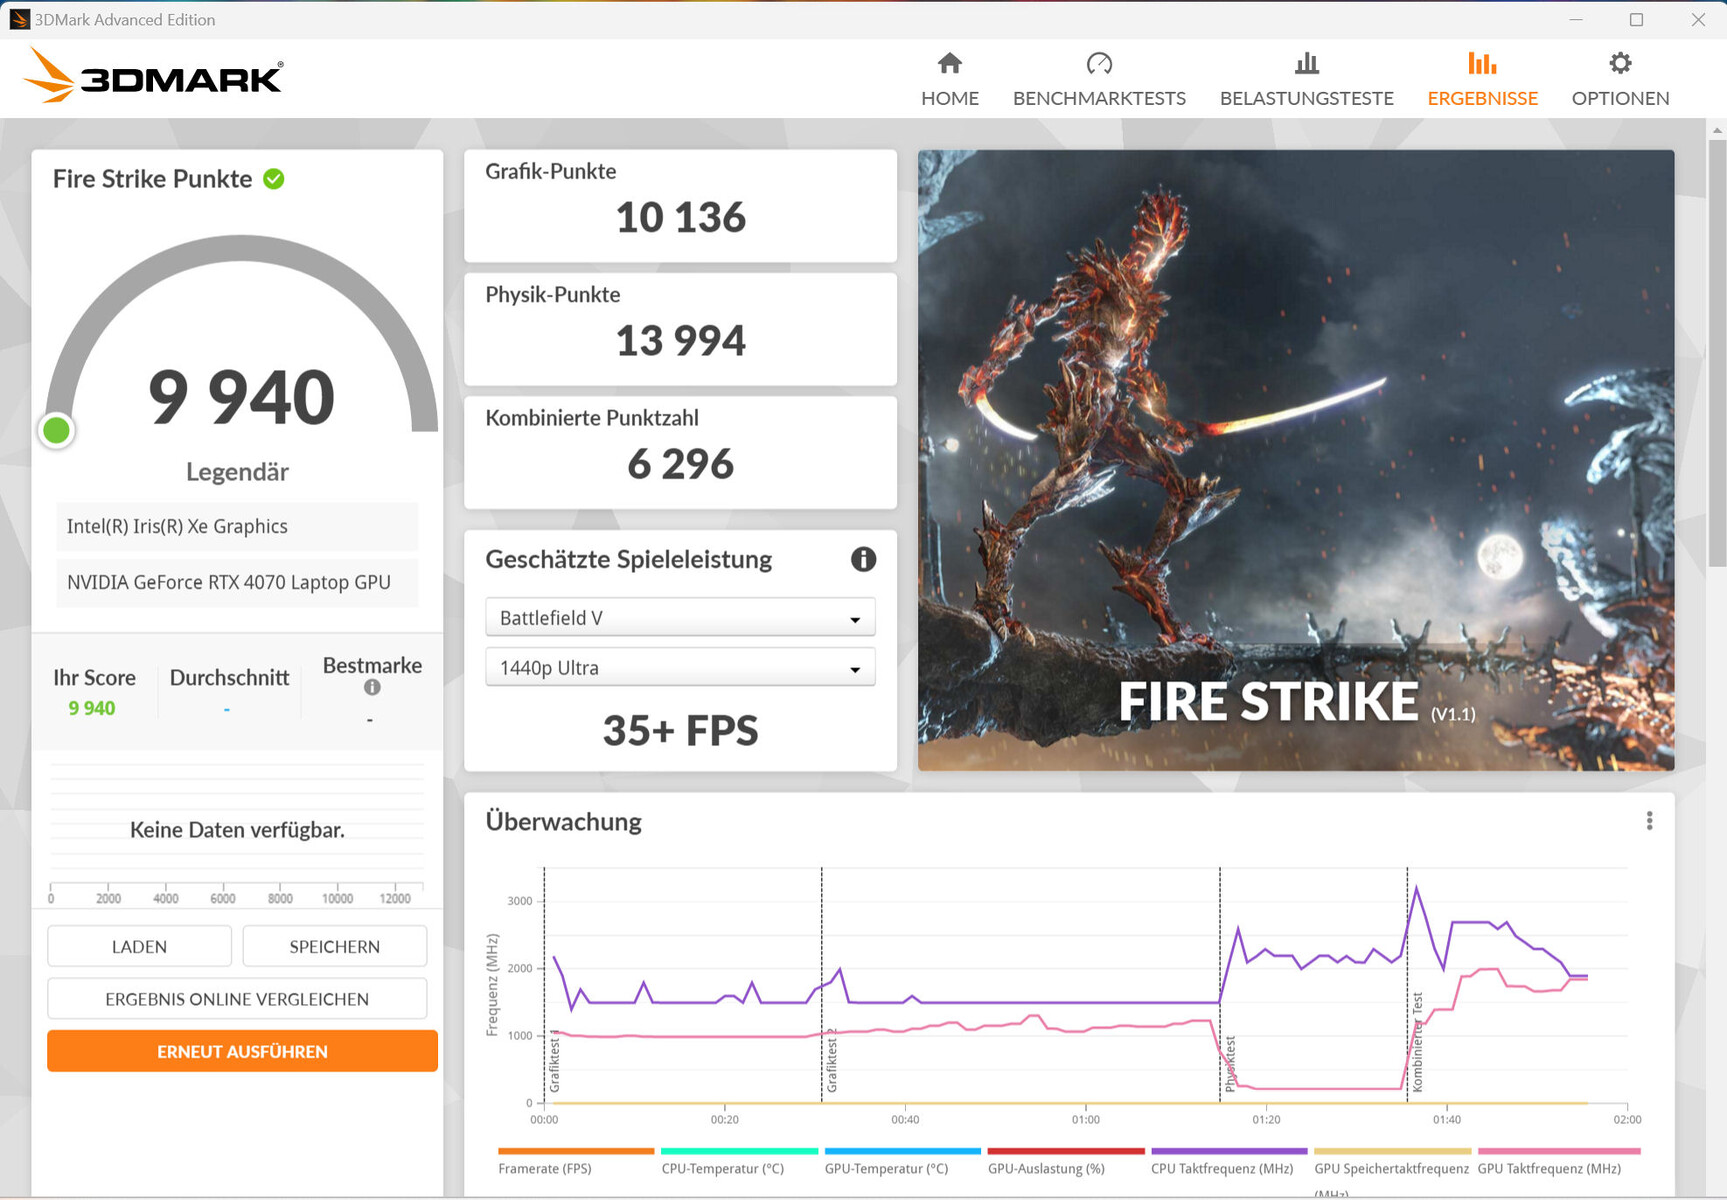
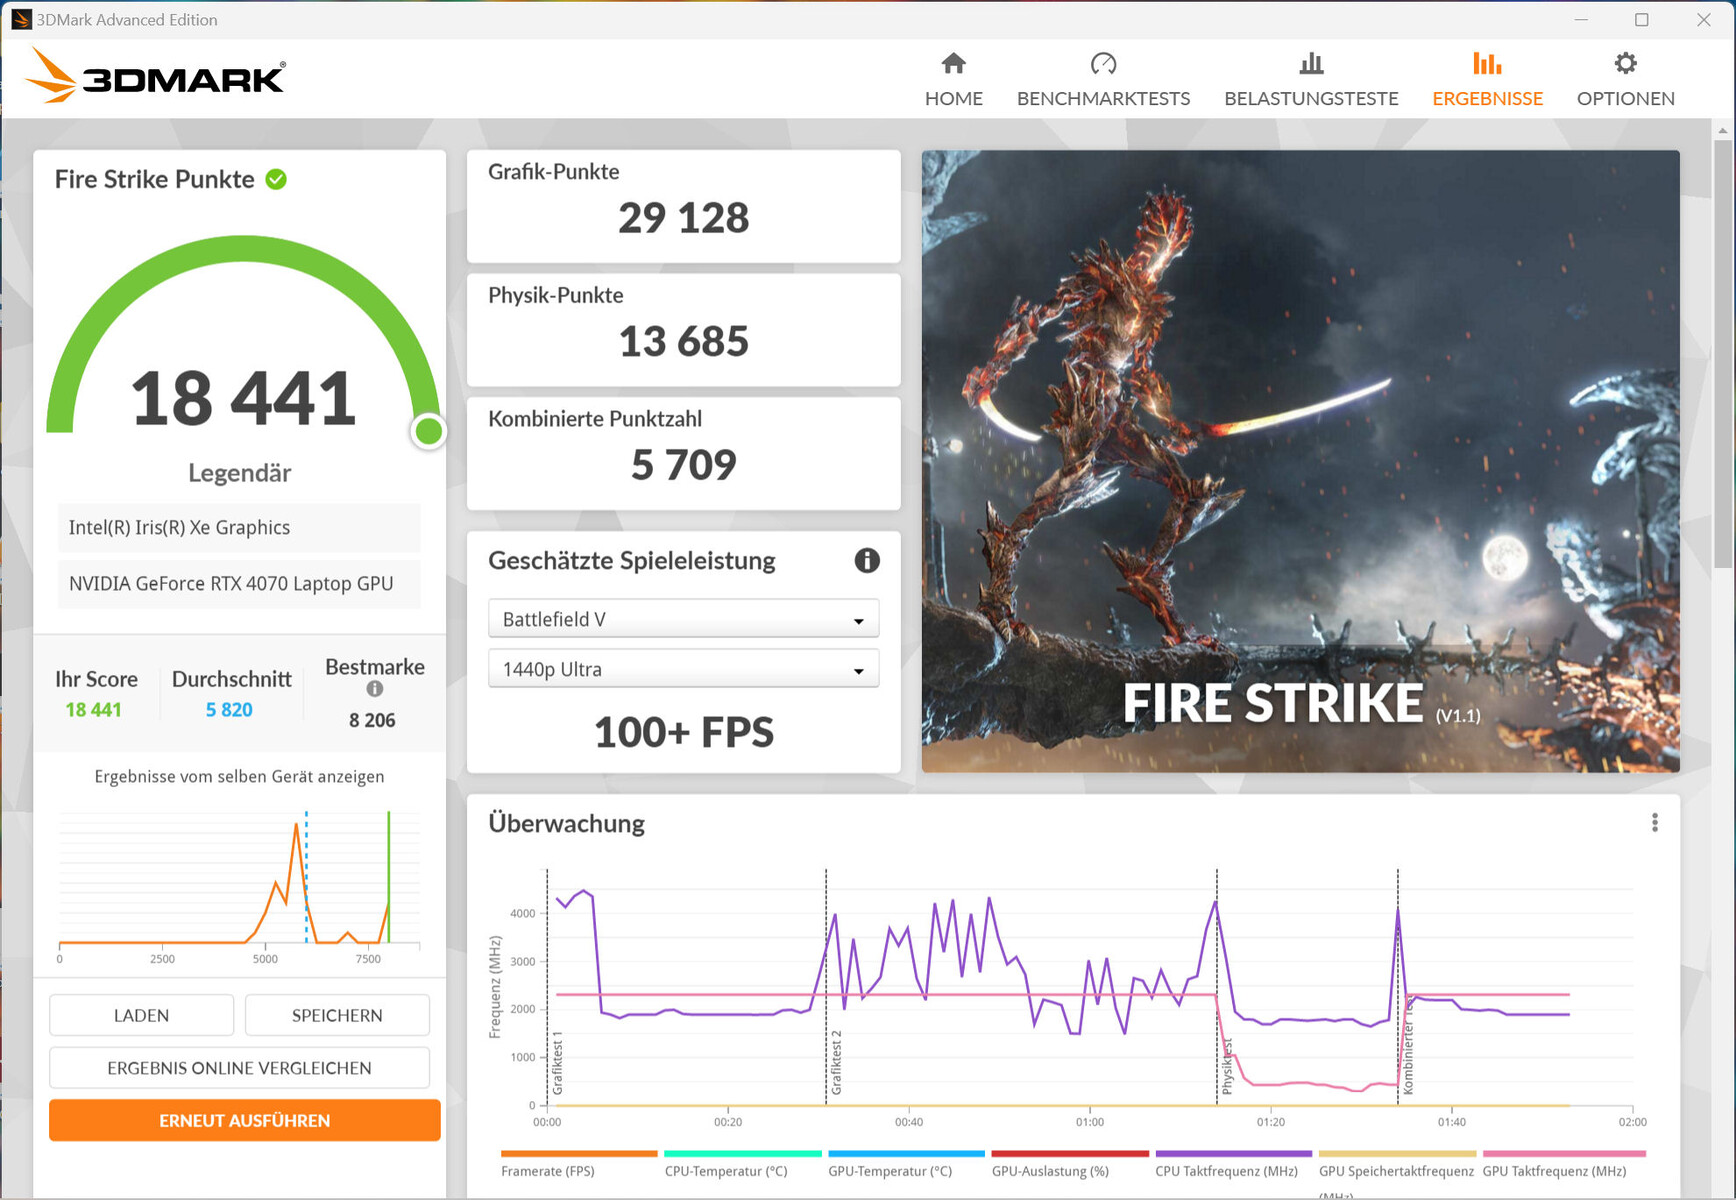
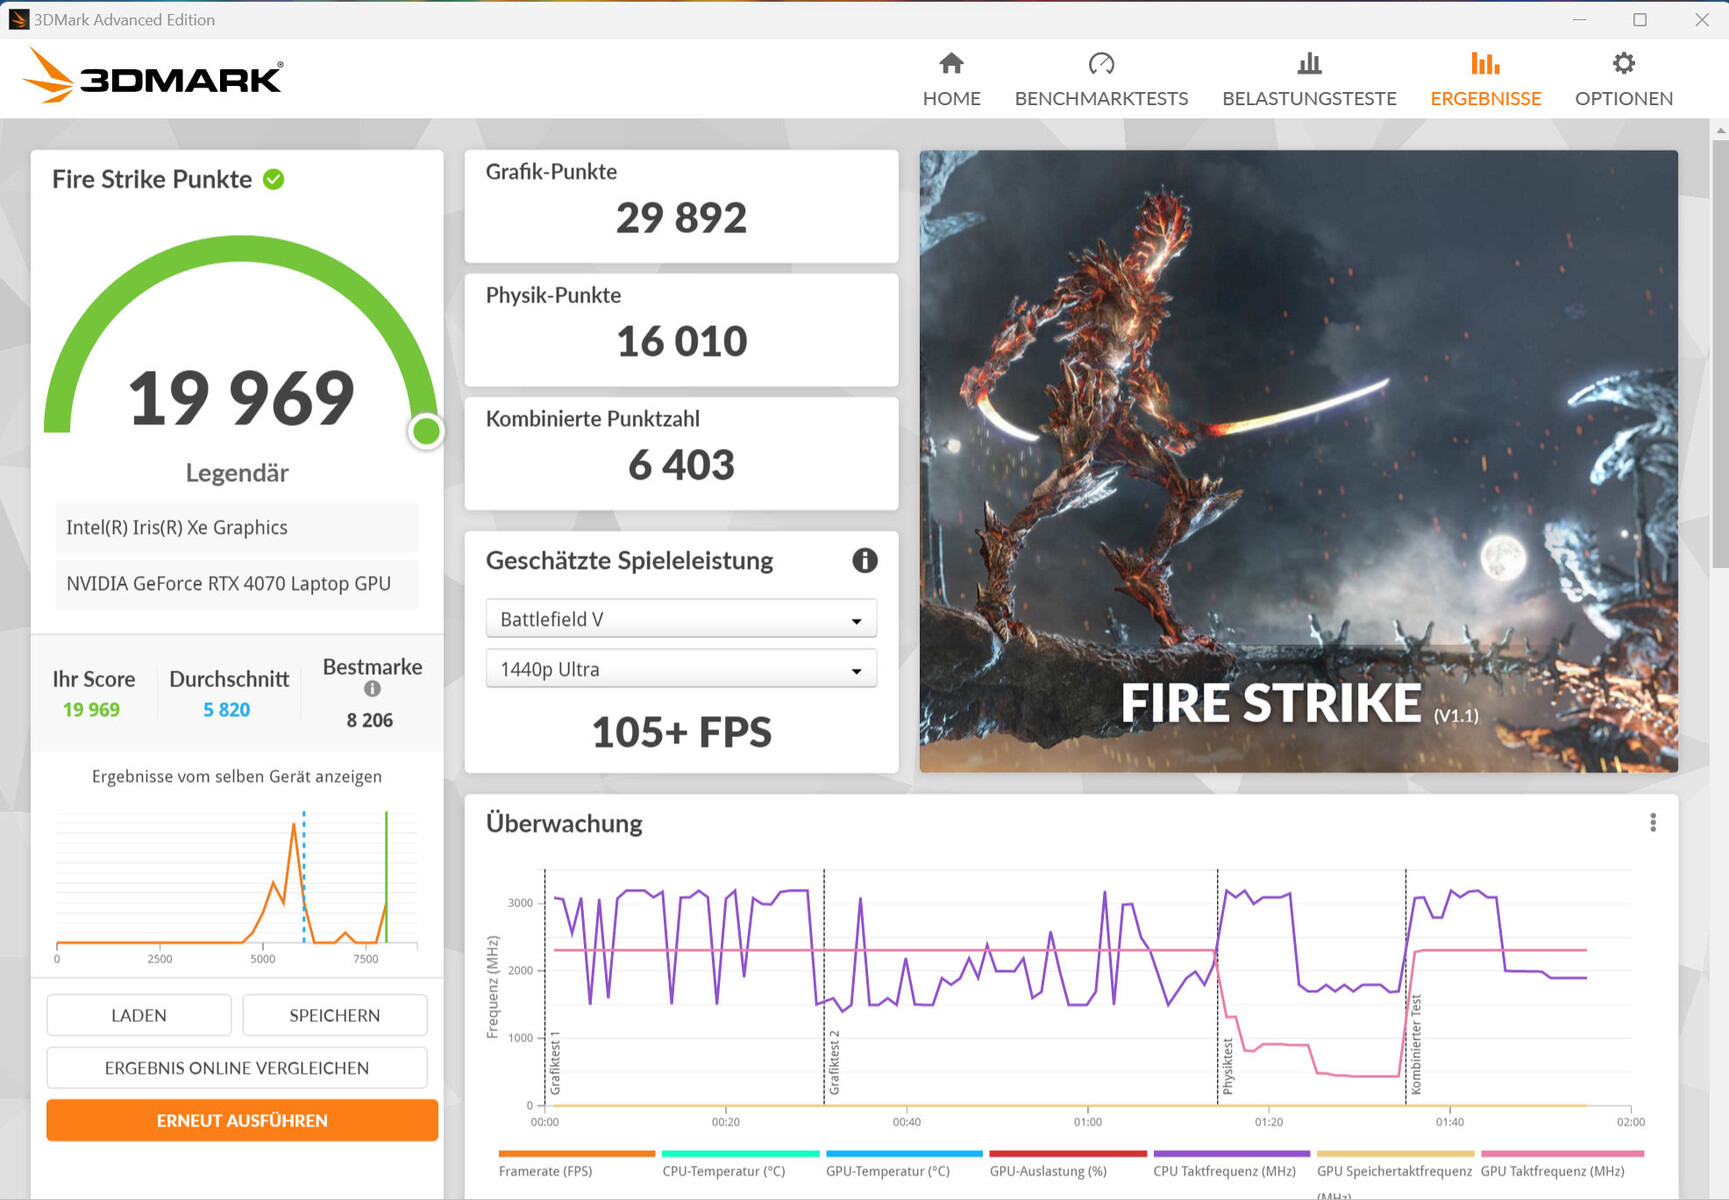
| 3DMark 06 Standard Score | 55084 pontos | |
| 3DMark 11 Performance | 33789 pontos | |
| 3DMark Cloud Gate Standard Score | 57822 pontos | |
| 3DMark Fire Strike Score | 26593 pontos | |
| 3DMark Time Spy Score | 12234 pontos | |
Ajuda | ||
| Geekbench 6.7 - GPU OpenCL | |
| Média da turma Gaming (67235 - 253130, n=103, últimos 2 anos) | |
| Aorus 15 BSF | |
| MSI Pulse 17 B13VGK | |
| Média NVIDIA GeForce RTX 4070 Laptop GPU (85488 - 129836, n=45) | |
* ... menor é melhor
Desempenho em jogos
O laptop foi projetado para jogos QHD em configurações altas ou máximas. Resoluções mais altas funcionariam em combinação com um monitor adequado - às vezes, com configurações reduzidas. As taxas de quadros nos jogos que testamos ficaram acima da média determinada para a RTX 4070. O uso do modo dGPU não levou a nenhum desempenho superior.
O uso do modo Meeting permite jogar com menos emissões de ruído: Embora o desempenho da GPU permaneça no mesmo nível, o desempenho da CPU diminui devido ao seu limite de energia reduzido. Nesse caso, talvez seja necessário reduzir as configurações.
| The Witcher 3 - 1920x1080 Ultra Graphics & Postprocessing (HBAO+) | |
| Média da turma Gaming (104.7 - 240, n=7, últimos 2 anos) | |
| Lenovo Legion Slim 7i 16 Gen 8 | |
| Aorus 15 BSF | |
| Acer Nitro 16 AN16-41 | |
| Média NVIDIA GeForce RTX 4070 Laptop GPU (69.8 - 133.7, n=57) | |
| HP Omen Transcend 16 | |
| MSI Pulse 17 B13VGK | |
| Asus TUF Gaming A16 FA617XS | |
| Final Fantasy XV Benchmark - 1920x1080 High Quality | |
| Média da turma Gaming (41 - 215, n=95, últimos 2 anos) | |
| Lenovo Legion Slim 7i 16 Gen 8 | |
| Aorus 15 BSF | |
| MSI Pulse 17 B13VGK | |
| Média NVIDIA GeForce RTX 4070 Laptop GPU (41 - 131.9, n=65) | |
| Acer Nitro 16 AN16-41 | |
| Asus TUF Gaming A16 FA617XS | |
| Cyberpunk 2077 1.6 | |
| 1920x1080 Ultra Preset | |
| Lenovo Legion Slim 7i 16 Gen 8 | |
| Aorus 15 BSF | |
| HP Omen Transcend 16 | |
| Acer Nitro 16 AN16-41 | |
| Média NVIDIA GeForce RTX 4070 Laptop GPU (48 - 110, n=24) | |
| 2560x1440 Ultra Preset | |
| HP Omen Transcend 16 | |
| Lenovo Legion Slim 7i 16 Gen 8 | |
| Acer Nitro 16 AN16-41 | |
| Aorus 15 BSF | |
| Média NVIDIA GeForce RTX 4070 Laptop GPU (30 - 63.9, n=24) | |
| 1920x1080 Ray Tracing Ultra Preset (DLSS off) | |
| Média NVIDIA GeForce RTX 4070 Laptop GPU (36.2 - 65, n=5) | |
| Aorus 15 BSF | |
| The Callisto Protocol | |
| 1920x1080 Ultra Preset (without FSR Upscaling) | |
| Aorus 15 BSF | |
| Acer Nitro 16 AN16-41 | |
| Média NVIDIA GeForce RTX 4070 Laptop GPU (78.9 - 88, n=4) | |
| 2560x1440 Ultra Preset (without FSR Upscaling) | |
| Aorus 15 BSF | |
| Acer Nitro 16 AN16-41 | |
| Média NVIDIA GeForce RTX 4070 Laptop GPU (58.4 - 68.3, n=4) | |
| 1920x1080 Ultra Preset (without FSR Upscaling) + Full Ray-Tracing | |
| Aorus 15 BSF | |
| Média NVIDIA GeForce RTX 4070 Laptop GPU (50.8 - 70, n=4) | |
| Acer Nitro 16 AN16-41 | |
| Returnal | |
| 1920x1080 Epic Preset | |
| Aorus 15 BSF | |
| HP Omen Transcend 16 | |
| Média NVIDIA GeForce RTX 4070 Laptop GPU (54 - 90, n=12) | |
| Asus TUF Gaming A16 FA617XS | |
| Lenovo Legion Slim 7i 16 Gen 8 | |
| 2560x1440 Epic Preset | |
| Aorus 15 BSF | |
| HP Omen Transcend 16 | |
| Média NVIDIA GeForce RTX 4070 Laptop GPU (39 - 66, n=12) | |
| Lenovo Legion Slim 7i 16 Gen 8 | |
| 1920x1080 Epic Preset + Epic Ray-Tracing | |
| Aorus 15 BSF | |
| Média NVIDIA GeForce RTX 4070 Laptop GPU (71 - 75, n=5) | |
| Asus TUF Gaming A16 FA617XS | |
| Baldur's Gate 3 | |
| 1920x1080 Ultra Preset AA:T | |
| Média da turma Gaming (59.4 - 246, n=104, últimos 2 anos) | |
| Média NVIDIA GeForce RTX 4070 Laptop GPU (66.7 - 128.5, n=30) | |
| Aorus 15 BSF | |
| 2560x1440 Ultra Preset AA:T | |
| Média da turma Gaming (60 - 175.5, n=85, últimos 2 anos) | |
| Média NVIDIA GeForce RTX 4070 Laptop GPU (54.4 - 89.6, n=25) | |
| Aorus 15 BSF | |
| Ratchet & Clank Rift Apart | |
| 1920x1080 Very High Preset AA:T | |
| Aorus 15 BSF | |
| Média NVIDIA GeForce RTX 4070 Laptop GPU (52.3 - 58.1, n=4) | |
| 2560x1440 Very High Preset AA:T | |
| Média NVIDIA GeForce RTX 4070 Laptop GPU (48.7 - 49.1, n=3) | |
| Aorus 15 BSF | |
| 1920x1080 Very High Preset + Very High Raytracing AA:T | |
| Média NVIDIA GeForce RTX 4070 Laptop GPU (43.4 - 44.8, n=2) | |
| Aorus 15 BSF | |
Para testar se as taxas de quadros permanecem estáveis por um longo período, deixamos o jogo The Witcher 3 rodar por cerca de 60 minutos em resolução Full HD e usando as configurações de qualidade máxima. Não movemos o personagem. Não notamos nenhuma queda na taxa de quadros.
Witcher 3 FPS diagram
| baixo | média | alto | ultra | QHD | |
|---|---|---|---|---|---|
| The Witcher 3 (2015) | 432.4 | 371.8 | 230.9 | 117 | |
| Dota 2 Reborn (2015) | 186.9 | 167.6 | 162.4 | 149.9 | |
| Final Fantasy XV Benchmark (2018) | 213 | 163.9 | 115.4 | 84.4 | |
| X-Plane 11.11 (2018) | 160 | 142.1 | 113.4 | ||
| Far Cry 5 (2018) | 178 | 156 | 149 | 140 | 117 |
| Strange Brigade (2018) | 485 | 295 | 231 | 202 | 133.6 |
| Cyberpunk 2077 1.6 (2022) | 135.4 | 113.8 | 96.7 | 90 | 53.4 |
| The Callisto Protocol (2022) | 162.8 | 142.2 | 136 | 88 | 68.3 |
| Returnal (2023) | 117 | 114 | 104 | 87 | 64 |
| F1 23 (2023) | 248 | 255 | 209 | 71.7 | 46.3 |
| Ratchet & Clank Rift Apart (2023) | 90.4 | 78.8 | 62.3 | 57.1 | 48.8 |
| Baldur's Gate 3 (2023) | 137.1 | 114.2 | 91.4 | 88.5 | 60.2 |
Emissões - O laptop Aorus pode ser bastante barulhento
Emissões de ruído
Durante os jogos, as emissões de ruído aumentam até 55 dB(A) ("Turbo"). Quando usamos o modo "AI Boost", medimos 53 dB(A). O modo Meeting oferece uma combinação mais equilibrada de desempenho, emissões e consumo de energia.
No modo inativo e no uso diário (escritório, Internet), as duas ventoinhas geralmente não fazem muito barulho - às vezes nem giram. Isso não significa que elas permaneçam silenciosas o tempo todo - medimos até 37 dB(A).
Barulho
| Ocioso |
| 25 / 31 / 37 dB |
| Carga |
| 51 / 57 dB |
 | ||
30 dB silencioso 40 dB(A) audível 50 dB(A) ruidosamente alto |
||
min: | ||
| Aorus 15 BSF i7-13700H, GeForce RTX 4070 Laptop GPU | HP Omen Transcend 16 i9-13900HX, GeForce RTX 4070 Laptop GPU | MSI Pulse 17 B13VGK i7-13700H, GeForce RTX 4070 Laptop GPU | Lenovo Legion Slim 7i 16 Gen 8 i9-13900H, GeForce RTX 4070 Laptop GPU | Acer Nitro 16 AN16-41 R7 7735HS, GeForce RTX 4070 Laptop GPU | Asus TUF Gaming A16 FA617XS R9 7940HS, Radeon RX 7600S | |
|---|---|---|---|---|---|---|
| Noise | 5% | 19% | 20% | 10% | 10% | |
| desligado / ambiente * (dB) | 24 | 22.9 5% | 24 -0% | 22.8 5% | 25.7 -7% | 25 -4% |
| Idle Minimum * (dB) | 25 | 29.1 -16% | 24 4% | 23.6 6% | 25.7 -3% | 25 -0% |
| Idle Average * (dB) | 31 | 29.1 6% | 24 23% | 23.6 24% | 25.7 17% | 26 16% |
| Idle Maximum * (dB) | 37 | 29.1 21% | 24 35% | 25.7 31% | 26.3 29% | 28 24% |
| Load Average * (dB) | 51 | 45.7 10% | 32.49 36% | 27.6 46% | 33.9 34% | 43 16% |
| Load Maximum * (dB) | 57 | 54.3 5% | 46.51 18% | 54.4 5% | 62 -9% | 53 7% |
| Witcher 3 ultra * (dB) | 54.3 | 46.51 | 54.4 | 51 |
* ... menor é melhor
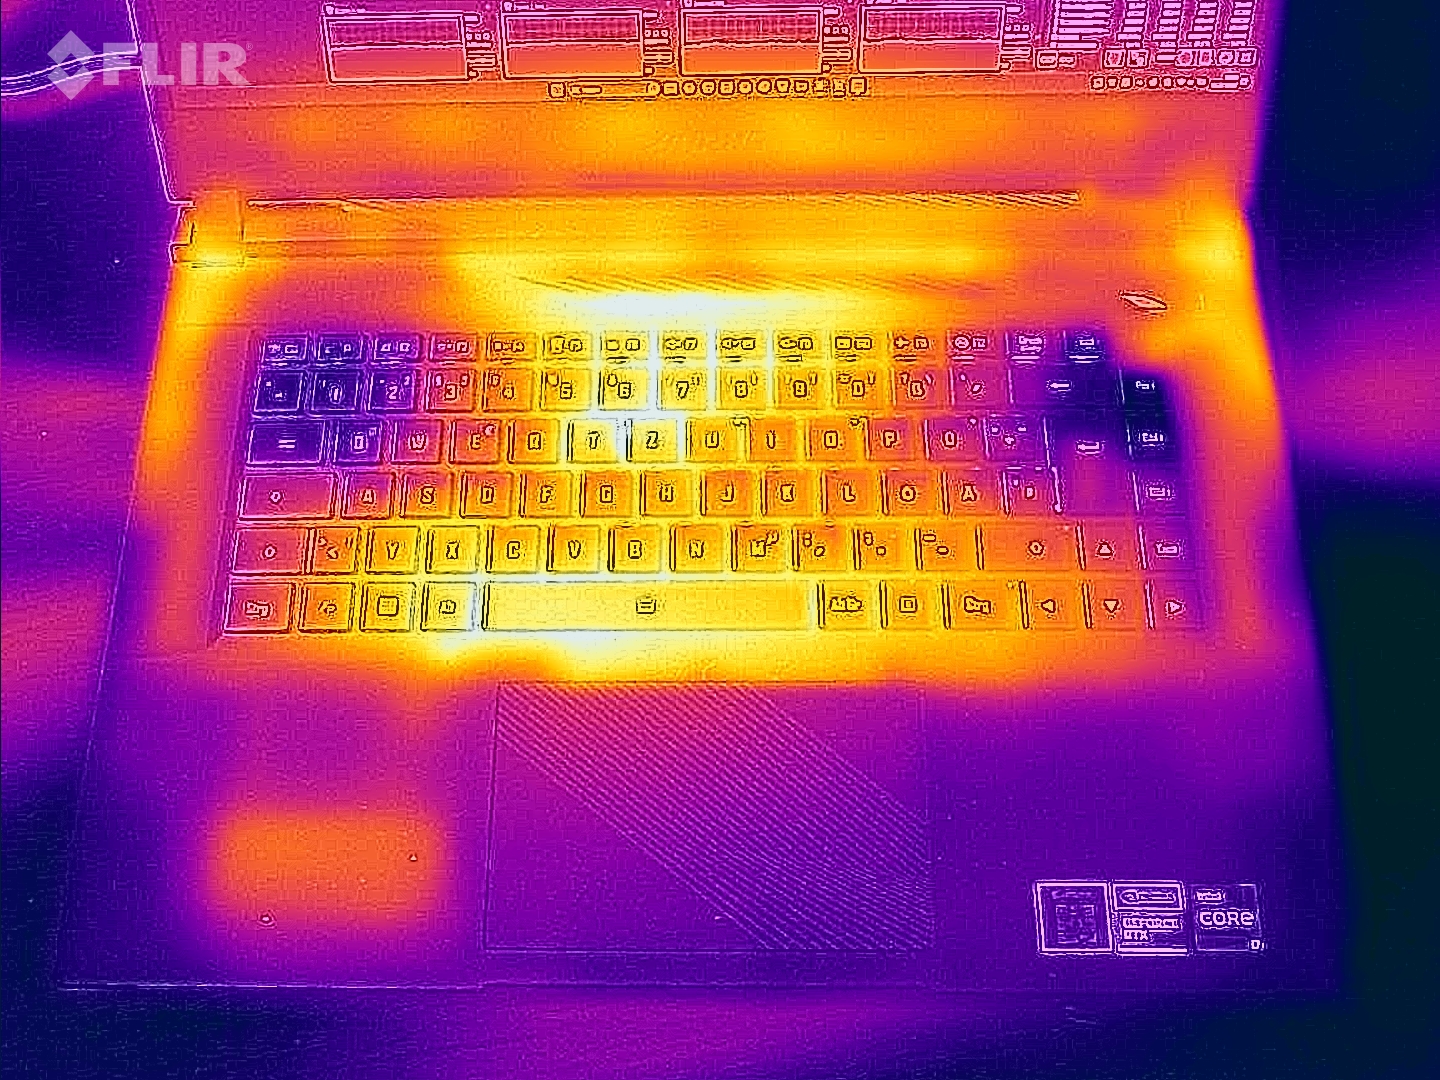
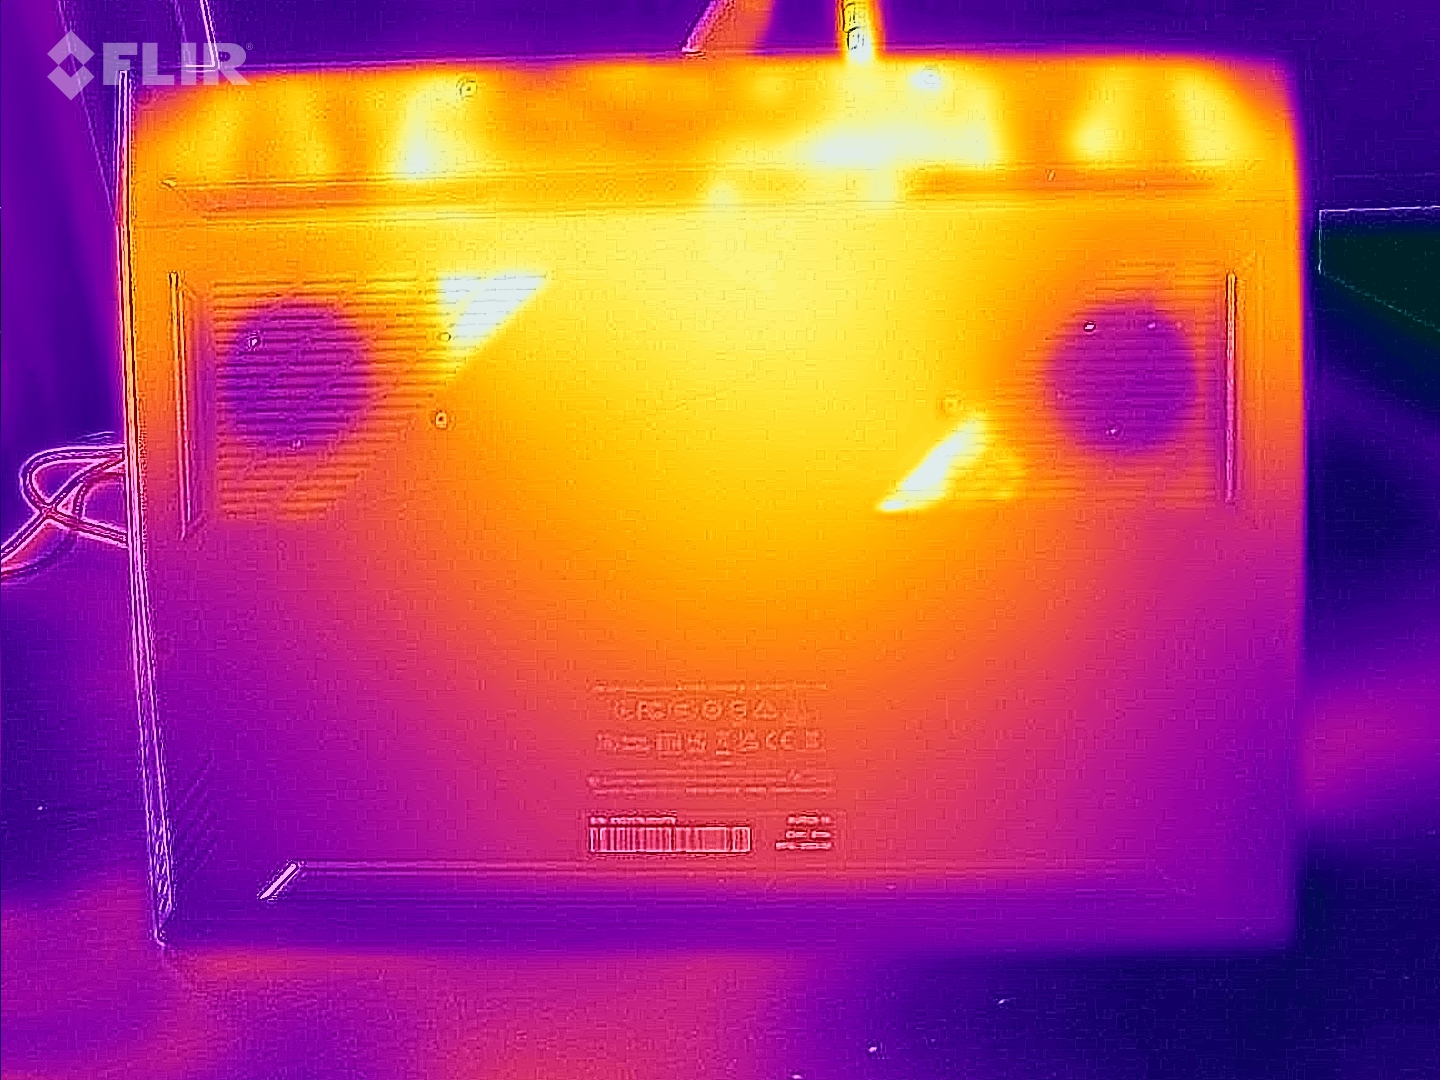
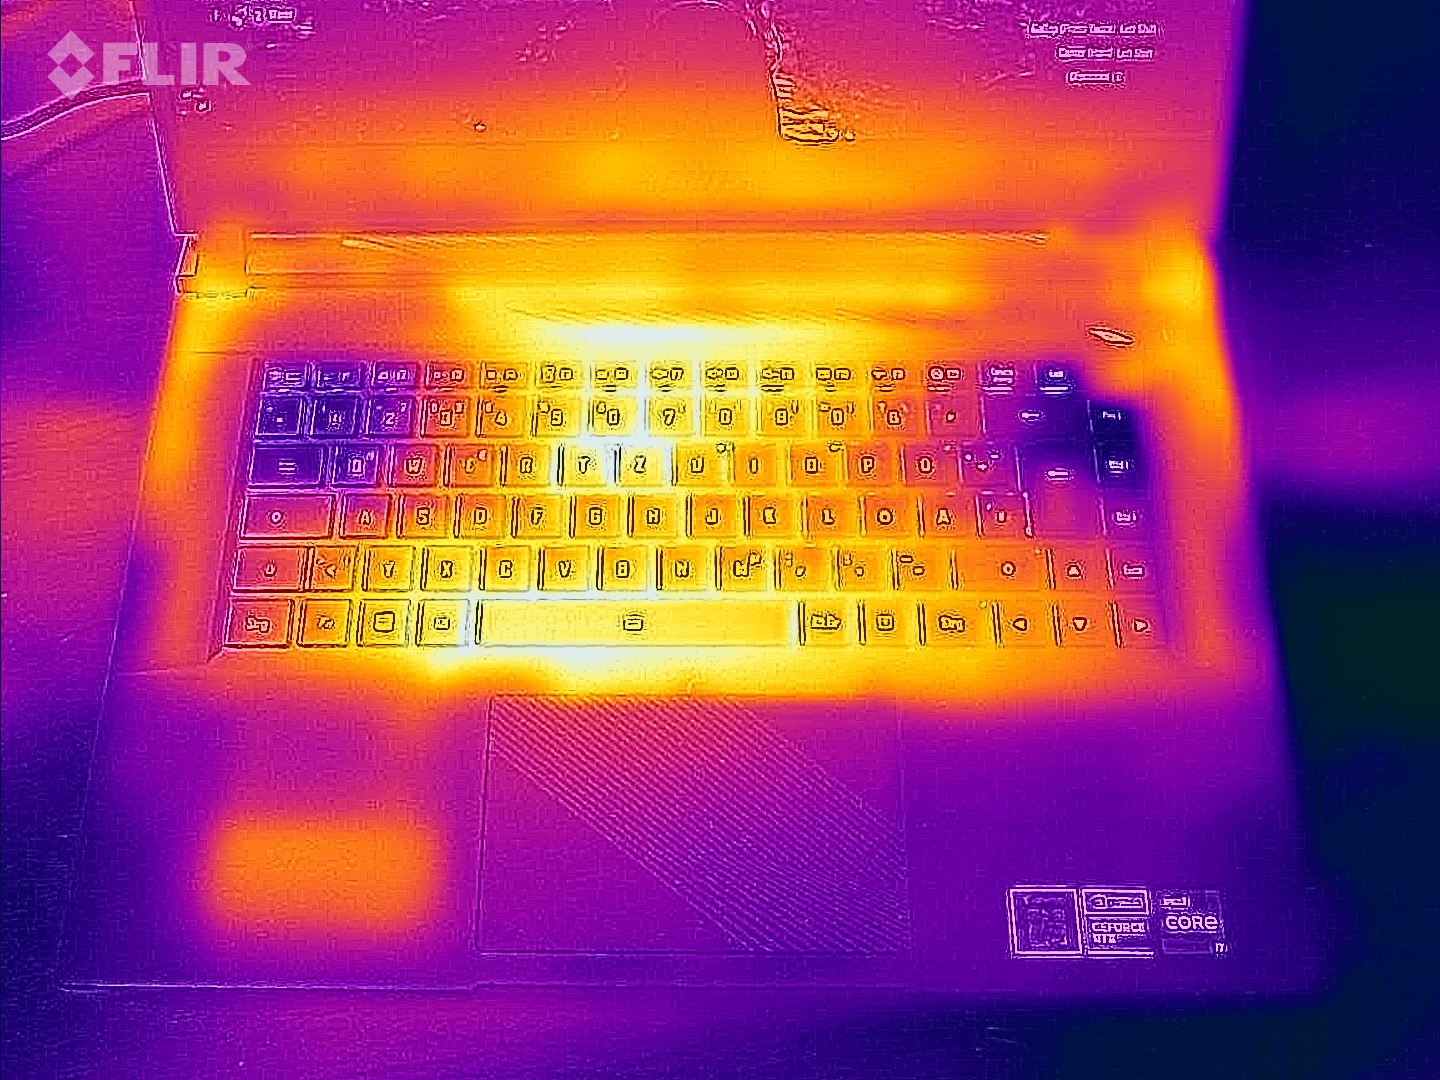
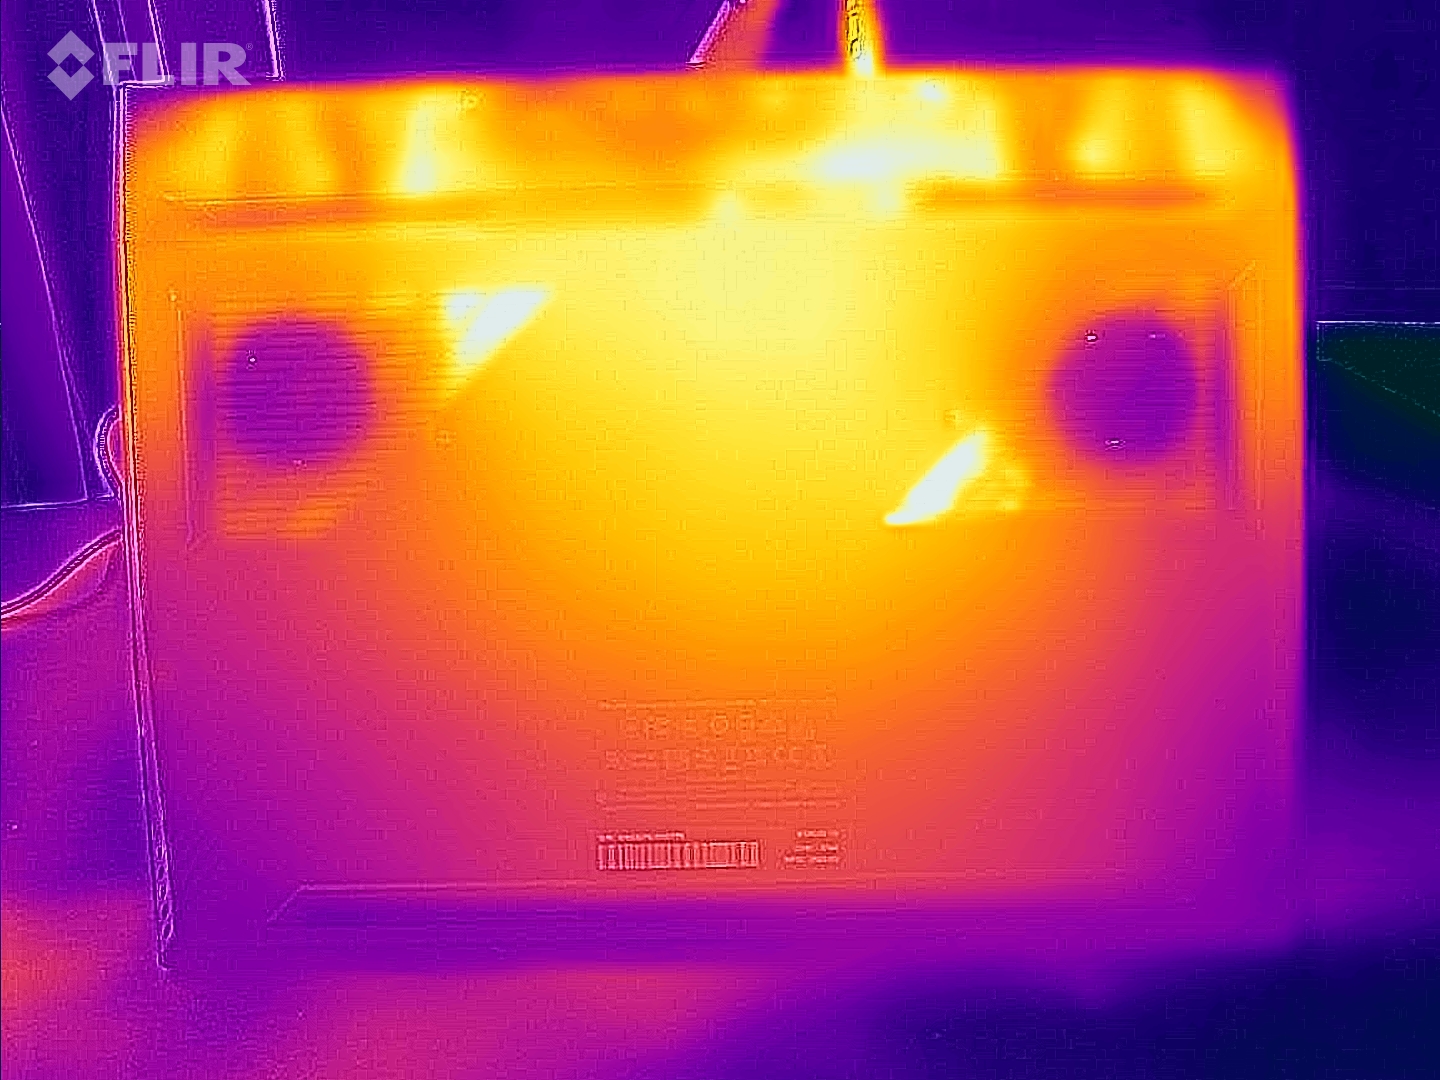
Temperatura
Nosso teste de estresse e o teste Witcher 3 fizeram com que o laptop esquentasse visivelmente, mas não extremamente. No uso diário (escritório, Internet), as temperaturas do gabinete geralmente permanecem dentro da área verde - em comparação com laptops semelhantes, elas são um pouco altas.
(-) A temperatura máxima no lado superior é 48 °C / 118 F, em comparação com a média de 40.4 °C / 105 F , variando de 21.2 a 68.8 °C para a classe Gaming.
(-) A parte inferior aquece até um máximo de 47 °C / 117 F, em comparação com a média de 43.2 °C / 110 F
(±) Em uso inativo, a temperatura média para o lado superior é 35.6 °C / 96 F, em comparação com a média do dispositivo de 33.9 °C / ### class_avg_f### F.
(-) Jogando The Witcher 3, a temperatura média para o lado superior é 41.9 °C / 107 F, em comparação com a média do dispositivo de 33.9 °C / ## #class_avg_f### F.
(-) Os apoios para as mãos e o touchpad podem ficar muito quentes ao toque, com um máximo de 42 °C / 107.6 F.
(-) A temperatura média da área do apoio para as mãos de dispositivos semelhantes foi 28.8 °C / 83.8 F (-13.2 °C / -23.8 F).
| Aorus 15 BSF Intel Core i7-13700H, NVIDIA GeForce RTX 4070 Laptop GPU | HP Omen Transcend 16 Intel Core i9-13900HX, NVIDIA GeForce RTX 4070 Laptop GPU | MSI Pulse 17 B13VGK Intel Core i7-13700H, NVIDIA GeForce RTX 4070 Laptop GPU | Lenovo Legion Slim 7i 16 Gen 8 Intel Core i9-13900H, NVIDIA GeForce RTX 4070 Laptop GPU | Acer Nitro 16 AN16-41 AMD Ryzen 7 7735HS, NVIDIA GeForce RTX 4070 Laptop GPU | Asus TUF Gaming A16 FA617XS AMD Ryzen 9 7940HS, AMD Radeon RX 7600S | |
|---|---|---|---|---|---|---|
| Heat | 7% | 6% | 8% | 6% | 6% | |
| Maximum Upper Side * (°C) | 48 | 47.4 1% | 48 -0% | 49.8 -4% | 41.5 14% | 53 -10% |
| Maximum Bottom * (°C) | 47 | 54.4 -16% | 50 -6% | 48.8 -4% | 51.8 -10% | 48 -2% |
| Idle Upper Side * (°C) | 39 | 28.4 27% | 30 23% | 29.4 25% | 31.6 19% | 30 23% |
| Idle Bottom * (°C) | 35 | 29.2 17% | 33 6% | 30 14% | 34.5 1% | 30 14% |
* ... menor é melhor
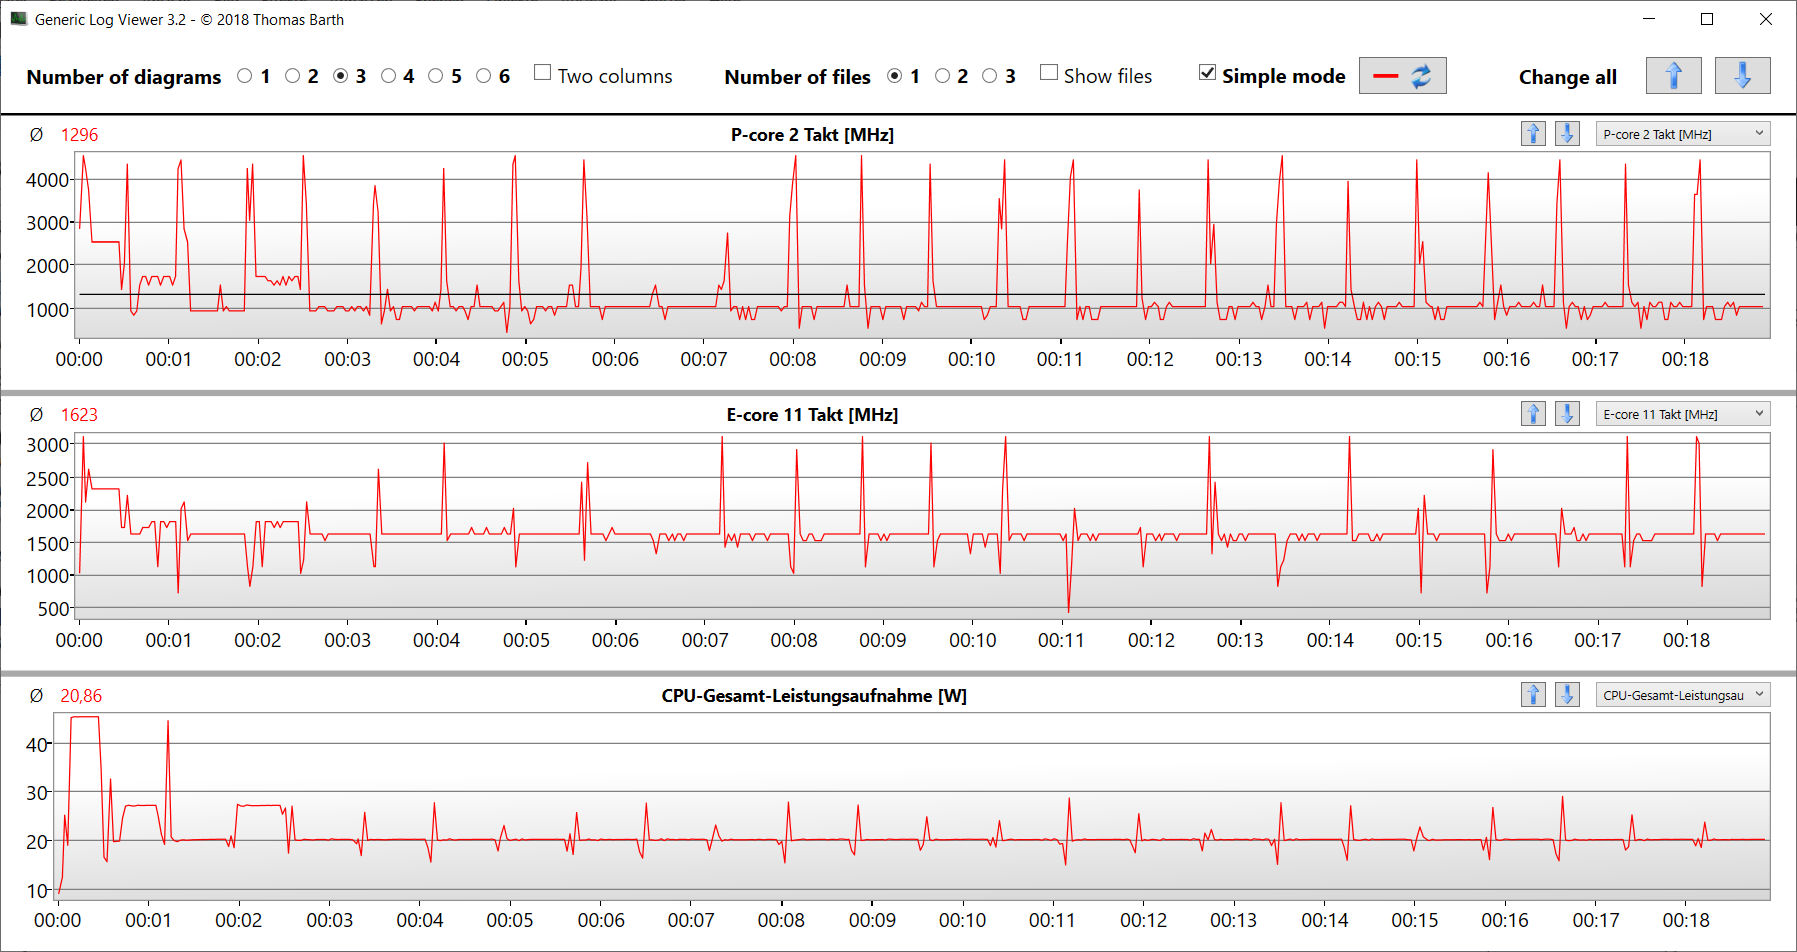
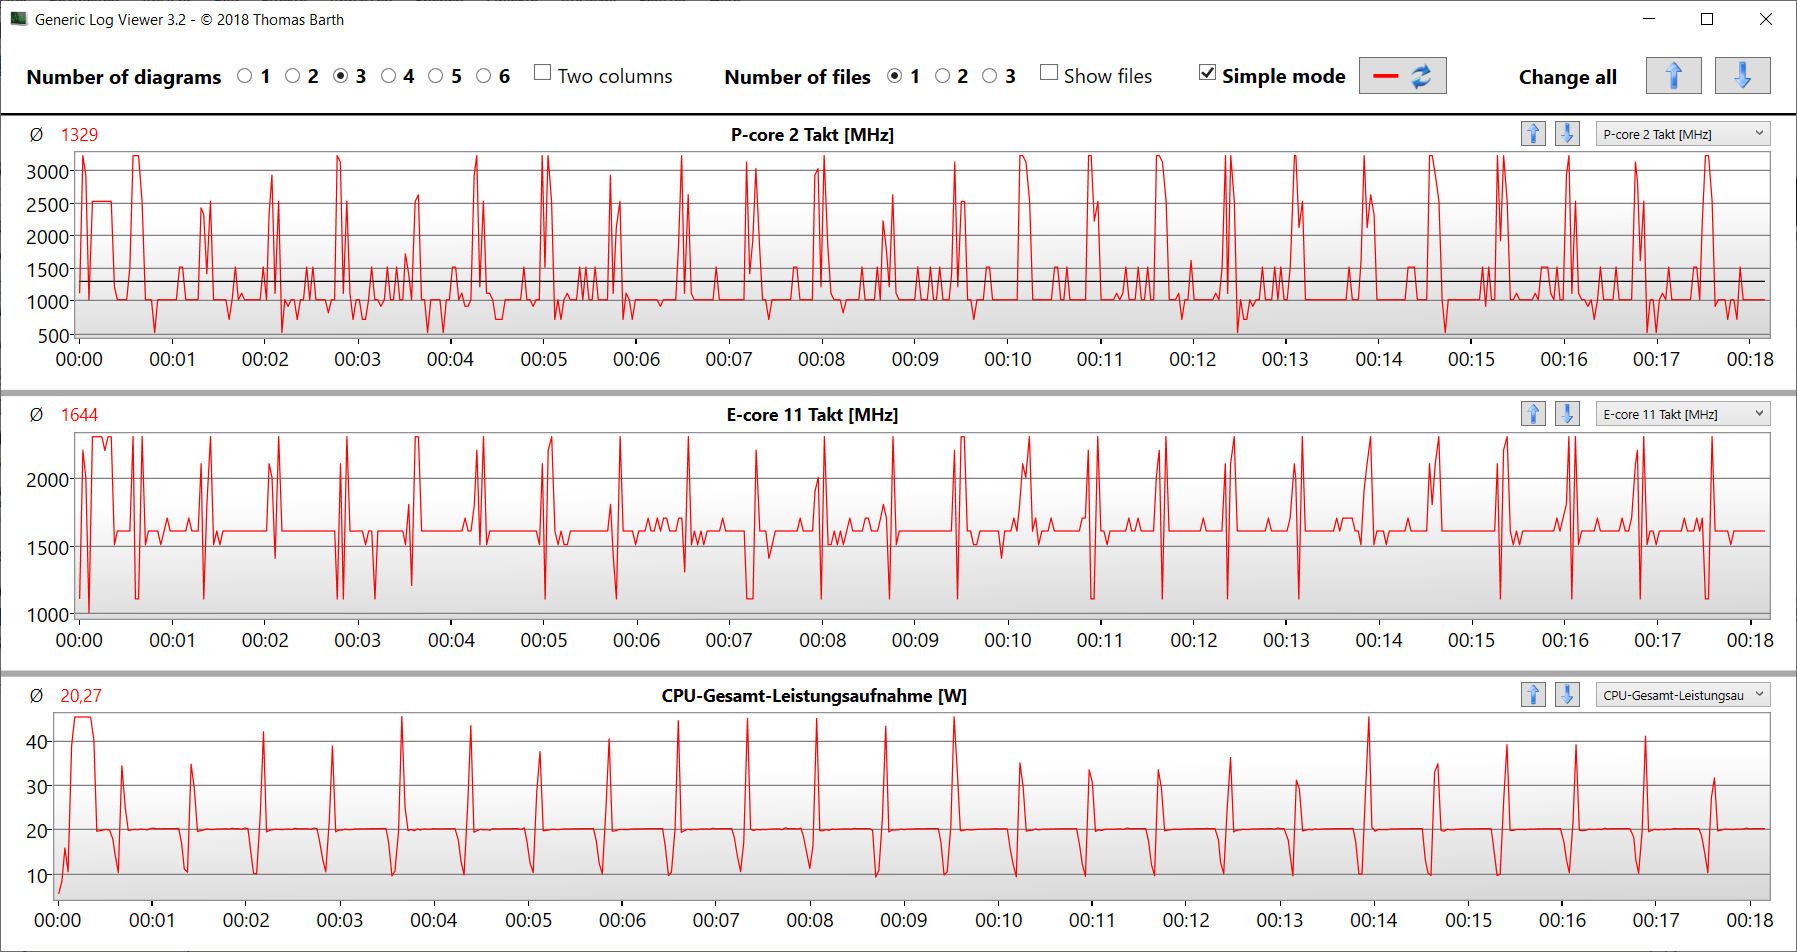
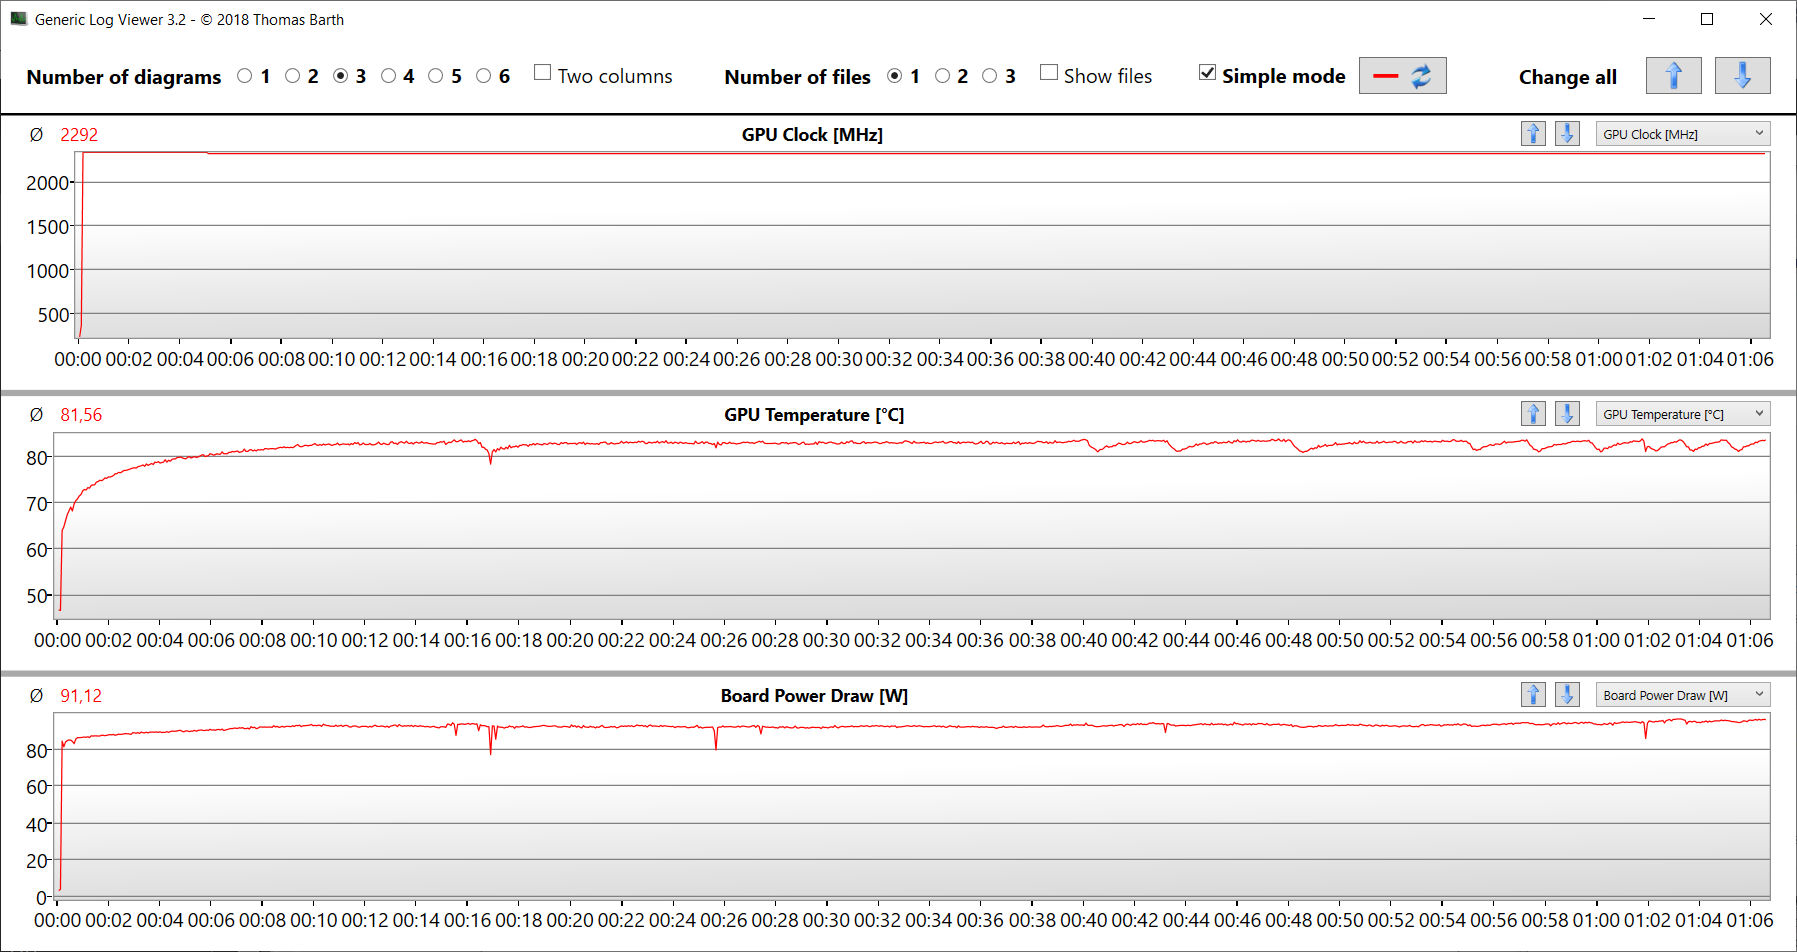
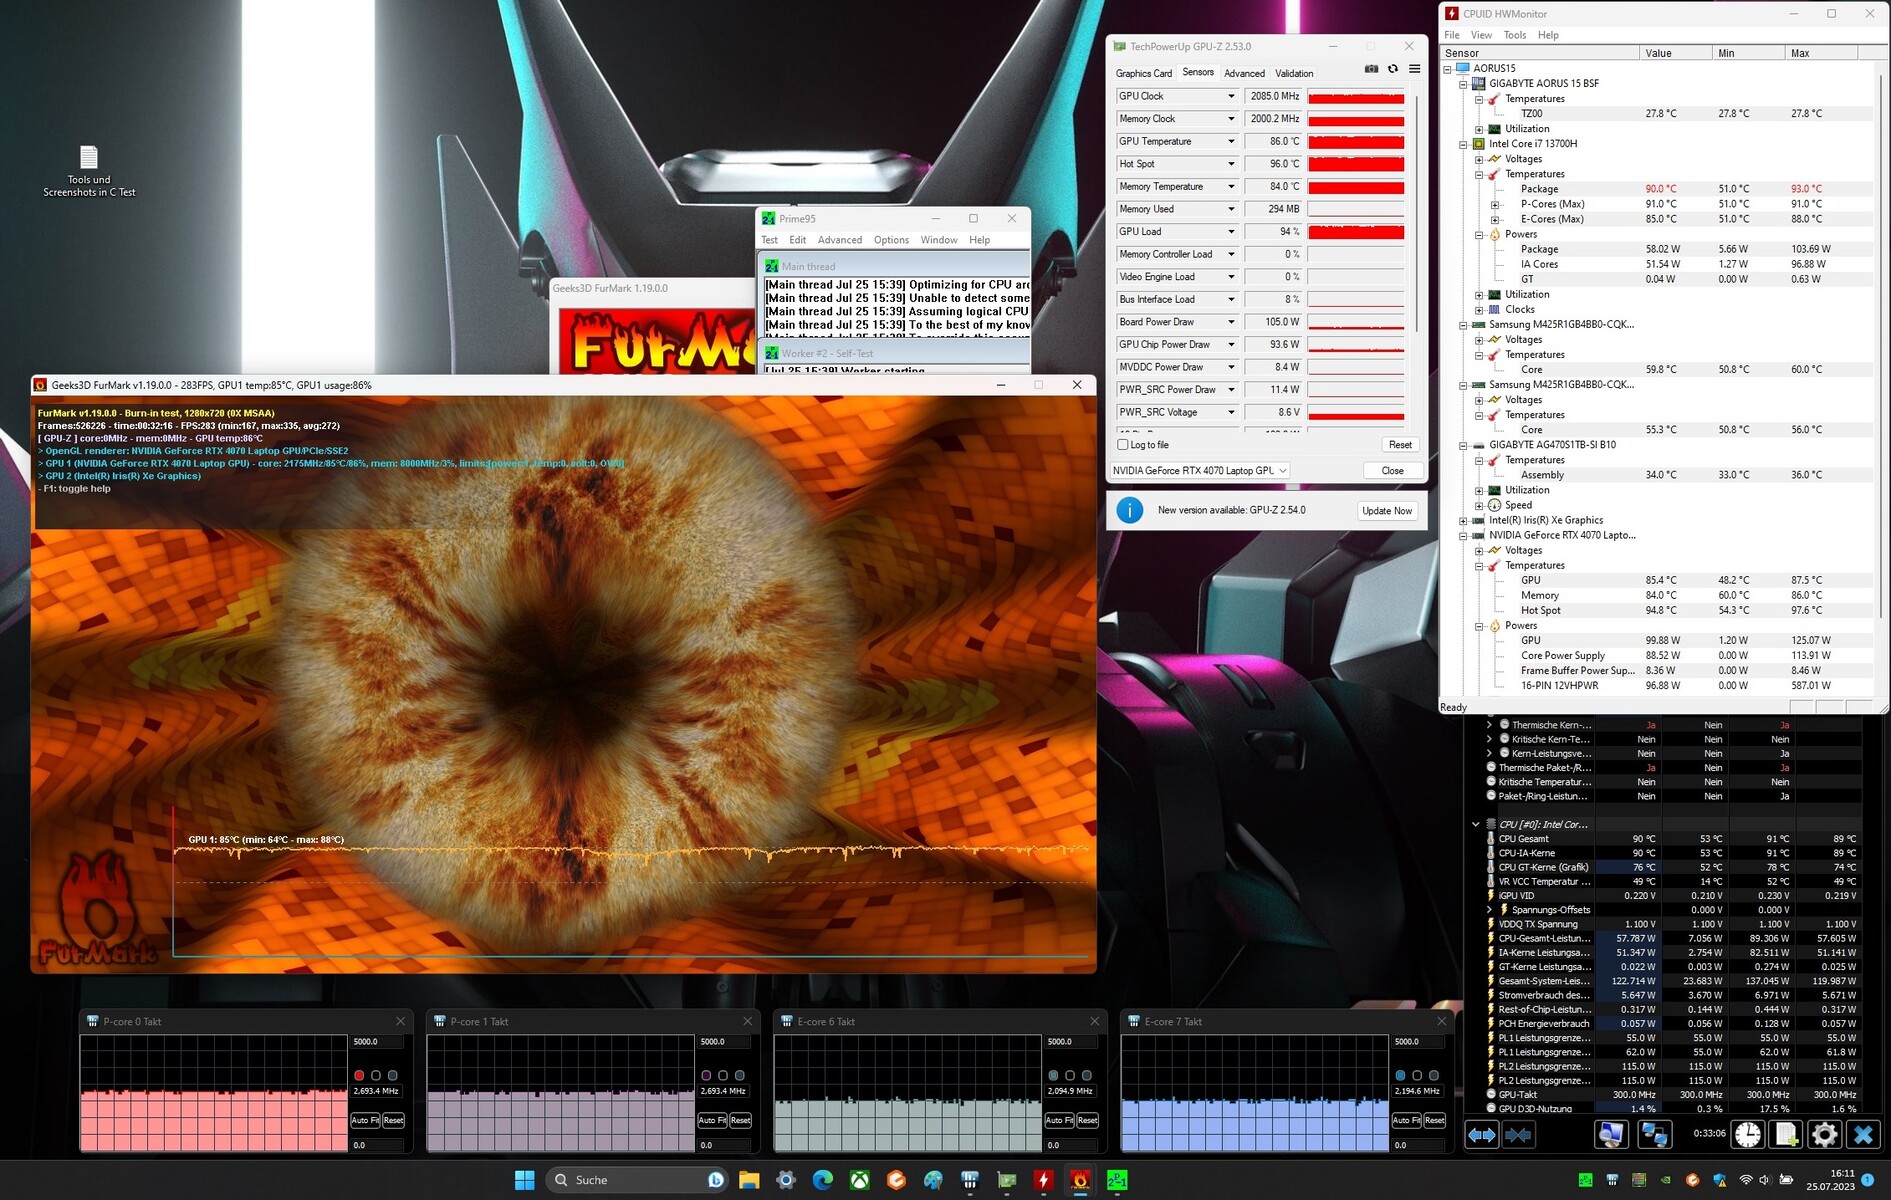
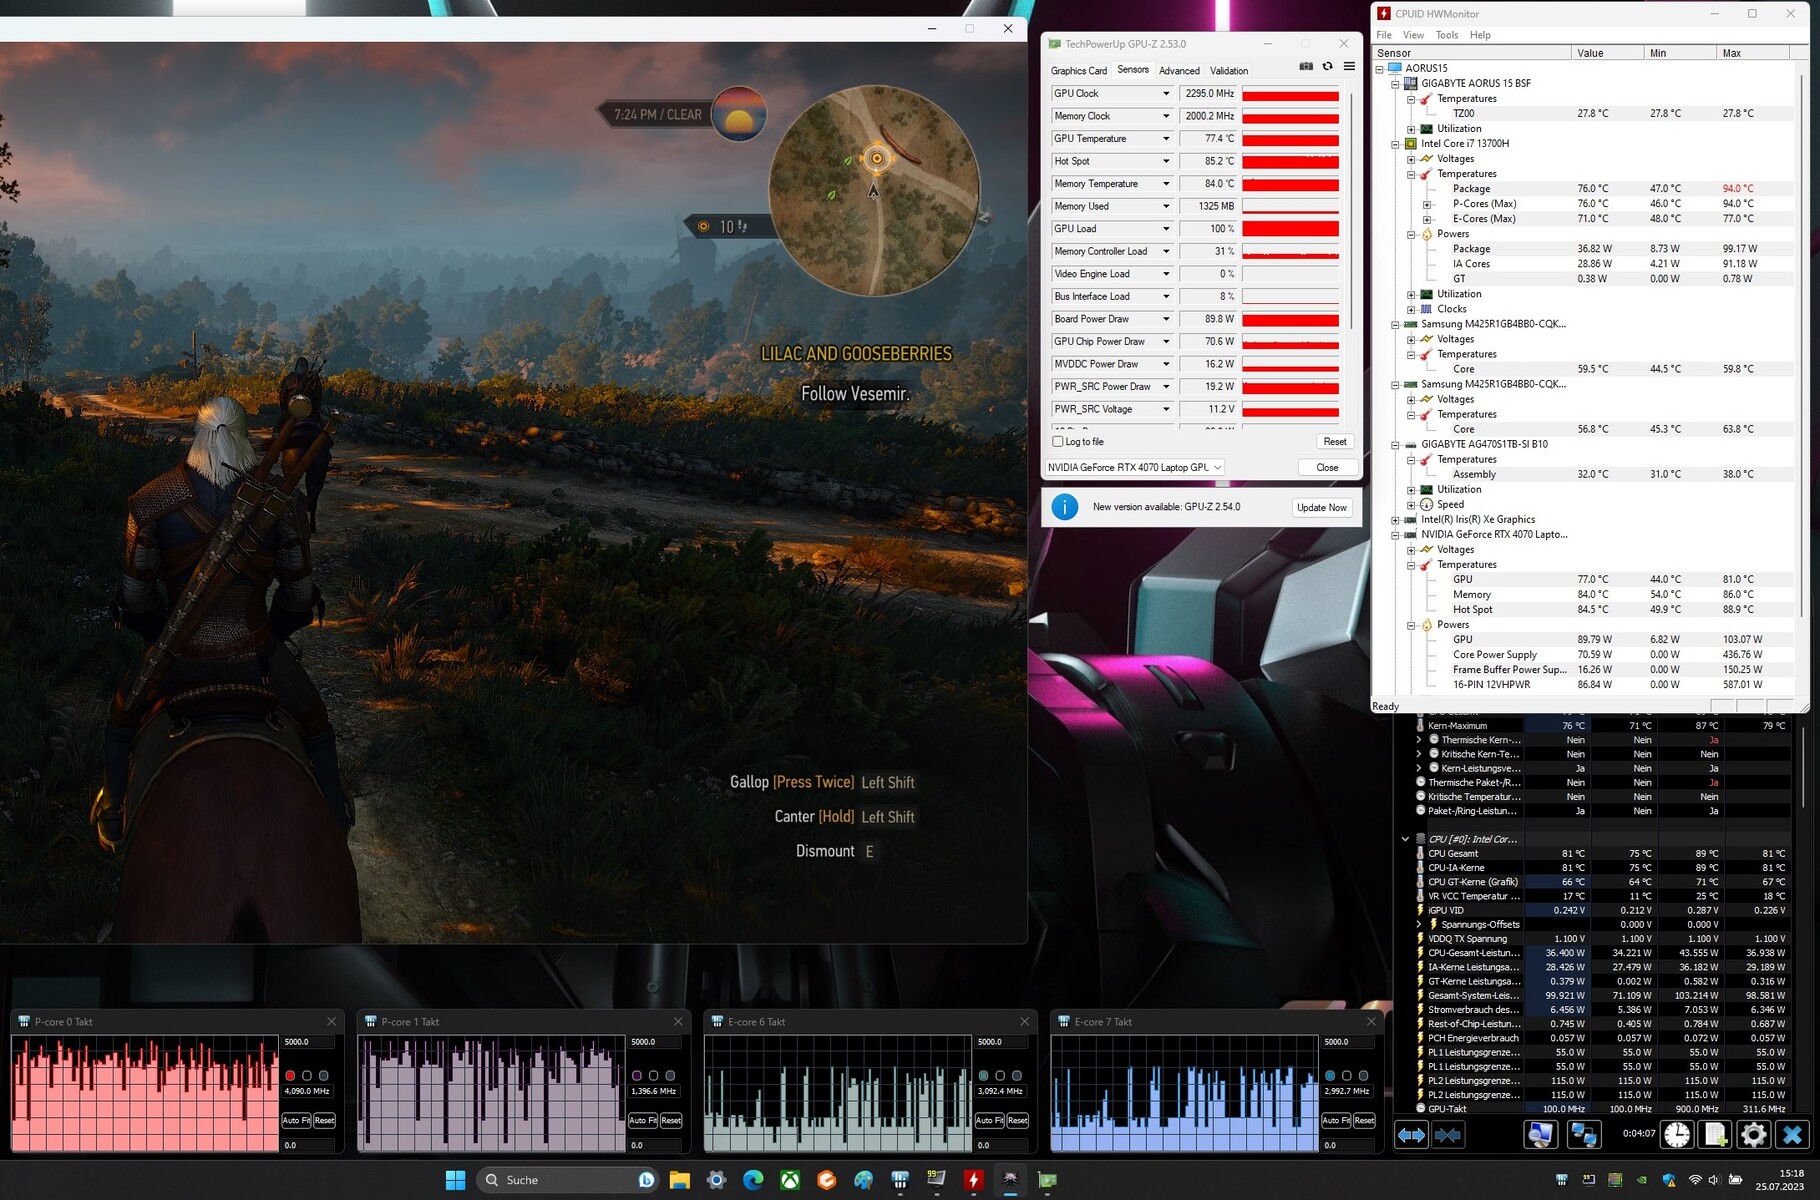
Teste de estresse
O teste de estresse (Prime95 e Furmark em uso contínuo) cria um cenário extremo para verificar a estabilidade do sistema sob carga total. A CPU (P: 2,7 - 2,8 GHz, E: 2,5 GHz) iniciou o teste com velocidades médias de clock. Após um curto período, o clock caiu para cerca de 2,6 - 2,7 GHz (núcleos P) e 2,1 - 2,2 GHz (núcleos E). O clock da GPU caiu de 2,3 GHz para 2,1 GHz.
Alto-falantes
Os alto-falantes estéreo produzem um som decente, mas quase não há graves. Recomenda-se o uso de fones de ouvido ou alto-falantes externos para uma melhor experiência sonora.
Aorus 15 BSF análise de áudio
(+) | os alto-falantes podem tocar relativamente alto (###valor### dB)
Graves 100 - 315Hz
(-) | quase nenhum baixo - em média 27.1% menor que a mediana
(-) | graves não são lineares (16% delta para frequência anterior)
Médios 400 - 2.000 Hz
(+) | médios equilibrados - apenas 4.2% longe da mediana
(+) | médios são lineares (3.6% delta para frequência anterior)
Altos 2 - 16 kHz
(+) | agudos equilibrados - apenas 2.8% longe da mediana
(+) | os máximos são lineares (6.8% delta da frequência anterior)
Geral 100 - 16.000 Hz
(±) | a linearidade do som geral é média (17.3% diferença em relação à mediana)
Comparado com a mesma classe
» 47% de todos os dispositivos testados nesta classe foram melhores, 12% semelhantes, 41% piores
» O melhor teve um delta de 6%, a média foi 18%, o pior foi 132%
Comparado com todos os dispositivos testados
» 33% de todos os dispositivos testados foram melhores, 8% semelhantes, 59% piores
» O melhor teve um delta de 4%, a média foi 23%, o pior foi 134%
Acer Nitro 16 AN16-41 análise de áudio
(+) | os alto-falantes podem tocar relativamente alto (###valor### dB)
Graves 100 - 315Hz
(-) | quase nenhum baixo - em média 33.5% menor que a mediana
(±) | a linearidade dos graves é média (13.2% delta para a frequência anterior)
Médios 400 - 2.000 Hz
(+) | médios equilibrados - apenas 2.4% longe da mediana
(+) | médios são lineares (4.9% delta para frequência anterior)
Altos 2 - 16 kHz
(+) | agudos equilibrados - apenas 3.6% longe da mediana
(+) | os máximos são lineares (4.2% delta da frequência anterior)
Geral 100 - 16.000 Hz
(±) | a linearidade do som geral é média (19.6% diferença em relação à mediana)
Comparado com a mesma classe
» 68% de todos os dispositivos testados nesta classe foram melhores, 6% semelhantes, 25% piores
» O melhor teve um delta de 6%, a média foi 18%, o pior foi 132%
Comparado com todos os dispositivos testados
» 49% de todos os dispositivos testados foram melhores, 7% semelhantes, 44% piores
» O melhor teve um delta de 4%, a média foi 23%, o pior foi 134%
Gerenciamento de energia - O computador Gigabyte não deixa a desejar em termos de resistência
Consumo de energia
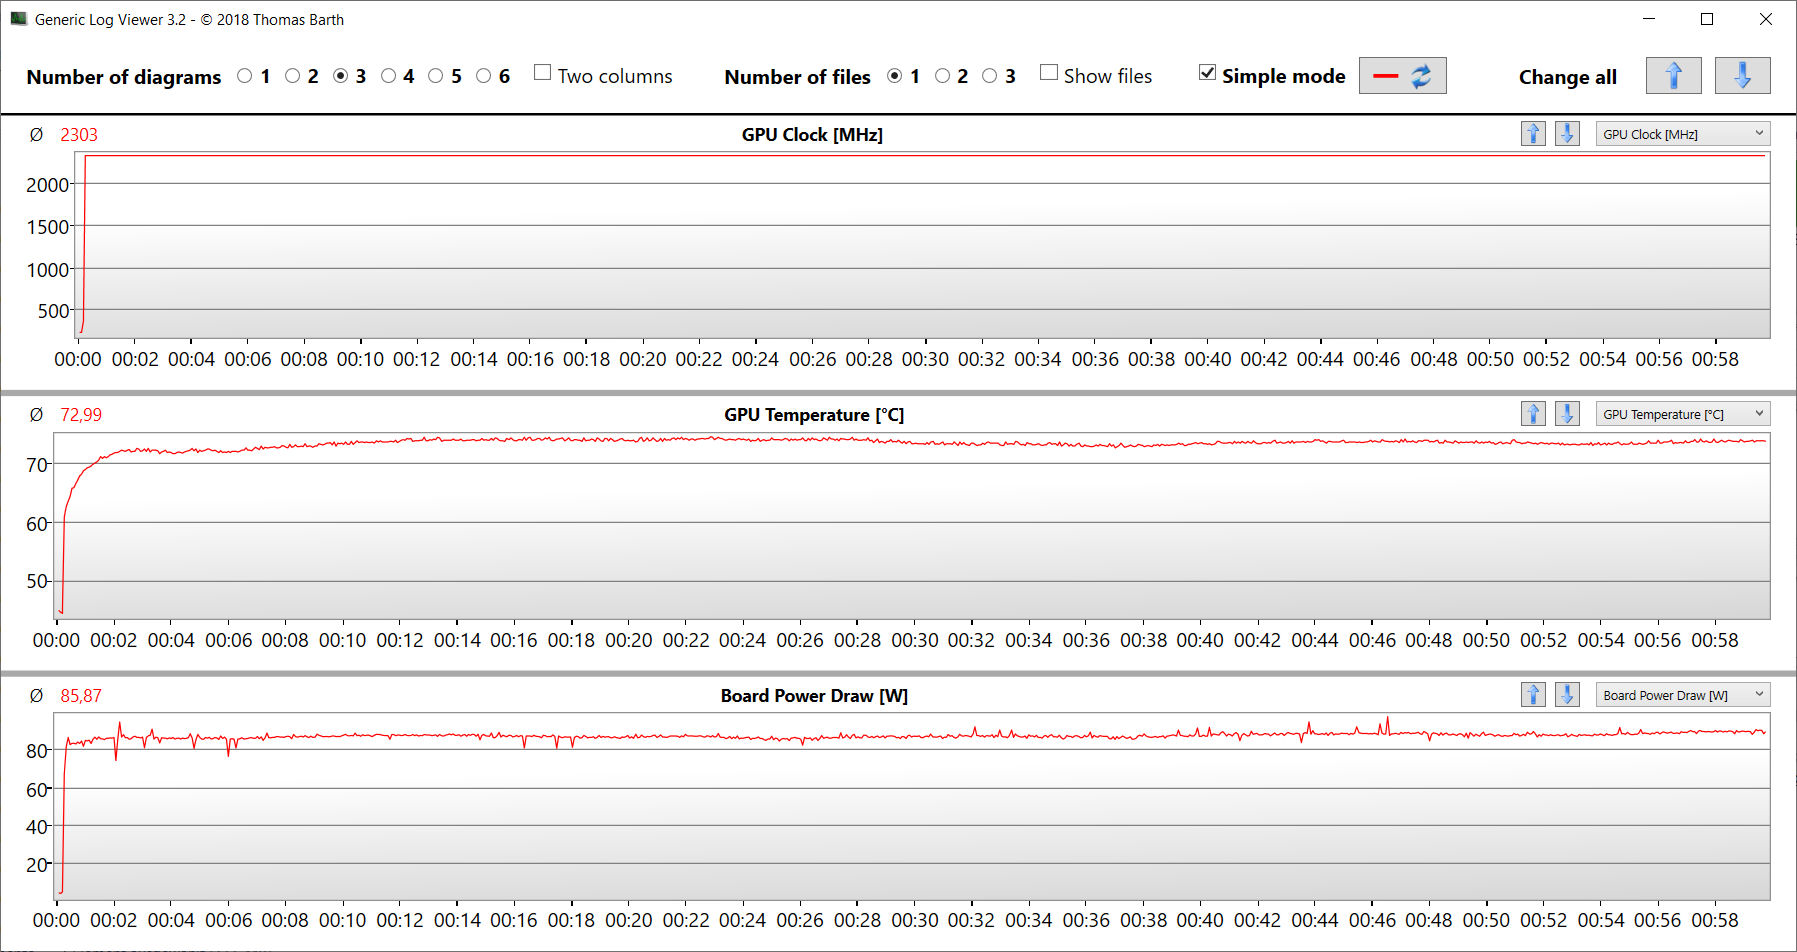
O laptop Gigabyte não apresentou nenhum problema em termos de consumo de energia. As taxas estão em um nível normal para o hardware instalado. O teste Witcher 3 teste e o teste de estresse foram executados com consumo de energia relativamente constante. A fonte de alimentação (240 watts) tem tamanho suficiente.
| desligado | |
| Ocioso | |
| Carga |
|
Key:
min: | |
| Aorus 15 BSF i7-13700H, GeForce RTX 4070 Laptop GPU | HP Omen Transcend 16 i9-13900HX, GeForce RTX 4070 Laptop GPU | MSI Pulse 17 B13VGK i7-13700H, GeForce RTX 4070 Laptop GPU | Lenovo Legion Slim 7i 16 Gen 8 i9-13900H, GeForce RTX 4070 Laptop GPU | Acer Nitro 16 AN16-41 R7 7735HS, GeForce RTX 4070 Laptop GPU | Asus TUF Gaming A16 FA617XS R9 7940HS, Radeon RX 7600S | Média da turma Gaming | |
|---|---|---|---|---|---|---|---|
| Power Consumption | -85% | 15% | -74% | -19% | 15% | -38% | |
| Idle Minimum * (Watt) | 7 | 19.2 -174% | 9 -29% | 22 -214% | 11.6 -66% | 7 -0% | 13 ? -86% |
| Idle Average * (Watt) | 12 | 22.7 -89% | 10.2 15% | 29 -142% | 15.6 -30% | 10 17% | 19 ? -58% |
| Idle Maximum * (Watt) | 20 | 55.4 -177% | 10.8 46% | 39.5 -98% | 16.5 17% | 15 25% | 24.6 ? -23% |
| Load Average * (Watt) | 94 | 128.4 -37% | 72 23% | 98.7 -5% | 155 -65% | 86 9% | 110.7 ? -18% |
| Witcher 3 ultra * (Watt) | 175.8 | 206 -17% | 130 26% | 171.8 2% | 154.8 12% | 160.6 9% | |
| Load Maximum * (Watt) | 247 | 292 -18% | 221 11% | 213.2 14% | 205 17% | 172 30% | 259 ? -5% |
* ... menor é melhor
Power consumption Witcher 3 / stress test
Power consumption with external monitor
Duração da bateria
O dispositivo de 15,6 polegadas alcançou tempos de execução de 10:19 h e 9:01 h no teste de WLAN (acessando sites por meio de um script) e no teste de vídeo (curta-metragem Big Buck Bunny (codificação H.264, FHD) em um loop), respectivamente. Durante os dois testes, os recursos de economia de energia do laptop foram desativados e o brilho da tela foi definido para cerca de 150 cd/m². Os módulos sem fio também foram desativados para o teste de vídeo.
O dispositivo apresentou tempos de execução muito bons. Muitos dos concorrentes ficaram muito atrás do Aorus 15, apesar de suas capacidades de bateria semelhantes. O laptop Aorus ainda não conseguiu chegar perto doAsus TUF Gaming A16os resultados incríveis do Asus TUF Gaming A16. O computador da Asus se beneficia de sua APU AMD mais econômica.
| Aorus 15 BSF i7-13700H, GeForce RTX 4070 Laptop GPU, 99 Wh | HP Omen Transcend 16 i9-13900HX, GeForce RTX 4070 Laptop GPU, 97 Wh | MSI Pulse 17 B13VGK i7-13700H, GeForce RTX 4070 Laptop GPU, 90 Wh | Lenovo Legion Slim 7i 16 Gen 8 i9-13900H, GeForce RTX 4070 Laptop GPU, 99.9 Wh | Acer Nitro 16 AN16-41 R7 7735HS, GeForce RTX 4070 Laptop GPU, 90 Wh | Asus TUF Gaming A16 FA617XS R9 7940HS, Radeon RX 7600S, 90 Wh | Média da turma Gaming | |
|---|---|---|---|---|---|---|---|
| Duração da bateria | -49% | -7% | -56% | -2% | 21% | -24% | |
| Reader / Idle (h) | 10.9 | 6.3 -42% | 5.1 -53% | 12.2 12% | 20.3 86% | 8.27 ? -24% | |
| H.264 (h) | 9 | 10.2 13% | 12.4 38% | 8.32 ? -8% | |||
| WiFi v1.3 (h) | 10.3 | 4.2 -59% | 9 -13% | 4.4 -57% | 9 -13% | 12.4 20% | 7.11 ? -31% |
| Load (h) | 2.2 | 1.2 -45% | 2.2 0% | 0.9 -59% | 1.8 -18% | 0.9 -59% | 1.502 ? -32% |
Pro
Contra
Veredicto - O laptop para jogos QHD vale o dinheiro
O Aorus 15 foi criado para jogos em QHD (configurações altas a máximas), mas também é excelente em outros campos de uso (edição de vídeo, renderização). Seu processadorCore i7-13700HeGeForce RTX 4070proporcionam o desempenho necessário. Ambos os chips são executados com uma taxa de clock consistentemente alta. Um SSD PCIe 4 rápido (1 TB) fornece o armazenamento necessário e garante que os tempos de carregamento sejam mantidos curtos.
O Aorus 15 BSF da Gigabyte é um laptop para jogos de médio porte excelente e completo.
As emissões de ruído e calor estão nos níveis esperados para essa faixa de preço. A redução das emissões de ruído pode ser obtida às custas de parte do desempenho do laptop. Seu painel IPS fosco (15,6 polegadas, 2.560 x 1.440 pixels, 165 Hz, DCI P3) geralmente causa uma boa impressão. No entanto, o brilho e o contraste poderiam ser um pouco melhores.
O carregamento completo da bateria (99 Wh) leva a uma duração prática de cerca de 9 a 10 horas - um resultado muito bom. Ponto positivo: A bateria pode ser carregada por meio de um cabo USB-C (mínimo de 65 watts, 20 V) - sua porta USB-C (Thunderbolt 4) é compatível com o Power Delivery. Isso significa que o volumoso conector de alimentação proprietário (240 watts) nem sempre precisa ser transportado com o dispositivo.
Uma alternativa a esse laptop poderia ser oAsus TUF Gaming A16 FA617XSque oferece melhor desempenho da CPU, uma tela 16:10 e tempos de execução ainda mais longos. Em termos de desempenho gráfico, ele está um pouco em desvantagem em relação ao Aorus 15.
Preço e disponibilidade
A versão do Aorus 15 BSF que testamos pode ser encontrada na Amazon por US$ 1.699.
Aorus 15 BSF
- 08/12/2023 v7 (old)
Sascha Mölck
Transparência
A seleção dos dispositivos a serem analisados é feita pela nossa equipe editorial. A amostra de teste foi fornecida ao autor como empréstimo pelo fabricante ou varejista para fins desta revisão. O credor não teve influência nesta revisão, nem o fabricante recebeu uma cópia desta revisão antes da publicação. Não houve obrigação de publicar esta revisão. Como empresa de mídia independente, a Notebookcheck não está sujeita à autoridade de fabricantes, varejistas ou editores.
É assim que o Notebookcheck está testando
Todos os anos, o Notebookcheck analisa de forma independente centenas de laptops e smartphones usando procedimentos padronizados para garantir que todos os resultados sejam comparáveis. Desenvolvemos continuamente nossos métodos de teste há cerca de 20 anos e definimos padrões da indústria no processo. Em nossos laboratórios de teste, equipamentos de medição de alta qualidade são utilizados por técnicos e editores experientes. Esses testes envolvem um processo de validação em vários estágios. Nosso complexo sistema de classificação é baseado em centenas de medições e benchmarks bem fundamentados, o que mantém a objetividade.Price comparison

