Revisão Aorus 15 XE5: Computador portátil compacto QHD com Thunderbolt 4
O Aorus 15 XE5 de 15,6 polegadas une-se aos laptops de jogos compactos e é alimentado por um Núcleo i7-12700H e um GeForce Computador portátil RTX 3070 Ti. A máquina está competindo com dispositivos como o Acer Nitro 5 AN515-46o MSI Katana GF66 12UGSo Schenker XMG Fusion 15 (meados de 22) e o Asus TUF DASH F15 FX517ZR.
Possíveis concorrentes em comparação
Avaliação | Data | Modelo | Peso | Altura | Size | Resolução | Preço |
|---|---|---|---|---|---|---|---|
| 85.5 % v7 (old) | 12/2022 | Aorus 15 XE5 i7-12700H, GeForce RTX 3070 Ti Laptop GPU | 2.3 kg | 24 mm | 15.60" | 2560x1440 | |
| 83.9 % v7 (old) | 11/2022 | Acer Nitro 5 AN515-46-R1A1 R7 6800H, GeForce RTX 3070 Ti Laptop GPU | 2.5 kg | 26.8 mm | 15.60" | 1920x1080 | |
| 87.4 % v7 (old) | 08/2022 | Schenker XMG Fusion 15 (Mid 22) i7-11800H, GeForce RTX 3070 Laptop GPU | 1.9 kg | 21.65 mm | 15.60" | 2560x1440 | |
| 85.8 % v7 (old) | 07/2022 | Asus TUF Dash F15 FX517ZR i7-12650H, GeForce RTX 3070 Laptop GPU | 2 kg | 20.7 mm | 15.60" | 2560x1440 | |
| 80.3 % v7 (old) | 06/2022 | MSI Katana GF66 12UGS i7-12700H, GeForce RTX 3070 Ti Laptop GPU | 2.3 kg | 27.5 mm | 15.60" | 1920x1080 |
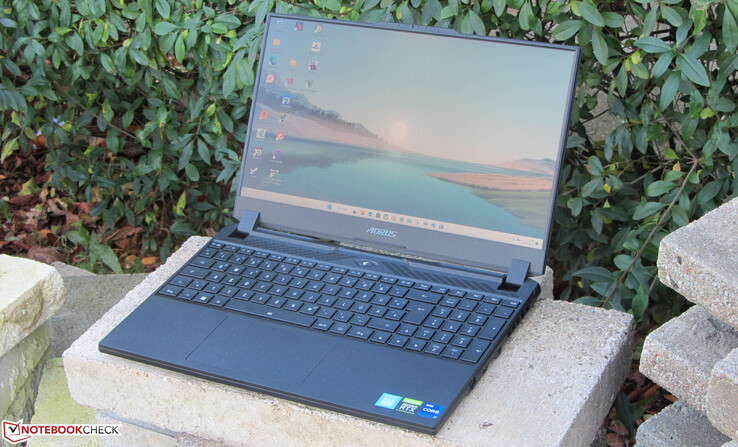
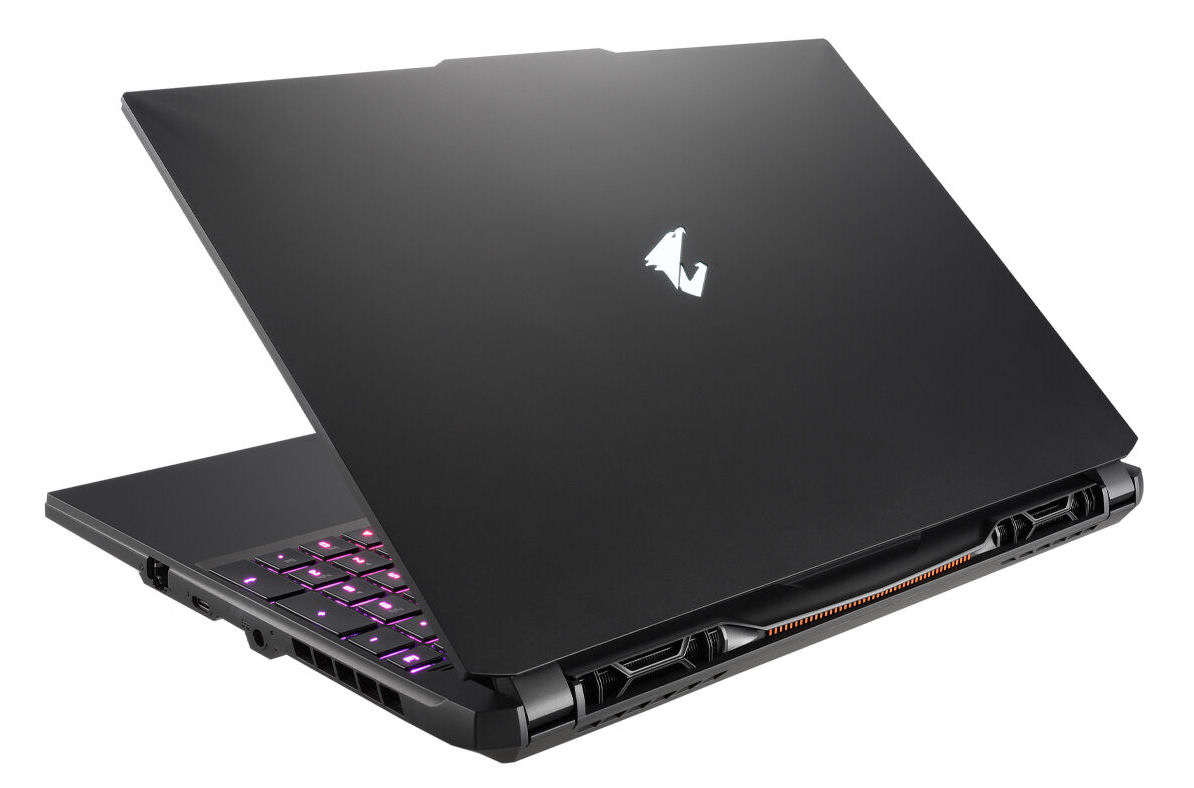
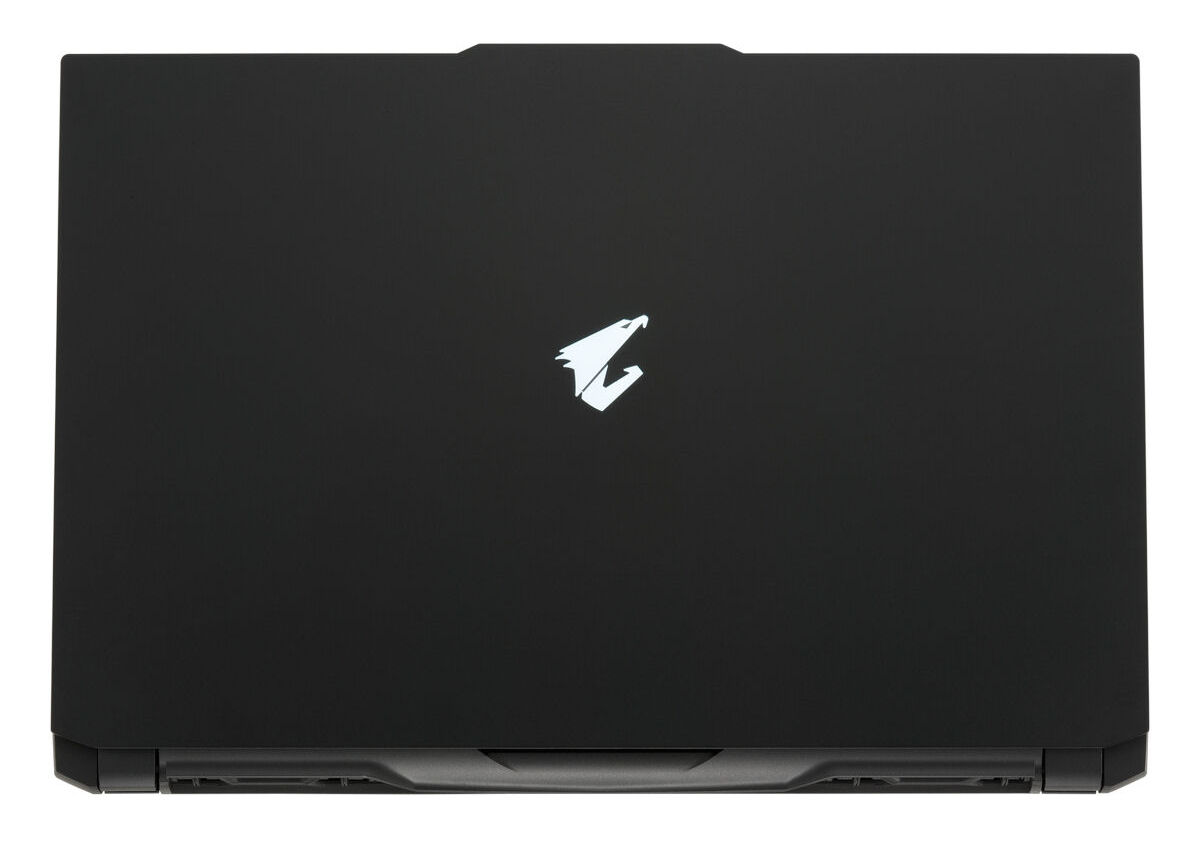
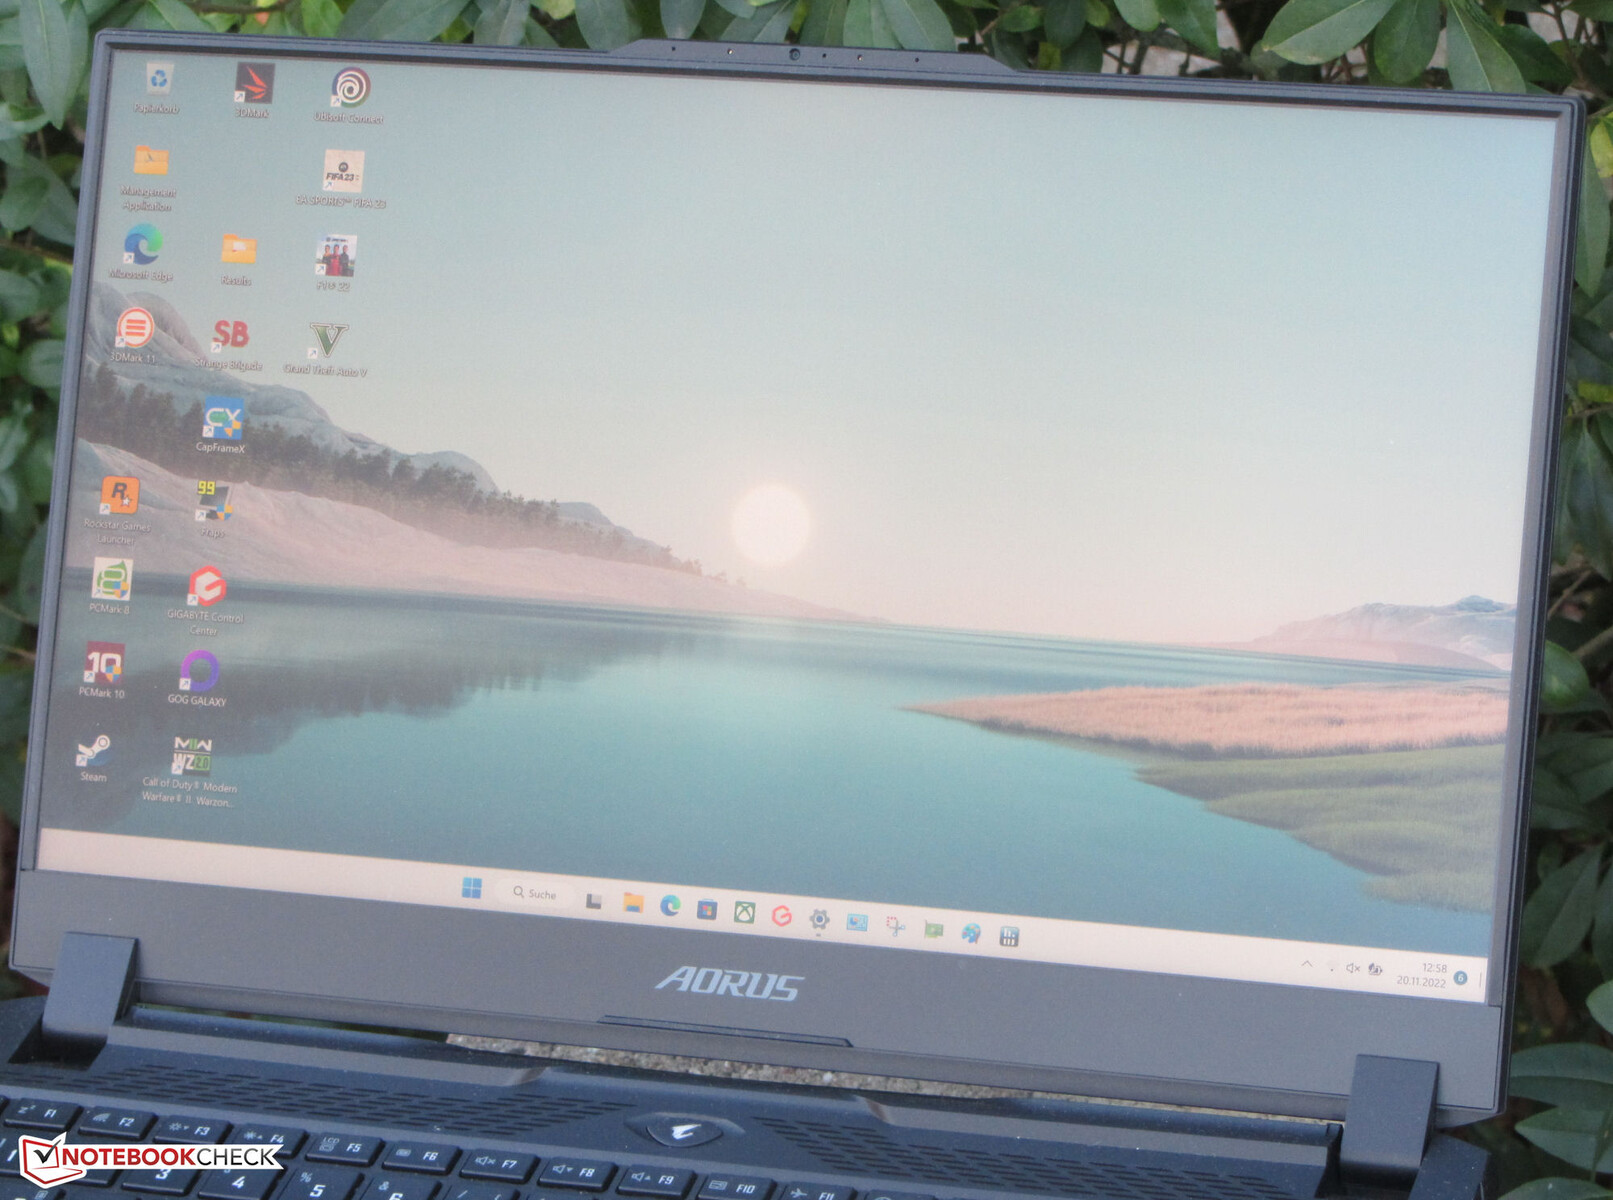
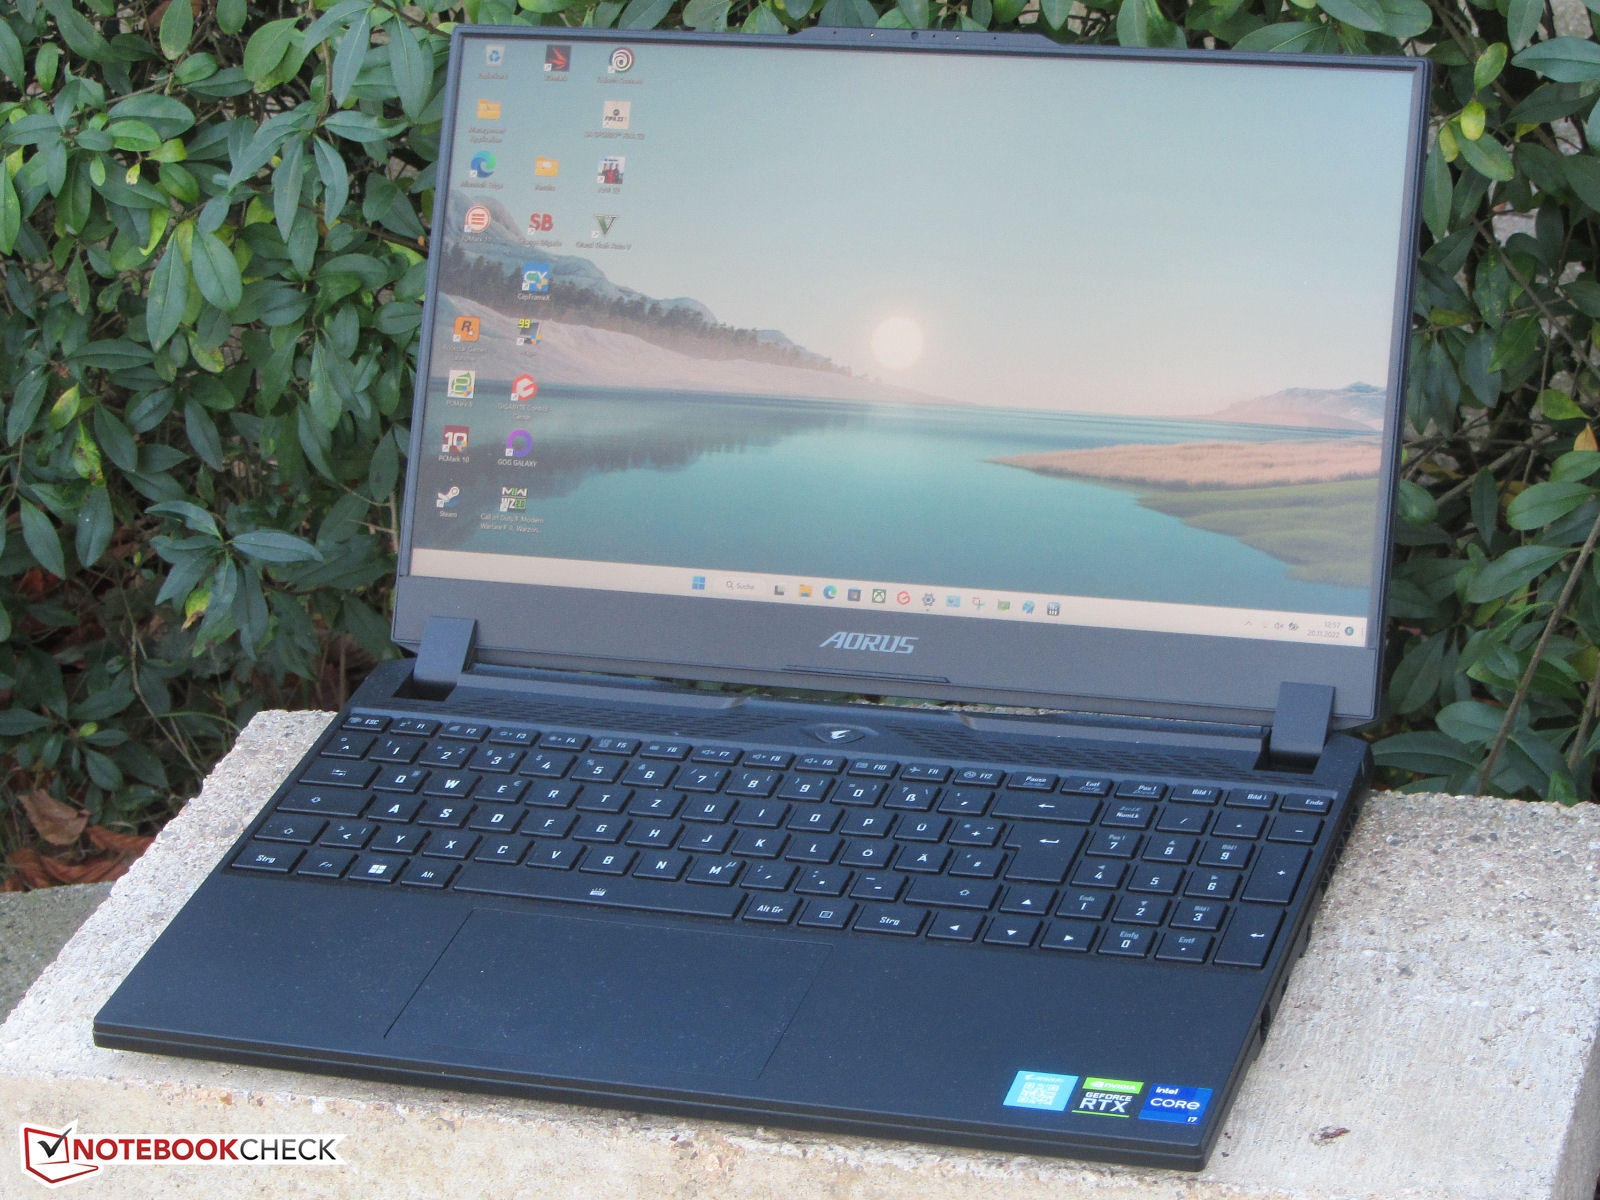
Case - O Aorus é impressionantemente compacto
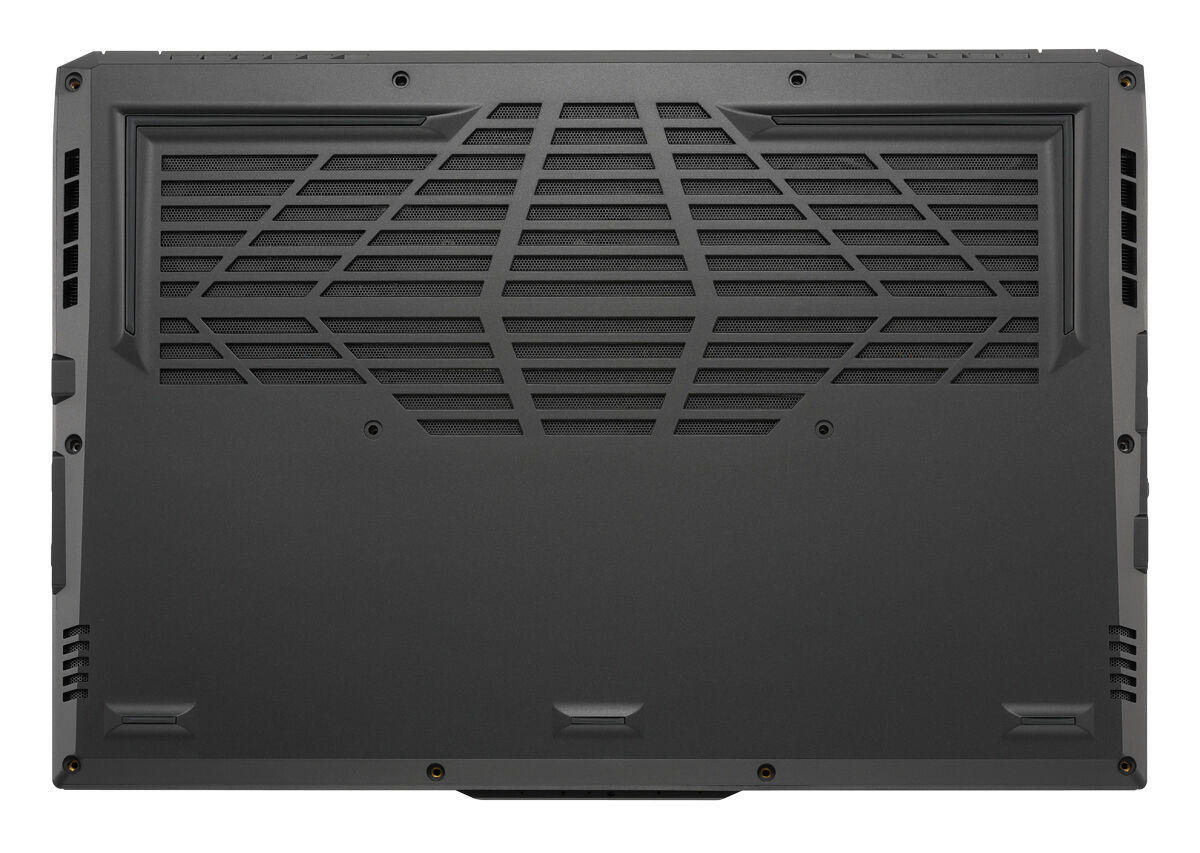
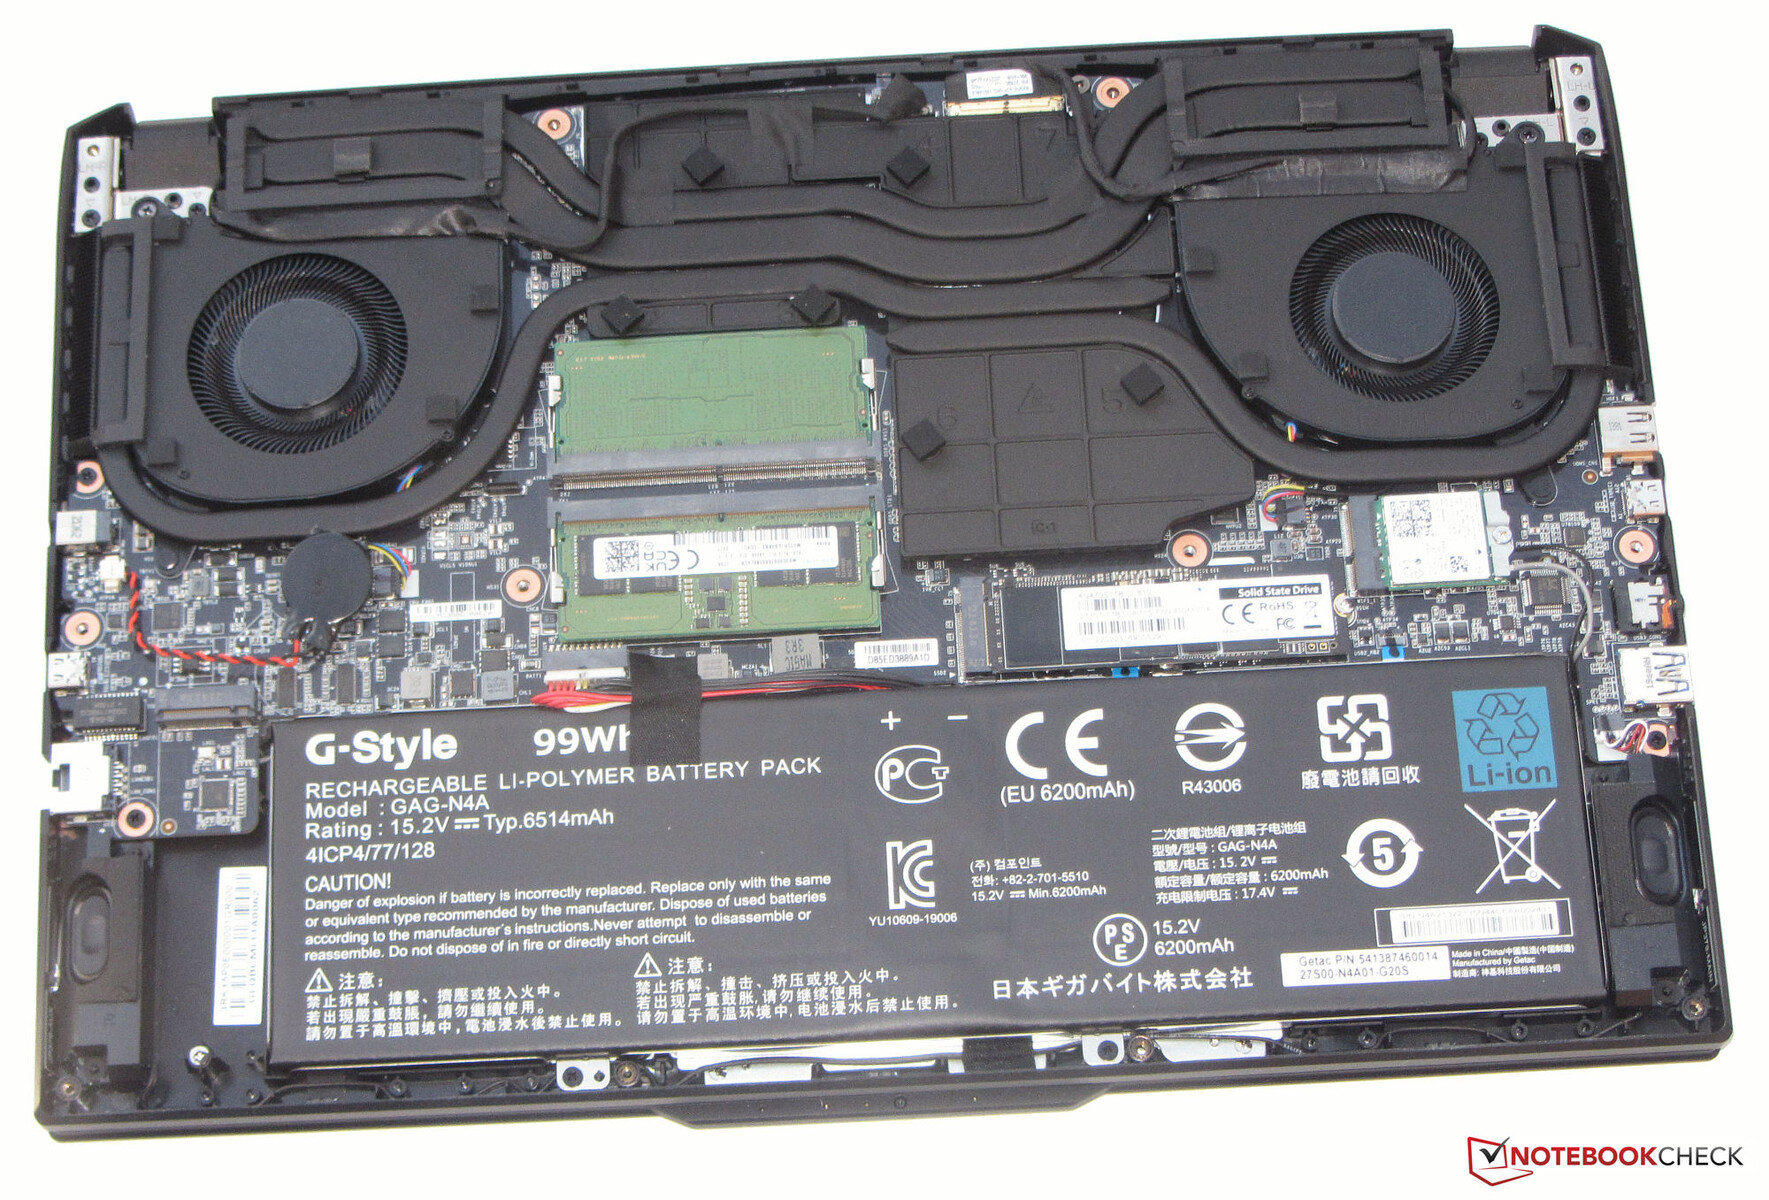
O Gigabyte Aorus 15 XE5 tem um chassi de plástico preto com superfícies lisas e foscas. O dispositivo não apresenta nenhum elemento de design extravagante. A fina moldura ao redor da tela dá ao laptop um certo ar de elegância. O design do laptop é acentuado pelo logo Aorus iluminado na parte de trás da tampa. Uma vez removido o painel inferior, você terá acesso à bateria (parafusada, não colada) e ao restante do interior.
Nossa unidade de revisão não parece ter nenhum problema de acabamento. As lacunas no chassi são apertadas, e não há excesso de materiais salientes do laptop. A seção da base dificilmente se move quando torcida, mas a tampa se mostra significativamente mais flexível. A tampa é mantida no lugar por duas dobradiças que permitem que a tela seja dobrada para trás em cerca de 150 graus. O laptop pode ser aberto usando apenas uma mão.
O 15 XE5 é um dos computadores portáteis mais compactos em nossa comparação. Entretanto, com cerca de 2,3 kg (5,07 lb), é mais pesado que os dispositivos concorrentes, tais como o XMG Fusion 15 e o TUF Dash F15.
Especificações - Suporte Thunderbolt 4
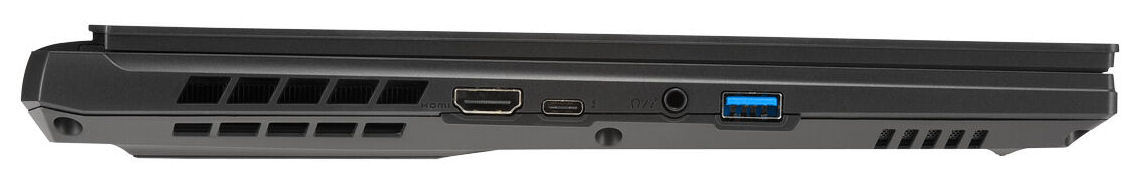
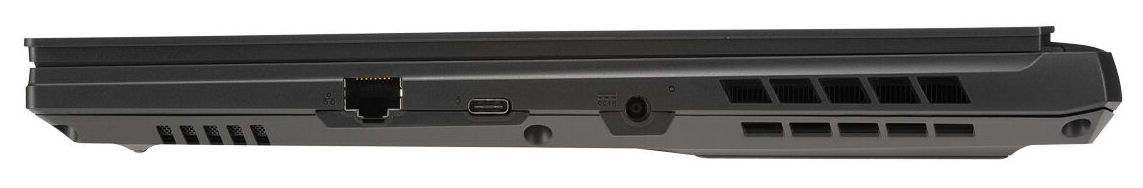
As duas portas USB-C (1x Thunderbolt 4, 1x USB 3.2 Gen 1) suportam DisplayPort sobre USB-C, e o conector Thunderbolt 4 também oferece Fornecimento de Energia. Pena que haja apenas uma porta USB-A (USB 3.2 Gen 1) no dispositivo. Aqueles que precisam de mais conectividade externa teriam que usar um adaptador ou uma doca. Você pode conectar até três monitores ao laptop (2x DP, 1x HDMI). Arredondando a seleção de portas estão uma tomada de áudio combinada e uma porta Gigabit Ethernet. O Aorus 15 XE5 não tem um leitor de cartões incorporado.
Conectividade
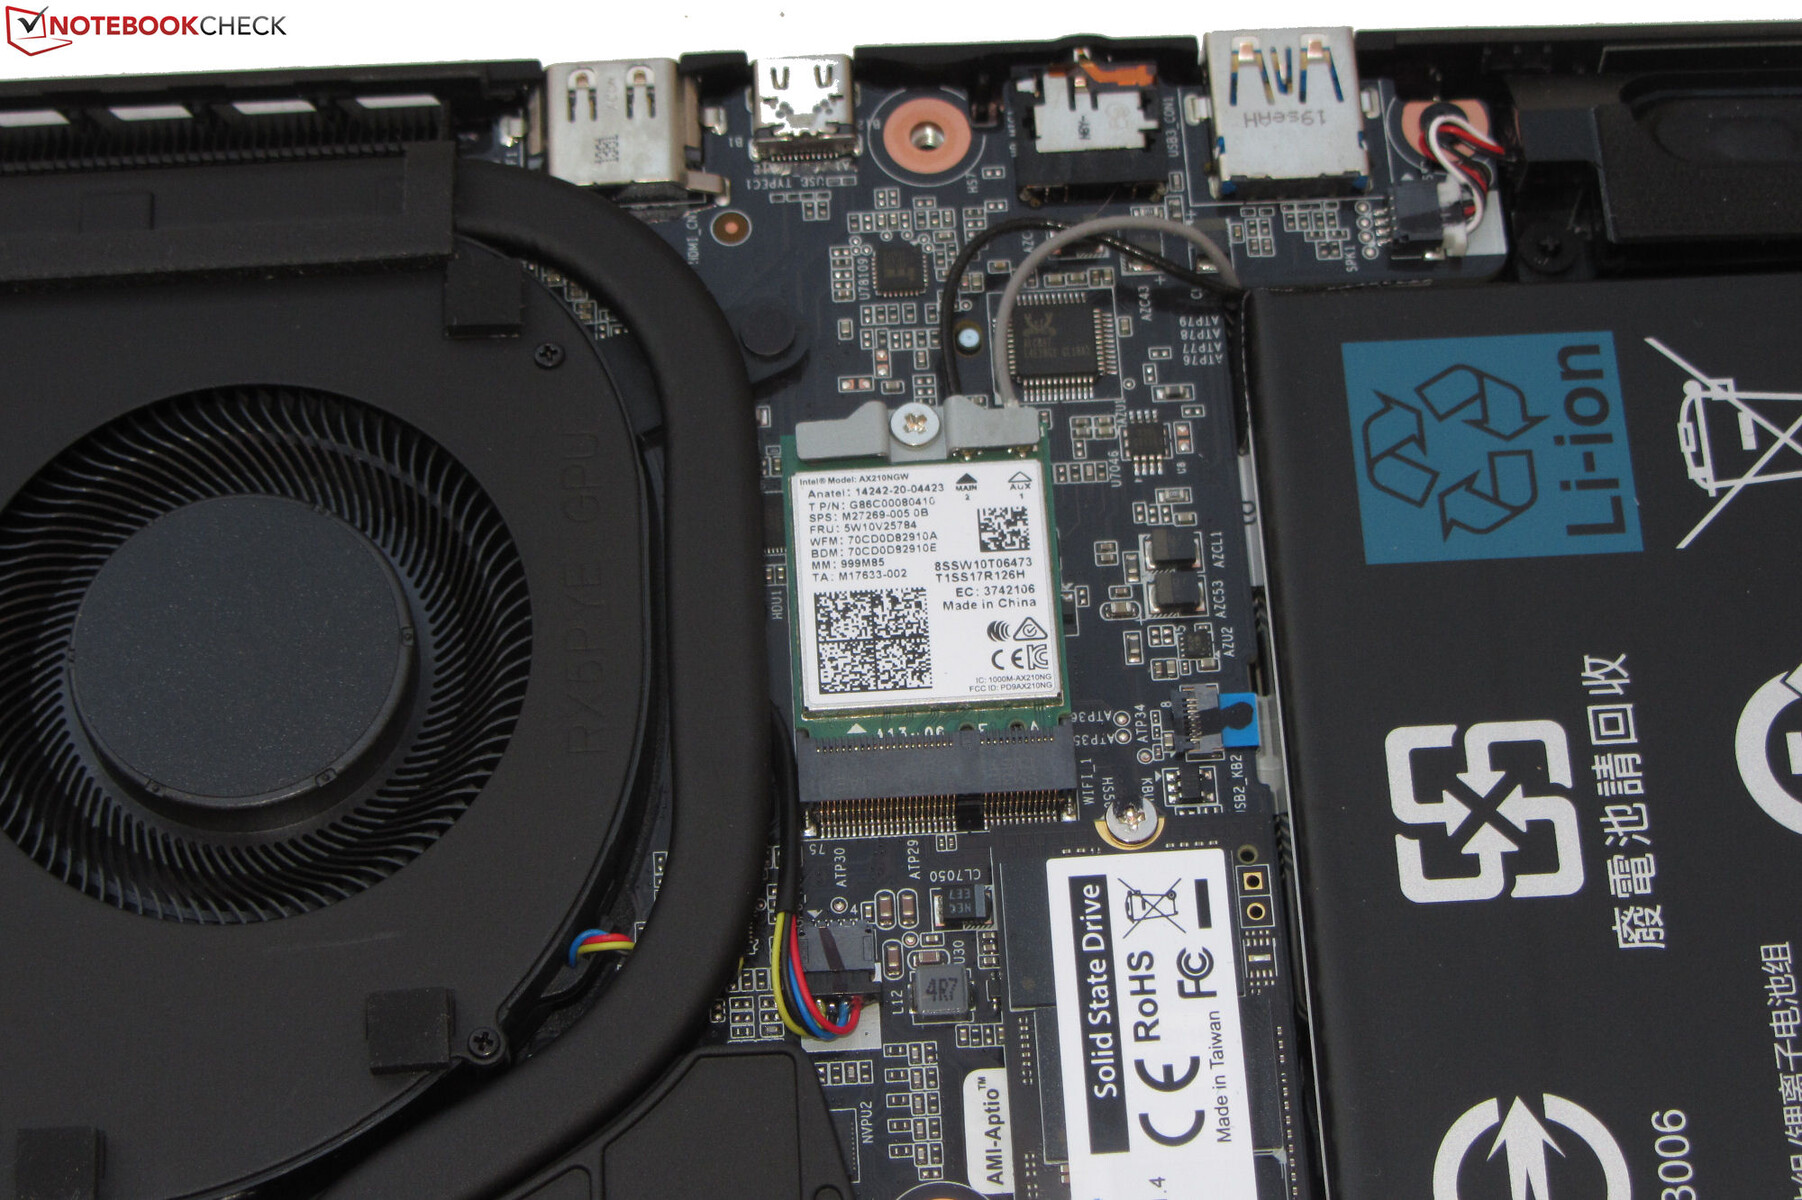
Sob condições ideais (nenhum outro dispositivo Wi-Fi nas proximidades, curta distância entre o laptop e o PC servidor), medimos excelentes velocidades de transferência Wi-Fi que correspondem ao que o módulo Wi-Fi dentro (Intel AX210, 802.11ax) é capaz de fazer. As conexões de rede com fio são tratadas por um chip Gigabit Ethernet fabricado pela Realtek (RTL8125, 2,5 Gbit).
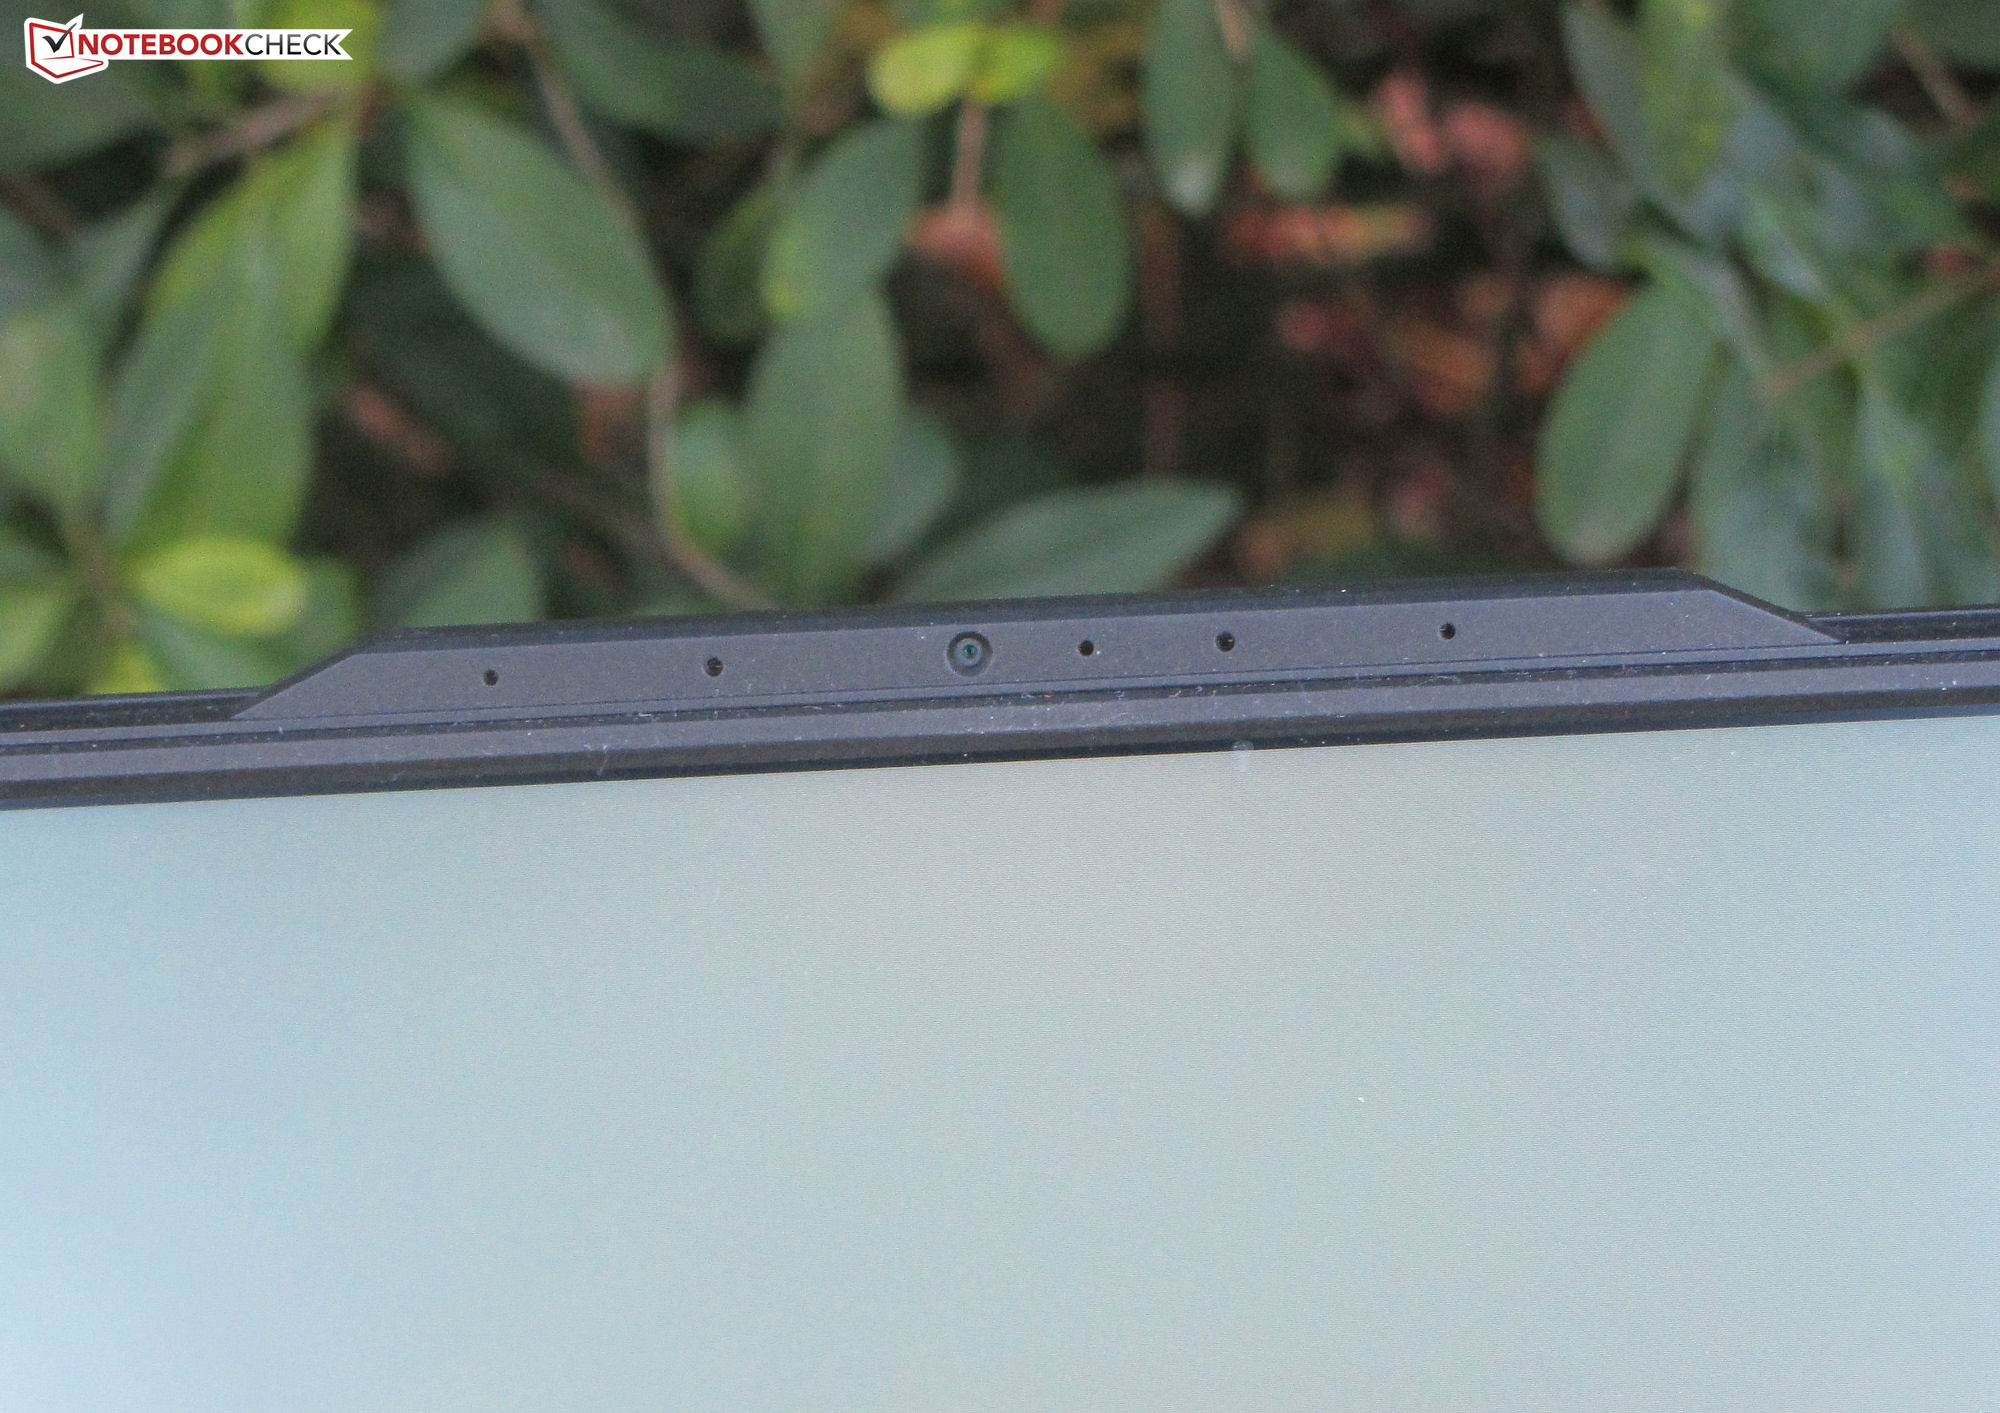
Webcam
A webcam (0,9 MP) pode capturar imagens com uma resolução de até 1.280 x 720 pixels. Ela não tem precisão de cor, produzindo cores que se desviam significativamente dos valores de referência. Também não há obturador mecânico de privacidade na webcam.


Acessórios
O Aorus 15 XE5 não vem com nenhum outro acessório além de um carregador e os documentos habituais (guia de início rápido e informações sobre garantia).
Manutenção
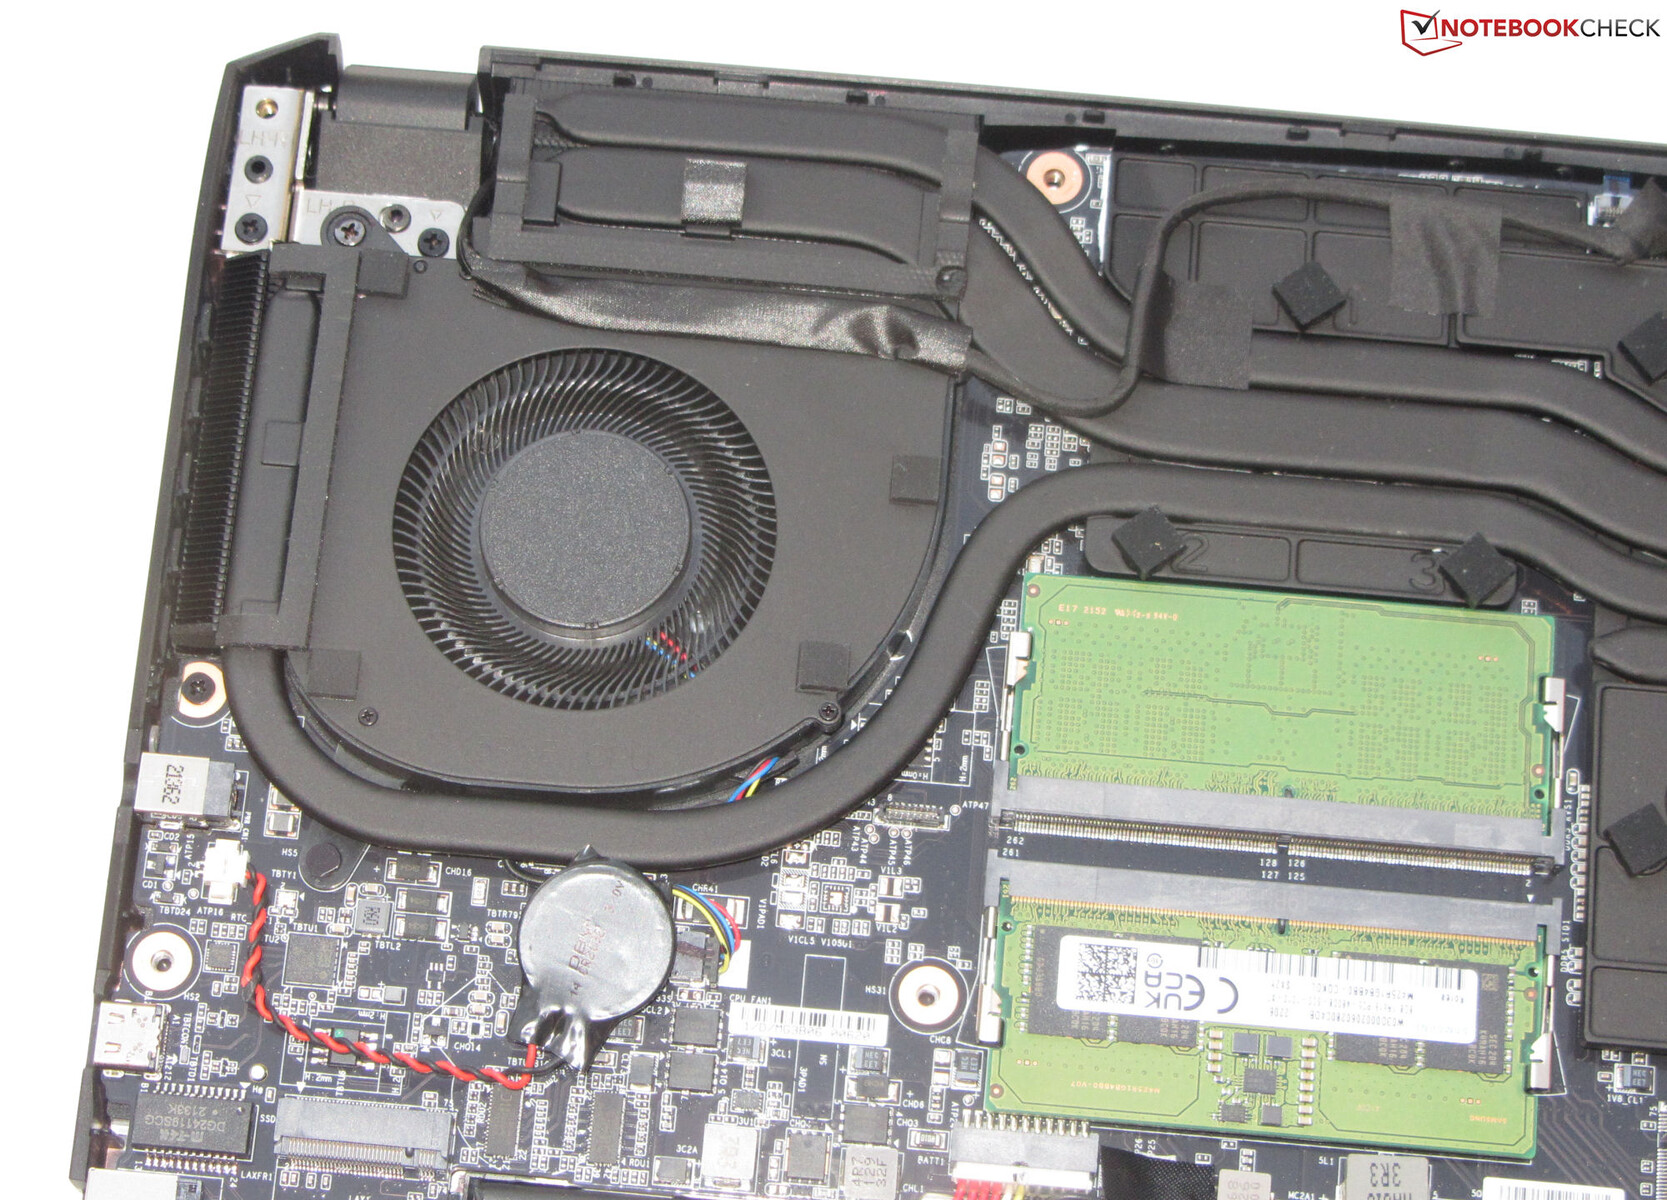
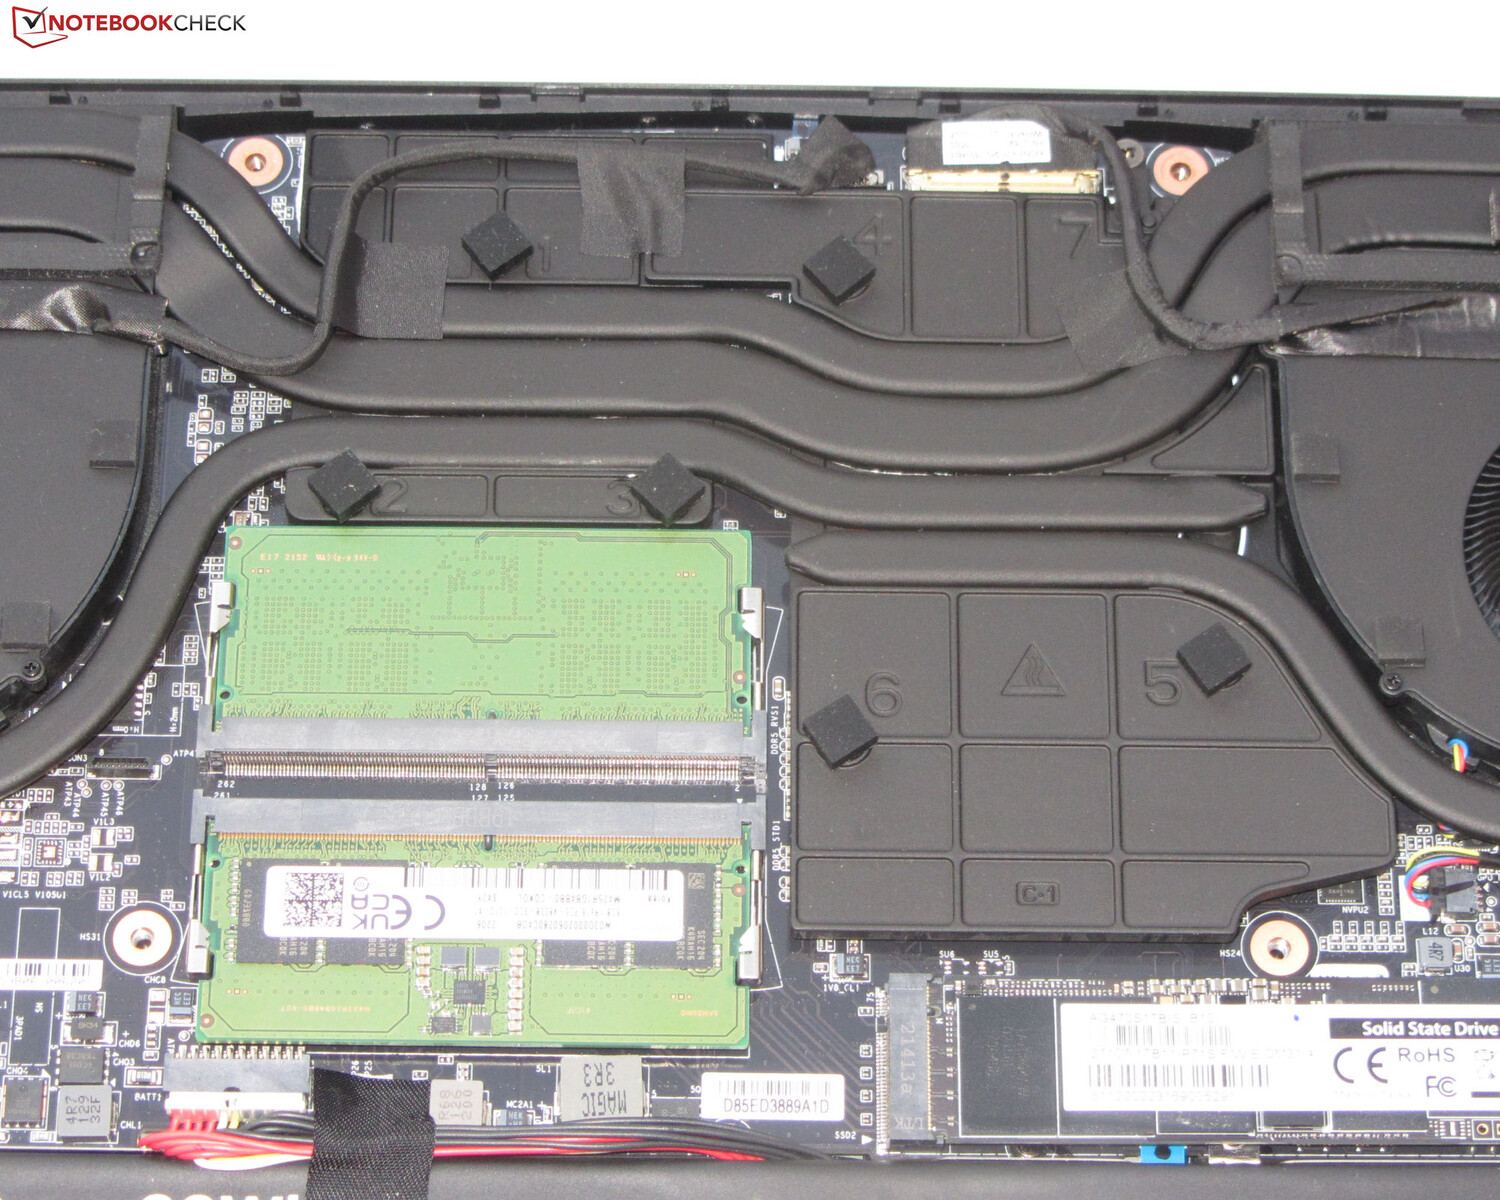
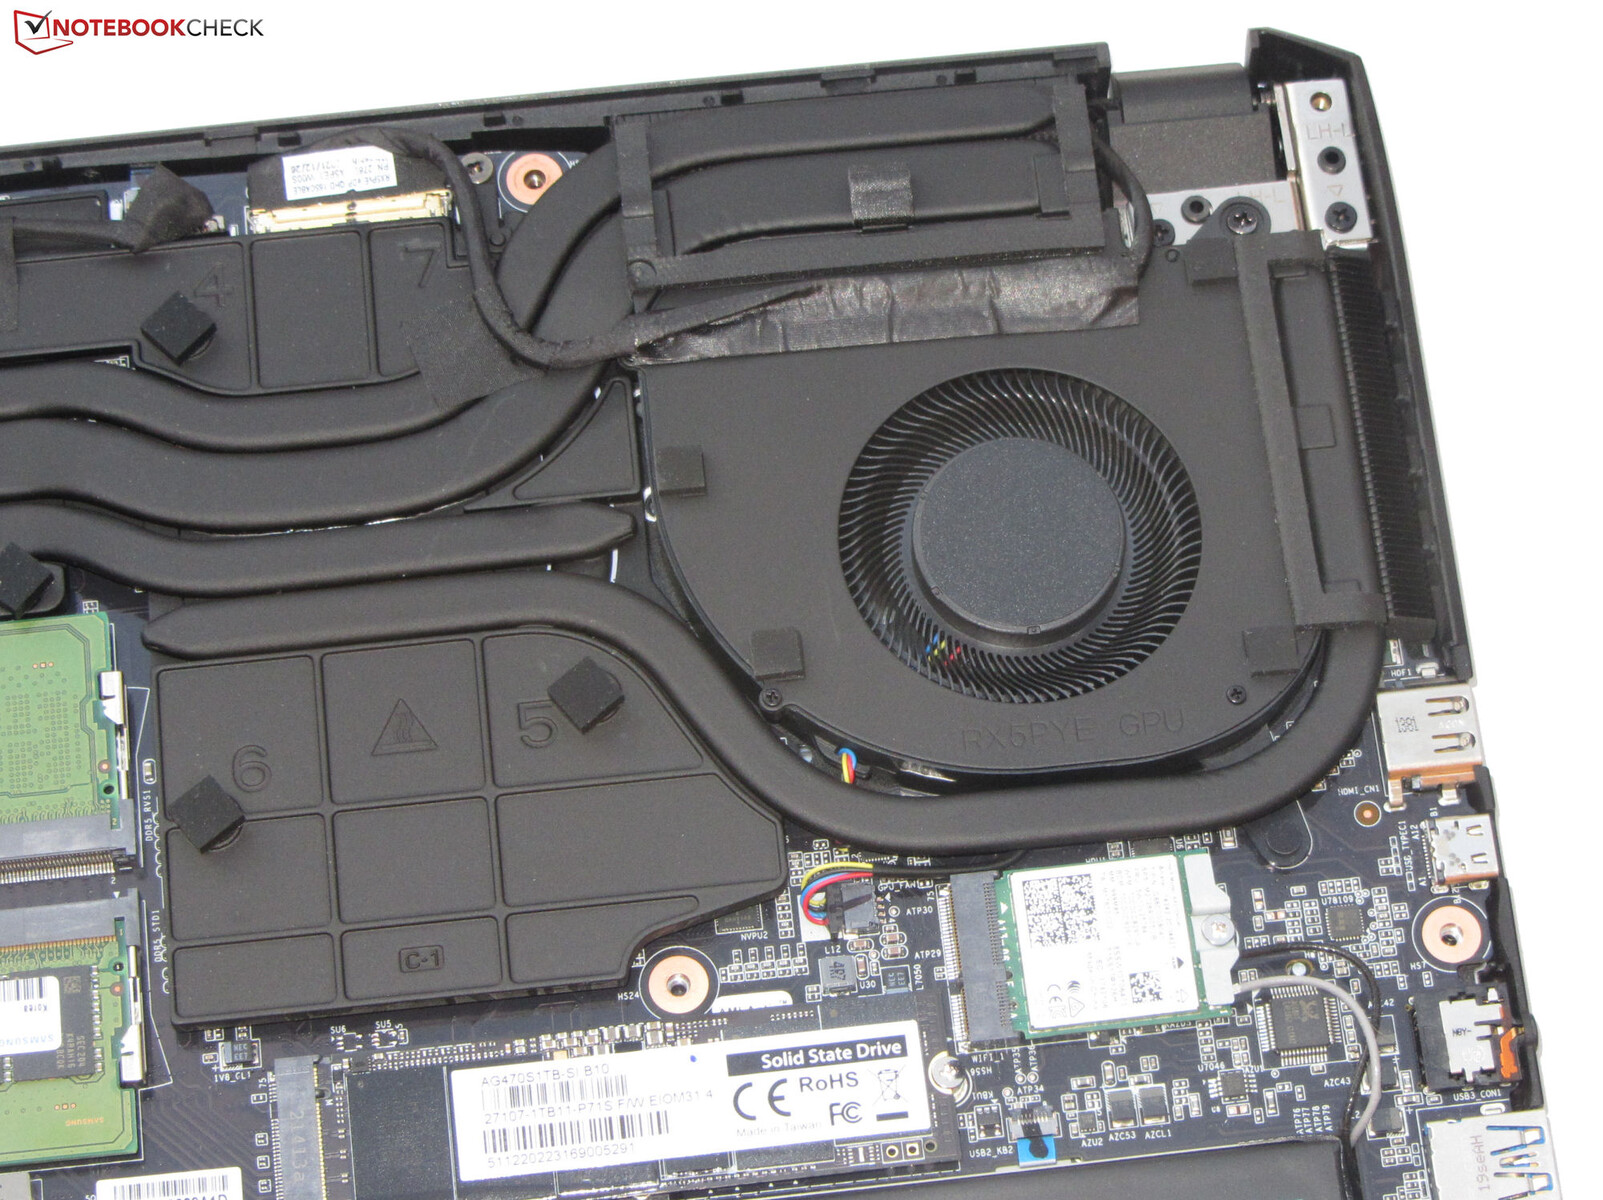
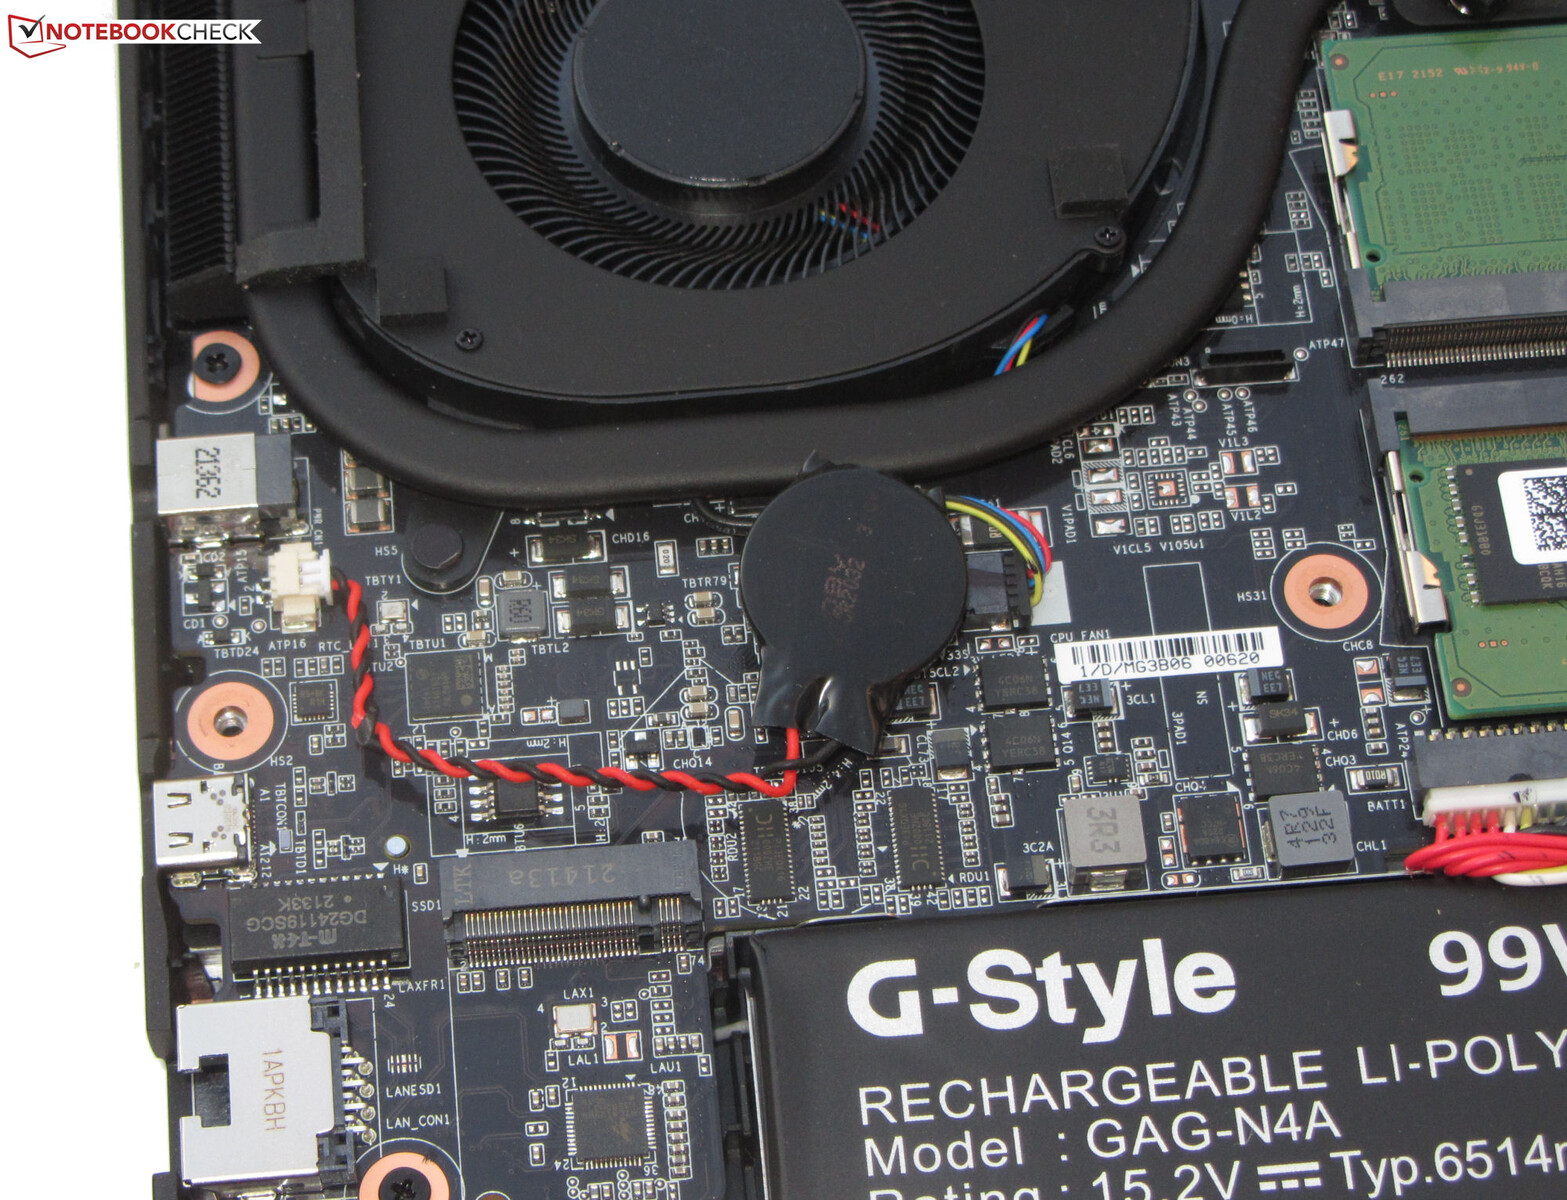
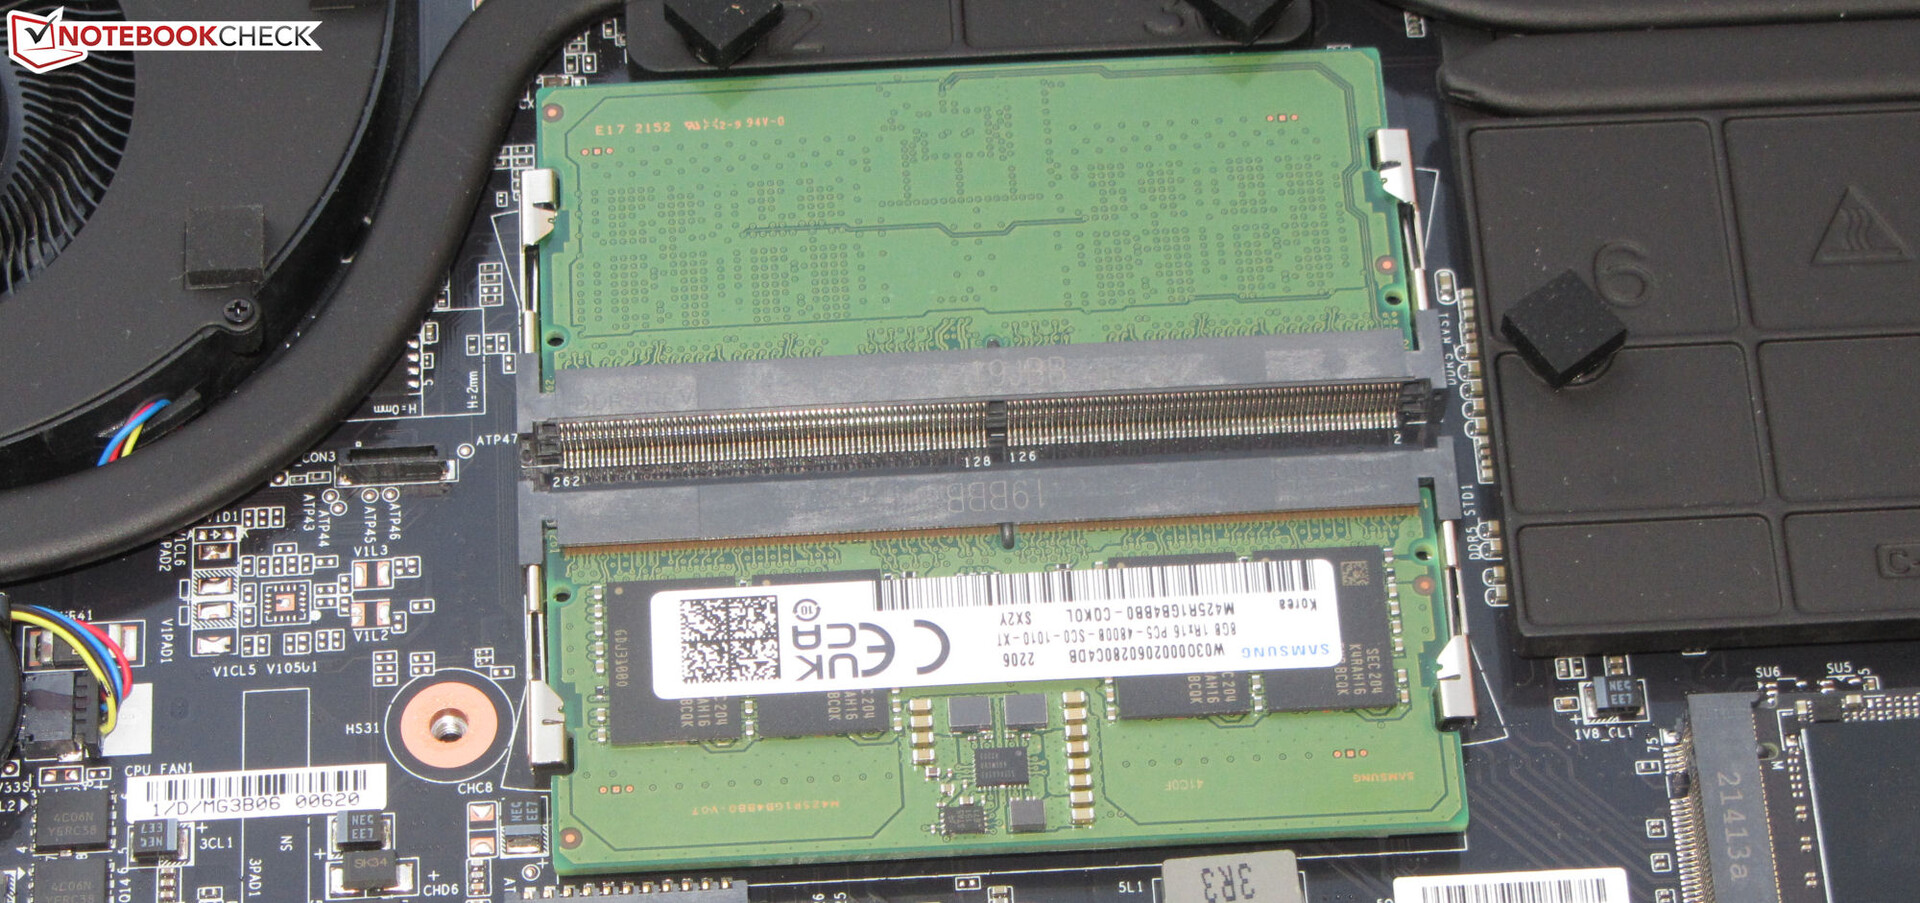
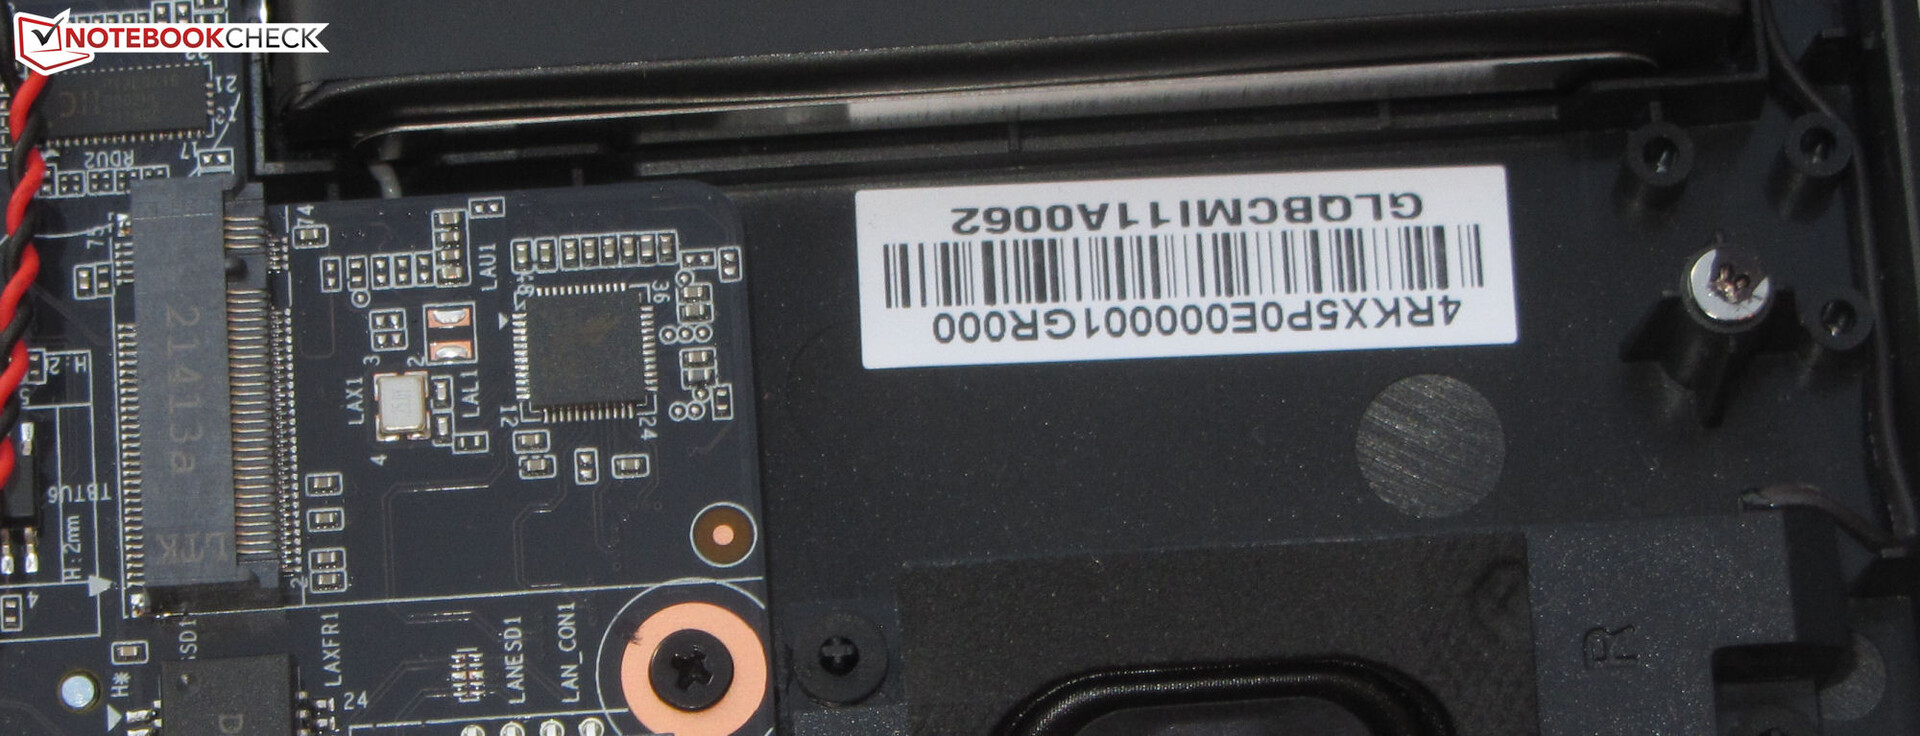
Depois que todos os parafusos no fundo tiverem sido removidos, o painel inferior pode ser aberto usando um spudger plano ou um raspador de calafetagem. Uma vez desligado o painel, você terá acesso aos dois slots de RAM (ambos ocupados), o PCIe 4.0 SSD, o segundo slot M.2 2280 (PCIe 4.0), a bateria BIOS, o módulo Wi-Fi, dois ventiladores, os alto-falantes e a bateria.
Garantia
Na Alemanha, a Gigabyte fornece uma garantia de dois anos para o laptop de 15,6 polegadas sem nenhuma opção de extensão. O escopo e o período de garantia podem variar de acordo com a região.
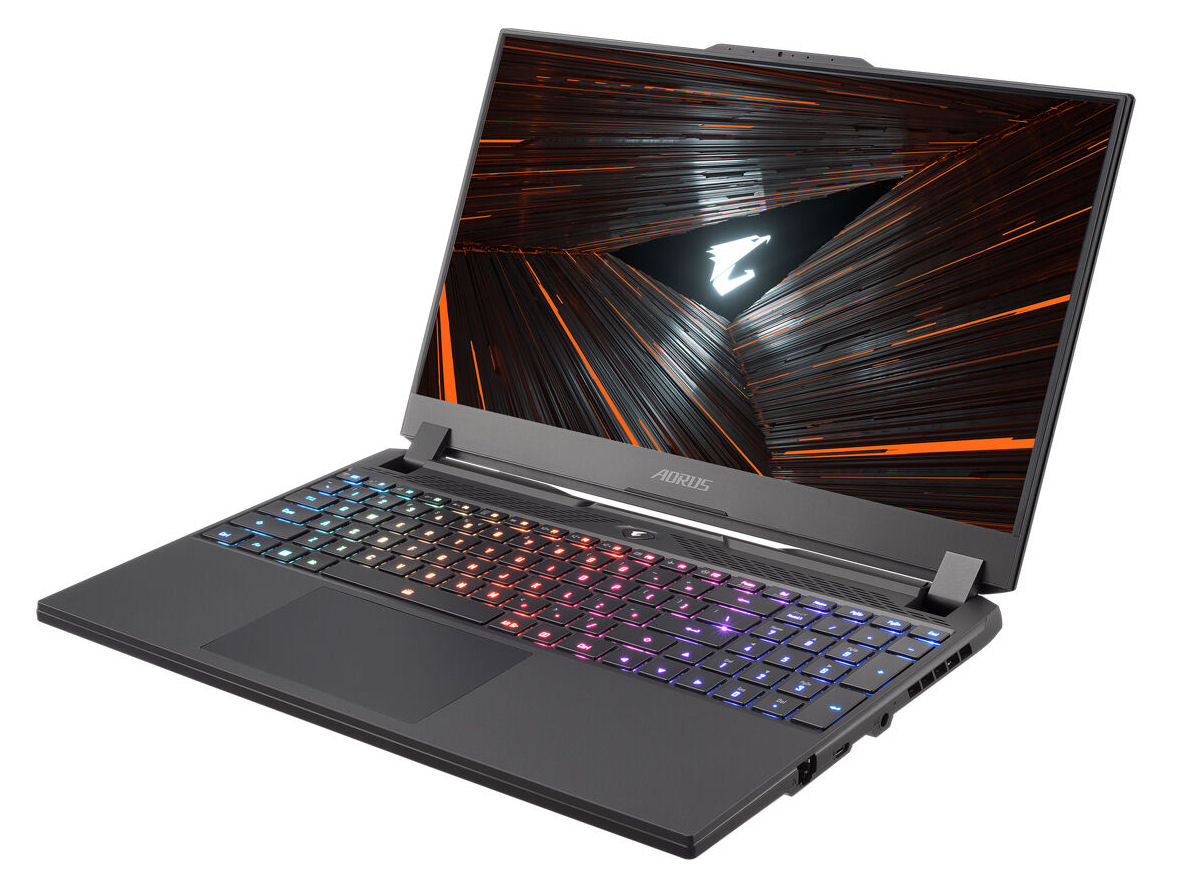
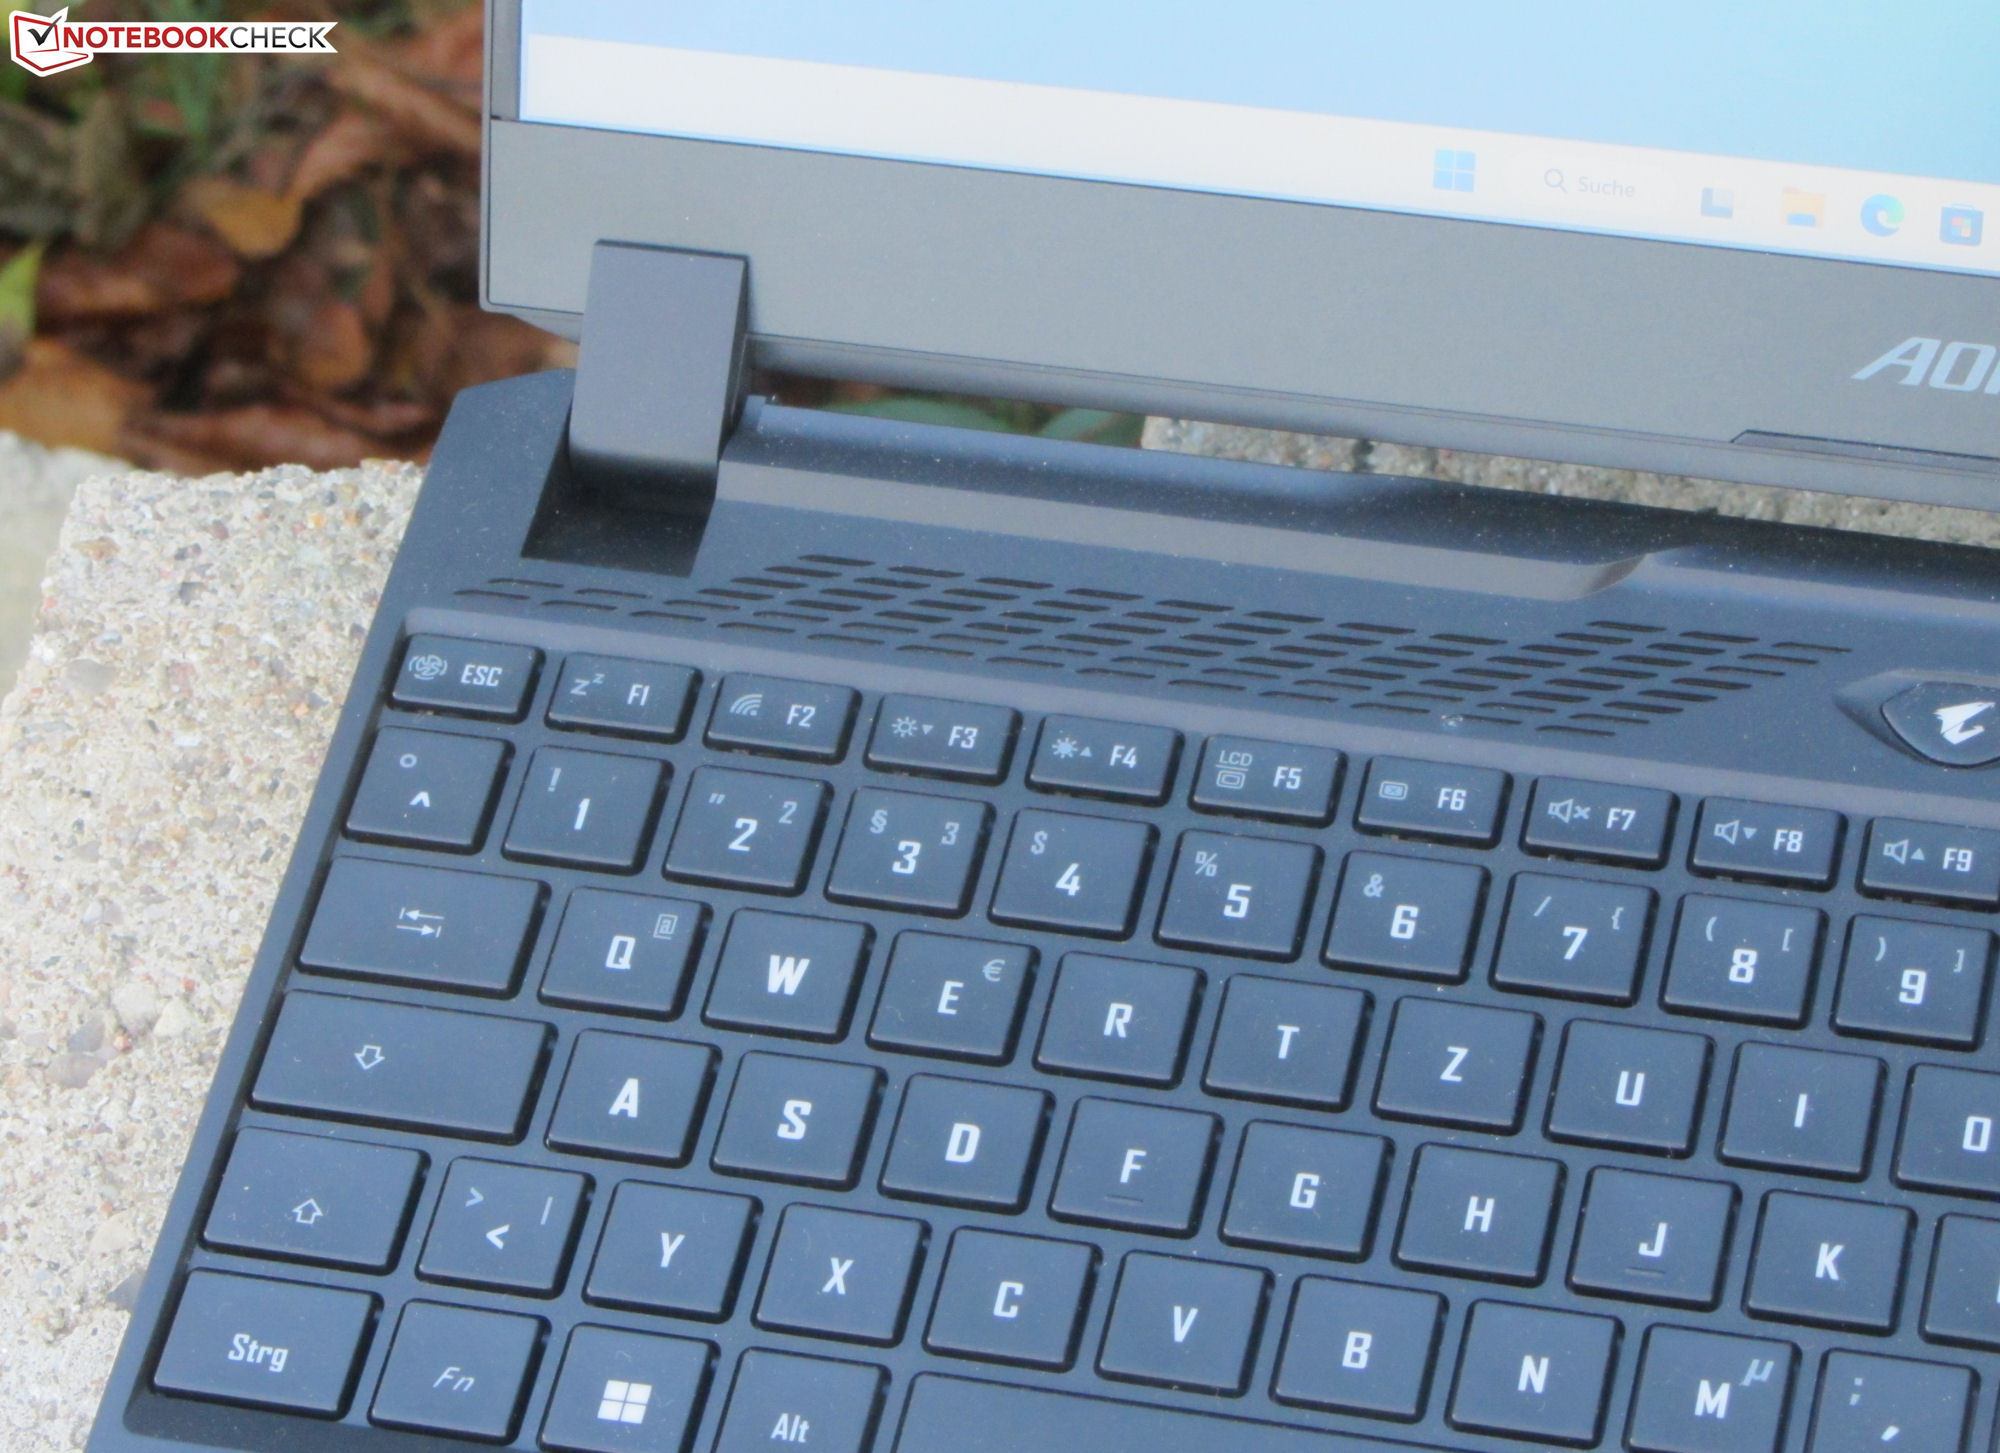
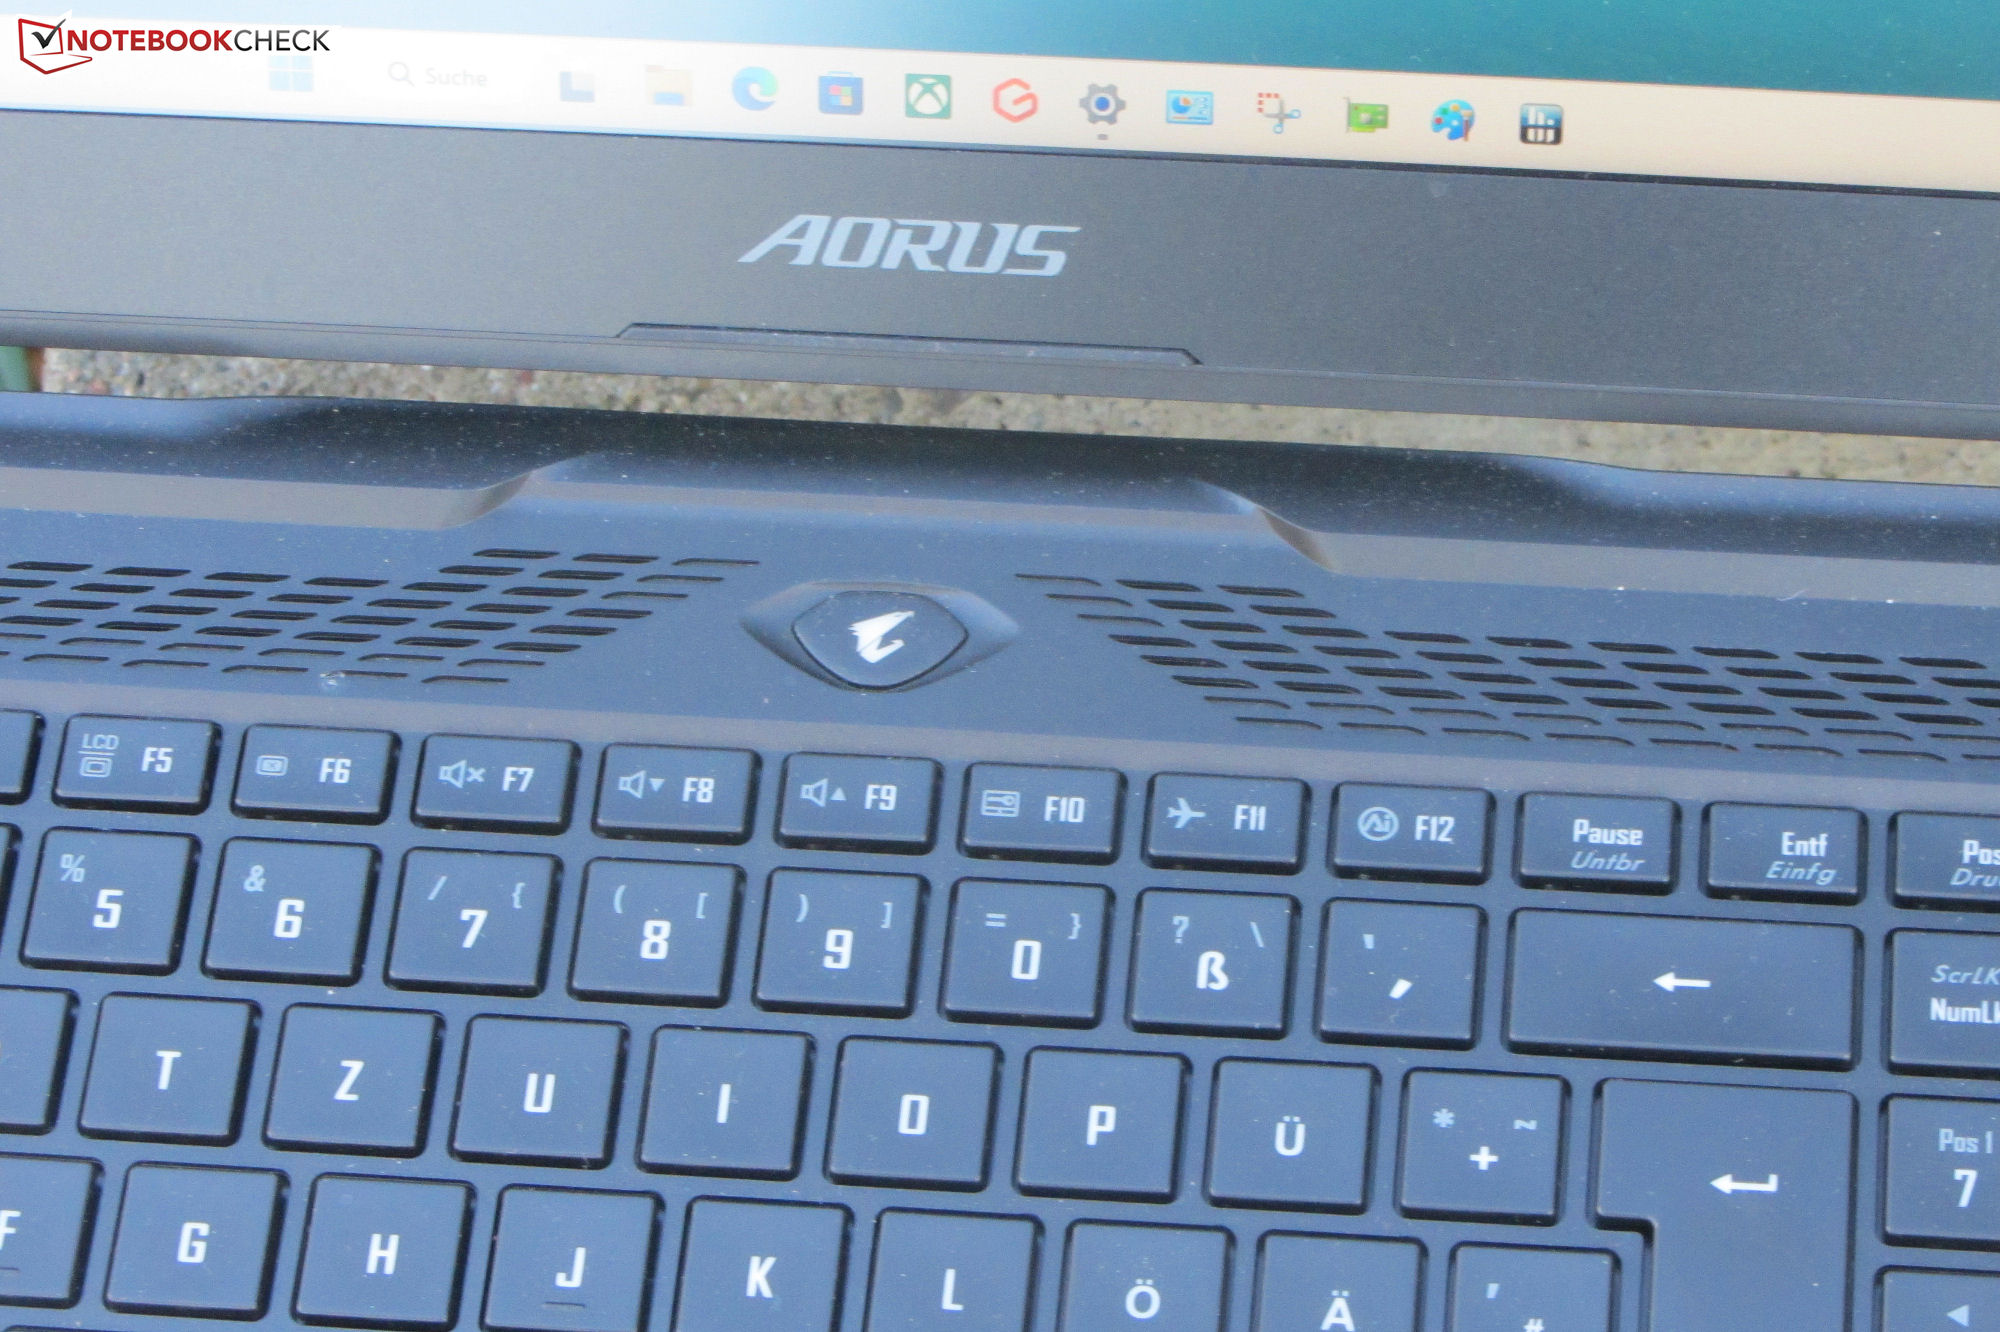
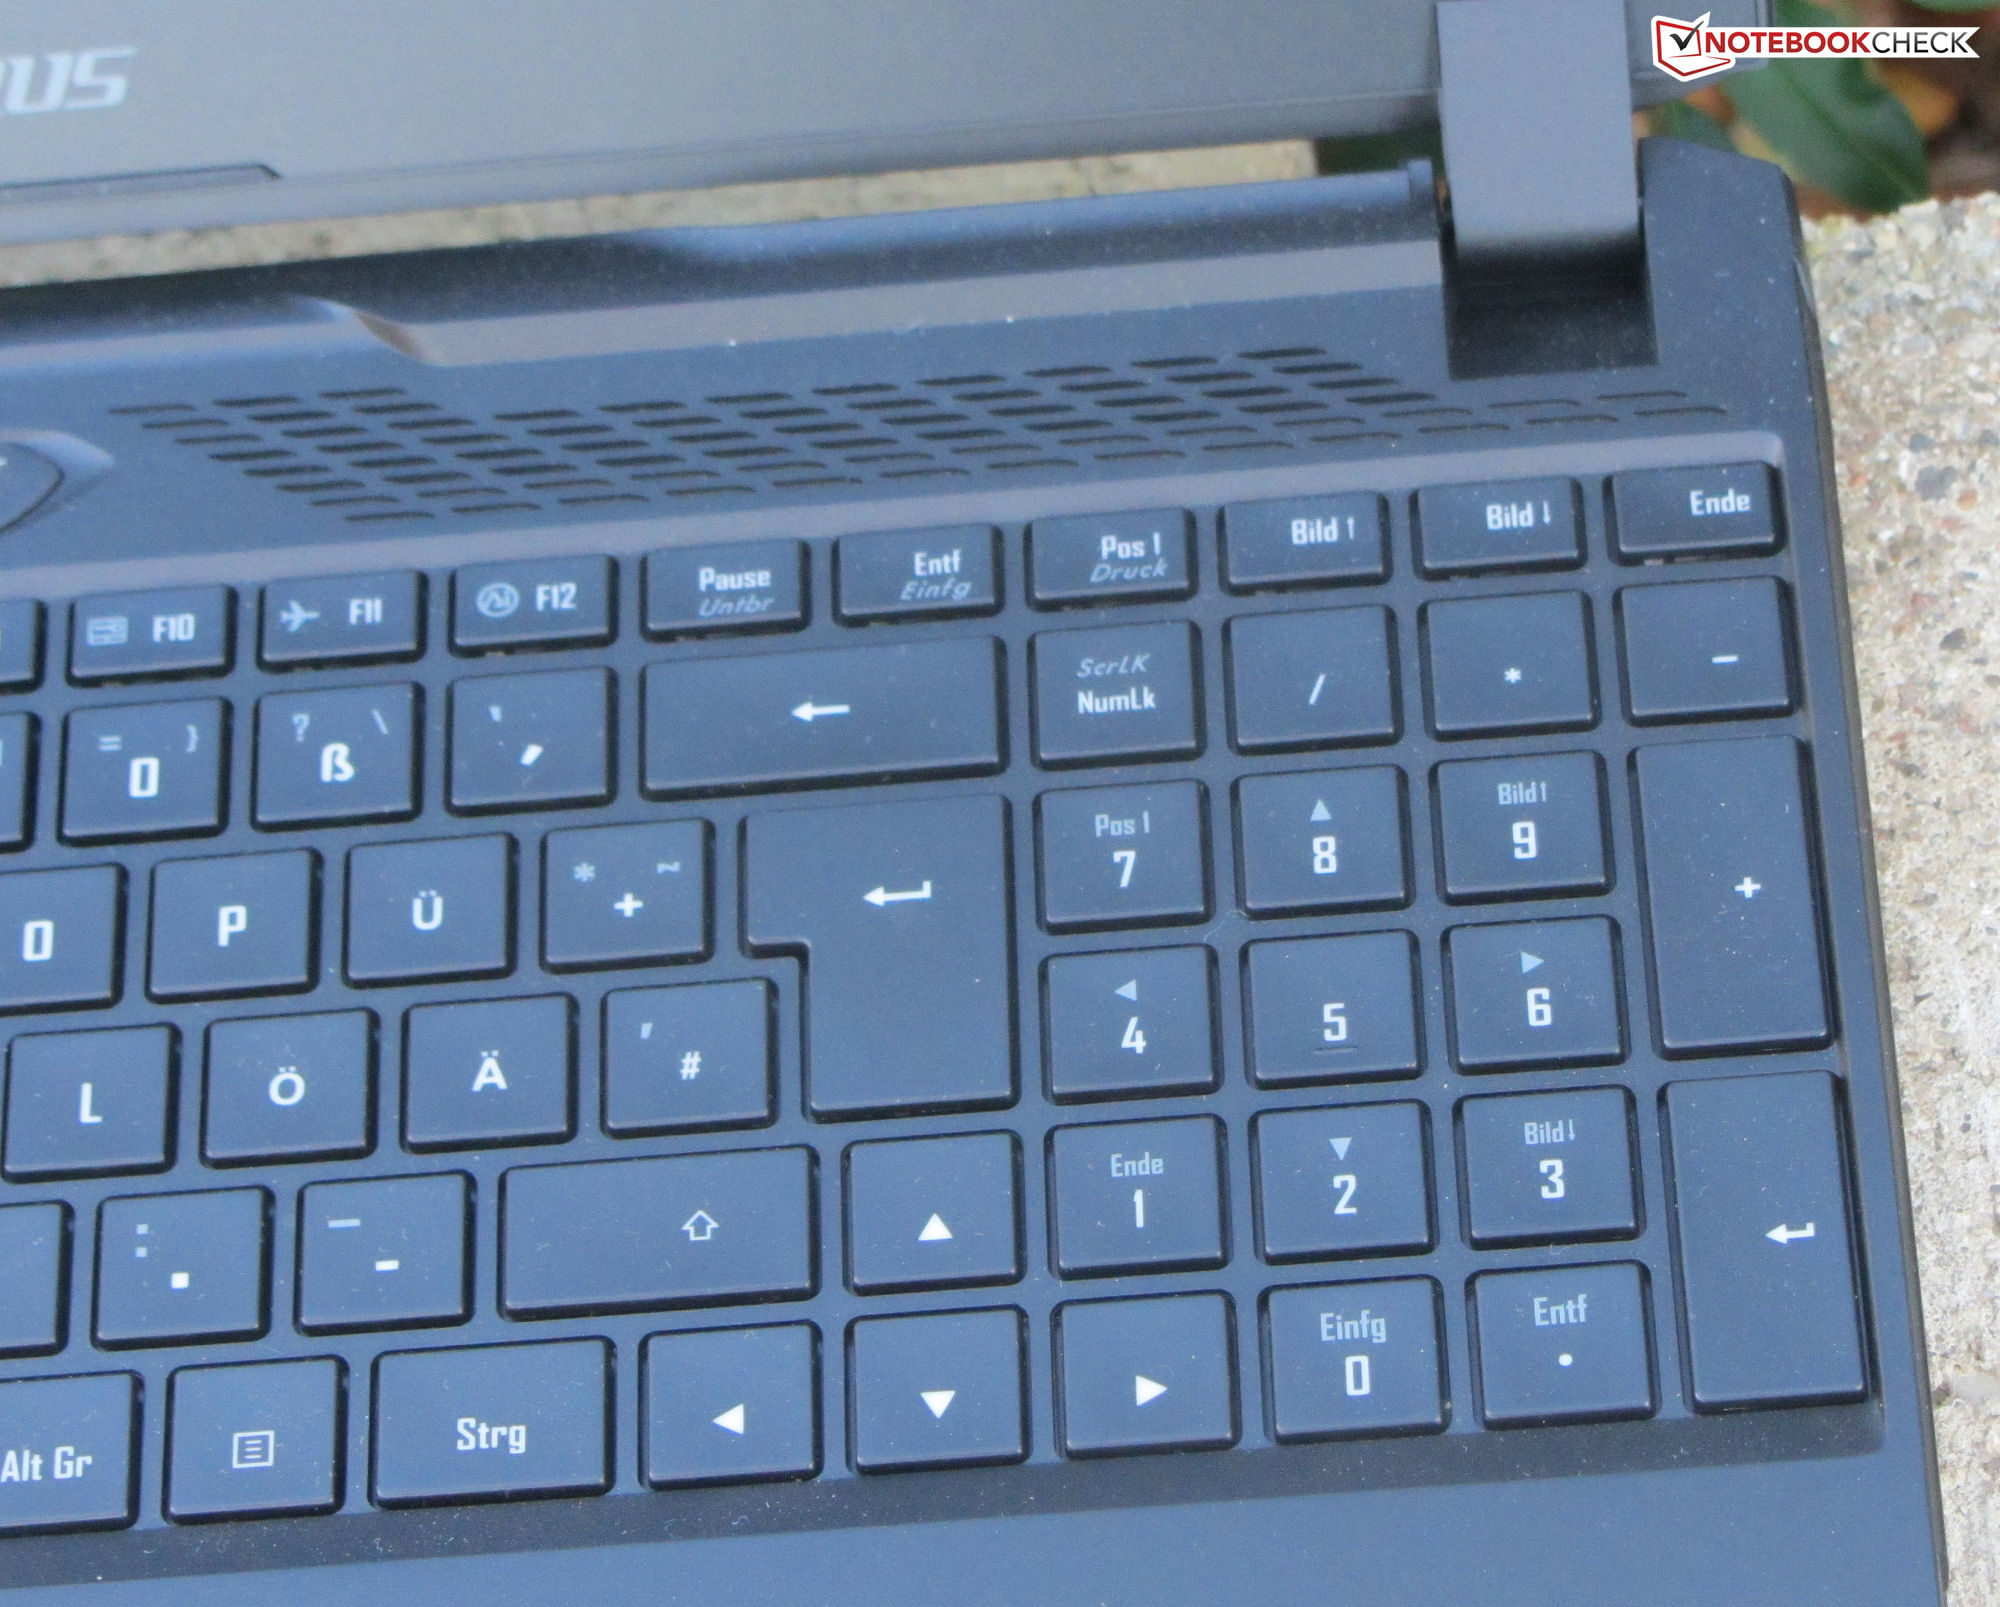
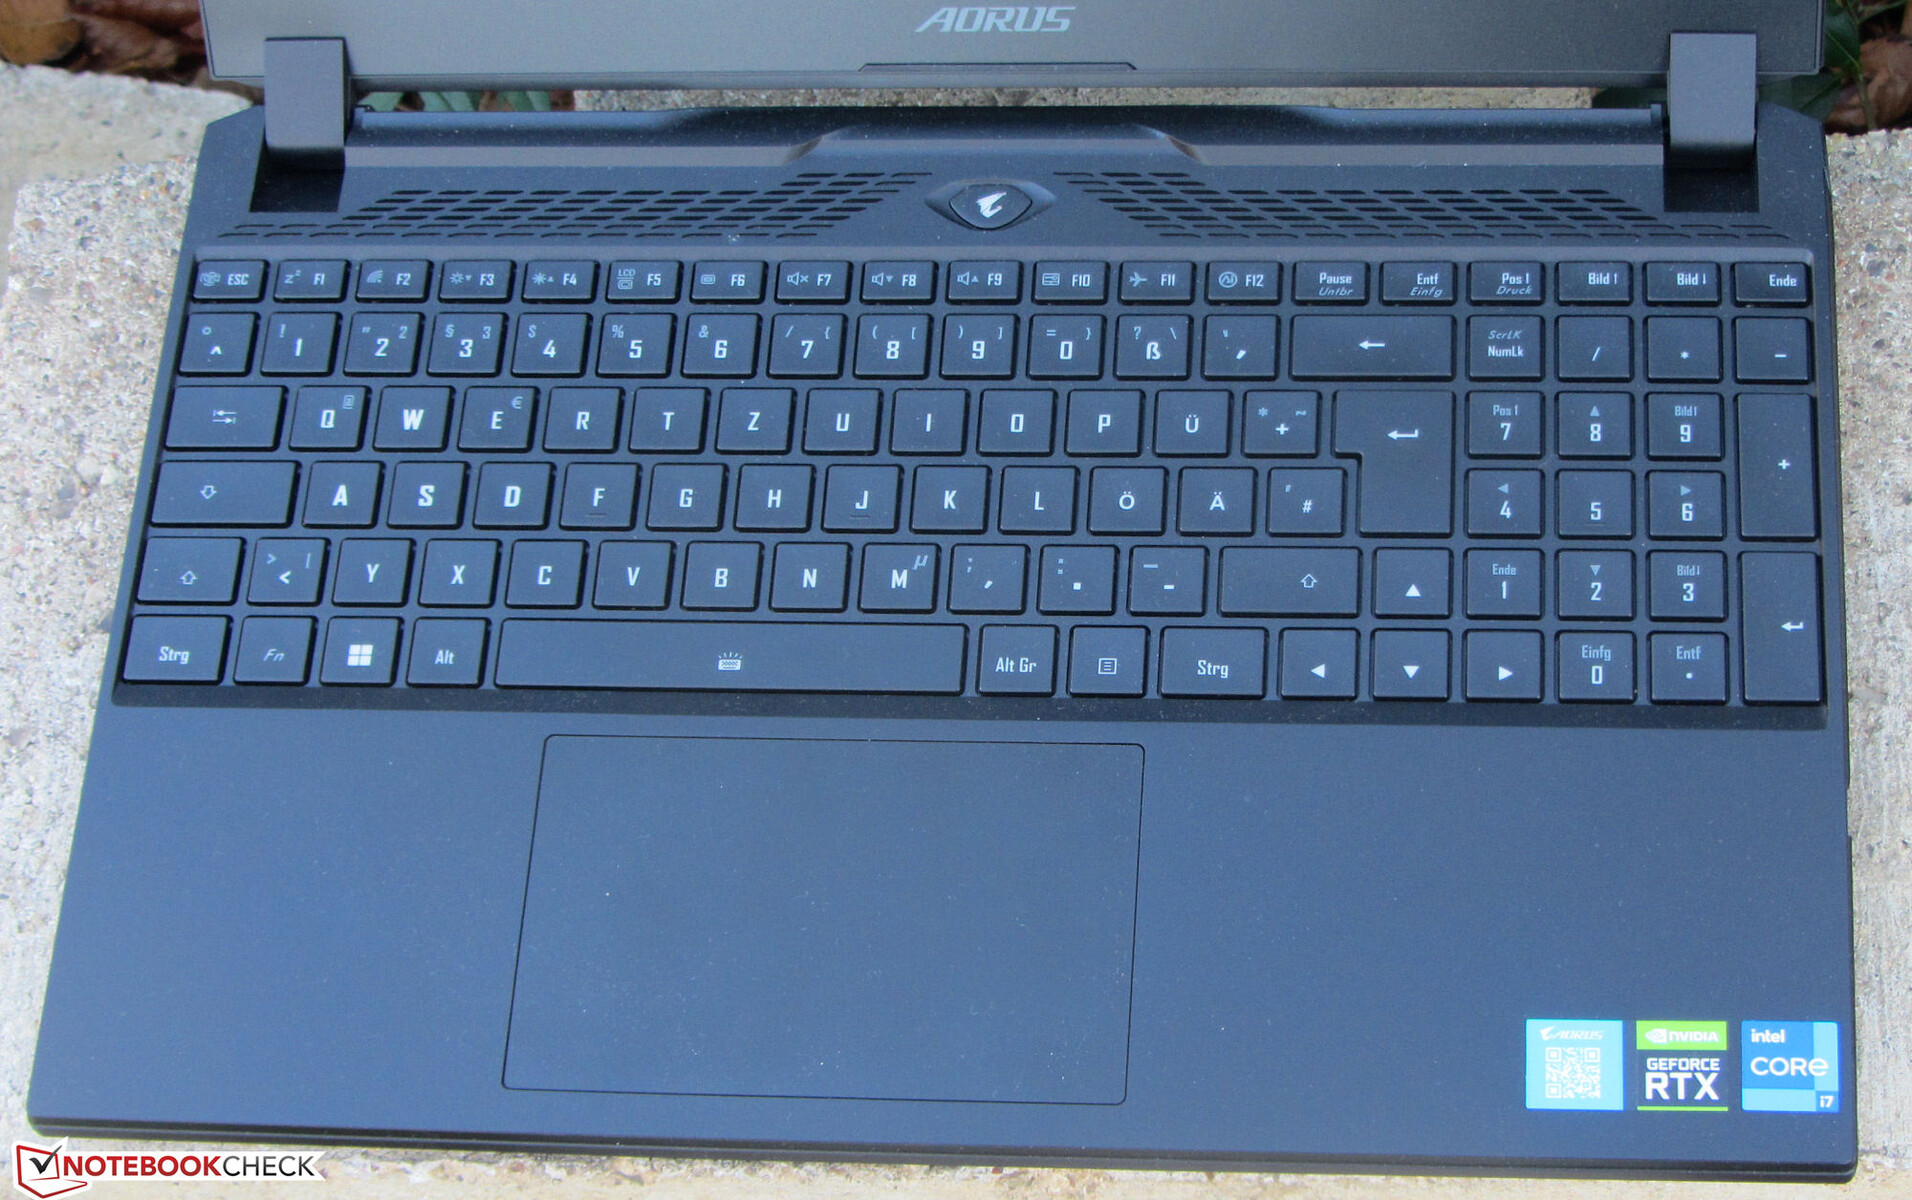
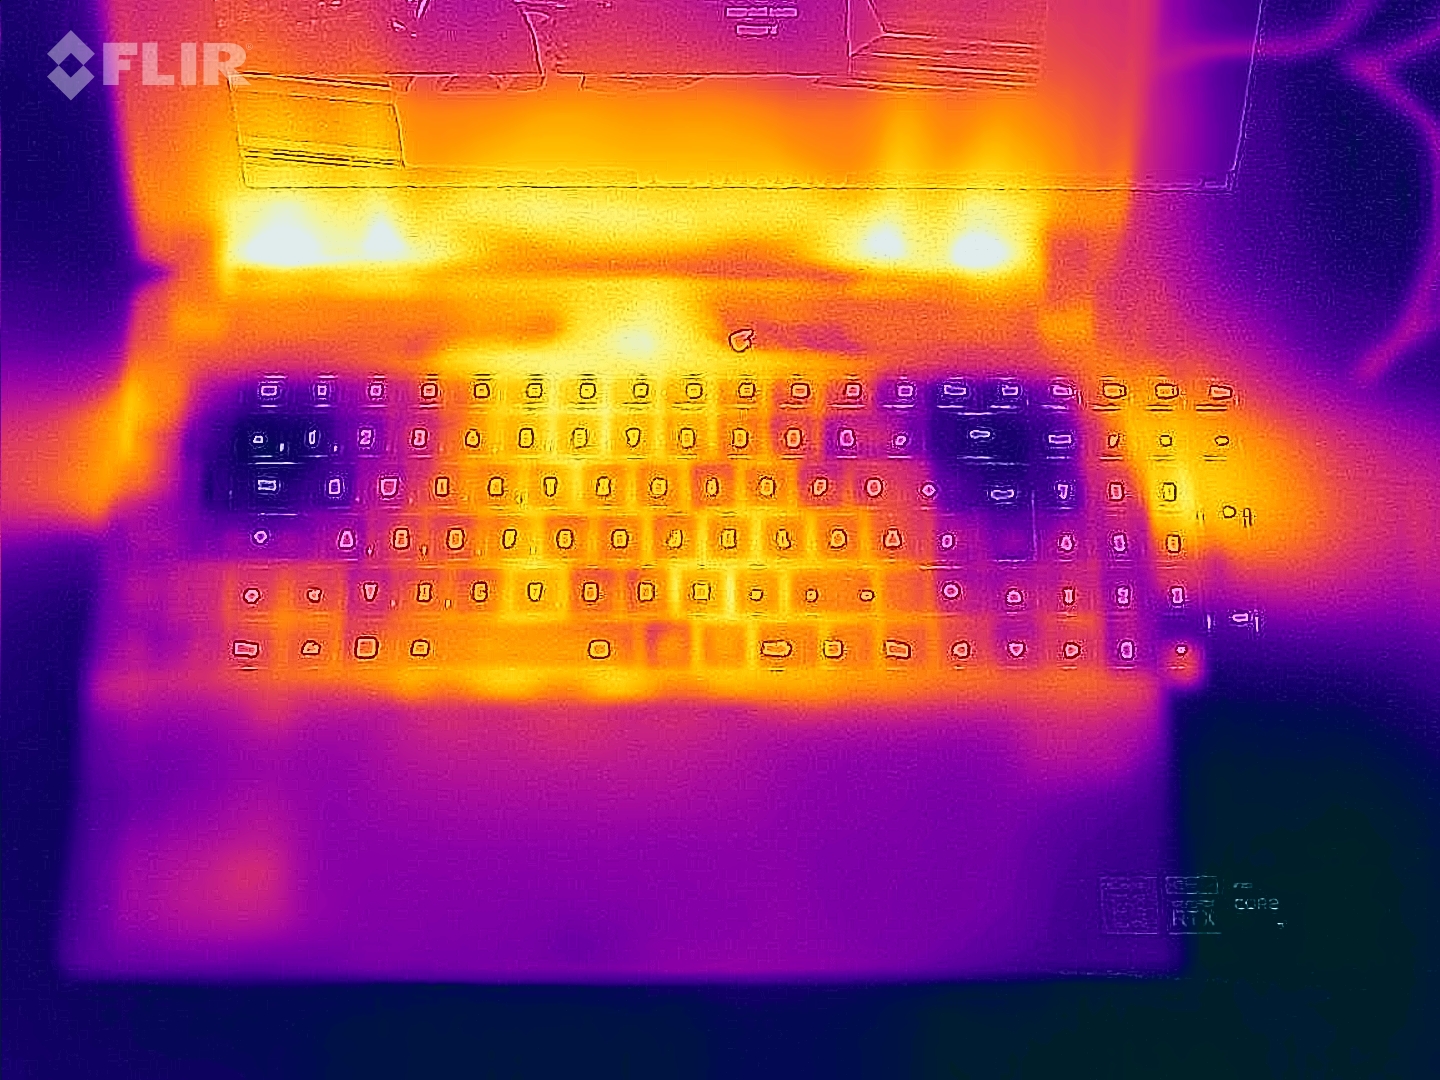
Dispositivos de entrada - Chaves RGB iluminadas individualmente
Teclado
O laptop para jogos vem com um teclado chiclet que inclui um teclado numérico. As teclas suaves oferecem uma distância de viagem moderada e um ponto de atuação distinto. O teclado não flexiona quando você está digitando. Cada tecla é iluminada individualmente e apresenta dois níveis de brilho. No geral, Gigabyte entregou um teclado que é adequado para o uso diário.
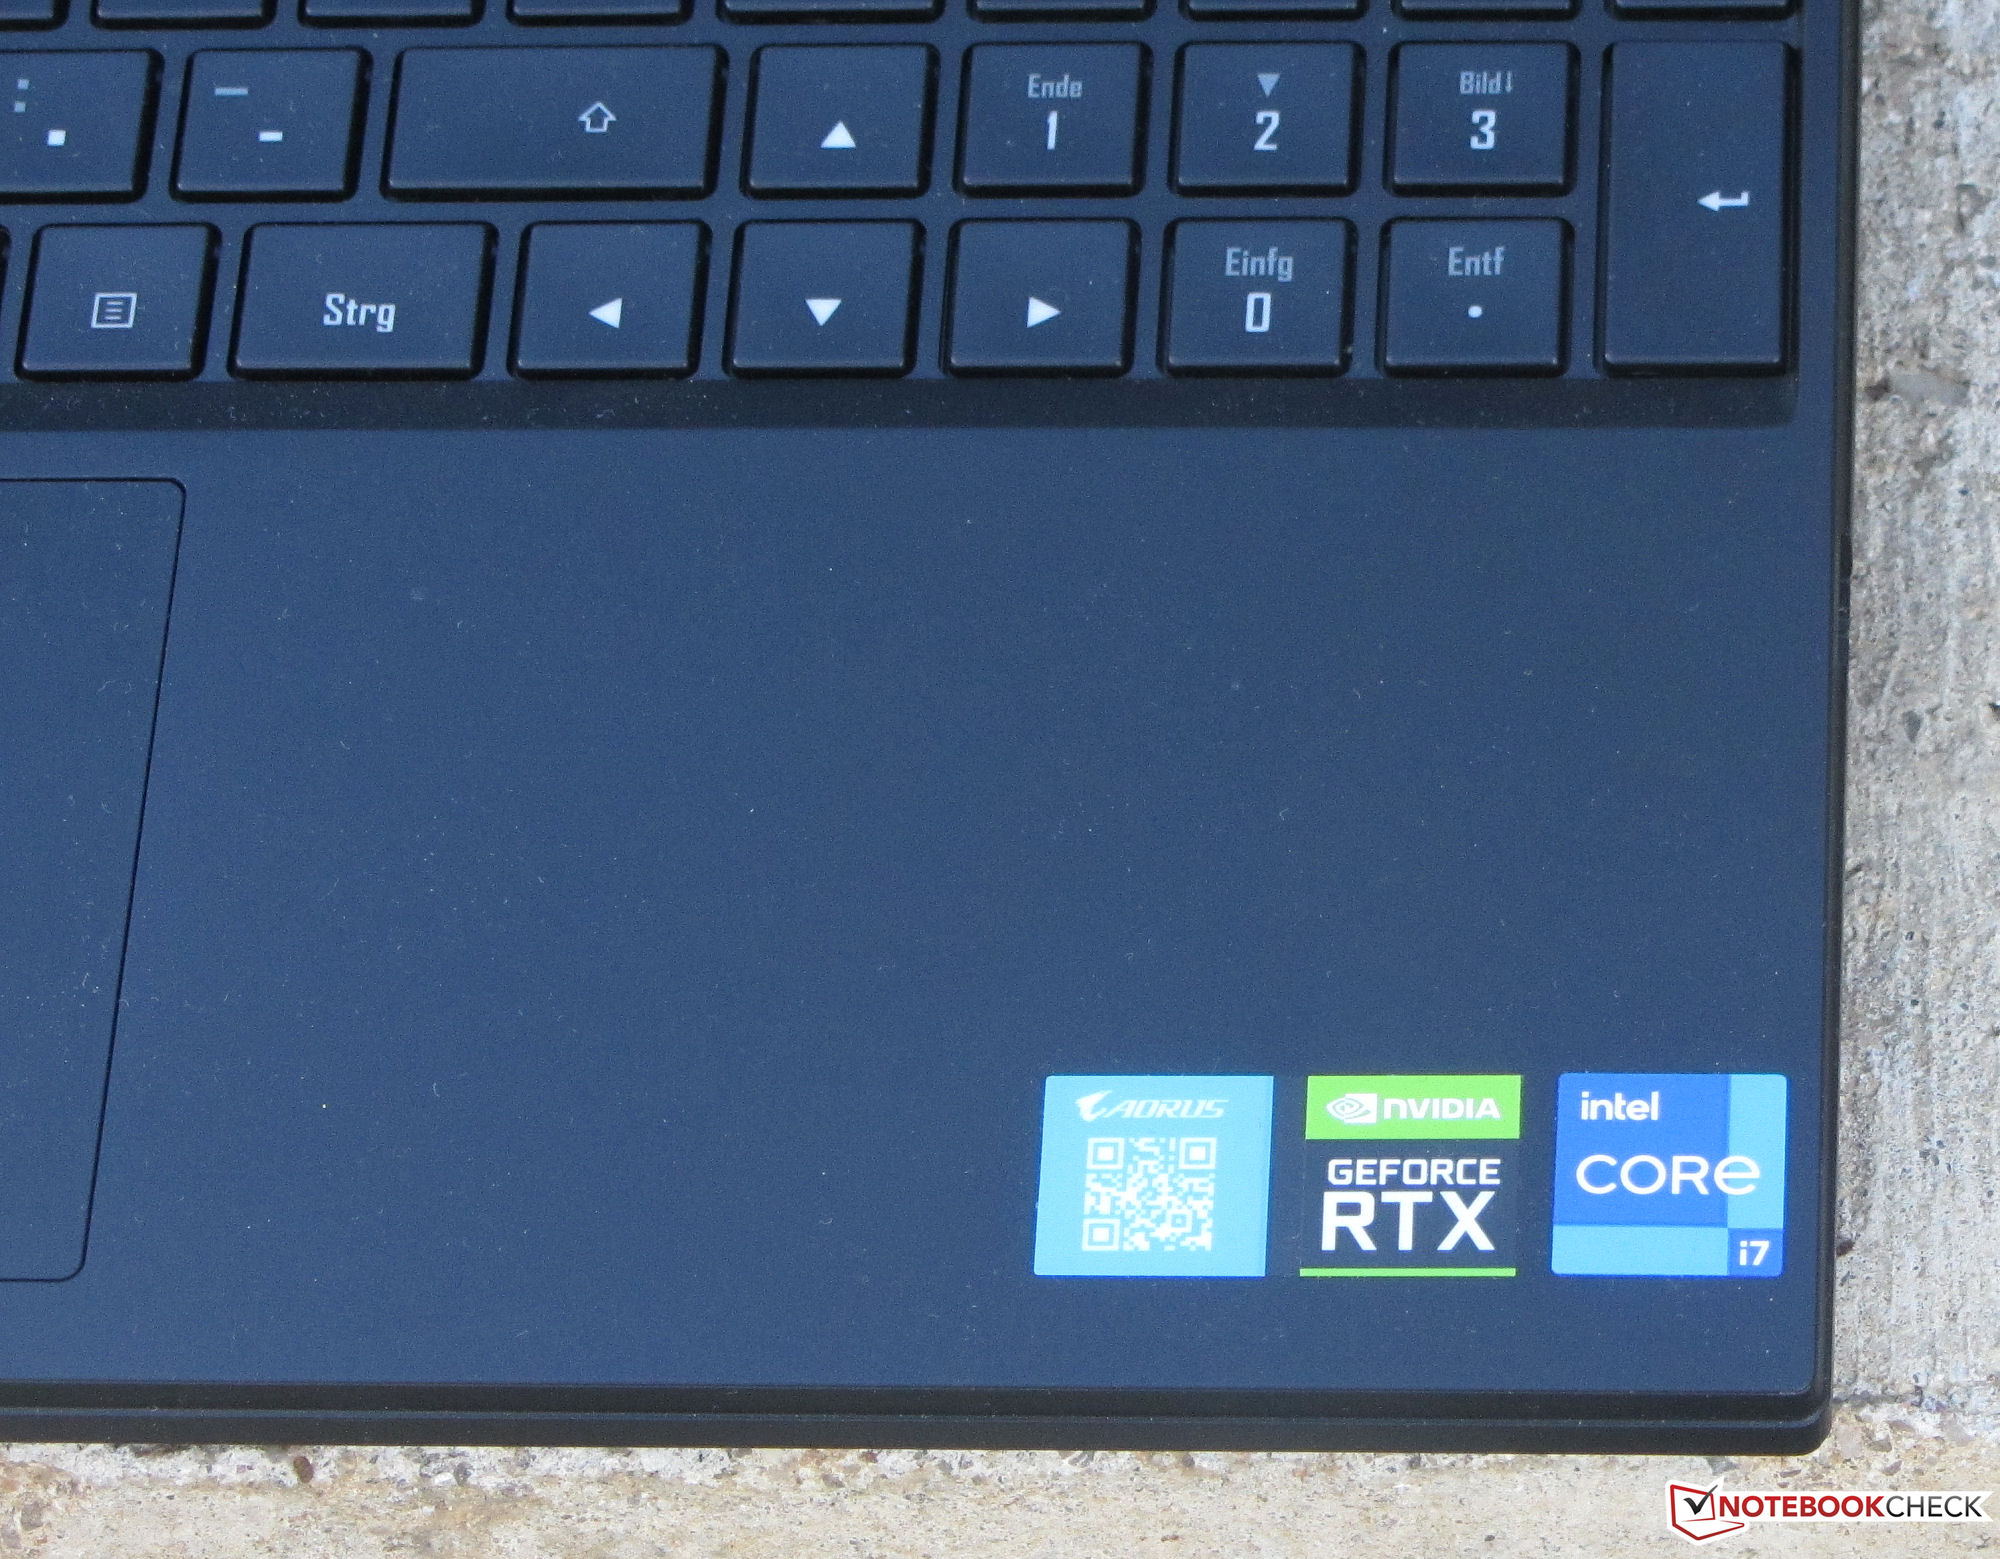
Touchpad
O clickpad multi-toque do laptop (aproximadamente 12,1 x 7,6 cm, ou 4,8 x 3,0") tem uma superfície lisa que facilita o deslizamento de seus dedos. É sensível às entradas mesmo nos cantos e tem um clique raso e um ponto de atuação distinto.
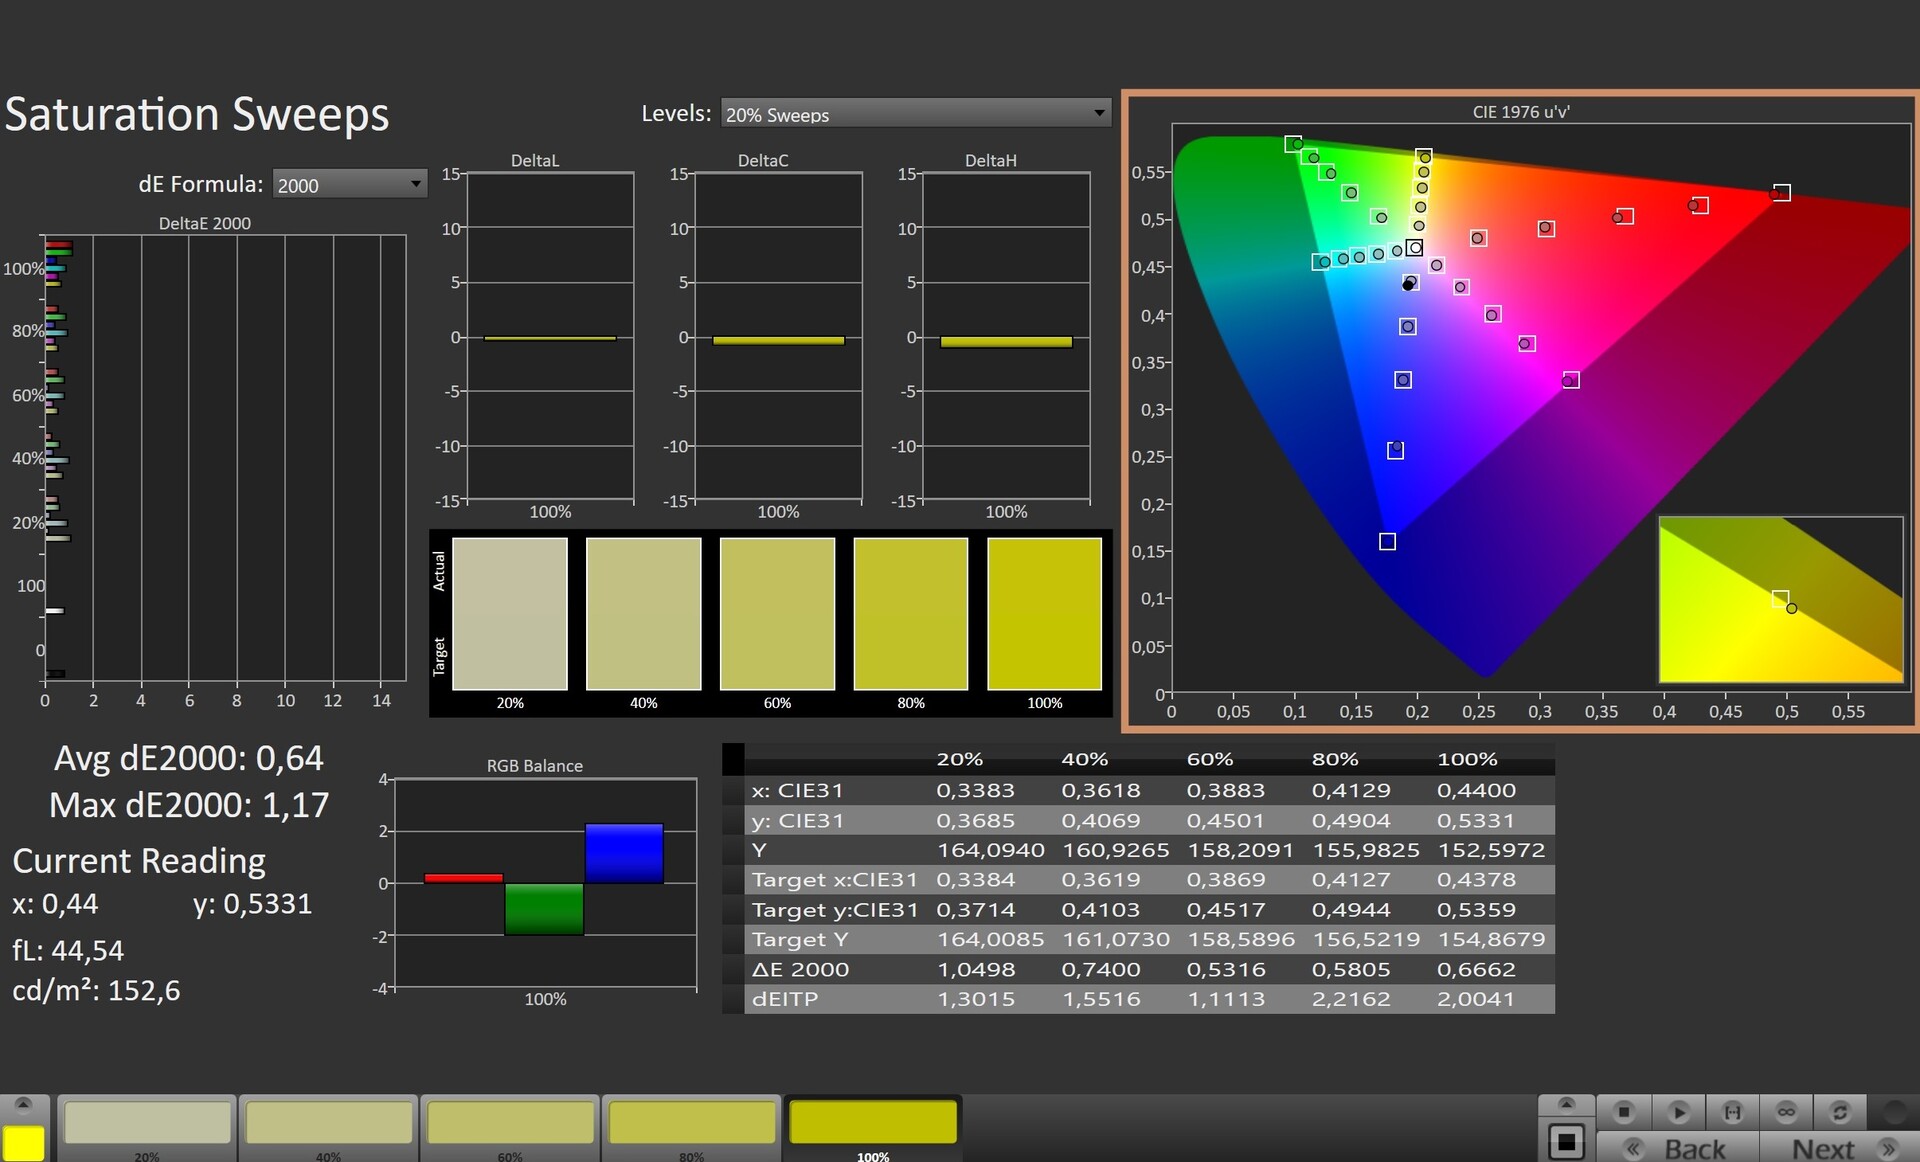
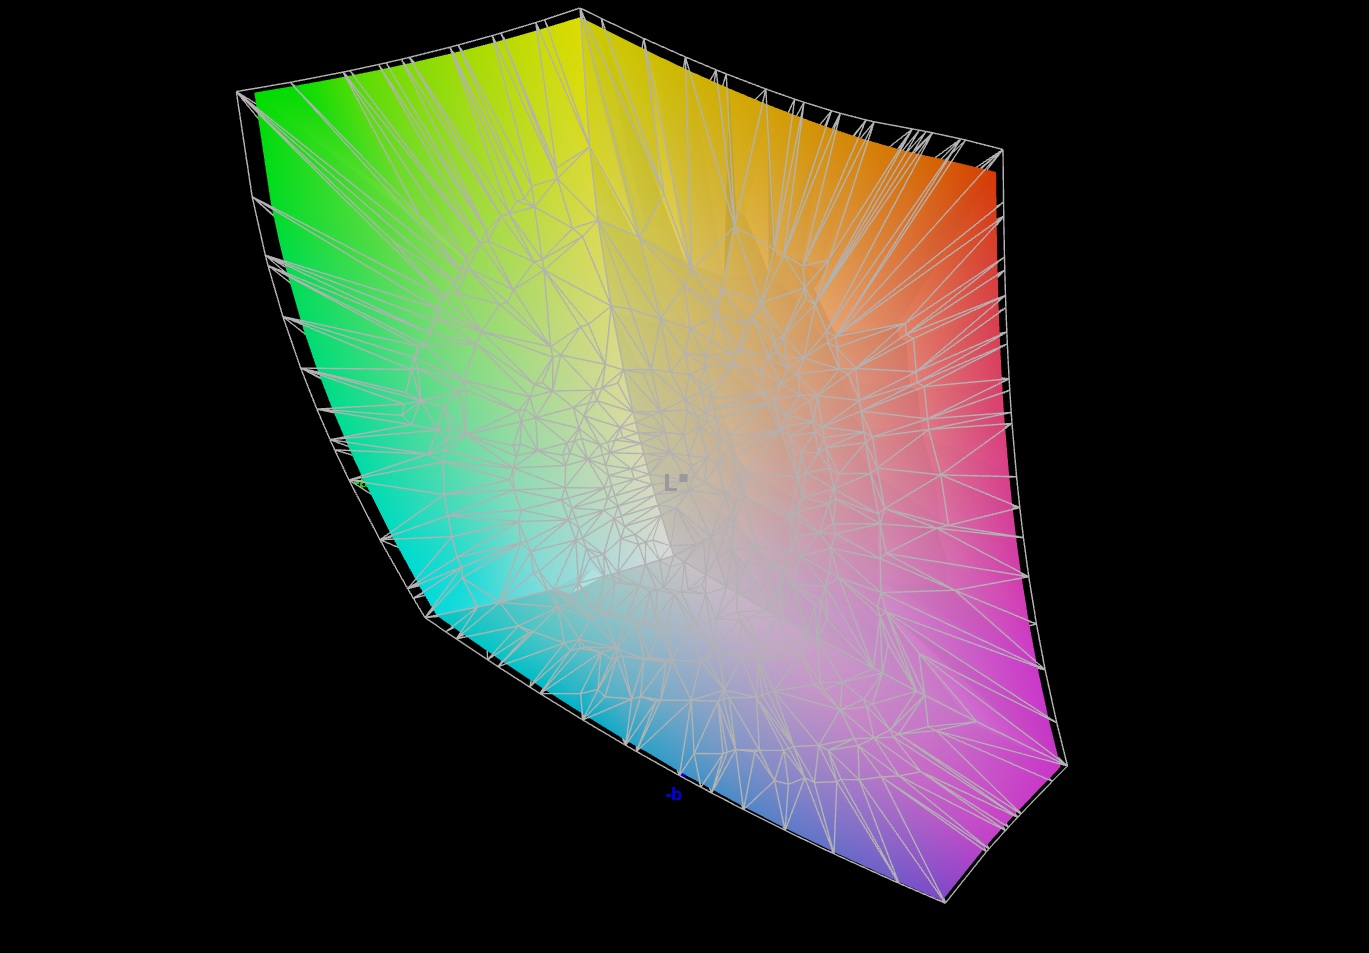
Display - Grande cobertura colorida
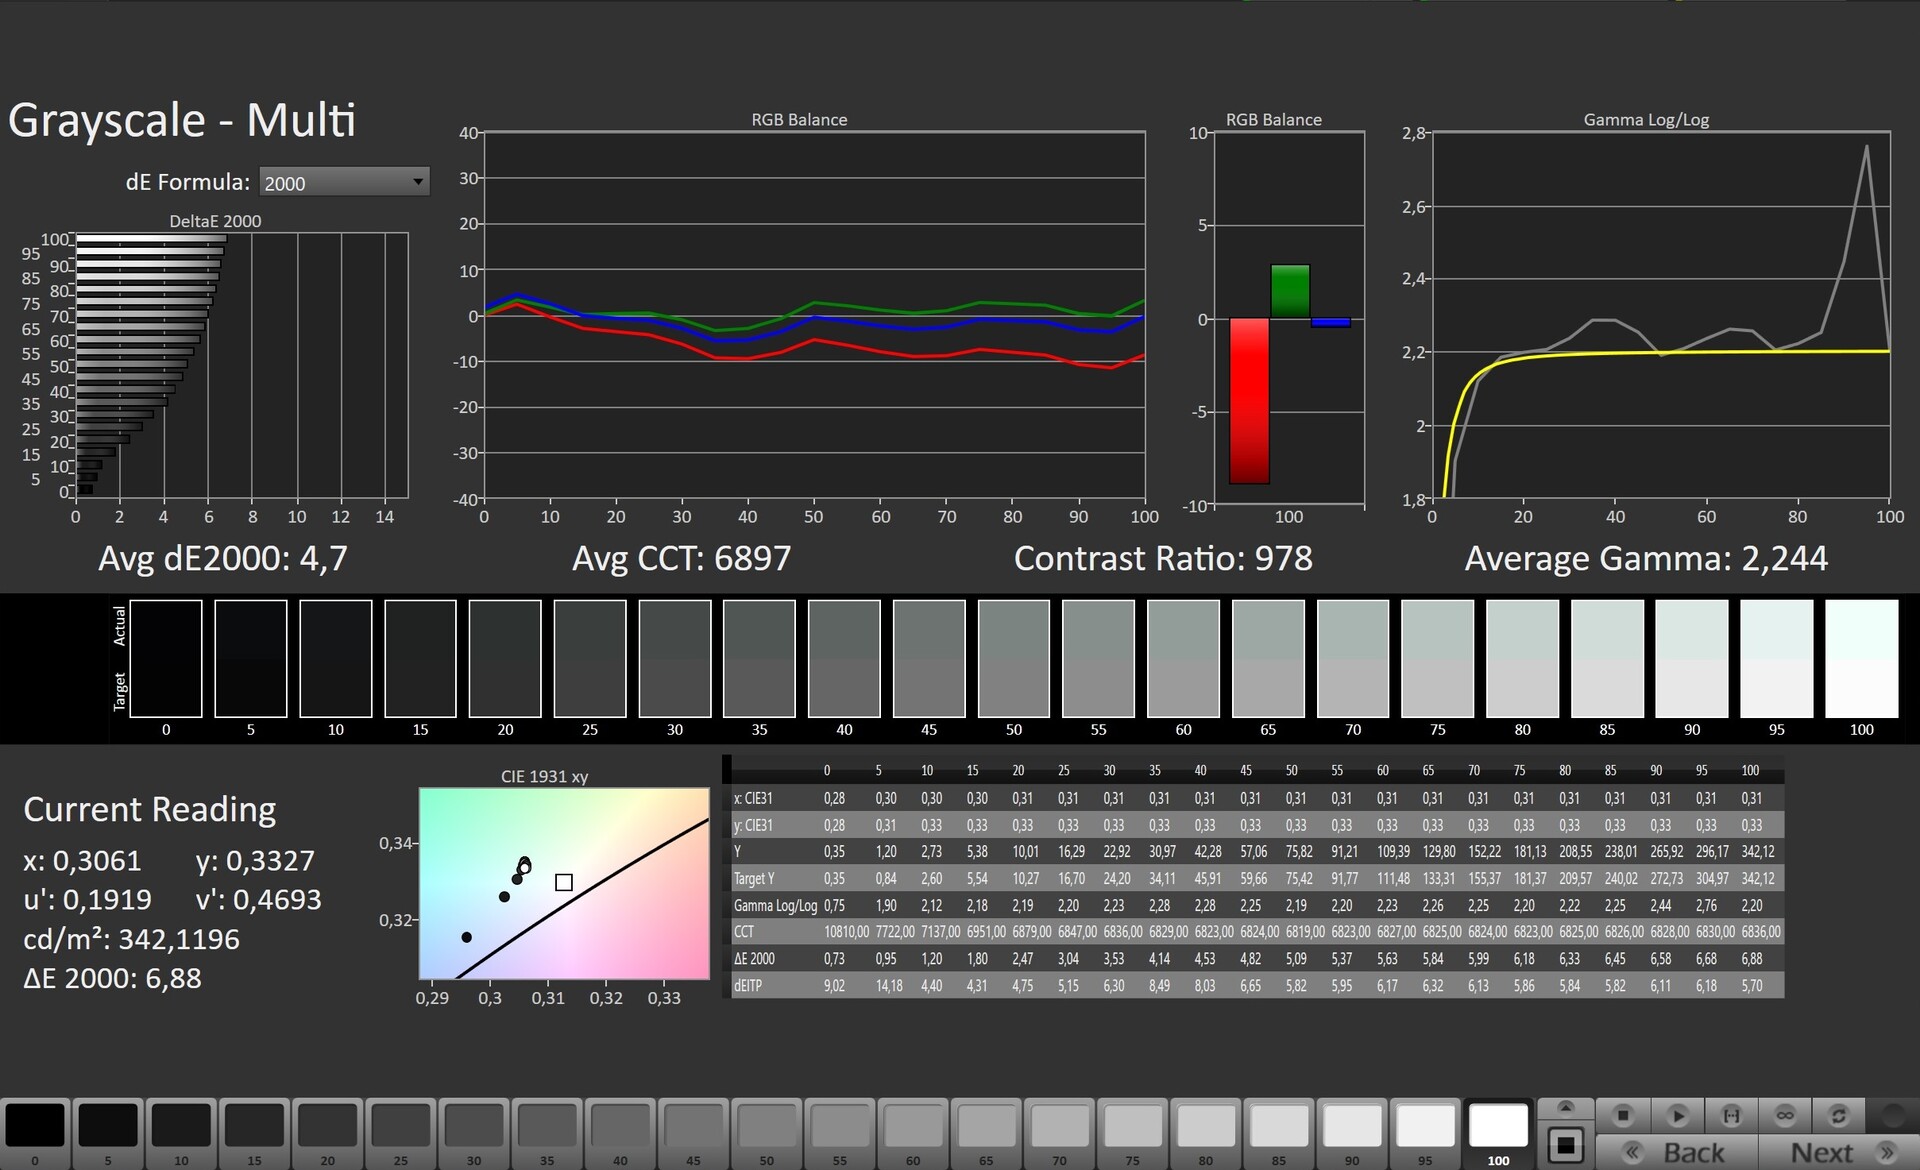
O laptop é equipado com um painel de 165Hz altamente responsivo que não exibe nenhuma cintilação PWM. O display mate de 15,6 polegadas (2.560 x 1.440 pixels) pode ficar aceitavelmente brilhante (>300 cd/m²), mas seu contraste (988:1) está abaixo do que é considerado bom (>1.000:1). A situação é o contrário com alguns dos concorrentes. Somente o Nitro tem uma tela que se sai bem em ambos os departamentos.
| |||||||||||||||||||||||||
iluminação: 89 %
iluminação com acumulador: 336 cd/m²
Contraste: 988:1 (Preto: 0.34 cd/m²)
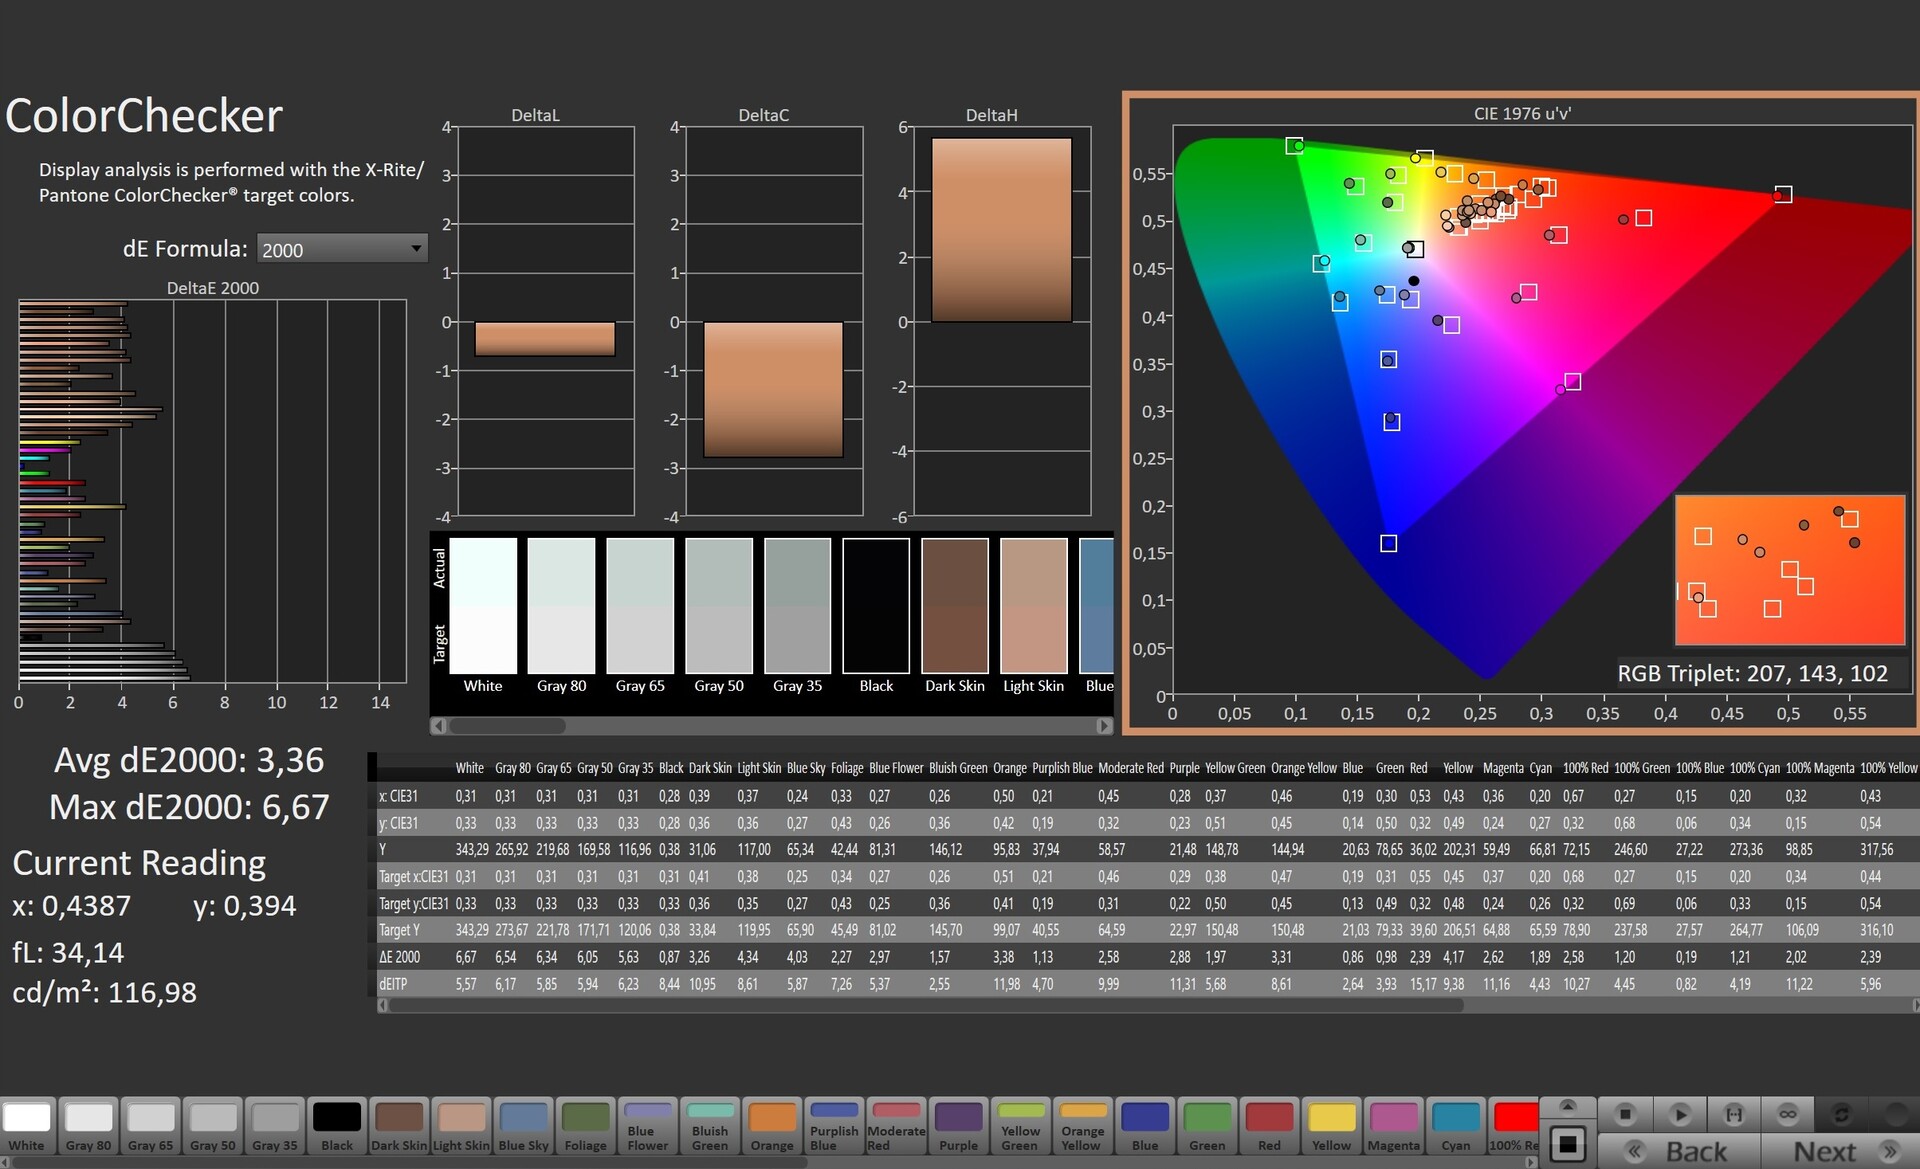
ΔE ColorChecker Calman: 3.36 | ∀{0.5-29.43 Ø4.71}
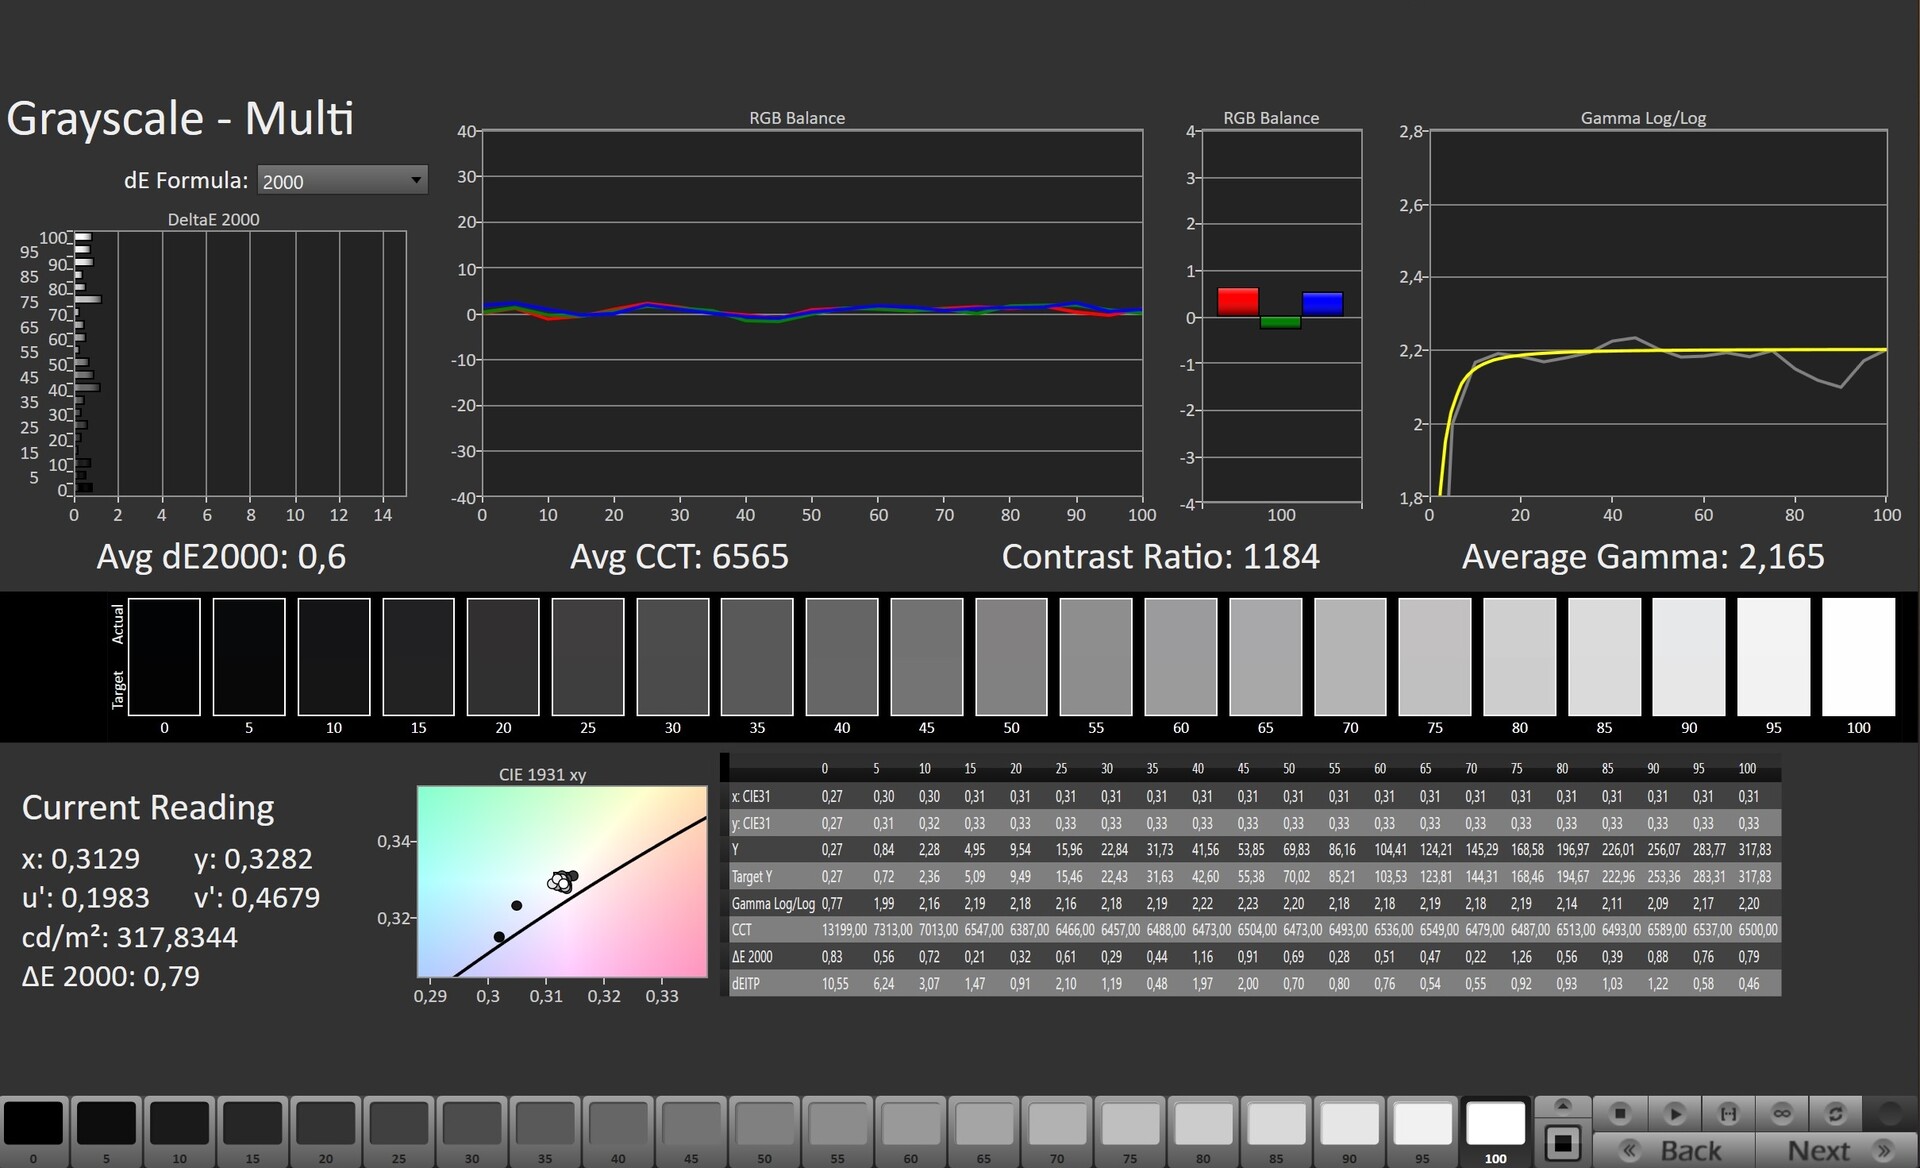
calibrated: 0.74
ΔE Greyscale Calman: 4.7 | ∀{0.09-98 Ø4.96}
84.5% AdobeRGB 1998 (Argyll 3D)
99.9% sRGB (Argyll 3D)
95.2% Display P3 (Argyll 3D)
Gamma: 2.244
CCT: 6897 K
| Aorus 15 XE5 Chi Mei N156KME-GNA, IPS, 2560x1440, 15.6" | Acer Nitro 5 AN515-46-R1A1 AU Optronics B156HAN12.H, IPS, 1920x1080, 15.6" | Schenker XMG Fusion 15 (Mid 22) BOE CQ NE156QHM-NY2, IPS, 2560x1440, 15.6" | Asus TUF Dash F15 FX517ZR BOE CQ NE156QHM-NY1, IPS, 2560x1440, 15.6" | MSI Katana GF66 12UGS AU Optronics AUOAF90, IPS, 1920x1080, 15.6" | |
|---|---|---|---|---|---|
| Display | -16% | -17% | 2% | -51% | |
| Display P3 Coverage (%) | 95.2 | 68.8 -28% | 67.3 -29% | 98.4 3% | 39.1 -59% |
| sRGB Coverage (%) | 99.9 | 98.1 -2% | 96.7 -3% | 99.9 0% | 58.3 -42% |
| AdobeRGB 1998 Coverage (%) | 84.5 | 69.7 -18% | 68.2 -19% | 85.9 2% | 40.4 -52% |
| Response Times | 9% | 19% | 26% | -204% | |
| Response Time Grey 50% / Grey 80% * (ms) | 14.4 ? | 13 ? 10% | 11.6 ? 19% | 5.6 ? 61% | 40 ? -178% |
| Response Time Black / White * (ms) | 8.6 ? | 8 ? 7% | 7 ? 19% | 9.4 ? -9% | 28.4 ? -230% |
| PWM Frequency (Hz) | |||||
| Screen | 2% | -14% | 13% | -64% | |
| Brightness middle (cd/m²) | 336 | 327 -3% | 326 -3% | 286 -15% | 227 -32% |
| Brightness (cd/m²) | 316 | 320 1% | 303 -4% | 266 -16% | 225 -29% |
| Brightness Distribution (%) | 89 | 93 4% | 89 0% | 87 -2% | 90 1% |
| Black Level * (cd/m²) | 0.34 | 0.24 29% | 0.33 3% | 0.25 26% | 0.21 38% |
| Contrast (:1) | 988 | 1363 38% | 988 0% | 1144 16% | 1081 9% |
| Colorchecker dE 2000 * | 3.36 | 3.26 3% | 2.73 19% | 2.14 36% | 4.19 -25% |
| Colorchecker dE 2000 max. * | 6.67 | 8.73 -31% | 9.54 -43% | 5.22 22% | 17.45 -162% |
| Colorchecker dE 2000 calibrated * | 0.74 | 0.87 -18% | 1.36 -84% | 0.67 9% | 3.81 -415% |
| Greyscale dE 2000 * | 4.7 | 4.87 -4% | 5.2 -11% | 2.8 40% | 2.7 43% |
| Gamma | 2.244 98% | 2.3 96% | 2.074 106% | 2.23 99% | 2.208 100% |
| CCT | 6897 94% | 7070 92% | 6911 94% | 7092 92% | 6176 105% |
| Média Total (Programa/Configurações) | -2% /
-1% | -4% /
-10% | 14% /
12% | -106% /
-81% |
* ... menor é melhor
O display tem uma reprodução decente de cores logo de saída da caixa. Sua diferença de cores de 3,36 está ligeiramente fora da faixa ideal (DeltaE <3). A calibração da tela reduziu a diferença de cores para 0,74 e fez com que os tons de cinza parecessem mais suaves. A tela cobre totalmente o espaço de cor sRGB (100%) e quase consegue reproduzir toda a gama DCI-P3 (95%). Também tem uma cobertura AdobeRGB de 85%.
O perfil de cores criado por nós pode ser baixado e utilizado gratuitamente. Você encontrará um link de download na infobox para a tela.
Exibir tempos de resposta
| ↔ Tempo de resposta preto para branco | ||
|---|---|---|
| 8.6 ms ... ascensão ↗ e queda ↘ combinadas | ↗ 5.1 ms ascensão | 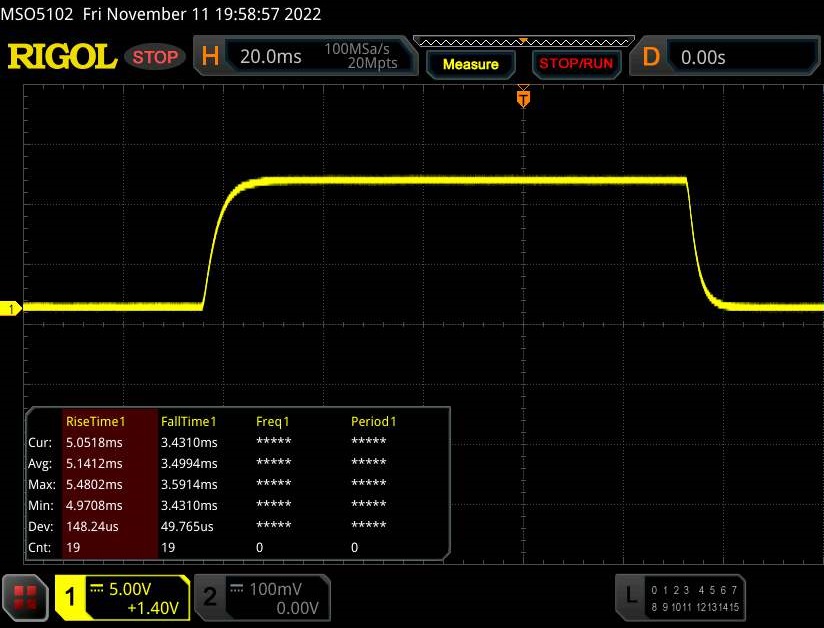 |
| ↘ 3.5 ms queda | ||
| A tela mostra taxas de resposta rápidas em nossos testes e deve ser adequada para jogos. Em comparação, todos os dispositivos testados variam de 0.1 (mínimo) a 240 (máximo) ms. » 24 % de todos os dispositivos são melhores. Isso significa que o tempo de resposta medido é melhor que a média de todos os dispositivos testados (19.8 ms). | ||
| ↔ Tempo de resposta 50% cinza a 80% cinza | ||
| 14.4 ms ... ascensão ↗ e queda ↘ combinadas | ↗ 6.9 ms ascensão | 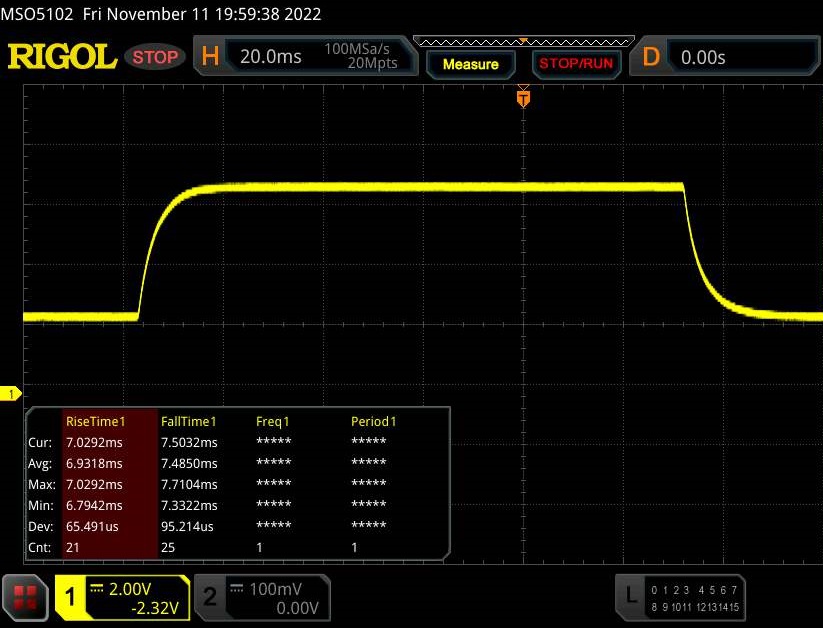 |
| ↘ 7.5 ms queda | ||
| A tela mostra boas taxas de resposta em nossos testes, mas pode ser muito lenta para jogadores competitivos. Em comparação, todos os dispositivos testados variam de 0.165 (mínimo) a 636 (máximo) ms. » 28 % de todos os dispositivos são melhores. Isso significa que o tempo de resposta medido é melhor que a média de todos os dispositivos testados (31 ms). | ||
Cintilação da tela / PWM (modulação por largura de pulso)
| Tela tremeluzindo / PWM não detectado |  | ||
[pwm_comparison] Em comparação: 52 % de todos os dispositivos testados não usam PWM para escurecer a tela. Se PWM foi detectado, uma média de 7754 (mínimo: 5 - máximo: 343500) Hz foi medida. | |||
O visor IPS tem um amplo ângulo de visão e é legível a partir de qualquer posição. Também é possível utilizar o display ao ar livre, desde que o sol não esteja muito claro.

Desempenho - Ampla potência graças ao Alder Lake e Ampere
O Gigabyte Aorus 15 XE5 é um poderoso laptop de 15,6 polegadas que se sai bem em todos os tipos de cenários de uso exigentes. Além da configuração de revisão, o Gigabyte também oferece dois outros modelos: um com um laptop RTX 3080 Ti (Aorus 15 YE5) e outro com um laptop RTX 3060 (Aorus 15 KE5).
Condições de teste
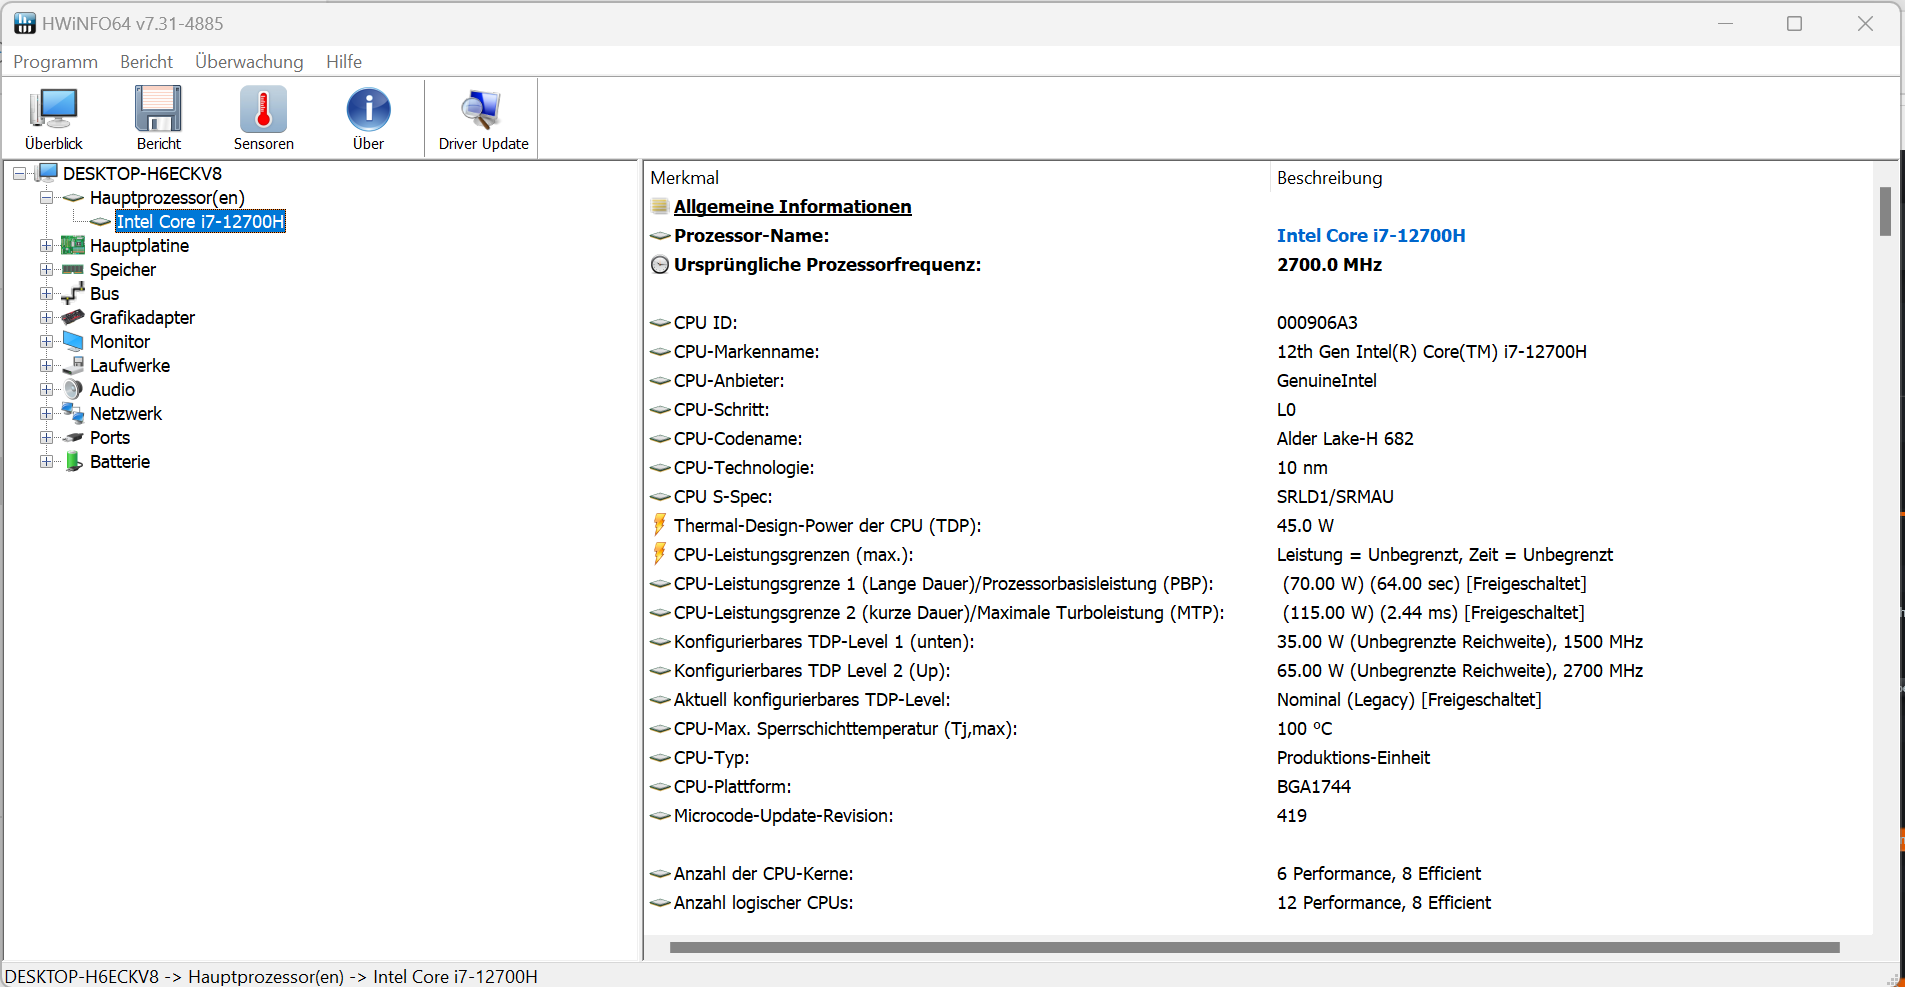
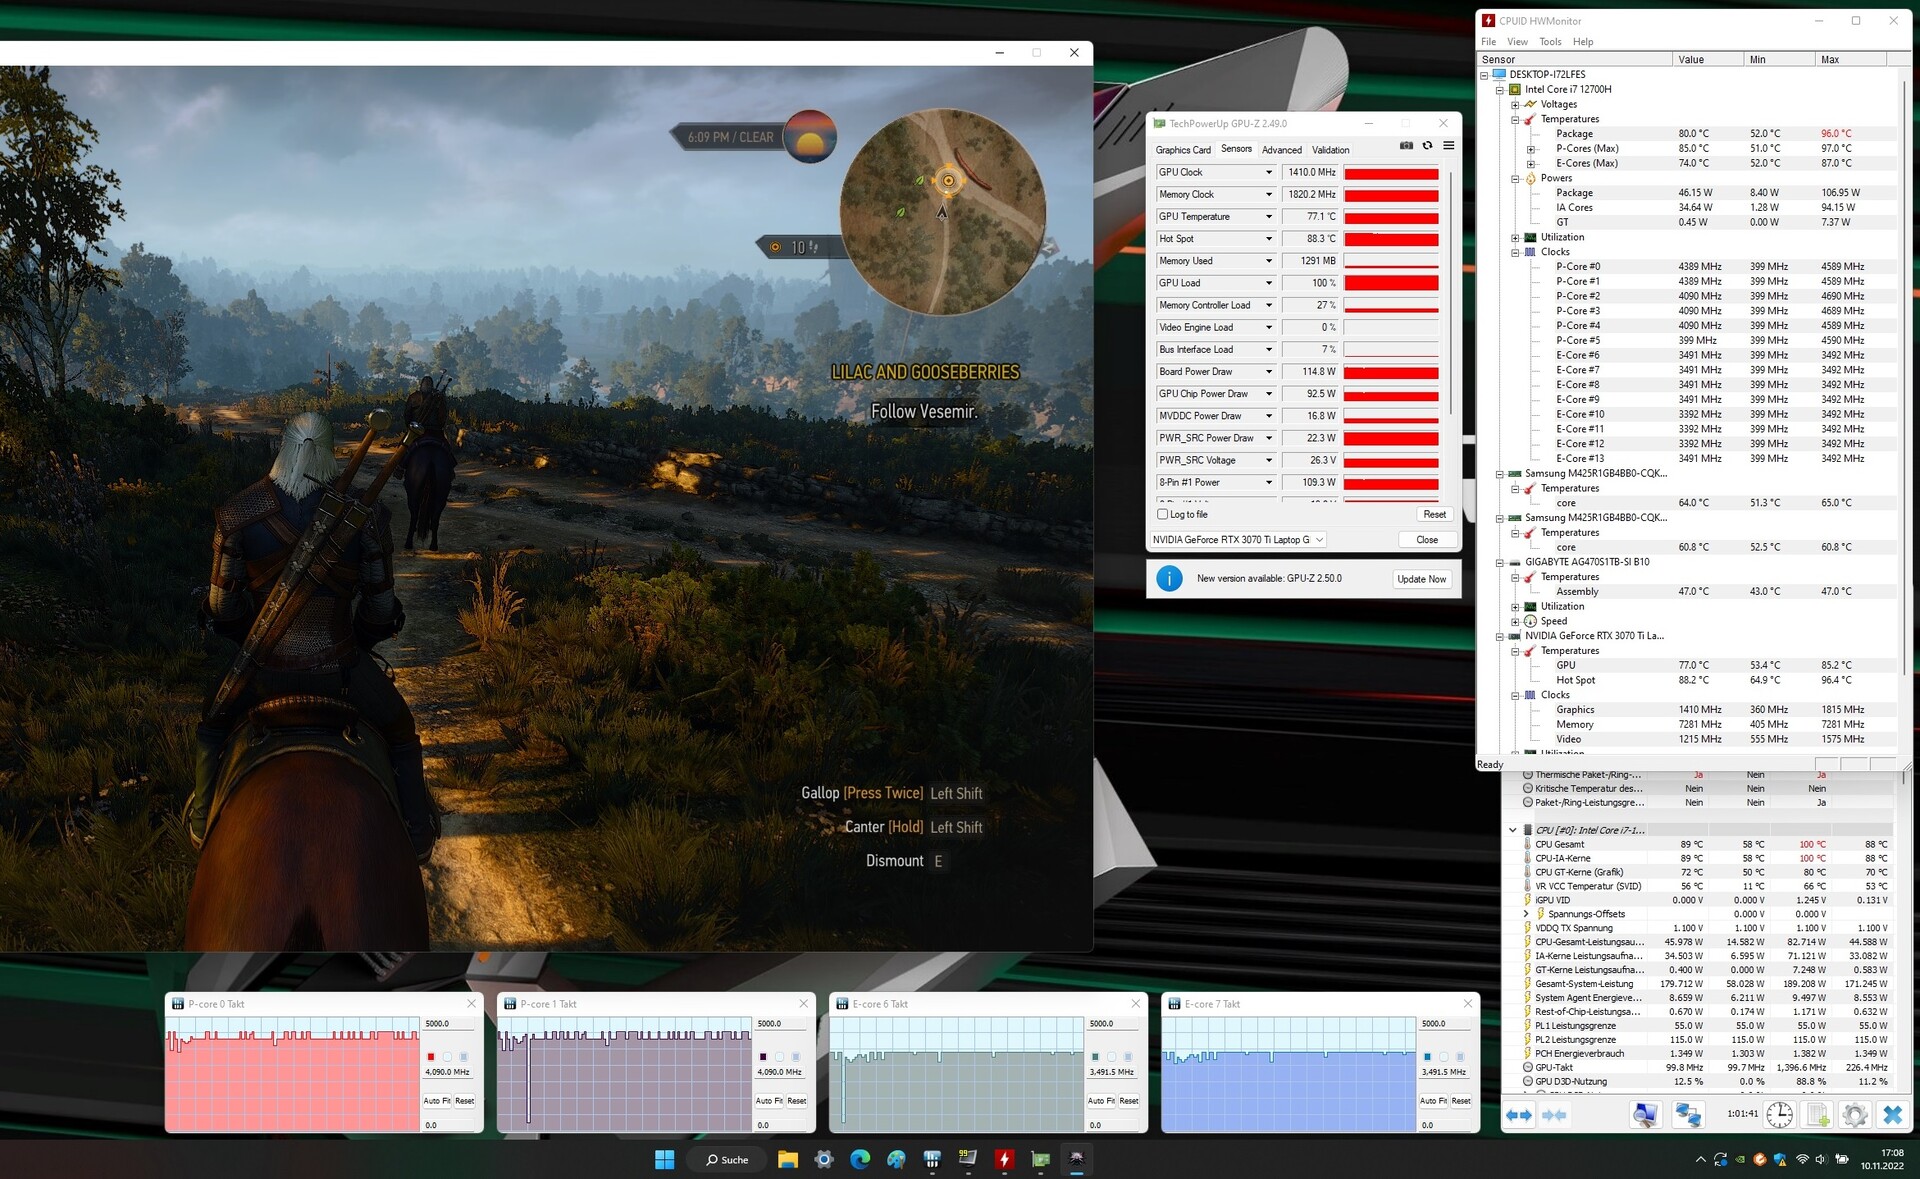
O Centro de Controle Gigabyte pré-instalado tem vários perfis de desempenho que permitem configurar o desempenho da CPU e GPU, atividade do ventilador, brilho da tela e temperatura da cor, e assim por diante. Para nossos testes, usamos a função AI Boost, que substitui qualquer configuração manual de desempenho e permite que o Centro de Controle escolha o perfil apropriado.
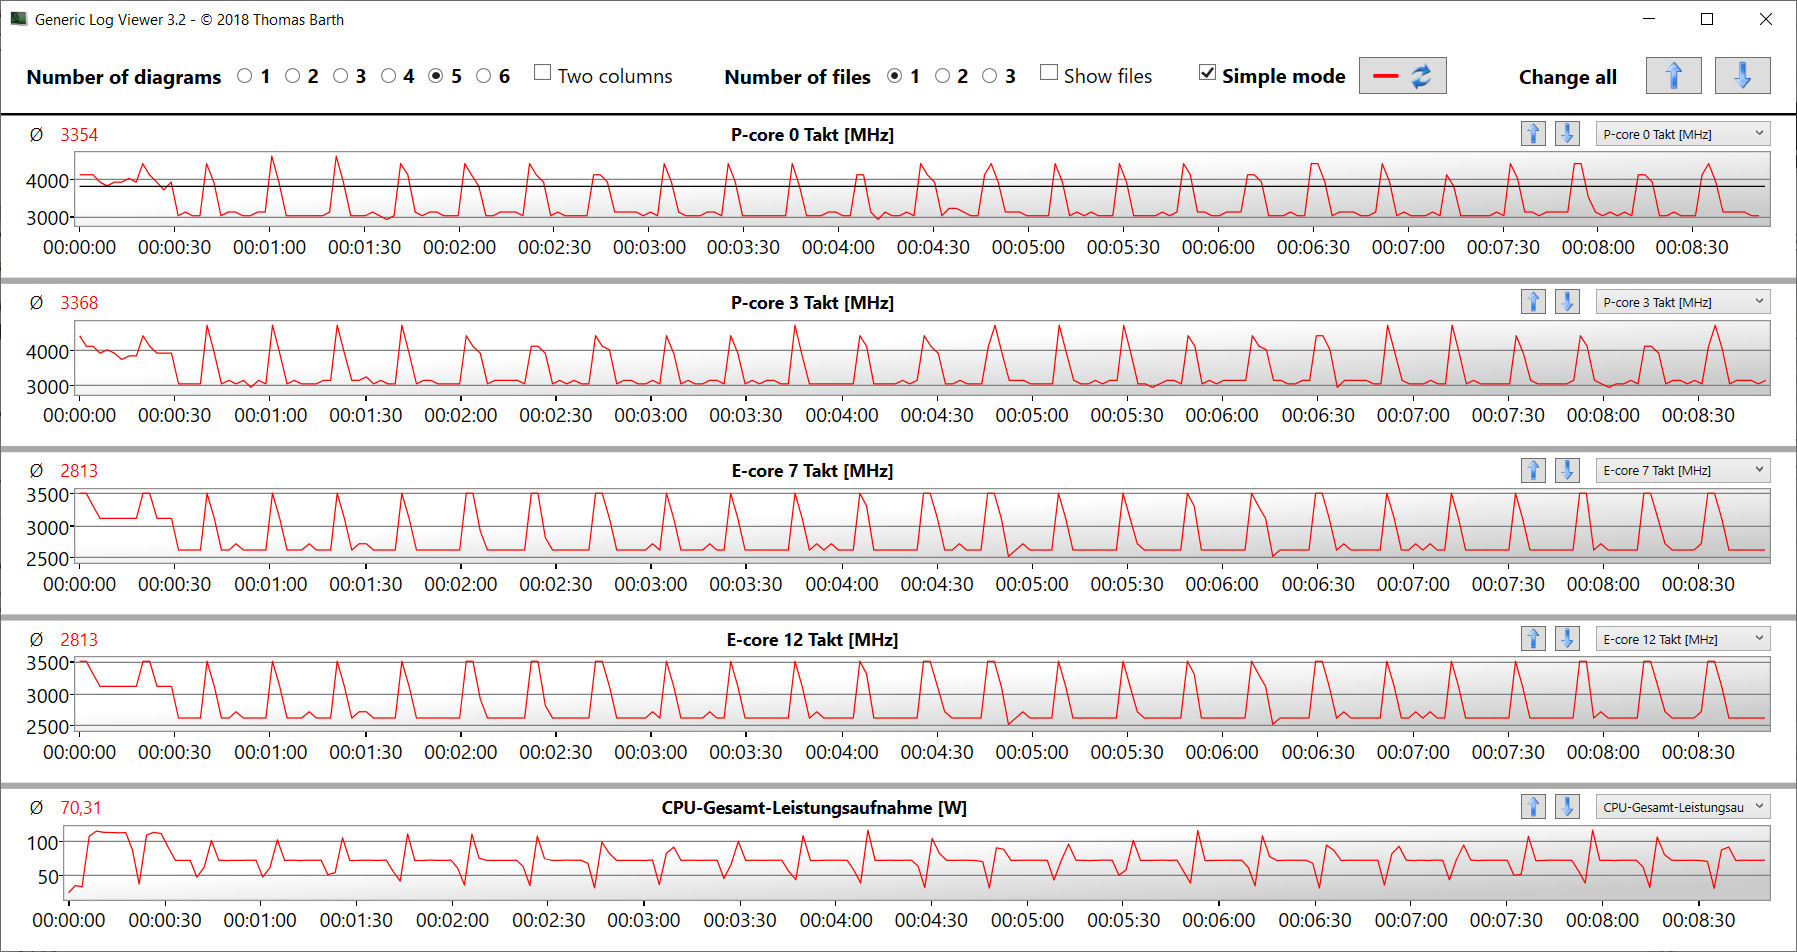
O uso do "Modo Turbo" dificilmente melhorou a performance de pico, mas resultou em uma performance mais sustentada sob carga constante (veja os resultados do loop CB15). No entanto, este ganho tem um preço - os ventiladores estavam funcionando continuamente em velocidade máxima.
| Modo Criador | Modo Turbo | Modo Jogo | Modo Reunião | Modo Silêncio Economia de Energia | |
|---|---|---|---|---|---|
| Limite de potência 1 | 70 watts | 70 watts | 55 watts | 15 watts | 15 watts |
| Limite de potência 2 | 115 watts | 115 watts | 115 watts | 30 watts | 30 watts |
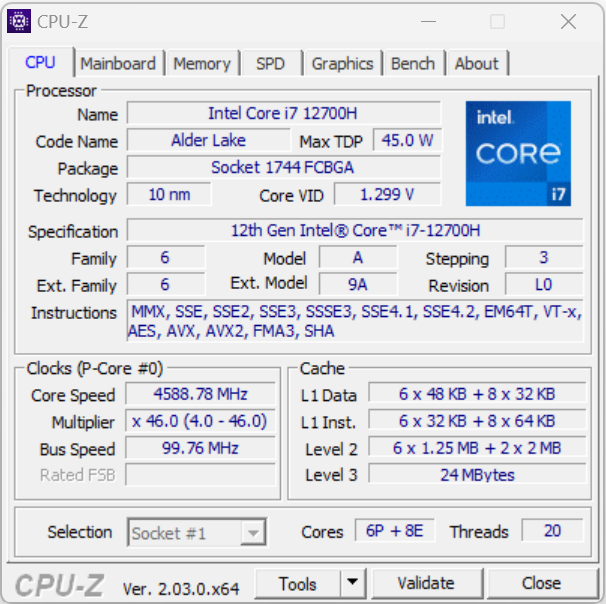
Processador
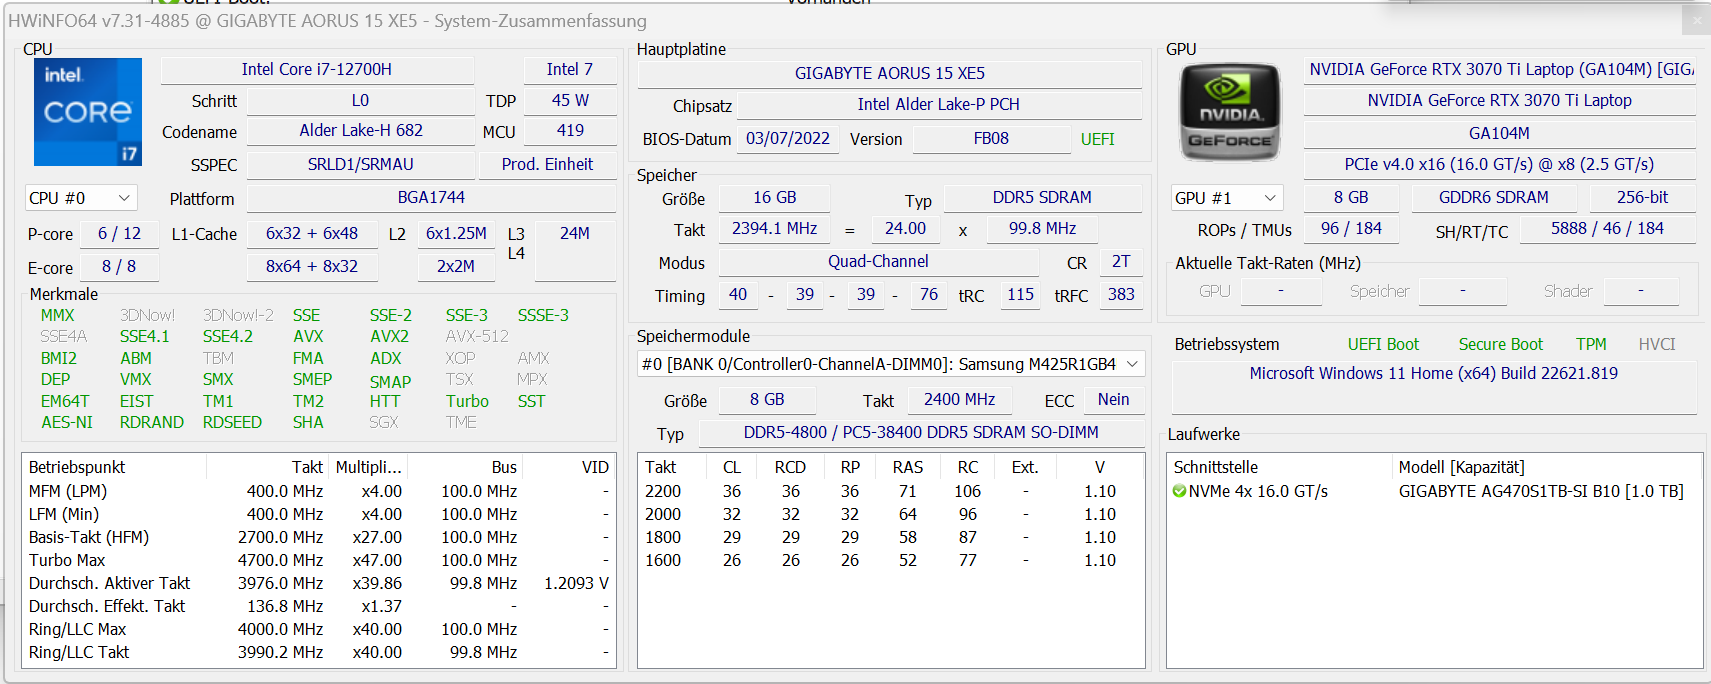
O Núcleo i7-12700H (Alder Lake) contém seis núcleos de desempenho (hyper-threading, 2,4 a 4,7 GHz) e oito núcleos de eficiência (sem hyper-threading, 1,8 a 3,5 GHz), dando um total de 20 núcleos de CPU lógica.
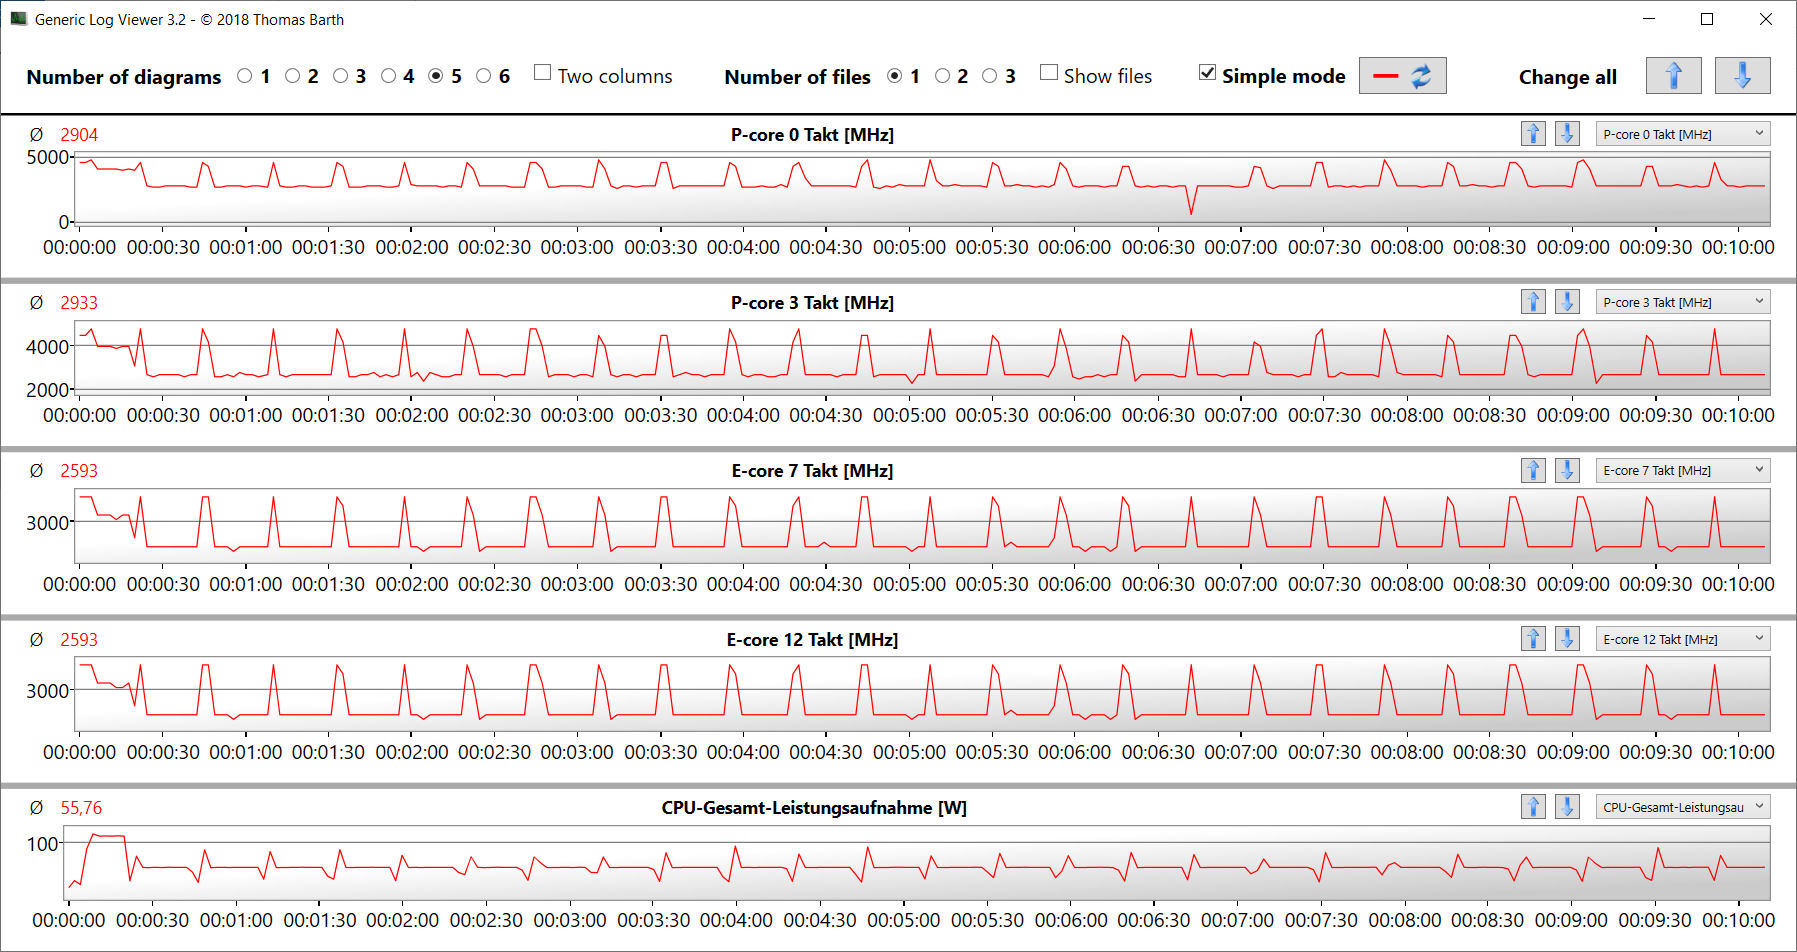
A CPU funcionou brevemente em altas velocidades de clock (P-cores: 4,4 GHz, E-cores: 3,5 GHz) durante o teste de múltiplas roscas Cinebench R15 antes de estabilizar em freqüências ligeiramente mais baixas (P-cores: 3,5 a 3,8 GHz, E-cores: 3 a 3,2 GHz). Durante o teste de rosca única, os núcleos P funcionaram em 4,4 a 4,7 GHz e os núcleos E em 3,5 GHz. As velocidades do relógio eram substancialmente mais baixas quando o laptop estava com bateria. No geral, o Core i7 no Aorus 15 XE5 forneceu resultados de referência ligeiramente acima da média.
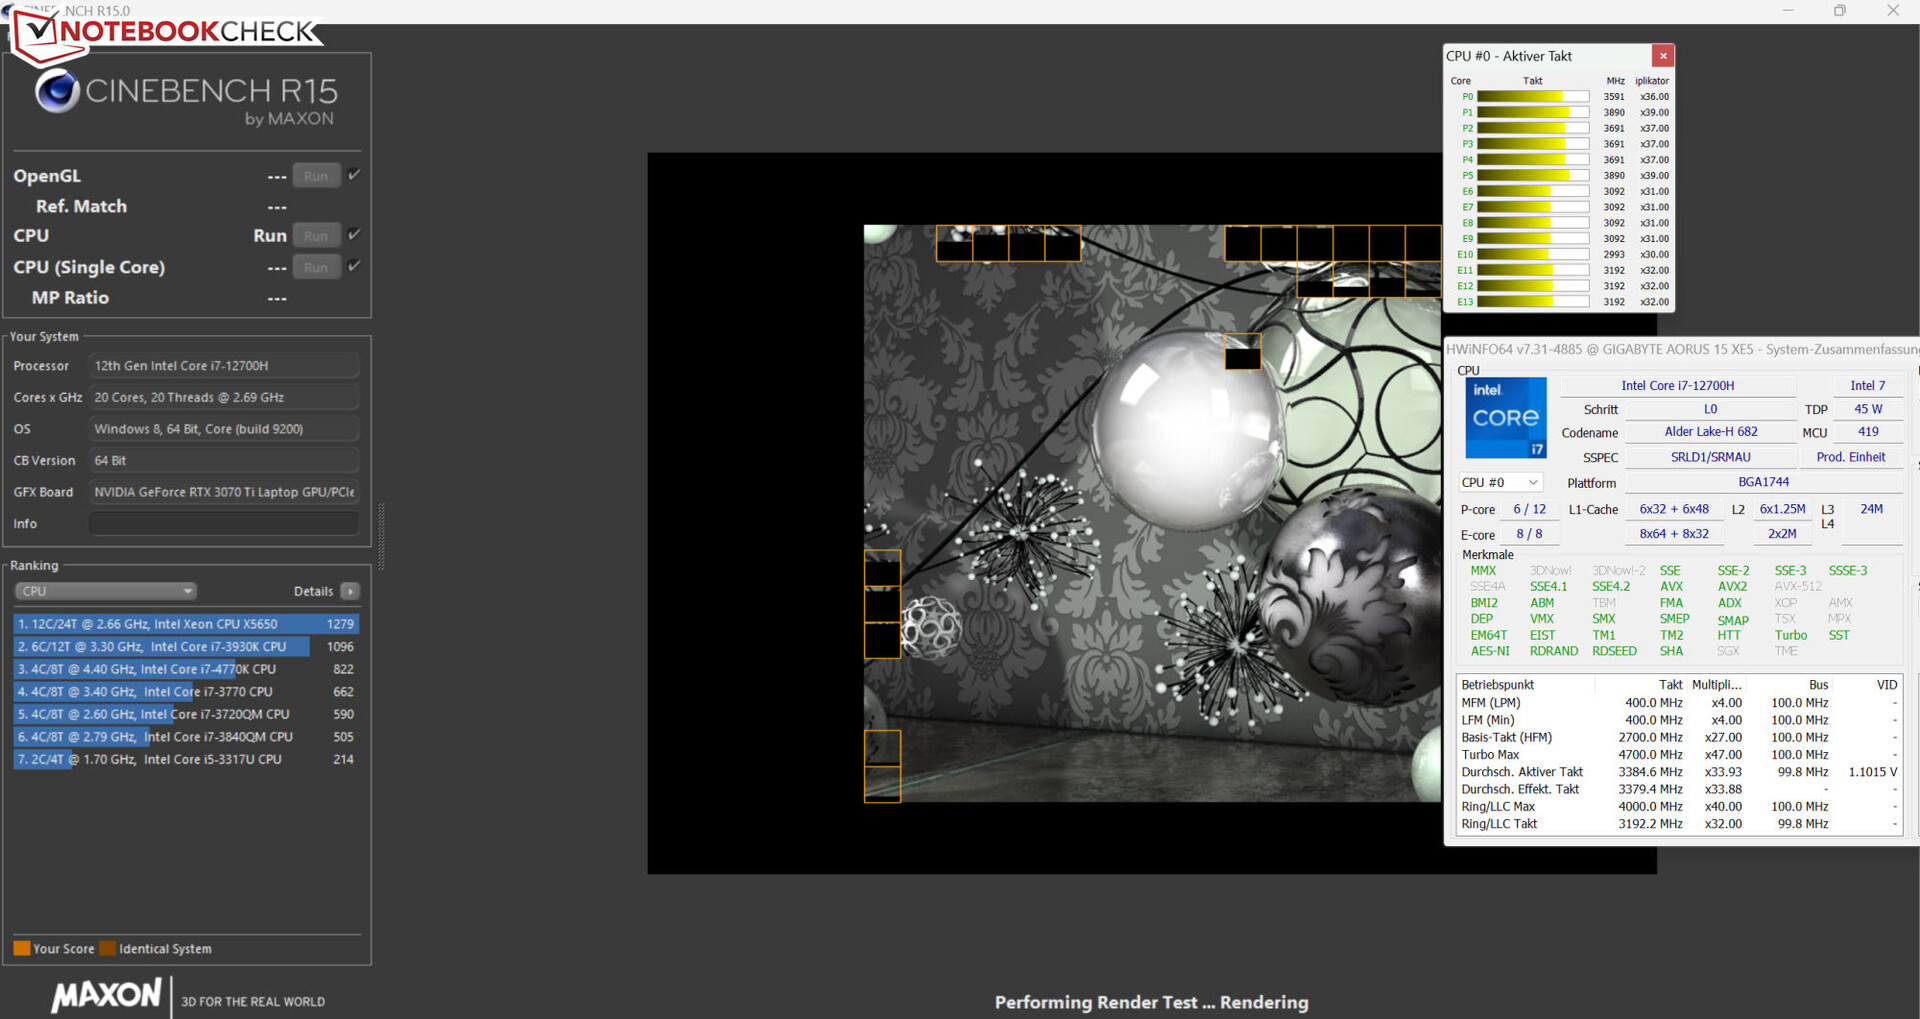
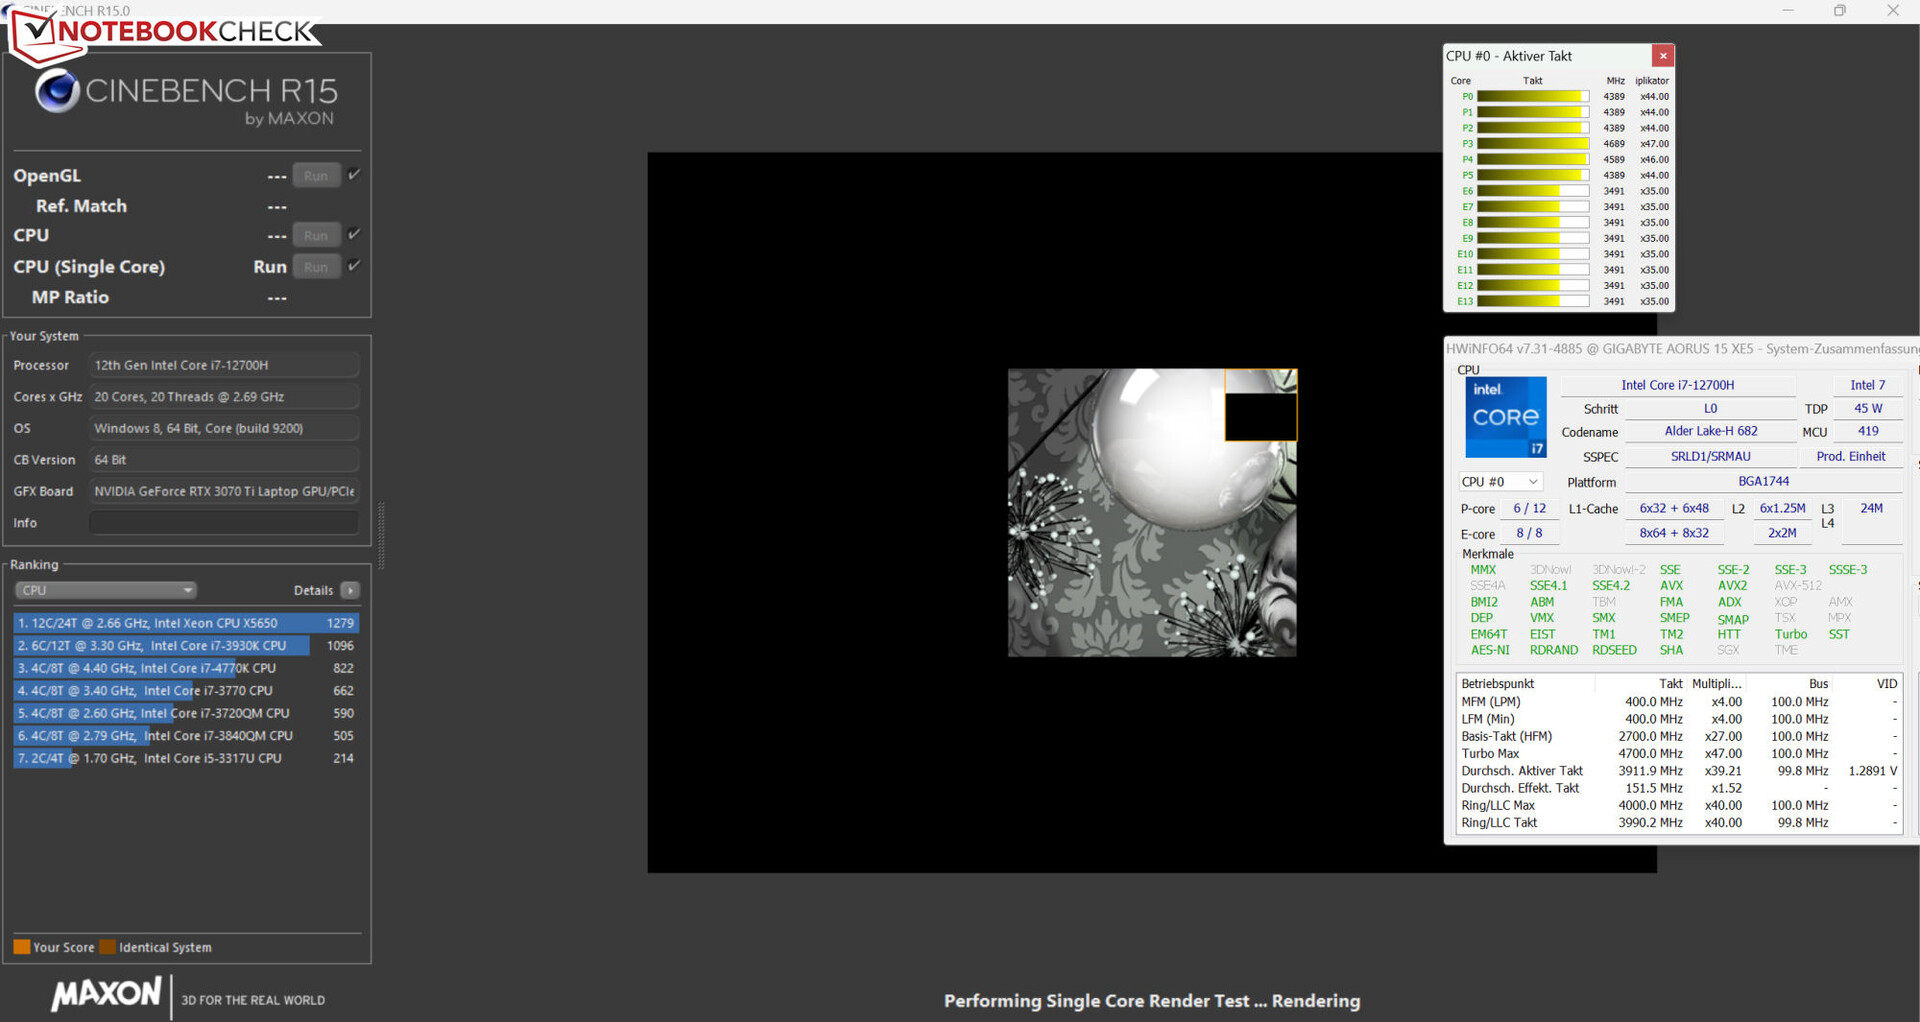
Também realizamos o teste multi-tarefa em Cinebench R15 em um loop para determinar se a CPU é capaz de manter sua velocidade turbo durante um período prolongado. A CPU só foi capaz de manter a alta velocidade do relógio por um curto período de tempo. Posteriormente, os núcleos P eram principalmente os que operavam no meio da faixa do turbo. A ativação do "Modo Turbo" resultou em um pequeno aumento no desempenho da CPU - não no auge, mas em média.
Cinebench R15 Multi Sustained Load
| CPU Performance rating - Percent | |
| Média da turma Gaming | |
| Aorus 15 XE5 | |
| Aorus 15 XE5 | |
| MSI Katana GF66 12UGS | |
| Média Intel Core i7-12700H | |
| Asus TUF Dash F15 FX517ZR | |
| Acer Nitro 5 AN515-46-R1A1 | |
| Schenker XMG Fusion 15 (Mid 22) | |
| Cinebench R20 | |
| CPU (Multi Core) | |
| Média da turma Gaming (4029 - 16433, n=106, últimos 2 anos) | |
| MSI Katana GF66 12UGS | |
| Aorus 15 XE5 (Turbo Mode) | |
| Aorus 15 XE5 | |
| Média Intel Core i7-12700H (1576 - 7407, n=64) | |
| Asus TUF Dash F15 FX517ZR | |
| Acer Nitro 5 AN515-46-R1A1 | |
| Schenker XMG Fusion 15 (Mid 22) | |
| CPU (Single Core) | |
| Média da turma Gaming (442 - 913, n=106, últimos 2 anos) | |
| MSI Katana GF66 12UGS | |
| Asus TUF Dash F15 FX517ZR | |
| Aorus 15 XE5 | |
| Média Intel Core i7-12700H (300 - 704, n=64) | |
| Aorus 15 XE5 (Turbo Mode) | |
| Acer Nitro 5 AN515-46-R1A1 | |
| Schenker XMG Fusion 15 (Mid 22) | |
| Blender - v2.79 BMW27 CPU | |
| Schenker XMG Fusion 15 (Mid 22) | |
| MSI Katana GF66 12UGS | |
| Aorus 15 XE5 | |
| Acer Nitro 5 AN515-46-R1A1 | |
| Asus TUF Dash F15 FX517ZR | |
| Média Intel Core i7-12700H (168 - 732, n=63) | |
| Aorus 15 XE5 (Turbo Mode) | |
| Média da turma Gaming (79 - 330, n=104, últimos 2 anos) | |
| HWBOT x265 Benchmark v2.2 - 4k Preset | |
| Média da turma Gaming (11.5 - 44.4, n=105, últimos 2 anos) | |
| Aorus 15 XE5 (Turbo Mode) | |
| Acer Nitro 5 AN515-46-R1A1 | |
| Asus TUF Dash F15 FX517ZR | |
| Média Intel Core i7-12700H (4.67 - 21.8, n=64) | |
| Aorus 15 XE5 | |
| MSI Katana GF66 12UGS | |
| Schenker XMG Fusion 15 (Mid 22) | |
| LibreOffice - 20 Documents To PDF | |
| Acer Nitro 5 AN515-46-R1A1 | |
| Média da turma Gaming (33.2 - 88.8, n=105, últimos 2 anos) | |
| Schenker XMG Fusion 15 (Mid 22) | |
| Média Intel Core i7-12700H (34.2 - 95.3, n=63) | |
| Asus TUF Dash F15 FX517ZR | |
| Aorus 15 XE5 (Turbo Mode) | |
| Aorus 15 XE5 | |
| MSI Katana GF66 12UGS | |
| R Benchmark 2.5 - Overall mean | |
| Schenker XMG Fusion 15 (Mid 22) | |
| Acer Nitro 5 AN515-46-R1A1 | |
| Aorus 15 XE5 (Turbo Mode) | |
| Média Intel Core i7-12700H (0.4441 - 1.052, n=63) | |
| Aorus 15 XE5 | |
| Asus TUF Dash F15 FX517ZR | |
| MSI Katana GF66 12UGS | |
| Média da turma Gaming (0.3439 - 0.759, n=106, últimos 2 anos) | |
* ... menor é melhor
AIDA64: FP32 Ray-Trace | FPU Julia | CPU SHA3 | CPU Queen | FPU SinJulia | FPU Mandel | CPU AES | CPU ZLib | FP64 Ray-Trace | CPU PhotoWorxx
| Performance rating | |
| Média da turma Gaming | |
| Acer Nitro 5 AN515-46-R1A1 | |
| Aorus 15 XE5 | |
| Aorus 15 XE5 | |
| Schenker XMG Fusion 15 (Mid 22) | |
| Asus TUF Dash F15 FX517ZR | |
| Média Intel Core i7-12700H | |
| MSI Katana GF66 12UGS | |
| AIDA64 / FP32 Ray-Trace | |
| Média da turma Gaming (10227 - 85542, n=105, últimos 2 anos) | |
| Acer Nitro 5 AN515-46-R1A1 (v6.75.6100) | |
| Aorus 15 XE5 (v6.75.6100, Turbo Mode) | |
| Asus TUF Dash F15 FX517ZR (v6.70.6000) | |
| Aorus 15 XE5 (v6.75.6100) | |
| Schenker XMG Fusion 15 (Mid 22) (v6.70.6000) | |
| Média Intel Core i7-12700H (2585 - 17957, n=64) | |
| MSI Katana GF66 12UGS (v6.50.5800) | |
| AIDA64 / FPU Julia | |
| Média da turma Gaming (51376 - 238426, n=105, últimos 2 anos) | |
| Acer Nitro 5 AN515-46-R1A1 (v6.75.6100) | |
| Aorus 15 XE5 (v6.75.6100, Turbo Mode) | |
| Asus TUF Dash F15 FX517ZR (v6.70.6000) | |
| Aorus 15 XE5 (v6.75.6100) | |
| Schenker XMG Fusion 15 (Mid 22) (v6.70.6000) | |
| Média Intel Core i7-12700H (12439 - 90760, n=64) | |
| MSI Katana GF66 12UGS (v6.50.5800) | |
| AIDA64 / CPU SHA3 | |
| Média da turma Gaming (2180 - 10115, n=105, últimos 2 anos) | |
| Schenker XMG Fusion 15 (Mid 22) (v6.70.6000) | |
| Aorus 15 XE5 (v6.75.6100, Turbo Mode) | |
| Acer Nitro 5 AN515-46-R1A1 (v6.75.6100) | |
| Média Intel Core i7-12700H (833 - 4242, n=64) | |
| MSI Katana GF66 12UGS (v6.50.5800) | |
| Aorus 15 XE5 (v6.75.6100) | |
| Asus TUF Dash F15 FX517ZR (v6.70.6000) | |
| AIDA64 / CPU Queen | |
| Média da turma Gaming (49785 - 173351, n=90, últimos 2 anos) | |
| Acer Nitro 5 AN515-46-R1A1 (v6.75.6100) | |
| Aorus 15 XE5 (v6.75.6100) | |
| Aorus 15 XE5 (v6.75.6100, Turbo Mode) | |
| MSI Katana GF66 12UGS (v6.50.5800) | |
| Média Intel Core i7-12700H (57923 - 103202, n=63) | |
| Asus TUF Dash F15 FX517ZR (v6.70.6000) | |
| Schenker XMG Fusion 15 (Mid 22) | |
| AIDA64 / FPU SinJulia | |
| Média da turma Gaming (4424 - 33636, n=105, últimos 2 anos) | |
| Acer Nitro 5 AN515-46-R1A1 (v6.75.6100) | |
| MSI Katana GF66 12UGS (v6.50.5800) | |
| Aorus 15 XE5 (v6.75.6100, Turbo Mode) | |
| Média Intel Core i7-12700H (3249 - 9939, n=64) | |
| Schenker XMG Fusion 15 (Mid 22) (v6.70.6000) | |
| Asus TUF Dash F15 FX517ZR (v6.70.6000) | |
| Aorus 15 XE5 (v6.75.6100) | |
| AIDA64 / FPU Mandel | |
| Média da turma Gaming (25115 - 128721, n=105, últimos 2 anos) | |
| Acer Nitro 5 AN515-46-R1A1 (v6.75.6100) | |
| Schenker XMG Fusion 15 (Mid 22) (v6.70.6000) | |
| Aorus 15 XE5 (v6.75.6100, Turbo Mode) | |
| Asus TUF Dash F15 FX517ZR (v6.70.6000) | |
| Aorus 15 XE5 (v6.75.6100) | |
| Média Intel Core i7-12700H (7135 - 44760, n=64) | |
| MSI Katana GF66 12UGS (v6.50.5800) | |
| AIDA64 / CPU AES | |
| Schenker XMG Fusion 15 (Mid 22) (v6.70.6000) | |
| Acer Nitro 5 AN515-46-R1A1 | |
| Aorus 15 XE5 (v6.75.6100, Turbo Mode) | |
| Aorus 15 XE5 (v6.75.6100) | |
| Média da turma Gaming (39258 - 247074, n=105, últimos 2 anos) | |
| MSI Katana GF66 12UGS (v6.50.5800) | |
| Média Intel Core i7-12700H (31839 - 144360, n=64) | |
| Asus TUF Dash F15 FX517ZR (v6.70.6000) | |
| AIDA64 / CPU ZLib | |
| Média da turma Gaming (574 - 2531, n=105, últimos 2 anos) | |
| MSI Katana GF66 12UGS (v6.50.5800) | |
| Aorus 15 XE5 (v6.75.6100, Turbo Mode) | |
| Média Intel Core i7-12700H (305 - 1171, n=64) | |
| Asus TUF Dash F15 FX517ZR (v6.70.6000) | |
| Acer Nitro 5 AN515-46-R1A1 (v6.75.6100) | |
| Aorus 15 XE5 (v6.75.6100) | |
| Schenker XMG Fusion 15 (Mid 22) (v6.70.6000) | |
| AIDA64 / FP64 Ray-Trace | |
| Média da turma Gaming (5509 - 45446, n=105, últimos 2 anos) | |
| Acer Nitro 5 AN515-46-R1A1 (v6.75.6100) | |
| Aorus 15 XE5 (v6.75.6100, Turbo Mode) | |
| Asus TUF Dash F15 FX517ZR (v6.70.6000) | |
| Schenker XMG Fusion 15 (Mid 22) (v6.70.6000) | |
| Aorus 15 XE5 (v6.75.6100) | |
| Média Intel Core i7-12700H (1437 - 9692, n=64) | |
| MSI Katana GF66 12UGS (v6.50.5800) | |
| AIDA64 / CPU PhotoWorxx | |
| Média da turma Gaming (12271 - 89891, n=105, últimos 2 anos) | |
| Aorus 15 XE5 (v6.75.6100, Turbo Mode) | |
| Aorus 15 XE5 (v6.75.6100) | |
| Asus TUF Dash F15 FX517ZR (v6.70.6000) | |
| Média Intel Core i7-12700H (12863 - 52207, n=64) | |
| Acer Nitro 5 AN515-46-R1A1 | |
| MSI Katana GF66 12UGS (v6.50.5800) | |
| Schenker XMG Fusion 15 (Mid 22) (v6.70.6000) | |
Desempenho do sistema
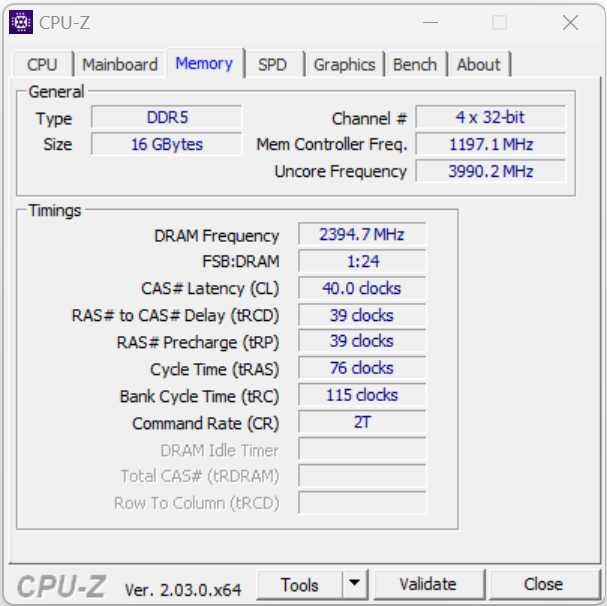
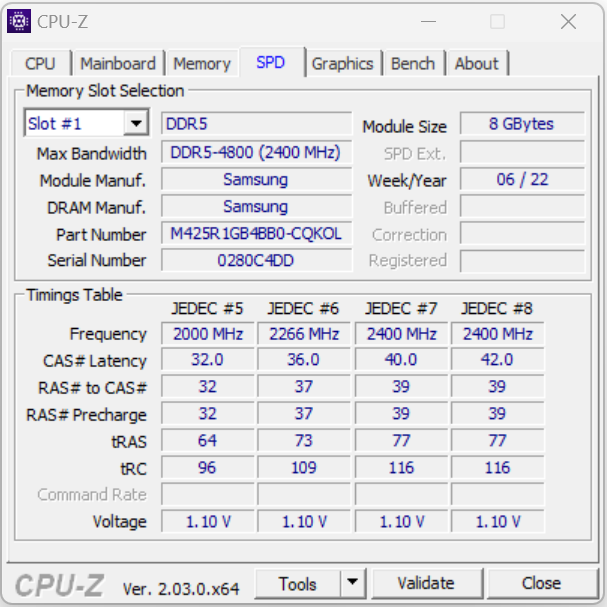
O sistema funciona sem problemas e oferece poder de computação suficiente para aplicações exigentes, como renderização, edição de vídeo e jogos. O laptop conseguiu fornecer ótimos resultados PCMark. As taxas de transferência de dados da RAM são bastante típicas para a memória DDR5-4800.
CrossMark: Overall | Productivity | Creativity | Responsiveness
| PCMark 10 / Score | |
| Média da turma Gaming (5828 - 12414, n=93, últimos 2 anos) | |
| Aorus 15 XE5 | |
| Média Intel Core i7-12700H, NVIDIA GeForce RTX 3070 Ti Laptop GPU (6941 - 7947, n=11) | |
| MSI Katana GF66 12UGS | |
| Asus TUF Dash F15 FX517ZR | |
| Acer Nitro 5 AN515-46-R1A1 | |
| Schenker XMG Fusion 15 (Mid 22) | |
| PCMark 10 / Essentials | |
| Aorus 15 XE5 | |
| Média da turma Gaming (8810 - 11935, n=97, últimos 2 anos) | |
| Média Intel Core i7-12700H, NVIDIA GeForce RTX 3070 Ti Laptop GPU (9892 - 10935, n=11) | |
| MSI Katana GF66 12UGS | |
| Acer Nitro 5 AN515-46-R1A1 | |
| Asus TUF Dash F15 FX517ZR | |
| Schenker XMG Fusion 15 (Mid 22) | |
| PCMark 10 / Productivity | |
| Média da turma Gaming (6845 - 25323, n=95, últimos 2 anos) | |
| Aorus 15 XE5 | |
| MSI Katana GF66 12UGS | |
| Média Intel Core i7-12700H, NVIDIA GeForce RTX 3070 Ti Laptop GPU (9024 - 10638, n=11) | |
| Asus TUF Dash F15 FX517ZR | |
| Acer Nitro 5 AN515-46-R1A1 | |
| Schenker XMG Fusion 15 (Mid 22) | |
| PCMark 10 / Digital Content Creation | |
| Média da turma Gaming (7602 - 19954, n=95, últimos 2 anos) | |
| Média Intel Core i7-12700H, NVIDIA GeForce RTX 3070 Ti Laptop GPU (10165 - 12546, n=11) | |
| Aorus 15 XE5 | |
| MSI Katana GF66 12UGS | |
| Asus TUF Dash F15 FX517ZR | |
| Acer Nitro 5 AN515-46-R1A1 | |
| Schenker XMG Fusion 15 (Mid 22) | |
| CrossMark / Overall | |
| Média da turma Gaming (1366 - 2409, n=94, últimos 2 anos) | |
| Aorus 15 XE5 | |
| MSI Katana GF66 12UGS | |
| Média Intel Core i7-12700H, NVIDIA GeForce RTX 3070 Ti Laptop GPU (974 - 2000, n=12) | |
| Asus TUF Dash F15 FX517ZR | |
| Schenker XMG Fusion 15 (Mid 22) | |
| Acer Nitro 5 AN515-46-R1A1 | |
| CrossMark / Productivity | |
| MSI Katana GF66 12UGS | |
| Aorus 15 XE5 | |
| Média da turma Gaming (1386 - 2254, n=94, últimos 2 anos) | |
| Média Intel Core i7-12700H, NVIDIA GeForce RTX 3070 Ti Laptop GPU (907 - 1962, n=12) | |
| Asus TUF Dash F15 FX517ZR | |
| Schenker XMG Fusion 15 (Mid 22) | |
| Acer Nitro 5 AN515-46-R1A1 | |
| CrossMark / Creativity | |
| Média da turma Gaming (1343 - 2786, n=94, últimos 2 anos) | |
| Asus TUF Dash F15 FX517ZR | |
| Aorus 15 XE5 | |
| MSI Katana GF66 12UGS | |
| Média Intel Core i7-12700H, NVIDIA GeForce RTX 3070 Ti Laptop GPU (1027 - 2057, n=12) | |
| Schenker XMG Fusion 15 (Mid 22) | |
| Acer Nitro 5 AN515-46-R1A1 | |
| CrossMark / Responsiveness | |
| MSI Katana GF66 12UGS | |
| Aorus 15 XE5 | |
| Média Intel Core i7-12700H, NVIDIA GeForce RTX 3070 Ti Laptop GPU (1029 - 2142, n=12) | |
| Média da turma Gaming (1226 - 2334, n=94, últimos 2 anos) | |
| Schenker XMG Fusion 15 (Mid 22) | |
| Asus TUF Dash F15 FX517ZR | |
| Acer Nitro 5 AN515-46-R1A1 | |
| PCMark 8 Home Score Accelerated v2 | 5280 pontos | |
| PCMark 8 Work Score Accelerated v2 | 6287 pontos | |
| PCMark 10 Score | 7695 pontos | |
Ajuda | ||
| AIDA64 / Memory Copy | |
| Média da turma Gaming (21750 - 129946, n=105, últimos 2 anos) | |
| Média Intel Core i7-12700H (25615 - 80511, n=64) | |
| Asus TUF Dash F15 FX517ZR | |
| Aorus 15 XE5 | |
| Acer Nitro 5 AN515-46-R1A1 | |
| Schenker XMG Fusion 15 (Mid 22) | |
| MSI Katana GF66 12UGS | |
| AIDA64 / Memory Read | |
| Média da turma Gaming (22956 - 118858, n=105, últimos 2 anos) | |
| Asus TUF Dash F15 FX517ZR | |
| Aorus 15 XE5 | |
| Média Intel Core i7-12700H (25586 - 79442, n=64) | |
| Acer Nitro 5 AN515-46-R1A1 | |
| Schenker XMG Fusion 15 (Mid 22) | |
| MSI Katana GF66 12UGS | |
| AIDA64 / Memory Write | |
| Média da turma Gaming (22297 - 135096, n=105, últimos 2 anos) | |
| Asus TUF Dash F15 FX517ZR | |
| Aorus 15 XE5 | |
| Acer Nitro 5 AN515-46-R1A1 | |
| Média Intel Core i7-12700H (23679 - 88660, n=64) | |
| MSI Katana GF66 12UGS | |
| Schenker XMG Fusion 15 (Mid 22) | |
| AIDA64 / Memory Latency | |
| Média da turma Gaming (75.3 - 259, n=105, últimos 2 anos) | |
| MSI Katana GF66 12UGS | |
| Asus TUF Dash F15 FX517ZR | |
| Aorus 15 XE5 | |
| Schenker XMG Fusion 15 (Mid 22) | |
| Acer Nitro 5 AN515-46-R1A1 | |
| Média Intel Core i7-12700H (76.2 - 133.9, n=62) | |
* ... menor é melhor
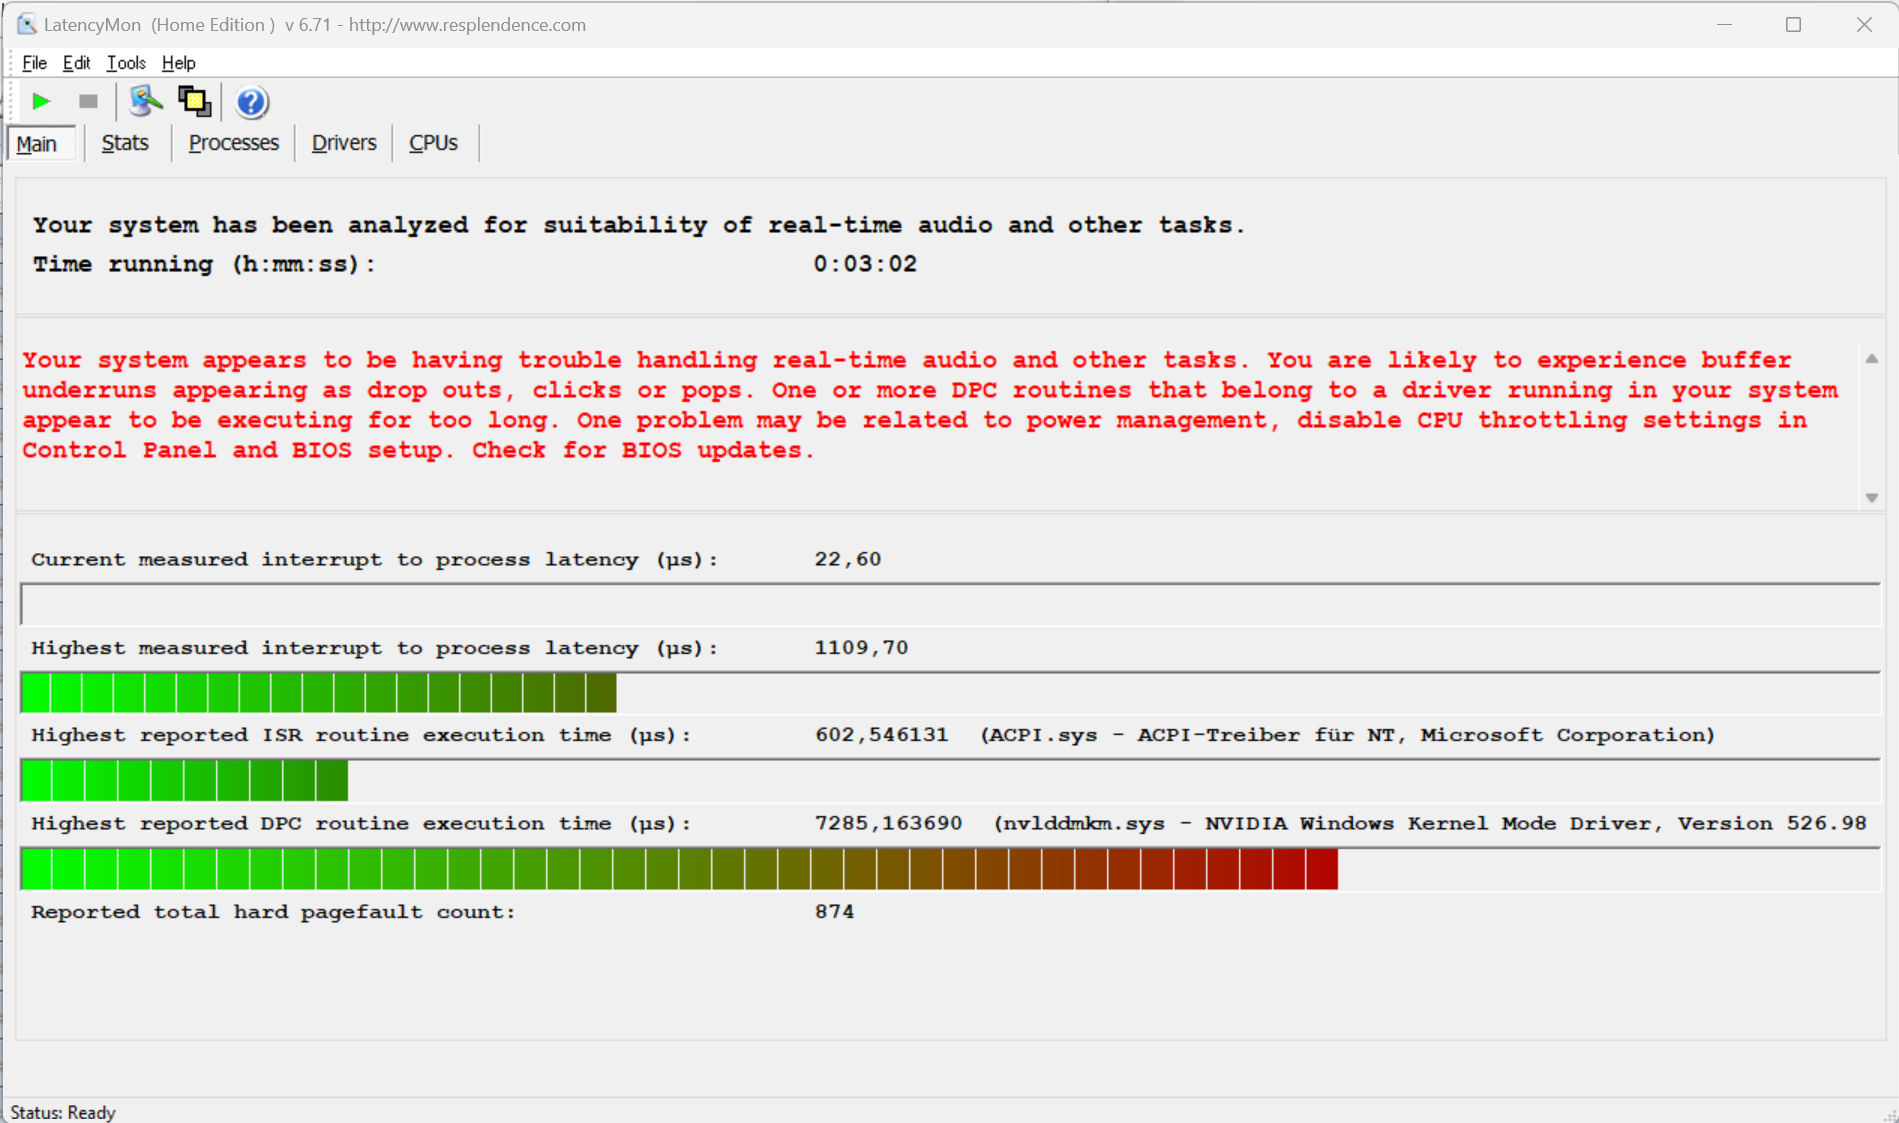
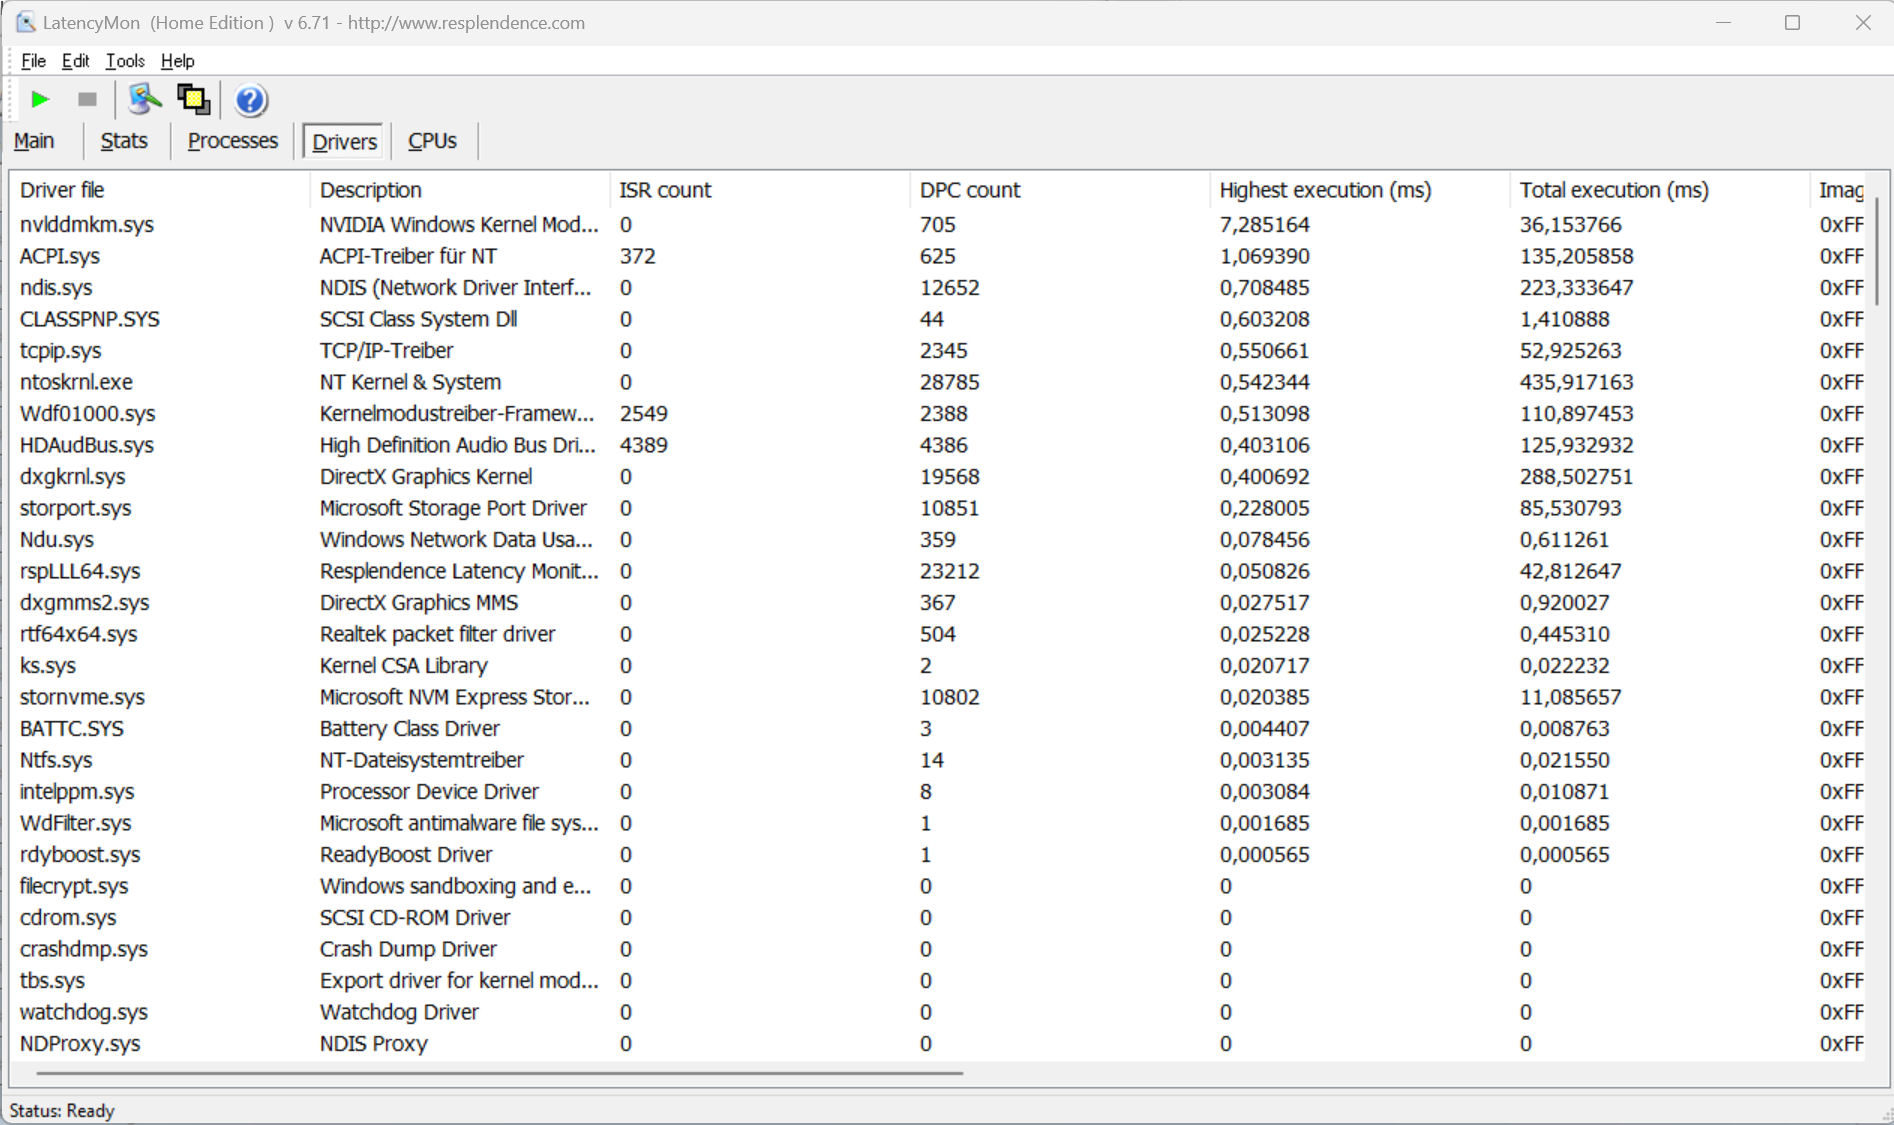
Latência do DPC
Nosso teste de monitor de latência padronizado (navegação na web, reprodução de vídeo 4K, Prime95 de alta carga) revelou alguns problemas com o sistema. Mesmo que o laptop não tenha uma latência muito alta, parece ter um problema com o motorista. Esperamos que futuras atualizações de software possam resolver o problema.
| DPC Latencies / LatencyMon - interrupt to process latency (max), Web, Youtube, Prime95 | |
| Acer Nitro 5 AN515-46-R1A1 | |
| Schenker XMG Fusion 15 (Mid 22) | |
| Aorus 15 XE5 | |
| MSI Katana GF66 12UGS | |
| Asus TUF Dash F15 FX517ZR | |
* ... menor é melhor
Armazenamento em massa
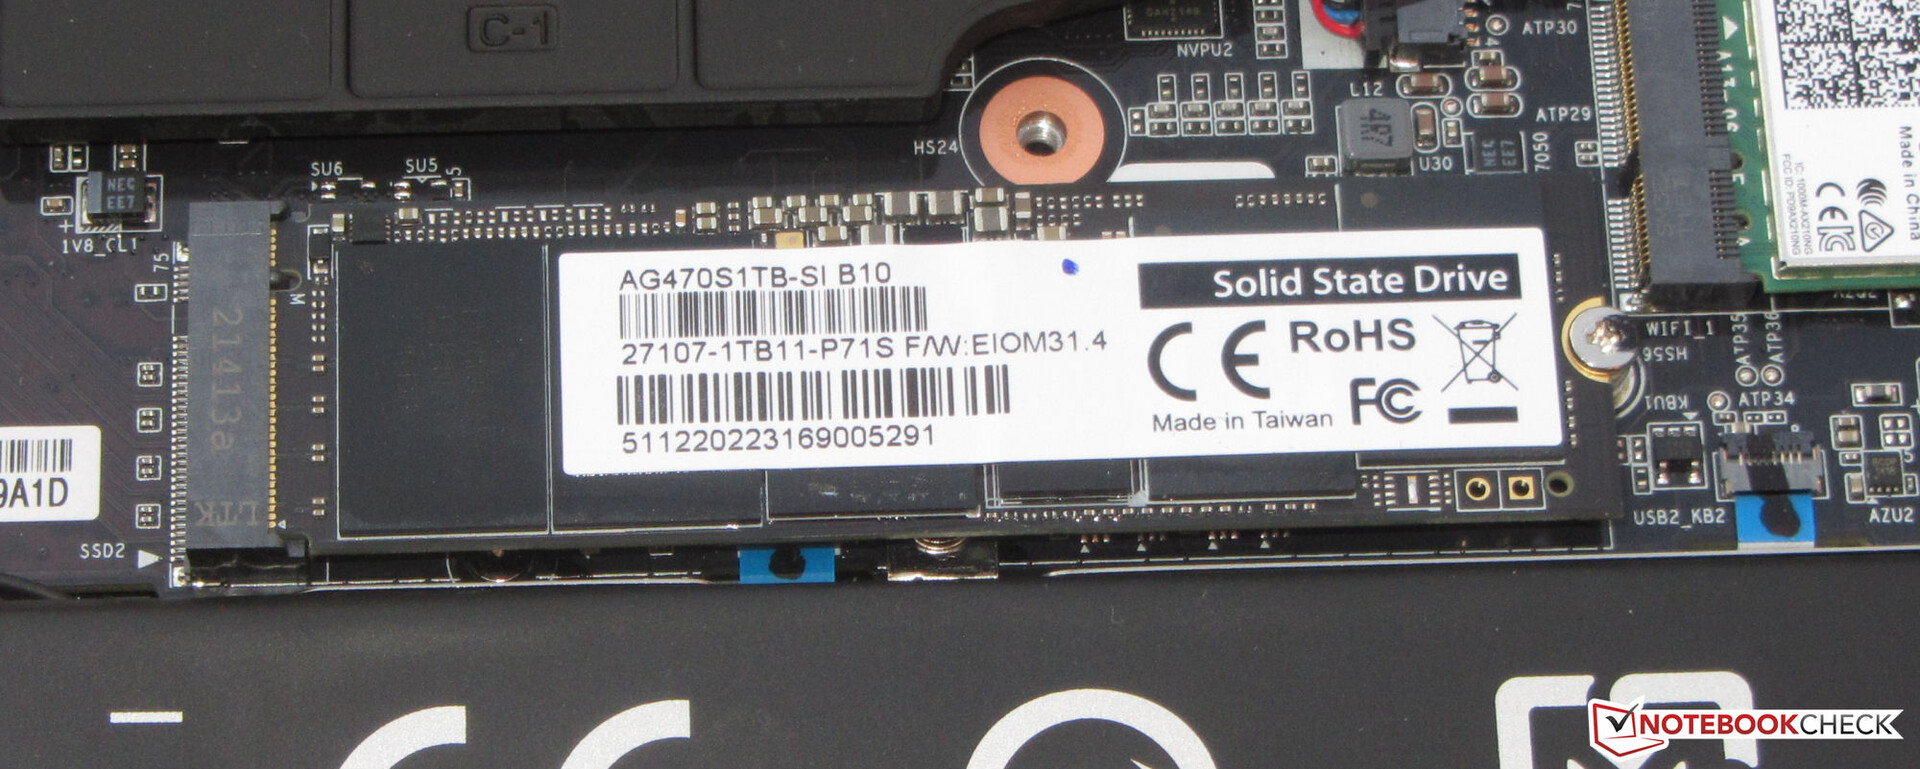
A Gigabyte equipou o Aorus 15 XE5 com um SSD PCIe 4.0 (1 TB, M.2 2280) feito pela própria empresa. Esta unidade de armazenamento proporciona excelentes velocidades de transferência. O laptop também tem um slot gratuito M.2 2280 para adicionar uma segunda PCIe 4.0 SSD.

* ... menor é melhor
Sustained Read: DiskSpd Read Loop, Queue Depth 8
Placa gráfica
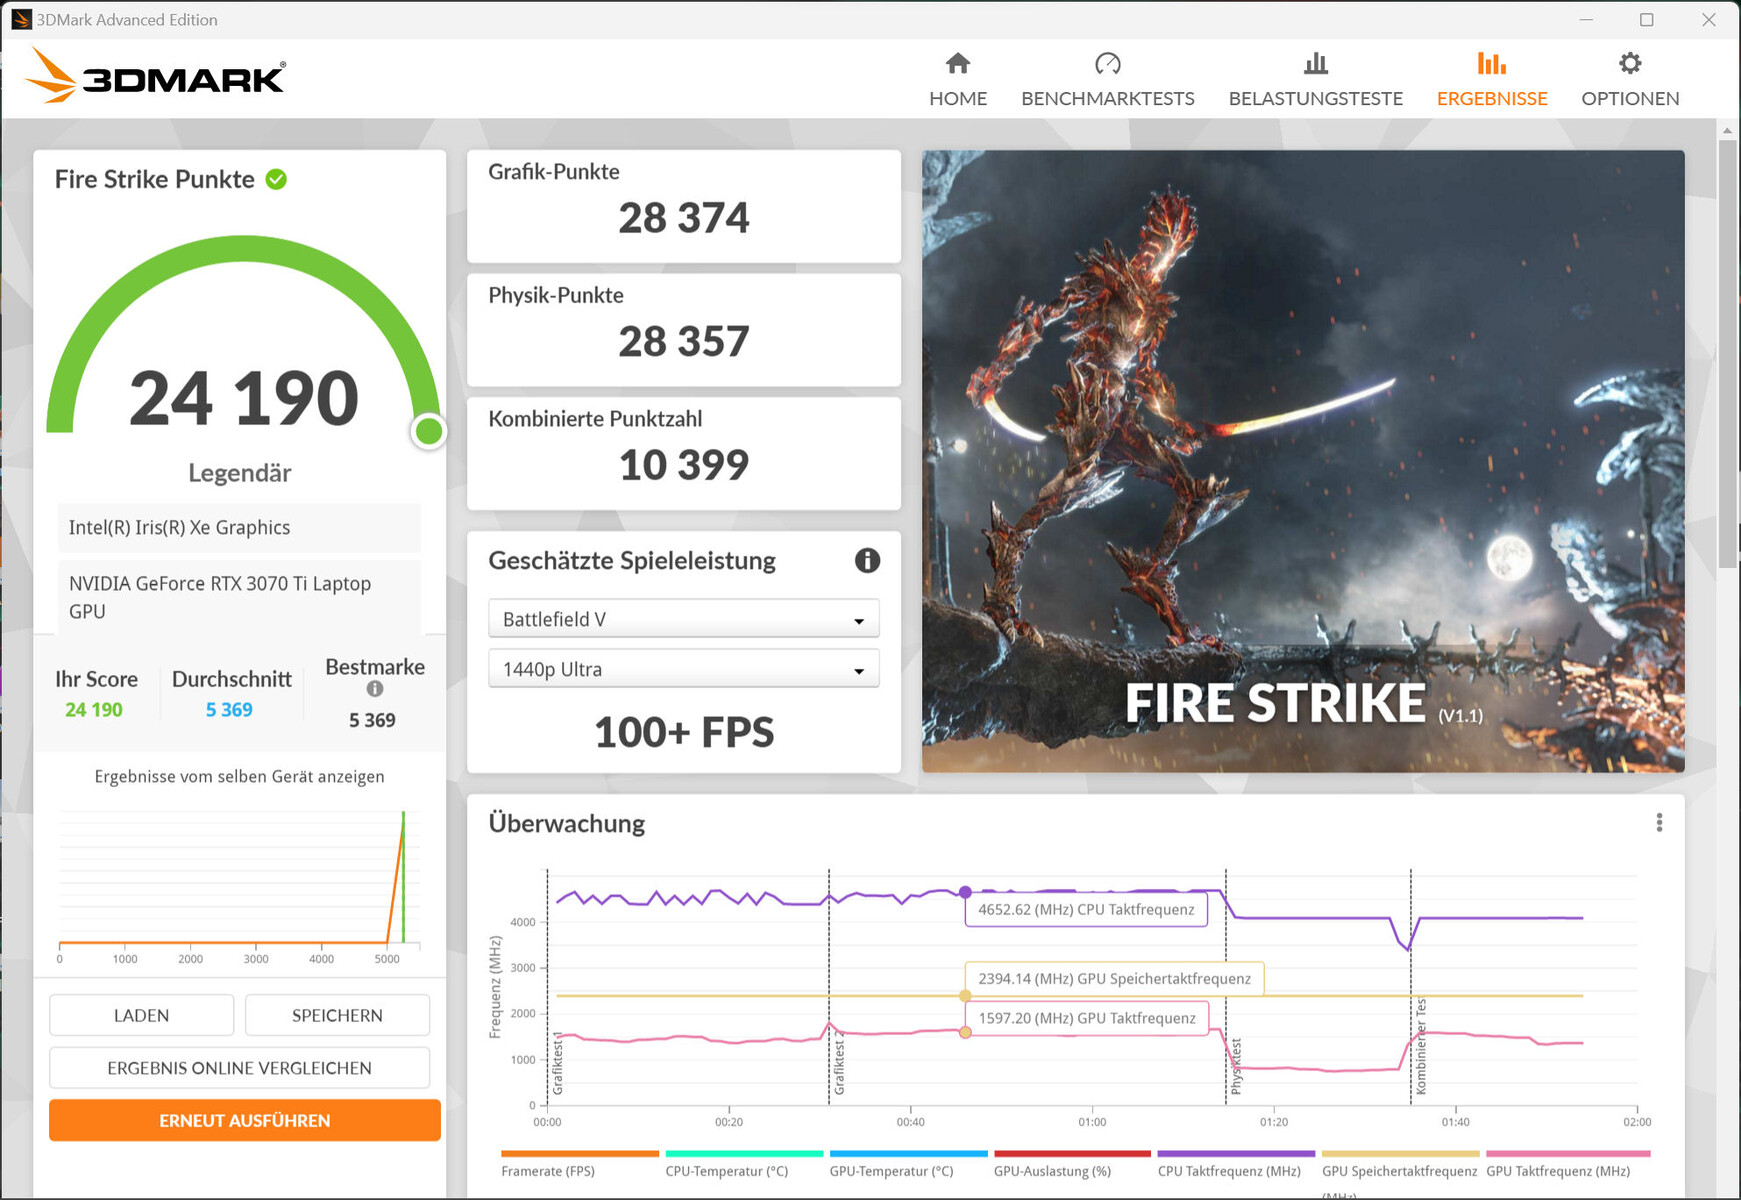
O desempenho real de uma GPU RTX Série 30 depende de alguns fatores: refrigeração, configuração de RAM e o TGP especificado por um fabricante de laptop (dentro dos limites definidos pela Nvidia). A Gigabyte optou por dar o Computador portátil RTX 3070 Ti um TGP de 130 watts. Entretanto, nosso teste Witcher 3 mostra que o sistema não utiliza totalmente este TGP.
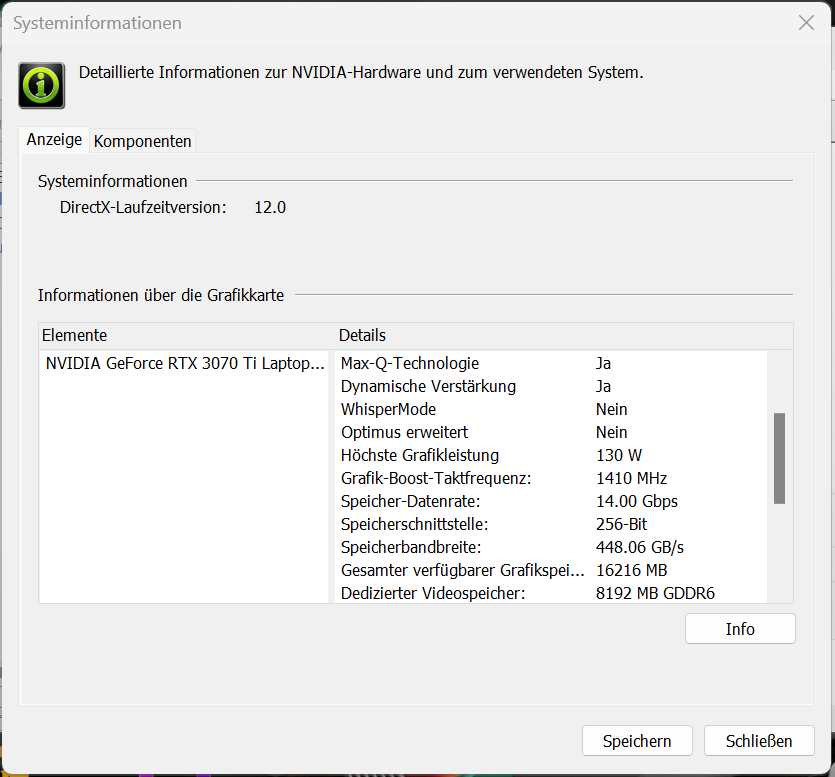
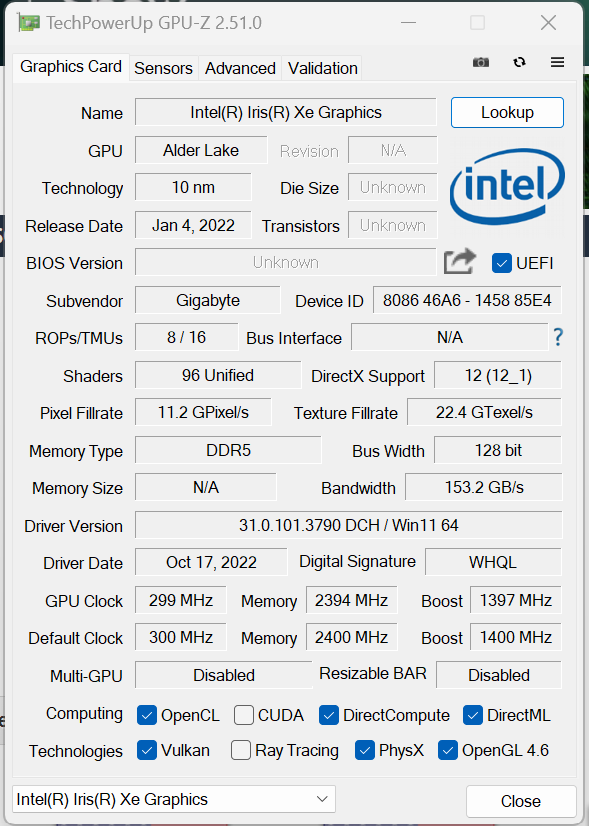
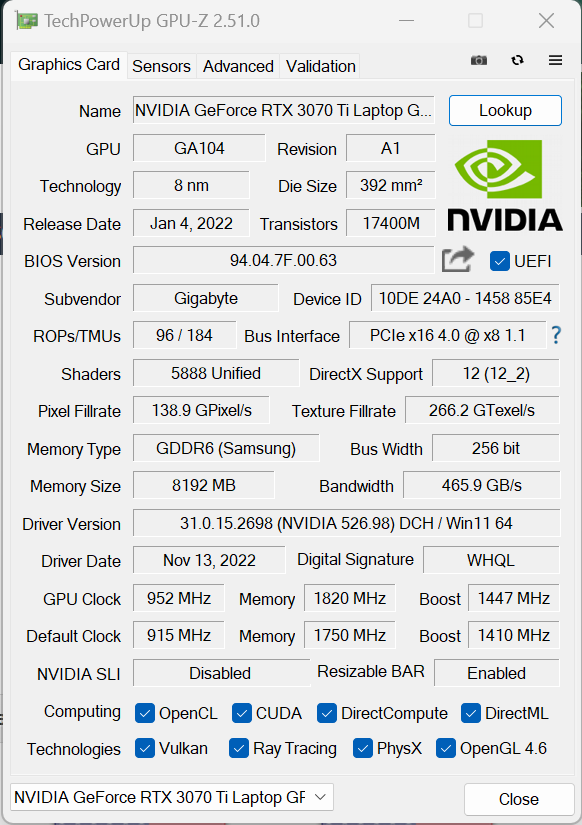
A GPU no Aorus tem acesso a 8.192 MB de VRAM GDDR6 rápido e entregou resultados 3DMark ligeiramente melhores do que o que vimos em média do RTX 3070 Ti. O integrado G7 96EU Iris Xe Graphics está ativo; o laptop usa a tecnologia de comutação gráfica Optimus da Nvidia e não oferece um modo dGPU.
| 3DMark Performance rating - Percent | |
| Média da turma Gaming | |
| Acer Nitro 5 AN515-46-R1A1 | |
| Aorus 15 XE5 | |
| Aorus 15 XE5 | |
| Média NVIDIA GeForce RTX 3070 Ti Laptop GPU | |
| MSI Katana GF66 12UGS | |
| Schenker XMG Fusion 15 (Mid 22) | |
| Asus TUF Dash F15 FX517ZR | |
| 3DMark 11 - 1280x720 Performance GPU | |
| Média da turma Gaming (21841 - 80022, n=104, últimos 2 anos) | |
| Aorus 15 XE5 (Turbo Mode) | |
| Aorus 15 XE5 | |
| Acer Nitro 5 AN515-46-R1A1 | |
| Média NVIDIA GeForce RTX 3070 Ti Laptop GPU (13799 - 42569, n=36) | |
| MSI Katana GF66 12UGS | |
| Schenker XMG Fusion 15 (Mid 22) | |
| Asus TUF Dash F15 FX517ZR | |
| 3DMark | |
| 1920x1080 Fire Strike Graphics | |
| Média da turma Gaming (12242 - 62849, n=115, últimos 2 anos) | |
| Acer Nitro 5 AN515-46-R1A1 | |
| Aorus 15 XE5 (Turbo Mode) | |
| Aorus 15 XE5 | |
| Média NVIDIA GeForce RTX 3070 Ti Laptop GPU (22612 - 32550, n=37) | |
| MSI Katana GF66 12UGS | |
| Schenker XMG Fusion 15 (Mid 22) | |
| Asus TUF Dash F15 FX517ZR | |
| 2560x1440 Time Spy Graphics | |
| Média da turma Gaming (5012 - 26212, n=115, últimos 2 anos) | |
| Acer Nitro 5 AN515-46-R1A1 | |
| Aorus 15 XE5 | |
| Aorus 15 XE5 (Turbo Mode) | |
| Média NVIDIA GeForce RTX 3070 Ti Laptop GPU (8142 - 12324, n=37) | |
| MSI Katana GF66 12UGS | |
| Schenker XMG Fusion 15 (Mid 22) | |
| Asus TUF Dash F15 FX517ZR | |
| 2560x1440 Port Royal Graphics | |
| Média da turma Gaming (4395 - 17286, n=71, últimos 2 anos) | |
| Acer Nitro 5 AN515-46-R1A1 | |
| Aorus 15 XE5 (Turbo Mode) | |
| Aorus 15 XE5 | |
| Média NVIDIA GeForce RTX 3070 Ti Laptop GPU (5091 - 7510, n=23) | |
| MSI Katana GF66 12UGS | |
| Schenker XMG Fusion 15 (Mid 22) | |
| Asus TUF Dash F15 FX517ZR | |
| 3DMark 06 Standard Score | 51253 pontos | |
| 3DMark 11 Performance | 32155 pontos | |
| 3DMark Fire Strike Score | 24190 pontos | |
| 3DMark Time Spy Score | 10840 pontos | |
Ajuda | ||
| Blender | |
| v3.3 Classroom OPTIX/RTX | |
| Asus TUF Dash F15 FX517ZR | |
| Média NVIDIA GeForce RTX 3070 Ti Laptop GPU (22 - 30, n=15) | |
| Acer Nitro 5 AN515-46-R1A1 (3.3.0) | |
| Aorus 15 XE5 (3.3.0) | |
| Aorus 15 XE5 (3.3.0, Turbo Mode) | |
| Média da turma Gaming (9 - 32, n=106, últimos 2 anos) | |
| v3.3 Classroom CUDA | |
| Asus TUF Dash F15 FX517ZR | |
| Média NVIDIA GeForce RTX 3070 Ti Laptop GPU (36 - 46, n=16) | |
| Acer Nitro 5 AN515-46-R1A1 (3.3.0) | |
| Aorus 15 XE5 (3.3.0) | |
| Aorus 15 XE5 (3.3.0, Turbo Mode) | |
| Média da turma Gaming (15 - 228, n=106, últimos 2 anos) | |
| v3.3 Classroom CPU | |
| Schenker XMG Fusion 15 (Mid 22) | |
| Asus TUF Dash F15 FX517ZR | |
| Aorus 15 XE5 (3.3.0) | |
| Acer Nitro 5 AN515-46-R1A1 (3.3.0) | |
| Média NVIDIA GeForce RTX 3070 Ti Laptop GPU (285 - 459, n=16) | |
| Aorus 15 XE5 (3.3.0, Turbo Mode) | |
| Média da turma Gaming (122 - 565, n=102, últimos 2 anos) | |
* ... menor é melhor
Desempenho do jogo
O hardware do laptop é capaz de rodar jogos em QHD e de alta a máxima configuração. Você também pode jogar jogos em resoluções mais altas se conectar o dispositivo a uma tela adequada - embora isto possa às vezes exigir que você baixe as configurações. No Aorus 15 XE5, os jogos que usamos para testes normalmente funcionam com taxas de quadros mais altas do que o RTX 3070 Ti pode produzir em média. Em alguns casos, habilitar o "Modo Turbo" levou a um ligeiro aumento nas taxas de quadros.
| Performance rating - Percent | |
| Média da turma Gaming | |
| Aorus 15 XE5 | |
| MSI Katana GF66 12UGS | |
| Schenker XMG Fusion 15 (Mid 22) | |
| Asus TUF Dash F15 FX517ZR | |
| Acer Nitro 5 AN515-46-R1A1 | |
| The Witcher 3 - 1920x1080 Ultra Graphics & Postprocessing (HBAO+) | |
| Média da turma Gaming (104.7 - 240, n=7, últimos 2 anos) | |
| Acer Nitro 5 AN515-46-R1A1 | |
| Aorus 15 XE5 | |
| MSI Katana GF66 12UGS | |
| Schenker XMG Fusion 15 (Mid 22) | |
| Asus TUF Dash F15 FX517ZR | |
| GTA V - 1920x1080 Highest AA:4xMSAA + FX AF:16x | |
| Média da turma Gaming (48.3 - 186.9, n=94, últimos 2 anos) | |
| Aorus 15 XE5 | |
| Asus TUF Dash F15 FX517ZR | |
| MSI Katana GF66 12UGS | |
| Schenker XMG Fusion 15 (Mid 22) | |
| Acer Nitro 5 AN515-46-R1A1 | |
| Final Fantasy XV Benchmark - 1920x1080 High Quality | |
| Média da turma Gaming (41 - 215, n=95, últimos 2 anos) | |
| Acer Nitro 5 AN515-46-R1A1 | |
| Aorus 15 XE5 | |
| Schenker XMG Fusion 15 (Mid 22) | |
| MSI Katana GF66 12UGS | |
| Asus TUF Dash F15 FX517ZR | |
| Strange Brigade - 1920x1080 ultra AA:ultra AF:16 | |
| Média da turma Gaming (76.3 - 458, n=87, últimos 2 anos) | |
| Aorus 15 XE5 | |
| Acer Nitro 5 AN515-46-R1A1 | |
| MSI Katana GF66 12UGS | |
| Schenker XMG Fusion 15 (Mid 22) | |
| Asus TUF Dash F15 FX517ZR | |
| Dota 2 Reborn - 1920x1080 ultra (3/3) best looking | |
| Média da turma Gaming (84.8 - 248, n=107, últimos 2 anos) | |
| Aorus 15 XE5 | |
| MSI Katana GF66 12UGS | |
| Schenker XMG Fusion 15 (Mid 22) | |
| Asus TUF Dash F15 FX517ZR | |
| Acer Nitro 5 AN515-46-R1A1 | |
| X-Plane 11.11 - 1920x1080 high (fps_test=3) | |
| Aorus 15 XE5 | |
| MSI Katana GF66 12UGS | |
| Asus TUF Dash F15 FX517ZR | |
| Média da turma Gaming (55.5 - 143.5, n=109, últimos 2 anos) | |
| Schenker XMG Fusion 15 (Mid 22) | |
| Acer Nitro 5 AN515-46-R1A1 | |
| Performance rating - Percent | |
| Média da turma Gaming -5! | |
| Aorus 15 XE5 | |
| Média NVIDIA GeForce RTX 3070 Ti Laptop GPU | |
| Aorus 15 XE5 -6! | |
| Acer Nitro 5 AN515-46-R1A1 -4! | |
| MSI Katana GF66 12UGS -6! | |
| Schenker XMG Fusion 15 (Mid 22) -6! | |
| Asus TUF Dash F15 FX517ZR -6! | |
| The Witcher 3 - 1920x1080 Ultra Graphics & Postprocessing (HBAO+) | |
| Média da turma Gaming (104.7 - 240, n=7, últimos 2 anos) | |
| Acer Nitro 5 AN515-46-R1A1 | |
| Aorus 15 XE5 (Turbo Mode) | |
| Média NVIDIA GeForce RTX 3070 Ti Laptop GPU (76.8 - 124.1, n=39) | |
| Aorus 15 XE5 | |
| MSI Katana GF66 12UGS | |
| Schenker XMG Fusion 15 (Mid 22) | |
| Asus TUF Dash F15 FX517ZR | |
| GTA V - 1920x1080 Highest AA:4xMSAA + FX AF:16x | |
| Média da turma Gaming (48.3 - 186.9, n=94, últimos 2 anos) | |
| Aorus 15 XE5 (Turbo Mode) | |
| Aorus 15 XE5 | |
| Média NVIDIA GeForce RTX 3070 Ti Laptop GPU (44 - 123.9, n=36) | |
| Asus TUF Dash F15 FX517ZR | |
| MSI Katana GF66 12UGS | |
| Schenker XMG Fusion 15 (Mid 22) | |
| Acer Nitro 5 AN515-46-R1A1 | |
| Final Fantasy XV Benchmark - 1920x1080 High Quality | |
| Média da turma Gaming (41 - 215, n=95, últimos 2 anos) | |
| Acer Nitro 5 AN515-46-R1A1 (1.3) | |
| Aorus 15 XE5 (1.3, Turbo Mode) | |
| Aorus 15 XE5 (1.3) | |
| Média NVIDIA GeForce RTX 3070 Ti Laptop GPU (49.5 - 122.4, n=35) | |
| Schenker XMG Fusion 15 (Mid 22) (1.3) | |
| MSI Katana GF66 12UGS (1.3) | |
| Asus TUF Dash F15 FX517ZR (1.3) | |
| Strange Brigade - 1920x1080 ultra AA:ultra AF:16 | |
| Média da turma Gaming (76.3 - 458, n=87, últimos 2 anos) | |
| Aorus 15 XE5 (1.47.22.14 D3D12, Turbo Mode) | |
| Aorus 15 XE5 (1.47.22.14 D3D12) | |
| Média NVIDIA GeForce RTX 3070 Ti Laptop GPU (109 - 221, n=37) | |
| Acer Nitro 5 AN515-46-R1A1 (1.47.22.14 D3D12) | |
| MSI Katana GF66 12UGS (1.47.22.14 D3D12) | |
| Schenker XMG Fusion 15 (Mid 22) (1.47.22.14 D3D12) | |
| Asus TUF Dash F15 FX517ZR (1.47.22.14 D3D12) | |
| Dota 2 Reborn - 1920x1080 ultra (3/3) best looking | |
| Média da turma Gaming (84.8 - 248, n=107, últimos 2 anos) | |
| Aorus 15 XE5 | |
| Aorus 15 XE5 (Turbo Mode) | |
| MSI Katana GF66 12UGS | |
| Média NVIDIA GeForce RTX 3070 Ti Laptop GPU (68.7 - 160.5, n=38) | |
| Schenker XMG Fusion 15 (Mid 22) | |
| Asus TUF Dash F15 FX517ZR | |
| Acer Nitro 5 AN515-46-R1A1 | |
| X-Plane 11.11 - 1920x1080 high (fps_test=3) | |
| Aorus 15 XE5 | |
| Aorus 15 XE5 (Turbo Mode) | |
| MSI Katana GF66 12UGS | |
| Asus TUF Dash F15 FX517ZR | |
| Média da turma Gaming (55.5 - 143.5, n=109, últimos 2 anos) | |
| Média NVIDIA GeForce RTX 3070 Ti Laptop GPU (51.6 - 116.9, n=37) | |
| Schenker XMG Fusion 15 (Mid 22) | |
| Acer Nitro 5 AN515-46-R1A1 | |
| F1 22 - 1920x1080 Ultra High Preset AA:T AF:16x | |
| Média da turma Gaming (40.1 - 121.2, n=4, últimos 2 anos) | |
| Acer Nitro 5 AN515-46-R1A1 (923662) | |
| Média NVIDIA GeForce RTX 3070 Ti Laptop GPU (58.1 - 80, n=8) | |
| Aorus 15 XE5 (928484, Turbo Mode) | |
| Aorus 15 XE5 (928484) | |
| The Quarry - 1920x1080 Ultra Preset | |
| Acer Nitro 5 AN515-46-R1A1 | |
| Média NVIDIA GeForce RTX 3070 Ti Laptop GPU (80 - 81.5, n=2) | |
| Aorus 15 XE5 | |
| A Plague Tale Requiem - 1920x1080 Ultra Preset | |
| Média NVIDIA GeForce RTX 3070 Ti Laptop GPU (61.9 - 62.9, n=2) | |
| Aorus 15 XE5 | |
| Uncharted Legacy of Thieves Collection - 1920x1080 Ultra Preset | |
| Aorus 15 XE5 | |
| Média NVIDIA GeForce RTX 3070 Ti Laptop GPU (69.3 - 72.4, n=2) | |
| Call of Duty Modern Warfare 2 2022 - 1920x1080 Extreme Quality Preset AA:T2X Filmic SM | |
| Aorus 15 XE5 | |
| Média NVIDIA GeForce RTX 3070 Ti Laptop GPU (84 - 86, n=3) | |
| Spider-Man Miles Morales - 1920x1080 Very High Preset AA:T | |
| Média NVIDIA GeForce RTX 3070 Ti Laptop GPU (91 - 93.2, n=2) | |
| Aorus 15 XE5 | |
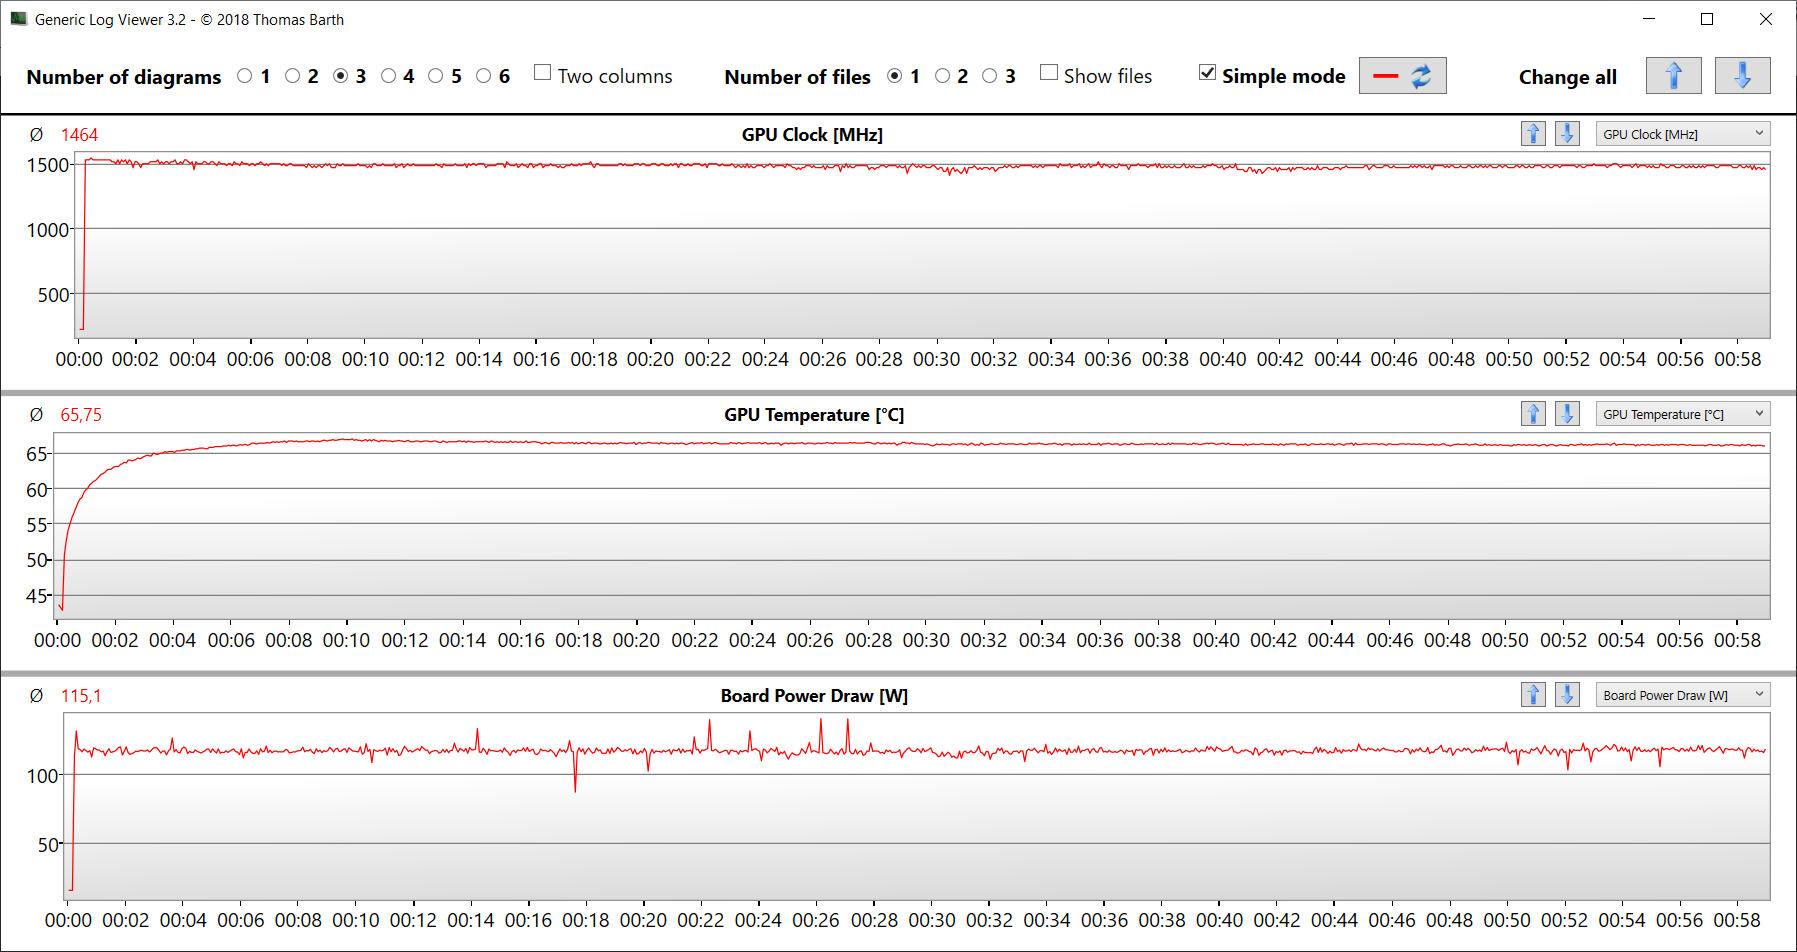
Para descobrir se o laptop pode rodar jogos a taxas de quadros constantes durante um período prolongado, rodamos "The Witcher 3" por cerca de 60 minutos em resolução Full HD e ajustes de qualidade máxima, sem mover o personagem do jogador. O resultado: não houve nenhuma queda na taxa de quadros.
Witcher 3 FPS chart
| baixo | média | alto | ultra | QHD | |
|---|---|---|---|---|---|
| GTA V (2015) | 186.4 | 182.3 | 176.4 | 115.6 | 99.9 |
| The Witcher 3 (2015) | 357 | 300 | 183.2 | 100.1 | |
| Dota 2 Reborn (2015) | 168.4 | 158 | 148.4 | 140.8 | |
| Final Fantasy XV Benchmark (2018) | 196.3 | 138.8 | 104.6 | 79.2 | |
| X-Plane 11.11 (2018) | 142 | 130.7 | 105.3 | ||
| Far Cry 5 (2018) | 166 | 144 | 137 | 129 | 103 |
| Strange Brigade (2018) | 445 | 255 | 212 | 188.5 | 140.9 |
| F1 22 (2022) | 220 | 215 | 181.3 | 64.2 | 42.7 |
| The Quarry (2022) | 156.2 | 119.1 | 98.4 | 80 | 56.1 |
| A Plague Tale Requiem (2022) | 93.8 | 81.8 | 71.1 | 61.9 | 48.6 |
| Uncharted Legacy of Thieves Collection (2022) | 81 | 80.2 | 75.4 | 72.4 | 55.5 |
| Call of Duty Modern Warfare 2 2022 (2022) | 127 | 111 | 87 | 86 | 61 |
| Spider-Man Miles Morales (2022) | 108.2 | 103.8 | 93 | 91 | 73.5 |
Emissões - Algum refinamento necessário
Emissões sonoras
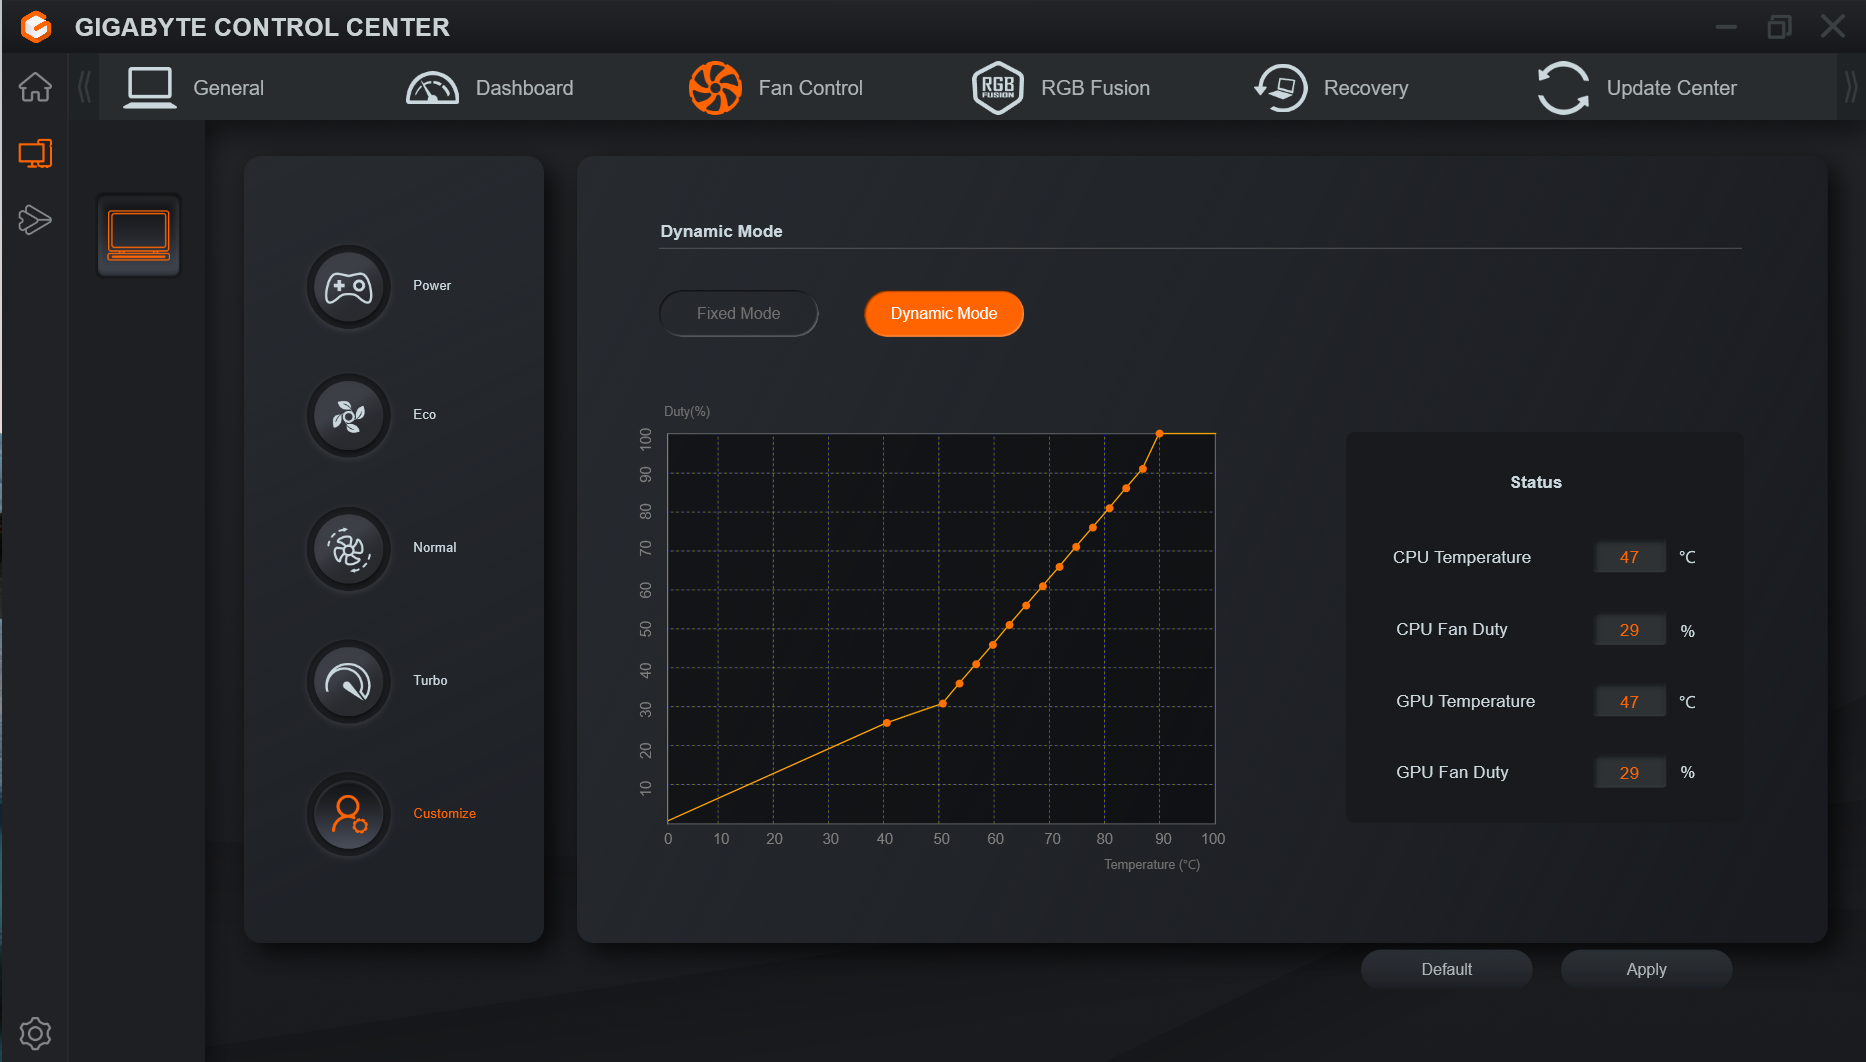
No uso diário (por exemplo, aplicações de escritório, navegação na web) e em modo inativo, os dois ventiladores no laptop são relativamente silenciosos e às vezes nem sequer giram. Sob carga média a alta, o sistema ficou bastante alto, com níveis de ruído chegando a 52 dB(A) durante o teste de estresse e o teste Witcher 3. O Centro de Controle Gigabyte permite aos usuários ajustar a velocidade dos ventiladores e configurar as curvas dos ventiladores.
Barulho
| Ocioso |
| 26 / 28 / 30 dB |
| Carga |
| 48 / 52 dB |
 | ||
30 dB silencioso 40 dB(A) audível 50 dB(A) ruidosamente alto |
||
min: | ||
| Aorus 15 XE5 i7-12700H, GeForce RTX 3070 Ti Laptop GPU | Acer Nitro 5 AN515-46-R1A1 R7 6800H, GeForce RTX 3070 Ti Laptop GPU | Schenker XMG Fusion 15 (Mid 22) i7-11800H, GeForce RTX 3070 Laptop GPU | Asus TUF Dash F15 FX517ZR i7-12650H, GeForce RTX 3070 Laptop GPU | MSI Katana GF66 12UGS i7-12700H, GeForce RTX 3070 Ti Laptop GPU | |
|---|---|---|---|---|---|
| Noise | -9% | 2% | -2% | 3% | |
| desligado / ambiente * (dB) | 24 | 25 -4% | 26 -8% | 26 -8% | 26 -8% |
| Idle Minimum * (dB) | 26 | 25 4% | 26 -0% | 26 -0% | 27 -4% |
| Idle Average * (dB) | 28 | 28.6 -2% | 28 -0% | 32 -14% | 28 -0% |
| Idle Maximum * (dB) | 30 | 44.3 -48% | 31 -3% | 33 -10% | 31 -3% |
| Load Average * (dB) | 48 | 47.6 1% | 45 6% | 48 -0% | 44 8% |
| Witcher 3 ultra * (dB) | 52 | 46 12% | 47 10% | 44 15% | |
| Load Maximum * (dB) | 52 | 53.6 -3% | 48 8% | 49 6% | 45 13% |
* ... menor é melhor
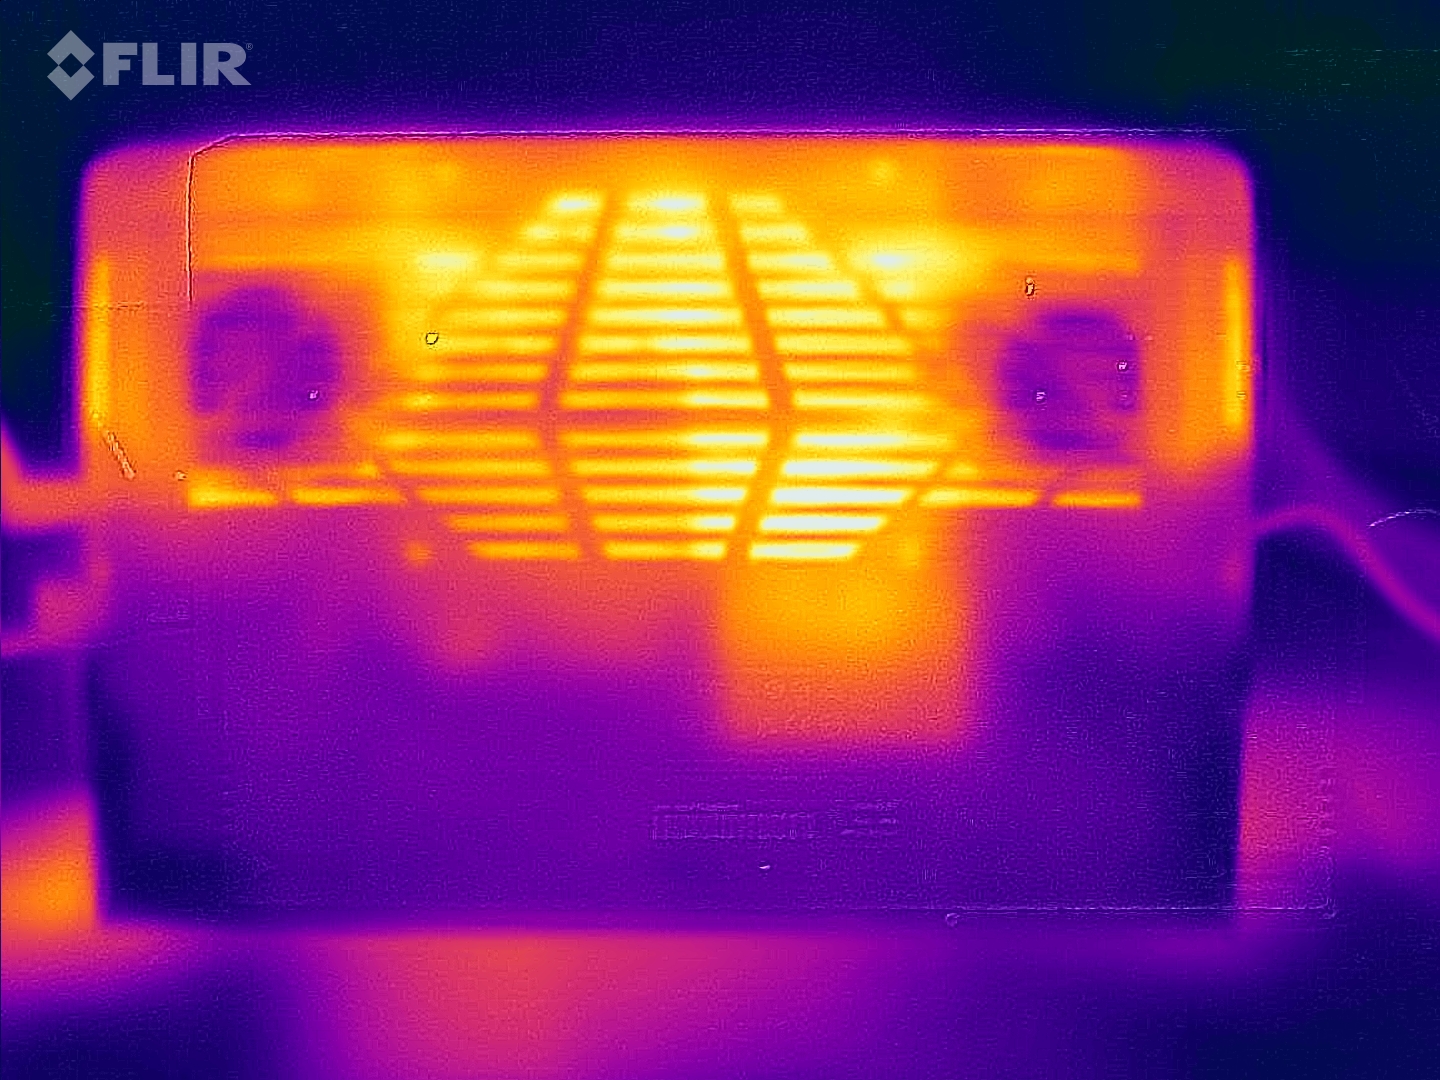
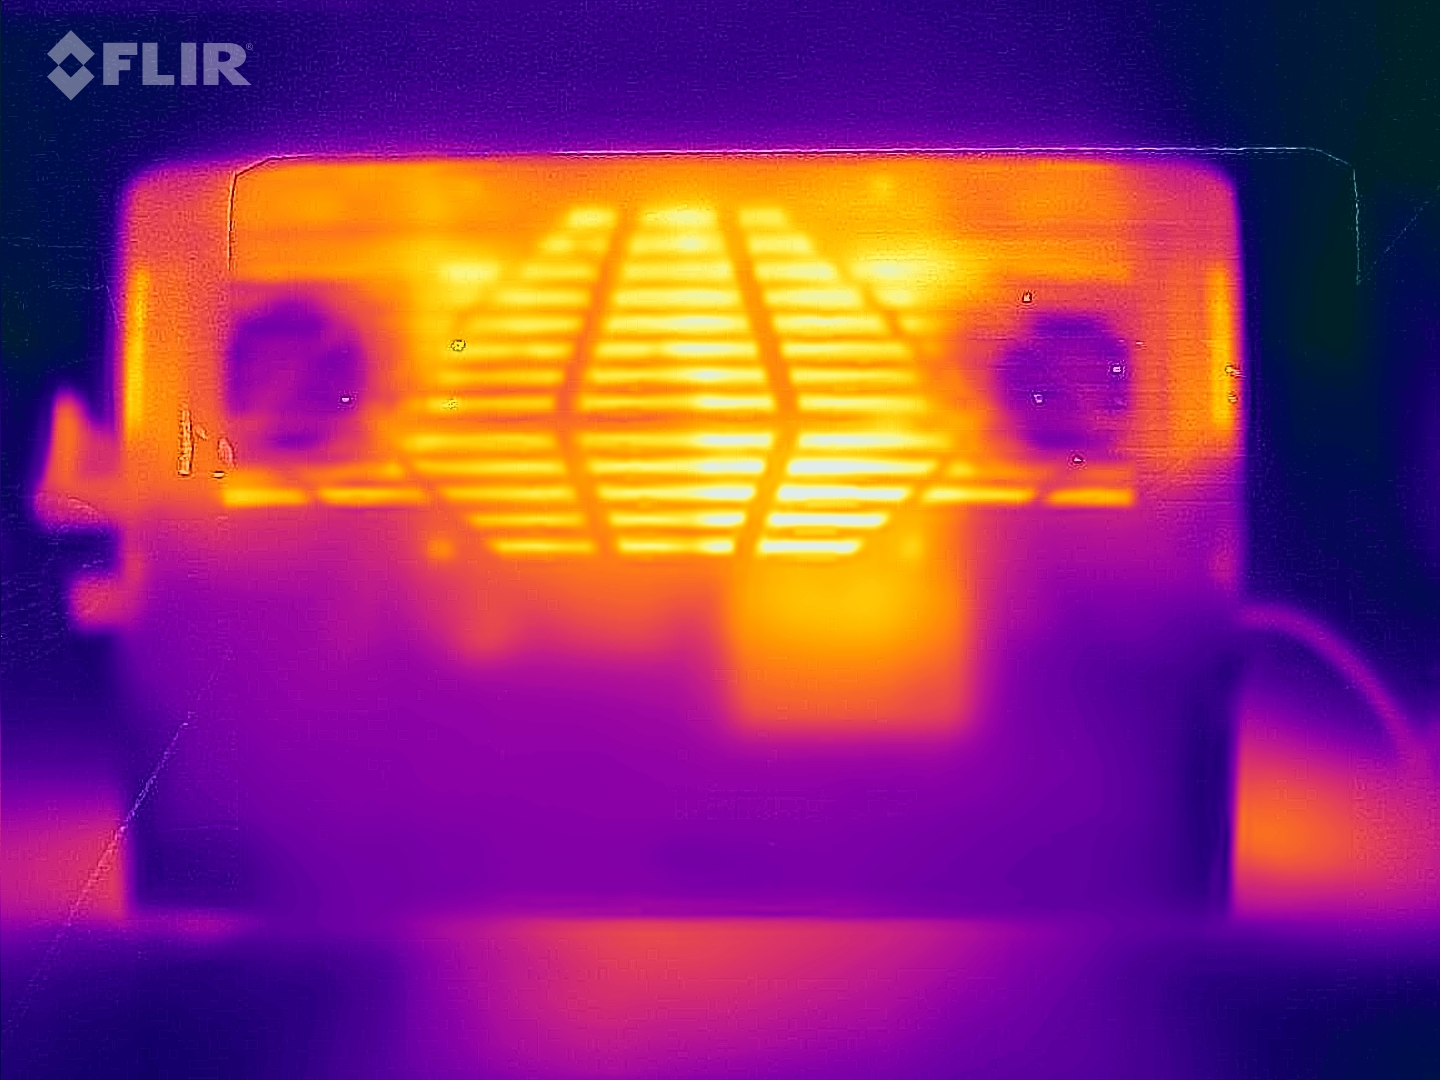
Temperaturas
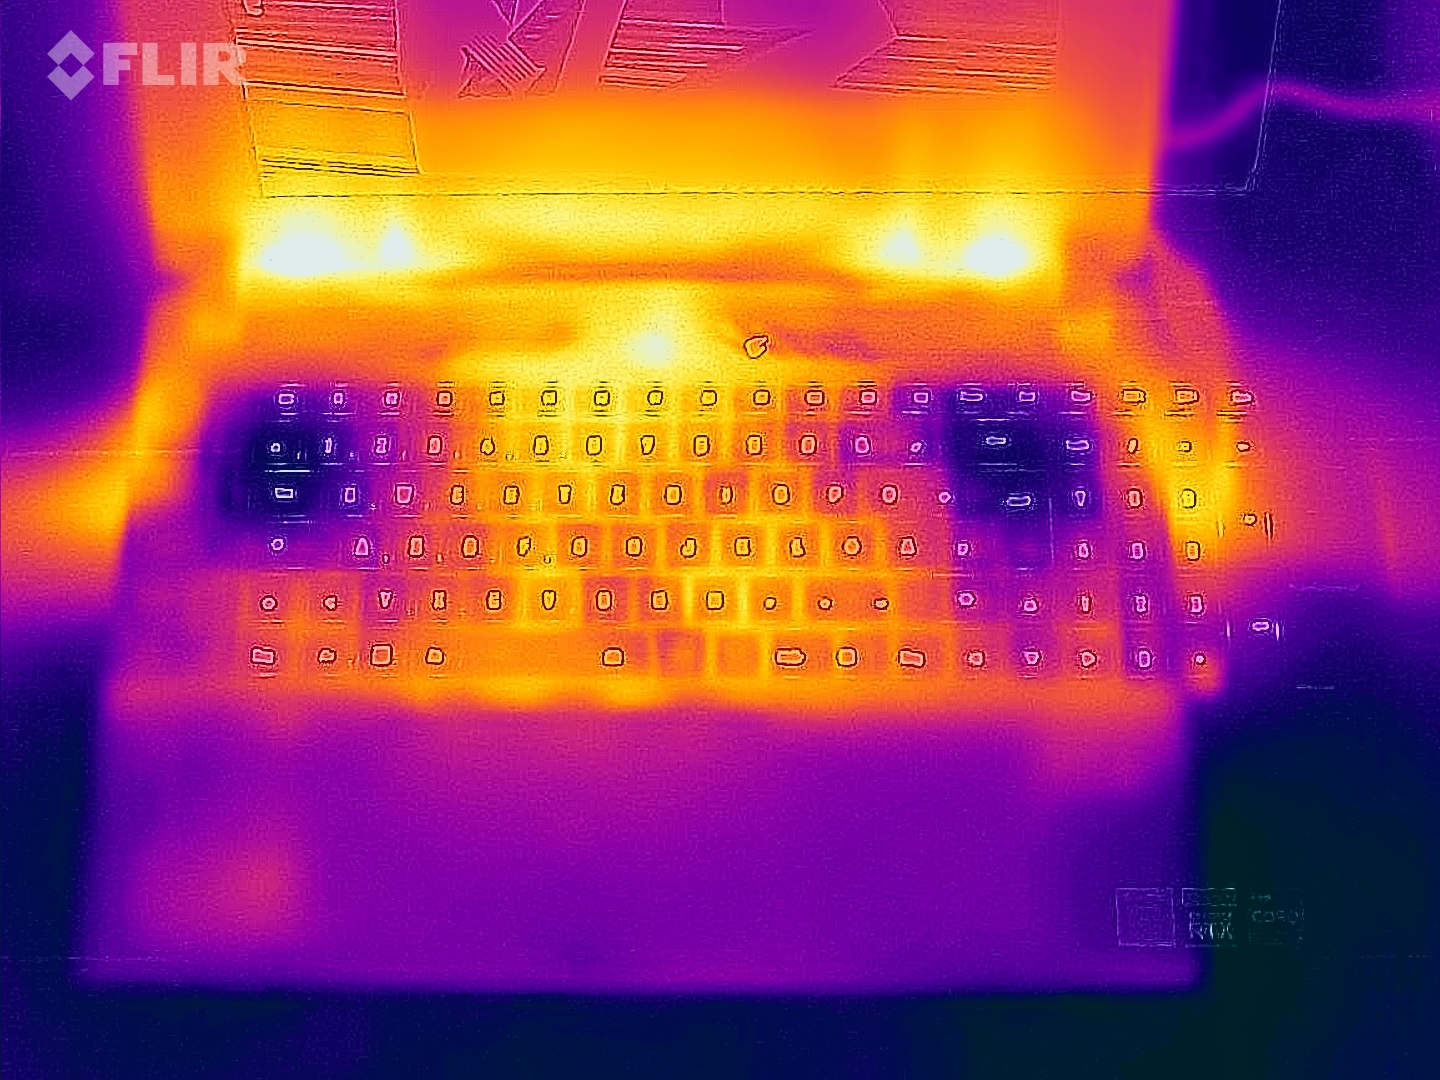
Quando o laptop está lidando com tarefas diárias, o chassi pode ficar relativamente quente, mas suas temperaturas ainda estão dentro de uma faixa aceitável. Sob carga (teste de estresse, Witcher 3), o laptop torna-se moderadamente quente em média através do dispositivo, mas há alguns pontos críticos muito perceptíveis. Dito isto, as temperaturas da CPU não dão nenhum motivo de preocupação.
(-) A temperatura máxima no lado superior é 46 °C / 115 F, em comparação com a média de 40.4 °C / 105 F , variando de 21.2 a 68.8 °C para a classe Gaming.
(-) A parte inferior aquece até um máximo de 57 °C / 135 F, em comparação com a média de 43.2 °C / 110 F
(±) Em uso inativo, a temperatura média para o lado superior é 32.4 °C / 90 F, em comparação com a média do dispositivo de 33.9 °C / ### class_avg_f### F.
(±) Jogando The Witcher 3, a temperatura média para o lado superior é 37.6 °C / 100 F, em comparação com a média do dispositivo de 33.9 °C / ## #class_avg_f### F.
(+) Os apoios para as mãos e o touchpad estão atingindo a temperatura máxima da pele (35 °C / 95 F) e, portanto, não estão quentes.
(-) A temperatura média da área do apoio para as mãos de dispositivos semelhantes foi 28.8 °C / 83.8 F (-6.2 °C / -11.2 F).
| Aorus 15 XE5 Intel Core i7-12700H, NVIDIA GeForce RTX 3070 Ti Laptop GPU | Acer Nitro 5 AN515-46-R1A1 AMD Ryzen 7 6800H, NVIDIA GeForce RTX 3070 Ti Laptop GPU | Schenker XMG Fusion 15 (Mid 22) Intel Core i7-11800H, NVIDIA GeForce RTX 3070 Laptop GPU | Asus TUF Dash F15 FX517ZR Intel Core i7-12650H, NVIDIA GeForce RTX 3070 Laptop GPU | MSI Katana GF66 12UGS Intel Core i7-12700H, NVIDIA GeForce RTX 3070 Ti Laptop GPU | |
|---|---|---|---|---|---|
| Heat | 14% | -3% | 6% | -8% | |
| Maximum Upper Side * (°C) | 46 | 48.1 -5% | 52 -13% | 52 -13% | 61 -33% |
| Maximum Bottom * (°C) | 57 | 49.7 13% | 63 -11% | 52 9% | 55 4% |
| Idle Upper Side * (°C) | 38 | 30 21% | 37 3% | 33 13% | 43 -13% |
| Idle Bottom * (°C) | 42 | 31.7 25% | 38 10% | 36 14% | 38 10% |
* ... menor é melhor
Teste de estresse
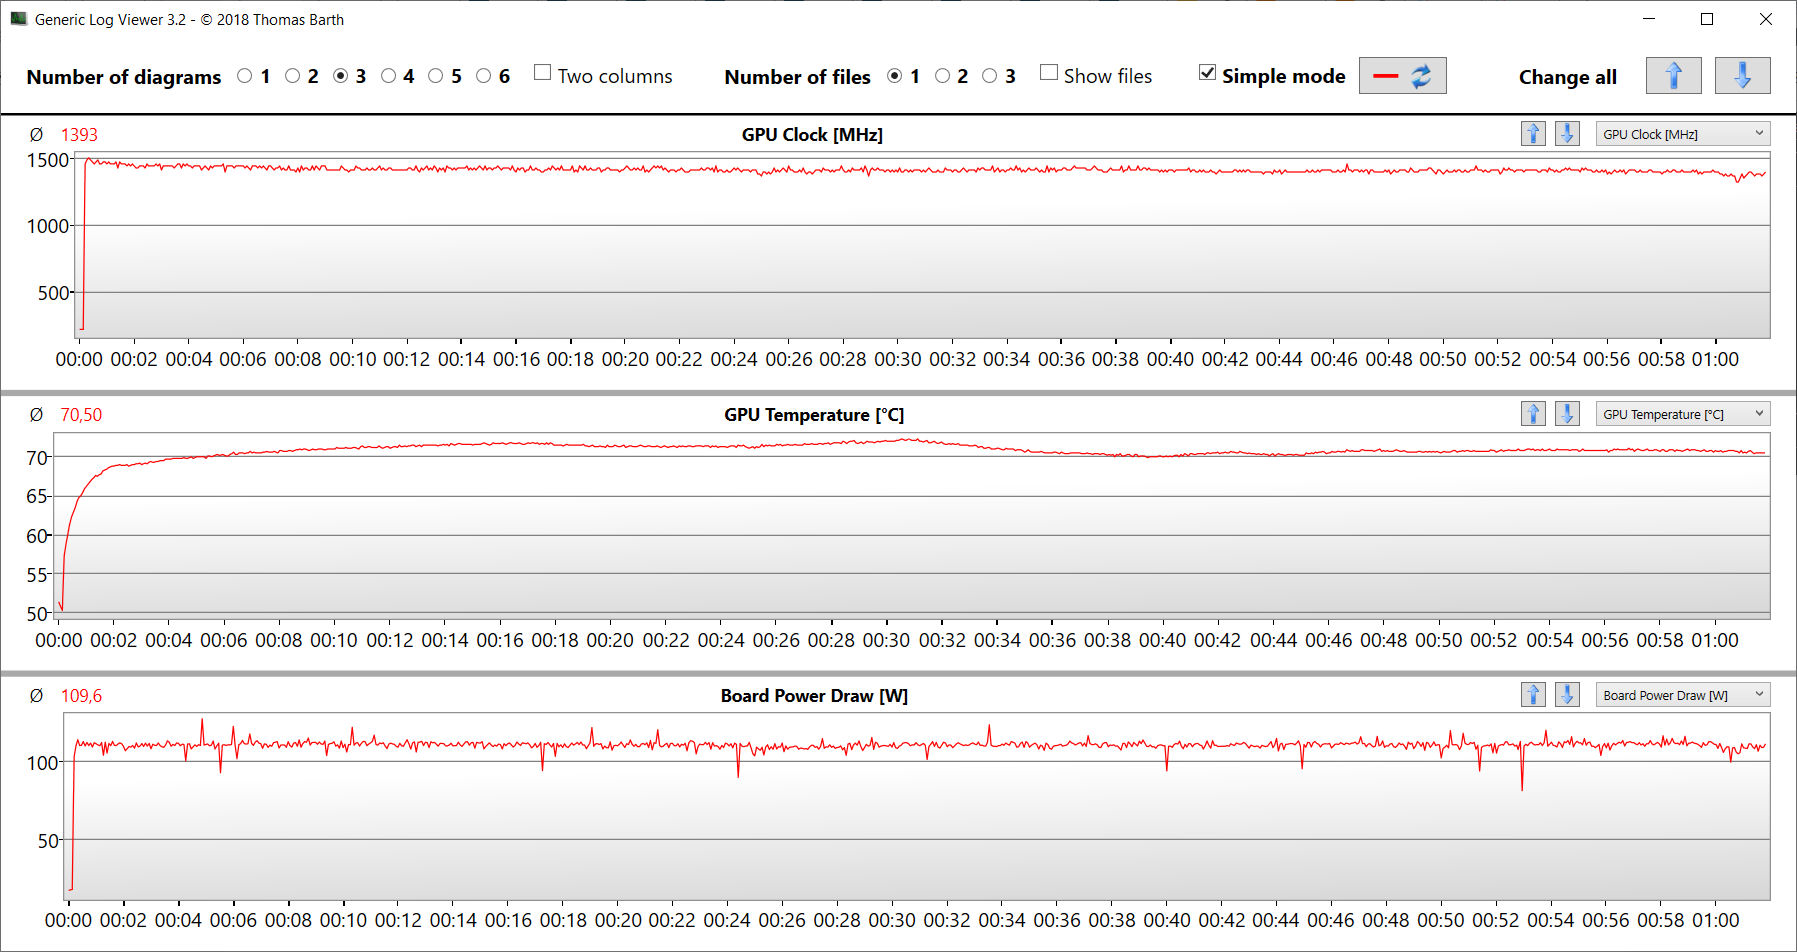
Nosso teste de estresse, que envolve correr Prime95 e FurMark ao mesmo tempo continuamente, representa um cenário extremo projetado para avaliar a estabilidade de um sistema sob carga total. Durante o teste (com duração mínima de uma hora), a CPU funcionou a velocidades moderadas do relógio (P-cores: aproximadamente 2,5 GHz; E-cores: aproximadamente 2,3 GHz), enquanto a GPU oscilou entre 1.000 e 1.500 MHz.
Oradores
Os alto-falantes estéreo soam decentemente, mas quase não têm graves. Recomendamos o uso de fones de ouvido ou alto-falantes externos para uma melhor experiência auditiva.
Aorus 15 XE5 análise de áudio
(+) | os alto-falantes podem tocar relativamente alto (###valor### dB)
Graves 100 - 315Hz
(-) | quase nenhum baixo - em média 27.9% menor que a mediana
(±) | a linearidade dos graves é média (11.4% delta para a frequência anterior)
Médios 400 - 2.000 Hz
(+) | médios equilibrados - apenas 4.9% longe da mediana
(+) | médios são lineares (4.4% delta para frequência anterior)
Altos 2 - 16 kHz
(+) | agudos equilibrados - apenas 3.5% longe da mediana
(+) | os máximos são lineares (2.9% delta da frequência anterior)
Geral 100 - 16.000 Hz
(±) | a linearidade do som geral é média (19.4% diferença em relação à mediana)
Comparado com a mesma classe
» 67% de todos os dispositivos testados nesta classe foram melhores, 7% semelhantes, 26% piores
» O melhor teve um delta de 6%, a média foi 18%, o pior foi 132%
Comparado com todos os dispositivos testados
» 48% de todos os dispositivos testados foram melhores, 7% semelhantes, 45% piores
» O melhor teve um delta de 4%, a média foi 23%, o pior foi 134%
Asus TUF Dash F15 FX517ZR análise de áudio
(±) | o volume do alto-falante é médio, mas bom (###valor### dB)
Graves 100 - 315Hz
(-) | quase nenhum baixo - em média 19.2% menor que a mediana
(±) | a linearidade dos graves é média (9.6% delta para a frequência anterior)
Médios 400 - 2.000 Hz
(+) | médios equilibrados - apenas 2.7% longe da mediana
(+) | médios são lineares (5% delta para frequência anterior)
Altos 2 - 16 kHz
(+) | agudos equilibrados - apenas 2.2% longe da mediana
(±) | a linearidade dos máximos é média (7.7% delta para frequência anterior)
Geral 100 - 16.000 Hz
(±) | a linearidade do som geral é média (15.3% diferença em relação à mediana)
Comparado com a mesma classe
» 34% de todos os dispositivos testados nesta classe foram melhores, 6% semelhantes, 60% piores
» O melhor teve um delta de 6%, a média foi 18%, o pior foi 132%
Comparado com todos os dispositivos testados
» 22% de todos os dispositivos testados foram melhores, 4% semelhantes, 74% piores
» O melhor teve um delta de 4%, a média foi 23%, o pior foi 134%
Gerenciamento de energia - o XE5 requer muita energia
Consumo de energia
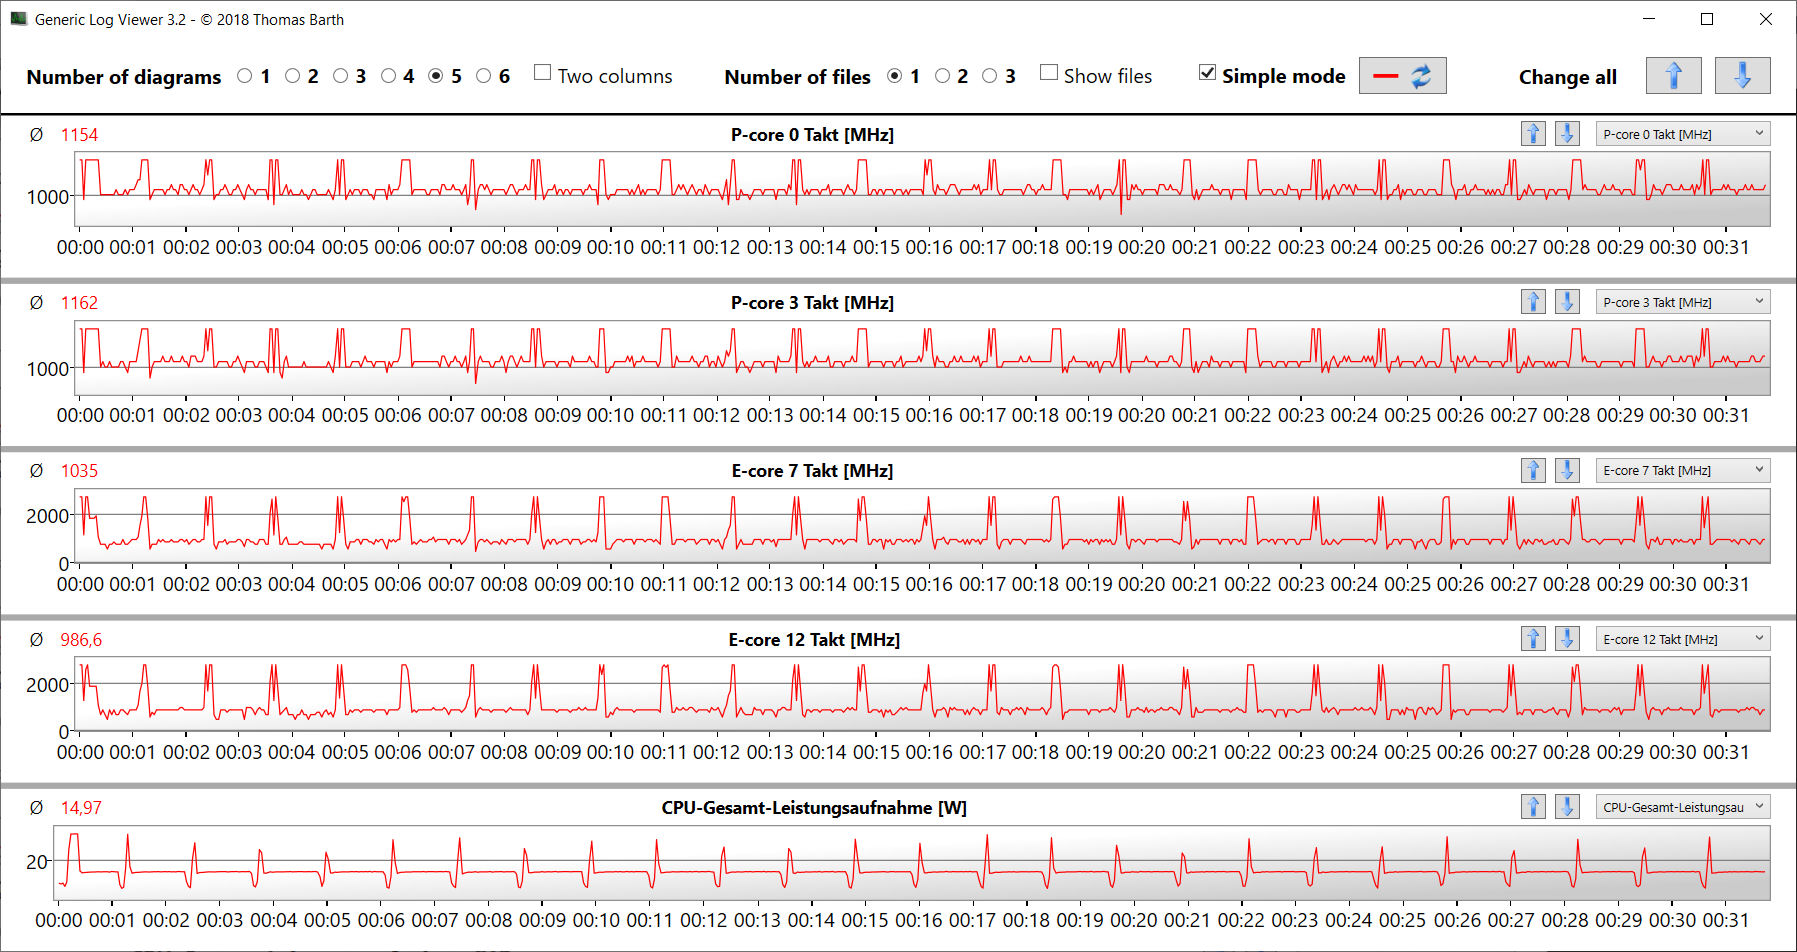
O Aorus 15 XE5 é muito sedento de potência ao ocioso, extraindo cerca de 31 a 46 watts e às vezes até mesmo 80 watts no pior dos casos. A comparação do XE5 com os concorrentes revela aproximadamente quanta potência um laptop com Optimus deve consumir em modo inativo. Este alto consumo de energia é provavelmente devido a um bug. O problema persiste mesmo quando a função AI Boost está desativada. Então teremos que esperar e ver se o Gigabyte é capaz de corrigir o problema através de atualizações de software ou BIOS.
Durante o teste de estresse e o teste Witcher 3, o consumo de energia do laptop permaneceu estável em um nível que é normal para o hardware. O carregador incluído tem capacidade suficiente para alimentar o laptop e também é capaz de lidar com picos transitórios acima de sua classificação de saída (240 watts).
| desligado | |
| Ocioso | |
| Carga |
|
Key:
min: | |
| Aorus 15 XE5 i7-12700H, GeForce RTX 3070 Ti Laptop GPU | Acer Nitro 5 AN515-46-R1A1 R7 6800H, GeForce RTX 3070 Ti Laptop GPU | Schenker XMG Fusion 15 (Mid 22) i7-11800H, GeForce RTX 3070 Laptop GPU | Asus TUF Dash F15 FX517ZR i7-12650H, GeForce RTX 3070 Laptop GPU | MSI Katana GF66 12UGS i7-12700H, GeForce RTX 3070 Ti Laptop GPU | Média NVIDIA GeForce RTX 3070 Ti Laptop GPU | Média da turma Gaming | |
|---|---|---|---|---|---|---|---|
| Power Consumption | 28% | 36% | 41% | 43% | 28% | 32% | |
| Idle Minimum * (Watt) | 31 | 7 77% | 12 61% | 10 68% | 9 71% | 14.2 ? 54% | 13 ? 58% |
| Idle Average * (Watt) | 35 | 8.9 75% | 17 51% | 14 60% | 13 63% | 19.9 ? 43% | 19 ? 46% |
| Idle Maximum * (Watt) | 46 | 14.4 69% | 24 48% | 20 57% | 20 57% | 26.2 ? 43% | 24.6 ? 47% |
| Load Average * (Watt) | 120 | 202 -68% | 106 12% | 122 -2% | 100 17% | 125.8 ? -5% | 110.7 ? 8% |
| Witcher 3 ultra * (Watt) | 202 | 203 -0% | 159.9 21% | 138.6 31% | 149 26% | ||
| Load Maximum * (Watt) | 268 | 230 14% | 208 22% | 189 29% | 212 21% | 248 ? 7% | 259 ? 3% |
* ... menor é melhor
Power consumption Witcher 3 / Stress test
Power consumption with external monitor
Duração da bateria
O dispositivo de 15,6 polegadas durou 6h 50m e 6h 11m respectivamente em nosso teste Wi-Fi (acessando websites usando um roteiro) e teste de vídeo (reproduzindo o curta-metragem "Big Buck Bunny" em loop no FHD, codificado em H.264). Durante ambos os testes, todos os recursos de economia de energia no laptop foram desativados e o brilho da tela foi ajustado para cerca de 150 cd/m². Além disso, o módulo sem fio também foi desativado para o teste de vídeo.
No total, o XE5 definitivamente oferece uma grande autonomia de bateria para um notebook para jogos QHD. No entanto, não surpreende que o Aorus não esteja muito à frente de um concorrente como o Nitro 5em termos de duração da bateria, apesar de ter quase o dobro da capacidade da bateria (99 Wh vs. 57,5 Wh). Isto porque o laptop Acer está equipado com um processador mais eficiente em termos de energia e um monitor FHD.
| Aorus 15 XE5 i7-12700H, GeForce RTX 3070 Ti Laptop GPU, 99 Wh | Acer Nitro 5 AN515-46-R1A1 R7 6800H, GeForce RTX 3070 Ti Laptop GPU, 57.5 Wh | Schenker XMG Fusion 15 (Mid 22) i7-11800H, GeForce RTX 3070 Laptop GPU, 93.48 Wh | Asus TUF Dash F15 FX517ZR i7-12650H, GeForce RTX 3070 Laptop GPU, 76 Wh | MSI Katana GF66 12UGS i7-12700H, GeForce RTX 3070 Ti Laptop GPU, 52 Wh | Média da turma Gaming | |
|---|---|---|---|---|---|---|
| Duração da bateria | -13% | 20% | 7% | -46% | 0% | |
| Reader / Idle (h) | 10 | 10.5 5% | 15.5 55% | 10.8 8% | 8.27 ? -17% | |
| H.264 (h) | 6.2 | 5.7 -8% | 7.5 21% | 5.8 -6% | 8.32 ? 34% | |
| WiFi v1.3 (h) | 6.8 | 5.8 -15% | 7.4 9% | 7 3% | 2.4 -65% | 7.11 ? 5% |
| Load (h) | 1.9 | 1.3 -32% | 1.8 -5% | 2.3 21% | 1.4 -26% | 1.502 ? -21% |
Pro
Contra
Veredicto - Besta do jogo faminta de poder
O Aorus 15 XE5 foi projetado para rodar jogos em QHD e de alta a máxima configuração. Mas também corta uma boa figura em outras aplicações exigentes, como edição e renderização de vídeo. Isto é possível graças ao Núcleo i7 12700H e GeForce Computador portátil RTX 3070 Ti dentro da máquina. Uma PCIe 4.0 SSD (1 TB) com velocidade de relâmpago permite tempos de carregamento curtos.
O Aorus 15 XE5 faz o que deve fazer: correr o jogo suavemente em sua tela fluida. Entretanto, seu uso de energia é muito alto.
A CPU e a GPU do laptop são capazes de rodar em velocidades de relógio constantemente altas. Embora a quantidade de ruído produzida pelo Aorus 15 XE5 seja típica de um laptop para jogos, ele gera muito calor em modo inativo. Isto também é verdade para seu consumo de energia em modo inativo e baixa carga - só se pode esperar que a Gigabyte lance uma atualização para resolver este problema. No entanto, o laptop não tem este problema quando funciona com bateria, durando cerca de 6 a 7 horas no uso diário - o que é bastante respeitável
O visor mate QHD (15,6 polegadas, IPS, taxa de atualização de 165Hz) deixa em sua maioria uma impressão positiva, embora certamente possa usar um pouco mais de contraste. A porta Thunderbolt 4 permite conectar várias opções de expansão, tais como uma solução de acoplamento ou uma GPU externa. Ela também suporta Power Delivery, ou seja, o laptop pode ser carregado através da porta (adaptador USB-C, mín. 65 watts, 20V).
O Schenker XMG Fusion 15 (meados de 22) e o Asus TUF Dash F15são duas alternativas para o Aorus 15 XE5. Embora estes dois laptops ofereçam menos desempenho e fiquem realmente quentes sob carga, são mais leves e têm maior vida útil da bateria em alguns casos.
Preço e disponibilidade
no momento desta revisão, o Gigabyte Aorus 15 XE5 está disponível na Amazônia por cerca de US$1.500nos EUA ou 2.200 euros na Alemanha.
Aorus 15 XE5
- 12/06/2022 v7 (old)
Sascha Mölck
Price comparison

