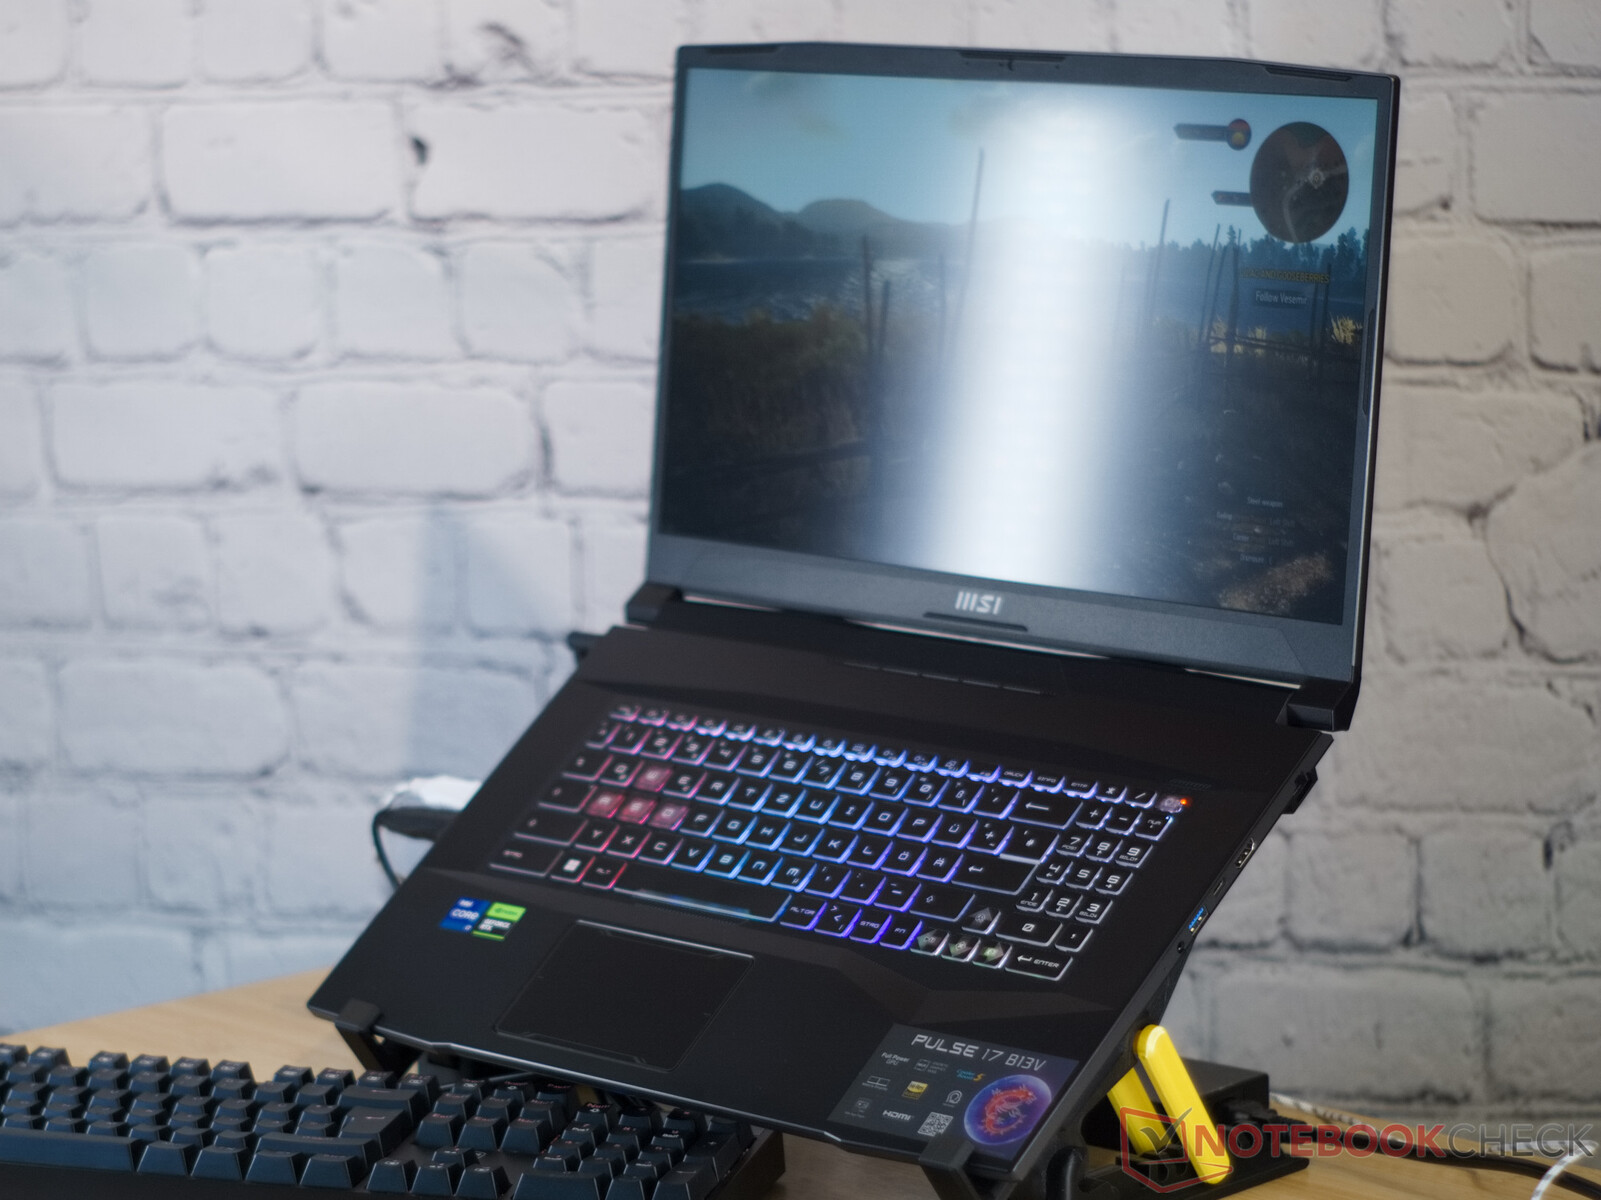
Análise do laptop para jogos MSI Pulse 17 B13V: Com asas silenciosas
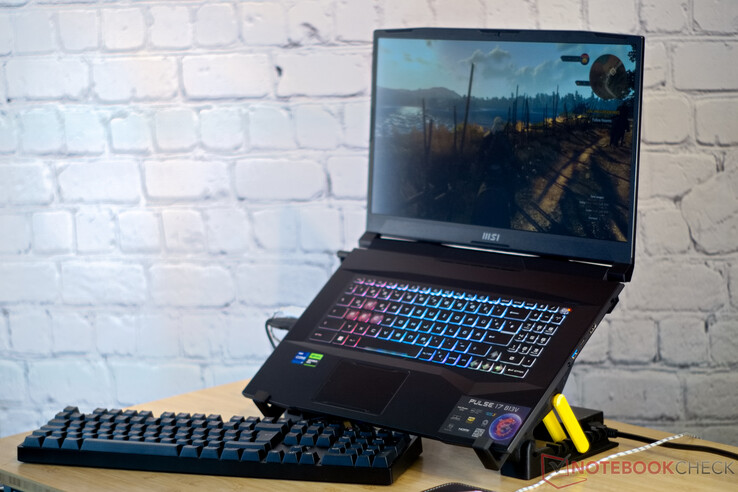
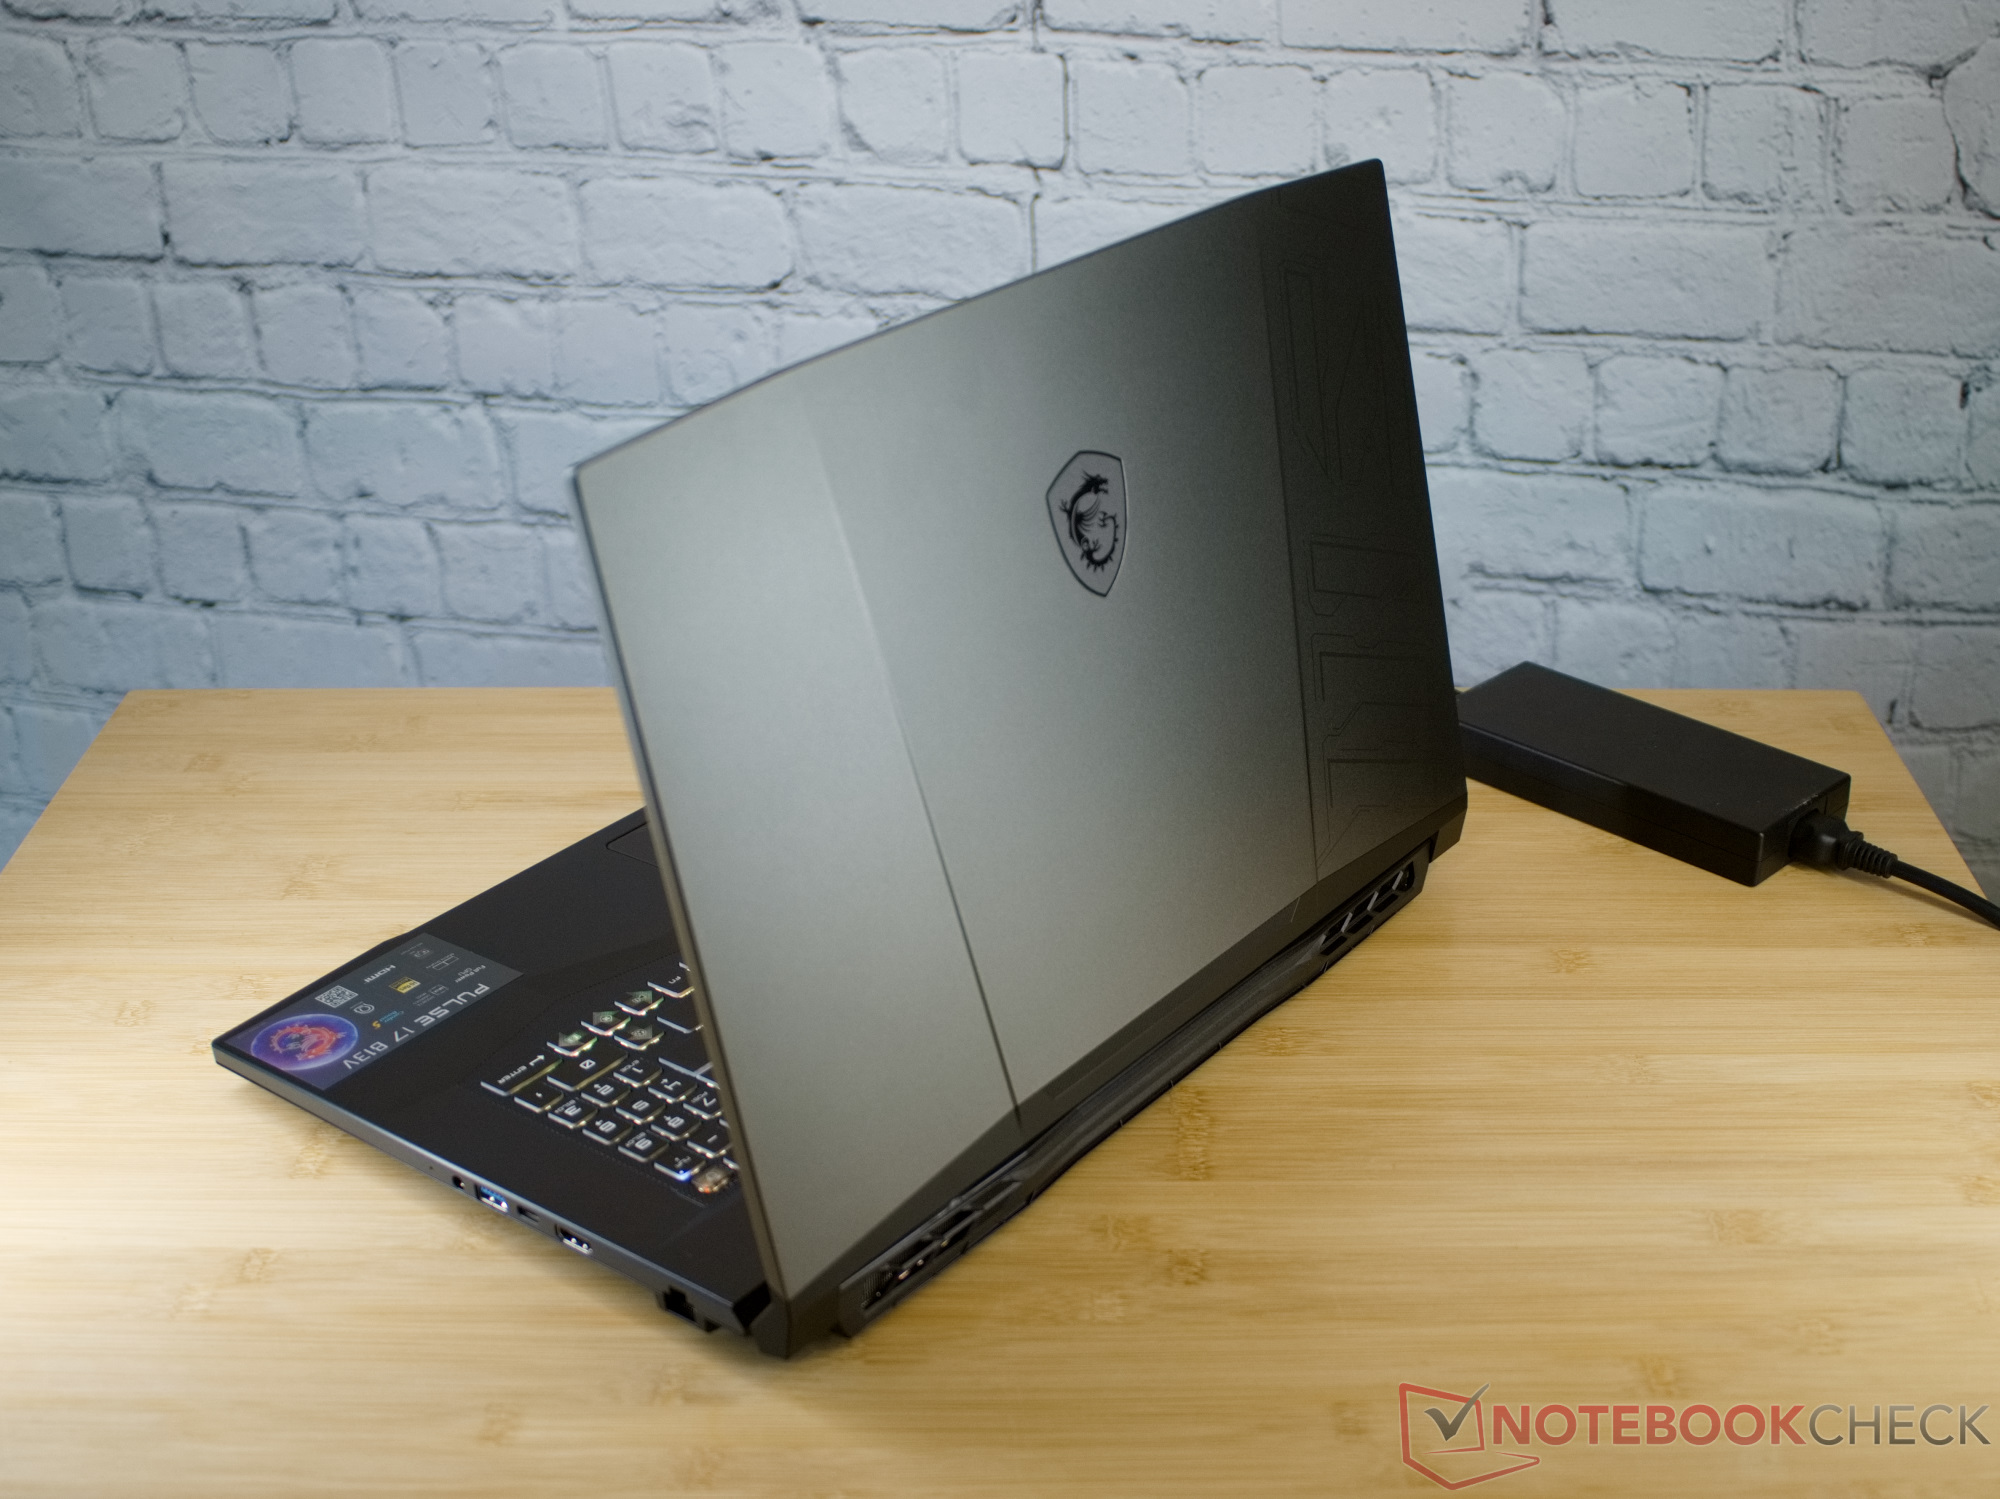
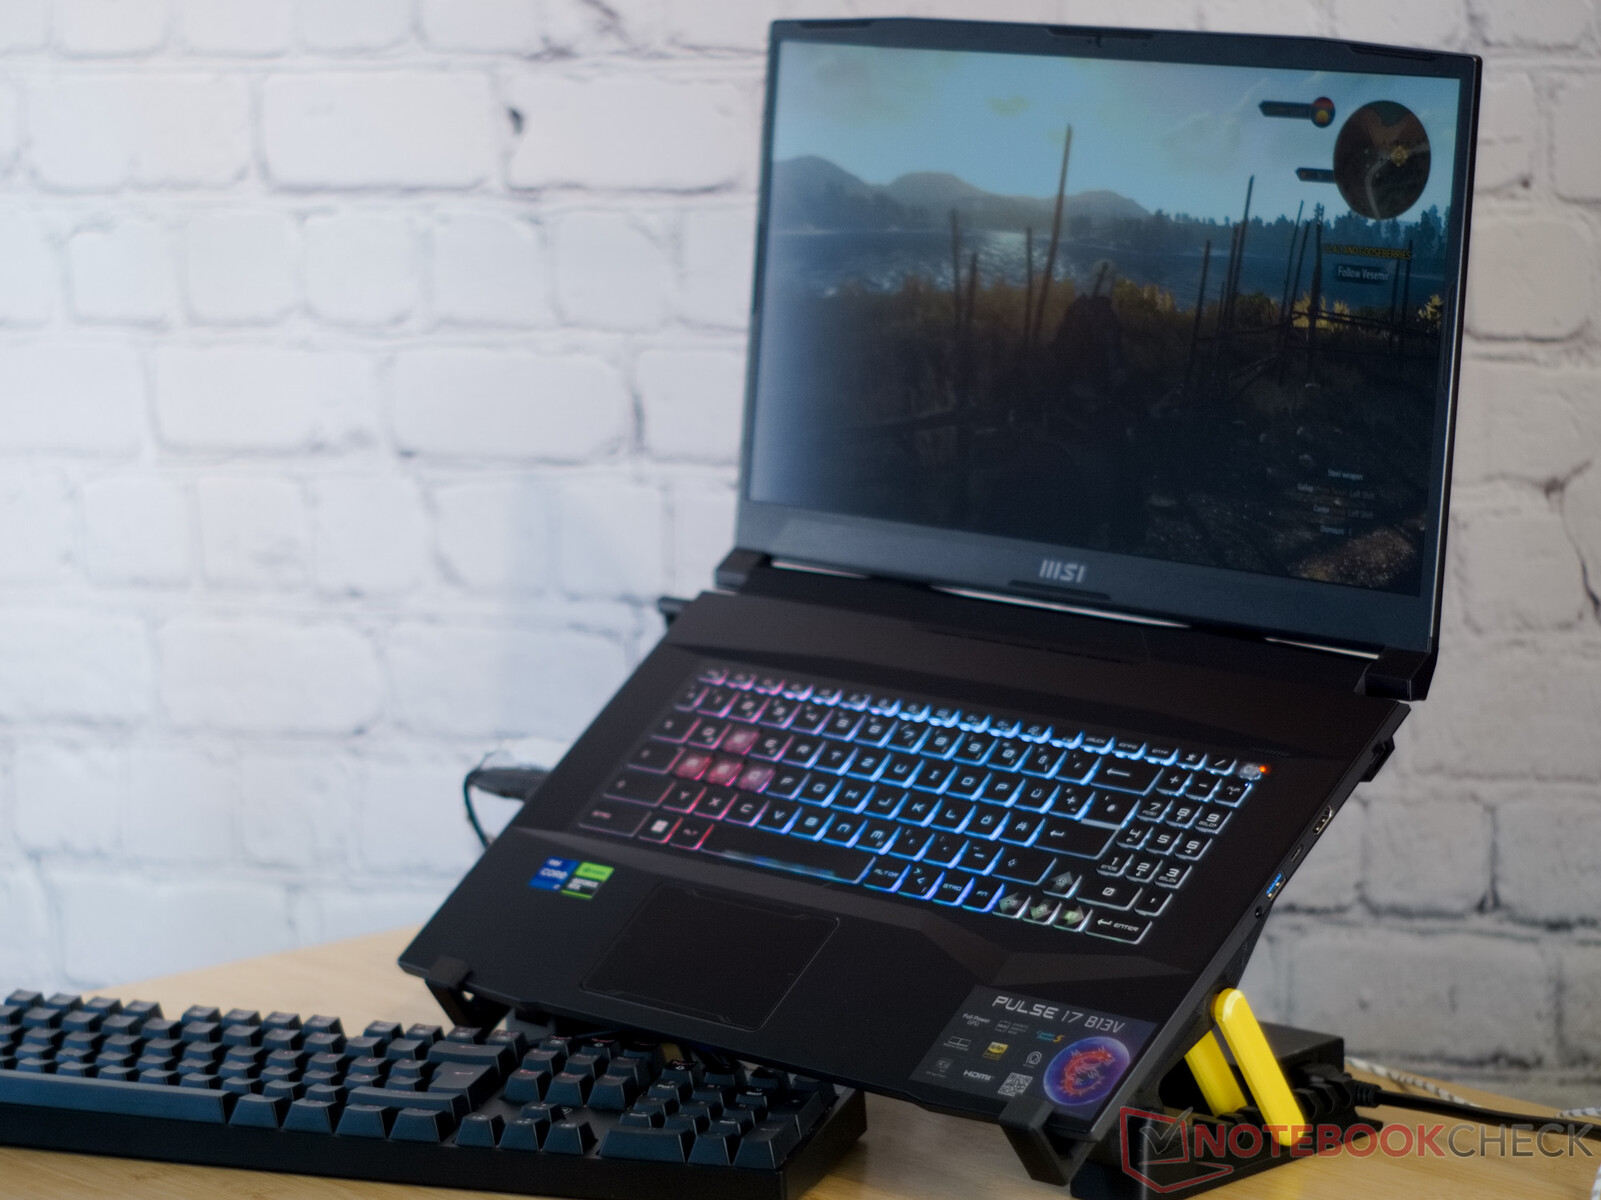
Com o MSI Pulse 17, a Red Dragon traz um laptop para jogos cujo exterior lembra um pouco a ficção científica. Essa impressão resulta da tampa da tela feita de alumínio anodizado, muitas bordas e cantos, e até mesmo a grade em forma de favo de mel na parte inferior do laptop de 17 polegadas. Mas dentro do laptop funcionam componentes atuais, e nossa unidade de teste está equipada com um Intel Core i7-13700He Nvidia GeForce RTX 4070. Quando nós testamos o antecessor no início do anoo desempenho do laptop foi convincente. Mas também notamos que o Pulse GL76 não tinha suporte para G-Sync, MUX, Advanced Optimus e Thunderbolt. O nível de ruído das ventoinhas do laptop para jogos também foi motivo de reclamação.
Agora, a MSI reformulou o laptop de forma significativa, introduzindo muitas melhorias, além do novo design, das gerações de chips e do nome enigmático. Com isso, o poderoso dispositivo subiu significativamente em nossas classificações. Comparamos o laptop com o Asus ROG Strix G17 G713PIe oMSI Katana 17 B13VFKe o Schenker XMG Focus 17 (E23).
Possíveis concorrentes em comparação
Avaliação | Data | Modelo | Peso | Altura | Size | Resolução | Preço |
|---|---|---|---|---|---|---|---|
| 86.3 % v7 (old) | 07/2023 | MSI Pulse 17 B13VGK i7-13700H, GeForce RTX 4070 Laptop GPU | 2.7 kg | 27.2 mm | 17.30" | 1920x1080 | |
| 83.2 % v7 (old) | 01/2023 | MSI Pulse GL76 12UGK i7-12700H, GeForce RTX 3070 Laptop GPU | 2.6 kg | 24.2 mm | 17.30" | 1920x1080 | |
| 82.1 % v7 (old) | 02/2023 | MSI Katana 17 B13VFK i7-13620H, GeForce RTX 4060 Laptop GPU | 2.8 kg | 25.2 mm | 17.30" | 1920x1080 | |
| 87.2 % v7 (old) | 07/2023 | Acer Nitro 17 AN17-51-71ER i7-13700H, GeForce RTX 4060 Laptop GPU | 3 kg | 30.3 mm | 17.30" | 2560x1440 | |
| 85.9 % v7 (old) | 06/2023 | Schenker XMG Focus 17 (E23) i9-13900HX, GeForce RTX 4070 Laptop GPU | 2.9 kg | 29.3 mm | 17.30" | 2560x1440 | |
| 88.4 % v7 (old) | 04/2023 | Asus ROG Strix G17 G713PI R9 7945HX, GeForce RTX 4070 Laptop GPU | 2.8 kg | 30.7 mm | 17.30" | 2560x1440 |
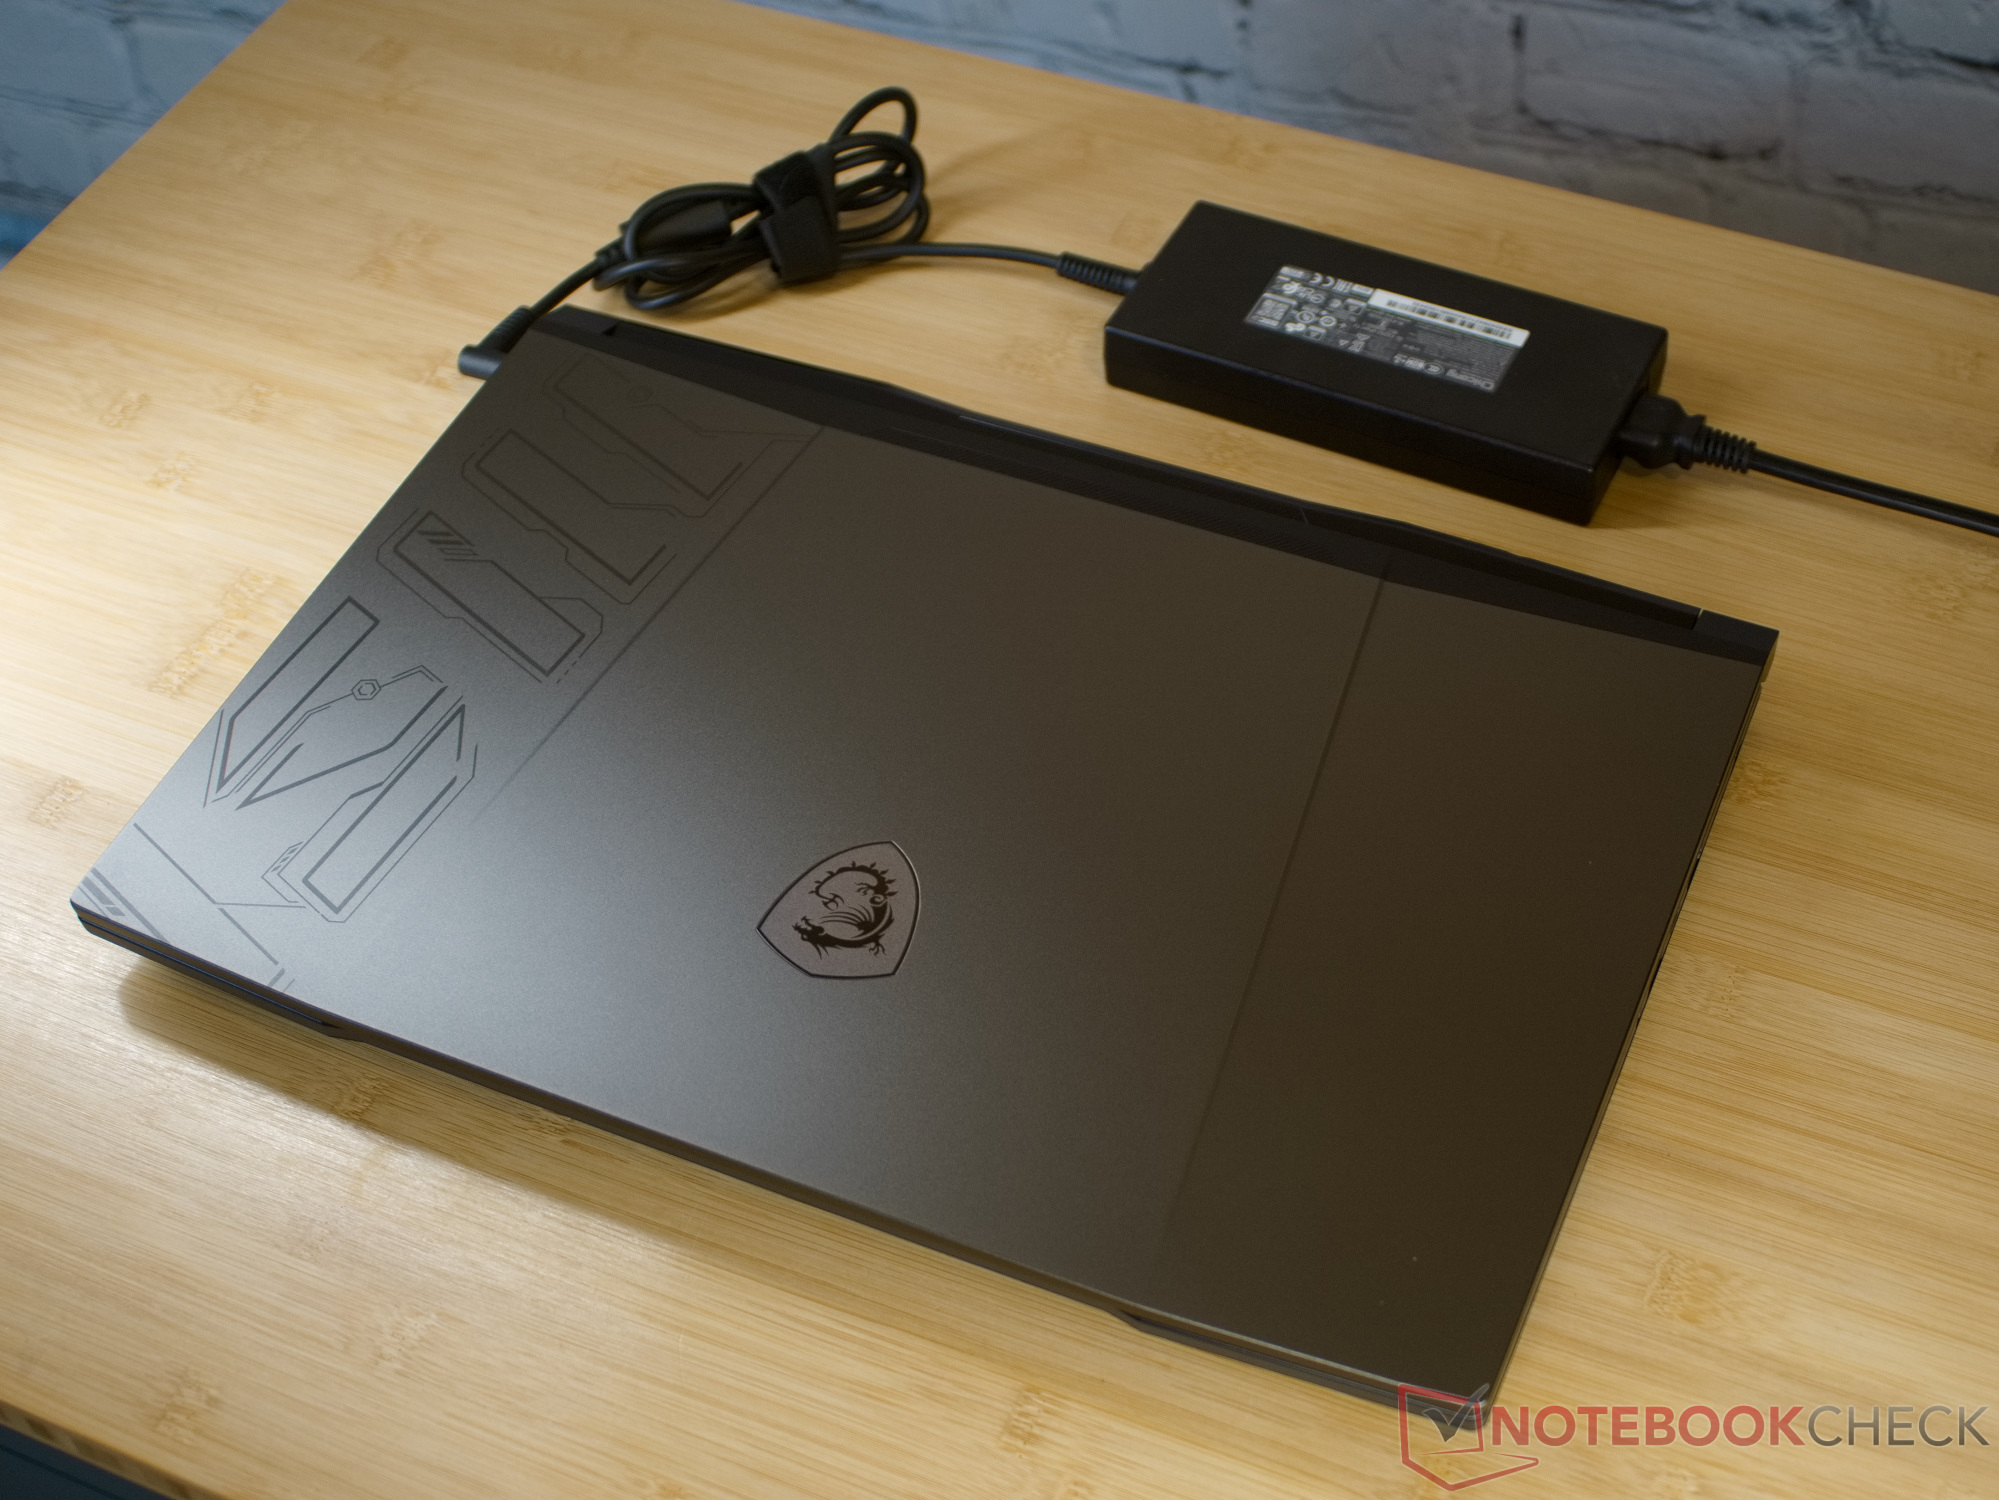
Estojo - Tampa de exibição de alumínio com aparência de ficção científica
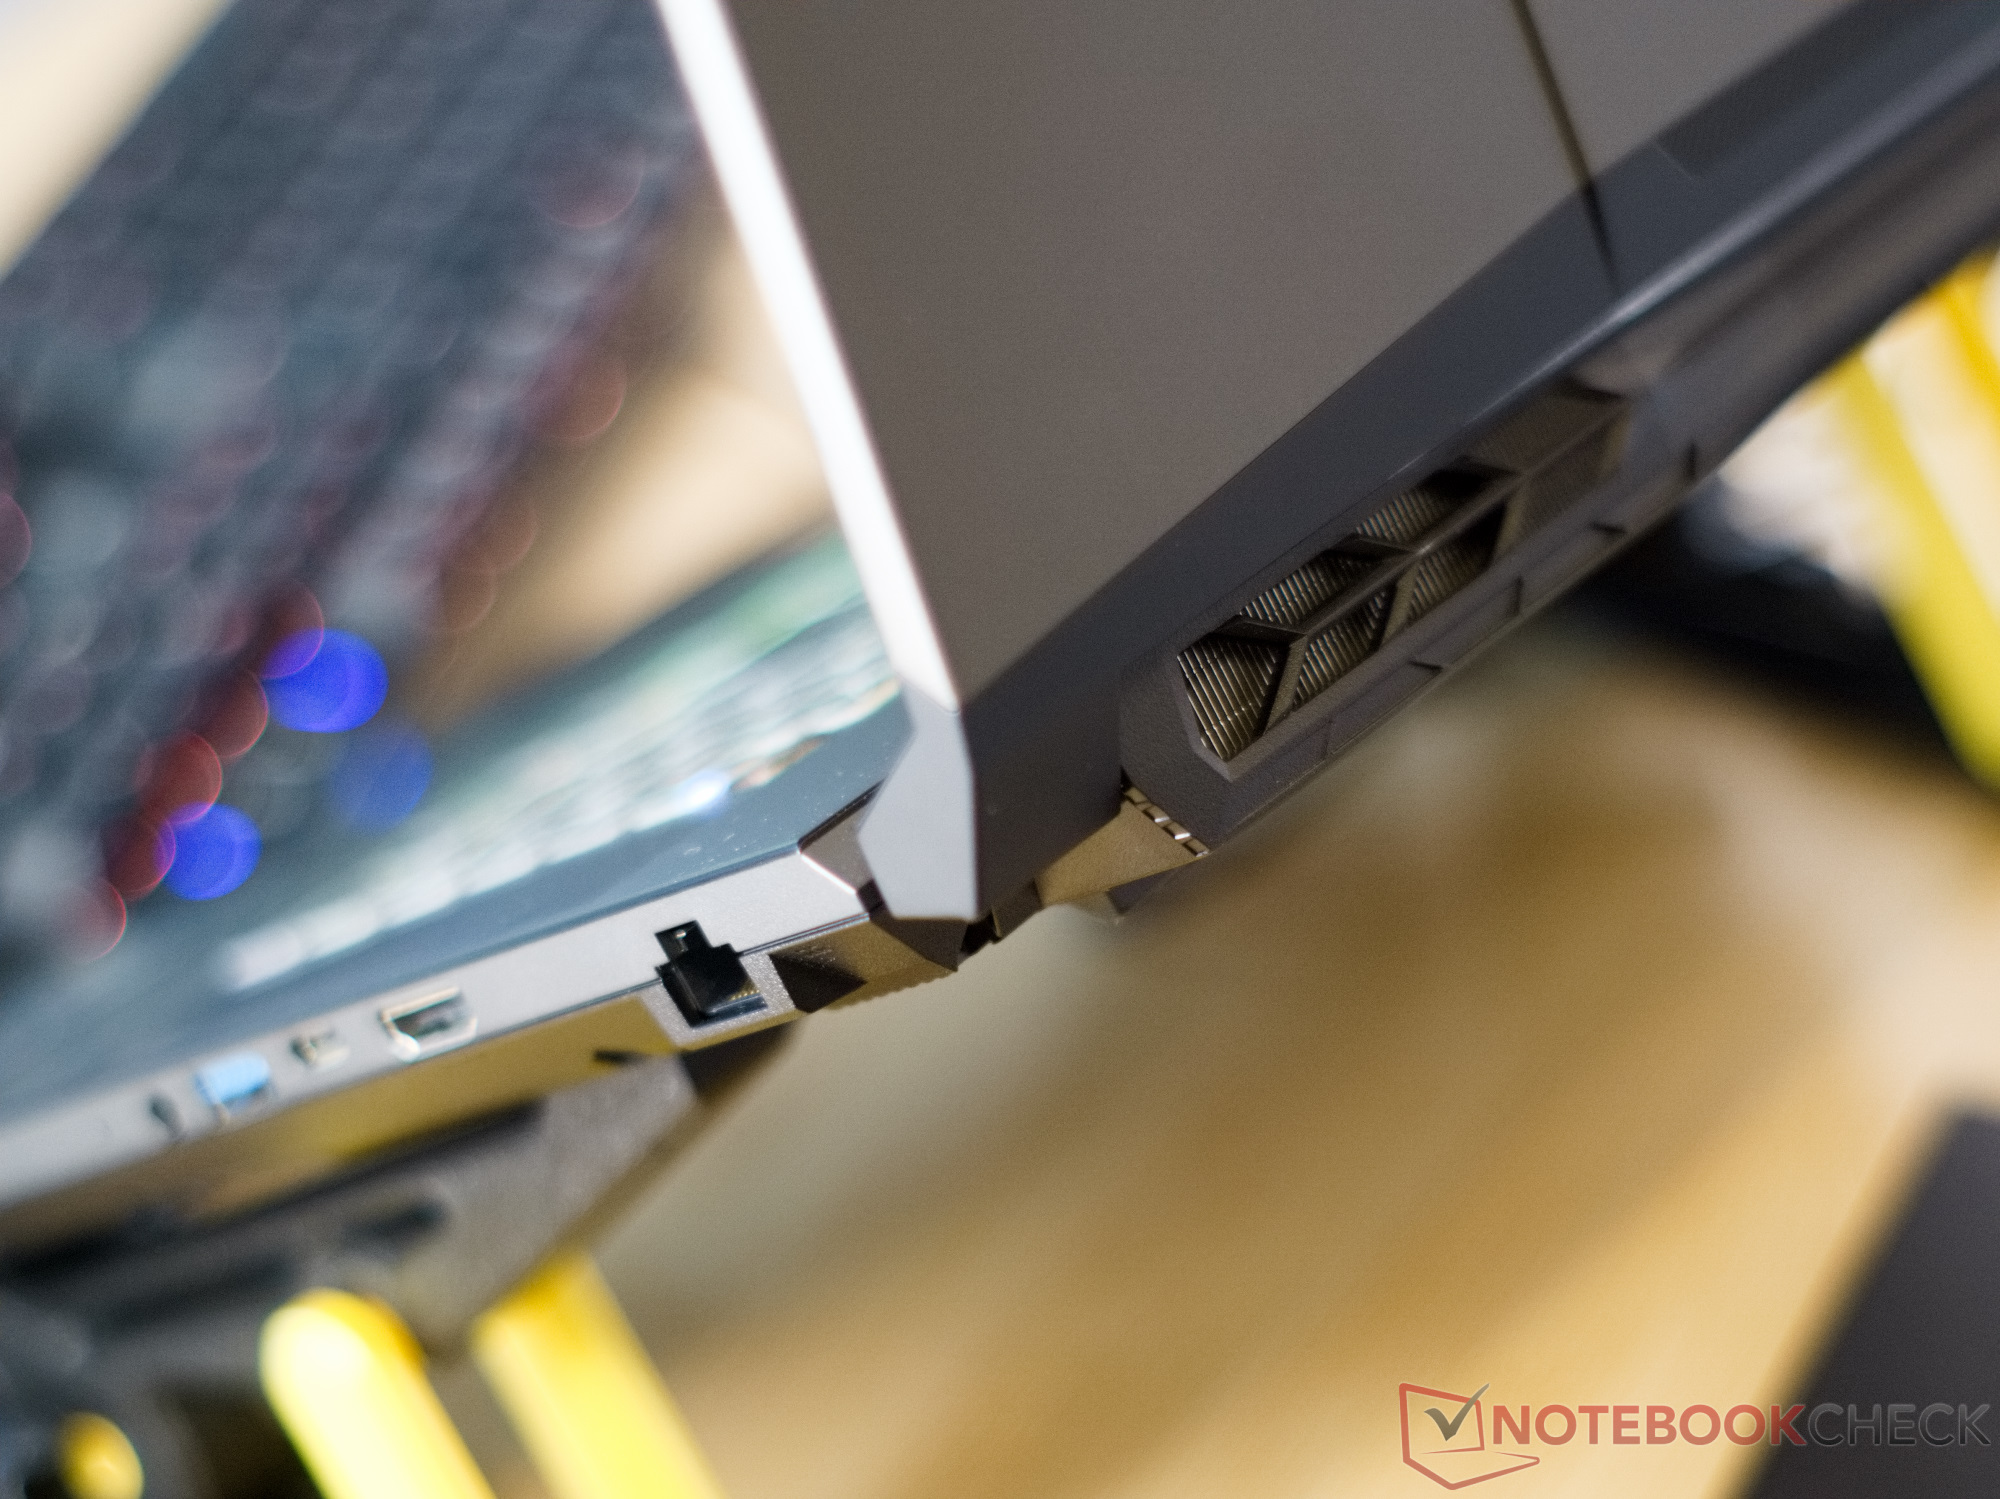
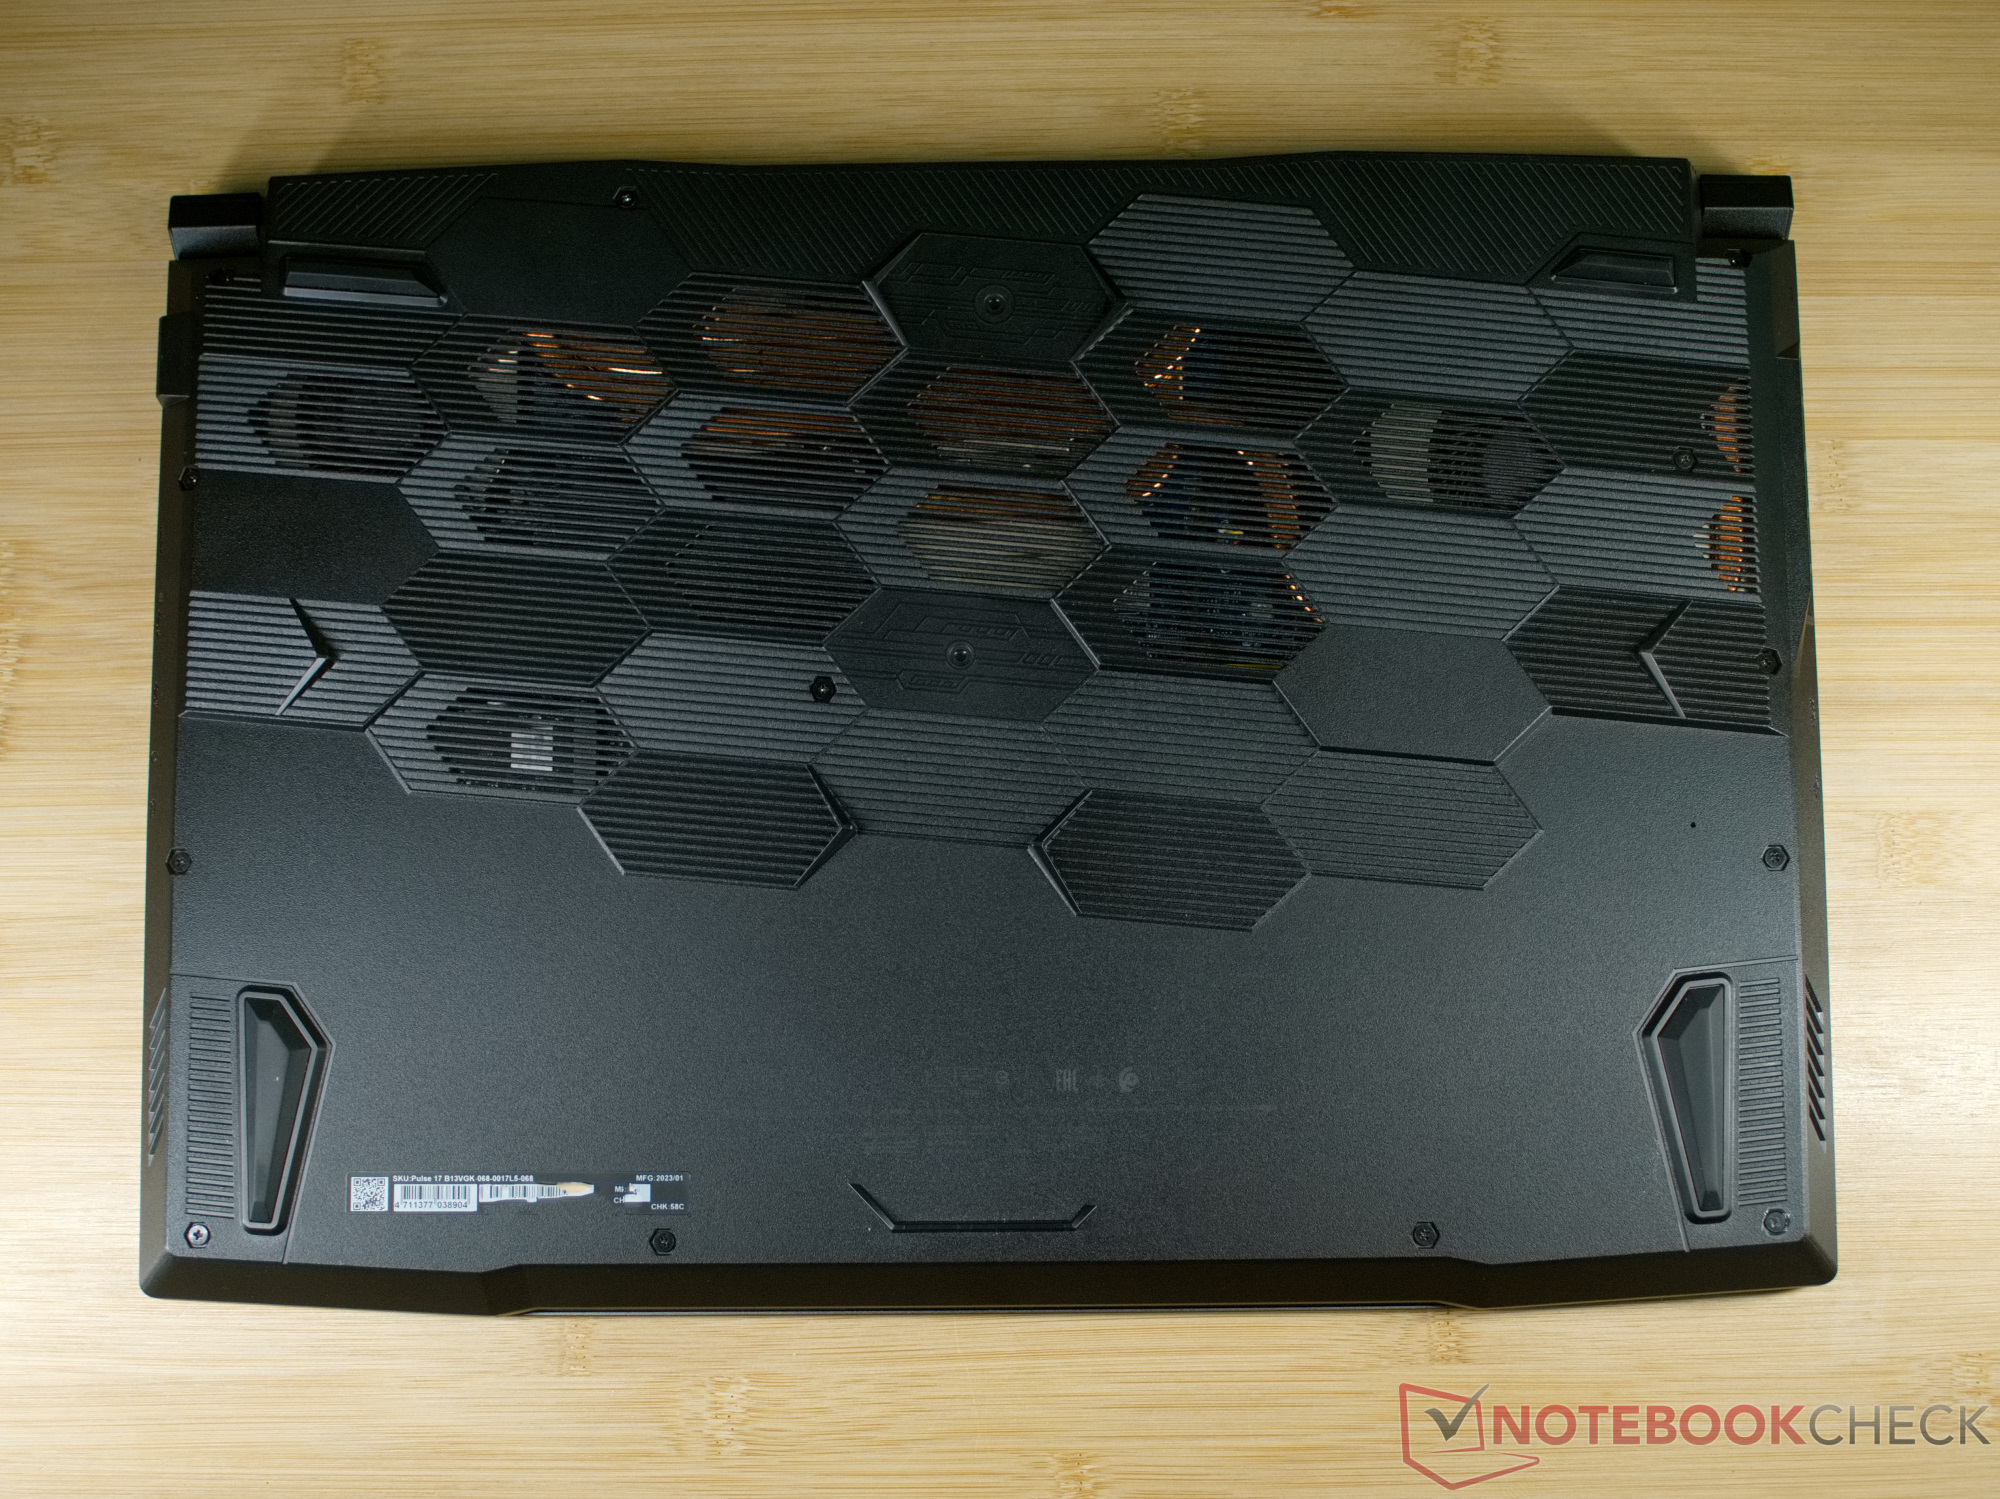
Quase todos os laptops para jogos atuais da MSI são projetados com um conceito semelhante. A MSI usa repetidamente as linhas agressivas na tampa da tela, bem como as dobradiças arrojadas e o padrão de favo de mel na parte inferior do gabinete. No Pulse 17, a tampa da tela de alumínio é ornamentada por algumas bordas que dão uma sensação adicional de ficção científica ao laptop. Sob a tampa, o tema futurista continua com a MSI também adicionando muitos elementos de design aqui.
Ao mesmo tempo, o gabinete do MSI Pulse 17 é bastante robusto, mas o tamanho grande do laptop também significa que ainda é possível deformar ou pressionar levemente os elementos plásticos. Entretanto, o Pulse 17 se apresenta como um dispositivo sólido no geral. A tela grande pode ser aberta em 180° e é capaz de manter sua posição até certo ponto. As dobradiças são quase fáceis demais de mover, e algumas vibrações leves ou toques na tela já a moverão um pouco.
Com um peso de 2,7 kg (~6 lb), o MSI Pulse 17 é o mais leve entre seus concorrentes de tamanho semelhante. Somente o modelo anterior pesa menos. Além disso, os laptops para jogos atuais em nossa comparação diferem muito pouco em termos de preenchimento da bolsa.
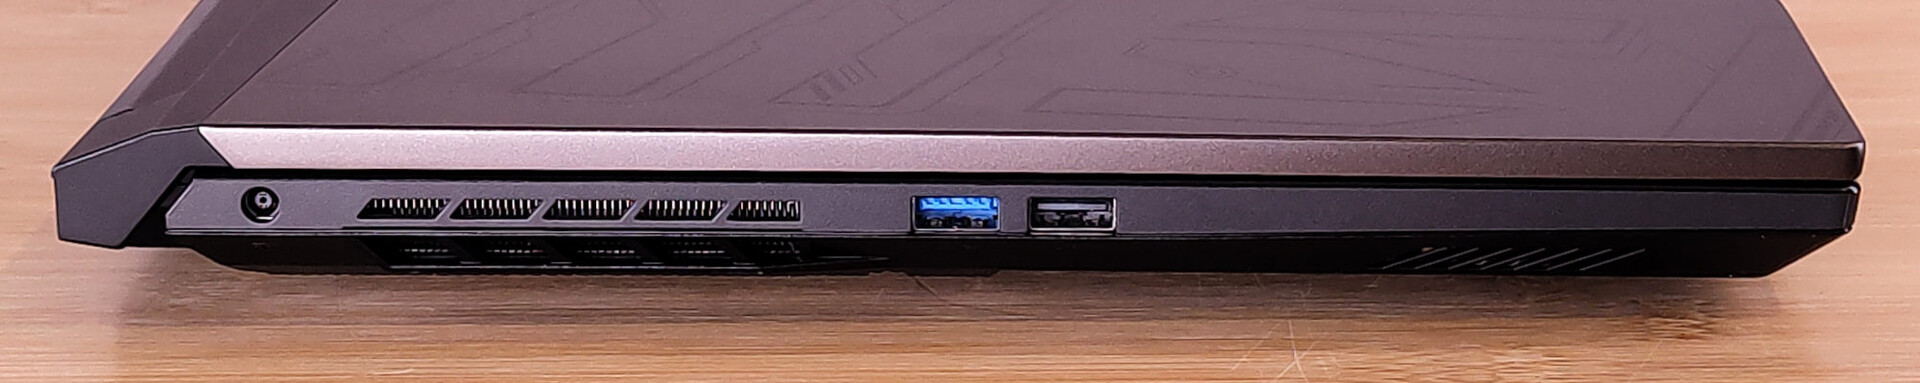
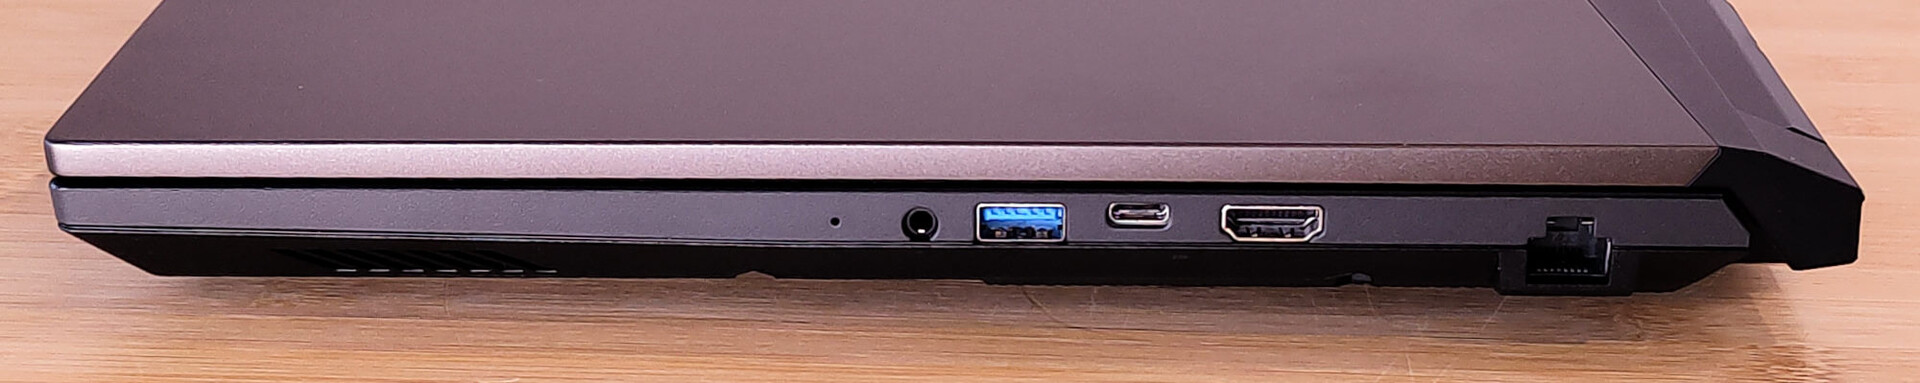
Equipamento - Sem Thunderbolt e somente USB 3.2 Gen 1
O fato de o Pulse oferecer duas conexões USB em cada lado é um design inteligente, permitindo que usuários destros e canhotos mantenham seus cabos fora do caminho. Uma das portas USB do lado direito é uma conexão USB-C, mas, infelizmente, ela suporta apenas transferência de dados e DisplayPort.
Comunicação
Com Gigabit LAN e WiFi 6 do módulo Intel AX201, o Pulse 17 não está realmente atualizado em termos de tecnologia de rede. Por outro lado, nossa unidade de teste mostra que velocidades de transferência altas e estáveis também são possíveis na rede de 5 GHz.
Webcam
A webcam do MSI Pulse 17 também não é nada moderna. Ela oferece resolução HD e produz imagens bastante borradas com fortes desvios cromáticos nas bordas contrastantes.


Acessórios
Além da documentação habitual, um adesivo com o dragão vermelho e o carregador para o laptop, não encontramos nenhum acessório adicional na caixa.
Manutenção
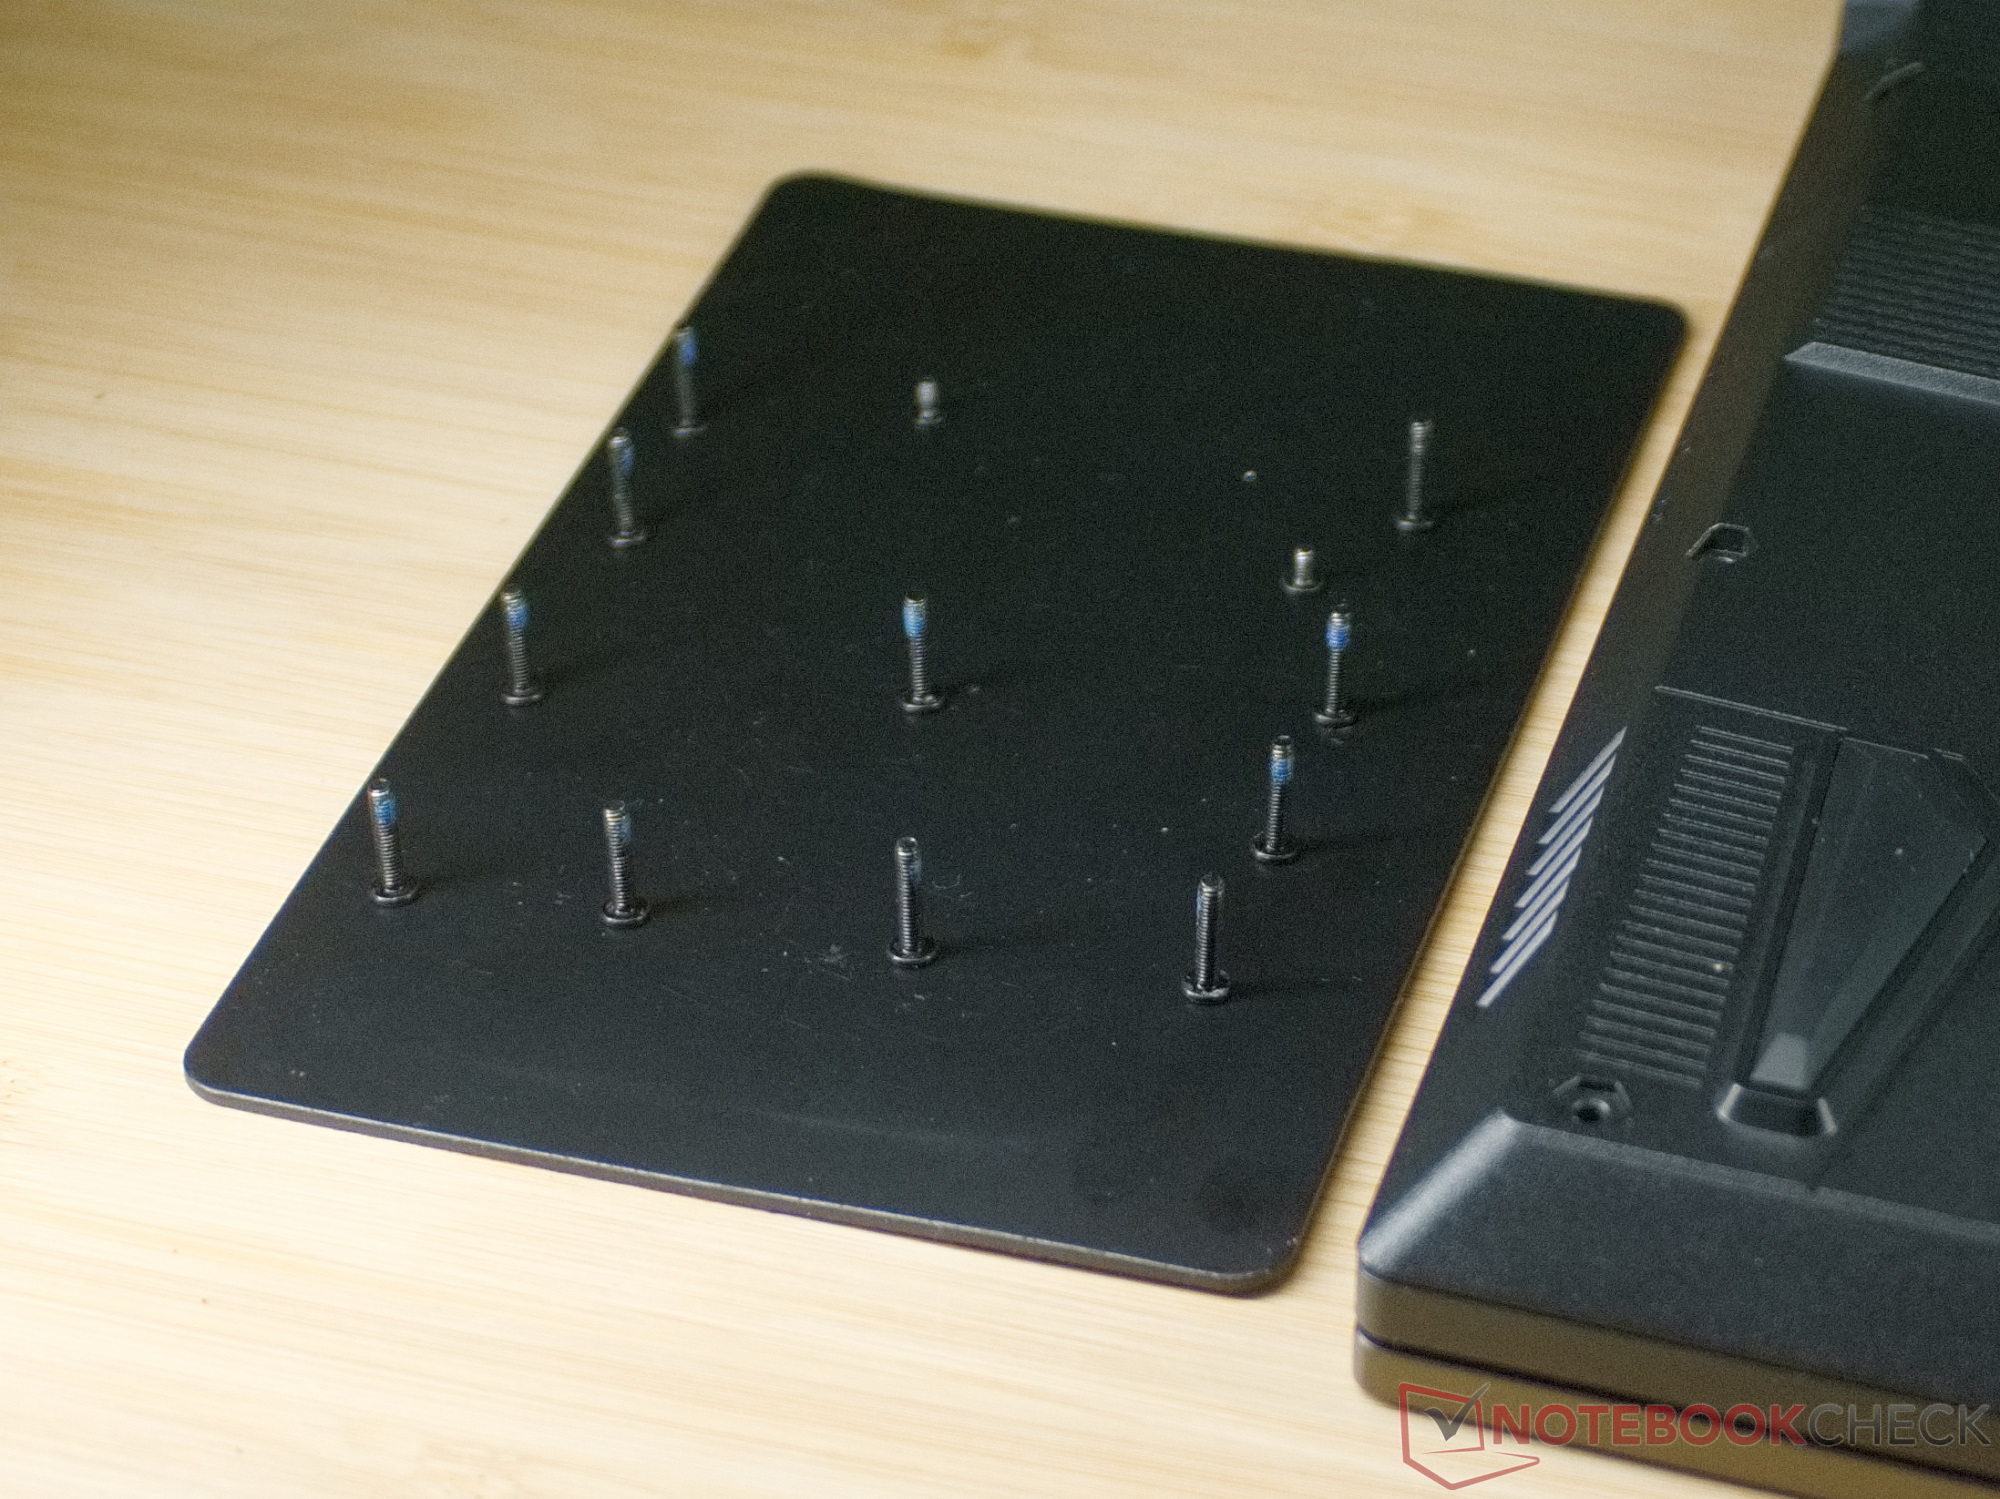
Um dos 13 parafusos Phillips PH0 que prendem a parte inferior do gabinete está protegido por um selo adesivo em nossa unidade de teste. Embora a MSI enfatize repetidamente que isso não é relevante para a garantia, alguns fornecedores podem protestar se o lacre for quebrado em um caso de garantia.
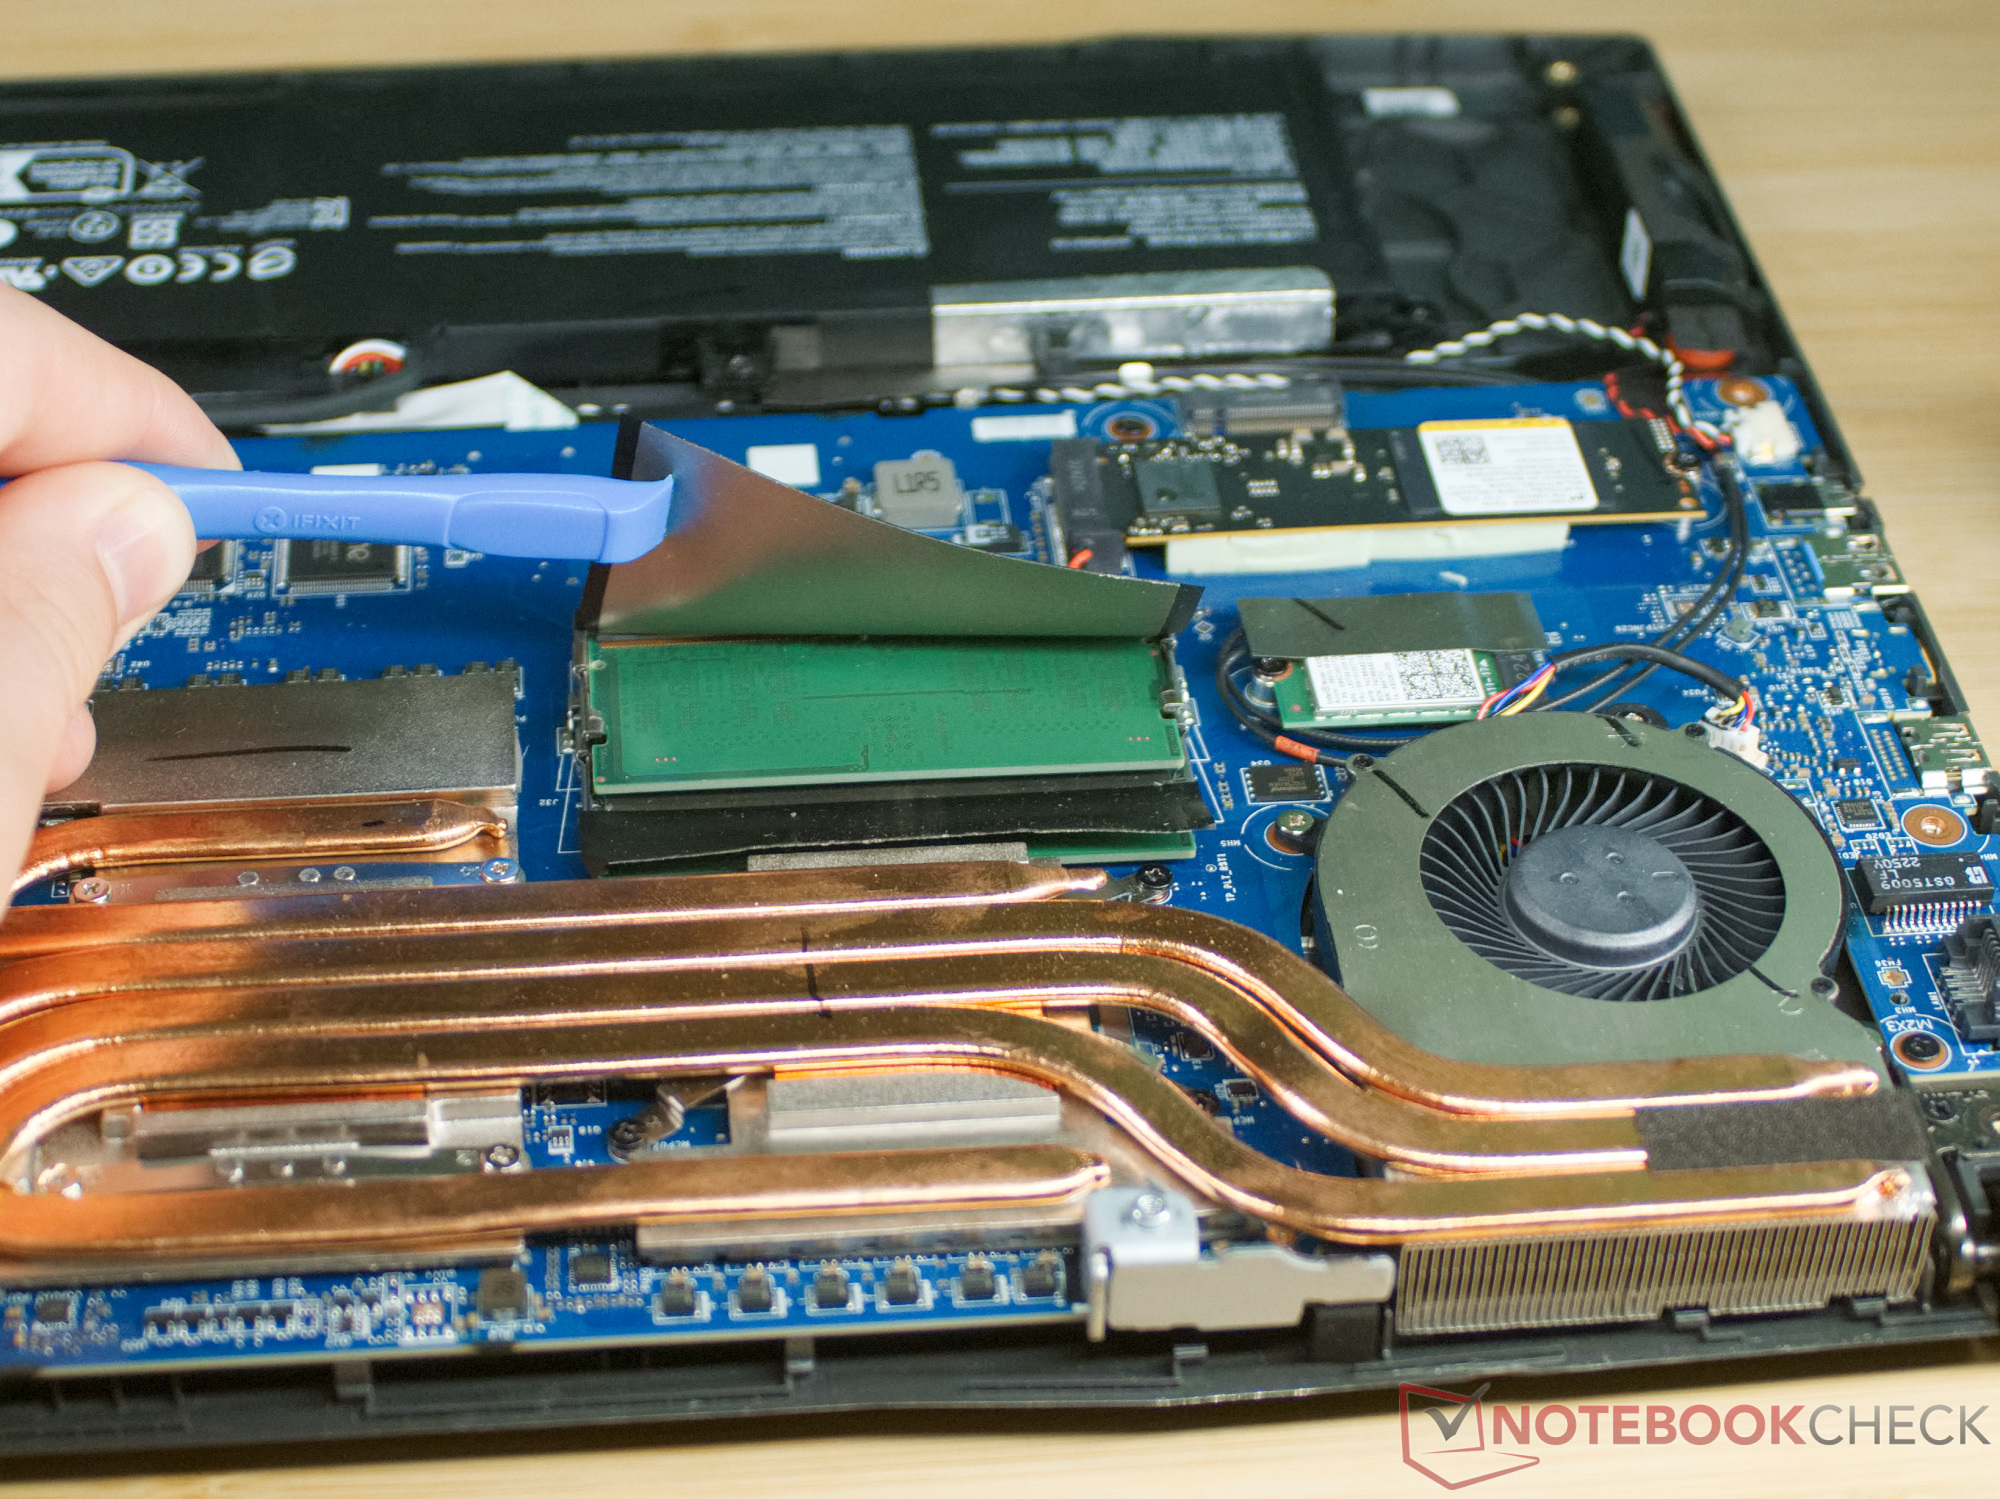
Ao remover os 13 parafusos, você também deve marcar a posição deles, pois dois dos parafusos são significativamente mais curtos. A tampa inferior também é presa por vários clipes, mas eles podem ser abertos facilmente com uma ferramenta de plástico, permitindo que você levante a tampa inferior depois.
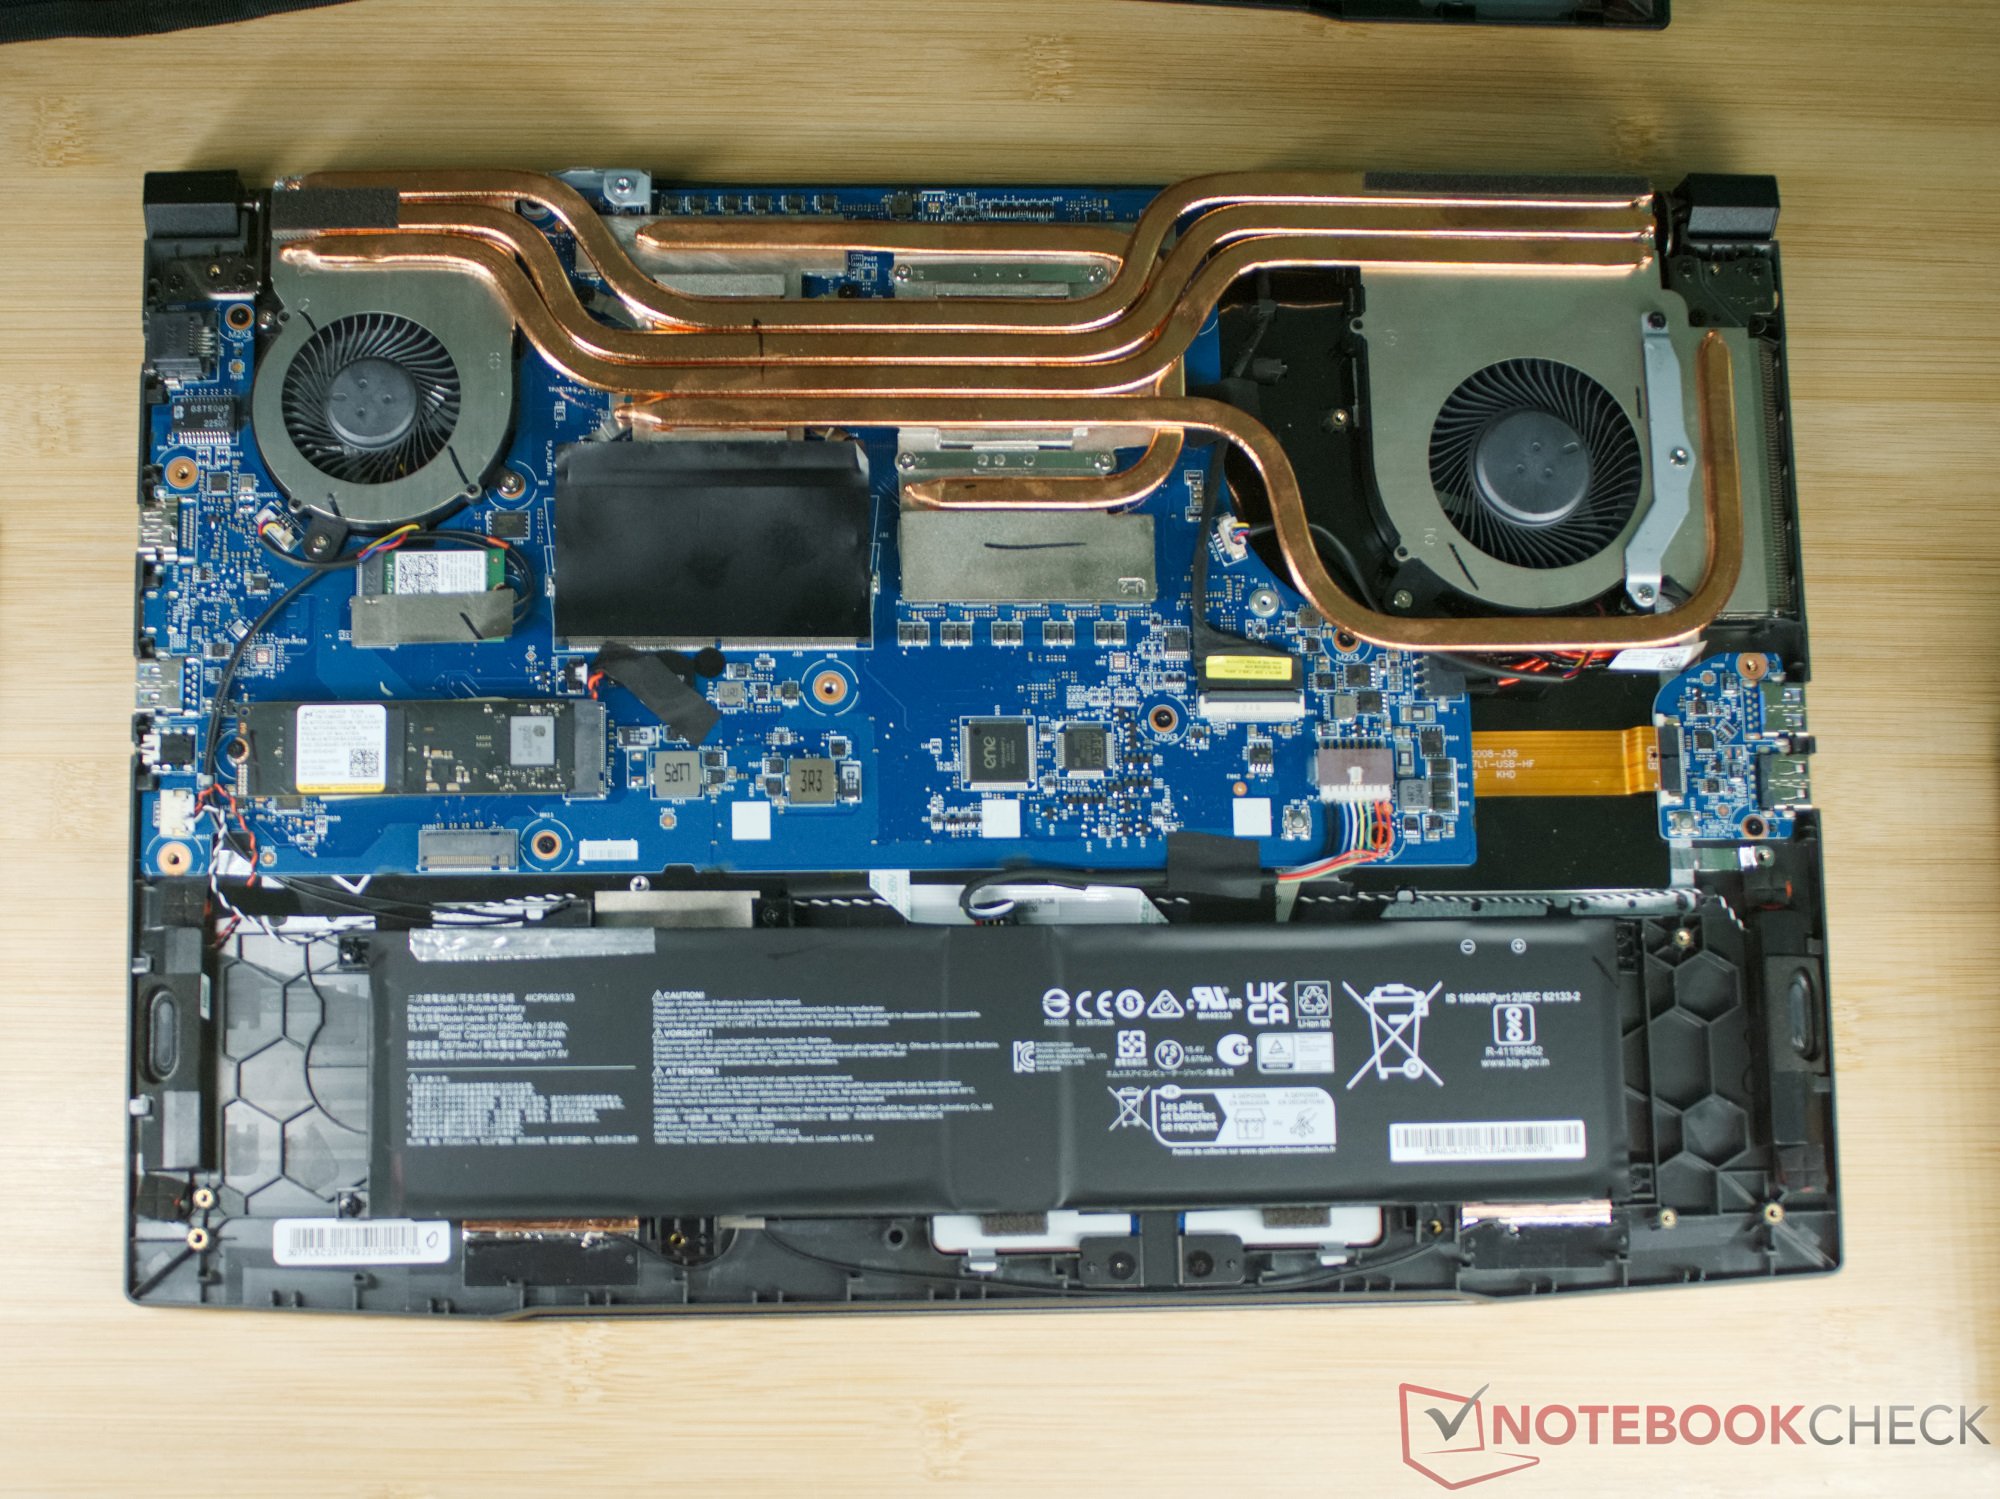
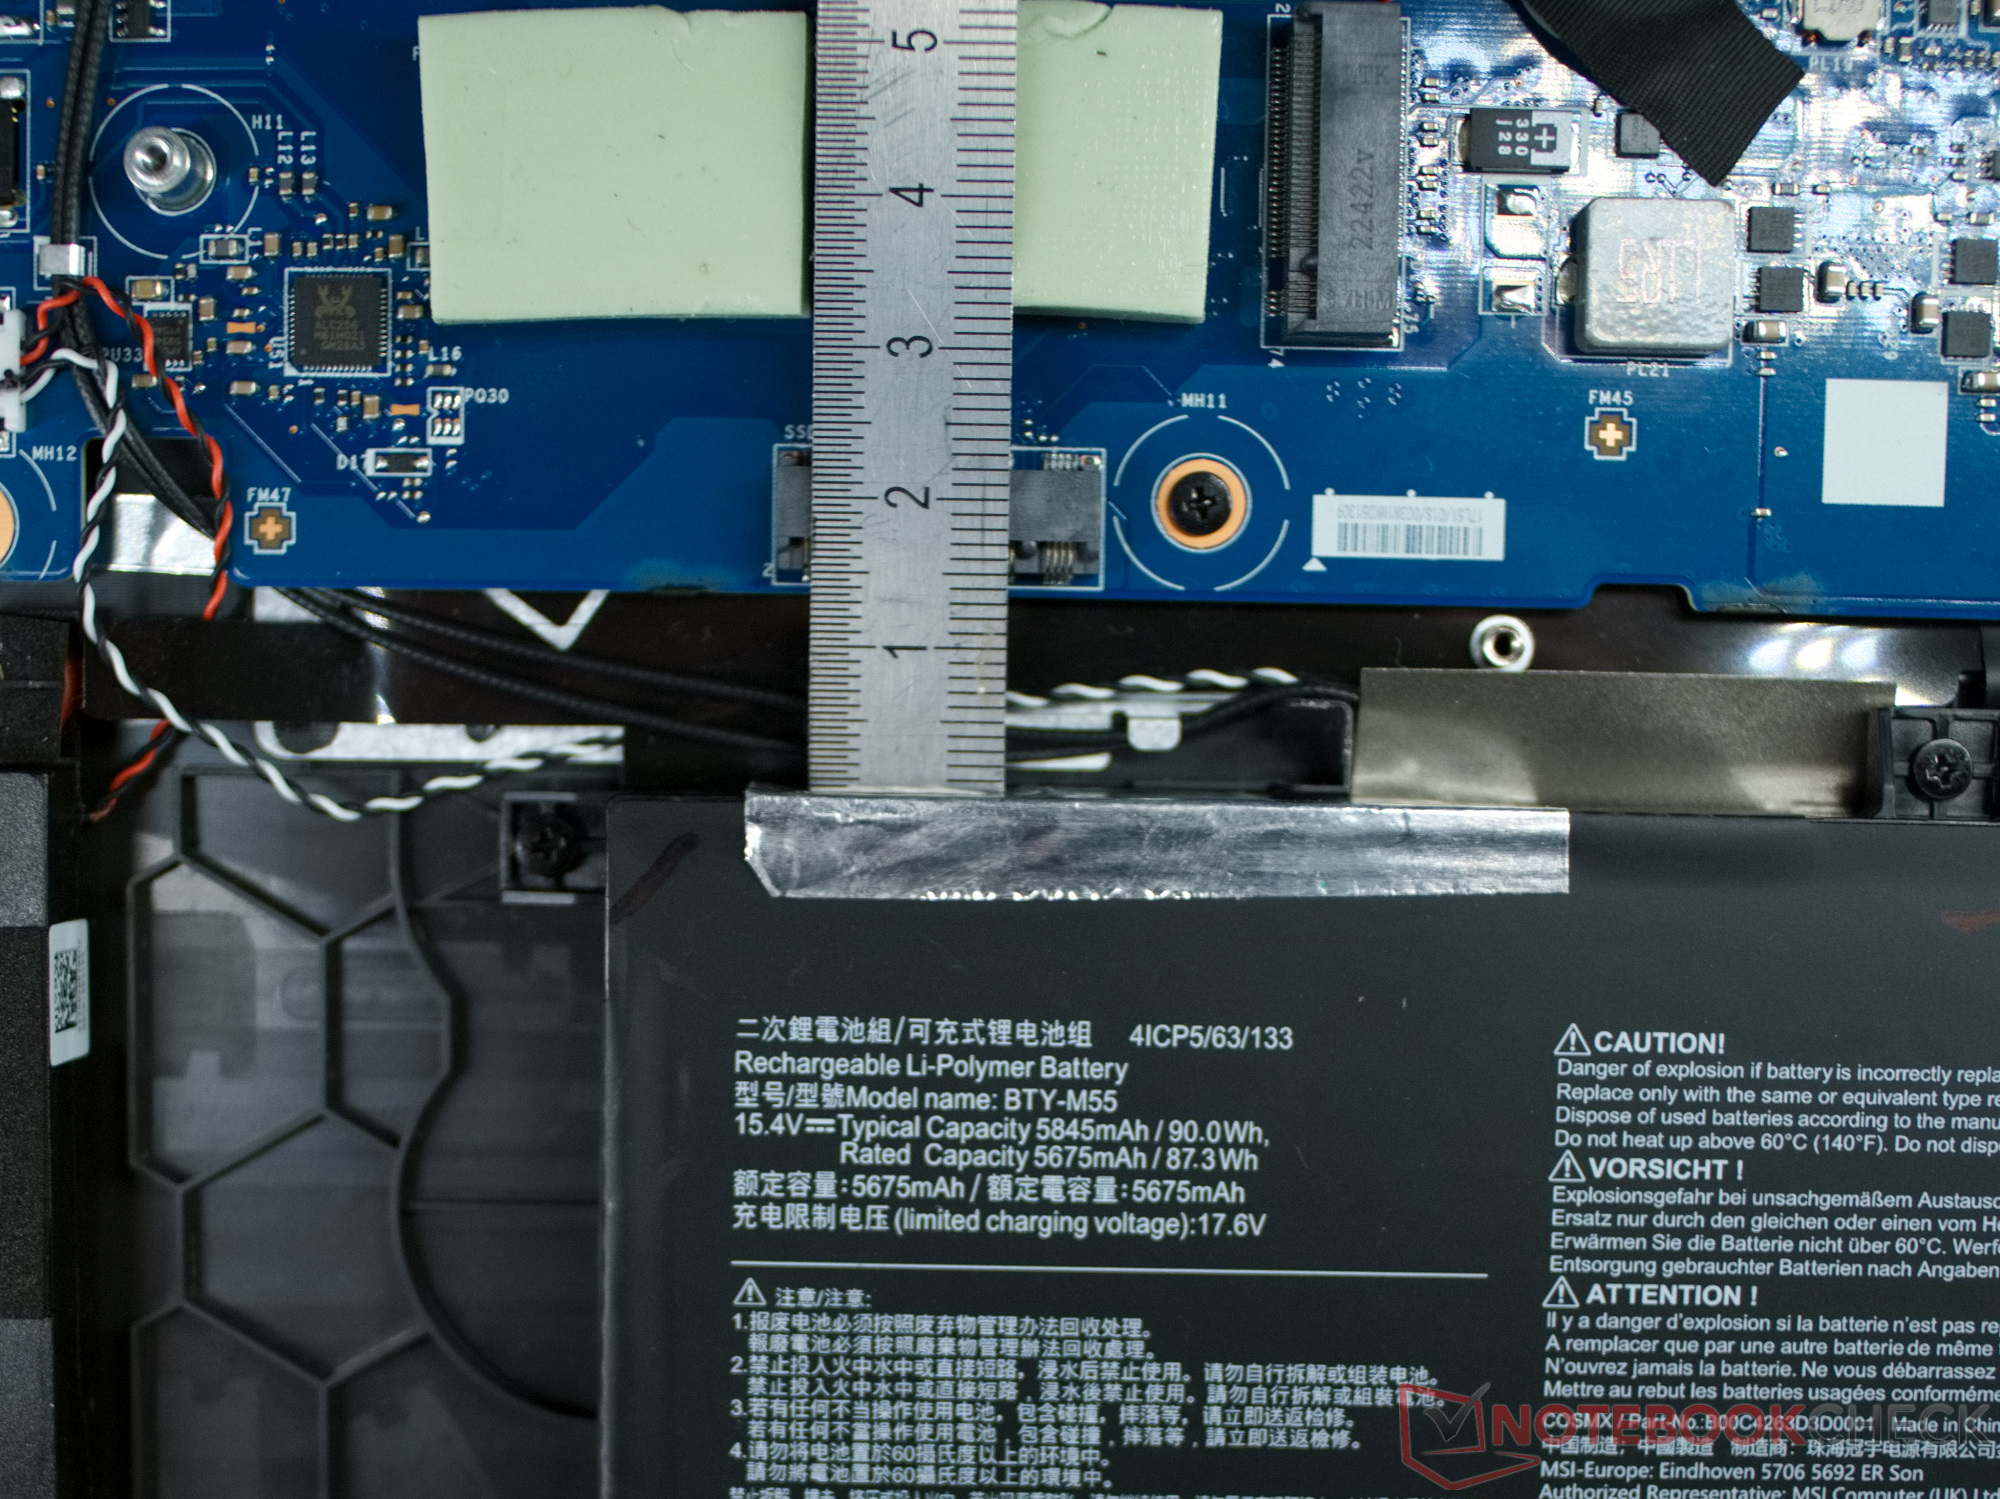
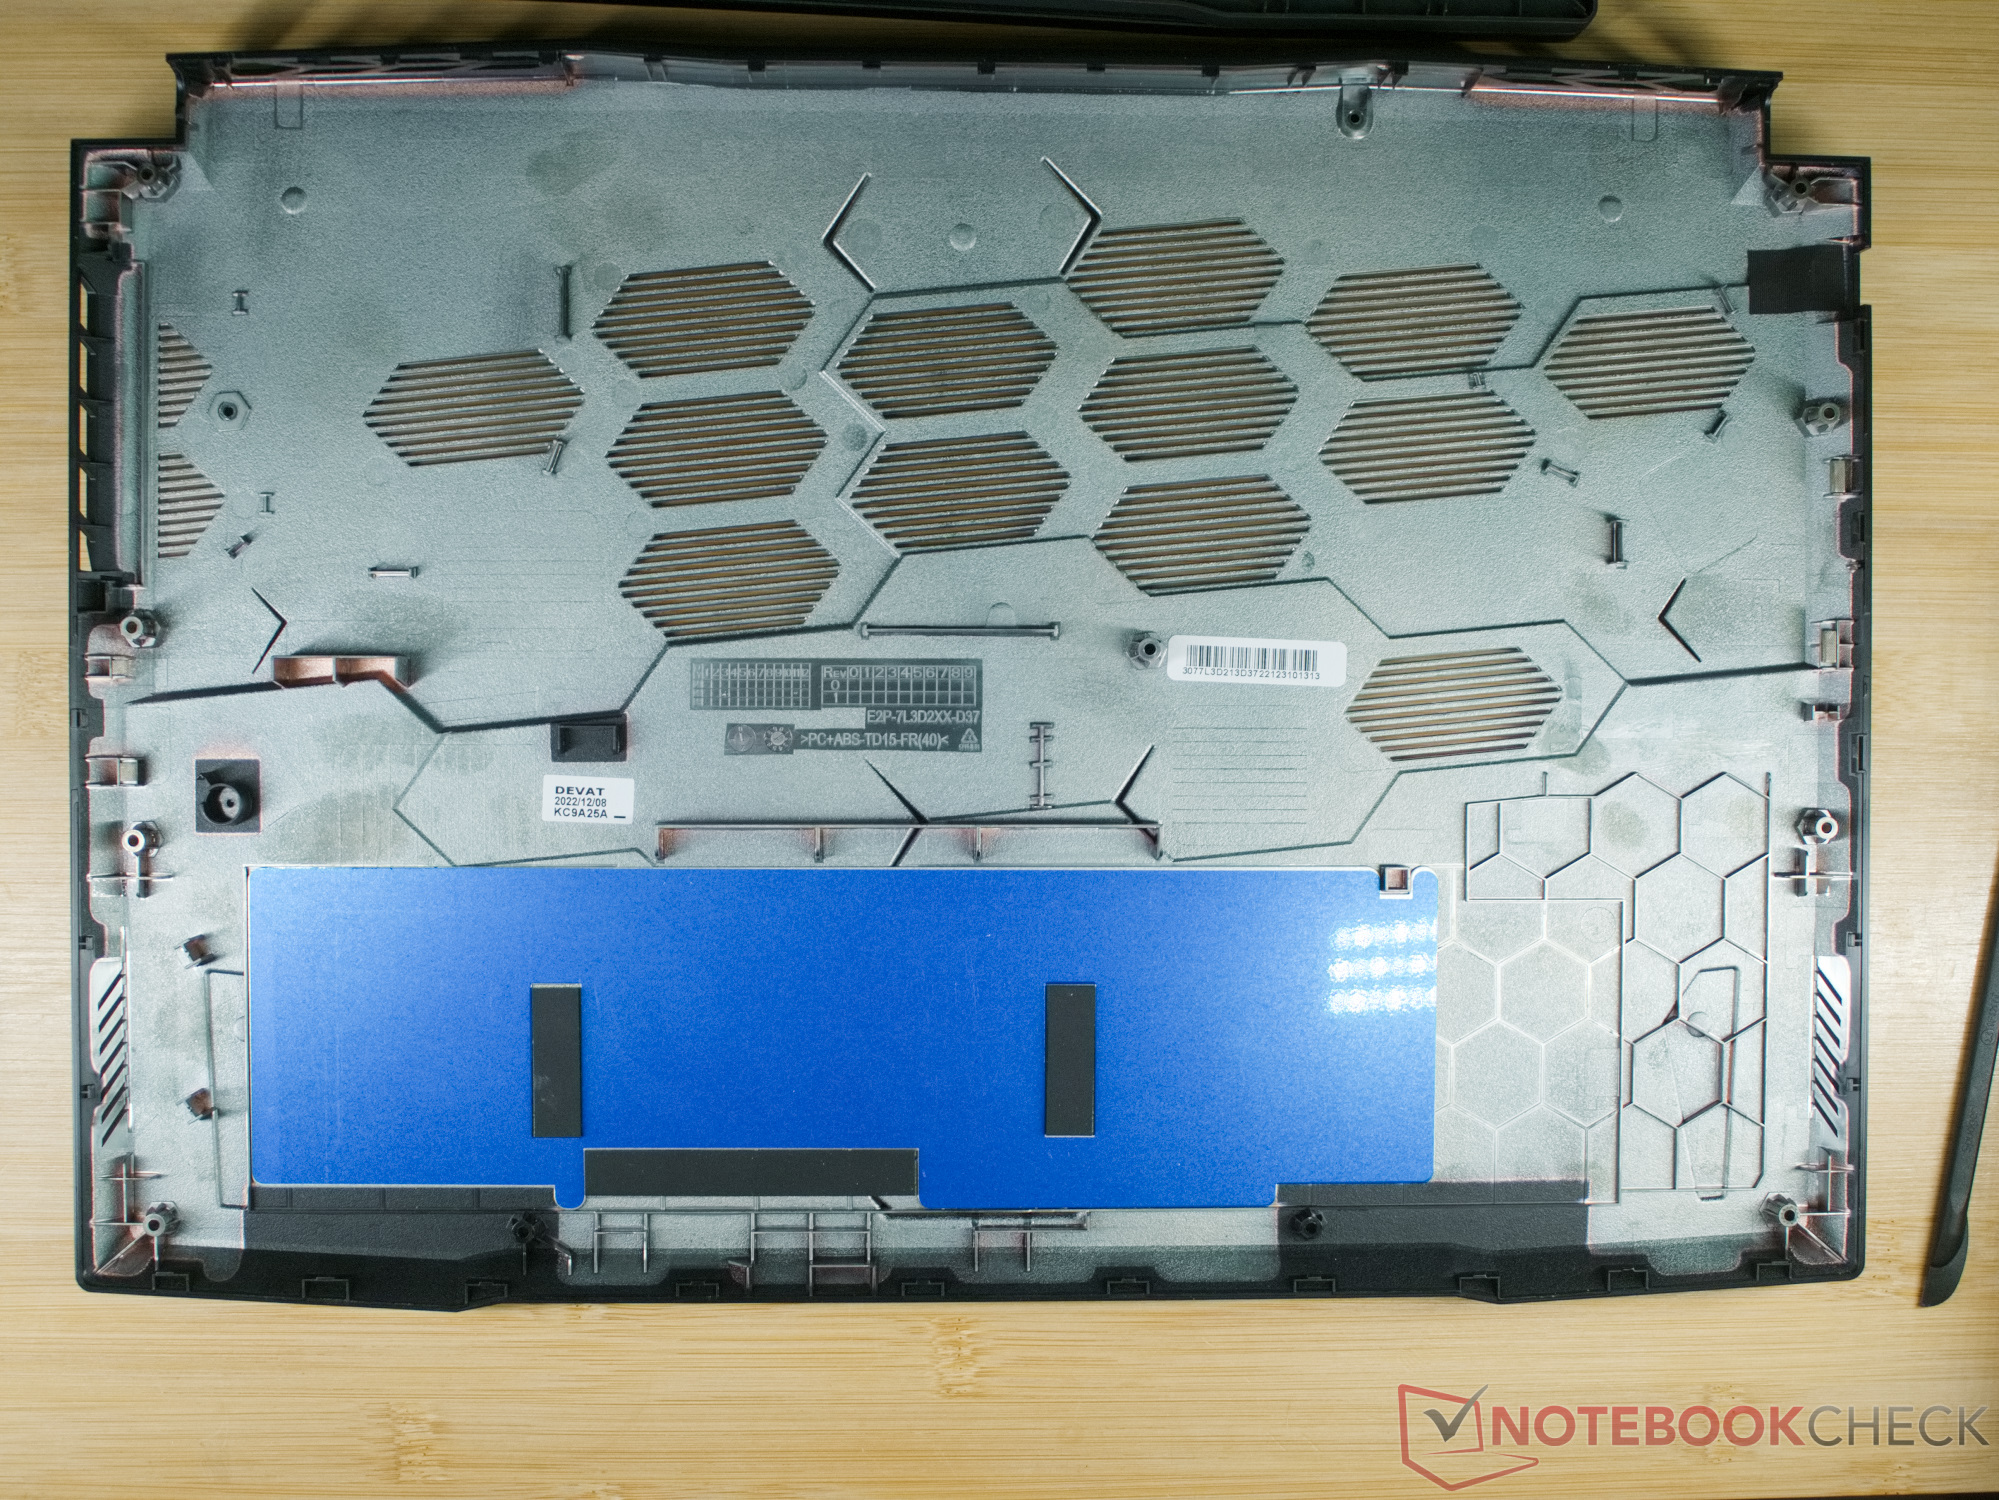
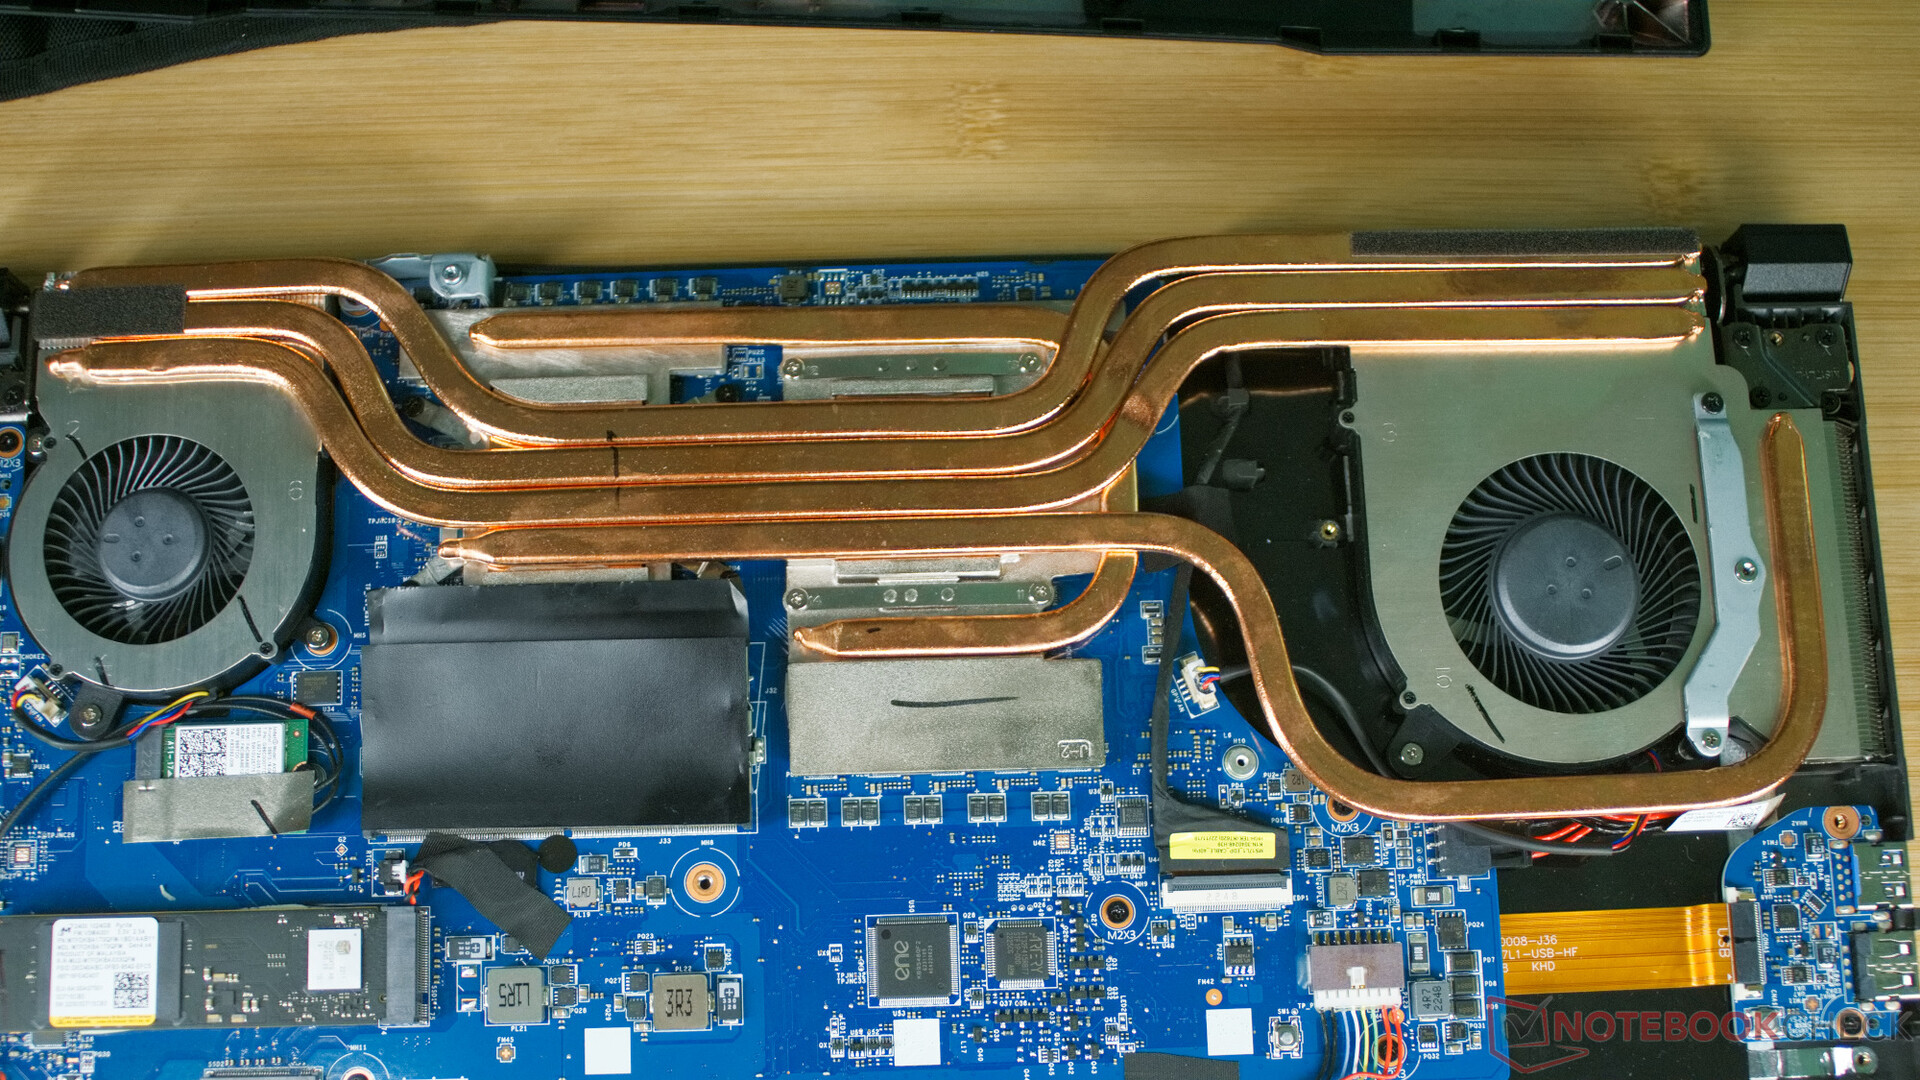
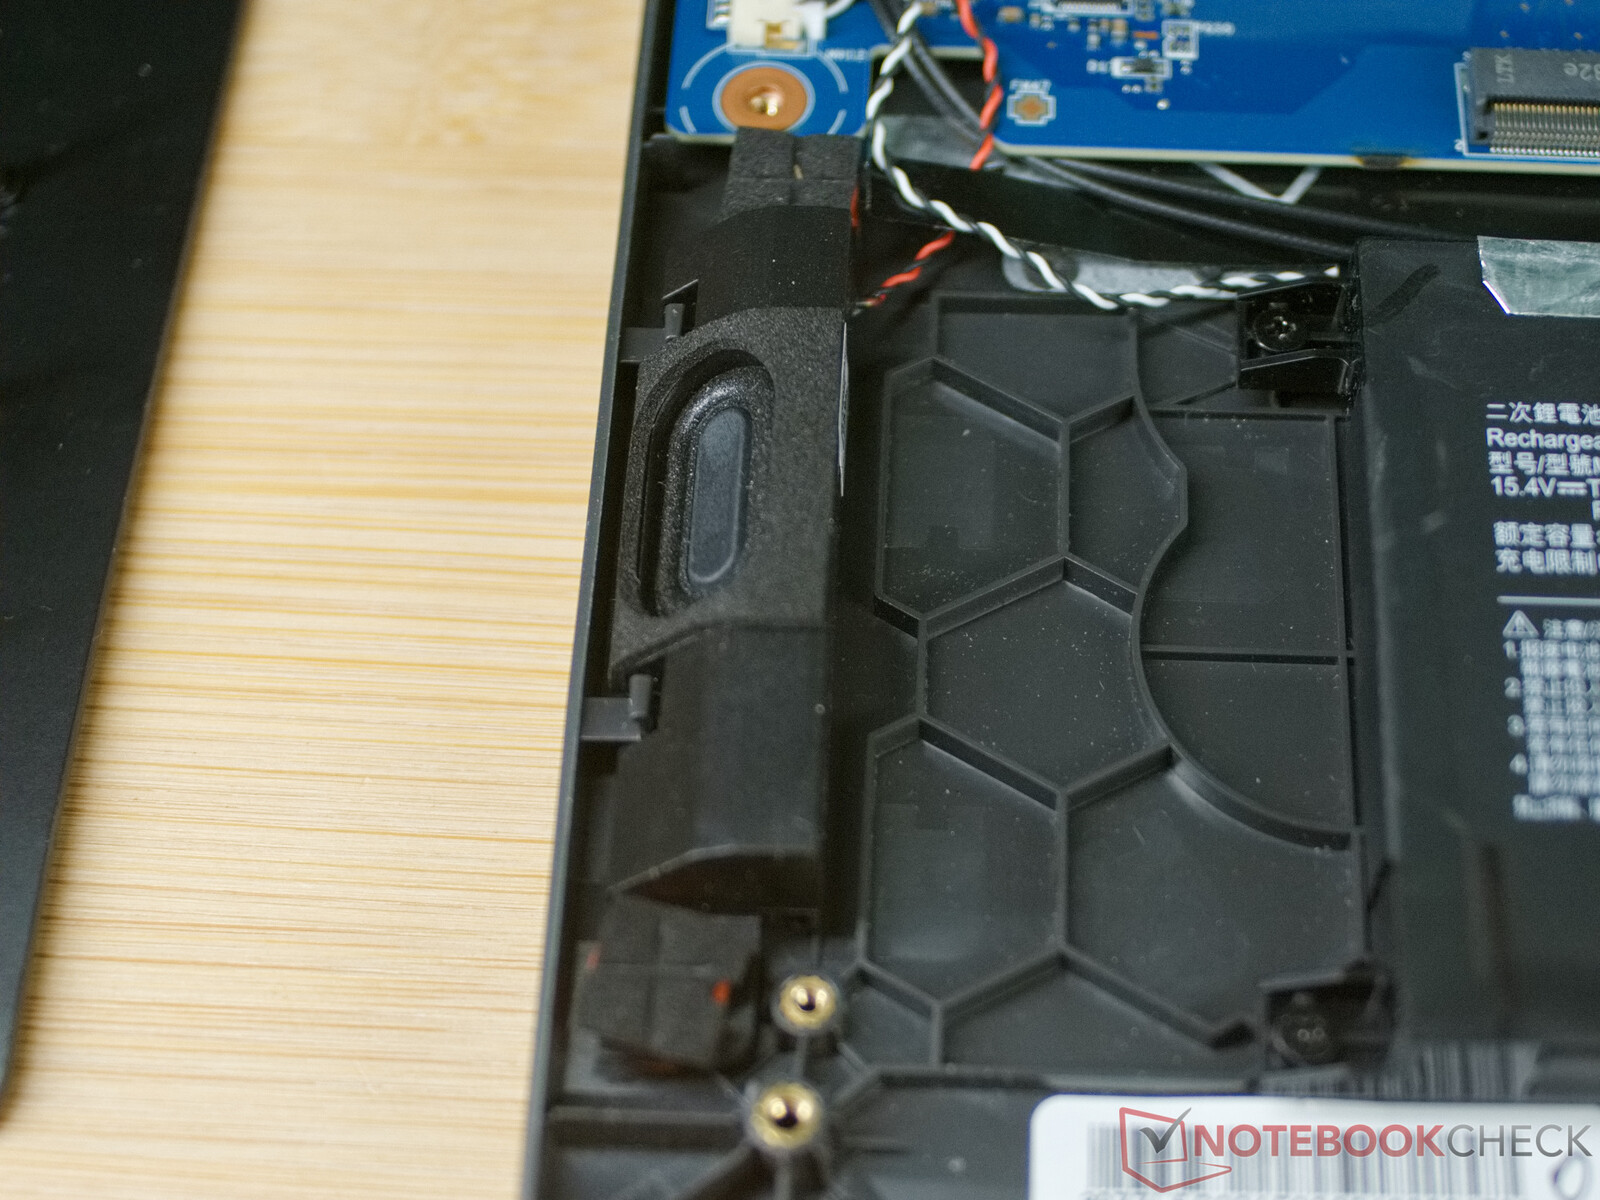
Dentro do notebook, encontramos uma construção bastante modular, de modo que a RAM, o SSD NVMe e a WLAN/Modul podem ser substituídos rapidamente. A bateria, os alto-falantes e a placa com as duas conexões USB também podem ser substituídos facilmente. Entretanto, aqueles que gostam de remover regularmente a poeira entre os ventiladores e as aletas de resfriamento precisam remover todo o sistema de resfriamento para poder fazer isso.
O laptop também oferece um segundo slot M.2 PCIe, mas, infelizmente, ele está bloqueado pela bateria. Portanto, você provavelmente só poderá instalar um segundo SSD com uma solução que utilize adaptadores e cabos.
Garantia
A MSI oferece uma garantia de 24 meses para compradores na Europa.
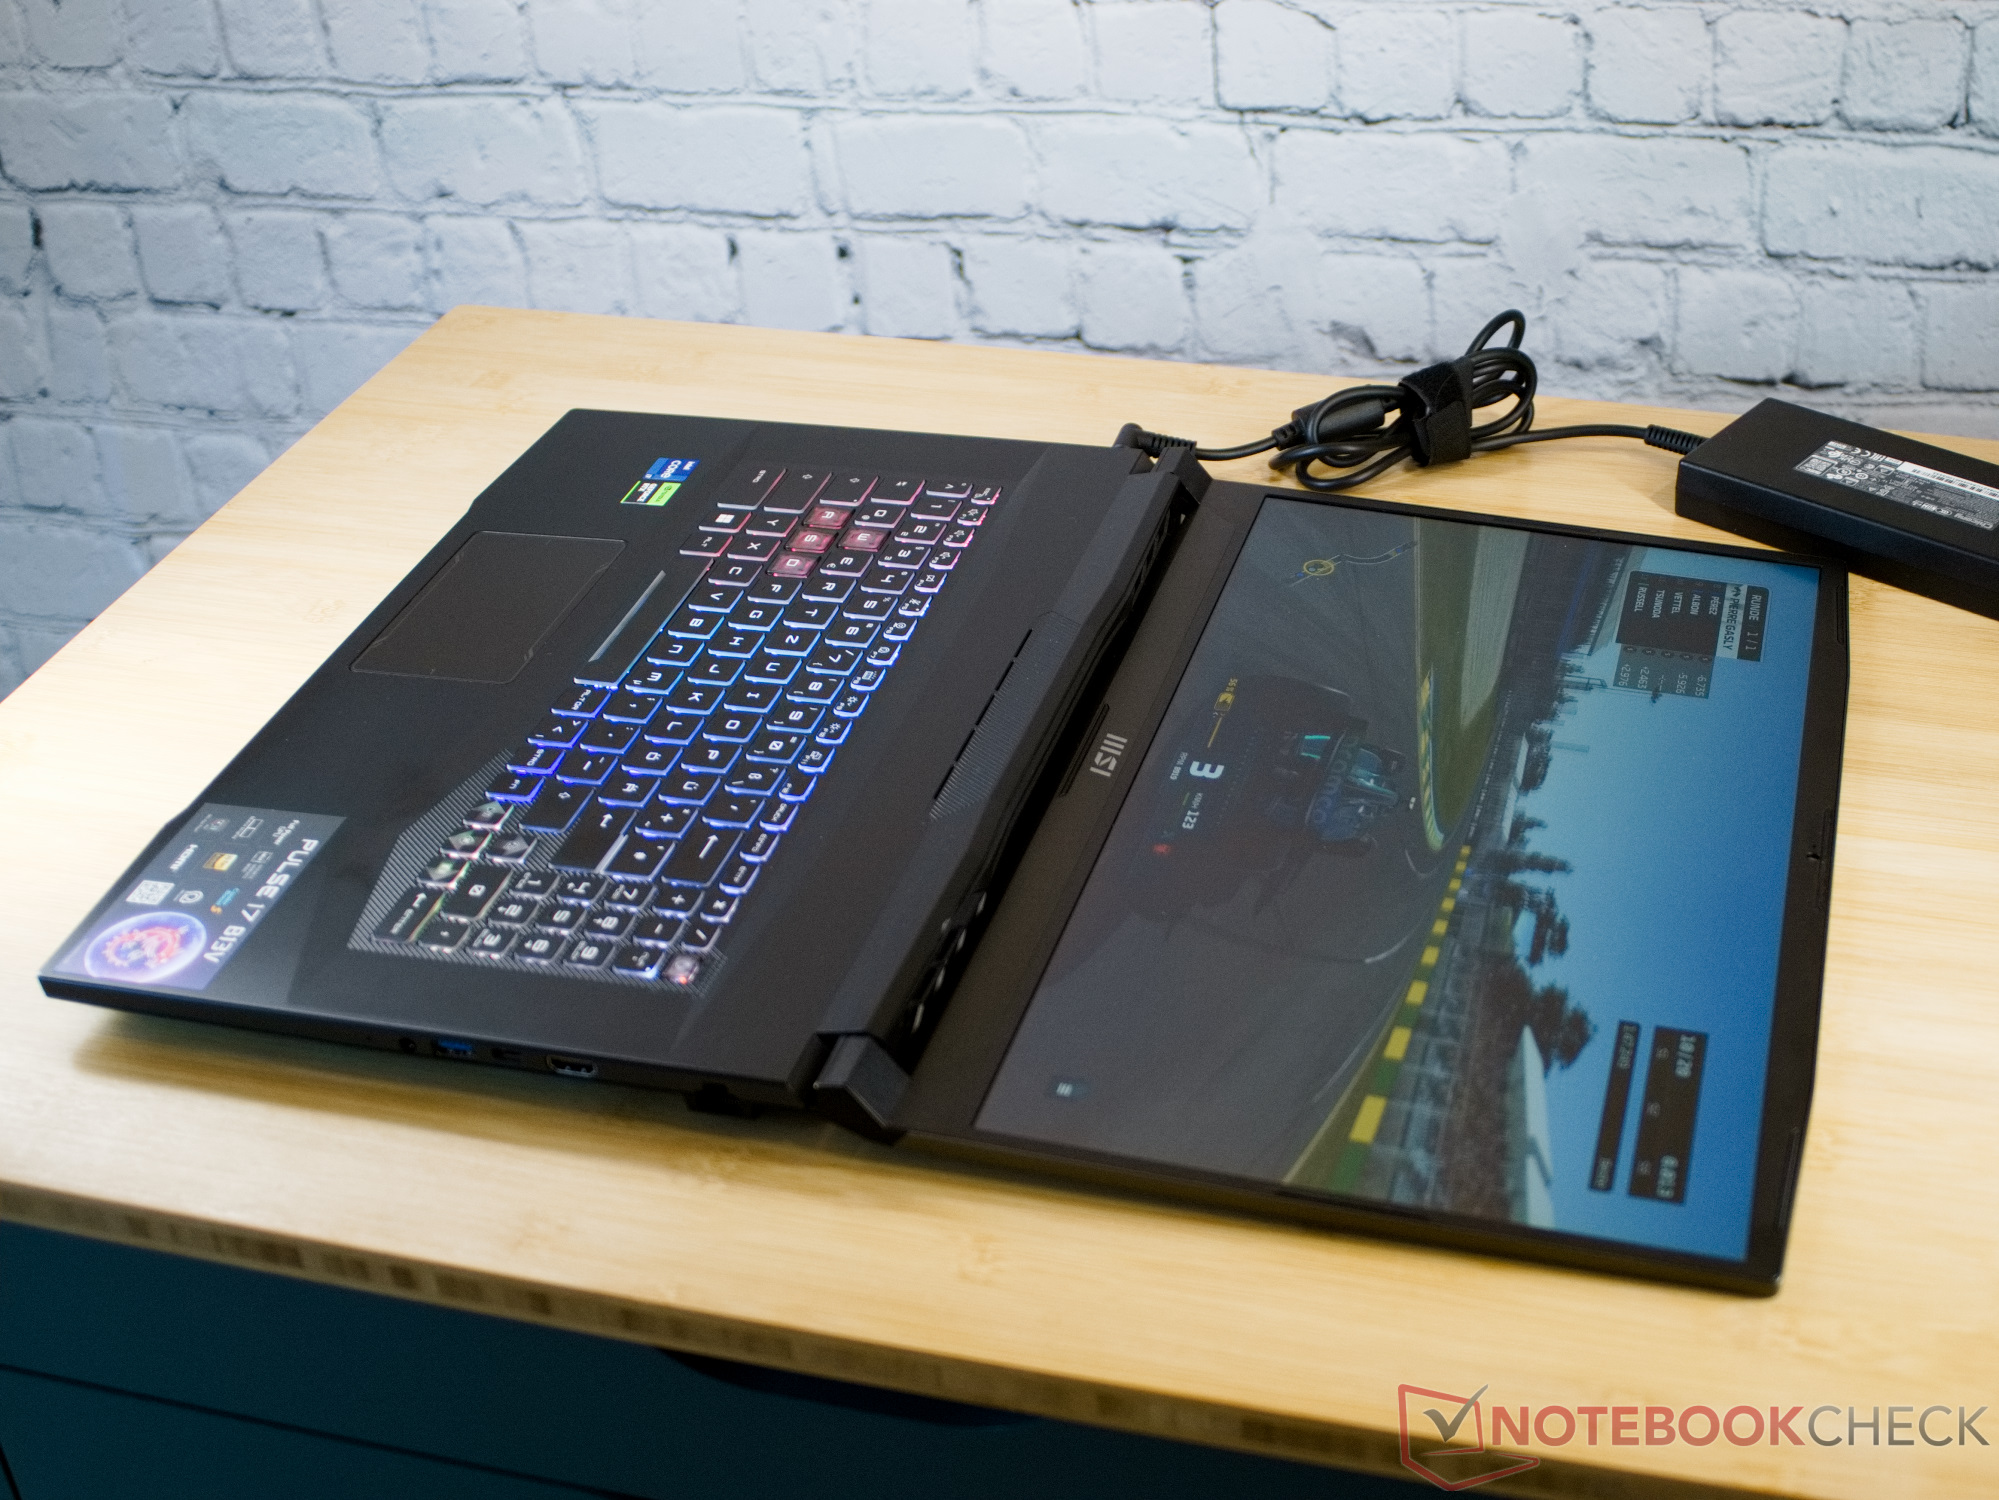
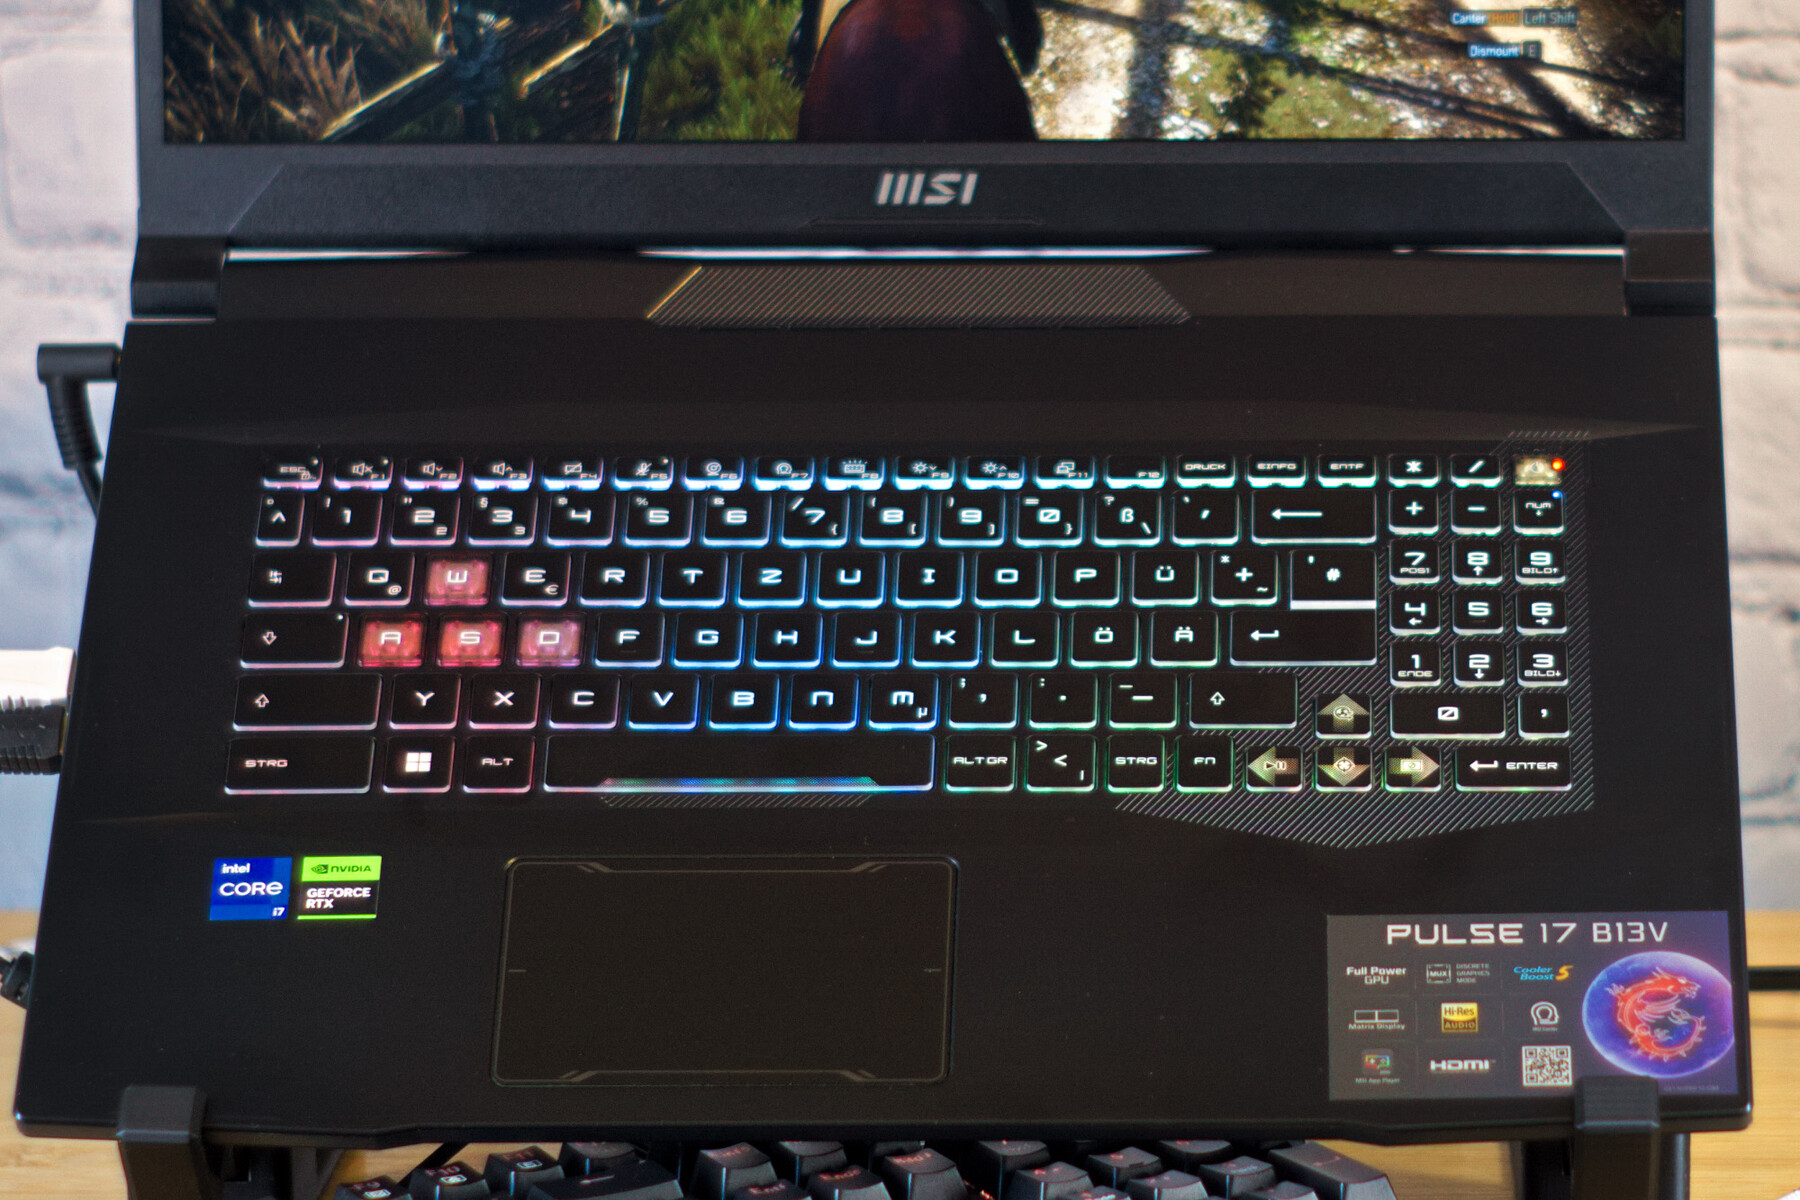
Input Devices - Four RGB zones and a small touchpad in the MSI Pulse
Teclado
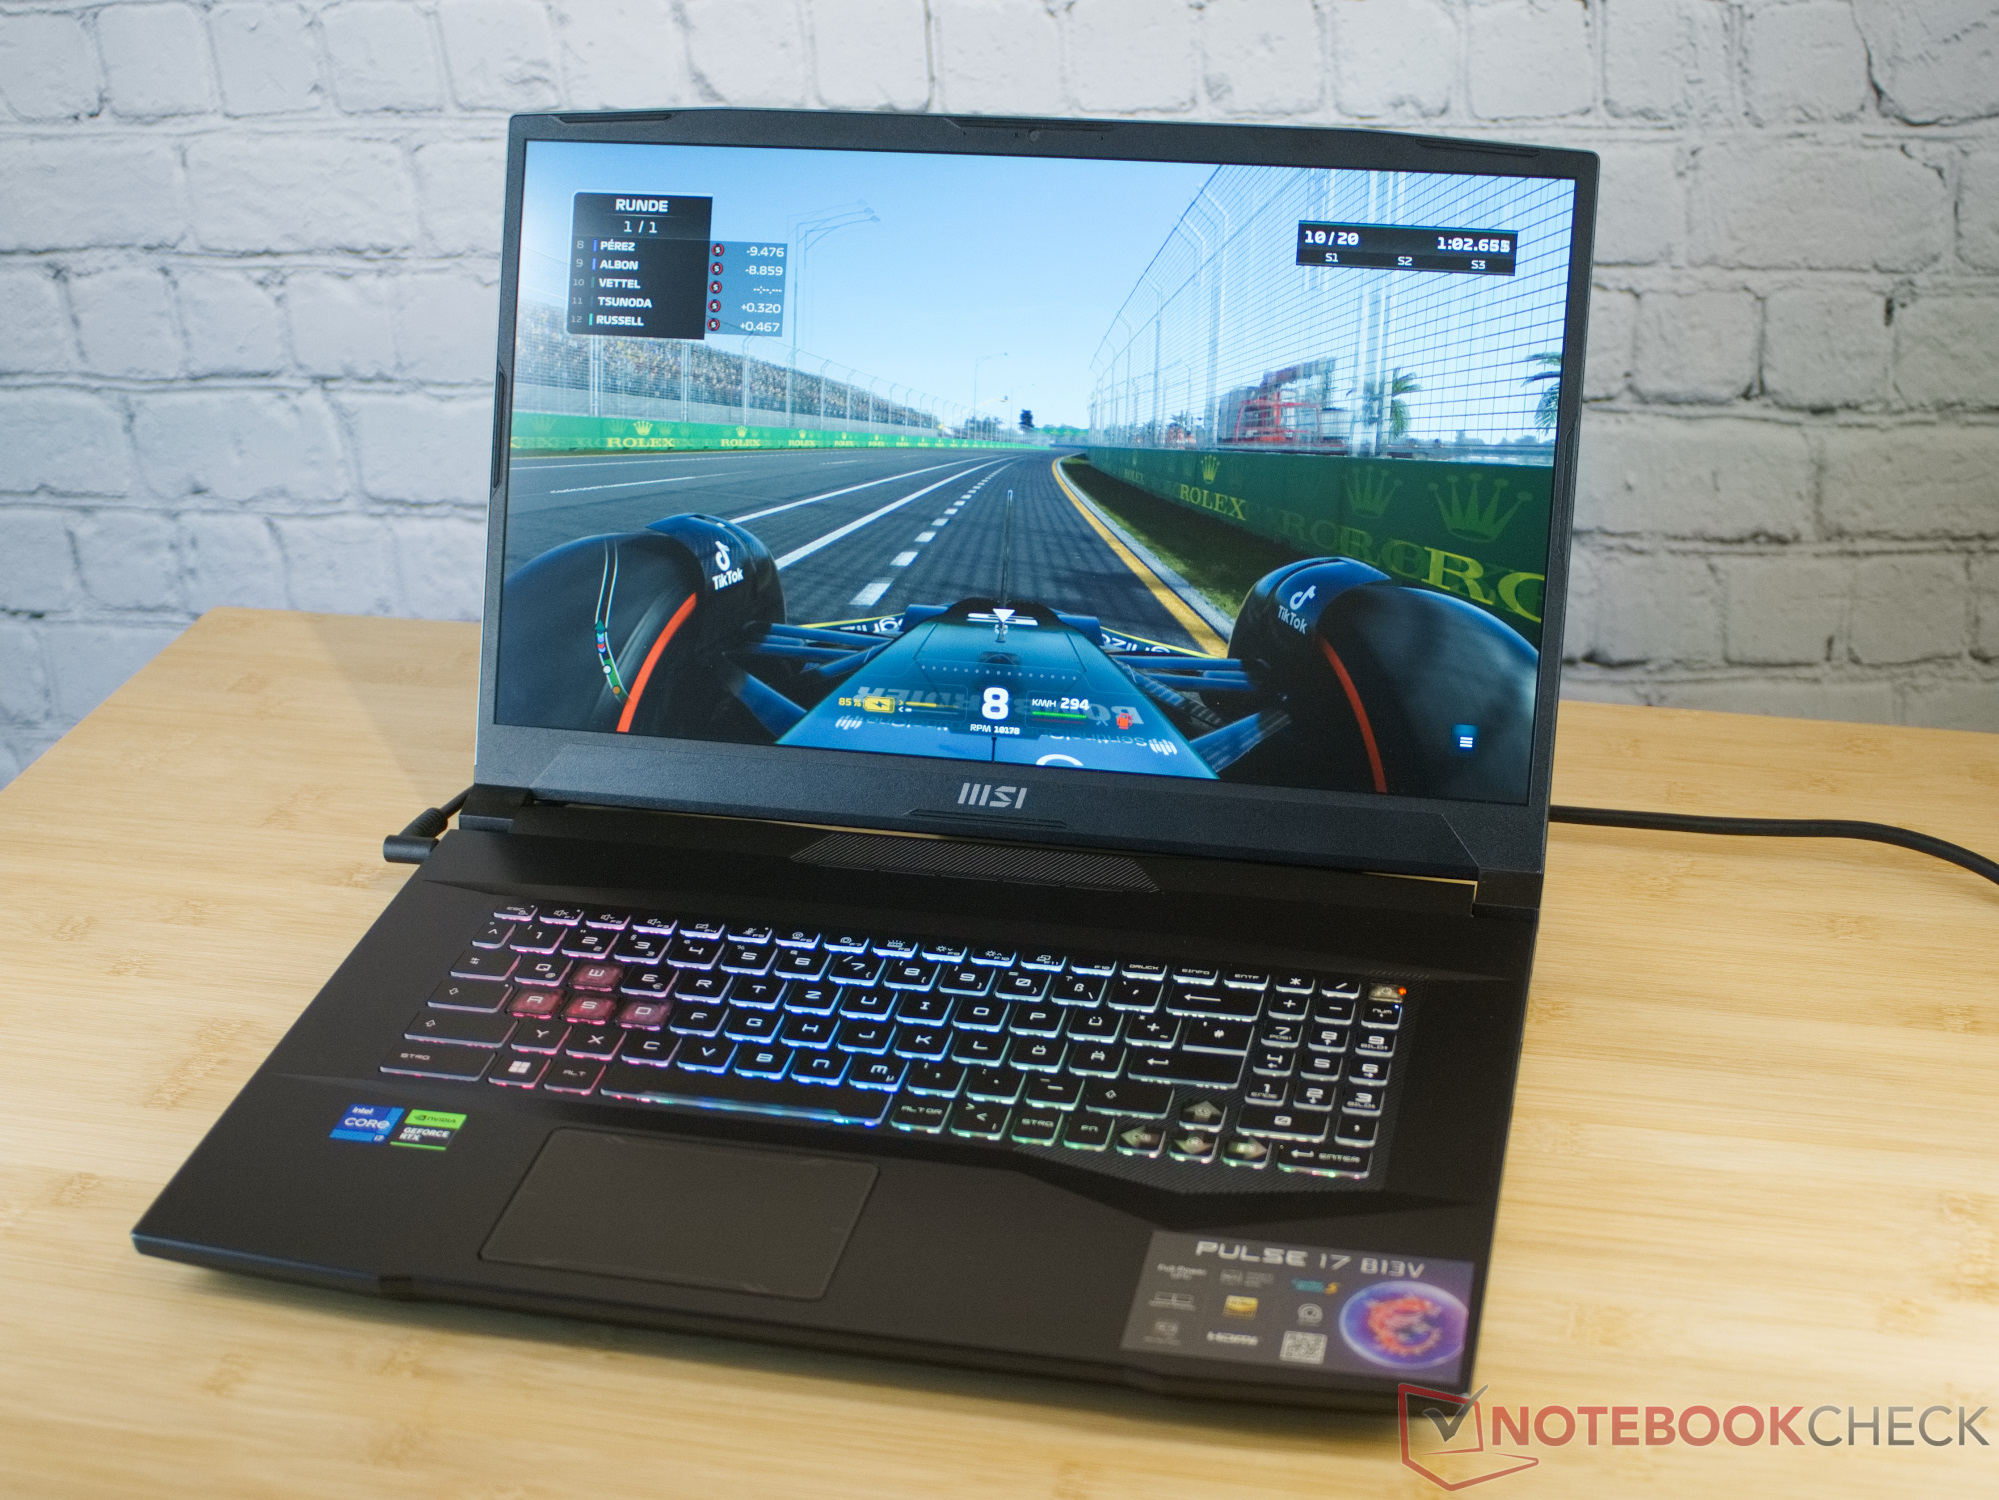
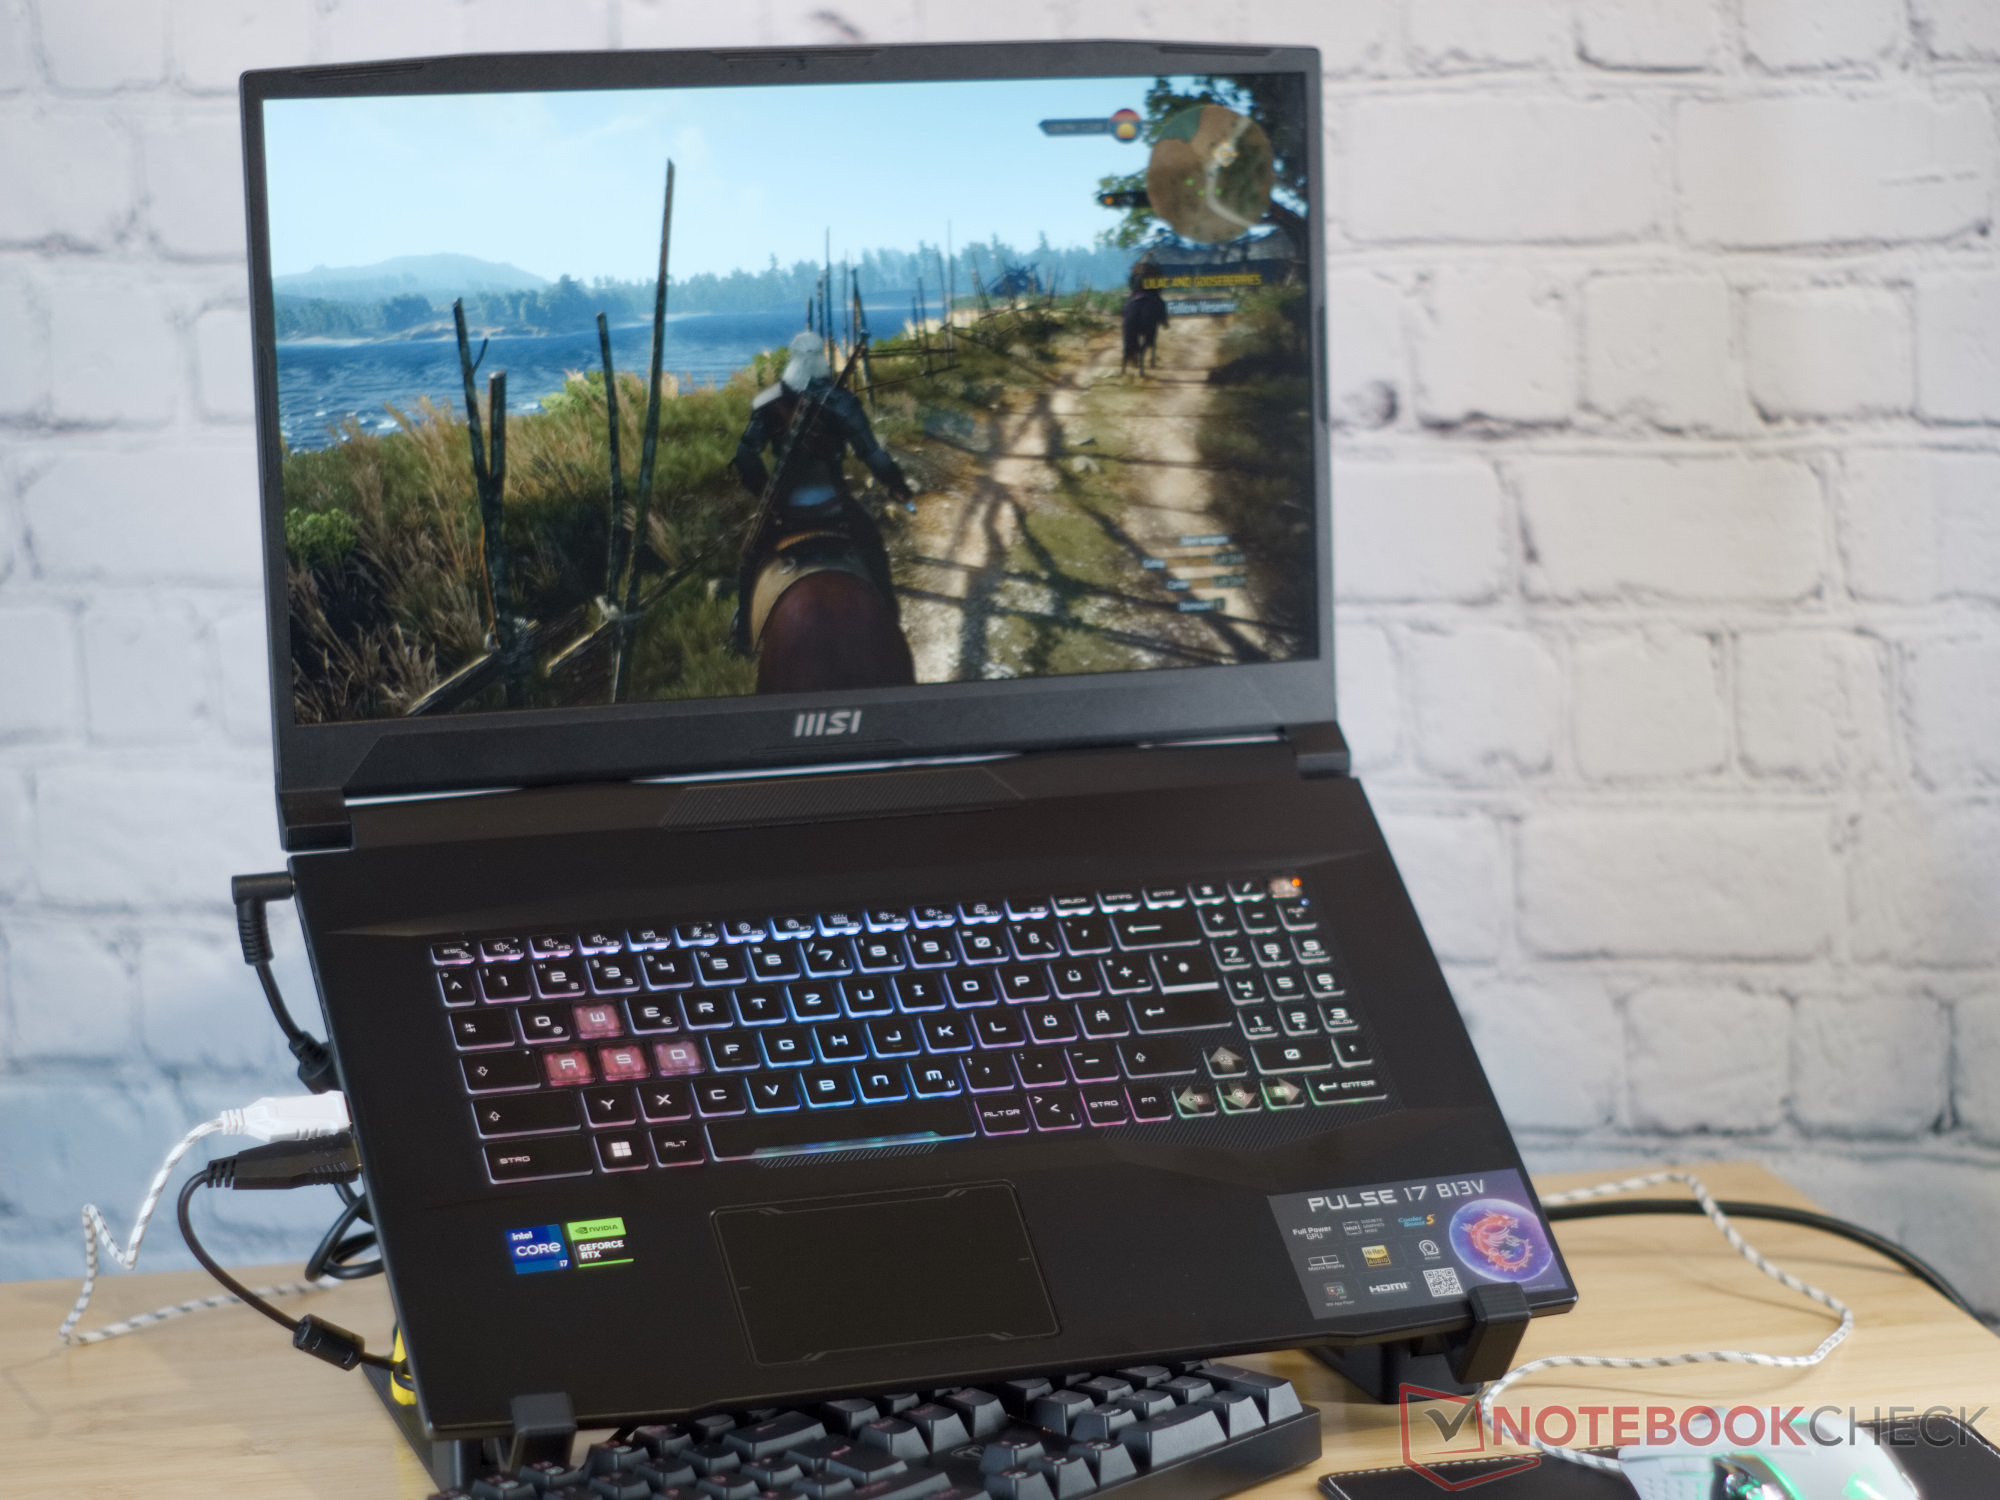
O MSI Control Center permite que você controle a iluminação de fundo RGB do teclado MSI Pluse 17. O fabricante também permite o uso de software de terceiros para alterar as cores e os efeitos nas quatro zonas de iluminação do teclado. As teclas transparentes W, A, S e D são particularmente enfatizadas aqui. O teclado oferece um bom feedback tátil e um toque de tecla de cerca de 1,2 mm (~0,05 pol.).
Touchpad
O touchpad do Pulse 17 é relativamente pequeno, mas isso também significa que ele não atrapalha as palmas das mãos durante os jogos. Com sua superfície lisa, teclas nítidas e alta precisão, ele funciona bem em geral.
Tela - Menos de 60% de cobertura sRGB
Em um laptop para jogos, a tela deve ser muito ágil, cobrir completamente o espaço de cores sRGB e oferecer um alto contraste. Dessas características, apenas uma alta taxa de contraste é suficiente para a tela do MSI Pulse. Mesmo que a tela fosca não seja particularmente brilhante com um brilho médio de 250 cd/m², o baixo valor de preto garante a alta taxa de contraste. A distribuição do brilho não é particularmente uniforme, mas pelo menos não notamos nenhum halos de luz visíveis.
Isso significa que a tela do Pulse 17 é significativamente pior em comparação com a do Pulse GL76. Os tempos de resposta quase dobraram em comparação, tornando-se quase 6 vezes mais lentos às vezes, e o número de cores exibidas foi reduzido quase à metade. Portanto, a MSI realizou um downgrade significativo da tela.
| |||||||||||||||||||||||||
iluminação: 91 %
iluminação com acumulador: 253 cd/m²
Contraste: 1814:1 (Preto: 0.14 cd/m²)
ΔE ColorChecker Calman: 4.52 | ∀{0.5-29.43 Ø4.71}
calibrated: 4.52
ΔE Greyscale Calman: 1 | ∀{0.09-98 Ø4.96}
39.7% AdobeRGB 1998 (Argyll 3D)
57.5% sRGB (Argyll 3D)
38.4% Display P3 (Argyll 3D)
Gamma: 2.44
CCT: 6502 K
| MSI Pulse 17 B13VGK AU Optronics B173HAN04.9, IPS, 1920x1080, 17.3" | MSI Pulse GL76 12UGK Sharp LQ173M1JW08, IPS, 1920x1080, 17.3" | MSI Katana 17 B13VFK B173HAN04.9, IPS LED, 1920x1080, 17.3" | Acer Nitro 17 AN17-51-71ER BOE0B7C NE173QHM-NY6, , 2560x1440, 17.3" | Schenker XMG Focus 17 (E23) BOE09F9 NE173QHM-NZ1, IPS, 2560x1440, 17.3" | Asus ROG Strix G17 G713PI BOE0B69, IPS, 2560x1440, 17.3" | |
|---|---|---|---|---|---|---|
| Display | 82% | 6% | 115% | 113% | 115% | |
| Display P3 Coverage (%) | 38.4 | 71.9 87% | 40.8 6% | 98.3 156% | 96.6 152% | 98.3 156% |
| sRGB Coverage (%) | 57.5 | 99.9 74% | 61 6% | 100 74% | 99.9 74% | 100 74% |
| AdobeRGB 1998 Coverage (%) | 39.7 | 73.7 86% | 42.2 6% | 85.7 116% | 84.5 113% | 85.9 116% |
| Response Times | 69% | -8% | 60% | 51% | 74% | |
| Response Time Grey 50% / Grey 80% * (ms) | 31.2 ? | 4.6 ? 85% | 33 ? -6% | 14.8 ? 53% | 16.4 ? 47% | 5.3 ? 83% |
| Response Time Black / White * (ms) | 23.6 ? | 11.2 ? 53% | 26 ? -10% | 8 ? 66% | 10.8 ? 54% | 8.6 ? 64% |
| PWM Frequency (Hz) | ||||||
| Screen | -55% | -13% | -50% | -10% | 2% | |
| Brightness middle (cd/m²) | 254 | 337.7 33% | 267 5% | 361 42% | 349 37% | 327 29% |
| Brightness (cd/m²) | 250 | 331 32% | 256 2% | 326 30% | 318 27% | 320 28% |
| Brightness Distribution (%) | 91 | 82 -10% | 93 2% | 87 -4% | 82 -10% | 89 -2% |
| Black Level * (cd/m²) | 0.14 | 0.31 -121% | 0.21 -50% | 0.6 -329% | 0.56 -300% | 0.38 -171% |
| Contrast (:1) | 1814 | 1089 -40% | 1271 -30% | 602 -67% | 623 -66% | 861 -53% |
| Colorchecker dE 2000 * | 4.52 | 4.12 9% | 4.7 -4% | 3.83 15% | 1.08 76% | 1.01 78% |
| Colorchecker dE 2000 max. * | 21.22 | 8.89 58% | 20.4 4% | 5.71 73% | 3.05 86% | 4.01 81% |
| Colorchecker dE 2000 calibrated * | 4.52 | 0.98 78% | 4.5 -0% | 3.48 23% | 1.08 76% | 0.41 91% |
| Greyscale dE 2000 * | 1 | 6.3 -530% | 1.5 -50% | 3.29 -229% | 1.14 -14% | 1.6 -60% |
| Gamma | 2.44 90% | 2.48 89% | 2.12 104% | 2.29 96% | 2.41 91% | 2.168 101% |
| CCT | 6502 100% | 6542 99% | 6552 99% | 6679 97% | 6687 97% | 6659 98% |
| Média Total (Programa/Configurações) | 32% /
-8% | -5% /
-9% | 42% /
1% | 51% /
25% | 64% /
37% |
* ... menor é melhor
Os espaços de cores AdobeRGB e DisplayP3 são cobertos apenas em menos de 40%, e mesmo o sRGB não é coberto em 60% pelo Pulse 17.
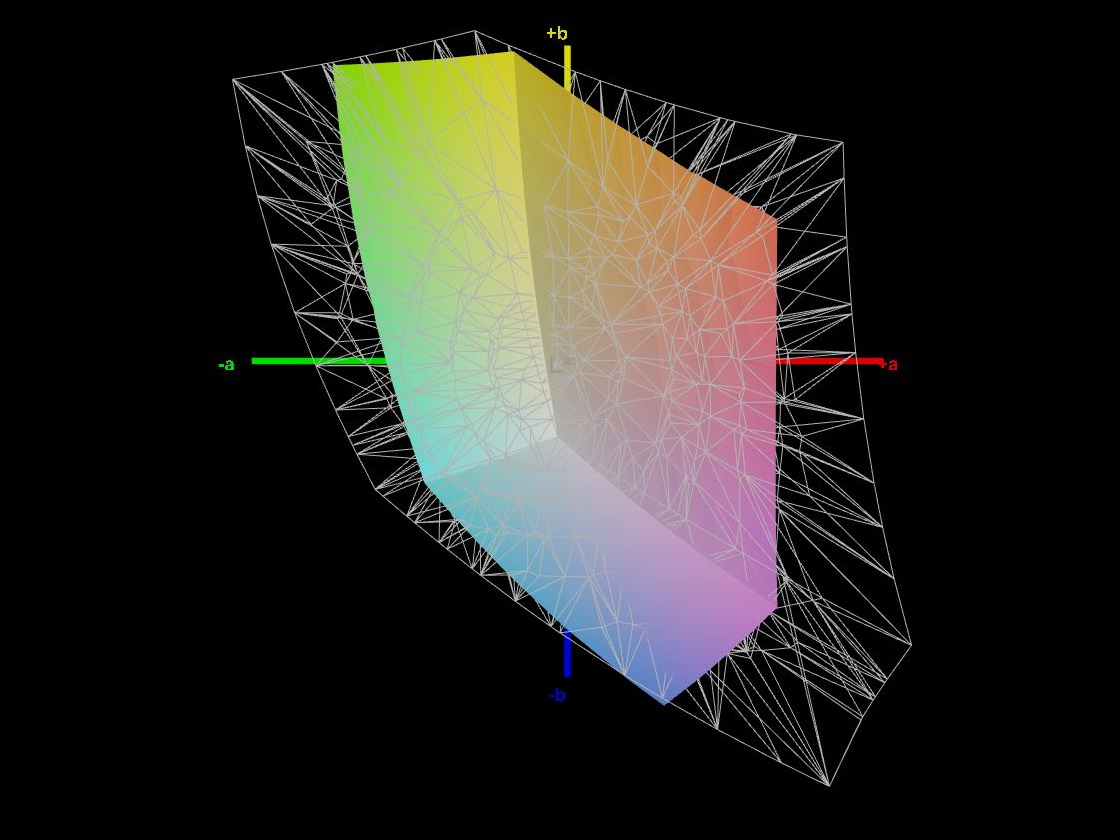
Pelo menos, o teste Calman mostra um bom resultado na exibição da escala de cinza. Entretanto, a avaliação da precisão da reprodução de cores com o Calman ColorChecker revela claramente os limites da tela. Com apenas 60% do espaço de cores sRGB, a tela claramente carece de grande parte das cores, ficando correspondentemente longe da escala de cores em vermelho, verde e azul. Isso resulta em um desvio máximo de cor de ΔΕ 21,22. Esse é um desvio máximo muito alto que não foi alcançado por nenhum dos outros notebooks comparados. Mas a tela se sai um pouco melhor nos desvios médios de cor. No entanto, uma calibração adicional não altera o resultado, de modo que mesmo o MSI Katanaacaba com desvios de cor mais baixos usando nosso perfil ICC.
Exibir tempos de resposta
| ↔ Tempo de resposta preto para branco | ||
|---|---|---|
| 23.6 ms ... ascensão ↗ e queda ↘ combinadas | ↗ 12.2 ms ascensão | 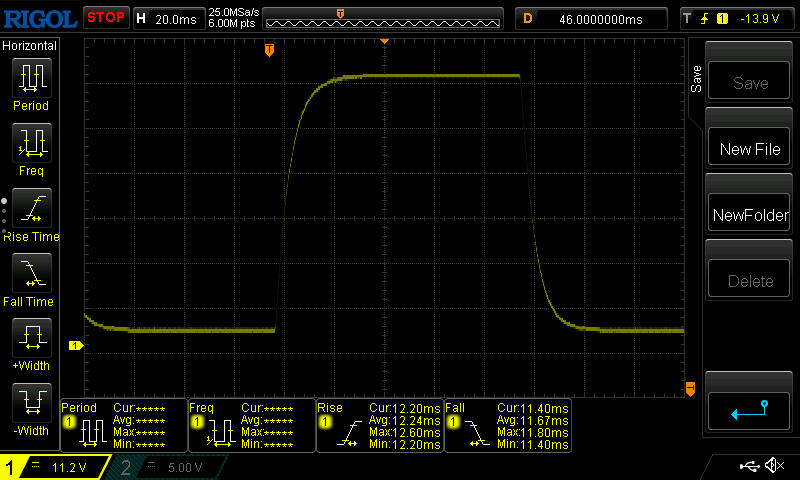 |
| ↘ 11.4 ms queda | ||
| A tela mostra boas taxas de resposta em nossos testes, mas pode ser muito lenta para jogadores competitivos. Em comparação, todos os dispositivos testados variam de 0.1 (mínimo) a 240 (máximo) ms. » 54 % de todos os dispositivos são melhores. Isso significa que o tempo de resposta medido é pior que a média de todos os dispositivos testados (19.8 ms). | ||
| ↔ Tempo de resposta 50% cinza a 80% cinza | ||
| 31.2 ms ... ascensão ↗ e queda ↘ combinadas | ↗ 14.2 ms ascensão | 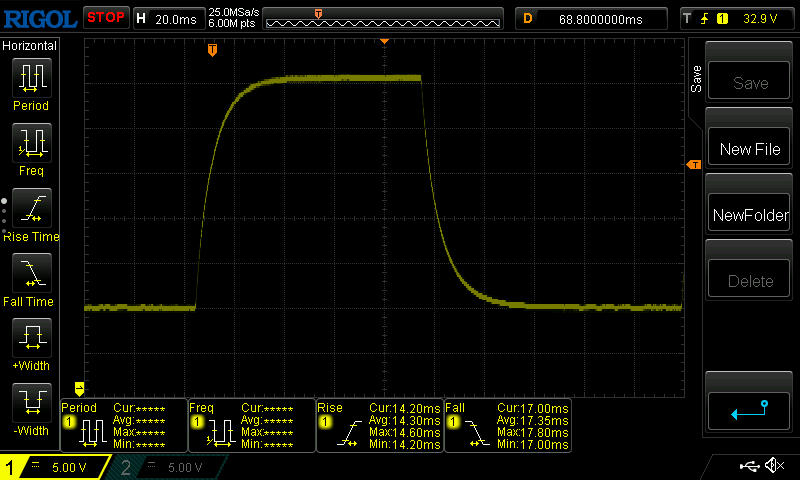 |
| ↘ 17 ms queda | ||
| A tela mostra taxas de resposta lentas em nossos testes e será insatisfatória para os jogadores. Em comparação, todos os dispositivos testados variam de 0.165 (mínimo) a 636 (máximo) ms. » 42 % de todos os dispositivos são melhores. Isso significa que o tempo de resposta medido é semelhante à média de todos os dispositivos testados (31 ms). | ||
Cintilação da tela / PWM (modulação por largura de pulso)
| Tela tremeluzindo / PWM não detectado | 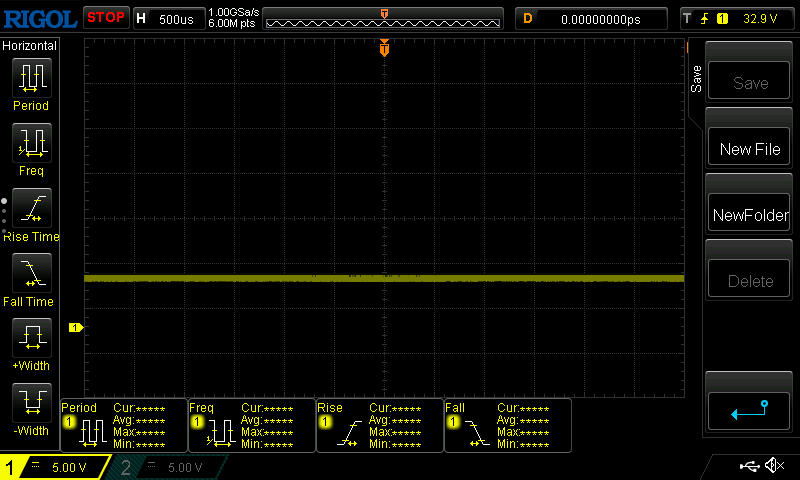 | ||
[pwm_comparison] Em comparação: 52 % de todos os dispositivos testados não usam PWM para escurecer a tela. Se PWM foi detectado, uma média de 7757 (mínimo: 5 - máximo: 343500) Hz foi medida. | |||
Os ângulos de visão do painel IPS do Pulse 17 são razoavelmente estáveis em termos de reprodução de cores, mas perdem significativamente o brilho com o aumento do ângulo. Ao usá-lo em ambientes externos, o laptop só é convincente até certo ponto, pois a tela não é brilhante o suficiente para ser visível sob luz solar intensa. Mesmo com a iluminação do nosso estúdio, fica rapidamente claro que a tela é bastante escura, com a superfície fosca ainda mostrando uma quantidade relativamente grande de reflexos.

Desempenho - Intel Core i7-13700H muito potente
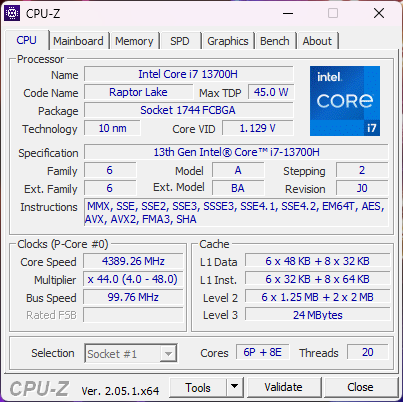
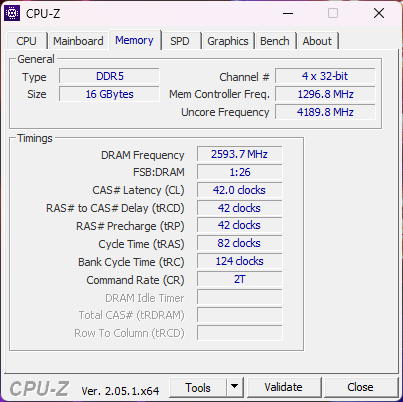
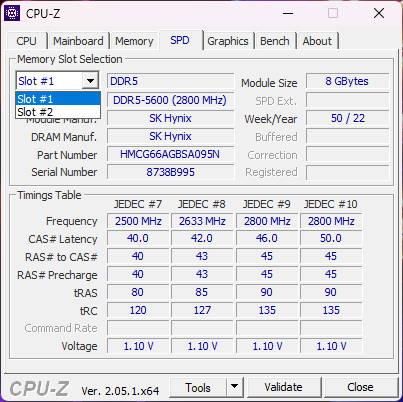
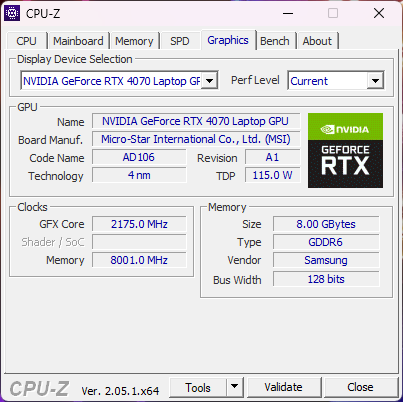
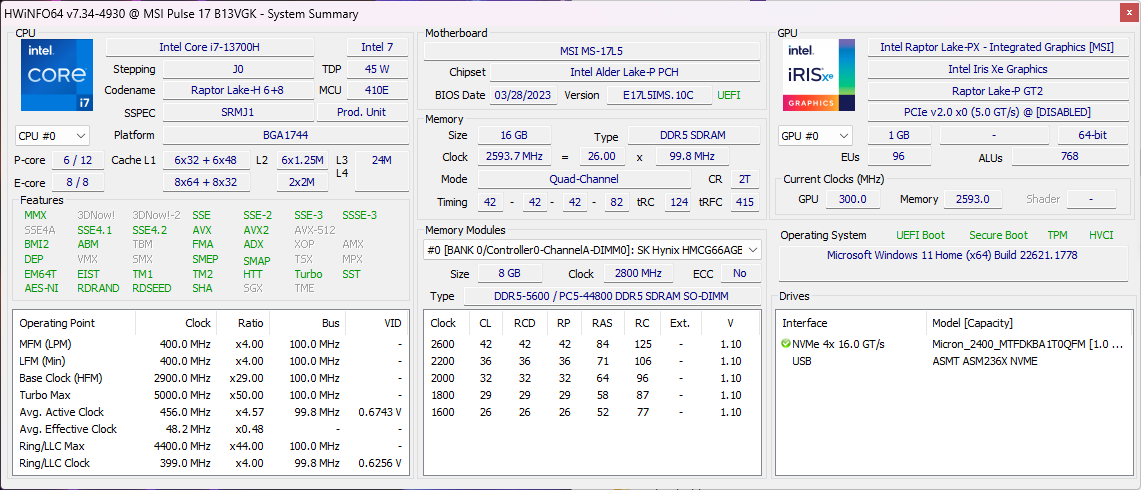
O MSI Pulse 17 B13V está disponível em duas configurações de equipamento que diferem apenas em termos de GPU. Enquanto nossa unidade de teste usa umaNvidia GeForce RTX 4070a outra configuração vem com uma RTX 4060. Como processador, o Intel Core i7-13700Hé usado. Ele é acompanhado por 16 GB de RAM DDR5-5200 e um SSD com capacidade de 1 TB. Com uma configuração de hardware tão potente, nossa unidade de teste é adequada para jogos com resoluções acima de Full HD.
Controle de energia e condições de teste
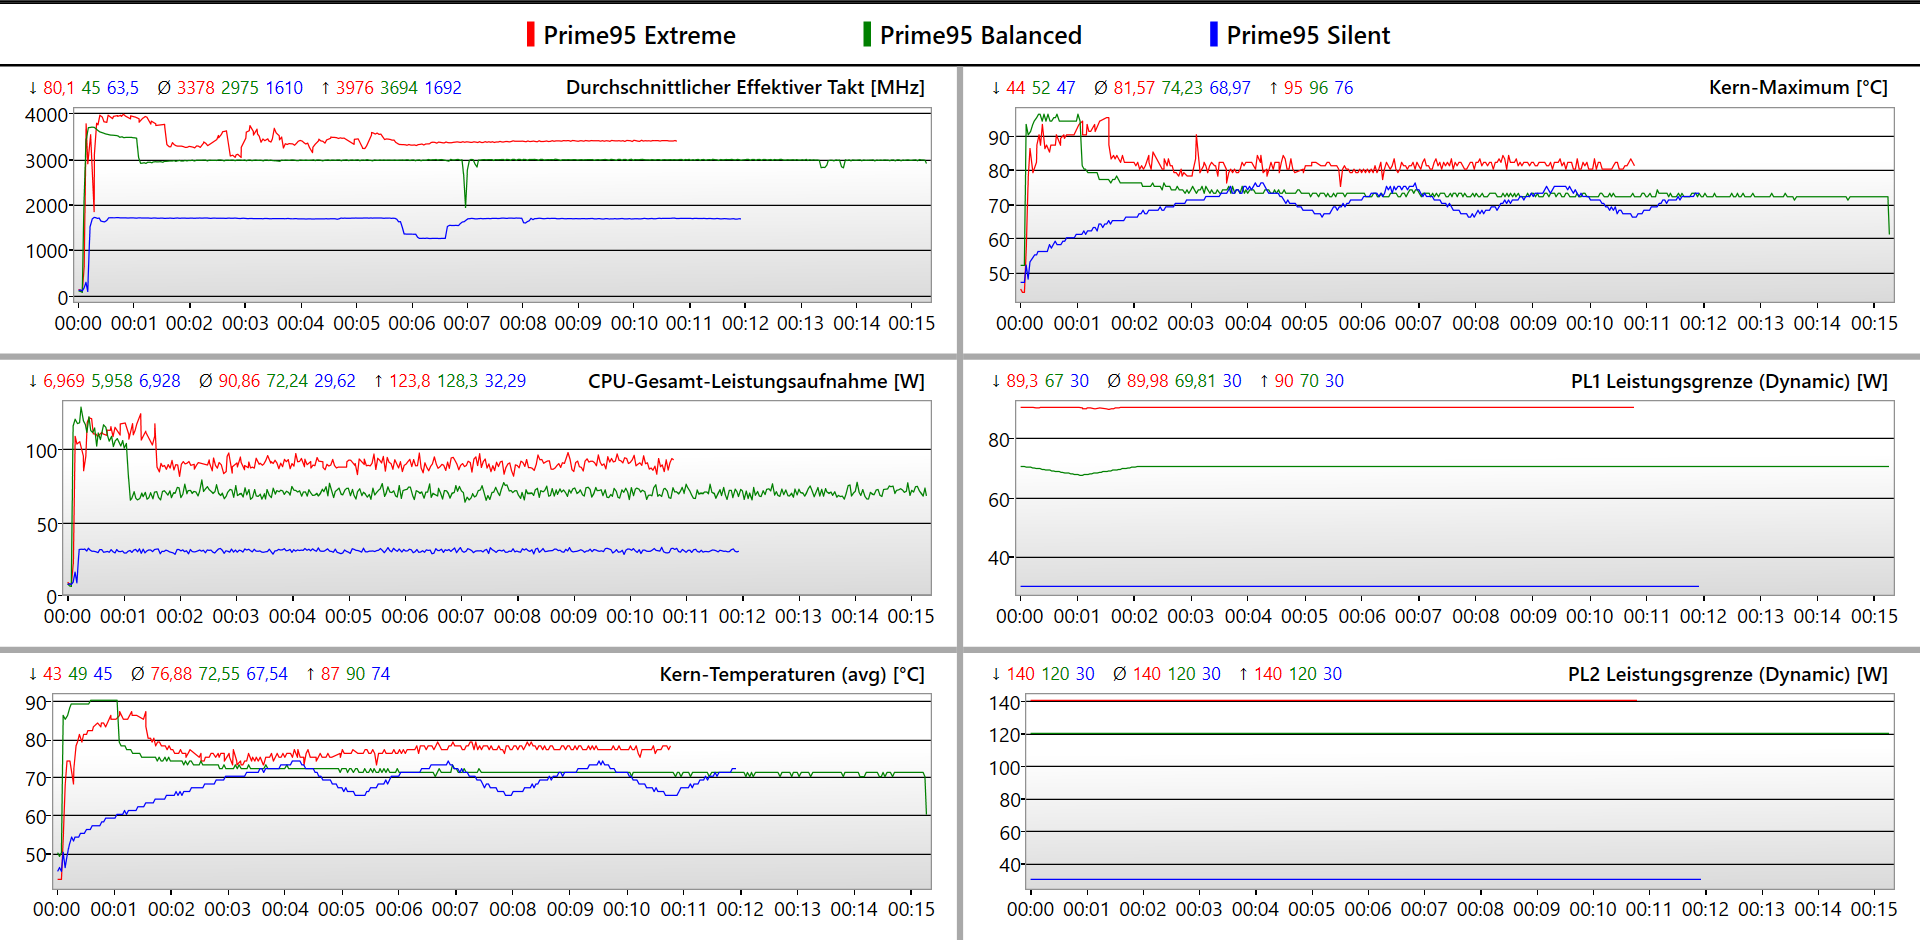
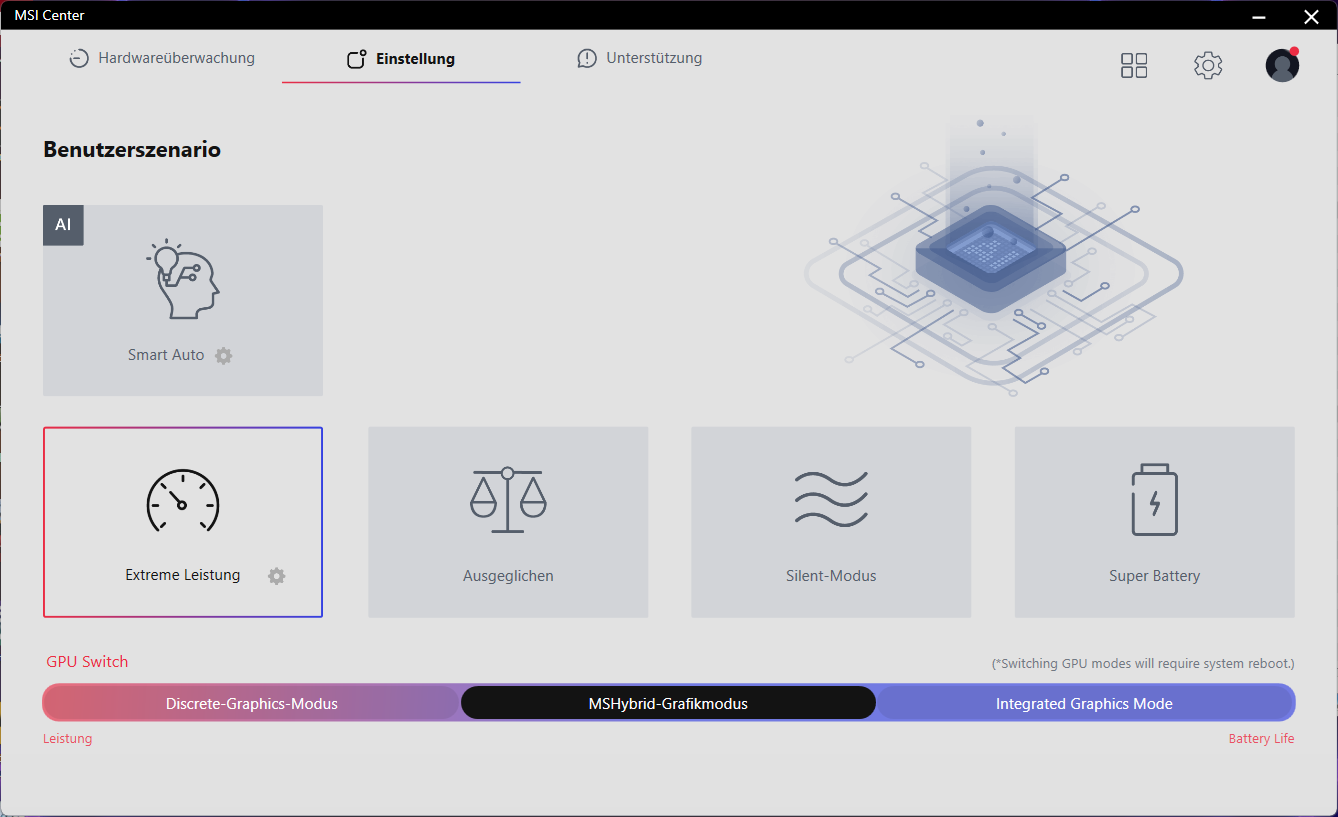
A MSI oferece três perfis de desempenho e um modo de economia de bateria no Pulse 17. Além disso, você também pode usar o modo AI da MSI. Quando a CPU é executada sozinha, ela é capaz de usar um PL1 de 90 watts no modo Extreme Performance, com um poderoso desempenho de reforço (PL2) de 140 watts. No modo Balanceado, o PL1 e o PL2 são de 70 e 120 watts, respectivamente. O modo de operação silenciosa, em que os ventiladores não são audíveis, funciona com 30 watts sem aumento.
Mas o que é mais interessante para um laptop para jogos é o desempenho durante os jogos. Em todos os três modos de desempenho, isso praticamente não difere nos primeiros 10 minutos de nosso teste. Somente as temperaturas atingem valores diferentes. Os modos Performance e Balanced garantem temperaturas constantes da CPU e da GPU. No modo Quiet Operation, as temperaturas sobem tanto que o desempenho é reduzido, caindo significativamente após cerca de 10 minutos.
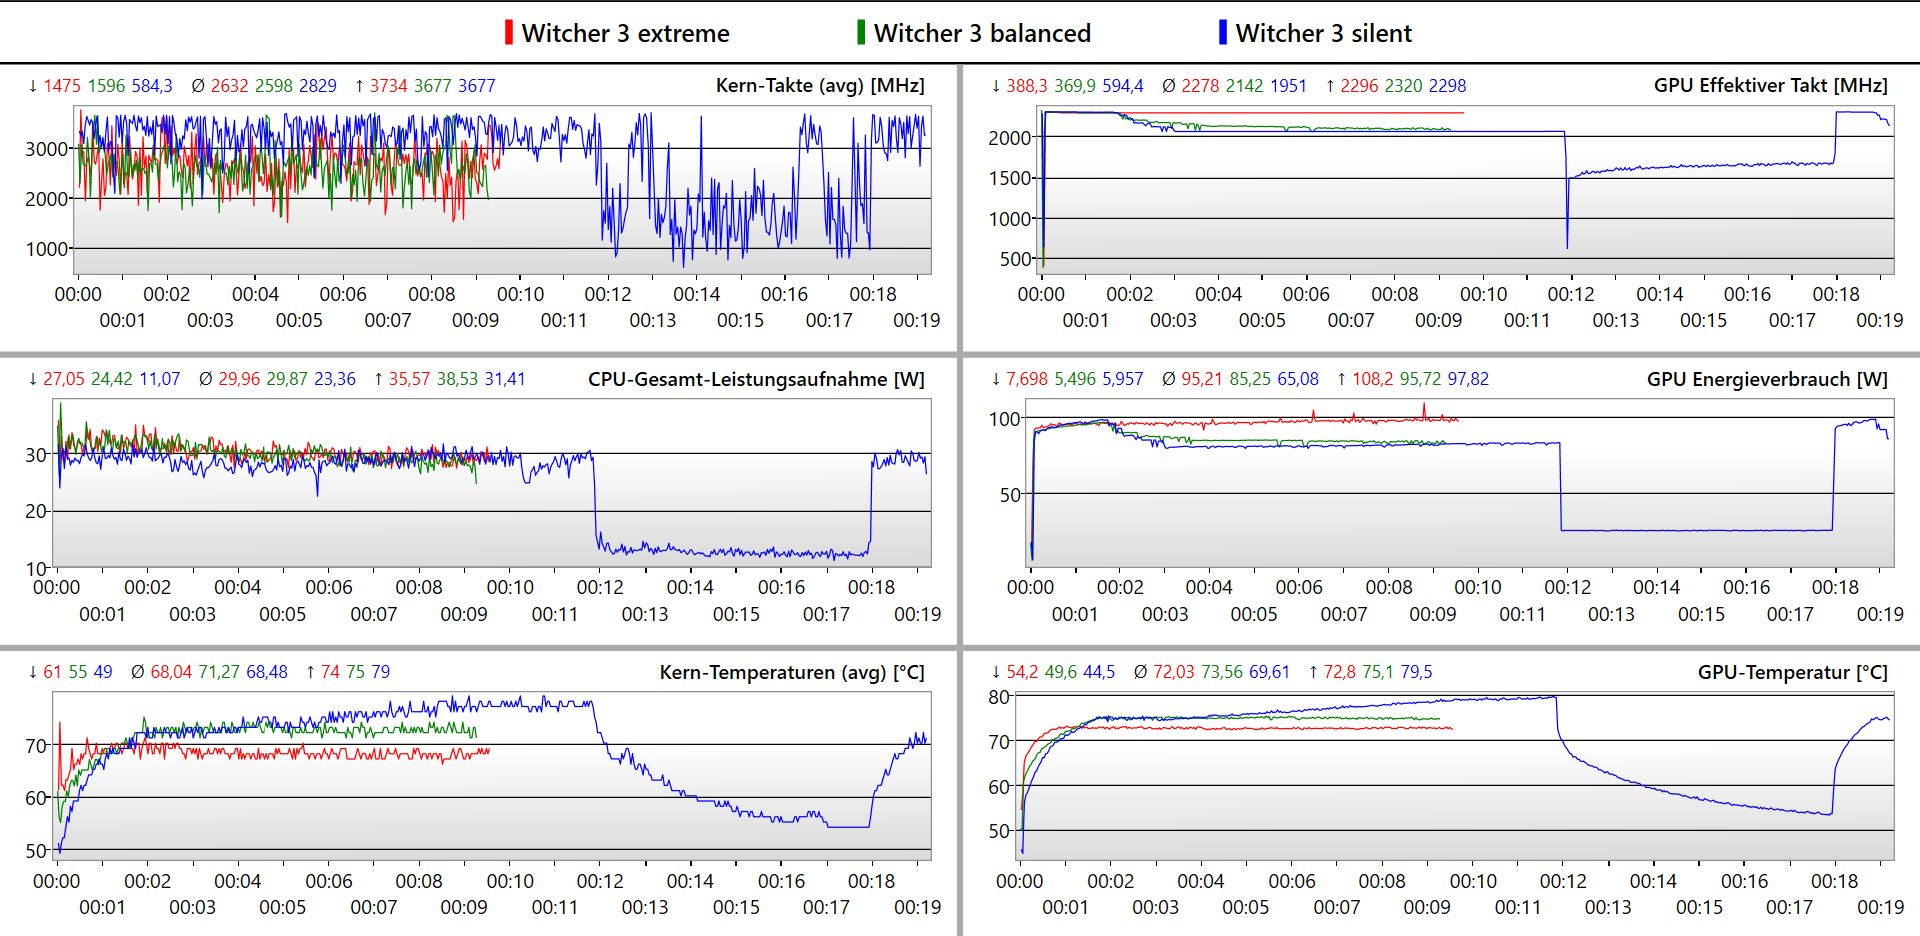
Portanto, decidimos executar todos os benchmarks genéricos no modo Desempenho e os benchmarks de jogos no modo Balanceado. Em todos os nossos jogos testados, também executamos um benchmark adicional com as configurações de qualidade mais altas no modo Desempenho. As taxas de quadros alcançadas diferiram em menos de um ponto percentual. Isso significa que o modo Desempenho dificilmente obtém qualquer vantagem de FPS em jogos.
Processador
Com seis núcleos P e oito núcleos E, o Intel Core i7-13700H no Pulse 17 é capaz de lidar com 20 threads. O processador é fornecido com uma quantidade relativamente alta de energia e, dessa forma, é capaz de se posicionar um pouco à frente dos outros dispositivos de comparação com o Core i7. No entanto, oXMG Focus 17com umCore i9e o Asus ROG Strix G17com umRyzen 9 superam significativamente os processadores i7.
Cinebench R15 Multi Constant Load Test
Cinebench R23: Multi Core | Single Core
Cinebench R20: CPU (Multi Core) | CPU (Single Core)
Cinebench R15: CPU Multi 64Bit | CPU Single 64Bit
Blender: v2.79 BMW27 CPU
7-Zip 18.03: 7z b 4 | 7z b 4 -mmt1
Geekbench 5.5: Multi-Core | Single-Core
HWBOT x265 Benchmark v2.2: 4k Preset
LibreOffice : 20 Documents To PDF
R Benchmark 2.5: Overall mean
| CPU Performance rating | |
| Asus ROG Strix G17 G713PI | |
| Schenker XMG Focus 17 (E23) | |
| Média da turma Gaming | |
| MSI Pulse 17 B13VGK | |
| MSI Pulse GL76 12UGK | |
| Média Intel Core i7-13700H | |
| MSI Katana 17 B13VFK | |
| Acer Nitro 17 AN17-51-71ER | |
| Cinebench R23 / Multi Core | |
| Asus ROG Strix G17 G713PI | |
| Schenker XMG Focus 17 (E23) | |
| Média da turma Gaming (10488 - 42661, n=107, últimos 2 anos) | |
| Acer Nitro 17 AN17-51-71ER | |
| MSI Pulse 17 B13VGK | |
| MSI Pulse GL76 12UGK | |
| MSI Katana 17 B13VFK | |
| Média Intel Core i7-13700H (5890 - 20034, n=29) | |
| Cinebench R23 / Single Core | |
| Média da turma Gaming (1166 - 2415, n=107, últimos 2 anos) | |
| Schenker XMG Focus 17 (E23) | |
| Asus ROG Strix G17 G713PI | |
| MSI Katana 17 B13VFK | |
| Média Intel Core i7-13700H (1323 - 1914, n=29) | |
| MSI Pulse GL76 12UGK | |
| MSI Pulse 17 B13VGK | |
| Acer Nitro 17 AN17-51-71ER | |
| Cinebench R20 / CPU (Multi Core) | |
| Média da turma Gaming (4029 - 16433, n=106, últimos 2 anos) | |
| Schenker XMG Focus 17 (E23) | |
| Asus ROG Strix G17 G713PI | |
| MSI Pulse 17 B13VGK | |
| Acer Nitro 17 AN17-51-71ER | |
| MSI Pulse GL76 12UGK | |
| MSI Katana 17 B13VFK | |
| Média Intel Core i7-13700H (2322 - 7674, n=29) | |
| Cinebench R20 / CPU (Single Core) | |
| Média da turma Gaming (442 - 913, n=106, últimos 2 anos) | |
| Schenker XMG Focus 17 (E23) | |
| Asus ROG Strix G17 G713PI | |
| Média Intel Core i7-13700H (508 - 741, n=29) | |
| MSI Katana 17 B13VFK | |
| MSI Pulse GL76 12UGK | |
| MSI Pulse 17 B13VGK | |
| Acer Nitro 17 AN17-51-71ER | |
| Cinebench R15 / CPU Multi 64Bit | |
| Asus ROG Strix G17 G713PI | |
| Schenker XMG Focus 17 (E23) | |
| Média da turma Gaming (1578 - 6330, n=105, últimos 2 anos) | |
| Acer Nitro 17 AN17-51-71ER | |
| MSI Pulse 17 B13VGK | |
| MSI Pulse GL76 12UGK | |
| Média Intel Core i7-13700H (905 - 2982, n=29) | |
| MSI Katana 17 B13VFK | |
| Cinebench R15 / CPU Single 64Bit | |
| Média da turma Gaming (188.8 - 350, n=106, últimos 2 anos) | |
| Asus ROG Strix G17 G713PI | |
| Schenker XMG Focus 17 (E23) | |
| Média Intel Core i7-13700H (213 - 278, n=29) | |
| MSI Katana 17 B13VFK | |
| MSI Pulse GL76 12UGK | |
| MSI Pulse 17 B13VGK | |
| Acer Nitro 17 AN17-51-71ER | |
| Blender / v2.79 BMW27 CPU | |
| Média Intel Core i7-13700H (169 - 555, n=29) | |
| MSI Katana 17 B13VFK | |
| MSI Pulse GL76 12UGK | |
| Acer Nitro 17 AN17-51-71ER | |
| MSI Pulse 17 B13VGK | |
| Média da turma Gaming (79 - 330, n=104, últimos 2 anos) | |
| Schenker XMG Focus 17 (E23) | |
| Asus ROG Strix G17 G713PI | |
| 7-Zip 18.03 / 7z b 4 | |
| Asus ROG Strix G17 G713PI | |
| Schenker XMG Focus 17 (E23) | |
| Média da turma Gaming (33491 - 148086, n=105, últimos 2 anos) | |
| MSI Pulse 17 B13VGK | |
| Acer Nitro 17 AN17-51-71ER | |
| MSI Pulse GL76 12UGK | |
| MSI Katana 17 B13VFK | |
| Média Intel Core i7-13700H (27322 - 76344, n=29) | |
| 7-Zip 18.03 / 7z b 4 -mmt1 | |
| Asus ROG Strix G17 G713PI | |
| Schenker XMG Focus 17 (E23) | |
| Média da turma Gaming (4199 - 7436, n=105, últimos 2 anos) | |
| Média Intel Core i7-13700H (4825 - 6238, n=29) | |
| MSI Katana 17 B13VFK | |
| MSI Pulse GL76 12UGK | |
| MSI Pulse 17 B13VGK | |
| Acer Nitro 17 AN17-51-71ER | |
| Geekbench 5.5 / Multi-Core | |
| Asus ROG Strix G17 G713PI | |
| Schenker XMG Focus 17 (E23) | |
| Média da turma Gaming (6460 - 28263, n=105, últimos 2 anos) | |
| MSI Pulse 17 B13VGK | |
| Acer Nitro 17 AN17-51-71ER | |
| MSI Pulse GL76 12UGK | |
| Média Intel Core i7-13700H (6165 - 14215, n=29) | |
| MSI Katana 17 B13VFK | |
| Geekbench 5.5 / Single-Core | |
| Média da turma Gaming (986 - 2474, n=105, últimos 2 anos) | |
| Asus ROG Strix G17 G713PI | |
| Schenker XMG Focus 17 (E23) | |
| Média Intel Core i7-13700H (1362 - 1919, n=29) | |
| MSI Katana 17 B13VFK | |
| MSI Pulse 17 B13VGK | |
| MSI Pulse GL76 12UGK | |
| Acer Nitro 17 AN17-51-71ER | |
| HWBOT x265 Benchmark v2.2 / 4k Preset | |
| Asus ROG Strix G17 G713PI | |
| Média da turma Gaming (11.5 - 44.4, n=105, últimos 2 anos) | |
| Schenker XMG Focus 17 (E23) | |
| MSI Pulse 17 B13VGK | |
| Acer Nitro 17 AN17-51-71ER | |
| MSI Pulse GL76 12UGK | |
| MSI Katana 17 B13VFK | |
| Média Intel Core i7-13700H (6.72 - 21.2, n=29) | |
| LibreOffice / 20 Documents To PDF | |
| MSI Pulse 17 B13VGK | |
| MSI Katana 17 B13VFK | |
| Acer Nitro 17 AN17-51-71ER | |
| Schenker XMG Focus 17 (E23) | |
| Média da turma Gaming (33.2 - 88.8, n=105, últimos 2 anos) | |
| Média Intel Core i7-13700H (31.3 - 62.4, n=29) | |
| MSI Pulse GL76 12UGK | |
| Asus ROG Strix G17 G713PI | |
| R Benchmark 2.5 / Overall mean | |
| Acer Nitro 17 AN17-51-71ER | |
| MSI Pulse 17 B13VGK | |
| MSI Pulse GL76 12UGK | |
| Média Intel Core i7-13700H (0.4308 - 0.607, n=29) | |
| MSI Katana 17 B13VFK | |
| Média da turma Gaming (0.3439 - 0.759, n=106, últimos 2 anos) | |
| Schenker XMG Focus 17 (E23) | |
| Asus ROG Strix G17 G713PI | |
* ... menor é melhor
AIDA64: FP32 Ray-Trace | FPU Julia | CPU SHA3 | CPU Queen | FPU SinJulia | FPU Mandel | CPU AES | CPU ZLib | FP64 Ray-Trace | CPU PhotoWorxx
| Performance rating | |
| Asus ROG Strix G17 G713PI | |
| Média da turma Gaming | |
| Schenker XMG Focus 17 (E23) | |
| Acer Nitro 17 AN17-51-71ER | |
| MSI Pulse 17 B13VGK | |
| MSI Pulse GL76 12UGK | |
| Média Intel Core i7-13700H | |
| MSI Katana 17 B13VFK | |
| AIDA64 / FP32 Ray-Trace | |
| Asus ROG Strix G17 G713PI | |
| Média da turma Gaming (10227 - 85542, n=105, últimos 2 anos) | |
| Schenker XMG Focus 17 (E23) | |
| MSI Pulse 17 B13VGK | |
| Acer Nitro 17 AN17-51-71ER | |
| MSI Pulse GL76 12UGK | |
| Média Intel Core i7-13700H (4986 - 18908, n=29) | |
| MSI Katana 17 B13VFK | |
| AIDA64 / FPU Julia | |
| Asus ROG Strix G17 G713PI | |
| Média da turma Gaming (51376 - 238426, n=105, últimos 2 anos) | |
| Schenker XMG Focus 17 (E23) | |
| MSI Pulse 17 B13VGK | |
| Acer Nitro 17 AN17-51-71ER | |
| MSI Pulse GL76 12UGK | |
| Média Intel Core i7-13700H (25360 - 92359, n=29) | |
| MSI Katana 17 B13VFK | |
| AIDA64 / CPU SHA3 | |
| Asus ROG Strix G17 G713PI | |
| Média da turma Gaming (2180 - 10115, n=105, últimos 2 anos) | |
| Schenker XMG Focus 17 (E23) | |
| Acer Nitro 17 AN17-51-71ER | |
| MSI Pulse 17 B13VGK | |
| MSI Pulse GL76 12UGK | |
| Média Intel Core i7-13700H (1339 - 4224, n=29) | |
| MSI Katana 17 B13VFK | |
| AIDA64 / CPU Queen | |
| Asus ROG Strix G17 G713PI | |
| Schenker XMG Focus 17 (E23) | |
| Média da turma Gaming (49785 - 173351, n=90, últimos 2 anos) | |
| MSI Pulse GL76 12UGK | |
| Acer Nitro 17 AN17-51-71ER | |
| MSI Pulse 17 B13VGK | |
| Média Intel Core i7-13700H (59324 - 107159, n=29) | |
| MSI Katana 17 B13VFK | |
| AIDA64 / FPU SinJulia | |
| Asus ROG Strix G17 G713PI | |
| Média da turma Gaming (4424 - 33636, n=105, últimos 2 anos) | |
| Schenker XMG Focus 17 (E23) | |
| MSI Pulse 17 B13VGK | |
| Acer Nitro 17 AN17-51-71ER | |
| MSI Pulse GL76 12UGK | |
| Média Intel Core i7-13700H (4800 - 11050, n=29) | |
| MSI Katana 17 B13VFK | |
| AIDA64 / FPU Mandel | |
| Asus ROG Strix G17 G713PI | |
| Média da turma Gaming (25115 - 128721, n=105, últimos 2 anos) | |
| Schenker XMG Focus 17 (E23) | |
| MSI Pulse 17 B13VGK | |
| Acer Nitro 17 AN17-51-71ER | |
| MSI Pulse GL76 12UGK | |
| Média Intel Core i7-13700H (12321 - 45118, n=29) | |
| MSI Katana 17 B13VFK | |
| AIDA64 / CPU AES | |
| Asus ROG Strix G17 G713PI | |
| Acer Nitro 17 AN17-51-71ER | |
| MSI Pulse GL76 12UGK | |
| Média da turma Gaming (39258 - 247074, n=105, últimos 2 anos) | |
| Schenker XMG Focus 17 (E23) | |
| MSI Pulse 17 B13VGK | |
| Média Intel Core i7-13700H (28769 - 151254, n=29) | |
| MSI Katana 17 B13VFK | |
| AIDA64 / CPU ZLib | |
| Asus ROG Strix G17 G713PI | |
| Schenker XMG Focus 17 (E23) | |
| Média da turma Gaming (574 - 2531, n=105, últimos 2 anos) | |
| Acer Nitro 17 AN17-51-71ER | |
| MSI Pulse 17 B13VGK | |
| MSI Pulse GL76 12UGK | |
| Média Intel Core i7-13700H (389 - 1215, n=29) | |
| MSI Katana 17 B13VFK | |
| AIDA64 / FP64 Ray-Trace | |
| Asus ROG Strix G17 G713PI | |
| Média da turma Gaming (5509 - 45446, n=105, últimos 2 anos) | |
| Schenker XMG Focus 17 (E23) | |
| MSI Pulse 17 B13VGK | |
| Acer Nitro 17 AN17-51-71ER | |
| MSI Pulse GL76 12UGK | |
| Média Intel Core i7-13700H (2540 - 10135, n=29) | |
| MSI Katana 17 B13VFK | |
| AIDA64 / CPU PhotoWorxx | |
| Schenker XMG Focus 17 (E23) | |
| Média da turma Gaming (12271 - 89891, n=105, últimos 2 anos) | |
| Média Intel Core i7-13700H (12872 - 52727, n=29) | |
| MSI Pulse 17 B13VGK | |
| Acer Nitro 17 AN17-51-71ER | |
| MSI Katana 17 B13VFK | |
| Asus ROG Strix G17 G713PI | |
| MSI Pulse GL76 12UGK | |
Desempenho do sistema
Executamos o benchmark PCMark 10 do desempenho do sistema duas vezes, já que na primeira execução, o MSI Pulse ficou muito atrás dos resultados poderosos que o processador conseguiu mostrar em seus benchmarks anteriores. Com apenas 6844 pontos, ele teria alcançado apenas o último lugar entre nossos dispositivos de comparação. No entanto, depois de várias atualizações usando o Windows Update, a situação mudou drasticamente.
O laptop para jogos agora está apenas um pouco à frente dos dispositivos de comparação. A única diferença clara ocorre na seção Essentials do benchmark. Suspeitamos que a culpa seja da SSD relativamente lenta da nossa unidade de teste, já que a seção Essentials dá ênfase especial aos tempos de acesso de dados e programas.
O CrossMark, que exige muita CPU, apresenta um quadro semelhante com os dispositivos de comparação com Core i9e Ryzen 9conseguem se posicionar significativamente à frente.
CrossMark: Overall | Productivity | Creativity | Responsiveness
| PCMark 10 / Score | |
| Média da turma Gaming (5828 - 12414, n=93, últimos 2 anos) | |
| MSI Pulse 17 B13VGK | |
| MSI Pulse GL76 12UGK | |
| Asus ROG Strix G17 G713PI | |
| Média Intel Core i7-13700H, NVIDIA GeForce RTX 4070 Laptop GPU (7158 - 7956, n=8) | |
| MSI Katana 17 B13VFK | |
| Acer Nitro 17 AN17-51-71ER | |
| Schenker XMG Focus 17 (E23) | |
| PCMark 10 / Essentials | |
| Asus ROG Strix G17 G713PI | |
| MSI Pulse GL76 12UGK | |
| MSI Katana 17 B13VFK | |
| Média Intel Core i7-13700H, NVIDIA GeForce RTX 4070 Laptop GPU (10252 - 11449, n=8) | |
| Média da turma Gaming (8810 - 11935, n=97, últimos 2 anos) | |
| MSI Pulse 17 B13VGK | |
| Acer Nitro 17 AN17-51-71ER | |
| Schenker XMG Focus 17 (E23) | |
| PCMark 10 / Productivity | |
| Média da turma Gaming (6845 - 25323, n=95, últimos 2 anos) | |
| Asus ROG Strix G17 G713PI | |
| MSI Pulse 17 B13VGK | |
| MSI Pulse GL76 12UGK | |
| Schenker XMG Focus 17 (E23) | |
| Média Intel Core i7-13700H, NVIDIA GeForce RTX 4070 Laptop GPU (8501 - 10769, n=8) | |
| MSI Katana 17 B13VFK | |
| Acer Nitro 17 AN17-51-71ER | |
| PCMark 10 / Digital Content Creation | |
| Média da turma Gaming (7602 - 19954, n=95, últimos 2 anos) | |
| Acer Nitro 17 AN17-51-71ER | |
| MSI Pulse 17 B13VGK | |
| MSI Pulse GL76 12UGK | |
| Média Intel Core i7-13700H, NVIDIA GeForce RTX 4070 Laptop GPU (10358 - 12908, n=8) | |
| MSI Katana 17 B13VFK | |
| Schenker XMG Focus 17 (E23) | |
| Asus ROG Strix G17 G713PI | |
| CrossMark / Overall | |
| Asus ROG Strix G17 G713PI | |
| Schenker XMG Focus 17 (E23) | |
| Média da turma Gaming (1366 - 2409, n=94, últimos 2 anos) | |
| MSI Pulse 17 B13VGK | |
| Média Intel Core i7-13700H, NVIDIA GeForce RTX 4070 Laptop GPU (1768 - 2073, n=6) | |
| MSI Katana 17 B13VFK | |
| MSI Pulse GL76 12UGK | |
| Acer Nitro 17 AN17-51-71ER | |
| CrossMark / Productivity | |
| Asus ROG Strix G17 G713PI | |
| Schenker XMG Focus 17 (E23) | |
| Média da turma Gaming (1386 - 2254, n=94, últimos 2 anos) | |
| MSI Pulse 17 B13VGK | |
| Média Intel Core i7-13700H, NVIDIA GeForce RTX 4070 Laptop GPU (1645 - 2006, n=6) | |
| MSI Pulse GL76 12UGK | |
| MSI Katana 17 B13VFK | |
| Acer Nitro 17 AN17-51-71ER | |
| CrossMark / Creativity | |
| Asus ROG Strix G17 G713PI | |
| Schenker XMG Focus 17 (E23) | |
| Média da turma Gaming (1343 - 2786, n=94, últimos 2 anos) | |
| MSI Pulse 17 B13VGK | |
| Média Intel Core i7-13700H, NVIDIA GeForce RTX 4070 Laptop GPU (1936 - 2137, n=6) | |
| MSI Katana 17 B13VFK | |
| MSI Pulse GL76 12UGK | |
| Acer Nitro 17 AN17-51-71ER | |
| CrossMark / Responsiveness | |
| MSI Pulse GL76 12UGK | |
| MSI Pulse 17 B13VGK | |
| Schenker XMG Focus 17 (E23) | |
| Média Intel Core i7-13700H, NVIDIA GeForce RTX 4070 Laptop GPU (1451 - 2202, n=6) | |
| MSI Katana 17 B13VFK | |
| Média da turma Gaming (1226 - 2334, n=94, últimos 2 anos) | |
| Asus ROG Strix G17 G713PI | |
| Acer Nitro 17 AN17-51-71ER | |
| PCMark 10 Score | 7796 pontos | |
Ajuda | ||
| AIDA64 / Memory Copy | |
| Schenker XMG Focus 17 (E23) | |
| Média da turma Gaming (21750 - 129946, n=105, últimos 2 anos) | |
| Média Intel Core i7-13700H (24334 - 78081, n=29) | |
| MSI Pulse 17 B13VGK | |
| Acer Nitro 17 AN17-51-71ER | |
| MSI Katana 17 B13VFK | |
| Asus ROG Strix G17 G713PI | |
| MSI Pulse GL76 12UGK | |
| AIDA64 / Memory Read | |
| Schenker XMG Focus 17 (E23) | |
| Média da turma Gaming (22956 - 118858, n=105, últimos 2 anos) | |
| MSI Pulse 17 B13VGK | |
| Acer Nitro 17 AN17-51-71ER | |
| Média Intel Core i7-13700H (23681 - 79656, n=29) | |
| MSI Katana 17 B13VFK | |
| Asus ROG Strix G17 G713PI | |
| MSI Pulse GL76 12UGK | |
| AIDA64 / Memory Write | |
| Média da turma Gaming (22297 - 135096, n=105, últimos 2 anos) | |
| Schenker XMG Focus 17 (E23) | |
| Média Intel Core i7-13700H (22986 - 99898, n=29) | |
| Acer Nitro 17 AN17-51-71ER | |
| MSI Pulse 17 B13VGK | |
| Asus ROG Strix G17 G713PI | |
| MSI Katana 17 B13VFK | |
| MSI Pulse GL76 12UGK | |
| AIDA64 / Memory Latency | |
| Acer Nitro 17 AN17-51-71ER | |
| Média da turma Gaming (75.3 - 259, n=105, últimos 2 anos) | |
| MSI Katana 17 B13VFK | |
| MSI Pulse 17 B13VGK | |
| Média Intel Core i7-13700H (82.4 - 136.8, n=29) | |
| MSI Pulse GL76 12UGK | |
| Schenker XMG Focus 17 (E23) | |
| Asus ROG Strix G17 G713PI | |
* ... menor é melhor
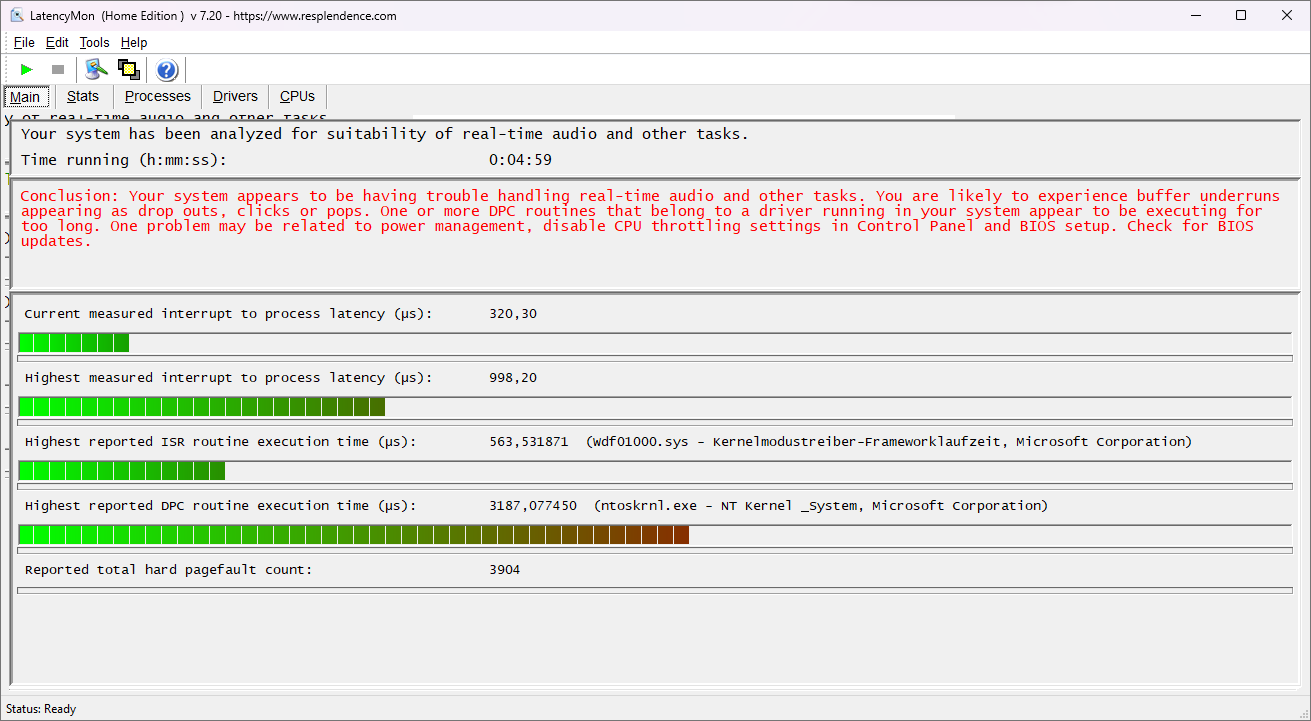
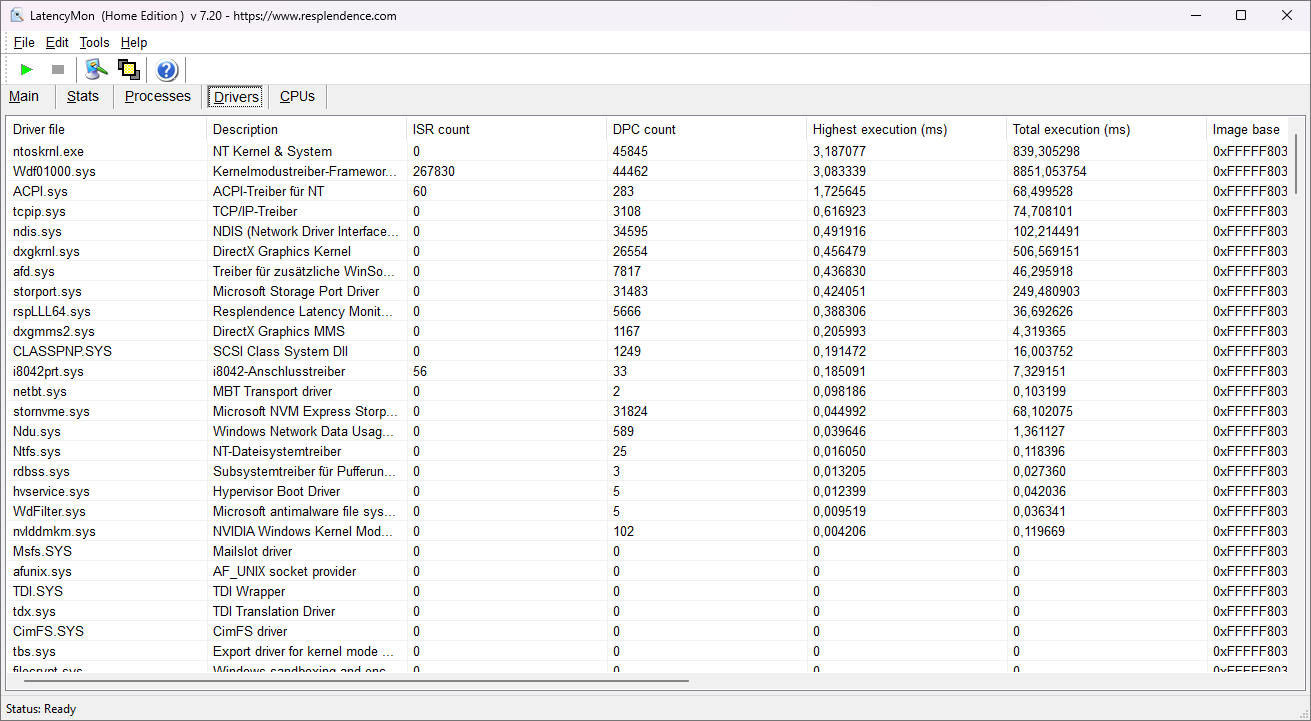
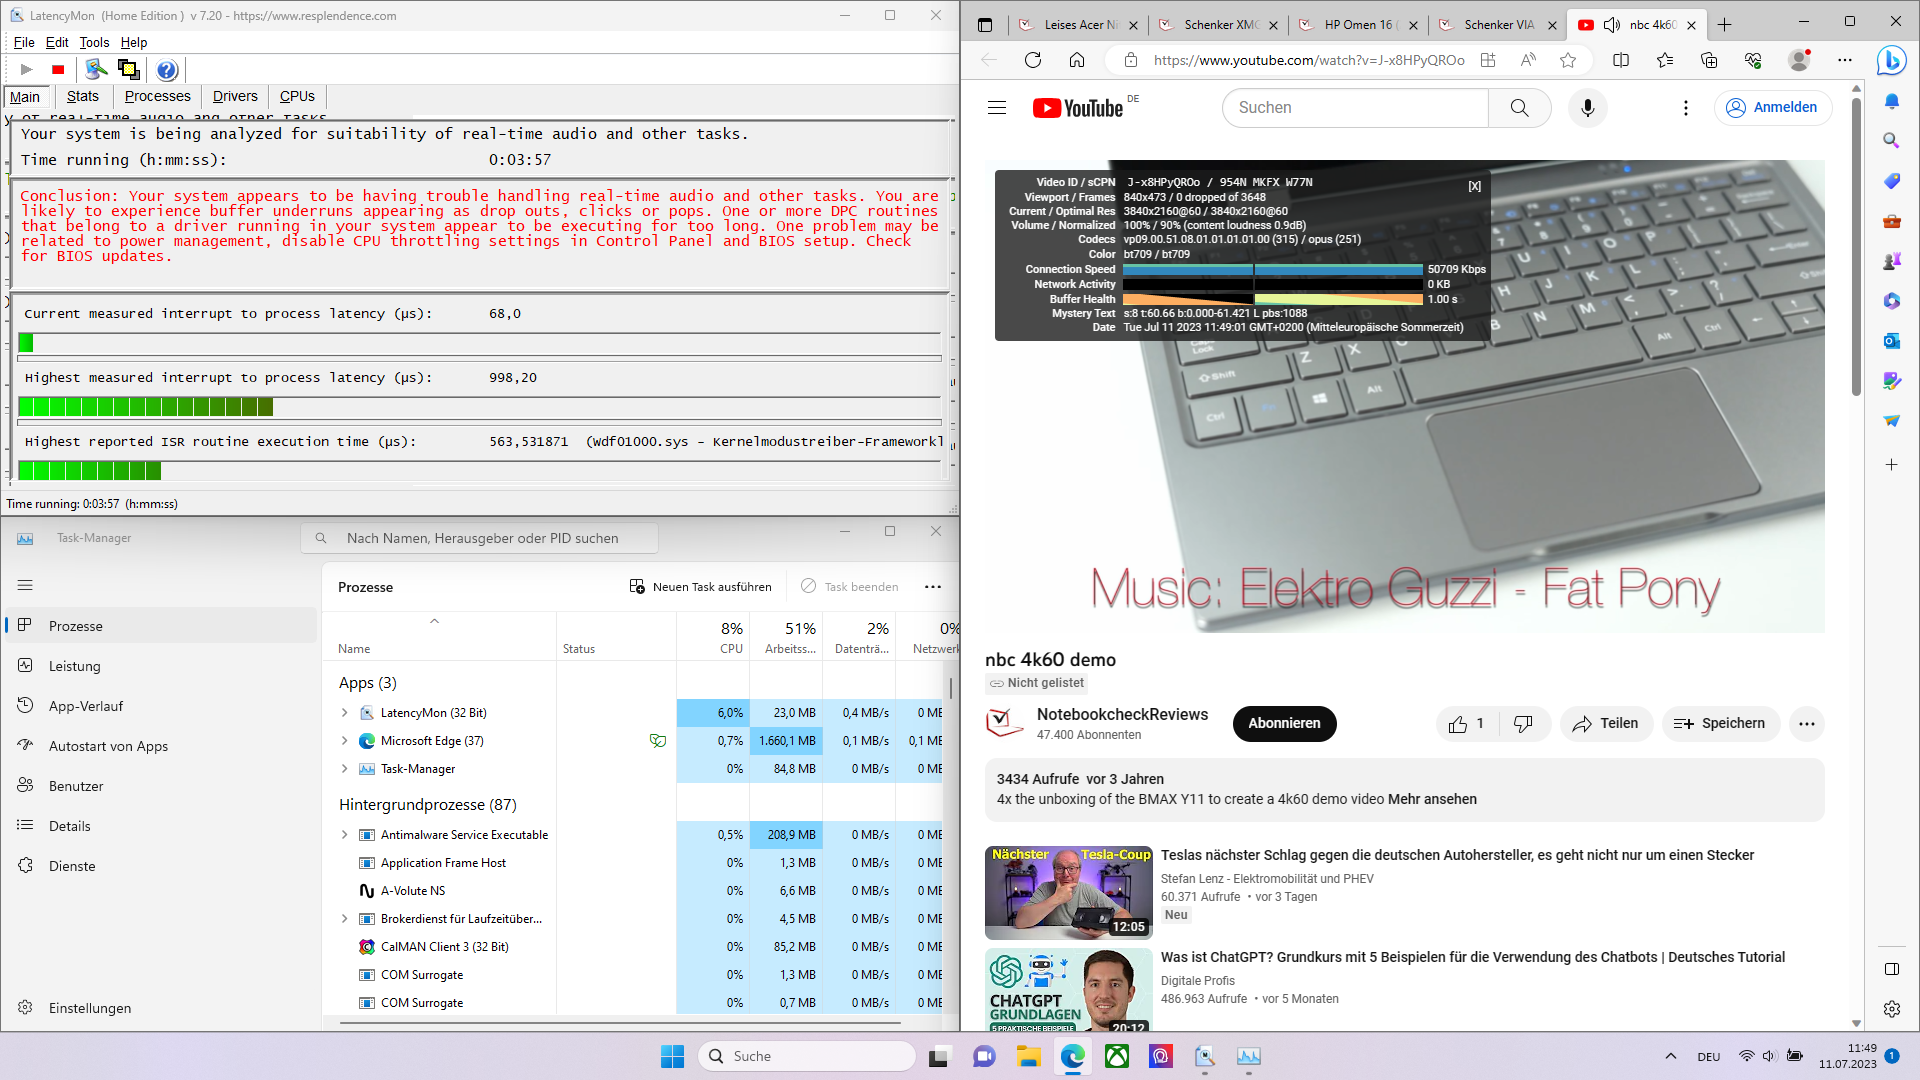
Latências DPC
Nas latências de DPC, o LatencyMon determina que o laptop para jogos com as atualizações disponíveis no momento do teste não é adequado para o processamento de áudio em tempo real. Aparentemente, o problema está no Kernel do Windows.
| DPC Latencies / LatencyMon - interrupt to process latency (max), Web, Youtube, Prime95 | |
| MSI Katana 17 B13VFK | |
| Asus ROG Strix G17 G713PI | |
| Acer Nitro 17 AN17-51-71ER | |
| MSI Pulse 17 B13VGK | |
| Schenker XMG Focus 17 (E23) | |
| MSI Pulse GL76 12UGK | |
* ... menor é melhor
Solução de armazenamento
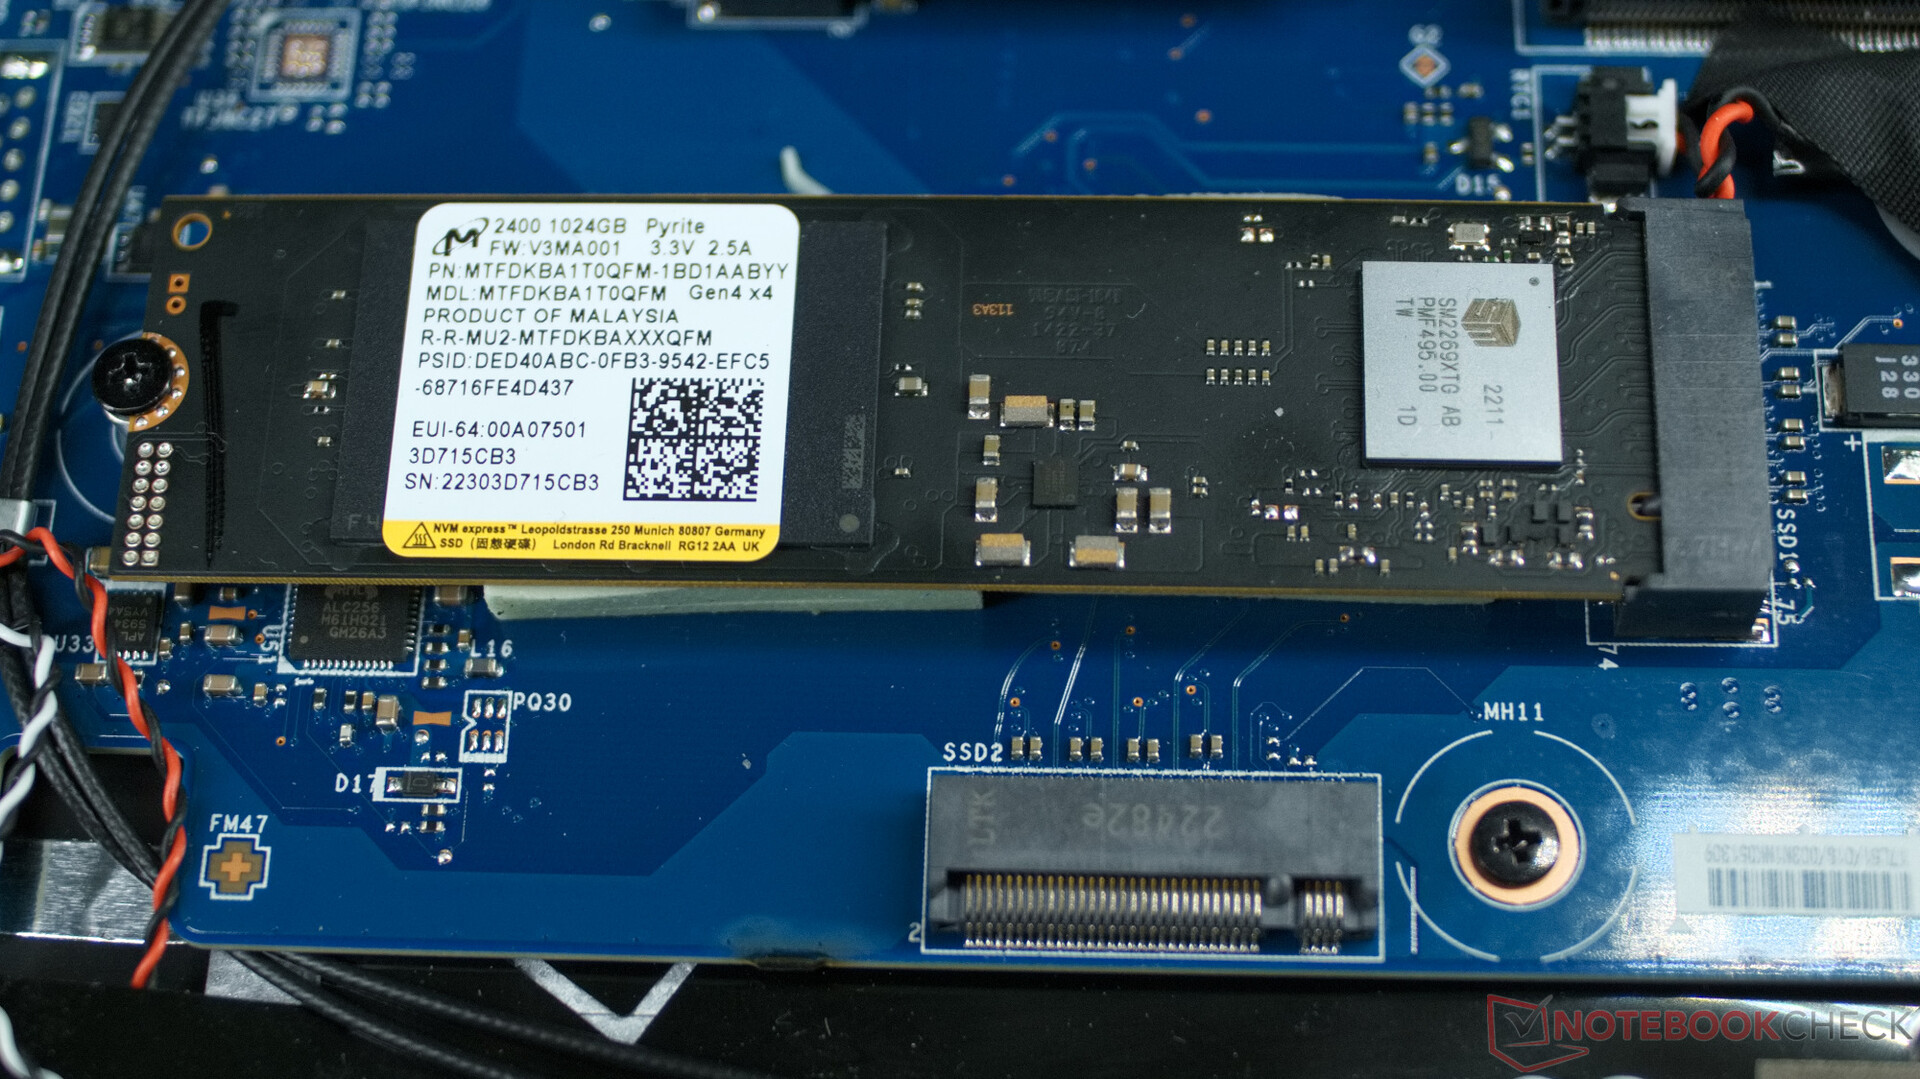
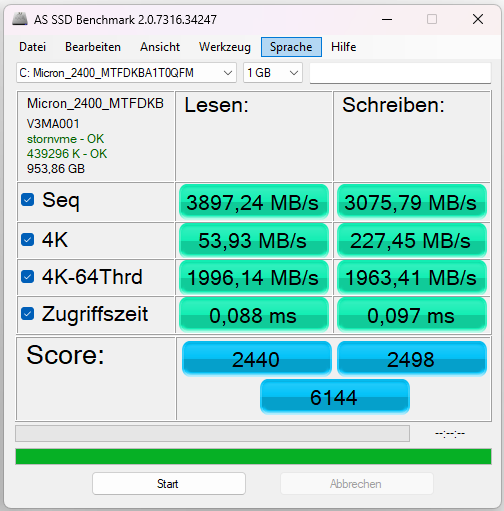
AsSSD Micron 2400 NVMe em nossa unidade de teste oferece uma capacidade de 1 Terabyte. Sua velocidade é média entre os notebooks para jogos e também pode ser mantida constantemente no MSI Pulse 17 por longos períodos de tempo sem problemas.

* ... menor é melhor
Constant Read Performance: DiskSpd Read Loop, Queue Depth 8
Placa gráfica
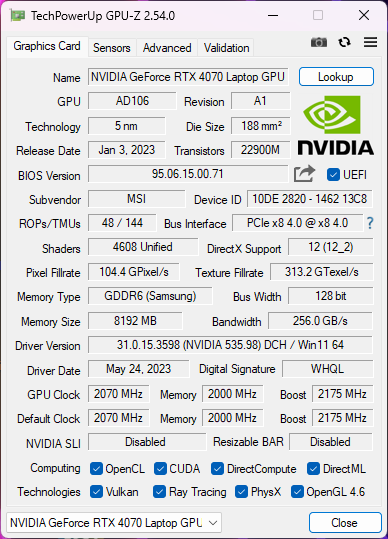
ANvidia RTX 4070é capaz de funcionar constantemente a uma potência de 100 a 140 watts no MSI Pulse 17 sem que as temperaturas do chip fiquem muito altas. Com isso, o chip gráfico oferece um desempenho comparativamente alto nos benchmarks do 3DMark. Isso significa que os jogos em Full HD e um pouco de raytracing leve não devem representar nenhum problema para a placa de vídeo, e o chip também domina rapidamente os aplicativos práticos, como a renderização de gráficos 3D em programas como o Blender.
| 3DMark 11 Performance | 34584 pontos | |
| 3DMark Cloud Gate Standard Score | 70329 pontos | |
| 3DMark Fire Strike Score | 27138 pontos | |
| 3DMark Time Spy Score | 12235 pontos | |
Ajuda | ||
| Geekbench 6.7 - GPU OpenCL | |
| Média da turma Gaming (67235 - 253130, n=103, últimos 2 anos) | |
| MSI Pulse 17 B13VGK | |
| Média NVIDIA GeForce RTX 4070 Laptop GPU (85488 - 129836, n=45) | |
* ... menor é melhor
Desempenho em jogos
OSchenker XMG Focus 17e Asus ROG Strix G17têm uma pequena vantagem em comparação com o MSI Pulse 17 aqui. Ambos os notebooks simplesmente oferecem um processador mais rápido, o que se reflete claramente nas taxas de quadros dos jogos que exigem muito da CPU, como o Dota 2 Reborn. No entanto, o Pulse 17 também mostra que é possível jogar em Full HD e muito mais com configurações de alta qualidade e até mesmo com raytracing, sem perder menos de 60 quadros por segundo. Ao mesmo tempo, o laptop permanece significativamente mais silencioso do que os outros concorrentes, e você pode jogar sem nenhuma queda no desempenho no modo balanceado com um nível de ruído de apenas 42 dB(A) (medido a uma distância de 15 cm, ~6 pol.).
| Performance rating - Percent | |
| Média da turma Gaming | |
| Asus ROG Strix G17 G713PI | |
| Schenker XMG Focus 17 (E23) | |
| MSI Katana 17 B13VFK | |
| MSI Pulse 17 B13VGK | |
| Acer Nitro 17 AN17-51-71ER | |
| MSI Pulse GL76 12UGK | |
| The Witcher 3 - 1920x1080 Ultra Graphics & Postprocessing (HBAO+) | |
| Média da turma Gaming (104.7 - 240, n=7, últimos 2 anos) | |
| Asus ROG Strix G17 G713PI | |
| Schenker XMG Focus 17 (E23) | |
| MSI Pulse 17 B13VGK | |
| Acer Nitro 17 AN17-51-71ER | |
| MSI Katana 17 B13VFK | |
| MSI Pulse GL76 12UGK | |
| GTA V - 1920x1080 Highest AA:4xMSAA + FX AF:16x | |
| Média da turma Gaming (48.3 - 186.9, n=94, últimos 2 anos) | |
| Schenker XMG Focus 17 (E23) | |
| MSI Pulse 17 B13VGK | |
| Acer Nitro 17 AN17-51-71ER | |
| Asus ROG Strix G17 G713PI | |
| MSI Katana 17 B13VFK | |
| MSI Pulse GL76 12UGK | |
| Final Fantasy XV Benchmark - 1920x1080 High Quality | |
| Média da turma Gaming (41 - 215, n=95, últimos 2 anos) | |
| Schenker XMG Focus 17 (E23) | |
| Asus ROG Strix G17 G713PI | |
| MSI Pulse 17 B13VGK | |
| Acer Nitro 17 AN17-51-71ER | |
| MSI Katana 17 B13VFK | |
| MSI Pulse GL76 12UGK | |
| Strange Brigade - 1920x1080 ultra AA:ultra AF:16 | |
| Média da turma Gaming (76.3 - 458, n=87, últimos 2 anos) | |
| Schenker XMG Focus 17 (E23) | |
| Asus ROG Strix G17 G713PI | |
| MSI Pulse 17 B13VGK | |
| Acer Nitro 17 AN17-51-71ER | |
| MSI Katana 17 B13VFK | |
| MSI Pulse GL76 12UGK | |
| Dota 2 Reborn - 1920x1080 ultra (3/3) best looking | |
| Schenker XMG Focus 17 (E23) | |
| Asus ROG Strix G17 G713PI | |
| MSI Katana 17 B13VFK | |
| Média da turma Gaming (84.8 - 248, n=107, últimos 2 anos) | |
| MSI Pulse 17 B13VGK | |
| Acer Nitro 17 AN17-51-71ER | |
| MSI Pulse GL76 12UGK | |
No teste de uma hora com o Witcher 3, é mostrado o intervalo típico de FPS no ritmo diurno e noturno do jogo. Não vemos nenhuma exceção significativa aqui.
The Witcher 3 FPS Chart
| baixo | média | alto | ultra | QHD | 4K | |
|---|---|---|---|---|---|---|
| GTA V (2015) | 184.8 | 182.2 | 176.9 | 116.4 | ||
| The Witcher 3 (2015) | 106.9 | |||||
| Dota 2 Reborn (2015) | 174 | 158 | 146.3 | 138.5 | 132.4 | |
| Final Fantasy XV Benchmark (2018) | 150.5 | 111.9 | 86.2 | 47.5 | ||
| X-Plane 11.11 (2018) | 147.6 | 130.8 | 102 | 102.2 | ||
| Far Cry 5 (2018) | 163 | 154 | 145 | |||
| Strange Brigade (2018) | 468 | 295 | 233 | 202 | ||
| F1 22 (2022) | 239 | 228 | 186.7 | 71 | ||
| F1 23 (2023) | 248 | 251 | 199.2 | 100 |
Emissões - Ventiladores silenciosos
Emissões de ruído
O MSI Pulse 17 é extremamente silencioso para um laptop para jogos. Medimos um nível máximo de ruído de apenas 46,5 dB(A) sob carga no modo Desempenho e, no modo Equilibrado, ele é até 4 dB(A) menor. Os ventiladores também são audíveis com um atraso sob carga. Por exemplo, elas só se tornam ativas pouco antes do final do benchmark em nossa medição sob cargas médias com o PCMark 06.
Barulho
| Ocioso |
| 24 / 24 / 24 dB |
| Carga |
| 32.49 / 46.51 dB |
 | ||
30 dB silencioso 40 dB(A) audível 50 dB(A) ruidosamente alto |
||
min: | ||
| MSI Pulse 17 B13VGK GeForce RTX 4070 Laptop GPU, i7-13700H, Micron 2400 MTFDKBA1T0QFM | MSI Pulse GL76 12UGK GeForce RTX 3070 Laptop GPU, i7-12700H, Micron 3400 1TB MTFDKBA1T0TFH | MSI Katana 17 B13VFK GeForce RTX 4060 Laptop GPU, i7-13620H, Micron 2400 MTFDKBA1T0QFM | Acer Nitro 17 AN17-51-71ER GeForce RTX 4060 Laptop GPU, i7-13700H, Samsung PM9A1 MZVL21T0HCLR | Schenker XMG Focus 17 (E23) GeForce RTX 4070 Laptop GPU, i9-13900HX, Crucial P5 Plus 1TB CT1000P5PSSD8 | Asus ROG Strix G17 G713PI GeForce RTX 4070 Laptop GPU, R9 7945HX, WD PC SN560 SDDPNQE-1T00 | |
|---|---|---|---|---|---|---|
| Noise | -13% | -24% | -11% | -19% | -14% | |
| desligado / ambiente * (dB) | 24 | 24.1 -0% | 24.5 -2% | 24 -0% | 24 -0% | 25 -4% |
| Idle Minimum * (dB) | 24 | 26.9 -12% | 24.5 -2% | 24 -0% | 24 -0% | 26 -8% |
| Idle Average * (dB) | 24 | 26.9 -12% | 24.5 -2% | 24 -0% | 24 -0% | 29 -21% |
| Idle Maximum * (dB) | 24 | 27 -13% | 40 -67% | 32.32 -35% | 26.47 -10% | 30 -25% |
| Load Average * (dB) | 32.49 | 43.8 -35% | 48.3 -49% | 35.18 -8% | 55.72 -71% | 46 -42% |
| Witcher 3 ultra * (dB) | 46.51 | 44.7 4% | 56 -20% | 54.78 -18% | 57.94 -25% | 46 1% |
| Load Maximum * (dB) | 46.51 | 58.3 -25% | 59.1 -27% | 54.78 -18% | 57.94 -25% | 47 -1% |
* ... menor é melhor
Temperaturas
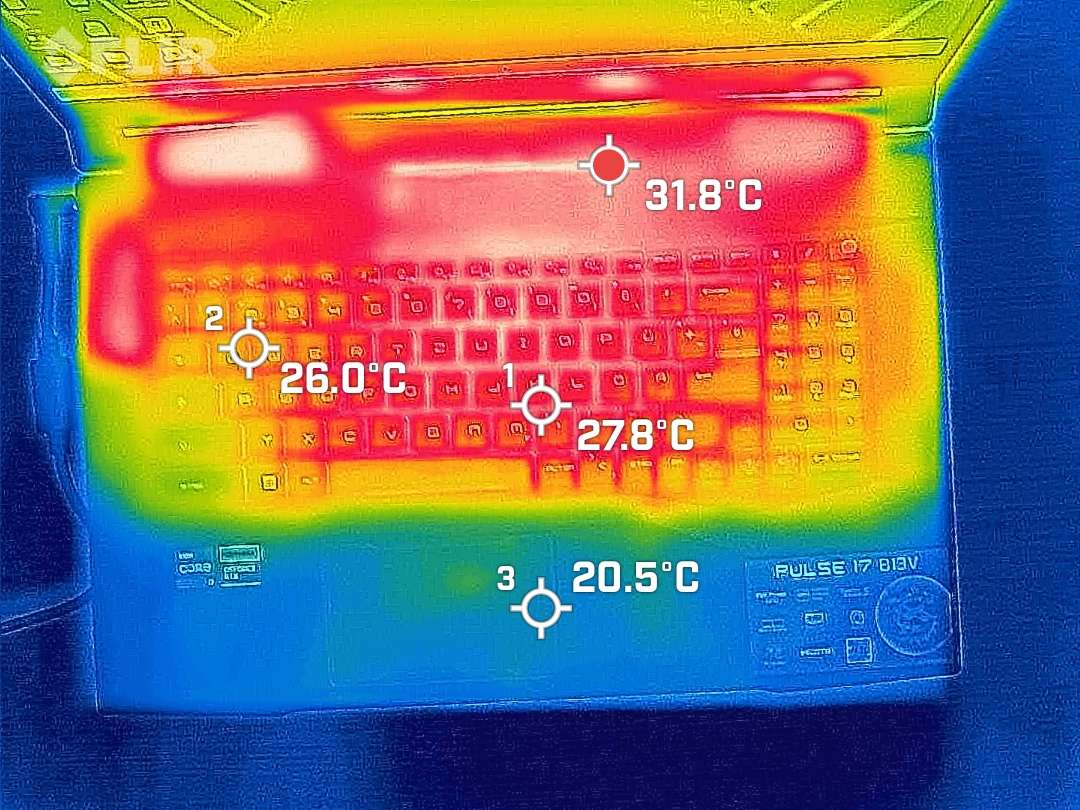
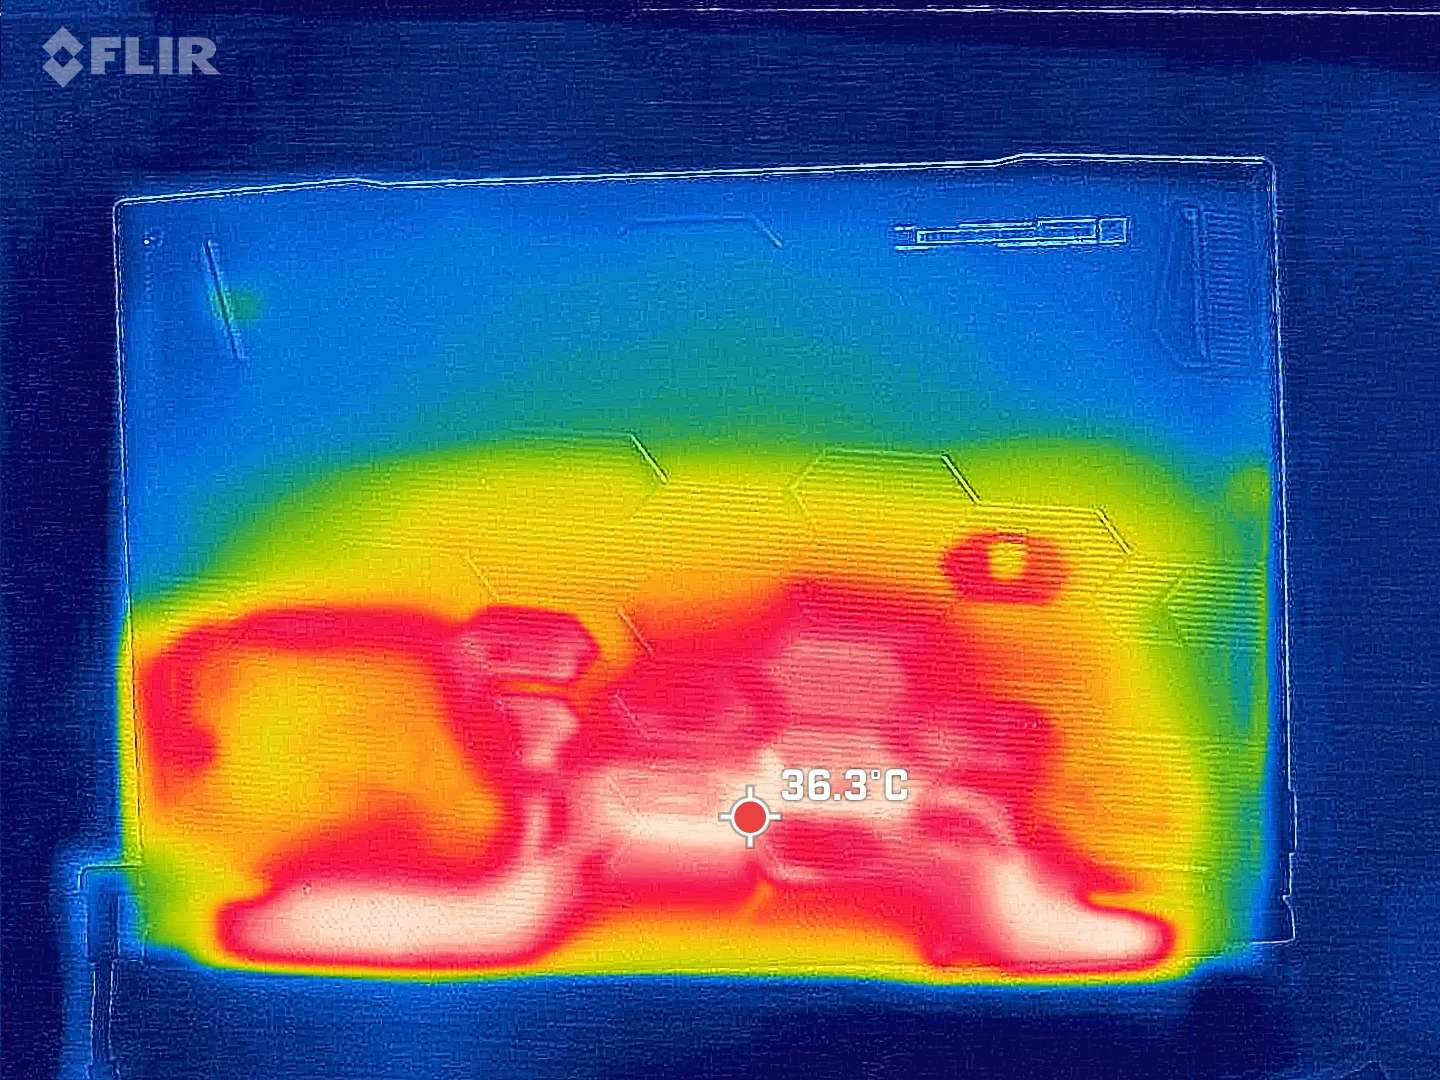
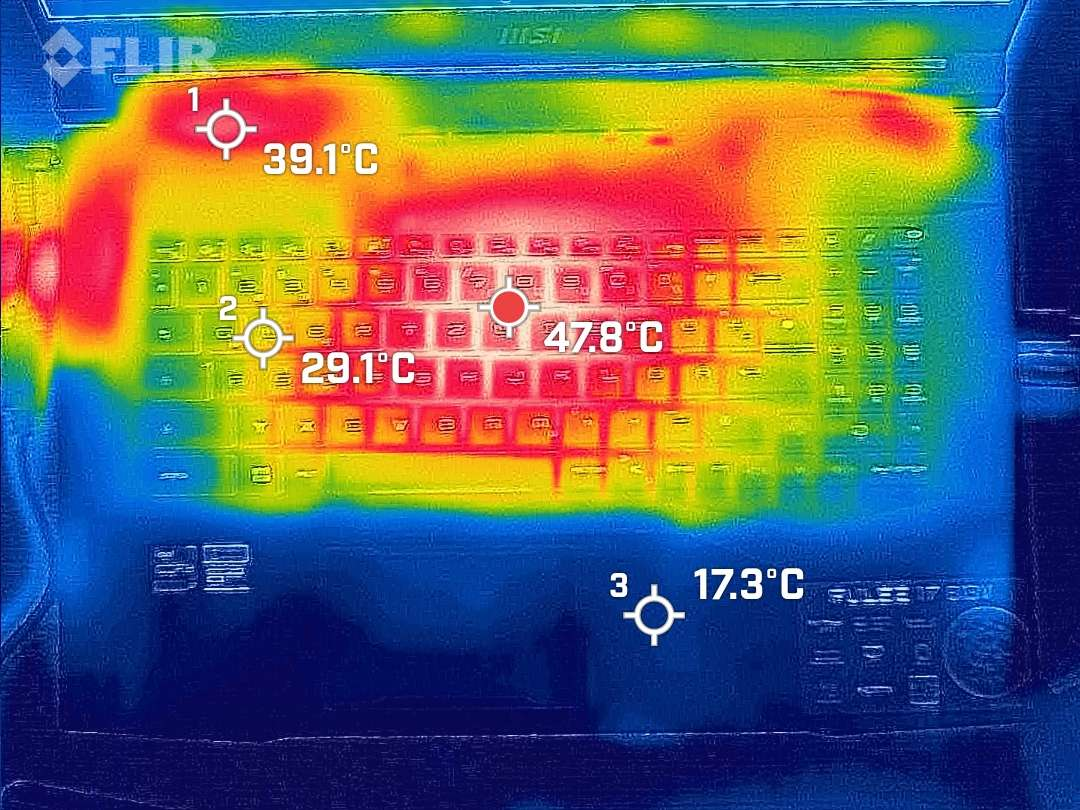
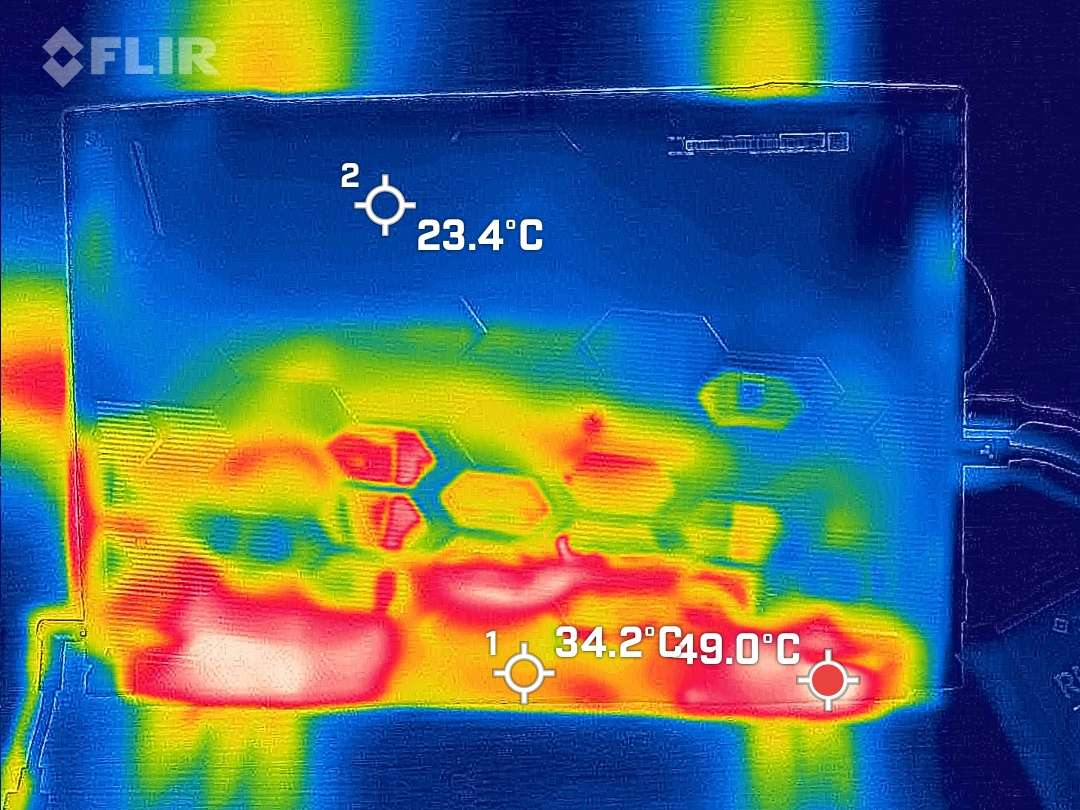
Em nossa unidade de teste, as temperaturas da superfície dos apoios para as mãos permaneceram consistentemente frias e apenas um pouco acima da temperatura ambiente. A temperatura máxima do dispositivo é de 48 °C (118 °F) e está distribuída em grandes áreas na borda traseira, acima e abaixo do sistema de resfriamento, bem como no centro do teclado. Entretanto, as temperaturas permanecem dentro de faixas toleráveis nas áreas importantes para jogos, bem como na parte inferior do laptop para jogos de alto desempenho.
(-) A temperatura máxima no lado superior é 48 °C / 118 F, em comparação com a média de 40.4 °C / 105 F , variando de 21.2 a 68.8 °C para a classe Gaming.
(-) A parte inferior aquece até um máximo de 50 °C / 122 F, em comparação com a média de 43.2 °C / 110 F
(+) Em uso inativo, a temperatura média para o lado superior é 27.8 °C / 82 F, em comparação com a média do dispositivo de 33.9 °C / ### class_avg_f### F.
(±) Jogando The Witcher 3, a temperatura média para o lado superior é 37 °C / 99 F, em comparação com a média do dispositivo de 33.9 °C / ## #class_avg_f### F.
(+) Os apoios para as mãos e o touchpad são mais frios que a temperatura da pele, com um máximo de 24 °C / 75.2 F e, portanto, são frios ao toque.
(+) A temperatura média da área do apoio para as mãos de dispositivos semelhantes foi 28.8 °C / 83.8 F (+4.8 °C / 8.6 F).
| MSI Pulse 17 B13VGK Intel Core i7-13700H, NVIDIA GeForce RTX 4070 Laptop GPU | |
|---|---|
| Heat | |
| Maximum Upper Side * (°C) | 48 |
| Maximum Bottom * (°C) | 50 |
| Idle Upper Side * (°C) | 30 |
| Idle Bottom * (°C) | 33 |
* ... menor é melhor
Teste de estresse
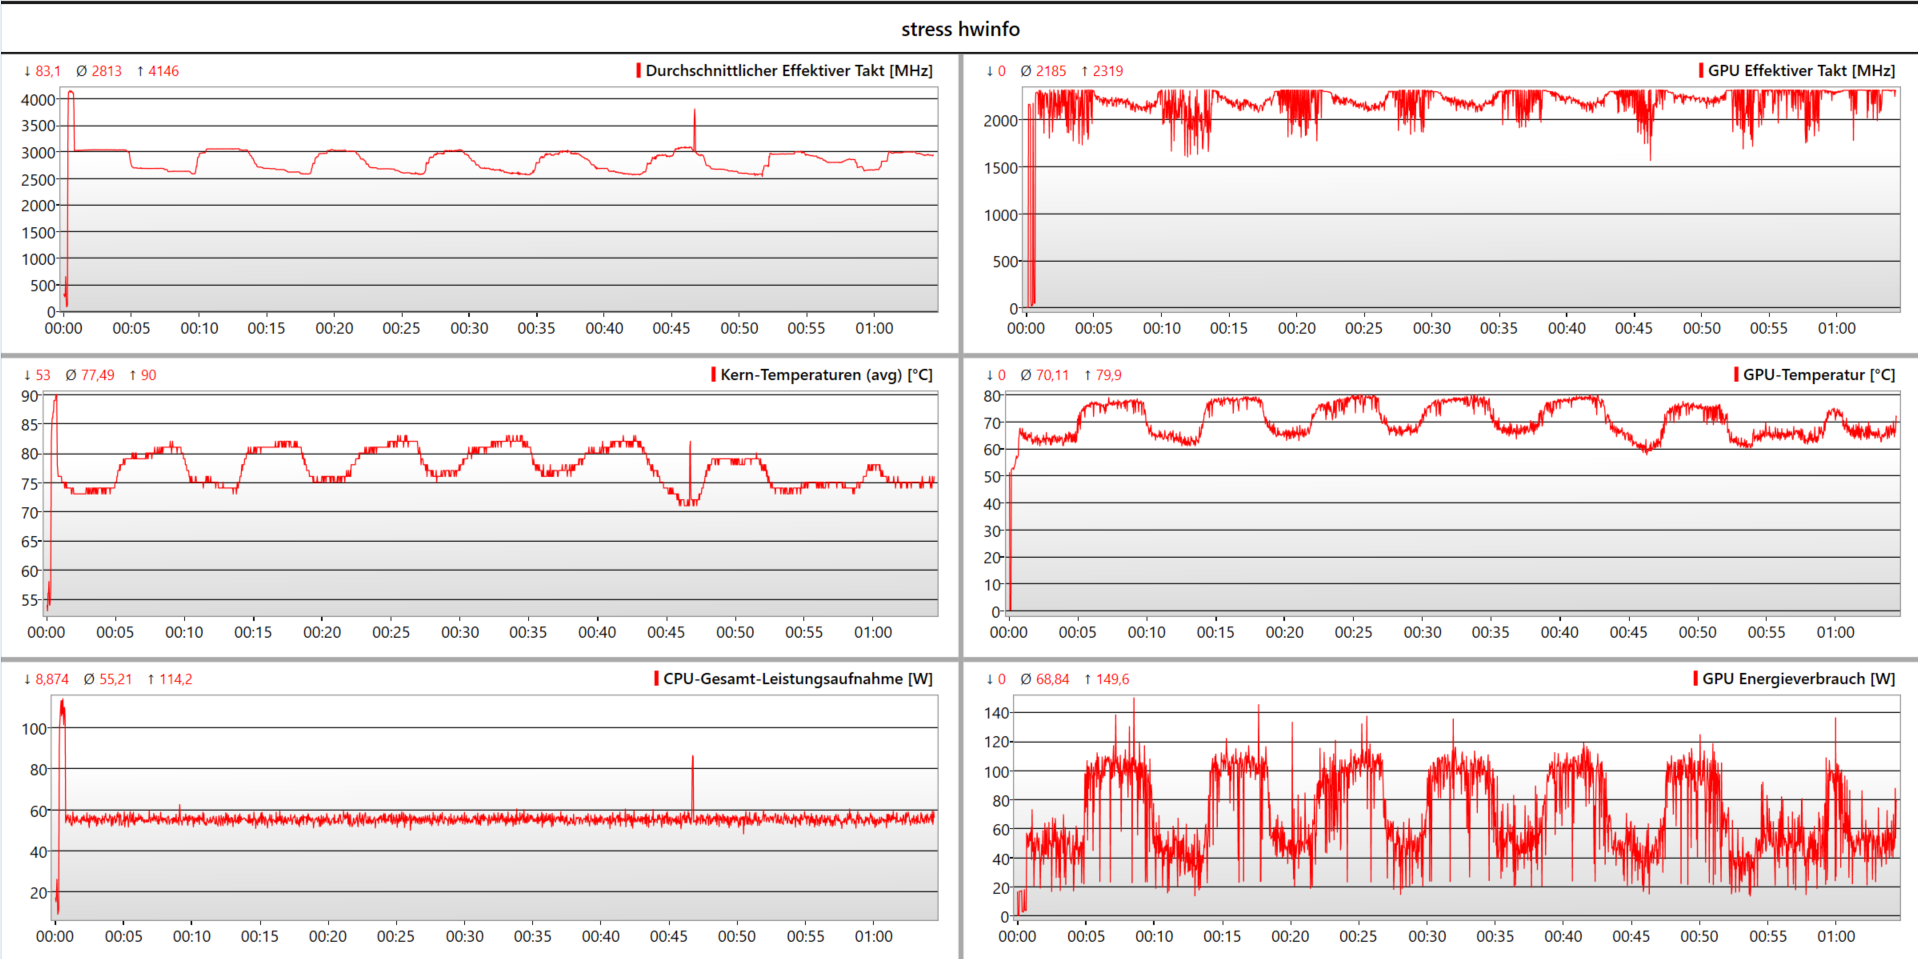
Executamos o teste de estresse no quase novo MSI Pulse 17. Aparentemente, a temperatura-alvo da GPU está em torno de 80 °C (176 °F). Assim que esse valor é atingido, o desempenho é reduzido até que a GPU tenha esfriado um pouco. Isso causa algumas oscilações em nosso registro do teste de estresse com o Prime95 e o Furmark. Após sua curta fase de aumento, o Core i7 funciona constantemente com cerca de 55 watts. A RTX 4070 tem que acelerar repetidamente de 110 watts para 50 watts. Nas partes posteriores do nosso teste do MSI Pulse 17, o controle de energia do notebook se estabilizou significativamente, de modo que podemos presumir algum efeito de aprendizado aqui.
Alto-falantes
Os médios superenfatizados fazem com que o MSI Pulse 17 soe um pouco diminuto. Entretanto, com até 85 dB(A), os pequenos alto-falantes são relativamente altos e facilmente capazes de abafar as ventoinhas silenciosas desse laptop para jogos. Aqueles que não gostarem dos alto-falantes podem conectar dispositivos externos usando Bluetooth ou a porta de áudio de 3,5 mm.
MSI Pulse 17 B13VGK análise de áudio
(+) | os alto-falantes podem tocar relativamente alto (###valor### dB)
Graves 100 - 315Hz
(±) | graves reduzidos - em média 13.2% menor que a mediana
(±) | a linearidade dos graves é média (12.3% delta para a frequência anterior)
Médios 400 - 2.000 Hz
(±) | médios mais altos - em média 9.4% maior que a mediana
(+) | médios são lineares (5.7% delta para frequência anterior)
Altos 2 - 16 kHz
(+) | agudos equilibrados - apenas 2.9% longe da mediana
(+) | os máximos são lineares (6.7% delta da frequência anterior)
Geral 100 - 16.000 Hz
(±) | a linearidade do som geral é média (15.8% diferença em relação à mediana)
Comparado com a mesma classe
» 37% de todos os dispositivos testados nesta classe foram melhores, 7% semelhantes, 56% piores
» O melhor teve um delta de 6%, a média foi 18%, o pior foi 132%
Comparado com todos os dispositivos testados
» 24% de todos os dispositivos testados foram melhores, 5% semelhantes, 70% piores
» O melhor teve um delta de 4%, a média foi 23%, o pior foi 134%
Apple MacBook Pro 16 2021 M1 Pro análise de áudio
(+) | os alto-falantes podem tocar relativamente alto (###valor### dB)
Graves 100 - 315Hz
(+) | bons graves - apenas 3.8% longe da mediana
(+) | o baixo é linear (5.2% delta para a frequência anterior)
Médios 400 - 2.000 Hz
(+) | médios equilibrados - apenas 1.3% longe da mediana
(+) | médios são lineares (2.1% delta para frequência anterior)
Altos 2 - 16 kHz
(+) | agudos equilibrados - apenas 1.9% longe da mediana
(+) | os máximos são lineares (2.7% delta da frequência anterior)
Geral 100 - 16.000 Hz
(+) | o som geral é linear (4.6% diferença em relação à mediana)
Comparado com a mesma classe
» 0% de todos os dispositivos testados nesta classe foram melhores, 0% semelhantes, 100% piores
» O melhor teve um delta de 5%, a média foi 17%, o pior foi 45%
Comparado com todos os dispositivos testados
» 0% de todos os dispositivos testados foram melhores, 0% semelhantes, 100% piores
» O melhor teve um delta de 4%, a média foi 23%, o pior foi 134%
Gerenciamento de energia - A bateria de 90 Wh garante uma longa duração
Consumo de energia
Embora o consumo máximo de energia do Pulse 17 sob carga seja bastante típico para a classe de laptops, durante a operação ociosa e mesmo sob cargas moderadas, nossa unidade de teste é excepcionalmente eficiente para um laptop para jogos.
| desligado | |
| Ocioso | |
| Carga |
|
Key:
min: | |
| MSI Pulse 17 B13VGK i7-13700H, GeForce RTX 4070 Laptop GPU, Micron 2400 MTFDKBA1T0QFM, IPS, 1920x1080, 17.3" | MSI Pulse GL76 12UGK i7-12700H, GeForce RTX 3070 Laptop GPU, Micron 3400 1TB MTFDKBA1T0TFH, IPS, 1920x1080, 17.3" | MSI Katana 17 B13VFK i7-13620H, GeForce RTX 4060 Laptop GPU, Micron 2400 MTFDKBA1T0QFM, IPS LED, 1920x1080, 17.3" | Acer Nitro 17 AN17-51-71ER i7-13700H, GeForce RTX 4060 Laptop GPU, Samsung PM9A1 MZVL21T0HCLR, , 2560x1440, 17.3" | Schenker XMG Focus 17 (E23) i9-13900HX, GeForce RTX 4070 Laptop GPU, Crucial P5 Plus 1TB CT1000P5PSSD8, IPS, 2560x1440, 17.3" | Asus ROG Strix G17 G713PI R9 7945HX, GeForce RTX 4070 Laptop GPU, WD PC SN560 SDDPNQE-1T00, IPS, 2560x1440, 17.3" | Média NVIDIA GeForce RTX 4070 Laptop GPU | Média da turma Gaming | |
|---|---|---|---|---|---|---|---|---|
| Power Consumption | -45% | -26% | -18% | -97% | -75% | -58% | -64% | |
| Idle Minimum * (Watt) | 9 | 12.4 -38% | 12.2 -36% | 8.3 8% | 17 -89% | 15 -67% | 13.2 ? -47% | 13 ? -44% |
| Idle Average * (Watt) | 10.2 | 13.1 -28% | 14.9 -46% | 13.5 -32% | 18 -76% | 20 -96% | 18.2 ? -78% | 18.7 ? -83% |
| Idle Maximum * (Watt) | 10.8 | 25.3 -134% | 15.8 -46% | 14.8 -37% | 25.8 -139% | 29 -169% | 24.6 ? -128% | 24.3 ? -125% |
| Load Average * (Watt) | 72 | 105.4 -46% | 85.22 -18% | 77 -7% | 178 -147% | 121 -68% | 97 ? -35% | 110.2 ? -53% |
| Witcher 3 ultra * (Watt) | 130 | 150 -15% | 151.1 -16% | 154 -18% | 265 -104% | 179.8 -38% | ||
| Load Maximum * (Watt) | 221 | 240.5 -9% | 212.8 4% | 263 -19% | 275 -24% | 246 -11% | 221 ? -0% | 258 ? -17% |
* ... menor é melhor
Power Consumption The Witcher 3 / Stress Test
Power Consumption With External Monitor
Duração da bateria
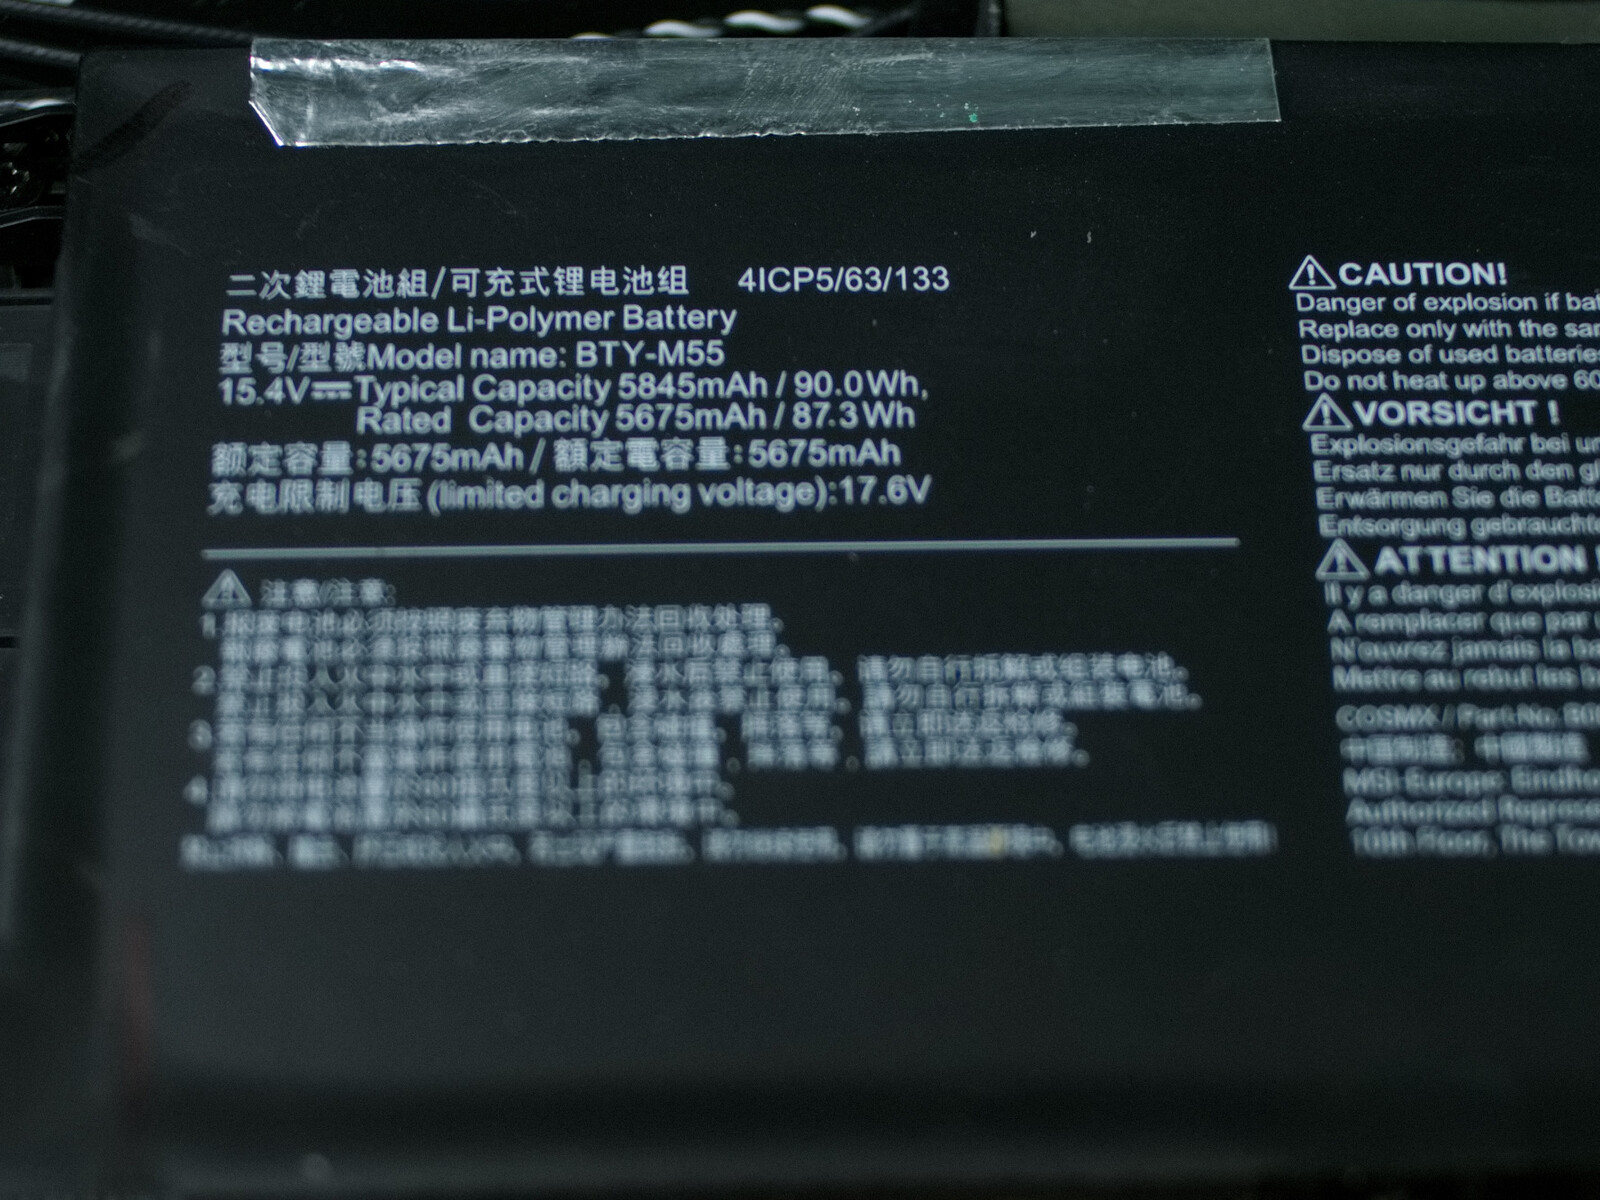
De acordo com nossas medições de consumo de energia, também não é surpreendente que o laptop para jogos dure muito tempo com sua bateria de 90 Wh em nosso teste de navegação na Web por WiFi, chegando a quase 9 horas aqui. Mesmo sob carga, a bateria dura 2 horas.
| MSI Pulse 17 B13VGK i7-13700H, GeForce RTX 4070 Laptop GPU, 90 Wh | MSI Pulse GL76 12UGK i7-12700H, GeForce RTX 3070 Laptop GPU, 90 Wh | MSI Katana 17 B13VFK i7-13620H, GeForce RTX 4060 Laptop GPU, 53.5 Wh | Acer Nitro 17 AN17-51-71ER i7-13700H, GeForce RTX 4060 Laptop GPU, 90 Wh | Schenker XMG Focus 17 (E23) i9-13900HX, GeForce RTX 4070 Laptop GPU, 73 Wh | Asus ROG Strix G17 G713PI R9 7945HX, GeForce RTX 4070 Laptop GPU, 90 Wh | Média da turma Gaming | |
|---|---|---|---|---|---|---|---|
| Duração da bateria | -20% | -62% | -9% | -57% | -54% | -27% | |
| WiFi v1.3 (h) | 9 | 5.9 -34% | 2.9 -68% | 8.2 -9% | 3.9 -57% | 4.3 -52% | 7.11 ? -21% |
| Load (h) | 2.2 | 2.1 -5% | 1 -55% | 1 -55% | 1.502 ? -32% | ||
| Reader / Idle (h) | 7.3 | 8.16 ? | |||||
| H.264 (h) | 6.9 | 3.1 | 2.8 | 8.32 ? | |||
| Witcher 3 ultra (h) | 2.5 | 1 | 1.1 |
Pro
Contra
Veredicto - Mais steam punk do que ficção científica
No lado positivo do MSI Pulse 17, há vários pontos fortes que falam a favor do laptop, com um ótimo desempenho do processador Core i7e Nvidia GeForce RTX 4070 principalmente. Para conseguir isso, o Pulse não precisa nem mesmo de ventiladores pulsantes, e o laptop é particularmente silencioso para sua classe de desempenho. Outros pontos positivos do laptop para jogos incluem um teclado decente e um bom posicionamento das conexões externas. A duração da bateria também é excelente para um laptop para jogos.
O Pulse 17 é um laptop para jogos capaz de oferecer um desempenho poderoso com baixo nível de ruído. Por outro lado, o dispositivo ainda não chegou ao ano 2023 em muitos outros aspectos.
Infelizmente, o laptop também tem algumas grandes desvantagens. Além do MSI Katana 17, nenhum outro laptop para jogos em nossa comparação tem uma tela tão ruim. O equipamento de conexão com portas USB 2.0 e USB 3.2 Gen 1 lentas e LAN de 1 GBit/s, bem como a falta de Wi-Fi de 6 GHz, também não apresentam o laptop para jogos como um dispositivo de ponta. Mas o que é realmente irritante é a porta M.2 NVMe bloqueada, já que o fabricante poderia ter evitado isso de duas maneiras. Em primeiro lugar, a placa-mãe e o gabinete teriam deixado espaço suficiente para mover o módulo ligeiramente para a esquerda para dar espaço para a bateria. E, segundo, as pistas PCIe desnecessariamente desperdiçadas também poderiam ter sido investidas em uma porta Thunderbolt.
Embora, em comparação com o antecessor, o modelo atual agora ofereça suporte a G-Sync, MUX e Advanced Optimus, ele ainda não tem Thunderbolt. Além disso, a tela do antecessor era significativamente melhor de acordo com nossas medições.
Com preços de rua a partir de 2.150 euros (~$2.415) no momento do nosso teste, há muitos laptops (em partes também significativamente mais acessíveis) como alternativas à nossa unidade de teste. O preço que você paga ao fabricante pelo Asus ROG Stix G17 está no mesmo nível do dispositivo MSI de muitos fornecedores. Embora você tenha que fazer algumas concessões pesadas na duração da bateria com o laptop da Asus, o Pulse 17 e o ROG Strix G17 são bastante semelhantes em todas as áreas de desempenho. Por outro lado, a tela e o equipamento de conexão do ROG Strix são significativamente melhores.
Preço e disponibilidade
O MSI Pulse 17 B13VGK está disponível apenas em alguns fornecedores nos EUA, como Newegg por ~$1963com mais fornecedores oferecendo-o em UK, Austráliaou Canadapor exemplo.
MSI Pulse 17 B13VGK
- 07/16/2023 v7 (old)
Marc Herter
Transparência
A seleção dos dispositivos a serem analisados é feita pela nossa equipe editorial. A amostra de teste foi fornecida ao autor como empréstimo pelo fabricante ou varejista para fins desta revisão. O credor não teve influência nesta revisão, nem o fabricante recebeu uma cópia desta revisão antes da publicação. Não houve obrigação de publicar esta revisão. Como empresa de mídia independente, a Notebookcheck não está sujeita à autoridade de fabricantes, varejistas ou editores.
É assim que o Notebookcheck está testando
Todos os anos, o Notebookcheck analisa de forma independente centenas de laptops e smartphones usando procedimentos padronizados para garantir que todos os resultados sejam comparáveis. Desenvolvemos continuamente nossos métodos de teste há cerca de 20 anos e definimos padrões da indústria no processo. Em nossos laboratórios de teste, equipamentos de medição de alta qualidade são utilizados por técnicos e editores experientes. Esses testes envolvem um processo de validação em vários estágios. Nosso complexo sistema de classificação é baseado em centenas de medições e benchmarks bem fundamentados, o que mantém a objetividade.Price comparison

