Análise do Aorus 15 YE5: O laptop para jogos de última geração para quem quer economizar
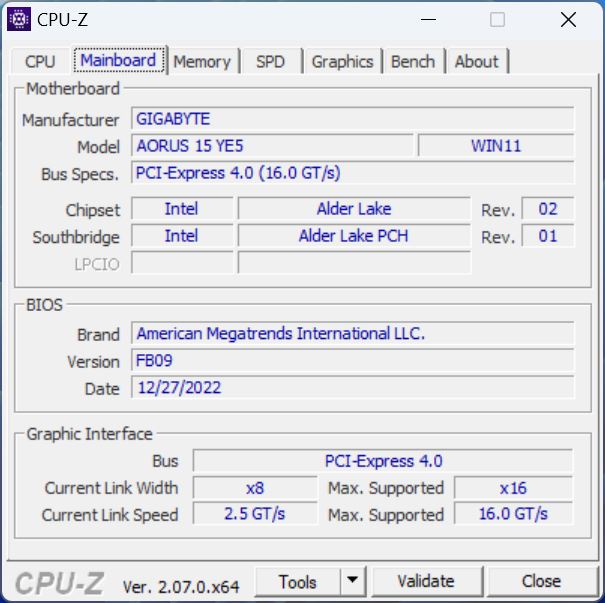
Graças ao seu baixo preço, o Aorus 15 YE já é um laptop para jogos interessante. Por fora, ele parece moderno e fino - o pacote acessível inclui até mesmo Thunderbolt 4 e DDR5. Por dentro, em contraste, o hardware (forte) de última geração está instalado, ou seja, um Core i5-12500H e o modelo carro-chefe anterior da Nvidia RTX 3080 Ti. Tudo isso faz do Aorus 15 YE5 um dos laptops para jogos mais potentes que o senhor pode adquirir por US$ 1.500.
Apesar de a CPU e a GPU serem da geração anterior, o Aorus precisa se defender dos concorrentes atuais para mostrar se consegue acompanhar o ritmo e se realmente consegue oferecer ao senhor um bom custo-benefício. Posteriormente, vamos confrontá-lo com os laptops atuais com a RTX 4060 ou a RTX 4070, como o Aorus 15 BSF (RTX 4070), Captiva Advanced Gaming I74-121 (RTX 4060), HP Victus 16 (RTX 4070), HP Omen 16 (RTX 4080) e o muito mais caro Dell XPS 15 9530 (RTX 4070).
Potenziali concorrenti a confronto
Avaliação | Data | Modelo | Peso | Altura | Size | Resolução | Preço |
|---|---|---|---|---|---|---|---|
| 86.6 % v7 (old) | 12/2023 | Aorus 15 YE5-54DEB34SH i5-12500H, GeForce RTX 3080 Ti Laptop GPU | 2.3 kg | 27 mm | 15.60" | 2560x1440 | |
| 85.7 % v7 (old) | 08/2023 | Aorus 15 BSF i7-13700H, GeForce RTX 4070 Laptop GPU | 2.4 kg | 20.9 mm | 15.60" | 2560x1440 | |
| 85.7 % v7 (old) | 09/2023 | Captiva Advanced Gaming I74-121 i5-13500H, GeForce RTX 4060 Laptop GPU | 2.3 kg | 29 mm | 15.60" | 1920x1080 | |
| 85.1 % v7 (old) | 09/2023 | HP Victus 16-r0077ng i7-13700H, GeForce RTX 4070 Laptop GPU | 2.4 kg | 24 mm | 16.10" | 1920x1080 | |
| 90.3 % v7 (old) | 04/2023 | Dell XPS 15 9530 RTX 4070 i7-13700H, GeForce RTX 4070 Laptop GPU | 1.9 kg | 18 mm | 15.60" | 3456x2160 | |
| 87.4 % v7 (old) | 07/2023 | HP Omen 16-wf000 i7-13700HX, GeForce RTX 4080 Laptop GPU | 2.4 kg | 23.6 mm | 16.10" | 2560x1440 |
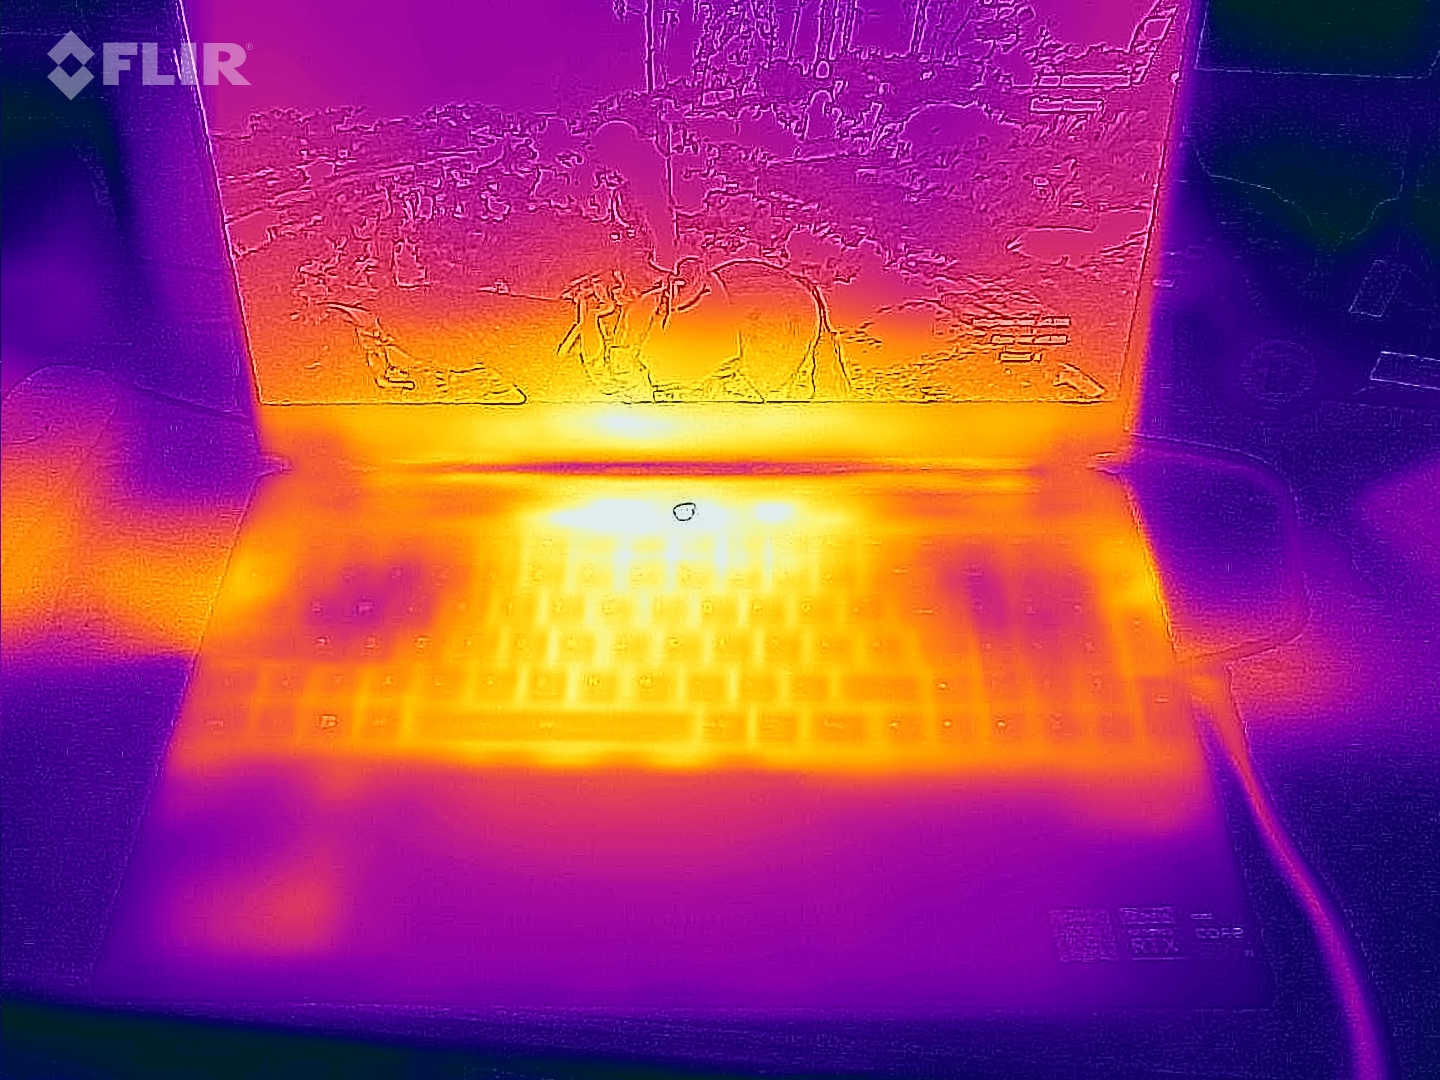
Estojo e conectividade: Moderno, mas com o mínimo de recursos
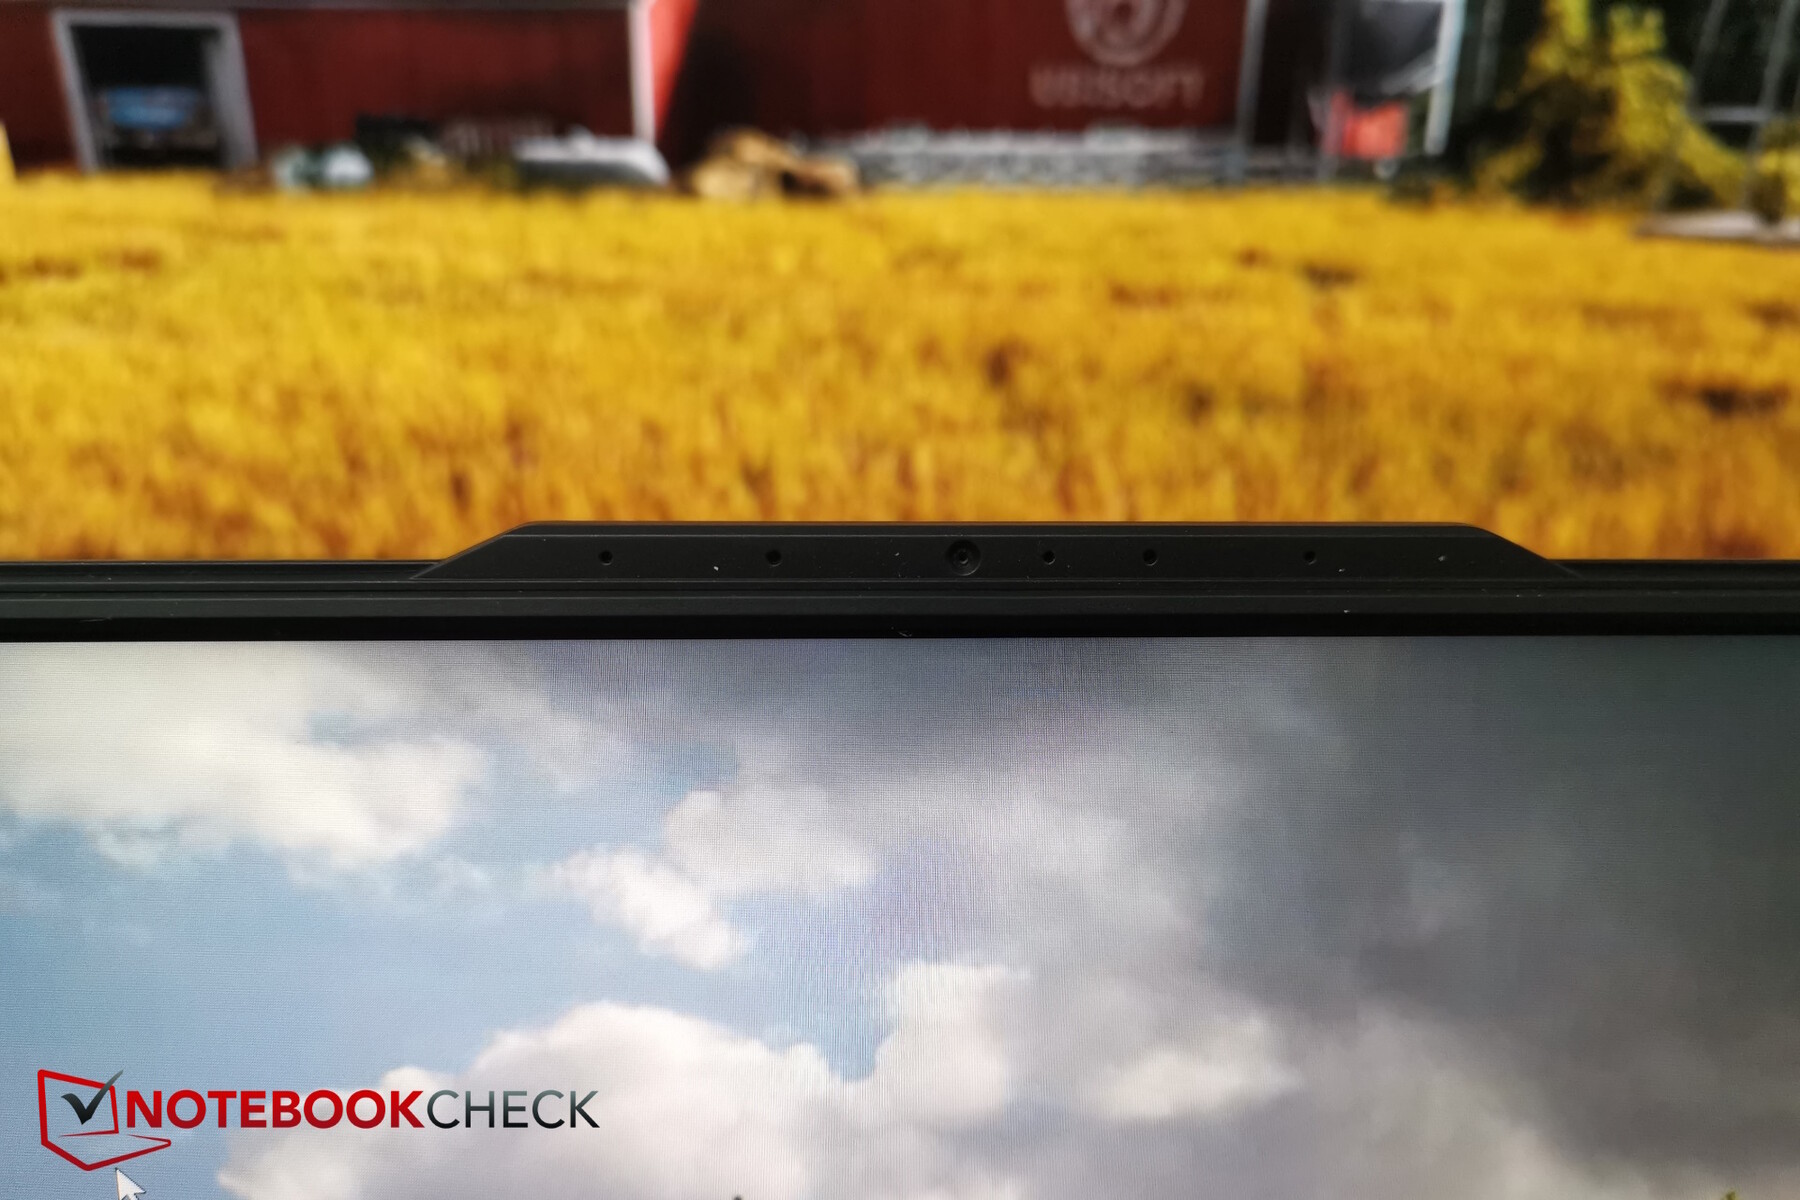
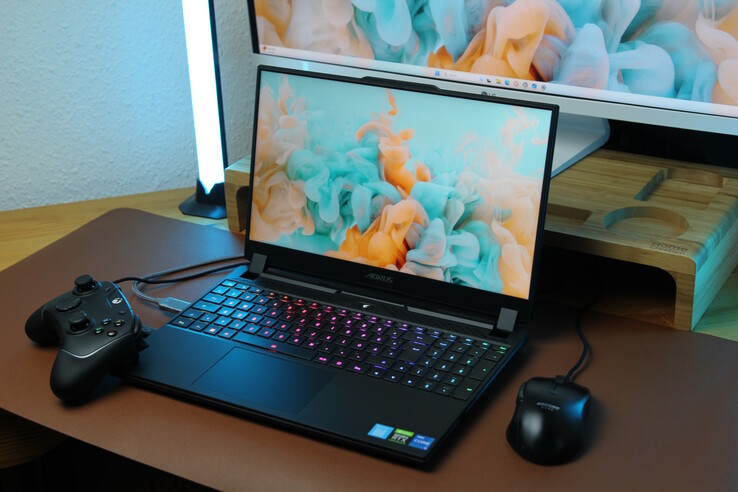
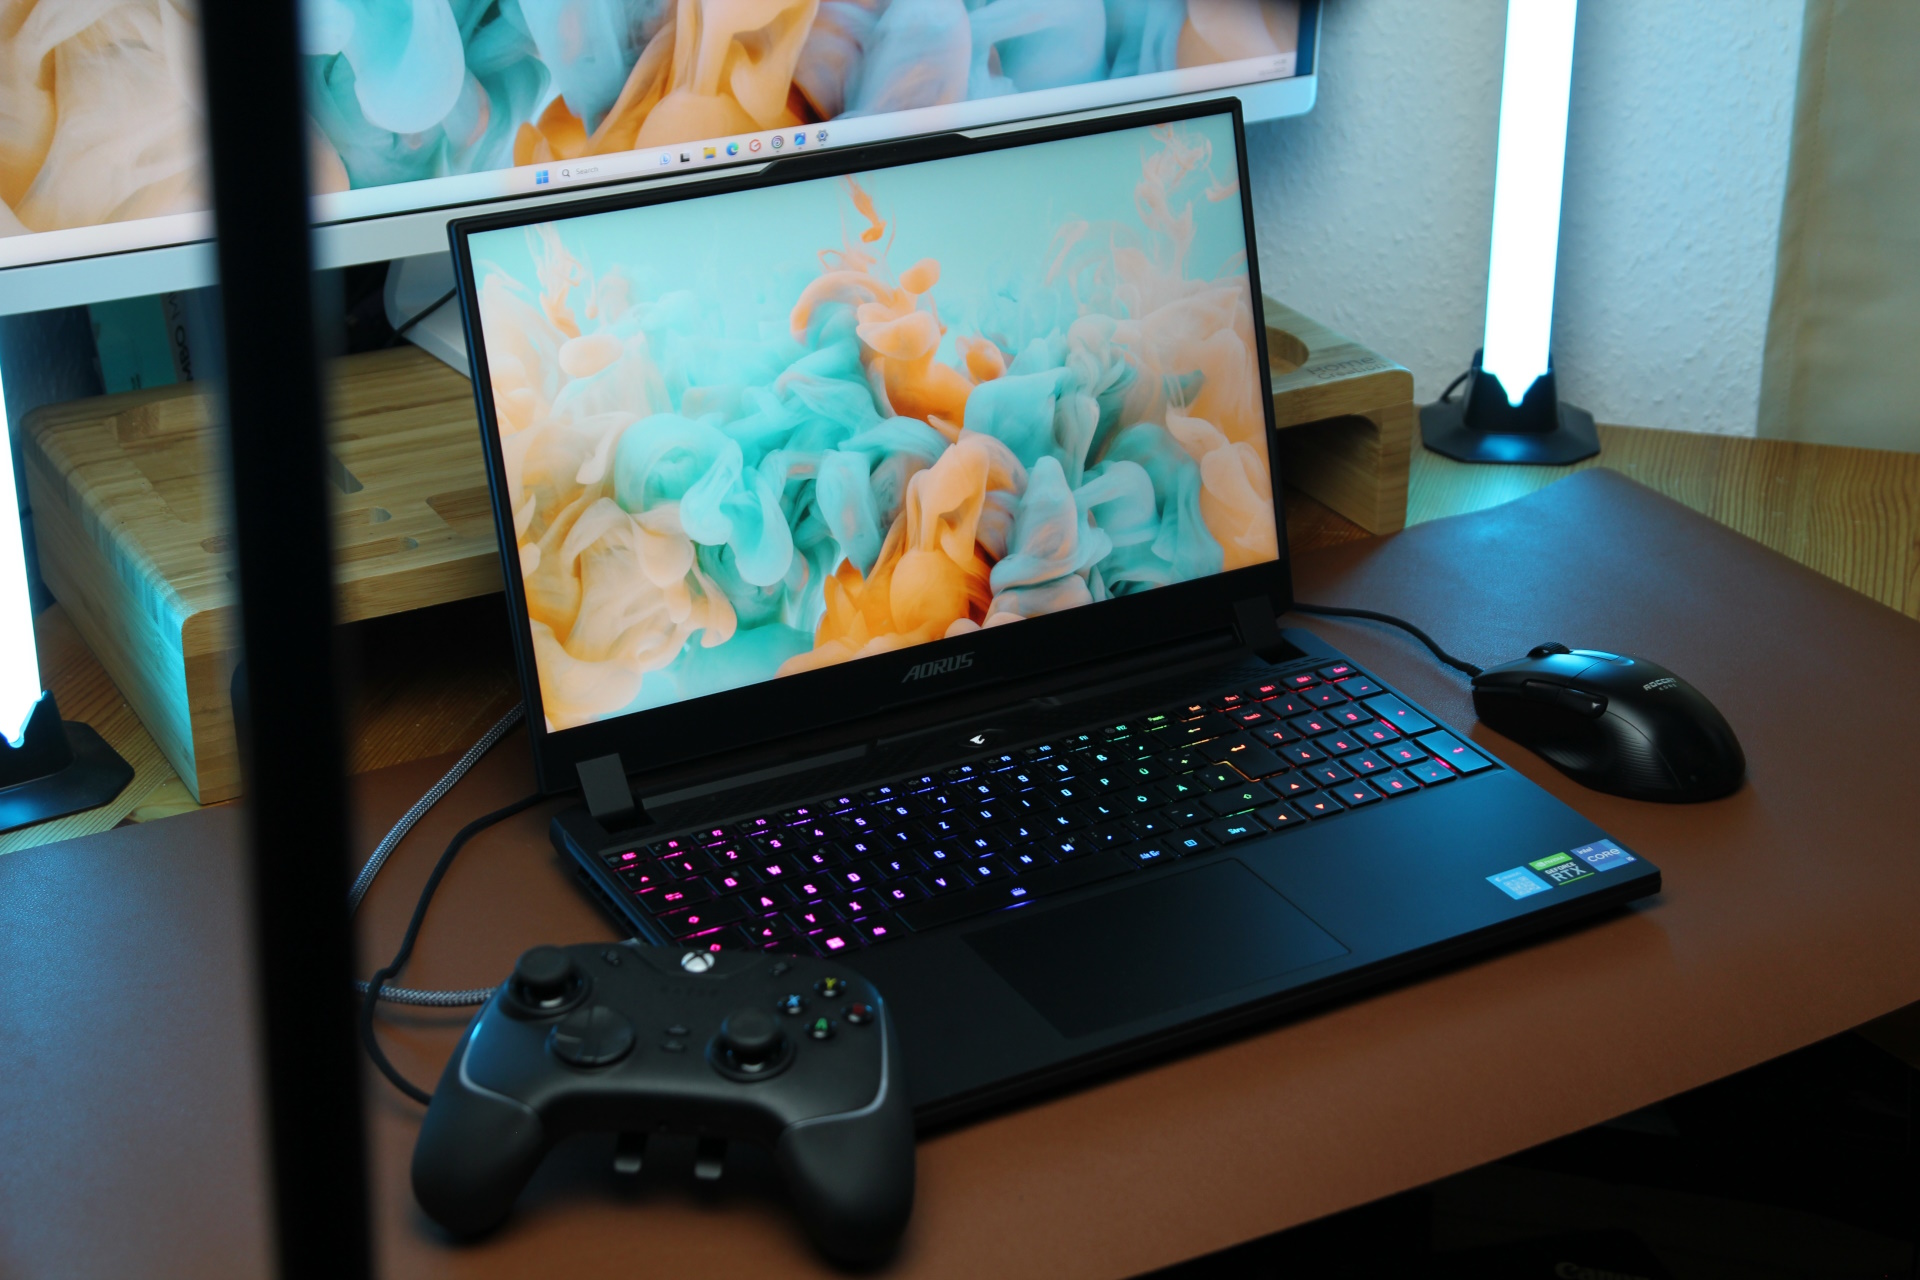
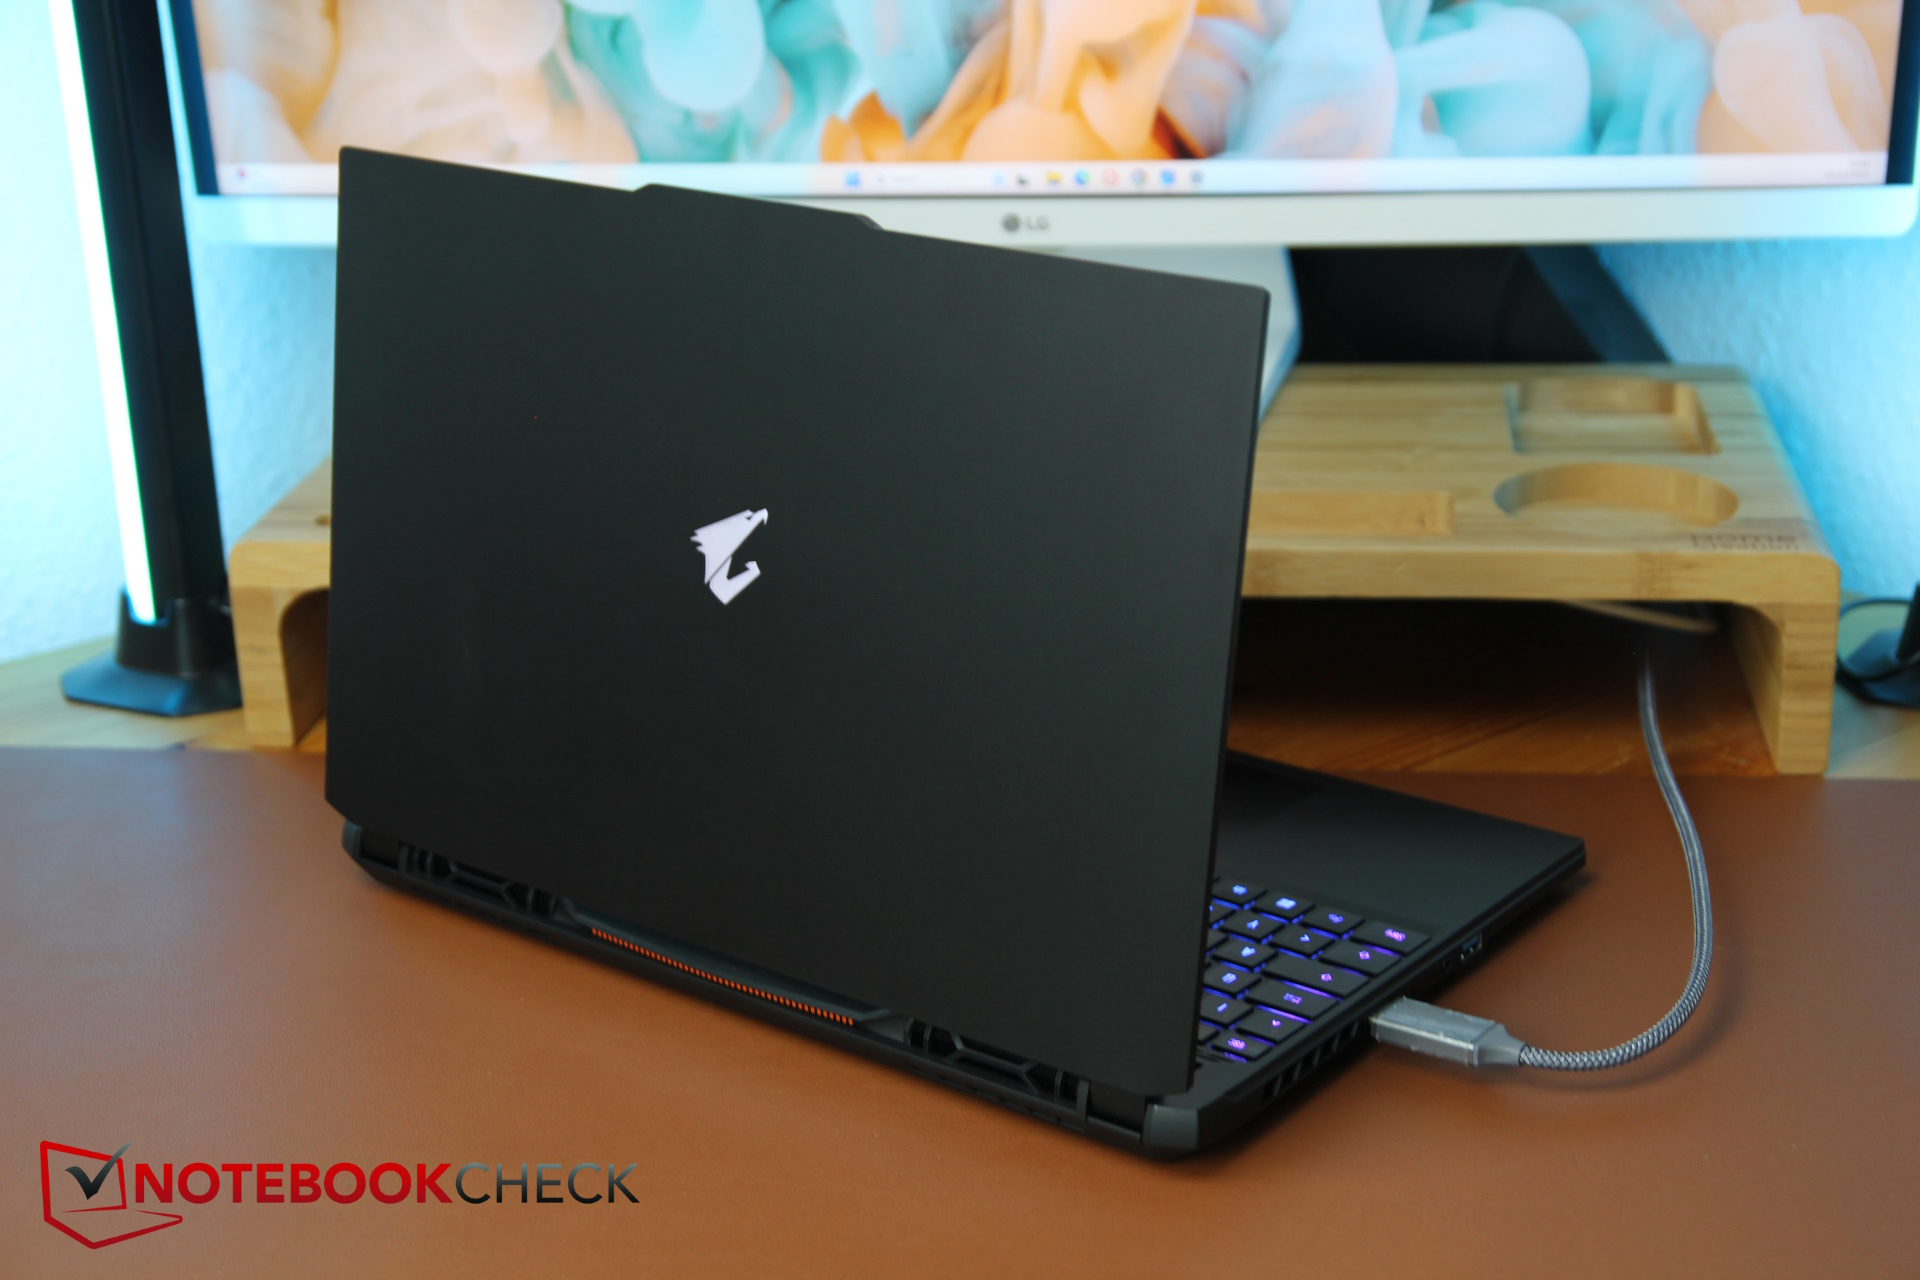
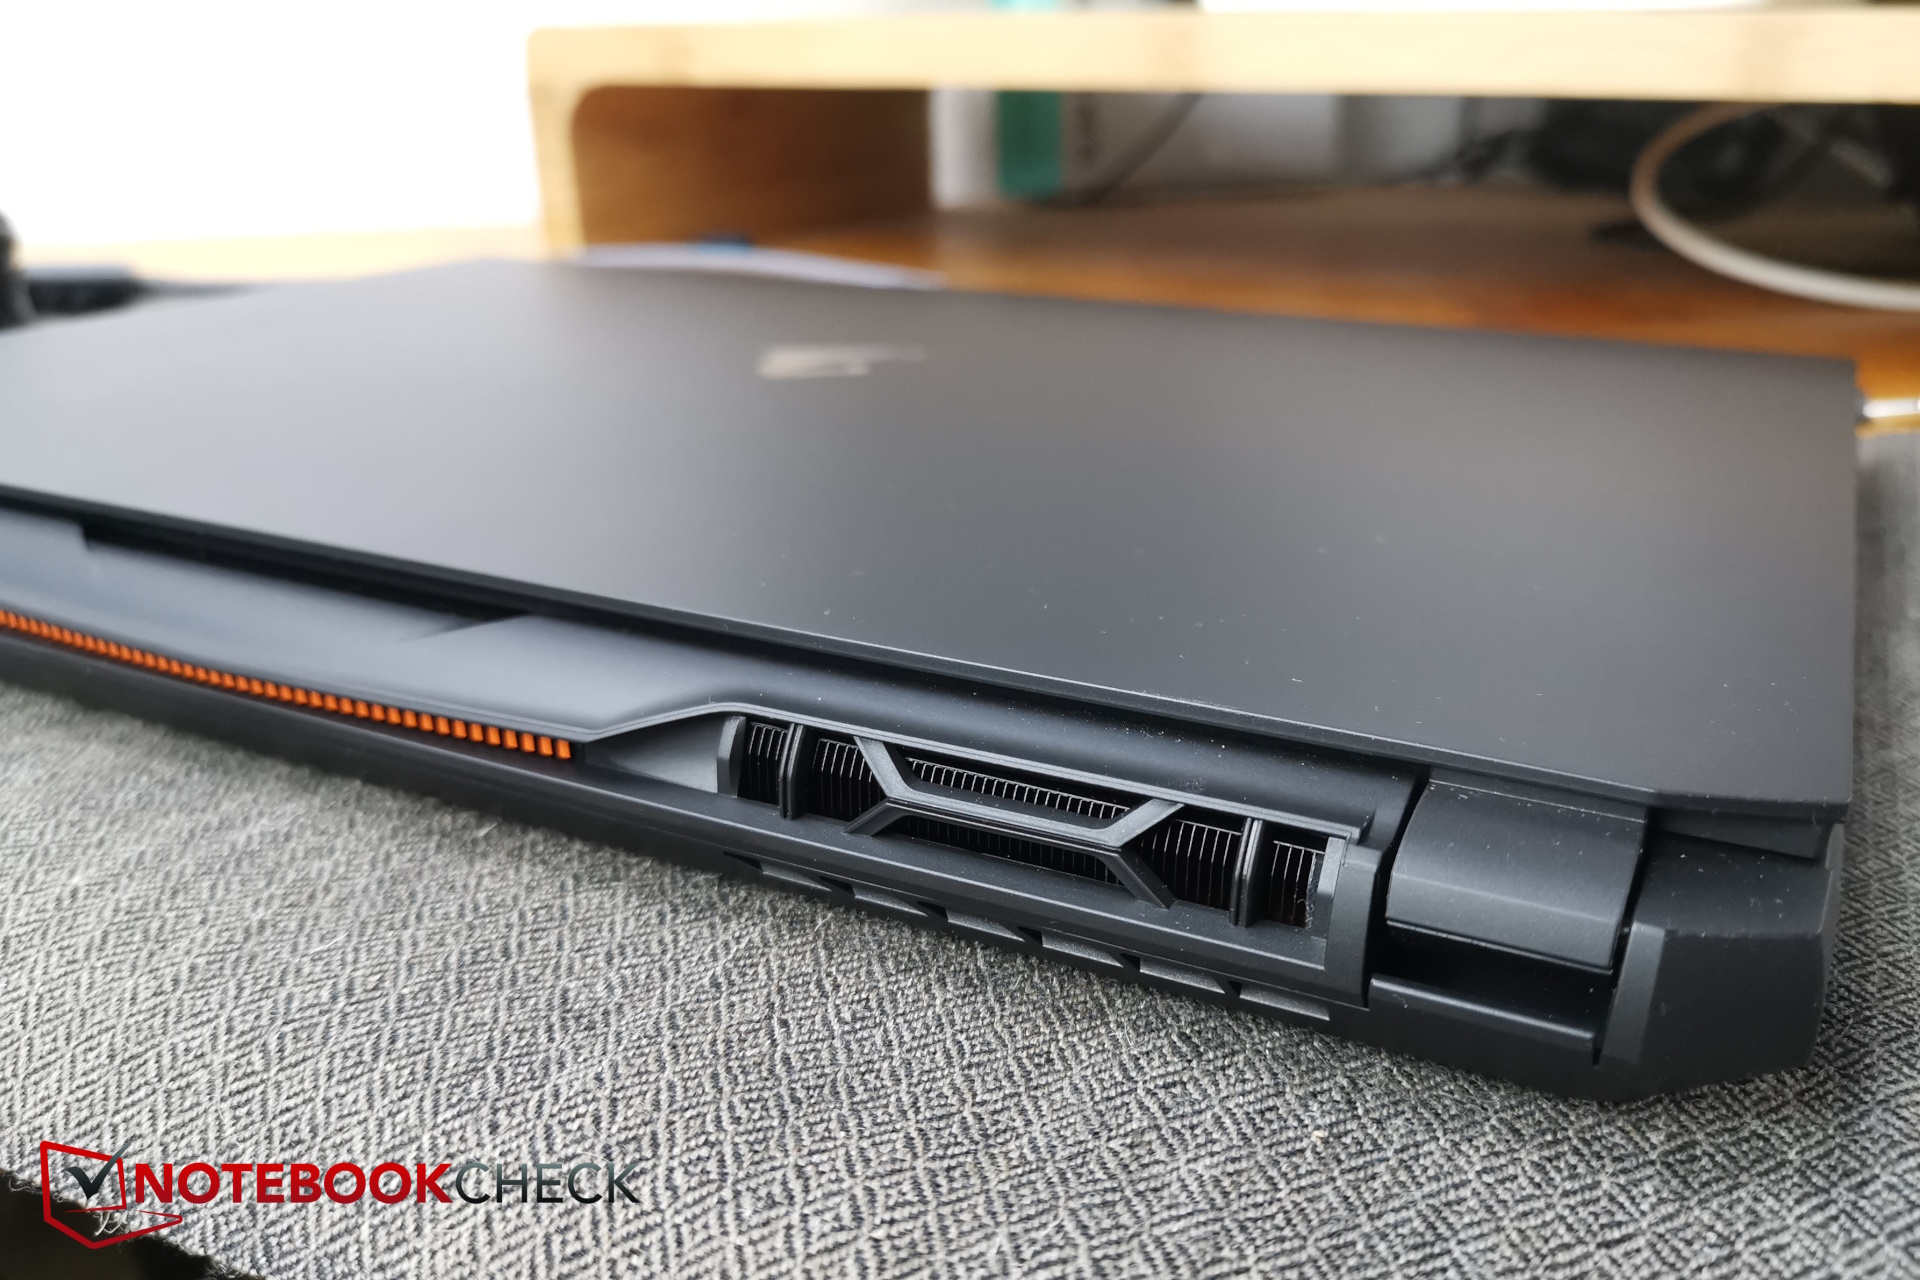
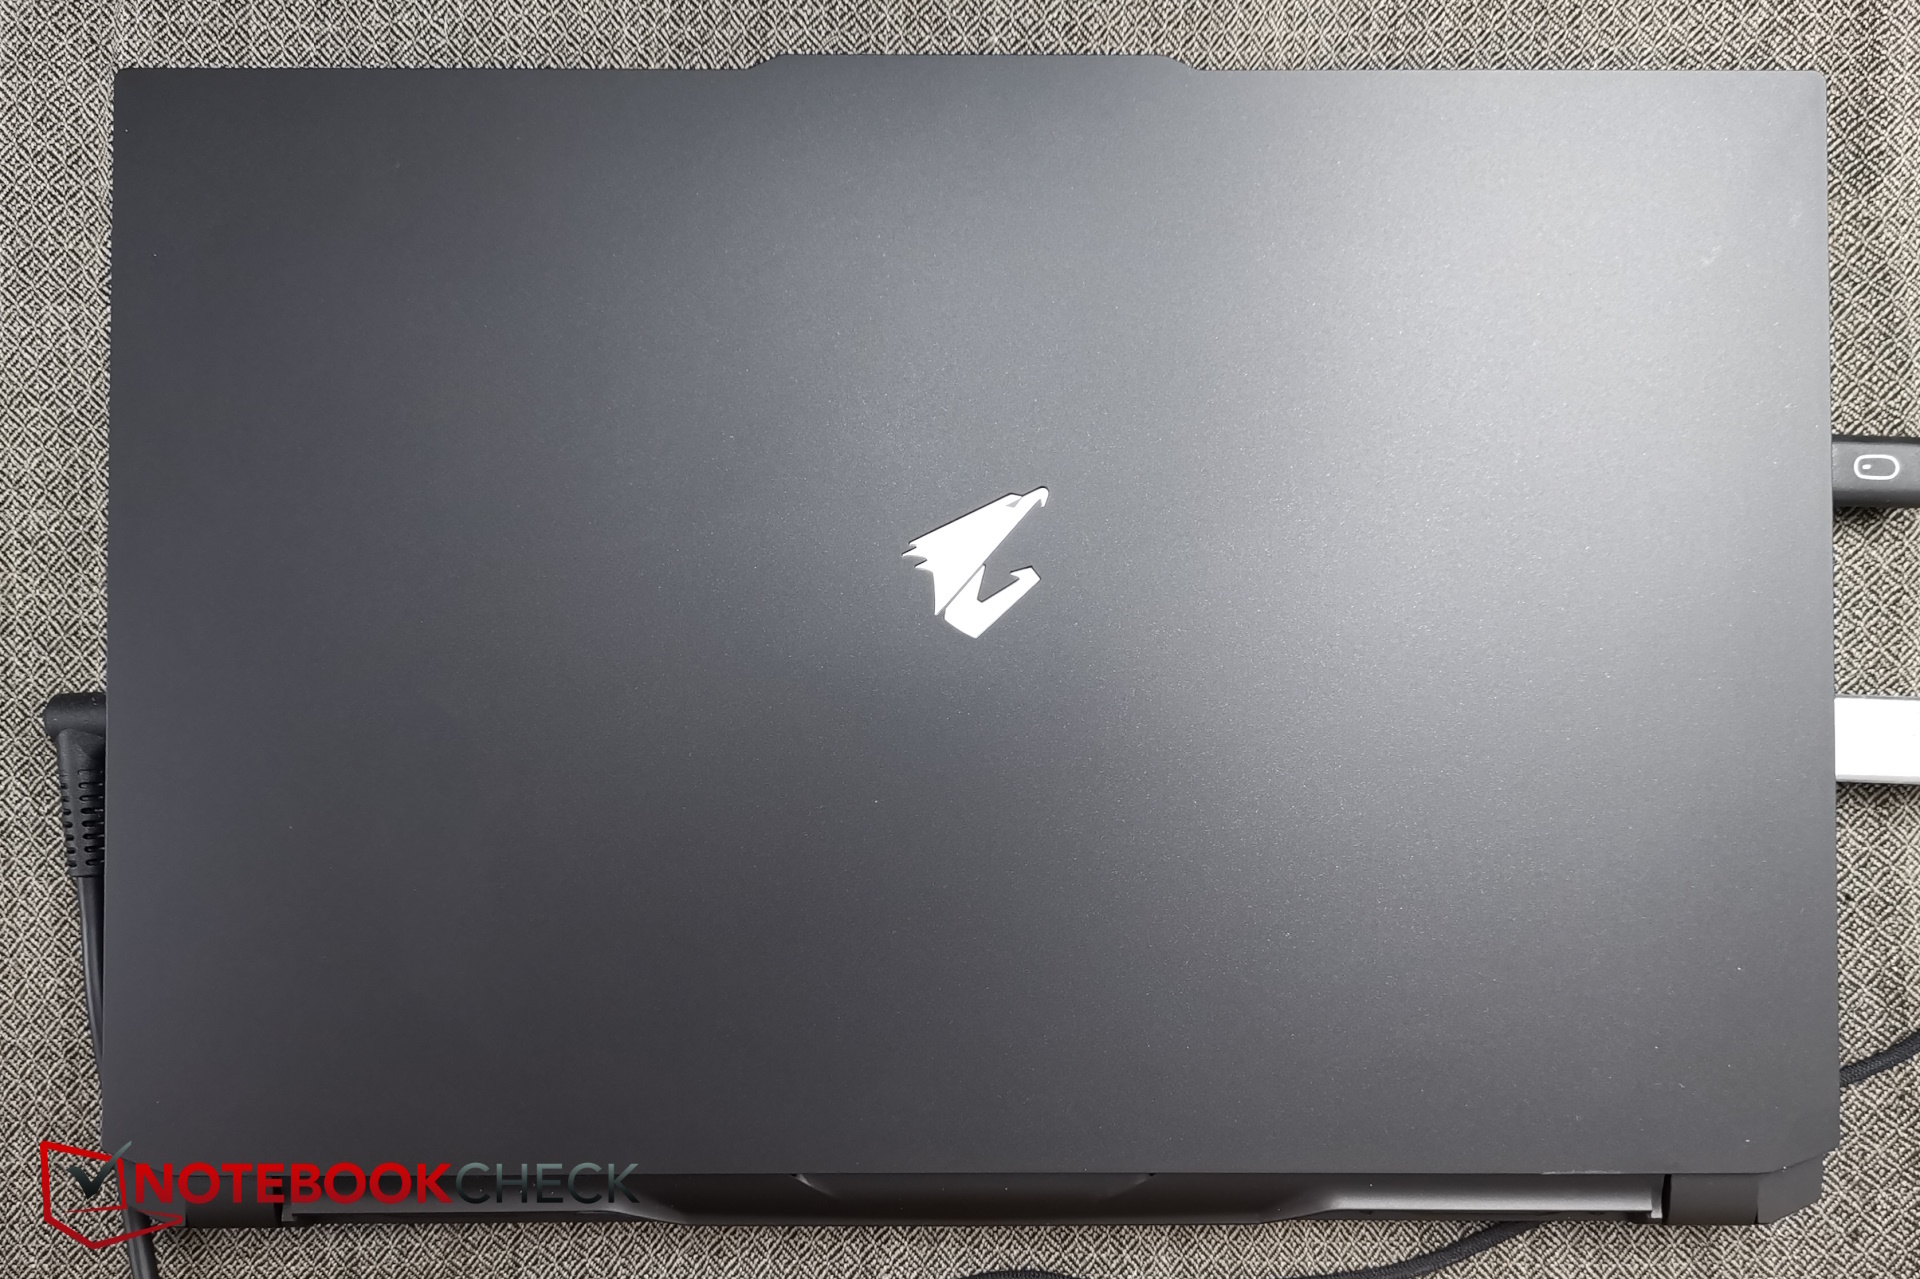
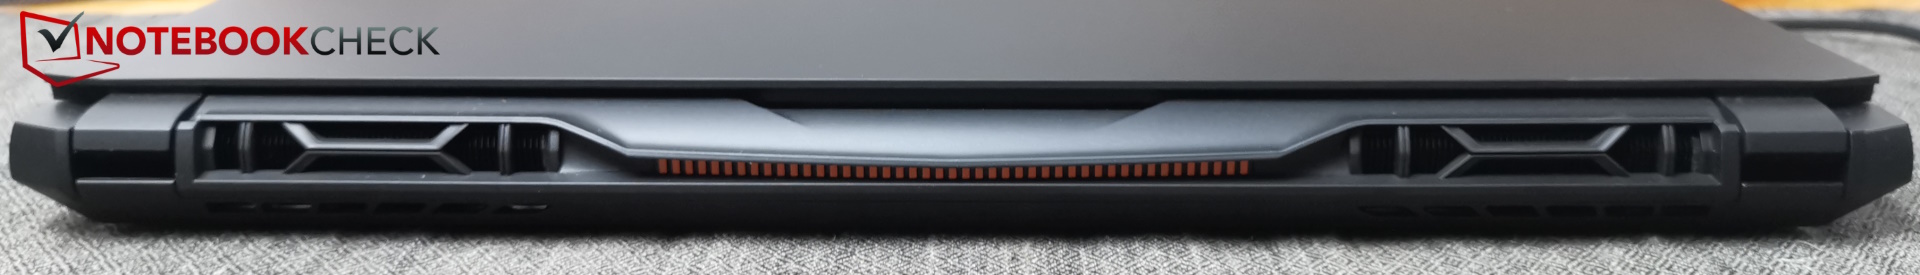
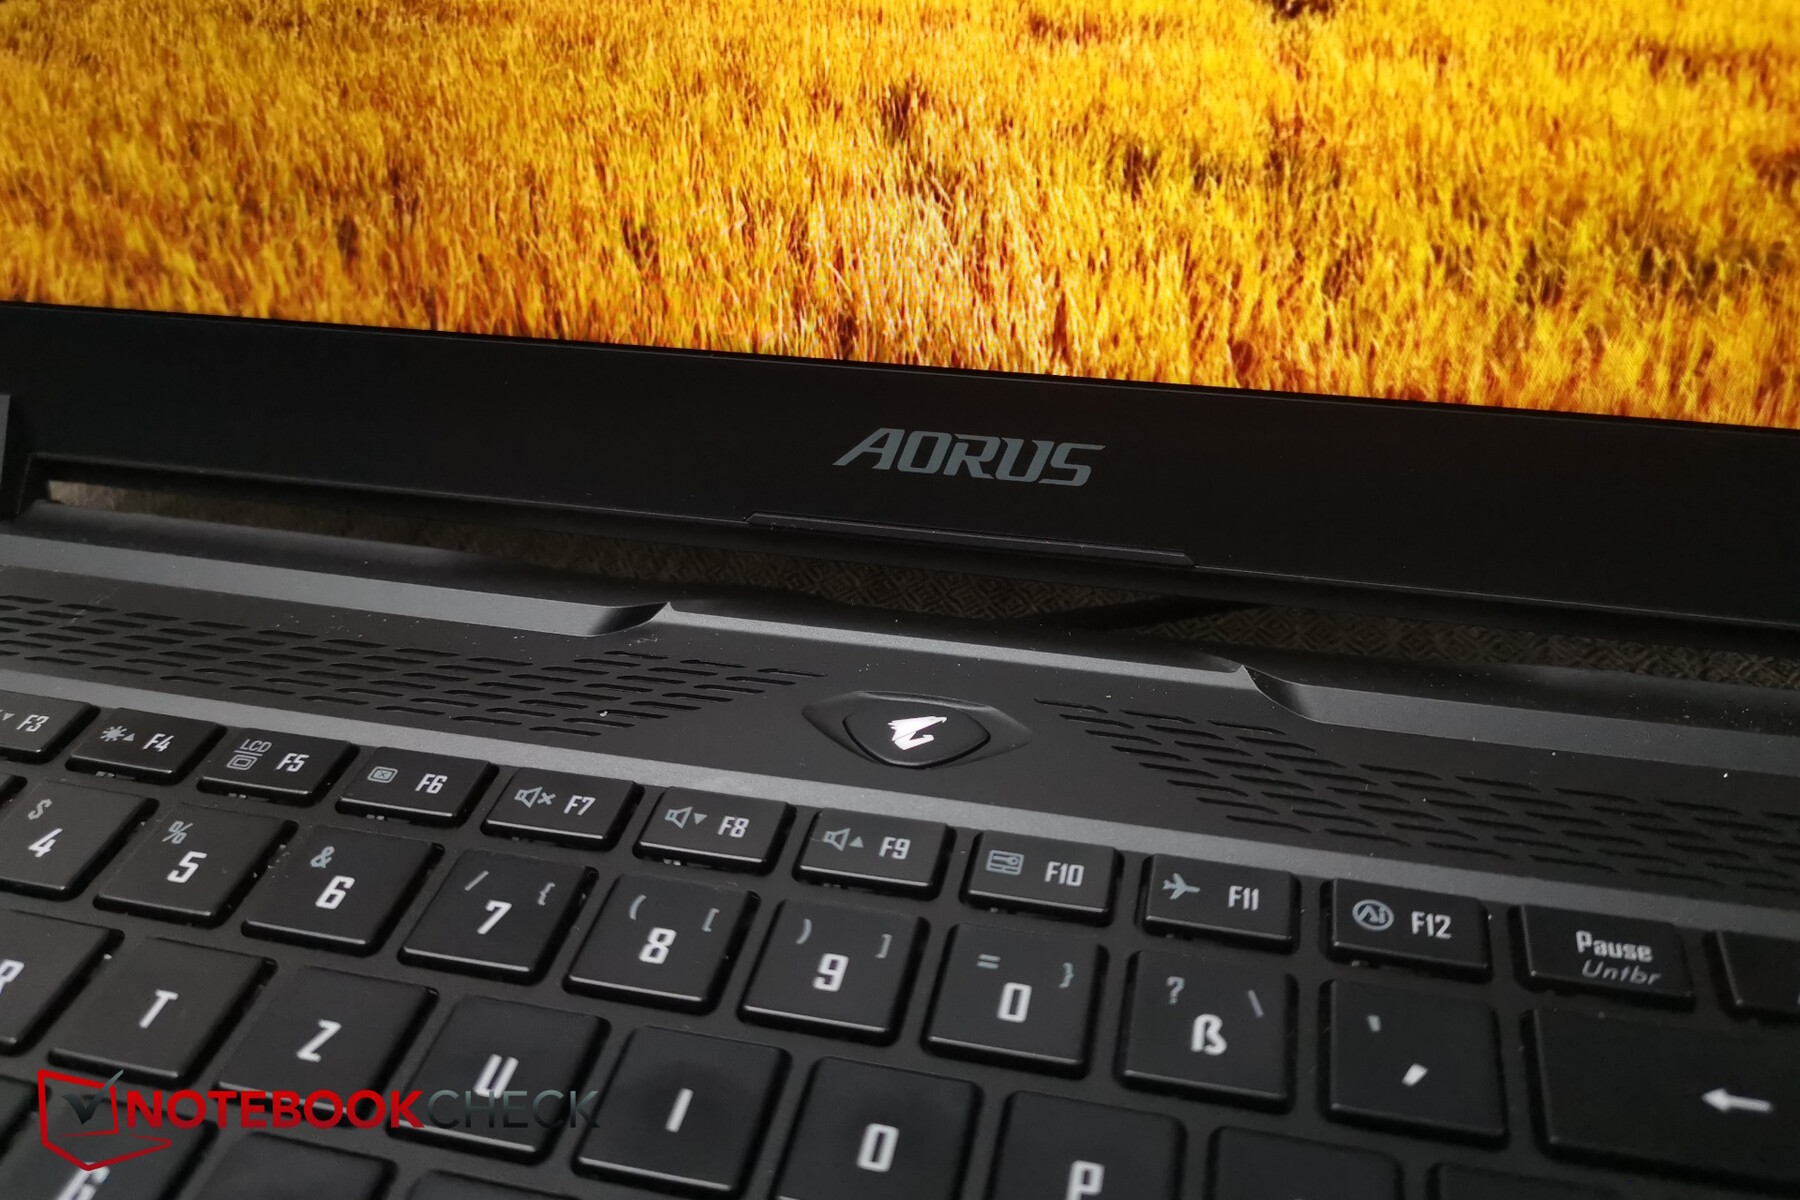
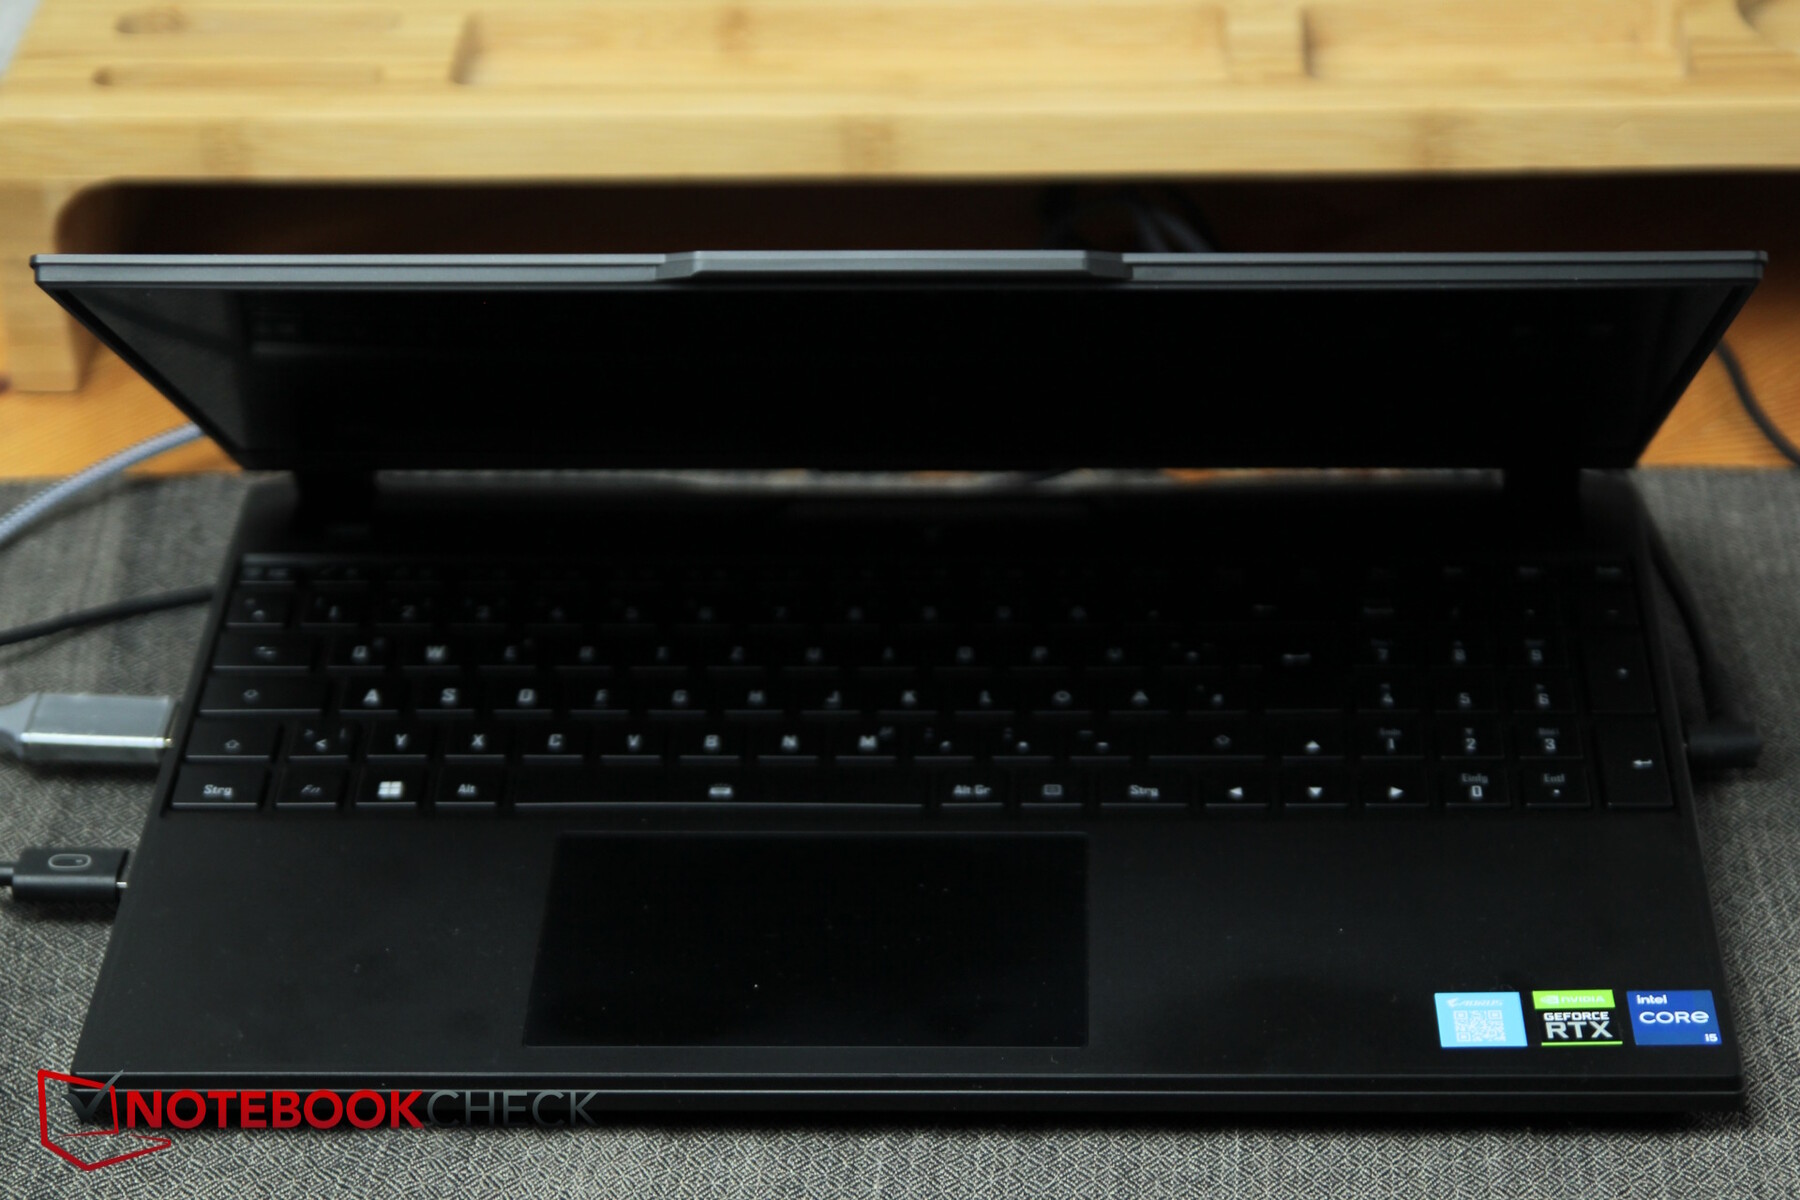
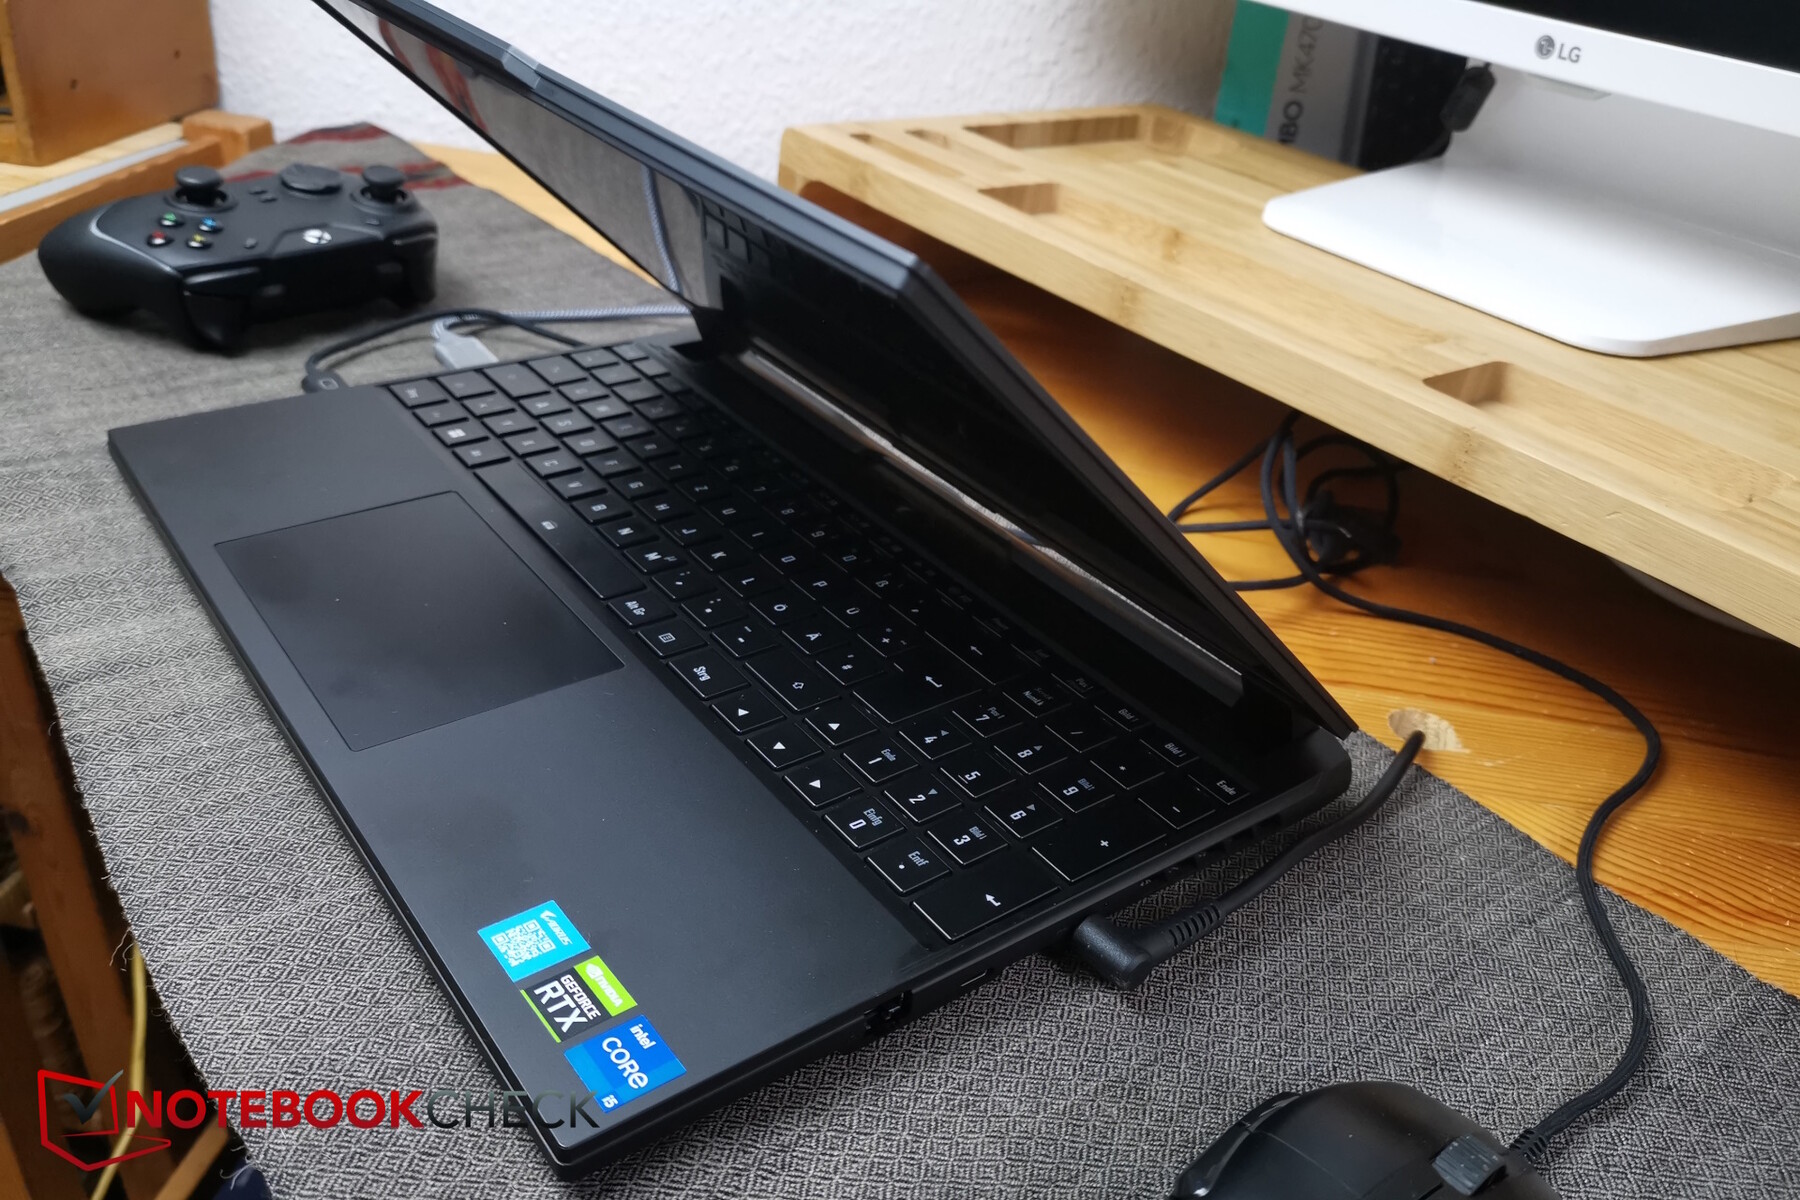
Visualmente, o Aorus parece bastante moderno e atraente. Isso se deve ao seu design preto fosco e de aparência fina, embora o laptop não seja tão fino assim (até 27 mm). Ao mesmo tempo, ele é elegante, mas continua sendo único, por exemplo, como resultado de sua estrutura ao longo da grade da ventoinha traseira e das pequenas cores laranja que aparecem ali, ou de suas bordas chanfradas especialmente projetadas. O logotipo prateado da Aorus chama a atenção para a parte superior do dispositivo. A tampa tem um pequeno entalhe ao longo da borda superior frontal, que abriga a webcam e os alto-falantes - além disso, proporciona uma ótima aderência ao abrir o laptop com uma mão.
Todos os lados do gabinete são feitos de plástico liso. A aparência é ótima, mas não é tão resistente a torções em comparação com alguns concorrentes. O teclado não apresenta nenhuma folga quando o usuário digita nele, o que significa que a estabilidade é boa no total.
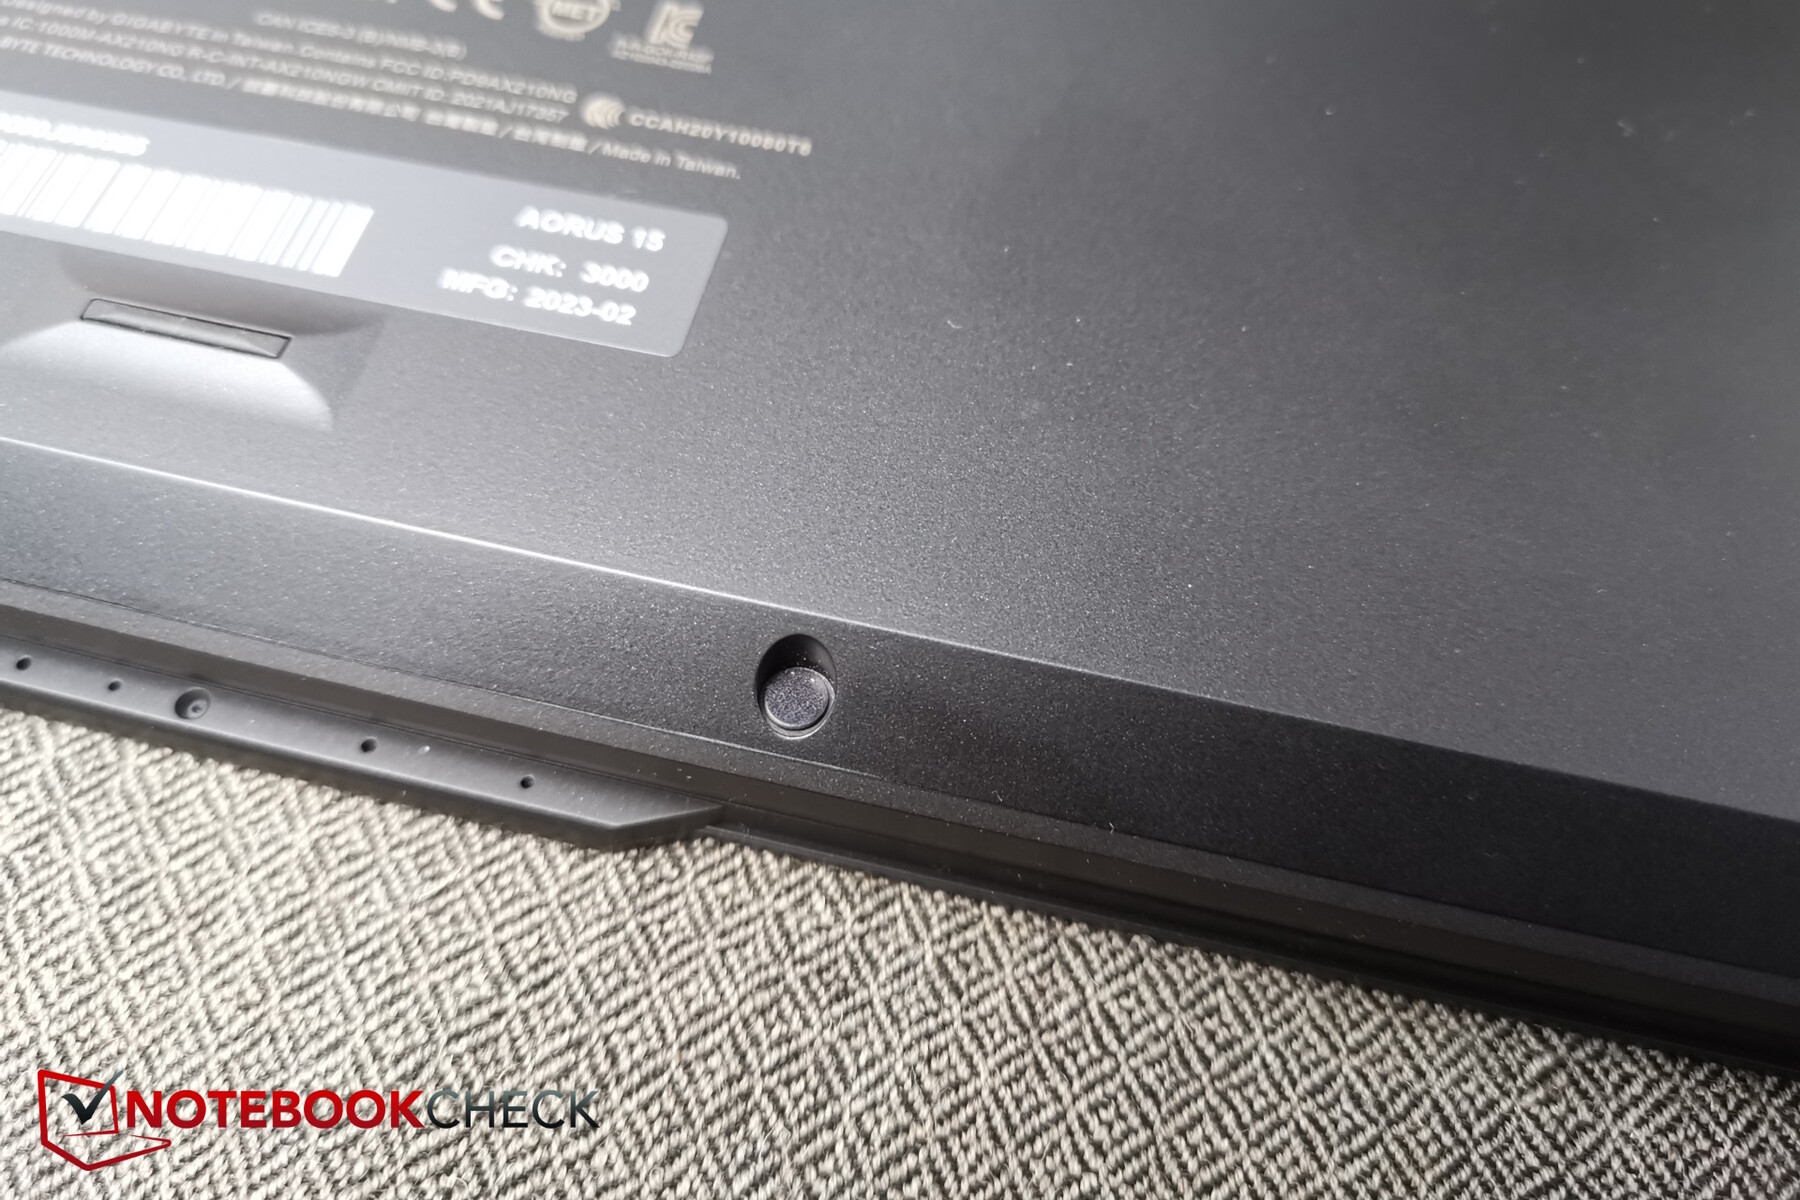
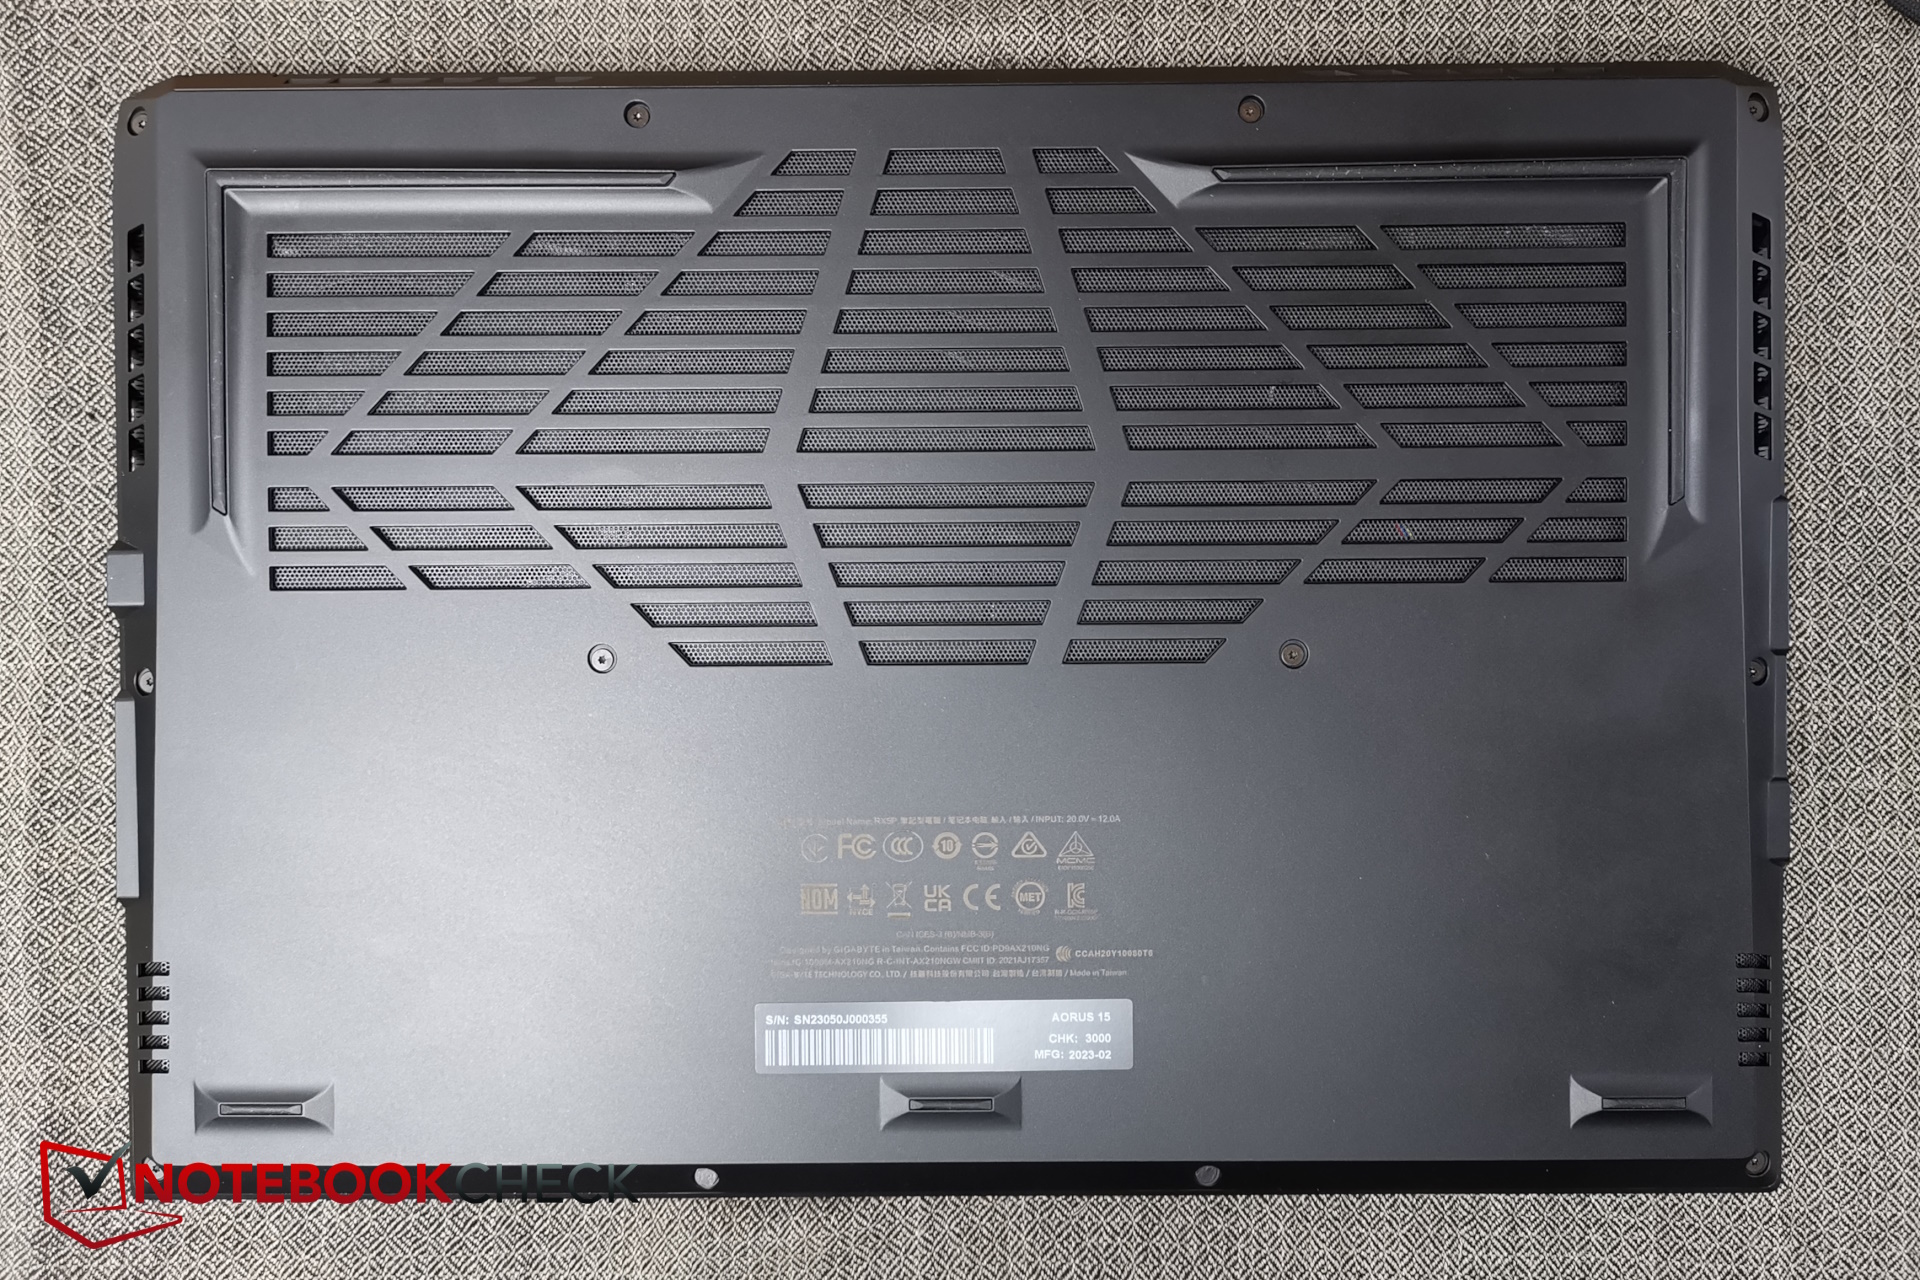
Não abrimos o Aorus, pois os dois parafusos Torx estão cobertos por um adesivo e não queríamos danificá-los no interesse do nosso Cyberport emprestado.
Conectividade
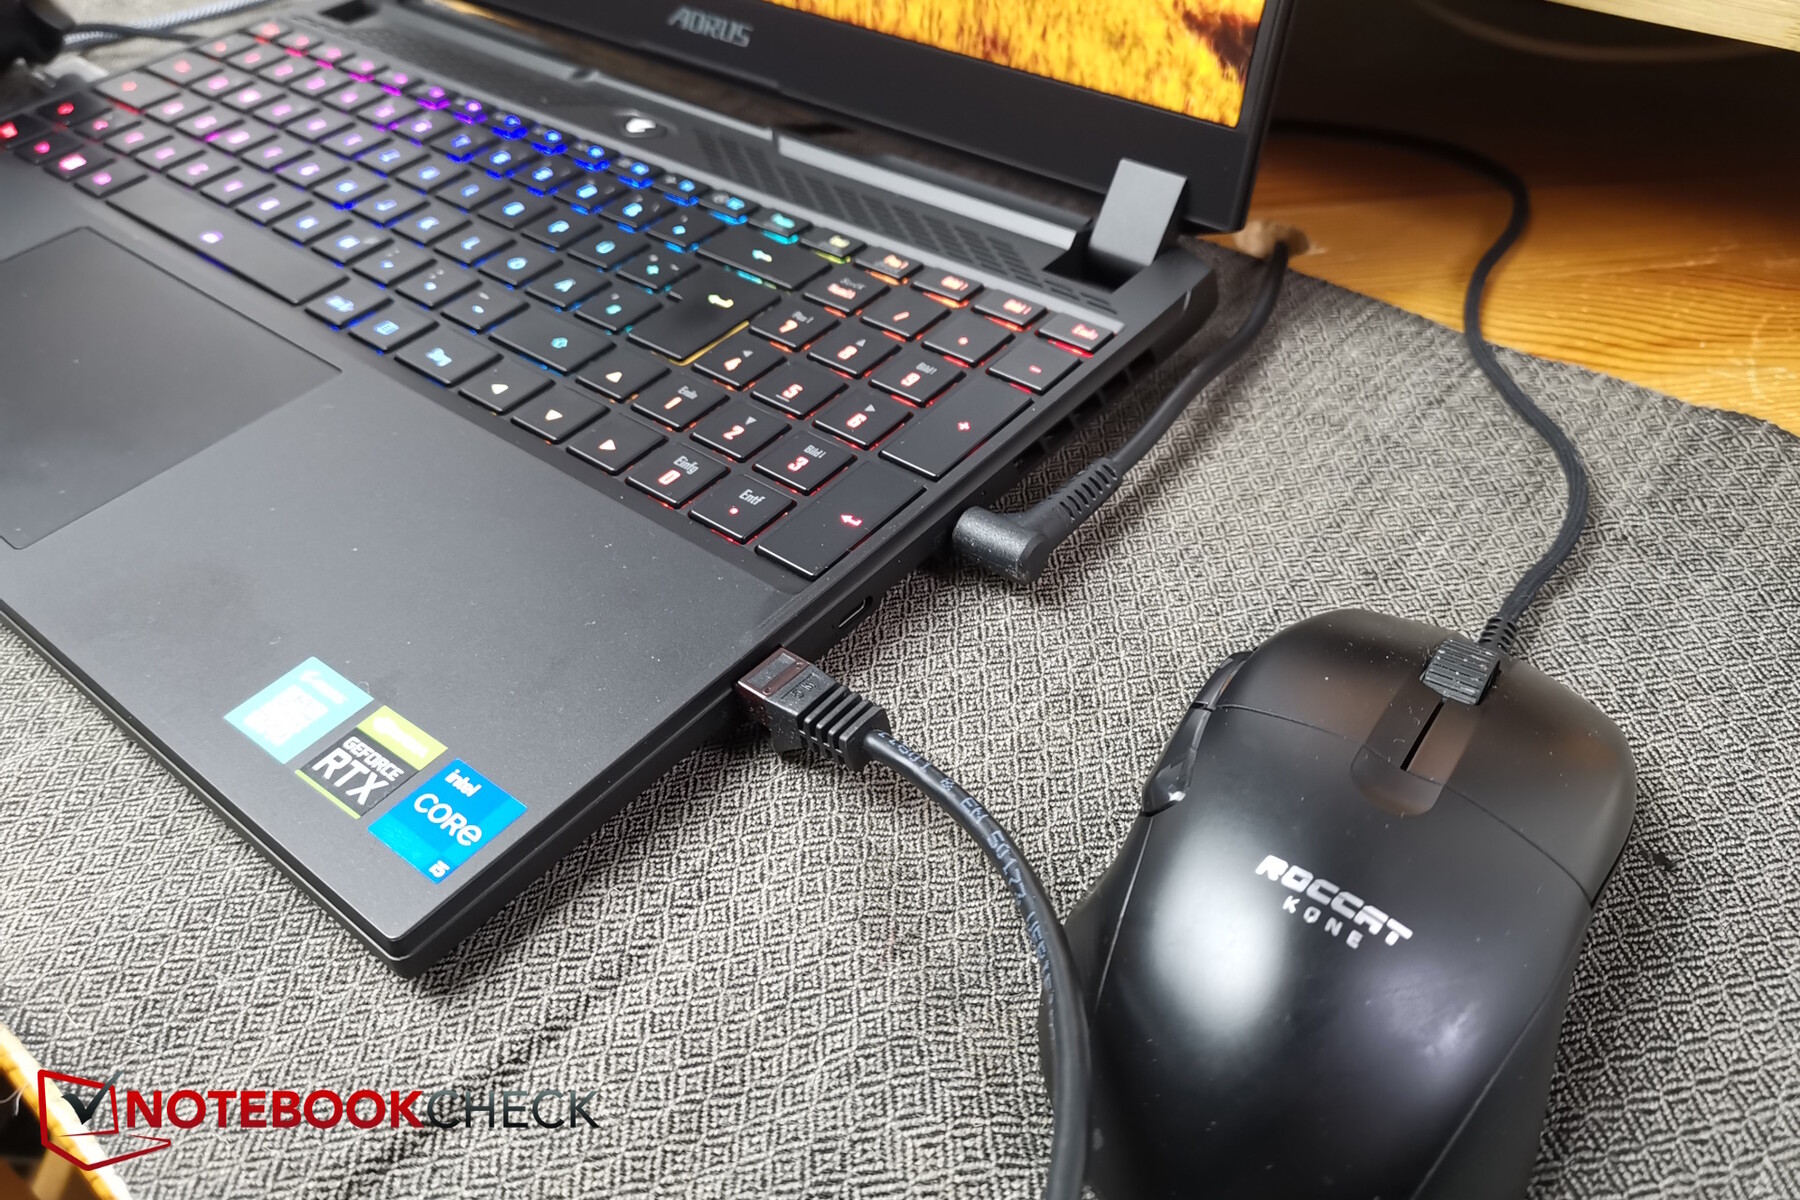
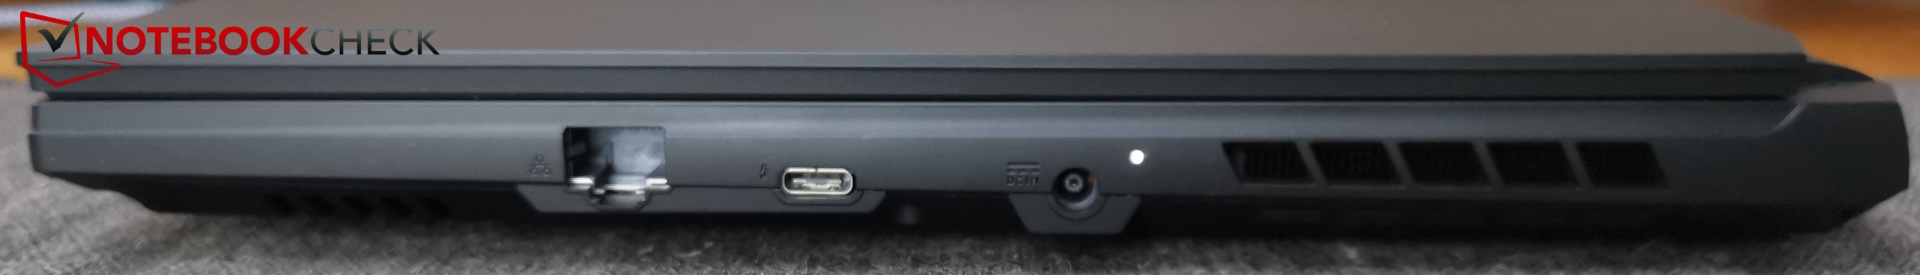
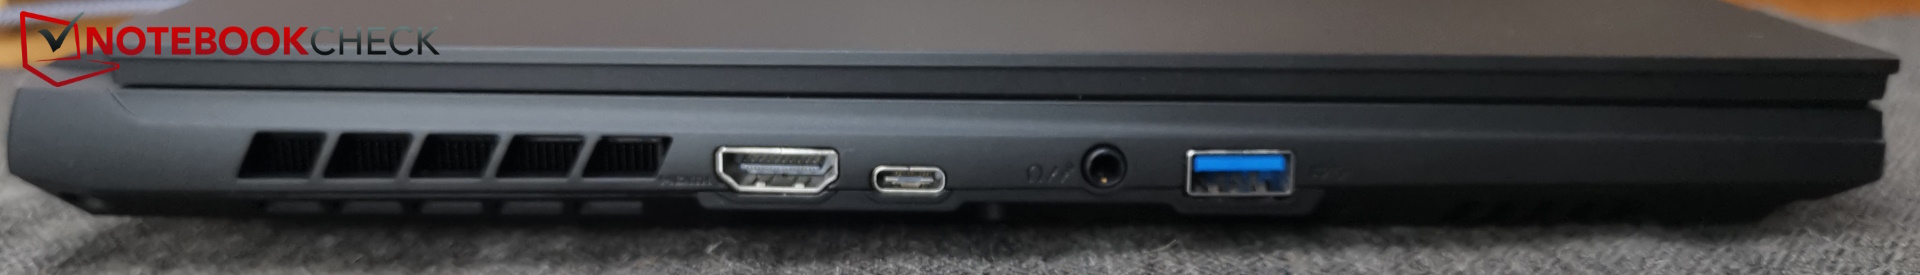
As opções de conectividade do laptop Aorus são modernas e, ao mesmo tempo, reduzidas ao mínimo. Das três portas USB, apenas uma é do tipo A, o que não é suficiente. Por sua vez, uma das duas portas Tipo C tem suporte para Thunderbolt 4. Além de uma quarta conexão USB, o dispositivo também não tem um leitor de cartão SD, uma trava Kensington e uma DisplayPort dedicada (2x disponível via USB-C).
Apesar de suas poucas portas, elas não estão muito bem dispostas - a porta RJ45 para cabos LAN rígidos está posicionada à direita e na frente. O espaço na parte traseira do Aorus, como de costume, não é usado. Ele acomoda apenas as saídas do ventilador.
WiFi e webcam
Suas taxas de transmissão WLAN estão entre as mais altas no campo de comparação, tanto nas redes de 6 GHz (WiFi 6E) quanto nas de 5 GHz.
Infelizmente, a webcam do dispositivo ainda é de última geração: Ela só tem uma resolução de 720p, seus desvios de cor são bastante altos e não há obturador na Central de Controle.


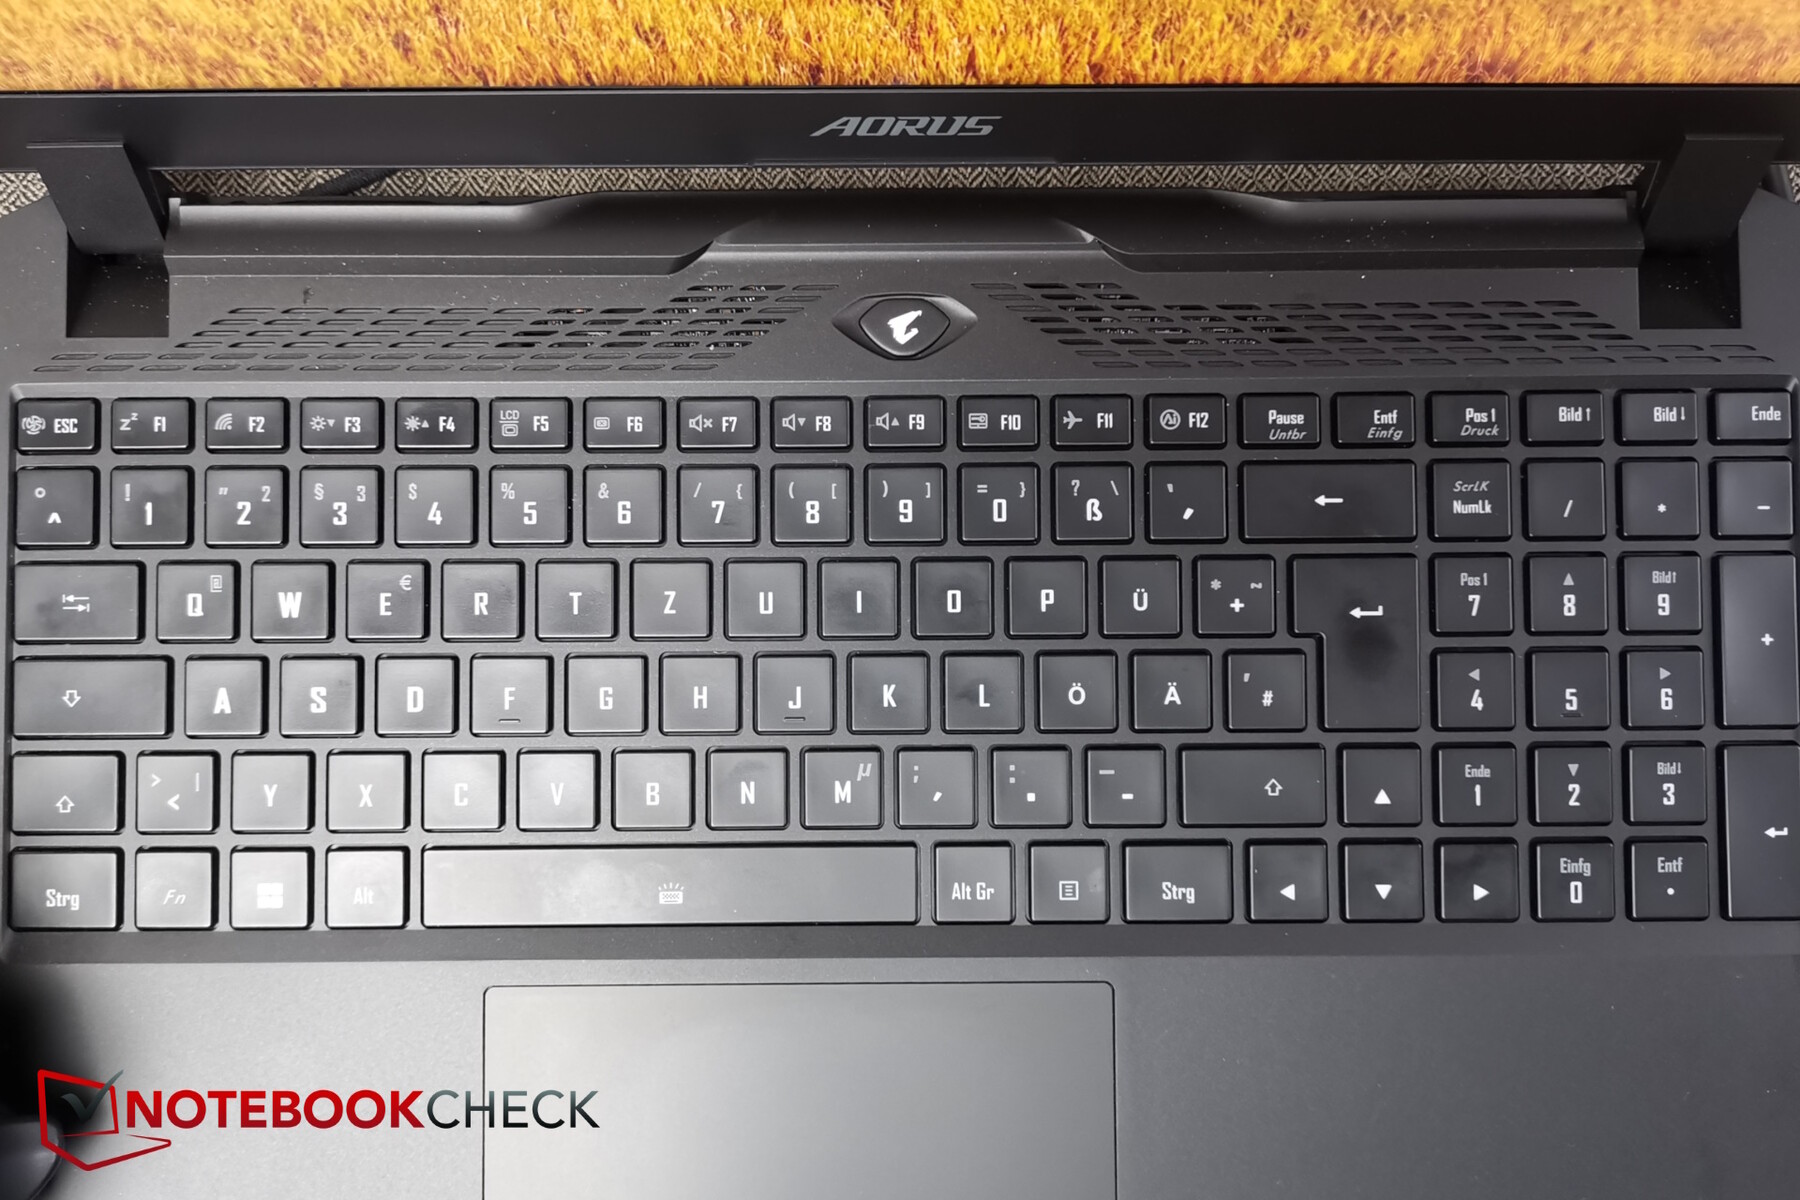
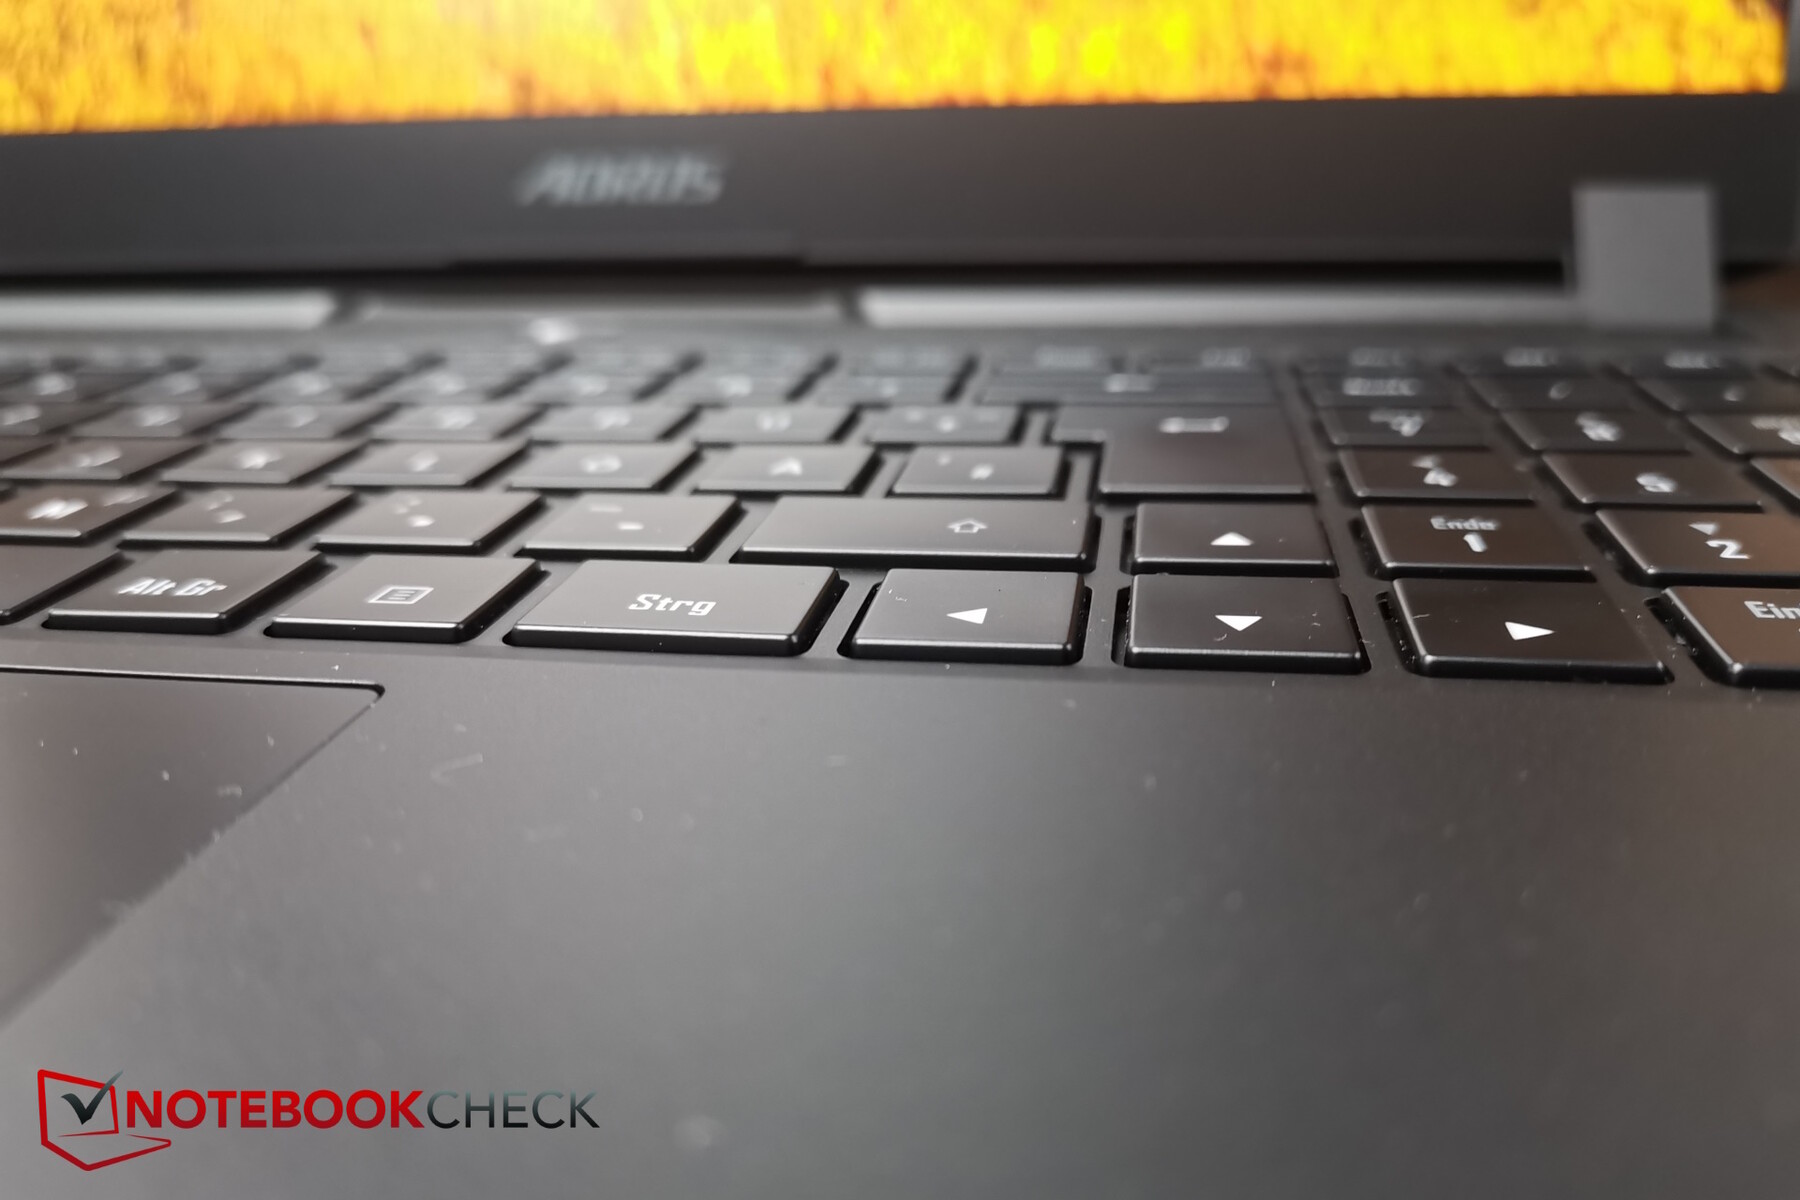
Dispositivos de entrada - Mais do que sólidos, mas com rotulagem de teclas especiais escuras
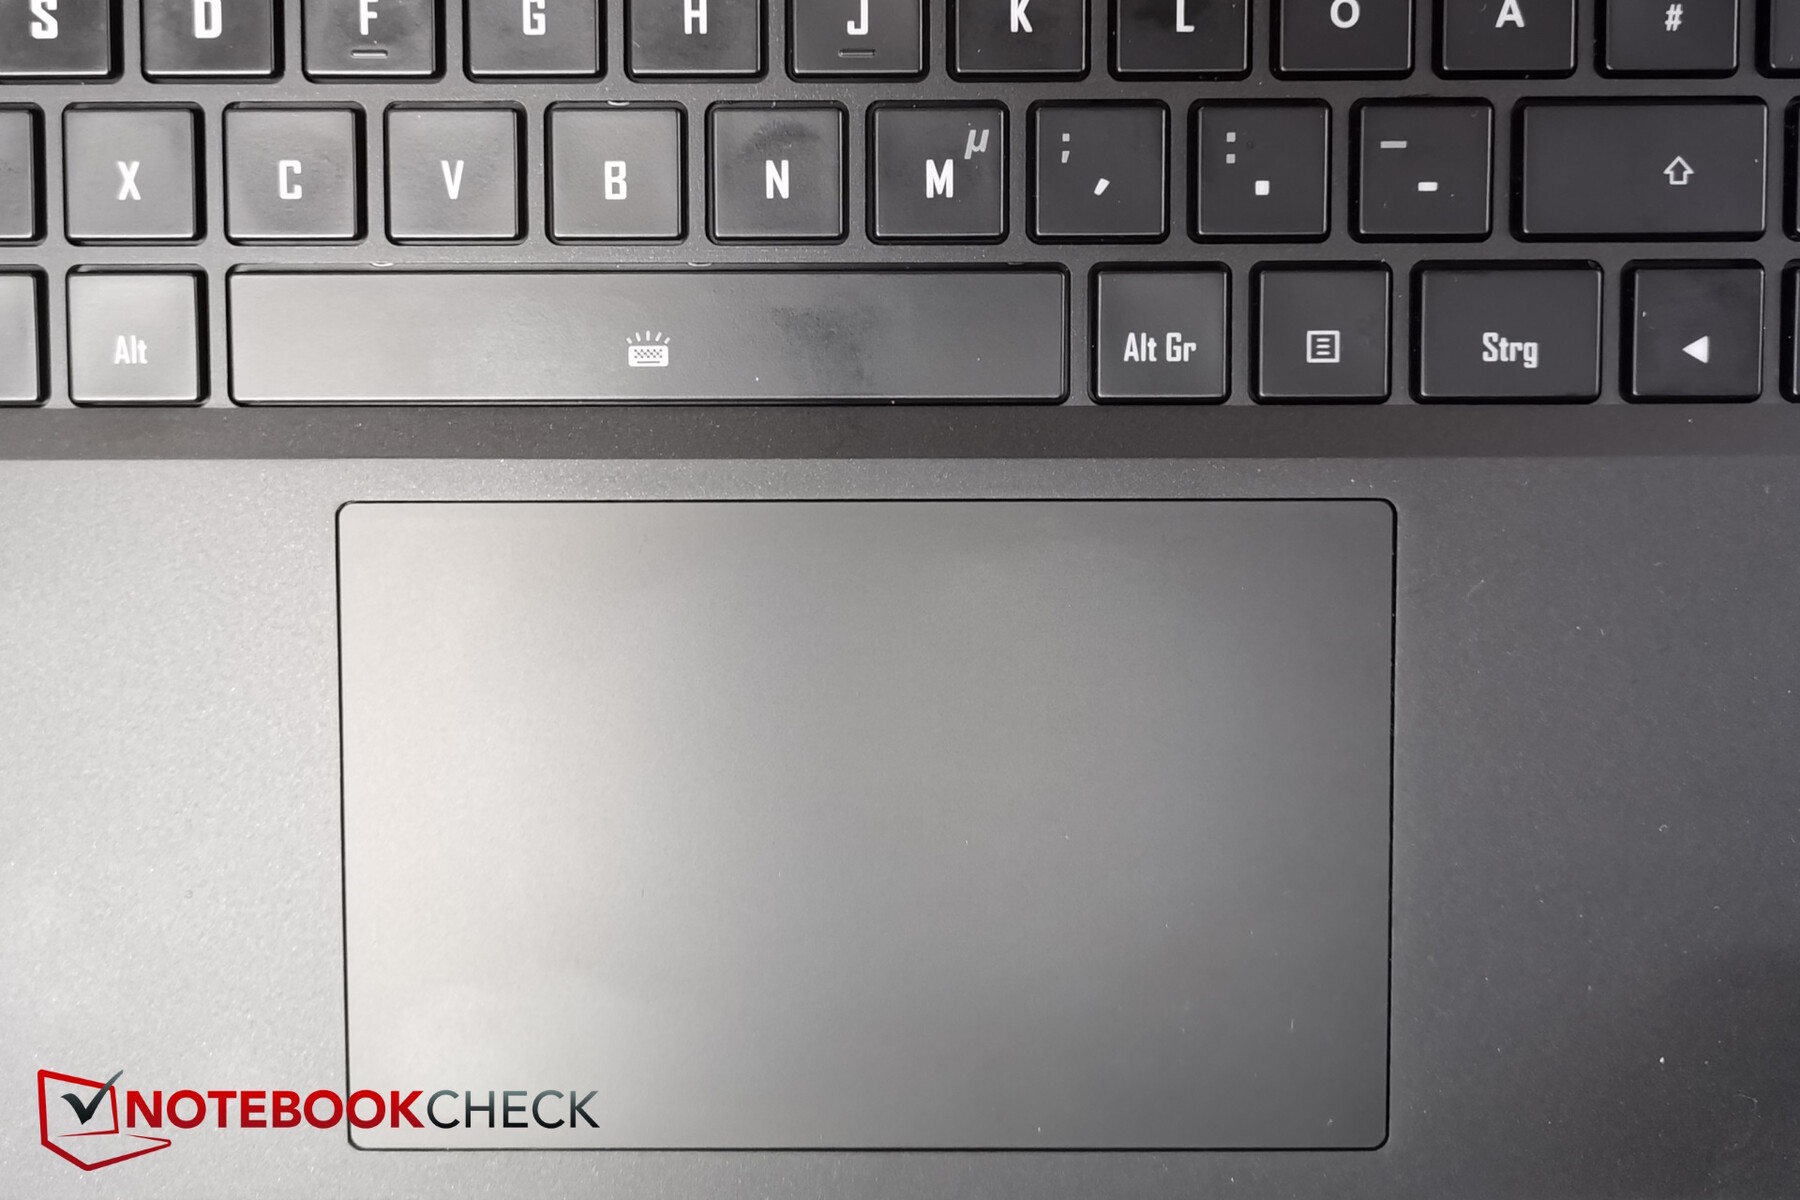
O layout das teclas é bem organizado - o teclado é ligeiramente rebaixado na base do laptop. As teclas de seta também têm o tamanho normal e há um teclado numérico diretamente à direita.
As teclas têm apenas uma elevação de baixa a média, mas ainda assim são surpreendentemente confortáveis ao digitar, o que também se deve ao feedback decente. Os ruídos durante a digitação são mais silenciosos, portanto, também são adequados para ambientes com pouco ruído.
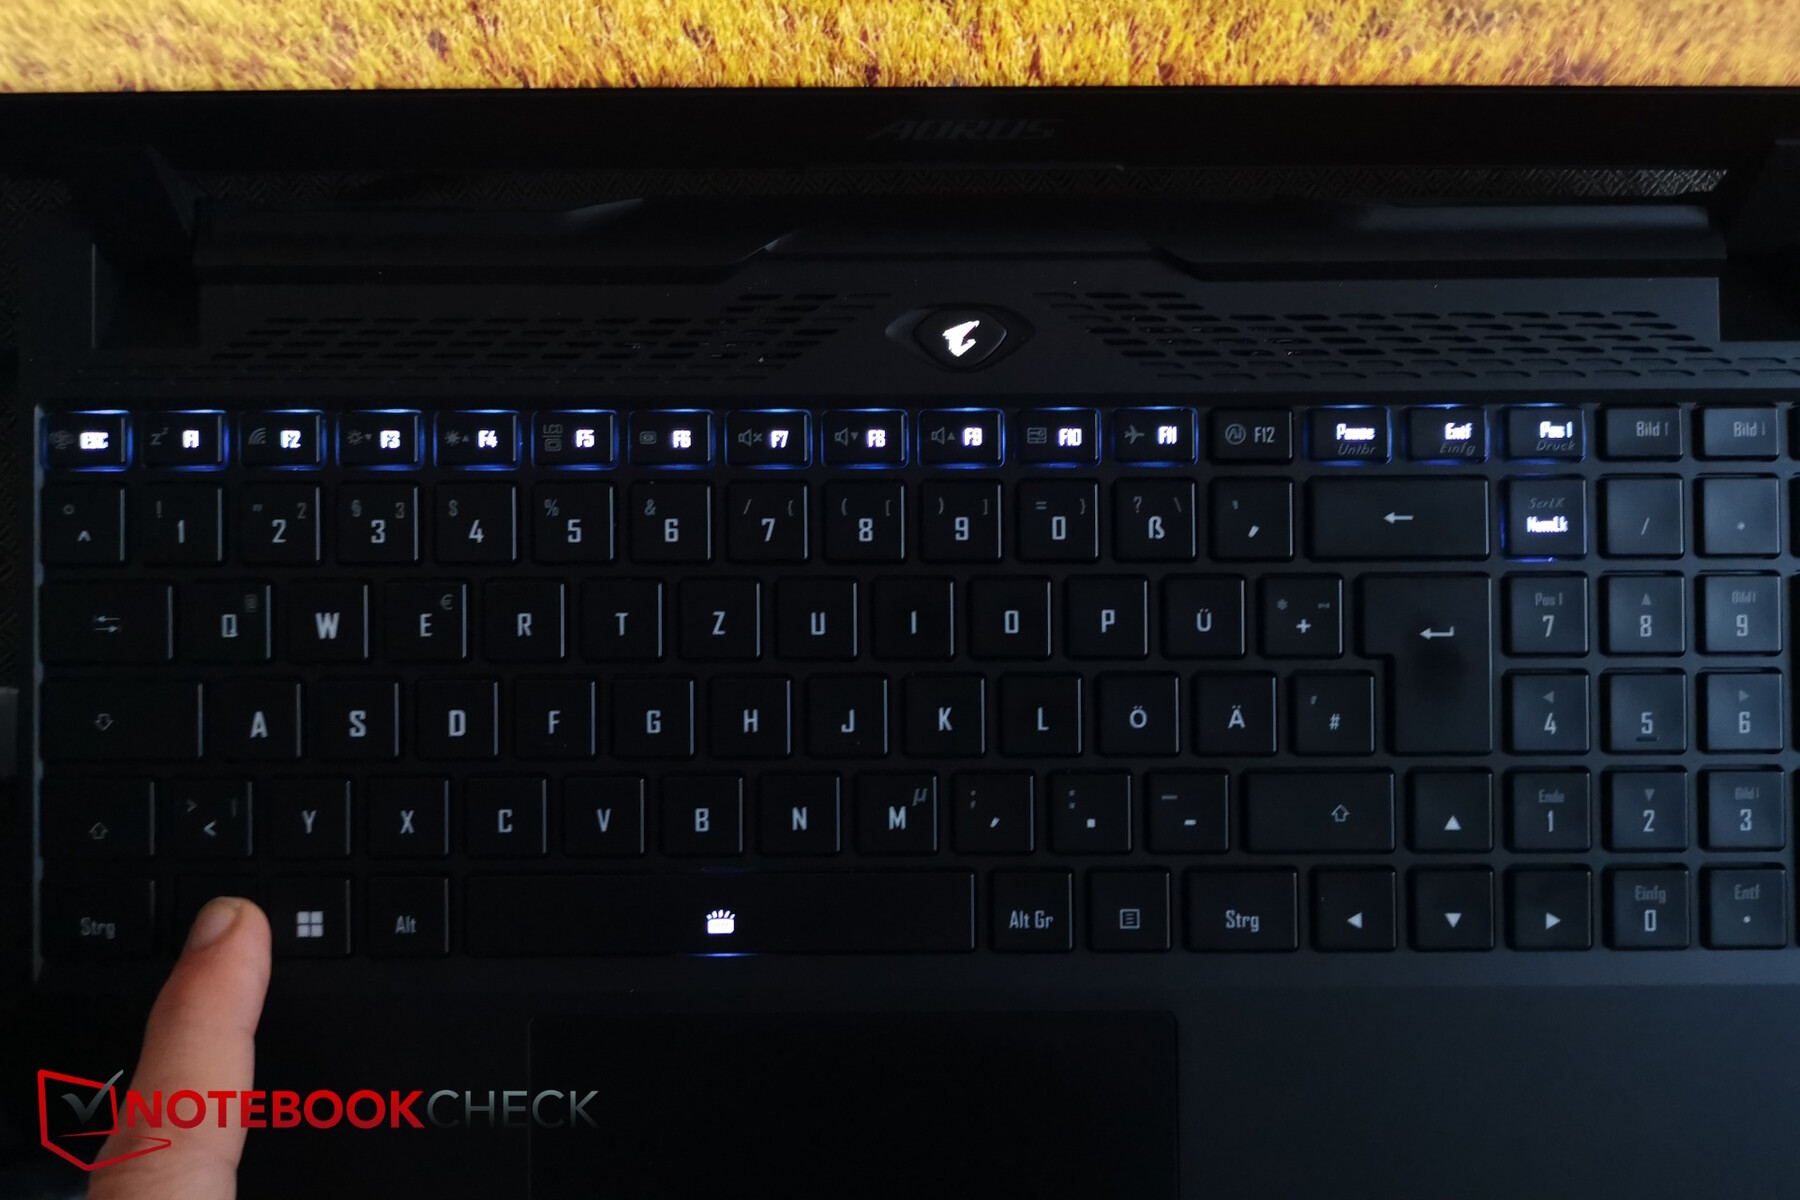
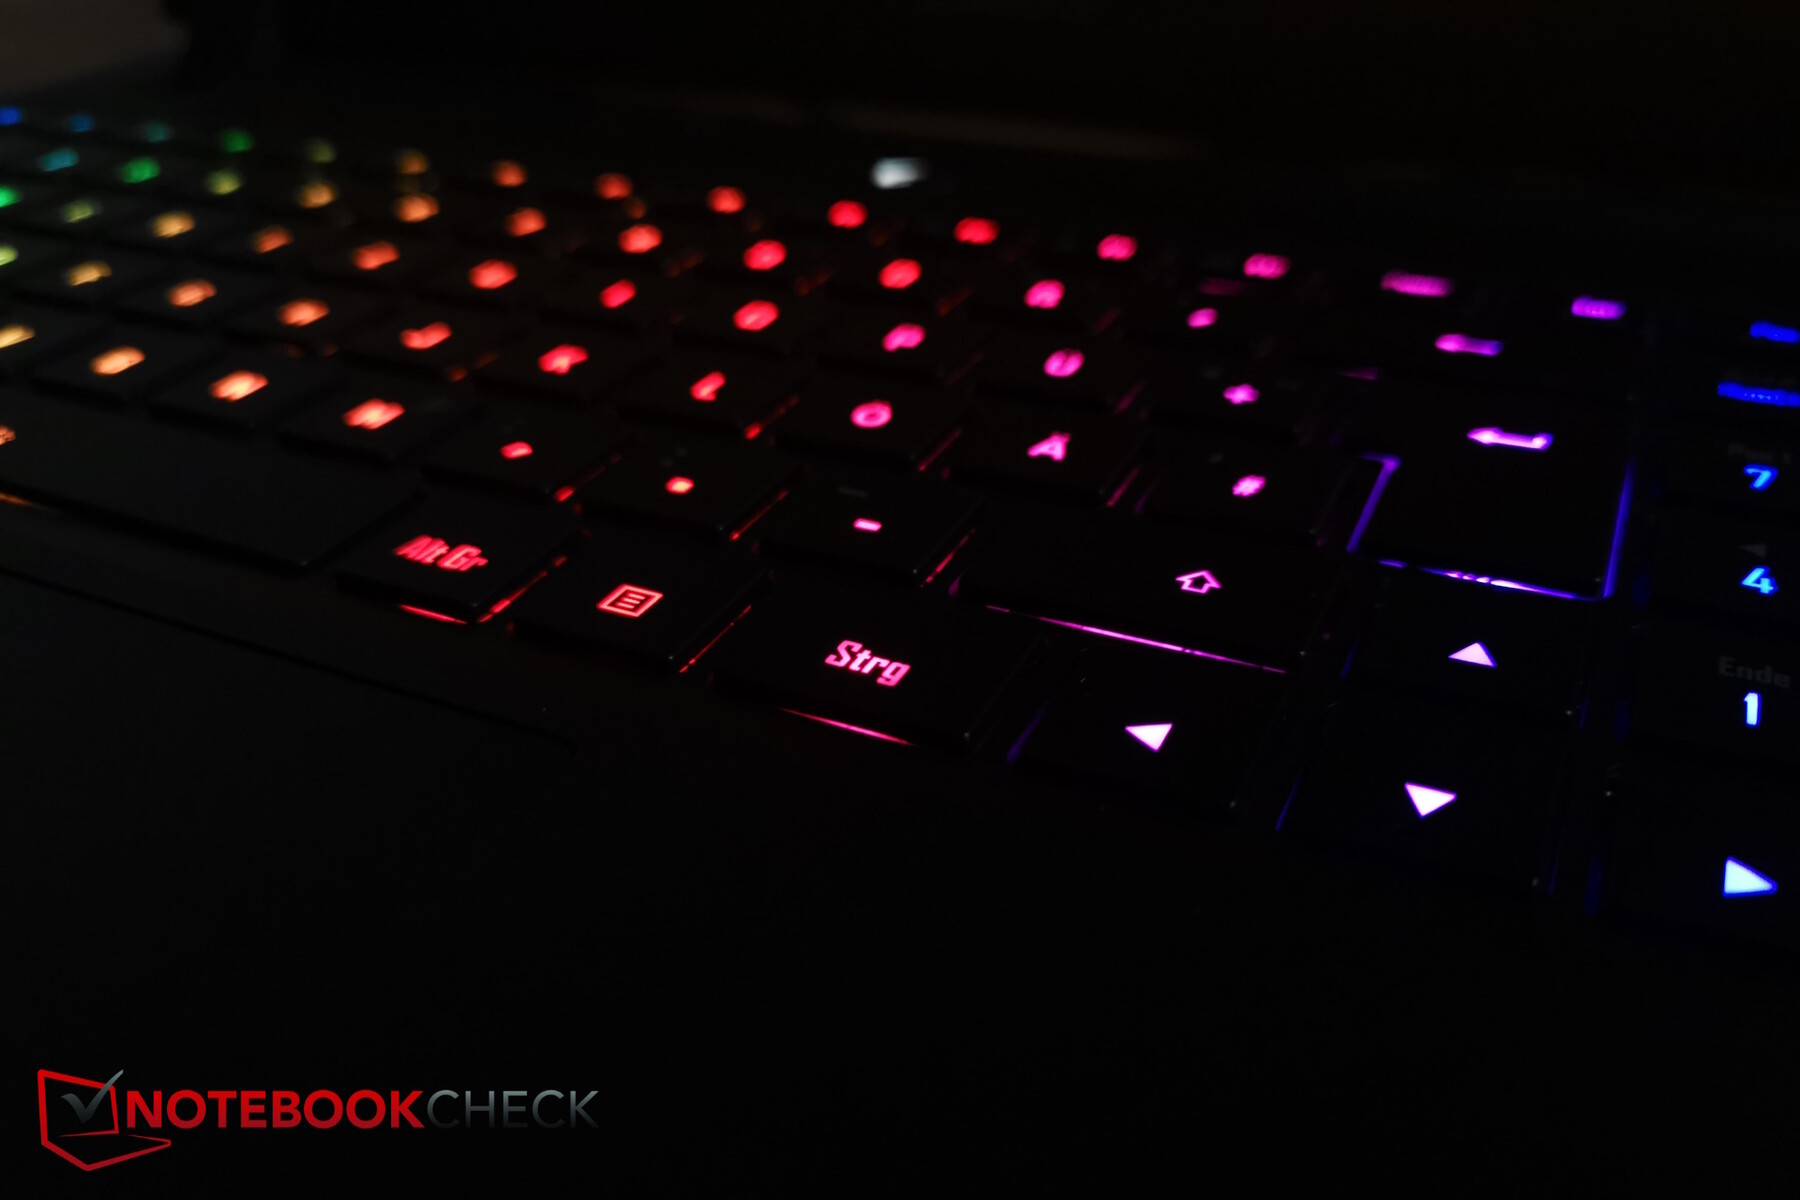
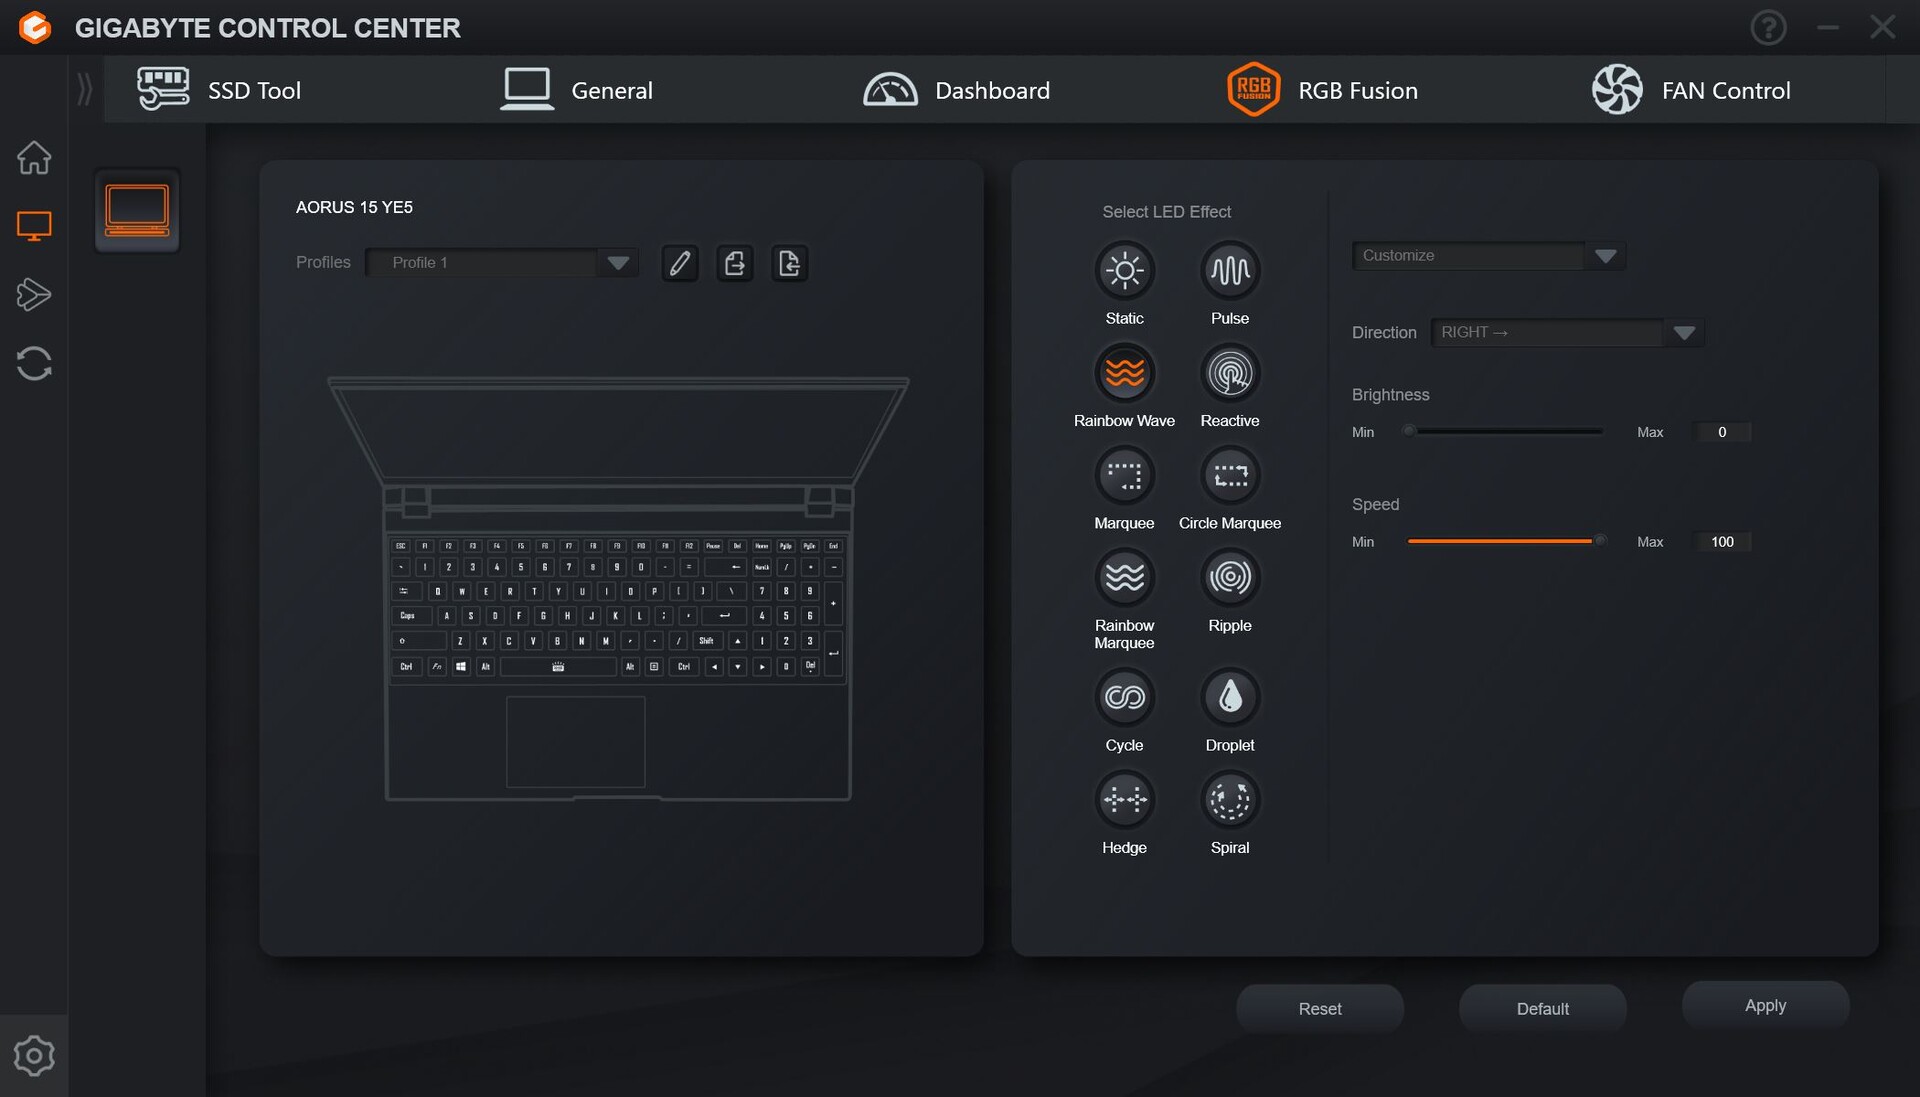
A luz de fundo das teclas é capaz de produzir vários efeitos RGB, mas não pode ser definida individualmente para cada tecla, embora elas possam se iluminar em cores diferentes para determinados efeitos (Rain Drop). Prático: se o senhor pressionar a tecla fn, todas as teclas que podem ser combinadas com fn para criar funções especiais serão iluminadas. Entretanto, apenas os rótulos normais das teclas são iluminados (por exemplo, "F7"), mas não sua função especial ("mute"), o que faz com que a função especial de uma tecla F não seja reconhecida em ambientes escuros.
O touchpad suficientemente grande (21,1 x 7,6 cm) é agradável e suave, mesmo que as mãos não estejam totalmente secas. Os botões de clique integrados exigem bastante força, o que significa que o ponto de pressão é claro. Os ruídos de clique são moderados.
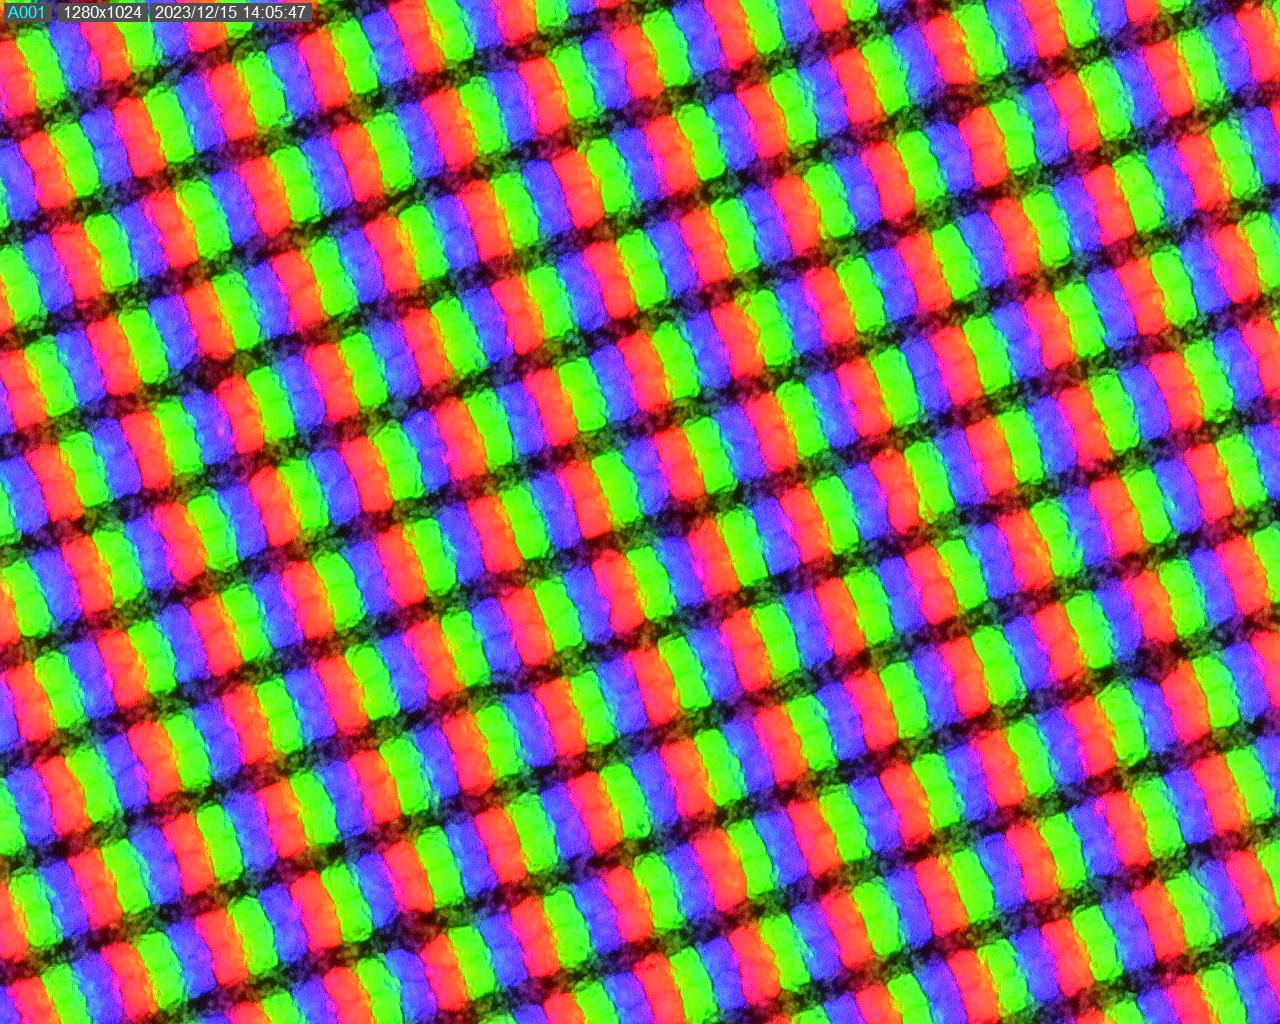
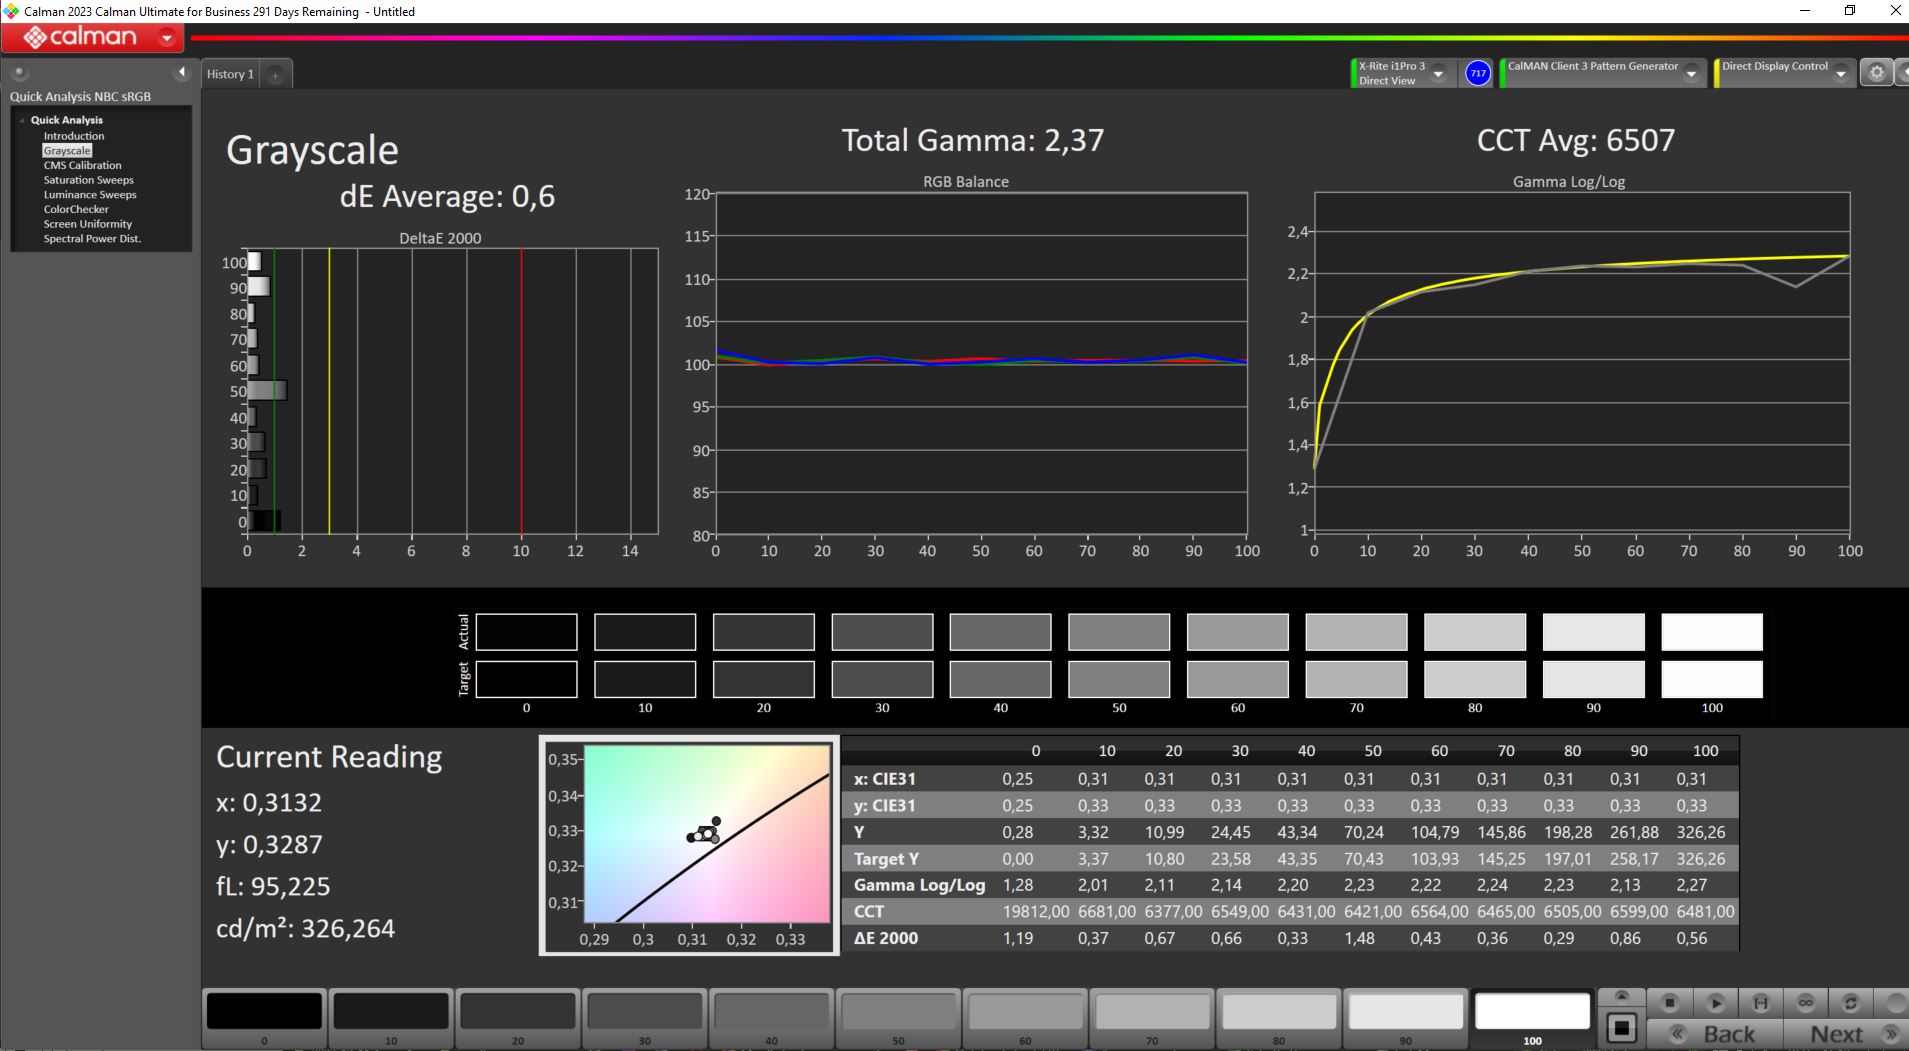
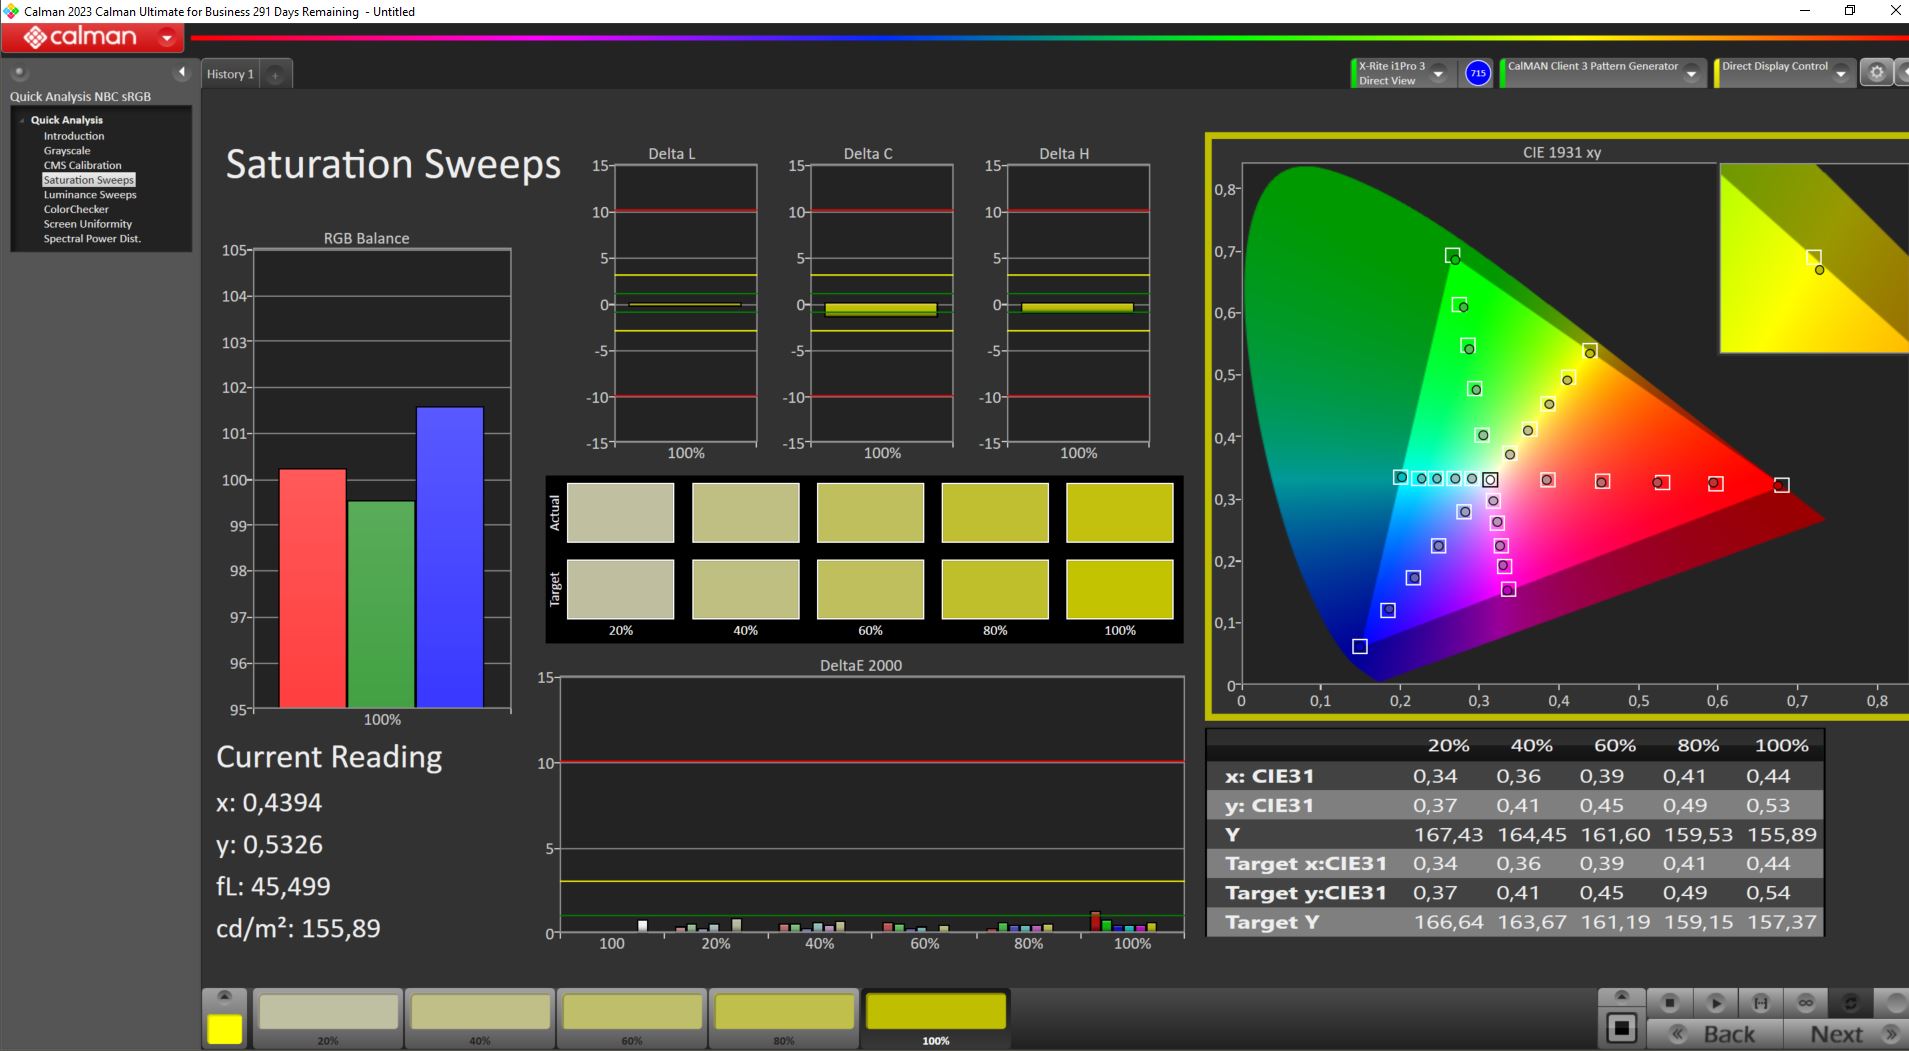
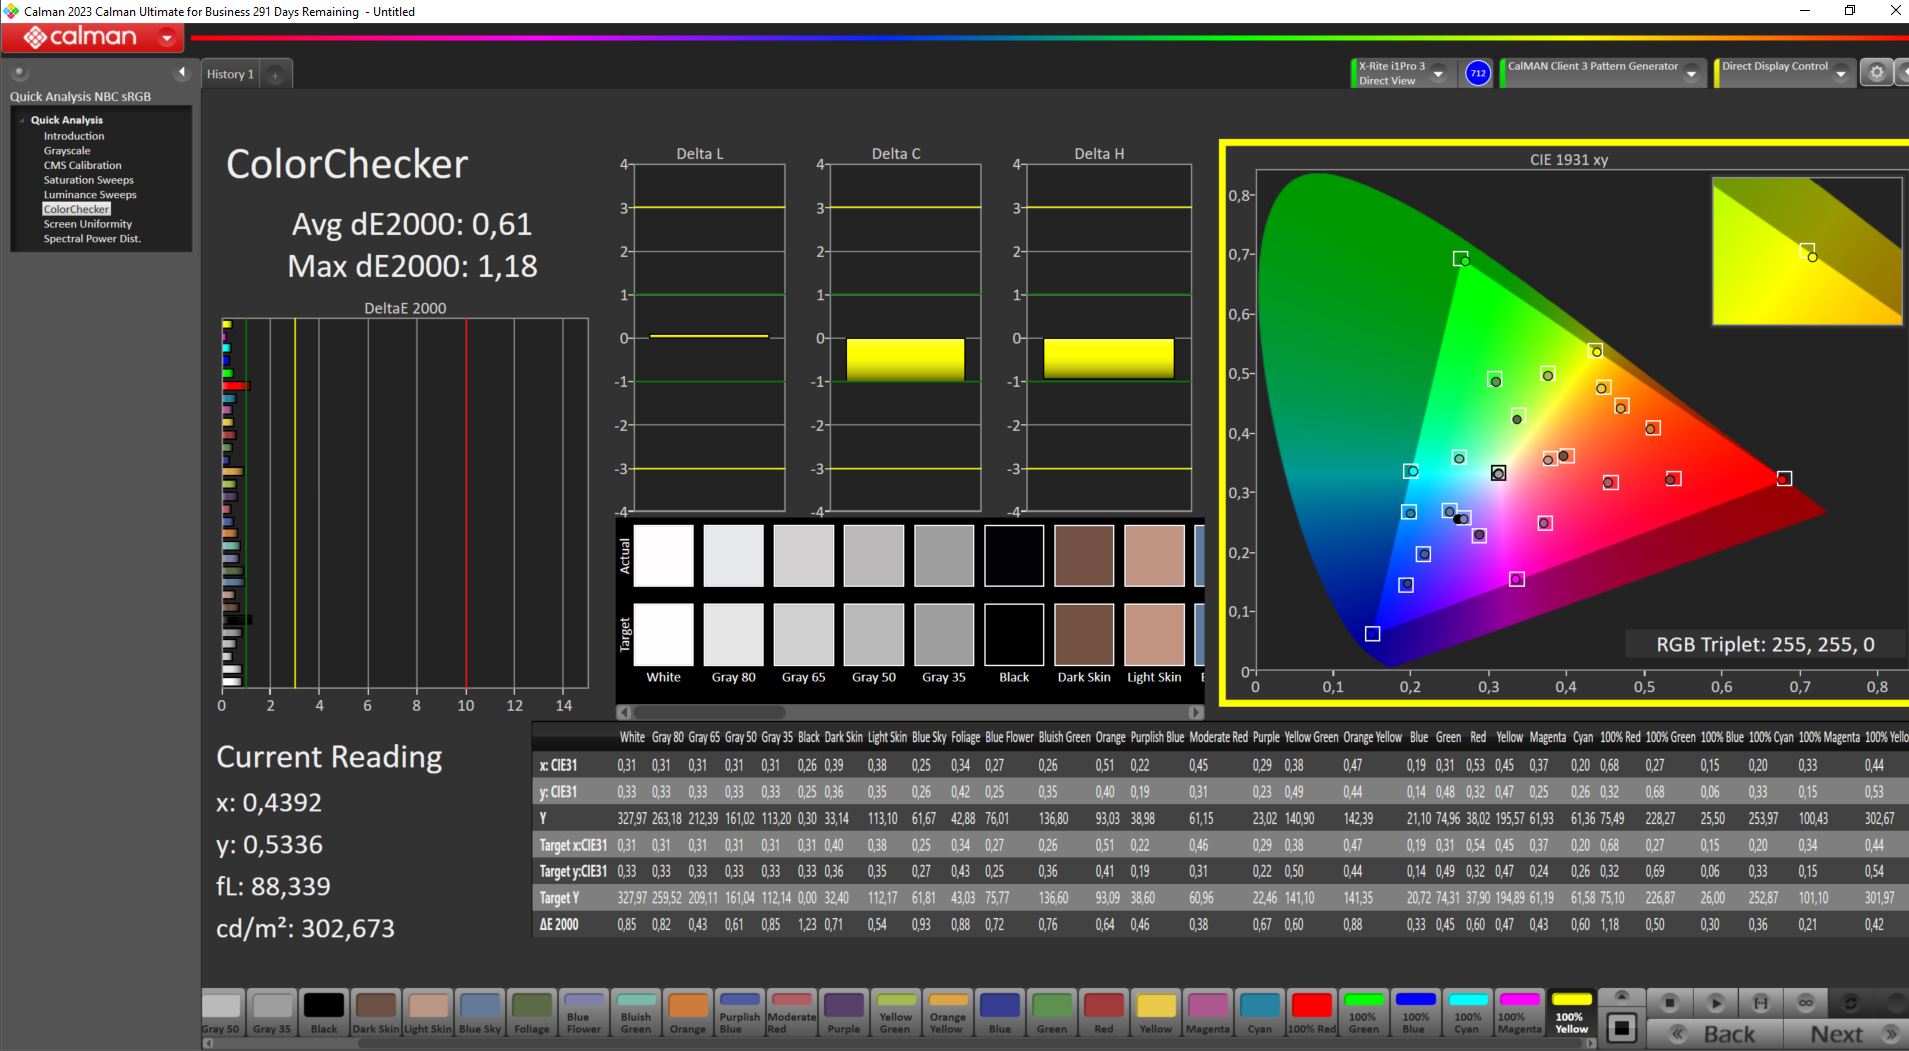
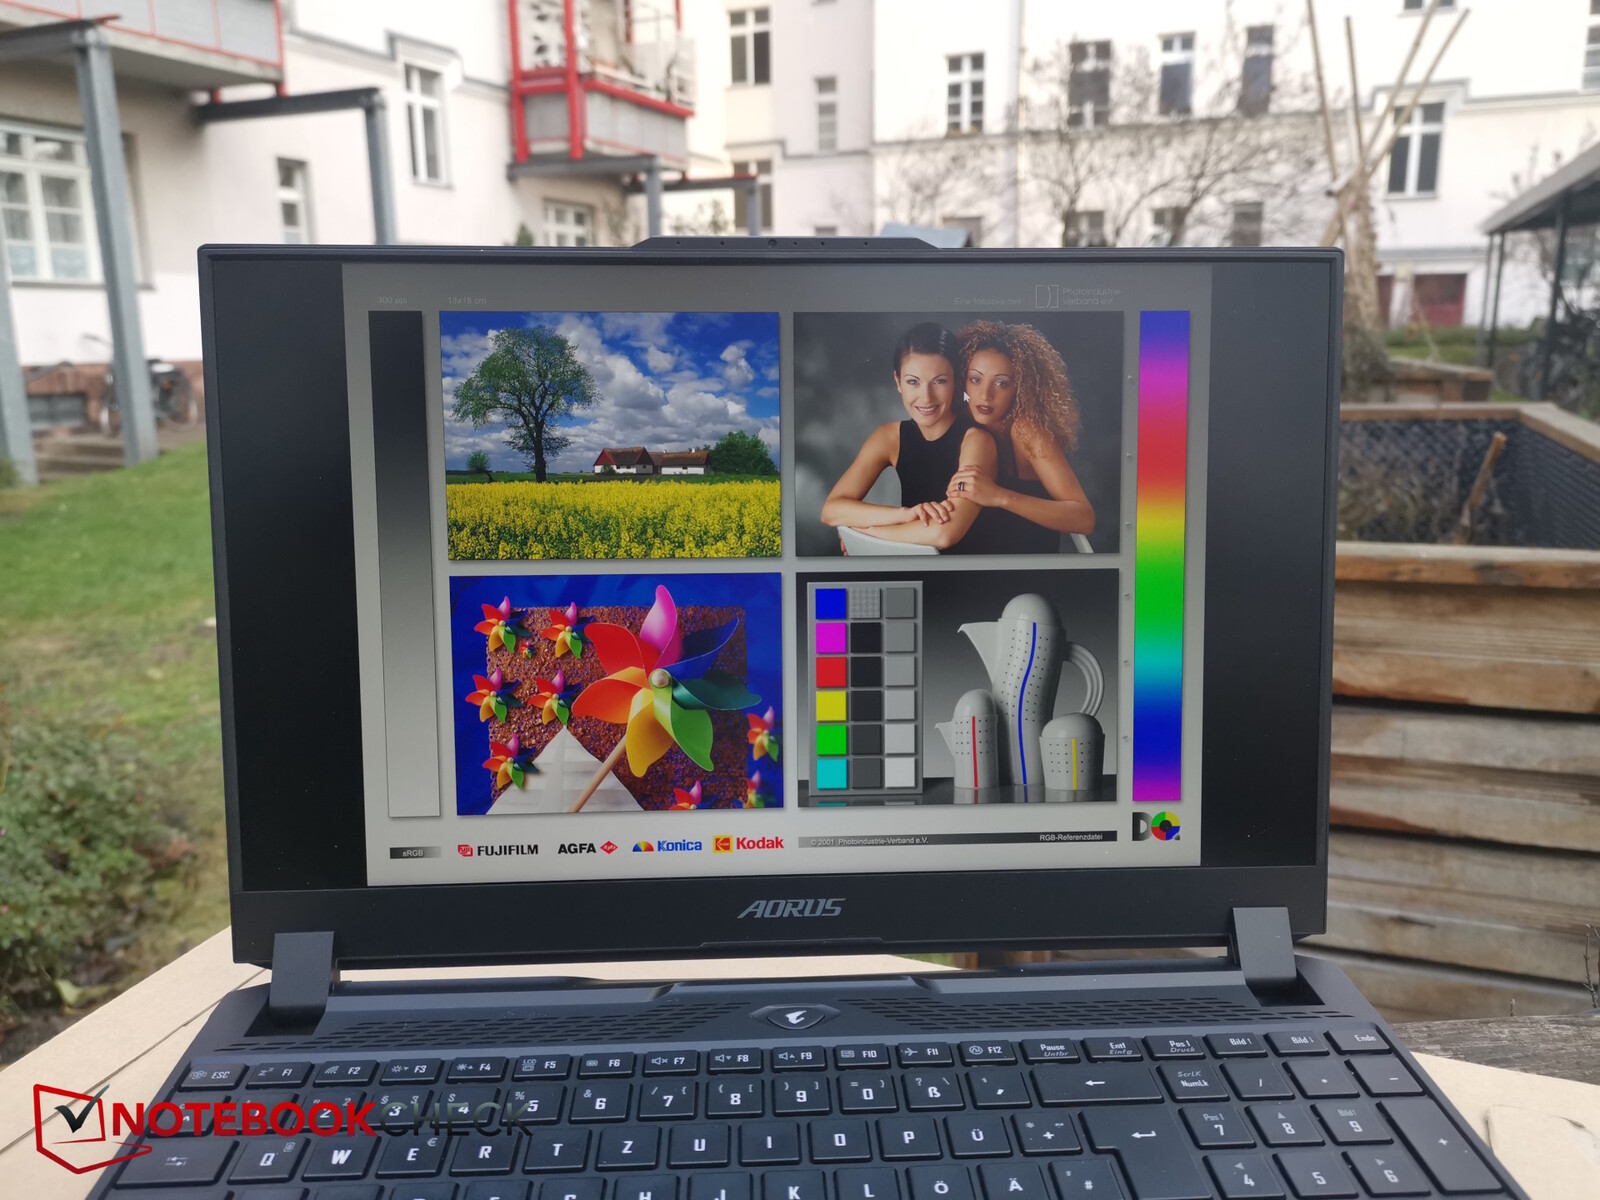
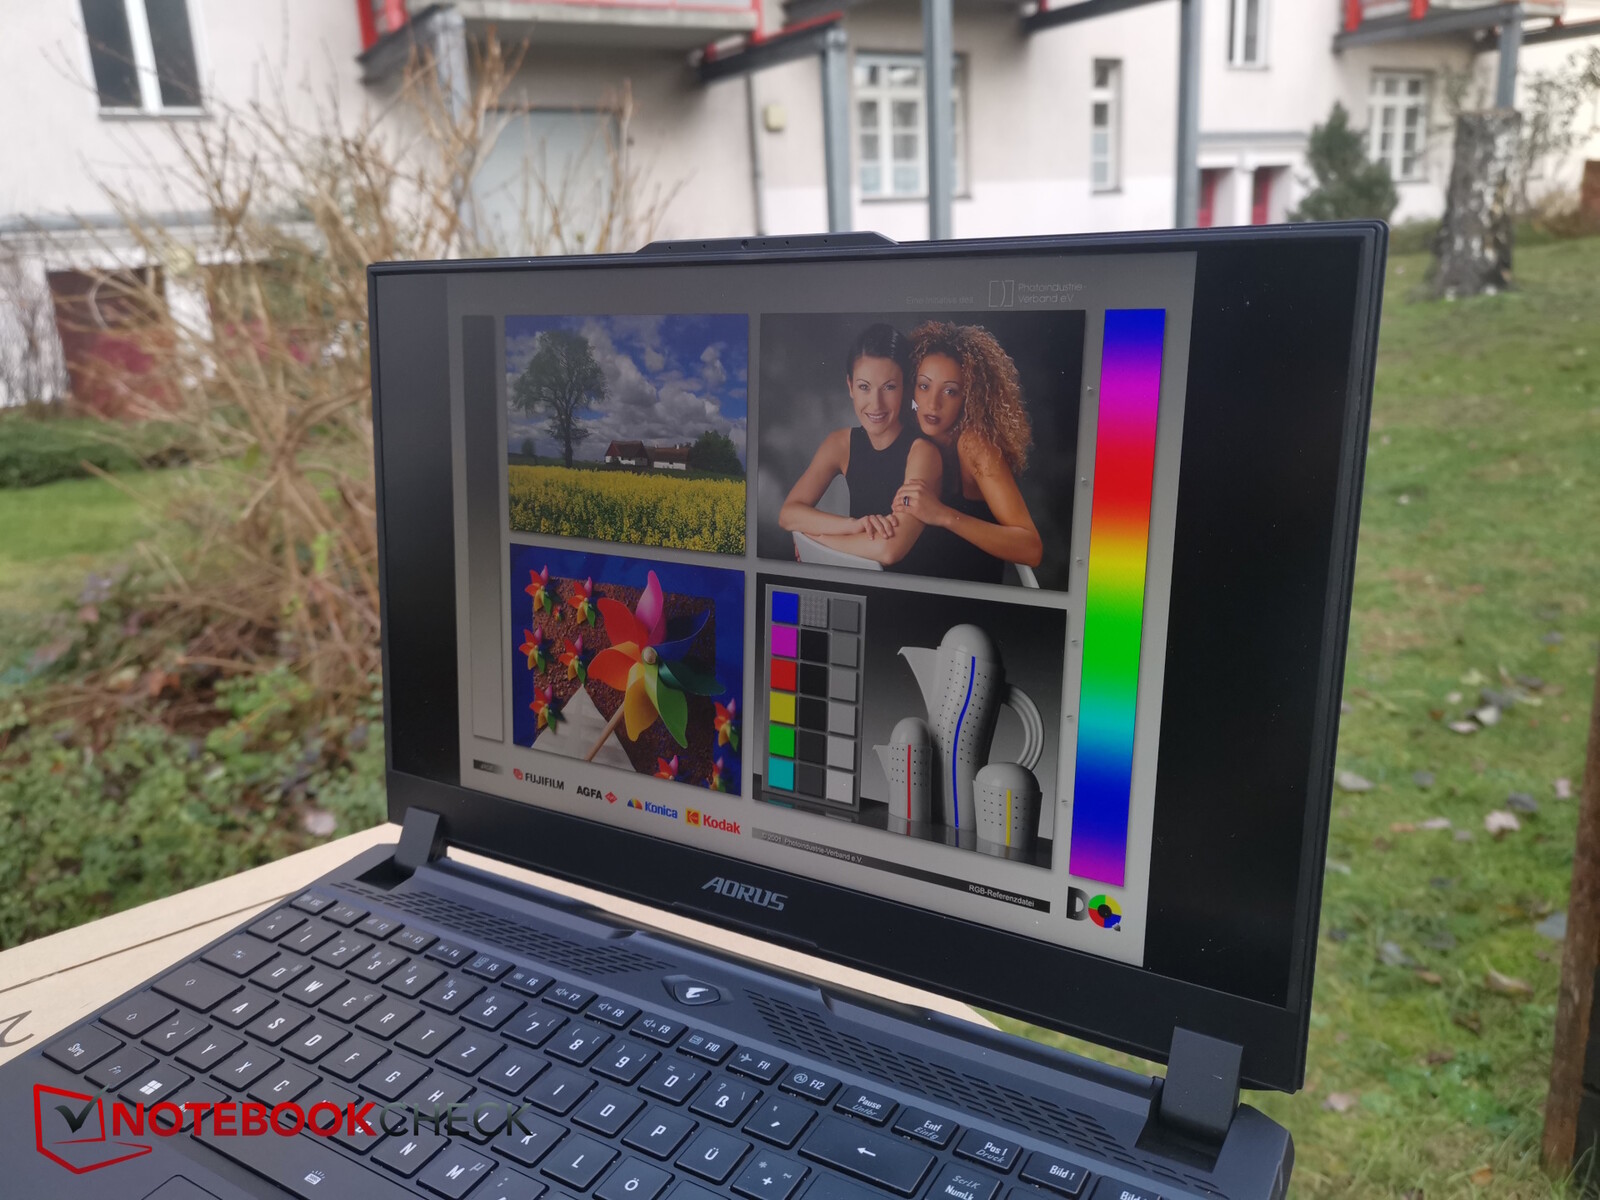
Tela - 1.440p com boa precisão de cores
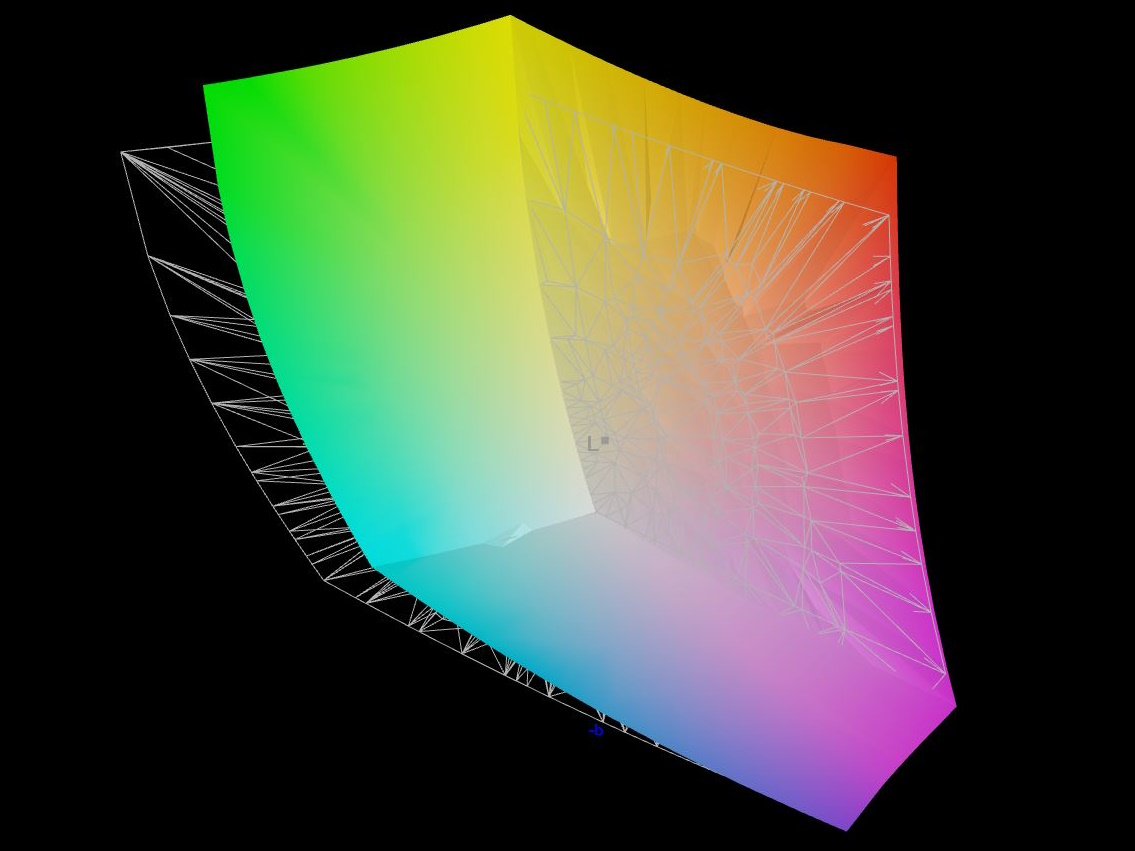
A tela WQHD fosca do laptop Aorus é fabricada pela Chi Mei e já foi usada no Asus ROG Zephyrus G15 em 2021. Foi um sucesso, portanto também não parece ultrapassado em 2023. Sua resolução de 2.560 x 1.440 pixels é tão impressionante quanto sua taxa de atualização de 165 Hz, seus tempos de resposta relativamente rápidos e sua cobertura de espaço de cores (100% sRGB, 97% Display P3). O brilho e o contraste da tela, por outro lado, são medianos. Como alternativa, há também um modelo Full HD com uma taxa de atualização de 360 Hz.
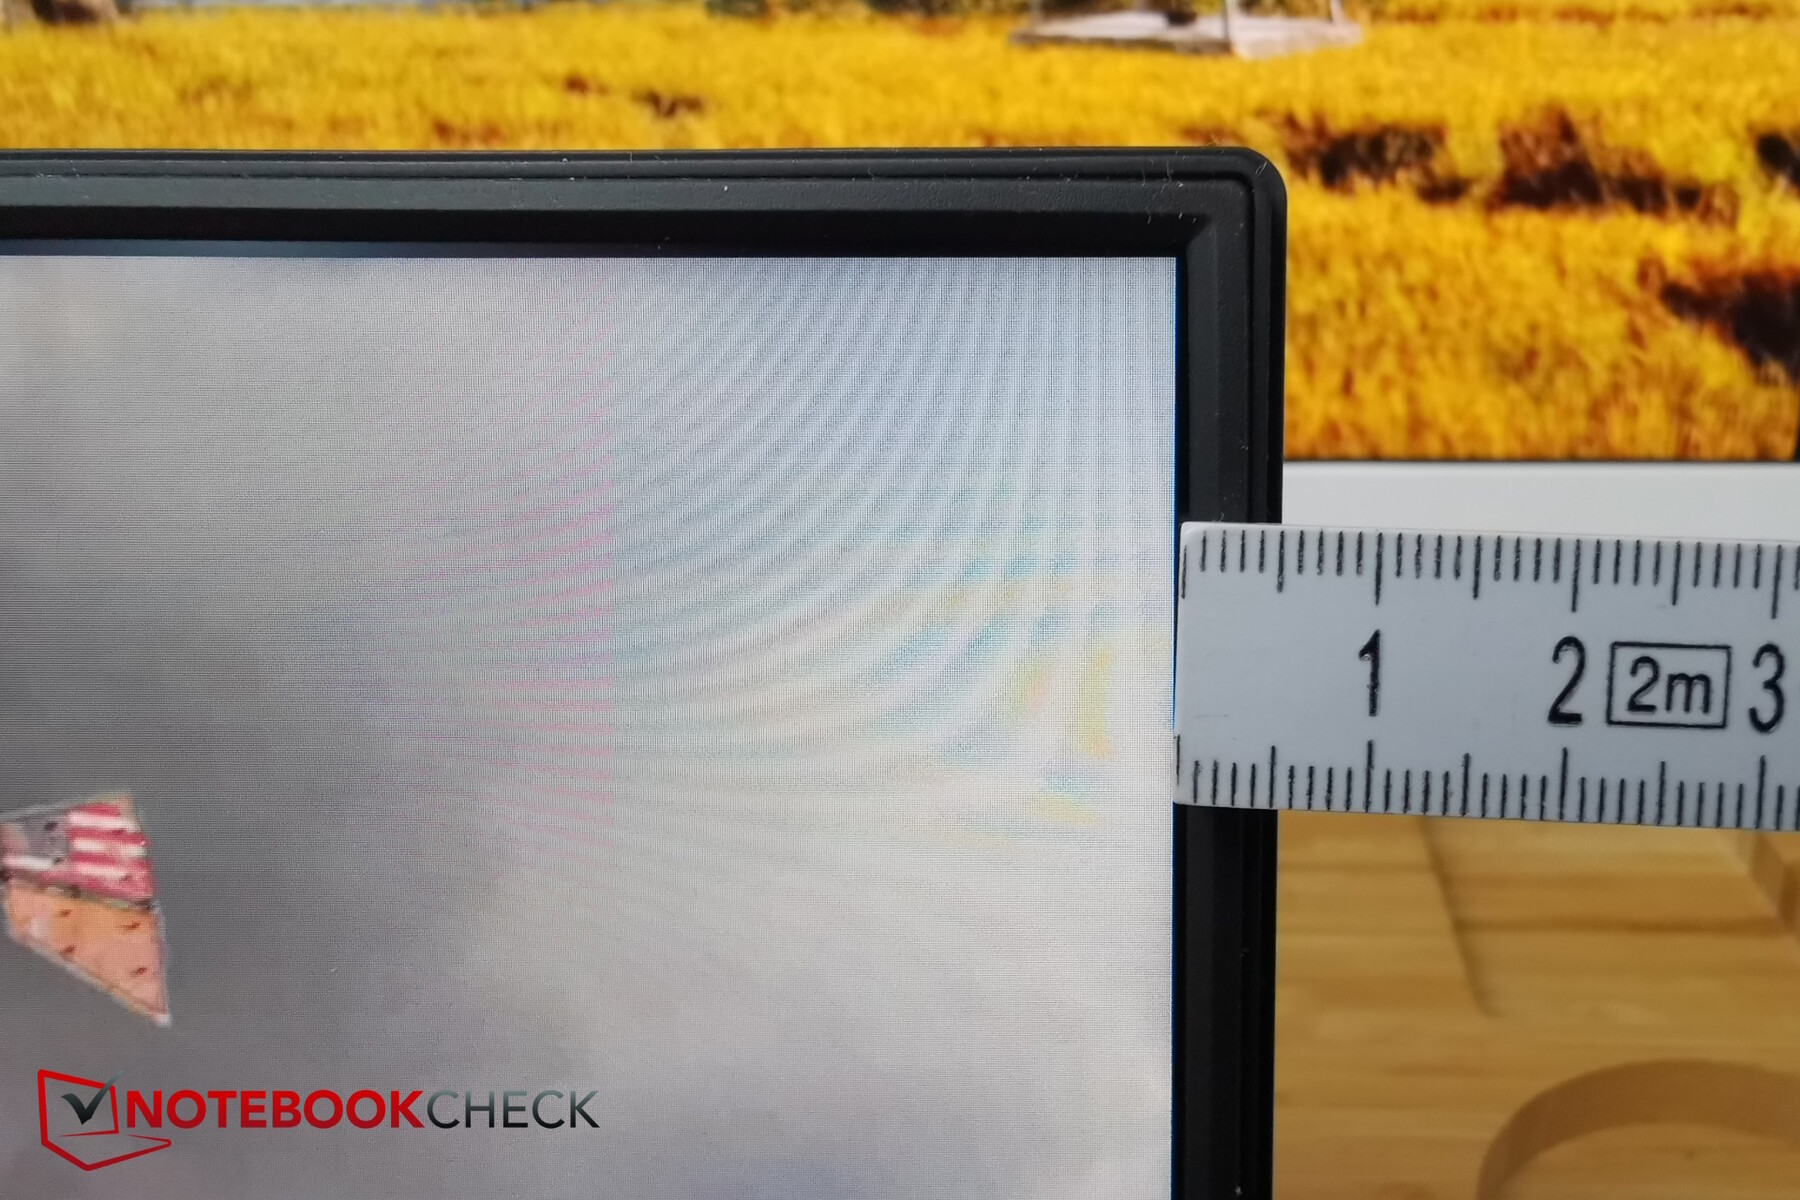
Menos bom é o sangramento muito visível da luz de fundo no canto inferior esquerdo e ao longo da borda superior direita. Entretanto, o PWM não é usado para controle de brilho. Seus tempos de resposta são medíocres, na melhor das hipóteses.

| |||||||||||||||||||||||||
iluminação: 81 %
iluminação com acumulador: 350 cd/m²
Contraste: 939:1 (Preto: 0.38 cd/m²)
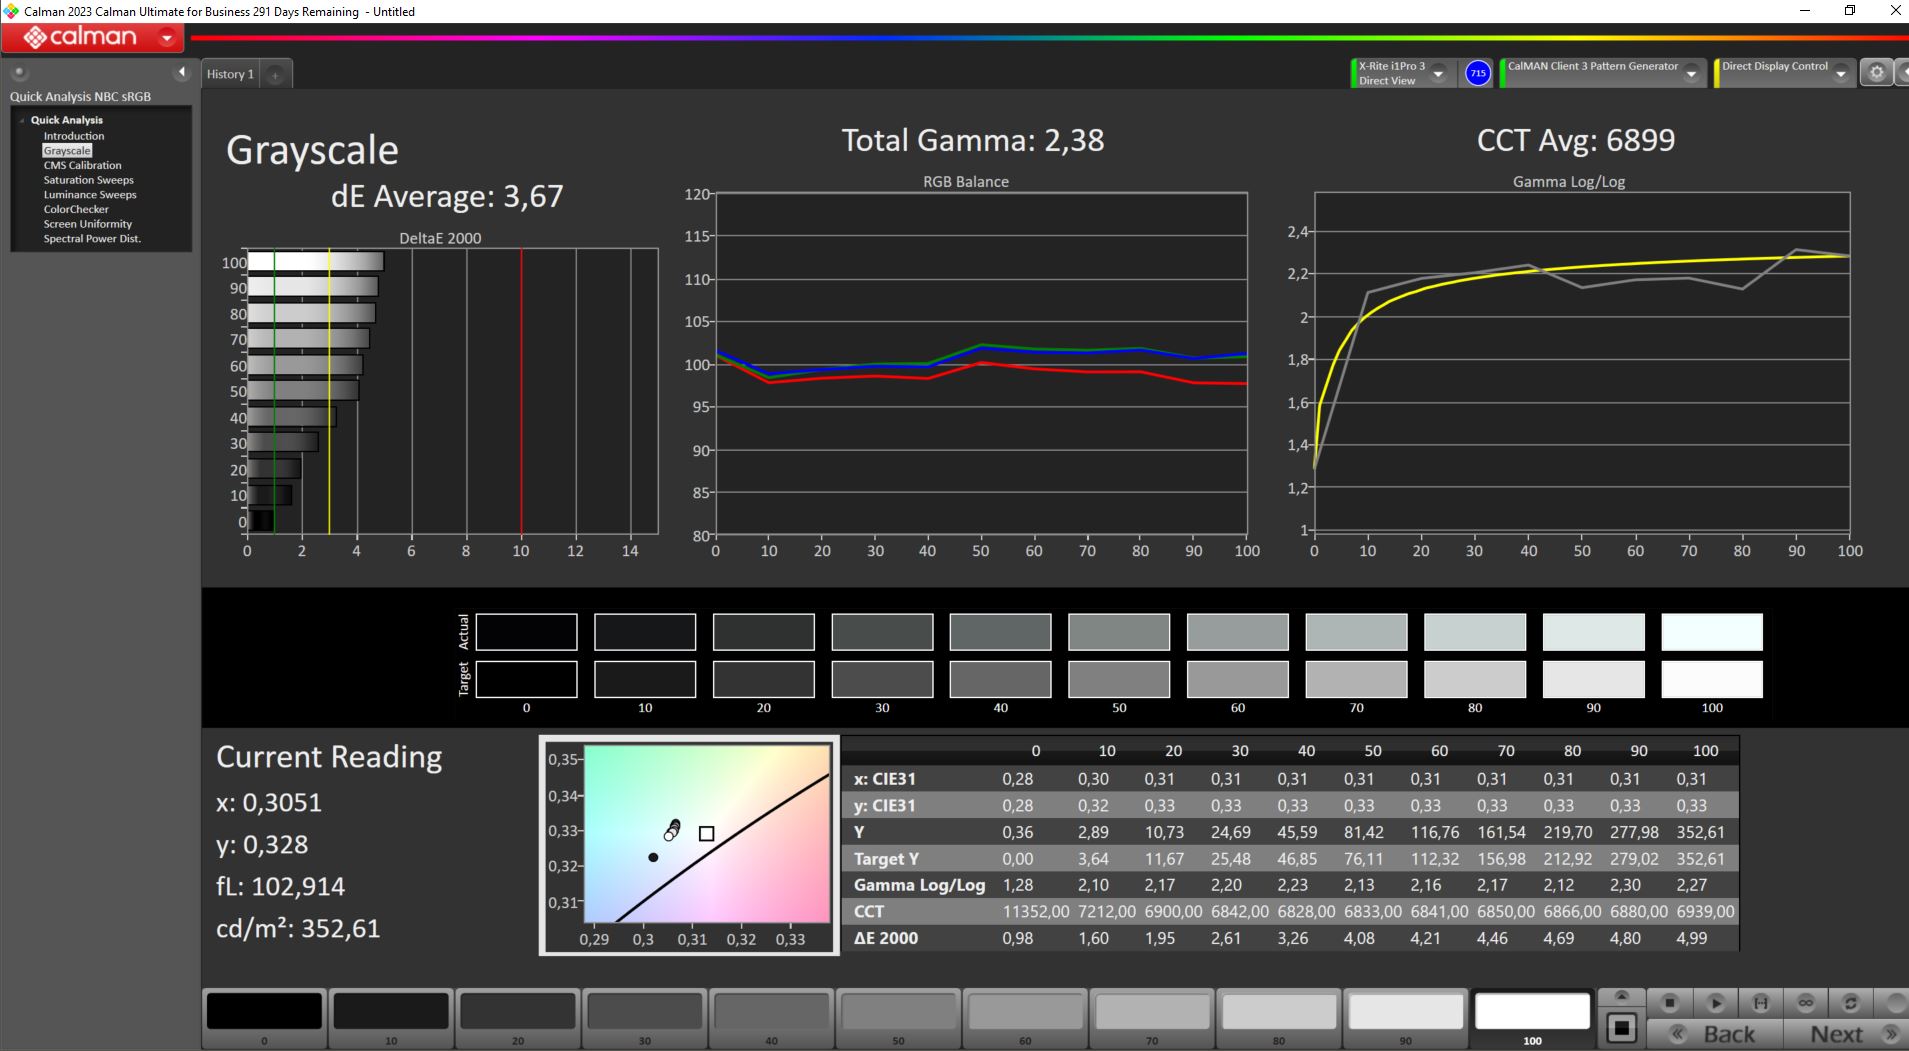
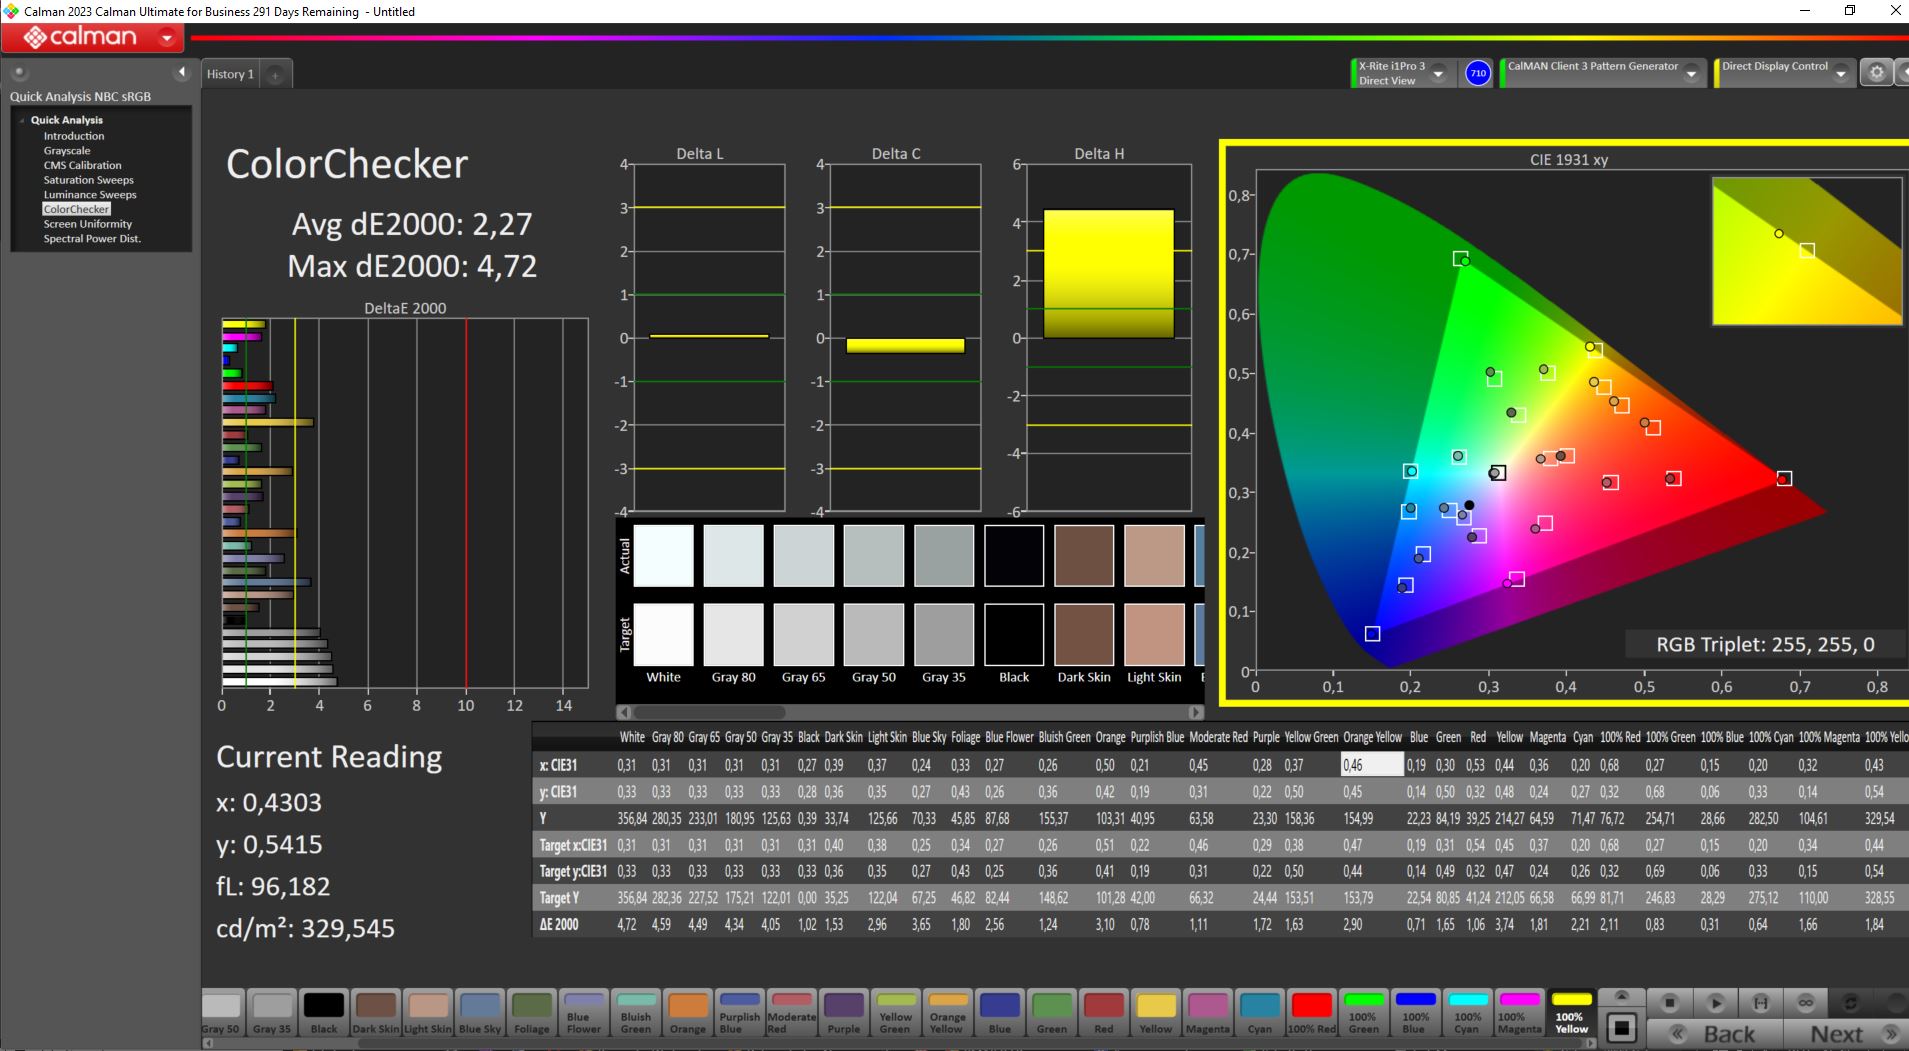
ΔE ColorChecker Calman: 2.27 | ∀{0.5-29.43 Ø4.71}
calibrated: 0.61
ΔE Greyscale Calman: 3.67 | ∀{0.09-98 Ø4.96}
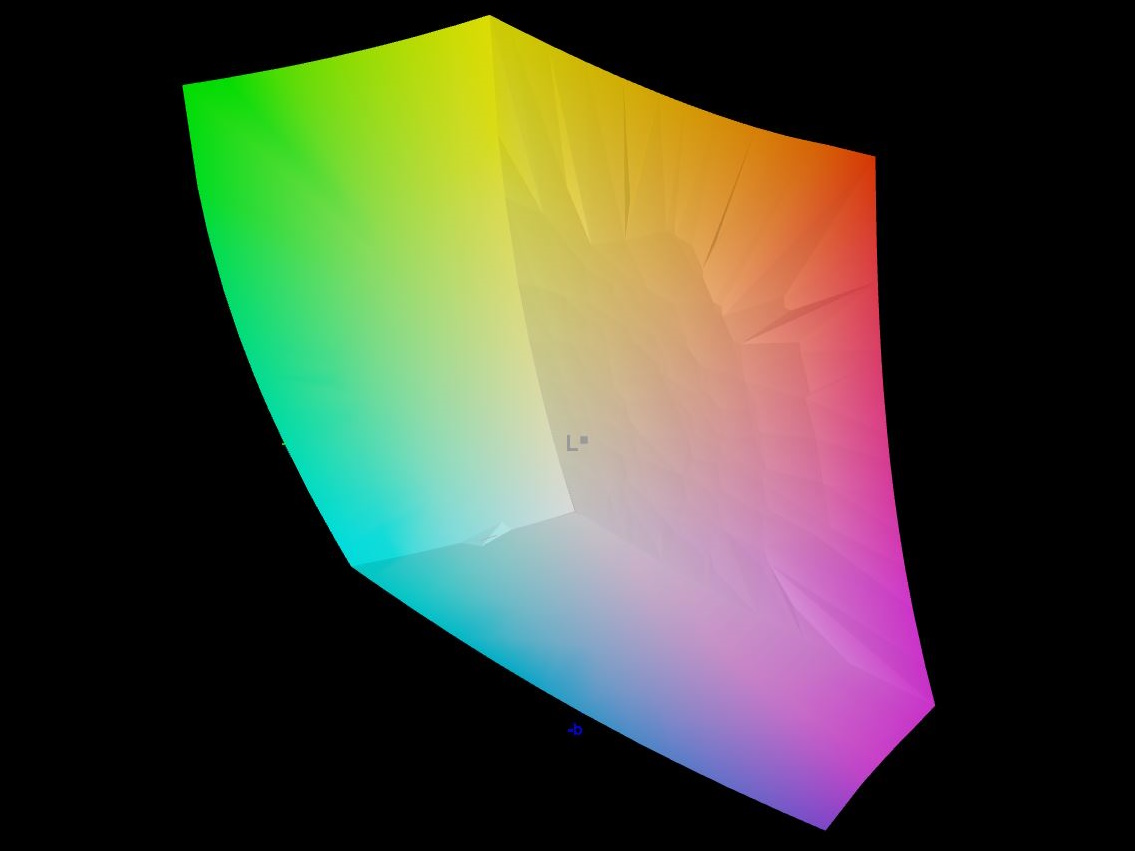
85.9% AdobeRGB 1998 (Argyll 3D)
100% sRGB (Argyll 3D)
97.7% Display P3 (Argyll 3D)
Gamma: 2.38
CCT: 7899 K
| Aorus 15 YE5-54DEB34SH Chi Mei CMN1540 (CMN N156KME-GNA), IPS, 2560x1440, 15.6" | Aorus 15 BSF Sharp LQ156T1JW05, IPS, 2560x1440, 15.6" | Captiva Advanced Gaming I74-121 BOE08B3, IPS, 1920x1080, 15.6" | HP Victus 16-r0077ng CMN162D, IPS, 1920x1080, 16.1" | Dell XPS 15 9530 RTX 4070 Samsung 156XG01, OLED, 3456x2160, 15.6" | HP Omen 16-wf000 BOE0B7D, IPS, 2560x1440, 16.1" | |
|---|---|---|---|---|---|---|
| Display | 0% | -21% | -18% | 6% | -16% | |
| Display P3 Coverage (%) | 97.7 | 98.2 1% | 64 -34% | 66.7 -32% | 99.8 2% | 69 -29% |
| sRGB Coverage (%) | 100 | 99.9 0% | 93.2 -7% | 98 -2% | 100 0% | 99.2 -1% |
| AdobeRGB 1998 Coverage (%) | 85.9 | 85.7 0% | 66 -23% | 69 -20% | 98.4 15% | 71.2 -17% |
| Response Times | 40% | 55% | 30% | 87% | 47% | |
| Response Time Grey 50% / Grey 80% * (ms) | 18.9 ? | 11.3 ? 40% | 5 ? 74% | 13.3 ? 30% | 1.68 ? 91% | 4.6 ? 76% |
| Response Time Black / White * (ms) | 11.7 ? | 7 ? 40% | 7.55 ? 35% | 8.2 ? 30% | 1.94 ? 83% | 9.7 ? 17% |
| PWM Frequency (Hz) | 239 | |||||
| Screen | -34% | -28% | 15% | -36% | 7% | |
| Brightness middle (cd/m²) | 357 | 299 -16% | 346 -3% | 308 -14% | 389.5 9% | 310.9 -13% |
| Brightness (cd/m²) | 322 | 282 -12% | 324 1% | 285 -11% | 392 22% | 296 -8% |
| Brightness Distribution (%) | 81 | 82 1% | 90 11% | 85 5% | 98 21% | 91 12% |
| Black Level * (cd/m²) | 0.38 | 0.31 18% | 0.35 8% | 0.25 34% | 0.35 8% | |
| Contrast (:1) | 939 | 965 3% | 989 5% | 1232 31% | 888 -5% | |
| Colorchecker dE 2000 * | 2.27 | 2.24 1% | 4.12 -81% | 1.3 43% | 4.95 -118% | 2.18 4% |
| Colorchecker dE 2000 max. * | 4.72 | 4.29 9% | 7.78 -65% | 2.76 42% | 8.65 -83% | 3.58 24% |
| Colorchecker dE 2000 calibrated * | 0.61 | 2.62 -330% | 1.22 -100% | 0.92 -51% | 1.53 -151% | 0.52 15% |
| Greyscale dE 2000 * | 3.67 | 3 18% | 4.81 -31% | 1.7 54% | 2 46% | 2.8 24% |
| Gamma | 2.38 92% | 2.086 105% | 2.31 95% | 2.167 102% | 2.27 97% | 2.18 101% |
| CCT | 7899 82% | 6289 103% | 7633 85% | 6767 96% | 6265 104% | 6002 108% |
| Média Total (Programa/Configurações) | 2% /
-16% | 2% /
-15% | 9% /
10% | 19% /
-5% | 13% /
8% |
* ... menor é melhor
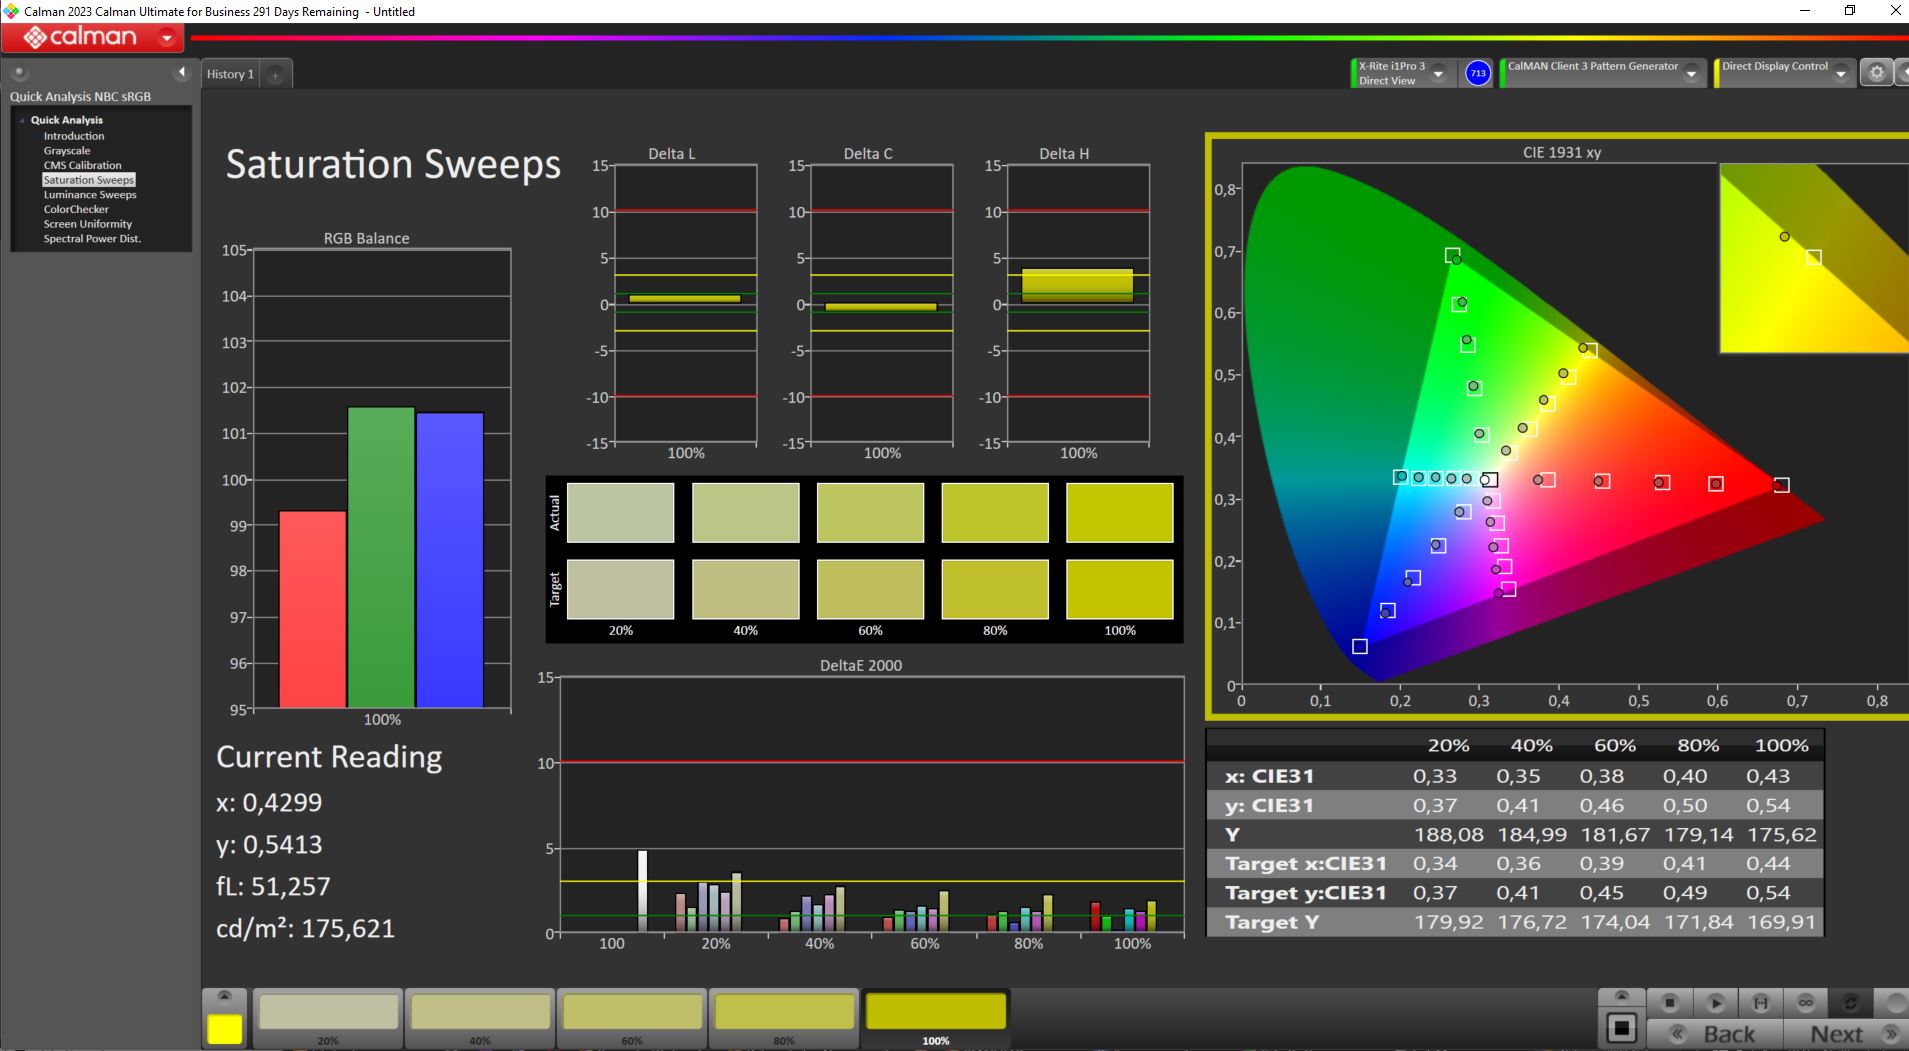
Em funcionamento, o monitor não vem calibrado de forma ideal, mas nossa calibração usando o dispositivo de medição X-Rite Fab e o software Calman reduz o valor DeltaE (significativo para desvios (de cor)) para bem abaixo de 1, tanto para tons de cinza quanto para cores. Juntamente com sua boa cobertura de espaço de cores (veja a última linha de imagens abaixo), a tela também é adequada para edição semiprofissional de imagens e vídeos.

Exibir tempos de resposta
| ↔ Tempo de resposta preto para branco | ||
|---|---|---|
| 11.7 ms ... ascensão ↗ e queda ↘ combinadas | ↗ 7.2 ms ascensão | 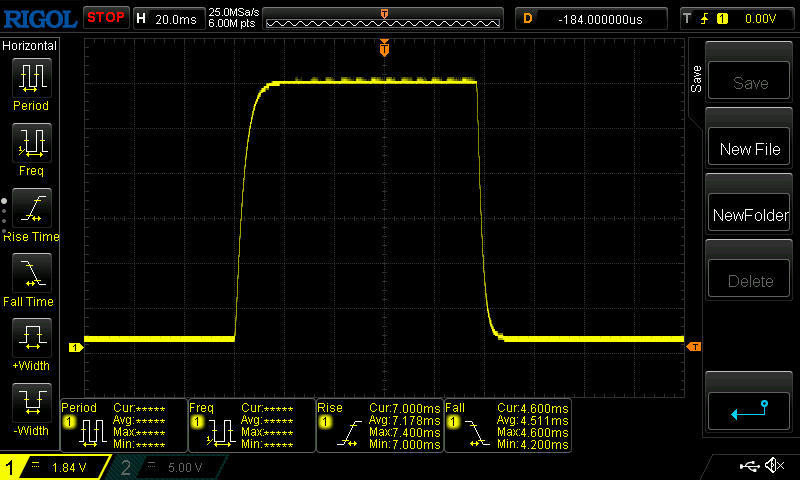 |
| ↘ 4.5 ms queda | ||
| A tela mostra boas taxas de resposta em nossos testes, mas pode ser muito lenta para jogadores competitivos. Em comparação, todos os dispositivos testados variam de 0.1 (mínimo) a 240 (máximo) ms. » 32 % de todos os dispositivos são melhores. Isso significa que o tempo de resposta medido é melhor que a média de todos os dispositivos testados (19.8 ms). | ||
| ↔ Tempo de resposta 50% cinza a 80% cinza | ||
| 18.9 ms ... ascensão ↗ e queda ↘ combinadas | ↗ 9.4 ms ascensão | 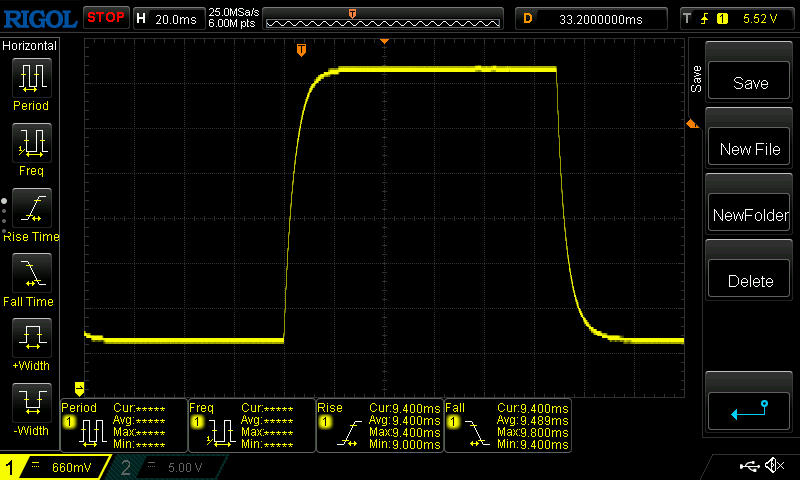 |
| ↘ 9.5 ms queda | ||
| A tela mostra boas taxas de resposta em nossos testes, mas pode ser muito lenta para jogadores competitivos. Em comparação, todos os dispositivos testados variam de 0.165 (mínimo) a 636 (máximo) ms. » 33 % de todos os dispositivos são melhores. Isso significa que o tempo de resposta medido é melhor que a média de todos os dispositivos testados (31 ms). | ||
Cintilação da tela / PWM (modulação por largura de pulso)
| Tela tremeluzindo / PWM não detectado | 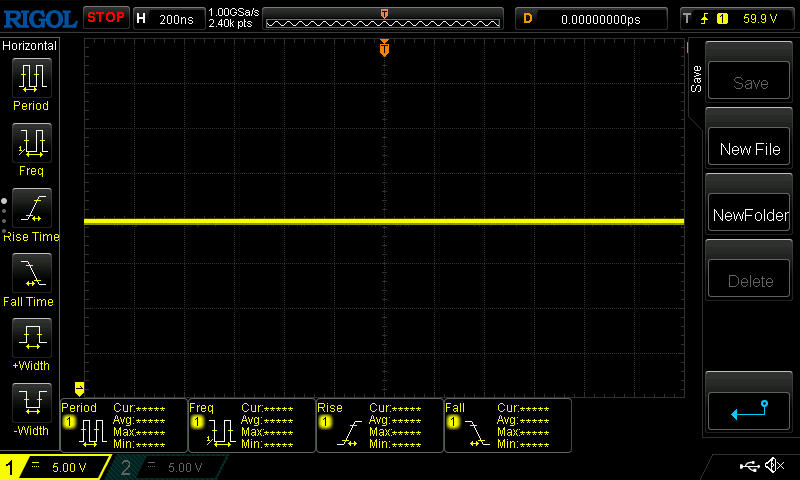 | ||
[pwm_comparison] Em comparação: 52 % de todos os dispositivos testados não usam PWM para escurecer a tela. Se PWM foi detectado, uma média de 7754 (mínimo: 5 - máximo: 343500) Hz foi medida. | |||
Graças ao seu brilho aceitável de mais de 300 nits e à sua superfície fosca, o conteúdo da tela do laptop ainda é fácil de ver em ambientes com sombra.

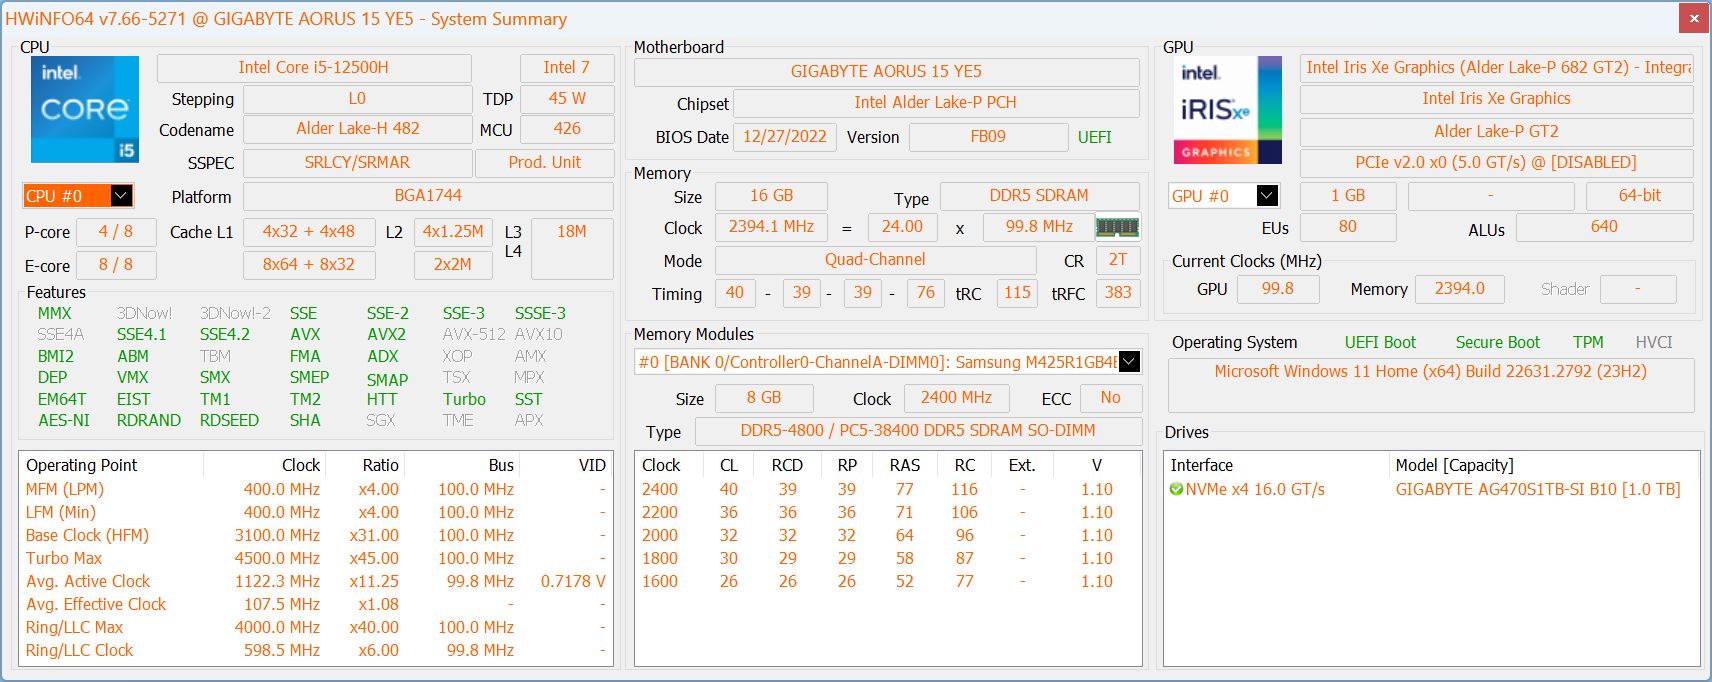
Desempenho - A última geração ainda oferece
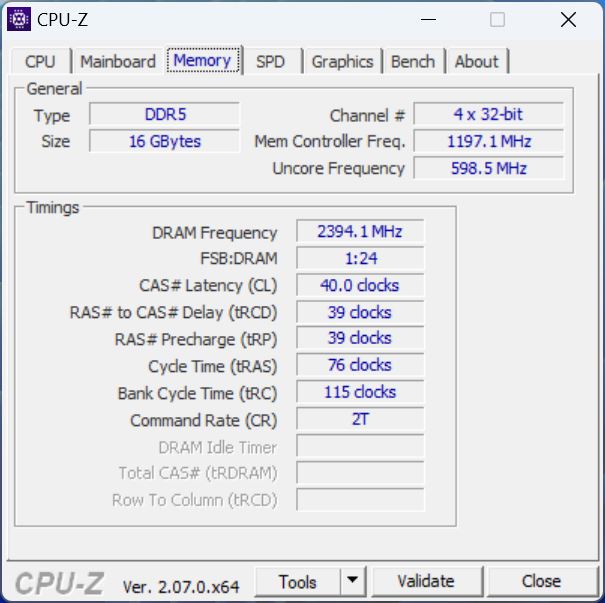
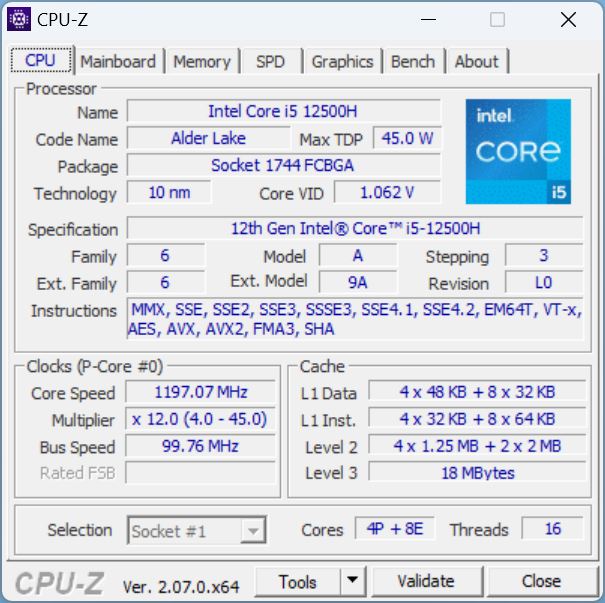
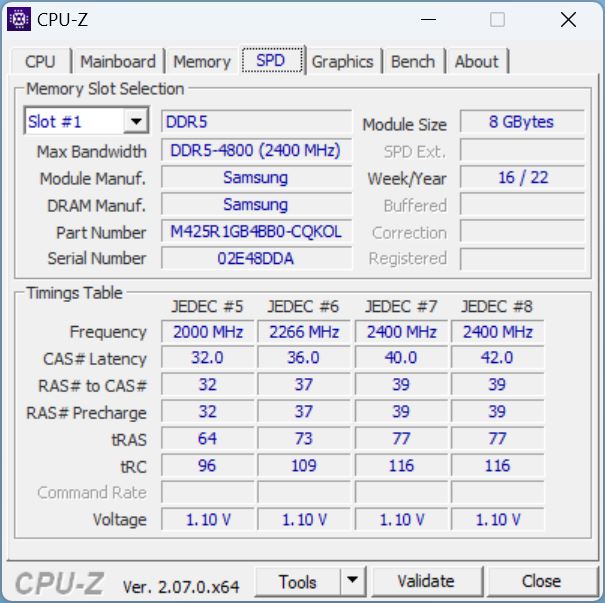
A CPU e a GPU de última geração alimentam o sistema. O antigo Core i5-12500H mais antigo tem acesso a 16 GB de RAM DDR5 4800 moderna e a um SSD NVMe de 1 TB da Gigabyte. Juntamente com sua RTX 3080 Tio Aorus 15 YE5 pode definitivamente ser classificado como um gamer de ponta, apesar de sua CPU de última geração e de médio porte.
Condições de teste
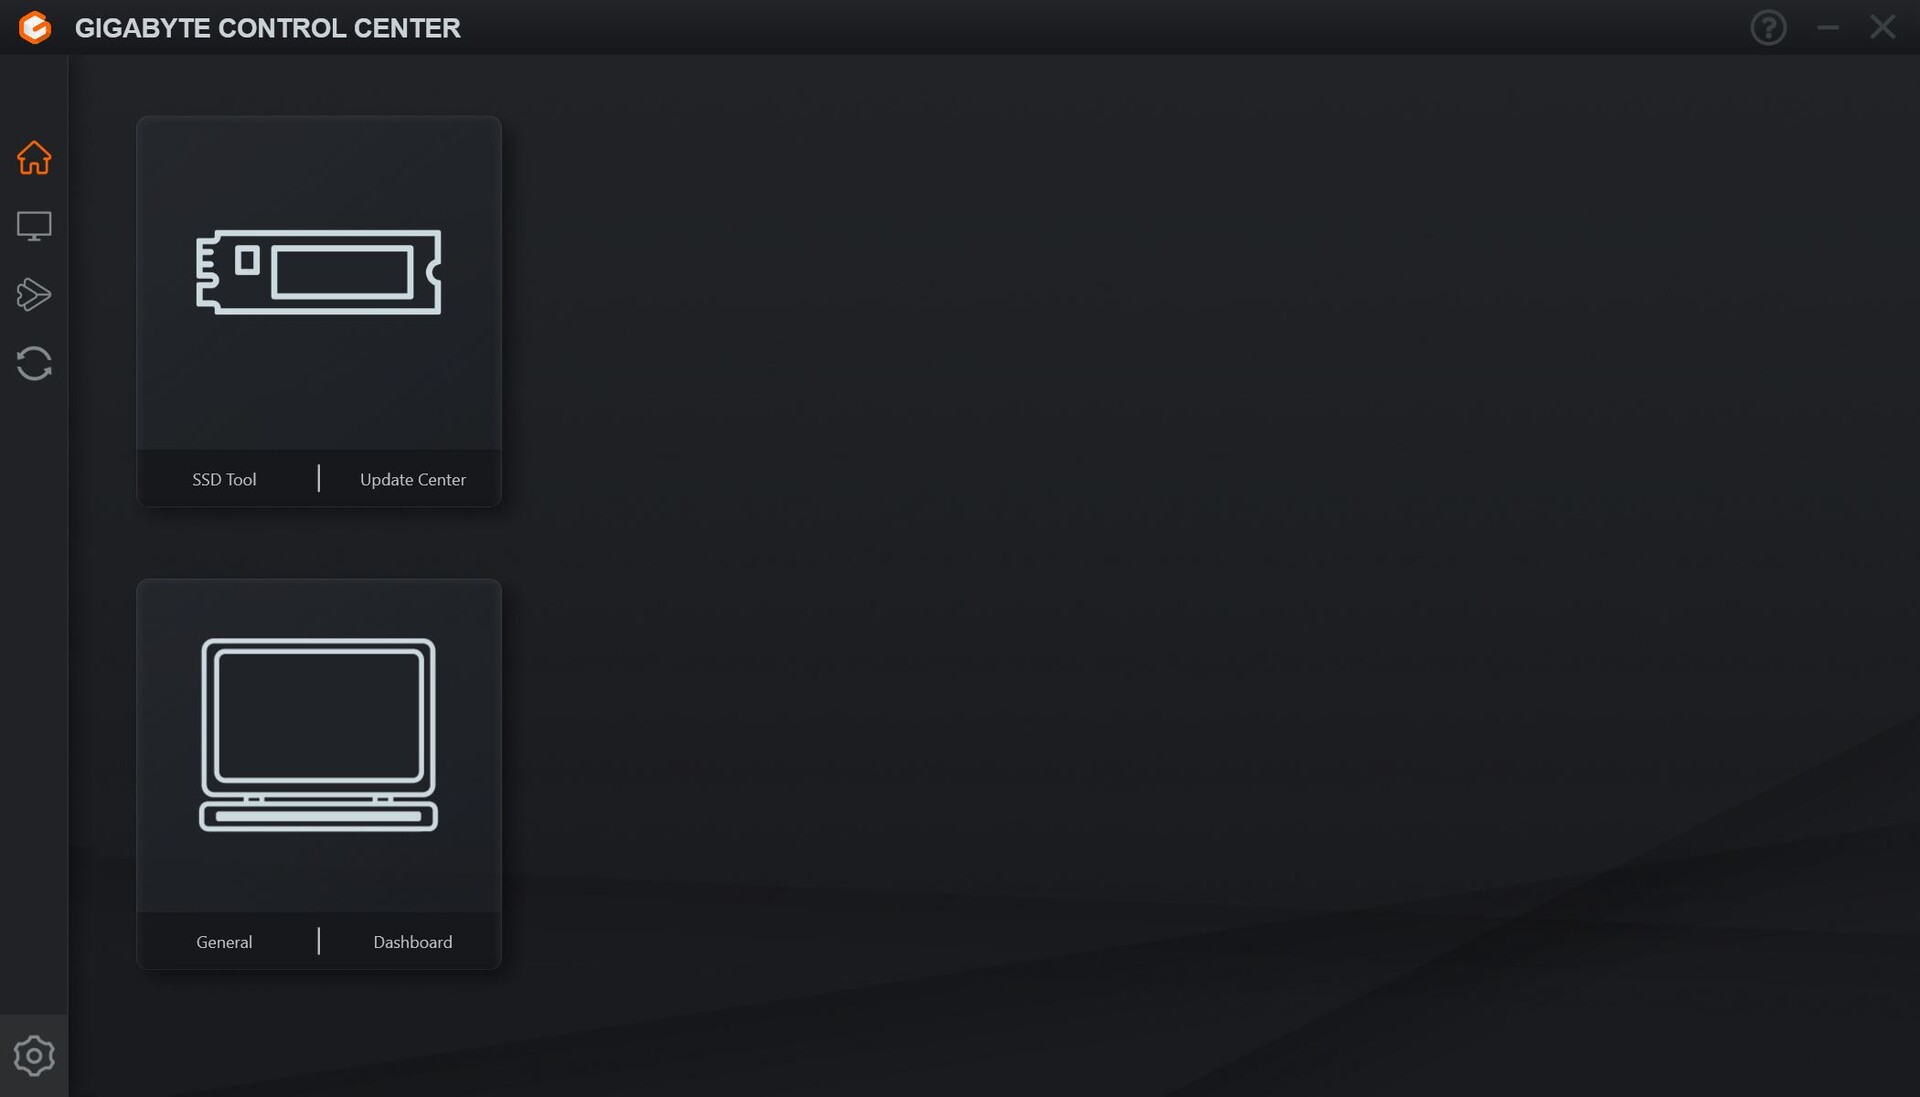
Ex funciona, o laptop não veio pré-instalado com um Control Center - ele deve ou pode ser baixado do site de suporte da Gigabyte https://www.gigabyte.com/de/Laptop/AORUS-15--Intel-12th-Gen/support#support-dl-utility se necessário.
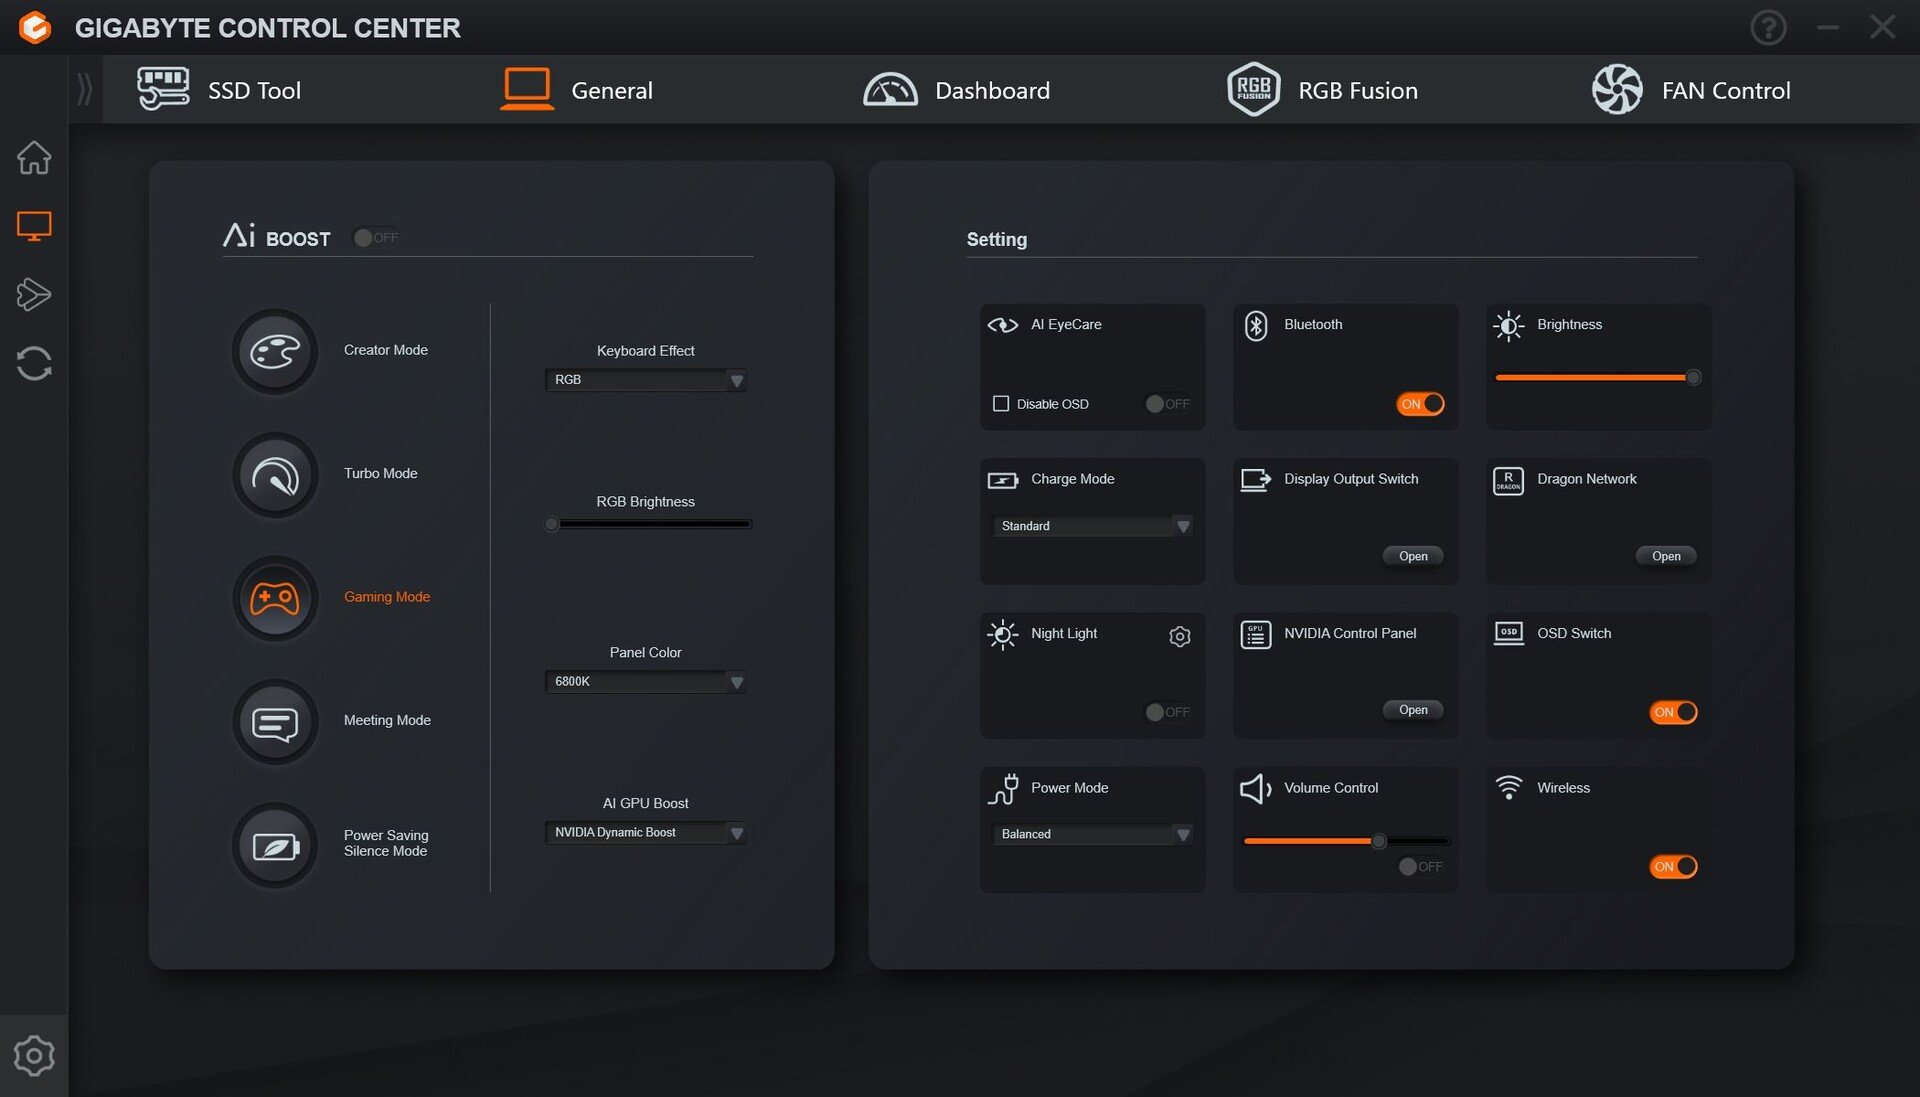
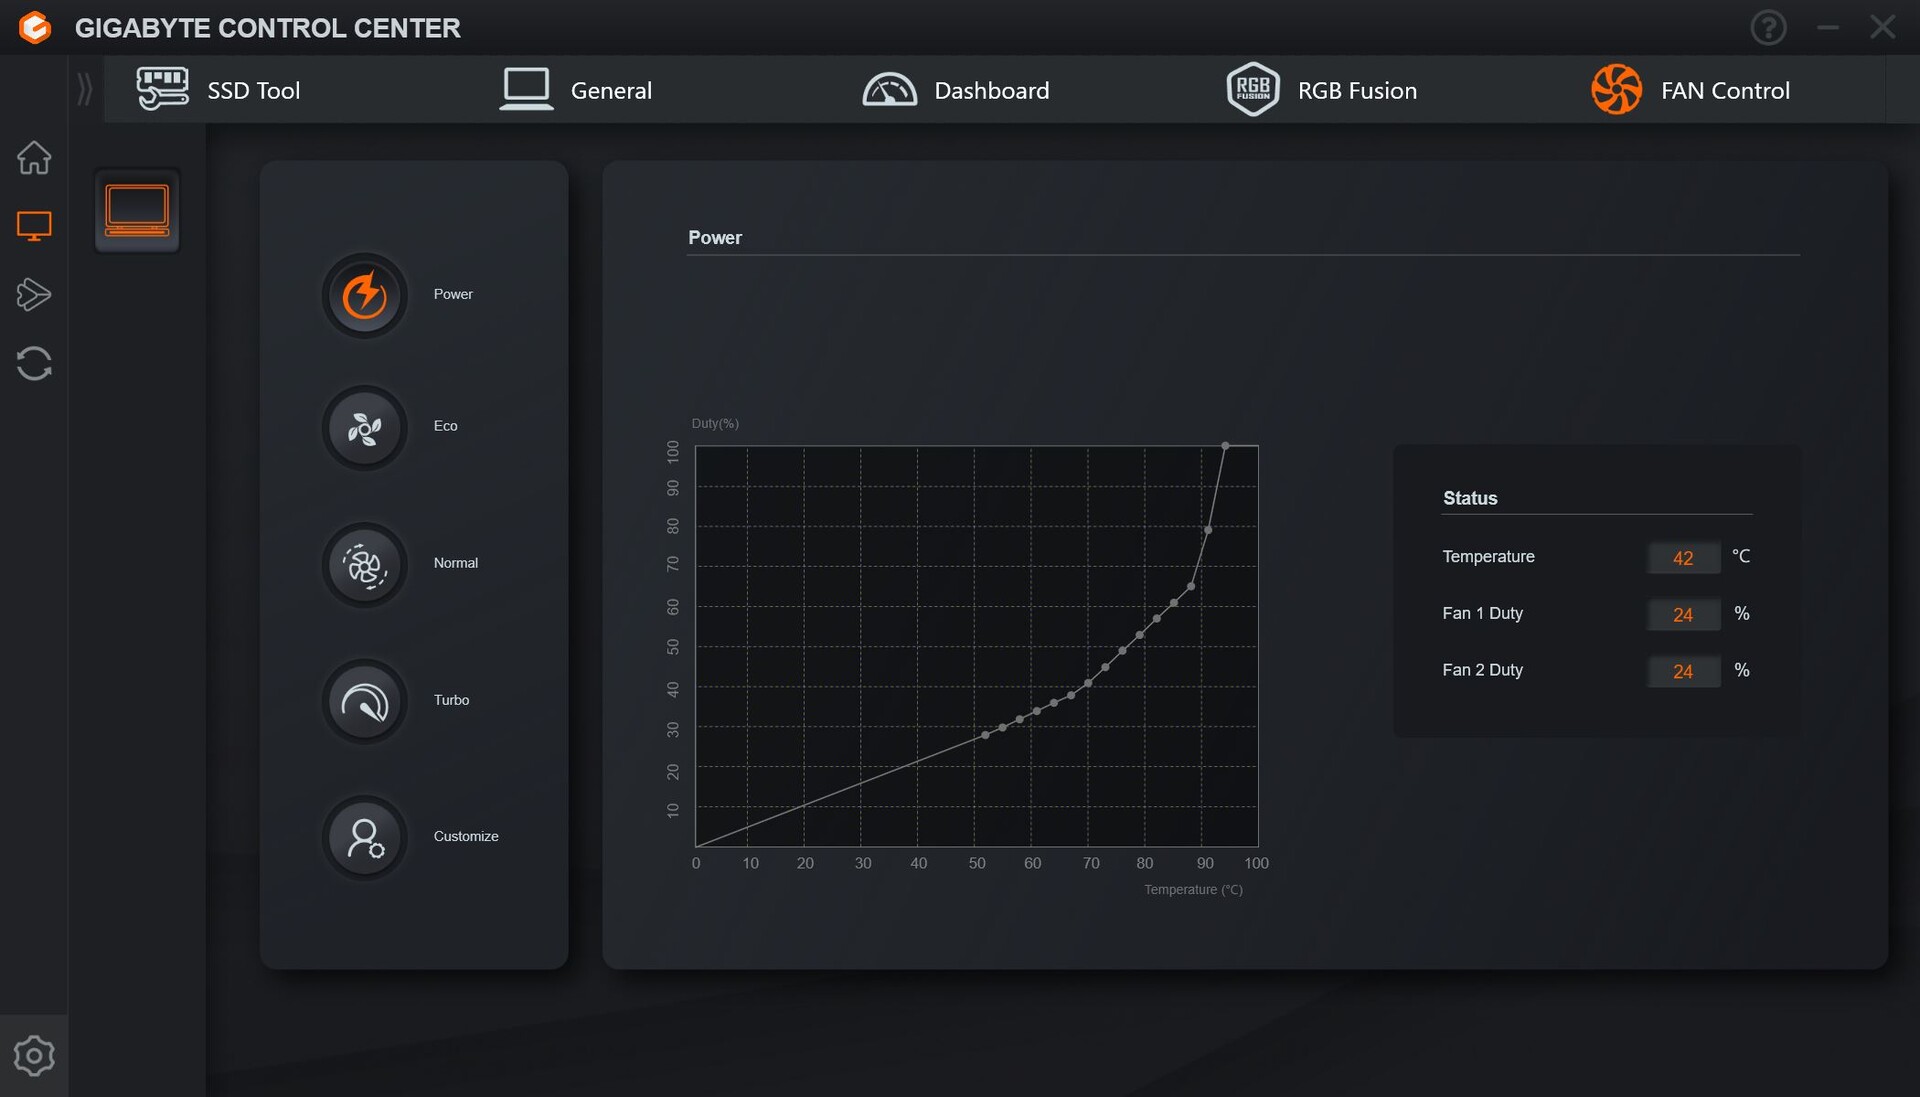
O Gigabyte Control Center contém muitas configurações importantes que controlam o desempenho, a luz de fundo do teclado e o SSD. O menu poderia ser um pouco mais bem estruturado, pois a tela inicial não parece exibir nenhuma informação útil - o senhor deve primeiro selecionar o próprio laptop ou o SSD para obter mais informações. No entanto, o senhor pode fazer o mesmo nos menus relevantes, e é por isso que a tela inicial, em particular, parece sem sentido. Também sentimos falta da opção de alternar as GPUs.
Por outro lado, há modos de desempenho, bem como curvas de ventoinha, um modo de desempenho ajustável separadamente e várias outras opções. Usamos o modo de jogo para nossos benchmarks. Ao usar o modo turbo, ainda mais potente, as ventoinhas sempre funcionam em velocidade máxima.
Uma palavra sobre o modo de espera: Com a Aorus (incluindo o Aorus 15G), parece ser comum que o laptop mude para o modo de espera assim que a tampa do laptop é ligeiramente fechada. Isso é extremamente irritante, por exemplo, se o senhor estiver usando um monitor externo e quiser dobrar um pouco a tampa do laptop para frente. No entanto, o sistema é desligado em cerca de 40 a 45 graus, o que é realmente muito cedo e irrita os senhores. Um laptop só deve ser desligado quando estiver realmente fechado e não na metade do caminho.
Processador
O laptop possui uma CPU Alder Lake - o Core i5-12500H - com 4 núcleos P e 8 E. Isso soma 8 núcleos e 16 threads no total. A antiga CPU de médio porte economizou o dinheiro do fabricante.
Durante o Cinebench R15 Loop, seu desempenho caiu um pouco nas duas primeiras execuções, depois permaneceu estável.
Em todos os testes de CPU, ficou claro que a geração 13 oferece uma vantagem de velocidade significativa (mas não enorme) em relação à geração 12.
O Captiva com um i5-13500H ficou cerca de 13% à frente. Os outros concorrentes com o melhor i7-13700H variaram de apenas 8% a mais (HP Victus) a um notável 22% melhor (Aorus 15 BSF).
| Cinebench R15 | Pontuação multi-thread (1ª execução) | Consumo de energia da CPU em watts |
|---|---|---|
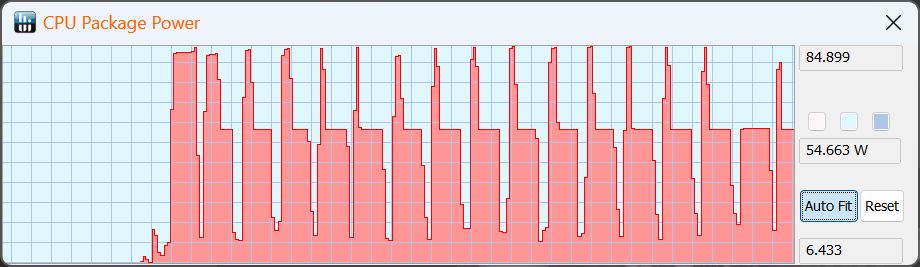
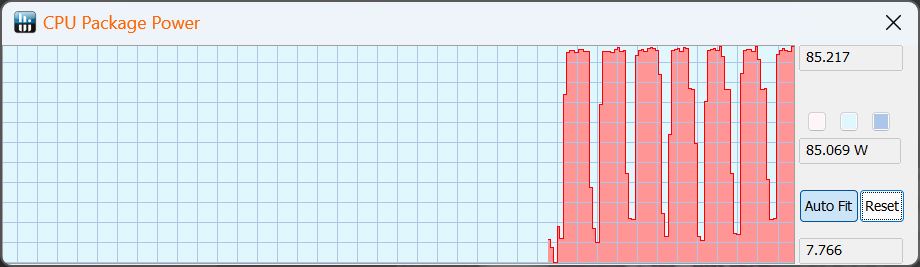
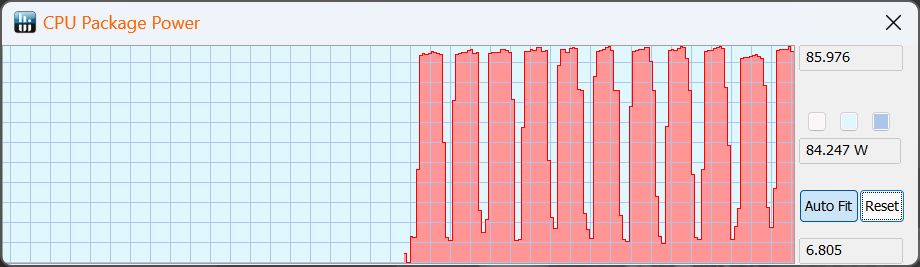
| AI Boost | 2.277 | 85 |
| Turbo | 2.283 | 85 |
| Gaming | 2.283 | 85, cai para 55 |
| Criador | 2.239 | 85 |
| Reunião | 836 | 30, cai rapidamente para 15 |
| Economia de energia | 724 | 30, cai para 15 |
| Bateria | 1.670 | 45 |
Cinebench R15 Multi continuous test
Cinebench R23: Multi Core | Single Core
Cinebench R20: CPU (Multi Core) | CPU (Single Core)
Cinebench R15: CPU Multi 64Bit | CPU Single 64Bit
Blender: v2.79 BMW27 CPU
7-Zip 18.03: 7z b 4 | 7z b 4 -mmt1
Geekbench 5.5: Multi-Core | Single-Core
HWBOT x265 Benchmark v2.2: 4k Preset
LibreOffice : 20 Documents To PDF
R Benchmark 2.5: Overall mean
| CPU Performance rating | |
| Média da turma Gaming | |
| HP Omen 16-wf000 -1! | |
| Aorus 15 BSF | |
| Dell XPS 15 9530 RTX 4070 | |
| Captiva Advanced Gaming I74-121 | |
| HP Victus 16-r0077ng | |
| Aorus 15 YE5-54DEB34SH | |
| Média Intel Core i5-12500H | |
| Cinebench R23 / Multi Core | |
| Média da turma Gaming (10488 - 42661, n=107, últimos 2 anos) | |
| HP Omen 16-wf000 | |
| Aorus 15 BSF | |
| Captiva Advanced Gaming I74-121 | |
| Dell XPS 15 9530 RTX 4070 | |
| HP Victus 16-r0077ng | |
| Aorus 15 YE5-54DEB34SH | |
| Média Intel Core i5-12500H (11330 - 14686, n=9) | |
| Cinebench R23 / Single Core | |
| Média da turma Gaming (1166 - 2415, n=107, últimos 2 anos) | |
| Aorus 15 BSF | |
| HP Omen 16-wf000 | |
| Dell XPS 15 9530 RTX 4070 | |
| Captiva Advanced Gaming I74-121 | |
| Aorus 15 YE5-54DEB34SH | |
| HP Victus 16-r0077ng | |
| Média Intel Core i5-12500H (1558 - 1701, n=9) | |
| Cinebench R20 / CPU (Multi Core) | |
| Média da turma Gaming (4029 - 16433, n=106, últimos 2 anos) | |
| HP Omen 16-wf000 | |
| Aorus 15 BSF | |
| Captiva Advanced Gaming I74-121 | |
| Dell XPS 15 9530 RTX 4070 | |
| HP Victus 16-r0077ng | |
| Média Intel Core i5-12500H (4687 - 5640, n=9) | |
| Aorus 15 YE5-54DEB34SH | |
| Cinebench R20 / CPU (Single Core) | |
| Média da turma Gaming (442 - 913, n=106, últimos 2 anos) | |
| Aorus 15 BSF | |
| HP Omen 16-wf000 | |
| Dell XPS 15 9530 RTX 4070 | |
| Captiva Advanced Gaming I74-121 | |
| Aorus 15 YE5-54DEB34SH | |
| HP Victus 16-r0077ng | |
| Média Intel Core i5-12500H (602 - 656, n=9) | |
| Cinebench R15 / CPU Multi 64Bit | |
| Média da turma Gaming (1578 - 6330, n=105, últimos 2 anos) | |
| HP Omen 16-wf000 | |
| Aorus 15 BSF | |
| Dell XPS 15 9530 RTX 4070 | |
| Captiva Advanced Gaming I74-121 | |
| HP Victus 16-r0077ng | |
| Aorus 15 YE5-54DEB34SH | |
| Média Intel Core i5-12500H (1970 - 2283, n=10) | |
| Cinebench R15 / CPU Single 64Bit | |
| Média da turma Gaming (188.8 - 350, n=106, últimos 2 anos) | |
| Aorus 15 BSF | |
| Dell XPS 15 9530 RTX 4070 | |
| HP Omen 16-wf000 | |
| Captiva Advanced Gaming I74-121 | |
| Aorus 15 YE5-54DEB34SH | |
| HP Victus 16-r0077ng | |
| Média Intel Core i5-12500H (220 - 250, n=9) | |
| Blender / v2.79 BMW27 CPU | |
| Aorus 15 YE5-54DEB34SH | |
| Média Intel Core i5-12500H (223 - 288, n=9) | |
| Aorus 15 BSF | |
| Dell XPS 15 9530 RTX 4070 | |
| HP Victus 16-r0077ng | |
| Captiva Advanced Gaming I74-121 | |
| Média da turma Gaming (79 - 330, n=104, últimos 2 anos) | |
| 7-Zip 18.03 / 7z b 4 | |
| Média da turma Gaming (33491 - 148086, n=105, últimos 2 anos) | |
| HP Omen 16-wf000 | |
| HP Victus 16-r0077ng | |
| Aorus 15 BSF | |
| Dell XPS 15 9530 RTX 4070 | |
| Captiva Advanced Gaming I74-121 | |
| Aorus 15 YE5-54DEB34SH | |
| Média Intel Core i5-12500H (44105 - 54380, n=9) | |
| 7-Zip 18.03 / 7z b 4 -mmt1 | |
| Média da turma Gaming (4199 - 7436, n=105, últimos 2 anos) | |
| Aorus 15 BSF | |
| Dell XPS 15 9530 RTX 4070 | |
| HP Omen 16-wf000 | |
| Captiva Advanced Gaming I74-121 | |
| HP Victus 16-r0077ng | |
| Aorus 15 YE5-54DEB34SH | |
| Média Intel Core i5-12500H (5151 - 5563, n=9) | |
| Geekbench 5.5 / Multi-Core | |
| Média da turma Gaming (6460 - 28263, n=105, últimos 2 anos) | |
| HP Omen 16-wf000 | |
| Aorus 15 BSF | |
| Dell XPS 15 9530 RTX 4070 | |
| HP Victus 16-r0077ng | |
| Aorus 15 YE5-54DEB34SH | |
| Captiva Advanced Gaming I74-121 | |
| Média Intel Core i5-12500H (7962 - 10828, n=9) | |
| Geekbench 5.5 / Single-Core | |
| Média da turma Gaming (986 - 2474, n=105, últimos 2 anos) | |
| Dell XPS 15 9530 RTX 4070 | |
| HP Omen 16-wf000 | |
| Aorus 15 BSF | |
| Captiva Advanced Gaming I74-121 | |
| HP Victus 16-r0077ng | |
| Aorus 15 YE5-54DEB34SH | |
| Média Intel Core i5-12500H (1471 - 1693, n=9) | |
| HWBOT x265 Benchmark v2.2 / 4k Preset | |
| Média da turma Gaming (11.5 - 44.4, n=105, últimos 2 anos) | |
| HP Omen 16-wf000 | |
| Captiva Advanced Gaming I74-121 | |
| Dell XPS 15 9530 RTX 4070 | |
| HP Victus 16-r0077ng | |
| Aorus 15 BSF | |
| Aorus 15 YE5-54DEB34SH | |
| Média Intel Core i5-12500H (12 - 16.6, n=9) | |
| LibreOffice / 20 Documents To PDF | |
| HP Victus 16-r0077ng | |
| Aorus 15 YE5-54DEB34SH | |
| Captiva Advanced Gaming I74-121 | |
| Média da turma Gaming (33.2 - 88.8, n=105, últimos 2 anos) | |
| Média Intel Core i5-12500H (40.1 - 58.5, n=9) | |
| Aorus 15 BSF | |
| HP Omen 16-wf000 | |
| Dell XPS 15 9530 RTX 4070 | |
| R Benchmark 2.5 / Overall mean | |
| Aorus 15 YE5-54DEB34SH | |
| Média Intel Core i5-12500H (0.4748 - 0.535, n=9) | |
| HP Victus 16-r0077ng | |
| Captiva Advanced Gaming I74-121 | |
| HP Omen 16-wf000 | |
| Aorus 15 BSF | |
| Dell XPS 15 9530 RTX 4070 | |
| Média da turma Gaming (0.3439 - 0.759, n=106, últimos 2 anos) | |
* ... menor é melhor
AIDA64: FP32 Ray-Trace | FPU Julia | CPU SHA3 | CPU Queen | FPU SinJulia | FPU Mandel | CPU AES | CPU ZLib | FP64 Ray-Trace | CPU PhotoWorxx
| Performance rating | |
| Média da turma Gaming | |
| Aorus 15 BSF | |
| Captiva Advanced Gaming I74-121 | |
| Dell XPS 15 9530 RTX 4070 | |
| HP Victus 16-r0077ng | |
| Aorus 15 YE5-54DEB34SH | |
| Média Intel Core i5-12500H | |
| AIDA64 / FP32 Ray-Trace | |
| Média da turma Gaming (10227 - 85542, n=105, últimos 2 anos) | |
| Captiva Advanced Gaming I74-121 | |
| HP Victus 16-r0077ng | |
| Dell XPS 15 9530 RTX 4070 | |
| Aorus 15 BSF | |
| Aorus 15 YE5-54DEB34SH | |
| Média Intel Core i5-12500H (6851 - 13947, n=9) | |
| AIDA64 / FPU Julia | |
| Média da turma Gaming (51376 - 238426, n=105, últimos 2 anos) | |
| Captiva Advanced Gaming I74-121 | |
| HP Victus 16-r0077ng | |
| Aorus 15 BSF | |
| Dell XPS 15 9530 RTX 4070 | |
| Aorus 15 YE5-54DEB34SH | |
| Média Intel Core i5-12500H (29874 - 68178, n=9) | |
| AIDA64 / CPU SHA3 | |
| Média da turma Gaming (2180 - 10115, n=105, últimos 2 anos) | |
| Captiva Advanced Gaming I74-121 | |
| HP Victus 16-r0077ng | |
| Aorus 15 BSF | |
| Dell XPS 15 9530 RTX 4070 | |
| Aorus 15 YE5-54DEB34SH | |
| Média Intel Core i5-12500H (2287 - 3337, n=9) | |
| AIDA64 / CPU Queen | |
| Média da turma Gaming (49785 - 173351, n=90, últimos 2 anos) | |
| Aorus 15 BSF | |
| Dell XPS 15 9530 RTX 4070 | |
| HP Victus 16-r0077ng | |
| Captiva Advanced Gaming I74-121 | |
| Aorus 15 YE5-54DEB34SH | |
| Média Intel Core i5-12500H (77935 - 80703, n=9) | |
| AIDA64 / FPU SinJulia | |
| Média da turma Gaming (4424 - 33636, n=105, últimos 2 anos) | |
| Aorus 15 BSF | |
| Dell XPS 15 9530 RTX 4070 | |
| HP Victus 16-r0077ng | |
| Captiva Advanced Gaming I74-121 | |
| Aorus 15 YE5-54DEB34SH | |
| Média Intel Core i5-12500H (6590 - 7431, n=9) | |
| AIDA64 / FPU Mandel | |
| Média da turma Gaming (25115 - 128721, n=105, últimos 2 anos) | |
| Captiva Advanced Gaming I74-121 | |
| HP Victus 16-r0077ng | |
| Dell XPS 15 9530 RTX 4070 | |
| Aorus 15 BSF | |
| Aorus 15 YE5-54DEB34SH | |
| Média Intel Core i5-12500H (18252 - 34041, n=9) | |
| AIDA64 / CPU AES | |
| Captiva Advanced Gaming I74-121 | |
| Aorus 15 BSF | |
| Aorus 15 YE5-54DEB34SH | |
| Média da turma Gaming (39258 - 247074, n=105, últimos 2 anos) | |
| Média Intel Core i5-12500H (50298 - 111567, n=9) | |
| HP Victus 16-r0077ng | |
| Dell XPS 15 9530 RTX 4070 | |
| AIDA64 / CPU ZLib | |
| Média da turma Gaming (574 - 2531, n=105, últimos 2 anos) | |
| Captiva Advanced Gaming I74-121 | |
| HP Victus 16-r0077ng | |
| Aorus 15 YE5-54DEB34SH | |
| Dell XPS 15 9530 RTX 4070 | |
| Aorus 15 BSF | |
| Média Intel Core i5-12500H (746 - 924, n=9) | |
| AIDA64 / FP64 Ray-Trace | |
| Média da turma Gaming (5509 - 45446, n=105, últimos 2 anos) | |
| Captiva Advanced Gaming I74-121 | |
| HP Victus 16-r0077ng | |
| Dell XPS 15 9530 RTX 4070 | |
| Aorus 15 BSF | |
| Aorus 15 YE5-54DEB34SH | |
| Média Intel Core i5-12500H (3848 - 7405, n=9) | |
| AIDA64 / CPU PhotoWorxx | |
| Média da turma Gaming (12271 - 89891, n=105, últimos 2 anos) | |
| Dell XPS 15 9530 RTX 4070 | |
| HP Victus 16-r0077ng | |
| Aorus 15 BSF | |
| Aorus 15 YE5-54DEB34SH | |
| Média Intel Core i5-12500H (13686 - 43813, n=9) | |
| Captiva Advanced Gaming I74-121 | |
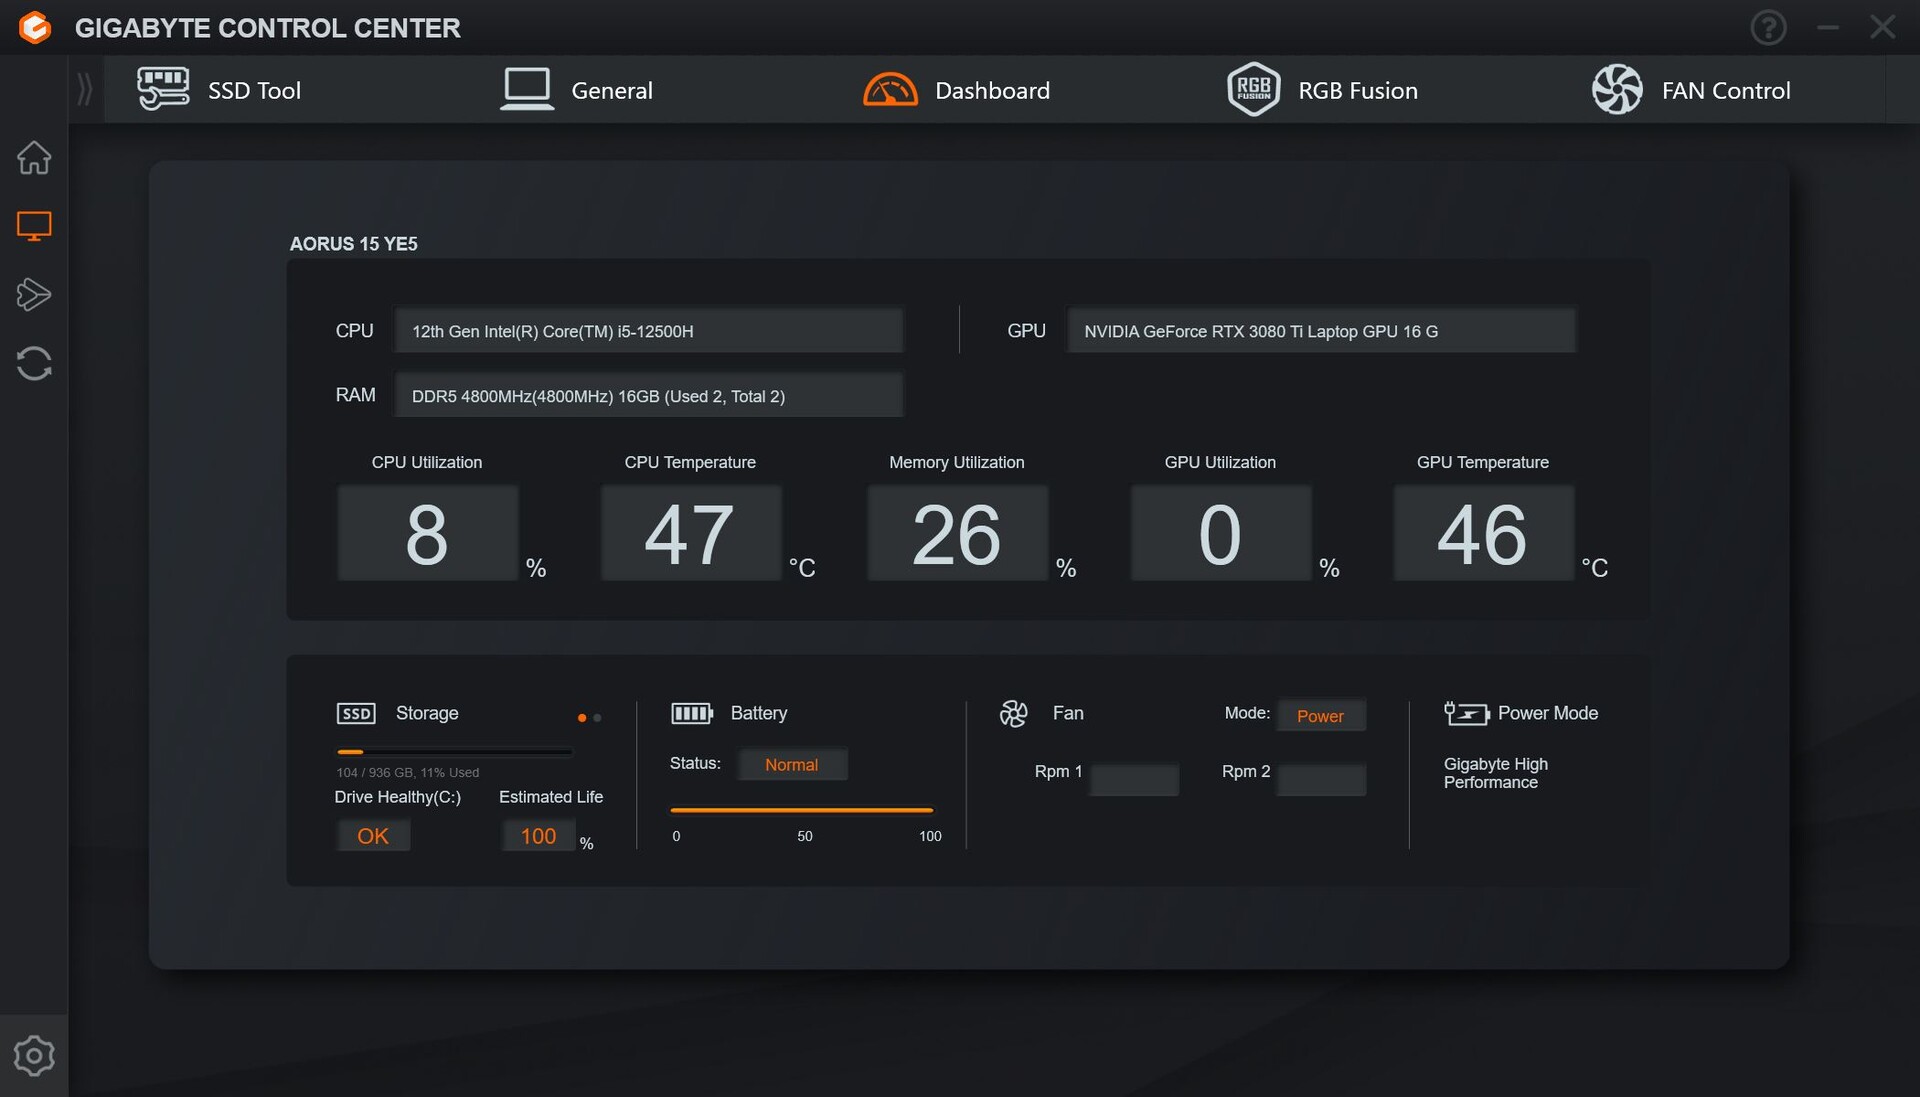
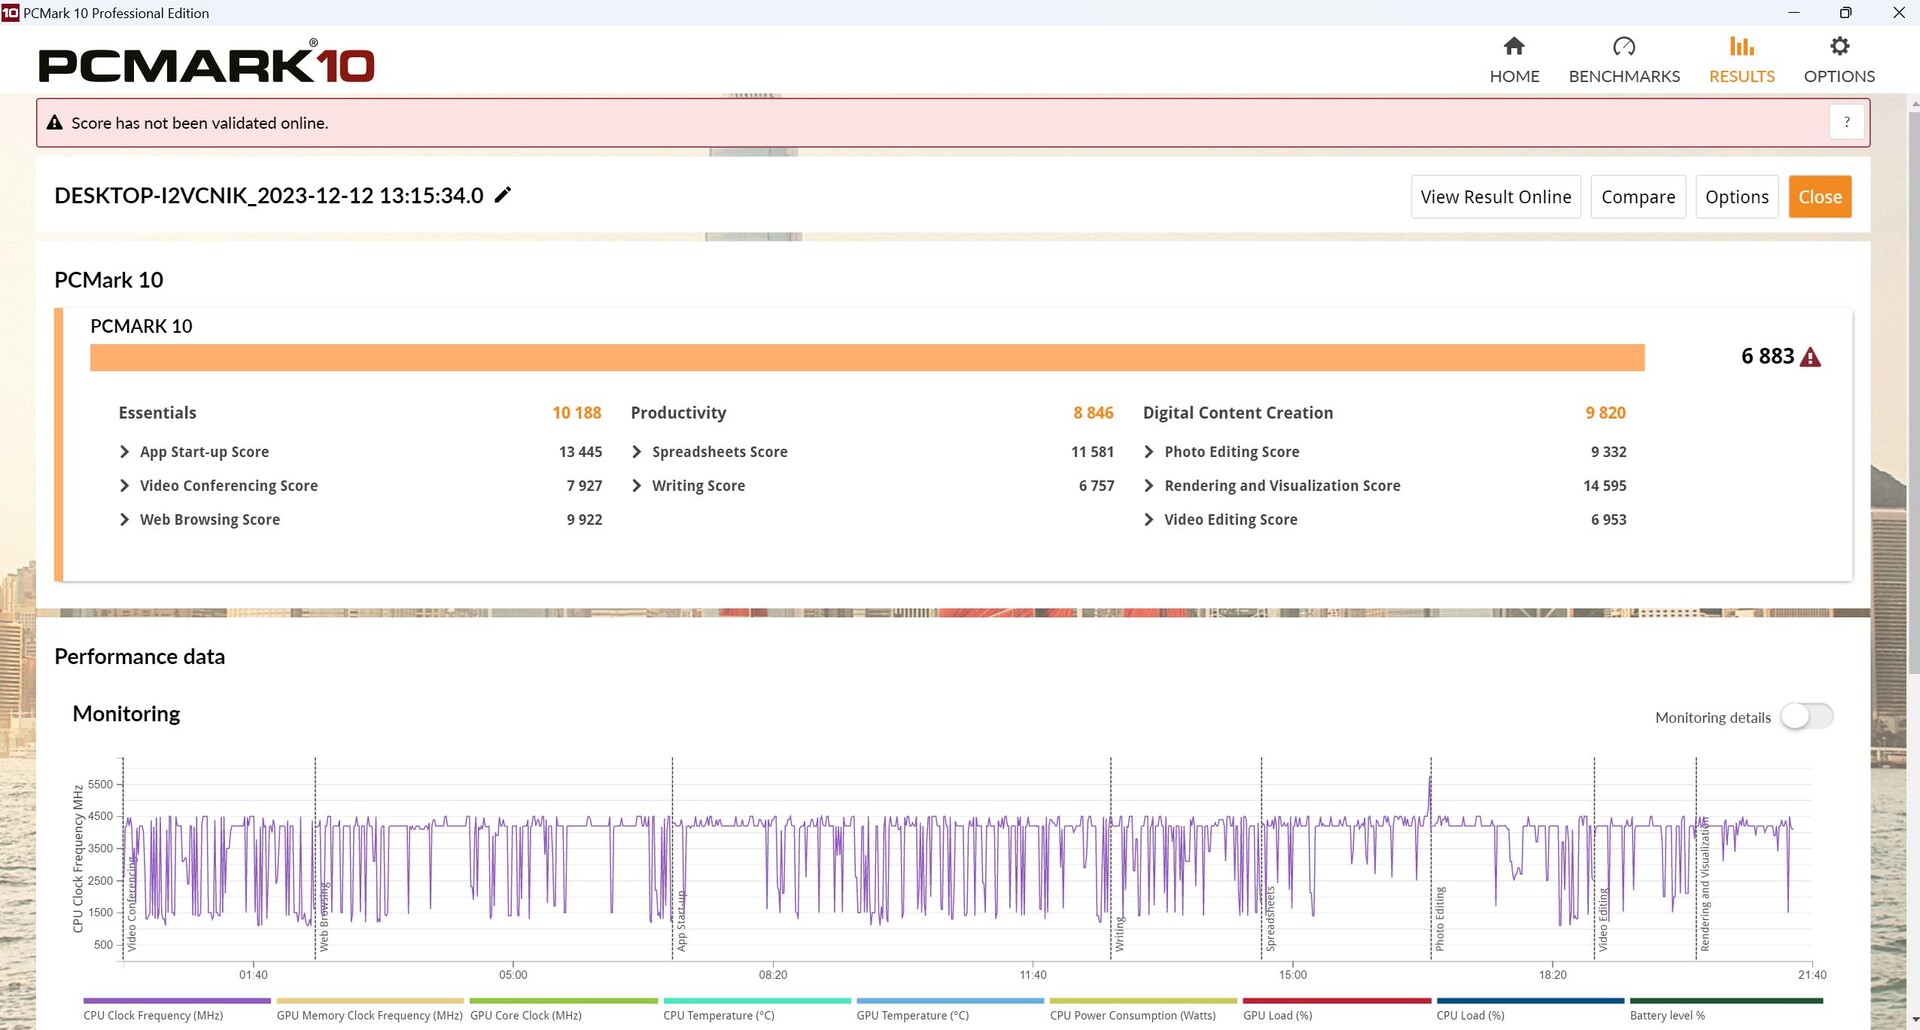
Desempenho do sistema
Durante o PCMark 10, o Captiva com a CPU sucessora ficou cerca de 7% à frente, enquanto os dois dispositivos tiveram o mesmo desempenho durante o CrossMark.
CrossMark: Overall | Productivity | Creativity | Responsiveness
WebXPRT 3: Overall
WebXPRT 4: Overall
Mozilla Kraken 1.1: Total
| PCMark 10 / Score | |
| Média da turma Gaming (5828 - 12414, n=93, últimos 2 anos) | |
| HP Omen 16-wf000 | |
| Captiva Advanced Gaming I74-121 | |
| Aorus 15 BSF | |
| Dell XPS 15 9530 RTX 4070 | |
| HP Victus 16-r0077ng | |
| Aorus 15 YE5-54DEB34SH | |
| Média Intel Core i5-12500H, NVIDIA GeForce RTX 3080 Ti Laptop GPU (n=1) | |
| PCMark 10 / Essentials | |
| Captiva Advanced Gaming I74-121 | |
| Dell XPS 15 9530 RTX 4070 | |
| Aorus 15 BSF | |
| HP Victus 16-r0077ng | |
| Média da turma Gaming (8810 - 11935, n=97, últimos 2 anos) | |
| HP Omen 16-wf000 | |
| Aorus 15 YE5-54DEB34SH | |
| Média Intel Core i5-12500H, NVIDIA GeForce RTX 3080 Ti Laptop GPU (n=1) | |
| PCMark 10 / Productivity | |
| Média da turma Gaming (6845 - 25323, n=95, últimos 2 anos) | |
| HP Omen 16-wf000 | |
| Captiva Advanced Gaming I74-121 | |
| Aorus 15 BSF | |
| HP Victus 16-r0077ng | |
| Aorus 15 YE5-54DEB34SH | |
| Média Intel Core i5-12500H, NVIDIA GeForce RTX 3080 Ti Laptop GPU (n=1) | |
| Dell XPS 15 9530 RTX 4070 | |
| PCMark 10 / Digital Content Creation | |
| Média da turma Gaming (7602 - 19954, n=95, últimos 2 anos) | |
| HP Omen 16-wf000 | |
| Aorus 15 BSF | |
| Dell XPS 15 9530 RTX 4070 | |
| Captiva Advanced Gaming I74-121 | |
| HP Victus 16-r0077ng | |
| Aorus 15 YE5-54DEB34SH | |
| Média Intel Core i5-12500H, NVIDIA GeForce RTX 3080 Ti Laptop GPU (n=1) | |
| CrossMark / Overall | |
| Aorus 15 BSF | |
| Média da turma Gaming (1366 - 2409, n=94, últimos 2 anos) | |
| Dell XPS 15 9530 RTX 4070 | |
| HP Omen 16-wf000 | |
| Captiva Advanced Gaming I74-121 | |
| Aorus 15 YE5-54DEB34SH | |
| Média Intel Core i5-12500H, NVIDIA GeForce RTX 3080 Ti Laptop GPU (n=1) | |
| CrossMark / Productivity | |
| Aorus 15 BSF | |
| Média da turma Gaming (1386 - 2254, n=94, últimos 2 anos) | |
| Dell XPS 15 9530 RTX 4070 | |
| Captiva Advanced Gaming I74-121 | |
| Aorus 15 YE5-54DEB34SH | |
| Média Intel Core i5-12500H, NVIDIA GeForce RTX 3080 Ti Laptop GPU (n=1) | |
| HP Omen 16-wf000 | |
| CrossMark / Creativity | |
| Média da turma Gaming (1343 - 2786, n=94, últimos 2 anos) | |
| Dell XPS 15 9530 RTX 4070 | |
| Aorus 15 BSF | |
| HP Omen 16-wf000 | |
| Aorus 15 YE5-54DEB34SH | |
| Média Intel Core i5-12500H, NVIDIA GeForce RTX 3080 Ti Laptop GPU (n=1) | |
| Captiva Advanced Gaming I74-121 | |
| CrossMark / Responsiveness | |
| Aorus 15 BSF | |
| Média da turma Gaming (1226 - 2334, n=94, últimos 2 anos) | |
| Dell XPS 15 9530 RTX 4070 | |
| Captiva Advanced Gaming I74-121 | |
| Aorus 15 YE5-54DEB34SH | |
| Média Intel Core i5-12500H, NVIDIA GeForce RTX 3080 Ti Laptop GPU (n=1) | |
| HP Omen 16-wf000 | |
| WebXPRT 3 / Overall | |
| Dell XPS 15 9530 RTX 4070 | |
| Média da turma Gaming (220 - 532, n=98, últimos 2 anos) | |
| Aorus 15 BSF | |
| HP Omen 16-wf000 | |
| HP Victus 16-r0077ng | |
| HP Victus 16-r0077ng | |
| Captiva Advanced Gaming I74-121 | |
| Captiva Advanced Gaming I74-121 | |
| Aorus 15 YE5-54DEB34SH | |
| Média Intel Core i5-12500H, NVIDIA GeForce RTX 3080 Ti Laptop GPU (n=1) | |
| WebXPRT 4 / Overall | |
| Média da turma Gaming (165 - 354, n=98, últimos 2 anos) | |
| Dell XPS 15 9530 RTX 4070 | |
| Aorus 15 BSF | |
| HP Omen 16-wf000 | |
| HP Victus 16-r0077ng | |
| HP Victus 16-r0077ng | |
| Aorus 15 YE5-54DEB34SH | |
| Média Intel Core i5-12500H, NVIDIA GeForce RTX 3080 Ti Laptop GPU (n=1) | |
| Captiva Advanced Gaming I74-121 | |
| Captiva Advanced Gaming I74-121 | |
| Mozilla Kraken 1.1 / Total | |
| Aorus 15 YE5-54DEB34SH | |
| Média Intel Core i5-12500H, NVIDIA GeForce RTX 3080 Ti Laptop GPU (n=1) | |
| HP Victus 16-r0077ng | |
| HP Victus 16-r0077ng | |
| Captiva Advanced Gaming I74-121 | |
| Captiva Advanced Gaming I74-121 | |
| HP Omen 16-wf000 | |
| Dell XPS 15 9530 RTX 4070 | |
| Aorus 15 BSF | |
| Média da turma Gaming (391 - 590, n=100, últimos 2 anos) | |
* ... menor é melhor
| PCMark 10 Score | 6883 pontos | |
Ajuda | ||
| AIDA64 / Memory Copy | |
| Média da turma Gaming (21750 - 129946, n=105, últimos 2 anos) | |
| Dell XPS 15 9530 RTX 4070 | |
| HP Victus 16-r0077ng | |
| Aorus 15 BSF | |
| Aorus 15 YE5-54DEB34SH | |
| Média Intel Core i5-12500H (23850 - 66598, n=9) | |
| Captiva Advanced Gaming I74-121 | |
| AIDA64 / Memory Read | |
| Média da turma Gaming (22956 - 118858, n=105, últimos 2 anos) | |
| Dell XPS 15 9530 RTX 4070 | |
| HP Victus 16-r0077ng | |
| Aorus 15 BSF | |
| Aorus 15 YE5-54DEB34SH | |
| Média Intel Core i5-12500H (24879 - 68013, n=9) | |
| Captiva Advanced Gaming I74-121 | |
| AIDA64 / Memory Write | |
| Aorus 15 BSF | |
| Média da turma Gaming (22297 - 135096, n=105, últimos 2 anos) | |
| Dell XPS 15 9530 RTX 4070 | |
| HP Victus 16-r0077ng | |
| Aorus 15 YE5-54DEB34SH | |
| Média Intel Core i5-12500H (23543 - 58797, n=9) | |
| Captiva Advanced Gaming I74-121 | |
| AIDA64 / Memory Latency | |
| Média da turma Gaming (75.3 - 259, n=105, últimos 2 anos) | |
| Aorus 15 YE5-54DEB34SH | |
| Média Intel Core i5-12500H (83.8 - 114.7, n=9) | |
| HP Victus 16-r0077ng | |
| Aorus 15 BSF | |
| Dell XPS 15 9530 RTX 4070 | |
| Captiva Advanced Gaming I74-121 | |
* ... menor é melhor
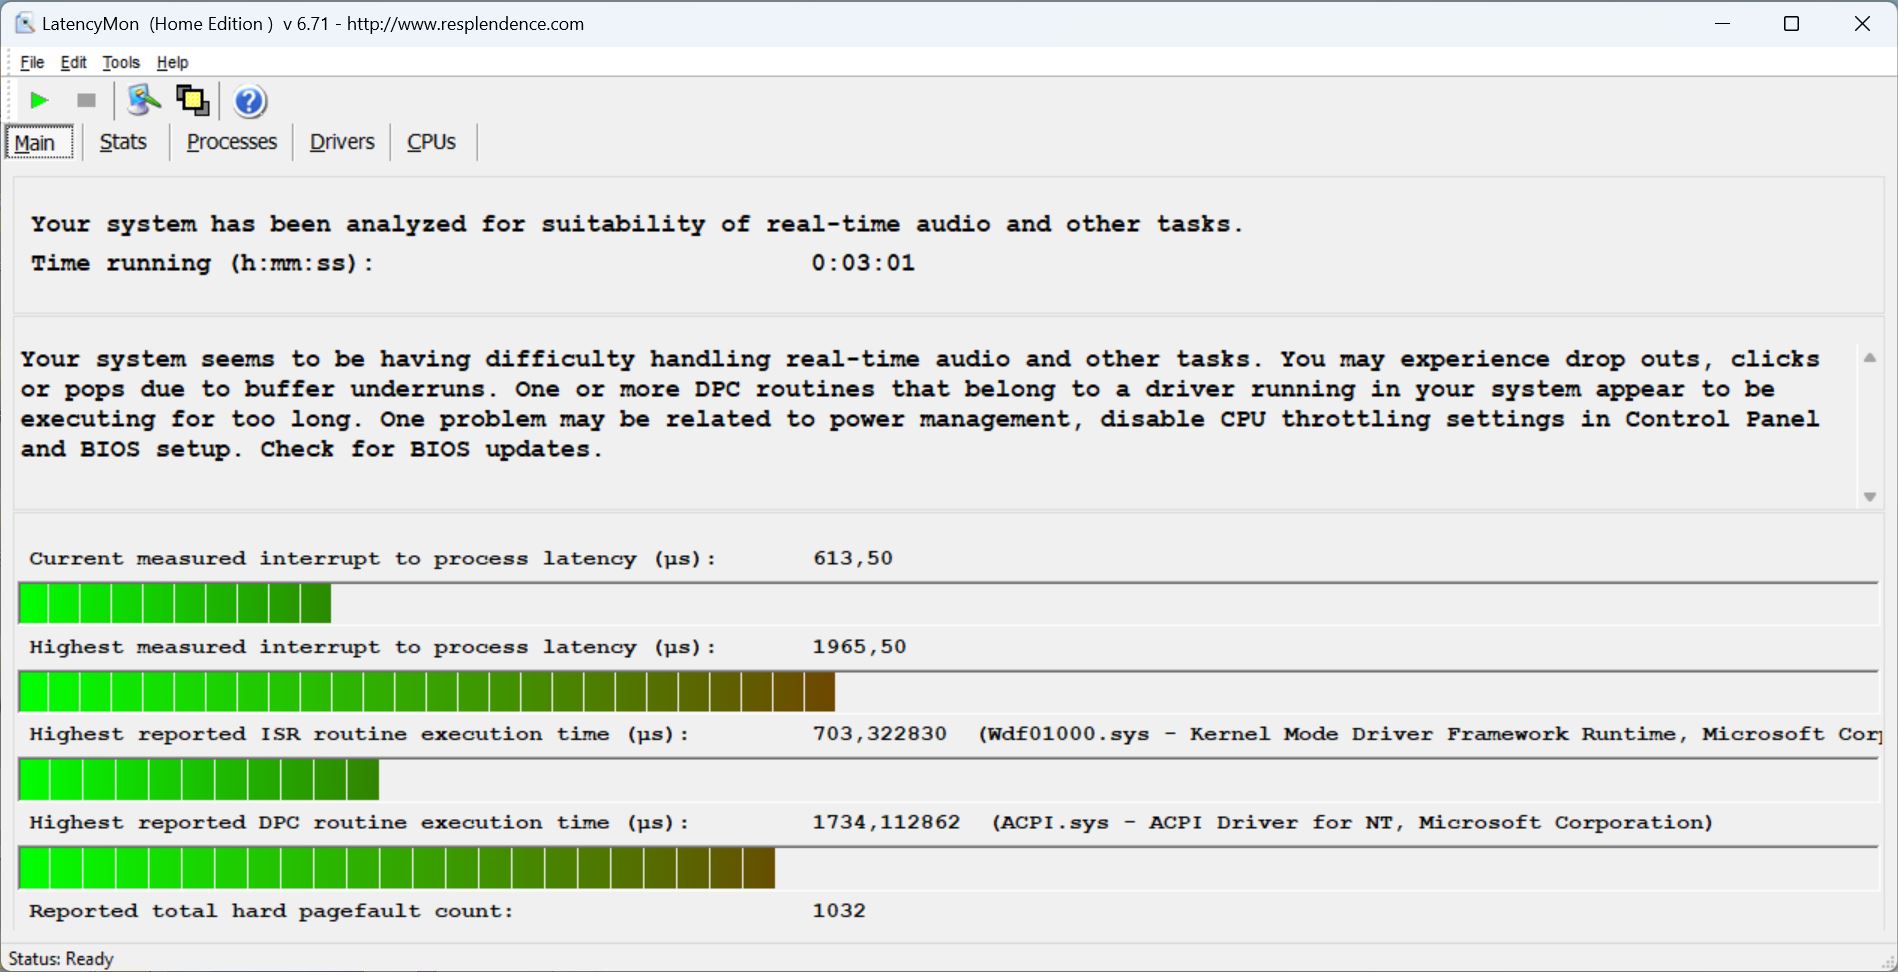
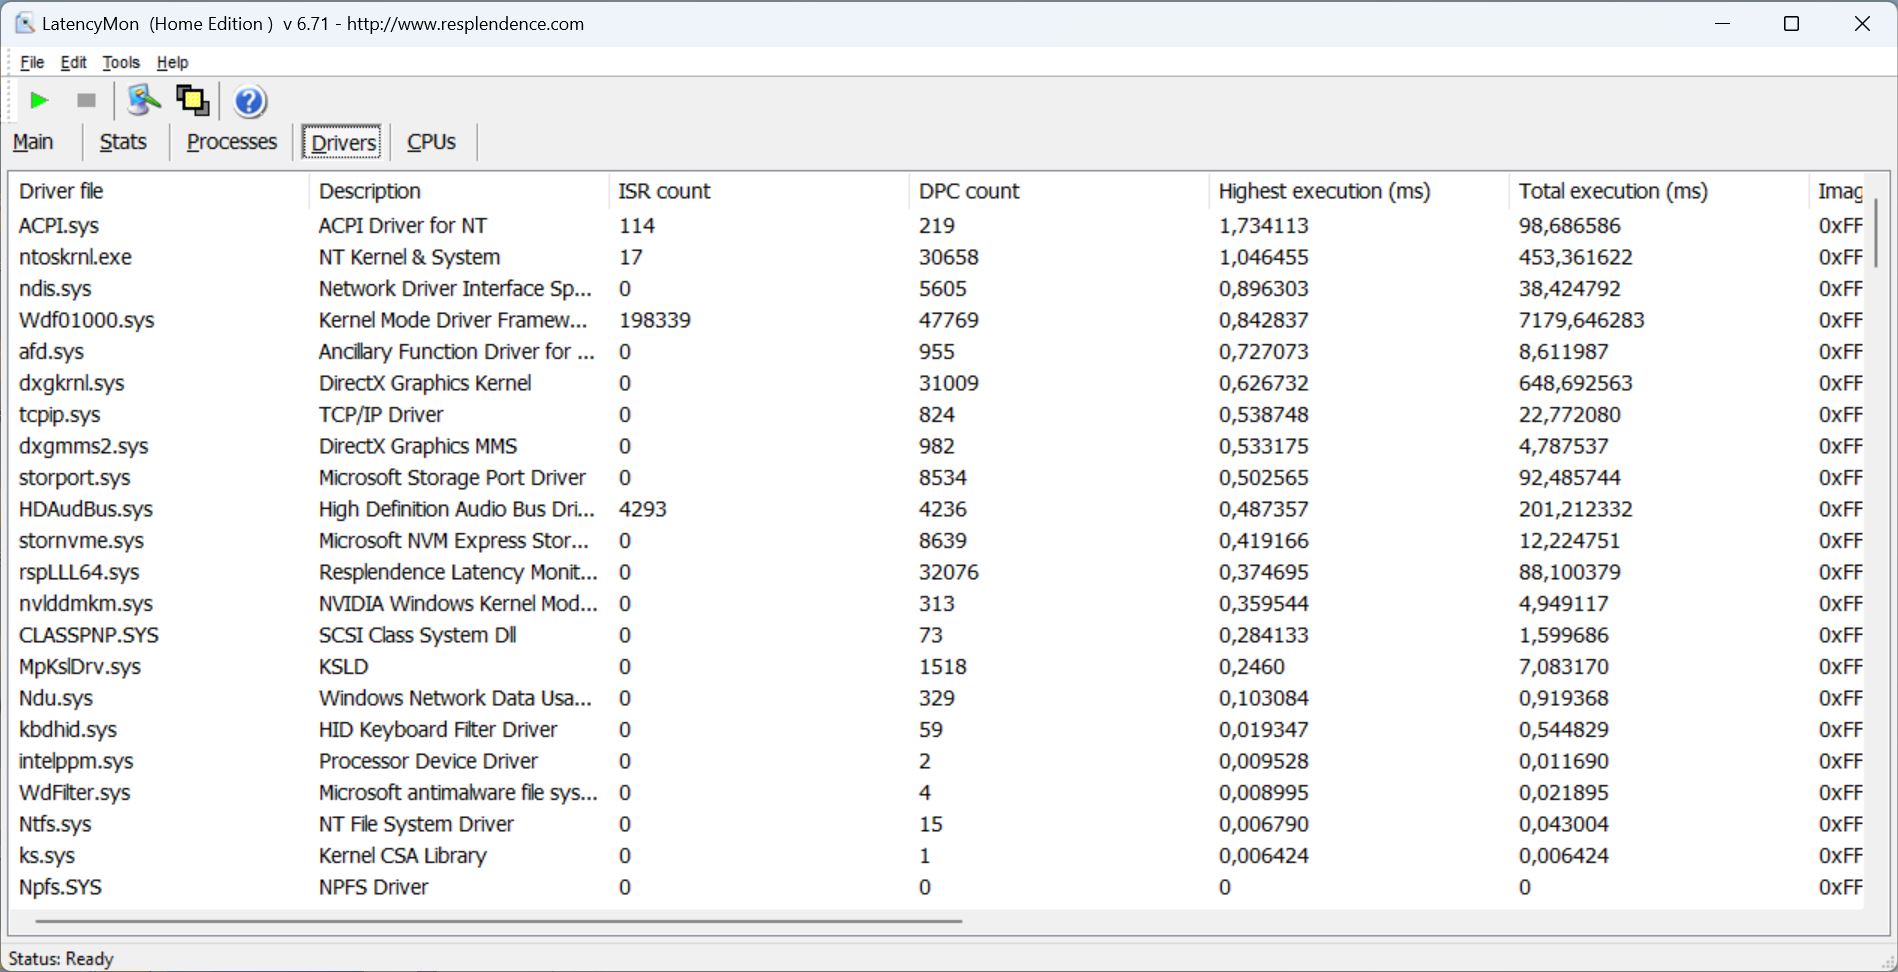
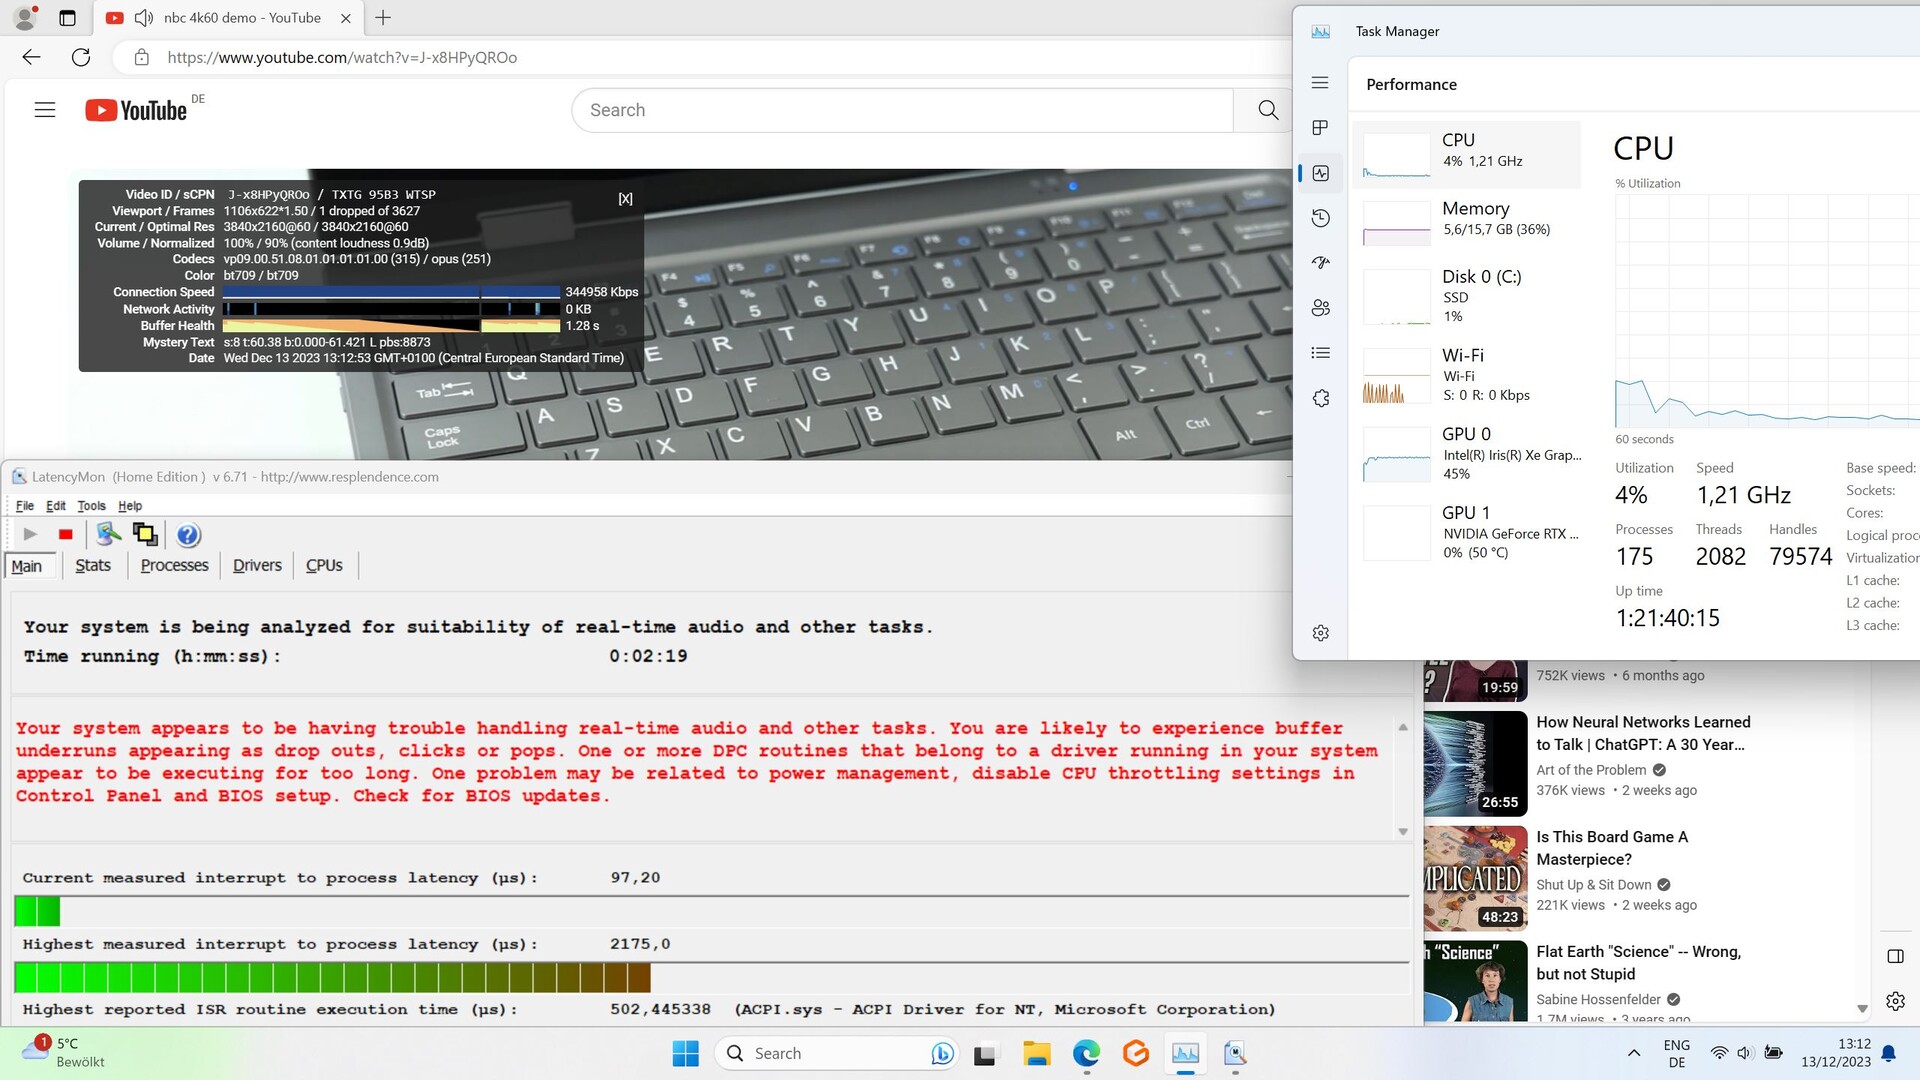
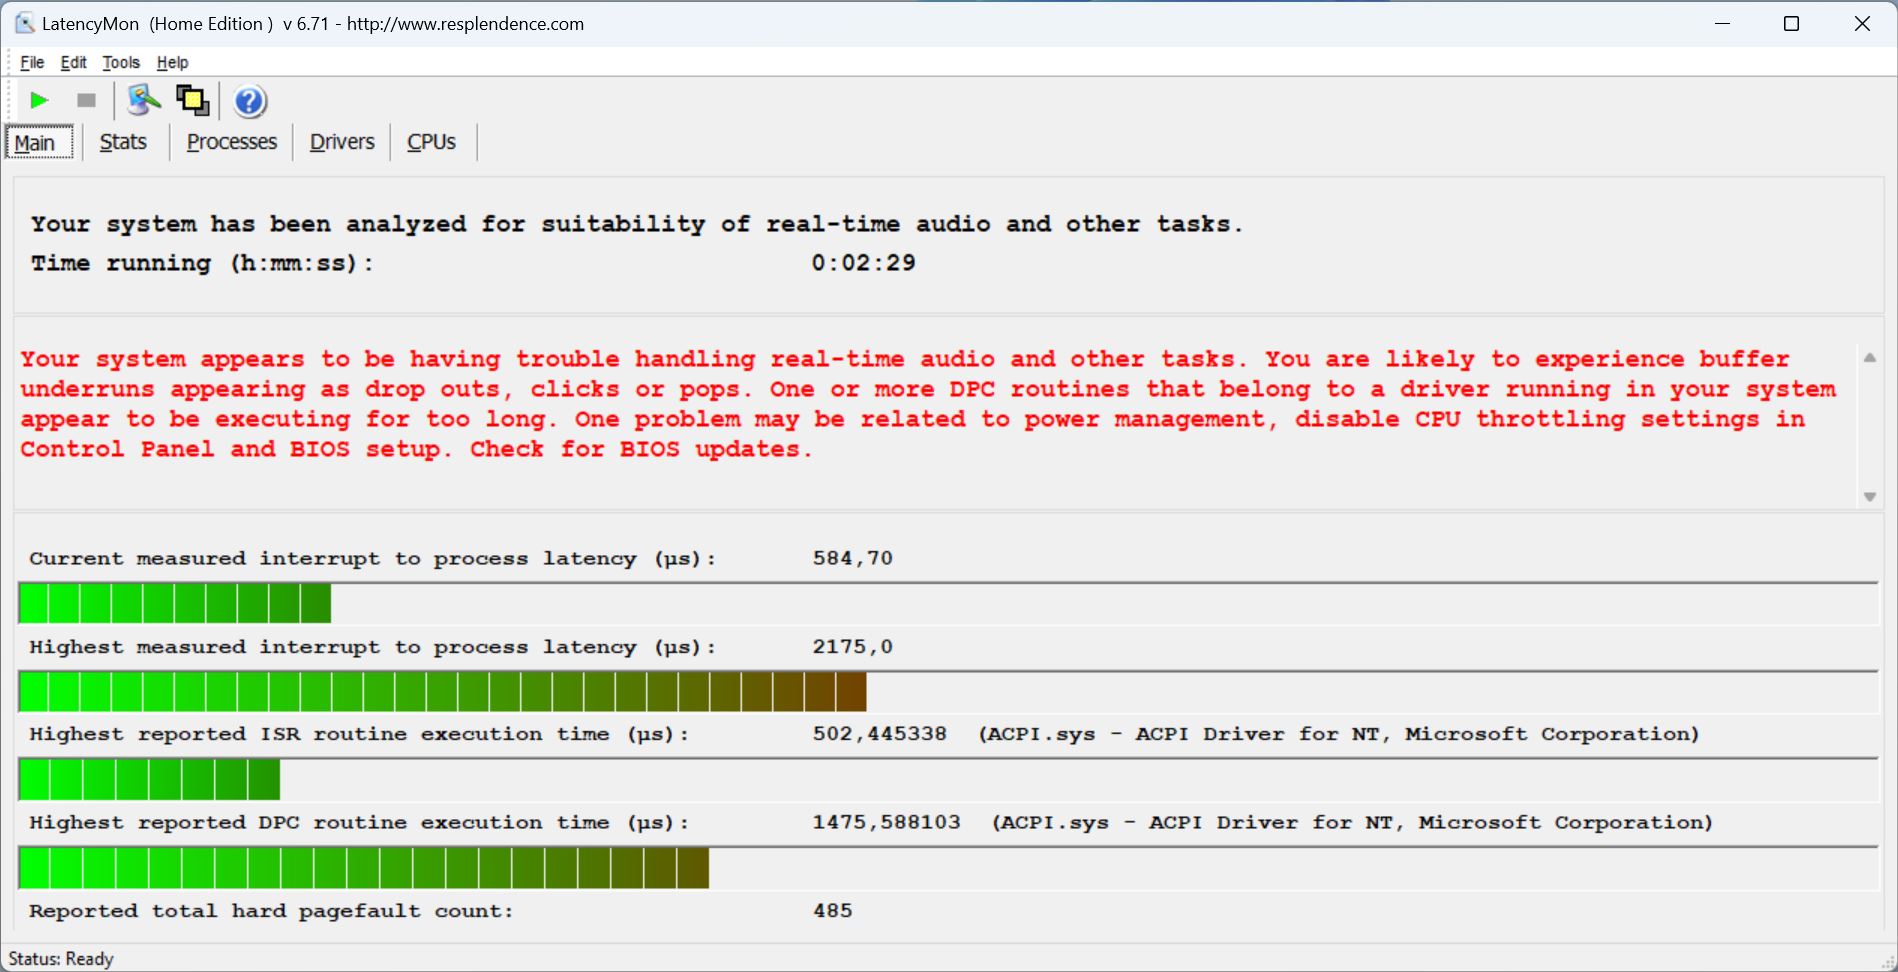
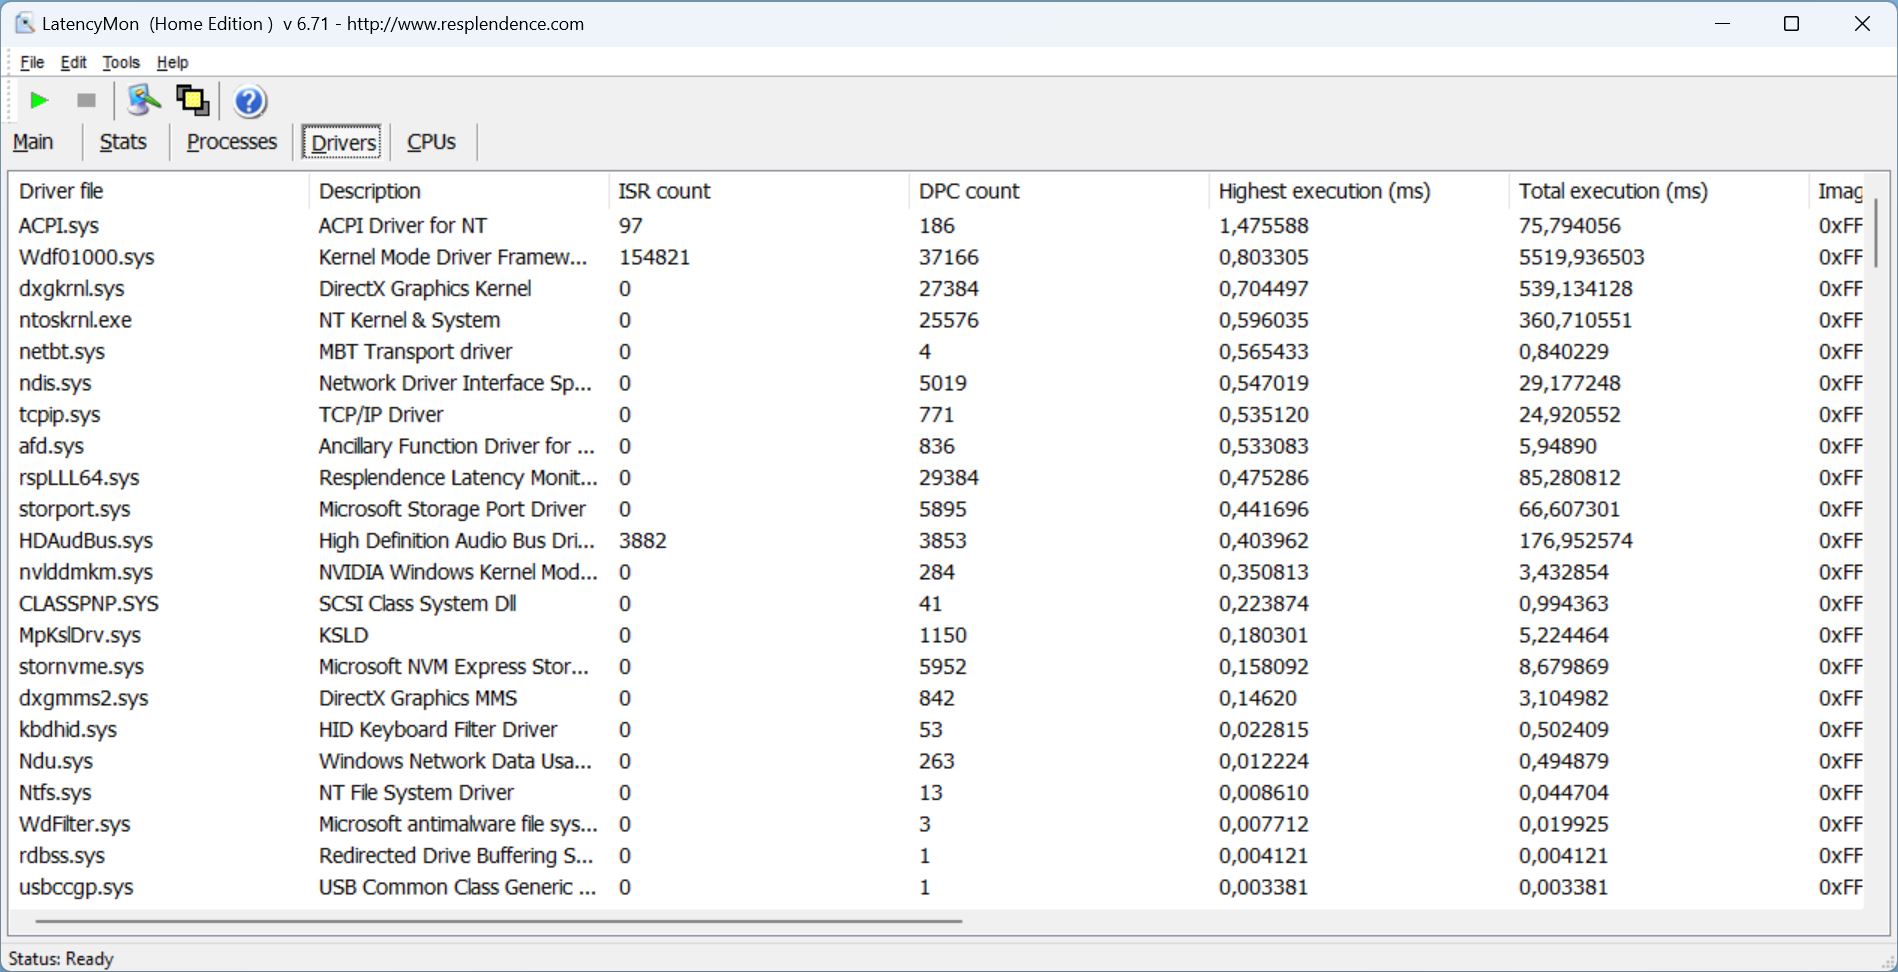
Latência DPC
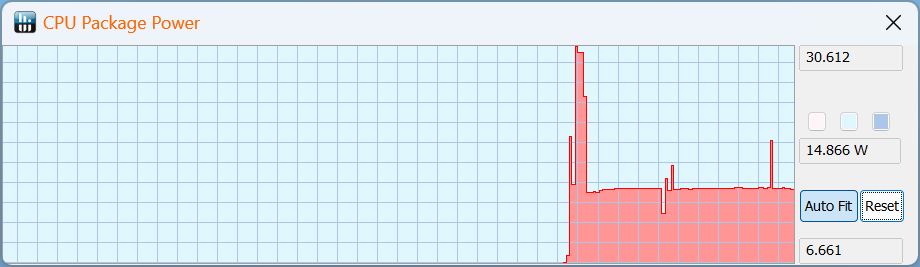
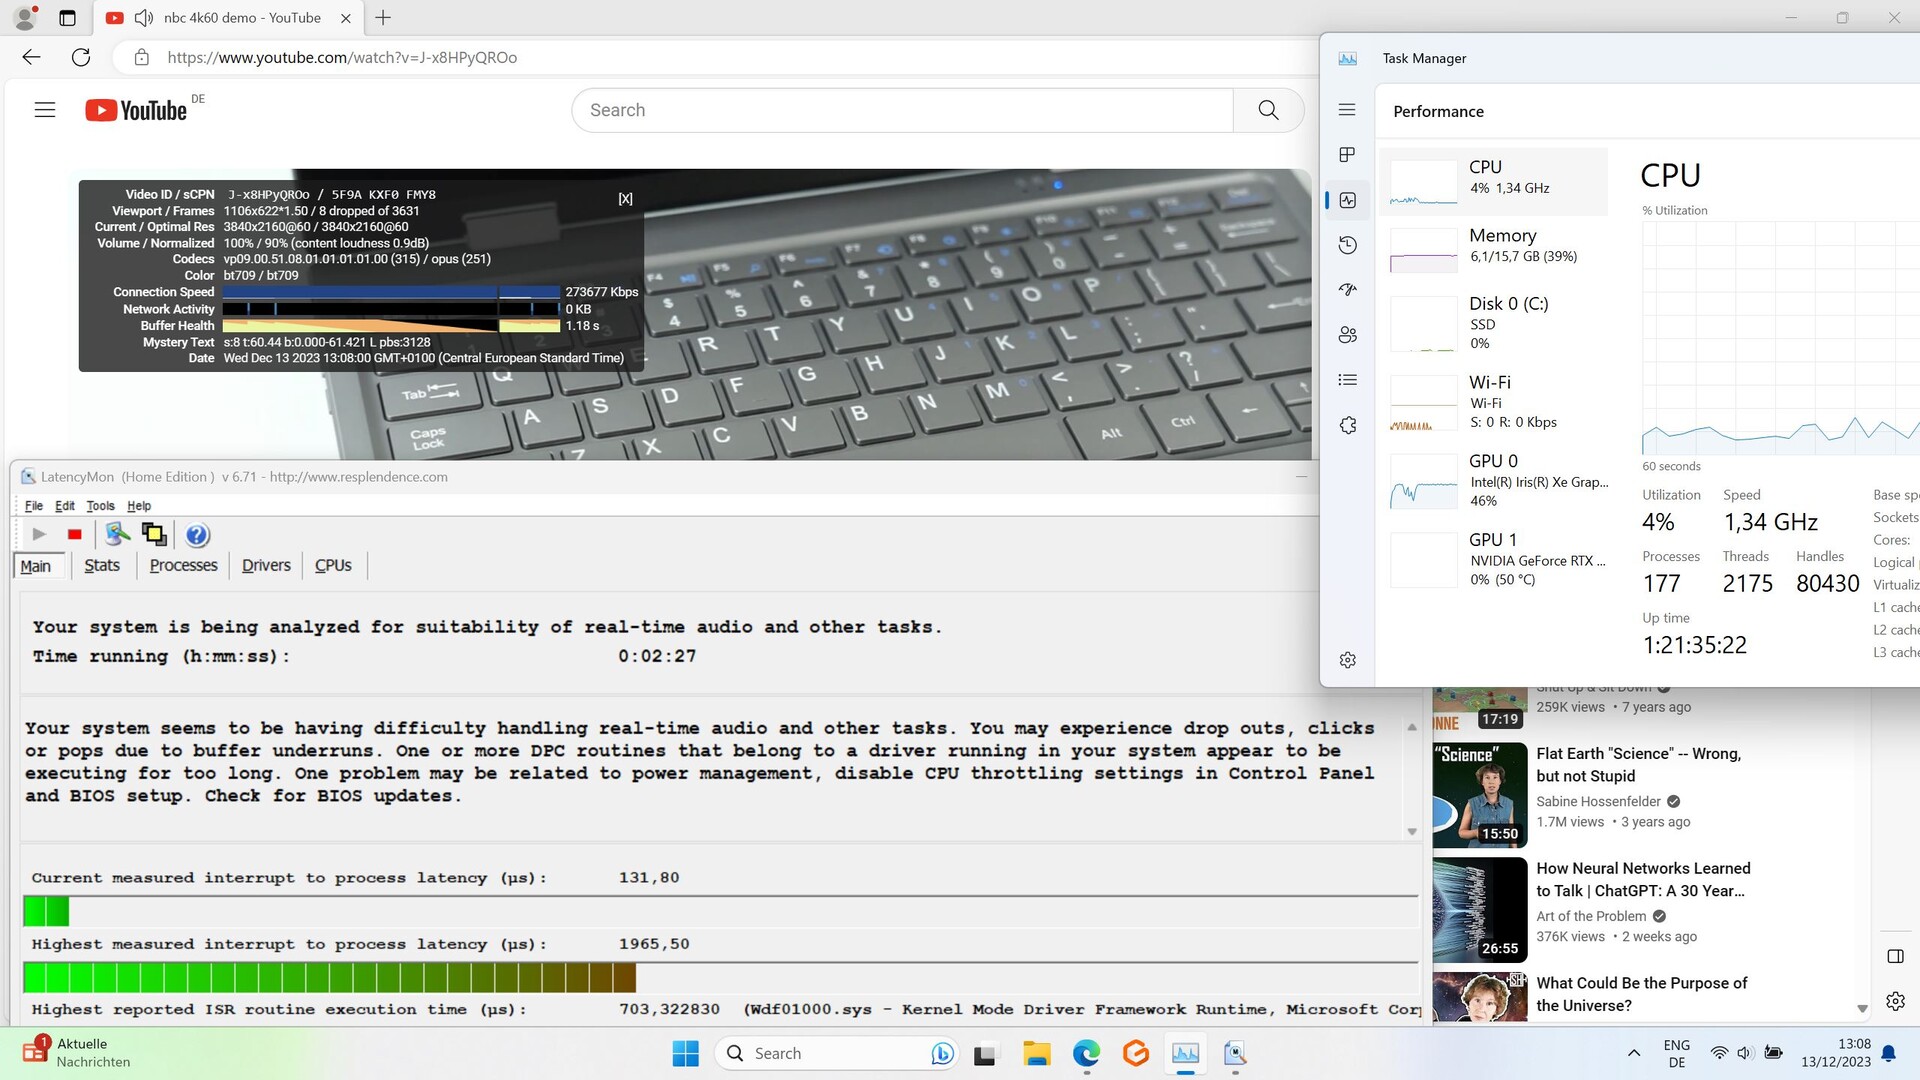
Como o Control Center não oferece um modo equilibrado, testamos o laptop usando os modos de reunião e de criador. O primeiro mostrou alguns problemas de latência ao abrir várias guias do navegador, que se tornaram ainda maiores durante o vídeo do YouTube em 4K/60 fps, resultando em oito quadros perdidos.
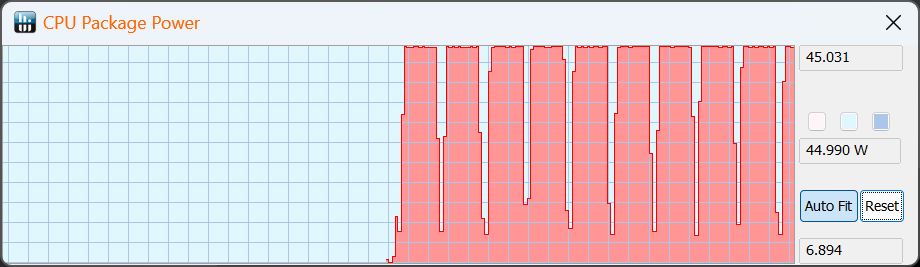
Se o senhor acha que isso pode mudar com o uso do modo de criador mais potente, infelizmente está enganado. Já notamos o aumento das latências ao abrir o navegador. Por outro lado, o vídeo foi executado com apenas um quadro perdido.
| DPC Latencies / LatencyMon - interrupt to process latency (max), Web, Youtube, Prime95 | |
| HP Omen 16-wf000 | |
| Aorus 15 YE5-54DEB34SH | |
| HP Victus 16-r0077ng | |
| Aorus 15 BSF | |
| Dell XPS 15 9530 RTX 4070 | |
| Captiva Advanced Gaming I74-121 | |
* ... menor é melhor
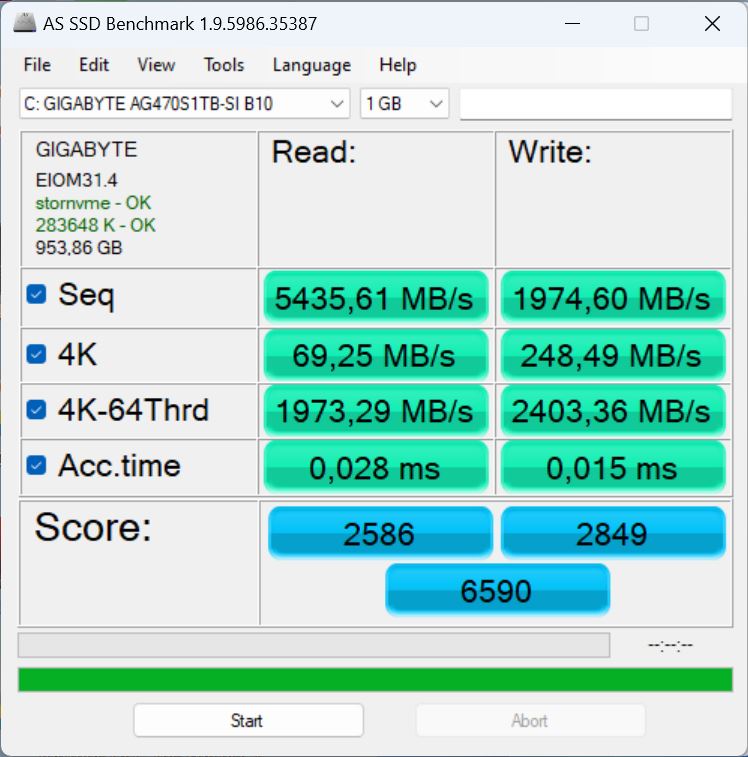
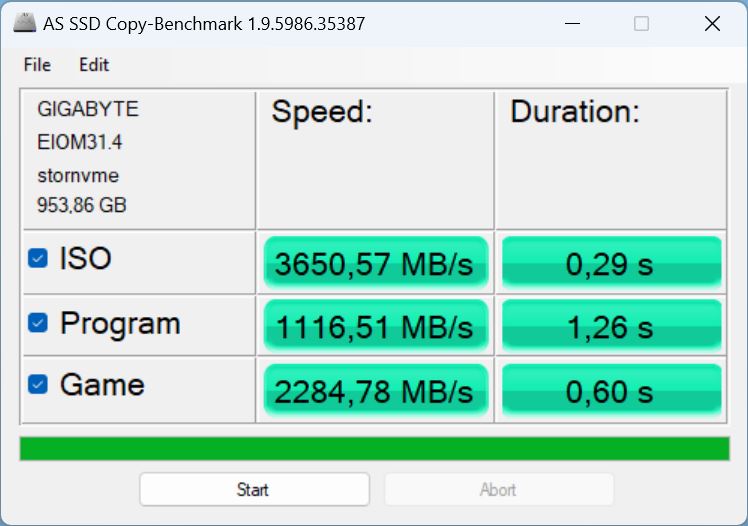
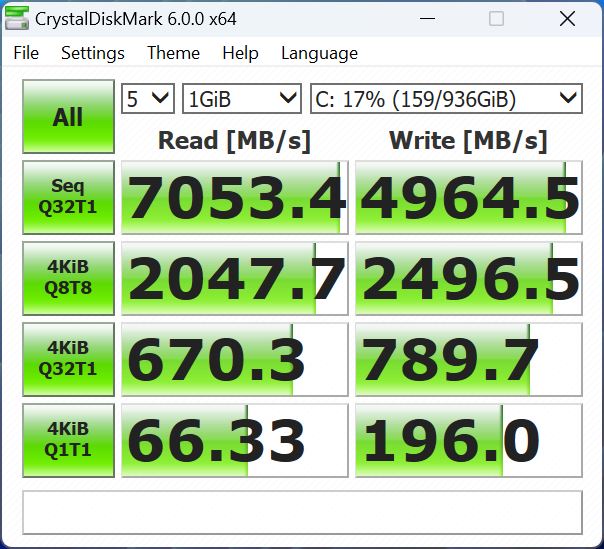
Dispositivos de armazenamento
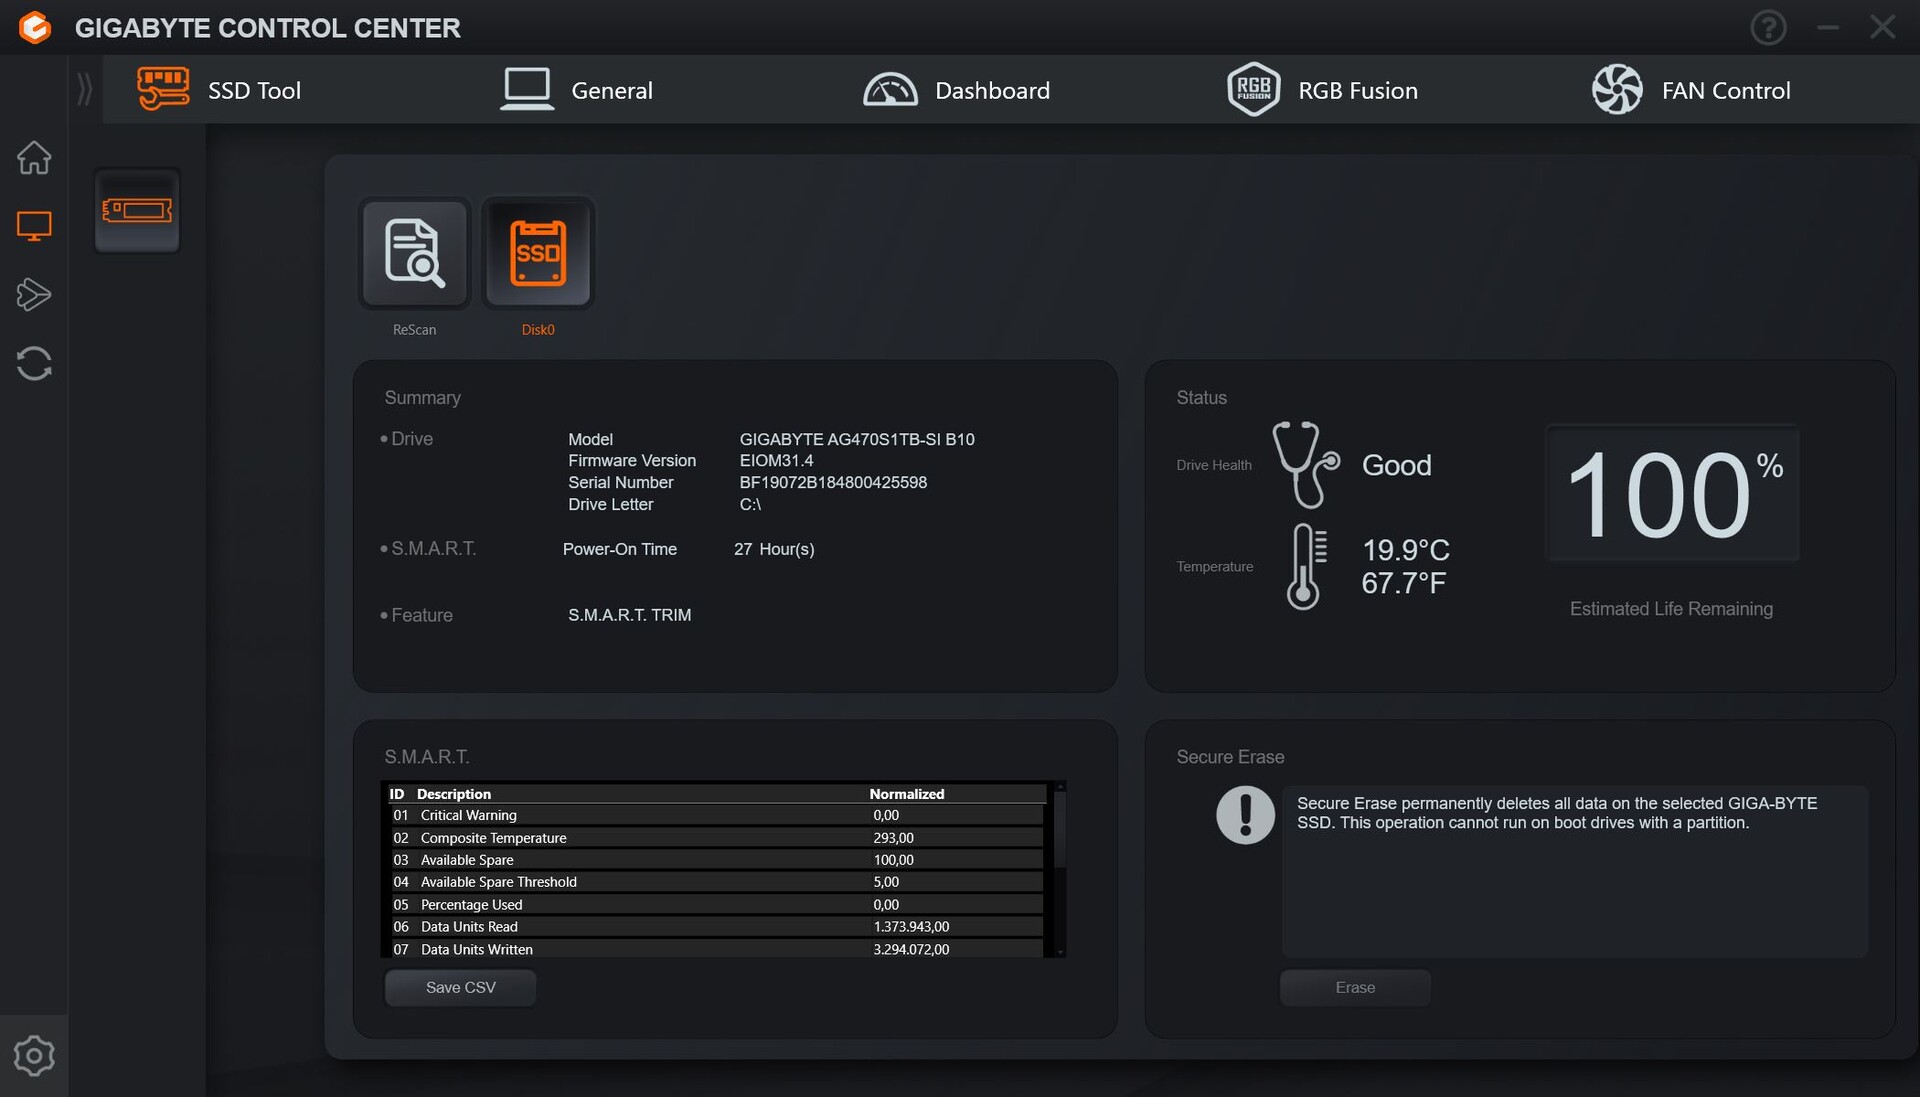
O Gigabyte AG470S1TB-SI B10 com armazenamento de 1 TB instalado é um SSD PCIe Gen 4 NVMe rápido e de alta qualidade. Em nossa Lista dos melhores SSDsele ocupa atualmente a posição 3, o que é excelente.
No Aorus 15 YE5, ele pode não conseguir usar todo o seu potencial (ficando 12% atrás do modelo de referência), mas ainda é mais rápido do que os SSDs dos concorrentes. A única exceção é a atual geração do Aorus 15. Ele usa a mesma SSD, mas é 28% mais rápido. Mesmo assim, o desempenho da nossa amostra de teste ainda é excelente e, acima de tudo, permaneceu constante e não apresentou problemas de estrangulamento durante o uso contínuo.

* ... menor é melhor
Reading continuous performance: DiskSpd Read Loop, Queue Depth 8
Placa de vídeo
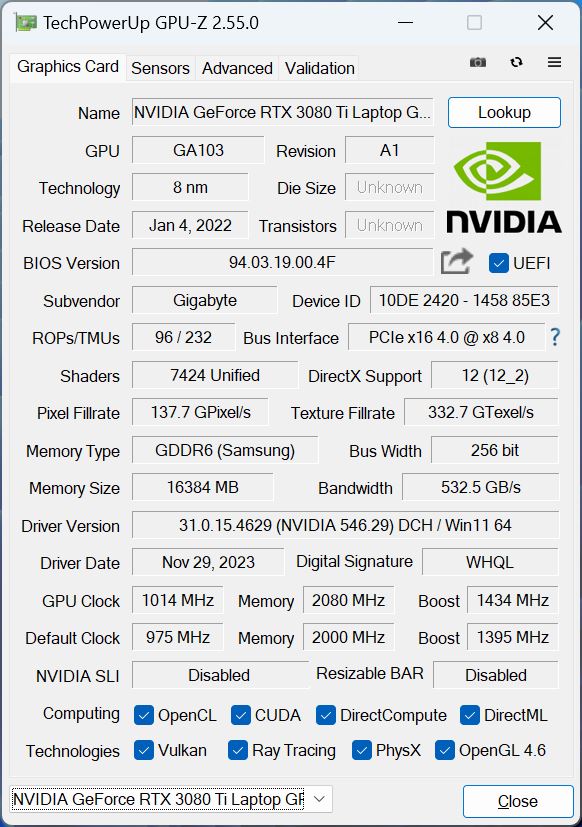
O antigo modelo principal Geforce RTX 3080 Ti com 16 GB de RAM é responsável pelos cálculos 3D como a placa de vídeo do laptop. No entanto, ela recebe apenas 130 watts do máximo possível de 165 watts. O poderoso chip Ampere não é tão eficiente quanto a atual arquitetura Ada Lovelace e provavelmente gerará mais calor.
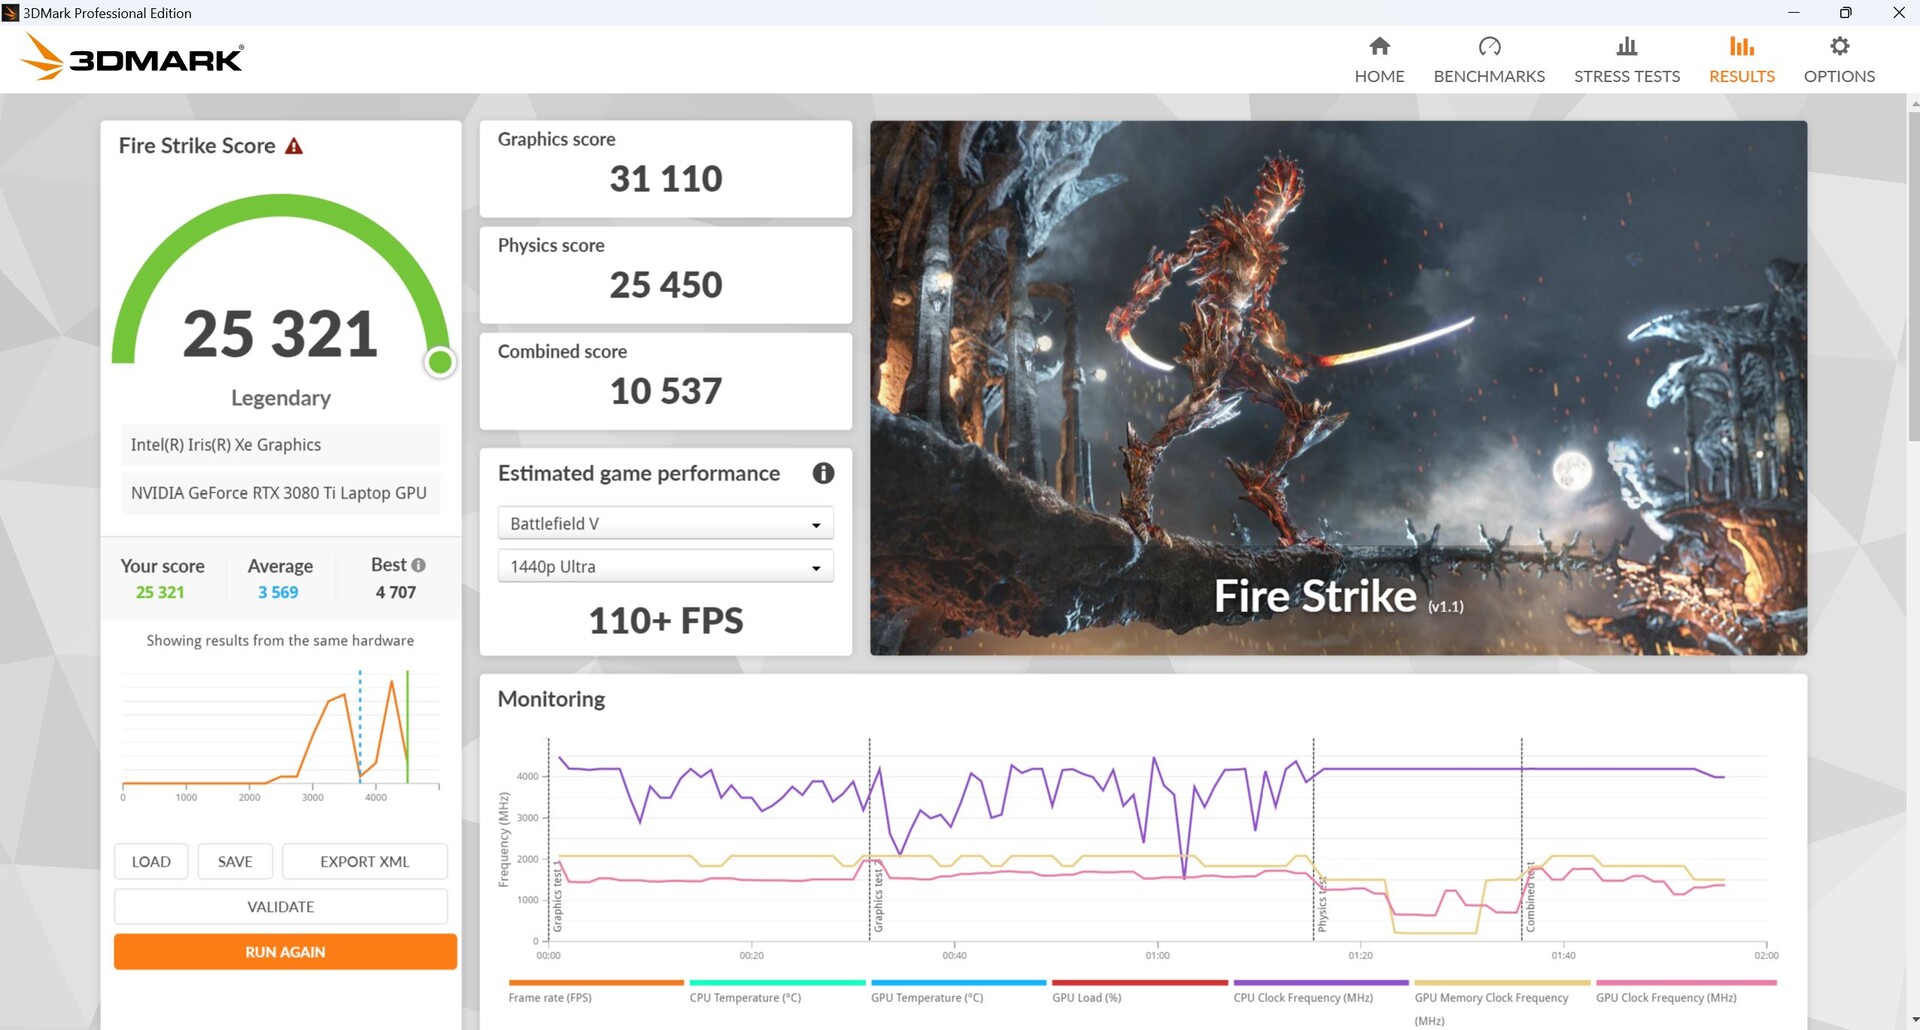
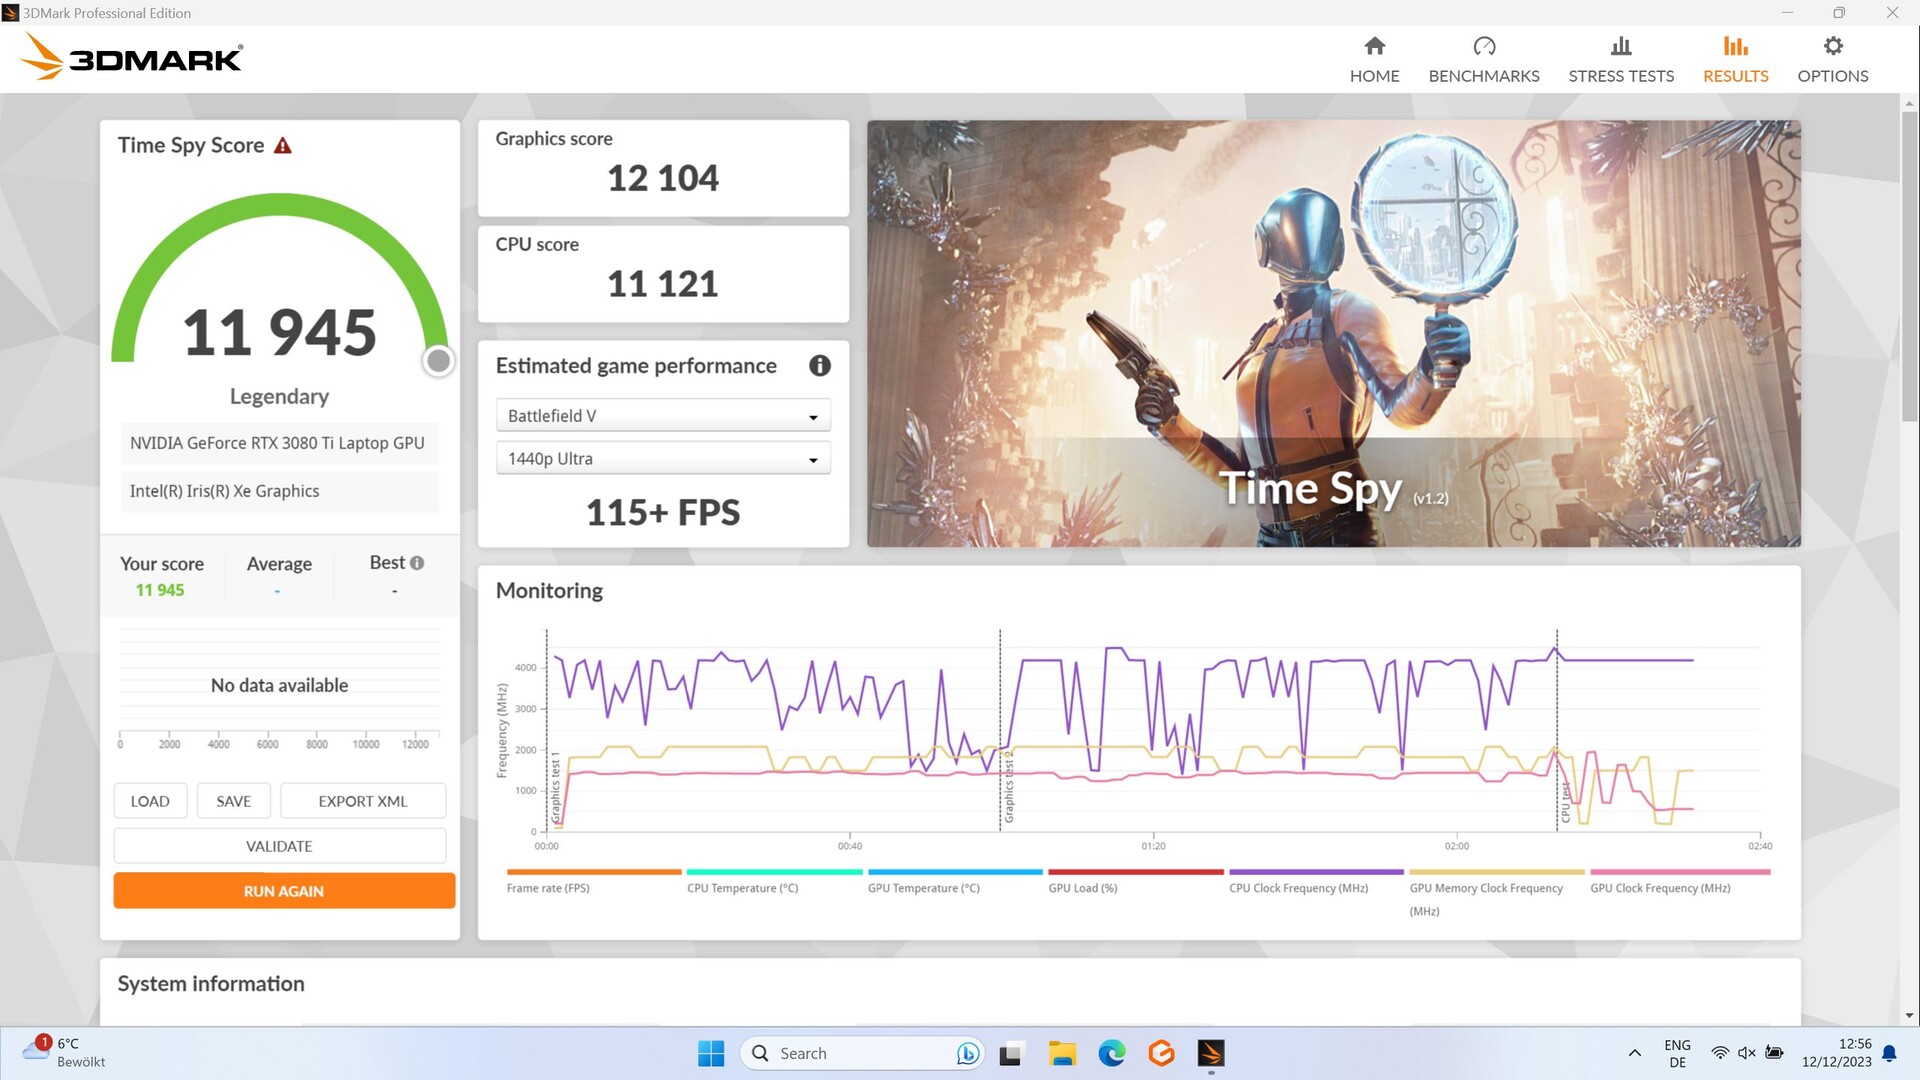
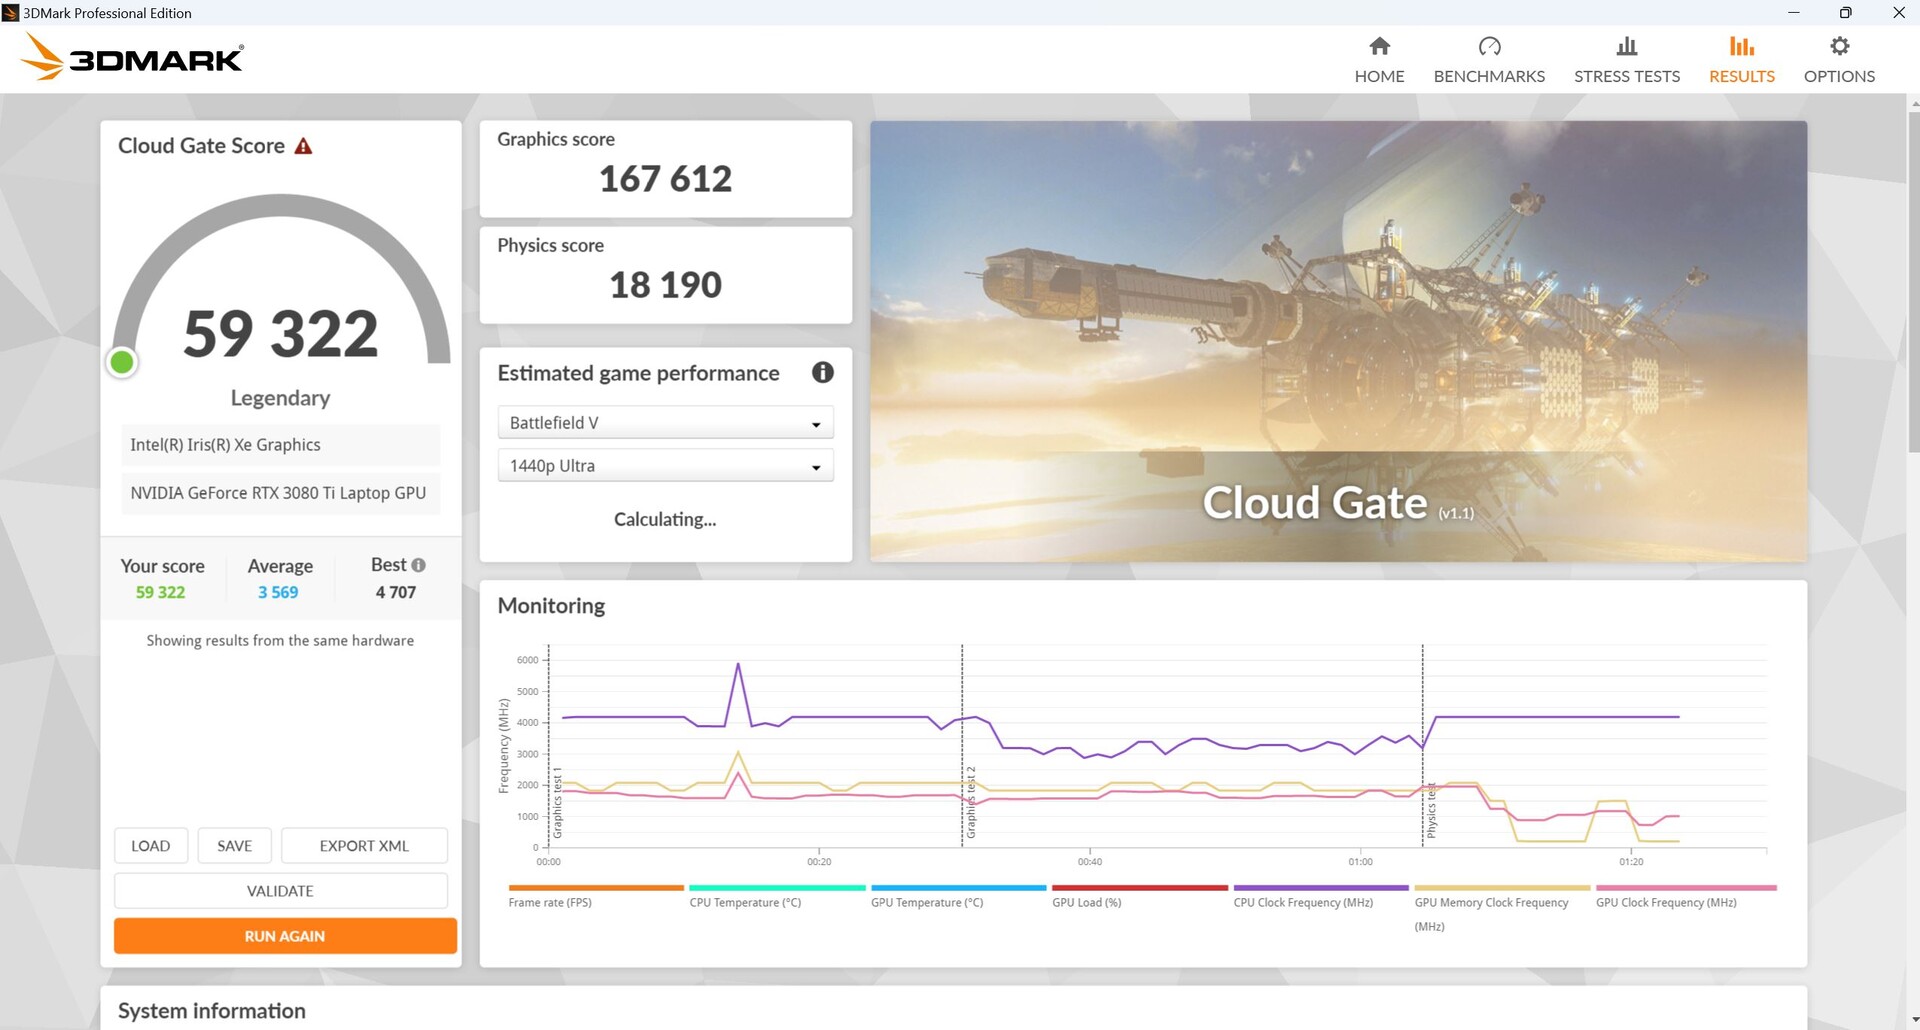
Durante os benchmarks sintéticos do 3DMark, nosso Aorus superou a concorrência da geração atual com uma RTX 4060 e uma RTX 4070. Nossa RTX 3080 Ti ficou à frente em quase todos os testes, mesmo que por apenas alguns pontos percentuais. No entanto, as diferenças entre elas são bem pequenas, mas constantes em todos os testes.
No modo de bateria, seu desempenho em Fire Strike caiu de 31.110 para apenas 6.921 pontos, uma queda de impressionantes 78%!
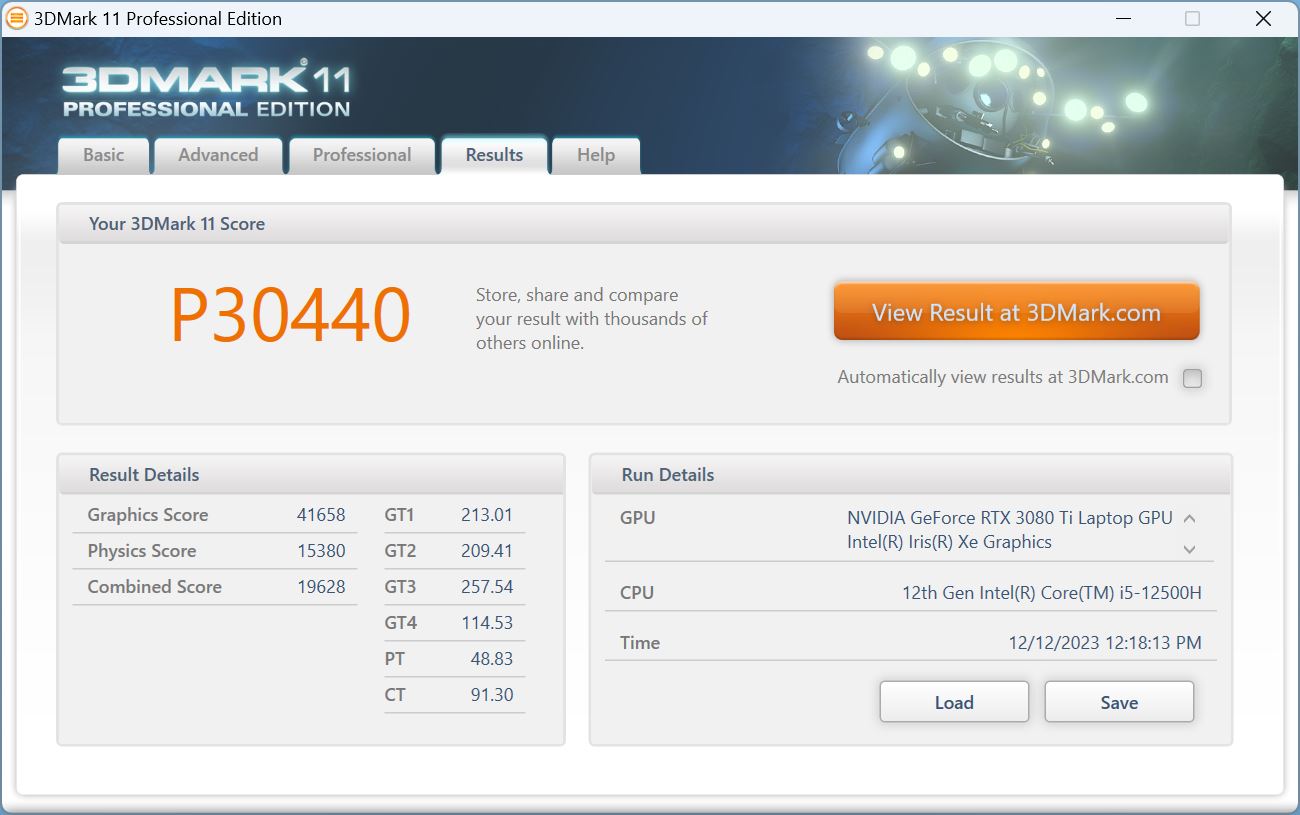
| 3DMark 11 Performance | 30440 pontos | |
| 3DMark Cloud Gate Standard Score | 59322 pontos | |
| 3DMark Fire Strike Score | 25321 pontos | |
| 3DMark Time Spy Score | 11945 pontos | |
Ajuda | ||
* ... menor é melhor
Jogos
Durante os jogos, a nossa Aorus ficou lado a lado com a aorus de última geração com uma RTX 4070 e até conseguiu vencê-la por uma margem estreita. Todos os outros concorrentes com uma RTX 4070 também foram derrotados por pouco. O Omen 16 com uma RTX 4080 permaneceu inalcançável no topo e foi cerca de 18% mais rápido do que o segundo colocado, o Aorus, em todos os testes de jogos. Em jogos com foco na CPU, seu desempenho ficou atrás da concorrência devido ao medíocre processador i5-12500H.
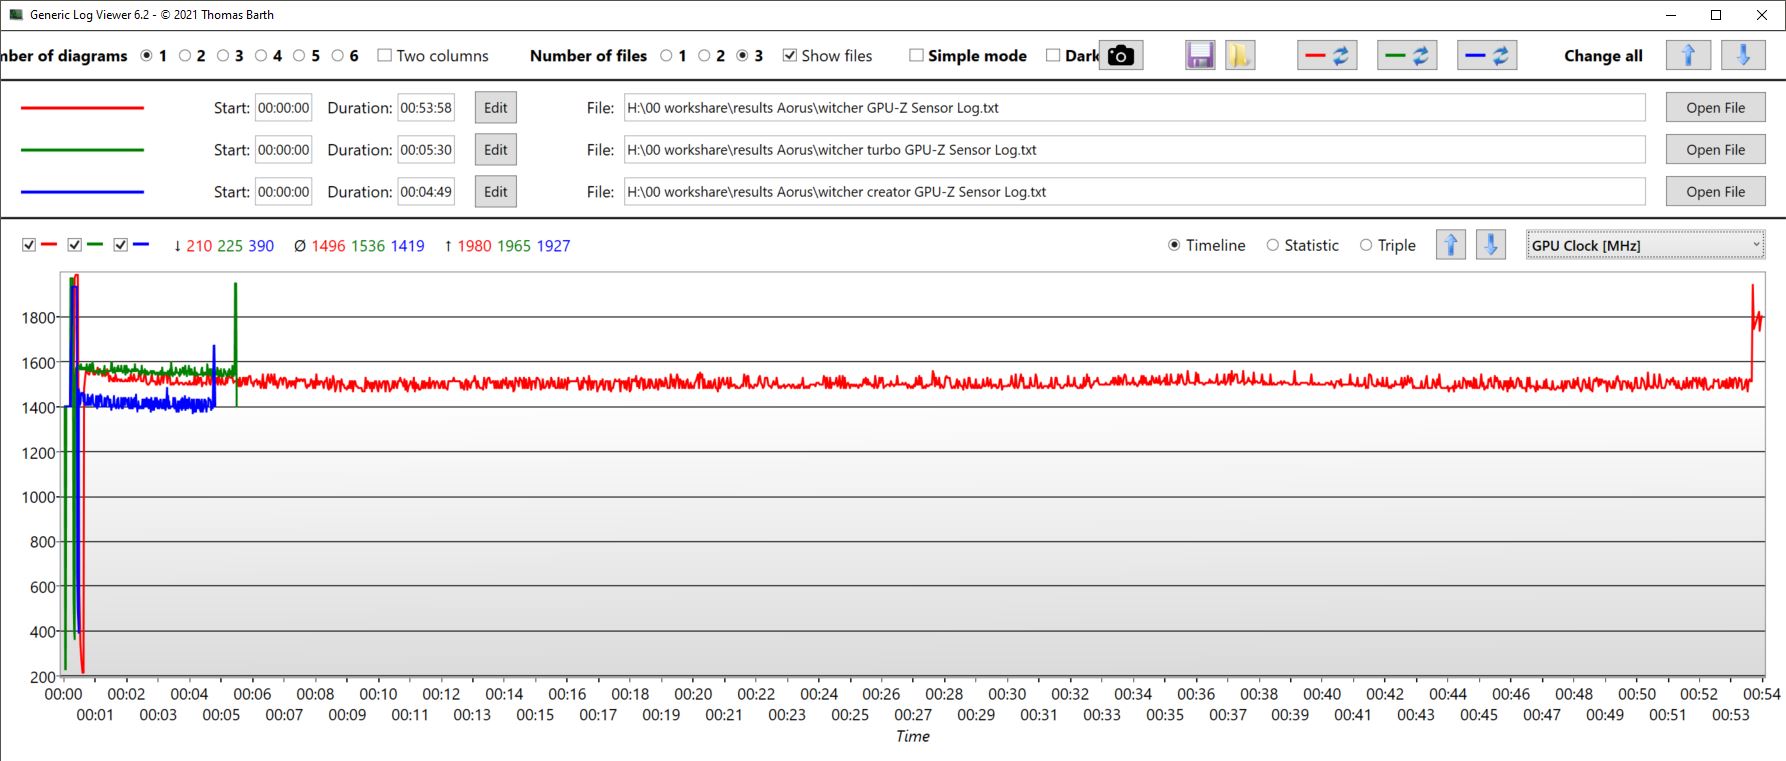
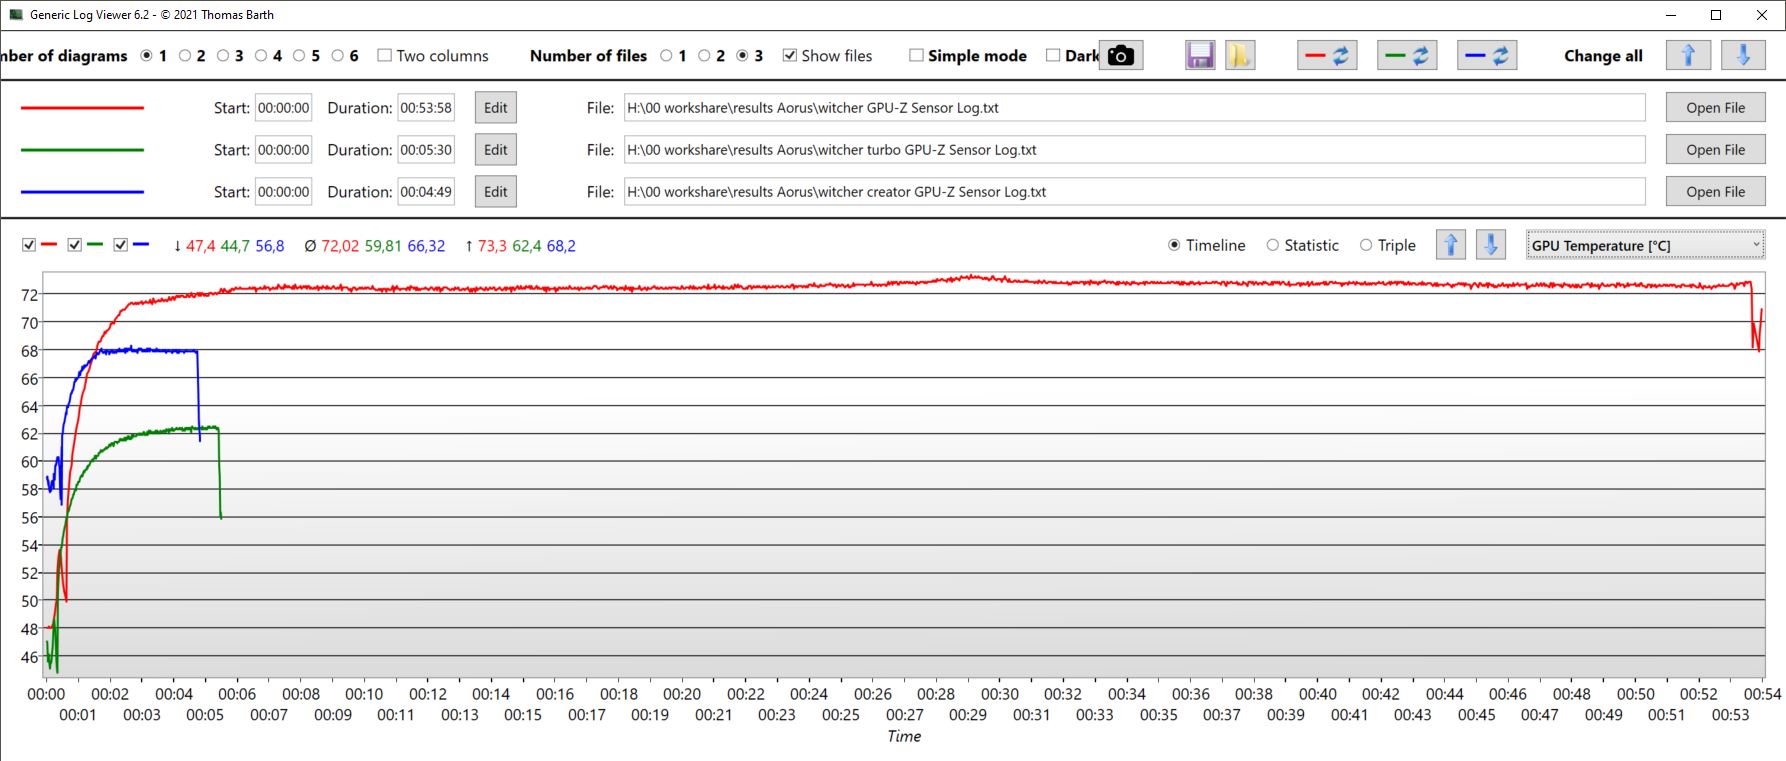
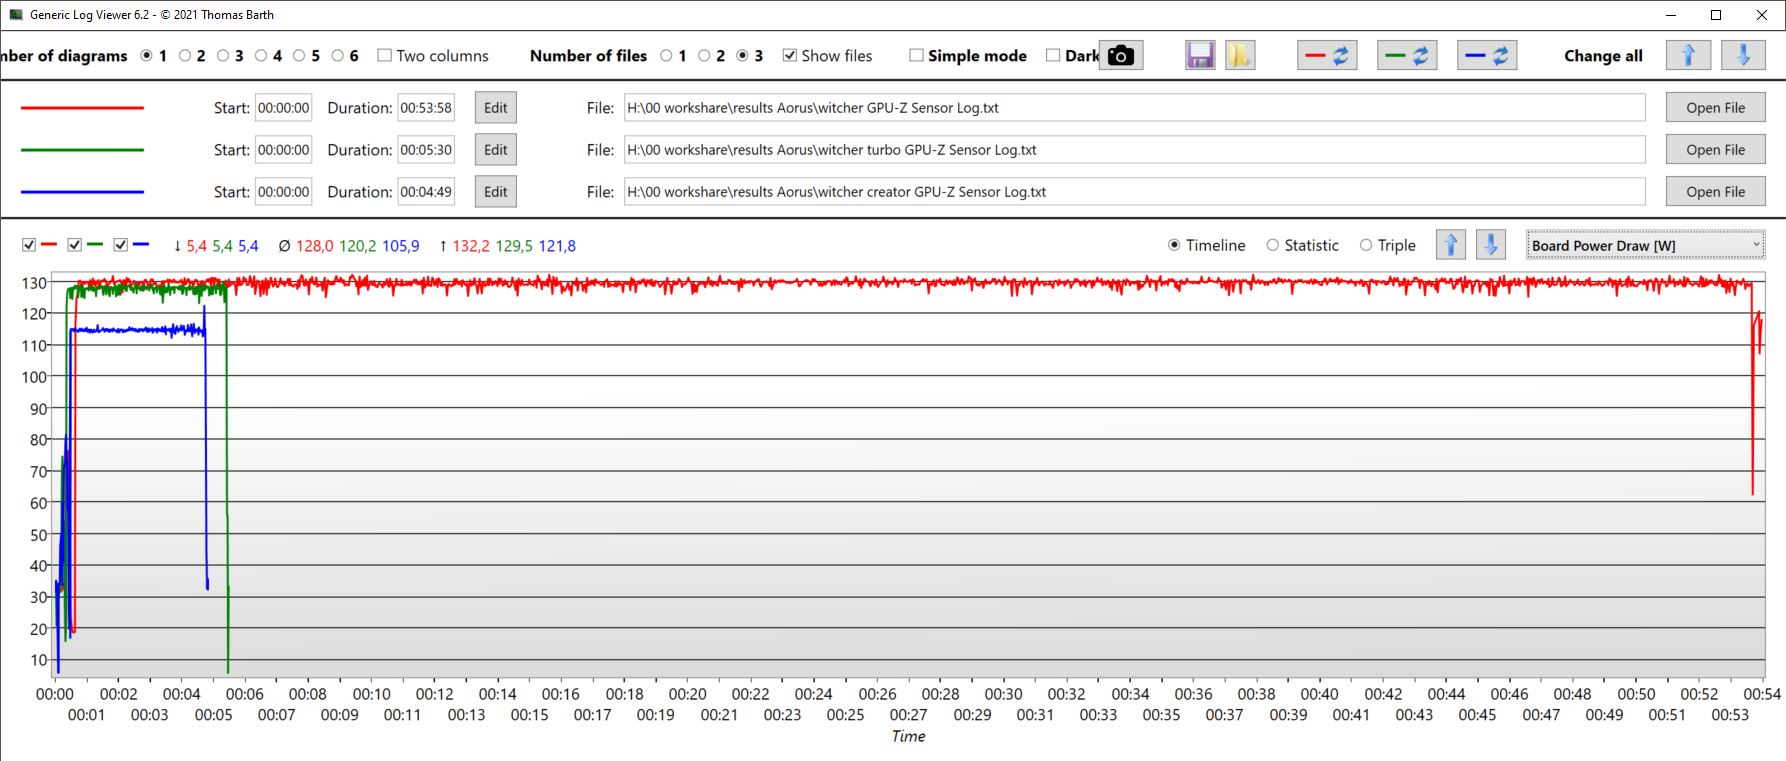
Ao comparar os modos, nota-se que turbo, IA e jogos apresentaram praticamente o mesmo desempenho de GPU no The Witcher 3. A única diferença é que a GPU permaneceu significativamente mais fria no modo turbo, mas esse modo também foi significativamente mais barulhento.
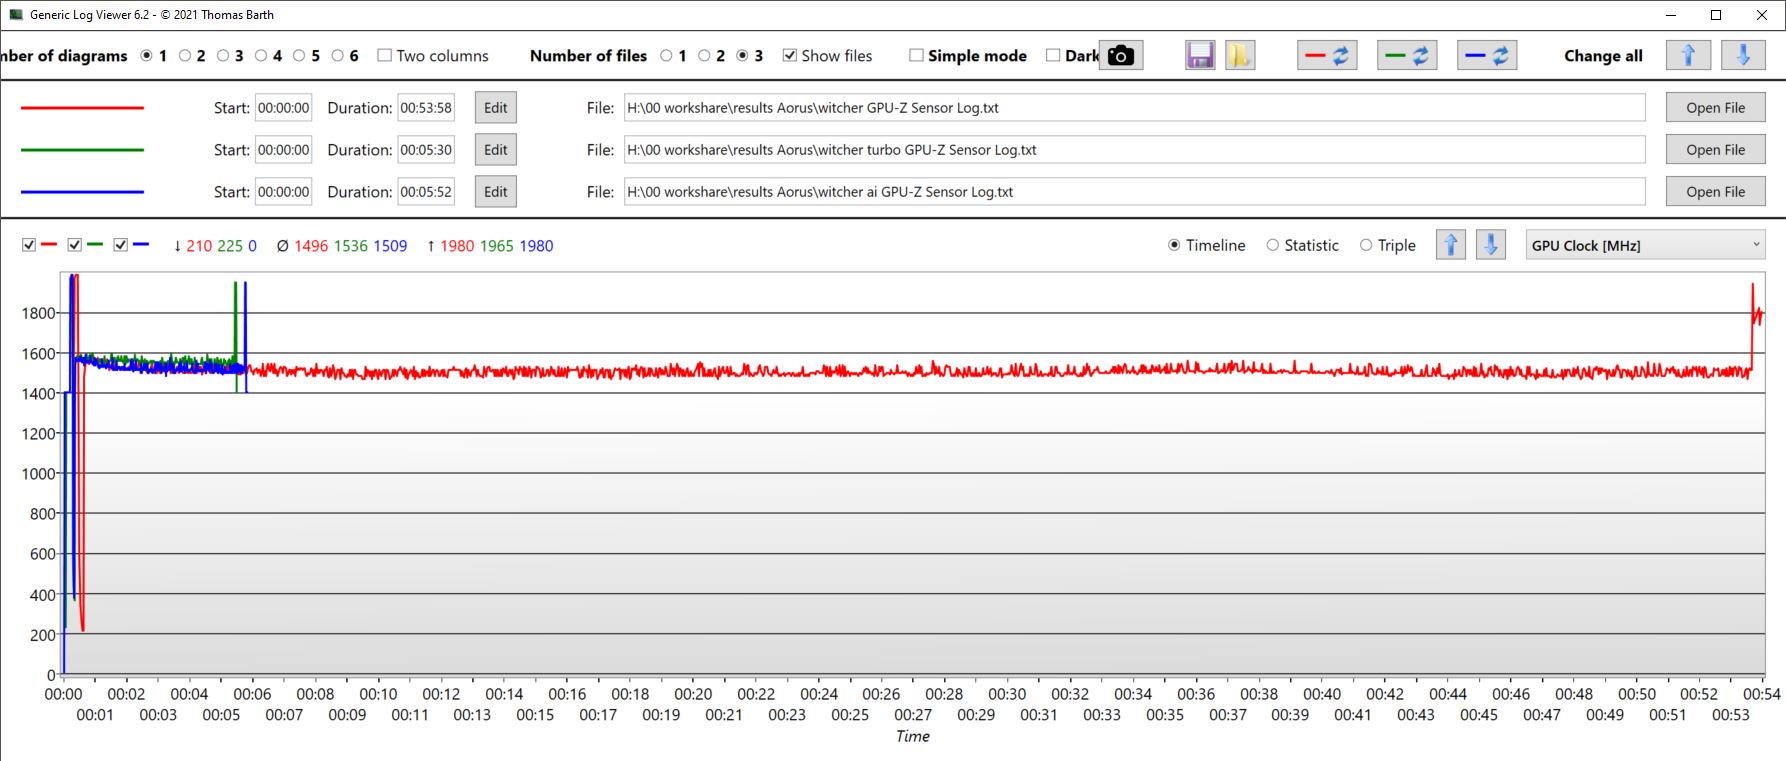
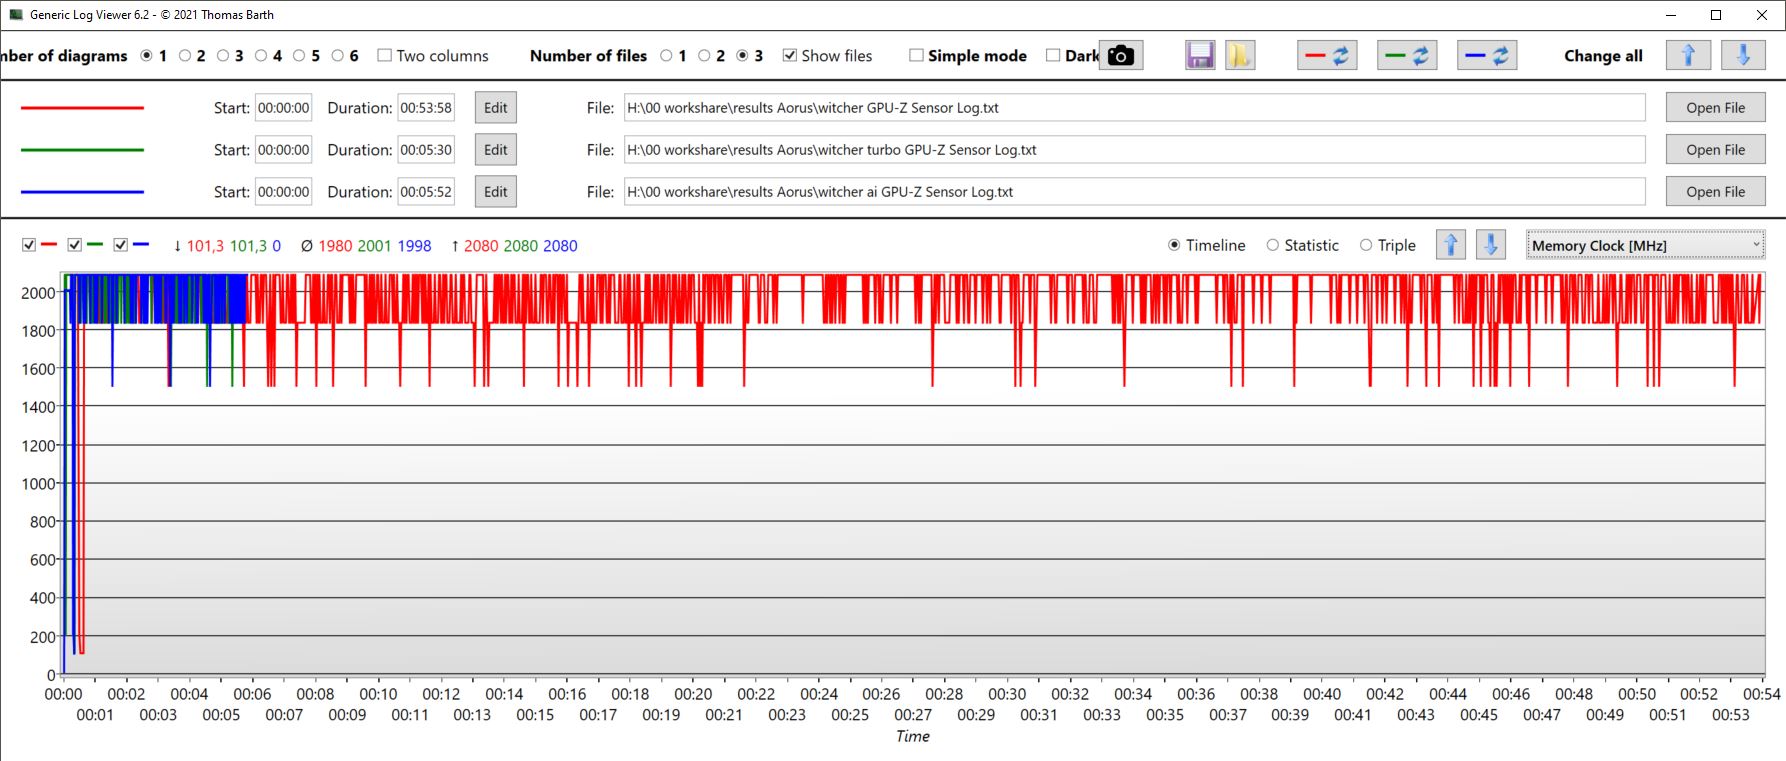
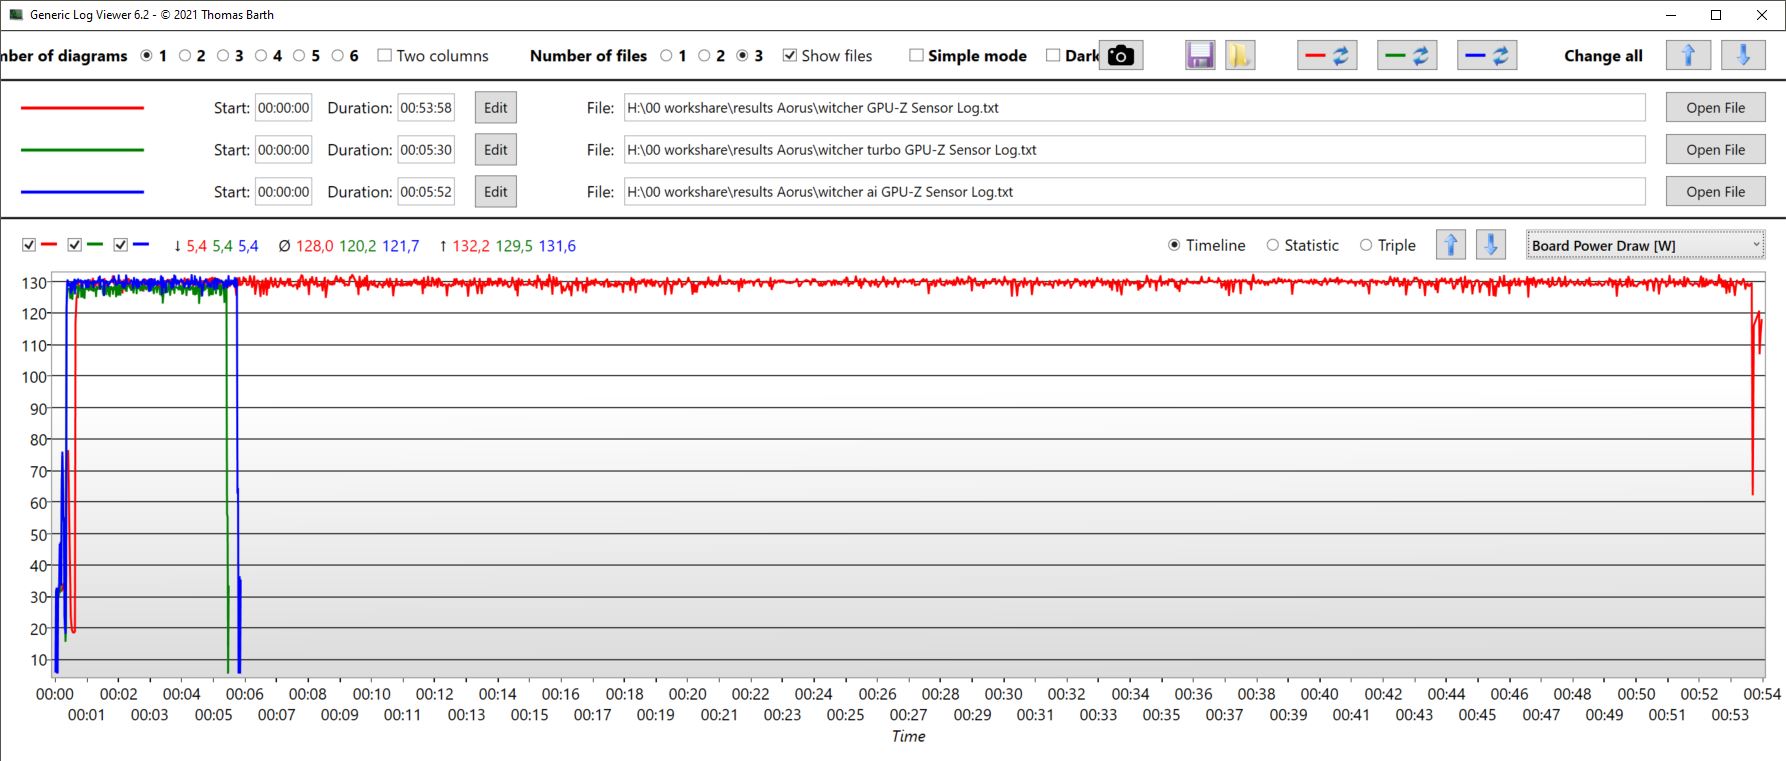
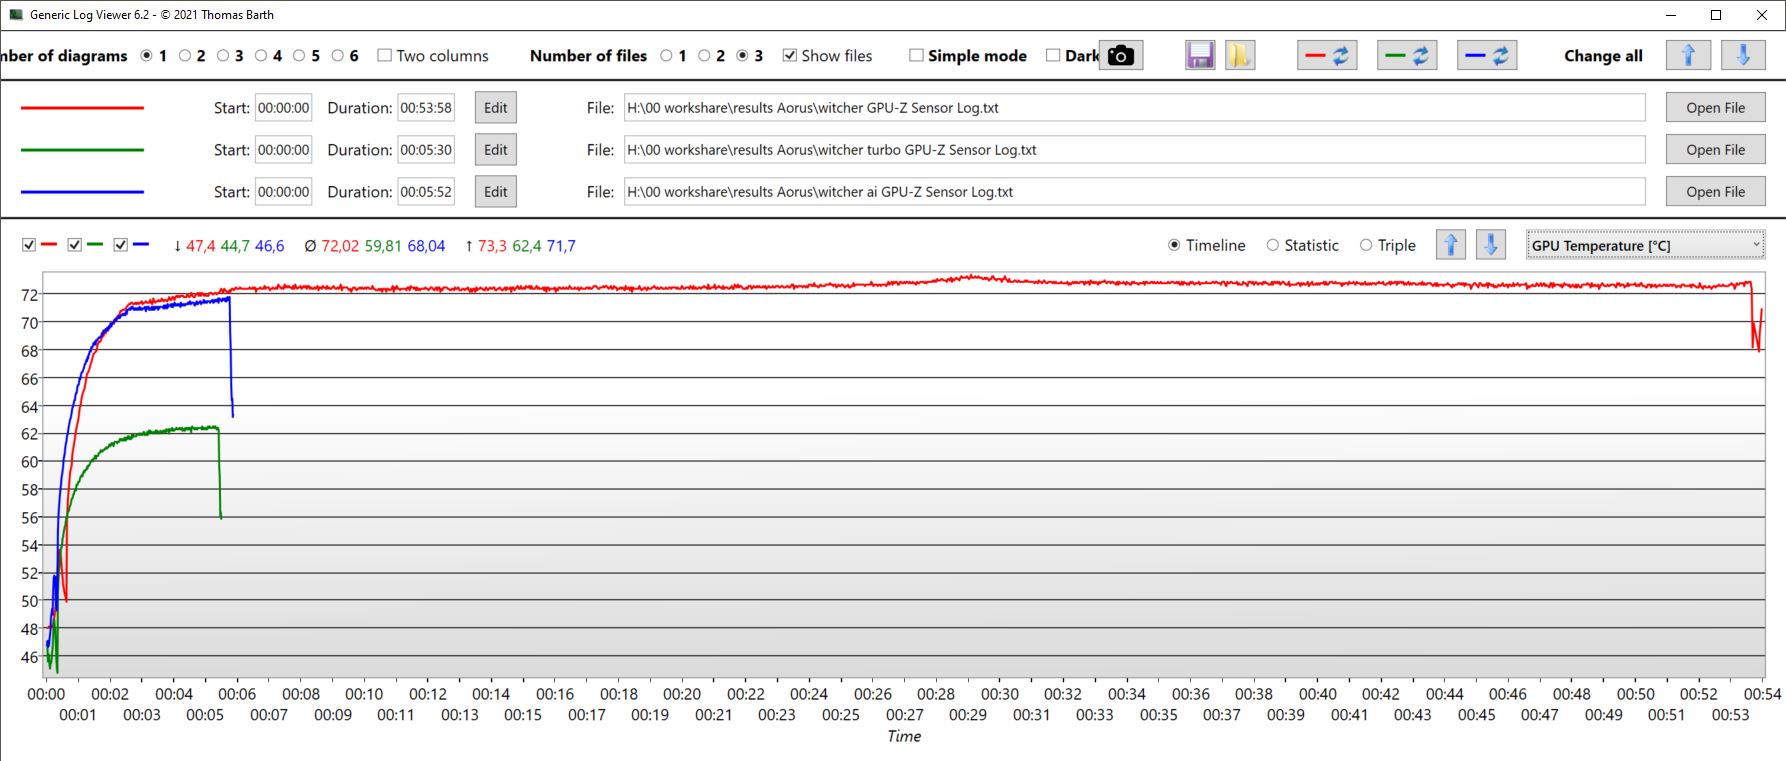
O modo Creator (curva azul desta vez) teve um desempenho um pouco pior, não consumiu tanta energia e permaneceu um pouco mais frio. Na seção de emissões de ruído, listamos os modos e seus efeitos sobre o FPS e as emissões de ruído ao executar o Witcher 3.
| Performance rating - Percent | |
| Média da turma Gaming | |
| HP Omen 16-wf000 | |
| Aorus 15 YE5-54DEB34SH -1! | |
| Aorus 15 BSF -1! | |
| Captiva Advanced Gaming I74-121 | |
| HP Victus 16-r0077ng | |
| Dell XPS 15 9530 RTX 4070 | |
| The Witcher 3 - 1920x1080 Ultra Graphics & Postprocessing (HBAO+) | |
| Média da turma Gaming (104.7 - 240, n=7, últimos 2 anos) | |
| HP Omen 16-wf000 | |
| Aorus 15 YE5-54DEB34SH | |
| Aorus 15 BSF | |
| HP Victus 16-r0077ng | |
| Captiva Advanced Gaming I74-121 | |
| Dell XPS 15 9530 RTX 4070 | |
| GTA V - 1920x1080 Highest AA:4xMSAA + FX AF:16x | |
| Média da turma Gaming (48.3 - 186.9, n=94, últimos 2 anos) | |
| Aorus 15 YE5-54DEB34SH | |
| Captiva Advanced Gaming I74-121 | |
| HP Omen 16-wf000 | |
| HP Victus 16-r0077ng | |
| Dell XPS 15 9530 RTX 4070 | |
| Final Fantasy XV Benchmark - 1920x1080 High Quality | |
| HP Omen 16-wf000 | |
| Média da turma Gaming (41 - 215, n=95, últimos 2 anos) | |
| Aorus 15 YE5-54DEB34SH | |
| Aorus 15 BSF | |
| HP Victus 16-r0077ng | |
| Captiva Advanced Gaming I74-121 | |
| Dell XPS 15 9530 RTX 4070 | |
| Strange Brigade - 1920x1080 ultra AA:ultra AF:16 | |
| HP Omen 16-wf000 | |
| Média da turma Gaming (76.3 - 458, n=87, últimos 2 anos) | |
| Aorus 15 BSF | |
| HP Victus 16-r0077ng | |
| Captiva Advanced Gaming I74-121 | |
| Dell XPS 15 9530 RTX 4070 | |
| Dota 2 Reborn - 1920x1080 ultra (3/3) best looking | |
| HP Omen 16-wf000 | |
| Média da turma Gaming (84.8 - 248, n=107, últimos 2 anos) | |
| Aorus 15 BSF | |
| Captiva Advanced Gaming I74-121 | |
| Aorus 15 YE5-54DEB34SH | |
| Dell XPS 15 9530 RTX 4070 | |
| HP Victus 16-r0077ng | |
| X-Plane 11.11 - 1920x1080 high (fps_test=3) | |
| HP Omen 16-wf000 | |
| Aorus 15 BSF | |
| Captiva Advanced Gaming I74-121 | |
| Média da turma Gaming (55.5 - 143.5, n=109, últimos 2 anos) | |
| HP Victus 16-r0077ng | |
| Aorus 15 YE5-54DEB34SH | |
| Dell XPS 15 9530 RTX 4070 | |
Witcher 3 FPS diagram
| baixo | média | alto | ultra | QHD | 4K | |
|---|---|---|---|---|---|---|
| GTA V (2015) | 184.4 | 180.8 | 176 | 118 | ||
| The Witcher 3 (2015) | 385 | 306 | 222 | 120 | 86 | |
| Dota 2 Reborn (2015) | 167.6 | 154.1 | 146.4 | 138.9 | 140.1 | |
| Final Fantasy XV Benchmark (2018) | 206 | 151.7 | 119.2 | 92.2 | ||
| X-Plane 11.11 (2018) | 134.1 | 121.3 | 94.9 | 85.4 | ||
| Far Cry 5 (2018) | 165 | 137 | 131 | 124 | 116 |
Emissões e potência - Melhor do que a RTX 3080 Ti poderia sugerir
Emissões de ruído
No modo turbo, as ventoinhas estão sempre próximas de seu limite, o que significa 52 a 55 dB. Nos outros modos, os ventiladores funcionam de forma mais situacional. A tabela abaixo lista os níveis de emissão de ruído dos diferentes modos após cerca de 10 minutos de reprodução do The Witcher 3. Em geral, suas emissões podem ser descritas como moderadas em relação ao seu desempenho e podem ser ajustadas de forma muito variável graças aos diversos modos. Tanto o Captiva e o HP Victus têm desempenho pior em aplicativos 3D, mas são igualmente barulhentos, sendo o Captiva ainda mais barulhento.
No modo de jogos, as ventoinhas também ficam ativas quando o laptop está em marcha lenta, embora silenciosamente. Em geral, elas são silenciosas no modo de reunião ou no Power Saver. Durante o cenário de carga média simulada (3DMark06) com o modo de jogo selecionado, suas emissões de ruído aumentaram gradualmente até 43 dB. No modo de economia de energia, o mesmo teste foi realizado com apenas 27 dB.
| Modo de desempenho/Witcher 3 | Taxa de quadros máxima | Taxa de quadros média | Emissões de ruído em dB | Consumo em watts |
|---|---|---|---|---|
| Turbo | 124 | 118 | 52,68 | 199 |
| AI | 122 | 116 | 44.78 | 197 |
| Jogos | 125 | 116 | 46.77 | 196 |
| Criador | 115 | 110 | 44.78 | 185 |
| Reunião | 111 | 105 | 36.53 | 163 |
| Power Saver | 115 | 106 | 36.53 | 162 |
Barulho
| Ocioso |
| 23 / 23 / 26.42 dB |
| Carga |
| 43.5 / 50.21 dB |
 | ||
30 dB silencioso 40 dB(A) audível 50 dB(A) ruidosamente alto |
||
min: | ||
| Aorus 15 YE5-54DEB34SH GeForce RTX 3080 Ti Laptop GPU, i5-12500H, Gigabyte AG470S1TB-SI B10 | Aorus 15 BSF GeForce RTX 4070 Laptop GPU, i7-13700H, Gigabyte AG470S1TB-SI B10 | Captiva Advanced Gaming I74-121 GeForce RTX 4060 Laptop GPU, i5-13500H, Samsung SSD 980 1TB MZ-V8V1T0BW | HP Victus 16-r0077ng GeForce RTX 4070 Laptop GPU, i7-13700H, Kioxia XG8 KXG80ZNV1T02 | Dell XPS 15 9530 RTX 4070 GeForce RTX 4070 Laptop GPU, i7-13700H, SK hynix PC801 HFS001TEJ9X101N | HP Omen 16-wf000 GeForce RTX 4080 Laptop GPU, i7-13700HX, SK hynix PC801 HFS002TEJ9X101N | |
|---|---|---|---|---|---|---|
| Noise | -20% | -3% | -9% | 10% | -13% | |
| desligado / ambiente * (dB) | 23 | 24 -4% | 23 -0% | 25 -9% | 23.1 -0% | 23 -0% |
| Idle Minimum * (dB) | 23 | 25 -9% | 23 -0% | 28 -22% | 23.1 -0% | 29.6 -29% |
| Idle Average * (dB) | 23 | 31 -35% | 25.67 -12% | 29 -26% | 23.1 -0% | 29.8 -30% |
| Idle Maximum * (dB) | 26.42 | 37 -40% | 25.67 3% | 30 -14% | 24.2 8% | 30.4 -15% |
| Load Average * (dB) | 43.5 | 51 -17% | 38.52 11% | 43 1% | 27.1 38% | 33.8 22% |
| Witcher 3 ultra * (dB) | 46.77 | 54.17 -16% | 46 2% | 40.1 14% | 57 -22% | |
| Load Maximum * (dB) | 50.21 | 57 -14% | 54.17 -8% | 48 4% | 44.6 11% | 58.3 -16% |
* ... menor é melhor
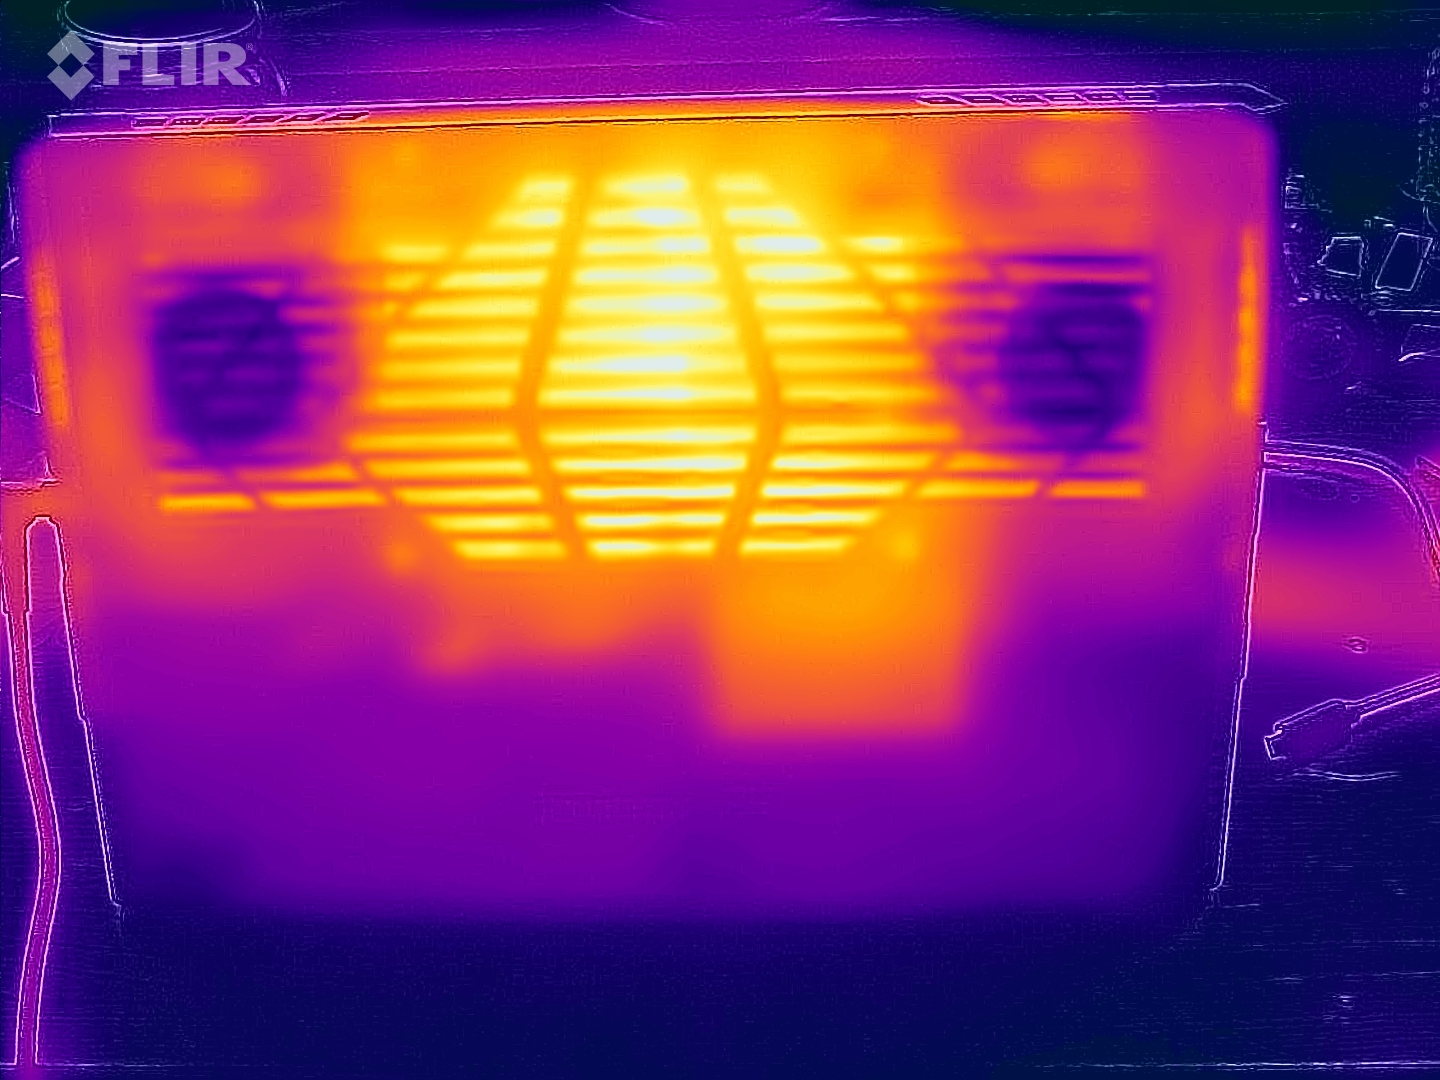
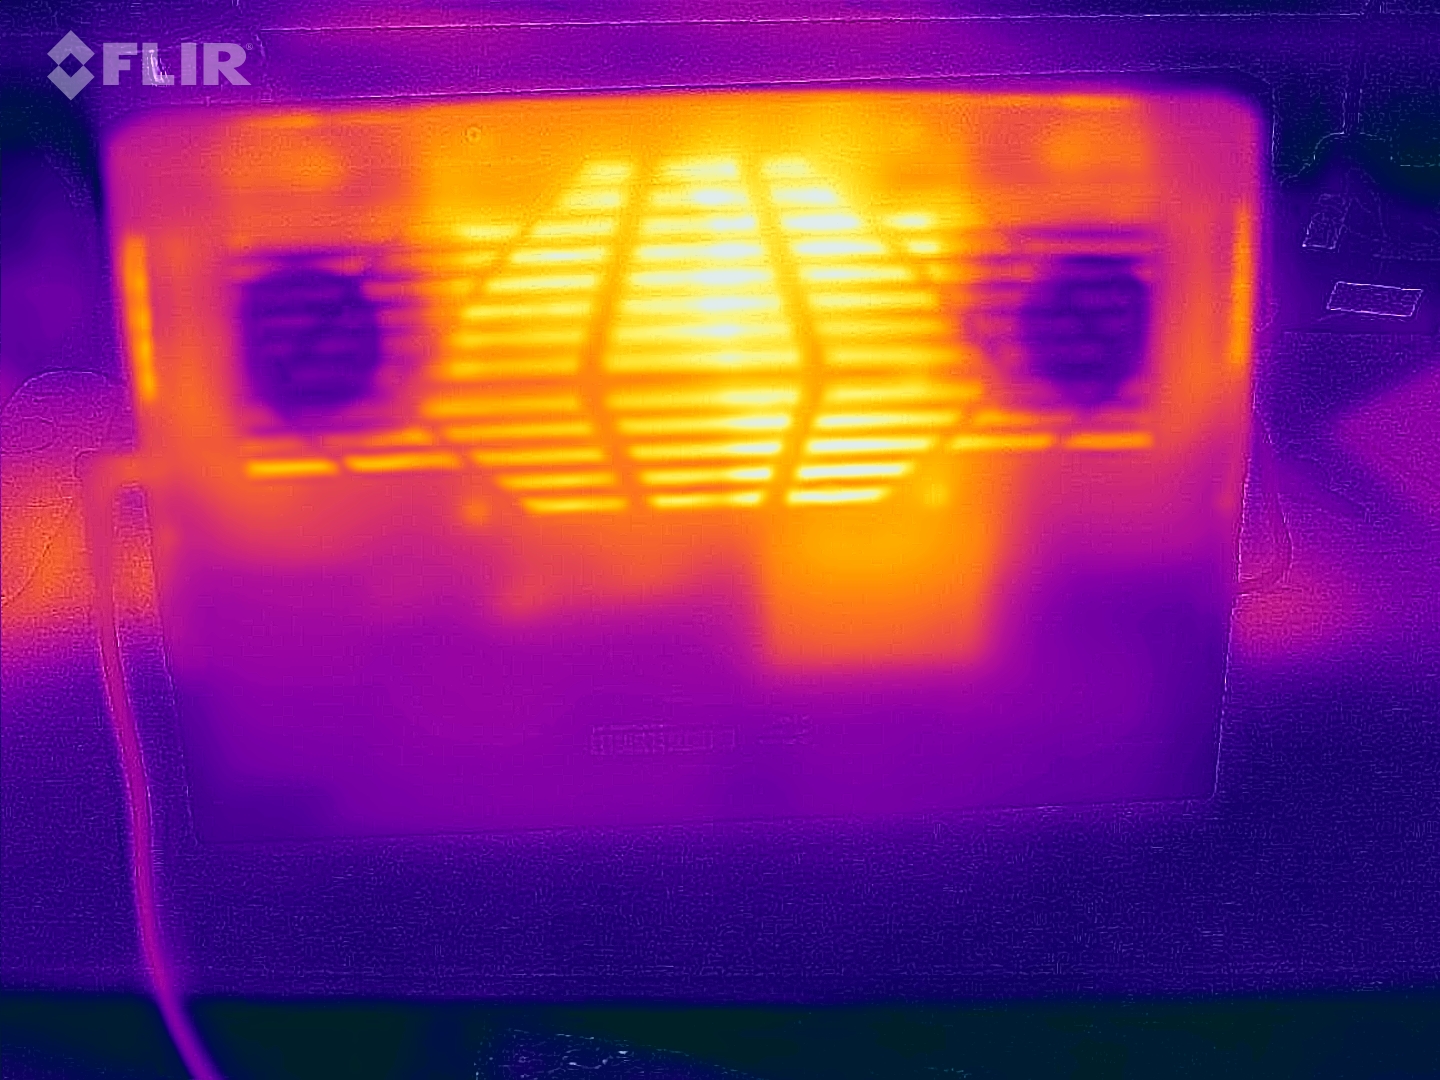
Temperatura
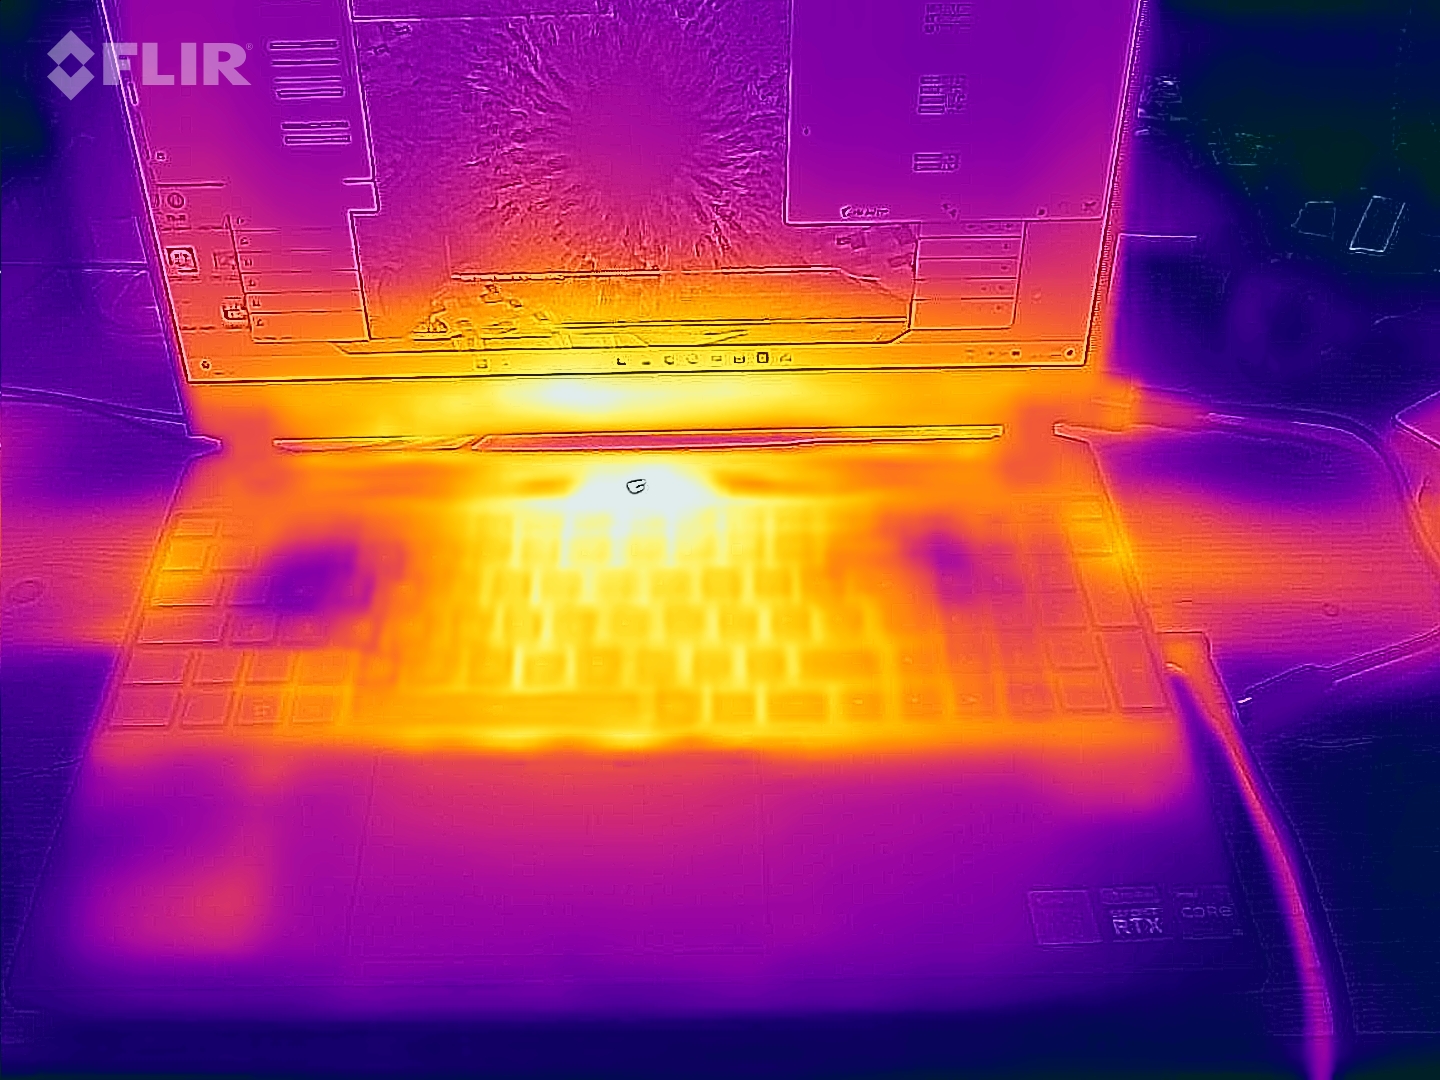
Ele esquenta sob alta carga, especialmente na parte inferior, no centro do dispositivo, em direção à tela. Entretanto, com até 50 °C, a temperatura está dentro da faixa de laptops típicos para jogos. A parte superior permanece surpreendentemente fria, com um máximo de 43 °C. No modo turbo, as temperaturas são ainda mais baixas.
(±) A temperatura máxima no lado superior é 43 °C / 109 F, em comparação com a média de 40.4 °C / 105 F , variando de 21.2 a 68.8 °C para a classe Gaming.
(-) A parte inferior aquece até um máximo de 50 °C / 122 F, em comparação com a média de 43.2 °C / 110 F
(+) Em uso inativo, a temperatura média para o lado superior é 27.3 °C / 81 F, em comparação com a média do dispositivo de 33.9 °C / ### class_avg_f### F.
(+) Jogando The Witcher 3, a temperatura média para o lado superior é 29.7 °C / 85 F, em comparação com a média do dispositivo de 33.9 °C / ## #class_avg_f### F.
(+) Os apoios para as mãos e o touchpad são mais frios que a temperatura da pele, com um máximo de 26 °C / 78.8 F e, portanto, são frios ao toque.
(+) A temperatura média da área do apoio para as mãos de dispositivos semelhantes foi 28.8 °C / 83.8 F (+2.8 °C / 5 F).
| Aorus 15 YE5-54DEB34SH Intel Core i5-12500H, NVIDIA GeForce RTX 3080 Ti Laptop GPU | Aorus 15 BSF Intel Core i7-13700H, NVIDIA GeForce RTX 4070 Laptop GPU | Captiva Advanced Gaming I74-121 Intel Core i5-13500H, NVIDIA GeForce RTX 4060 Laptop GPU | HP Victus 16-r0077ng Intel Core i7-13700H, NVIDIA GeForce RTX 4070 Laptop GPU | Dell XPS 15 9530 RTX 4070 Intel Core i7-13700H, NVIDIA GeForce RTX 4070 Laptop GPU | HP Omen 16-wf000 Intel Core i7-13700HX, NVIDIA GeForce RTX 4080 Laptop GPU | |
|---|---|---|---|---|---|---|
| Heat | -8% | 4% | -8% | 1% | 5% | |
| Maximum Upper Side * (°C) | 43 | 48 -12% | 41 5% | 51 -19% | 45.6 -6% | 45 -5% |
| Maximum Bottom * (°C) | 50 | 47 6% | 42 16% | 54 -8% | 42 16% | 48.8 2% |
| Idle Upper Side * (°C) | 33 | 39 -18% | 32 3% | 37 -12% | 34.4 -4% | 29.2 12% |
| Idle Bottom * (°C) | 32 | 35 -9% | 35 -9% | 29 9% | 33.2 -4% | 28.8 10% |
* ... menor é melhor
Alto-falantes
Um aspecto positivo é o volume decente dos alto-falantes. Entretanto, quase não há graves e mesmo os médios e agudos não são particularmente equilibrados.
Um conector combinado de 3,5 mm para microfones e fones de ouvido está disponível para conectar dispositivos de áudio externos.
Aorus 15 YE5-54DEB34SH análise de áudio
(+) | os alto-falantes podem tocar relativamente alto (###valor### dB)
Graves 100 - 315Hz
(-) | quase nenhum baixo - em média 27.1% menor que a mediana
(±) | a linearidade dos graves é média (12.4% delta para a frequência anterior)
Médios 400 - 2.000 Hz
(±) | médios mais altos - em média 6.2% maior que a mediana
(±) | a linearidade dos médios é média (7.7% delta para frequência anterior)
Altos 2 - 16 kHz
(±) | máximos mais altos - em média 7.4% maior que a mediana
(±) | a linearidade dos máximos é média (7.5% delta para frequência anterior)
Geral 100 - 16.000 Hz
(±) | a linearidade do som geral é média (22.5% diferença em relação à mediana)
Comparado com a mesma classe
» 81% de todos os dispositivos testados nesta classe foram melhores, 5% semelhantes, 14% piores
» O melhor teve um delta de 6%, a média foi 18%, o pior foi 132%
Comparado com todos os dispositivos testados
» 66% de todos os dispositivos testados foram melhores, 6% semelhantes, 28% piores
» O melhor teve um delta de 4%, a média foi 23%, o pior foi 134%
Apple MacBook Pro 16 2021 M1 Pro análise de áudio
(+) | os alto-falantes podem tocar relativamente alto (###valor### dB)
Graves 100 - 315Hz
(+) | bons graves - apenas 3.8% longe da mediana
(+) | o baixo é linear (5.2% delta para a frequência anterior)
Médios 400 - 2.000 Hz
(+) | médios equilibrados - apenas 1.3% longe da mediana
(+) | médios são lineares (2.1% delta para frequência anterior)
Altos 2 - 16 kHz
(+) | agudos equilibrados - apenas 1.9% longe da mediana
(+) | os máximos são lineares (2.7% delta da frequência anterior)
Geral 100 - 16.000 Hz
(+) | o som geral é linear (4.6% diferença em relação à mediana)
Comparado com a mesma classe
» 0% de todos os dispositivos testados nesta classe foram melhores, 0% semelhantes, 100% piores
» O melhor teve um delta de 5%, a média foi 17%, o pior foi 45%
Comparado com todos os dispositivos testados
» 0% de todos os dispositivos testados foram melhores, 0% semelhantes, 100% piores
» O melhor teve um delta de 4%, a média foi 23%, o pior foi 134%
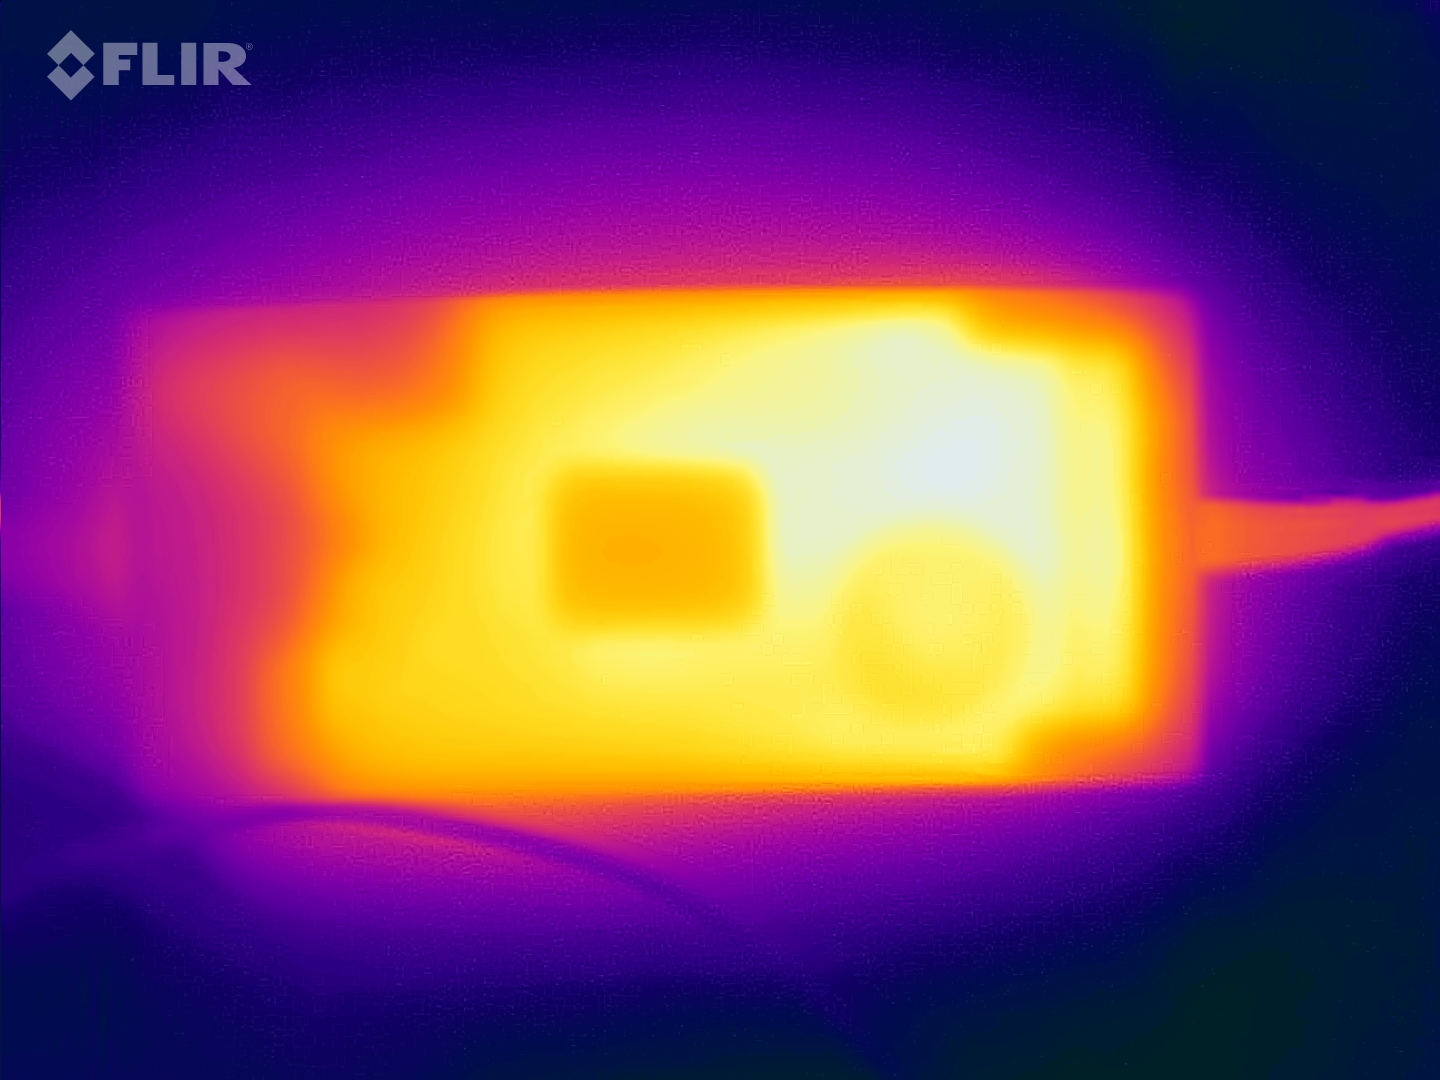
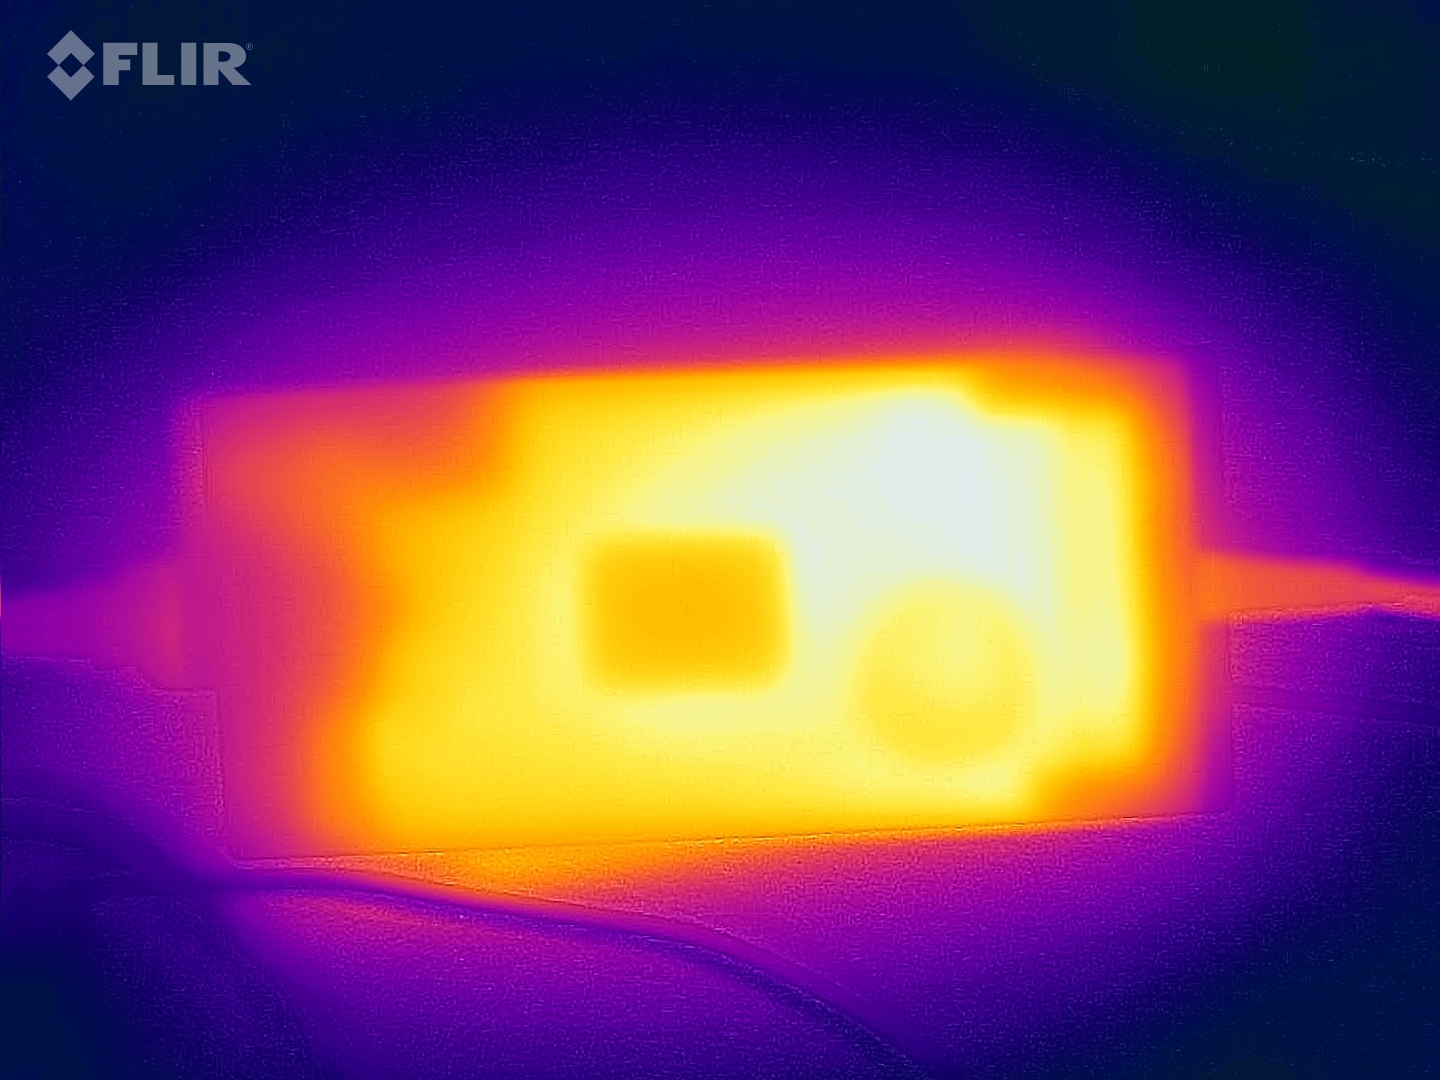
Consumo de energia
Ok, a RTX 3080 Ti não é exatamente econômica - tecnicamente, a atual geração de CPU/GPU já deveria ser mais eficiente.
Para consumir tão "pouco" quanto o Captiva ao jogar The Witcher 3, por exemplo, o senhor teria que configurar nosso Aorus para o modo de reunião ou Power Saver. No entanto, as taxas de atualização no jogo também estão em um nível um tanto surpreendente (consulte a tabela na seção de emissões de ruído).
Acima de tudo, os 150 watts que medimos em nosso teste 3DMark06 (carga média) se destacam negativamente; em contrapartida, o Captiva consome apenas 85 watts. De modo geral, mesmo em modo inativo, é de se esperar um consumo um pouco mais alto, mas isso é relativizado durante os jogos.
Medimos um valor máximo e temporário de 204 watts, com o qual a fonte de alimentação de 240 watts da Delta pode lidar facilmente.
| desligado | |
| Ocioso | |
| Carga |
|
Key:
min: | |
| Aorus 15 YE5-54DEB34SH GeForce RTX 3080 Ti Laptop GPU, i5-12500H, Gigabyte AG470S1TB-SI B10 | Aorus 15 BSF GeForce RTX 4070 Laptop GPU, i7-13700H, Gigabyte AG470S1TB-SI B10 | Captiva Advanced Gaming I74-121 GeForce RTX 4060 Laptop GPU, i5-13500H, Samsung SSD 980 1TB MZ-V8V1T0BW | HP Victus 16-r0077ng GeForce RTX 4070 Laptop GPU, i7-13700H, Kioxia XG8 KXG80ZNV1T02 | Dell XPS 15 9530 RTX 4070 GeForce RTX 4070 Laptop GPU, i7-13700H, SK hynix PC801 HFS001TEJ9X101N | HP Omen 16-wf000 GeForce RTX 4080 Laptop GPU, i7-13700HX, SK hynix PC801 HFS002TEJ9X101N | |
|---|---|---|---|---|---|---|
| Power Consumption | 10% | 15% | 23% | 23% | -24% | |
| Idle 150cd/m2 * (Watt) | 16 | 12.4 22% | 18 -13% | 12.8 20% | 20.1 -26% | 23.2 -45% |
| 3DMark06 Return To Proxycon * (Watt) | 150 | 85 43% | ||||
| Witcher 3 ultra * (Watt) | 196 | 175.8 10% | 164 16% | 141.8 28% | 95.4 51% | 214 -9% |
| 1280x720 Prime95 28.10 and Furmark 1.25 * (Watt) | 204 | 210 -3% | 179 12% | 164.1 20% | 117.2 43% | 240 -18% |
* ... menor é melhor
Power consumption Witcher 3 / stress test
Power consumption with external monitor
Tempos de execução
O Aorus decepciona em termos de tempo de funcionamento, presumivelmente devido ao aumento do consumo em modo inativo. A Gigabyte instalou uma generosa bateria de 99 Wh, mas seus tempos de funcionamento ainda estão no mesmo nível do Captiva com uma bateria de 53 Wh! O Aorus BSF de geração atual com um i7-13700H e uma RTX 4070 durou 65% mais com sua bateria de 99 Wh e quase o dobro do tempo no teste de WLAN! Ele durou mais de 10 horas, enquanto o nosso Aorus durou menos de 5,5 horas.
| Aorus 15 YE5-54DEB34SH i5-12500H, GeForce RTX 3080 Ti Laptop GPU, 99 Wh | Aorus 15 BSF i7-13700H, GeForce RTX 4070 Laptop GPU, 99 Wh | Captiva Advanced Gaming I74-121 i5-13500H, GeForce RTX 4060 Laptop GPU, 53 Wh | HP Victus 16-r0077ng i7-13700H, GeForce RTX 4070 Laptop GPU, 83 Wh | Dell XPS 15 9530 RTX 4070 i7-13700H, GeForce RTX 4070 Laptop GPU, 86 Wh | HP Omen 16-wf000 i7-13700HX, GeForce RTX 4080 Laptop GPU, 83 Wh | Média da turma Gaming | |
|---|---|---|---|---|---|---|---|
| Duração da bateria | 64% | -5% | 34% | 20% | -20% | 26% | |
| H.264 (h) | 5.3 | 9 70% | 4.9 -8% | 8.32 ? 57% | |||
| WiFi v1.3 (h) | 5.3 | 10.3 94% | 5.3 0% | 7.1 34% | 8 51% | 5.1 -4% | 7.11 ? 34% |
| Load (h) | 1.7 | 2.2 29% | 1.6 -6% | 1.5 -12% | 1.1 -35% | 1.502 ? -12% | |
| Reader / Idle (h) | 10.9 | 11.5 | 5.5 | 8.27 ? |
Pro
Contra
Veredicto - Definitivamente competitivo!


A combinação de uma CPU Gen-12 e uma RTX 3080 Ti não é, de forma alguma, coisa do passado, especialmente quando se trata de desempenho (3D). O Aorus 15 YE5 pode superar a maioria dos outros notebooks para jogos com uma RTX 4070, o que faz com que valha a pena considerá-lo, especialmente em relação ao seu baixo preço. Apesar disso, o Aorus não abriu mão de recursos modernos, como o Thunderbolt 4, um SSD rápido ou um design completo, como muitos de seus concorrentes.
Sua baixa eficiência não está mais totalmente atualizada, o que se reflete principalmente nos tempos de execução decepcionantes do laptop, apesar de sua grande bateria. Sua antiga webcam de 720p pode não ser absolutamente inútil, no entanto, para os jogadores, essa é uma clara desvantagem. Um recurso irritante, típico da Aorus, é que o dispositivo muda para o modo de espera muito rapidamente assim que o usuário fecha a tela em 45 graus.
O Aorus 15 YE5 oferece um desempenho muito bom para jogos a um preço baixo, sem parecer barato, como acontece com outros concorrentes mais caros. Sua GPU de última geração é particularmente impressionante quando se trata de desempenho em 3D, embora sua eficiência e tempo de execução sejam insuficientes.
Há algumas alternativas disponíveis com preços semelhantes, como o MSI Katana com uma RTX 4070. Entretanto, o Aorus deve ser um pouco mais rápido em muitos jogos. Além disso, o Katana não conta com Thunderbolt 4 nem tem a mesma qualidade. Por sua vez, o MSI se beneficia de tempos de execução mais longos. O HP Victus 16 se comporta de forma semelhante - ele até custa um pouco mais, mas não é tão rápido nem tem a mesma qualidade que o Aorus. Atualmente, o senhor terá que gastar cerca de US$ 300 a mais para comprar o Aorus da geração atual.
Preço e disponibilidade
Atualmente, a Aorus 15 YE5 é vendida por cerca de US$ 1.500. No momento em que escrevemos este artigo, não conseguimos encontrá-la à venda em nenhum varejista on-line nos EUA.
Aorus 15 YE5-54DEB34SH
- 12/15/2023 v7 (old)
Christian Hintze
Transparência
A seleção dos dispositivos a serem analisados é feita pela nossa equipe editorial. A amostra de teste foi fornecida ao autor como empréstimo pelo fabricante ou varejista para fins desta revisão. O credor não teve influência nesta revisão, nem o fabricante recebeu uma cópia desta revisão antes da publicação. Não houve obrigação de publicar esta revisão. Como empresa de mídia independente, a Notebookcheck não está sujeita à autoridade de fabricantes, varejistas ou editores.
É assim que o Notebookcheck está testando
Todos os anos, o Notebookcheck analisa de forma independente centenas de laptops e smartphones usando procedimentos padronizados para garantir que todos os resultados sejam comparáveis. Desenvolvemos continuamente nossos métodos de teste há cerca de 20 anos e definimos padrões da indústria no processo. Em nossos laboratórios de teste, equipamentos de medição de alta qualidade são utilizados por técnicos e editores experientes. Esses testes envolvem um processo de validação em vários estágios. Nosso complexo sistema de classificação é baseado em centenas de medições e benchmarks bem fundamentados, o que mantém a objetividade.Price comparison

