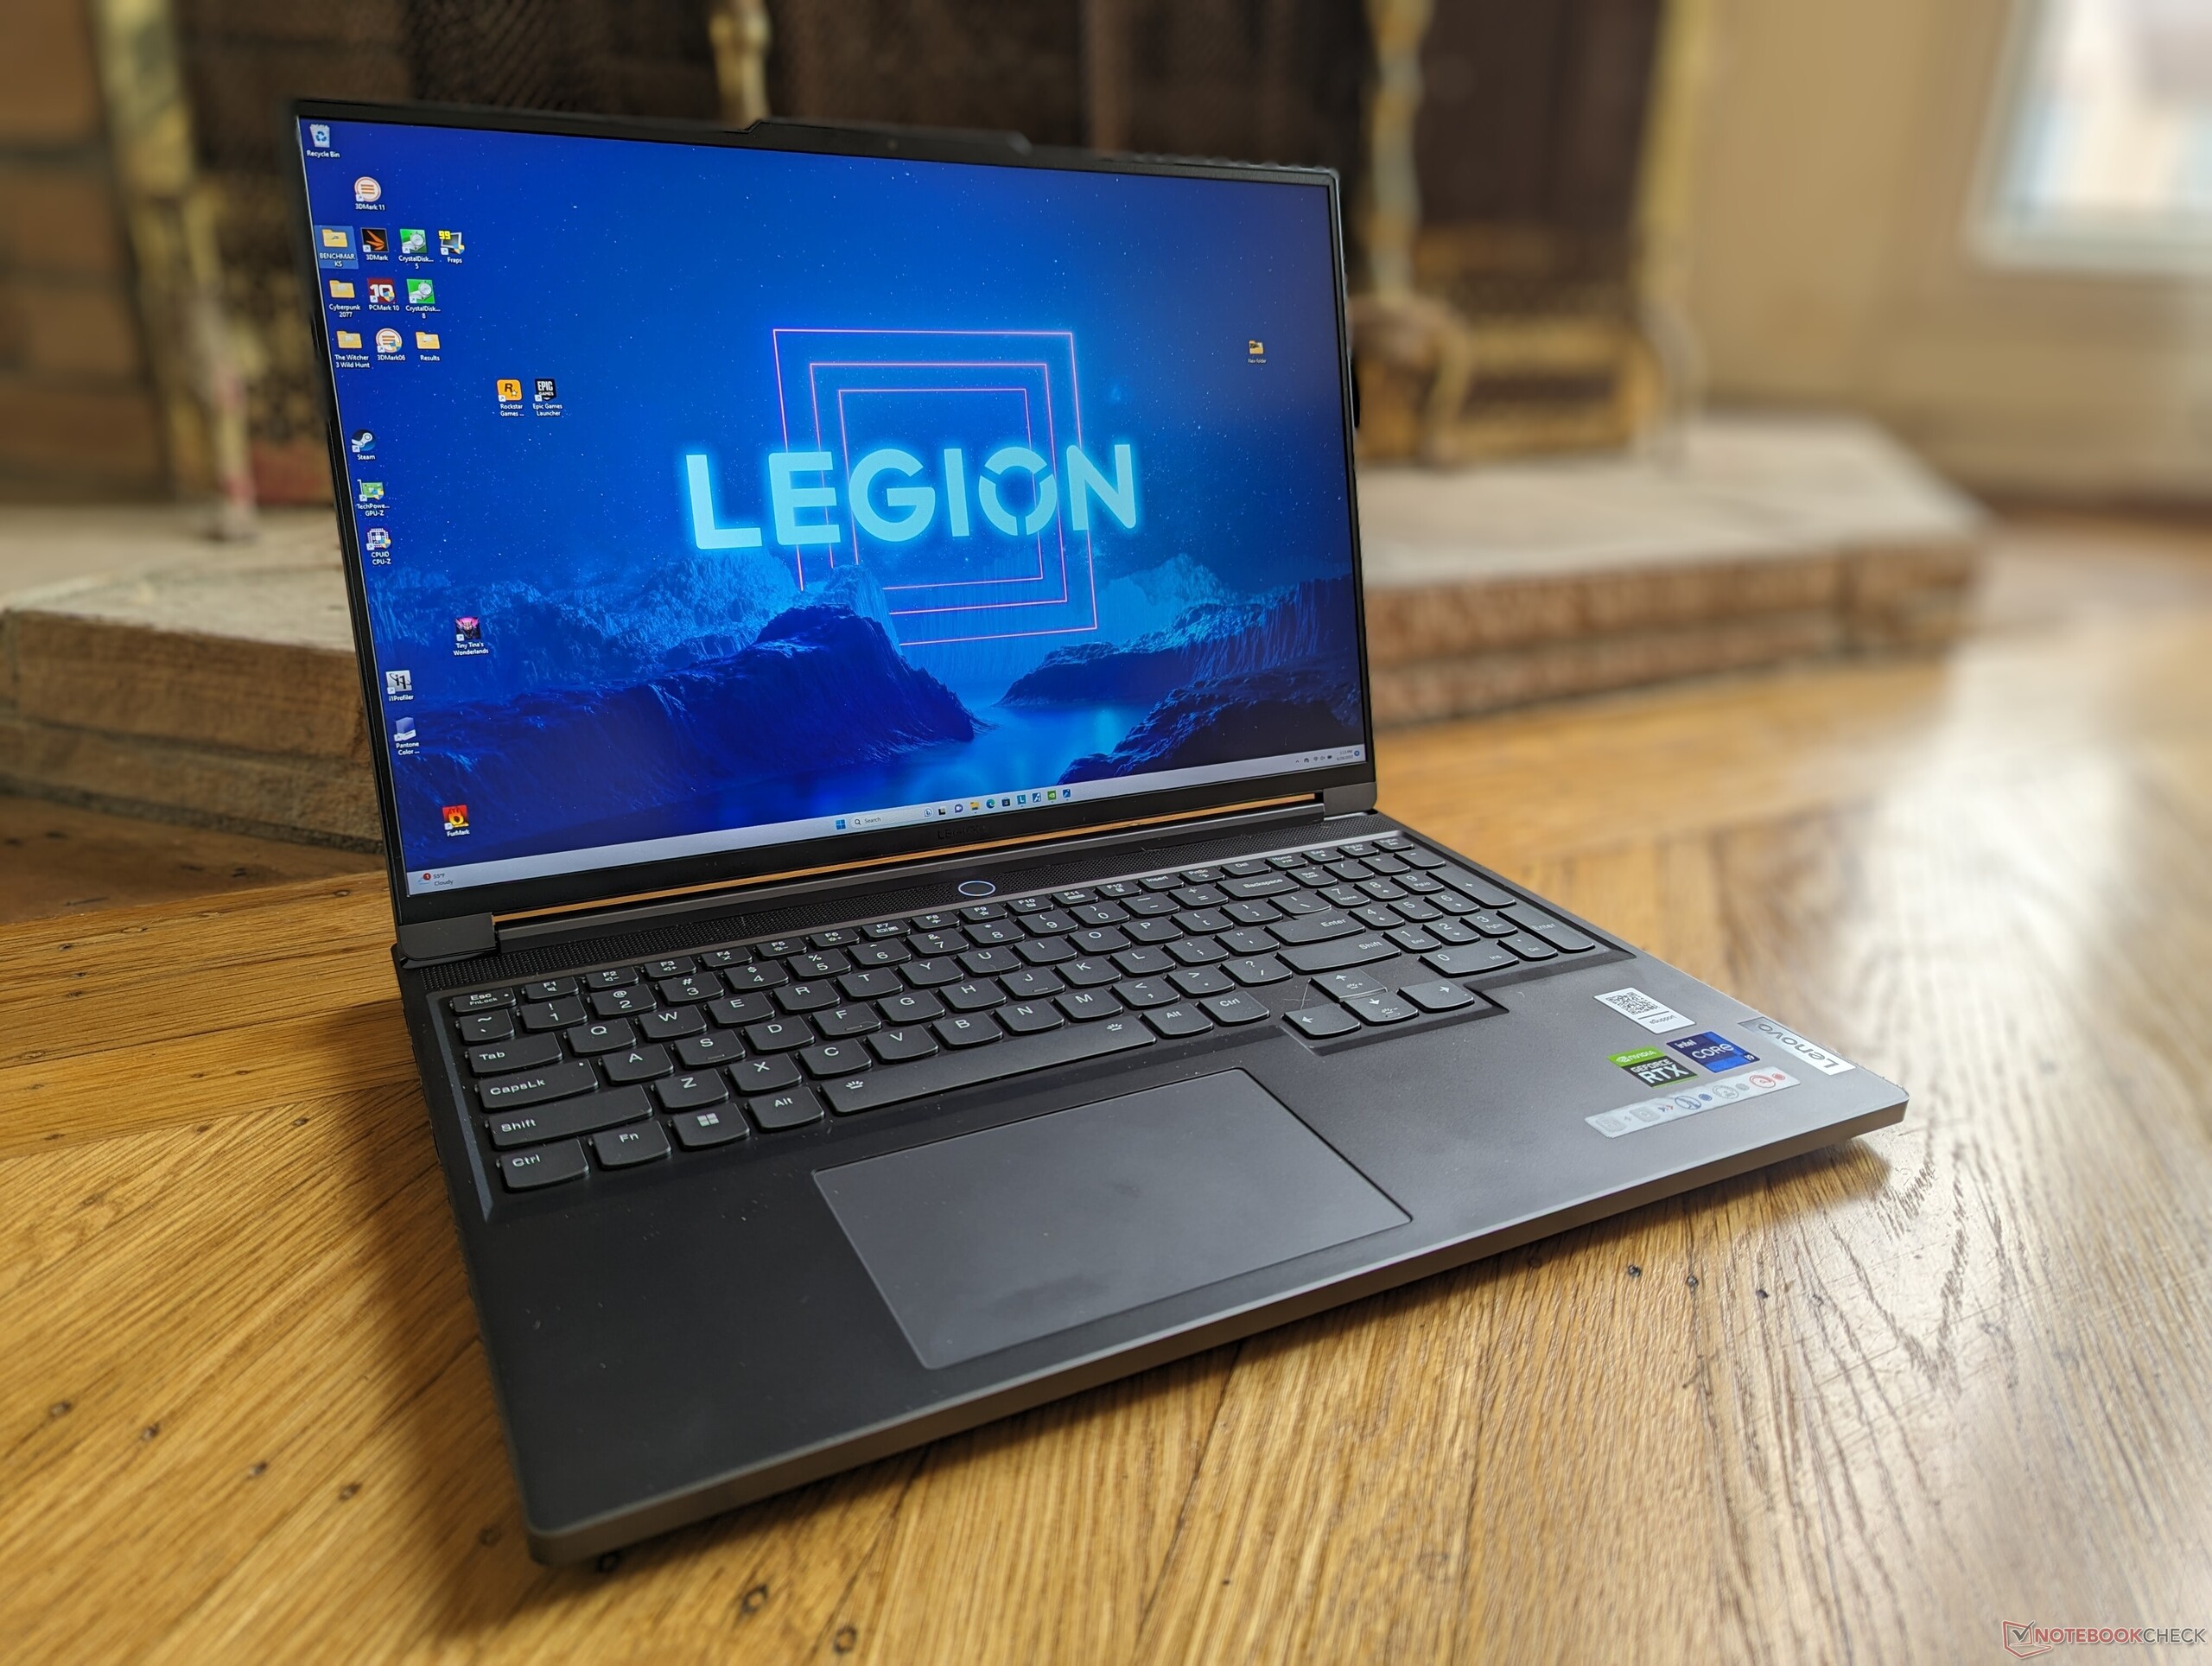
Análise do laptop Lenovo Legion Slim 7i 16 Gen 8: Mais fino que o Razer Blade 16

O Lenovo Legion Slim 7i Gen 8 substitui o modelo do ano passado Legion Slim 7i Gen 7 com CPUs Raptor Lake-H de 13ª geração mais recentes, GPUs Nvidia Ada Lovelace e um design de chassi revisado. Ele complementa a série Slim 7i Gen 7, mais espessa e mais potente Legion Série Pro 7.
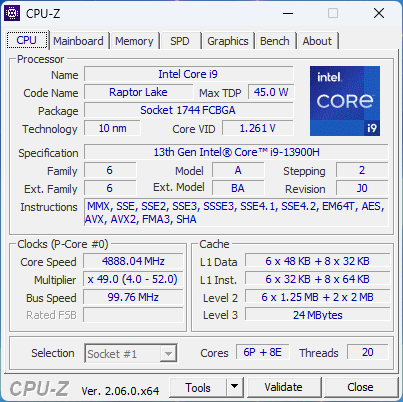
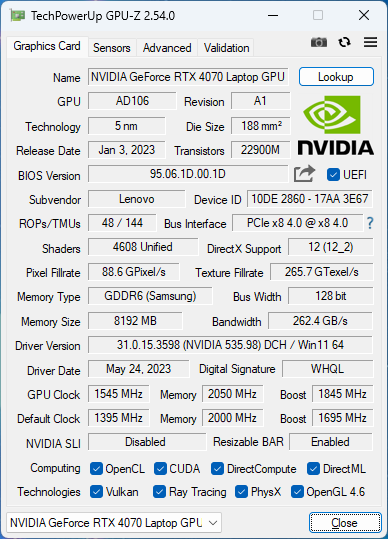
Nossa unidade de análise é uma configuração de ponta com o Core i9-13900H, GPU GeForce RTX 4070 de 140 W e tela IPS de 2560 x 1600 240 Hz por aproximadamente US$ 1.600 no varejo. Outras SKUs estão disponíveis com o Core i7-13700H menor, RTX 4060 ou tela de resolução mais alta de 3200 x 2000 165 Hz a partir de aproximadamente US$ 1500.
Os concorrentes do Legion Slim 7i G8 incluem outros laptops para jogos finos e leves de 16 polegadas, como o Razer Blade 16, HP Omen 16, Asus ROG Zephyrus M16ou o Alienware x16 R1.
Mais análises da Lenovo:
Possíveis concorrentes em comparação
Avaliação | Data | Modelo | Peso | Altura | Size | Resolução | Preço |
|---|---|---|---|---|---|---|---|
| 90 % v7 (old) | 07/2023 | Lenovo Legion Slim 7i 16 Gen 8 i9-13900H, GeForce RTX 4070 Laptop GPU | 2.1 kg | 19.9 mm | 16.00" | 2560x1600 | |
| 87.4 % v7 (old) | 07/2023 | HP Omen 16-wf000 i7-13700HX, GeForce RTX 4080 Laptop GPU | 2.4 kg | 23.6 mm | 16.10" | 2560x1440 | |
| 88.4 % v7 (old) | 06/2023 | Alienware x16 R1 i9-13900HK, GeForce RTX 4080 Laptop GPU | 2.6 kg | 18.57 mm | 16.00" | 2560x1600 | |
| 88.8 % v7 (old) | 06/2023 | Lenovo Legion Pro 7 RTX4090 i9-13900HX, GeForce RTX 4090 Laptop GPU | 2.7 kg | 26 mm | 16.00" | 2560x1600 | |
| 88.4 % v7 (old) | 03/2023 | Asus ROG Strix G16 G614JZ i9-13980HX, GeForce RTX 4080 Laptop GPU | 2.4 kg | 30.4 mm | 16.00" | 2560x1600 | |
| 91.2 % v7 (old) | 02/2023 | Razer Blade 16 Early 2023 i9-13950HX, GeForce RTX 4080 Laptop GPU | 2.4 kg | 21.99 mm | 16.00" | 2560x1600 |
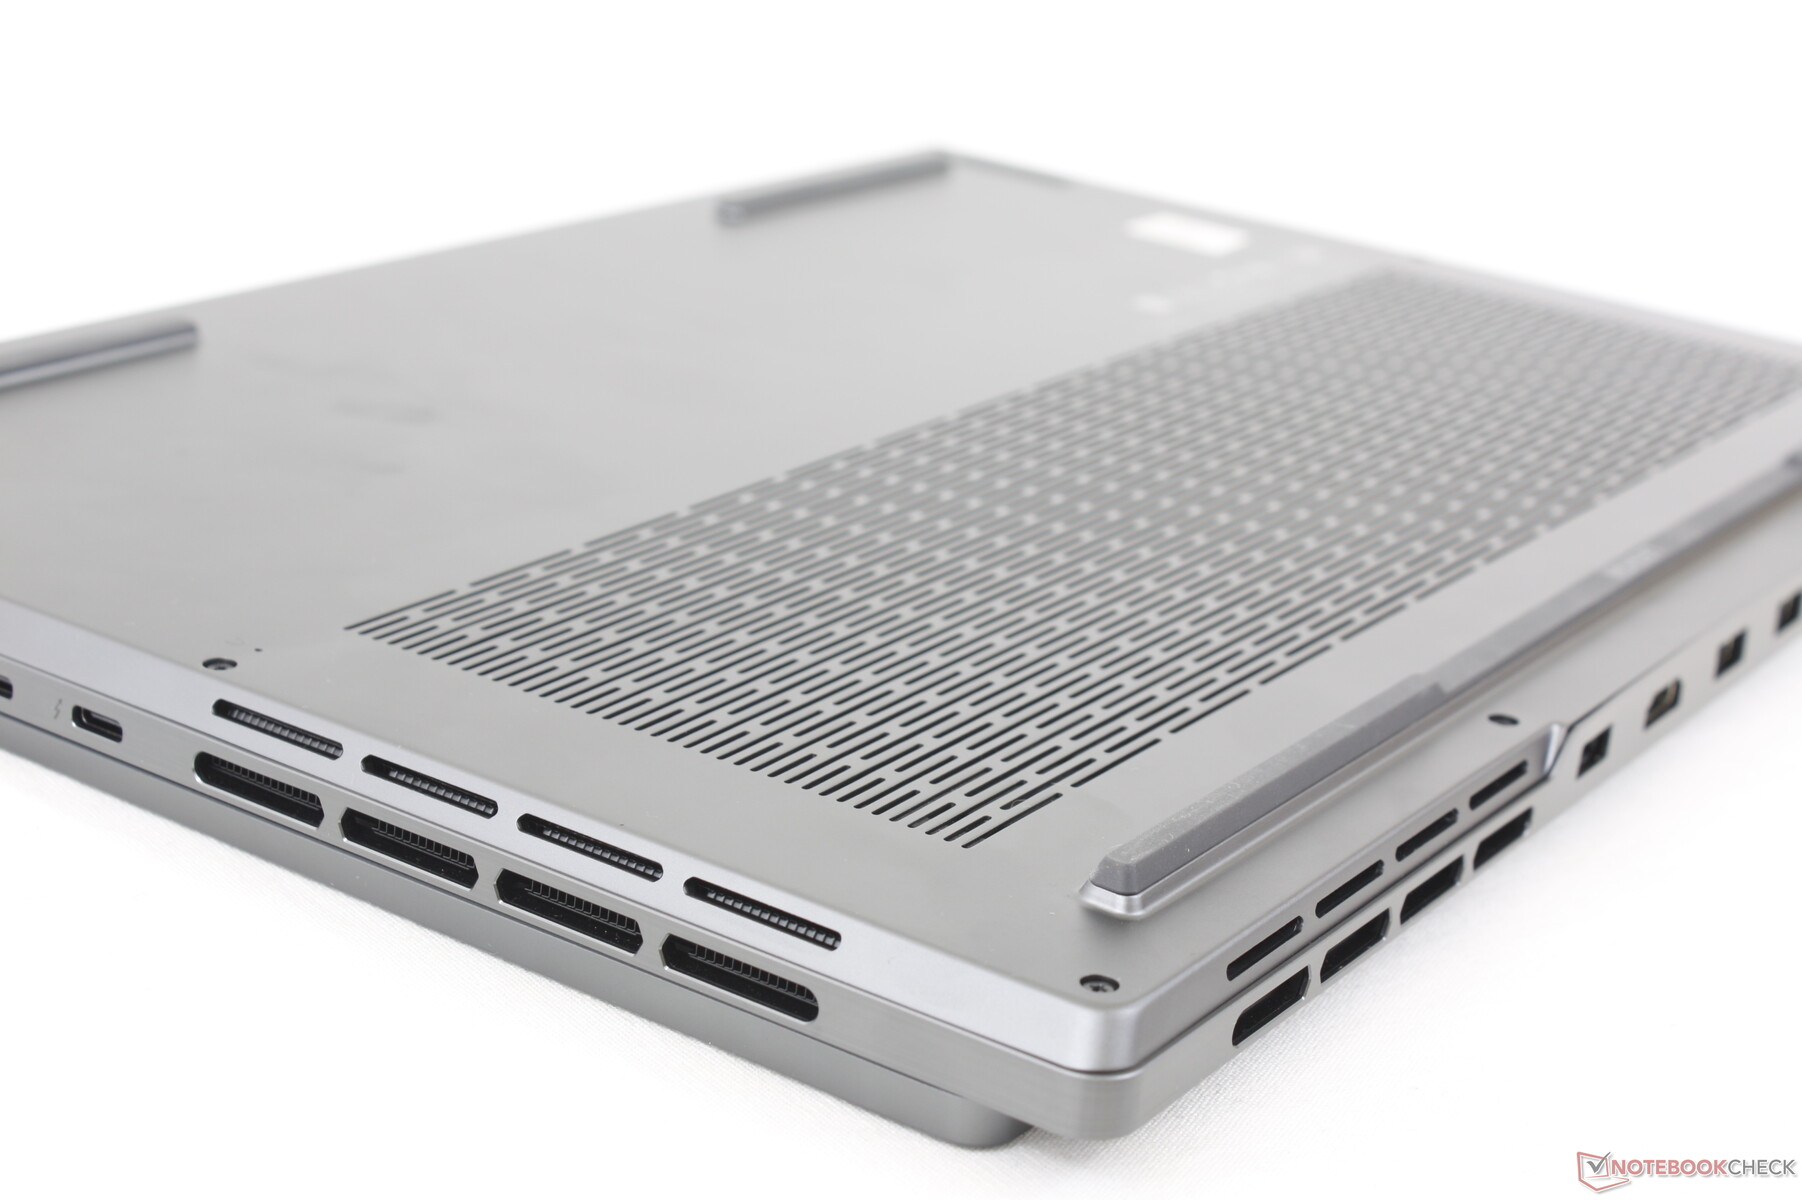
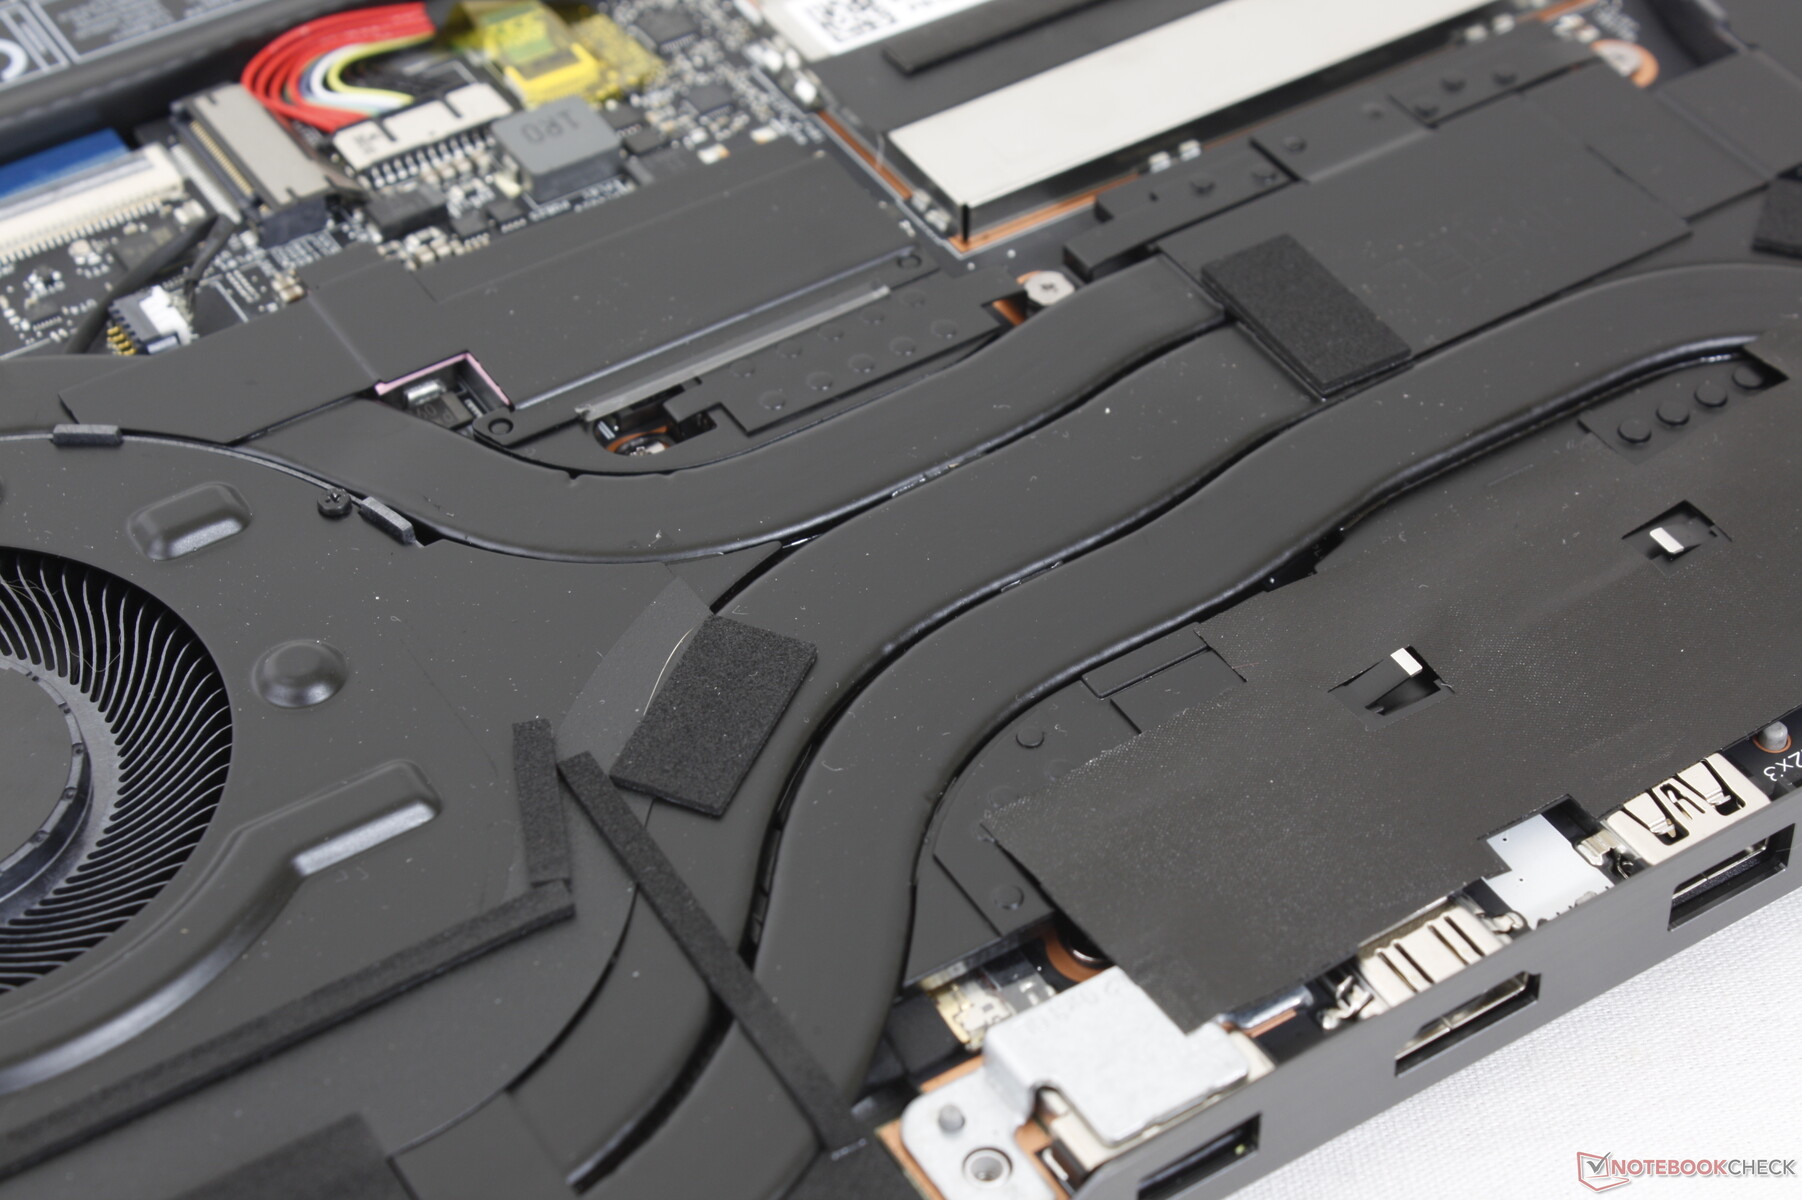
Case - agora com mais grades de ventilação
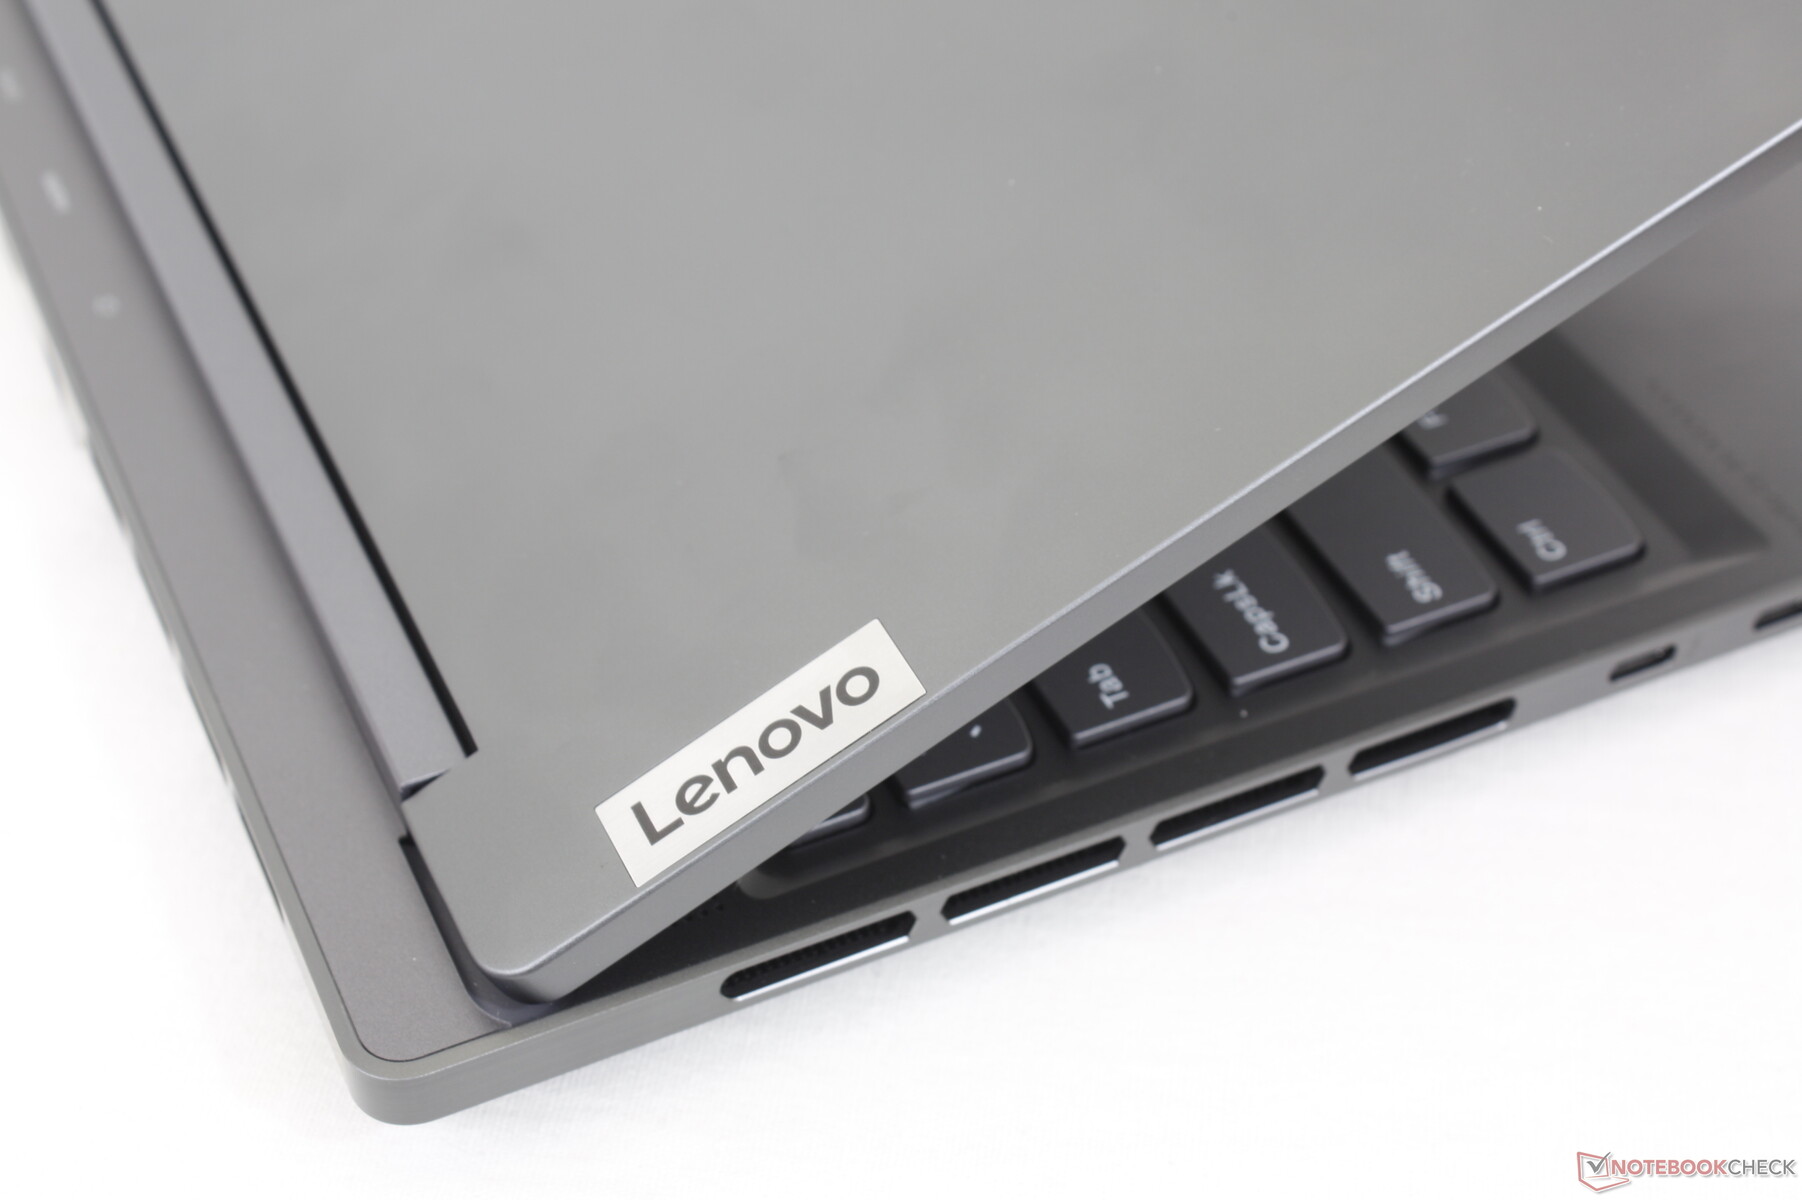
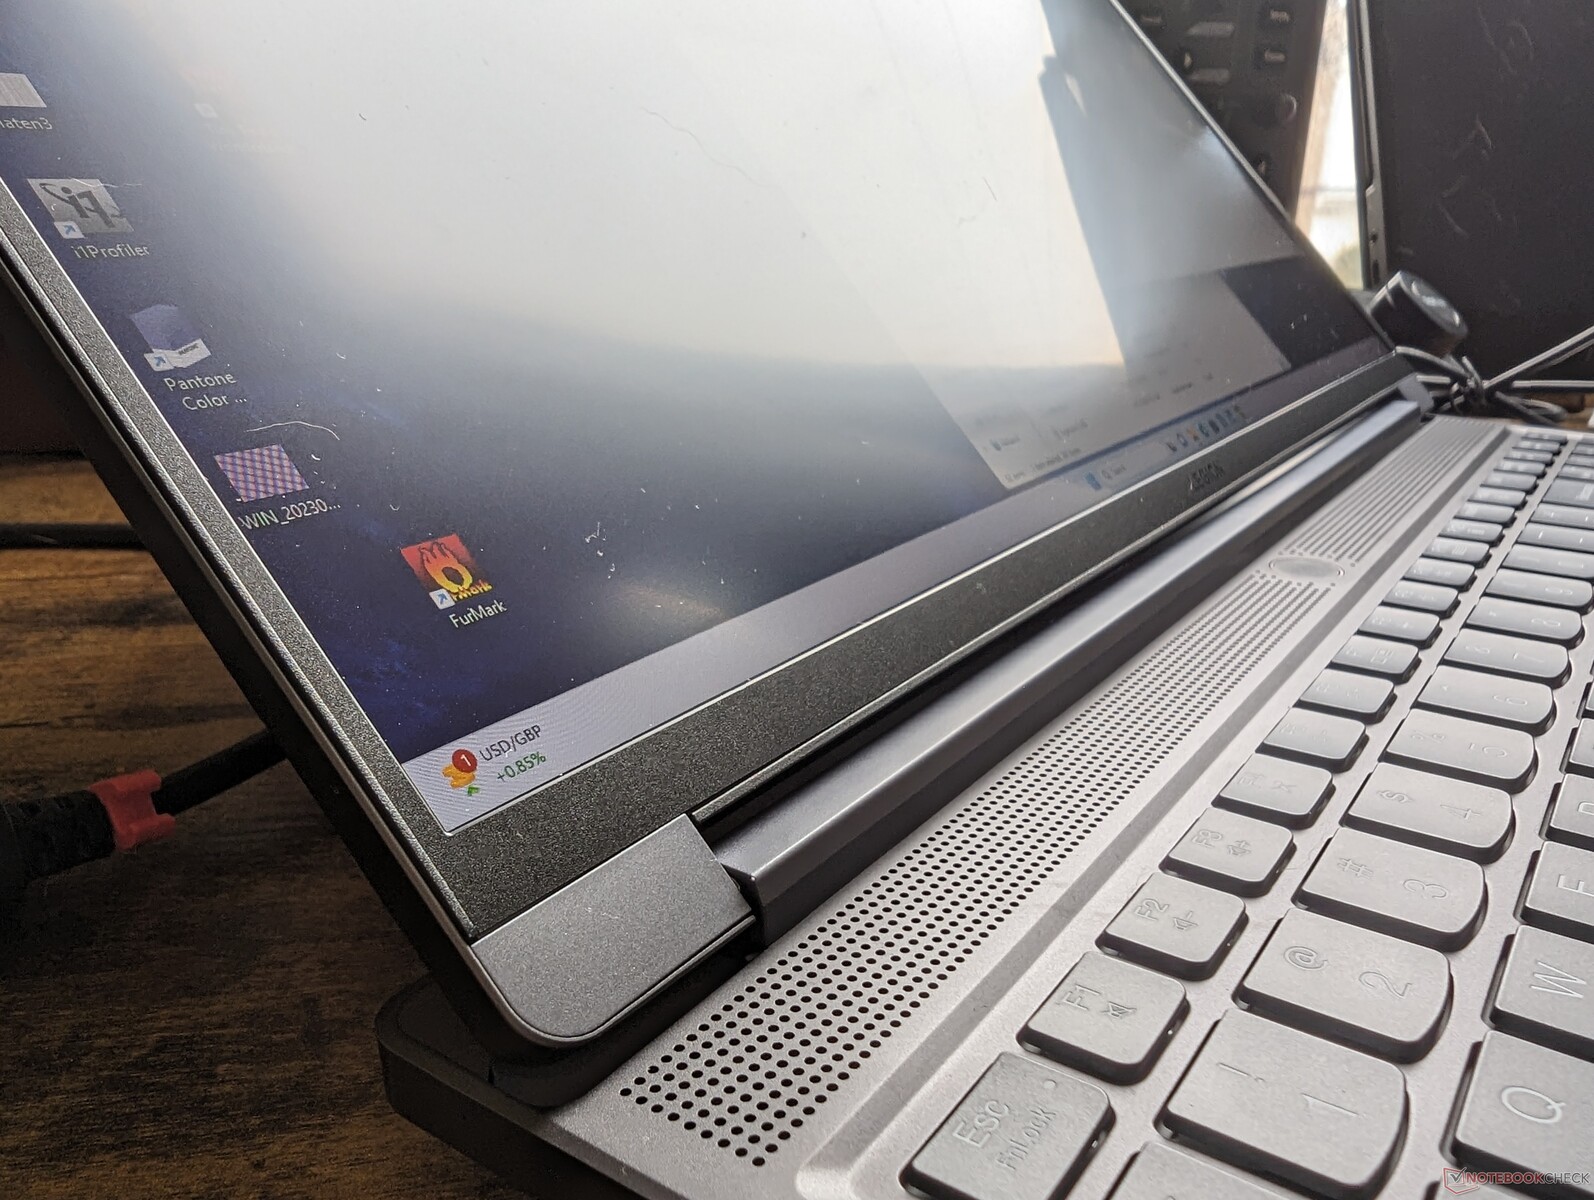
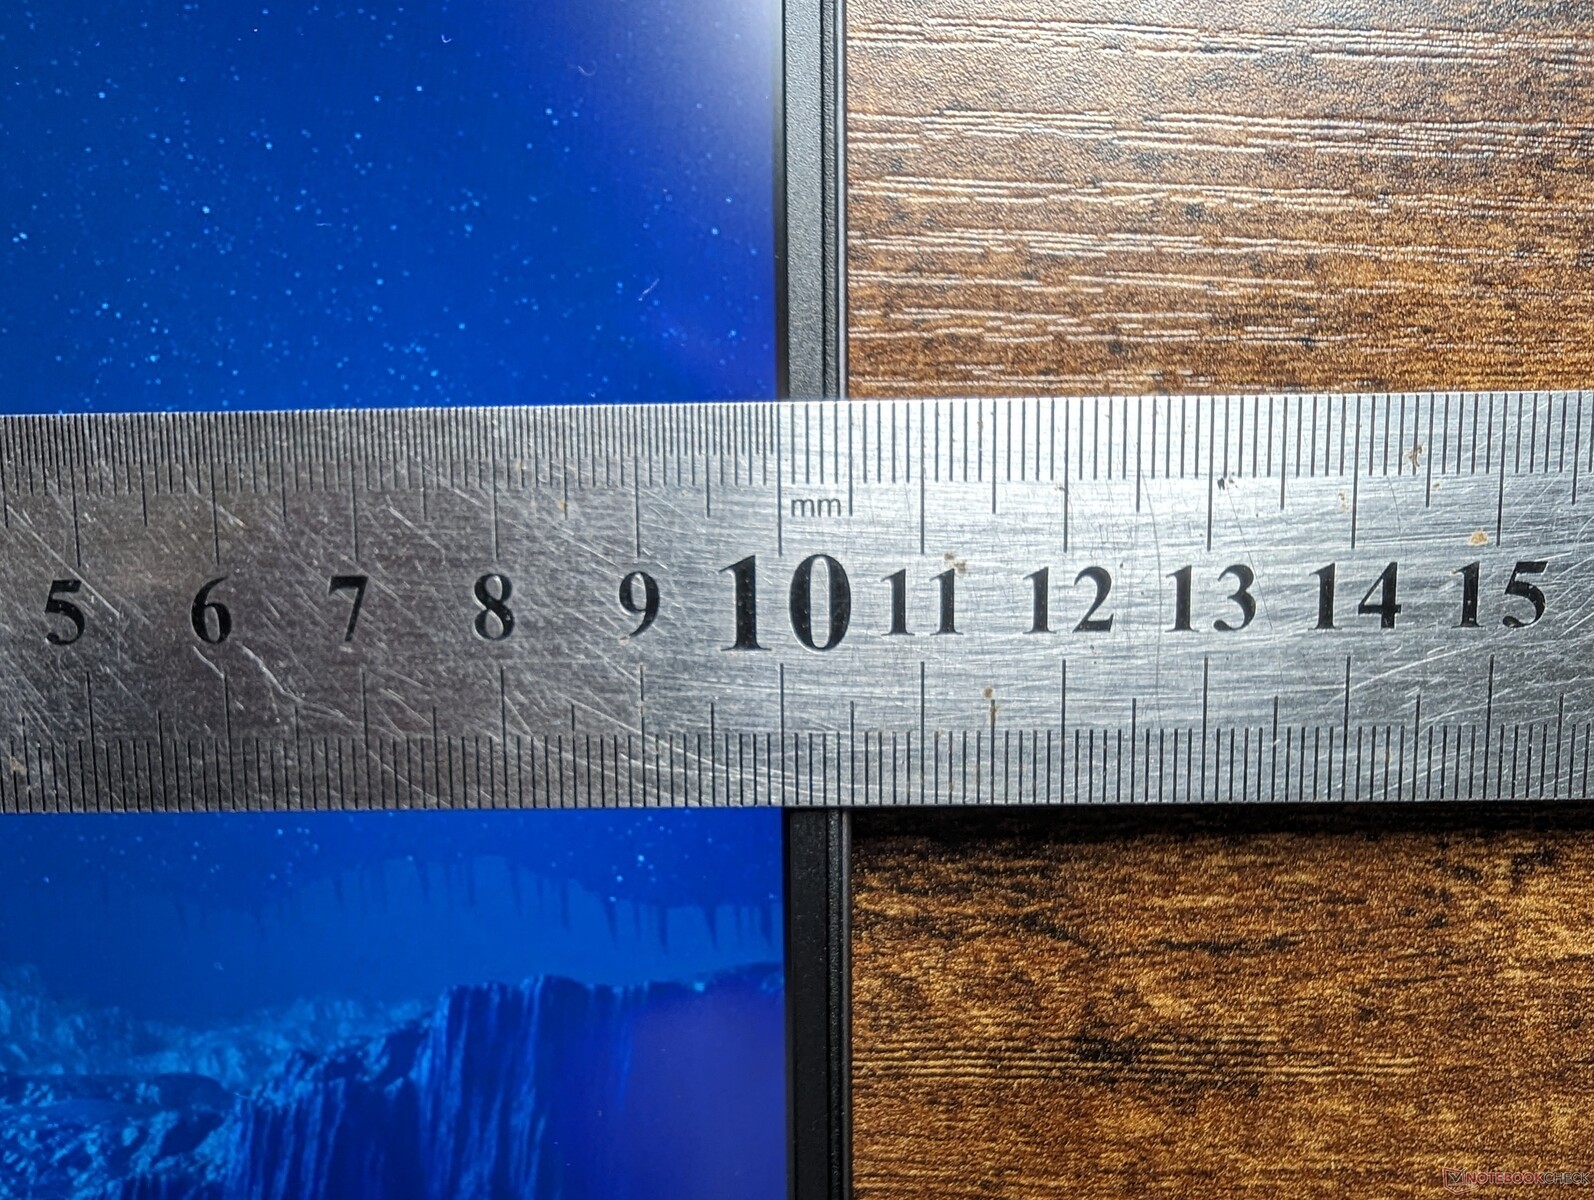
O chassi pode parecer semelhante ao Legion Slim 7i 16 G7 do ano passado na parte frontal, mas a maioria das alterações externas está na parte traseira e nas laterais inferiores. A borda traseira, por exemplo, agora é plana para uma aparência mais limpa, enquanto as grades de ventilação são visivelmente maiores desta vez para melhorar o resfriamento.
Os materiais do chassi têm o mesmo acabamento em alumínio cinza e a mesma sensação observada em outros modelos do Legion 7. A base permanece rígida apesar do perfil fino e a tampa também é relativamente firme. As dobradiças pequenas não são tão sólidas quanto as maiores do Asus ROG Strix G16mas permitem uma abertura total de 180 graus, o que não é comum em laptops para jogos.
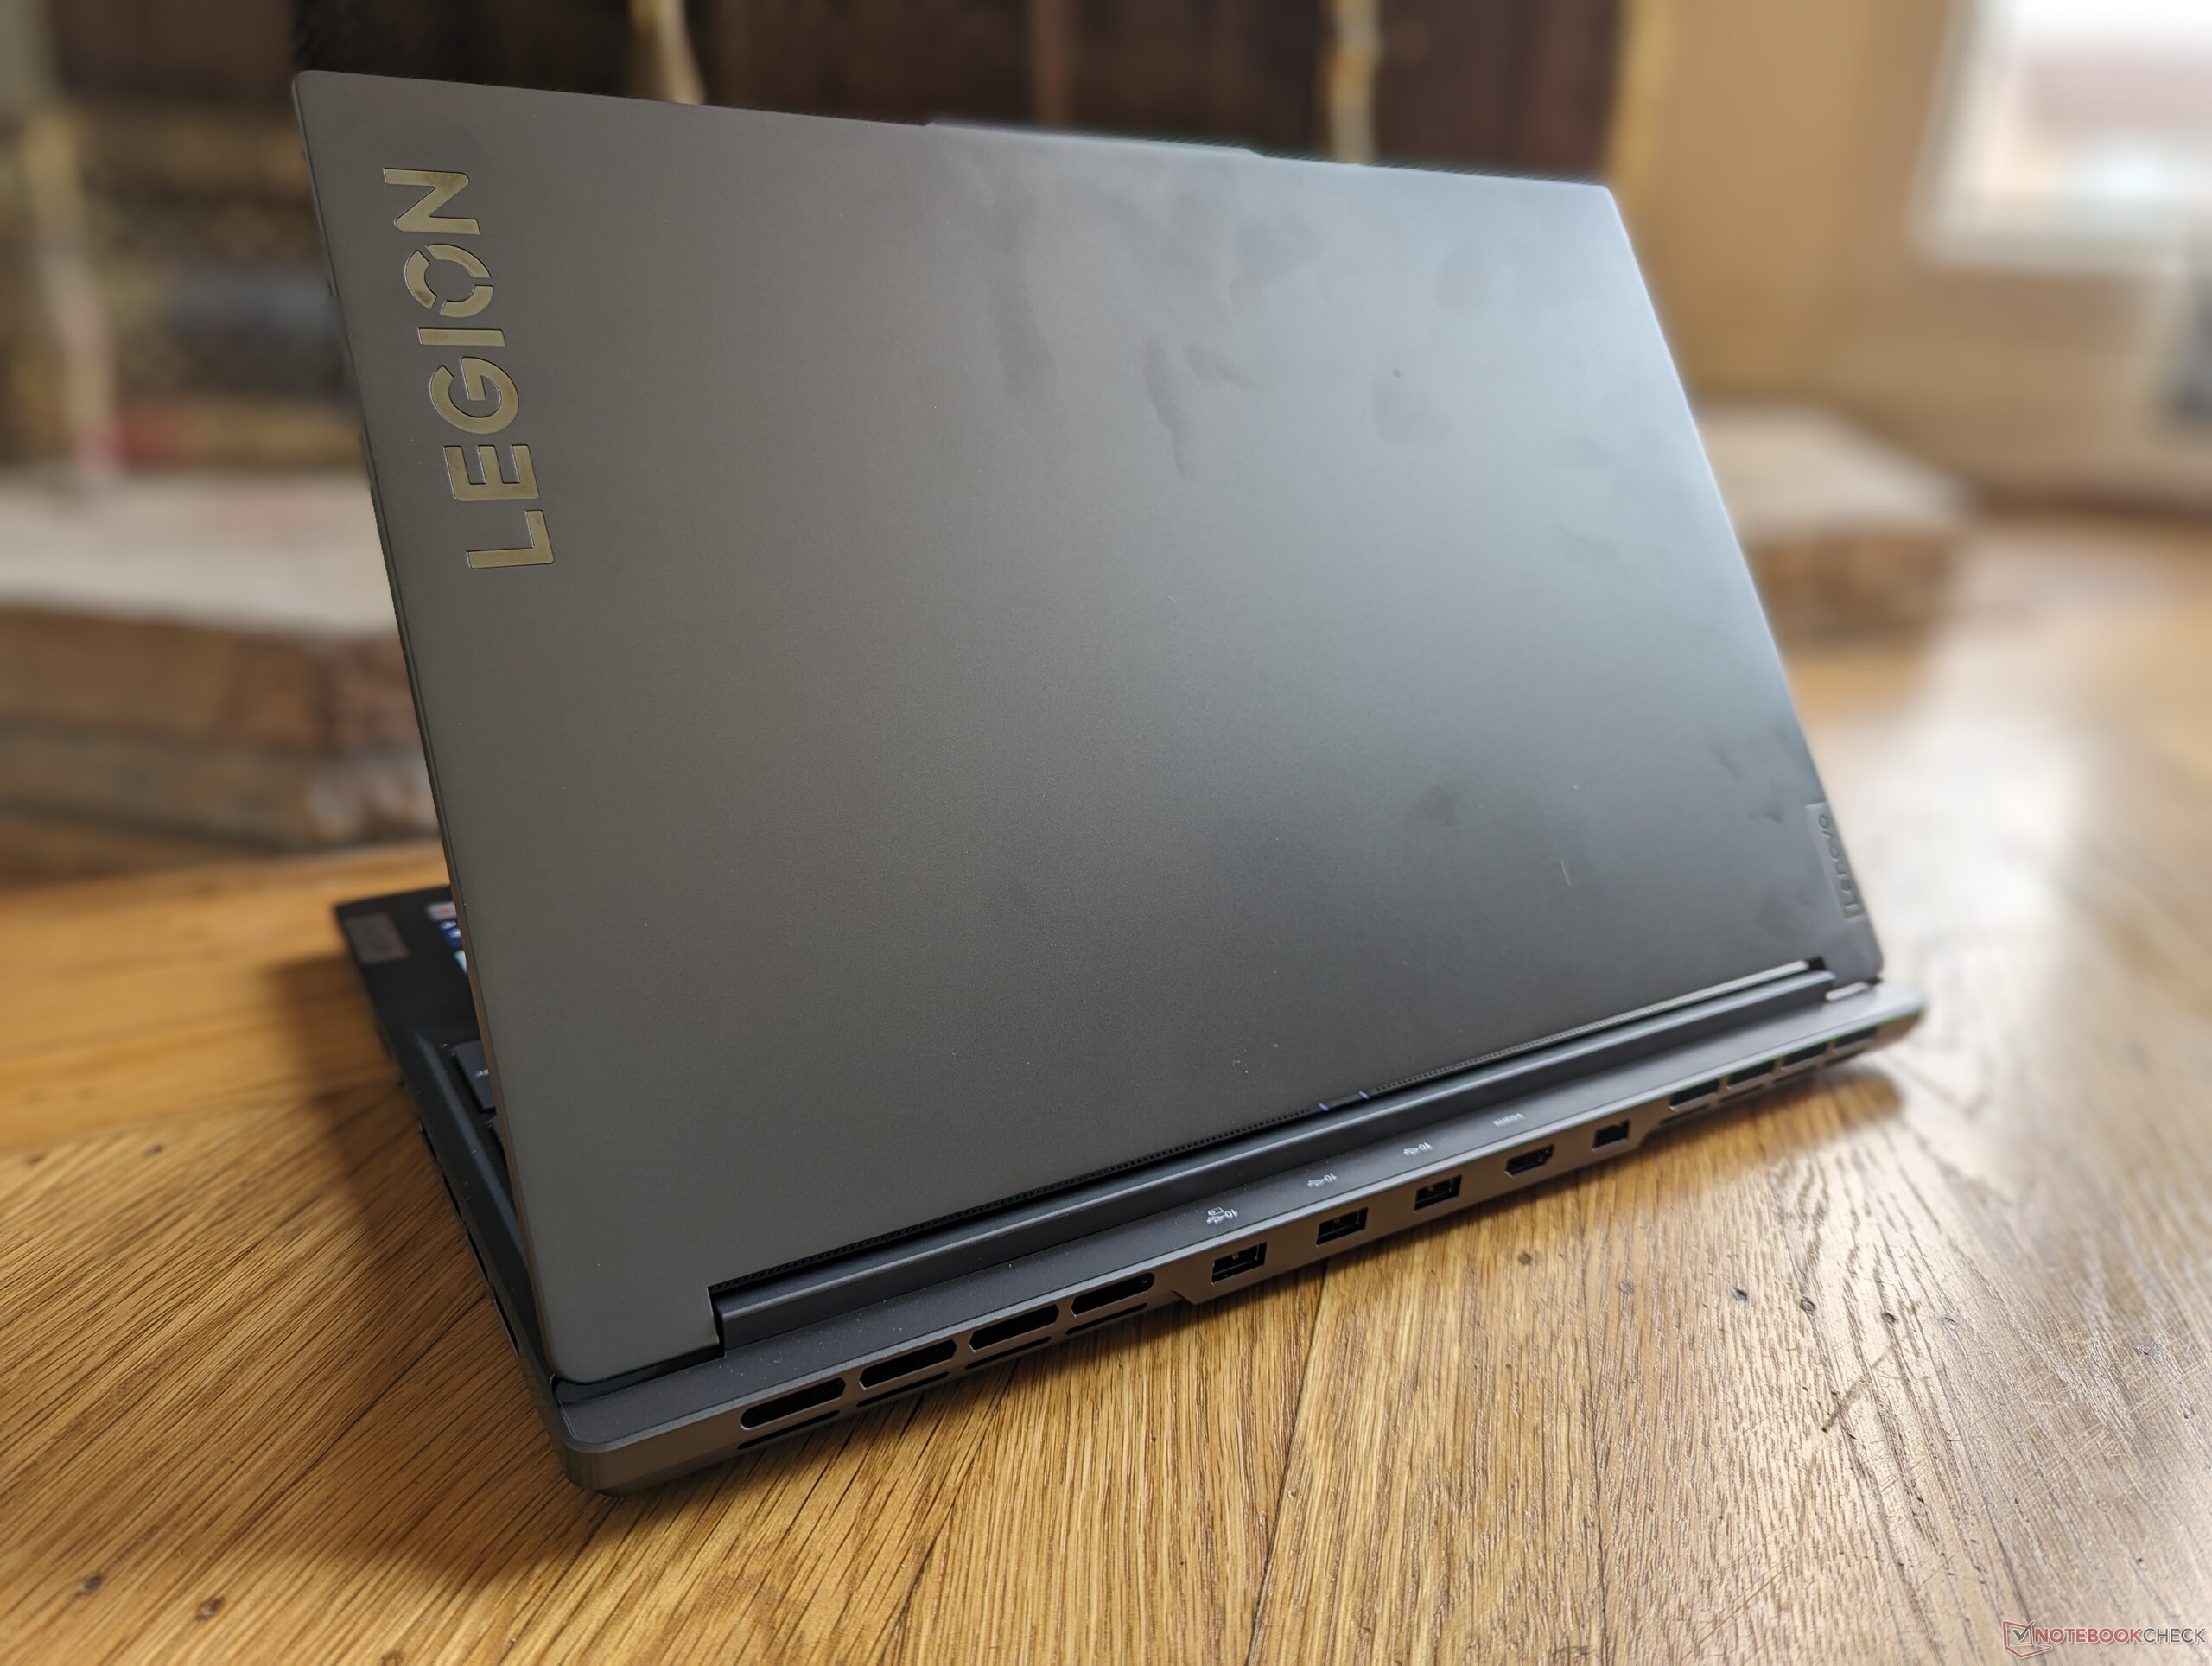
A Lenovo não o chama de Legion Slim 7 à toa. Em comparação com o Legion Pro 7, nossa versão Slim é significativamente mais leve, com 600 g, e visivelmente mais fina, com mais de 6 mm. De fato, o Legion Slim 7 é um dos notebooks para jogos de 16 polegadas mais finos e leves disponíveis no mercado, perdendo apenas para o ligeiramente mais fino e mais leve MSI GS66.
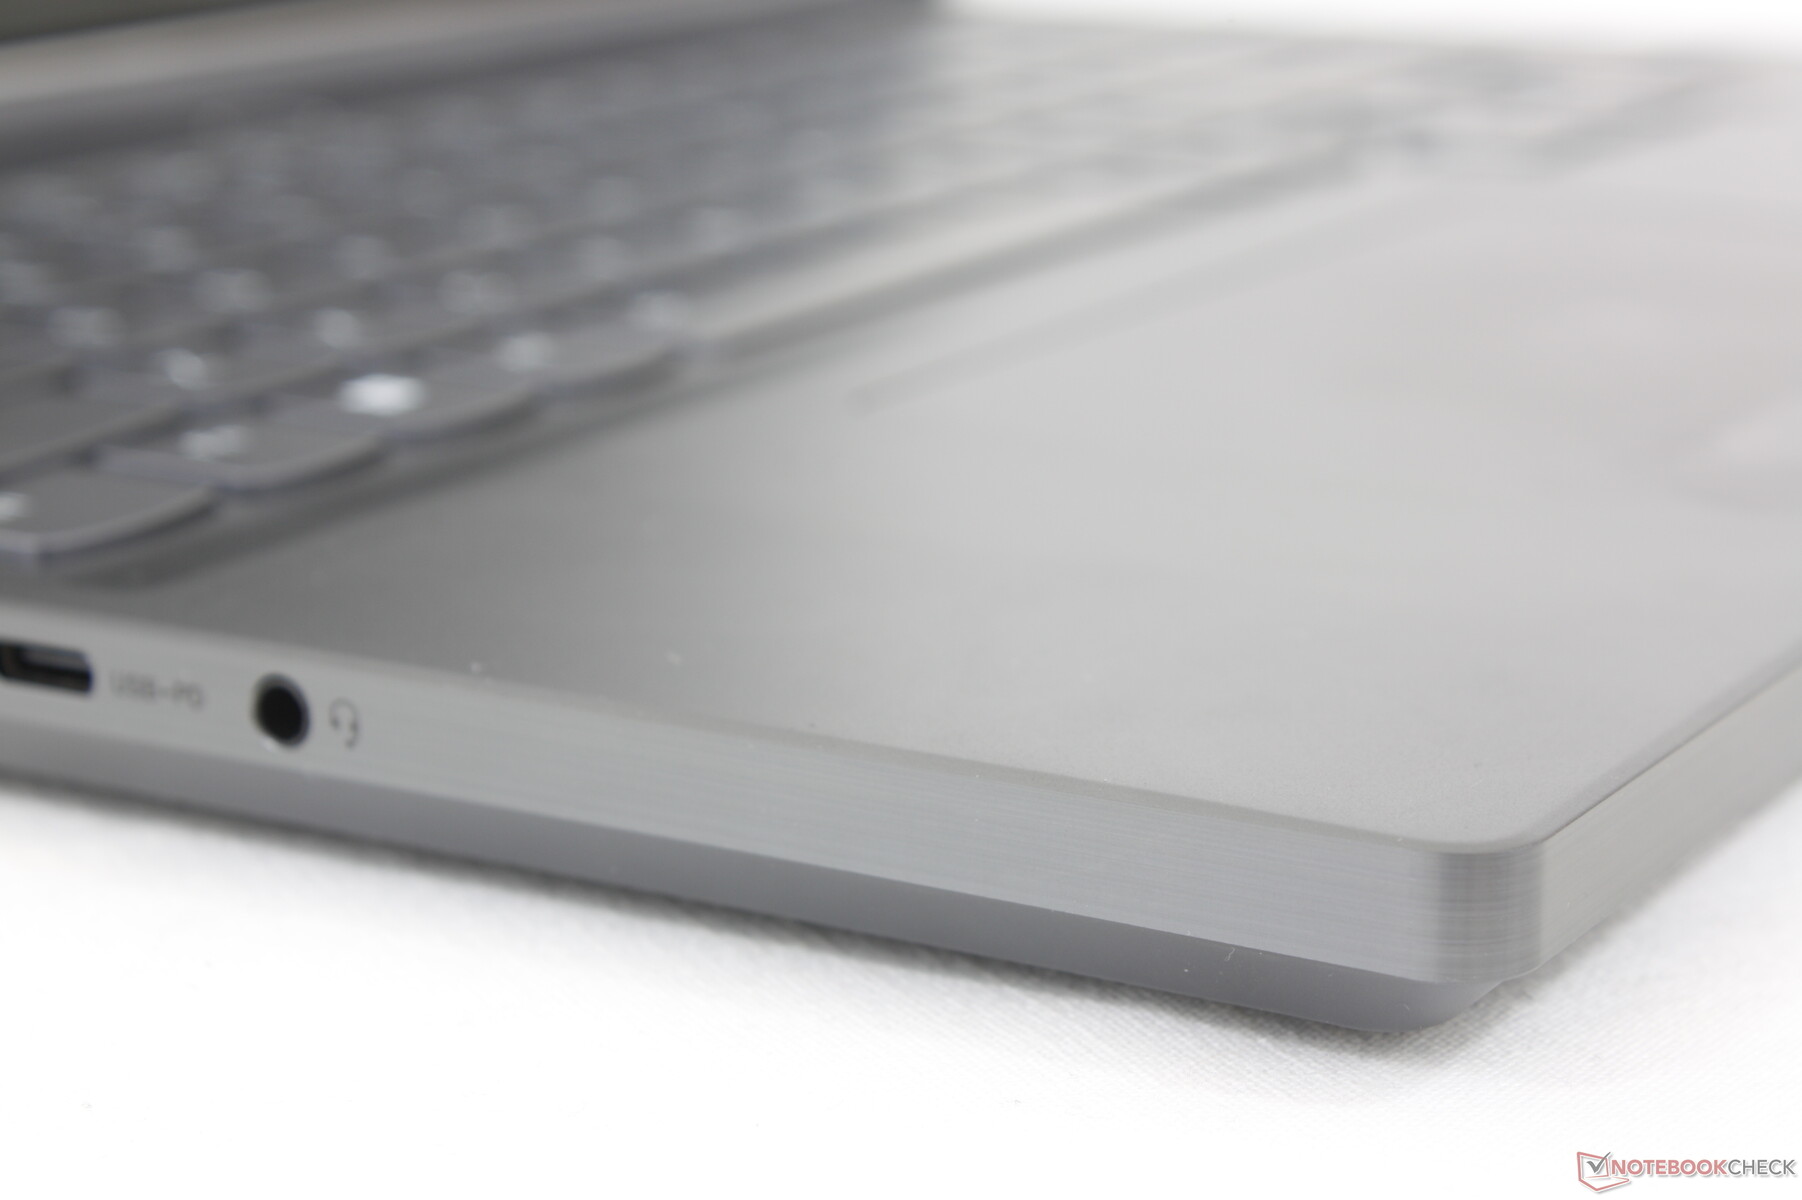
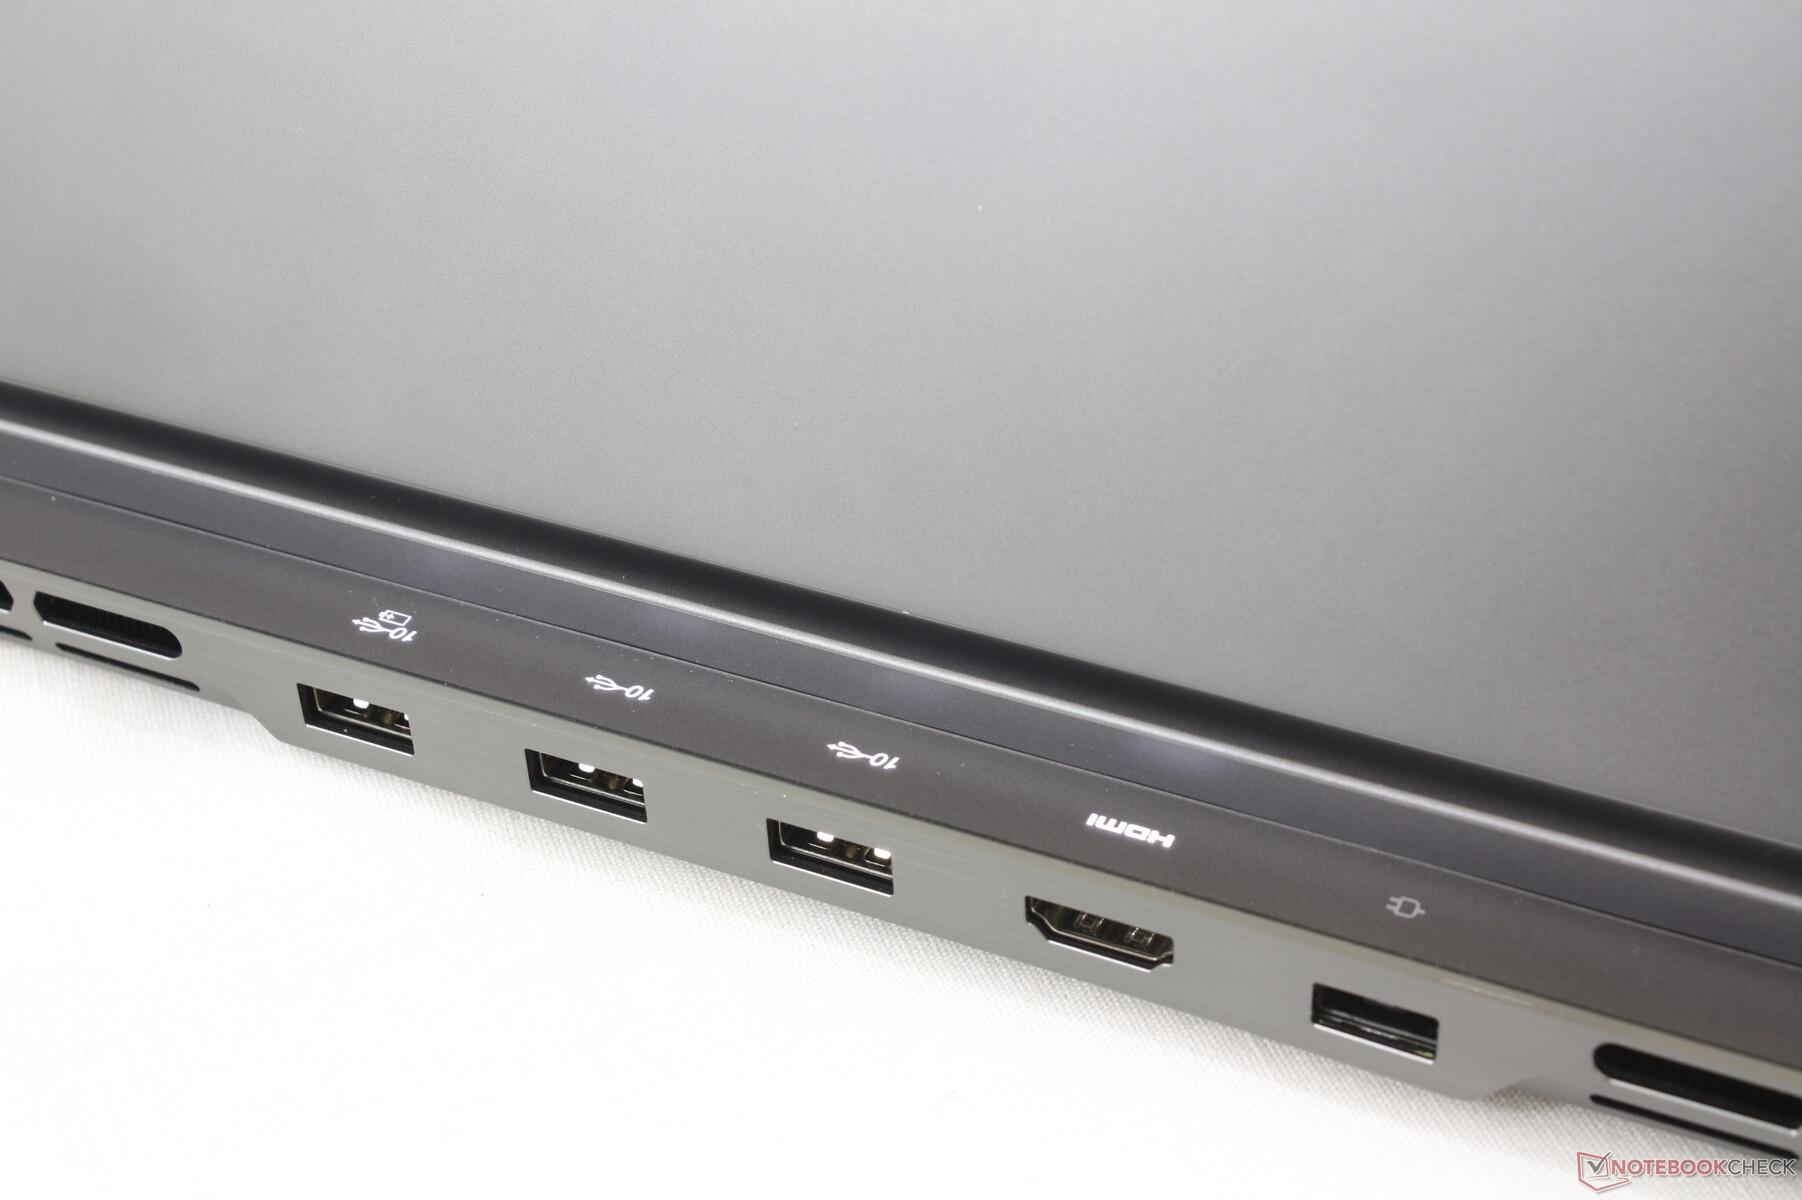
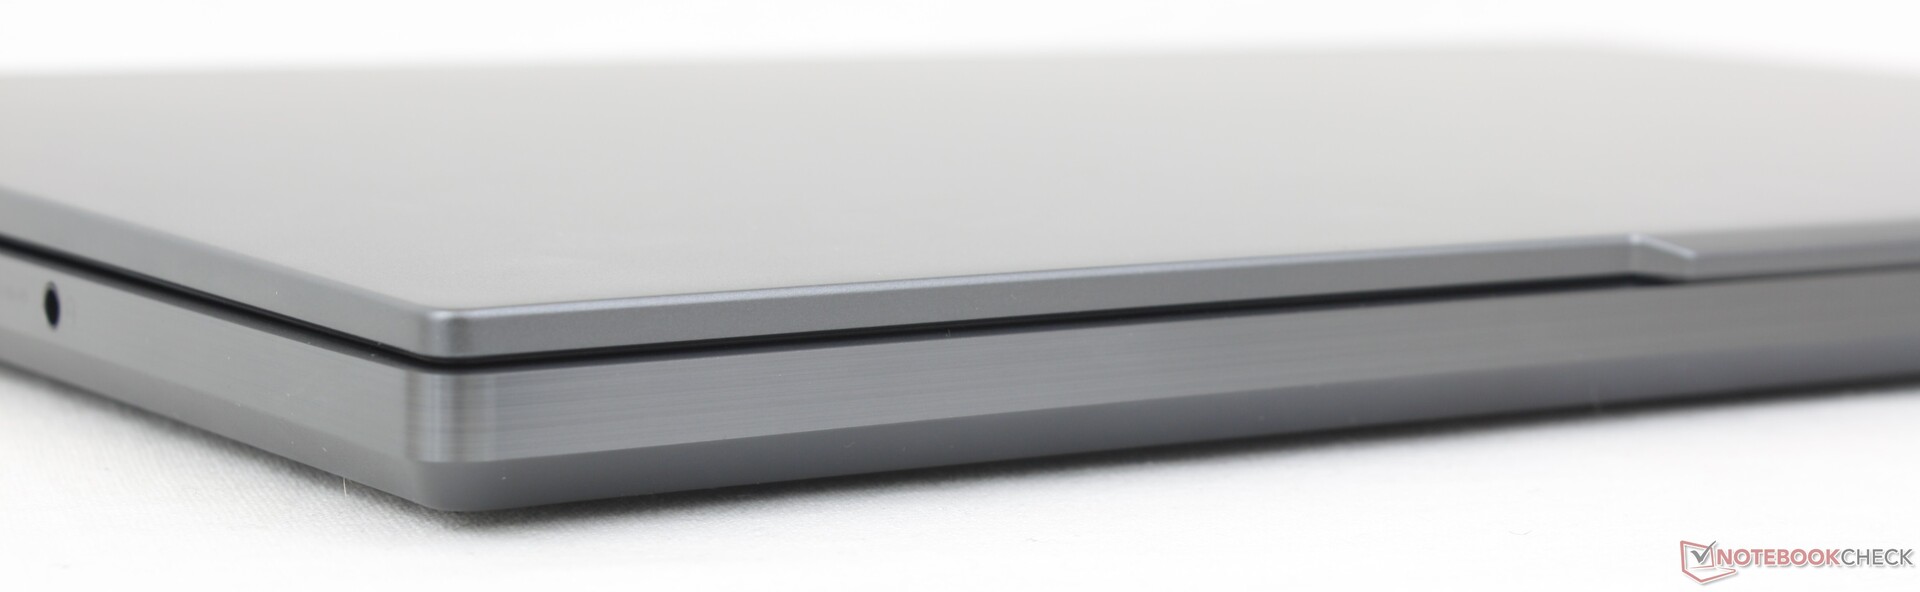
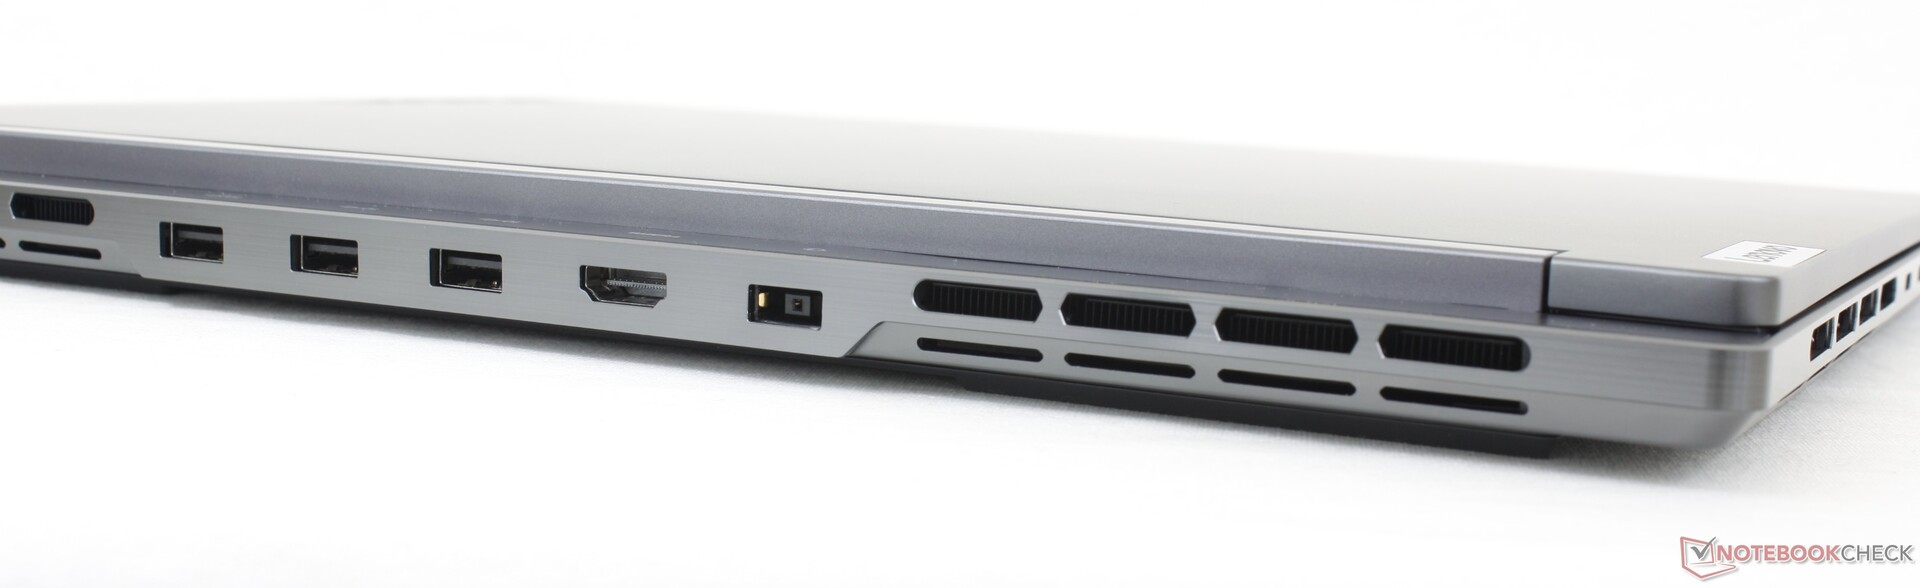
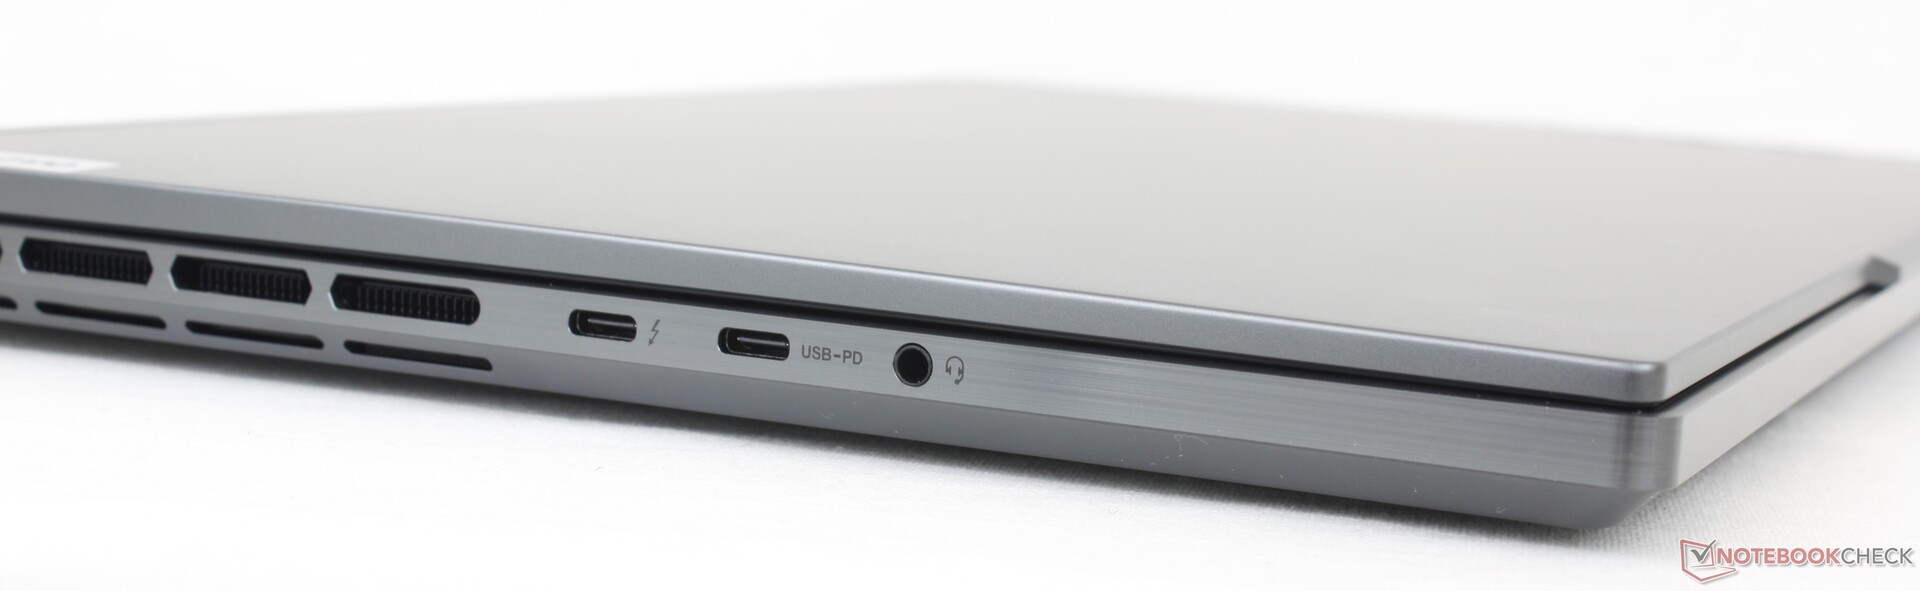
Conectividade - Suporte a Thunderbolt 4
As opções de portas são variadas, com a maioria ao longo da borda traseira, como na série Alienware. Ao contrário do Alienware, no entanto, as duas portas USB-C do nosso Lenovo estão ao longo da borda esquerda para facilitar o acesso.
Observe que apenas uma das duas portas USB-C é compatível com Thunderbolt 4. Se determinados acessórios não funcionarem em uma porta, não deixe de experimentar a outra. Nosso monitor externo Lepow, por exemplo, funcionaria na porta USB-C 3.2, mas não na porta USB-C Thunderbolt.
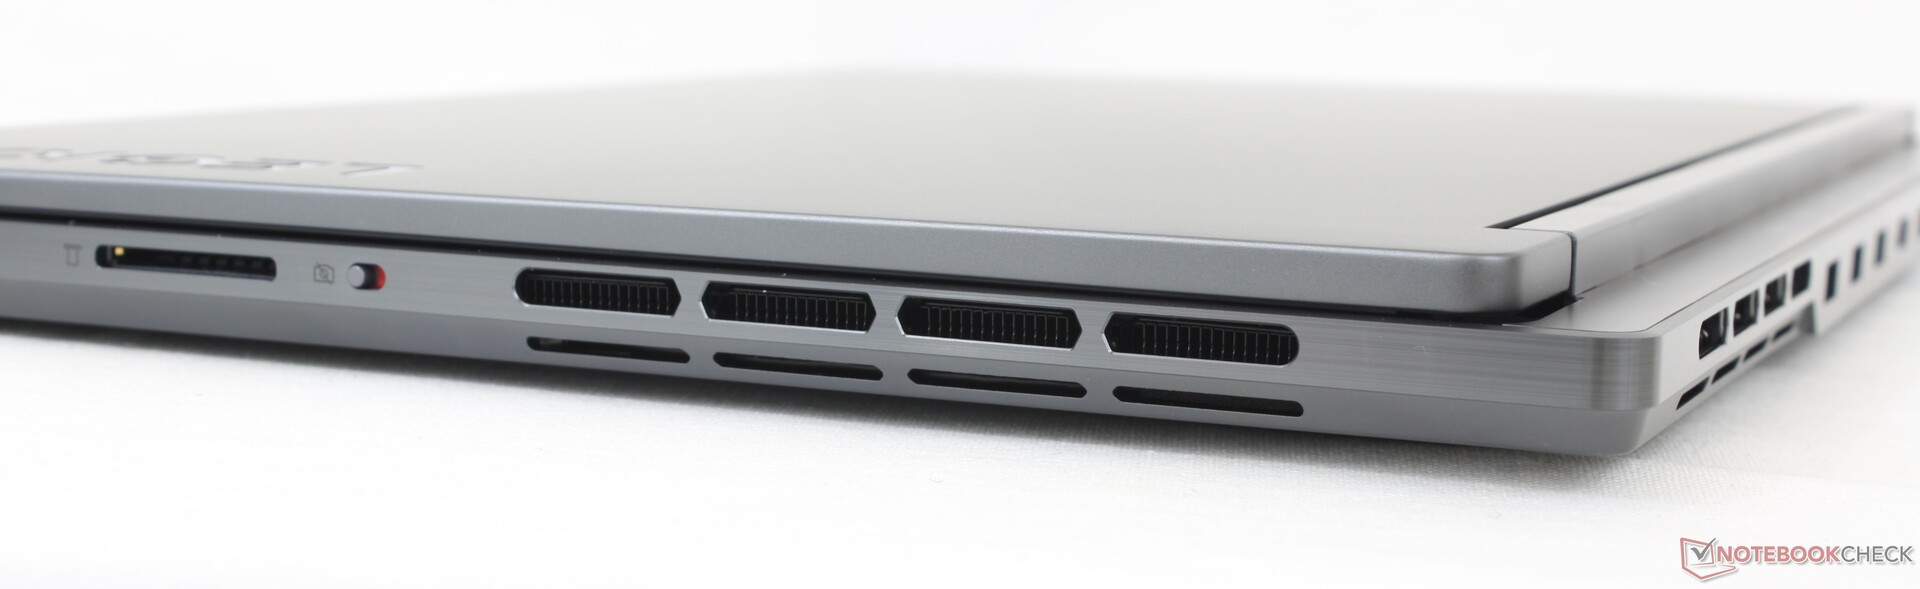
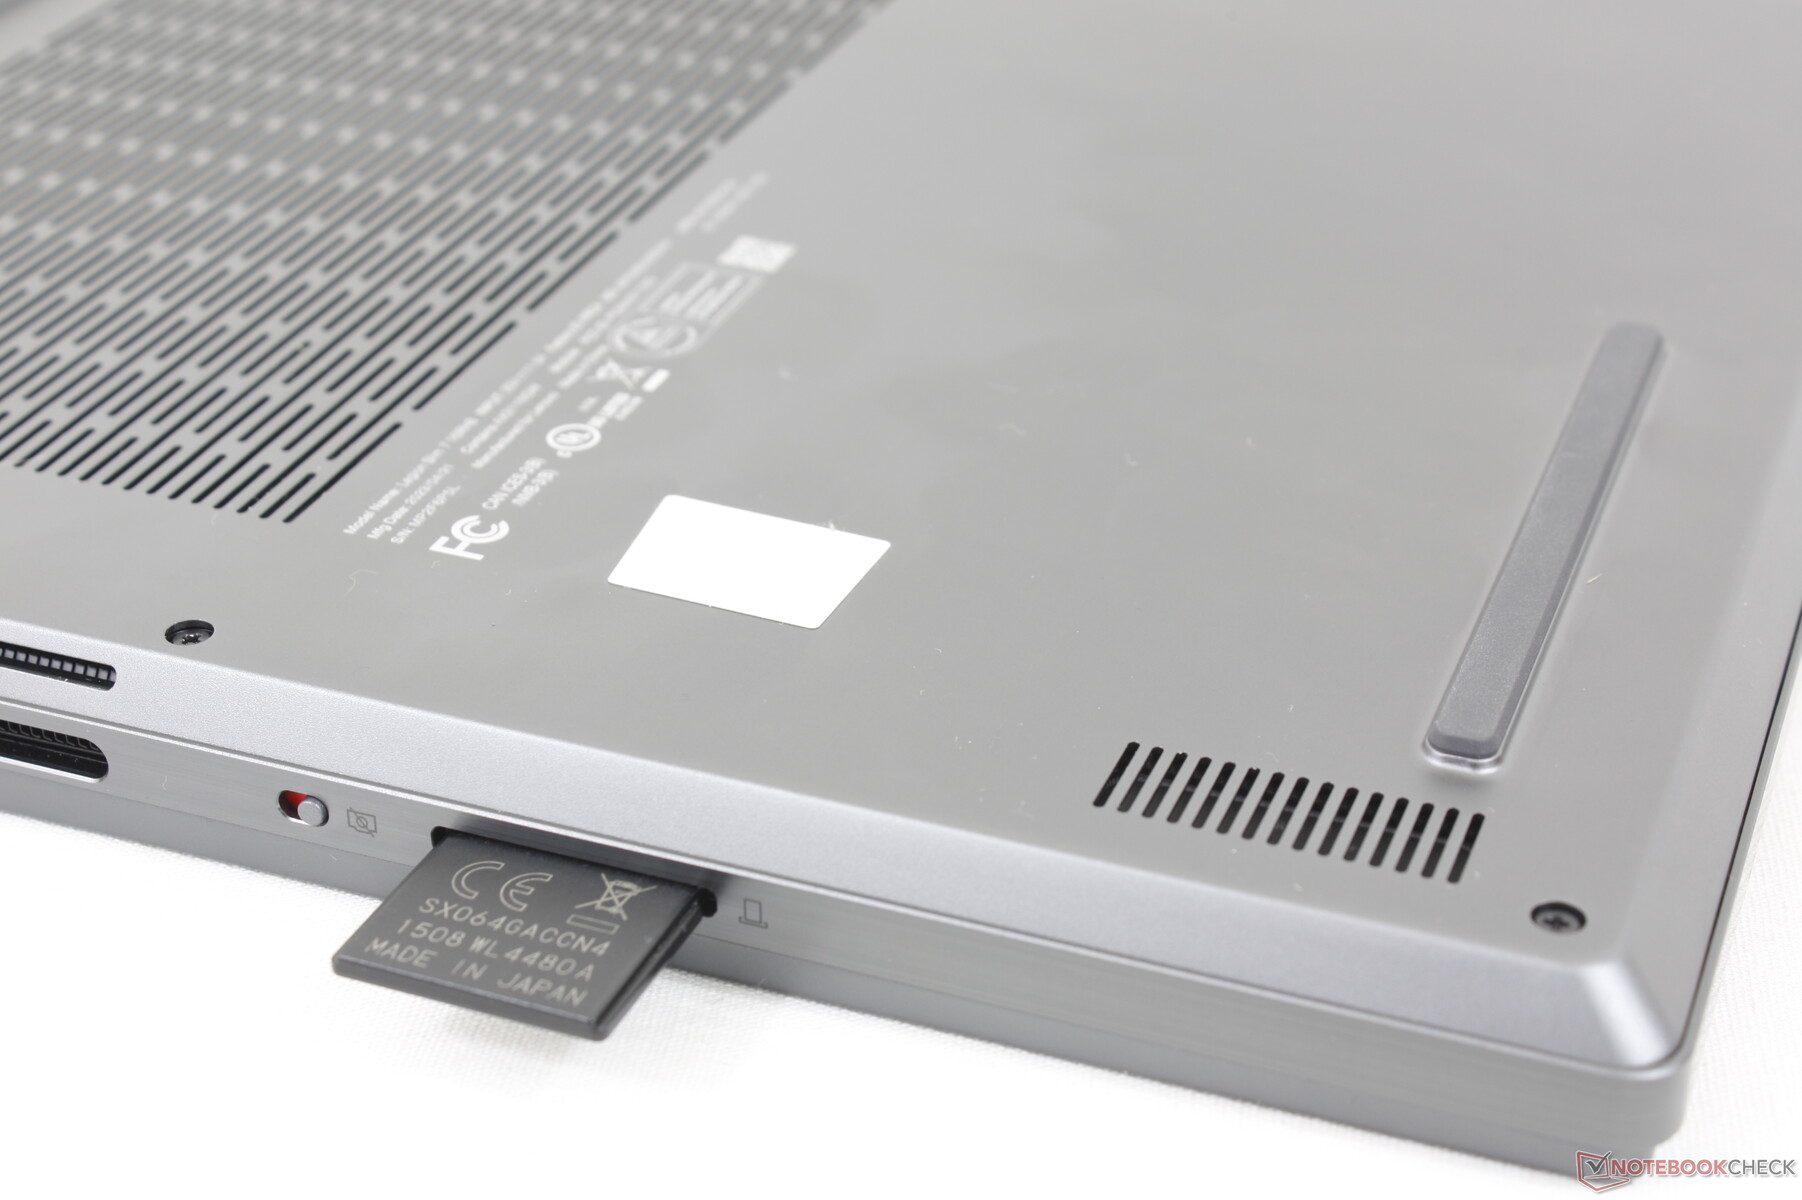
Leitor de cartão SD
As taxas de transferência por meio do leitor de cartão SD são, em média, de cerca de 80 MB/s com nosso cartão de teste UHS-II, que é aproximadamente a metade da velocidade do leitor de cartão do Blade 16.
| SD Card Reader | |
| average JPG Copy Test (av. of 3 runs) | |
| Razer Blade 16 Early 2023 (AV PRO microSD 128 GB V60) | |
| Lenovo Legion Slim 7i 16 Gen 8 (Toshiba Exceria Pro SDXC 64 GB UHS-II) | |
| Alienware x16 R1 (AV PRO microSD 128 GB V60) | |
| maximum AS SSD Seq Read Test (1GB) | |
| Alienware x16 R1 (AV PRO microSD 128 GB V60) | |
| Razer Blade 16 Early 2023 (AV PRO microSD 128 GB V60) | |
| Lenovo Legion Slim 7i 16 Gen 8 (Toshiba Exceria Pro SDXC 64 GB UHS-II) | |
Comunicação
Um Intel AX211 é padrão para conectividade Wi-Fi 6E e Bluetooth 5.3. O desempenho é estável e confiável quando emparelhado com nossa rede Asus AXE11000 de 6 GHz.
| Networking | |
| iperf3 transmit AXE11000 | |
| Lenovo Legion Pro 7 RTX4090 | |
| Asus ROG Strix G16 G614JZ | |
| Razer Blade 16 Early 2023 | |
| Lenovo Legion Slim 7i 16 Gen 8 | |
| HP Omen 16-wf000 | |
| Alienware x16 R1 | |
| iperf3 receive AXE11000 | |
| Lenovo Legion Pro 7 RTX4090 | |
| Asus ROG Strix G16 G614JZ | |
| Razer Blade 16 Early 2023 | |
| Alienware x16 R1 | |
| HP Omen 16-wf000 | |
| Lenovo Legion Slim 7i 16 Gen 8 | |
| iperf3 transmit AXE11000 6GHz | |
| Lenovo Legion Slim 7i 16 Gen 8 | |
| Razer Blade 16 Early 2023 | |
| HP Omen 16-wf000 | |
| Alienware x16 R1 | |
| iperf3 receive AXE11000 6GHz | |
| Lenovo Legion Slim 7i 16 Gen 8 | |
| Razer Blade 16 Early 2023 | |
| HP Omen 16-wf000 | |
| Alienware x16 R1 | |
Webcam
A webcam de 2 MP permanece a mesma do modelo do ano passado. Não há suporte a infravermelho, mas um interruptor de desativação da webcam é padrão.


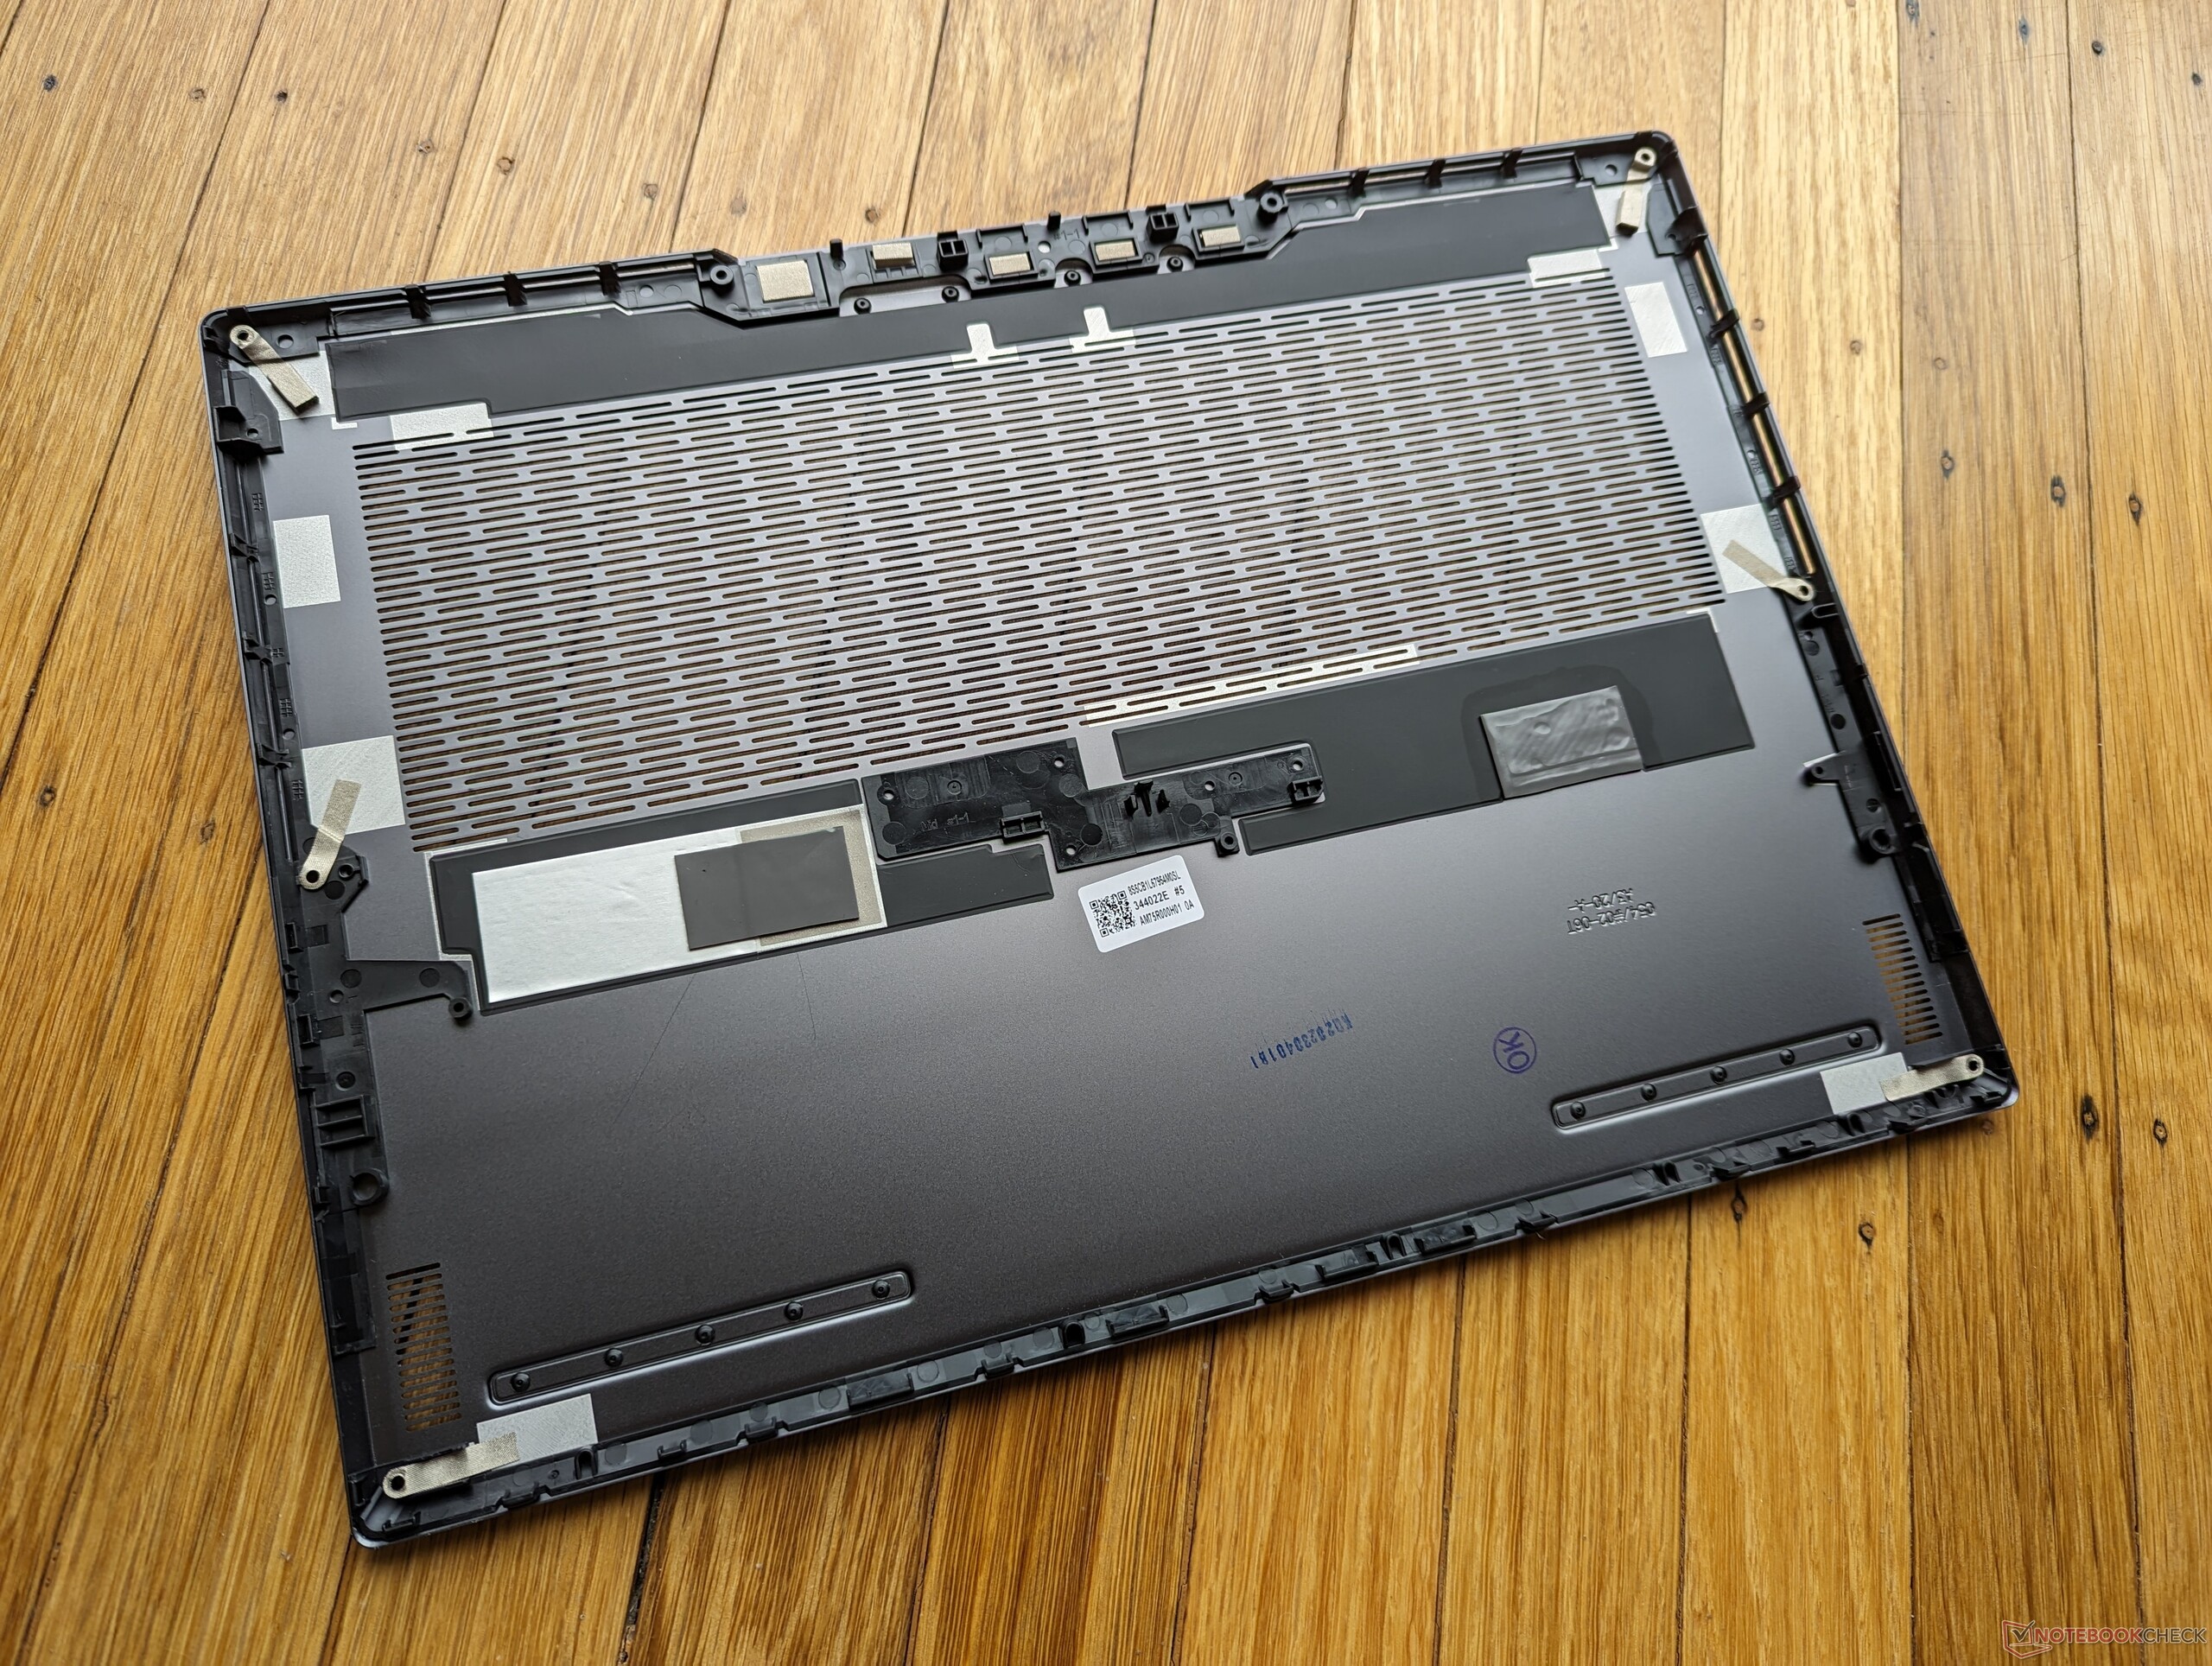
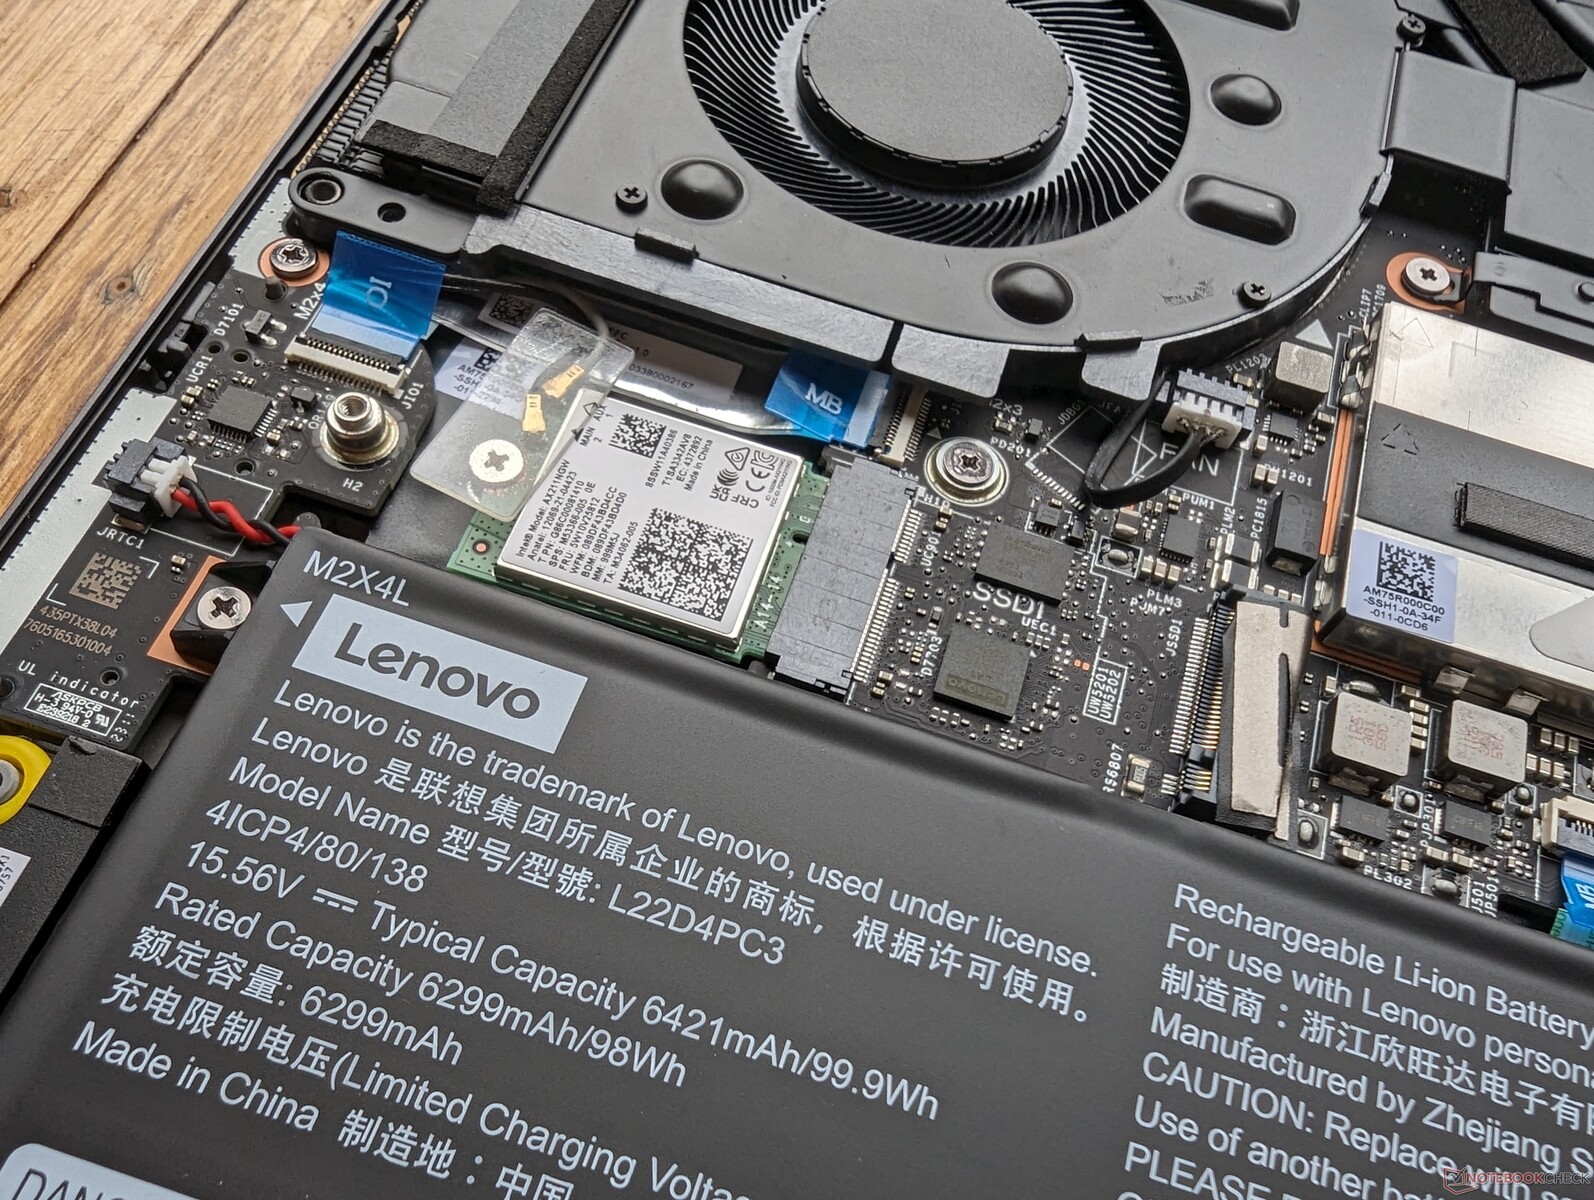
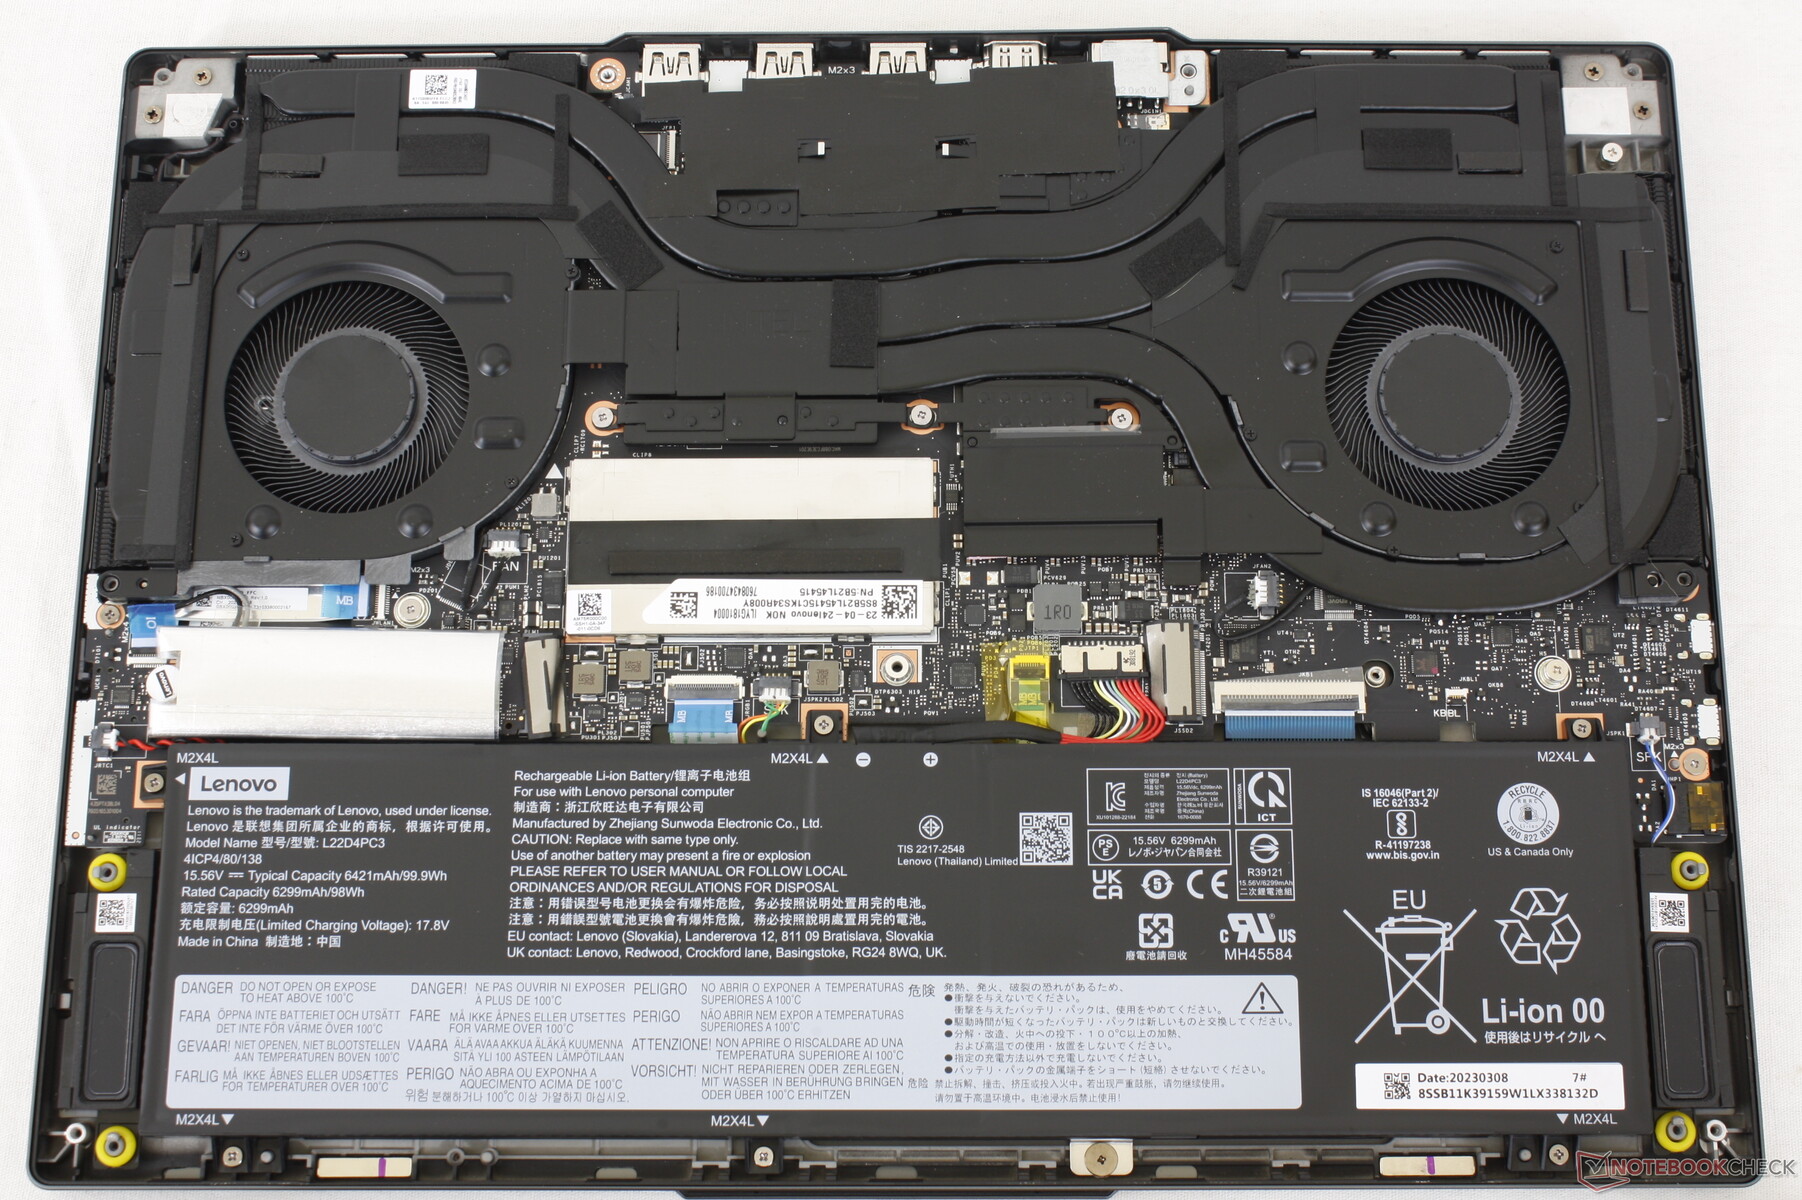
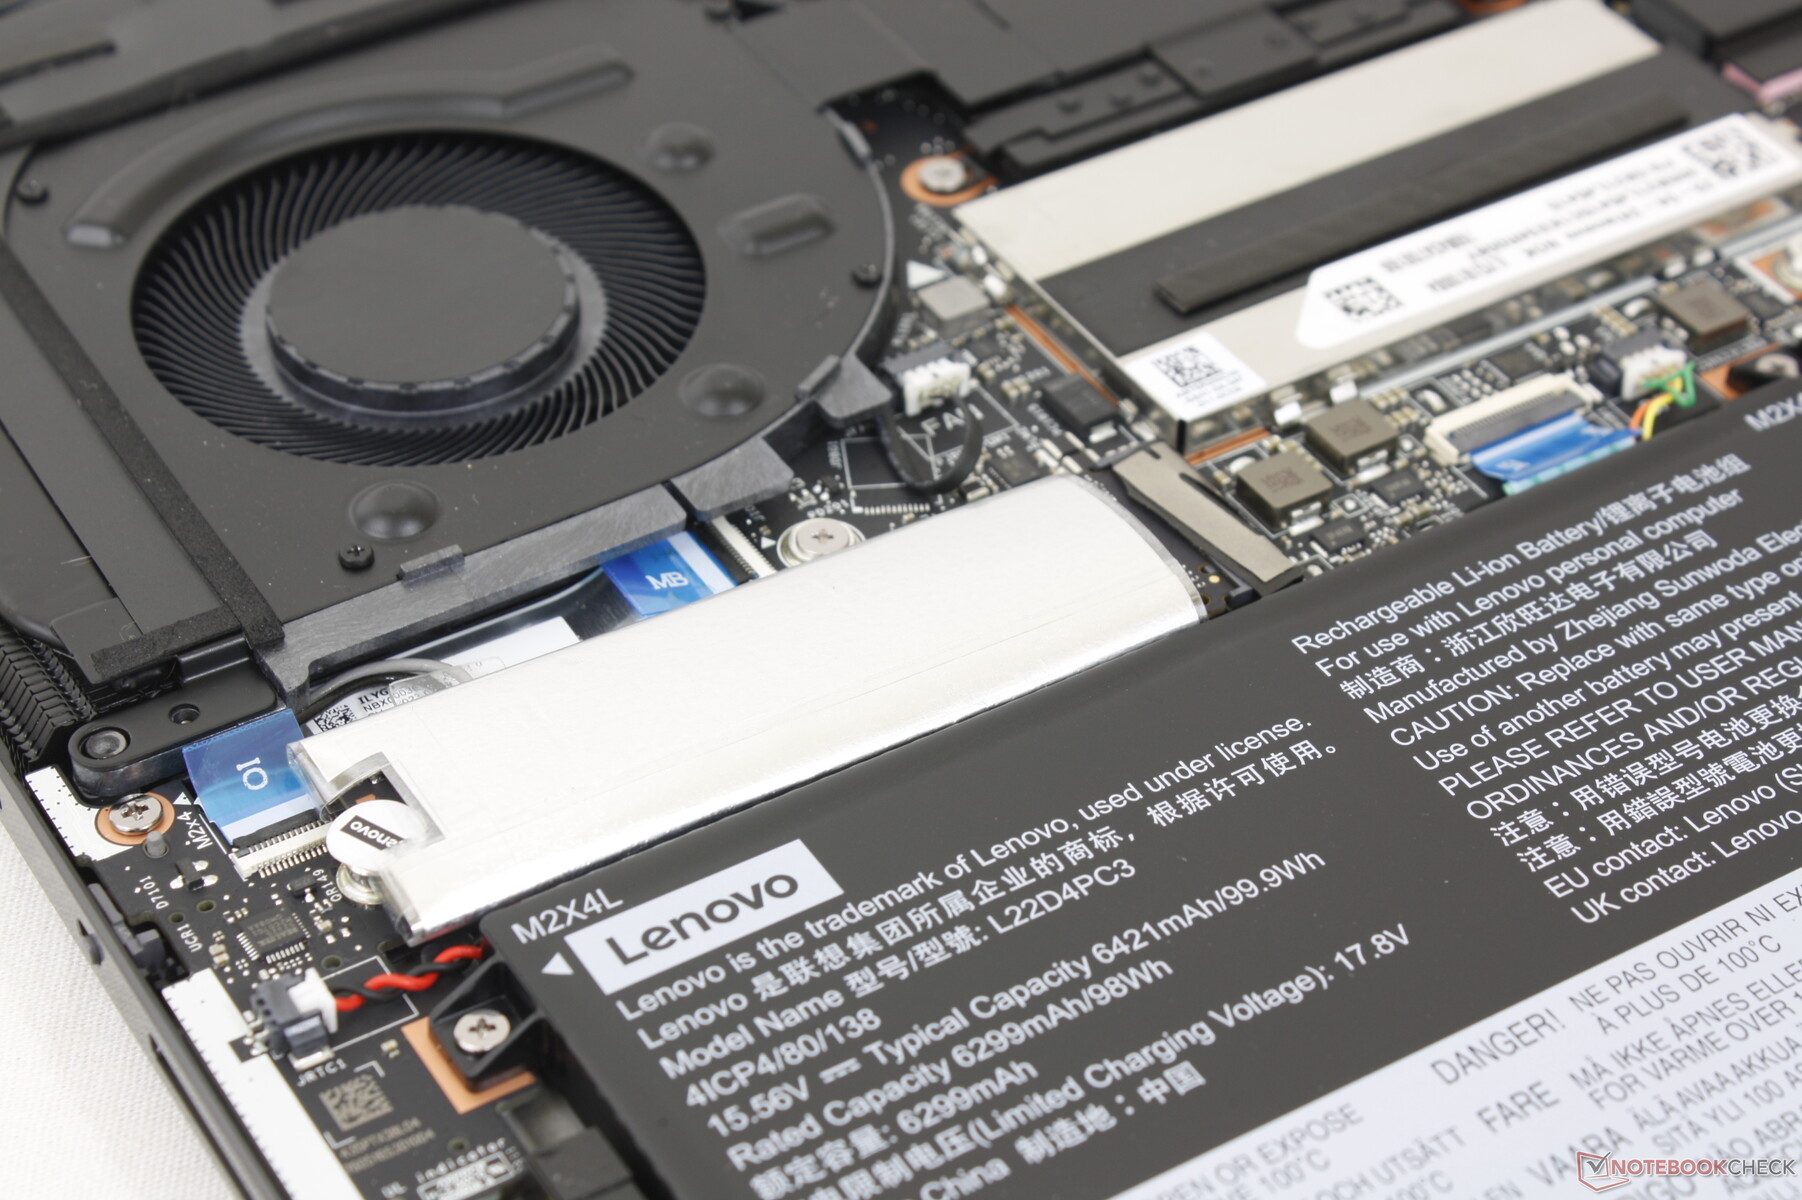
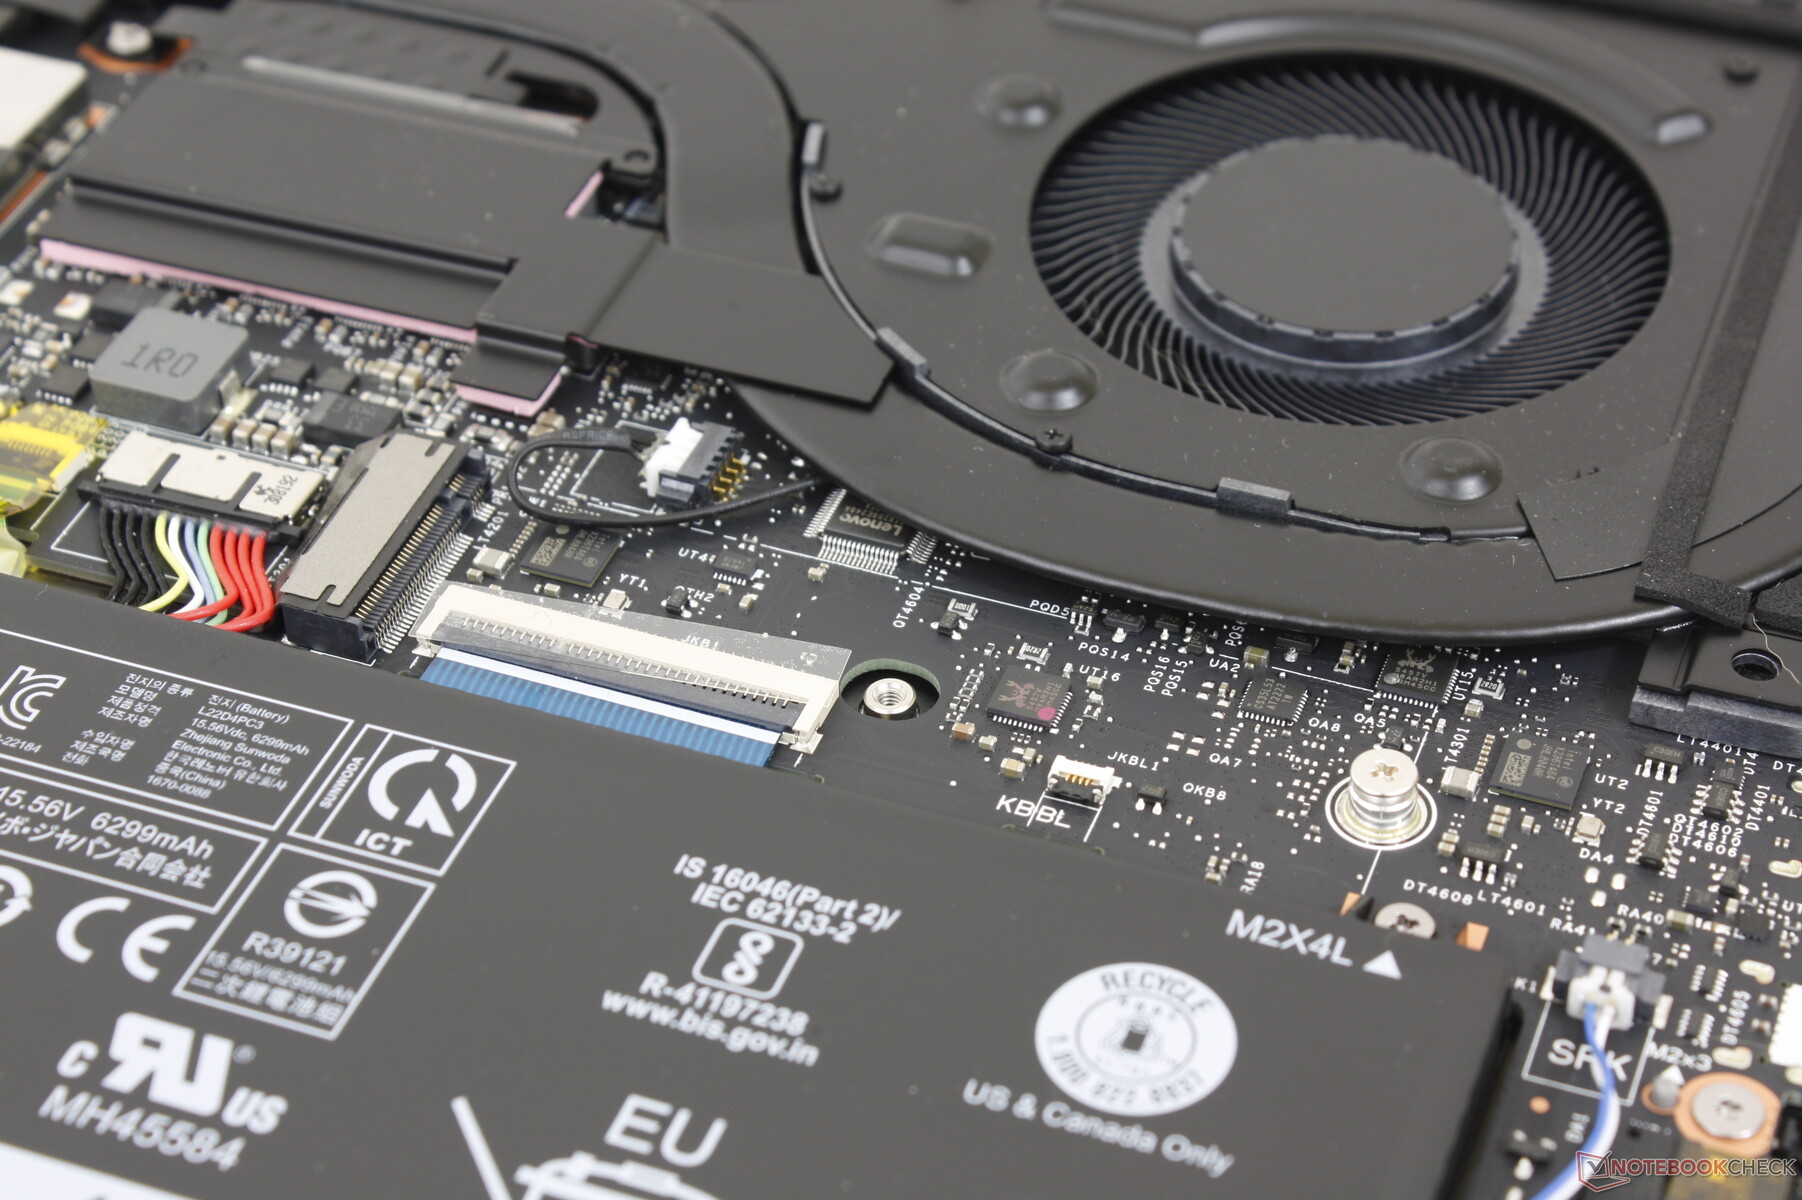
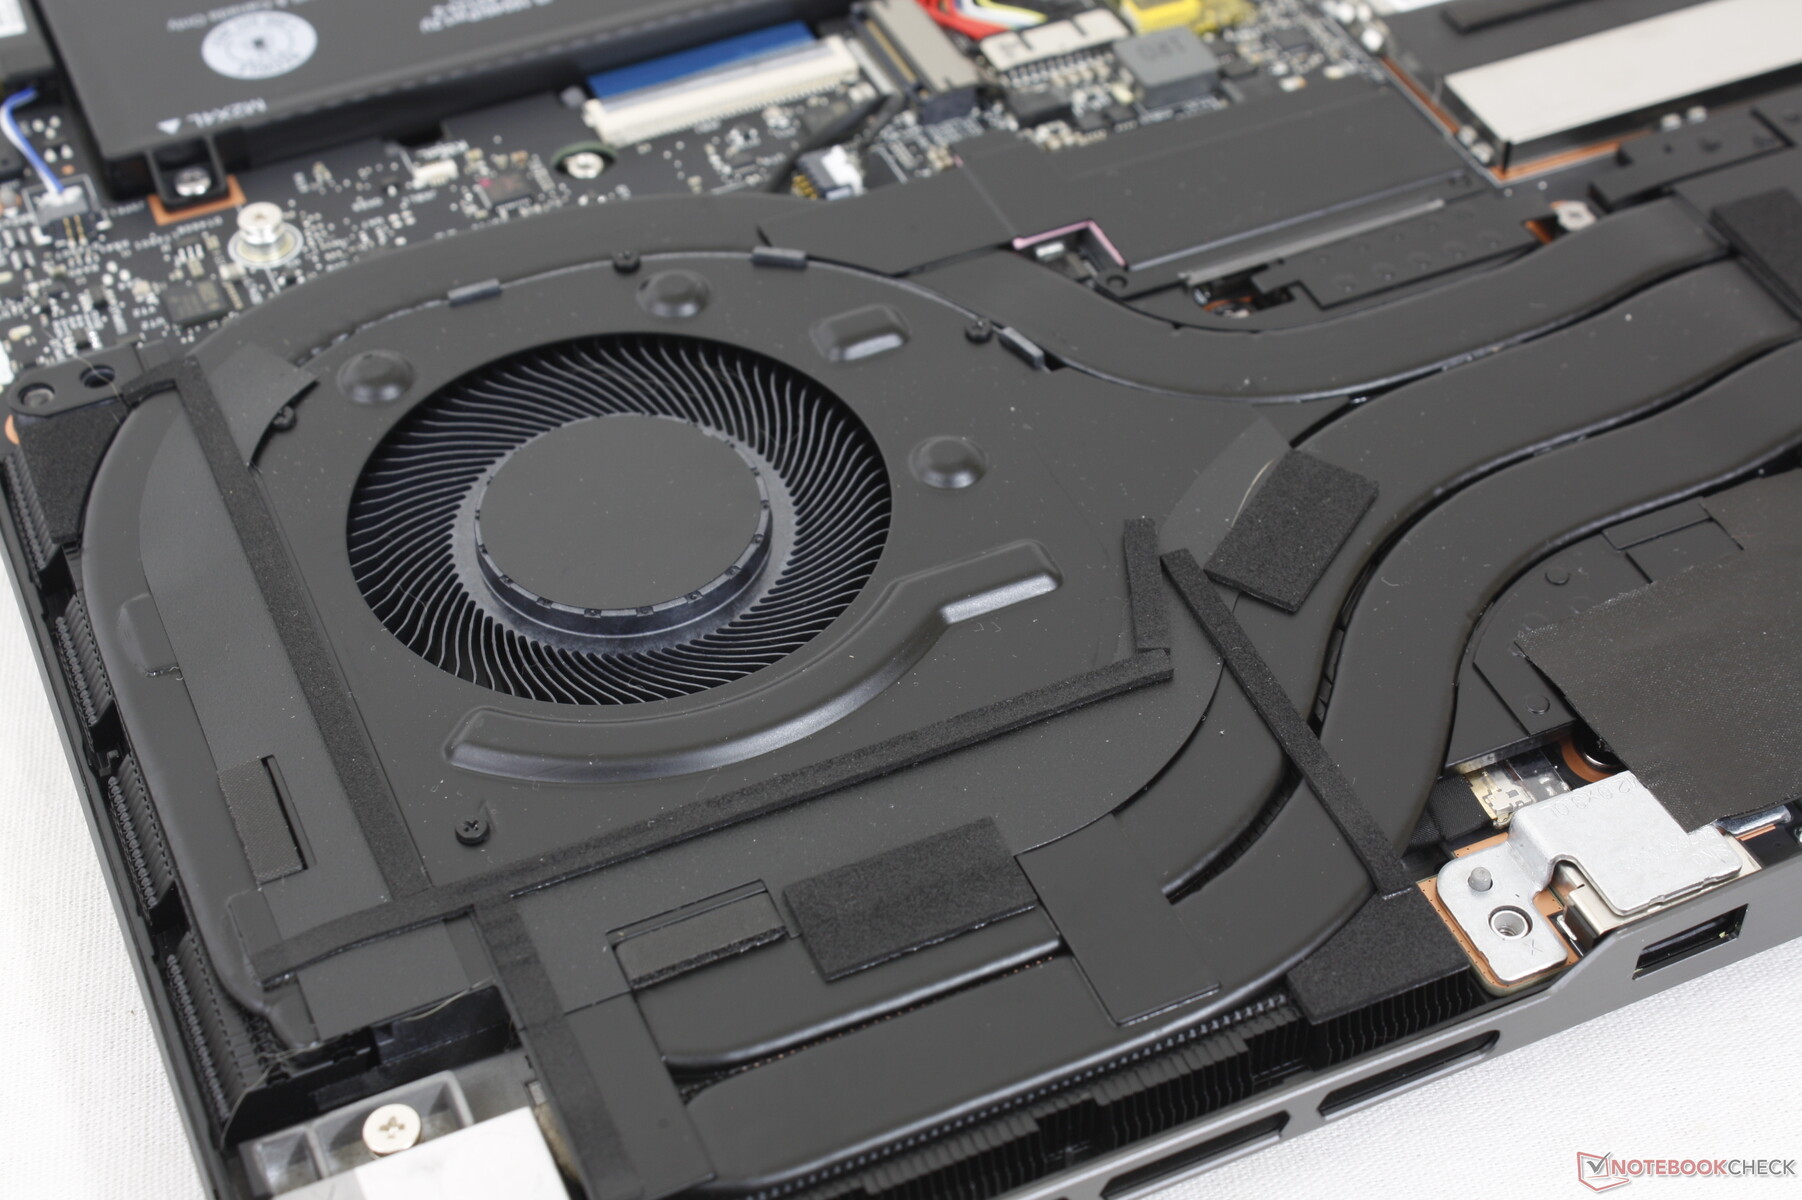
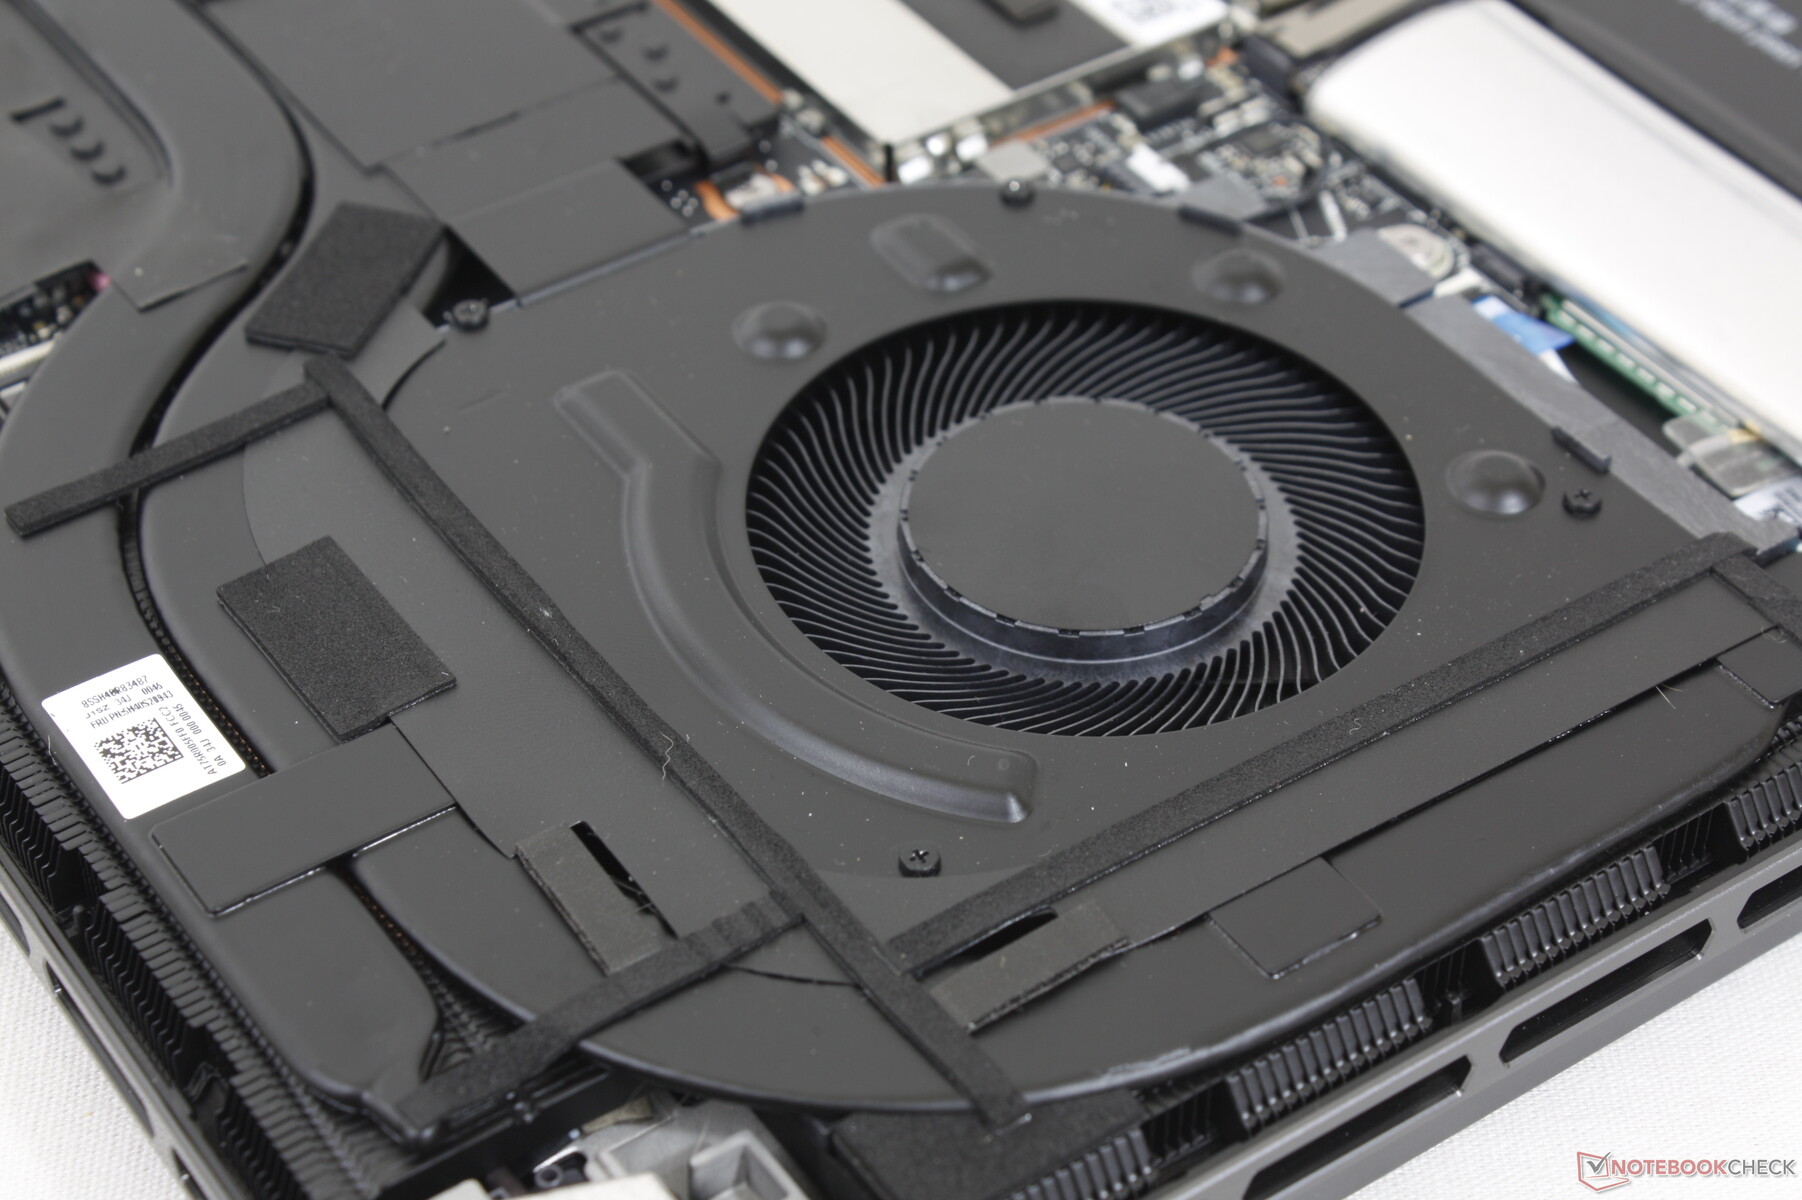
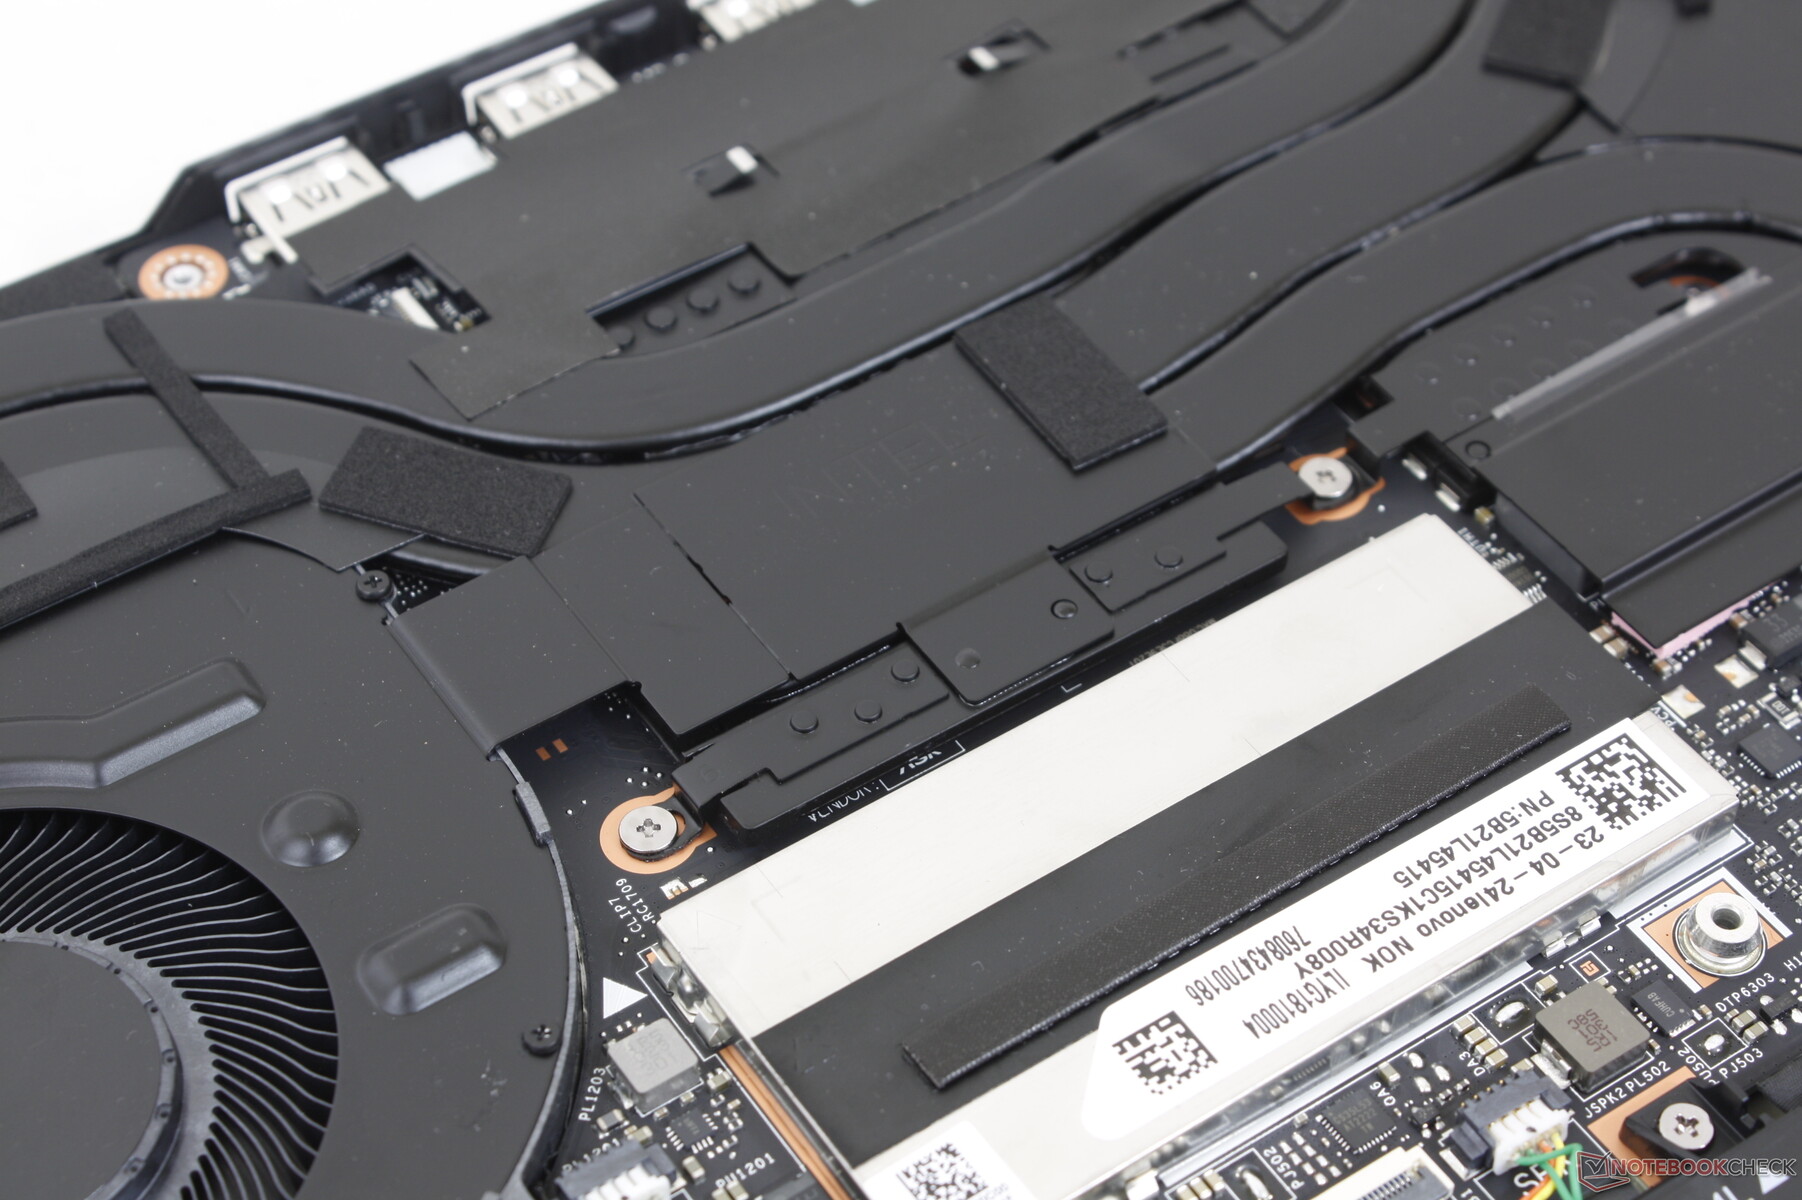
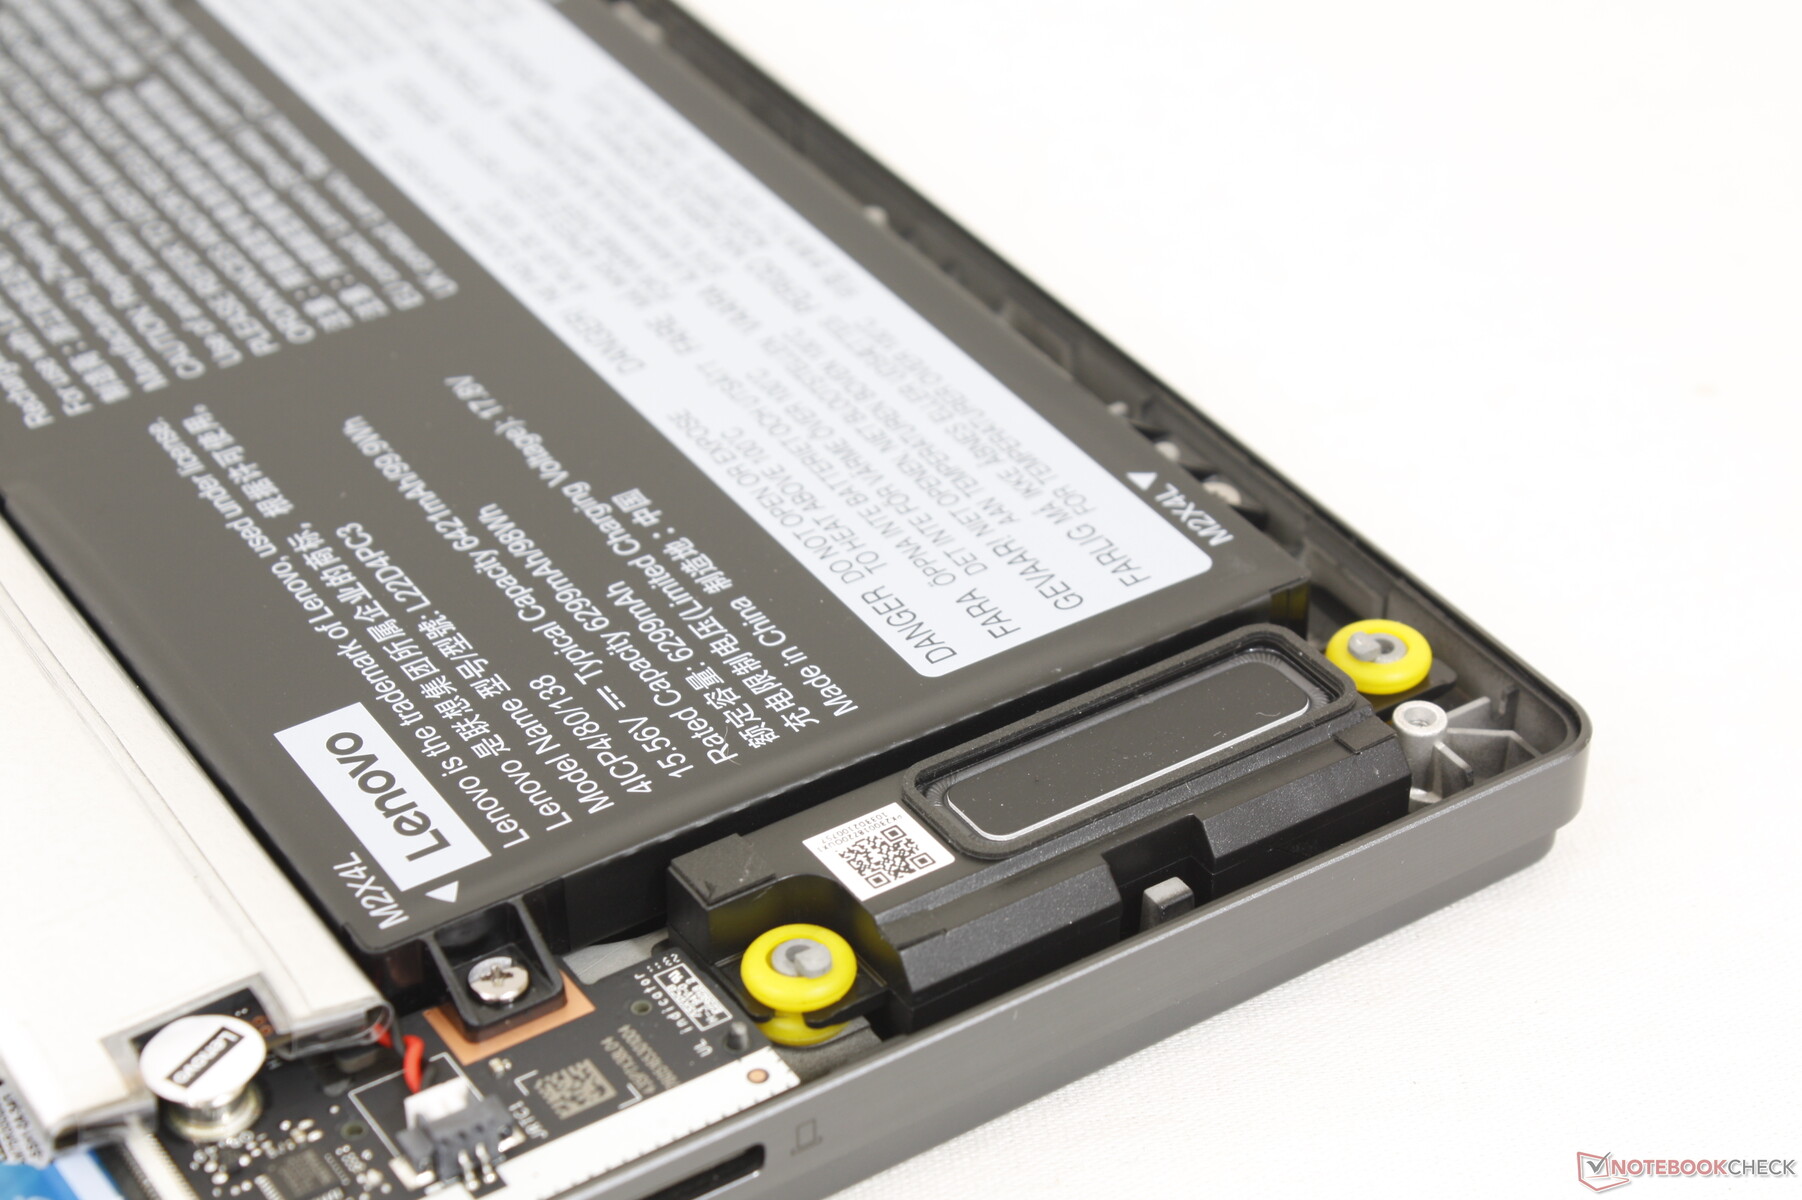
Manutenção
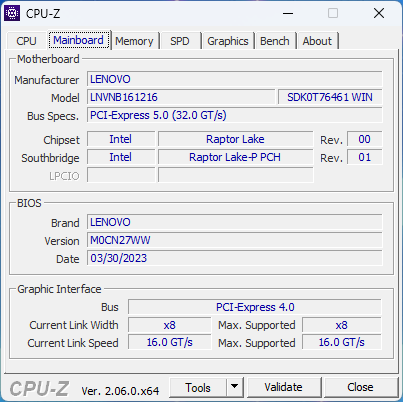
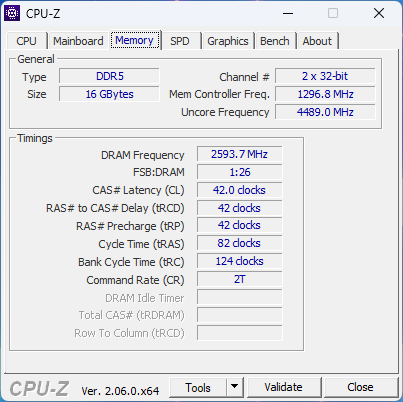
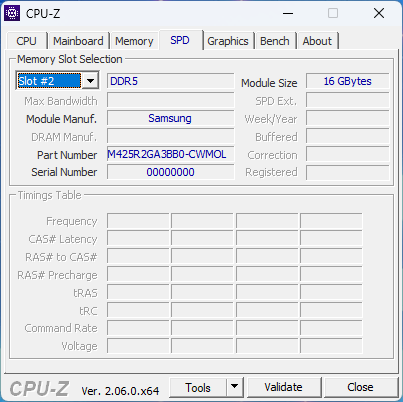
O painel inferior é fixado por oito parafusos Phillips para facilitar a remoção. Os proprietários têm acesso direto aos dois slots M.2 2280 PCIe4, ao módulo WLAN e à bateria. A RAM consiste em 16 GB de DDR5-5200 soldado e um slot SODIMM expansível sob a blindagem de alumínio próxima ao centro.
Acessórios e garantia
Não há extras na caixa além do adaptador CA e da documentação. A garantia padrão limitada de um ano do fabricante se aplica se for comprada nos EUA.
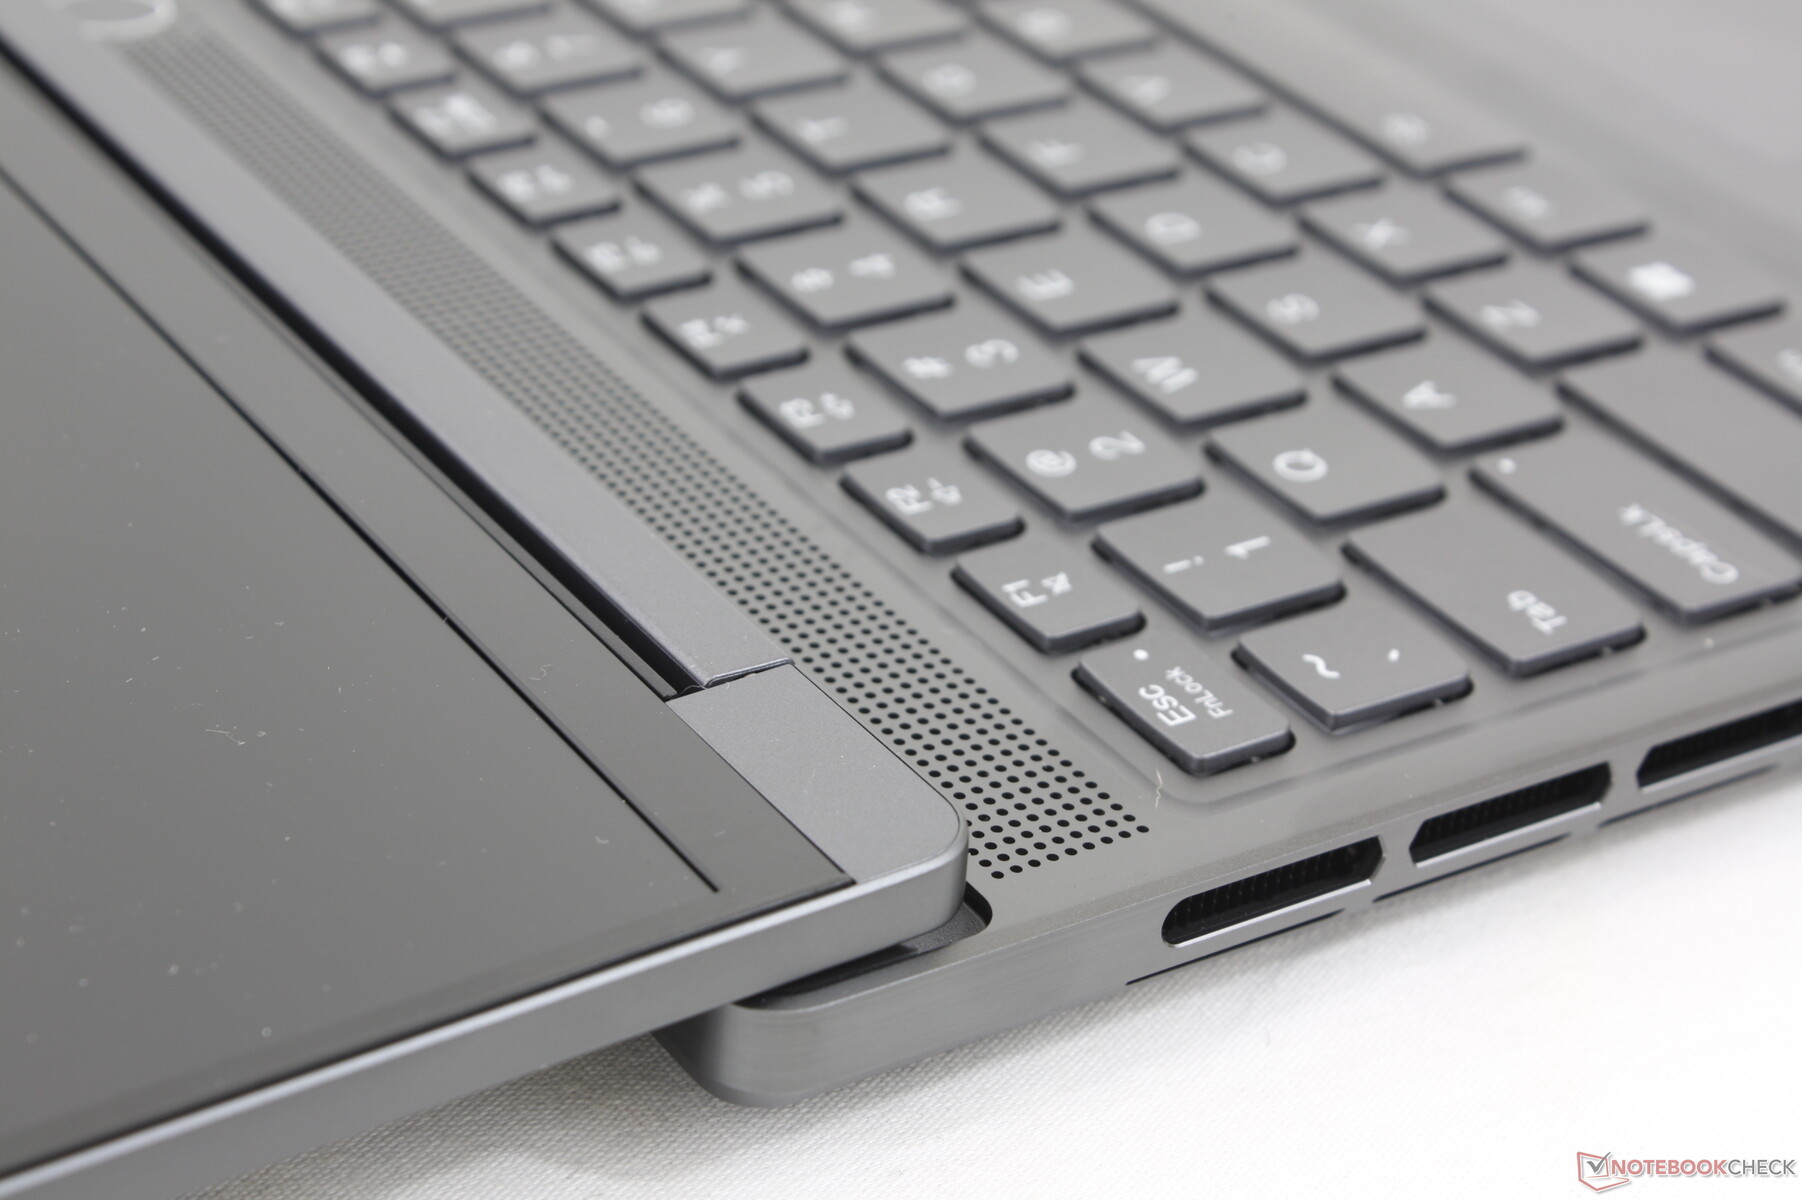
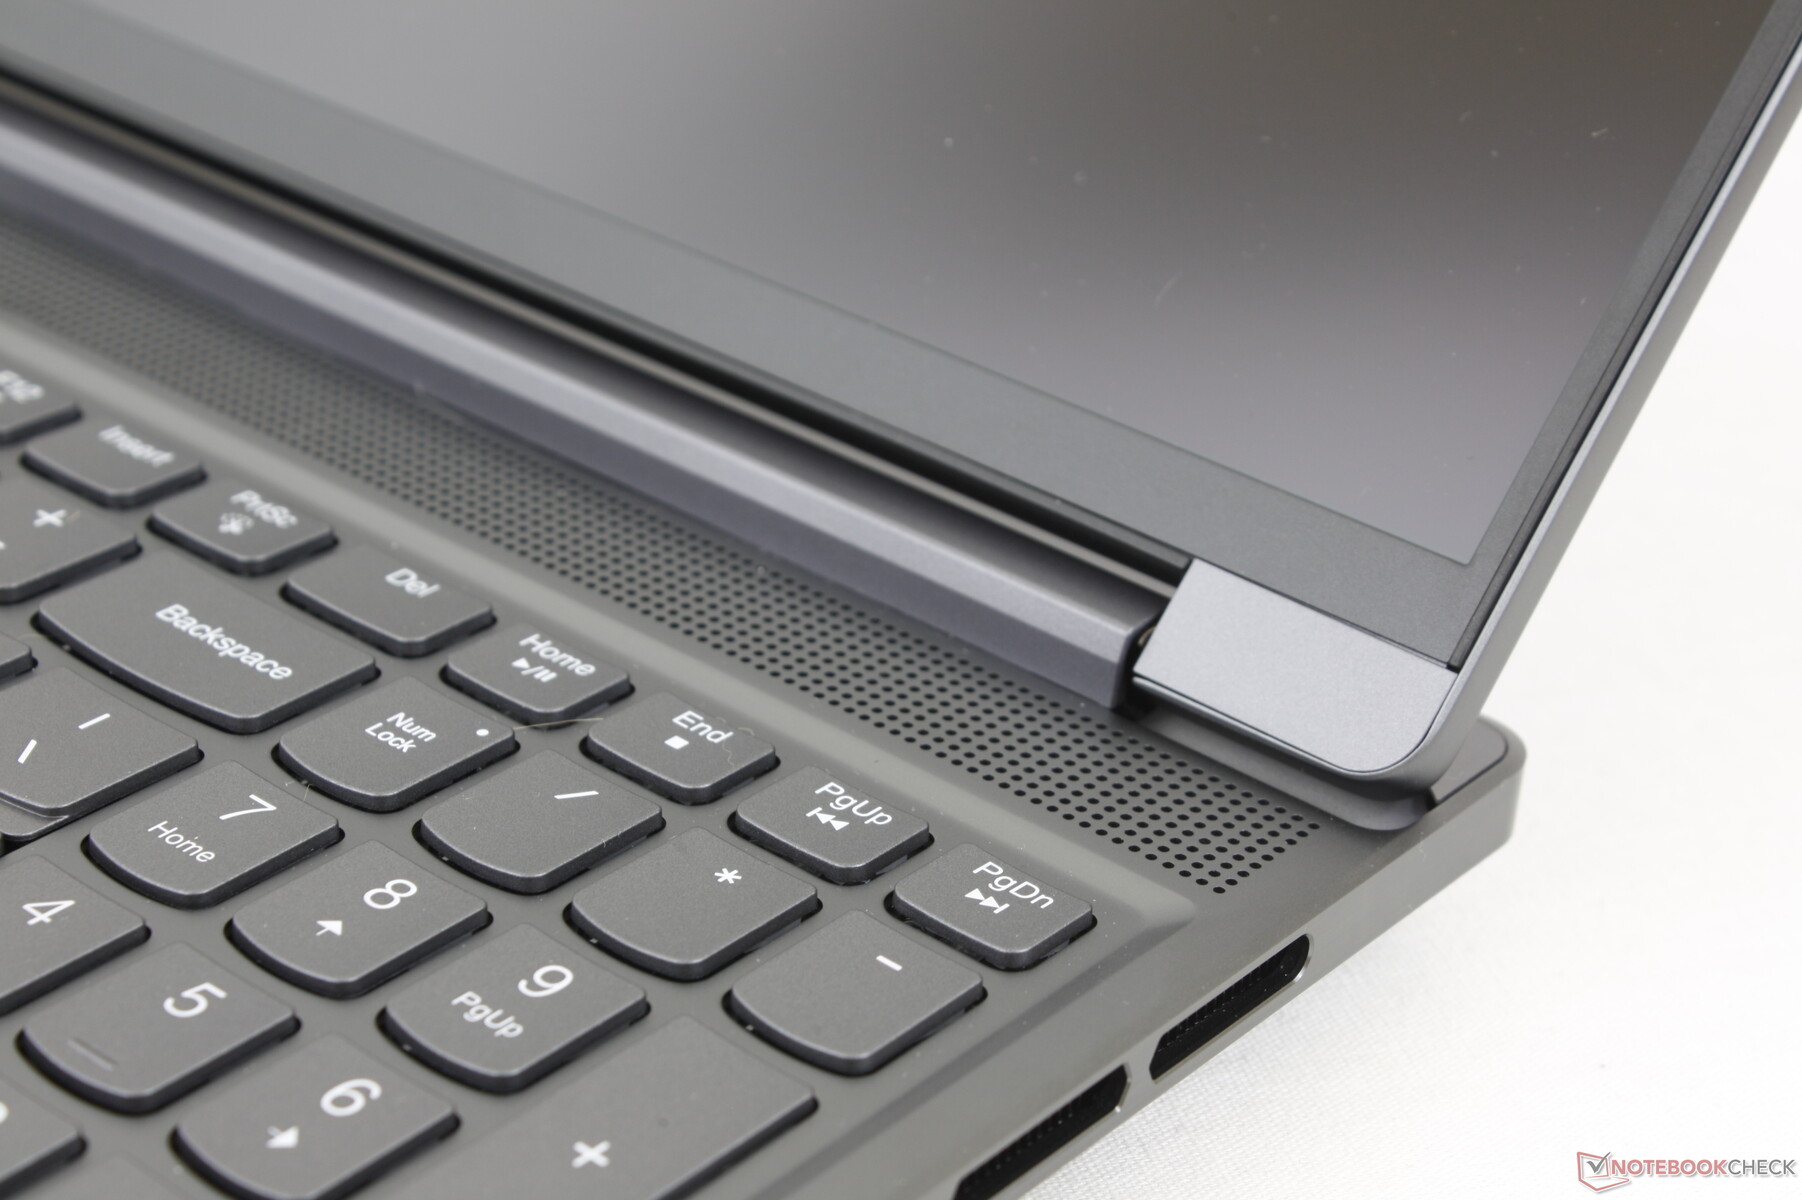
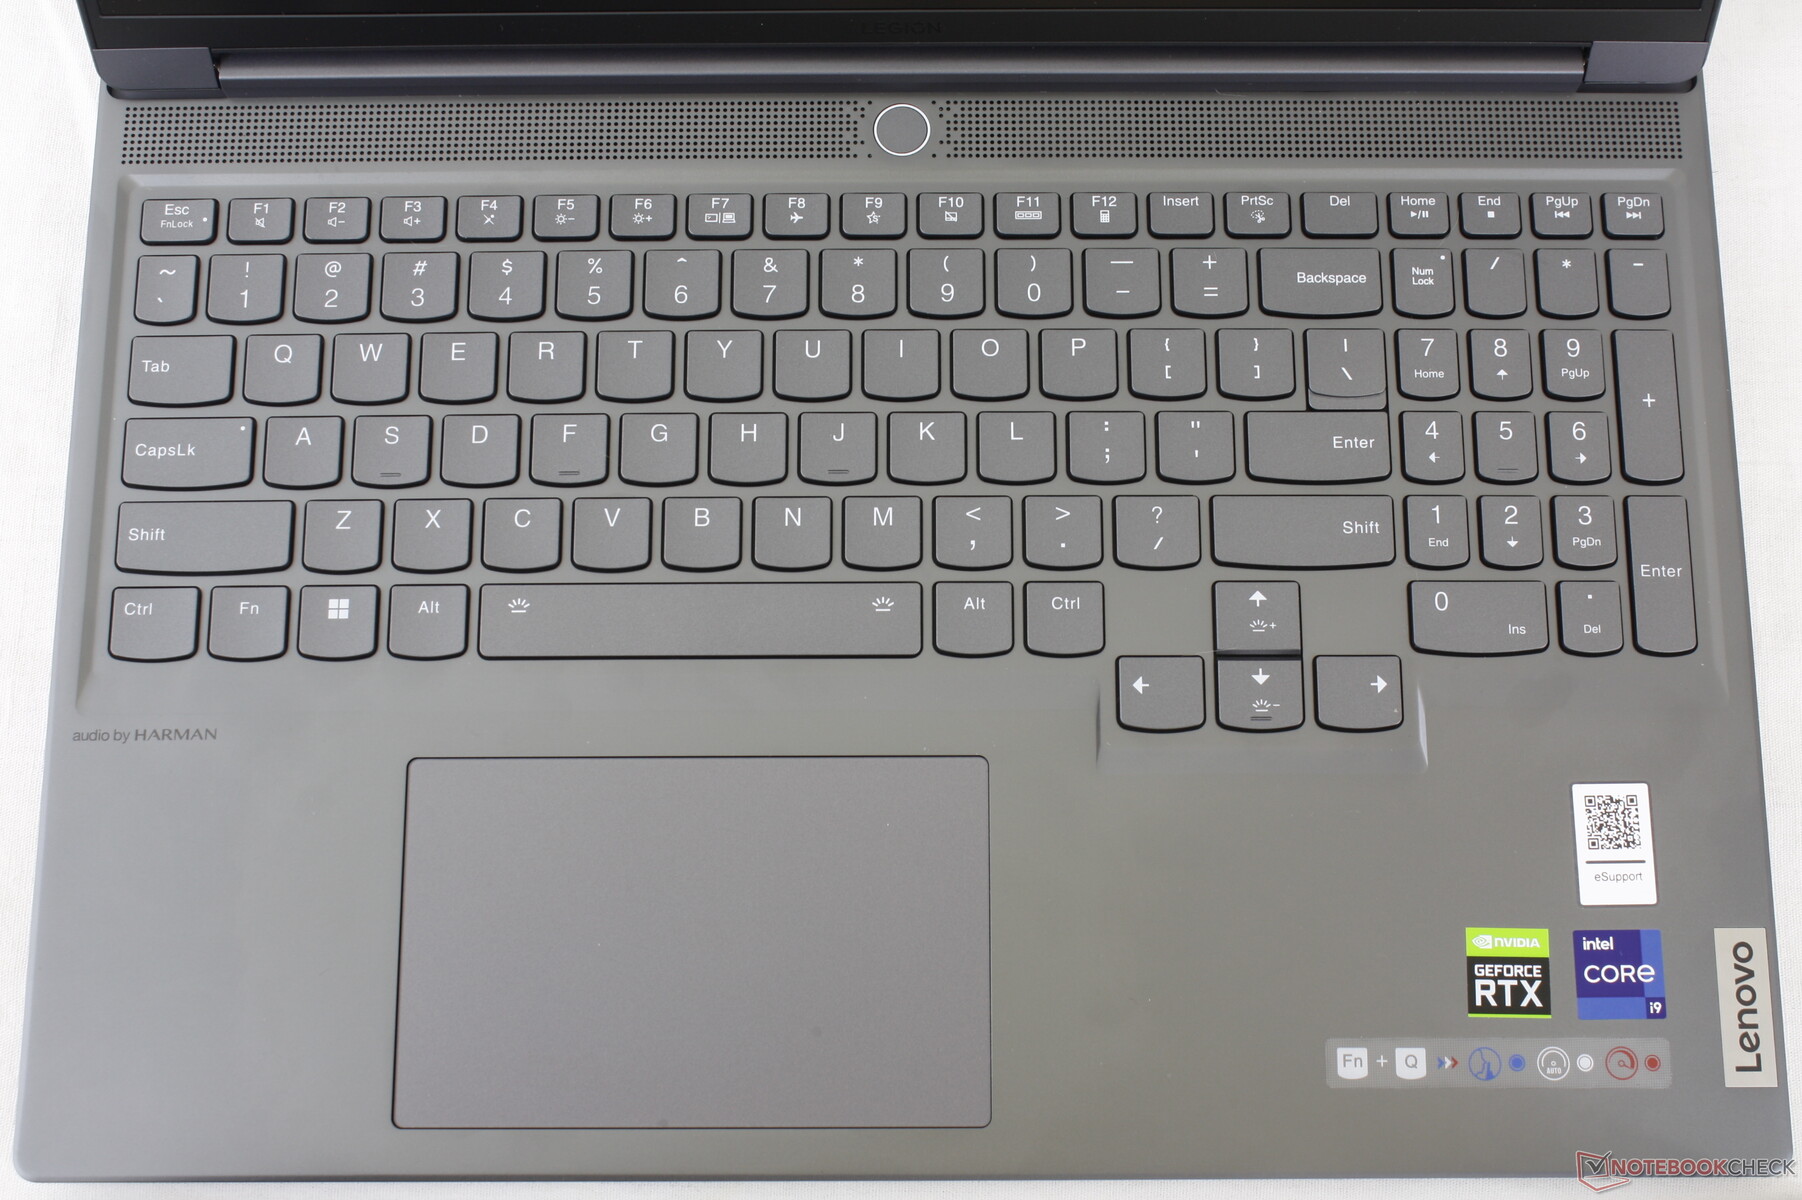
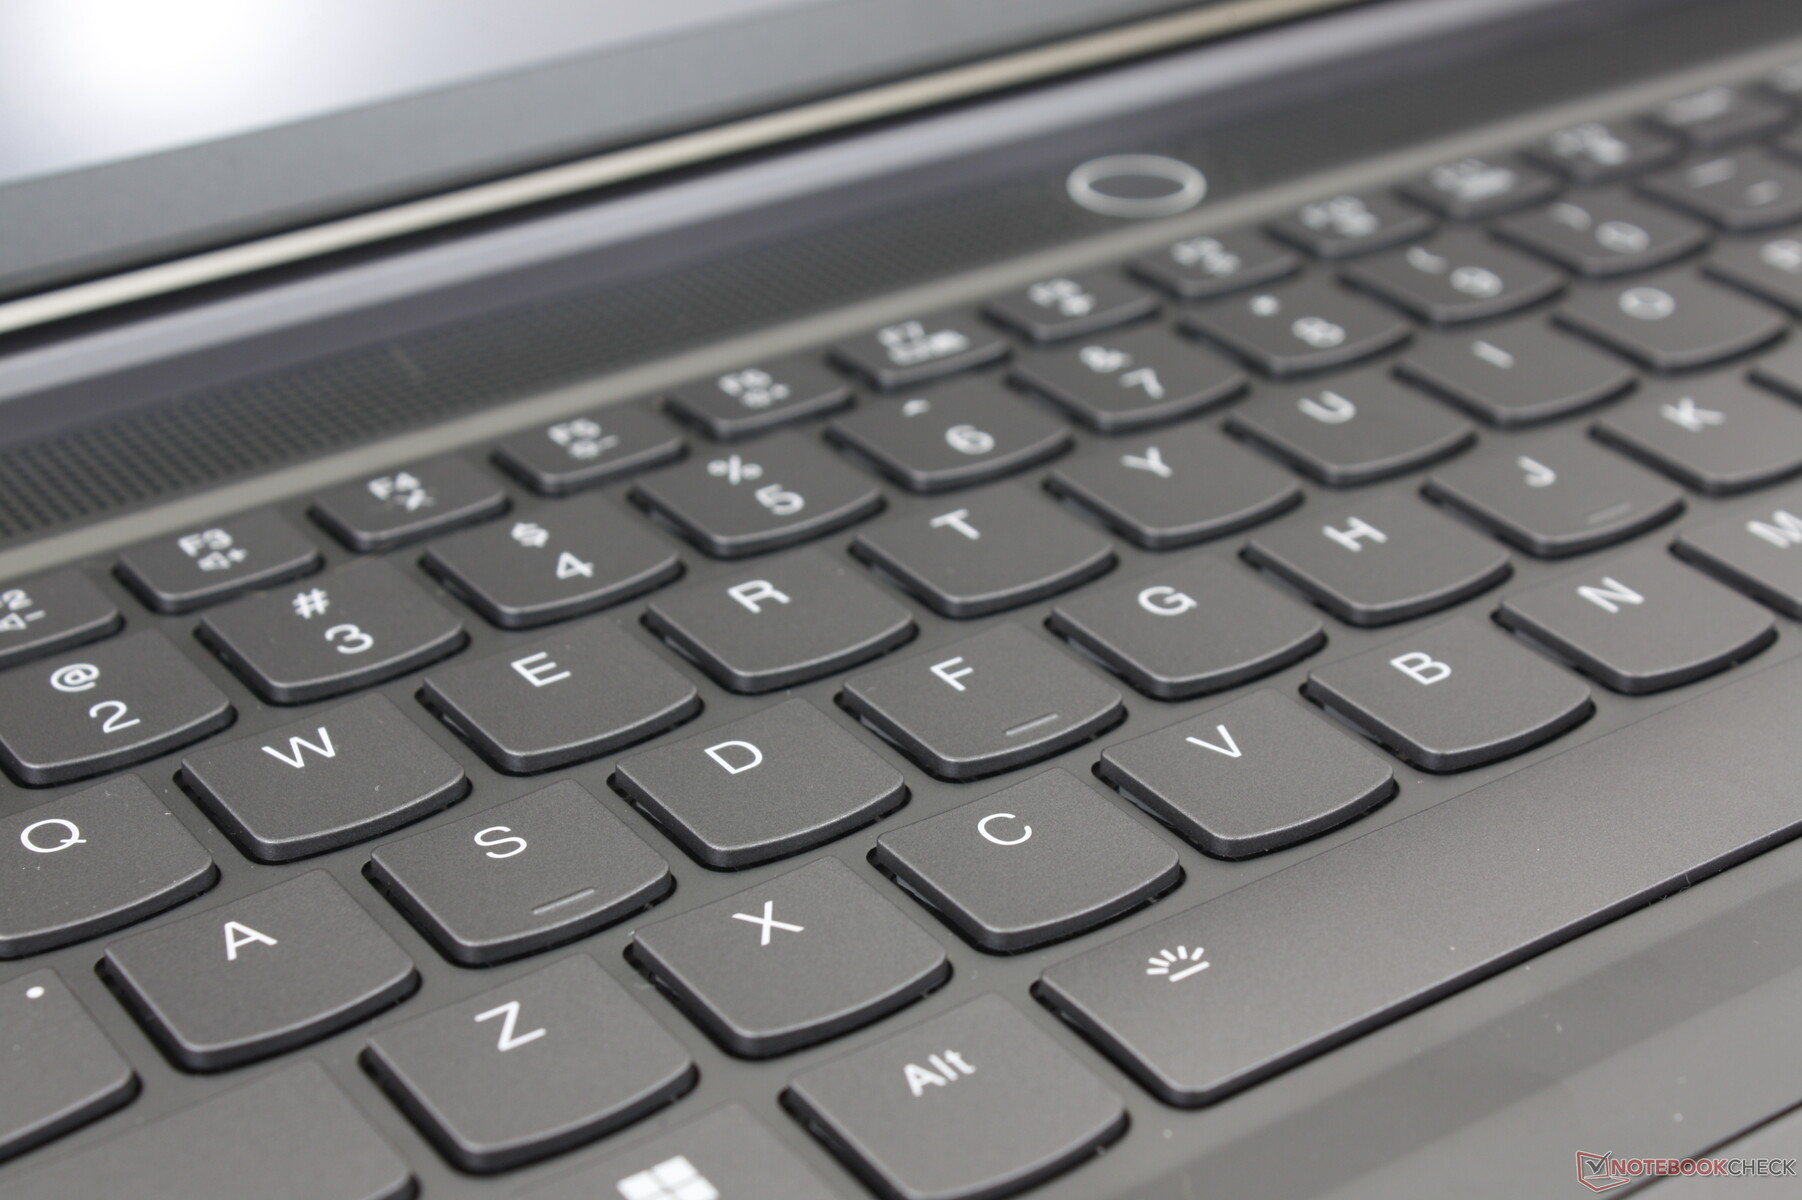
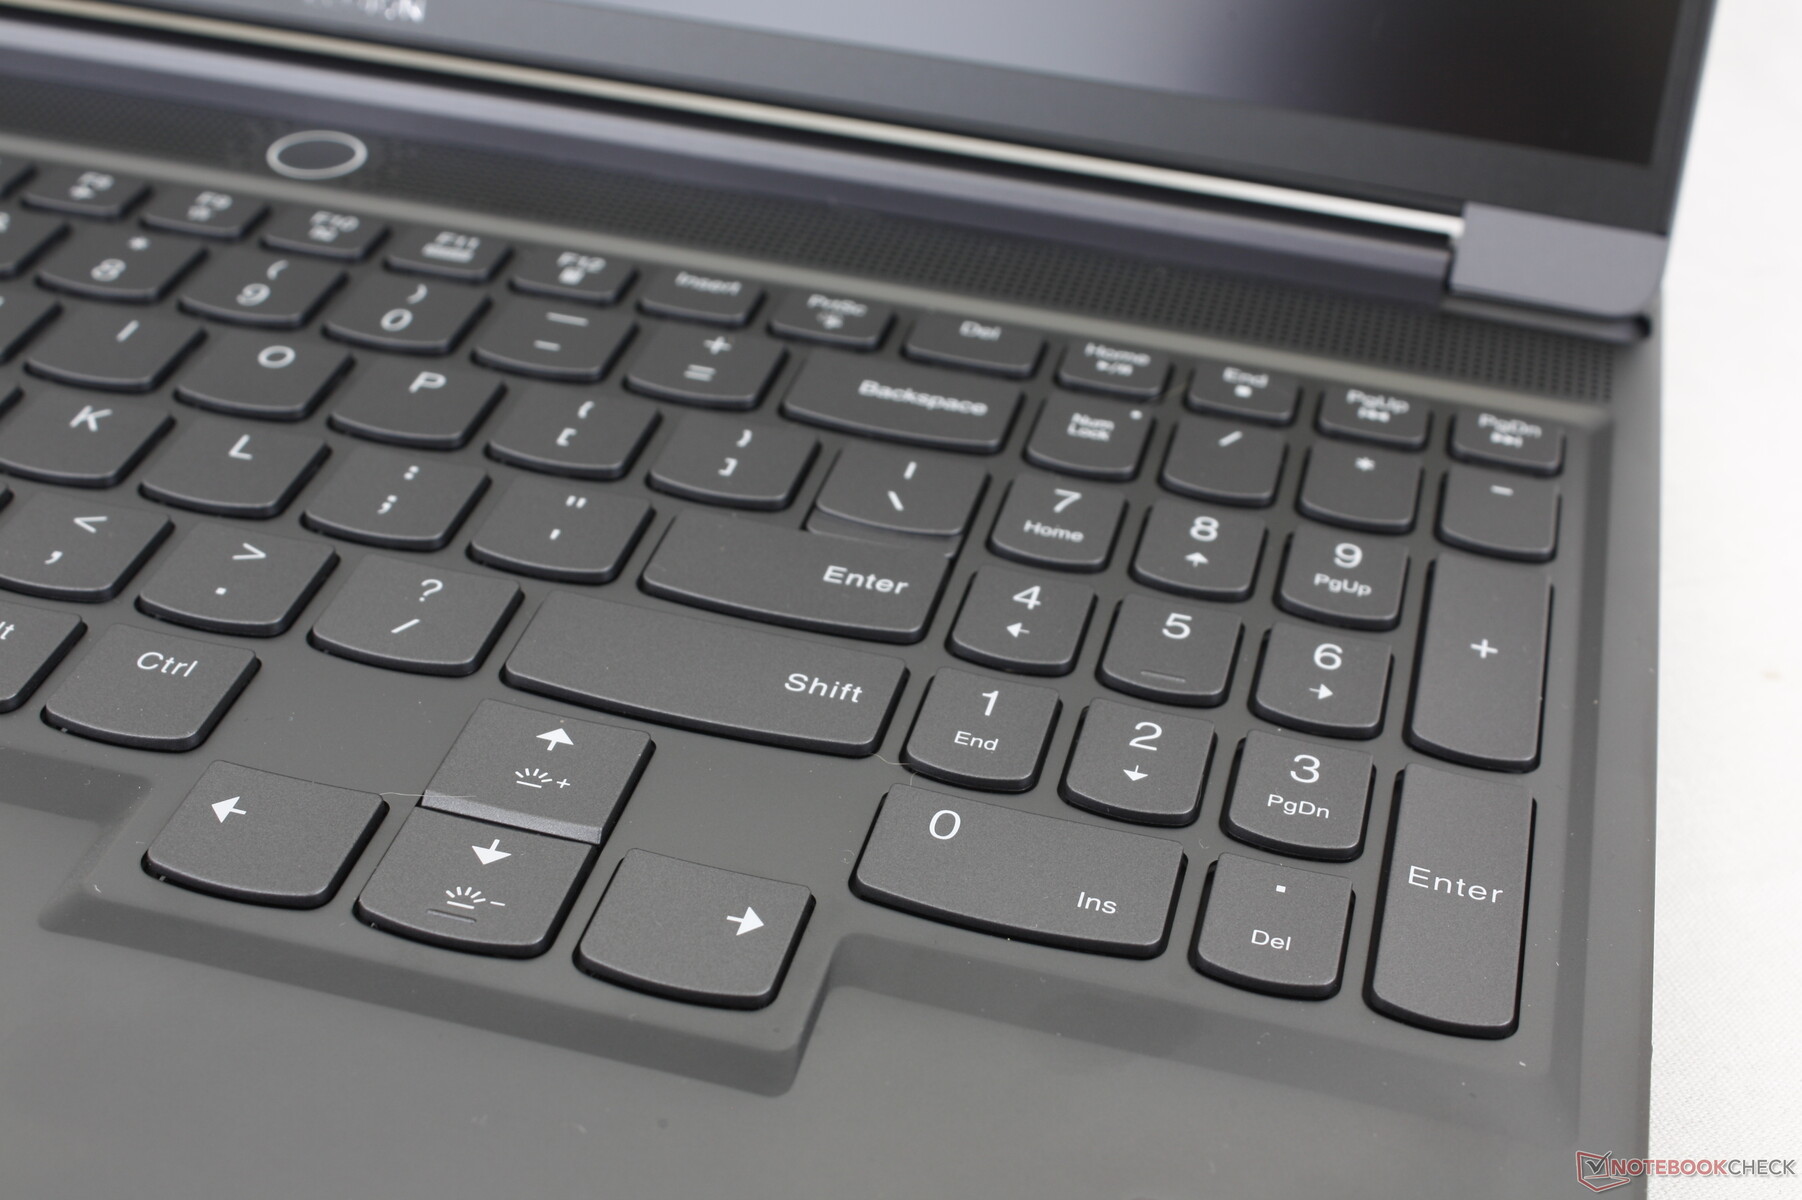
Dispositivos de entrada - Espaçoso com iluminação RGB por tecla
O teclado e o clickpad não foram alterados em comparação com o modelo do ano passado Legion Slim 7i G7 do ano passado e, portanto, a experiência da interface do usuário continua a mesma. Isso não é necessariamente uma coisa ruim, pois o deslocamento das teclas de 1,5 mm e o feedback firme ainda são mais confortáveis para digitação em comparação com as teclas mais rasas do Blade 16. Também gostamos das teclas de seta grandes, pois essas mesmas teclas costumam ser frustrantemente pequenas em outros notebooks para jogos, como a série Série Asus ROG Strix ou a série Série MSI Pulse.
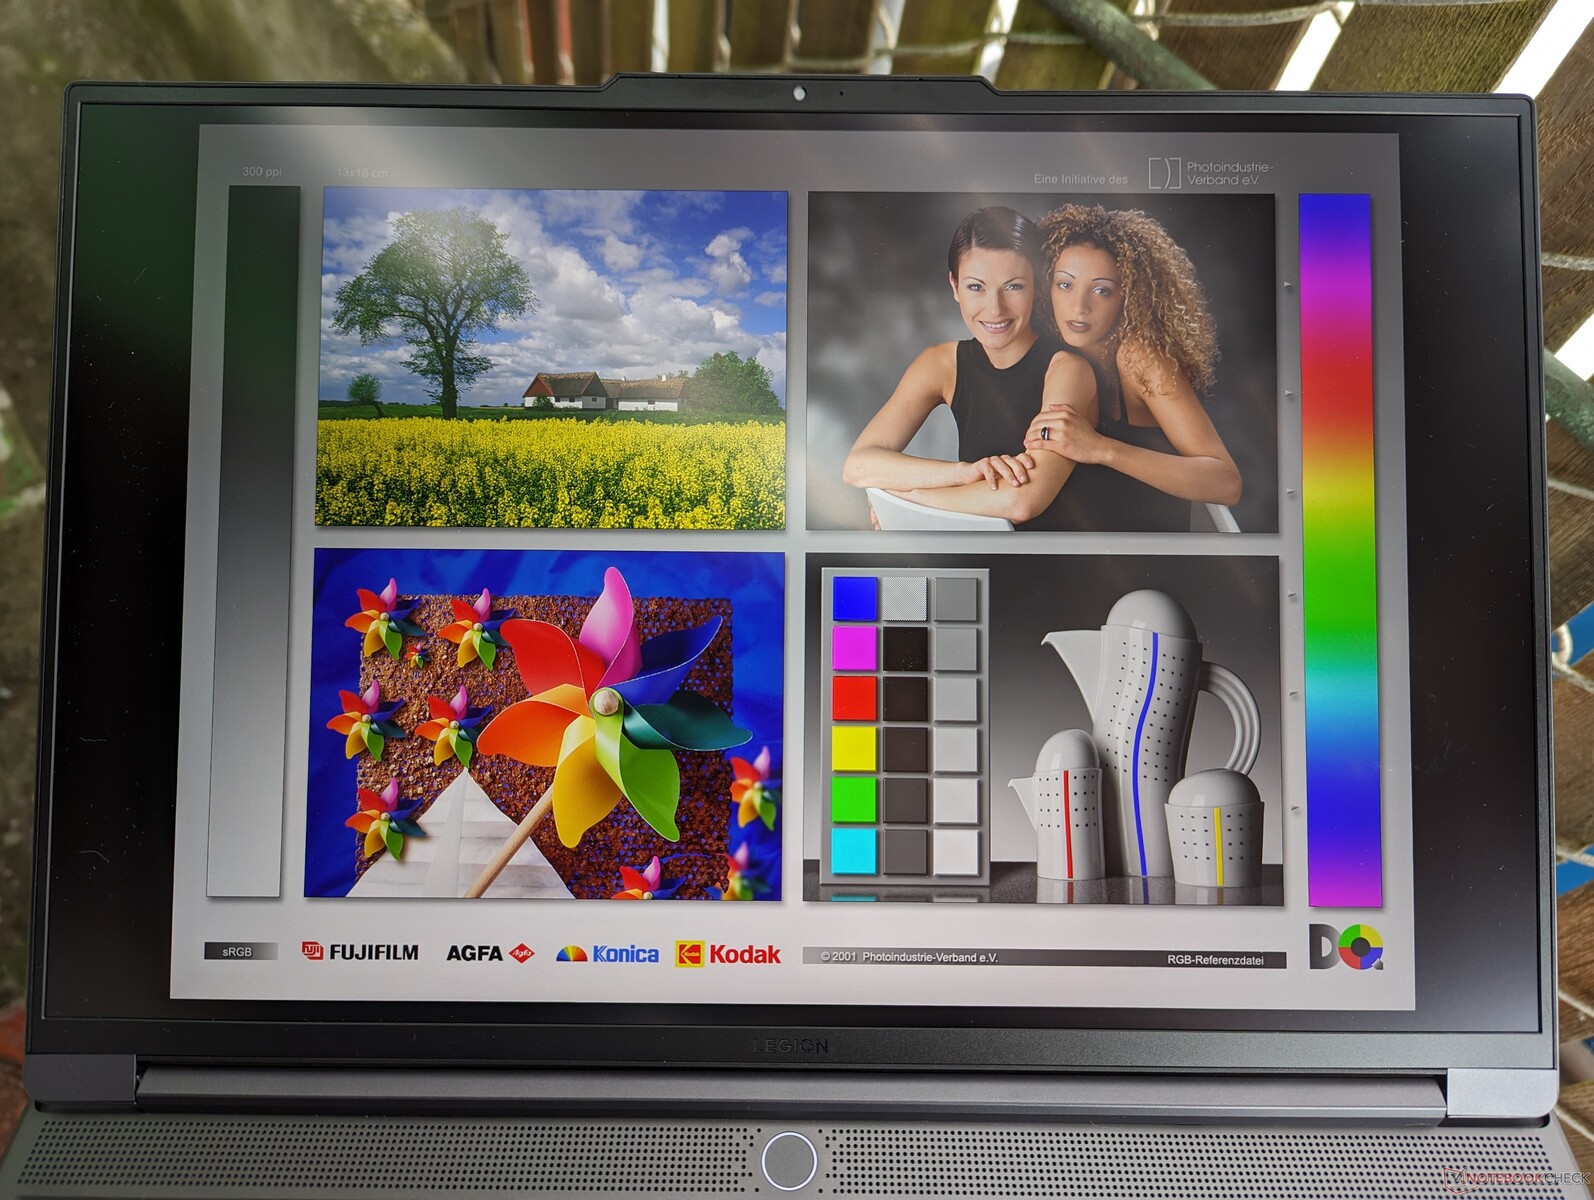
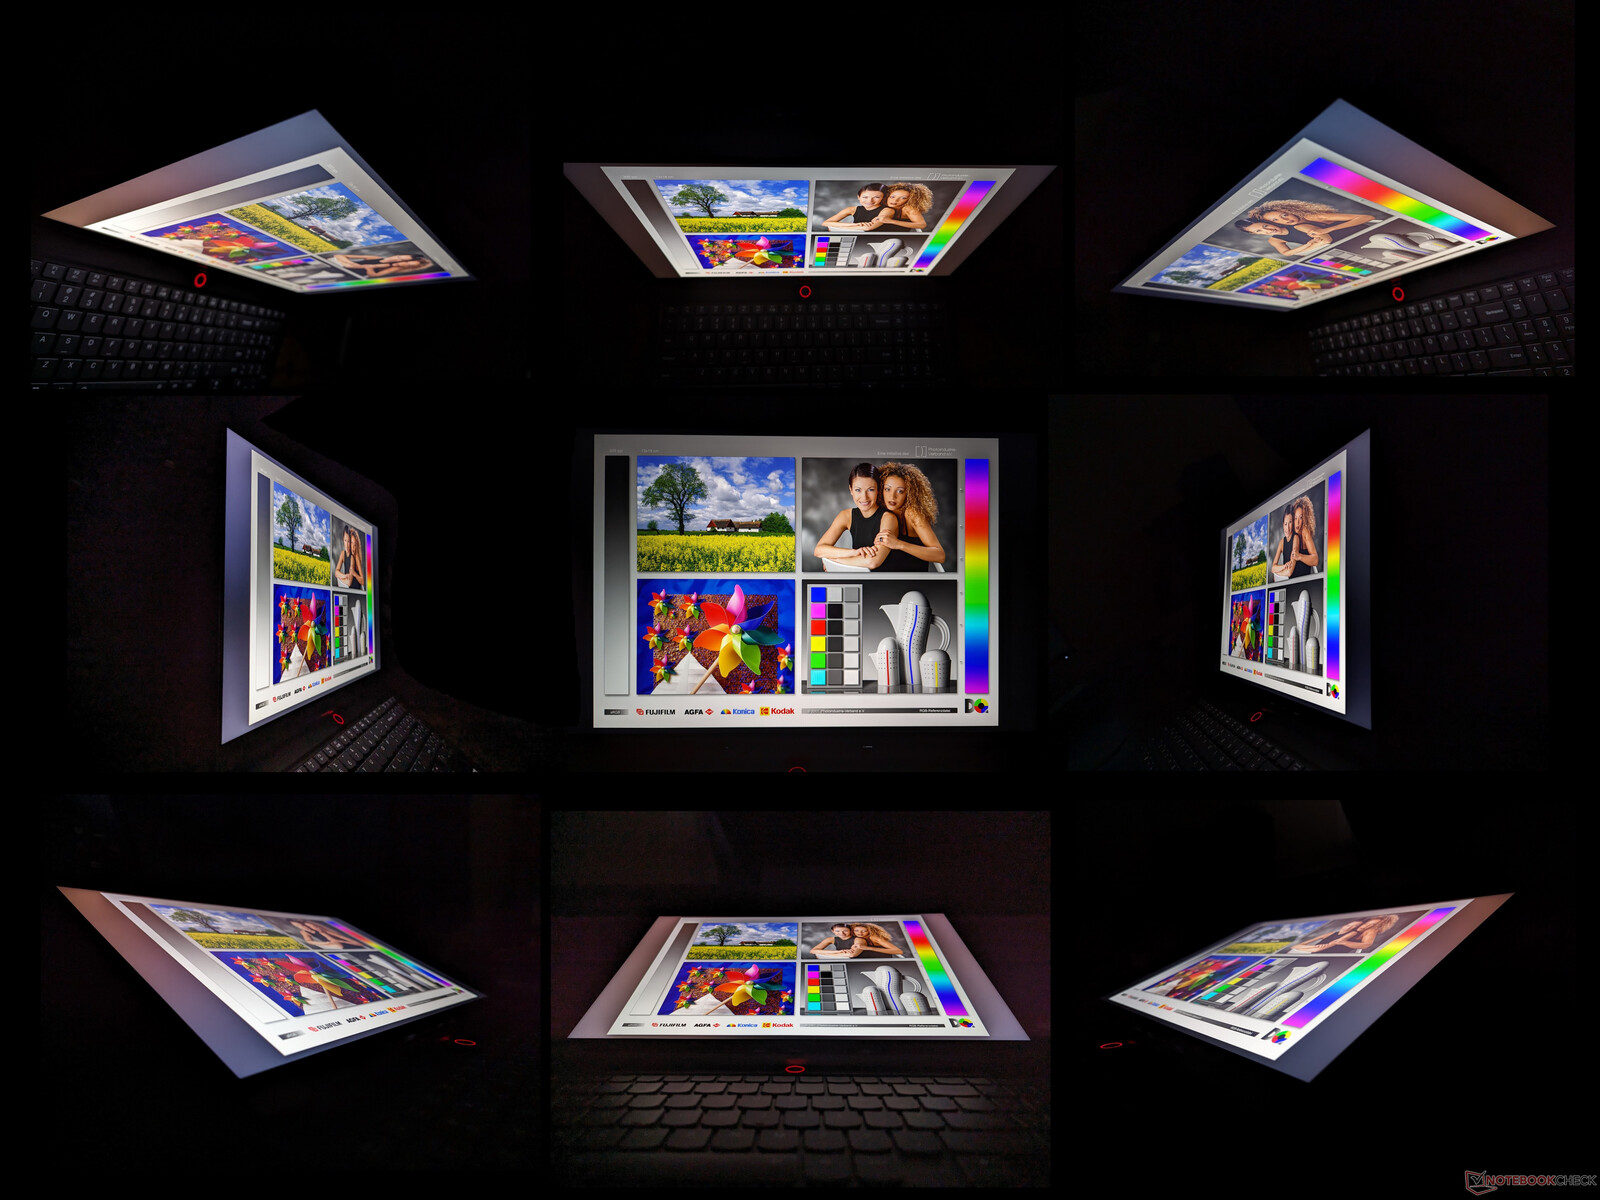
Tela - idêntica à do Legion Pro 7
Duas opções de painel estão disponíveis, ambas com suporte a G-Sync:
- 2560 x 1600, 240 Hz, tempos de resposta de 5 ms, 100% sRGB, 500 nits, certificado Pantone
- 3000 x 2000, 165 Hz, tempos de resposta de 3 ms, 100% DCI-P3, 430 nits, certificado Pantone
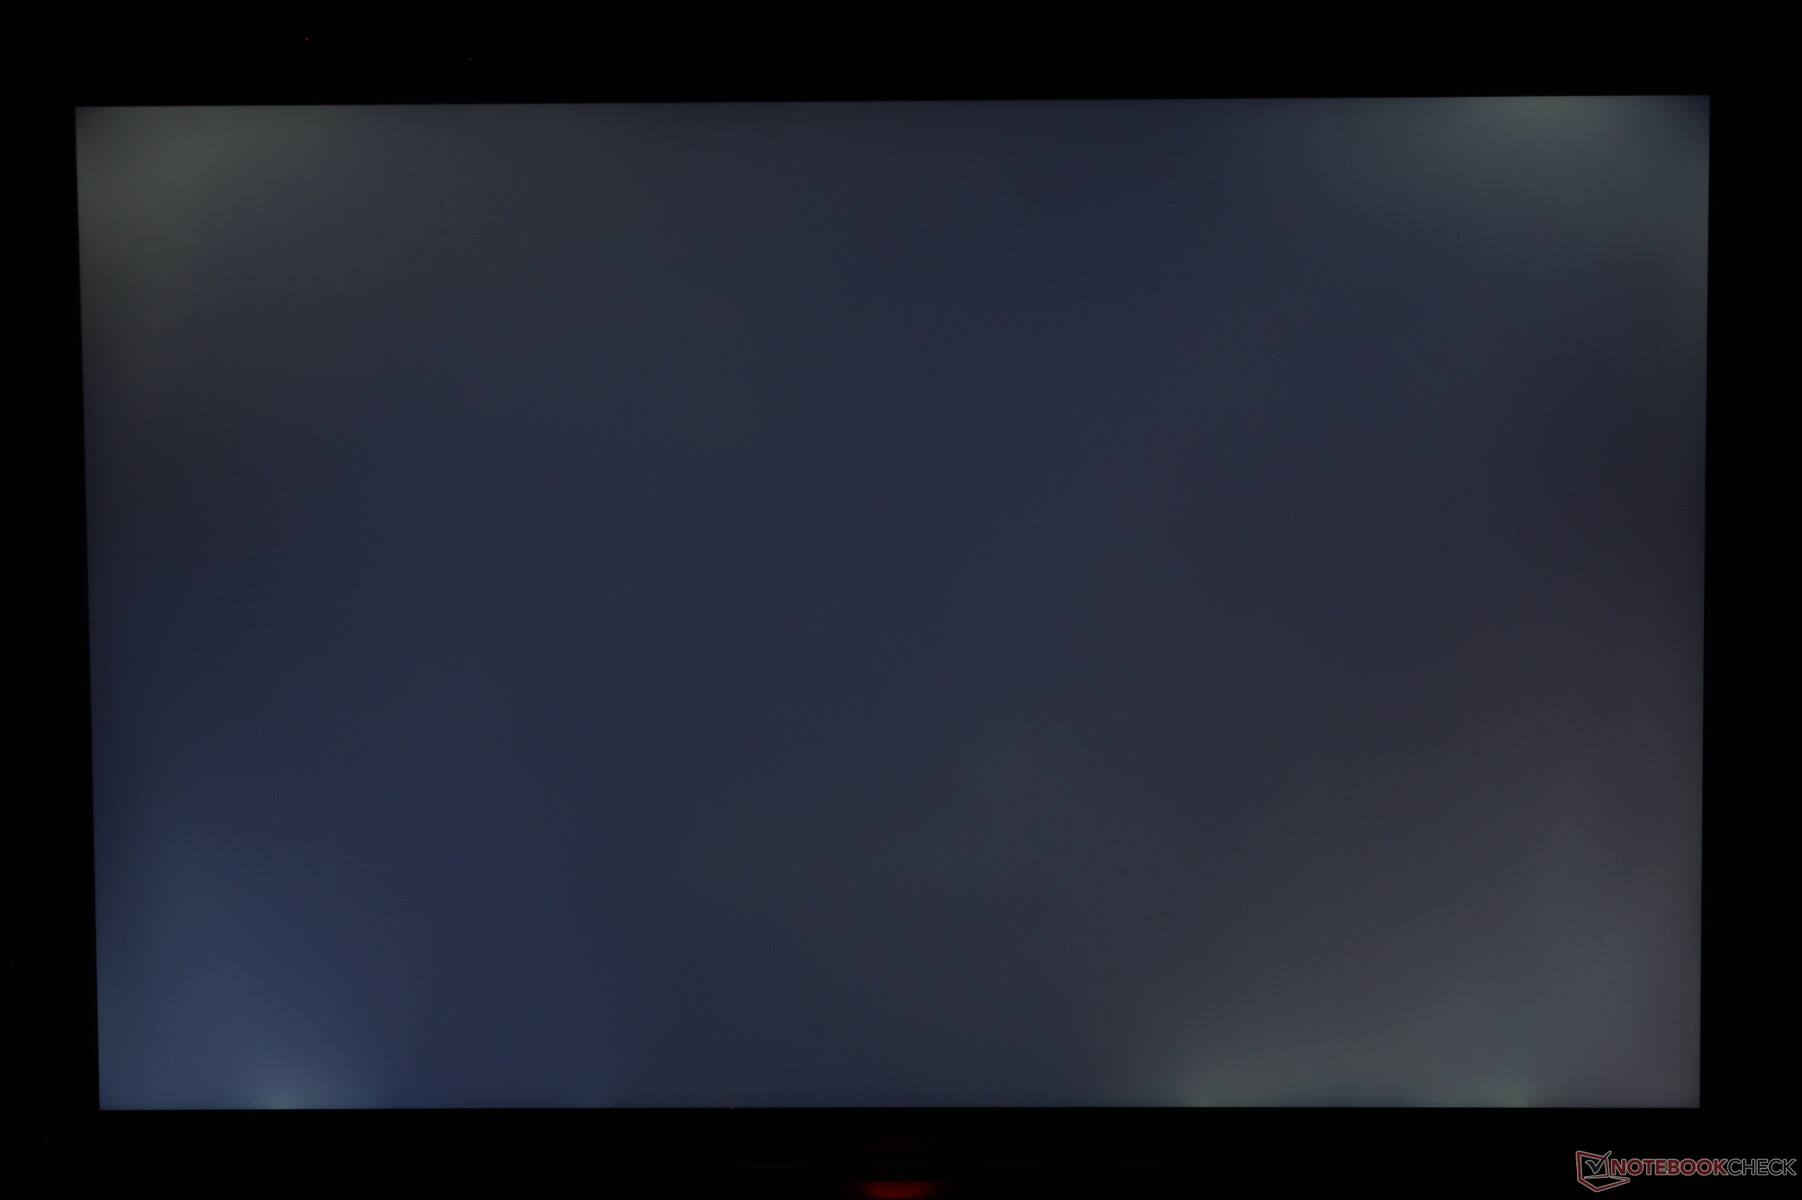
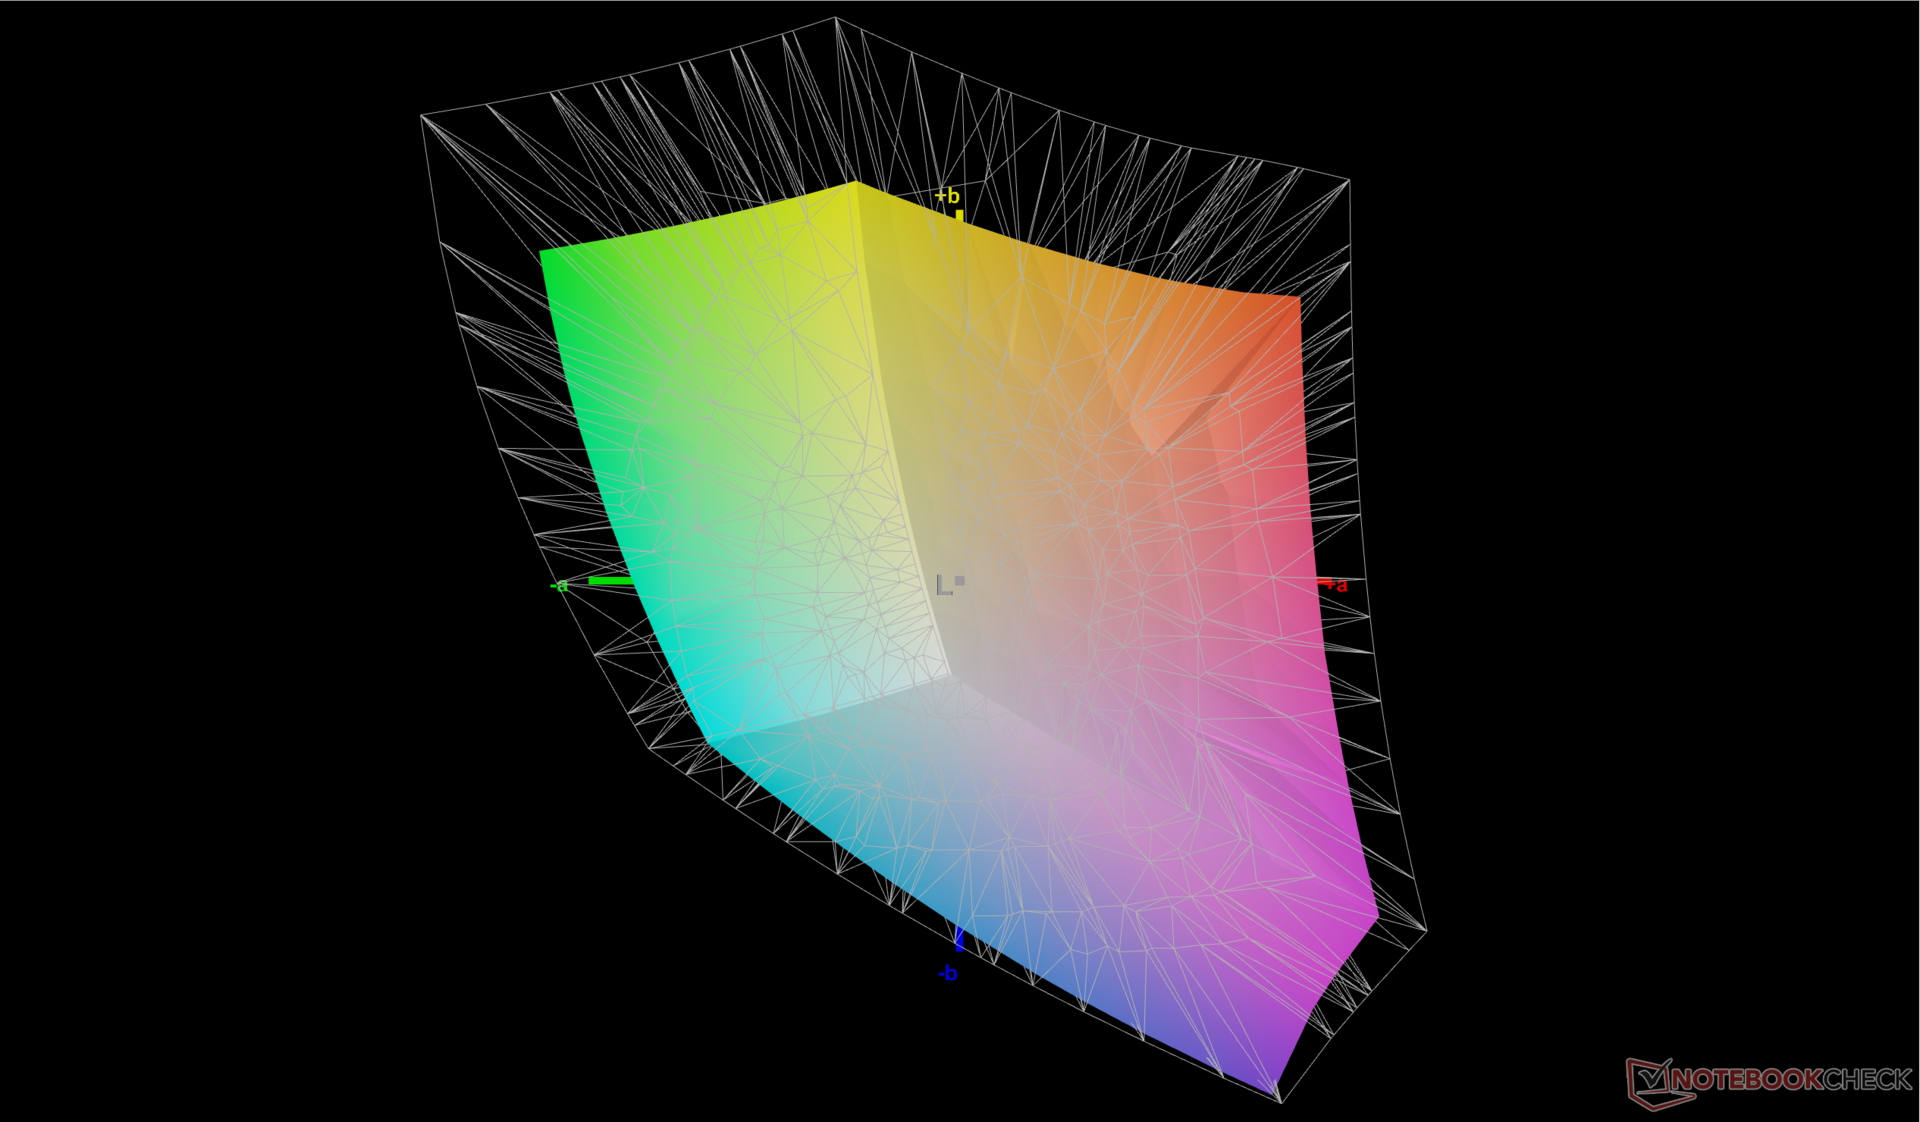
Nossa configuração 1600p vem exatamente com o mesmo painel IPS MNG007DA2-3 encontrado no maior e mais caro Legion Pro 7 para uma experiência de visualização idêntica entre os dois modelos. Esse é um painel de alta qualidade adequado para jogos e edição de gráficos amadores, apesar de ser a opção básica. O sangramento da luz de fundo, no entanto, é mais perceptível do que gostaríamos, como mostra a captura de tela abaixo.

| |||||||||||||||||||||||||
iluminação: 86 %
iluminação com acumulador: 474.6 cd/m²
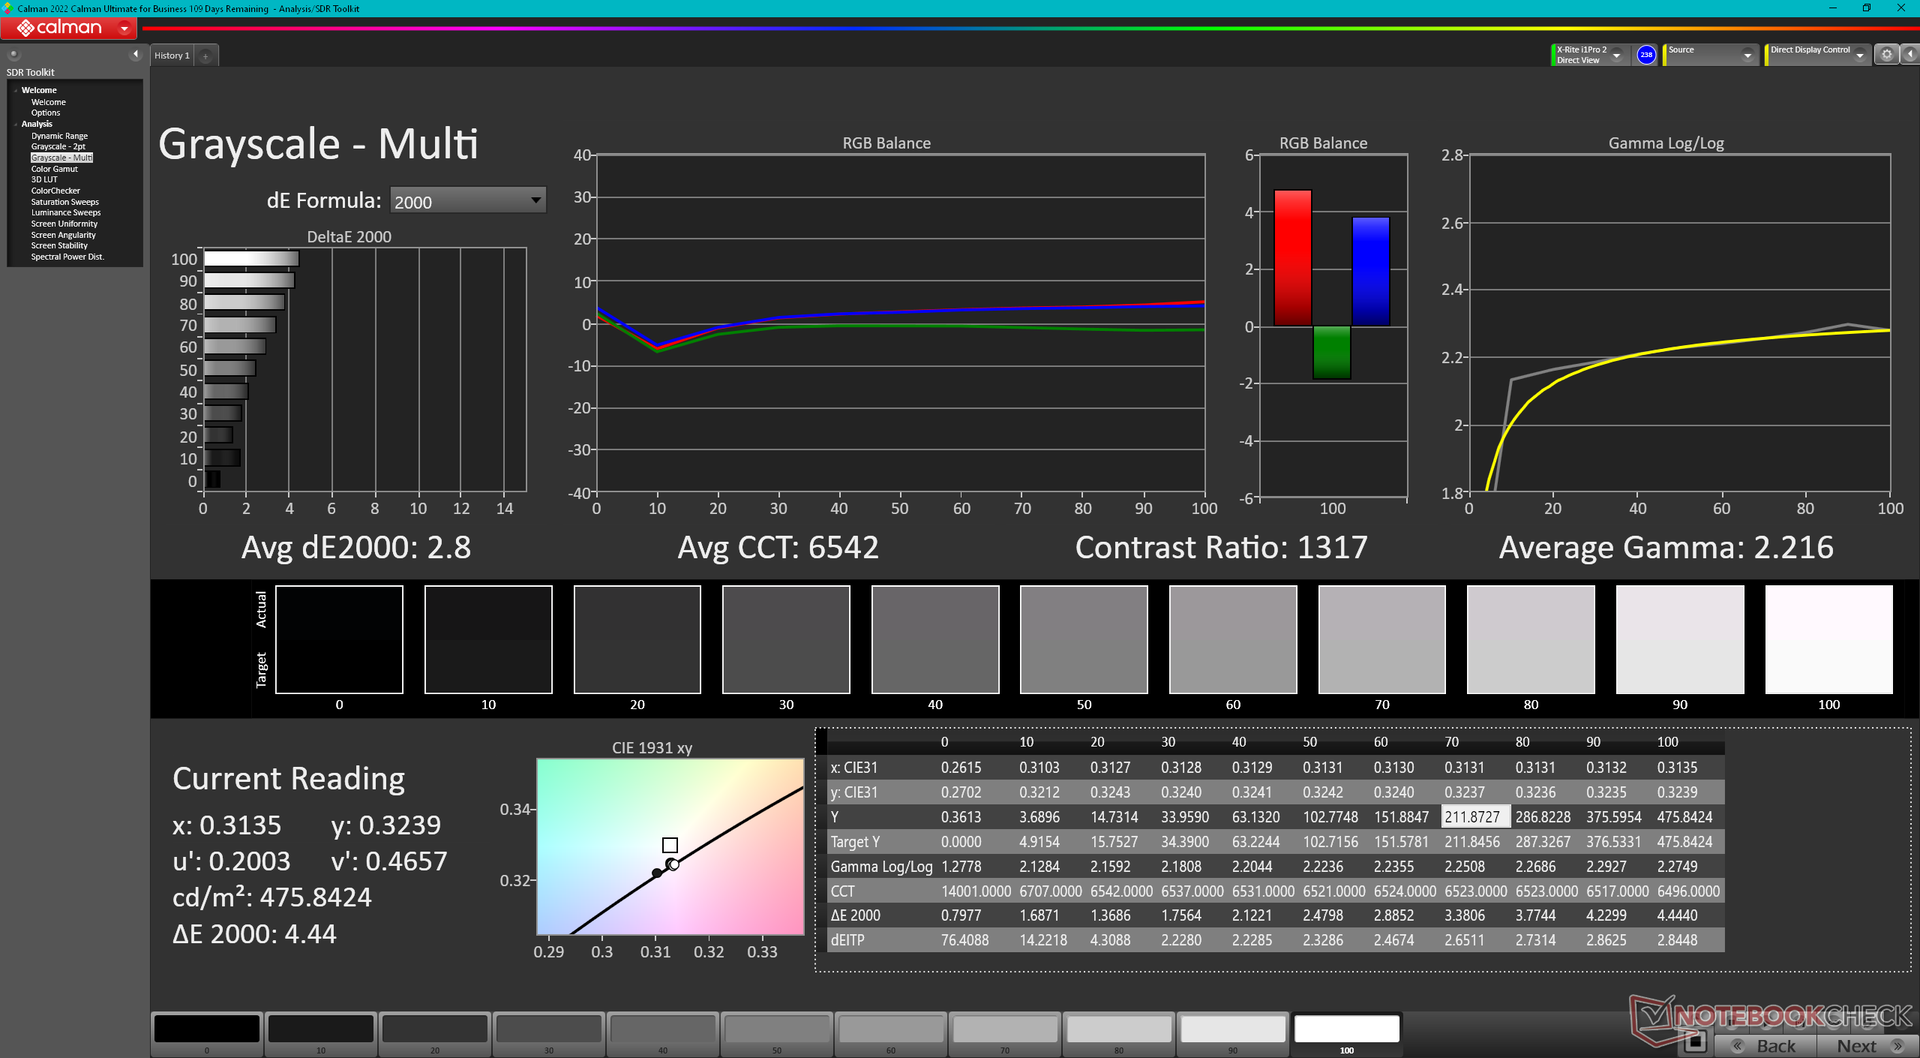
Contraste: 1217:1 (Preto: 0.39 cd/m²)
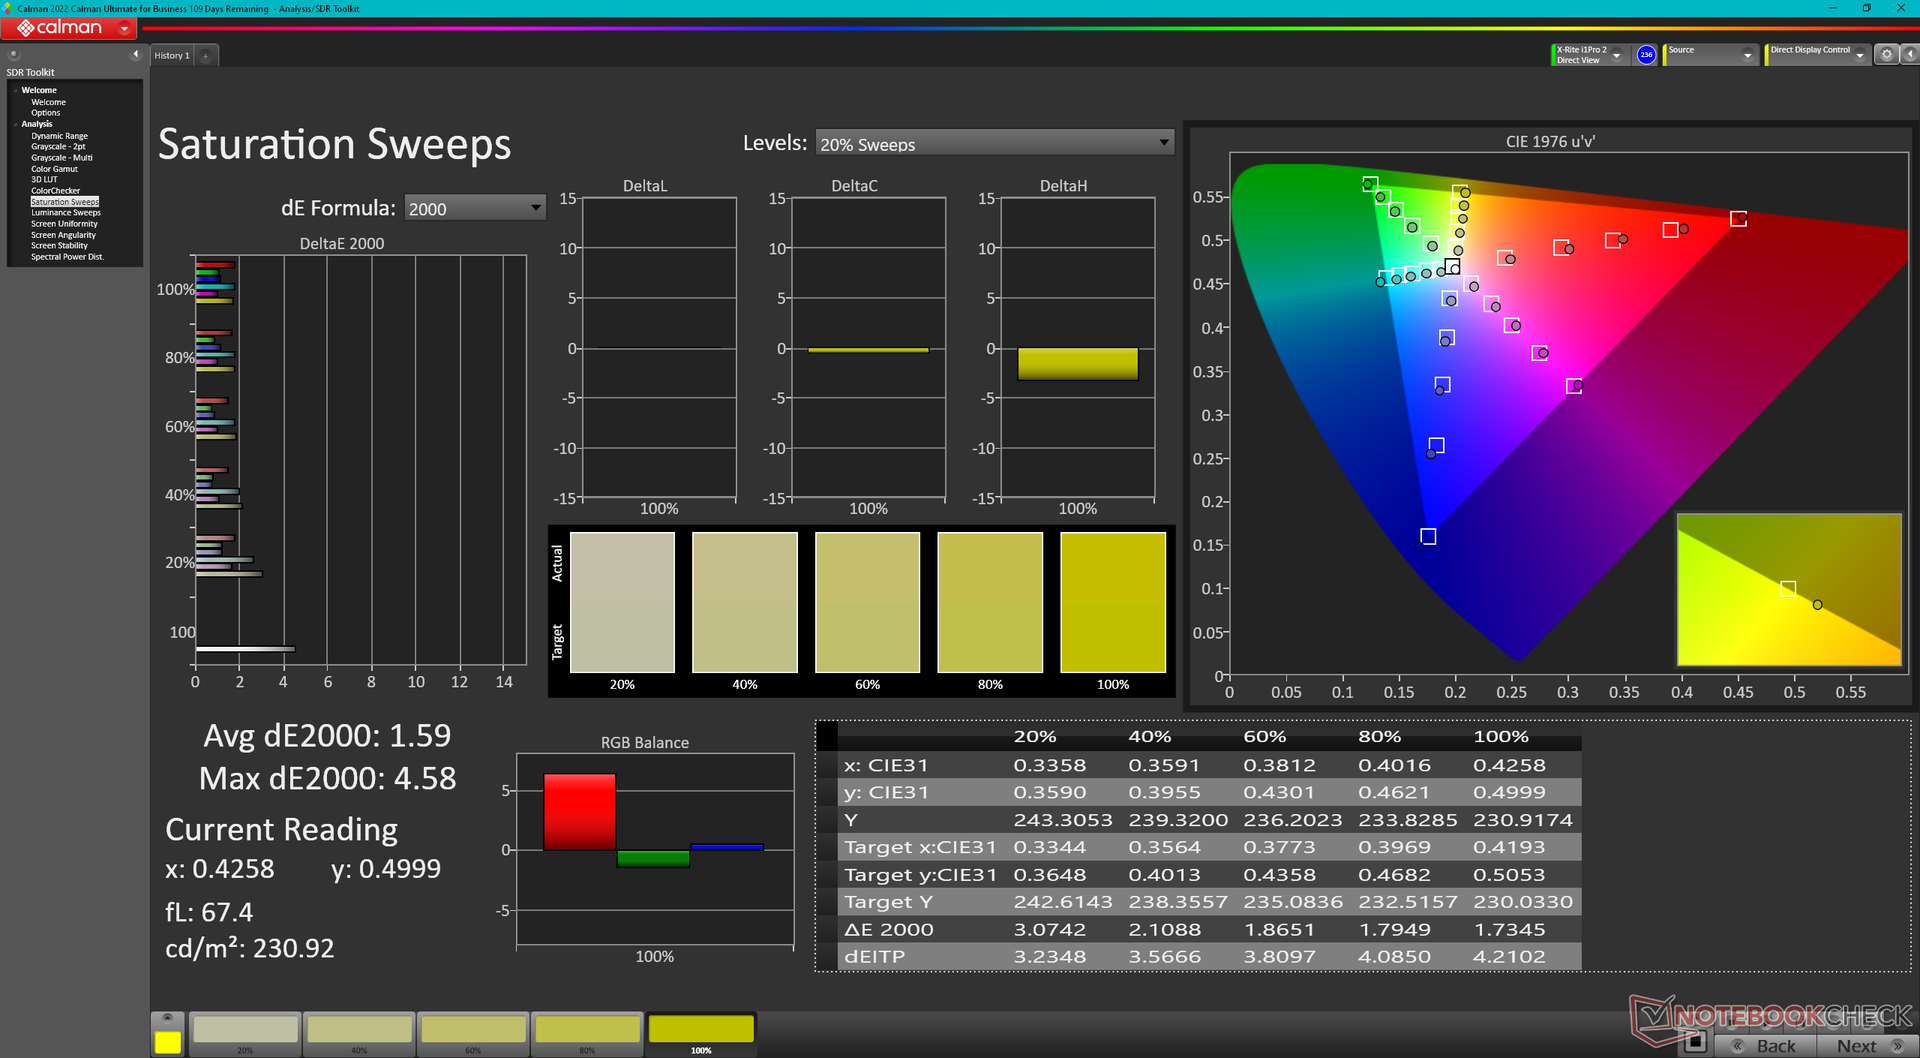
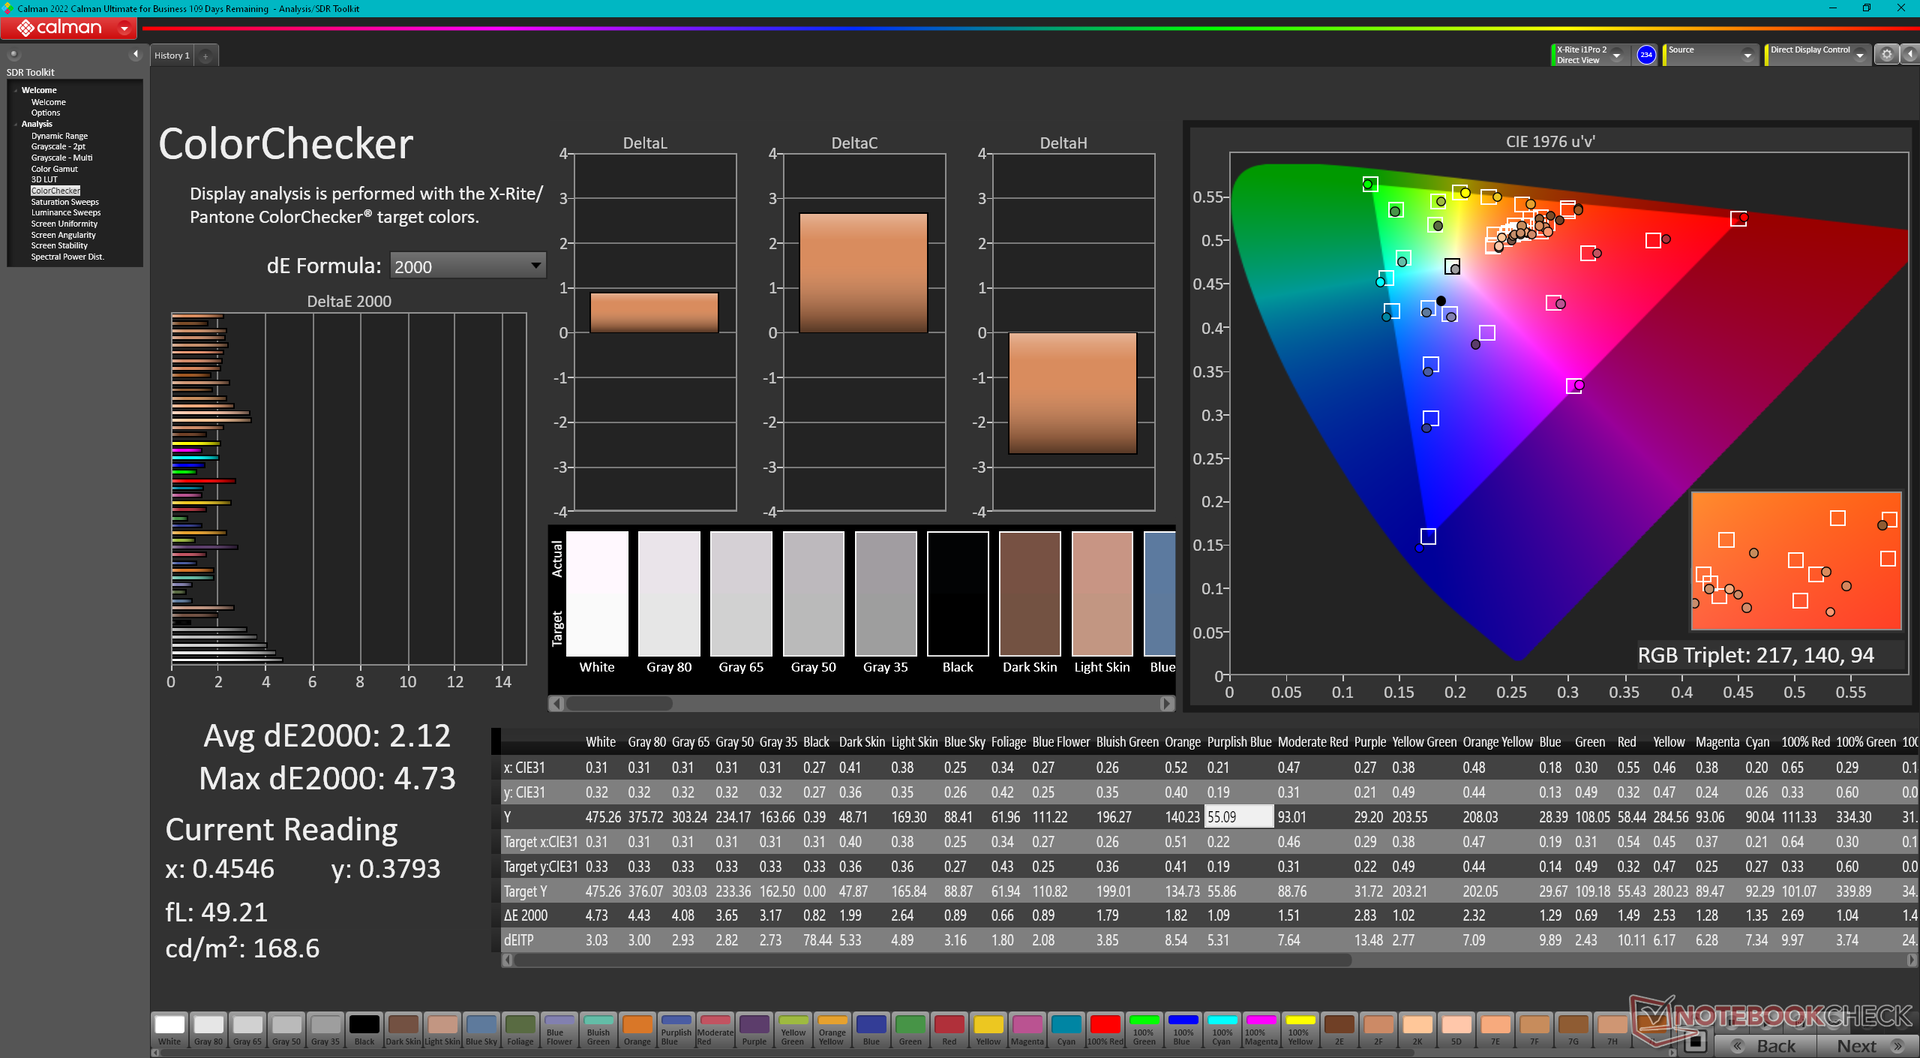
ΔE ColorChecker Calman: 2.12 | ∀{0.5-29.43 Ø4.71}
calibrated: 0.57
ΔE Greyscale Calman: 2.8 | ∀{0.09-98 Ø4.96}
72.5% AdobeRGB 1998 (Argyll 3D)
99.4% sRGB (Argyll 3D)
70.4% Display P3 (Argyll 3D)
Gamma: 2.22
CCT: 6542 K
| Lenovo Legion Slim 7i 16 Gen 8 CSOT T3 MNG007DA2-3, IPS, 2560x1600, 16" | HP Omen 16-wf000 BOE0B7D, IPS, 2560x1440, 16.1" | Alienware x16 R1 BOE NE16NZ4, IPS, 2560x1600, 16" | Lenovo Legion Pro 7 RTX4090 MNG007DA2-3 (CSO1628), IPS, 2560x1600, 16" | Asus ROG Strix G16 G614JZ TL160ADMP03-0, IPS, 2560x1600, 16" | Razer Blade 16 Early 2023 CSOT T3 MNG007DA4-1, IPS, 2560x1600, 16" | |
|---|---|---|---|---|---|---|
| Display | -1% | 21% | -1% | 19% | 22% | |
| Display P3 Coverage (%) | 70.4 | 69 -2% | 99.2 41% | 69.5 -1% | 97 38% | 98.5 40% |
| sRGB Coverage (%) | 99.4 | 99.2 0% | 100 1% | 99.8 0% | 99.9 1% | 100 1% |
| AdobeRGB 1998 Coverage (%) | 72.5 | 71.2 -2% | 88.6 22% | 71.6 -1% | 84.9 17% | 89.7 24% |
| Response Times | 27% | 21% | 29% | 42% | 5% | |
| Response Time Grey 50% / Grey 80% * (ms) | 12 ? | 4.6 ? 62% | 5.1 ? 57% | 10.9 ? 9% | 5.1 ? 57% | 6.6 ? 45% |
| Response Time Black / White * (ms) | 8.9 ? | 9.7 ? -9% | 10.3 ? -16% | 4.6 ? 48% | 6.6 ? 26% | 12 ? -35% |
| PWM Frequency (Hz) | ||||||
| Screen | -5% | -11% | -5% | -4% | -12% | |
| Brightness middle (cd/m²) | 474.6 | 310.9 -34% | 302.2 -36% | 491 3% | 470 -1% | 456.8 -4% |
| Brightness (cd/m²) | 445 | 296 -33% | 285 -36% | 472 6% | 459 3% | 437 -2% |
| Brightness Distribution (%) | 86 | 91 6% | 89 3% | 91 6% | 93 8% | 83 -3% |
| Black Level * (cd/m²) | 0.39 | 0.35 10% | 0.26 33% | 0.4 -3% | 0.42 -8% | 0.35 10% |
| Contrast (:1) | 1217 | 888 -27% | 1162 -5% | 1228 1% | 1119 -8% | 1305 7% |
| Colorchecker dE 2000 * | 2.12 | 2.18 -3% | 1.63 23% | 1.6 25% | 1.86 12% | 3.7 -75% |
| Colorchecker dE 2000 max. * | 4.73 | 3.58 24% | 4.13 13% | 5.15 -9% | 3.87 18% | 6.42 -36% |
| Colorchecker dE 2000 calibrated * | 0.57 | 0.52 9% | 1.17 -105% | 0.97 -70% | 0.93 -63% | 0.66 -16% |
| Greyscale dE 2000 * | 2.8 | 2.8 -0% | 2.5 11% | 3 -7% | 2.7 4% | 2.6 7% |
| Gamma | 2.22 99% | 2.18 101% | 2.23 99% | 2.211 100% | 2.246 98% | 2.3 96% |
| CCT | 6542 99% | 6002 108% | 6590 99% | 6979 93% | 6711 97% | 6108 106% |
| Média Total (Programa/Configurações) | 7% /
0% | 10% /
0% | 8% /
1% | 19% /
7% | 5% /
-3% |
* ... menor é melhor
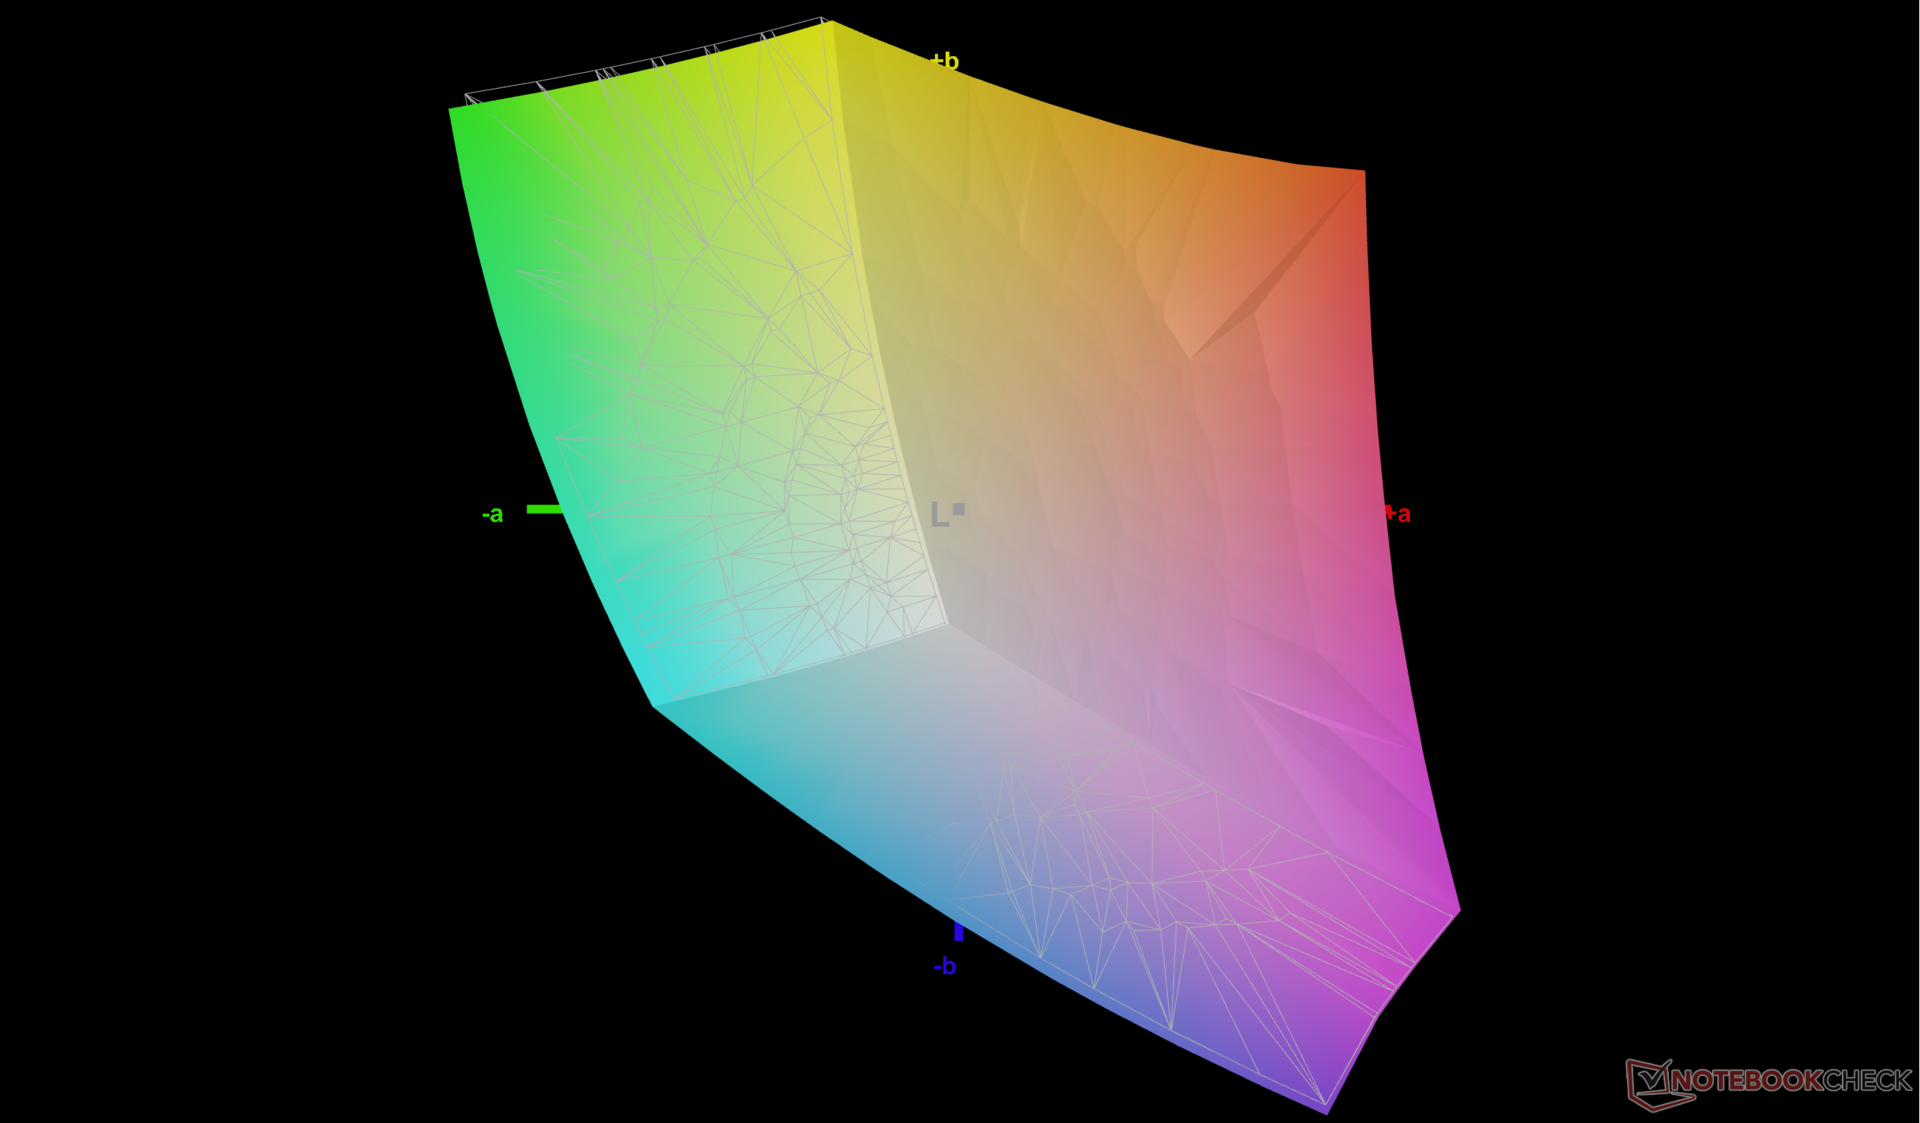
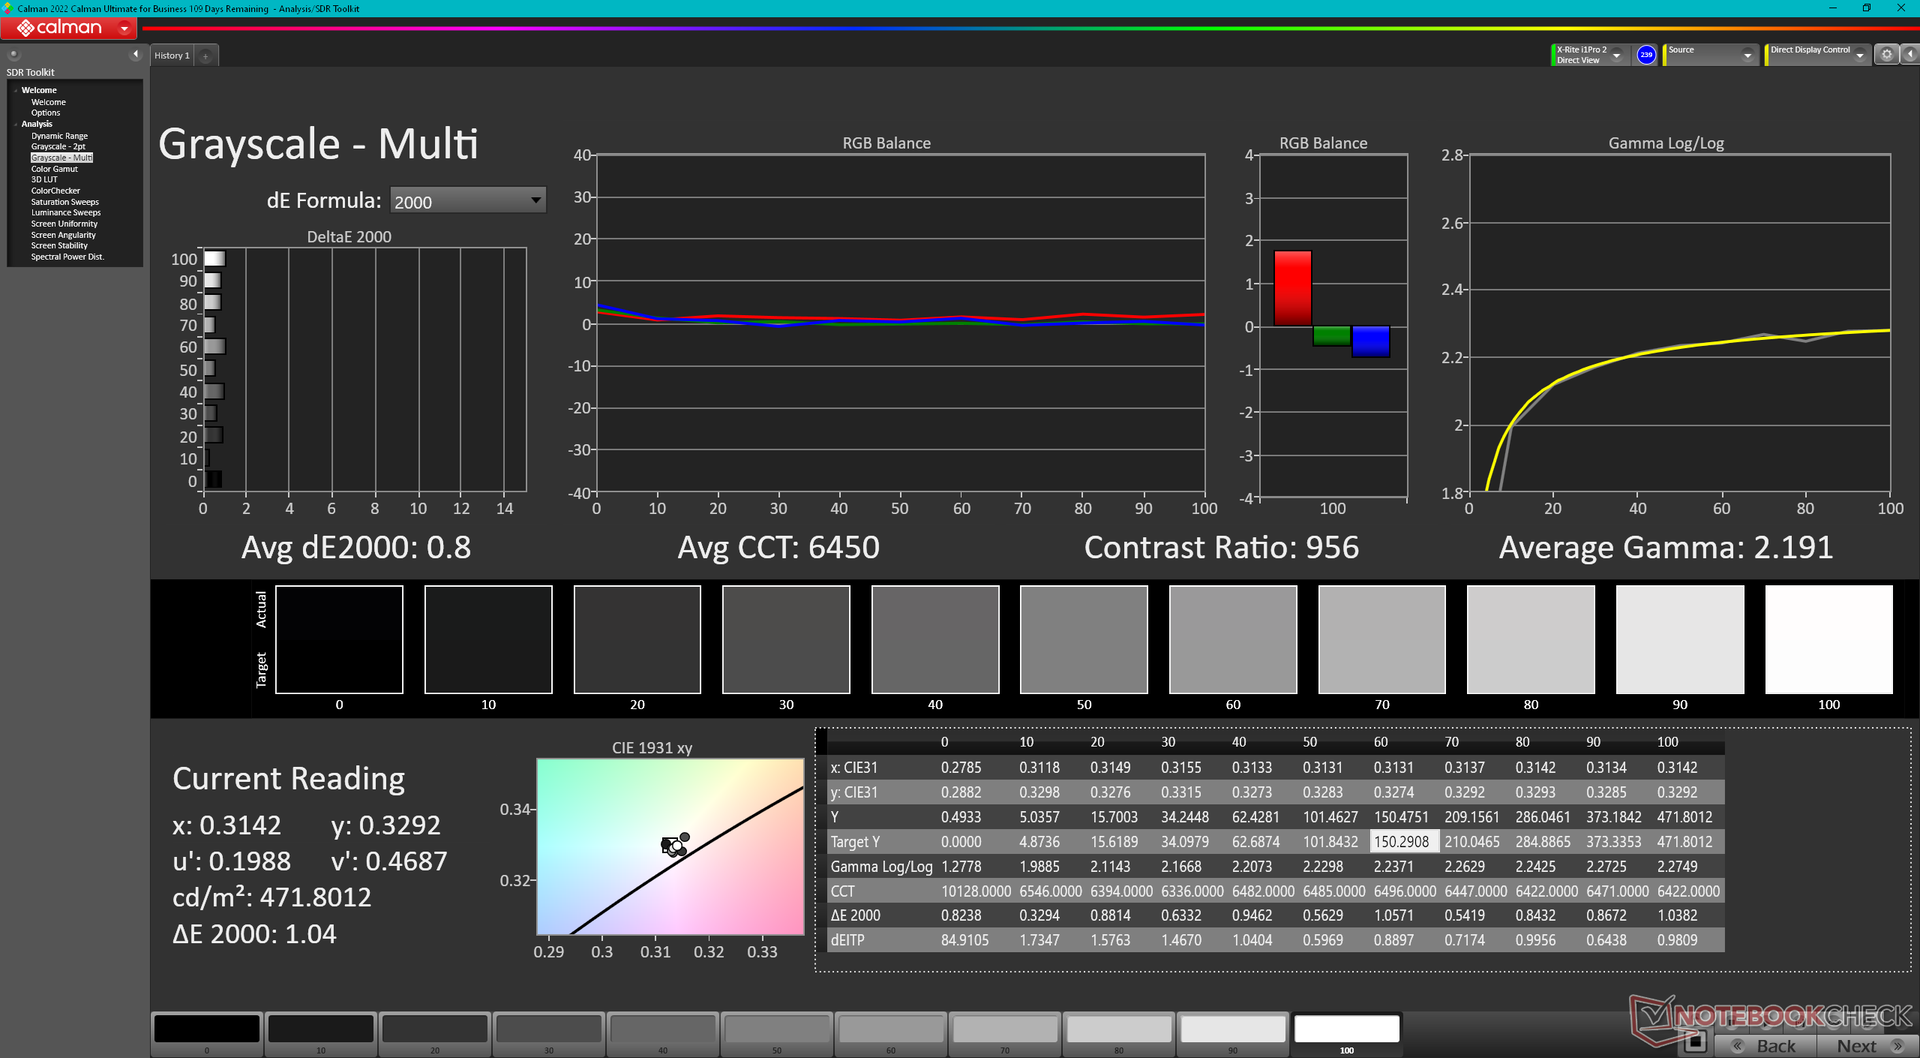
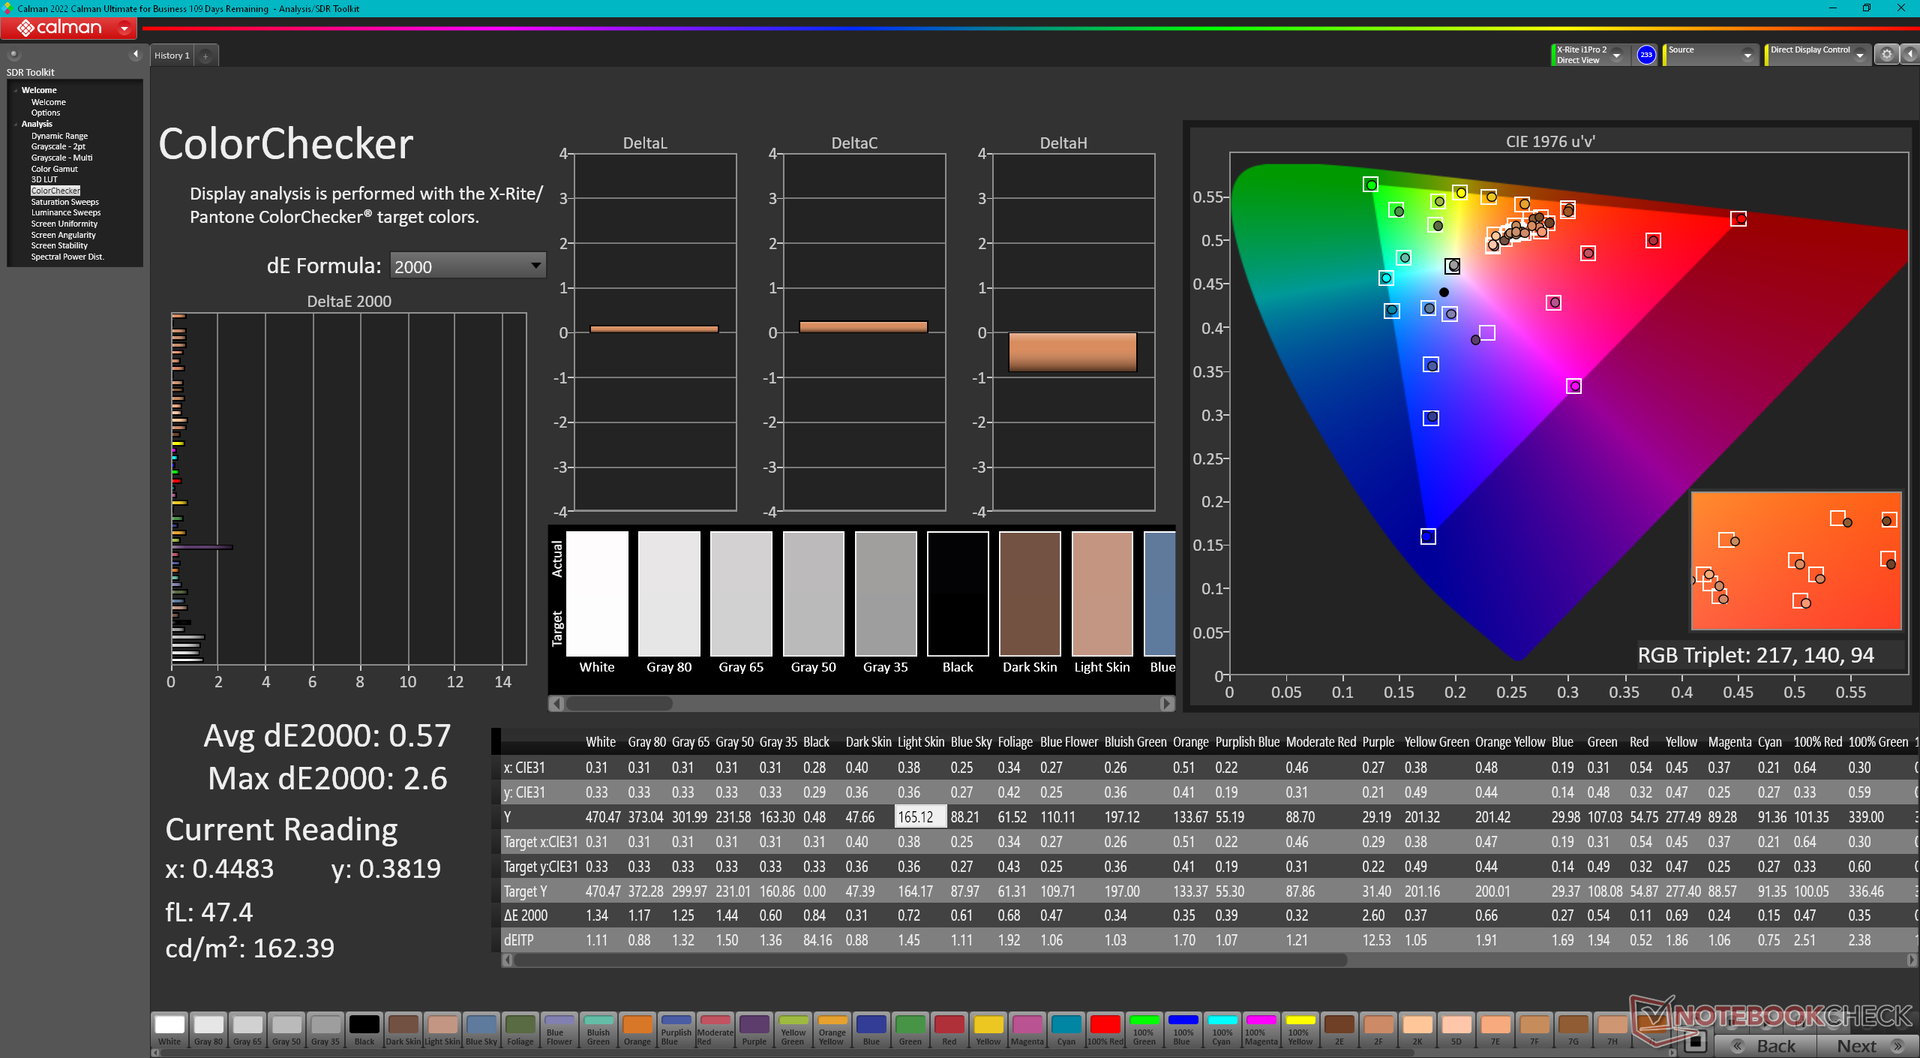
A tela vem pré-calibrada com valores médios de deltaE em escala de cinza e cor de apenas 2,8 e 2,12, respectivamente. A calibração feita por nós mesmos com um colorímetro X-Rite melhoraria ainda mais essas médias para apenas 0,8 e 0,57, respectivamente. Portanto, uma calibração do usuário final não é totalmente necessária, mas nosso perfil ICM calibrado está disponível gratuitamente para os usuários interessados.

Exibir tempos de resposta
| ↔ Tempo de resposta preto para branco | ||
|---|---|---|
| 8.9 ms ... ascensão ↗ e queda ↘ combinadas | ↗ 5.1 ms ascensão | 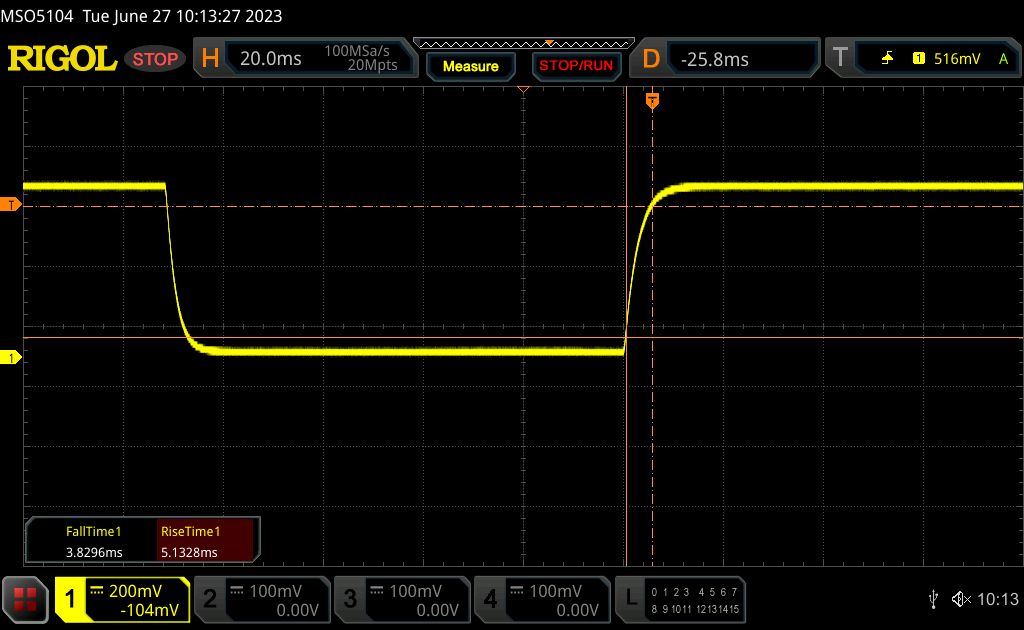 |
| ↘ 3.8 ms queda | ||
| A tela mostra taxas de resposta rápidas em nossos testes e deve ser adequada para jogos. Em comparação, todos os dispositivos testados variam de 0.1 (mínimo) a 240 (máximo) ms. » 25 % de todos os dispositivos são melhores. Isso significa que o tempo de resposta medido é melhor que a média de todos os dispositivos testados (19.8 ms). | ||
| ↔ Tempo de resposta 50% cinza a 80% cinza | ||
| 12 ms ... ascensão ↗ e queda ↘ combinadas | ↗ 6 ms ascensão | 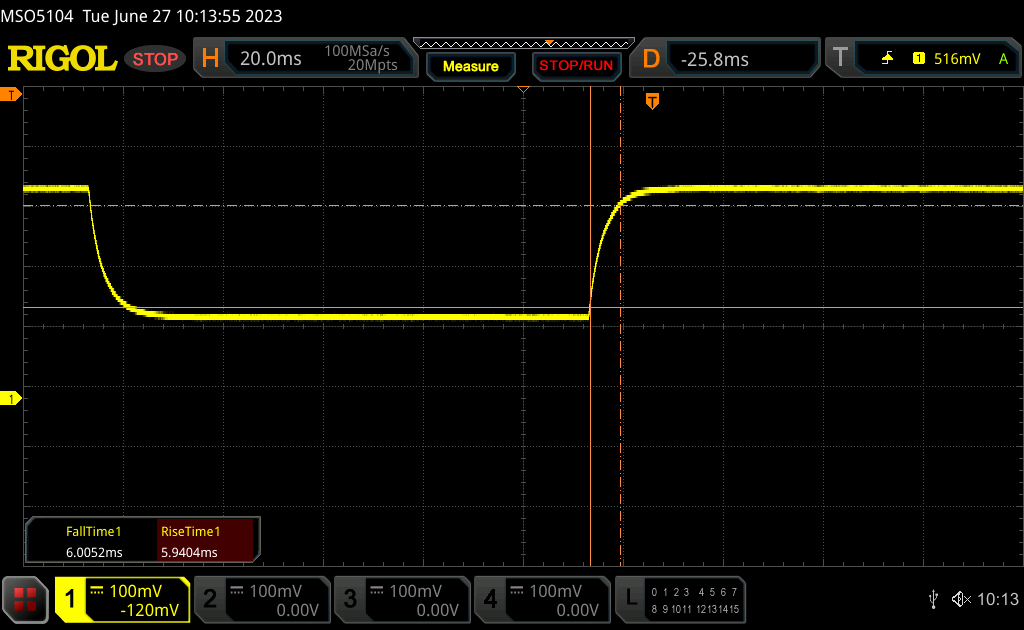 |
| ↘ 6 ms queda | ||
| A tela mostra boas taxas de resposta em nossos testes, mas pode ser muito lenta para jogadores competitivos. Em comparação, todos os dispositivos testados variam de 0.165 (mínimo) a 636 (máximo) ms. » 25 % de todos os dispositivos são melhores. Isso significa que o tempo de resposta medido é melhor que a média de todos os dispositivos testados (31 ms). | ||
Cintilação da tela / PWM (modulação por largura de pulso)
| Tela tremeluzindo / PWM não detectado | 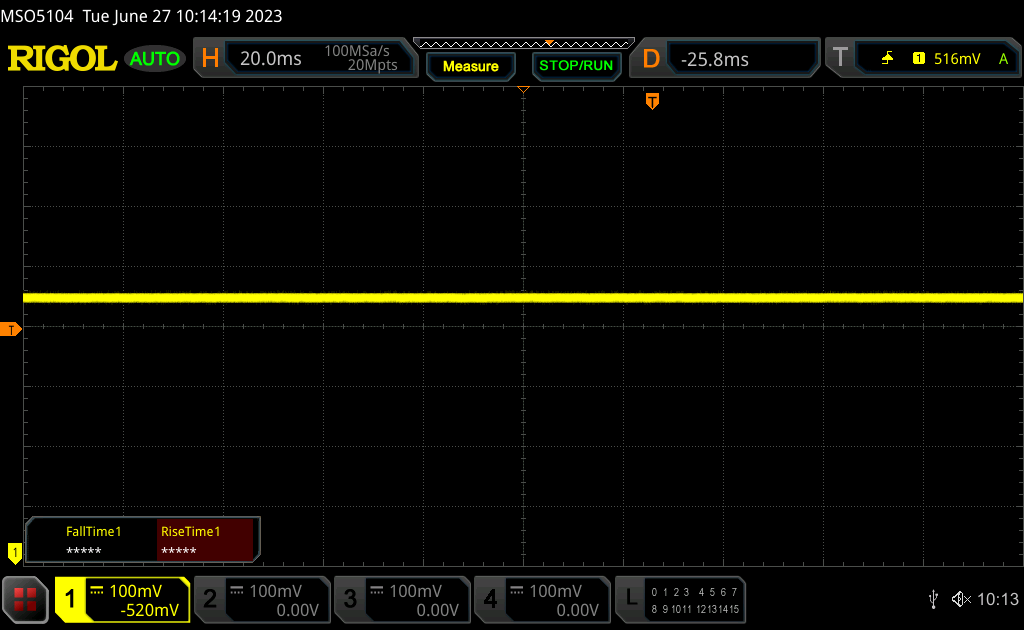 | ||
[pwm_comparison] Em comparação: 52 % de todos os dispositivos testados não usam PWM para escurecer a tela. Se PWM foi detectado, uma média de 7757 (mínimo: 5 - máximo: 343500) Hz foi medida. | |||
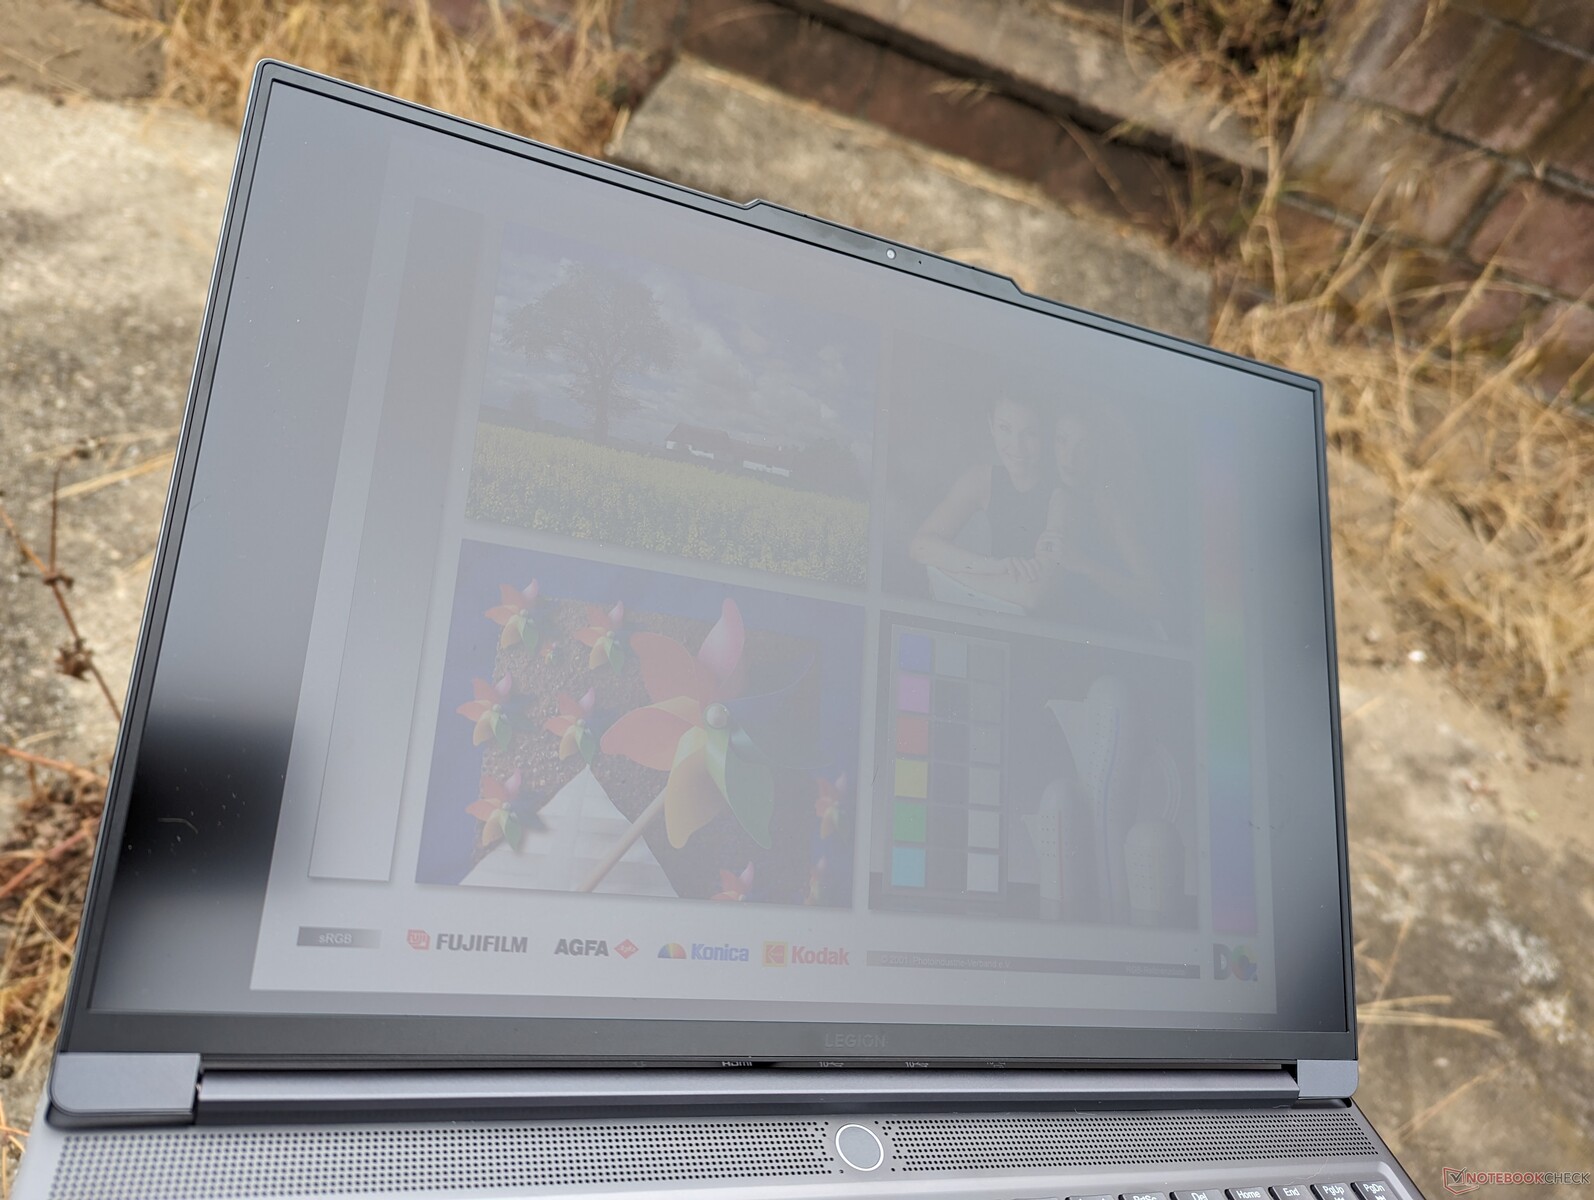
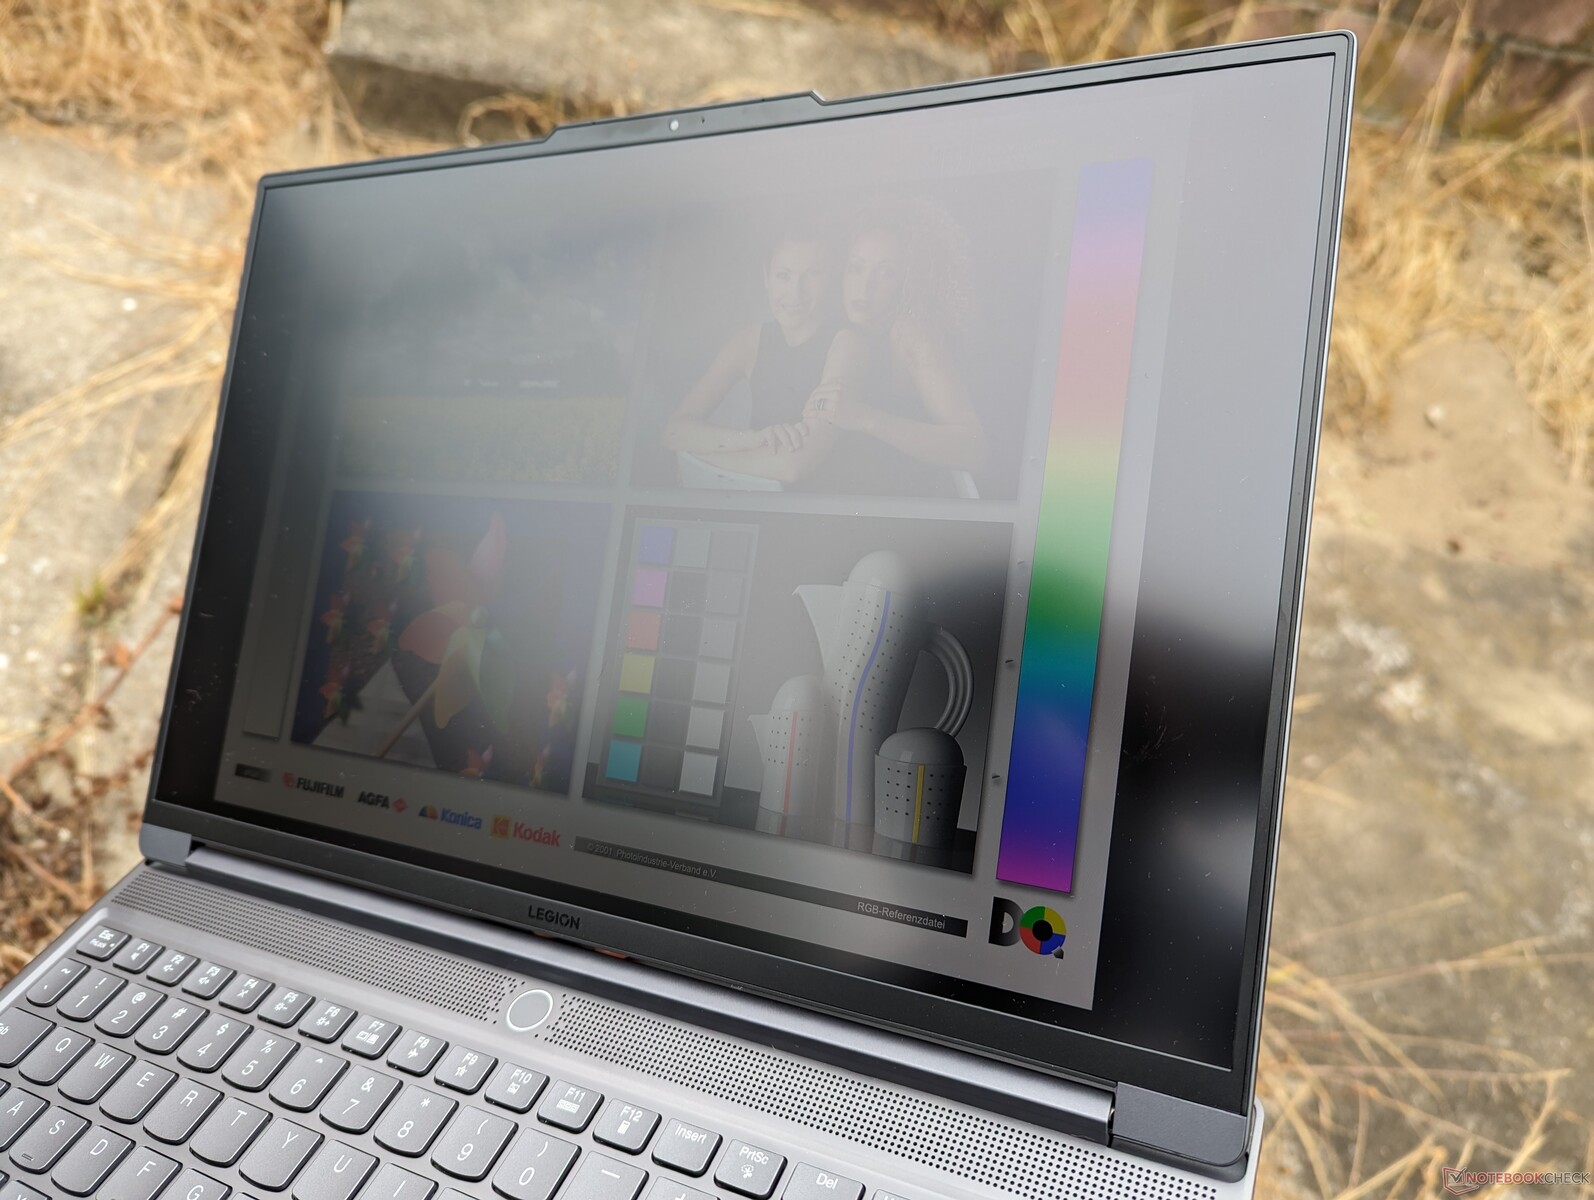
A tela é visivelmente mais brilhante do que a doOmen 16 ou no Alienware x16 R1 para facilitar a leitura em ambientes externos. Na verdade, sua configuração de brilho máximo é apenas cerca de 10% mais fraca do que a do MacBook Pro 16.
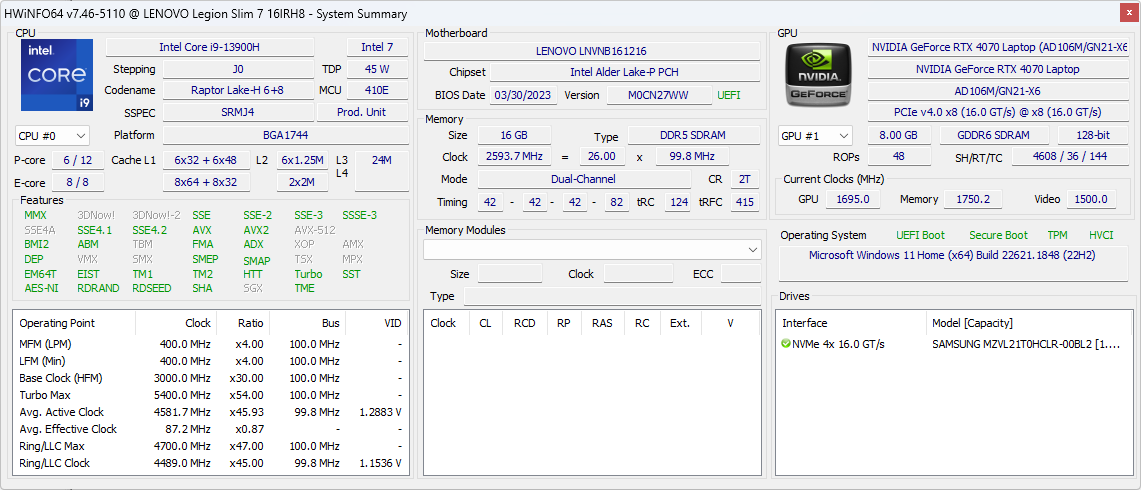
Desempenho - Core i9 de 13ª geração
Condições de teste
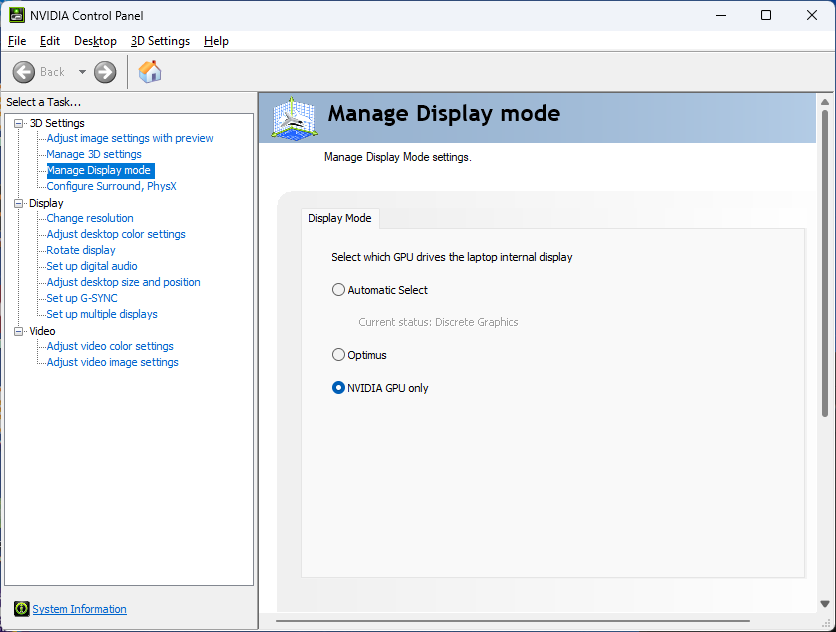
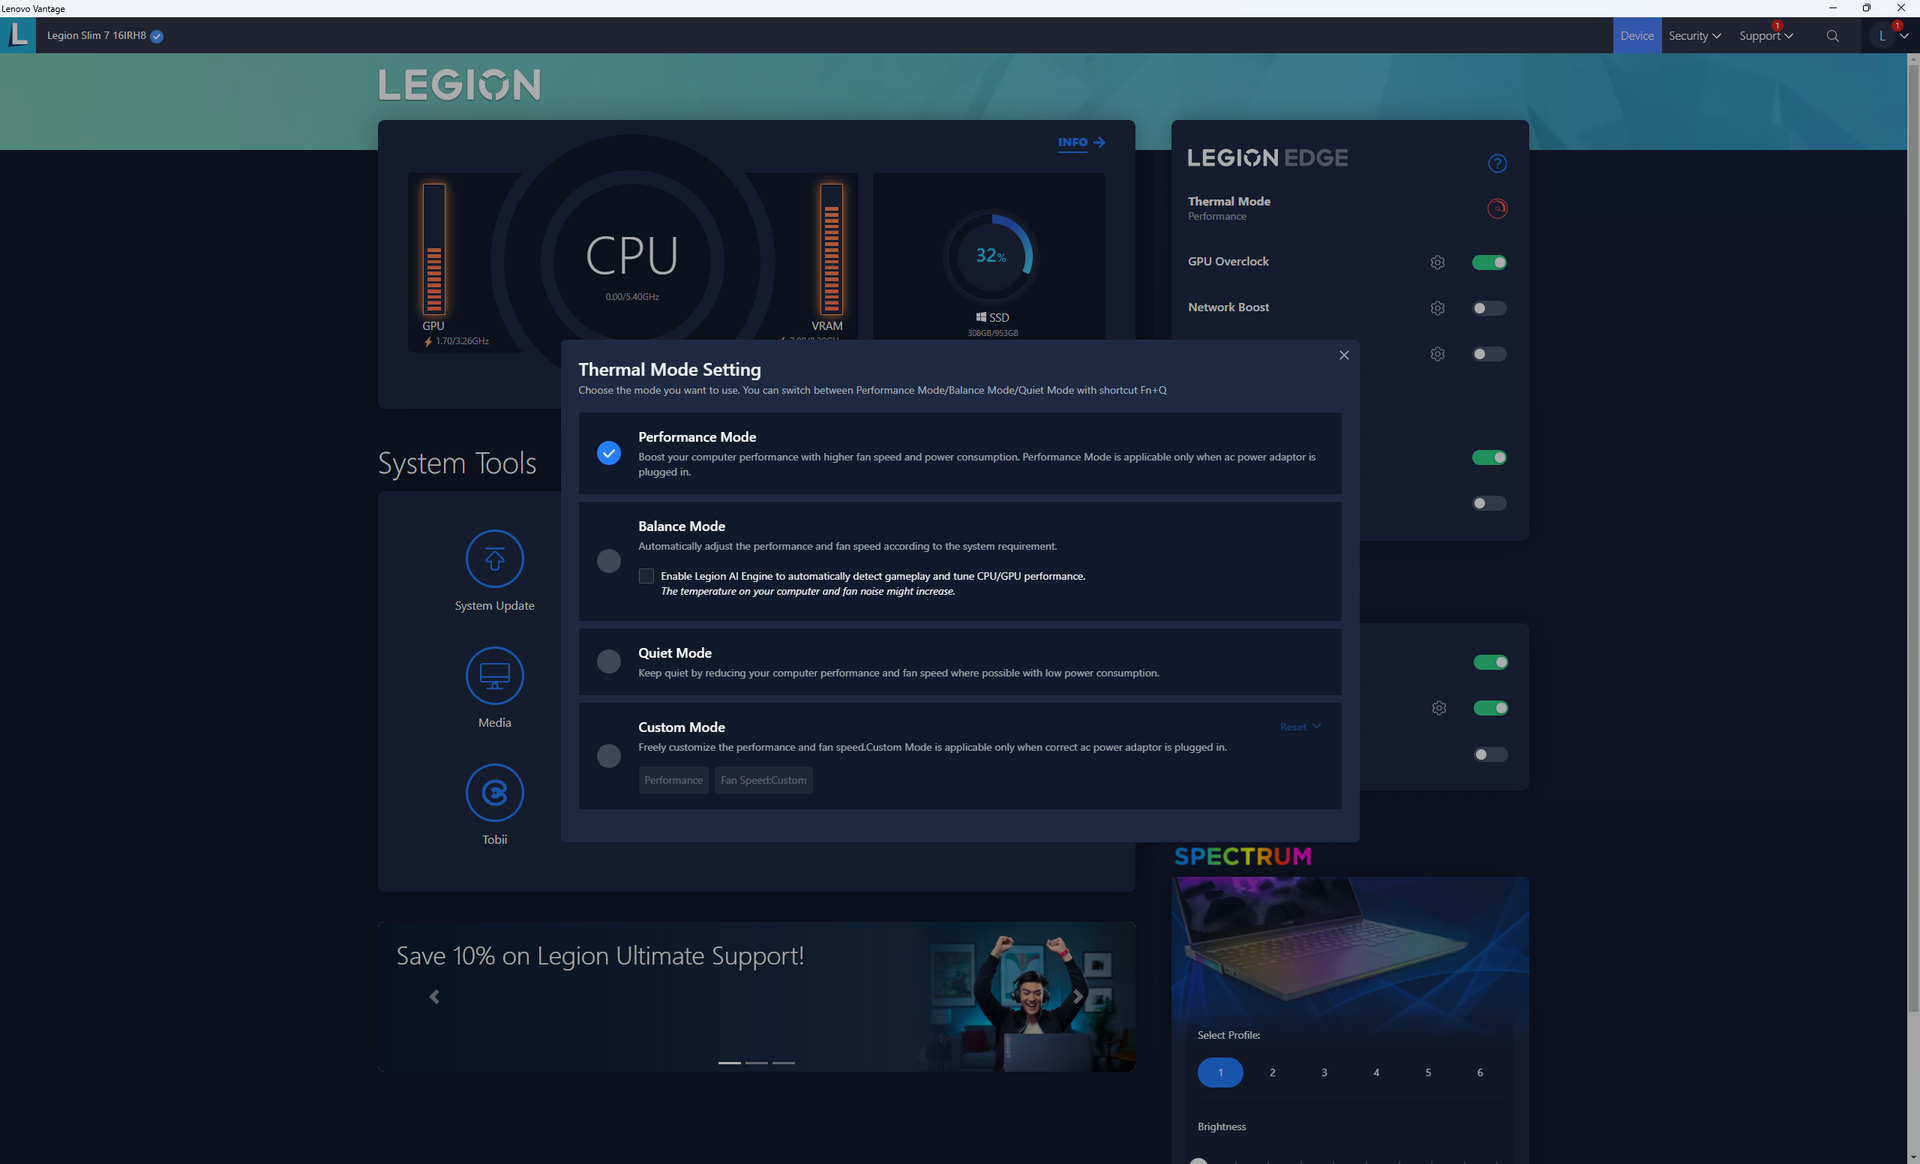
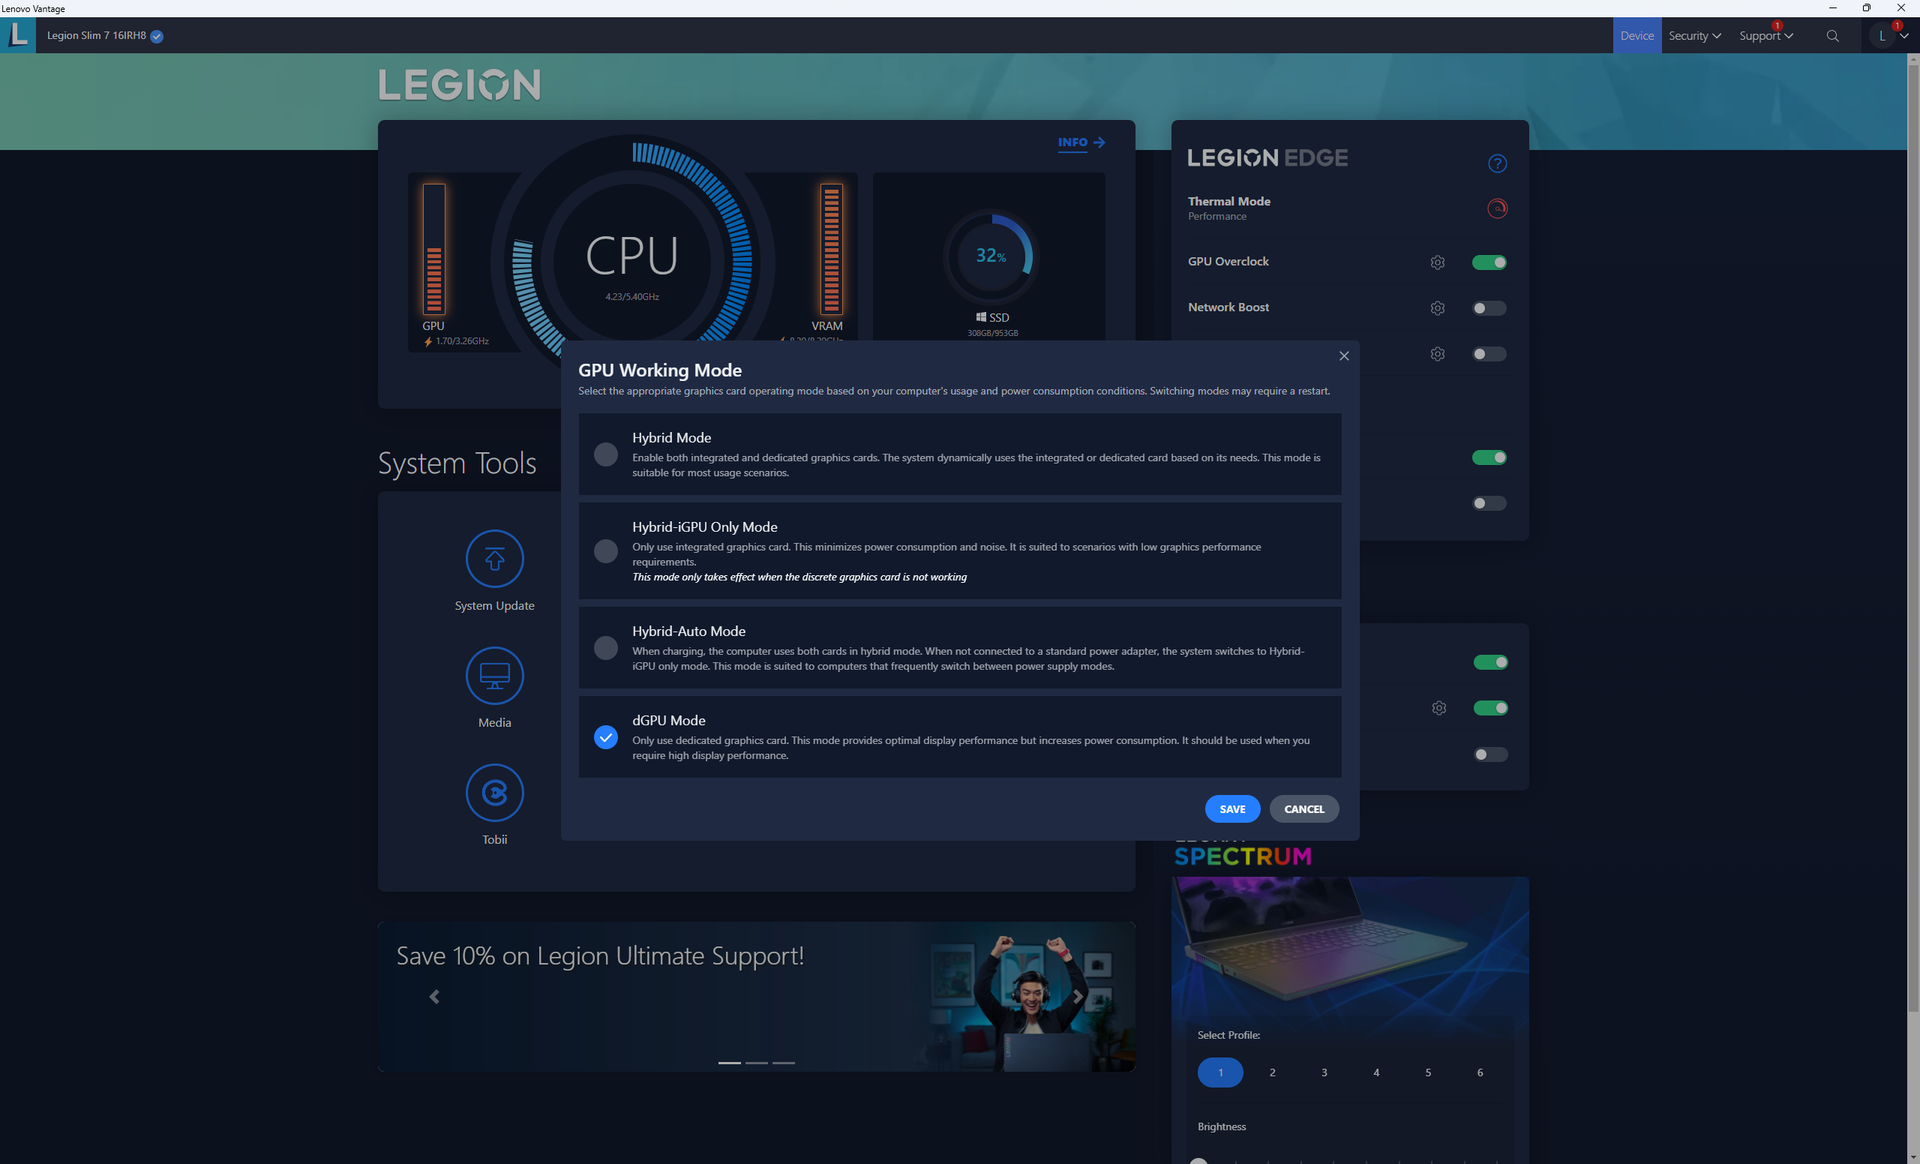
Configuramos nossa unidade para o modo dGPU e o modo Desempenho com Overclock e Overdrive da GPU ativos antes de executar os benchmarks abaixo. O Lenovo Vantage é o centro de controle para ajustar o desempenho, as atualizações, a garantia, o RGB e outros recursos.
Há suporte para Optimus avançado ou MUX.
É importante observar que nossa unidade tem um slot SODIMM desocupado e, portanto, está funcionando apenas com 16 GB de RAM soldada de canal único. Os resultados do benchmark de memória AIDA64 são, portanto, muito mais baixos do que na maioria dos outros notebooks para jogos.
Processador
O Raptor Lake-H Core i9-13900H oferece um aumento respeitável de 25% no desempenho multi-thread em relação ao Alder Lake-H Core i9-12900H. Mais notavelmente, seu desempenho é essencialmente idêntico ao do mais caroCore i7-13700HX e Core i9-13900HK. Se você decidir entre qualquer uma dessas três CPUs de 13ª geração, a opção Core i9-13900H será a melhor opção para o seu bolso.
Fazendo downgrade para o processador básico Core i7-13700H deverá reduzir o desempenho do processador em cerca de 20 a 25%.
Cinebench R15 Multi Loop
Cinebench R20: CPU (Multi Core) | CPU (Single Core)
Cinebench R23: Multi Core | Single Core
Cinebench R15: CPU Multi 64Bit | CPU Single 64Bit
Blender: v2.79 BMW27 CPU
7-Zip 18.03: 7z b 4 | 7z b 4 -mmt1
Geekbench 5.5: Multi-Core | Single-Core
HWBOT x265 Benchmark v2.2: 4k Preset
LibreOffice : 20 Documents To PDF
R Benchmark 2.5: Overall mean
* ... menor é melhor
AIDA64: FP32 Ray-Trace | FPU Julia | CPU SHA3 | CPU Queen | FPU SinJulia | FPU Mandel | CPU AES | CPU ZLib | FP64 Ray-Trace | CPU PhotoWorxx
| Performance rating | |
| Lenovo Legion Pro 7 RTX4090 | |
| Asus ROG Strix G16 G614JZ | |
| Razer Blade 16 Early 2023 | |
| Alienware x16 R1 | |
| HP Omen 16-wf000 | |
| Lenovo Legion Slim 7i 16 Gen 8 | |
| Média Intel Core i9-13900H | |
| AIDA64 / FP32 Ray-Trace | |
| Asus ROG Strix G16 G614JZ | |
| Lenovo Legion Pro 7 RTX4090 | |
| Razer Blade 16 Early 2023 | |
| Razer Blade 16 Early 2023 | |
| Razer Blade 16 Early 2023 | |
| HP Omen 16-wf000 | |
| Alienware x16 R1 | |
| Lenovo Legion Slim 7i 16 Gen 8 | |
| Média Intel Core i9-13900H (6788 - 19557, n=25) | |
| AIDA64 / CPU Queen | |
| Asus ROG Strix G16 G614JZ | |
| Lenovo Legion Pro 7 RTX4090 | |
| Razer Blade 16 Early 2023 | |
| Razer Blade 16 Early 2023 | |
| Lenovo Legion Slim 7i 16 Gen 8 | |
| Alienware x16 R1 | |
| Média Intel Core i9-13900H (65121 - 120936, n=25) | |
| HP Omen 16-wf000 | |
| AIDA64 / FP64 Ray-Trace | |
| Asus ROG Strix G16 G614JZ | |
| Lenovo Legion Pro 7 RTX4090 | |
| Razer Blade 16 Early 2023 | |
| Razer Blade 16 Early 2023 | |
| Razer Blade 16 Early 2023 | |
| HP Omen 16-wf000 | |
| Alienware x16 R1 | |
| Lenovo Legion Slim 7i 16 Gen 8 | |
| Média Intel Core i9-13900H (3655 - 10716, n=25) | |
| AIDA64 / CPU PhotoWorxx | |
| Razer Blade 16 Early 2023 | |
| Razer Blade 16 Early 2023 | |
| Razer Blade 16 Early 2023 | |
| Lenovo Legion Pro 7 RTX4090 | |
| Alienware x16 R1 | |
| HP Omen 16-wf000 | |
| Média Intel Core i9-13900H (10871 - 50488, n=25) | |
| Asus ROG Strix G16 G614JZ | |
| Lenovo Legion Slim 7i 16 Gen 8 | |
Desempenho do sistema
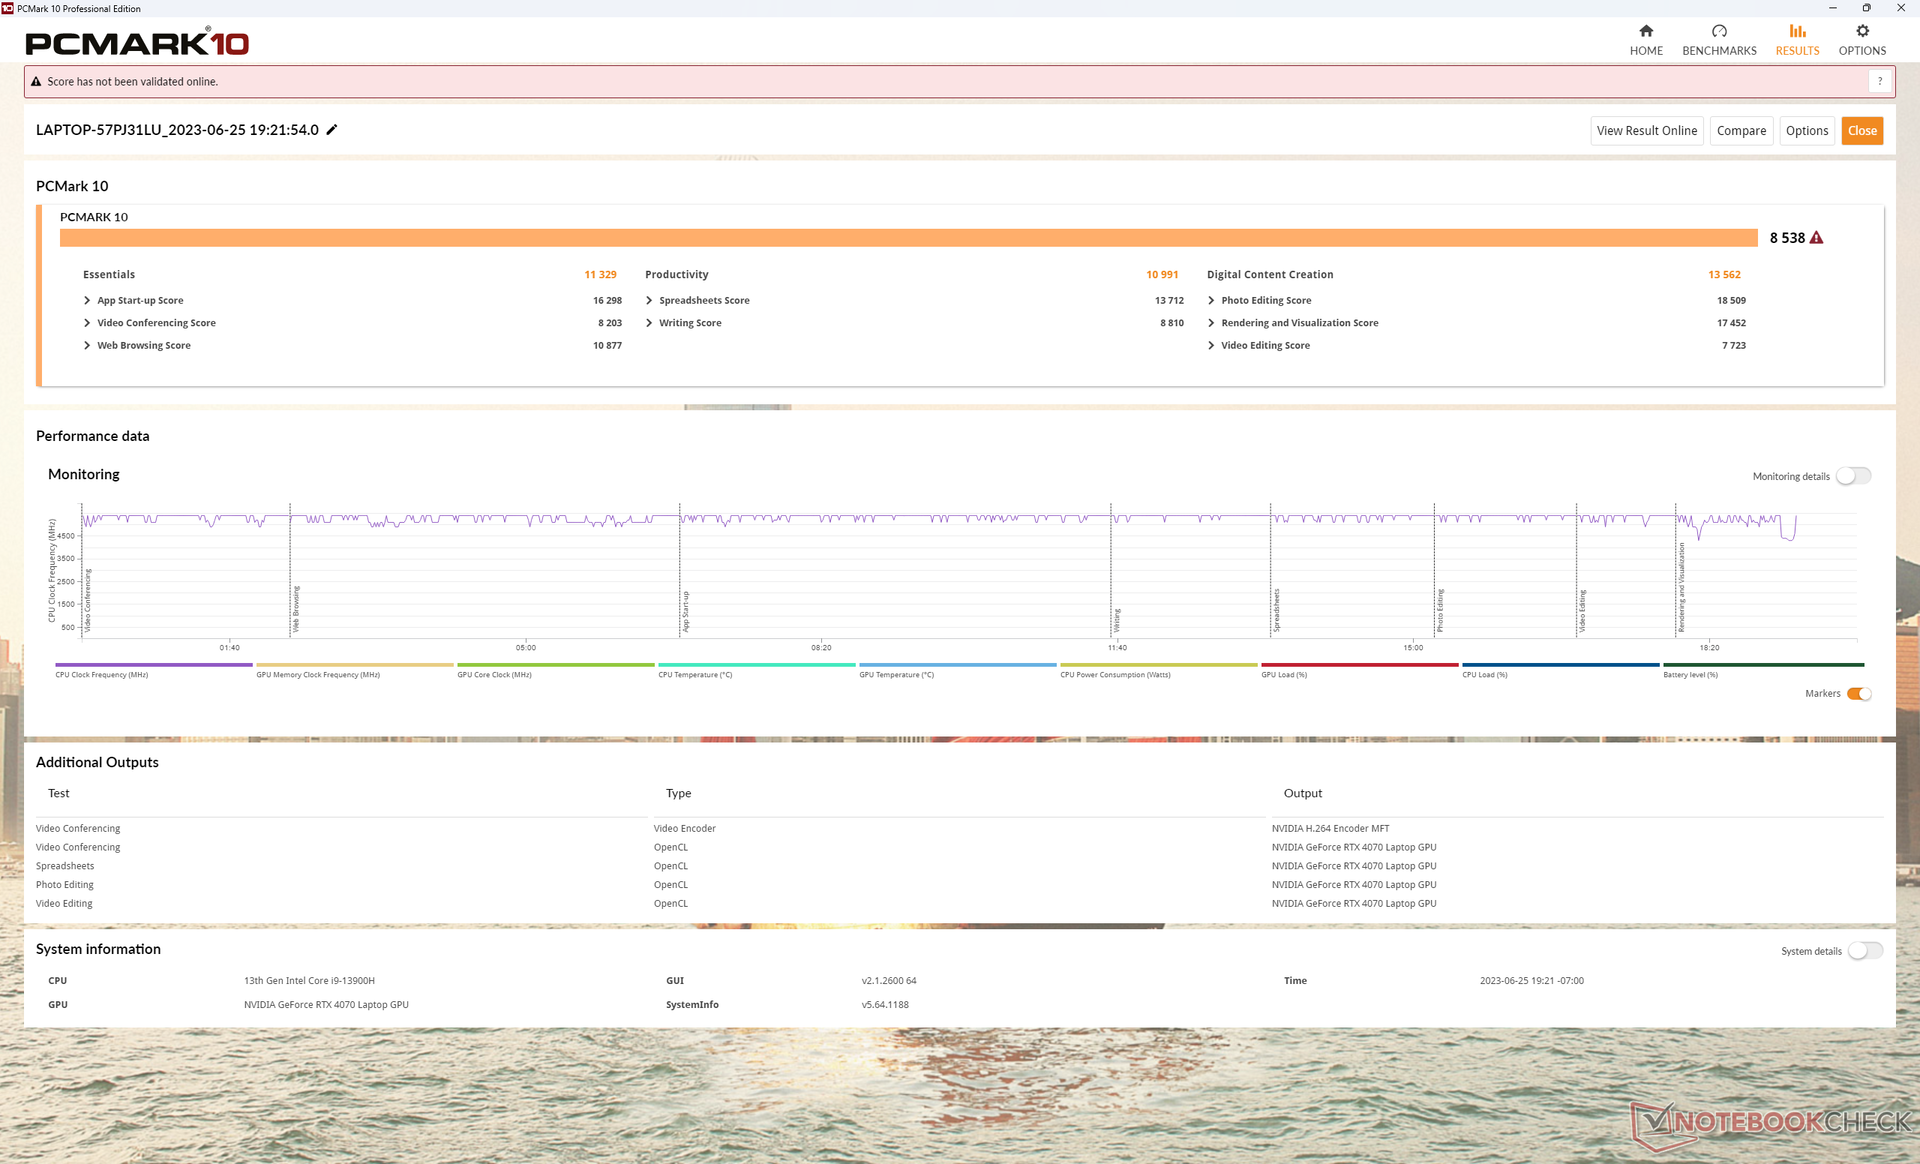
Os resultados do PCMark são excelentes, comparáveis aos de outros notebooks de última geração para jogos. No entanto, tivemos problemas ao acordar do modo de suspensão, em que o laptop frequentemente levava até 10 segundos para ligar a tela corretamente, em comparação com apenas alguns segundos, no máximo, em outros laptops.
CrossMark: Overall | Productivity | Creativity | Responsiveness
| PCMark 10 / Score | |
| Lenovo Legion Slim 7i 16 Gen 8 | |
| Alienware x16 R1 | |
| Lenovo Legion Pro 7 RTX4090 | |
| Razer Blade 16 Early 2023 | |
| HP Omen 16-wf000 | |
| Média Intel Core i9-13900H, NVIDIA GeForce RTX 4070 Laptop GPU (5855 - 8538, n=8) | |
| Asus ROG Strix G16 G614JZ | |
| PCMark 10 / Essentials | |
| Asus ROG Strix G16 G614JZ | |
| Lenovo Legion Slim 7i 16 Gen 8 | |
| Alienware x16 R1 | |
| Lenovo Legion Pro 7 RTX4090 | |
| Razer Blade 16 Early 2023 | |
| Média Intel Core i9-13900H, NVIDIA GeForce RTX 4070 Laptop GPU (8835 - 11940, n=8) | |
| HP Omen 16-wf000 | |
| PCMark 10 / Productivity | |
| Lenovo Legion Slim 7i 16 Gen 8 | |
| Alienware x16 R1 | |
| Média Intel Core i9-13900H, NVIDIA GeForce RTX 4070 Laptop GPU (7967 - 10991, n=8) | |
| HP Omen 16-wf000 | |
| Lenovo Legion Pro 7 RTX4090 | |
| Razer Blade 16 Early 2023 | |
| Asus ROG Strix G16 G614JZ | |
| PCMark 10 / Digital Content Creation | |
| Lenovo Legion Pro 7 RTX4090 | |
| Razer Blade 16 Early 2023 | |
| Alienware x16 R1 | |
| Lenovo Legion Slim 7i 16 Gen 8 | |
| HP Omen 16-wf000 | |
| Média Intel Core i9-13900H, NVIDIA GeForce RTX 4070 Laptop GPU (7738 - 13575, n=8) | |
| Asus ROG Strix G16 G614JZ | |
| CrossMark / Overall | |
| Asus ROG Strix G16 G614JZ | |
| Lenovo Legion Slim 7i 16 Gen 8 | |
| Alienware x16 R1 | |
| Média Intel Core i9-13900H, NVIDIA GeForce RTX 4070 Laptop GPU (1104 - 1974, n=7) | |
| HP Omen 16-wf000 | |
| Razer Blade 16 Early 2023 | |
| CrossMark / Productivity | |
| Asus ROG Strix G16 G614JZ | |
| Lenovo Legion Slim 7i 16 Gen 8 | |
| Alienware x16 R1 | |
| Média Intel Core i9-13900H, NVIDIA GeForce RTX 4070 Laptop GPU (1058 - 1914, n=7) | |
| HP Omen 16-wf000 | |
| Razer Blade 16 Early 2023 | |
| CrossMark / Creativity | |
| Asus ROG Strix G16 G614JZ | |
| Lenovo Legion Slim 7i 16 Gen 8 | |
| Alienware x16 R1 | |
| Média Intel Core i9-13900H, NVIDIA GeForce RTX 4070 Laptop GPU (1178 - 2254, n=7) | |
| HP Omen 16-wf000 | |
| Razer Blade 16 Early 2023 | |
| CrossMark / Responsiveness | |
| Asus ROG Strix G16 G614JZ | |
| Alienware x16 R1 | |
| Lenovo Legion Slim 7i 16 Gen 8 | |
| Média Intel Core i9-13900H, NVIDIA GeForce RTX 4070 Laptop GPU (1037 - 1952, n=7) | |
| HP Omen 16-wf000 | |
| Razer Blade 16 Early 2023 | |
| PCMark 10 Score | 8538 pontos | |
Ajuda | ||
| AIDA64 / Memory Latency | |
| Alienware x16 R1 | |
| Razer Blade 16 Early 2023 | |
| Razer Blade 16 Early 2023 | |
| Razer Blade 16 Early 2023 | |
| Média Intel Core i9-13900H (75.8 - 102.3, n=25) | |
| Asus ROG Strix G16 G614JZ | |
| HP Omen 16-wf000 | |
| Lenovo Legion Pro 7 RTX4090 | |
| Lenovo Legion Slim 7i 16 Gen 8 | |
* ... menor é melhor
Latência DPC
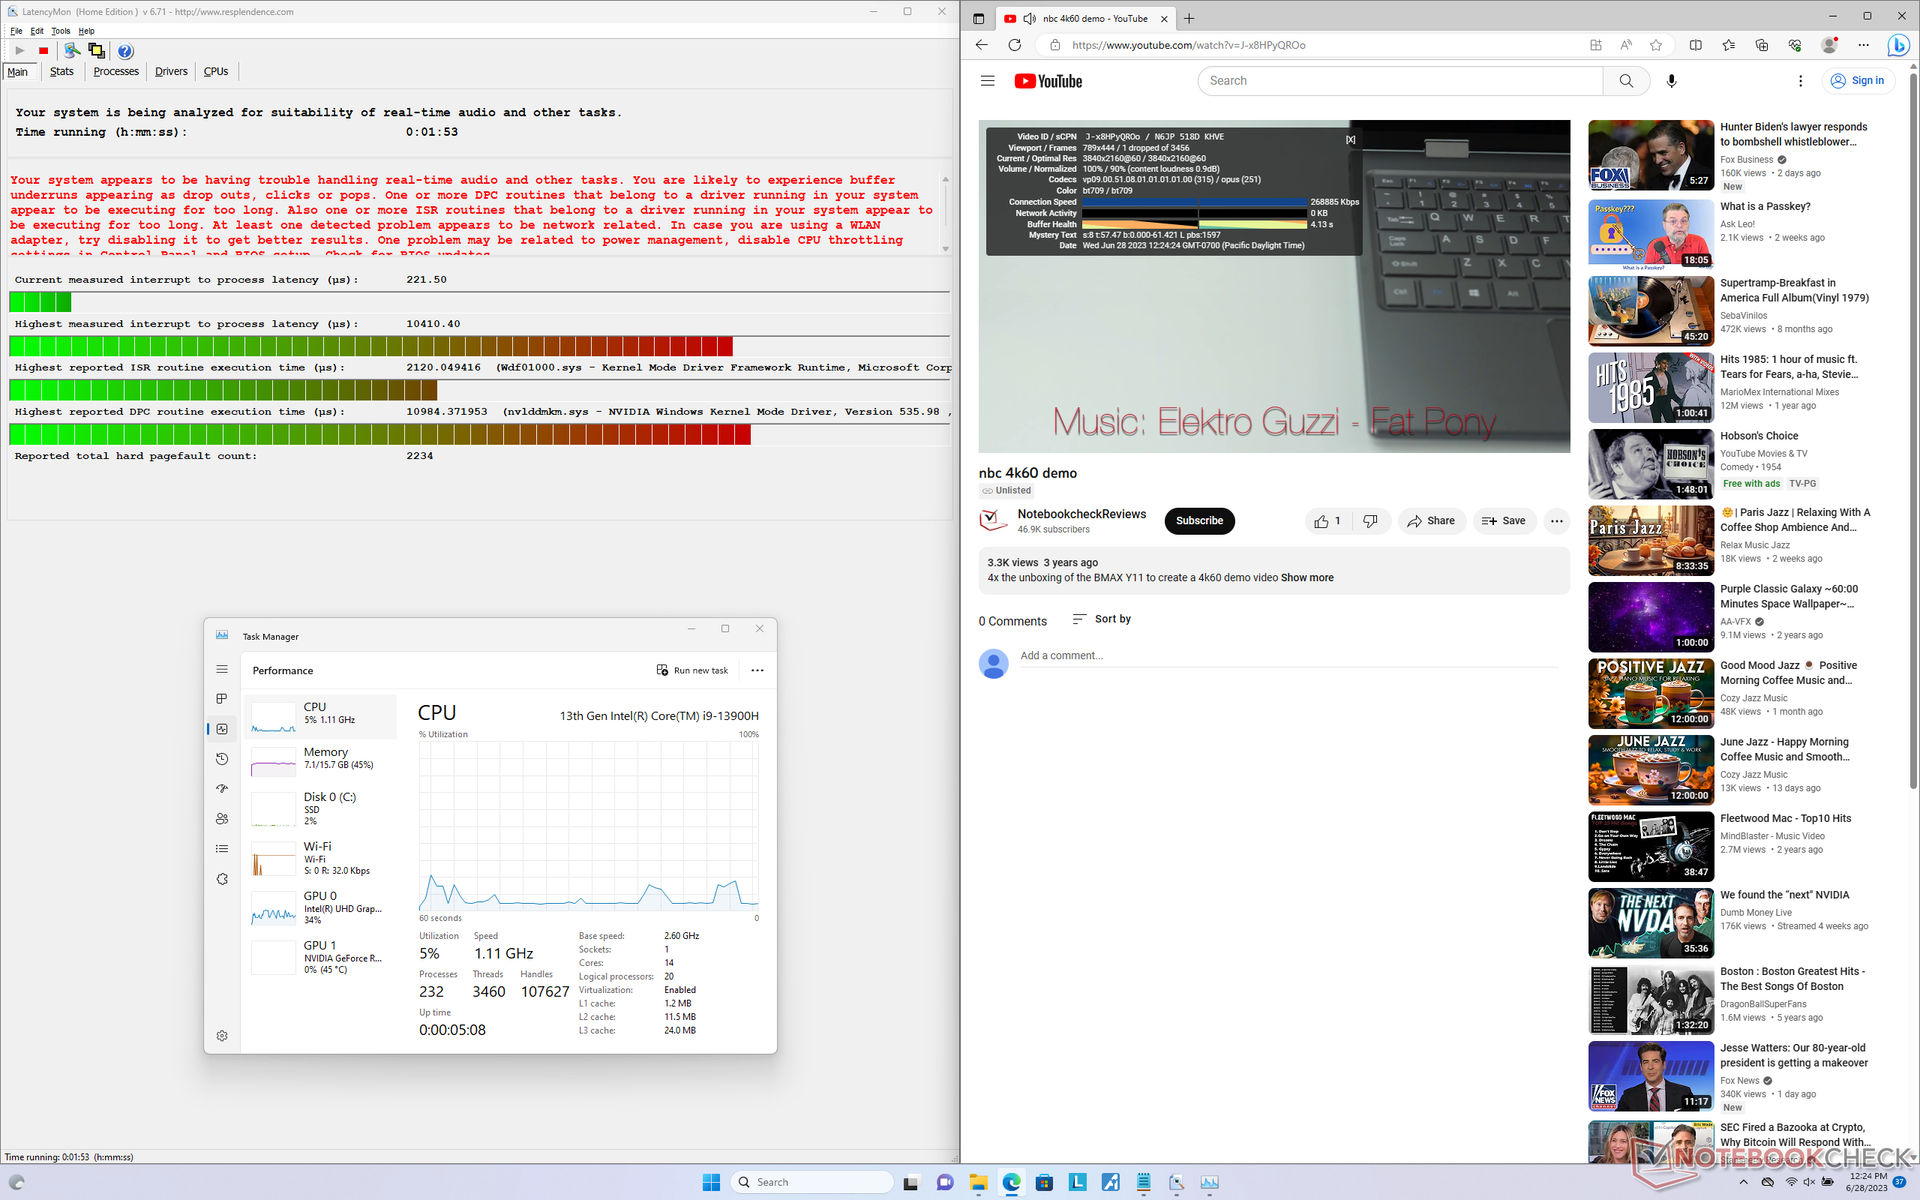
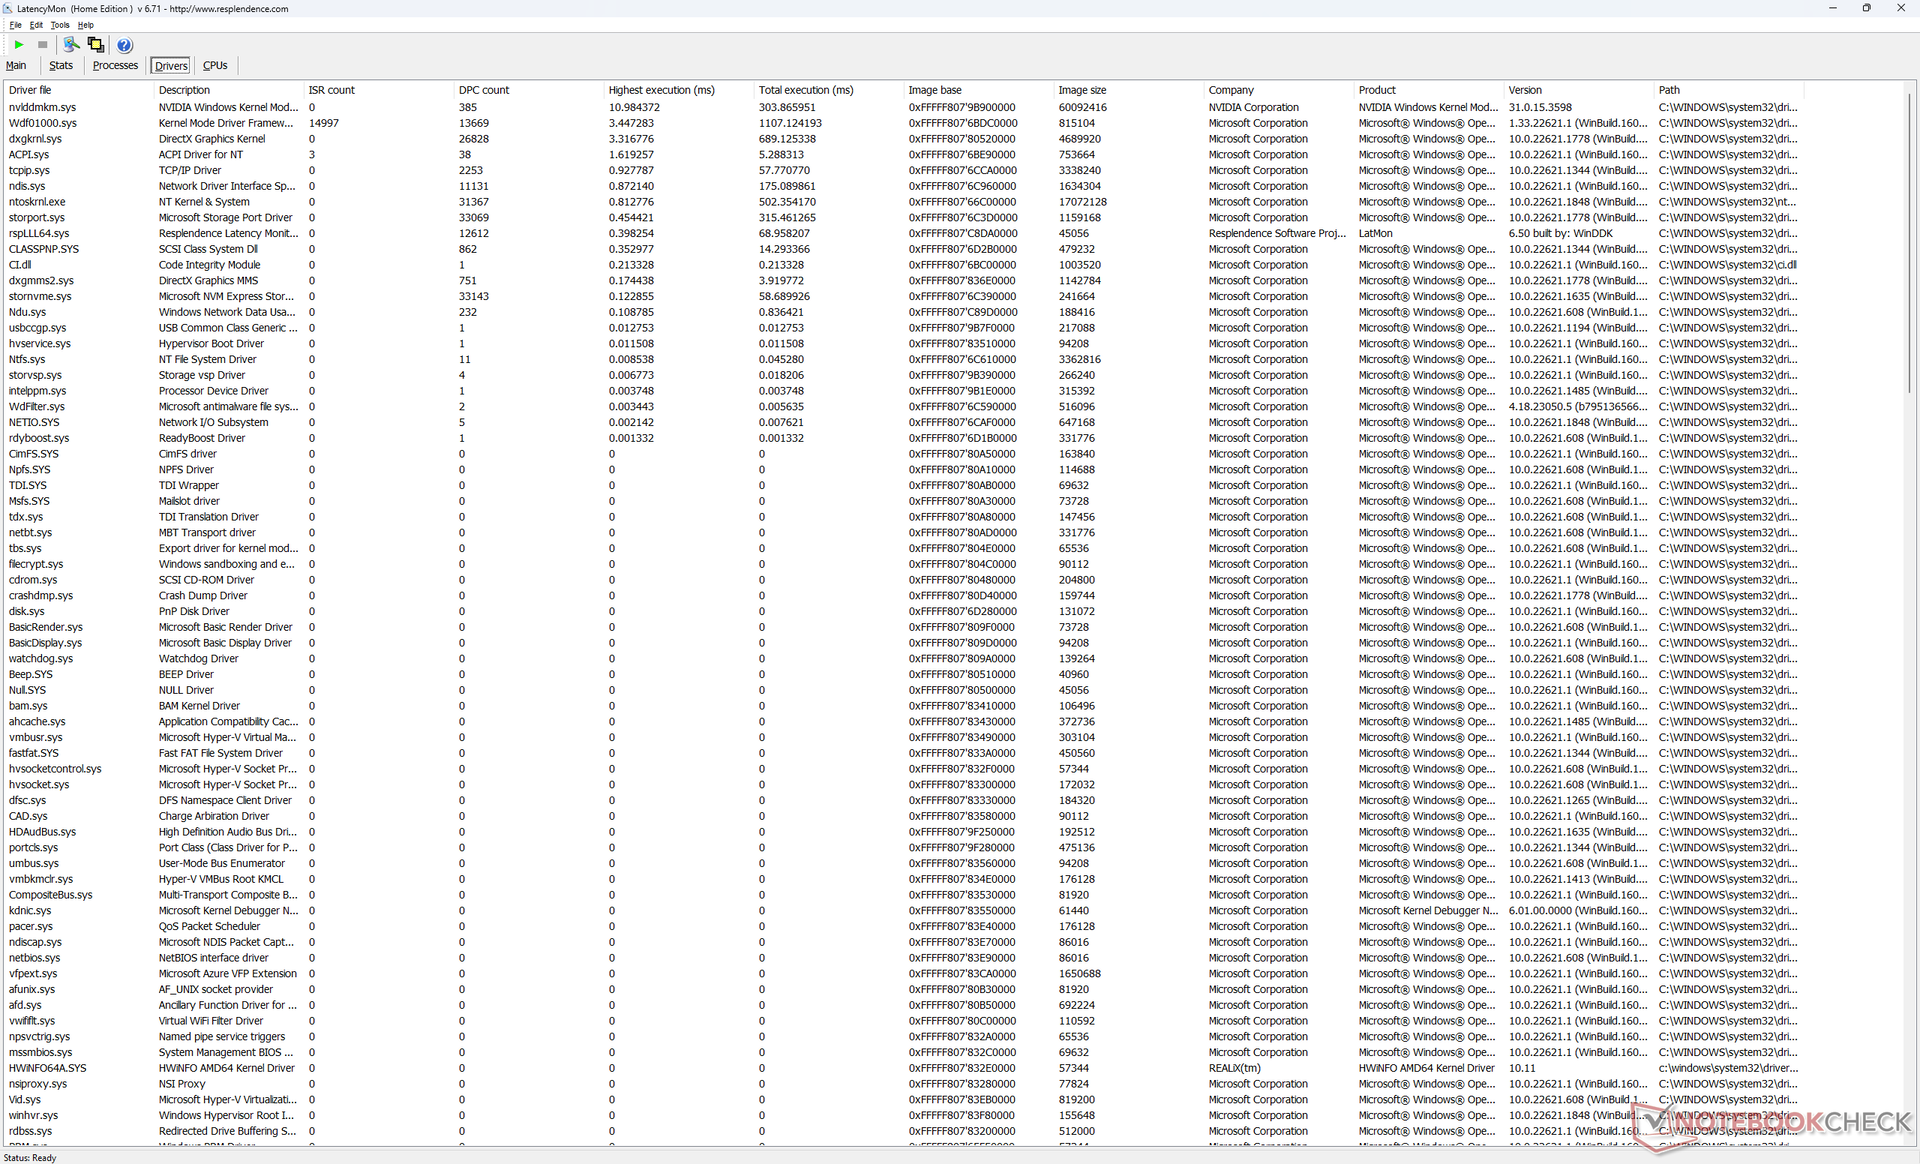
O LatencyMon revela problemas de DPC relacionados ao driver NVLDDMKM da Nvidia, muito parecidos com o que observamos no Legion Pro 7 mesmo depois de várias tentativas. a reprodução de vídeo 4K a 60 FPS é quase perfeita, com apenas um quadro perdido durante nosso vídeo de teste.
| DPC Latencies / LatencyMon - interrupt to process latency (max), Web, Youtube, Prime95 | |
| Lenovo Legion Pro 7 RTX4090 | |
| Lenovo Legion Slim 7i 16 Gen 8 | |
| HP Omen 16-wf000 | |
| Asus ROG Strix G16 G614JZ | |
| Razer Blade 16 Early 2023 | |
| Alienware x16 R1 | |
* ... menor é melhor
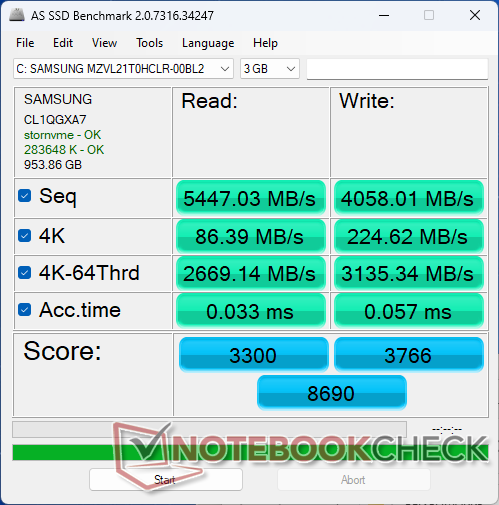
Dispositivos de armazenamento - Até dois SSDs M.2
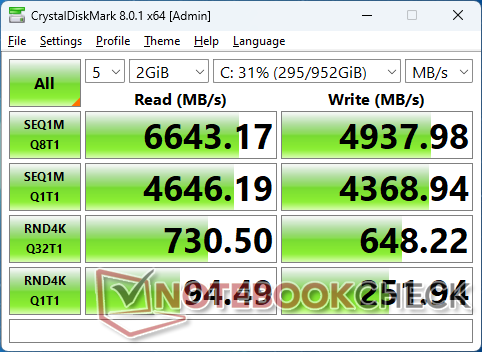
Nossa unidade é fornecida com uma unidade de 1 TBSamsung PM9A1 que é uma das unidades PCIe4 x4 mais rápidas disponíveis para o consumidor. Infelizmente, as taxas de transferência diminuiriam de 6700 MB/s para até 3300 MB/s quando estressadas, conforme mostra a tabela abaixo, o que sugere uma dissipação de calor deficiente. ORazer Blade 14 vem com exatamente o mesmo SSD Samsung e não apresenta esses problemas.

| Drive Performance rating - Percent | |
| Alienware x16 R1 | |
| Lenovo Legion Slim 7i 16 Gen 8 | |
| Lenovo Legion Pro 7 RTX4090 | |
| HP Omen 16-wf000 | |
| Razer Blade 16 Early 2023 | |
| Asus ROG Strix G16 G614JZ | |
* ... menor é melhor
Disk Throttling: DiskSpd Read Loop, Queue Depth 8
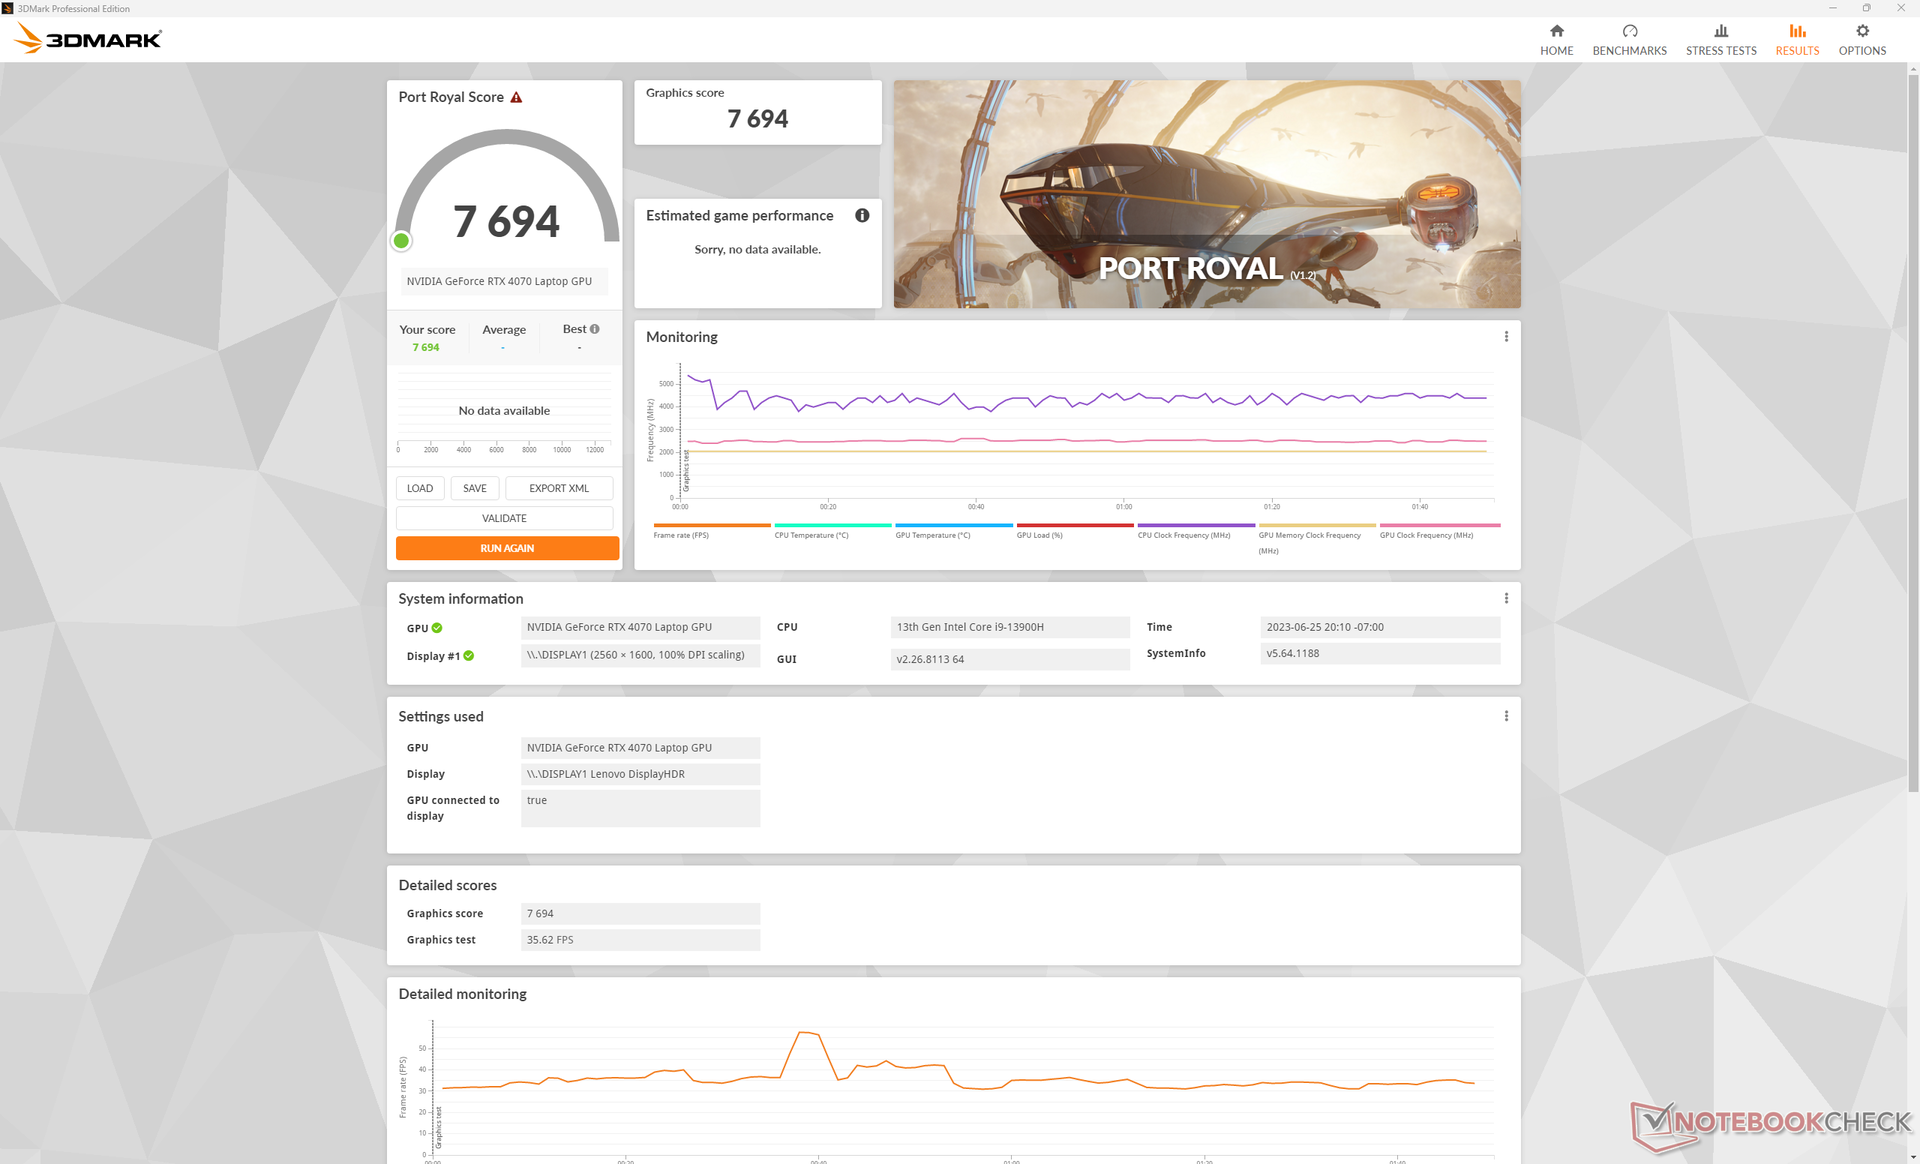
Desempenho da GPU - Gráficos RTX de 140 W
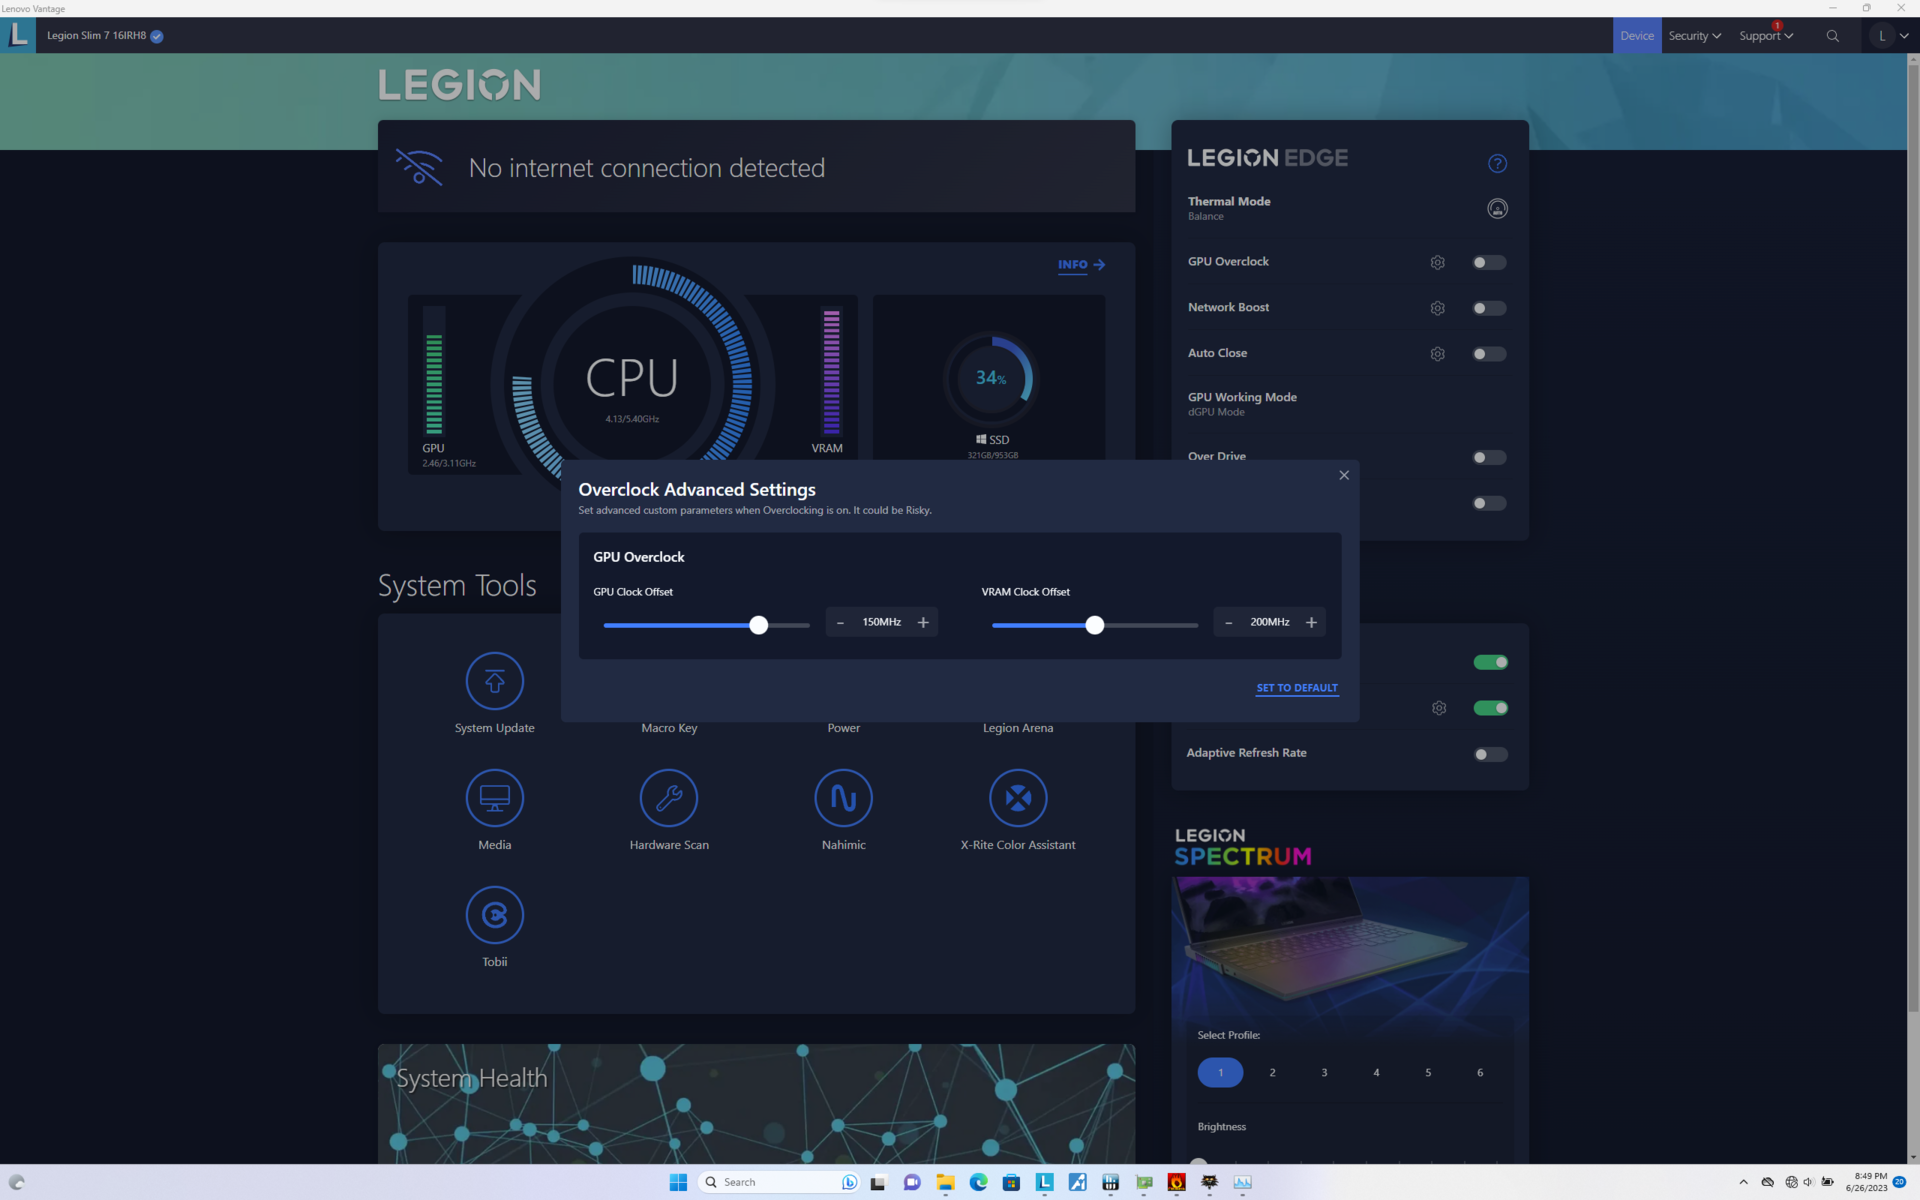
O desempenho gráfico bruto é cerca de 5 a 10 por cento mais rápido do que o laptop médio em nosso banco de dados com a mesma rTX 4070 móvel MÓVEL. Portanto, o desempenho geral está praticamente no mesmo nível da rTX 3080 Ti móvel do ano passado.
O desempenho da GPU cai em 5% se o recurso Overclock for desativado. Se estiver no modo Balanced, o desempenho da CPU e da GPU cairá cerca de 10% e 15%, respectivamente, como mostra a tabela abaixo. Alguns usuários podem preferir os ventiladores mais silenciosos do modo Balanced, mesmo que isso signifique um desempenho mais lento.
Fazer downgrade para a RTX 4060 da nossa configuração RTX 4070 deverá afetar o desempenho da GPU em cerca de 10 a 15%, com base em nossa experiência com a Legion Pro 5 16.
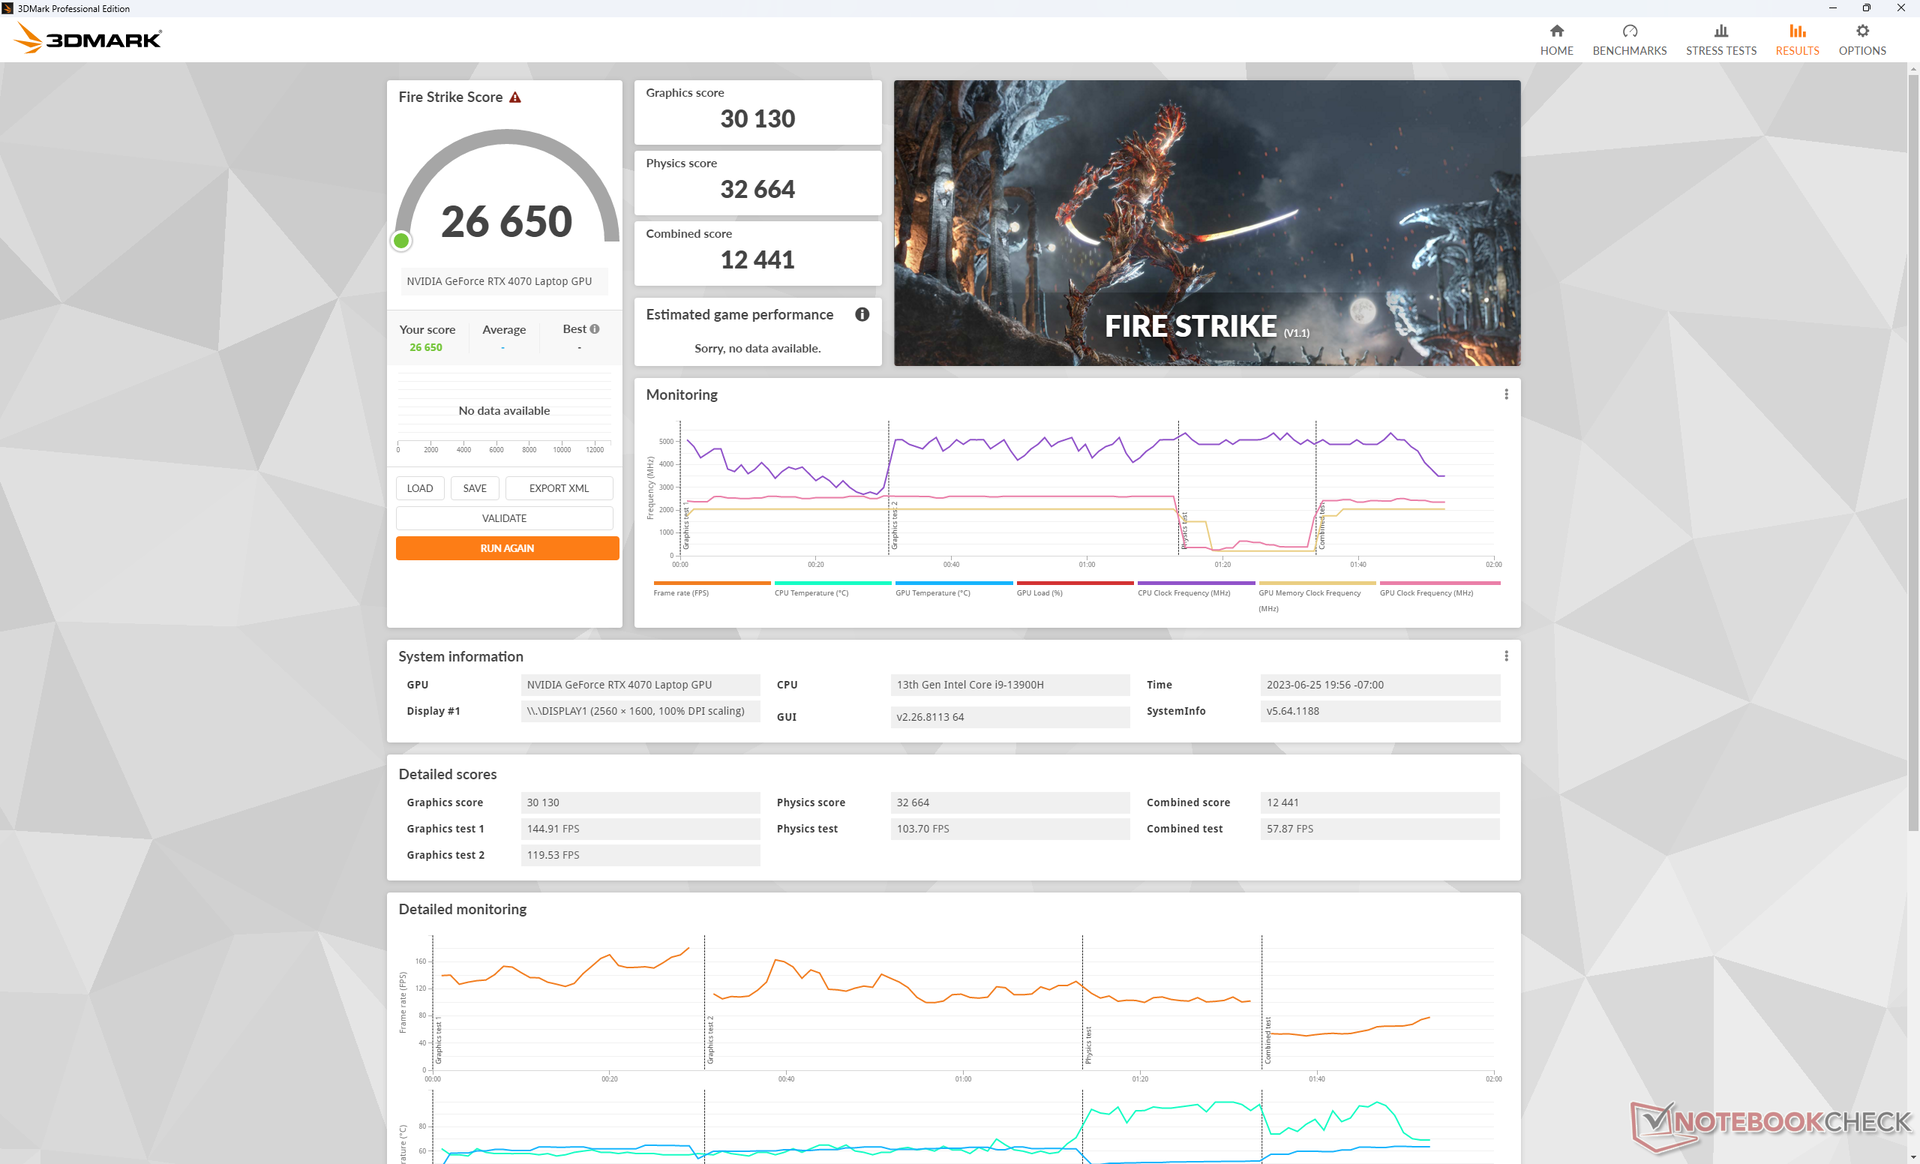
| Configuração do perfil de energia | Fire Strike Pontuação de física | Fire Strike Pontuação da GPU | Fire Strike Pontuação combinada |
| Desempenho + Overclock da GPU ativado + Overdrive ativado | 32664 | 30130 | 12441 |
| Desempenho + Overclock da GPU ligado + Overdrive desligado | 32439 | 30153 | 13360 |
| Desempenho + Overclock da GPU desligado + Overdrive desligado | 32550 | 28629 (-5%) | 12319 |
| Equilibrado | 27499 (-16%) | 27708 (-8%) | 11295 (-9%) |
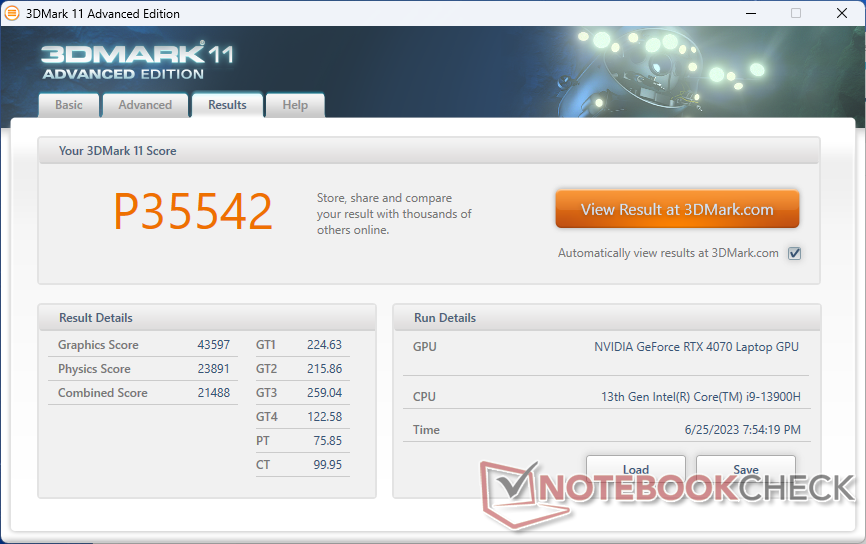
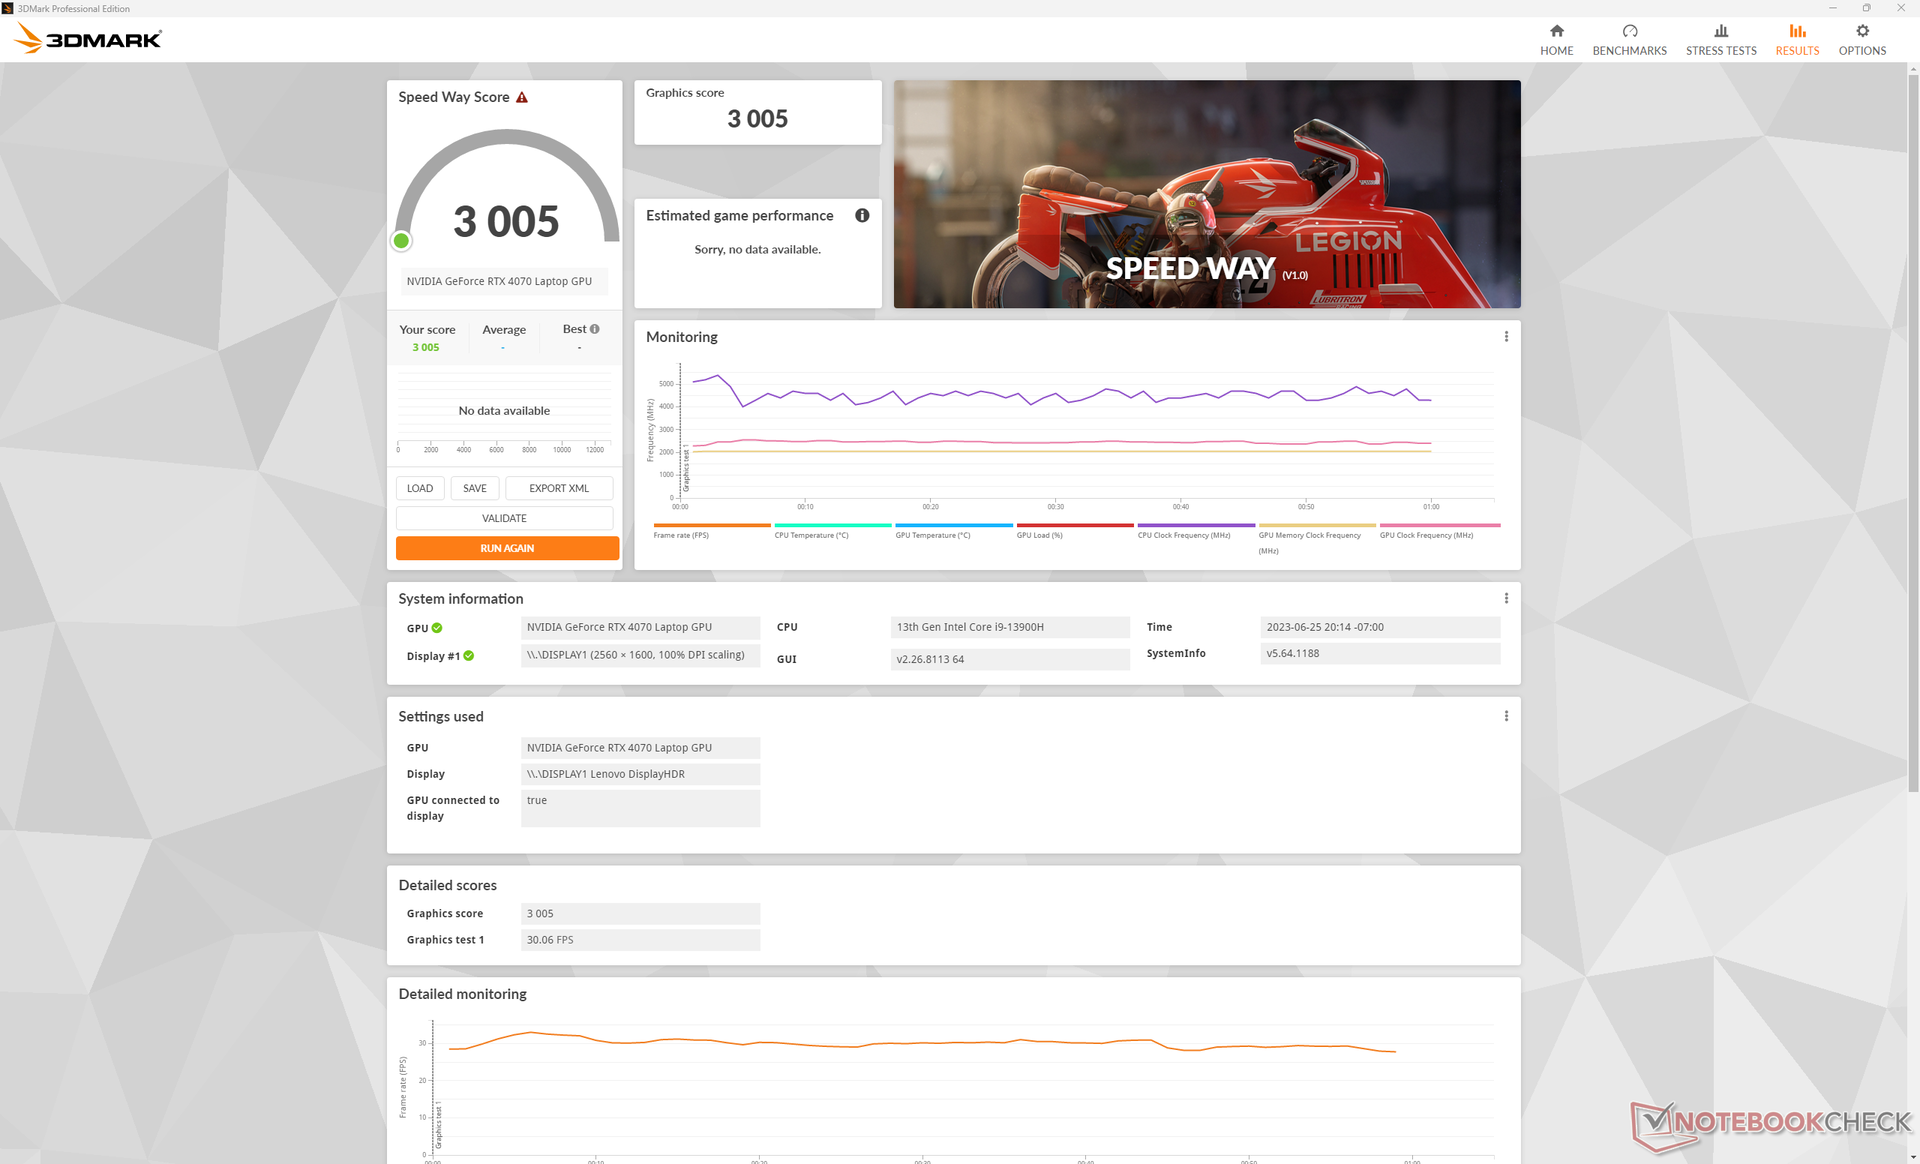
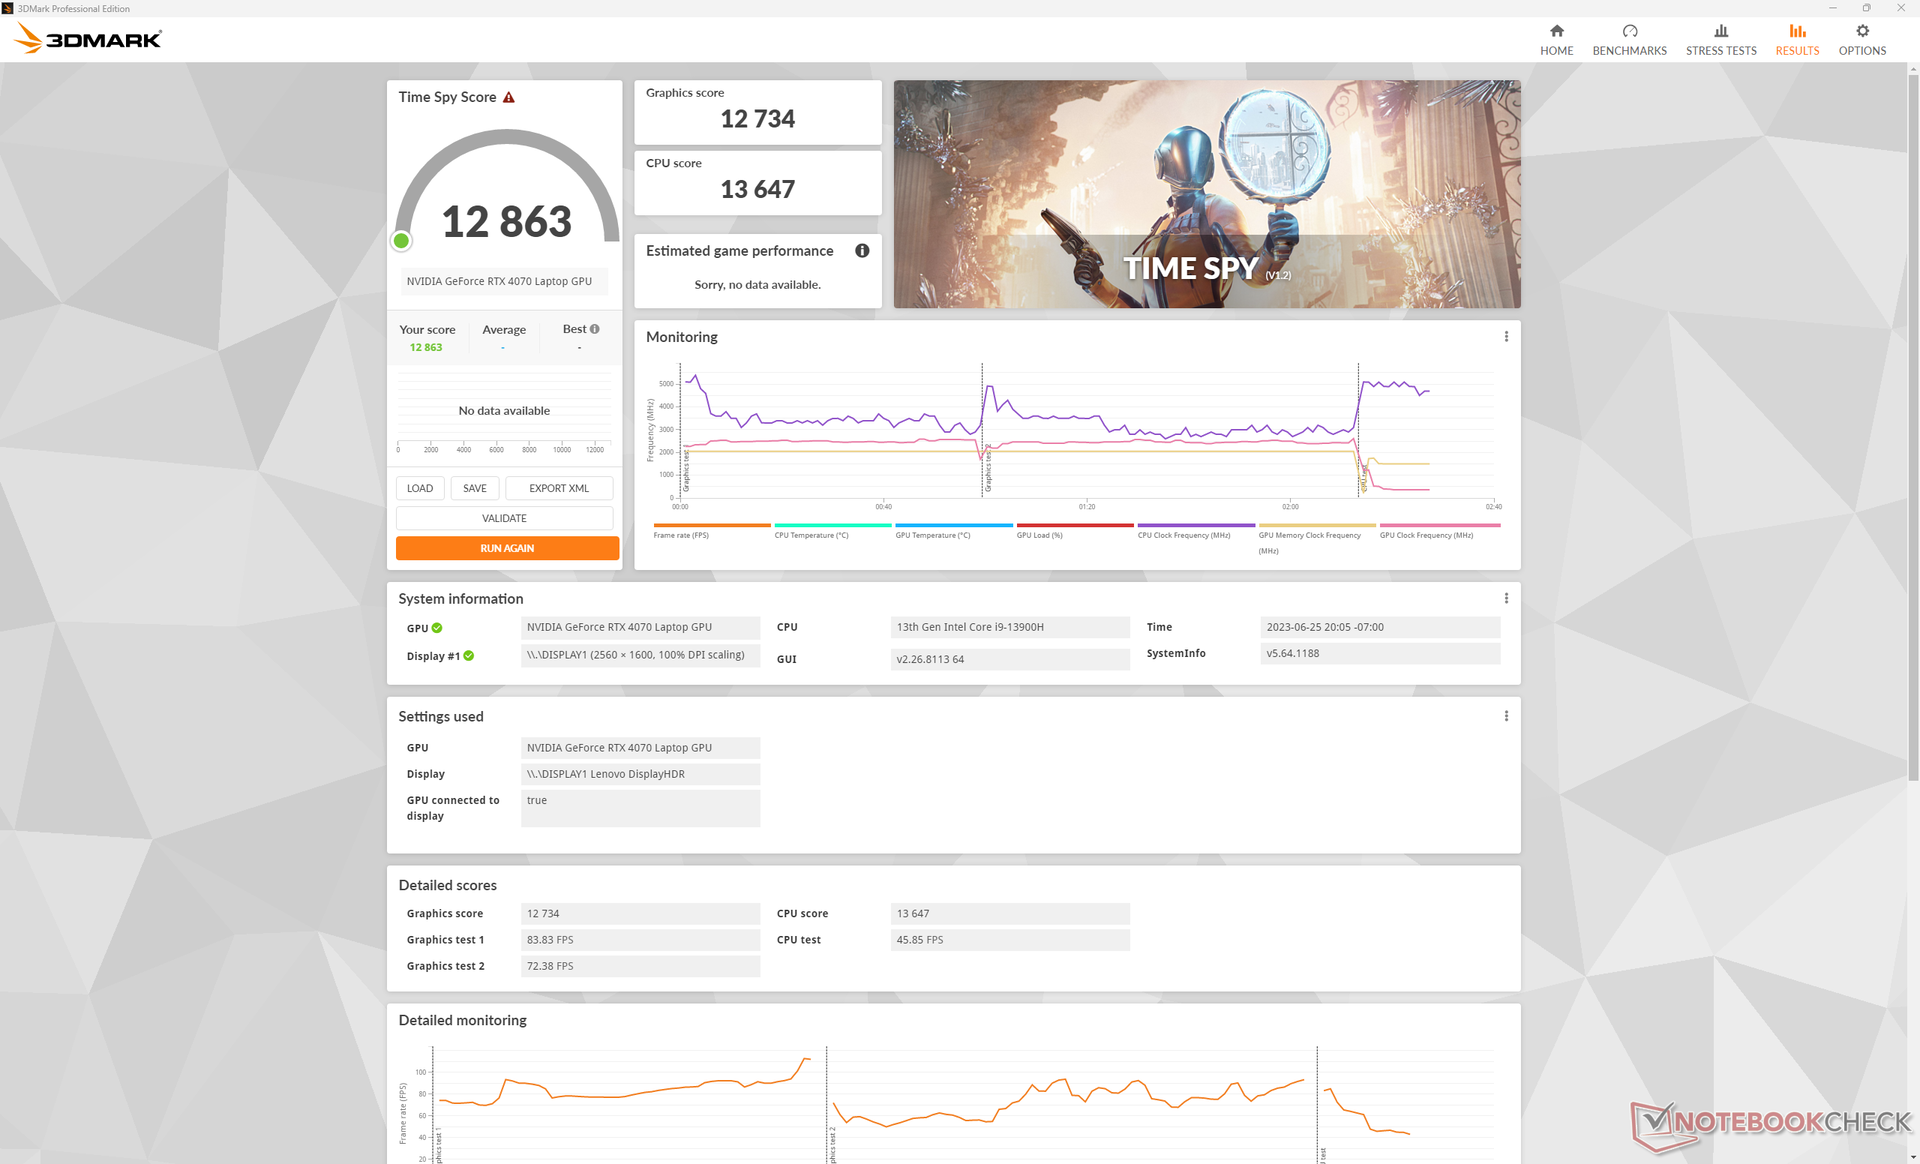
| 3DMark 11 Performance | 35542 pontos | |
| 3DMark Fire Strike Score | 26650 pontos | |
| 3DMark Time Spy Score | 12863 pontos | |
Ajuda | ||
* ... menor é melhor
Desempenho em jogos
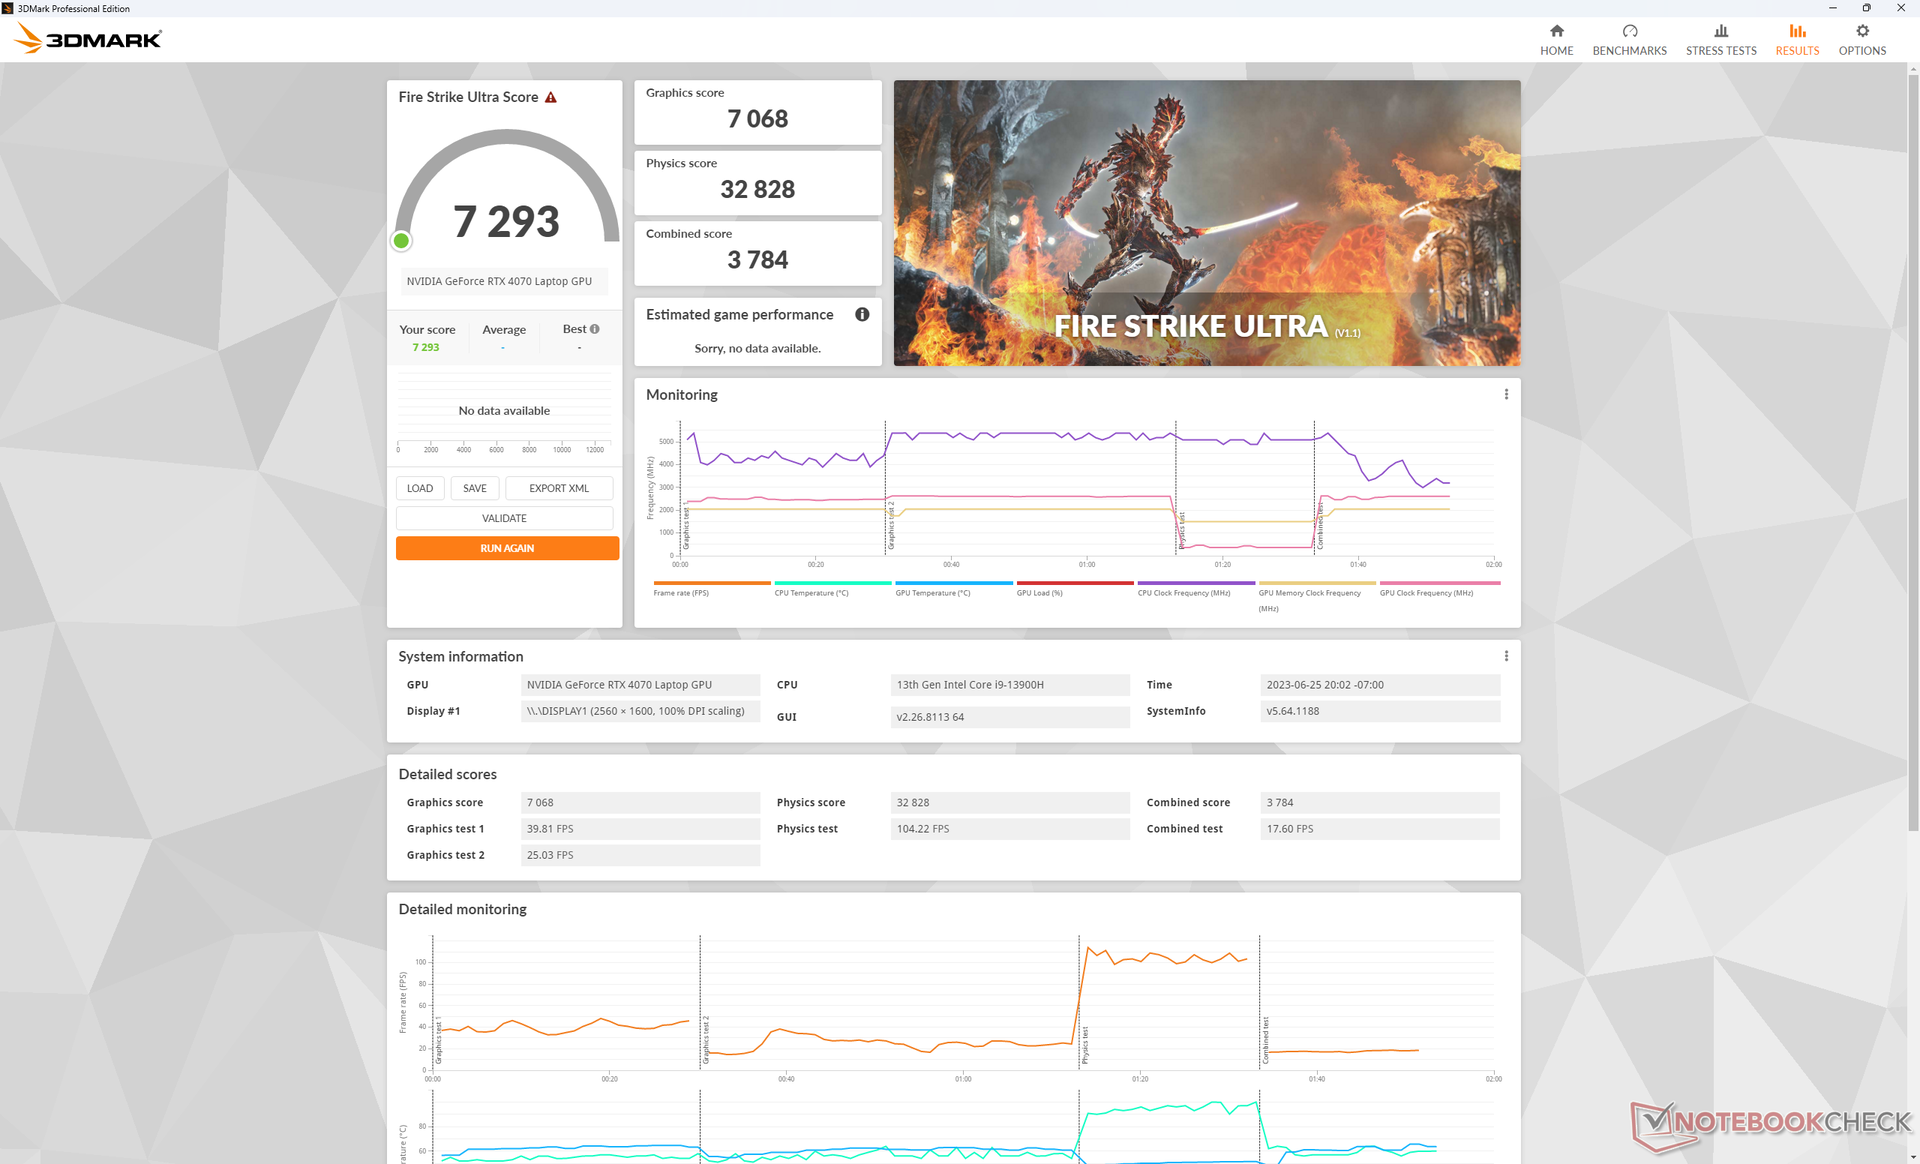
A RTX 4070 móvel funciona bem para atingir 1440p/1600p e 60 FPS em configurações altas, enquanto a muito mais rápida rTX 4070 Ti para desktop para desktop, muito mais rápida, pode atingir configurações Ultra ou máximas. A execução do Returnal nas configurações máximas de 1440p com o nosso Lenovo, por exemplo, mal ultrapassaria a marca de 50 FPS.
O DLSS se torna muito mais importante quando a RTX 4070 começa a se sentir com pouca potência. A execução do Cyberpunk 2077 em configurações 4K Ultra, por exemplo, teria uma média de apenas 23 FPS sem o DLSS, chegando a 38 FPS mais jogáveis com o DLSS2 ativado.
Witcher 3 FPS Chart
| baixo | média | alto | ultra | QHD | 4K | |
|---|---|---|---|---|---|---|
| GTA V (2015) | 184 | 180.3 | 175 | 115.2 | 94.3 | 98.7 |
| The Witcher 3 (2015) | 459.3 | 356.8 | 225.9 | 117.9 | 70 | |
| Dota 2 Reborn (2015) | 203 | 183.2 | 175.8 | 165.3 | 141.3 | |
| Final Fantasy XV Benchmark (2018) | 213 | 168.8 | 122.7 | 91.4 | 51.5 | |
| X-Plane 11.11 (2018) | 182.9 | 158.7 | 122.4 | 105.7 | ||
| Strange Brigade (2018) | 483 | 316 | 259 | 228 | 149.2 | 75.7 |
| Cyberpunk 2077 1.6 (2022) | 138.3 | 141.9 | 106.1 | 91 | 54.4 | 23.1 |
| Tiny Tina's Wonderlands (2022) | 244.3 | 204.8 | 143.7 | 113.9 | 78.1 | 37 |
| F1 22 (2022) | 258 | 261 | 219 | 81.5 | 46.2 | 25.9 |
| Returnal (2023) | 83 | 81 | 76 | 61 | 52 | 27 |
Emissões
Ruído do sistema
Os ventiladores internos estão sempre ativos, com pouco menos de 26 dB(A) contra um fundo silencioso de 23 dB(A). Não é alto o suficiente para distrair na maioria dos ambientes de escritório ou de conferência e elas fazem um excelente trabalho ao permanecerem silenciosas por períodos mais longos, mesmo quando cargas mais altas, como o 3DMark 06, são introduzidas.
Os jogos no modo Performance induzem a um ruído constante da ventoinha de 54,4 dB(A), que é semelhante ao do Alienware x16 R1, mas mais alto do que o do Blade 16. Ao passar para o modo Balanced, você perde um pouco do desempenho mencionado acima e obtém um ruído do ventilador visivelmente mais baixo, de 48,9 dB(A).
Barulho
| Ocioso |
| 23.6 / 23.6 / 25.7 dB |
| Carga |
| 27.6 / 54.4 dB |
 | ||
30 dB silencioso 40 dB(A) audível 50 dB(A) ruidosamente alto |
||
min: | ||
| Lenovo Legion Slim 7i 16 Gen 8 GeForce RTX 4070 Laptop GPU, i9-13900H, Samsung PM9A1 MZVL21T0HCLR | HP Omen 16-wf000 GeForce RTX 4080 Laptop GPU, i7-13700HX, SK hynix PC801 HFS002TEJ9X101N | Alienware x16 R1 GeForce RTX 4080 Laptop GPU, i9-13900HK, SK hynix PC801 HFS001TEJ9X101N | Lenovo Legion Pro 7 RTX4090 GeForce RTX 4090 Laptop GPU, i9-13900HX, Samsung PM9A1 MZVL21T0HCLR | Asus ROG Strix G16 G614JZ GeForce RTX 4080 Laptop GPU, i9-13980HX, WD PC SN560 SDDPNQE-1T00 | Razer Blade 16 Early 2023 GeForce RTX 4080 Laptop GPU, i9-13950HX, SSSTC CA6-8D1024 | |
|---|---|---|---|---|---|---|
| Noise | -15% | -6% | -25% | -17% | -2% | |
| desligado / ambiente * (dB) | 22.8 | 23 -1% | 22.7 -0% | 25 -10% | 25 -10% | 23 -1% |
| Idle Minimum * (dB) | 23.6 | 29.6 -25% | 23.1 2% | 28 -19% | 26 -10% | 23 3% |
| Idle Average * (dB) | 23.6 | 29.8 -26% | 25.8 -9% | 30 -27% | 28 -19% | 23 3% |
| Idle Maximum * (dB) | 25.7 | 30.4 -18% | 25.8 -0% | 38 -48% | 30 -17% | 23.6 8% |
| Load Average * (dB) | 27.6 | 33.8 -22% | 39.3 -42% | 48 -74% | 48 -74% | 39 -41% |
| Witcher 3 ultra * (dB) | 54.4 | 57 -5% | 49.9 8% | 53 3% | 49 10% | 51.6 5% |
| Load Maximum * (dB) | 54.4 | 58.3 -7% | 54.8 -1% | 55 -1% | 52 4% | 51.3 6% |
* ... menor é melhor
Temperatura
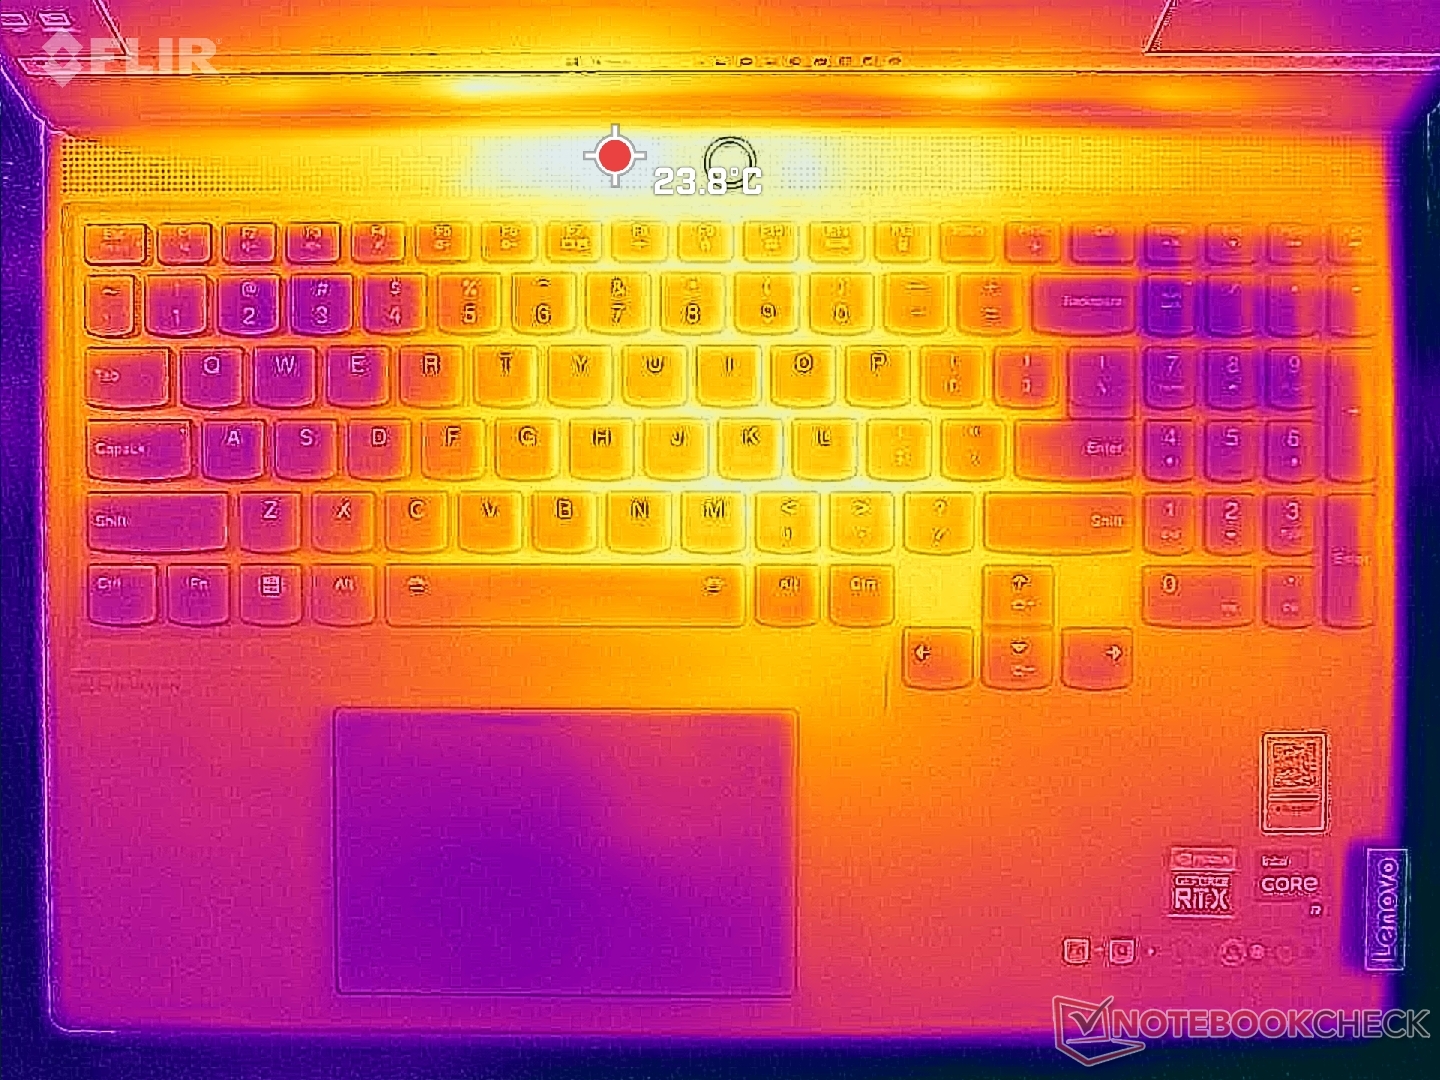
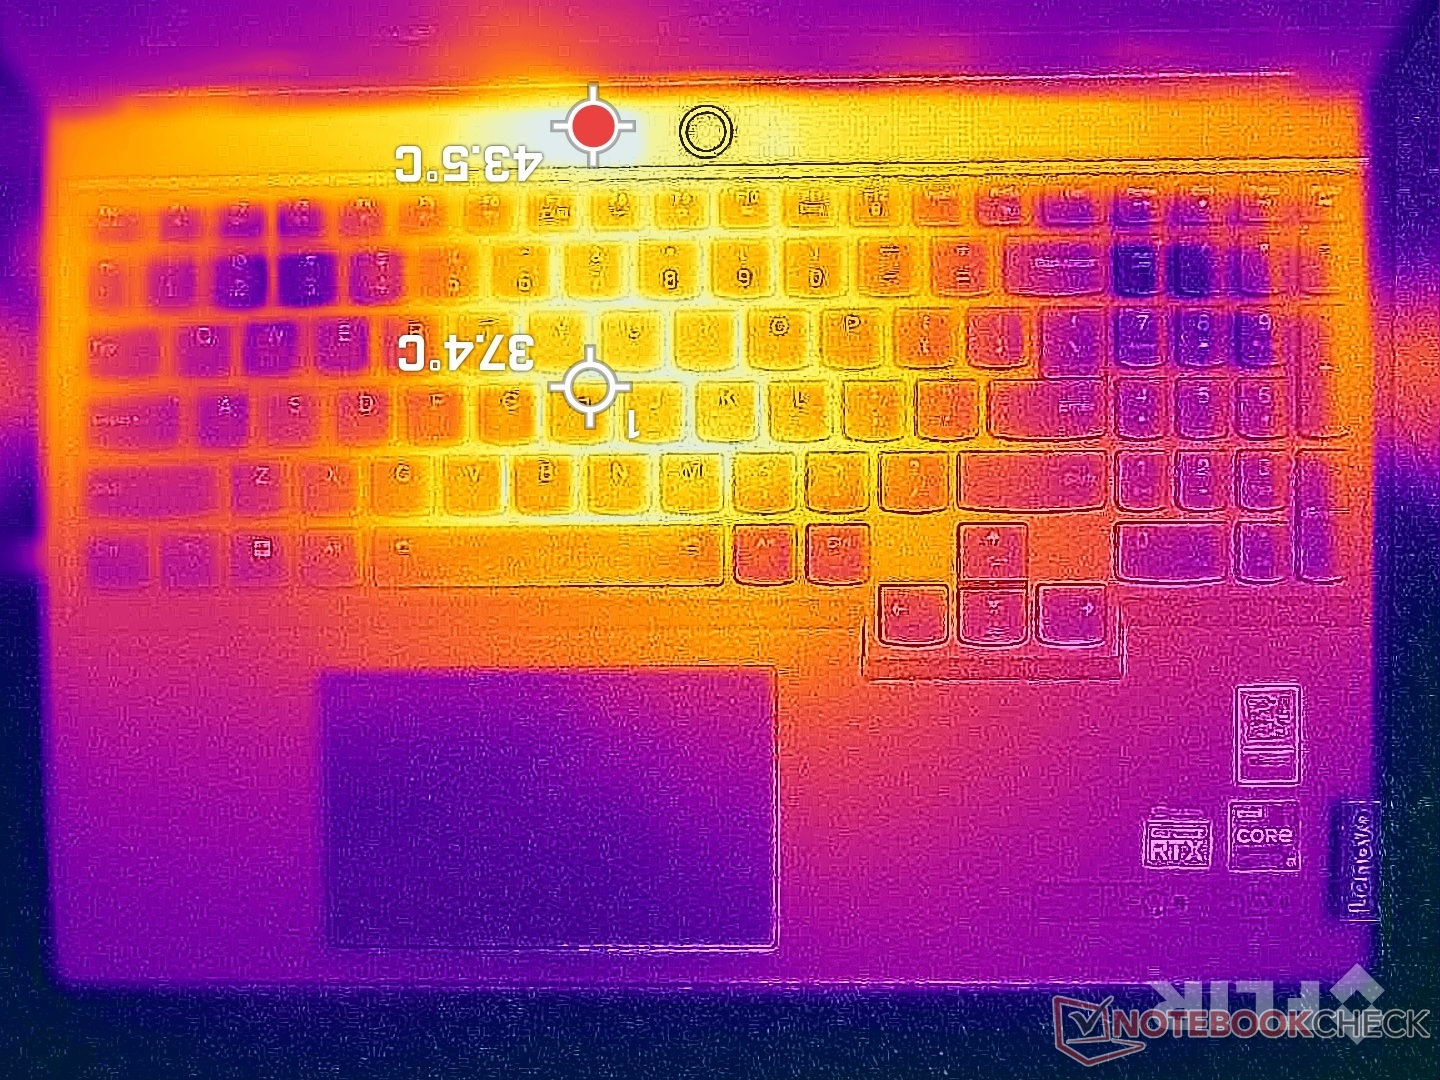
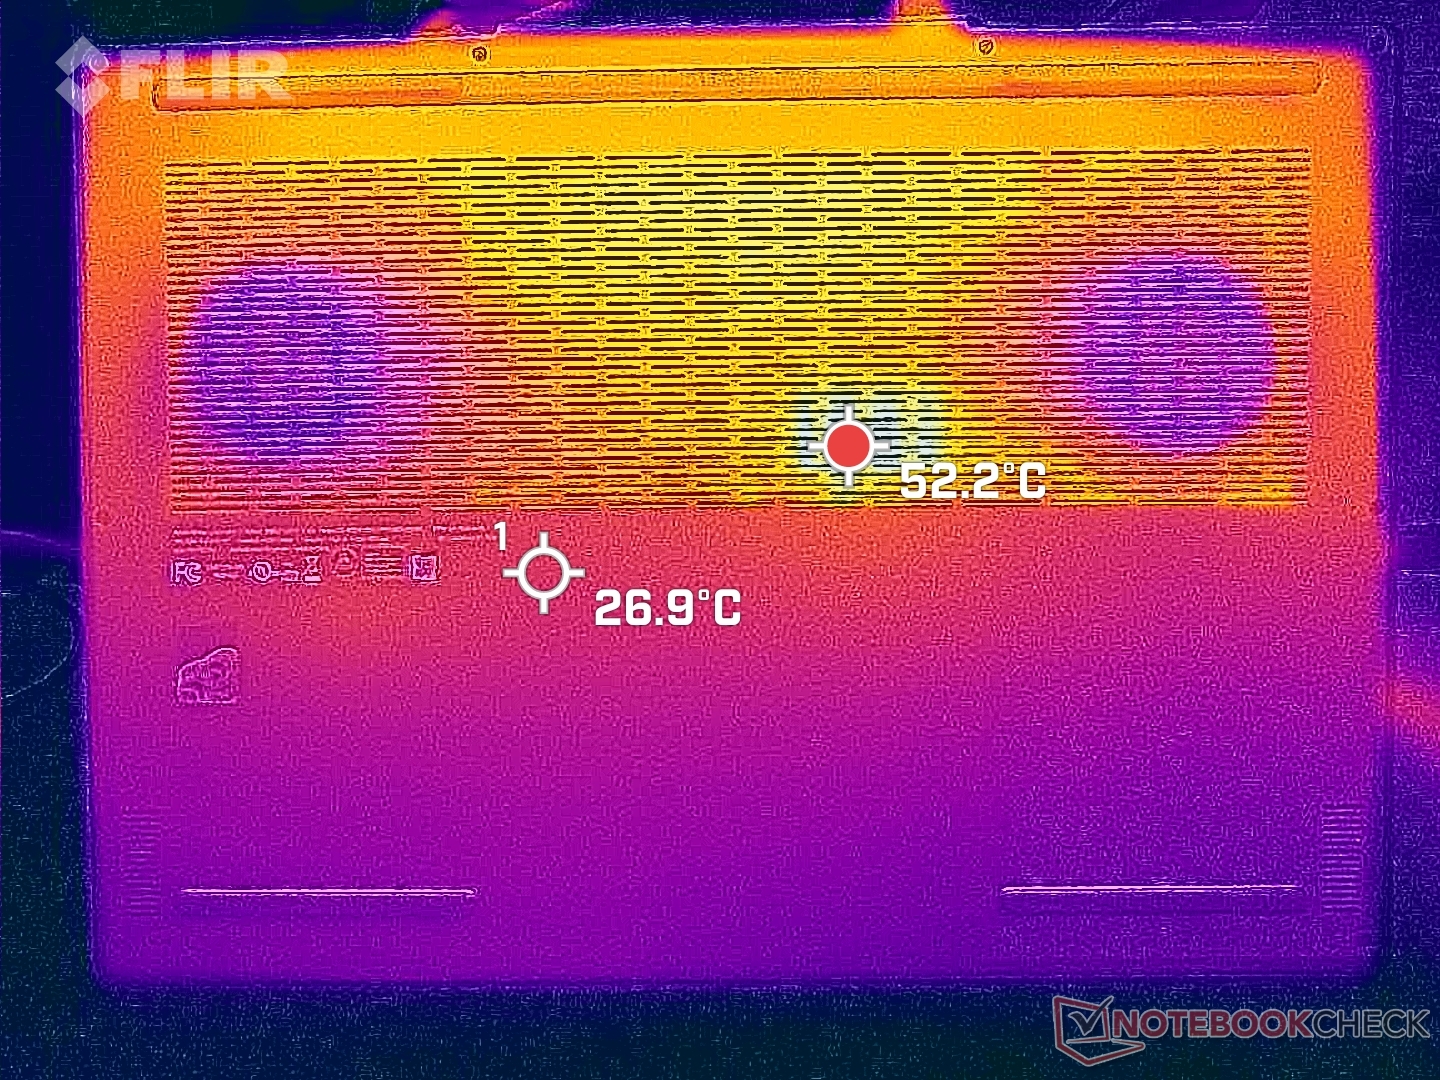
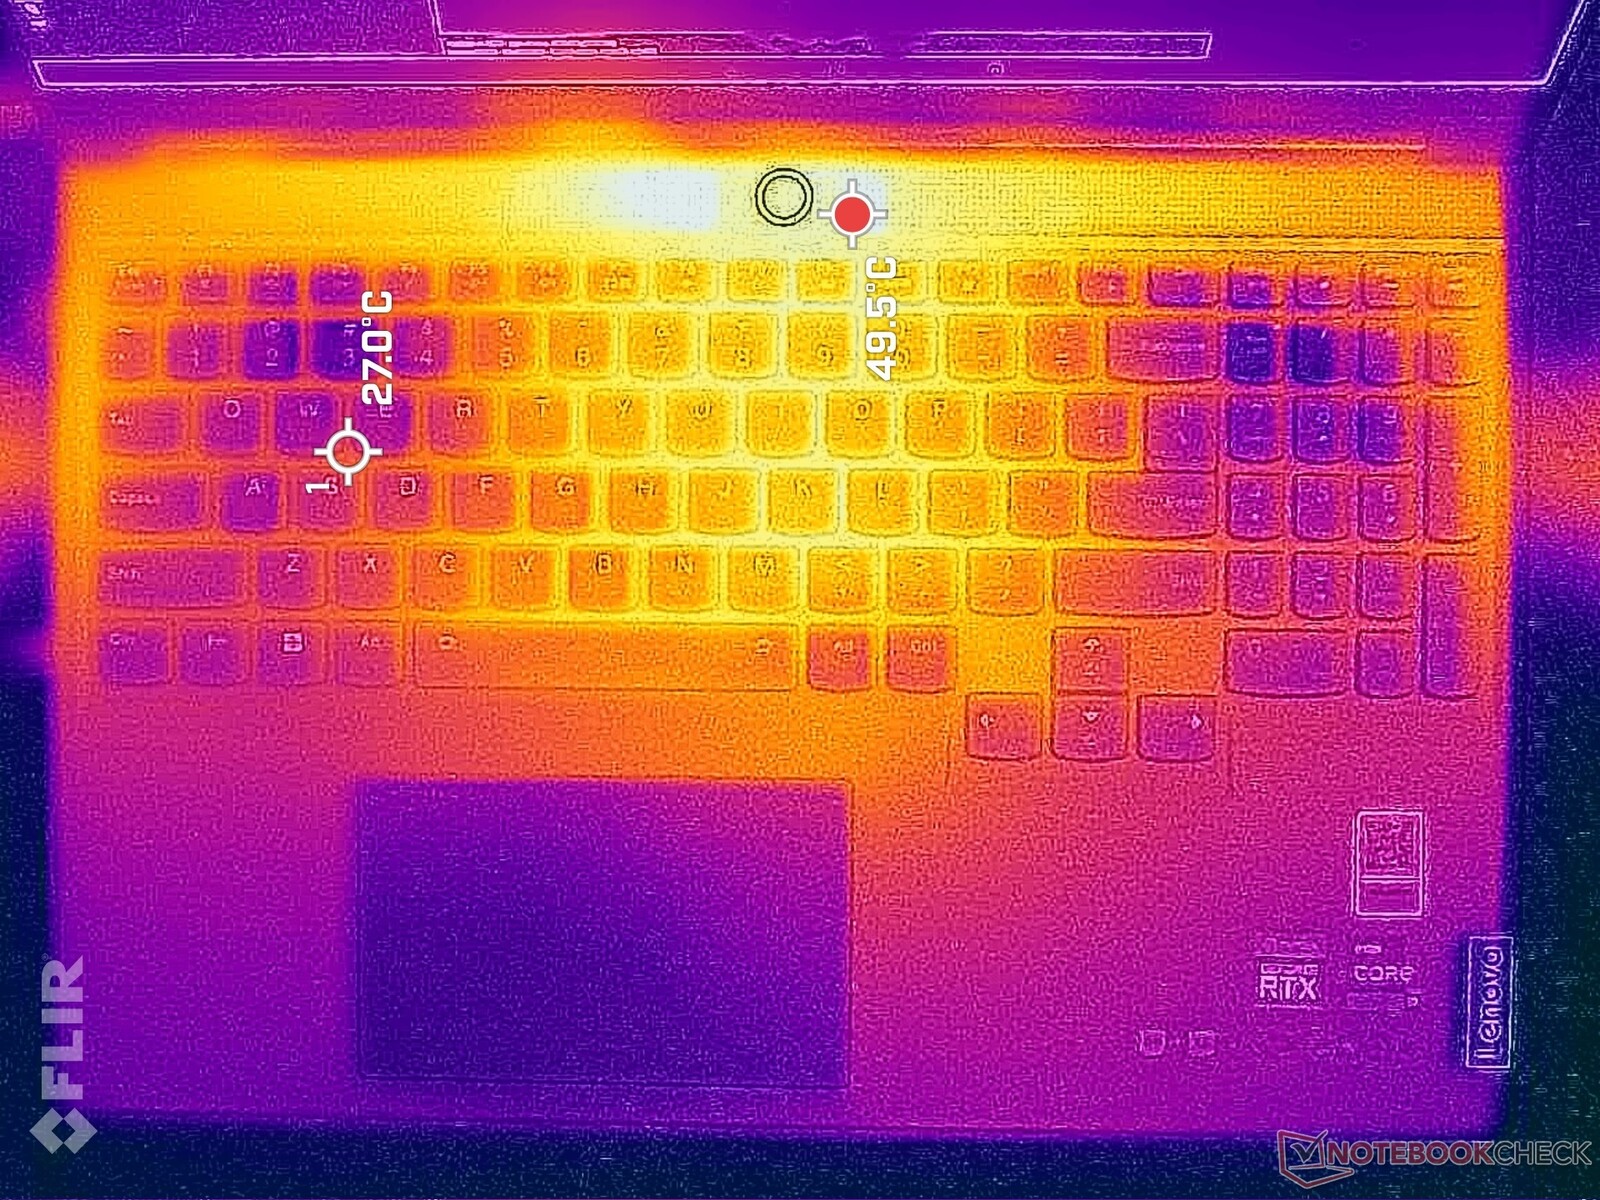
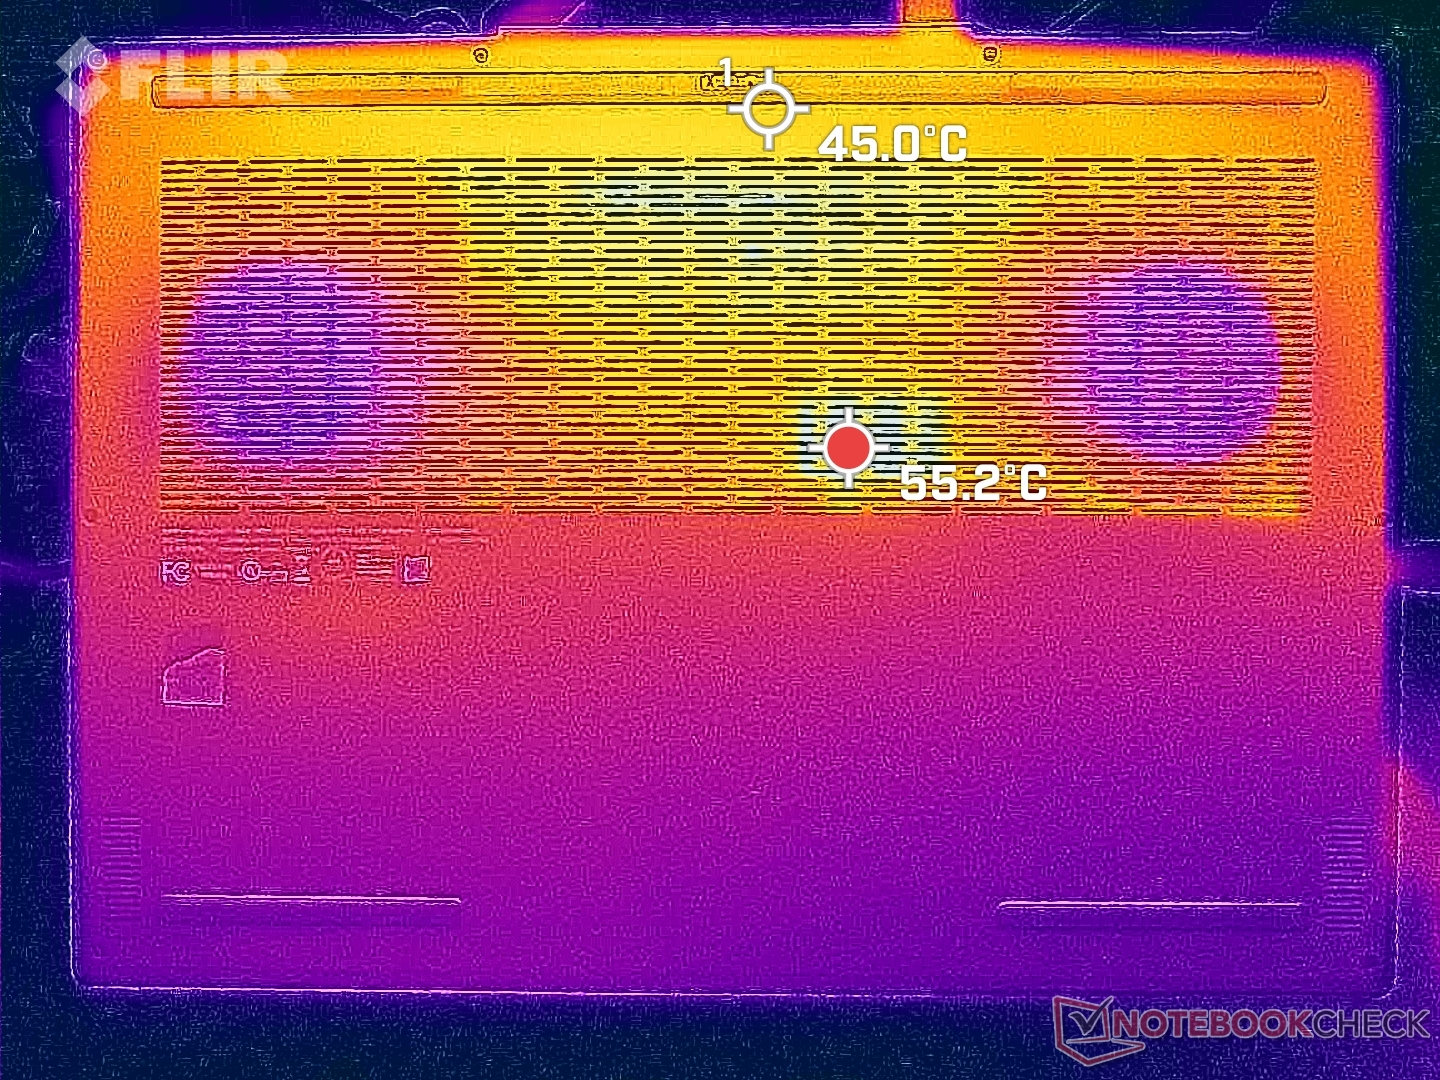
Os pontos quentes da temperatura da superfície podem chegar a 43 C a 50 C, semelhante ao Alienware x16 R1 ao executar cargas exigentes, como jogos. Felizmente, o ponto quente está mais próximo da borda traseira e logo acima da primeira linha de teclas do teclado, como mostram os mapas de temperatura abaixo, onde é improvável que os dedos e a pele toquem. Os apoios para as mãos e as teclas WASD permanecem mais frios em comparação.
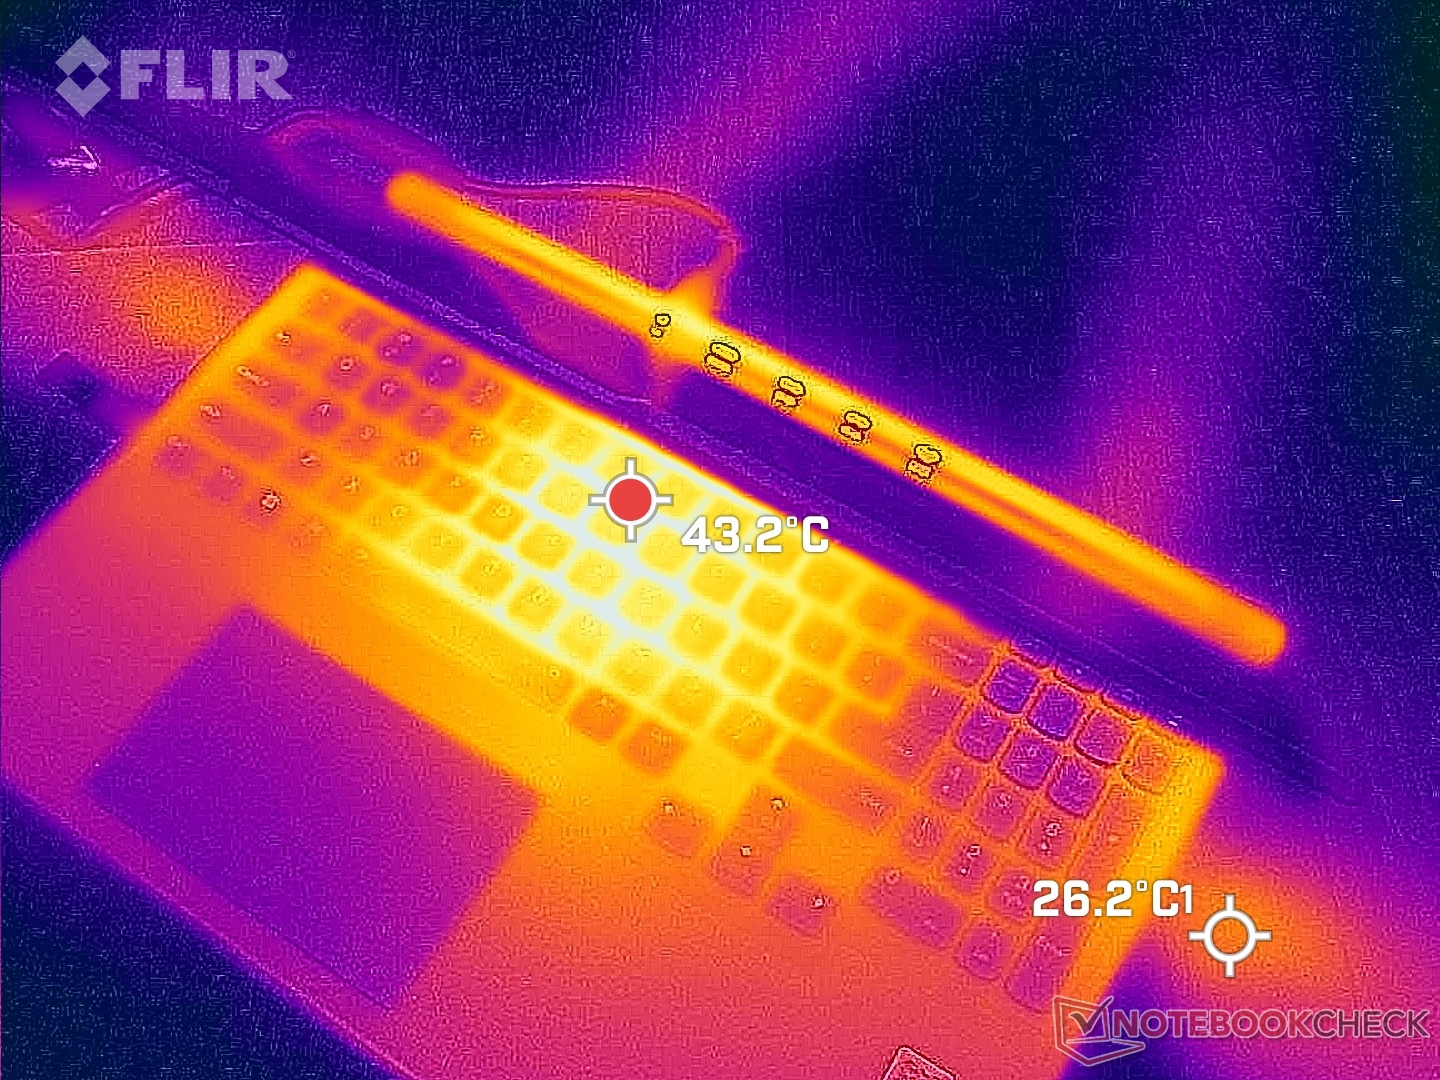
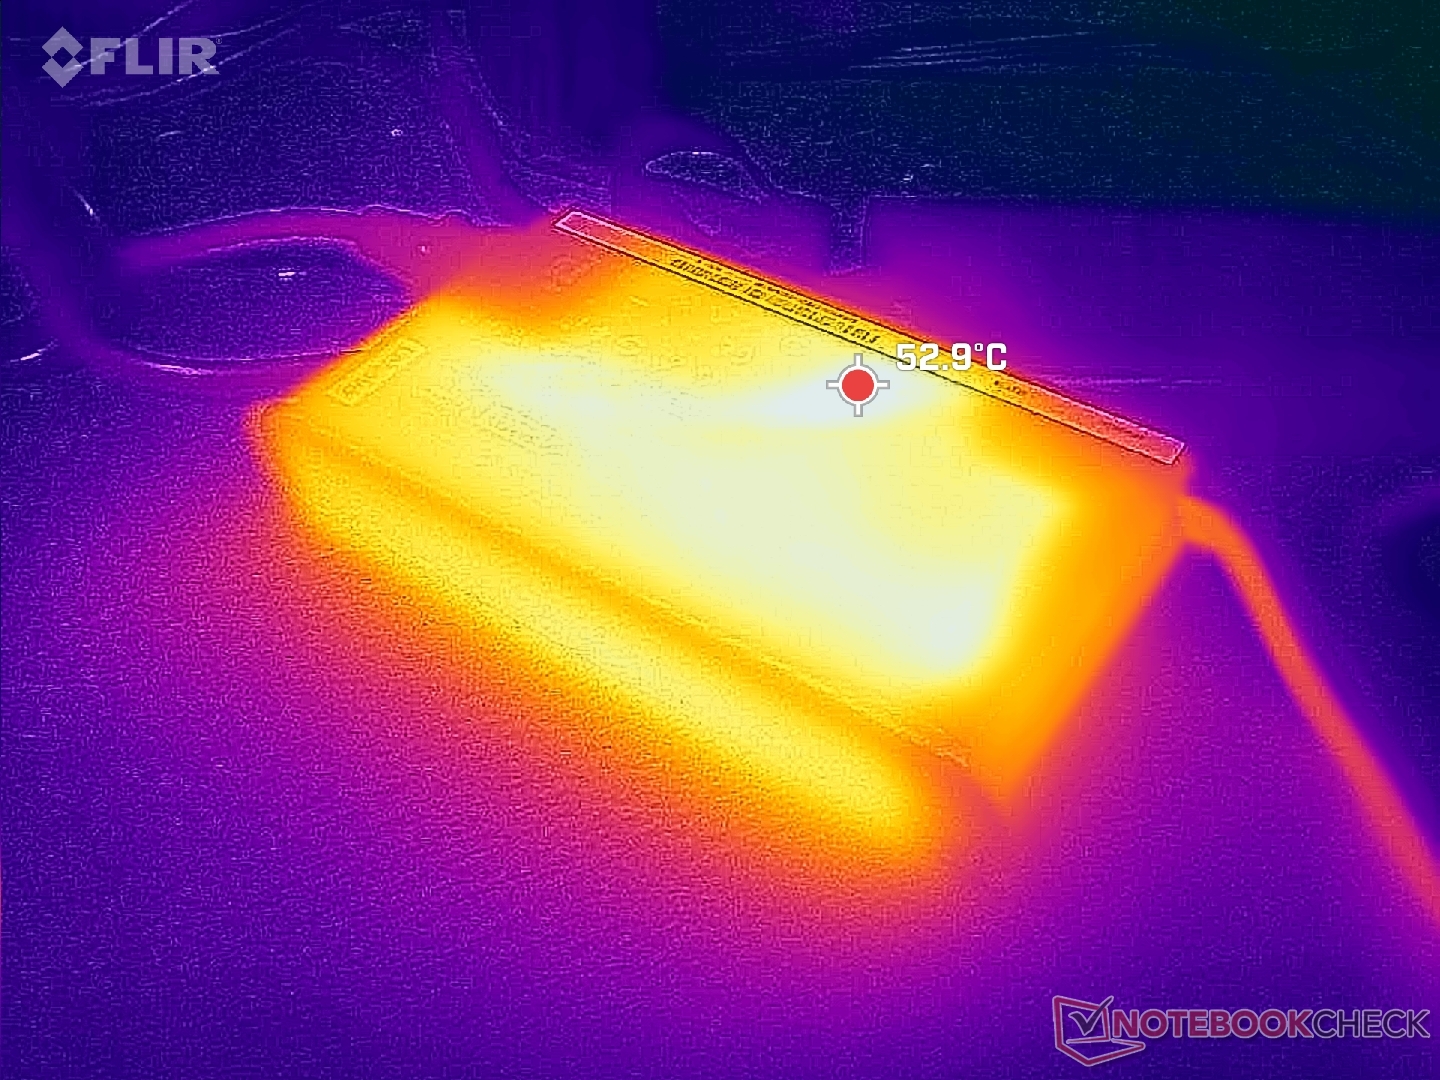
(-) A temperatura máxima no lado superior é 49.8 °C / 122 F, em comparação com a média de 40.4 °C / 105 F , variando de 21.2 a 68.8 °C para a classe Gaming.
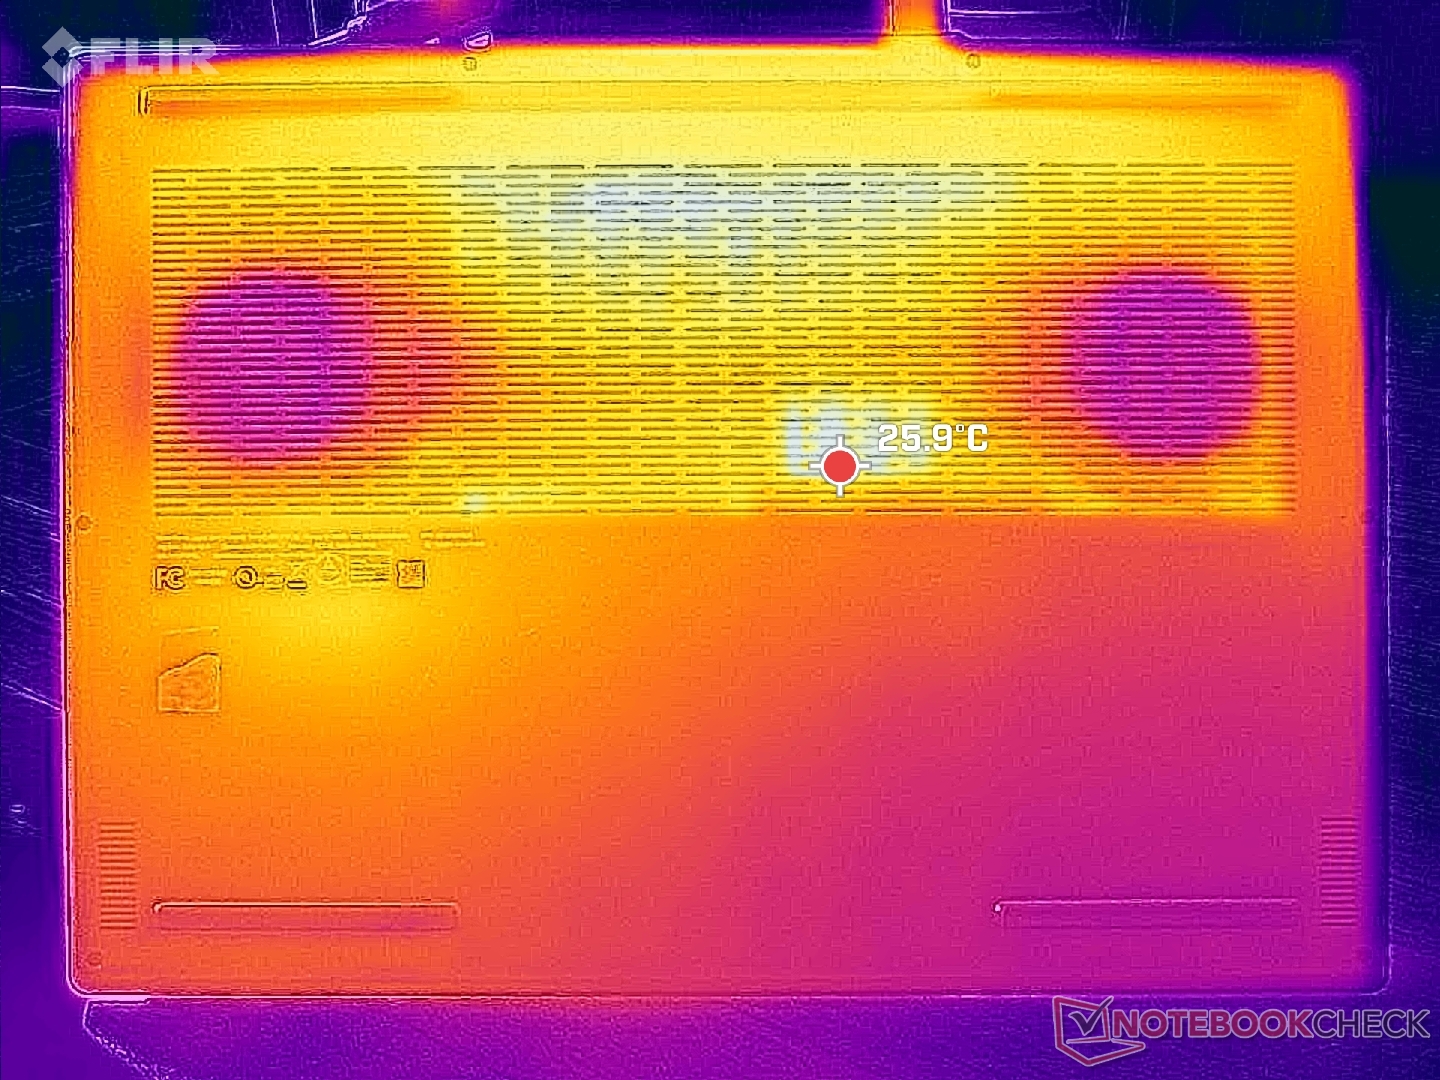
(-) A parte inferior aquece até um máximo de 48.8 °C / 120 F, em comparação com a média de 43.2 °C / 110 F
(+) Em uso inativo, a temperatura média para o lado superior é 26 °C / 79 F, em comparação com a média do dispositivo de 33.9 °C / ### class_avg_f### F.
(±) Jogando The Witcher 3, a temperatura média para o lado superior é 35.1 °C / 95 F, em comparação com a média do dispositivo de 33.9 °C / ## #class_avg_f### F.
(+) Os apoios para as mãos e o touchpad são mais frios que a temperatura da pele, com um máximo de 29.4 °C / 84.9 F e, portanto, são frios ao toque.
(±) A temperatura média da área do apoio para as mãos de dispositivos semelhantes foi 28.8 °C / 83.8 F (-0.6 °C / -1.1 F).
| Lenovo Legion Slim 7i 16 Gen 8 Intel Core i9-13900H, NVIDIA GeForce RTX 4070 Laptop GPU | HP Omen 16-wf000 Intel Core i7-13700HX, NVIDIA GeForce RTX 4080 Laptop GPU | Alienware x16 R1 Intel Core i9-13900HK, NVIDIA GeForce RTX 4080 Laptop GPU | Lenovo Legion Pro 7 RTX4090 Intel Core i9-13900HX, NVIDIA GeForce RTX 4090 Laptop GPU | Asus ROG Strix G16 G614JZ Intel Core i9-13980HX, NVIDIA GeForce RTX 4080 Laptop GPU | Razer Blade 16 Early 2023 Intel Core i9-13950HX, NVIDIA GeForce RTX 4080 Laptop GPU | |
|---|---|---|---|---|---|---|
| Heat | 4% | -9% | -13% | -8% | 7% | |
| Maximum Upper Side * (°C) | 49.8 | 45 10% | 47.2 5% | 53 -6% | 54 -8% | 40 20% |
| Maximum Bottom * (°C) | 48.8 | 48.8 -0% | 47.8 2% | 59 -21% | 55 -13% | 37.6 23% |
| Idle Upper Side * (°C) | 29.4 | 29.2 1% | 36.8 -25% | 34 -16% | 29 1% | 32.4 -10% |
| Idle Bottom * (°C) | 30 | 28.8 4% | 35.8 -19% | 32 -7% | 33 -10% | 31.4 -5% |
* ... menor é melhor
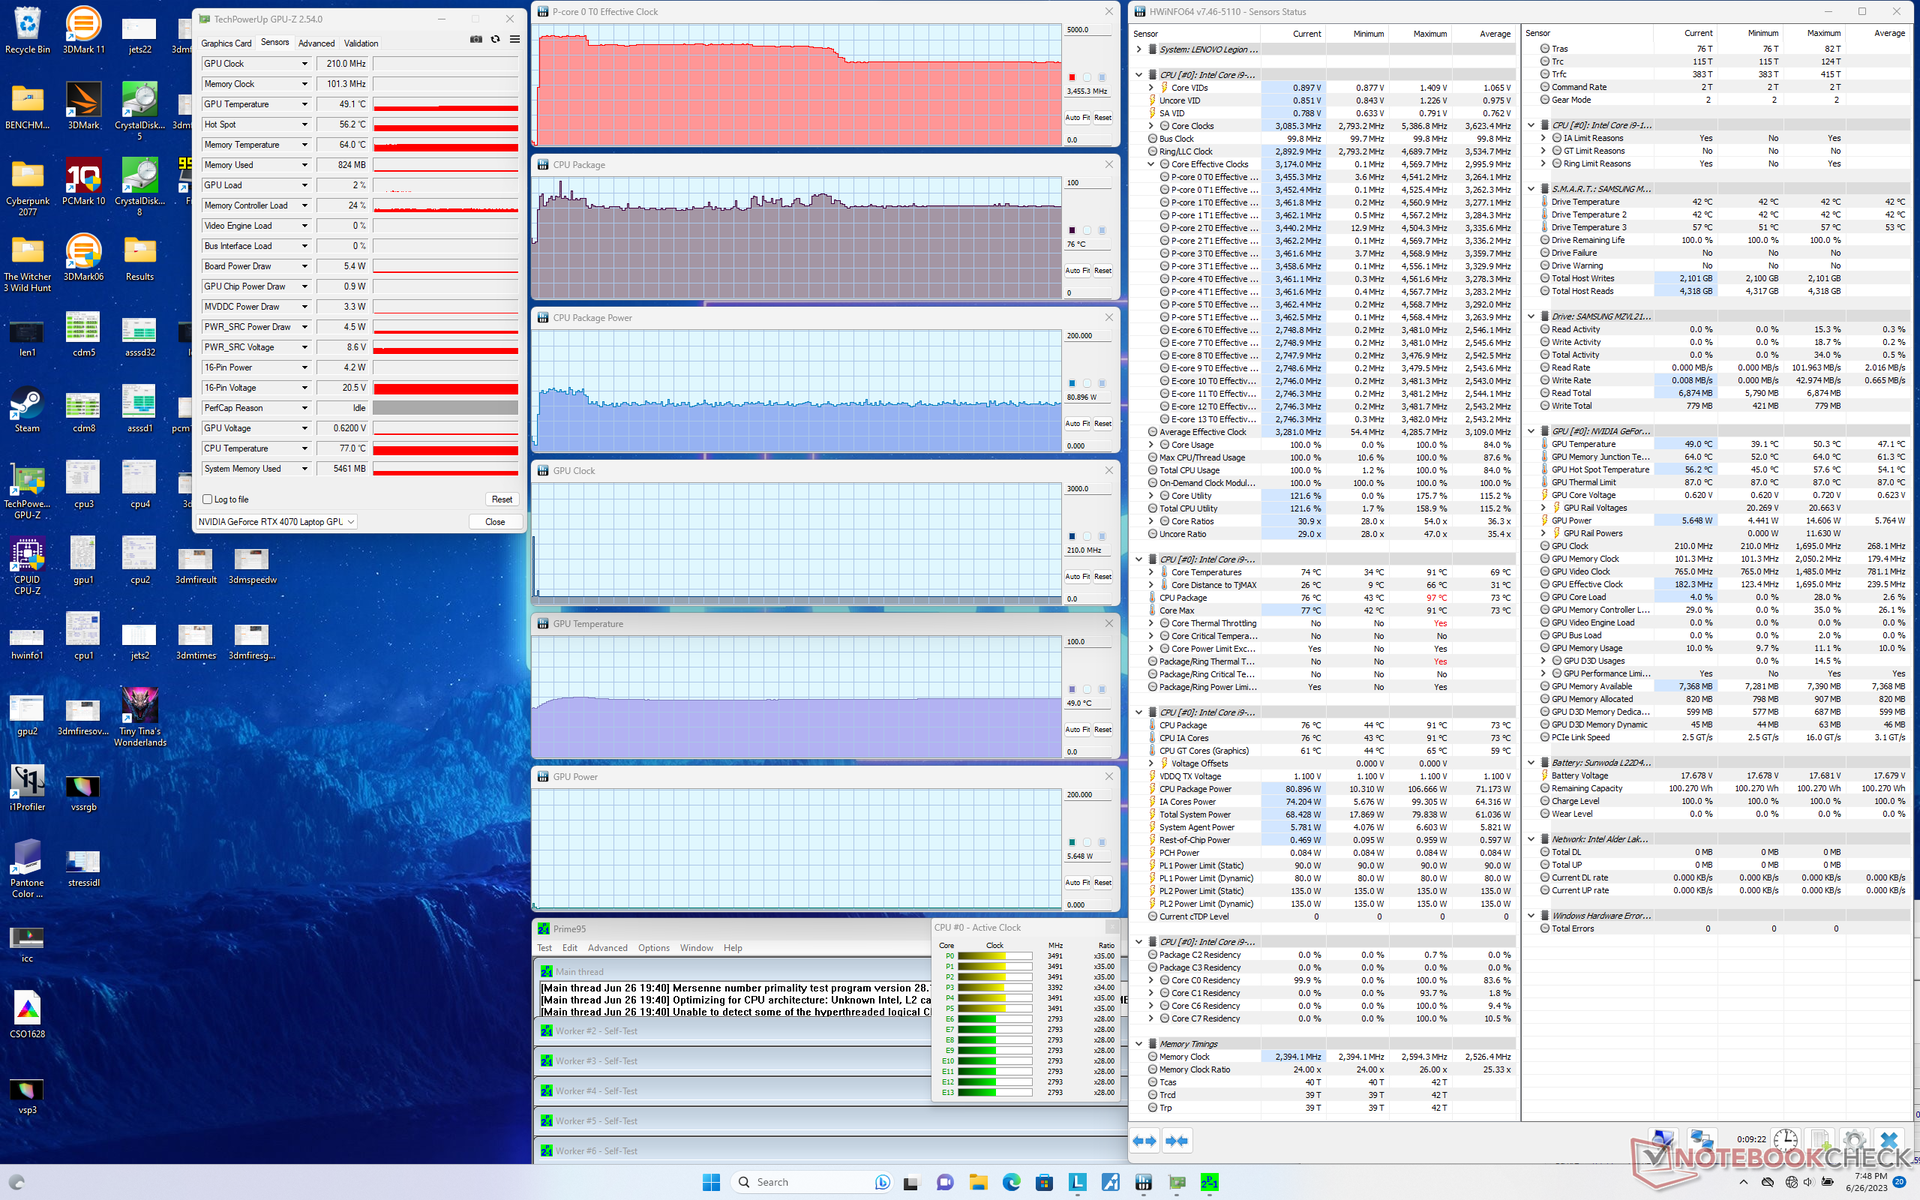
Teste de estresse
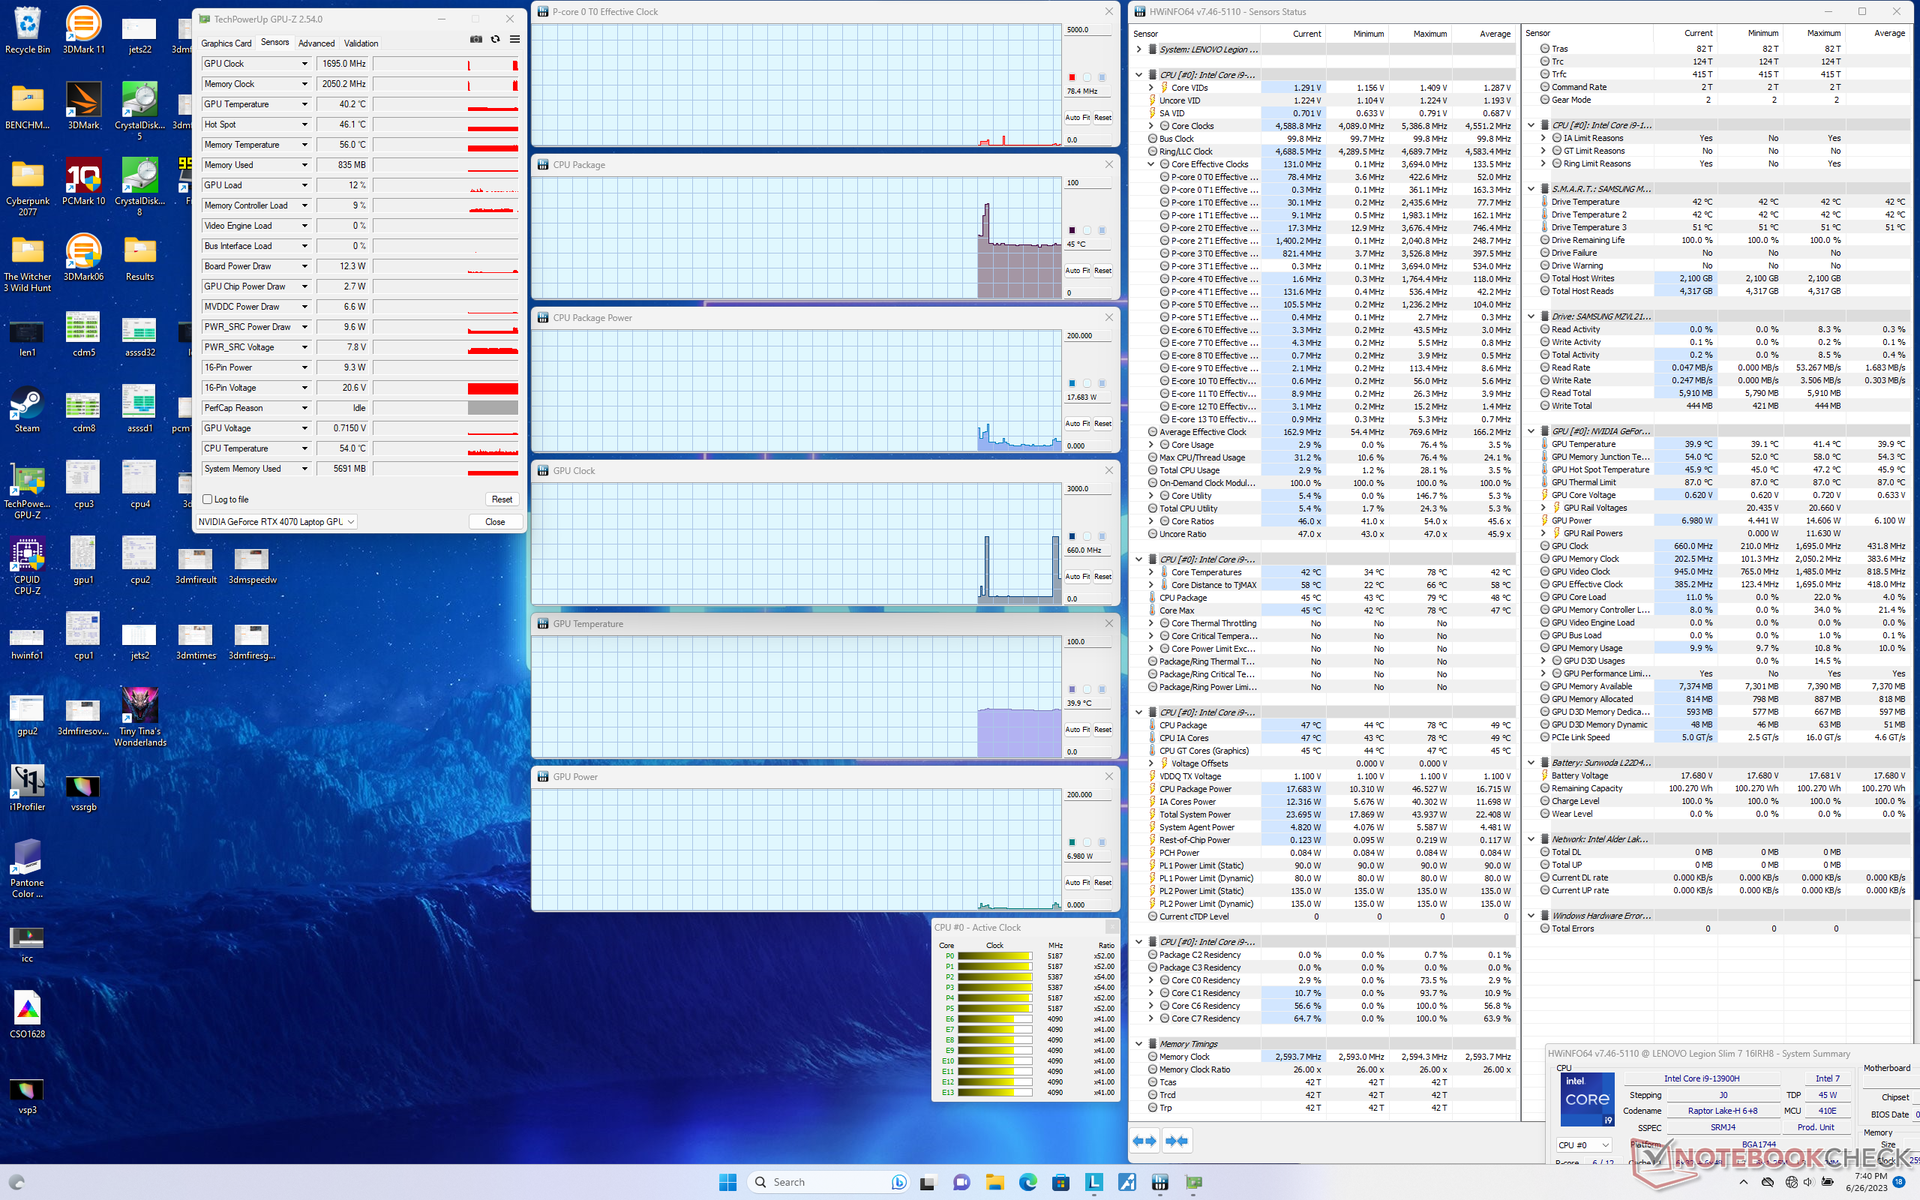
As taxas de clock da CPU, a temperatura e o consumo de energia da placa durante a execução do Prime95 chegavam a 4,5 GHz, 87 °C e 100 W, respectivamente, com duração de cerca de um minuto. Em seguida, a CPU acabava se estabilizando em 3,5 GHz e 80 W para manter uma temperatura de núcleo razoável de 76 C. Repetindo esse mesmo teste no blade 16 com o Core i9-13950HX mais rápido resultaria em uma temperatura central mais quente de 82 °C.
A GPU da Nvidia se estabilizaria em 2580 MHz, 114 W e 71 °C, respectivamente, quando configurada no modo Desempenho com Overdrive e GPU Overclock ativos. A GPU tem como meta 140 W no papel, mas só conseguimos atingir 123 W mesmo ao executar o Cyberpunk 2077. O consumo de energia da placa e a temperatura do núcleo cairiam para apenas 84 W e 64 C, respectivamente, se o jogo fosse realizado no modo Balanced. As temperaturas do núcleo são baixas para um notebook fino e leve para jogos; as temperaturas da CPU e da GPU no Alienware x16 R1, por exemplo, seriam de 80 a 95 °C ao executar os mesmos jogos.
A execução com a energia da bateria limita o desempenho, pois o perfil de energia Performance fica acinzentado. Fire Strike com baterias retornaria pontuações de Física e Gráficos de apenas 25602 e 21049 pontos, respectivamente, em comparação com 32664 e 30130 pontos quando na rede elétrica.
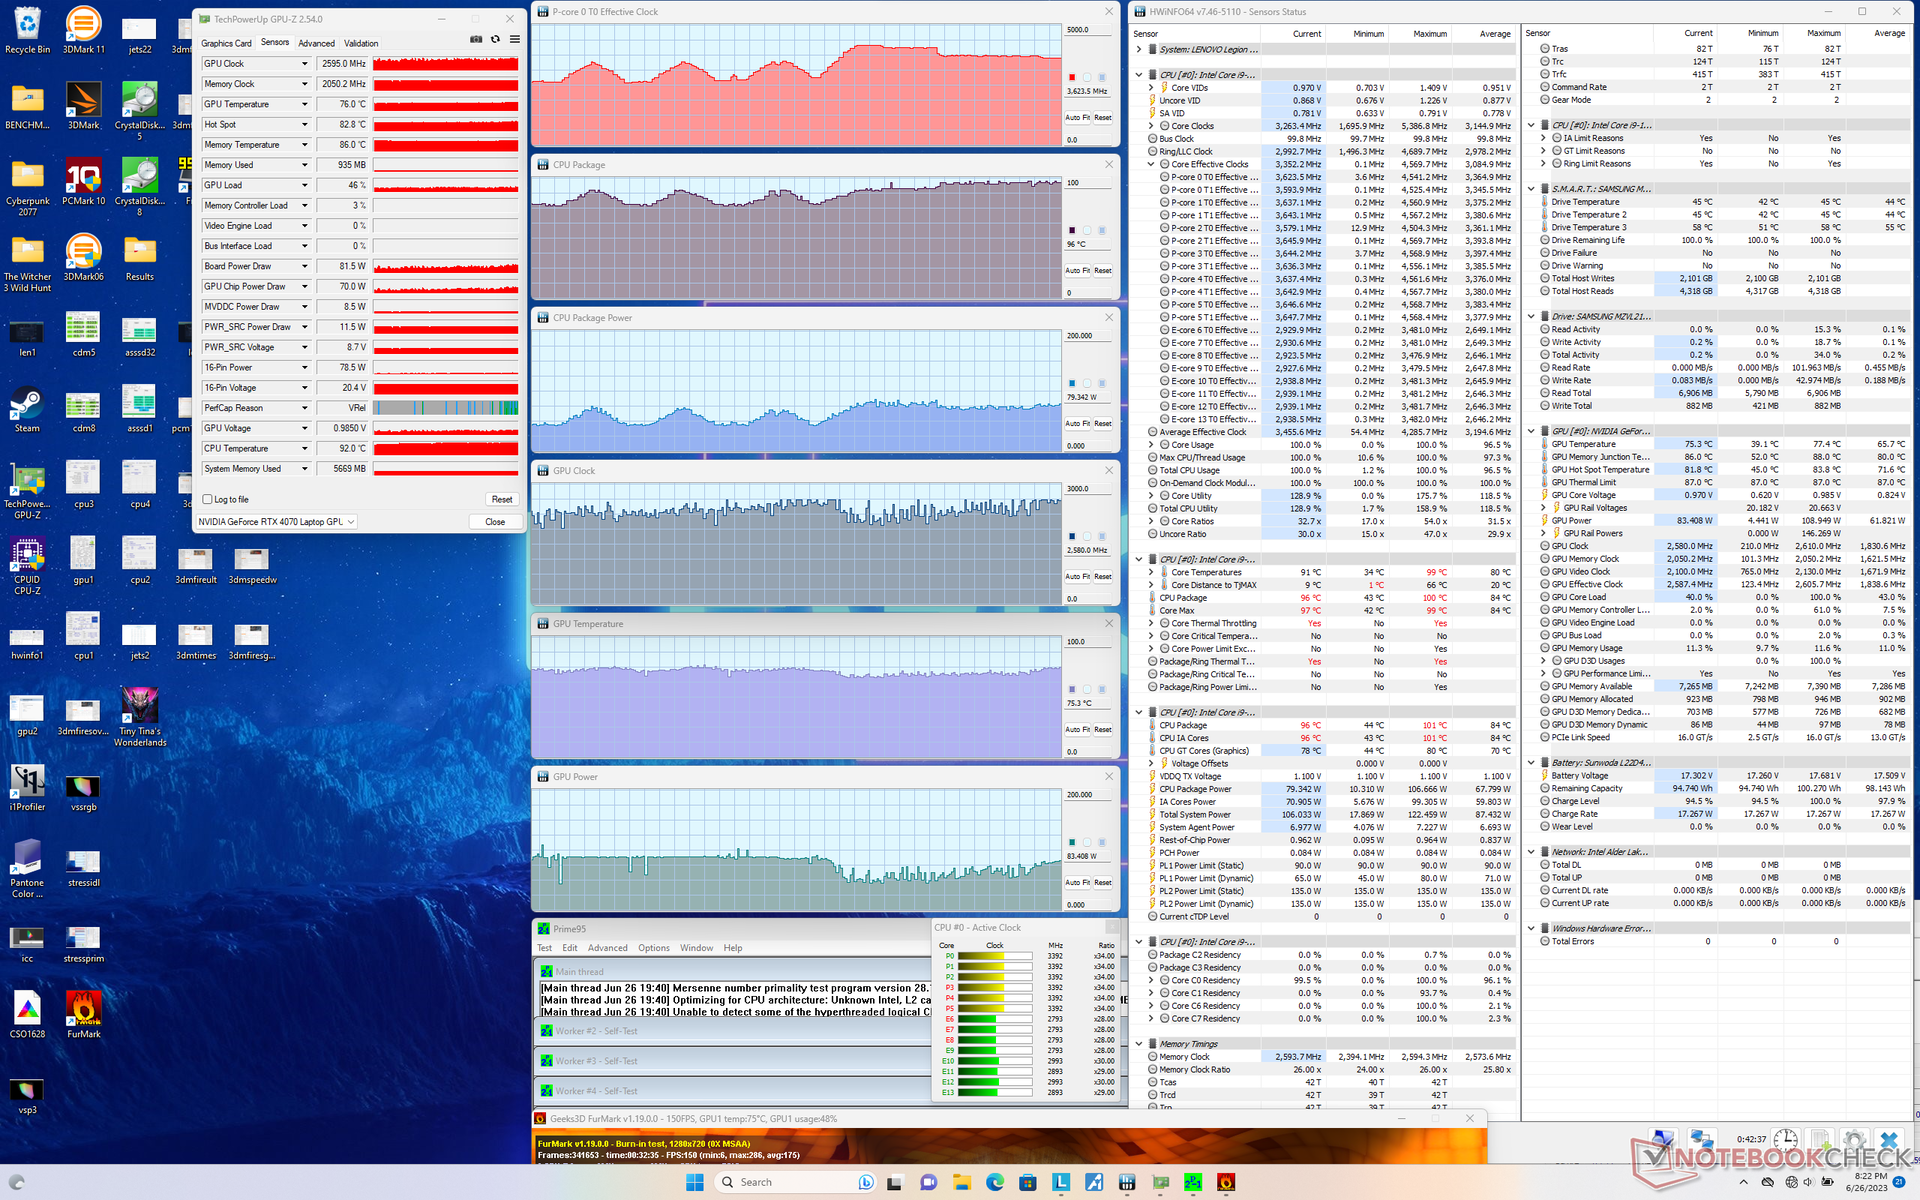
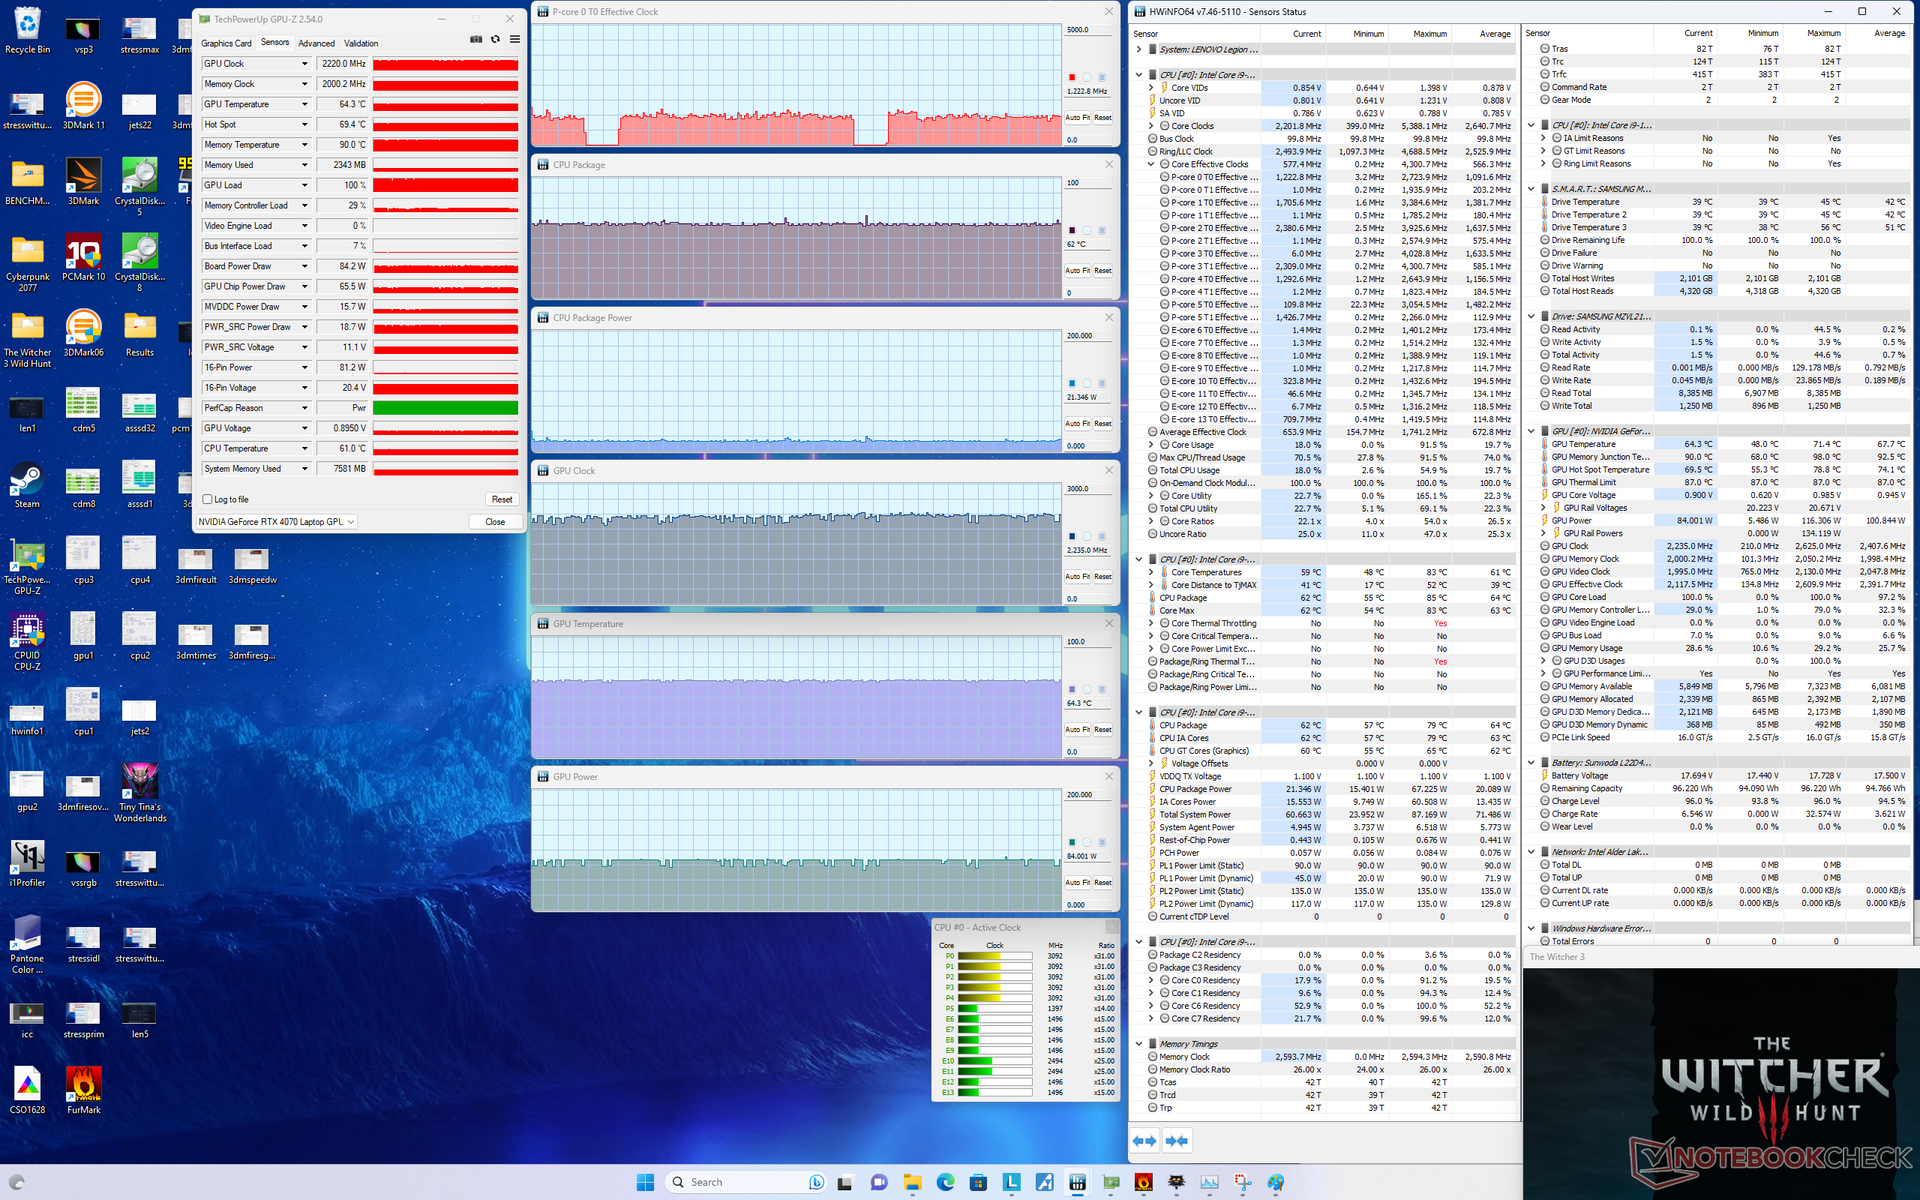
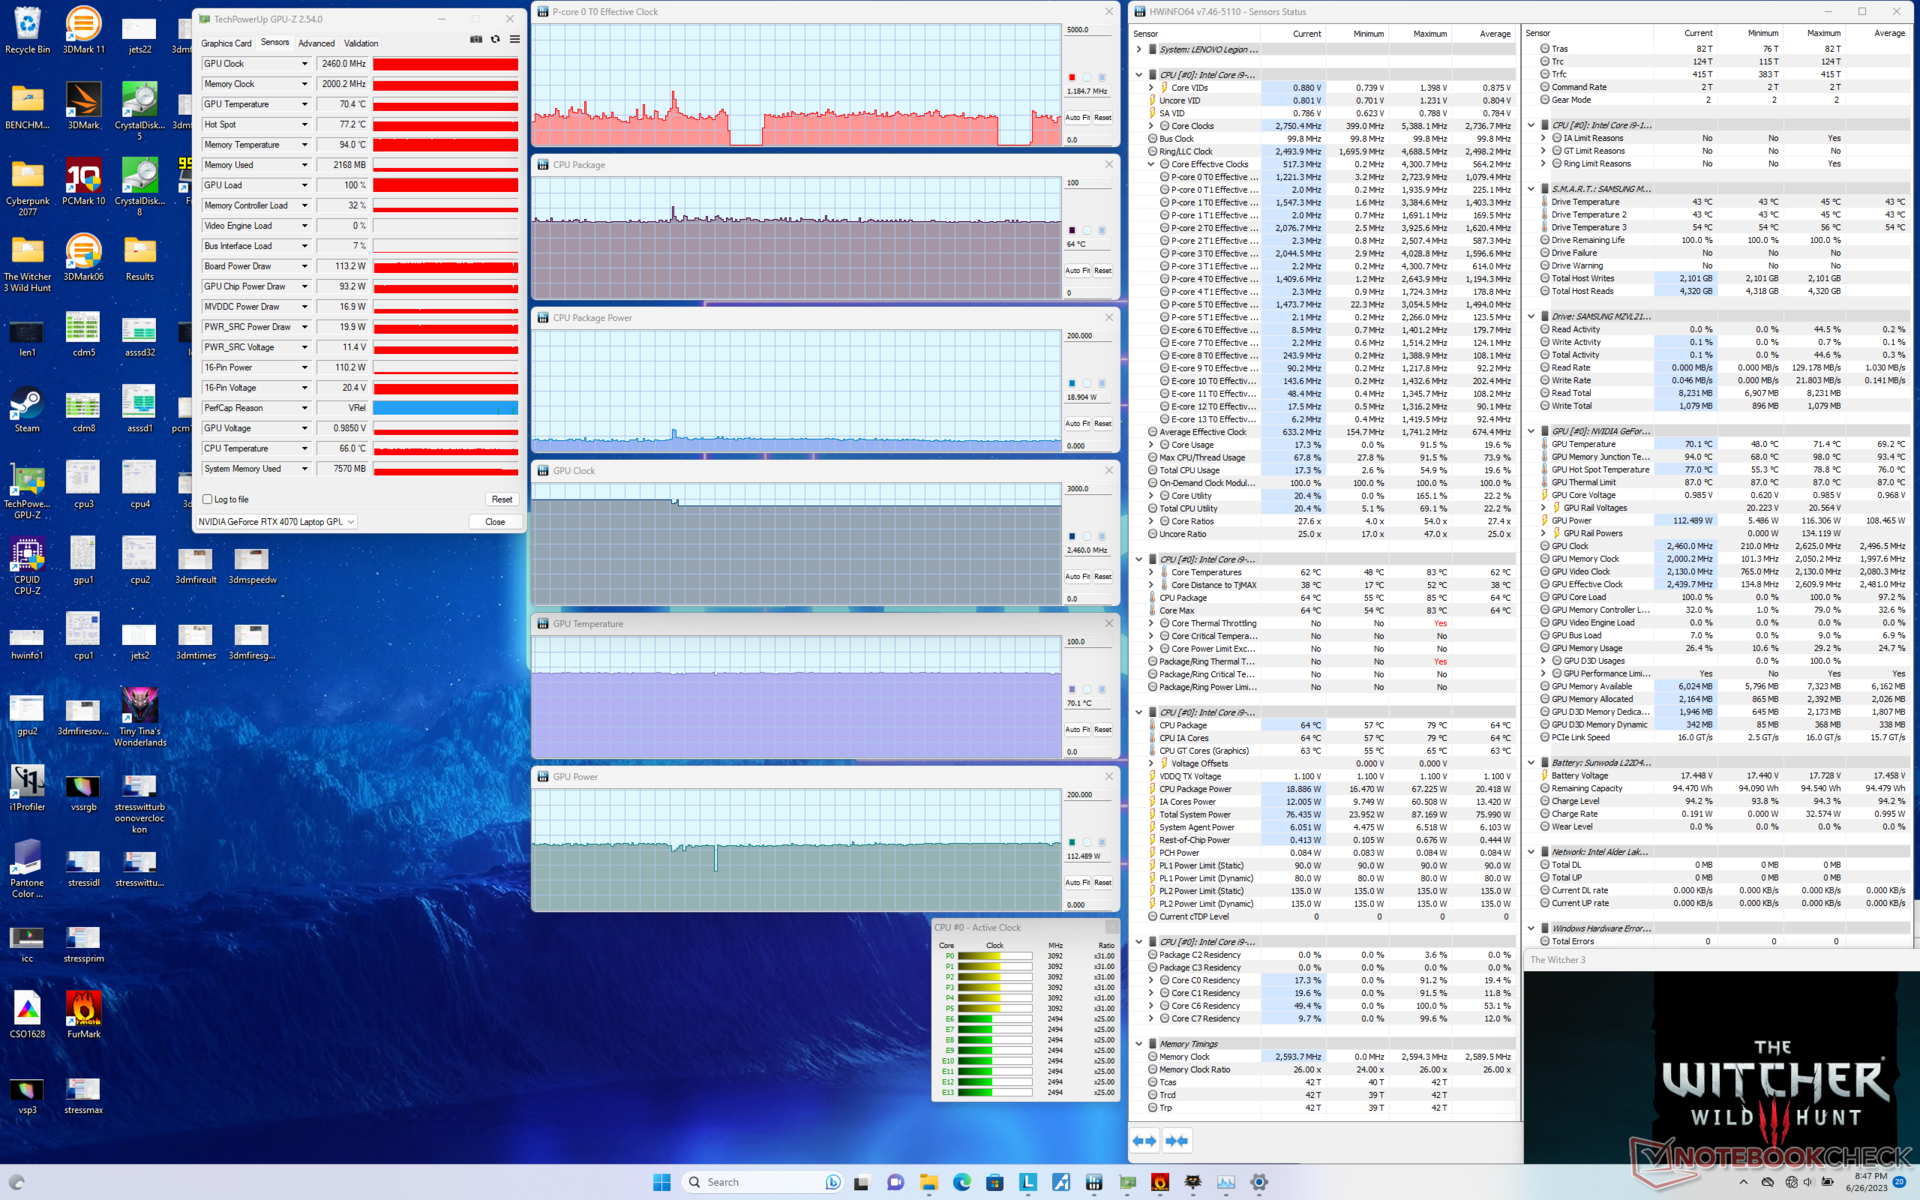
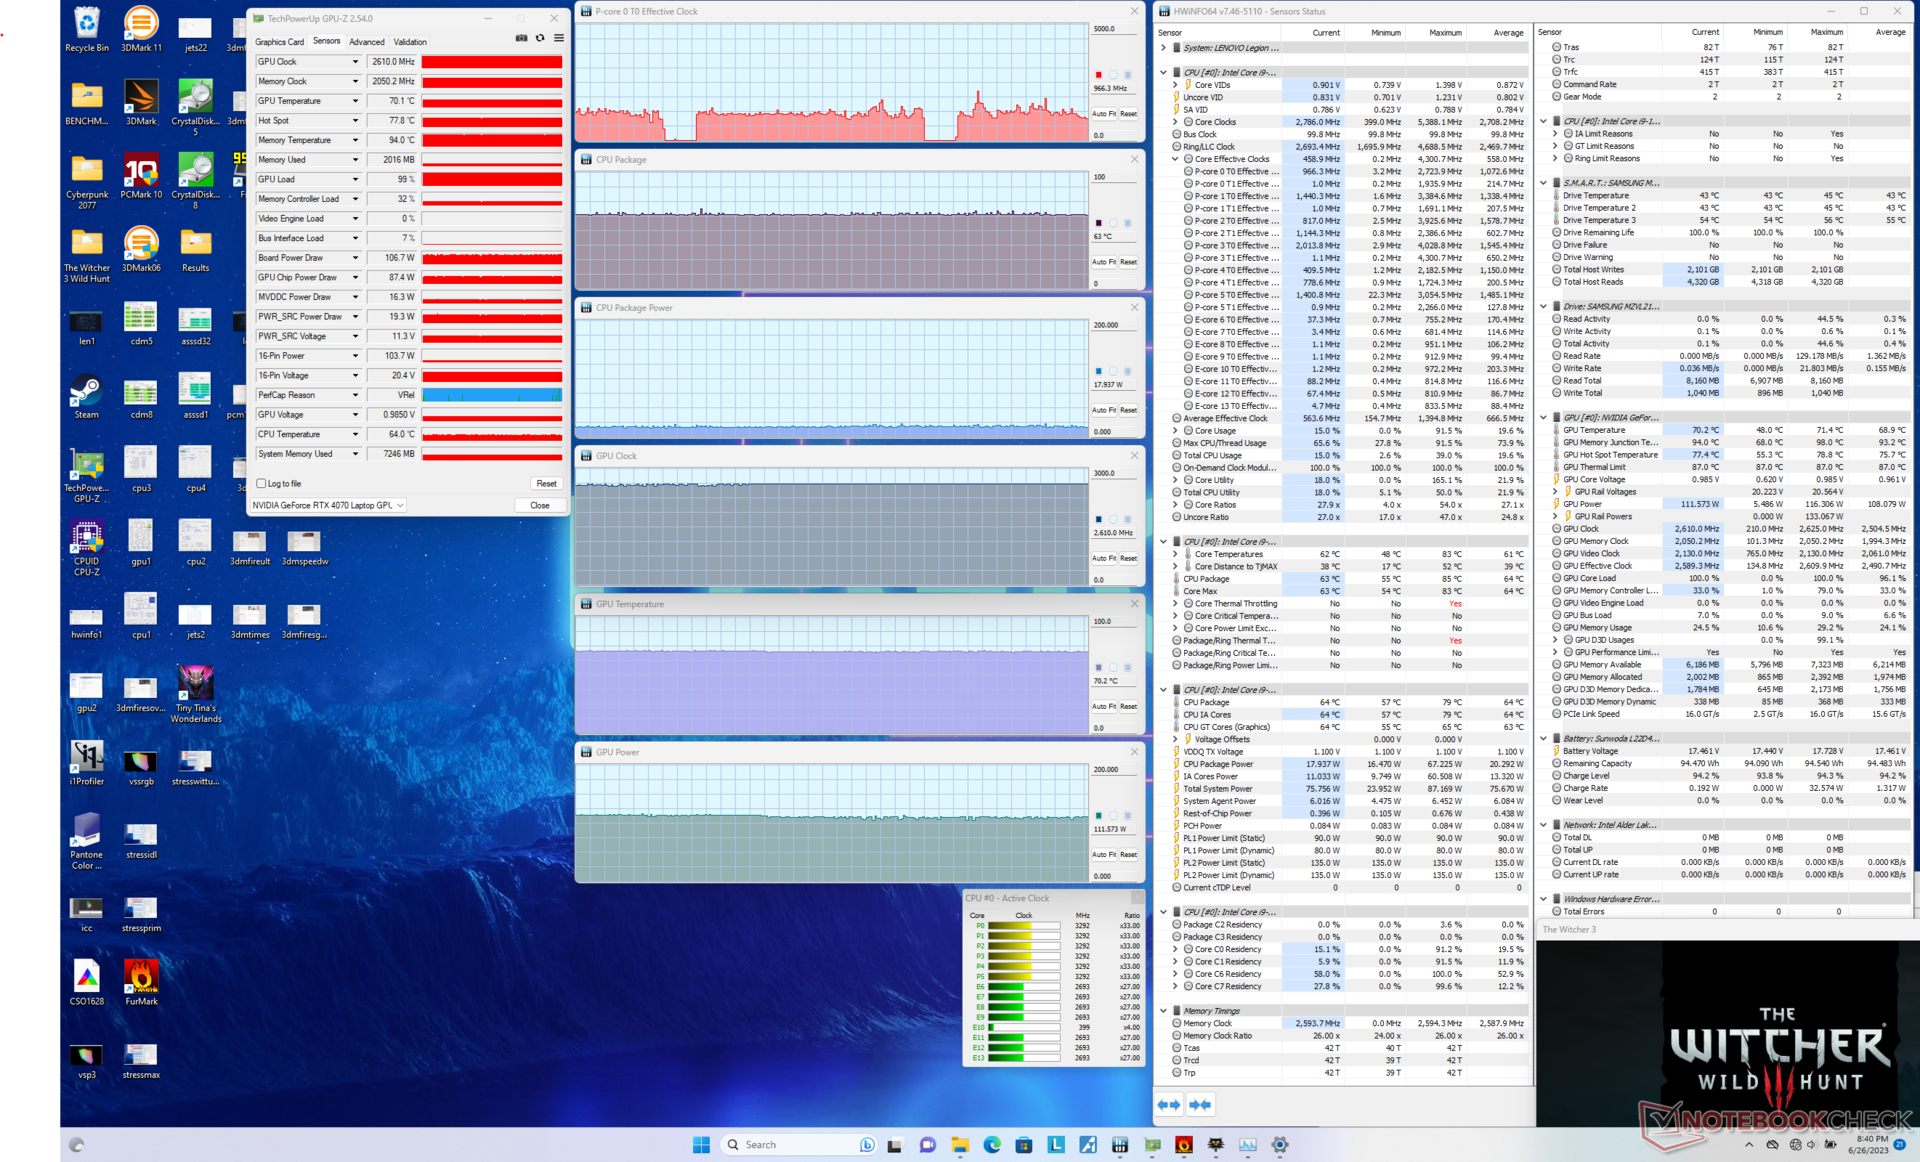
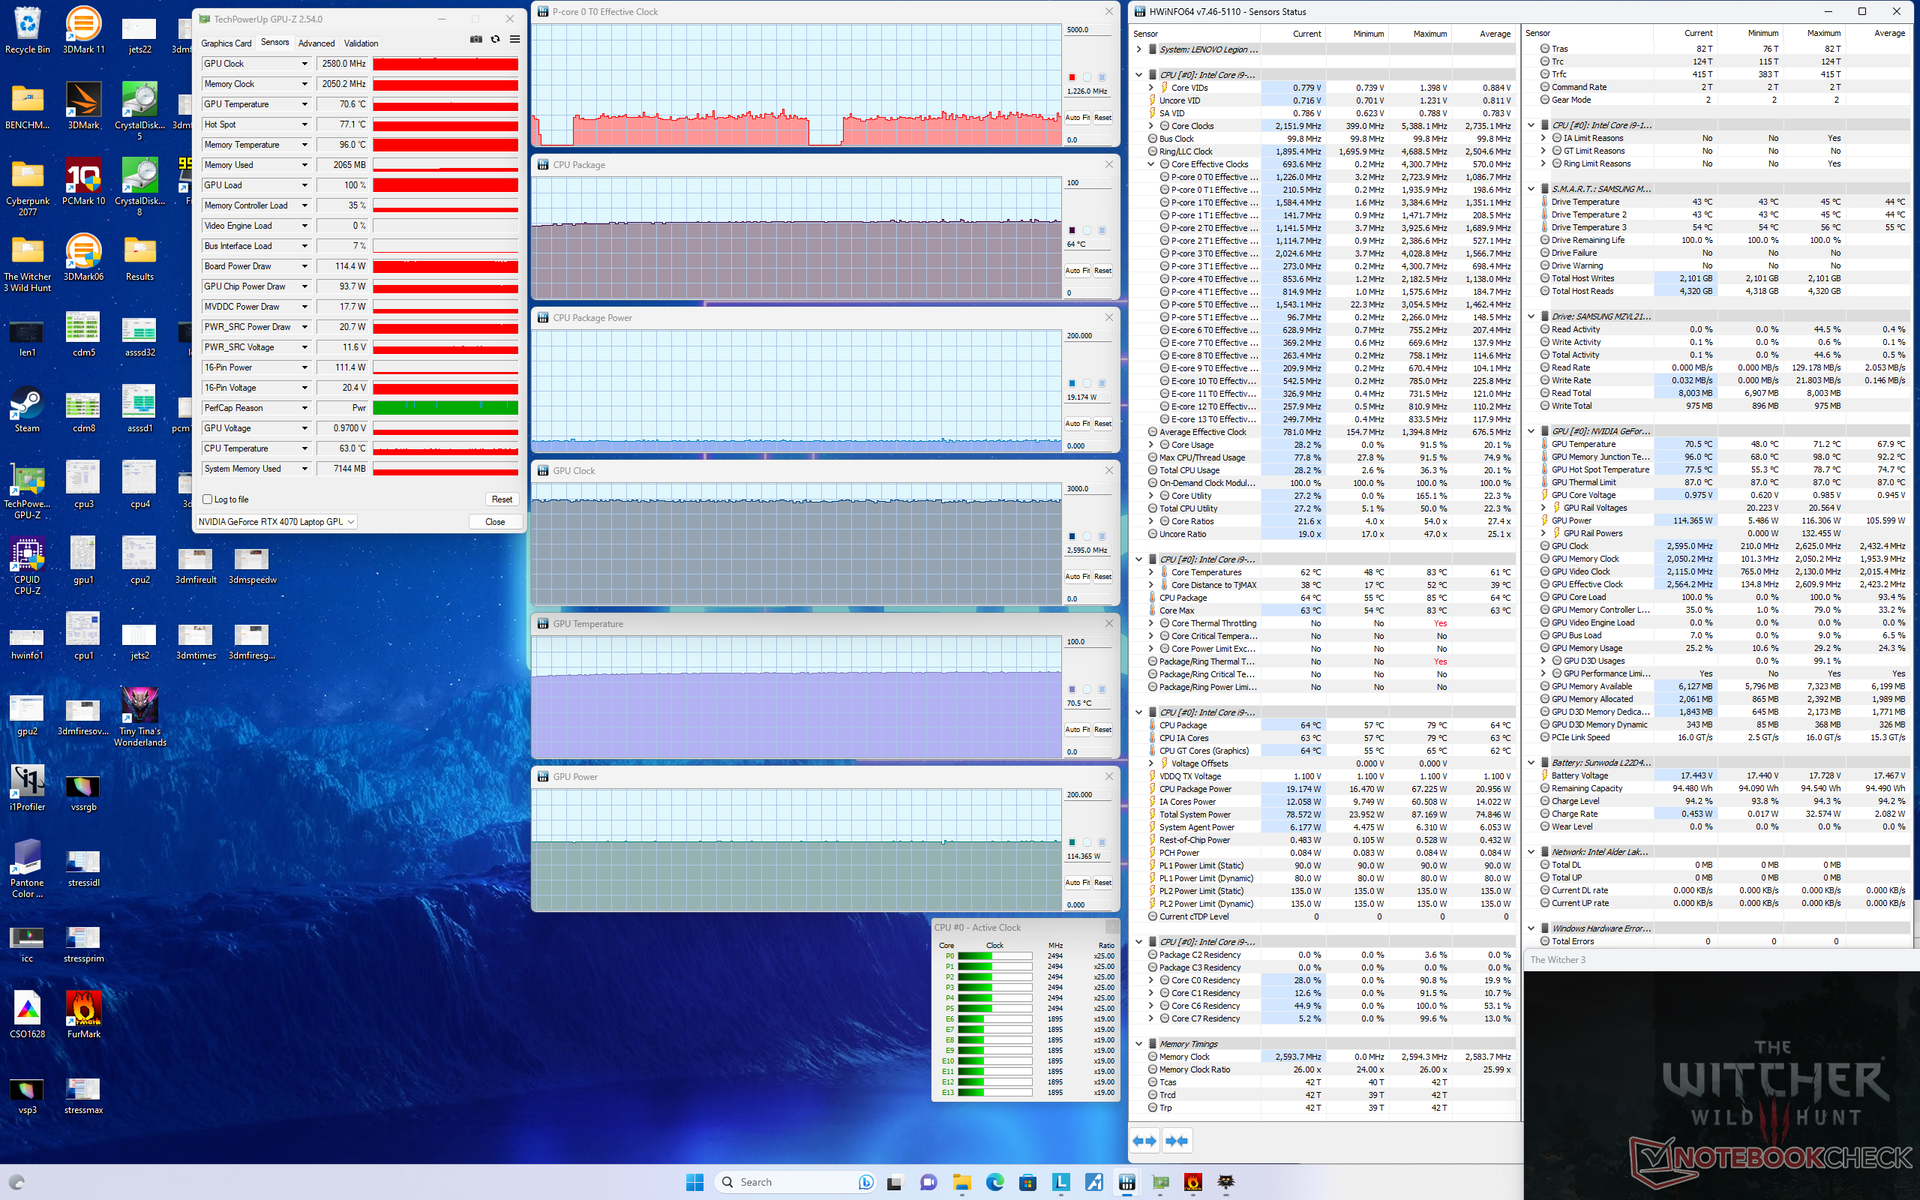
| Clock da CPU (GHz) | Clock da GPU (MHz) | Temperatura média da CPU (°C) | Temperatura média da GPU (°C) | |
| Sistema ocioso | -- | -- | 45 | 40 |
| Estresse doPrime95 | 3.5 | -- | 76 | 49 |
| Estresse doPrime95 + FurMark | 2,6 - 3,5 | 1920 - 2610 | 77 - 90 | 75 |
| Witcher 3 Estresse(modo balanceado) | ~1,2 | 2220 | 62 | 64 |
| Witcher 3 Estresse(desempenho com GPU Overclock desligado + Overdrive desligado) | ~1,2 | 2460 | 64 | 70 |
| Witcher 3 Estresse (desempenho comGPU Overclock ligado + Overdrive desligado) | ~1,2 | 2610 | 63 | 70 |
| Witcher 3 Estresse(desempenho com GPU Overclock ligado + Overdrive ligado) | ~1.2 | 2580 | 64 | 71 |
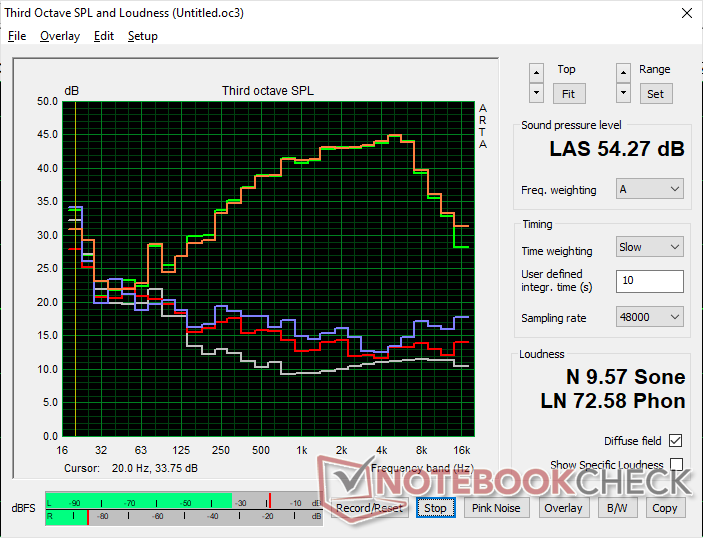
Alto-falantes
Com cerca de 85 dB(A) no máximo, os alto-falantes são tão altos quanto os da maioria dos outros laptops para jogos. Também não há nada de especial na qualidade do áudio ou na reprodução de graves. Os alto-falantes têm melhor desempenho ao jogar no modo balanceado, pois os ventiladores não são tão altos.
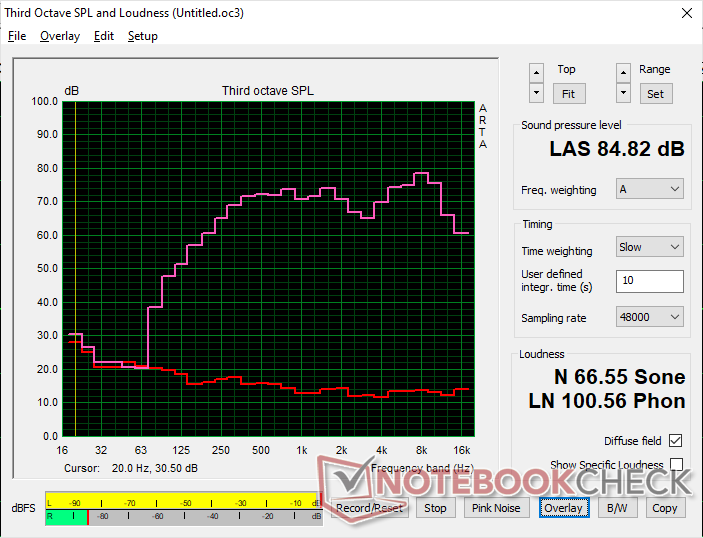
Lenovo Legion Slim 7i 16 Gen 8 análise de áudio
(+) | os alto-falantes podem tocar relativamente alto (###valor### dB)
Graves 100 - 315Hz
(±) | graves reduzidos - em média 12.1% menor que a mediana
(±) | a linearidade dos graves é média (9% delta para a frequência anterior)
Médios 400 - 2.000 Hz
(+) | médios equilibrados - apenas 1.4% longe da mediana
(+) | médios são lineares (3.3% delta para frequência anterior)
Altos 2 - 16 kHz
(+) | agudos equilibrados - apenas 4.4% longe da mediana
(+) | os máximos são lineares (5.6% delta da frequência anterior)
Geral 100 - 16.000 Hz
(+) | o som geral é linear (10.5% diferença em relação à mediana)
Comparado com a mesma classe
» 6% de todos os dispositivos testados nesta classe foram melhores, 2% semelhantes, 92% piores
» O melhor teve um delta de 6%, a média foi 18%, o pior foi 132%
Comparado com todos os dispositivos testados
» 5% de todos os dispositivos testados foram melhores, 1% semelhantes, 93% piores
» O melhor teve um delta de 4%, a média foi 23%, o pior foi 134%
Apple MacBook Pro 16 2021 M1 Pro análise de áudio
(+) | os alto-falantes podem tocar relativamente alto (###valor### dB)
Graves 100 - 315Hz
(+) | bons graves - apenas 3.8% longe da mediana
(+) | o baixo é linear (5.2% delta para a frequência anterior)
Médios 400 - 2.000 Hz
(+) | médios equilibrados - apenas 1.3% longe da mediana
(+) | médios são lineares (2.1% delta para frequência anterior)
Altos 2 - 16 kHz
(+) | agudos equilibrados - apenas 1.9% longe da mediana
(+) | os máximos são lineares (2.7% delta da frequência anterior)
Geral 100 - 16.000 Hz
(+) | o som geral é linear (4.6% diferença em relação à mediana)
Comparado com a mesma classe
» 0% de todos os dispositivos testados nesta classe foram melhores, 0% semelhantes, 100% piores
» O melhor teve um delta de 5%, a média foi 17%, o pior foi 45%
Comparado com todos os dispositivos testados
» 0% de todos os dispositivos testados foram melhores, 0% semelhantes, 100% piores
» O melhor teve um delta de 4%, a média foi 23%, o pior foi 134%
Gerenciamento de energia
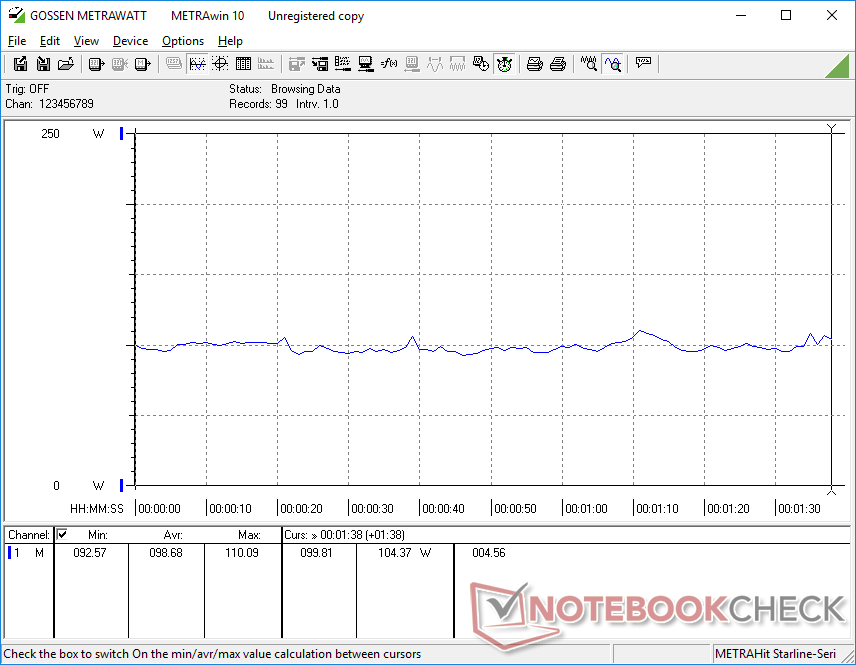
Consumo de energia - altas taxas de inatividade
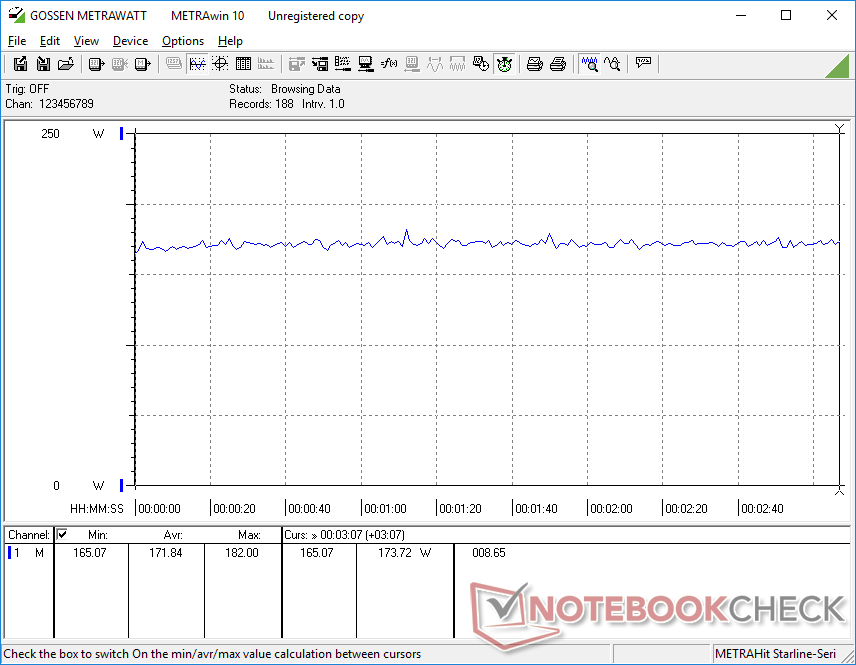
O consumo de energia quando ocioso na área de trabalho é relativamente alto, 22 W, mesmo com o Power Saver e as configurações mínimas de brilho. Essa parece ser uma característica comum entre os notebooks para jogos equipados com CPUs Core-H de 13ª geração, conforme mostra a tabela abaixo, o que provavelmente contribui para a duração medíocre da bateria. Em comparação, o AMD Zen 4-powered Legion Pro 5 16 pode chegar a 8 W em condições semelhantes.
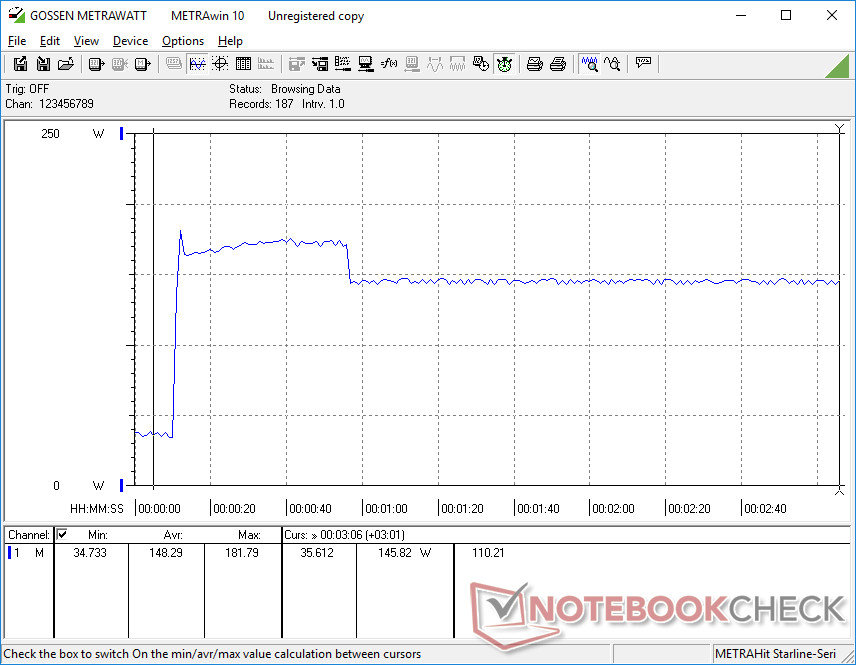
Os jogos consomem cerca de 172 W, o que é muito semelhante ao antigo Zephyrus M16 equipado com o Core i9-12900H e RTX 3070 Ti. Nosso Legion Slim 7 é, portanto, capaz de oferecer um desempenho gráfico cerca de 15% mais rápido sem a necessidade de consumir mais energia para obter um desempenho mais alto por watt em relação aos laptops para jogos mais antigos com tecnologia Ampere.
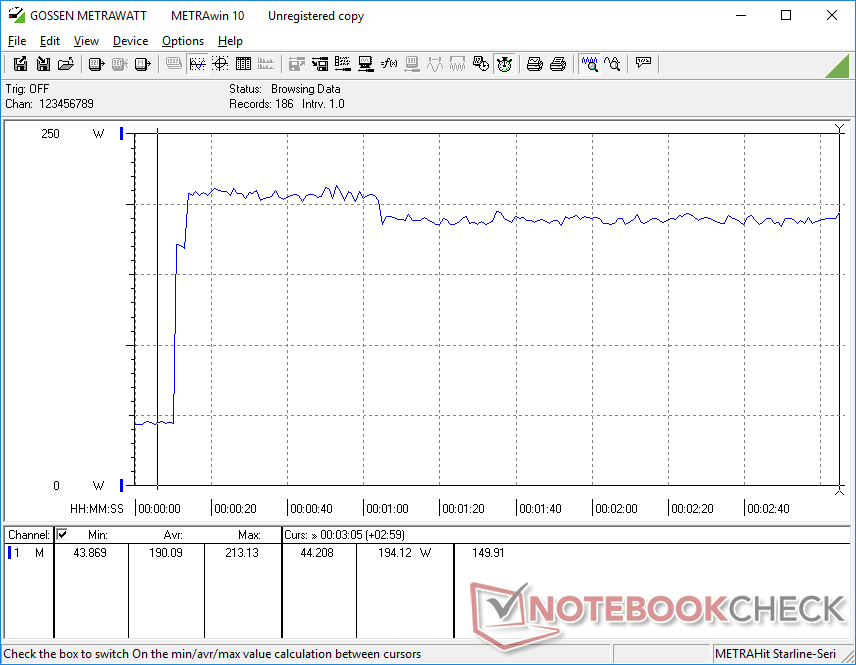
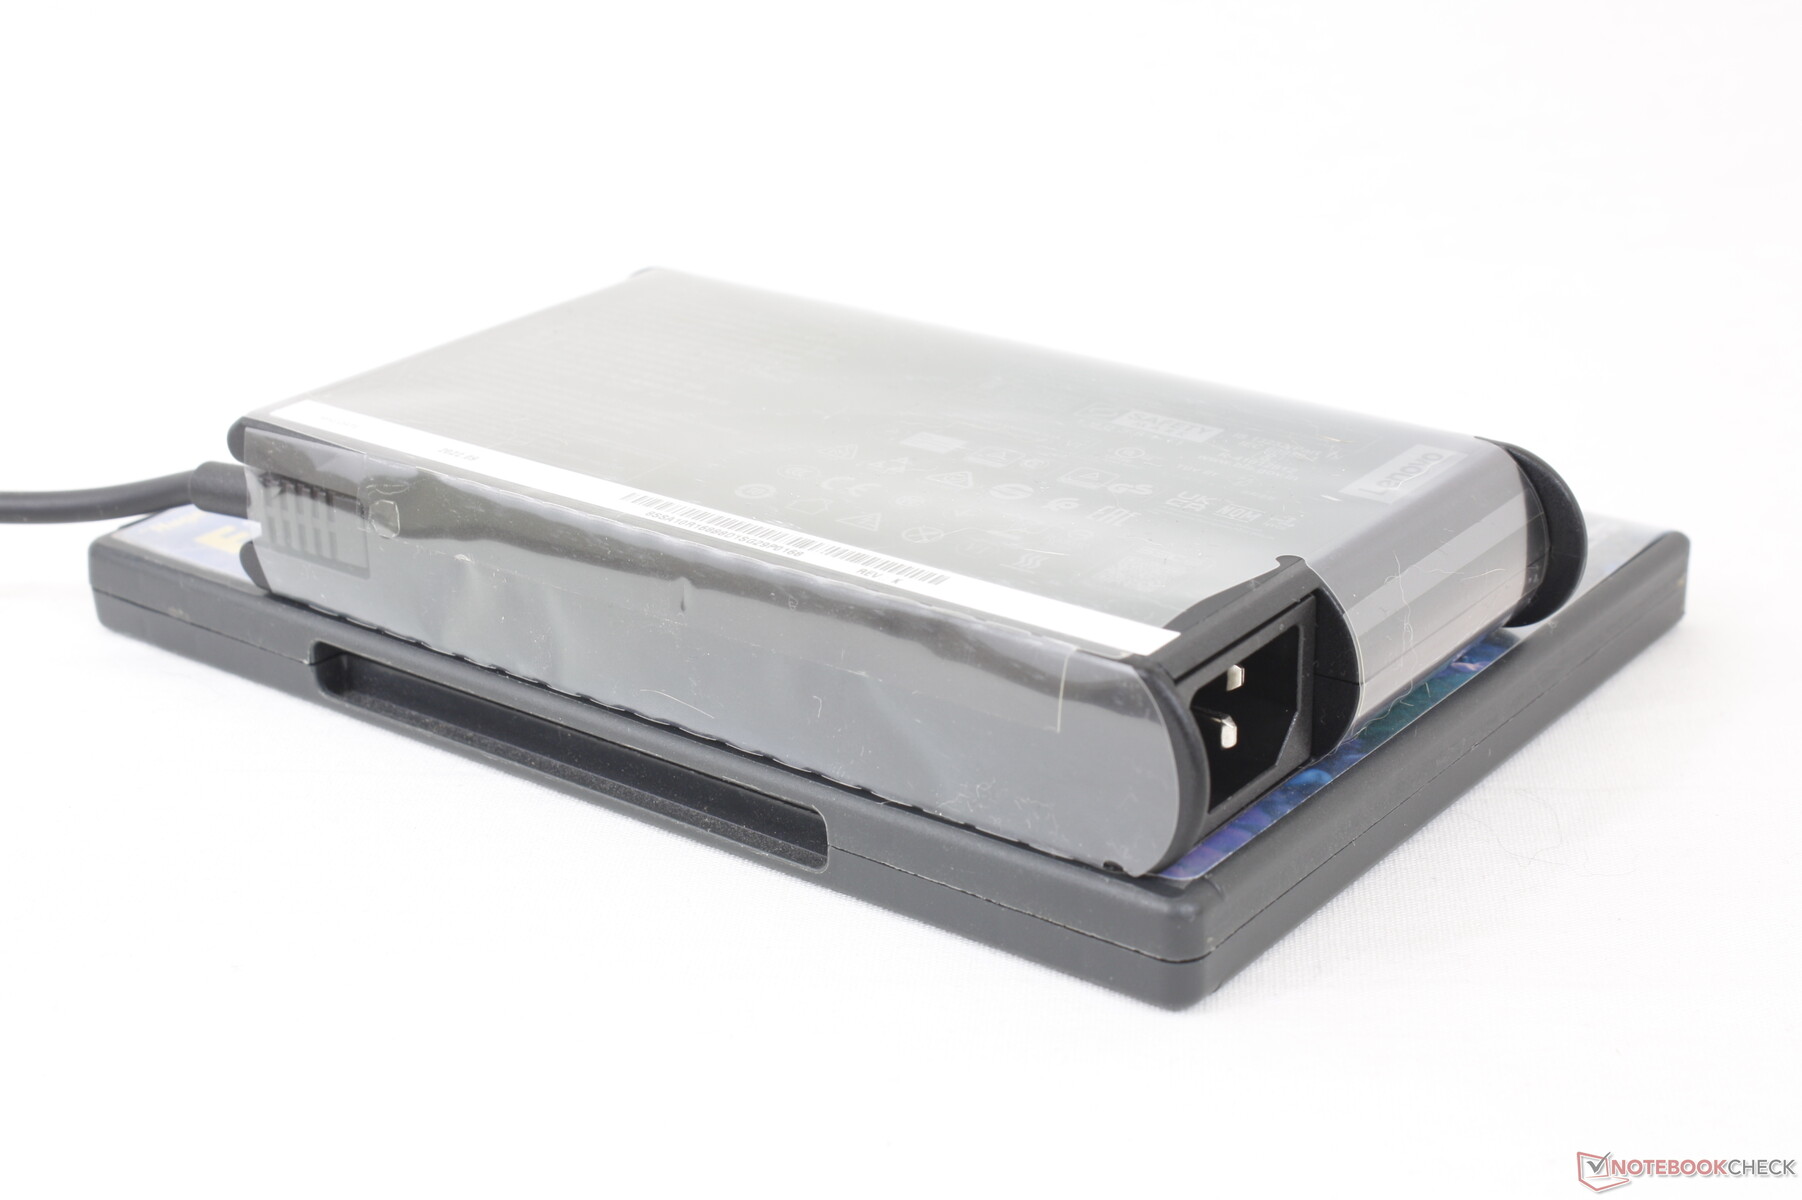
Conseguimos medir um pico de consumo de 213 W com o adaptador CA de 230 W de tamanho médio (~16,9 x 8,8 x 2,6 cm). Um adaptador maior, de 330 W, está incluído no Legion Pro 7 maior, que vem com o Core i9-13900HX e RTX 4080 muito mais potentes.
| desligado | |
| Ocioso | |
| Carga |
|
Key:
min: | |
| Lenovo Legion Slim 7i 16 Gen 8 i9-13900H, GeForce RTX 4070 Laptop GPU, Samsung PM9A1 MZVL21T0HCLR, IPS, 2560x1600, 16" | Acer Predator Helios 16 PH16-71-731Q i7-13700HX, GeForce RTX 4060 Laptop GPU, Micron 3400 1TB MTFDKBA1T0TFH, IPS-LED, 2560x1600, 16" | HP Omen 16-wf000 i7-13700HX, GeForce RTX 4080 Laptop GPU, SK hynix PC801 HFS002TEJ9X101N, IPS, 2560x1440, 16.1" | Lenovo Legion Pro 7 RTX4090 i9-13900HX, GeForce RTX 4090 Laptop GPU, Samsung PM9A1 MZVL21T0HCLR, IPS, 2560x1600, 16" | Alienware x16 R1 i9-13900HK, GeForce RTX 4080 Laptop GPU, SK hynix PC801 HFS001TEJ9X101N, IPS, 2560x1600, 16" | Lenovo Legion Pro 5 16ARX8 R7 7745HX, GeForce RTX 4070 Laptop GPU, Samsung PM9A1 MZVL21T0HCLR, IPS, 2560x1600, 16" | |
|---|---|---|---|---|---|---|
| Power Consumption | 11% | -8% | -20% | -25% | 15% | |
| Idle Minimum * (Watt) | 22 | 15.9 28% | 21.8 1% | 20 9% | 25.2 -15% | 8.1 63% |
| Idle Average * (Watt) | 29 | 20.5 29% | 26 10% | 25 14% | 29.9 -3% | 15.9 45% |
| Idle Maximum * (Watt) | 39.5 | 20.9 47% | 36 9% | 35 11% | 49.8 -26% | 37.2 6% |
| Load Average * (Watt) | 98.7 | 106 -7% | 115.5 -17% | 136 -38% | 105.4 -7% | 90.9 8% |
| Witcher 3 ultra * (Watt) | 171.8 | 175 -2% | 214 -25% | 282 -64% | 263 -53% | 189.6 -10% |
| Load Maximum * (Watt) | 213.2 | 276 -29% | 269.7 -27% | 320 -50% | 313.8 -47% | 263.5 -24% |
* ... menor é melhor
Power Consumption Witcher 3 / Stresstest
Power Consumption external Monitor
Duração da bateria
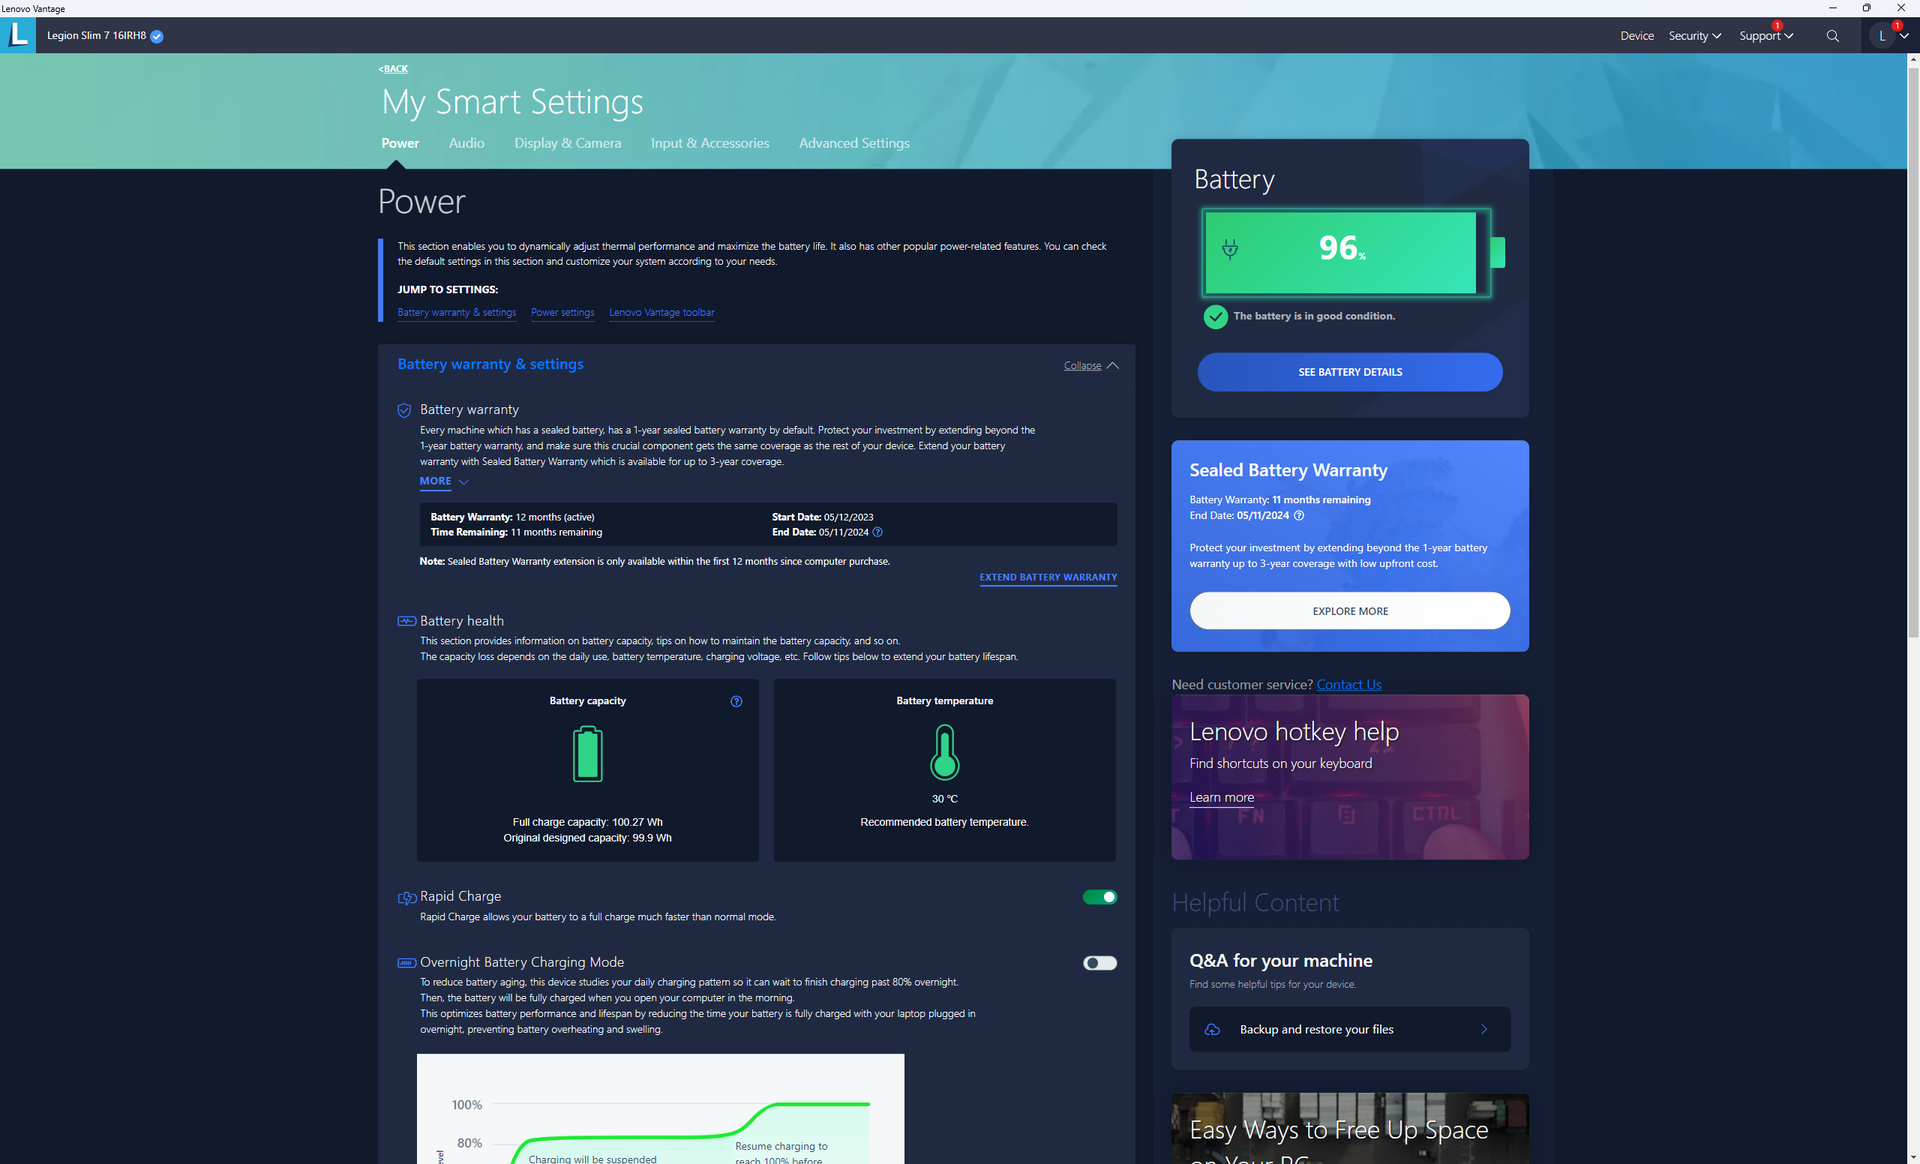
Surpreendentemente, a capacidade da bateria é tão grande quanto a do Legion Pro 7 17, apesar do perfil mais fino do nosso design Slim 7i. No entanto, a duração da bateria ainda é média, na melhor das hipóteses, com pouco menos de 4,5 horas de uso em navegação no mundo real. A maioria dos outros notebooks para jogos com CPUs Intel de 13ª geração teria tempos de execução semelhantes ou mais curtos, incluindo o Omen 16 ou o Alienware x16 R1.
O carregamento de vazio para cheio leva apenas 70 minutos com o Rapid Charge ativado, em comparação com 90 minutos ou mais na maioria dos outros laptops para jogos. O sistema também pode ser recarregado via USB-C com até 140 W.
| Lenovo Legion Slim 7i 16 Gen 8 i9-13900H, GeForce RTX 4070 Laptop GPU, 99.9 Wh | HP Omen 16-wf000 i7-13700HX, GeForce RTX 4080 Laptop GPU, 83 Wh | Alienware x16 R1 i9-13900HK, GeForce RTX 4080 Laptop GPU, 90 Wh | Lenovo Legion Pro 7 RTX4090 i9-13900HX, GeForce RTX 4090 Laptop GPU, 99.9 Wh | Asus ROG Strix G16 G614JZ i9-13980HX, GeForce RTX 4080 Laptop GPU, 90 Wh | Razer Blade 16 Early 2023 i9-13950HX, GeForce RTX 4080 Laptop GPU, 95.2 Wh | |
|---|---|---|---|---|---|---|
| Duração da bateria | 15% | -7% | 16% | 71% | 57% | |
| Reader / Idle (h) | 5.1 | 5.5 8% | 7.3 43% | 8.9 75% | ||
| WiFi v1.3 (h) | 4.4 | 5.1 16% | 2.5 -43% | 5.1 16% | 9.7 120% | 6.1 39% |
| Load (h) | 0.9 | 1.1 22% | 0.7 -22% | 1.1 22% | 1.4 56% |
Pro
Contra
Veredicto - convincente em quase todos os aspectos
O Legion Slim 7i 16 Gen 8 é um dos laptops para jogos mais equilibrados da família Legion. Além de ser mais fino e mais leve do que a maioria na categoria de tamanho de 16 polegadas, ele também não economiza nas opções de portas, no espaçoso teclado RGB por tecla, nas opções de tela respeitáveis para jogadores e criadores de conteúdo e até mesmo na capacidade da bateria e no leitor de SD. O modelo preenche uma série de requisitos, considerando seu perfil fino.
O Lenovo Legion Slim 7i 16 G8 sacrifica algumas opções de desempenho em função do tamanho mais fino e do peso mais leve, mas o modelo é tão equilibrado em termos de desempenho e portabilidade que a maioria dos jogadores provavelmente não se importaria com isso.
Algumas rachaduras começam a aparecer quando você se aprofunda na máquina. A configuração de RAM soldada e expansível, por exemplo, é incomum em laptops para jogos, enquanto o SSD tende a ser acelerado quando sob estresse. As opções de CPU e GPU não incluem o Core i9-13900HX e a RTX 4080 de ponta, respectivamente, que só estão disponíveis no Legion Pro 7 16, mais espesso e mais pesado. Os entusiastas que quiserem tudo e a cozinha terão, portanto, que se contentar com alternativas maiores e mais pesadas, como o Legion Pro 7alienware m16 ou o Razer Blade 16 que oferecem opções de processadores mais rápidos.
Preço e disponibilidade
A Lenovo agora está enviando seu Legion Slim 7i 16 Gen 8 a partir de US$ 1.500 para a configuração básica Core i7-13700H e RTX 4060 até US$ 1.800 com nossa configuração Core i9-13900H e RTX 4070. A configuração mais avançada também está disponível na Best Buy.
Lenovo Legion Slim 7i 16 Gen 8
- 07/03/2023 v7 (old)
Allen Ngo
Transparência
A seleção dos dispositivos a serem analisados é feita pela nossa equipe editorial. A amostra de teste foi fornecida ao autor como empréstimo pelo fabricante ou varejista para fins desta revisão. O credor não teve influência nesta revisão, nem o fabricante recebeu uma cópia desta revisão antes da publicação. Não houve obrigação de publicar esta revisão. Como empresa de mídia independente, a Notebookcheck não está sujeita à autoridade de fabricantes, varejistas ou editores.
É assim que o Notebookcheck está testando
Todos os anos, o Notebookcheck analisa de forma independente centenas de laptops e smartphones usando procedimentos padronizados para garantir que todos os resultados sejam comparáveis. Desenvolvemos continuamente nossos métodos de teste há cerca de 20 anos e definimos padrões da indústria no processo. Em nossos laboratórios de teste, equipamentos de medição de alta qualidade são utilizados por técnicos e editores experientes. Esses testes envolvem um processo de validação em vários estágios. Nosso complexo sistema de classificação é baseado em centenas de medições e benchmarks bem fundamentados, o que mantém a objetividade.Price comparison

