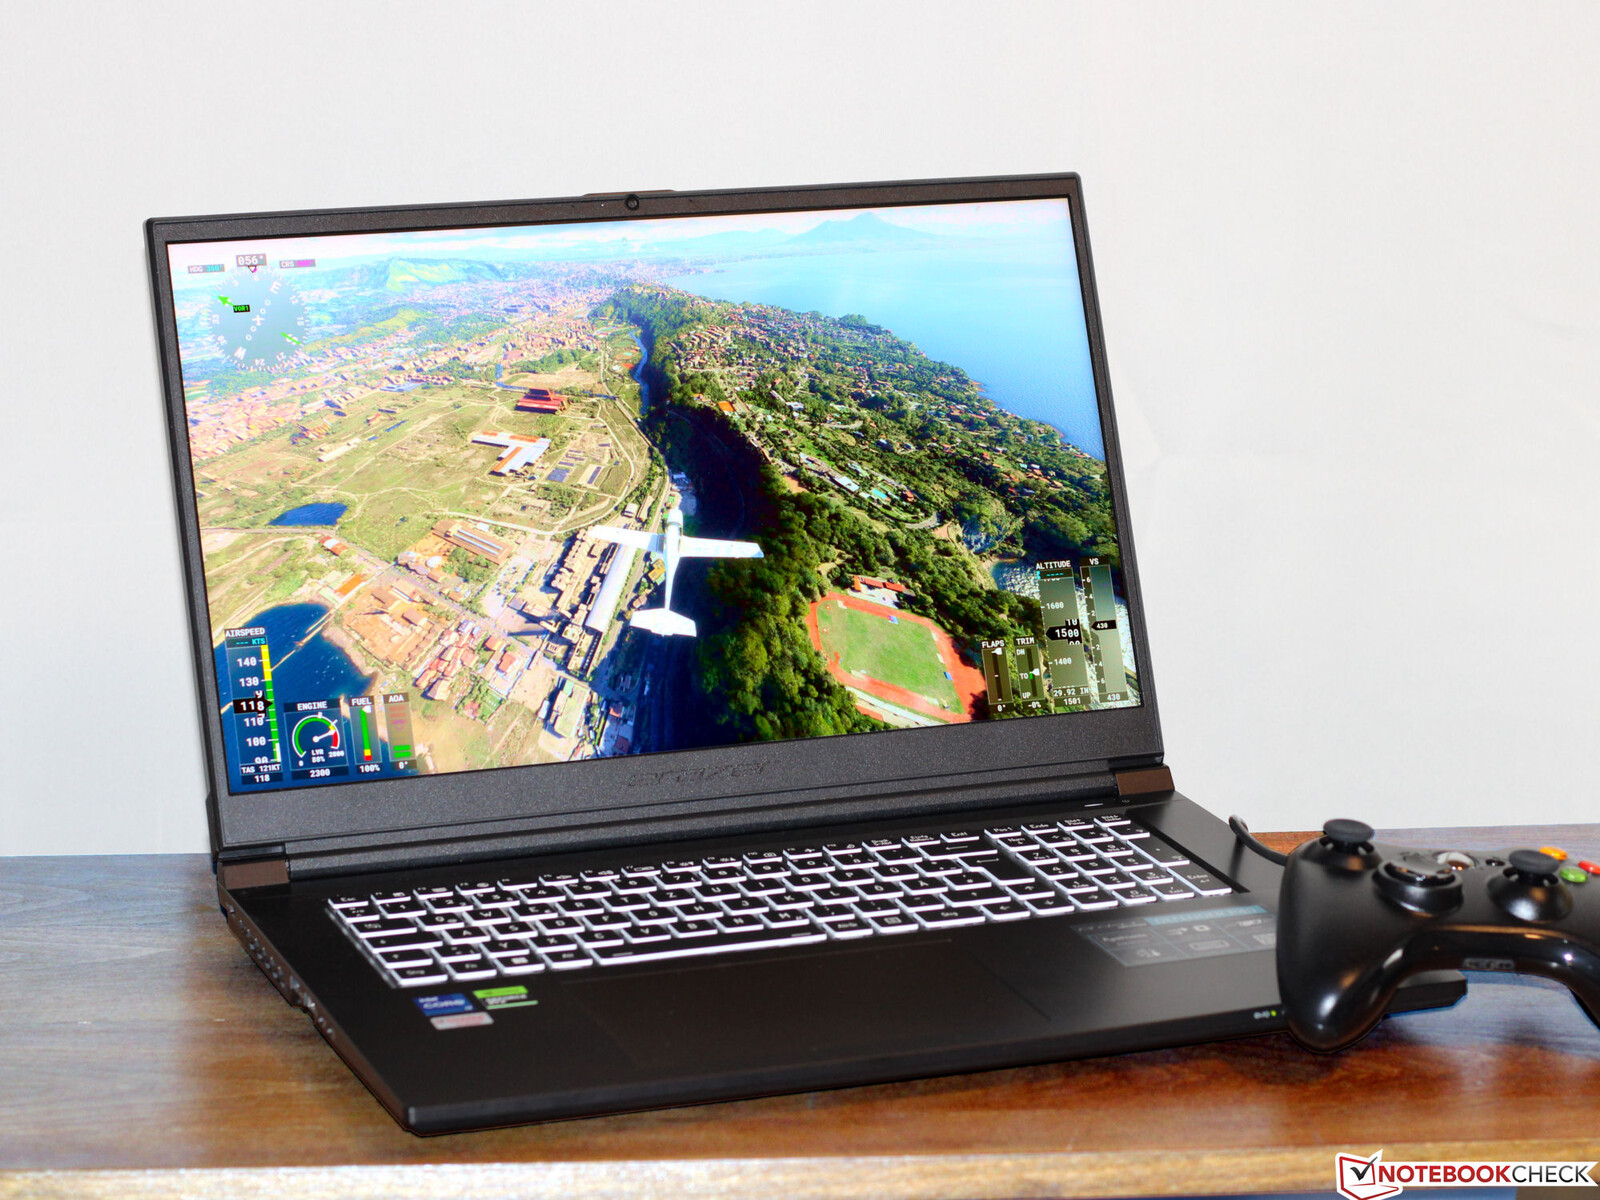
Análise do Medion Erazer Defender P40: O laptop para jogos QHD acessível com uma RTX 4060
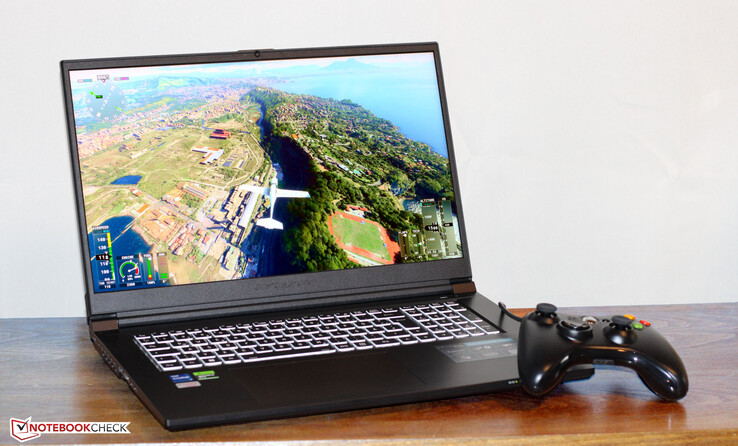
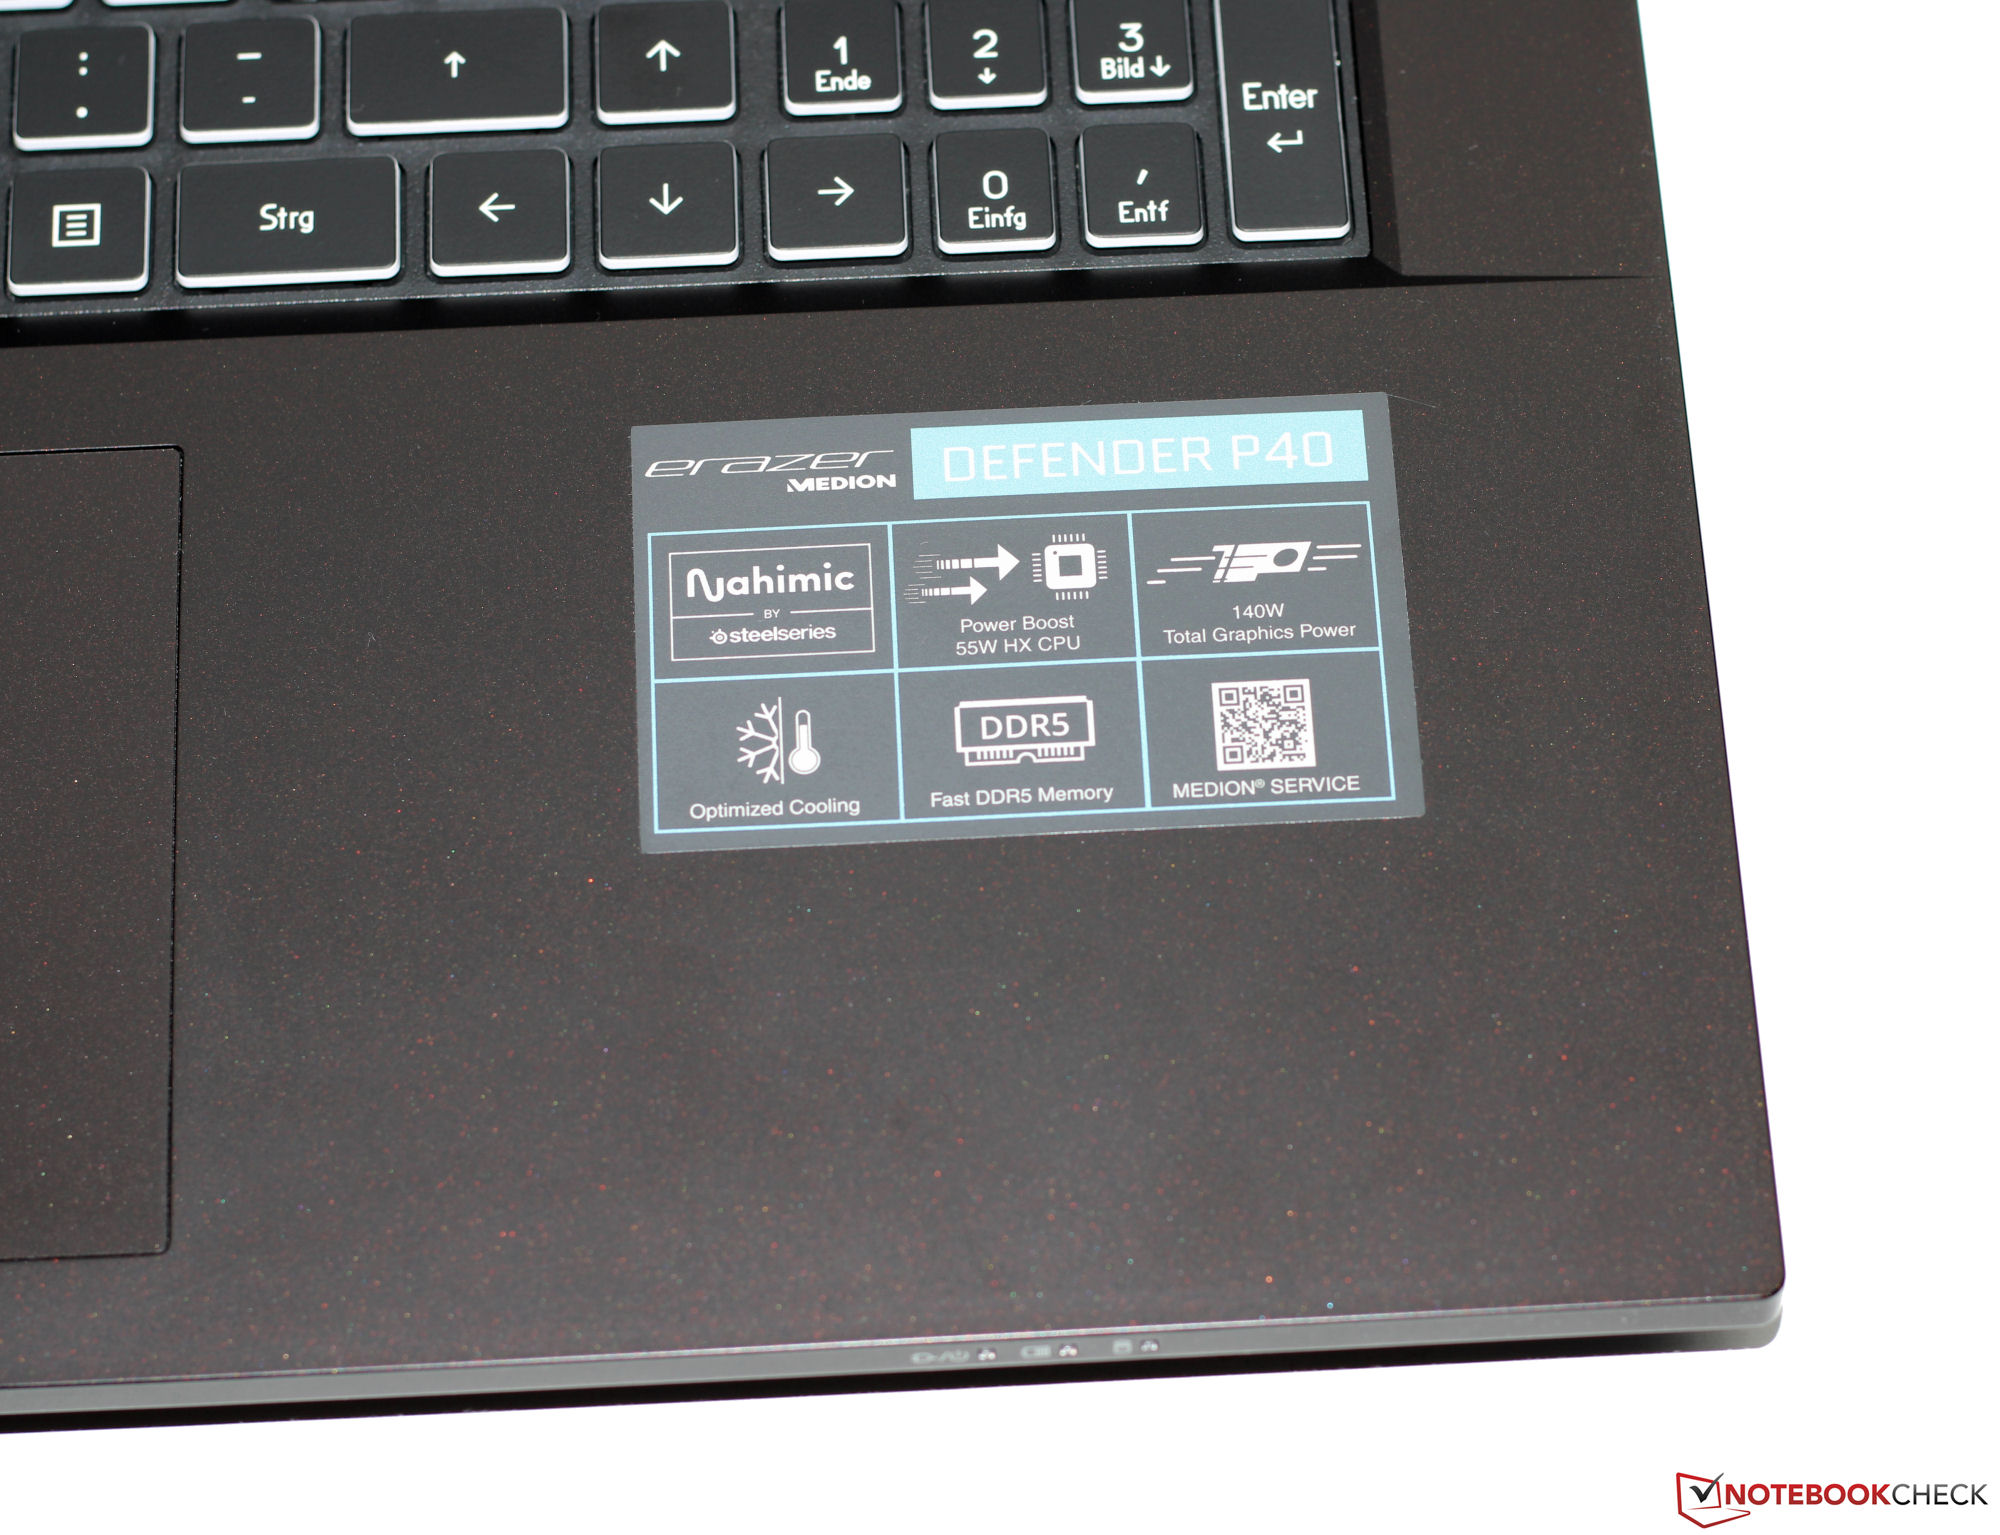
A Medion apresentou o Erazer Defender P40, um laptop para jogos QHD de médio porte equipado com um Core-i7-13700HXe um processadorGeForce-RTX-4060gPU para laptop. Ele é baseado em um barebone (NP70SND) fabricado pela empresa Clevo e está disponível por cerca de US$ 1.900. Os concorrentes incluem dispositivos como oMSI Katana 17,Acer Predator Helios 300, Lenovo Legion Pro 5 16IRX8, Asus TUF Gaming A16 FA617e o Gigabyte G7 KE.
Possíveis concorrentes em comparação
Avaliação | Data | Modelo | Peso | Altura | Size | Resolução | Preço |
|---|---|---|---|---|---|---|---|
| 84.6 % v7 (old) | 05/2023 | Medion Erazer Defender P40 i7-13700HX, GeForce RTX 4060 Laptop GPU | 2.9 kg | 33 mm | 17.30" | 2560x1440 | |
| 82.1 % v7 (old) | 02/2023 | MSI Katana 17 B13VFK i7-13620H, GeForce RTX 4060 Laptop GPU | 2.8 kg | 25.2 mm | 17.30" | 1920x1080 | |
| 86.5 % v7 (old) | 11/2022 | Acer Predator Helios 300 (i7-12700H, RTX 3070 Ti) i7-12700H, GeForce RTX 3070 Ti Laptop GPU | 3 kg | 27.65 mm | 17.30" | 2560x1440 | |
| 87.9 % v7 (old) | 05/2023 | Lenovo Legion Pro 5 16IRX8 i7-13700HX, GeForce RTX 4060 Laptop GPU | 2.5 kg | 26.8 mm | 16.00" | 2560x1600 | |
| 86.2 % v7 (old) | 02/2023 | Asus TUF Gaming A16 FA617 R7 7735HS, Radeon RX 7600S | 2.2 kg | 27 mm | 16.00" | 1920x1200 | |
| 83.3 % v7 (old) | 01/2023 | Gigabyte G7 KE i5-12500H, GeForce RTX 3060 Laptop GPU | 2.6 kg | 25 mm | 17.30" | 1920x1080 |
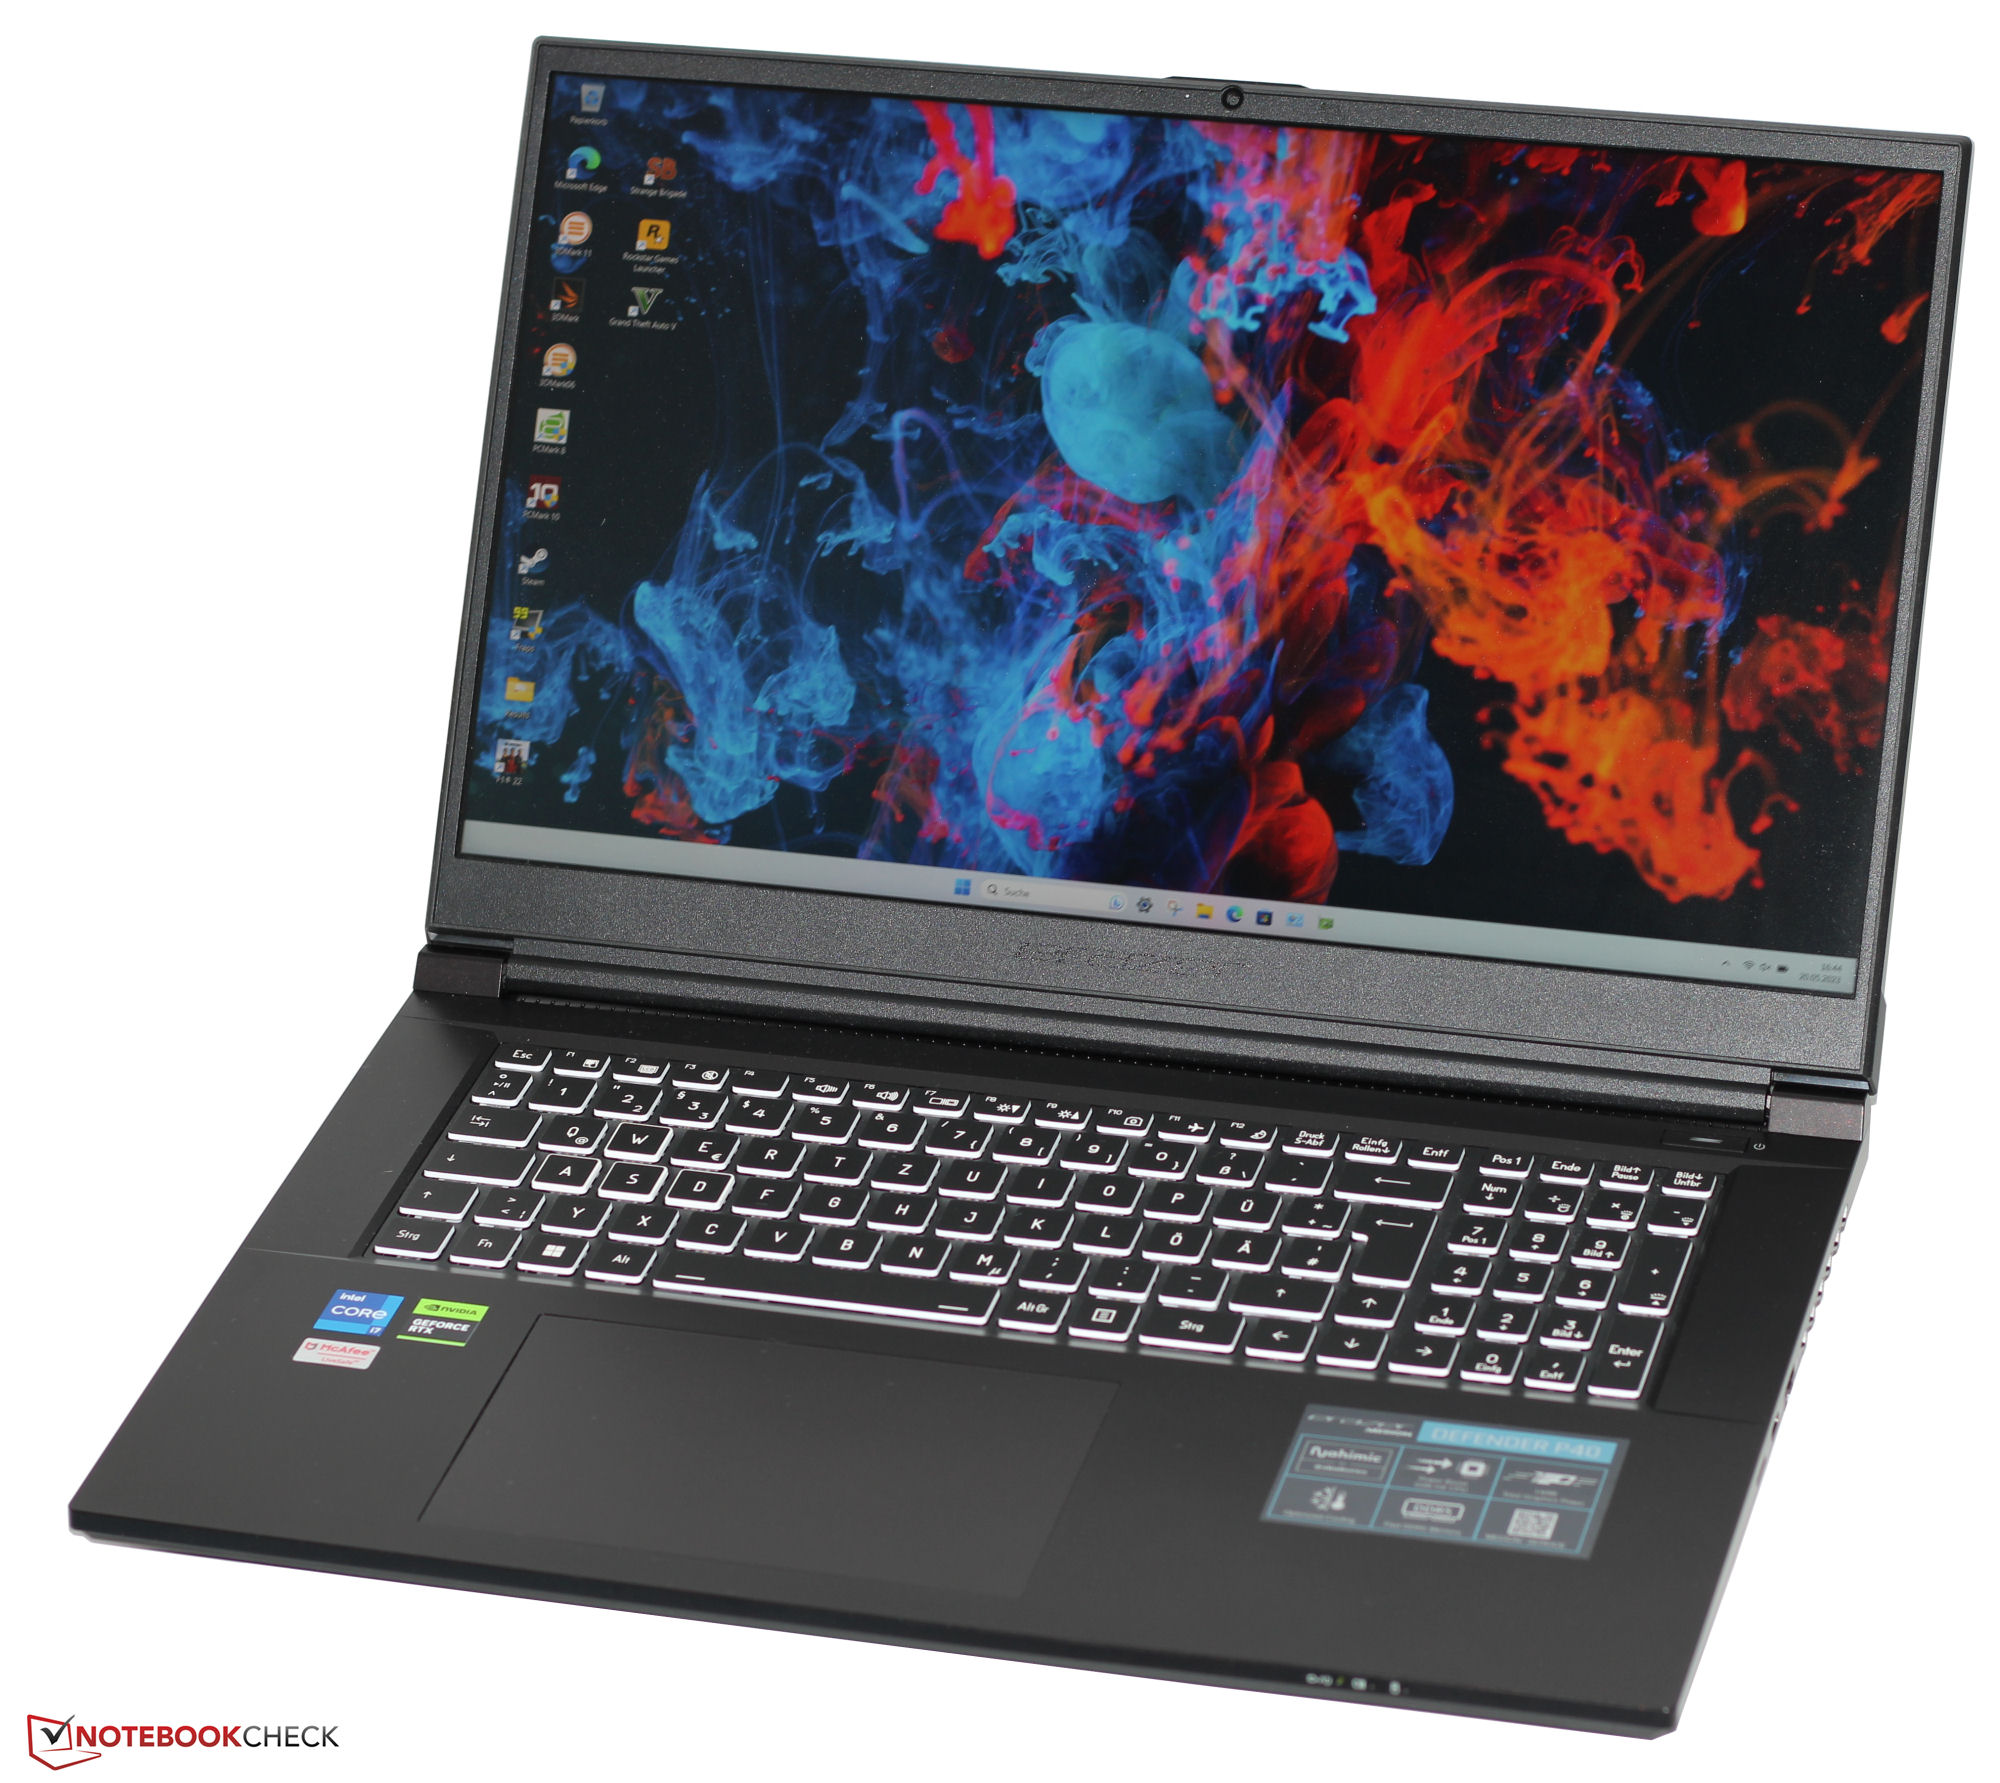
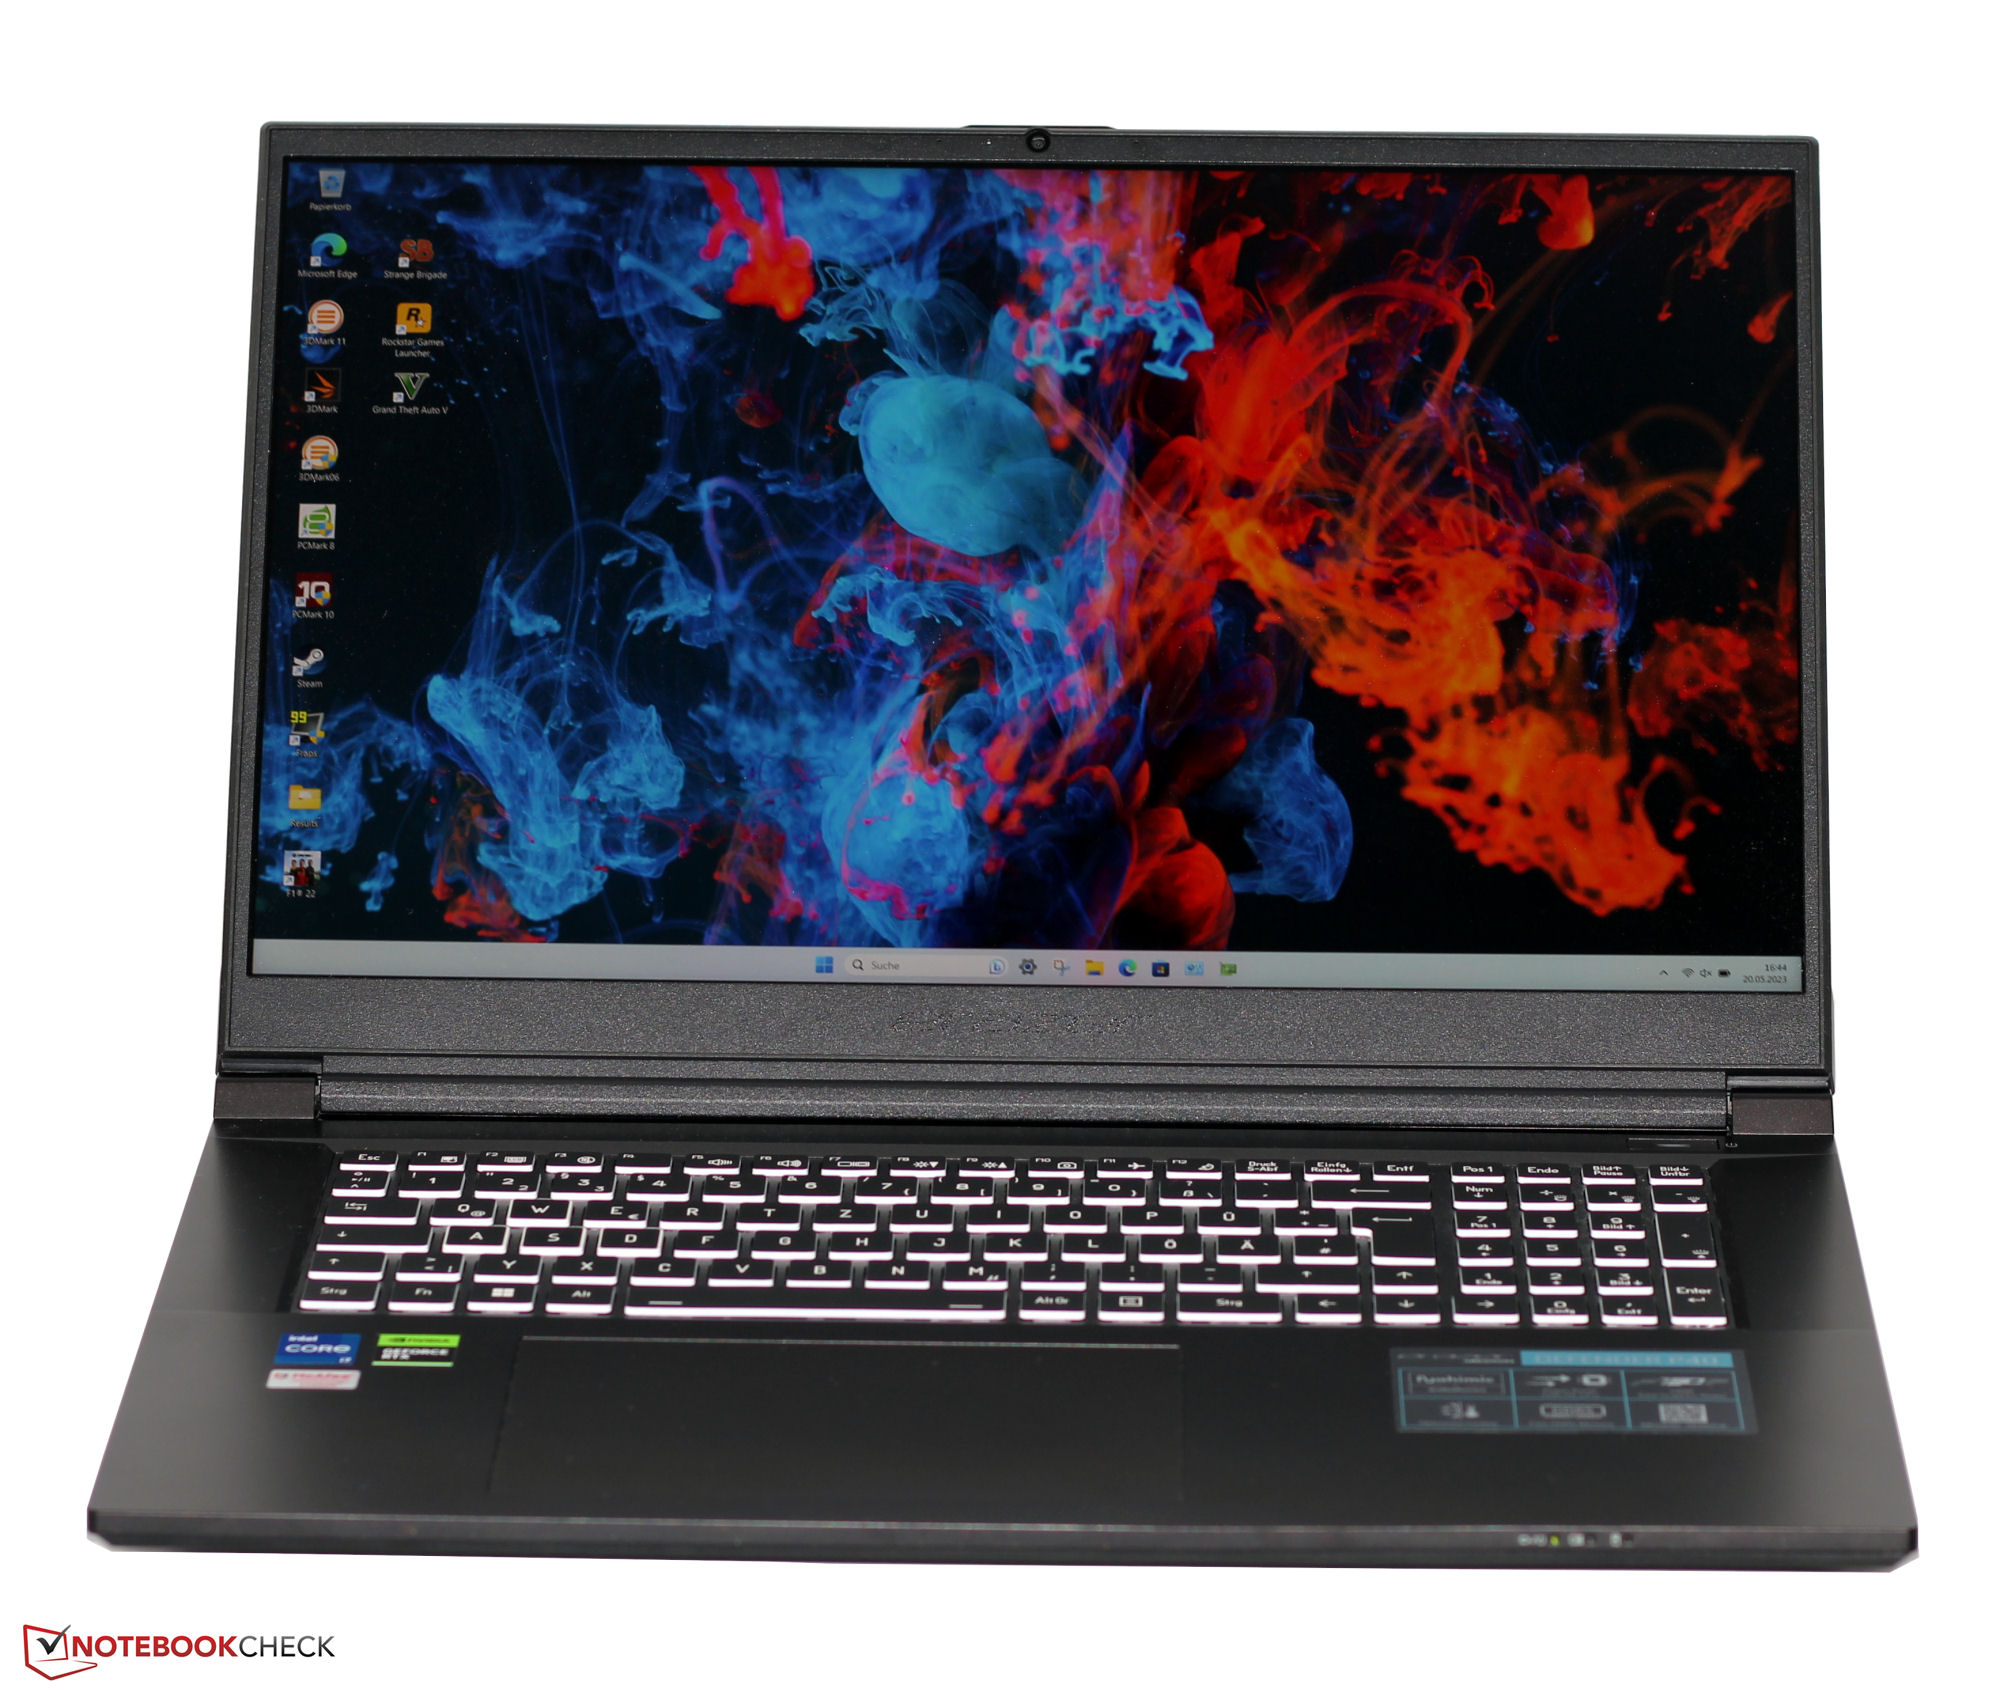
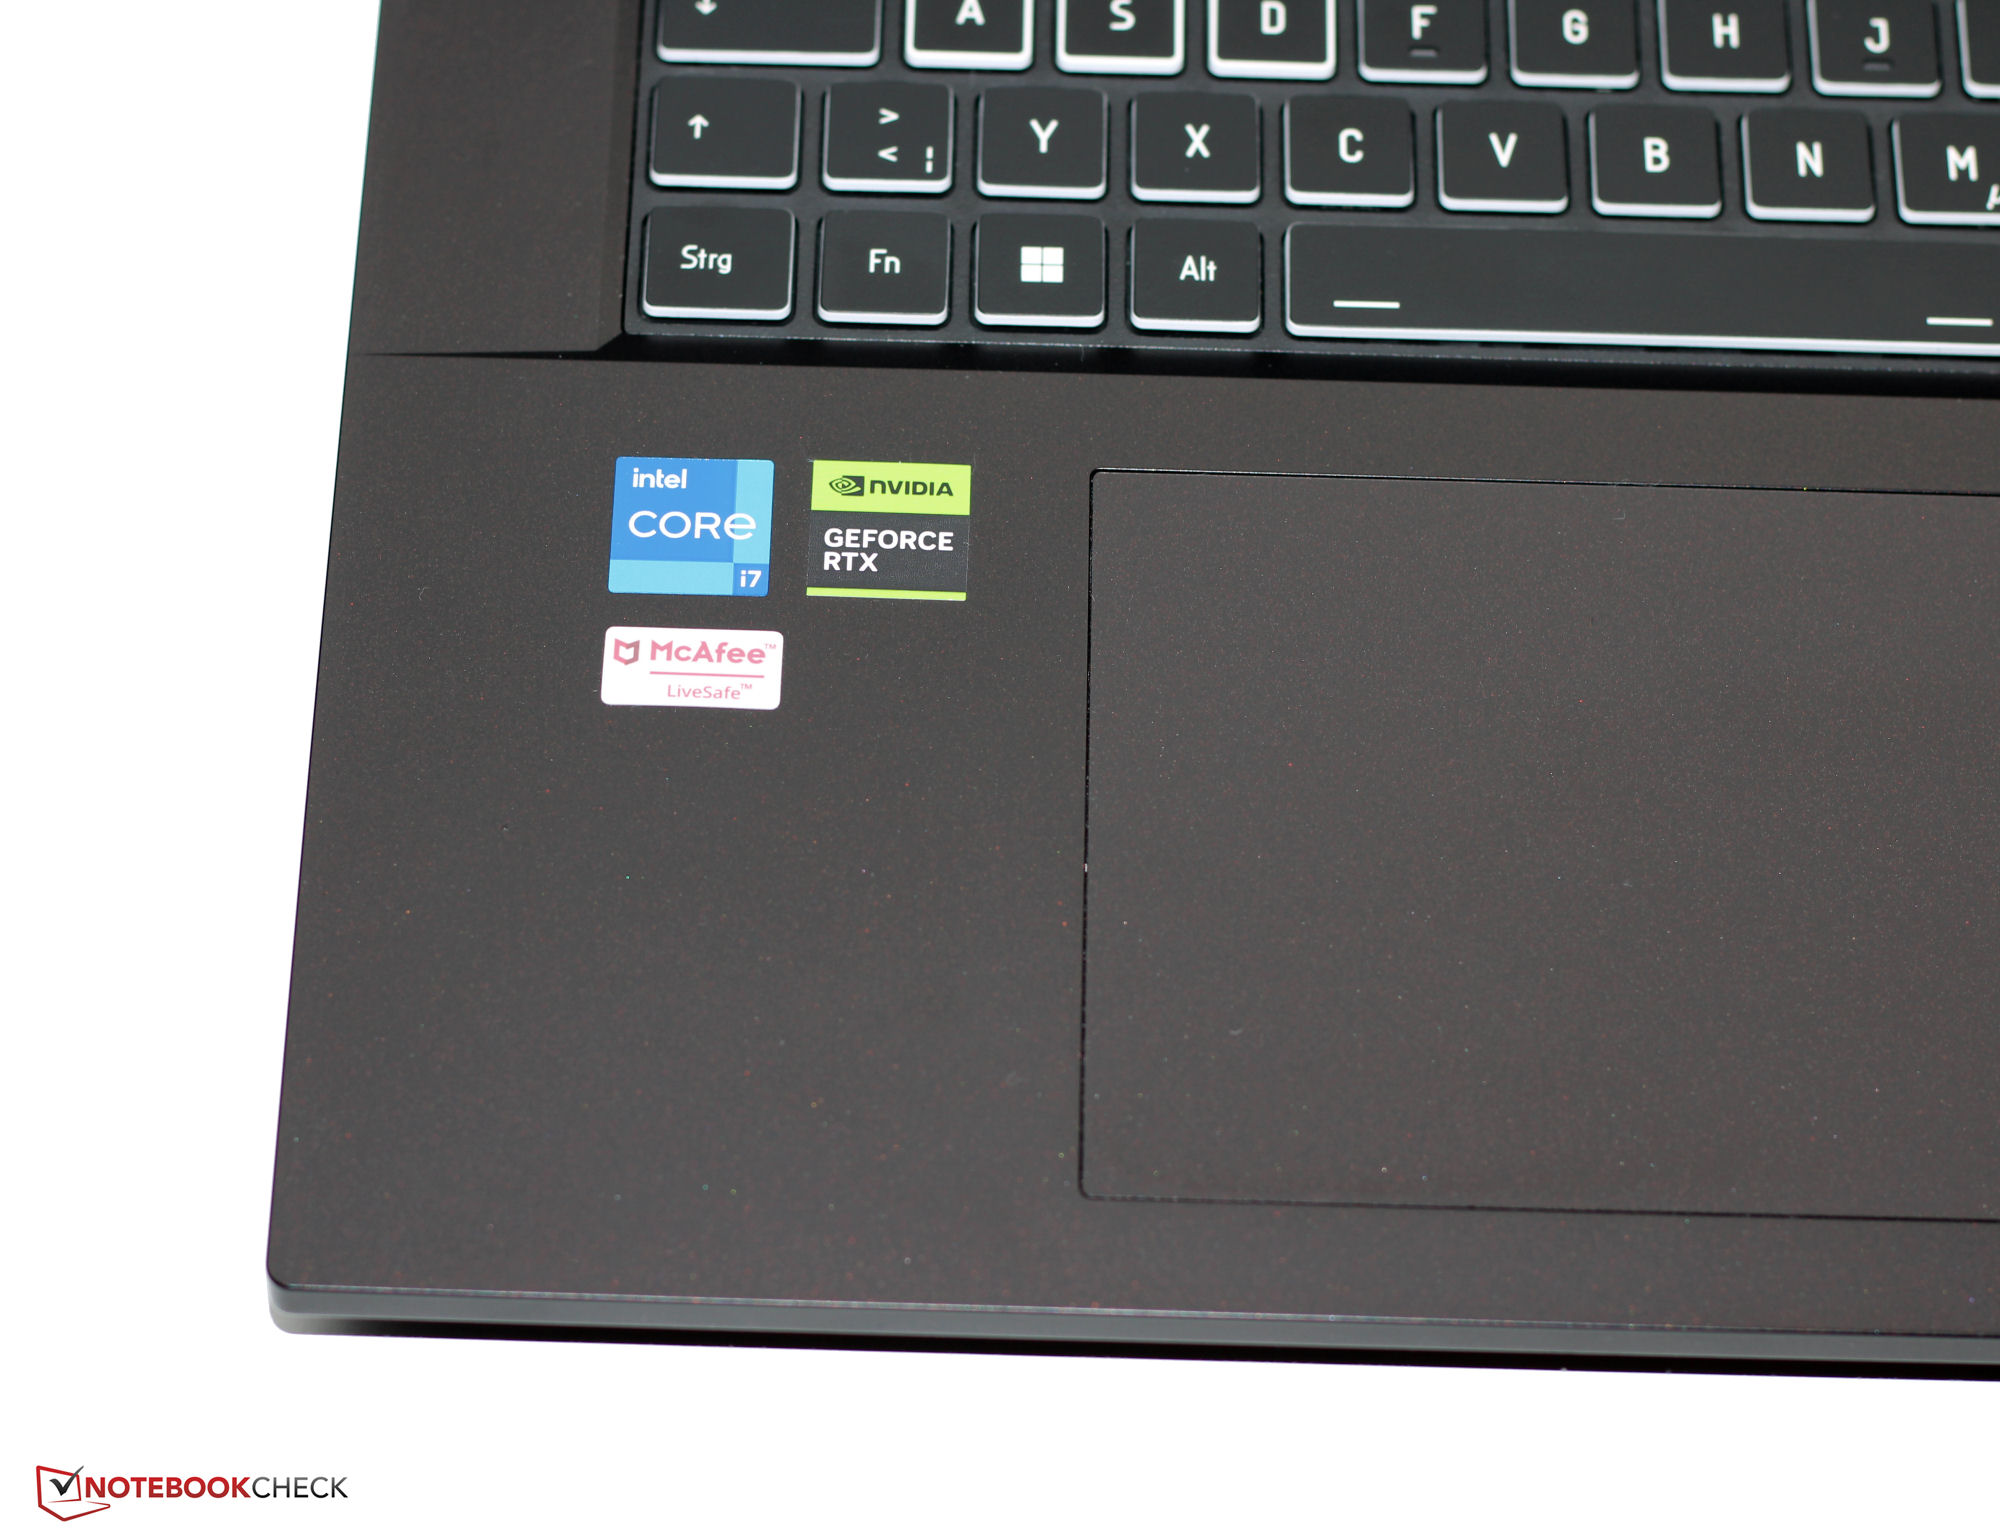
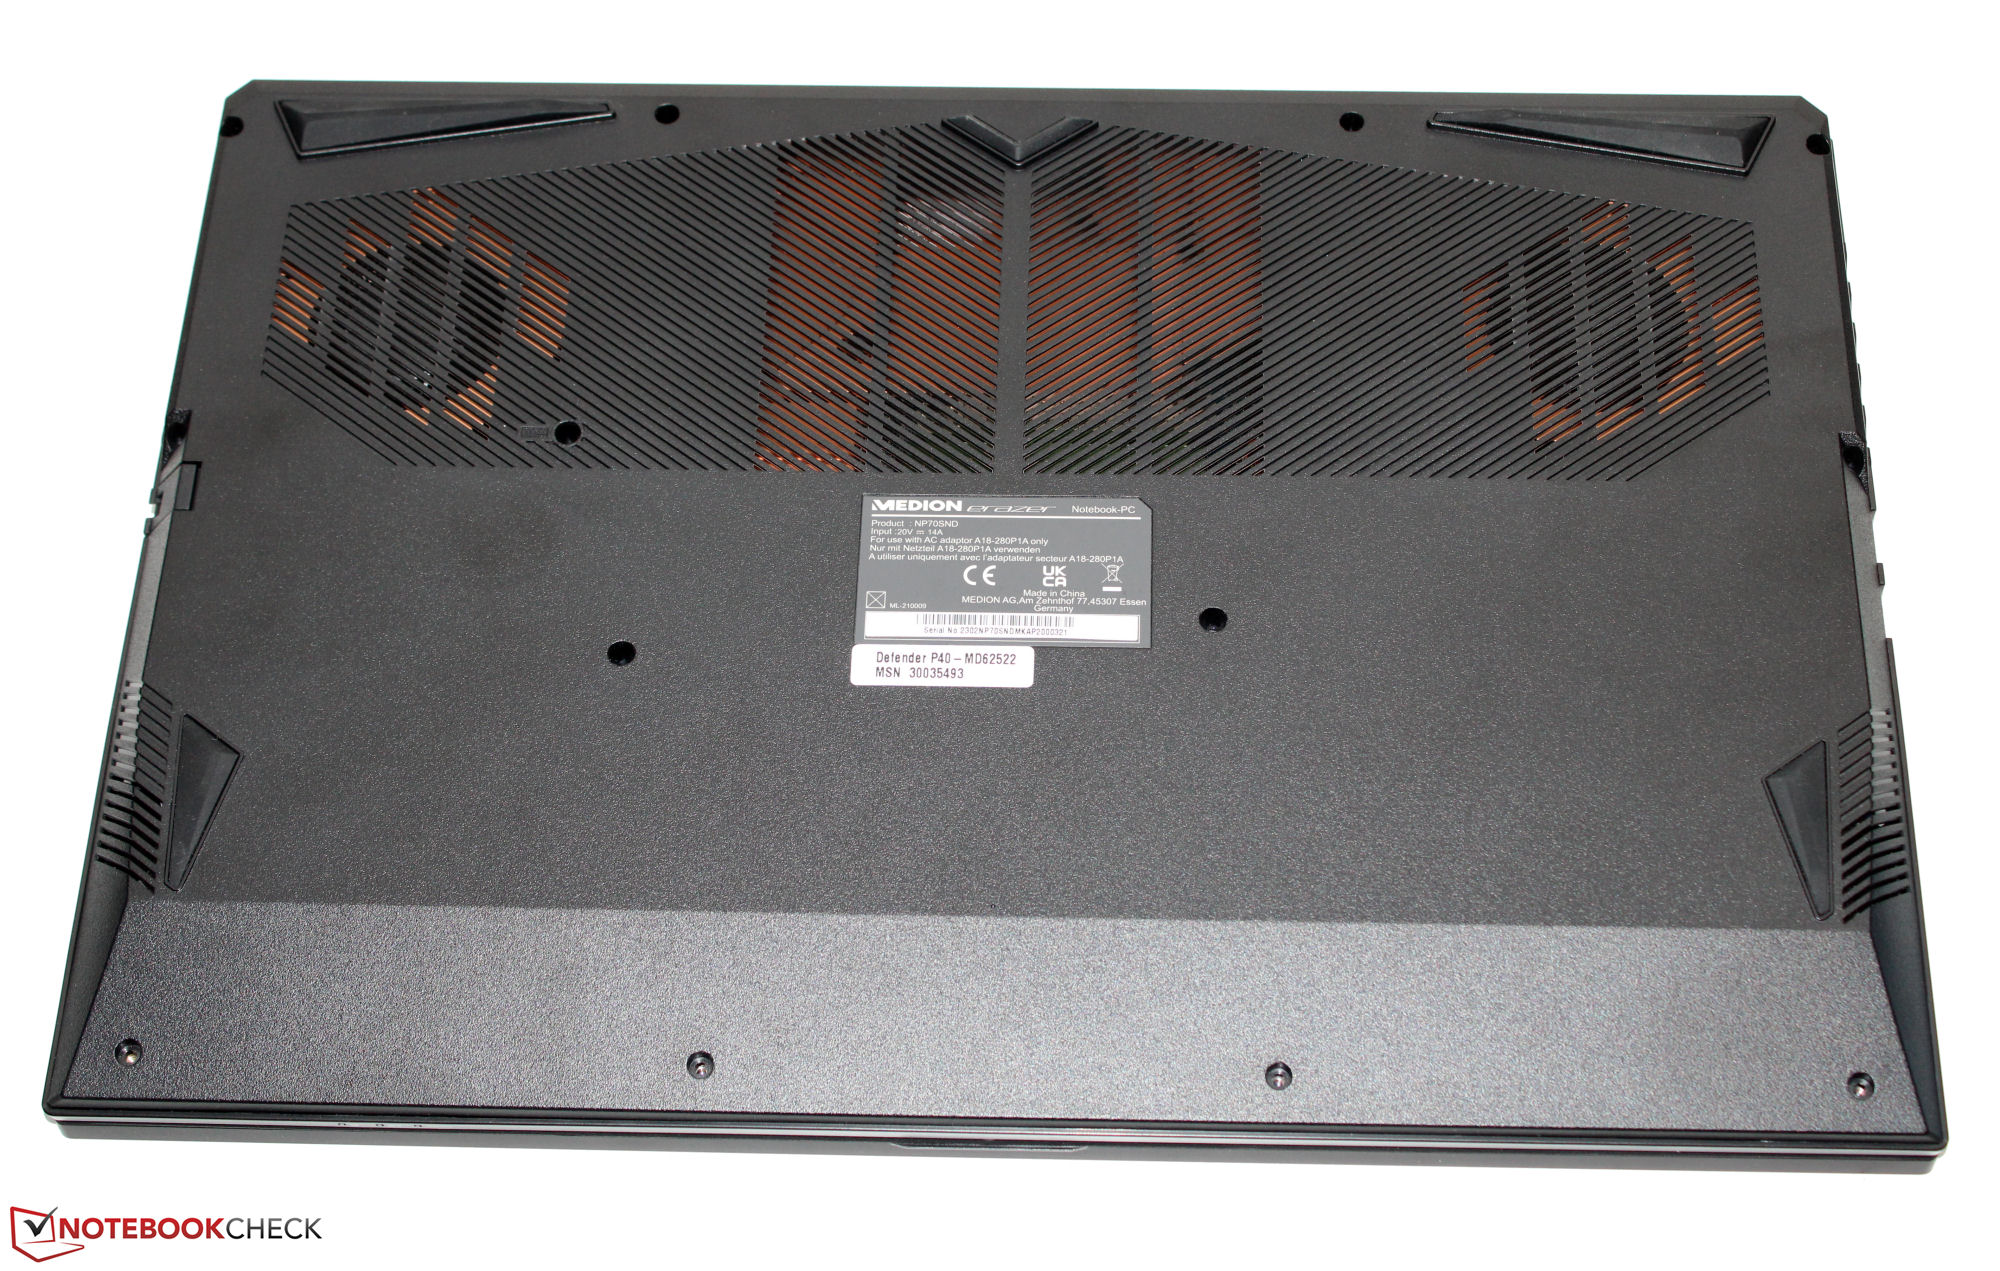
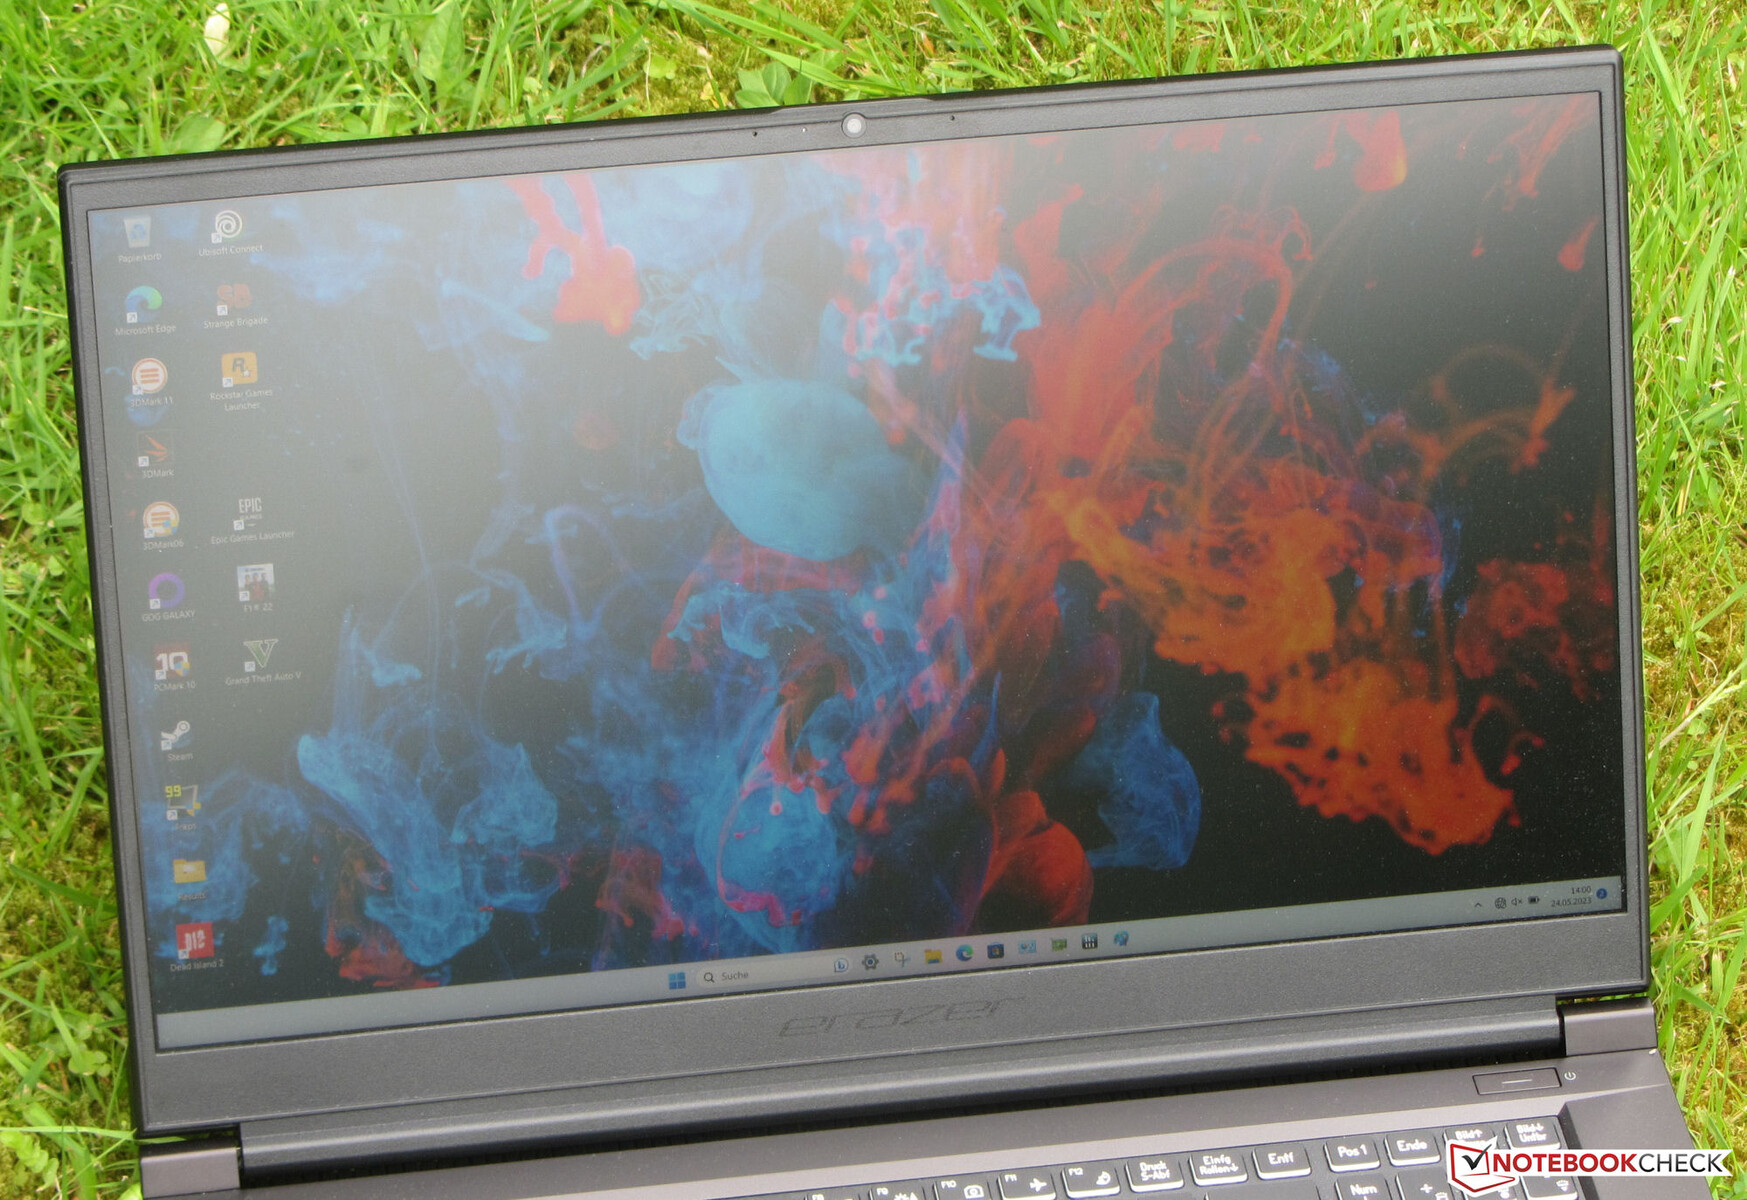
Estojo - O P40 tem um estojo de plástico
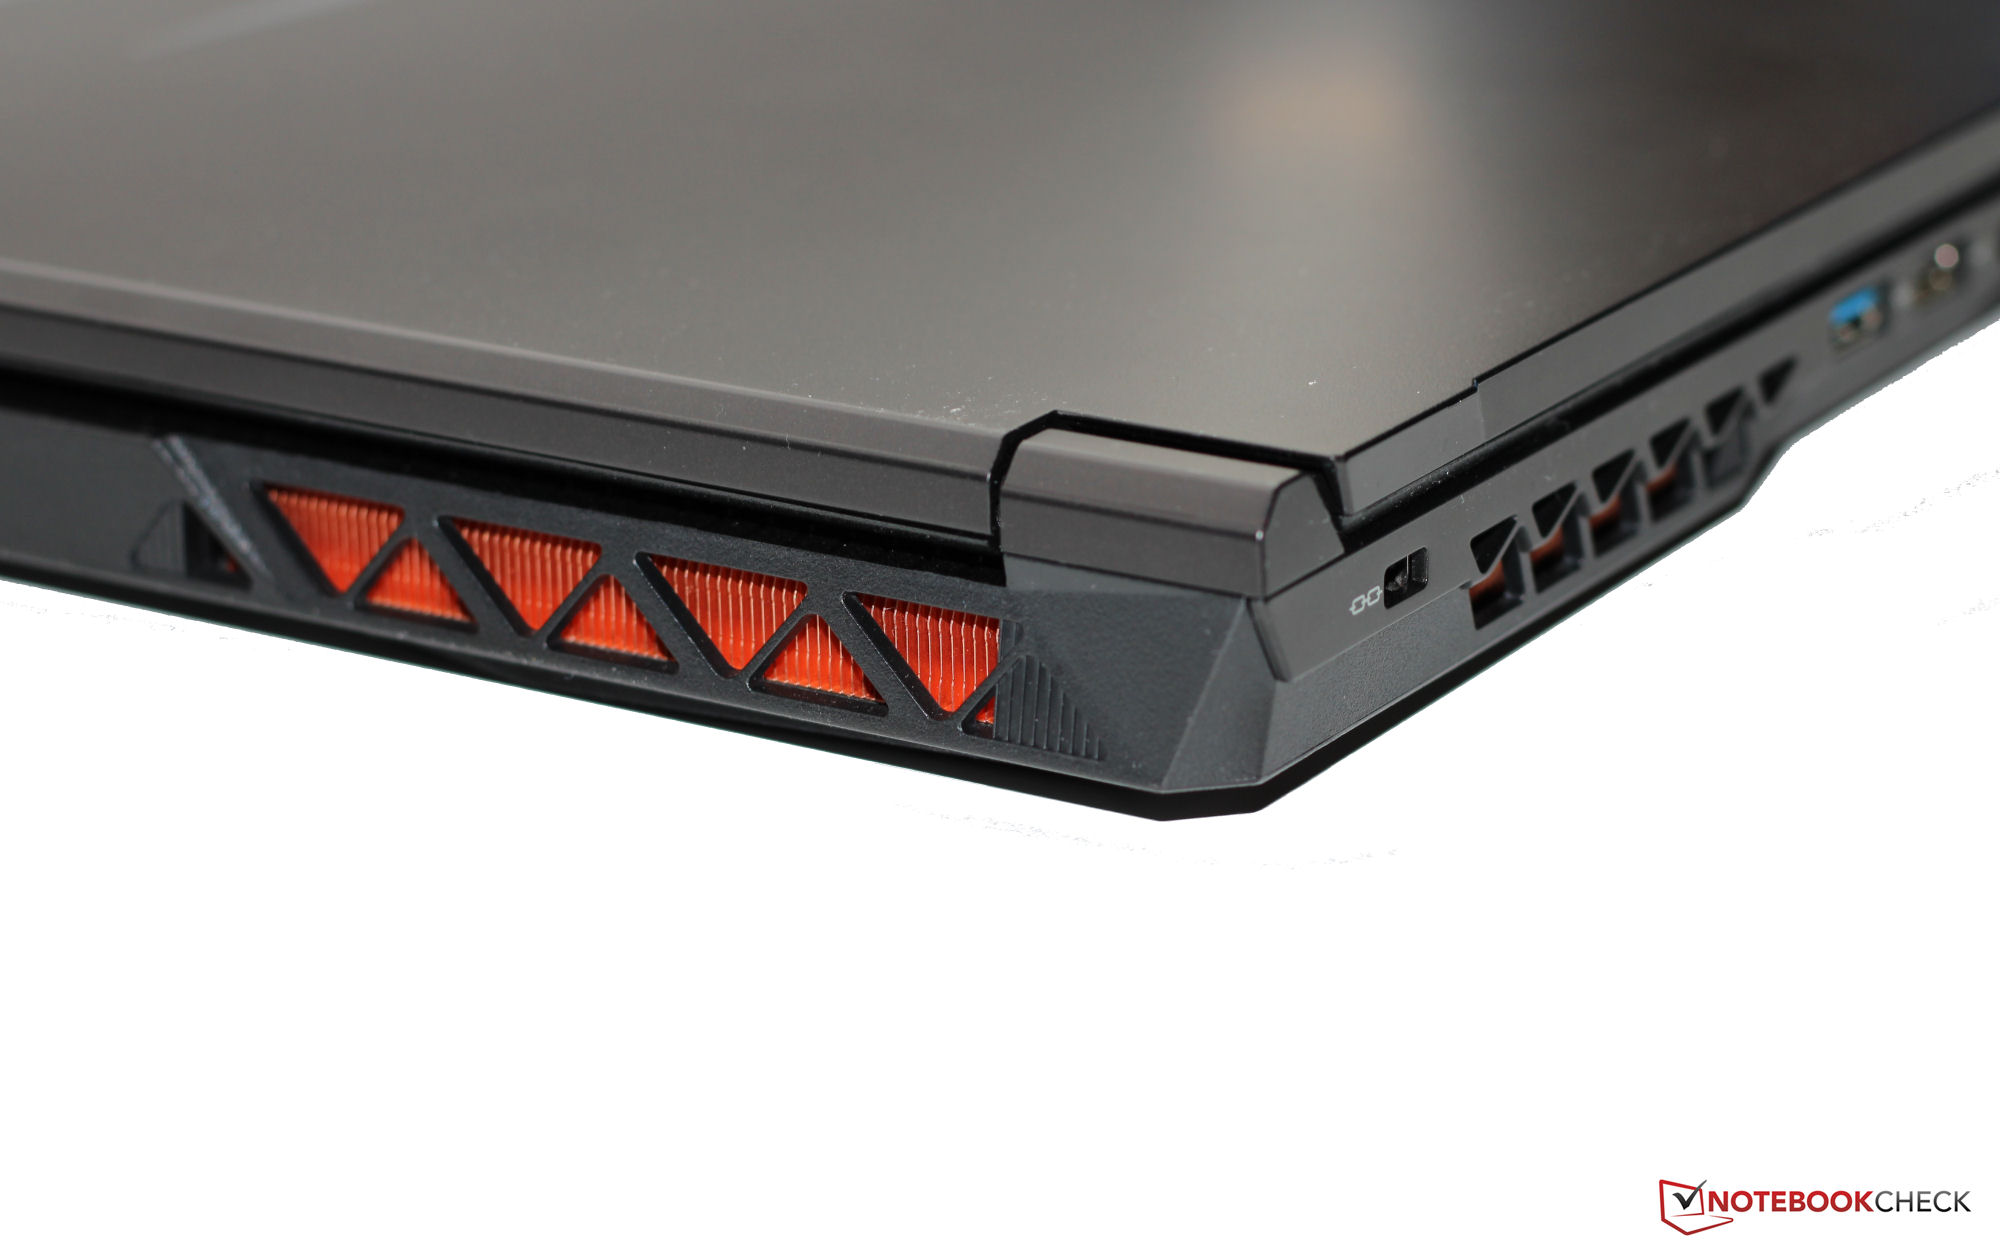
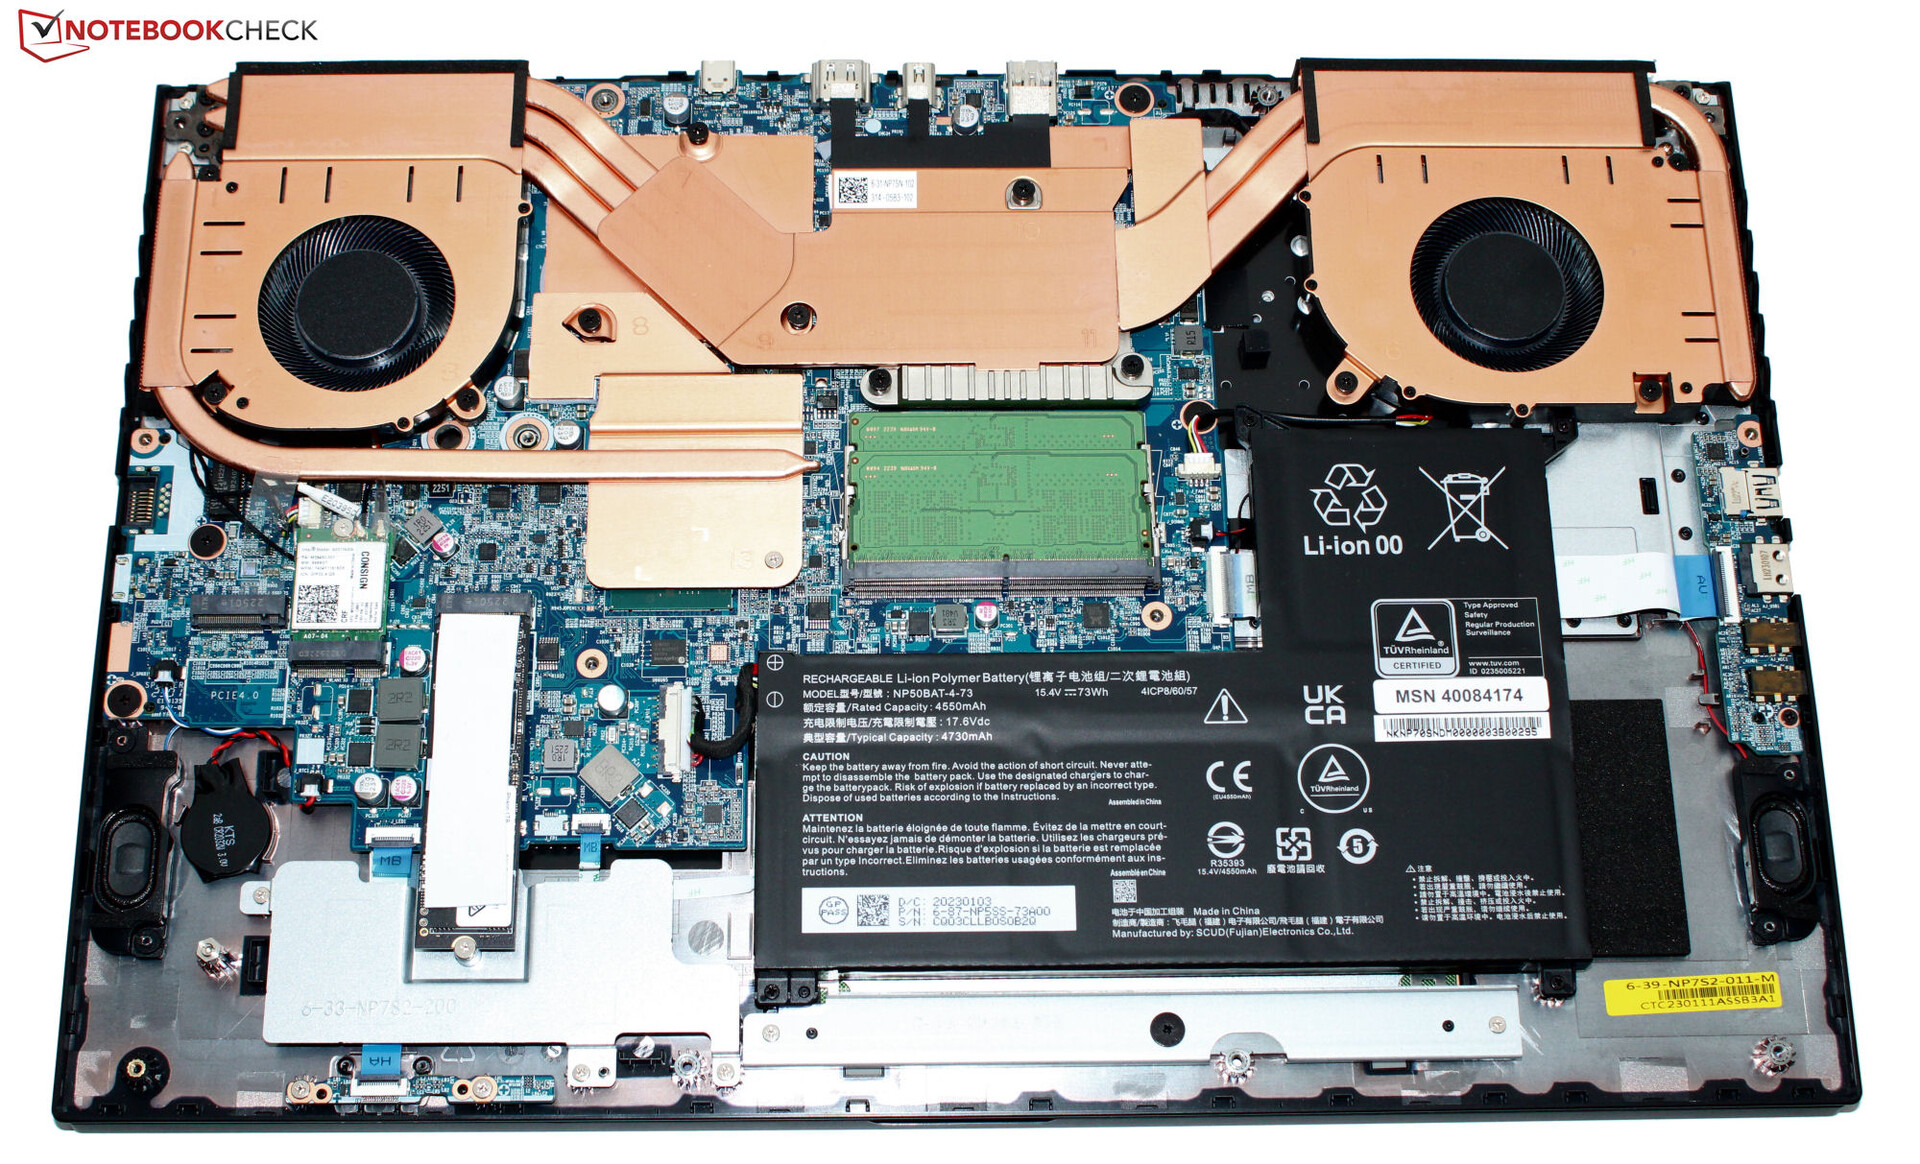
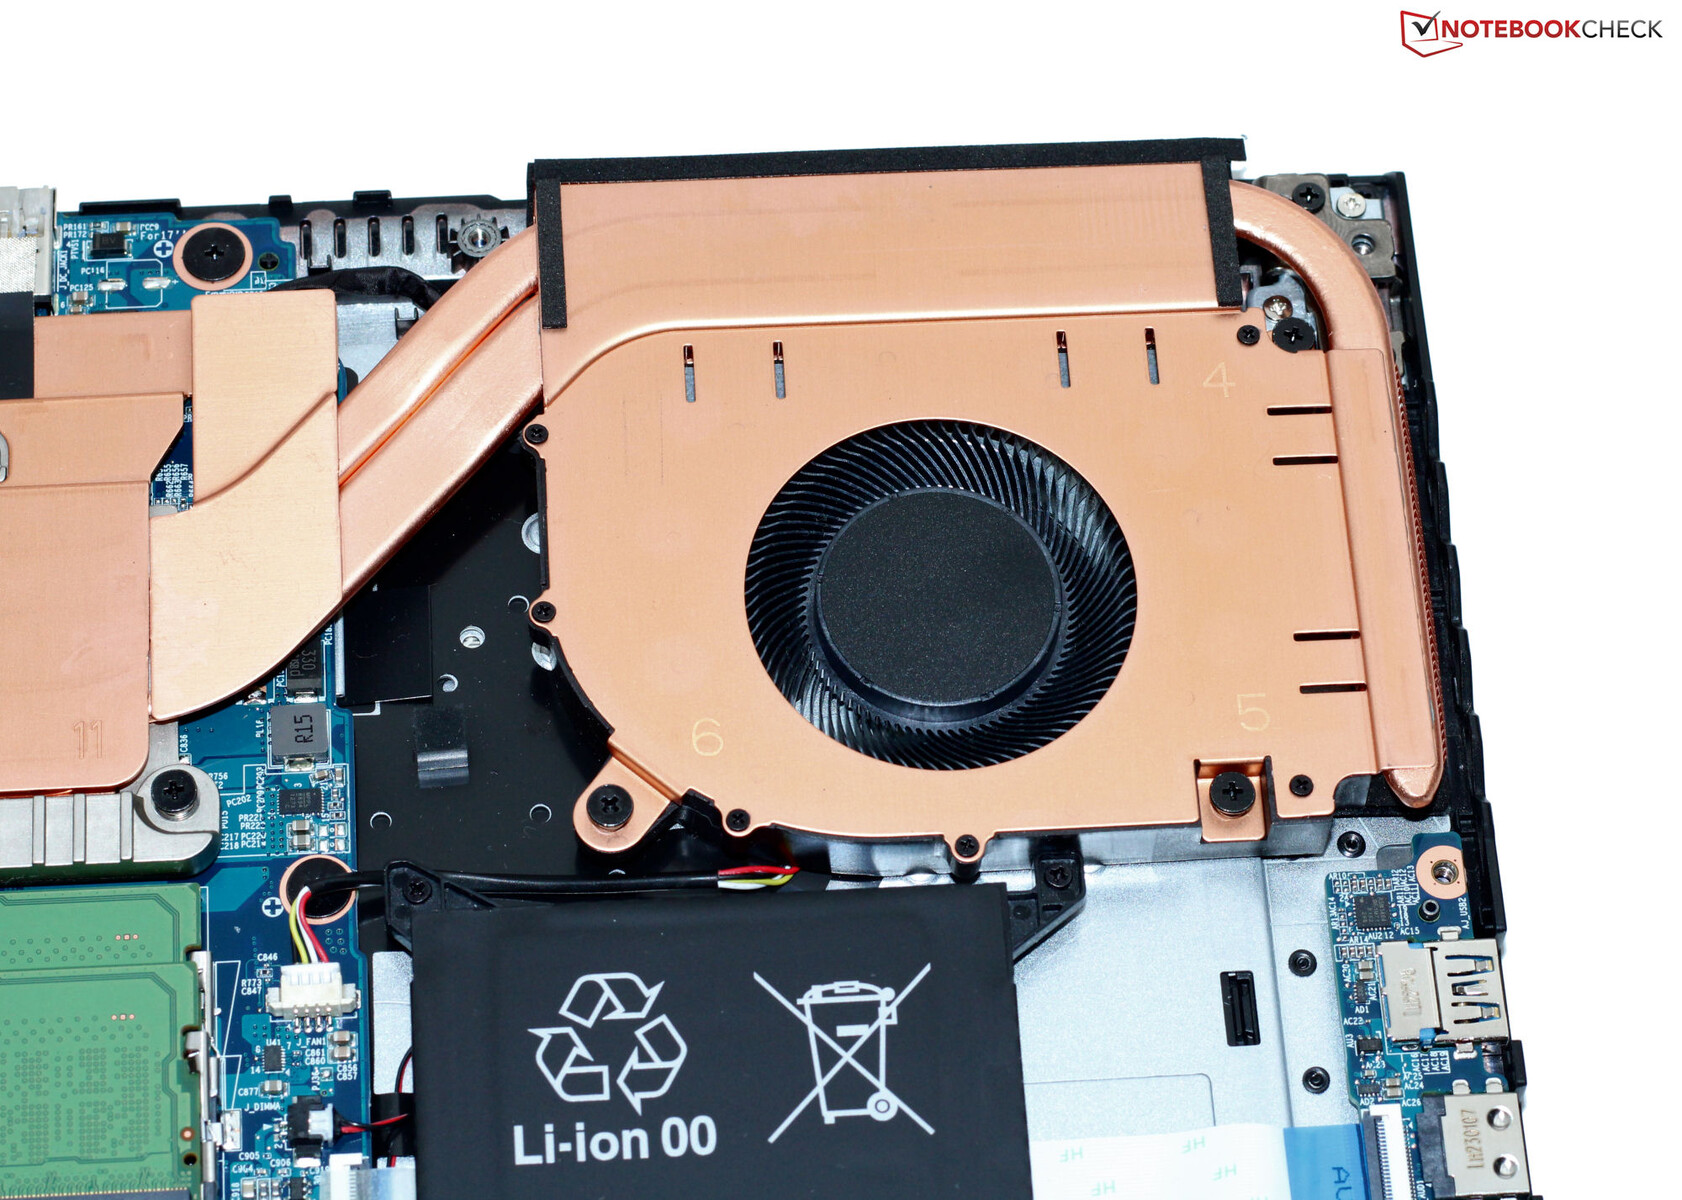
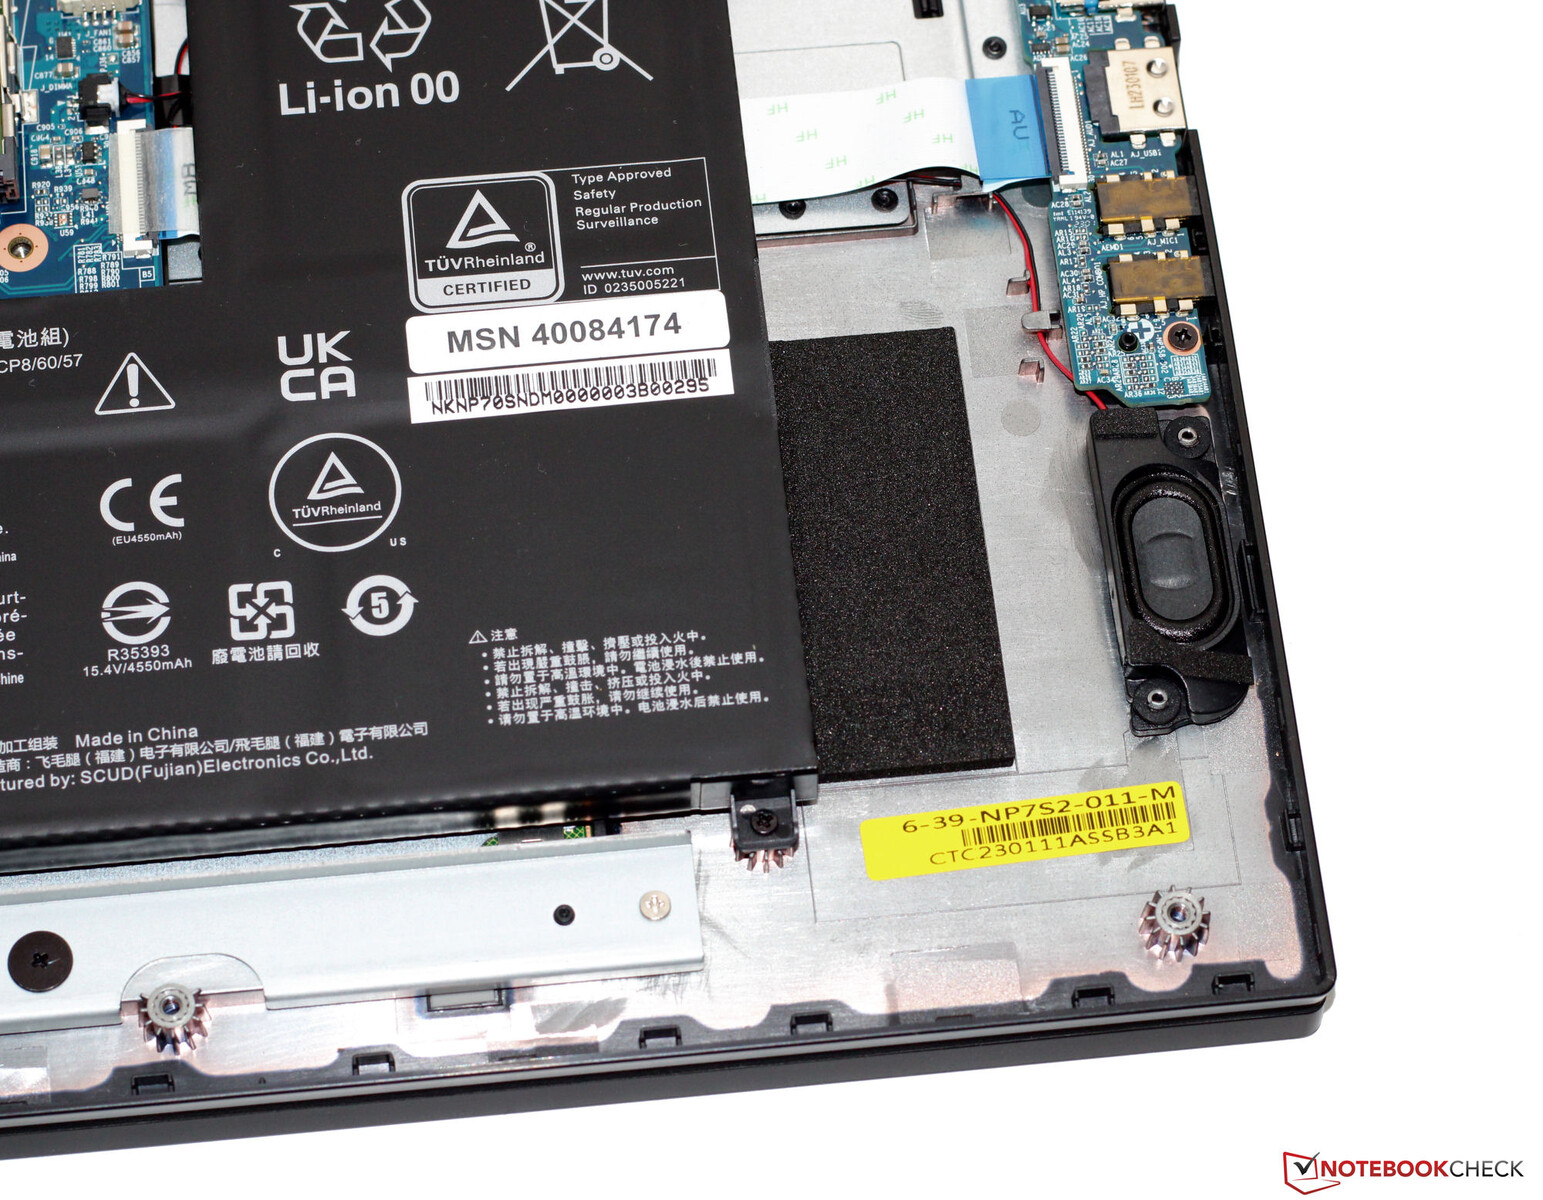
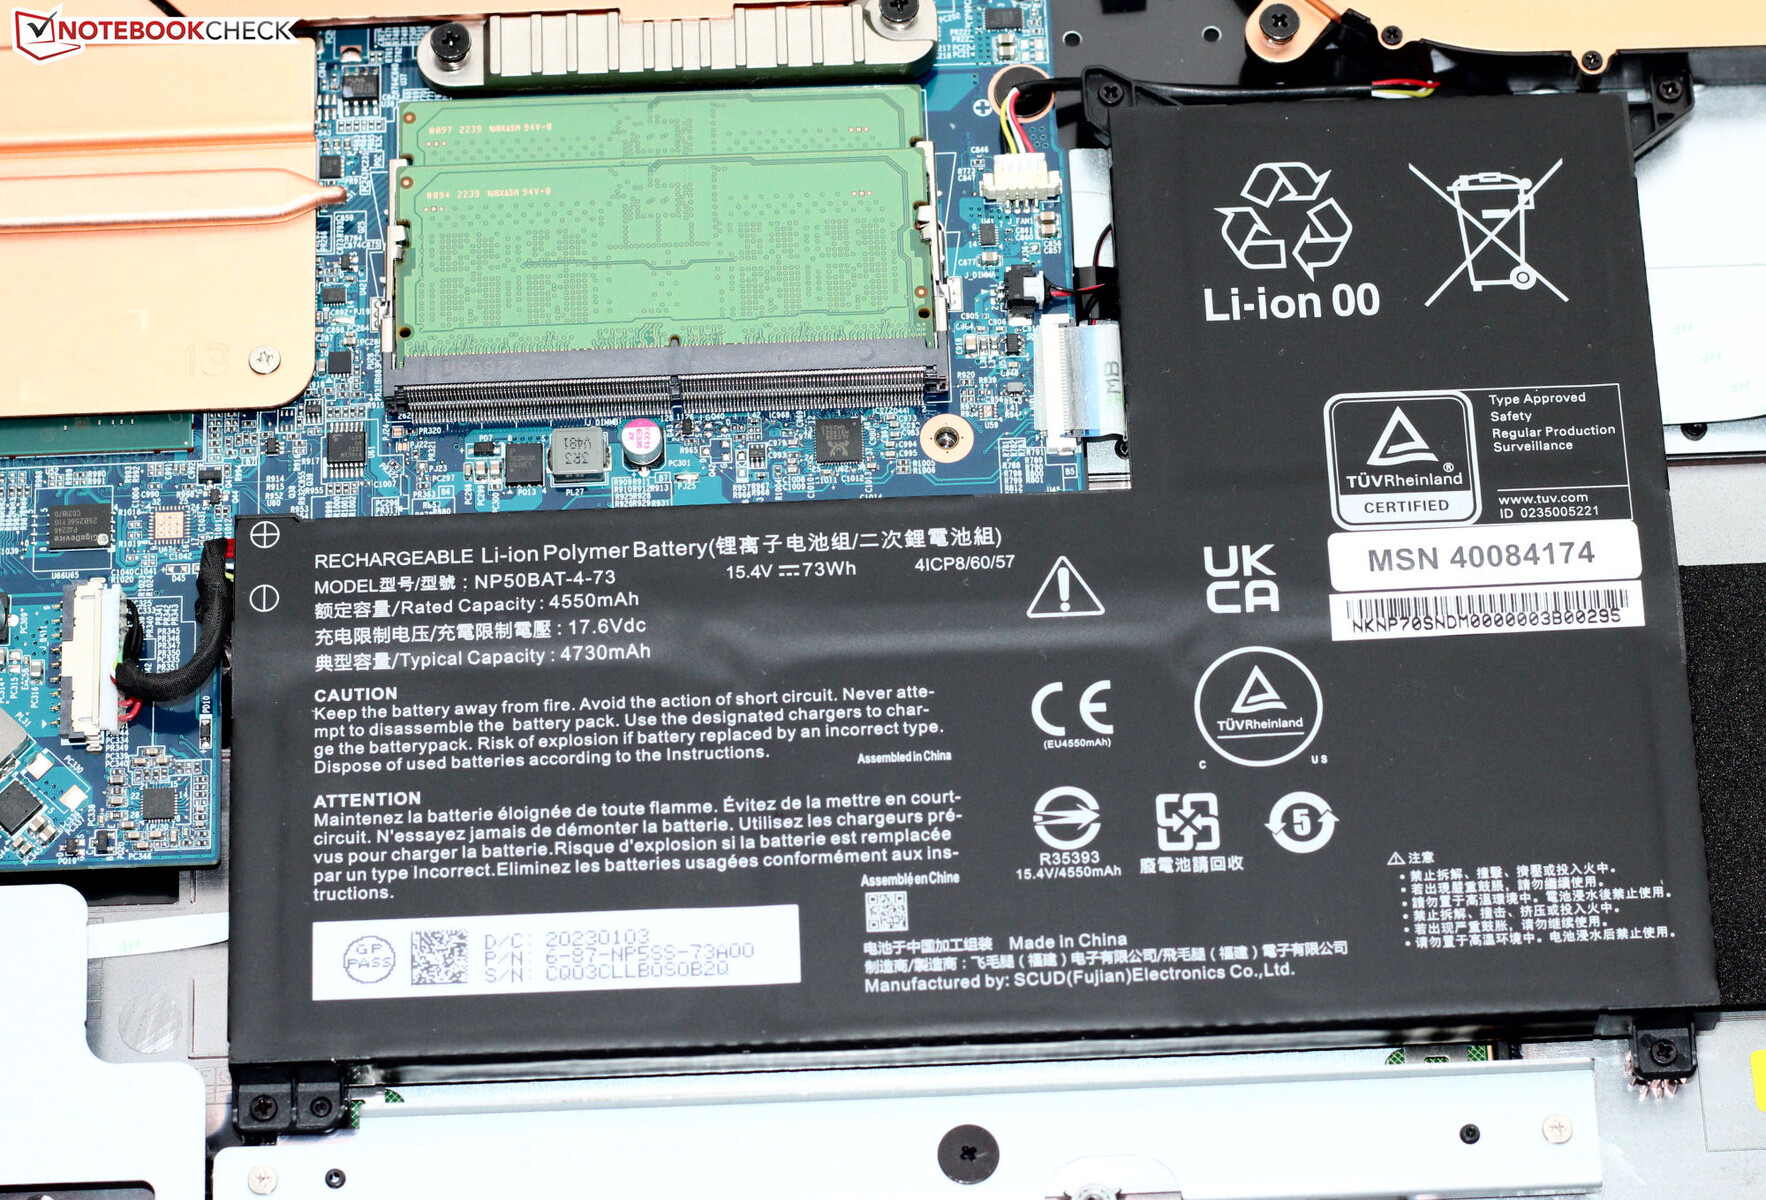
A Medion escolheu um gabinete preto para o P40 com superfícies lisas e foscas que refletem a luz. O laptop de aparência elegante não tem recursos de design extravagantes. Além do teclado iluminado, o laptop não apresenta elementos de LED. A bateria (aparafusada, não colada) e o restante das partes internas do laptop podem ser facilmente acessados depois que a parte inferior do gabinete for removida.
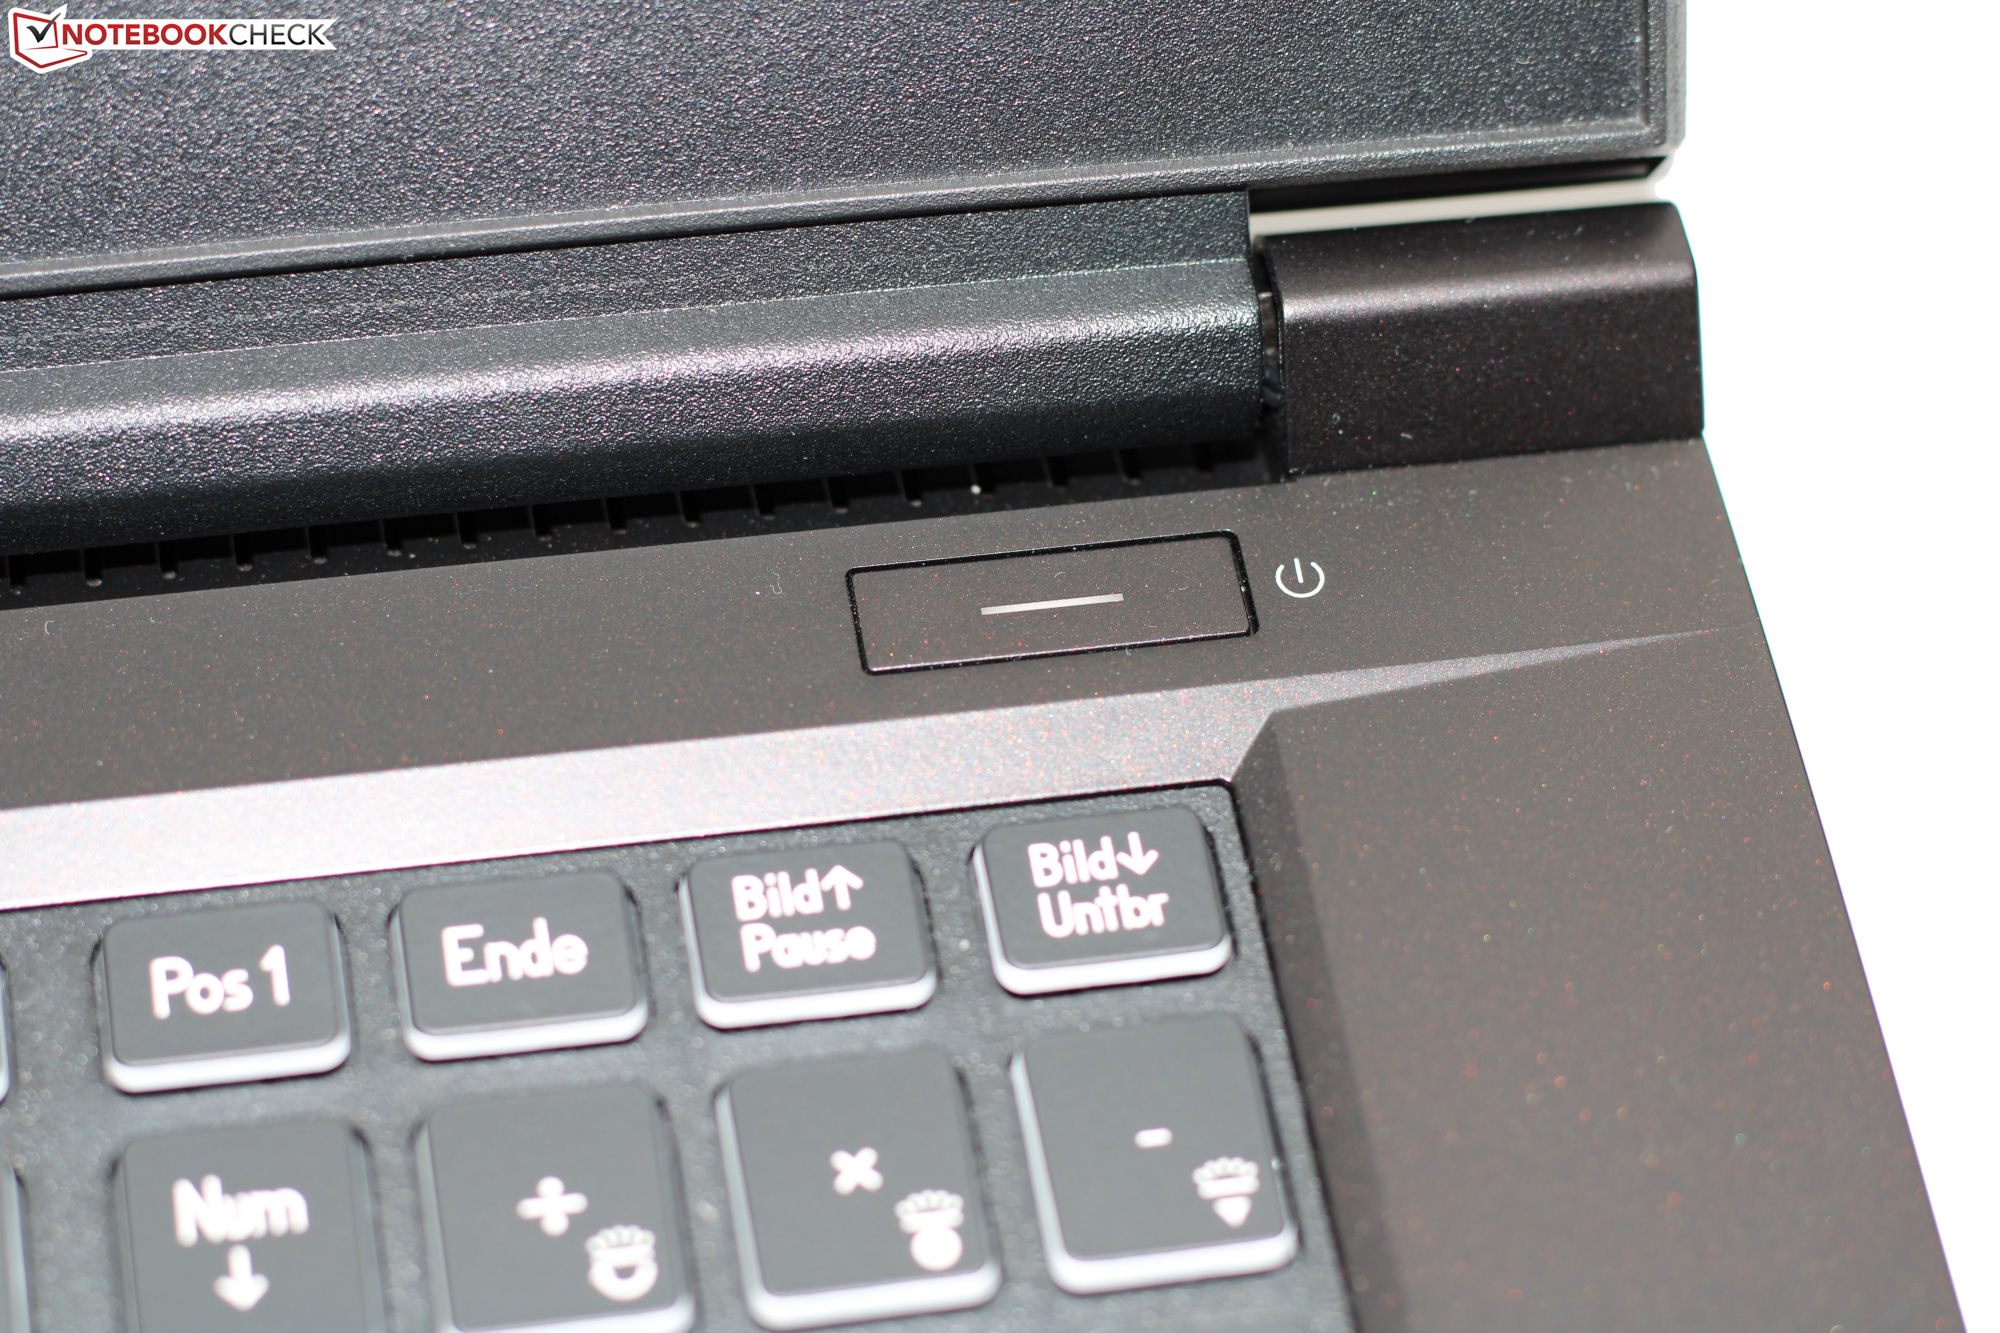
Não há problemas de construção - todos os espaços se encaixam e não há bordas afiadas. A unidade base e a tampa podem ser ligeiramente torcidas, mas isso não é nada fora do comum. As dobradiças mantêm a tampa do laptop firmemente no lugar e seu ângulo máximo de abertura é de cerca de 135 graus. O laptop pode ser aberto com uma mão.
A P40 é um pouco mais compacta do que aKatana 17mas pesa cerca de 100 gramas a mais. Ambos os dispositivos são superados peloGigabyte G7 KEnessas categorias.
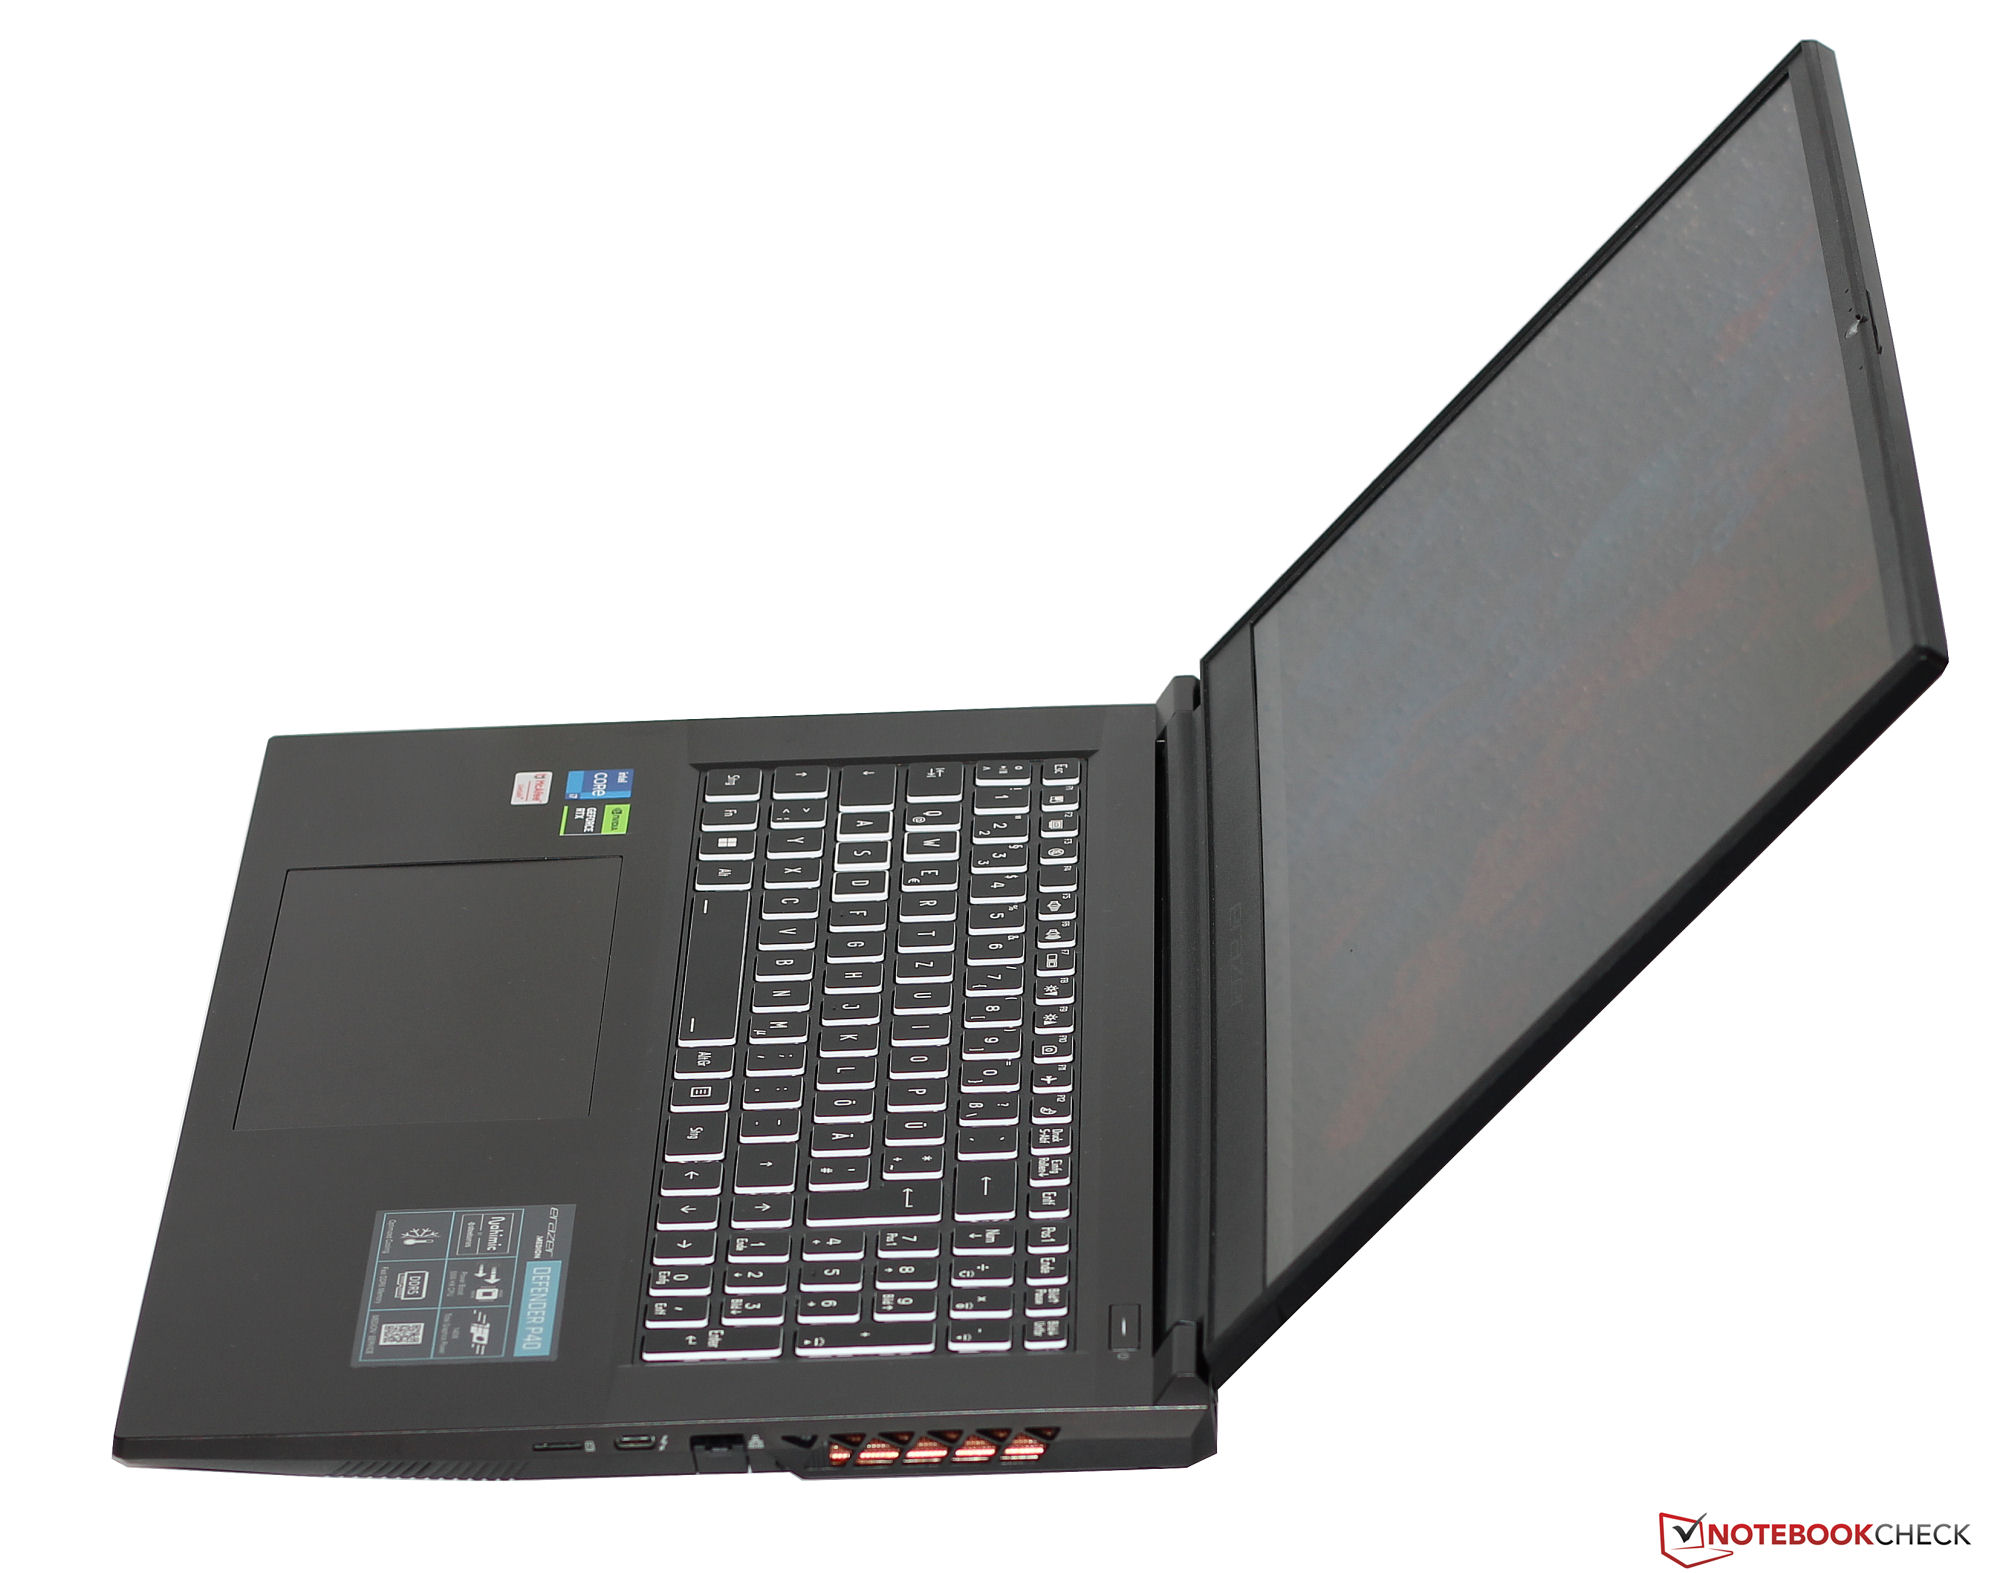
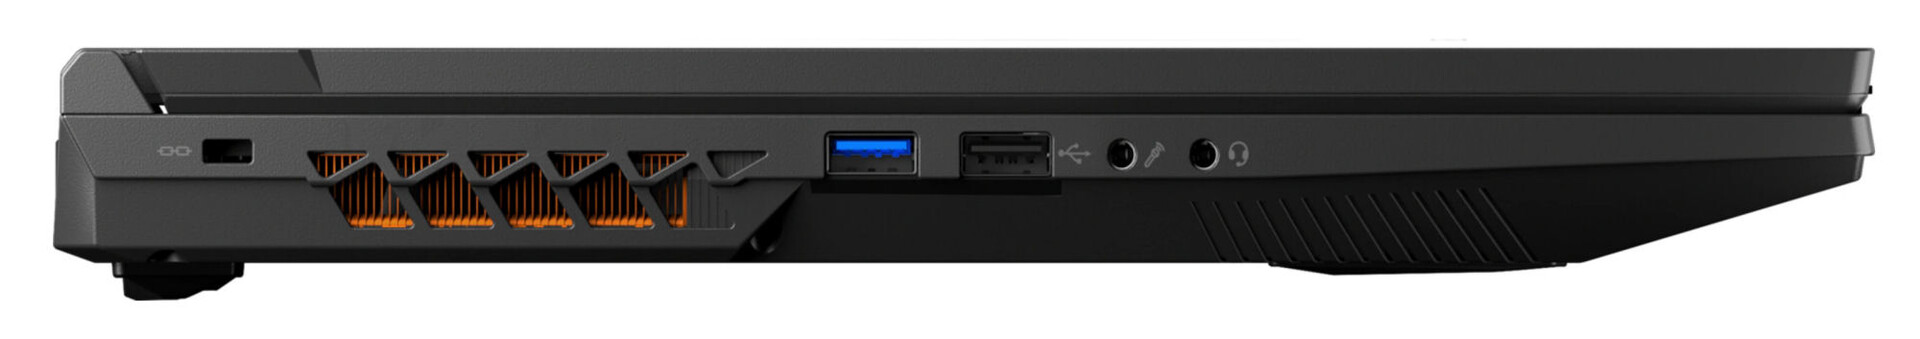
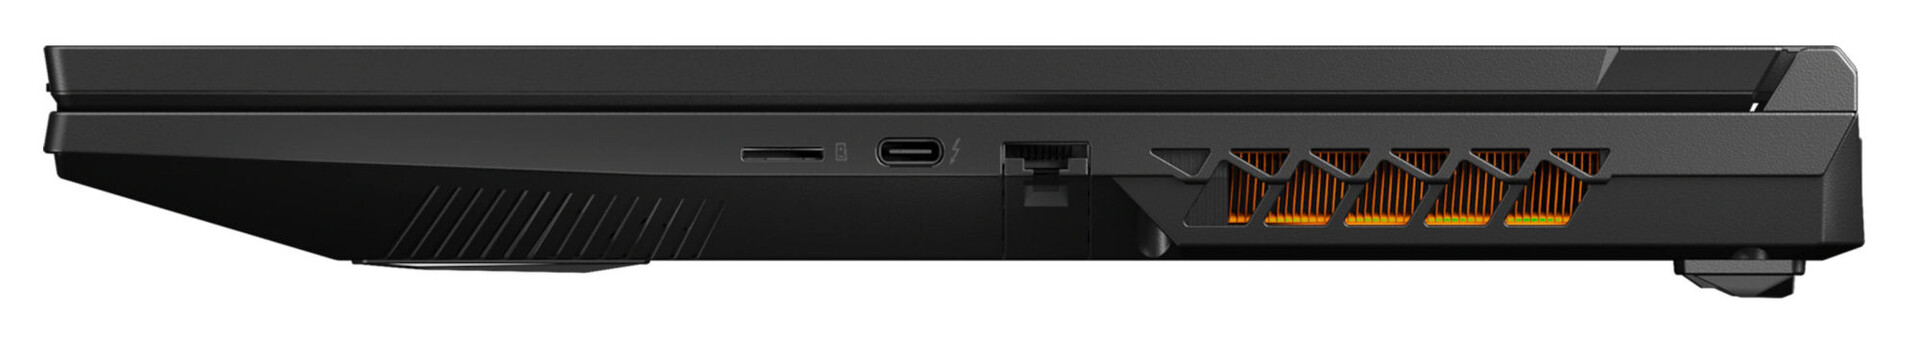
Conectividade - O Medion Defender tem Thunderbolt, mas não tem Power Delivery
Apesar de seu tamanho de 17,3 polegadas, o laptop tem apenas duas conexões USB-A (1x USB 3.2 Gen 1, 1x USB 2.0) - uma terceira porta no lado direito do laptop seria muito útil. Nenhuma das portas USB-C (1x Thunderbolt 4, 1x USB 3.2 Gen 2) suporta Power Delivery, mas a porta TB4 pode emitir um sinal DisplayPort. No total, o dispositivo tem três saídas de vídeo (2x DP, 1x HDMI), duas portas de áudio e uma porta Gigabit Ethernet.
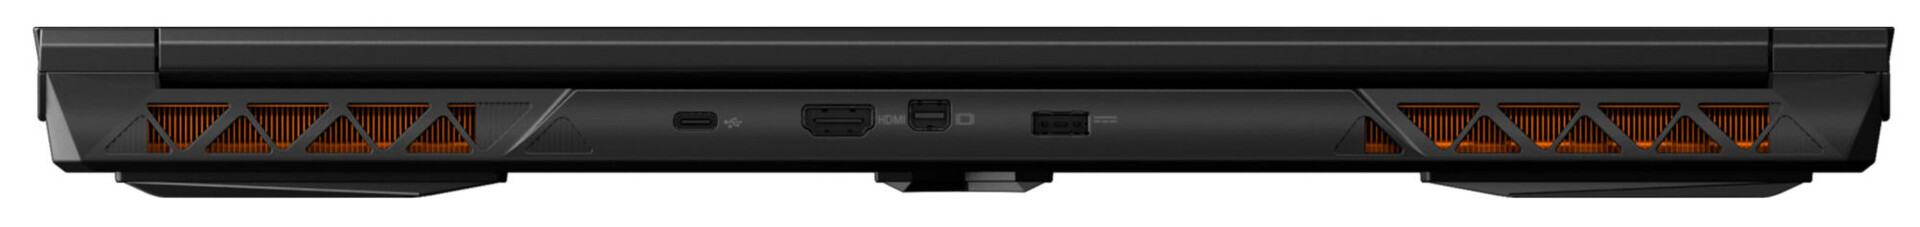
Duas saídas de vídeo e a conexão de energia estão na parte traseira do laptop. Os cabos correspondentes ficam afastados da parte traseira do dispositivo, o que significa que não atrapalharão seu caminho. Infelizmente, o mesmo não se pode dizer do cabo Ethernet, se estiver em uso.
Leitor de cartão SD
O leitor de cartão SD (cartão de referência: AV PRO microSD 128 GB V60) tem taxas de transferência máximas de 86 MB/s (transferência de 250 imagens jpg - cerca de 5 MB cada) e 91 MB/s (cópia de grandes blocos de dados), o que faz dele um modelo com velocidades médias.
| SD Card Reader | |
| average JPG Copy Test (av. of 3 runs) | |
| Média da turma Gaming (20.9 - 210, n=54, últimos 2 anos) | |
| HP Omen 17-ck1075ng (AV Pro SD microSD 128 GB V60) | |
| Medion Erazer Defender P40 (AV PRO microSD 128 GB V60) | |
| MSI GE78HX 13VH-070US (Angelibird AV Pro V60) | |
| maximum AS SSD Seq Read Test (1GB) | |
| Média da turma Gaming (25.5 - 261, n=51, últimos 2 anos) | |
| HP Omen 17-ck1075ng (AV Pro SD microSD 128 GB V60) | |
| Medion Erazer Defender P40 (AV PRO microSD 128 GB V60) | |
| Gigabyte G7 KE (AV PRO microSD 128 GB V60) | |
| MSI GE78HX 13VH-070US (Angelibird AV Pro V60) | |
Comunicação
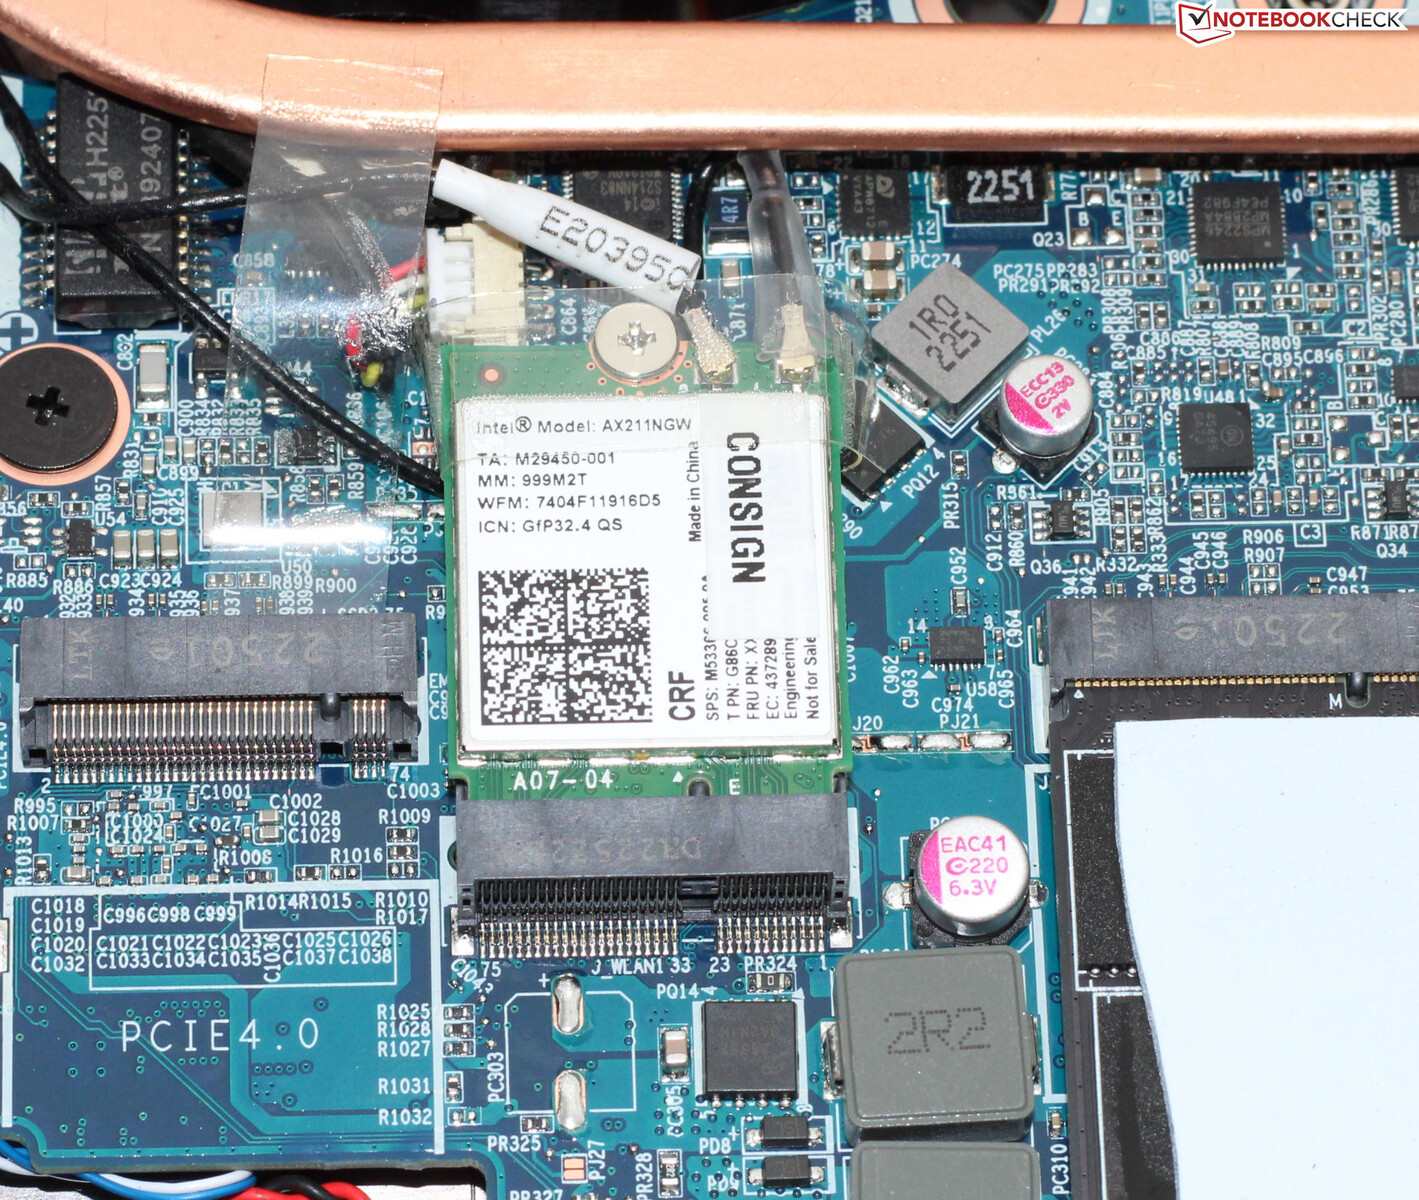
Em condições ideais (sem dispositivos WLAN nas proximidades, curta distância entre o laptop e o PC servidor), o laptop conseguiu atingir taxas de dados WiFi impressionantes. O laptop da Medion usa um chip WiFi 6E (Intel AX211). As conexões com fio também são feitas por um chip Intel (I219-V; 1 GBit/s).
Webcam
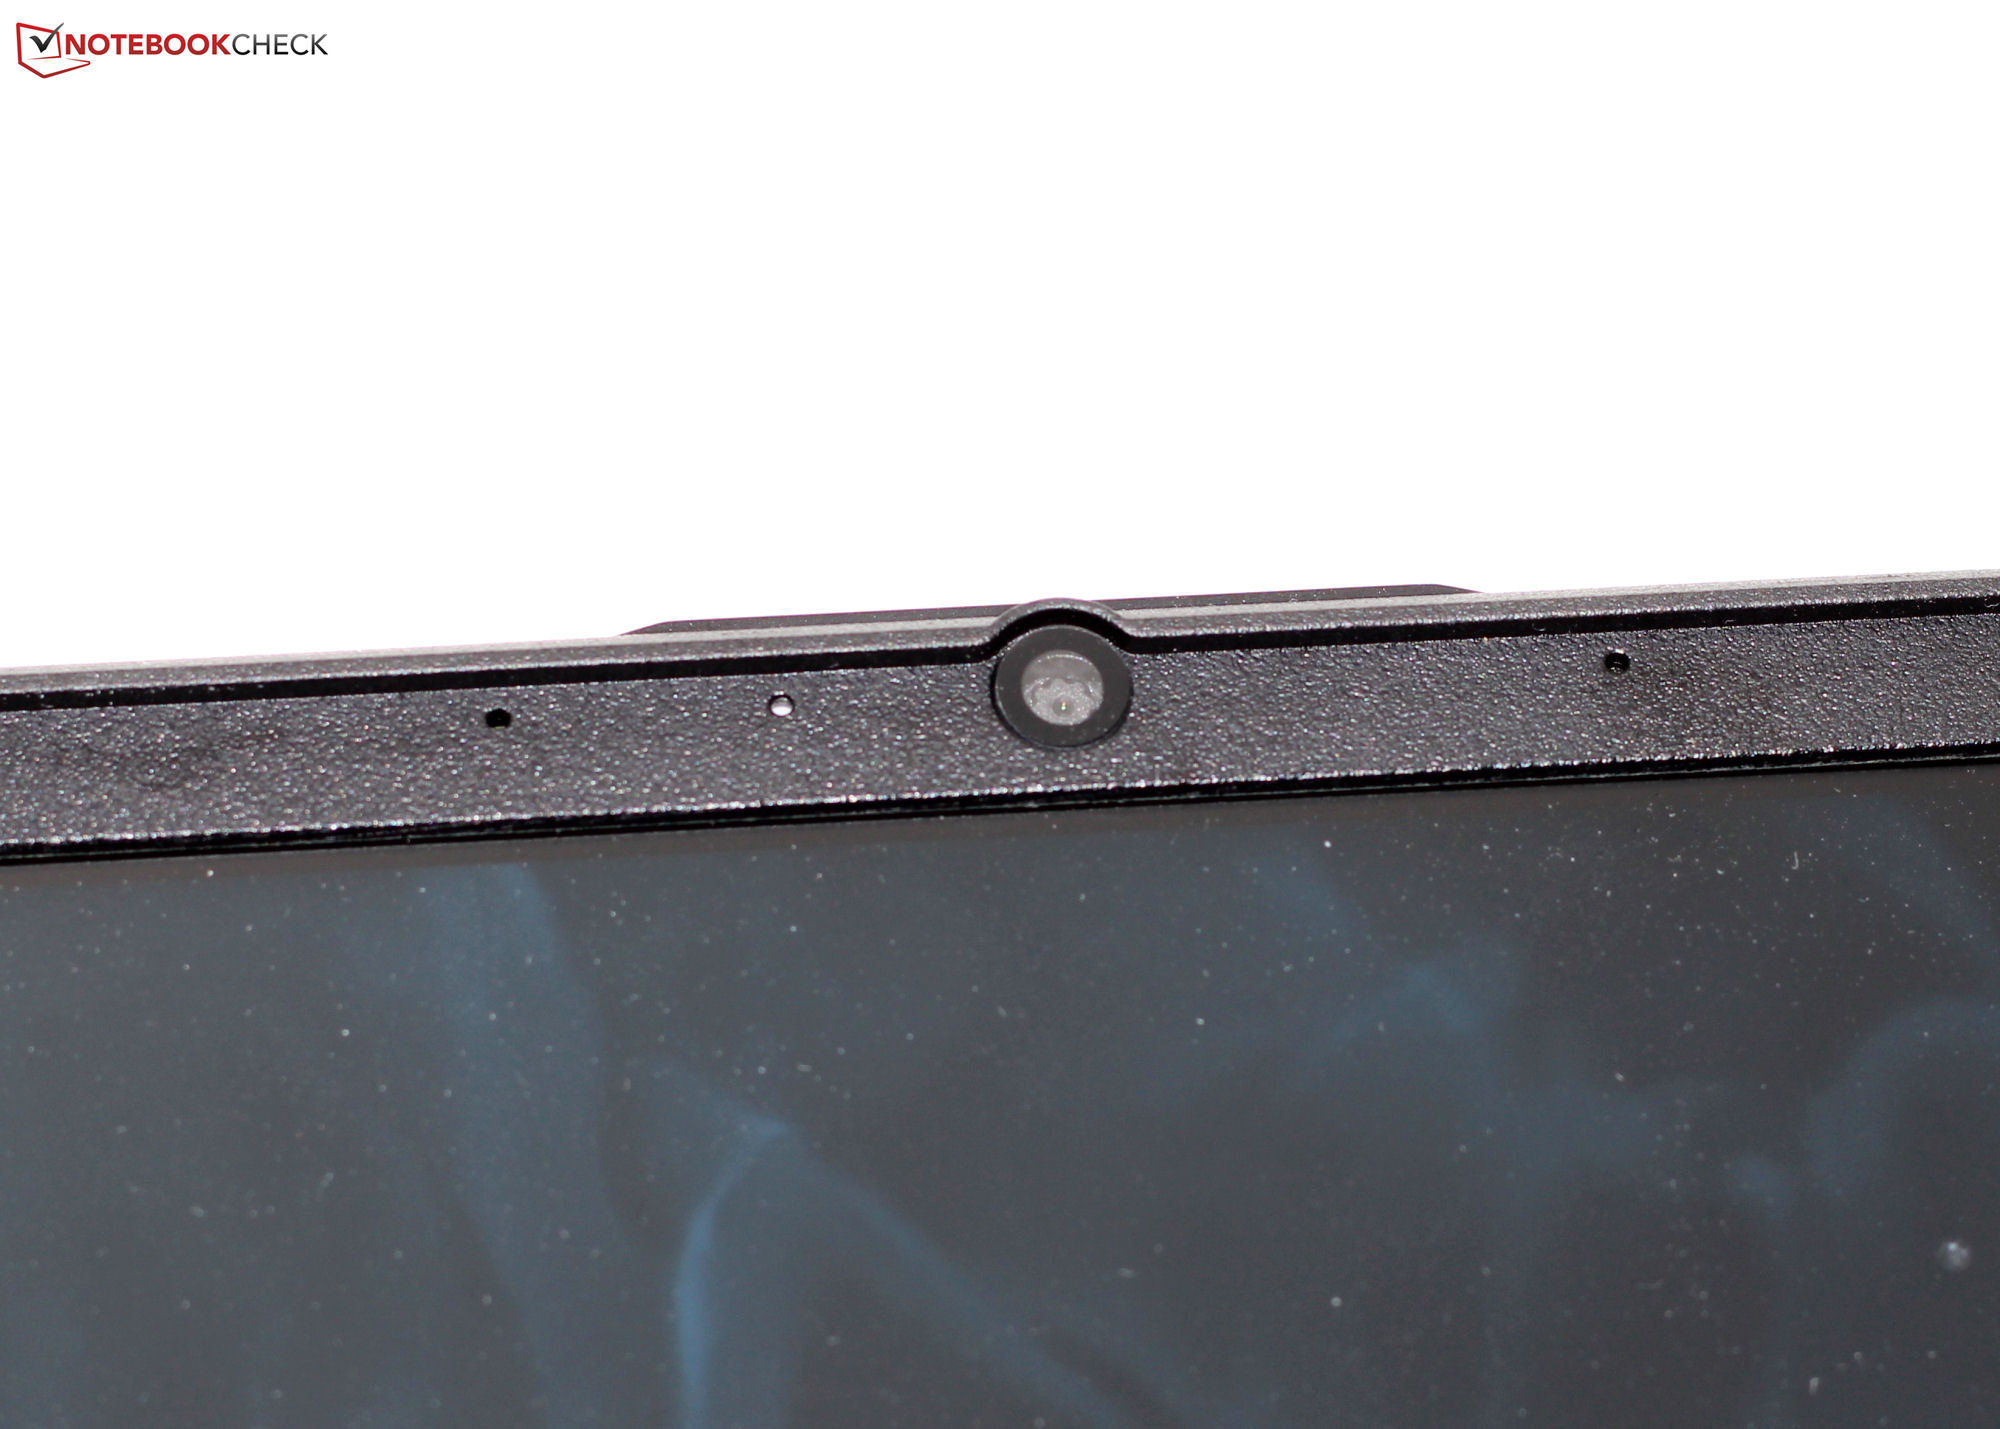
A webcam (0,9 MP, máx. 1.280 x 720 pixels) não tem uma cobertura mecânica. Sua qualidade, infelizmente, não é das melhores - no entanto, em comparação, o desvio de cor é mínimo.


Acessórios
Além dos documentos habituais (guia de início rápido e informações sobre garantia), o laptop não vem com nenhum acessório adicional.
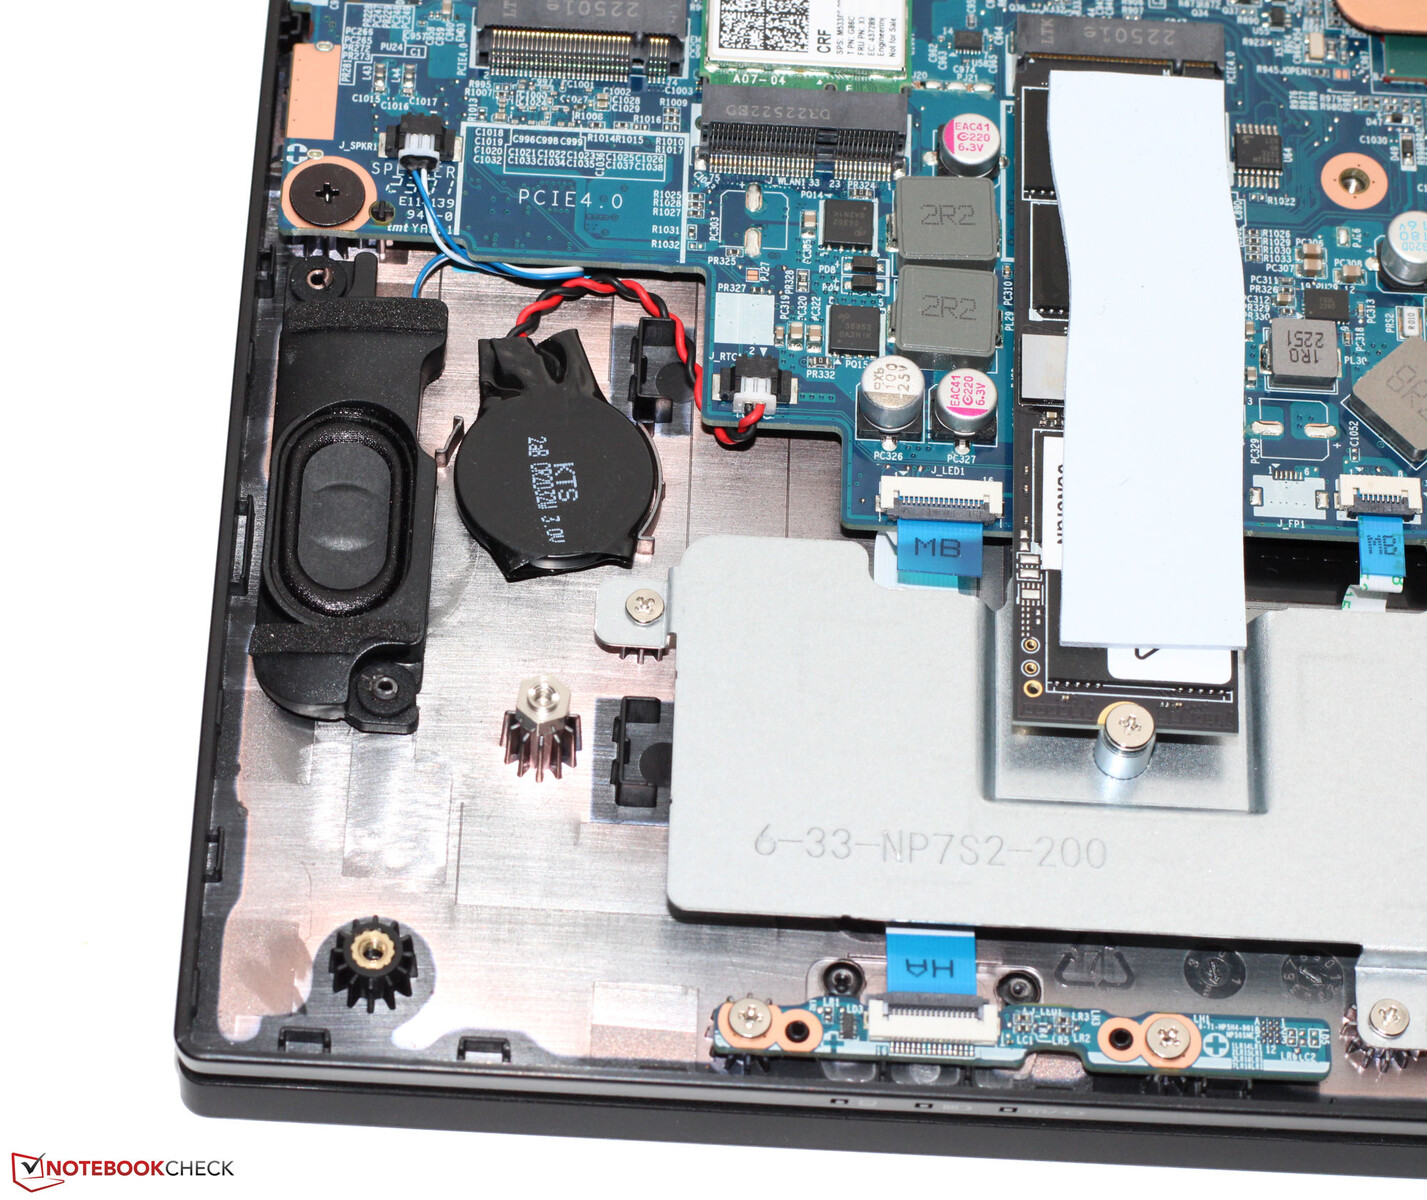
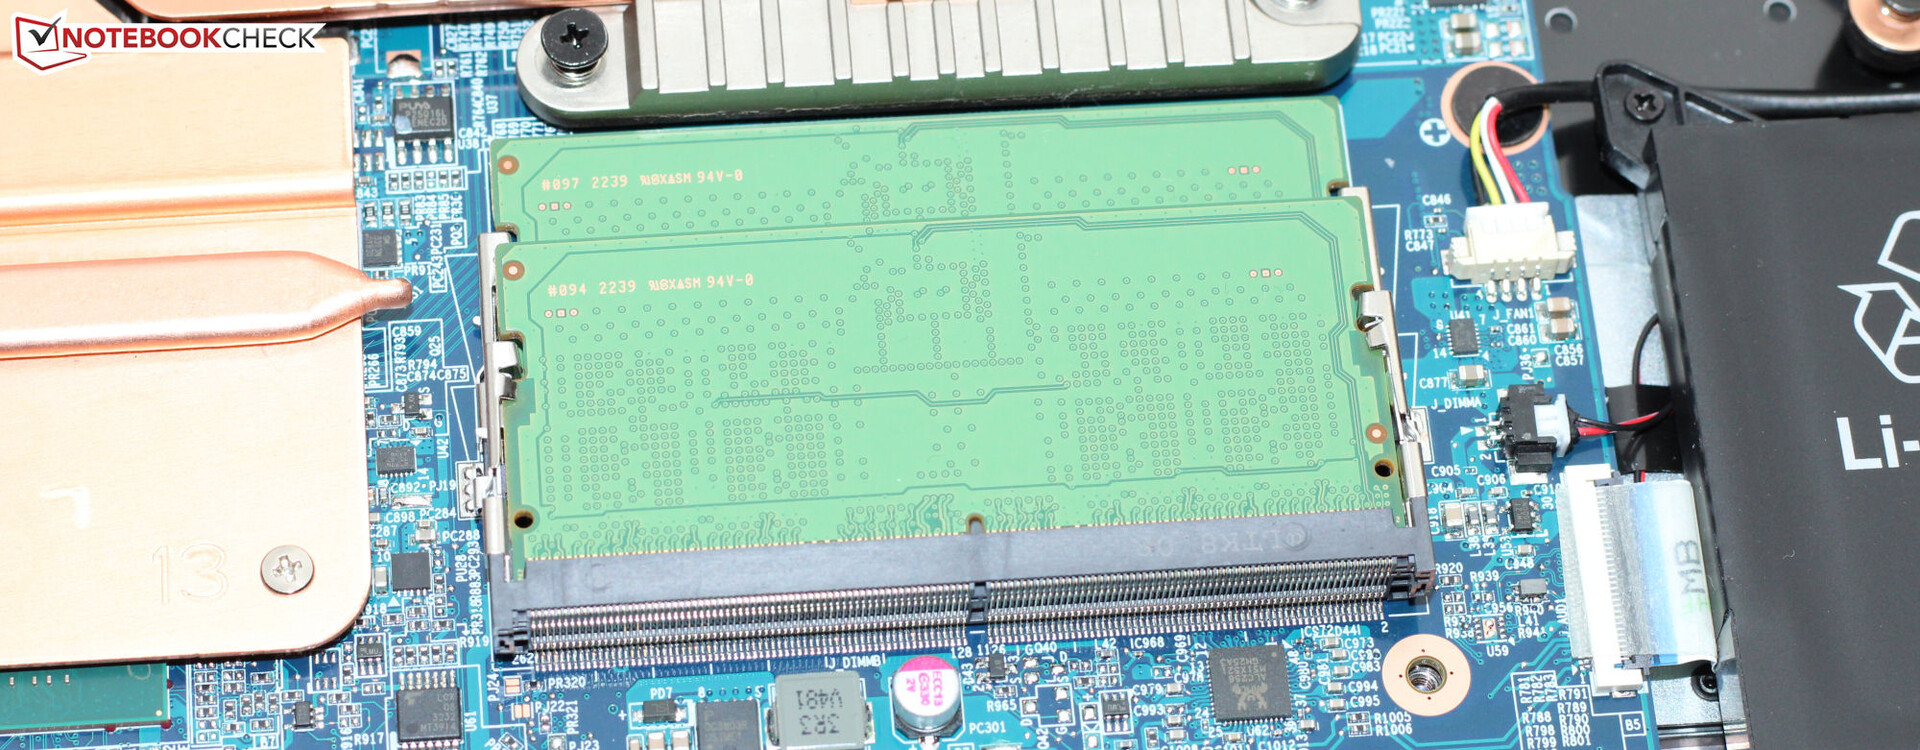
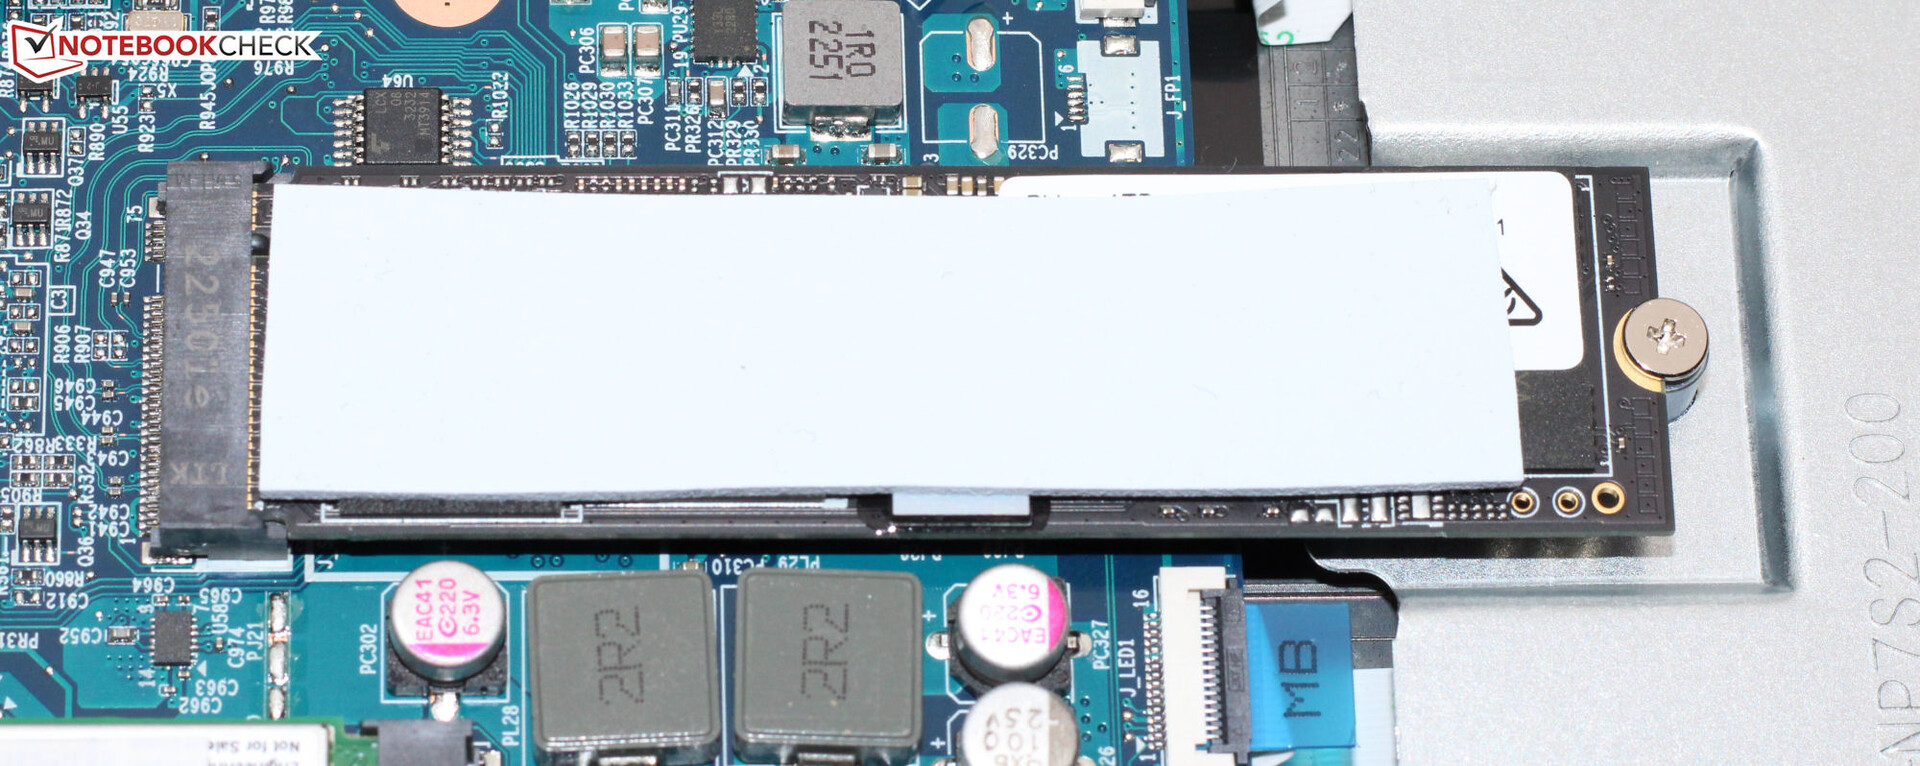
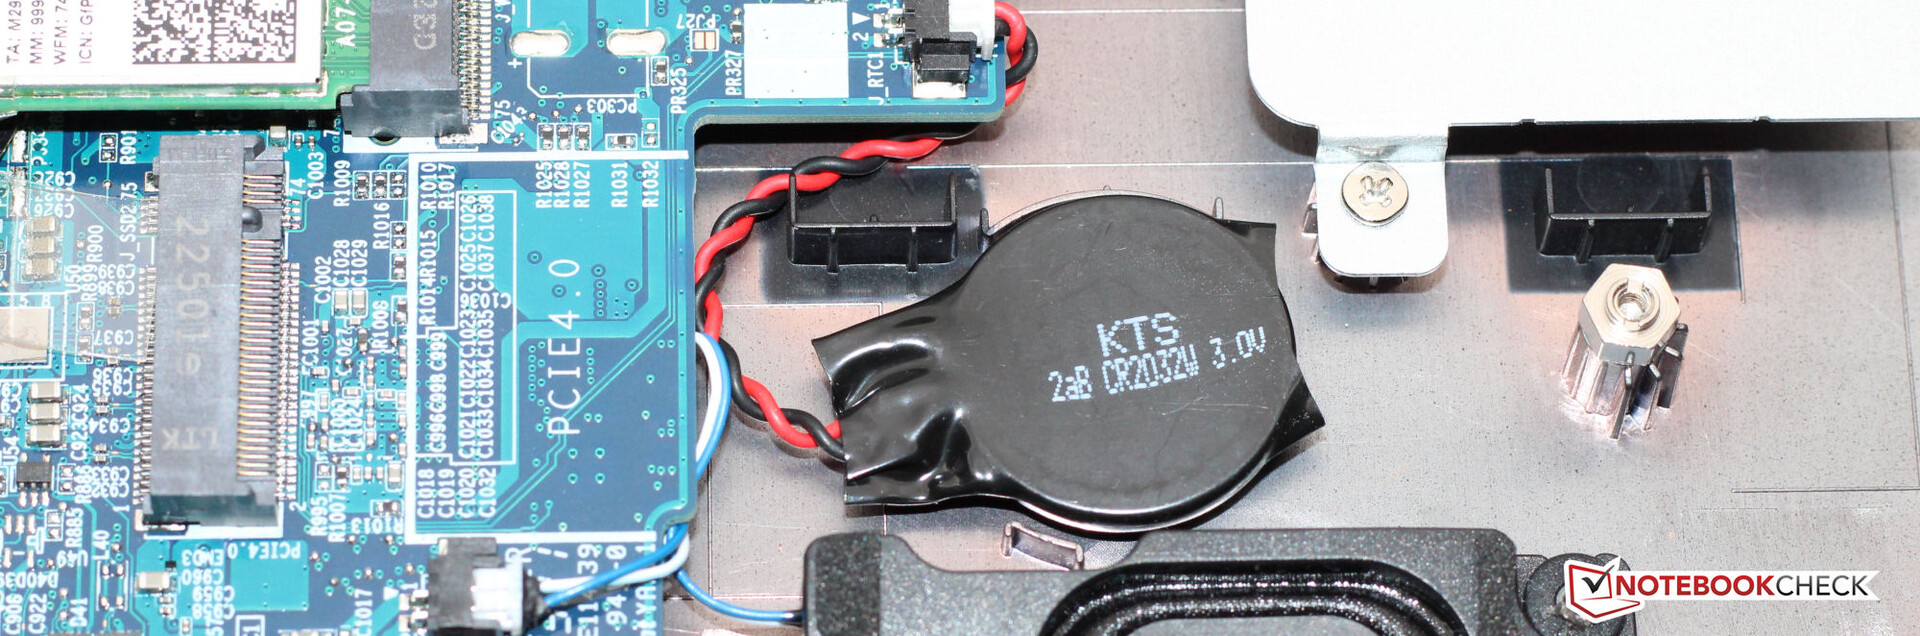
Manutenção
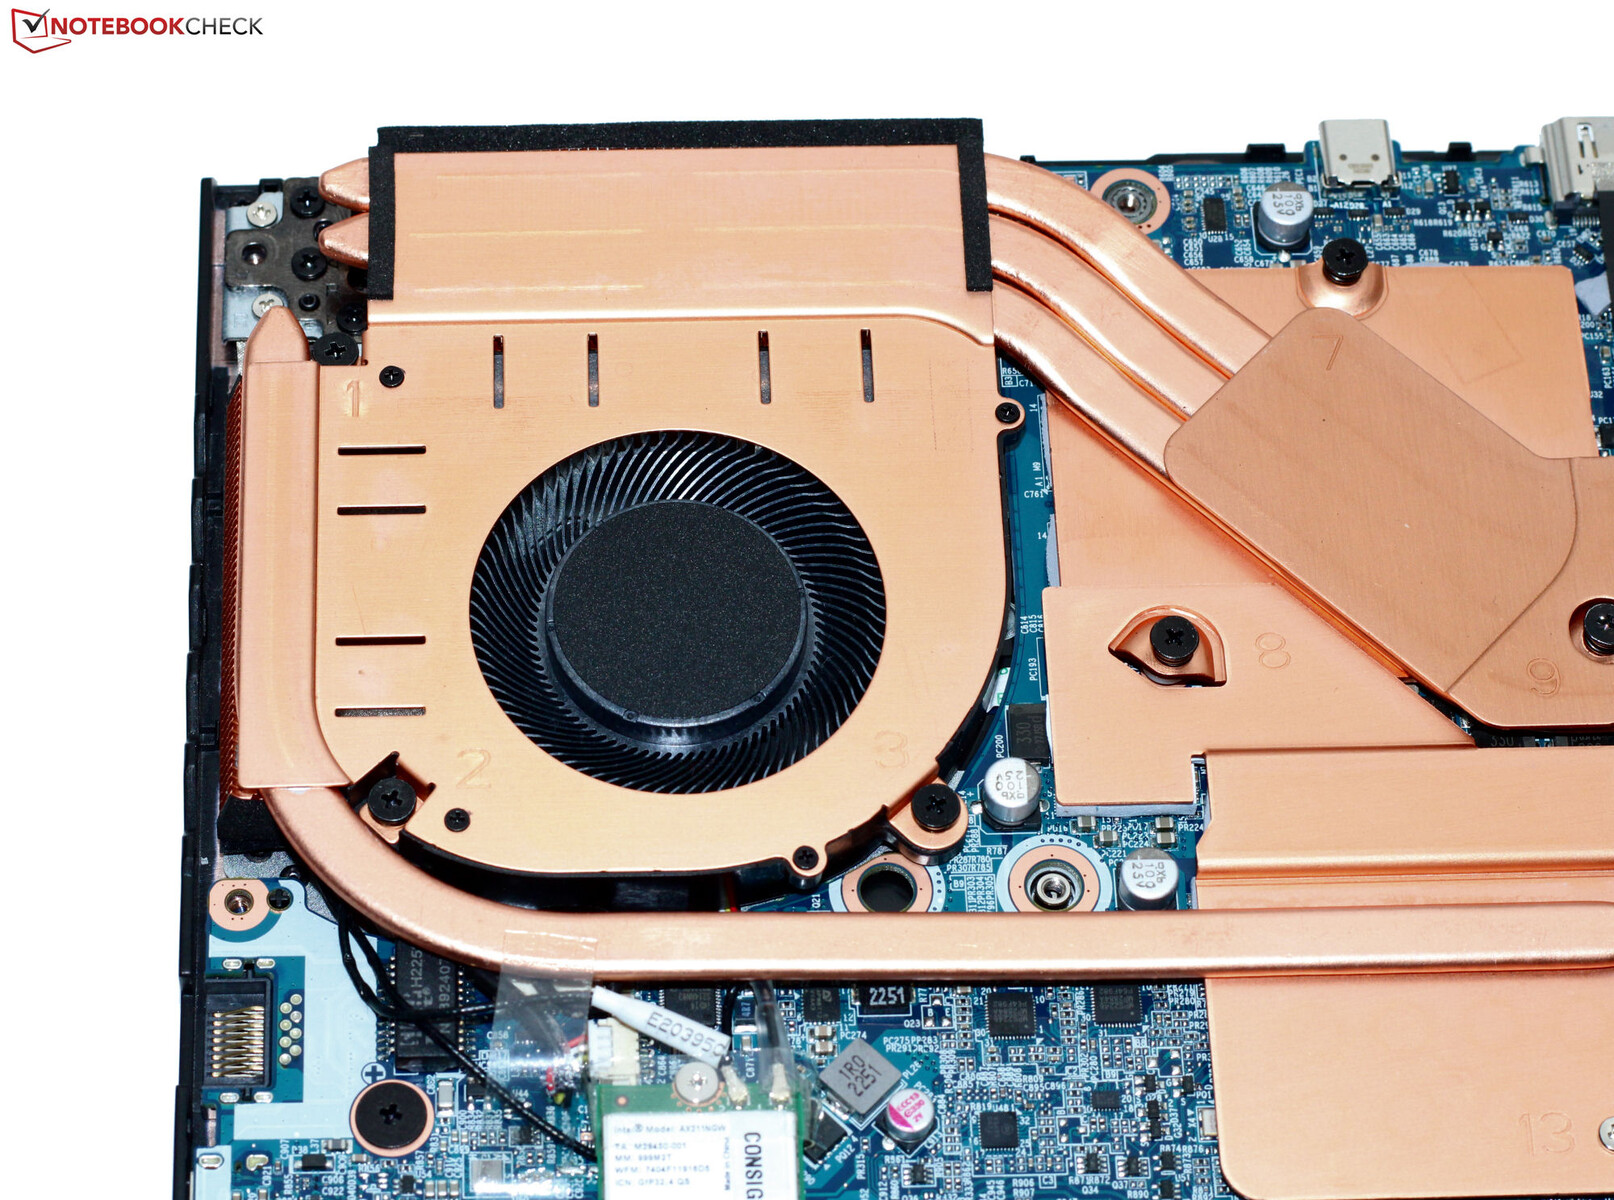
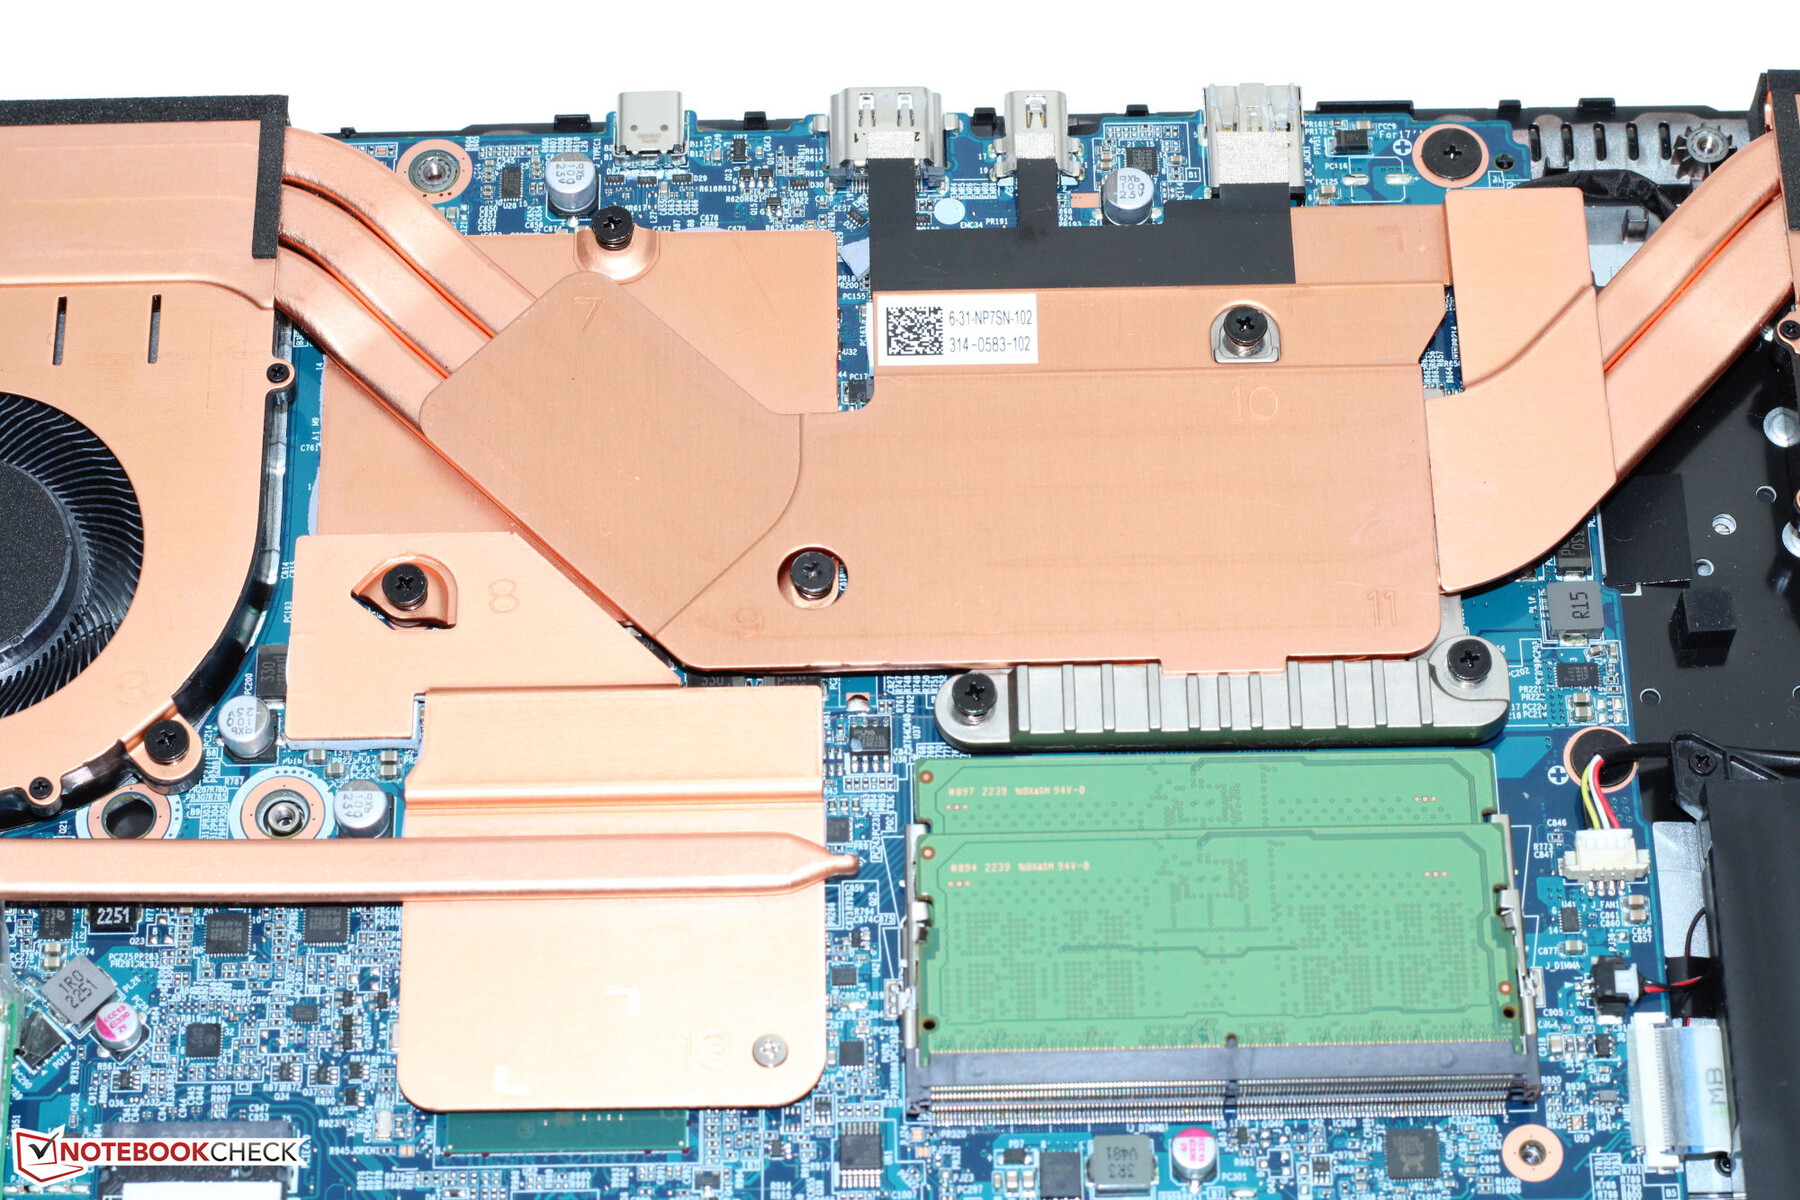
Depois de remover todos os parafusos na parte inferior do dispositivo, a placa inferior pode ser removida usando uma espátula plana ou um plectro. Assim, é possível acessar os dois bancos de memória (em uso), o segundo slot SSD (PCIe 4, M.2-2280), o módulo WLAN, a bateria do BIOS, os ventiladores e a bateria.
Garantia
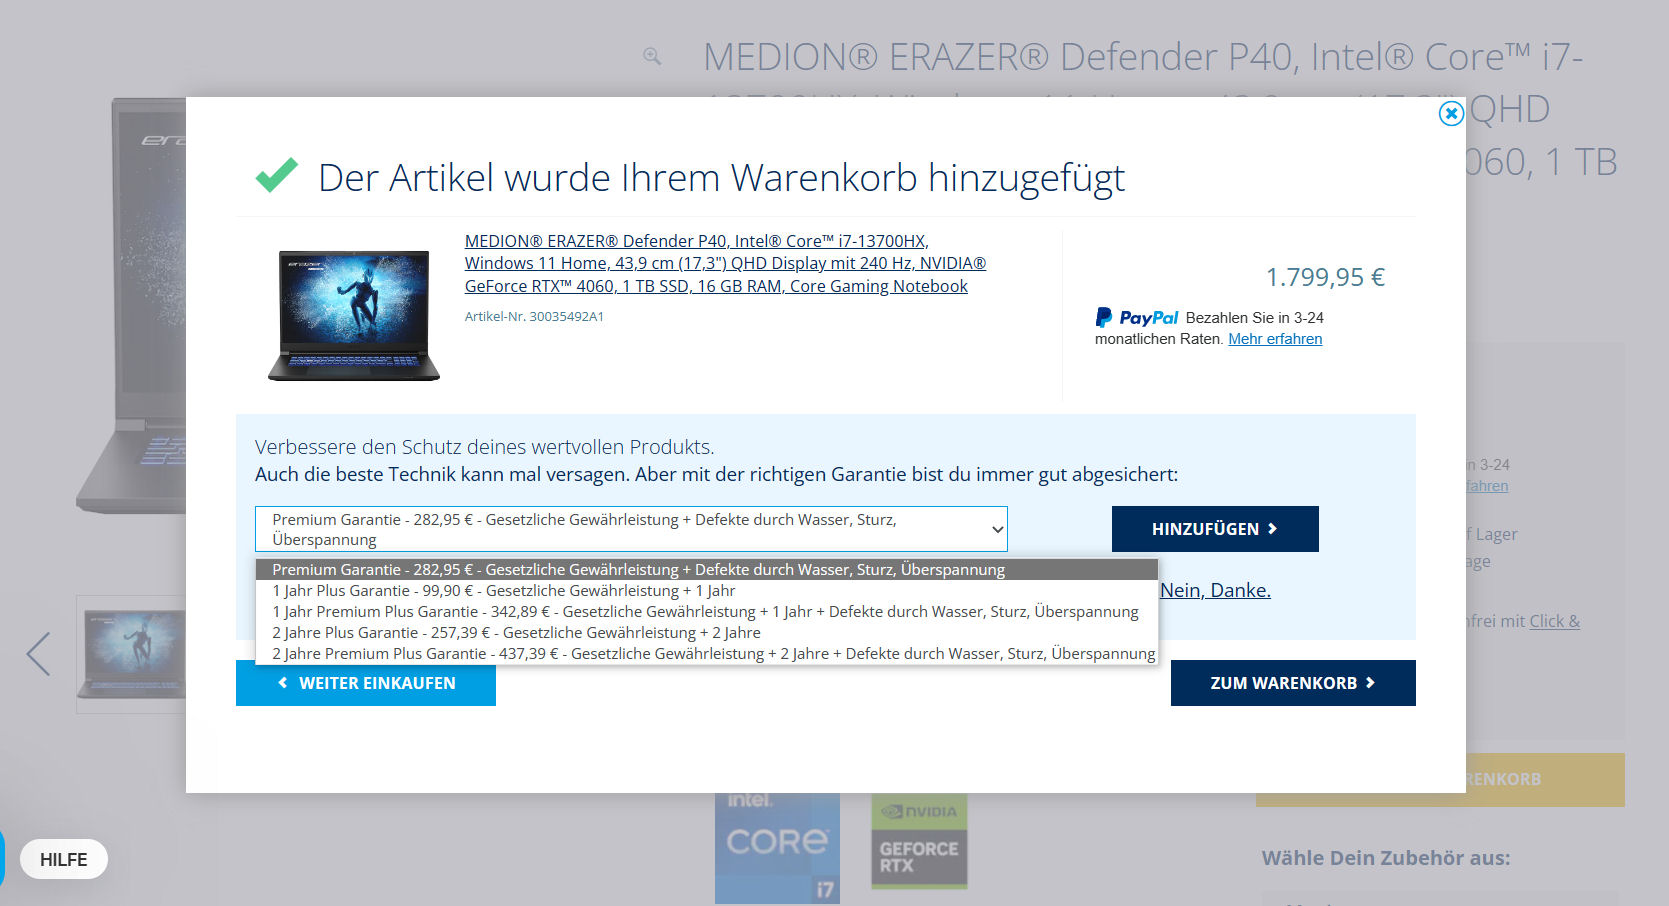
O Erazer da Medion vem com uma garantia de dois anos. Há extensões de garantia disponíveis, no entanto, elas devem ser adquiridas juntamente com o laptop na loja on-line da Medion - não é possível adquirir uma extensão retroativamente.
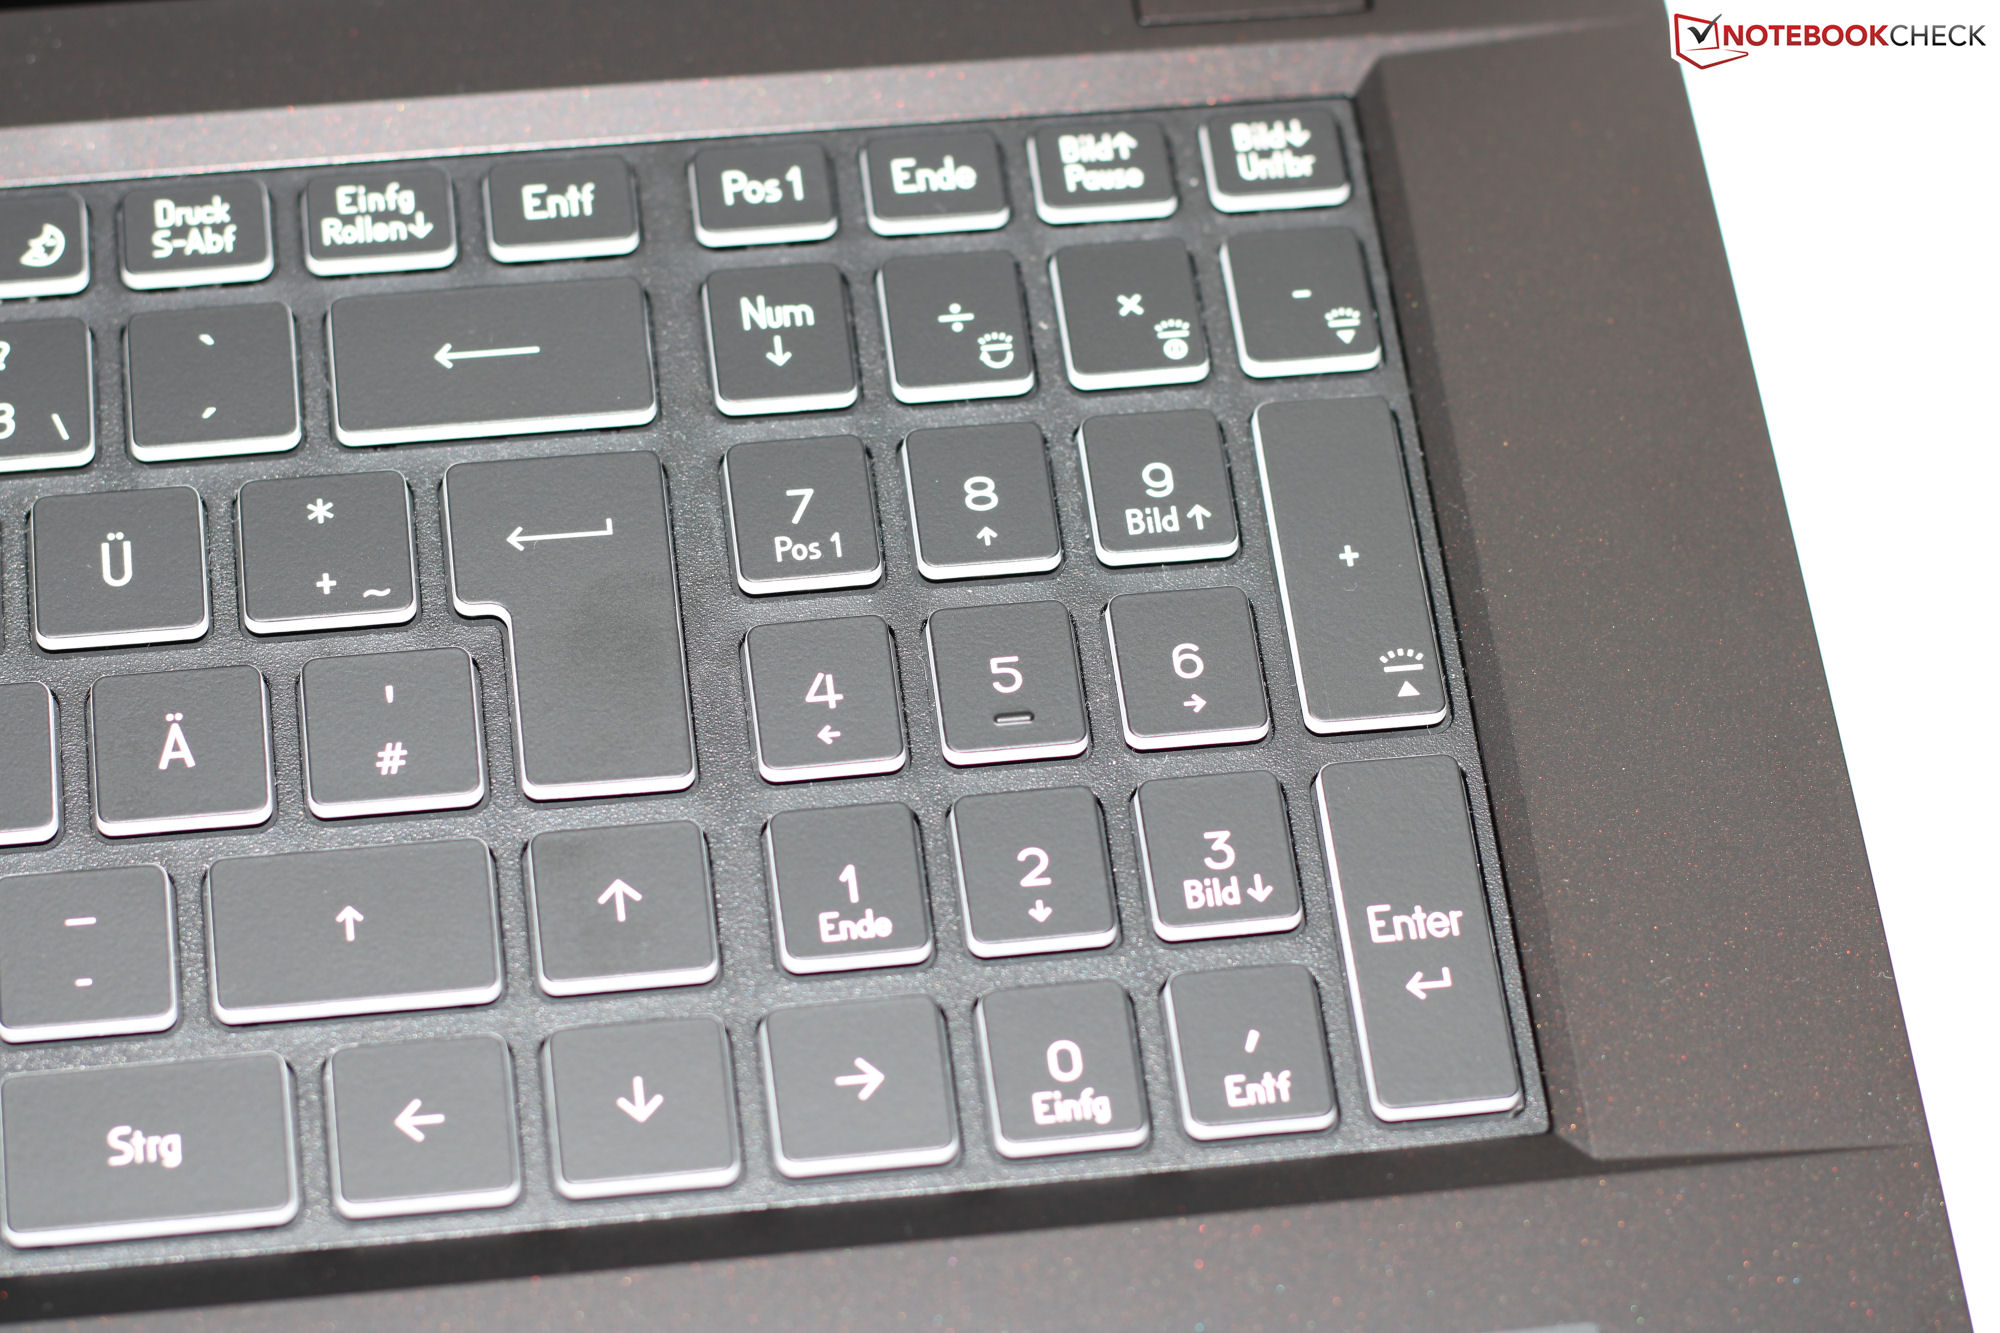
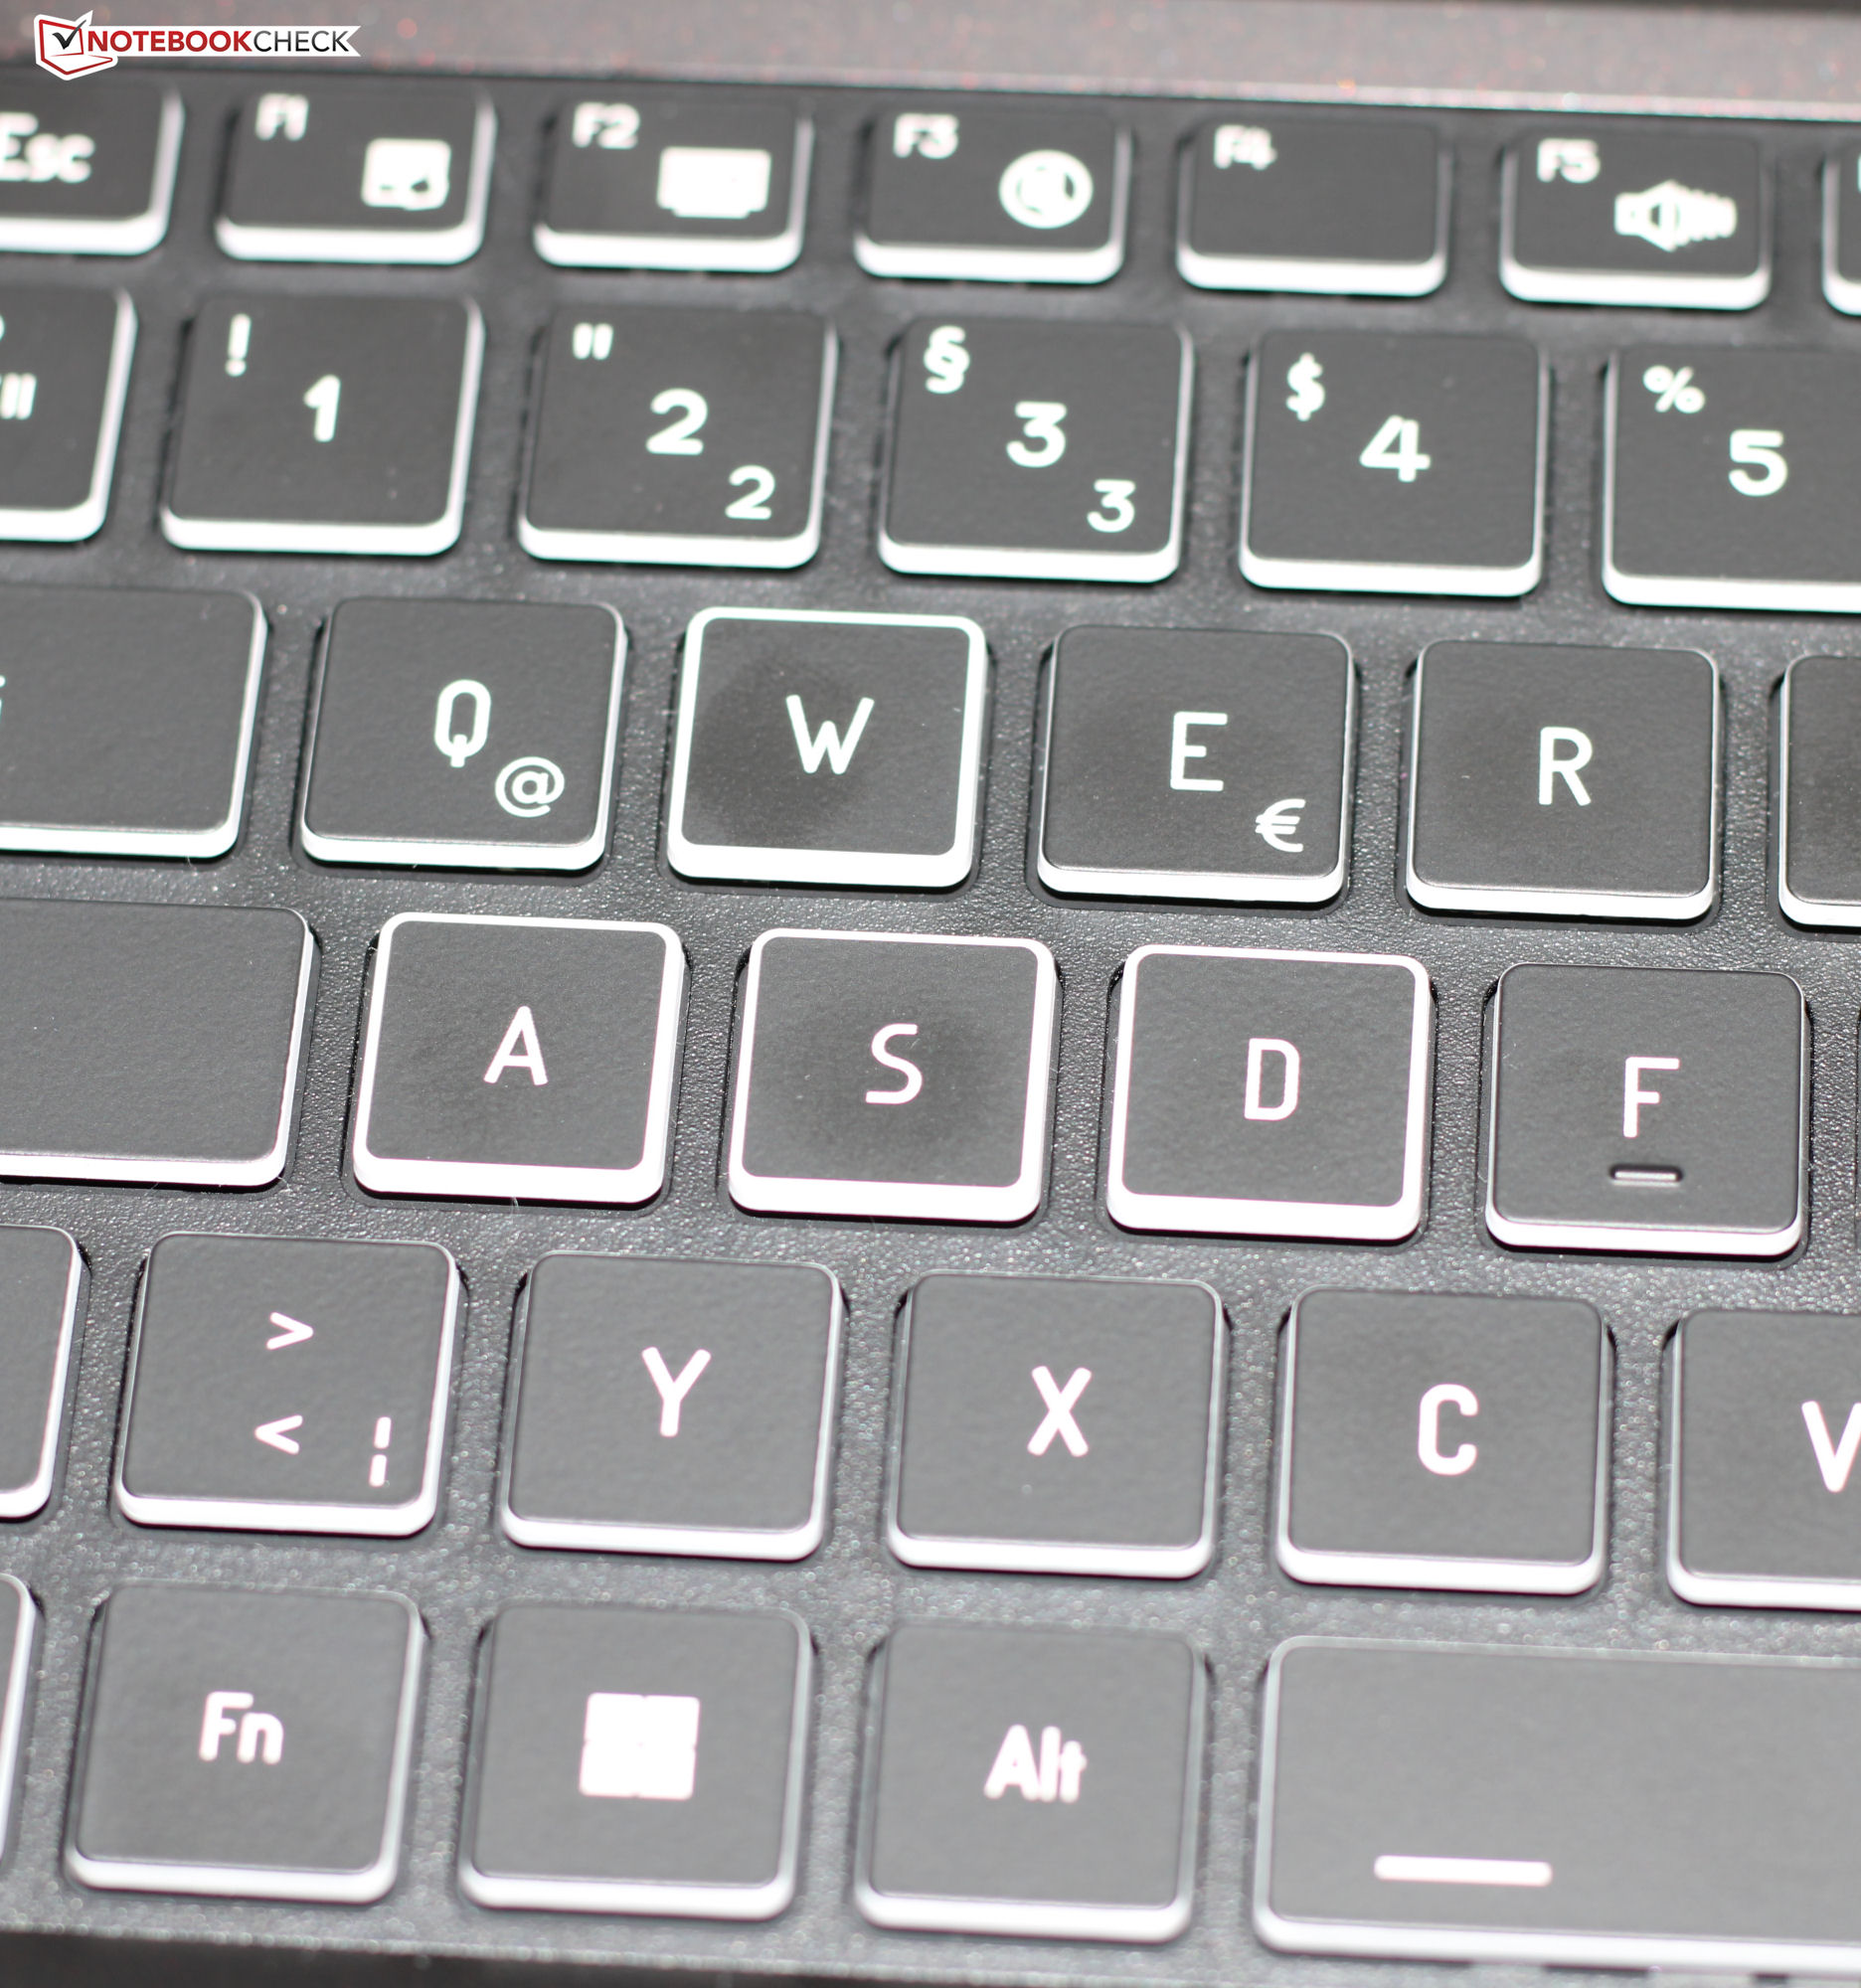
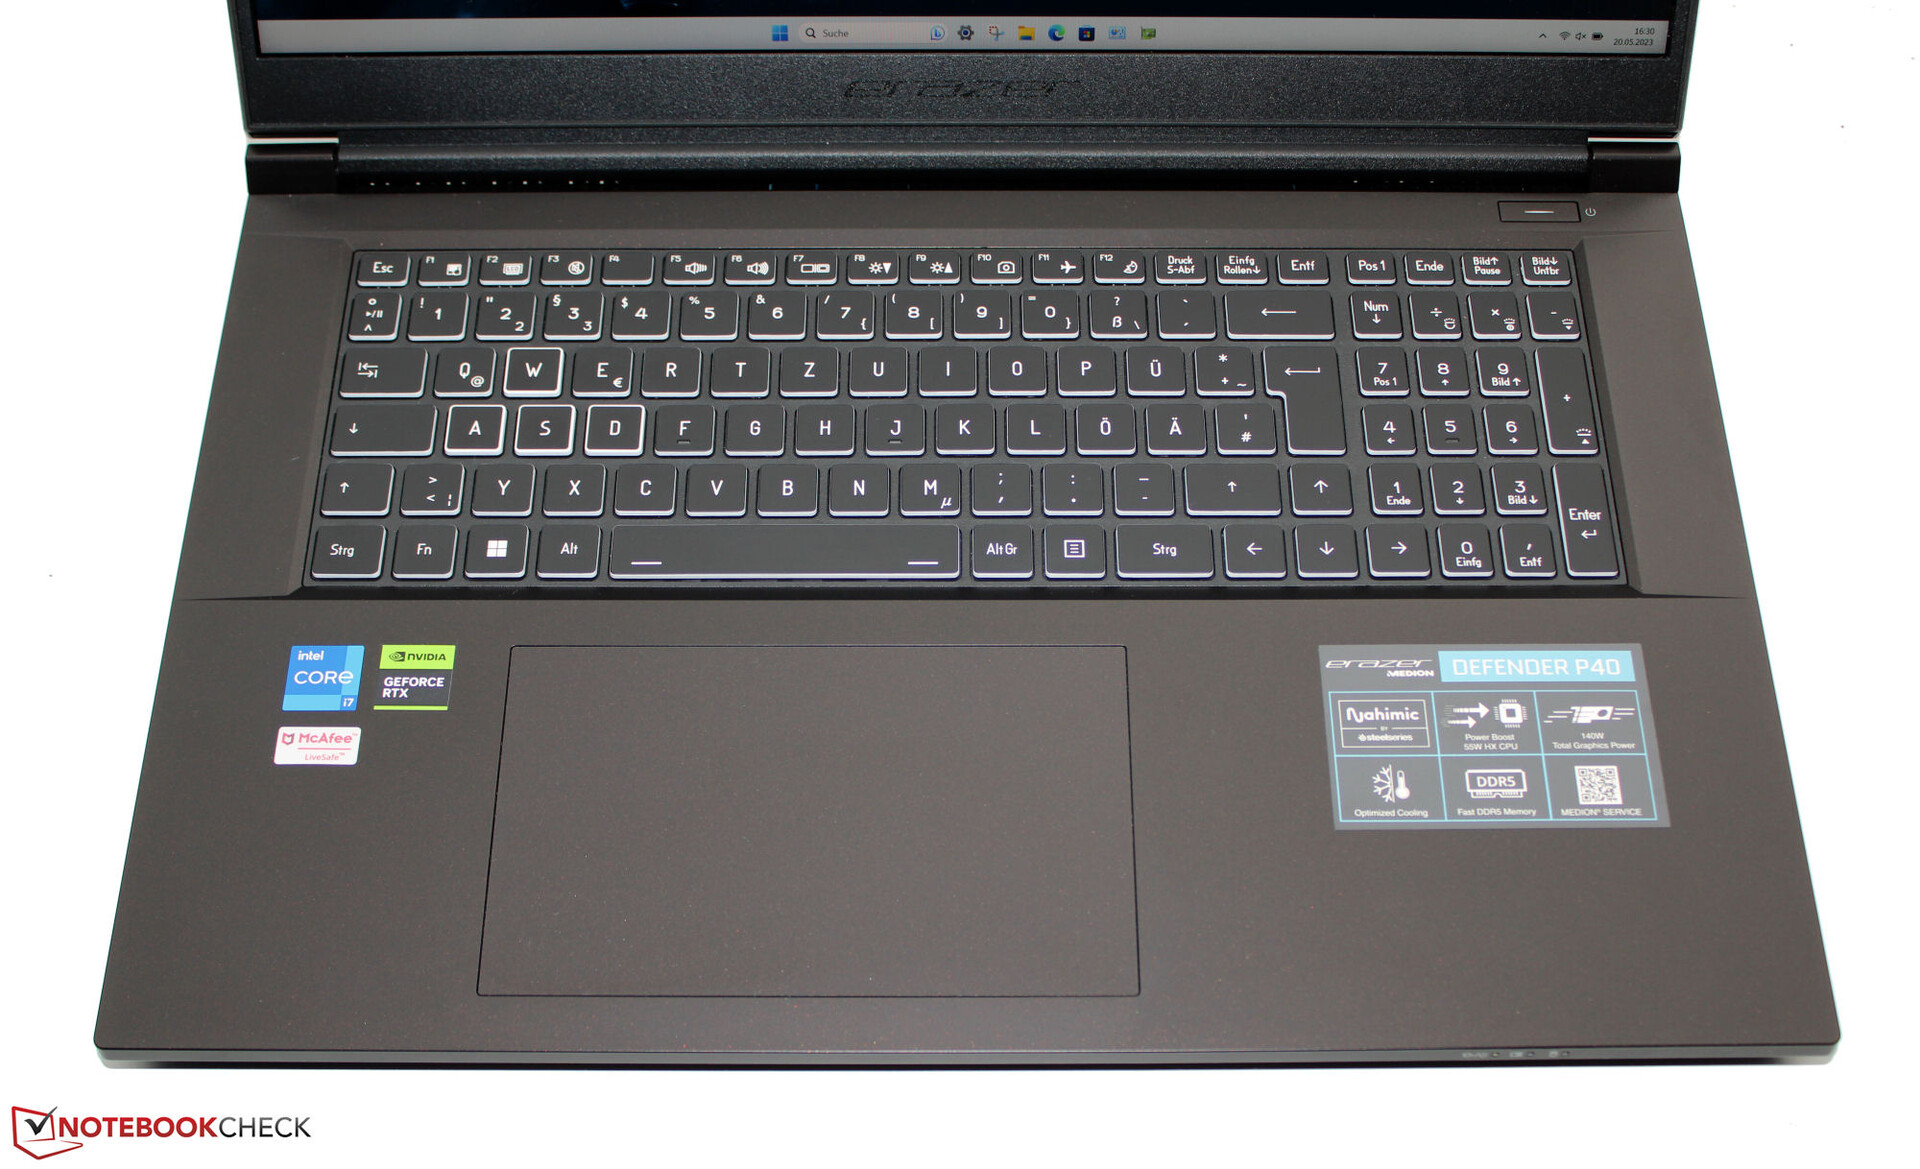
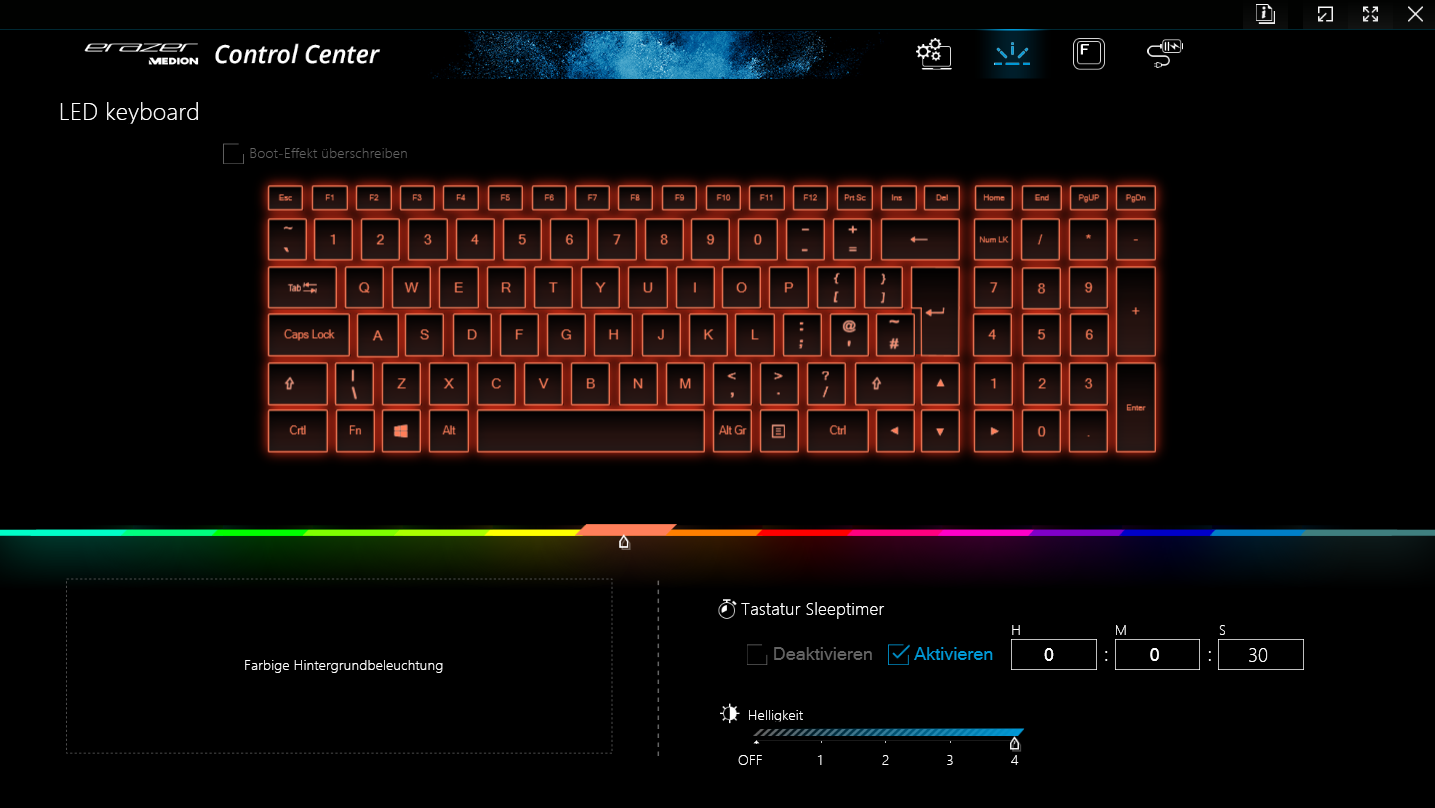
Dispositivos de entrada - O teclado do P40 é retroiluminado por RGB
Teclado
O teclado chiclet iluminado (4 níveis) do laptop (incluindo um teclado numérico) é composto por teclas suaves e uniformes. Elas têm uma elevação curta, um ponto de pressão claro e um bom nível de resistência. Quando você digita, as teclas têm uma leve elasticidade, mas isso não deve ser muito incômodo. Em suma, a Medion forneceu um teclado adequado para o uso diário.
Touchpad
Um click pad (cerca de 15,1 x 9,2 cm) substitui a necessidade de um mouse - ele tem uma superfície lisa sobre a qual os dedos podem deslizar facilmente. Ele tem uma elevação curta e um ponto de pressão claro.
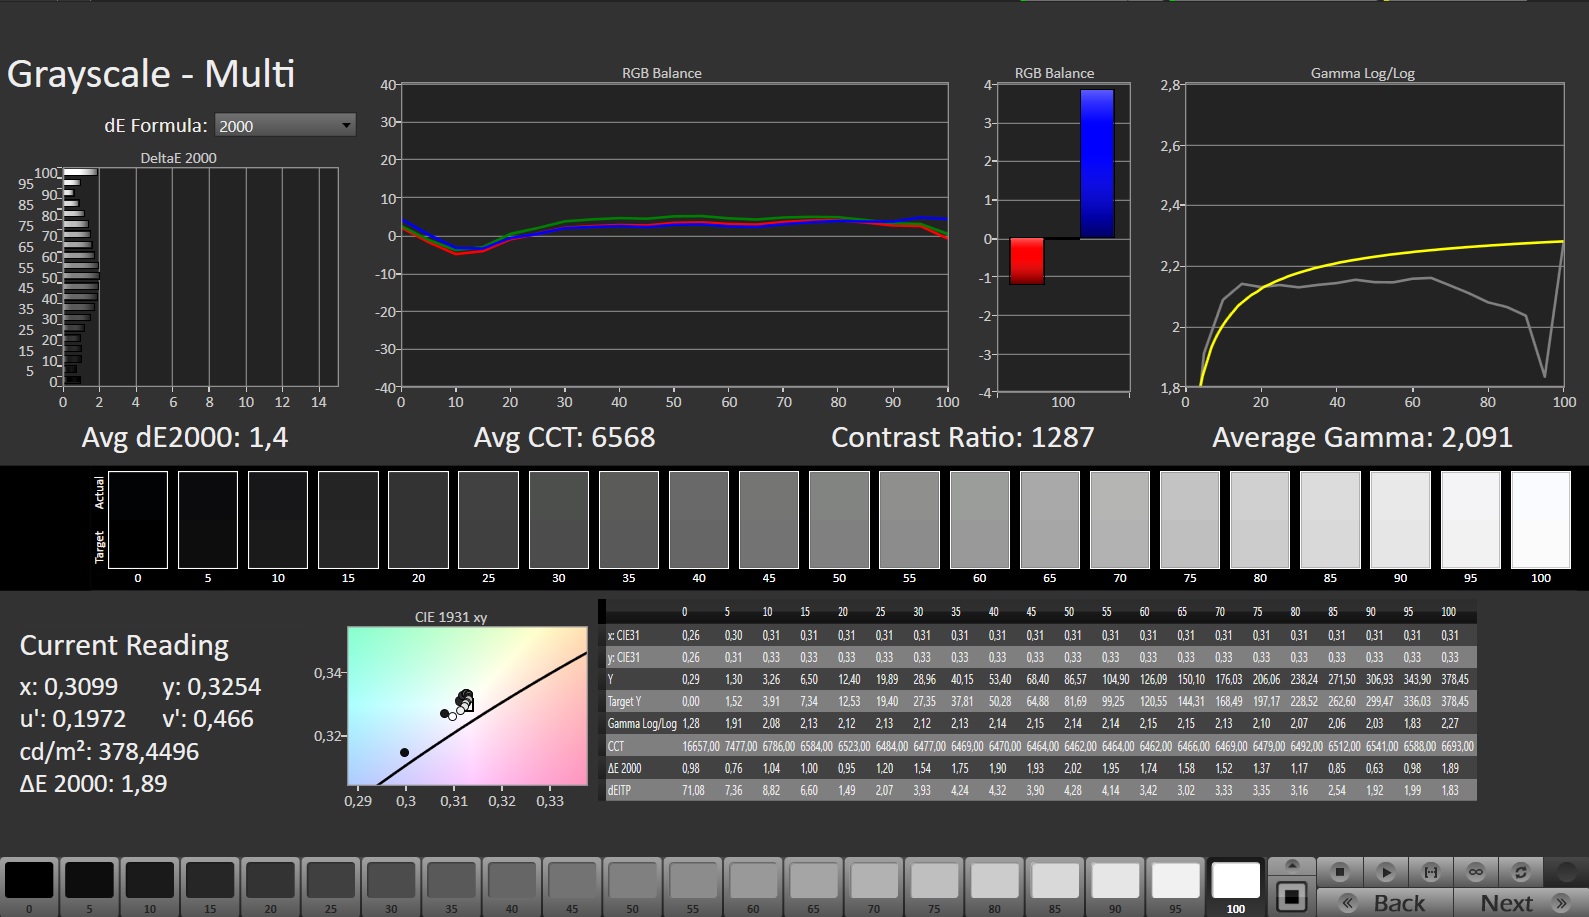
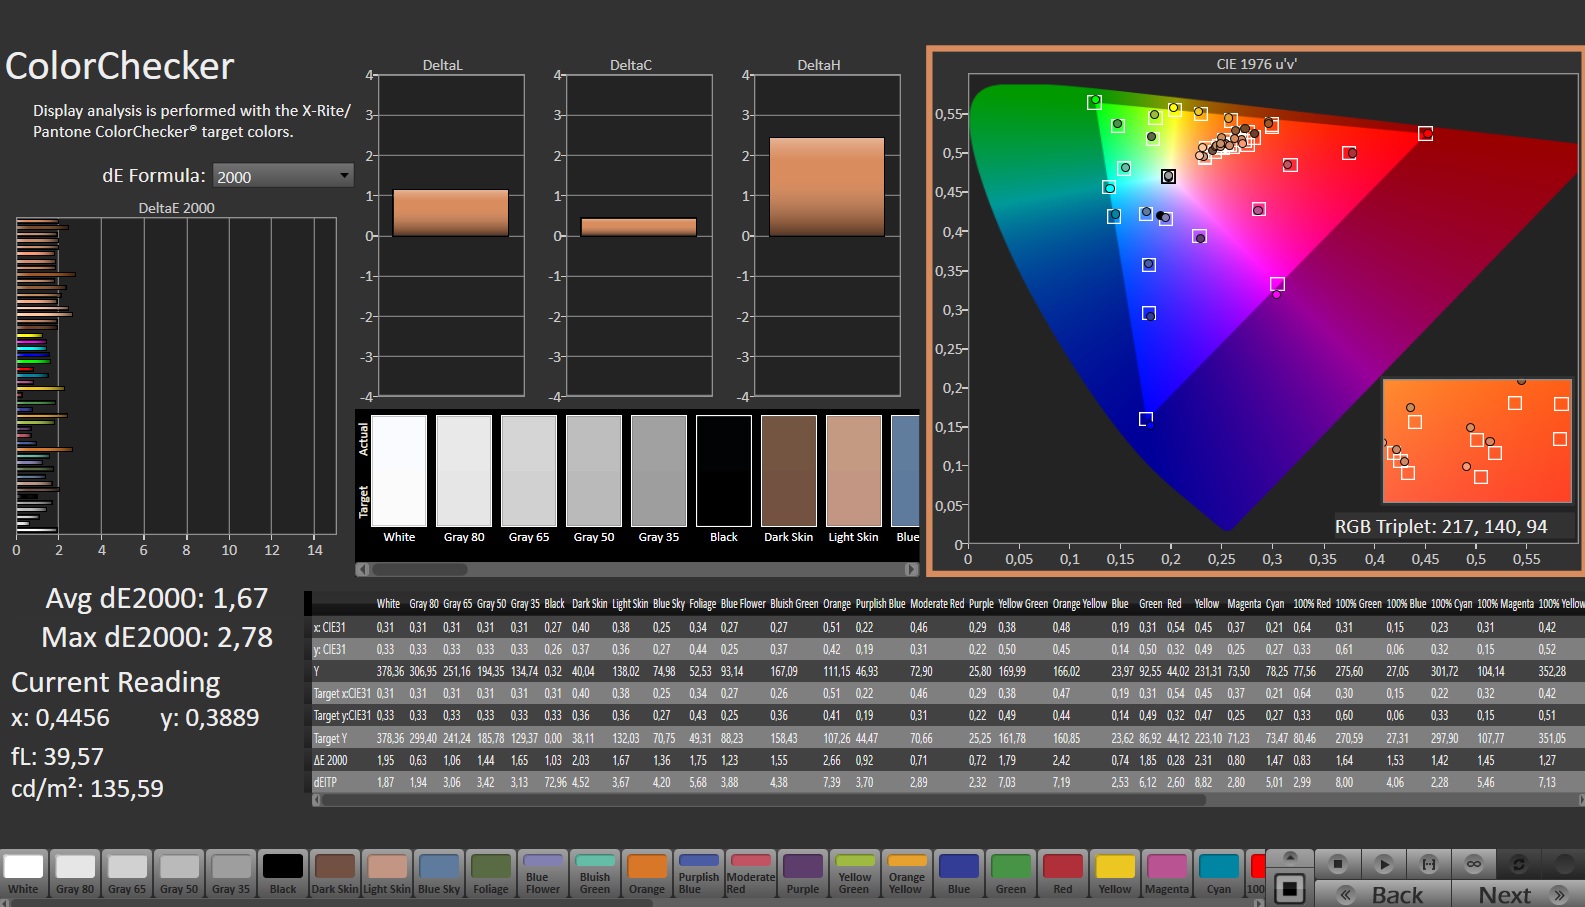
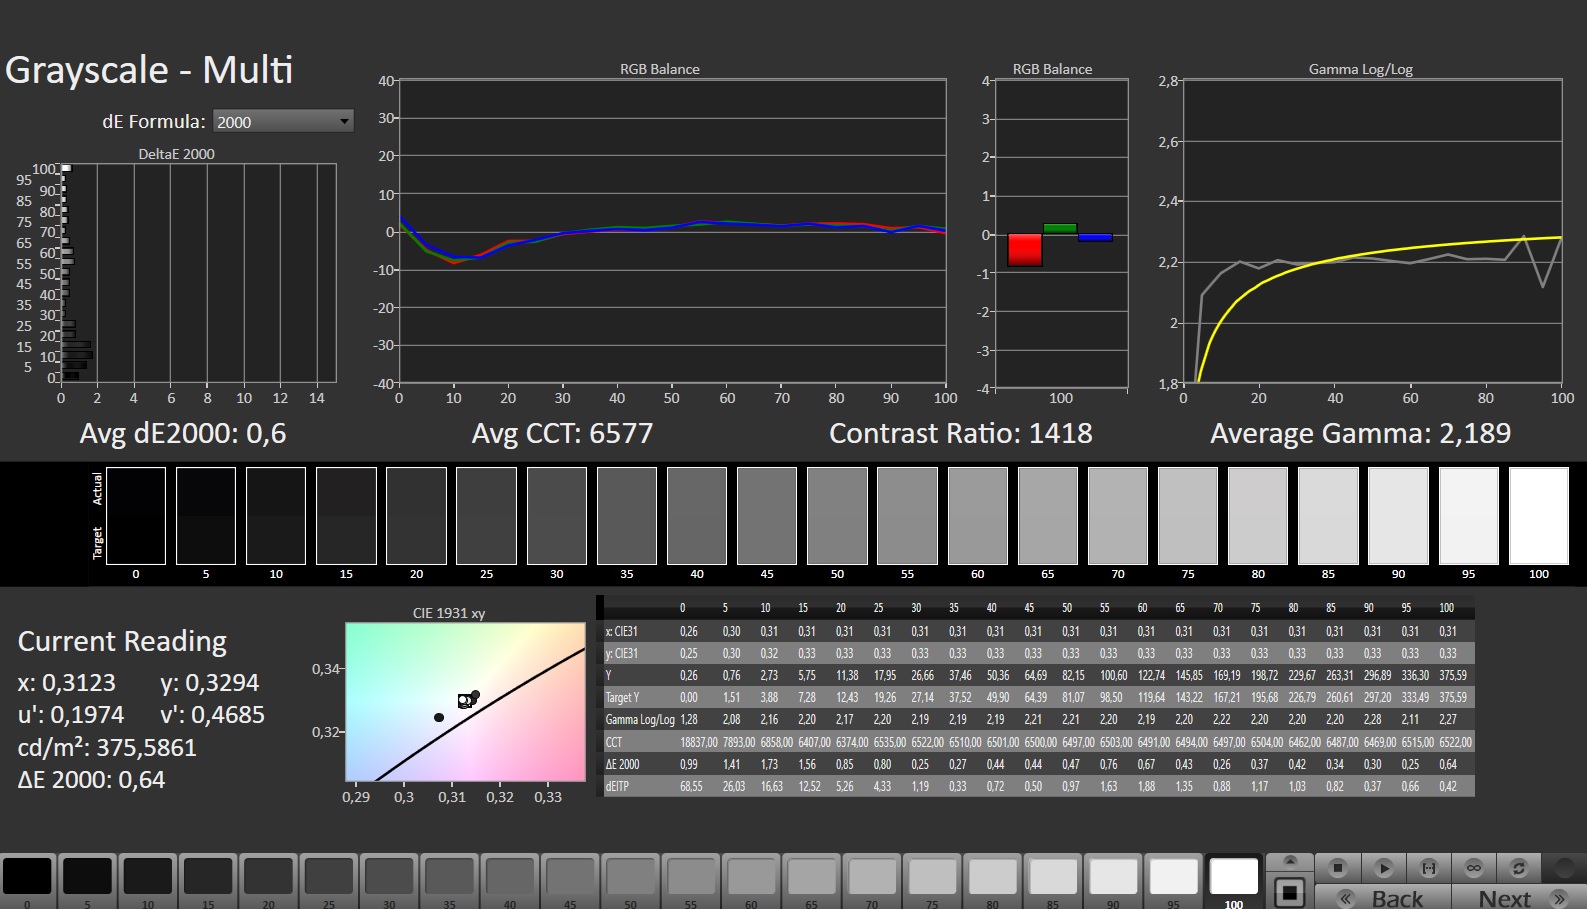
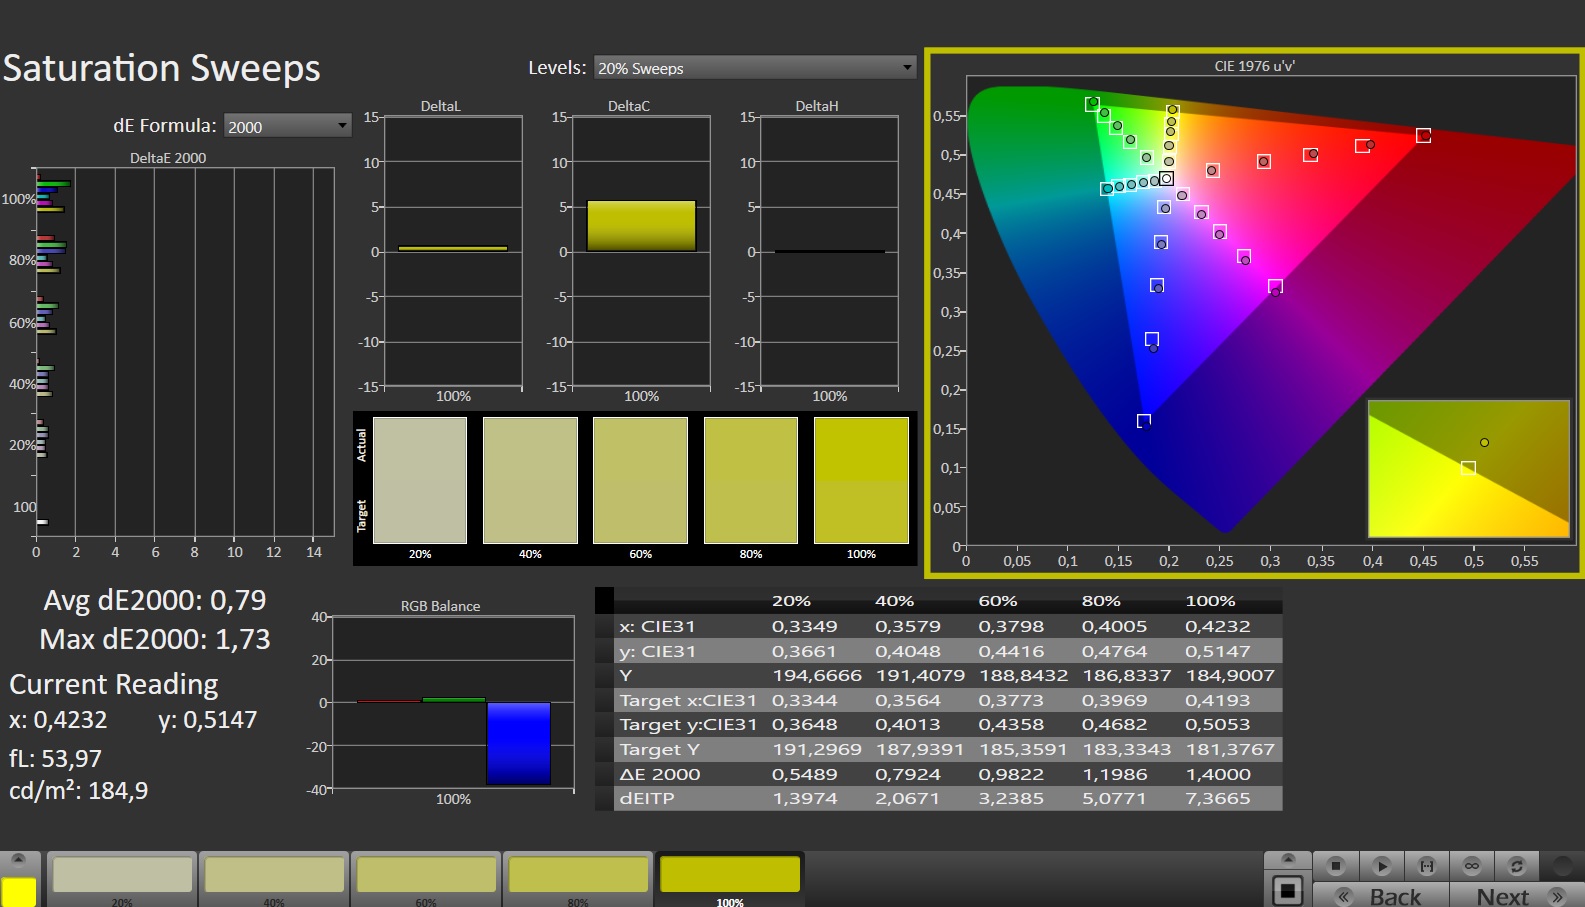
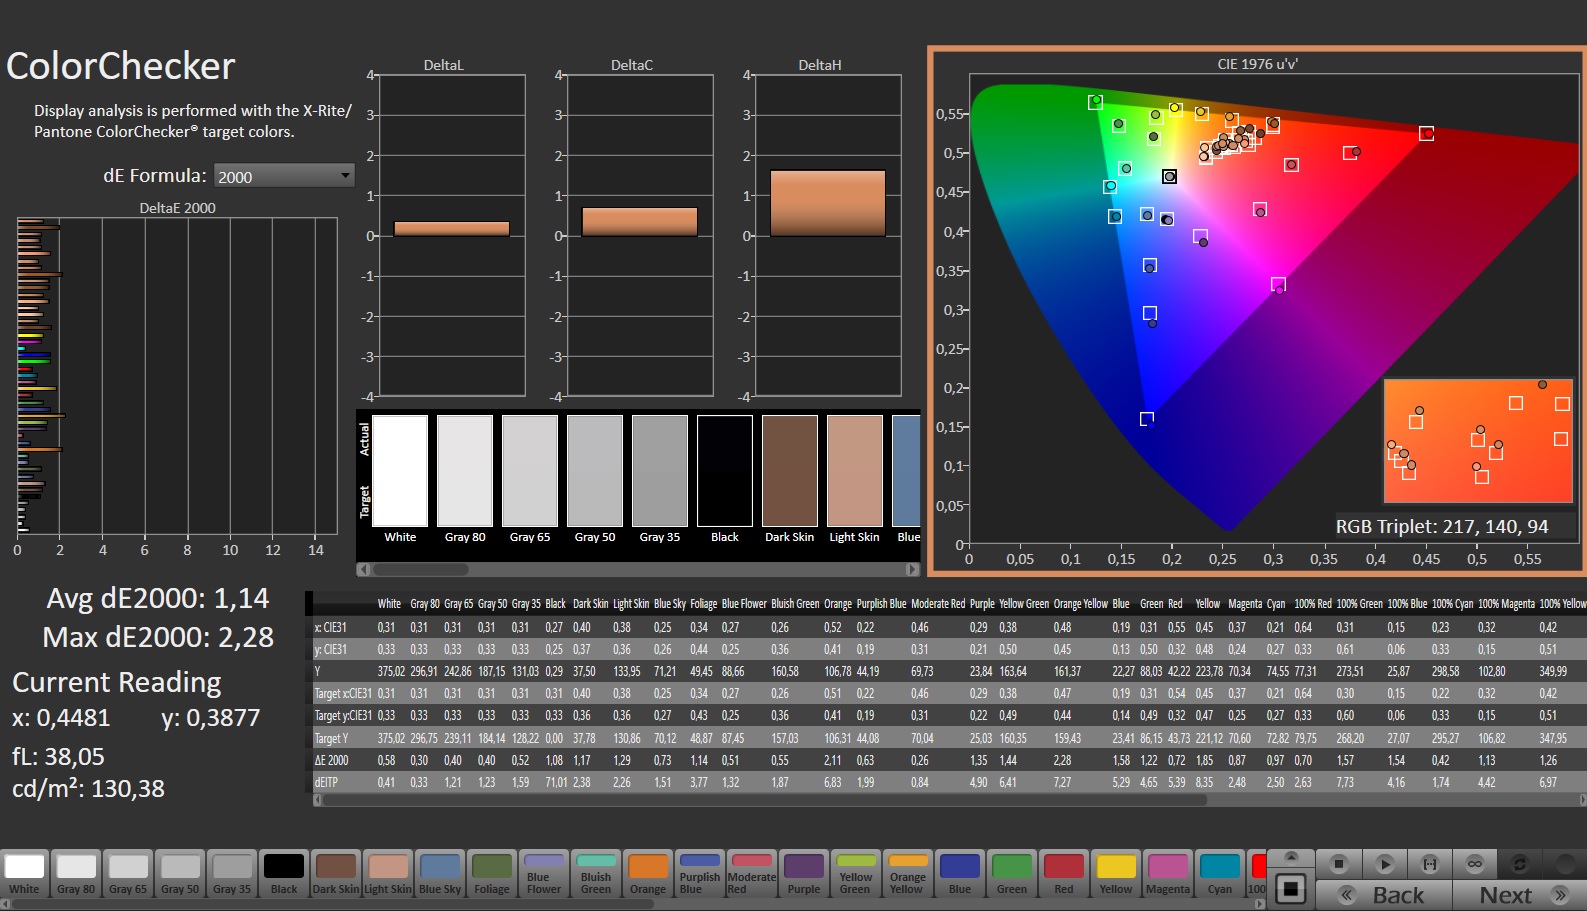
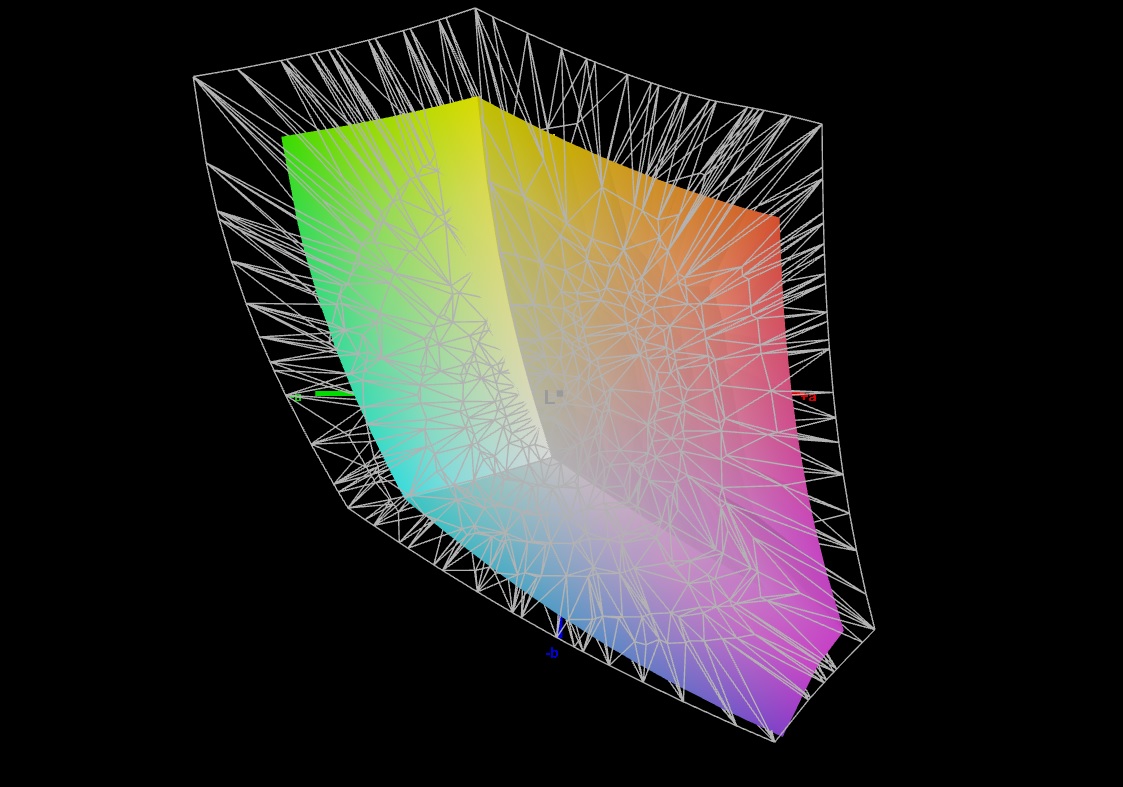
Tela - Tela QHD com cobertura sRGB
O painel swift de 240 Hz com formato 16:9 não apresenta oscilação de PWM em nenhum nível de brilho. O brilho e o contraste da tela de 17,3 polegadas (2.560 x 1.440 pixels) são exatamente como deveriam ser (> 300 cd/m² ou 1.000:1). A Medion não oferece nenhuma outra opção de tela.
| |||||||||||||||||||||||||
iluminação: 86 %
iluminação com acumulador: 364 cd/m²
Contraste: 1300:1 (Preto: 0.28 cd/m²)
ΔE ColorChecker Calman: 1.67 | ∀{0.5-29.43 Ø4.71}
calibrated: 1.14
ΔE Greyscale Calman: 1.4 | ∀{0.09-98 Ø4.96}
69.8% AdobeRGB 1998 (Argyll 3D)
98.1% sRGB (Argyll 3D)
68.3% Display P3 (Argyll 3D)
Gamma: 2.091
CCT: 6568 K
| Medion Erazer Defender P40 BOE CQ NE173QHM-NZ3, IPS, 2560x1440, 17.3" | MSI Katana 17 B13VFK B173HAN04.9, IPS LED, 1920x1080, 17.3" | Acer Predator Helios 300 (i7-12700H, RTX 3070 Ti) BOE0A1A, IPS, 2560x1440, 17.3" | Lenovo Legion Pro 5 16IRX8 AU Optronics B160QAN03.1, IPS, 2560x1600, 16" | Asus TUF Gaming A16 FA617 NE160WUM-NX2 (BOE0B33), IPS-Level, 1920x1200, 16" | Gigabyte G7 KE AU Optronics B173HAN05.1, IPS, 1920x1080, 17.3" | |
|---|---|---|---|---|---|---|
| Display | -39% | 22% | 3% | 1% | 3% | |
| Display P3 Coverage (%) | 68.3 | 40.8 -40% | 96.8 42% | 71.2 4% | 69.4 2% | 70.4 3% |
| sRGB Coverage (%) | 98.1 | 61 -38% | 99.9 2% | 98.8 1% | 97.8 0% | 99.8 2% |
| AdobeRGB 1998 Coverage (%) | 69.8 | 42.2 -40% | 84.8 21% | 73.3 5% | 70.9 2% | 71.7 3% |
| Response Times | -163% | -21% | -10% | -16% | 36% | |
| Response Time Grey 50% / Grey 80% * (ms) | 14.6 ? | 33 ? -126% | 16.4 ? -12% | 14.5 ? 1% | 17 ? -16% | 5 ? 66% |
| Response Time Black / White * (ms) | 8.7 ? | 26 ? -199% | 11.2 ? -29% | 10.4 ? -20% | 10.1 ? -16% | 8.3 ? 5% |
| PWM Frequency (Hz) | ||||||
| Screen | -126% | -59% | -2% | -5% | -6% | |
| Brightness middle (cd/m²) | 364 | 267 -27% | 366 1% | 405.7 11% | 308 -15% | 307 -16% |
| Brightness (cd/m²) | 343 | 256 -25% | 340 -1% | 368 7% | 293 -15% | 301 -12% |
| Brightness Distribution (%) | 86 | 93 8% | 85 -1% | 87 1% | 90 5% | 93 8% |
| Black Level * (cd/m²) | 0.28 | 0.21 25% | 0.31 -11% | 0.38 -36% | 0.23 18% | 0.2 29% |
| Contrast (:1) | 1300 | 1271 -2% | 1181 -9% | 1068 -18% | 1339 3% | 1535 18% |
| Colorchecker dE 2000 * | 1.67 | 4.7 -181% | 3.56 -113% | 1.65 1% | 1.47 12% | 1.32 21% |
| Colorchecker dE 2000 max. * | 2.78 | 20.4 -634% | 5.66 -104% | 4.2 -51% | 2.98 -7% | 4.6 -65% |
| Colorchecker dE 2000 calibrated * | 1.14 | 4.5 -295% | 3.31 -190% | 0.53 54% | 1.02 11% | 1.03 10% |
| Greyscale dE 2000 * | 1.4 | 1.5 -7% | 2.84 -103% | 1.2 14% | 2.2 -57% | 2.1 -50% |
| Gamma | 2.091 105% | 2.12 104% | 2.29 96% | 2.3 96% | 2.228 99% | 2.247 98% |
| CCT | 6568 99% | 6552 99% | 6835 95% | 6453 101% | 6228 104% | 6815 95% |
| Média Total (Programa/Configurações) | -109% /
-113% | -19% /
-36% | -3% /
-2% | -7% /
-5% | 11% /
2% |
* ... menor é melhor
Ex funciona, a tela já tem uma ótima representação de cores: Um desvio de cerca de 1,7 é aceitável (DeltaE < 3). A calibração leva a um desvio menor de 1,13 e a tons de cinza mais equilibrados.
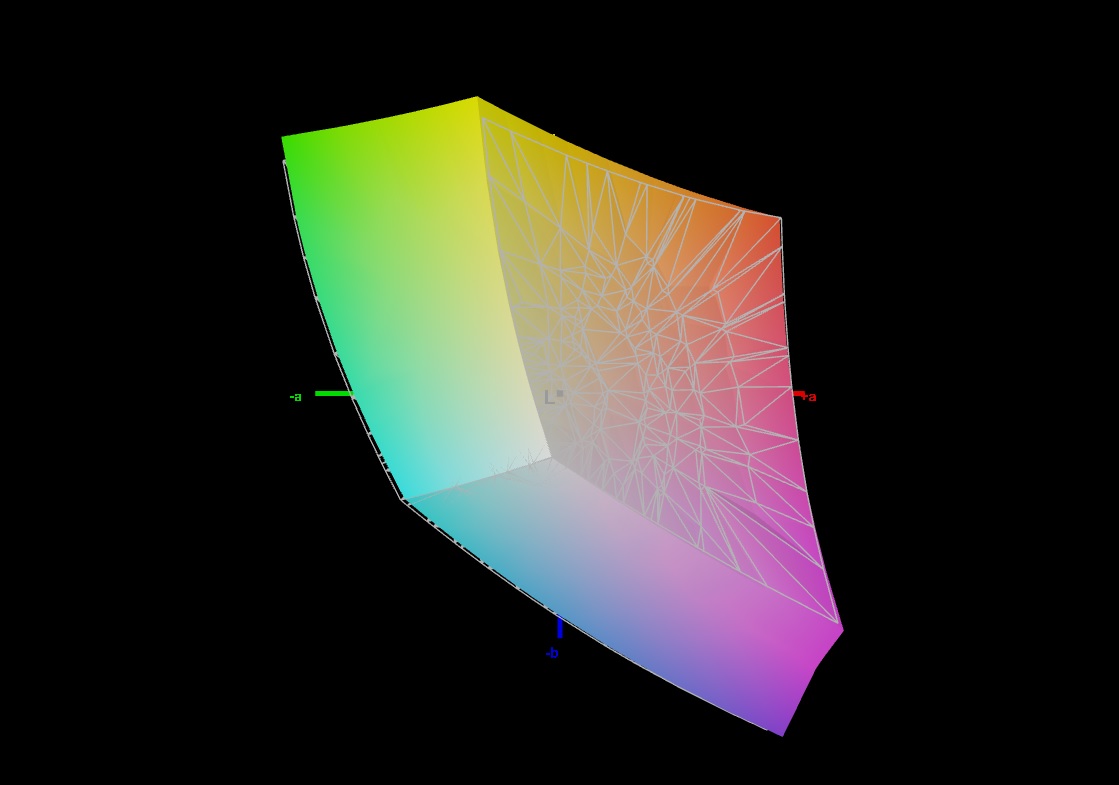
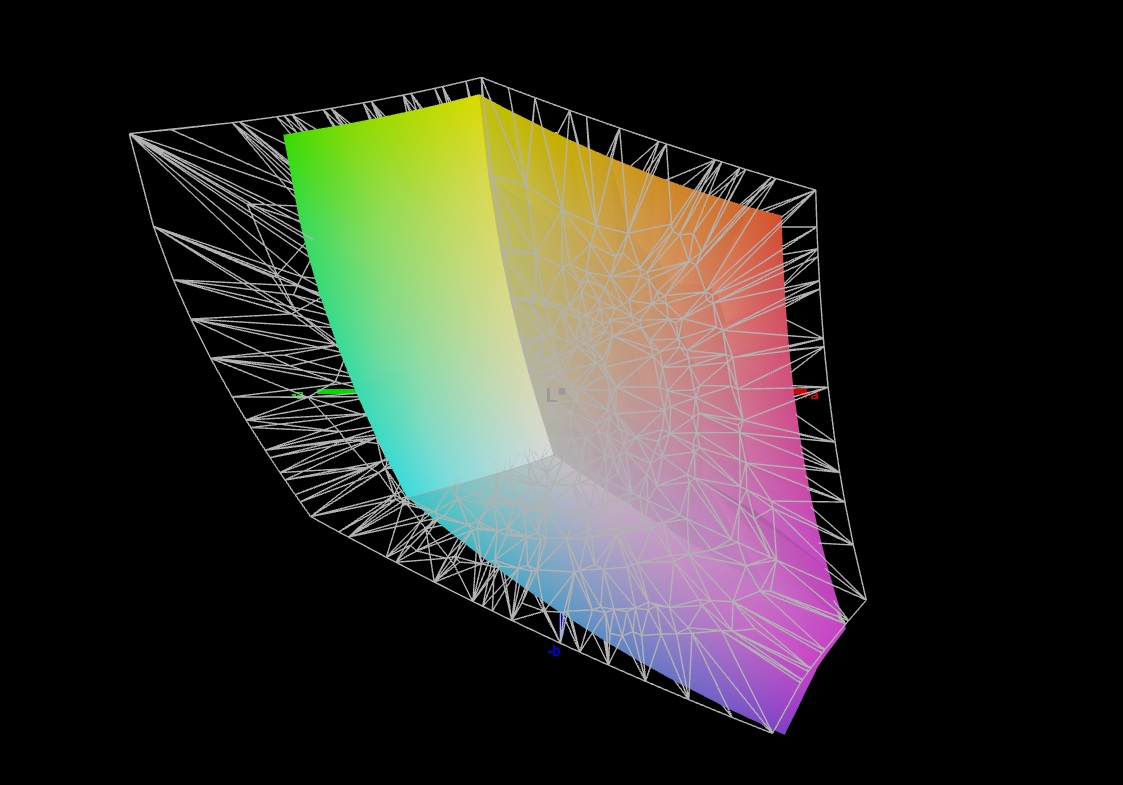
O painel cobre todo o espaço de cores sRGB, mas não o AdobeRGB ou o DCI P3. Isso não é muito diferente dos concorrentes do dispositivo. Somente a tela do Acer Predator Revisão do Acer Predator Helios 300: Laptop de jogos com overclocking e uma boa tela pode representar o espaço P3.

Exibir tempos de resposta
| ↔ Tempo de resposta preto para branco | ||
|---|---|---|
| 8.7 ms ... ascensão ↗ e queda ↘ combinadas | ↗ 3.6 ms ascensão | 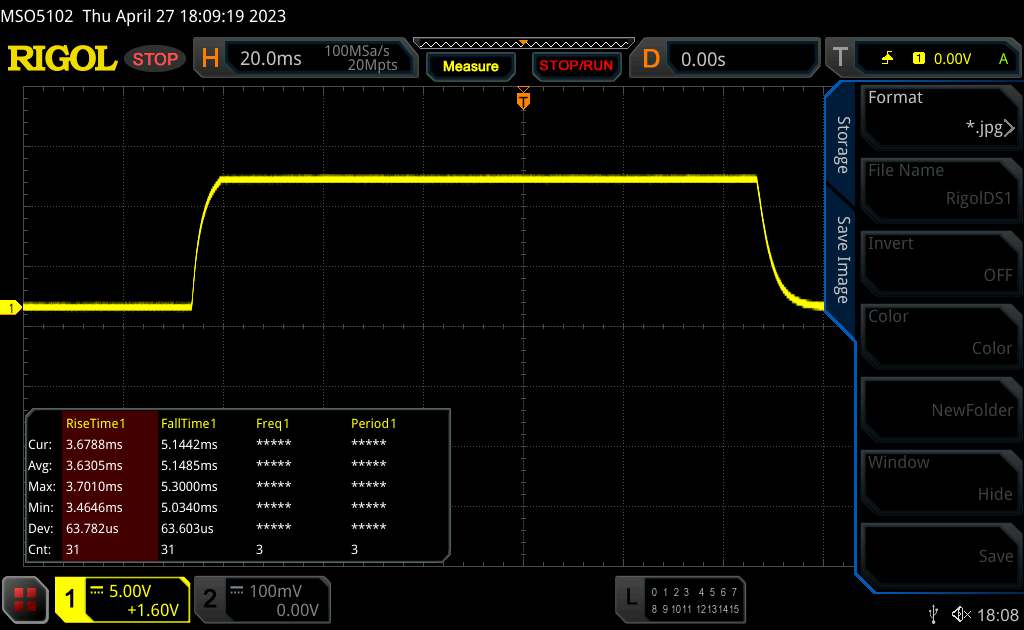 |
| ↘ 5.1 ms queda | ||
| A tela mostra taxas de resposta rápidas em nossos testes e deve ser adequada para jogos. Em comparação, todos os dispositivos testados variam de 0.1 (mínimo) a 240 (máximo) ms. » 24 % de todos os dispositivos são melhores. Isso significa que o tempo de resposta medido é melhor que a média de todos os dispositivos testados (19.8 ms). | ||
| ↔ Tempo de resposta 50% cinza a 80% cinza | ||
| 14.6 ms ... ascensão ↗ e queda ↘ combinadas | ↗ 7.1 ms ascensão | 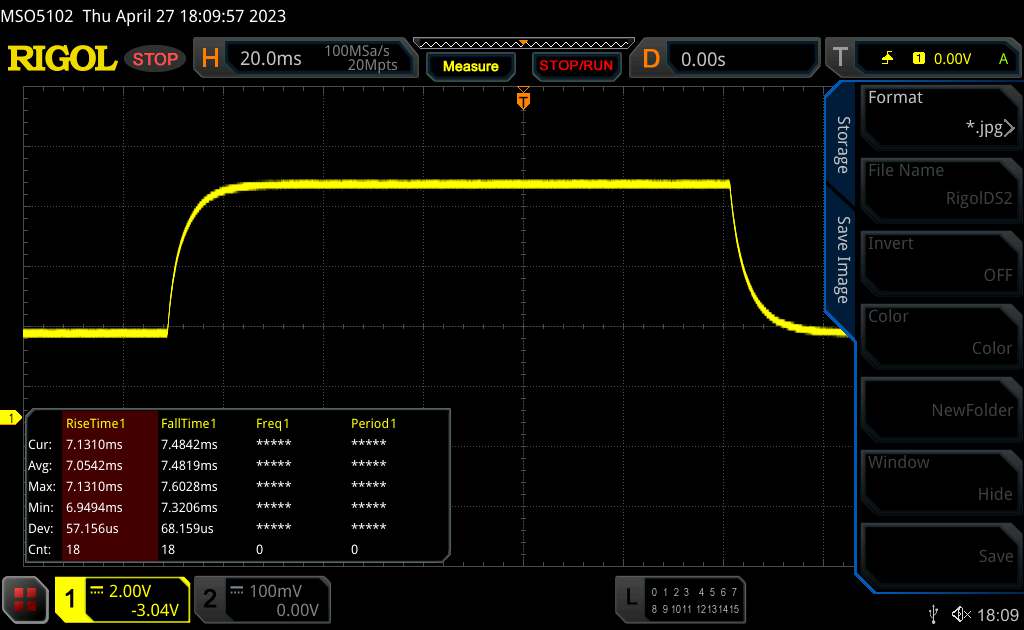 |
| ↘ 7.5 ms queda | ||
| A tela mostra boas taxas de resposta em nossos testes, mas pode ser muito lenta para jogadores competitivos. Em comparação, todos os dispositivos testados variam de 0.165 (mínimo) a 636 (máximo) ms. » 29 % de todos os dispositivos são melhores. Isso significa que o tempo de resposta medido é melhor que a média de todos os dispositivos testados (31 ms). | ||
Cintilação da tela / PWM (modulação por largura de pulso)
| Tela tremeluzindo / PWM não detectado | 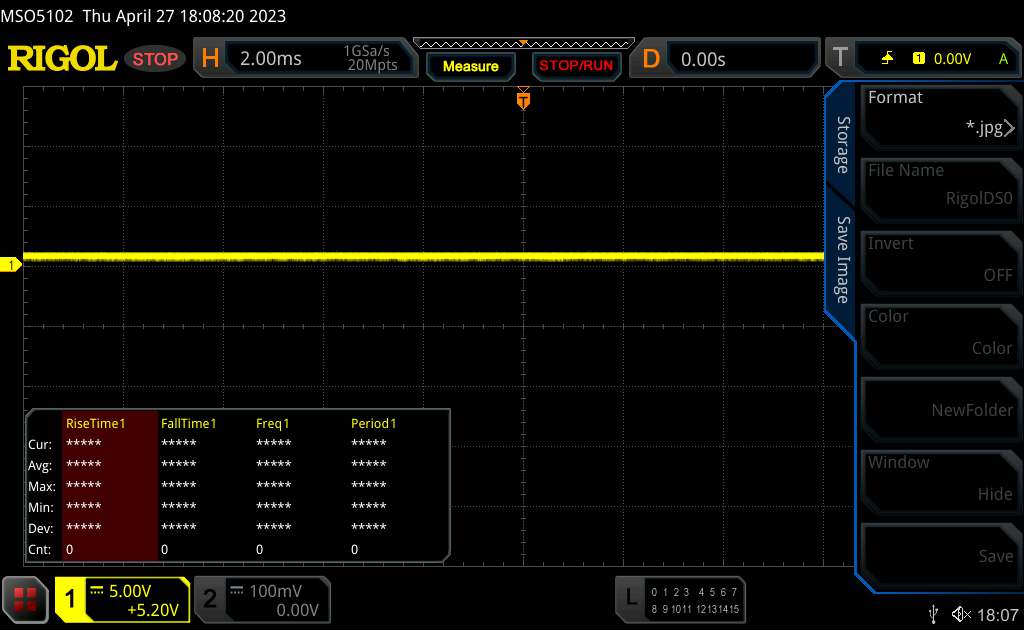 | ||
[pwm_comparison] Em comparação: 52 % de todos os dispositivos testados não usam PWM para escurecer a tela. Se PWM foi detectado, uma média de 7754 (mínimo: 5 - máximo: 343500) Hz foi medida. | |||
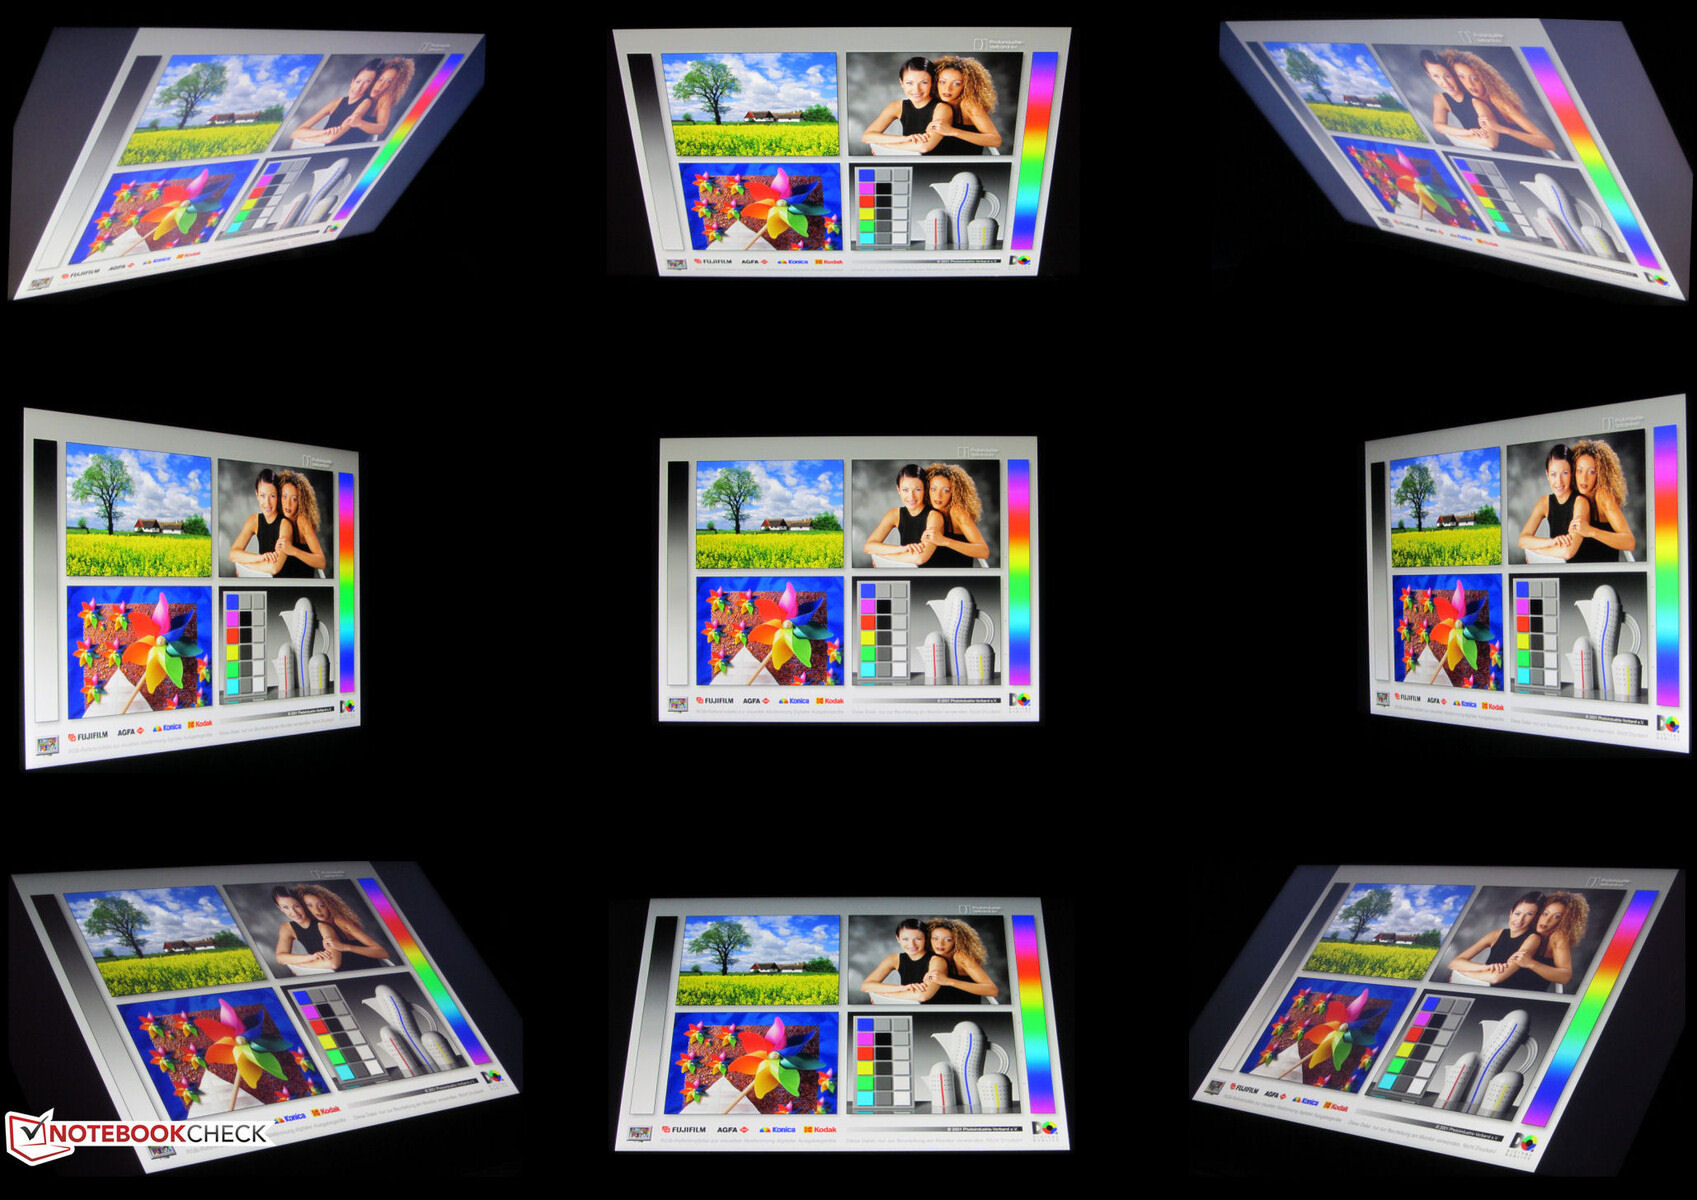
O painel IBS estável com ângulo de visão permanece legível em qualquer posição. Em ambientes externos, a tela permanece legível, desde que o sol não esteja brilhando muito forte.
Desempenho - O computador Erazer apresenta hardware de médio porte
O Erazer Defender P40 da Medion é um laptop para jogos QHD de médio porte. Raptor Lake e Ada Lovelace oferecem o desempenho de processamento necessário. O modelo atual pode ser adquirido por cerca de US$ 1.900 - outros modelos com recursos diferentes não estão disponíveis.
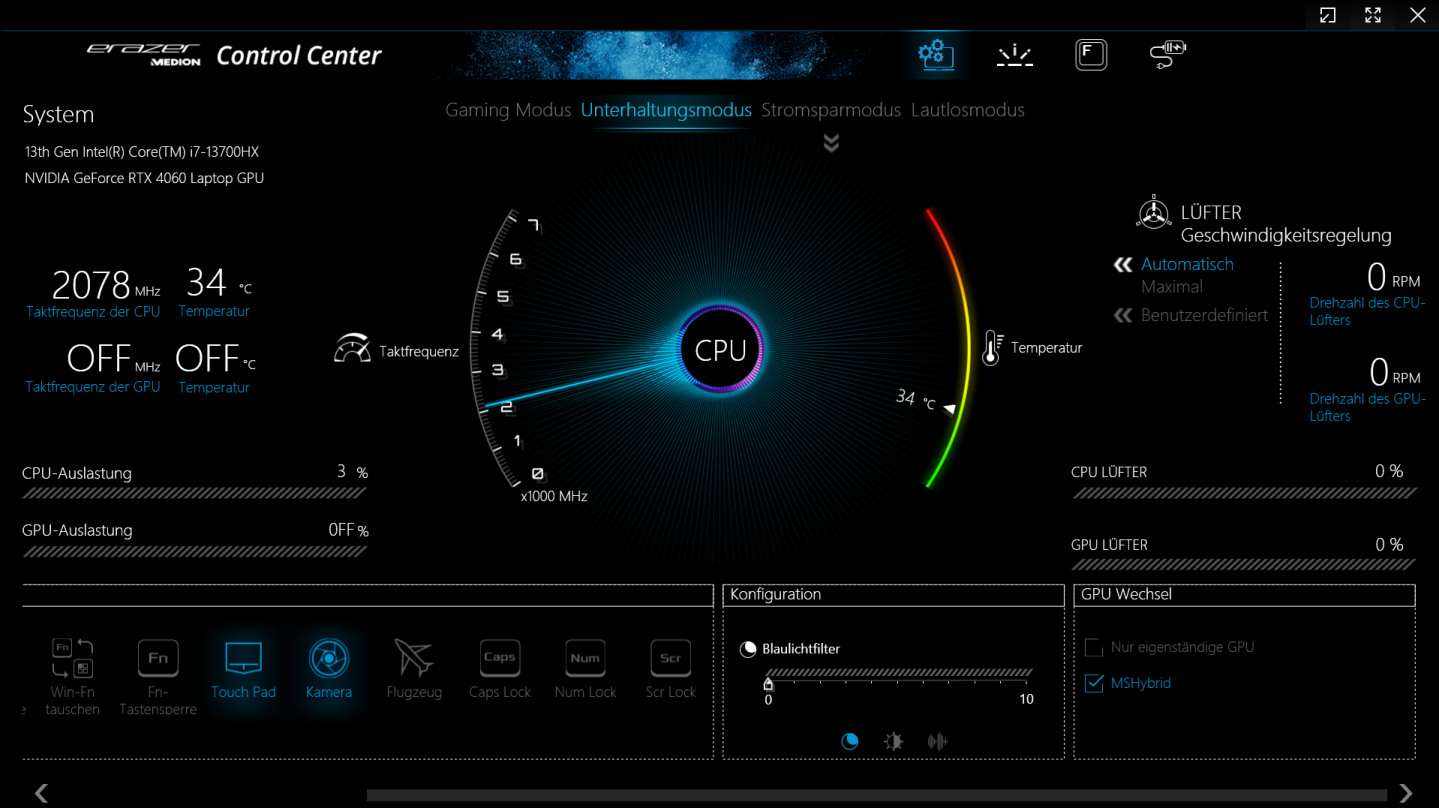
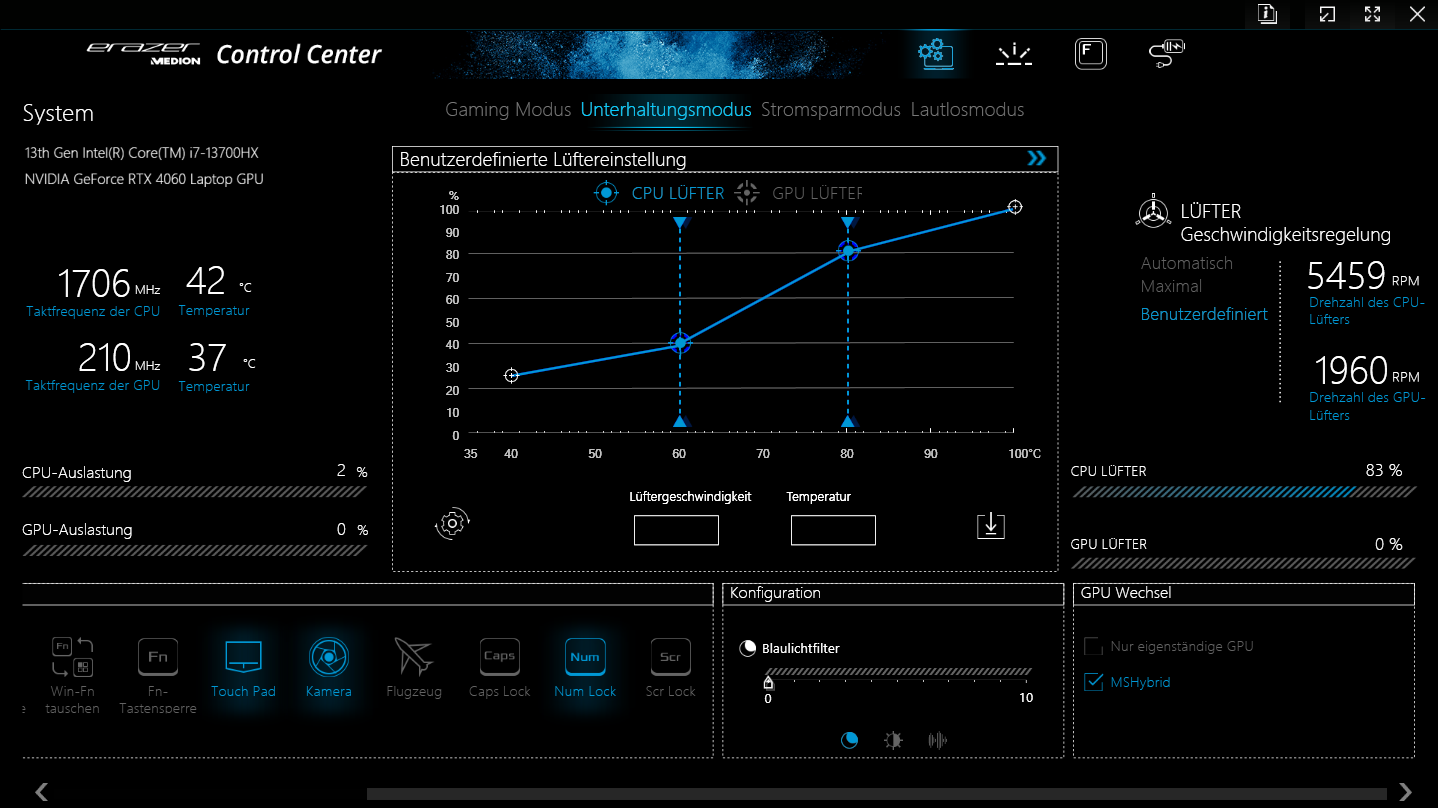
Condições de teste
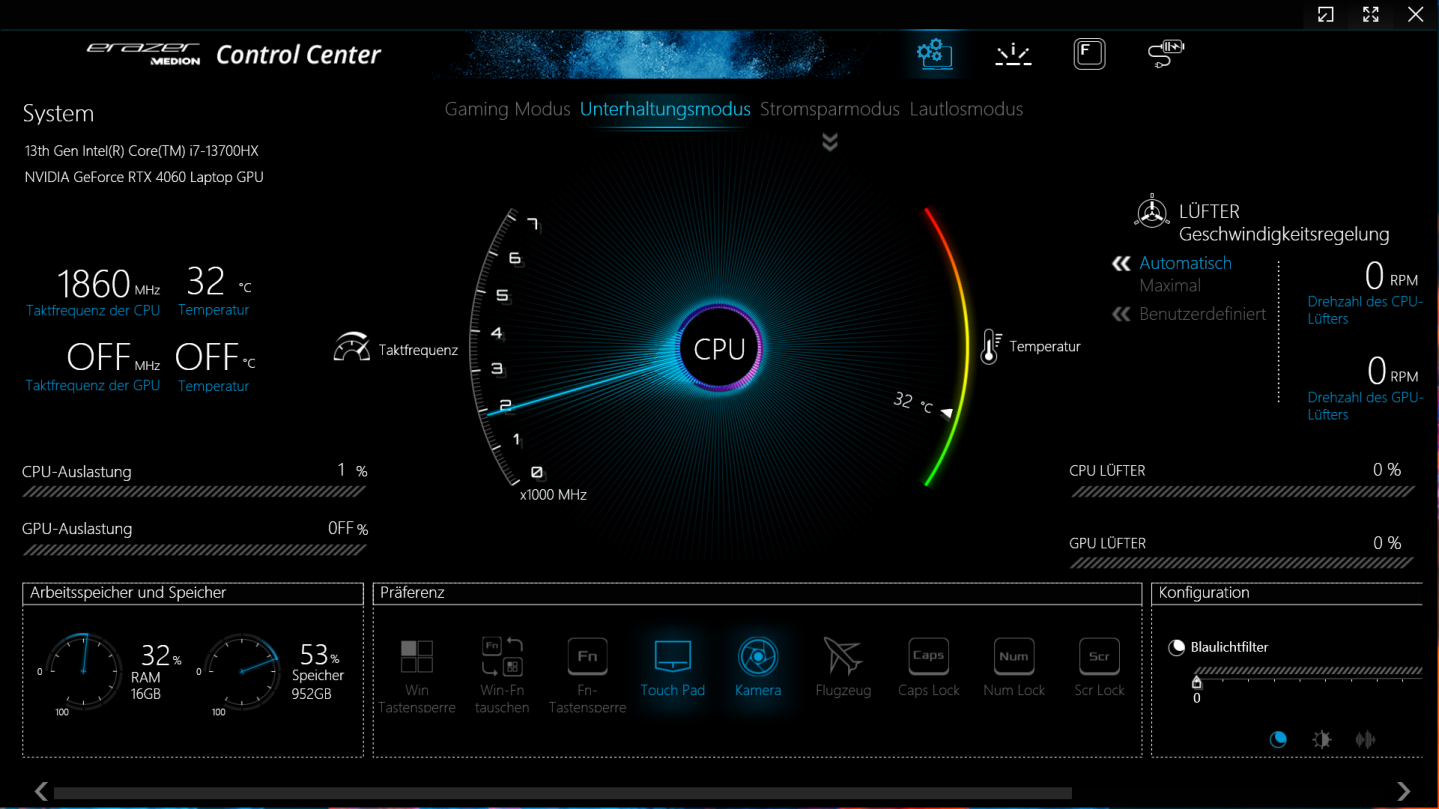
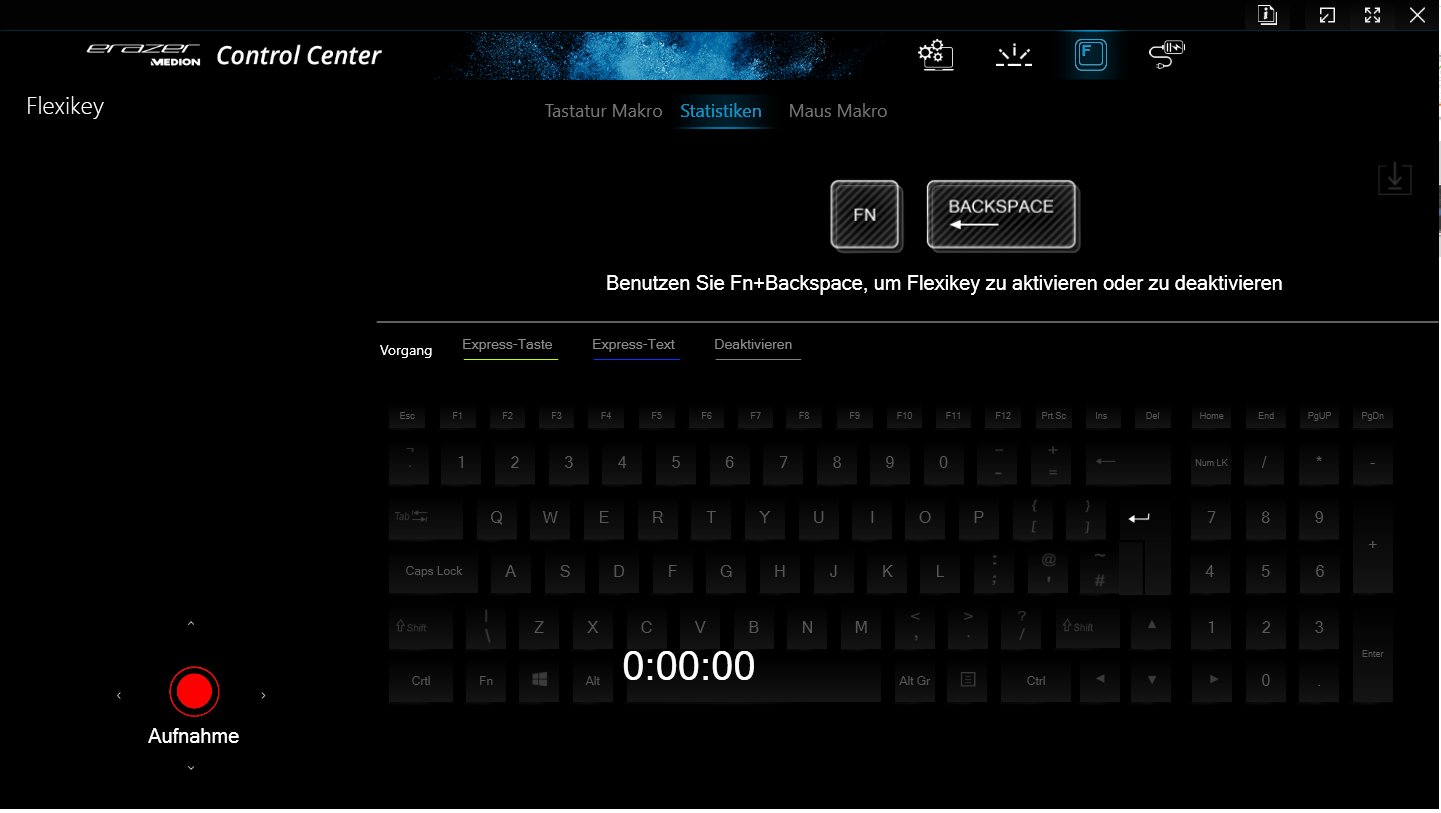
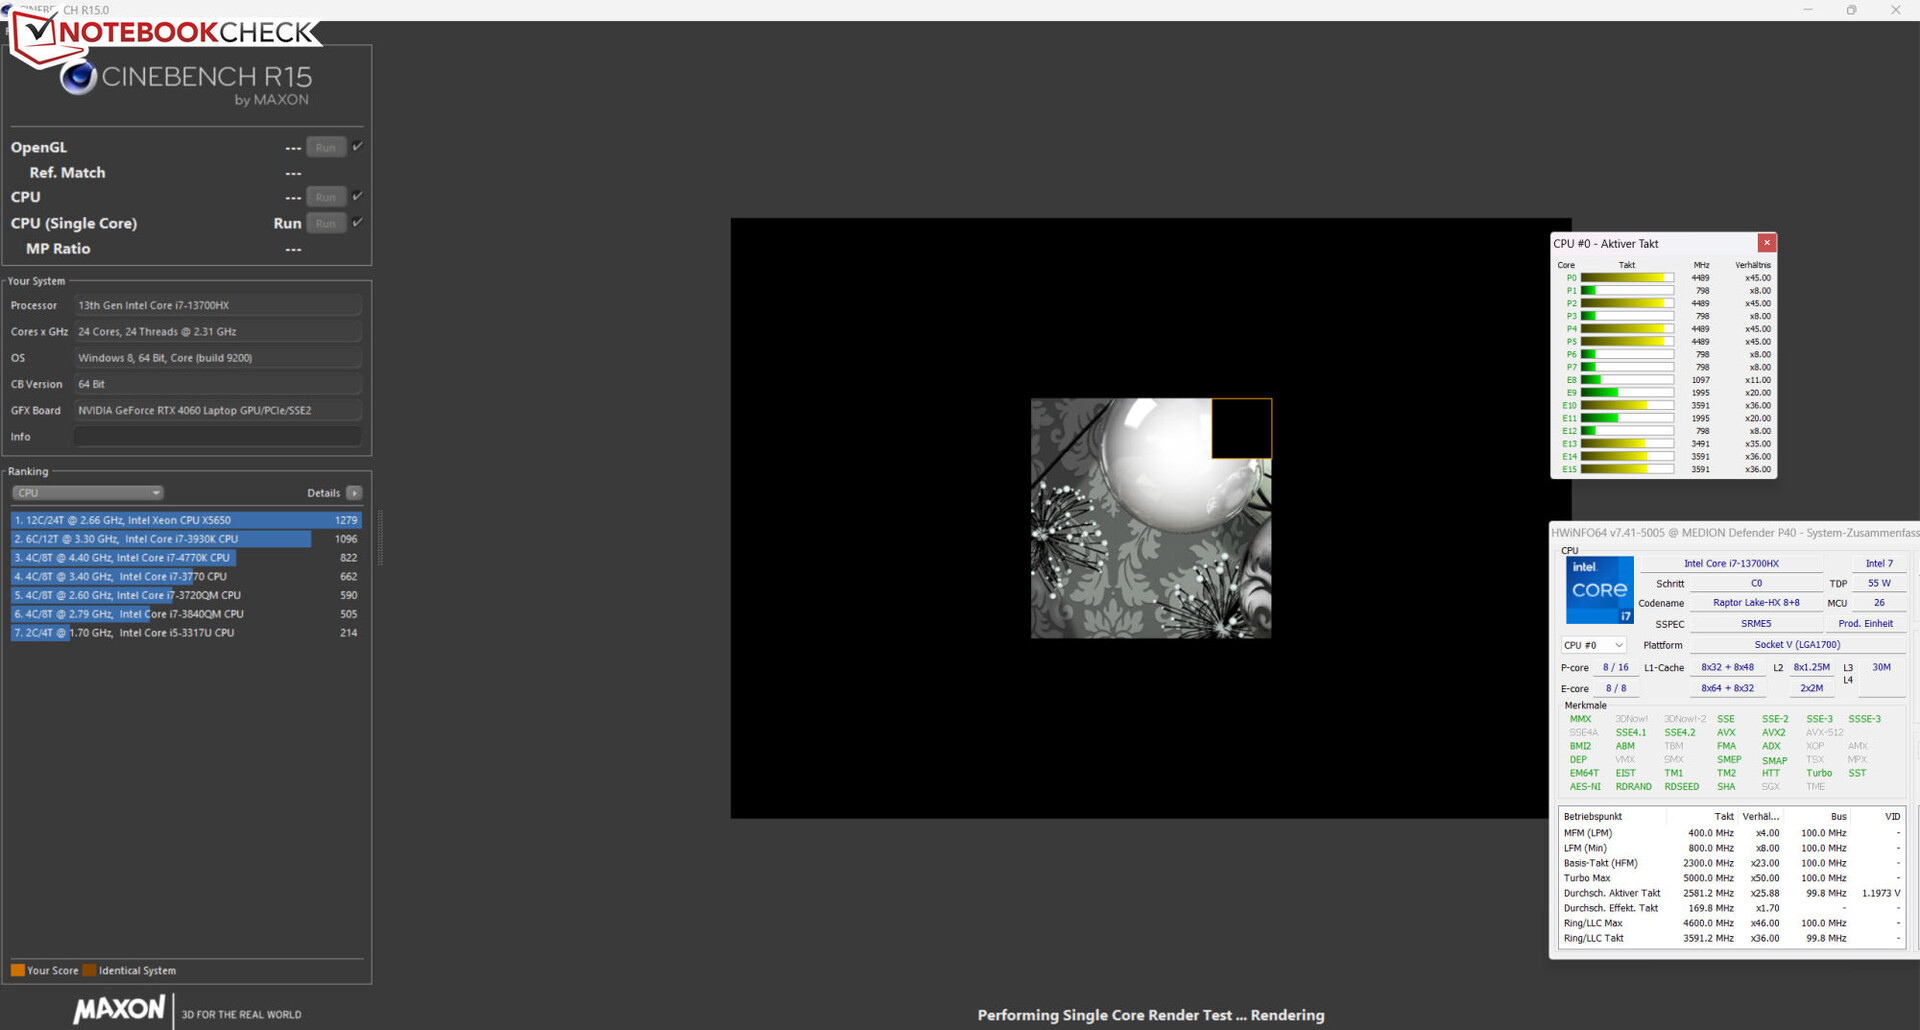
O P40 tem quatro modos de desempenho específicos do fabricante (consulte a tabela) que podem ser alternados por meio do software da central de controle do laptop. Usamos o "modo de entretenimento" (benchmarks) e o "modo de economia de energia" (testes de bateria; desativa a RTX 4060). O Optimus foi ativado. Também testamos os outros dois modos: o "modo de jogo" leva a melhorias no desempenho da CPU e o "modo silencioso" permite jogos com menos emissões de ruído.
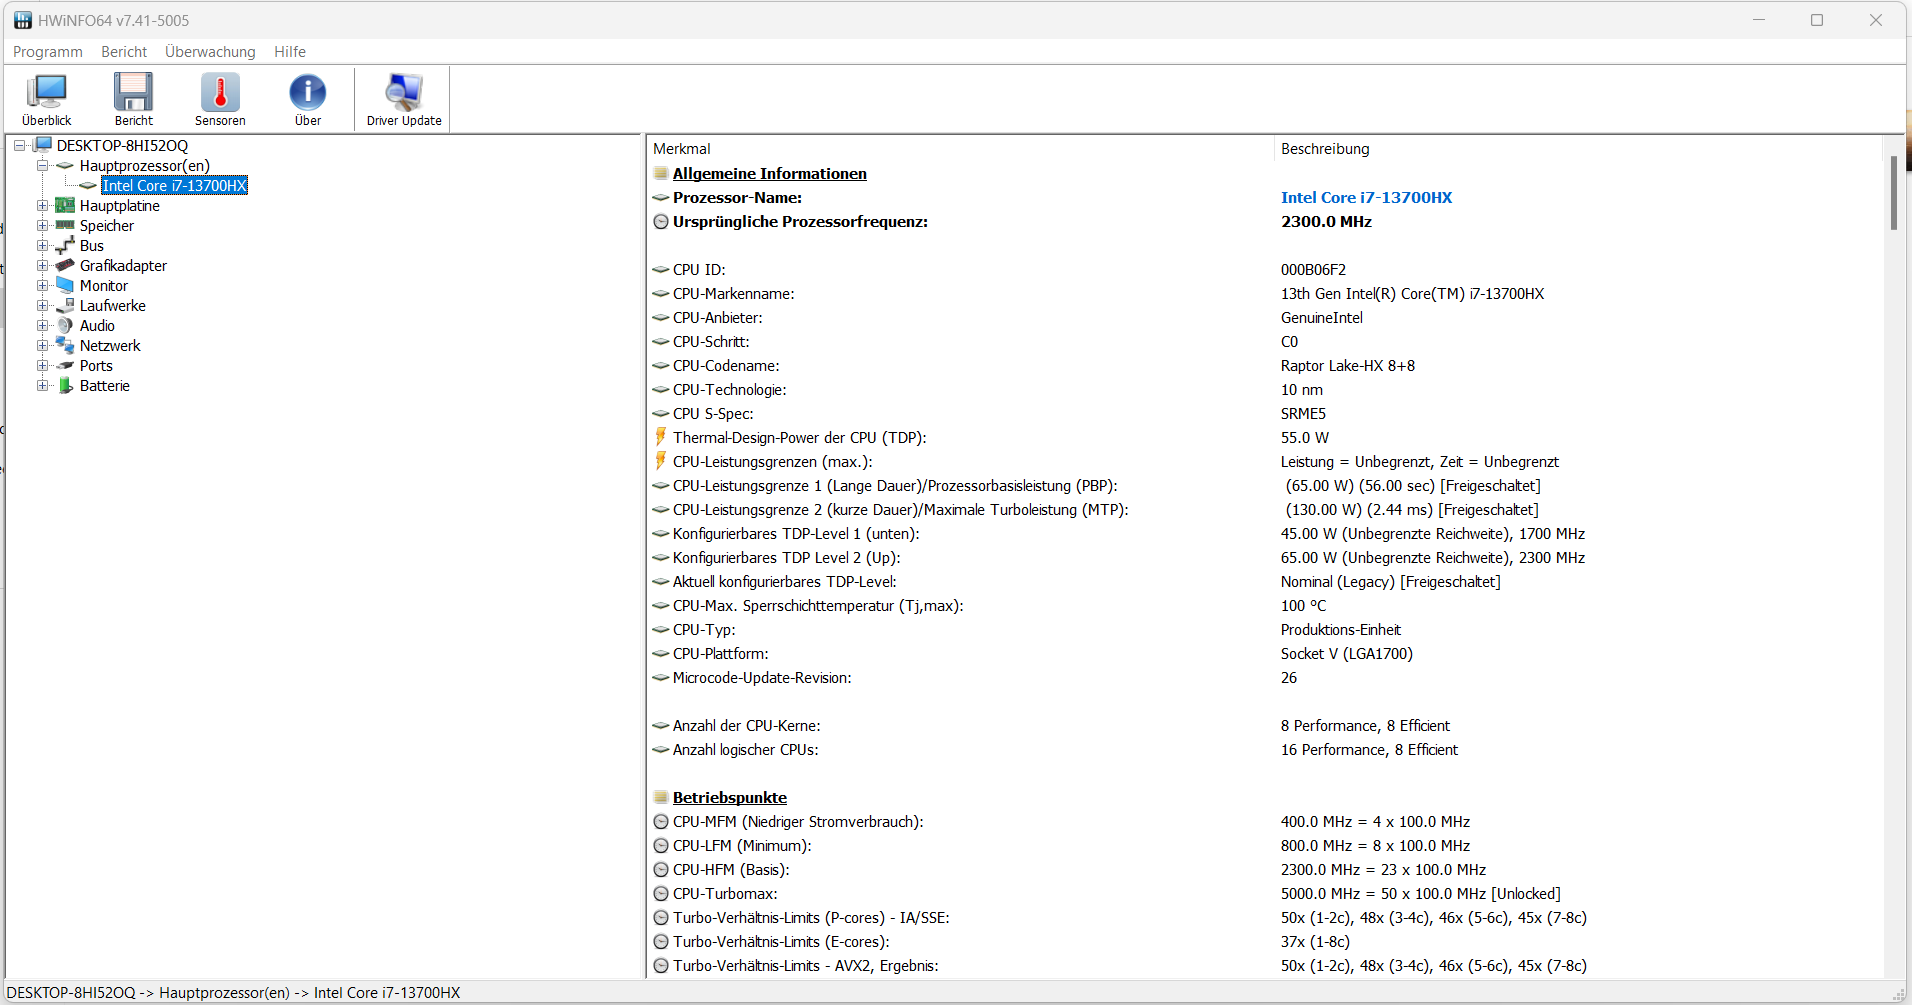
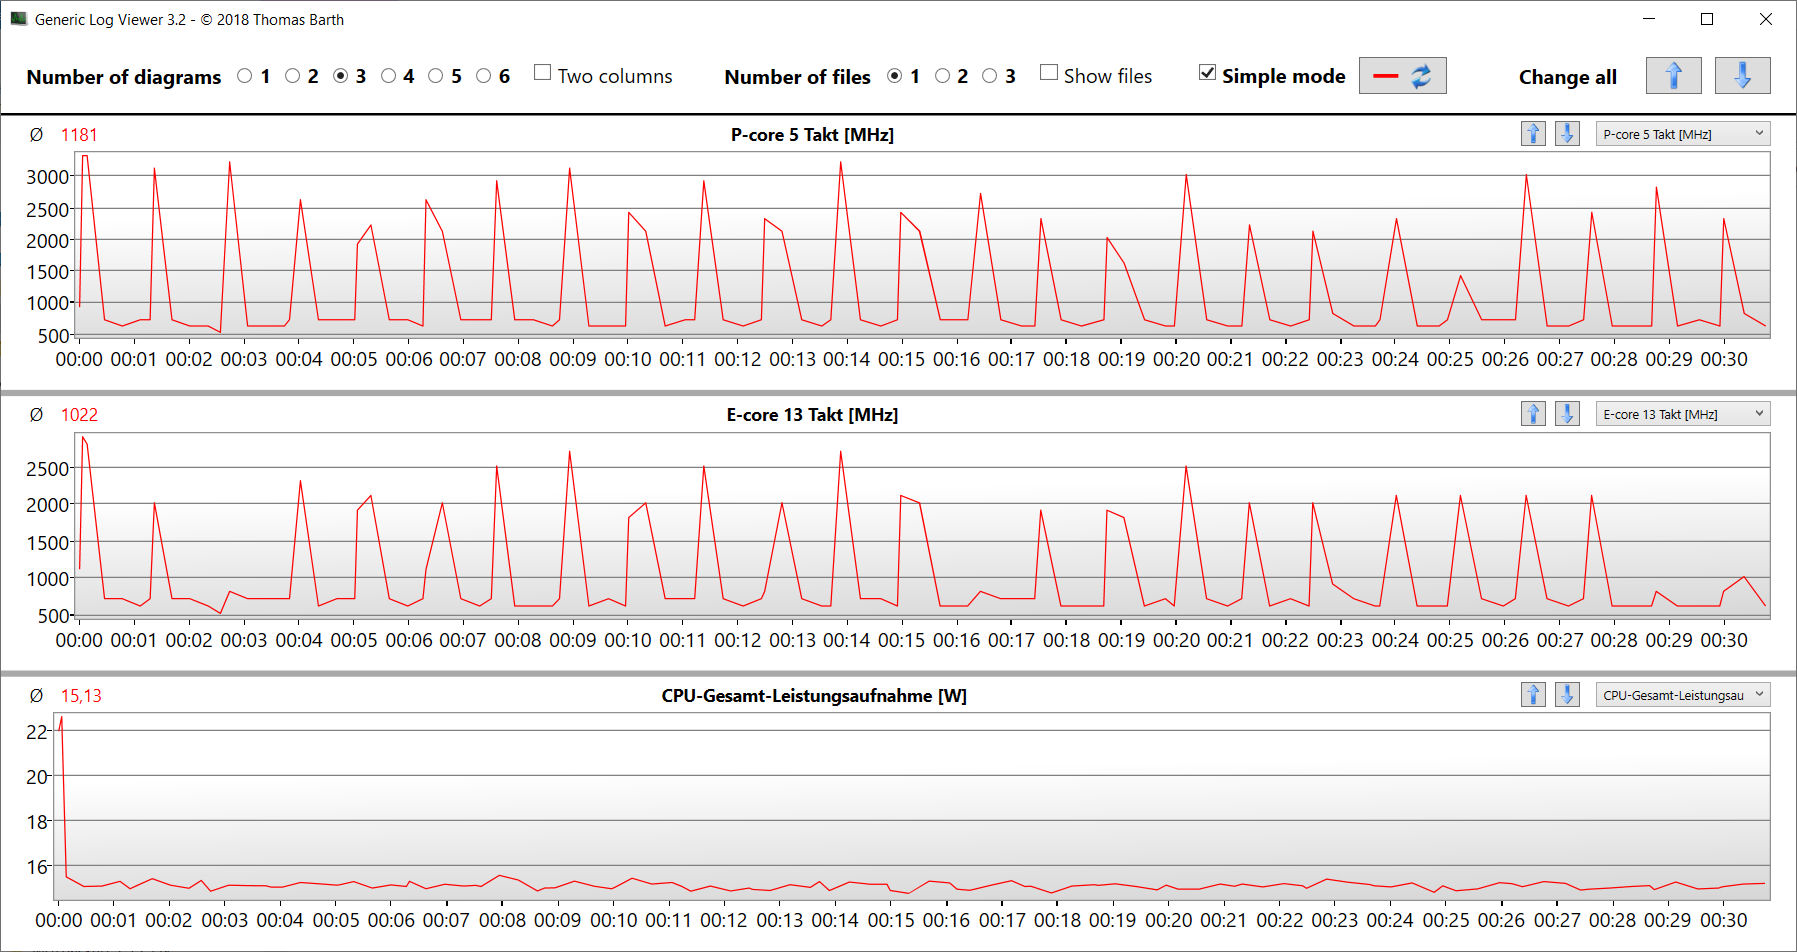
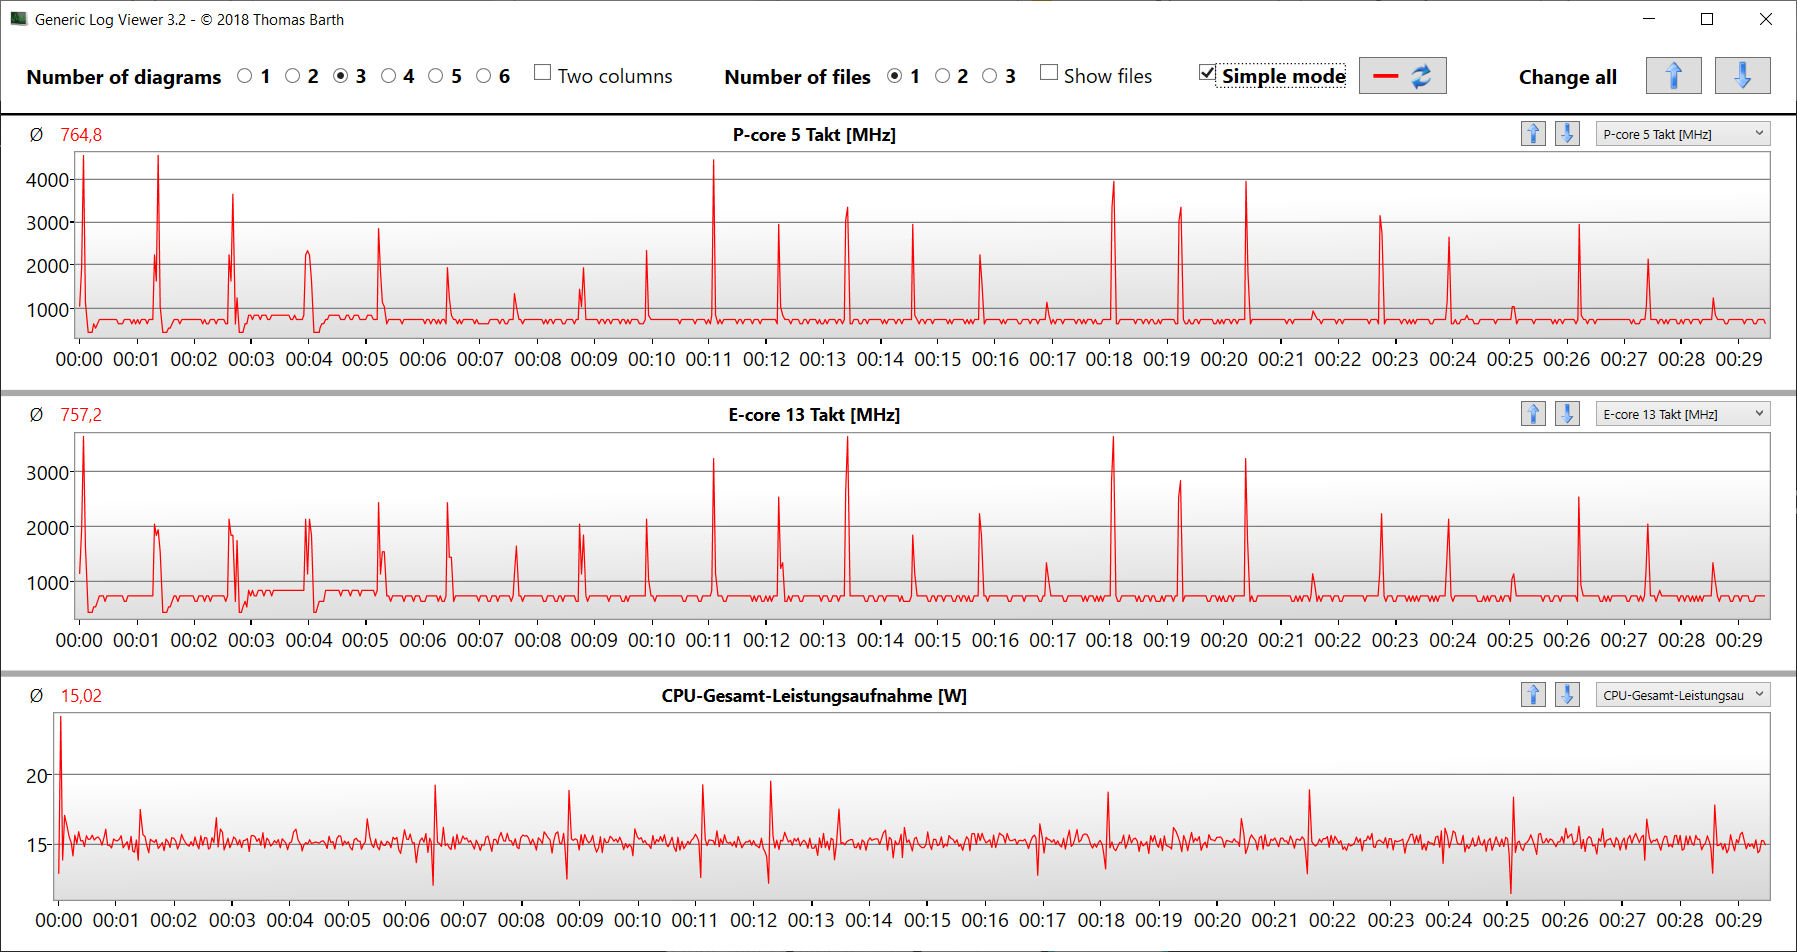
De acordo com o HWInfo, o "modo de economia de energia" define o PL 1 (45 watts) da CPU em um nível mais alto do que o PL 2 (30 watts). É provável que isso seja um bug. Durante a execução do loop CB15, o consumo de energia da CPU é de 15 watts.
| Modo de jogo | Modo de entretenimento | Modo de economia de energia | Modo silencioso | |
|---|---|---|---|---|
| CPU PL1 (HWInfo) | 135 watts | 65 watts | 45 watts | 15 watts |
| CPU PL2 (HWInfo) | 162 watts | 130 watts | 30 watts | 30 watts |
| Ruído (Witcher 3) | 62 dB(A) | 56 dB(A) | - | 36 dB(A) |
| Desempenho (Witcher 3) | ~102 fps | ~100 fps | - | 30 - 50 fps |
Processador
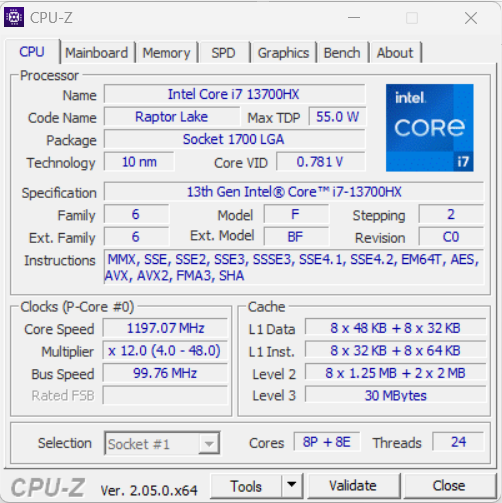
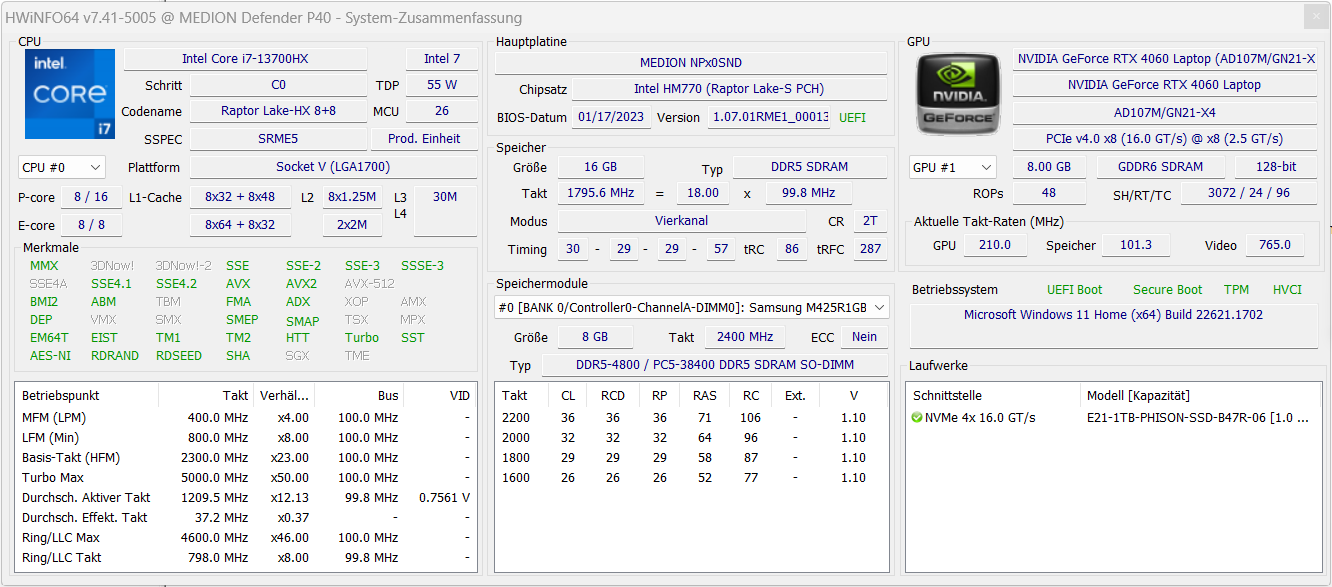
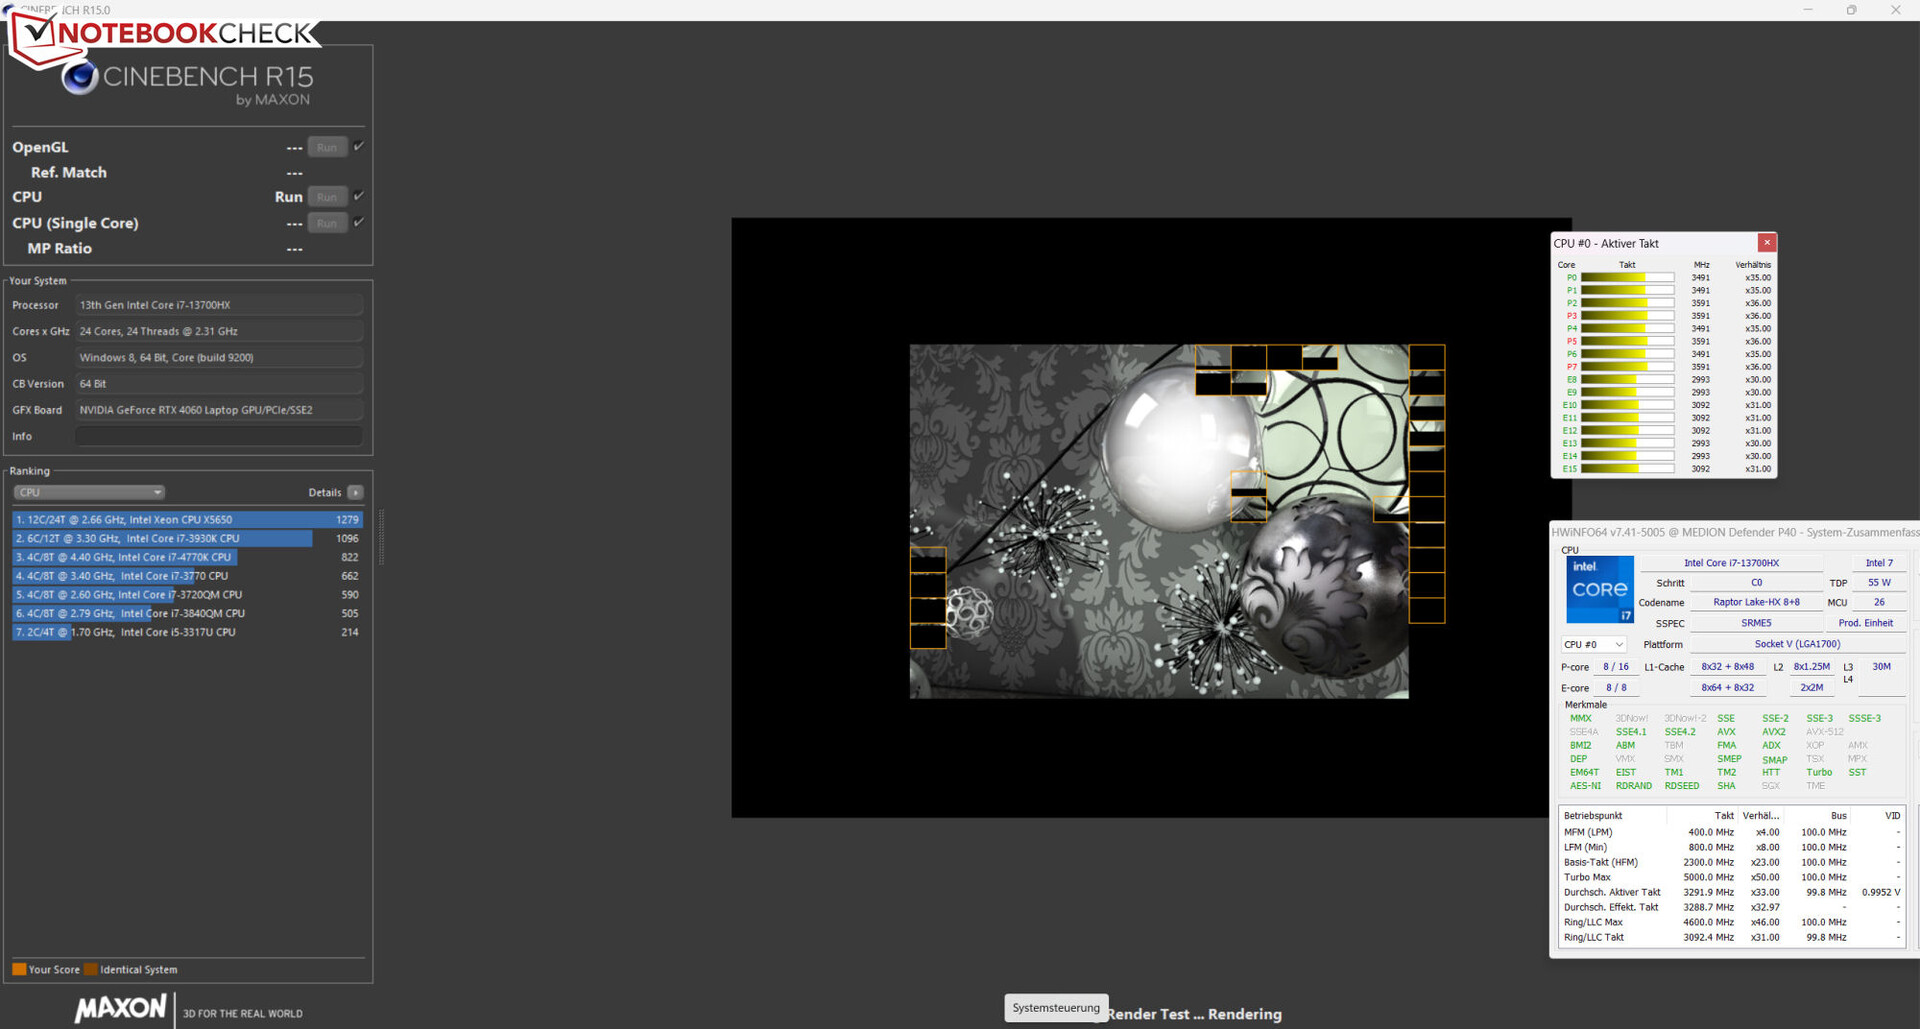
OCore-i7-13700HX(Raptor Lake) consiste em oito núcleos de eficiência (sem hyperthreading, 1,5 - 3,7 GHz) e oito núcleos de desempenho (hyperthreading, 2,1 - 5 GHz). Isso soma 24 núcleos lógicos de CPU no total.
Os benchmarks apresentaram resultados logo abaixo da média anterior da CPU ("modo de entretenimento"). o "modo de jogo" geralmente só levou a um aumento mínimo de desempenho, com exceção dos benchmarks AIDA64. Ele só conseguiu mostrar suas qualidades aprimoradas em carga contínua. O desempenho single-thread mais relevante do laptop (205 pontos) foi menos reduzido no modo de bateria do que o desempenho multi-core (1.619 pontos).
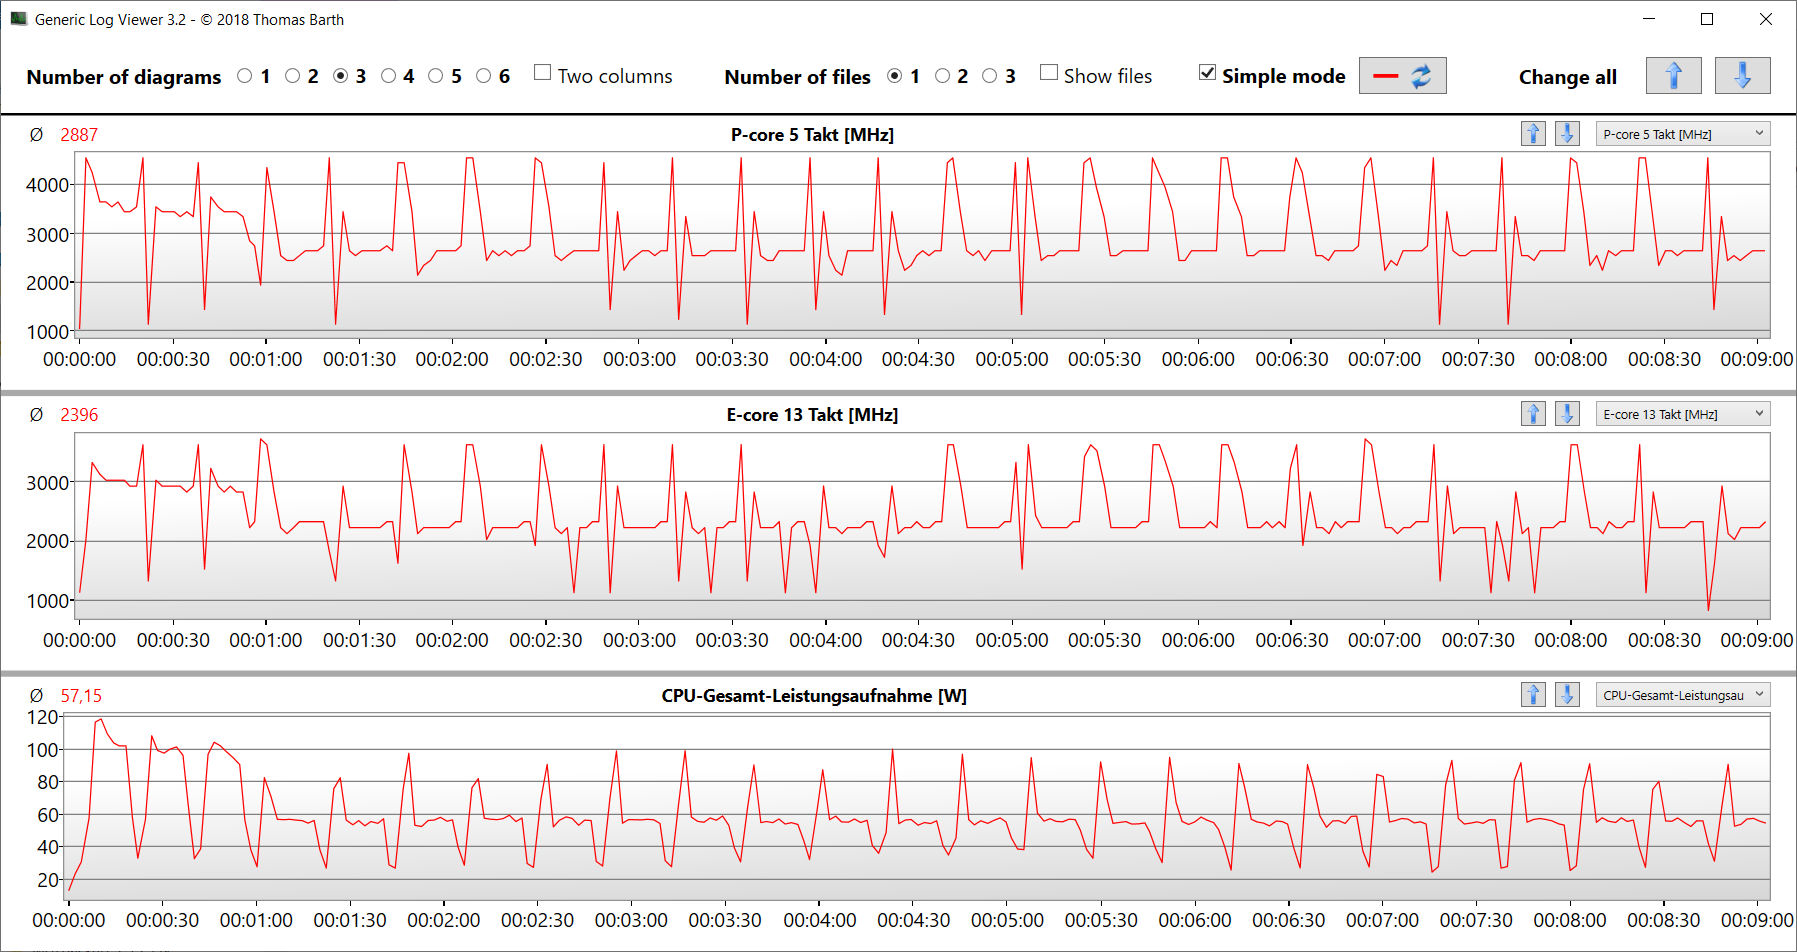
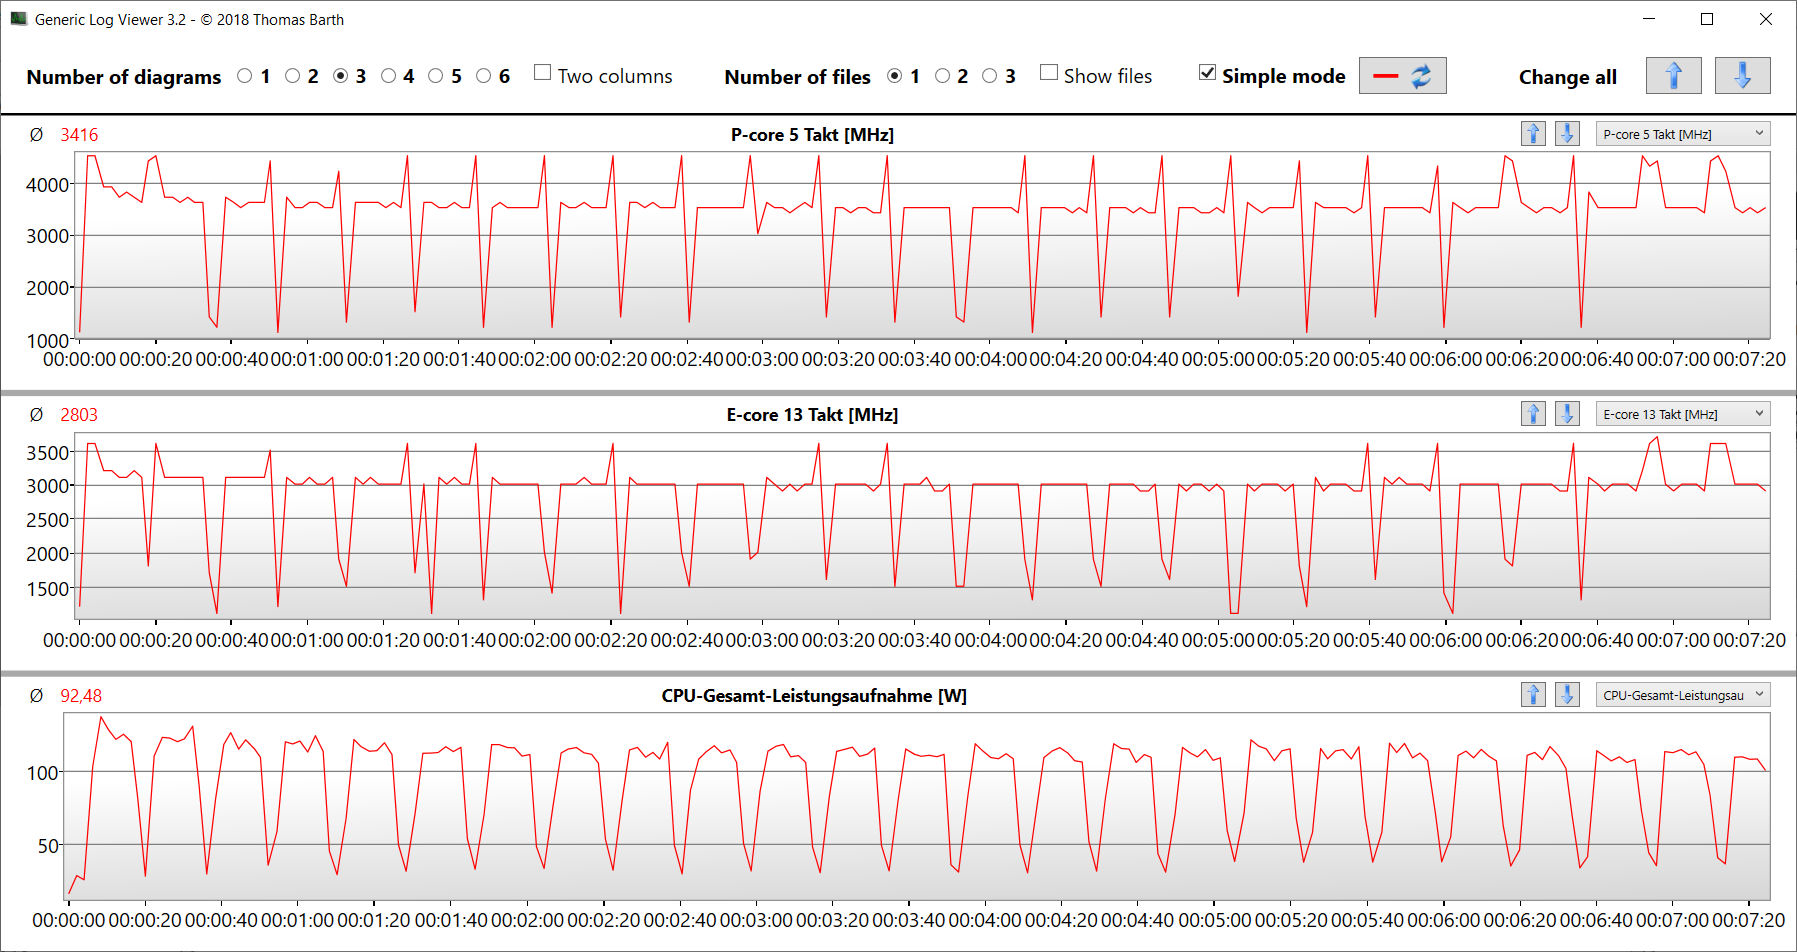
O teste de loop CB15 mostrou: A carga permanente de vários threads fez com que a taxa de clock do turbo caísse da primeira para a quarta execução. Posteriormente, ele manteve taxas consistentes. o "modo de jogo" levou a taxas de clock continuamente mais altas.
Cinebench R15 Multi continuous test
* ... menor é melhor
AIDA64: FP32 Ray-Trace | FPU Julia | CPU SHA3 | CPU Queen | FPU SinJulia | FPU Mandel | CPU AES | CPU ZLib | FP64 Ray-Trace | CPU PhotoWorxx
| Performance rating | |
| Média da turma Gaming | |
| Lenovo Legion Pro 5 16IRX8 | |
| Média Intel Core i7-13700HX | |
| Acer Predator Helios 300 (i7-12700H, RTX 3070 Ti) | |
| Asus TUF Gaming A16 FA617 | |
| Medion Erazer Defender P40 | |
| Gigabyte G7 KE | |
| MSI Katana 17 B13VFK | |
| AIDA64 / FP32 Ray-Trace | |
| Média da turma Gaming (10227 - 85542, n=105, últimos 2 anos) | |
| Lenovo Legion Pro 5 16IRX8 (v6.85.6300) | |
| Média Intel Core i7-13700HX (14261 - 21999, n=11) | |
| Acer Predator Helios 300 (i7-12700H, RTX 3070 Ti) (v6.75.6100) | |
| Asus TUF Gaming A16 FA617 (v6.85.6300) | |
| Medion Erazer Defender P40 (v6.75.6100) | |
| MSI Katana 17 B13VFK (v6.85.6300) | |
| Gigabyte G7 KE (v6.75.6100) | |
| AIDA64 / FPU Julia | |
| Média da turma Gaming (51376 - 238426, n=105, últimos 2 anos) | |
| Lenovo Legion Pro 5 16IRX8 (v6.85.6300) | |
| Asus TUF Gaming A16 FA617 (v6.85.6300) | |
| Média Intel Core i7-13700HX (74636 - 109364, n=11) | |
| Acer Predator Helios 300 (i7-12700H, RTX 3070 Ti) (v6.75.6100) | |
| Medion Erazer Defender P40 (v6.75.6100) | |
| MSI Katana 17 B13VFK (v6.85.6300) | |
| Gigabyte G7 KE (v6.75.6100) | |
| AIDA64 / CPU SHA3 | |
| Média da turma Gaming (2180 - 10115, n=105, últimos 2 anos) | |
| Lenovo Legion Pro 5 16IRX8 (v6.85.6300) | |
| Média Intel Core i7-13700HX (3359 - 5053, n=11) | |
| Acer Predator Helios 300 (i7-12700H, RTX 3070 Ti) (v6.75.6100) | |
| Asus TUF Gaming A16 FA617 (v6.85.6300) | |
| Medion Erazer Defender P40 (v6.75.6100) | |
| Gigabyte G7 KE (v6.75.6100) | |
| MSI Katana 17 B13VFK (v6.85.6300) | |
| AIDA64 / CPU Queen | |
| Média da turma Gaming (49785 - 173351, n=90, últimos 2 anos) | |
| Lenovo Legion Pro 5 16IRX8 (v6.85.6300) | |
| Medion Erazer Defender P40 (v6.75.6100) | |
| Média Intel Core i7-13700HX (86532 - 114717, n=11) | |
| Asus TUF Gaming A16 FA617 (v6.85.6300) | |
| Acer Predator Helios 300 (i7-12700H, RTX 3070 Ti) (v6.75.6100) | |
| Gigabyte G7 KE (v6.75.6100) | |
| MSI Katana 17 B13VFK | |
| AIDA64 / FPU SinJulia | |
| Média da turma Gaming (4424 - 33636, n=105, últimos 2 anos) | |
| Lenovo Legion Pro 5 16IRX8 (v6.85.6300) | |
| Asus TUF Gaming A16 FA617 (v6.85.6300) | |
| Média Intel Core i7-13700HX (9290 - 13519, n=11) | |
| Medion Erazer Defender P40 (v6.75.6100) | |
| Acer Predator Helios 300 (i7-12700H, RTX 3070 Ti) (v6.75.6100) | |
| MSI Katana 17 B13VFK | |
| Gigabyte G7 KE (v6.75.6100) | |
| AIDA64 / FPU Mandel | |
| Média da turma Gaming (25115 - 128721, n=105, últimos 2 anos) | |
| Asus TUF Gaming A16 FA617 (v6.85.6300) | |
| Lenovo Legion Pro 5 16IRX8 (v6.85.6300) | |
| Média Intel Core i7-13700HX (35751 - 53484, n=11) | |
| Acer Predator Helios 300 (i7-12700H, RTX 3070 Ti) (v6.75.6100) | |
| Medion Erazer Defender P40 (v6.75.6100) | |
| MSI Katana 17 B13VFK (v6.85.6300) | |
| Gigabyte G7 KE (v6.75.6100) | |
| AIDA64 / CPU AES | |
| Média Intel Core i7-13700HX (67846 - 182575, n=11) | |
| Gigabyte G7 KE (v6.75.6100) | |
| Média da turma Gaming (39258 - 247074, n=105, últimos 2 anos) | |
| Lenovo Legion Pro 5 16IRX8 (v6.85.6300) | |
| Acer Predator Helios 300 (i7-12700H, RTX 3070 Ti) (v6.75.6100) | |
| Medion Erazer Defender P40 (v6.75.6100) | |
| Asus TUF Gaming A16 FA617 (v6.85.6300) | |
| MSI Katana 17 B13VFK (v6.85.6300) | |
| AIDA64 / CPU ZLib | |
| Média da turma Gaming (574 - 2531, n=105, últimos 2 anos) | |
| Lenovo Legion Pro 5 16IRX8 (v6.85.6300) | |
| Média Intel Core i7-13700HX (981 - 1451, n=11) | |
| Acer Predator Helios 300 (i7-12700H, RTX 3070 Ti) (v6.75.6100) | |
| Medion Erazer Defender P40 (v6.75.6100) | |
| Gigabyte G7 KE (v6.75.6100) | |
| Asus TUF Gaming A16 FA617 (v6.85.6300) | |
| MSI Katana 17 B13VFK (v6.85.6300) | |
| AIDA64 / FP64 Ray-Trace | |
| Média da turma Gaming (5509 - 45446, n=105, últimos 2 anos) | |
| Lenovo Legion Pro 5 16IRX8 (v6.85.6300) | |
| Média Intel Core i7-13700HX (7728 - 11837, n=11) | |
| Acer Predator Helios 300 (i7-12700H, RTX 3070 Ti) (v6.75.6100) | |
| Asus TUF Gaming A16 FA617 (v6.85.6300) | |
| Medion Erazer Defender P40 (v6.75.6100) | |
| MSI Katana 17 B13VFK (v6.85.6300) | |
| Gigabyte G7 KE (v6.75.6100) | |
| AIDA64 / CPU PhotoWorxx | |
| Média da turma Gaming (12271 - 89891, n=105, últimos 2 anos) | |
| Acer Predator Helios 300 (i7-12700H, RTX 3070 Ti) (v6.75.6100) | |
| Lenovo Legion Pro 5 16IRX8 (v6.85.6300) | |
| Medion Erazer Defender P40 (v6.75.6100) | |
| Média Intel Core i7-13700HX (19678 - 42415, n=11) | |
| MSI Katana 17 B13VFK (v6.85.6300) | |
| Gigabyte G7 KE (v6.75.6100) | |
| Asus TUF Gaming A16 FA617 (v6.85.6300) | |
Desempenho do sistema
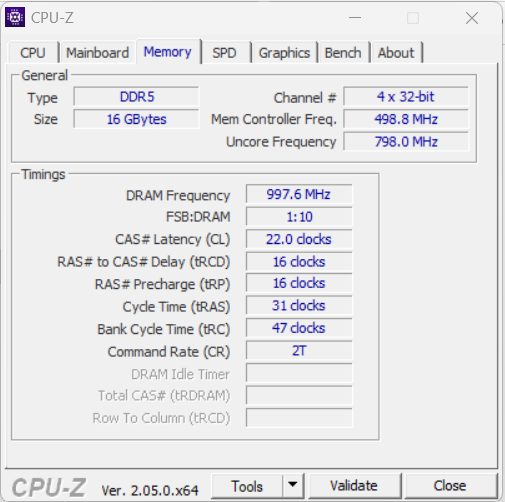
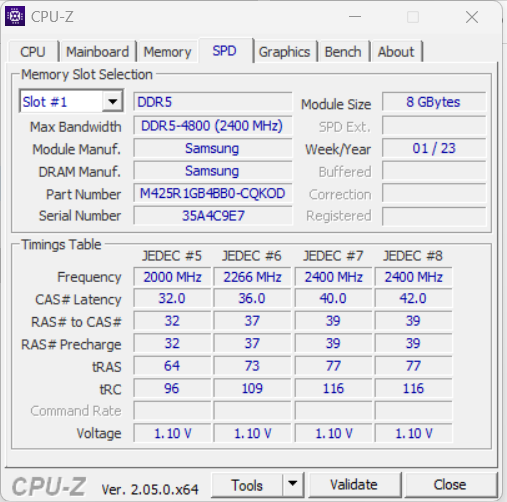
Seu sistema de funcionamento suave está preparado para áreas de aplicativos que exigem muito desempenho, como renderização e jogos - os bons resultados do laptop no PCMark confirmam isso. As taxas de transferência da RAM estão em um nível normal para a RAM DDR5 4800.
CrossMark: Overall | Productivity | Creativity | Responsiveness
| PCMark 10 / Score | |
| Média da turma Gaming (5828 - 12414, n=93, últimos 2 anos) | |
| Acer Predator Helios 300 (i7-12700H, RTX 3070 Ti) | |
| Lenovo Legion Pro 5 16IRX8 | |
| Média Intel Core i7-13700HX, NVIDIA GeForce RTX 4060 Laptop GPU (6909 - 7743, n=5) | |
| Asus TUF Gaming A16 FA617 | |
| MSI Katana 17 B13VFK | |
| Medion Erazer Defender P40 | |
| Gigabyte G7 KE | |
| PCMark 10 / Essentials | |
| Lenovo Legion Pro 5 16IRX8 | |
| MSI Katana 17 B13VFK | |
| Acer Predator Helios 300 (i7-12700H, RTX 3070 Ti) | |
| Média da turma Gaming (8810 - 11935, n=97, últimos 2 anos) | |
| Média Intel Core i7-13700HX, NVIDIA GeForce RTX 4060 Laptop GPU (9760 - 11313, n=5) | |
| Asus TUF Gaming A16 FA617 | |
| Gigabyte G7 KE | |
| Medion Erazer Defender P40 | |
| PCMark 10 / Productivity | |
| Média da turma Gaming (6845 - 25323, n=95, últimos 2 anos) | |
| Acer Predator Helios 300 (i7-12700H, RTX 3070 Ti) | |
| Medion Erazer Defender P40 | |
| Média Intel Core i7-13700HX, NVIDIA GeForce RTX 4060 Laptop GPU (9131 - 11018, n=5) | |
| Asus TUF Gaming A16 FA617 | |
| MSI Katana 17 B13VFK | |
| Lenovo Legion Pro 5 16IRX8 | |
| Gigabyte G7 KE | |
| PCMark 10 / Digital Content Creation | |
| Média da turma Gaming (7602 - 19954, n=95, últimos 2 anos) | |
| Acer Predator Helios 300 (i7-12700H, RTX 3070 Ti) | |
| Lenovo Legion Pro 5 16IRX8 | |
| Média Intel Core i7-13700HX, NVIDIA GeForce RTX 4060 Laptop GPU (9393 - 12434, n=5) | |
| Asus TUF Gaming A16 FA617 | |
| MSI Katana 17 B13VFK | |
| Medion Erazer Defender P40 | |
| Gigabyte G7 KE | |
| CrossMark / Overall | |
| Média da turma Gaming (1366 - 2409, n=94, últimos 2 anos) | |
| Acer Predator Helios 300 (i7-12700H, RTX 3070 Ti) | |
| Média Intel Core i7-13700HX, NVIDIA GeForce RTX 4060 Laptop GPU (1663 - 2105, n=5) | |
| MSI Katana 17 B13VFK | |
| Gigabyte G7 KE | |
| Medion Erazer Defender P40 | |
| Lenovo Legion Pro 5 16IRX8 | |
| CrossMark / Productivity | |
| Média da turma Gaming (1386 - 2254, n=94, últimos 2 anos) | |
| Gigabyte G7 KE | |
| Acer Predator Helios 300 (i7-12700H, RTX 3070 Ti) | |
| Média Intel Core i7-13700HX, NVIDIA GeForce RTX 4060 Laptop GPU (1618 - 1989, n=5) | |
| MSI Katana 17 B13VFK | |
| Medion Erazer Defender P40 | |
| Lenovo Legion Pro 5 16IRX8 | |
| CrossMark / Creativity | |
| Média da turma Gaming (1343 - 2786, n=94, últimos 2 anos) | |
| Acer Predator Helios 300 (i7-12700H, RTX 3070 Ti) | |
| Média Intel Core i7-13700HX, NVIDIA GeForce RTX 4060 Laptop GPU (1710 - 2274, n=5) | |
| MSI Katana 17 B13VFK | |
| Medion Erazer Defender P40 | |
| Gigabyte G7 KE | |
| Lenovo Legion Pro 5 16IRX8 | |
| CrossMark / Responsiveness | |
| Gigabyte G7 KE | |
| MSI Katana 17 B13VFK | |
| Acer Predator Helios 300 (i7-12700H, RTX 3070 Ti) | |
| Média da turma Gaming (1226 - 2334, n=94, últimos 2 anos) | |
| Média Intel Core i7-13700HX, NVIDIA GeForce RTX 4060 Laptop GPU (1269 - 1983, n=5) | |
| Lenovo Legion Pro 5 16IRX8 | |
| Medion Erazer Defender P40 | |
| PCMark 8 Home Score Accelerated v2 | 4659 pontos | |
| PCMark 8 Work Score Accelerated v2 | 5797 pontos | |
| PCMark 10 Score | 6909 pontos | |
Ajuda | ||
| AIDA64 / Memory Copy | |
| Média da turma Gaming (21750 - 129946, n=105, últimos 2 anos) | |
| Lenovo Legion Pro 5 16IRX8 | |
| Medion Erazer Defender P40 | |
| Acer Predator Helios 300 (i7-12700H, RTX 3070 Ti) | |
| Média Intel Core i7-13700HX (36125 - 63990, n=11) | |
| MSI Katana 17 B13VFK | |
| Asus TUF Gaming A16 FA617 | |
| Gigabyte G7 KE | |
| AIDA64 / Memory Read | |
| Média da turma Gaming (22956 - 118858, n=105, últimos 2 anos) | |
| Lenovo Legion Pro 5 16IRX8 | |
| Medion Erazer Defender P40 | |
| MSI Katana 17 B13VFK | |
| Média Intel Core i7-13700HX (36510 - 69729, n=11) | |
| Acer Predator Helios 300 (i7-12700H, RTX 3070 Ti) | |
| Asus TUF Gaming A16 FA617 | |
| Gigabyte G7 KE | |
| AIDA64 / Memory Write | |
| Média da turma Gaming (22297 - 135096, n=105, últimos 2 anos) | |
| Lenovo Legion Pro 5 16IRX8 | |
| Média Intel Core i7-13700HX (33598 - 85675, n=11) | |
| Medion Erazer Defender P40 | |
| Acer Predator Helios 300 (i7-12700H, RTX 3070 Ti) | |
| Asus TUF Gaming A16 FA617 | |
| MSI Katana 17 B13VFK | |
| Gigabyte G7 KE | |
| AIDA64 / Memory Latency | |
| Média da turma Gaming (75.3 - 259, n=105, últimos 2 anos) | |
| MSI Katana 17 B13VFK | |
| Medion Erazer Defender P40 | |
| Acer Predator Helios 300 (i7-12700H, RTX 3070 Ti) | |
| Gigabyte G7 KE | |
| Média Intel Core i7-13700HX (81.5 - 97.9, n=11) | |
| Asus TUF Gaming A16 FA617 | |
| Lenovo Legion Pro 5 16IRX8 | |
* ... menor é melhor
Latência DPC
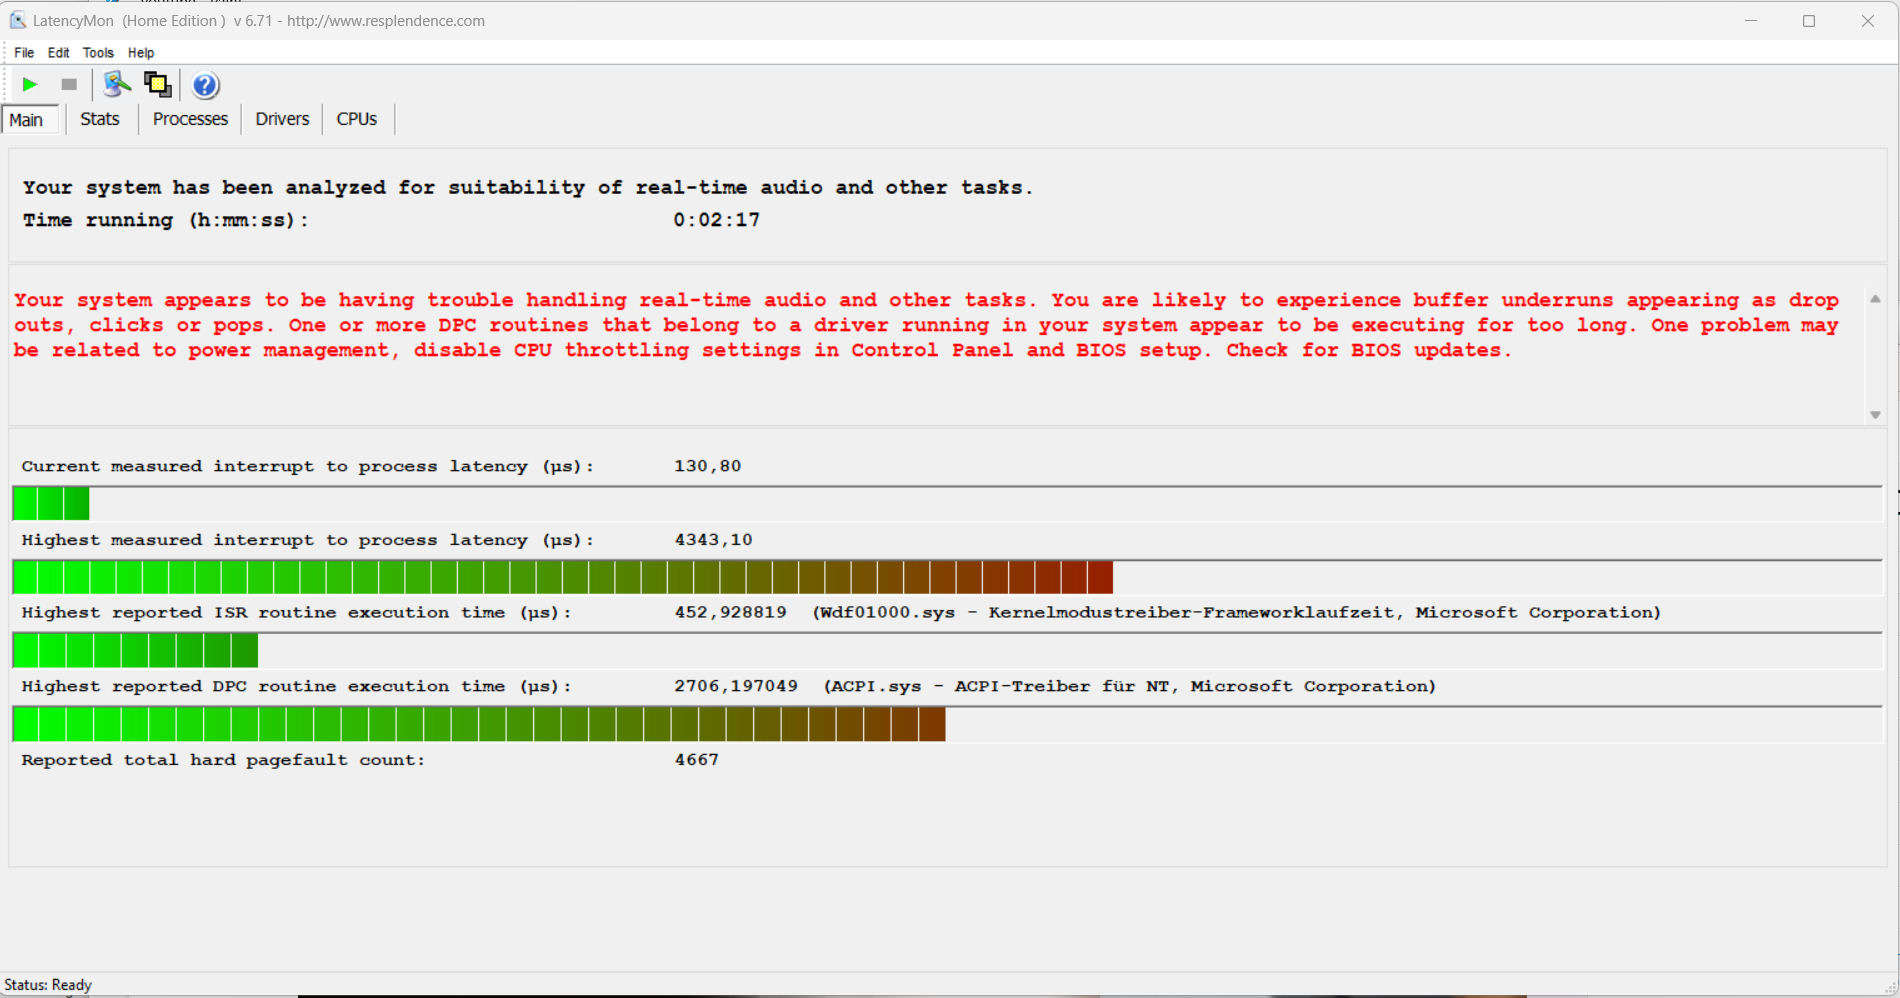
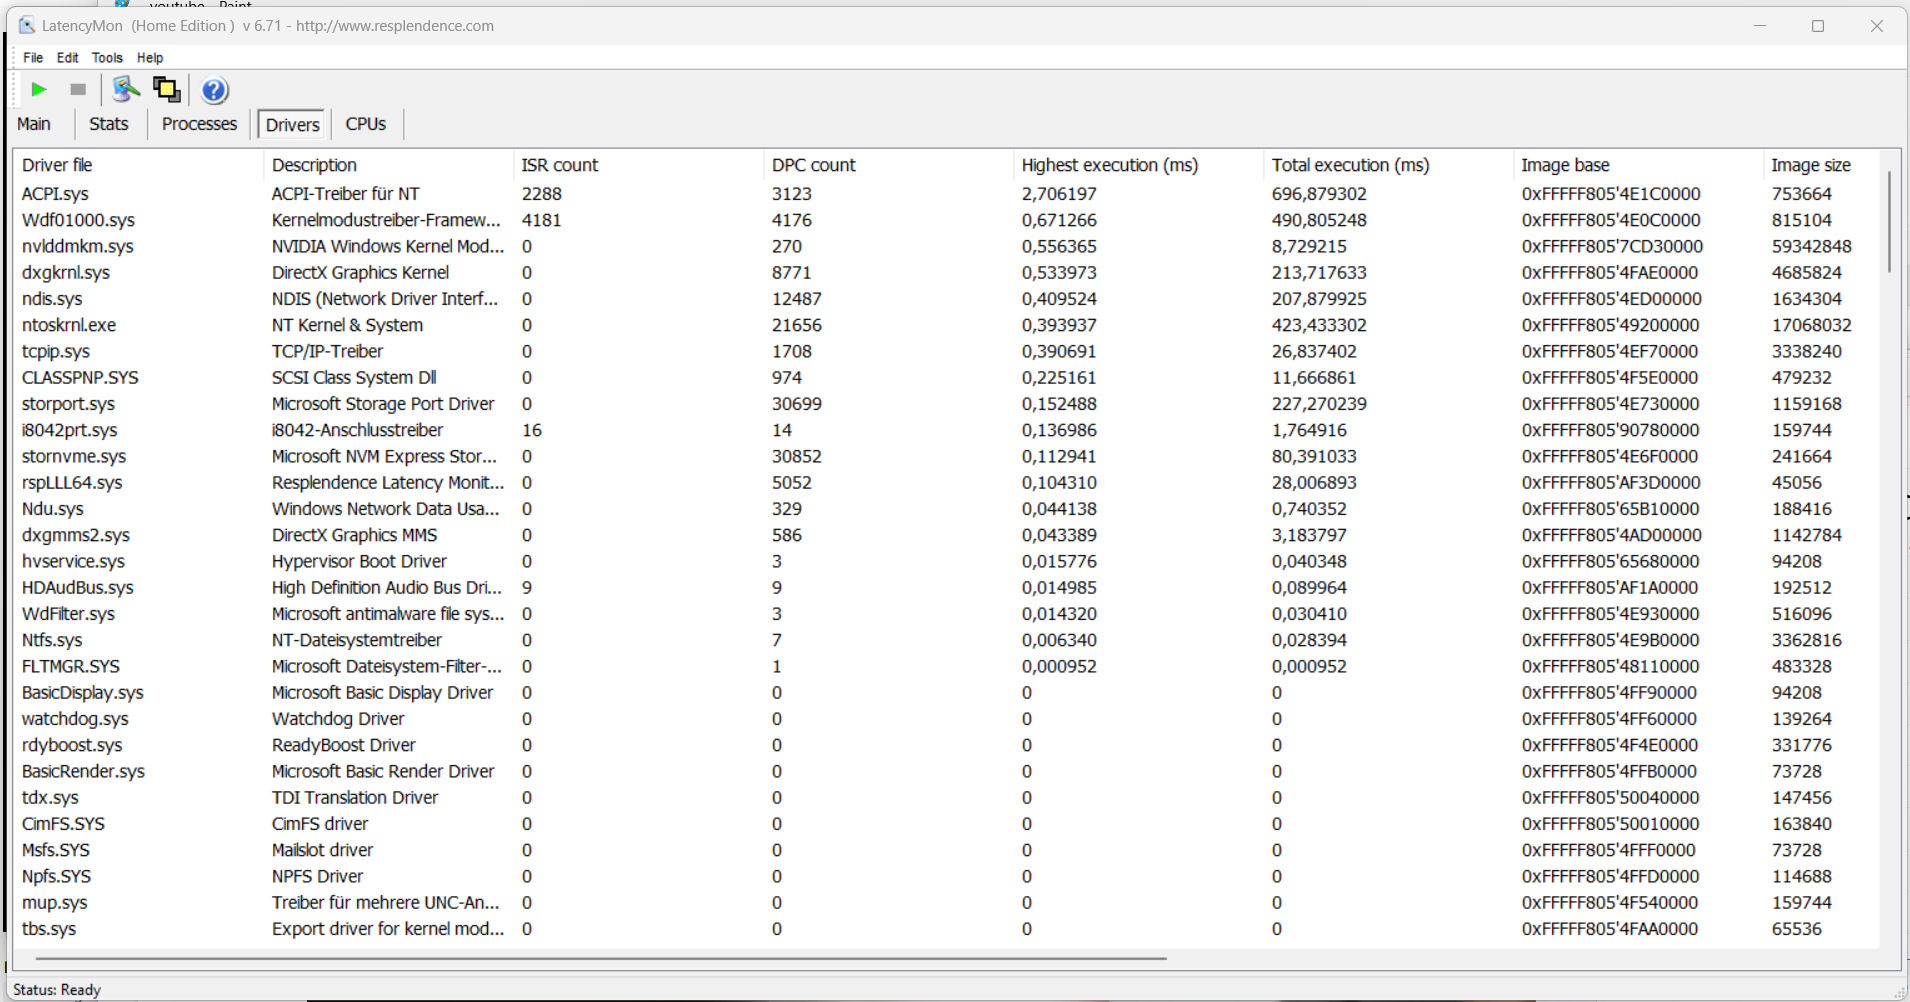
O teste padronizado do monitor de latência (navegação na Web, reprodução de vídeo 4k, alta carga do Prime95) revelou algumas anomalias. O sistema não parece ser adequado para edição de vídeo e áudio em tempo real. Futuras atualizações de software podem levar a melhorias ou até mesmo a degradações.
| DPC Latencies / LatencyMon - interrupt to process latency (max), Web, Youtube, Prime95 | |
| Medion Erazer Defender P40 | |
| MSI Katana 17 B13VFK | |
| Gigabyte G7 KE | |
| Acer Predator Helios 300 (i7-12700H, RTX 3070 Ti) | |
| Lenovo Legion Pro 5 16IRX8 | |
| Asus TUF Gaming A16 FA617 | |
* ... menor é melhor
Dispositivos de armazenamento
O P40 tem um SSD PCIe-4 (1 TB) no formato M.2-2280 da Phison. Ele oferece taxas de transferência muito boas, mas não é um dos melhores SSDs. Não ocorrem quedas de desempenho devido à limitação térmica. O laptop tem espaço para um segundo SSD PCIe-4.

* ... menor é melhor
Reading continuous performance: DiskSpd Read Loop, Queue Depth 8
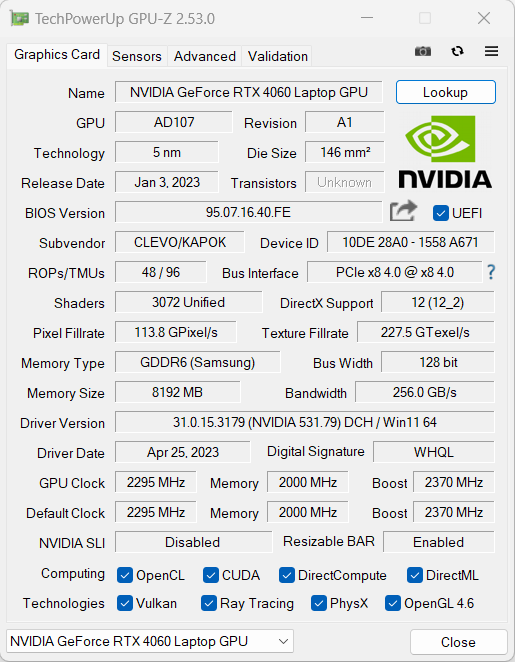
Placa de vídeo
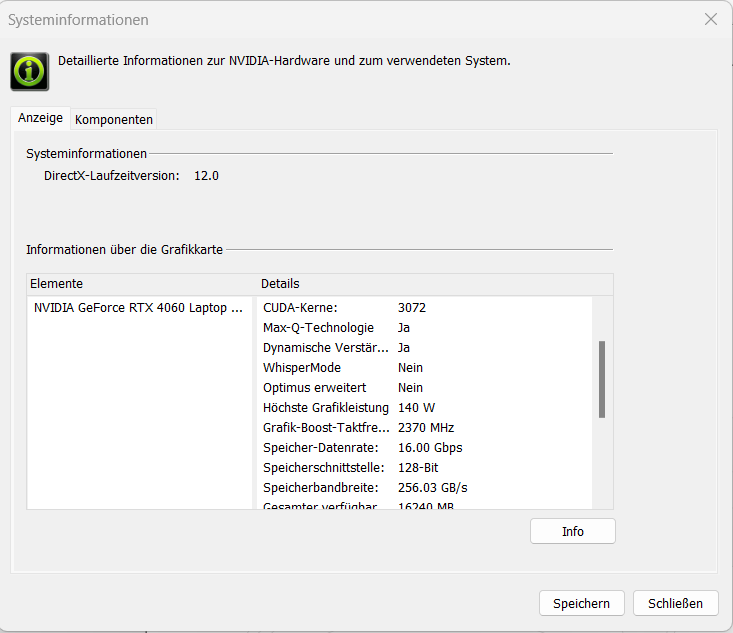
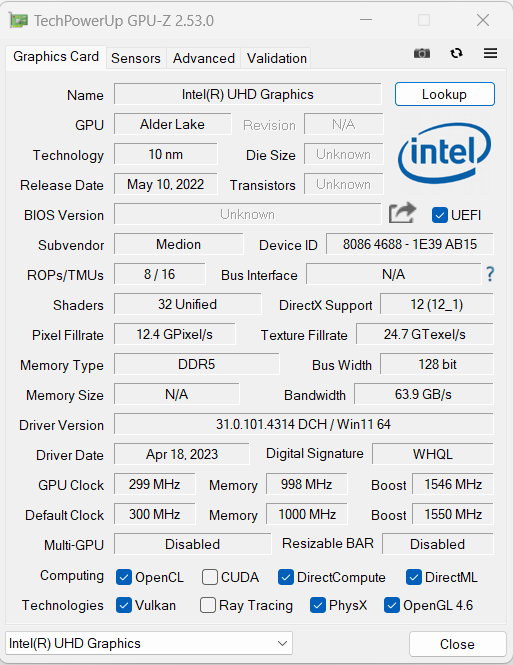
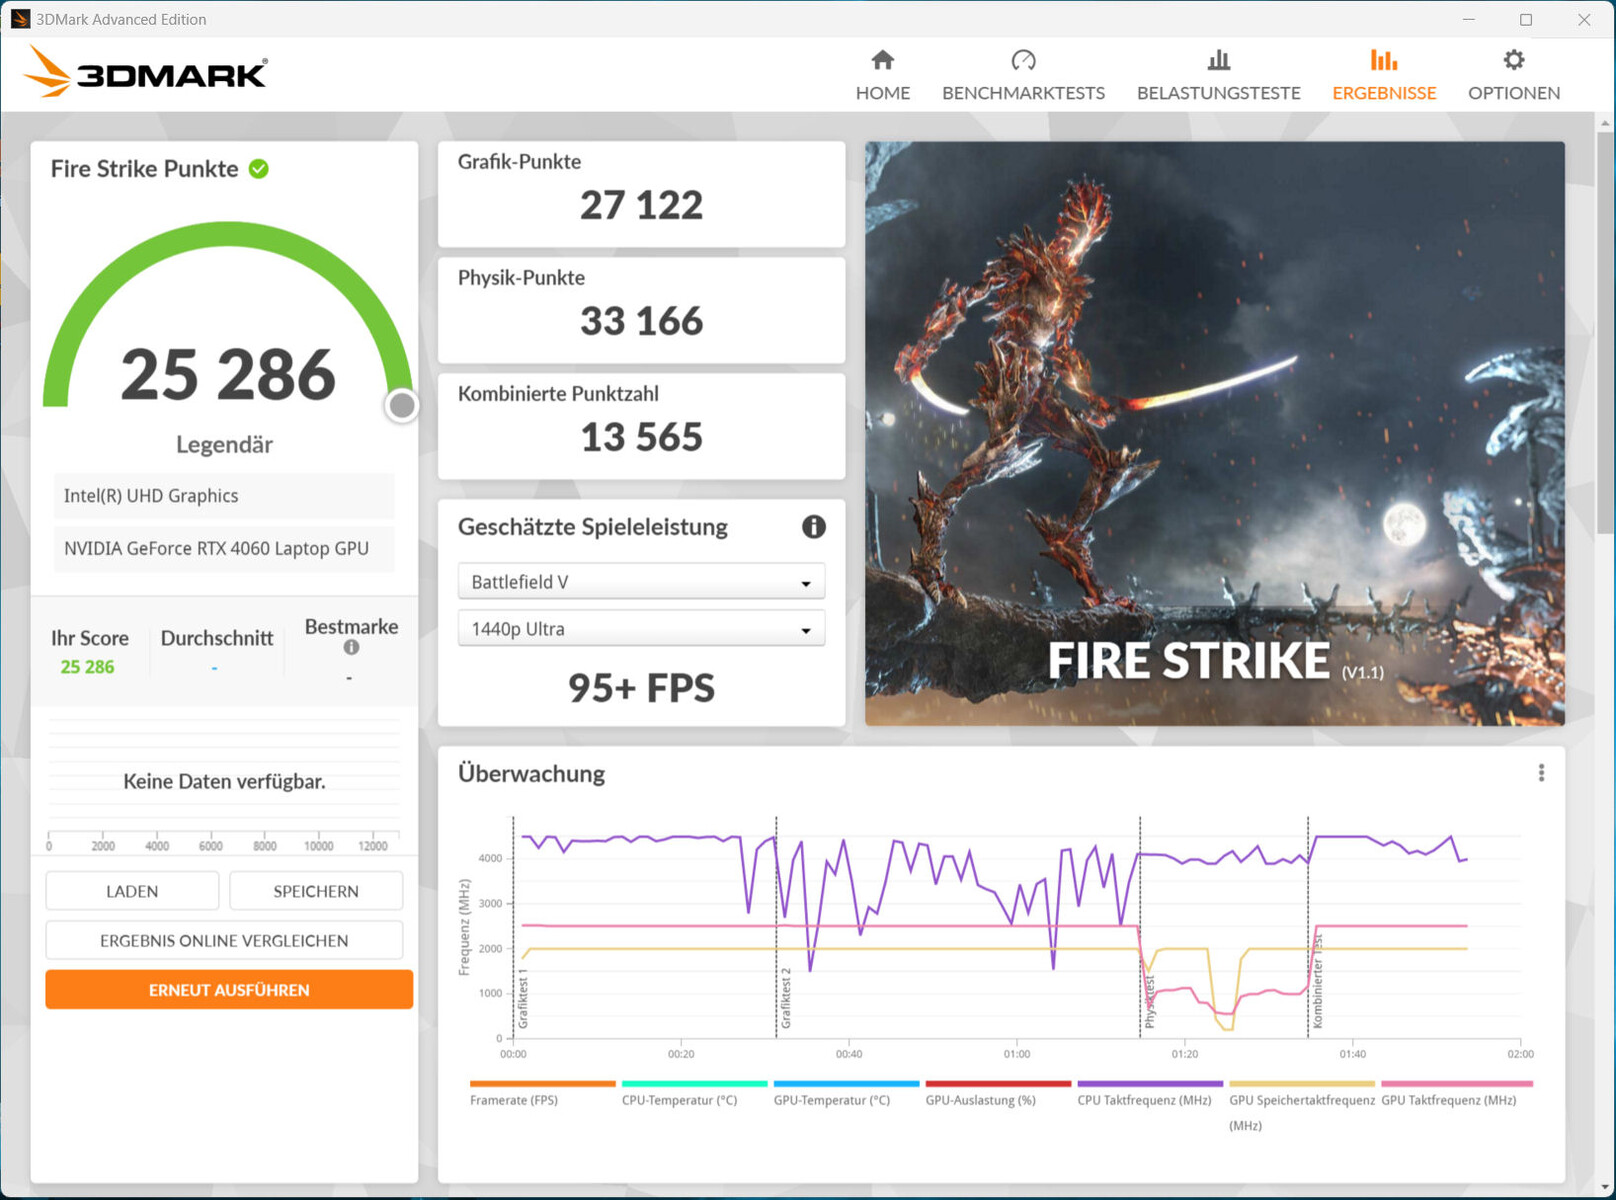
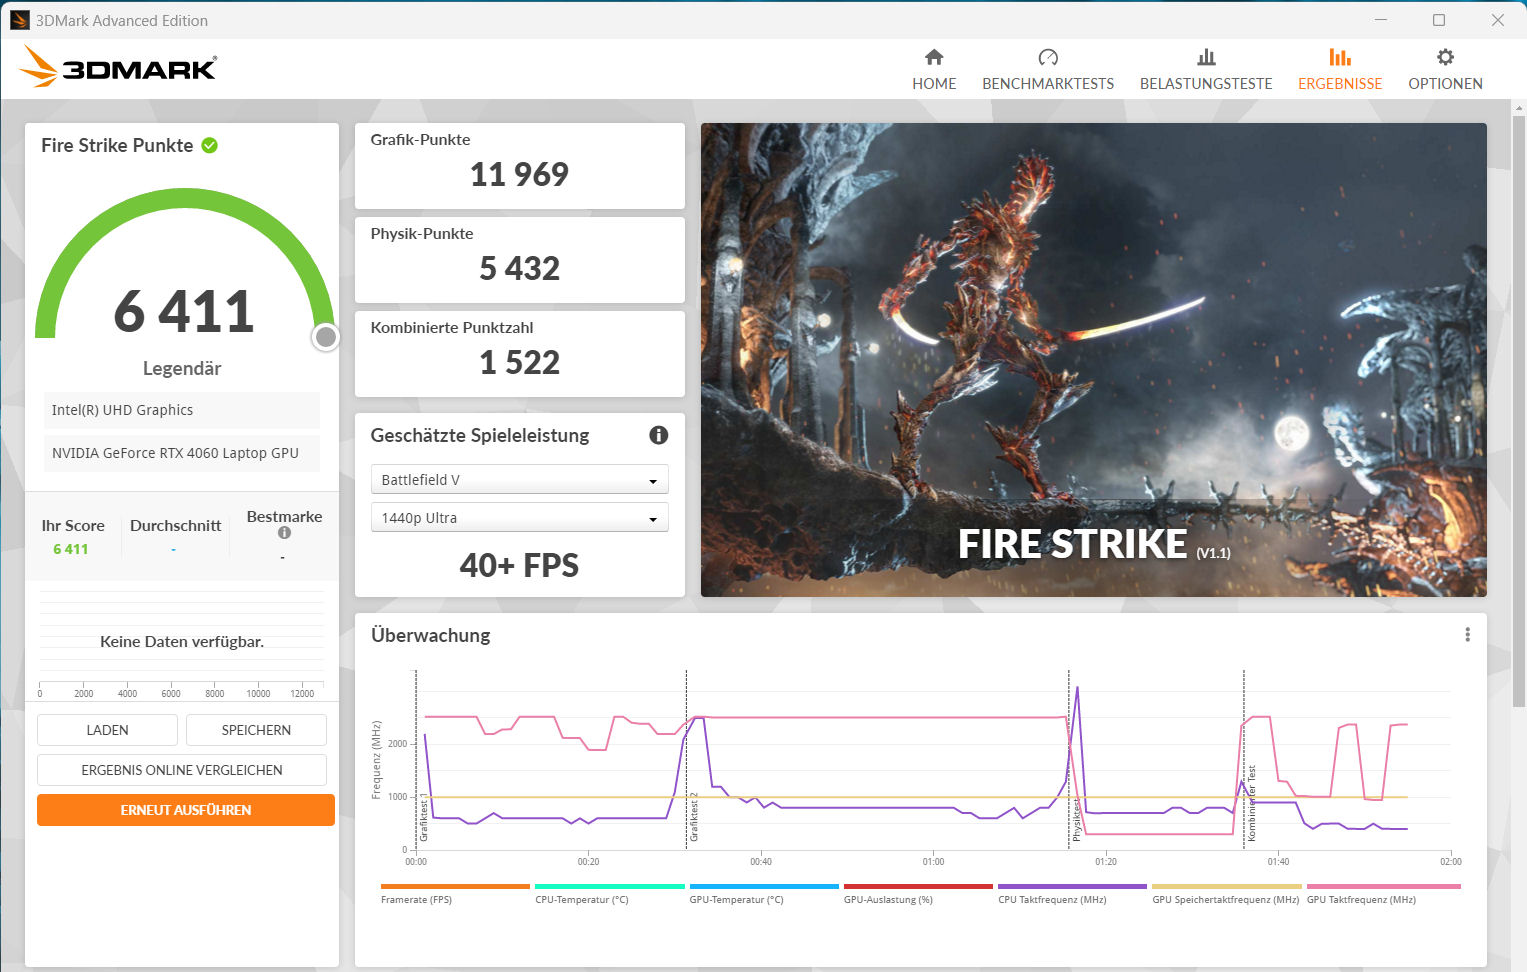
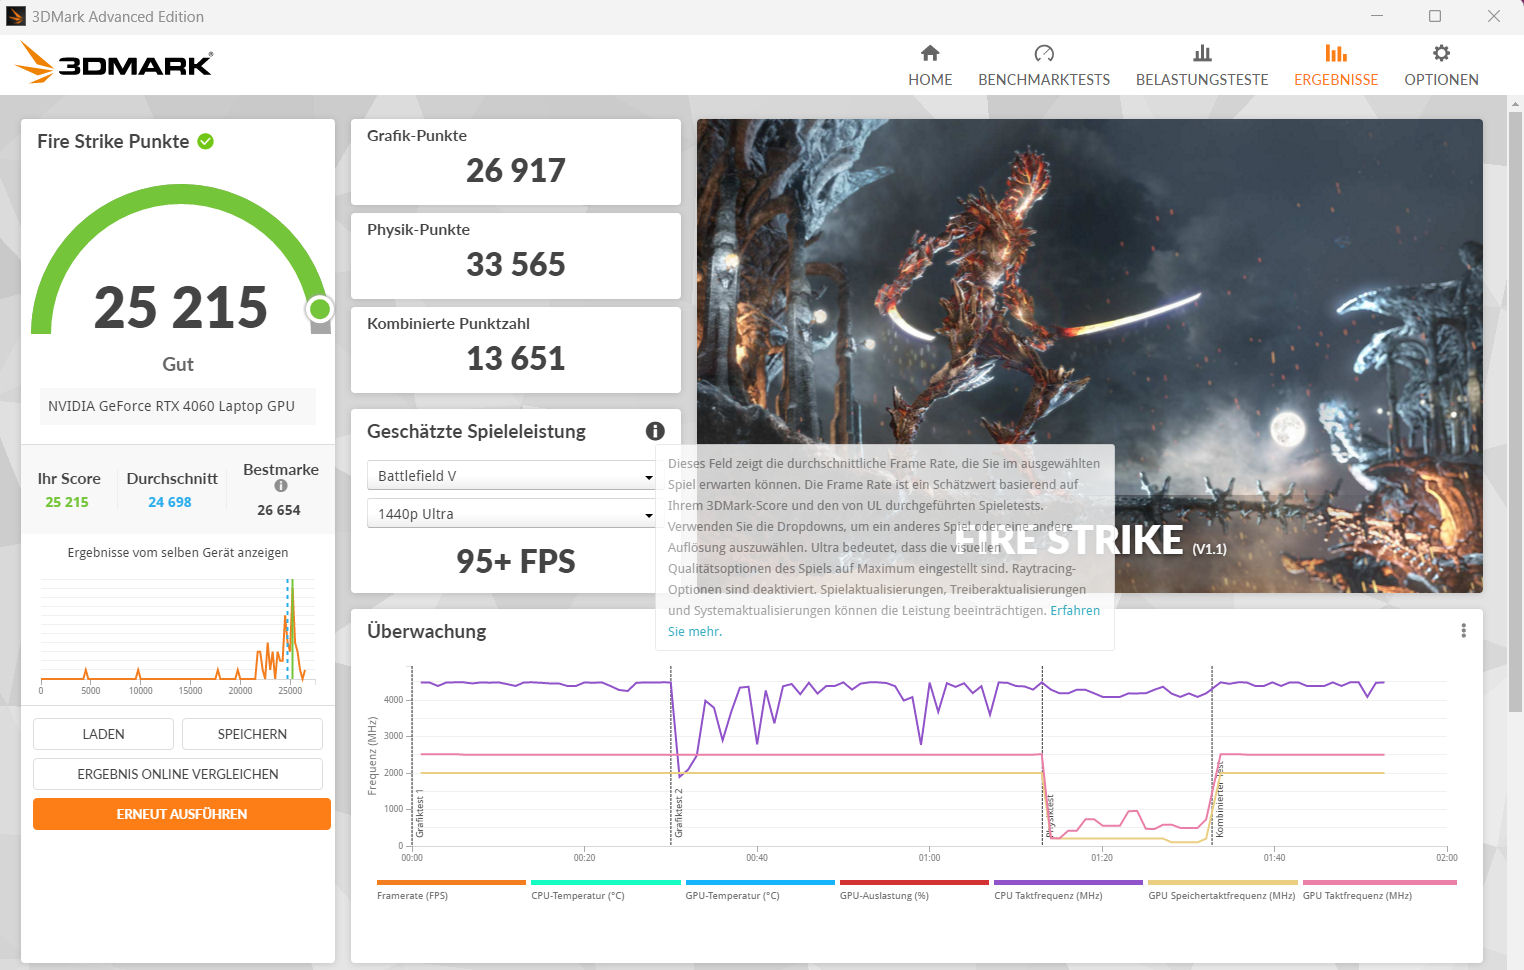
Dentro da atual linha de GPUs para laptop RTX 4000 da Nvidia, aGeForce-RTX-4060 para laptop usado aqui ocupa a quarta posição e, portanto, pode ser classificado como um modelo de médio porte. Ele oferece 3.072 shaders, um barramento de 128 bits de largura e memória GDDR6 rápida (8.192 MB). Ele tem um TGP máximo de 140 watts (115 watts + 25 watts de Dynamic Boost) - não é possível fazer mais. O TGP não é totalmente utilizado de acordo com o Witcher 3 teste.
Os resultados do benchmark estão acima da média RTX 4060 determinada anteriormente ("modo de entretenimento") - no mesmo nível das taxas doMSI Katana 17 (RTX 4060, 140 watts). Nem o "modo de jogo" nem a saída direta de imagem via GPU GeForce (modo dGPU) levaram a um aumento de desempenho. A alternância entre os modos Optimus e dGPU pode ser feita pelo BIOS ou pelo Control Center. O Optimus avançado não é suportado.
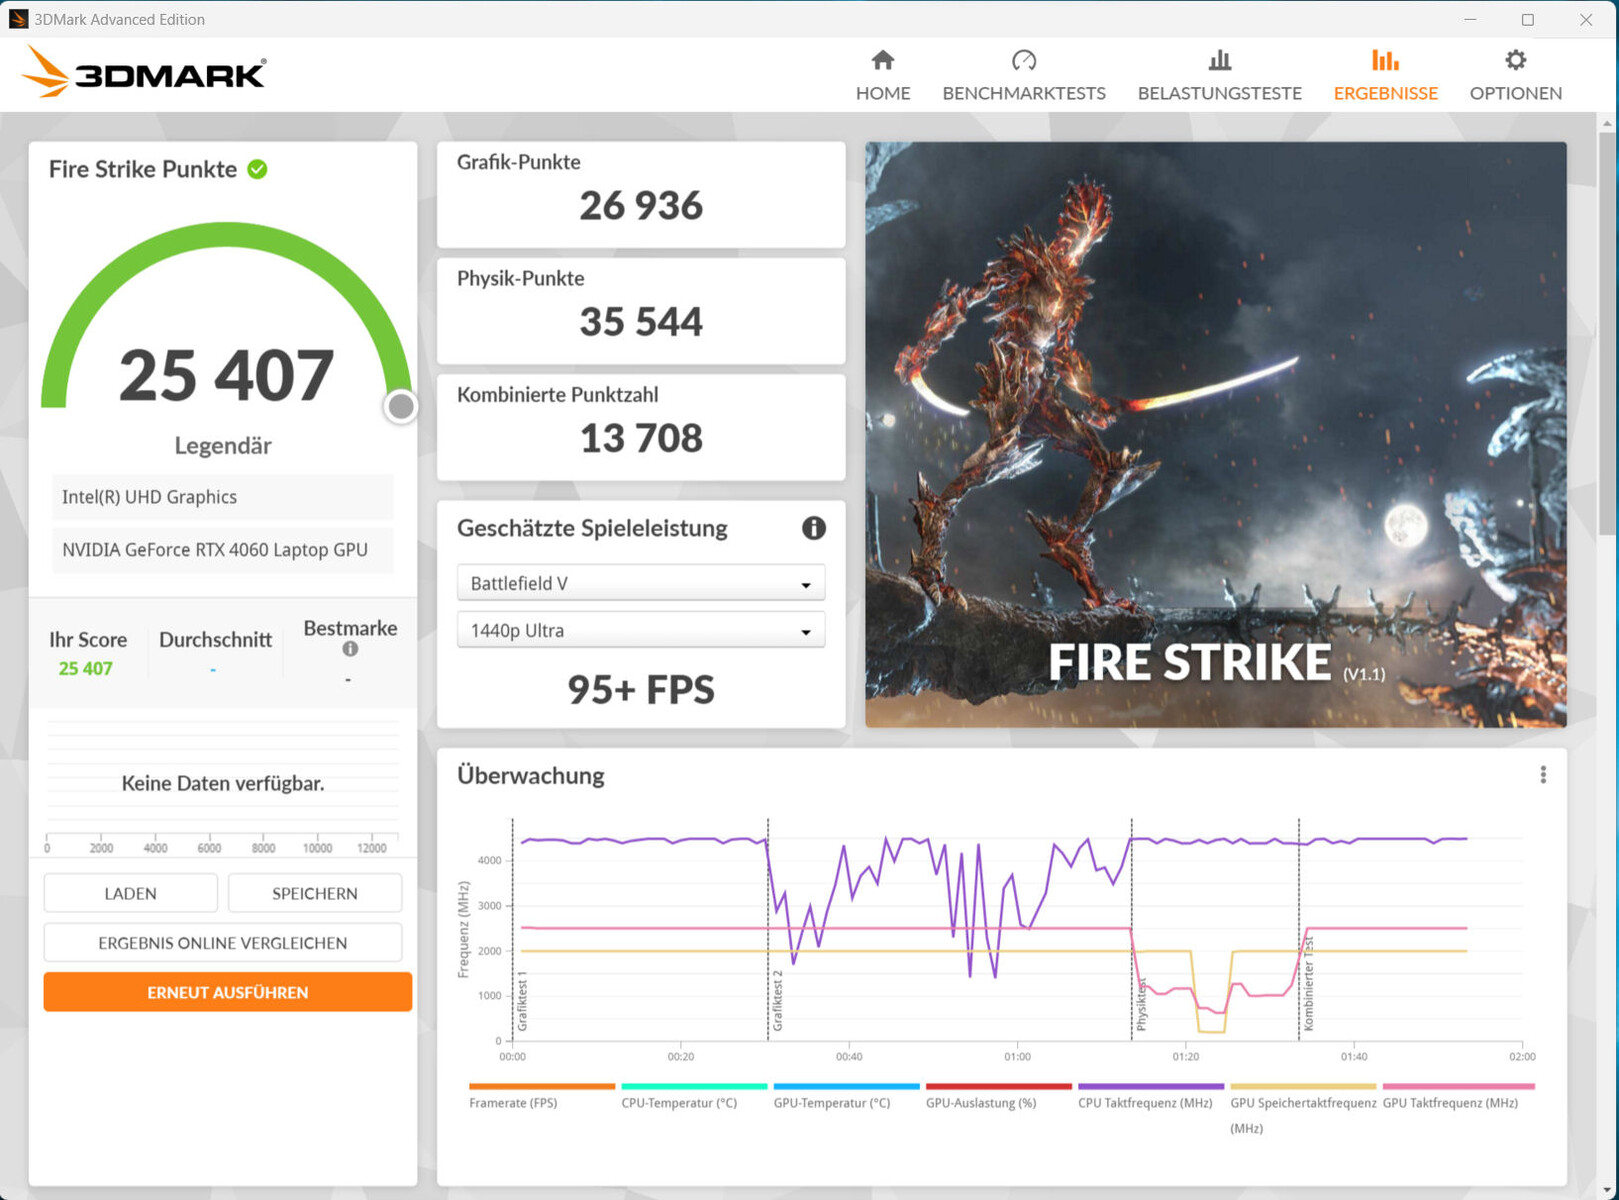
| 3DMark 06 Standard Score | 50480 pontos | |
| 3DMark 11 Performance | 31939 pontos | |
| 3DMark Cloud Gate Standard Score | 57165 pontos | |
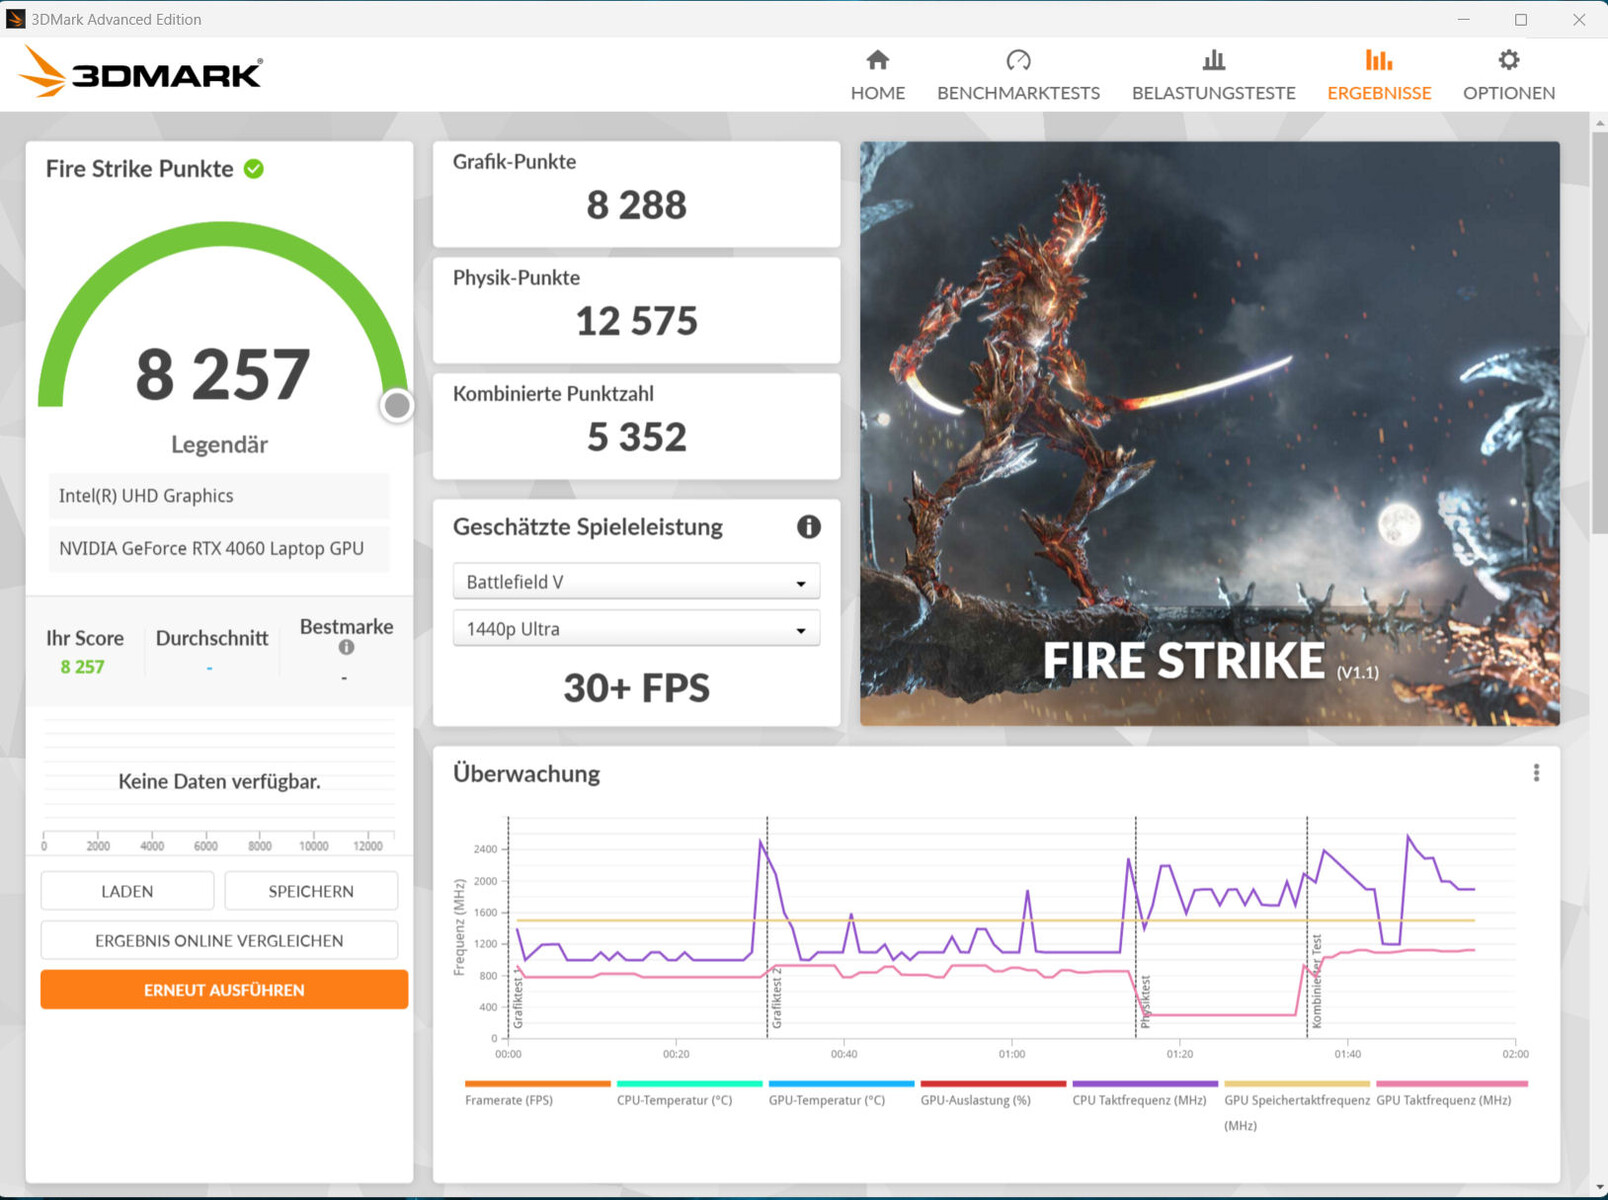
| 3DMark Fire Strike Score | 25286 pontos | |
| 3DMark Time Spy Score | 10764 pontos | |
Ajuda | ||
| V-Ray Benchmark Next 4.10 | |
| GPU | |
| Média da turma Gaming (427 - 1627, n=99, últimos 2 anos) | |
| MSI Katana 17 B13VFK (v4.10.07 ) | |
| Média NVIDIA GeForce RTX 4060 Laptop GPU (483 - 715, n=46) | |
| Medion Erazer Defender P40 (v4.10.07 ) | |
| Acer Predator Helios 300 (i7-12700H, RTX 3070 Ti) (v4.10.07 ) | |
| Gigabyte G7 KE (v4.10.07 ) | |
| Asus TUF Gaming A16 FA617 (v4.10.07 ) | |
| CPU | |
| Média da turma Gaming (10048 - 45327, n=97, últimos 2 anos) | |
| Média NVIDIA GeForce RTX 4060 Laptop GPU (12680 - 32360, n=46) | |
| Medion Erazer Defender P40 (v4.10.07 ) | |
| Acer Predator Helios 300 (i7-12700H, RTX 3070 Ti) (v4.10.07 ) | |
| MSI Katana 17 B13VFK (v4.10.07 ) | |
| Asus TUF Gaming A16 FA617 (v4.10.07 ) | |
| Gigabyte G7 KE (v4.10.07 ) | |
* ... menor é melhor
Desempenho em jogos
O Medion Defender foi projetado para jogos QHD em configurações altas ou máximas. Resoluções mais altas podem ser obtidas com um monitor externo, com configurações parcialmente reduzidas. São alcançadas taxas de quadros acima da média da RTX 4060. O modo dGPU pode, dependendo do jogo, levar a um aumento mínimo nas taxas de quadros.
O "modo silencioso" permite jogar com baixo ruído operacional. No entanto, as taxas de quadros jogáveis geralmente só são alcançadas com configurações reduzidas porque a potência de computação do hardware é significativamente reduzida.
| The Witcher 3 - 1920x1080 Ultra Graphics & Postprocessing (HBAO+) | |
| Média da turma Gaming (104.7 - 240, n=7, últimos 2 anos) | |
| Acer Predator Helios 300 (i7-12700H, RTX 3070 Ti) | |
| Lenovo Legion Pro 5 16IRX8 | |
| MSI Katana 17 B13VFK | |
| Medion Erazer Defender P40 | |
| Média NVIDIA GeForce RTX 4060 Laptop GPU (77 - 159.7, n=42) | |
| Asus TUF Gaming A16 FA617 | |
| Gigabyte G7 KE | |
| Final Fantasy XV Benchmark - 1920x1080 High Quality | |
| Média da turma Gaming (41 - 215, n=95, últimos 2 anos) | |
| Acer Predator Helios 300 (i7-12700H, RTX 3070 Ti) (1.3) | |
| Lenovo Legion Pro 5 16IRX8 (1.3) | |
| Medion Erazer Defender P40 (1.3) | |
| Média NVIDIA GeForce RTX 4060 Laptop GPU (75.1 - 109.8, n=51) | |
| MSI Katana 17 B13VFK (1.3) | |
| Gigabyte G7 KE (1.3) | |
| Asus TUF Gaming A16 FA617 (1.3) | |
| Strange Brigade - 1920x1080 ultra AA:ultra AF:16 | |
| Média da turma Gaming (76.3 - 458, n=87, últimos 2 anos) | |
| Acer Predator Helios 300 (i7-12700H, RTX 3070 Ti) (1.47.22.14 D3D12) | |
| Medion Erazer Defender P40 (1.47.22.14 D3D12) | |
| MSI Katana 17 B13VFK (1.47.22.14 D3D12) | |
| Média NVIDIA GeForce RTX 4060 Laptop GPU (135.3 - 210, n=50) | |
| Asus TUF Gaming A16 FA617 (1.47.22.14 D3D12) | |
| Gigabyte G7 KE (1.47.22.14 D3D12) | |
| Dead Space Remake | |
| 1920x1080 Ultra Preset AA:T | |
| Medion Erazer Defender P40 | |
| MSI Katana 17 B13VFK | |
| Média NVIDIA GeForce RTX 4060 Laptop GPU (53.3 - 70.4, n=3) | |
| Gigabyte G7 KE | |
| Asus TUF Gaming A16 FA617 | |
| Média da turma Gaming (n=1últimos 2 anos) | |
| 2560x1440 Ultra Preset AA:T | |
| Medion Erazer Defender P40 | |
| Média NVIDIA GeForce RTX 4060 Laptop GPU (43.4 - 44.5, n=2) | |
| MSI Katana 17 B13VFK | |
| Asus TUF Gaming A16 FA617 | |
| The Witcher 3 v4 | |
| 1920x1080 Ultra Preset / On AA:FX | |
| Asus TUF Gaming A16 FA617 | |
| Gigabyte G7 KE | |
| Medion Erazer Defender P40 | |
| MSI Katana 17 B13VFK | |
| Média NVIDIA GeForce RTX 4060 Laptop GPU (50.3 - 72.8, n=3) | |
| 2560x1440 Ultra Preset / On AA:FX | |
| Asus TUF Gaming A16 FA617 | |
| Medion Erazer Defender P40 | |
| Média NVIDIA GeForce RTX 4060 Laptop GPU (40.5 - 44.8, n=2) | |
| MSI Katana 17 B13VFK | |
| Resident Evil 4 Remake | |
| 1920x1080 Max Preset | |
| Medion Erazer Defender P40 | |
| Média NVIDIA GeForce RTX 4060 Laptop GPU (50.9 - 72.7, n=3) | |
| 2560x1440 Max Preset | |
| Média NVIDIA GeForce RTX 4060 Laptop GPU (52.1 - 55.1, n=2) | |
| Medion Erazer Defender P40 | |
| Dead Island 2 | |
| 1920x1080 Ultra Preset AA:High T | |
| XMG Pro 15 E23 | |
| Média NVIDIA GeForce RTX 4060 Laptop GPU (148.5 - 158.8, n=2) | |
| Medion Erazer Defender P40 | |
| 2560x1440 Ultra Preset AA:High T | |
| XMG Pro 15 E23 | |
| Média NVIDIA GeForce RTX 4060 Laptop GPU (98 - 101.9, n=2) | |
| Medion Erazer Defender P40 | |
| Star Wars Jedi Survivor | |
| 1920x1080 Epic Preset | |
| XMG Pro 15 E23 | |
| Medion Erazer Defender P40 | |
| Média NVIDIA GeForce RTX 4060 Laptop GPU (45.5 - 66.7, n=10) | |
| 2560x1440 Epic Preset | |
| XMG Pro 15 E23 | |
| Medion Erazer Defender P40 | |
| Média NVIDIA GeForce RTX 4060 Laptop GPU (30.3 - 41.7, n=10) | |
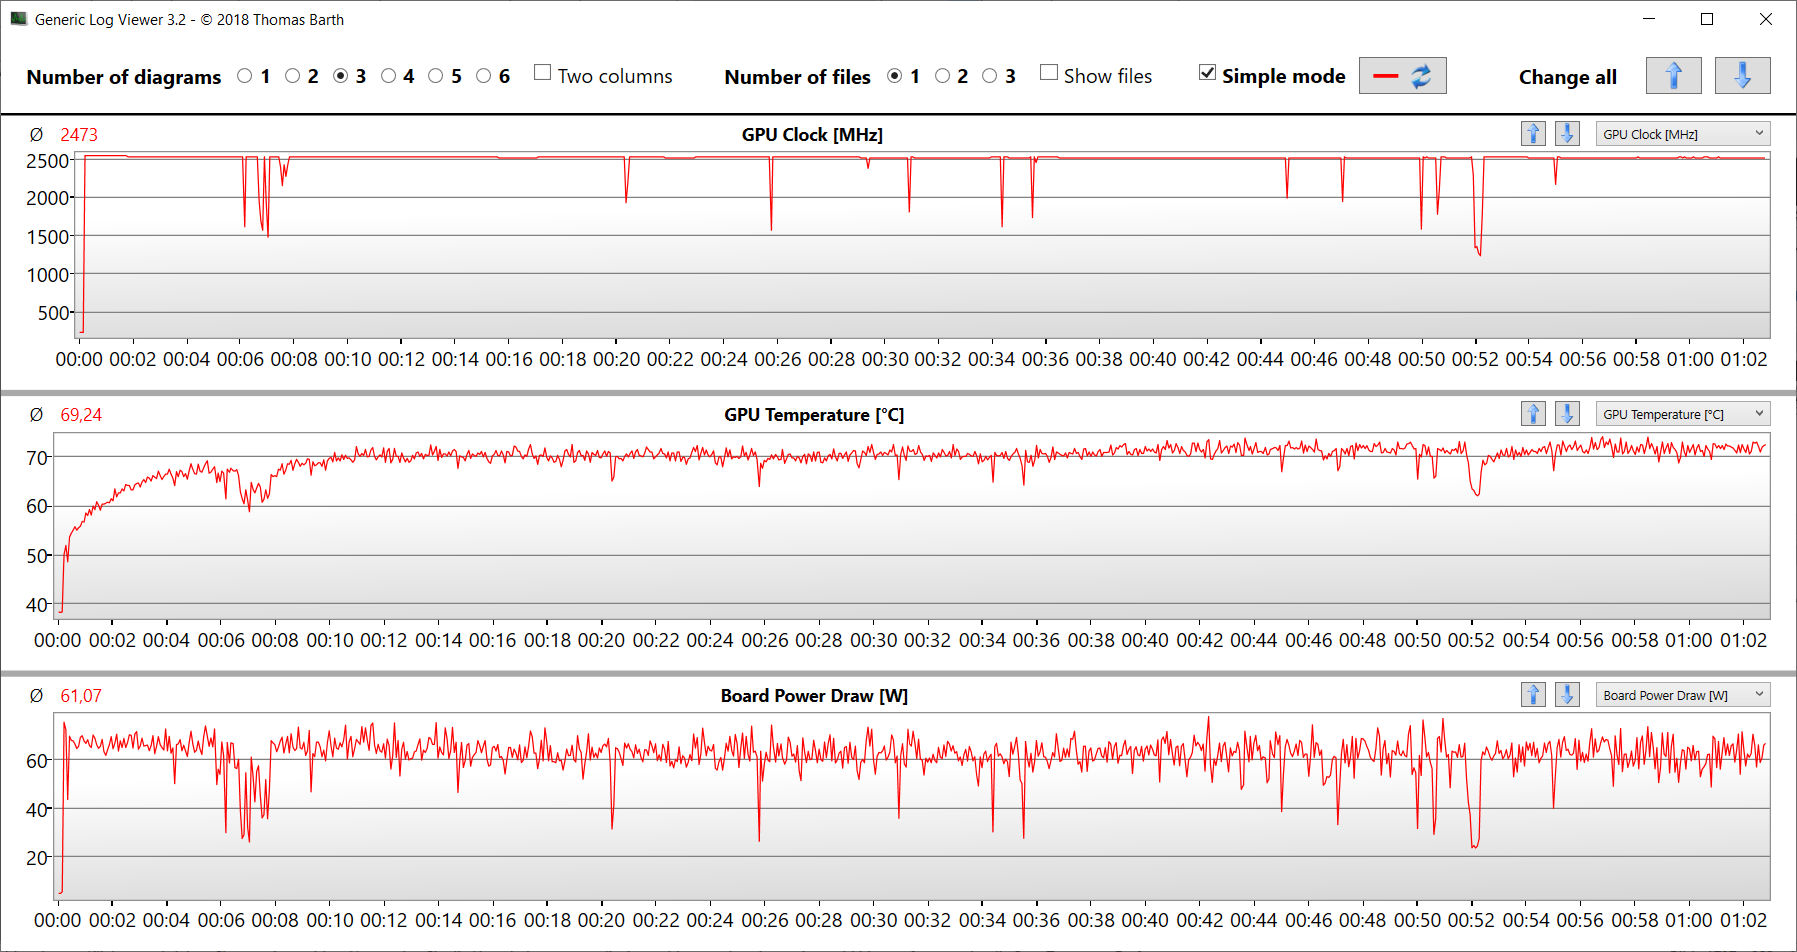
Para verificar se as taxas de quadros permanecem praticamente constantes em um período mais longo, executamos o jogo The Witcher 3 por cerca de 60 minutos em resolução Full HD e configurações de qualidade máxima. O personagem do jogo não foi movido. A queda nas taxas de quadros só ocorreu quando o "modo silencioso" estava ativo.
Witcher 3 FPS diagram
| baixo | média | alto | ultra | QHD | |
|---|---|---|---|---|---|
| GTA V (2015) | 186.3 | 183.1 | 176 | 113.9 | 83.1 |
| The Witcher 3 (2015) | 459.5 | 318.2 | 195.9 | 103 | |
| Dota 2 Reborn (2015) | 178.7 | 163.1 | 151.3 | 144.3 | |
| Final Fantasy XV Benchmark (2018) | 188.5 | 141.9 | 100.8 | 74 | |
| X-Plane 11.11 (2018) | 159.8 | 139.1 | 109.3 | ||
| Far Cry 5 (2018) | 167 | 142 | 136 | 128 | 102 |
| Strange Brigade (2018) | 473 | 279 | 221 | 188.3 | 126.4 |
| F1 22 (2022) | 243 | 232 | 178 | 65.7 | 42 |
| The Witcher 3 v4 (2023) | 210 | 171.6 | 85.4 | 72.8 | 44.8 |
| Dead Space Remake (2023) | 88.5 | 83.2 | 71.1 | 70.4 | 44.5 |
| Resident Evil 4 Remake (2023) | 141.5 | 107.2 | 97.3 | 72.7 | 52.1 |
| Dead Island 2 (2023) | 189.9 | 181.7 | 153.5 | 148.5 | 98 |
| Star Wars Jedi Survivor (2023) | 77.2 | 69.1 | 64.8 | 61.7 | 38.5 |
Emissões - Um laptop Medion com aumentos moderados de temperatura
Emissões de ruído
Quando carregado, o Erazer Defender pode produzir muito ruído. o "modo de jogo" fez com que o nível de pressão sonora subisse até 62 dB(A), e um máximo de 56 dB(A) foi atingido com o "modo de entretenimento" ativado - ainda muito alto.
Os outros dois modos reduziram bastante o ruído em detrimento da potência de computação - provavelmente uma primeira opção para o uso diário. Entretanto, o "modo silencioso" não faz jus ao seu nome. Mesmo assim: Ele permite jogar em um volume operacional baixo (Witcher 3: 36 dB(A)).
| HD Baixo | FHD Baixo | FHD Médio | FHD Alto | FHD Ultra | |
|---|---|---|---|---|---|
| Dota 2 Reborn | 85.8 fps | - | - | 51.7 fps | 45.1 fps |
| X-Plane 11.11 | 52,1 fps | - | 41,2 fps | 35,9 fps | - |
| Strange Brigade | - | - | - | - | 60 fps |
O notebook geralmente funciona de forma silenciosa, às vezes silenciosa, no modo inativo, bem como no uso diário (escritório, Internet). No entanto, as ventoinhas ocasionalmente aceleram desnecessariamente (um fenômeno típico dos barebones da Clevo).
Barulho
| Ocioso |
| 26 / 27 / 32 dB |
| Carga |
| 53 / 64 dB |
 | ||
30 dB silencioso 40 dB(A) audível 50 dB(A) ruidosamente alto |
||
min: | ||
| Medion Erazer Defender P40 GeForce RTX 4060 Laptop GPU, i7-13700HX, Phison PS5021-E21 1TB | MSI Katana 17 B13VFK GeForce RTX 4060 Laptop GPU, i7-13620H, Micron 2400 MTFDKBA1T0QFM | Acer Predator Helios 300 (i7-12700H, RTX 3070 Ti) GeForce RTX 3070 Ti Laptop GPU, i7-12700H, Samsung PM9A1 MZVL21T0HCLR | Lenovo Legion Pro 5 16IRX8 GeForce RTX 4060 Laptop GPU, i7-13700HX, SK hynix PC801 HFS512GEJ9X115N | Asus TUF Gaming A16 FA617 Radeon RX 7600S, R7 7735HS, Micron 2400 MTFDKBA1T0QFM | Gigabyte G7 KE GeForce RTX 3060 Laptop GPU, i5-12500H, Gigabyte AG470S1TB-SI B10 | |
|---|---|---|---|---|---|---|
| Noise | 1% | 1% | 16% | 12% | -7% | |
| desligado / ambiente * (dB) | 25 | 24.5 2% | 23 8% | 23 8% | 24 4% | 27 -8% |
| Idle Minimum * (dB) | 26 | 24.5 6% | 23 12% | 23.1 11% | 24 8% | 27 -4% |
| Idle Average * (dB) | 27 | 24.5 9% | 25.92 4% | 23.1 14% | 25 7% | 35 -30% |
| Idle Maximum * (dB) | 32 | 40 -25% | 40.67 -27% | 26.6 17% | 28 12% | 38 -19% |
| Load Average * (dB) | 53 | 48.3 9% | 42.7 19% | 34.7 35% | 42 21% | 52 2% |
| Witcher 3 ultra * (dB) | 56 | 56 -0% | 62.48 -12% | 47.6 15% | 50 11% | 56 -0% |
| Load Maximum * (dB) | 64 | 59.1 8% | 62.67 2% | 54.8 14% | 50 22% | 59 8% |
* ... menor é melhor
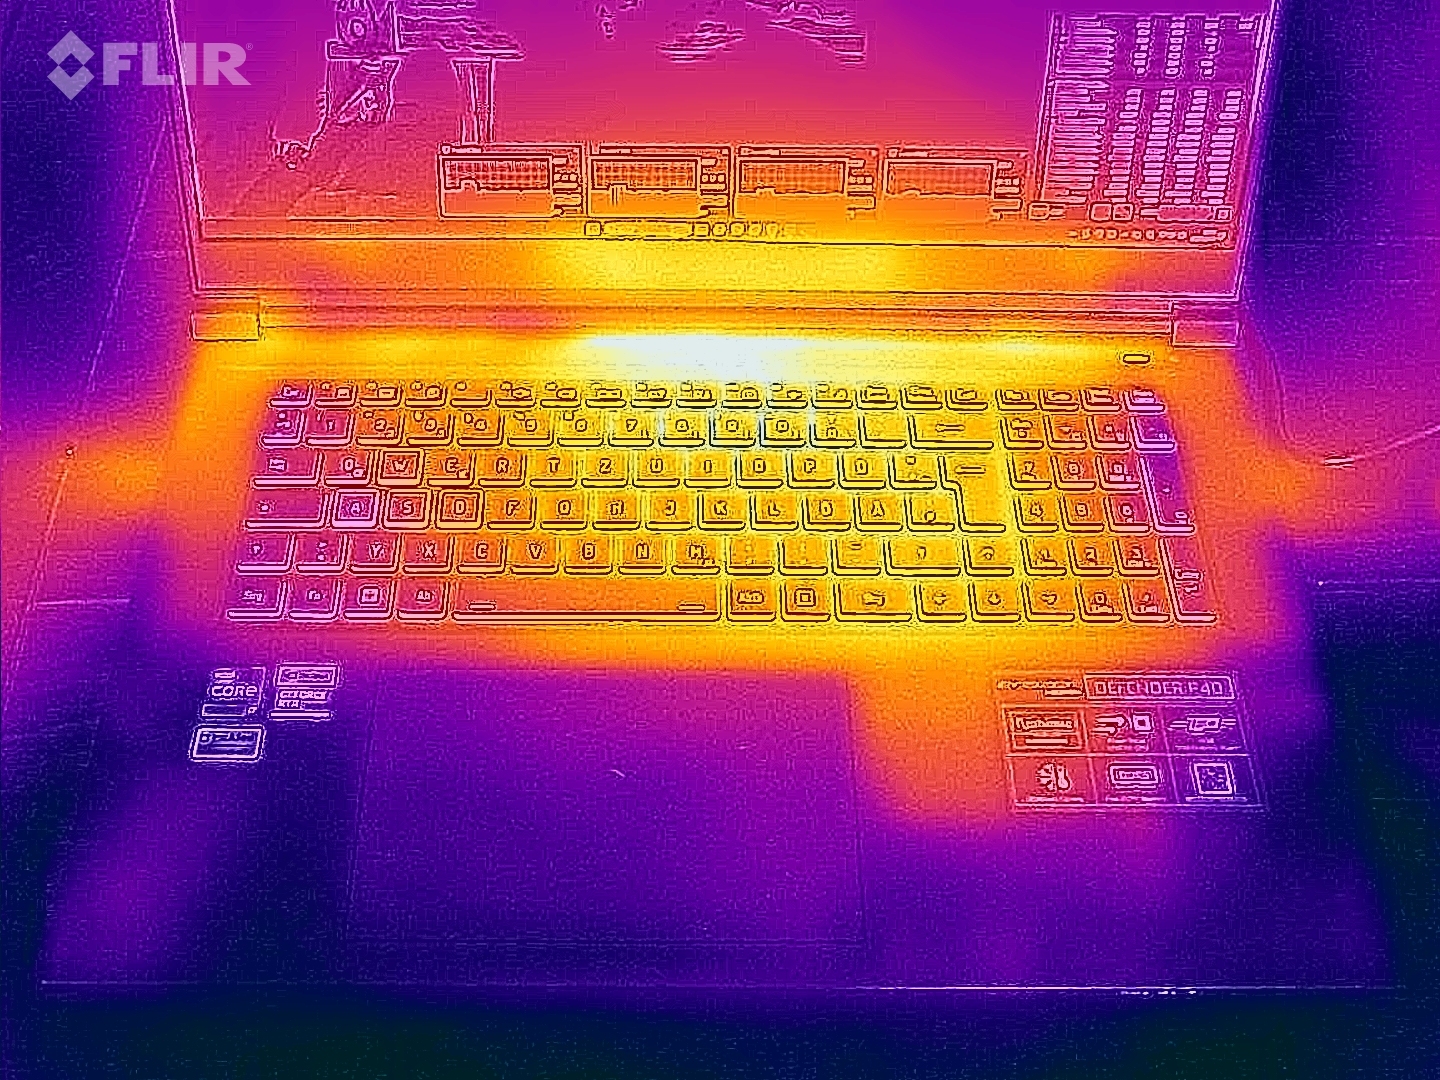
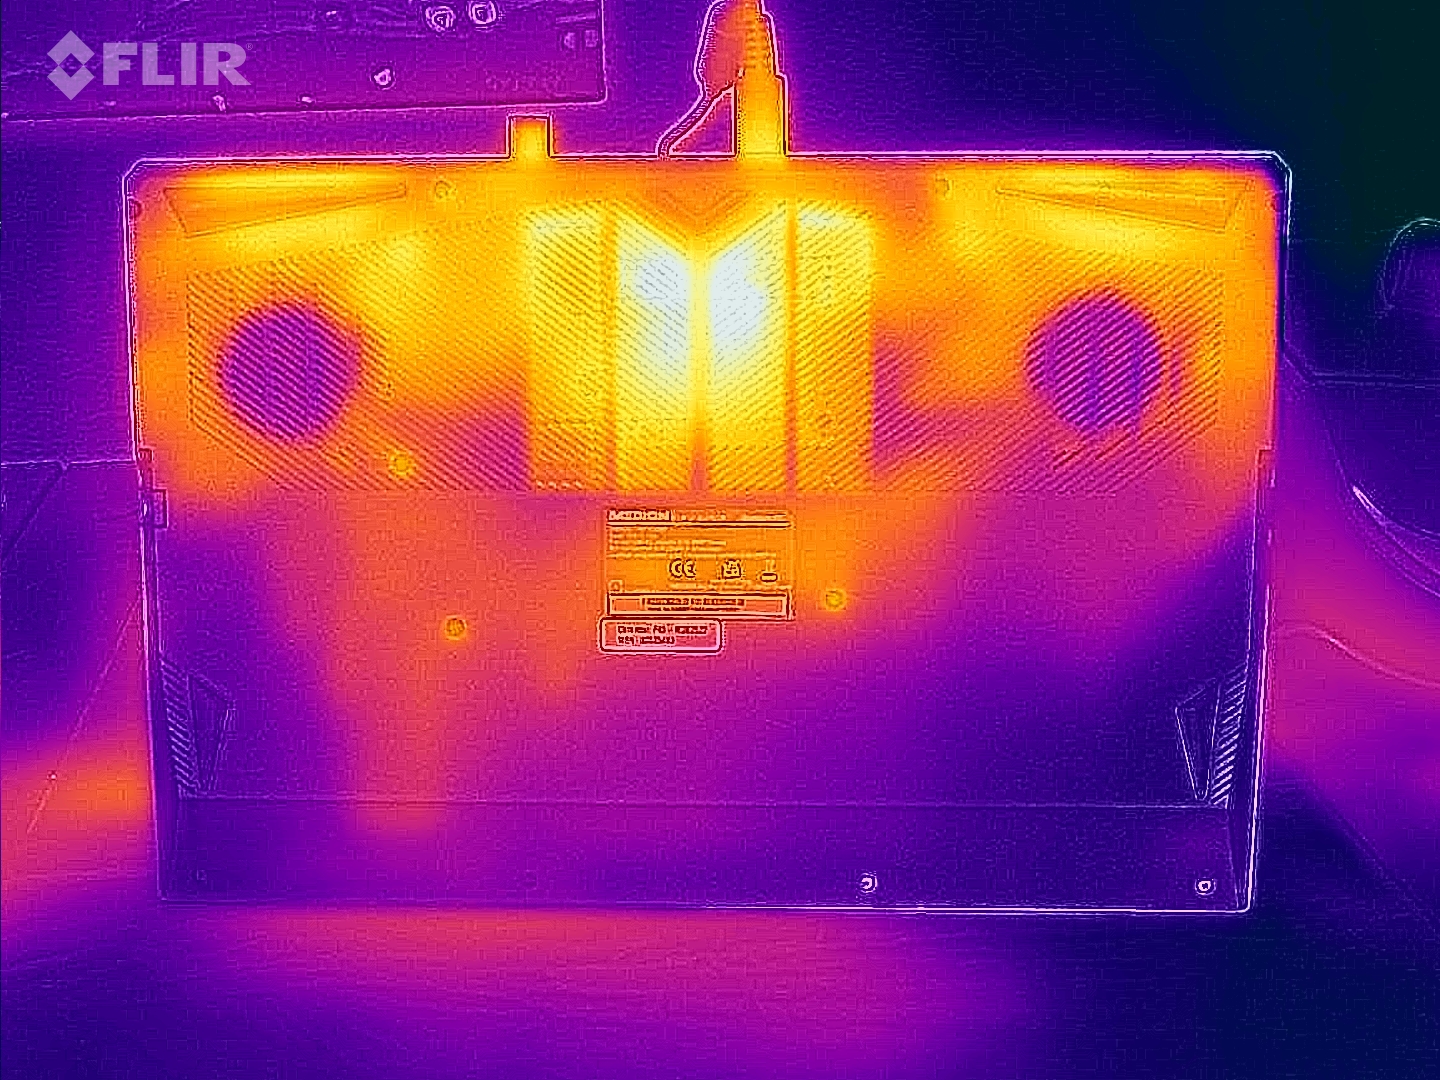
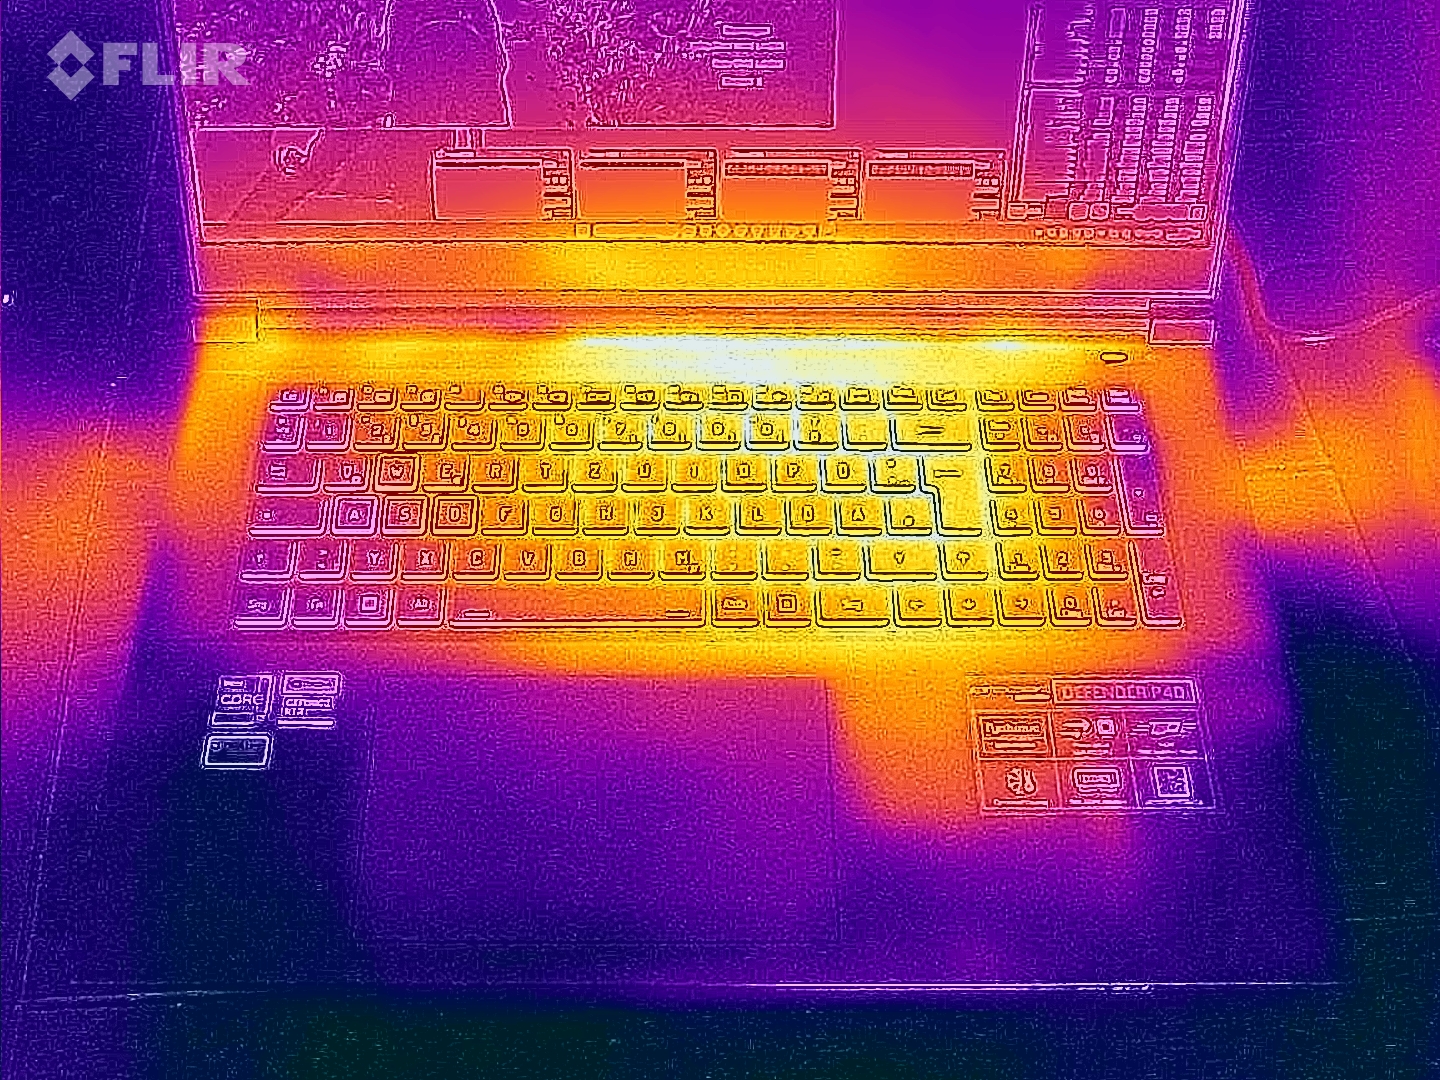
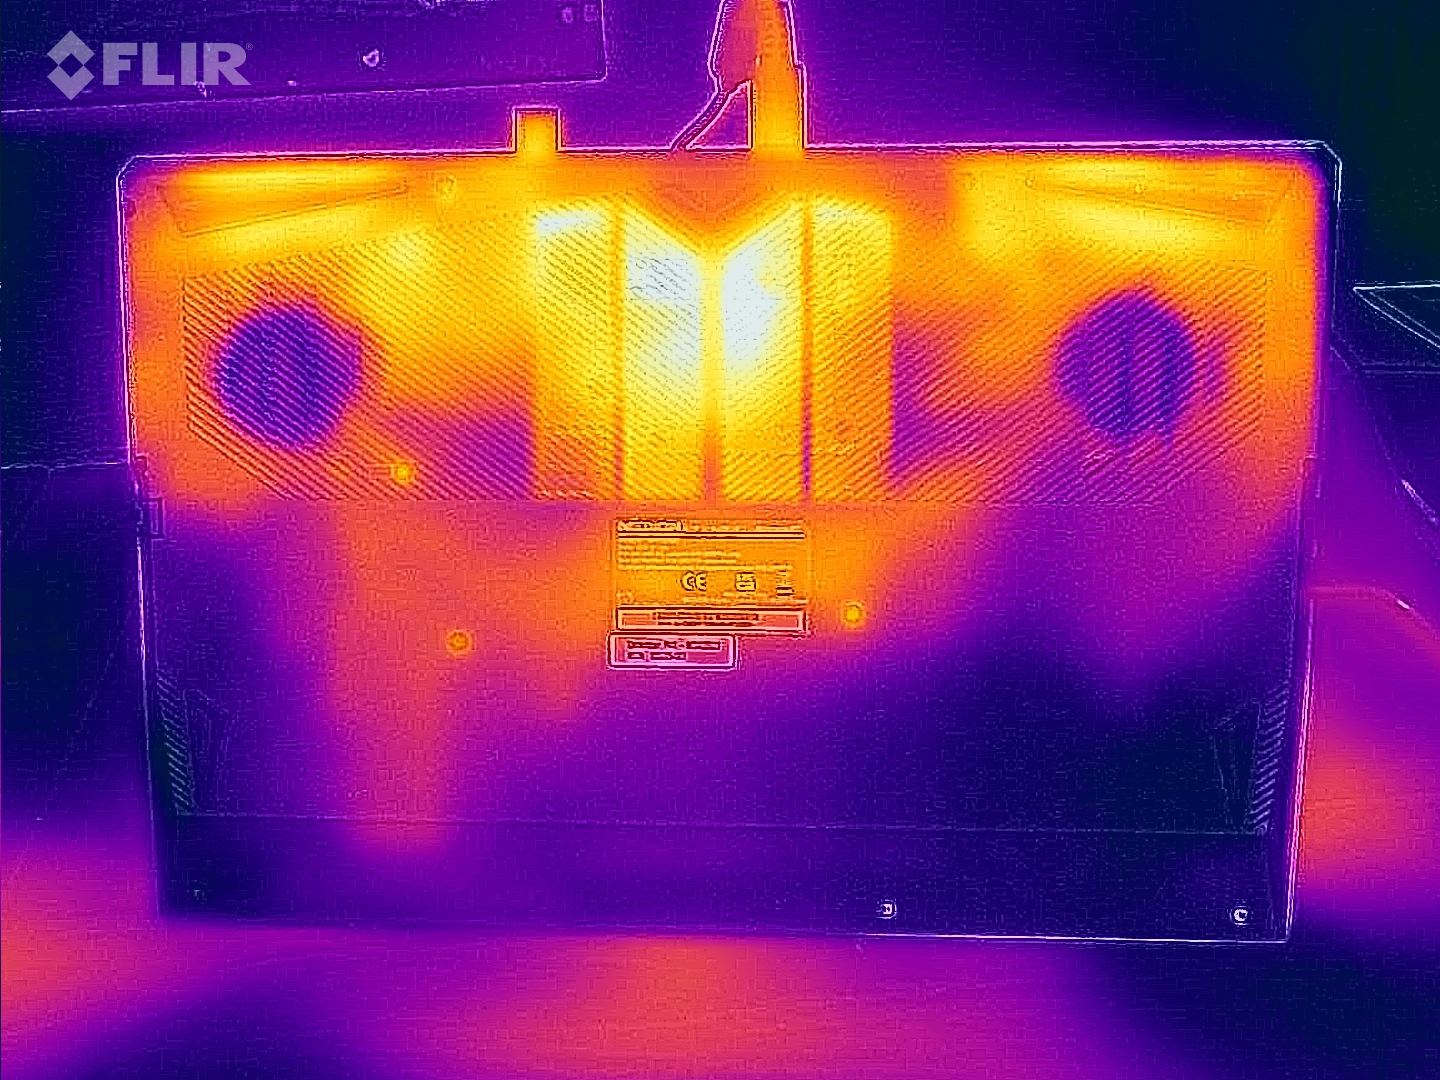
Temperatura
O notebook não esquenta muito. Temperaturas bem abaixo de 50°C são registradas em todos os pontos de medição. As taxas estão dentro da zona verde no uso diário.
(±) A temperatura máxima no lado superior é 42 °C / 108 F, em comparação com a média de 40.4 °C / 105 F , variando de 21.2 a 68.8 °C para a classe Gaming.
(±) A parte inferior aquece até um máximo de 45 °C / 113 F, em comparação com a média de 43.2 °C / 110 F
(+) Em uso inativo, a temperatura média para o lado superior é 26.6 °C / 80 F, em comparação com a média do dispositivo de 33.9 °C / ### class_avg_f### F.
(±) Jogando The Witcher 3, a temperatura média para o lado superior é 37.1 °C / 99 F, em comparação com a média do dispositivo de 33.9 °C / ## #class_avg_f### F.
(+) Os apoios para as mãos e o touchpad são mais frios que a temperatura da pele, com um máximo de 31 °C / 87.8 F e, portanto, são frios ao toque.
(-) A temperatura média da área do apoio para as mãos de dispositivos semelhantes foi 28.8 °C / 83.8 F (-2.2 °C / -4 F).
| Medion Erazer Defender P40 Intel Core i7-13700HX, NVIDIA GeForce RTX 4060 Laptop GPU | MSI Katana 17 B13VFK Intel Core i7-13620H, NVIDIA GeForce RTX 4060 Laptop GPU | Acer Predator Helios 300 (i7-12700H, RTX 3070 Ti) Intel Core i7-12700H, NVIDIA GeForce RTX 3070 Ti Laptop GPU | Lenovo Legion Pro 5 16IRX8 Intel Core i7-13700HX, NVIDIA GeForce RTX 4060 Laptop GPU | Asus TUF Gaming A16 FA617 AMD Ryzen 7 7735HS, AMD Radeon RX 7600S | Gigabyte G7 KE Intel Core i5-12500H, NVIDIA GeForce RTX 3060 Laptop GPU | |
|---|---|---|---|---|---|---|
| Heat | -7% | -5% | -8% | -27% | -13% | |
| Maximum Upper Side * (°C) | 42 | 41.6 1% | 35 17% | 42.8 -2% | 54 -29% | 52 -24% |
| Maximum Bottom * (°C) | 45 | 43.1 4% | 53 -18% | 50 -11% | 47 -4% | 54 -20% |
| Idle Upper Side * (°C) | 28 | 32 -14% | 29 -4% | 29.6 -6% | 40 -43% | 28 -0% |
| Idle Bottom * (°C) | 30 | 35.8 -19% | 34 -13% | 34 -13% | 40 -33% | 32 -7% |
* ... menor é melhor
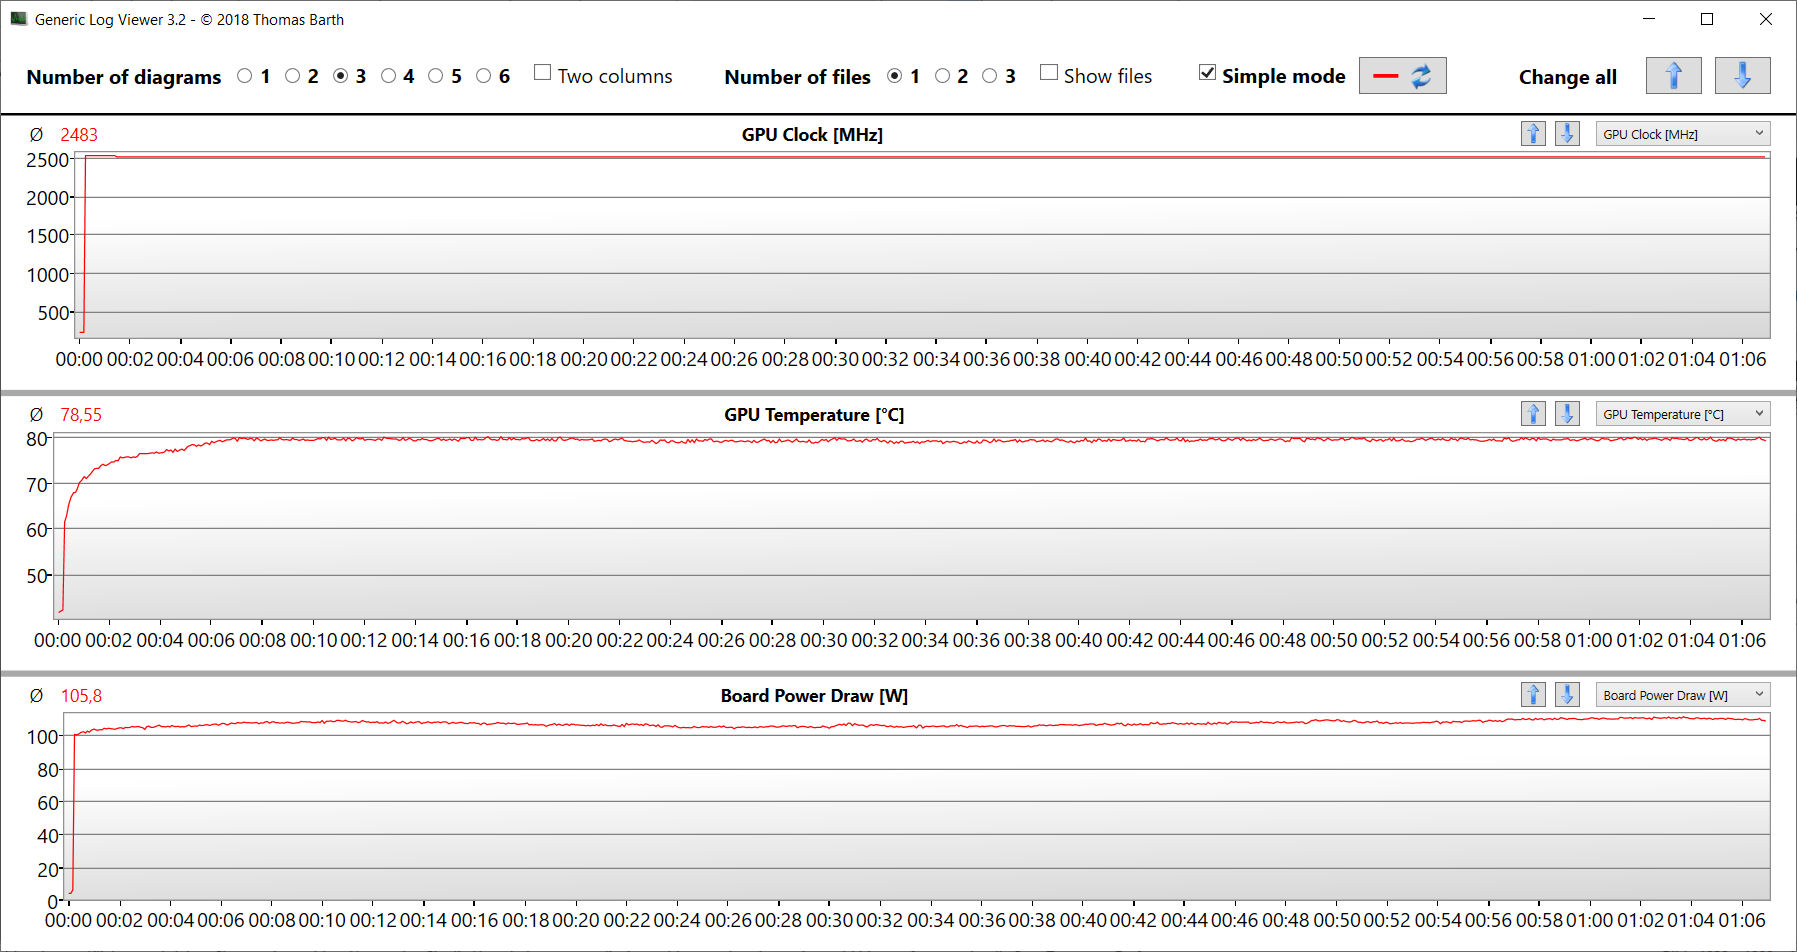
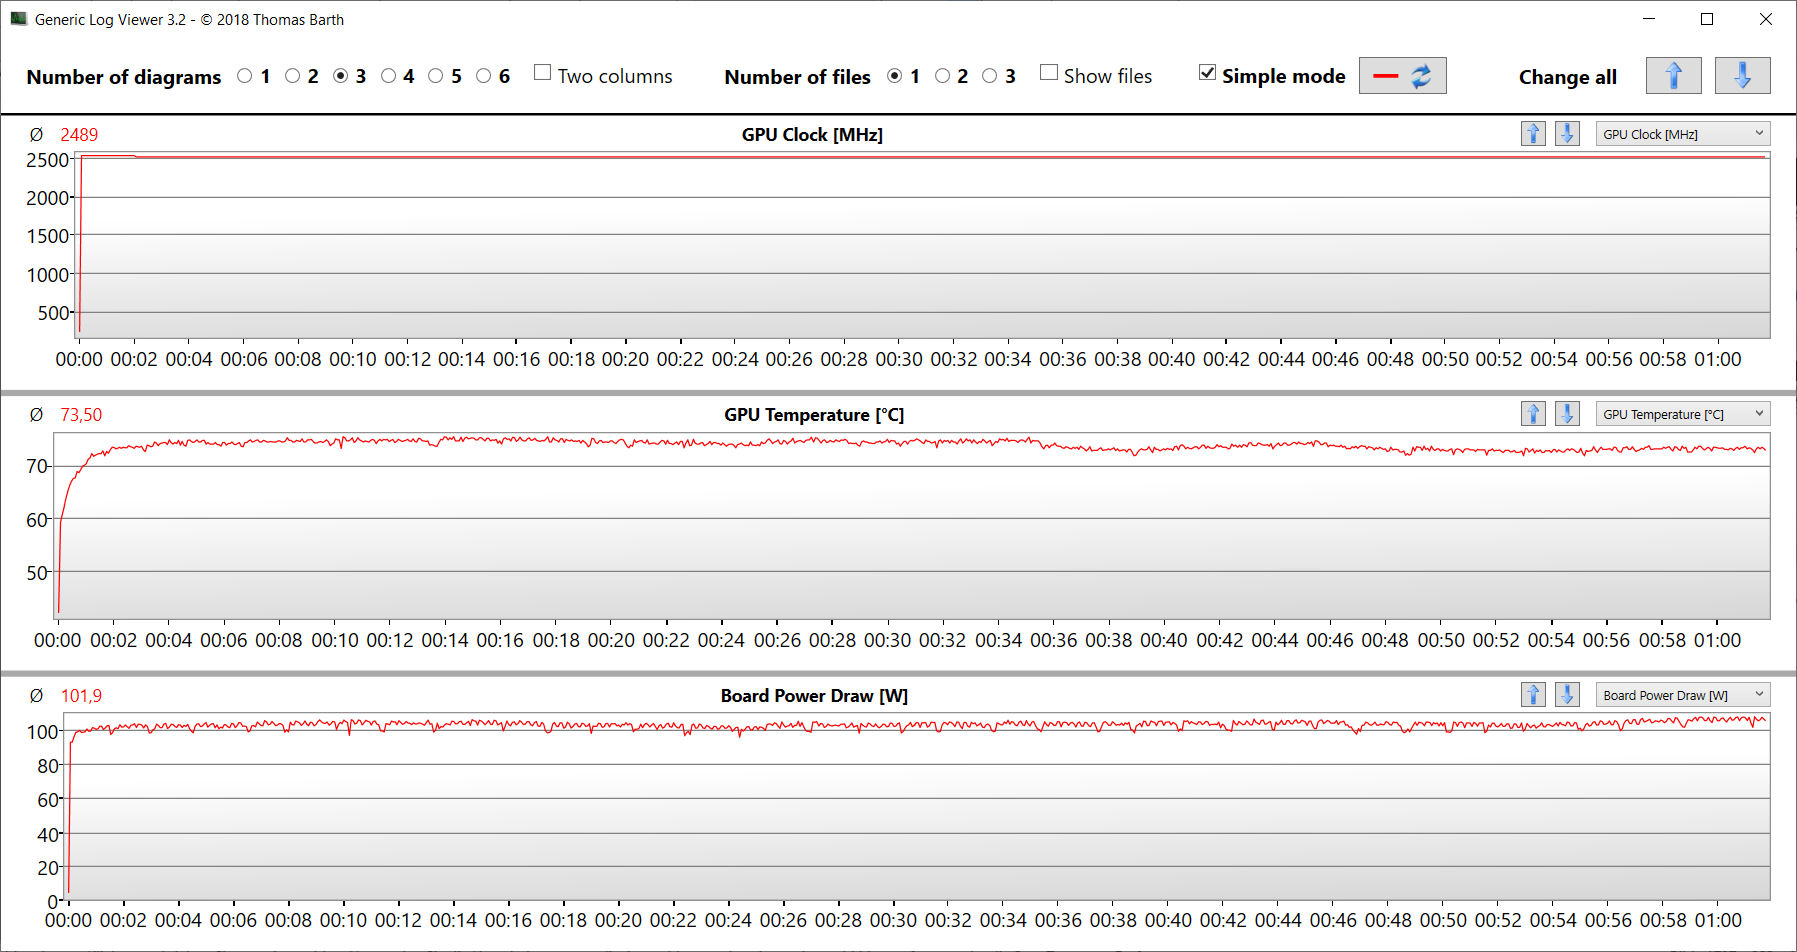
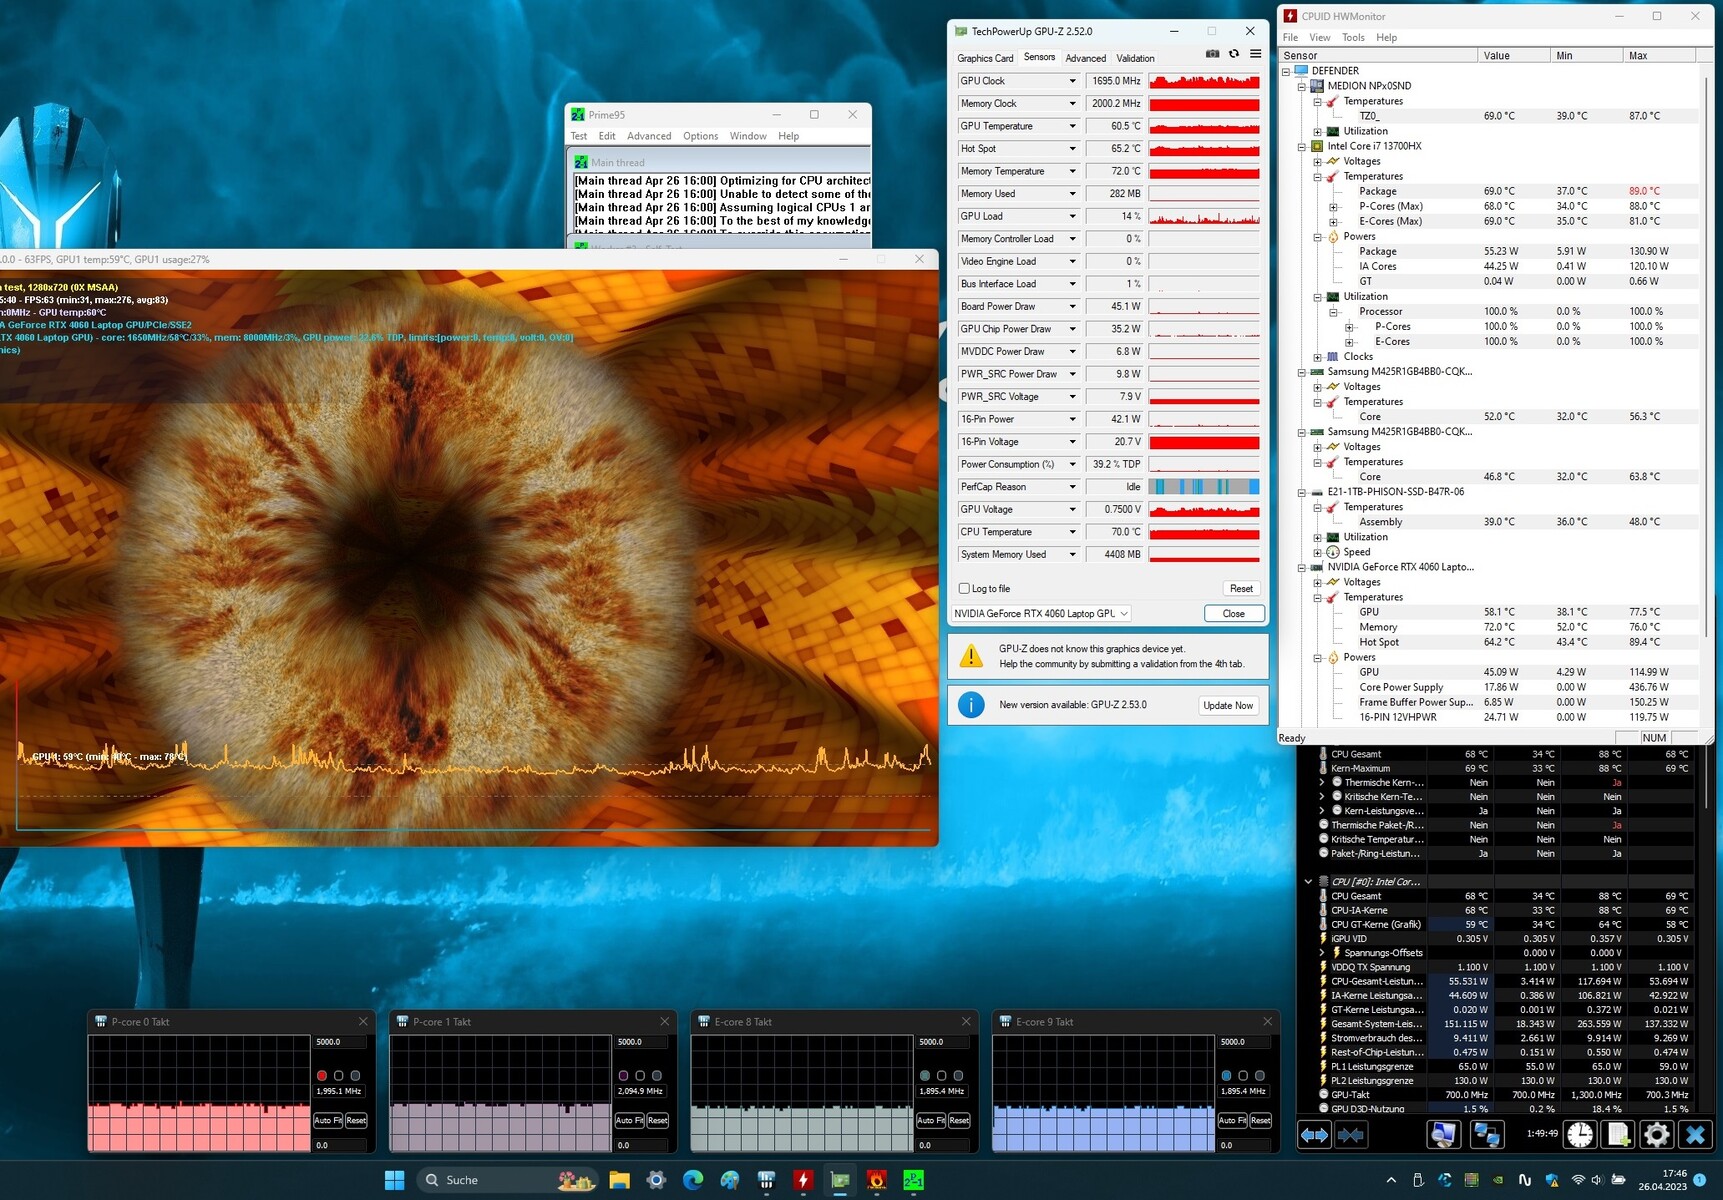
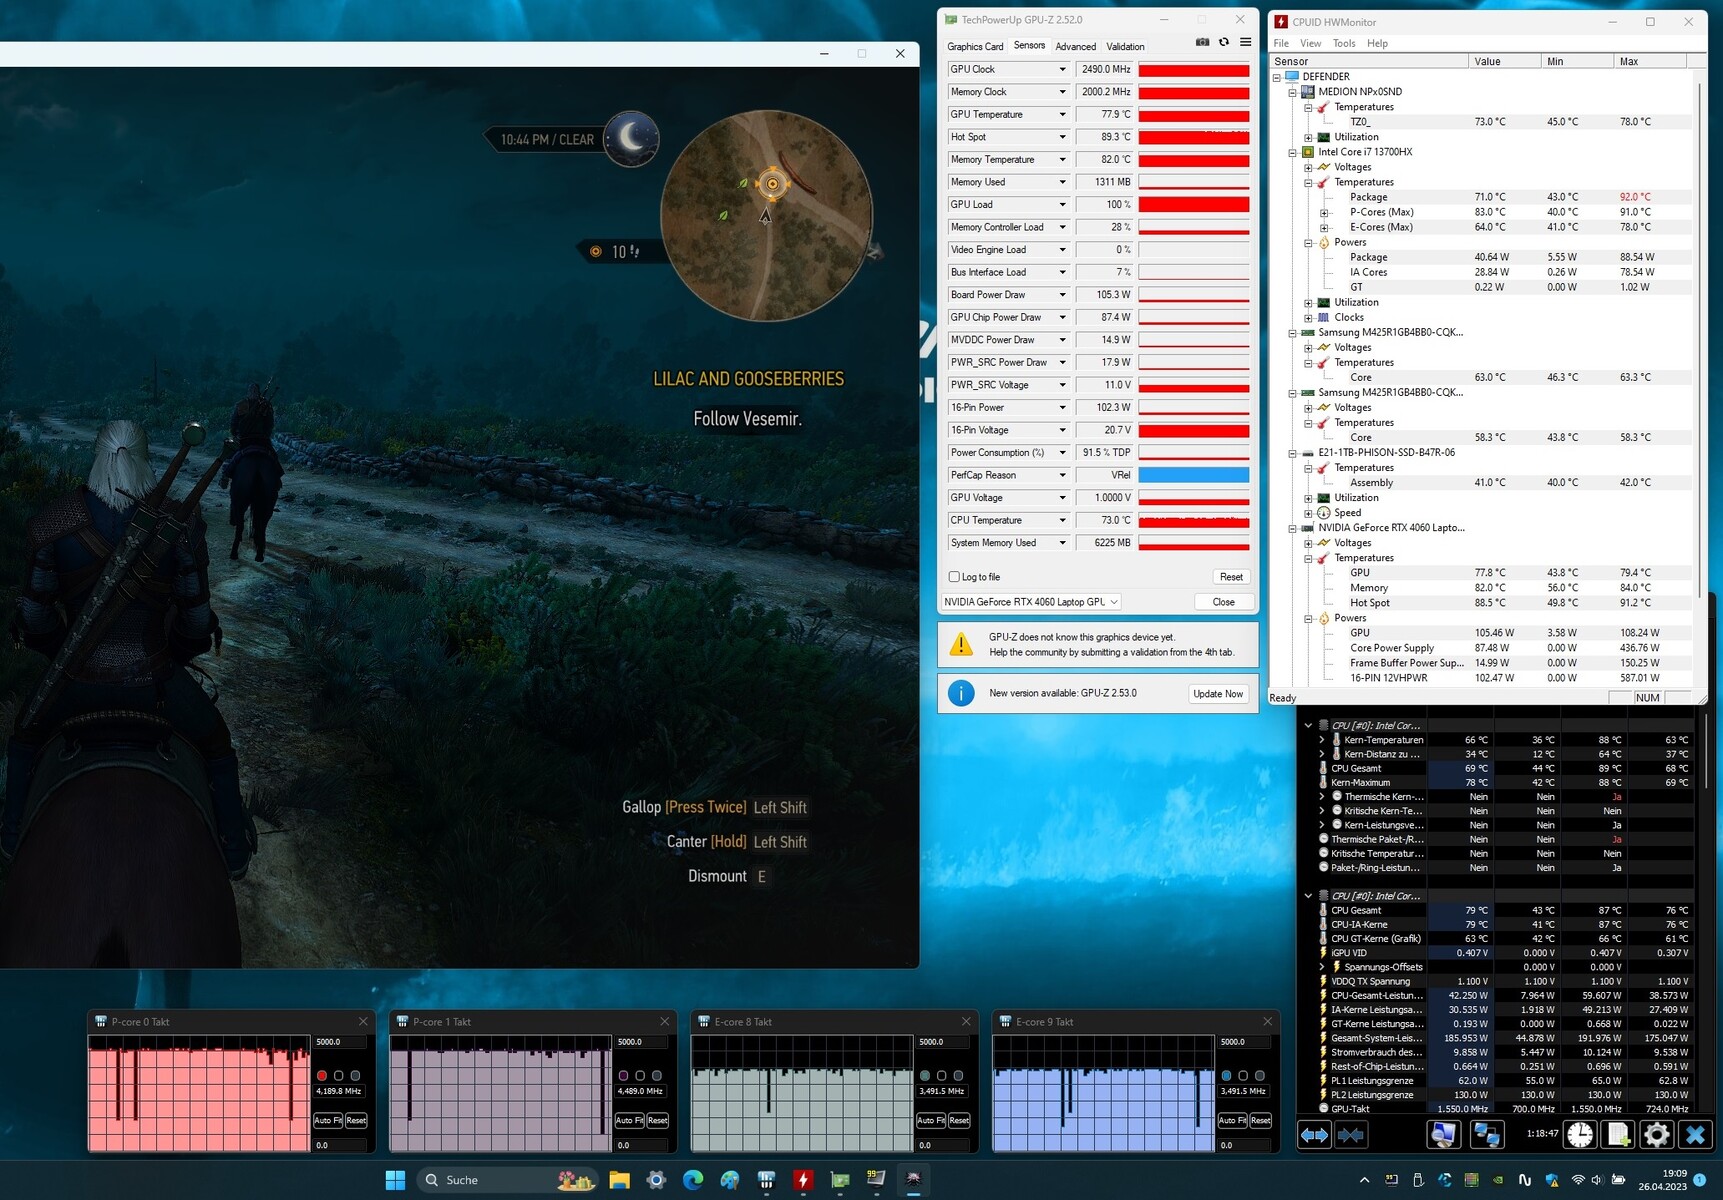
Teste de estresse
O teste de estresse (Prime95 e Furmark em operação contínua) simula um cenário extremo para testar a estabilidade do sistema em carga total. A CPU iniciou o teste com altas taxas de clock (P: 3,5 a 3,8 GHz, E: 3,1 a 3,2 GHz) com a GPU em execução a 2,4 a 2,5 GHz. Embora o clock da CPU tenha sido reduzido após pouco menos de um minuto, a GPU funcionou com potência máxima durante todo o tempo.
Alto-falantes
Os alto-falantes estéreo produzem um som decente que, infelizmente, quase não tem graves para oferecer. Seria possível obter uma experiência sonora melhor usando fones de ouvido ou alto-falantes externos.
Medion Erazer Defender P40 análise de áudio
(±) | o volume do alto-falante é médio, mas bom (###valor### dB)
Graves 100 - 315Hz
(-) | quase nenhum baixo - em média 29.9% menor que a mediana
(±) | a linearidade dos graves é média (12.4% delta para a frequência anterior)
Médios 400 - 2.000 Hz
(±) | médios mais altos - em média 6.4% maior que a mediana
(±) | a linearidade dos médios é média (8.1% delta para frequência anterior)
Altos 2 - 16 kHz
(+) | agudos equilibrados - apenas 2.4% longe da mediana
(+) | os máximos são lineares (3.6% delta da frequência anterior)
Geral 100 - 16.000 Hz
(±) | a linearidade do som geral é média (22.4% diferença em relação à mediana)
Comparado com a mesma classe
» 80% de todos os dispositivos testados nesta classe foram melhores, 6% semelhantes, 14% piores
» O melhor teve um delta de 6%, a média foi 18%, o pior foi 132%
Comparado com todos os dispositivos testados
» 66% de todos os dispositivos testados foram melhores, 6% semelhantes, 29% piores
» O melhor teve um delta de 4%, a média foi 23%, o pior foi 134%
MSI Katana 17 B13VFK análise de áudio
(±) | o volume do alto-falante é médio, mas bom (###valor### dB)
Graves 100 - 315Hz
(-) | quase nenhum baixo - em média 17.7% menor que a mediana
(±) | a linearidade dos graves é média (11.7% delta para a frequência anterior)
Médios 400 - 2.000 Hz
(±) | médios mais altos - em média 6.8% maior que a mediana
(+) | médios são lineares (6.7% delta para frequência anterior)
Altos 2 - 16 kHz
(+) | agudos equilibrados - apenas 3.2% longe da mediana
(±) | a linearidade dos máximos é média (7.2% delta para frequência anterior)
Geral 100 - 16.000 Hz
(±) | a linearidade do som geral é média (19.4% diferença em relação à mediana)
Comparado com a mesma classe
» 67% de todos os dispositivos testados nesta classe foram melhores, 7% semelhantes, 26% piores
» O melhor teve um delta de 6%, a média foi 18%, o pior foi 132%
Comparado com todos os dispositivos testados
» 48% de todos os dispositivos testados foram melhores, 7% semelhantes, 45% piores
» O melhor teve um delta de 4%, a média foi 23%, o pior foi 134%
Gerenciamento de energia - O laptop para jogos com tempos de execução decentes
Consumo de energia
O consumo de energia do laptop Medion está em um nível normal para o hardware instalado. O teste Witcher 3 teste e o teste de estresse foram executados com consumo de energia constante ou relativamente constante. A fonte de alimentação (280 watts) tem tamanho suficiente.
| desligado | |
| Ocioso | |
| Carga |
|
Key:
min: | |
| Medion Erazer Defender P40 i7-13700HX, GeForce RTX 4060 Laptop GPU, Phison PS5021-E21 1TB, IPS, 2560x1440, 17.3" | MSI Katana 17 B13VFK i7-13620H, GeForce RTX 4060 Laptop GPU, Micron 2400 MTFDKBA1T0QFM, IPS LED, 1920x1080, 17.3" | Acer Predator Helios 300 (i7-12700H, RTX 3070 Ti) i7-12700H, GeForce RTX 3070 Ti Laptop GPU, Samsung PM9A1 MZVL21T0HCLR, IPS, 2560x1440, 17.3" | Lenovo Legion Pro 5 16IRX8 i7-13700HX, GeForce RTX 4060 Laptop GPU, SK hynix PC801 HFS512GEJ9X115N, IPS, 2560x1600, 16" | Asus TUF Gaming A16 FA617 R7 7735HS, Radeon RX 7600S, Micron 2400 MTFDKBA1T0QFM, IPS-Level, 1920x1200, 16" | Gigabyte G7 KE i5-12500H, GeForce RTX 3060 Laptop GPU, Gigabyte AG470S1TB-SI B10, IPS, 1920x1080, 17.3" | Média NVIDIA GeForce RTX 4060 Laptop GPU | Média da turma Gaming | |
|---|---|---|---|---|---|---|---|---|
| Power Consumption | -1% | -40% | -71% | 13% | -24% | -11% | -32% | |
| Idle Minimum * (Watt) | 8 | 12.2 -53% | 15 -88% | 24.5 -206% | 8 -0% | 15 -88% | 11.5 ? -44% | 13 ? -63% |
| Idle Average * (Watt) | 12 | 14.9 -24% | 20 -67% | 29.2 -143% | 11 8% | 17 -42% | 16 ? -33% | 19 ? -58% |
| Idle Maximum * (Watt) | 18 | 15.8 12% | 22.3 -24% | 34.3 -91% | 16 11% | 24 -33% | 20.3 ? -13% | 24.6 ? -37% |
| Load Average * (Watt) | 101 | 85.22 16% | 133 -32% | 98.7 2% | 97 4% | 111 -10% | 92.9 ? 8% | 110.7 ? -10% |
| Witcher 3 ultra * (Watt) | 180.8 | 151.1 16% | 231 -28% | 178.6 1% | 161.5 11% | 174.1 4% | ||
| Load Maximum * (Watt) | 284 | 212.8 25% | 290 -2% | 249.6 12% | 168 41% | 208 27% | 210 ? 26% | 259 ? 9% |
* ... menor é melhor
Power consumption Witcher 3 / stress test
Power consumption with external monitor
Duração da bateria
O laptop de 17,3 polegadas alcançou tempos de execução de 6:13 h e 5:39 h no teste de WLAN (acessando sites por meio de um script) e no teste de vídeo (curta-metragem Big Buck Bunny (codificação H.264, FHD) em um loop), respectivamente. Durante os dois testes, os recursos de economia de energia do dispositivo foram desativados e o brilho da tela foi definido para cerca de 150 cd/m². Os módulos sem fio também foram desativados para o teste de vídeo.
No geral, o P40 alcançou taxas de resistência muito boas. Ele se colocou no meio do campo dos dispositivos de comparação. Nenhum dos computadores conseguiu igualar os excelentes tempos de execução do Asus TUF Gaming A16. Este último se beneficia da combinação de uma APU econômica e da grande capacidade da bateria.
| Medion Erazer Defender P40 i7-13700HX, GeForce RTX 4060 Laptop GPU, 73 Wh | MSI Katana 17 B13VFK i7-13620H, GeForce RTX 4060 Laptop GPU, 53.5 Wh | Acer Predator Helios 300 (i7-12700H, RTX 3070 Ti) i7-12700H, GeForce RTX 3070 Ti Laptop GPU, 90 Wh | Lenovo Legion Pro 5 16IRX8 i7-13700HX, GeForce RTX 4060 Laptop GPU, 80 Wh | Asus TUF Gaming A16 FA617 R7 7735HS, Radeon RX 7600S, 90 Wh | Gigabyte G7 KE i5-12500H, GeForce RTX 3060 Laptop GPU, 54 Wh | Média da turma Gaming | |
|---|---|---|---|---|---|---|---|
| Duração da bateria | -38% | 13% | -38% | 80% | -24% | 18% | |
| Reader / Idle (h) | 8.8 | 6.7 -24% | 20.2 130% | 7.1 -19% | 8.27 ? -6% | ||
| H.264 (h) | 5.7 | 5.9 4% | 2.2 -61% | 8.32 ? 46% | |||
| WiFi v1.3 (h) | 6.2 | 2.9 -53% | 6 -3% | 3.4 -45% | 12.1 95% | 5.3 -15% | 7.11 ? 15% |
| Load (h) | 1.3 | 1 -23% | 1.8 38% | 0.7 -46% | 1.5 15% | 1.3 0% | 1.502 ? 16% |
Pro
Contra
Veredicto - Um caso bem resolvido
O P40 é adequado para jogos QHD em configurações altas ou máximas, mas o laptop deve ser ótimo para uso em muitas outras áreas (edição de vídeo, renderização) graças ao seuCore i7-13700HXe àGeForce RTX 4060. A CPU e a GPU funcionam com taxas de clock consistentemente altas e um SSD PCIe 4 rápido (1 TB) significa tempos de carregamento rápidos.
O Erazer Defender P40 da Medion é um laptop para jogos QHD de médio porte bem equipado.
O laptop não esquenta muito quando carregado, mas pode fazer barulho. Para compensar esse fato, o dispositivo tem um "modo silencioso", o que prejudica o desempenho do processamento. Ele permite jogos mais silenciosos (mas não totalmente silenciosos).
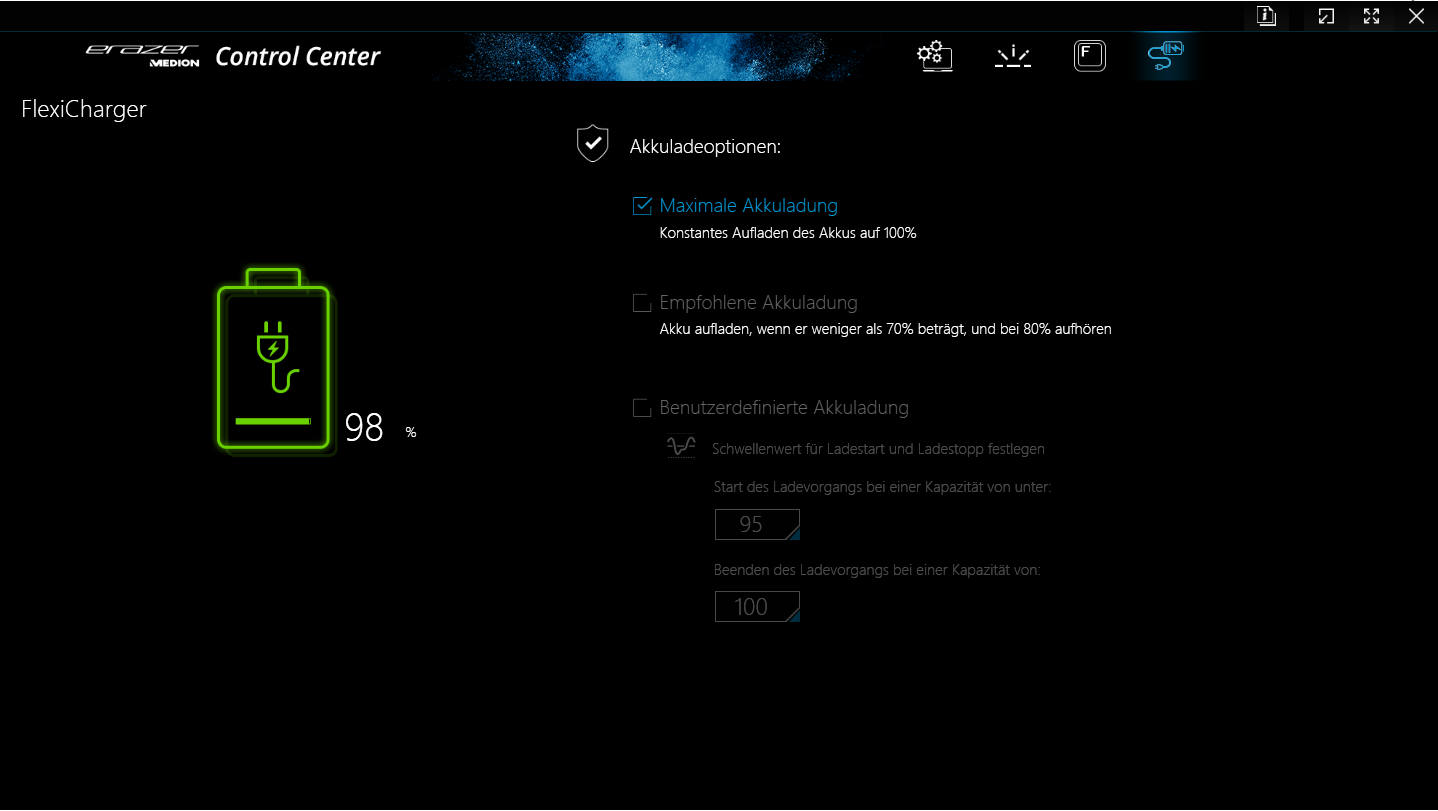
Uma carga de bateria (73 Wh) significa que você pode obter tempos de execução realistas de 5,5 a 6,5 horas, o que é bastante razoável. A bateria não pode ser carregada por meio de um carregador USB-C. Em vez disso, é necessário usar a volumosa fonte de alimentação incluída no notebook. No geral, sua tela fosca de 17,3 polegadas (QHD, IPS, 240 Hz, sRGB) nos deixou uma boa impressão.
OMSI Katana 17vem à mente como uma possível alternativa ao P40. Ele oferece desempenho semelhante, mas tempos de execução piores. OGigabyte G7 KEé uma alternativa um pouco mais barata: por cerca de US$ 1.000 (sem o Windows), ele permite jogos em FHD em configurações altas ou máximas.
Preço e disponibilidade
O Medion Erazer Defender P40 é vendido por cerca de US$ 1.900. No momento da compra, não conseguimos encontrar o laptop à venda nos principais varejistas on-line nos EUA. No entanto, você pode conferir dispositivos semelhantes, como o MSI Katana 17 ou o Acer Predator Helios 300 na Amazon.
Medion Erazer Defender P40
- 05/24/2023 v7 (old)
Sascha Mölck
Transparência
A seleção dos dispositivos a serem analisados é feita pela nossa equipe editorial. A amostra de teste foi fornecida ao autor como empréstimo pelo fabricante ou varejista para fins desta revisão. O credor não teve influência nesta revisão, nem o fabricante recebeu uma cópia desta revisão antes da publicação. Não houve obrigação de publicar esta revisão. Como empresa de mídia independente, a Notebookcheck não está sujeita à autoridade de fabricantes, varejistas ou editores.
É assim que o Notebookcheck está testando
Todos os anos, o Notebookcheck analisa de forma independente centenas de laptops e smartphones usando procedimentos padronizados para garantir que todos os resultados sejam comparáveis. Desenvolvemos continuamente nossos métodos de teste há cerca de 20 anos e definimos padrões da indústria no processo. Em nossos laboratórios de teste, equipamentos de medição de alta qualidade são utilizados por técnicos e editores experientes. Esses testes envolvem um processo de validação em vários estágios. Nosso complexo sistema de classificação é baseado em centenas de medições e benchmarks bem fundamentados, o que mantém a objetividade.Price comparison

