Revisão do MSI Raider GE78 HX 13VH laptop: 13ª geração Core i9-13950HX e GeForce Atualizações RTX 4080
Revelado no CES 2023o Raider GE78 de 16:10 de 17,0 polegadas sucede o Raider GE77 de 16:9 de 17,3 polegadas de 2022 com internos atualizados e um projeto de chassi novinho em folha. Ele é fornecido com algumas das mais potentes CPUs Raptor Lake-H Intel e móveis GeForce 40 GPUs atualmente disponíveis em qualquer modelo de laptop. A série MSI GE fica logo abaixo da série GT77 Titan, ainda mais cara e maior em termos de classificação.
As SKUs vão desde a CPU Core i9-13950HX da 13ª geração, 140 W GeForce RTX 4070 GPU, e a tela IPS 1920 x 1200 165 Hz até a tela IPS Core i9-13980HX, 175 W RTX 4090, e 2560 x 1600 240 Hz por cerca de US$4200. Nossa unidade específica de revisão é uma configuração de médio alcance superior com a tela Core i9-13950HX, 175 W RTX 4080, e 1600p por cerca de $3700 USD.
Os concorrentes do GE78 incluem outros laptops para jogos de alta qualidade de 17 polegadas como o Lâmina Razer 17, Asus ROG Strix Scar 17,Alienware m17 R5ou oEluktronics Mech-17 GP2. Uma versão de 16,0 polegadas também está disponível chamada de Raider GE68.
Mais revisões da MSI:
Possíveis concorrentes em comparação
Avaliação | Data | Modelo | Peso | Altura | Size | Resolução | Preço |
|---|---|---|---|---|---|---|---|
| 88.3 % v7 (old) | 03/2023 | MSI GE78HX 13VH-070US i9-13950HX, GeForce RTX 4080 Laptop GPU | 3 kg | 23 mm | 17.00" | 2560x1600 | |
| 89.9 % v7 (old) | 03/2023 | Eluktronics Mech-17 GP2 i9-13900HX, GeForce RTX 4090 Laptop GPU | 2.9 kg | 27 mm | 17.00" | 2560x1600 | |
| 88.4 % v7 (old) | 04/2023 | Asus ROG Strix G17 G713PI R9 7945HX, GeForce RTX 4070 Laptop GPU | 2.8 kg | 30.7 mm | 17.30" | 2560x1440 | |
| 89 % v7 (old) | 02/2023 | MSI Titan GT77 HX 13VI i9-13950HX, GeForce RTX 4090 Laptop GPU | 3.5 kg | 23 mm | 17.30" | 3840x2160 | |
| 86.8 % v7 (old) | 07/2022 | MSI Raider GE77 HX 12UHS i9-12900HX, GeForce RTX 3080 Ti Laptop GPU | 3.1 kg | 25.9 mm | 17.30" | 3840x2160 | |
| 89.9 % v7 (old) | 07/2022 | Razer Blade 17 Early 2022 i9-12900H, GeForce RTX 3080 Ti Laptop GPU | 2.8 kg | 19.9 mm | 17.30" | 3840x2160 |
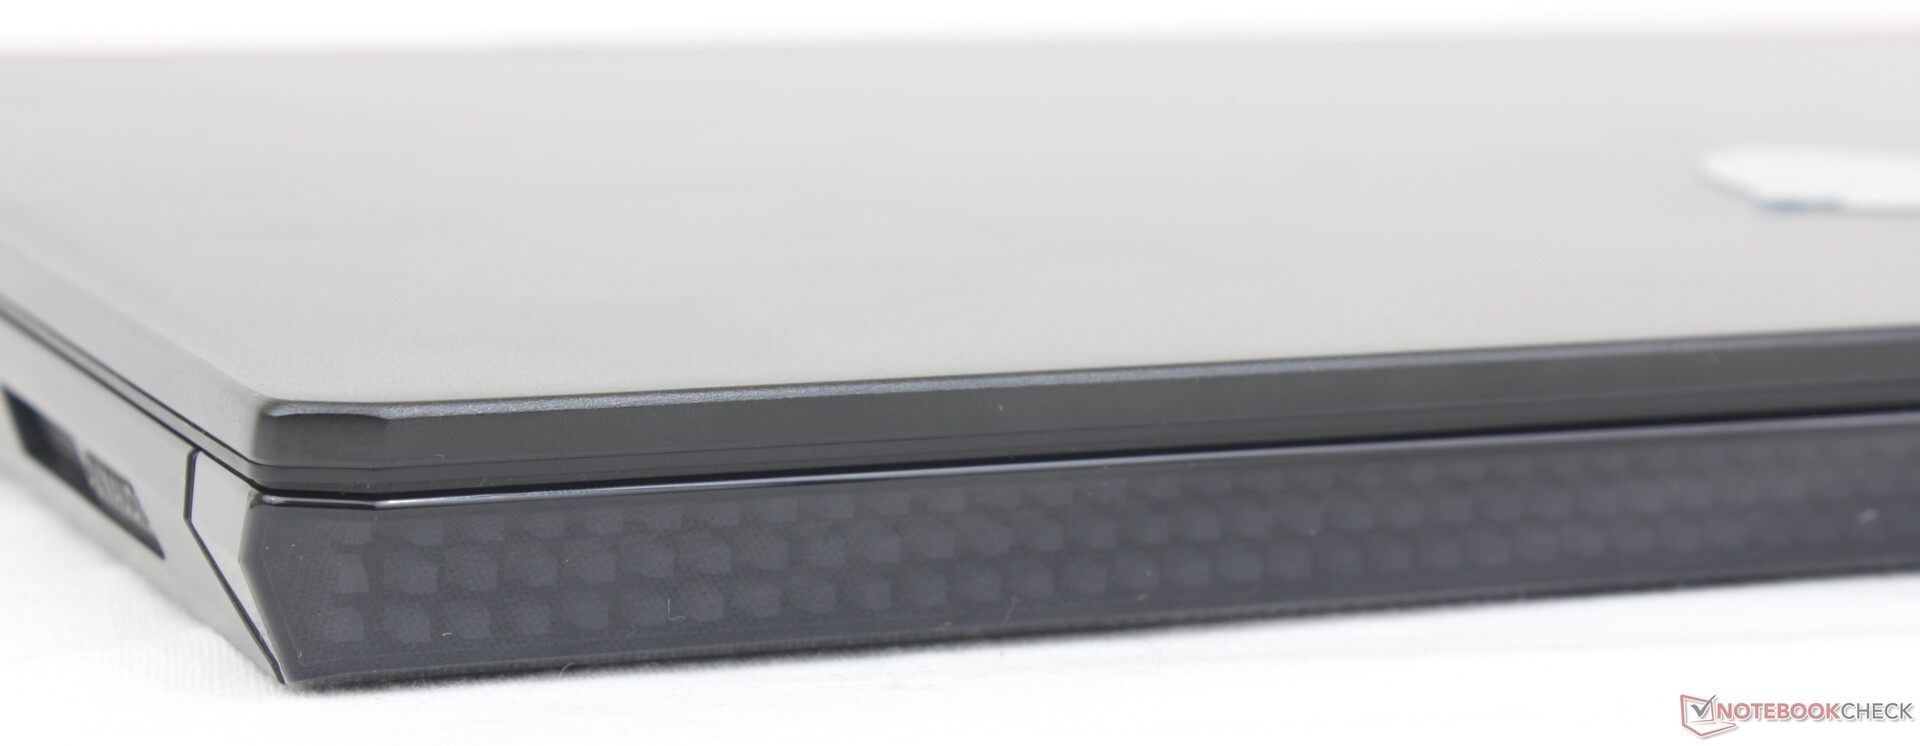
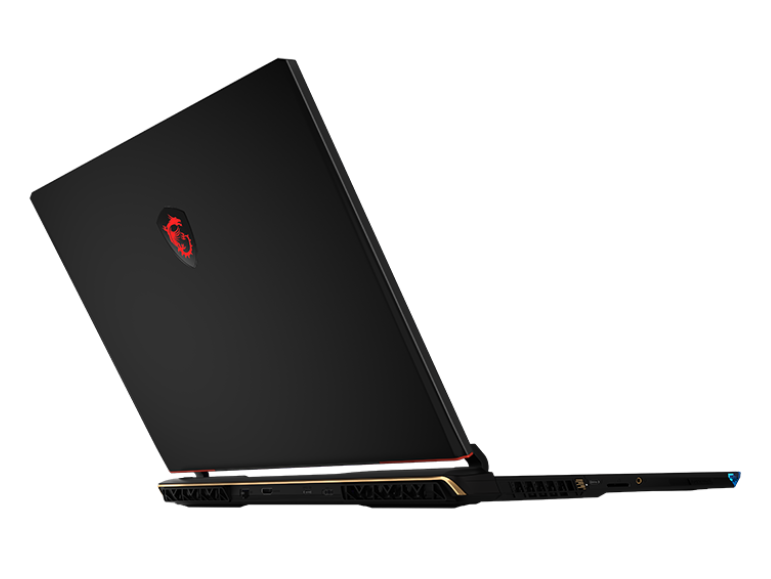
Case - Retro-futurístico
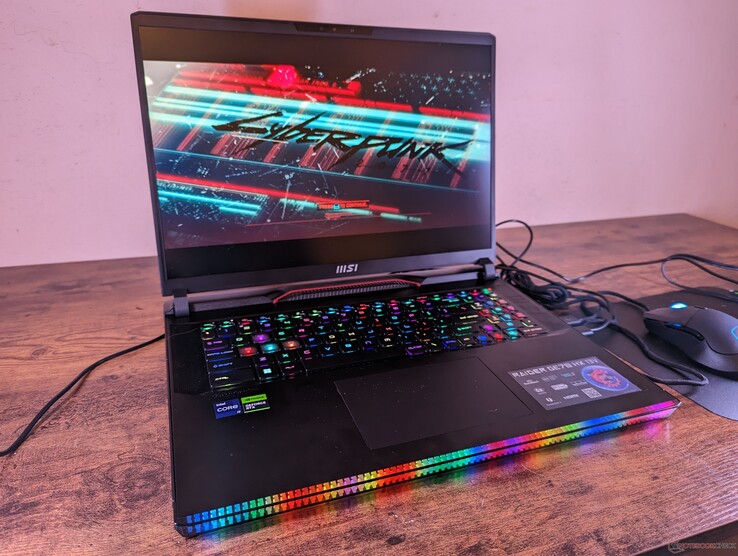
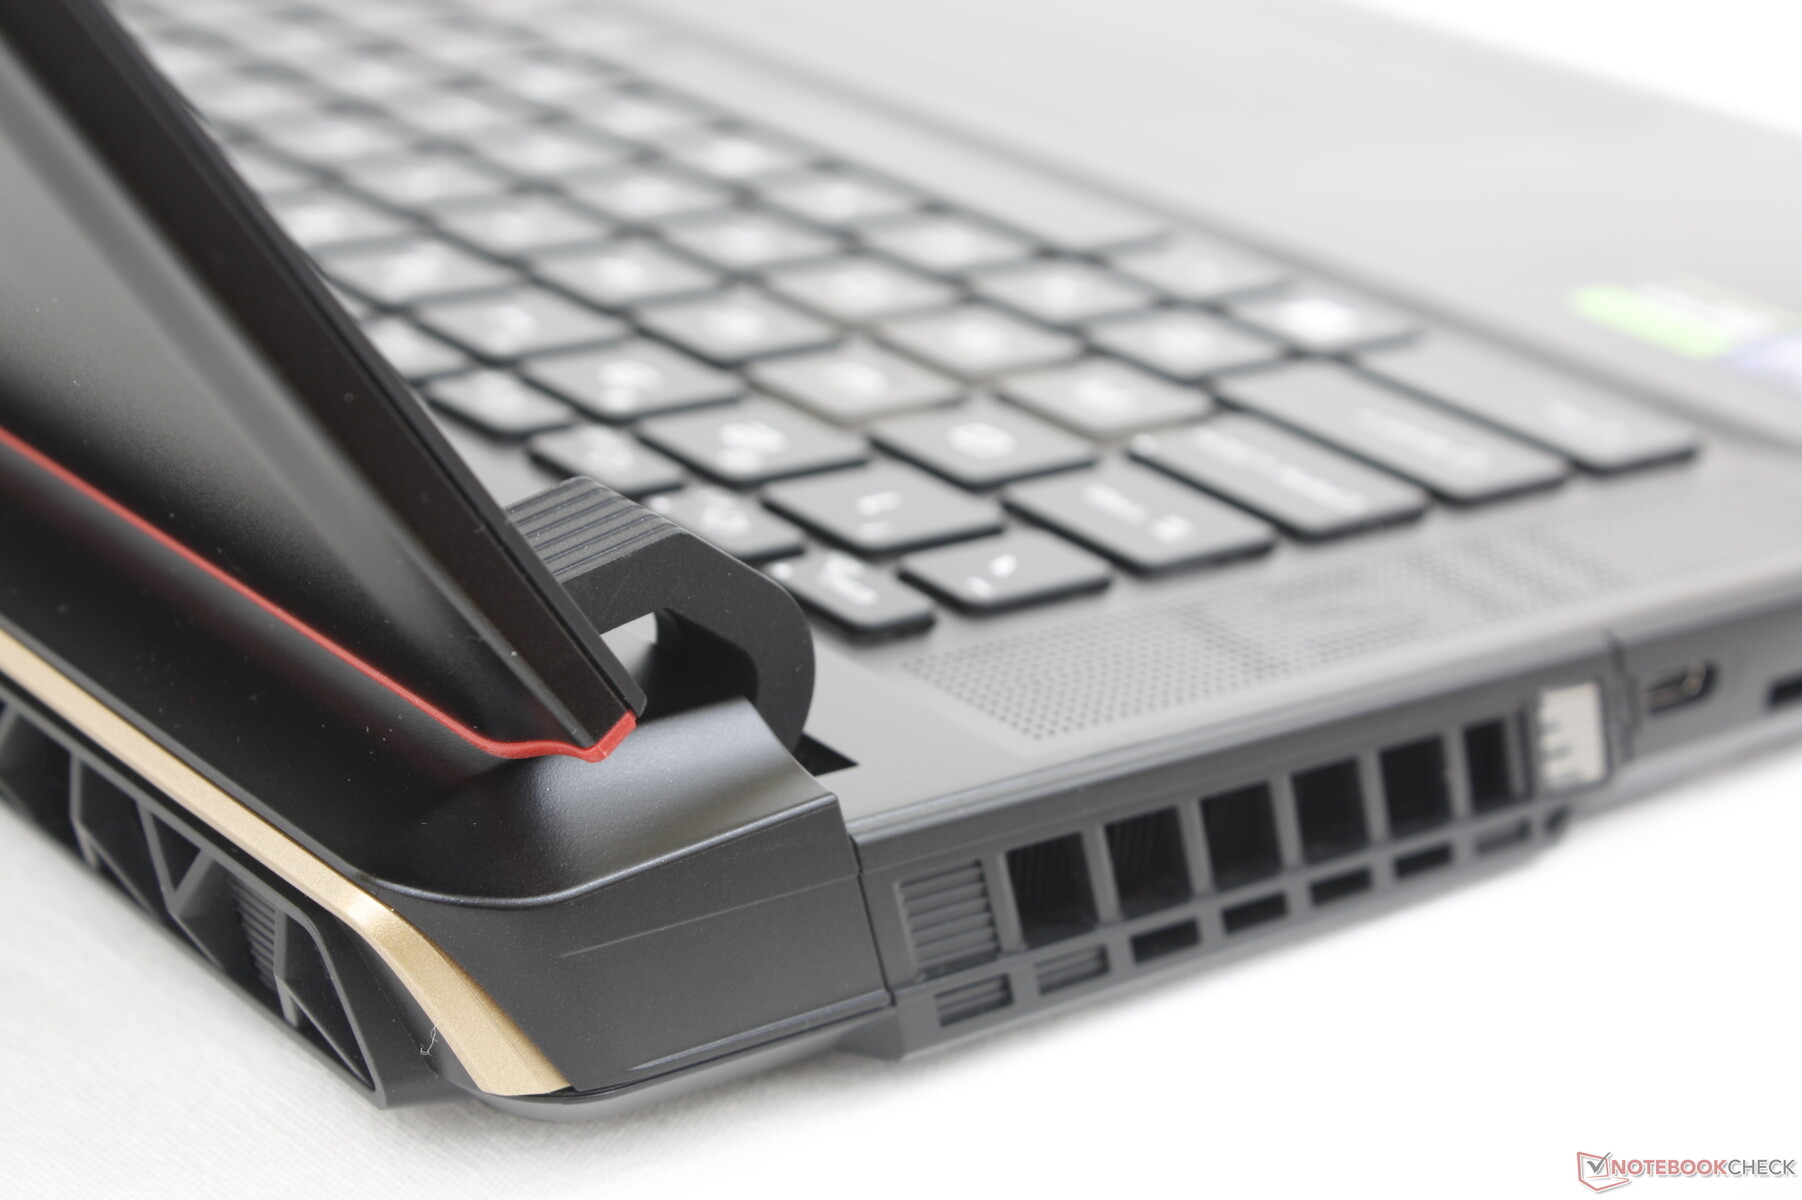
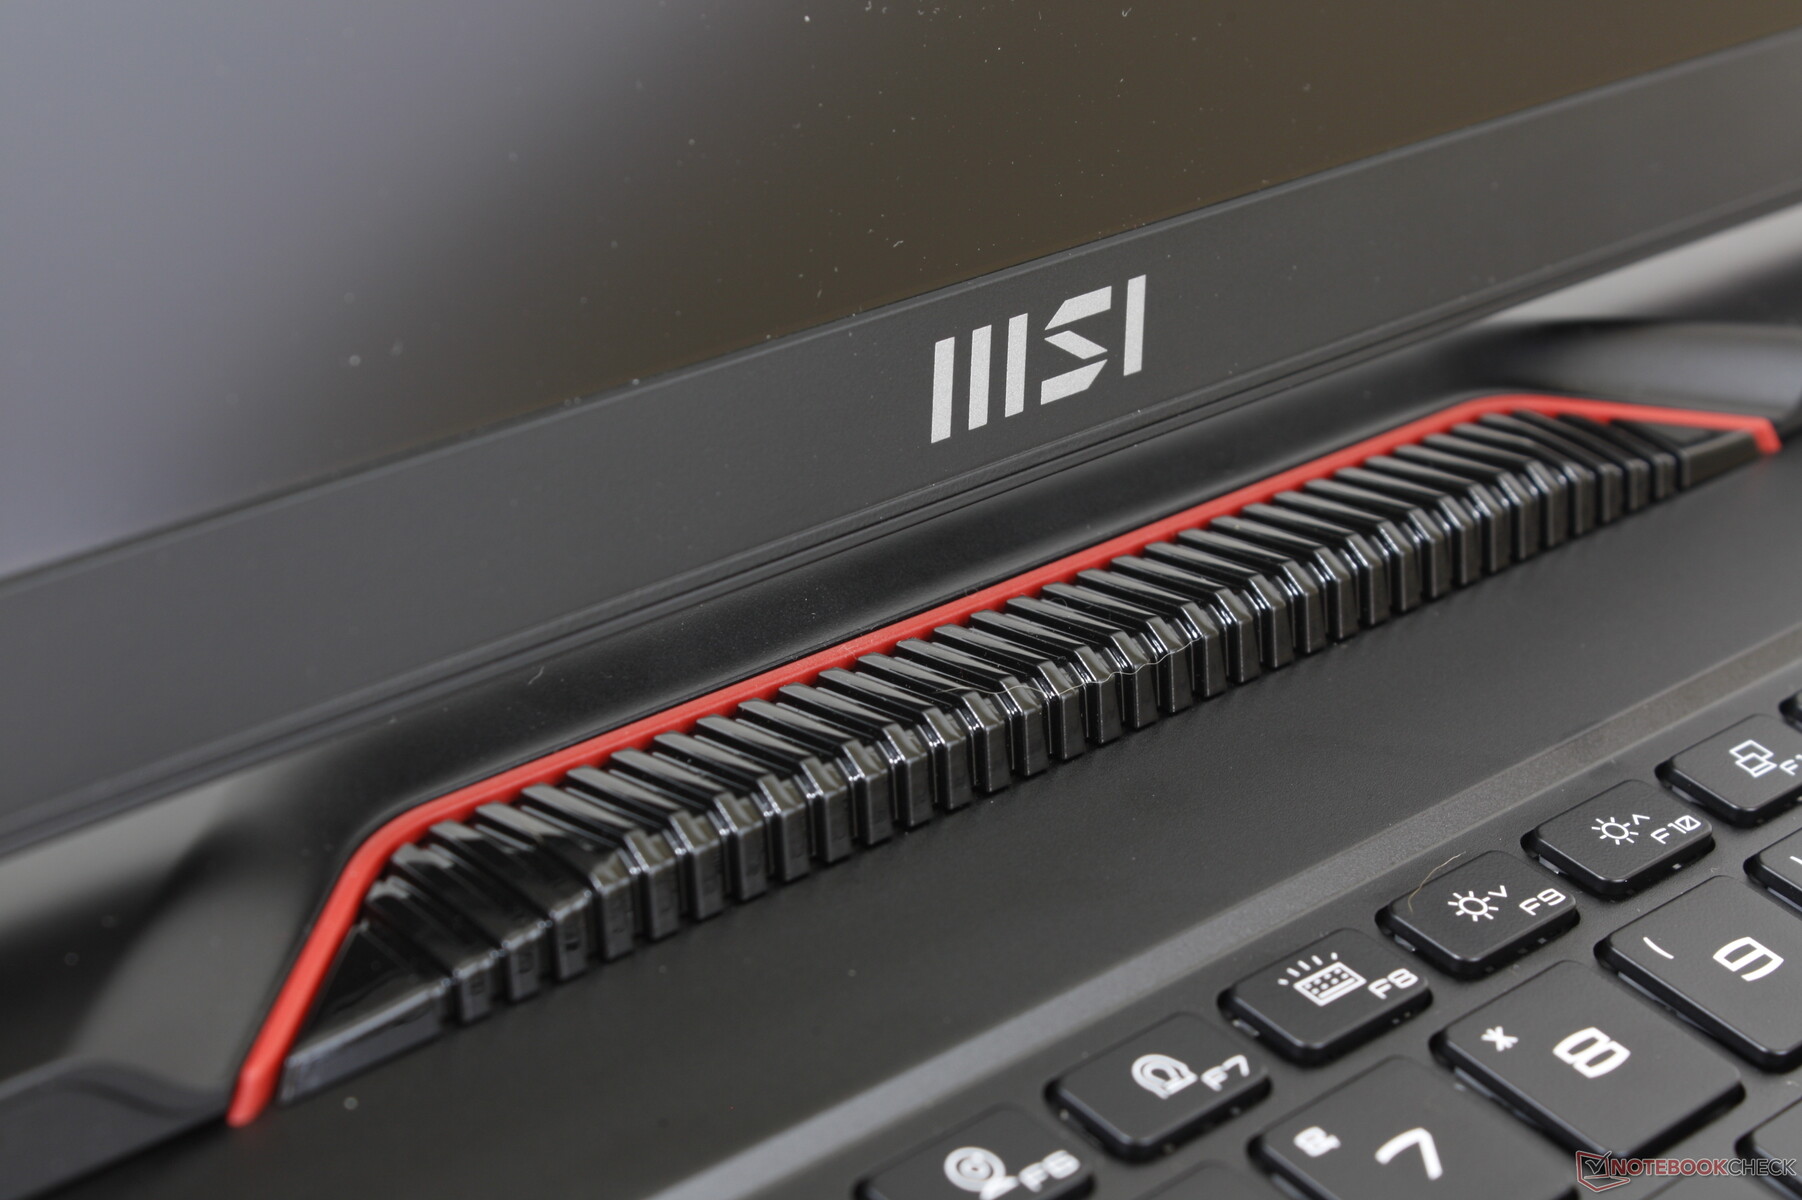
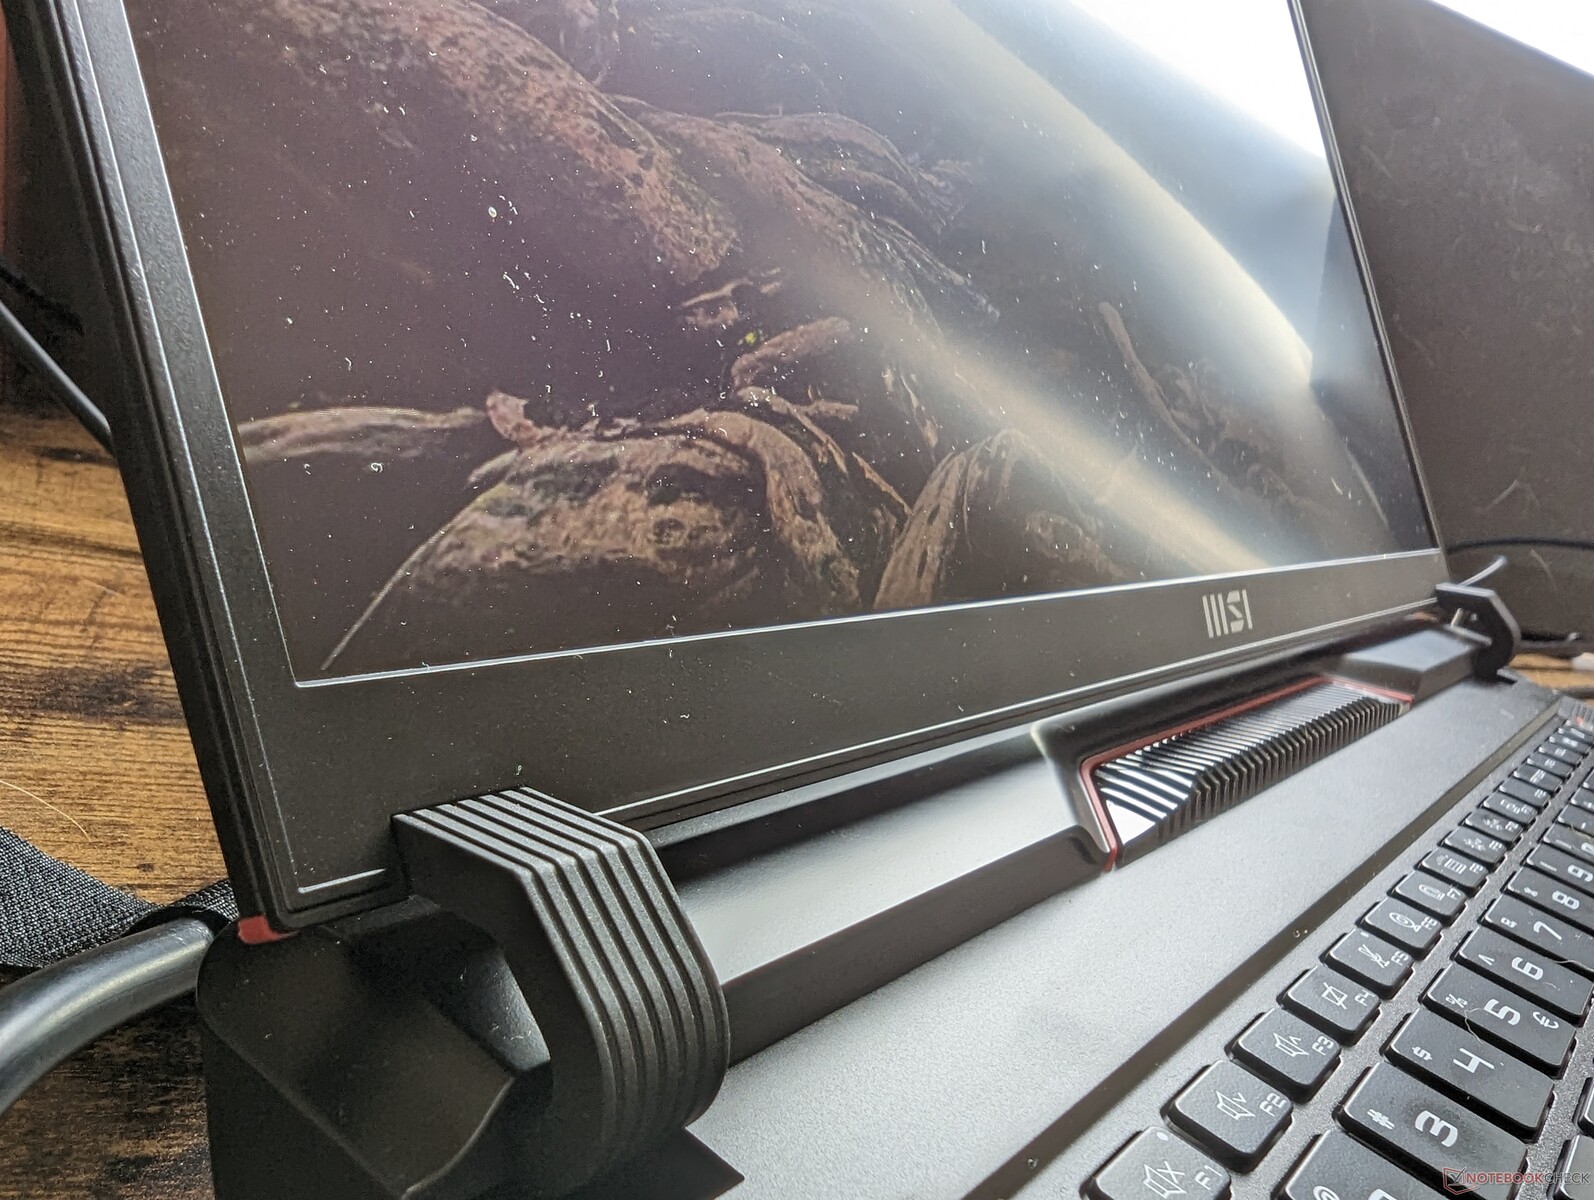
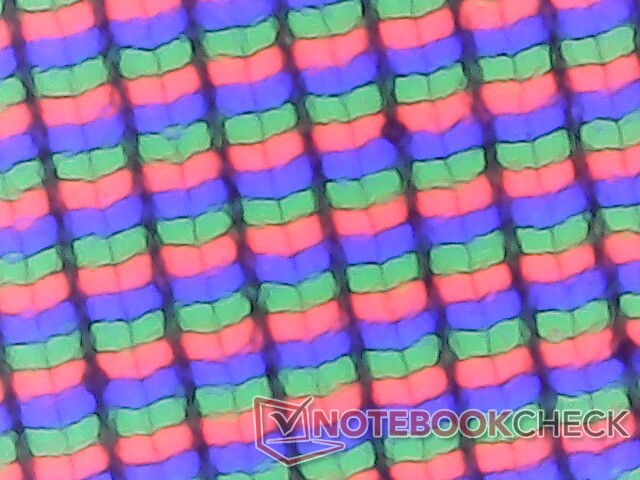
De acordo com a MSI, o último projeto do modelo GE priorizou o minimalismo com superfícies lisas e planas. Numa tentativa de trazer algum estilo de volta à série, o design do GE78 foi inspirado em jogos de 8 bits e na estética dos anos 80. Assim, o último modelo incorpora mais curvas ao longo de sua traseira e uma barra de luz reimaginada ao longo da borda dianteira que consiste de "pixels" RGB individuais LED. As luzes pixelizadas são semelhantes em estilo ao Hyundai Ioniq 6 que por sua vez também foi inspirado pela estética retro. O resultado final é um visual único que ajuda a distinguir visualmente o GE78 do mar de outros laptops de jogos no mercado. Se o novo GE78 parece ou não melhor do que o antigo GE77, no entanto, é tudo uma questão de gosto.
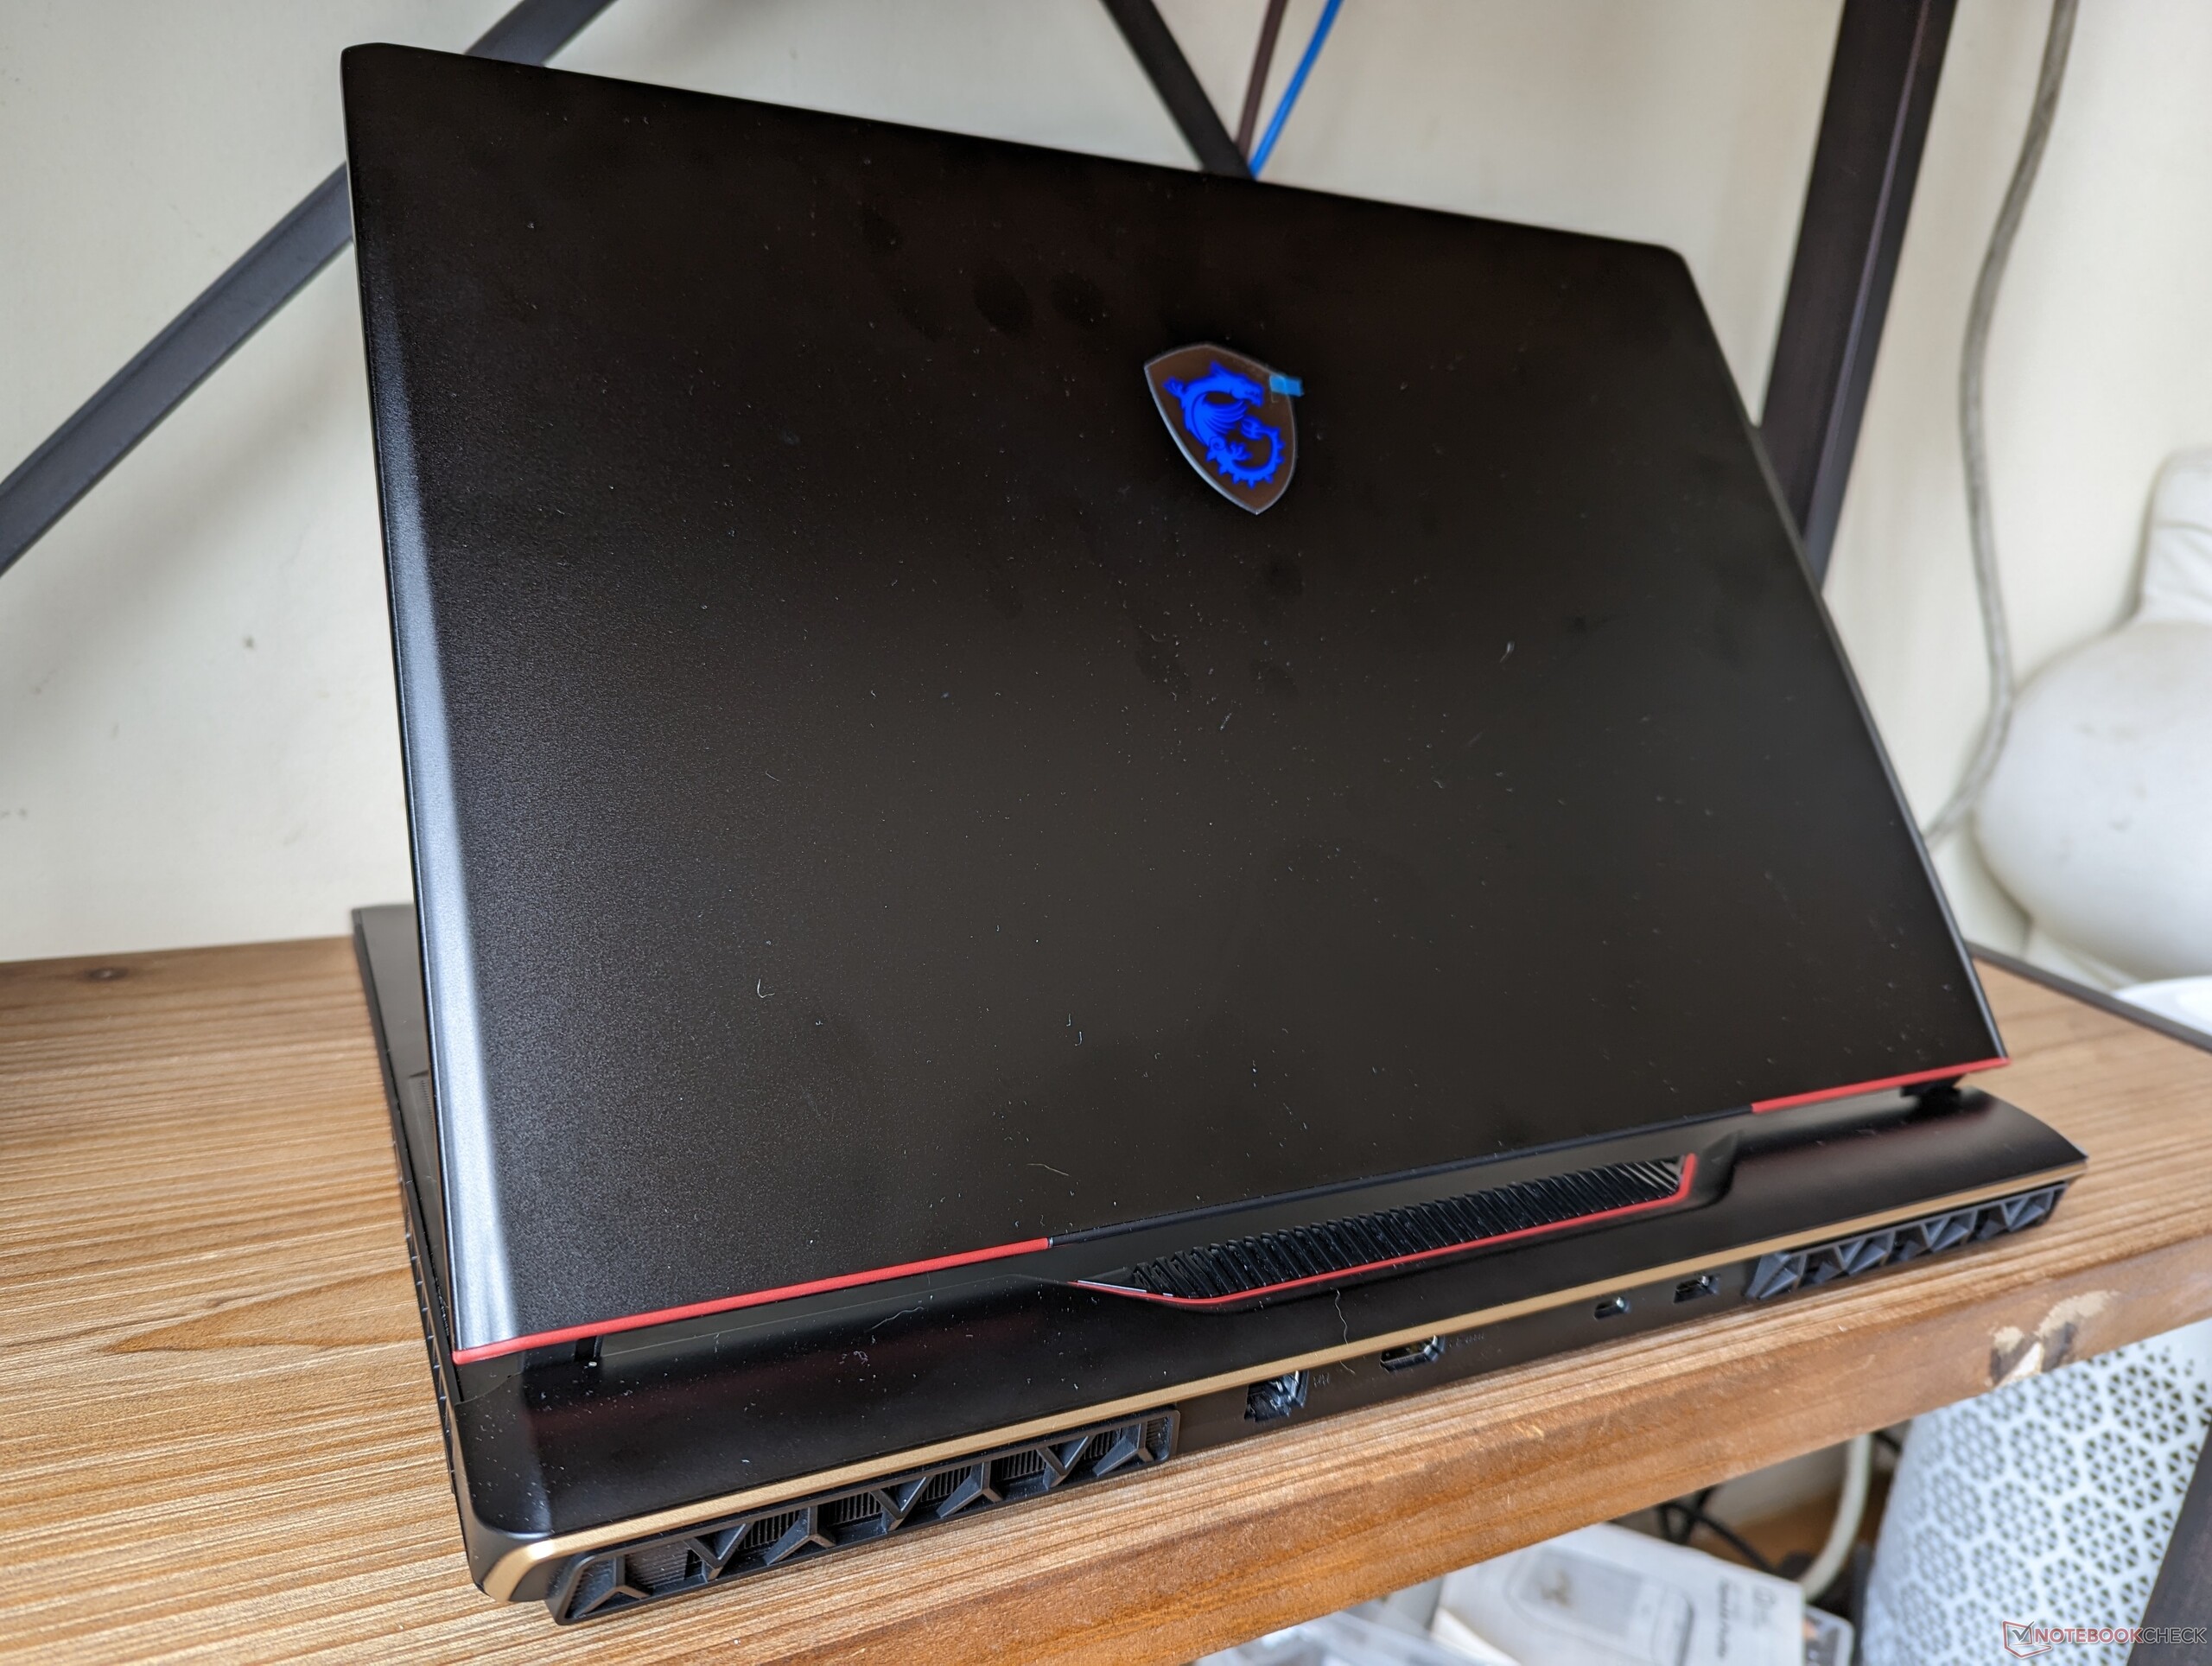
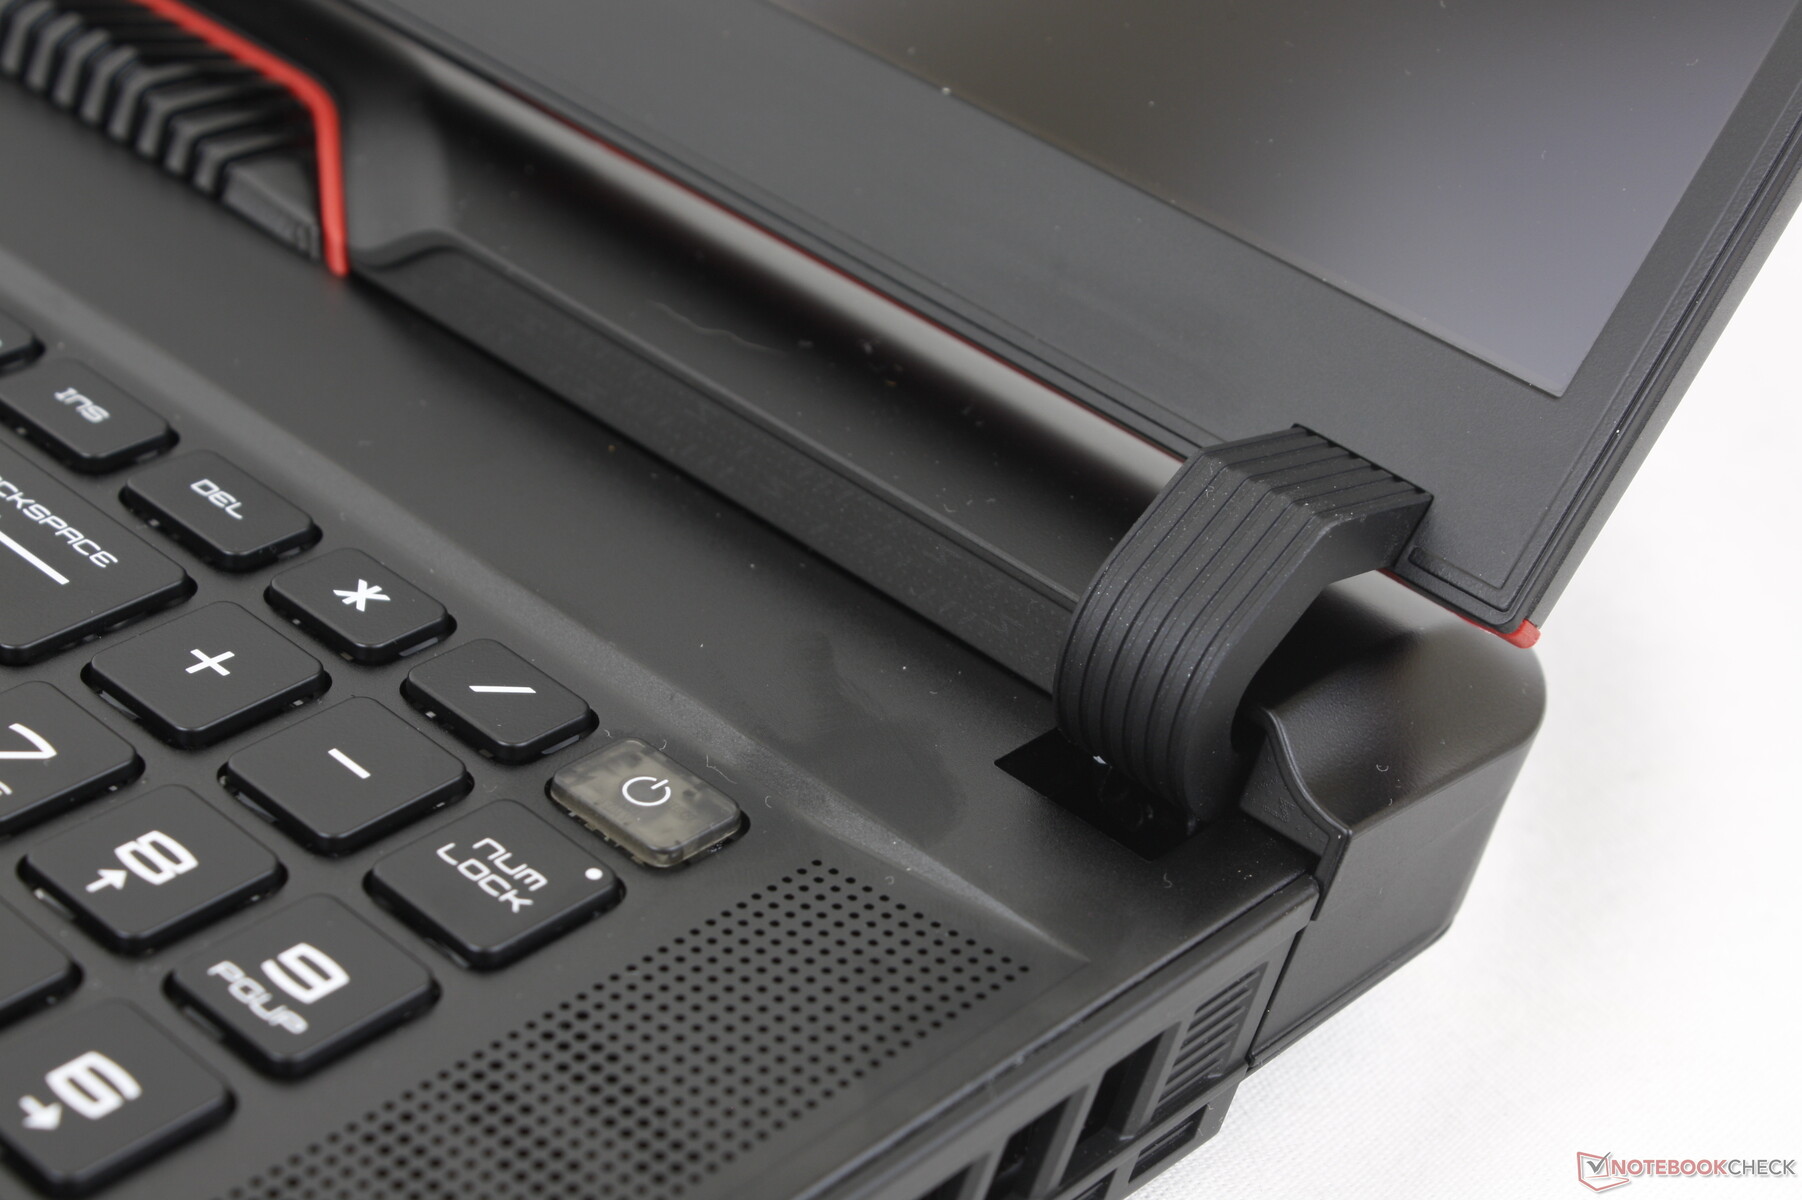
A qualidade de construção não tira um lugar secundário de todas as mudanças estéticas. As novas dobradiças, por exemplo, são agora maiores e mais firmes do que as dobradiças do GE77 e, portanto, é provável que durem mais tempo. Na verdade, elas se parecem muito com as dobradiças do Série Asus Strix Scar. A rigidez do chassi é semelhante ao GE77 com mínimo rangido e apenas um pouco de deformação ao aplicar pressão sobre a tampa externa.
Há uma maior chance de espaços entre materiais, uma vez que o esqueleto GE78 consiste de mais peças individuais do que um desenho típico unibody como a Lâmina Razer. Isto é especialmente verdadeiro para a parte traseira e bordas onde podemos notar uma folga ligeiramente maior de um lado do que do outro em nossa unidade de teste. Não é de nenhuma preocupação, mas vale a pena verificar.
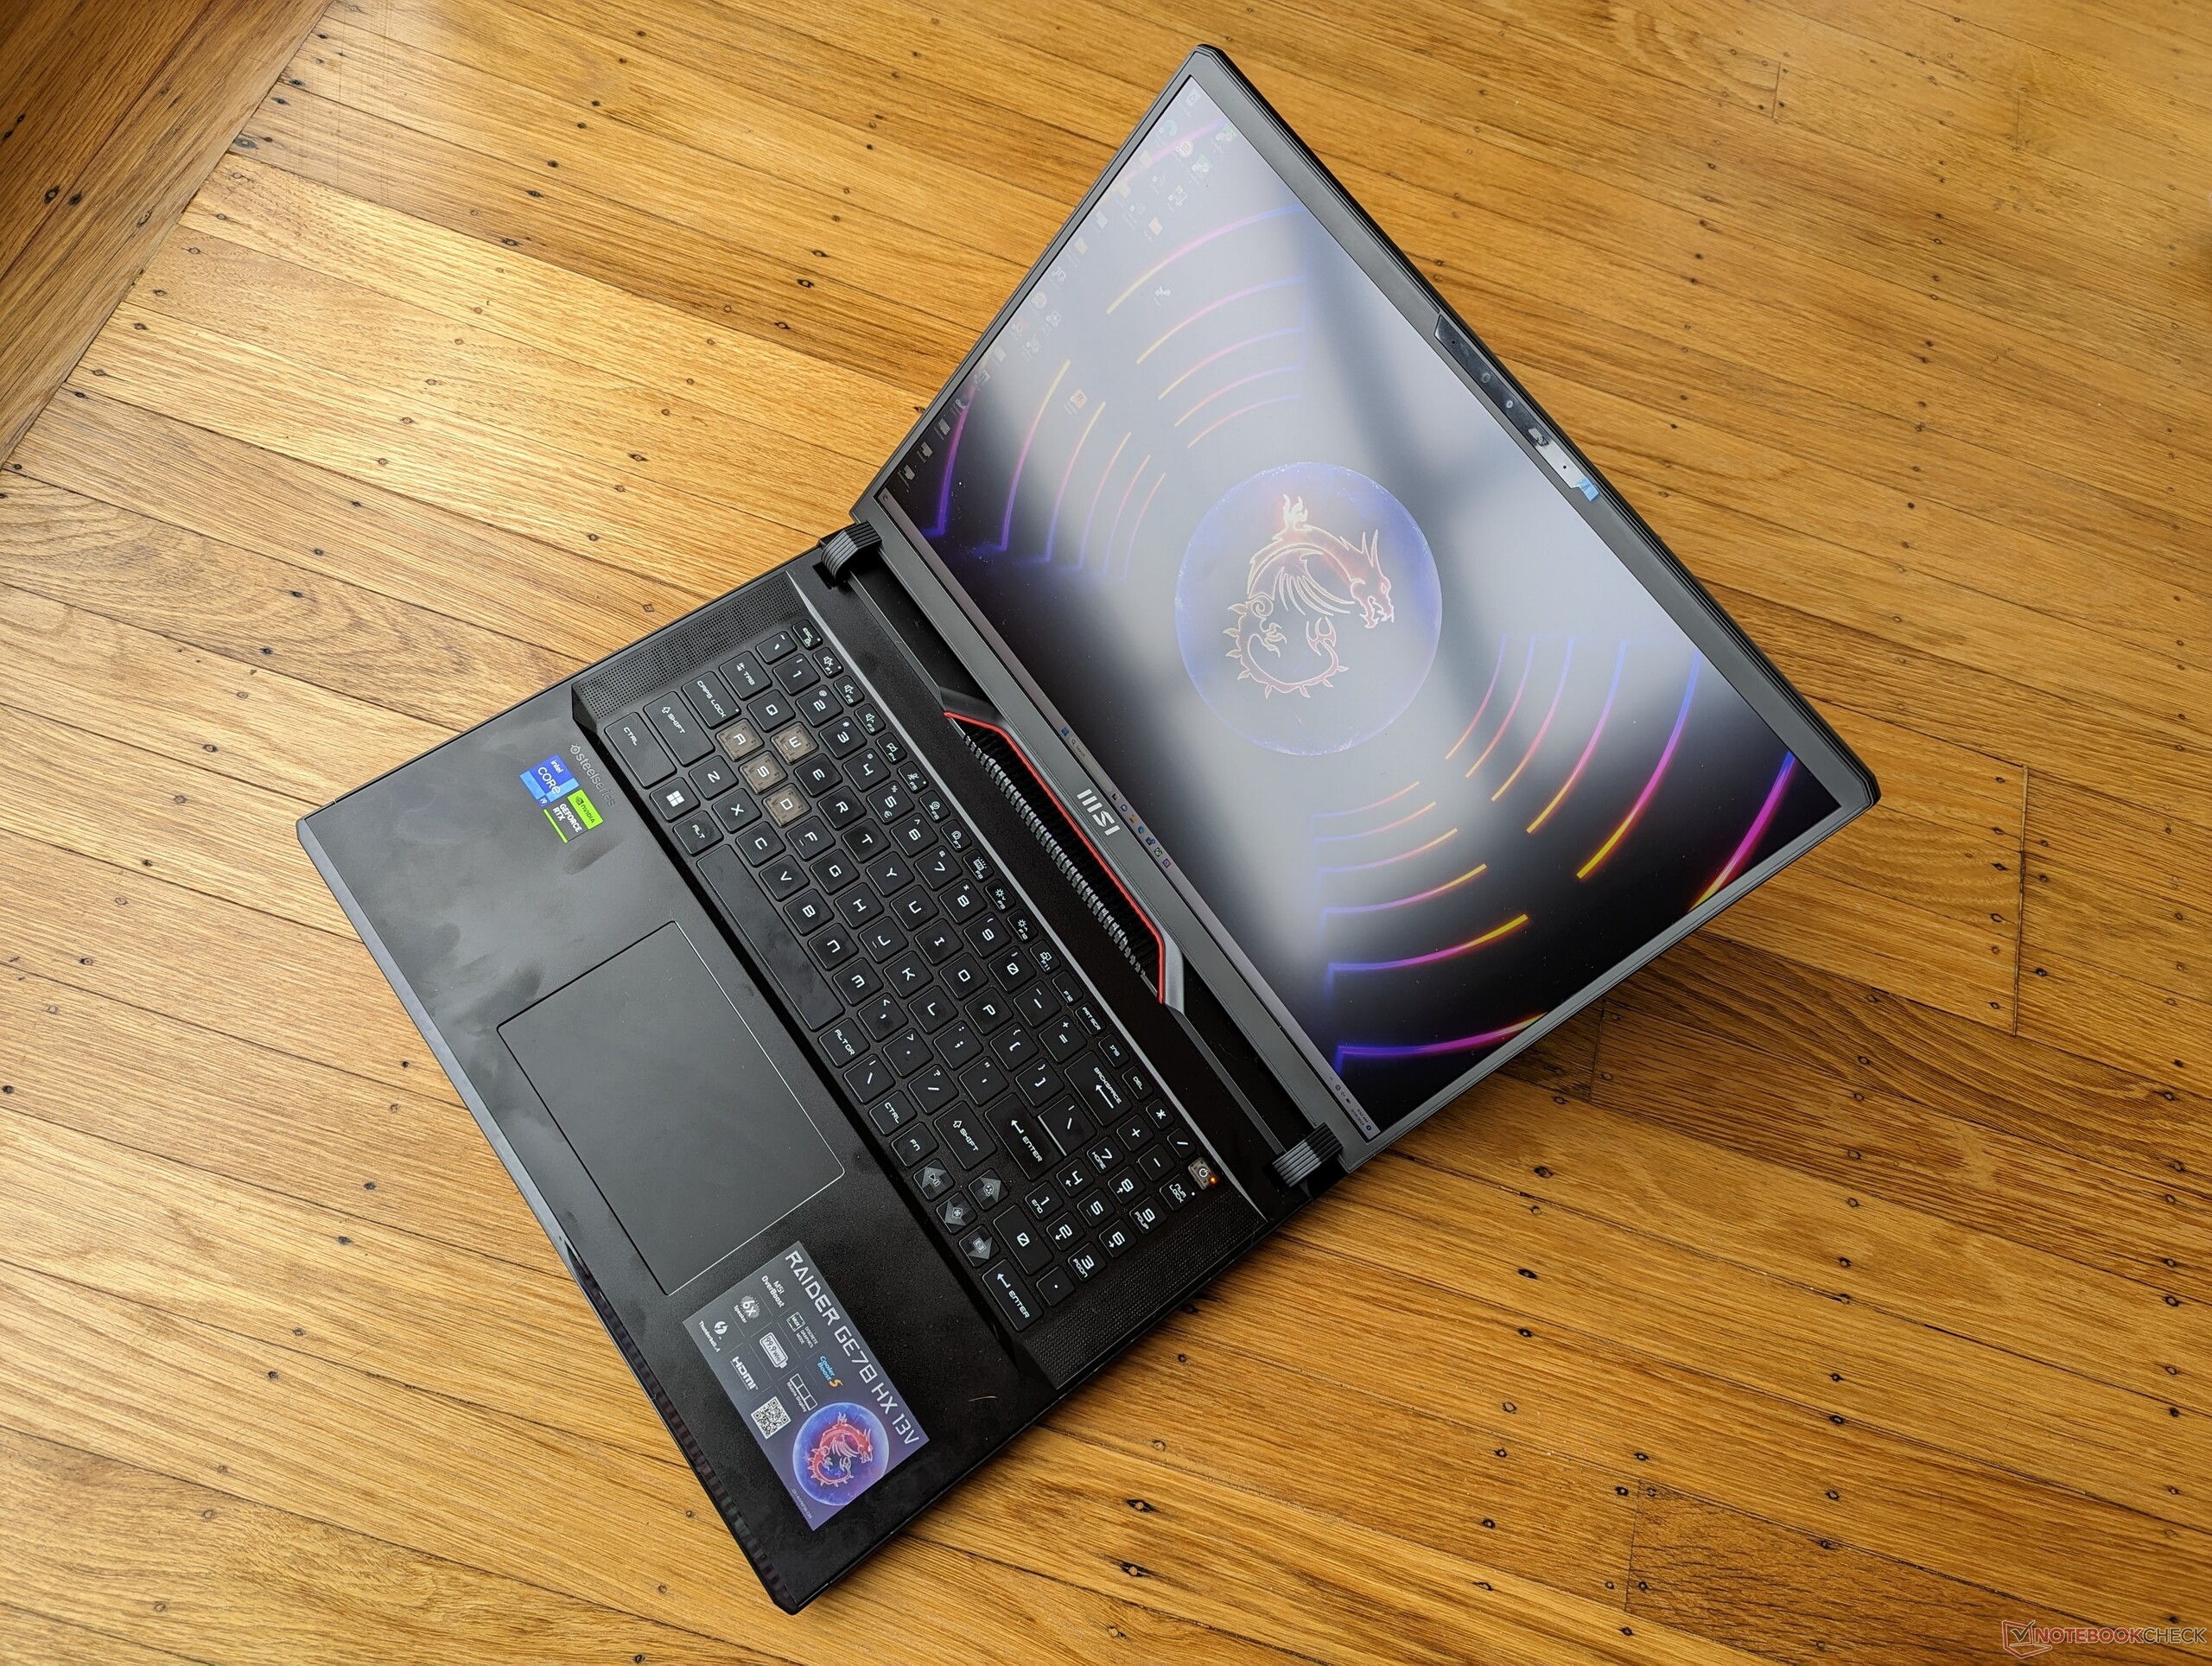
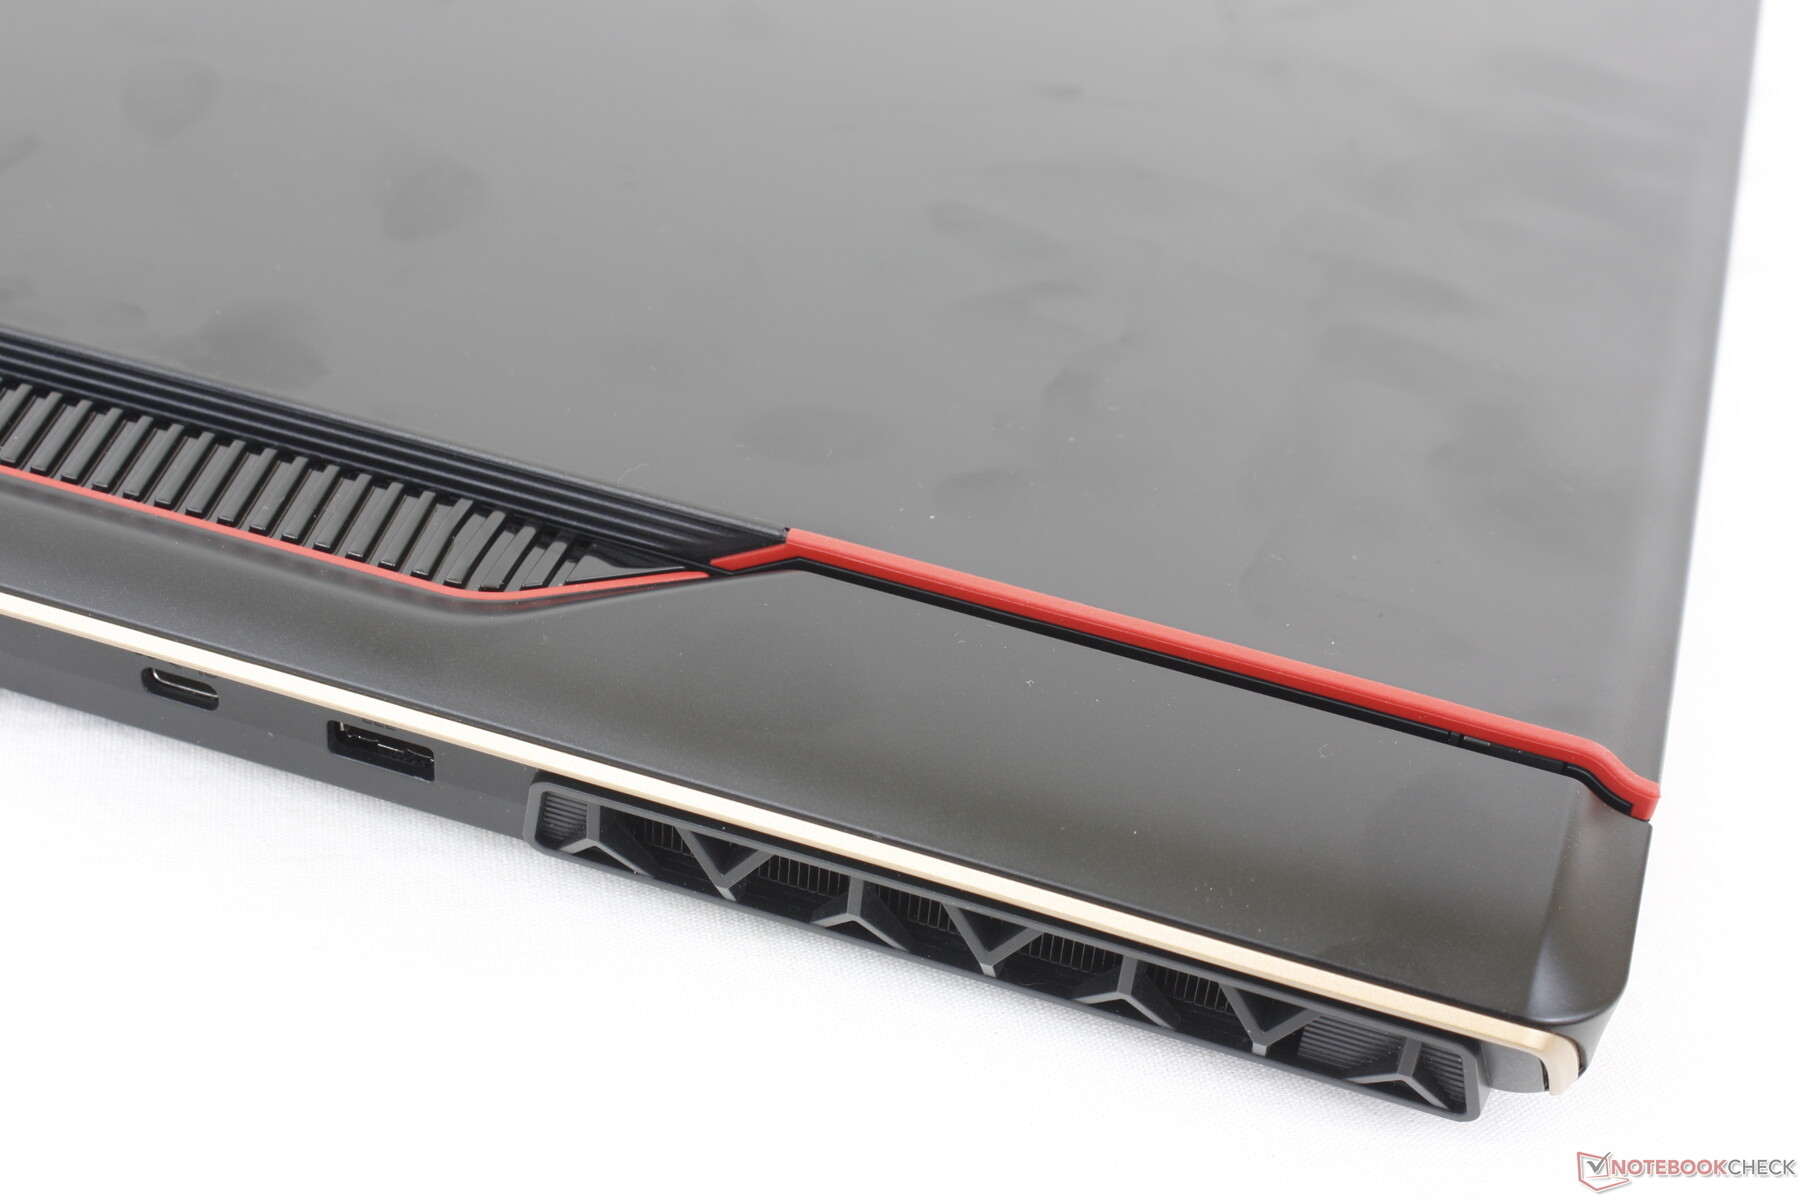
Devido à mudança na relação de aspecto de 16:9 para 16:10, o GE78 é mais curto em comprimento, mas mais largo em largura para uma pegada mais quadrada do que seu predecessor. No entanto, ele ainda é mais fino por alguns milímetros, portanto, não assuma que o GE78 seja mais grosso apenas por causa de sua estética retro-inspirada. O peso total é cerca de 200 gramas mais pesado do que o Lâmina Razer 17.
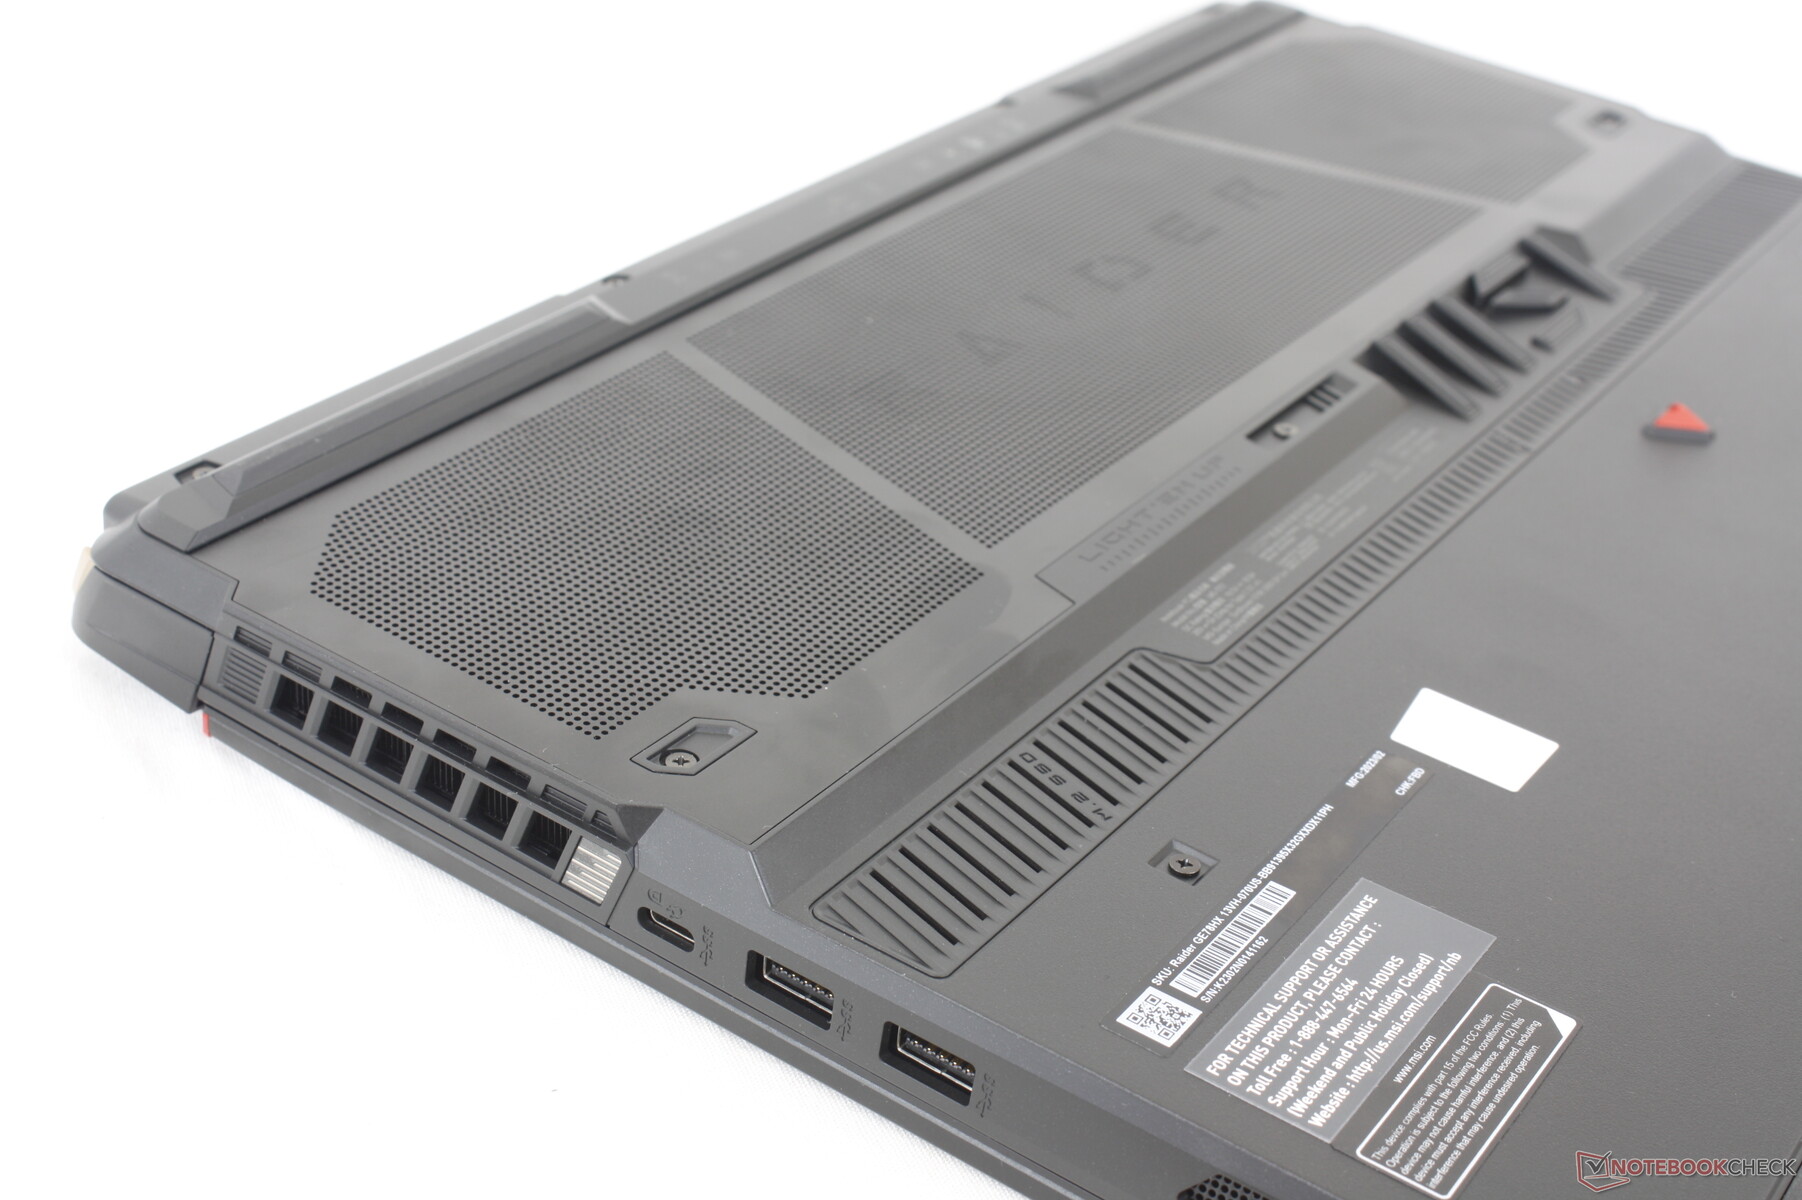
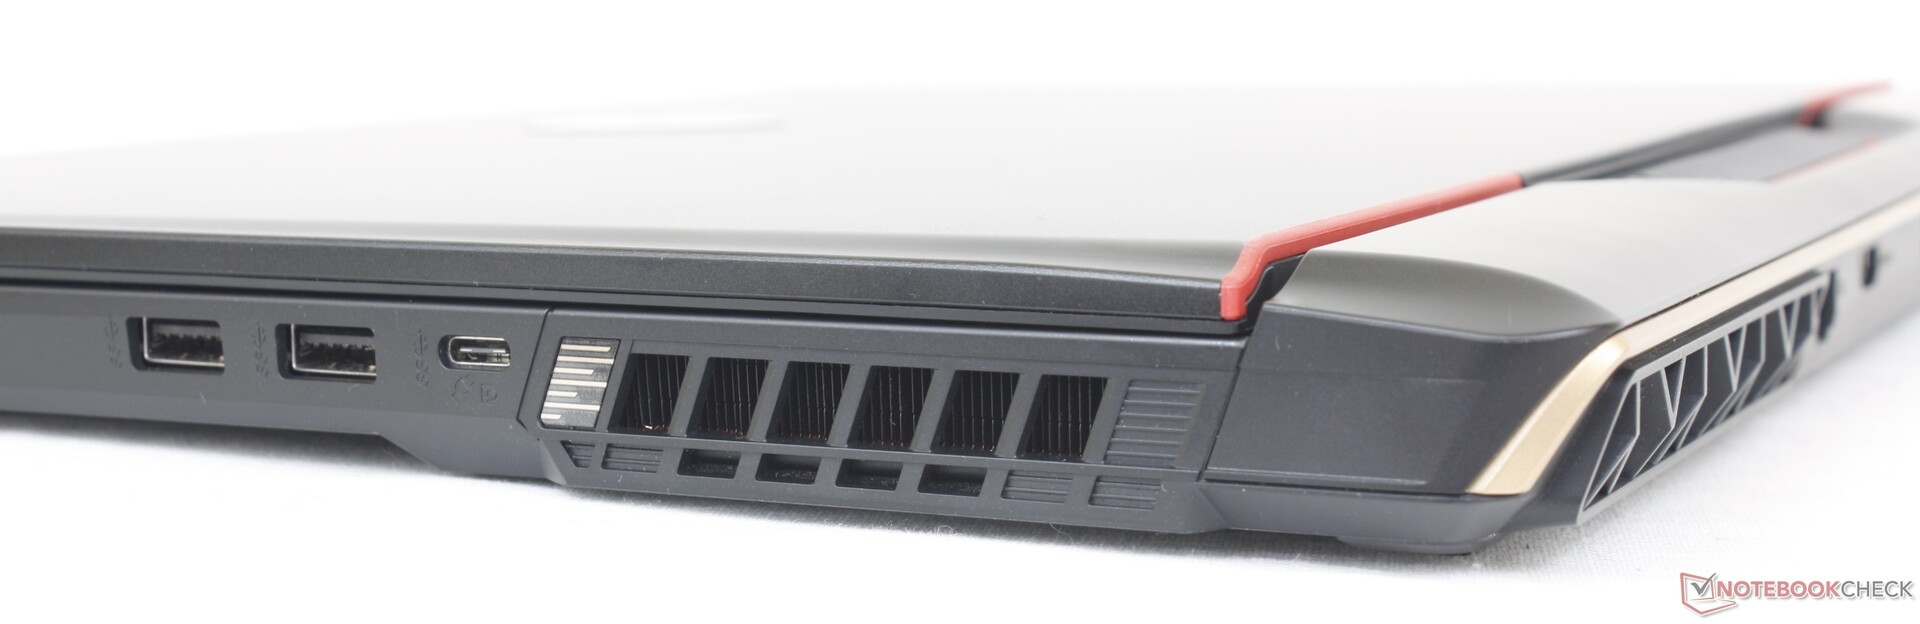
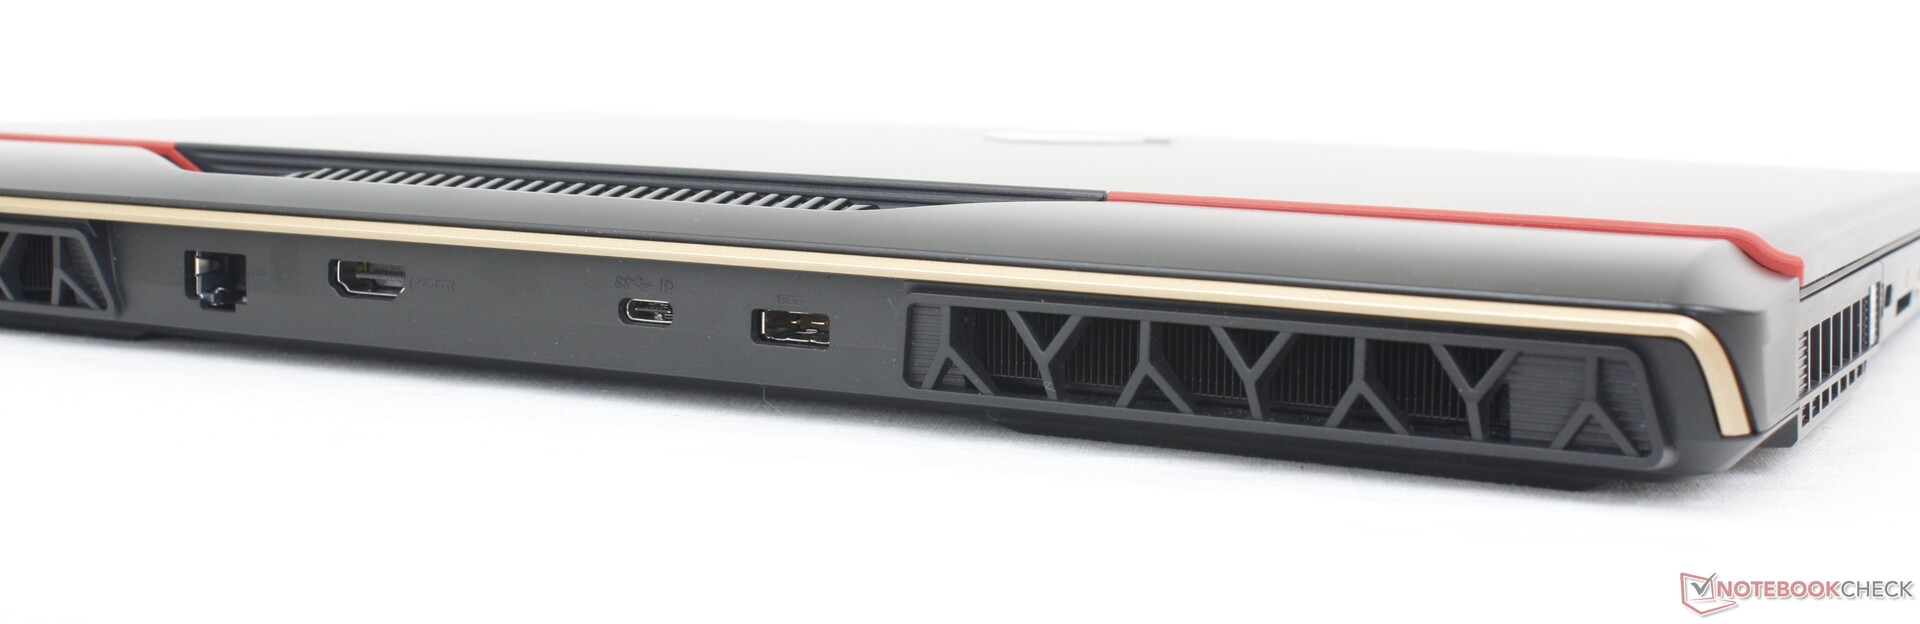
Conectividade - USB-C Em todas as direções
As opções de porta e posicionamento mudaram em relação ao GE77. Mais notavelmente, o GE78 troca uma porta USB-A por uma terceira porta USB-C e, portanto, agora há uma porta USB-C em cada lado do chassi.
Infelizmente, as três portas USB-C não são todas criadas de forma igual. Primeiro, os dispositivos Thunderbolt só são suportados através da porta USB-C esquerda. E, em segundo lugar, suas funcionalidades DisplayPort estão vinculadas à configuração MUX. Quando o dGPU está ativo, por exemplo, nosso monitor externo DP só funcionaria na porta USB-C ao longo da borda direita enquanto não funcionaria na porta USB-C esquerda ou traseira. Se o modo iGPU ou GPU híbrido estiver ativo, nosso monitor externo DP só funcionaria na borda esquerda da porta USB-C enquanto não funcionaria nas portas USB-C traseiras ou na borda direita. Não somos capazes de fazer com que o DP trabalhe na porta USB-C traseira.
Em terceiro lugar, a MSI anuncia o Power Delivery, mas não conseguimos fazer com que isso funcione também. Nossa unidade não recarregaria via USB-C, não importa qual porta ou quantos adaptadores USB-C testamos.
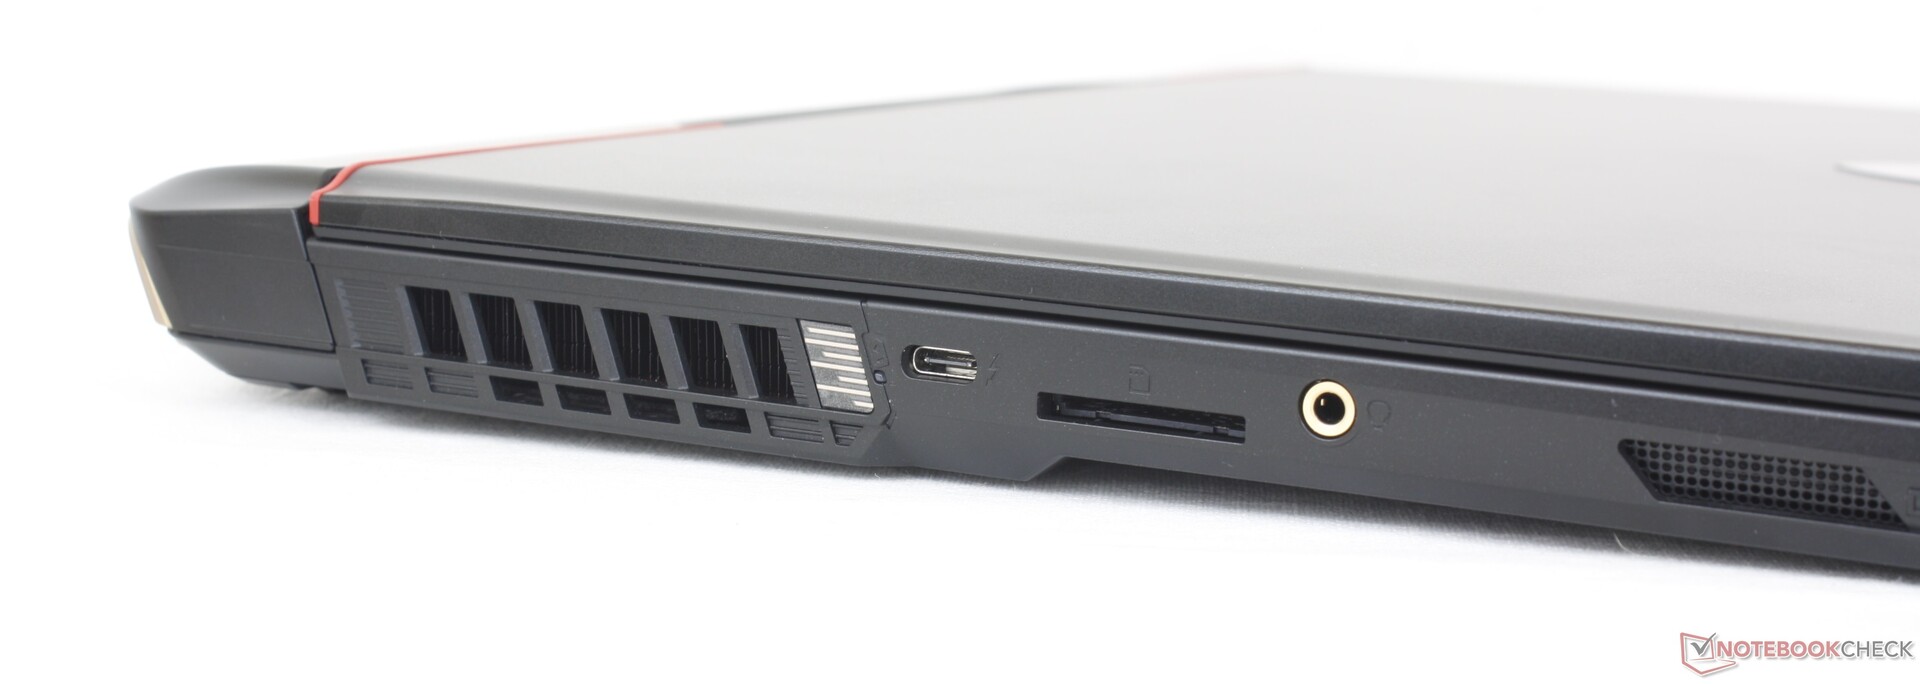
Leitor de cartões SD
As taxas de transferência do leitor SD integrado são decepcionantes, considerando o alto preço do GE78. A transferência de 1 GB de fotos de nosso cartão de teste UHS-II para a área de trabalho leva cerca de 16 segundos, em comparação com a metade do Lâmina Razer 17.
| SD Card Reader | |
| average JPG Copy Test (av. of 3 runs) | |
| Razer Blade 17 Early 2022 (AV PRO microSD 128 GB V60) | |
| MSI Titan GT77 HX 13VI (Angelibird AV Pro V60) | |
| Eluktronics Mech-17 GP2 (Angelibird AV Pro V60) | |
| MSI GE78HX 13VH-070US (Angelibird AV Pro V60) | |
| MSI Raider GE77 HX 12UHS (AV PRO microSD 128 GB V60) | |
| maximum AS SSD Seq Read Test (1GB) | |
| Eluktronics Mech-17 GP2 (Angelibird AV Pro V60) | |
| MSI GE78HX 13VH-070US (Angelibird AV Pro V60) | |
| MSI Titan GT77 HX 13VI (Angelibird AV Pro V60) | |
Comunicação
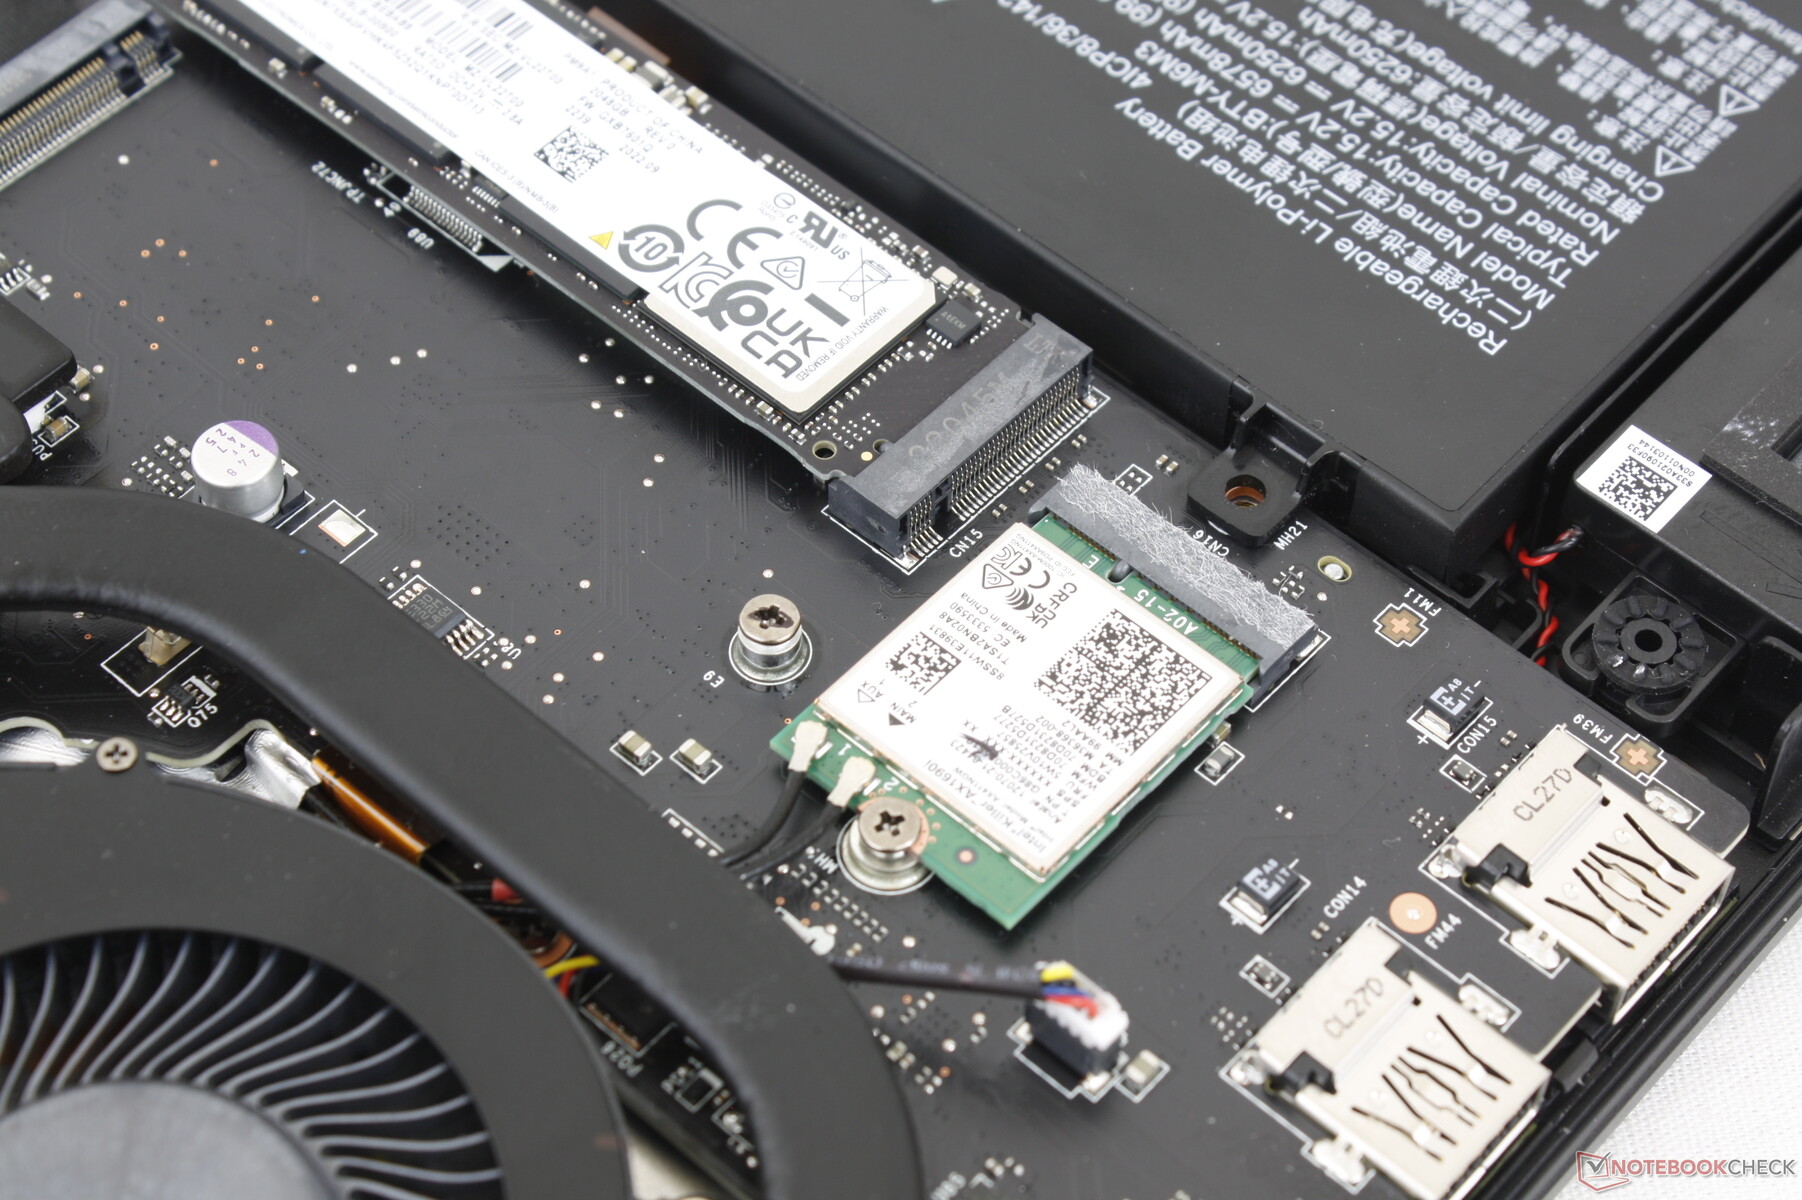
Um Killer AX1690i vem como padrão para conectividade Wi-Fi 6E e Bluetooth 5.3. O módulo Killer é essencialmente um Intel AX210/211 rebrandedizado, otimizado para laptops de jogos. Não tivemos nenhum problema quando acoplado ao nosso roteador de teste Asus AXE11000 de 6 GHz.
| Networking | |
| iperf3 transmit AXE11000 | |
| Asus ROG Strix G17 G713PI | |
| MSI Titan GT77 HX 13VI | |
| Eluktronics Mech-17 GP2 | |
| MSI GE78HX 13VH-070US | |
| iperf3 receive AXE11000 | |
| Asus ROG Strix G17 G713PI | |
| Razer Blade 17 Early 2022 | |
| MSI Titan GT77 HX 13VI | |
| Eluktronics Mech-17 GP2 | |
| MSI GE78HX 13VH-070US | |
| iperf3 transmit AXE11000 6GHz | |
| MSI GE78HX 13VH-070US | |
| iperf3 receive AXE11000 6GHz | |
| MSI Raider GE77 HX 12UHS | |
| MSI GE78HX 13VH-070US | |
Webcam
A webcam integrada de 2 MP no GE78 continua sendo um padrão na maioria dos laptops de jogos. Alguns outros fabricantes como a Razer elevaram a fasquia para 5 MP para uma imagem mais nítida.
IR e um obturador físico da webcam vêm como padrão para suporte do Hello e privacidade adicional, respectivamente.


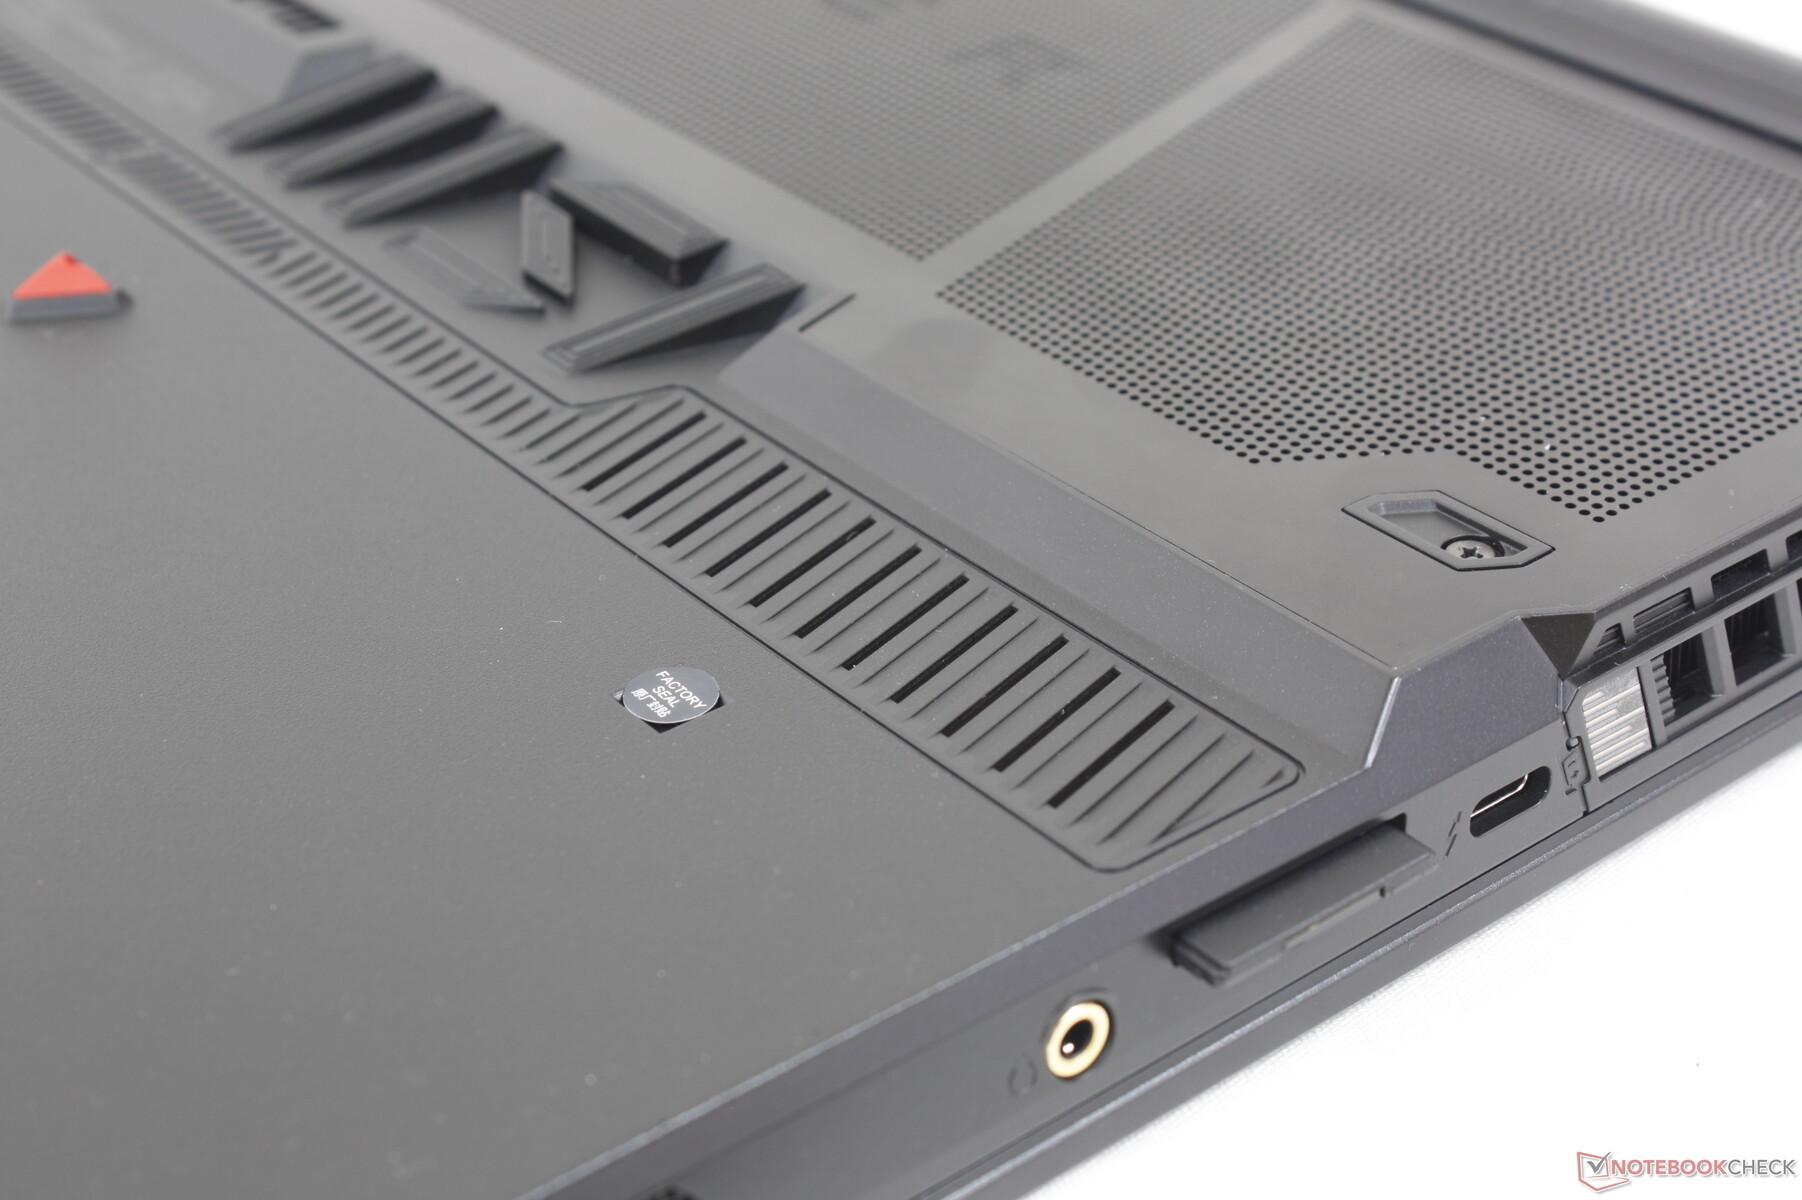
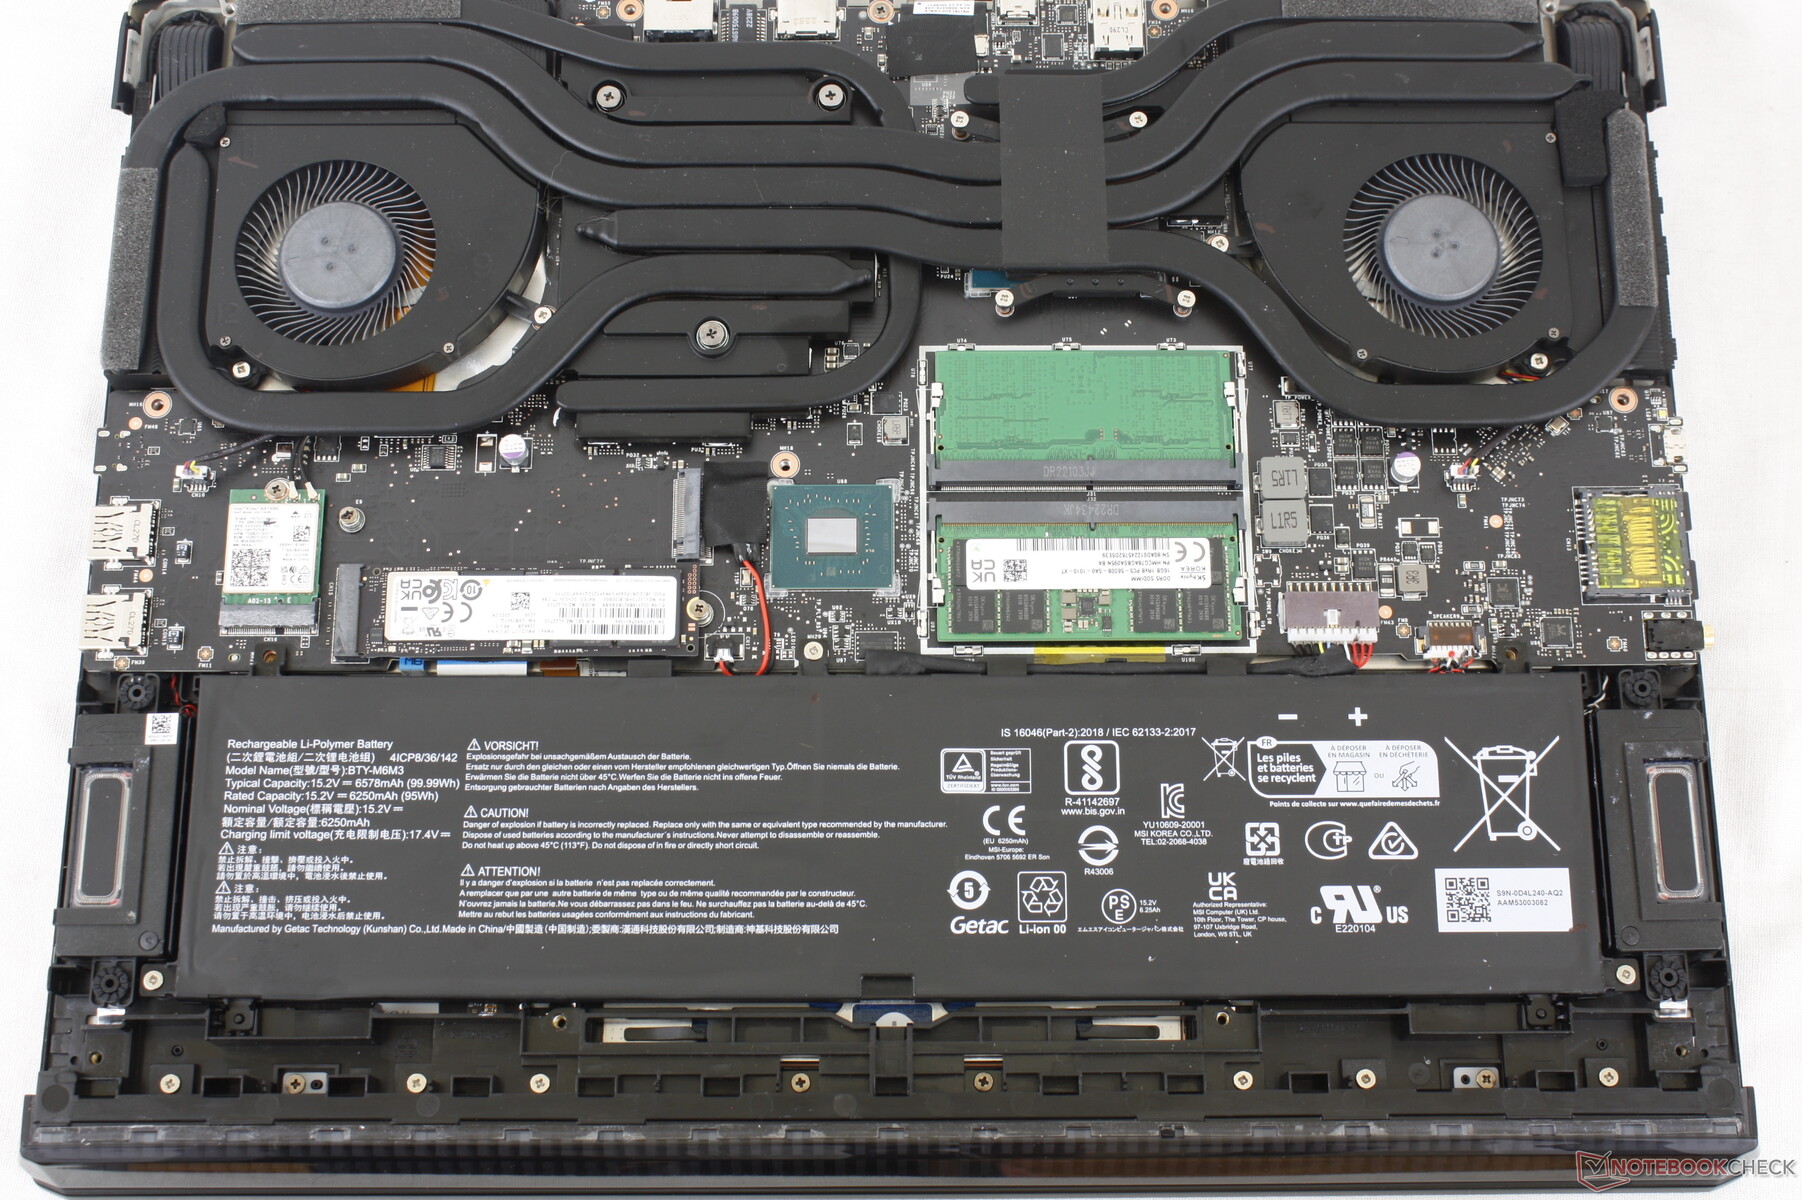
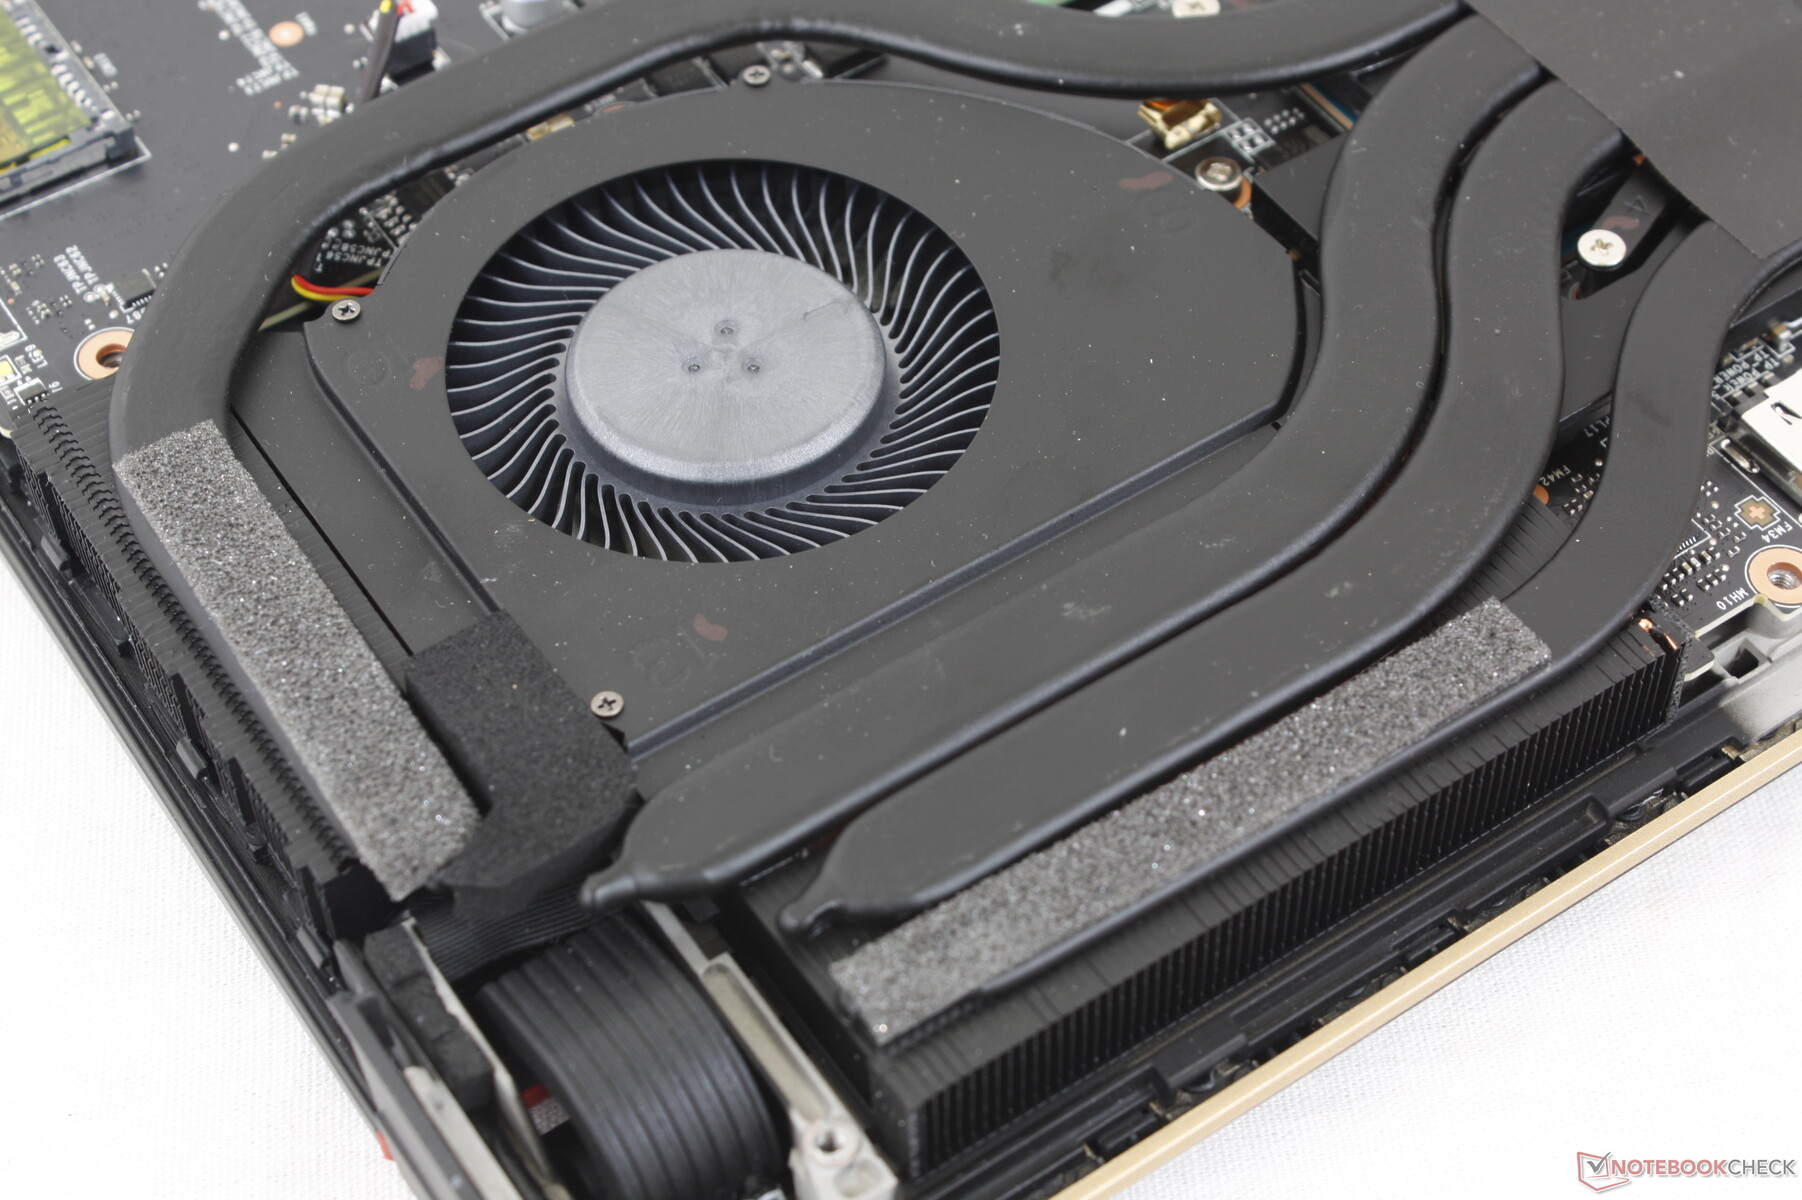
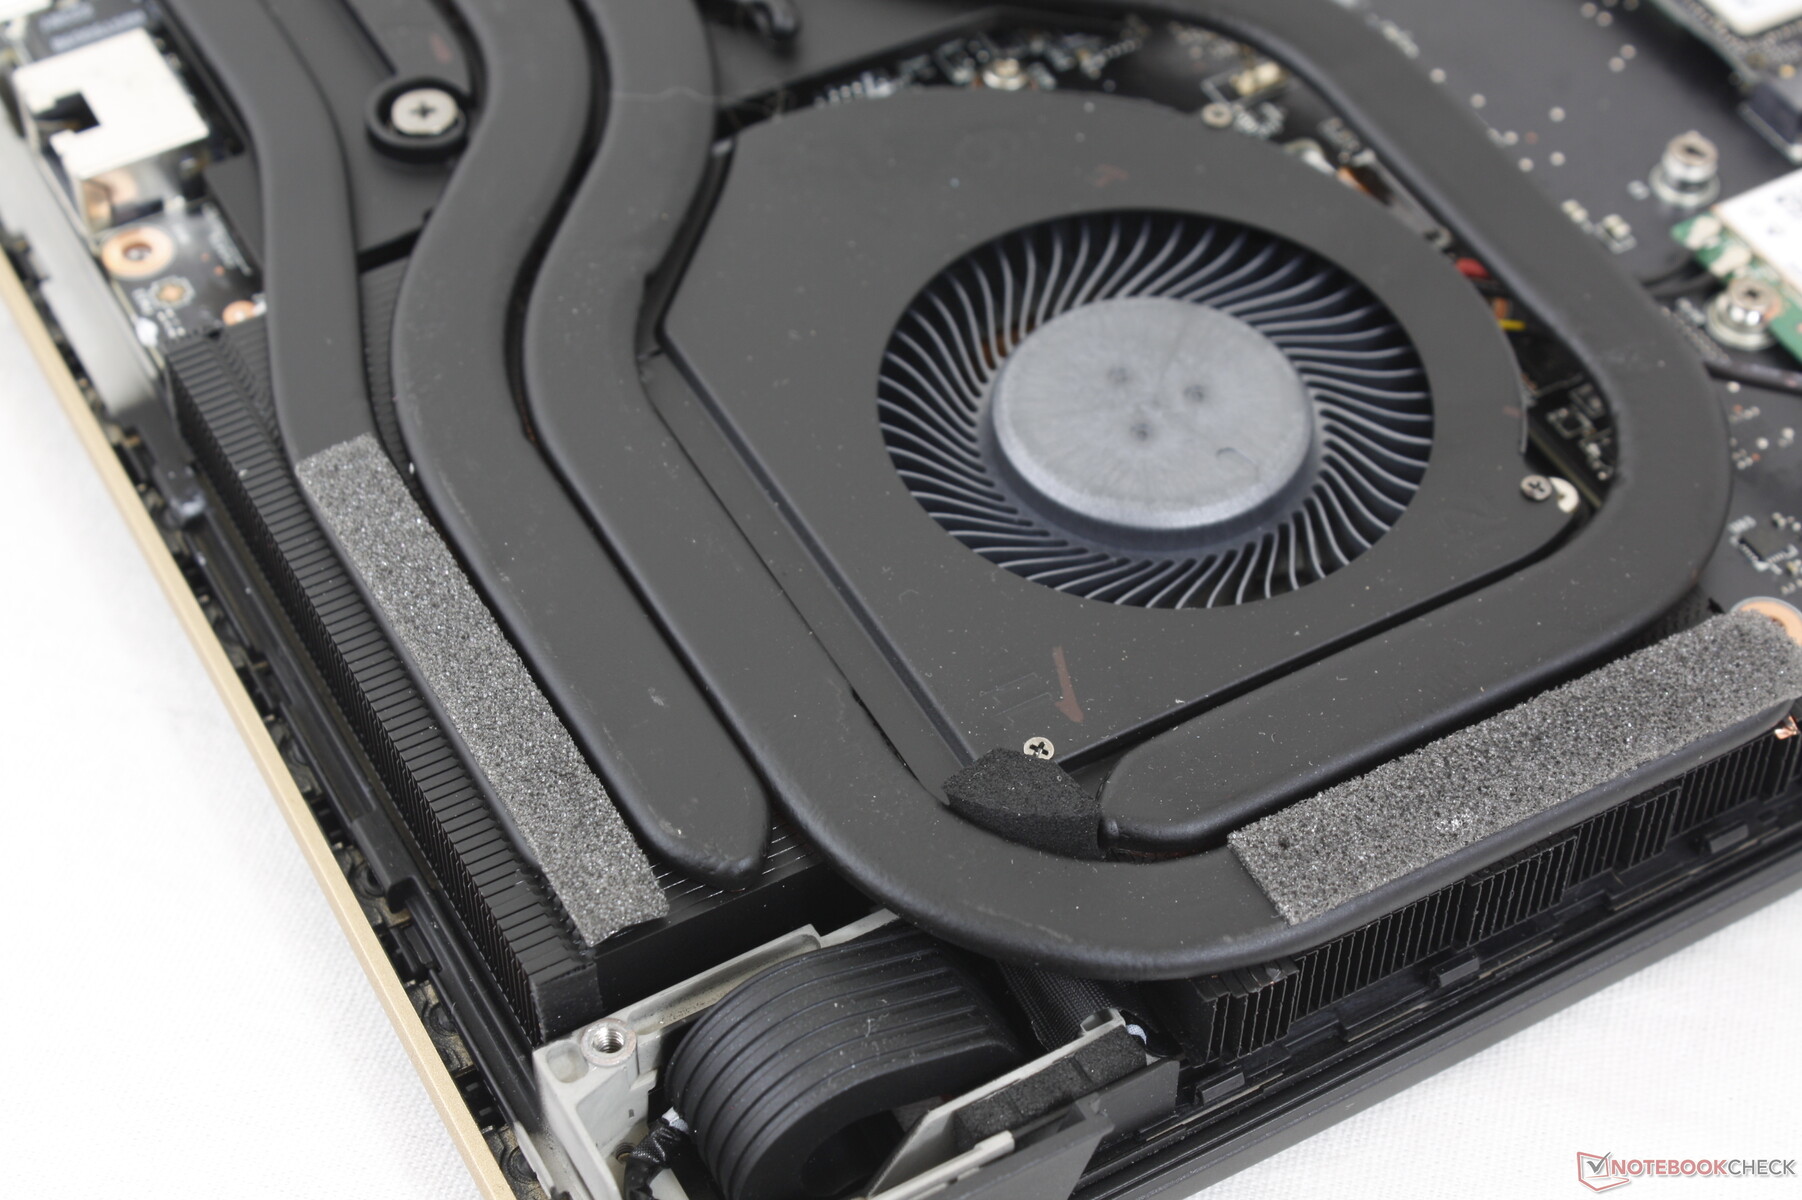
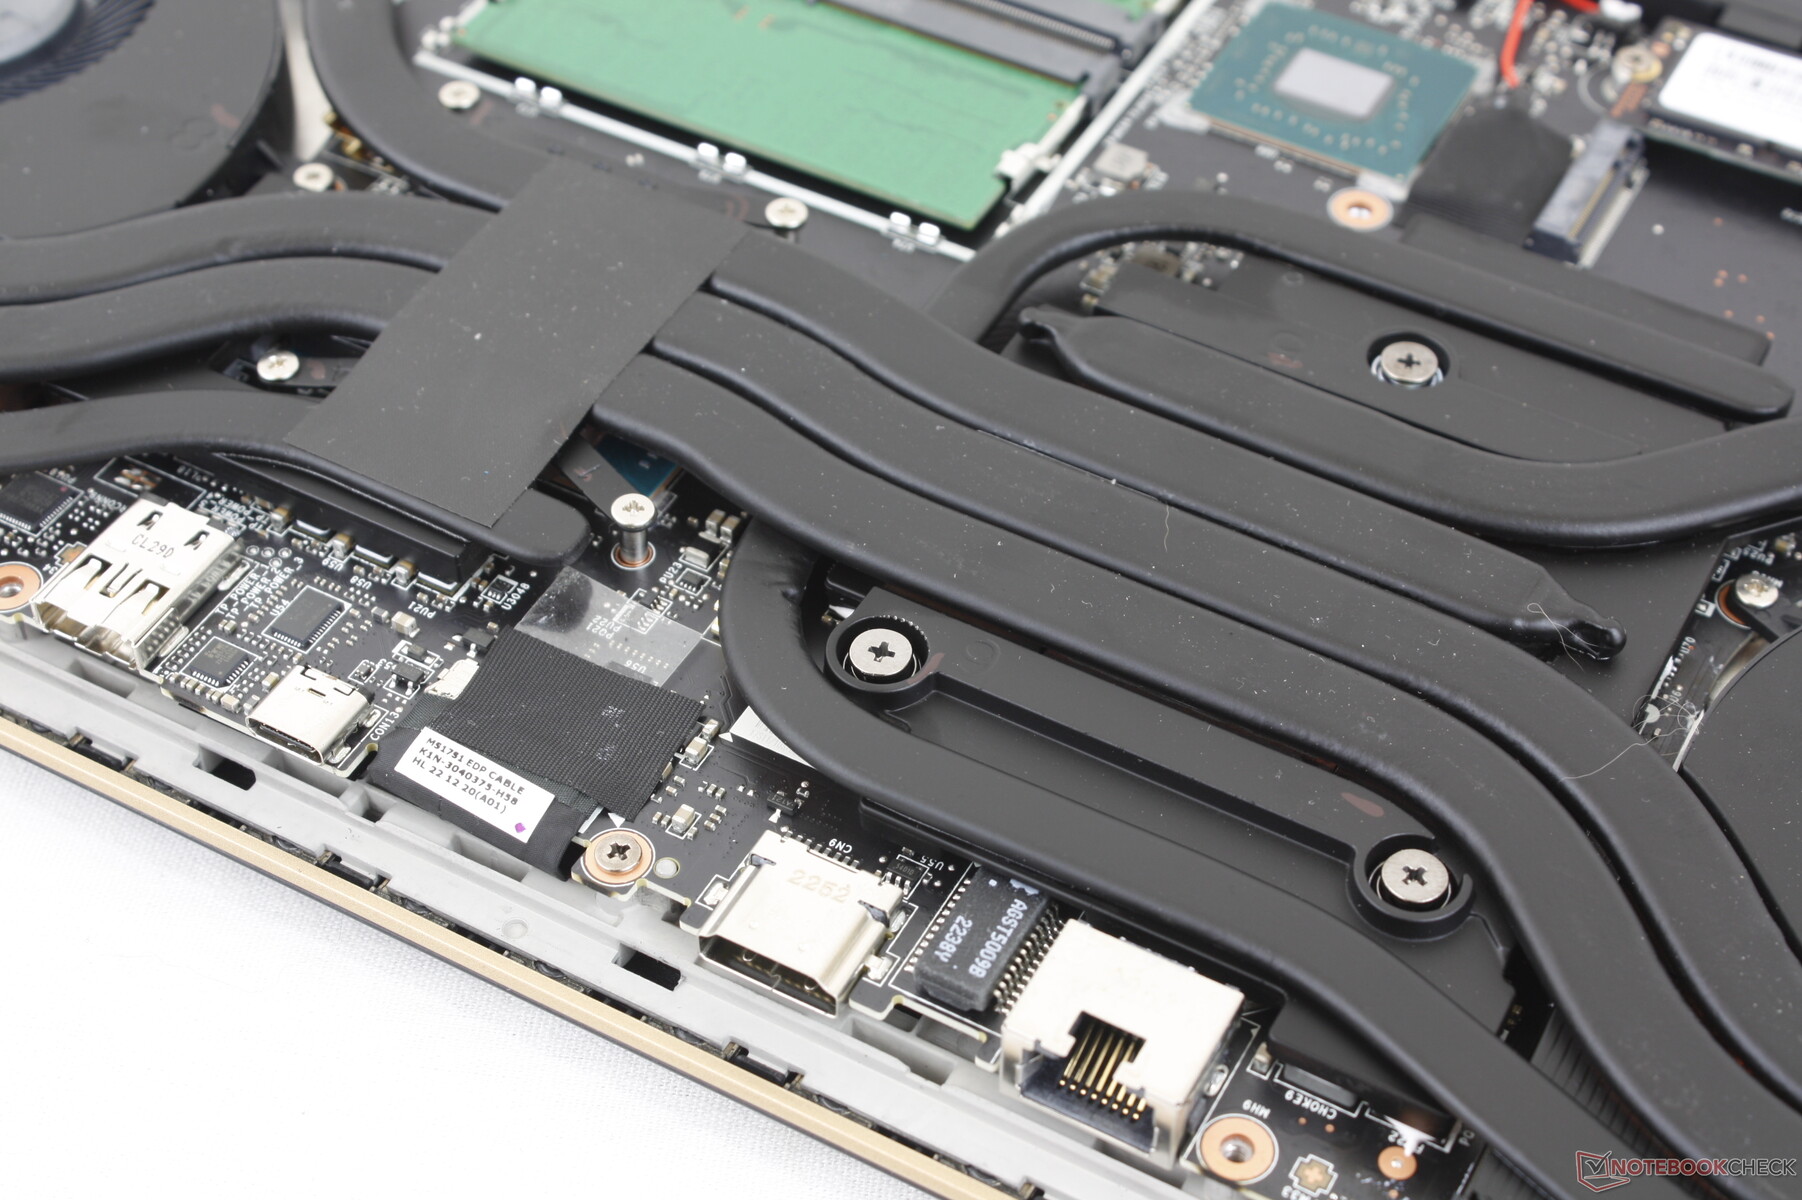
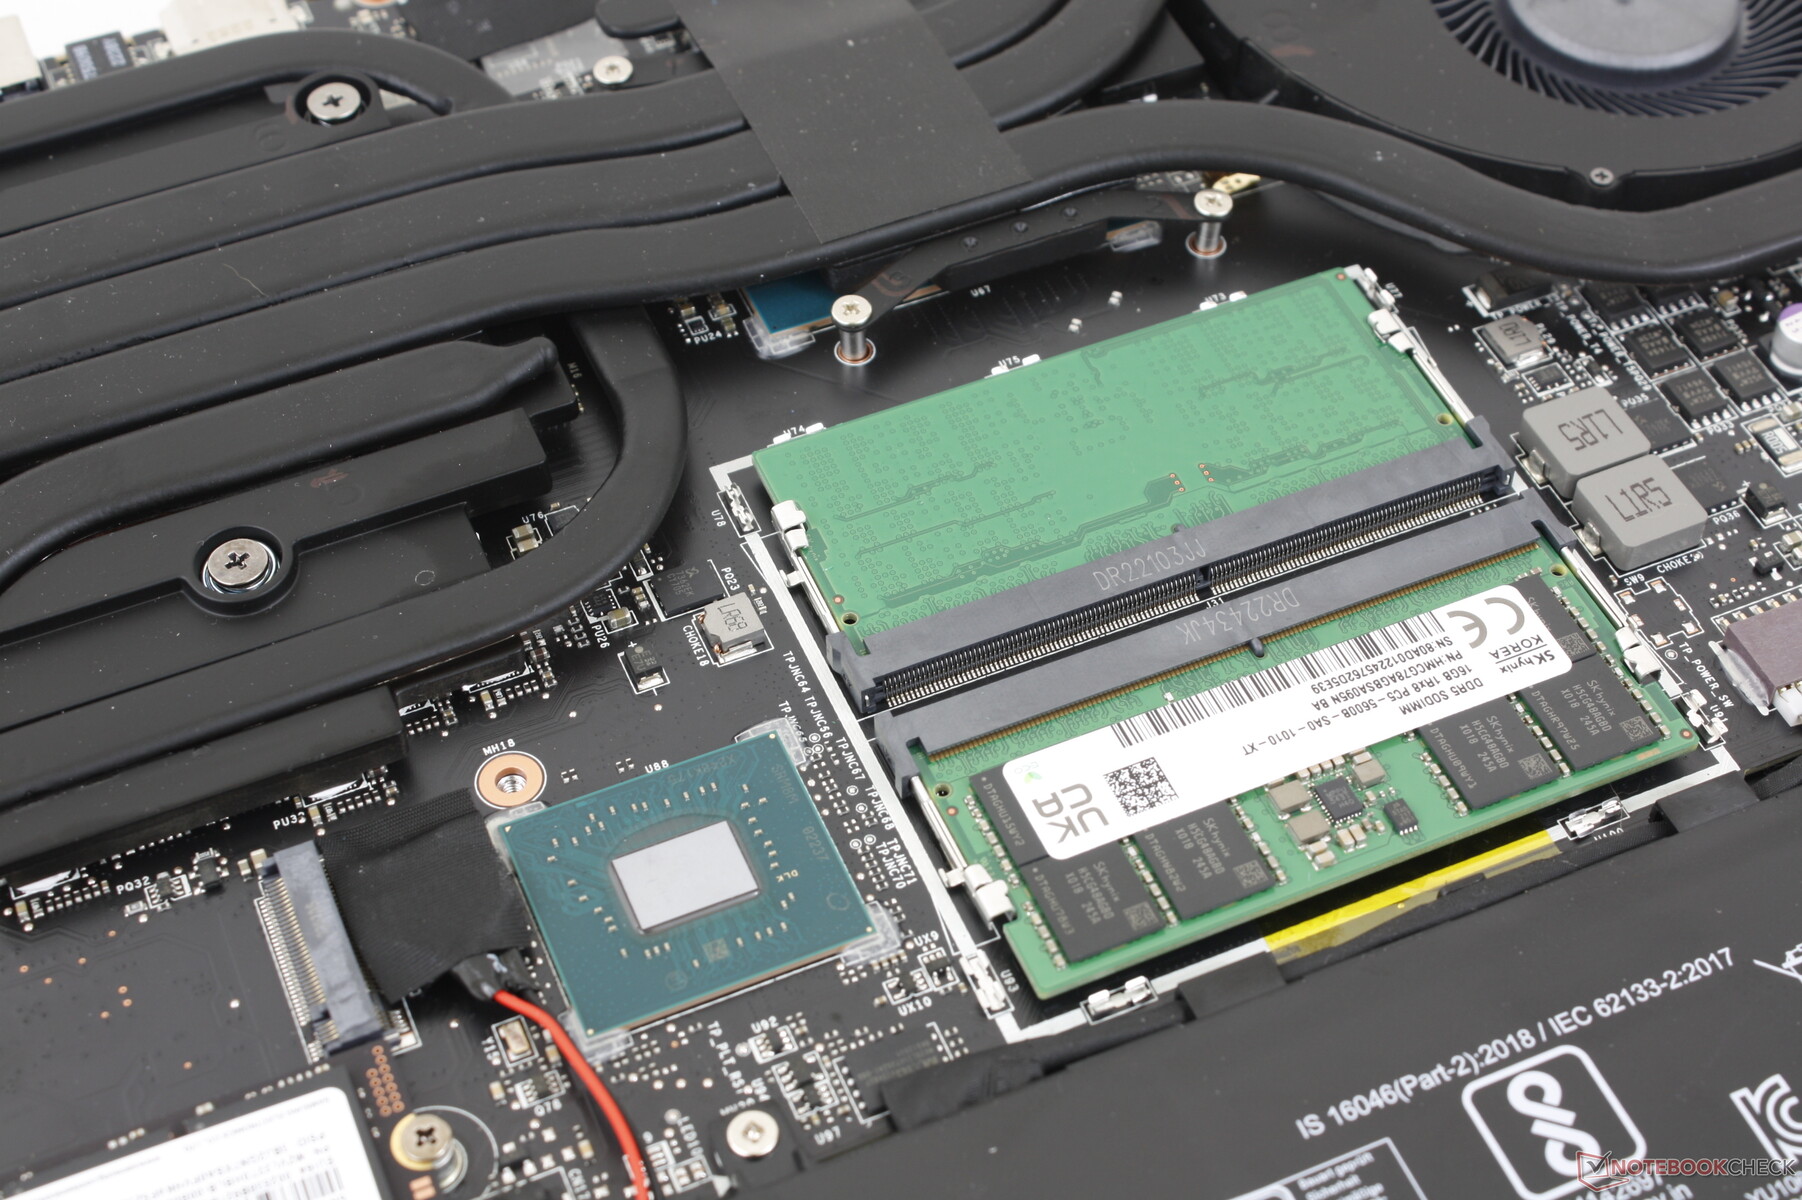
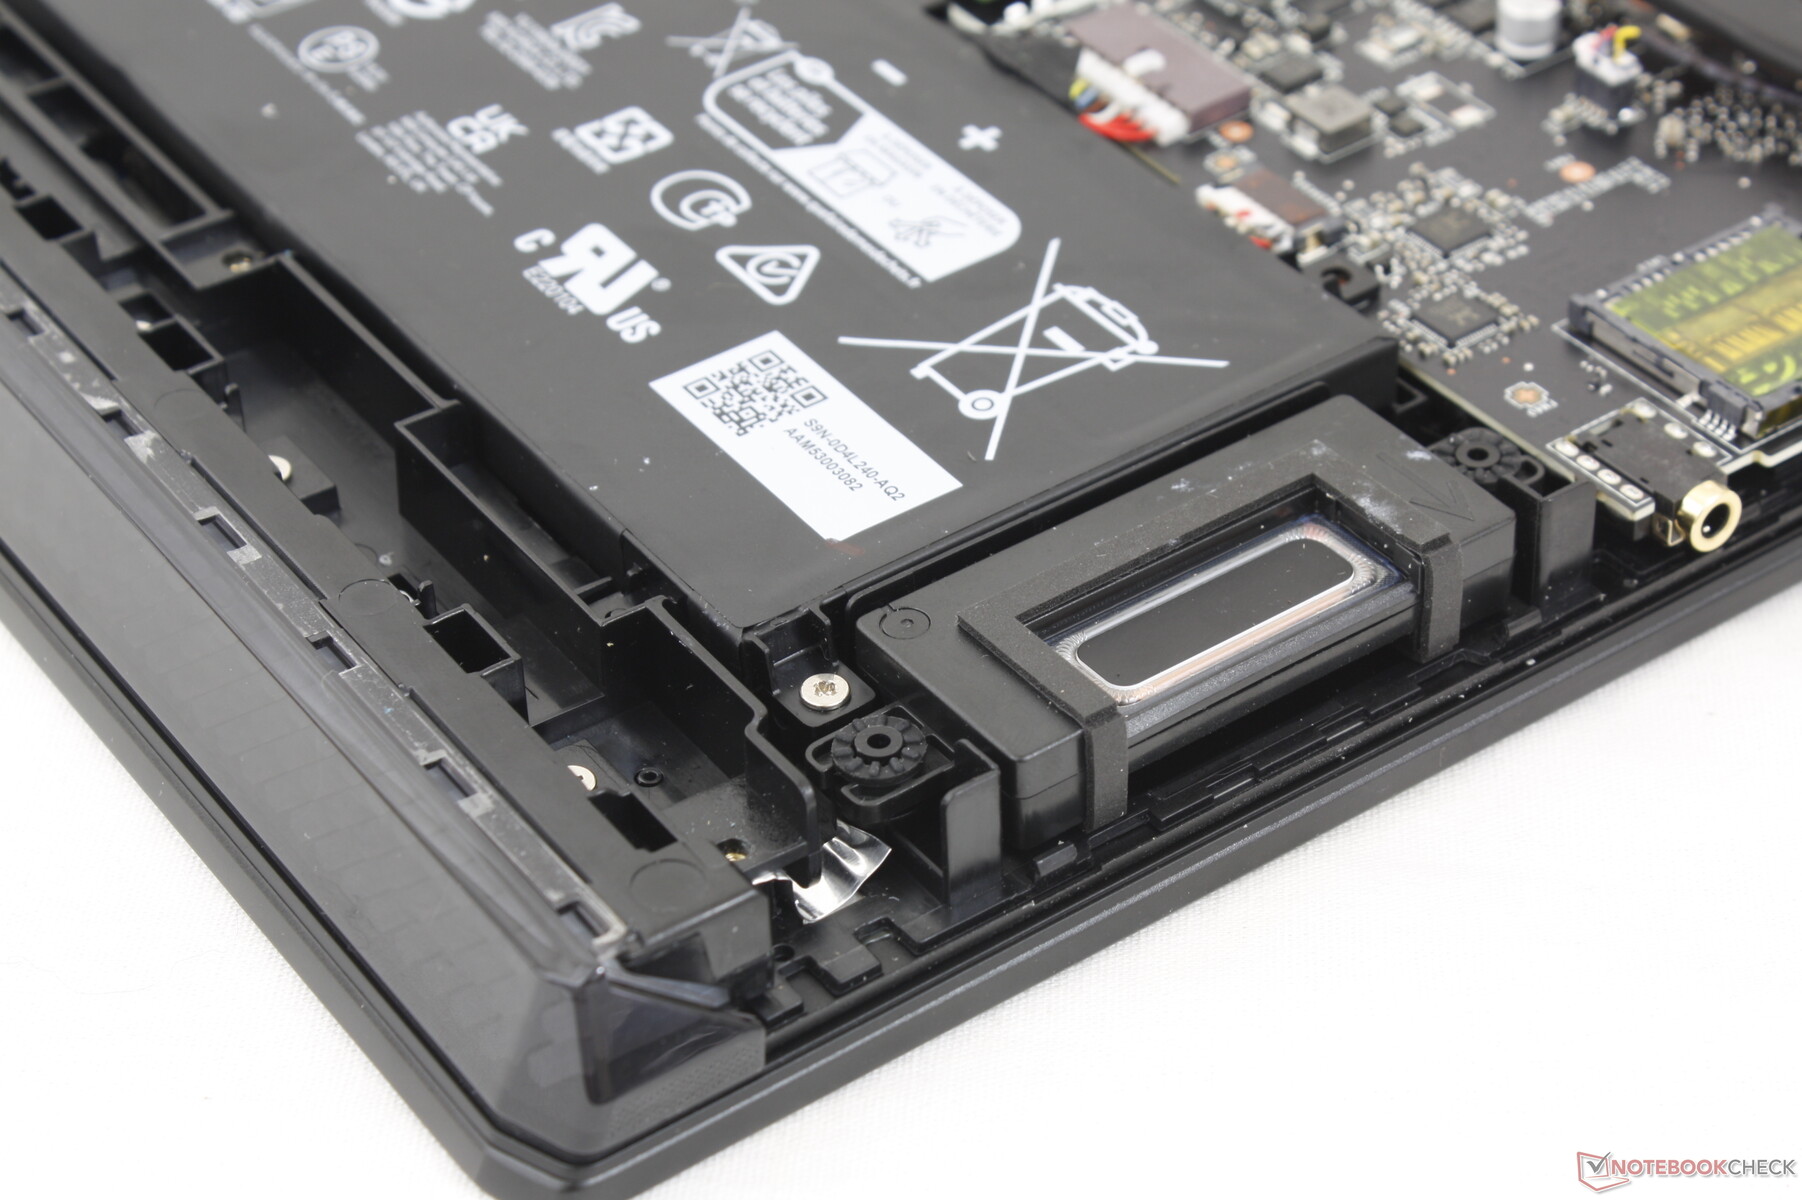
Manutenção - Um pouco mais difícil do que antes
O painel inferior é fixado por 12 parafusos Philips. Como de costume para a MSI, um adesivo de "vedação de fábrica" deve ser quebrado se os proprietários quiserem remover o painel inferior para qualquer manutenção.
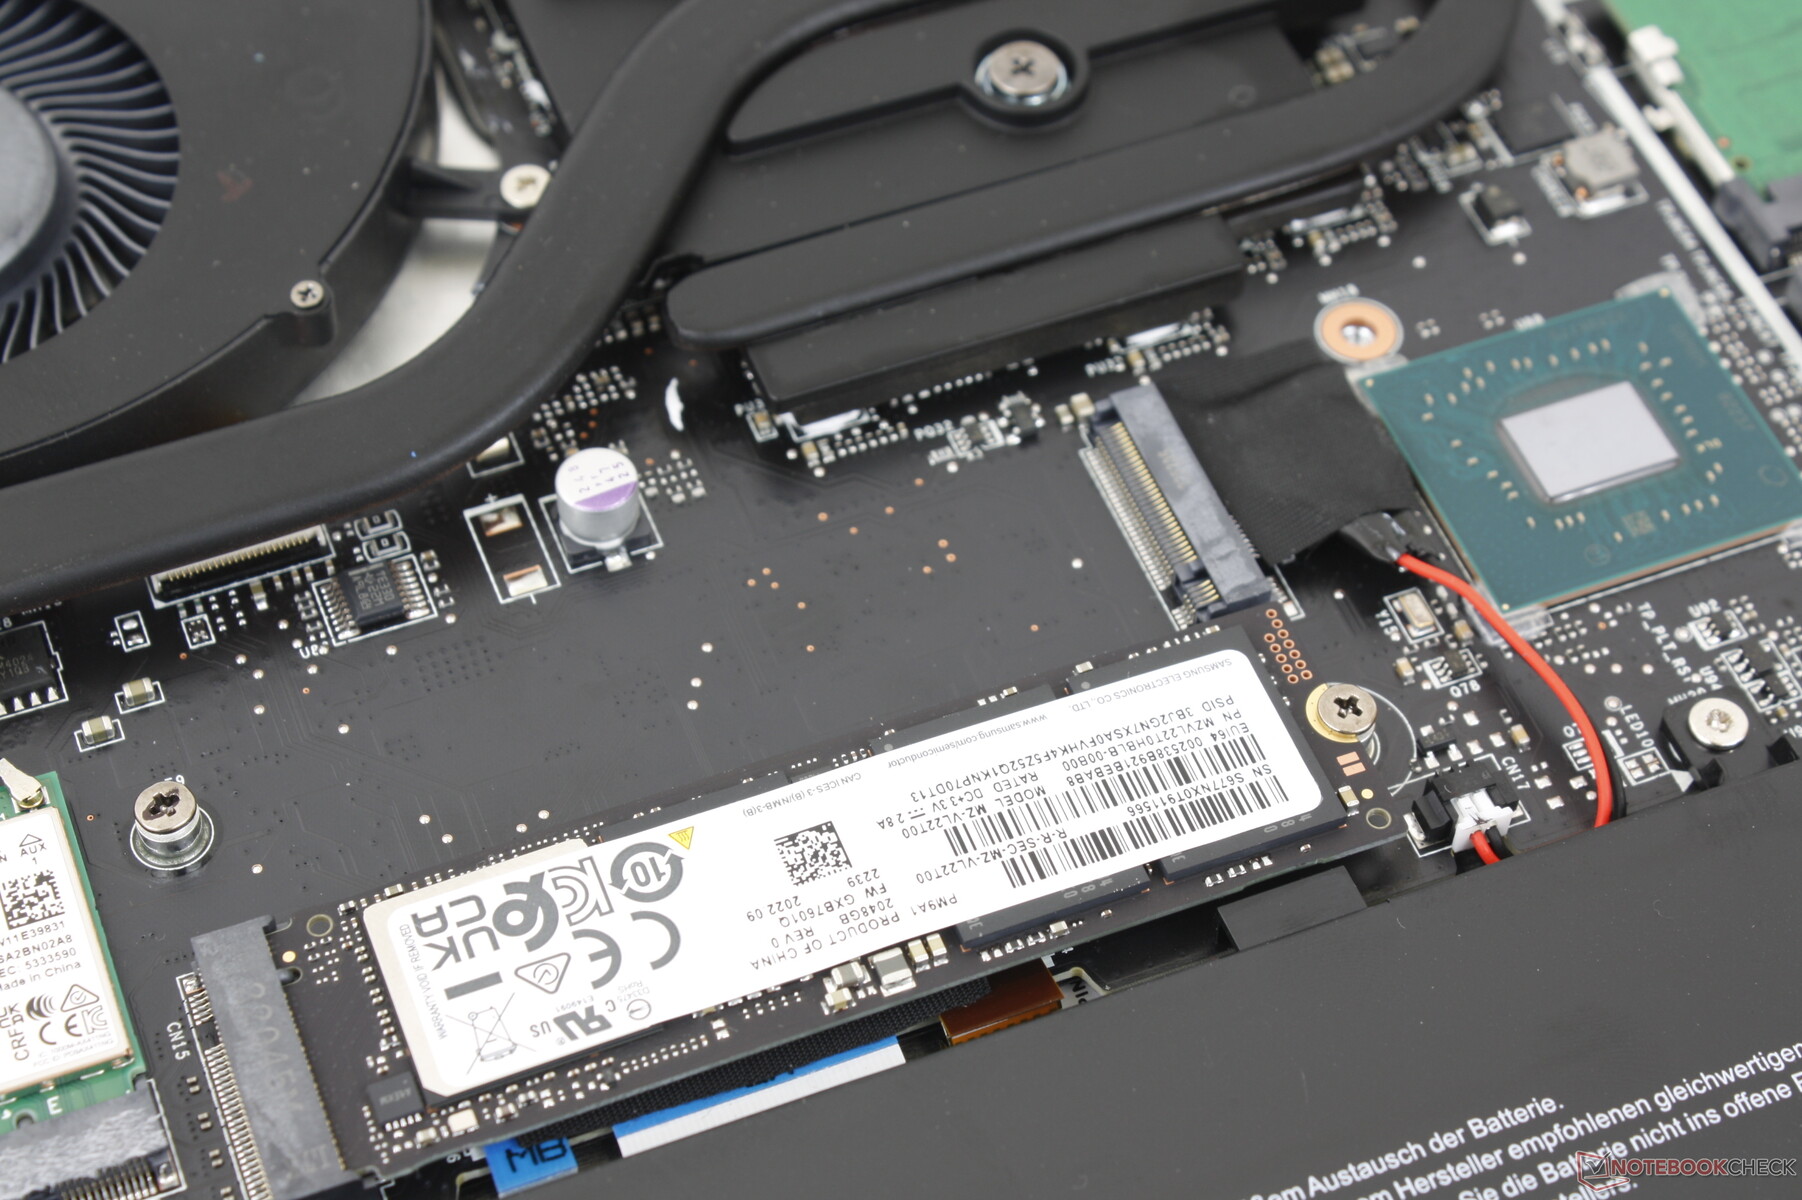
É recomendado usar uma aresta plástica afiada ao remover o painel inferior, pois as travas ao redor das bordas podem ser bastante apertadas. Uma vez fora, os usuários terão acesso direto a 2x slots SODIMM, 2x slots M.2 SSD, módulo WLAN, e bateria.
Acessórios e Garantia
Não há extras na caixa além do adaptador AC e da papelada. A garantia padrão limitada de um ano se aplica se comprada nos EUA.
Dispositivos de entrada - Maiores e mais refinados
Teclado
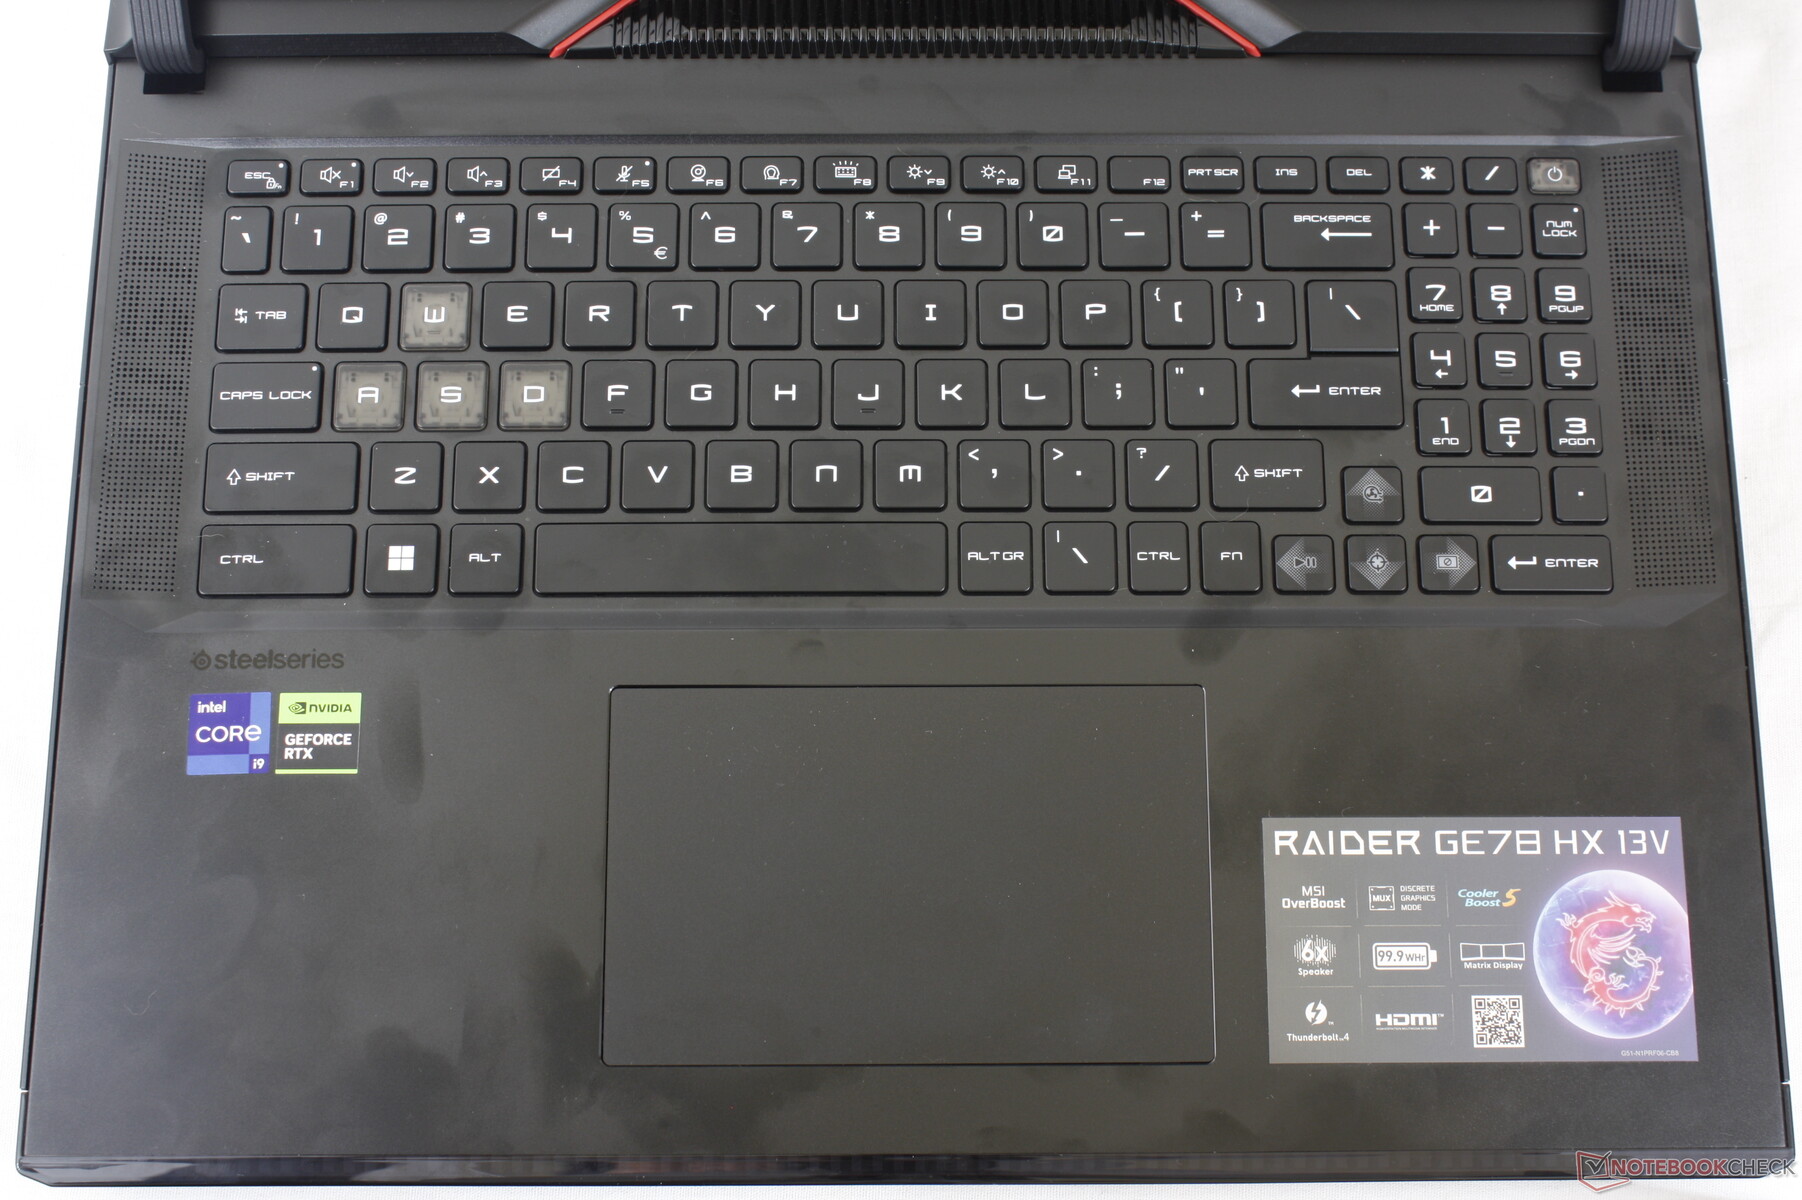
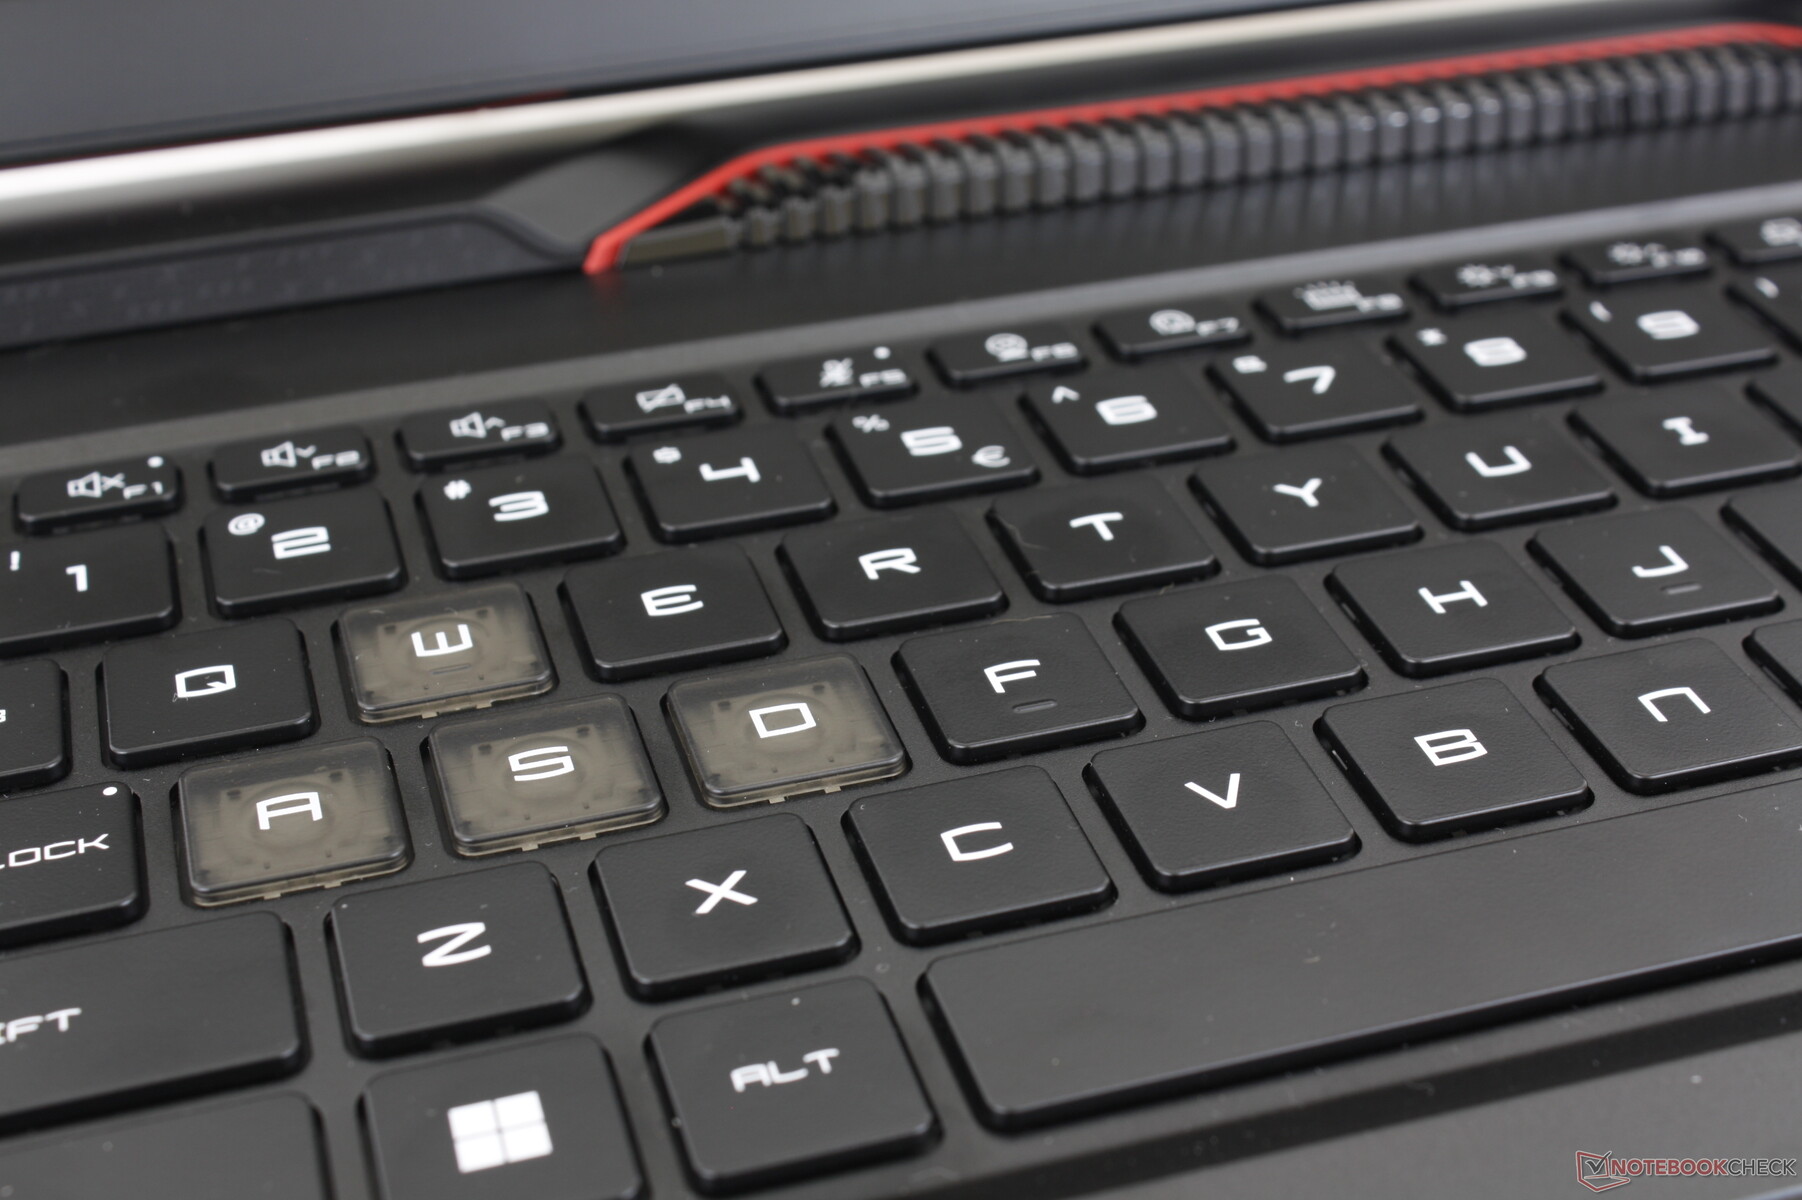
A MSI reformulou as tampas das chaves e a etiquetagem nas chaves quando comparada com a GE77. O feedback das teclas ainda é muito bom, se não melhor do que antes; as teclas Space e Enter em particular são mais barulhentas e com mais cliques desta vez para uma experiência de digitação mais satisfatória.
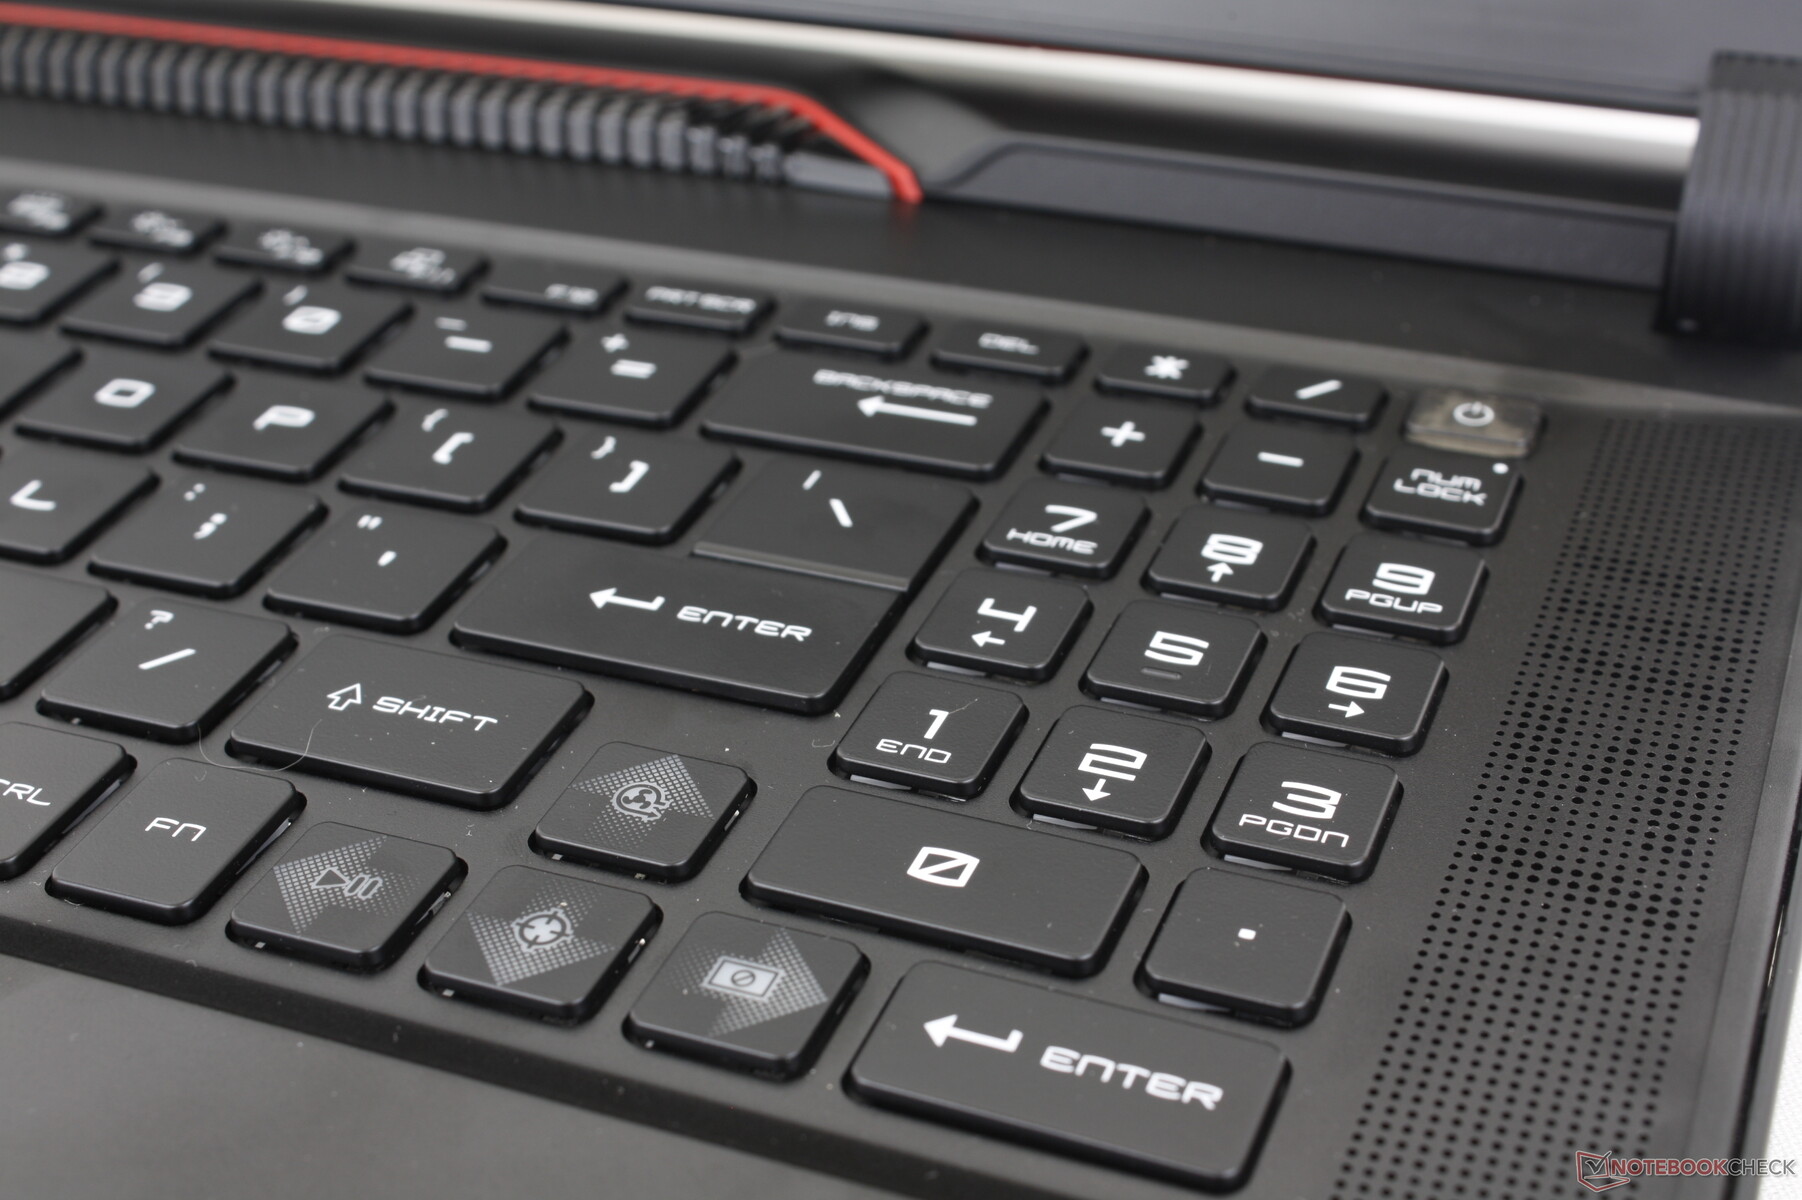
As teclas de setas e o numpad poderiam usar algum trabalho. Apesar do grande fator de forma de 17 polegadas, estas teclas específicas são pequenas e apertadas. Em comparação, as teclas de setas e o numpad no Lenovo Legion série são maiores e mais espaçosos. Jogos que freqüentemente utilizam as teclas de seta, tais como títulos de corrida, podem ser mais difíceis de jogar no sistema MSI.
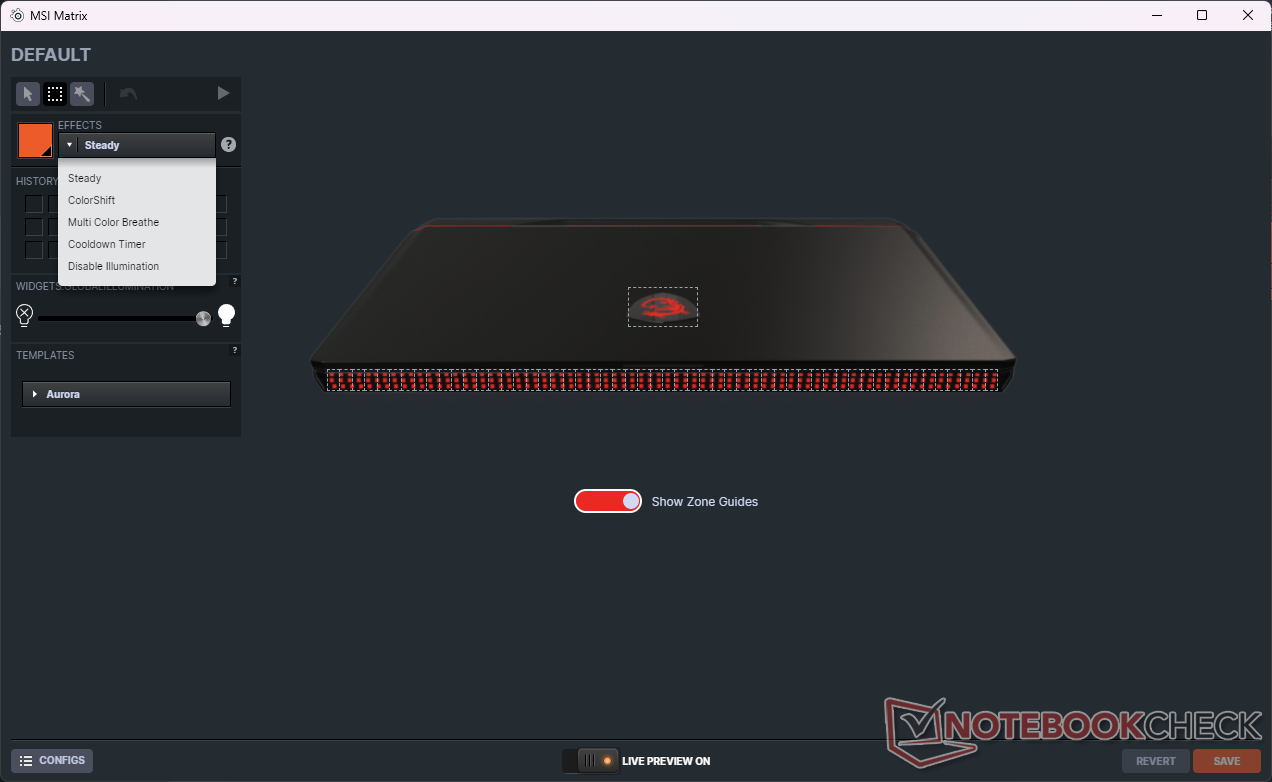
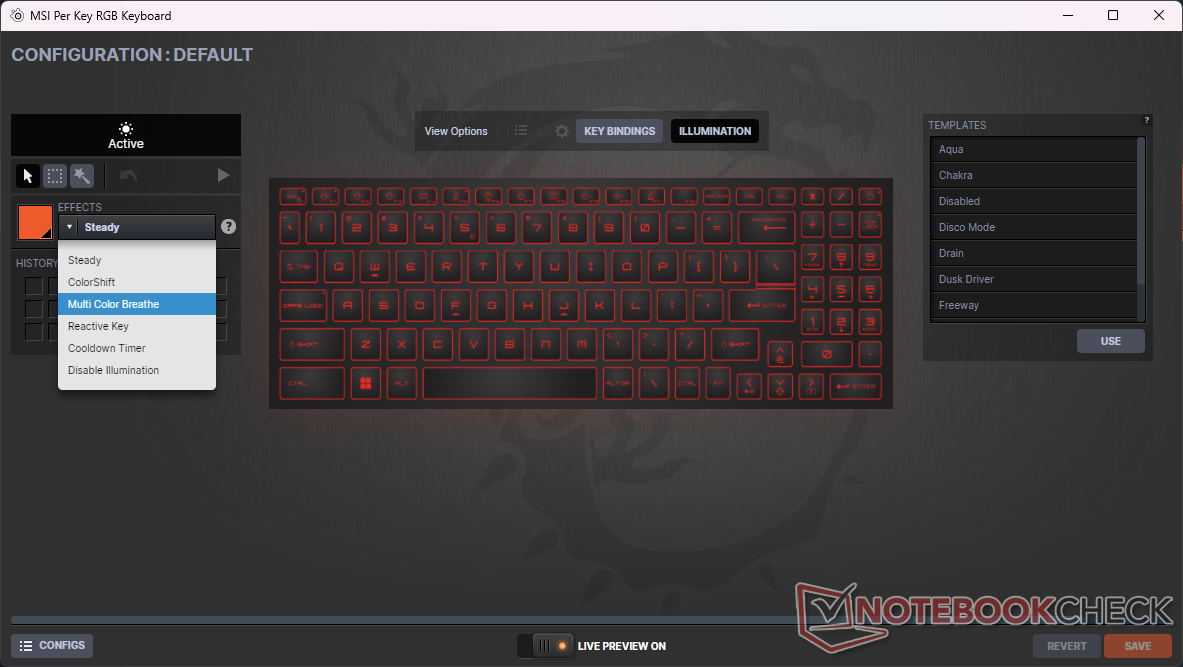
Os efeitos de iluminação por tecla RGB são controlados pelo software SteelSeries GG pré-instalado, como mostrado pelas telas abaixo. O aplicativo controla a barra de luz "matriz" de pixels ao longo da borda frontal do chassi também.
Touchpad
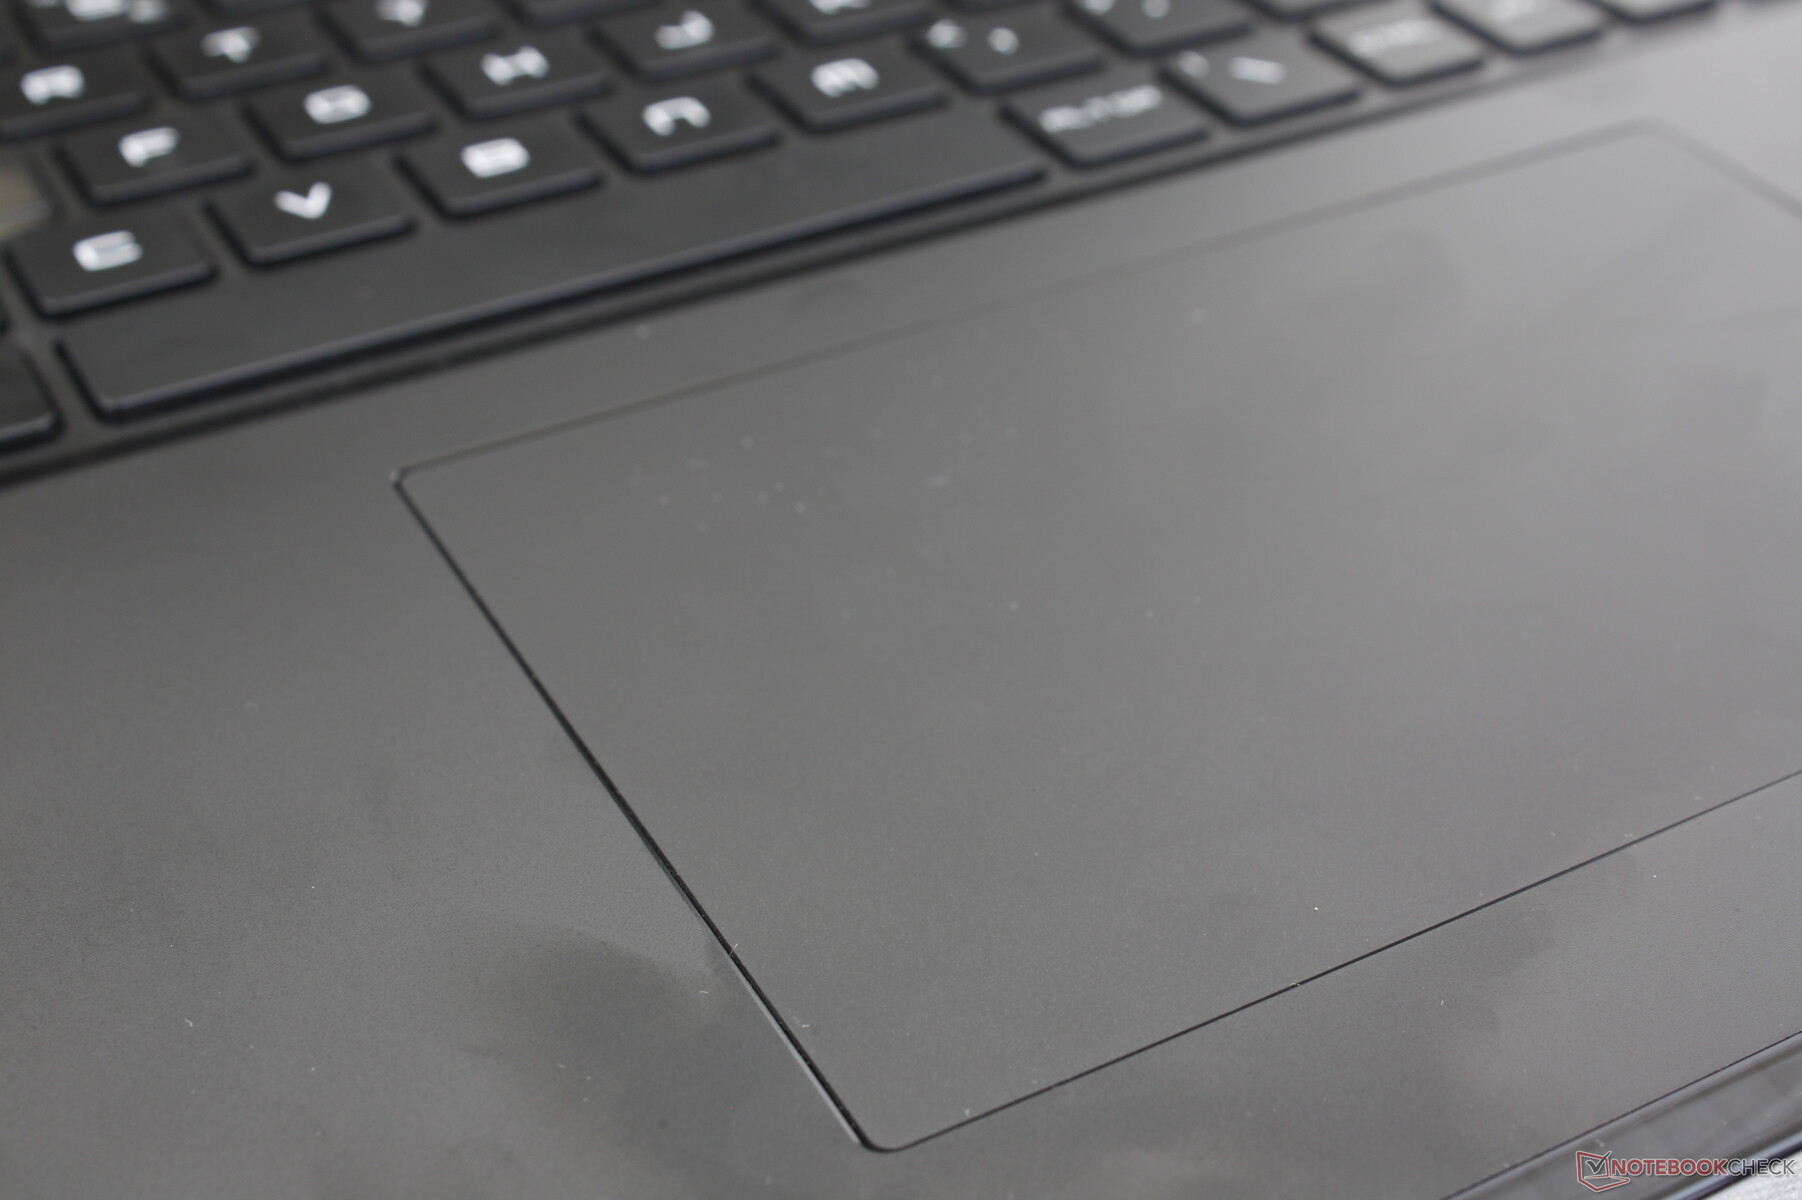
O clickpad cresceu em tamanho desde a minúscula superfície de 10,5 x 6,5 cm no GE77 até muito mais espaço 13 x 8,2 cm no GE78. O deslizamento na superfície de plástico é mais pegajoso do que o esperado, no entanto, e por isso há um pouco mais de resistência ao deslizamento em velocidades mais rápidas. O feedback quando se pressiona para baixo é silencioso, mas muito superficial e fraco para uma sensação de insatisfação geral.
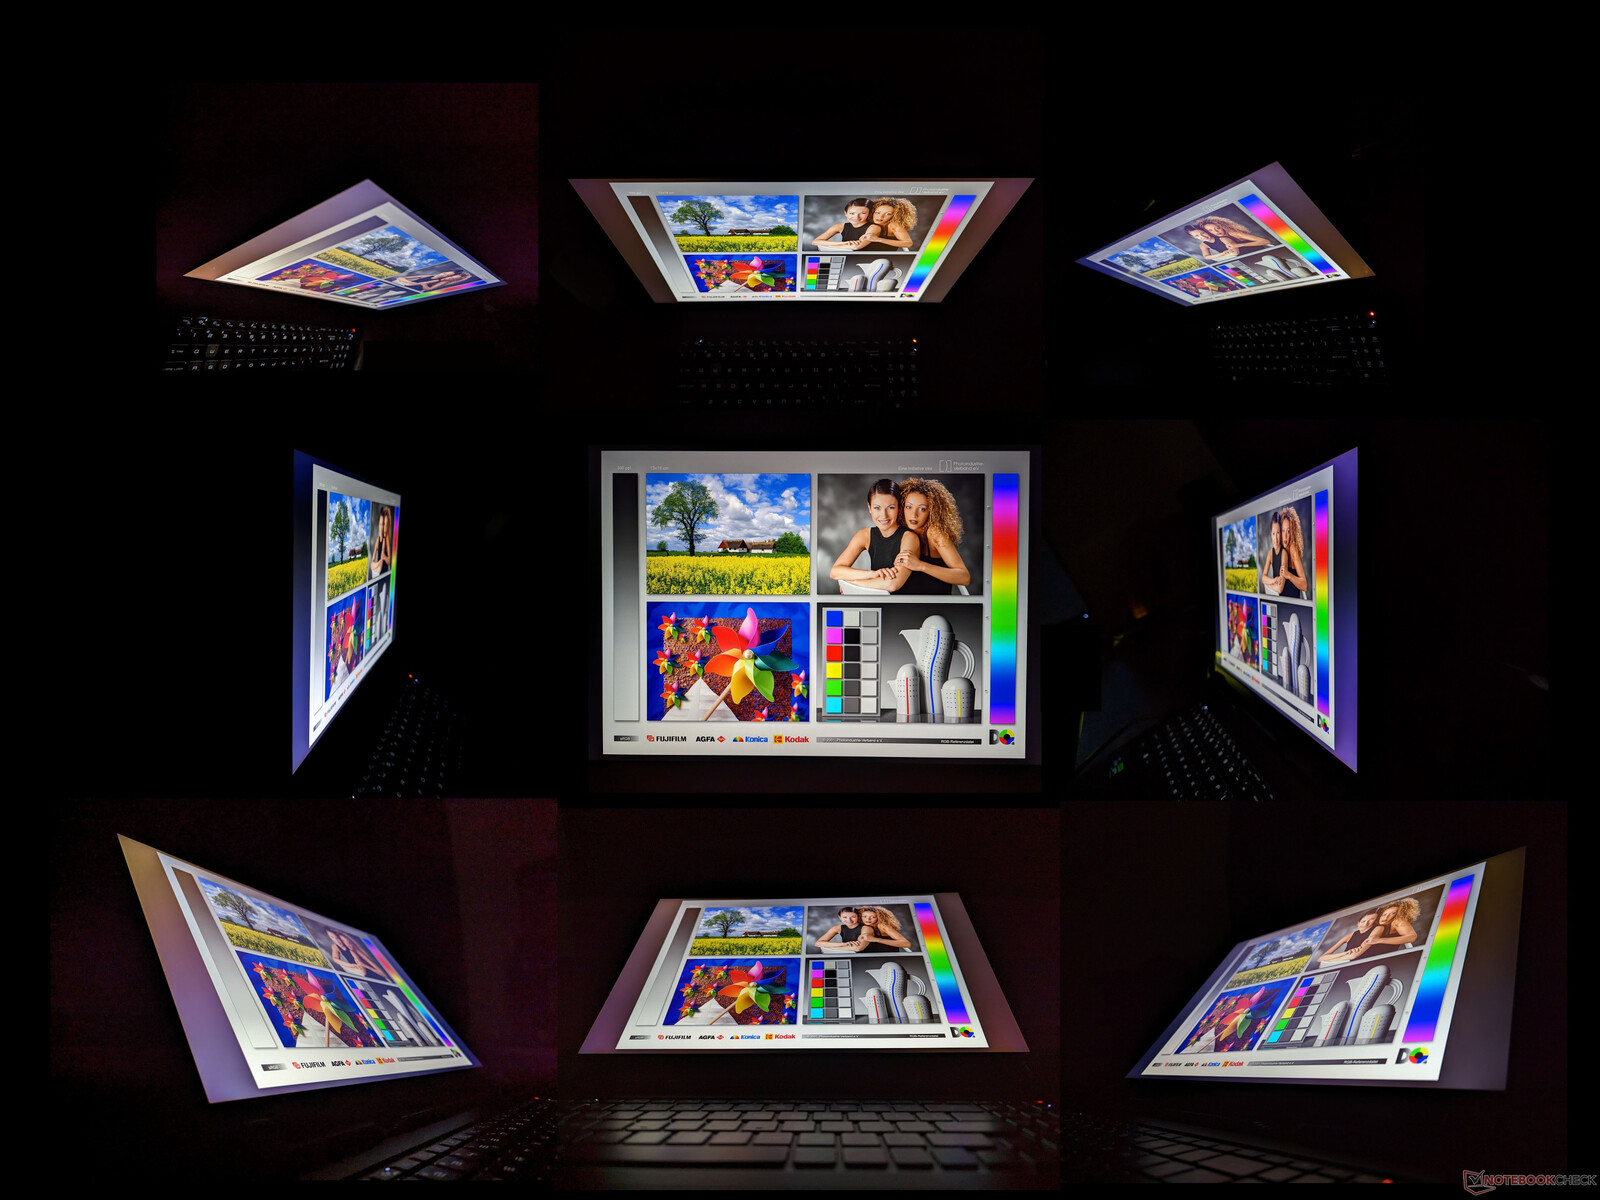
Exibição - Onde está o suporte da G-Sync?
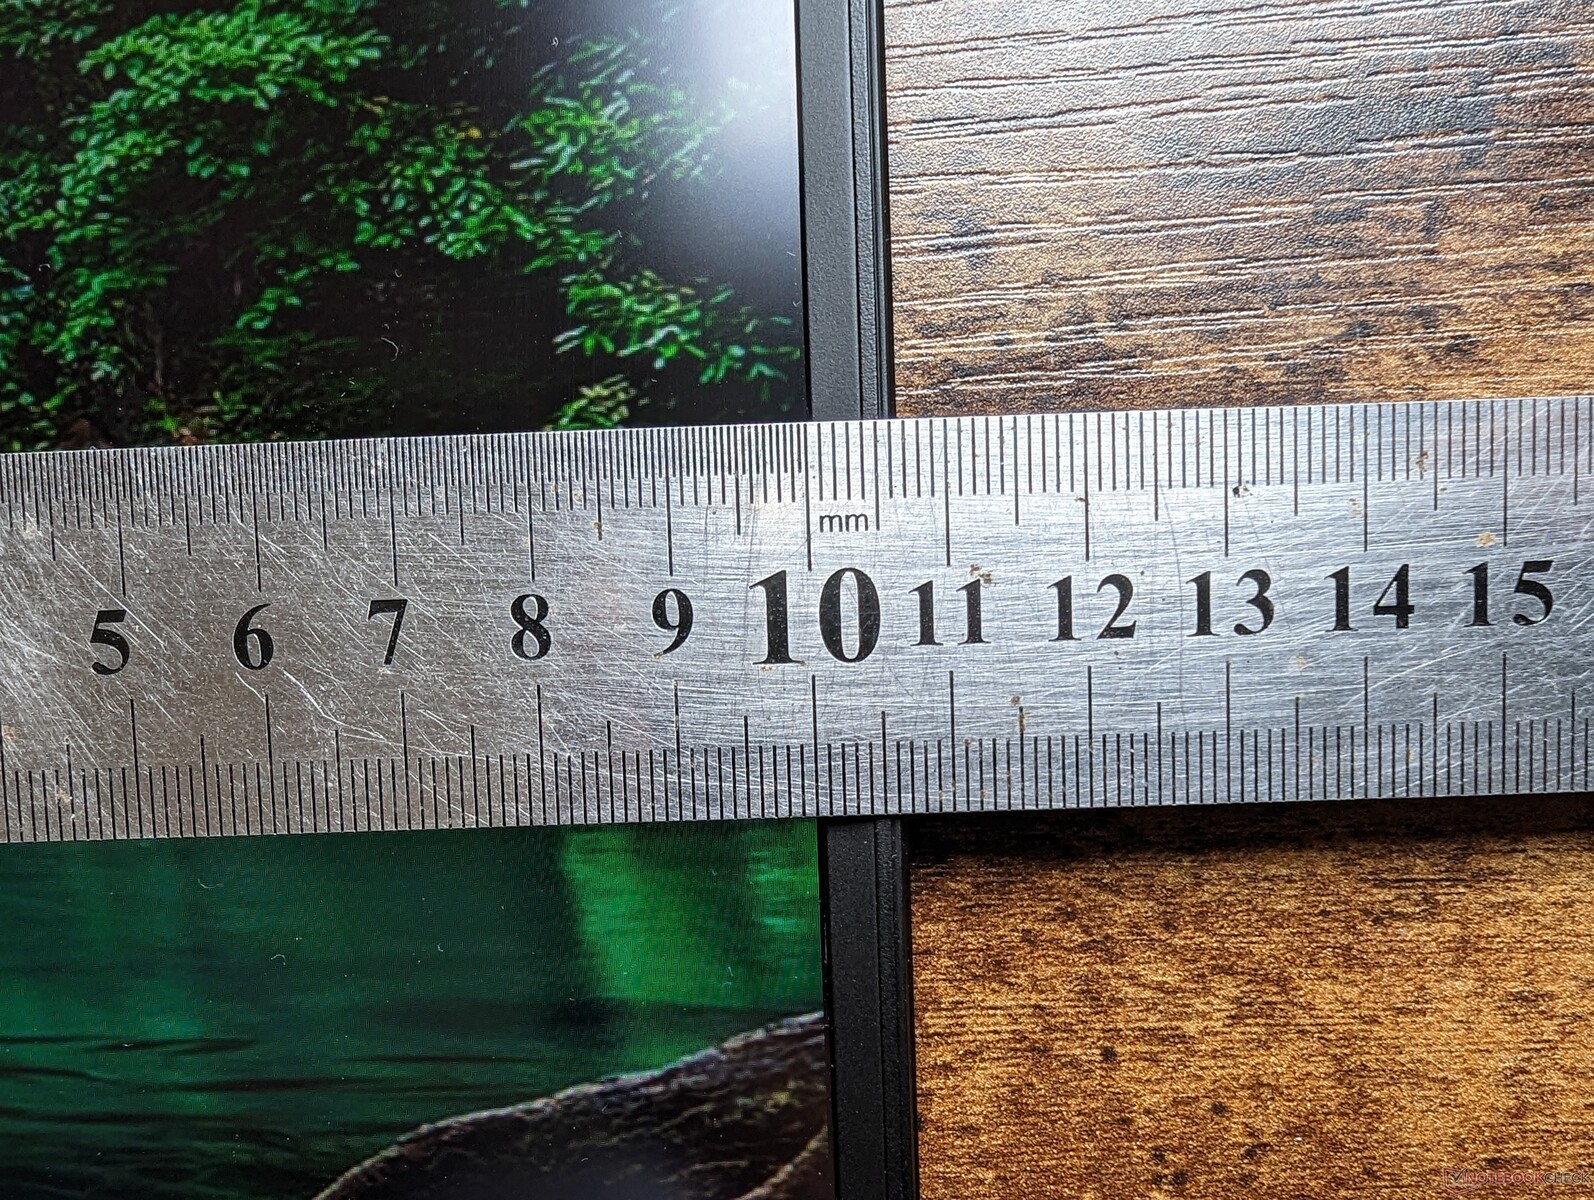
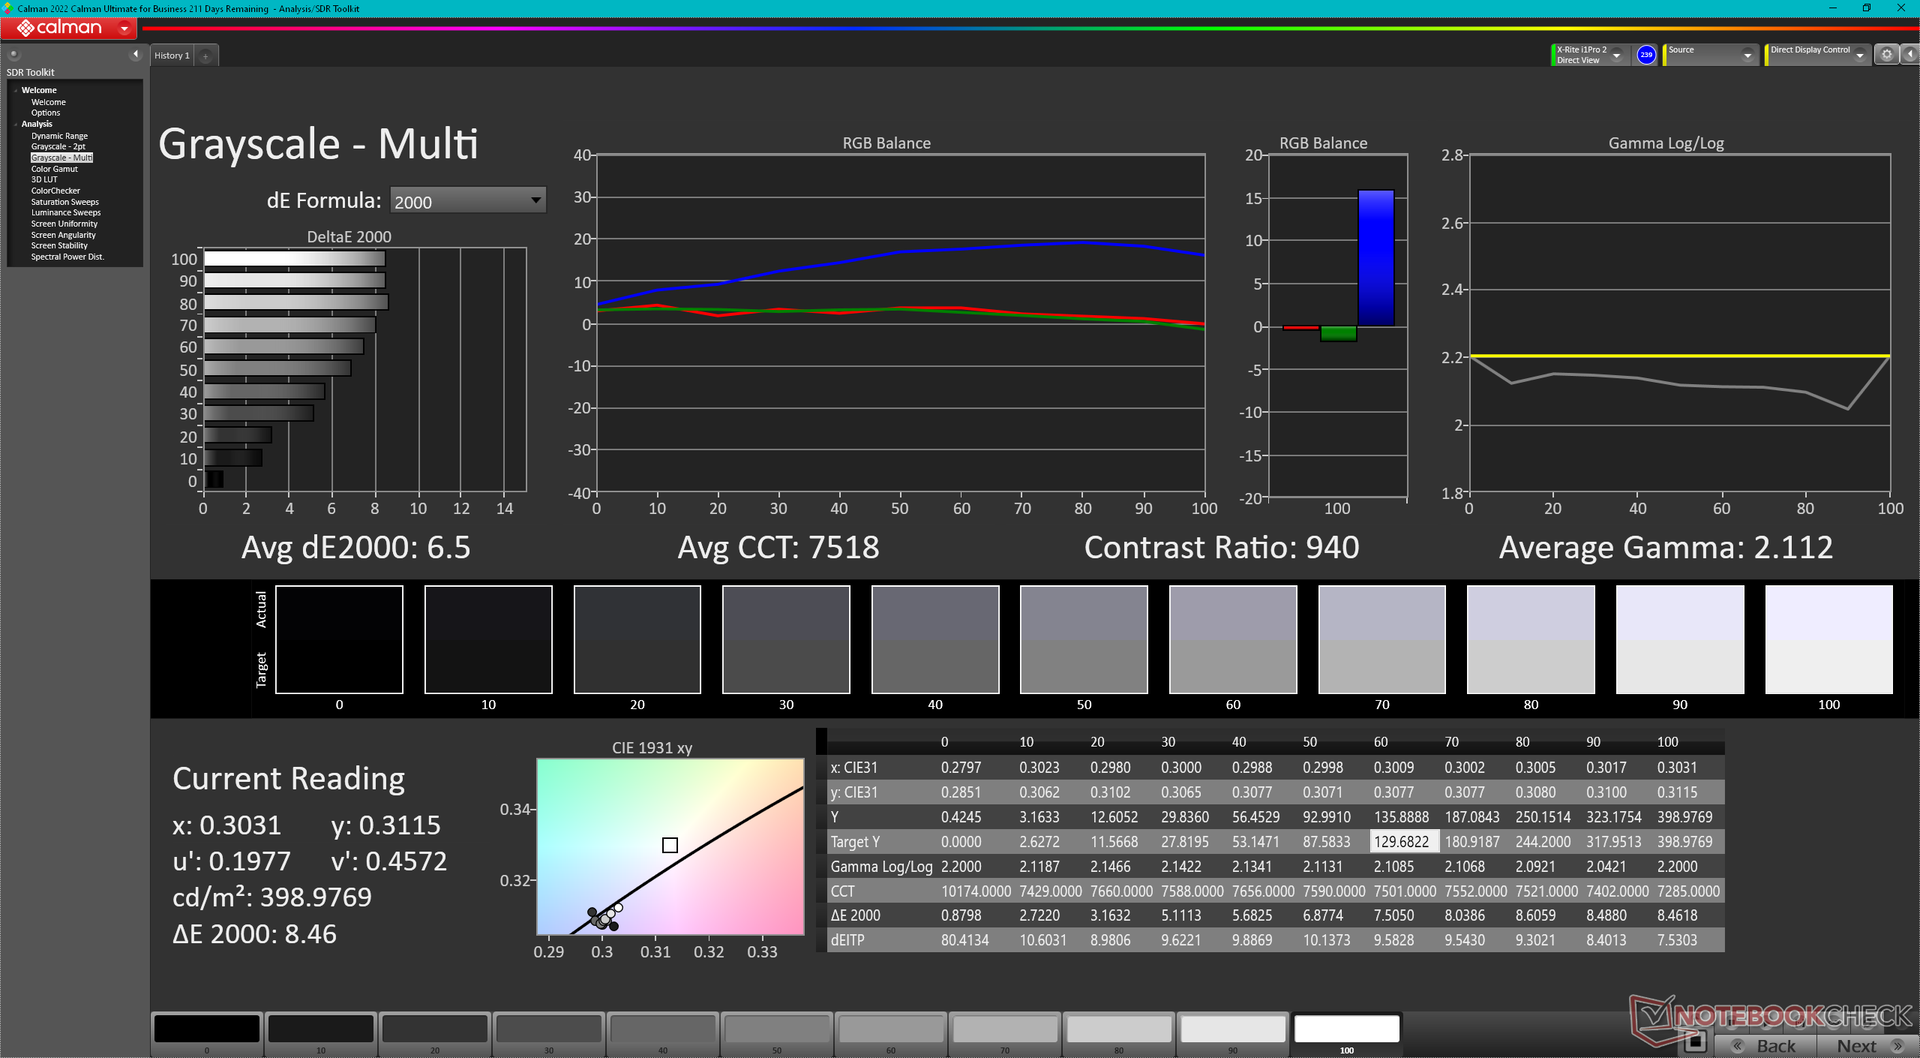
O GE78 é o primeiro laptop em nosso banco de dados a utilizar o painel IPS AU Optronics B170QAN01.2. Entretanto, todas as nossas medidas internas mostram que ele é essencialmente idêntico ao painel AU Optronics B173ZAN06.1 no GE77 do ano passado, exceto em tamanho (17,0 polegadas vs. 17,3 polegadas), relação de aspecto (16:10 vs. 16:9) e taxa de atualização (240 Hz vs. 120 Hz). Atributos principais como as amplas cores P3, tempos de resposta rápidos, brilho de 400-nit e relação de contraste decente permanecem praticamente os mesmos para uma experiência visual semelhante entre eles.
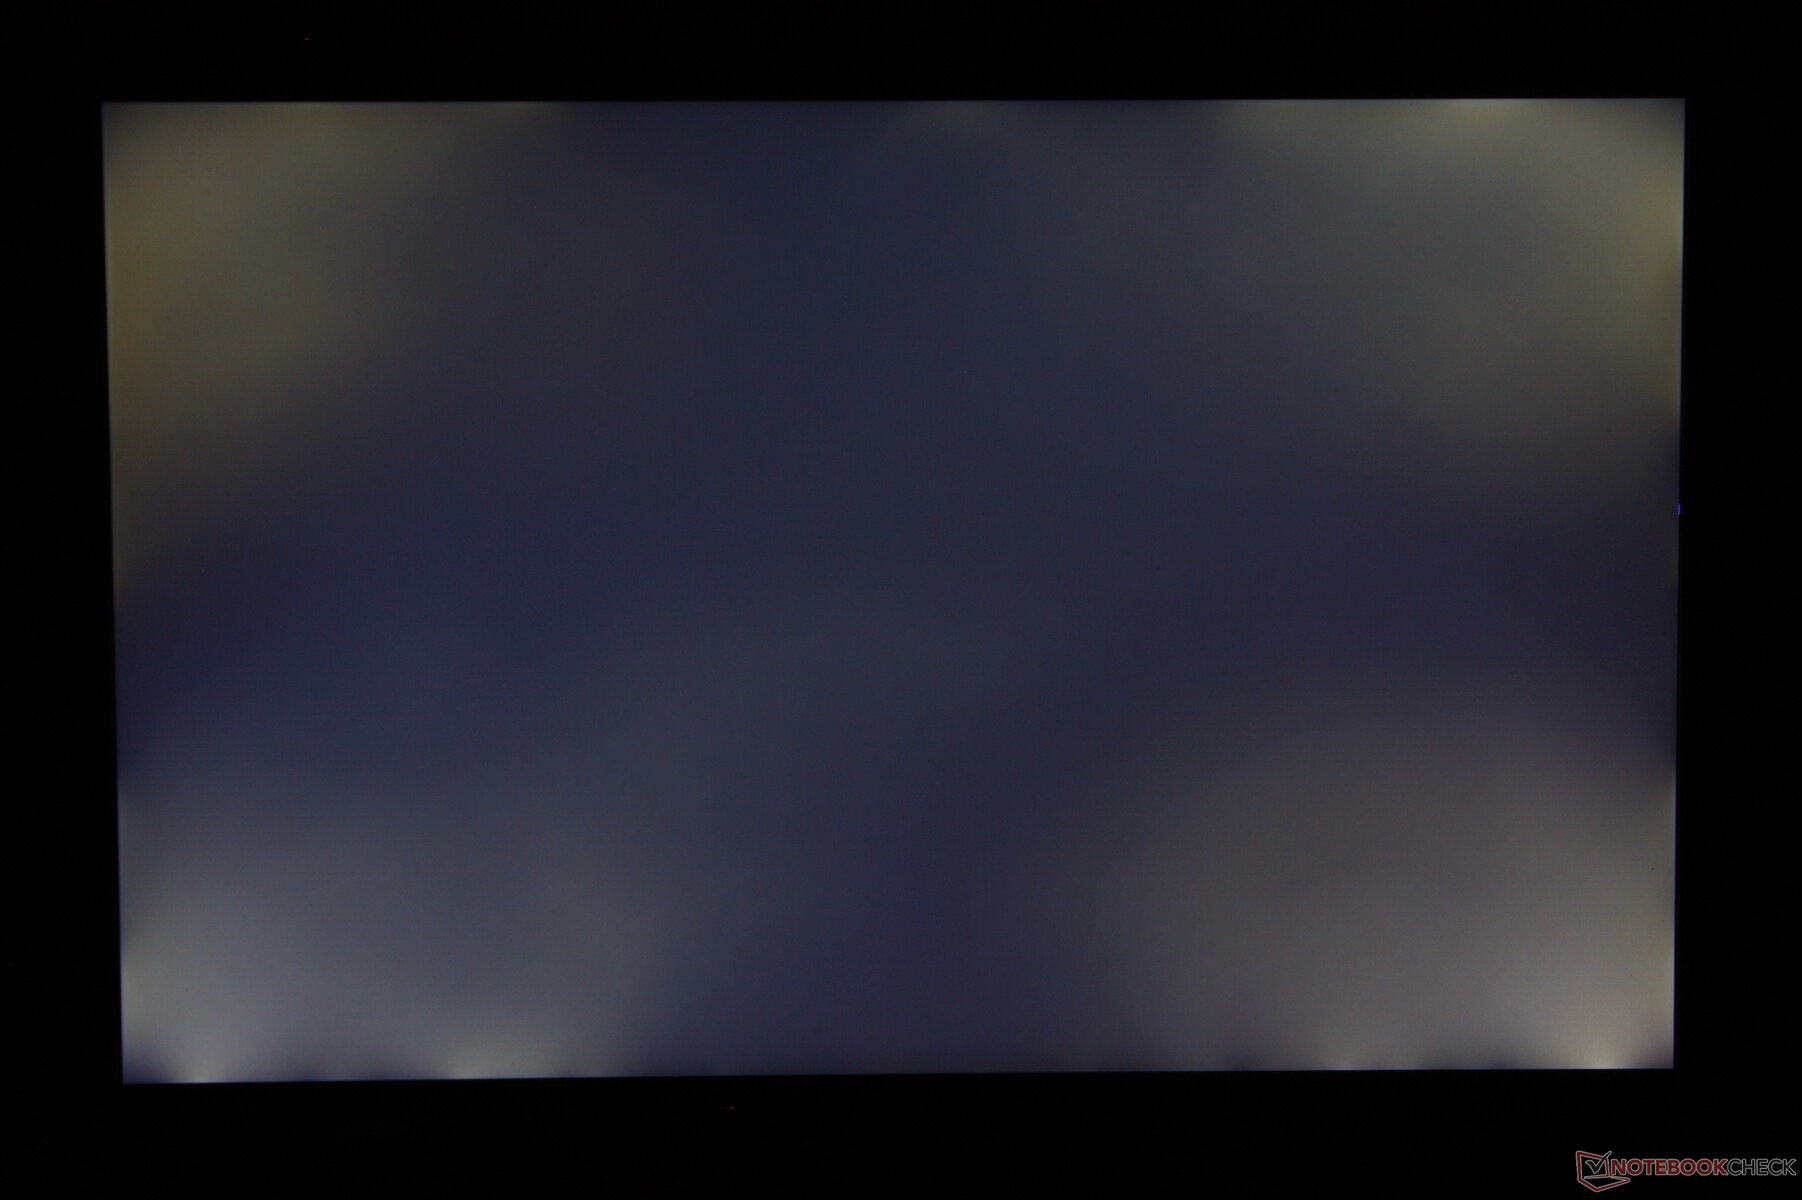
Talvez o aspecto mais flagrante do visor seja seu terrível controle de sangramento de luz de fundo em nossa unidade de teste específica. Como mostra a captura de tela abaixo, o sangramento de luz é perceptível especialmente durante a reprodução de filmes com bordas pretas ou quando se joga certos jogos. É de se esperar algum nível de sangramento de luz de fundo na maioria dos painéis IPS, mas é muito substancial em um laptop de alta qualidade como nosso GE78.
| |||||||||||||||||||||||||
iluminação: 89 %
iluminação com acumulador: 398.6 cd/m²
Contraste: 867:1 (Preto: 0.46 cd/m²)
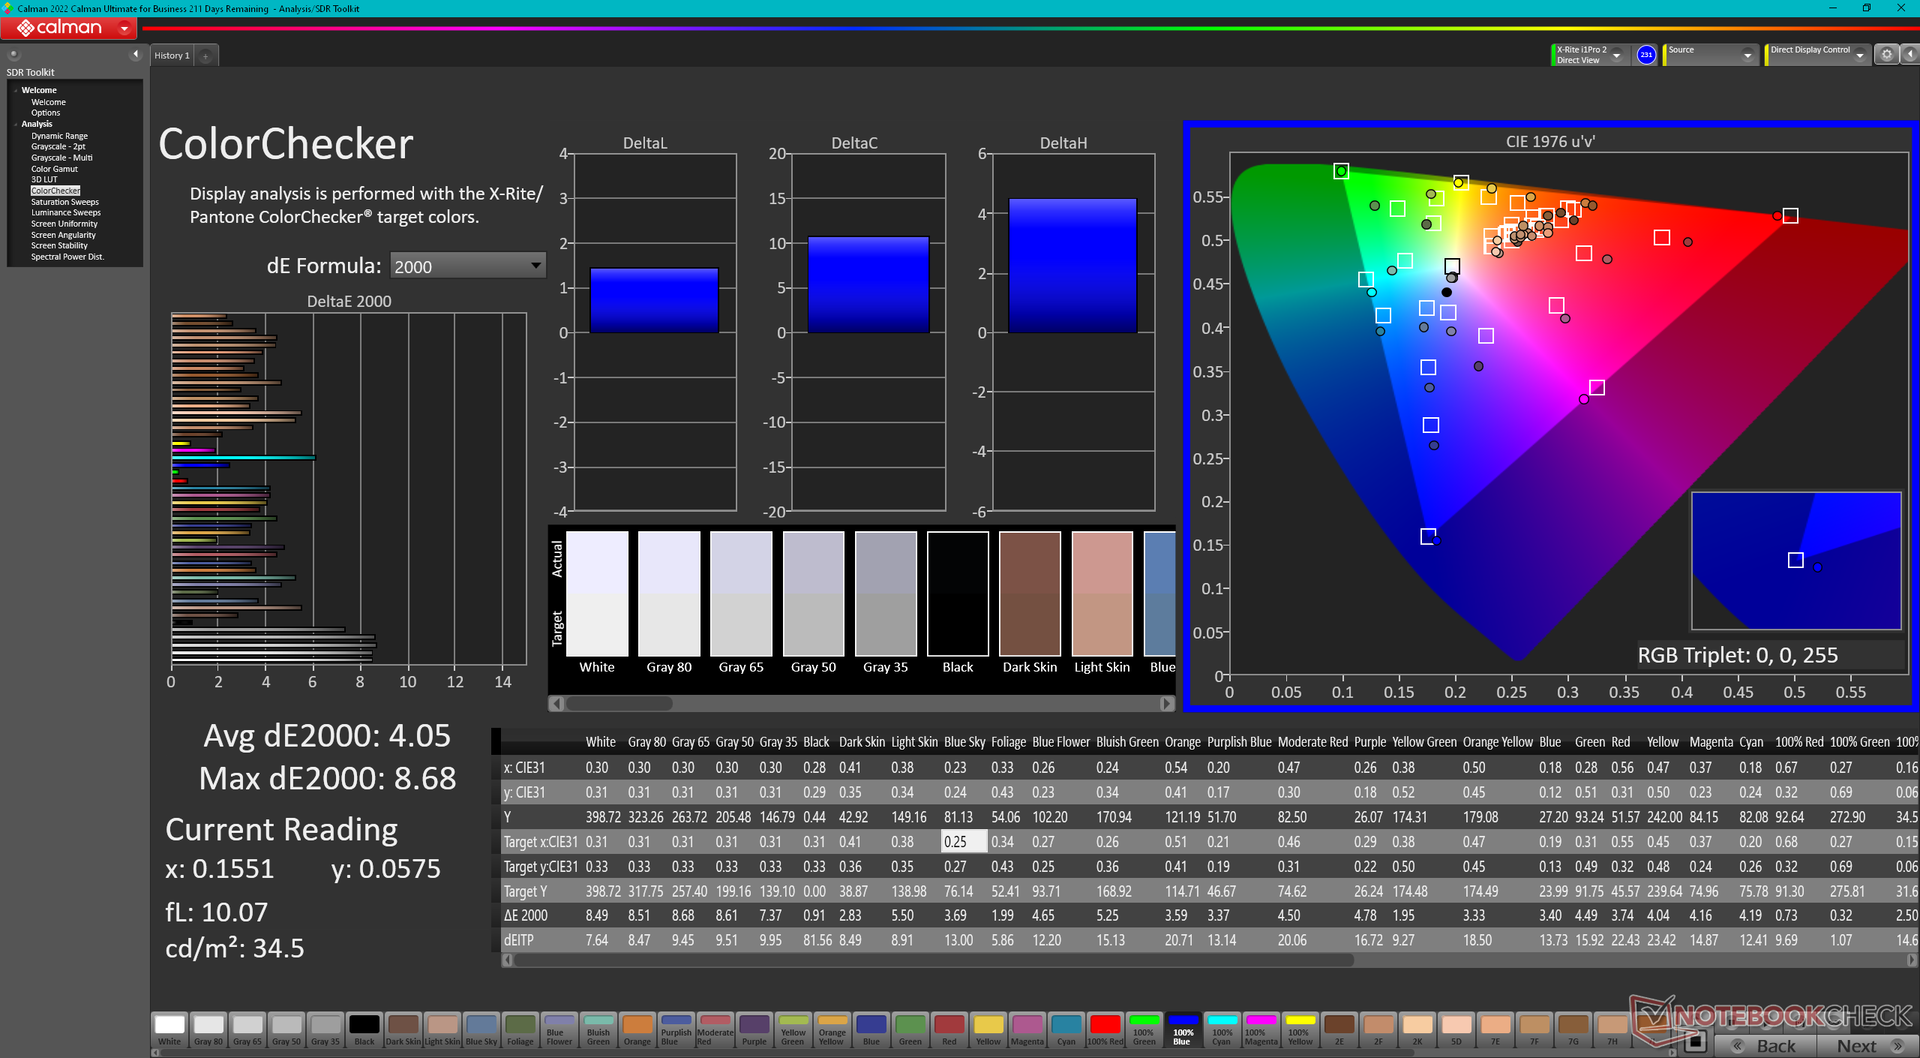
ΔE ColorChecker Calman: 4.05 | ∀{0.5-29.43 Ø4.71}
calibrated: 1.02
ΔE Greyscale Calman: 6.5 | ∀{0.09-98 Ø4.96}
86.5% AdobeRGB 1998 (Argyll 3D)
99.9% sRGB (Argyll 3D)
97.6% Display P3 (Argyll 3D)
Gamma: 2.11
CCT: 7518 K
| MSI GE78HX 13VH-070US AU Optronics B170QAN01.2, IPS, 2560x1600, 17" | Eluktronics Mech-17 GP2 BOE NE170QDM-NZ1, IPS, 2560x1600, 17" | Asus ROG Strix G17 G713PI BOE0B69, IPS, 2560x1440, 17.3" | MSI Titan GT77 HX 13VI B173ZAN06.C, Mini-LED, 3840x2160, 17.3" | MSI Raider GE77 HX 12UHS AU Optronics B173ZAN06.1, IPS, 3840x2160, 17.3" | Razer Blade 17 Early 2022 AU Optronics B173ZAN06.9, IPS, 3840x2160, 17.3" | |
|---|---|---|---|---|---|---|
| Display | -16% | 0% | 1% | -1% | 1% | |
| Display P3 Coverage (%) | 97.6 | 69.1 -29% | 98.3 1% | 94.9 -3% | 96.6 -1% | 99.4 2% |
| sRGB Coverage (%) | 99.9 | 99.7 0% | 100 0% | 99.9 0% | 99.8 0% | 100 0% |
| AdobeRGB 1998 Coverage (%) | 86.5 | 69.8 -19% | 85.9 -1% | 92.4 7% | 85.8 -1% | 87.3 1% |
| Response Times | -117% | -30% | -565% | -13% | -33% | |
| Response Time Grey 50% / Grey 80% * (ms) | 4.2 ? | 12 ? -186% | 5.3 ? -26% | 38.4 ? -814% | 5.8 ? -38% | 7.5 ? -79% |
| Response Time Black / White * (ms) | 6.4 ? | 9.4 ? -47% | 8.6 ? -34% | 26.6 ? -316% | 5.6 ? 13% | 5.6 ? 13% |
| PWM Frequency (Hz) | 2380 ? | |||||
| Screen | 27% | 27% | 77665% | -32% | 36% | |
| Brightness middle (cd/m²) | 398.6 | 417.3 5% | 327 -18% | 606 52% | 381 -4% | 503 26% |
| Brightness (cd/m²) | 384 | 387 1% | 320 -17% | 602 57% | 371 -3% | 486 27% |
| Brightness Distribution (%) | 89 | 87 -2% | 89 0% | 93 4% | 84 -6% | 84 -6% |
| Black Level * (cd/m²) | 0.46 | 0.42 9% | 0.38 17% | 0.0001 100% | 0.52 -13% | 0.44 4% |
| Contrast (:1) | 867 | 994 15% | 861 -1% | 6060000 698862% | 733 -15% | 1143 32% |
| Colorchecker dE 2000 * | 4.05 | 2.14 47% | 1.01 75% | 4.8 -19% | 1.08 73% | |
| Colorchecker dE 2000 max. * | 8.68 | 4.09 53% | 4.01 54% | 8.2 6% | 4.54 48% | |
| Colorchecker dE 2000 calibrated * | 1.02 | 0.42 59% | 0.41 60% | 1.8 -76% | 2.53 -148% | 0.6 41% |
| Greyscale dE 2000 * | 6.5 | 3.1 52% | 1.6 75% | 6.5 -0% | 1.3 80% | |
| Gamma | 2.11 104% | 2.19 100% | 2.168 101% | 2.63 84% | 2.151 102% | |
| CCT | 7518 86% | 6040 108% | 6659 98% | 6596 99% | 6541 99% | |
| Média Total (Programa/Configurações) | -35% /
-3% | -1% /
13% | 25700% /
49847% | -15% /
-20% | 1% /
19% |
* ... menor é melhor
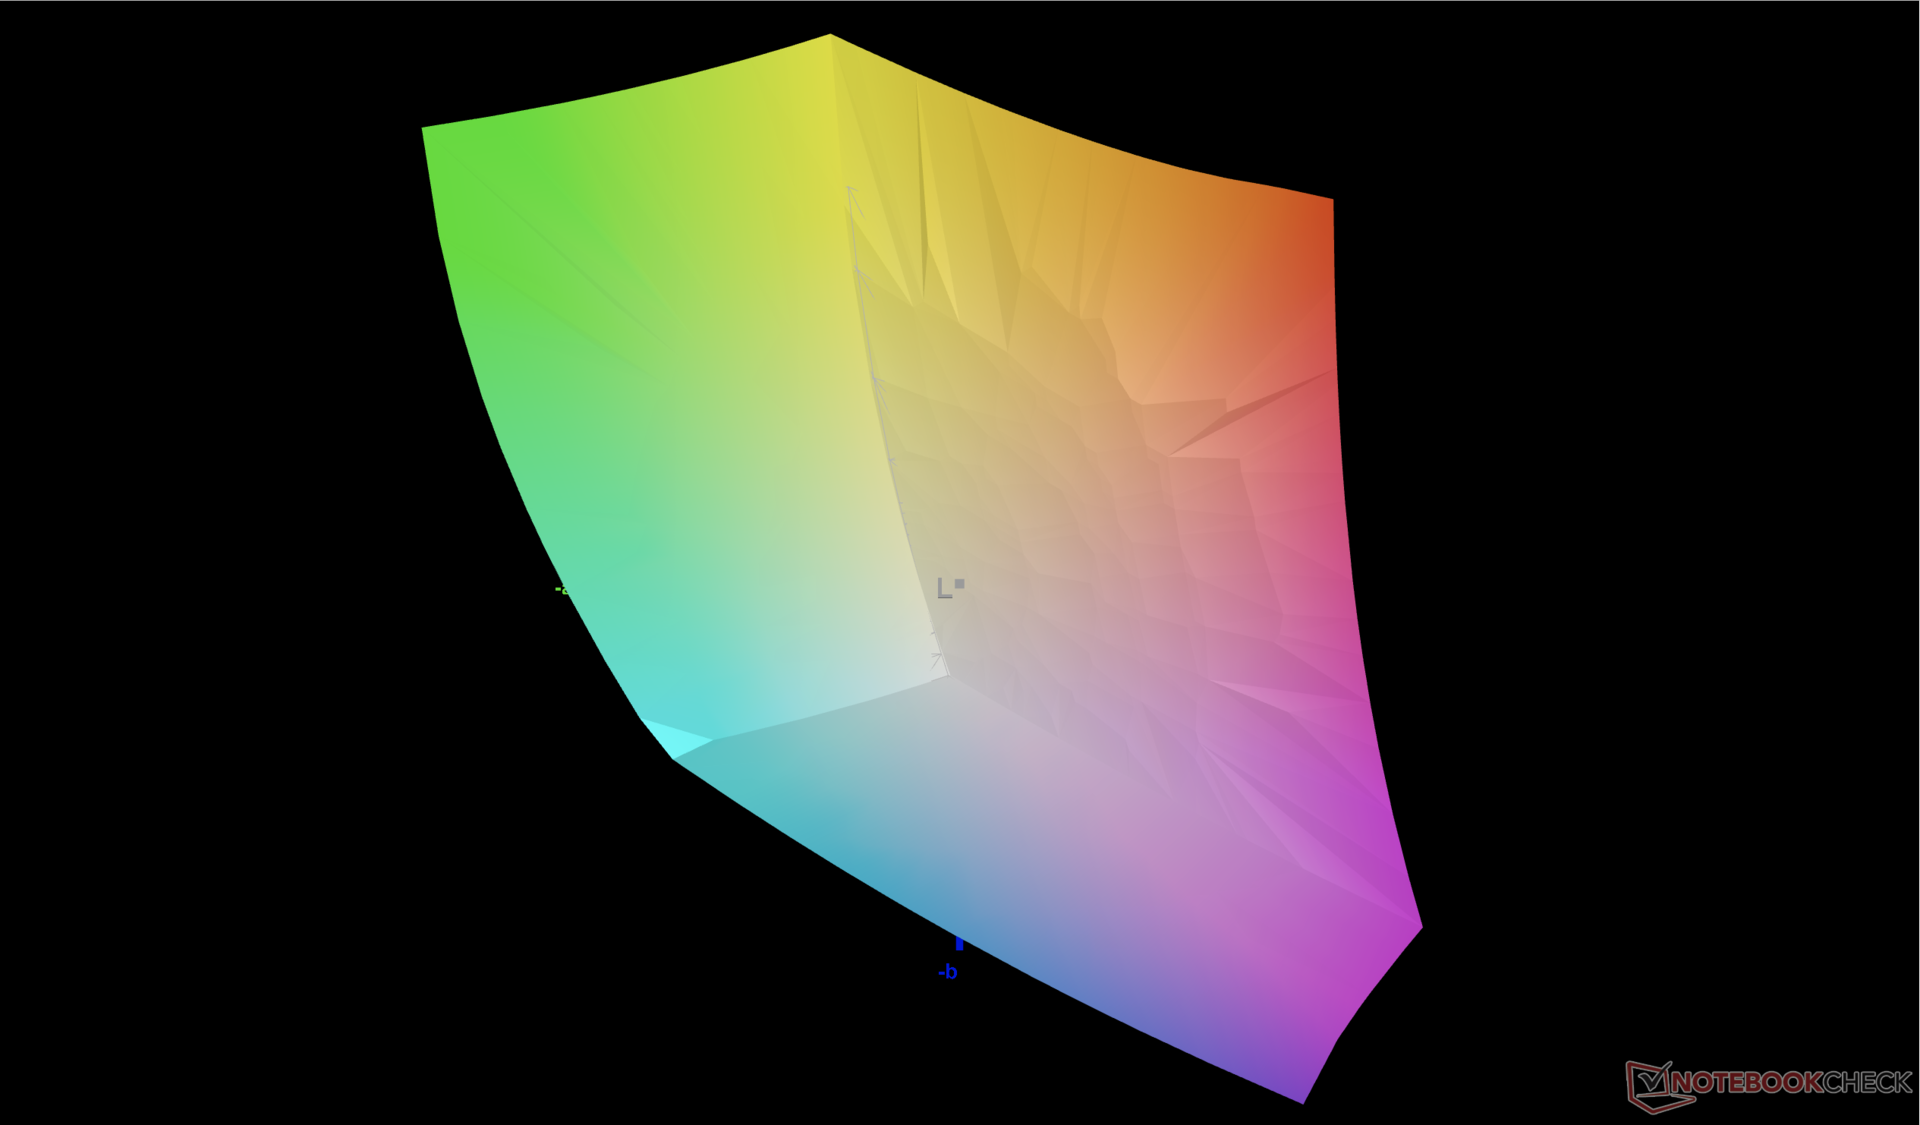
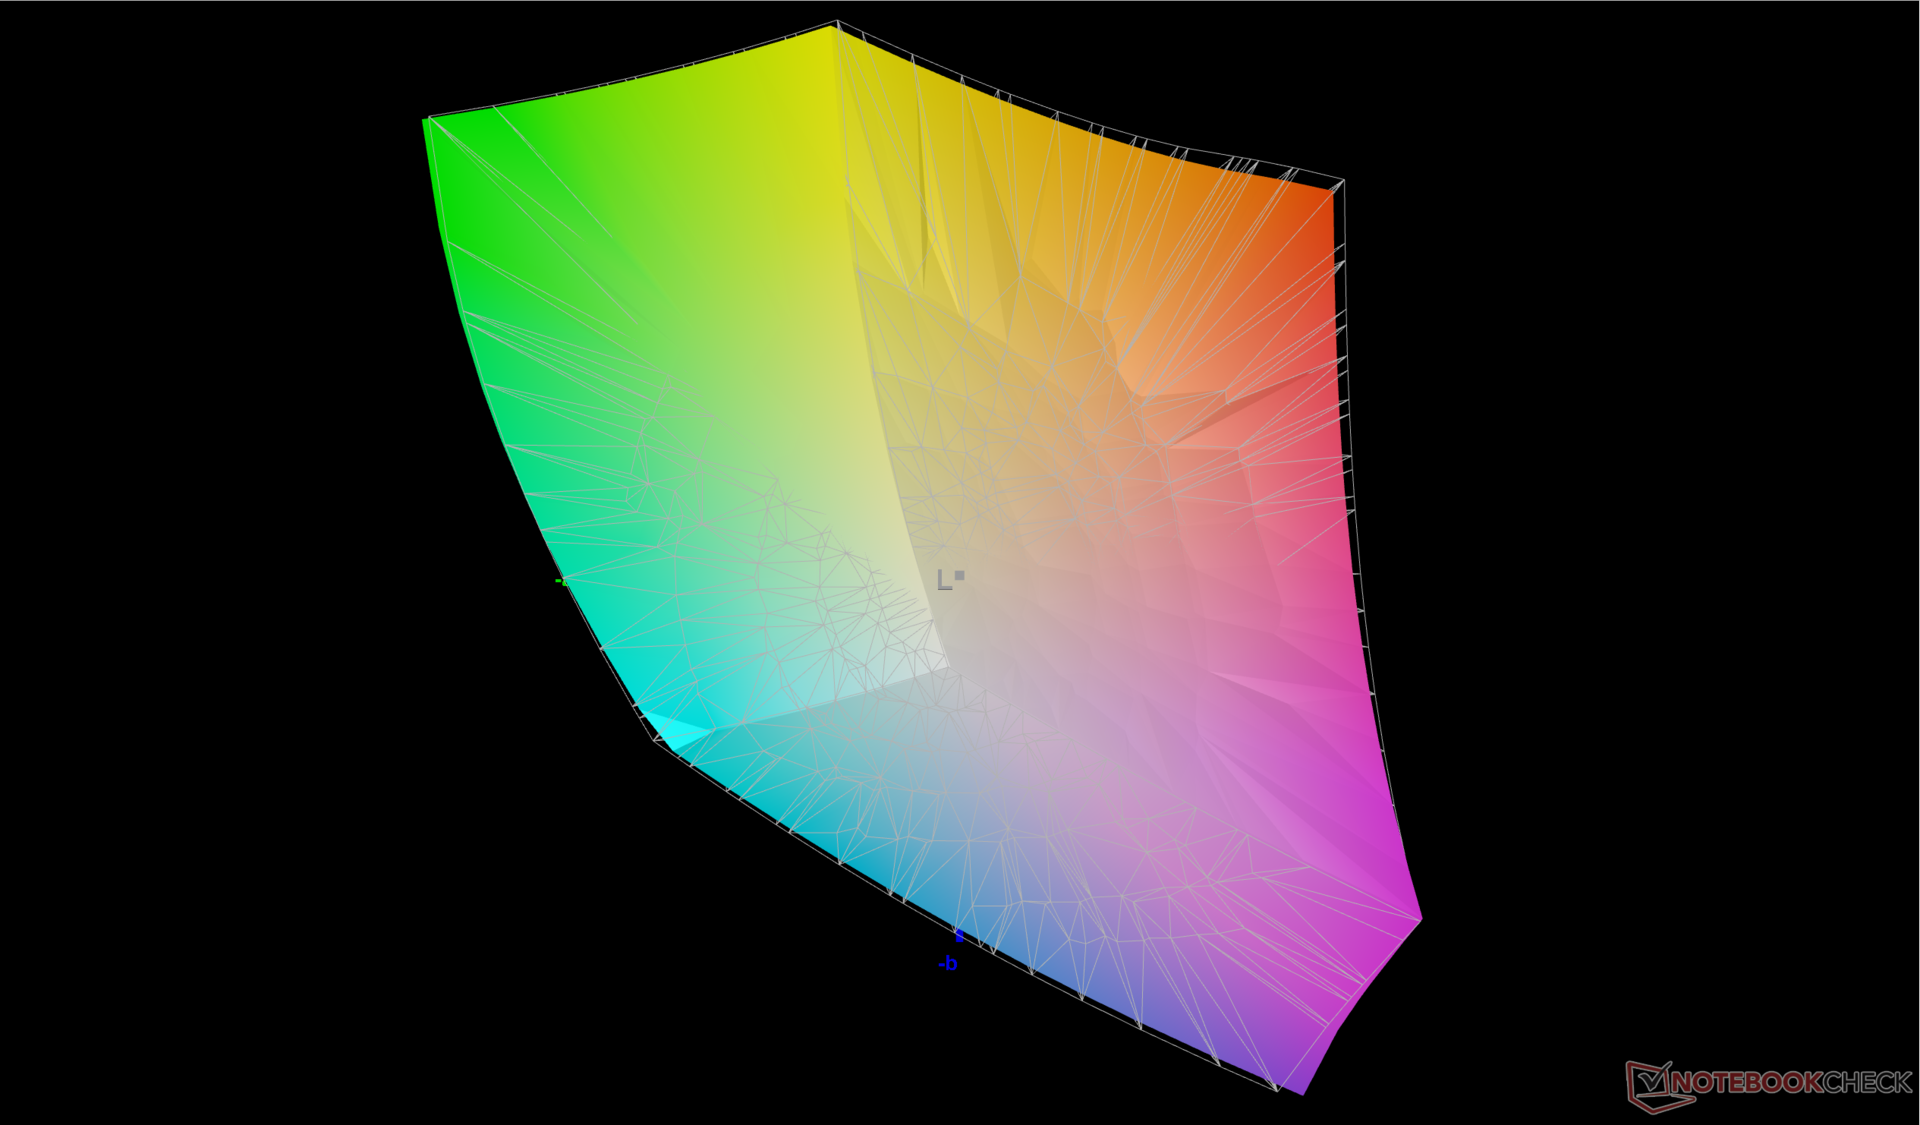
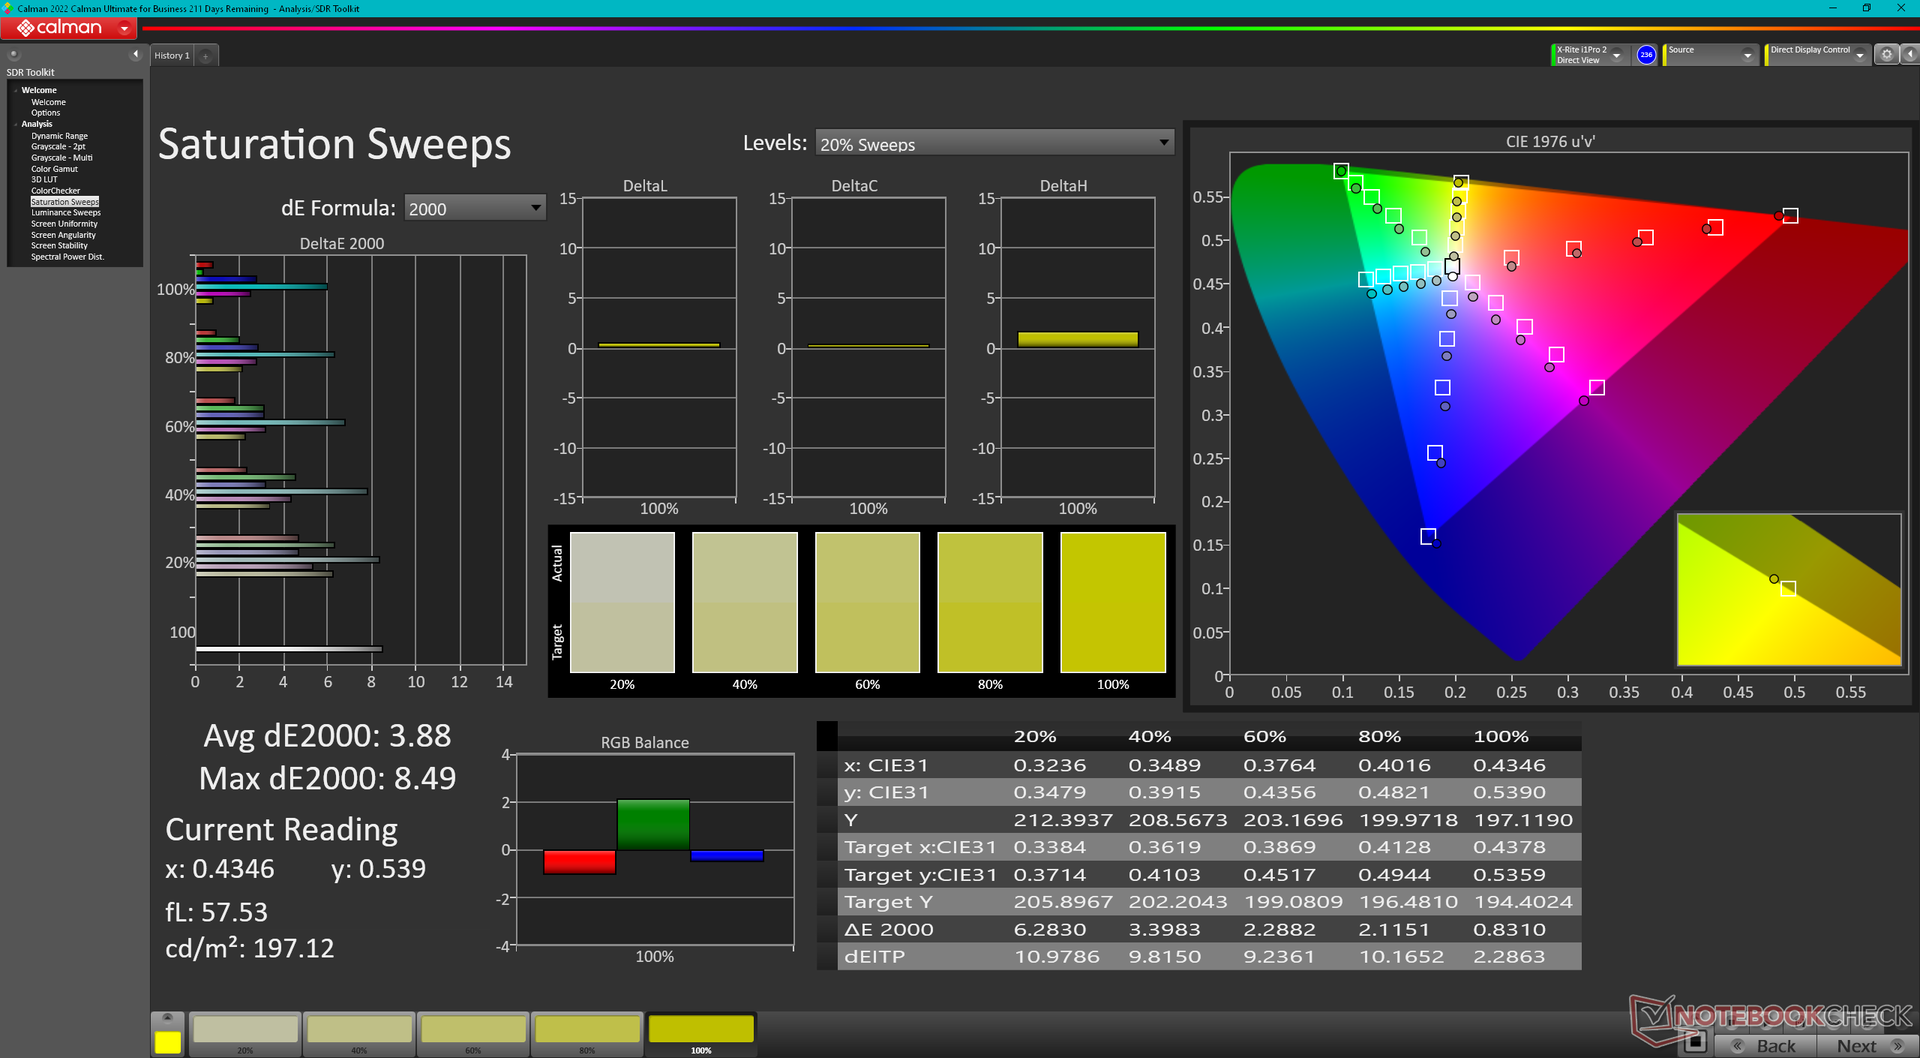
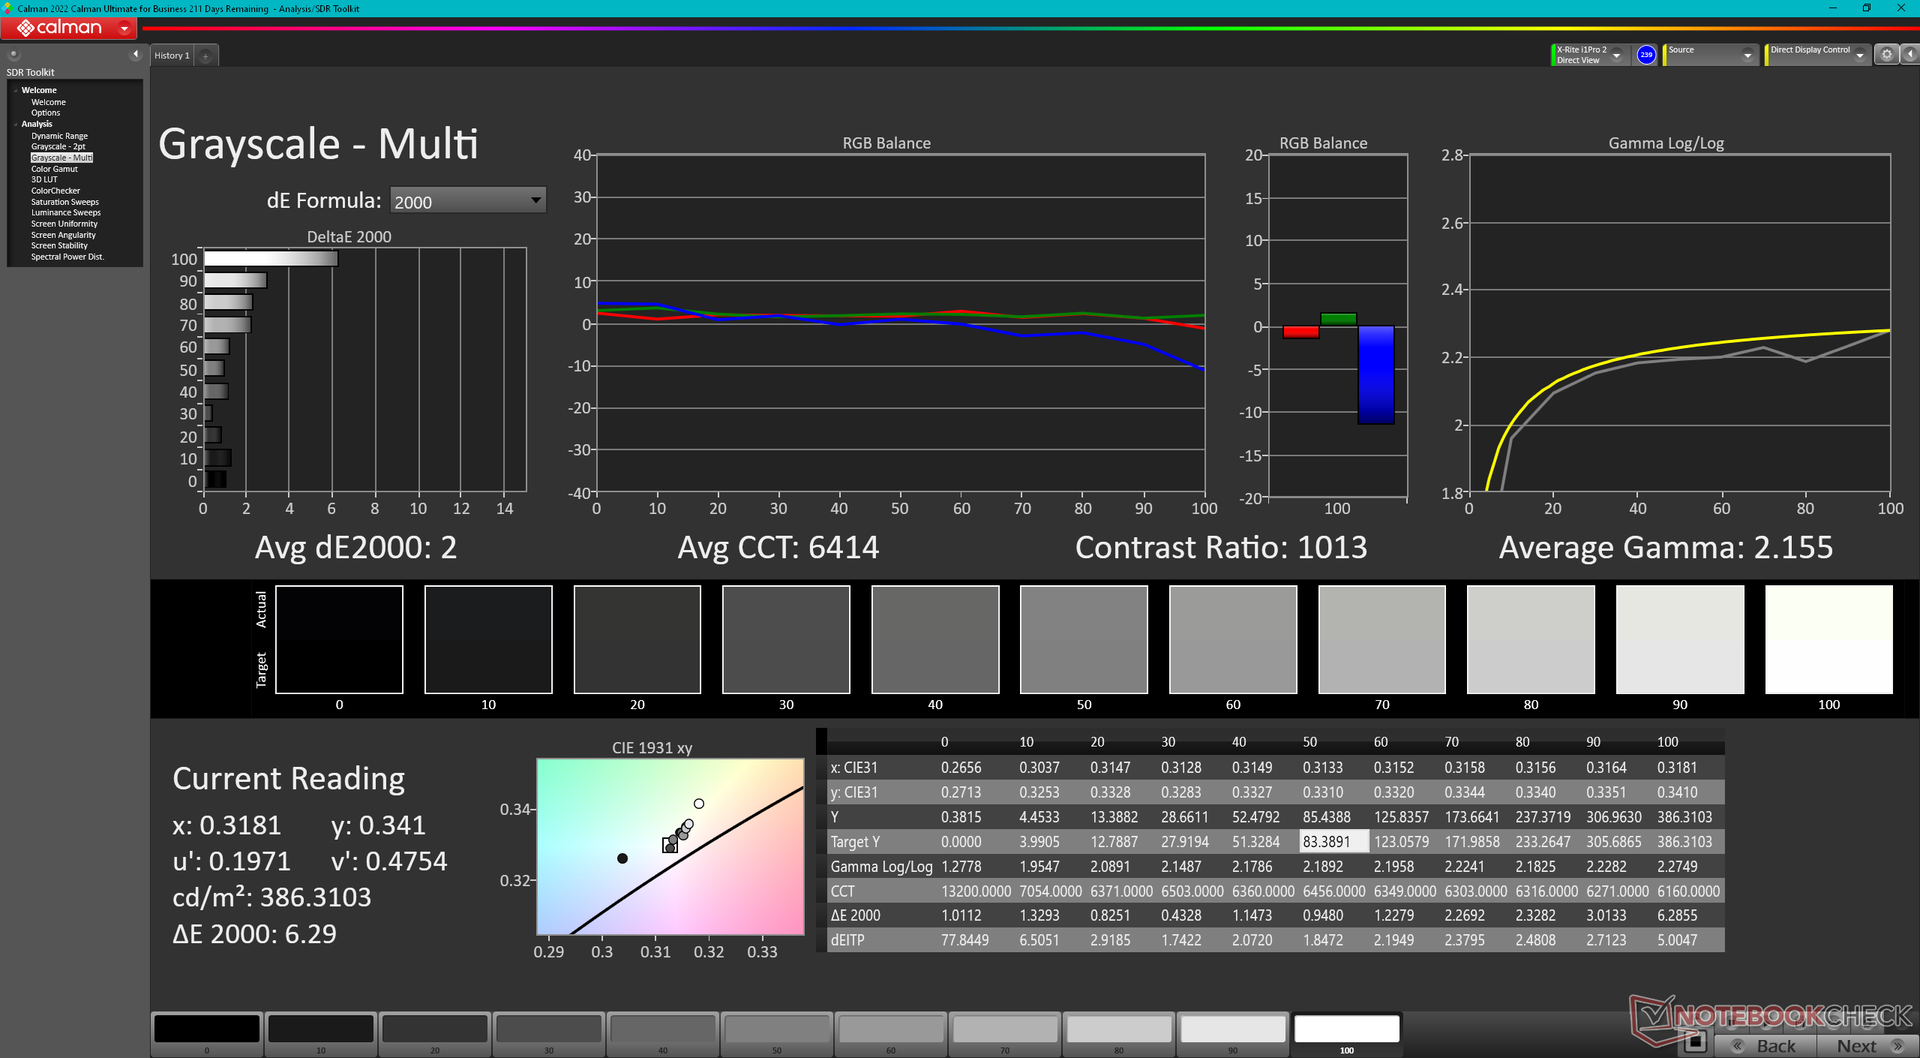
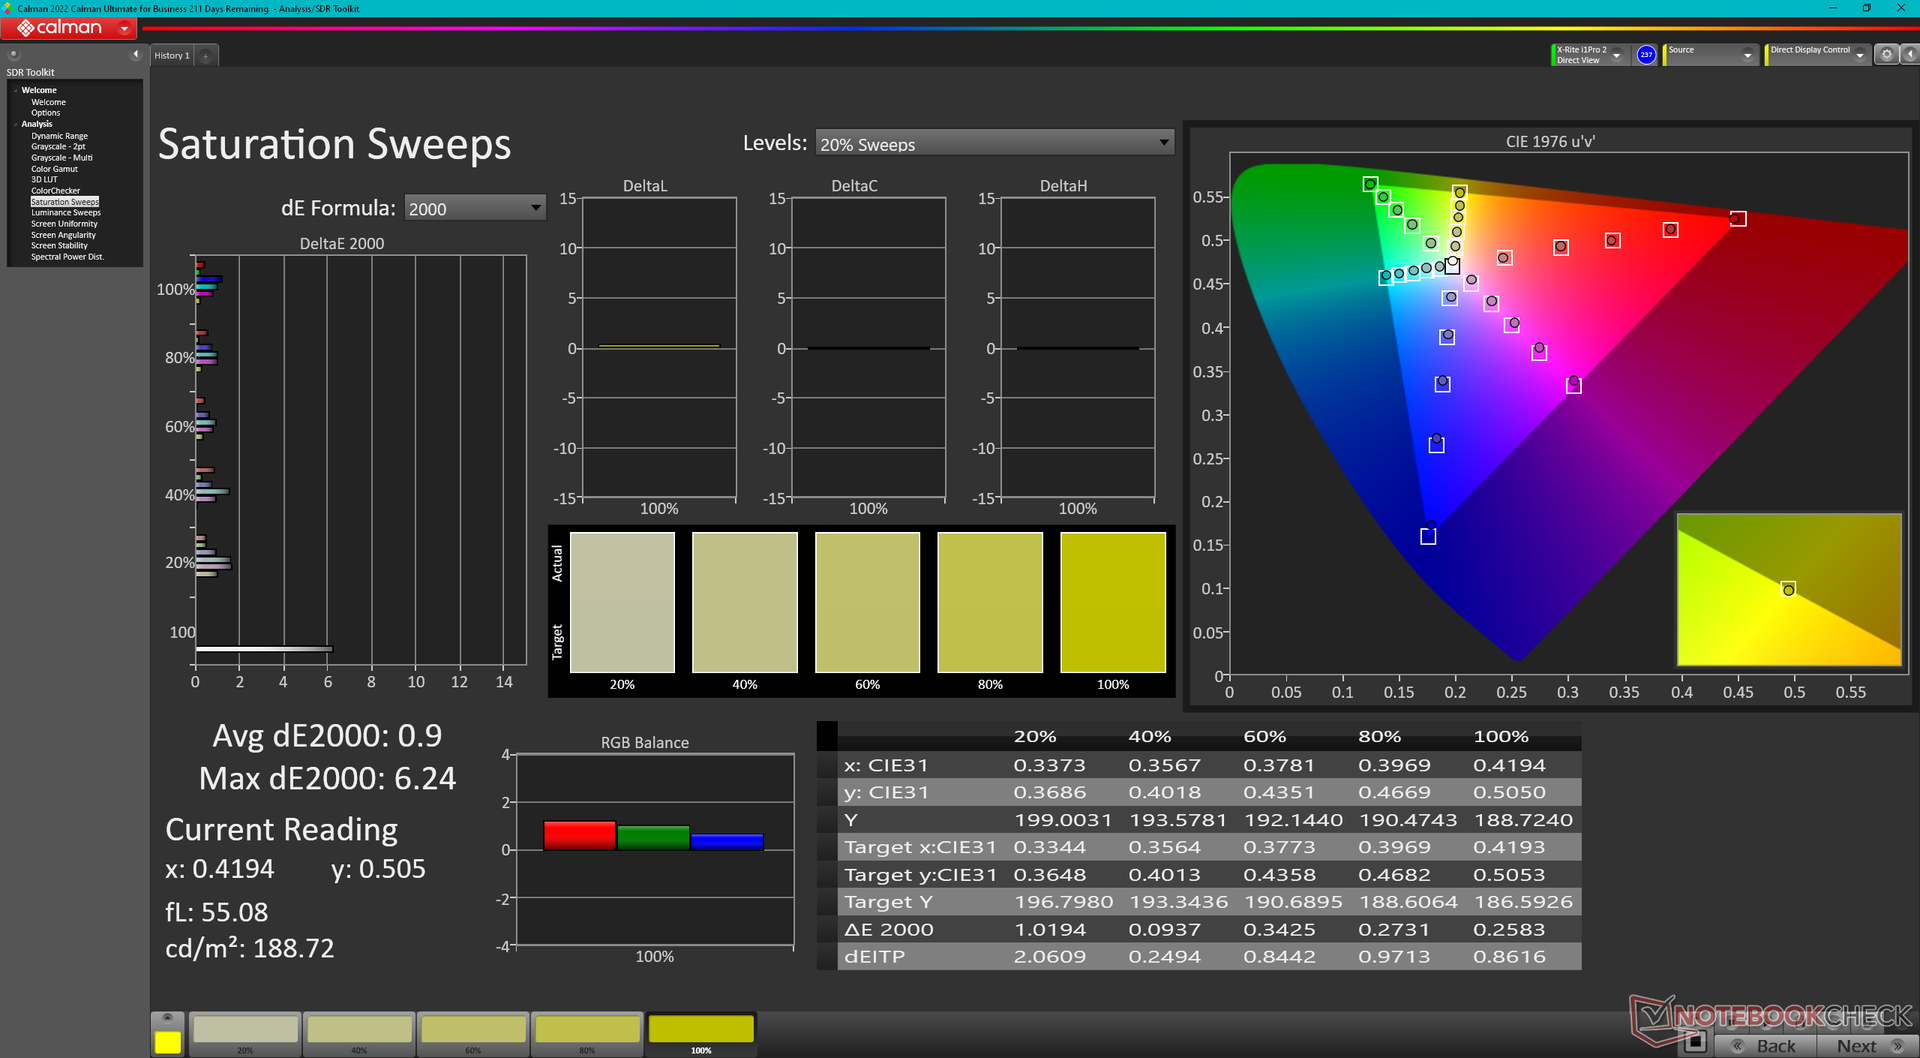
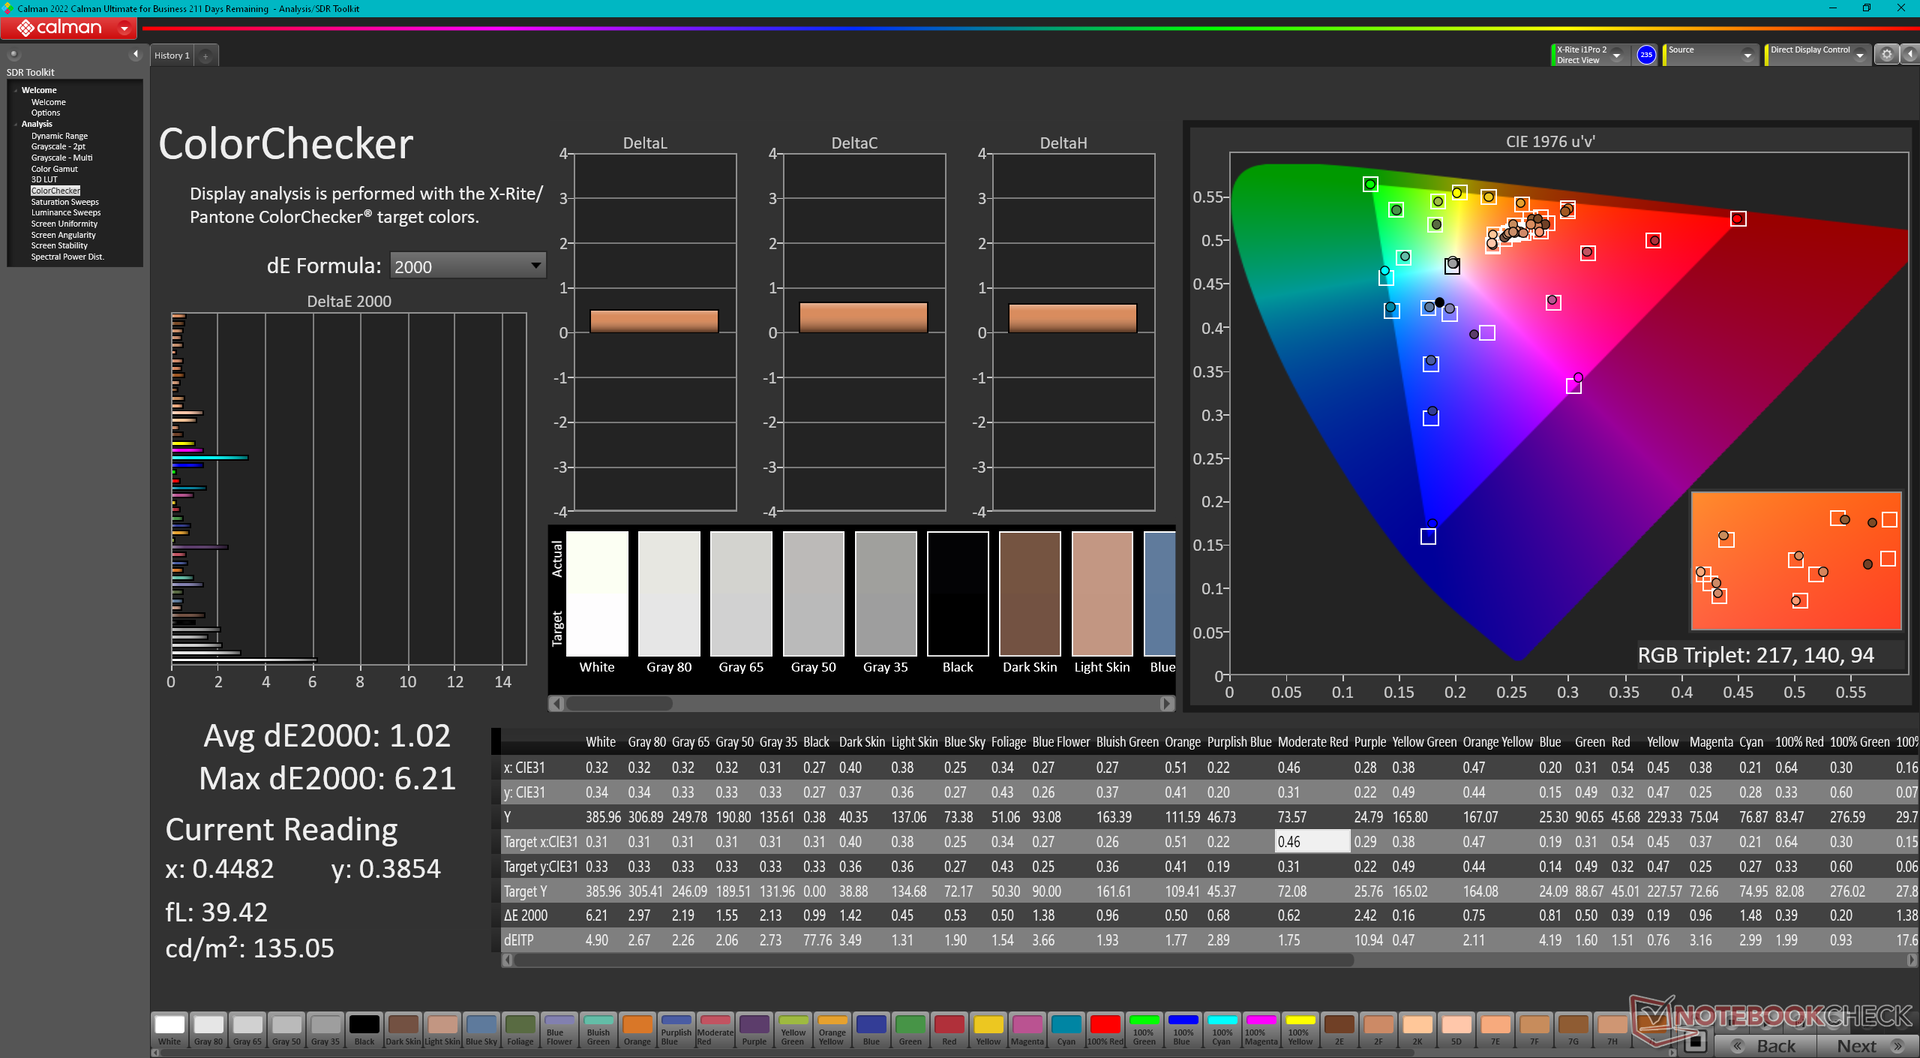
O display é definido para cores P3 fora da caixa, por padrão. Embora a precisão das cores não seja ruim, o modelo não é calibrado na fábrica, ao contrário do Série MSI Creator. Recomendamos aplicar nosso perfil de ICM calibrado acima para obter cores mais precisas do painel, especialmente porque ele cobre sRGB e P3 inteiramente. Somos capazes de reduzir os valores médios de escala de cinza e cor DeltaE para apenas 2 e 1,02, respectivamente, com nosso colorímetro X-Rite.
Exibir tempos de resposta
| ↔ Tempo de resposta preto para branco | ||
|---|---|---|
| 6.4 ms ... ascensão ↗ e queda ↘ combinadas | ↗ 2.8 ms ascensão | 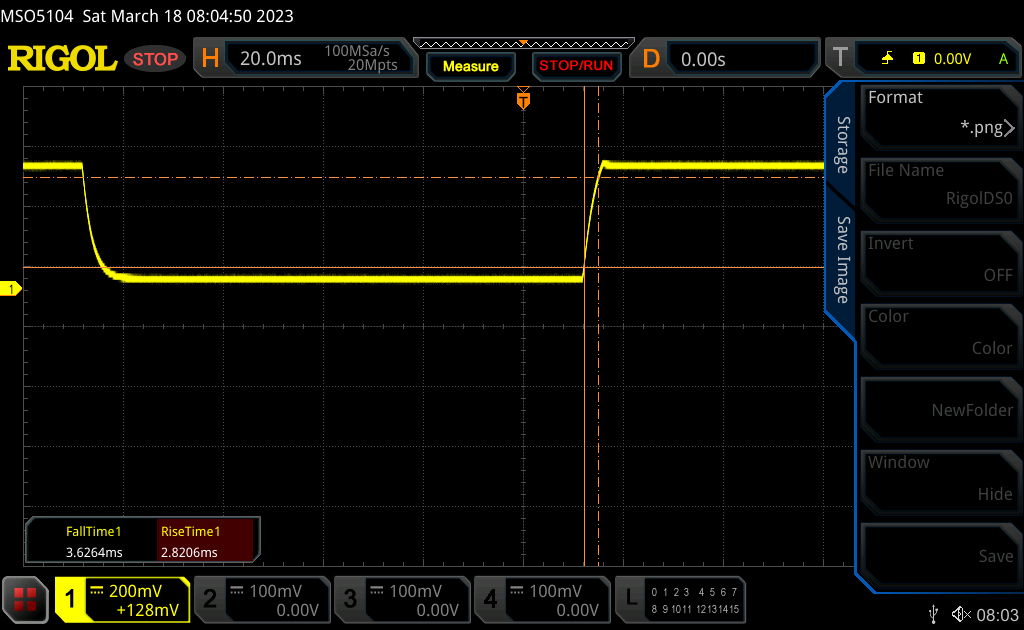 |
| ↘ 3.6 ms queda | ||
| A tela mostra taxas de resposta muito rápidas em nossos testes e deve ser muito adequada para jogos em ritmo acelerado. Em comparação, todos os dispositivos testados variam de 0.1 (mínimo) a 240 (máximo) ms. » 20 % de todos os dispositivos são melhores. Isso significa que o tempo de resposta medido é melhor que a média de todos os dispositivos testados (19.8 ms). | ||
| ↔ Tempo de resposta 50% cinza a 80% cinza | ||
| 4.2 ms ... ascensão ↗ e queda ↘ combinadas | ↗ 1.9 ms ascensão | 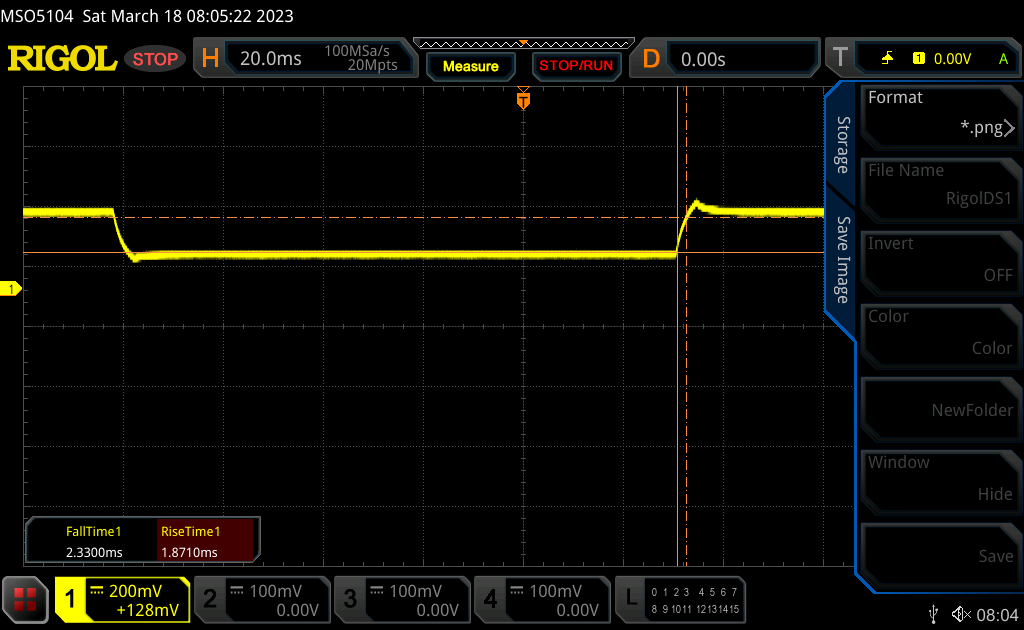 |
| ↘ 2.3 ms queda | ||
| A tela mostra taxas de resposta muito rápidas em nossos testes e deve ser muito adequada para jogos em ritmo acelerado. Em comparação, todos os dispositivos testados variam de 0.165 (mínimo) a 636 (máximo) ms. » 16 % de todos os dispositivos são melhores. Isso significa que o tempo de resposta medido é melhor que a média de todos os dispositivos testados (31 ms). | ||
Cintilação da tela / PWM (modulação por largura de pulso)
| Tela tremeluzindo / PWM não detectado | 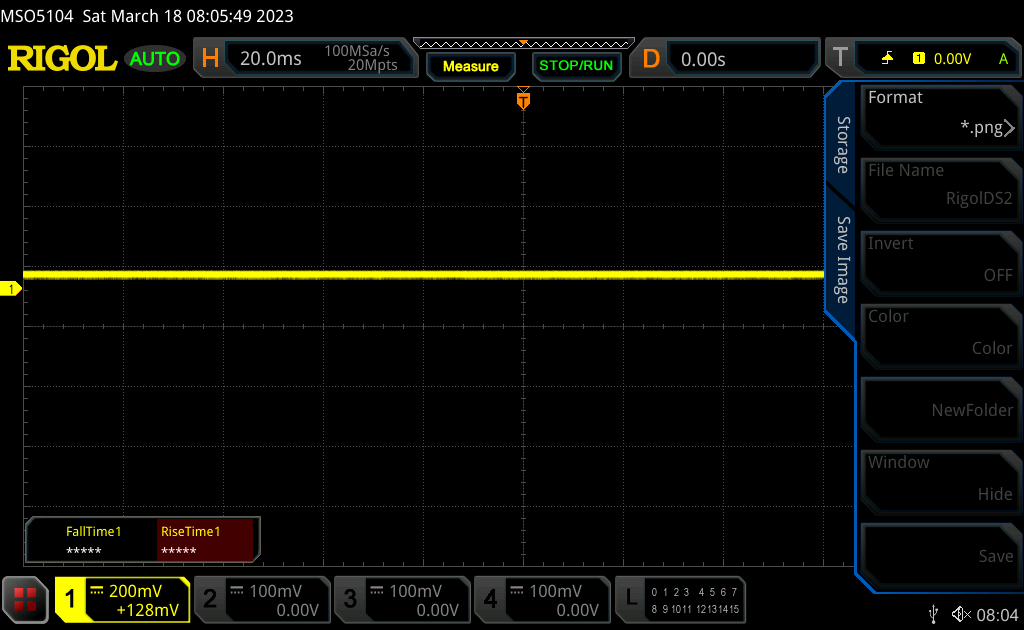 | ||
[pwm_comparison] Em comparação: 52 % de todos os dispositivos testados não usam PWM para escurecer a tela. Se PWM foi detectado, uma média de 7757 (mínimo: 5 - máximo: 343500) Hz foi medida. | |||
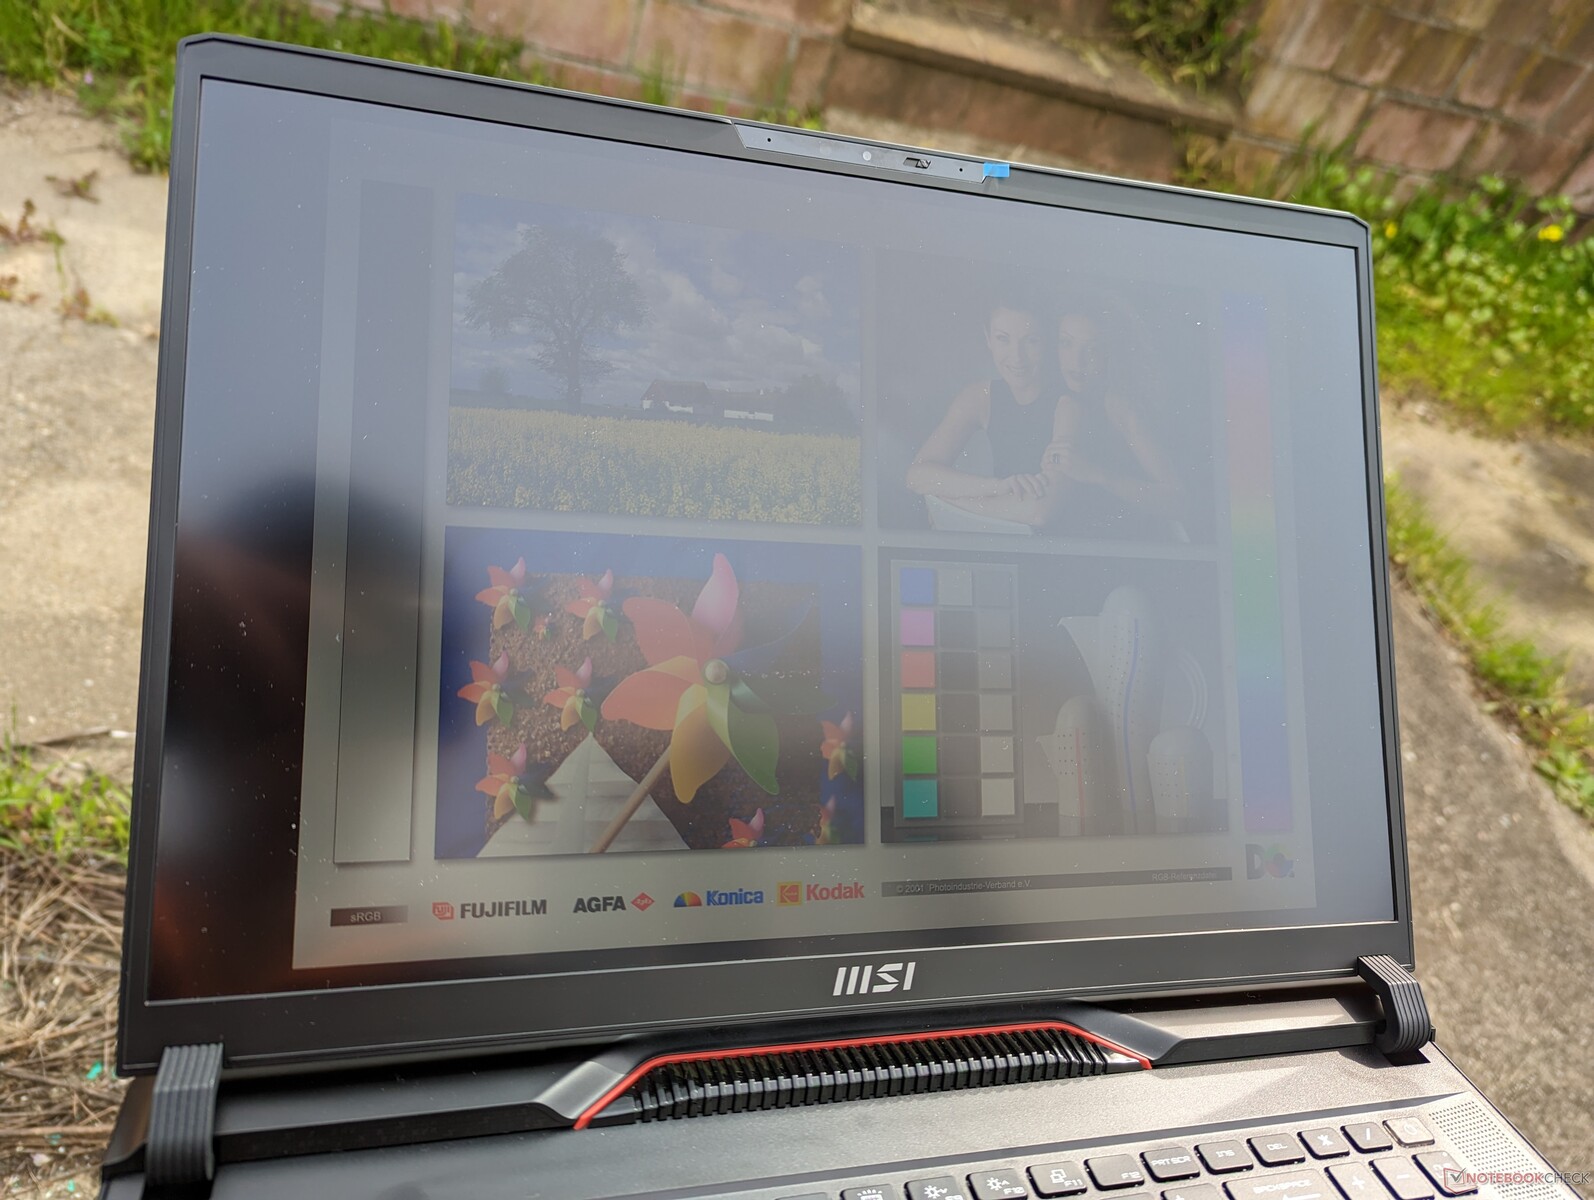
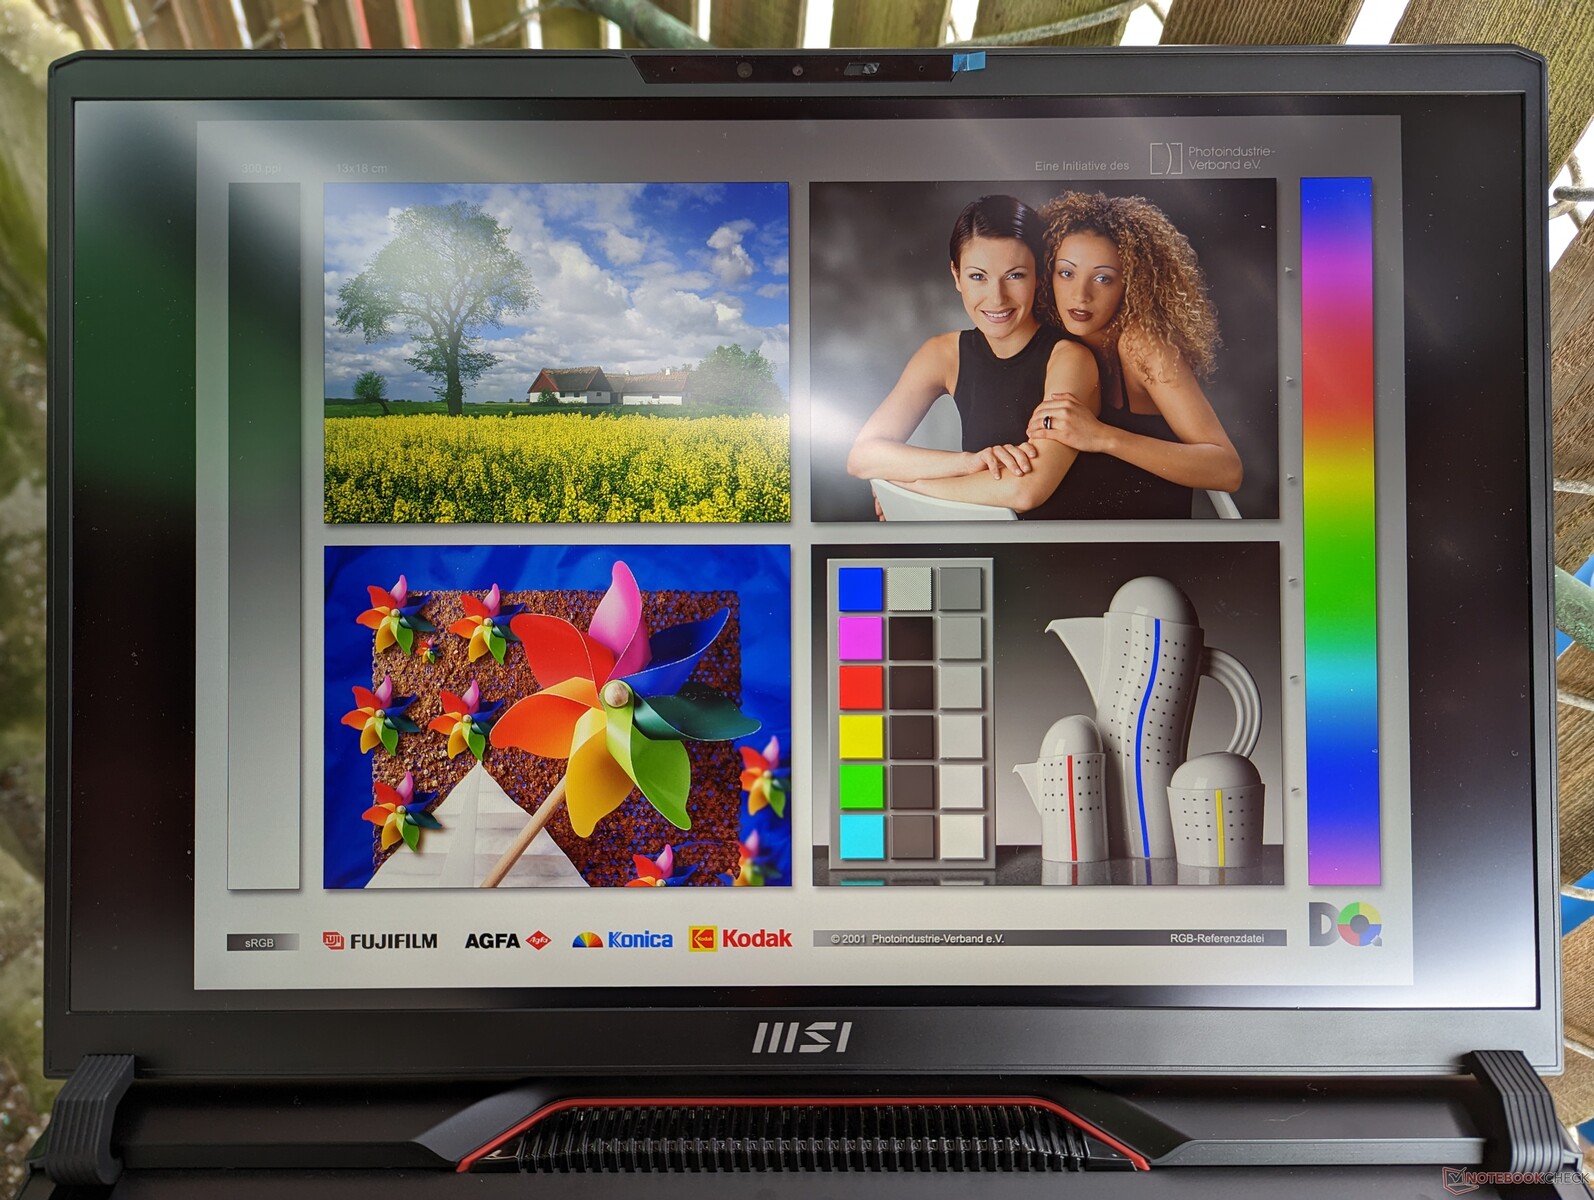
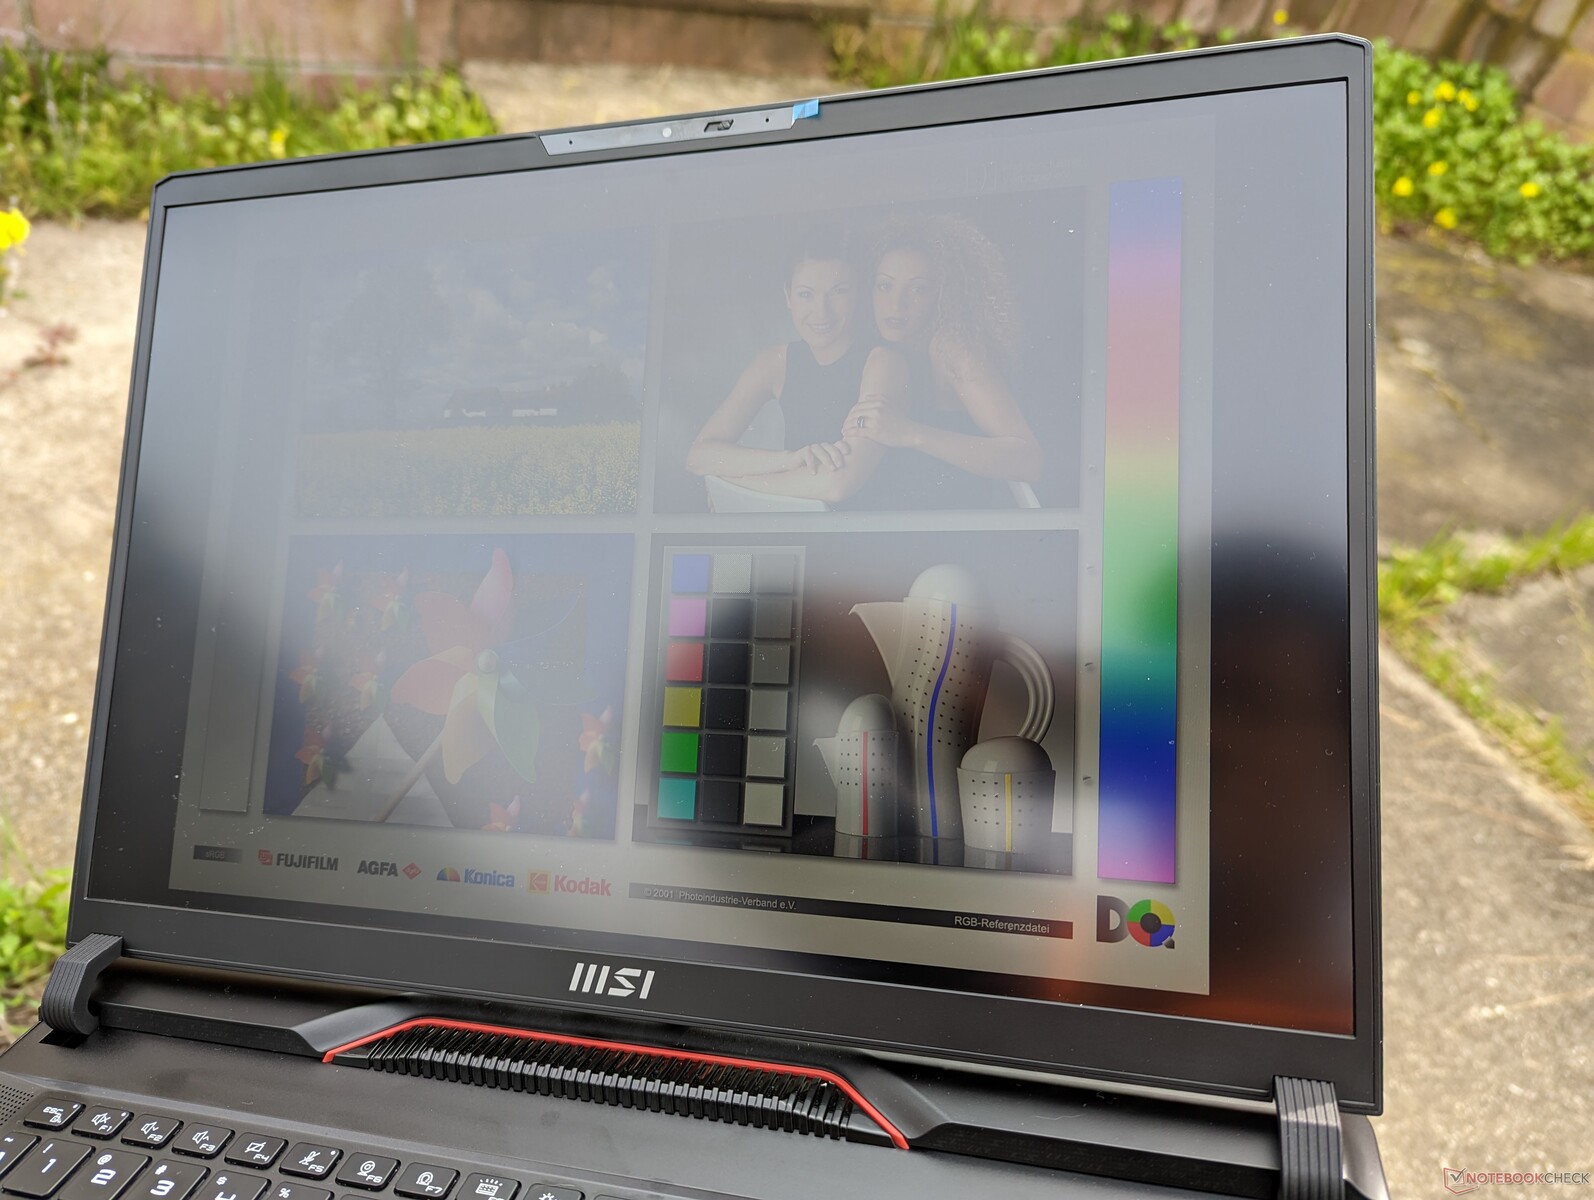
A visibilidade ao ar livre permanece praticamente a mesma que na GE77. O painel mini-LED noTitan GT77 é ainda mais brilhante por 1,5x para melhor visibilidade externa, mas o modelo em si é muito maior do que nosso GE78.
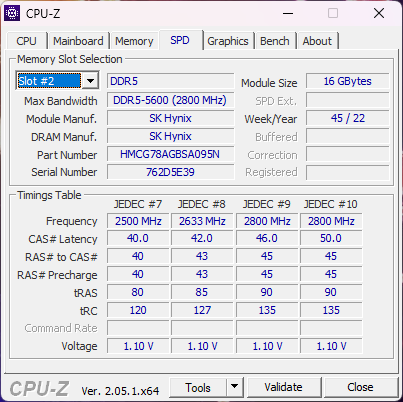
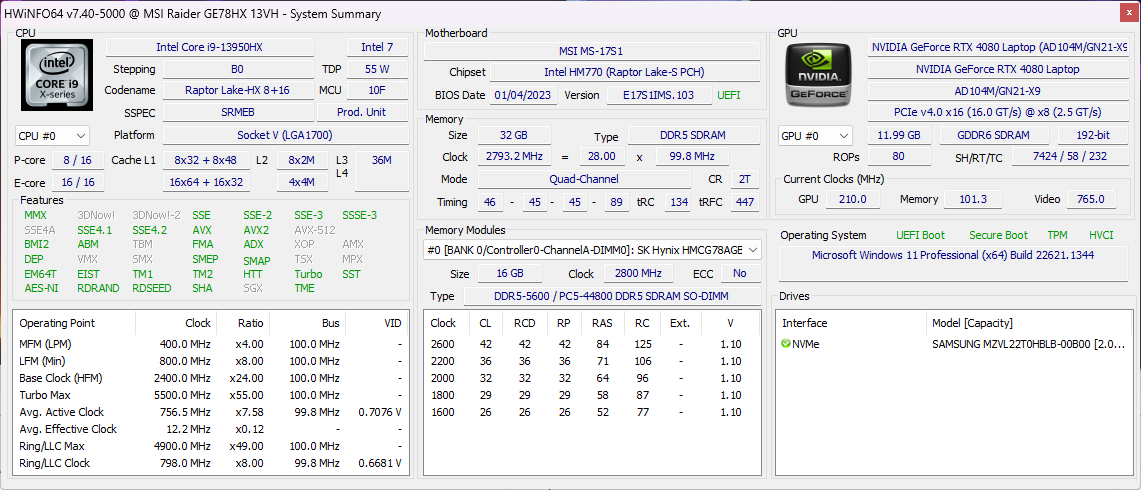
Desempenho - Intel 13th Gen + Mobile GeForce RTX 40
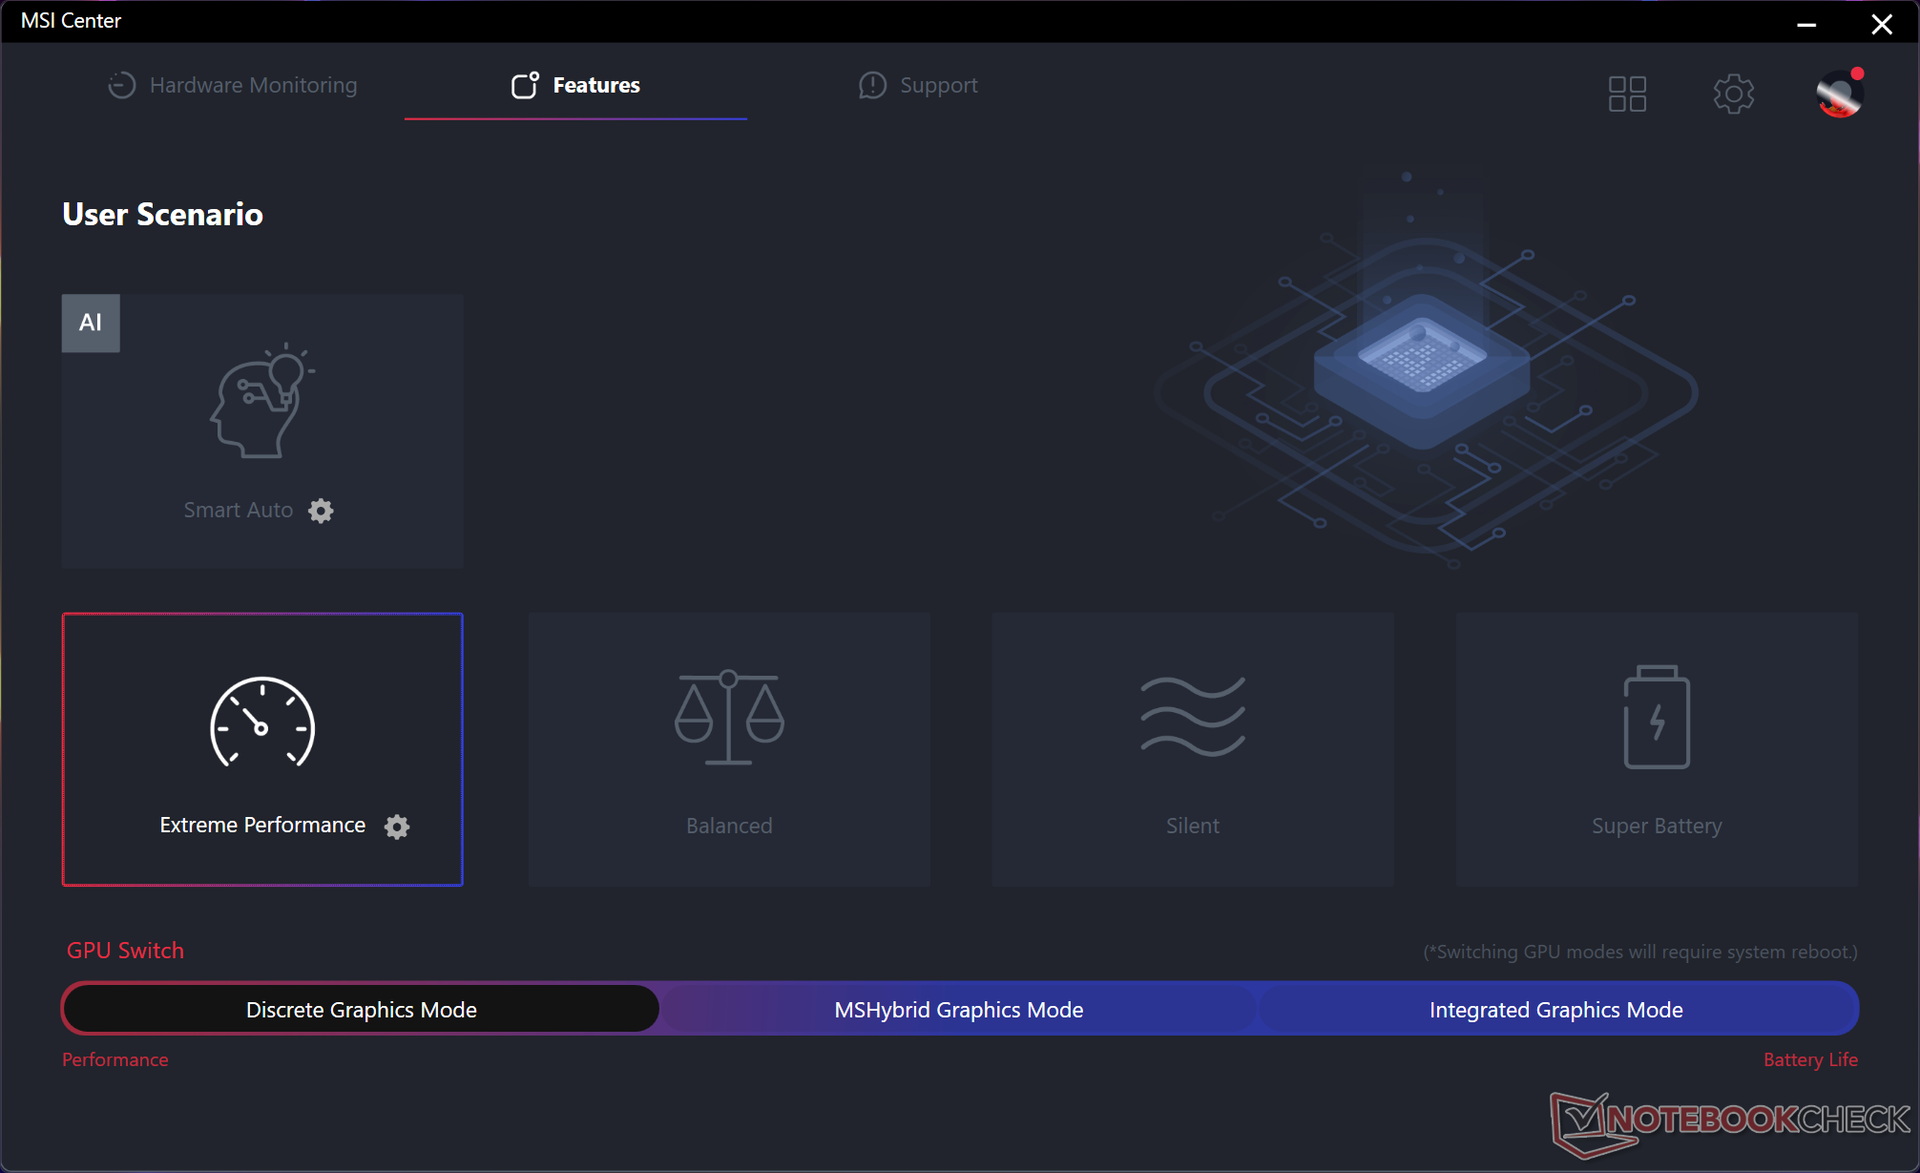
Condições de teste
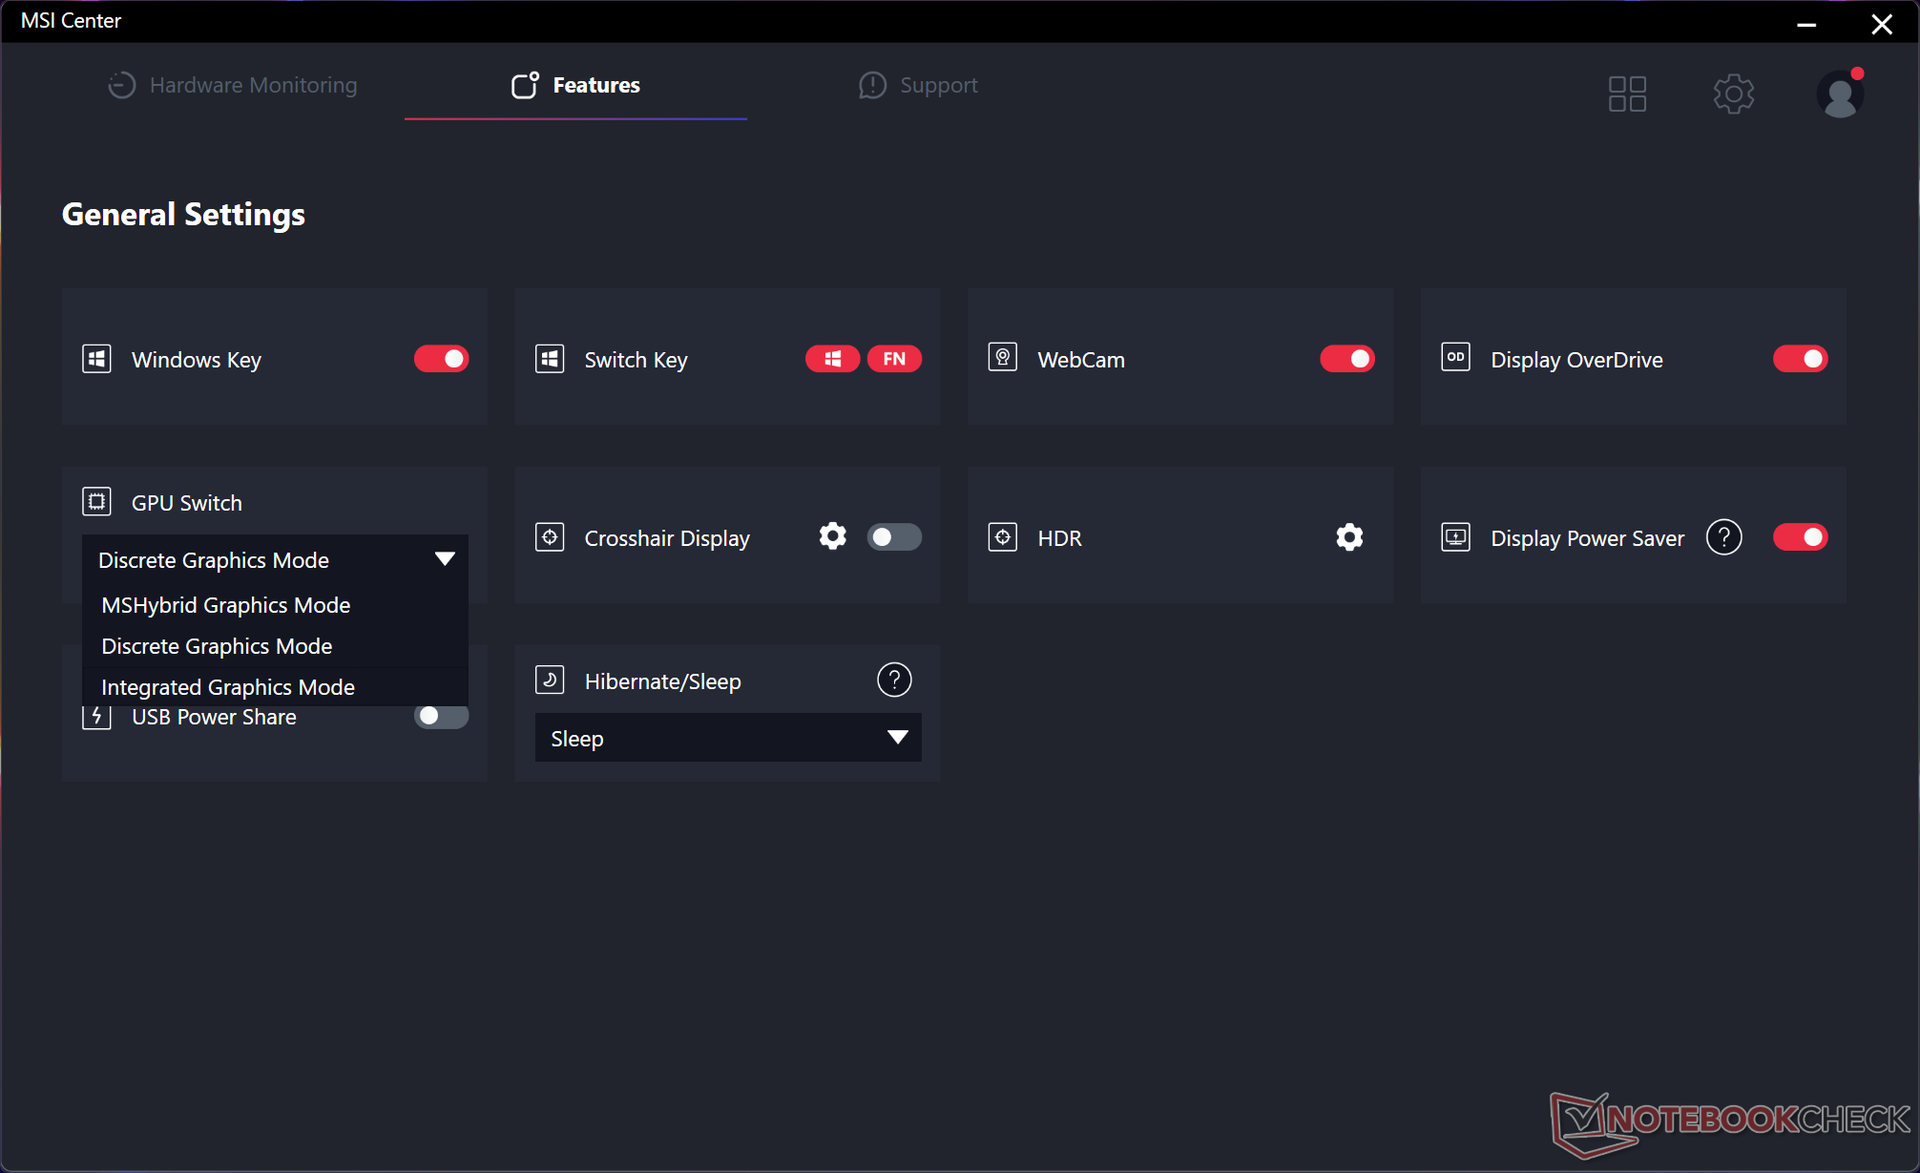
Configuramos nossa unidade para modo Extreme Performance, modo Ventilador Automático, modo Gráfico Discreto e modo Melhor Performance do Windows antes de executar qualquer benchmarks abaixo. Curiosamente, os modos de potência MSI não se sincronizam com o Windows e, portanto, é possível ter o MSI Center configurado para o modo Extreme Performance e o Windows configurado para o modo Power Saver simultaneamente.
Outro modo de ventilador está disponível chamado modo Cooler Boost que eleva os ventiladores para suas RPMs mais altas, independentemente da atividade na tela. Isto não melhora necessariamente o desempenho, no entanto, como nossa seção de Teste de Estresse abaixo irá mostrar.
Note que o MSI Center se ajustará automaticamente ao modo de desempenho extremo ao rodar em modo gráfico discreto, mesmo quando você disser ao software para rodar em modo balanceado. Seria melhor simplesmente desativar quaisquer opções de modo de desempenho se elas forem incompatíveis com a seleção atual da GPU para evitar confusão.
O Advanced Optimus não é suportado e, portanto, uma reinicialização é necessária ao alternar entre a GPU discreta (MUX) e o modo MS Hybrid. A G-Sync não é suportada na tela interna.
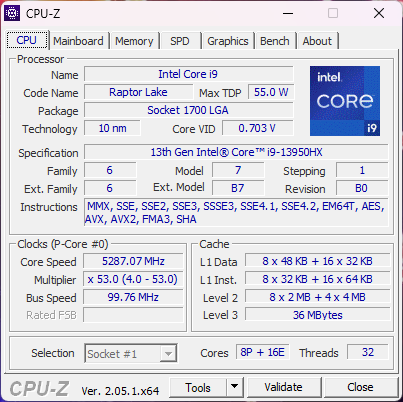
Processador
O desempenho bruto da CPU é um dos mais rápidos em qualquer laptop, independentemente do tamanho ou do fabricante. O 13º gênero Núcleo i9-13950HX em nosso MSI teria um desempenho melhor do que o último Zen 4 Ryzen 9 7945HX na concorrente Asus ROG Strix G17 G713PI em até 5% e 15% nos testes com rosca múltipla e rosca única, respectivamente. Os ganhos anuais em relação ao 12º gênero anterior Núcleo i9-12900HX no GE77 do ano passado também é significativo em 45 por cento.
Por mais impressionante que o Core i9-13950HX possa ser, os compradores potenciais ainda podem querer considerar o menor Núcleo i9-13900HX em vez disso, porque as diferenças de desempenho entre os dois processadores estão dentro de apenas 5% um do outro.
Cinebench R15 Multi Loop
Cinebench R23: Multi Core | Single Core
Cinebench R20: CPU (Multi Core) | CPU (Single Core)
Cinebench R15: CPU Multi 64Bit | CPU Single 64Bit
Blender: v2.79 BMW27 CPU
7-Zip 18.03: 7z b 4 | 7z b 4 -mmt1
Geekbench 5.5: Multi-Core | Single-Core
HWBOT x265 Benchmark v2.2: 4k Preset
LibreOffice : 20 Documents To PDF
R Benchmark 2.5: Overall mean
* ... menor é melhor
AIDA64: FP32 Ray-Trace | FPU Julia | CPU SHA3 | CPU Queen | FPU SinJulia | FPU Mandel | CPU AES | CPU ZLib | FP64 Ray-Trace | CPU PhotoWorxx
| Performance rating | |
| Asus ROG Strix G17 G713PI | |
| Eluktronics Mech-17 GP2 | |
| MSI GE78HX 13VH-070US | |
| MSI Titan GT77 HX 13VI | |
| Média Intel Core i9-13950HX | |
| MSI Raider GE77 HX 12UHS | |
| Razer Blade 17 Early 2022 | |
| AIDA64 / FP32 Ray-Trace | |
| Asus ROG Strix G17 G713PI | |
| MSI Titan GT77 HX 13VI | |
| MSI GE78HX 13VH-070US | |
| Eluktronics Mech-17 GP2 | |
| Média Intel Core i9-13950HX (17993 - 28957, n=9) | |
| MSI Raider GE77 HX 12UHS | |
| Razer Blade 17 Early 2022 | |
| AIDA64 / FPU Julia | |
| Asus ROG Strix G17 G713PI | |
| MSI Titan GT77 HX 13VI | |
| MSI GE78HX 13VH-070US | |
| Eluktronics Mech-17 GP2 | |
| Média Intel Core i9-13950HX (89362 - 144303, n=9) | |
| MSI Raider GE77 HX 12UHS | |
| Razer Blade 17 Early 2022 | |
| AIDA64 / CPU SHA3 | |
| Asus ROG Strix G17 G713PI | |
| MSI Titan GT77 HX 13VI | |
| Eluktronics Mech-17 GP2 | |
| MSI GE78HX 13VH-070US | |
| Média Intel Core i9-13950HX (4518 - 7093, n=9) | |
| MSI Raider GE77 HX 12UHS | |
| Razer Blade 17 Early 2022 | |
| AIDA64 / CPU Queen | |
| Asus ROG Strix G17 G713PI | |
| Eluktronics Mech-17 GP2 | |
| MSI GE78HX 13VH-070US | |
| MSI Titan GT77 HX 13VI | |
| Média Intel Core i9-13950HX (131931 - 140103, n=8) | |
| MSI Raider GE77 HX 12UHS | |
| Razer Blade 17 Early 2022 | |
| AIDA64 / FPU SinJulia | |
| Asus ROG Strix G17 G713PI | |
| Eluktronics Mech-17 GP2 | |
| MSI Titan GT77 HX 13VI | |
| MSI GE78HX 13VH-070US | |
| Média Intel Core i9-13950HX (12318 - 17057, n=9) | |
| MSI Raider GE77 HX 12UHS | |
| Razer Blade 17 Early 2022 | |
| AIDA64 / FPU Mandel | |
| Asus ROG Strix G17 G713PI | |
| MSI Titan GT77 HX 13VI | |
| MSI GE78HX 13VH-070US | |
| Eluktronics Mech-17 GP2 | |
| Média Intel Core i9-13950HX (44372 - 71038, n=9) | |
| MSI Raider GE77 HX 12UHS | |
| Razer Blade 17 Early 2022 | |
| AIDA64 / CPU AES | |
| Eluktronics Mech-17 GP2 | |
| MSI Raider GE77 HX 12UHS | |
| Asus ROG Strix G17 G713PI | |
| Média Intel Core i9-13950HX (99981 - 204491, n=9) | |
| MSI Titan GT77 HX 13VI | |
| MSI GE78HX 13VH-070US | |
| Razer Blade 17 Early 2022 | |
| AIDA64 / CPU ZLib | |
| Asus ROG Strix G17 G713PI | |
| MSI GE78HX 13VH-070US | |
| MSI Titan GT77 HX 13VI | |
| Eluktronics Mech-17 GP2 | |
| Média Intel Core i9-13950HX (1263 - 2069, n=9) | |
| MSI Raider GE77 HX 12UHS | |
| Razer Blade 17 Early 2022 | |
| AIDA64 / FP64 Ray-Trace | |
| Asus ROG Strix G17 G713PI | |
| MSI Titan GT77 HX 13VI | |
| MSI GE78HX 13VH-070US | |
| Eluktronics Mech-17 GP2 | |
| Média Intel Core i9-13950HX (9649 - 15573, n=9) | |
| MSI Raider GE77 HX 12UHS | |
| Razer Blade 17 Early 2022 | |
| AIDA64 / CPU PhotoWorxx | |
| MSI GE78HX 13VH-070US | |
| Média Intel Core i9-13950HX (40233 - 50864, n=9) | |
| MSI Raider GE77 HX 12UHS | |
| Eluktronics Mech-17 GP2 | |
| MSI Titan GT77 HX 13VI | |
| Razer Blade 17 Early 2022 | |
| Asus ROG Strix G17 G713PI | |
Desempenho do sistema
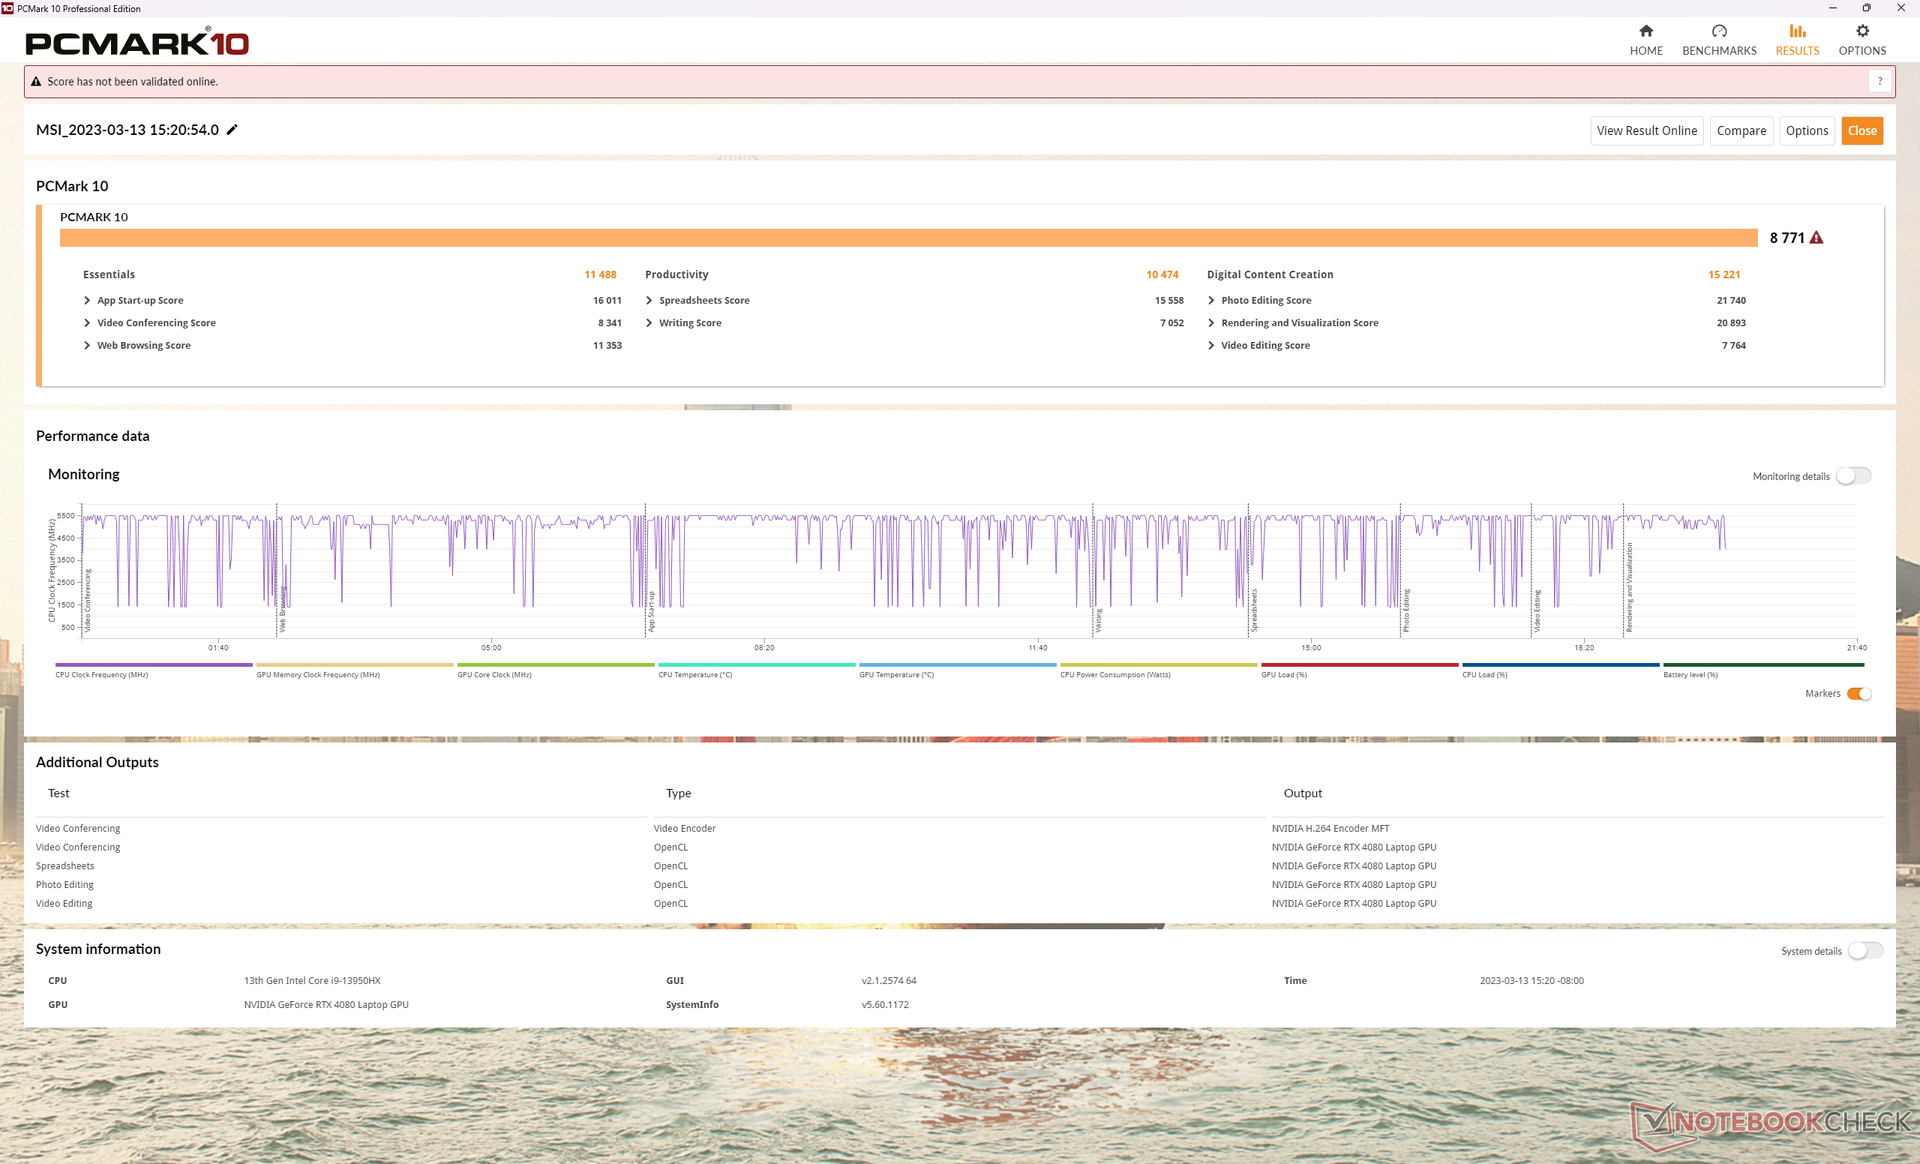
Os resultados da PCMark 10 estão consistentemente à frente do GE77 rodando em hardware de última geração, especialmente no sub-teste de Conteúdo Digital, onde o desempenho da GPU é favorecido.
Sentimos um problema em nossa unidade se alguns não acordassem do sono, o que exigiria uma reinicialização dura a cada vez. O problema aparentemente ocorreria mais freqüentemente no modo dGPU do que no modo MS Hybrid.
CrossMark: Overall | Productivity | Creativity | Responsiveness
| PCMark 10 / Score | |
| Eluktronics Mech-17 GP2 | |
| MSI Titan GT77 HX 13VI | |
| MSI GE78HX 13VH-070US | |
| Média Intel Core i9-13950HX, NVIDIA GeForce RTX 4080 Laptop GPU (7888 - 8771, n=2) | |
| Asus ROG Strix G17 G713PI | |
| Razer Blade 17 Early 2022 | |
| MSI Raider GE77 HX 12UHS | |
| PCMark 10 / Essentials | |
| Eluktronics Mech-17 GP2 | |
| MSI Titan GT77 HX 13VI | |
| MSI GE78HX 13VH-070US | |
| Média Intel Core i9-13950HX, NVIDIA GeForce RTX 4080 Laptop GPU (11078 - 11488, n=2) | |
| Asus ROG Strix G17 G713PI | |
| Razer Blade 17 Early 2022 | |
| MSI Raider GE77 HX 12UHS | |
| PCMark 10 / Productivity | |
| Asus ROG Strix G17 G713PI | |
| Eluktronics Mech-17 GP2 | |
| MSI GE78HX 13VH-070US | |
| MSI Titan GT77 HX 13VI | |
| MSI Raider GE77 HX 12UHS | |
| Média Intel Core i9-13950HX, NVIDIA GeForce RTX 4080 Laptop GPU (8271 - 10474, n=2) | |
| Razer Blade 17 Early 2022 | |
| PCMark 10 / Digital Content Creation | |
| MSI Titan GT77 HX 13VI | |
| Eluktronics Mech-17 GP2 | |
| MSI GE78HX 13VH-070US | |
| Média Intel Core i9-13950HX, NVIDIA GeForce RTX 4080 Laptop GPU (14535 - 15221, n=2) | |
| Razer Blade 17 Early 2022 | |
| MSI Raider GE77 HX 12UHS | |
| Asus ROG Strix G17 G713PI | |
| CrossMark / Overall | |
| Eluktronics Mech-17 GP2 | |
| MSI Raider GE77 HX 12UHS | |
| MSI Titan GT77 HX 13VI | |
| Asus ROG Strix G17 G713PI | |
| MSI GE78HX 13VH-070US | |
| Razer Blade 17 Early 2022 | |
| Média Intel Core i9-13950HX, NVIDIA GeForce RTX 4080 Laptop GPU (1592 - 1899, n=2) | |
| CrossMark / Productivity | |
| MSI Raider GE77 HX 12UHS | |
| Eluktronics Mech-17 GP2 | |
| MSI Titan GT77 HX 13VI | |
| Asus ROG Strix G17 G713PI | |
| MSI GE78HX 13VH-070US | |
| Razer Blade 17 Early 2022 | |
| Média Intel Core i9-13950HX, NVIDIA GeForce RTX 4080 Laptop GPU (1509 - 1846, n=2) | |
| CrossMark / Creativity | |
| Eluktronics Mech-17 GP2 | |
| MSI Titan GT77 HX 13VI | |
| MSI Raider GE77 HX 12UHS | |
| Asus ROG Strix G17 G713PI | |
| MSI GE78HX 13VH-070US | |
| Média Intel Core i9-13950HX, NVIDIA GeForce RTX 4080 Laptop GPU (1780 - 2035, n=2) | |
| Razer Blade 17 Early 2022 | |
| CrossMark / Responsiveness | |
| MSI Raider GE77 HX 12UHS | |
| MSI Titan GT77 HX 13VI | |
| Eluktronics Mech-17 GP2 | |
| MSI GE78HX 13VH-070US | |
| Asus ROG Strix G17 G713PI | |
| Razer Blade 17 Early 2022 | |
| Média Intel Core i9-13950HX, NVIDIA GeForce RTX 4080 Laptop GPU (1342 - 1681, n=2) | |
| PCMark 10 Score | 8771 pontos | |
Ajuda | ||
| AIDA64 / Memory Copy | |
| MSI GE78HX 13VH-070US | |
| Média Intel Core i9-13950HX (61938 - 78813, n=9) | |
| MSI Raider GE77 HX 12UHS | |
| Eluktronics Mech-17 GP2 | |
| MSI Titan GT77 HX 13VI | |
| Razer Blade 17 Early 2022 | |
| Asus ROG Strix G17 G713PI | |
| AIDA64 / Memory Read | |
| MSI GE78HX 13VH-070US | |
| Média Intel Core i9-13950HX (62368 - 86831, n=9) | |
| Eluktronics Mech-17 GP2 | |
| MSI Raider GE77 HX 12UHS | |
| MSI Titan GT77 HX 13VI | |
| Razer Blade 17 Early 2022 | |
| Asus ROG Strix G17 G713PI | |
| AIDA64 / Memory Write | |
| MSI GE78HX 13VH-070US | |
| Média Intel Core i9-13950HX (59501 - 80441, n=9) | |
| Eluktronics Mech-17 GP2 | |
| MSI Raider GE77 HX 12UHS | |
| MSI Titan GT77 HX 13VI | |
| Asus ROG Strix G17 G713PI | |
| Razer Blade 17 Early 2022 | |
| AIDA64 / Memory Latency | |
| MSI Titan GT77 HX 13VI | |
| Média Intel Core i9-13950HX (84.4 - 99.5, n=9) | |
| Eluktronics Mech-17 GP2 | |
| Asus ROG Strix G17 G713PI | |
| MSI GE78HX 13VH-070US | |
| MSI Raider GE77 HX 12UHS | |
* ... menor é melhor
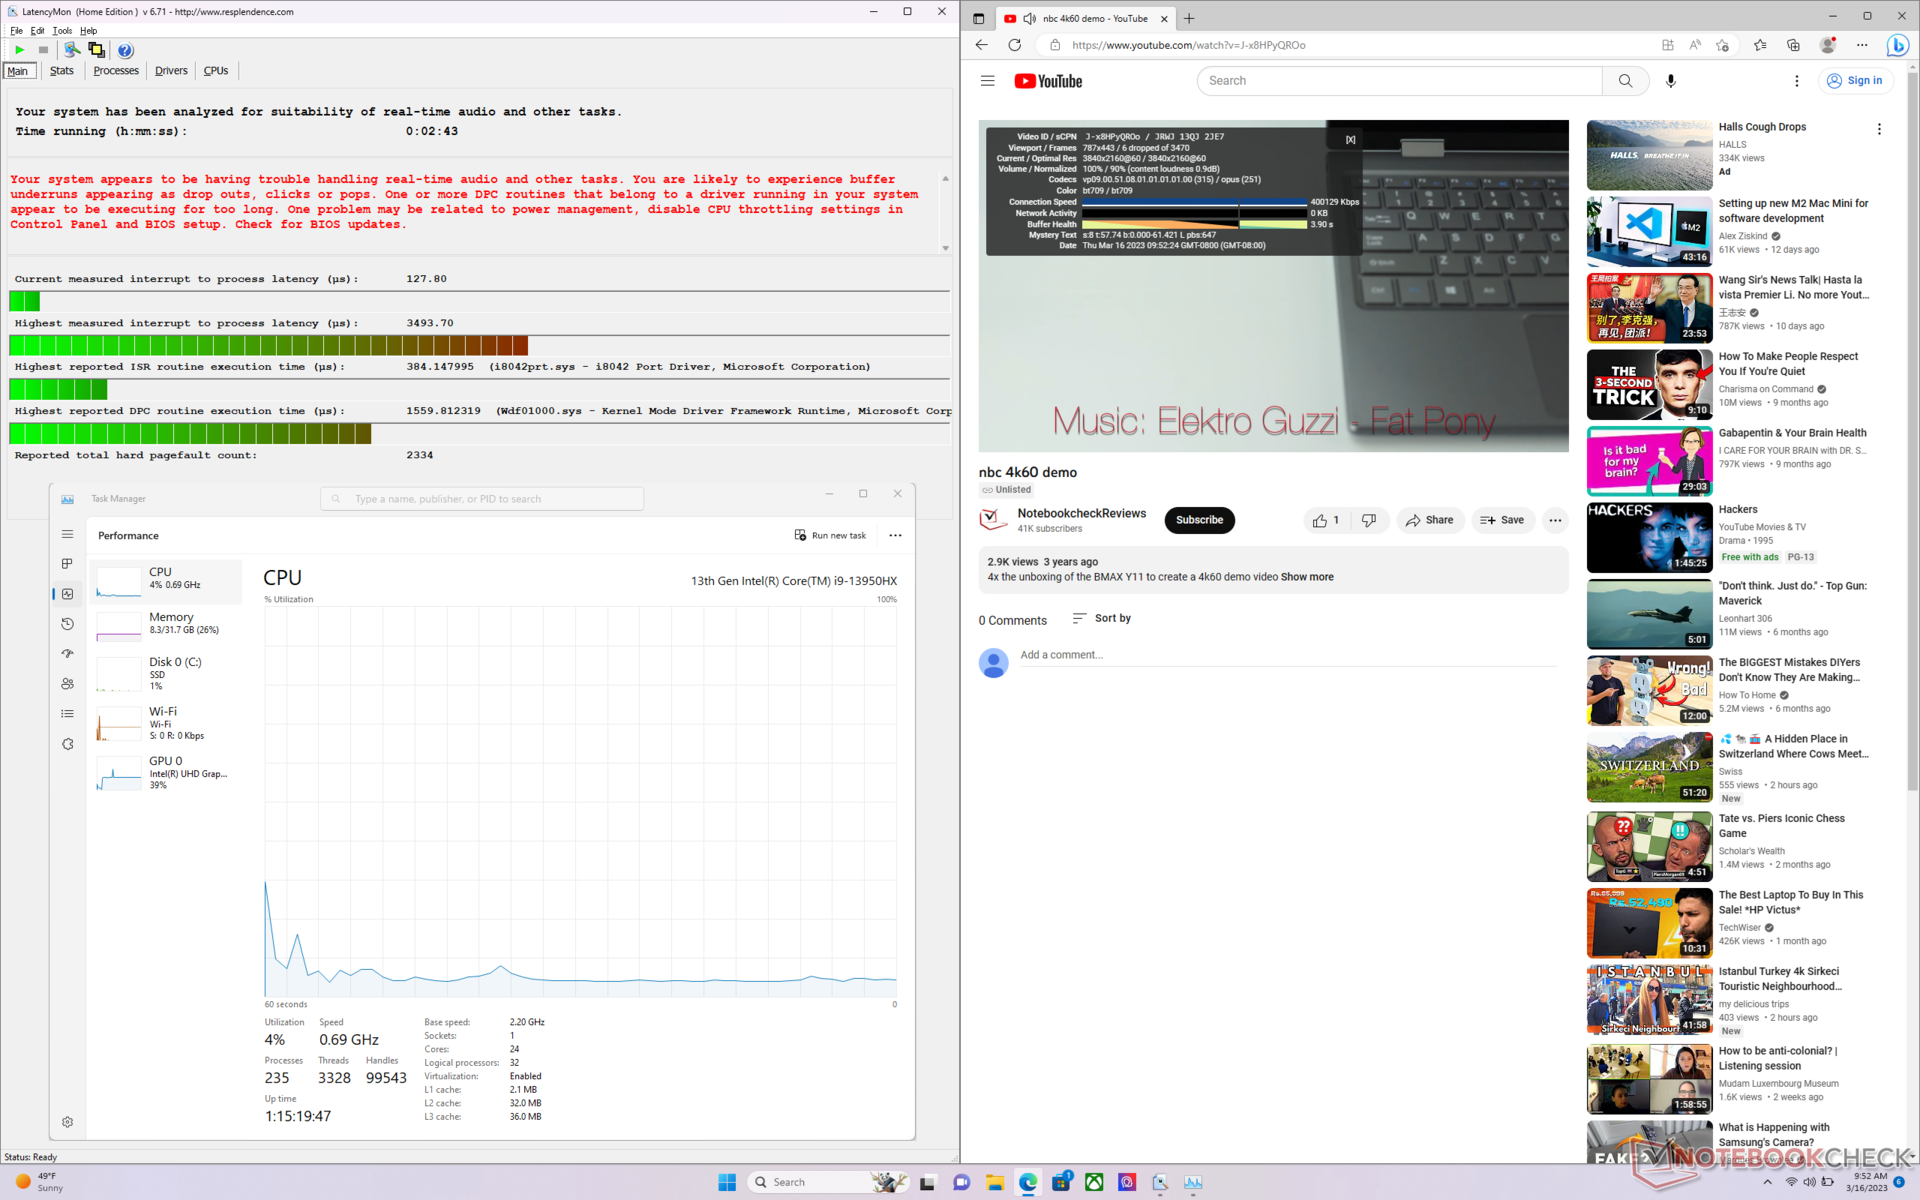
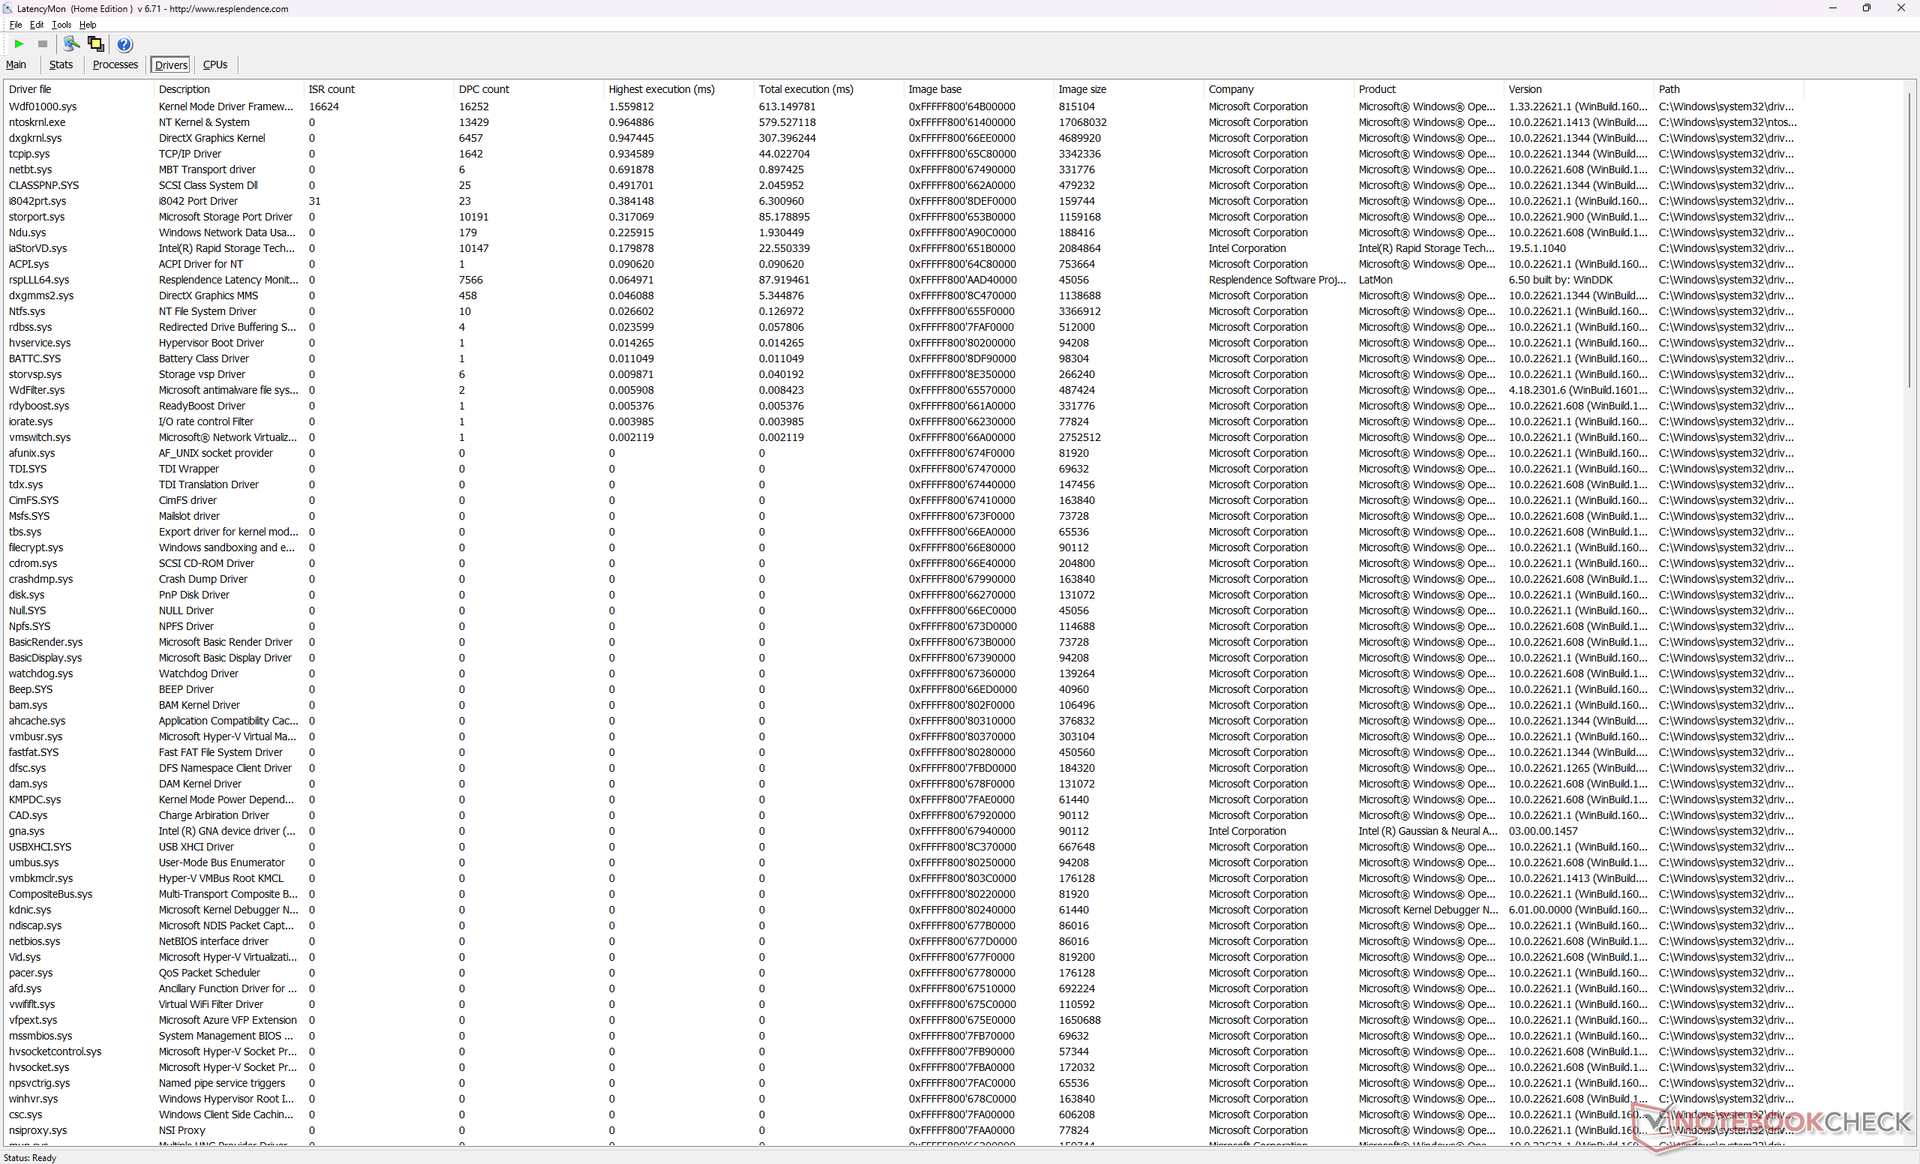
Latência do DPC
LatencyMon revela problemas de DPC ao abrir várias abas do navegador de nossa página inicial, mesmo quando configurado apenas para o iGPU. A Nvidia reconheceu um bug com seus últimos drivers gráficos resultando em altas latências de DPC também.
a reprodução de vídeo de 4K a 60 FPS é imperfeita com 6 quadros descartados durante nosso vídeo de teste de minutos. A repetição do teste não melhoraria nossos resultados.
| DPC Latencies / LatencyMon - interrupt to process latency (max), Web, Youtube, Prime95 | |
| MSI Titan GT77 HX 13VI | |
| MSI GE78HX 13VH-070US | |
| MSI Raider GE77 HX 12UHS | |
| Asus ROG Strix G17 G713PI | |
| Eluktronics Mech-17 GP2 | |
| Razer Blade 17 Early 2022 | |
* ... menor é melhor
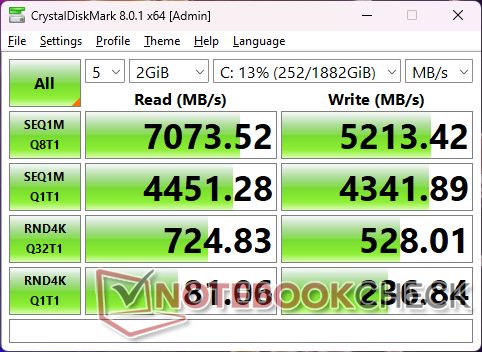
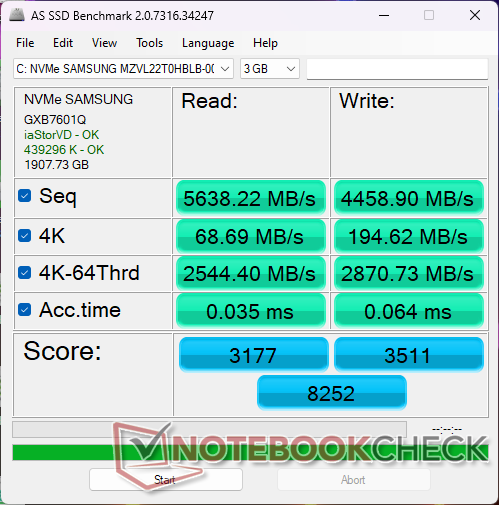
Dispositivos de armazenamento - Prontos para SSDs PCIe5
Nossa unidade de teste é enviada com um 2 TB Samsung PM9A1 que é uma das SSDs PCIe4 x4 NVMe mais rápidas disponíveis. A unidade não teria problemas em manter taxas de transferência superiores a 7000 MB/s, mesmo quando estressada, como mostram os resultados de nosso loop DiskSpd abaixo. Isto é de se esperar, uma vez que o GE78 pode suportar SSDs PCIe5 ainda mais rápidas uma vez que se tornem amplamente disponíveis.

| Drive Performance rating - Percent | |
| MSI Raider GE77 HX 12UHS | |
| Razer Blade 17 Early 2022 | |
| MSI GE78HX 13VH-070US | |
| MSI Titan GT77 HX 13VI | |
| Eluktronics Mech-17 GP2 | |
| Asus ROG Strix G17 G713PI | |
* ... menor é melhor
Disk Throttling: DiskSpd Read Loop, Queue Depth 8
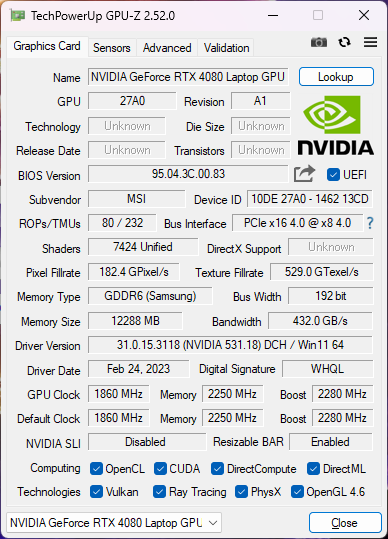
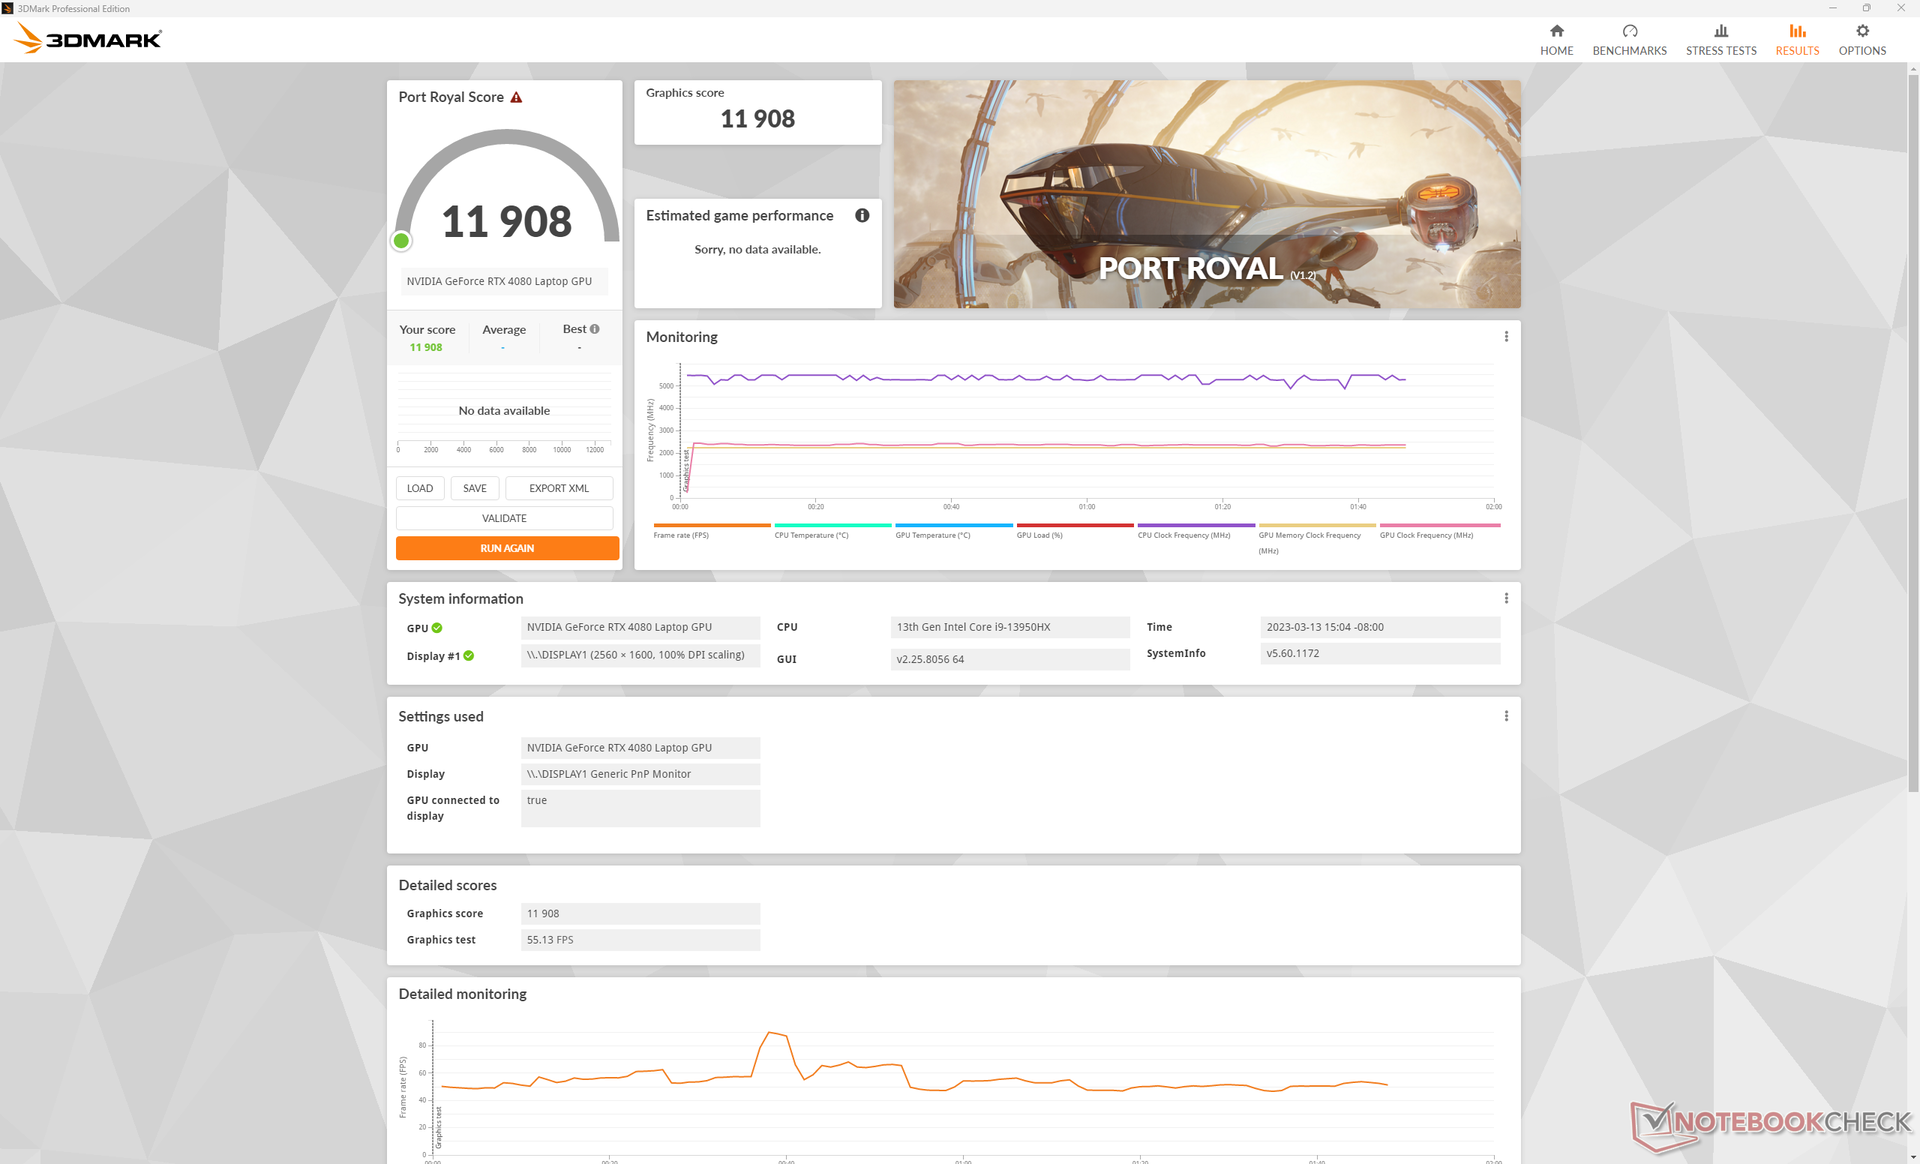
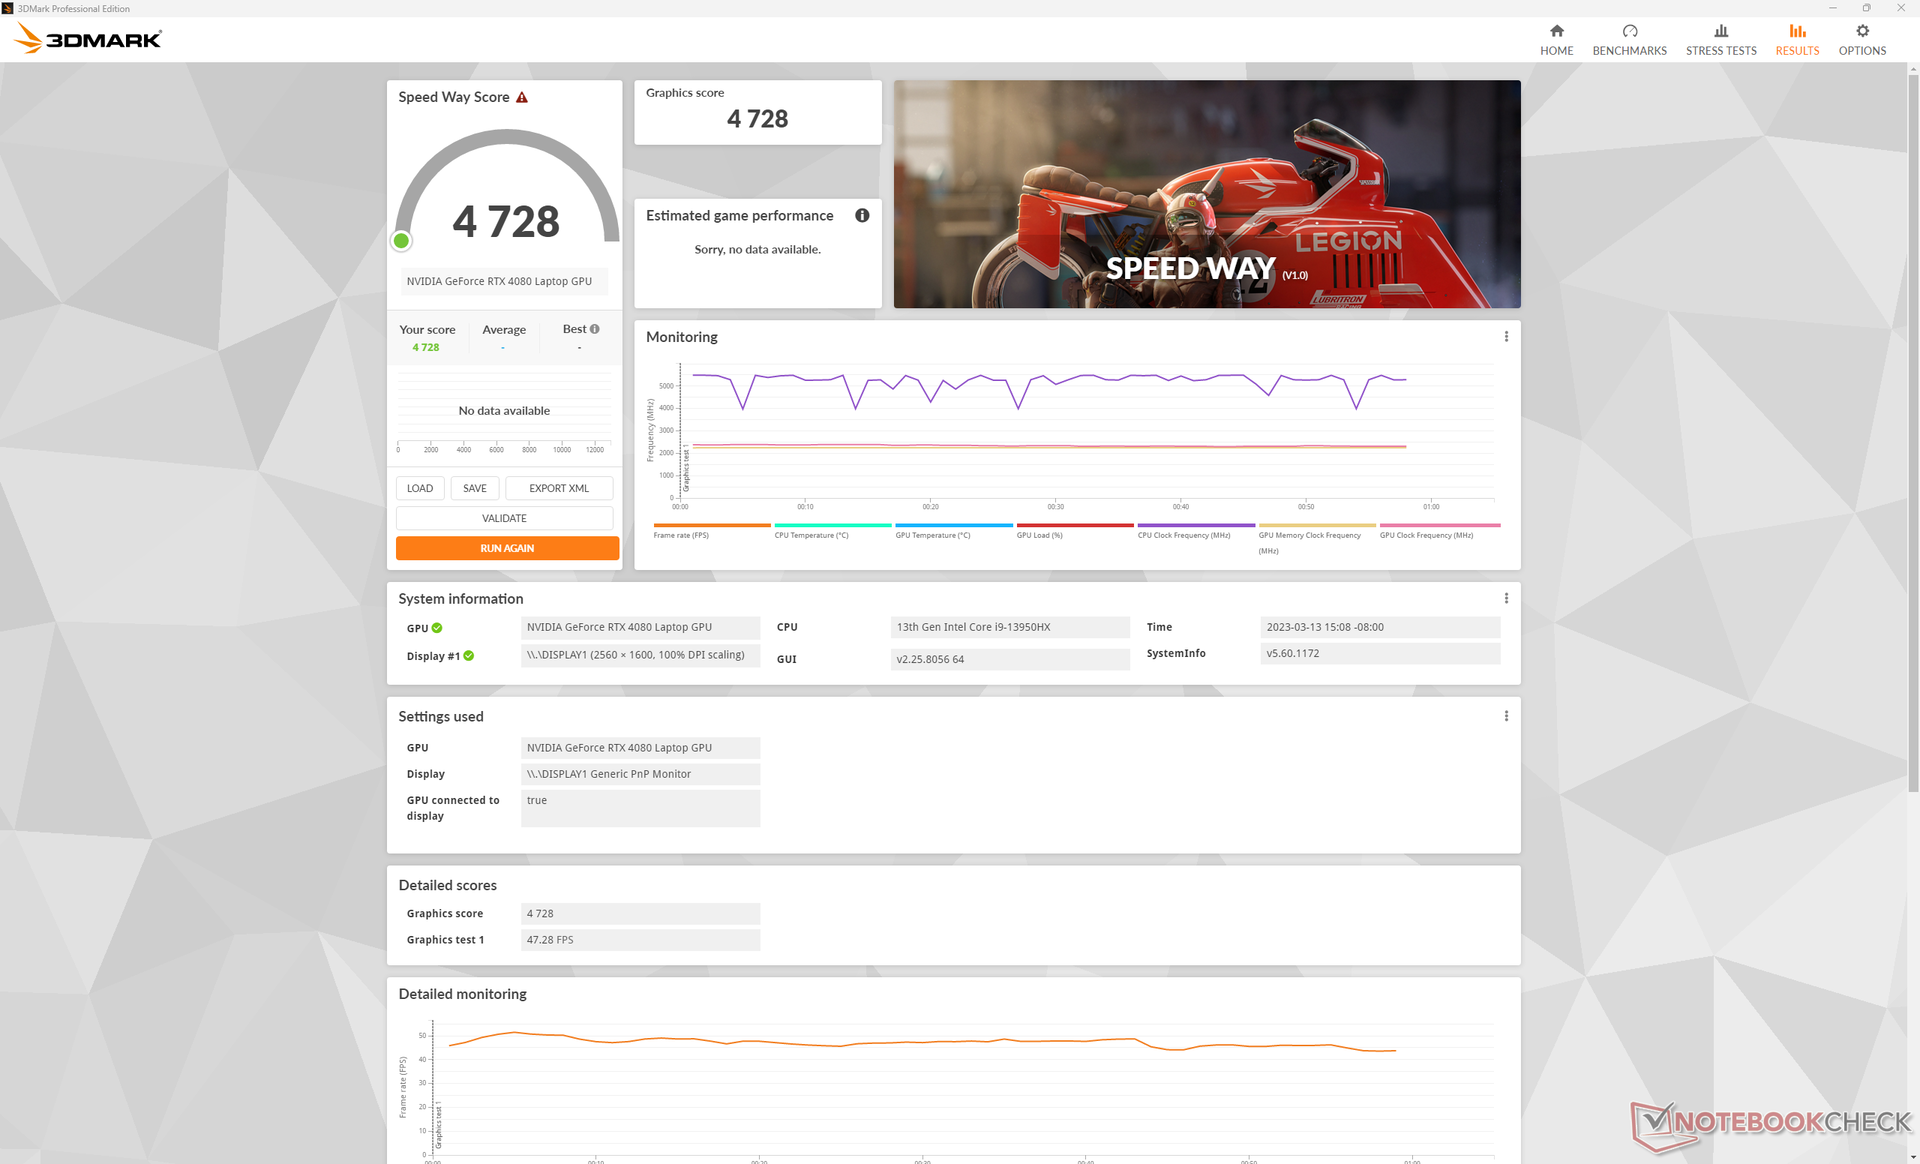
Desempenho da GPU - Gráficos de 175 W
O modelo oferece atualmente três opções de GPU móvel: o GeForce RTX 4070, 4080ou 4090. Pular do 4070 móvel para o 4080 móvel aumentará o desempenho em 40 a 60 por cento enquanto que pular do 4080 móvel para o 4090 móvel só aumentará o desempenho em cerca de 10 por cento. Saber como estas três GPUs móveis se comparam umas com as outras deve ajudar a decidir qual configuração GE78 comprar.
Nossa configuração RTX 4080 oferece um desempenho bruto 30 a 50 por cento mais rápido do que a móvel RTX 3080 Ti no GE77 do ano passado. Se o título suporta DLSS 3 como Cyberpunk 2077, então o desempenho pode ser até 2x a 3x mais rápido. Recomendamos verificar nosso página de revisão dedicada no móvel RTX 4080 para mais referências e comparações relacionadas com a série móvel GeForce 40.
O móvel RTX 4080 não deve ser diretamente comparado com o desktop RTX 4080 que é significativamente mais faminto de poder e ainda mais rápido em cerca de 1,5x.
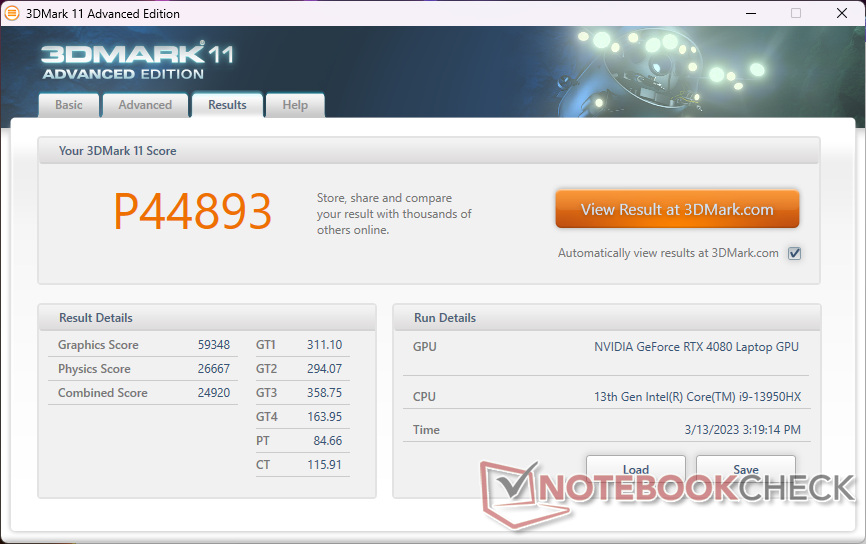
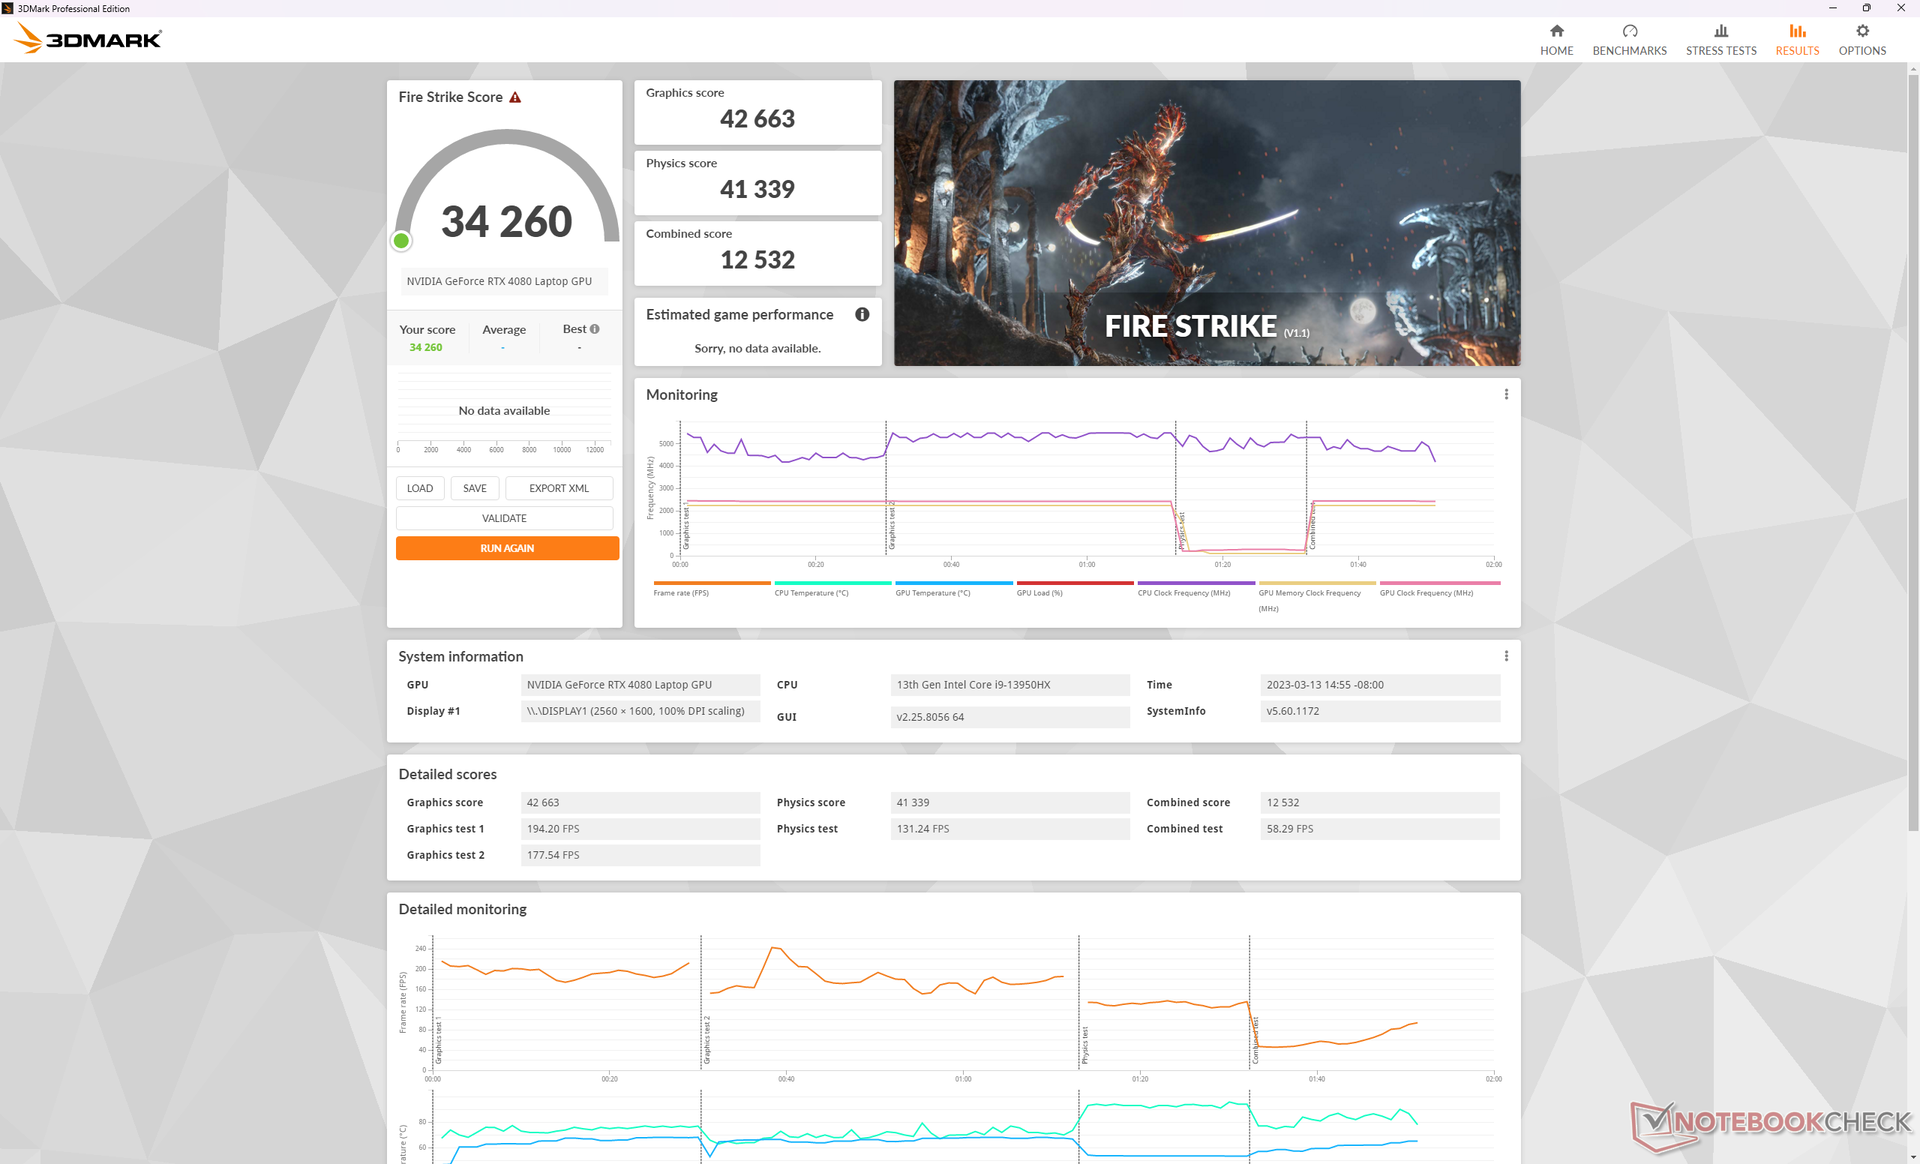
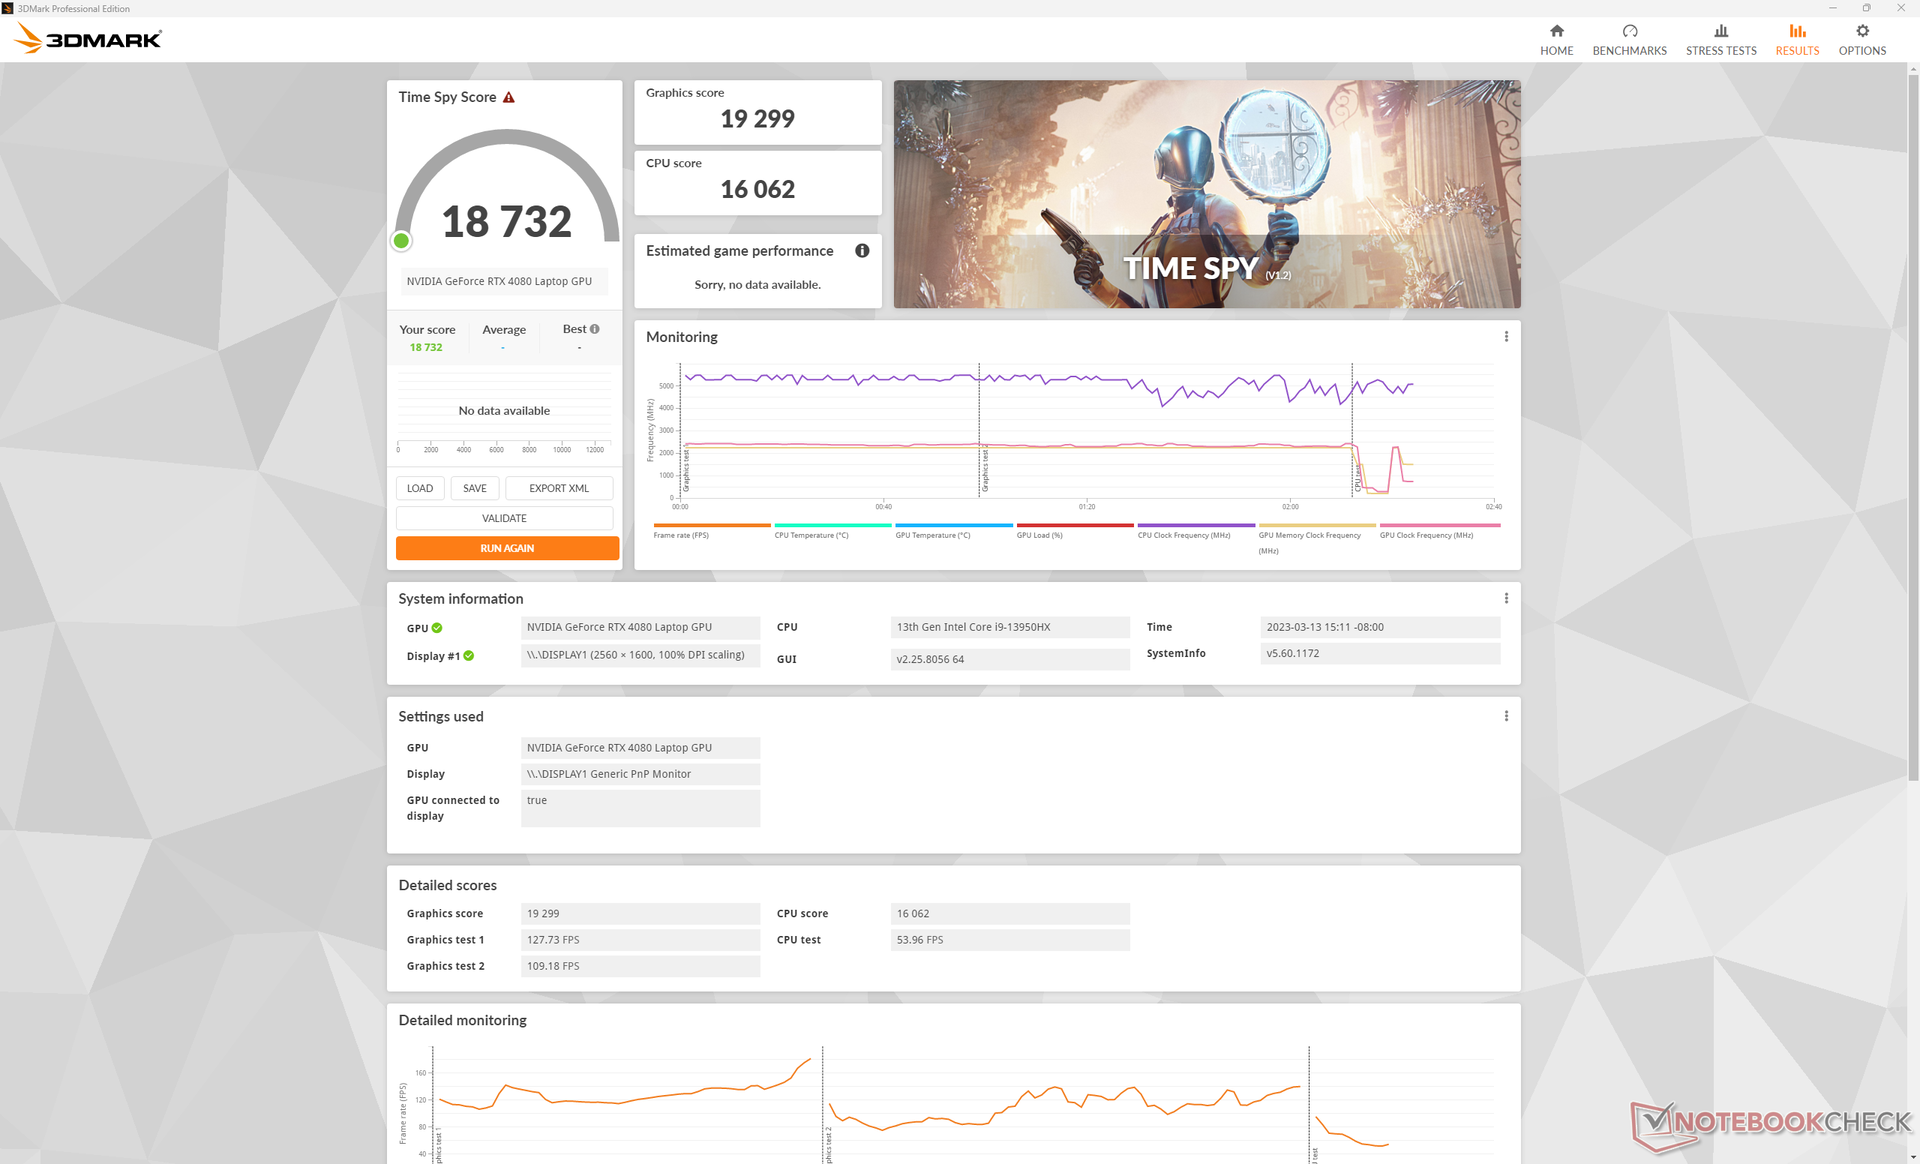
| 3DMark 11 Performance | 44893 pontos | |
| 3DMark Fire Strike Score | 34260 pontos | |
| 3DMark Time Spy Score | 18732 pontos | |
Ajuda | ||
* ... menor é melhor
| The Witcher 3 - 1920x1080 Ultra Graphics & Postprocessing (HBAO+) | |
| KFA2 GeForce RTX 4080 SG | |
| Eluktronics Mech-17 GP2 | |
| MSI GE78HX 13VH-070US | |
| MSI Raider GE77 HX 12UHS | |
| Alienware m17 R5 (R9 6900HX, RX 6850M XT) | |
| Asus ROG Strix G17 G713PI | |
| Corsair Voyager a1600 | |
| MSI Katana 17 B13VFK | |
| Schenker Compact 17 | |
| Schenker XMG Core 15 (M22) | |
| HP Omen 15-en0375ng | |
Witcher 3 FPS Chart
| baixo | média | alto | ultra | QHD | 4K | |
|---|---|---|---|---|---|---|
| GTA V (2015) | 172.9 | 170 | 164.7 | 102.9 | 103.7 | 144.6 |
| The Witcher 3 (2015) | 605.7 | 539.8 | 382.9 | 175.9 | 129.4 | |
| Dota 2 Reborn (2015) | 180.4 | 161.7 | 154.8 | 145.6 | 142.6 | |
| Final Fantasy XV Benchmark (2018) | 180.4 | 166.9 | 148.5 | 131.6 | 76.2 | |
| X-Plane 11.11 (2018) | 174.1 | 157.4 | 126.8 | 110 | ||
| Strange Brigade (2018) | 324 | 272 | 267 | 258 | 237 | 121.5 |
| Cyberpunk 2077 1.6 (2022) | 149.2 | 142.6 | 136.8 | 135.8 | 88.6 | 40.2 |
| F1 22 (2022) | 237 | 235 | 228 | 115.4 | 77.4 | 39 |
Emissões - One Loud Gamer
Ruído do sistema
Os ventiladores internos estão quase sempre ativos, não importa a carga na tela. Somos capazes de gravar um zumbido silencioso de 24,2 dB(A) contra um fundo silencioso de 23,4 dB(A) quando simplesmente ociosos no modo Power Saver. Se a navegação na web ou streaming de vídeo, o ruído do ventilador normalmente pairaria entre a faixa de 25 e 31 dB(A). Não é barulhento o suficiente para distrair, mas é perceptível, no entanto. Máquinas concorrentes como aEluktronics Mech-17 ou Asus ROG Strix G17 G713PI se comportariam de forma semelhante.
Os jogos no modo Performance (ou modo Extreme) induziriam um ruído de ventilador de pouco mais de 56 dB(A) que está na parte superior do espectro quando se trata de laptops para jogos. Os laptops Eluktronics e Asus acima mencionados, por exemplo, funcionariam visivelmente mais silenciosos a 51 e 46 dB(A), respectivamente, sob cargas de jogo similares.
A ativação do modo Cooler Boost elevará as RPMs do ventilador ao limite absoluto, não importando a carga na tela, para um nível de ruído que se aproxima de 60 dB(A). O desempenho dos jogos, no entanto, não é necessariamente mais rápido e, portanto, o modo Cooler Boost é mais sobre o controle de temperatura do que sobre o controle de desempenho. Tivemos observações semelhantes em outros laptops MSI com o mesmo recurso de Cooler Boost.
Barulho
| Ocioso |
| 24.2 / 25.6 / 31 dB |
| Carga |
| 43.3 / 59.1 dB |
 | ||
30 dB silencioso 40 dB(A) audível 50 dB(A) ruidosamente alto |
||
min: | ||
| MSI GE78HX 13VH-070US GeForce RTX 4080 Laptop GPU, i9-13950HX, Samsung PM9A1 MZVL22T0HBLB | Eluktronics Mech-17 GP2 GeForce RTX 4090 Laptop GPU, i9-13900HX, Samsung PM9A1 MZVL21T0HCLR | Asus ROG Strix G17 G713PI GeForce RTX 4070 Laptop GPU, R9 7945HX, WD PC SN560 SDDPNQE-1T00 | MSI Titan GT77 HX 13VI GeForce RTX 4090 Laptop GPU, i9-13950HX, Samsung PM9A1 MZVL22T0HBLB | MSI Raider GE77 HX 12UHS GeForce RTX 3080 Ti Laptop GPU, i9-12900HX, Samsung PM9A1 MZVL22T0HBLB | Razer Blade 17 Early 2022 GeForce RTX 3080 Ti Laptop GPU, i9-12900H, Samsung PM9A1 MZVL21T0HCLR | |
|---|---|---|---|---|---|---|
| Noise | -1% | 1% | -7% | -15% | -3% | |
| desligado / ambiente * (dB) | 23.4 | 25.2 -8% | 25 -7% | 24.6 -5% | 26 -11% | 26 -11% |
| Idle Minimum * (dB) | 24.2 | 28 -16% | 26 -7% | 29.2 -21% | 26 -7% | 26 -7% |
| Idle Average * (dB) | 25.6 | 28 -9% | 29 -13% | 29.2 -14% | 34 -33% | 27 -5% |
| Idle Maximum * (dB) | 31 | 30.4 2% | 30 3% | 29.2 6% | 46 -48% | 32 -3% |
| Load Average * (dB) | 43.3 | 41 5% | 46 -6% | 50.7 -17% | 50 -15% | 50 -15% |
| Witcher 3 ultra * (dB) | 56.3 | 50.7 10% | 46 18% | 53.3 5% | 55 2% | 51 9% |
| Load Maximum * (dB) | 59.1 | 52.6 11% | 47 20% | 61 -3% | 57 4% | 51 14% |
* ... menor é melhor
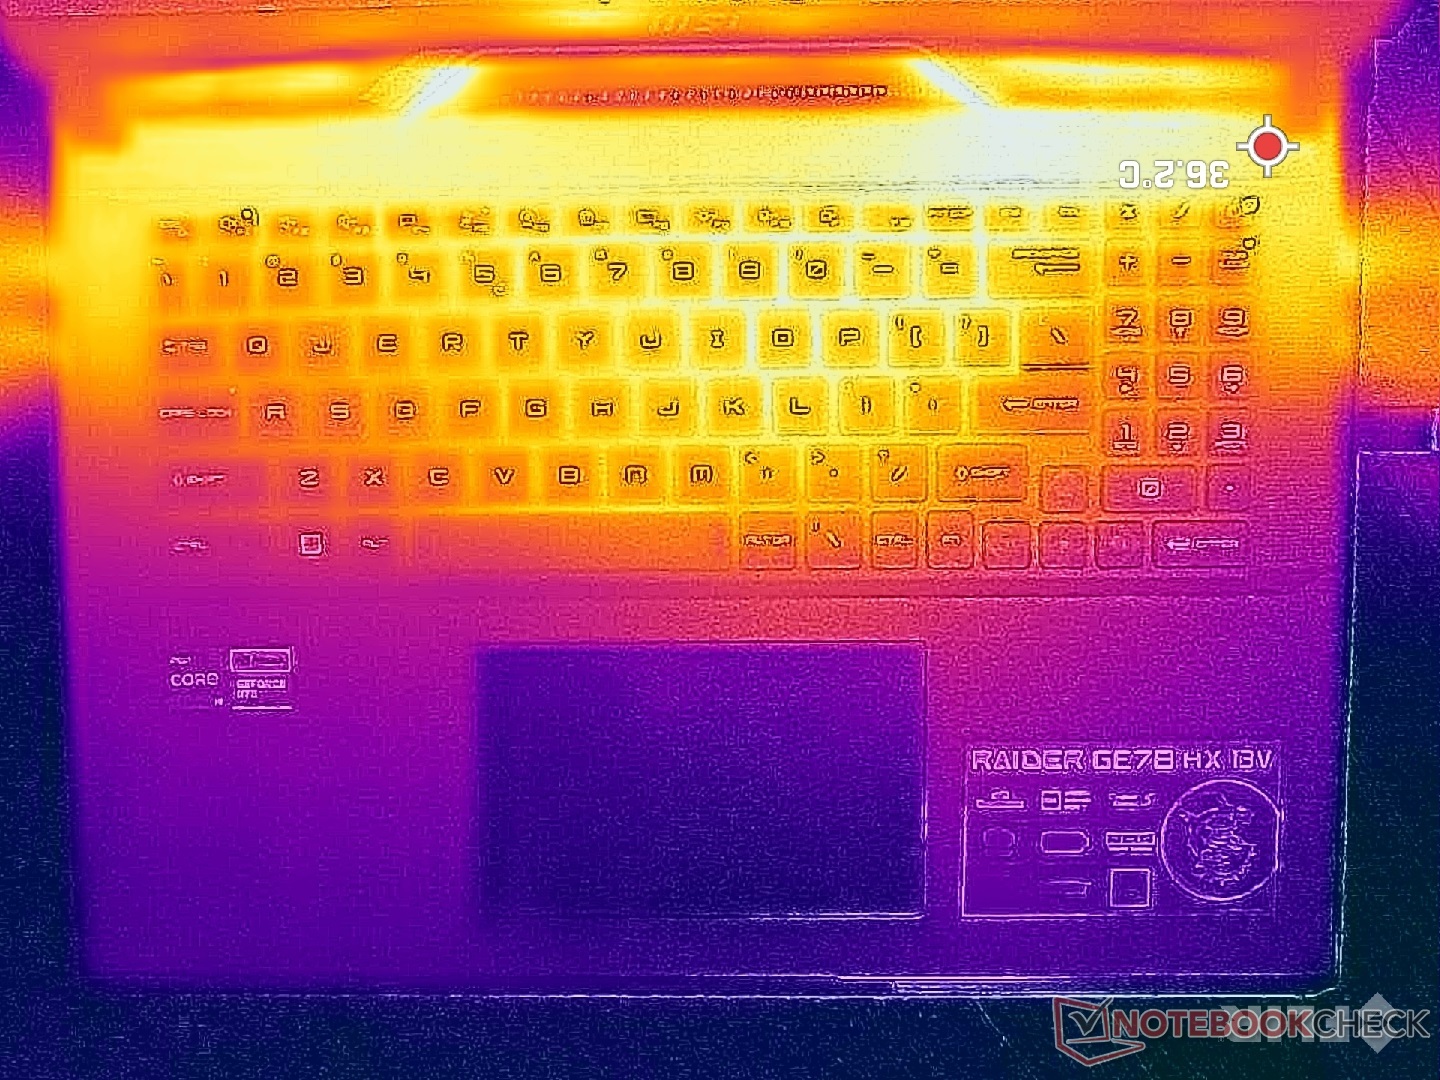
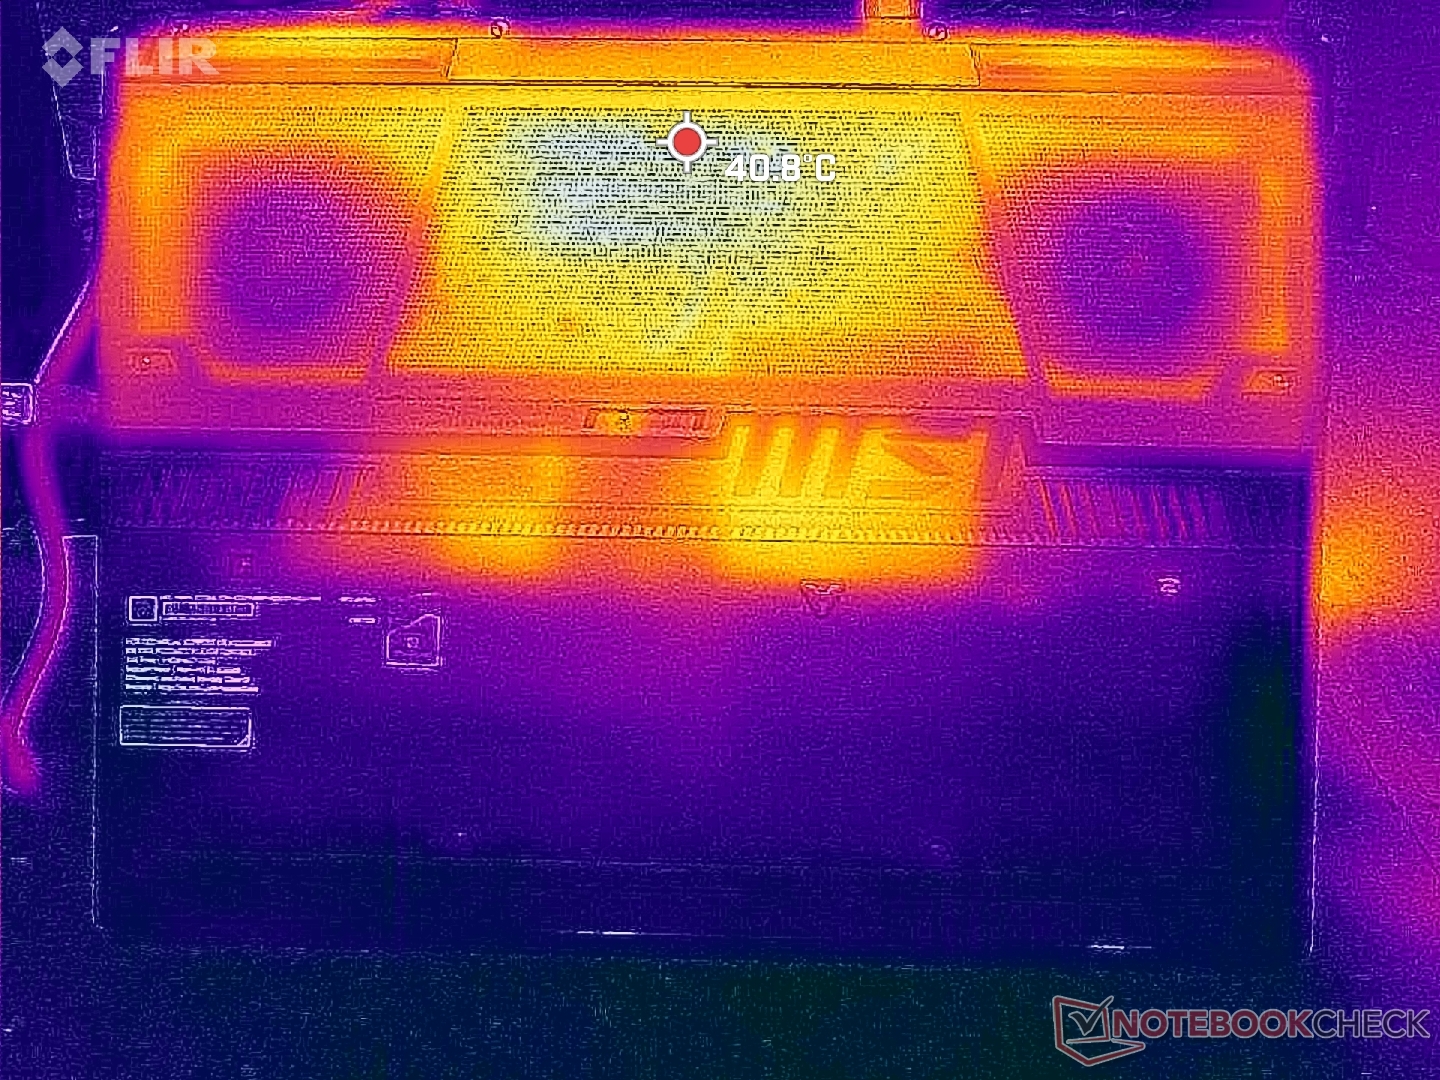
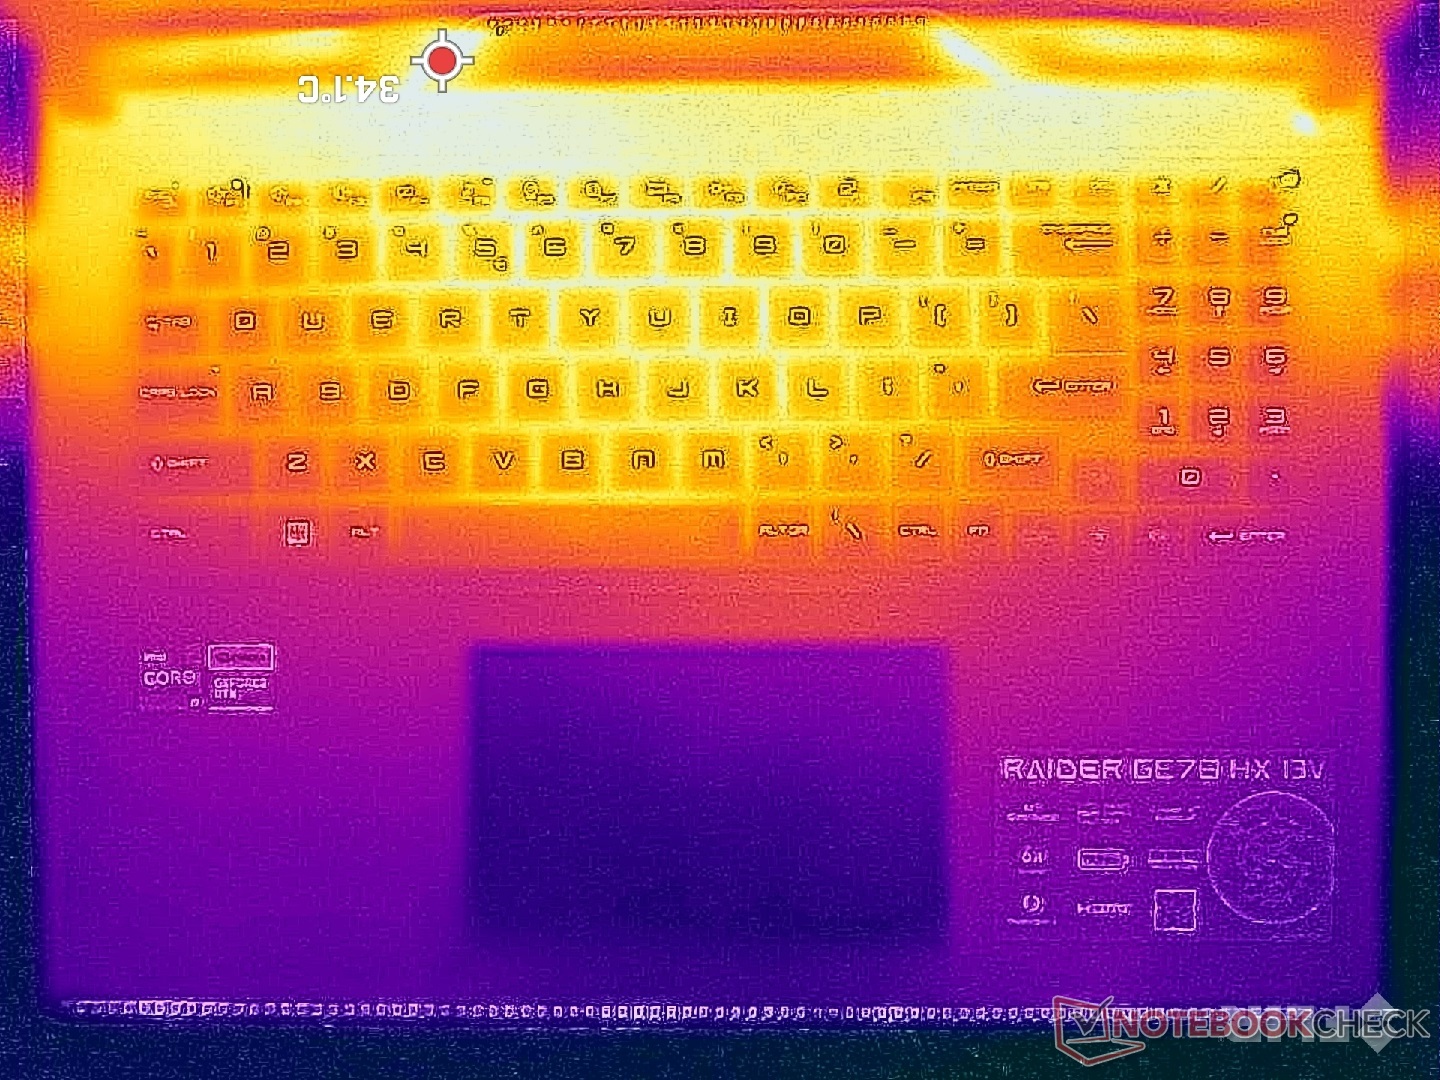
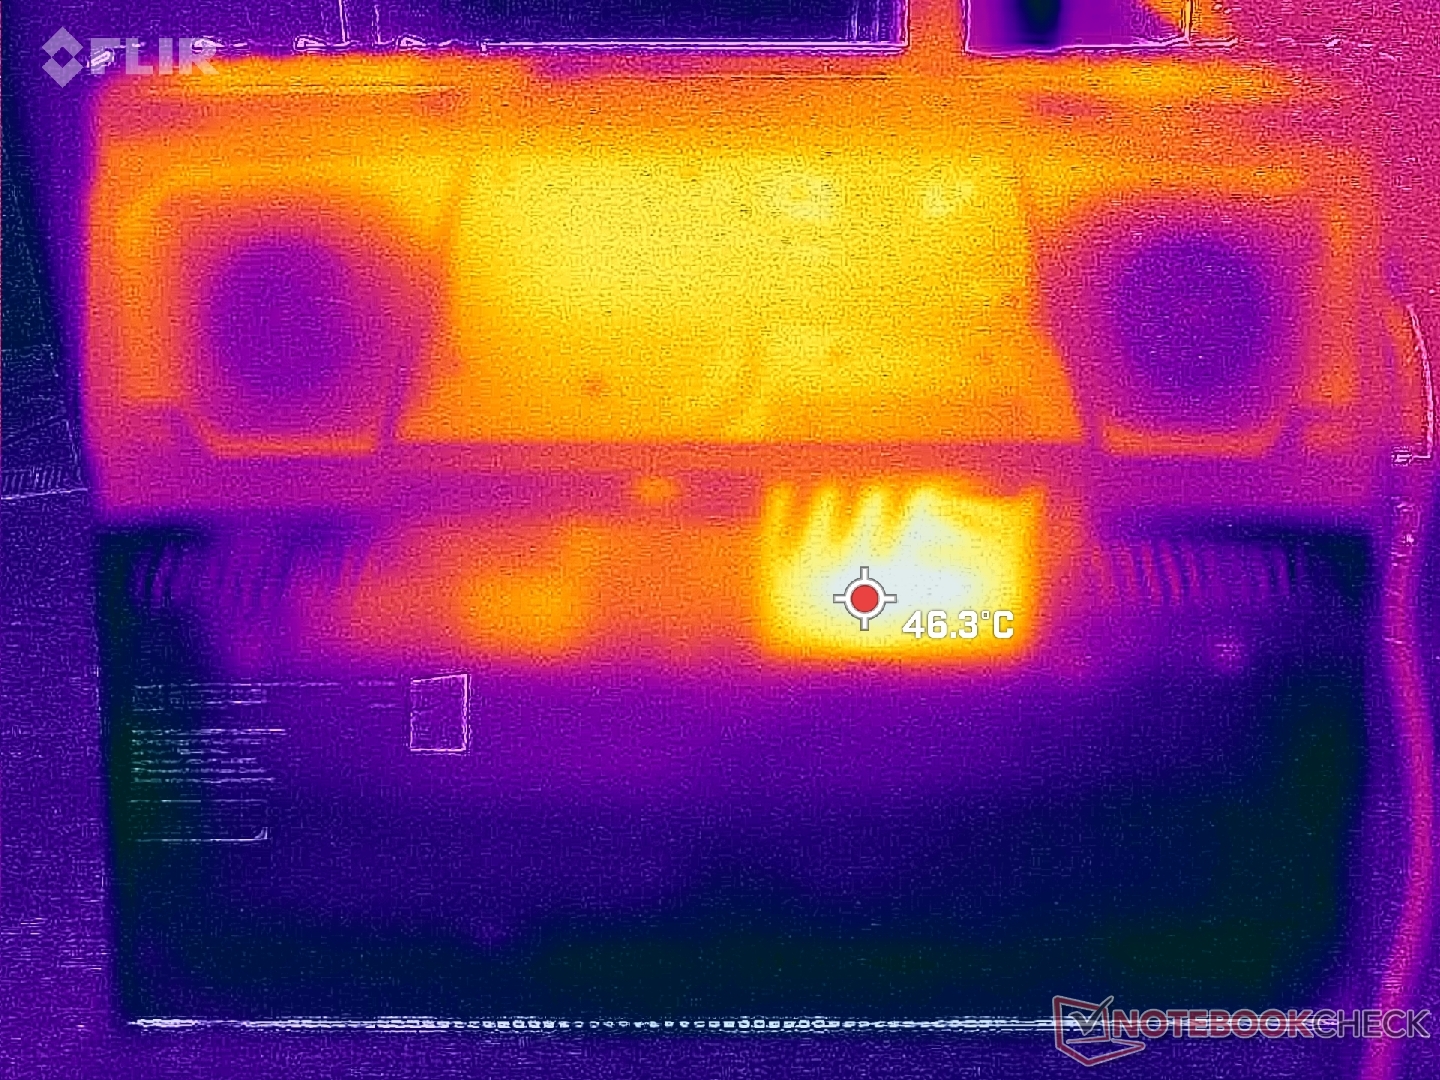
Temperatura
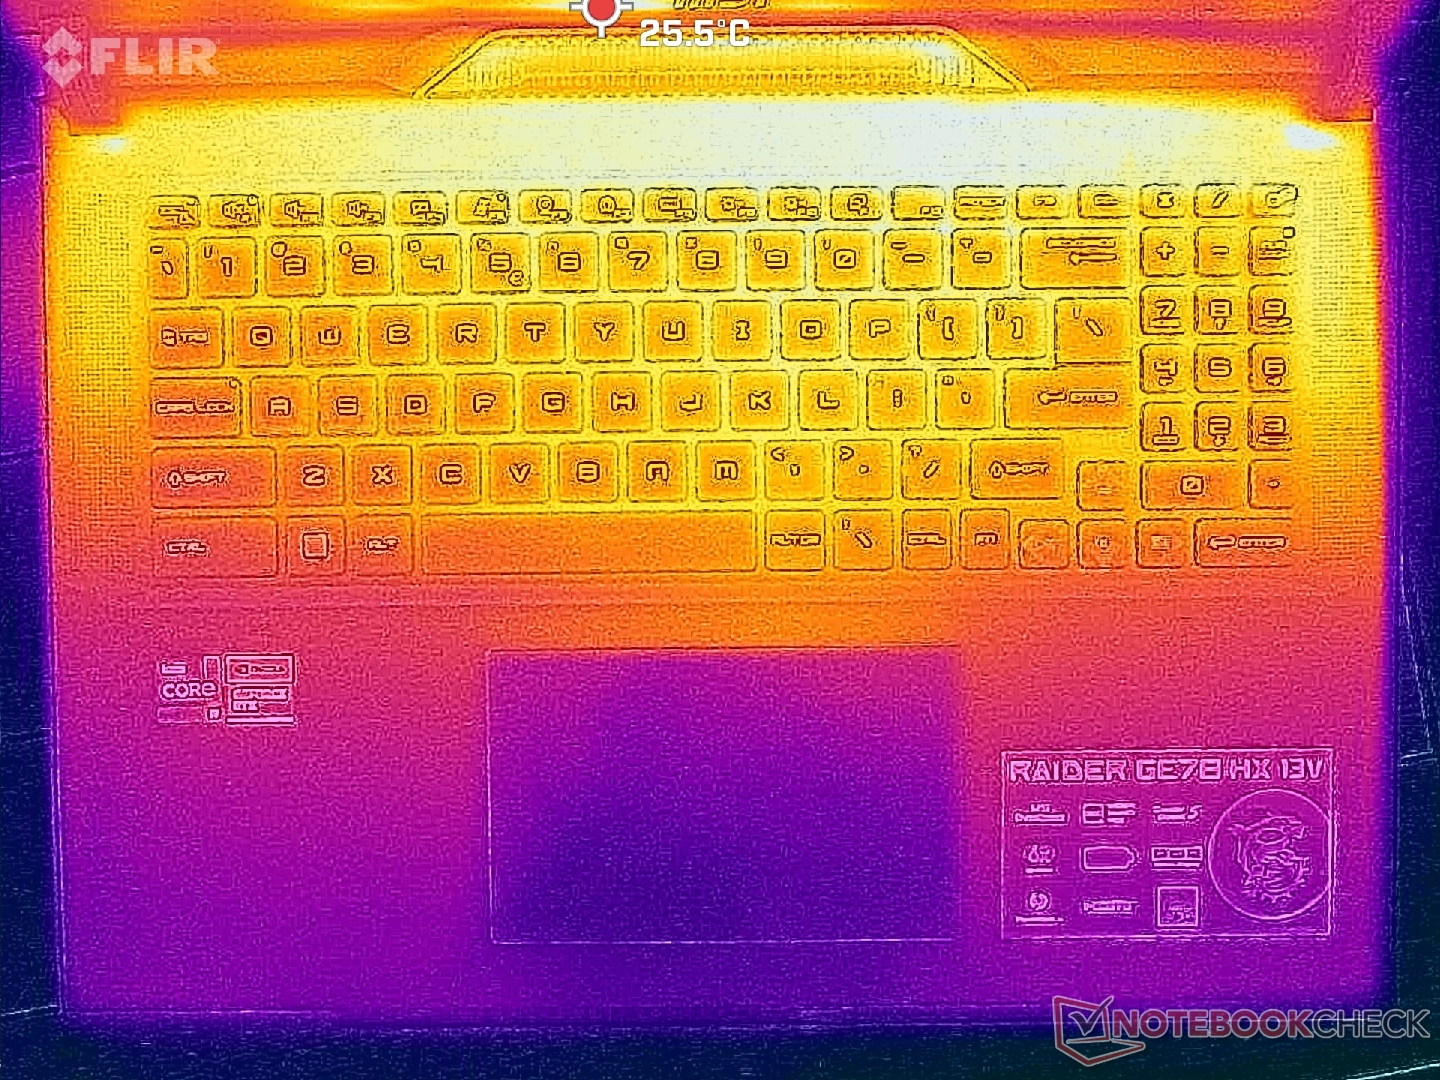
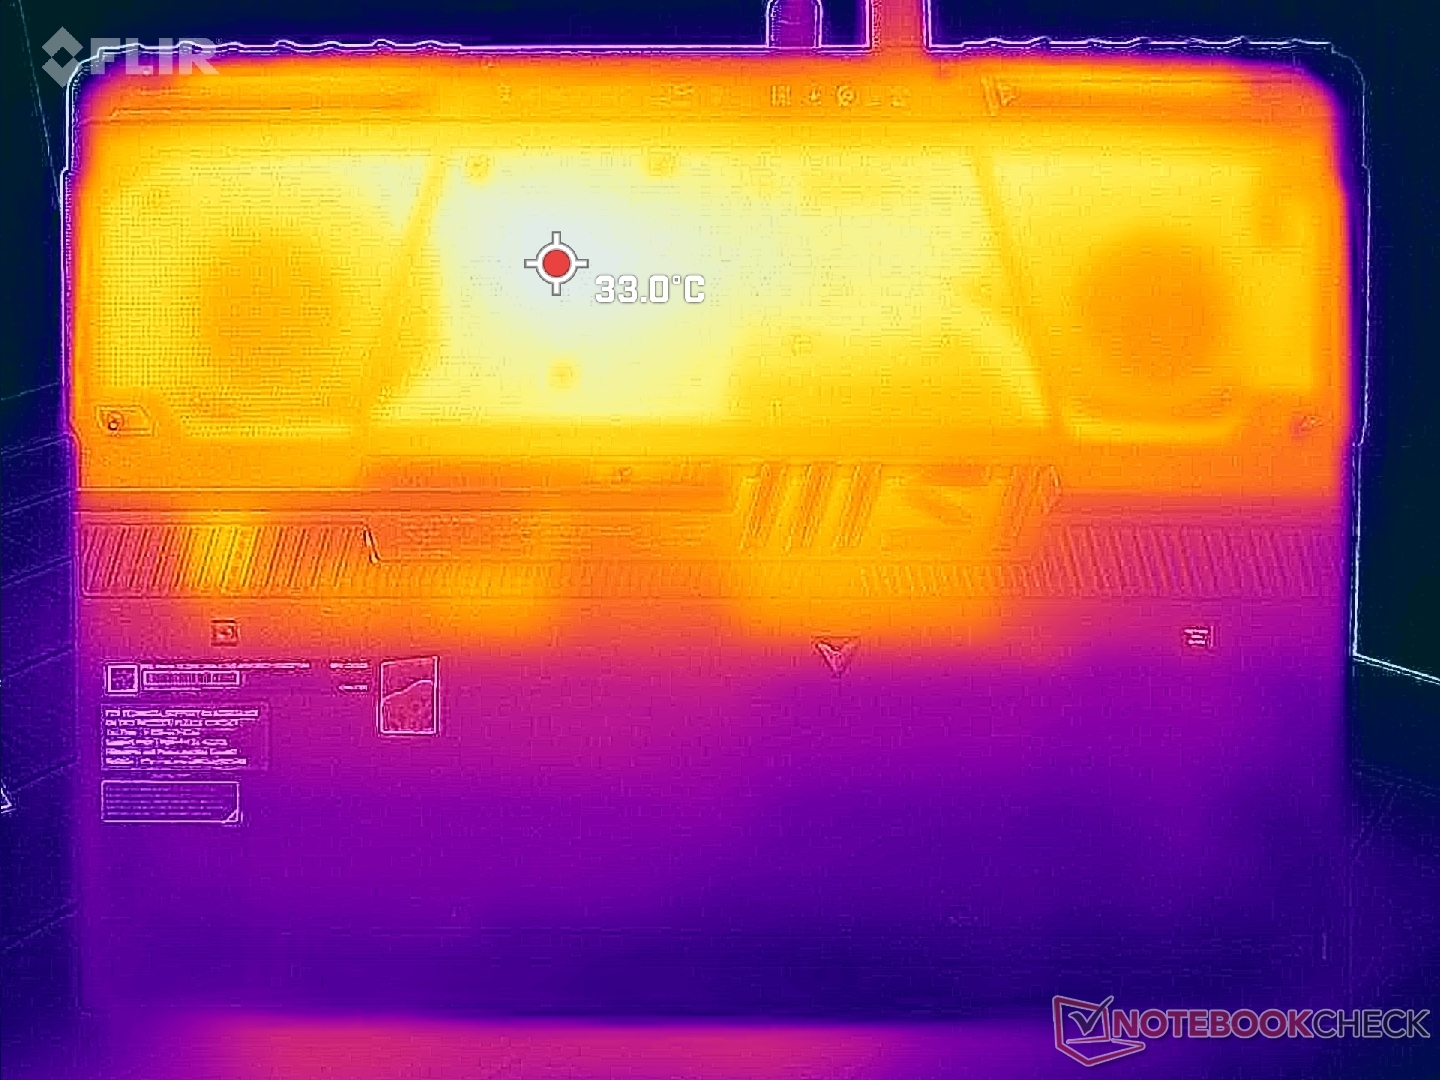
As temperaturas de superfície geralmente não são um problema nos modelos MSI GE e GT, uma vez que eles são em grande parte plásticos e de design mais grosso. A temperatura média da superfície quando se joga no GE78, por exemplo, é de cerca de 32 C tanto na parte superior quanto na inferior, em comparação com 43 C a 44 C no modelo GE78 Lâmina Razer 17.
Quaisquer pontos quentes no sistema estão na parte de trás do chassi e longe da frente, como mostram os mapas de temperatura abaixo. As palmas ou dedos não devem, portanto, sentir-se desconfortavelmente quentes durante a digitação ou jogos.
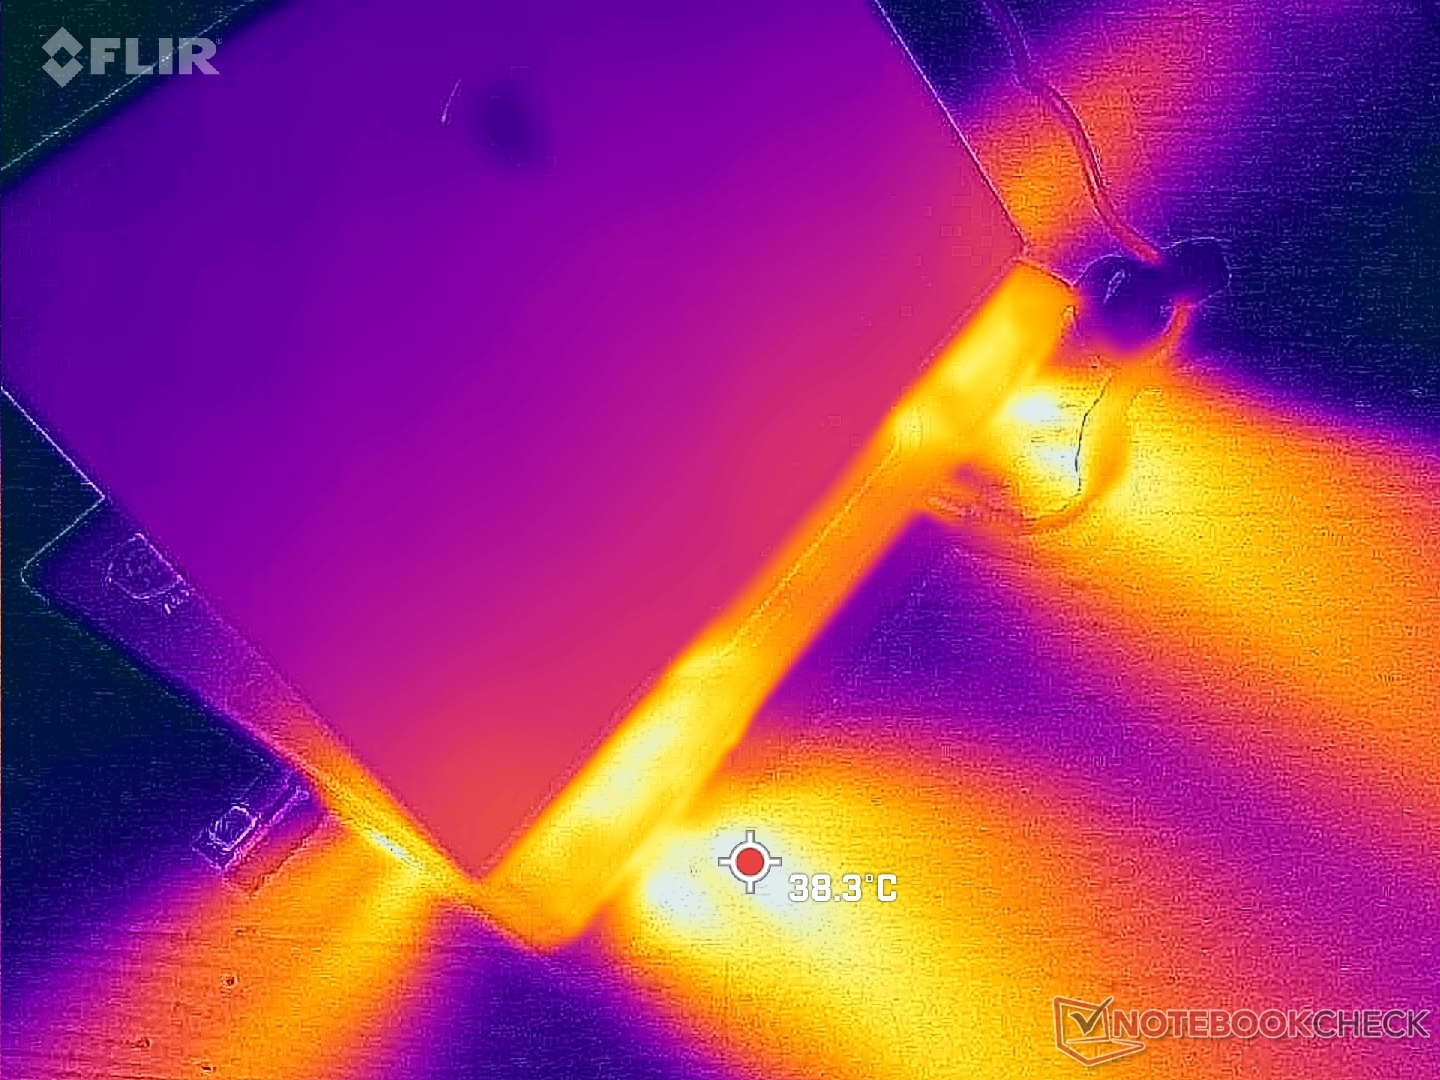
(+) A temperatura máxima no lado superior é 37.4 °C / 99 F, em comparação com a média de 40.4 °C / 105 F , variando de 21.2 a 68.8 °C para a classe Gaming.
(±) A parte inferior aquece até um máximo de 45 °C / 113 F, em comparação com a média de 43.2 °C / 110 F
(+) Em uso inativo, a temperatura média para o lado superior é 25.7 °C / 78 F, em comparação com a média do dispositivo de 33.9 °C / ### class_avg_f### F.
(+) Jogando The Witcher 3, a temperatura média para o lado superior é 30.5 °C / 87 F, em comparação com a média do dispositivo de 33.9 °C / ## #class_avg_f### F.
(+) Os apoios para as mãos e o touchpad são mais frios que a temperatura da pele, com um máximo de 24.6 °C / 76.3 F e, portanto, são frios ao toque.
(+) A temperatura média da área do apoio para as mãos de dispositivos semelhantes foi 28.8 °C / 83.8 F (+4.2 °C / 7.5 F).
| MSI GE78HX 13VH-070US Intel Core i9-13950HX, NVIDIA GeForce RTX 4080 Laptop GPU | Eluktronics Mech-17 GP2 Intel Core i9-13900HX, NVIDIA GeForce RTX 4090 Laptop GPU | Asus ROG Strix G17 G713PI AMD Ryzen 9 7945HX, NVIDIA GeForce RTX 4070 Laptop GPU | MSI Titan GT77 HX 13VI Intel Core i9-13950HX, NVIDIA GeForce RTX 4090 Laptop GPU | MSI Raider GE77 HX 12UHS Intel Core i9-12900HX, NVIDIA GeForce RTX 3080 Ti Laptop GPU | Razer Blade 17 Early 2022 Intel Core i9-12900H, NVIDIA GeForce RTX 3080 Ti Laptop GPU | |
|---|---|---|---|---|---|---|
| Heat | 1% | -5% | 5% | -33% | -24% | |
| Maximum Upper Side * (°C) | 37.4 | 39 -4% | 42 -12% | 40.6 -9% | 53 -42% | 50 -34% |
| Maximum Bottom * (°C) | 45 | 44 2% | 41 9% | 41.1 9% | 58 -29% | 56 -24% |
| Idle Upper Side * (°C) | 29.8 | 31 -4% | 33 -11% | 26.2 12% | 38 -28% | 36 -21% |
| Idle Bottom * (°C) | 32.4 | 29.8 8% | 34 -5% | 30.3 6% | 43 -33% | 38 -17% |
* ... menor é melhor
Teste de estresse
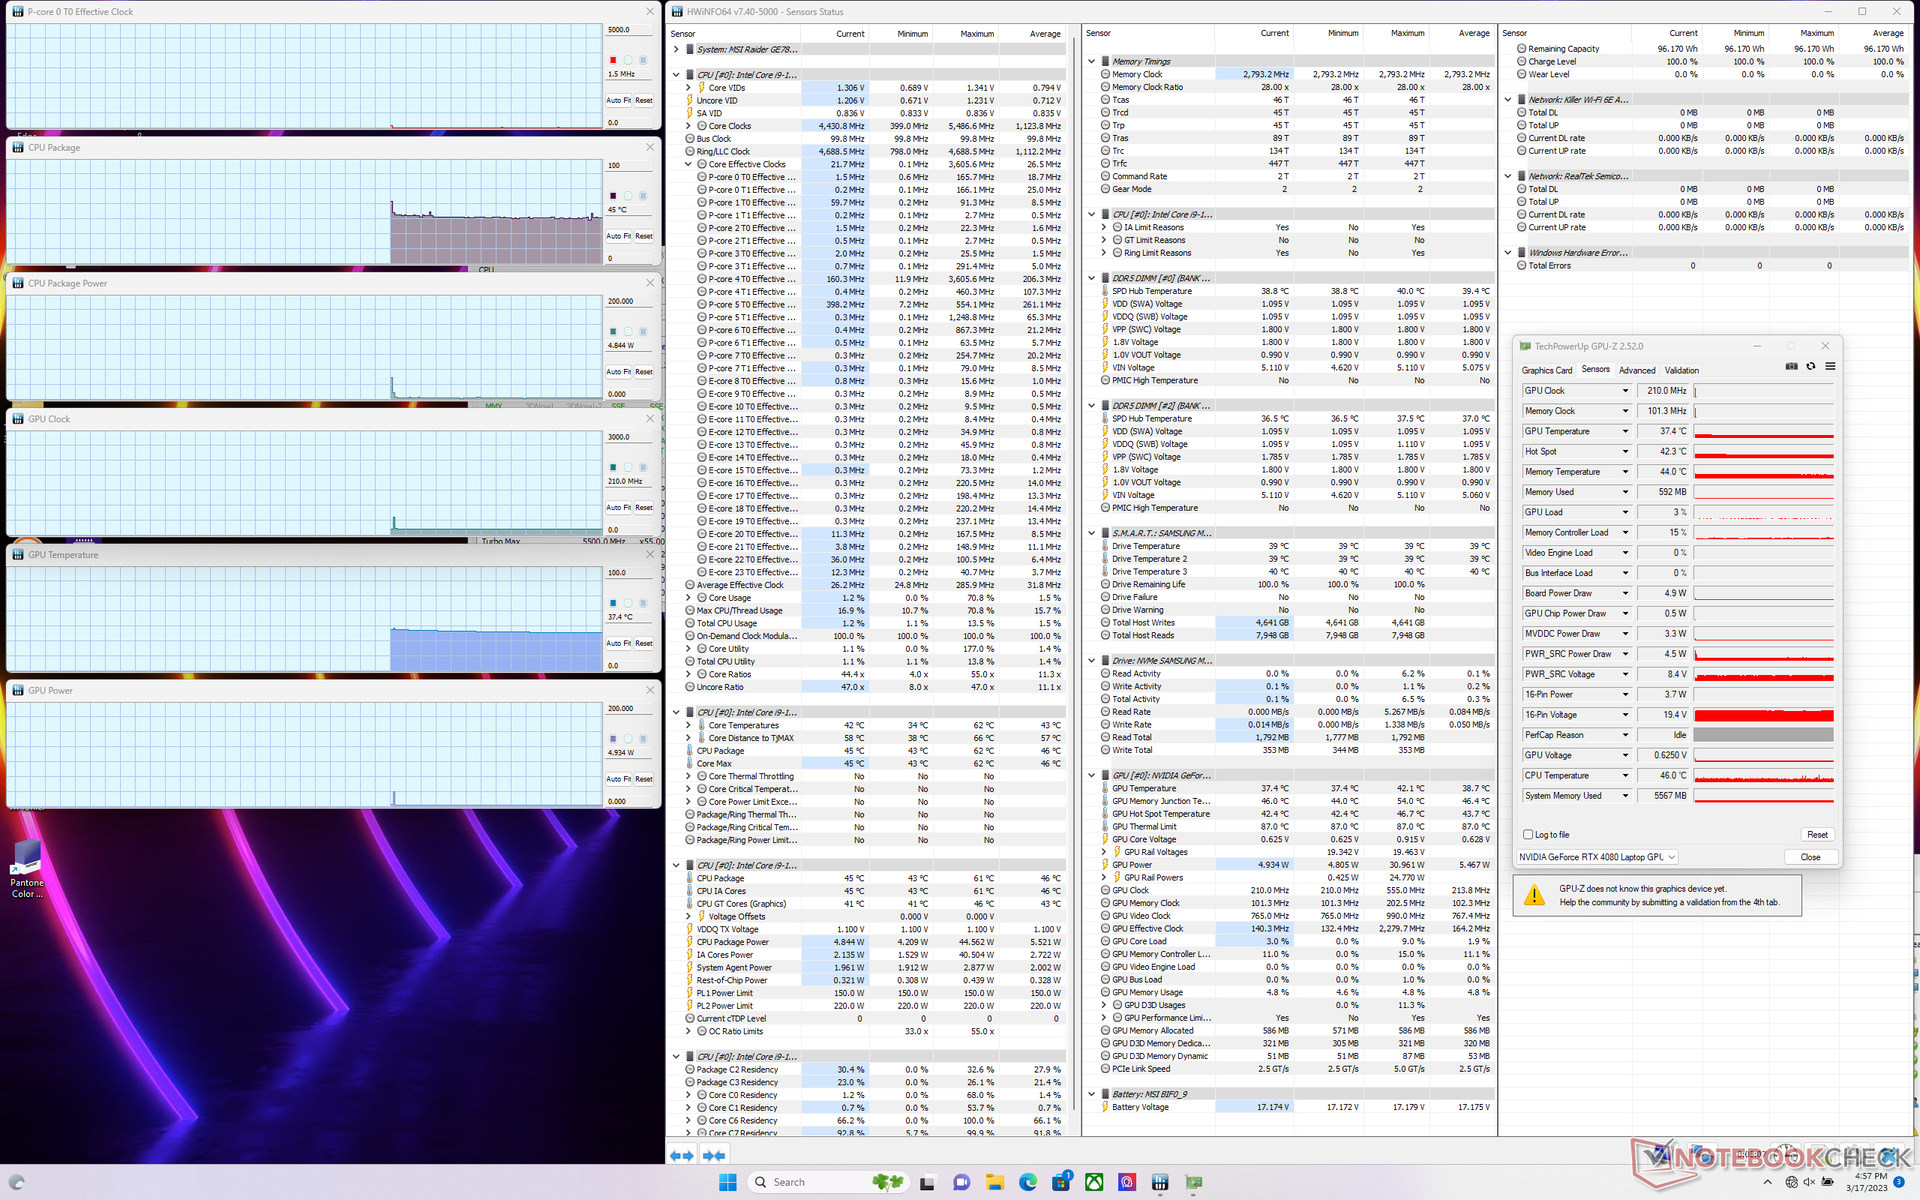
Ao executar Prime95 para enfatizar a CPU, as taxas de clock e o consumo de energia da placa aumentariam para 4,5 GHz e 173 W, respectivamente, durando apenas alguns segundos ou até atingir uma temperatura central de 95 C. Depois disso, as taxas de clock e o consumo de energia da placa diminuiriam constantemente até estabilizarem em cerca de 3,7 GHz e 144 W, respectivamente. A temperatura central permaneceria muito alta a 91 C, o que significa que há muito pouco espaço de manobra para qualquer desempenho adicional do processador. Repetindo este mesmo teste noLâmina Razer 16 com uma CPU Core i9 similar resultaria em taxas de relógio médias mais lentas e uma temperatura de núcleo mais fria de ~3,2 GHz e 82 C, respectivamente. A série Core i9 da Intel 13ª geração pode ser rápida, mas espera-se que as temperaturas do núcleo sejam altas em toda a linha.
Rodando Witcher 3 para representar cargas típicas de jogos resultaria em uma taxa de relógio GPU estável, temperatura GPU, e consumo de energia da placa de 2430 MHz, 73 C, e 156 W, respectivamente. Os resultados permaneceriam idênticos se o Cooler Boost fosse ativado. Esperamos que o consumo de energia da placa seja mais próximo de 175 W se configurado com a GPU RTX 4090 mais rápida.
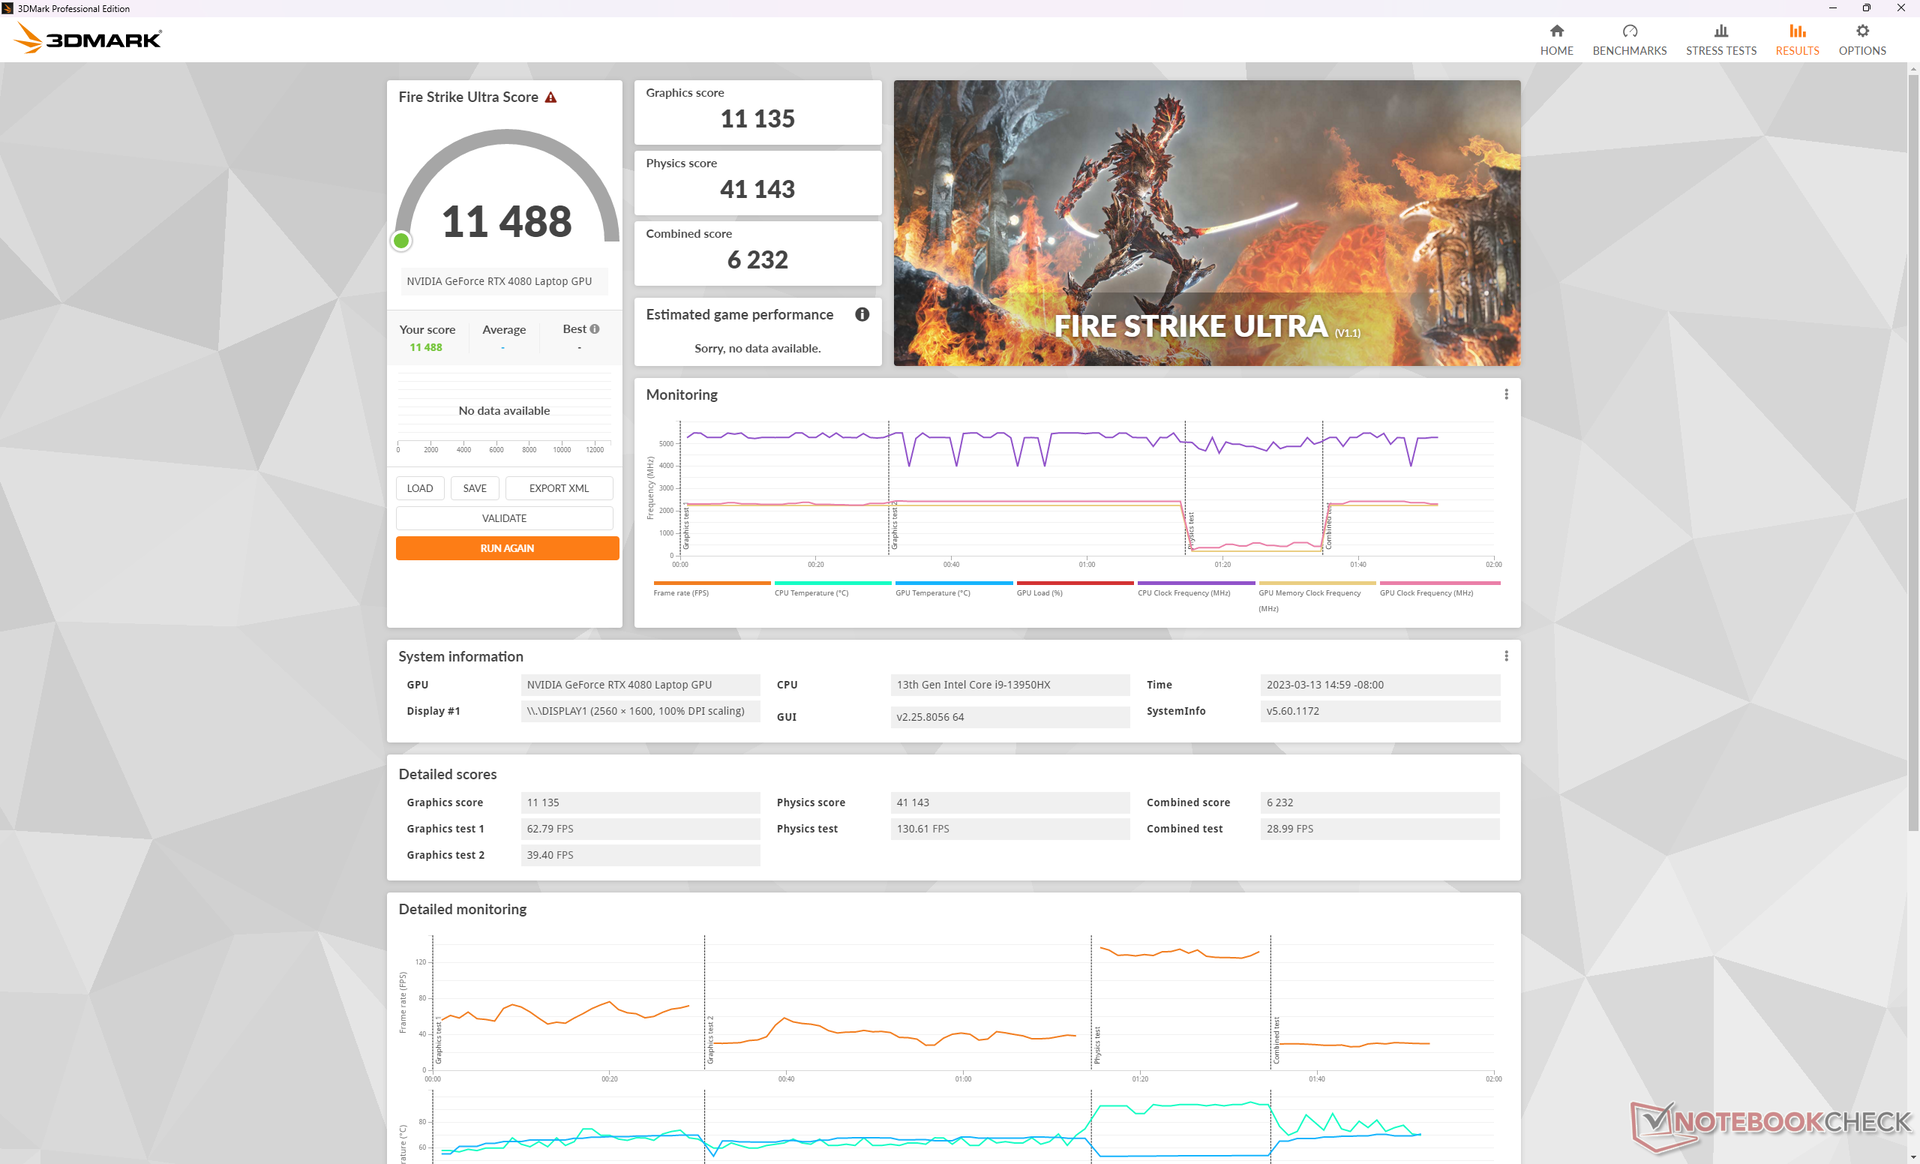
O funcionamento com baterias limita o desempenho esperado. Fire Strike em baterias retornaria pontuações de Física e Gráficos de apenas 18881 e 22232 pontos, respectivamente, em comparação com 41339 e 42663 pontos quando na rede elétrica.
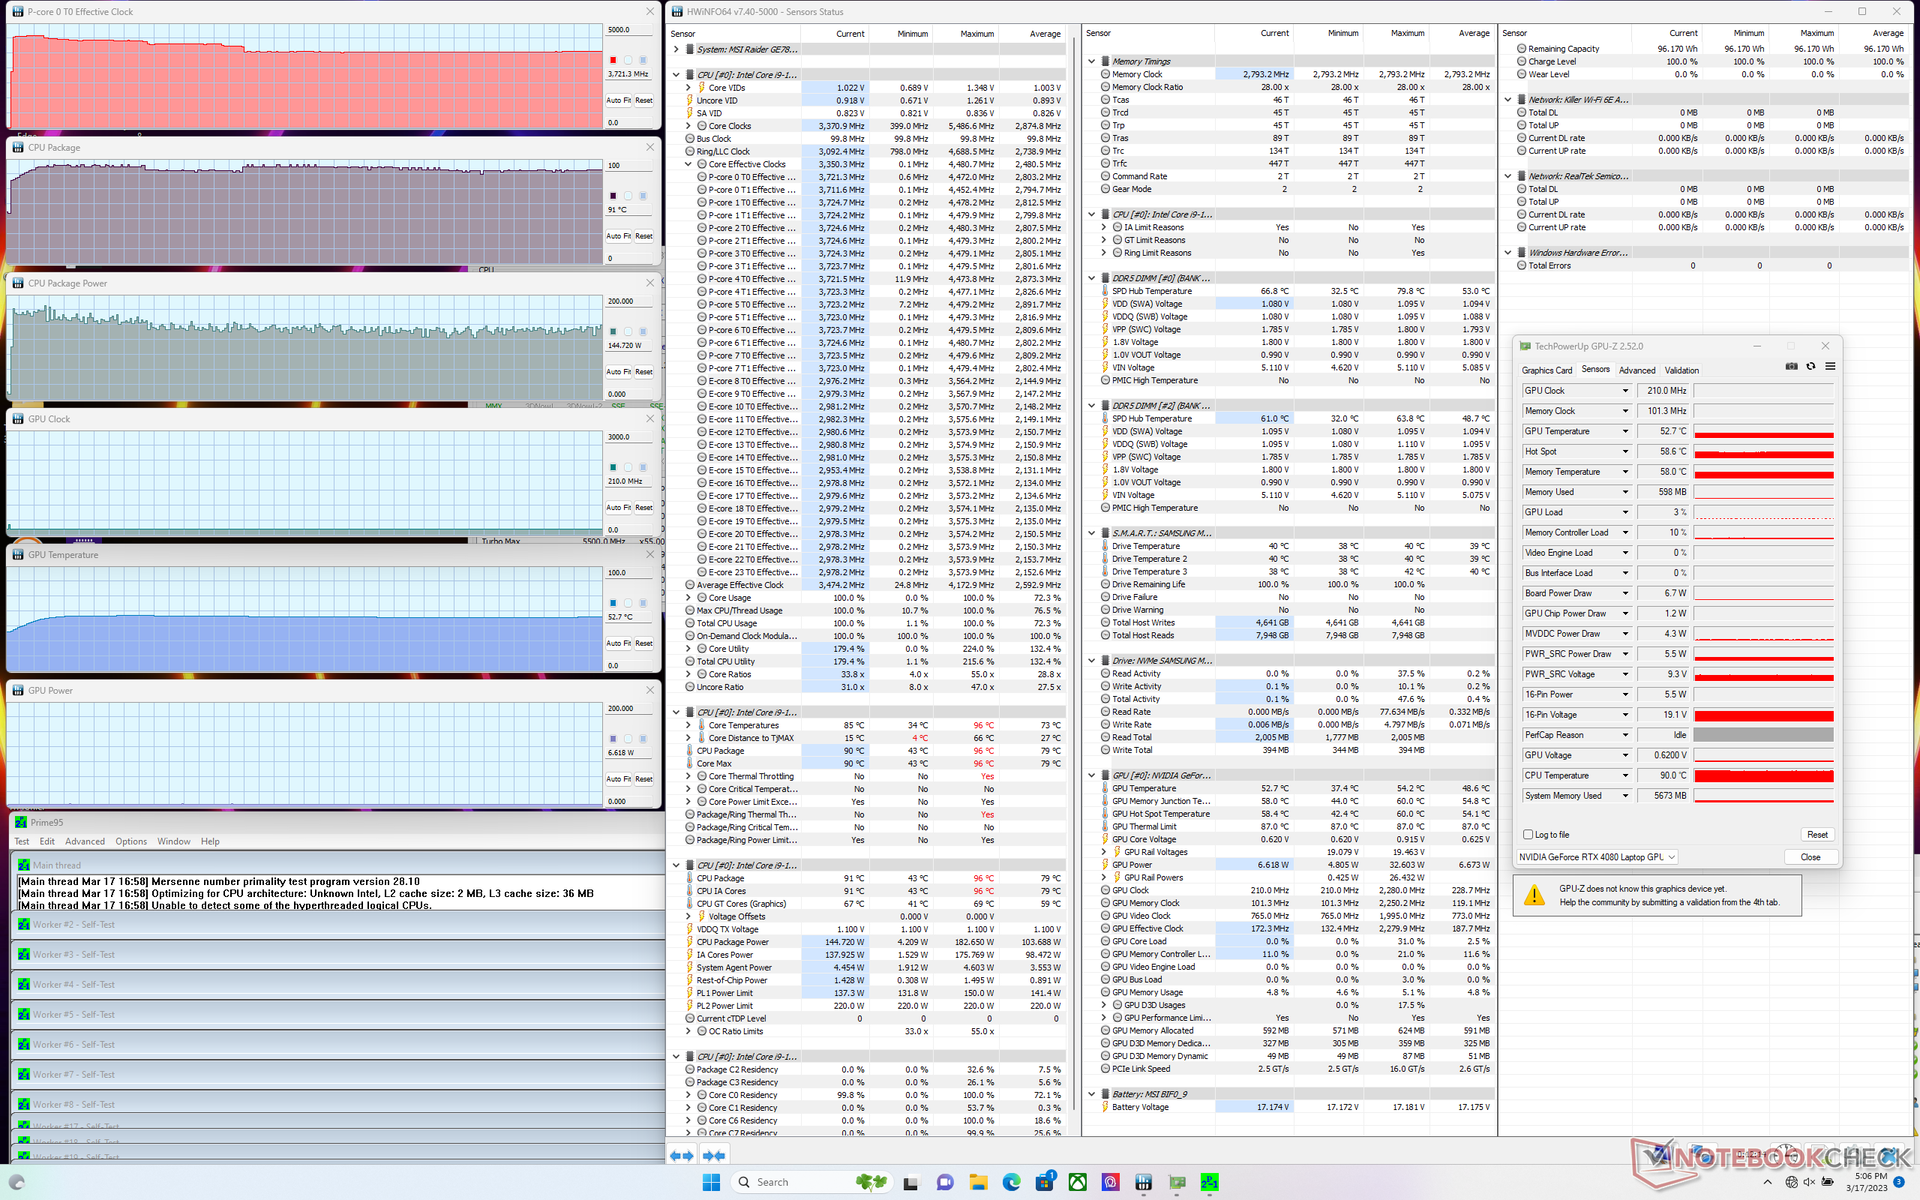
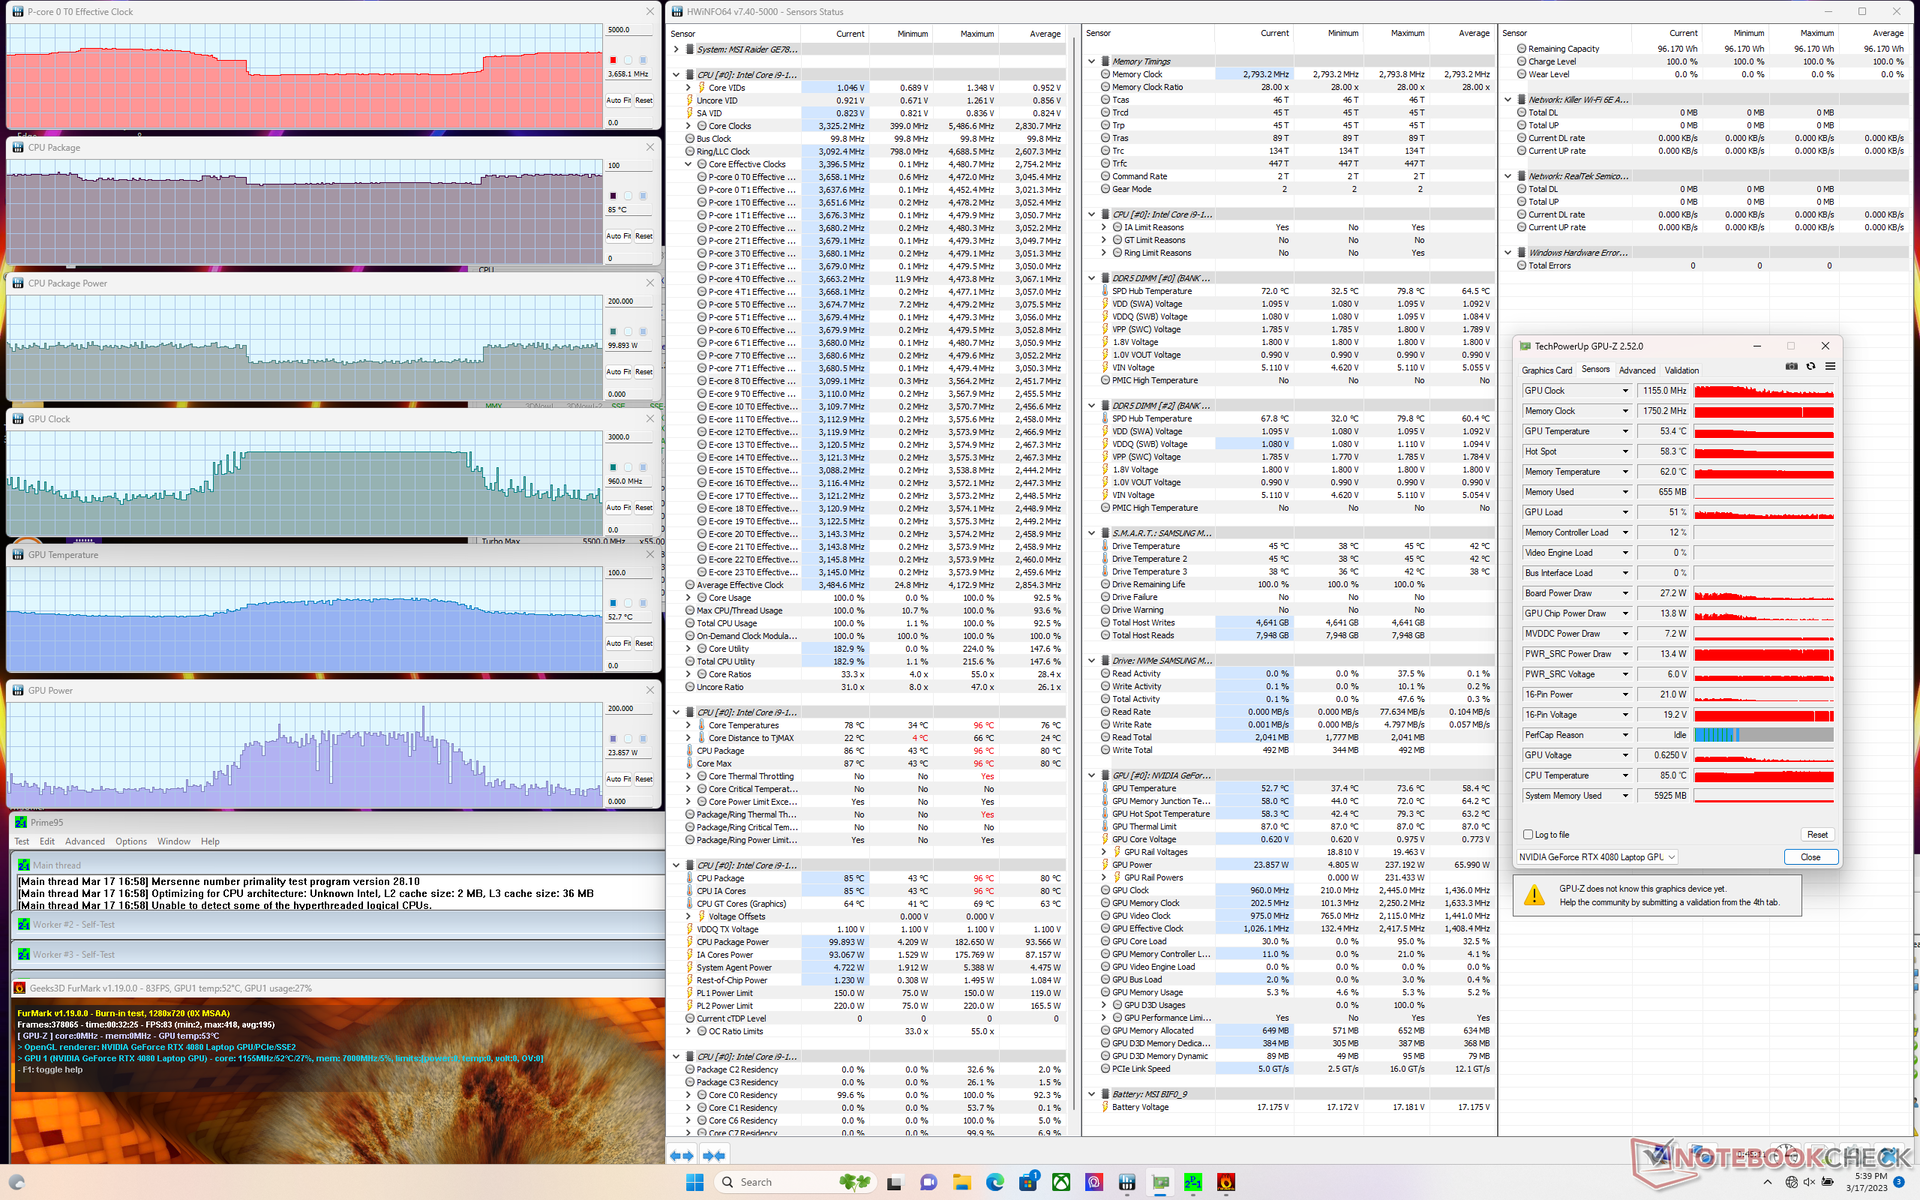
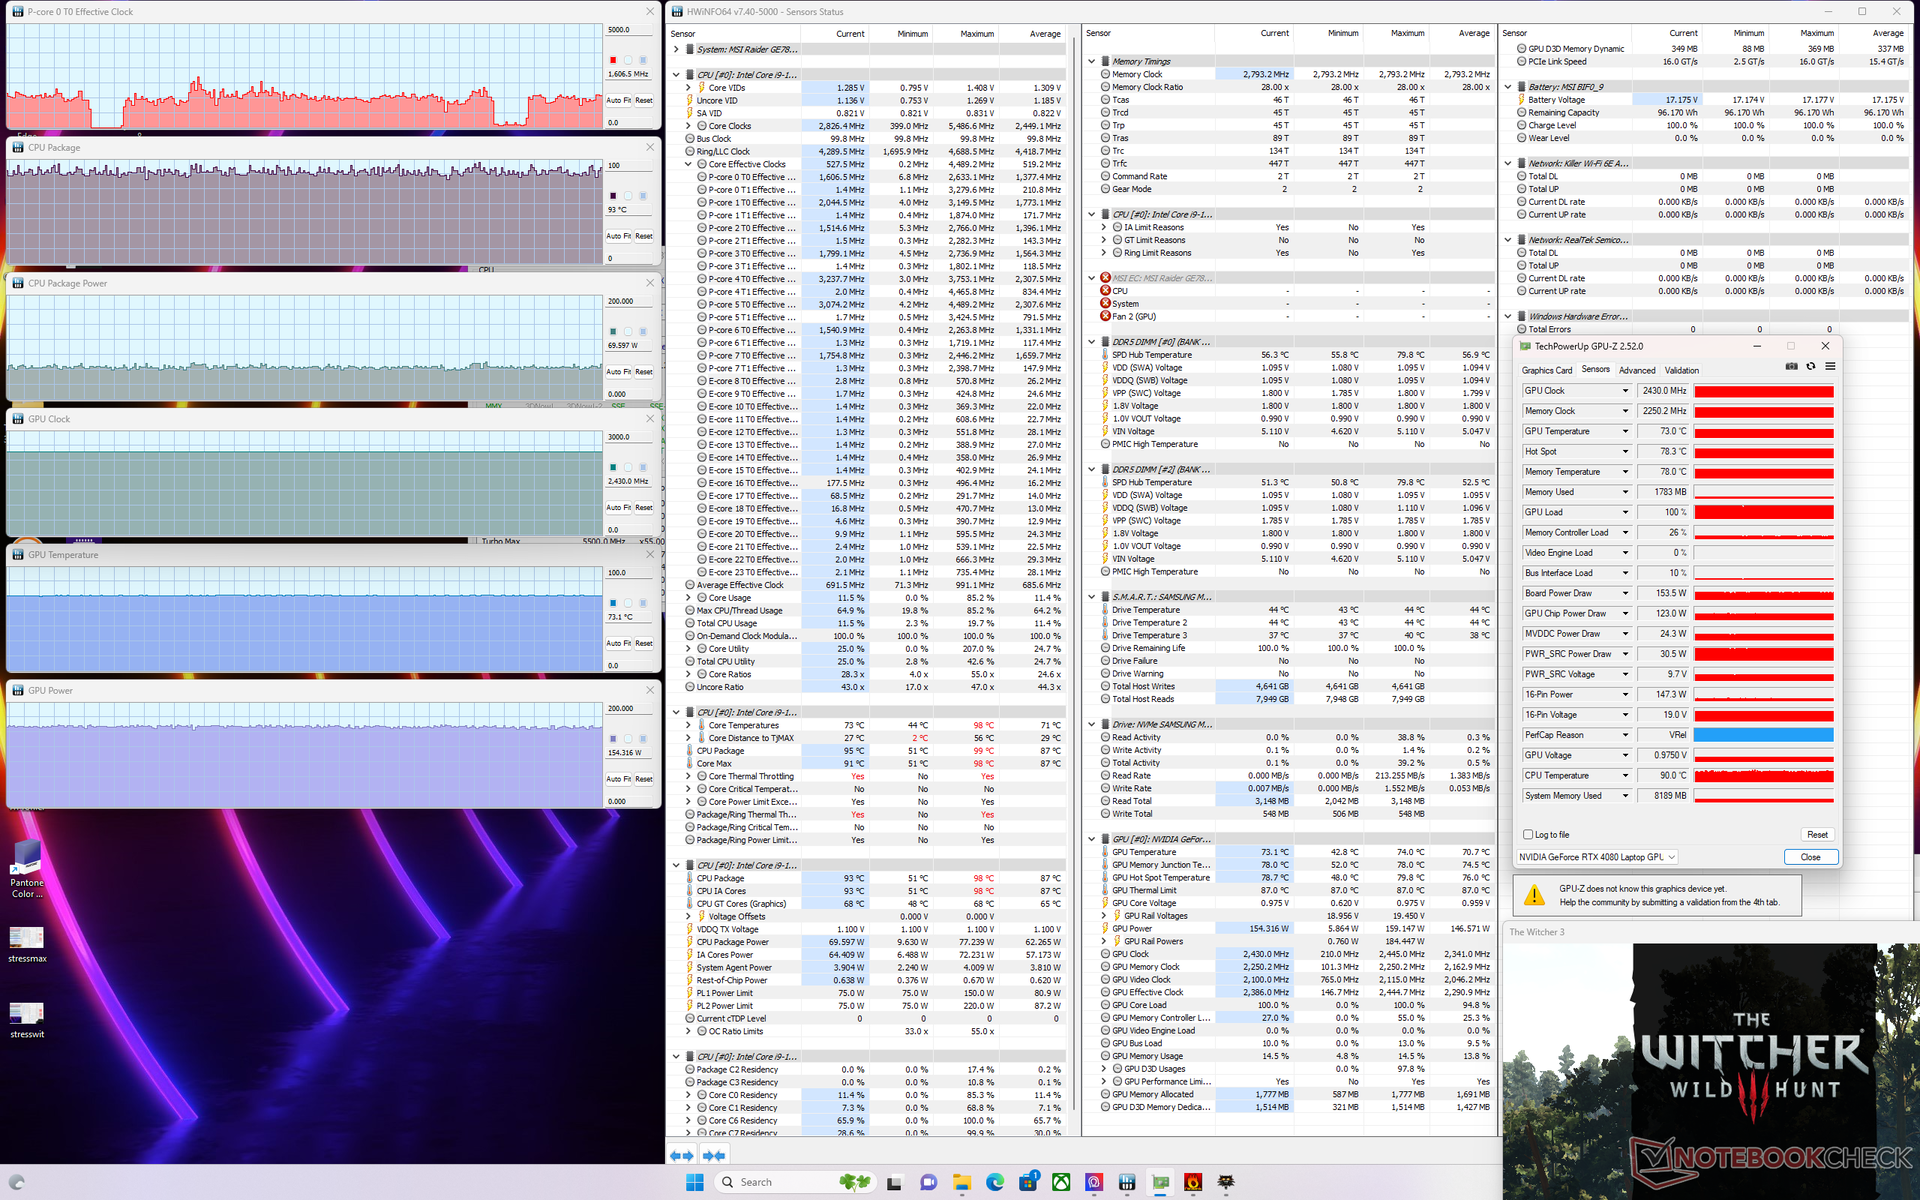
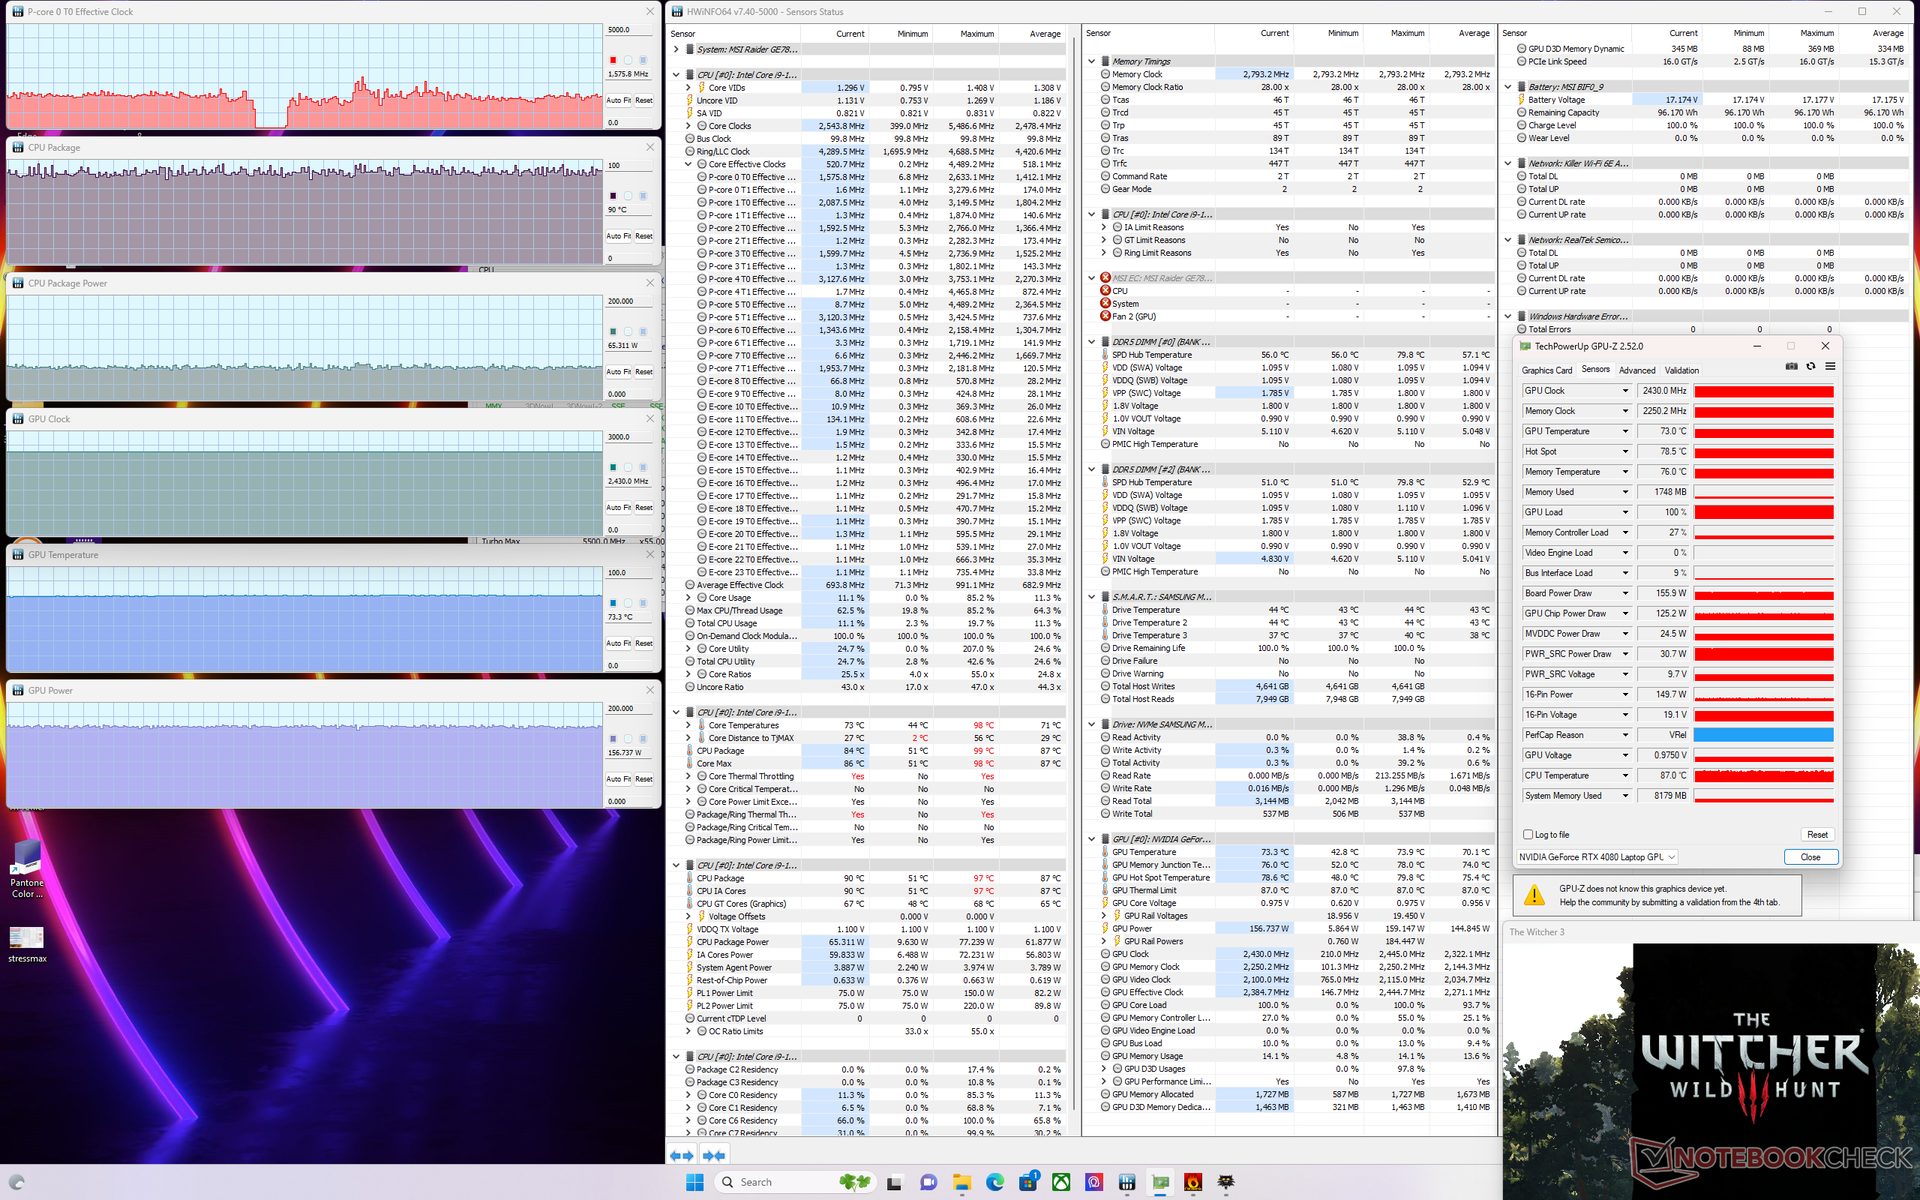
| Relógio CPU (GHz) | Relógio GPU (MHz) | Temperatura média da CPU (°C) | Temperatura média da GPU (°C) | |
| System Idle | -- | -- | 45 | 37 |
| Prime95 Stress | 3.7 | -- | 91 | 53 |
| Prime95 + FurMark Stress | 2.4 - 3.7 | 960 - 2360 | 82 - 85 | 53 - 60 |
| Witcher 3 Stress | ~1.6 | 2430 | 93 | 73 |
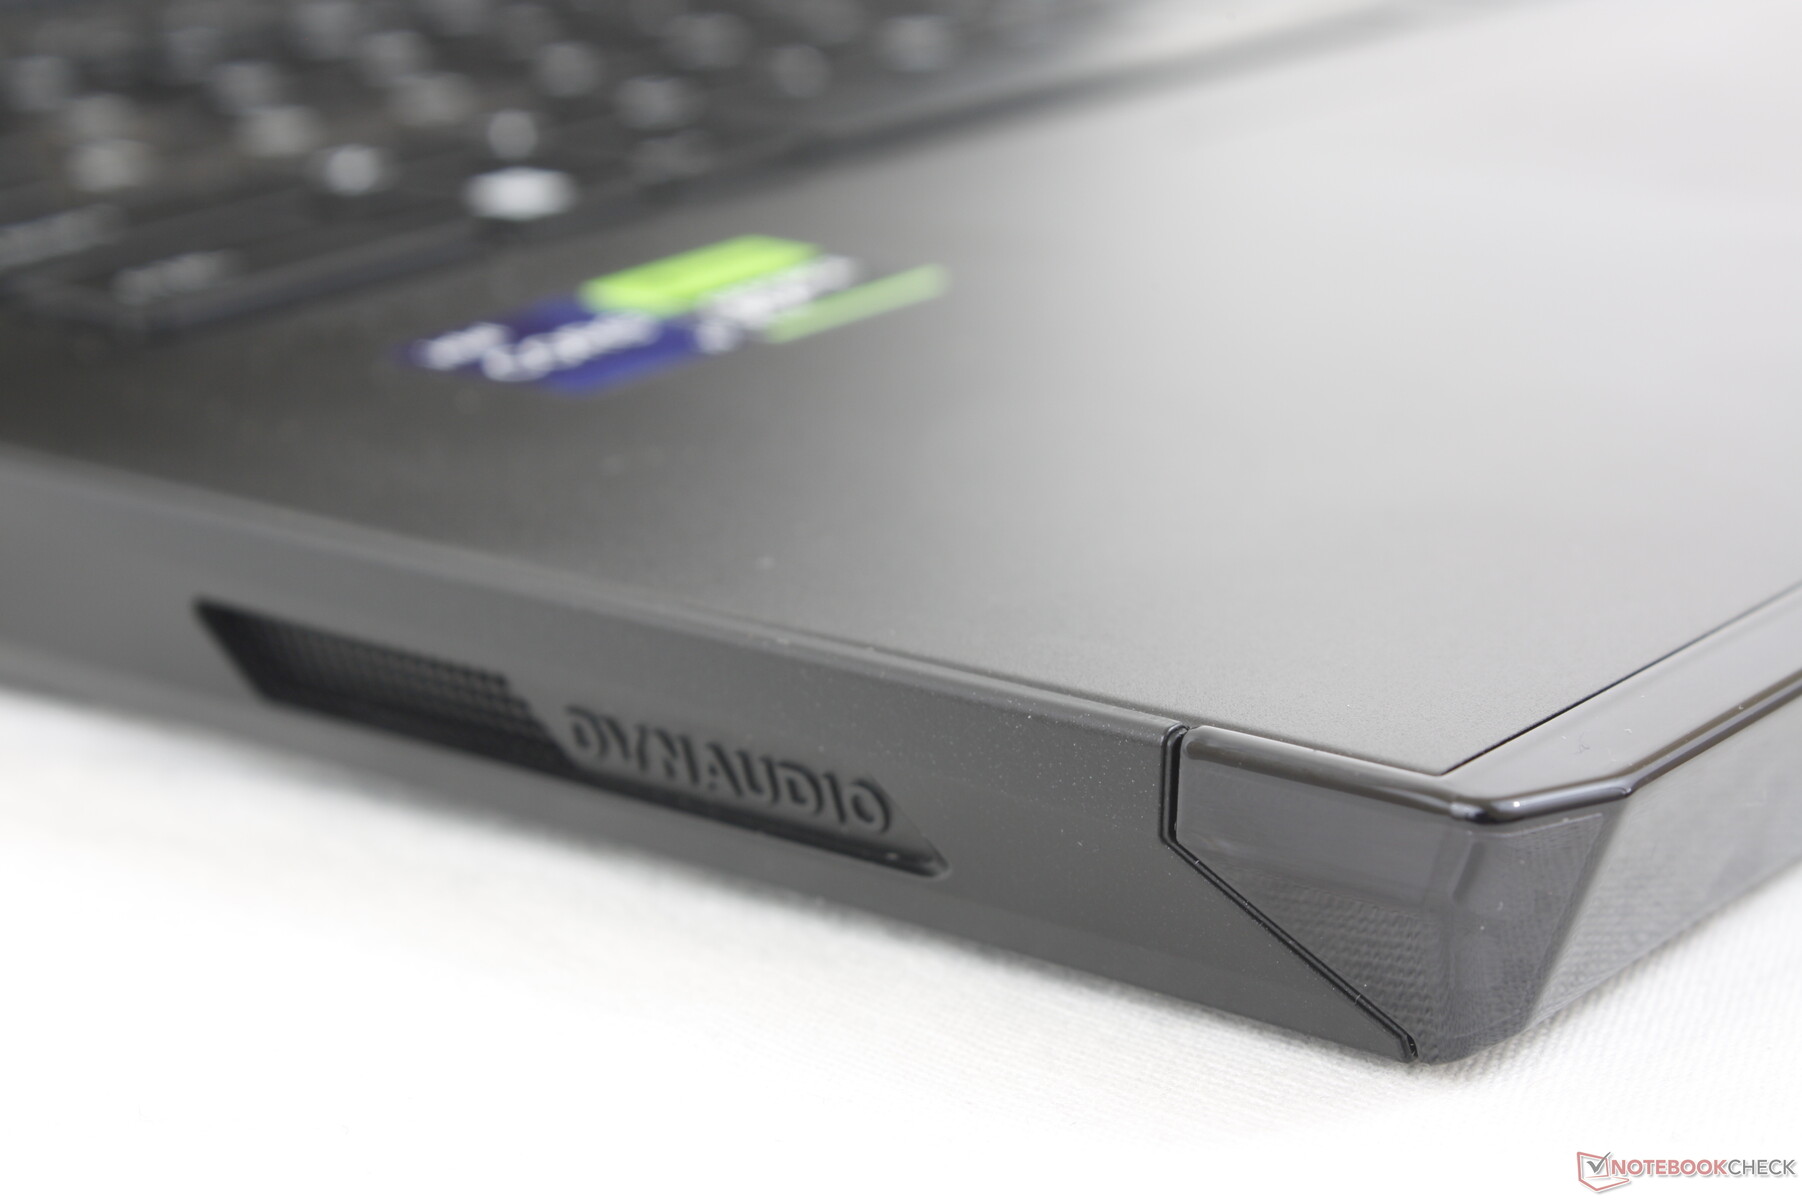
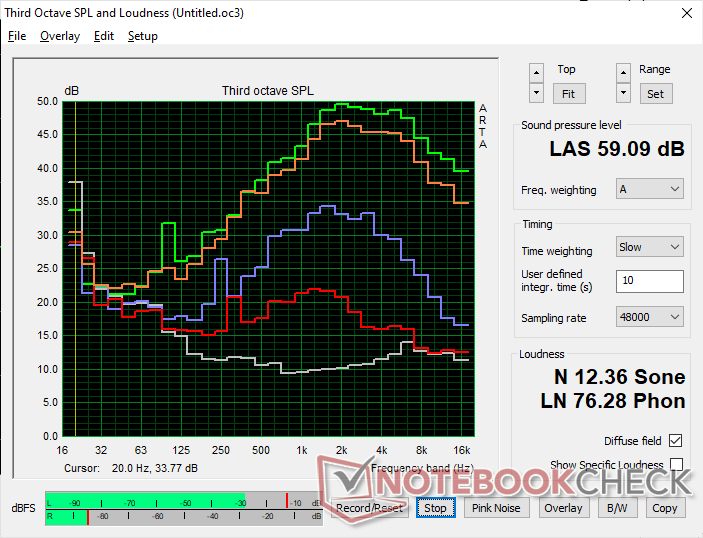
Oradores
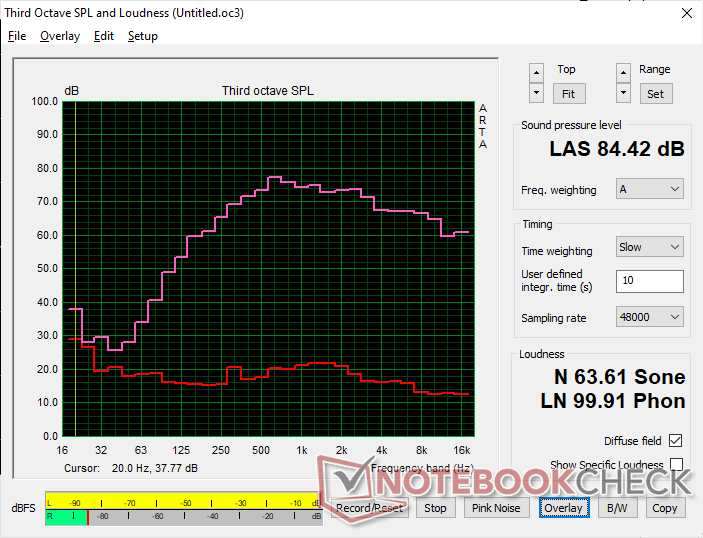
MSI GE78HX 13VH-070US análise de áudio
(+) | os alto-falantes podem tocar relativamente alto (###valor### dB)
Graves 100 - 315Hz
(±) | graves reduzidos - em média 8.3% menor que a mediana
(±) | a linearidade dos graves é média (9.3% delta para a frequência anterior)
Médios 400 - 2.000 Hz
(±) | médios mais altos - em média 6.8% maior que a mediana
(+) | médios são lineares (3.4% delta para frequência anterior)
Altos 2 - 16 kHz
(+) | agudos equilibrados - apenas 2% longe da mediana
(+) | os máximos são lineares (2.6% delta da frequência anterior)
Geral 100 - 16.000 Hz
(+) | o som geral é linear (12% diferença em relação à mediana)
Comparado com a mesma classe
» 12% de todos os dispositivos testados nesta classe foram melhores, 4% semelhantes, 84% piores
» O melhor teve um delta de 6%, a média foi 18%, o pior foi 132%
Comparado com todos os dispositivos testados
» 9% de todos os dispositivos testados foram melhores, 2% semelhantes, 88% piores
» O melhor teve um delta de 4%, a média foi 23%, o pior foi 134%
Apple MacBook Pro 16 2021 M1 Pro análise de áudio
(+) | os alto-falantes podem tocar relativamente alto (###valor### dB)
Graves 100 - 315Hz
(+) | bons graves - apenas 3.8% longe da mediana
(+) | o baixo é linear (5.2% delta para a frequência anterior)
Médios 400 - 2.000 Hz
(+) | médios equilibrados - apenas 1.3% longe da mediana
(+) | médios são lineares (2.1% delta para frequência anterior)
Altos 2 - 16 kHz
(+) | agudos equilibrados - apenas 1.9% longe da mediana
(+) | os máximos são lineares (2.7% delta da frequência anterior)
Geral 100 - 16.000 Hz
(+) | o som geral é linear (4.6% diferença em relação à mediana)
Comparado com a mesma classe
» 0% de todos os dispositivos testados nesta classe foram melhores, 0% semelhantes, 100% piores
» O melhor teve um delta de 5%, a média foi 17%, o pior foi 45%
Comparado com todos os dispositivos testados
» 0% de todos os dispositivos testados foram melhores, 0% semelhantes, 100% piores
» O melhor teve um delta de 4%, a média foi 23%, o pior foi 134%
Gerenciamento de energia - tijolo com alto consumo de energia
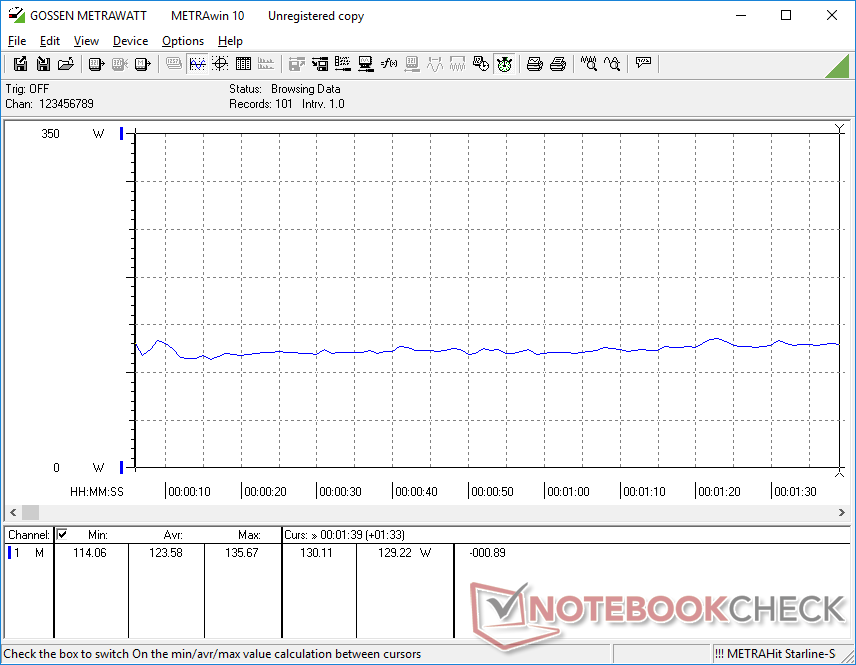
Consumo de energia
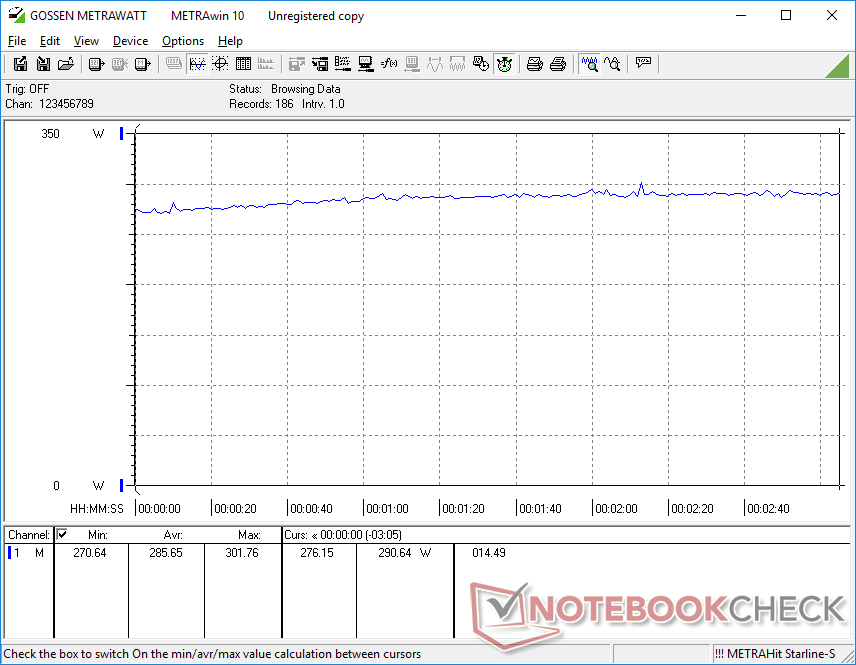
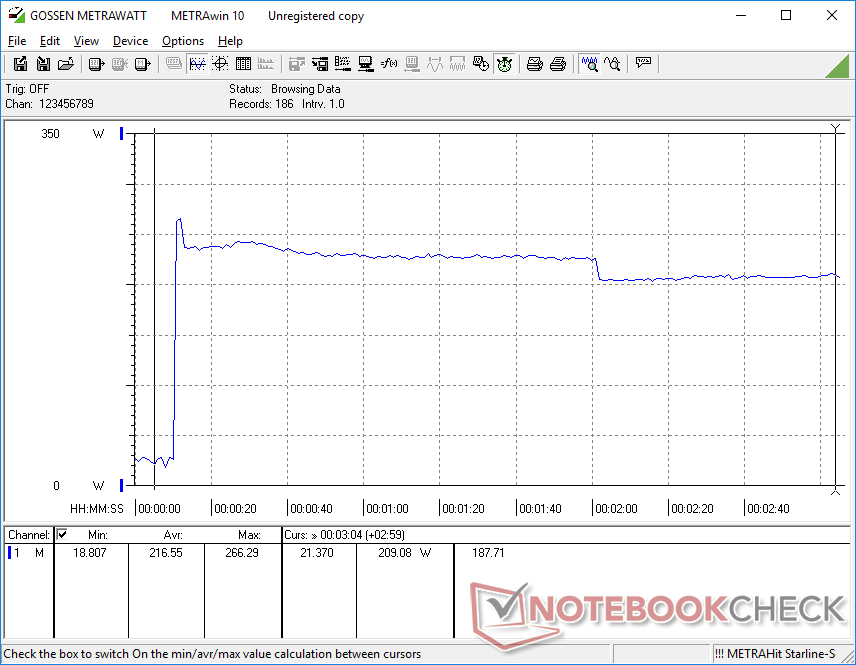
O consumo de energia é agora ainda maior do que em laptops rodando em CPUs Intel da 12ª geração anterior e GeForce 30 GPUs que já eram bastante altas para começar. Por exemplo, os jogos consumiriam 286 W em comparação com os 247 W do GE77. O desempenho da GPU por watt ainda é melhor na série GeForce 40, no entanto, pelo menos o aumento no consumo é relativamente menor em todas as coisas consideradas
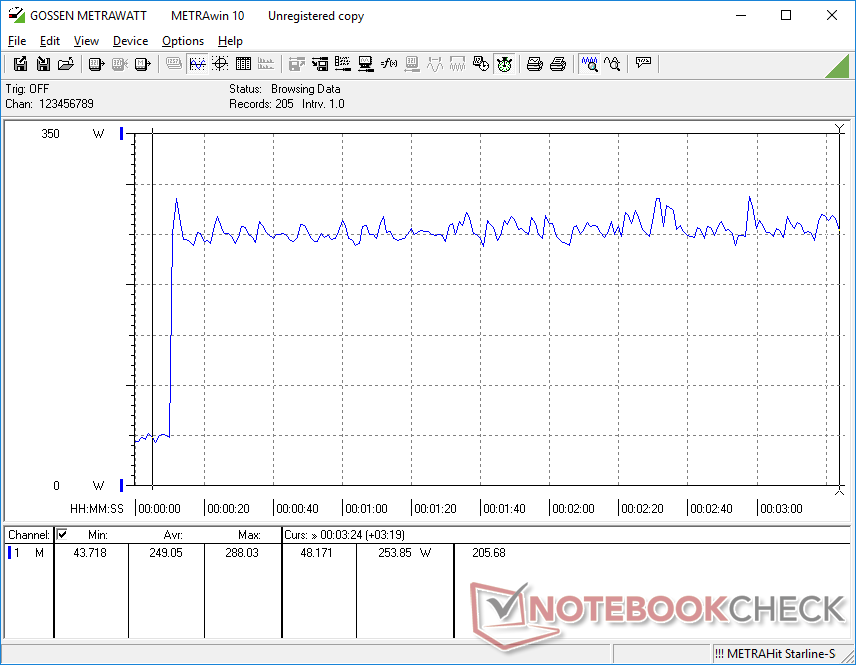
.A execução do Prime95 em um monitor externo consumiria 32% mais energia do que no GE77 quando sob cargas semelhantes para um aumento de 40% a 45% no desempenho do processador bruto. O desempenho da CPU por watt é, portanto, apenas um pouco maior quando se salta entre a série Core-H do 12º gênero e do 13º gênero.
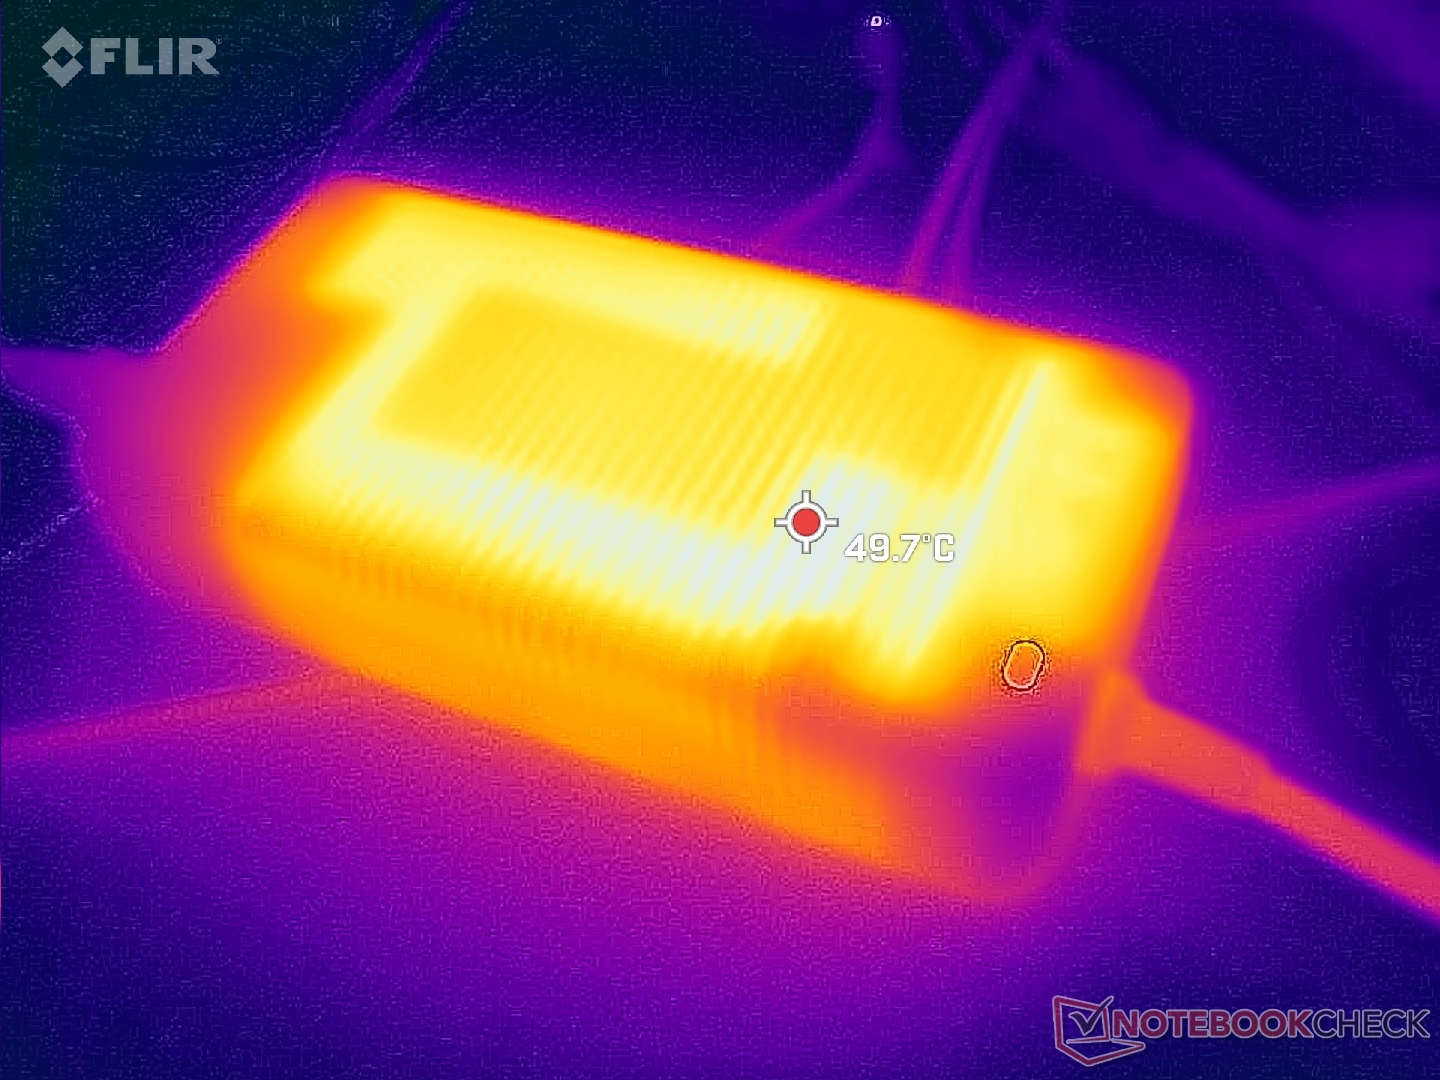
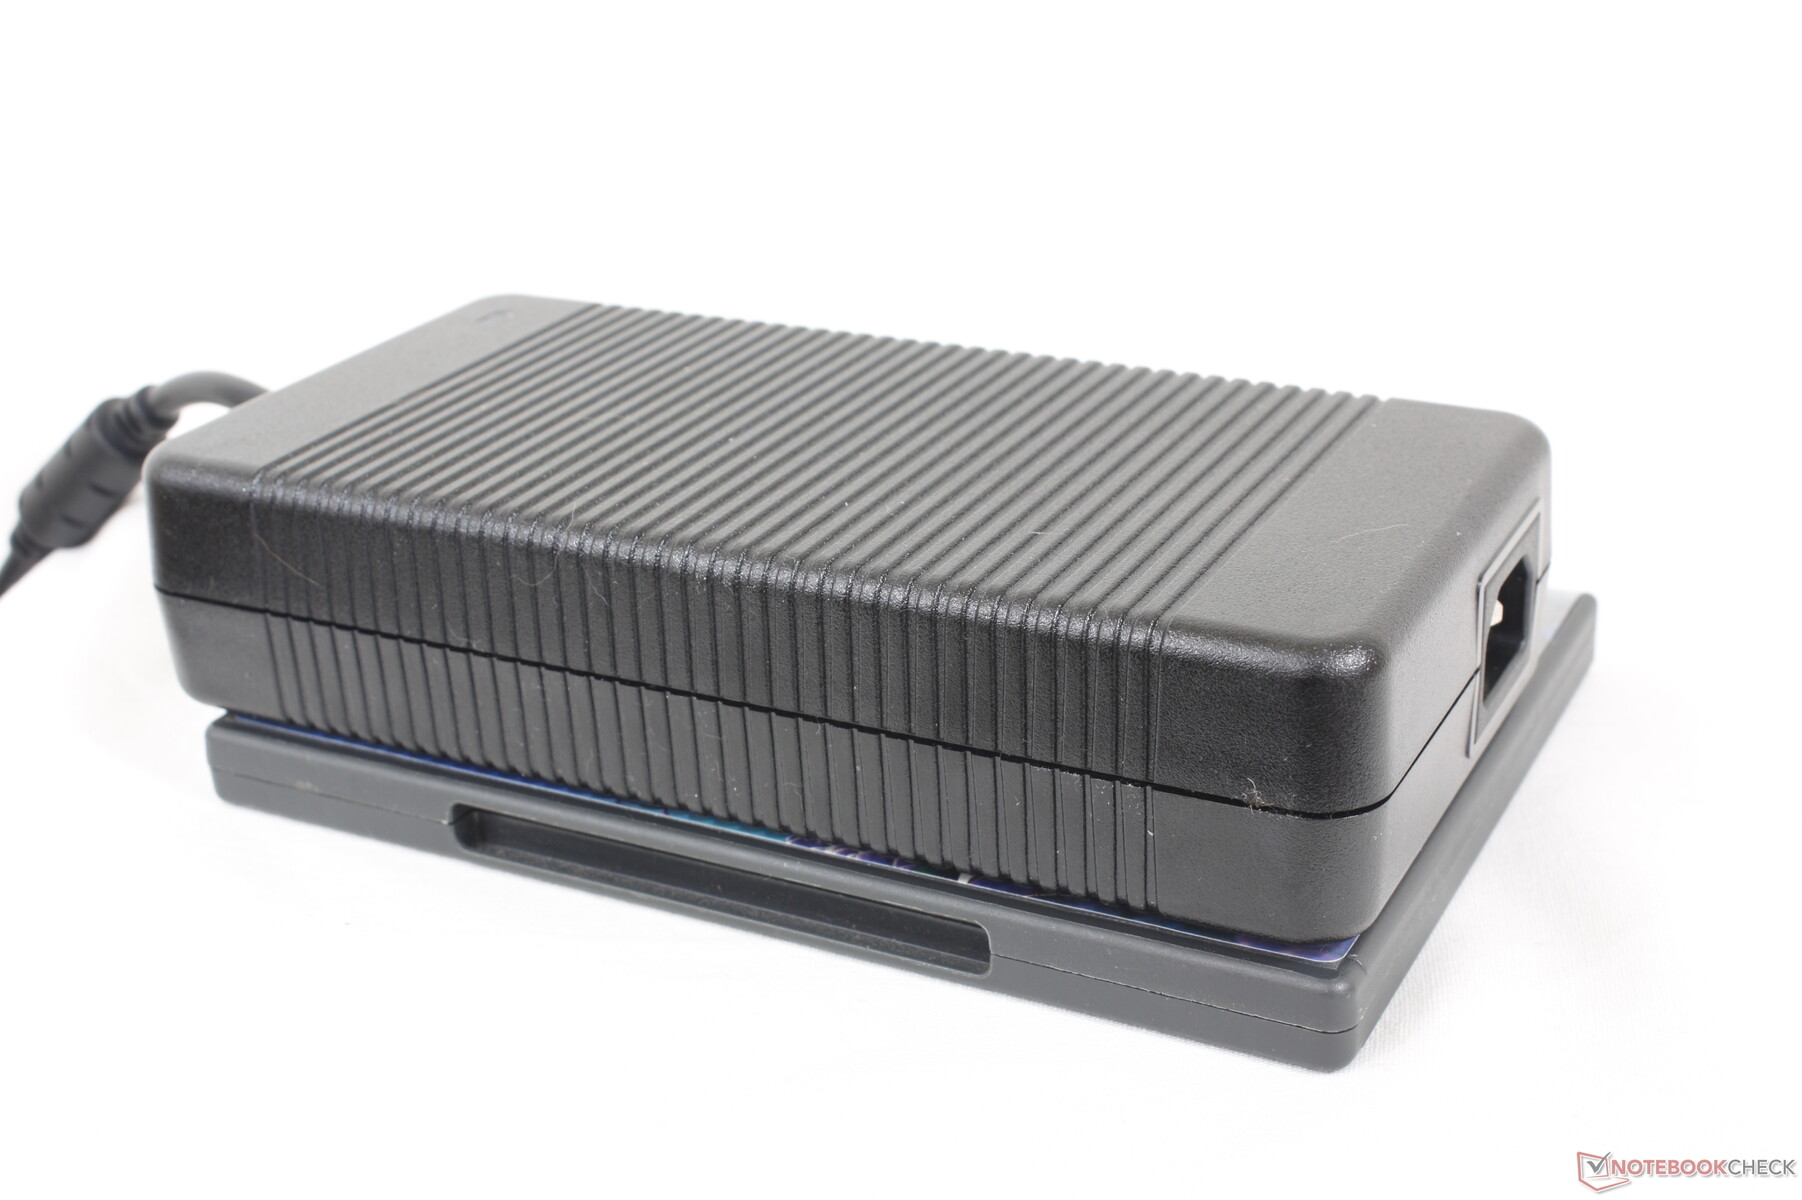
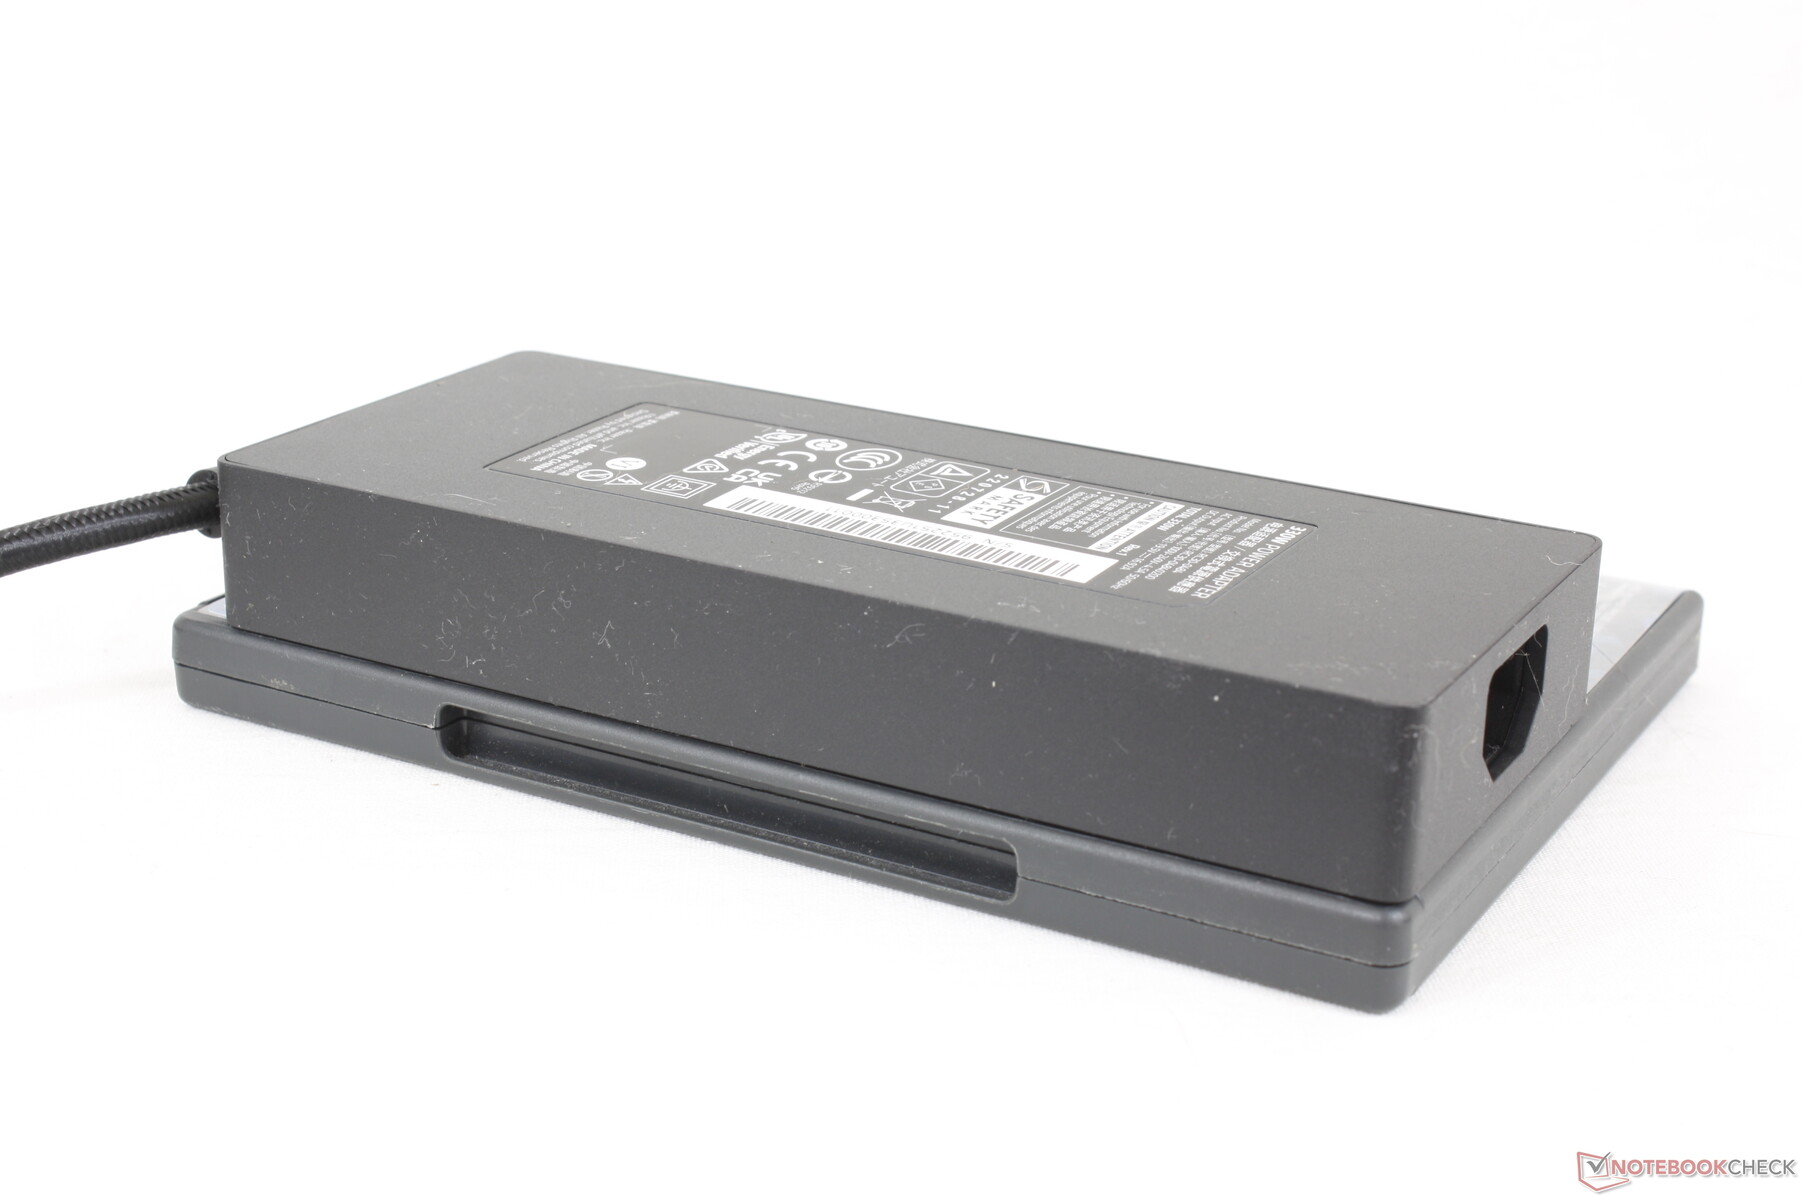
Somos capazes de registrar um consumo máximo temporário de 288 W do adaptador CA volumoso (~19,9 x 9,8 x 4,2 cm) de 330 W quando a CPU e a GPU estão sob estresse sob Prime95 e FurMark simultaneamente. Ao contrário da Razer, a MSI ainda não migrou para o carregamento GaN e por isso seu tijolo de 330 W de potência é visivelmente maior e mais pesado do que a solução 330 W Razer.
| desligado | |
| Ocioso | |
| Carga |
|
Key:
min: | |
| MSI GE78HX 13VH-070US i9-13950HX, GeForce RTX 4080 Laptop GPU, Samsung PM9A1 MZVL22T0HBLB, IPS, 2560x1600, 17" | Eluktronics Mech-17 GP2 i9-13900HX, GeForce RTX 4090 Laptop GPU, Samsung PM9A1 MZVL21T0HCLR, IPS, 2560x1600, 17" | Asus ROG Strix G17 G713PI R9 7945HX, GeForce RTX 4070 Laptop GPU, WD PC SN560 SDDPNQE-1T00, IPS, 2560x1440, 17.3" | MSI Titan GT77 HX 13VI i9-13950HX, GeForce RTX 4090 Laptop GPU, Samsung PM9A1 MZVL22T0HBLB, Mini-LED, 3840x2160, 17.3" | MSI Raider GE77 HX 12UHS i9-12900HX, GeForce RTX 3080 Ti Laptop GPU, Samsung PM9A1 MZVL22T0HBLB, IPS, 3840x2160, 17.3" | Razer Blade 17 Early 2022 i9-12900H, GeForce RTX 3080 Ti Laptop GPU, Samsung PM9A1 MZVL21T0HCLR, IPS, 3840x2160, 17.3" | |
|---|---|---|---|---|---|---|
| Power Consumption | 1% | 15% | 2% | 5% | 6% | |
| Idle Minimum * (Watt) | 16.1 | 14 13% | 15 7% | 14 13% | 13 19% | 17 -6% |
| Idle Average * (Watt) | 24 | 19.3 20% | 20 17% | 21.6 10% | 19 21% | 23 4% |
| Idle Maximum * (Watt) | 34 | 36.8 -8% | 29 15% | 24.8 27% | 29 15% | 34 -0% |
| Load Average * (Watt) | 123.6 | 117.2 5% | 121 2% | 122.5 1% | 143 -16% | 120 3% |
| Witcher 3 ultra * (Watt) | 286 | 304 -6% | 179.8 37% | 265 7% | 247 14% | 229 20% |
| Load Maximum * (Watt) | 285.7 | 342.5 -20% | 246 14% | 418 -46% | 352 -23% | 243 15% |
* ... menor é melhor
Power Consumption Witcher 3 / Stresstest
Power Consumption external Monitor
Vida útil da bateria
Os tempos de execução são muito bons, considerando o hardware exigente no interior. Somos capazes de cronometrar em pouco mais de 6 horas de navegação WLAN no mundo real quando no perfil de potência Balanceado com o iGPU ativo. Concorrentes como aEluktronics Mech-17 GP2 ou Asus ROG Strix G17 G713PI duraria de uma a duas horas a menos, respectivamente, quando sob condições semelhantes.
O carregamento da capacidade vazia à plena leva cerca de 2,5 horas, o que é uma hora completa mais longa do que na maioria dos Ultrabooks. Embora a MSI diga que a carga PD é suportada, não podemos carregar nossa unidade de teste através de qualquer uma das três portas USB-C.
| MSI GE78HX 13VH-070US i9-13950HX, GeForce RTX 4080 Laptop GPU, 99 Wh | Eluktronics Mech-17 GP2 i9-13900HX, GeForce RTX 4090 Laptop GPU, 99 Wh | Asus ROG Strix G17 G713PI R9 7945HX, GeForce RTX 4070 Laptop GPU, 90 Wh | MSI Titan GT77 HX 13VI i9-13950HX, GeForce RTX 4090 Laptop GPU, 99.9 Wh | MSI Raider GE77 HX 12UHS i9-12900HX, GeForce RTX 3080 Ti Laptop GPU, 99.99 Wh | Razer Blade 17 Early 2022 i9-12900H, GeForce RTX 3080 Ti Laptop GPU, 82 Wh | |
|---|---|---|---|---|---|---|
| Duração da bateria | -16% | -32% | -10% | 19% | -9% | |
| Reader / Idle (h) | 7.3 | 9.8 34% | 7.1 -3% | |||
| WiFi v1.3 (h) | 6.1 | 5.1 -16% | 4.3 -30% | 5.3 -13% | 5.4 -11% | 3.8 -38% |
| Load (h) | 1.5 | 1 -33% | 1.4 -7% | 2 33% | 1.7 13% | |
| H.264 (h) | 2.8 | 6 | 6.5 | 4.8 | ||
| Witcher 3 ultra (h) | 1.1 |
Pro
Contra
Veredicto - Excelente aumento de desempenho ano após ano
Em termos de desempenho, o GE78 oferece um impulso significativo sobre o GE77 para um consumo de energia apenas ligeiramente maior. Você terá que obter as configurações RTX 4080 ou 4090 para ver as vantagens de desempenho, entretanto, já que o RTX 4070 está mais próximo em desempenho do RTX 3080 Ti mais antigo.
Em termos de design, alguns usuários podem preferir o visual minimalista 16:9 do antigo GE77 ao invés do GE78 retro-inspirado 16:10 e vice versa. Não chamaríamos um melhor do que o outro em termos de estética, mas daremos a vantagem ao GE78 por suas dobradiças mais fortes e teclas e clickpad maiores.
O MSI GE78 é um grande passo adiante sobre o GE77 em termos de desempenho. Algumas de suas características, no entanto, estão faltando contra a concorrência, especialmente quando se considera a faixa de preços >$3000 USD.
Esperamos que os problemas que experimentamos em nossa unidade não sejam generalizados nas unidades de varejo. O congelamento ao acordar do sono, sangramento leve e problemas de latência DPC são problemas que não deveriam estar presentes em um modelo caro como o GE78. A falta de G-Sync, Advanced Optimus e GaN mais fino também são lamentáveis quando alternativas como o Série Razer Blade agora os oferecem por padrão.
Preço e Disponibilidade
MSI GE78HX 13VH-070US
- 03/21/2023 v7 (old)
Allen Ngo
Transparência
A seleção dos dispositivos a serem analisados é feita pela nossa equipe editorial. A amostra de teste foi fornecida ao autor como empréstimo pelo fabricante ou varejista para fins desta revisão. O credor não teve influência nesta revisão, nem o fabricante recebeu uma cópia desta revisão antes da publicação. Não houve obrigação de publicar esta revisão. Como empresa de mídia independente, a Notebookcheck não está sujeita à autoridade de fabricantes, varejistas ou editores.
É assim que o Notebookcheck está testando
Todos os anos, o Notebookcheck analisa de forma independente centenas de laptops e smartphones usando procedimentos padronizados para garantir que todos os resultados sejam comparáveis. Desenvolvemos continuamente nossos métodos de teste há cerca de 20 anos e definimos padrões da indústria no processo. Em nossos laboratórios de teste, equipamentos de medição de alta qualidade são utilizados por técnicos e editores experientes. Esses testes envolvem um processo de validação em vários estágios. Nosso complexo sistema de classificação é baseado em centenas de medições e benchmarks bem fundamentados, o que mantém a objetividade.Price comparison

