Análise do laptop Lenovo Legion Pro 5 16IRX8: Um alto valor de US$ 1600 para a GeForce RTX 4060
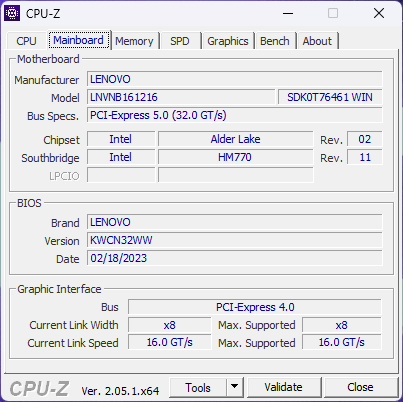
O Legion Pro 5 16 IRX8 (ou Legion Pro 5i 16 Gen 8) é o sucessor do 2022 Legion Pro 5i 16 Gen 7. Ele apresenta várias mudanças, incluindo uma revisão do chassi com CPU Intel Raptor Lake-H de 13ª geração e opções de GPU Nvidia Ada Lovelace para substituir as antigas opções Alder Lake-H e Ampere de 12ª geração, respectivamente. É um modelo para jogos de nível médio superior que fica entre a série de jogos IdeaPad de nível básico e o carro-chefe Legion Série Pro 7.
Nossa unidade de teste específica é uma configuração intermediária com o Core i7-13700HX, GeForce RTX 4060 e tela IPS de 165 Hz por aproximadamente US$ 1400 a US$ 1700. SKUs inferiores e superiores estão disponíveis com o Core i5-12500HrTX 4050, RTX 4070 ou tela IPS de 240 Hz, mas todas as opções de tela no momento têm G-Sync e uma resolução nativa de 2560 x 1600.
Os concorrentes do Legion Pro 5 16 incluem outros laptops para jogos de 16 polegadas, como o Razer Blade 16,Asus ROG Zephyrus M16,Dell G16 7620ou Gigabyte Aero 16.
Mais análises da Lenovo:
Possíveis concorrentes em comparação
Avaliação | Data | Modelo | Peso | Altura | Size | Resolução | Preço |
|---|---|---|---|---|---|---|---|
| 87.9 % v7 (old) | 05/2023 | Lenovo Legion Pro 5 16IRX8 i7-13700HX, GeForce RTX 4060 Laptop GPU | 2.5 kg | 26.8 mm | 16.00" | 2560x1600 | |
| 87.8 % v7 (old) | 02/2023 | Asus ROG Zephyrus M16 GU603Z i9-12900H, GeForce RTX 3070 Ti Laptop GPU | 2.1 kg | 19.9 mm | 16.00" | 2560x1600 | |
| 91.2 % v7 (old) | 02/2023 | Razer Blade 16 Early 2023 i9-13950HX, GeForce RTX 4080 Laptop GPU | 2.4 kg | 21.99 mm | 16.00" | 2560x1600 | |
| 89.4 % v7 (old) | 02/2023 | Lenovo Legion Pro 7 16IRX8H i9-13900HX, GeForce RTX 4080 Laptop GPU | 2.7 kg | 26 mm | 16.00" | 2560x1600 | |
| 87.7 % v7 (old) | 10/2022 | Lenovo Legion 5 Pro 16ARH7H RTX 3070 Ti R7 6800H, GeForce RTX 3070 Ti Laptop GPU | 2.6 kg | 26.6 mm | 16.00" | 2560x1600 | |
| 89.3 % v7 (old) | 01/2023 | Lenovo Legion S7 16ARHA7 R9 6900HX, Radeon RX 6800S | 2.2 kg | 16.9 mm | 16.00" | 2560x1600 |
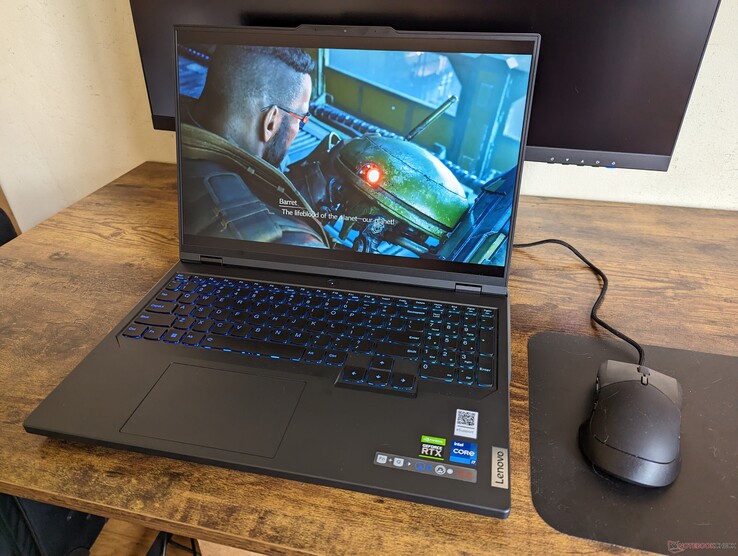
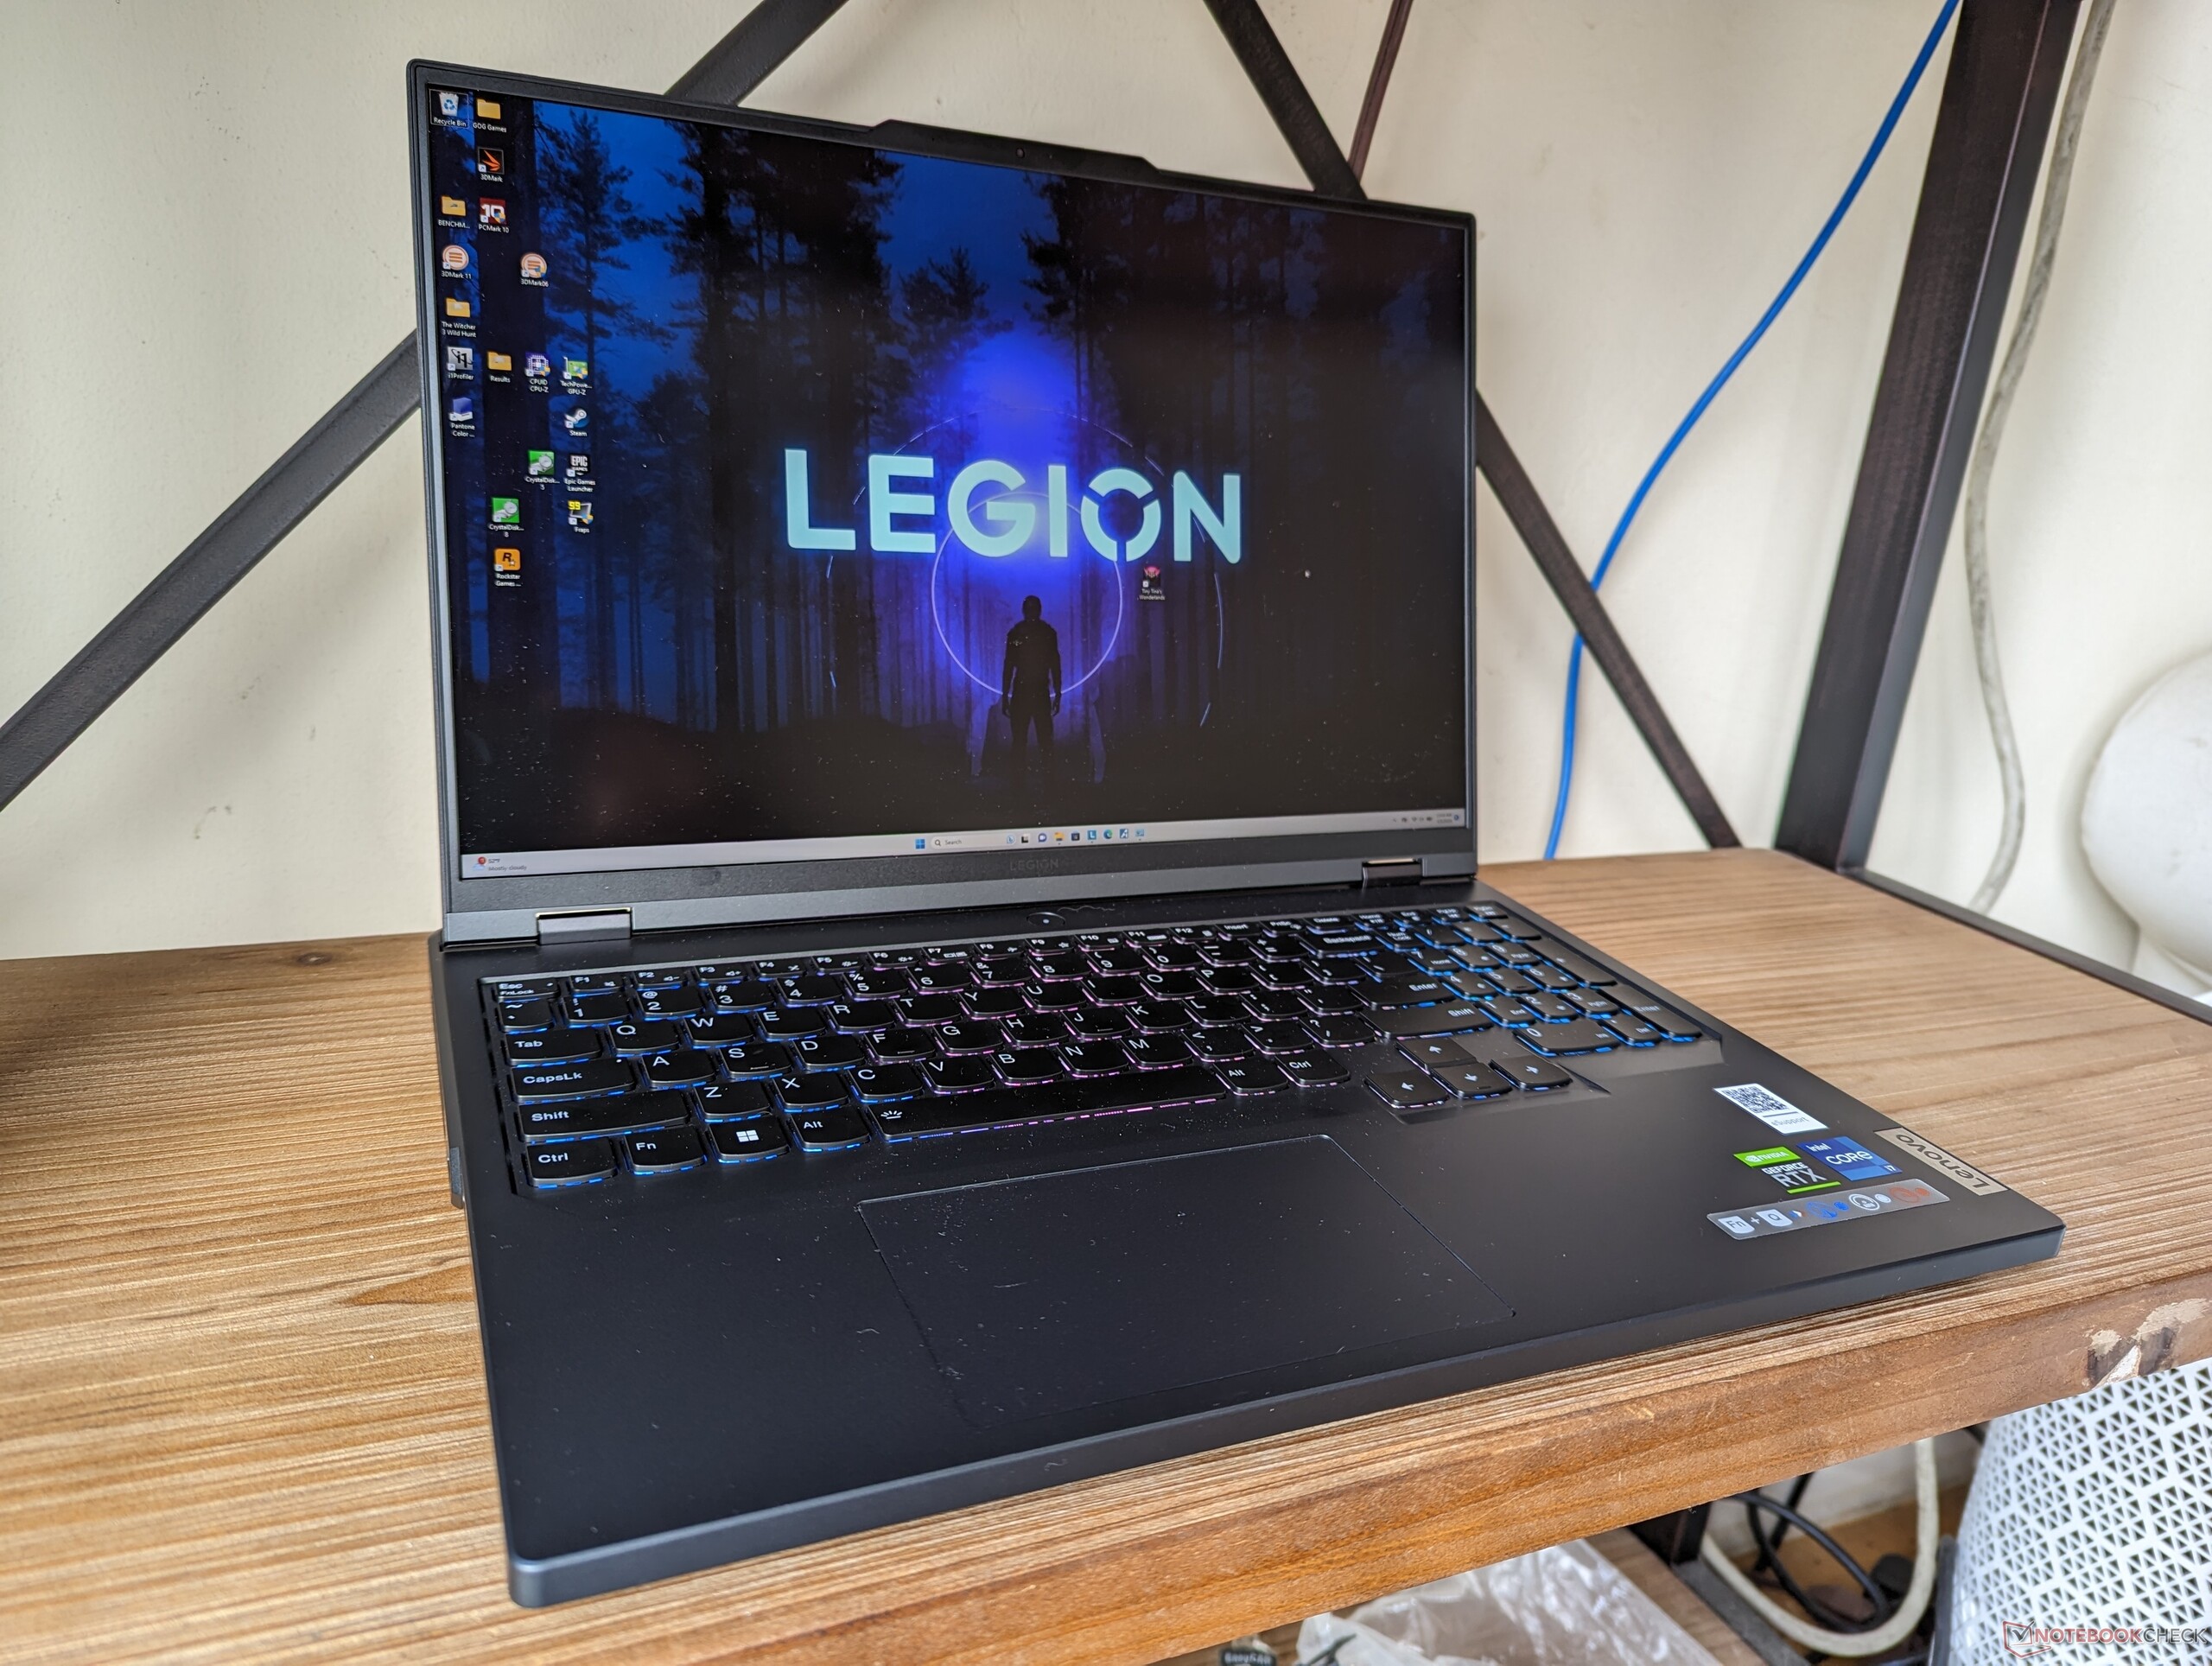
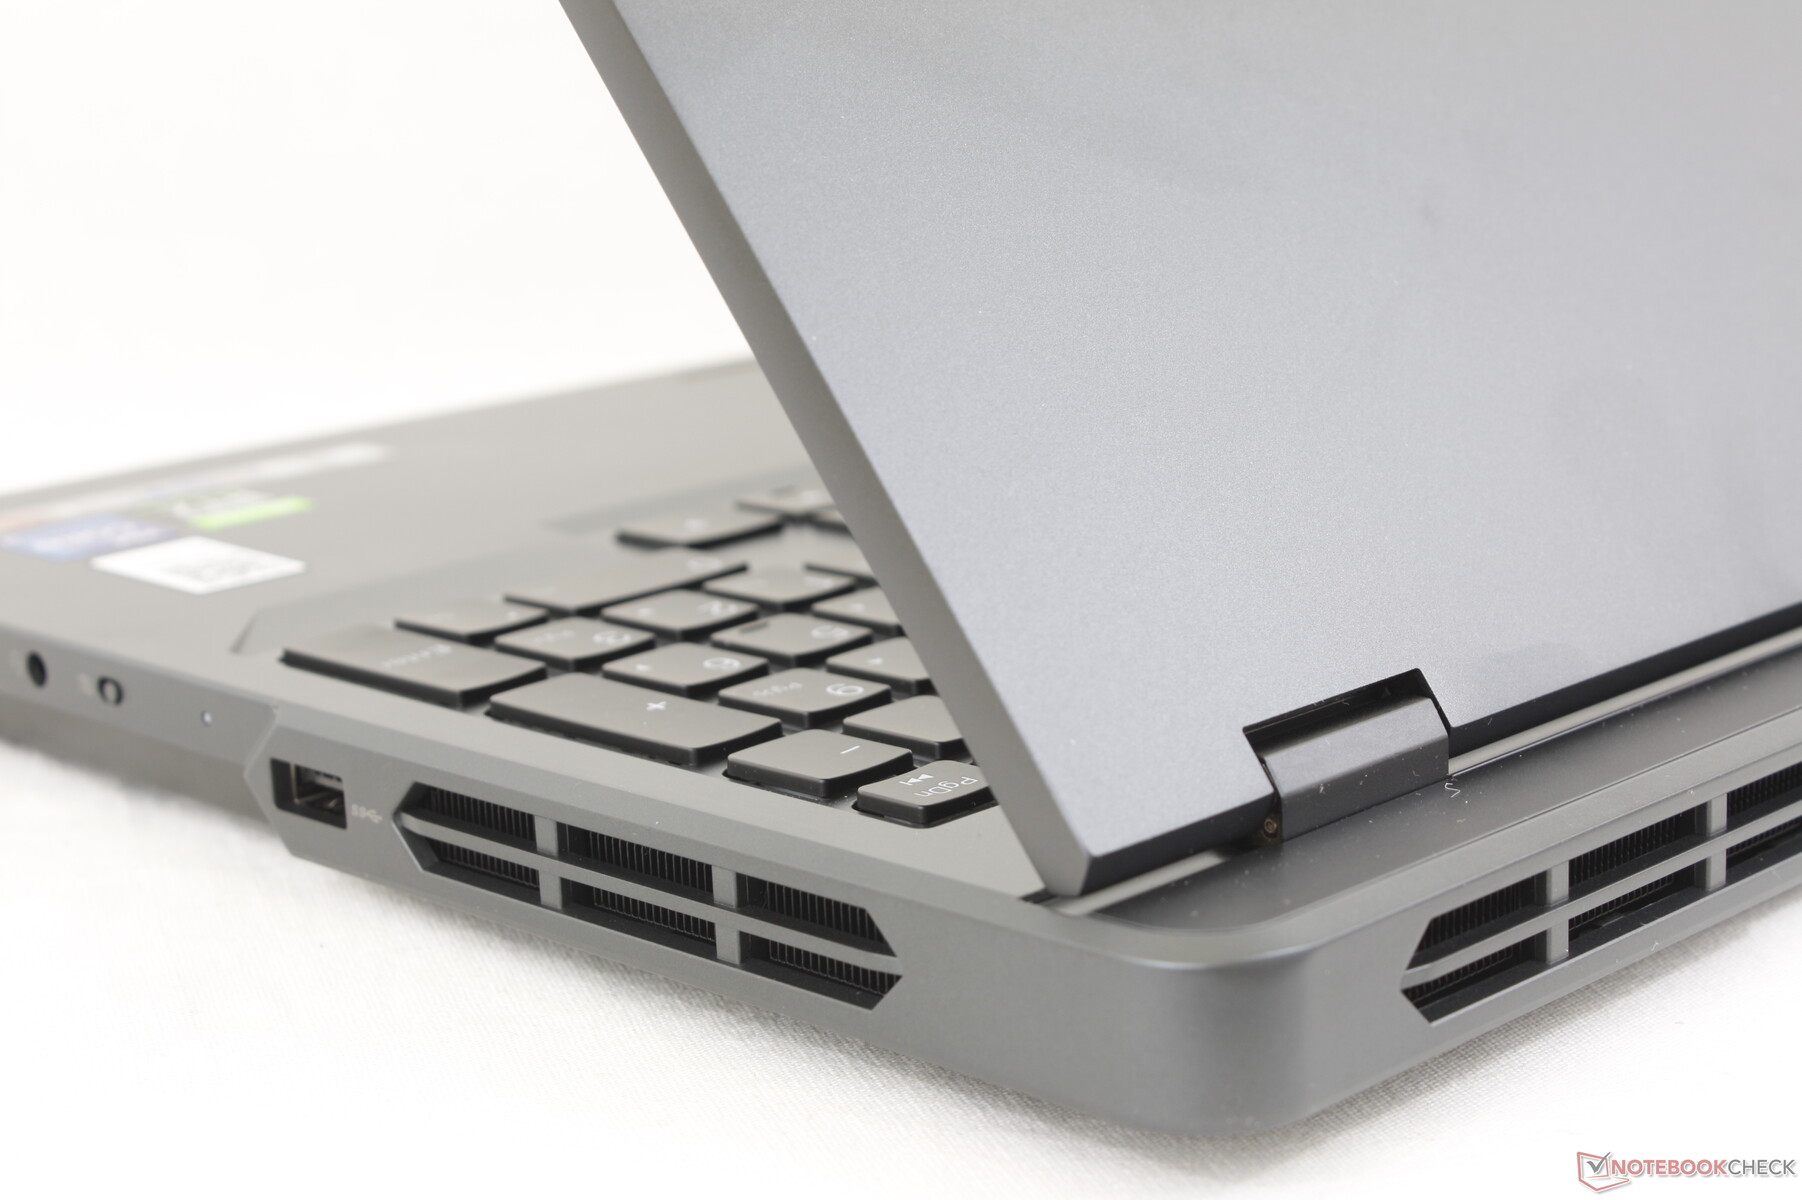
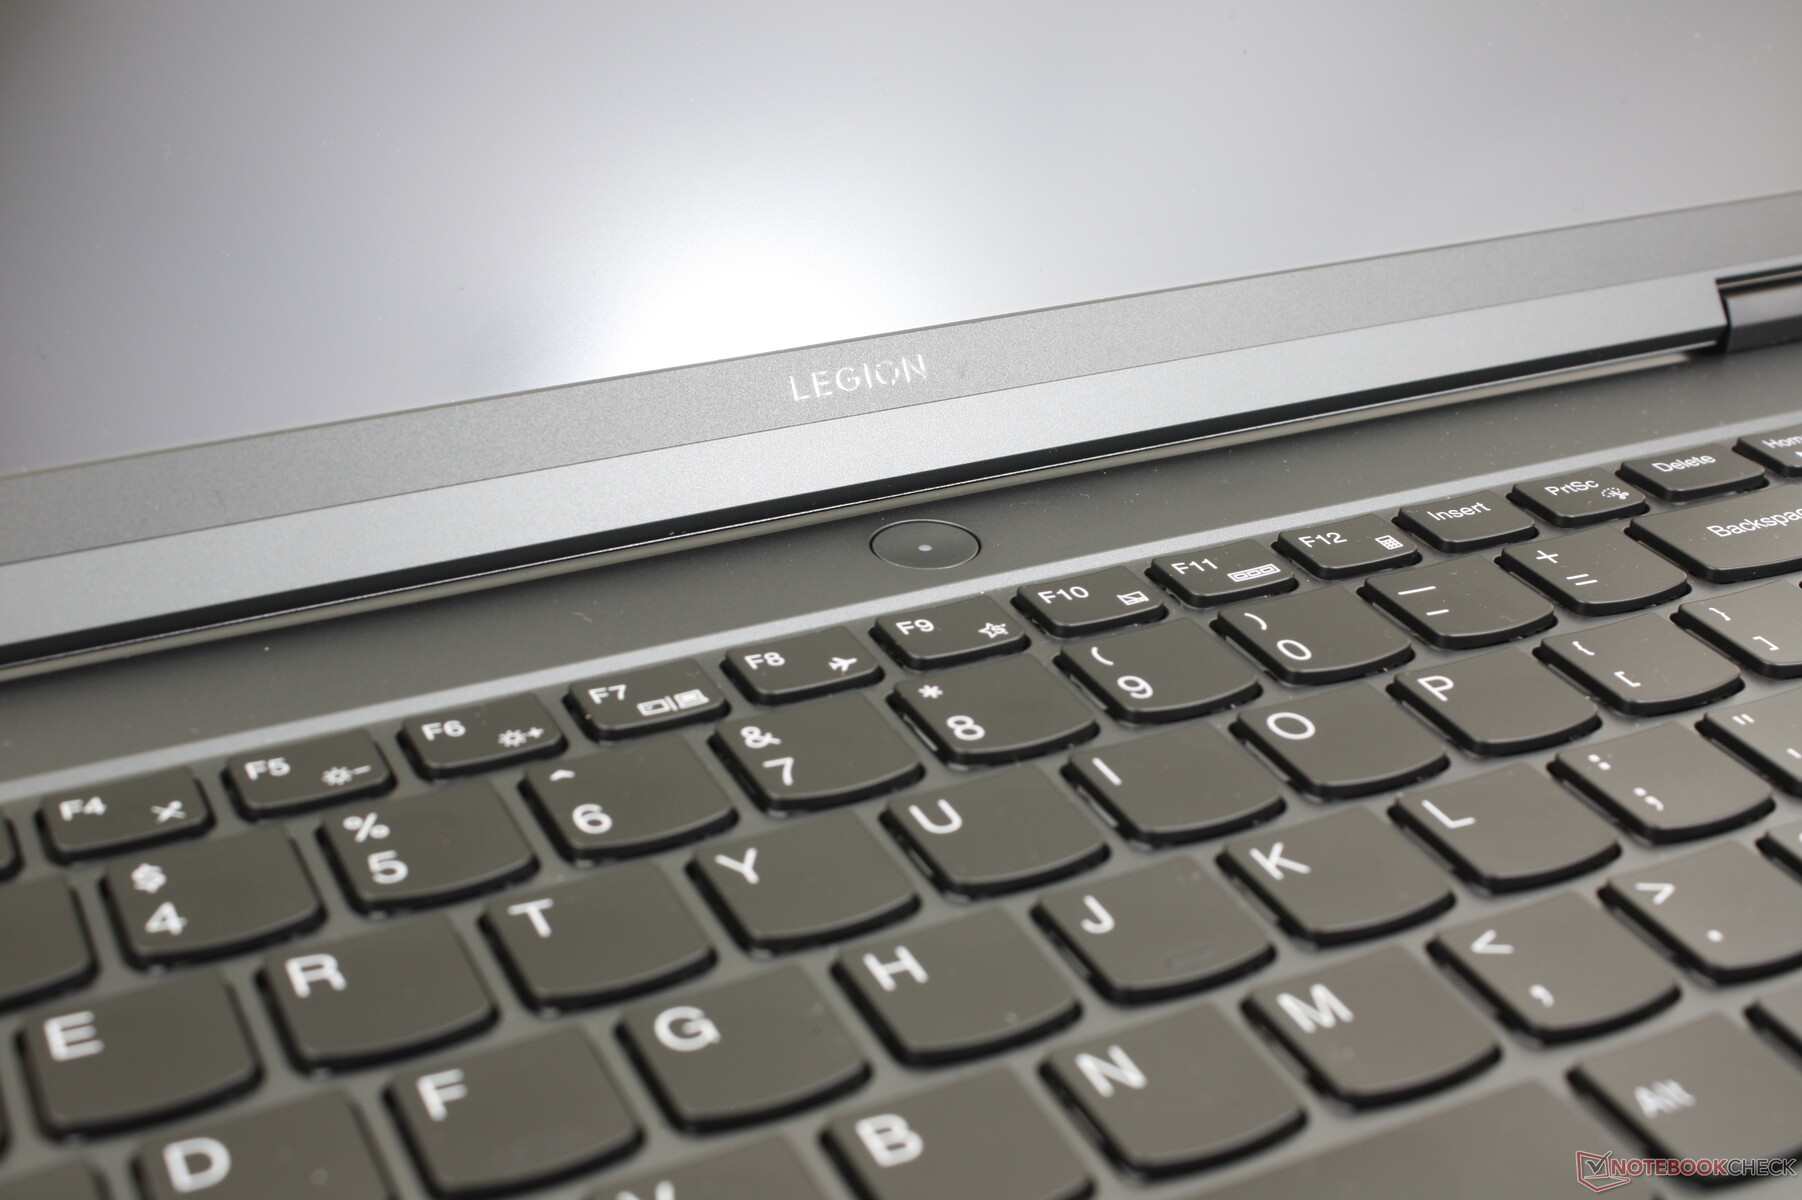
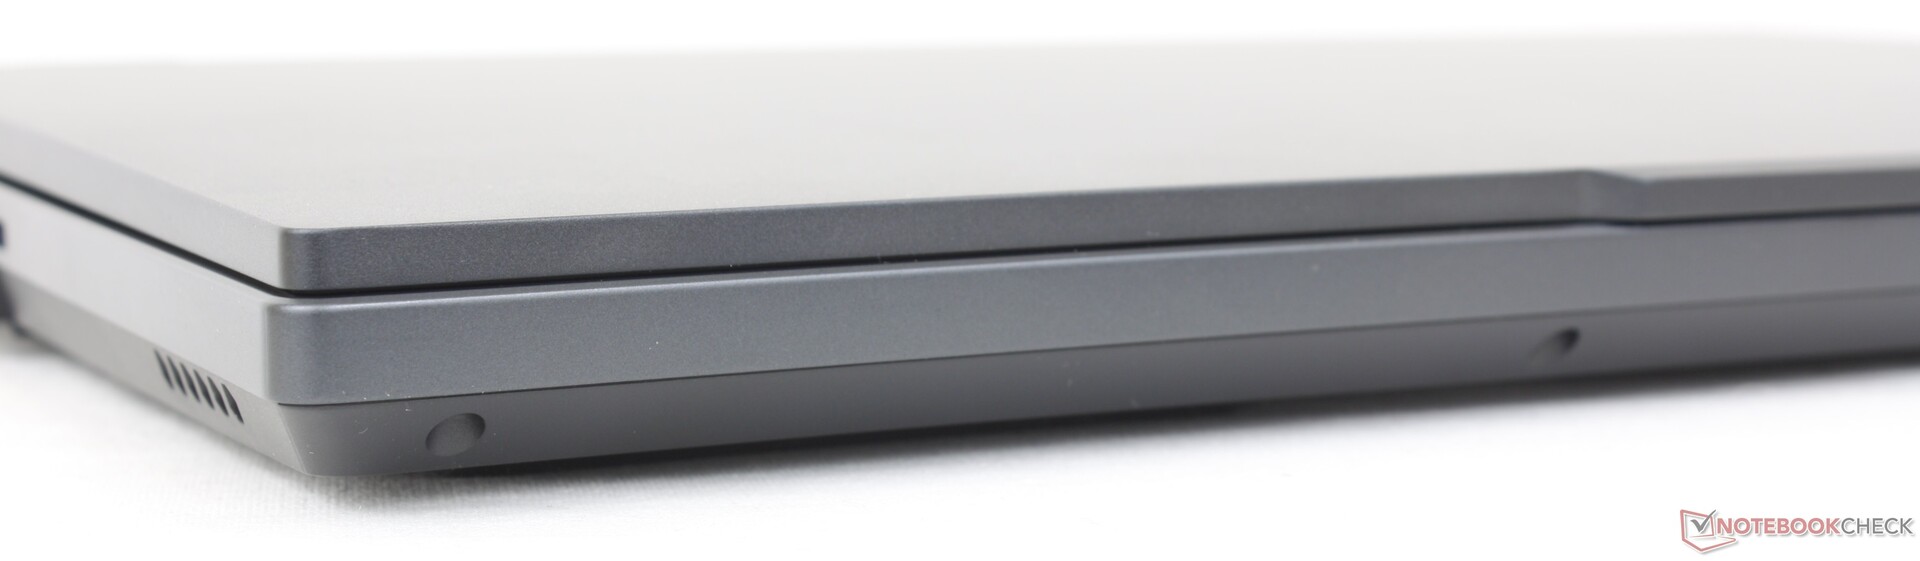
Caso - Um mais enxuto Legion
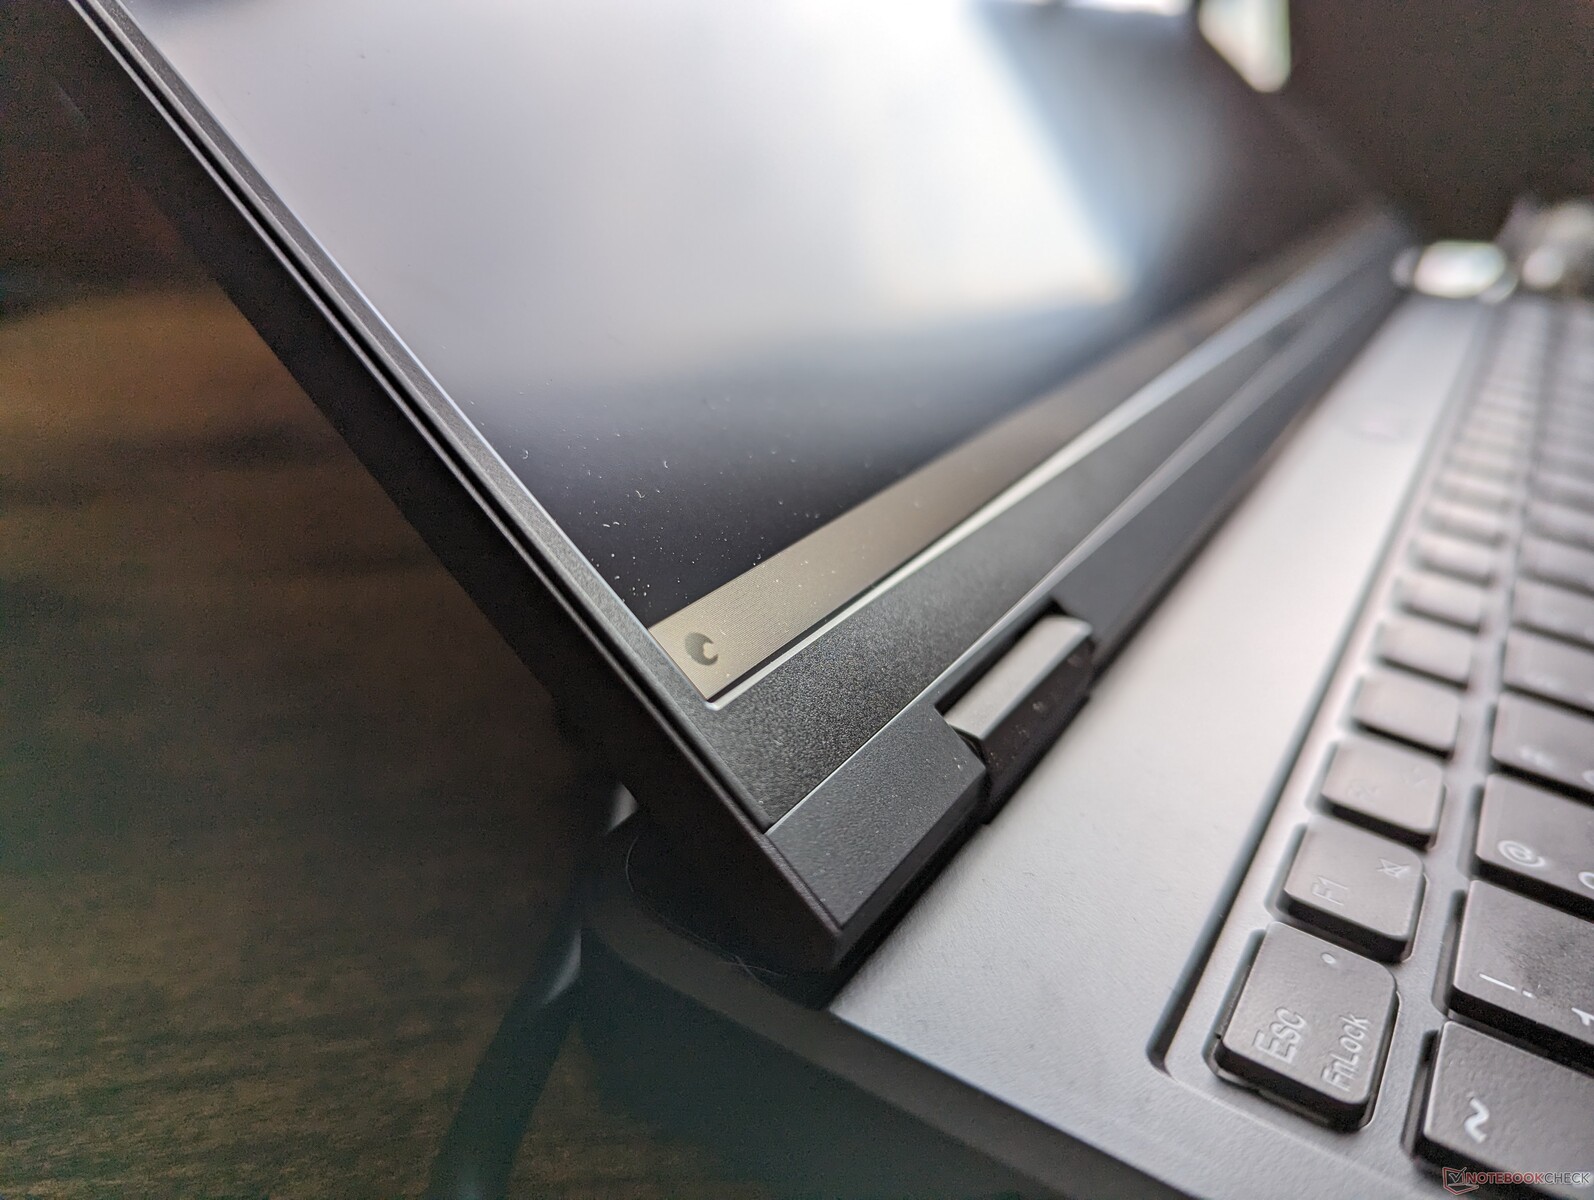
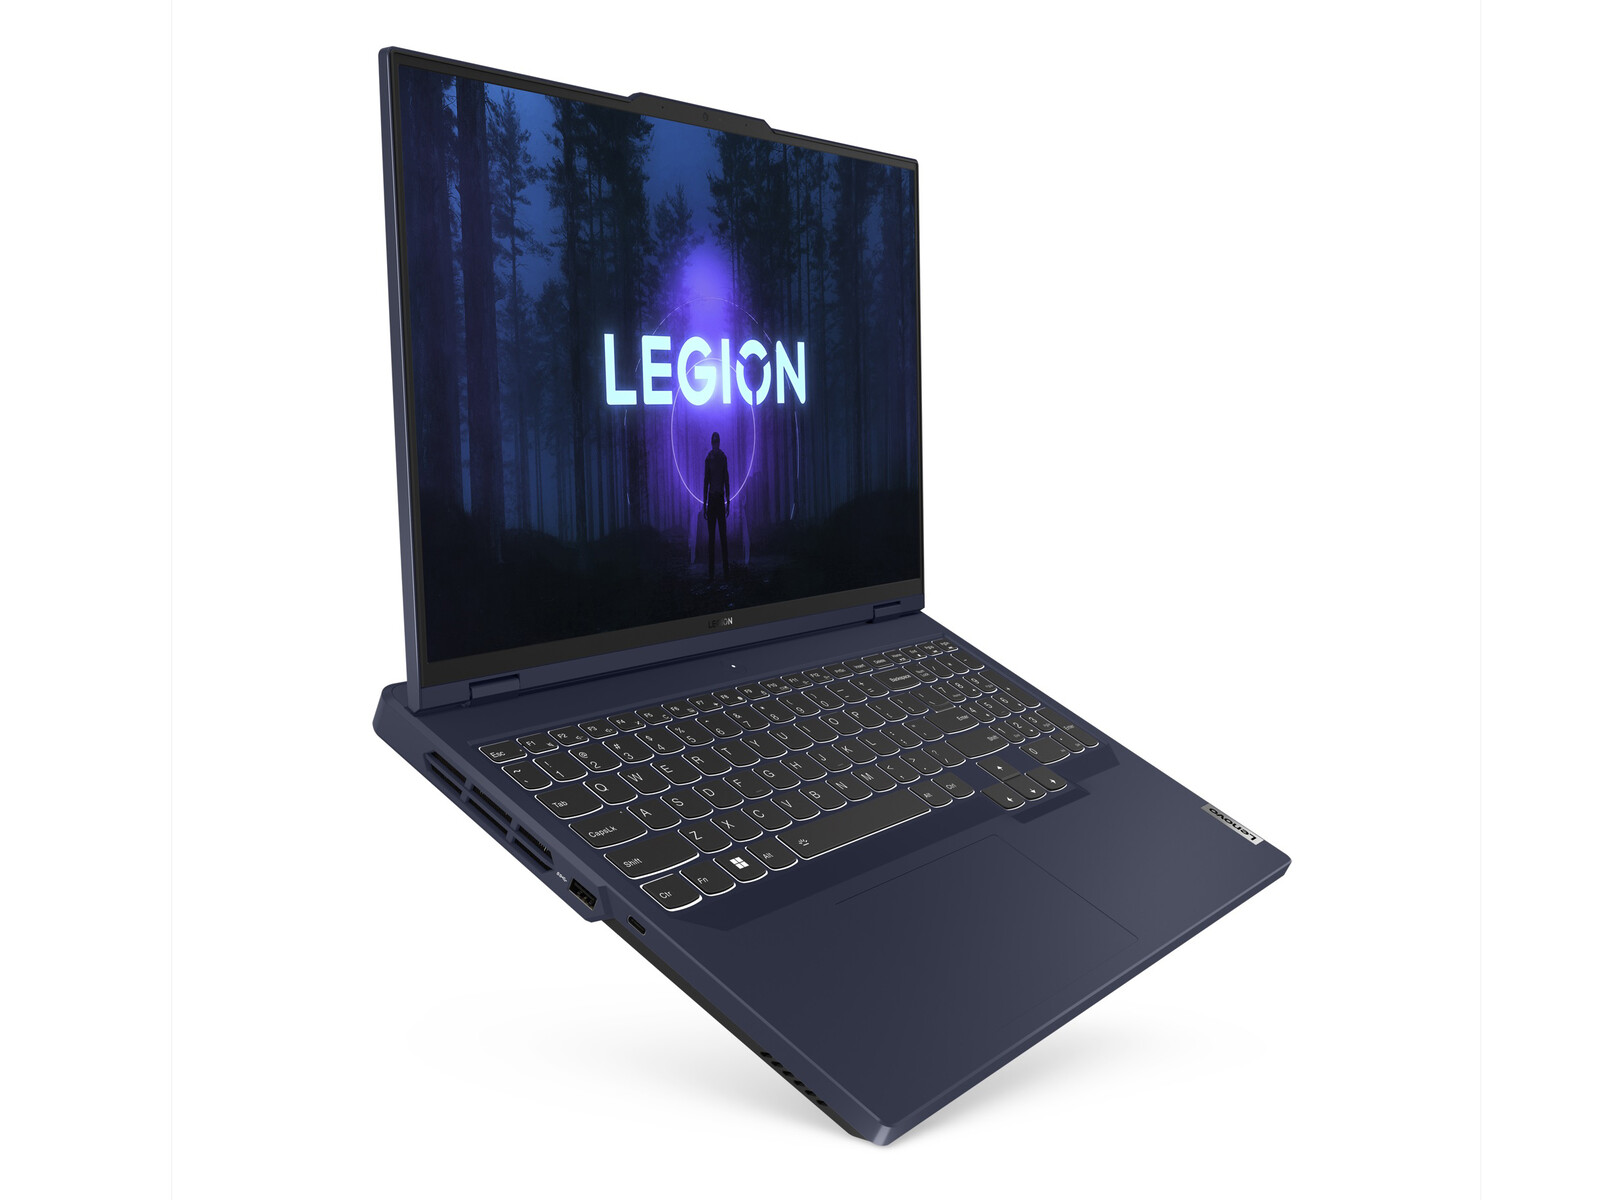
Visualmente, o chassi revisado tem menos acentos e ângulos para uma aparência mais plana e profissional do que o modelo do ano passado, especialmente na traseira. O esquema de cores cinza e prata de dois tons desapareceu em favor de uma aparência mais uniforme. Preferimos o novo design, pois ele se inclina para o minimalismo e, ao mesmo tempo, mantém muitos dos recursos característicos do Legion.
A rigidez do chassi é excelente em nossa unidade, sem rangidos audíveis ou pontos terrivelmente fracos. A base e a tampa apresentam mais torções do que o mais rígido Blade 16mais rígido, mas não o suficiente para ser motivo de grande preocupação.
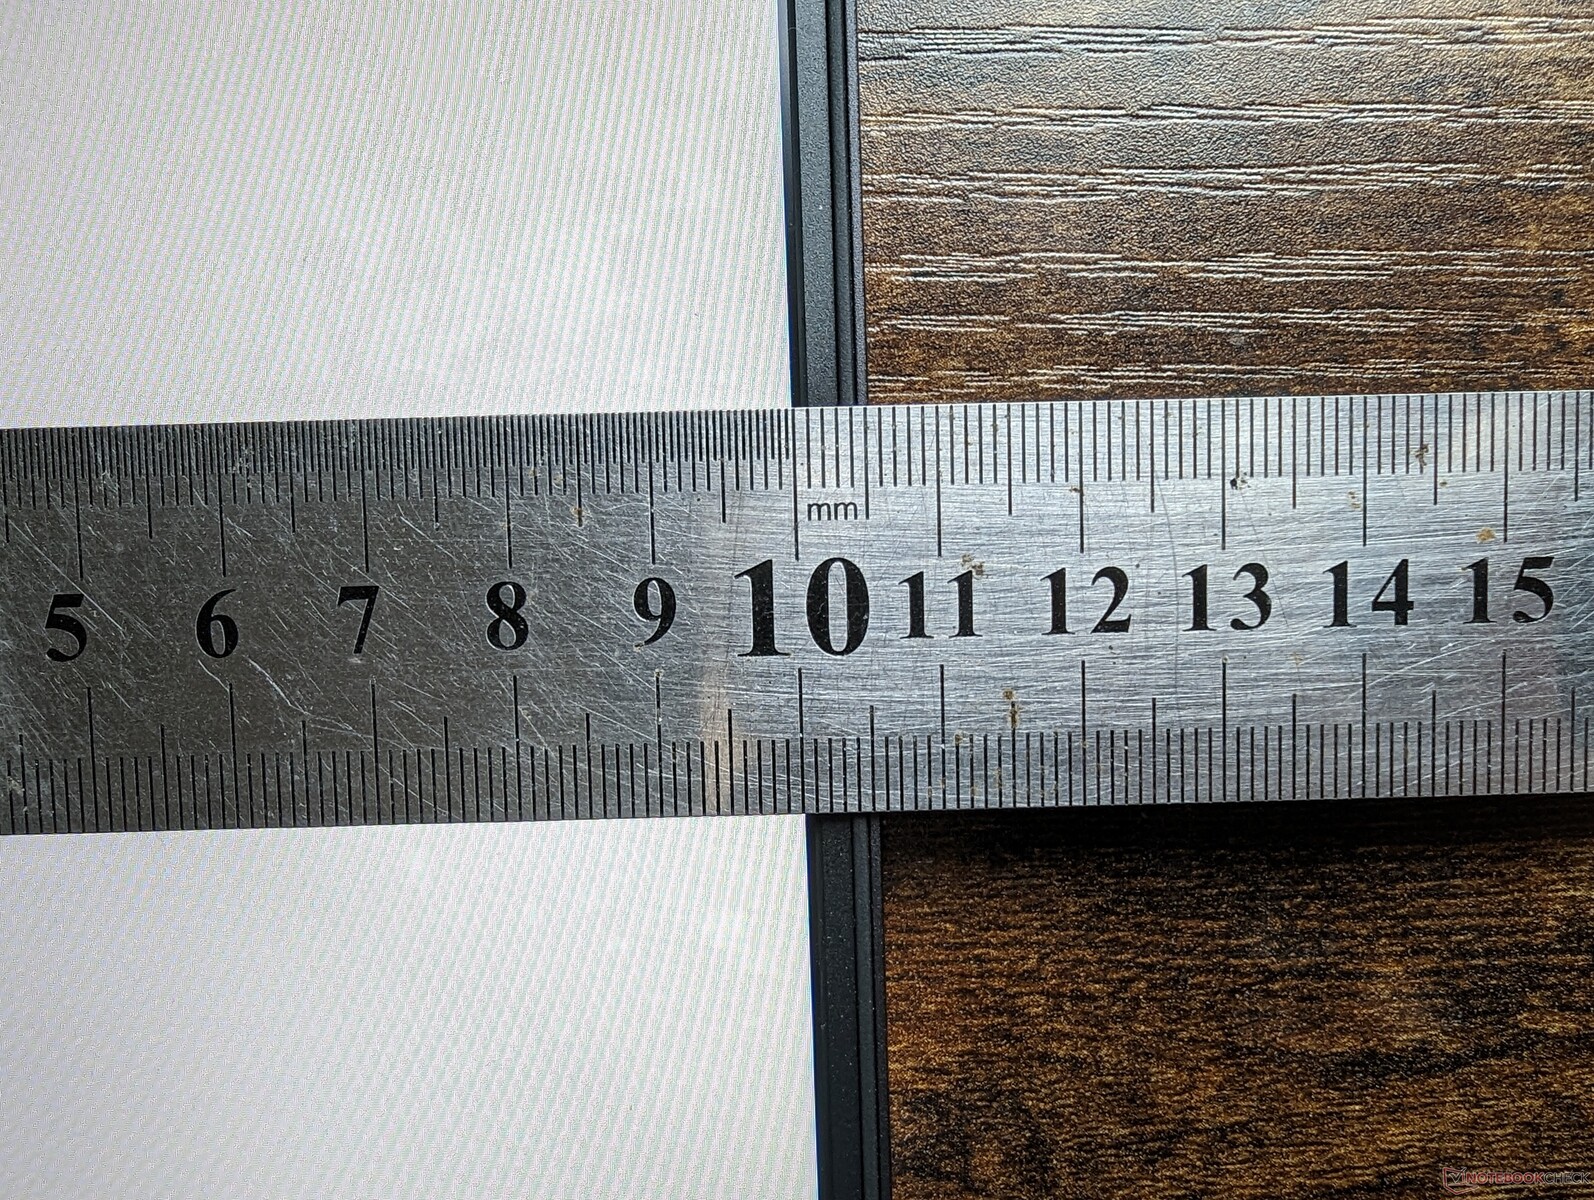
O Legion Pro 5 16 é visivelmente maior e mais pesado do que muitos de seus concorrentes. O Aero 16, o Blade 16 e o Zephyrus M16 são todos mais finos e mais leves que o Lenovo em até 8 mm ou 400 gramas, o que não é insignificante. Embora certamente não seja nem de longe tão volumoso quanto muitos notebooks para jogos de 17,3 polegadas, o Legion Pro 5 16 também não é exatamente a opção mais fácil de transportar em sua classe de tamanho de 16 polegadas.
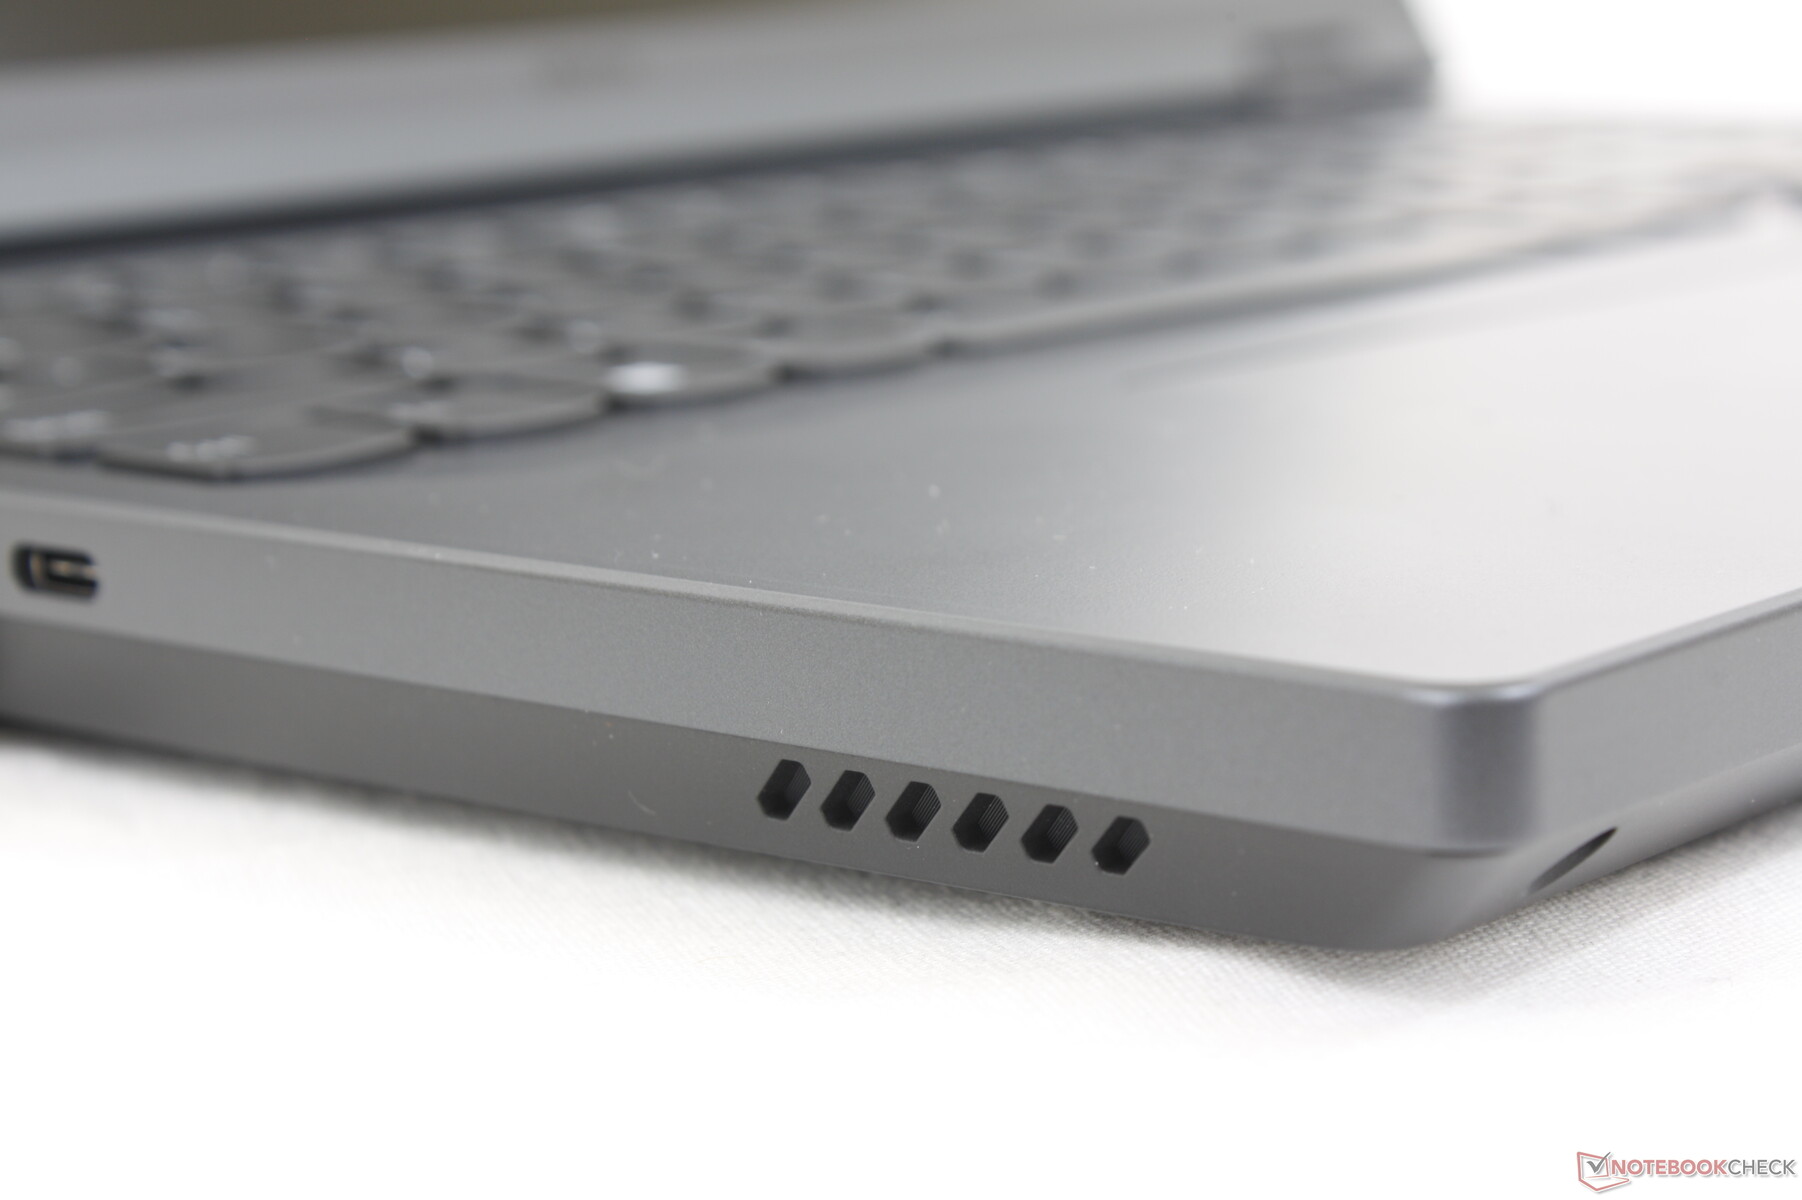
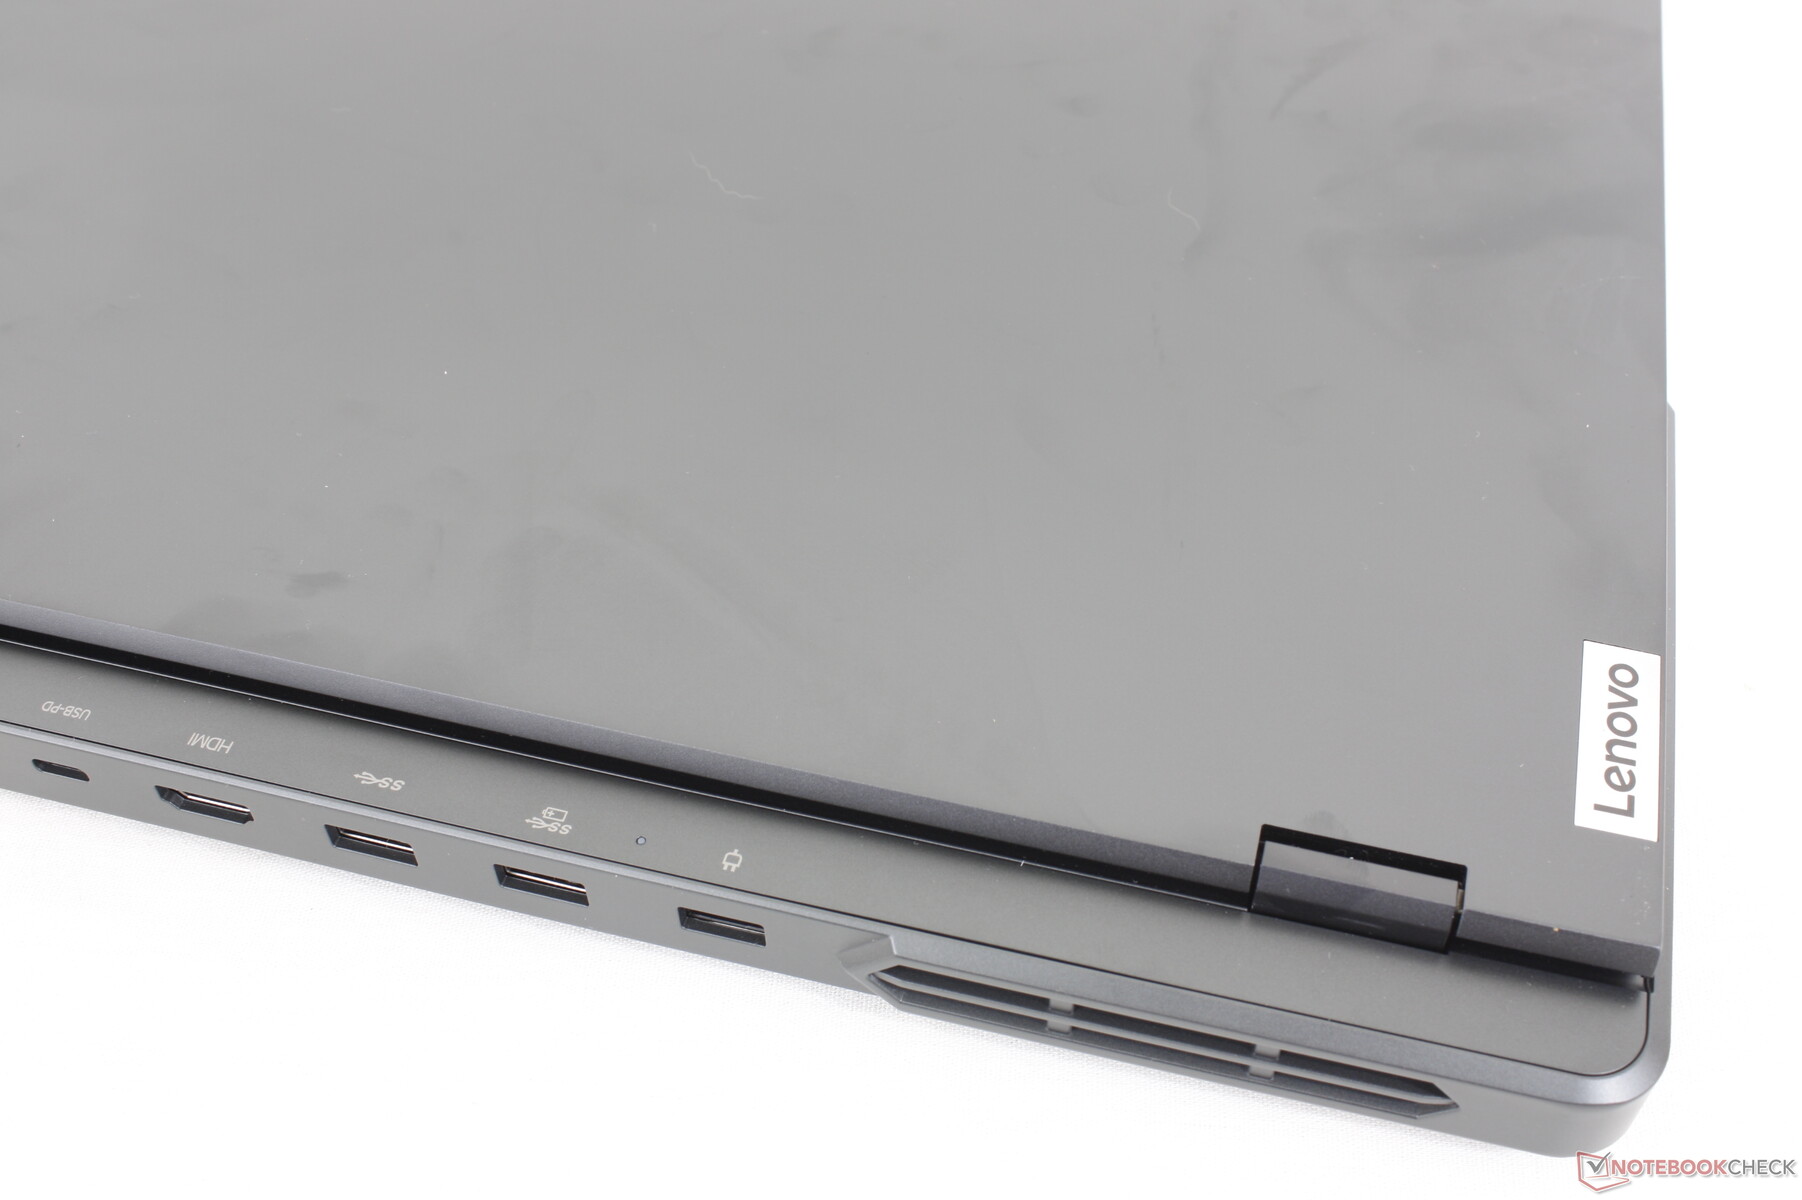
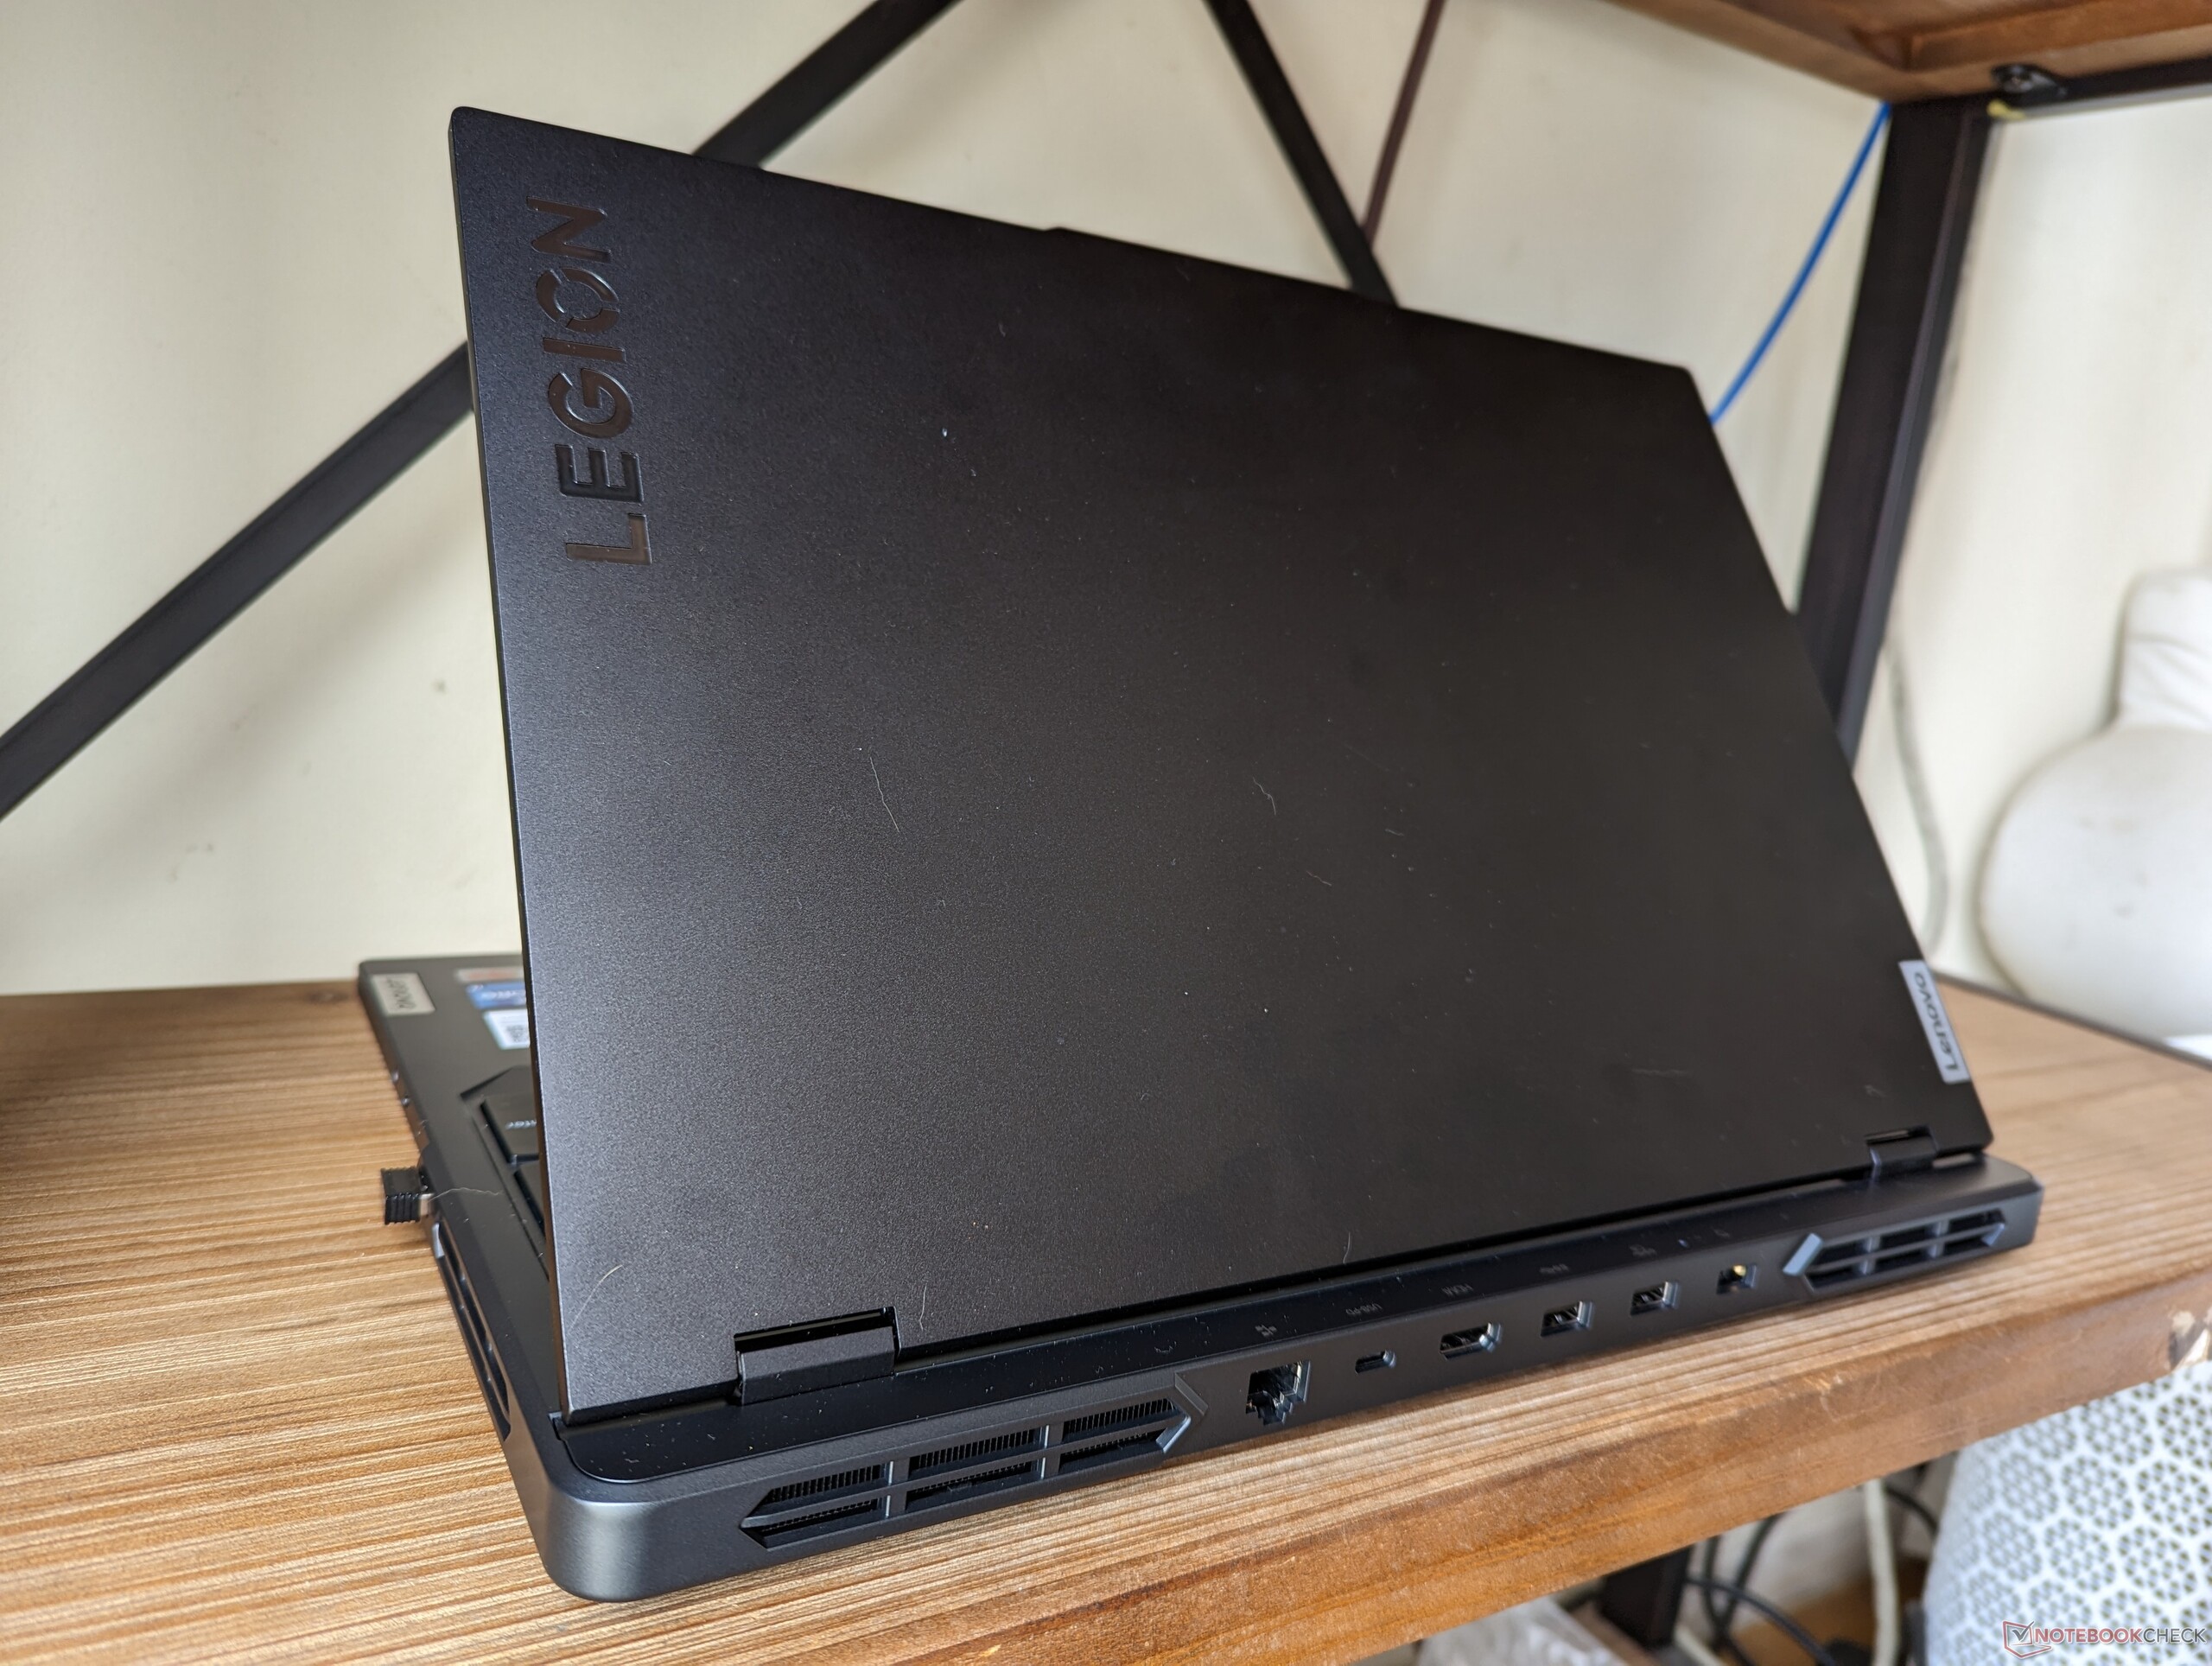
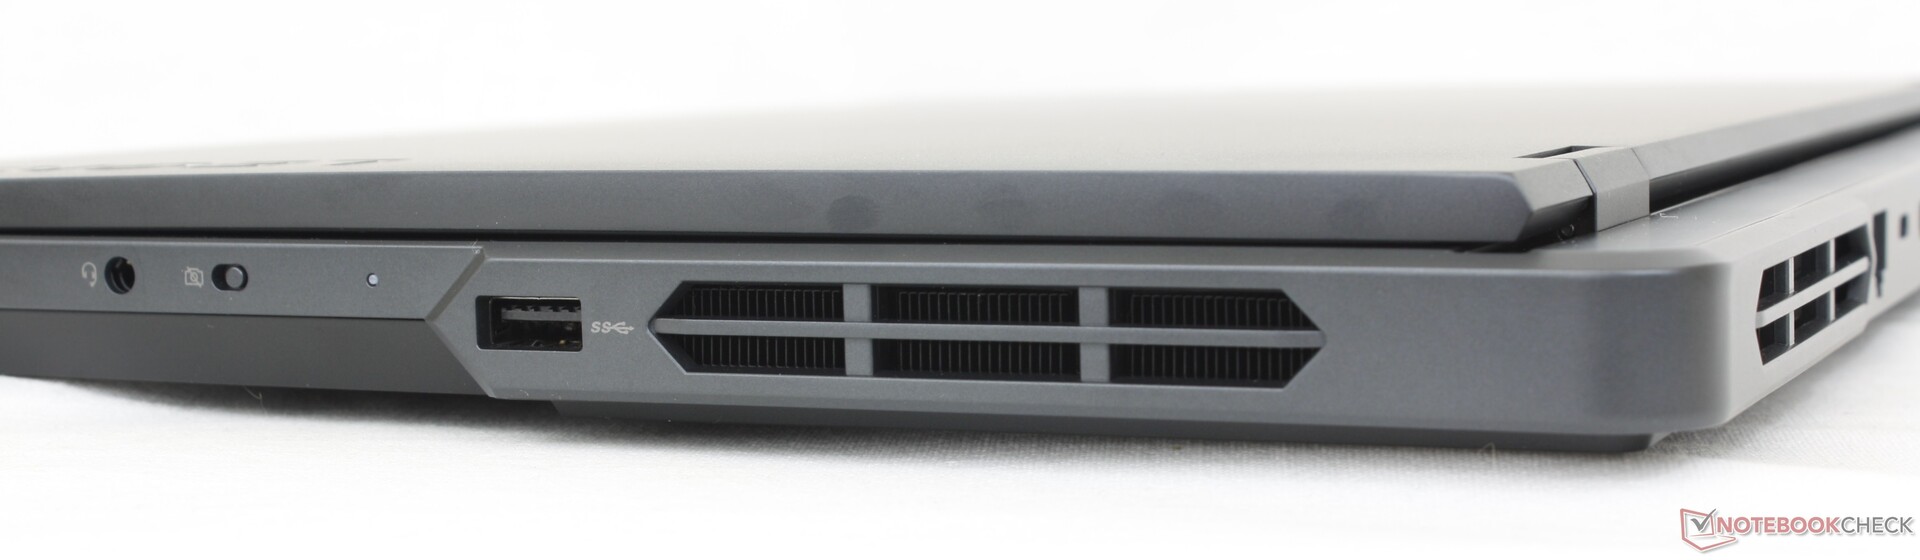
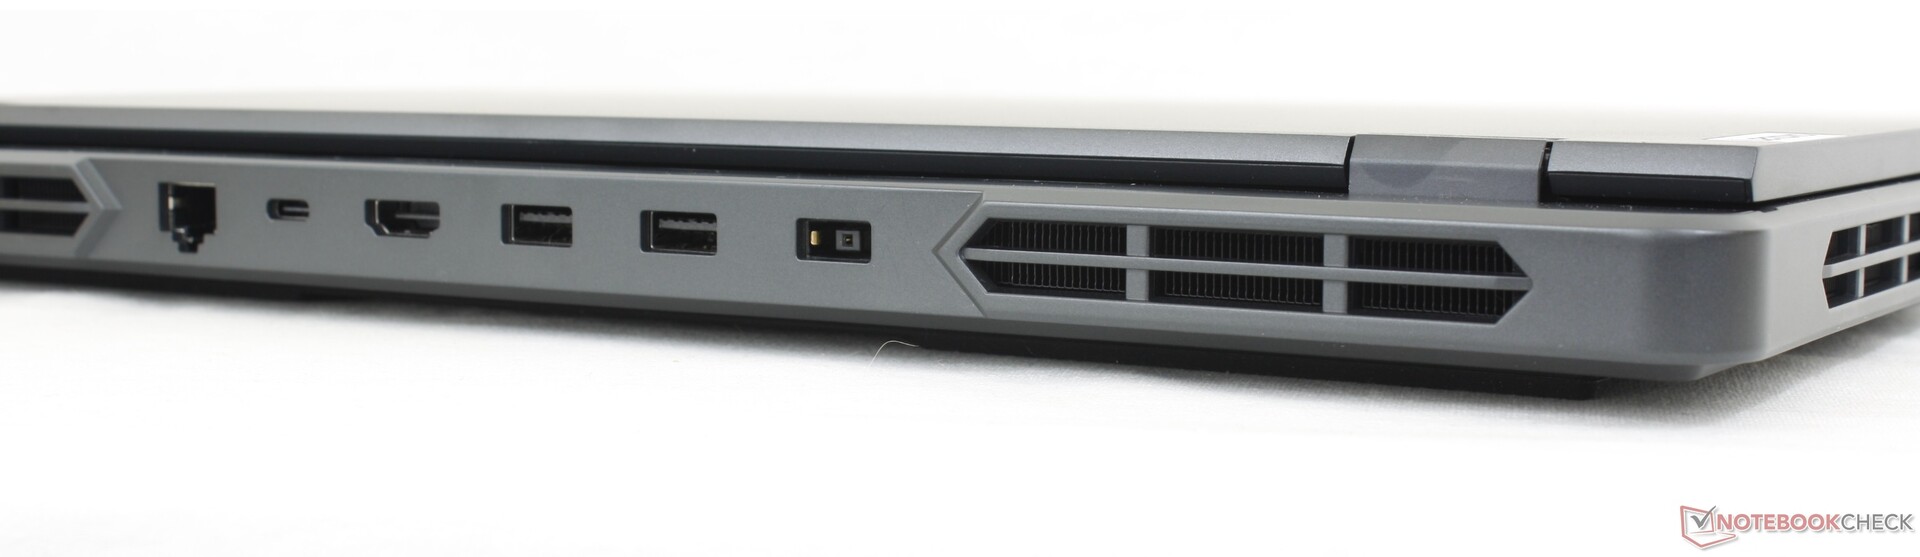
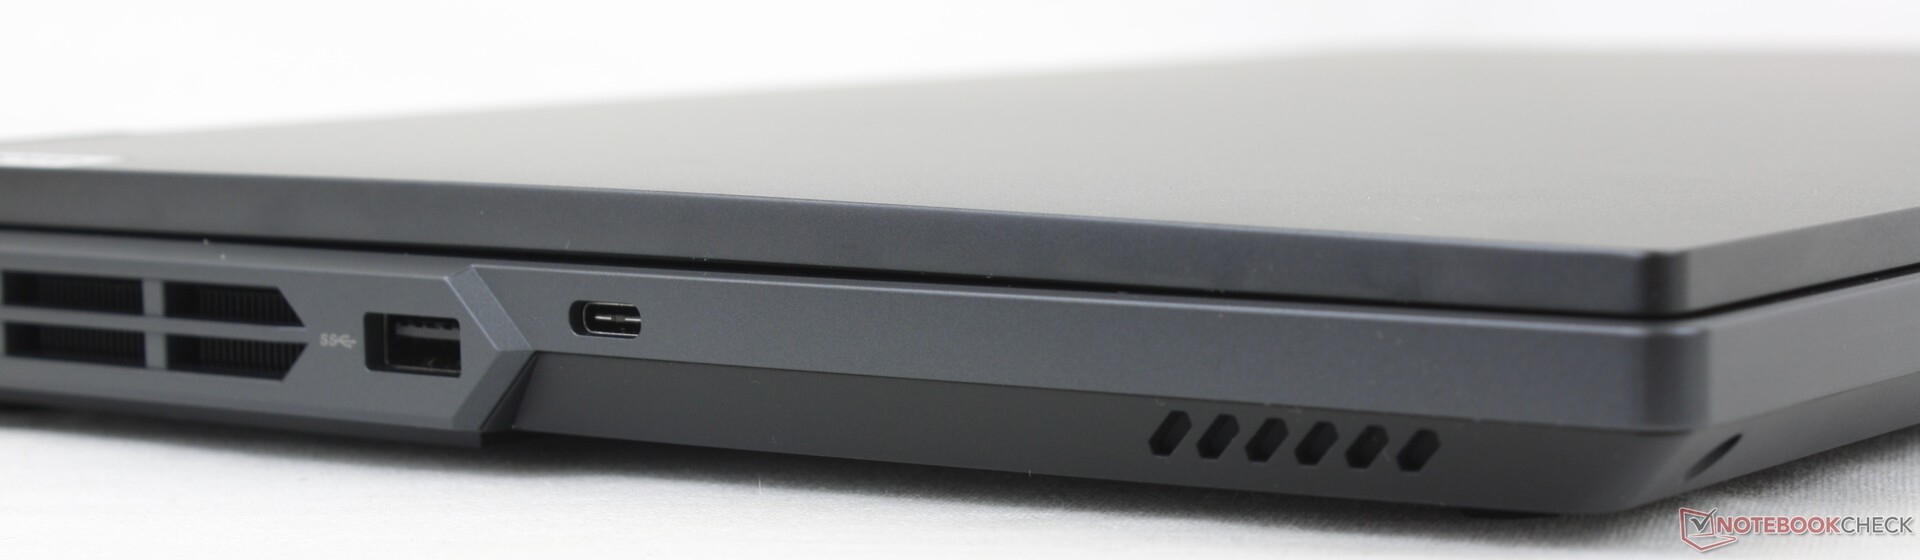
Conectividade - Muitas portas, mas sem Thunderbolt
Há uma seleção saudável de portas, com a maioria delas posicionada na parte traseira. Na verdade, o modelo compartilha exatamente as mesmas portas e o mesmo posicionamento do modelo mais sofisticadoLegion Pro 7 16IRX8H embora os dois modelos sejam visualmente diferentes.
Observe que o modelo não é compatível com Thunderbolt. Pelo menos, ele vem com uma porta RJ-45, ao contrário do Blade 16.
As portas traseiras são rotuladas com ícones visíveis na parte superior do chassi, conforme mostrado na imagem acima. Os ícones facilitam a conexão dos cabos, ao contrário das portas traseiras do Alienware m18, mas infelizmente não acendem.
Comunicação
Um Intel AX211 vem como padrão para conectividade Wi-Fi 6E e Bluetooth 5.2. Tivemos taxas de transferência estáveis e nenhum problema quando emparelhado com nossa rede Asus AXE11000 de 6 GHz.
Webcam
A webcam de 1080p ou 2 MP tornou-se padrão nos notebooks para jogos. No entanto, em nosso Lenovo, os ajustes automáticos de brilho ocorriam mais lentamente do que o normal, resultando em uma imagem mais escura.
Há um obturador eletrônico da webcam para controle de privacidade, mas não há sensor de infravermelho.


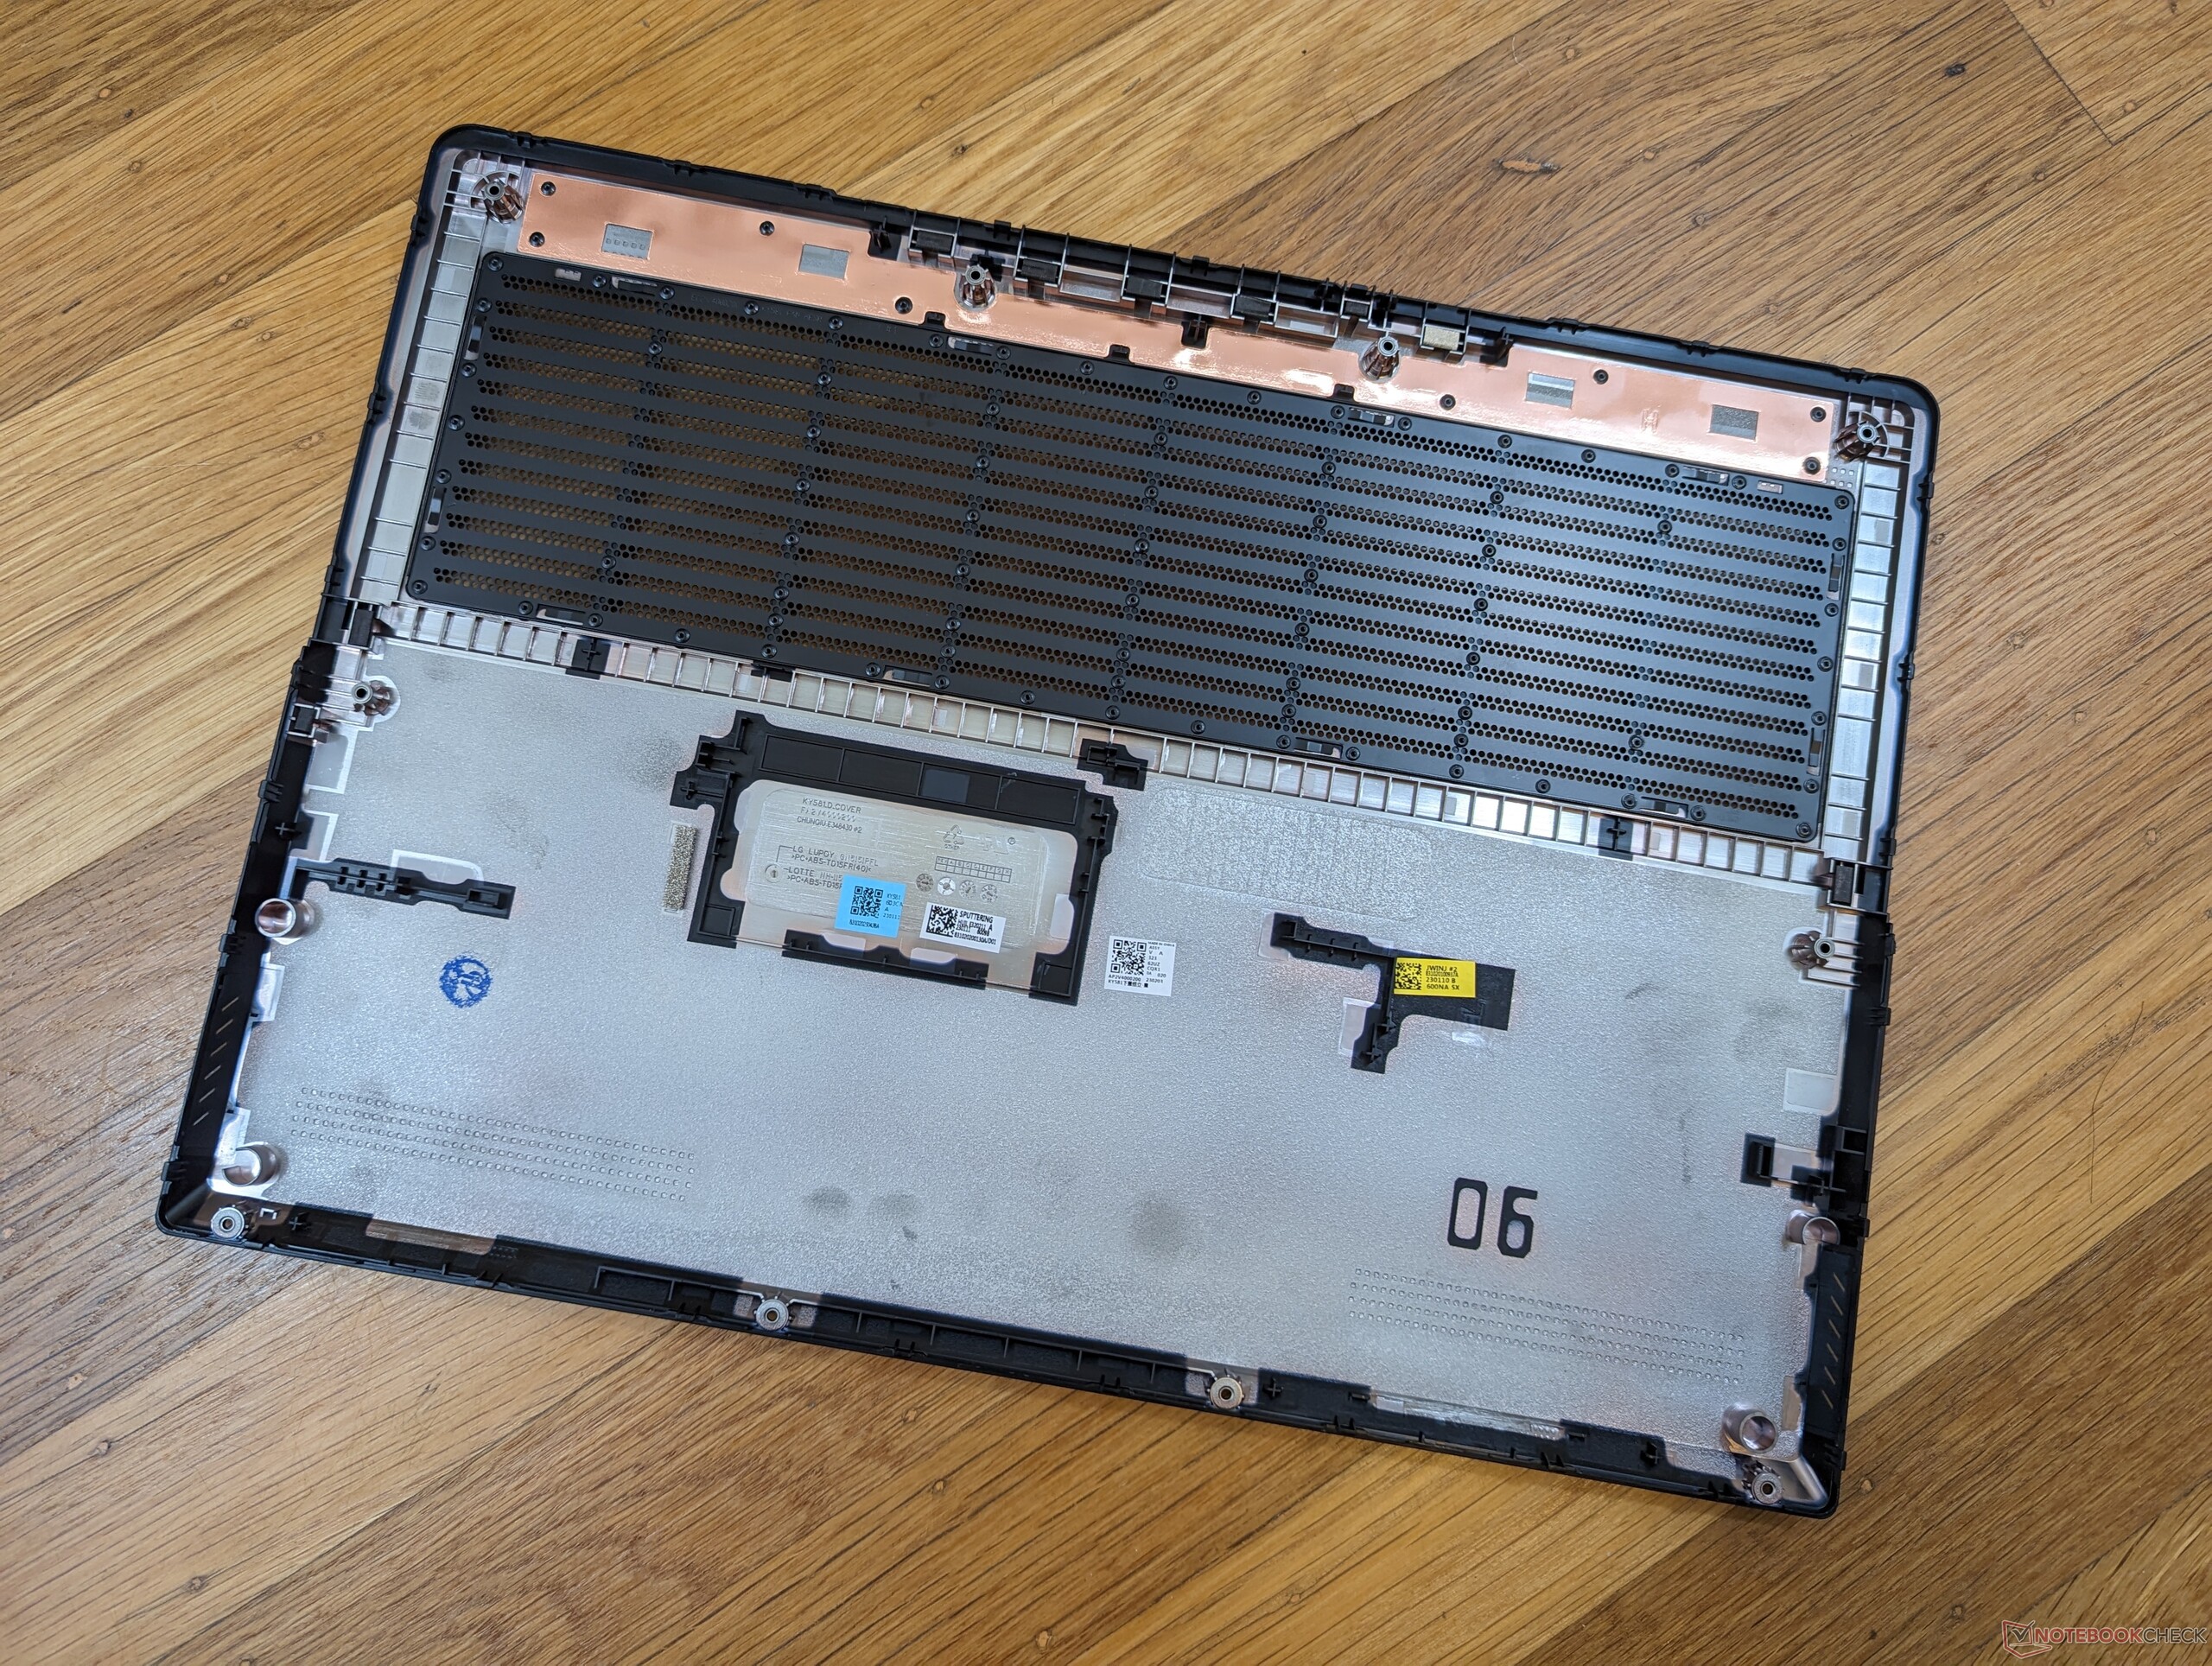
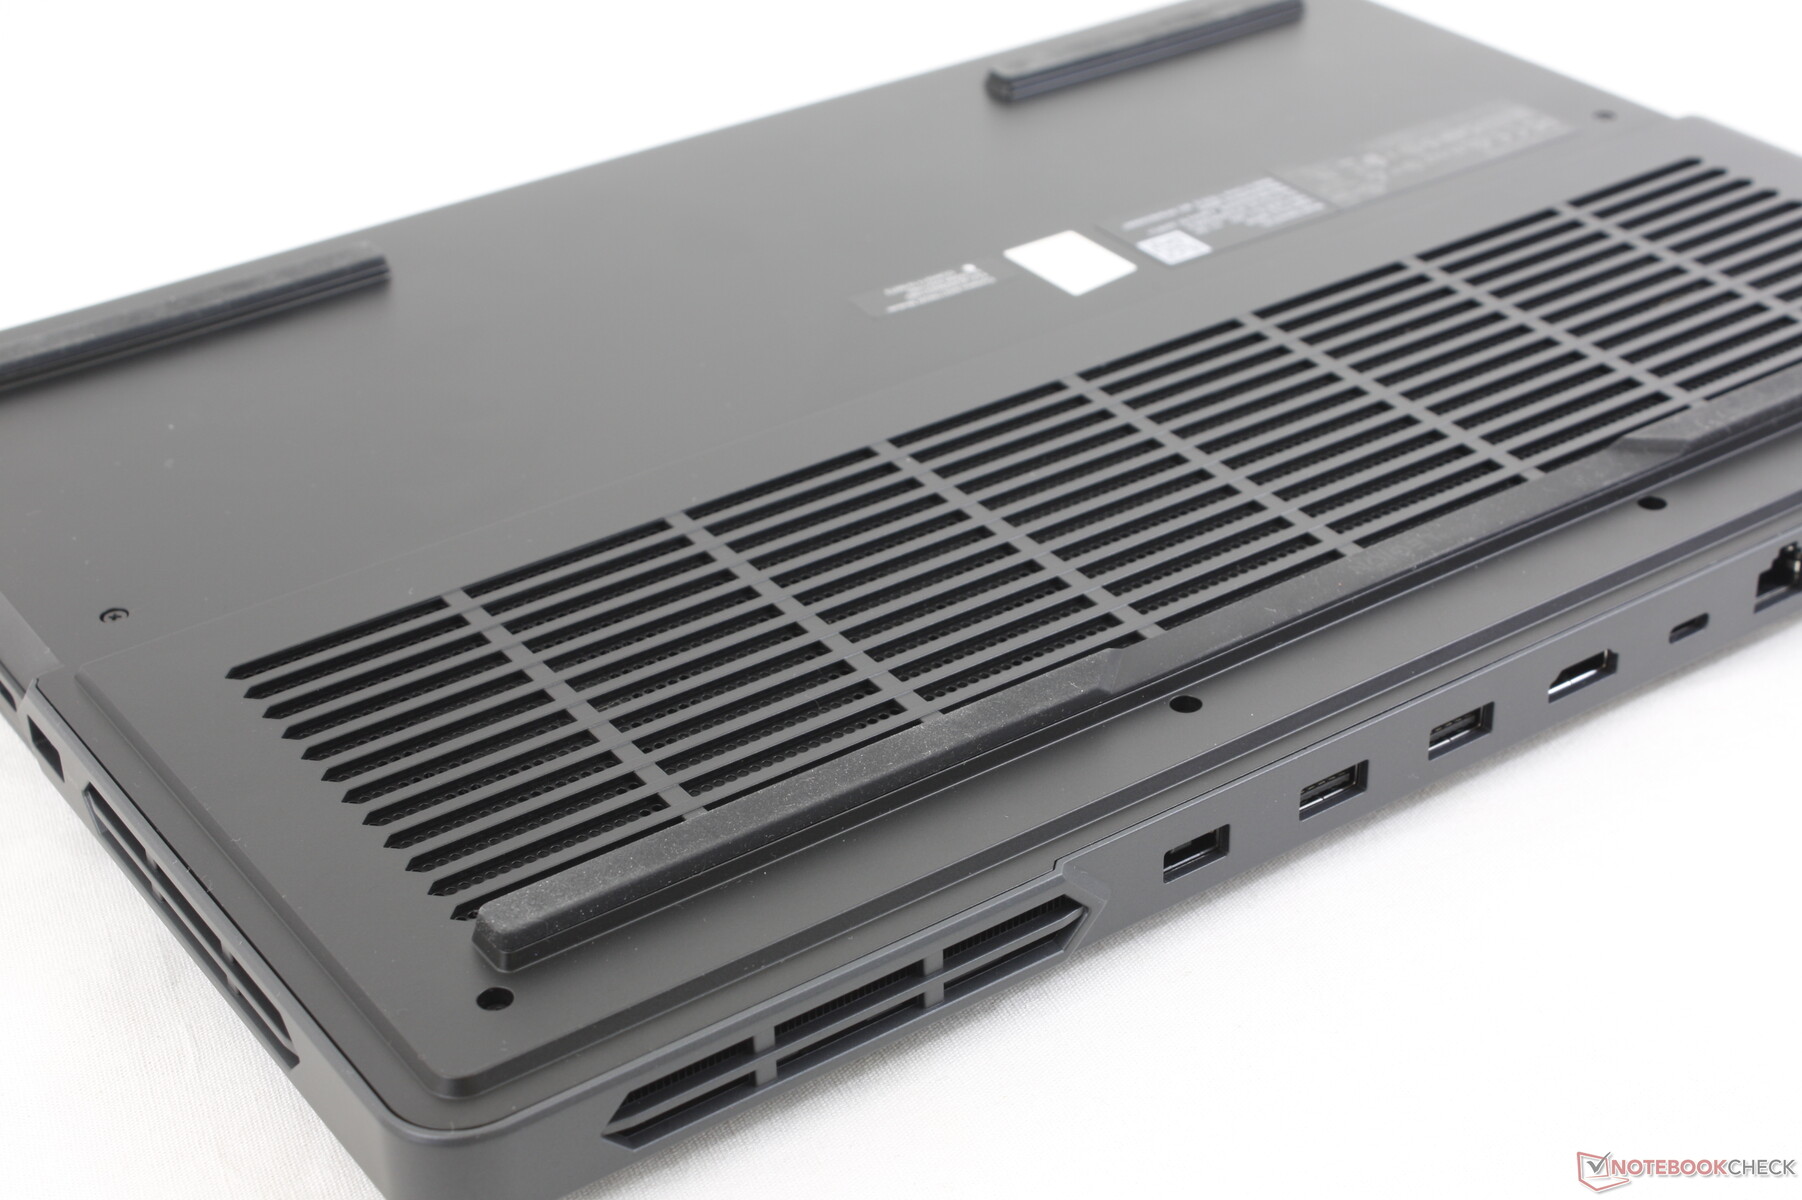
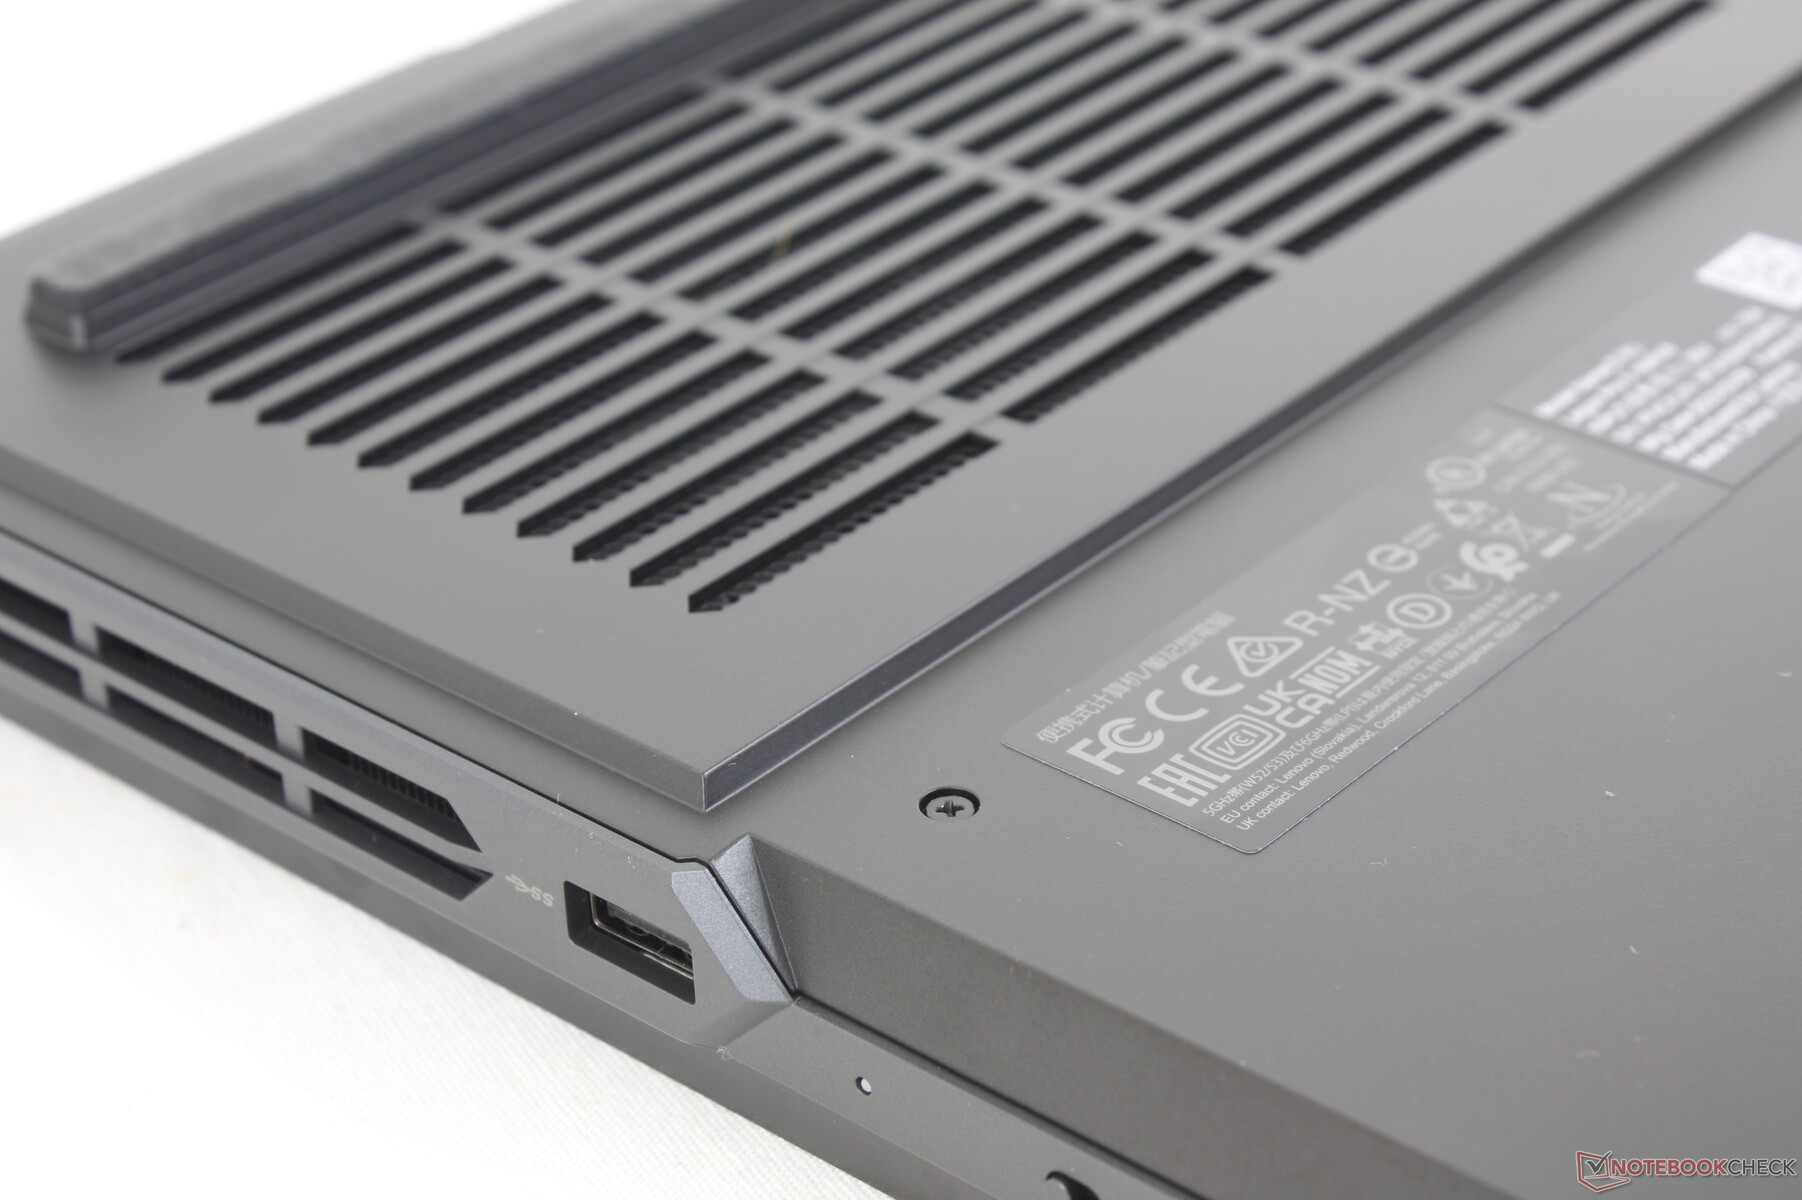
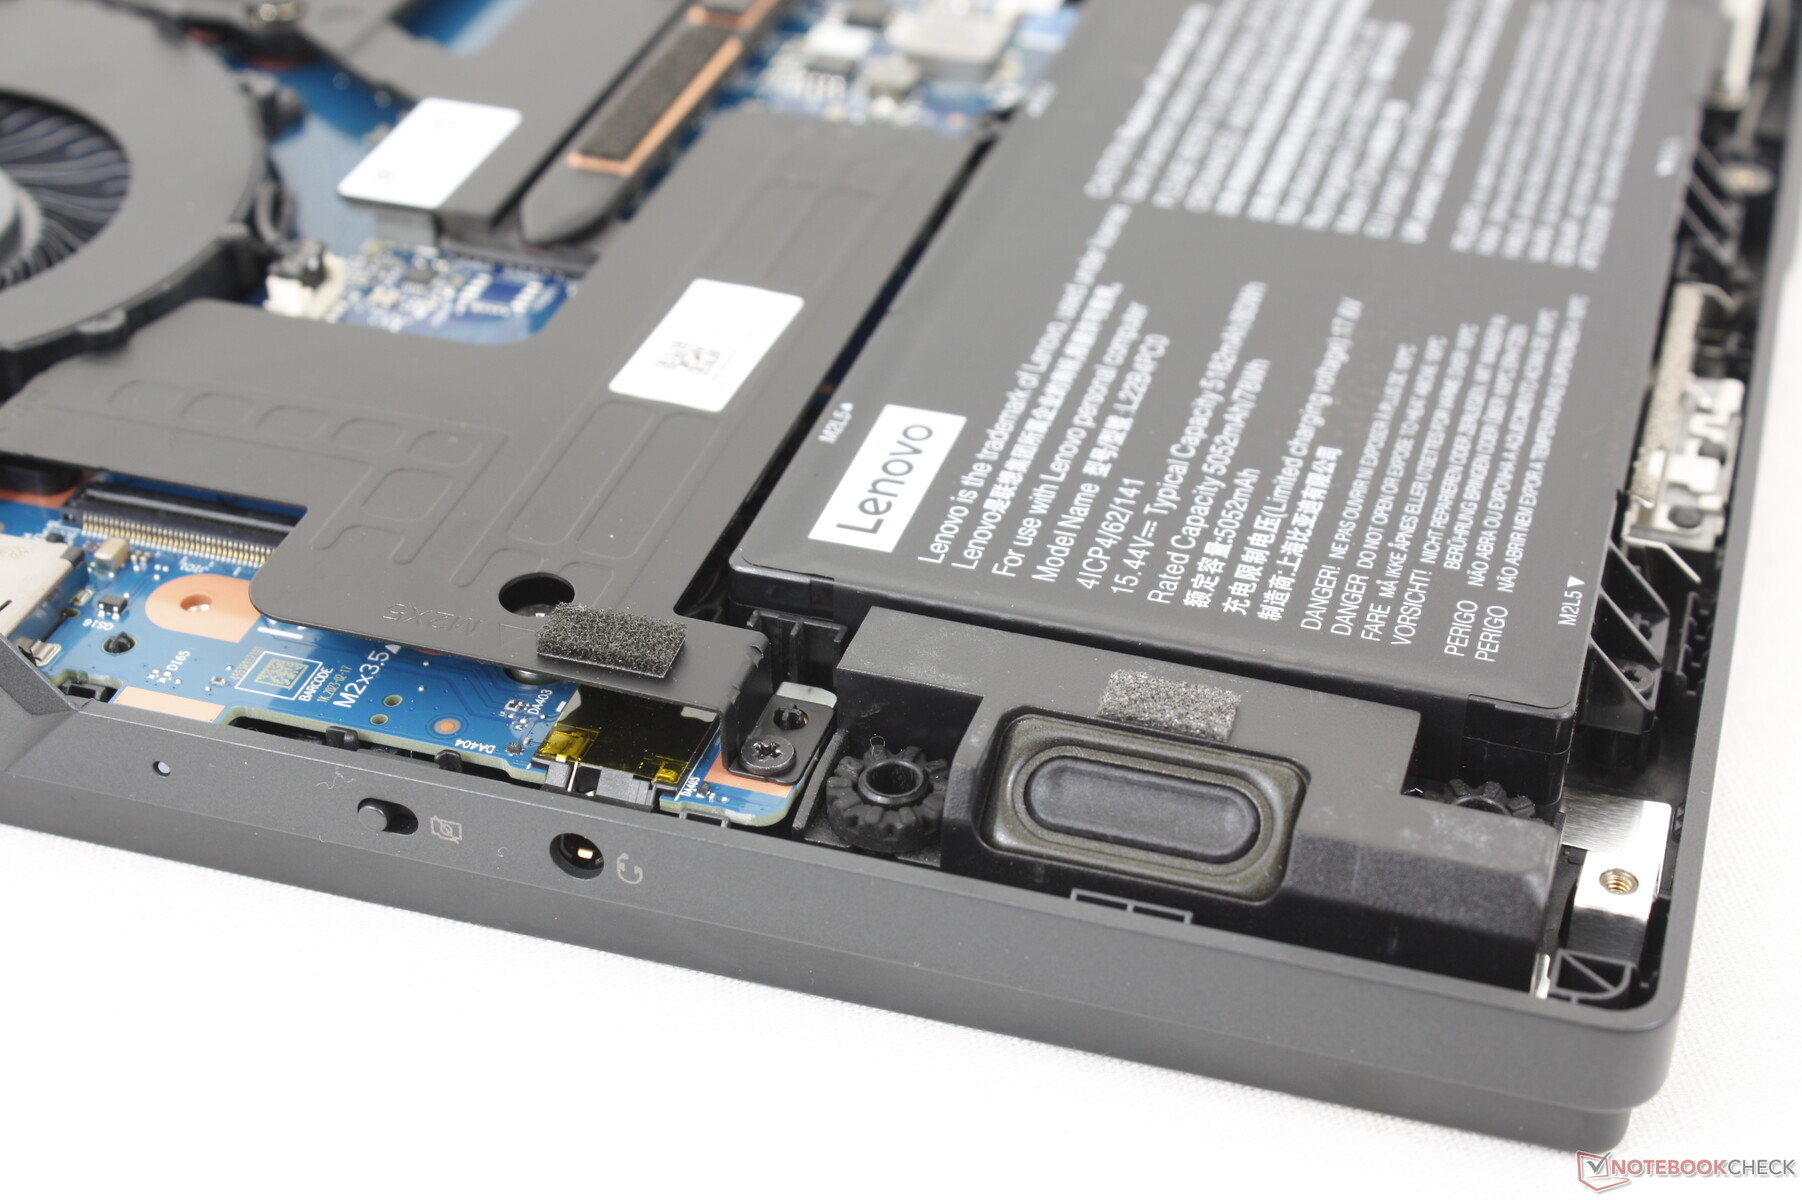
Manutenção
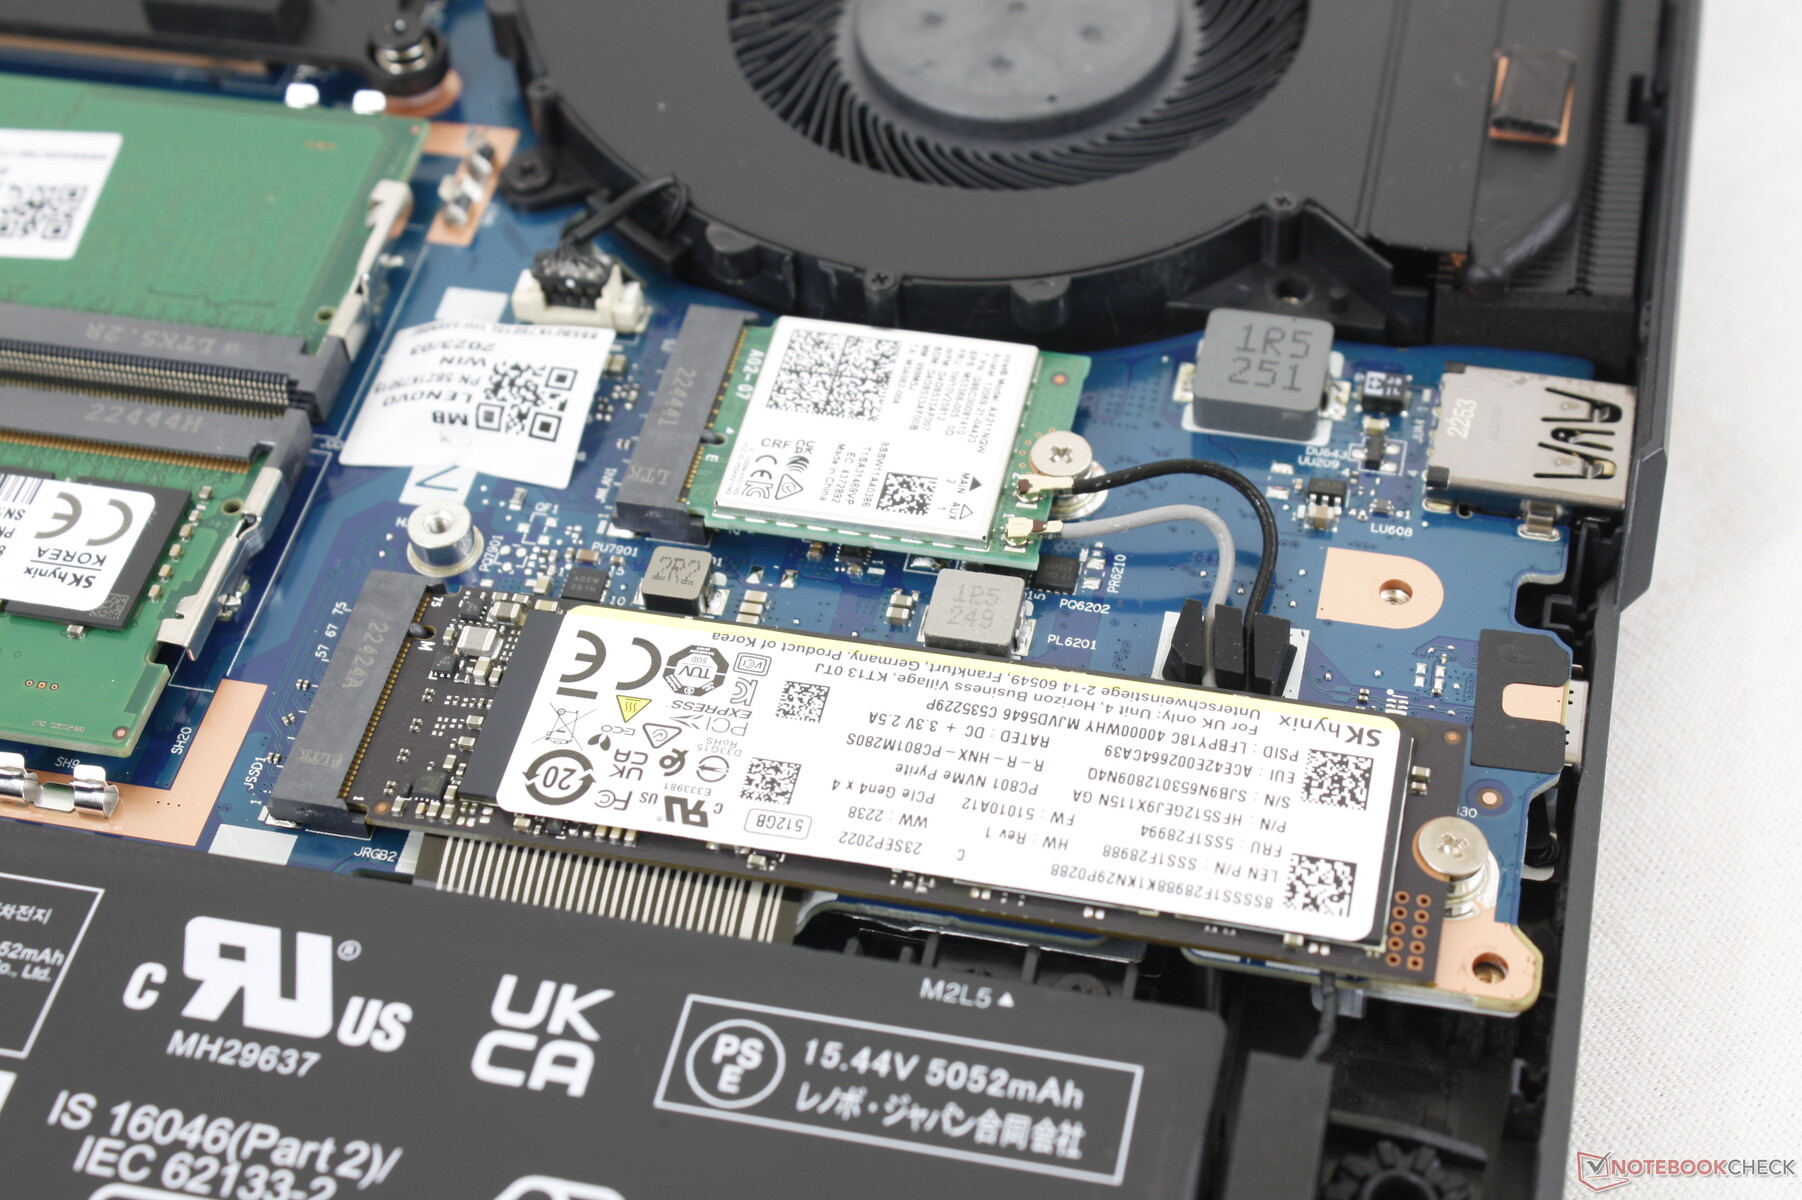
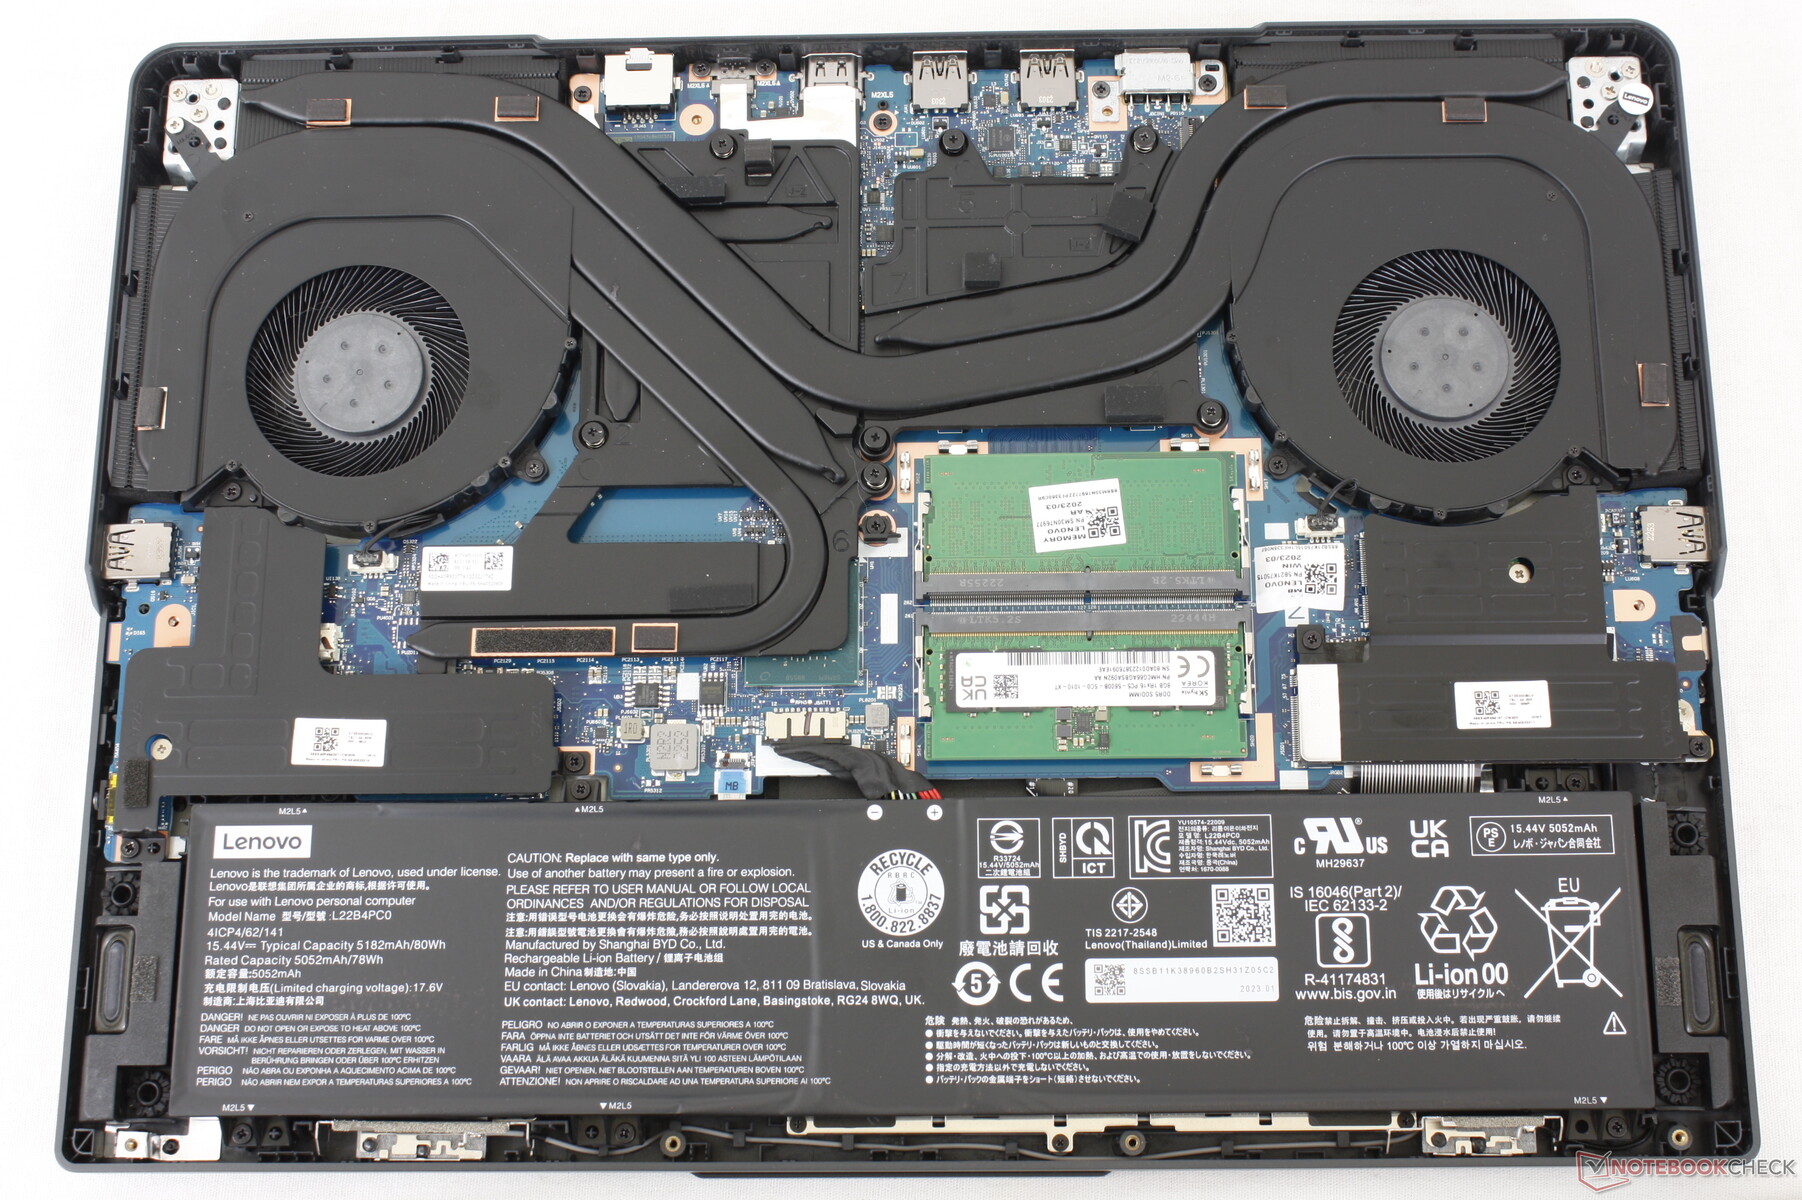
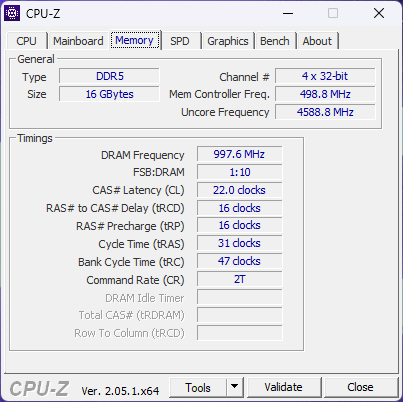
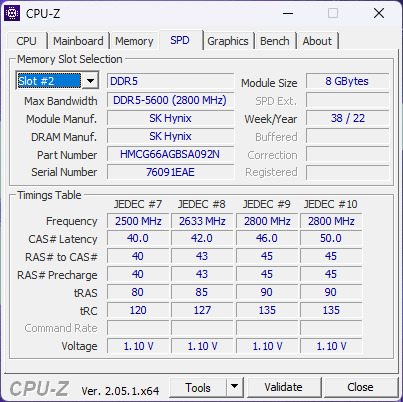
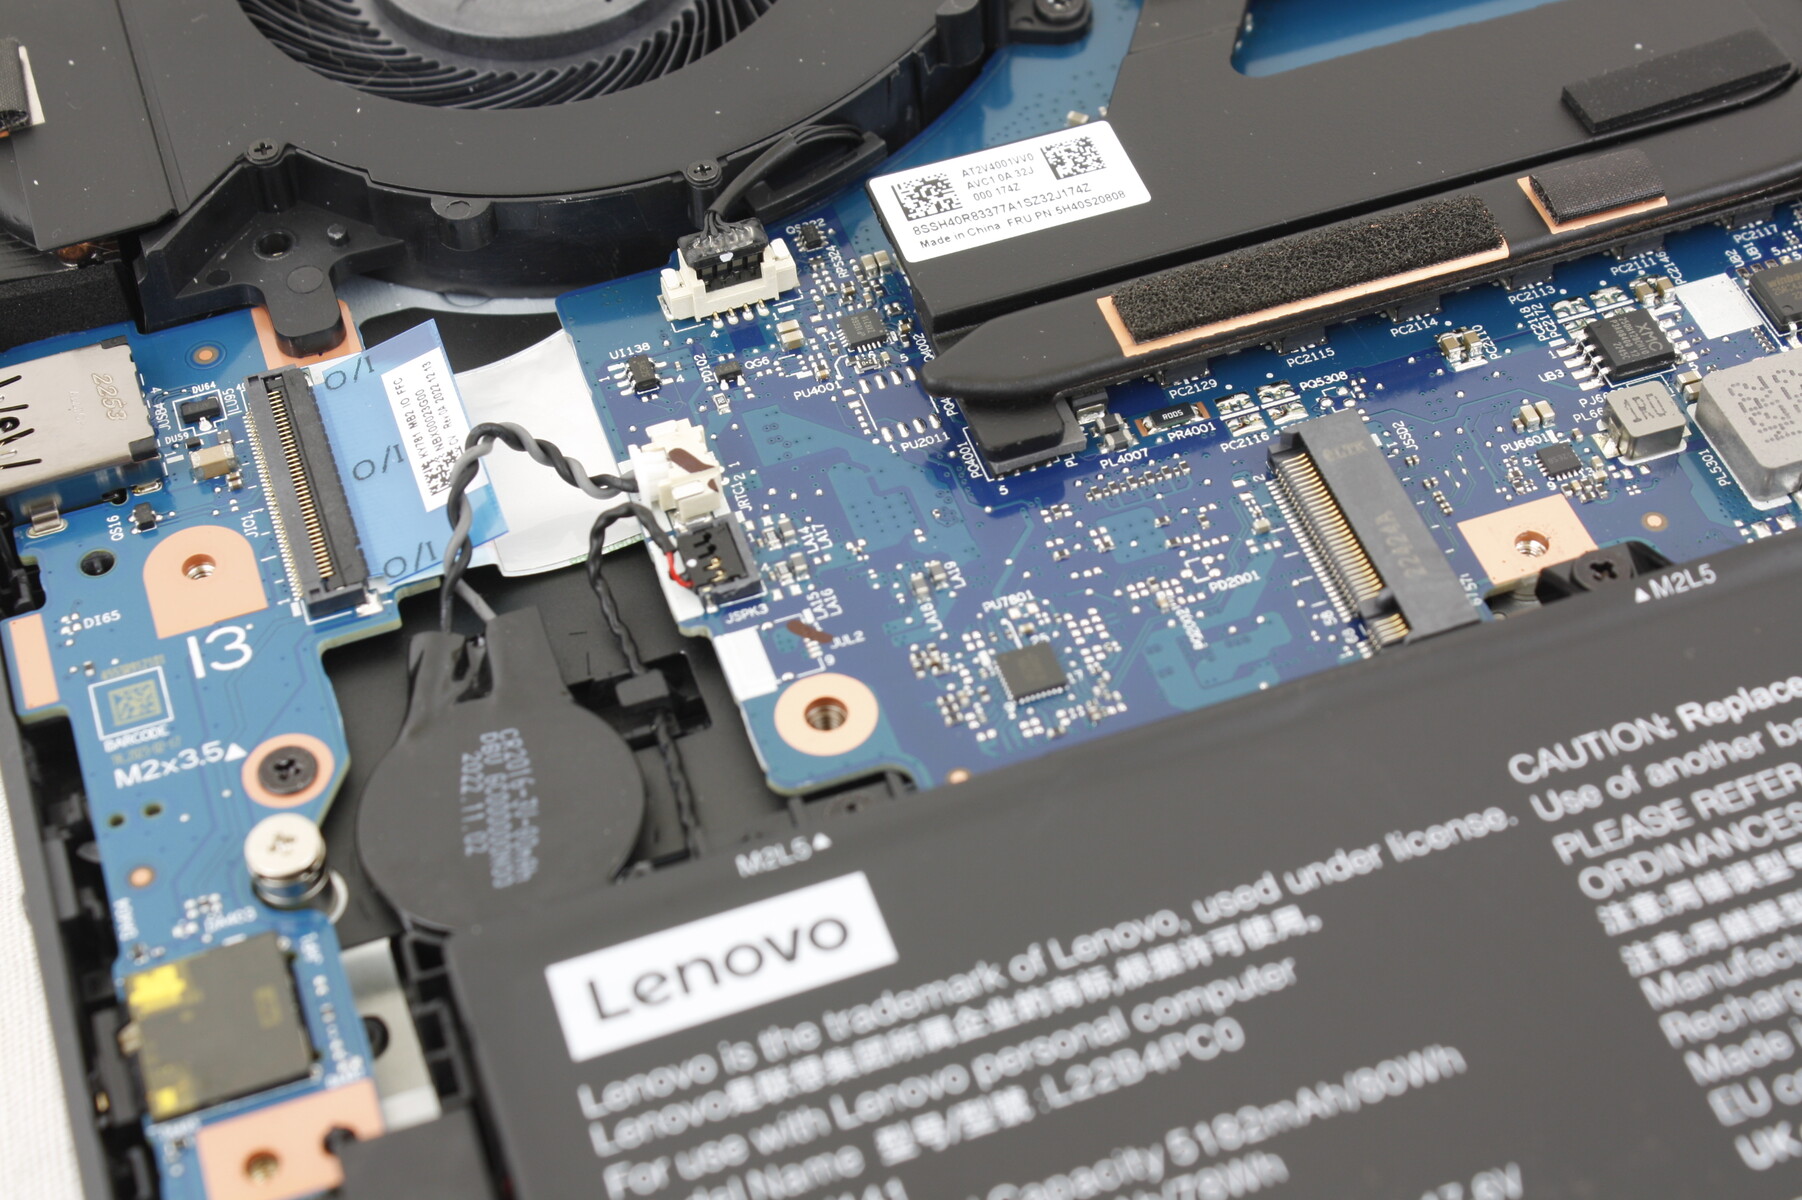
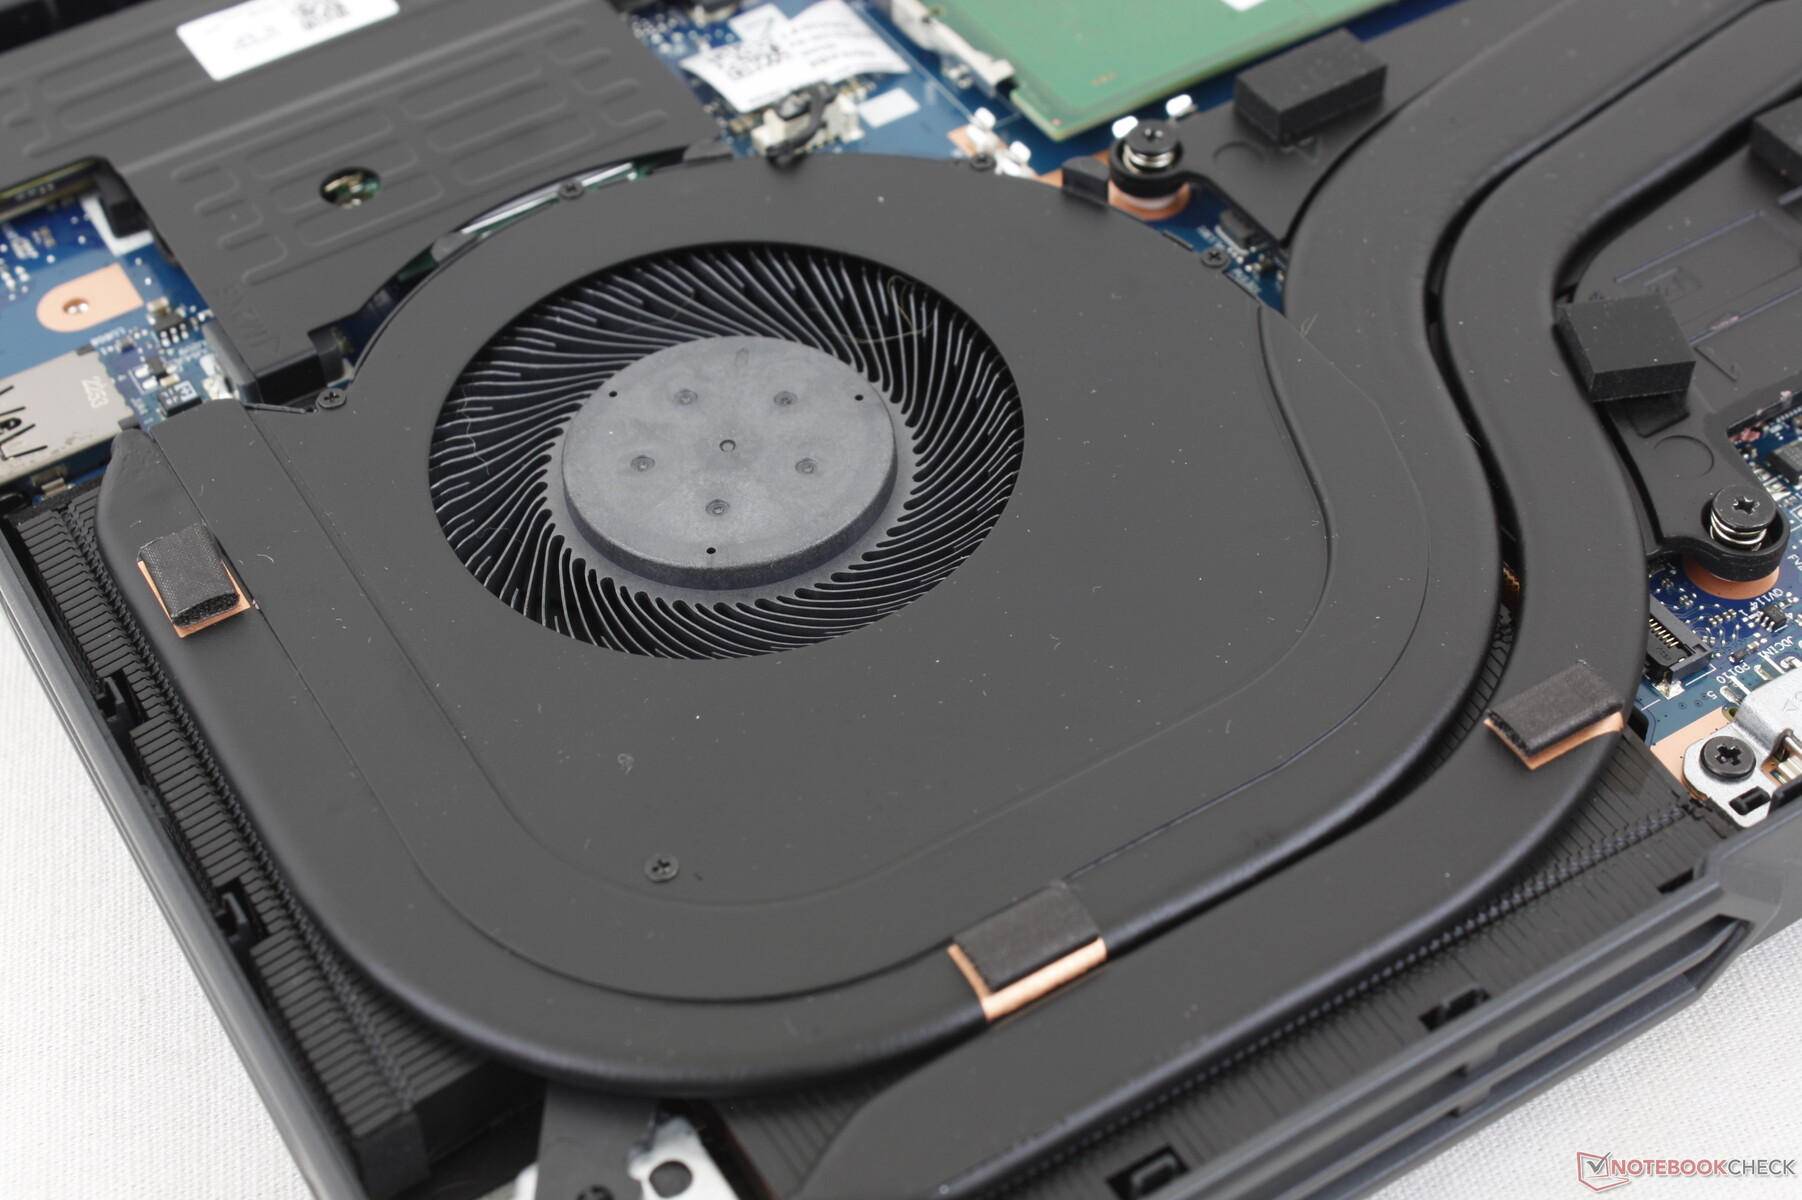
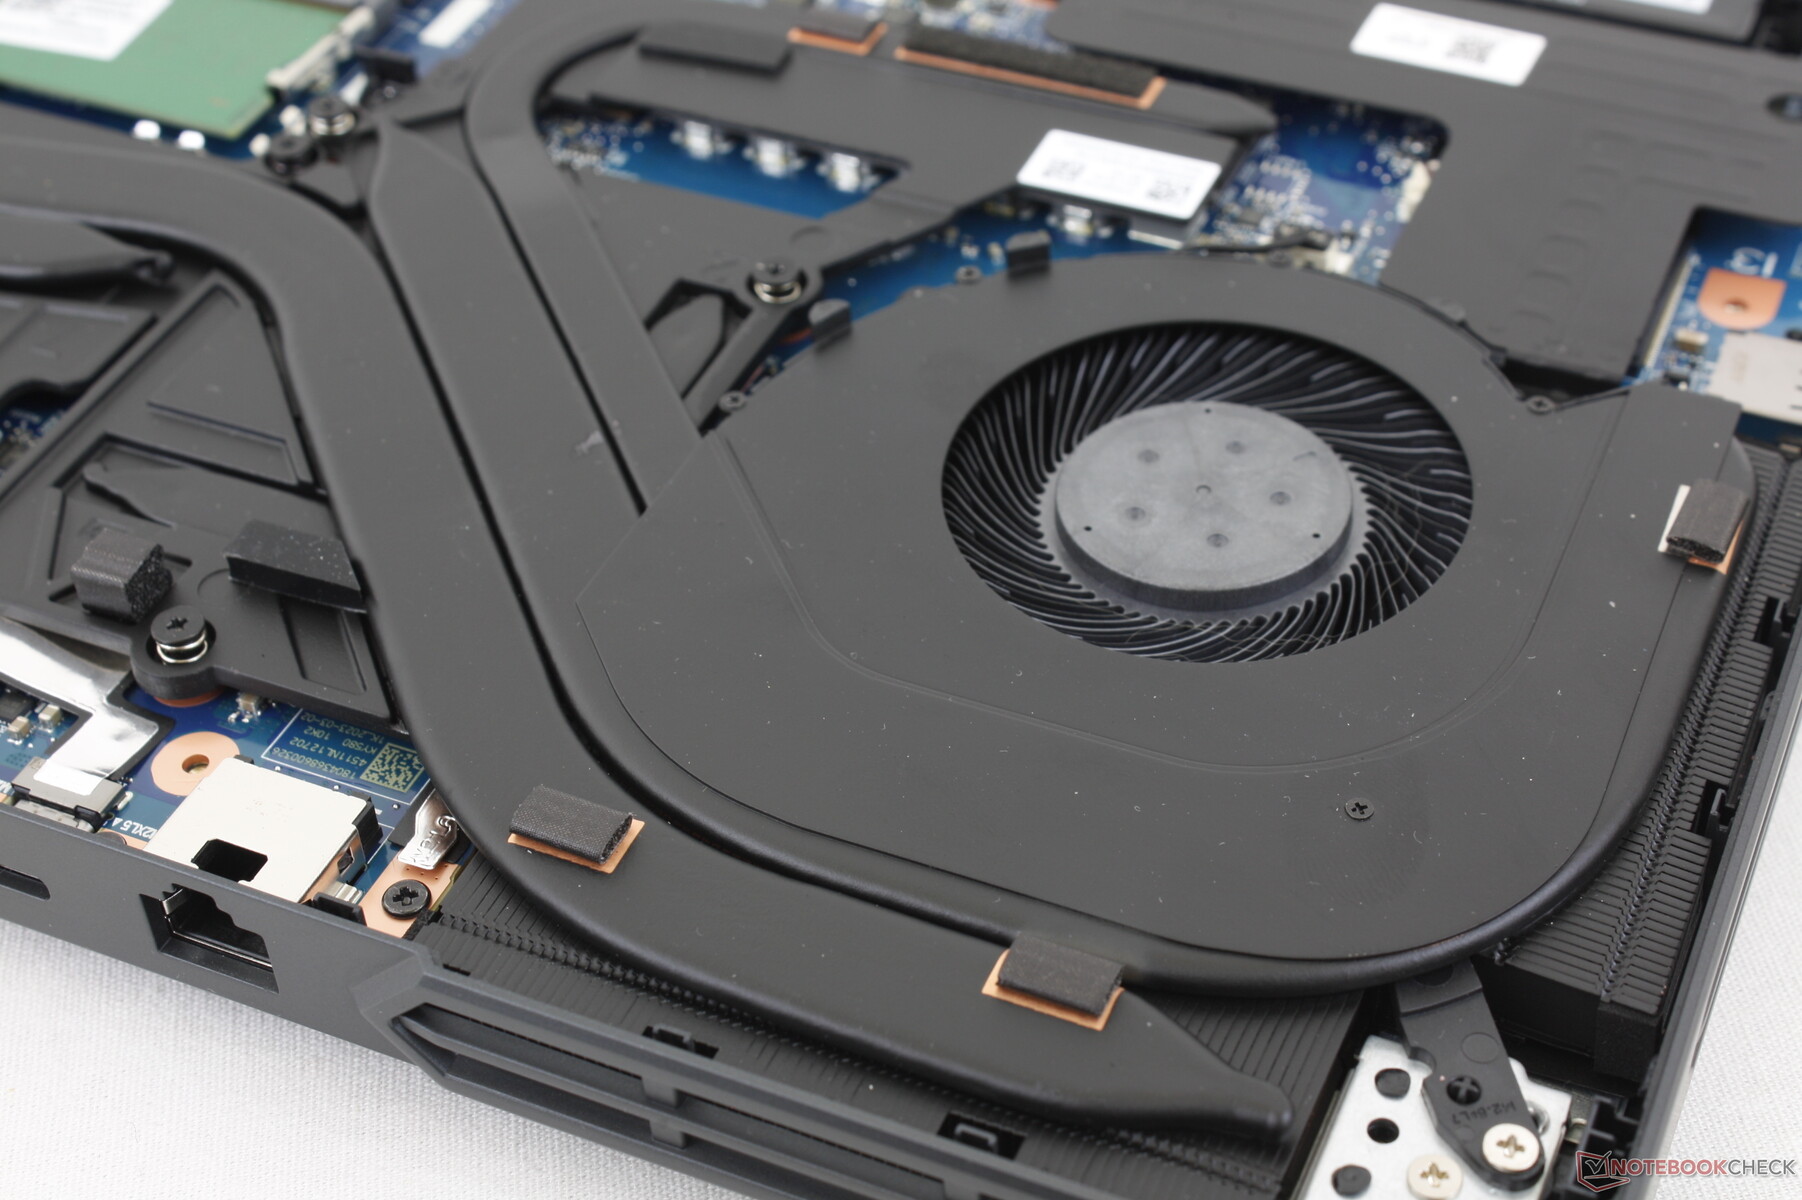
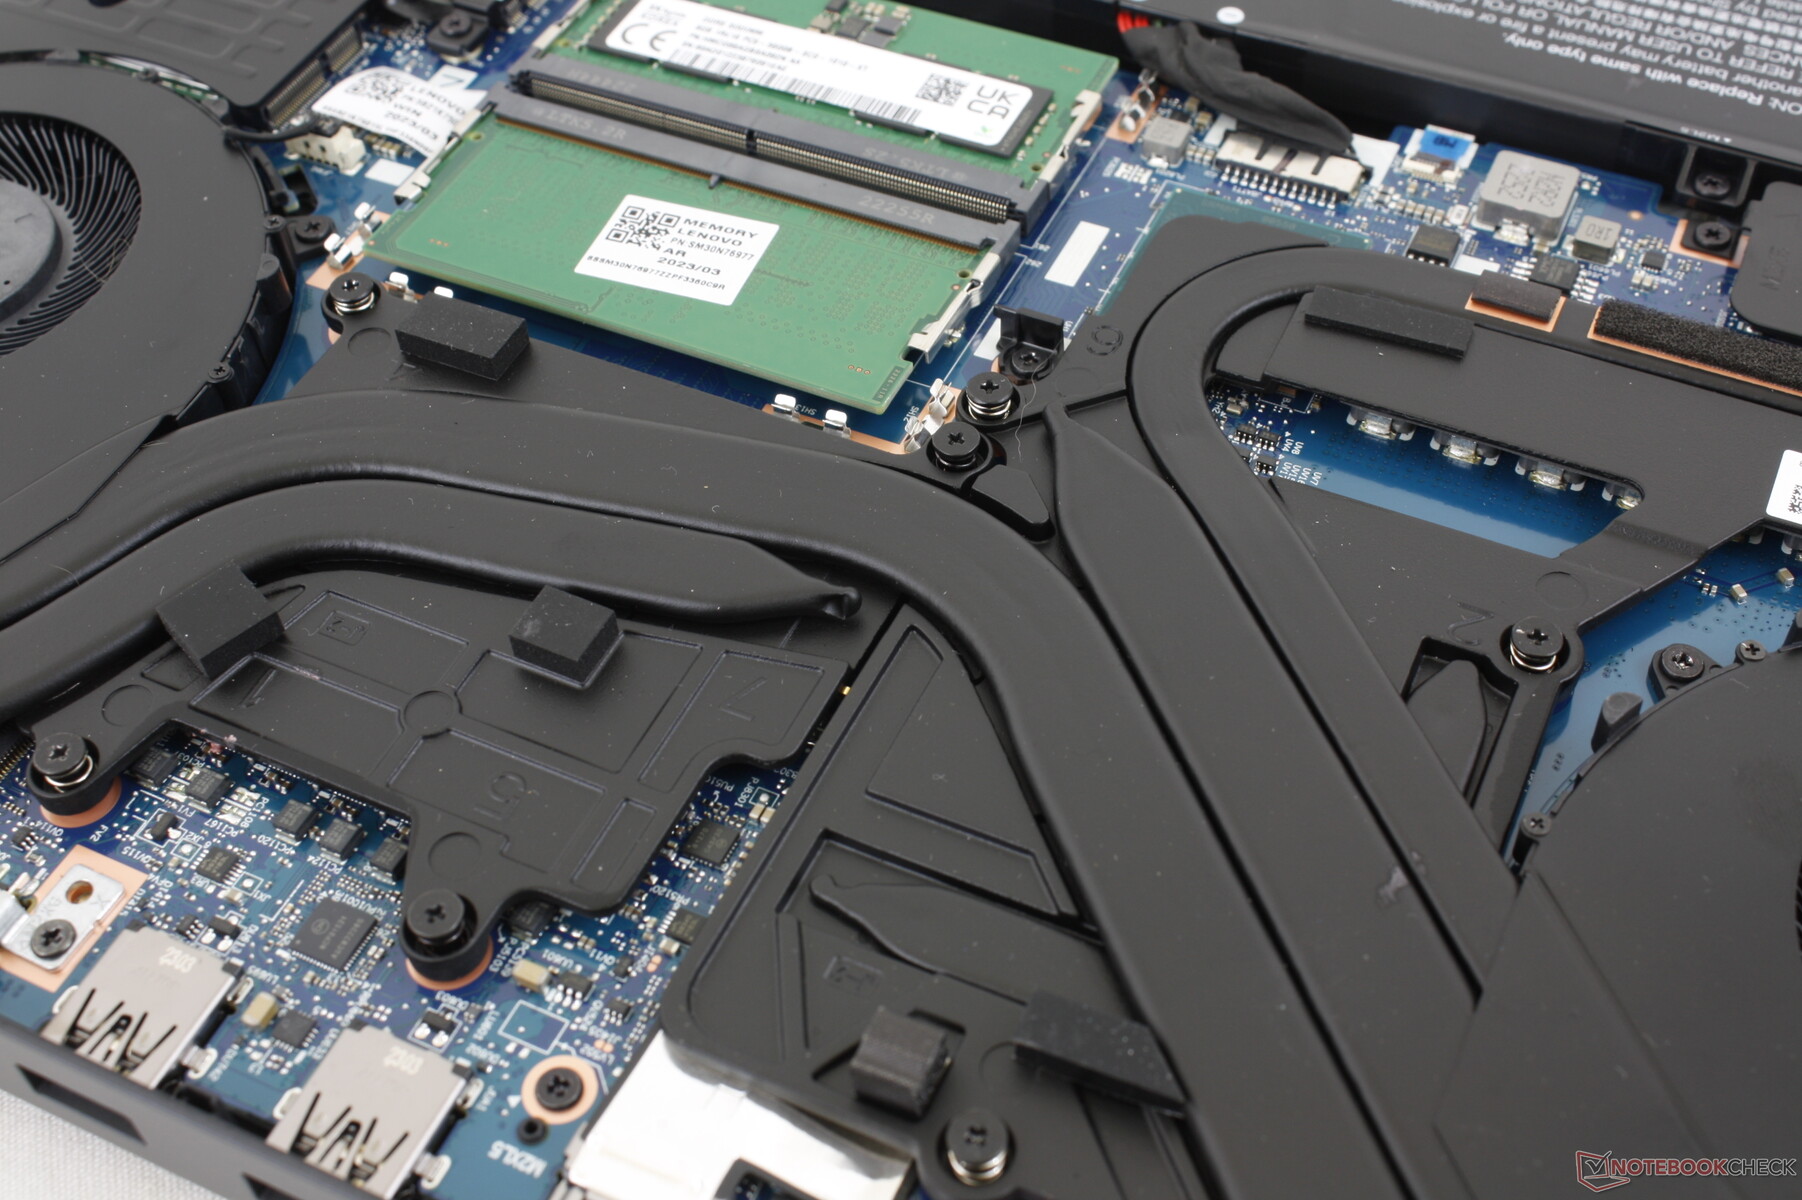
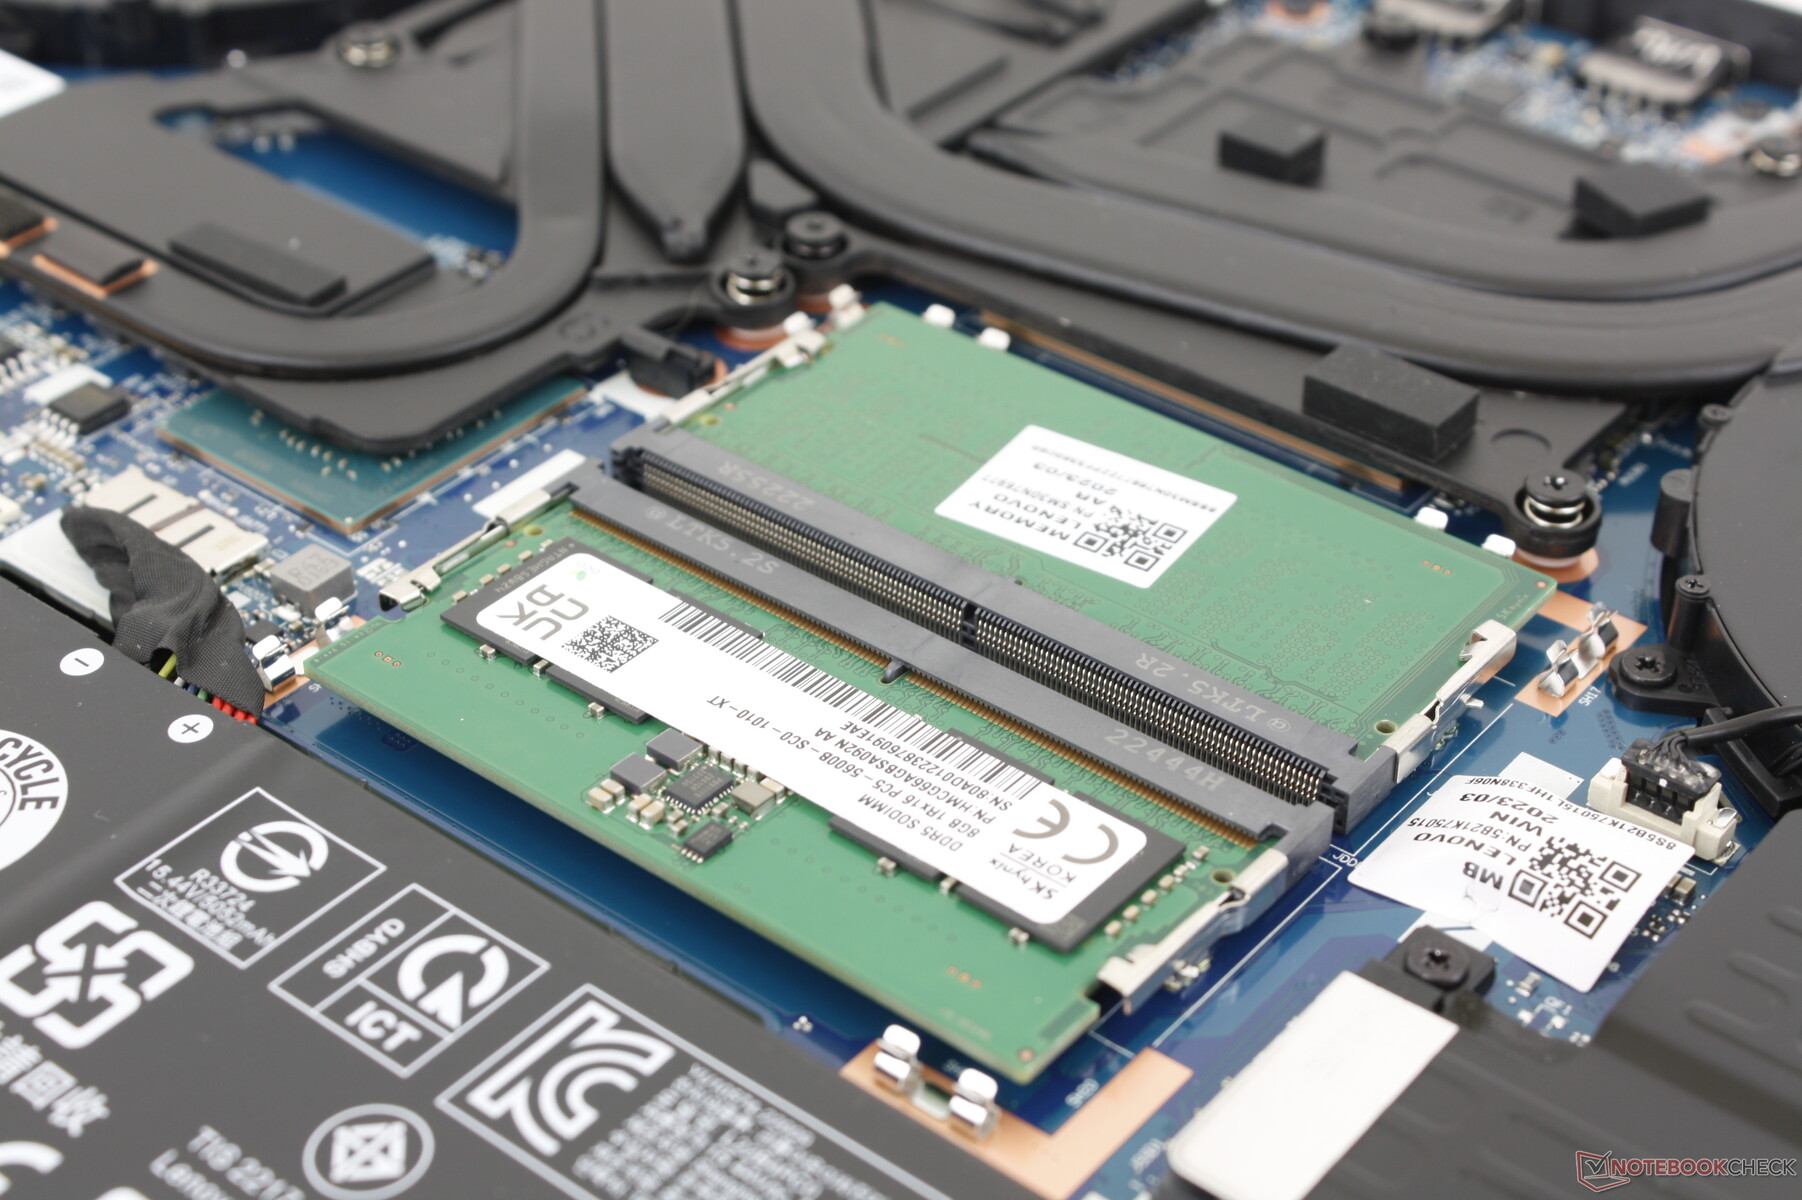
O painel inferior se solta facilmente com apenas uma chave de fenda Philips para revelar dois compartimentos M.2 2280 PCIe4 x4, dois slots SODIMM e o módulo WLAN removível. Observe que os compartimentos e o slot WLAN estão cobertos por dissipadores de calor de alumínio.
Acessórios e garantia
Não há extras na caixa além do adaptador CA e da documentação. O fabricante limitado de um ano se aplica se for comprado nos EUA.
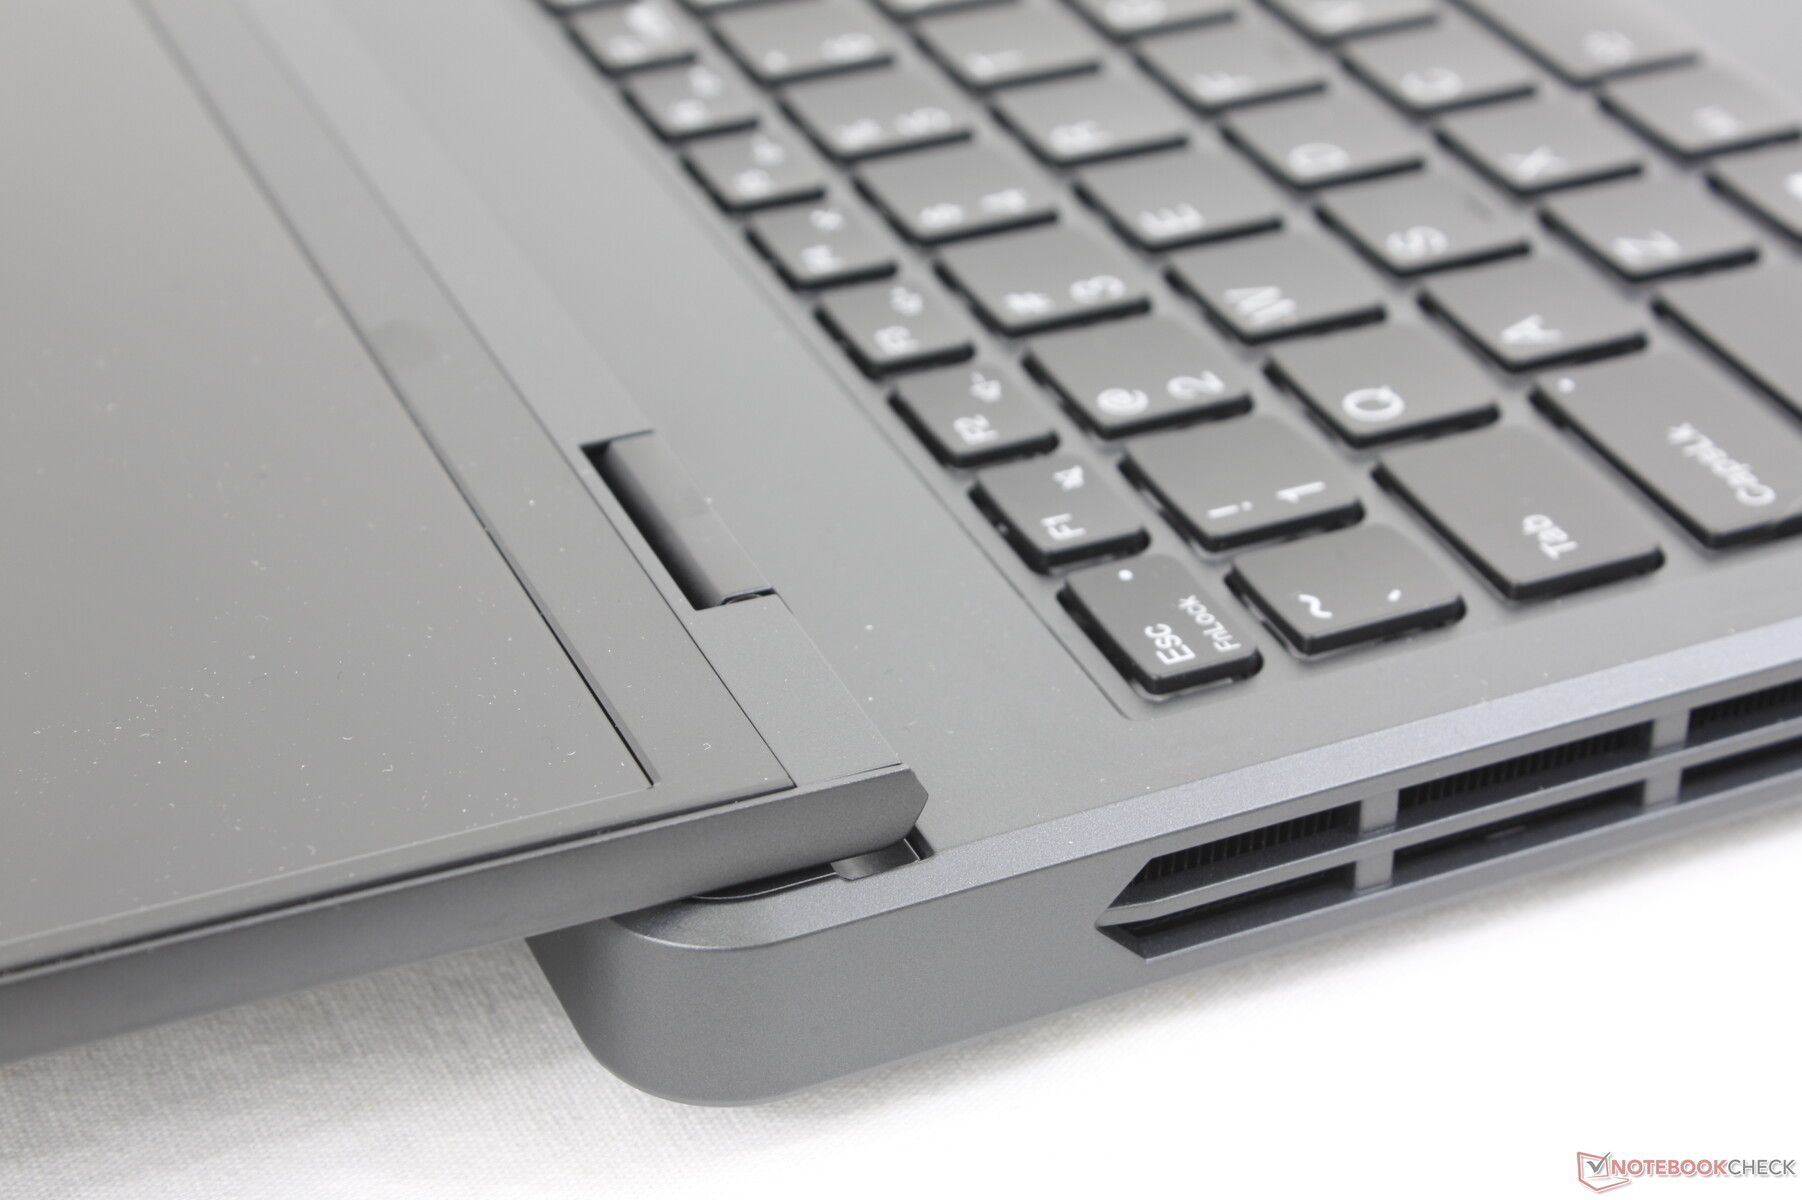
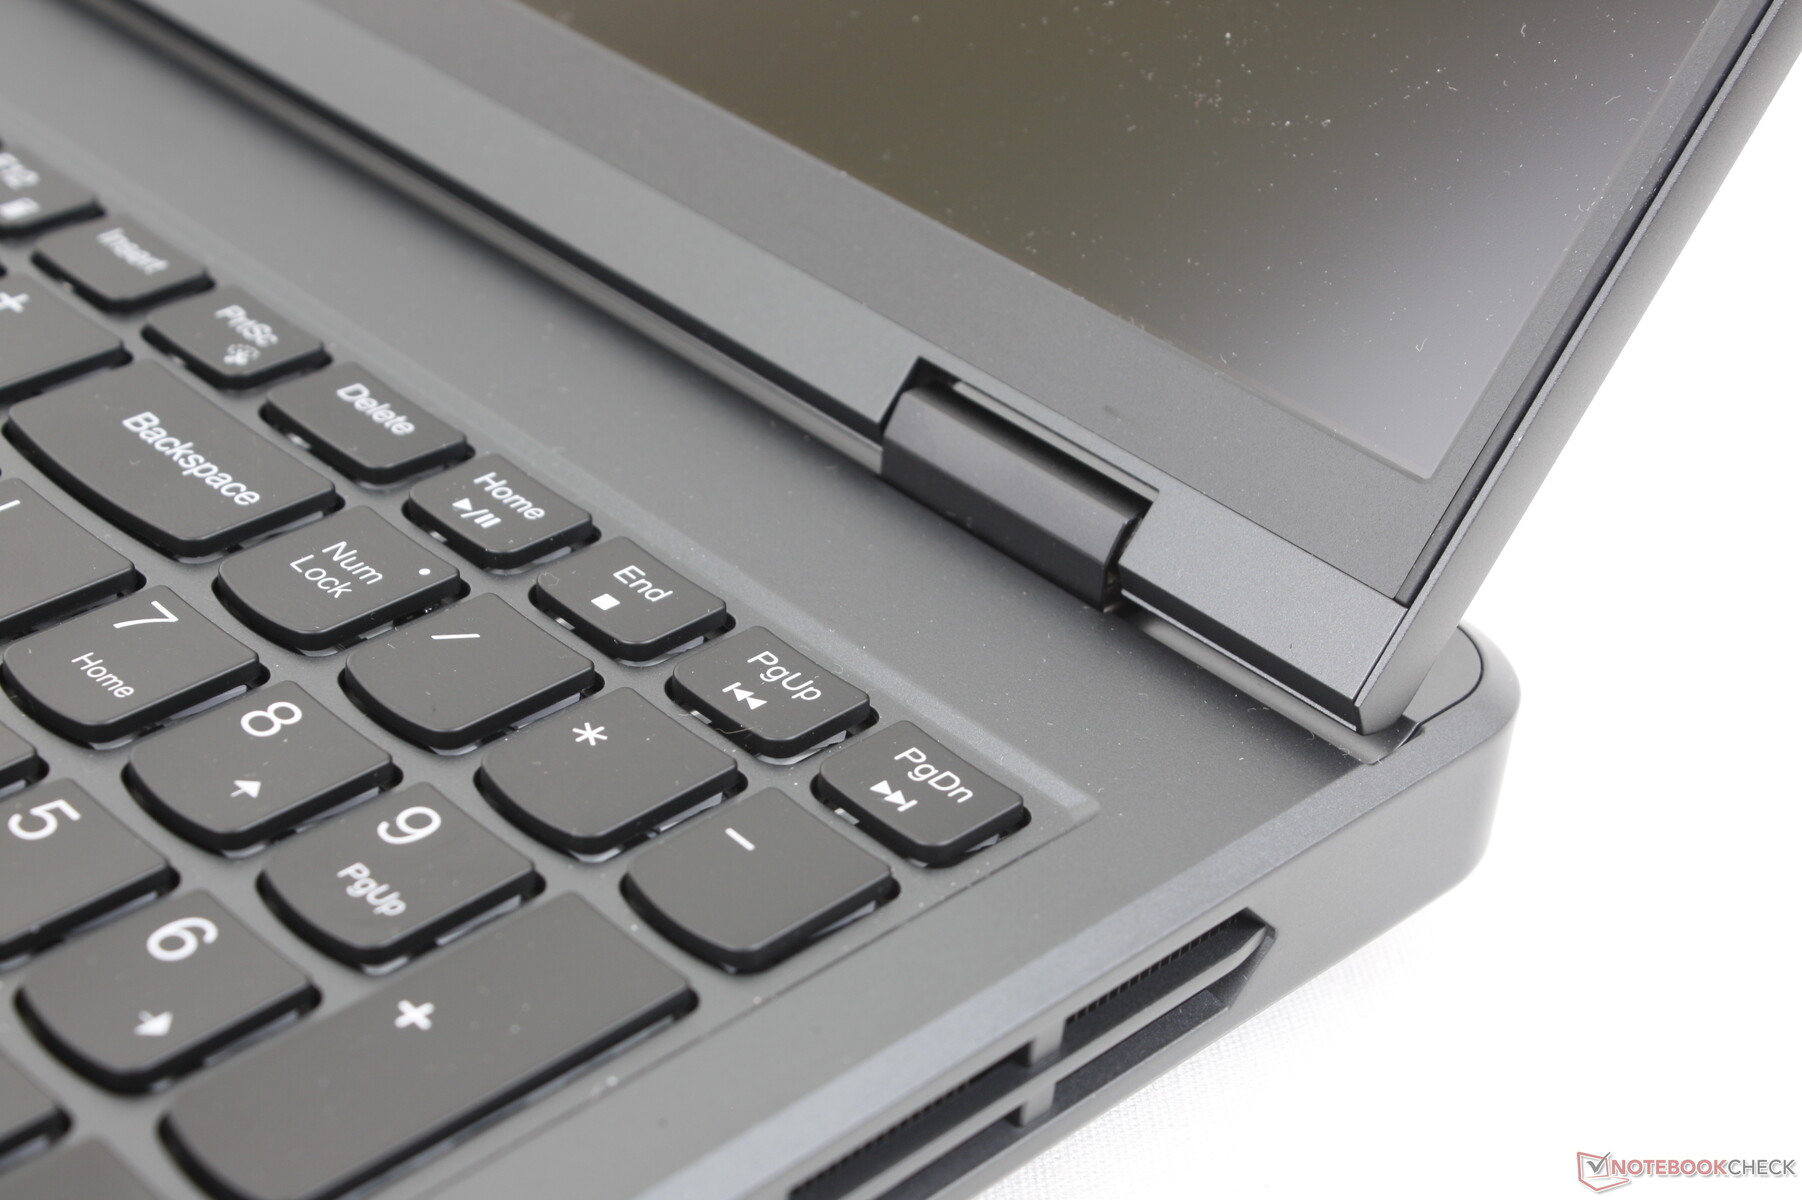
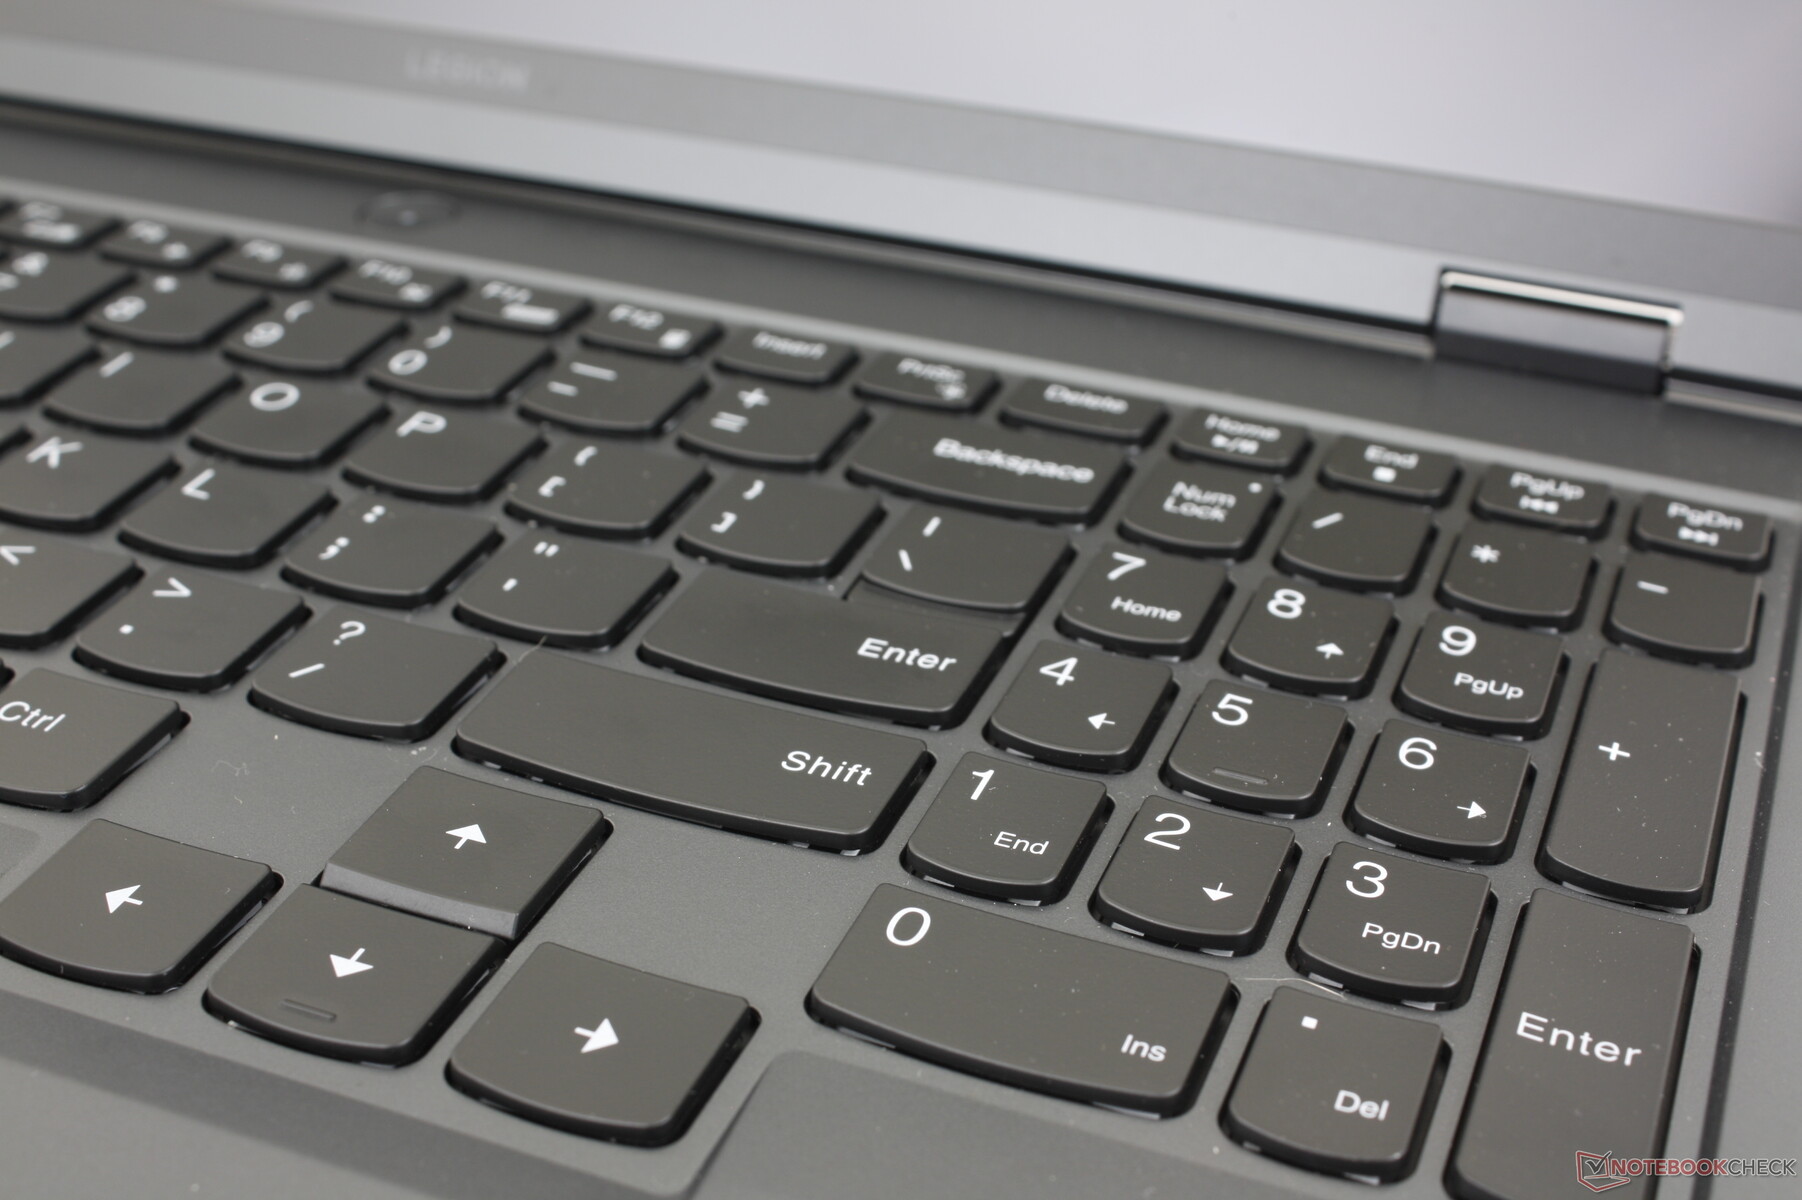
Dispositivos de entrada - Teclado confortável e espaçoso
Teclado
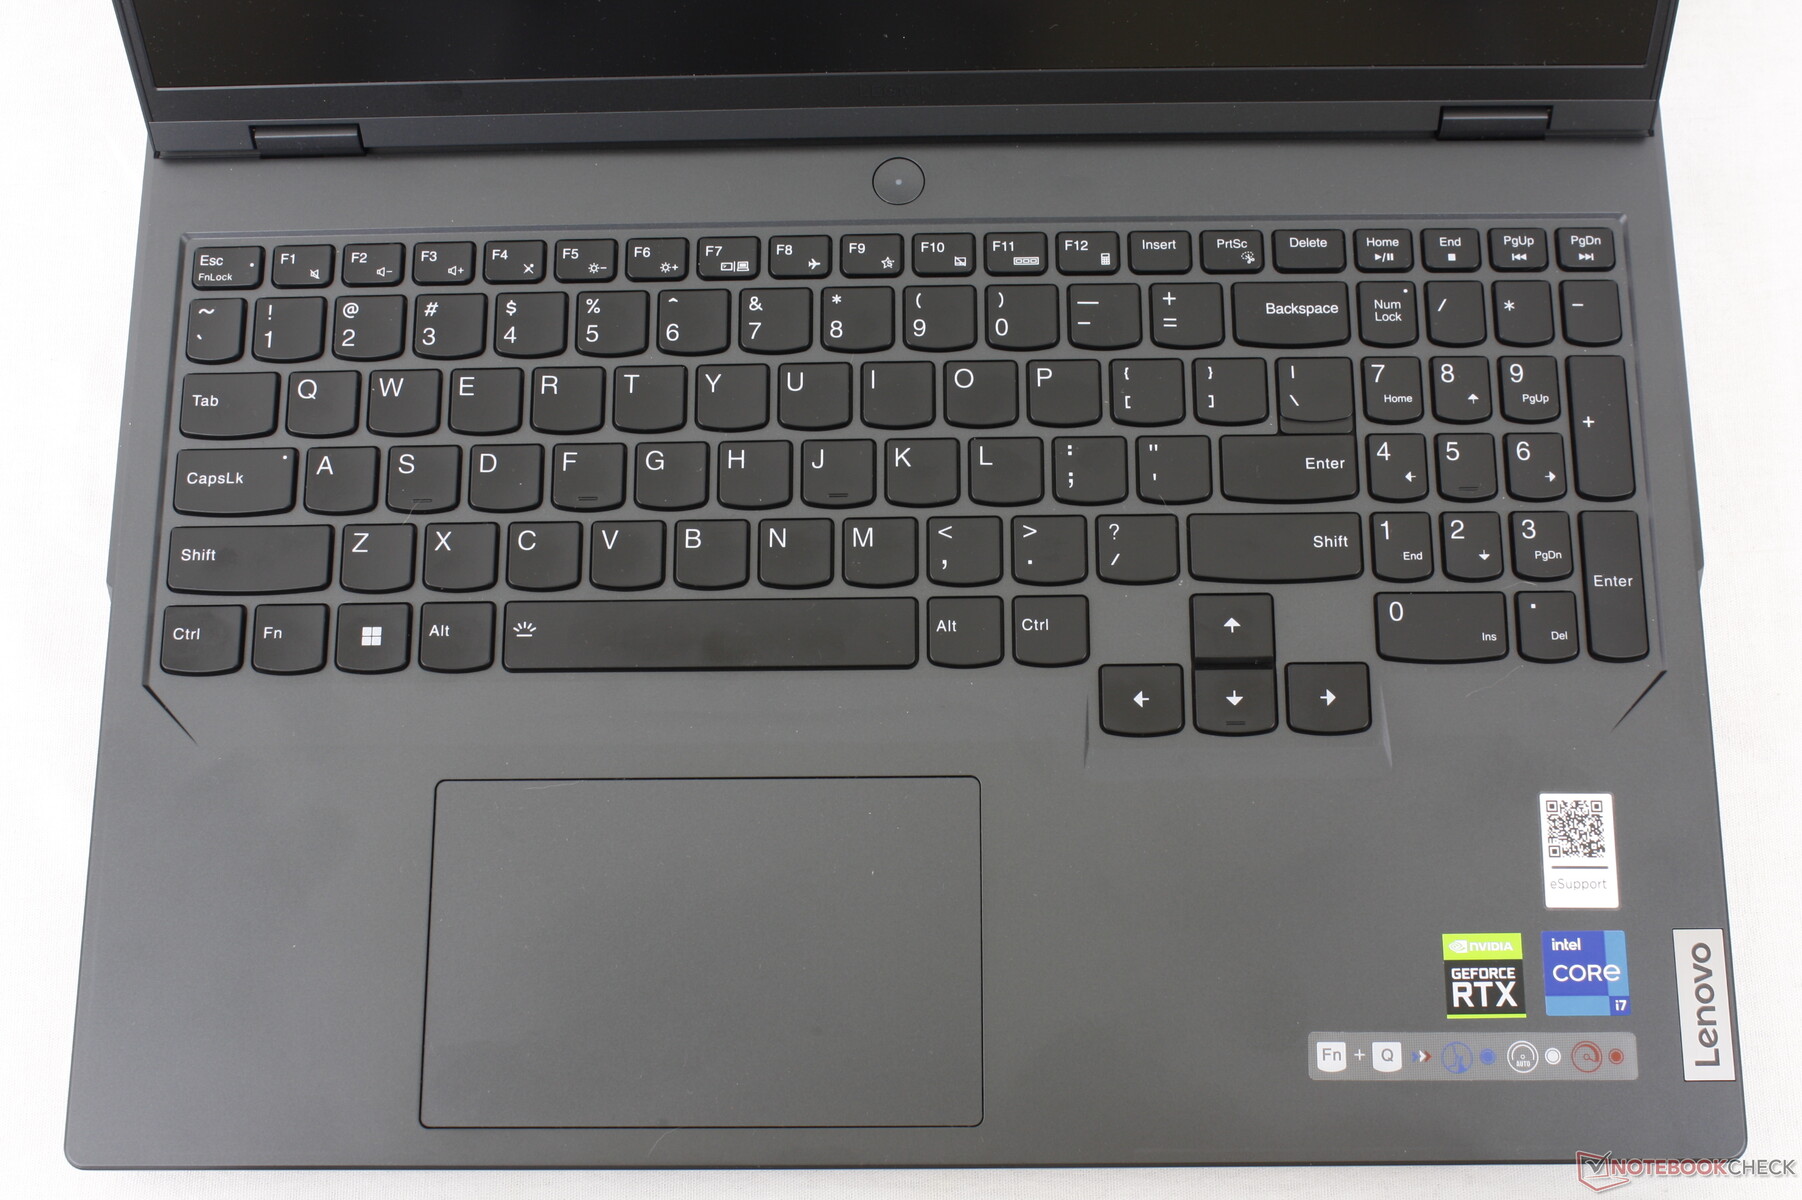
O teclado oferece 1,5 mm de deslocamento, 0,2 mm de inclinação e 100% de anti-ghosting para fins de jogos. O deslocamento e o feedback por si só já são mais profundos e mais fortes, respectivamente, do que os teclados do Razer Blade 16 ou do Asus Zephyrus M16, proporcionando uma experiência de digitação mais satisfatória do que a de qualquer um dos concorrentes.
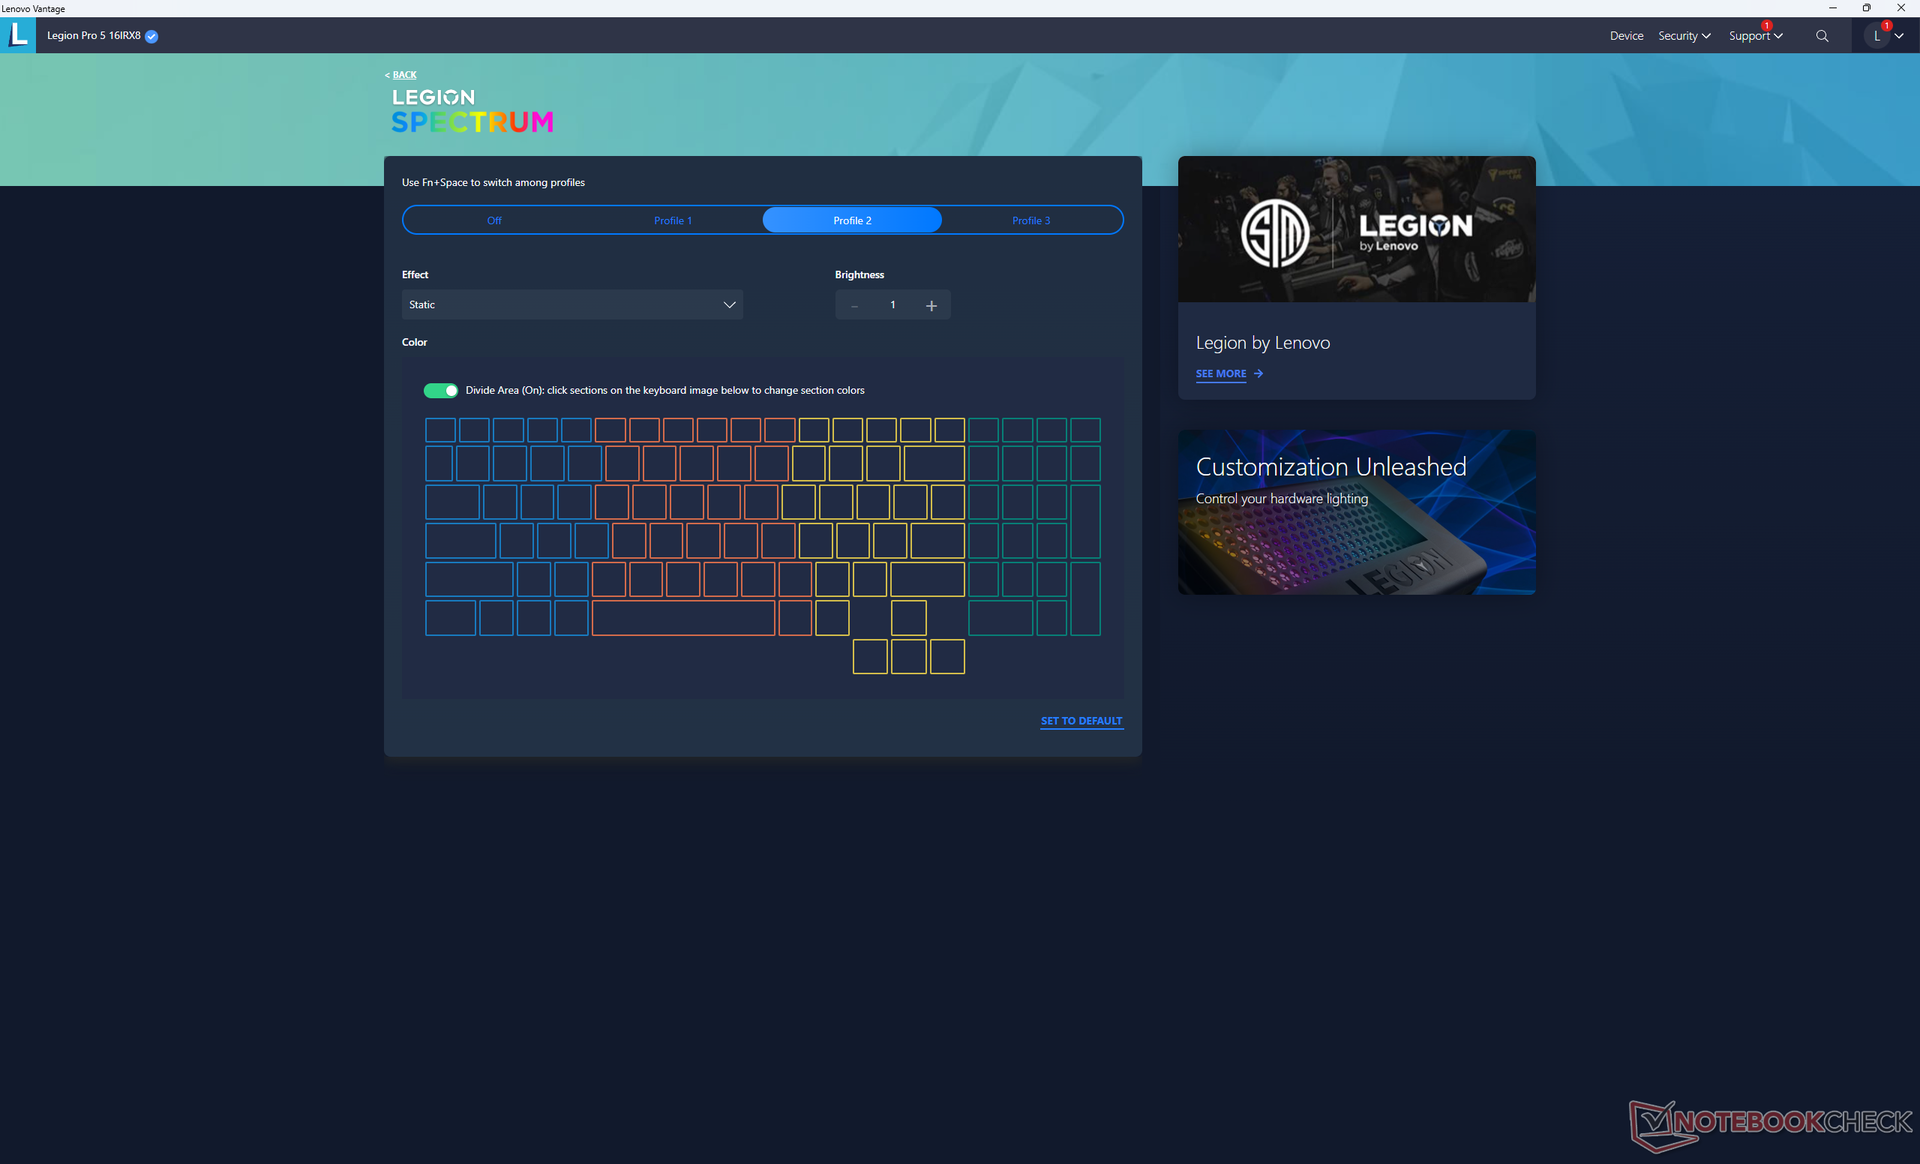
Certos recursos permanecem exclusivos da série Legion 7 Pro de ponta, como o teclado mecânico e a iluminação RGB por tecla. O primeiro é compreensível, mas achamos ridículo que a Lenovo não ofereça o segundo em nossa configuração de mais de US$ 1.500. Em vez disso, os proprietários têm que se contentar com a iluminação RGB de quatro zonas.
Touchpad
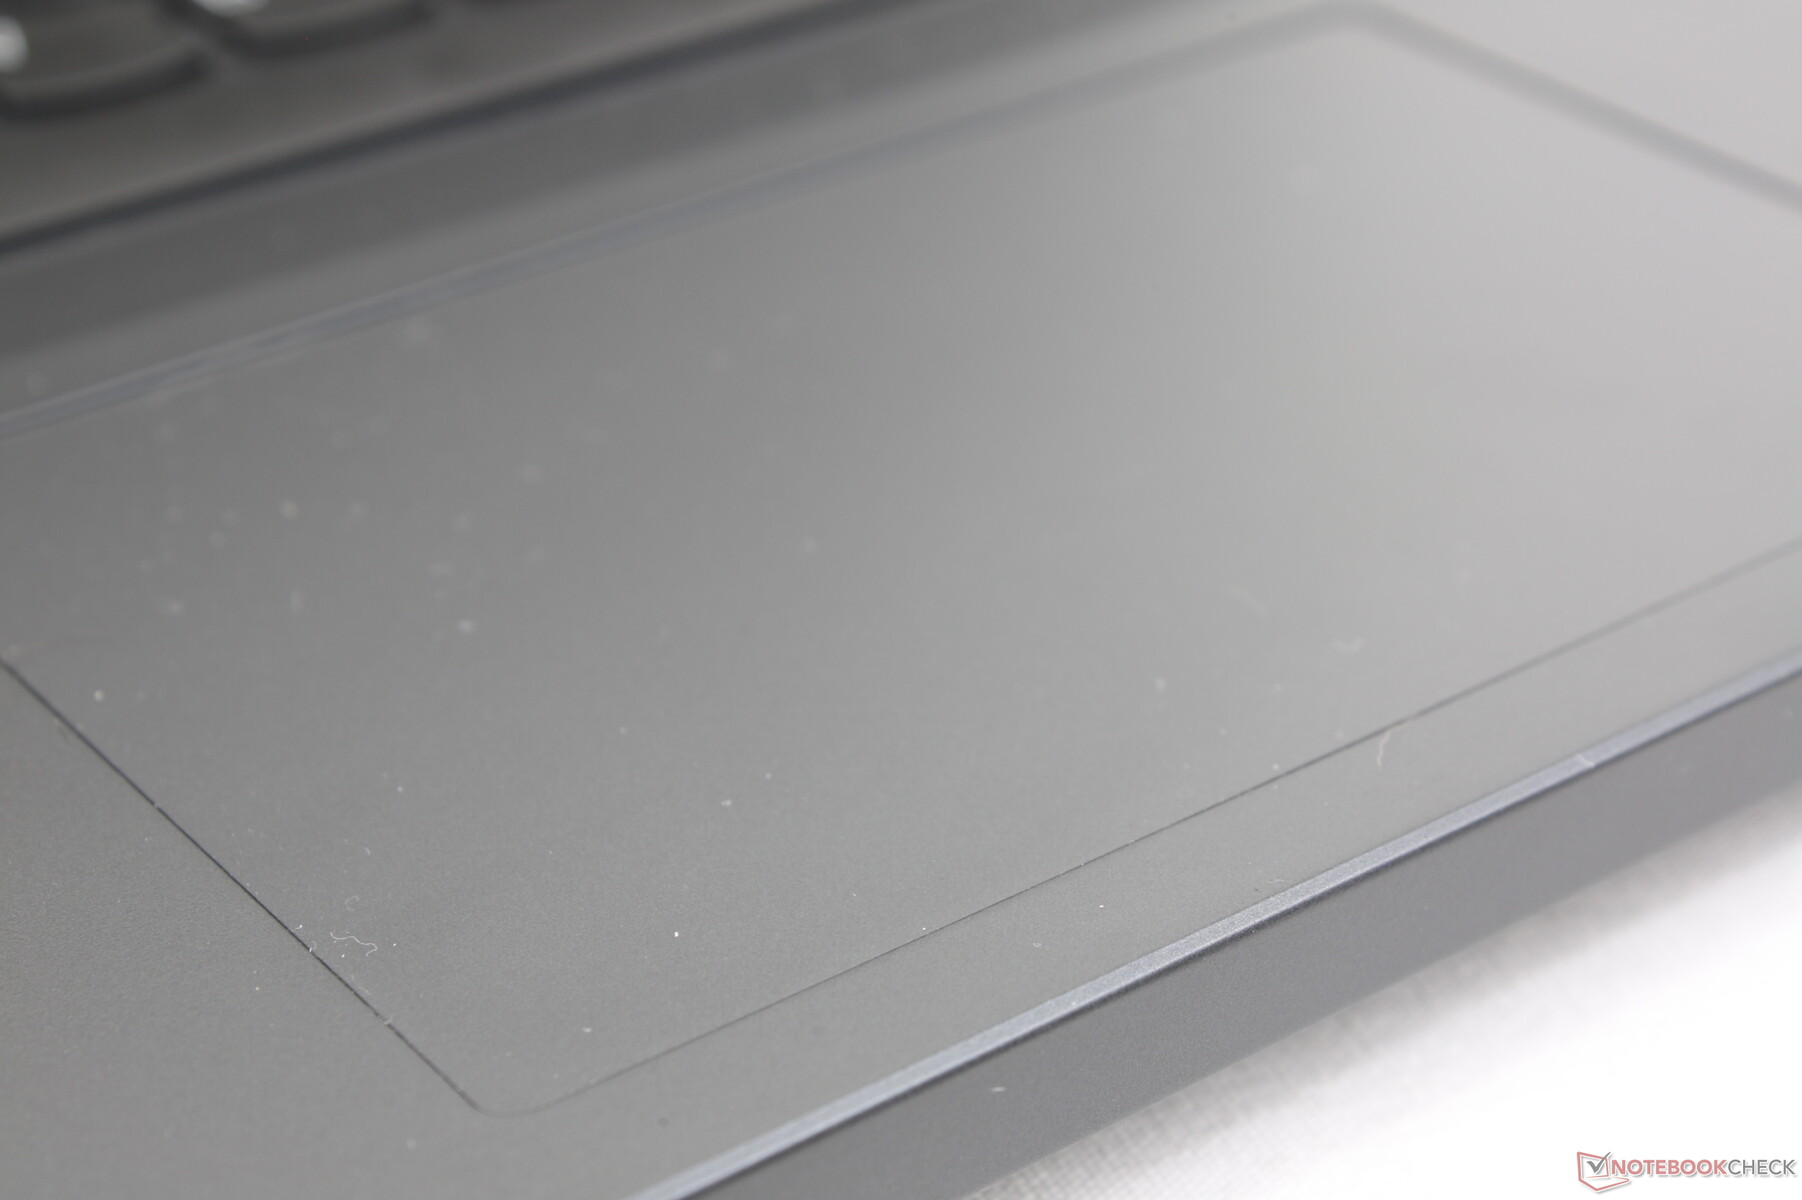
O clickpad (12 x 7,5 cm) tem aproximadamente o mesmo tamanho que o doInspiron 16 Plus 7620 (11,5 x 8 cm). O deslizamento é suave e responsivo, com apenas um pouco de aderência em velocidades mais lentas para cliques mais precisos. No entanto, o deslocamento é muito superficial ao clicar e o feedback não é muito forte. Mesmo assim, o clickpad funciona de forma confiável o suficiente para tarefas simples quando não há um mouse disponível.

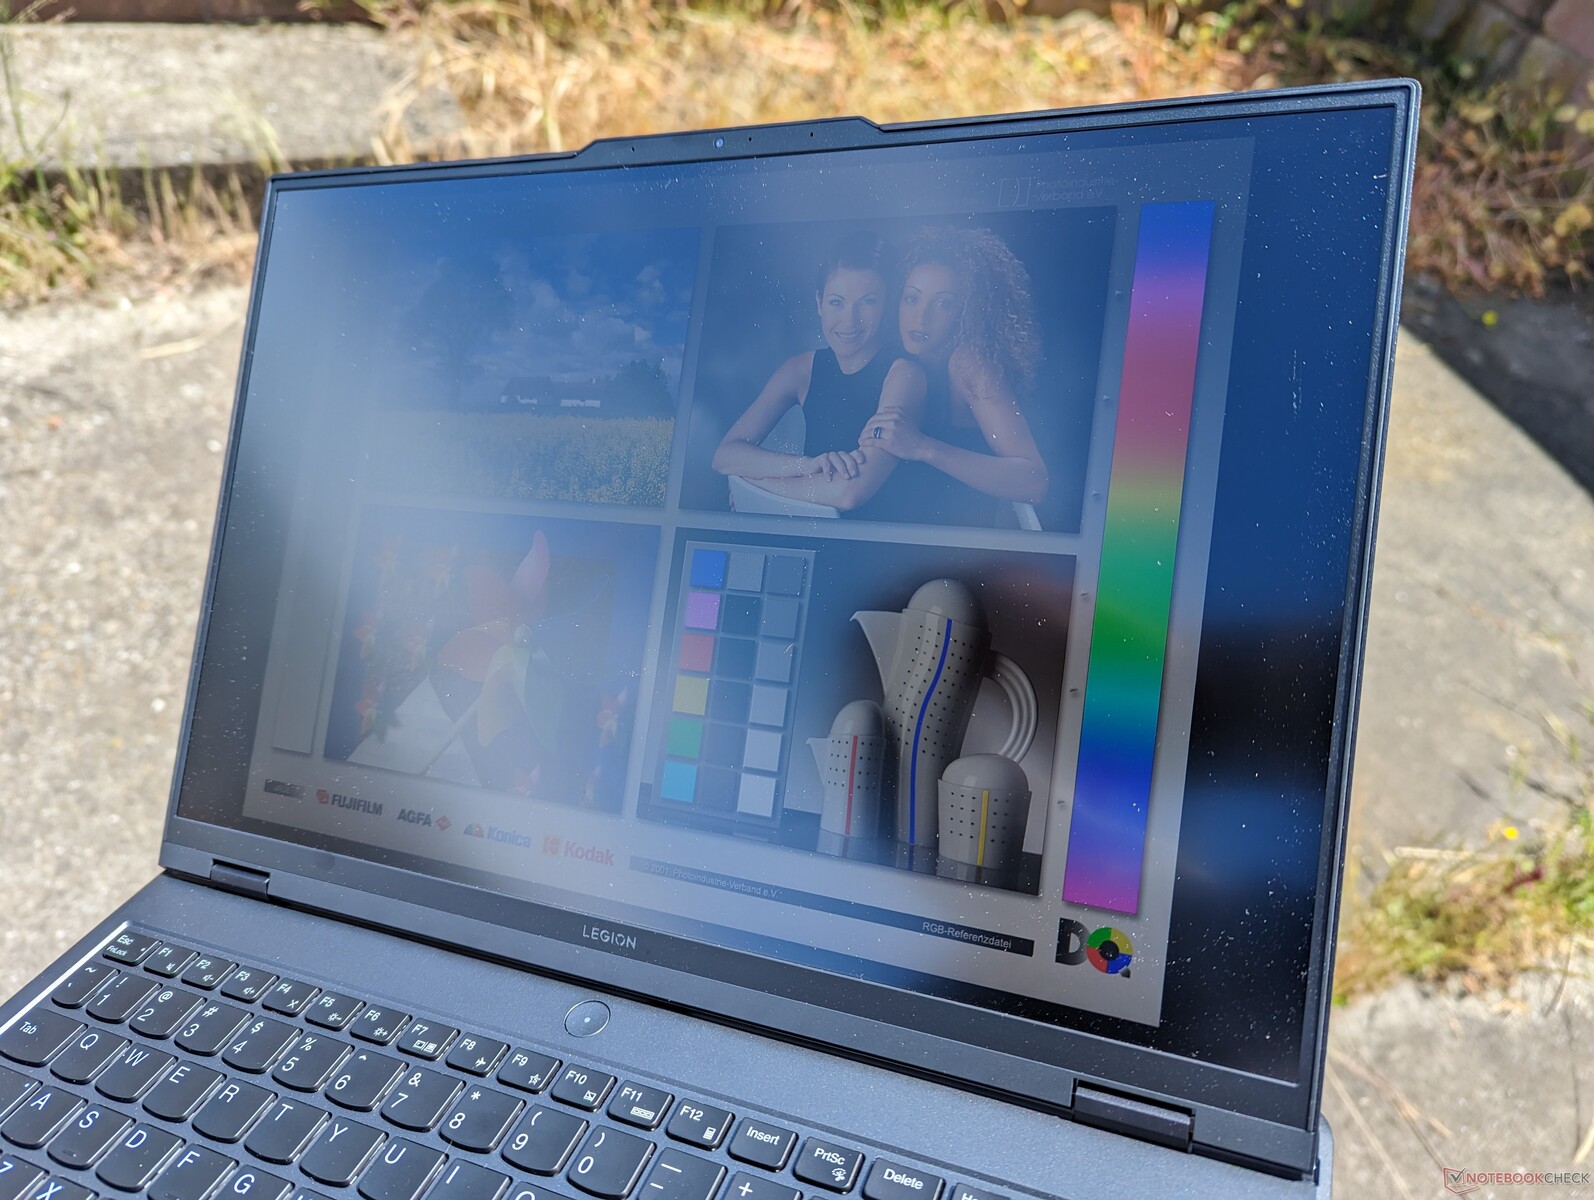
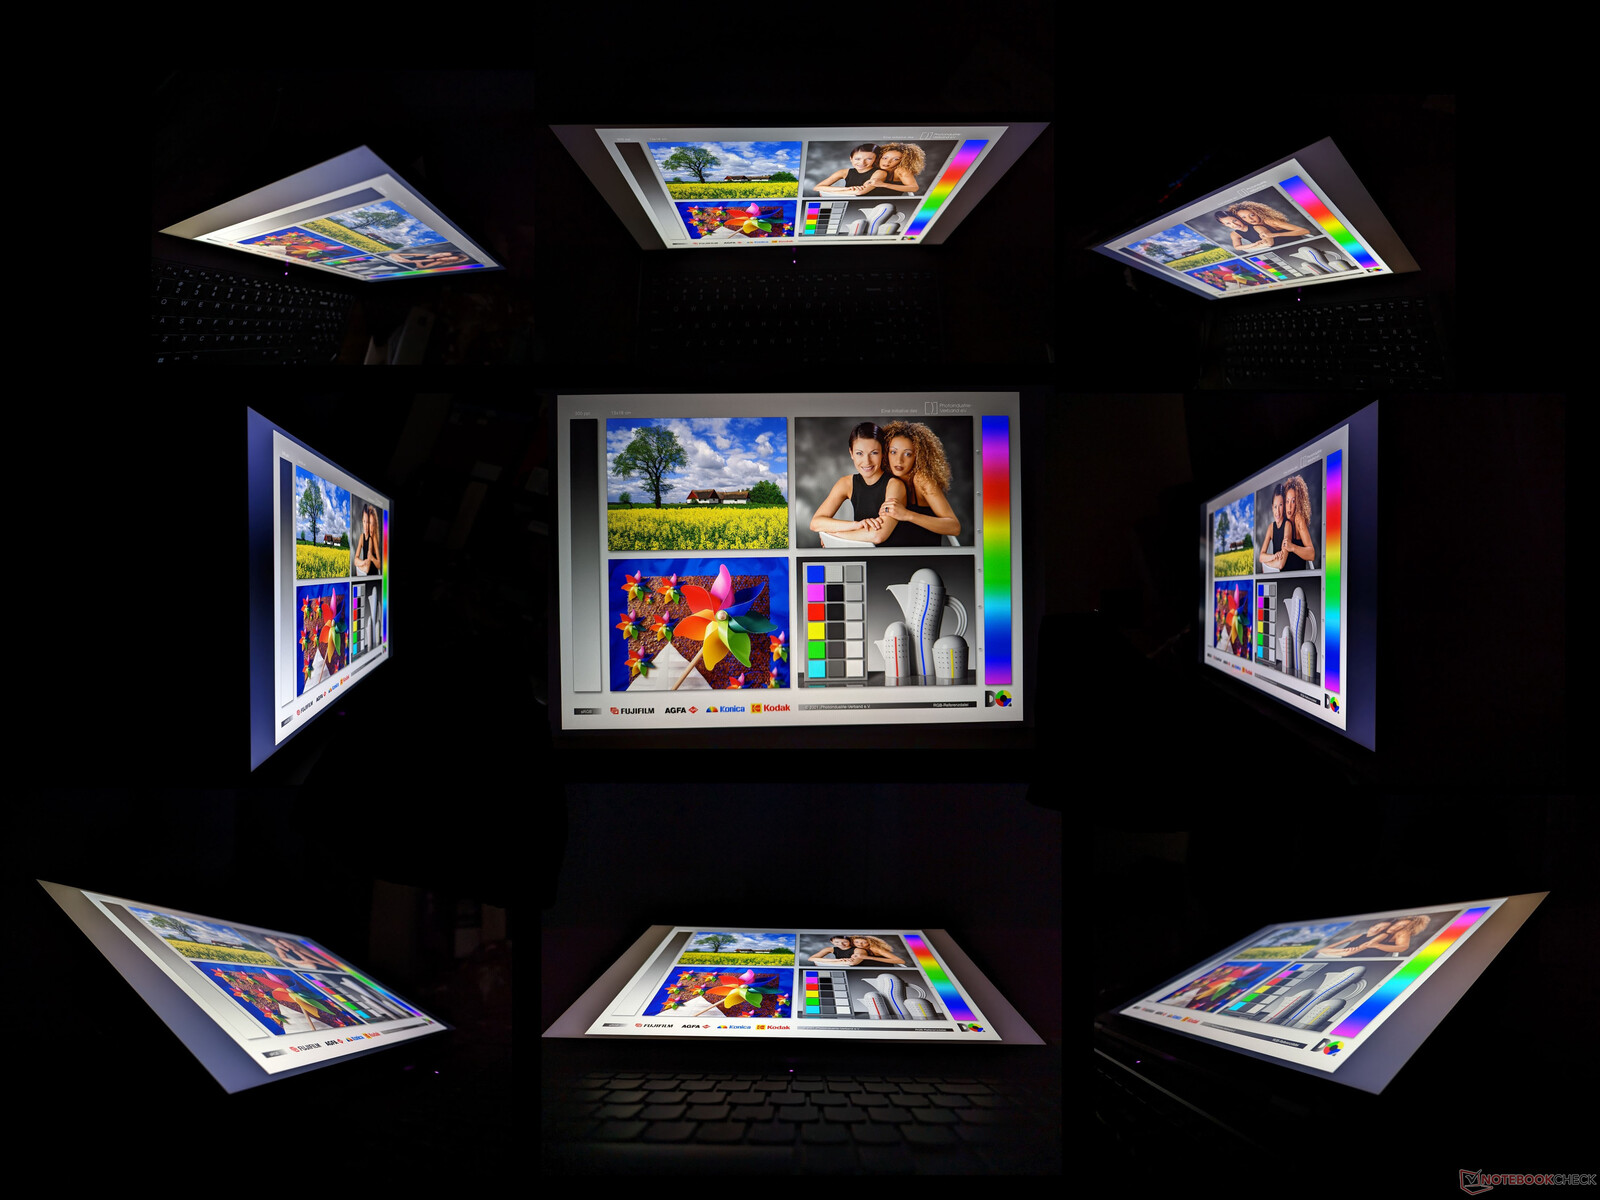
Tela - mínimo de 165 Hz
Há duas opções de tela para o 2023 Legion Pro 5 16: 165 Hz e 240 Hz. Ambas suportam G-Sync, resolução nativa de 2560 x 1600 e cobertura total de sRGB, enquanto apenas o painel de 240 Hz suporta HDR400. A opção básica de 165 Hz deve ser mais do que suficiente para o jogador de médio porte. A qualidade da imagem é excelente, com granulação surpreendentemente mínima para um painel fosco.
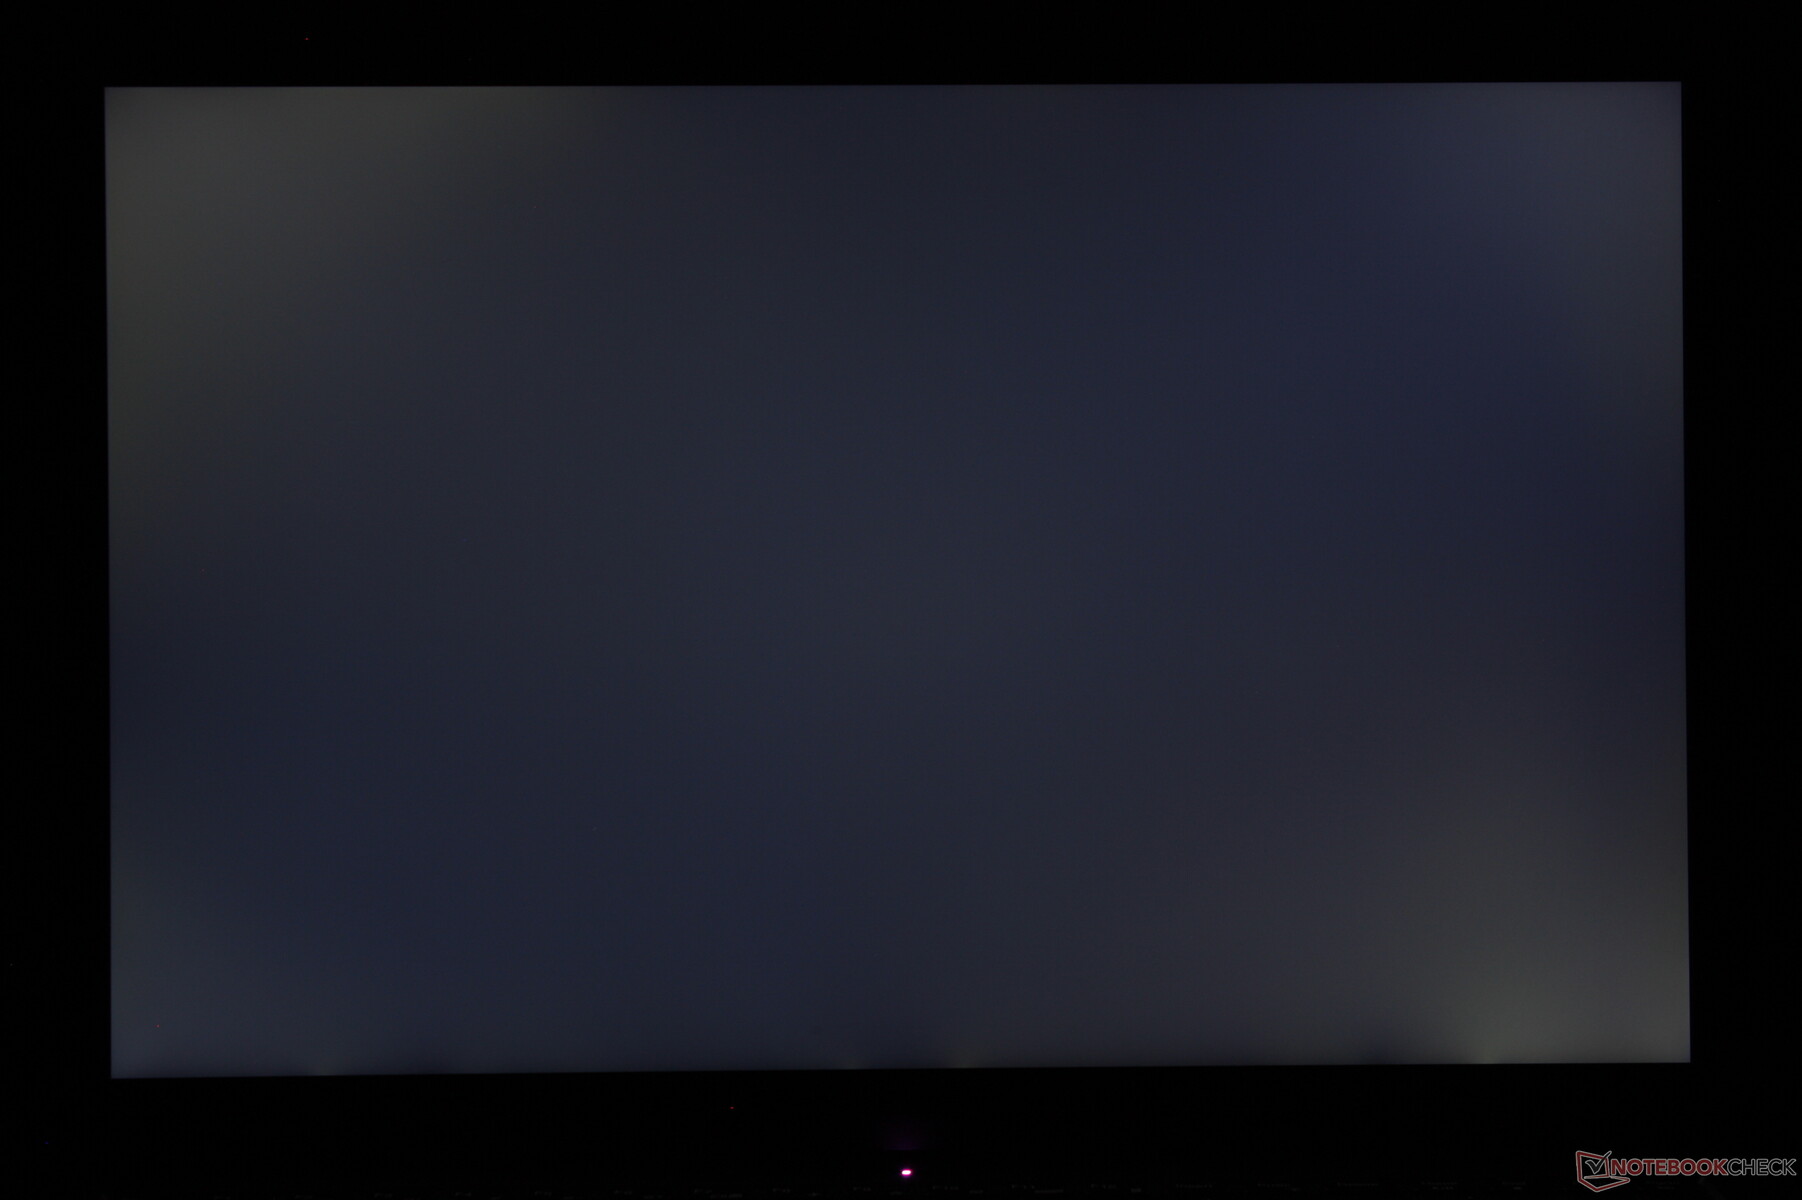
O sangramento da luz de fundo certamente poderia ser melhorado. A nossa unidade exibia uma quantidade razoável de vazamento de luz, o que consideramos inaceitável em um laptop para jogos dessa faixa de preço.
Os usuários interessados em OLED ou em cores AdobeRGB mais amplas terão que ir além da série de médio porte Legion Pro 5.

| |||||||||||||||||||||||||
iluminação: 87 %
iluminação com acumulador: 405.7 cd/m²
Contraste: 1068:1 (Preto: 0.38 cd/m²)
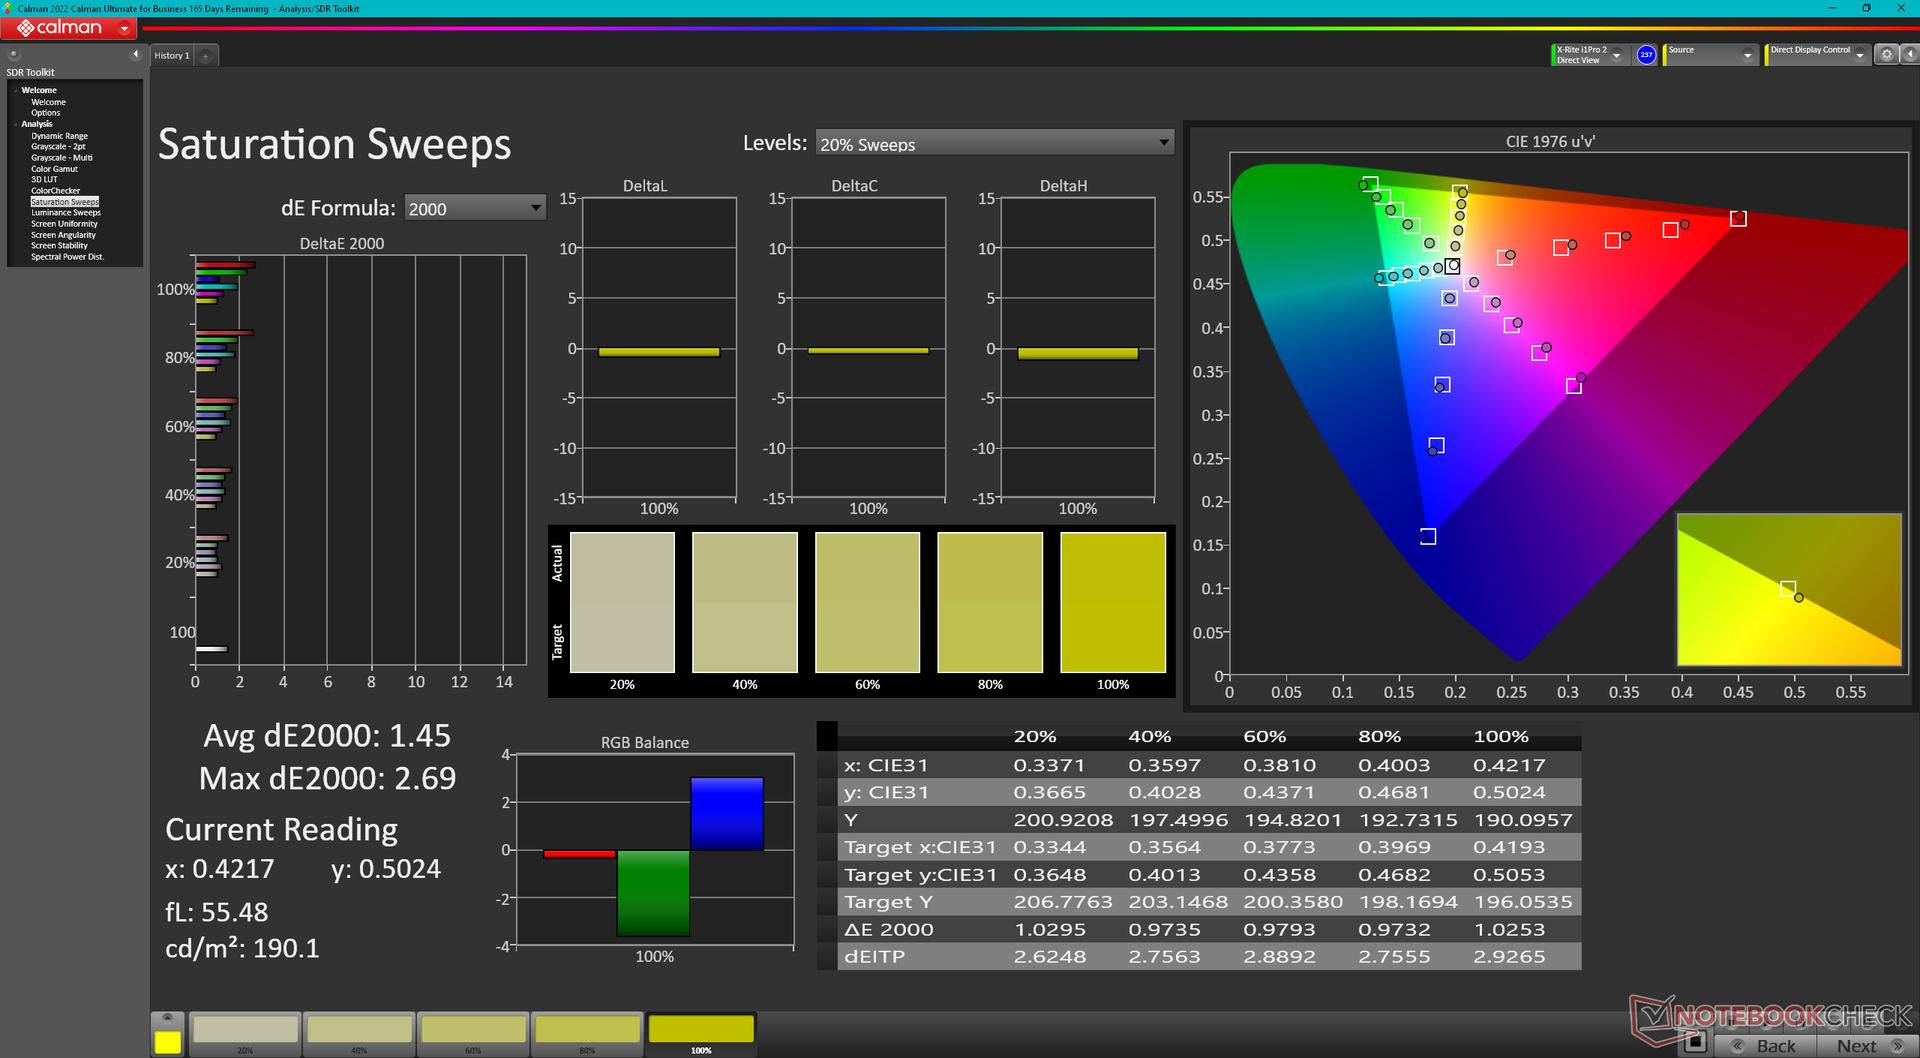
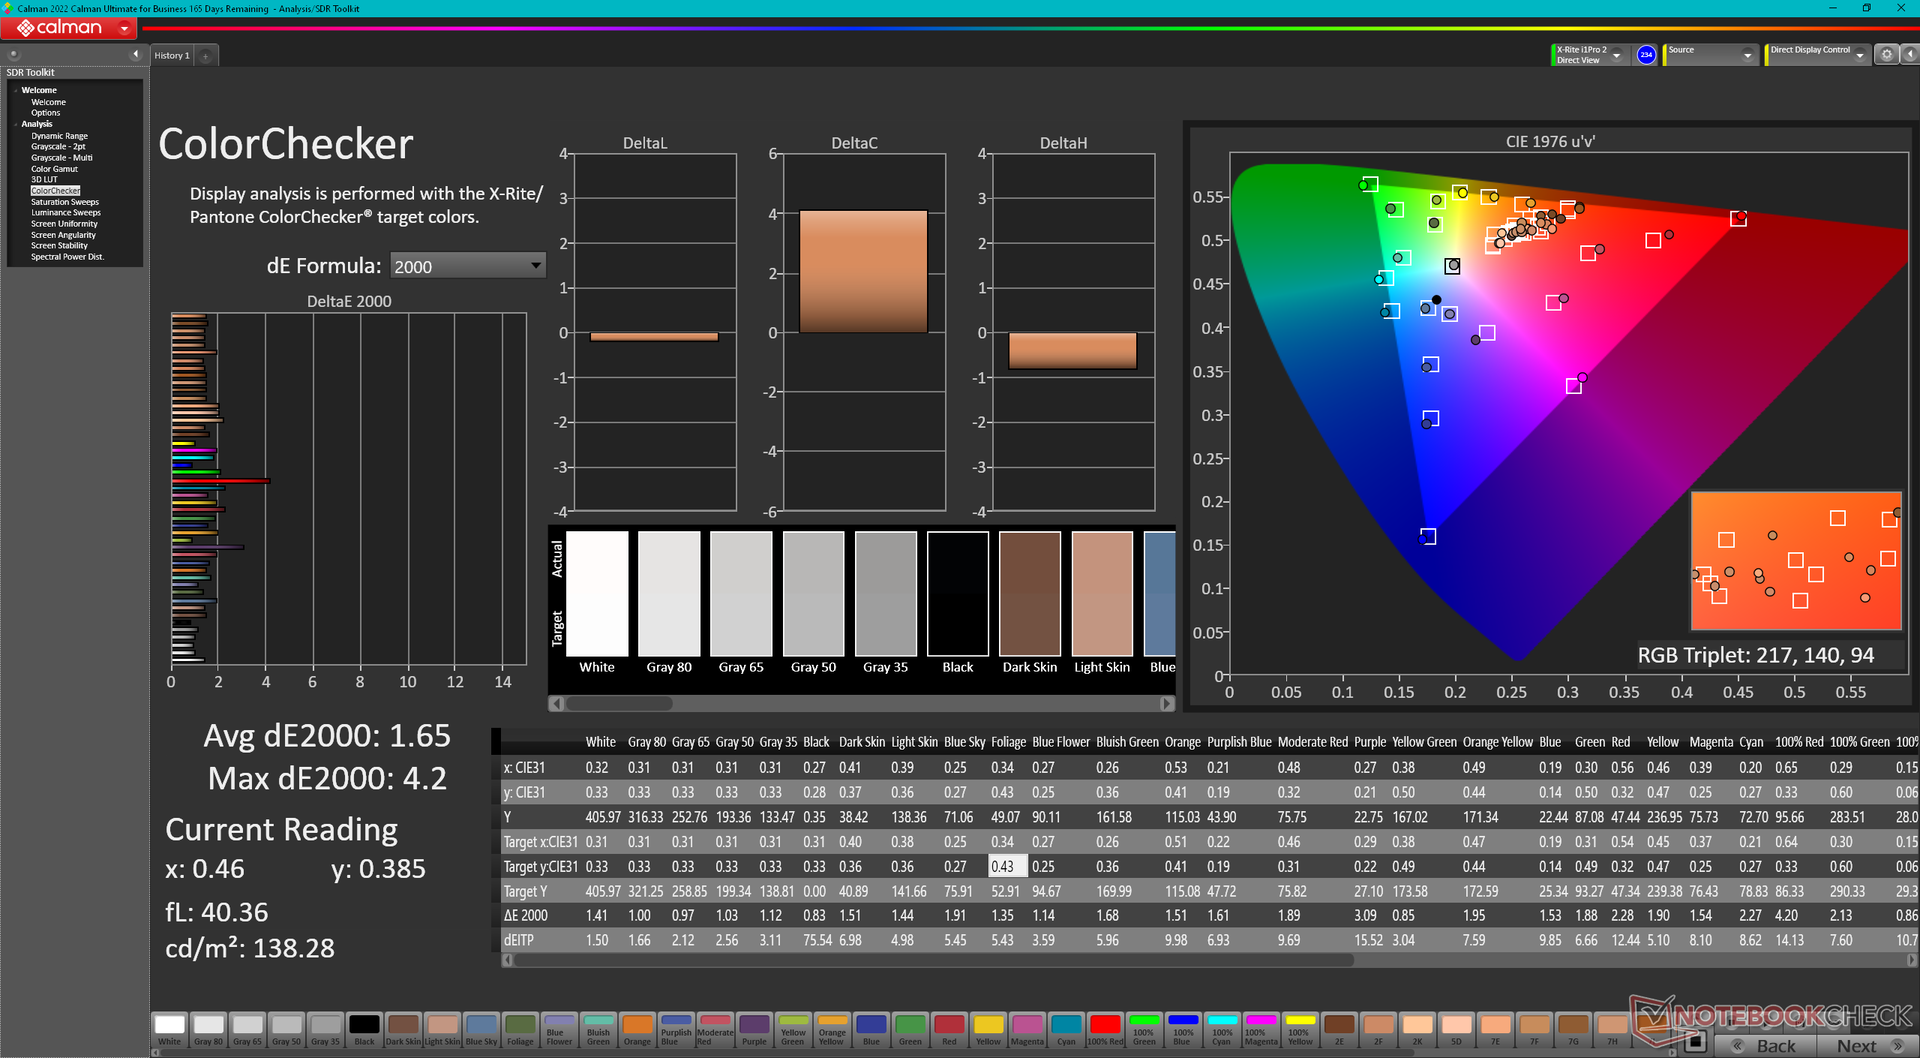
ΔE ColorChecker Calman: 1.65 | ∀{0.5-29.43 Ø4.71}
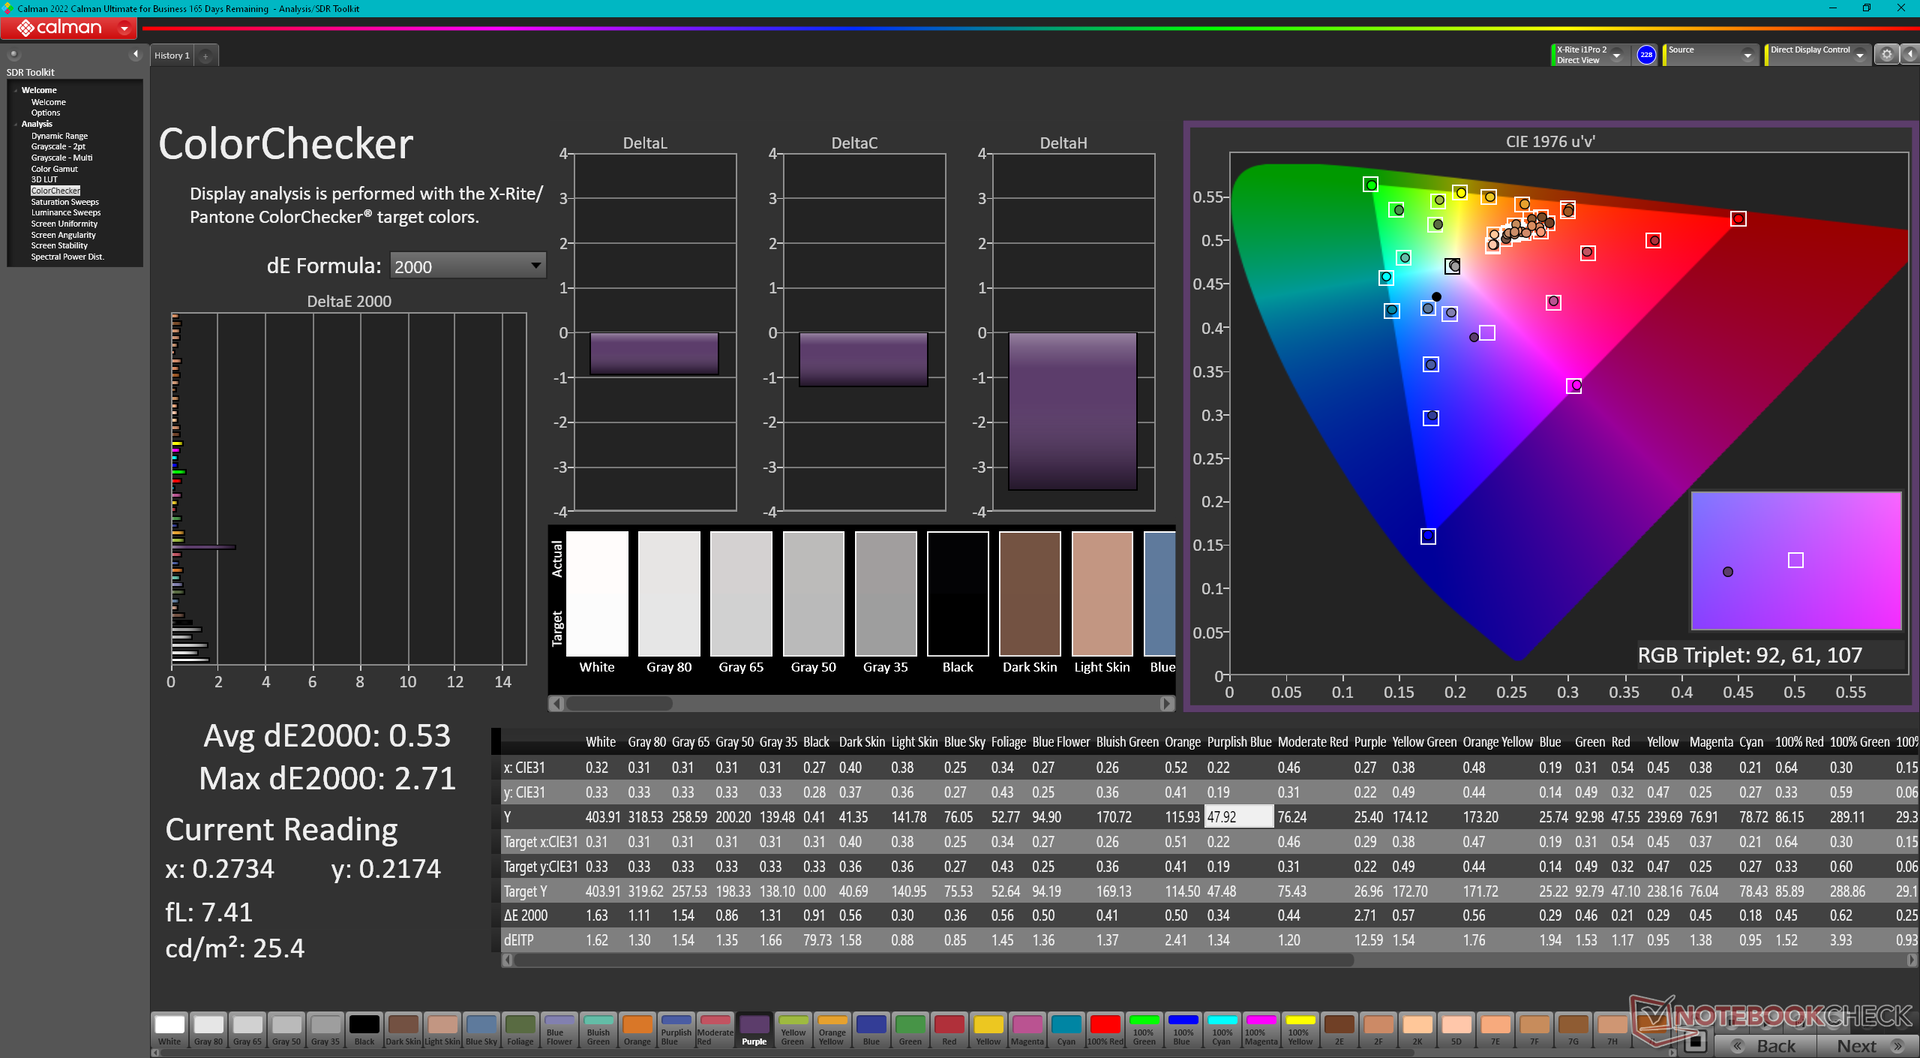
calibrated: 0.53
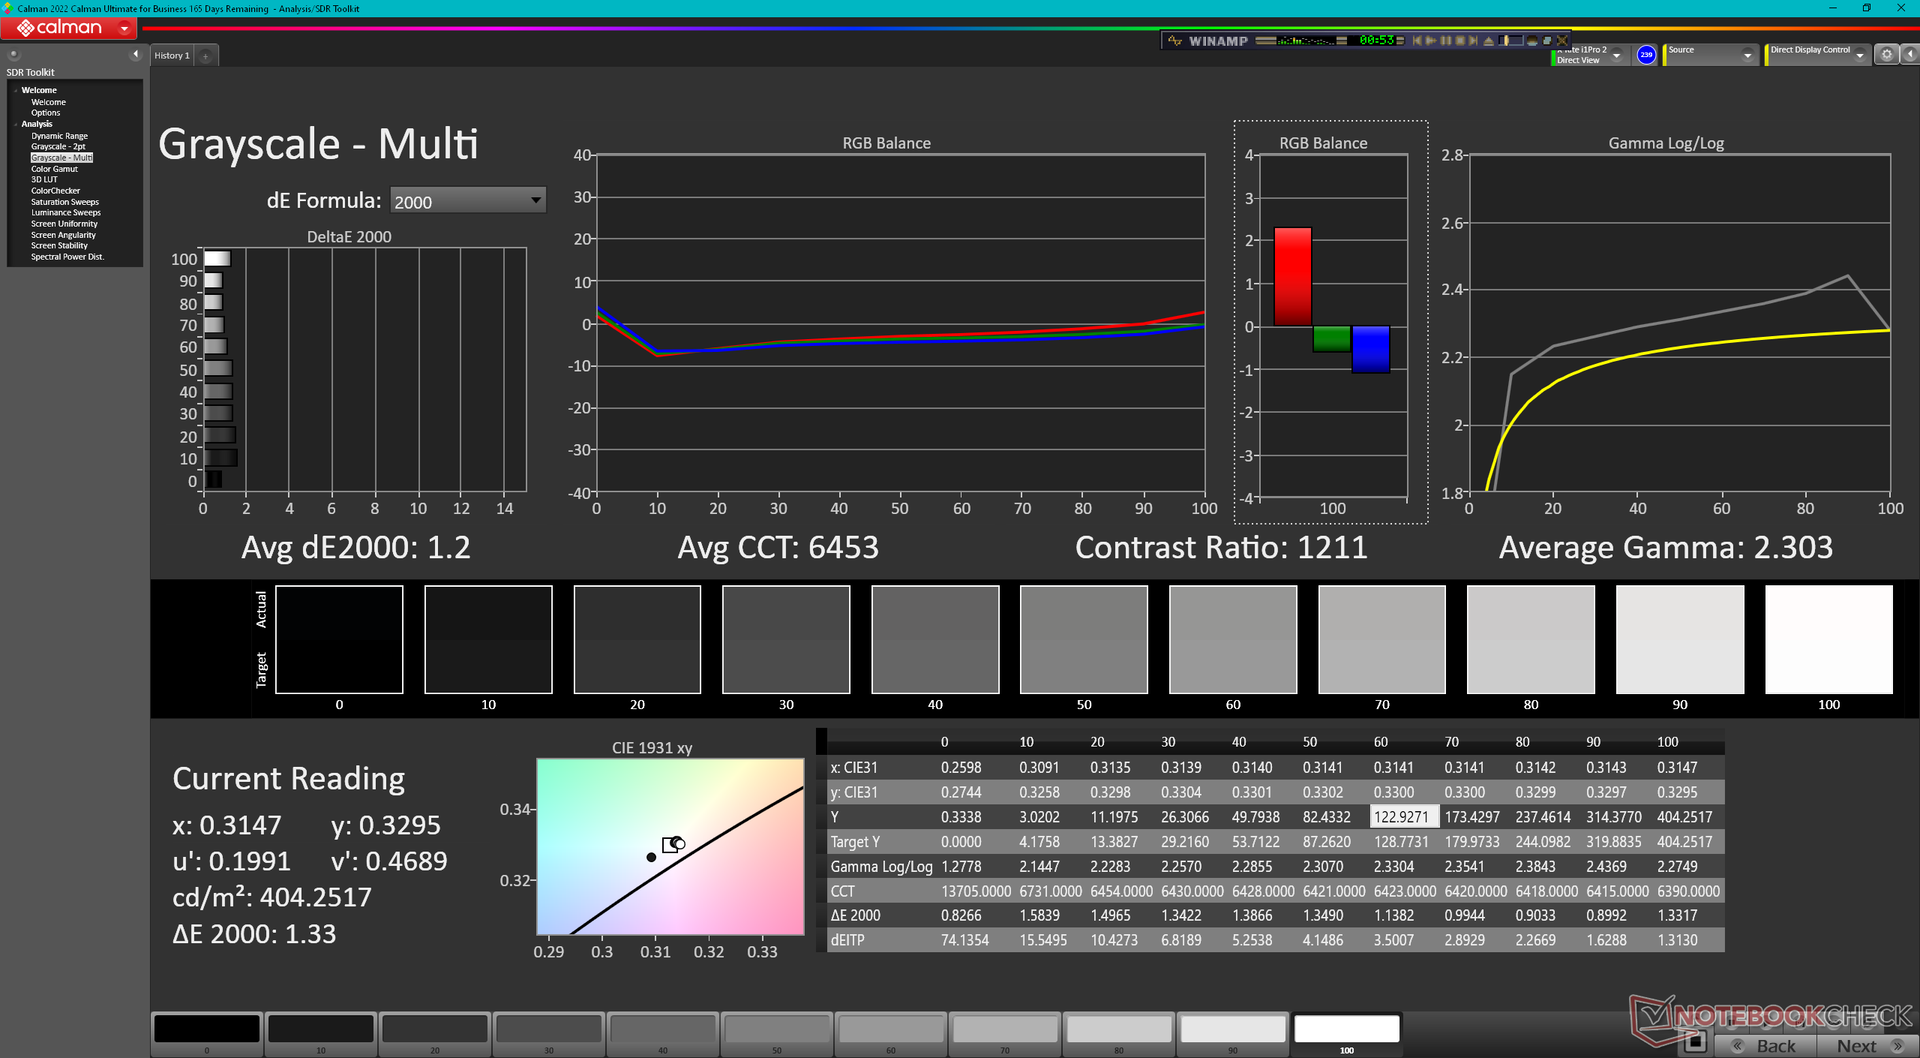
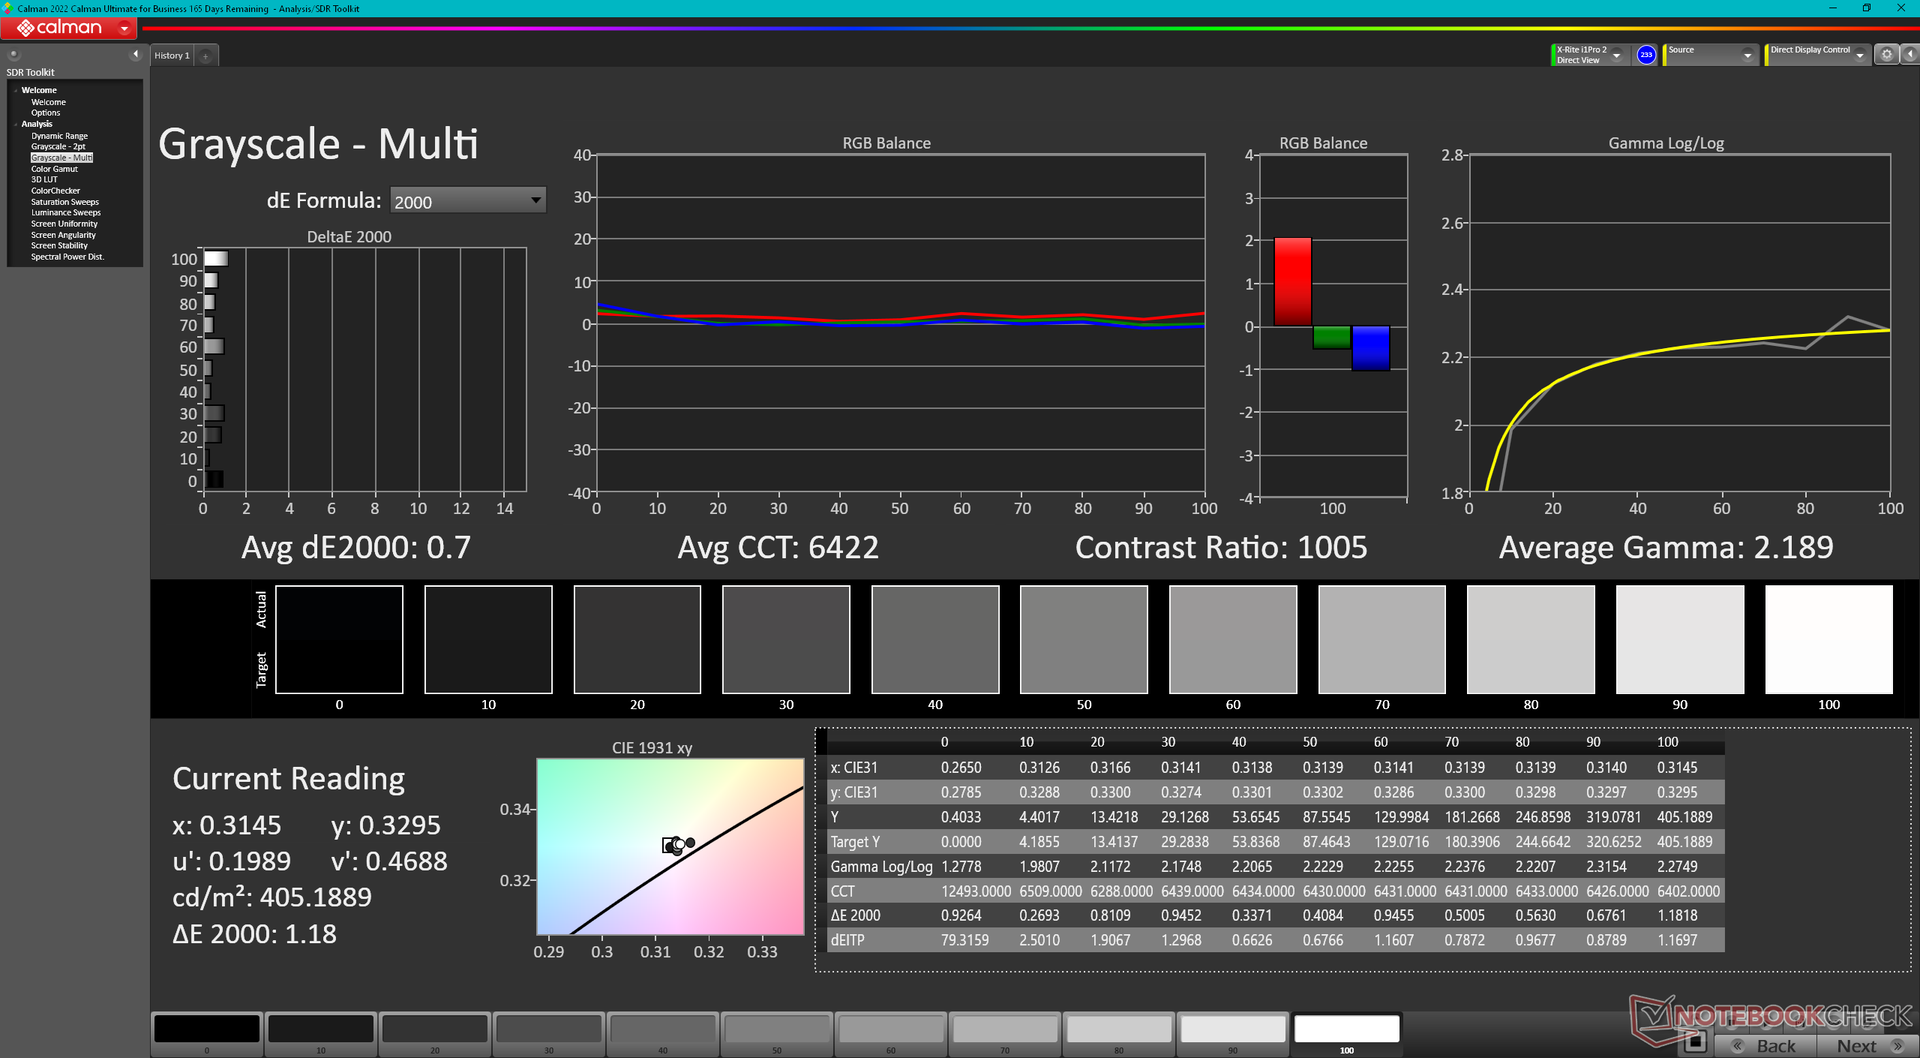
ΔE Greyscale Calman: 1.2 | ∀{0.09-98 Ø4.96}
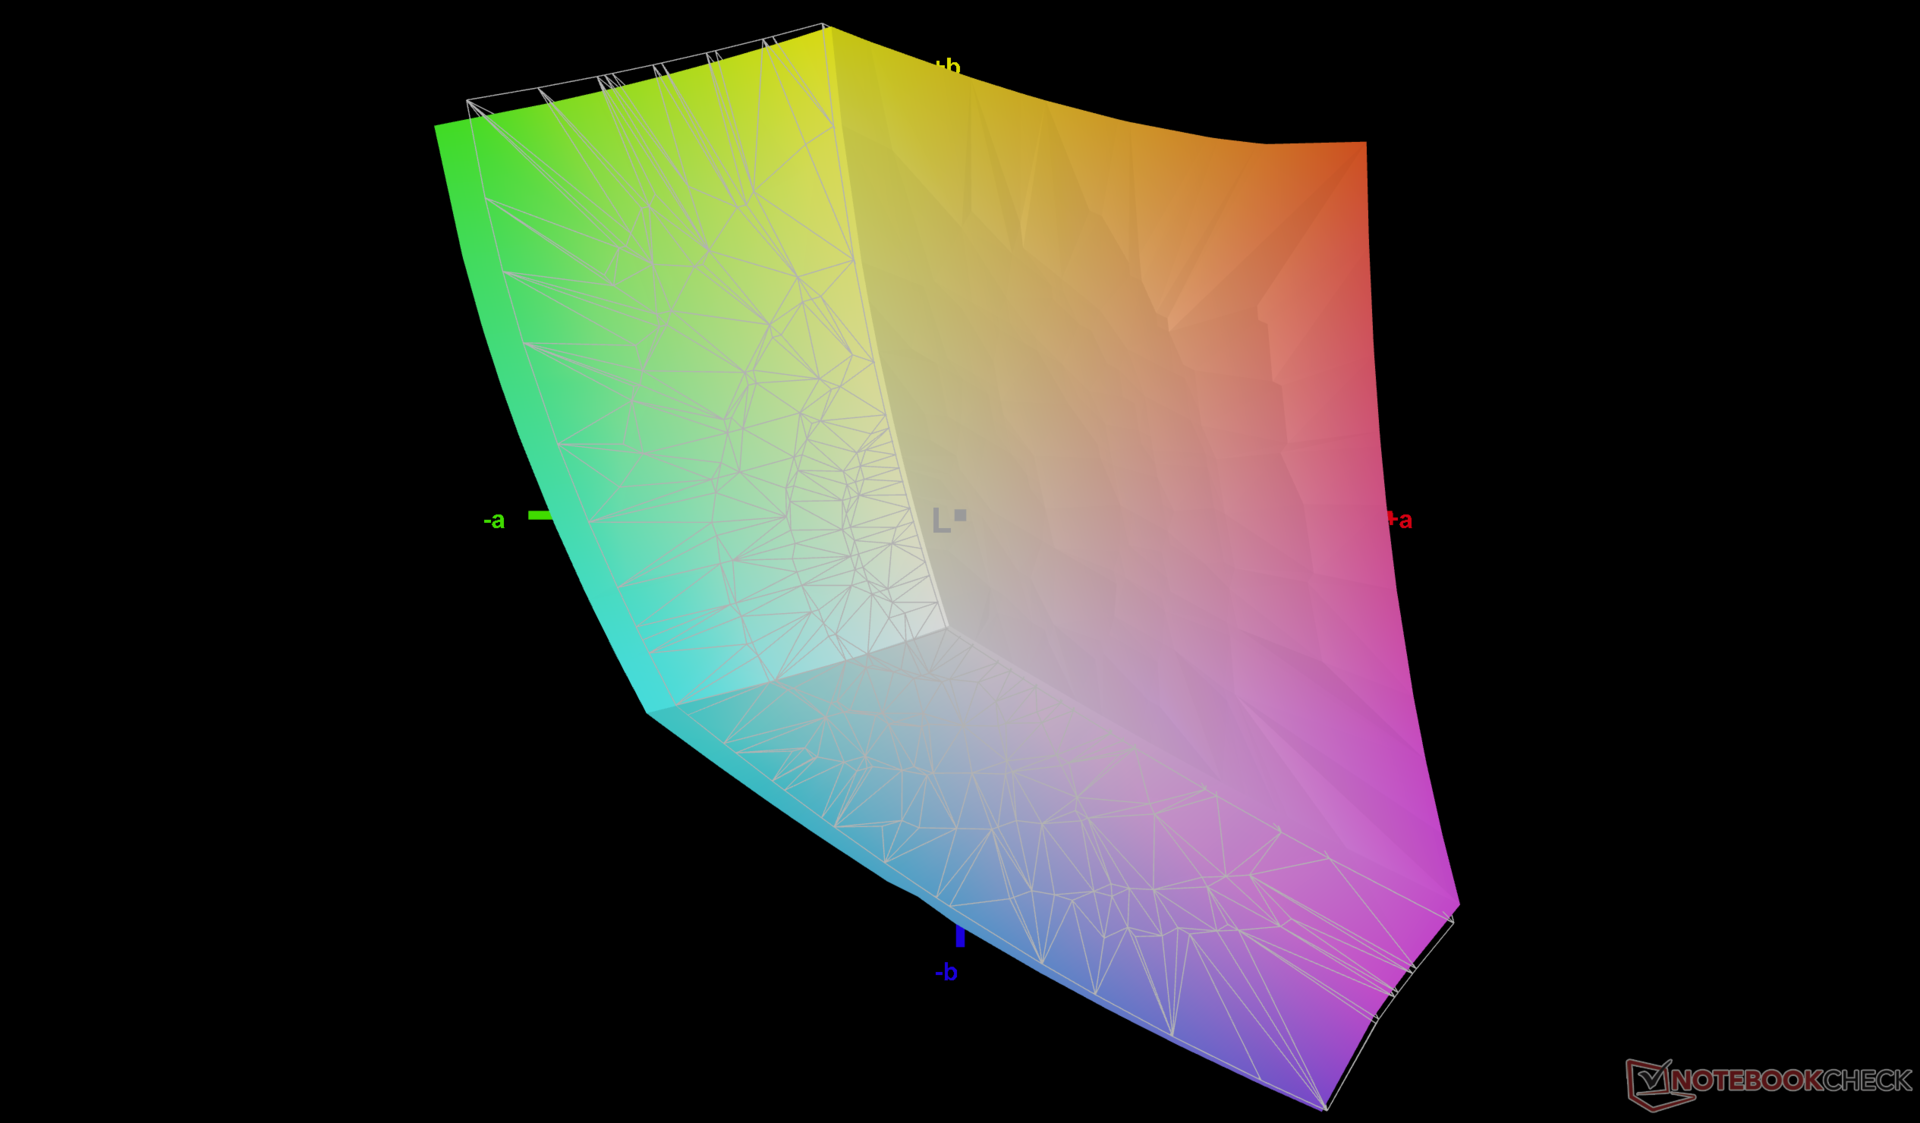
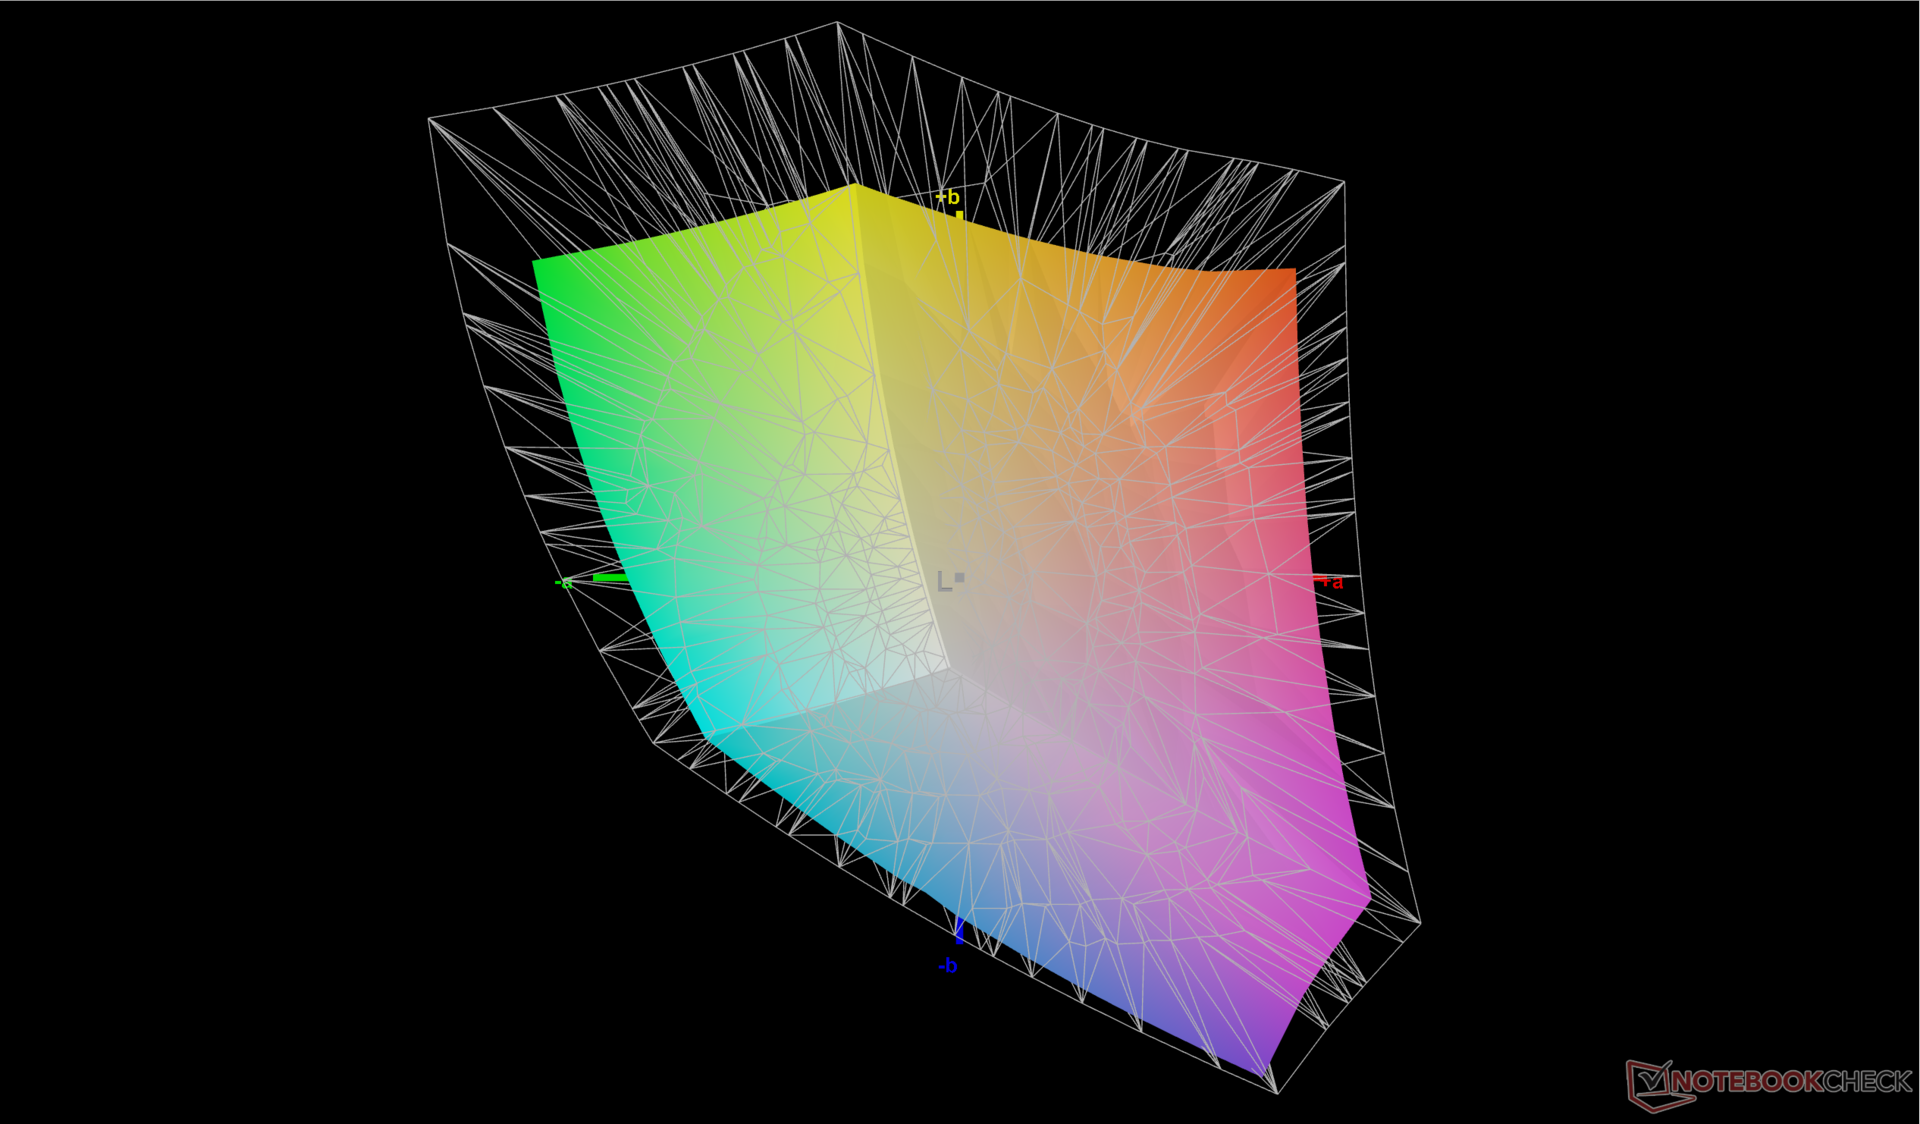
73.3% AdobeRGB 1998 (Argyll 3D)
98.8% sRGB (Argyll 3D)
71.2% Display P3 (Argyll 3D)
Gamma: 2.3
CCT: 6453 K
| Lenovo Legion Pro 5 16IRX8 AU Optronics B160QAN03.1, IPS, 2560x1600, 16" | Asus ROG Zephyrus M16 GU603Z BOE0A0B (BOE CQ NE160QDM-NY3), IPS, 2560x1600, 16" | Razer Blade 16 Early 2023 CSOT T3 MNG007DA4-1, IPS, 2560x1600, 16" | Lenovo Legion Pro 7 16IRX8H MNG007DA2-3 (CSO1628), IPS, 2560x1600, 16" | Lenovo Legion 5 Pro 16ARH7H RTX 3070 Ti BOE CQ NE160QDM-NY1, IPS, 2560x1600, 16" | Lenovo Legion S7 16ARHA7 BOE CQ NE160QDM-NY1, IPS, 2560x1600, 16" | |
|---|---|---|---|---|---|---|
| Display | 14% | 20% | -2% | -4% | -2% | |
| Display P3 Coverage (%) | 71.2 | 92.8 30% | 98.5 38% | 69.1 -3% | 67.3 -5% | 69.8 -2% |
| sRGB Coverage (%) | 98.8 | 98.5 0% | 100 1% | 99.7 1% | 96.1 -3% | 98.1 -1% |
| AdobeRGB 1998 Coverage (%) | 73.3 | 83.1 13% | 89.7 22% | 71.2 -3% | 69.5 -5% | 71.9 -2% |
| Response Times | 26% | 20% | 29% | -4% | 4% | |
| Response Time Grey 50% / Grey 80% * (ms) | 14.5 ? | 7.6 ? 48% | 6.6 ? 54% | 12.3 ? 15% | 14.4 ? 1% | 10 ? 31% |
| Response Time Black / White * (ms) | 10.4 ? | 10 ? 4% | 12 ? -15% | 5.9 ? 43% | 11.2 ? -8% | 12.8 ? -23% |
| PWM Frequency (Hz) | ||||||
| Screen | -62% | -29% | 15% | -22% | -8% | |
| Brightness middle (cd/m²) | 405.7 | 497 23% | 456.8 13% | 511 26% | 522.8 29% | 492.4 21% |
| Brightness (cd/m²) | 368 | 481 31% | 437 19% | 469 27% | 503 37% | 471 28% |
| Brightness Distribution (%) | 87 | 82 -6% | 83 -5% | 86 -1% | 84 -3% | 90 3% |
| Black Level * (cd/m²) | 0.38 | 0.21 45% | 0.35 8% | 0.4 -5% | 0.41 -8% | 0.4 -5% |
| Contrast (:1) | 1068 | 2367 122% | 1305 22% | 1278 20% | 1275 19% | 1231 15% |
| Colorchecker dE 2000 * | 1.65 | 3.53 -114% | 3.7 -124% | 0.95 42% | 2.47 -50% | 1.9 -15% |
| Colorchecker dE 2000 max. * | 4.2 | 6.15 -46% | 6.42 -53% | 2.07 51% | 6.56 -56% | 3.81 9% |
| Colorchecker dE 2000 calibrated * | 0.53 | 3.53 -566% | 0.66 -25% | 0.91 -72% | 0.61 -15% | 0.99 -87% |
| Greyscale dE 2000 * | 1.2 | 1.74 -45% | 2.6 -117% | 0.6 50% | 3 -150% | 1.7 -42% |
| Gamma | 2.3 96% | 2.2 100% | 2.3 96% | 2.176 101% | 2.27 97% | 2.36 93% |
| CCT | 6453 101% | 6418 101% | 6108 106% | 6545 99% | 6719 97% | 6497 100% |
| Média Total (Programa/Configurações) | -7% /
-33% | 4% /
-12% | 14% /
14% | -10% /
-16% | -2% /
-5% |
* ... menor é melhor
A tela vem bem calibrada e pronta para uso, com valores médios de deltaE em escala de cinza e de cores de apenas 1,2 e 1,65, respectivamente. Esses valores são baixos o suficiente para que não seja necessária uma calibração do usuário final. Calibrar o painel de qualquer forma melhoraria ainda mais a precisão das cores para <1, conforme mostrado nas capturas de tela abaixo. Se quisermos fazer uma análise minuciosa, o roxo parece ser representado com a menor precisão de todas as cores testadas, com um deltaE de 2,71.

Exibir tempos de resposta
| ↔ Tempo de resposta preto para branco | ||
|---|---|---|
| 10.4 ms ... ascensão ↗ e queda ↘ combinadas | ↗ 5.7 ms ascensão | 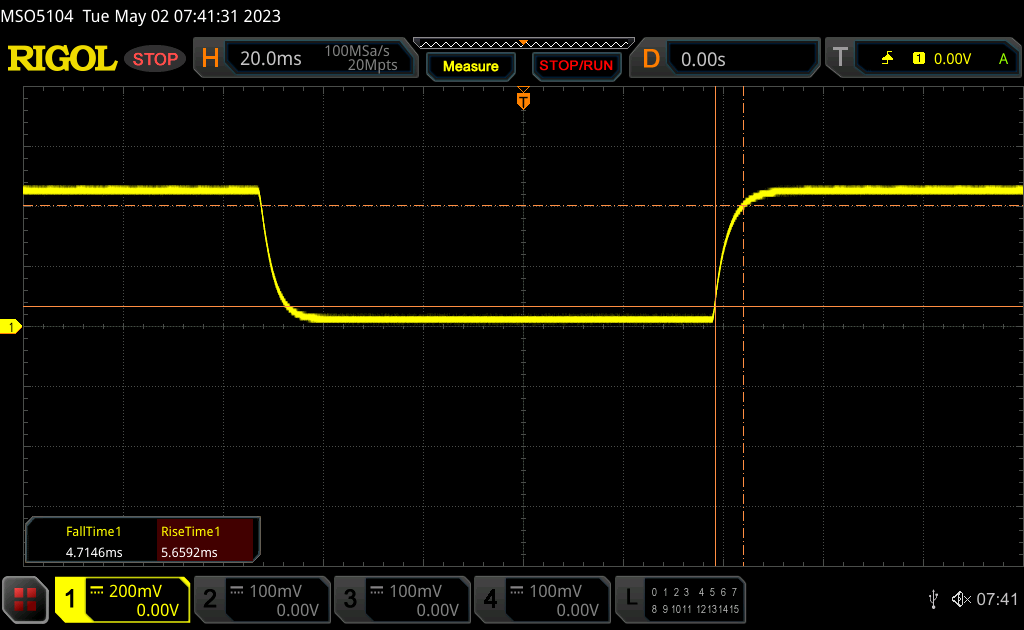 |
| ↘ 4.7 ms queda | ||
| A tela mostra boas taxas de resposta em nossos testes, mas pode ser muito lenta para jogadores competitivos. Em comparação, todos os dispositivos testados variam de 0.1 (mínimo) a 240 (máximo) ms. » 28 % de todos os dispositivos são melhores. Isso significa que o tempo de resposta medido é melhor que a média de todos os dispositivos testados (19.8 ms). | ||
| ↔ Tempo de resposta 50% cinza a 80% cinza | ||
| 14.5 ms ... ascensão ↗ e queda ↘ combinadas | ↗ 7 ms ascensão | 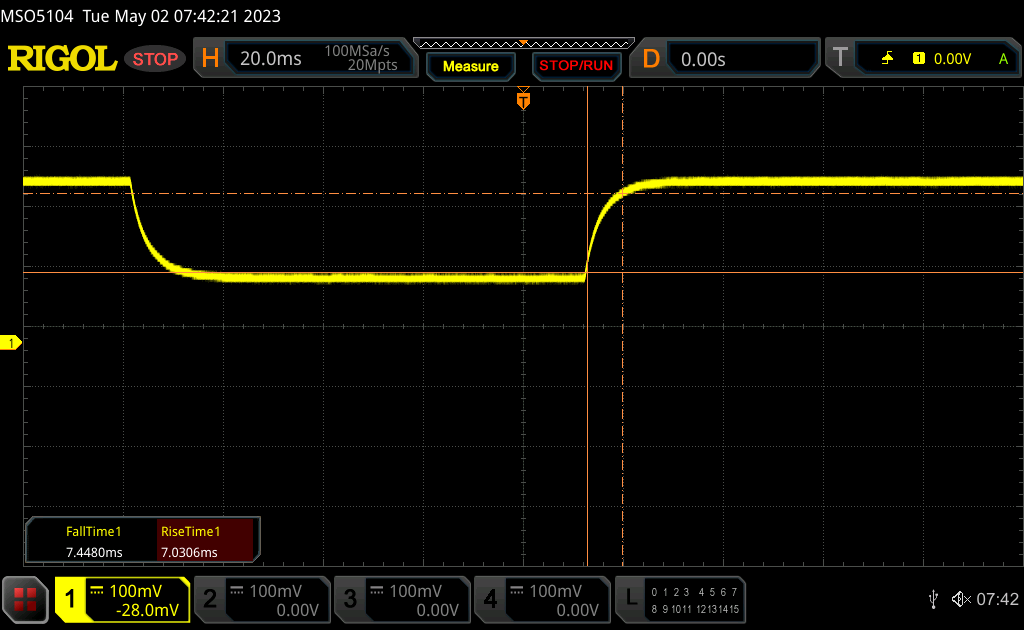 |
| ↘ 7.5 ms queda | ||
| A tela mostra boas taxas de resposta em nossos testes, mas pode ser muito lenta para jogadores competitivos. Em comparação, todos os dispositivos testados variam de 0.165 (mínimo) a 636 (máximo) ms. » 29 % de todos os dispositivos são melhores. Isso significa que o tempo de resposta medido é melhor que a média de todos os dispositivos testados (31 ms). | ||
Cintilação da tela / PWM (modulação por largura de pulso)
| Tela tremeluzindo / PWM não detectado | 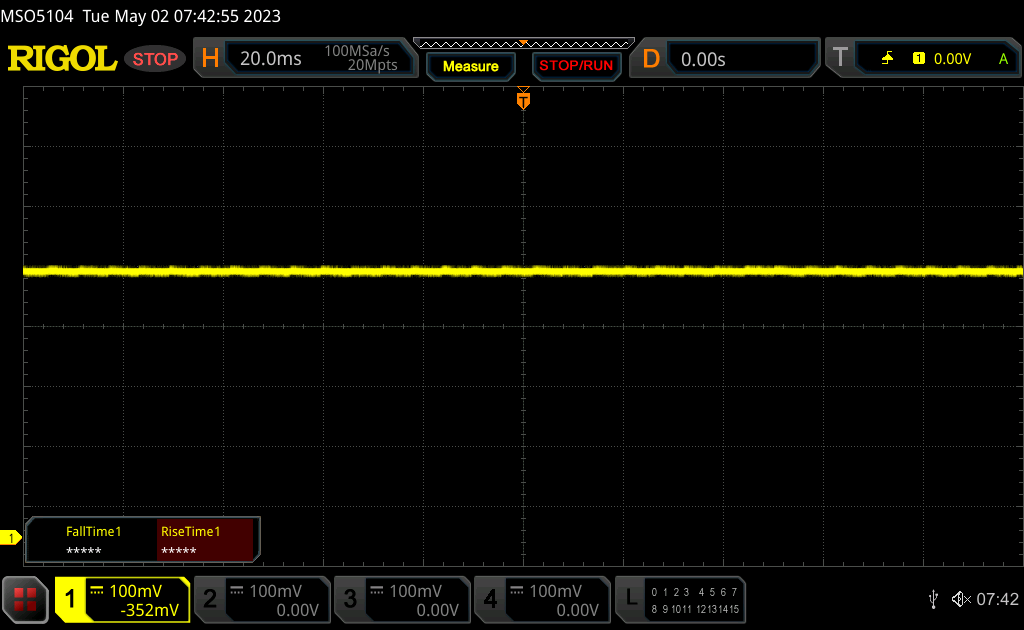 | ||
[pwm_comparison] Em comparação: 52 % de todos os dispositivos testados não usam PWM para escurecer a tela. Se PWM foi detectado, uma média de 7754 (mínimo: 5 - máximo: 343500) Hz foi medida. | |||
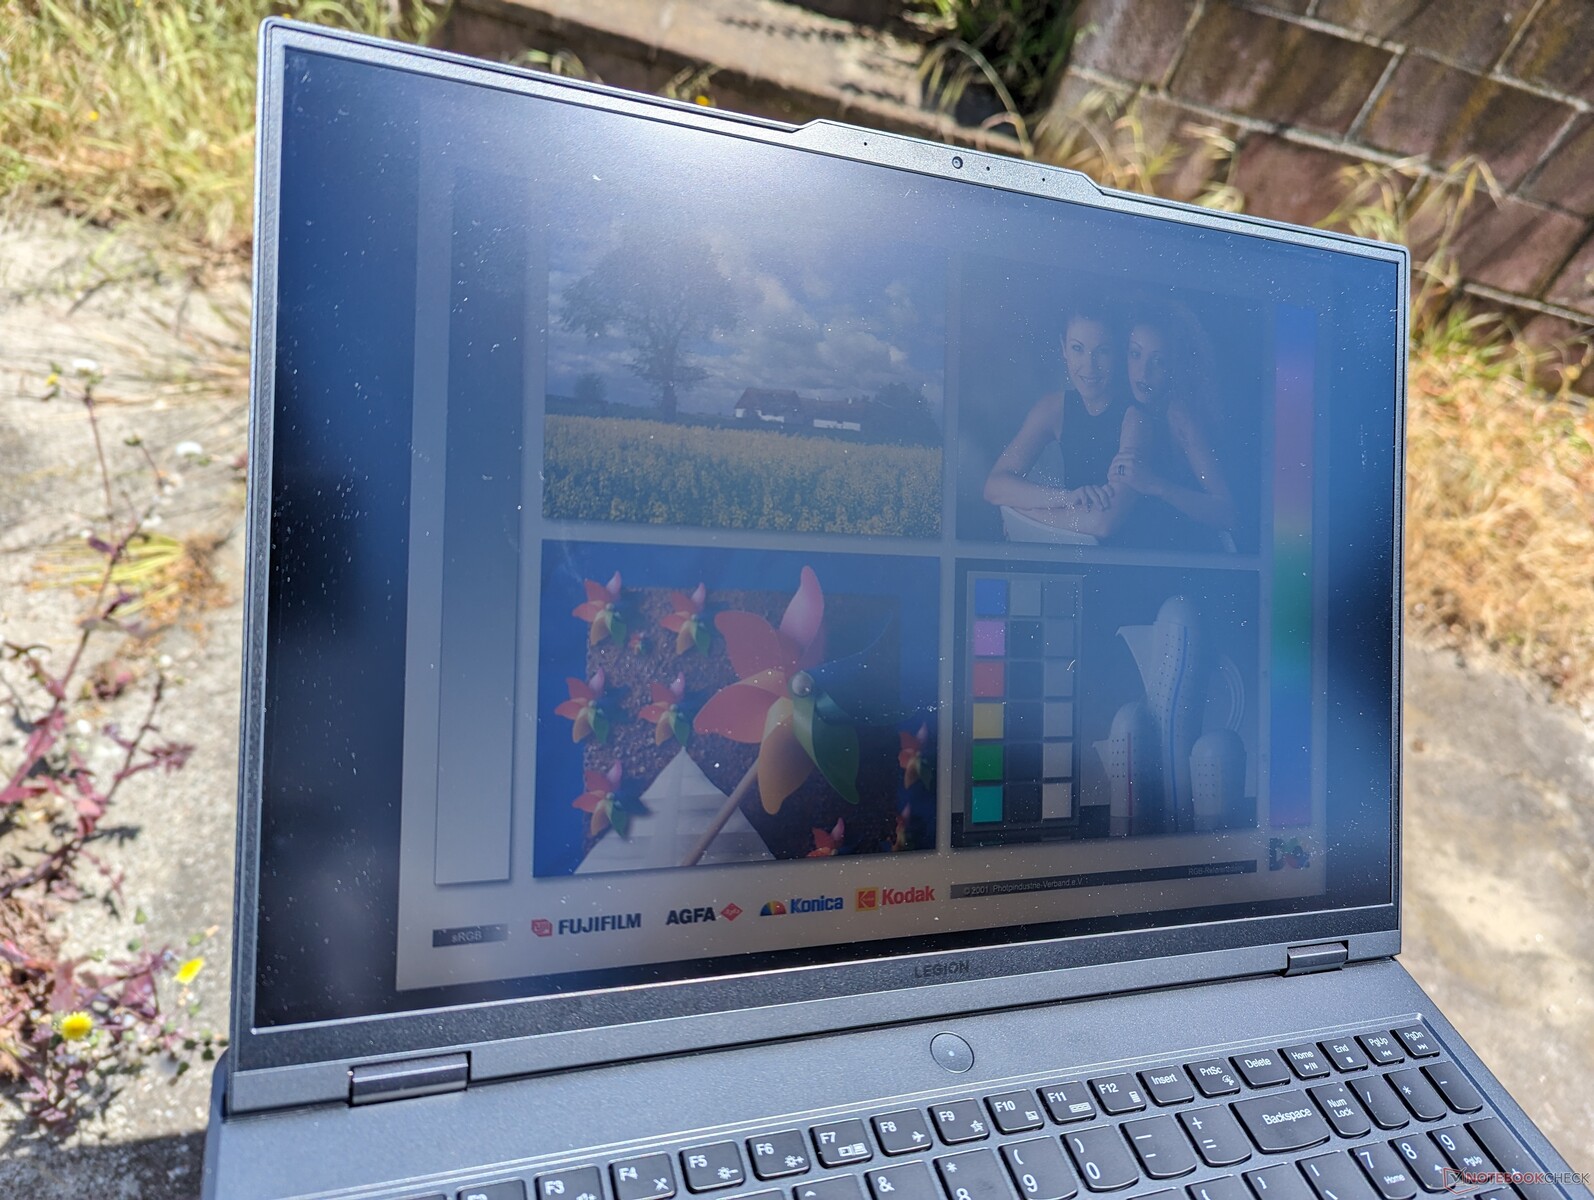
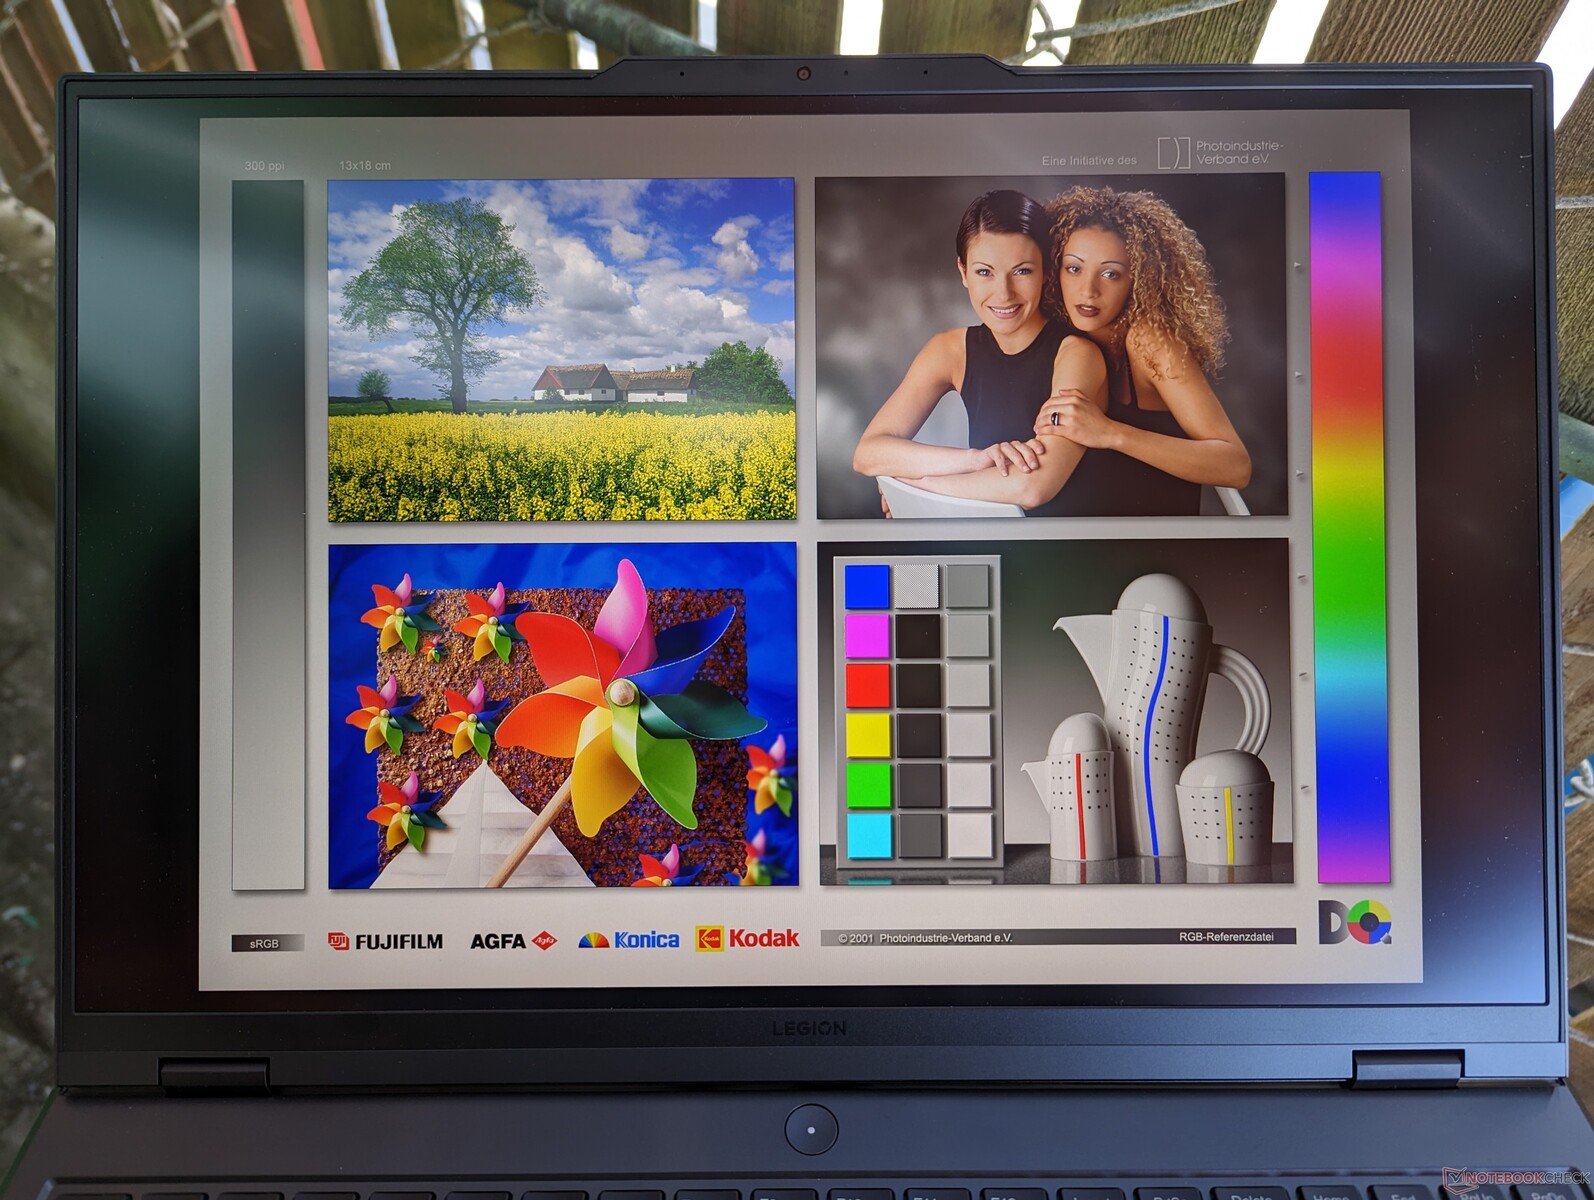
Com 400 nits, a tela é geralmente utilizável sob a sombra. A opção de painel de 240 Hz é um pouco mais brilhante se a visibilidade externa for uma preocupação. As telas na maioria das máquinas de jogos de 16 polegadas já são mais brilhantes do que em muitos Ultrabooks de médio porte, onde 300 nits é comum.
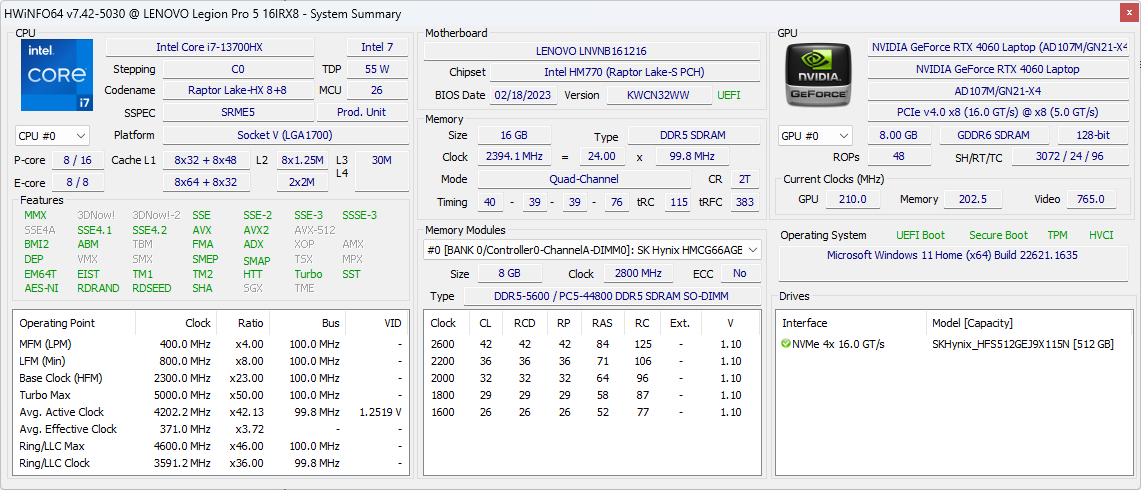
Desempenho - Raptor Lake de 13ª geração
Condições de teste
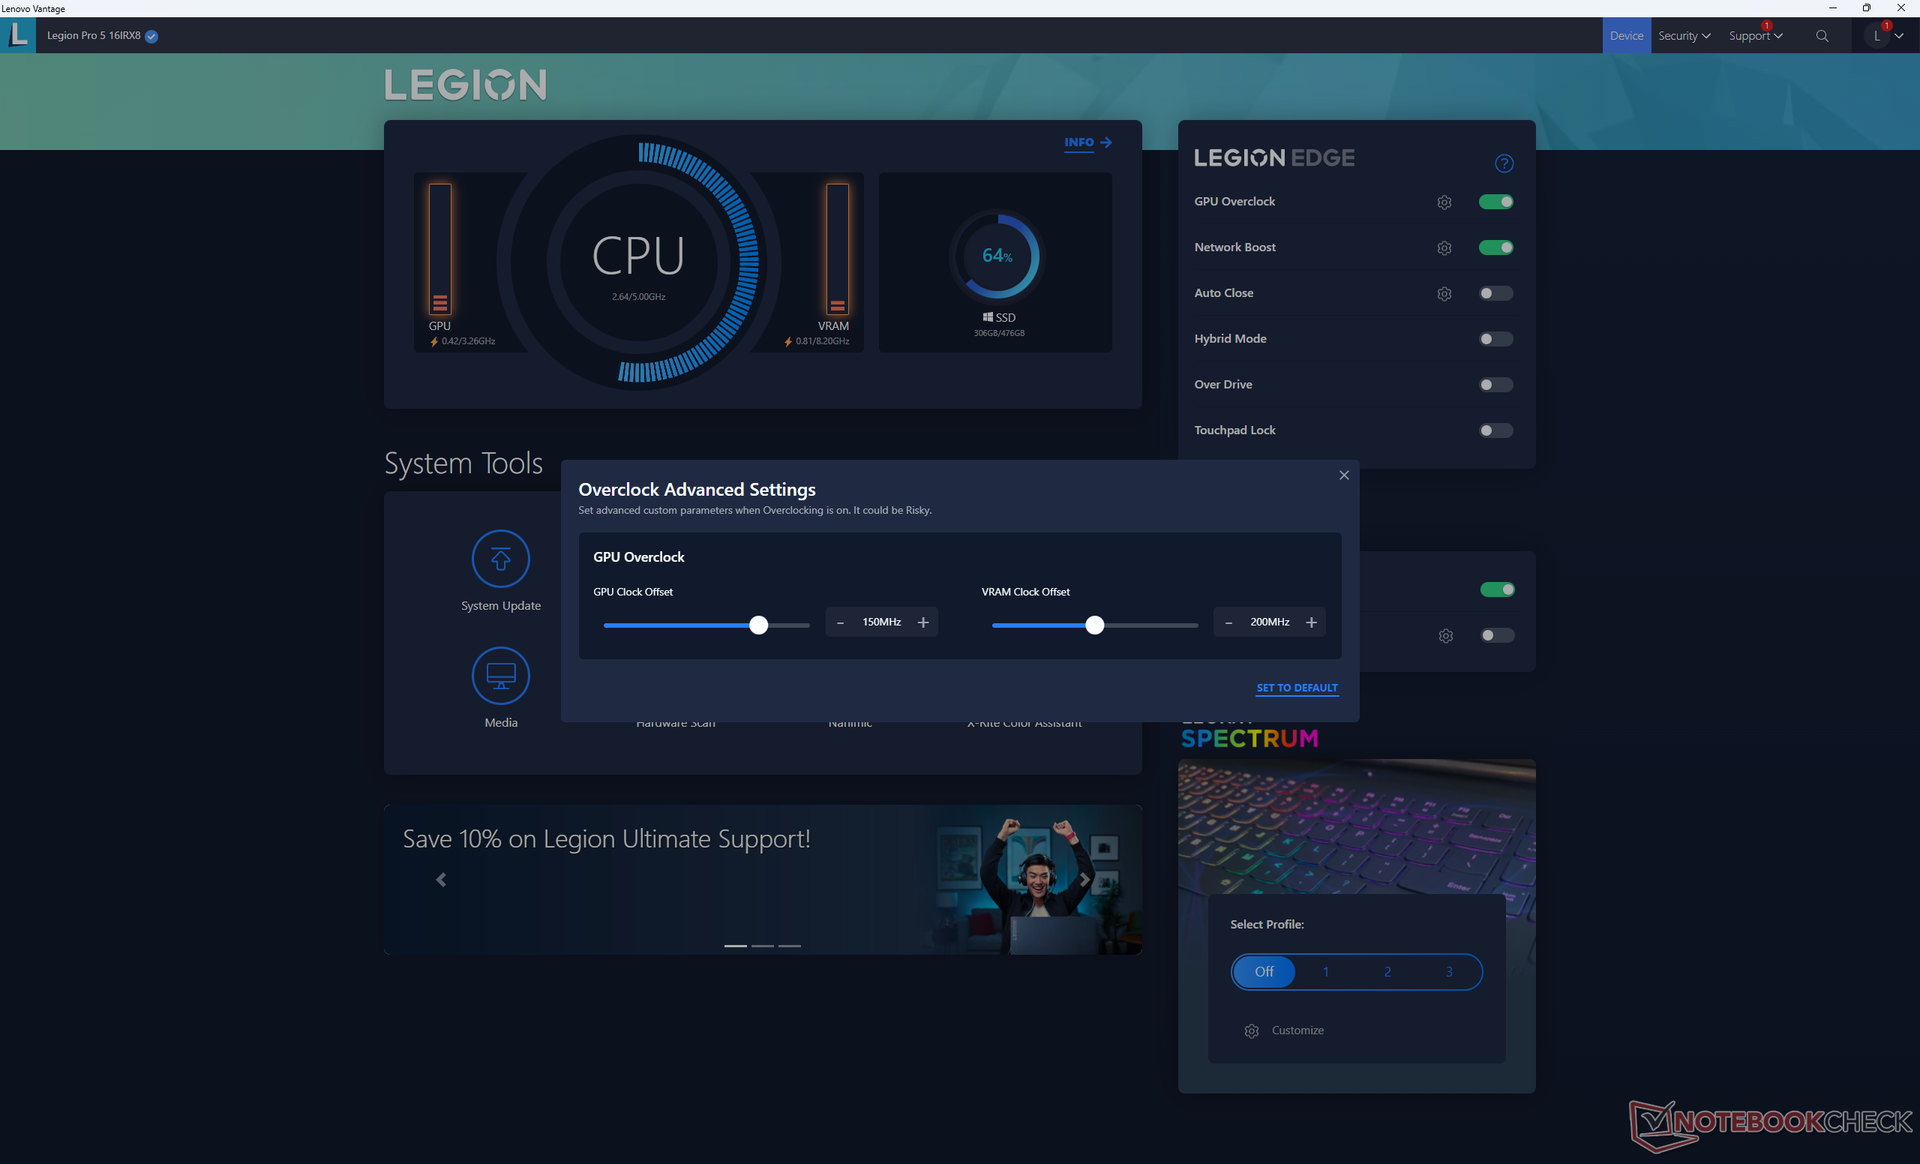
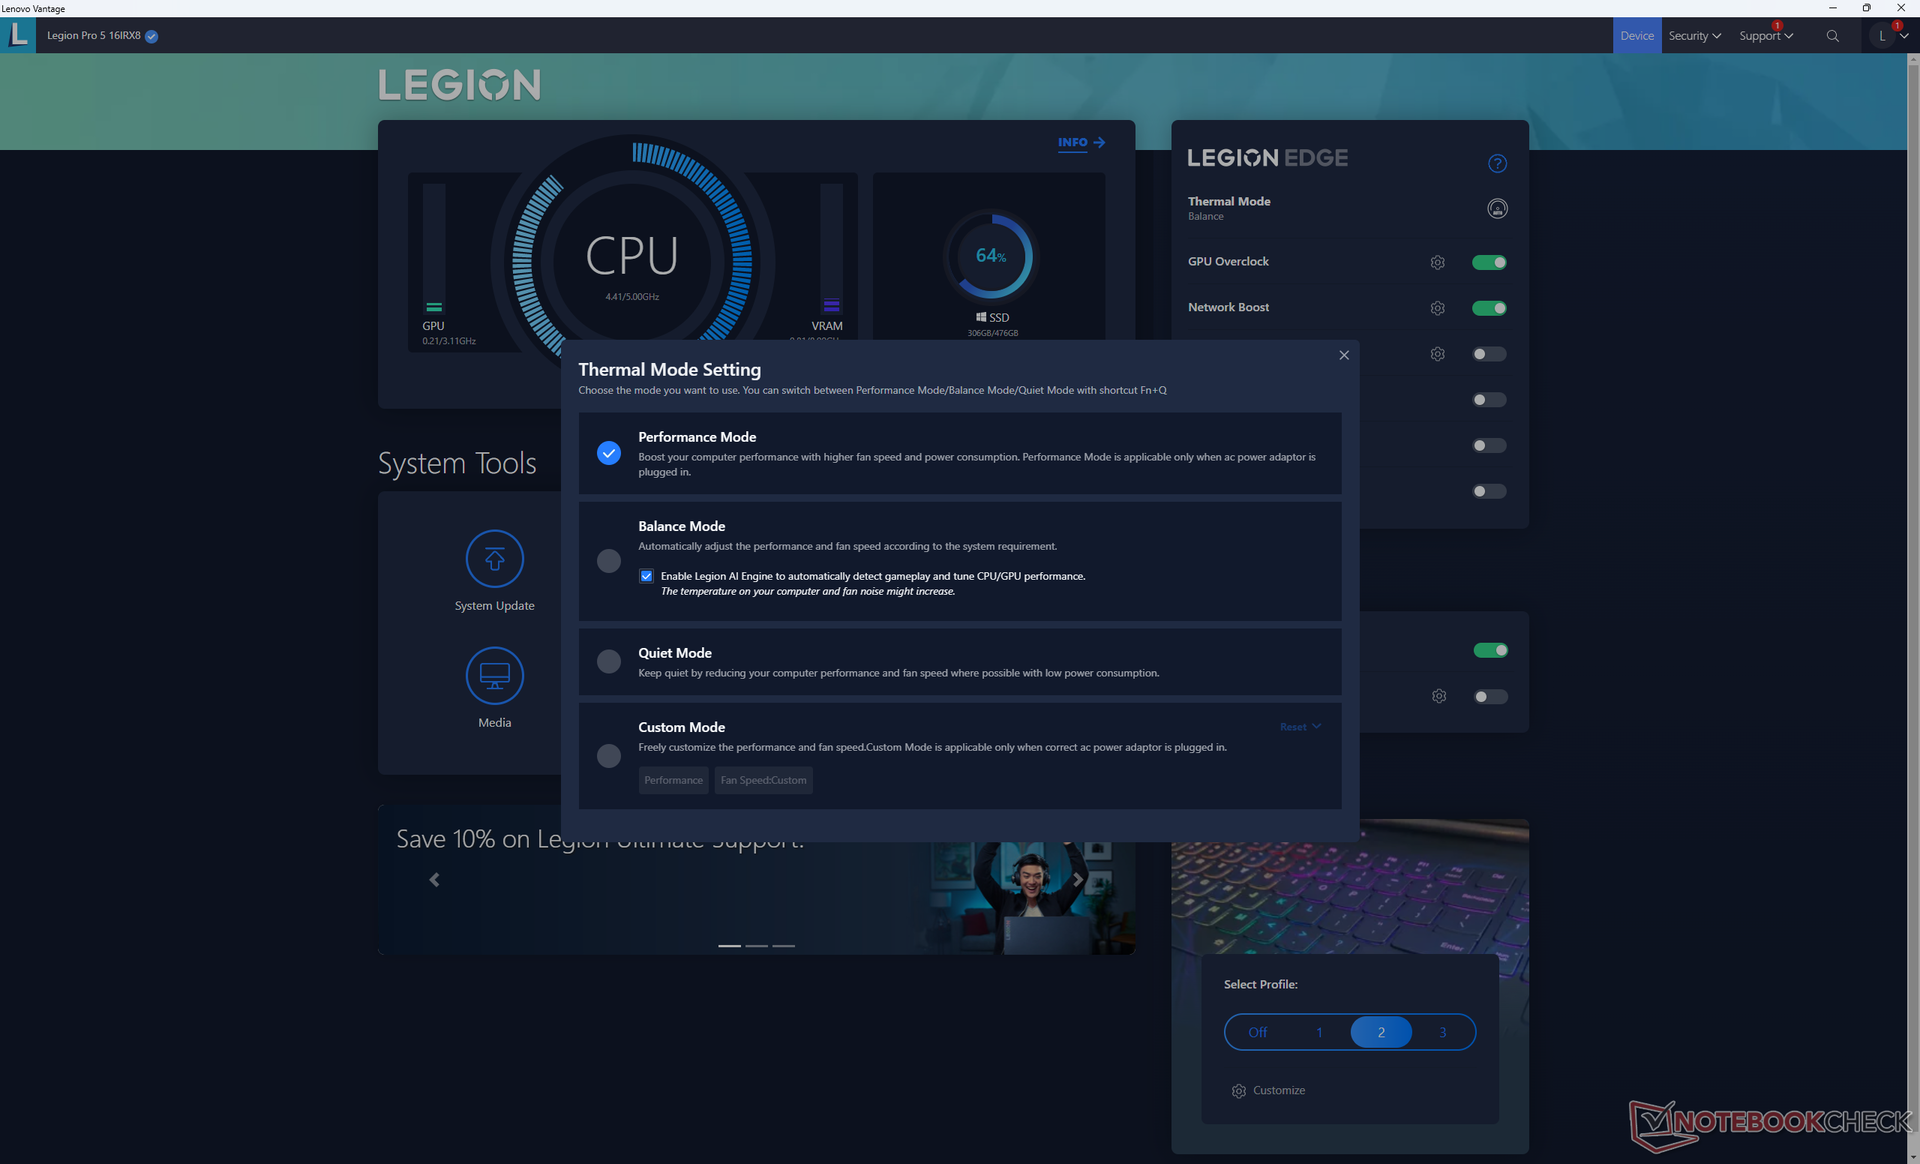
Configuramos nossa unidade de teste para o modo Desempenho com o Overclock da GPU ativo e o modo Híbrido desativado antes de executar os benchmarks abaixo. Felizmente, todas essas configurações podem ser facilmente acessadas na tela inicial do Lenovo Vantage.
Observe que, embora o MUX seja compatível com a alternância entre os modos Optimus e GPU discreta, sempre será necessário reiniciar o sistema. Portanto, o Optimus avançado não é suportado. O G-Sync para a tela interna só funciona no modo dGPU.
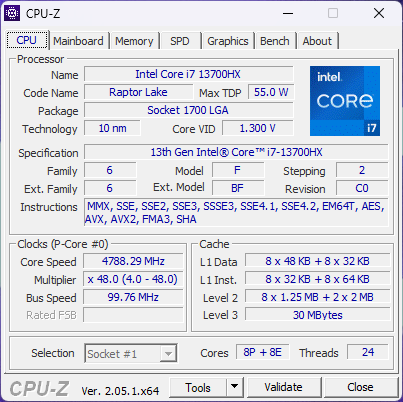
Processador
Nosso Core i7-13700HX é apenas cerca de 5 a 15 por cento mais rápido em cargas multithread do que o antigo Core i7-12700H que ele substitui. As vantagens são mensuráveis, embora relativamente pequenas. O desempenho geral é comparável ao do Core i9-12900H.
A sustentabilidade do desempenho é excelente, sem quedas notáveis ao longo do tempo ao executar o CineBench R15 xT em um loop.
A atualização para o Core i9-13900HX Espera-se que a SKU aumente significativamente o desempenho multithread em 50 a 70% em relação ao Core i7-13700HX. Se você valoriza o desempenho do processador, talvez valha a pena deixar as opções Core i5-13500H e Core i7-13700HX para o Core i9.
Cinebench R15 Multi Loop
Cinebench R23: Multi Core | Single Core
Cinebench R20: CPU (Multi Core) | CPU (Single Core)
Cinebench R15: CPU Multi 64Bit | CPU Single 64Bit
Blender: v2.79 BMW27 CPU
7-Zip 18.03: 7z b 4 | 7z b 4 -mmt1
Geekbench 5.5: Multi-Core | Single-Core
HWBOT x265 Benchmark v2.2: 4k Preset
LibreOffice : 20 Documents To PDF
R Benchmark 2.5: Overall mean
* ... menor é melhor
AIDA64: FP32 Ray-Trace | FPU Julia | CPU SHA3 | CPU Queen | FPU SinJulia | FPU Mandel | CPU AES | CPU ZLib | FP64 Ray-Trace | CPU PhotoWorxx
| Performance rating | |
| Lenovo Legion Pro 7 16IRX8H | |
| Razer Blade 16 Early 2023 | |
| Lenovo Legion Pro 5 16IRX8 | |
| Média Intel Core i7-13700HX | |
| Lenovo Legion 5 Pro 16ARH7H RTX 3070 Ti | |
| Lenovo Legion S7 16ARHA7 | |
| Asus ROG Zephyrus M16 GU603Z | |
Desempenho do sistema
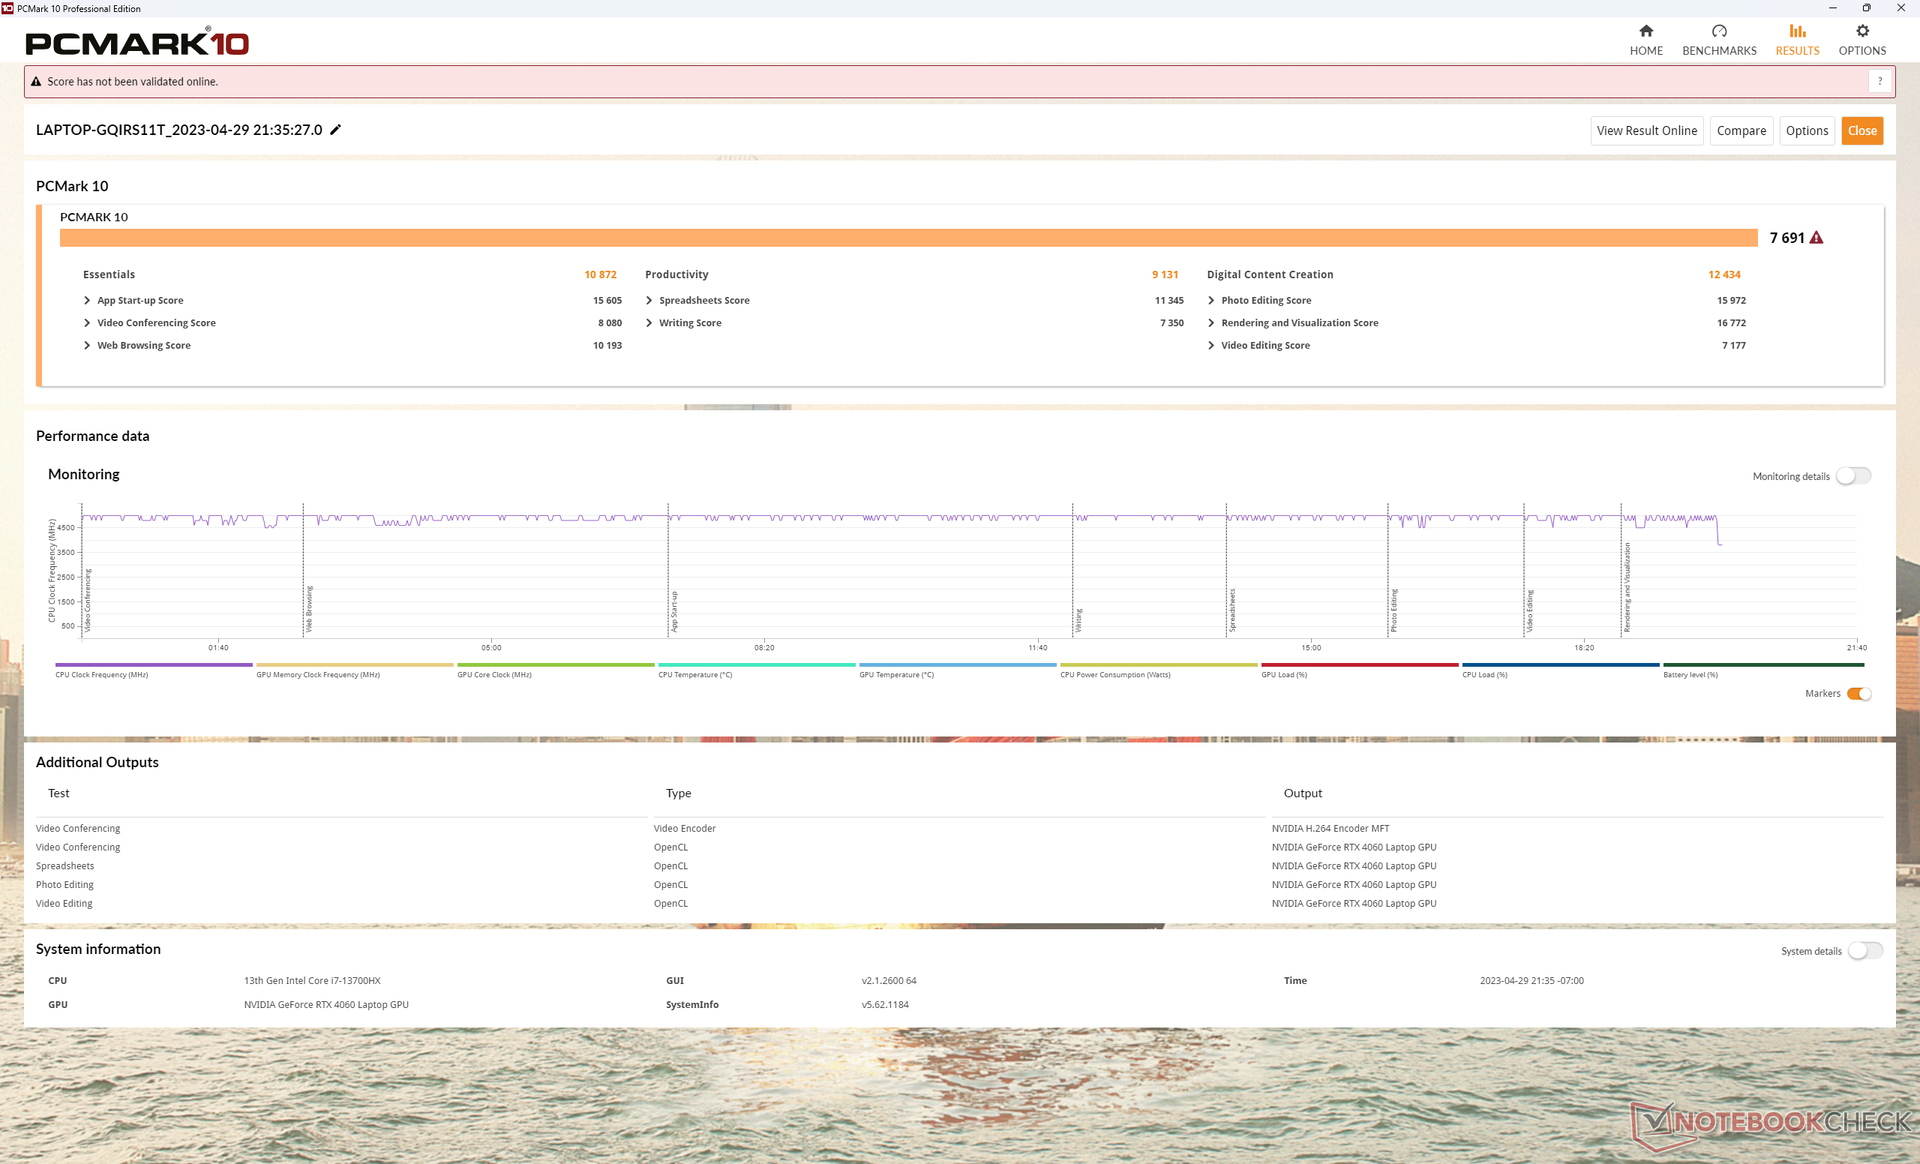
Legion Os resultados do PCMark são comparáveis aos de outros modelos Legion, como o 5 Pro 16 de 2022, apesar dos processadores de geração mais recente em nossa unidade de 2023. Isso sugere que, embora a CPU e a GPU possam ser mais rápidas desta vez, elas não necessariamente executarão aplicativos do dia a dia, como trabalho de escritório ou navegadores, de forma visivelmente mais rápida do que um laptop para jogos do passado.
CrossMark: Overall | Productivity | Creativity | Responsiveness
| PCMark 10 / Score | |
| Razer Blade 16 Early 2023 | |
| Asus ROG Zephyrus M16 GU603Z | |
| Lenovo Legion Pro 7 16IRX8H | |
| Lenovo Legion Pro 5 16IRX8 | |
| Lenovo Legion S7 16ARHA7 | |
| Lenovo Legion 5 Pro 16ARH7H RTX 3070 Ti | |
| Média Intel Core i7-13700HX, NVIDIA GeForce RTX 4060 Laptop GPU (6909 - 7743, n=5) | |
| PCMark 10 / Essentials | |
| Lenovo Legion Pro 7 16IRX8H | |
| Razer Blade 16 Early 2023 | |
| Asus ROG Zephyrus M16 GU603Z | |
| Lenovo Legion Pro 5 16IRX8 | |
| Lenovo Legion S7 16ARHA7 | |
| Média Intel Core i7-13700HX, NVIDIA GeForce RTX 4060 Laptop GPU (9760 - 11313, n=5) | |
| Lenovo Legion 5 Pro 16ARH7H RTX 3070 Ti | |
| PCMark 10 / Productivity | |
| Lenovo Legion Pro 7 16IRX8H | |
| Asus ROG Zephyrus M16 GU603Z | |
| Lenovo Legion S7 16ARHA7 | |
| Média Intel Core i7-13700HX, NVIDIA GeForce RTX 4060 Laptop GPU (9131 - 11018, n=5) | |
| Lenovo Legion 5 Pro 16ARH7H RTX 3070 Ti | |
| Lenovo Legion Pro 5 16IRX8 | |
| Razer Blade 16 Early 2023 | |
| PCMark 10 / Digital Content Creation | |
| Razer Blade 16 Early 2023 | |
| Lenovo Legion Pro 5 16IRX8 | |
| Asus ROG Zephyrus M16 GU603Z | |
| Lenovo Legion 5 Pro 16ARH7H RTX 3070 Ti | |
| Lenovo Legion S7 16ARHA7 | |
| Média Intel Core i7-13700HX, NVIDIA GeForce RTX 4060 Laptop GPU (9393 - 12434, n=5) | |
| Lenovo Legion Pro 7 16IRX8H | |
| CrossMark / Overall | |
| Asus ROG Zephyrus M16 GU603Z | |
| Média Intel Core i7-13700HX, NVIDIA GeForce RTX 4060 Laptop GPU (1663 - 2105, n=5) | |
| Lenovo Legion S7 16ARHA7 | |
| Lenovo Legion Pro 5 16IRX8 | |
| Lenovo Legion 5 Pro 16ARH7H RTX 3070 Ti | |
| Razer Blade 16 Early 2023 | |
| CrossMark / Productivity | |
| Asus ROG Zephyrus M16 GU603Z | |
| Média Intel Core i7-13700HX, NVIDIA GeForce RTX 4060 Laptop GPU (1618 - 1989, n=5) | |
| Lenovo Legion S7 16ARHA7 | |
| Lenovo Legion Pro 5 16IRX8 | |
| Lenovo Legion 5 Pro 16ARH7H RTX 3070 Ti | |
| Razer Blade 16 Early 2023 | |
| CrossMark / Creativity | |
| Média Intel Core i7-13700HX, NVIDIA GeForce RTX 4060 Laptop GPU (1710 - 2274, n=5) | |
| Asus ROG Zephyrus M16 GU603Z | |
| Lenovo Legion S7 16ARHA7 | |
| Razer Blade 16 Early 2023 | |
| Lenovo Legion 5 Pro 16ARH7H RTX 3070 Ti | |
| Lenovo Legion Pro 5 16IRX8 | |
| CrossMark / Responsiveness | |
| Asus ROG Zephyrus M16 GU603Z | |
| Média Intel Core i7-13700HX, NVIDIA GeForce RTX 4060 Laptop GPU (1269 - 1983, n=5) | |
| Lenovo Legion Pro 5 16IRX8 | |
| Lenovo Legion S7 16ARHA7 | |
| Lenovo Legion 5 Pro 16ARH7H RTX 3070 Ti | |
| Razer Blade 16 Early 2023 | |
| PCMark 10 Score | 7691 pontos | |
Ajuda | ||
* ... menor é melhor
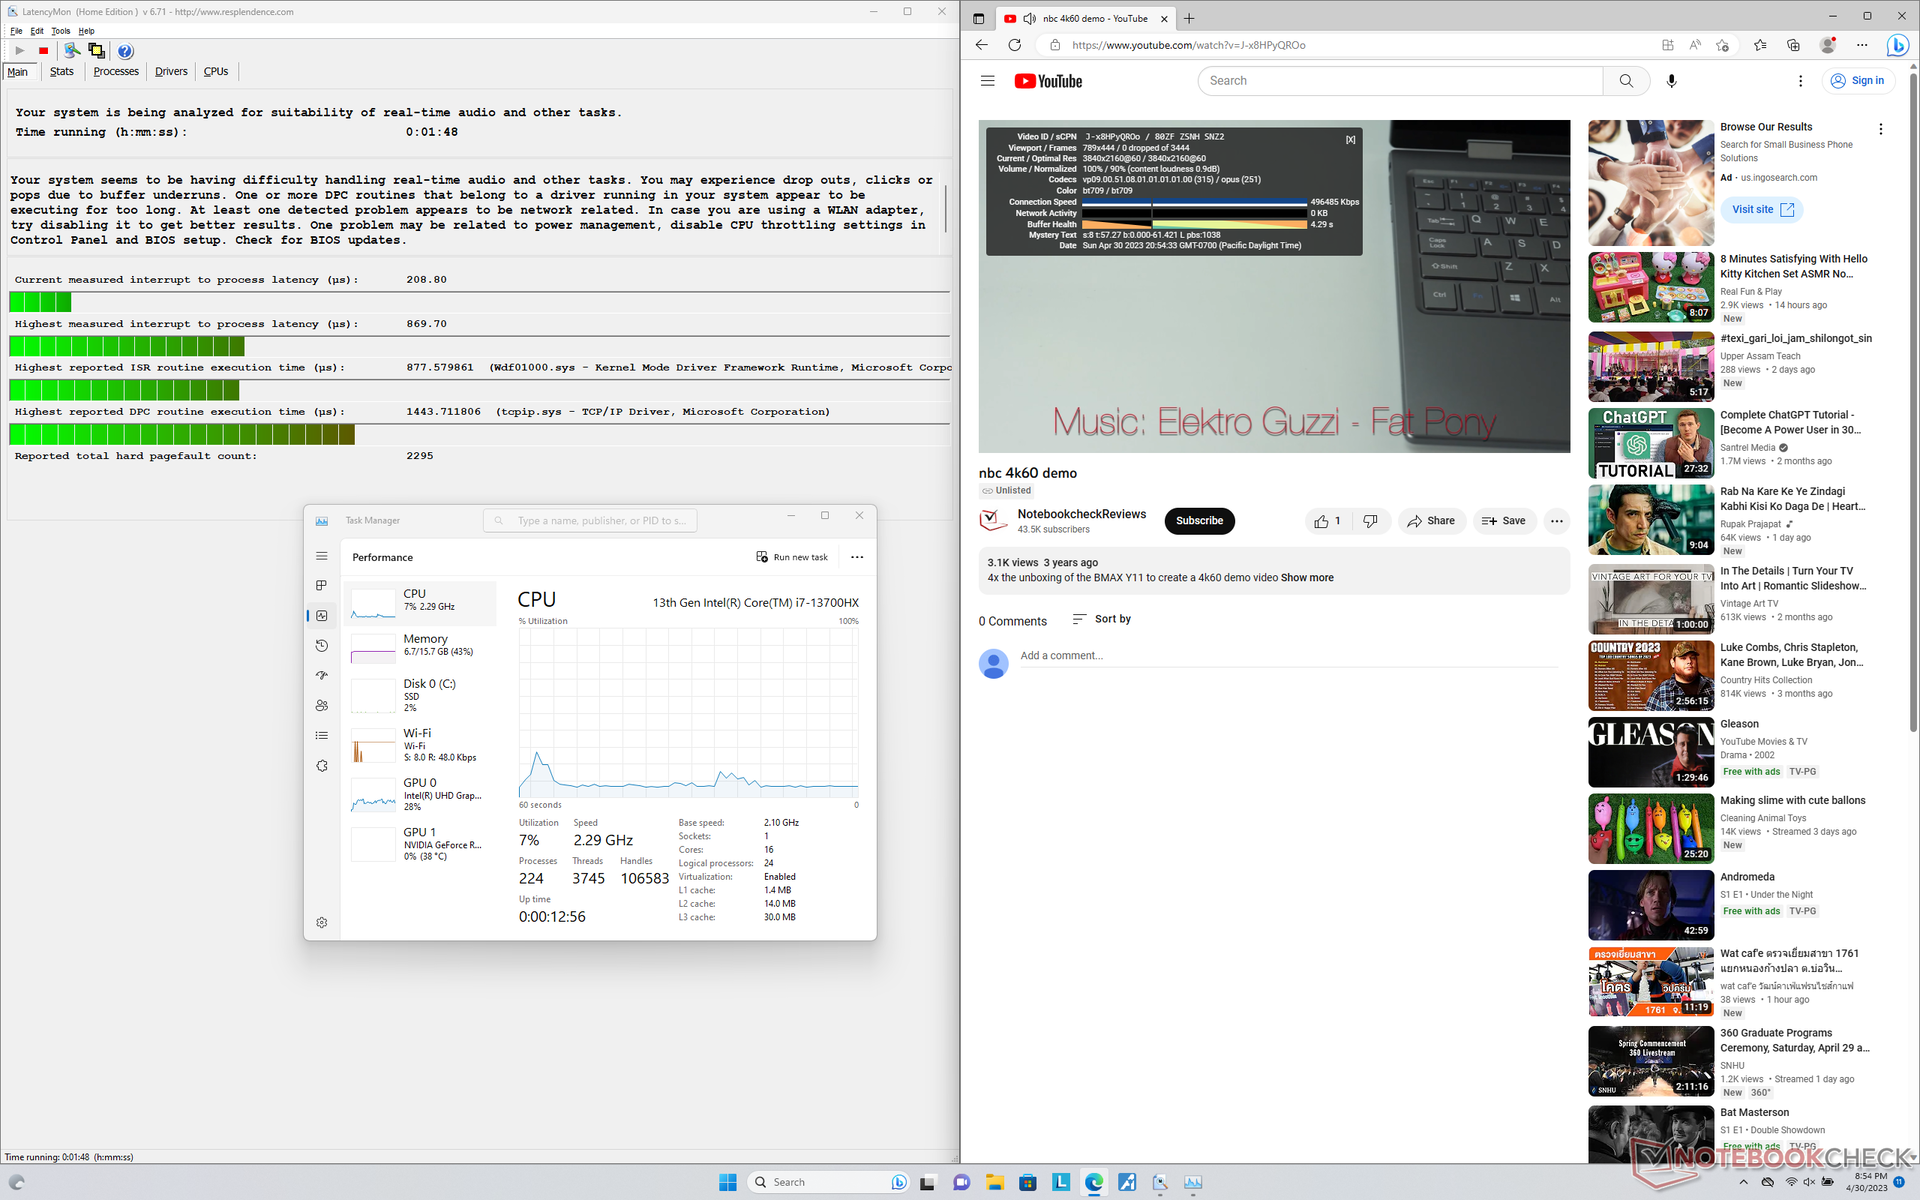
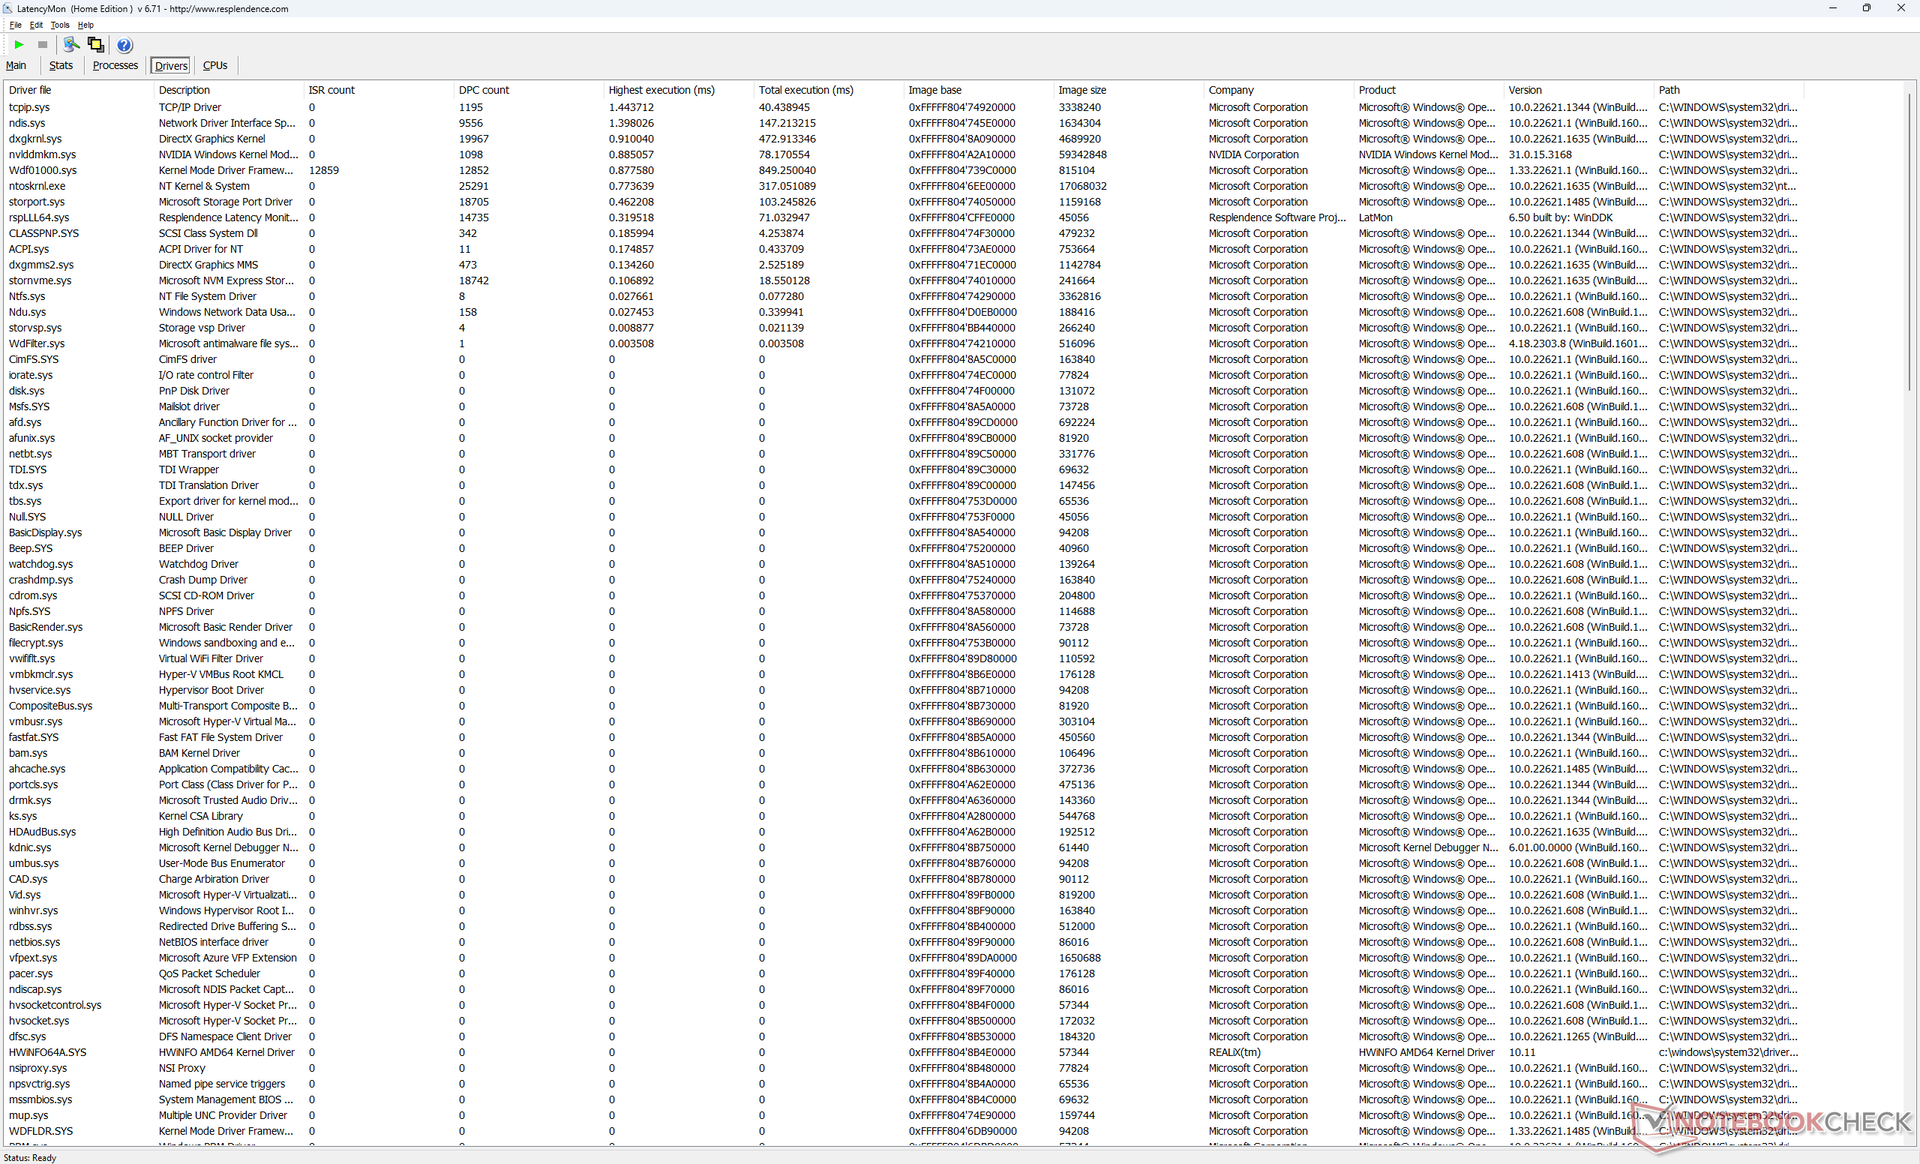
Latência DPC
O LatencyMon revela pequenos problemas de DPC ao abrir várias guias do navegador em nossa página inicial, mesmo no modo iGPU. a reprodução de vídeo 4K a 60 FPS é perfeita, sem registro de queda de quadros.
| DPC Latencies / LatencyMon - interrupt to process latency (max), Web, Youtube, Prime95 | |
| Razer Blade 16 Early 2023 | |
| Asus ROG Zephyrus M16 GU603Z | |
| Lenovo Legion S7 16ARHA7 | |
| Lenovo Legion Pro 5 16IRX8 | |
| Lenovo Legion 5 Pro 16ARH7H RTX 3070 Ti | |
| Lenovo Legion Pro 7 16IRX8H | |
* ... menor é melhor
Dispositivos de armazenamento - até duas unidades PCIe4 x4
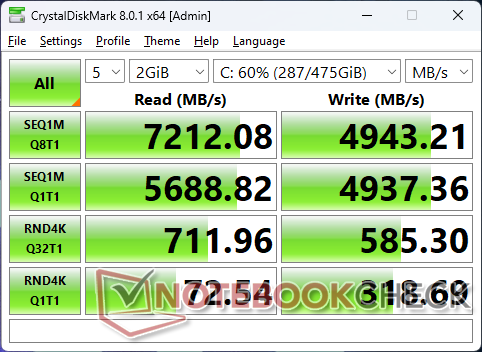
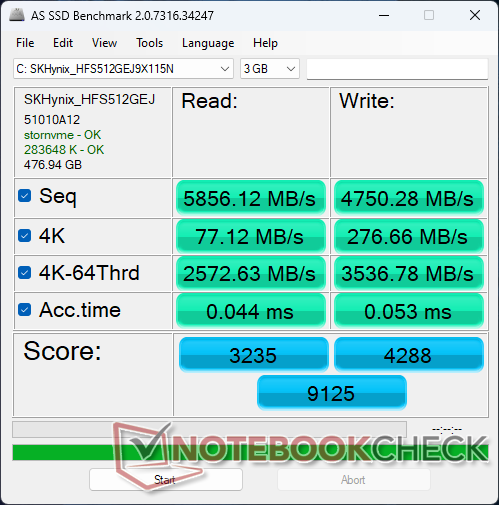
Nossa unidade utiliza a mesma unidade PCIe4 x4 de 512 GB Unidade SK Hynix encontrada no Lenovo Legion S7 16. O desempenho é excelente, com taxas de leitura e gravação sequenciais próximas a 7200 MB/s e 5000 MB/s, respectivamente, rivalizando com o popular Samsung PM9A1. Mesmo assim, ainda há espaço para melhorias, pois as taxas de transferência podem ser periodicamente reduzidas para 6300 MB/s em vez de manter um máximo estável de 7200 MB/s.

* ... menor é melhor
Disk Throttling: DiskSpd Read Loop, Queue Depth 8
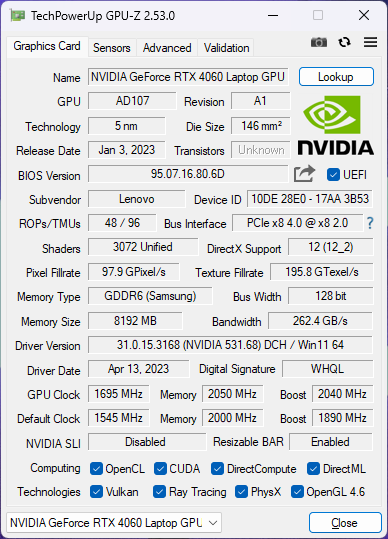
Desempenho da GPU - GeForce RTX 4060
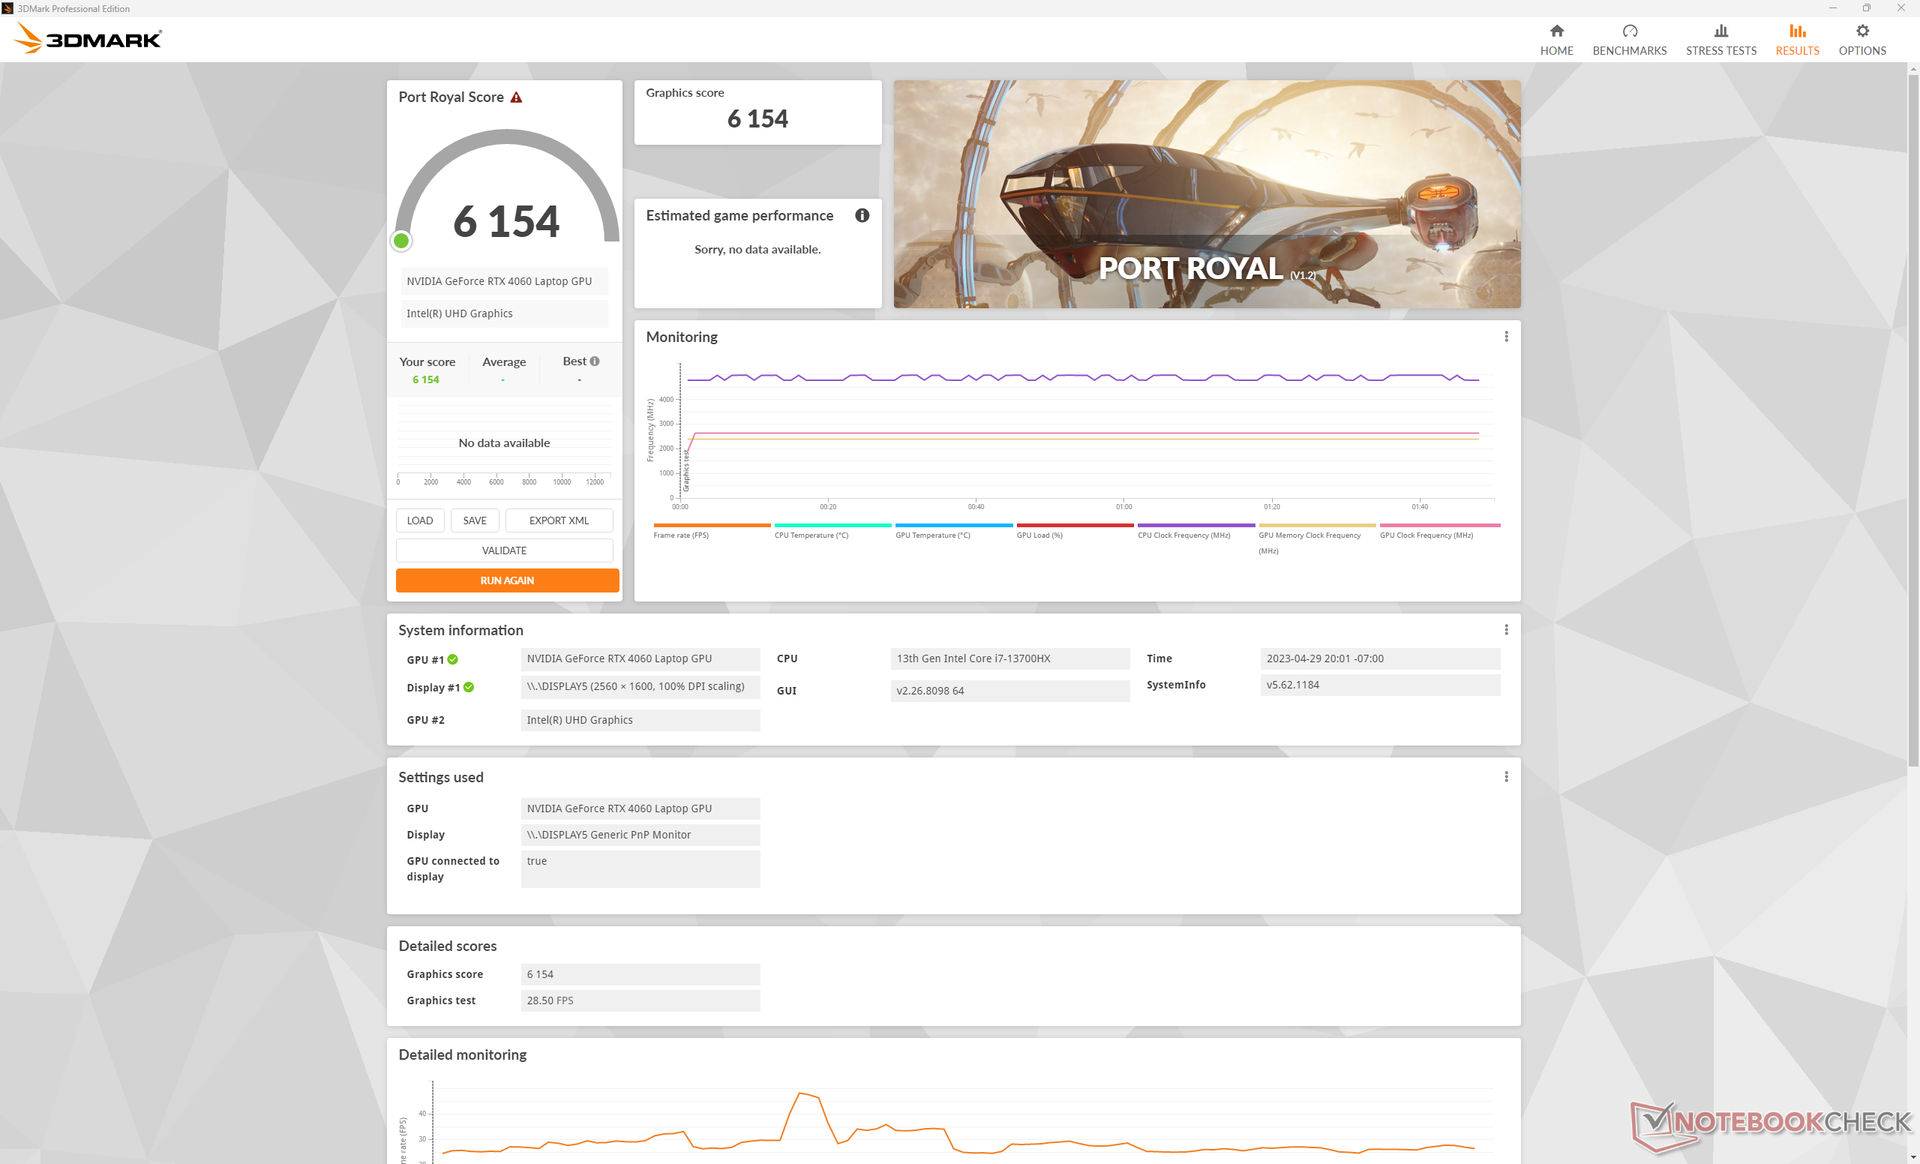
O desempenho gráfico é de 10 a 15% mais rápido do que o laptop médio em nosso banco de dados com a mesma móvel GeForce RTX 4060 GPU MÓVEL. Portanto, o Legion Pro 5 16 pode ser uma boa opção para aqueles que desejam maximizar o desempenho gráfico. O MSI Cyborg 15por exemplo, vem com a mesma GPU, mas tem como meta um TGP de 45 W muito mais baixo para um desempenho geral mais lento.
A rTX 3070 Ti móvel do ano passado do ano passado é ligeiramente mais rápida do que nossa RTX 4060 móvel em cerca de 15%. A atualização de um laptop Laptop RTX 3060 para a nossa RTX 4060 melhorará o desempenho em cerca de 20 a 25%, o que não é ruim para uma placa de médio porte. Você terá que jogar títulos que suportem DLSS3 para explorar melhor a RTX 4060, pois o recurso não está disponível nas GPUs GeForce 30.
O upgrade para a RTX 4070 SKU melhorará o desempenho gráfico em 15 a 20% em relação ao nosso RTX 4060. Para as opções RTX 4080 ou RTX 4090, no entanto, você terá que considerar a série Legion 7 Pro mais avançada.
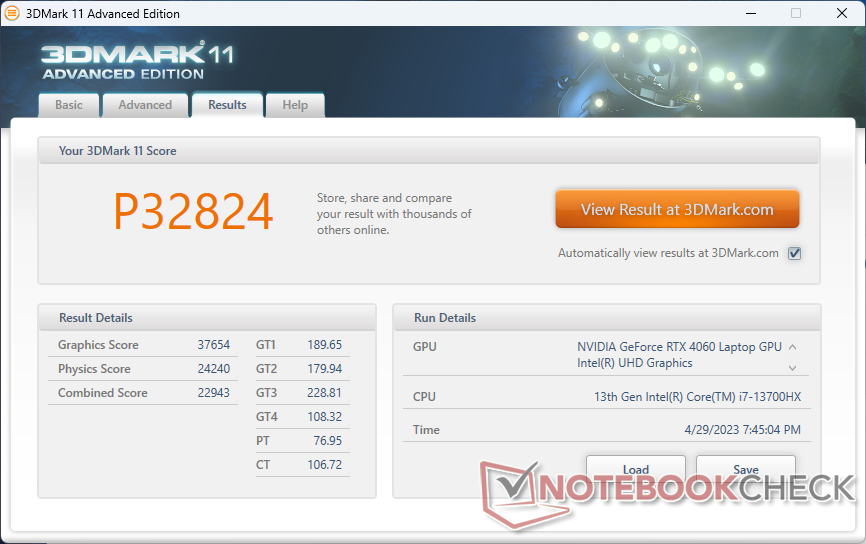
| 3DMark 11 Performance | 32824 pontos | |
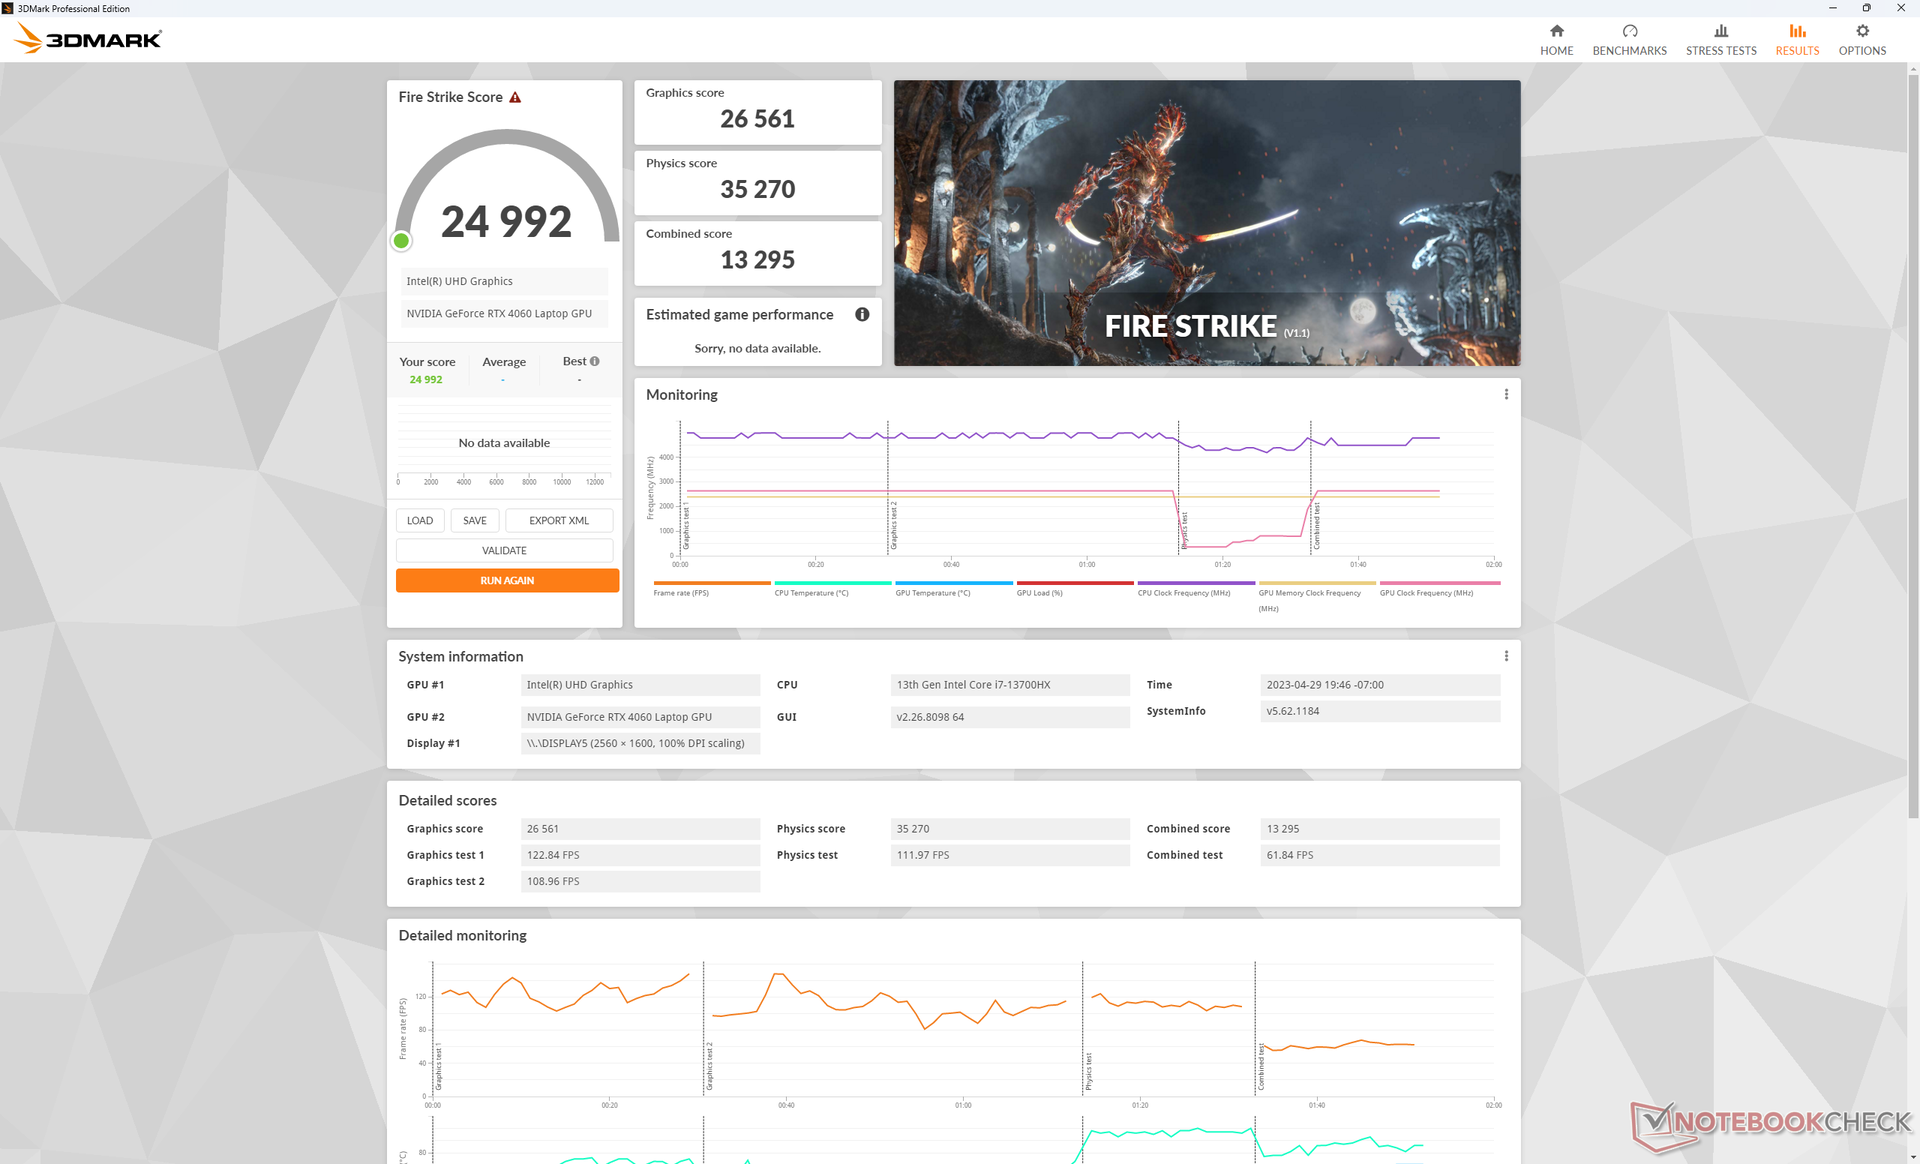
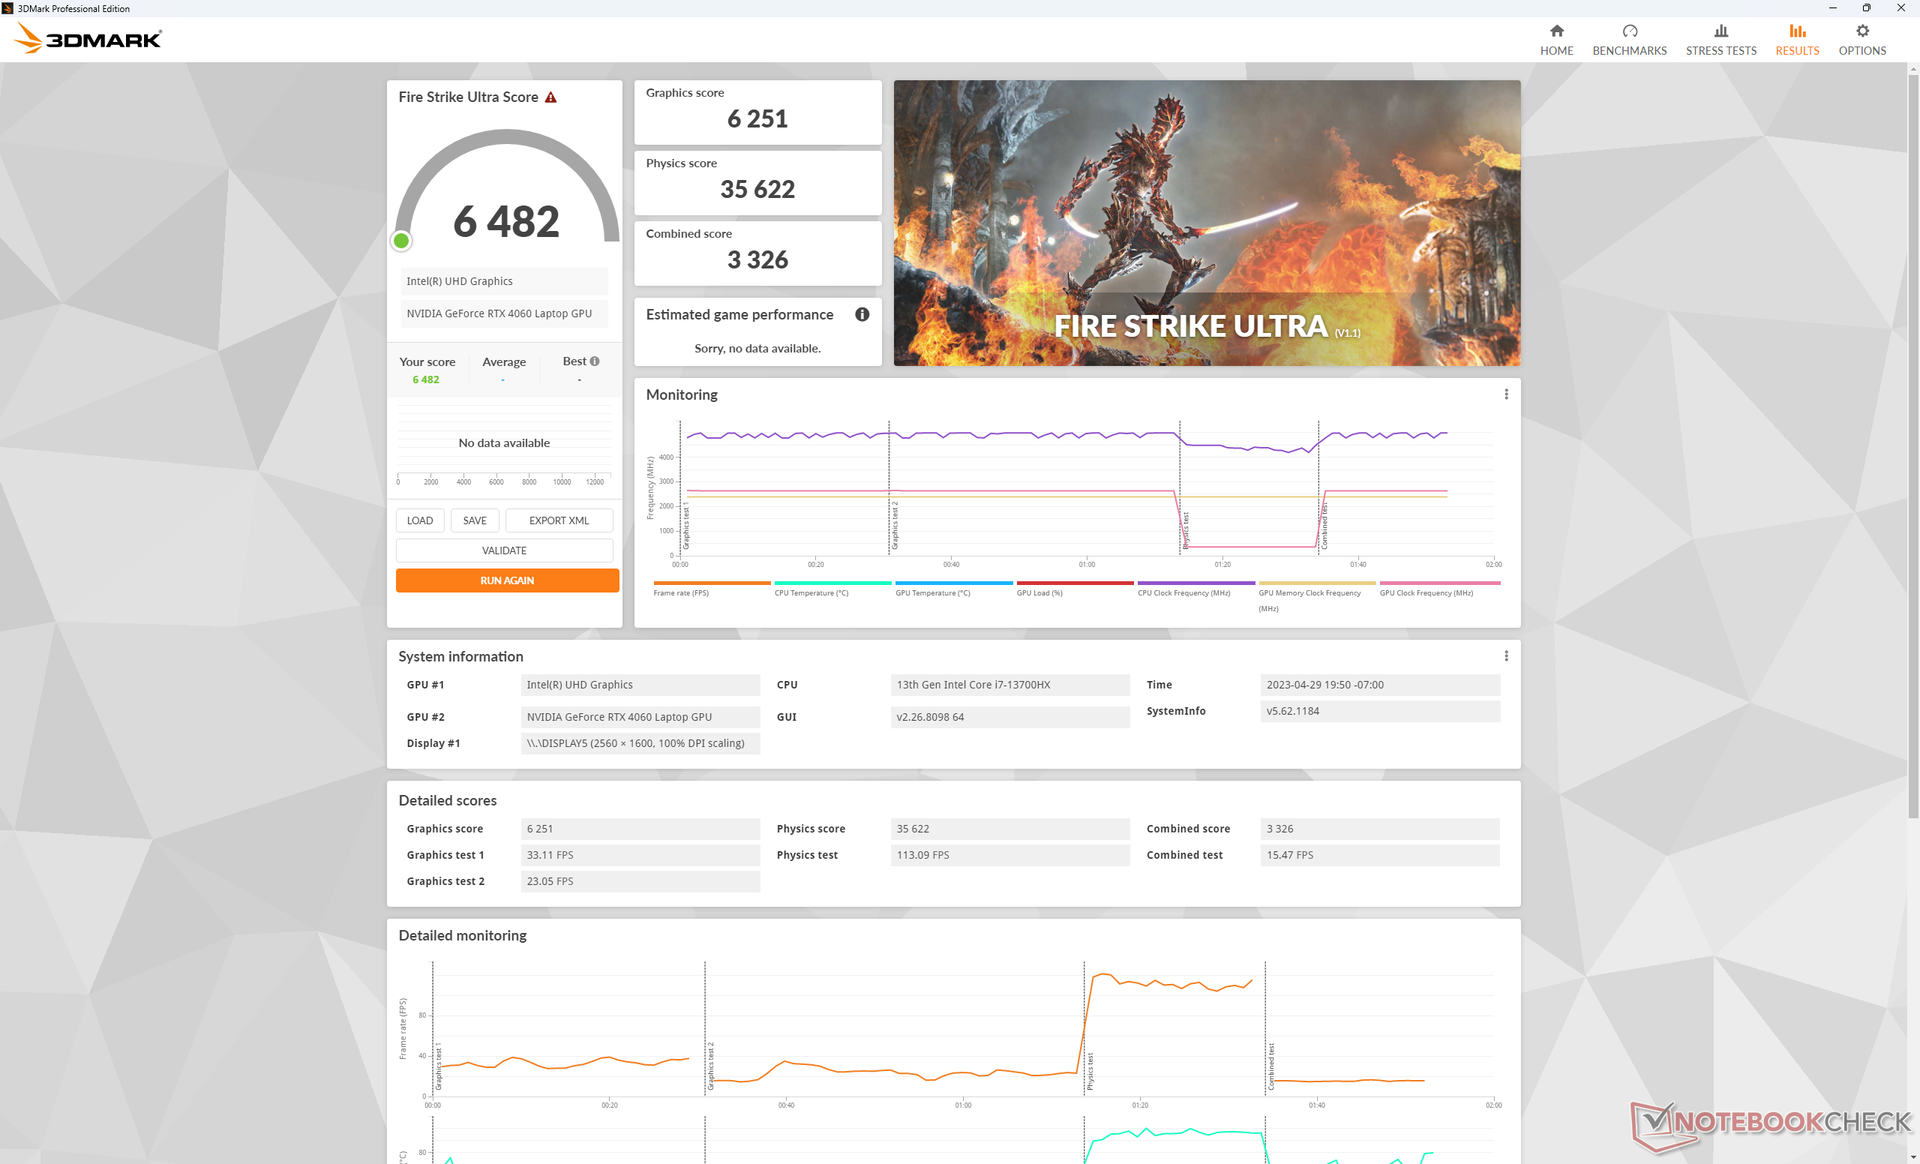
| 3DMark Fire Strike Score | 24992 pontos | |
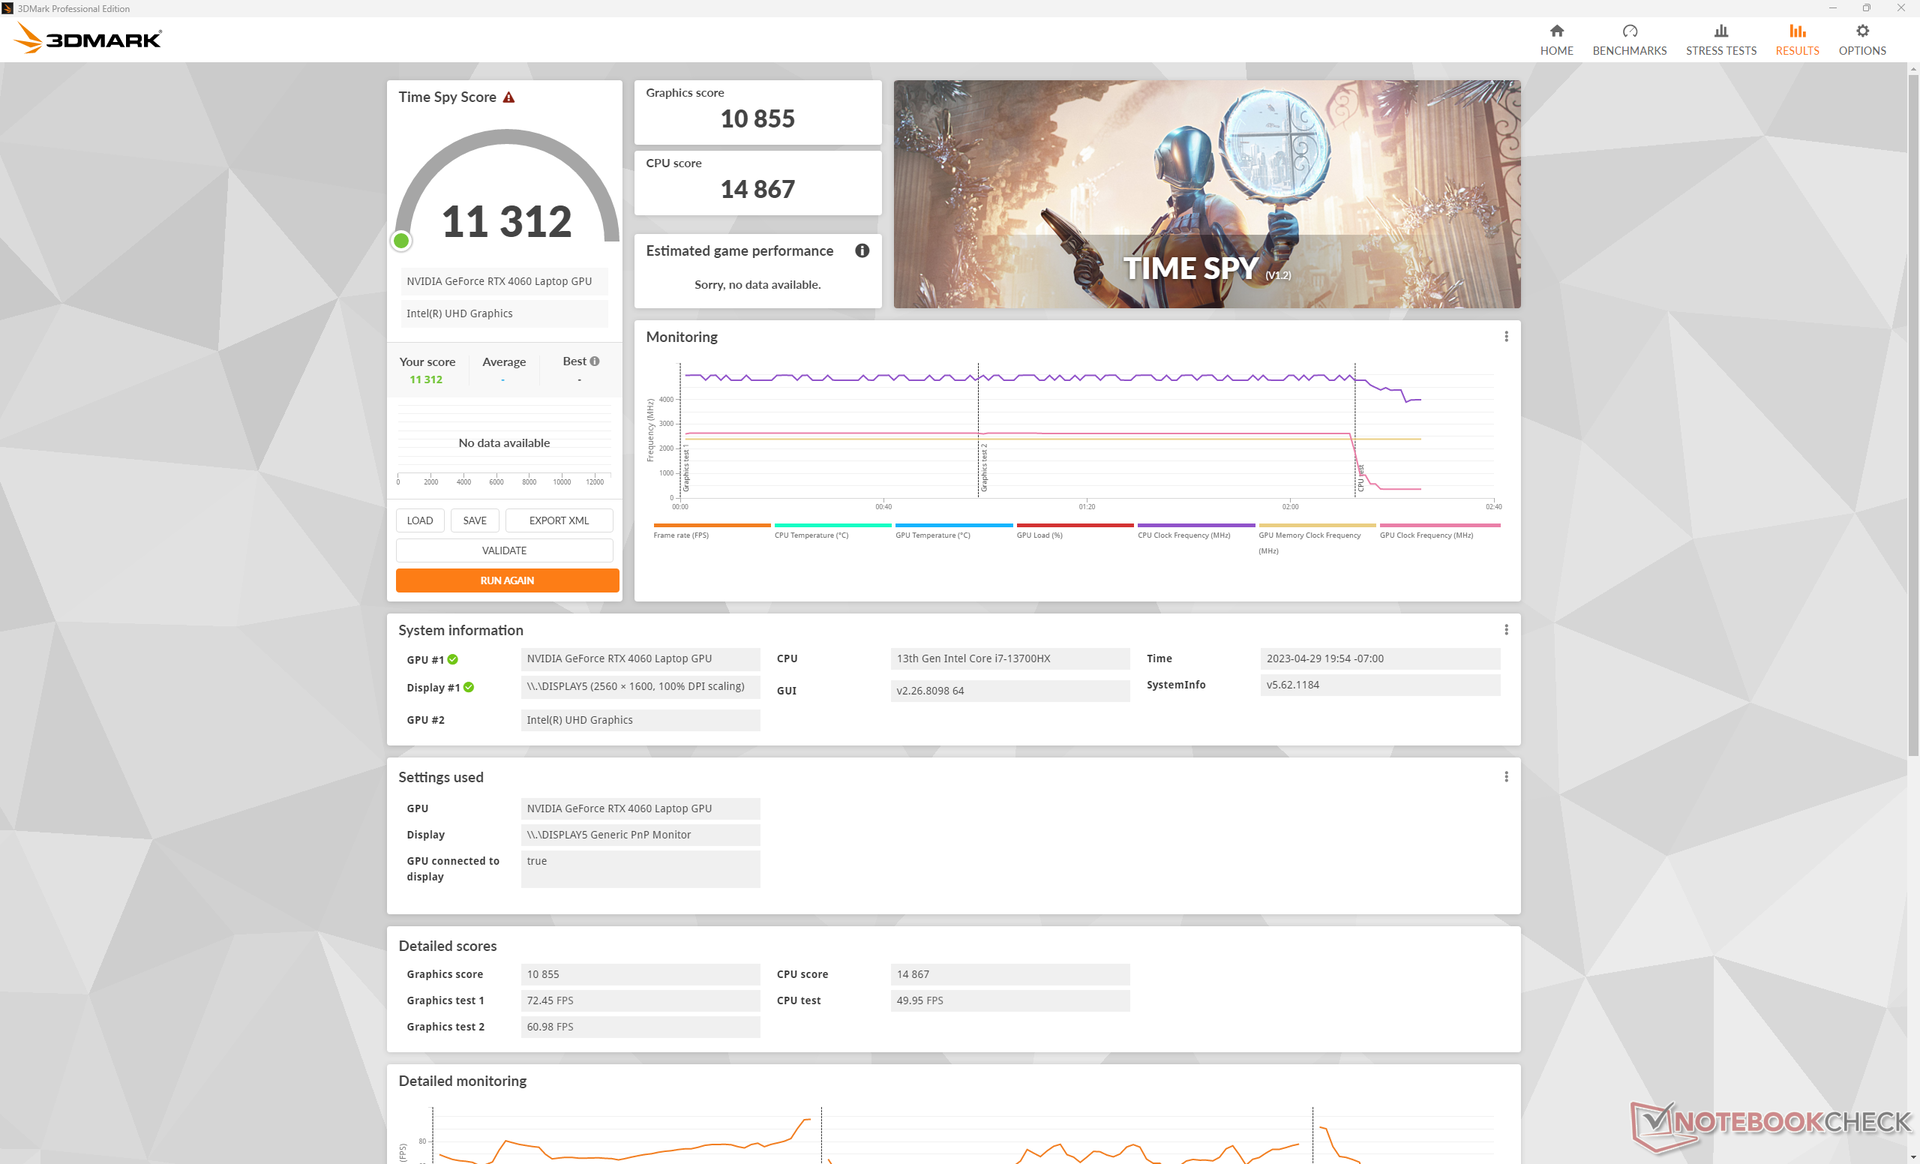
| 3DMark Time Spy Score | 11312 pontos | |
Ajuda | ||
* ... menor é melhor
Desempenho em jogos
Qualquer título atual pode rodar bem acima de 60 FPS em configurações ultra de 1080p. A execução na resolução QHD+ nativa, no entanto, requer o ajuste de algumas configurações, especialmente para títulos exigentes como Returnal ou F1 2022. Atingir 165 FPS estáveis para corresponder à taxa de atualização de 165 Hz é difícil na maioria dos títulos com a RTX 3060 de médio porte. Em vez disso, recomendamos que se busque de 50 a 100 FPS com o G-Sync ativado para reduzir o screen tearing.
| Returnal | |
| 1920x1080 Low Preset | |
| Média NVIDIA GeForce RTX 4060 Laptop GPU (71 - 99, n=5) | |
| Lenovo Legion Pro 5 16IRX8 | |
| 1920x1080 Medium Preset | |
| Média NVIDIA GeForce RTX 4060 Laptop GPU (68 - 93, n=5) | |
| Lenovo Legion Pro 5 16IRX8 | |
| 1920x1080 High Preset | |
| Lenovo Legion Pro 5 16IRX8 | |
| Média NVIDIA GeForce RTX 4060 Laptop GPU (63 - 87, n=6) | |
| 1920x1080 Epic Preset | |
| Lenovo Legion Pro 5 16IRX8 | |
| Média NVIDIA GeForce RTX 4060 Laptop GPU (57 - 75, n=6) | |
| 2560x1440 Epic Preset | |
| Média NVIDIA GeForce RTX 4060 Laptop GPU (39 - 59.4, n=5) | |
| Lenovo Legion Pro 5 16IRX8 | |
| 3840x2160 Epic Preset | |
| Média NVIDIA GeForce RTX 4060 Laptop GPU (25 - 29, n=2) | |
| Lenovo Legion Pro 5 16IRX8 | |
Witcher 3 FPS Chart
| baixo | média | alto | ultra | QHD | 4K | |
|---|---|---|---|---|---|---|
| GTA V (2015) | 186.7 | 184 | 178.9 | 119.6 | 88.9 | 85.5 |
| The Witcher 3 (2015) | 521.8 | 369.3 | 215.8 | 107.6 | 67.2 | |
| Dota 2 Reborn (2015) | 196.6 | 176.5 | 170.3 | 161.8 | 142.9 | |
| Final Fantasy XV Benchmark (2018) | 222 | 161.2 | 109.8 | 79.4 | 45.4 | |
| X-Plane 11.11 (2018) | 177.4 | 156.3 | 121.9 | 104.4 | ||
| Cyberpunk 2077 1.6 (2022) | 150.7 | 136.6 | 106 | 87.4 | 51.7 | 22.9 |
| Tiny Tina's Wonderlands (2022) | 234.6 | 192.3 | 121.2 | 92.7 | 64.2 | 33.6 |
| F1 22 (2022) | 276 | 274 | 208 | 70.1 | 44.8 | 21.5 |
| Returnal (2023) | 81 | 79 | 75 | 70 | 48 | 25 |
Emissões
Ruído do sistema - Comportamento constante da RPM do ventilador
O ruído do ventilador durante cargas baixas, como navegação ou streaming de vídeo, tende a se estabilizar em 26,6 dB(A) contra um fundo silencioso de 23 dB(A). É alto o suficiente para ser audível, mas não chega a distrair. Felizmente, as ventoinhas são estáveis em RPM e não pulsam com frequência nesse estado, mesmo quando estão no modo Desempenho.
O ruído do ventilador durante a execução Witcher 3 no modo Performance se estabilizaria em 47,6 dB(A) em comparação com 55 dB(A) cada no Legion Pro 5 16 do ano passado com gráficos RTX 3070 Ti e no Legion Pro 7. No entanto, se a CPU e a GPU forem submetidas a um estresse significativamente maior, como em benchmarks ou em jogos muito exigentes, nosso Legion Pro 5 16 pode atingir o mesmo máximo de 55 dB(A).
Os jogos no modo balanceado são um pouco mais silenciosos, com 46 dB(A) contra os 47,6 dB(A) mencionados acima. A diferença é tão pequena que há poucos motivos para usar o modo balanceado na maioria dos cenários de jogos.
Barulho
| Ocioso |
| 23.1 / 23.1 / 26.6 dB |
| Carga |
| 34.7 / 54.8 dB |
 | ||
30 dB silencioso 40 dB(A) audível 50 dB(A) ruidosamente alto |
||
min: | ||
| Lenovo Legion Pro 5 16IRX8 GeForce RTX 4060 Laptop GPU, i7-13700HX, SK hynix PC801 HFS512GEJ9X115N | Asus ROG Zephyrus M16 GU603Z GeForce RTX 3070 Ti Laptop GPU, i9-12900H, Micron 3400 1TB MTFDKBA1T0TFH | Razer Blade 16 Early 2023 GeForce RTX 4080 Laptop GPU, i9-13950HX, SSSTC CA6-8D1024 | Lenovo Legion Pro 7 16IRX8H GeForce RTX 4080 Laptop GPU, i9-13900HX, Samsung PM9A1 MZVL21T0HCLR | Lenovo Legion 5 Pro 16ARH7H RTX 3070 Ti GeForce RTX 3070 Ti Laptop GPU, R7 6800H, Samsung PM9A1 MZVL21T0HCLR | Lenovo Legion S7 16ARHA7 Radeon RX 6800S, R9 6900HX, SK Hynix HFS001TEJ9X115N | |
|---|---|---|---|---|---|---|
| Noise | -16% | -0% | -17% | -12% | 3% | |
| desligado / ambiente * (dB) | 23 | 23 -0% | 23 -0% | 24 -4% | 23.5 -2% | 23.1 -0% |
| Idle Minimum * (dB) | 23.1 | 23 -0% | 23 -0% | 26 -13% | 23.7 -3% | 23.1 -0% |
| Idle Average * (dB) | 23.1 | 24 -4% | 23 -0% | 28 -21% | 31.1 -35% | 23.1 -0% |
| Idle Maximum * (dB) | 26.6 | 47 -77% | 23.6 11% | 34 -28% | 32.2 -21% | 23.1 13% |
| Load Average * (dB) | 34.7 | 47.91 -38% | 39 -12% | 47 -35% | 38.4 -11% | 31.4 10% |
| Witcher 3 ultra * (dB) | 47.6 | 48.91 -3% | 51.6 -8% | 55 -16% | 54.8 -15% | 51.4 -8% |
| Load Maximum * (dB) | 54.8 | 50.25 8% | 51.3 6% | 56 -2% | 54.8 -0% | 51.2 7% |
* ... menor é melhor
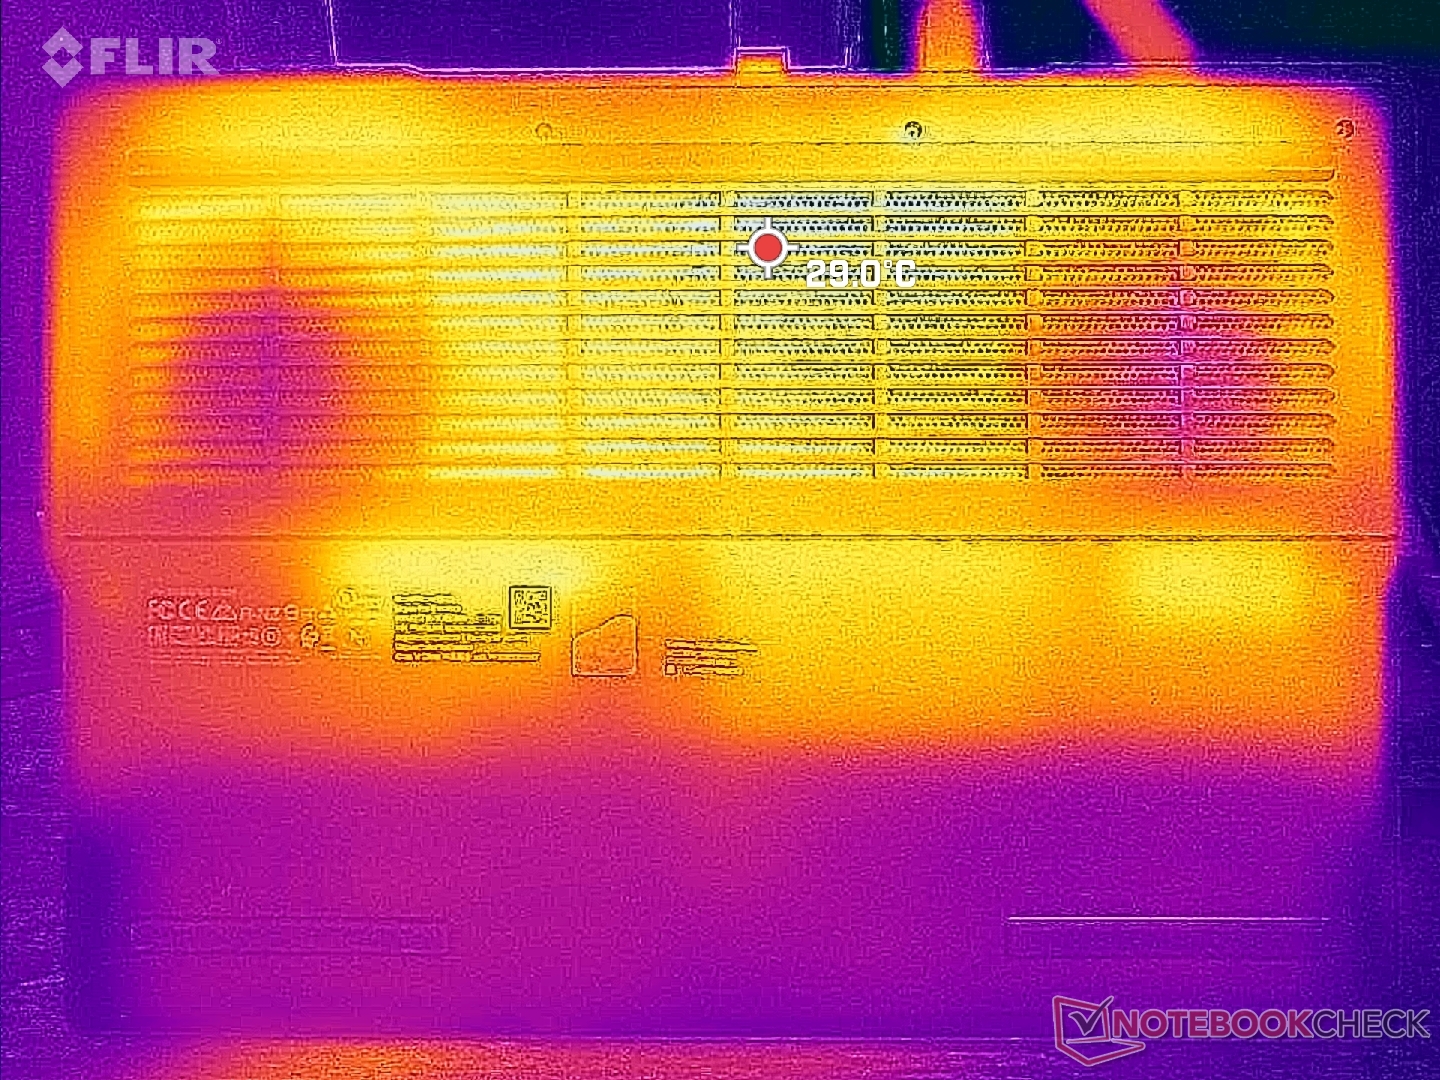
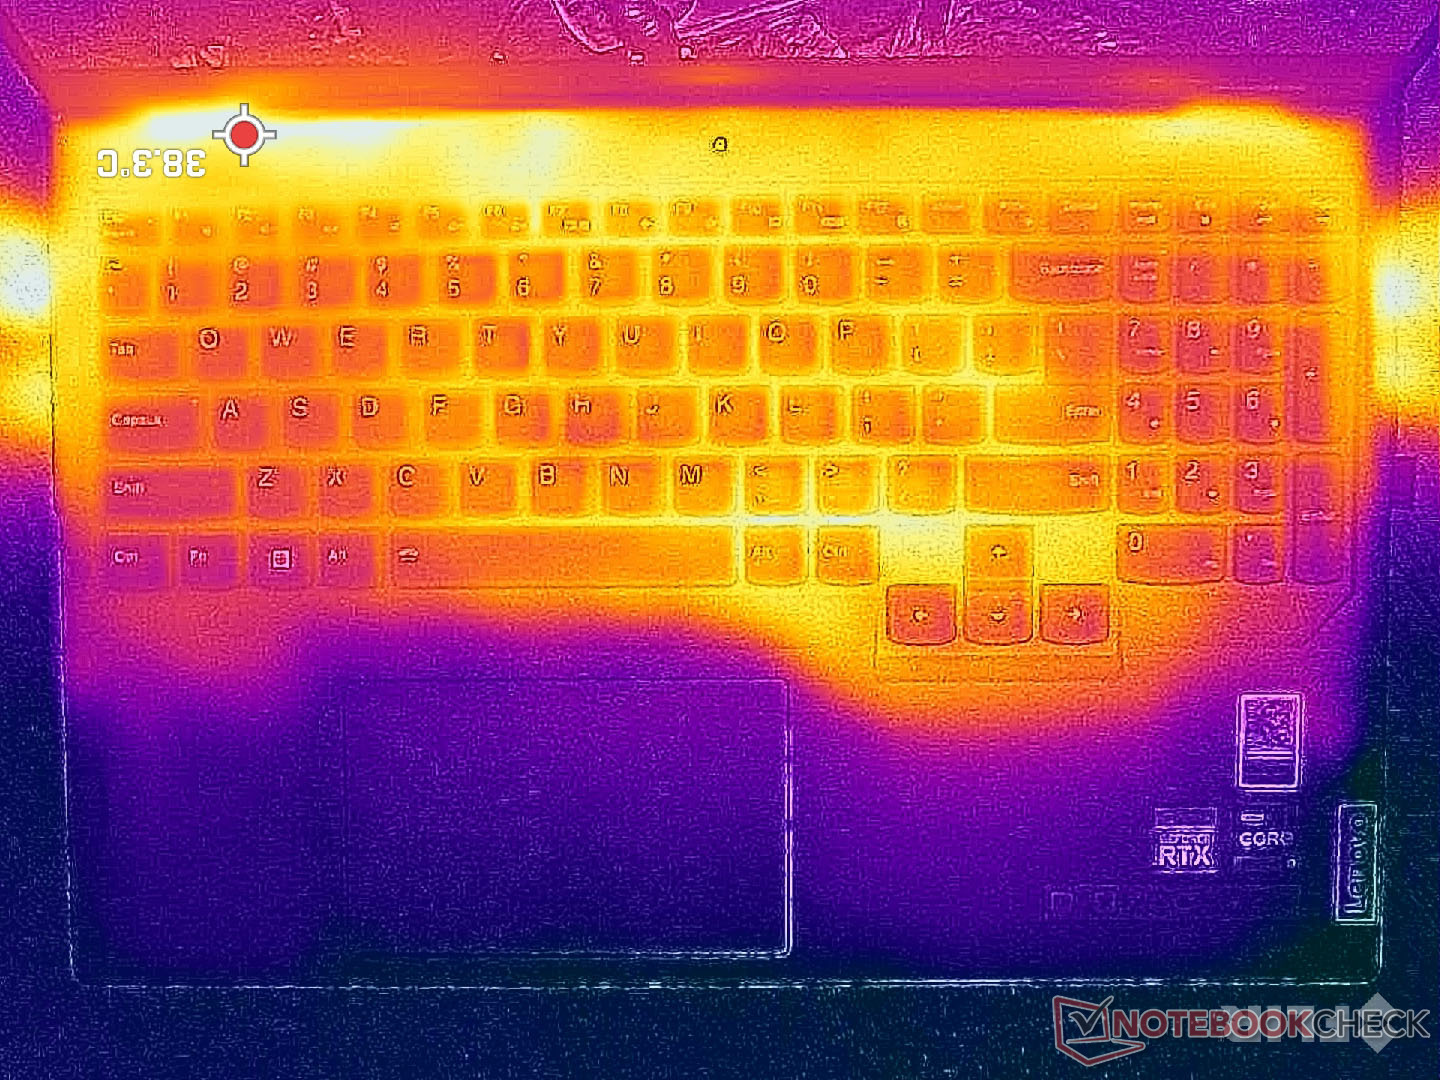
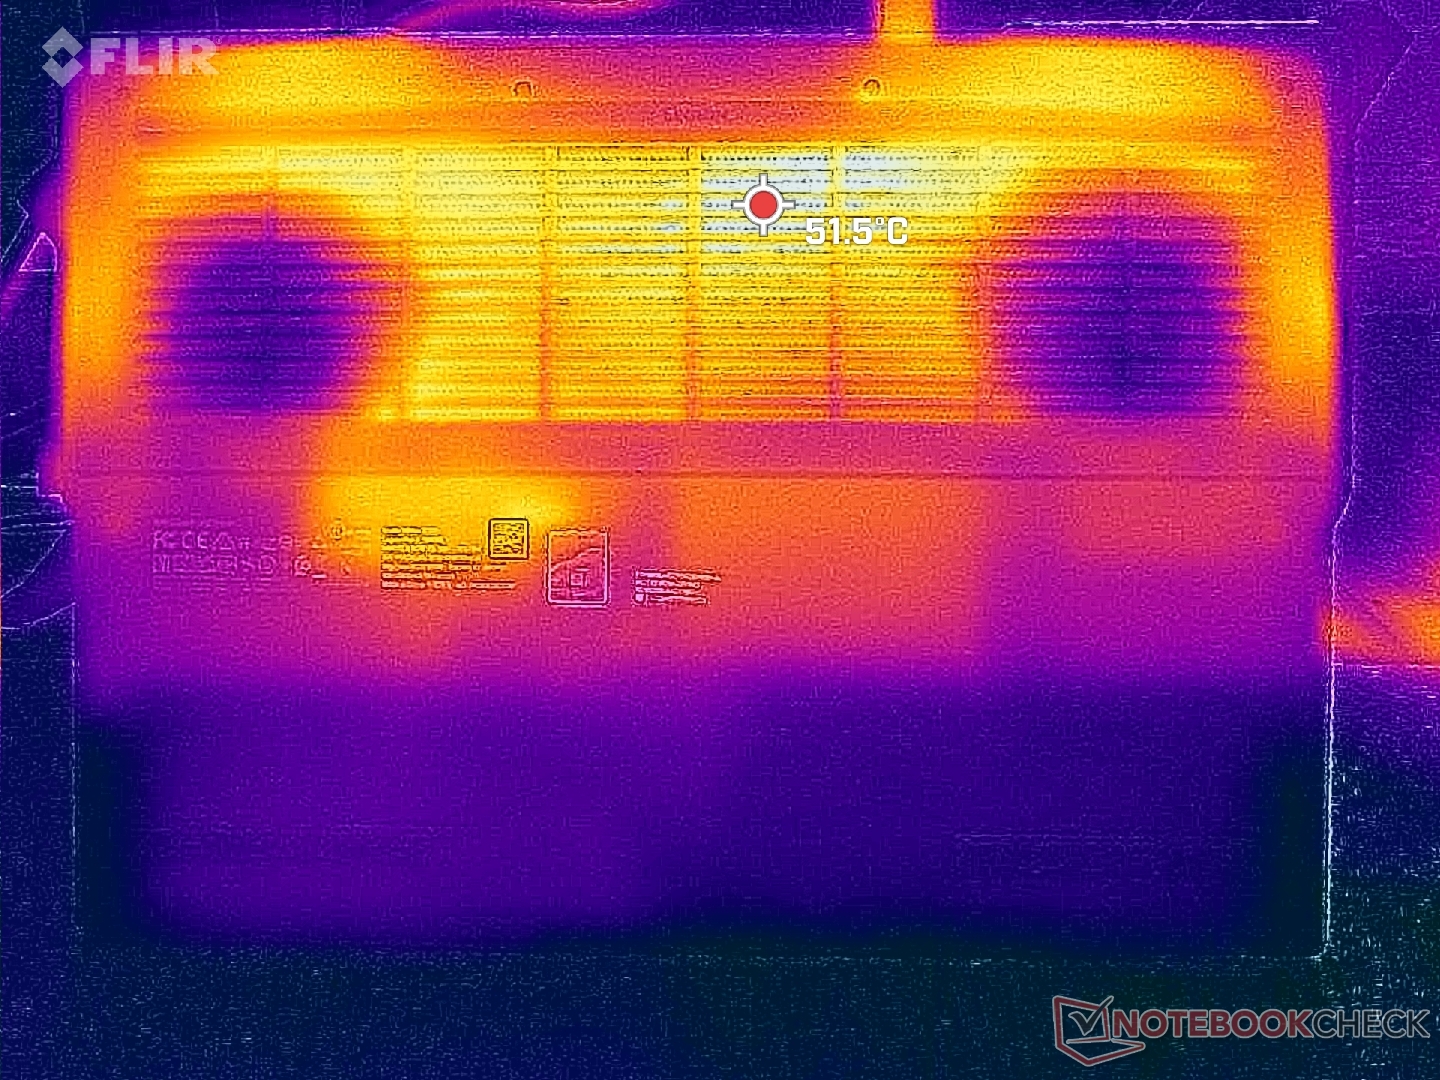
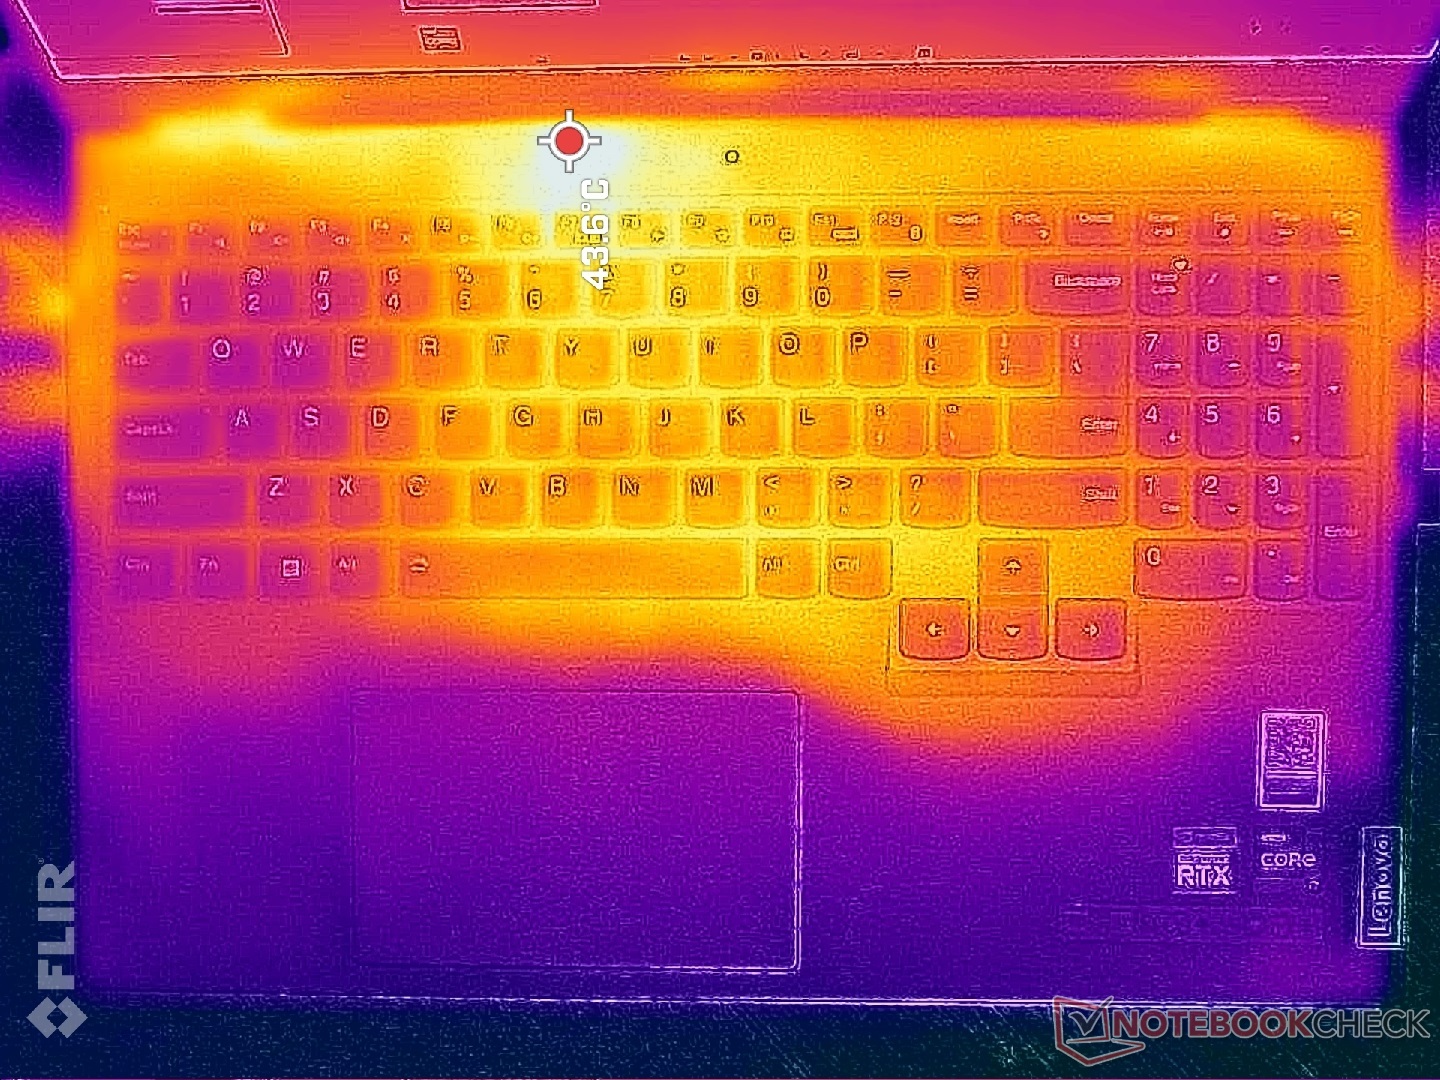
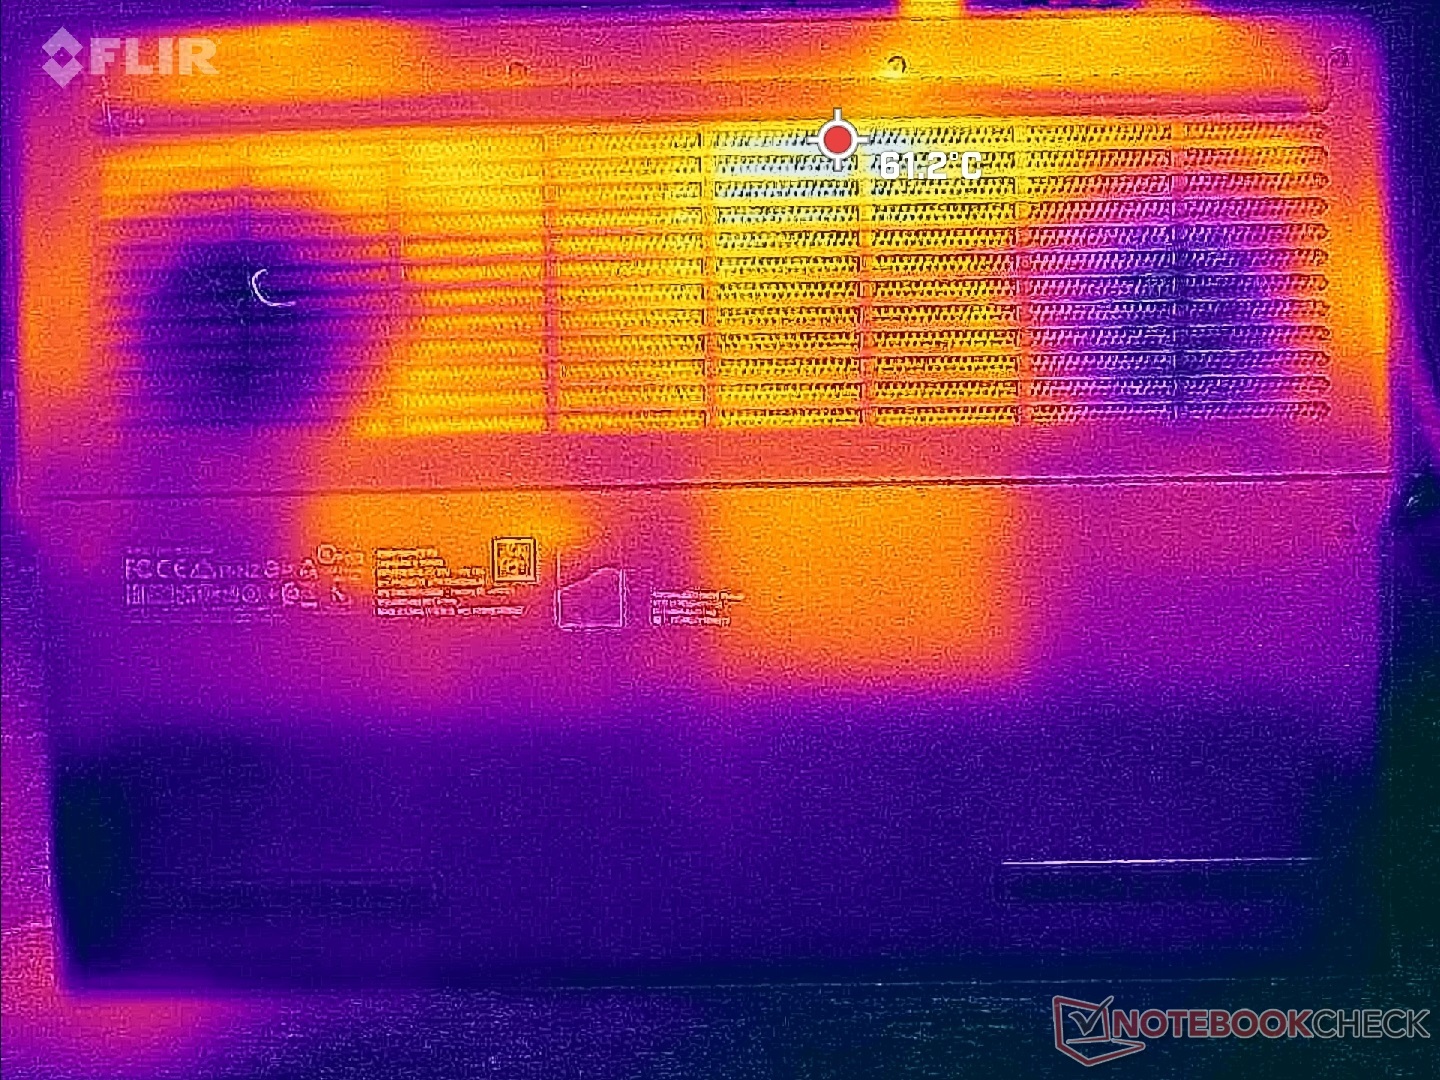
Temperatura - Apoio para as mãos frio
As temperaturas da superfície durante a execução de jogos podem chegar a 43 °C a 50 °C na parte superior e inferior, respectivamente. Felizmente, esses pontos quentes estão concentrados na parte traseira, onde é improvável que a pele entre em contato. A tela mais fina do ROG Zephyrus M16 mais fino, pode ser ainda mais quente, em média, e com pontos quentes maiores.
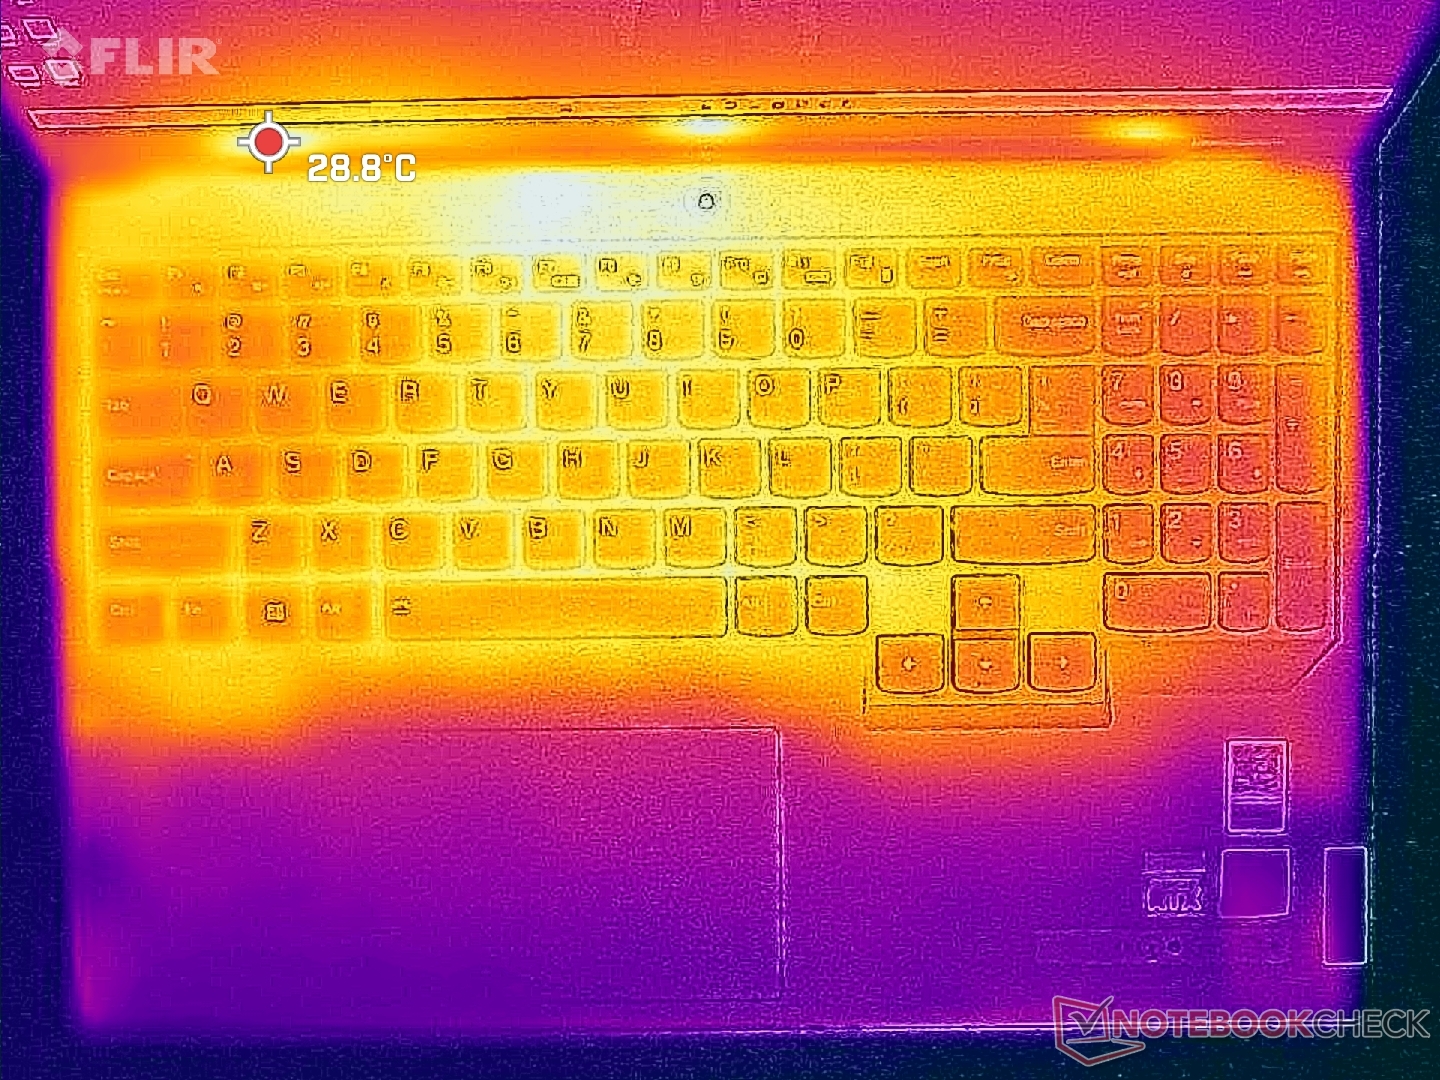
Em geral, as laterais do teclado são mais frias do que o centro em alguns graus C, pois as ventoinhas estão posicionadas diretamente embaixo, como mostram os mapas de temperatura abaixo. Portanto, é menos provável que as palmas das mãos e os dedos fiquem desconfortáveis ao jogar.
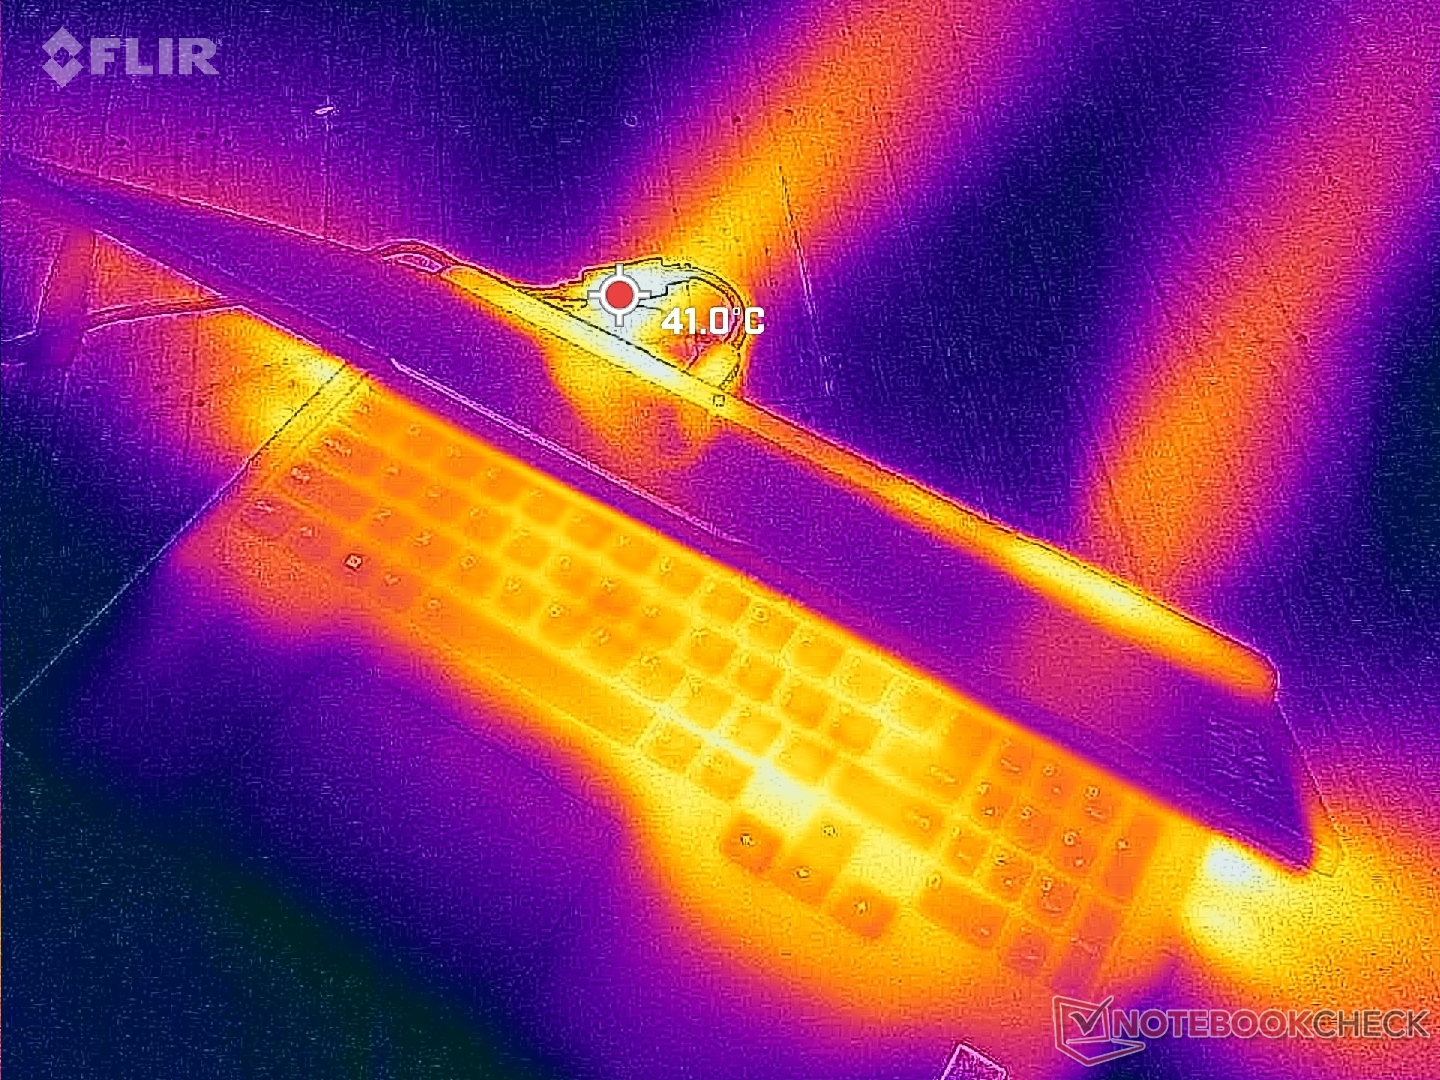
(±) A temperatura máxima no lado superior é 42.8 °C / 109 F, em comparação com a média de 40.4 °C / 105 F , variando de 21.2 a 68.8 °C para a classe Gaming.
(-) A parte inferior aquece até um máximo de 50 °C / 122 F, em comparação com a média de 43.2 °C / 110 F
(+) Em uso inativo, a temperatura média para o lado superior é 27.2 °C / 81 F, em comparação com a média do dispositivo de 33.9 °C / ### class_avg_f### F.
(±) Jogando The Witcher 3, a temperatura média para o lado superior é 32.4 °C / 90 F, em comparação com a média do dispositivo de 33.9 °C / ## #class_avg_f### F.
(+) Os apoios para as mãos e o touchpad são mais frios que a temperatura da pele, com um máximo de 26.2 °C / 79.2 F e, portanto, são frios ao toque.
(+) A temperatura média da área do apoio para as mãos de dispositivos semelhantes foi 28.8 °C / 83.8 F (+2.6 °C / 4.6 F).
| Lenovo Legion Pro 5 16IRX8 Intel Core i7-13700HX, NVIDIA GeForce RTX 4060 Laptop GPU | Asus ROG Zephyrus M16 GU603Z Intel Core i9-12900H, NVIDIA GeForce RTX 3070 Ti Laptop GPU | Razer Blade 16 Early 2023 Intel Core i9-13950HX, NVIDIA GeForce RTX 4080 Laptop GPU | Lenovo Legion Pro 7 16IRX8H Intel Core i9-13900HX, NVIDIA GeForce RTX 4080 Laptop GPU | Lenovo Legion 5 Pro 16ARH7H RTX 3070 Ti AMD Ryzen 7 6800H, NVIDIA GeForce RTX 3070 Ti Laptop GPU | Lenovo Legion S7 16ARHA7 AMD Ryzen 9 6900HX, AMD Radeon RX 6800S | |
|---|---|---|---|---|---|---|
| Heat | -5% | 8% | -11% | -1% | 5% | |
| Maximum Upper Side * (°C) | 42.8 | 52 -21% | 40 7% | 48 -12% | 43.8 -2% | 46.6 -9% |
| Maximum Bottom * (°C) | 50 | 51 -2% | 37.6 25% | 49 2% | 53 -6% | 50.8 -2% |
| Idle Upper Side * (°C) | 29.6 | 29 2% | 32.4 -9% | 40 -35% | 30 -1% | 26.4 11% |
| Idle Bottom * (°C) | 34 | 33 3% | 31.4 8% | 33 3% | 31.8 6% | 27.2 20% |
* ... menor é melhor
Teste de estresse
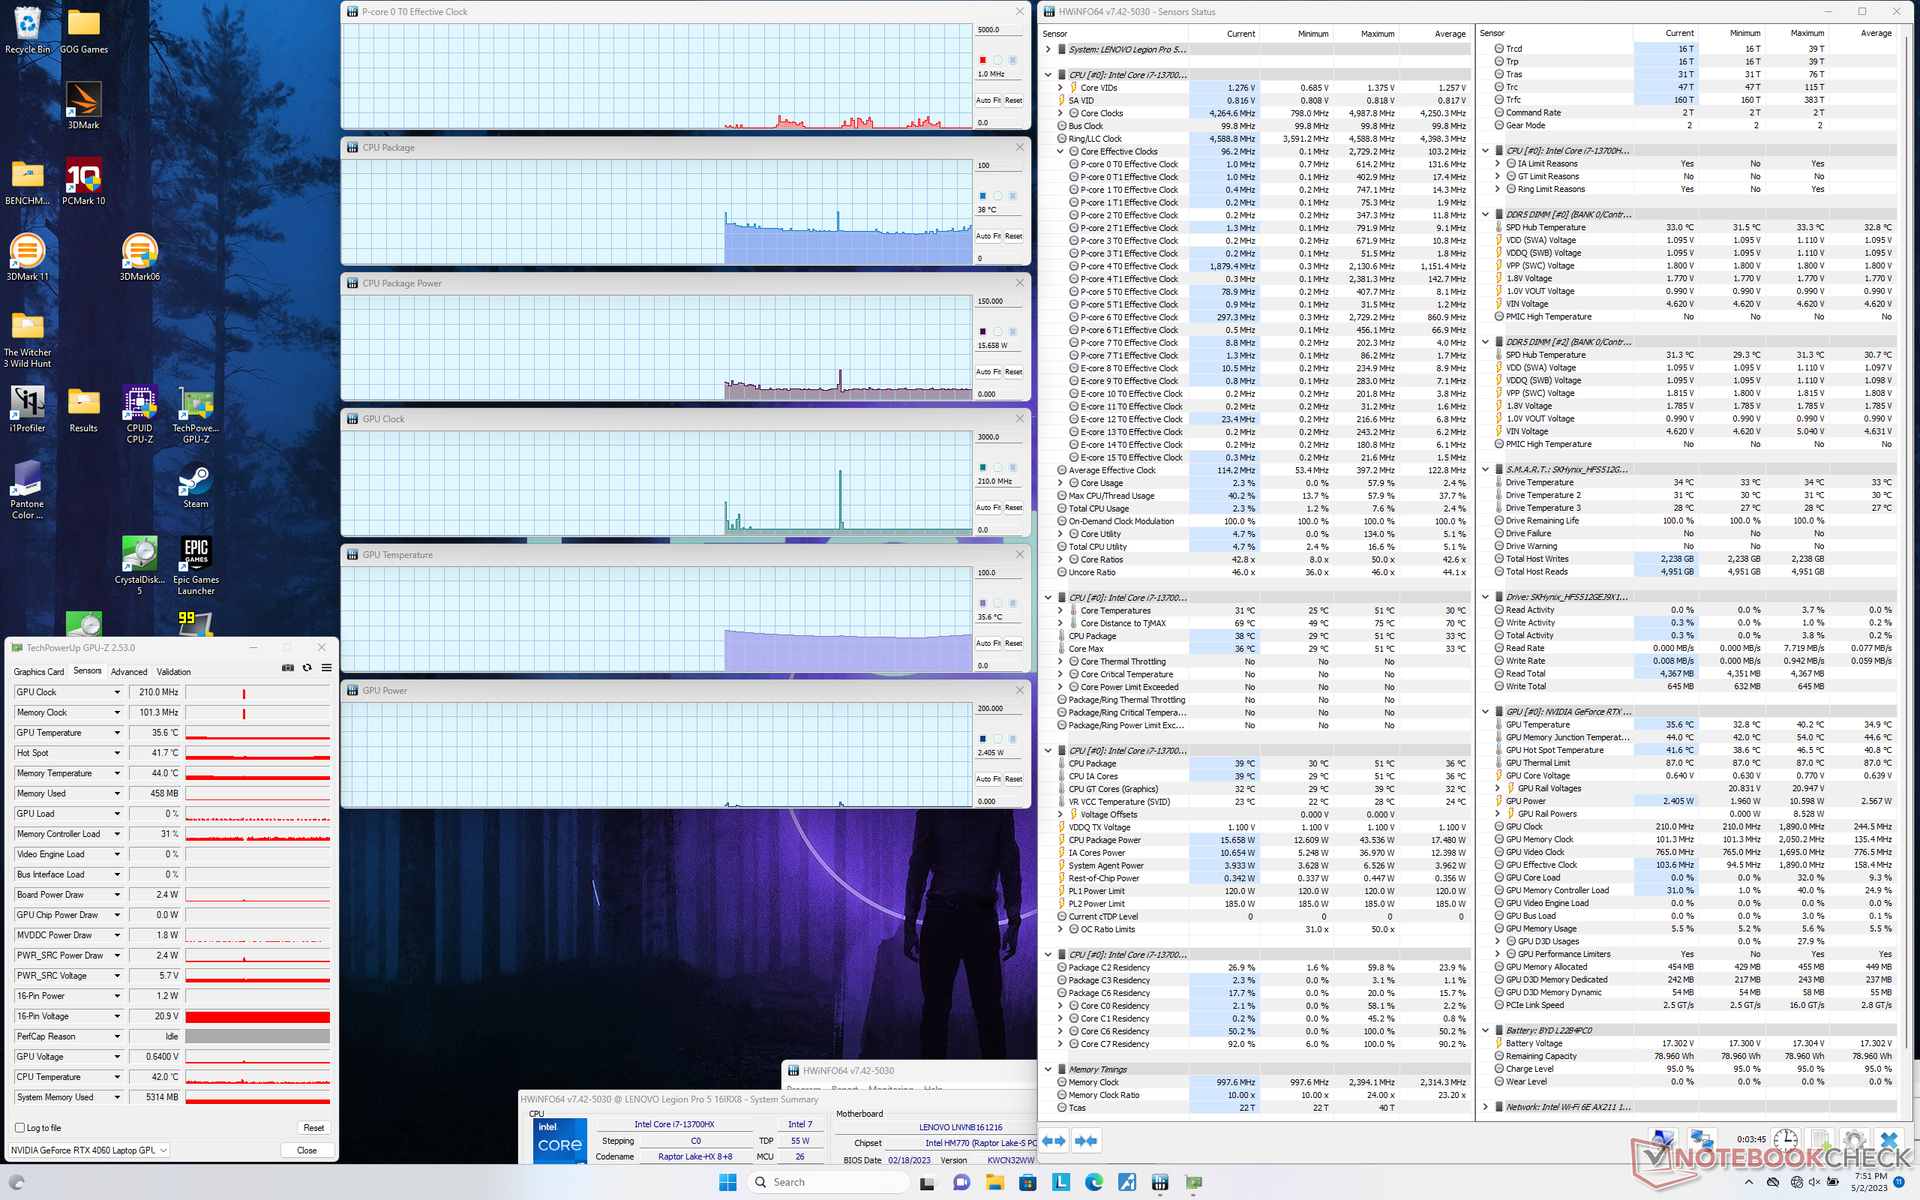
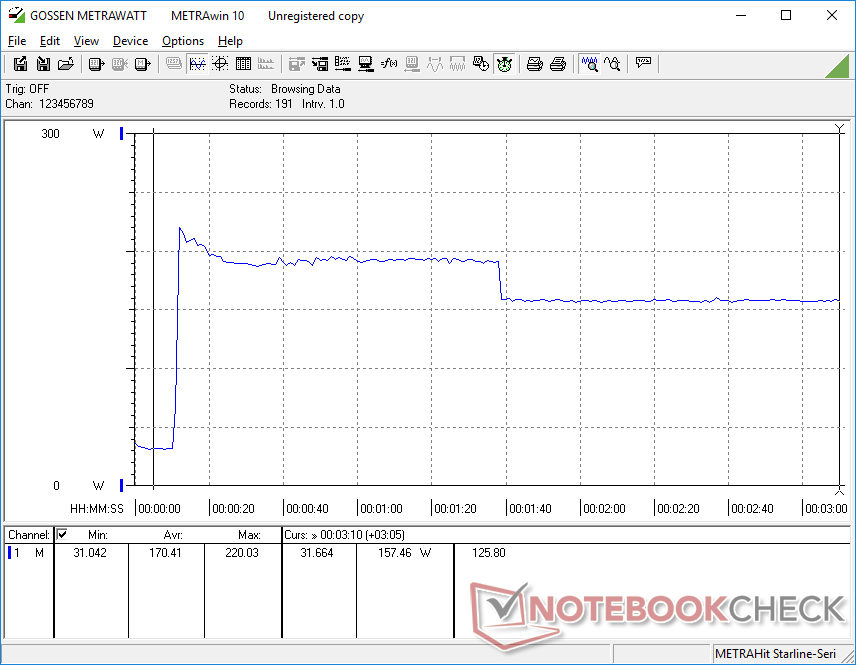
Quando estressada no Prime95, a CPU aumentava para 4,3 GHz, 157 W e 97 C, com duração de cerca de um minuto. Depois disso, as taxas de clock e o consumo de energia da placa caíam para a faixa de 3,3 a 3,6 GHz e 117 W, respectivamente, a fim de manter uma temperatura central mais fria de 81 C. Portanto, o Turbo Boost máximo não é sustentável por longos períodos. Repetindo esse mesmo teste no modelo mais lento do ano passado, equipado com AMD Legion Pro 5 16 mais lento do ano passado, resultaria em uma temperatura de CPU mais quente, de 93 °C.
Ao executar Witcher 3no modo Desempenho para representar cargas típicas de jogos, nossa GPU RTX 4060 se estabilizaria em 2640 MHz de clock, 2050 MHz de RAM, 76 °C e 109 W, o que é nitidamente inferior aos 140 W declarados no Painel de Controle da Nvidia. Se estiver no modo Balanced, a GPU cairá ligeiramente para 2475 MHz de clock, 2000 MHz de RAM e 105 W de consumo de energia da placa, enquanto a temperatura do núcleo permanecerá a mesma. Portanto, você deve configurar o sistema para o modo Performance para explorar totalmente a GPU. A temperatura do núcleo é cerca de 10 °C mais fria do que no modelo do ano passado com a RTX 3070 Ti, já que esta última atingiria um consumo de energia da placa de 149 W mais alto.
A execução com a energia da bateria limita o desempenho, como era de se esperar. Um teste no site Fire Strike com baterias retornaria pontuações de Física e Gráficos de 21363 e 12851 pontos, respectivamente, em comparação com 35270 e 26561 pontos quando ligado à rede elétrica.
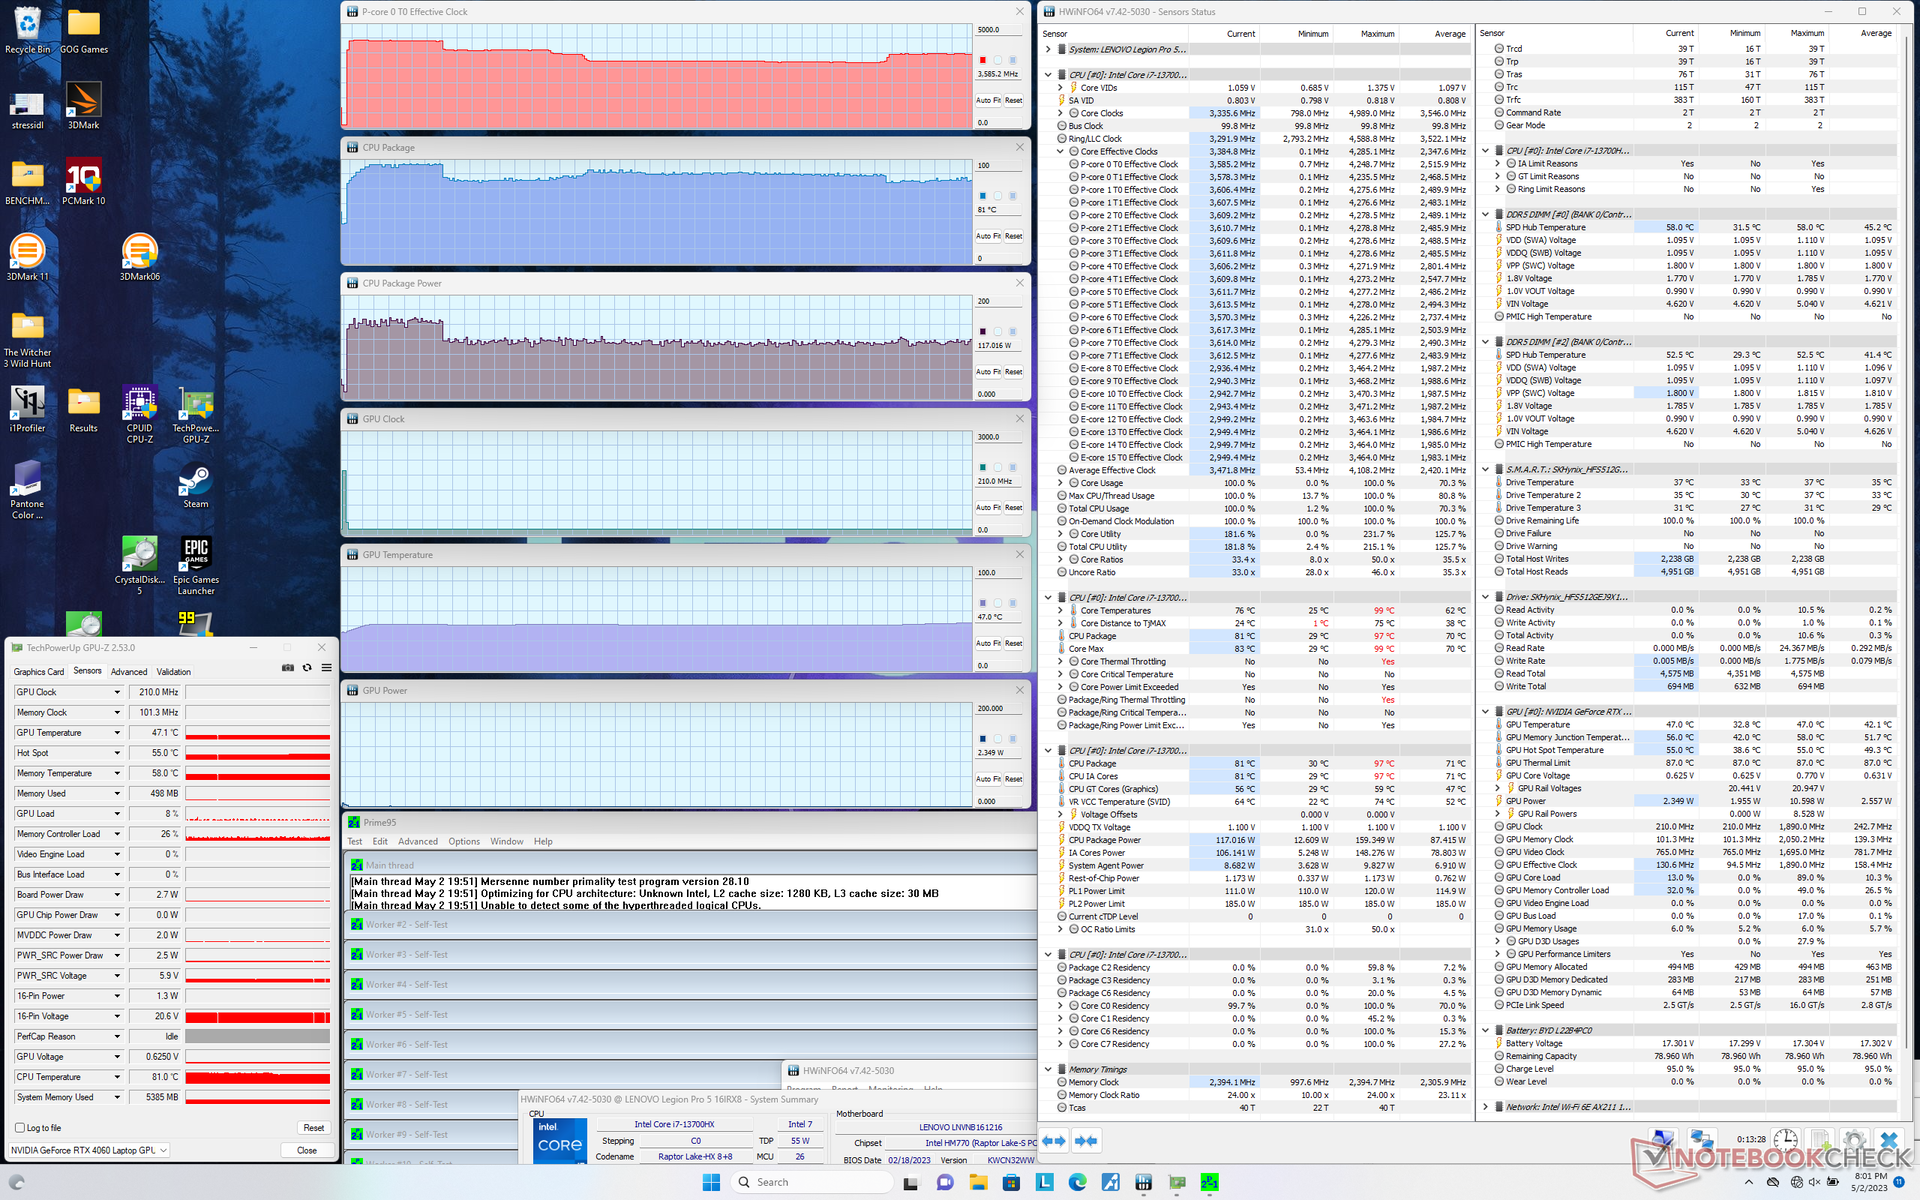
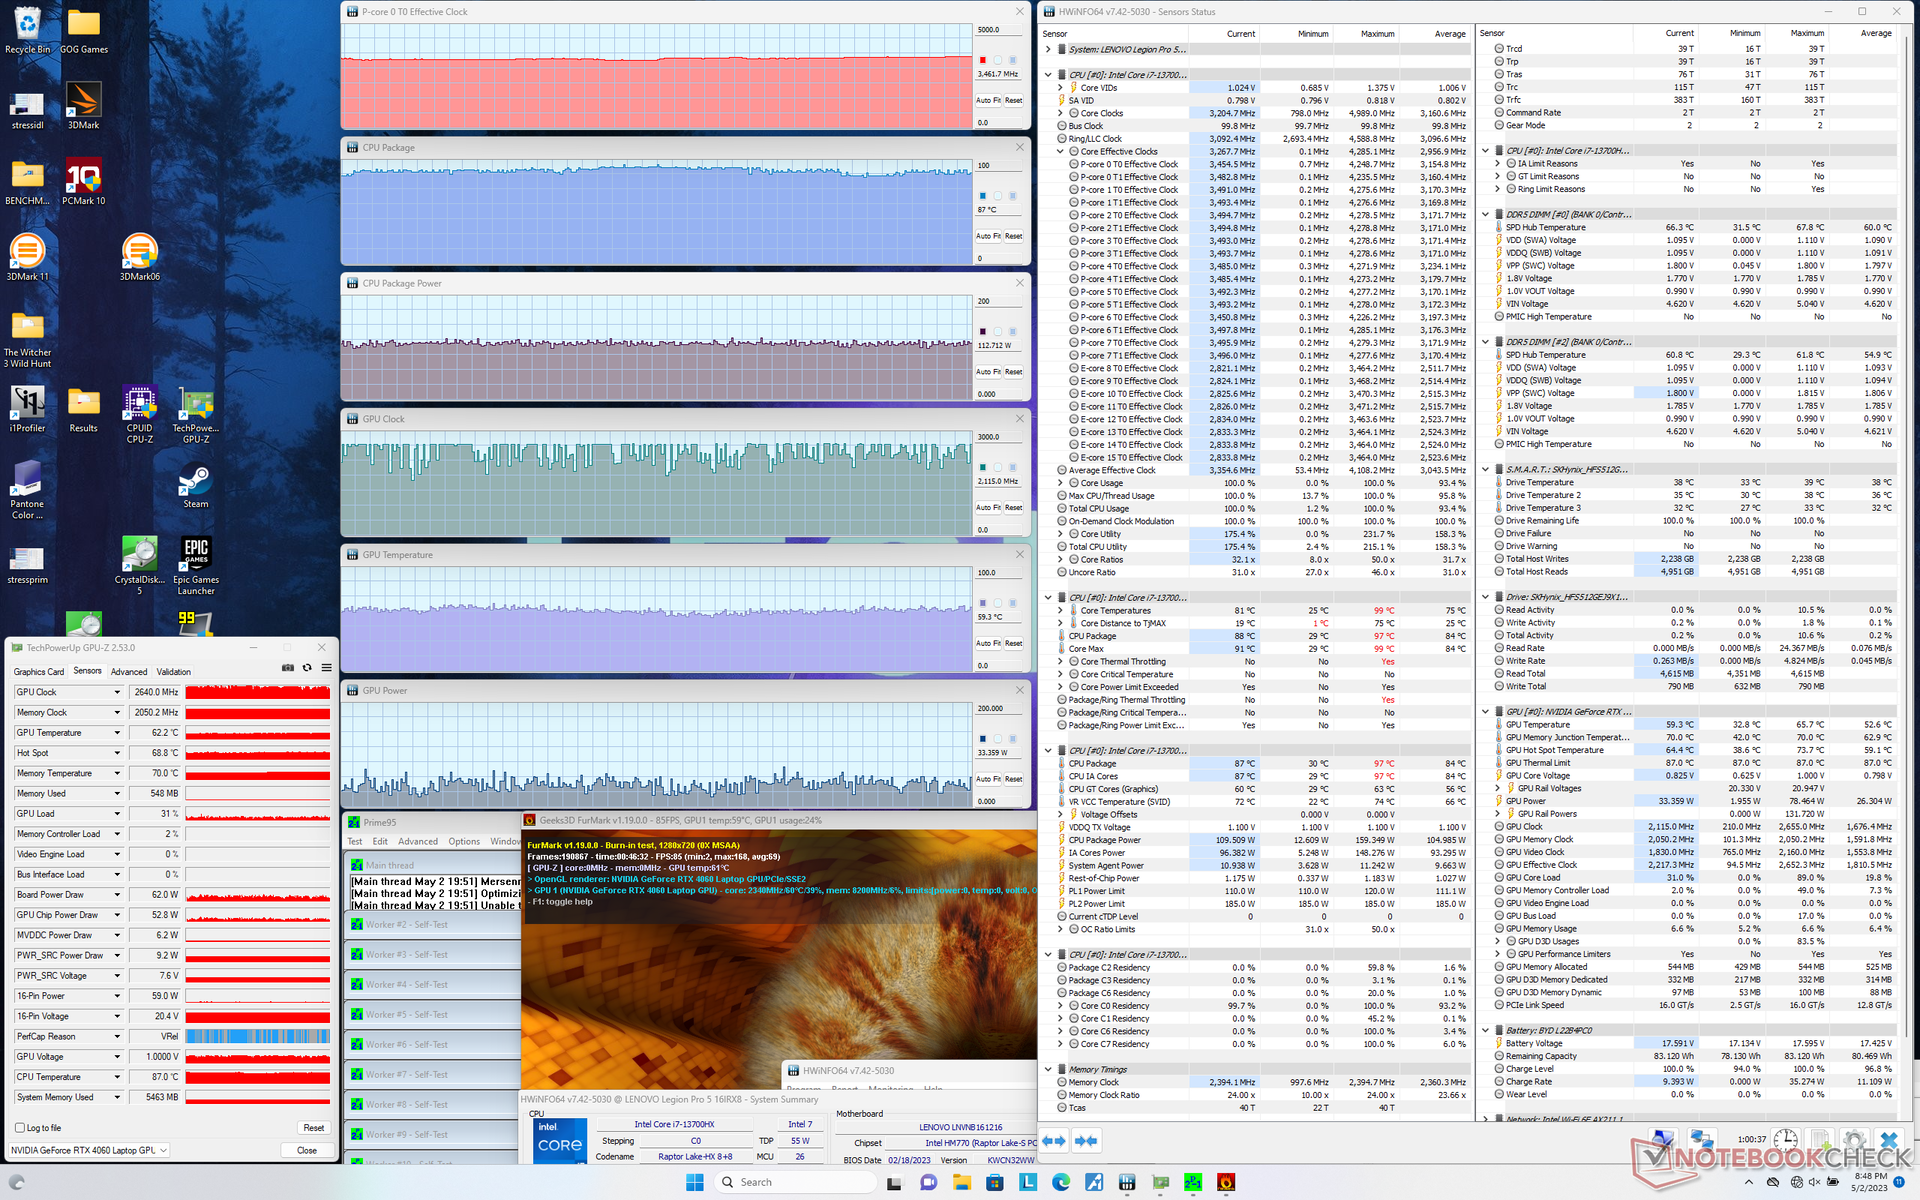
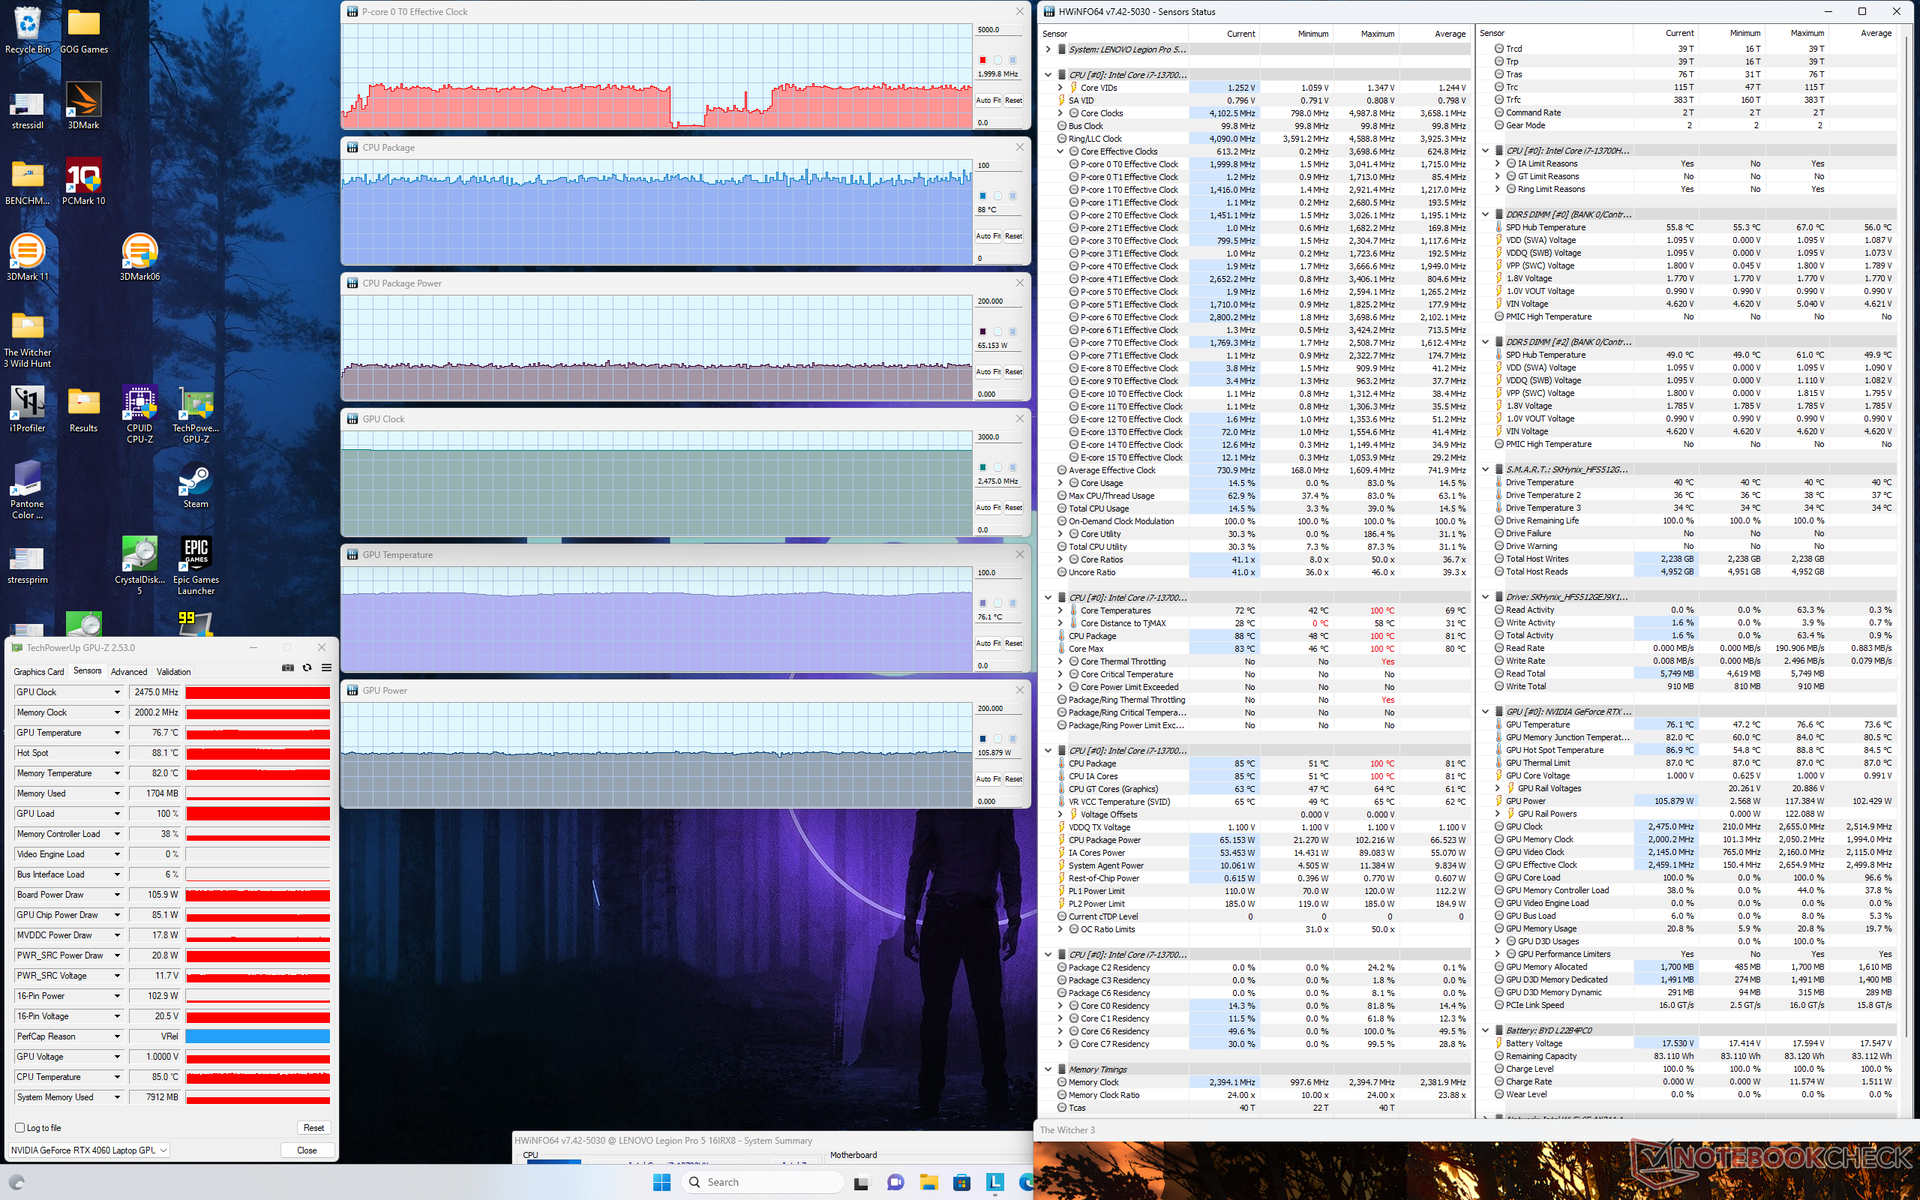
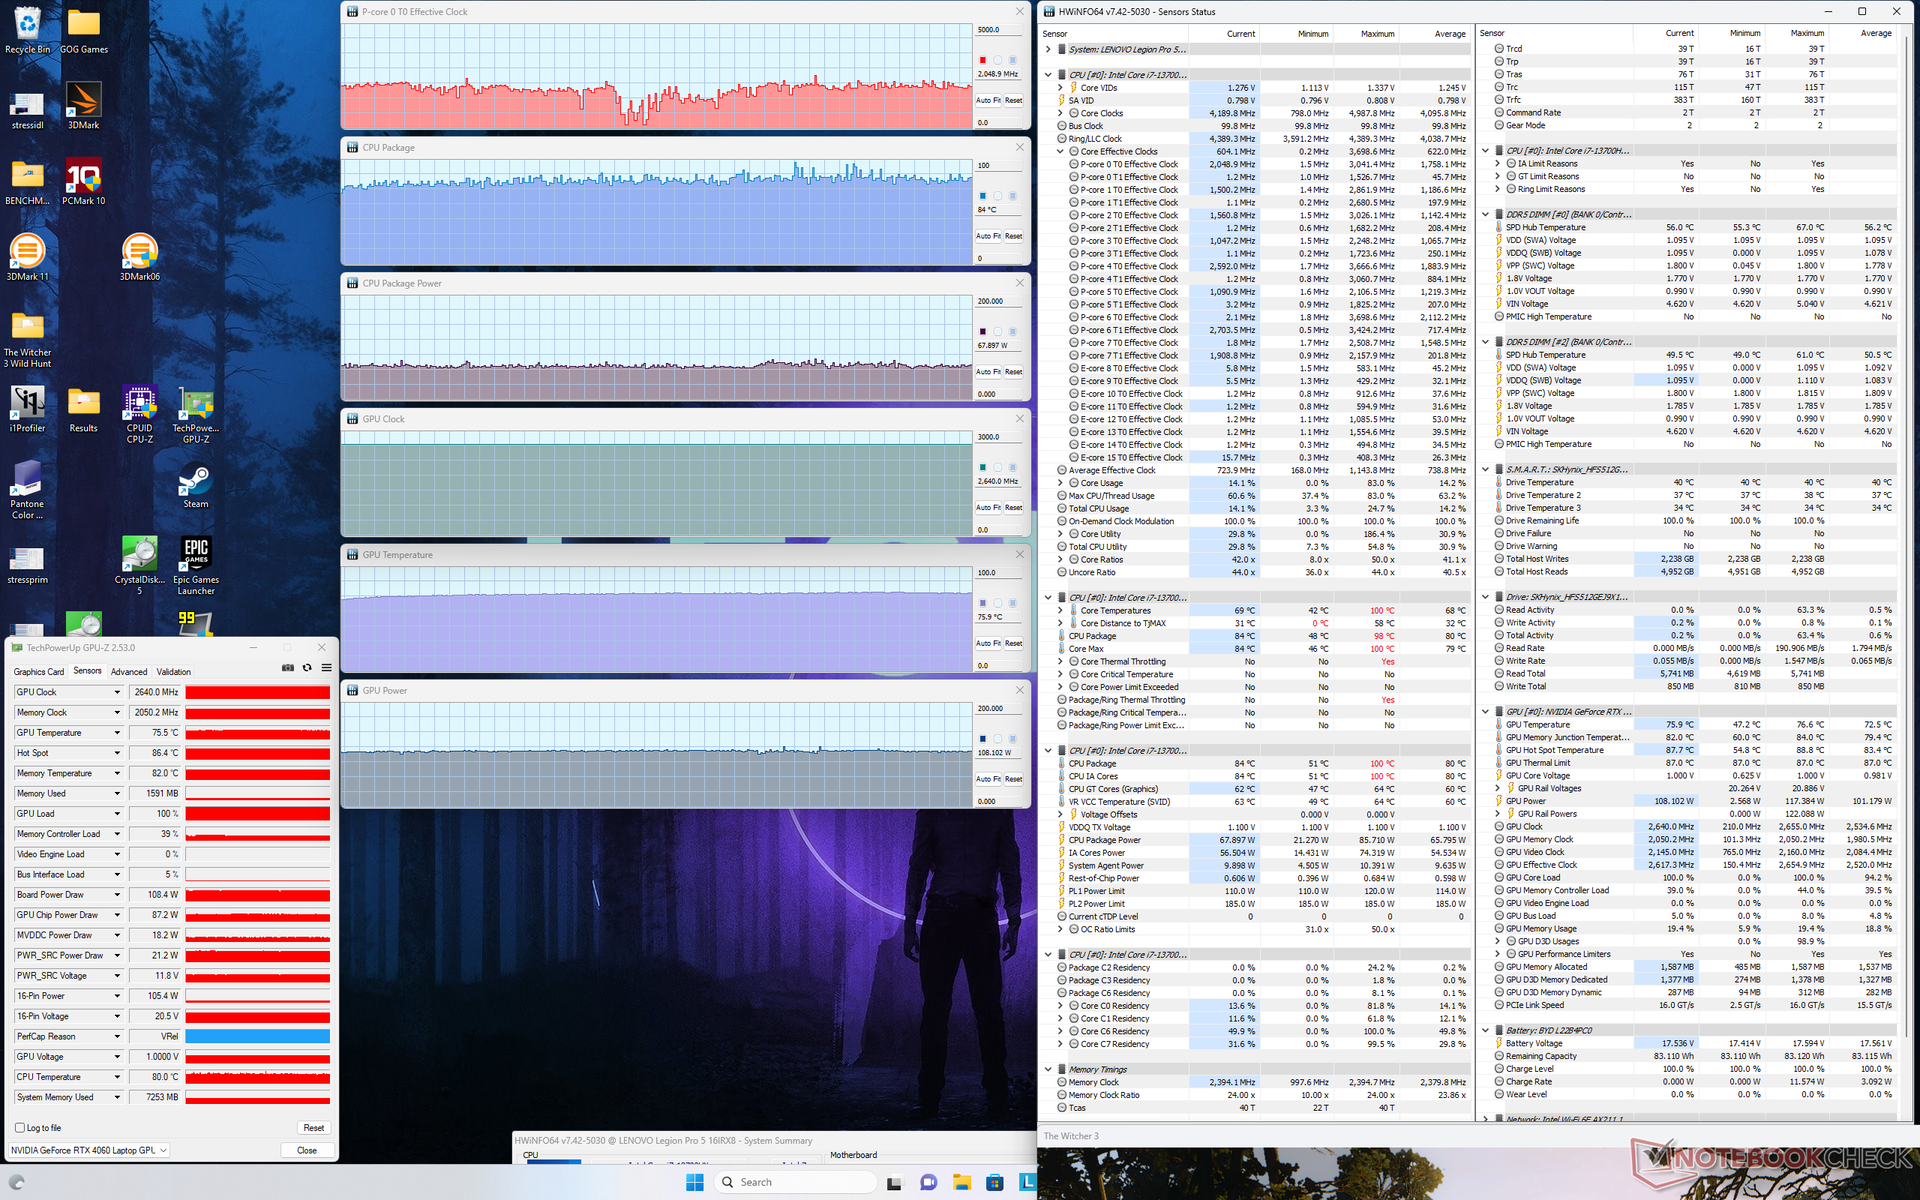
| Relógio da CPU (GHz) | Relógio da GPU (MHz) | Temperatura média da CPU (°C) | Temperatura média da GPU (°C) | |
| Sistema ocioso | -- | -- | 37 | 36 |
| Estresse doPrime95 | 3.3 - 3.6 | -- | 81 - 86 | 47 |
| EstressePrime95 + FurMark | 3.5 | 1714 - 2640 | 87 | 59 |
| Witcher 3 Estresse(modo balanceado) | ~2,0 | 2475 | 88 | 76 |
| Witcher 3 Estresse(modo de desempenho) | ~2,0 | 2640 | 84 | 76 |
Alto-falantes
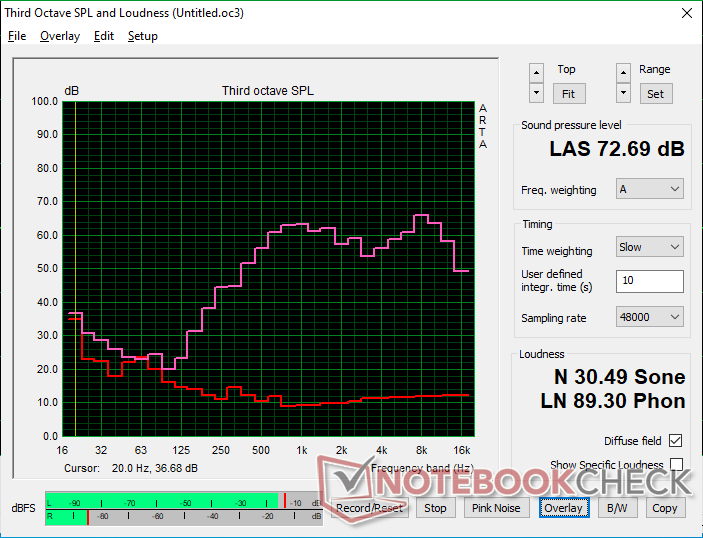
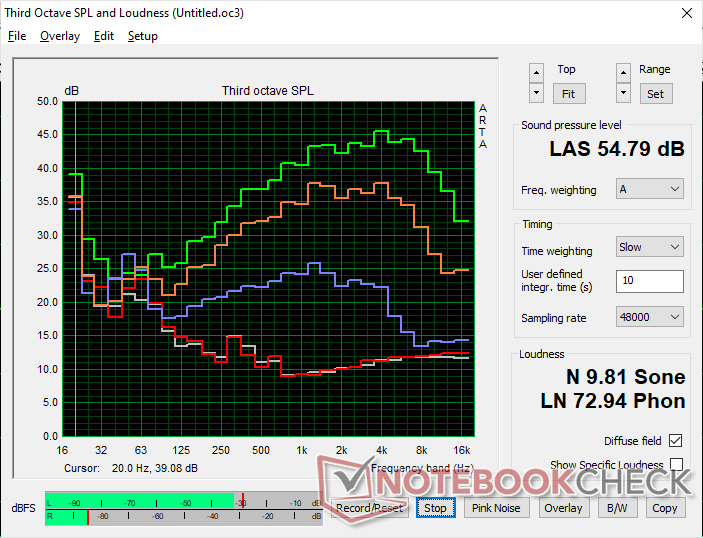
Lenovo Legion Pro 5 16IRX8 análise de áudio
(±) | o volume do alto-falante é médio, mas bom (###valor### dB)
Graves 100 - 315Hz
(-) | quase nenhum baixo - em média 23.7% menor que a mediana
(±) | a linearidade dos graves é média (10.7% delta para a frequência anterior)
Médios 400 - 2.000 Hz
(+) | médios equilibrados - apenas 3.8% longe da mediana
(±) | a linearidade dos médios é média (7.1% delta para frequência anterior)
Altos 2 - 16 kHz
(+) | agudos equilibrados - apenas 3.7% longe da mediana
(+) | os máximos são lineares (6.7% delta da frequência anterior)
Geral 100 - 16.000 Hz
(±) | a linearidade do som geral é média (21.9% diferença em relação à mediana)
Comparado com a mesma classe
» 79% de todos os dispositivos testados nesta classe foram melhores, 6% semelhantes, 16% piores
» O melhor teve um delta de 6%, a média foi 18%, o pior foi 132%
Comparado com todos os dispositivos testados
» 63% de todos os dispositivos testados foram melhores, 7% semelhantes, 30% piores
» O melhor teve um delta de 4%, a média foi 23%, o pior foi 134%
Apple MacBook Pro 16 2021 M1 Pro análise de áudio
(+) | os alto-falantes podem tocar relativamente alto (###valor### dB)
Graves 100 - 315Hz
(+) | bons graves - apenas 3.8% longe da mediana
(+) | o baixo é linear (5.2% delta para a frequência anterior)
Médios 400 - 2.000 Hz
(+) | médios equilibrados - apenas 1.3% longe da mediana
(+) | médios são lineares (2.1% delta para frequência anterior)
Altos 2 - 16 kHz
(+) | agudos equilibrados - apenas 1.9% longe da mediana
(+) | os máximos são lineares (2.7% delta da frequência anterior)
Geral 100 - 16.000 Hz
(+) | o som geral é linear (4.6% diferença em relação à mediana)
Comparado com a mesma classe
» 0% de todos os dispositivos testados nesta classe foram melhores, 0% semelhantes, 100% piores
» O melhor teve um delta de 5%, a média foi 17%, o pior foi 45%
Comparado com todos os dispositivos testados
» 0% de todos os dispositivos testados foram melhores, 0% semelhantes, 100% piores
» O melhor teve um delta de 4%, a média foi 23%, o pior foi 134%
Gerenciamento de energia
Consumo de energia - tão exigente quanto antes
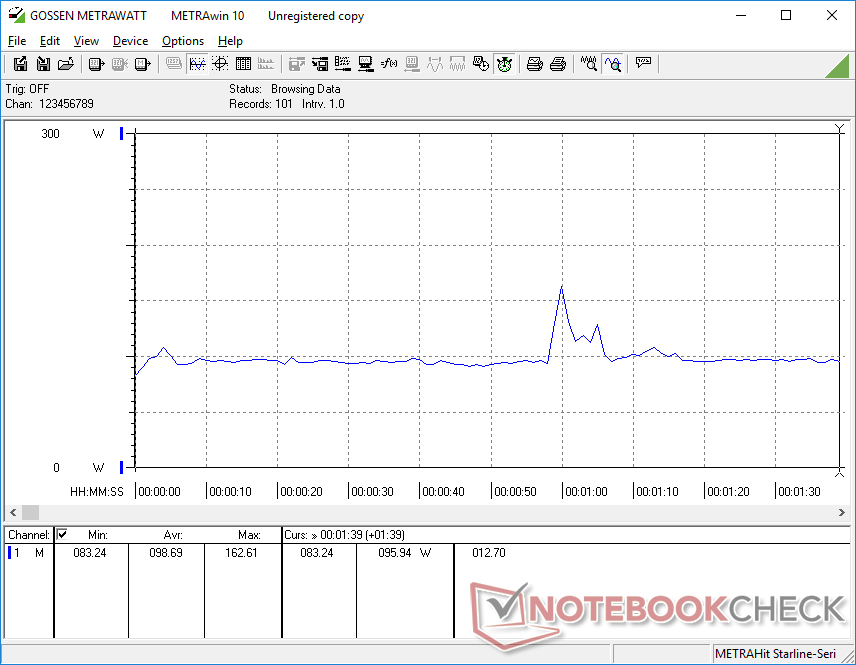
O sistema é excepcionalmente exigente quando em marcha lenta no desktop, onde conseguimos medir um mínimo de 24 W em comparação com apenas 10 W a 15 W em alternativas como a ROG Zephyrus M16 ou o Blade 16. Até mesmo nos certificamos de configurar o sistema para o modo de economia de energia com a iGPU ativa e com a configuração de brilho mínimo, mas os resultados não melhoraram. O consumo relativamente alto pode ser parcialmente responsável pela duração da bateria mais curta do que o esperado, conforme observado na próxima seção.
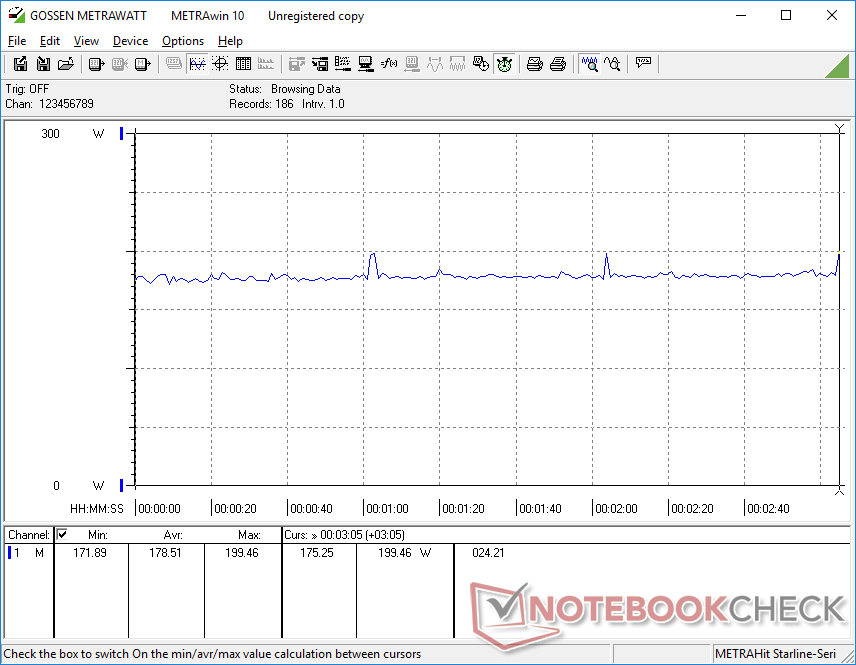
A execução do Witcher 3 consumiria 179 W em comparação com 209 W no Legion 5 Pro 16 do ano passado com a RTX 3070 Ti. Essa GPU específica é cerca de 15% a 20% mais rápida do que a nossa RTX 4060 e com uma meta de TGP mais alta, conforme mencionado anteriormente, o que se correlaciona com seu consumo de energia 15% maior. Como resultado, o desempenho por watt permanece relativamente linear ano a ano.
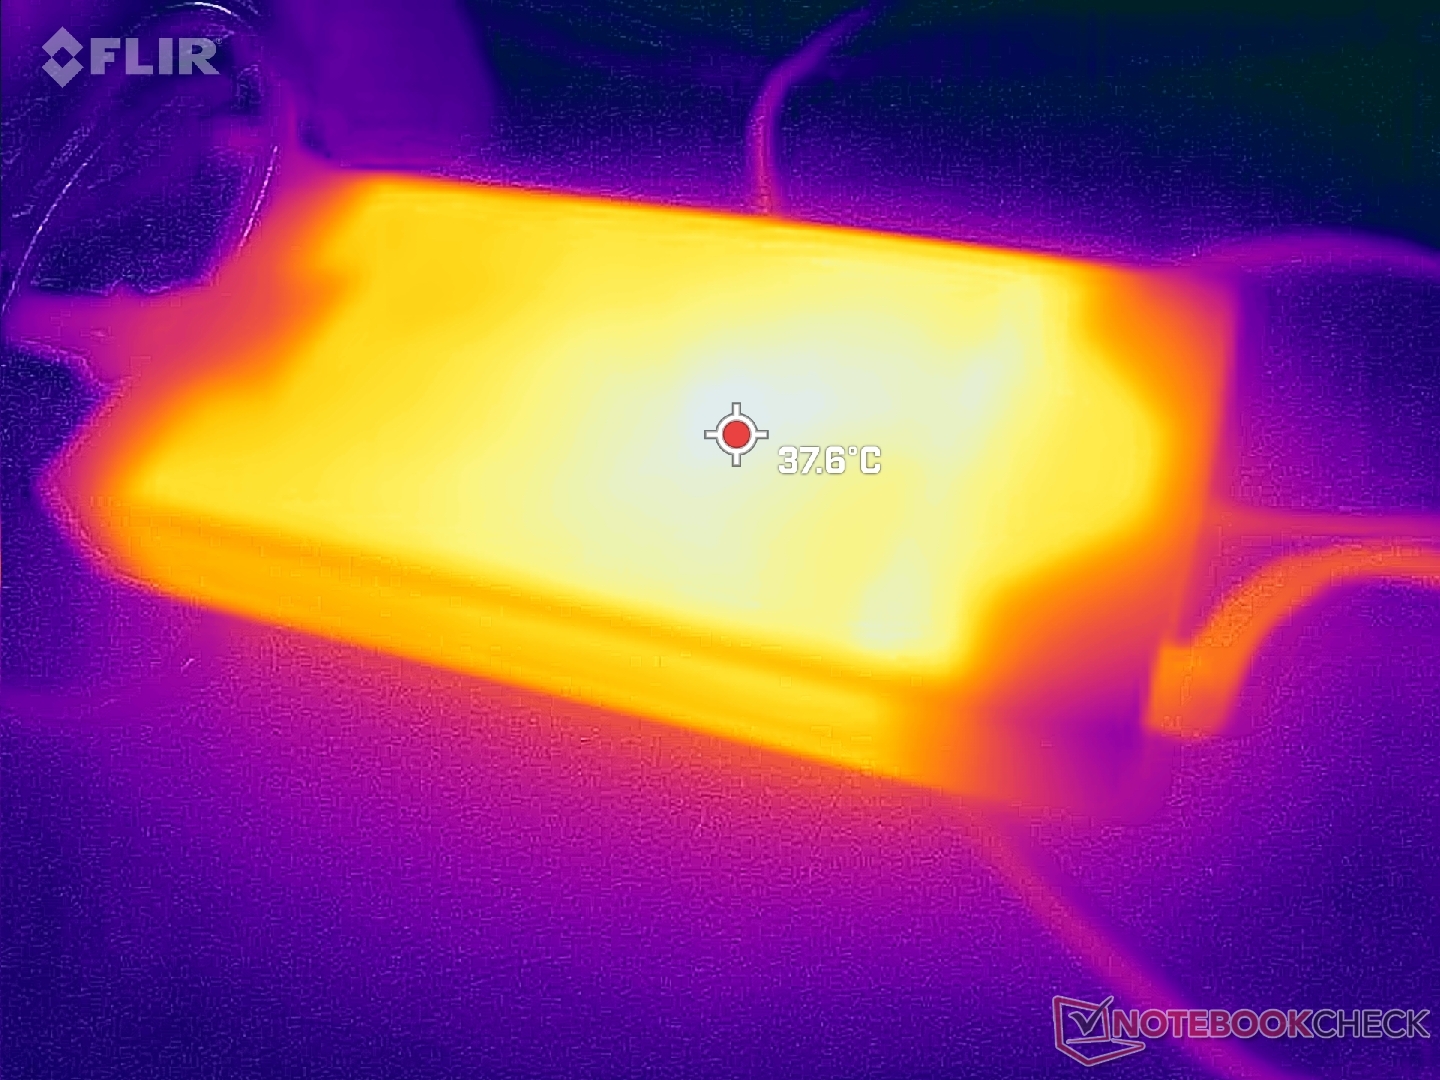
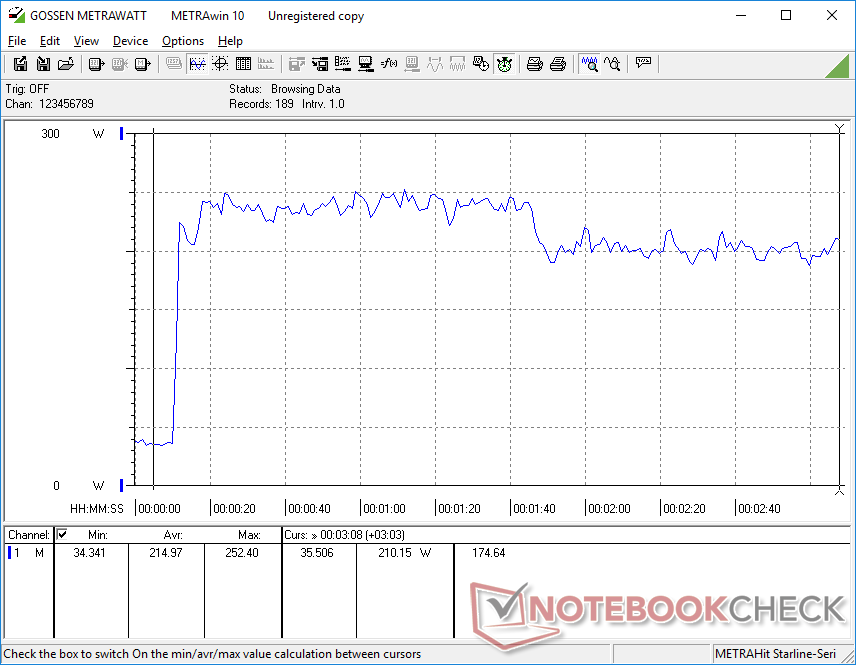
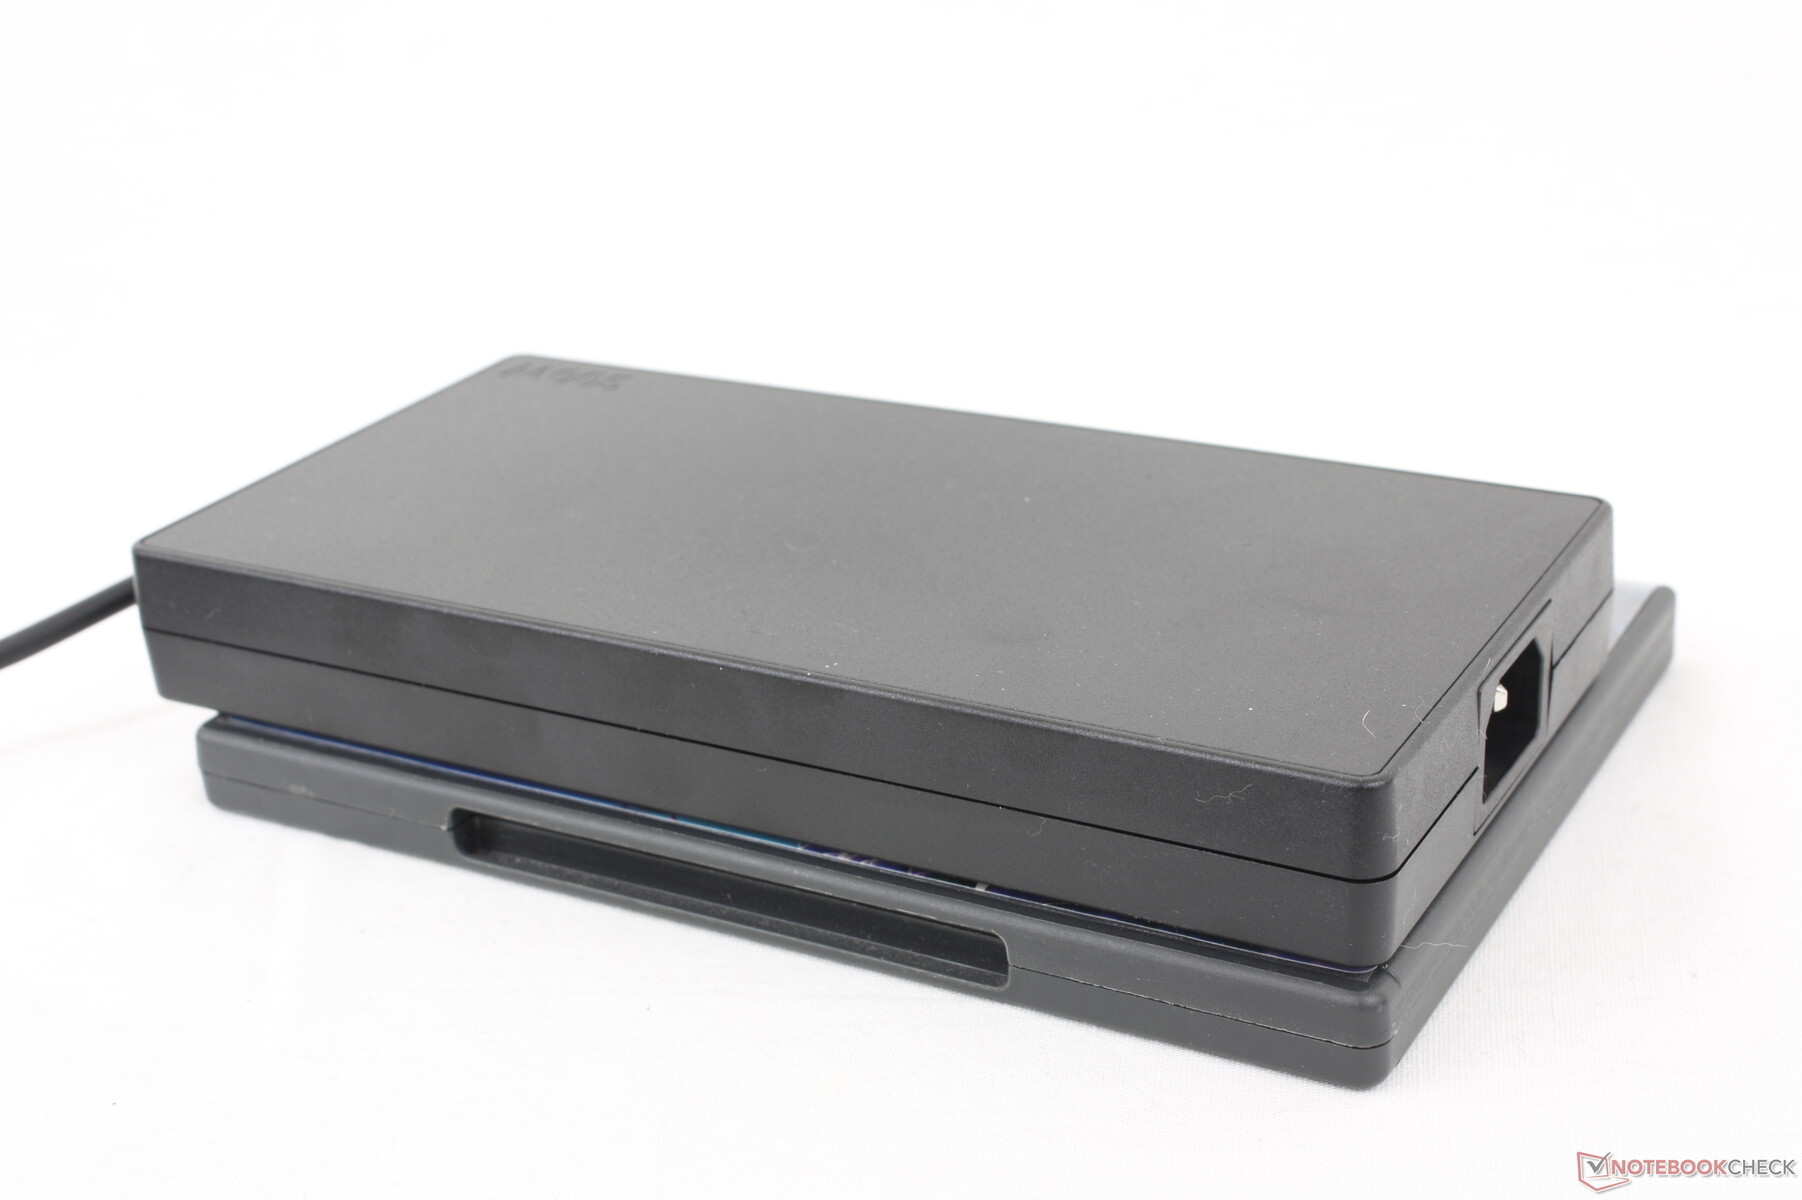
Conseguimos medir um consumo máximo de 250 W do grande adaptador CA de 300 W (~19,9 x 9,9 x 2,6 cm) quando a CPU e a GPU estão com 100% de utilização. A Lenovo também utiliza esse mesmo adaptador de 300 W para muitos de seus outros modelos Legion.
| desligado | |
| Ocioso | |
| Carga |
|
Key:
min: | |
| Lenovo Legion Pro 5 16IRX8 i7-13700HX, GeForce RTX 4060 Laptop GPU, SK hynix PC801 HFS512GEJ9X115N, IPS, 2560x1600, 16" | Asus ROG Zephyrus M16 GU603Z i9-12900H, GeForce RTX 3070 Ti Laptop GPU, Micron 3400 1TB MTFDKBA1T0TFH, IPS, 2560x1600, 16" | Razer Blade 16 Early 2023 i9-13950HX, GeForce RTX 4080 Laptop GPU, SSSTC CA6-8D1024, IPS, 2560x1600, 16" | Lenovo Legion Pro 7 16IRX8H i9-13900HX, GeForce RTX 4080 Laptop GPU, Samsung PM9A1 MZVL21T0HCLR, IPS, 2560x1600, 16" | Lenovo Legion 5 Pro 16ARH7H RTX 3070 Ti R7 6800H, GeForce RTX 3070 Ti Laptop GPU, Samsung PM9A1 MZVL21T0HCLR, IPS, 2560x1600, 16" | Lenovo Legion S7 16ARHA7 R9 6900HX, Radeon RX 6800S, SK Hynix HFS001TEJ9X115N, IPS, 2560x1600, 16" | |
|---|---|---|---|---|---|---|
| Power Consumption | 27% | -9% | -9% | 10% | 31% | |
| Idle Minimum * (Watt) | 24.5 | 10.8 56% | 15.2 38% | 18 27% | 9.7 60% | 8.8 64% |
| Idle Average * (Watt) | 29.2 | 17 42% | 22.8 22% | 24 18% | 14.8 49% | 14.7 50% |
| Idle Maximum * (Watt) | 34.3 | 17.8 48% | 49.8 -45% | 32 7% | 45.8 -34% | 19.8 42% |
| Load Average * (Watt) | 98.7 | 116 -18% | 121.2 -23% | 130 -32% | 87.2 12% | 85.3 14% |
| Witcher 3 ultra * (Watt) | 178.6 | 144 19% | 242 -35% | 260 -46% | 209 -17% | 167.5 6% |
| Load Maximum * (Watt) | 249.6 | 220 12% | 273.7 -10% | 320 -28% | 275.3 -10% | 230.7 8% |
* ... menor é melhor
Power Consumption Witcher 3 / Stresstest
Power Consumption external Monitor
Duração da bateria - Mais curta do que a de outros notebooks para jogos
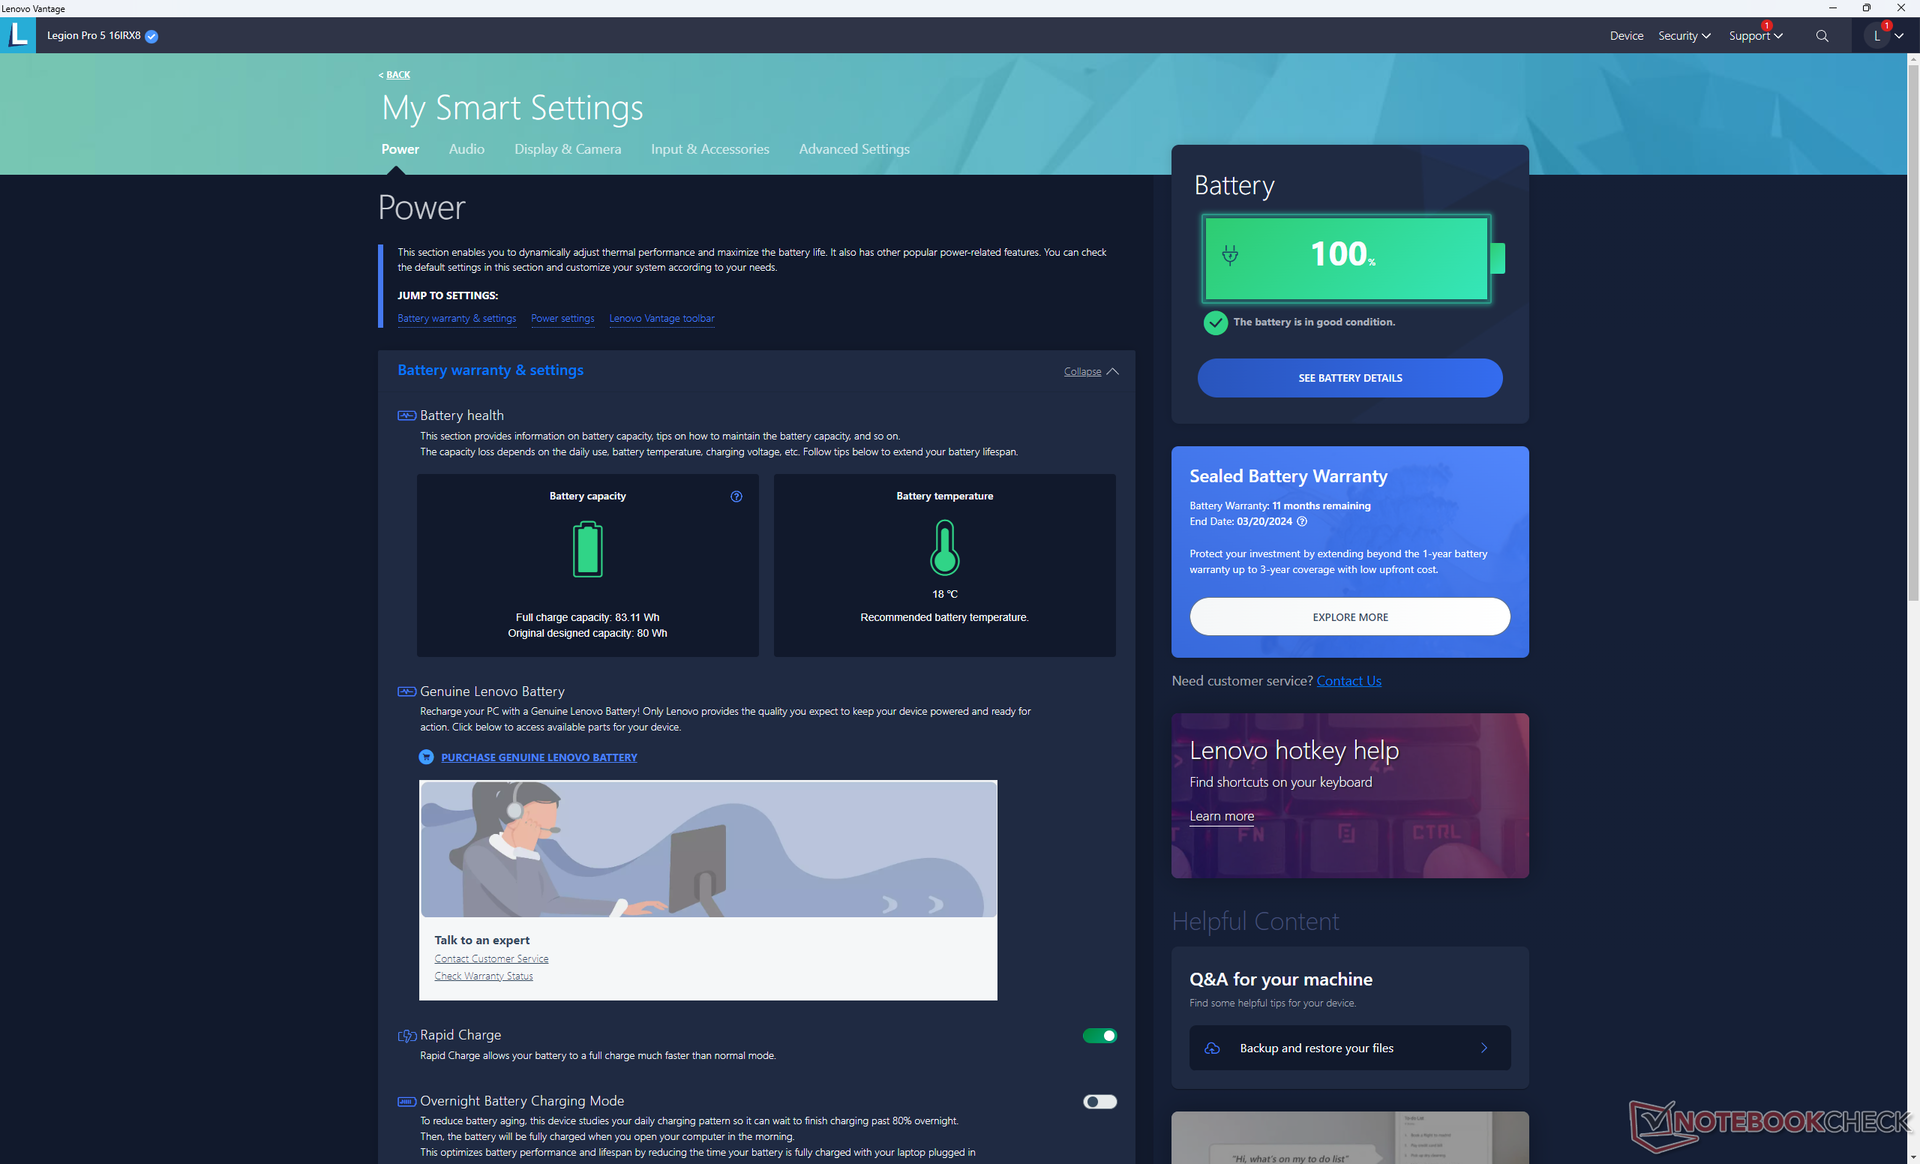
A capacidade da bateria permanece em 80 Wh, em comparação com os 99 Wh do modelo mais caro Legion 7 Pro mais cara. Os tempos de execução são curtos, o que parece ser uma tendência entre os modelos do Legion. Só conseguimos registrar um tempo de execução de WLAN de menos de 3,5 horas, mesmo quando configurado para os modos de perfil iGPU e Balanced. O Razer Blade 16 e o Asus ROG Zephyrus M16 podem durar várias horas a mais em comparação.
O carregamento de vazio para cheio é relativamente rápido, com menos de 90 minutos com o adaptador CA incluído. O sistema também pode ser recarregado por meio de adaptadores USB-C menores, embora em um ritmo mais lento e com desempenho limitado.
| Lenovo Legion Pro 5 16IRX8 i7-13700HX, GeForce RTX 4060 Laptop GPU, 80 Wh | Asus ROG Zephyrus M16 GU603Z i9-12900H, GeForce RTX 3070 Ti Laptop GPU, 90 Wh | Razer Blade 16 Early 2023 i9-13950HX, GeForce RTX 4080 Laptop GPU, 95.2 Wh | Lenovo Legion Pro 7 16IRX8H i9-13900HX, GeForce RTX 4080 Laptop GPU, 99.9 Wh | Lenovo Legion 5 Pro 16ARH7H RTX 3070 Ti R7 6800H, GeForce RTX 3070 Ti Laptop GPU, 80 Wh | Lenovo Legion S7 16ARHA7 R9 6900HX, Radeon RX 6800S, 71 Wh | |
|---|---|---|---|---|---|---|
| Duração da bateria | 109% | 71% | 82% | 29% | 82% | |
| Reader / Idle (h) | 6.7 | 8.9 33% | 6.4 -4% | |||
| WiFi v1.3 (h) | 3.4 | 7.4 118% | 6.1 79% | 5.1 50% | 4.4 29% | 6.2 82% |
| Load (h) | 0.7 | 1.4 100% | 1.4 100% | 2.1 200% | ||
| H.264 (h) | 7.3 |
Pro
Contra
Veredicto - Faltam alguns recursos pelo preço
O 2023 Legion Pro 5 16 configurado com gráficos GeForce RTX 4060 não é um laptop para jogos barato, custando US$ 1.600. Isso não é um problema, é claro, desde que ele venha com os recursos que os gamers realmente desejam. G-Sync, QHD+ 165 Hz, cores sRGB completas, facilidade de manutenção e teclas de seta grandes são todos padrões para tornar o modelo um laptop para jogos completo.
No entanto, podemos notar alguns cortes, mesmo nessa faixa de preço. O modelo omite alguns recursos importantes, como iluminação RGB por tecla, suporte a Thunderbolt, Advanced Optimus e opções de painel AdobeRGB. Esse último, em particular, significa que o Legion Pro 5 16 pode não ser a melhor solução para usuários que são criadores de conteúdo ou artistas digitais e jogadores. Modelos concorrentes, como oRazer Blade 16, Aero 16ou Asus ROG Zephyrus M16 não são apenas mais leves e mais finos, mas oferecem opções de tela mais amplas, além de alguns dos recursos ausentes mencionados anteriormente.
O atualizado Legion Pro 5 16 cobre quase tudo o que você deseja de um laptop para jogos de médio porte. Entretanto, alguns recursos desejáveis, como AdobeRGB, Thunderbolt e Advanced Optimus, infelizmente foram omitidos.
Em relação ao desempenho, os usuários que podem estar usando sistemas com CPUs Intel de 12ª geração e GPUs GeForce RTX 3070 ou superiores não verão muitos benefícios ao fazer o upgrade para a Intel de 13ª geração com gráficos GeForce RTX 4060 ou 4070. As máquinas mais antigas que utilizam GeForce GPUs RTX 20 com CPUs Intel ou AMD Zen 3 de 11ª geração podem considerar a possibilidade de fazer o upgrade.
Preço e disponibilidade
A Lenovo agora está enviando o Legion Pro 5 16IRX8 em nossa configuração de análise por US$ 1.600.
Lenovo Legion Pro 5 16IRX8
- 05/05/2023 v7 (old)
Allen Ngo
Transparência
A seleção dos dispositivos a serem analisados é feita pela nossa equipe editorial. A amostra de teste foi fornecida ao autor como empréstimo pelo fabricante ou varejista para fins desta revisão. O credor não teve influência nesta revisão, nem o fabricante recebeu uma cópia desta revisão antes da publicação. Não houve obrigação de publicar esta revisão. Como empresa de mídia independente, a Notebookcheck não está sujeita à autoridade de fabricantes, varejistas ou editores.
É assim que o Notebookcheck está testando
Todos os anos, o Notebookcheck analisa de forma independente centenas de laptops e smartphones usando procedimentos padronizados para garantir que todos os resultados sejam comparáveis. Desenvolvemos continuamente nossos métodos de teste há cerca de 20 anos e definimos padrões da indústria no processo. Em nossos laboratórios de teste, equipamentos de medição de alta qualidade são utilizados por técnicos e editores experientes. Esses testes envolvem um processo de validação em vários estágios. Nosso complexo sistema de classificação é baseado em centenas de medições e benchmarks bem fundamentados, o que mantém a objetividade.Price comparison

