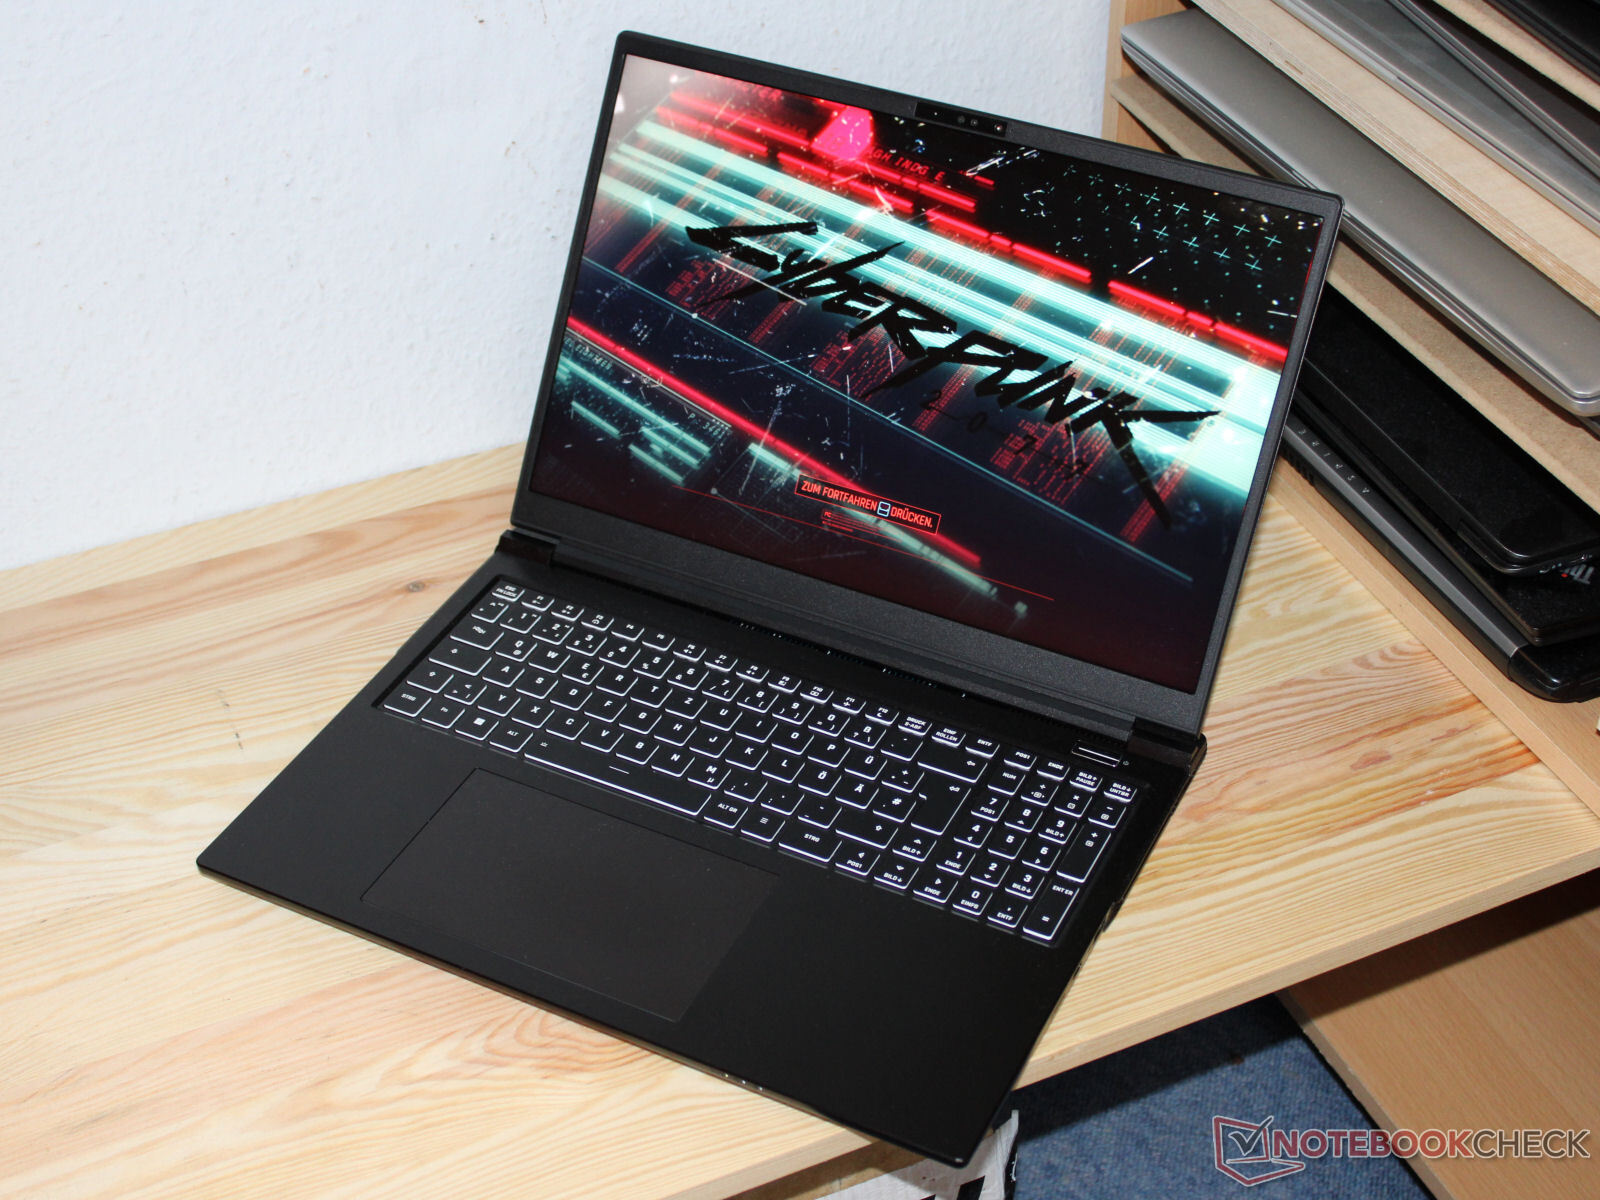
Análise do XMG Pro 16 Studio (Mid 23): O laptop RTX 4070 para gamers e criadores
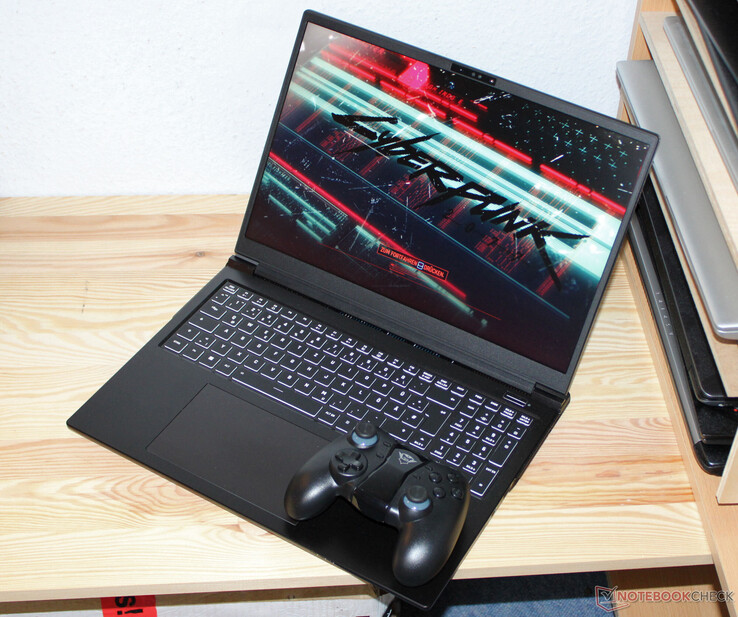
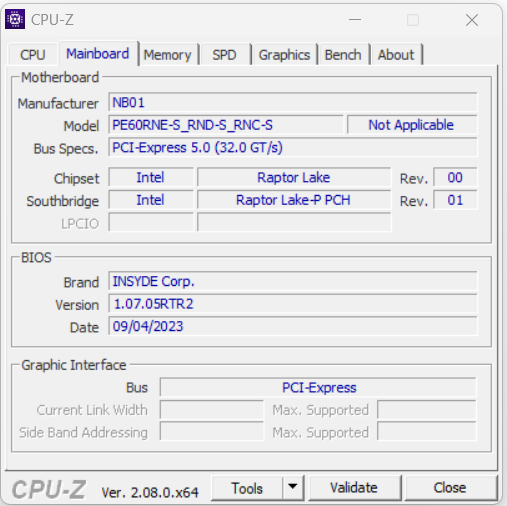
O XMG Pro 16 Studio (Mid 23) - um laptop de 16 polegadas para gamers e criadores - é baseado em um barebone (PE60RNE-S) fabricado pela Clevo e a variante atual pode ser encontrada atualmente por cerca de US$ 2.400. Os concorrentes incluem oLenovo Legion Slim 7i 16 Gen 8, HP Omen Transcend 16, Asus Vivobook Pro 16X e oMSI Stealth 16 Studio A13VG.
Possíveis concorrentes em comparação
Avaliação | Data | Modelo | Peso | Altura | Size | Resolução | Preço |
|---|---|---|---|---|---|---|---|
| 87.9 % v7 (old) | 10/2023 | Schenker XMG Pro 16 Studio (Mid 23) i9-13900H, GeForce RTX 4070 Laptop GPU | 2.6 kg | 19.9 mm | 16.00" | 2560x1600 | |
| 86.2 % v7 (old) | 07/2023 | Asus Vivobook Pro 16X K6604JV-MX016W i9-13980HX, GeForce RTX 4060 Laptop GPU | 2.1 kg | 22.8 mm | 16.00" | 3200x2000 | |
| 90 % v7 (old) | 07/2023 | Lenovo Legion Slim 7i 16 Gen 8 i9-13900H, GeForce RTX 4070 Laptop GPU | 2.1 kg | 19.9 mm | 16.00" | 2560x1600 | |
| 87.9 % v7 (old) | 08/2023 | HP Omen Transcend 16 i9-13900HX, GeForce RTX 4070 Laptop GPU | 2.3 kg | 19.8 mm | 16.00" | 2560x1600 | |
| 88.8 % v7 (old) | 07/2023 | MSI Stealth 16 Studio A13VG i7-13700H, GeForce RTX 4070 Laptop GPU | 2 kg | 19.95 mm | 16.00" | 2560x1600 |
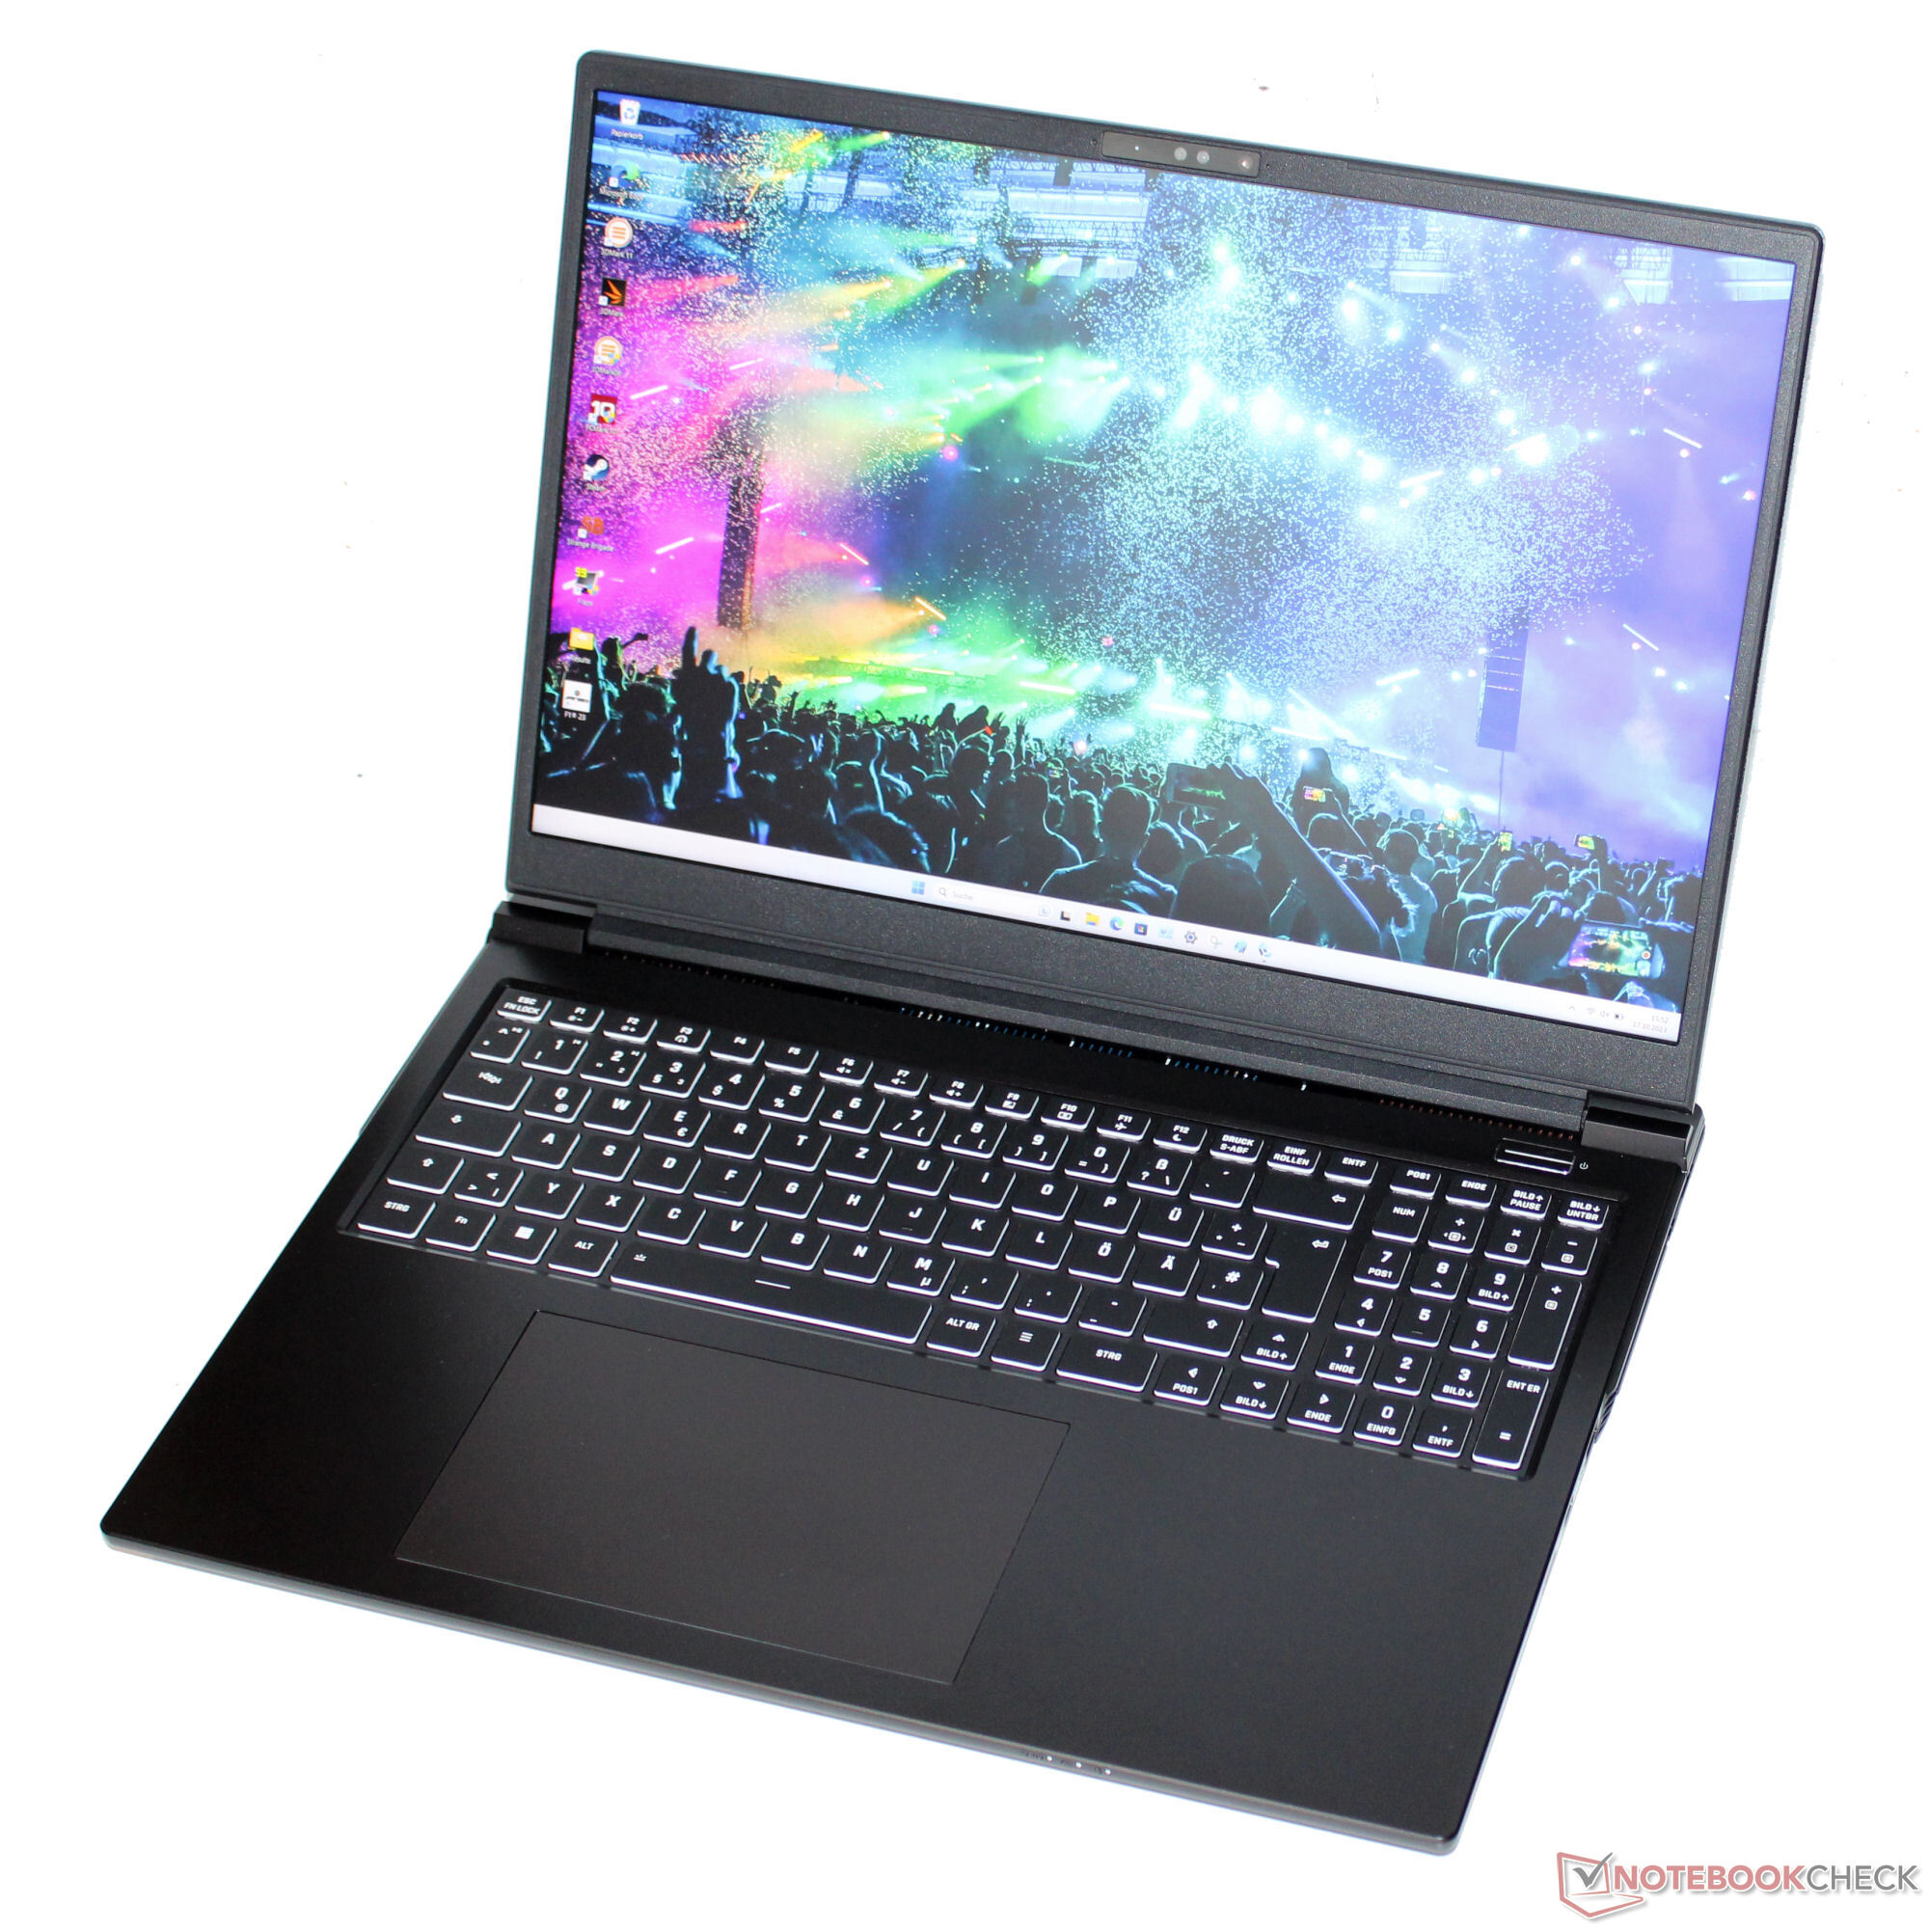
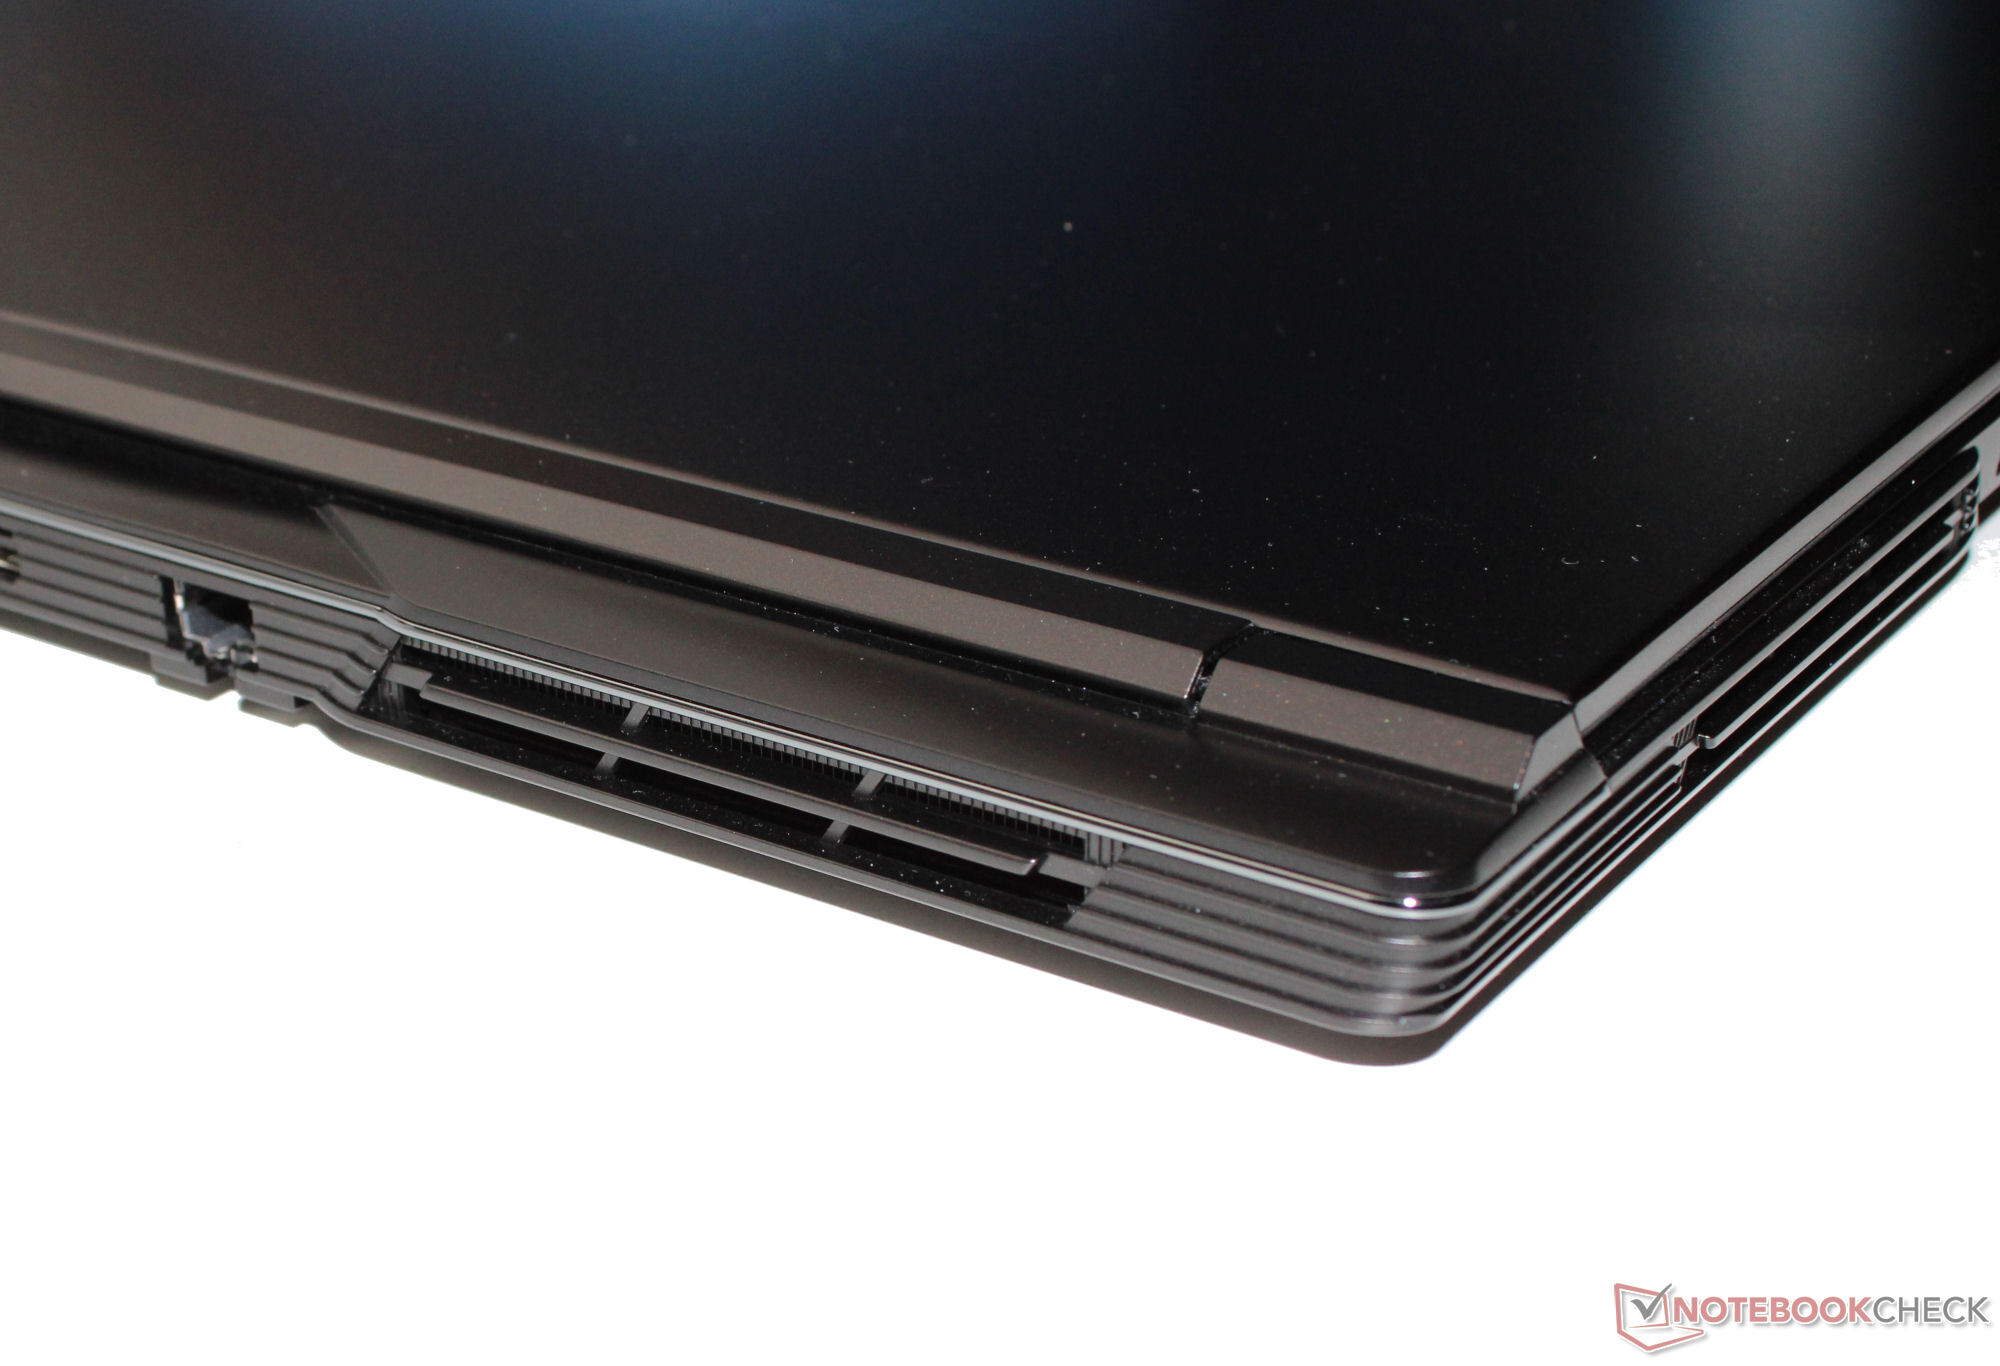
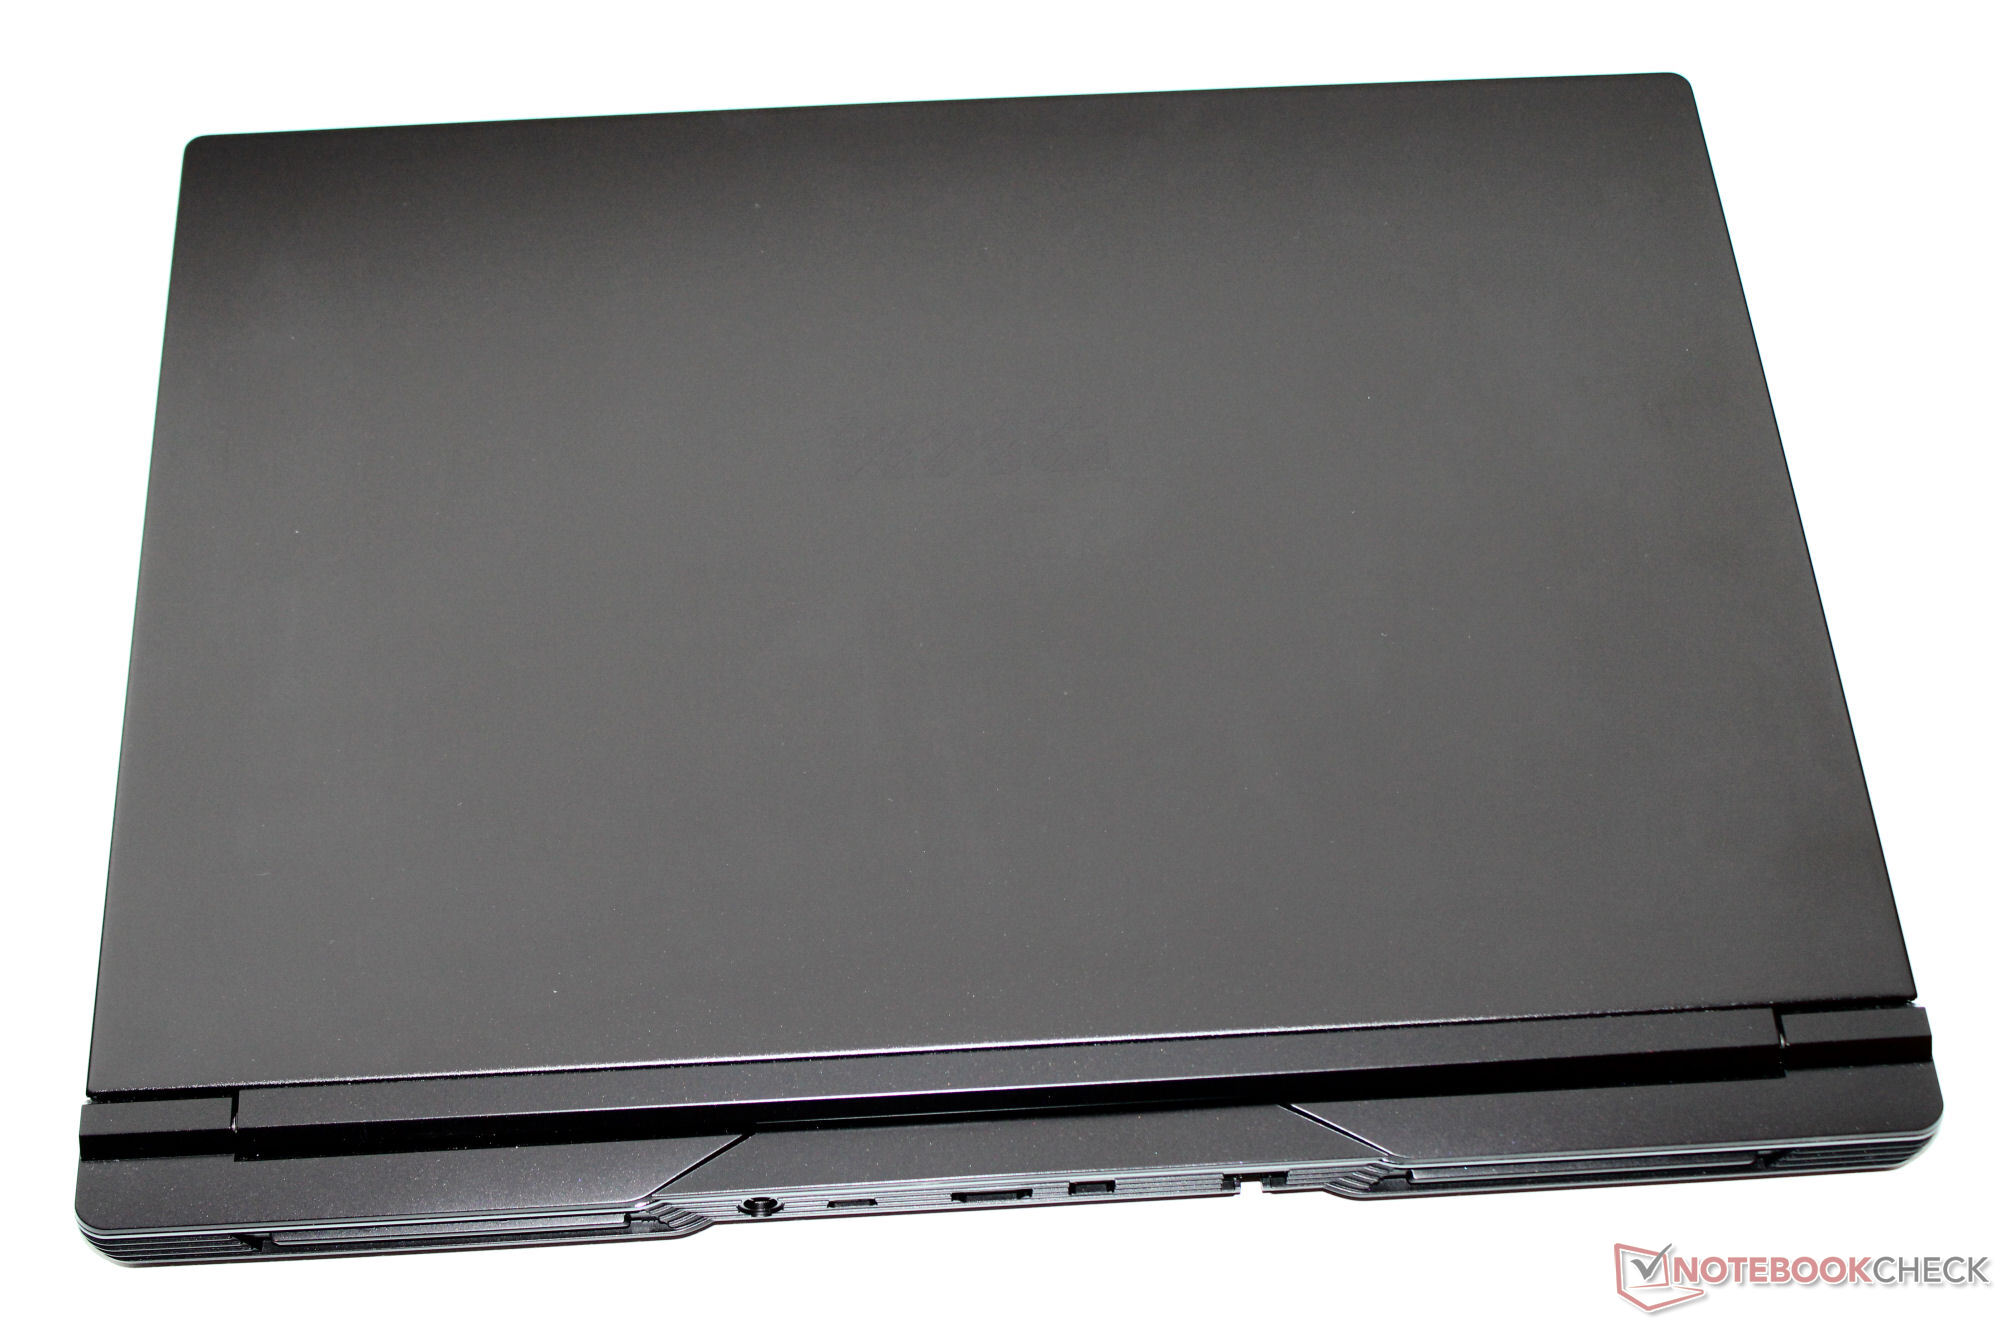
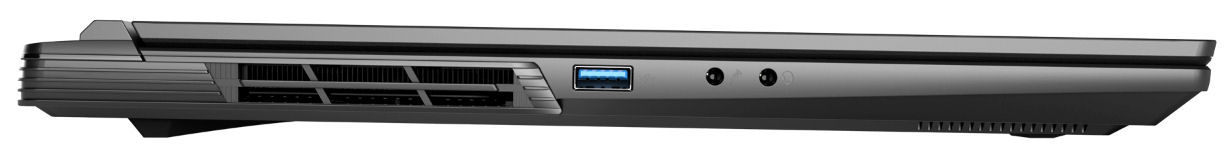
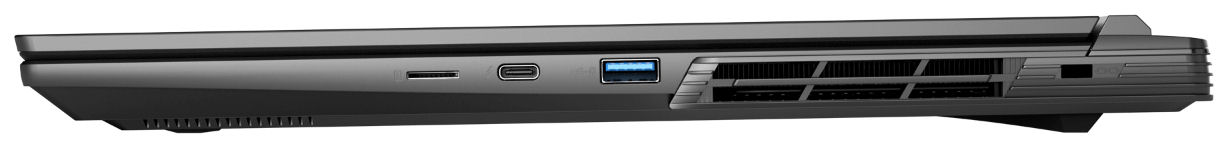
Case e conectividade - Clevo barebone com Thunderbolt 4
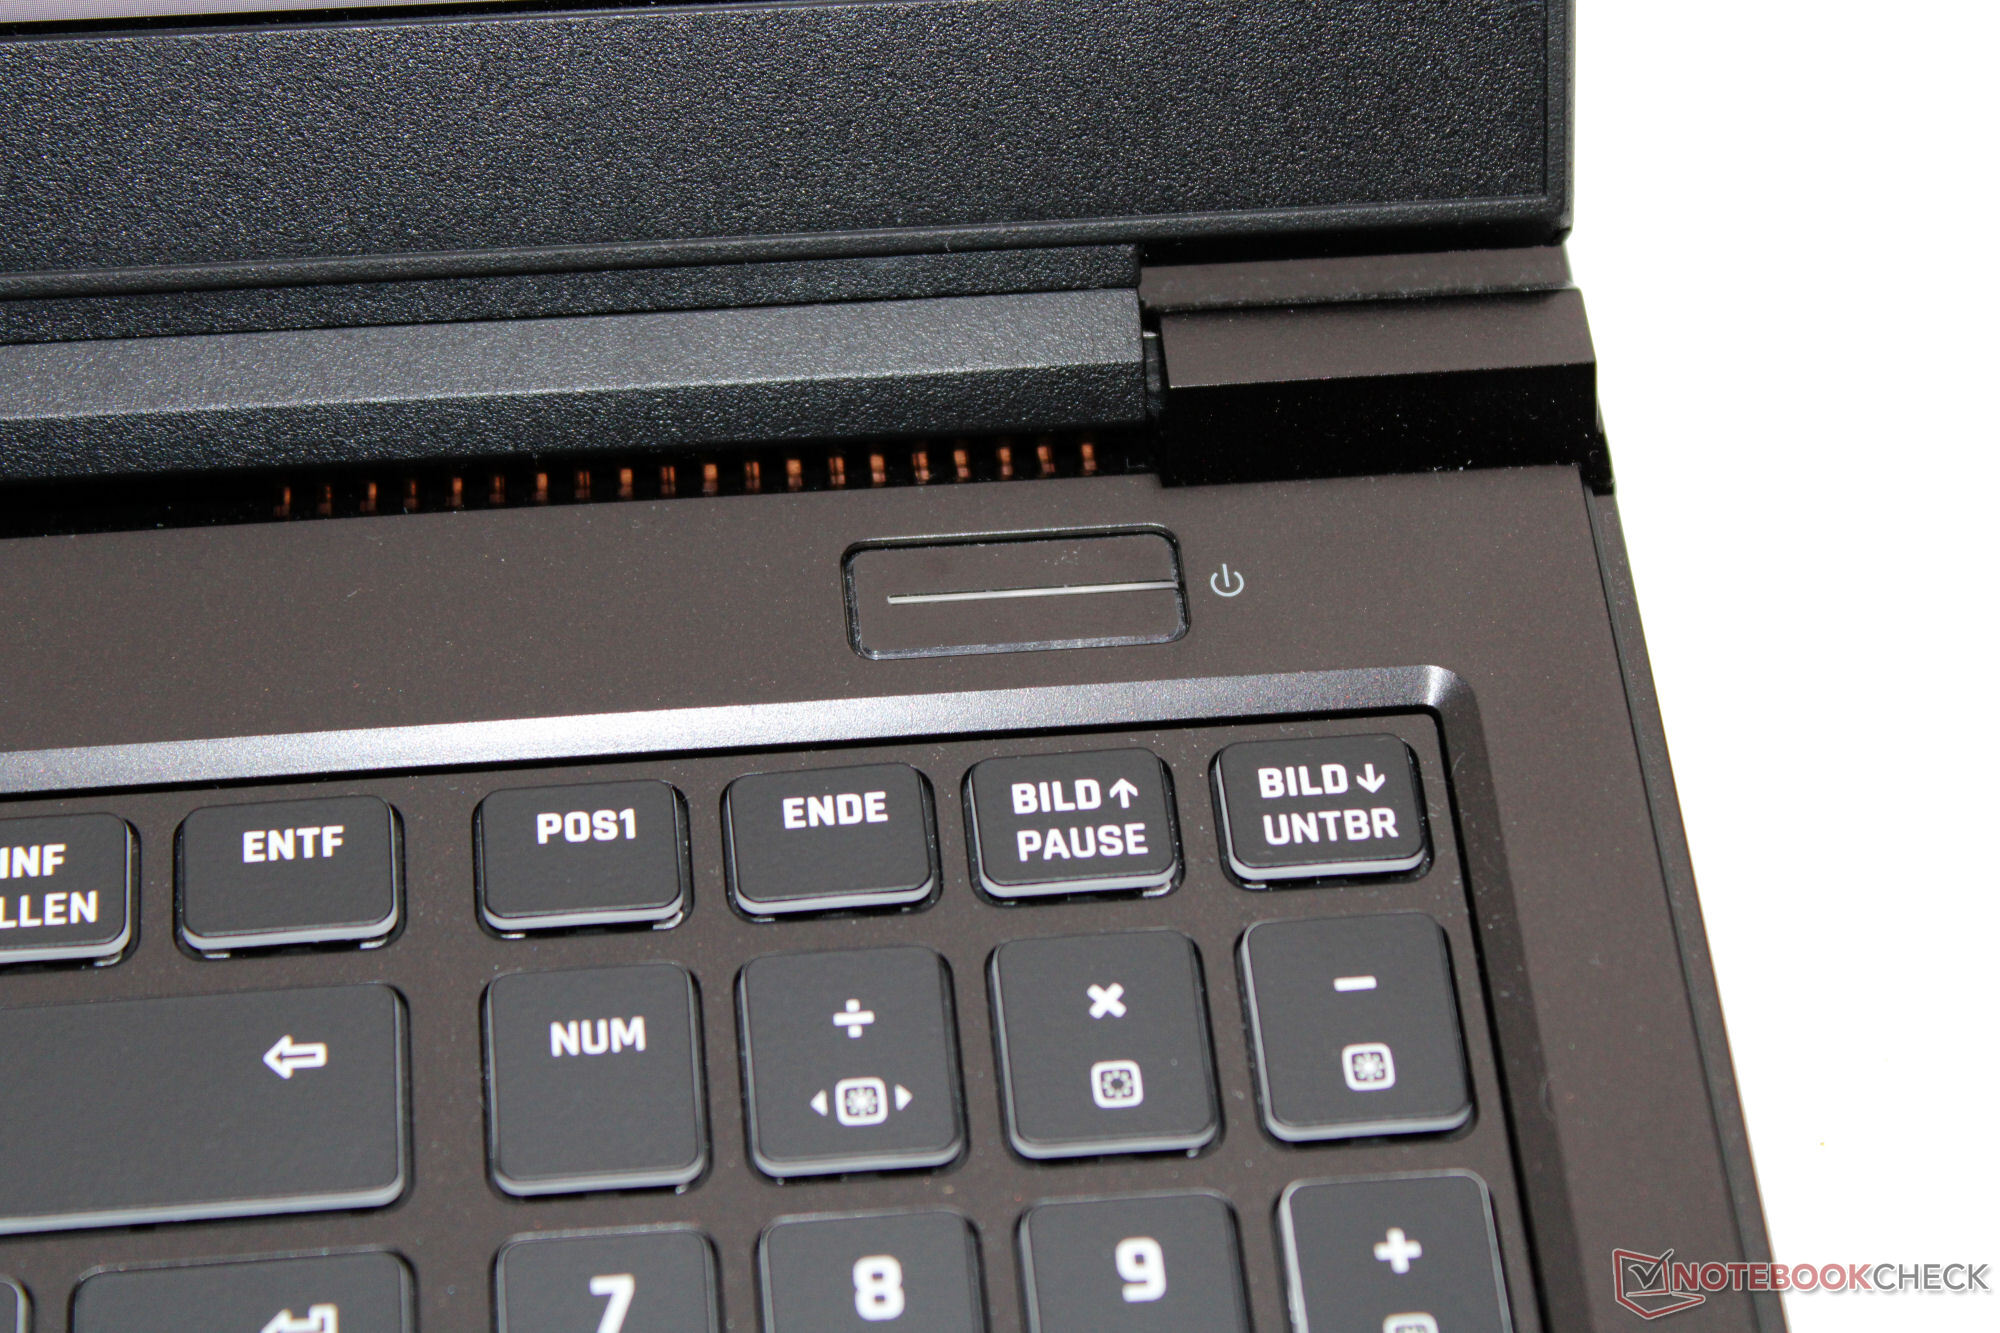
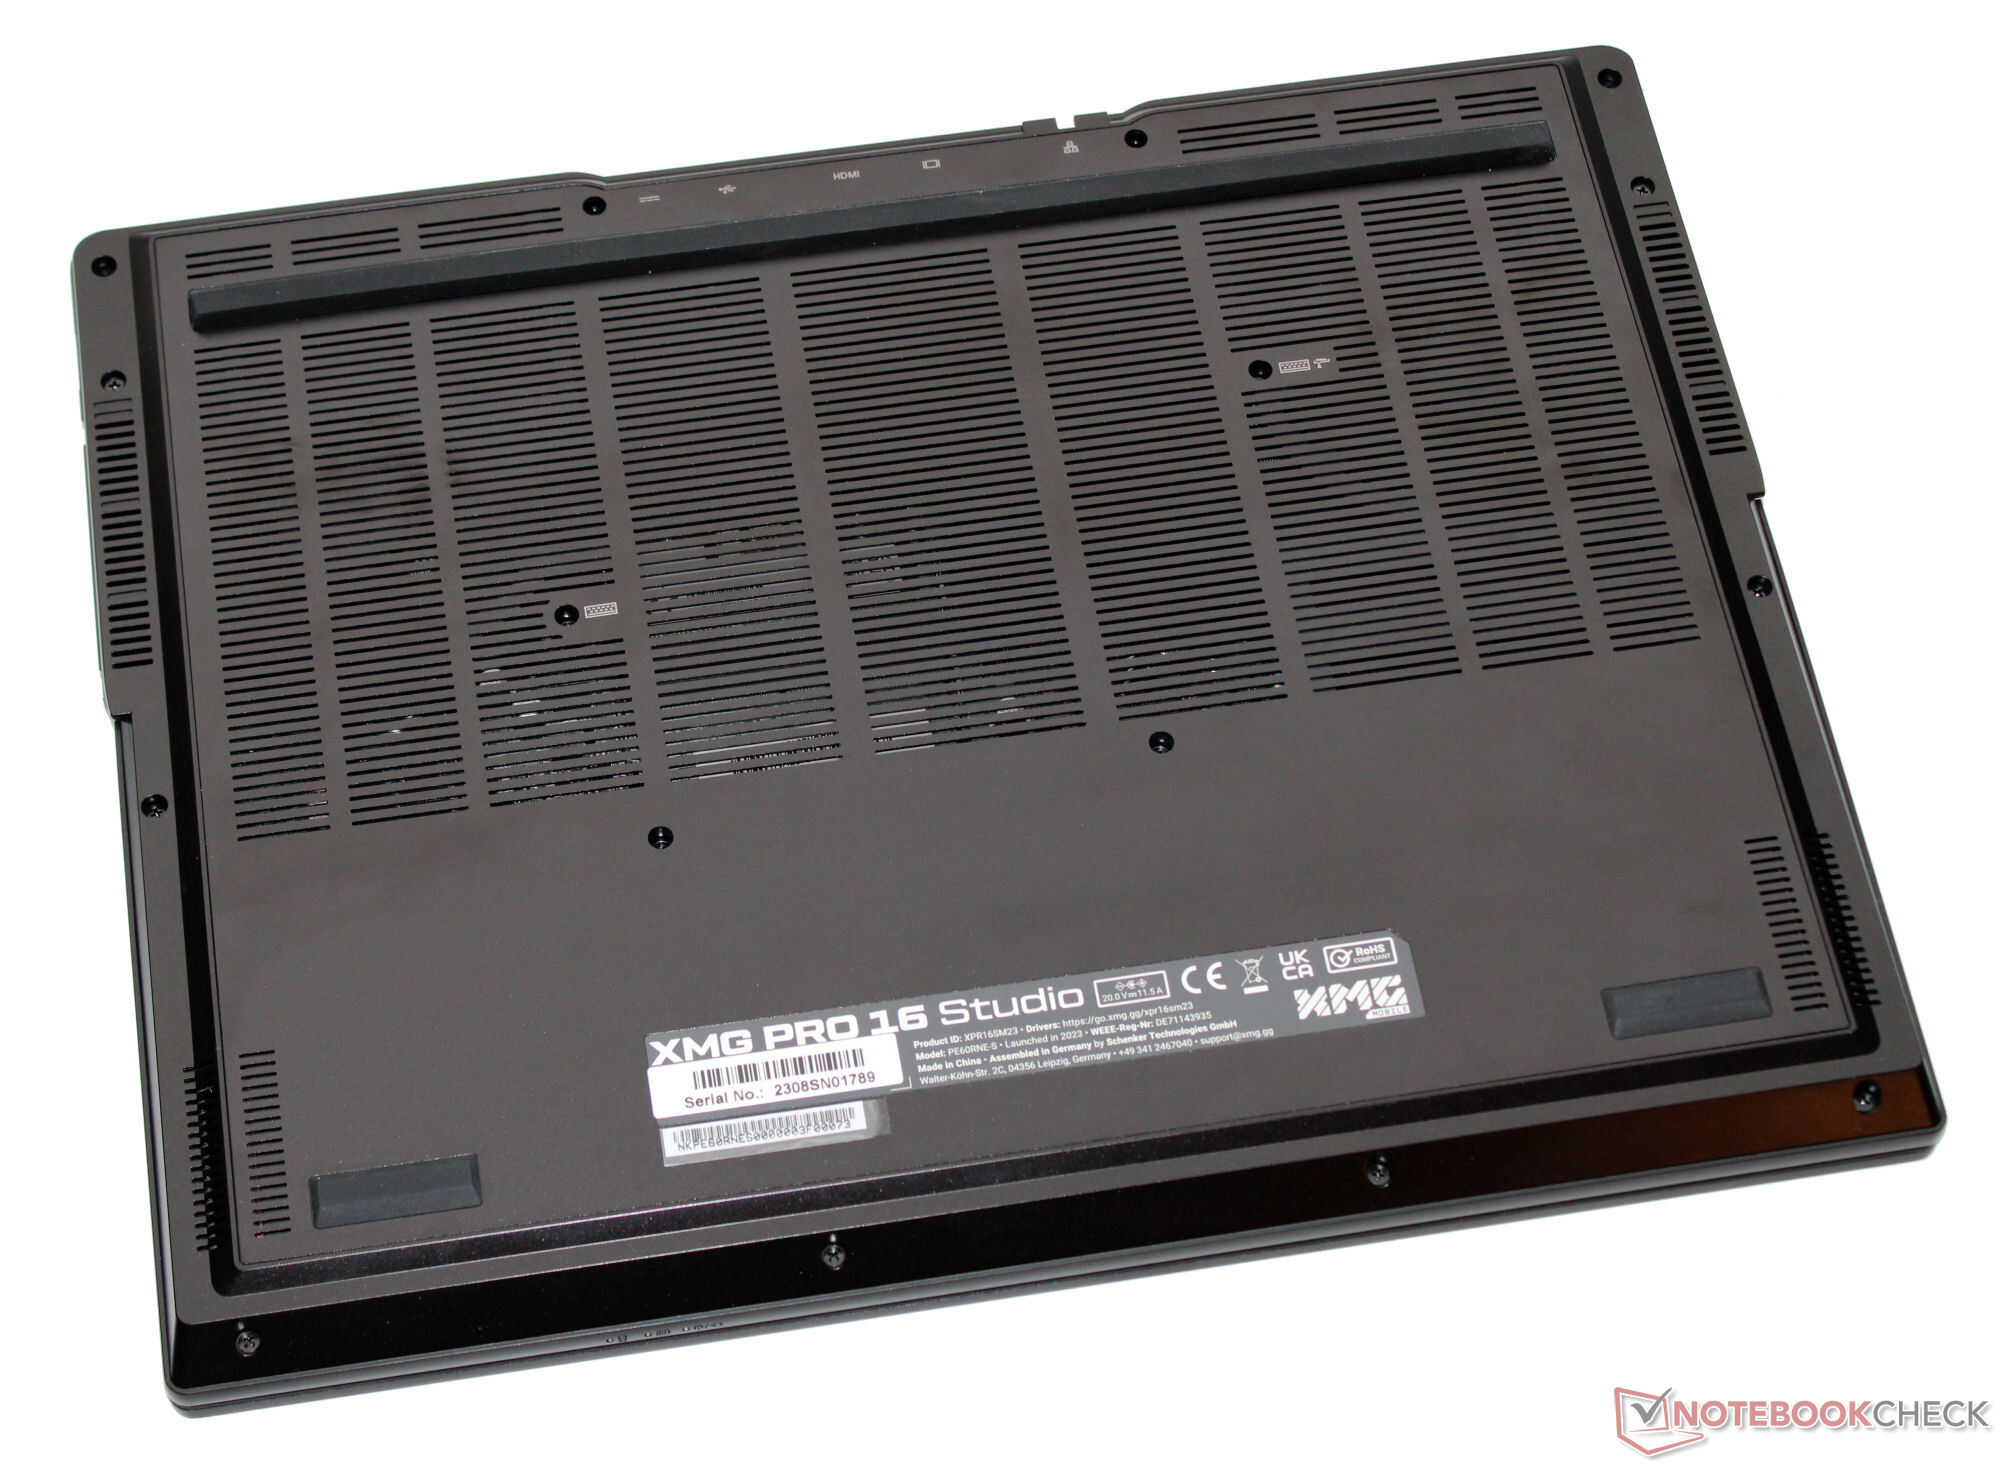
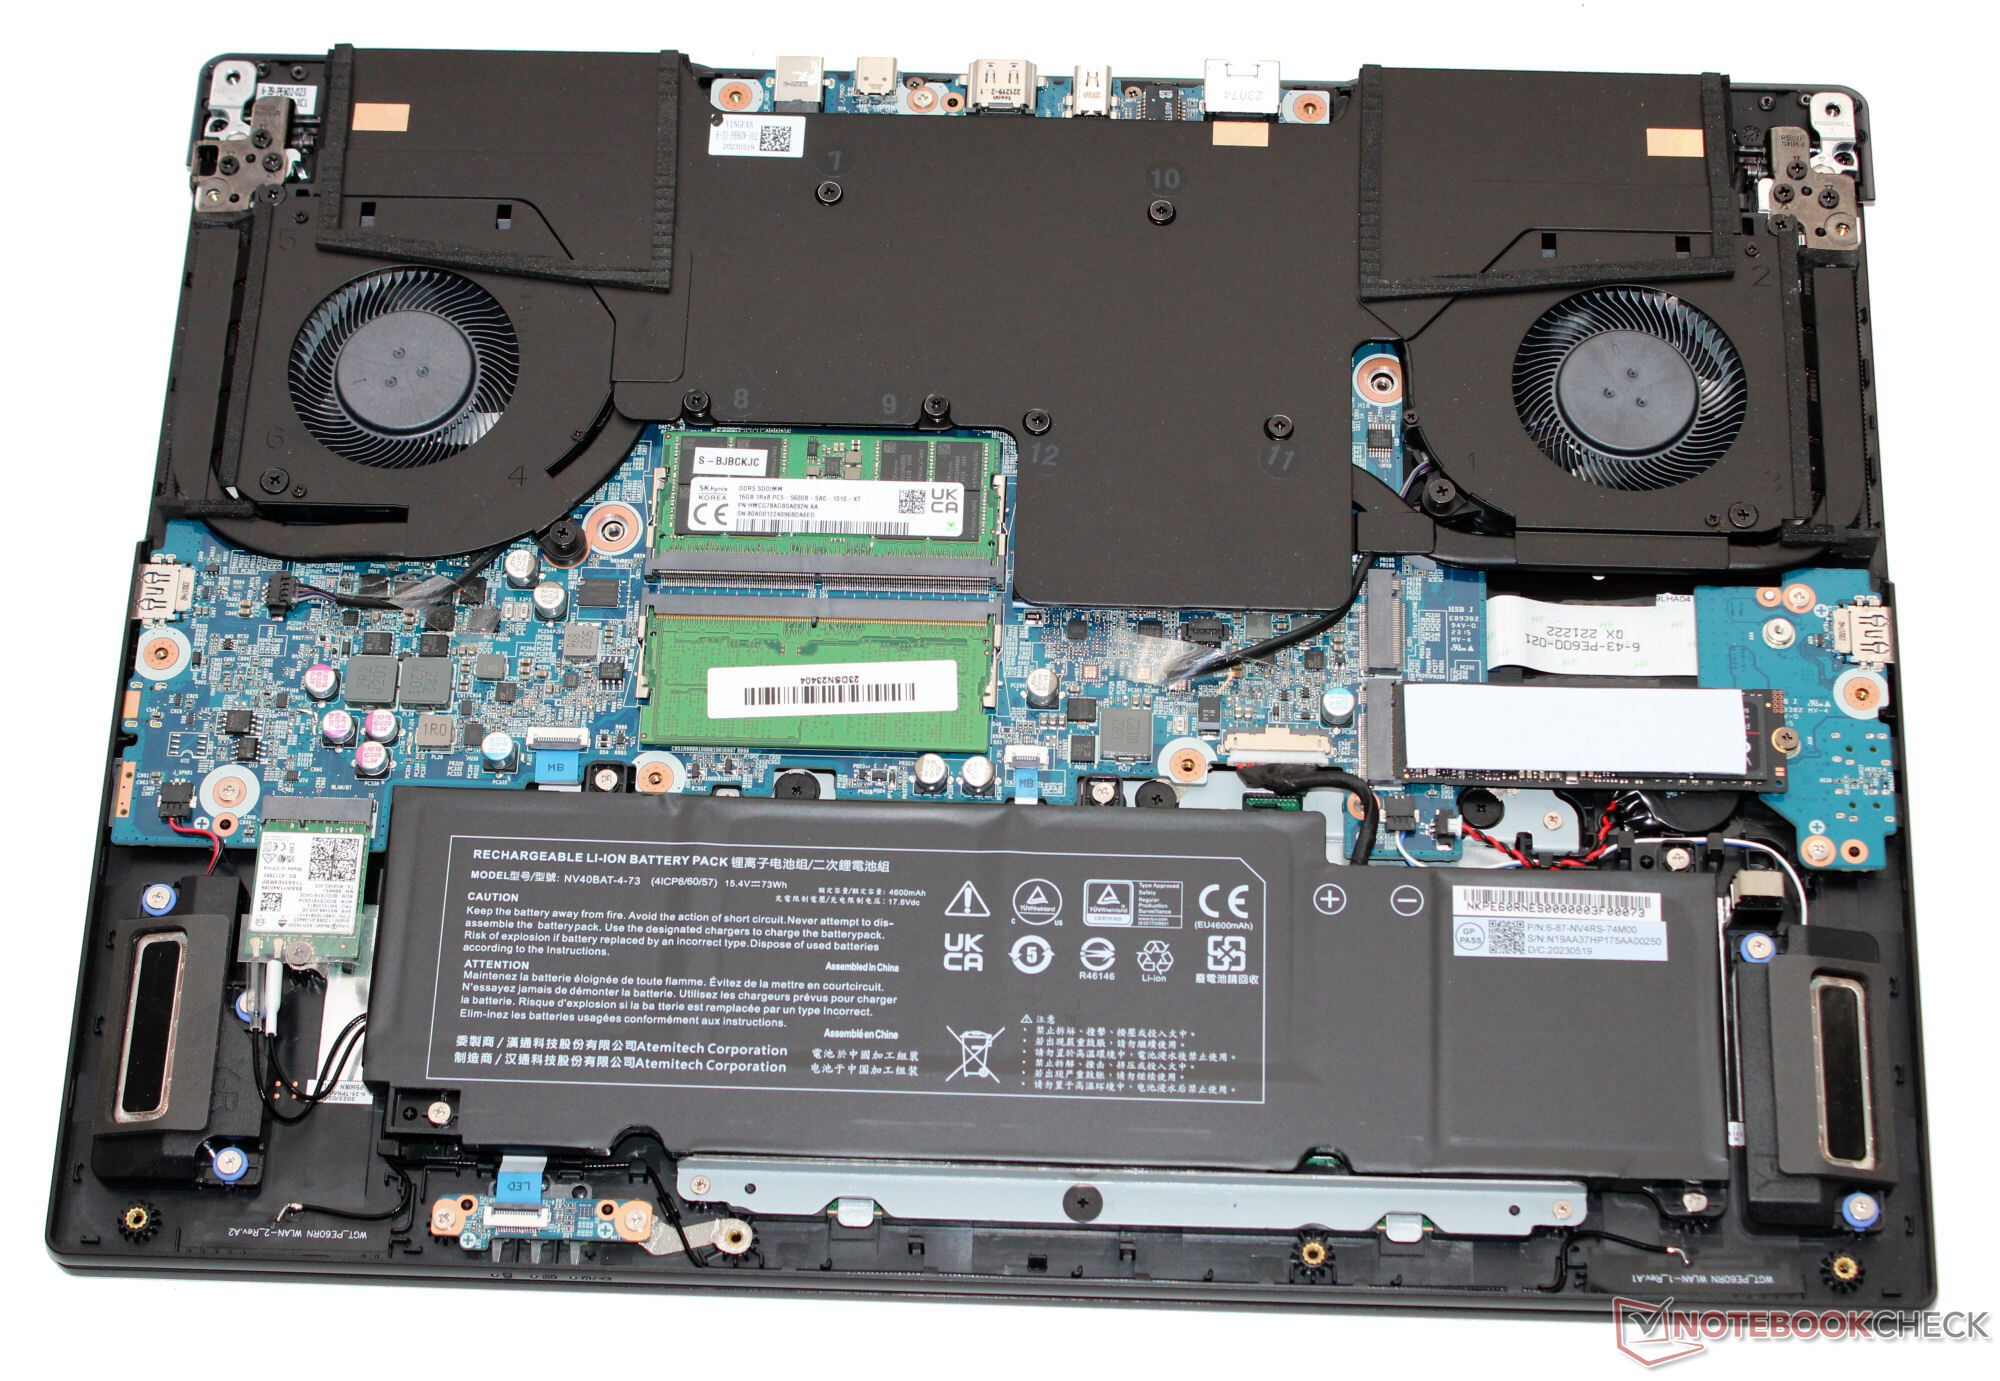
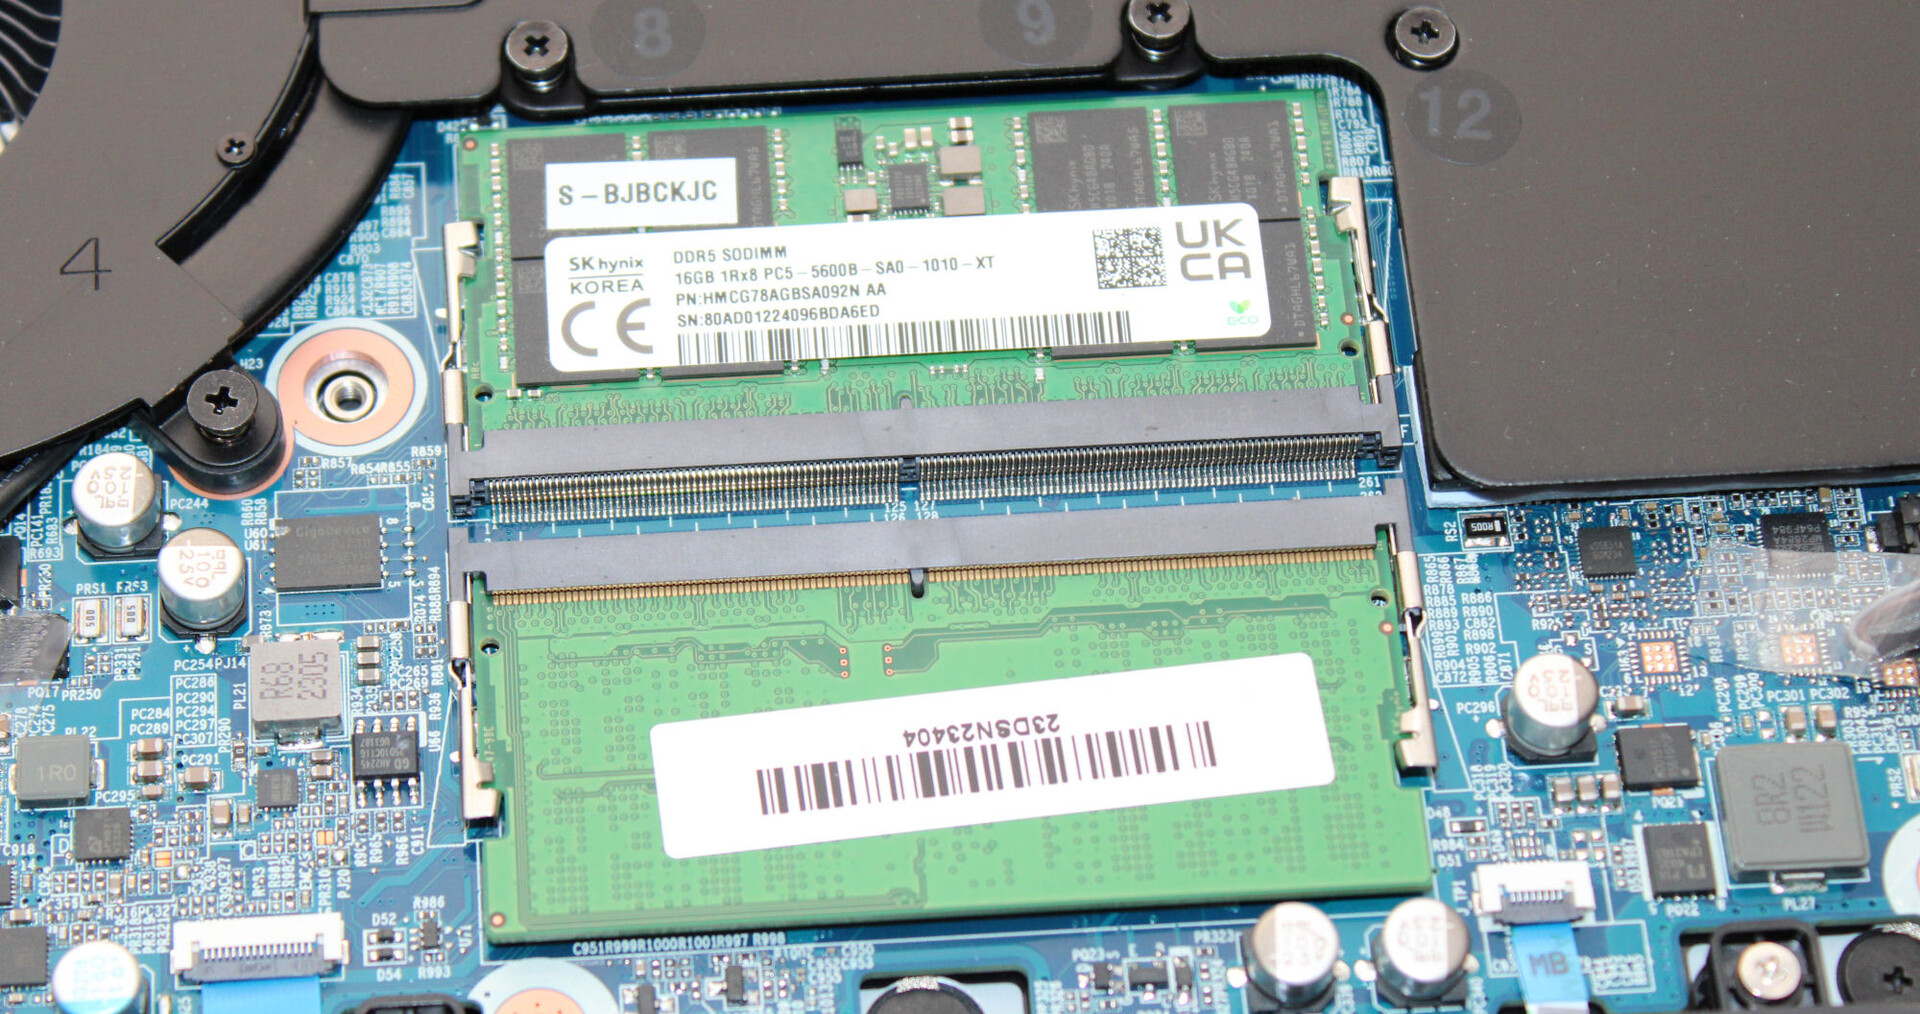
A tampa e a base do gabinete preto fosco são feitas de alumínio e o restante é feito de plástico. O gabinete com design sutil é bem construído. A unidade de base e a tampa podem ser ligeiramente torcidas, mas isso não é motivo de preocupação. A bateria (aparafusada, não colada) e o restante das entranhas do laptop podem ser acessados quando o senhor remove a placa inferior.
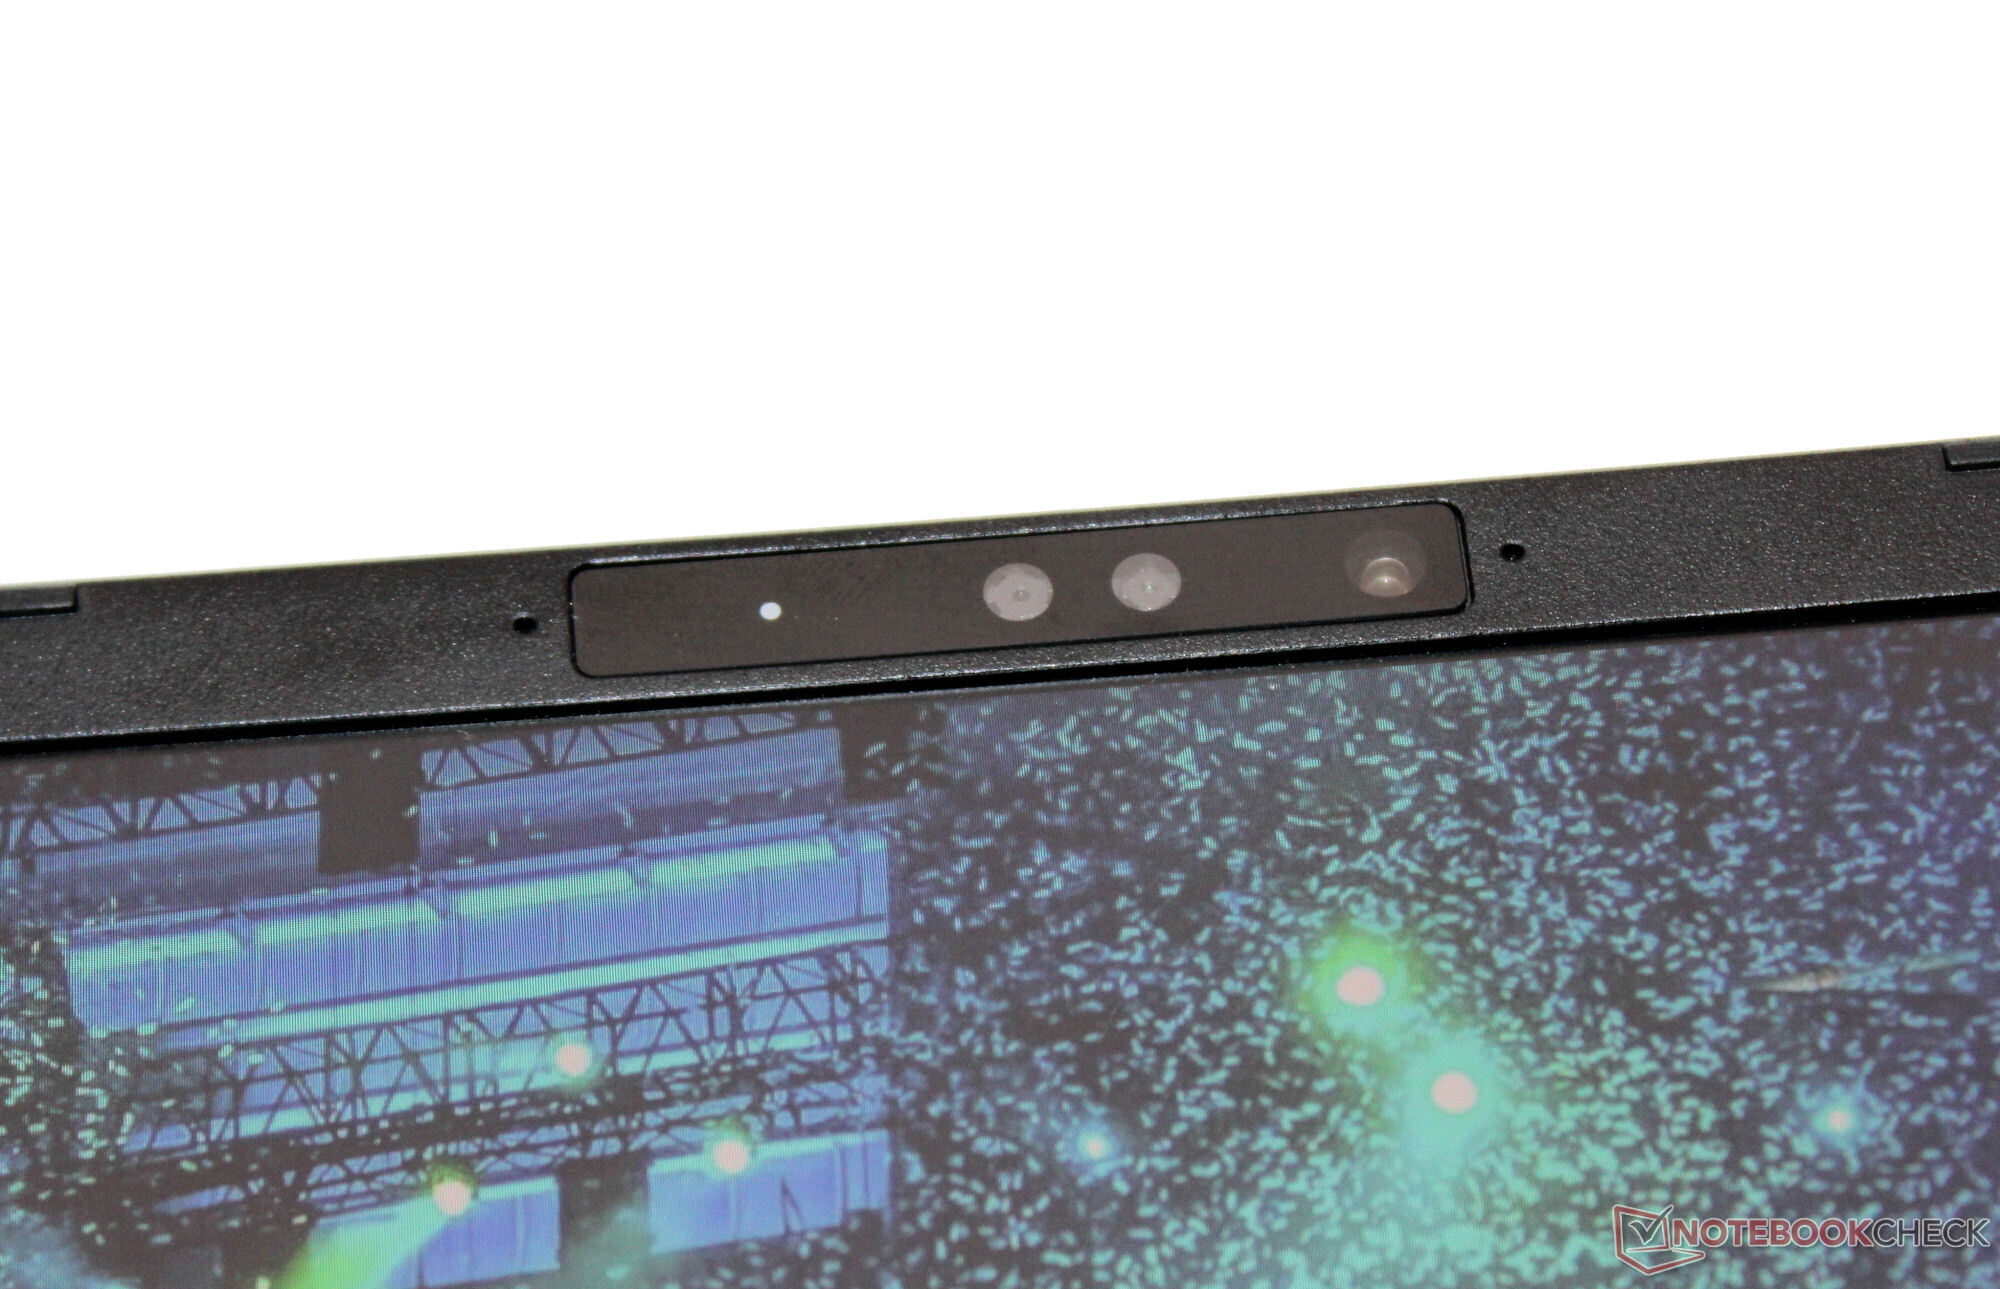
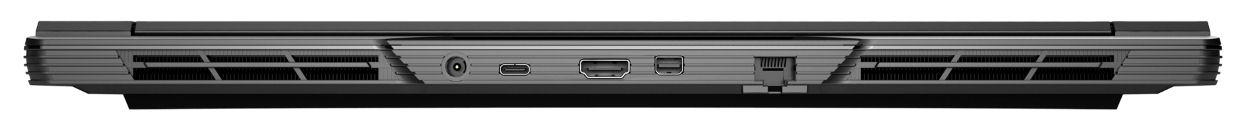
O Pro tem duas portas USB-A (USB 3.2 Gen 1) e duas portas USB-C (1x USB 3.2 Gen 2, 1x Thunderbolt 4). A porta TB-4 suporta Power Delivery e pode emitir um sinal DisplayPort. No total, o laptop tem três saídas de vídeo (1x HDMI, 2x DP). Seu leitor de cartão MicroSD (cartão de referência: AV PRO microSD 128 GB V60) pode ser classificado como de velocidade média. Sua webcam (2,1 MP, máx. 1.920 x 1.080 pixels, sem cobertura) é bastante padrão.
Em condições ideais (sem dispositivos WiFi nas proximidades, curta distância entre o laptop e o PC servidor), ele atinge excelentes taxas de dados WiFi. O laptop usa um chip WiFi 6E (Intel AX211), e as conexões com fio são feitas por um controlador Realtek RTL8125 (2,5 GBit/s).
| SD Card Reader | |
| average JPG Copy Test (av. of 3 runs) | |
| MSI Stealth 16 Studio A13VG | |
| Média da turma Gaming (20.9 - 210, n=54, últimos 2 anos) | |
| Asus Vivobook Pro 16X K6604JV-MX016W | |
| Schenker XMG Pro 16 Studio (Mid 23) (AV PRO microSD 128 GB V60) | |
| Lenovo Legion Slim 7i 16 Gen 8 (Toshiba Exceria Pro SDXC 64 GB UHS-II) | |
| maximum AS SSD Seq Read Test (1GB) | |
| MSI Stealth 16 Studio A13VG | |
| Média da turma Gaming (25.5 - 261, n=51, últimos 2 anos) | |
| Asus Vivobook Pro 16X K6604JV-MX016W | |
| Schenker XMG Pro 16 Studio (Mid 23) (AV PRO microSD 128 GB V60) | |
| Lenovo Legion Slim 7i 16 Gen 8 (Toshiba Exceria Pro SDXC 64 GB UHS-II) | |

 GeForce RTX 4070 Laptop GPU, i9-13900H, Samsung 990 Pro 1 TB")
 GeForce RTX 4070 Laptop GPU, i9-13900H, Samsung 990 Pro 1 TB")
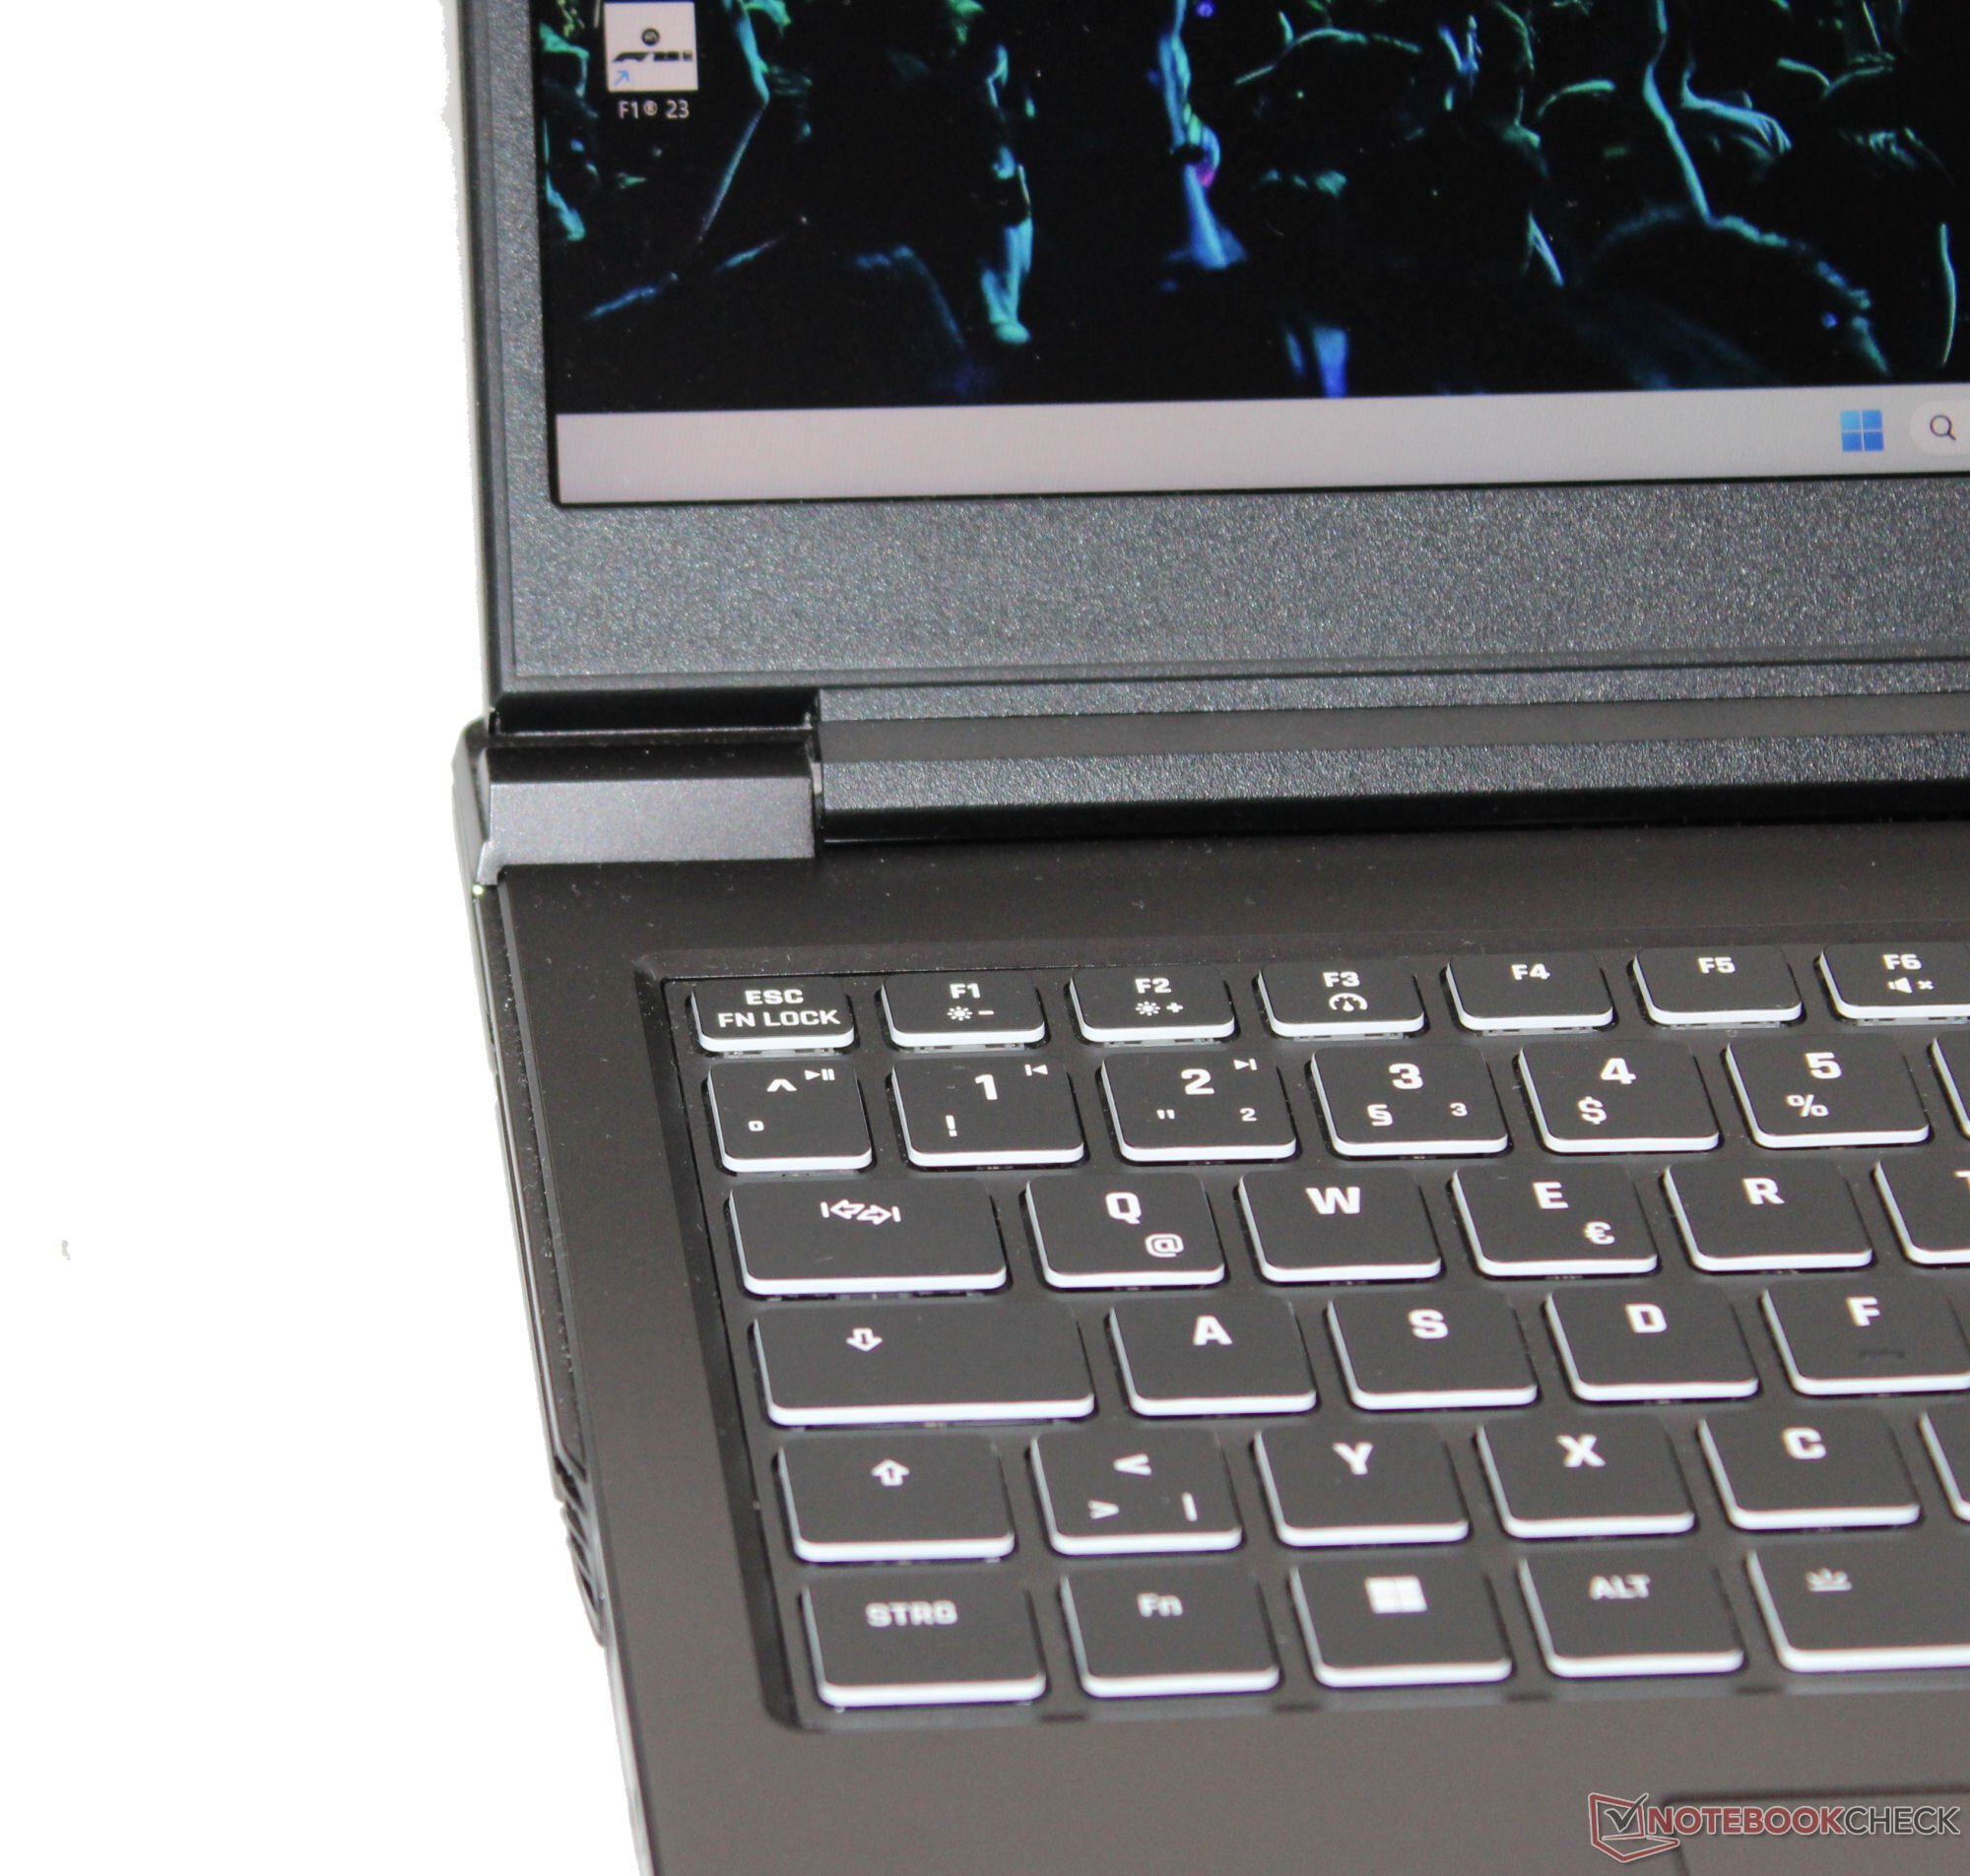
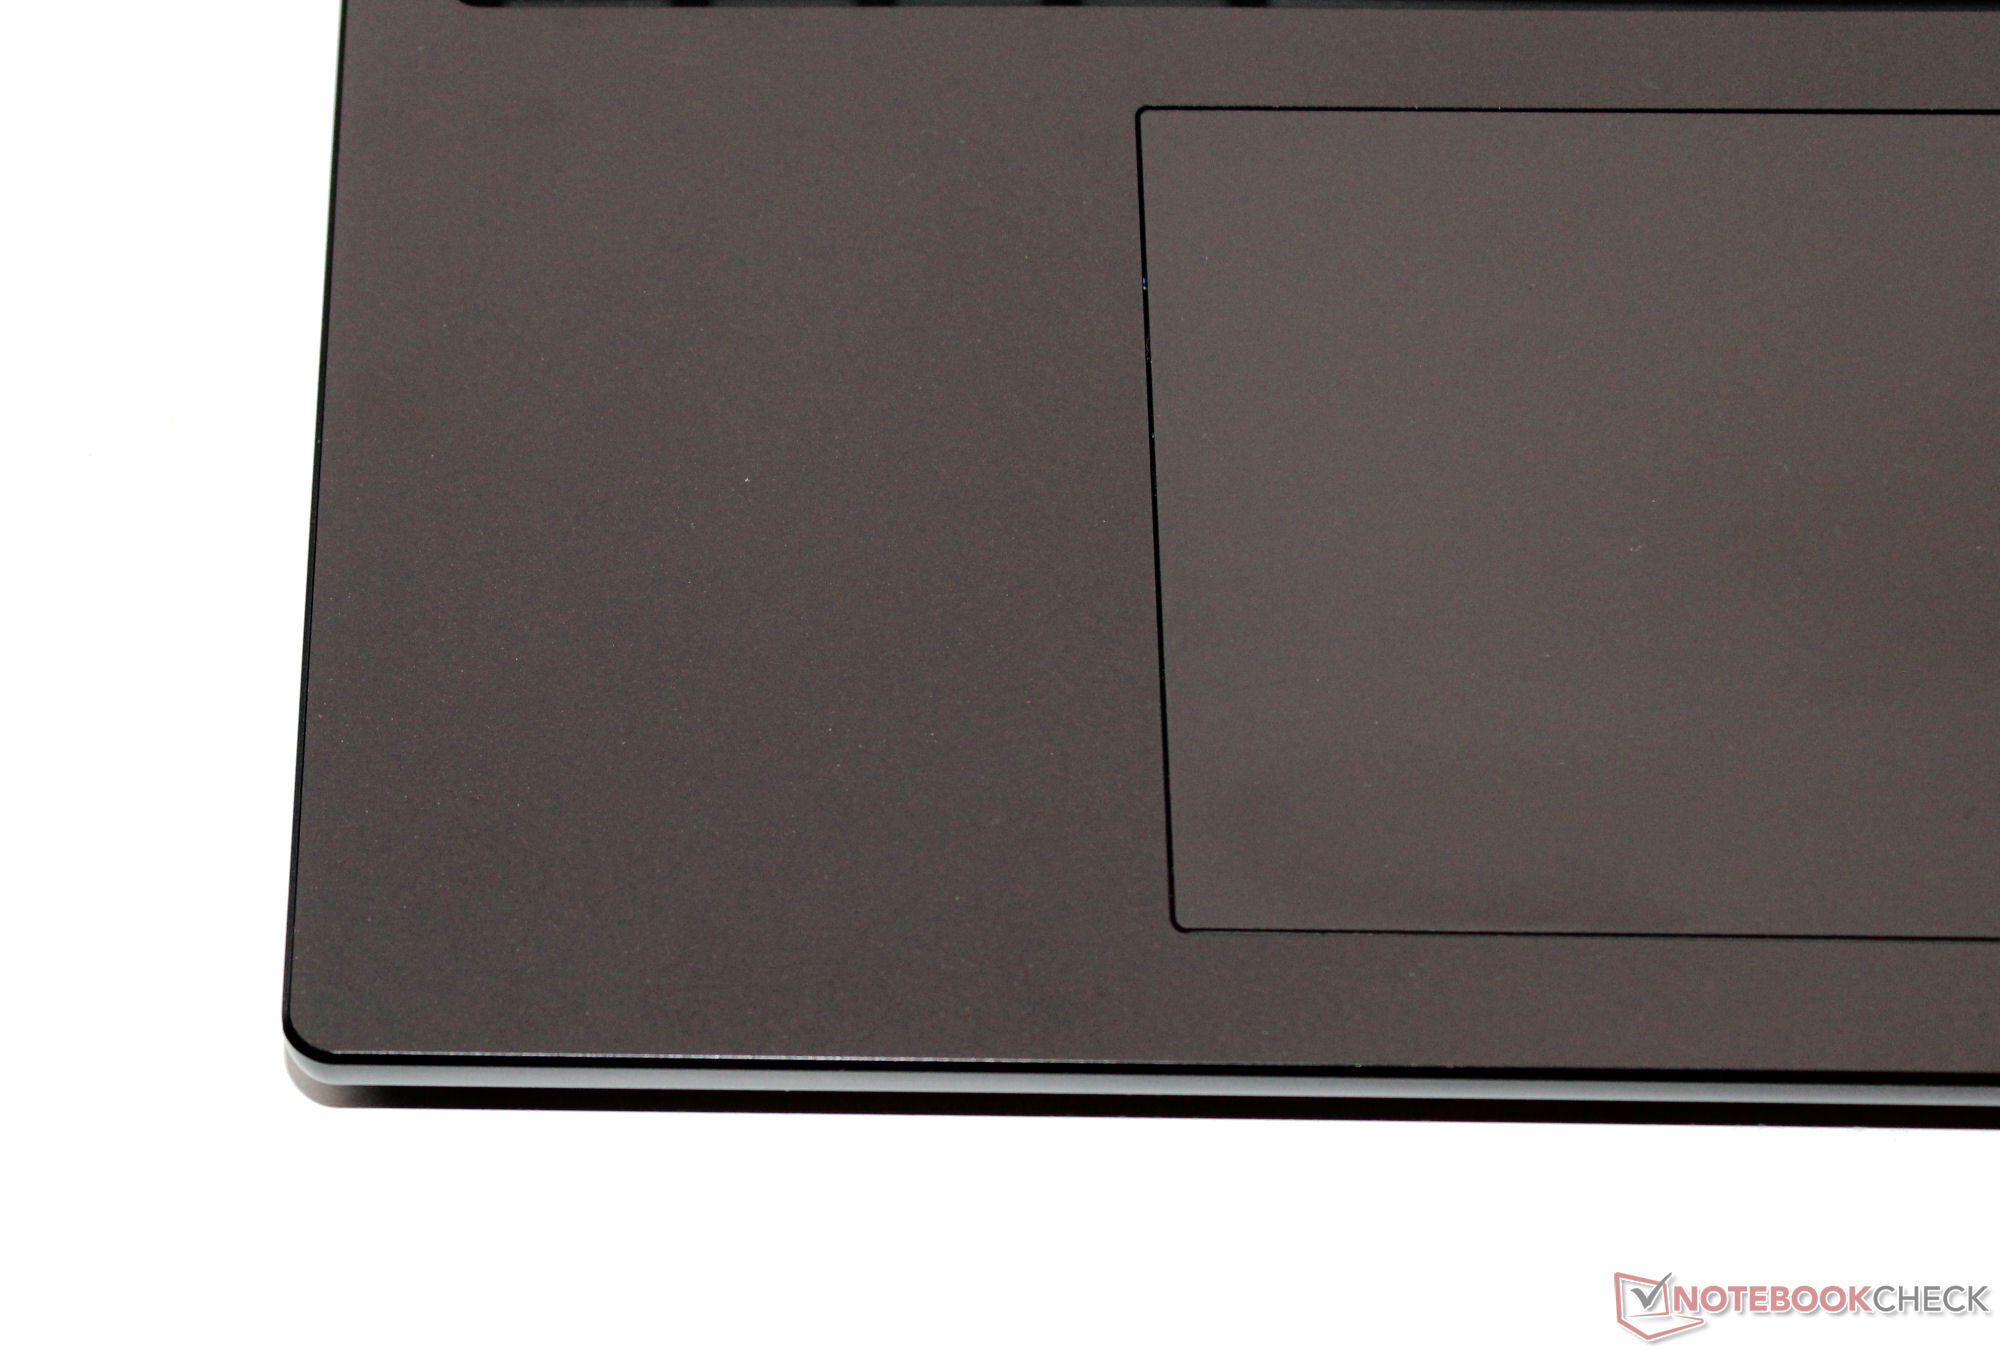
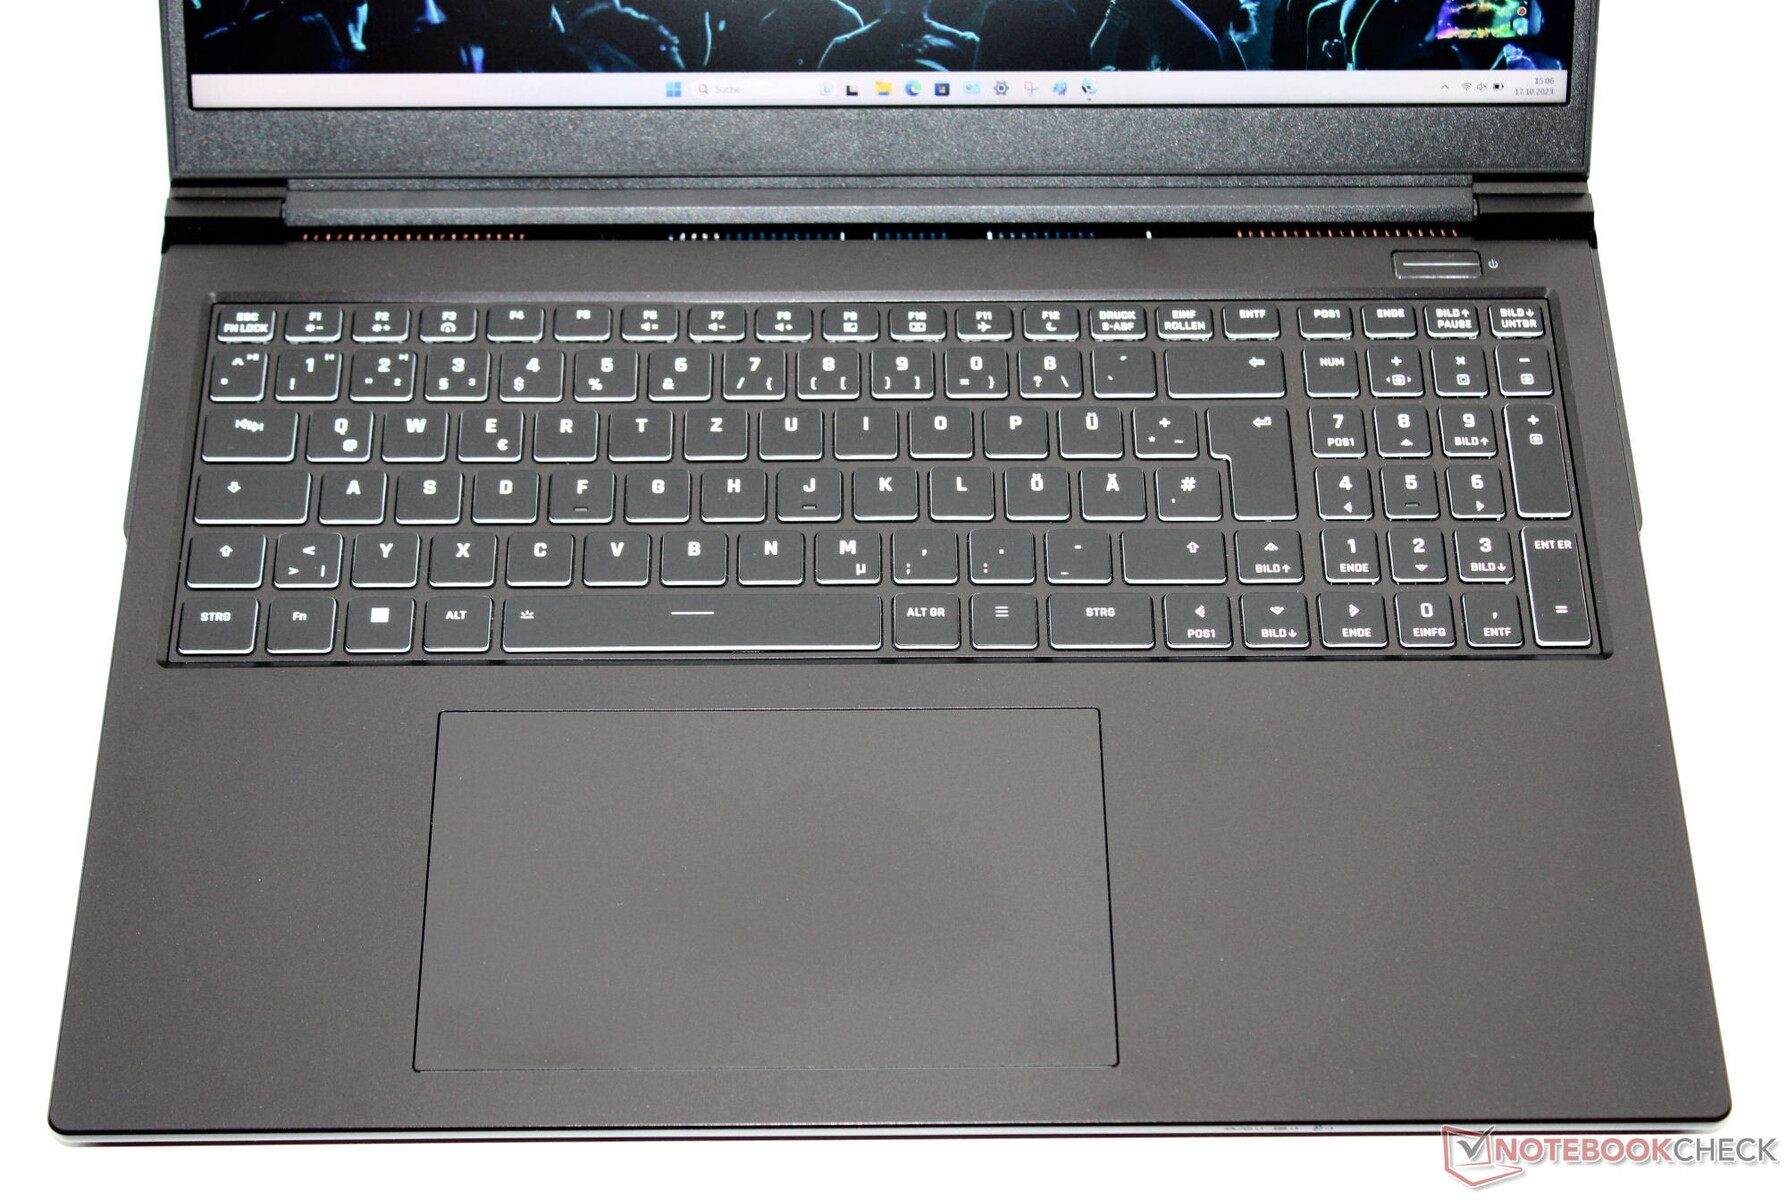
Dispositivos de entrada - O laptop XMG possui teclas iluminadas
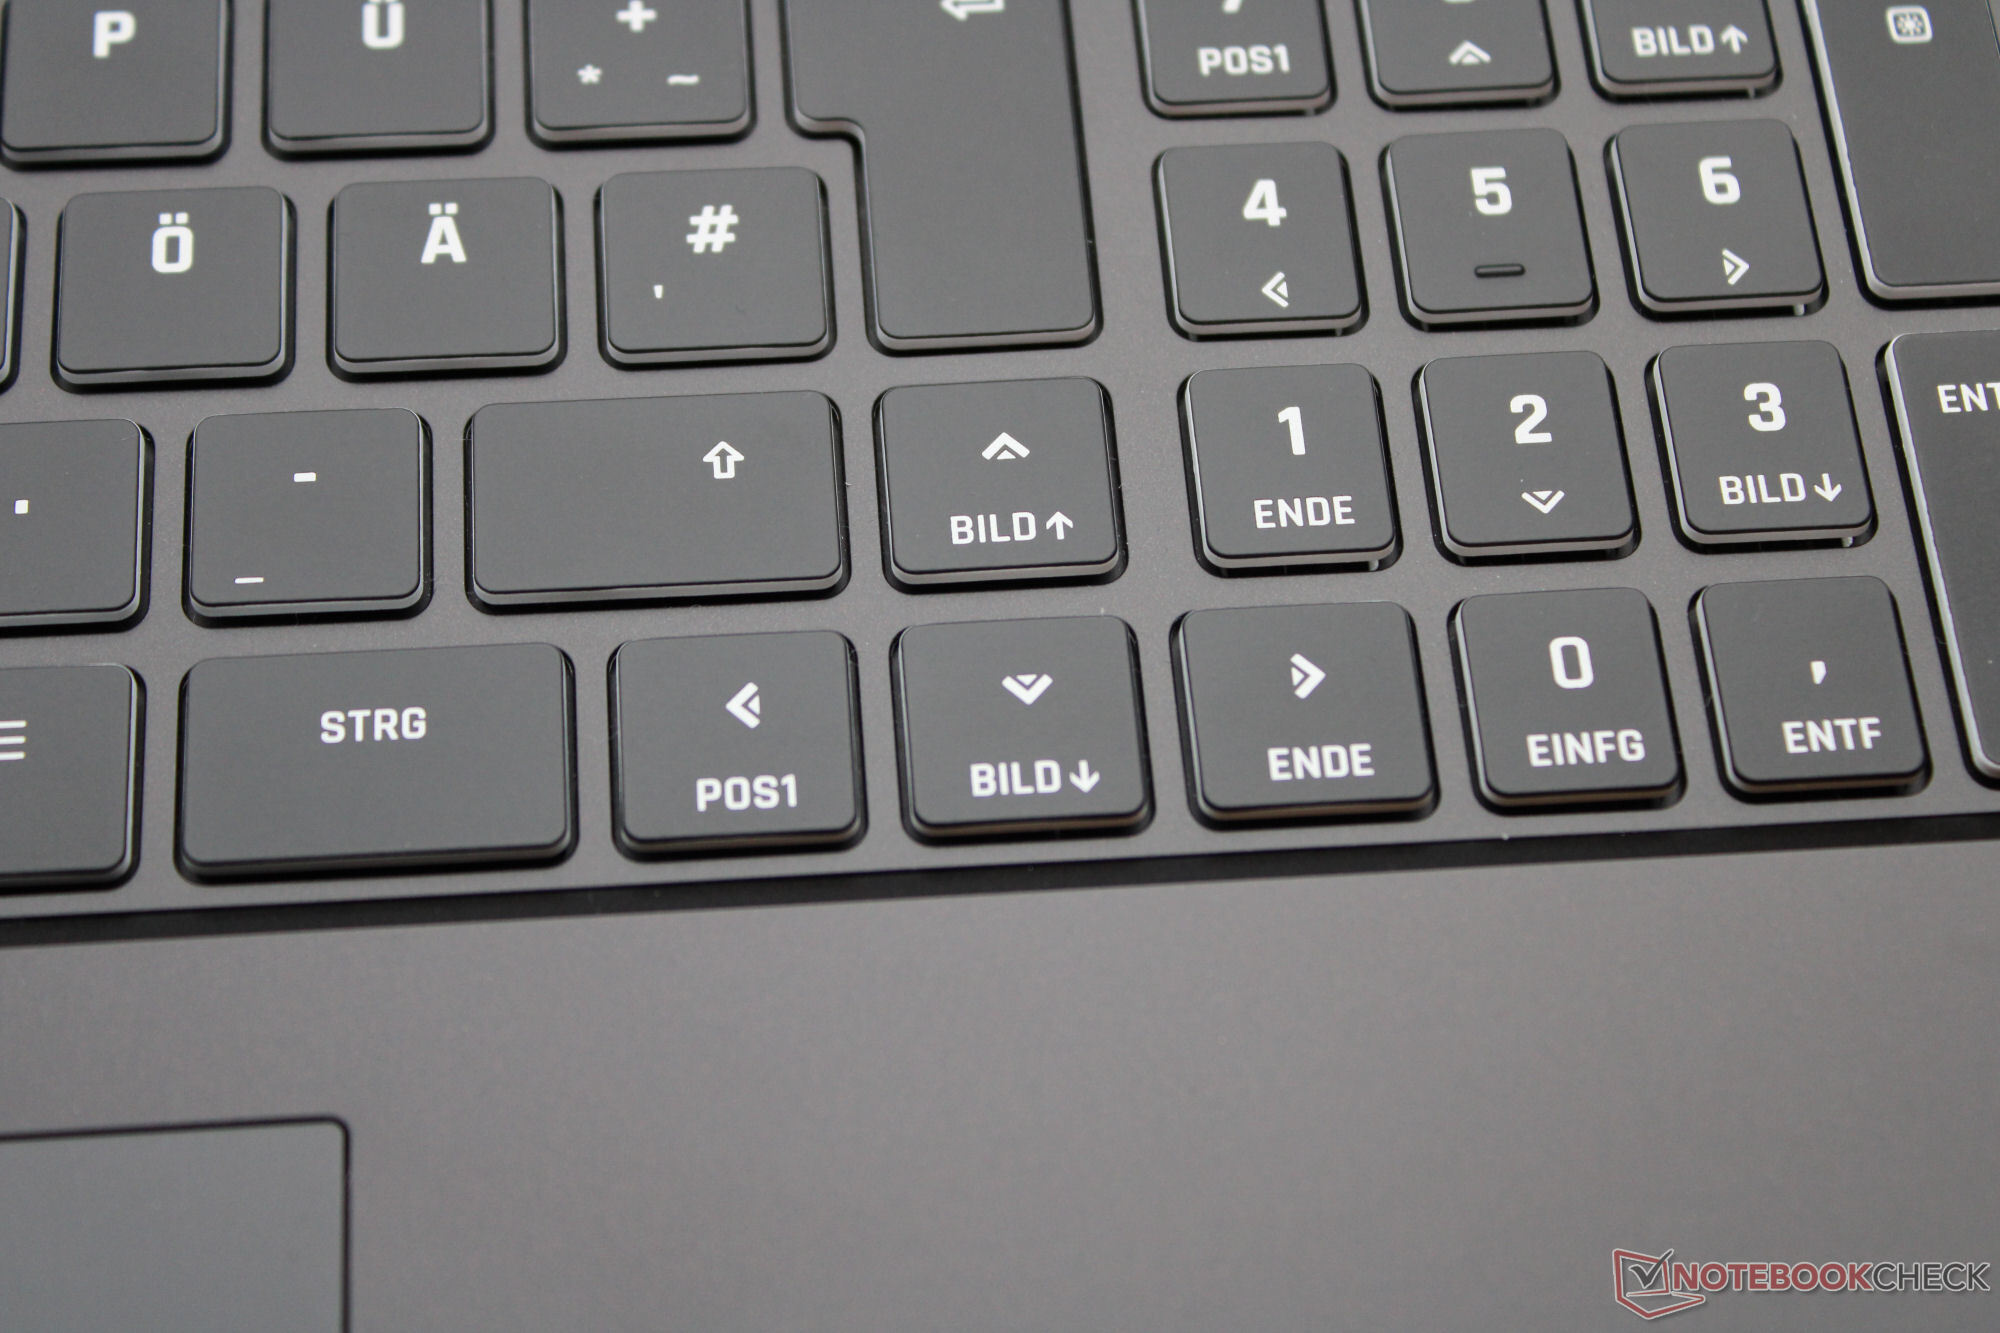
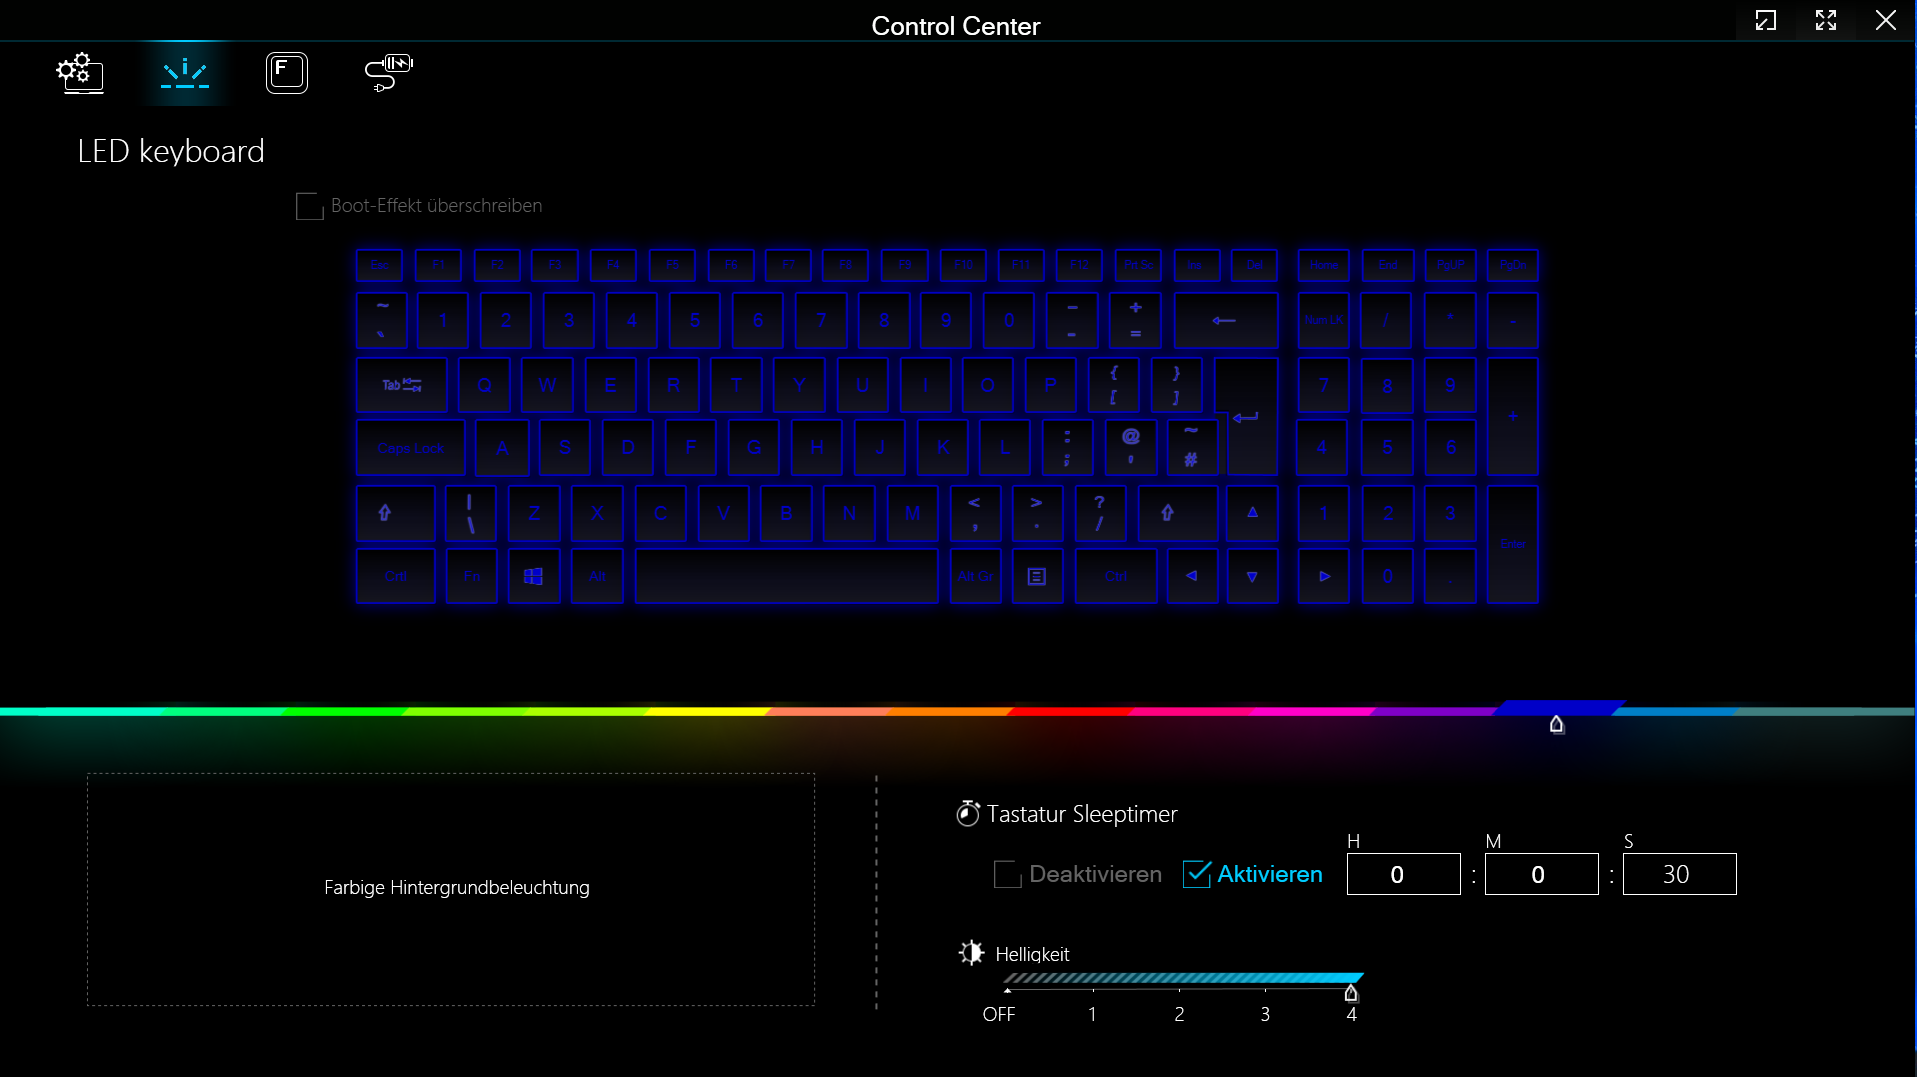
As teclas uniformes e suaves do teclado chiclet (iluminação RGB) apresentam uma elevação média e um ponto de pressão claro. A resistência das teclas poderia ser um pouco mais nítida. No total, a Schenker forneceu um teclado adequado para o uso diário. Um clickpad substitui o mouse (cerca de 15,1 x 9,1 cm), que apresenta uma elevação curta e um ponto de pressão claro.
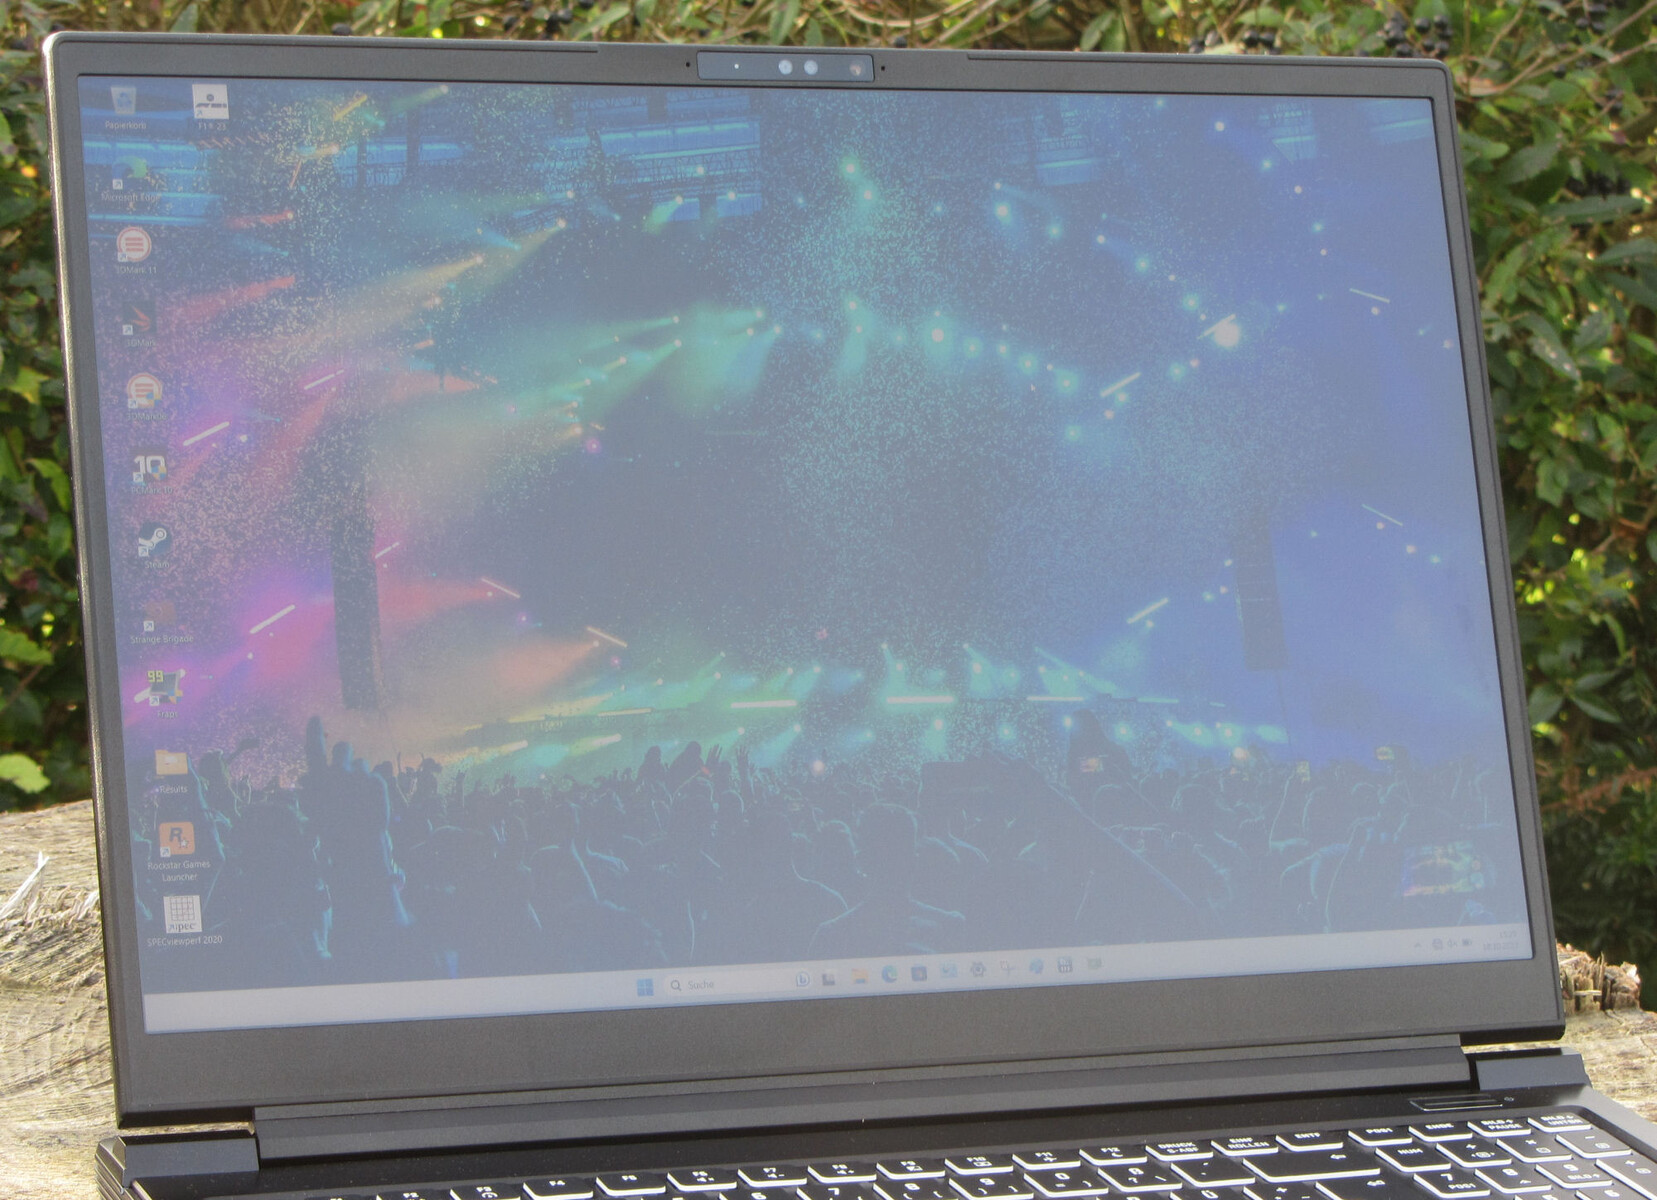
Tela - Um painel 16:10 com cobertura sRGB
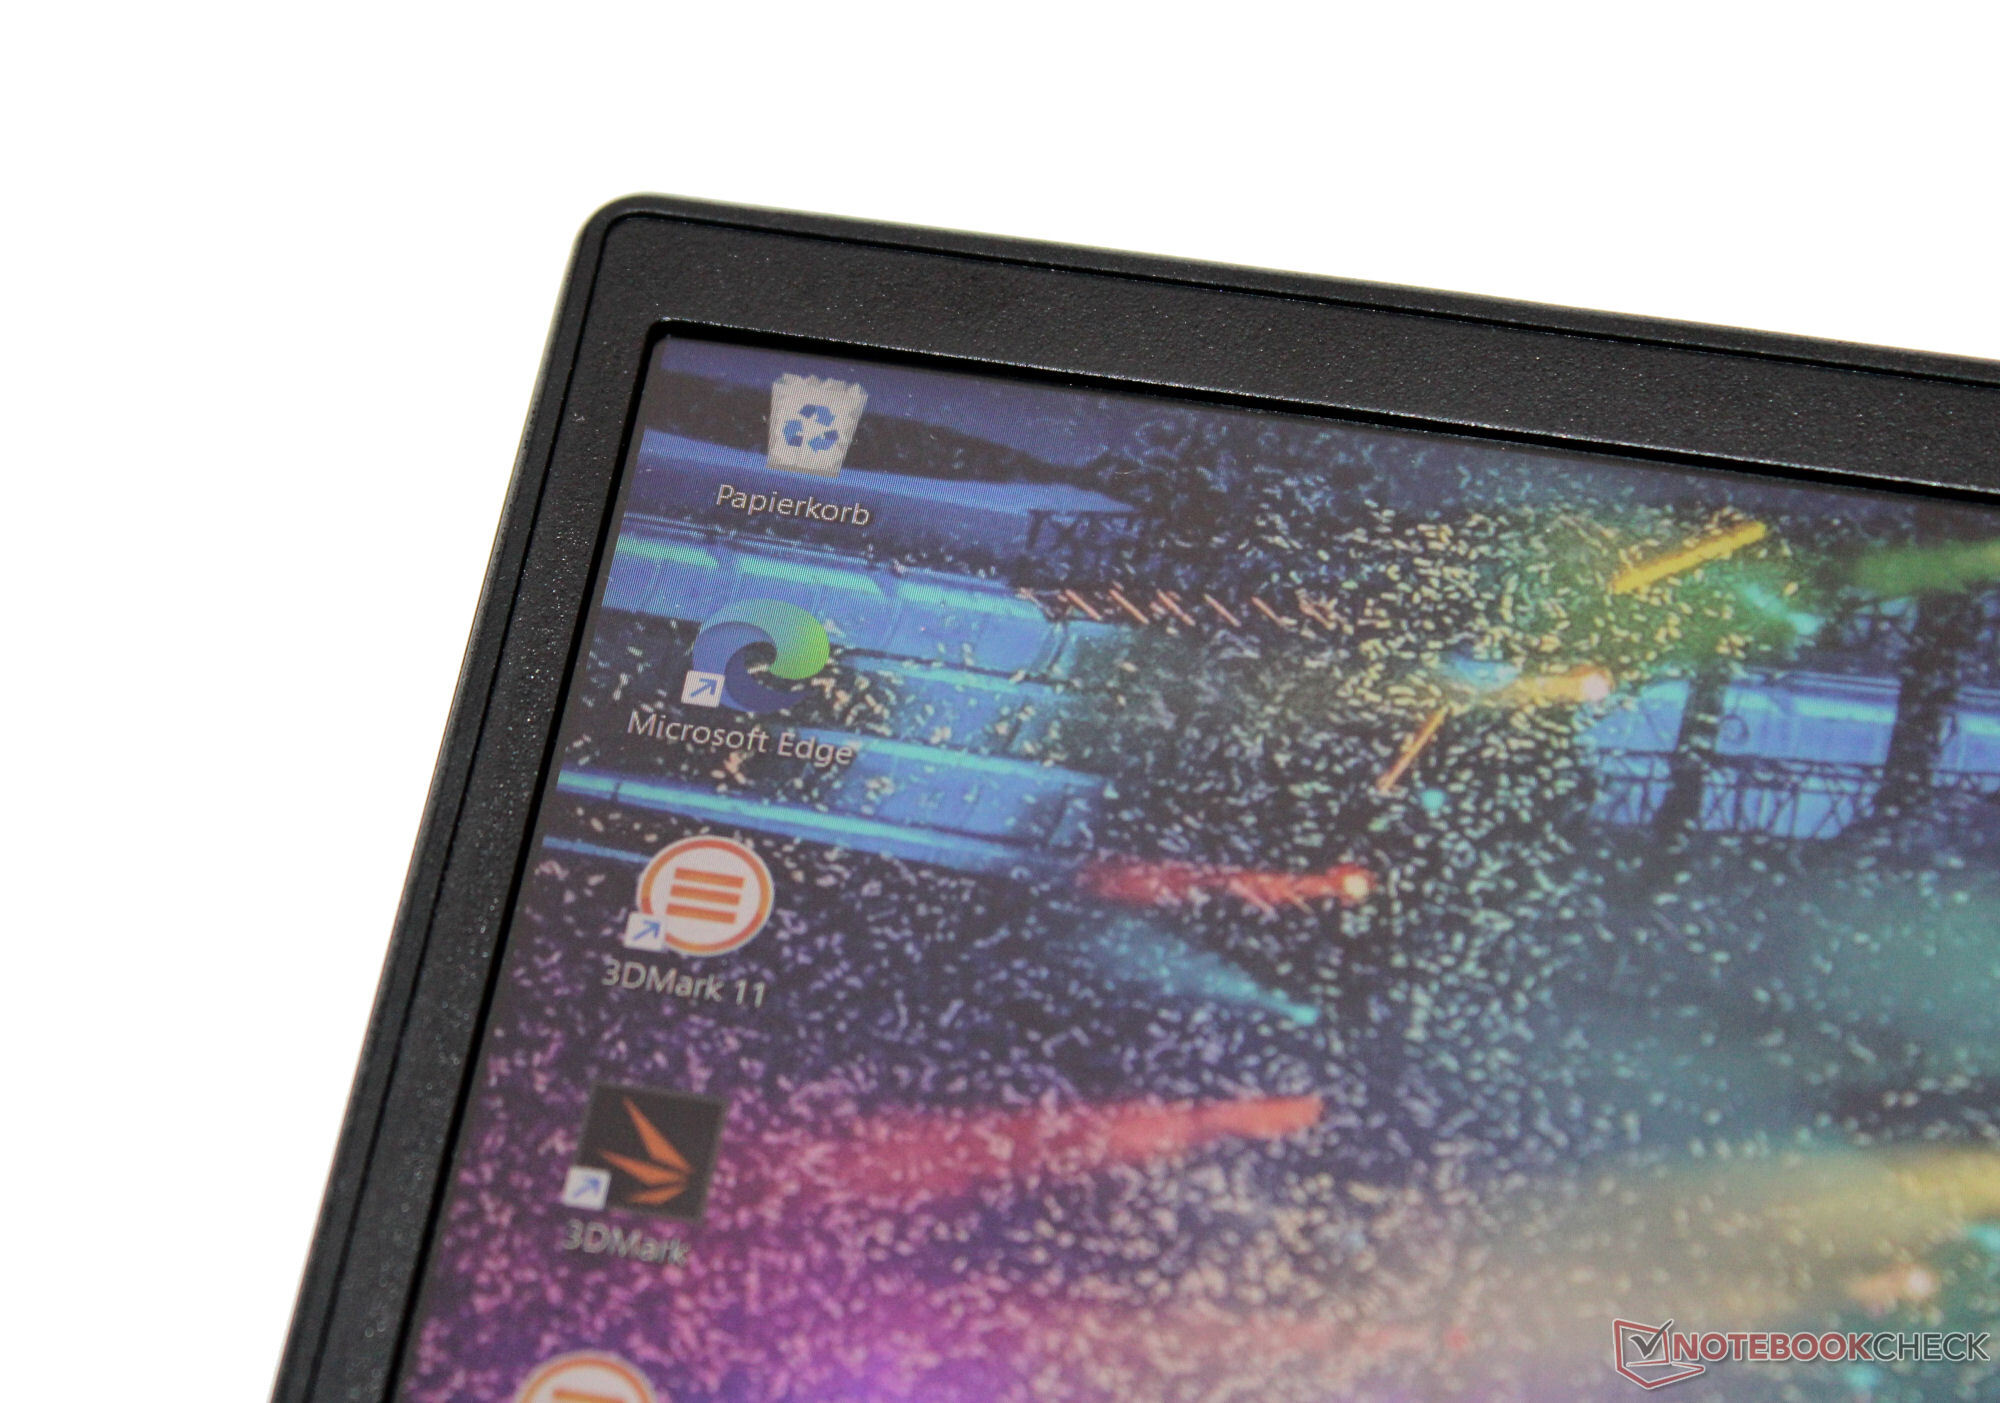
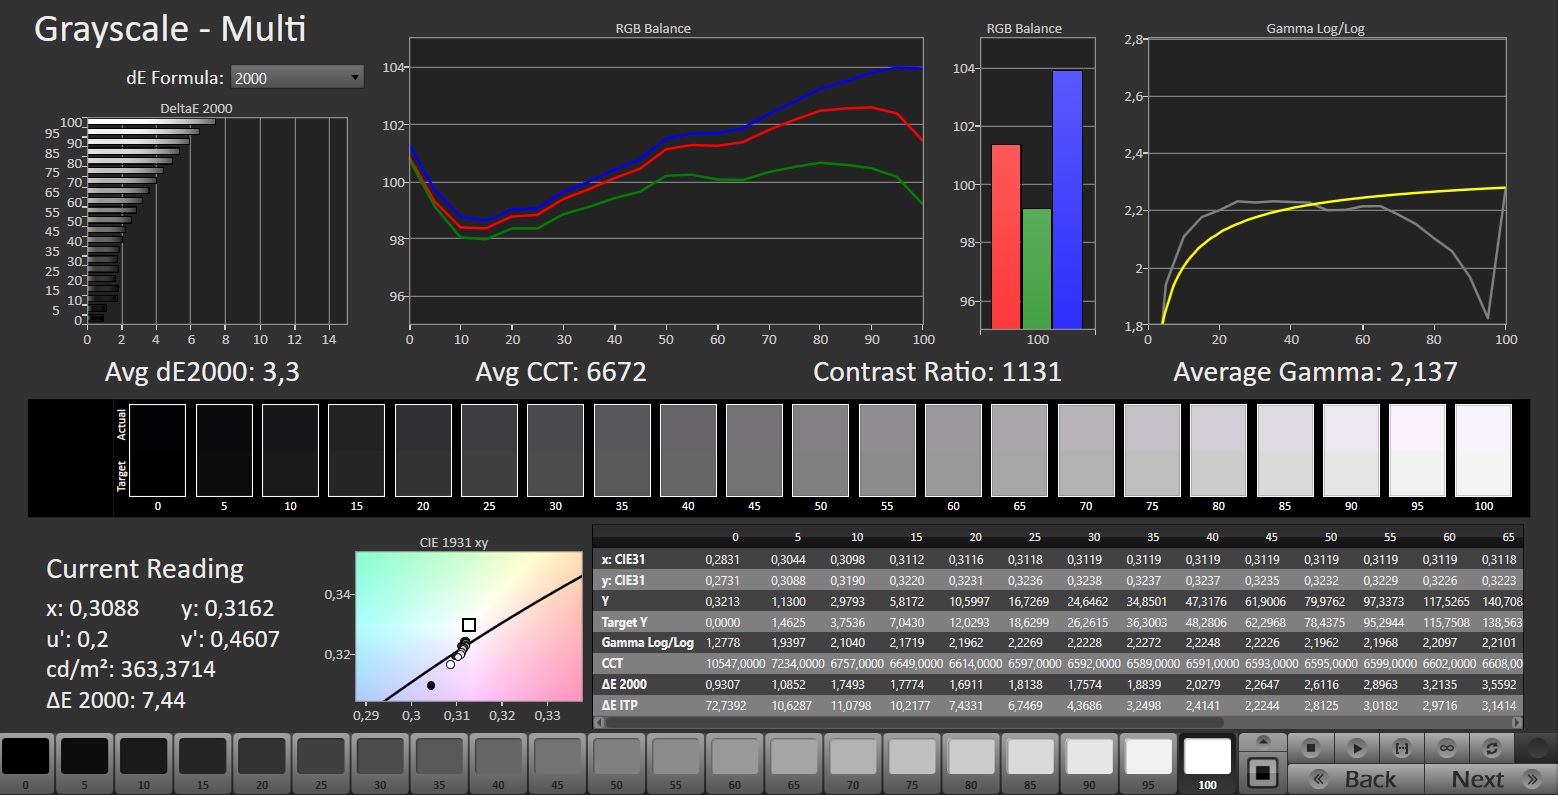
O painel de 240 Hz de reação rápida do dispositivo com uma proporção de 16:10 não mostra sinais de oscilação de PWM em nenhum nível de brilho. O brilho e o contraste da tela fosca de 16 polegadas (2.560 x 1.600 pixels) atingiram suas respectivas metas (> 300 cd/m² e 1.000:1). Não há telas alternativas disponíveis.
| |||||||||||||||||||||||||
iluminação: 93 %
iluminação com acumulador: 349 cd/m²
Contraste: 1091:1 (Preto: 0.32 cd/m²)
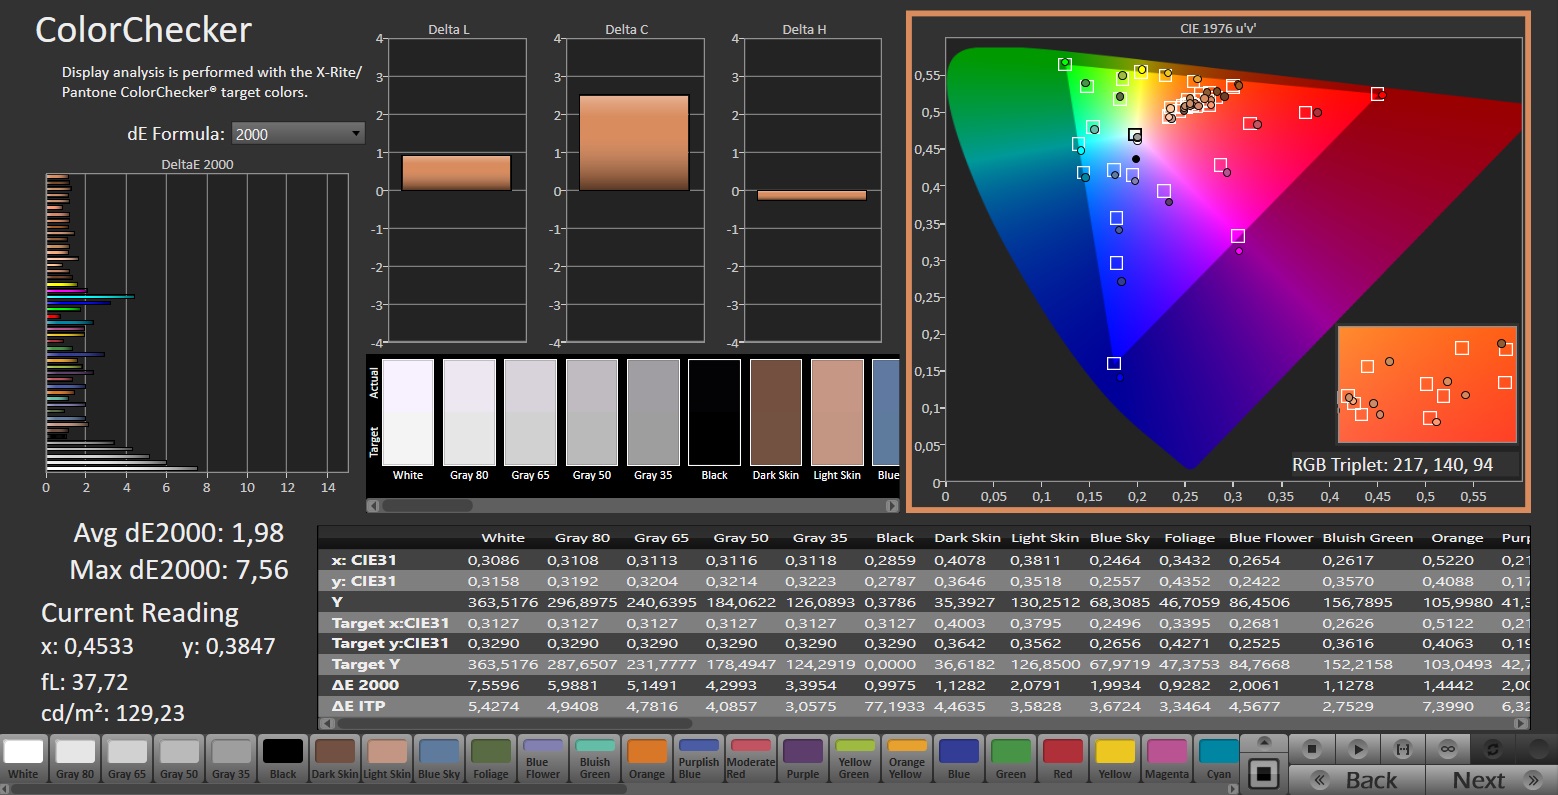
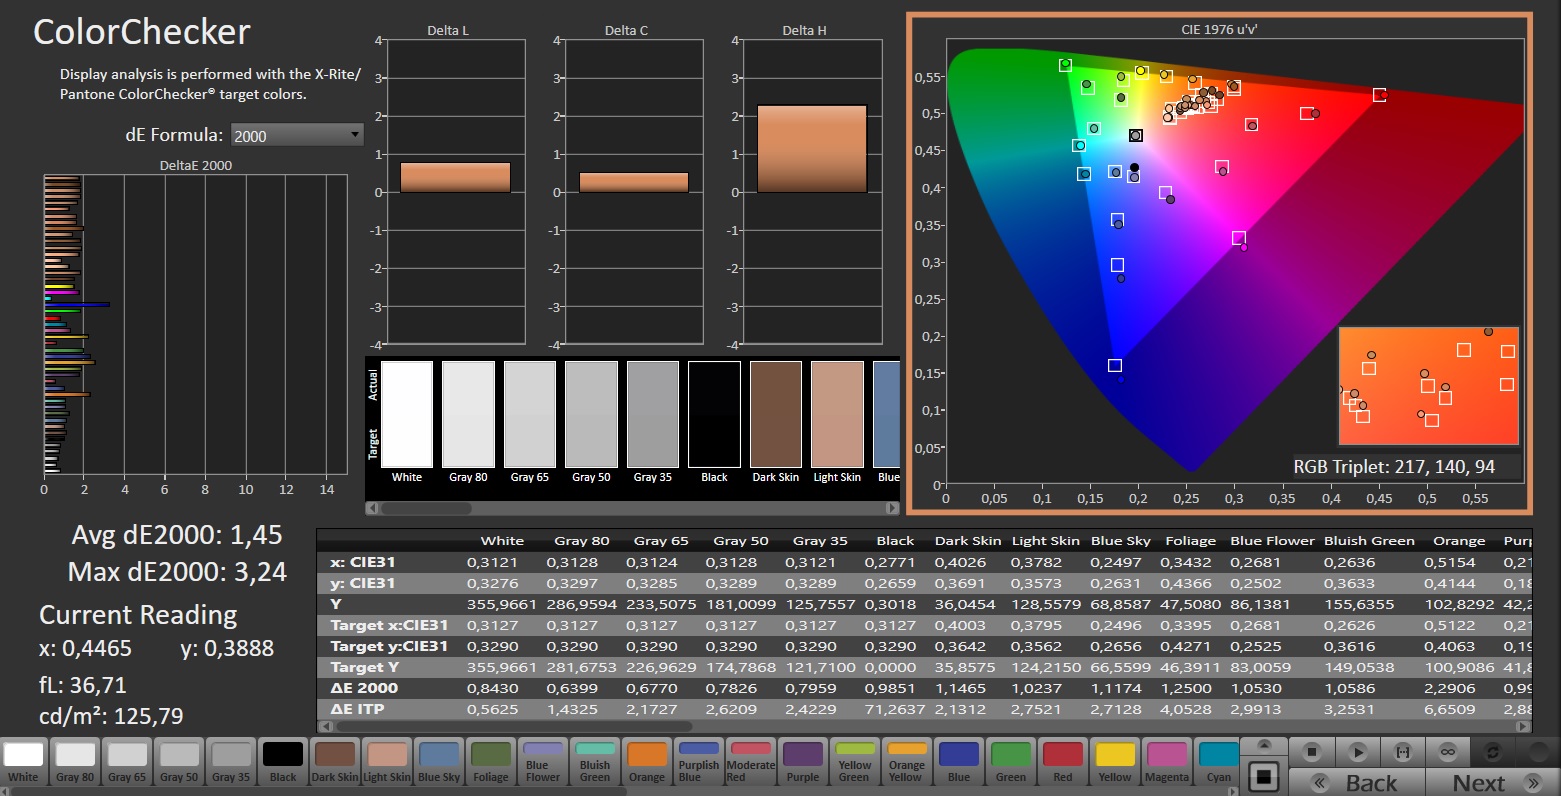
ΔE ColorChecker Calman: 1.98 | ∀{0.5-29.43 Ø4.71}
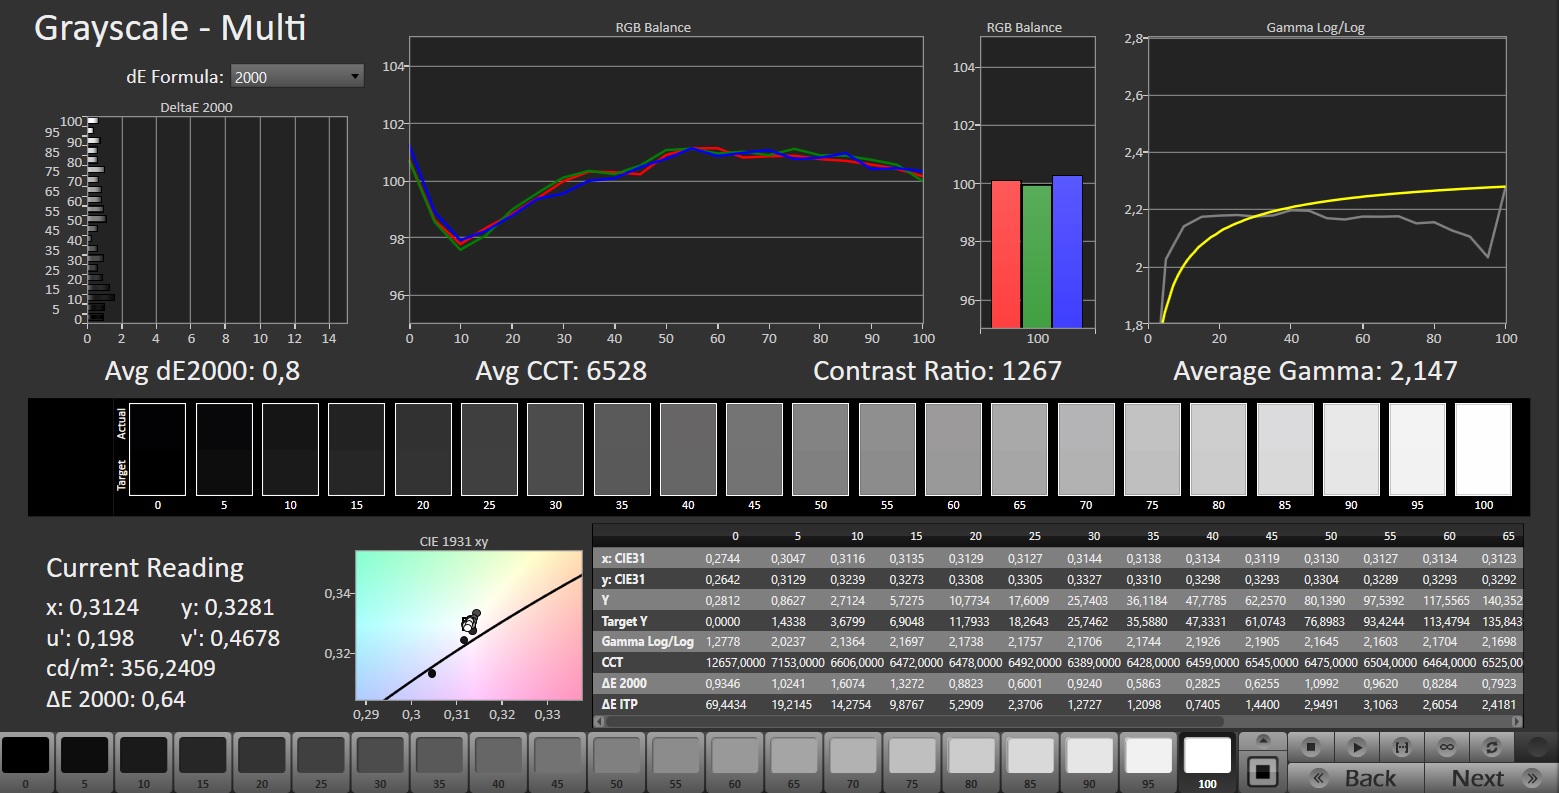
calibrated: 1.45
ΔE Greyscale Calman: 3.3 | ∀{0.09-98 Ø4.96}
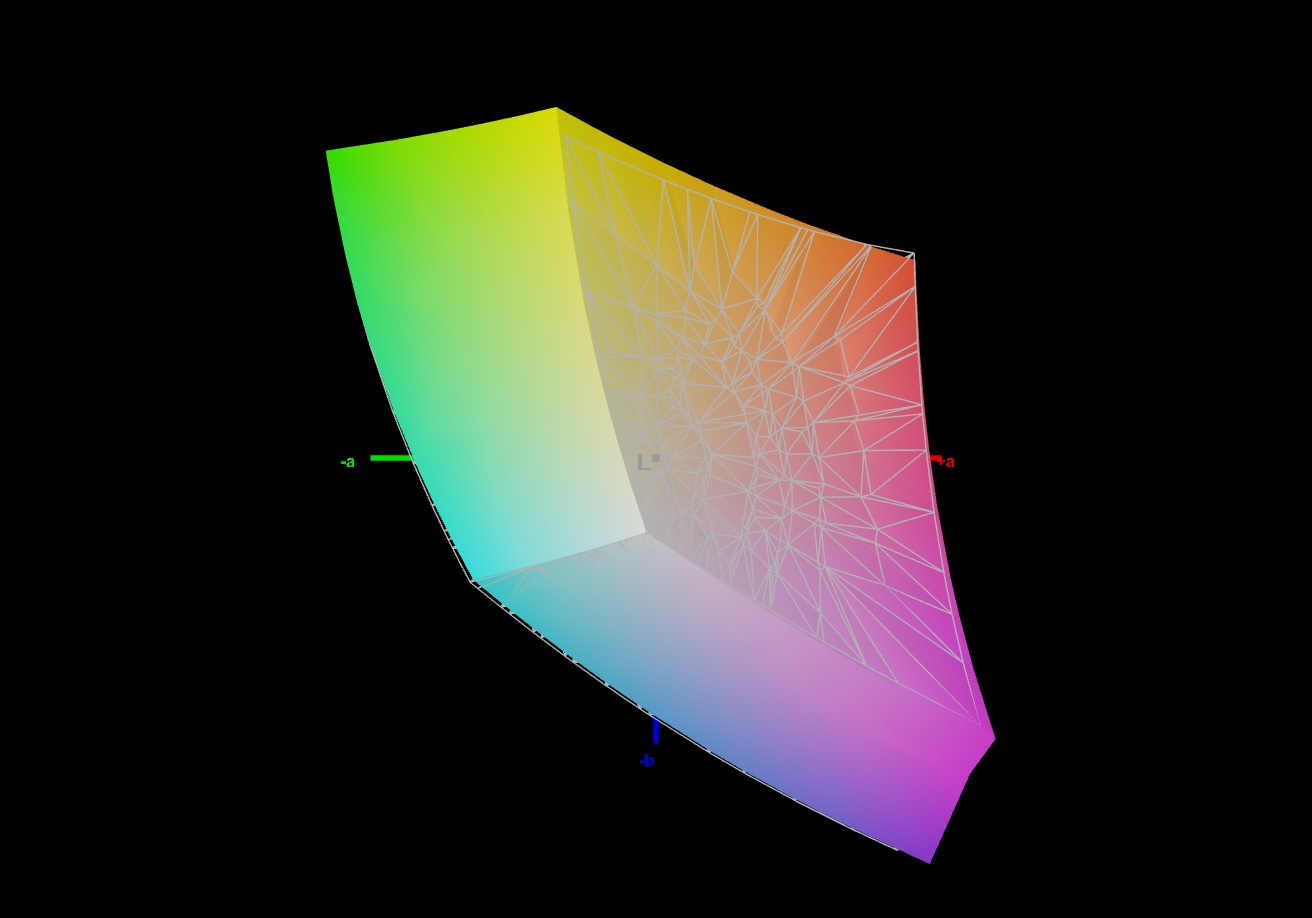
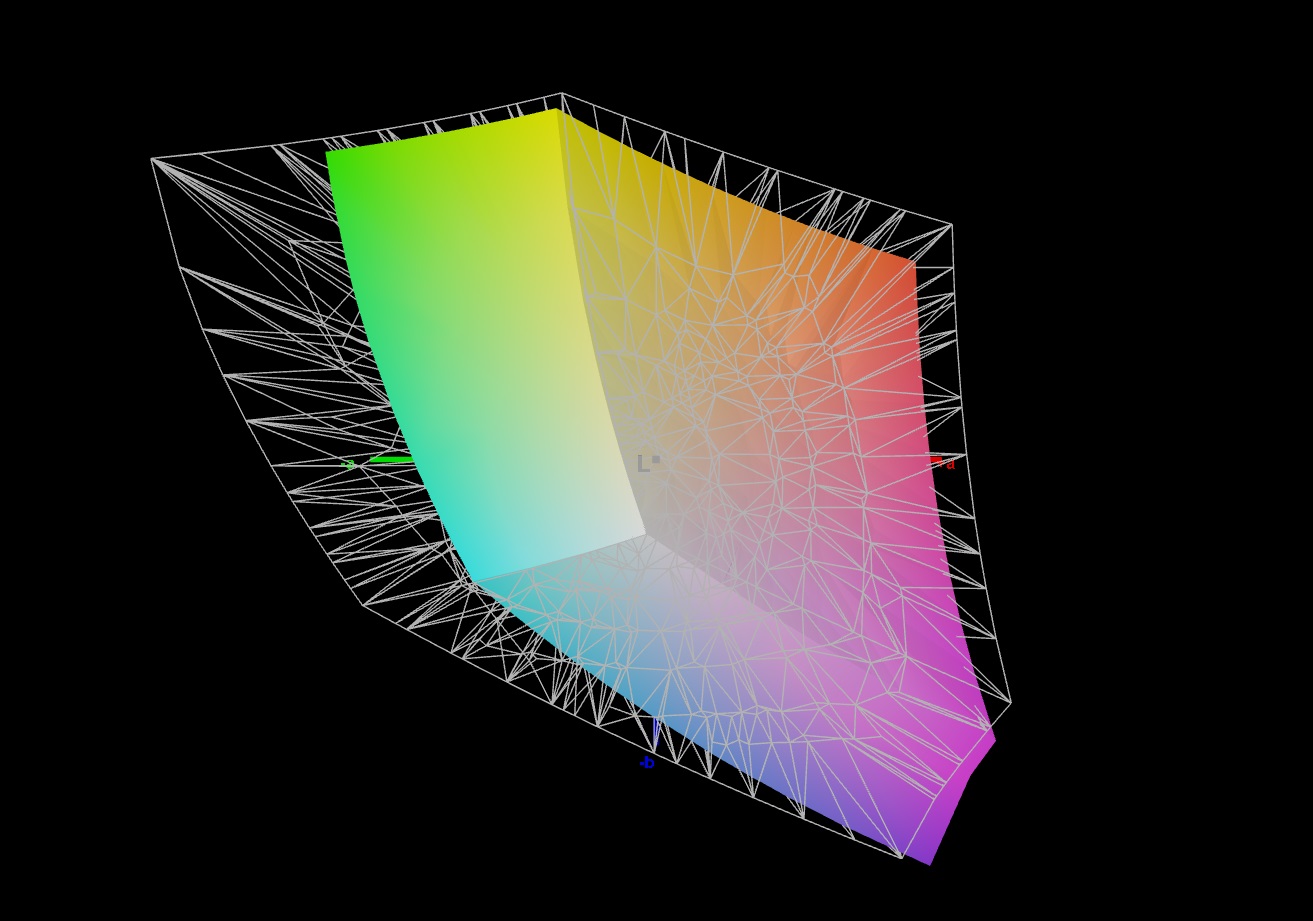
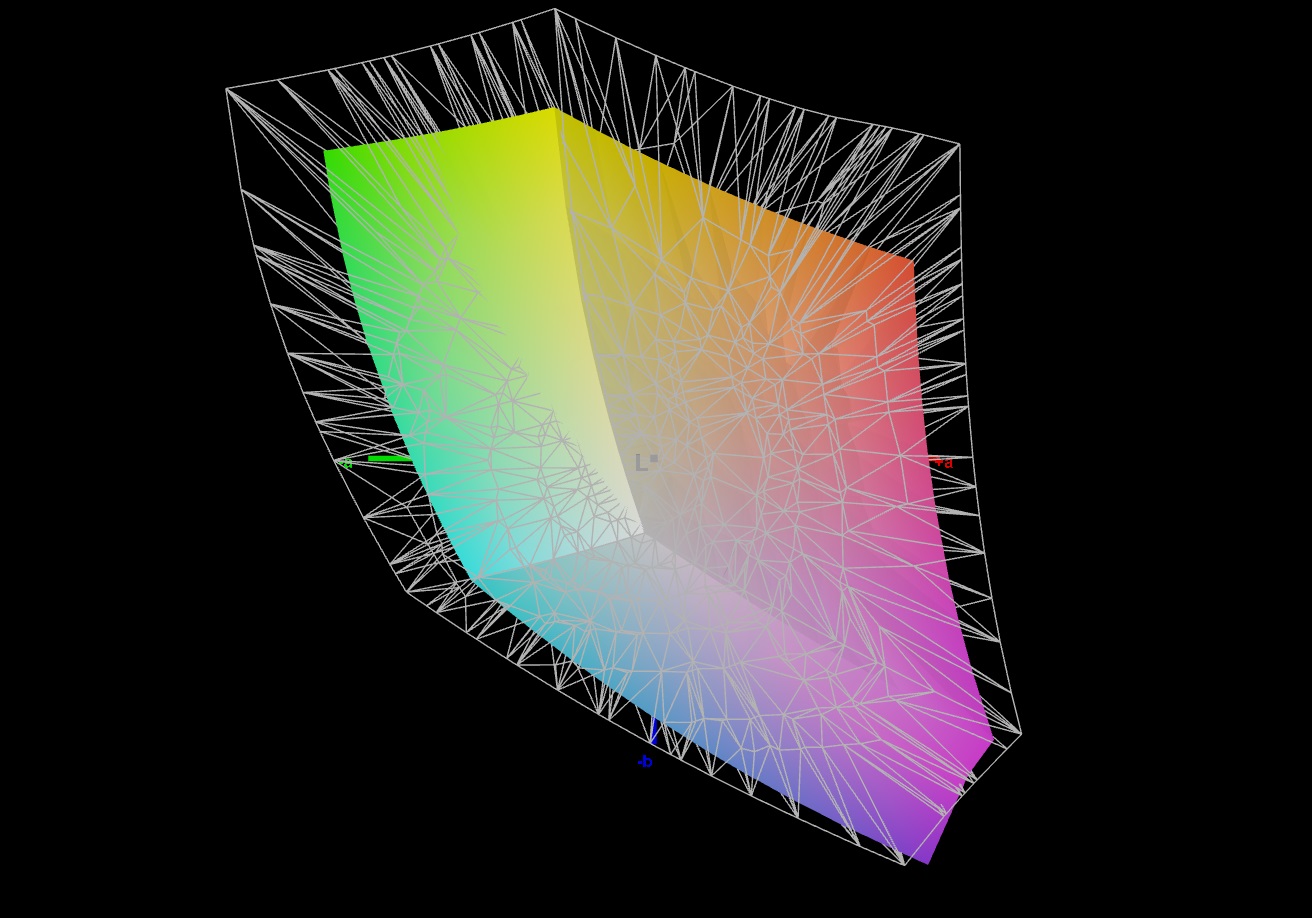
70.1% AdobeRGB 1998 (Argyll 3D)
98.2% sRGB (Argyll 3D)
69.4% Display P3 (Argyll 3D)
Gamma: 2.137
CCT: 6672 K
| Schenker XMG Pro 16 Studio (Mid 23) BOE CQ NE160QDM-NZ1, IPS, 2560x1600, 16" | Asus Vivobook Pro 16X K6604JV-MX016W Samsung SDC4178 ATNA60BX01-1, OLED, 3200x2000, 16" | Lenovo Legion Slim 7i 16 Gen 8 CSOT T3 MNG007DA2-3, IPS, 2560x1600, 16" | HP Omen Transcend 16 AUOA3A6, Mini-LED, 2560x1600, 16" | MSI Stealth 16 Studio A13VG AUO26A9, IPS, 2560x1600, 16" | |
|---|---|---|---|---|---|
| Display | 27% | 2% | 23% | 21% | |
| Display P3 Coverage (%) | 69.4 | 98.4 42% | 70.4 1% | 99.2 43% | 96.4 39% |
| sRGB Coverage (%) | 98.2 | 99.7 2% | 99.4 1% | 100 2% | 99.7 2% |
| AdobeRGB 1998 Coverage (%) | 70.1 | 95.8 37% | 72.5 3% | 87.6 25% | 84.8 21% |
| Response Times | 85% | -7% | -191% | 46% | |
| Response Time Grey 50% / Grey 80% * (ms) | 12.2 ? | 1.6 ? 87% | 12 ? 2% | 26.4 ? -116% | 4.4 ? 64% |
| Response Time Black / White * (ms) | 7.7 ? | 1.4 ? 82% | 8.9 ? -16% | 28.2 ? -266% | 5.6 ? 27% |
| PWM Frequency (Hz) | 120 ? | 3506 ? | |||
| Screen | 66% | 17% | 204% | -19% | |
| Brightness middle (cd/m²) | 349 | 347 -1% | 474.6 36% | 791.1 127% | 424 21% |
| Brightness (cd/m²) | 348 | 346 -1% | 445 28% | 800 130% | 411 18% |
| Brightness Distribution (%) | 93 | 97 4% | 86 -8% | 95 2% | 88 -5% |
| Black Level * (cd/m²) | 0.32 | 0.06 81% | 0.39 -22% | 0.04 87% | 0.37 -16% |
| Contrast (:1) | 1091 | 5783 430% | 1217 12% | 19778 1713% | 1146 5% |
| Colorchecker dE 2000 * | 1.98 | 1.89 5% | 2.12 -7% | 4.37 -121% | 3.04 -54% |
| Colorchecker dE 2000 max. * | 7.56 | 3.26 57% | 4.73 37% | 10.39 -37% | 7.5 1% |
| Colorchecker dE 2000 calibrated * | 1.45 | 1.97 -36% | 0.57 61% | 1.04 28% | 3.04 -110% |
| Greyscale dE 2000 * | 3.3 | 1.55 53% | 2.8 15% | 6.5 -97% | 4.34 -32% |
| Gamma | 2.137 103% | 2.39 92% | 2.22 99% | 2.28 96% | 2.32 95% |
| CCT | 6672 97% | 6458 101% | 6542 99% | 6000 108% | 6952 93% |
| Média Total (Programa/Configurações) | 59% /
60% | 4% /
10% | 12% /
109% | 16% /
-1% |
* ... menor é melhor
Assim que sai da caixa, a tela mostra uma representação de cores muito boa: Com um desvio de cerca de 2, sua meta (DeltaE < 3) é atingida. A calibração da tela leva a um desvio menor de 1,45 e a tons de cinza mais equilibrados. O painel pode representar quase totalmente o espaço de cores sRGB, mas não o AdobeRGB ou o DCI P3. Aqui, a concorrência às vezes tem mais a oferecer.

Exibir tempos de resposta
| ↔ Tempo de resposta preto para branco | ||
|---|---|---|
| 7.7 ms ... ascensão ↗ e queda ↘ combinadas | ↗ 4 ms ascensão | 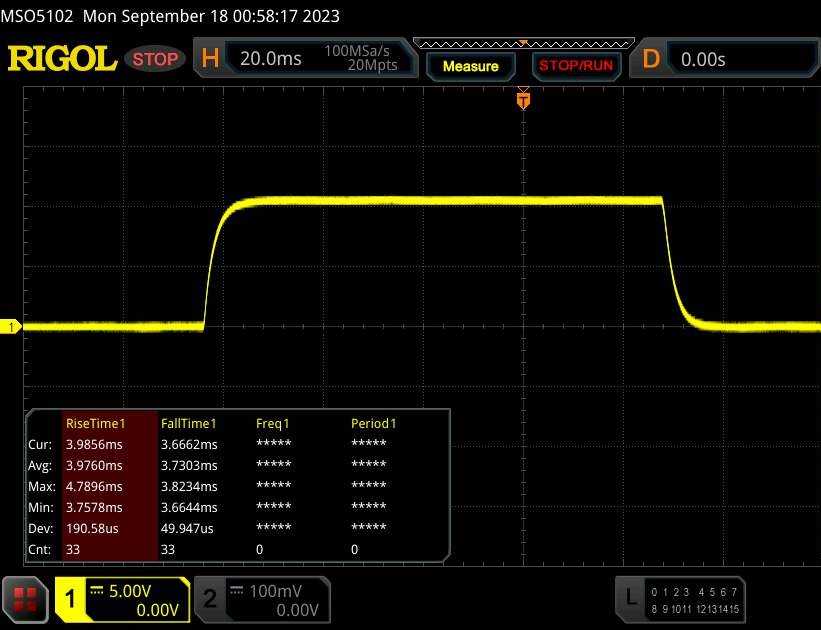 |
| ↘ 3.7 ms queda | ||
| A tela mostra taxas de resposta muito rápidas em nossos testes e deve ser muito adequada para jogos em ritmo acelerado. Em comparação, todos os dispositivos testados variam de 0.1 (mínimo) a 240 (máximo) ms. » 22 % de todos os dispositivos são melhores. Isso significa que o tempo de resposta medido é melhor que a média de todos os dispositivos testados (19.8 ms). | ||
| ↔ Tempo de resposta 50% cinza a 80% cinza | ||
| 12.2 ms ... ascensão ↗ e queda ↘ combinadas | ↗ 5.9 ms ascensão | 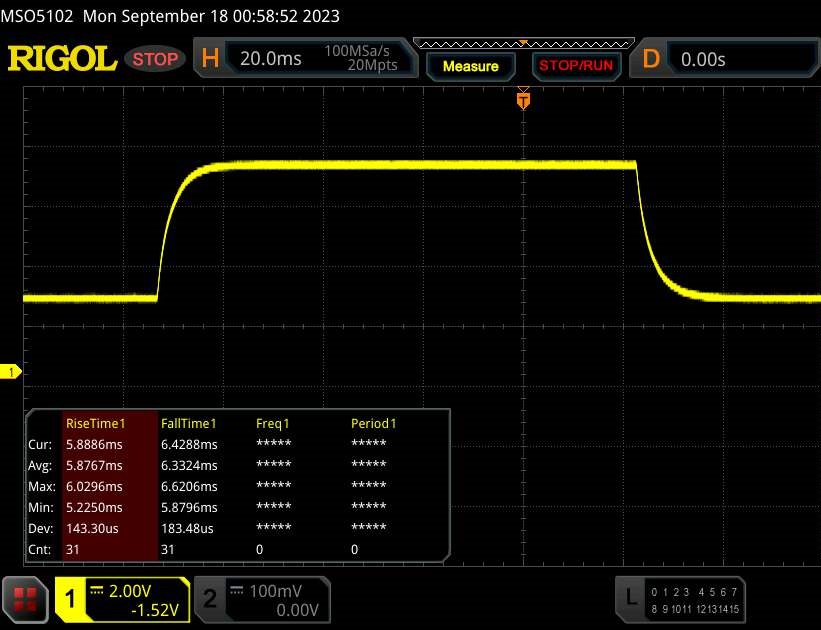 |
| ↘ 6.3 ms queda | ||
| A tela mostra boas taxas de resposta em nossos testes, mas pode ser muito lenta para jogadores competitivos. Em comparação, todos os dispositivos testados variam de 0.165 (mínimo) a 636 (máximo) ms. » 26 % de todos os dispositivos são melhores. Isso significa que o tempo de resposta medido é melhor que a média de todos os dispositivos testados (31 ms). | ||
Cintilação da tela / PWM (modulação por largura de pulso)
| Tela tremeluzindo / PWM não detectado | 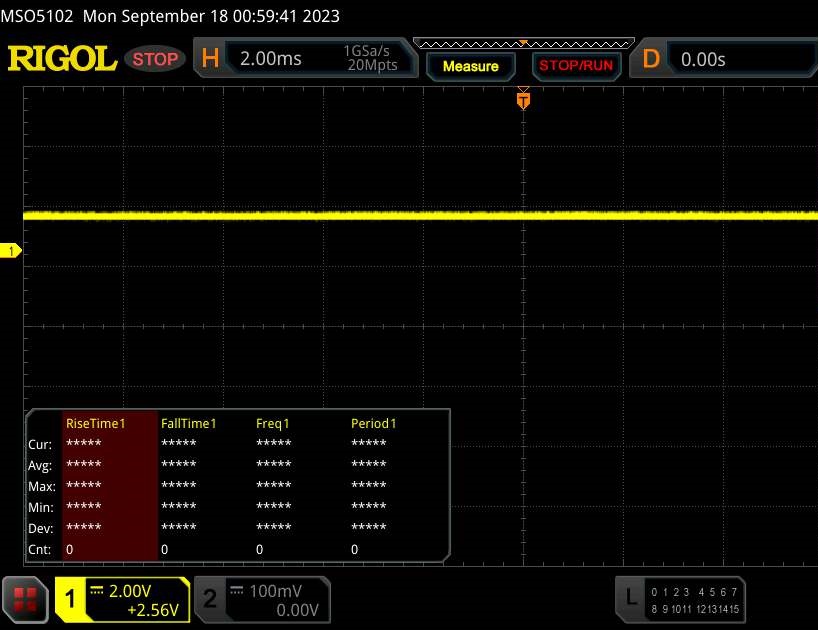 | ||
[pwm_comparison] Em comparação: 52 % de todos os dispositivos testados não usam PWM para escurecer a tela. Se PWM foi detectado, uma média de 7757 (mínimo: 5 - máximo: 343500) Hz foi medida. | |||
O painel IPS estável com ângulo de visão do laptop permanece legível de todos os ângulos. Na área externa, o senhor pode ler na tela, desde que o sol não esteja brilhando muito forte.
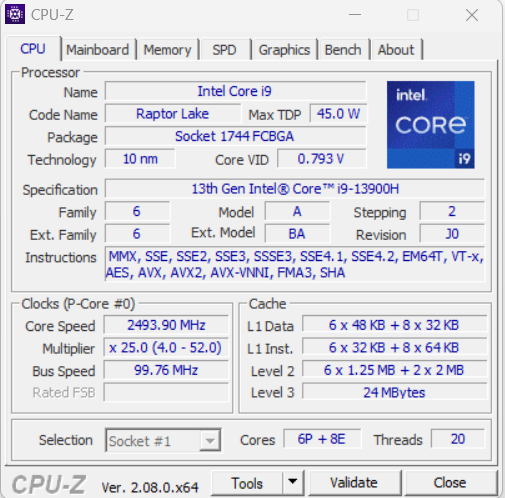
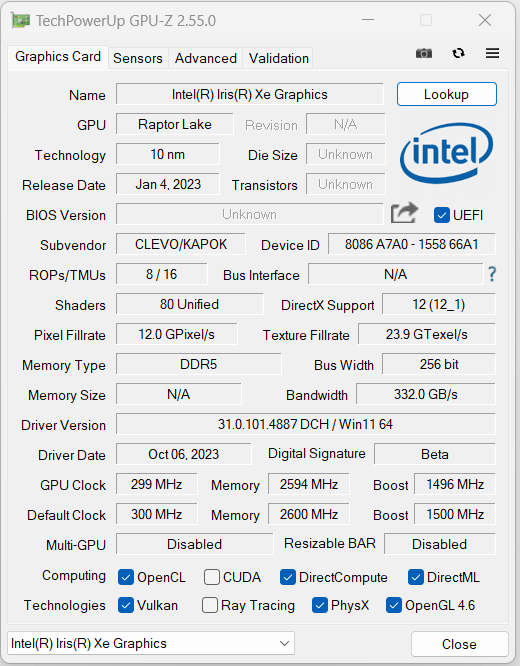
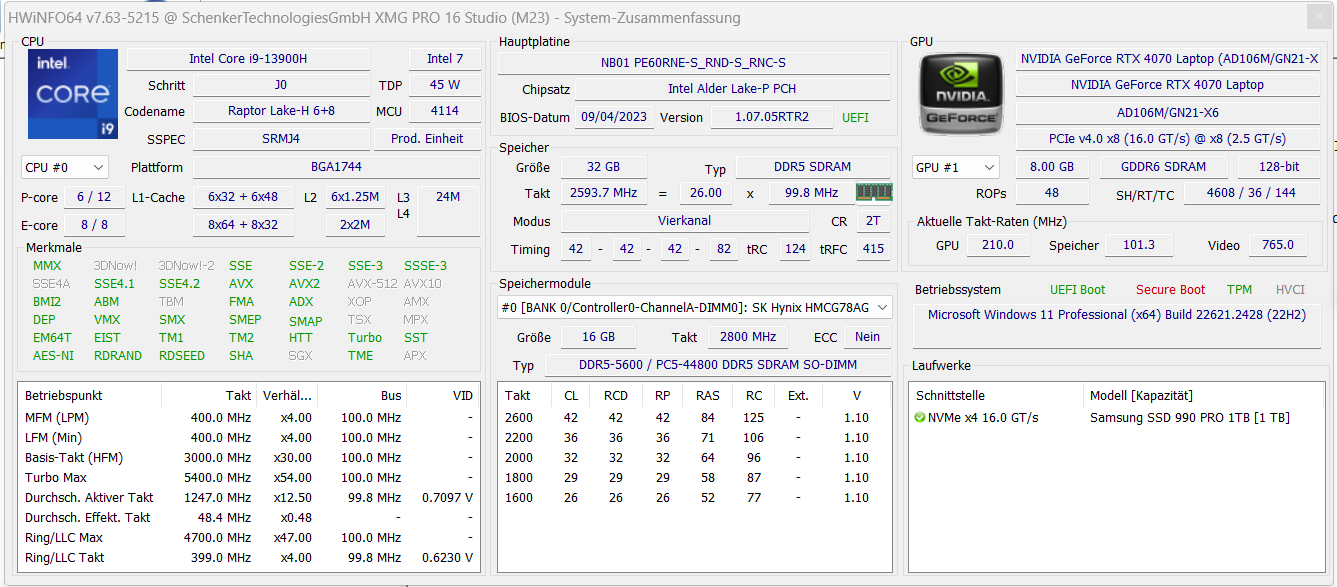
Desempenho - O laptop Schenker conta com o Raptor Lake e o Ada Lovelace
O XMG Pro 16 Studio, voltado para jogadores e criadores, conta com Raptor Lake e Ada Lovelace. A certificação GeForce RTX Studio deve garantir alto desempenho, drivers personalizados, bom suporte de software e uma cobertura adequada do espaço de cores da tela. O laptop pode ser configurado individualmente na loja on-line da Schenker. A variante atual pode ser adquirida por cerca de US$ 2.400 e os modelos mais baratos custam a partir de US$ 1.900.
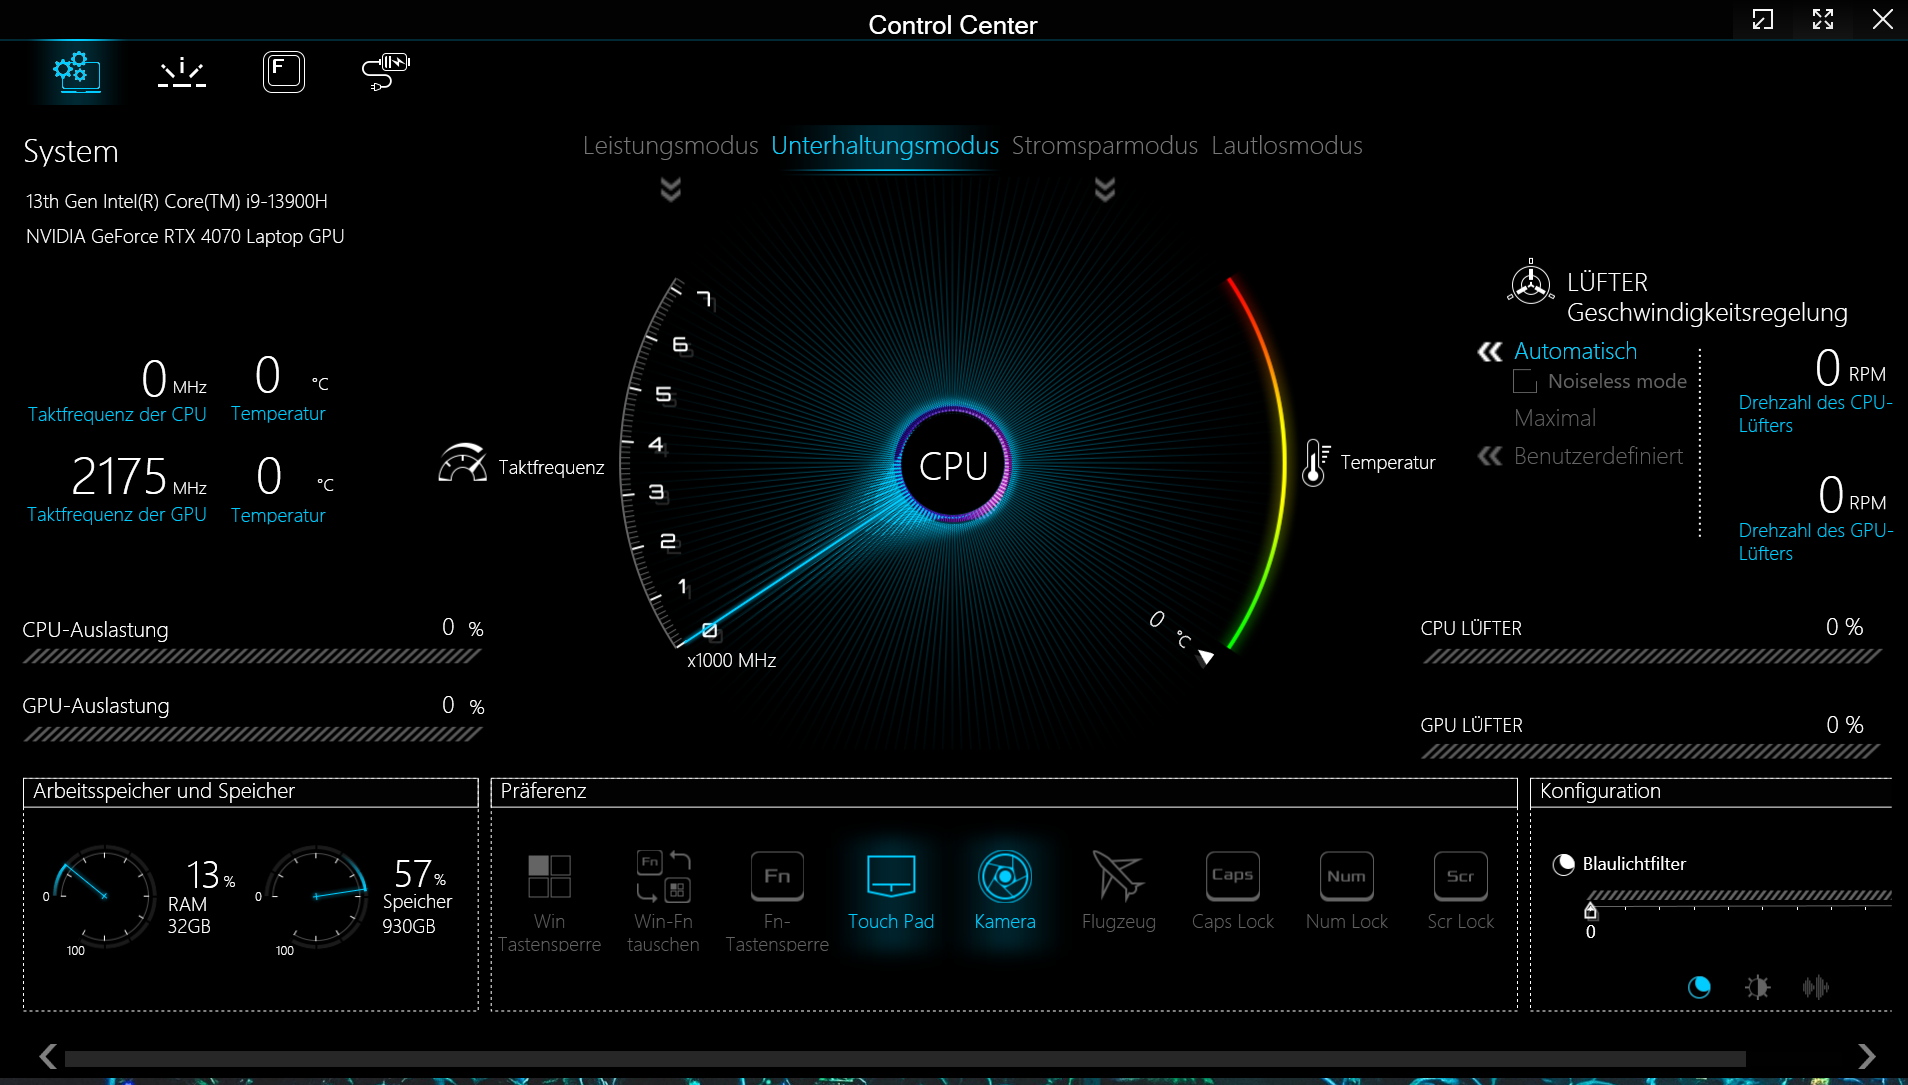
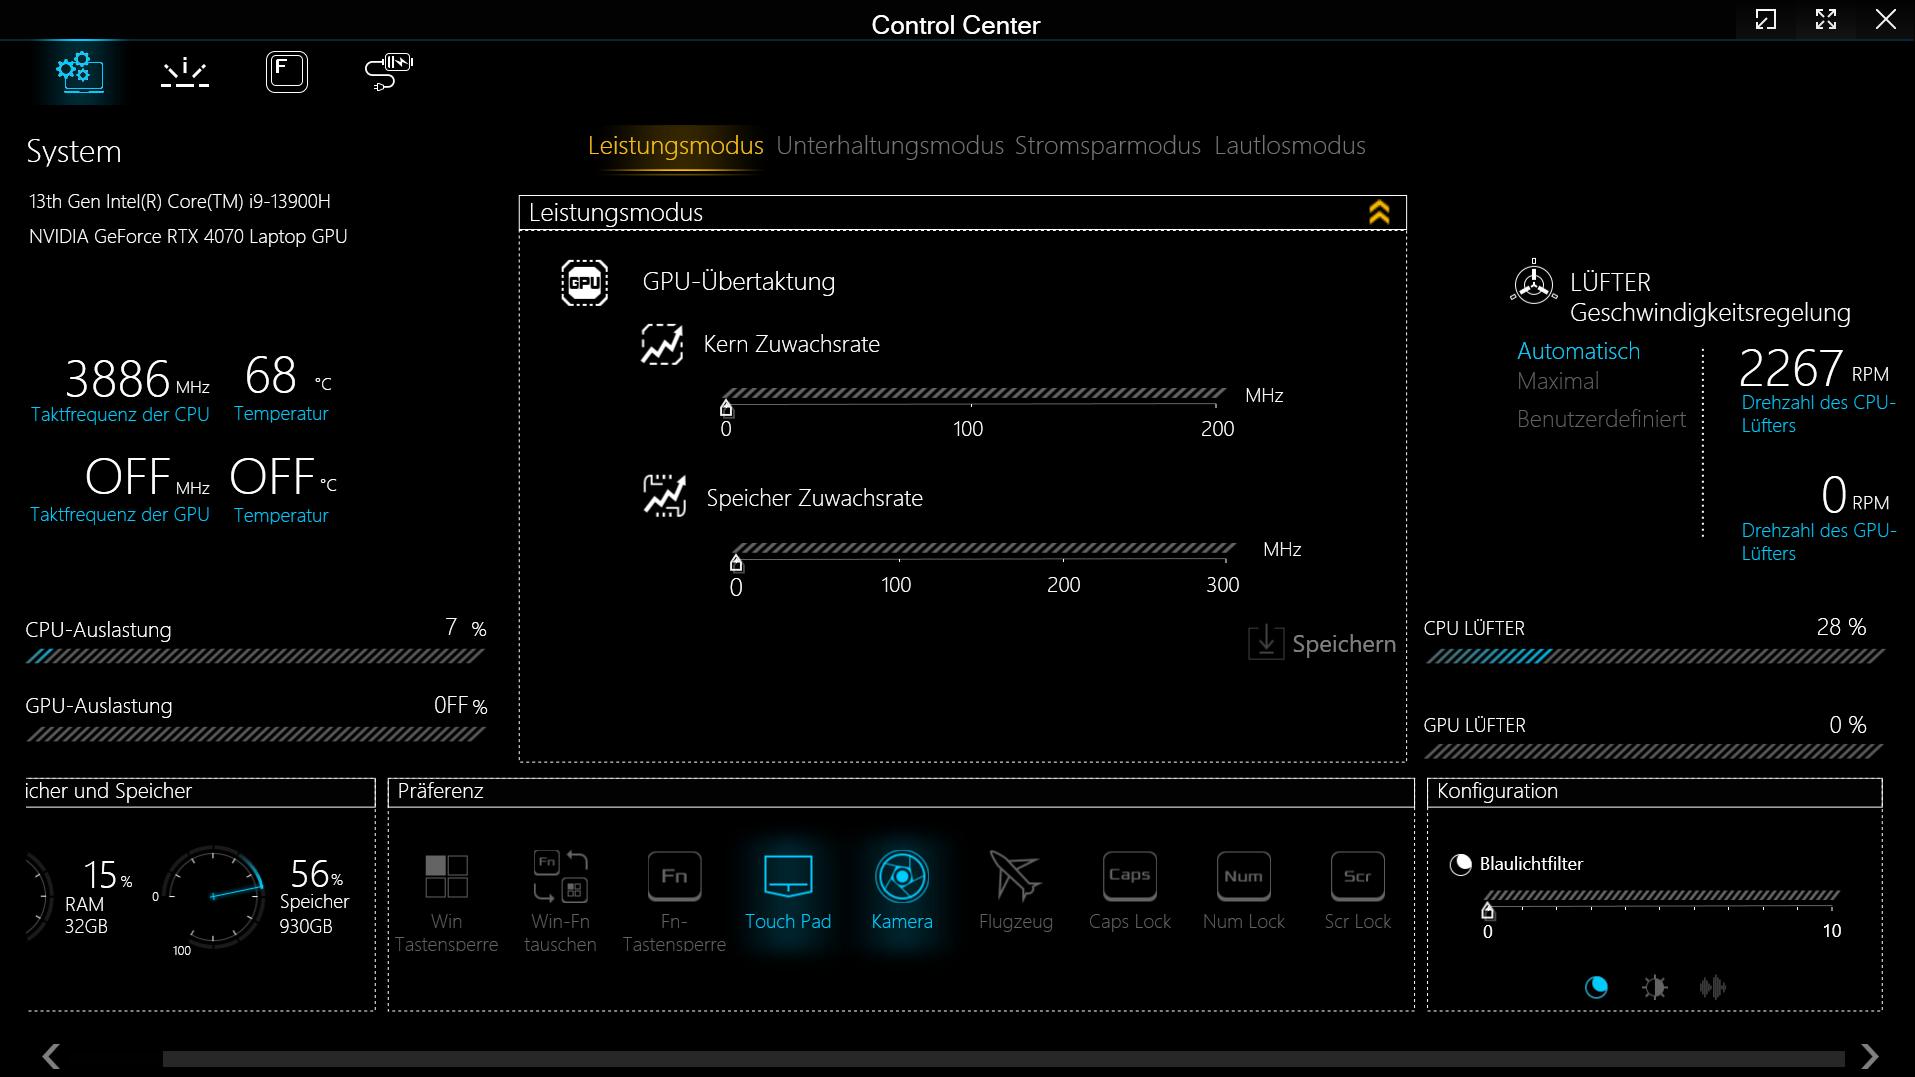
Condições de teste
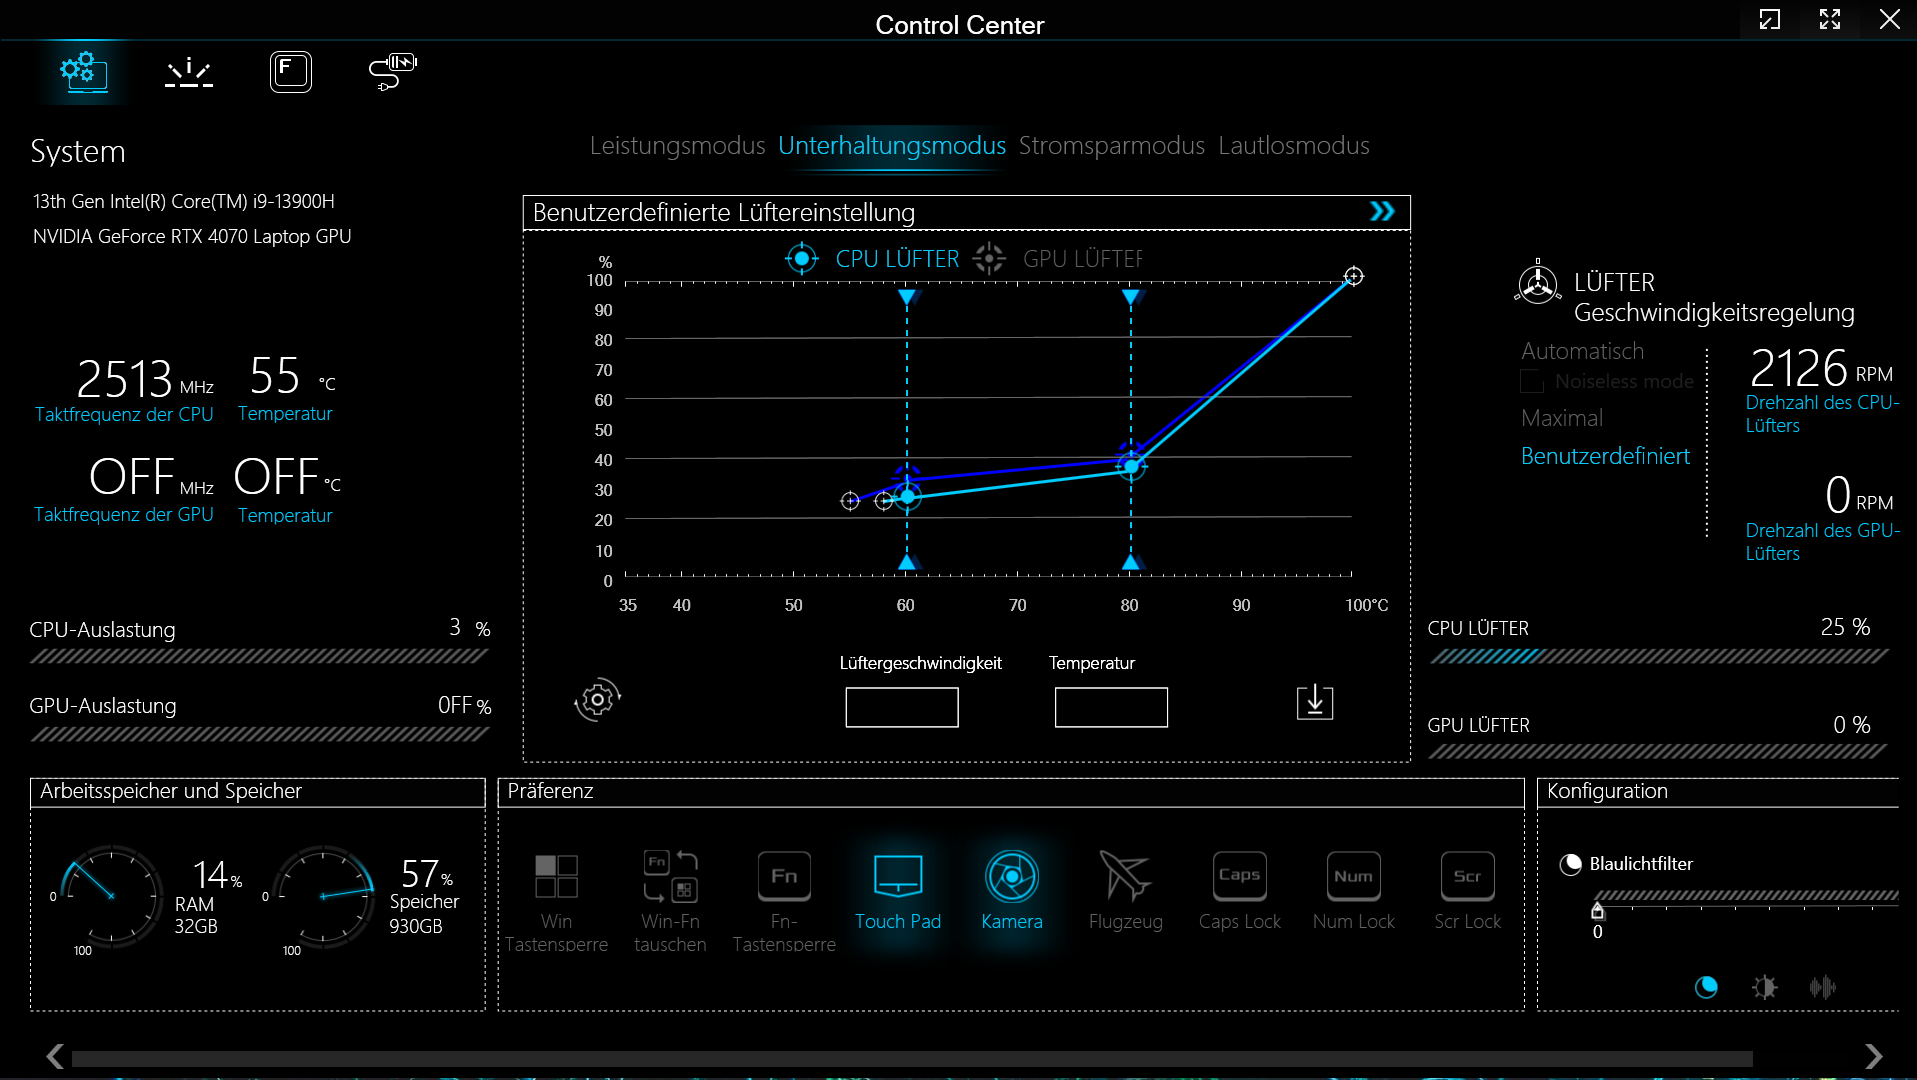
O Pro oferece quatro modos de desempenho específicos do fabricante (consulte a tabela) que podem ser alternados por meio do software Control Center (o centro de controle do laptop). foram usados o "Modo de entretenimento" (benchmarks) e o "Modo de economia de energia" (testes de bateria). O Optimus estava ativo.
| Entertainment Mode (Modo de entretenimento) | Performance Mode (Modo de desempenho) | Power Saving Mode (Modo de economia de energia) | Silent Mode (Modo silencioso) | |
|---|---|---|---|---|
| Limite de energia 1 (HWInfo) | 70 watts | 100 watts | 15 watts | 15 watts |
| Limite de energia 2 (HWInfo) | 90 watts | 120 watts | 30 watts | 30 watts |
| Ruído (Witcher 3) | 48 dB(A) | 55 dB (A) | - | 42 dB (A) |
| Desempenho (Witcher 3) | ~114 fps | ~118 fps | - | ~100-114 fps |
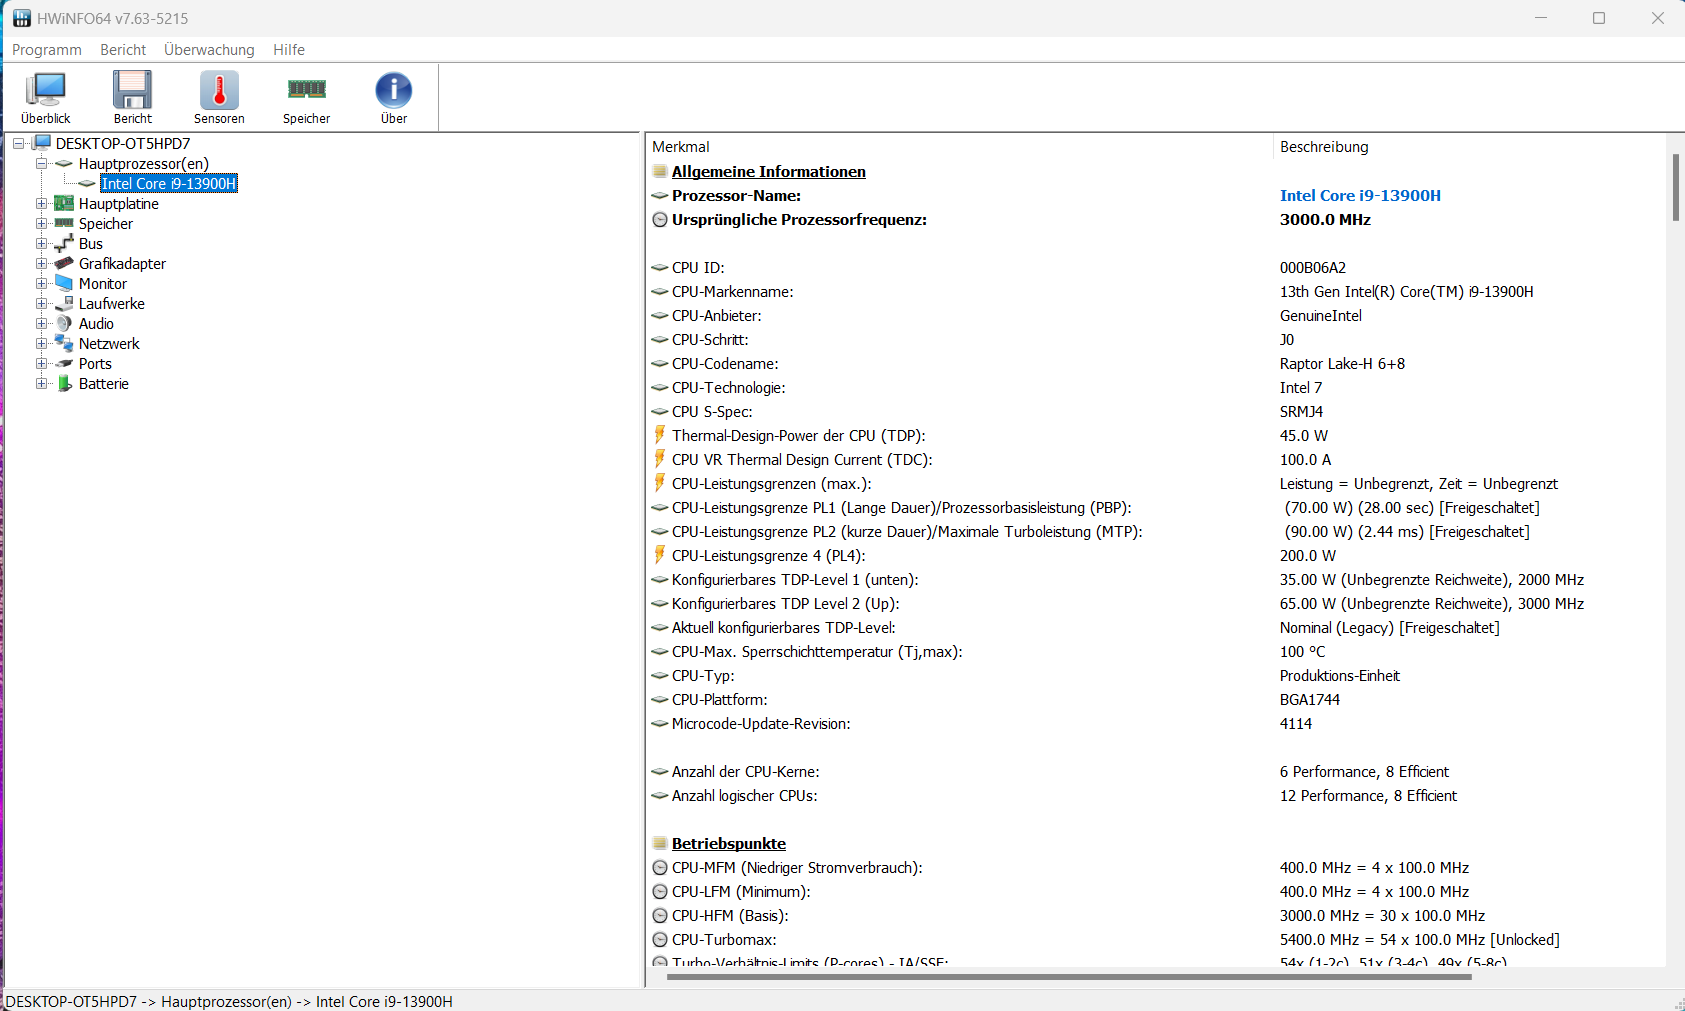
Processador
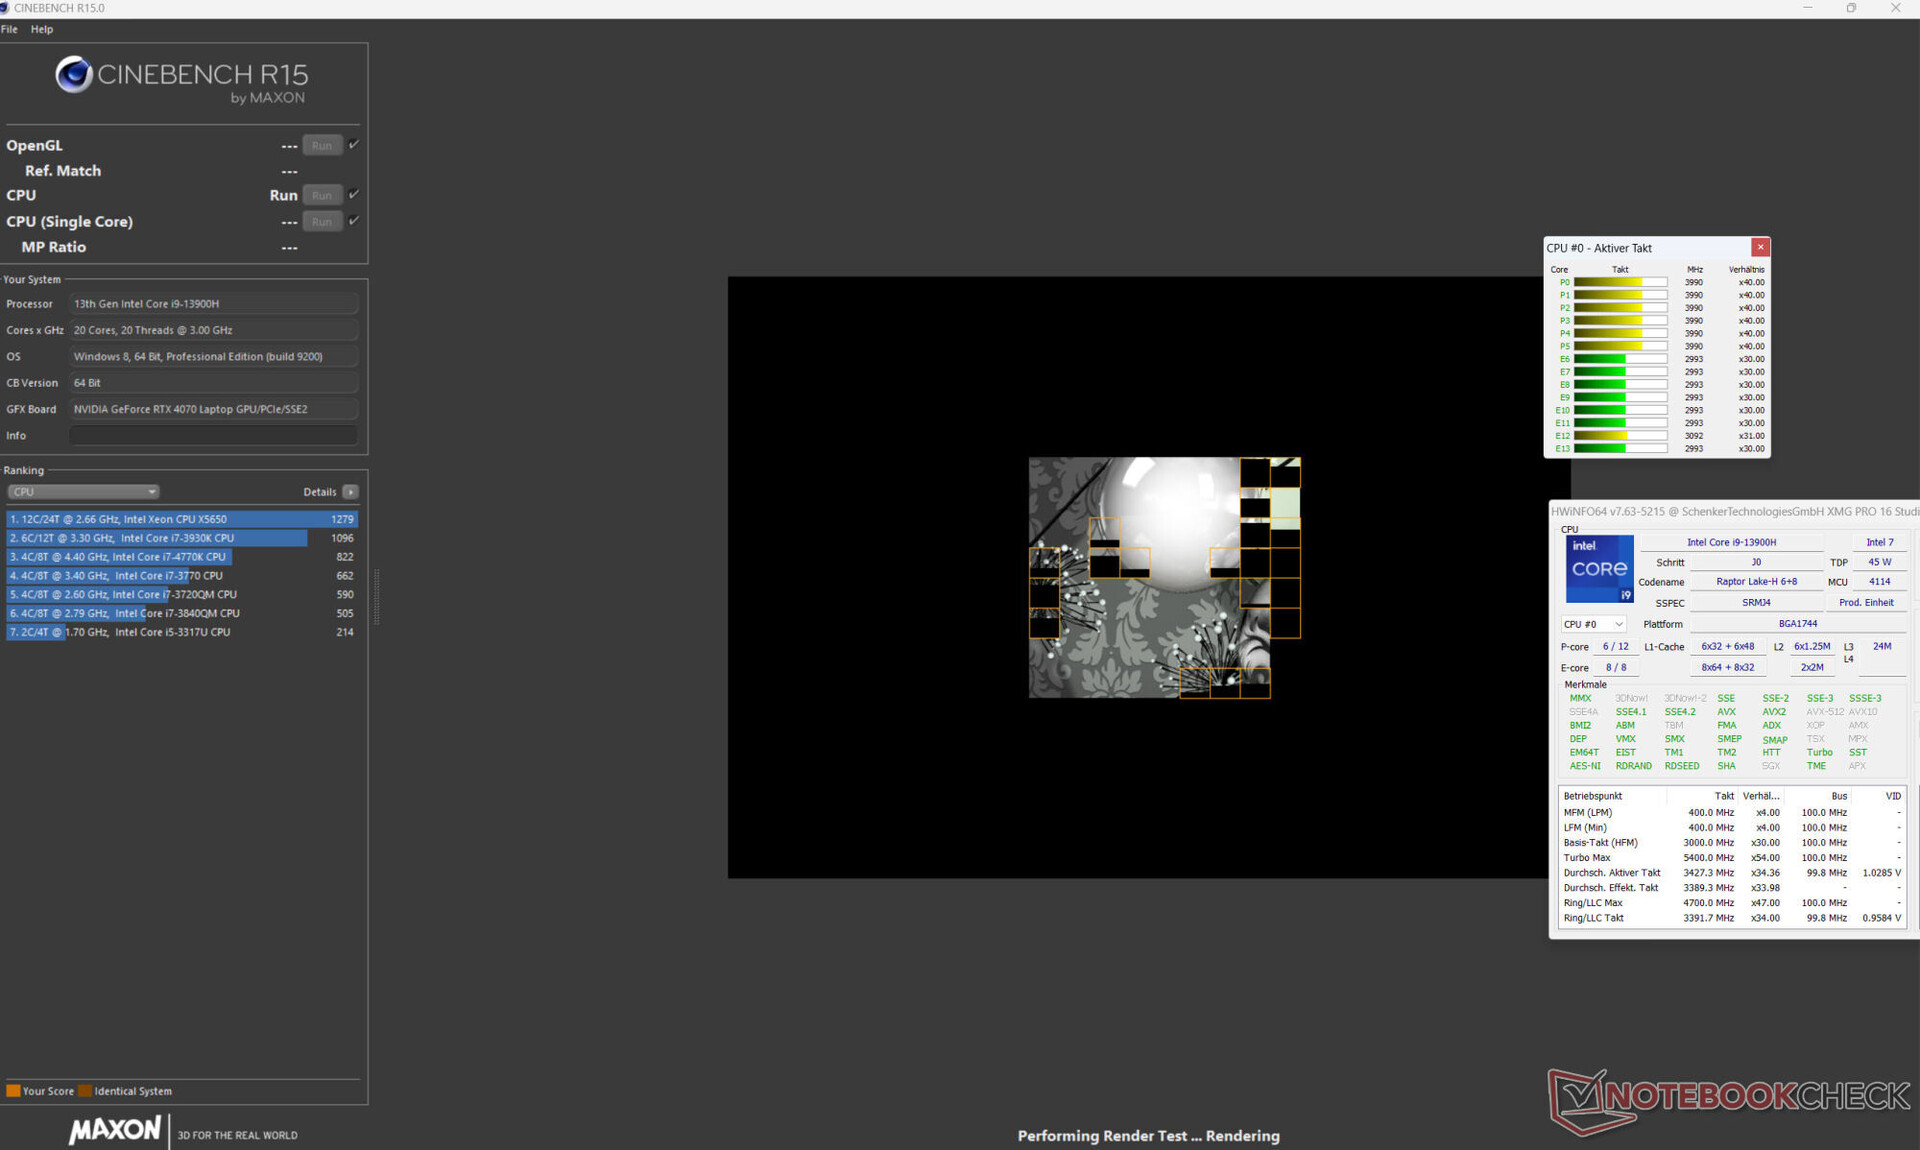
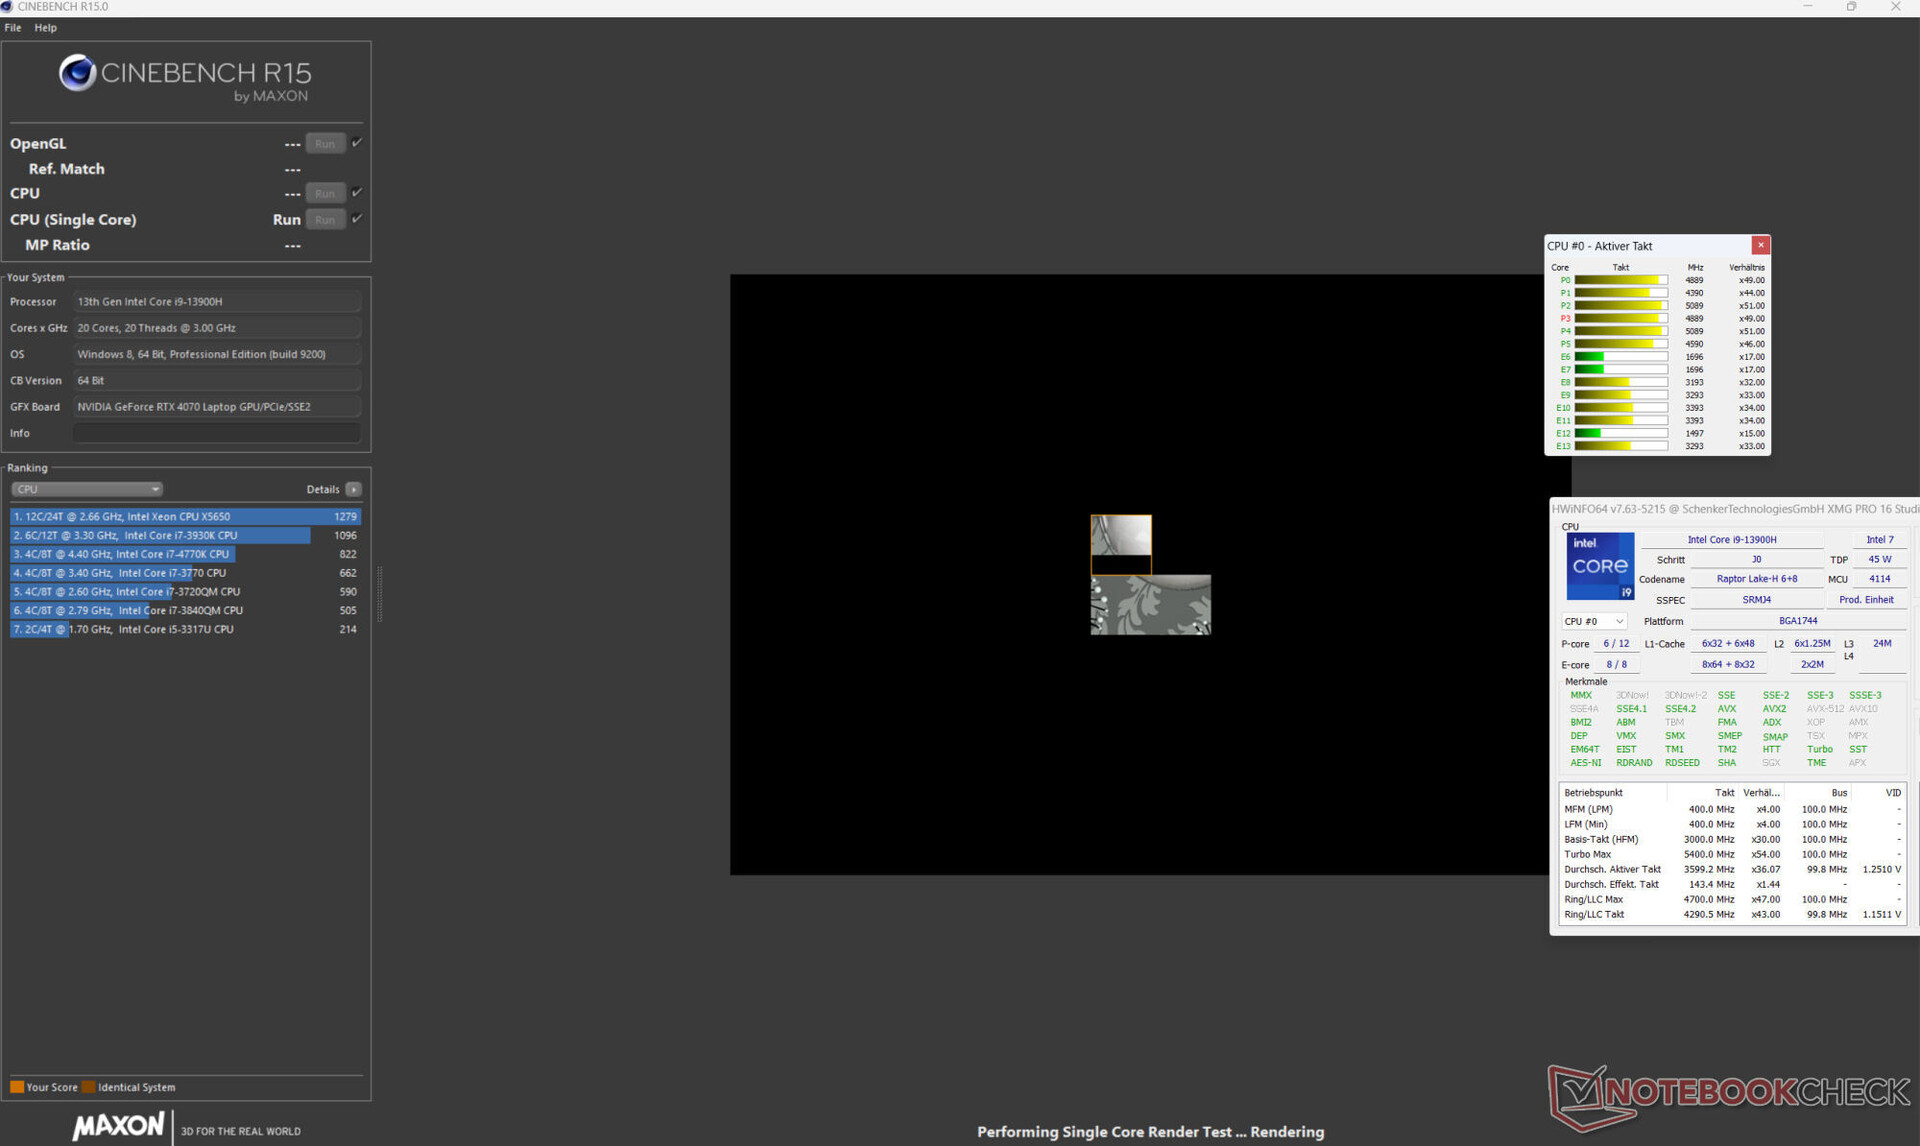
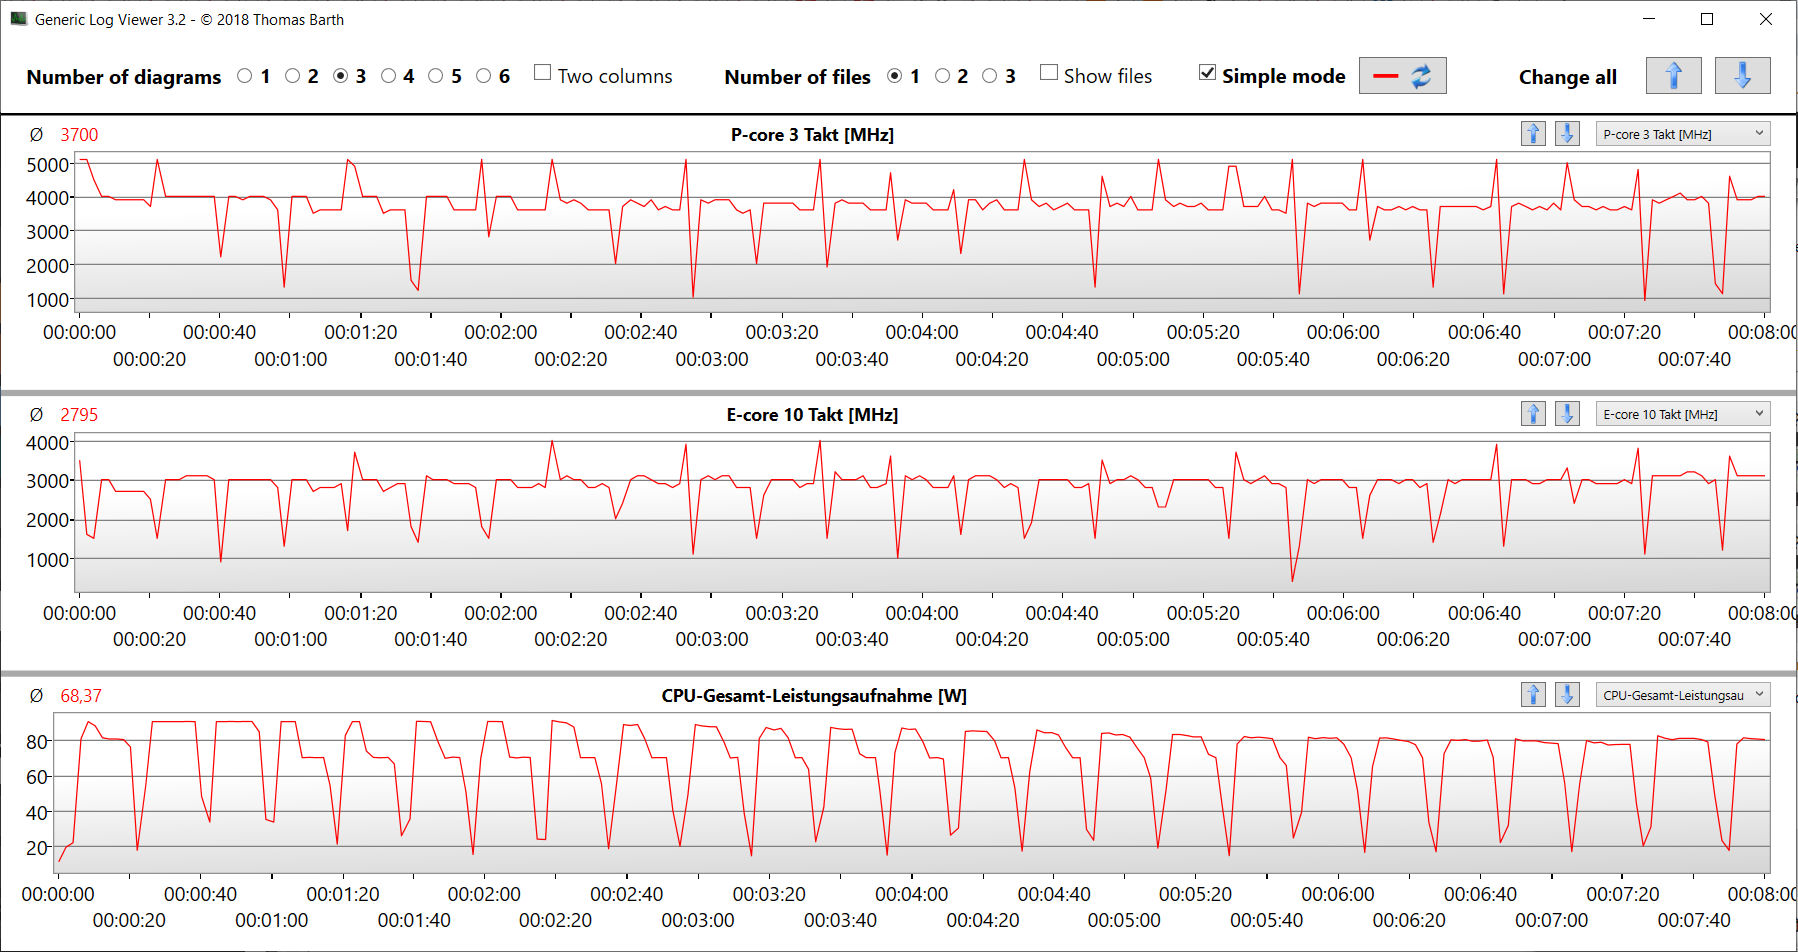
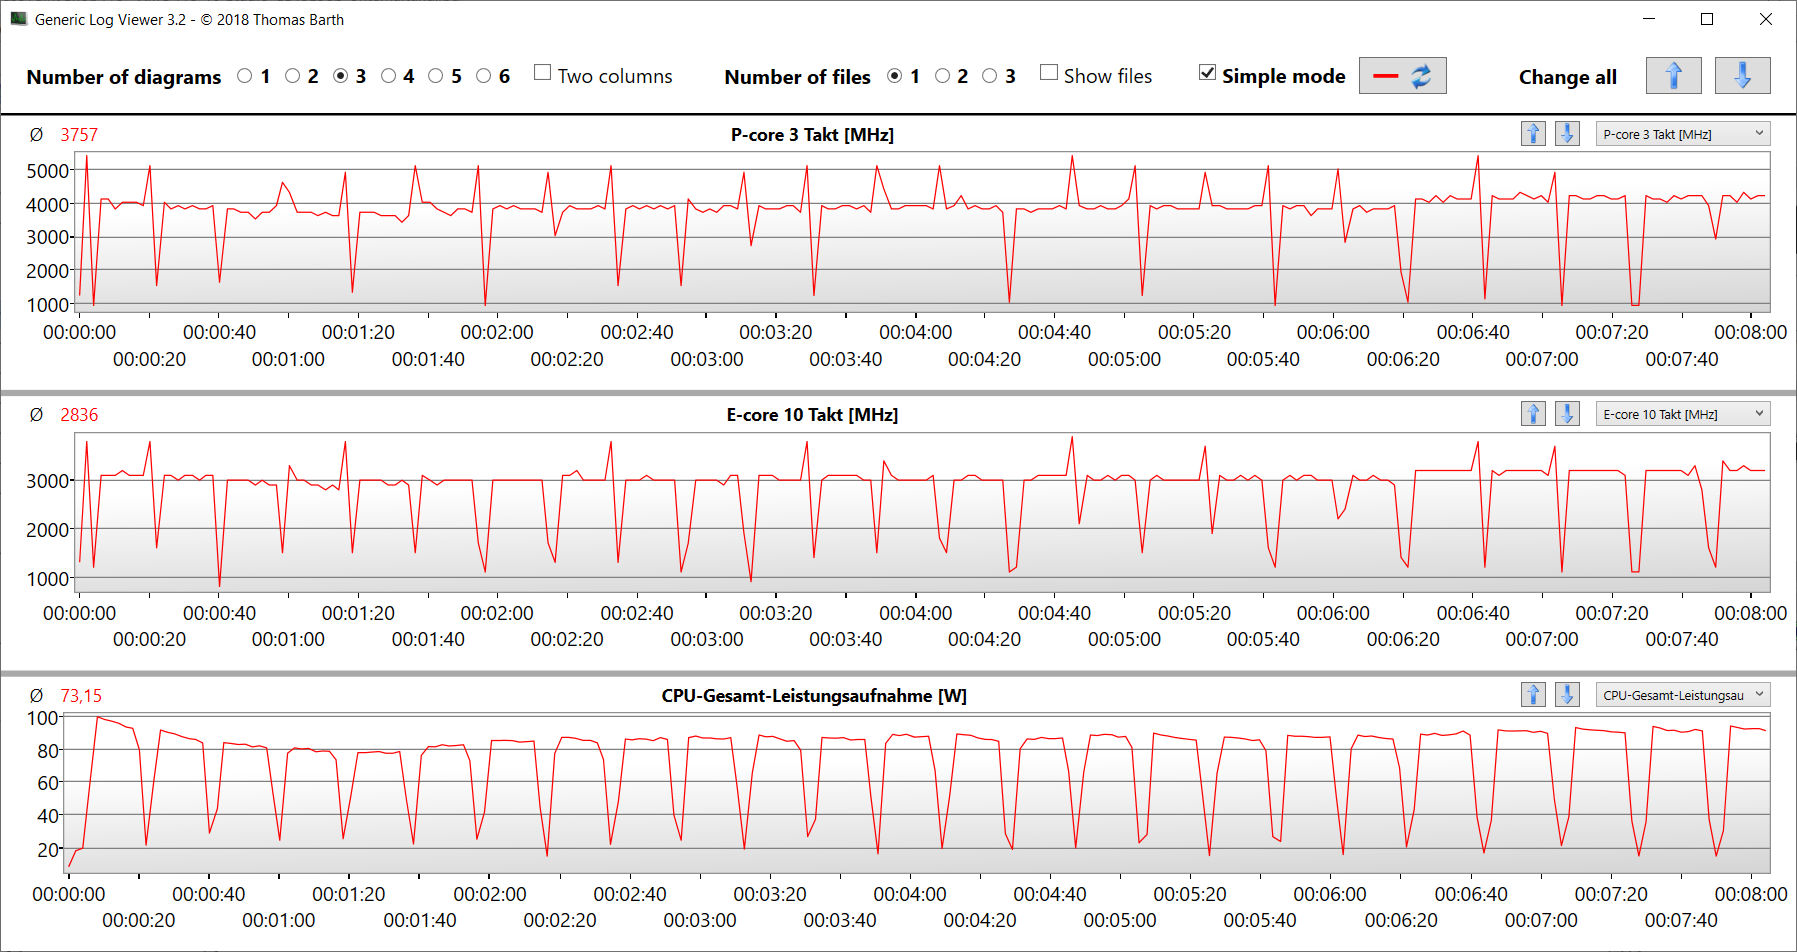
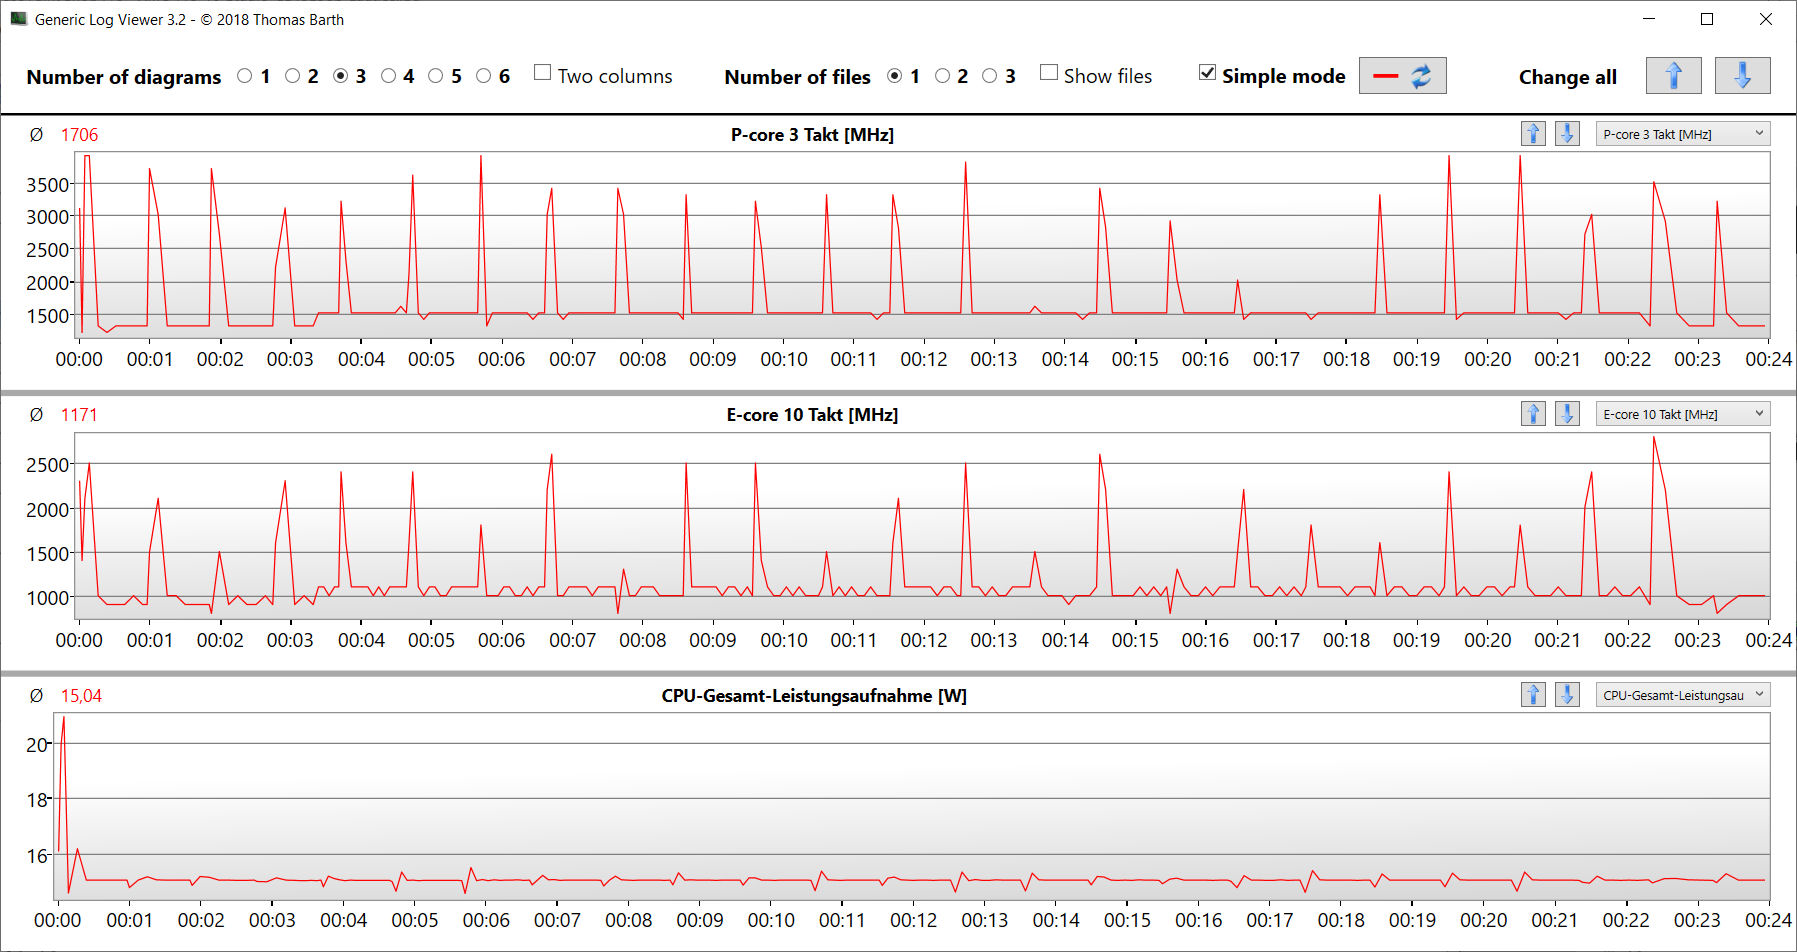
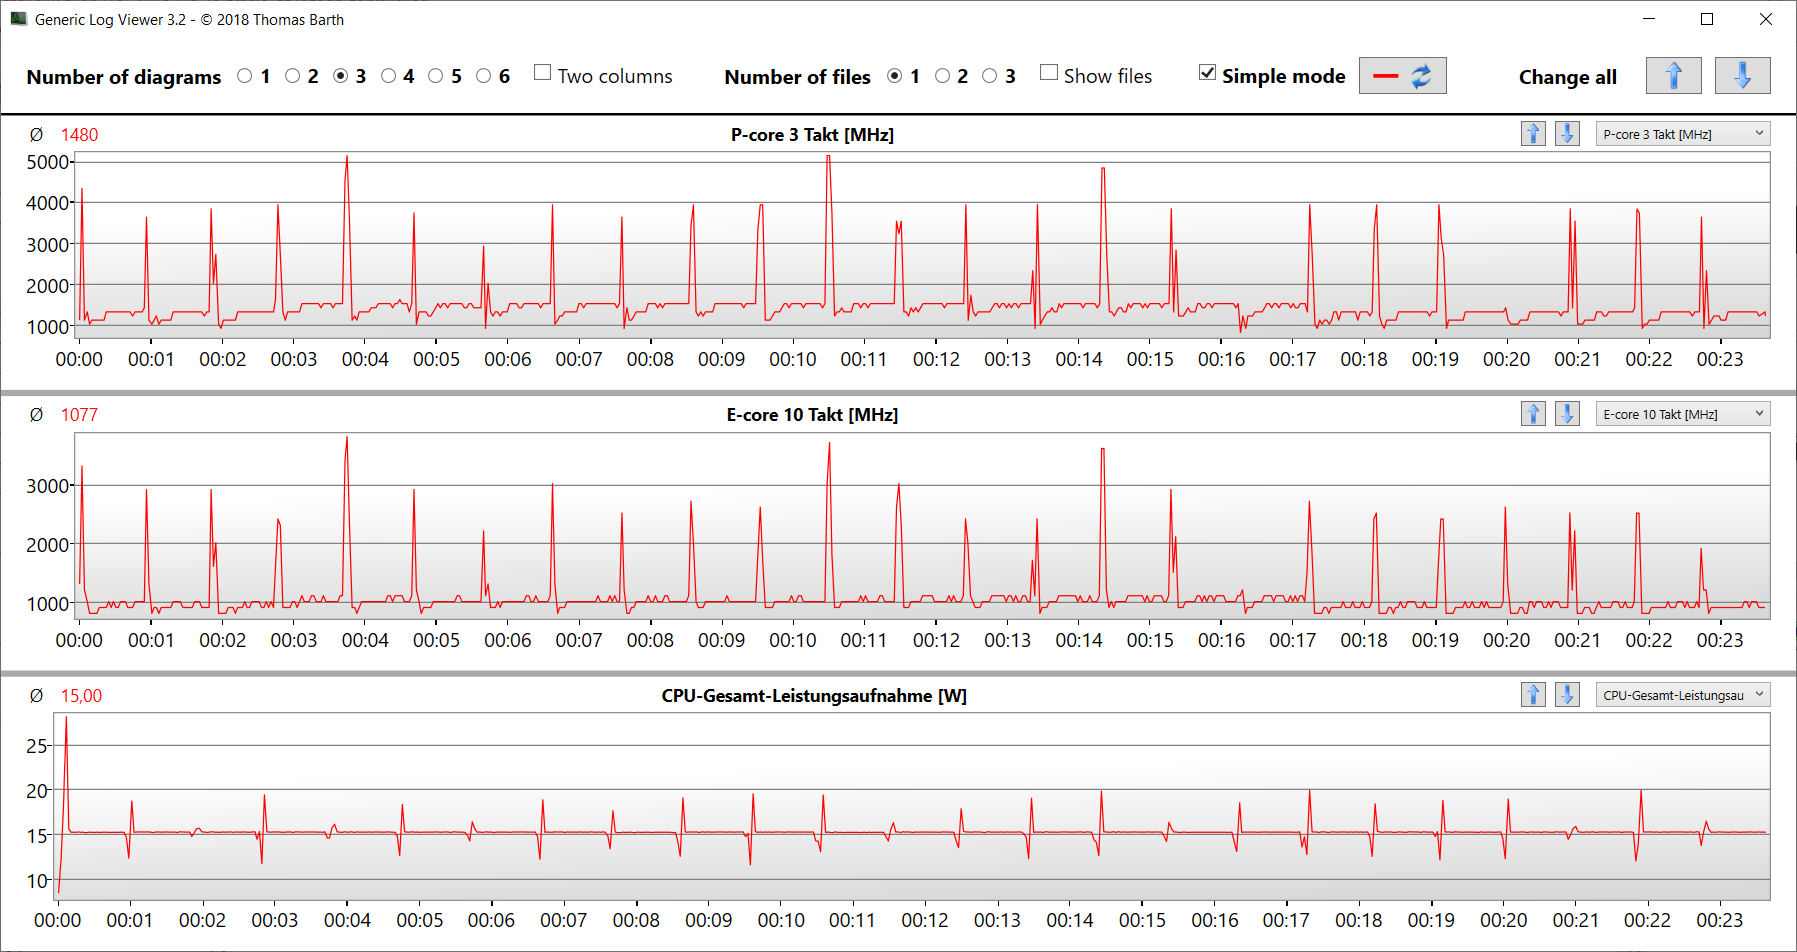
OCore i9-13900H(6P, 8E) com 14 núcleos de CPU atinge taxas de clock máximas de 5,4 GHz (P) e 4,1 GHz (E). A carga permanente de vários threads (CB15 Loop) fez com que a taxa de clock diminuísse ligeiramente da primeira à quarta execução. Depois disso, os valores permaneceram constantes.
Medimos os resultados do benchmark um pouco acima da média da CPU determinada anteriormente (conectado à rede elétrica). No modo de bateria, o desempenho single-thread mais relevante (158 pontos; CB15) afundou mais do que o desempenho multi-thread (1.696 pontos; CB15).
Cinebench R15 Multi continuous test
* ... menor é melhor
AIDA64: FP32 Ray-Trace | FPU Julia | CPU SHA3 | CPU Queen | FPU SinJulia | FPU Mandel | CPU AES | CPU ZLib | FP64 Ray-Trace | CPU PhotoWorxx
| Performance rating | |
| Média da turma Gaming | |
| HP Omen Transcend 16 | |
| Asus Vivobook Pro 16X K6604JV-MX016W | |
| Schenker XMG Pro 16 Studio (Mid 23) | |
| MSI Stealth 16 Studio A13VG | |
| Lenovo Legion Slim 7i 16 Gen 8 | |
| Média Intel Core i9-13900H | |
| AIDA64 / FP32 Ray-Trace | |
| Média da turma Gaming (10227 - 85542, n=105, últimos 2 anos) | |
| HP Omen Transcend 16 | |
| Asus Vivobook Pro 16X K6604JV-MX016W | |
| MSI Stealth 16 Studio A13VG | |
| Lenovo Legion Slim 7i 16 Gen 8 | |
| Schenker XMG Pro 16 Studio (Mid 23) | |
| Média Intel Core i9-13900H (6788 - 19557, n=25) | |
| AIDA64 / FPU Julia | |
| Média da turma Gaming (51376 - 238426, n=105, últimos 2 anos) | |
| HP Omen Transcend 16 | |
| Asus Vivobook Pro 16X K6604JV-MX016W | |
| Lenovo Legion Slim 7i 16 Gen 8 | |
| Schenker XMG Pro 16 Studio (Mid 23) | |
| MSI Stealth 16 Studio A13VG | |
| Média Intel Core i9-13900H (22551 - 95579, n=25) | |
| AIDA64 / CPU SHA3 | |
| Média da turma Gaming (2180 - 10115, n=105, últimos 2 anos) | |
| HP Omen Transcend 16 | |
| Asus Vivobook Pro 16X K6604JV-MX016W | |
| MSI Stealth 16 Studio A13VG | |
| Lenovo Legion Slim 7i 16 Gen 8 | |
| Schenker XMG Pro 16 Studio (Mid 23) | |
| Média Intel Core i9-13900H (2491 - 4270, n=25) | |
| AIDA64 / CPU Queen | |
| Asus Vivobook Pro 16X K6604JV-MX016W | |
| HP Omen Transcend 16 | |
| Lenovo Legion Slim 7i 16 Gen 8 | |
| Média da turma Gaming (49785 - 173351, n=90, últimos 2 anos) | |
| MSI Stealth 16 Studio A13VG | |
| Média Intel Core i9-13900H (65121 - 120936, n=25) | |
| Schenker XMG Pro 16 Studio (Mid 23) | |
| AIDA64 / FPU SinJulia | |
| Média da turma Gaming (4424 - 33636, n=105, últimos 2 anos) | |
| Asus Vivobook Pro 16X K6604JV-MX016W | |
| HP Omen Transcend 16 | |
| Lenovo Legion Slim 7i 16 Gen 8 | |
| MSI Stealth 16 Studio A13VG | |
| Schenker XMG Pro 16 Studio (Mid 23) | |
| Média Intel Core i9-13900H (6108 - 11631, n=25) | |
| AIDA64 / FPU Mandel | |
| Média da turma Gaming (25115 - 128721, n=105, últimos 2 anos) | |
| HP Omen Transcend 16 | |
| Asus Vivobook Pro 16X K6604JV-MX016W | |
| Lenovo Legion Slim 7i 16 Gen 8 | |
| MSI Stealth 16 Studio A13VG | |
| Schenker XMG Pro 16 Studio (Mid 23) | |
| Média Intel Core i9-13900H (11283 - 48474, n=25) | |
| AIDA64 / CPU AES | |
| Schenker XMG Pro 16 Studio (Mid 23) | |
| HP Omen Transcend 16 | |
| Média da turma Gaming (39258 - 247074, n=105, últimos 2 anos) | |
| Asus Vivobook Pro 16X K6604JV-MX016W | |
| Média Intel Core i9-13900H (3691 - 149377, n=25) | |
| MSI Stealth 16 Studio A13VG | |
| Lenovo Legion Slim 7i 16 Gen 8 | |
| AIDA64 / CPU ZLib | |
| HP Omen Transcend 16 | |
| Média da turma Gaming (574 - 2531, n=105, últimos 2 anos) | |
| Asus Vivobook Pro 16X K6604JV-MX016W | |
| Lenovo Legion Slim 7i 16 Gen 8 | |
| Schenker XMG Pro 16 Studio (Mid 23) | |
| Média Intel Core i9-13900H (789 - 1254, n=25) | |
| MSI Stealth 16 Studio A13VG | |
| AIDA64 / FP64 Ray-Trace | |
| Média da turma Gaming (5509 - 45446, n=105, últimos 2 anos) | |
| HP Omen Transcend 16 | |
| Asus Vivobook Pro 16X K6604JV-MX016W | |
| MSI Stealth 16 Studio A13VG | |
| Lenovo Legion Slim 7i 16 Gen 8 | |
| Schenker XMG Pro 16 Studio (Mid 23) | |
| Média Intel Core i9-13900H (3655 - 10716, n=25) | |
| AIDA64 / CPU PhotoWorxx | |
| HP Omen Transcend 16 | |
| Schenker XMG Pro 16 Studio (Mid 23) | |
| MSI Stealth 16 Studio A13VG | |
| Média da turma Gaming (12271 - 89891, n=105, últimos 2 anos) | |
| Asus Vivobook Pro 16X K6604JV-MX016W | |
| Média Intel Core i9-13900H (10871 - 50488, n=25) | |
| Lenovo Legion Slim 7i 16 Gen 8 | |
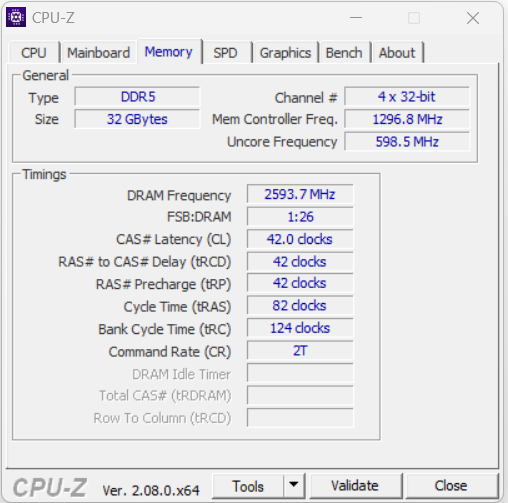
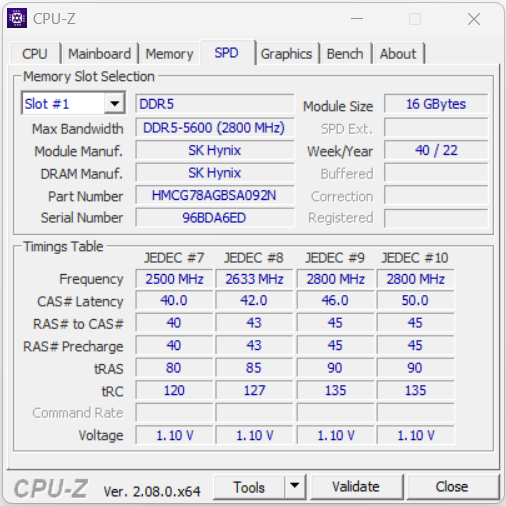
Desempenho do sistema
O sistema de funcionamento suave não deixa a desejar em termos de potência de computação. Os jogos, a renderização e a edição de vídeo estão entre as principais competências do computador. As taxas de transferência da RAM estão em um nível normal para a RAM DDR5-5600.
CrossMark: Overall | Productivity | Creativity | Responsiveness
| PCMark 10 / Score | |
| Lenovo Legion Slim 7i 16 Gen 8 | |
| Média da turma Gaming (5828 - 12414, n=93, últimos 2 anos) | |
| HP Omen Transcend 16 | |
| Schenker XMG Pro 16 Studio (Mid 23) | |
| Média Intel Core i9-13900H, NVIDIA GeForce RTX 4070 Laptop GPU (5855 - 8538, n=8) | |
| MSI Stealth 16 Studio A13VG | |
| Asus Vivobook Pro 16X K6604JV-MX016W | |
| PCMark 10 / Essentials | |
| Schenker XMG Pro 16 Studio (Mid 23) | |
| Lenovo Legion Slim 7i 16 Gen 8 | |
| HP Omen Transcend 16 | |
| Média Intel Core i9-13900H, NVIDIA GeForce RTX 4070 Laptop GPU (8835 - 11940, n=8) | |
| Média da turma Gaming (8810 - 11935, n=97, últimos 2 anos) | |
| Asus Vivobook Pro 16X K6604JV-MX016W | |
| MSI Stealth 16 Studio A13VG | |
| PCMark 10 / Productivity | |
| Média da turma Gaming (6845 - 25323, n=95, últimos 2 anos) | |
| Lenovo Legion Slim 7i 16 Gen 8 | |
| Schenker XMG Pro 16 Studio (Mid 23) | |
| Média Intel Core i9-13900H, NVIDIA GeForce RTX 4070 Laptop GPU (7967 - 10991, n=8) | |
| HP Omen Transcend 16 | |
| MSI Stealth 16 Studio A13VG | |
| Asus Vivobook Pro 16X K6604JV-MX016W | |
| PCMark 10 / Digital Content Creation | |
| Média da turma Gaming (7602 - 19954, n=95, últimos 2 anos) | |
| Lenovo Legion Slim 7i 16 Gen 8 | |
| HP Omen Transcend 16 | |
| Média Intel Core i9-13900H, NVIDIA GeForce RTX 4070 Laptop GPU (7738 - 13575, n=8) | |
| Schenker XMG Pro 16 Studio (Mid 23) | |
| MSI Stealth 16 Studio A13VG | |
| Asus Vivobook Pro 16X K6604JV-MX016W | |
| CrossMark / Overall | |
| Asus Vivobook Pro 16X K6604JV-MX016W | |
| Média da turma Gaming (1366 - 2409, n=94, últimos 2 anos) | |
| Lenovo Legion Slim 7i 16 Gen 8 | |
| HP Omen Transcend 16 | |
| Schenker XMG Pro 16 Studio (Mid 23) | |
| Média Intel Core i9-13900H, NVIDIA GeForce RTX 4070 Laptop GPU (1104 - 1974, n=7) | |
| MSI Stealth 16 Studio A13VG | |
| CrossMark / Productivity | |
| Asus Vivobook Pro 16X K6604JV-MX016W | |
| Lenovo Legion Slim 7i 16 Gen 8 | |
| Schenker XMG Pro 16 Studio (Mid 23) | |
| Média da turma Gaming (1386 - 2254, n=94, últimos 2 anos) | |
| HP Omen Transcend 16 | |
| Média Intel Core i9-13900H, NVIDIA GeForce RTX 4070 Laptop GPU (1058 - 1914, n=7) | |
| MSI Stealth 16 Studio A13VG | |
| CrossMark / Creativity | |
| Asus Vivobook Pro 16X K6604JV-MX016W | |
| HP Omen Transcend 16 | |
| Média da turma Gaming (1343 - 2786, n=94, últimos 2 anos) | |
| Lenovo Legion Slim 7i 16 Gen 8 | |
| Schenker XMG Pro 16 Studio (Mid 23) | |
| Média Intel Core i9-13900H, NVIDIA GeForce RTX 4070 Laptop GPU (1178 - 2254, n=7) | |
| MSI Stealth 16 Studio A13VG | |
| CrossMark / Responsiveness | |
| Schenker XMG Pro 16 Studio (Mid 23) | |
| Lenovo Legion Slim 7i 16 Gen 8 | |
| Média da turma Gaming (1226 - 2334, n=94, últimos 2 anos) | |
| Asus Vivobook Pro 16X K6604JV-MX016W | |
| Média Intel Core i9-13900H, NVIDIA GeForce RTX 4070 Laptop GPU (1037 - 1952, n=7) | |
| MSI Stealth 16 Studio A13VG | |
| HP Omen Transcend 16 | |
| PCMark 10 Score | 8010 pontos | |
Ajuda | ||
| AIDA64 / Memory Copy | |
| HP Omen Transcend 16 | |
| Média da turma Gaming (21750 - 129946, n=105, últimos 2 anos) | |
| Schenker XMG Pro 16 Studio (Mid 23) | |
| MSI Stealth 16 Studio A13VG | |
| Asus Vivobook Pro 16X K6604JV-MX016W | |
| Média Intel Core i9-13900H (37448 - 74486, n=25) | |
| Lenovo Legion Slim 7i 16 Gen 8 | |
| AIDA64 / Memory Read | |
| HP Omen Transcend 16 | |
| Asus Vivobook Pro 16X K6604JV-MX016W | |
| Schenker XMG Pro 16 Studio (Mid 23) | |
| Média da turma Gaming (22956 - 118858, n=105, últimos 2 anos) | |
| MSI Stealth 16 Studio A13VG | |
| Média Intel Core i9-13900H (41599 - 75433, n=25) | |
| Lenovo Legion Slim 7i 16 Gen 8 | |
| AIDA64 / Memory Write | |
| Média da turma Gaming (22297 - 135096, n=105, últimos 2 anos) | |
| HP Omen Transcend 16 | |
| Schenker XMG Pro 16 Studio (Mid 23) | |
| MSI Stealth 16 Studio A13VG | |
| Asus Vivobook Pro 16X K6604JV-MX016W | |
| Média Intel Core i9-13900H (36152 - 88505, n=25) | |
| Lenovo Legion Slim 7i 16 Gen 8 | |
| AIDA64 / Memory Latency | |
| Média da turma Gaming (75.3 - 259, n=105, últimos 2 anos) | |
| Asus Vivobook Pro 16X K6604JV-MX016W | |
| Média Intel Core i9-13900H (75.8 - 102.3, n=25) | |
| HP Omen Transcend 16 | |
| MSI Stealth 16 Studio A13VG | |
| Schenker XMG Pro 16 Studio (Mid 23) | |
| Lenovo Legion Slim 7i 16 Gen 8 | |
* ... menor é melhor
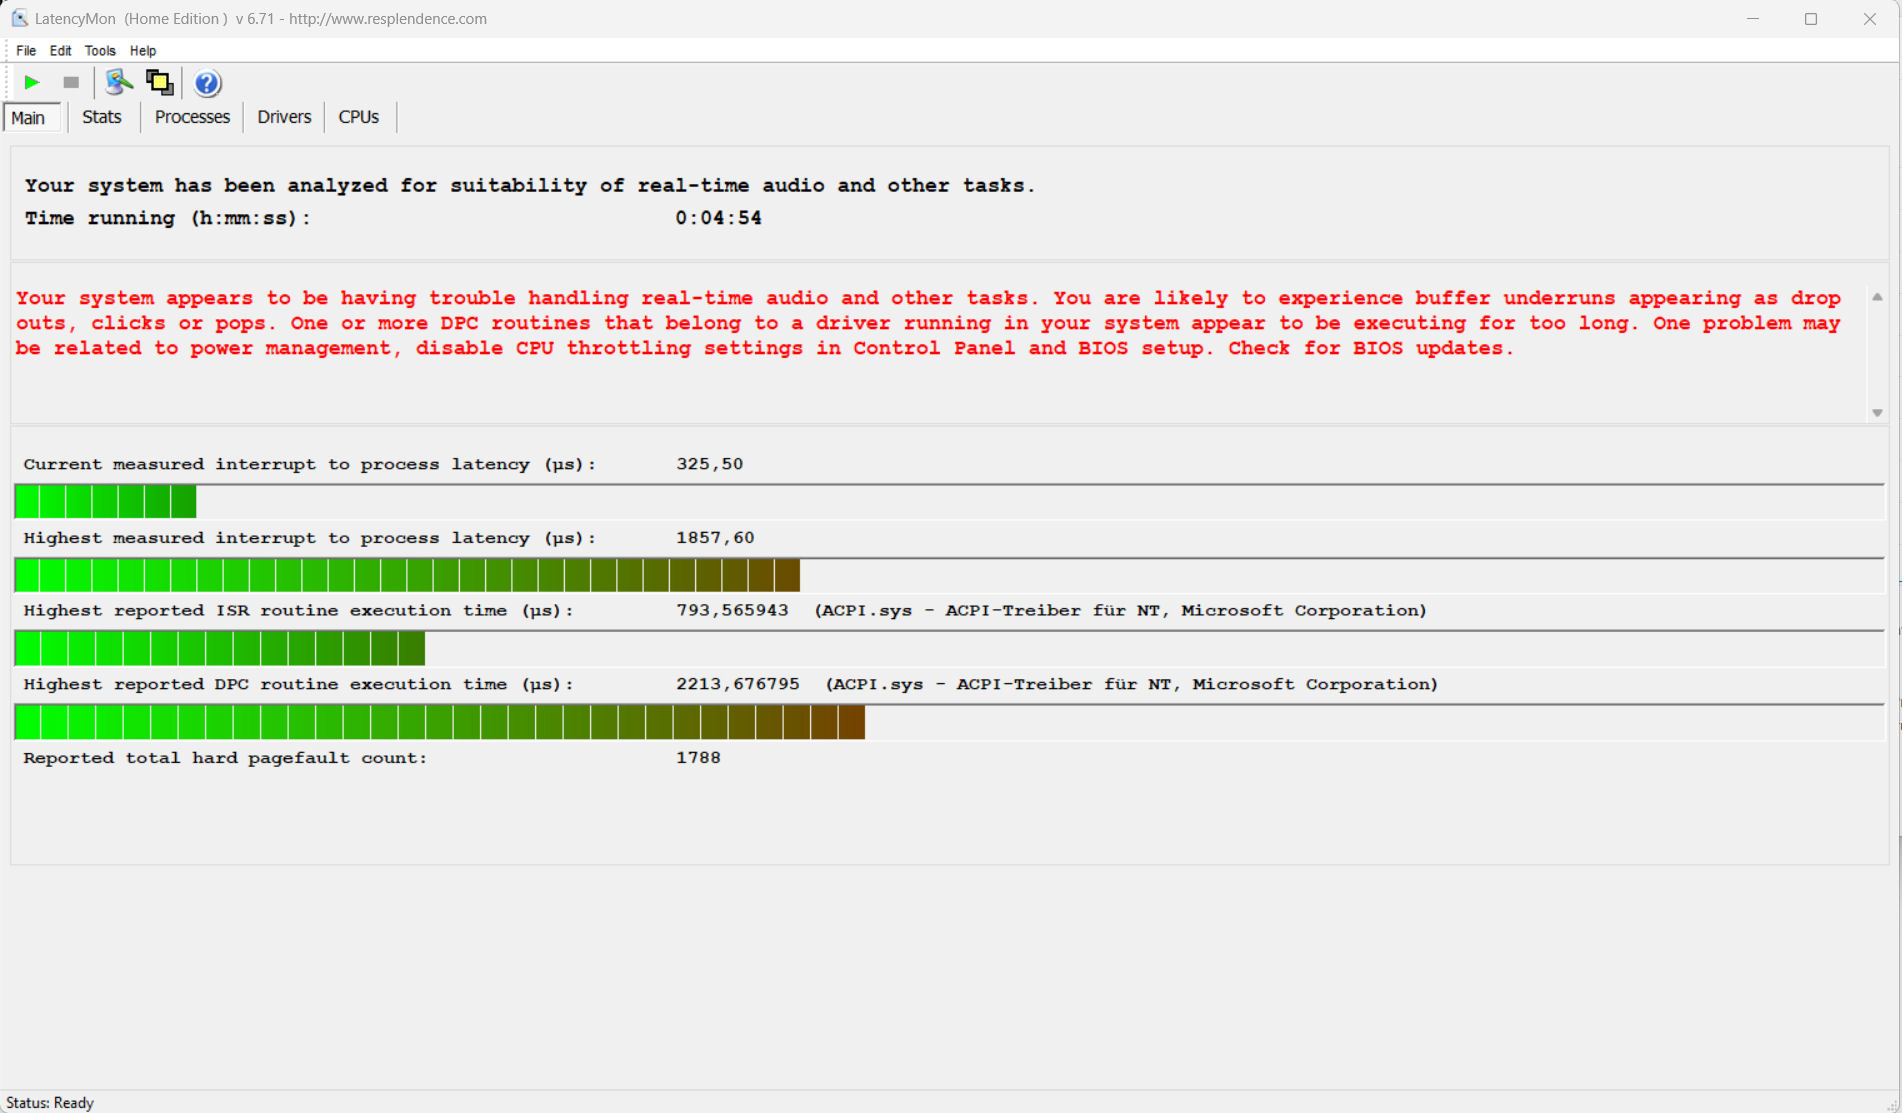
Latência DPC
O teste padronizado do monitor de latência (navegação na Web, reprodução de vídeo 4k, alta carga do Prime95) revelou algumas anomalias. O sistema não parece ser adequado para edição de vídeo e áudio em tempo real. Futuras atualizações de software podem levar a melhorias ou até mesmo a degradações.
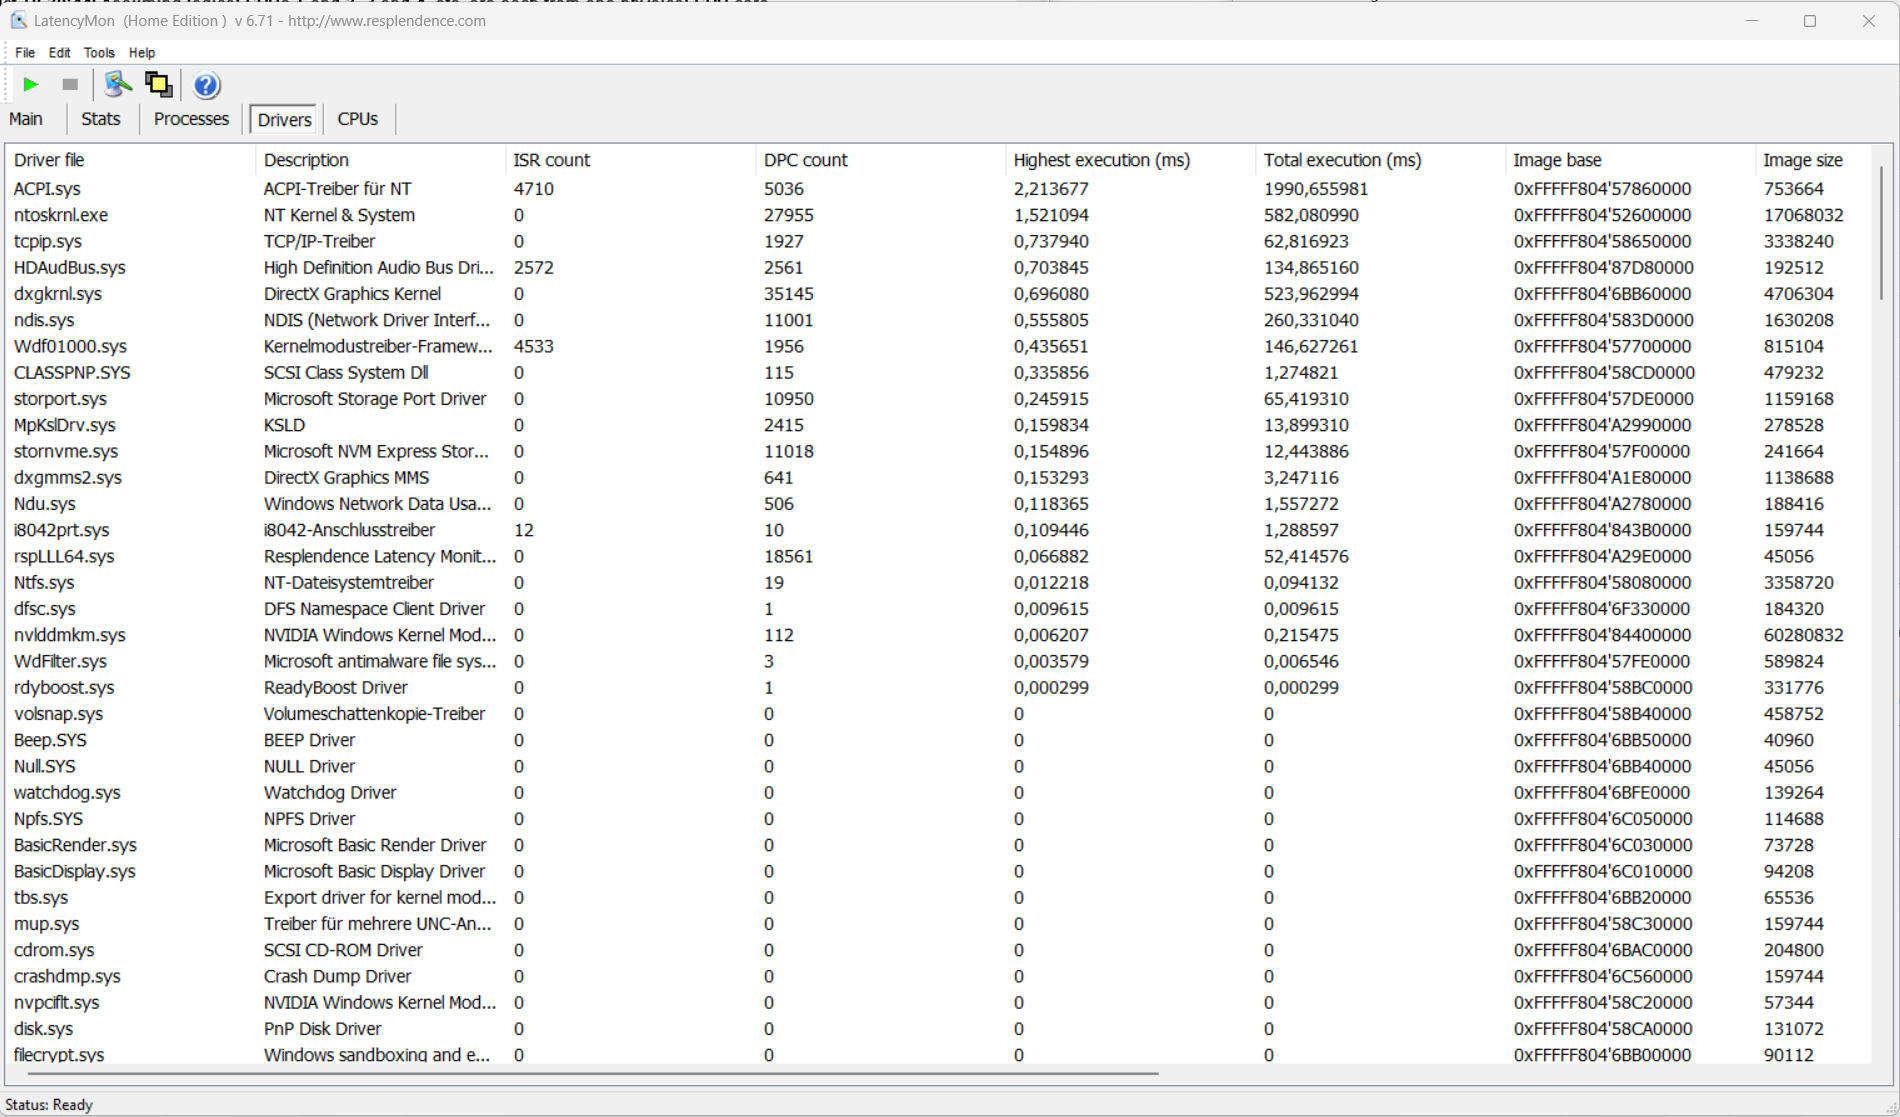
| DPC Latencies / LatencyMon - interrupt to process latency (max), Web, Youtube, Prime95 | |
| MSI Stealth 16 Studio A13VG | |
| Lenovo Legion Slim 7i 16 Gen 8 | |
| Asus Vivobook Pro 16X K6604JV-MX016W | |
| Schenker XMG Pro 16 Studio (Mid 23) | |
| HP Omen Transcend 16 | |
* ... menor é melhor
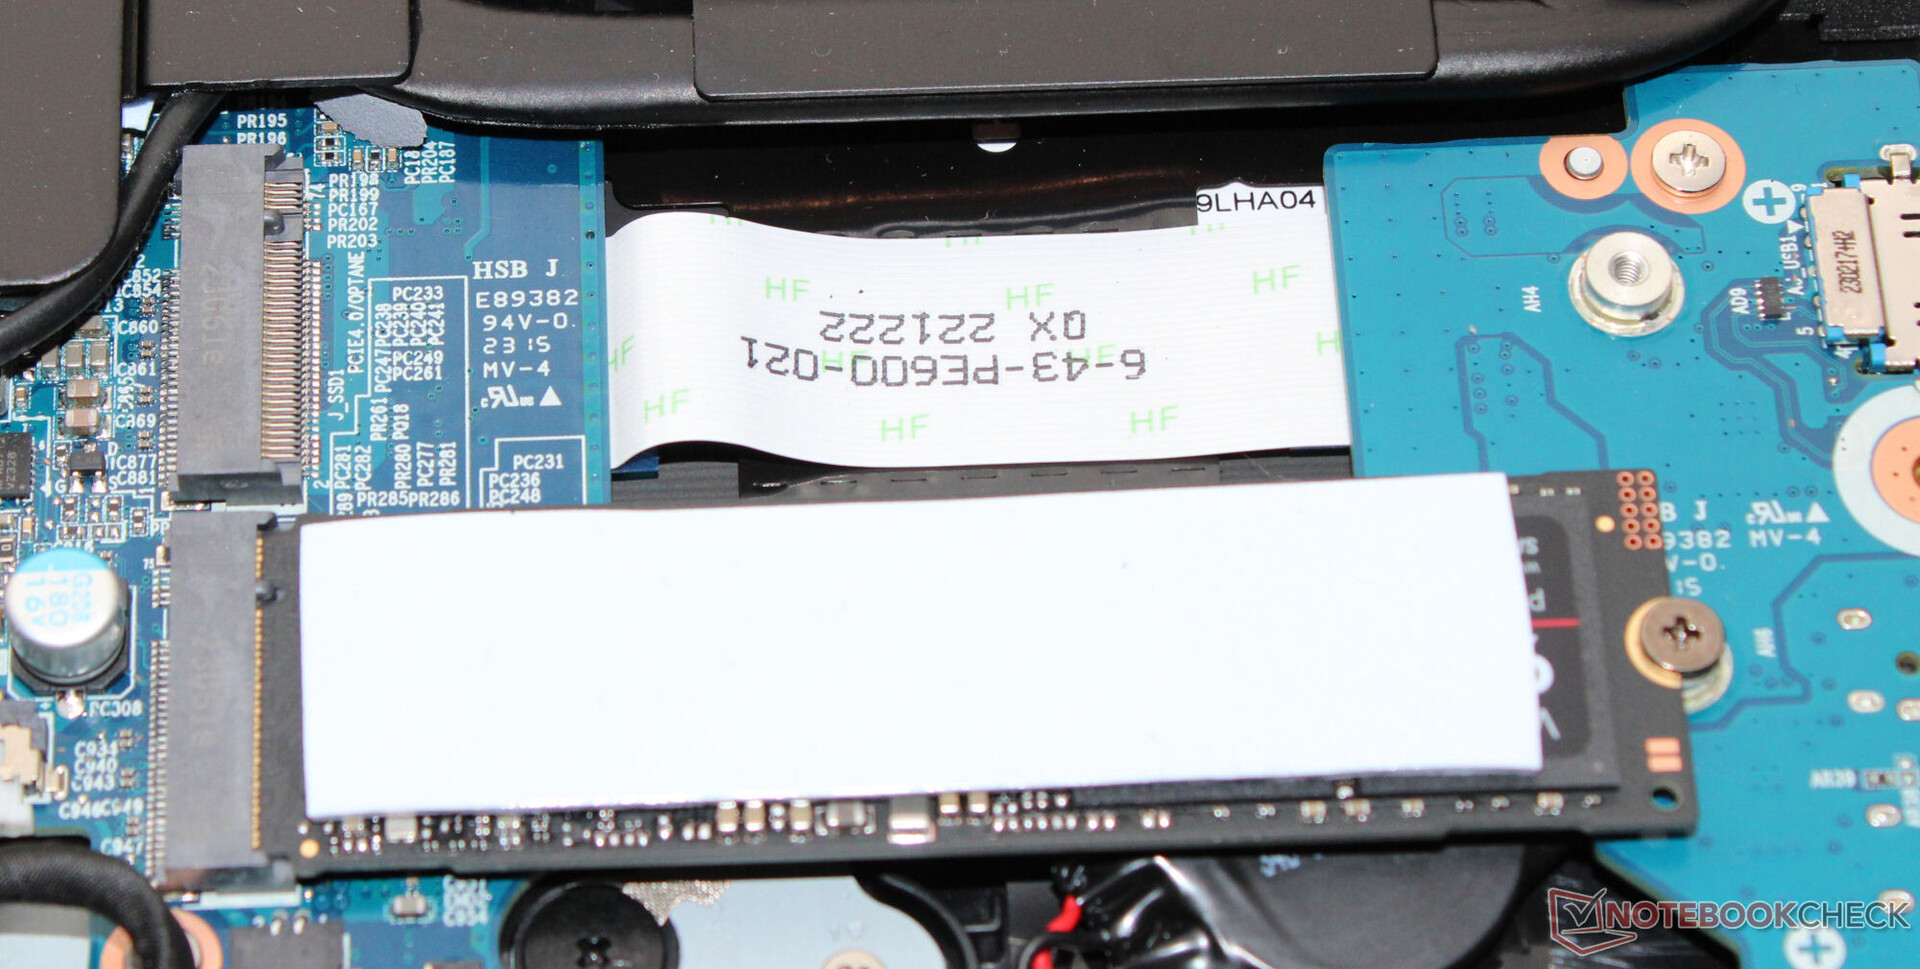
Dispositivos de armazenamento
O Pro 16 pode acomodar um total de dois SSDs PCIe 4 com o formato M.2-2280. Há suporte para RAID-0/1. O SSD da Samsung (1 TB, PCIe 4, M.2-2280) em nosso dispositivo de teste apresentou excelentes taxas de transferência. Positivo: Não houve estrangulamento térmico.

* ... menor é melhor
Reading continuous performance: DiskSpd Read Loop, Queue Depth 8
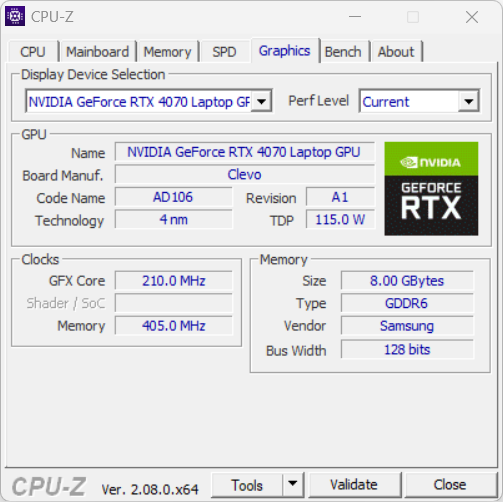
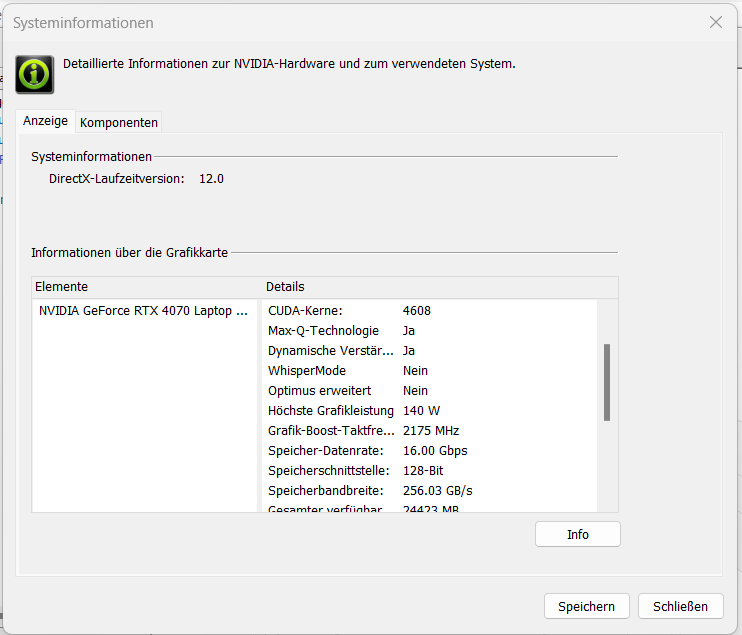
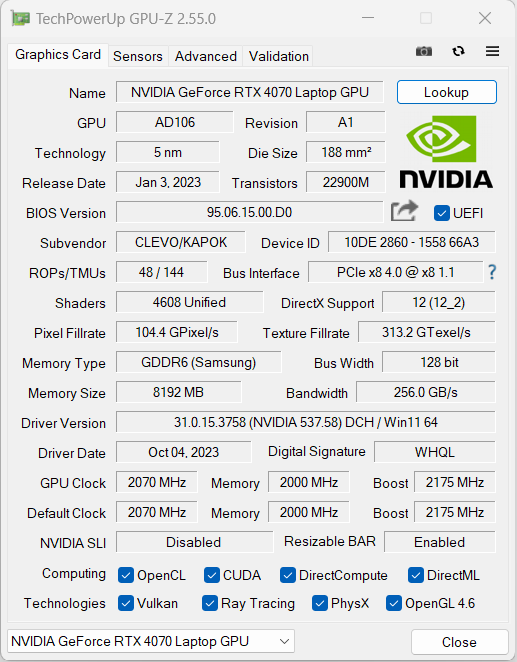
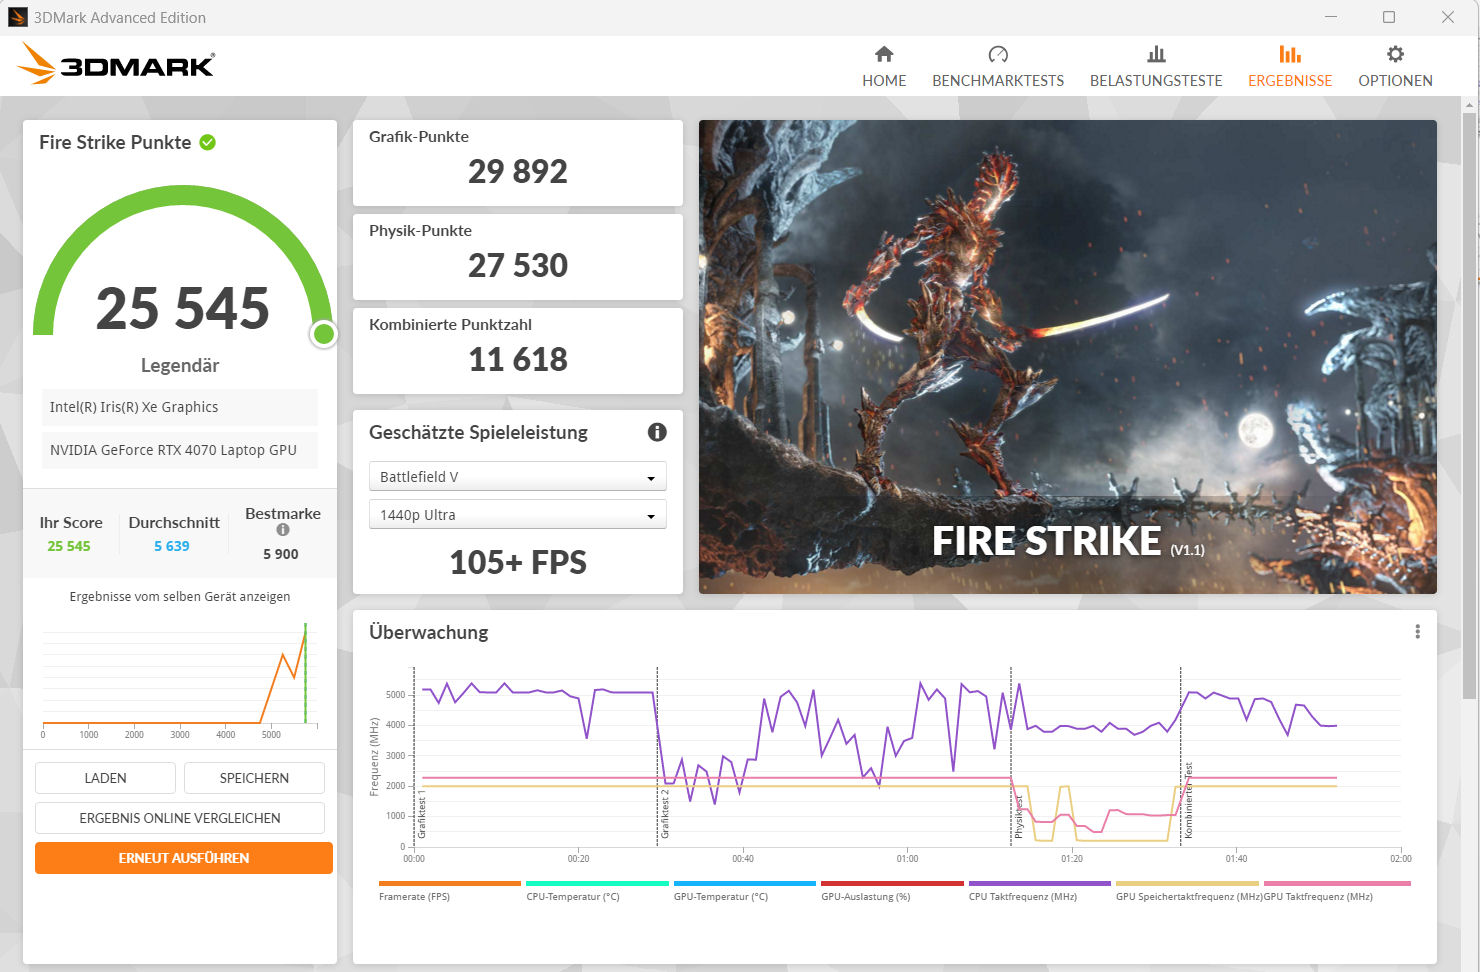
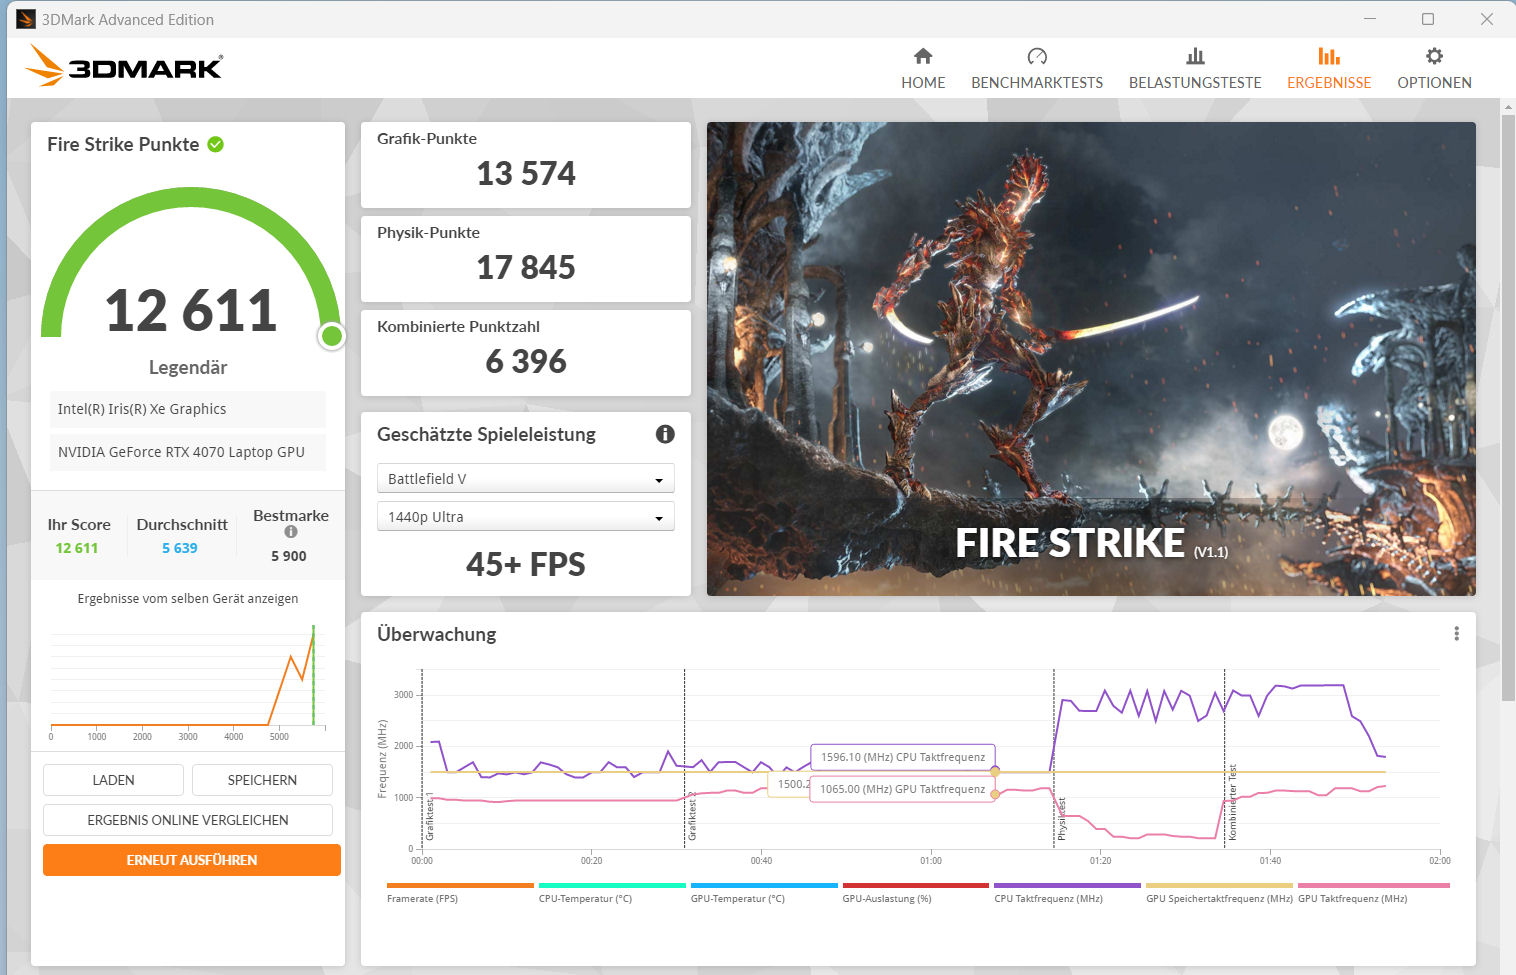
Placa de vídeo
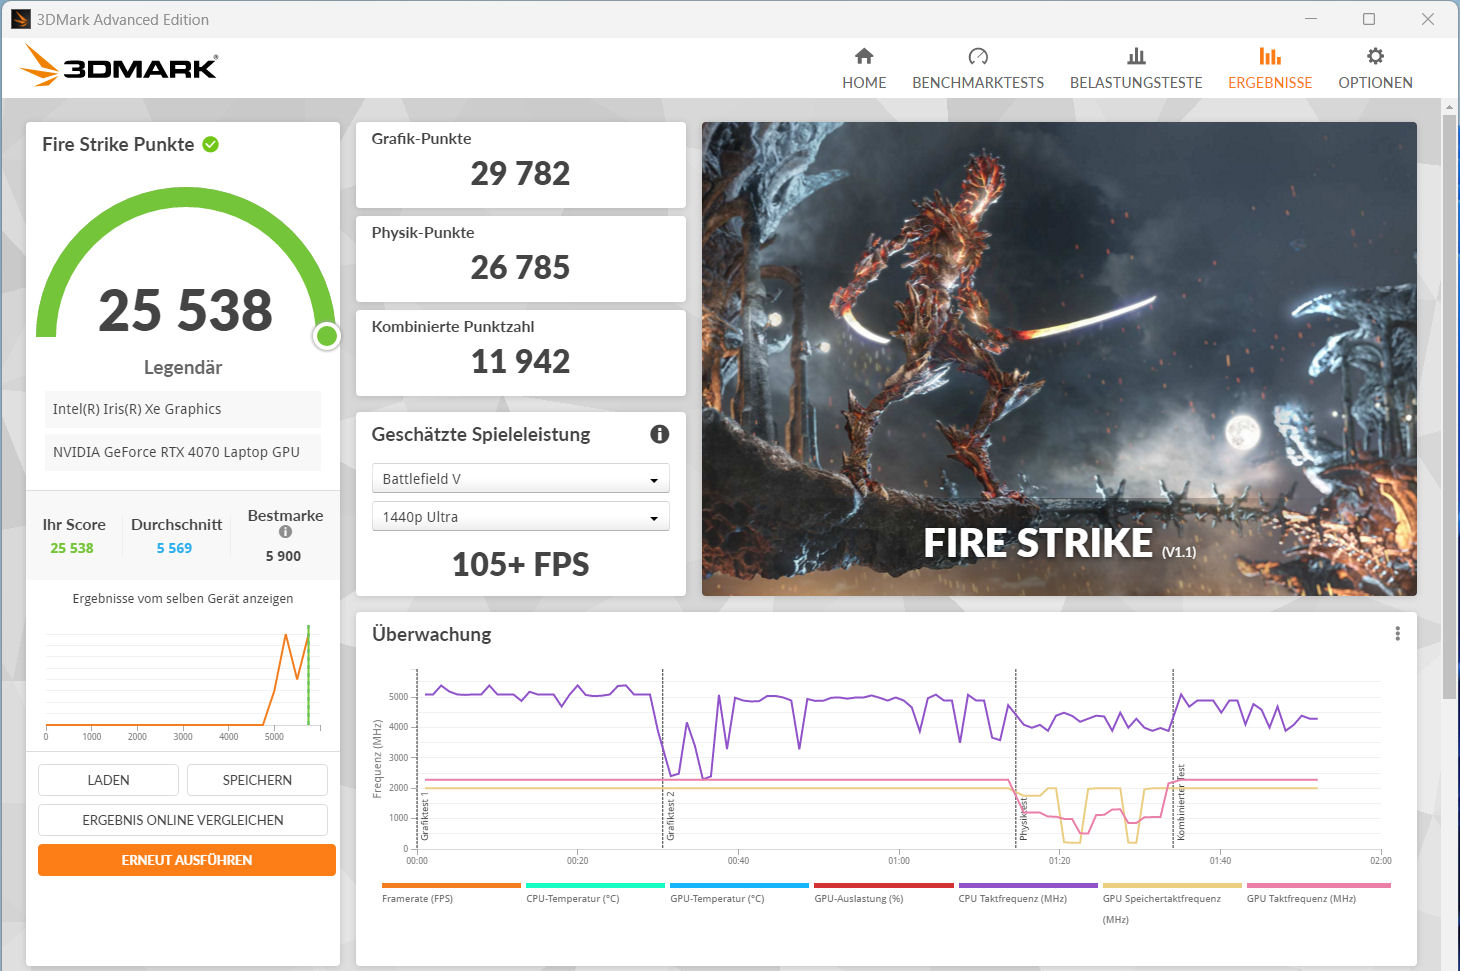
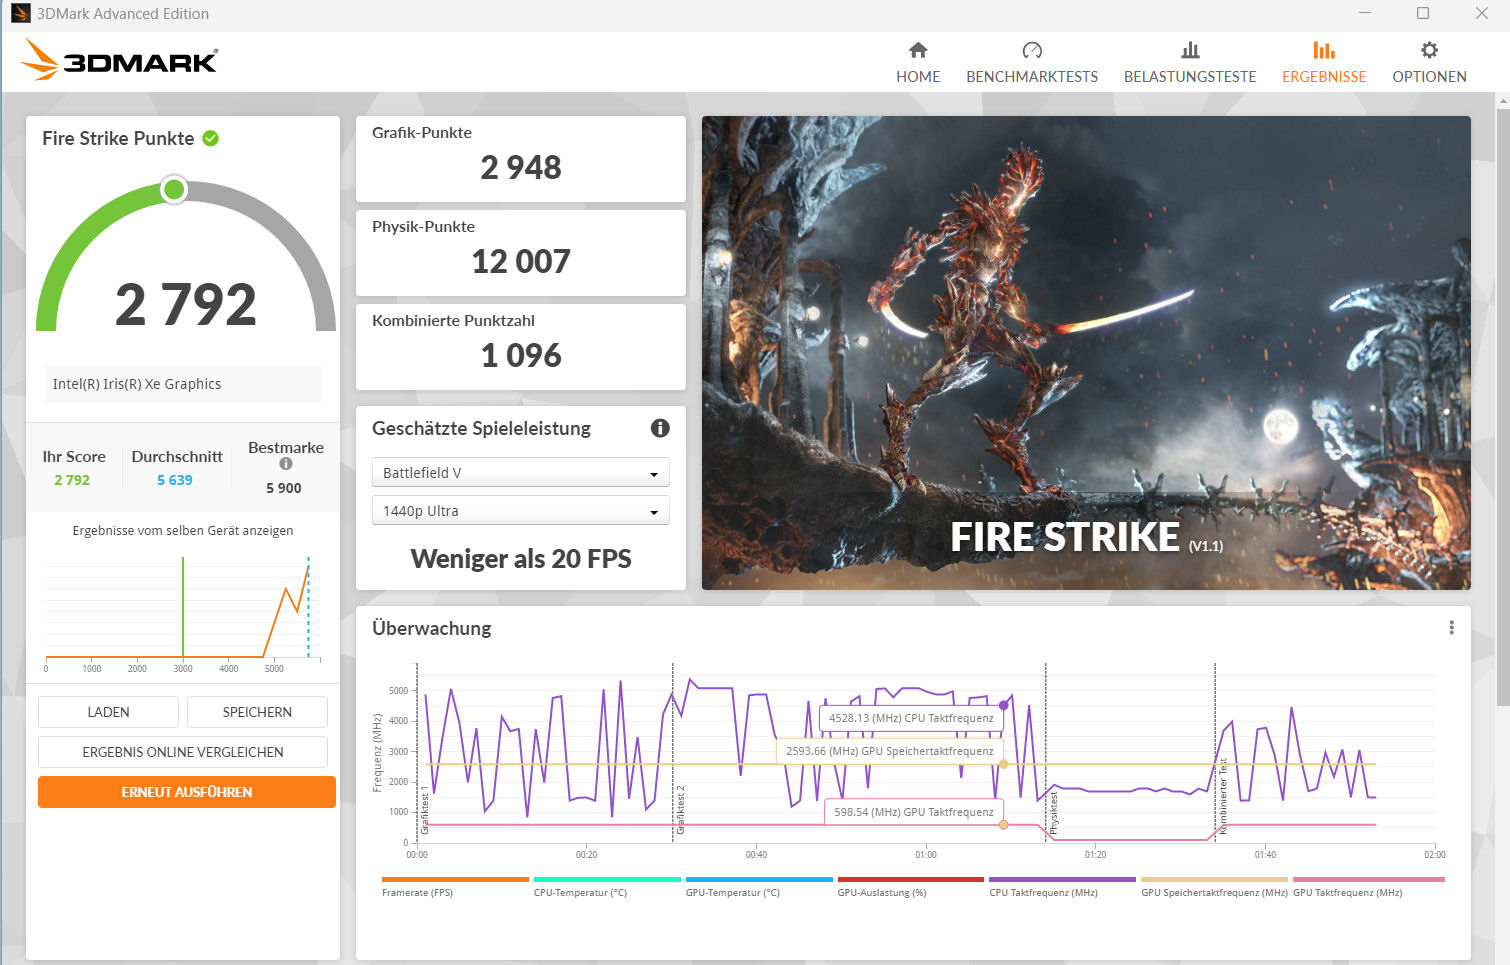
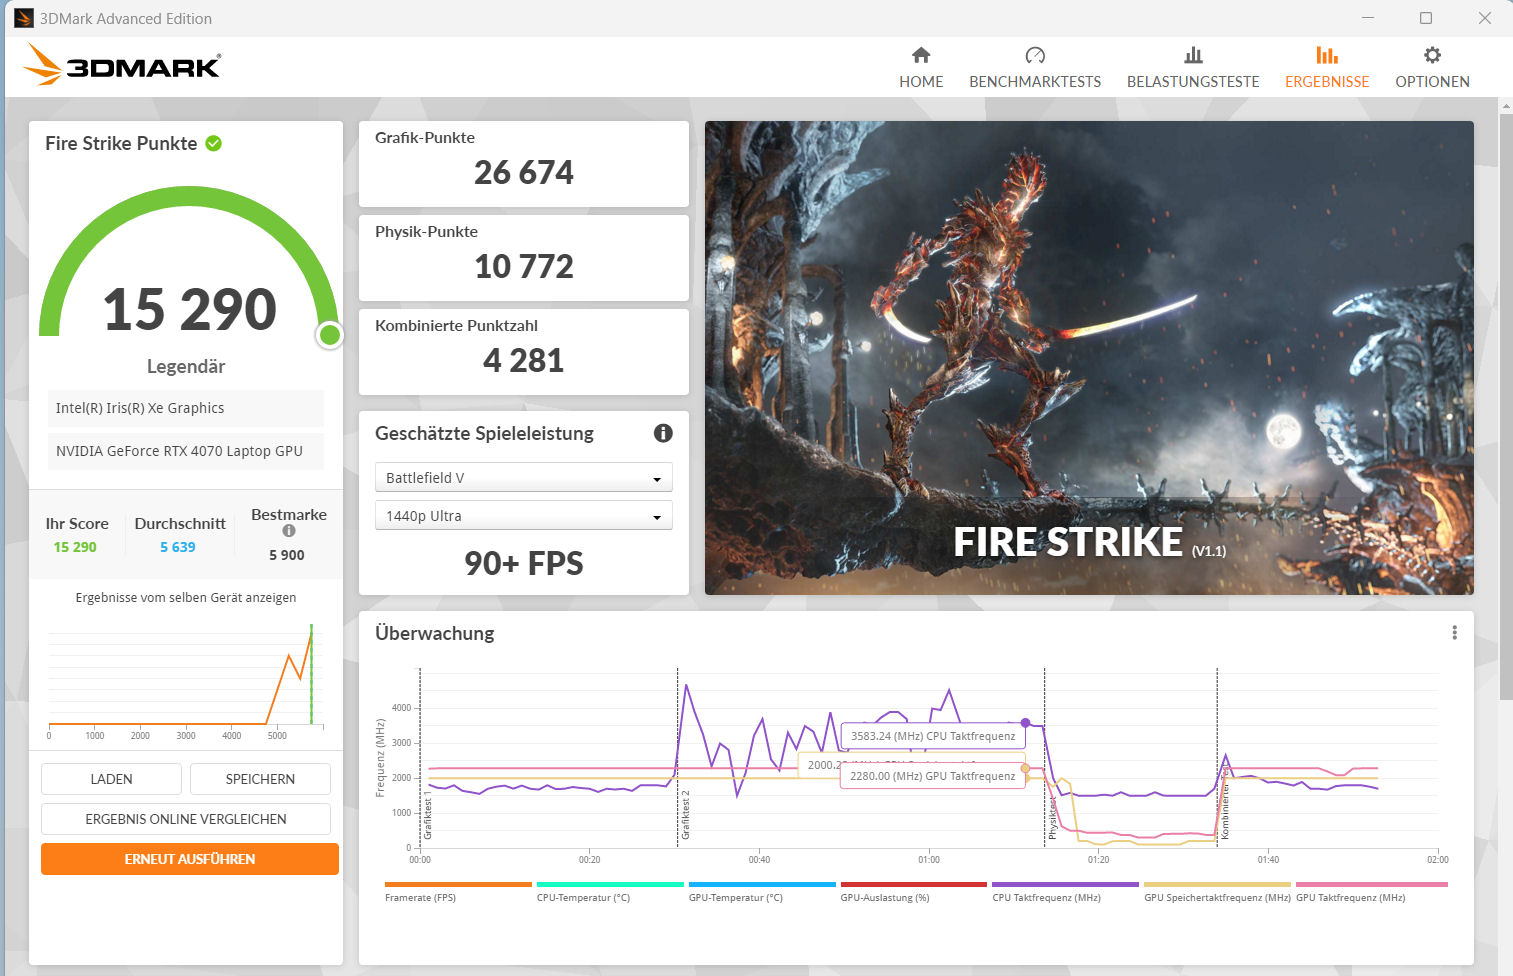
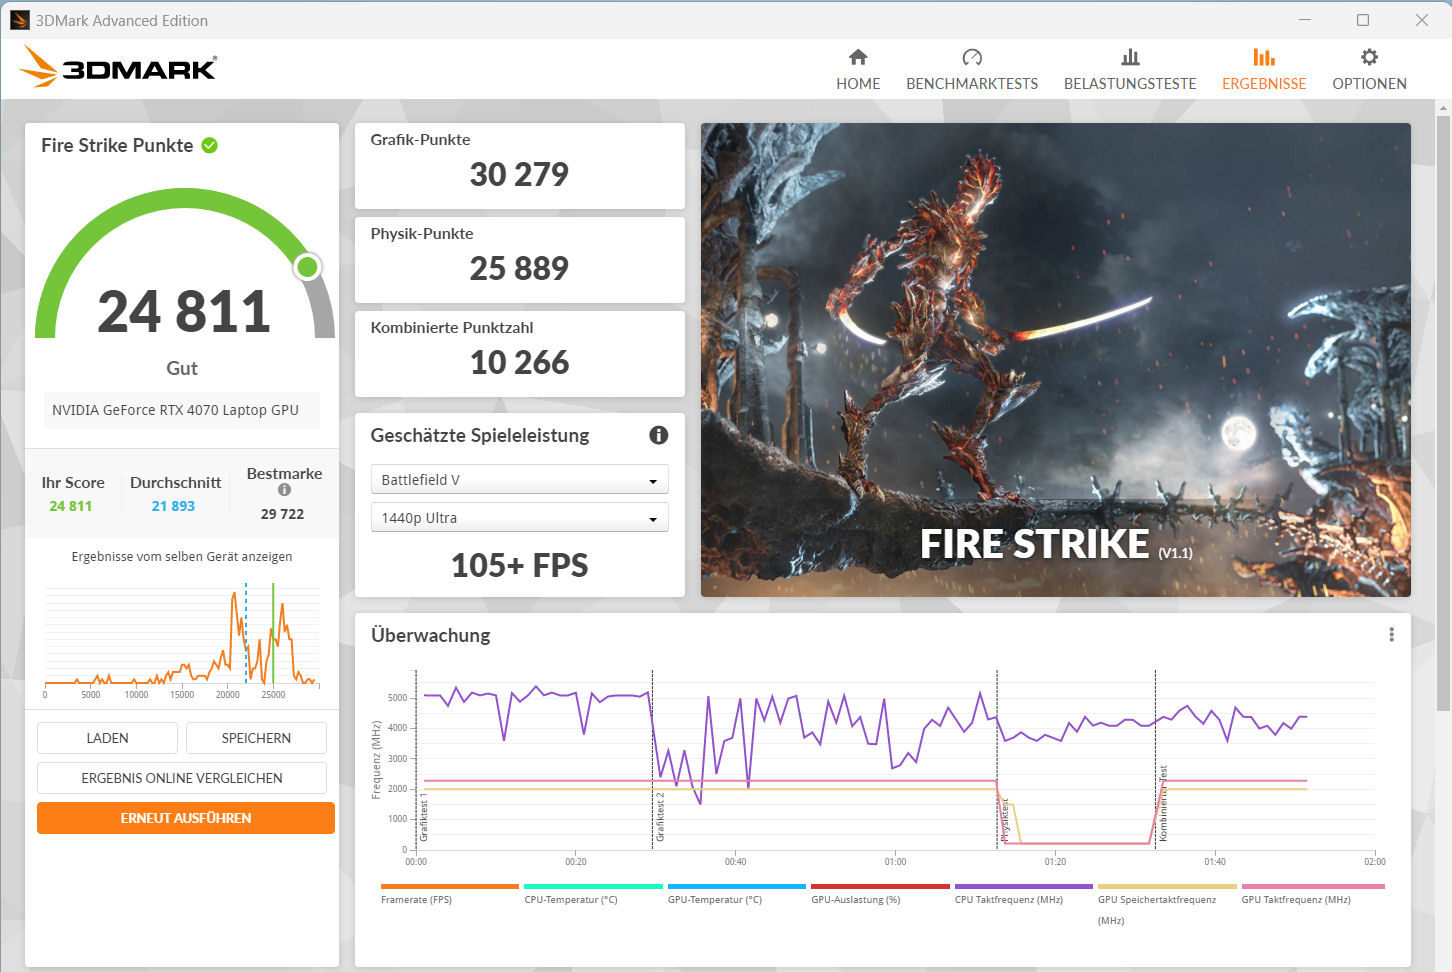
AGeForce RTX 4070 oferece 4.608 shaders, um barramento de 128 bits de largura e uma rápida RAM GDDR6 (8.192 MB). A Schenker definiu seu TGP máximo em 140 watts (115 watts + 25 watts de Dynamic Boost) - não é possível fazer mais.
O núcleo gráfico permite jogos QHD em configurações altas ou máximas. Ao fazer isso, ele atinge taxas de quadros acima da média da RTX 4070 determinada anteriormente. O uso do modo dGPU (ativado pelo BIOS) leva a um leve aumento no desempenho. O núcleo gráfico e a memória podem ser submetidos a overclock por meio do Control Center (Modo de desempenho -> clique nas setas apontando para baixo). Não há suporte para o Advanced Optimus.
| 3DMark 06 Standard Score | 54913 pontos | |
| 3DMark 11 Performance | 34302 pontos | |
| 3DMark Cloud Gate Standard Score | 62061 pontos | |
| 3DMark Fire Strike Score | 25545 pontos | |
| 3DMark Time Spy Score | 12134 pontos | |
Ajuda | ||
* ... menor é melhor
| The Witcher 3 - 1920x1080 Ultra Graphics & Postprocessing (HBAO+) | |
| Média da turma Gaming (104.7 - 240, n=7, últimos 2 anos) | |
| MSI Stealth 16 Studio A13VG | |
| Schenker XMG Pro 16 Studio (Mid 23) | |
| Lenovo Legion Slim 7i 16 Gen 8 | |
| Média NVIDIA GeForce RTX 4070 Laptop GPU (69.8 - 133.7, n=57) | |
| HP Omen Transcend 16 | |
| Asus Vivobook Pro 16X K6604JV-MX016W | |
| Lies of P | |
| 1920x1080 Best Preset | |
| Média NVIDIA GeForce RTX 4070 Laptop GPU (137.4 - 148.1, n=4) | |
| Schenker XMG Pro 16 Studio (Mid 23) | |
| 2560x1440 Best Preset | |
| Média NVIDIA GeForce RTX 4070 Laptop GPU (97.2 - 98.8, n=4) | |
| Schenker XMG Pro 16 Studio (Mid 23) | |
| Assassin's Creed Mirage | |
| 1920x1080 Ultra High Preset (Adaptive Quality Off) | |
| Schenker XMG Pro 16 Studio (Mid 23) | |
| Média NVIDIA GeForce RTX 4070 Laptop GPU (91 - 99, n=6) | |
| 2560x1440 Ultra High Preset (Adaptive Quality Off) | |
| Média NVIDIA GeForce RTX 4070 Laptop GPU (73 - 80, n=6) | |
| Schenker XMG Pro 16 Studio (Mid 23) | |
| Lords of the Fallen | |
| 1920x1080 Ultra Preset | |
| Média NVIDIA GeForce RTX 4070 Laptop GPU (44.3 - 67.7, n=4) | |
| Schenker XMG Pro 16 Studio (Mid 23) | |
| 2560x1440 Ultra Preset | |
| Média NVIDIA GeForce RTX 4070 Laptop GPU (29.1 - 47.1, n=4) | |
| Schenker XMG Pro 16 Studio (Mid 23) | |
| Total War Pharaoh | |
| 1920x1080 Ultra Preset | |
| Média NVIDIA GeForce RTX 4070 Laptop GPU (110 - 136.2, n=5) | |
| Schenker XMG Pro 16 Studio (Mid 23) | |
| Média da turma Gaming (42.9 - 161.4, n=2, últimos 2 anos) | |
| 2560x1440 Ultra Preset | |
| Média NVIDIA GeForce RTX 4070 Laptop GPU (87.2 - 96.6, n=5) | |
| Schenker XMG Pro 16 Studio (Mid 23) | |
| Média da turma Gaming (24.1 - 127.4, n=2, últimos 2 anos) | |
| F1 23 | |
| 1920x1080 Ultra High Preset AA:T AF:16x | |
| MSI Stealth 16 Studio A13VG | |
| Média NVIDIA GeForce RTX 4070 Laptop GPU (49.5 - 100, n=14) | |
| Schenker XMG Pro 16 Studio (Mid 23) | |
| Asus Vivobook Pro 16X K6604JV-MX016W | |
| 2560x1440 Ultra High Preset AA:T AF:16x | |
| Schenker XMG Pro 16 Studio (Mid 23) | |
| MSI Stealth 16 Studio A13VG | |
| Média NVIDIA GeForce RTX 4070 Laptop GPU (35.2 - 49, n=13) | |
| Asus Vivobook Pro 16X K6604JV-MX016W | |
Witcher 3 FPS diagram
| baixo | média | alto | ultra | QHD | |
|---|---|---|---|---|---|
| GTA V (2015) | 186.8 | 185.9 | 181.3 | 125.4 | 93.2 |
| The Witcher 3 (2015) | 474.9 | 365.4 | 231.4 | 118.4 | 86.9 |
| Dota 2 Reborn (2015) | 210 | 187.5 | 176.5 | 162.8 | |
| Final Fantasy XV Benchmark (2018) | 219 | 159.8 | 115.5 | 84.1 | |
| X-Plane 11.11 (2018) | 166.7 | 146.4 | 119.5 | ||
| Strange Brigade (2018) | 544 | 280 | 232 | 202 | 132.8 |
| Cyberpunk 2077 1.6 (2022) | 147 | 115 | 95.3 | 86.7 | 55.4 |
| Returnal (2023) | 115 | 112 | 101 | 85 | 63 |
| F1 23 (2023) | 279 | 261 | 198.2 | 67.6 | 45.6 |
| Lies of P (2023) | 206 | 182 | 159.8 | 140.1 | 97.3 |
| Cyberpunk 2077 (2023) | 131.7 | 113.2 | 98.3 | 87.9 | 57.1 |
| Assassin's Creed Mirage (2023) | 143 | 132 | 125 | 99 | 75 |
| Total War Pharaoh (2023) | 385.9 | 239.5 | 146.2 | 113.3 | 87.2 |
| Lords of the Fallen (2023) | 96.9 | 84.1 | 63.4 | 45.9 | 29.1 |
Emissões e potência - O Pro 16 oferece bons tempos de funcionamento
Emissões de ruído
Durante os jogos, as emissões de ruído podem chegar a 55 dB(A) (Modo de desempenho). o "Modo Entretenimento", que usamos, oferece emissões de ruído moderadas de 48 dB(A). Ele poderia ser mais silencioso: No Modo Silencioso, o senhor pode obter emissões de 42 dB(A), às custas de algum desempenho em jogos. No modo ocioso e no uso diário (escritório, Internet), uma das duas ventoinhas está sempre em uso e, às vezes, ambas permanecem desligadas.
Barulho
| Ocioso |
| 26 / 29 / 34 dB |
| Carga |
| 43 / 48 dB |
 | ||
30 dB silencioso 40 dB(A) audível 50 dB(A) ruidosamente alto |
||
min: | ||
| Schenker XMG Pro 16 Studio (Mid 23) i9-13900H, GeForce RTX 4070 Laptop GPU | Asus Vivobook Pro 16X K6604JV-MX016W i9-13980HX, GeForce RTX 4060 Laptop GPU | Lenovo Legion Slim 7i 16 Gen 8 i9-13900H, GeForce RTX 4070 Laptop GPU | HP Omen Transcend 16 i9-13900HX, GeForce RTX 4070 Laptop GPU | MSI Stealth 16 Studio A13VG i7-13700H, GeForce RTX 4070 Laptop GPU | |
|---|---|---|---|---|---|
| Noise | -4% | 10% | -3% | 11% | |
| desligado / ambiente * (dB) | 25 | 25.2 -1% | 22.8 9% | 22.9 8% | 24 4% |
| Idle Minimum * (dB) | 26 | 26.6 -2% | 23.6 9% | 29.1 -12% | 24 8% |
| Idle Average * (dB) | 29 | 26.6 8% | 23.6 19% | 29.1 -0% | 24 17% |
| Idle Maximum * (dB) | 34 | 29.2 14% | 25.7 24% | 29.1 14% | 24 29% |
| Load Average * (dB) | 43 | 53.4 -24% | 27.6 36% | 45.7 -6% | 34.81 19% |
| Witcher 3 ultra * (dB) | 48 | 54.4 -13% | 54.3 -13% | 44.05 8% | |
| Load Maximum * (dB) | 48 | 56.9 -19% | 54.4 -13% | 54.3 -13% | 51.57 -7% |
* ... menor é melhor
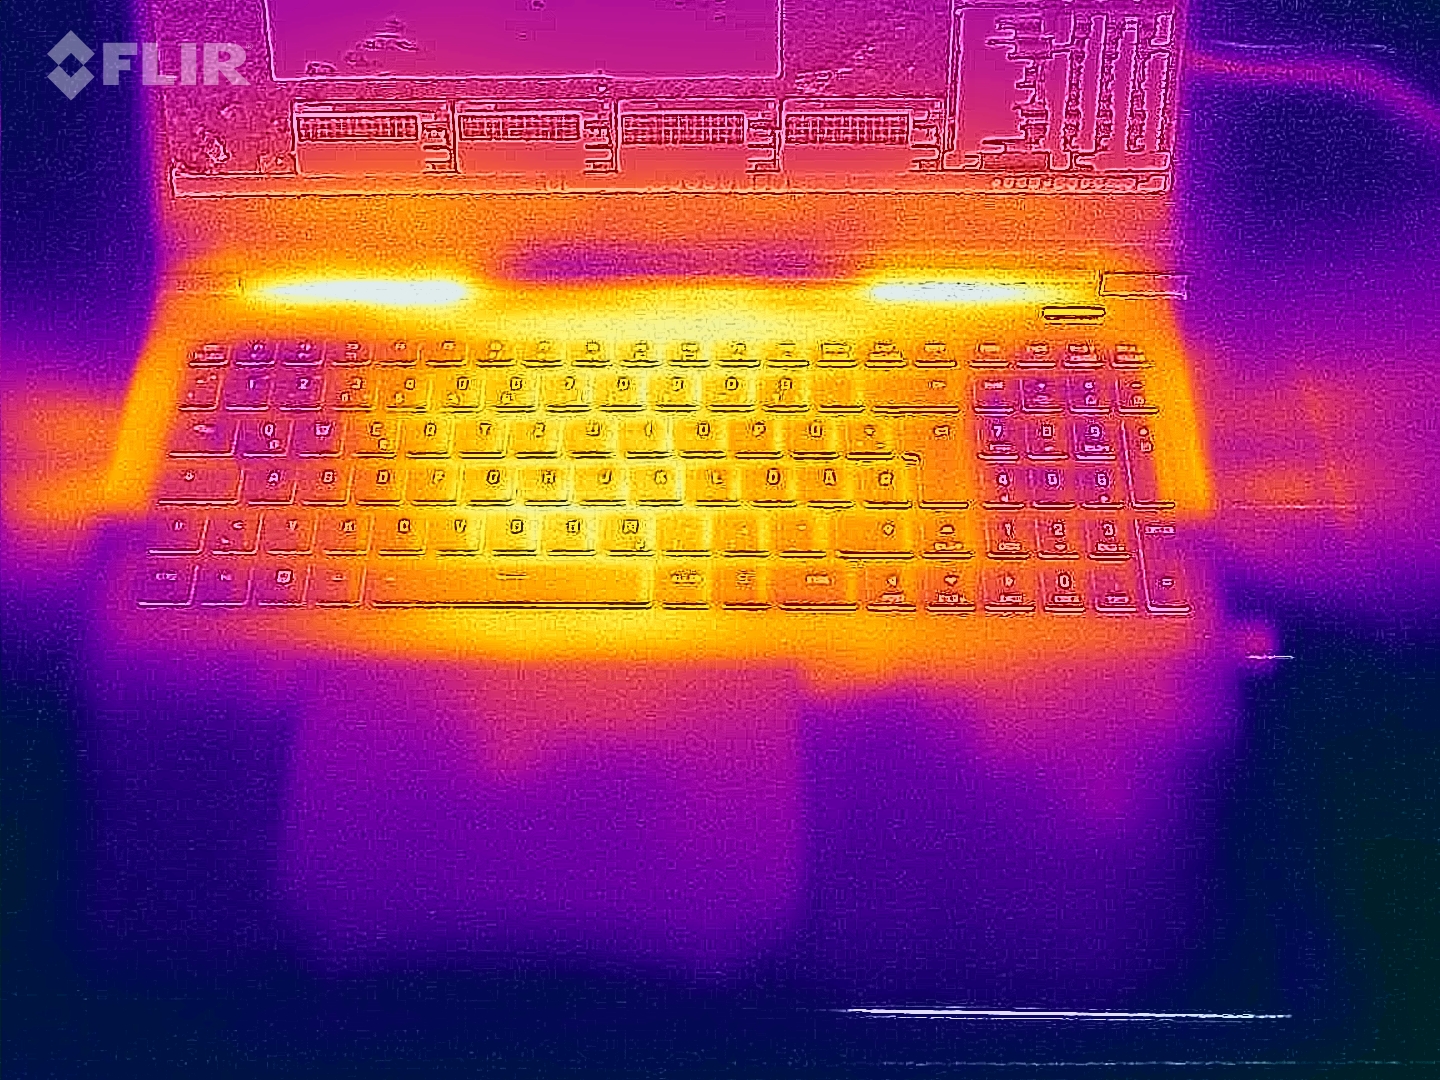
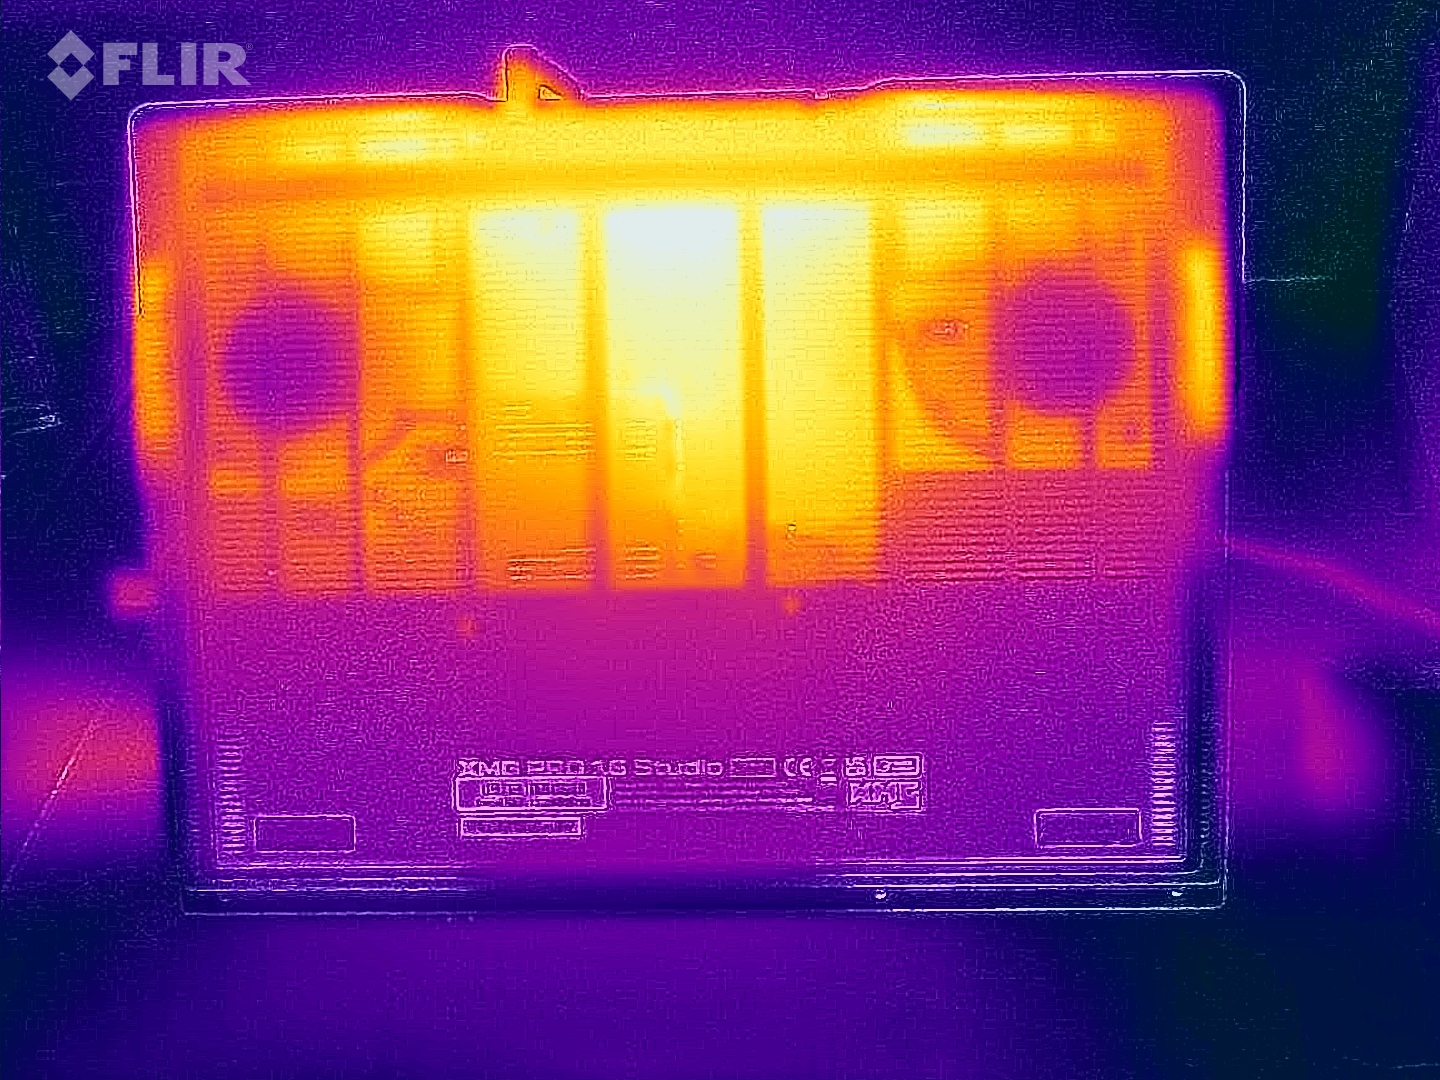
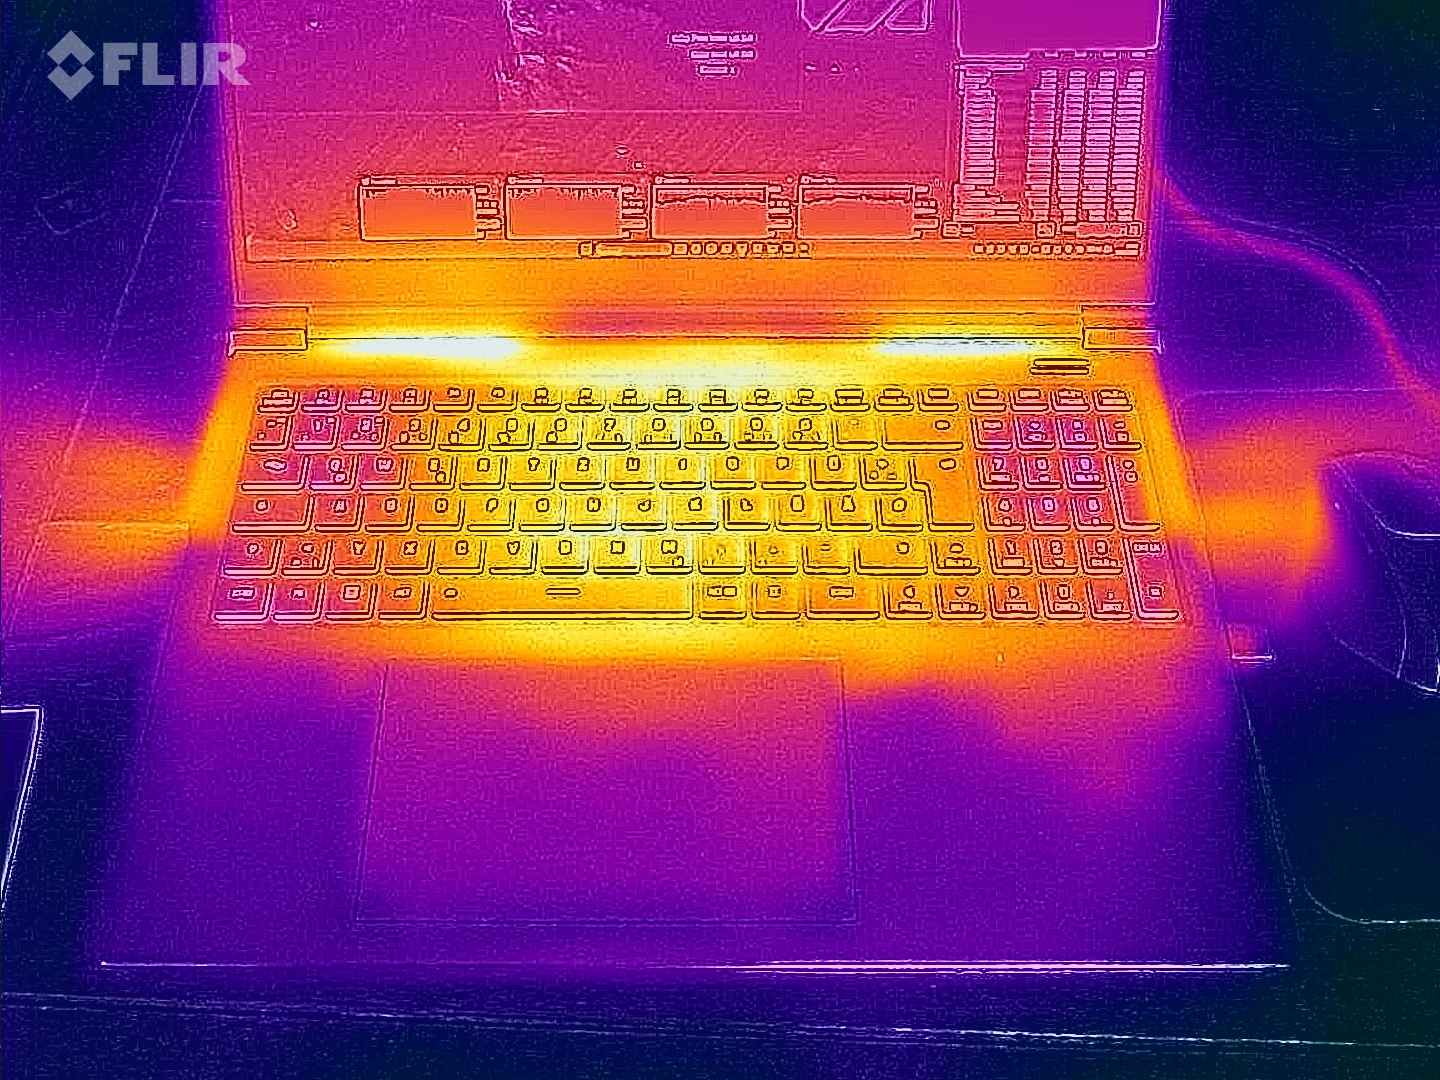
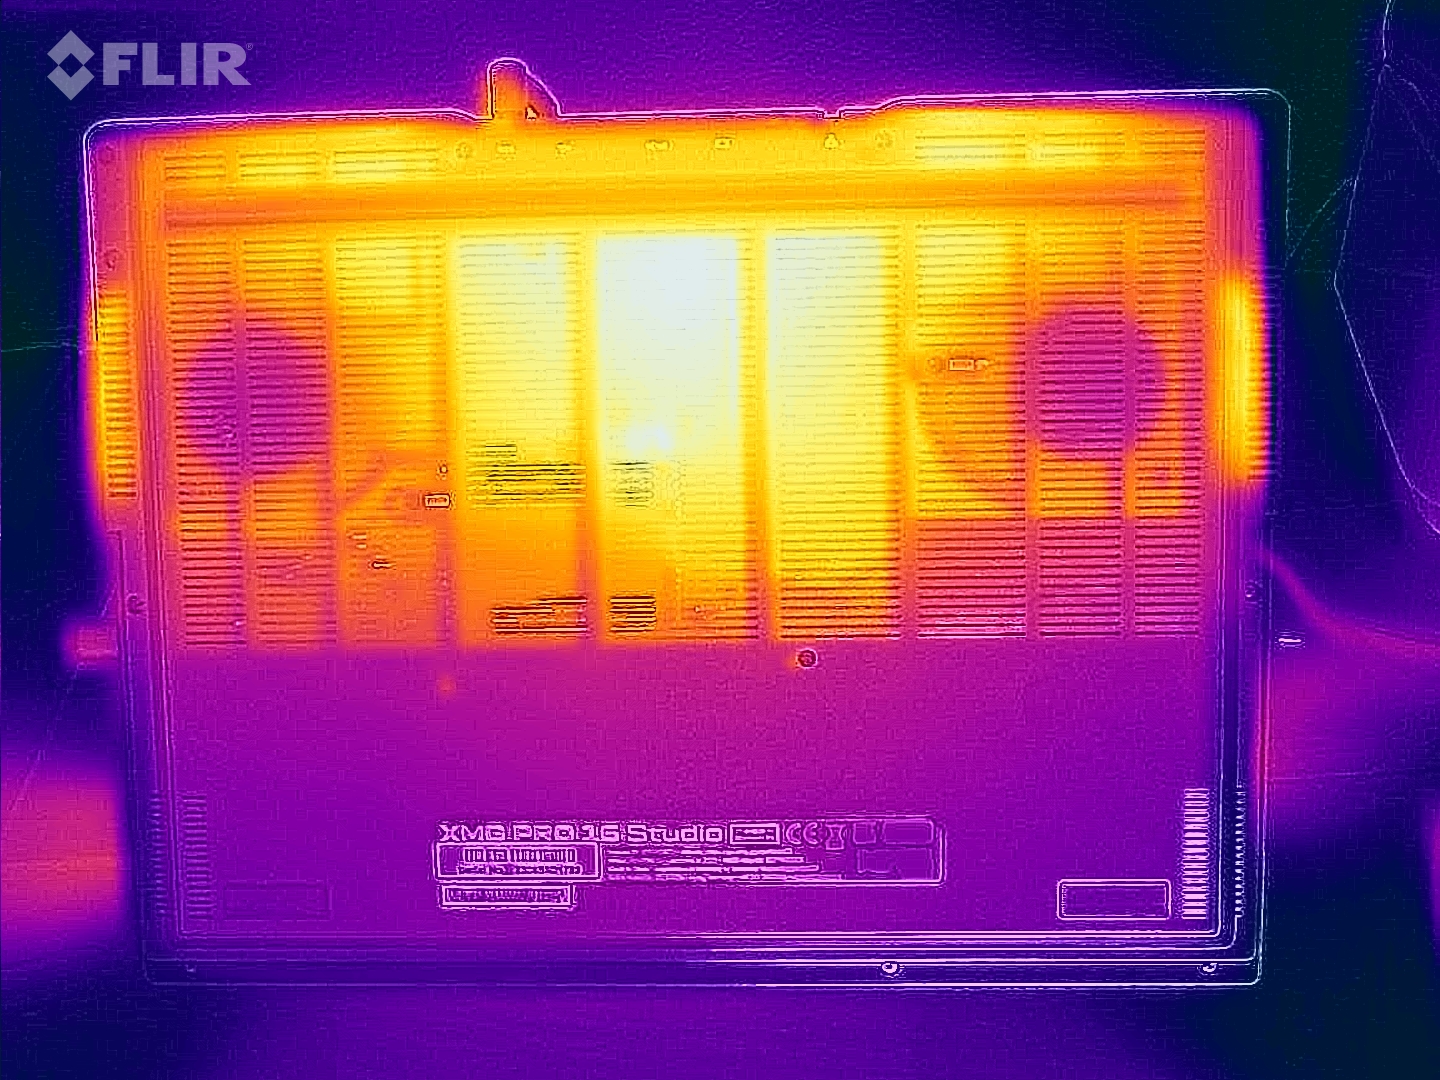
Temperatura
O teste de estresse e o Witcher 3 fizeram com que as temperaturas do laptop aumentassem significativamente. Em determinadas áreas, medimos temperaturas acima de 60 graus Celsius. No uso diário (escritório, Internet), esses valores geralmente permanecem dentro da zona verde - mas em um nível mais alto do que o de concorrentes como oLenovo Legion Slim 7i 16 Gen 8.
(-) A temperatura máxima no lado superior é 55 °C / 131 F, em comparação com a média de 40.4 °C / 105 F , variando de 21.2 a 68.8 °C para a classe Gaming.
(-) A parte inferior aquece até um máximo de 66 °C / 151 F, em comparação com a média de 43.2 °C / 110 F
(+) Em uso inativo, a temperatura média para o lado superior é 30.1 °C / 86 F, em comparação com a média do dispositivo de 33.9 °C / ### class_avg_f### F.
(-) Jogando The Witcher 3, a temperatura média para o lado superior é 43.9 °C / 111 F, em comparação com a média do dispositivo de 33.9 °C / ## #class_avg_f### F.
(+) Os apoios para as mãos e o touchpad estão atingindo a temperatura máxima da pele (33 °C / 91.4 F) e, portanto, não estão quentes.
(-) A temperatura média da área do apoio para as mãos de dispositivos semelhantes foi 28.8 °C / 83.8 F (-4.2 °C / -7.6 F).
| Schenker XMG Pro 16 Studio (Mid 23) Intel Core i9-13900H, NVIDIA GeForce RTX 4070 Laptop GPU | Asus Vivobook Pro 16X K6604JV-MX016W Intel Core i9-13980HX, NVIDIA GeForce RTX 4060 Laptop GPU | Lenovo Legion Slim 7i 16 Gen 8 Intel Core i9-13900H, NVIDIA GeForce RTX 4070 Laptop GPU | HP Omen Transcend 16 Intel Core i9-13900HX, NVIDIA GeForce RTX 4070 Laptop GPU | MSI Stealth 16 Studio A13VG Intel Core i7-13700H, NVIDIA GeForce RTX 4070 Laptop GPU | |
|---|---|---|---|---|---|
| Heat | 11% | 15% | 16% | -6% | |
| Maximum Upper Side * (°C) | 55 | 39.7 28% | 49.8 9% | 47.4 14% | 60 -9% |
| Maximum Bottom * (°C) | 66 | 60 9% | 48.8 26% | 54.4 18% | 61 8% |
| Idle Upper Side * (°C) | 33 | 30.9 6% | 29.4 11% | 28.4 14% | 38.2 -16% |
| Idle Bottom * (°C) | 35 | 34.7 1% | 30 14% | 29.2 17% | 37.7 -8% |
* ... menor é melhor
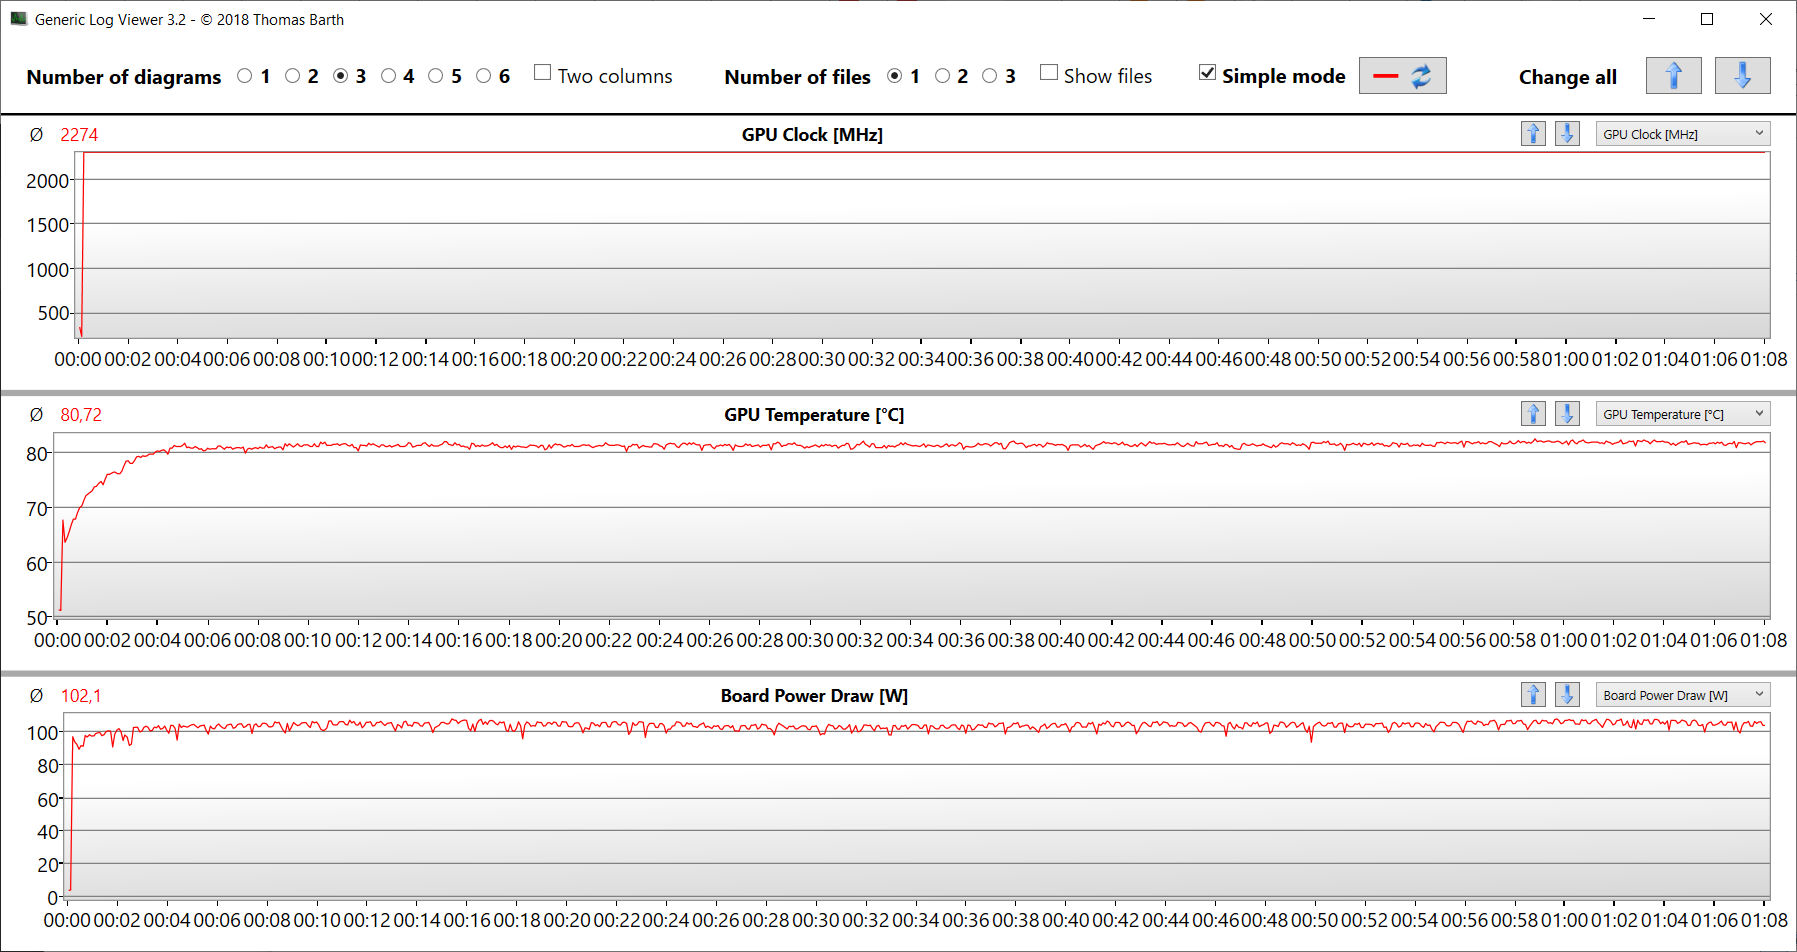
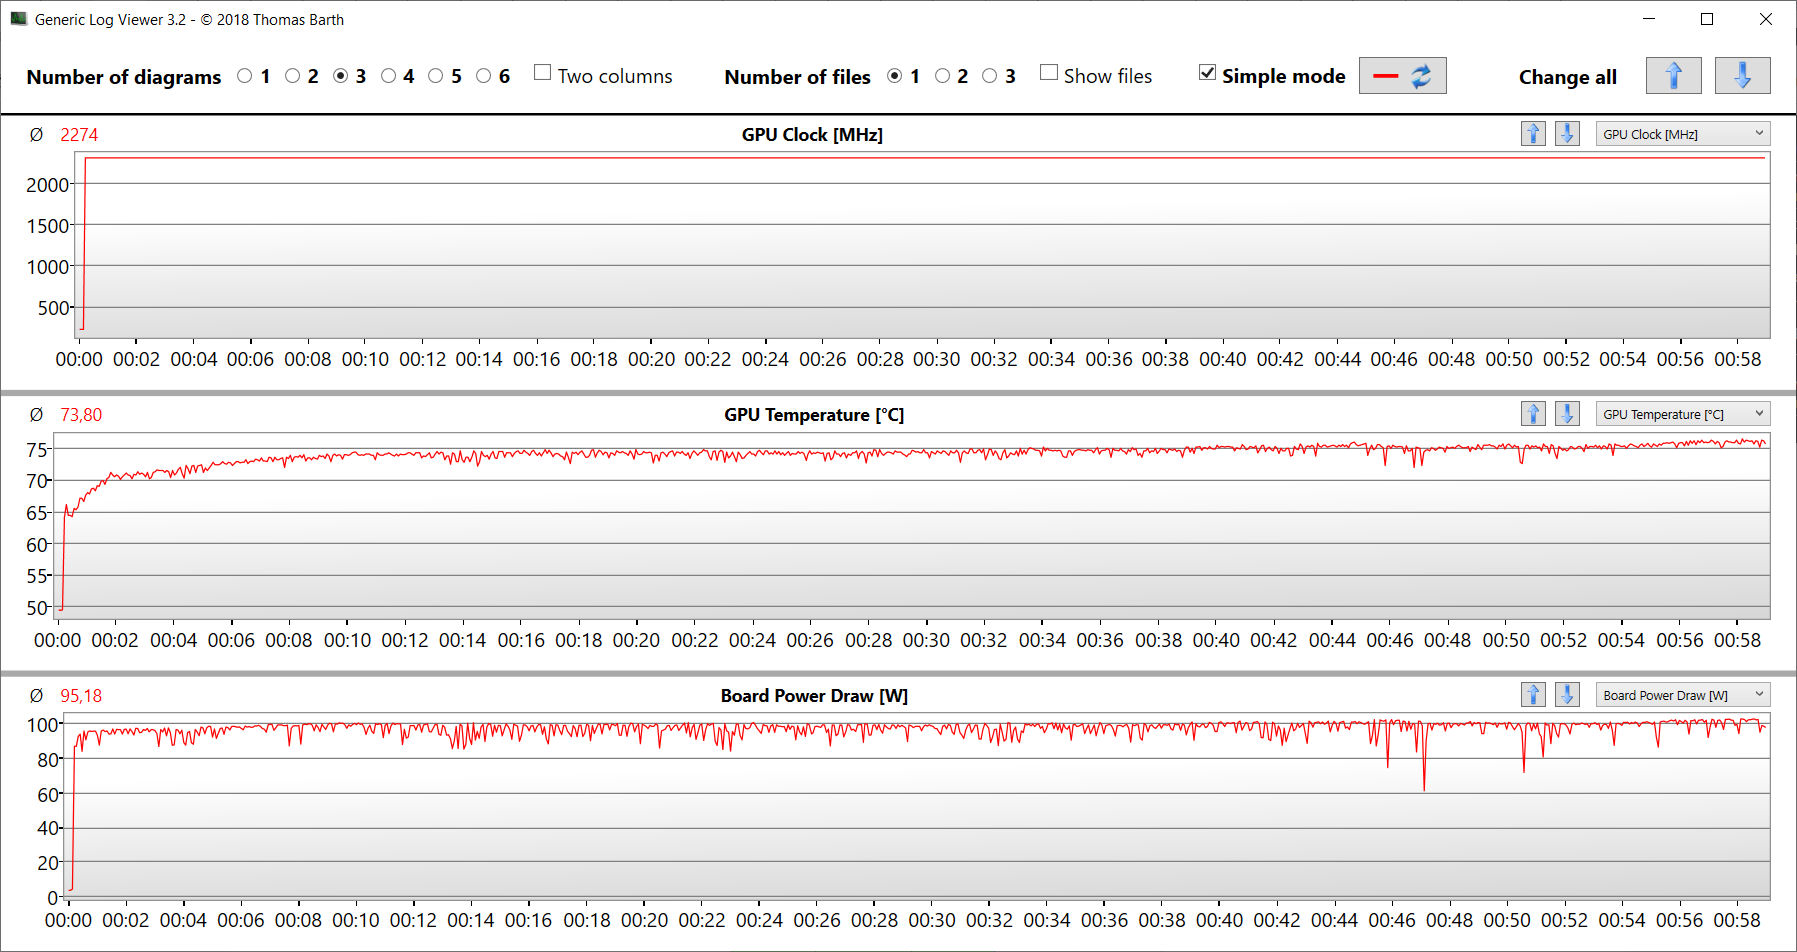
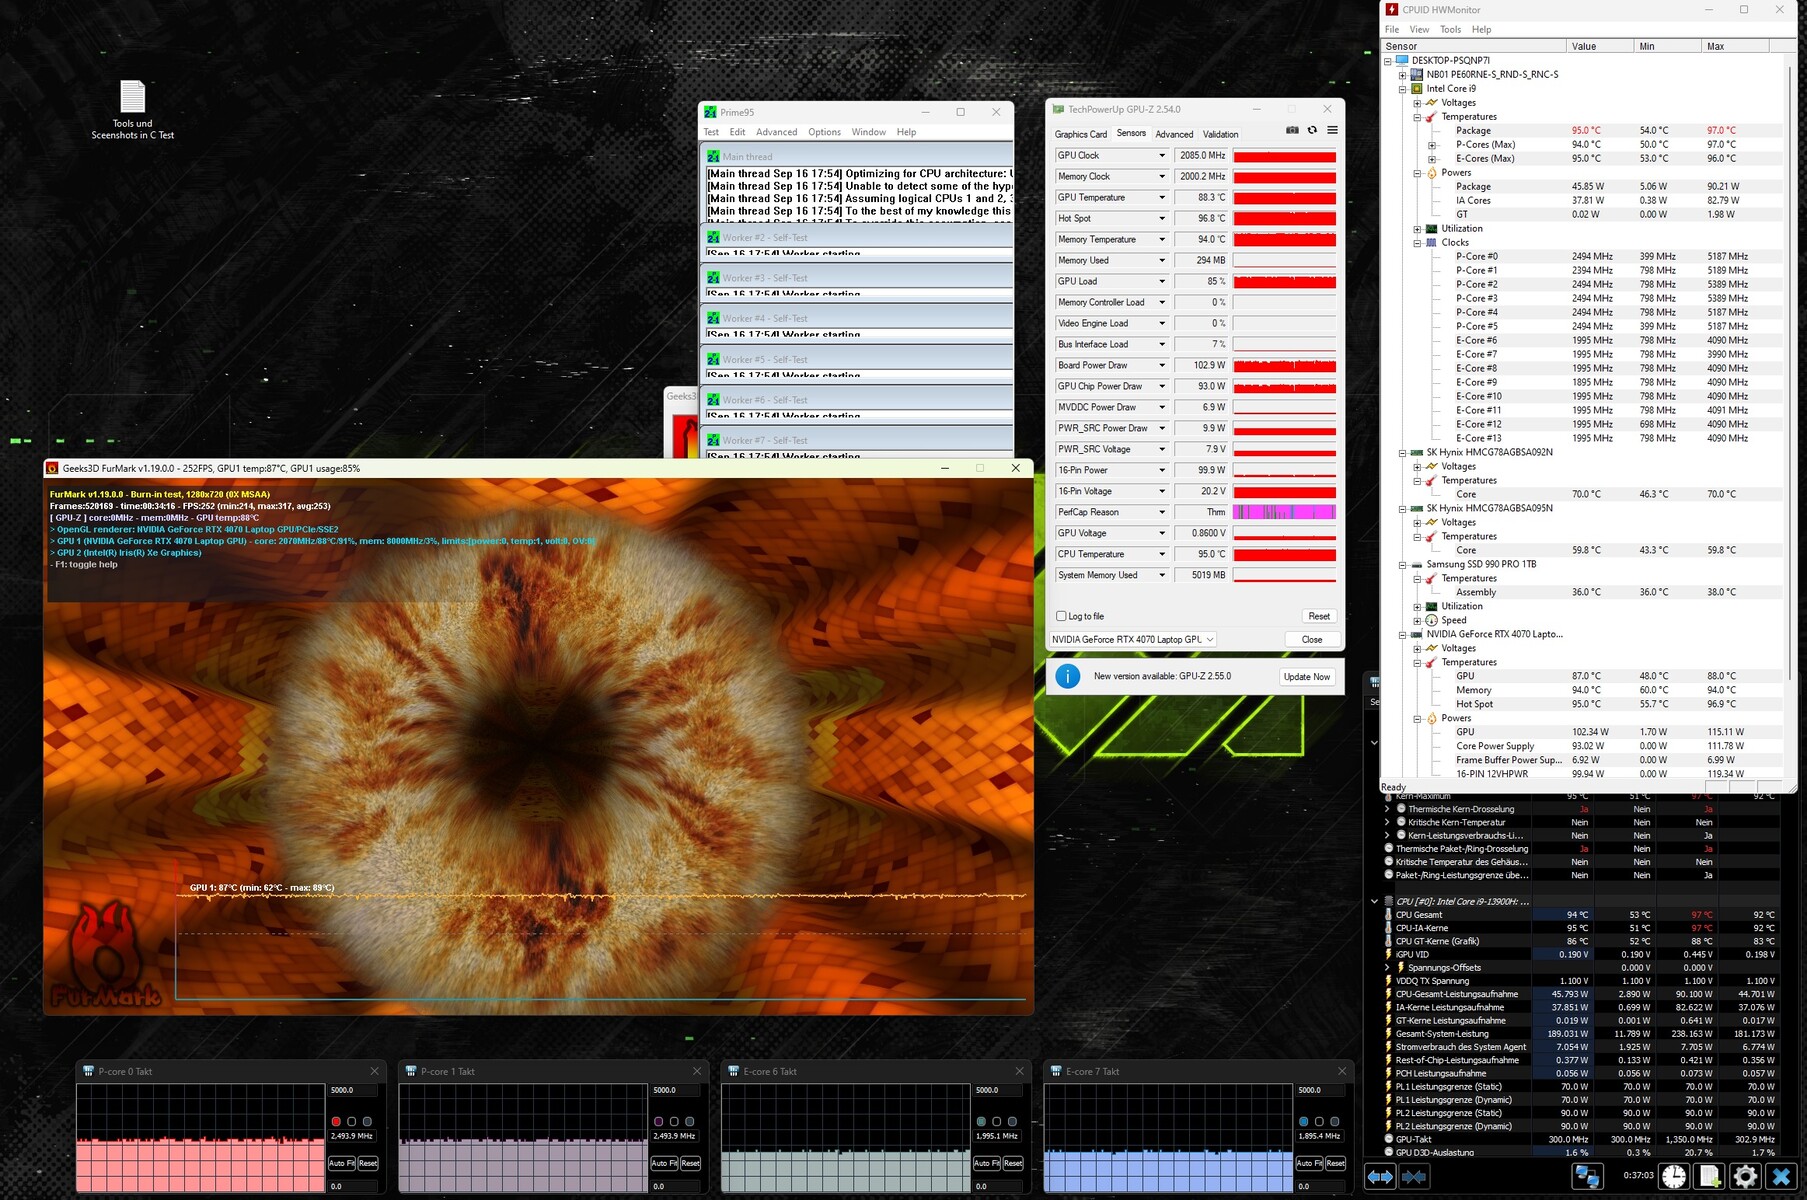
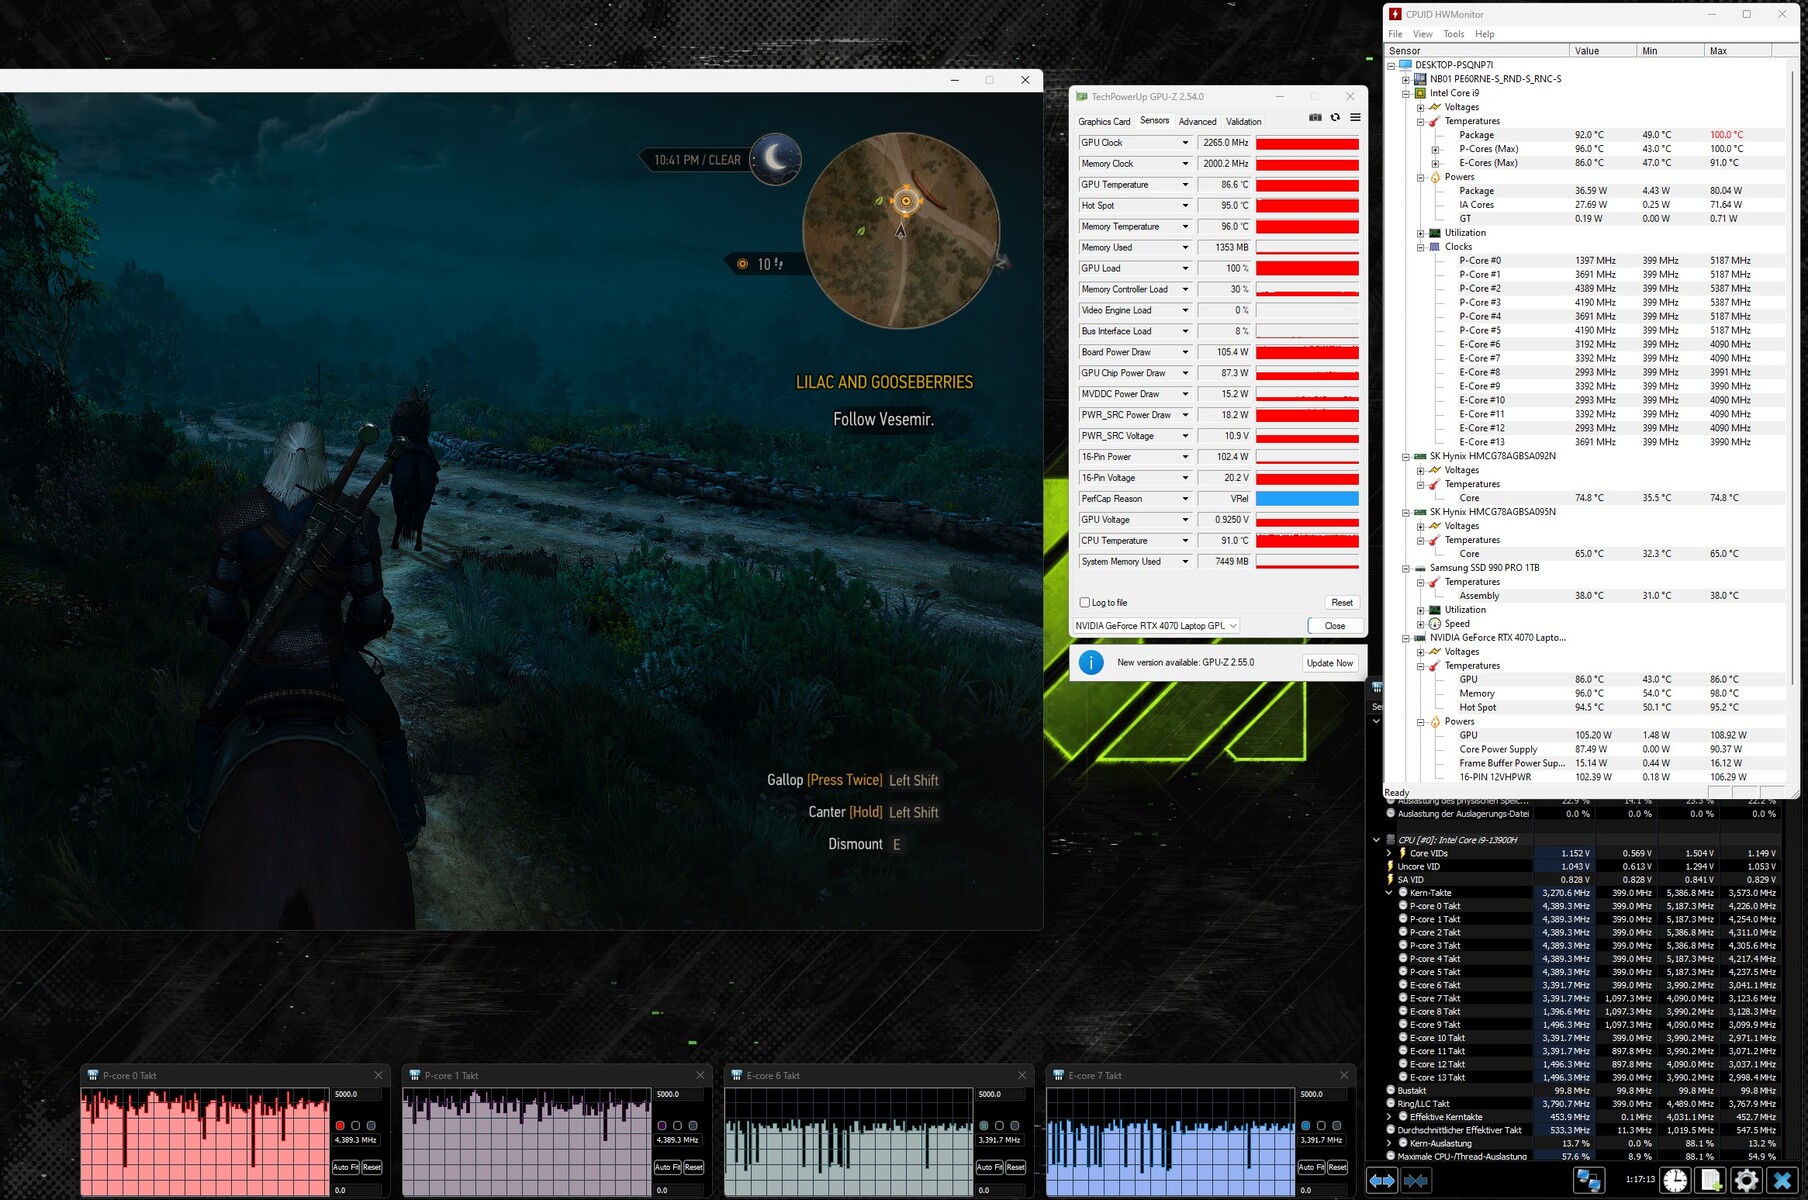
Teste de estresse
O teste de estresse (Prime95 e Furmark em uso contínuo) simula um cenário extremo para testar a estabilidade do sistema sob carga total. A CPU (P: 3,8 a 3,9 GHz, E: 2,7 GHz) começou o teste com altas taxas de clock. No decorrer do teste, esses valores caíram para o nível do clock base. A GPU funcionou com potência quase total.
Alto-falantes
Os alto-falantes estéreo produzem um som bastante decente em geral. Os graves poderiam ser mais potentes.
Schenker XMG Pro 16 Studio (Mid 23) análise de áudio
(±) | o volume do alto-falante é médio, mas bom (###valor### dB)
Graves 100 - 315Hz
(±) | graves reduzidos - em média 12.7% menor que a mediana
(+) | o baixo é linear (6.1% delta para a frequência anterior)
Médios 400 - 2.000 Hz
(+) | médios equilibrados - apenas 2.3% longe da mediana
(+) | médios são lineares (4.8% delta para frequência anterior)
Altos 2 - 16 kHz
(+) | agudos equilibrados - apenas 2.6% longe da mediana
(+) | os máximos são lineares (6% delta da frequência anterior)
Geral 100 - 16.000 Hz
(+) | o som geral é linear (10.9% diferença em relação à mediana)
Comparado com a mesma classe
» 7% de todos os dispositivos testados nesta classe foram melhores, 3% semelhantes, 90% piores
» O melhor teve um delta de 6%, a média foi 18%, o pior foi 132%
Comparado com todos os dispositivos testados
» 6% de todos os dispositivos testados foram melhores, 2% semelhantes, 92% piores
» O melhor teve um delta de 4%, a média foi 23%, o pior foi 134%
Lenovo Legion Slim 7i 16 Gen 8 análise de áudio
(+) | os alto-falantes podem tocar relativamente alto (###valor### dB)
Graves 100 - 315Hz
(±) | graves reduzidos - em média 12.1% menor que a mediana
(±) | a linearidade dos graves é média (9% delta para a frequência anterior)
Médios 400 - 2.000 Hz
(+) | médios equilibrados - apenas 1.4% longe da mediana
(+) | médios são lineares (3.3% delta para frequência anterior)
Altos 2 - 16 kHz
(+) | agudos equilibrados - apenas 4.4% longe da mediana
(+) | os máximos são lineares (5.6% delta da frequência anterior)
Geral 100 - 16.000 Hz
(+) | o som geral é linear (10.5% diferença em relação à mediana)
Comparado com a mesma classe
» 6% de todos os dispositivos testados nesta classe foram melhores, 2% semelhantes, 92% piores
» O melhor teve um delta de 6%, a média foi 18%, o pior foi 132%
Comparado com todos os dispositivos testados
» 5% de todos os dispositivos testados foram melhores, 1% semelhantes, 93% piores
» O melhor teve um delta de 4%, a média foi 23%, o pior foi 134%
Consumo de energia
O Pro 16 não apresentou nenhum valor de consumo de energia notável. As taxas estão em um nível normal para o hardware instalado. O teste Witcher 3 teste e o teste de estresse foram executados com um consumo de energia ligeiramente menor. A fonte de alimentação (230 watts) tem tamanho suficiente. É digno de elogio: Dentro do campo de comparação, o laptop XMG tem o menor consumo geral de energia.
| desligado | |
| Ocioso | |
| Carga |
|
Key:
min: | |
| Schenker XMG Pro 16 Studio (Mid 23) i9-13900H, GeForce RTX 4070 Laptop GPU | Asus Vivobook Pro 16X K6604JV-MX016W i9-13980HX, GeForce RTX 4060 Laptop GPU | Lenovo Legion Slim 7i 16 Gen 8 i9-13900H, GeForce RTX 4070 Laptop GPU | HP Omen Transcend 16 i9-13900HX, GeForce RTX 4070 Laptop GPU | MSI Stealth 16 Studio A13VG i7-13700H, GeForce RTX 4070 Laptop GPU | Média da turma Gaming | |
|---|---|---|---|---|---|---|
| Power Consumption | -23% | -65% | -76% | -8% | -33% | |
| Idle Minimum * (Watt) | 8 | 13.8 -73% | 22 -175% | 19.2 -140% | 11 -38% | 13 ? -63% |
| Idle Average * (Watt) | 12 | 16 -33% | 29 -142% | 22.7 -89% | 18 -50% | 19 ? -58% |
| Idle Maximum * (Watt) | 23 | 19 17% | 39.5 -72% | 55.4 -141% | 19 17% | 24.6 ? -7% |
| Load Average * (Watt) | 94 | 147 -56% | 98.7 -5% | 128.4 -37% | 91 3% | 110.7 ? -18% |
| Witcher 3 ultra * (Watt) | 181.5 | 147.8 19% | 171.8 5% | 206 -13% | 130 28% | |
| Load Maximum * (Watt) | 215 | 244 -13% | 213.2 1% | 292 -36% | 228 -6% | 259 ? -20% |
* ... menor é melhor
Power consumption Witcher 3 / stress test
Power consumption with external monitor
Tempos de execução
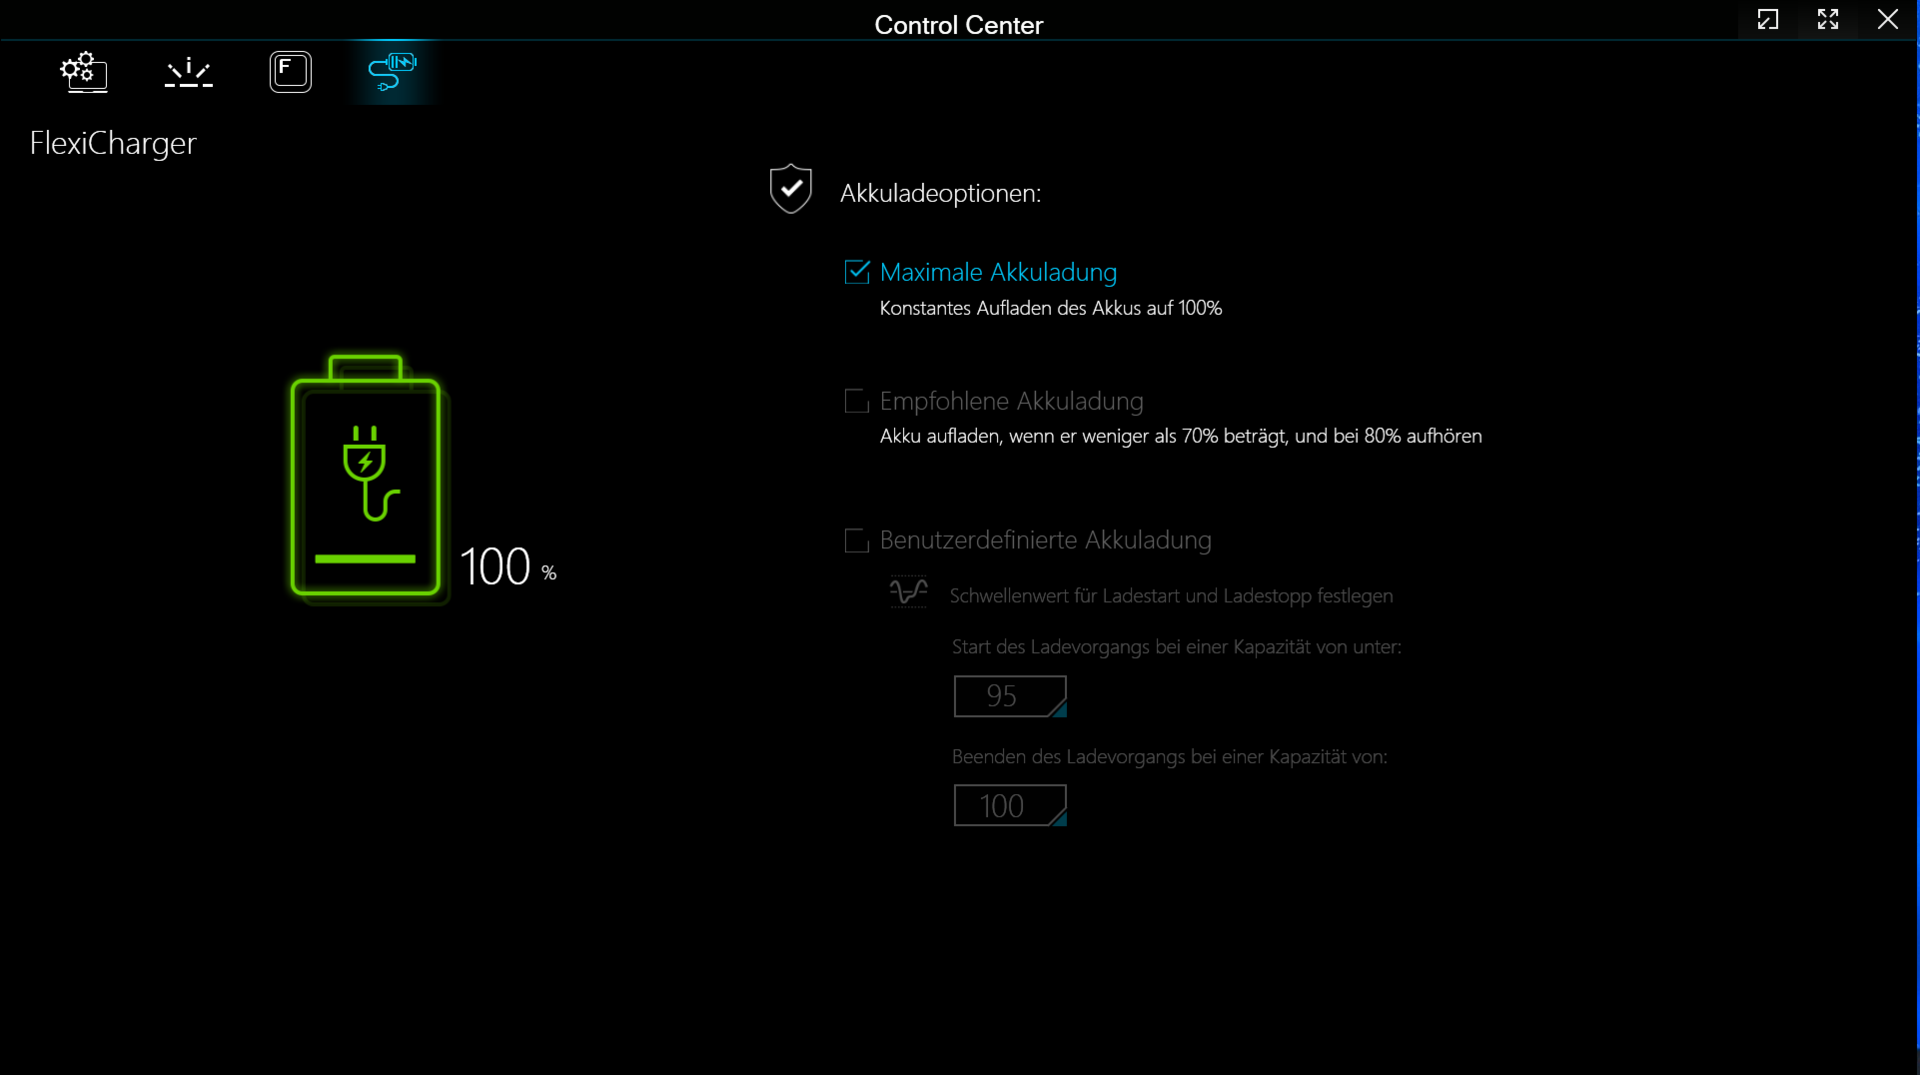
Em nosso teste realista de WLAN (que descreve a carga ao acessar sites usando um script), o laptop de 16 polegadas alcançou tempos de execução de 6:45 h - um resultado geralmente bom. Dentro do campo de comparação, o Pro 16 apresenta a menor capacidade de bateria (73 Wh), mas oferece os melhores tempos de execução por Wh.
Pro
Contra
Veredicto - Uma potência harmoniosa
A edição de vídeo e imagem, o streaming, a renderização e os jogos fazem parte da experiência do laptop. A potência necessária é fornecida por um processadorCore i9-13900He umaGeForce RTX 4070em um nível consistentemente alto. É possível encontrar um bom compromisso entre desempenho e emissões de ruído.
O XMG Pro 16 Studio (Mid 23) da Schenker prova ser uma ferramenta poderosa para jogadores e criadores.
Sua tela QHD+ (16 polegadas, 2.560 x 1.600 pixels, sRGB, IPS, 240 Hz) com uma relação de aspecto 16:10 amigável para o trabalho geralmente nos deixou uma boa impressão. Mesmo assim: A tela de um notebook para criadores deve ser capaz de representar o espaço de cores DCI P3. Dois slots de SSD (PCIe 4), incluindo suporte a RAID-0/1, garantem muito armazenamento e tempos de carregamento curtos.
Suas portas USB-C (1x USB 3.2 Gen 2, 1x Thunderbolt 4) facilitam a integração do notebook às configurações existentes do espaço de trabalho e abrem mais opções de expansão (GPU externa, docking). Sua porta TB-4 pode emitir um sinal DisplayPort e é compatível com o Power Delivery. Além disso, os tempos de execução são relativamente bons.
Uma alternativa poderia ser oLenovo Legion Slim 7i 16 Gen 8: Ele apresenta a mesma CPU e GPU, mas pode oferecer um pouco mais de potência de computação. Os pontos fracos do laptop: Maior consumo de energia, RAM soldada, aceleração do SSD.
Preço e disponibilidade
O XMG Pro 16 Studio pode ser configurado individualmente e encomendado por meio da loja on-line Schenker. Nosso dispositivo de teste pode ser adquirido por cerca de US$ 2.400.
Schenker XMG Pro 16 Studio (Mid 23)
- 10/22/2023 v7 (old)
Sascha Mölck
Transparência
A seleção dos dispositivos a serem analisados é feita pela nossa equipe editorial. A amostra de teste foi fornecida ao autor como empréstimo pelo fabricante ou varejista para fins desta revisão. O credor não teve influência nesta revisão, nem o fabricante recebeu uma cópia desta revisão antes da publicação. Não houve obrigação de publicar esta revisão. Como empresa de mídia independente, a Notebookcheck não está sujeita à autoridade de fabricantes, varejistas ou editores.
É assim que o Notebookcheck está testando
Todos os anos, o Notebookcheck analisa de forma independente centenas de laptops e smartphones usando procedimentos padronizados para garantir que todos os resultados sejam comparáveis. Desenvolvemos continuamente nossos métodos de teste há cerca de 20 anos e definimos padrões da indústria no processo. Em nossos laboratórios de teste, equipamentos de medição de alta qualidade são utilizados por técnicos e editores experientes. Esses testes envolvem um processo de validação em vários estágios. Nosso complexo sistema de classificação é baseado em centenas de medições e benchmarks bem fundamentados, o que mantém a objetividade.Price comparison

