Análise do Asus Vivobook Pro 16X: Notebook para criadores com um processador excepcional
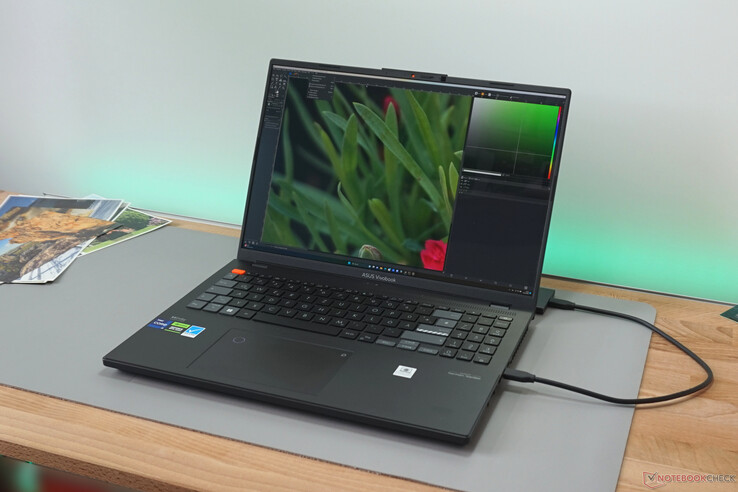
O VivoBook Pro pertence à categoria de laptops multimídia destinados a usuários domésticos ambiciosos para projetos criativos. Um processador potente, o modelo top atuali9-13980HX nesse caso, e uma GPU móvel em várias configurações garantem a velocidade de trabalho adequada. Uma tela OLED ilustra o respectivo conteúdo de forma quase realista e o "Asus Dial" também distingue esse modelo dos notebooks simples.
O Asus VivoBook Pro 16X em análise hoje não se parece muito com os Vivobooks típicos, que começam em torno de US$1.500. O processador e a tela vêm da série profissional ProArt Studiobook, que já analisamos na forma doAsus ProArt Studiobook 16 OLED H7604. O gabinete e muitos recursos, por outro lado, foram mantidos simples. O VivoBook Pro 16X, portanto, se move na área cinzenta entre um laptop hiperpotente para o lar e um dispositivo de trabalho criativo em uma aparência (muito) simples.
Os concorrentes em um nível comparável incluem oGigabyte AERO 16 OLED ou o Samsung Galaxy Book3 Ultra 16nossa análise revelará se o Vivobook consegue se destacar com seus empréstimos do segmento profissional.
Possíveis concorrentes em comparação
Avaliação | Data | Modelo | Peso | Altura | Size | Resolução | Preço |
|---|---|---|---|---|---|---|---|
| 86.2 % v7 (old) | 07/2023 | Asus Vivobook Pro 16X K6604JV-MX016W i9-13980HX, GeForce RTX 4060 Laptop GPU | 2.1 kg | 22.8 mm | 16.00" | 3200x2000 | |
| 90.3 % v7 (old) | 04/2023 | Dell XPS 15 9530 RTX 4070 i7-13700H, GeForce RTX 4070 Laptop GPU | 1.9 kg | 18 mm | 15.60" | 3456x2160 | |
| 89.4 % v7 (old) | 04/2023 | Samsung Galaxy Book3 Ultra 16 i7-13700H, GeForce RTX 4050 Laptop GPU | 1.8 kg | 16.5 mm | 16.00" | 2880x1800 | |
| 88.6 % v7 (old) | 07/2023 | Schenker VISION 16 Pro (M23) i7-13700H, GeForce RTX 4070 Laptop GPU | 1.6 kg | 17.1 mm | 16.00" | 2560x1600 | |
| 86.1 % v7 (old) | 06/2023 | Asus ProArt Studiobook 16 OLED H7604 i9-13980HX, GeForce RTX 4070 Laptop GPU | 2.4 kg | 23.9 mm | 16.00" | 3200x2000 | |
| 83.8 % v7 (old) | 09/2022 | MSI Creator Z17 A12UGST-054 i9-12900H, GeForce RTX 3070 Ti Laptop GPU | 2.5 kg | 19 mm | 17.00" | 2560x1600 |
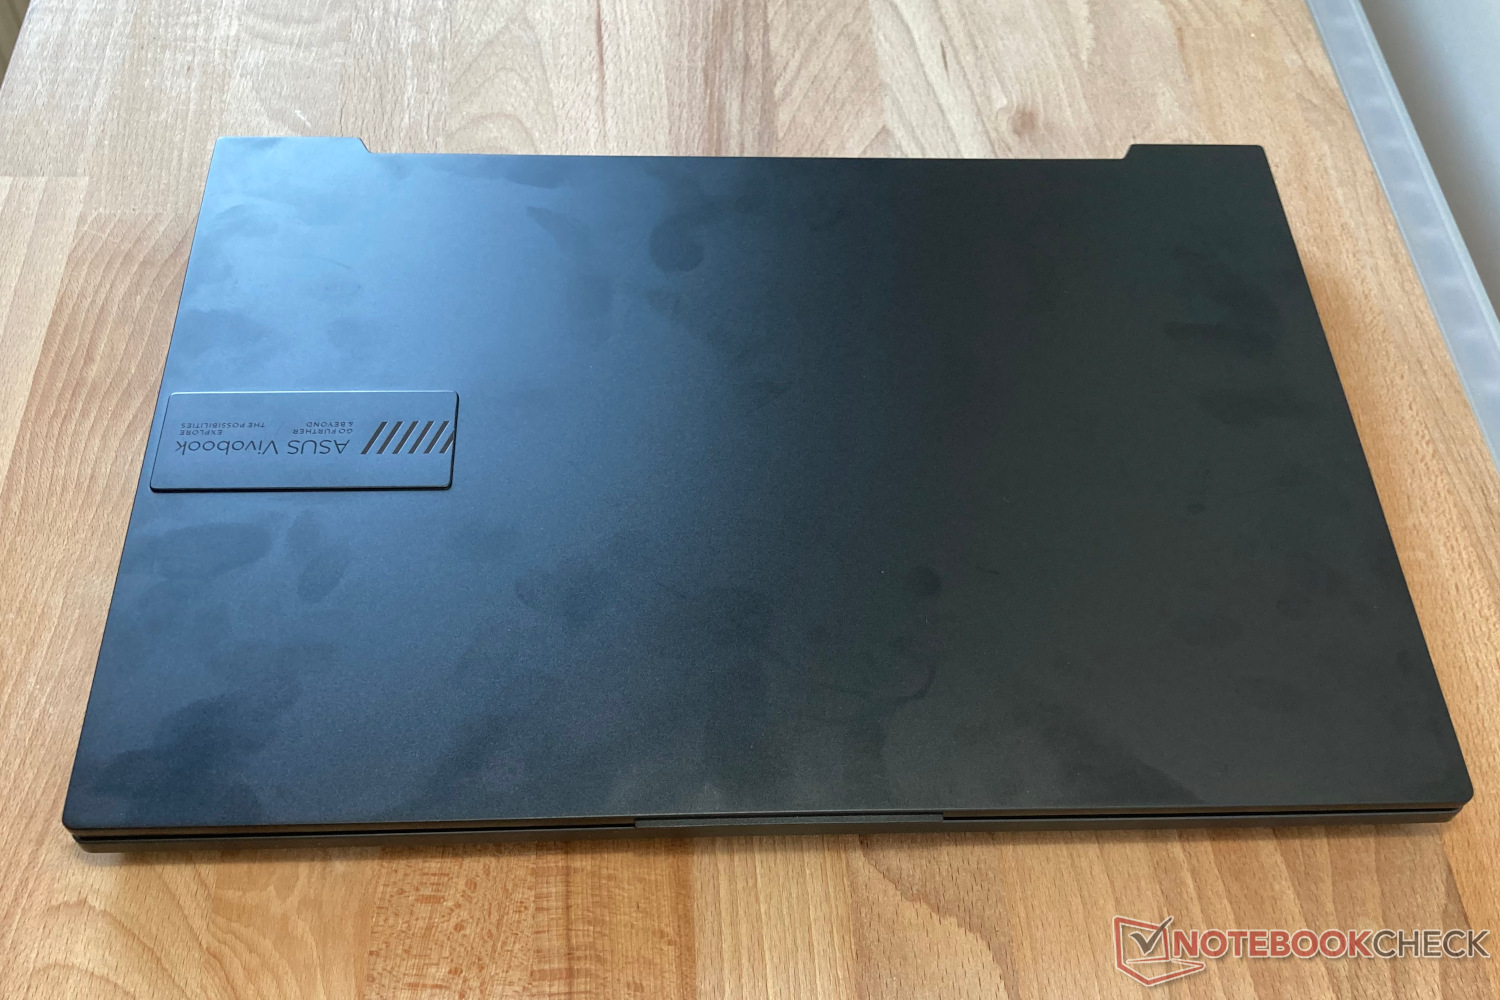
Capa - Muito plástico no Vivobook
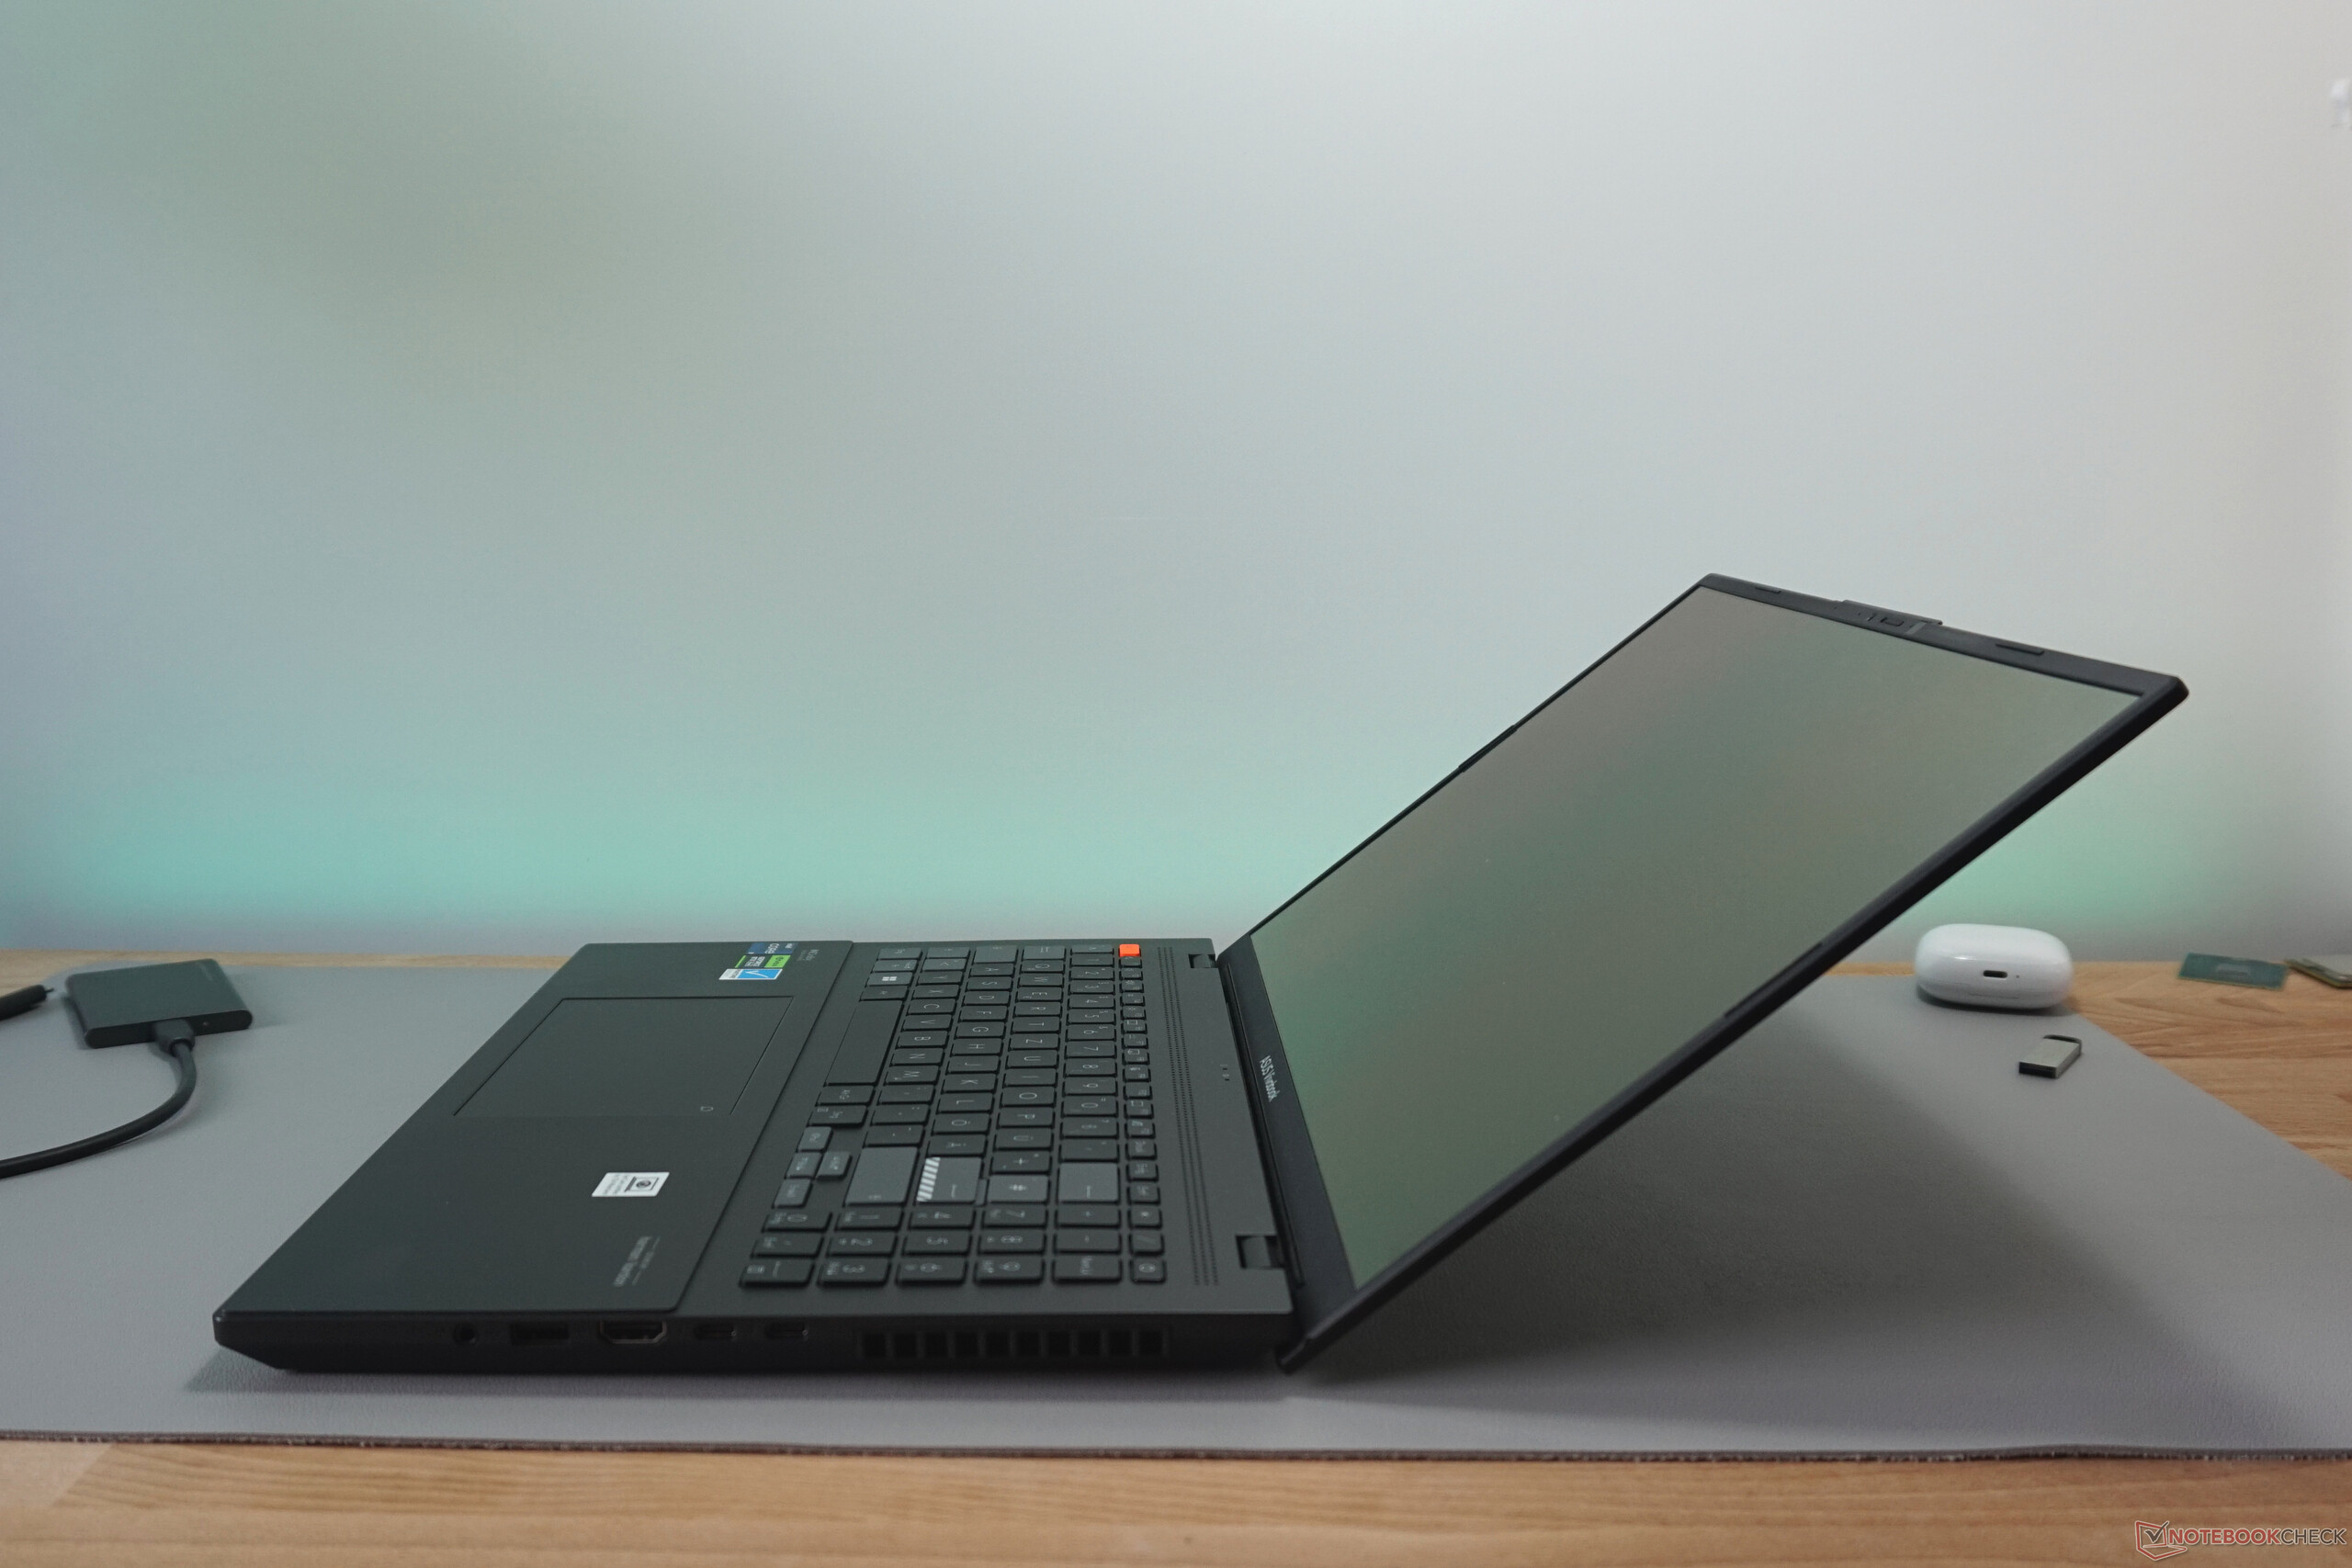
Feito inteiramente de plástico preto, o gabinete do Vivobook Pro 16X causa uma impressão bastante simples. Os pés em laranja neon dão um toque de cor. O acabamento da base e das dobradiças é sólido. Apenas uma torção mínima pode ser obtida quando o gabinete é segurado por um dos cantos frontais. Além disso, a tela sempre permanece firme no ângulo definido, que chega a pouco mais de 140°.
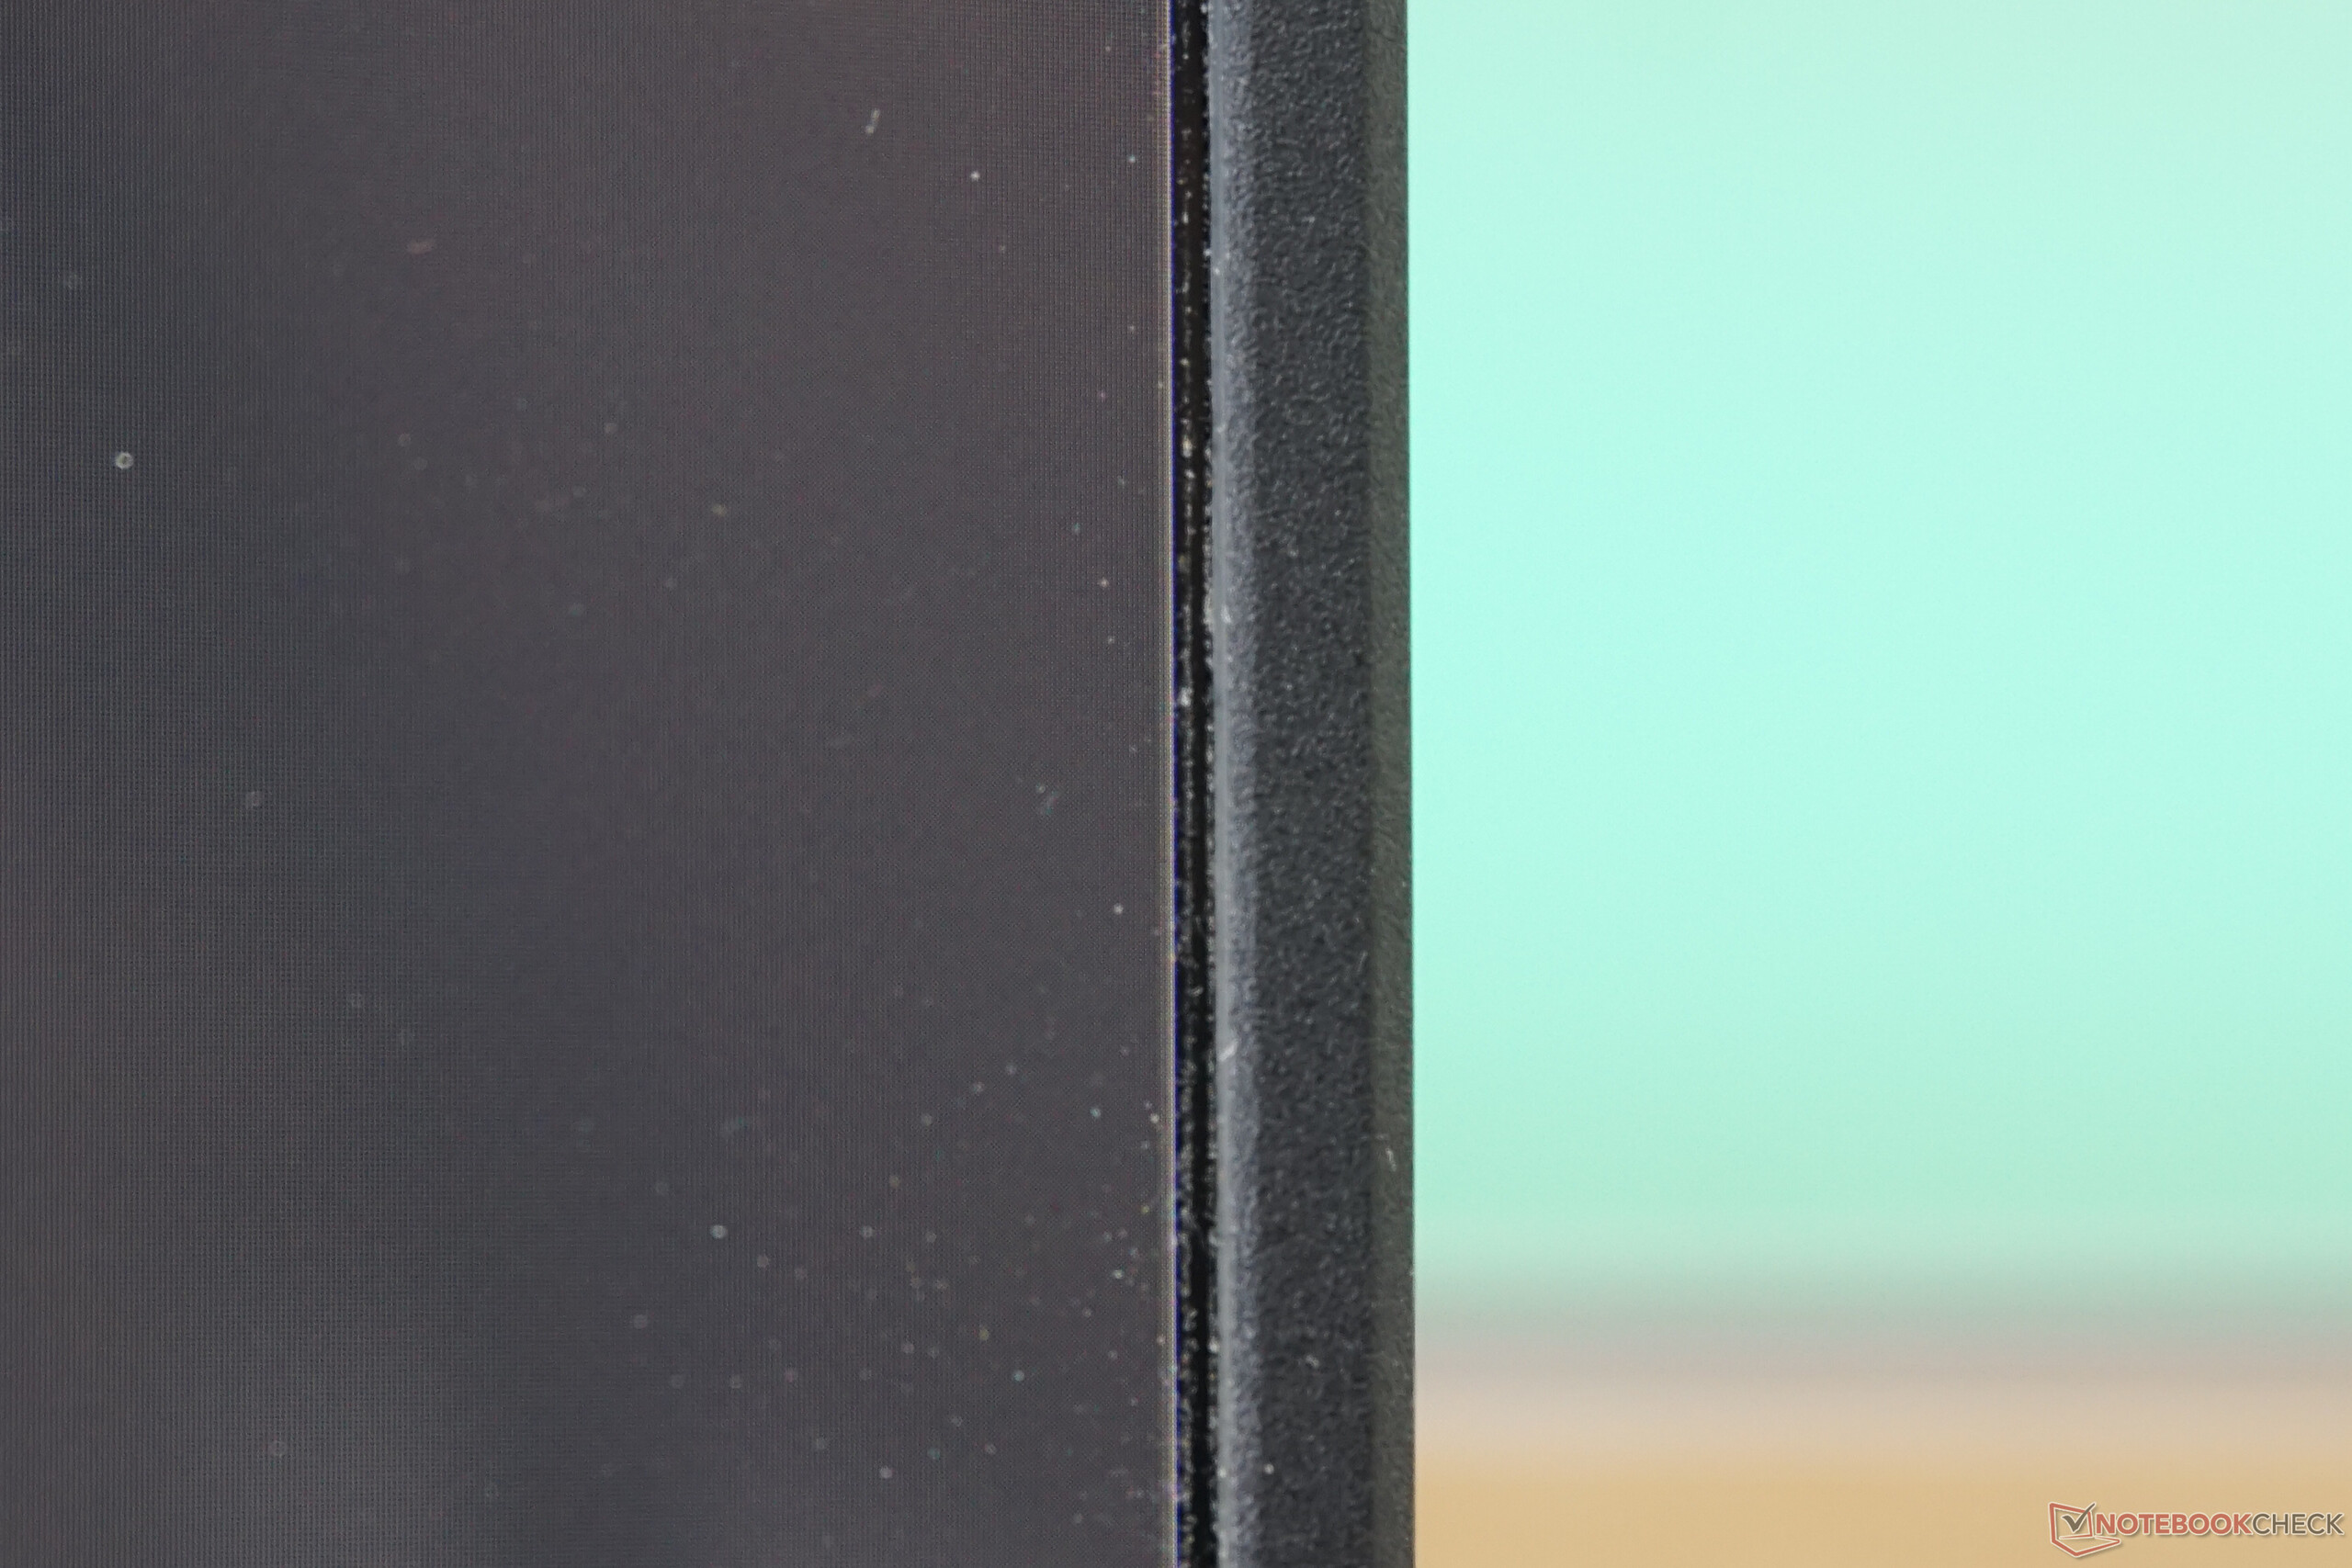
A tampa do visor e a moldura da tela OLED, por outro lado, poderiam ter sido mais bem projetadas. Dada a cobertura de plástico, não é de surpreender que a tela possa ser dobrada. As bordas também não são retas, o que também se manifesta na curvatura desagradável da tela. Além disso, no nosso modelo de teste, há um espaço na moldura do visor à direita da tela, no qual a poeira se acumulou rapidamente.
O peso e o tamanho do case são bastante médios para um notebook com tela de 16 polegadas. OSamsung Galaxy Book3 Ultrada Samsung, por exemplo, é mais fino e mais leve. O Asus ProArt Studiobookda Asus, por outro lado, é maior e mais pesado.
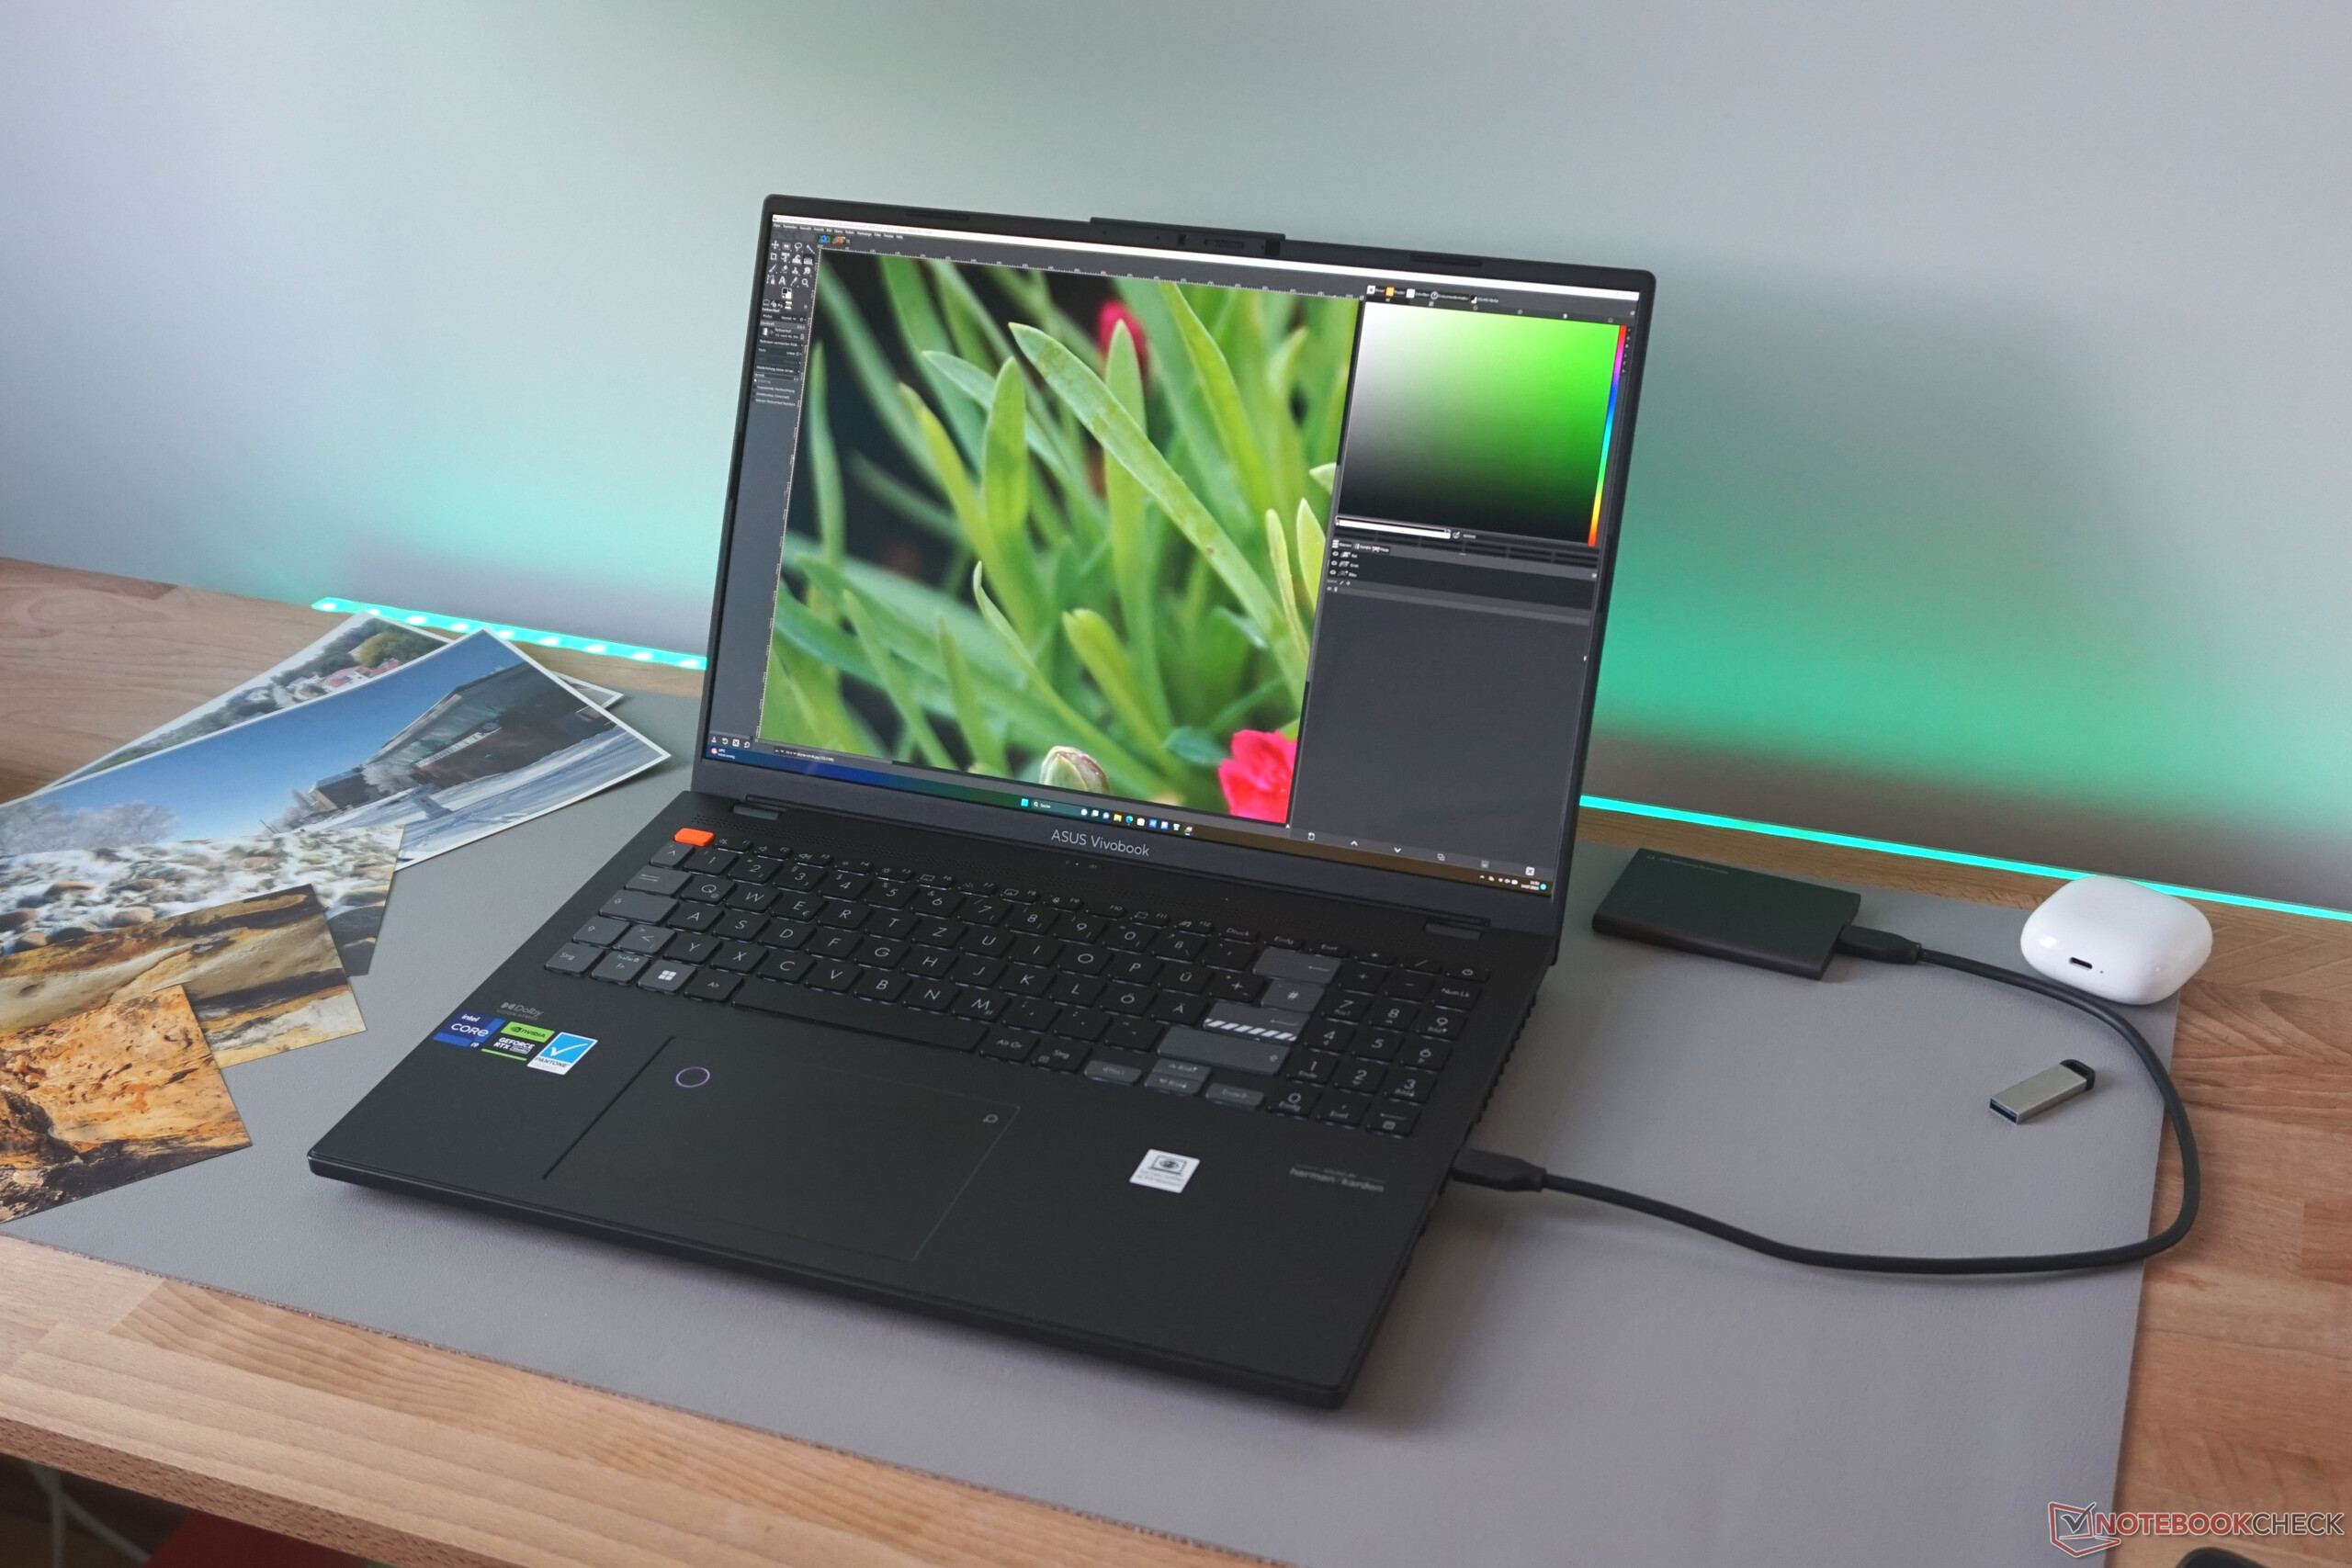
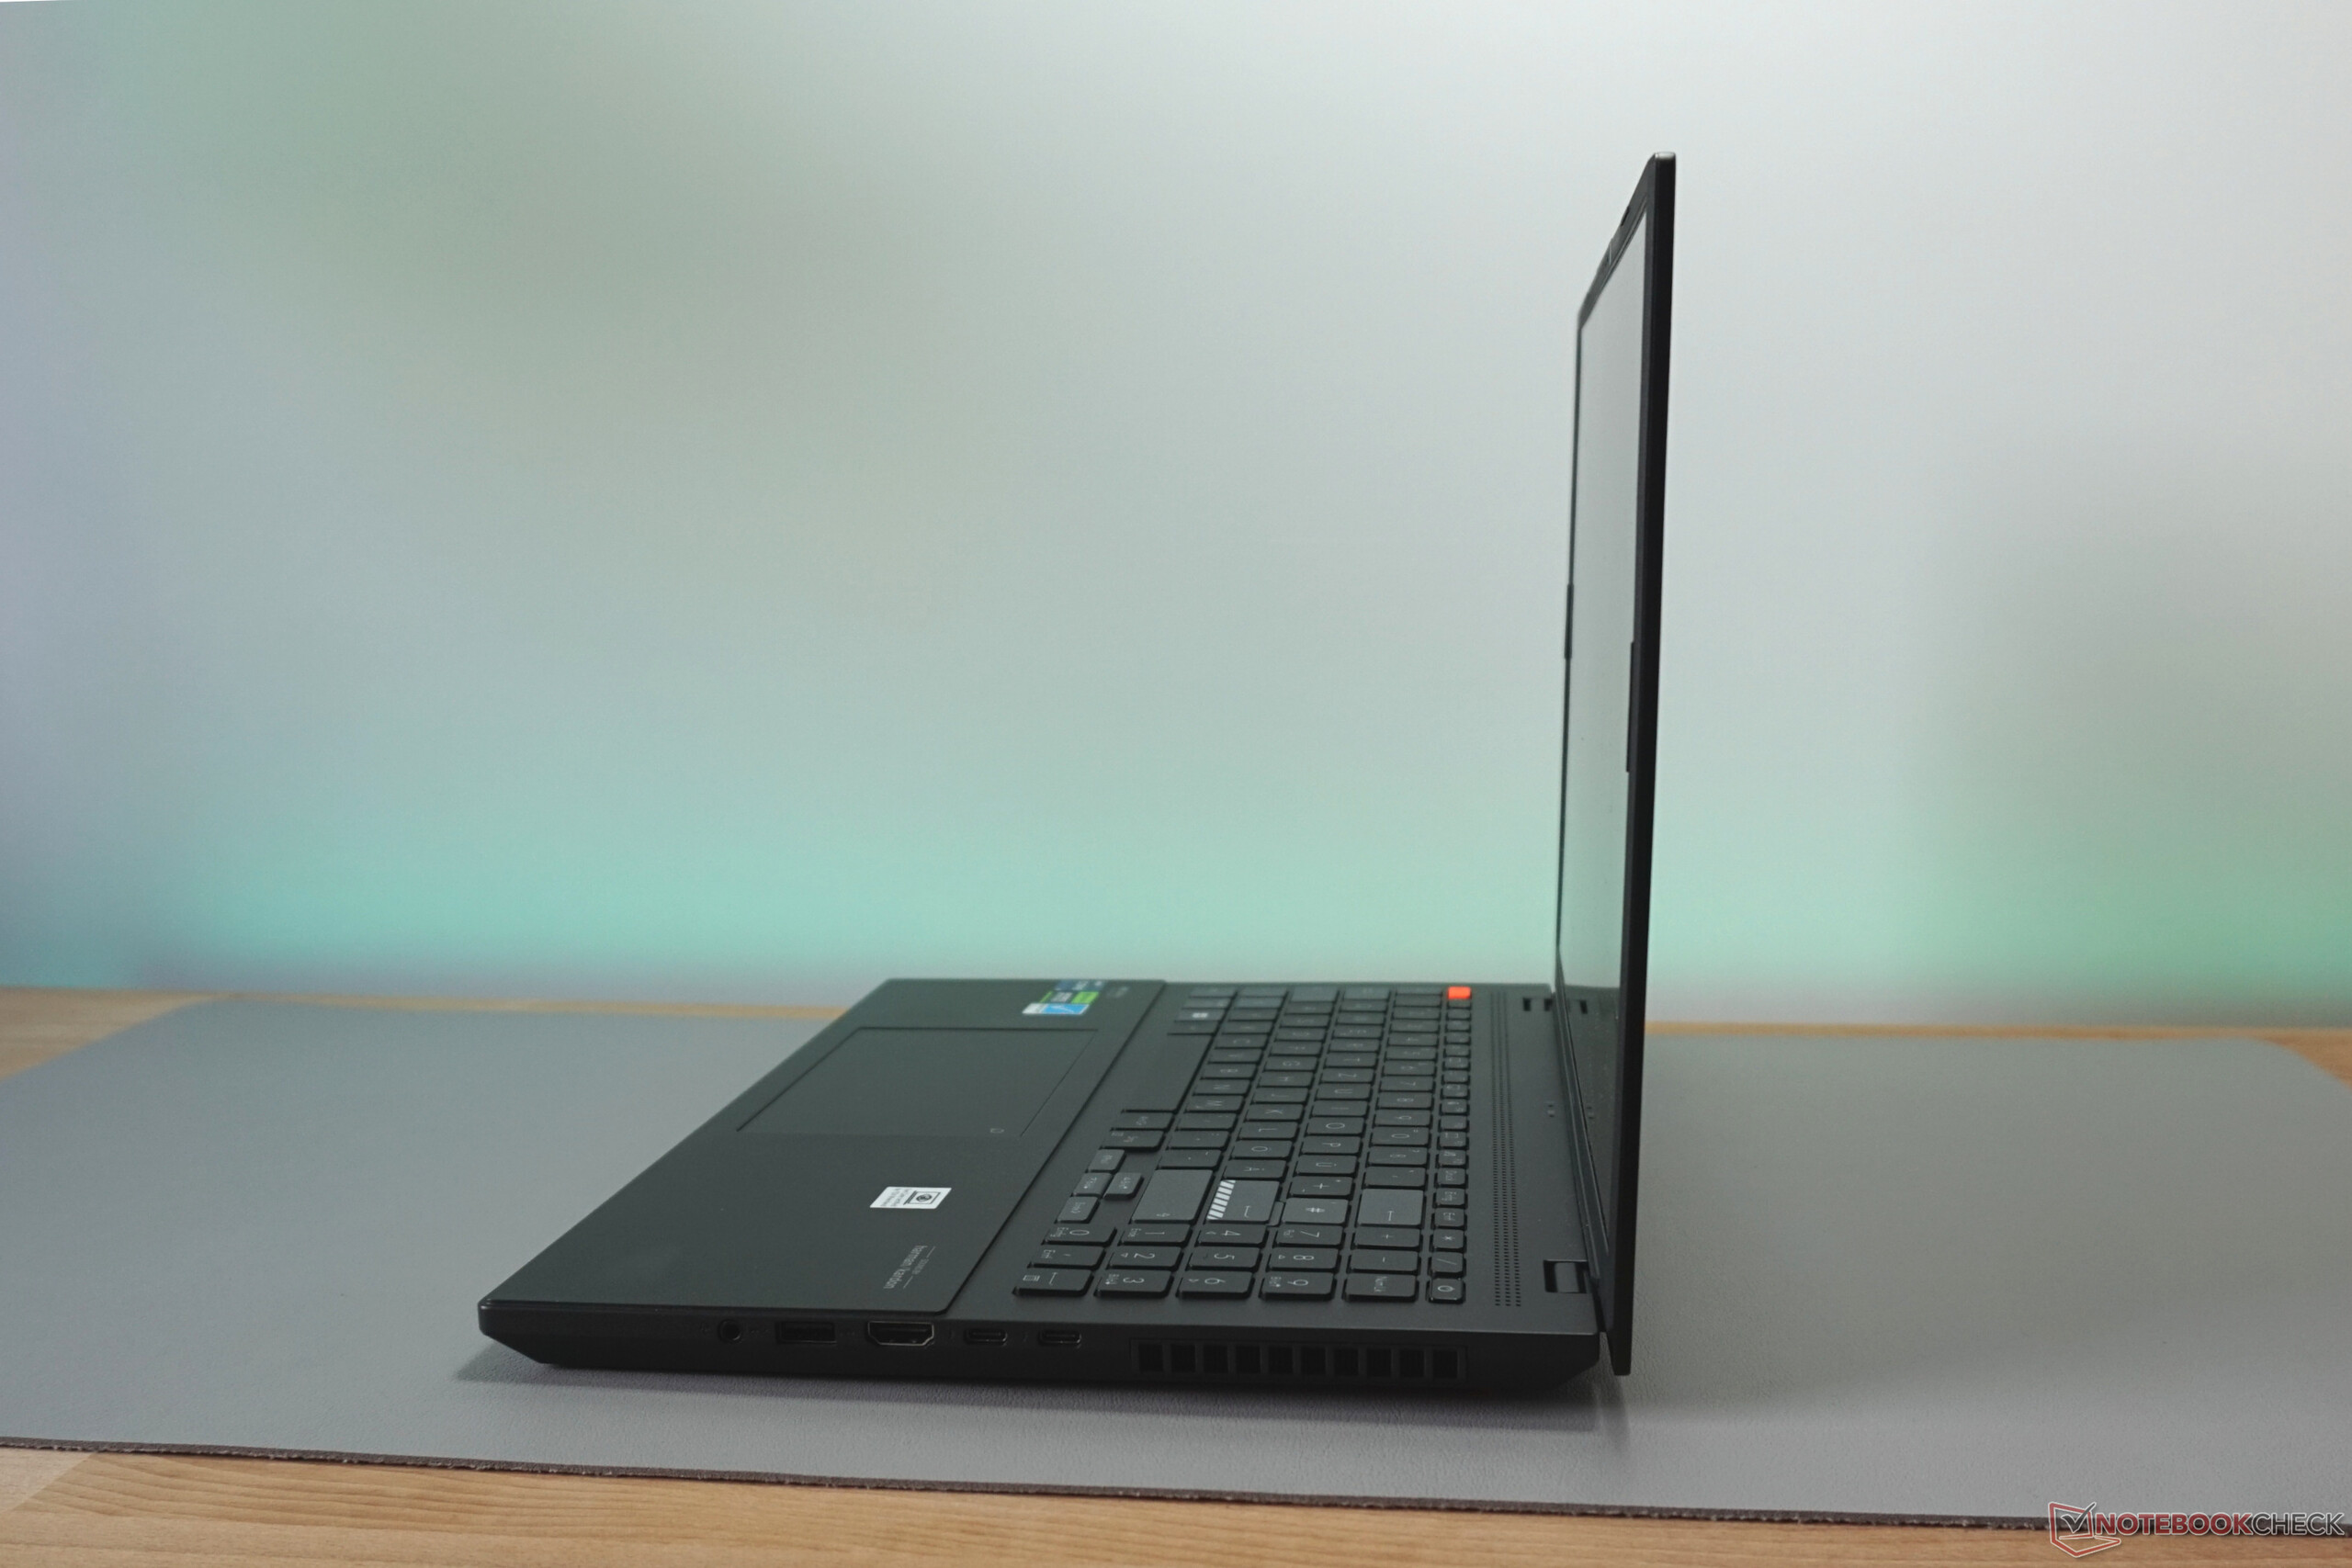
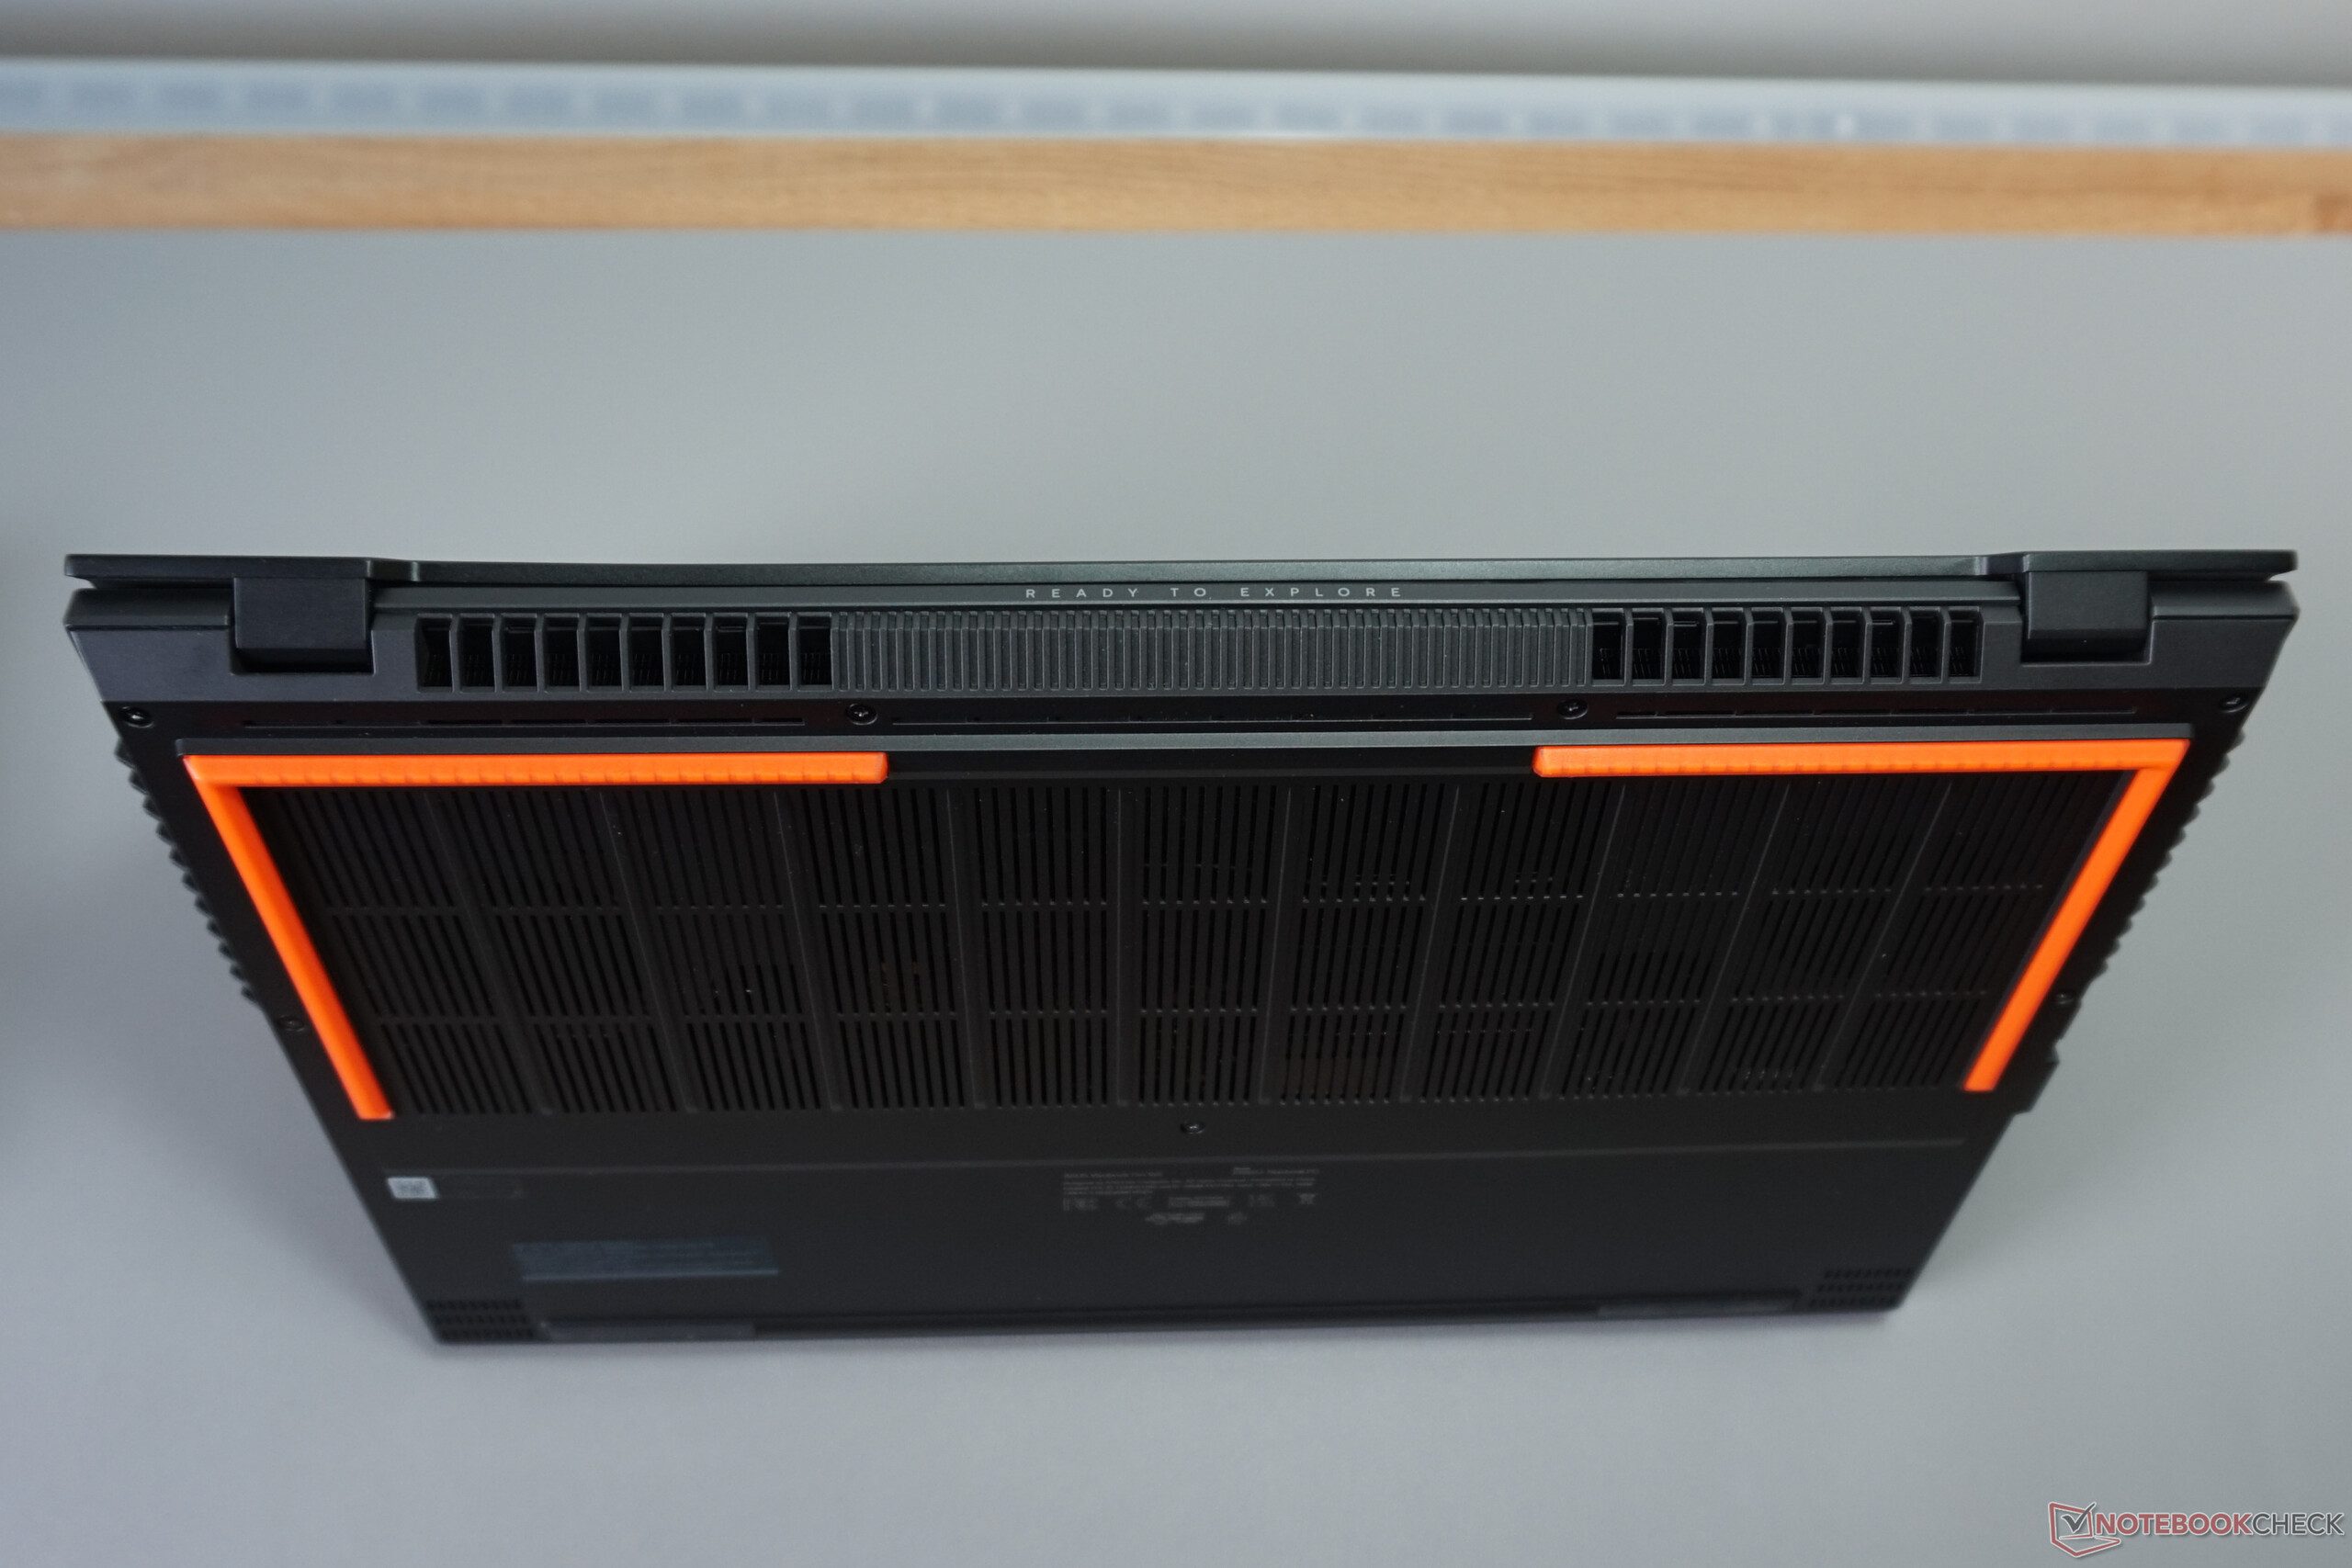
Equipamento - Tudo o que é importante está incluído e dois TB4
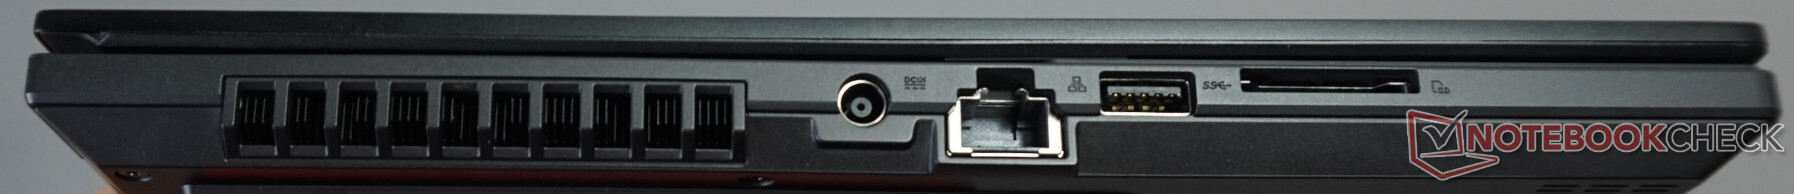
Todas as portas importantes estão distribuídas à esquerda e à direita. Nem o alcance nem o número deixam espaço para críticas. Convenientemente, há uma porta USB-A em ambos os lados. Os dados de vídeo e imagem podem ser facilmente copiados de uma câmera por meio do leitor de cartão SD. Graças à porta LAN, é possível estabelecer uma conexão de rede rápida na mesa. Além disso, há duas portas Thunderbolt 4 para troca rápida de dados, para uma estação de acoplamento ou para carregar a bateria, se necessário.

Leitor de cartão SD
Com o leitor de cartão SD completo, nosso cartão de referência AV PRO microSD 128 GB V60 atinge uma taxa de transferência sólida. Uma média de 120 MB/s significa que um cartão completo de 32 GB é copiado em pouco menos de 4 minutos. Isso levaria dois minutos a mais com o Samsung Galaxy Book3 Ultra 16da Samsung, por exemplo.
| SD Card Reader | |
| average JPG Copy Test (av. of 3 runs) | |
| Dell XPS 15 9530 RTX 4070 (Toshiba Exceria Pro SDXC 64 GB UHS-II) | |
| Média da turma Multimedia (23 - 531, n=37, últimos 2 anos) | |
| Asus Vivobook Pro 16X K6604JV-MX016W | |
| MSI Creator Z17 A12UGST-054 (AV Pro SD microSD 128 GB V60) | |
| Samsung Galaxy Book3 Ultra 16 (AV PRO microSD 128 GB V60) | |
| Asus ProArt Studiobook 16 OLED H7604 (Angelibird AV Pro V60) | |
| Schenker VISION 16 Pro (M23) (Angelbird AV Pro V60) | |
| maximum AS SSD Seq Read Test (1GB) | |
| Média da turma Multimedia (37.3 - 1455, n=36, últimos 2 anos) | |
| Dell XPS 15 9530 RTX 4070 (Toshiba Exceria Pro SDXC 64 GB UHS-II) | |
| Asus Vivobook Pro 16X K6604JV-MX016W | |
| Asus ProArt Studiobook 16 OLED H7604 (Angelibird AV Pro V60) | |
| Samsung Galaxy Book3 Ultra 16 (AV PRO microSD 128 GB V60) | |
| MSI Creator Z17 A12UGST-054 (AV Pro SD microSD 128 GB V60) | |
| Schenker VISION 16 Pro (M23) (Angelbird AV Pro V60) | |
Comunicação
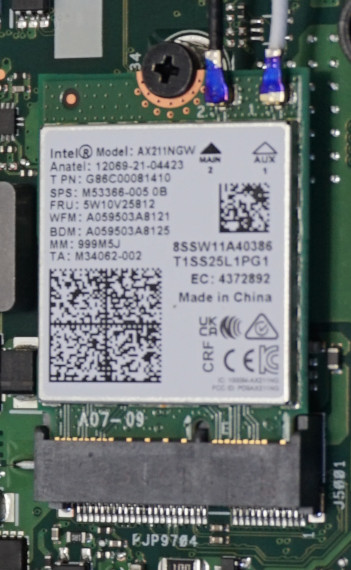
O módulo Intel AX211 WLAN instalado, que pode ser substituído, funciona com taxas de transferência consistentemente altas. Os valores medidos para receber dados de pouco menos de 1.700 Mbps estão quase 25% acima da média de todos os valores registrados com hardware idêntico. O XPS 15 9530 da Dell, por exemplo, tem uma pontuação cerca de um terço pior, embora também use o AX211 da Intel.
Uma porta LAN Gigabit da Realtek também está integrada para transmissão com fio.
Webcam
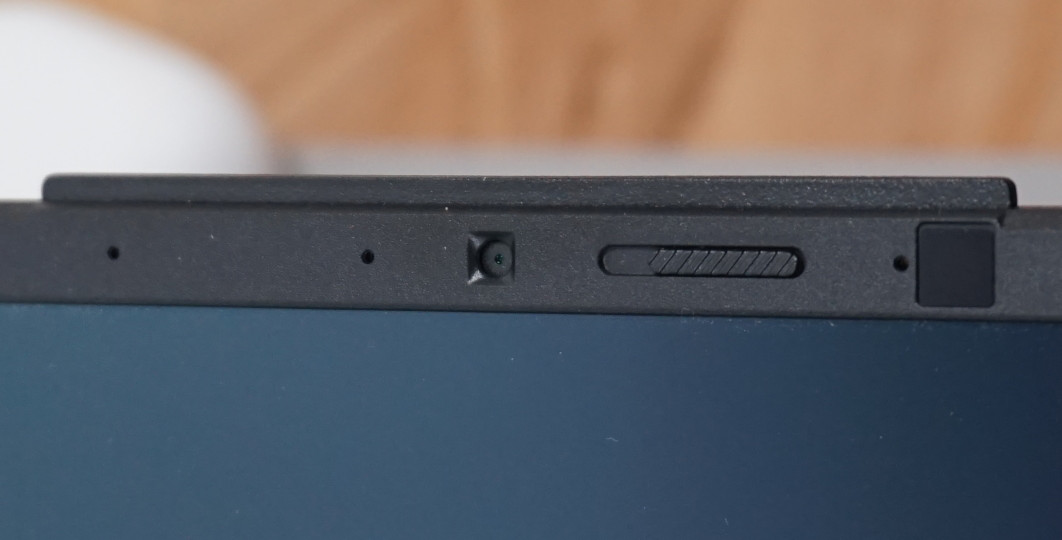
Os recursos da webcam Full HD são sólidos. Há um obturador mecânico que tem a mesma cor laranja dos pés e do botão Esc . Além disso, há uma câmera infravermelha para fazer login por meio de reconhecimento facial e um microfone de matriz dupla.
Em termos de qualidade de imagem, definitivamente há espaço para melhorias. Embora o brilho da imagem de vídeo seja convincente em ambientes com pouca luz, o ruído da imagem aumenta enormemente ao mesmo tempo. A qualidade de gravação da voz, por outro lado, é boa. Ela soa natural e é gravada uniformemente de diferentes distâncias e direções de fala.


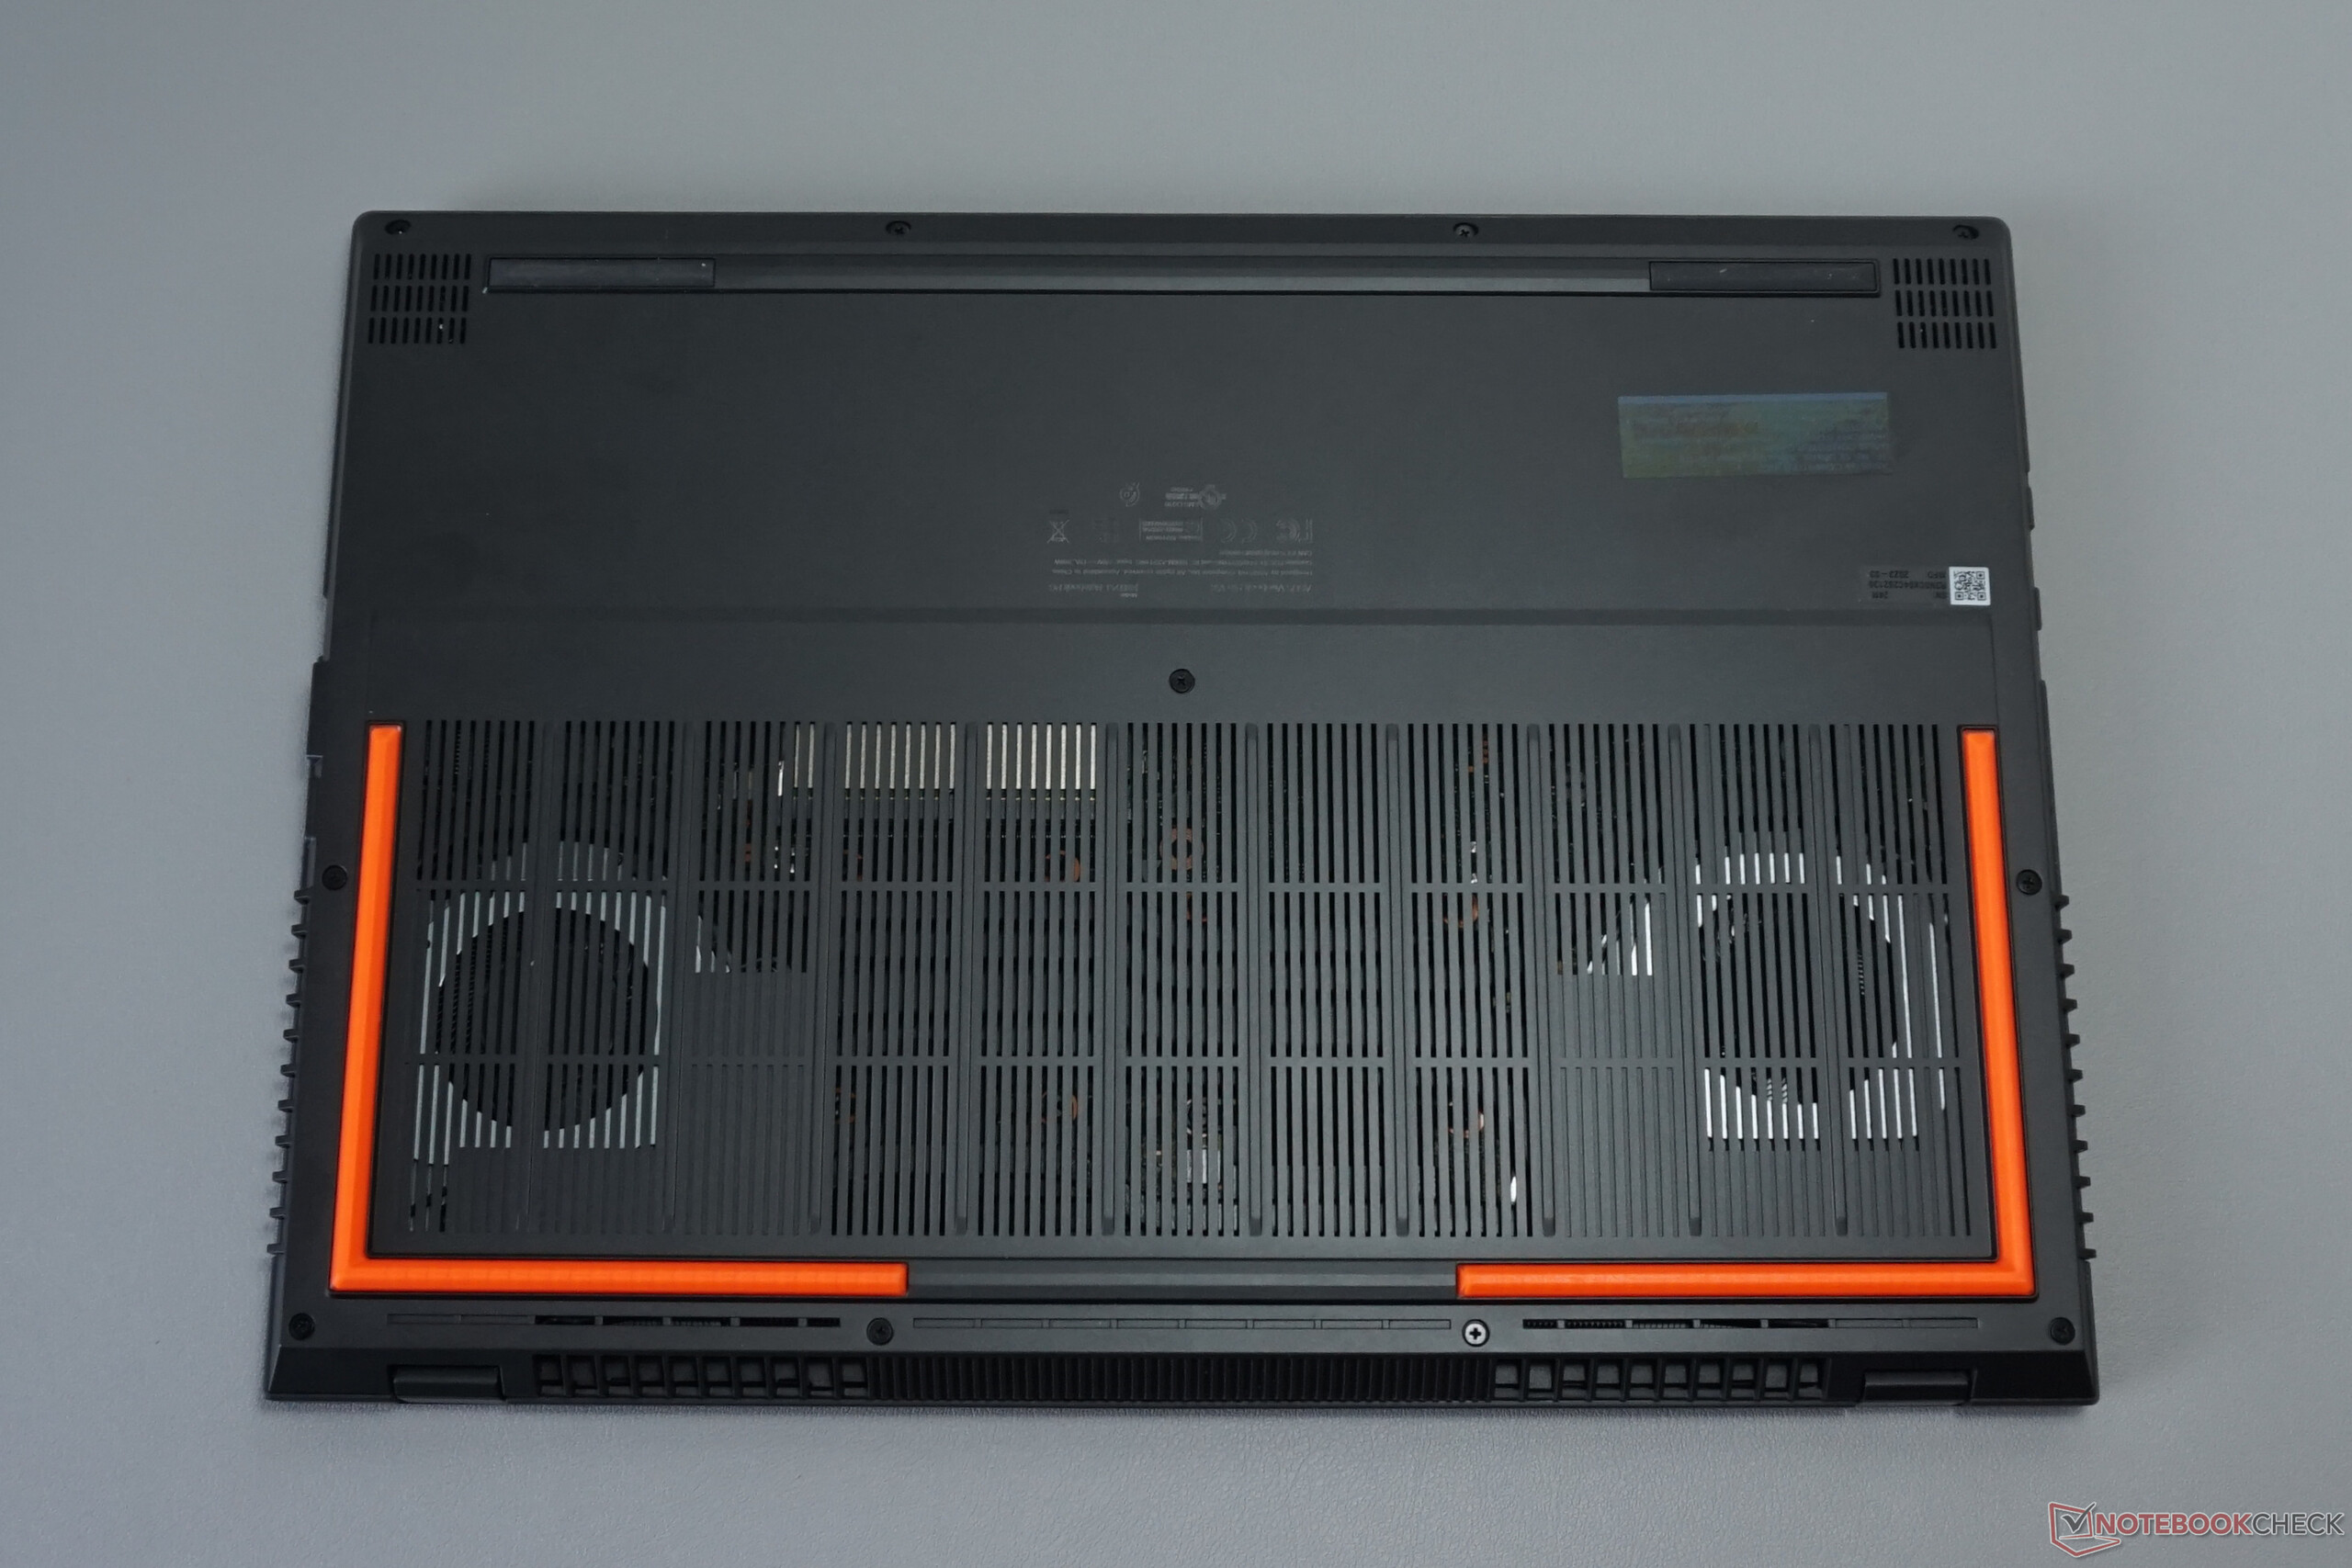
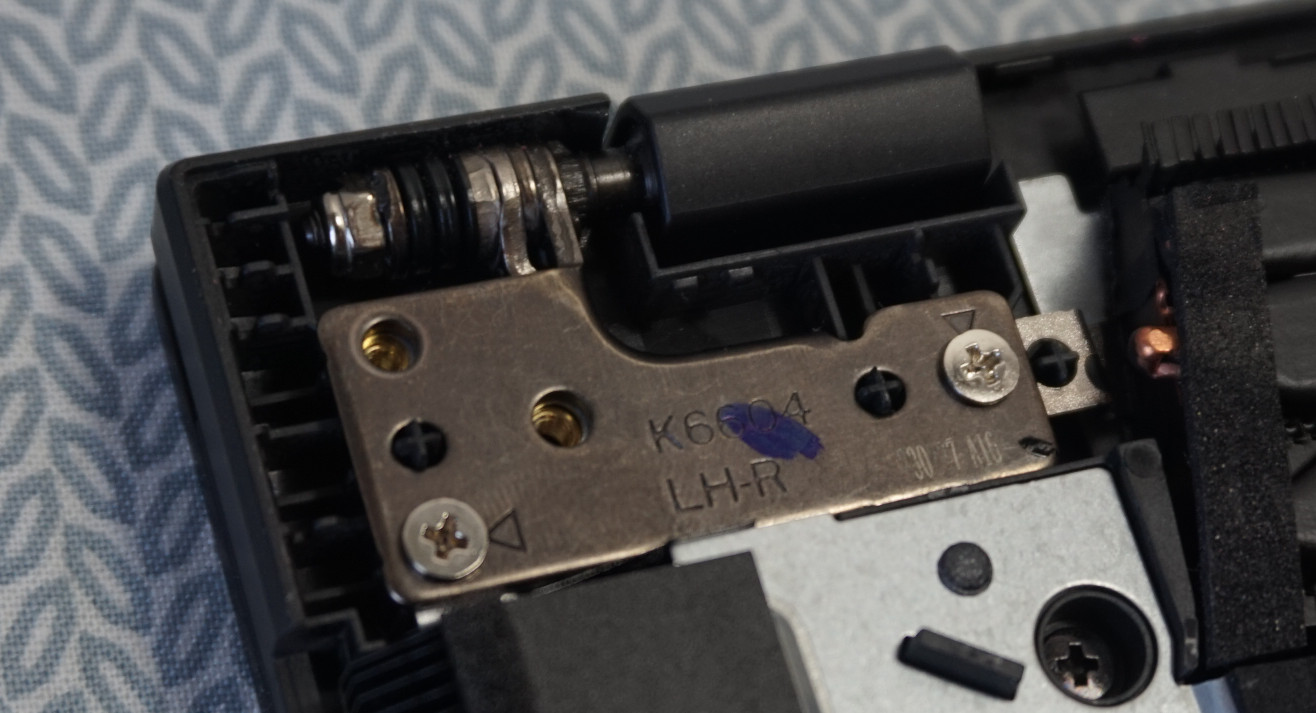
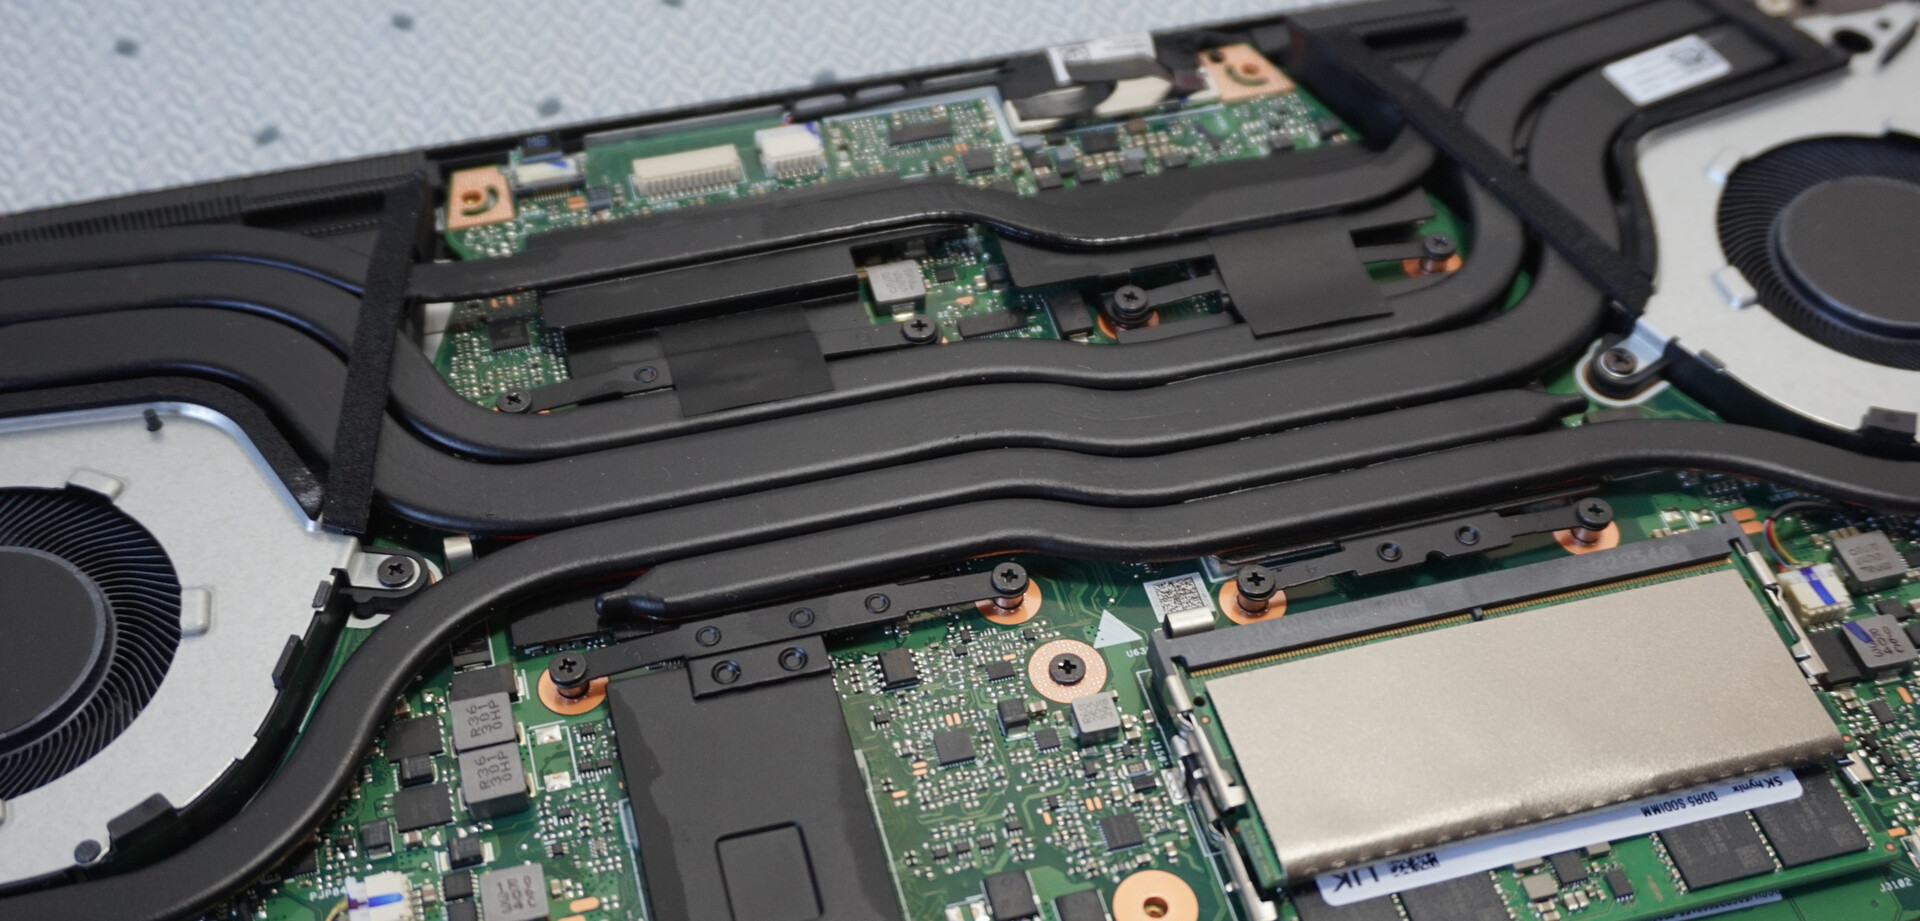
Manutenção
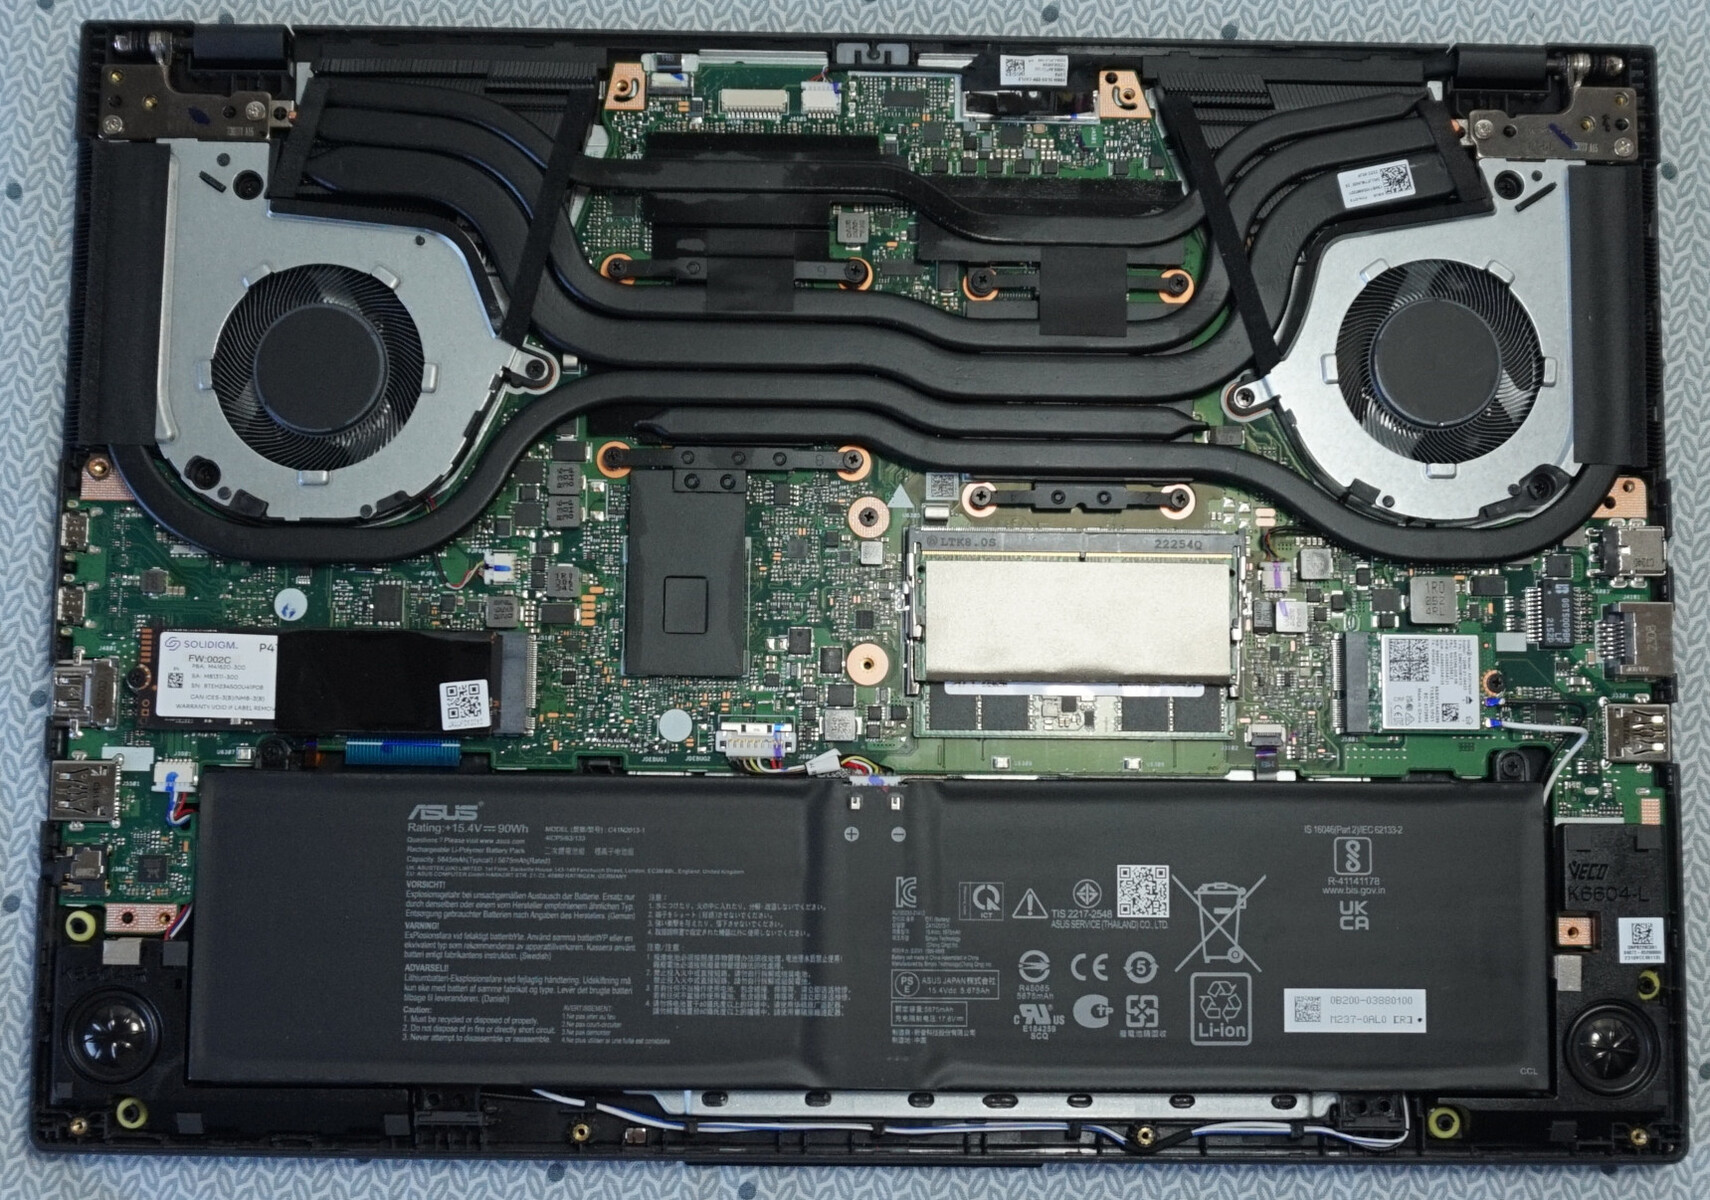
Onze parafusos Phillips precisam ser soltos. Também é necessário um pouco de força para soltar os diversos grampos de plástico. Como sempre acontece, é recomendável começar próximo às dobradiças. Com uma pequena ferramenta de alavanca ou pinça, será fácil abrir a parte inferior sem danos.
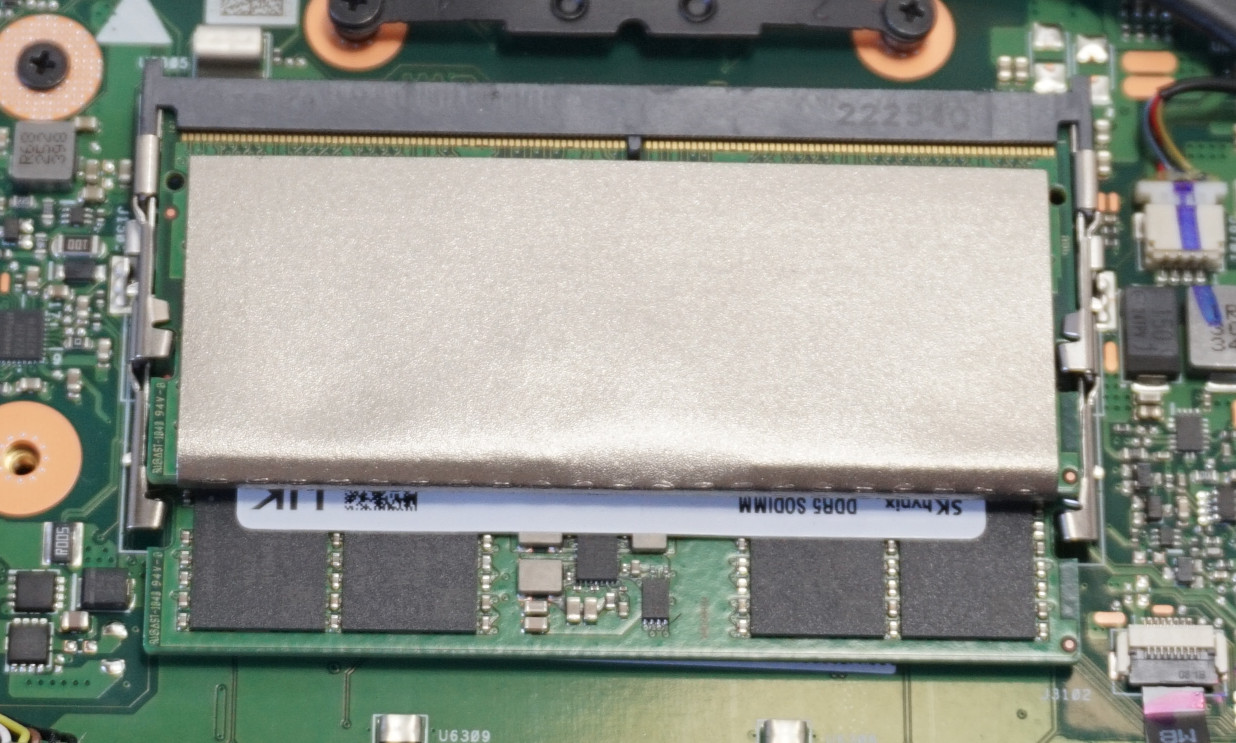
A bateria, a RAM, o SSD e o módulo WLAN são facilmente acessíveis e substituíveis. Infelizmente, não há um segundo slot para um SSD M.2 NVMe.
Garantia
A Asus oferece uma garantia do fabricante de 2 anos, mas limita a garantia legal para a bateria. Para poder usar a garantia, o VivoBook deve ser registrado na Asus após a compra. Essas condições podem ser diferentes em outras regiões, portanto, os compradores interessados devem verificar antes de comprar.
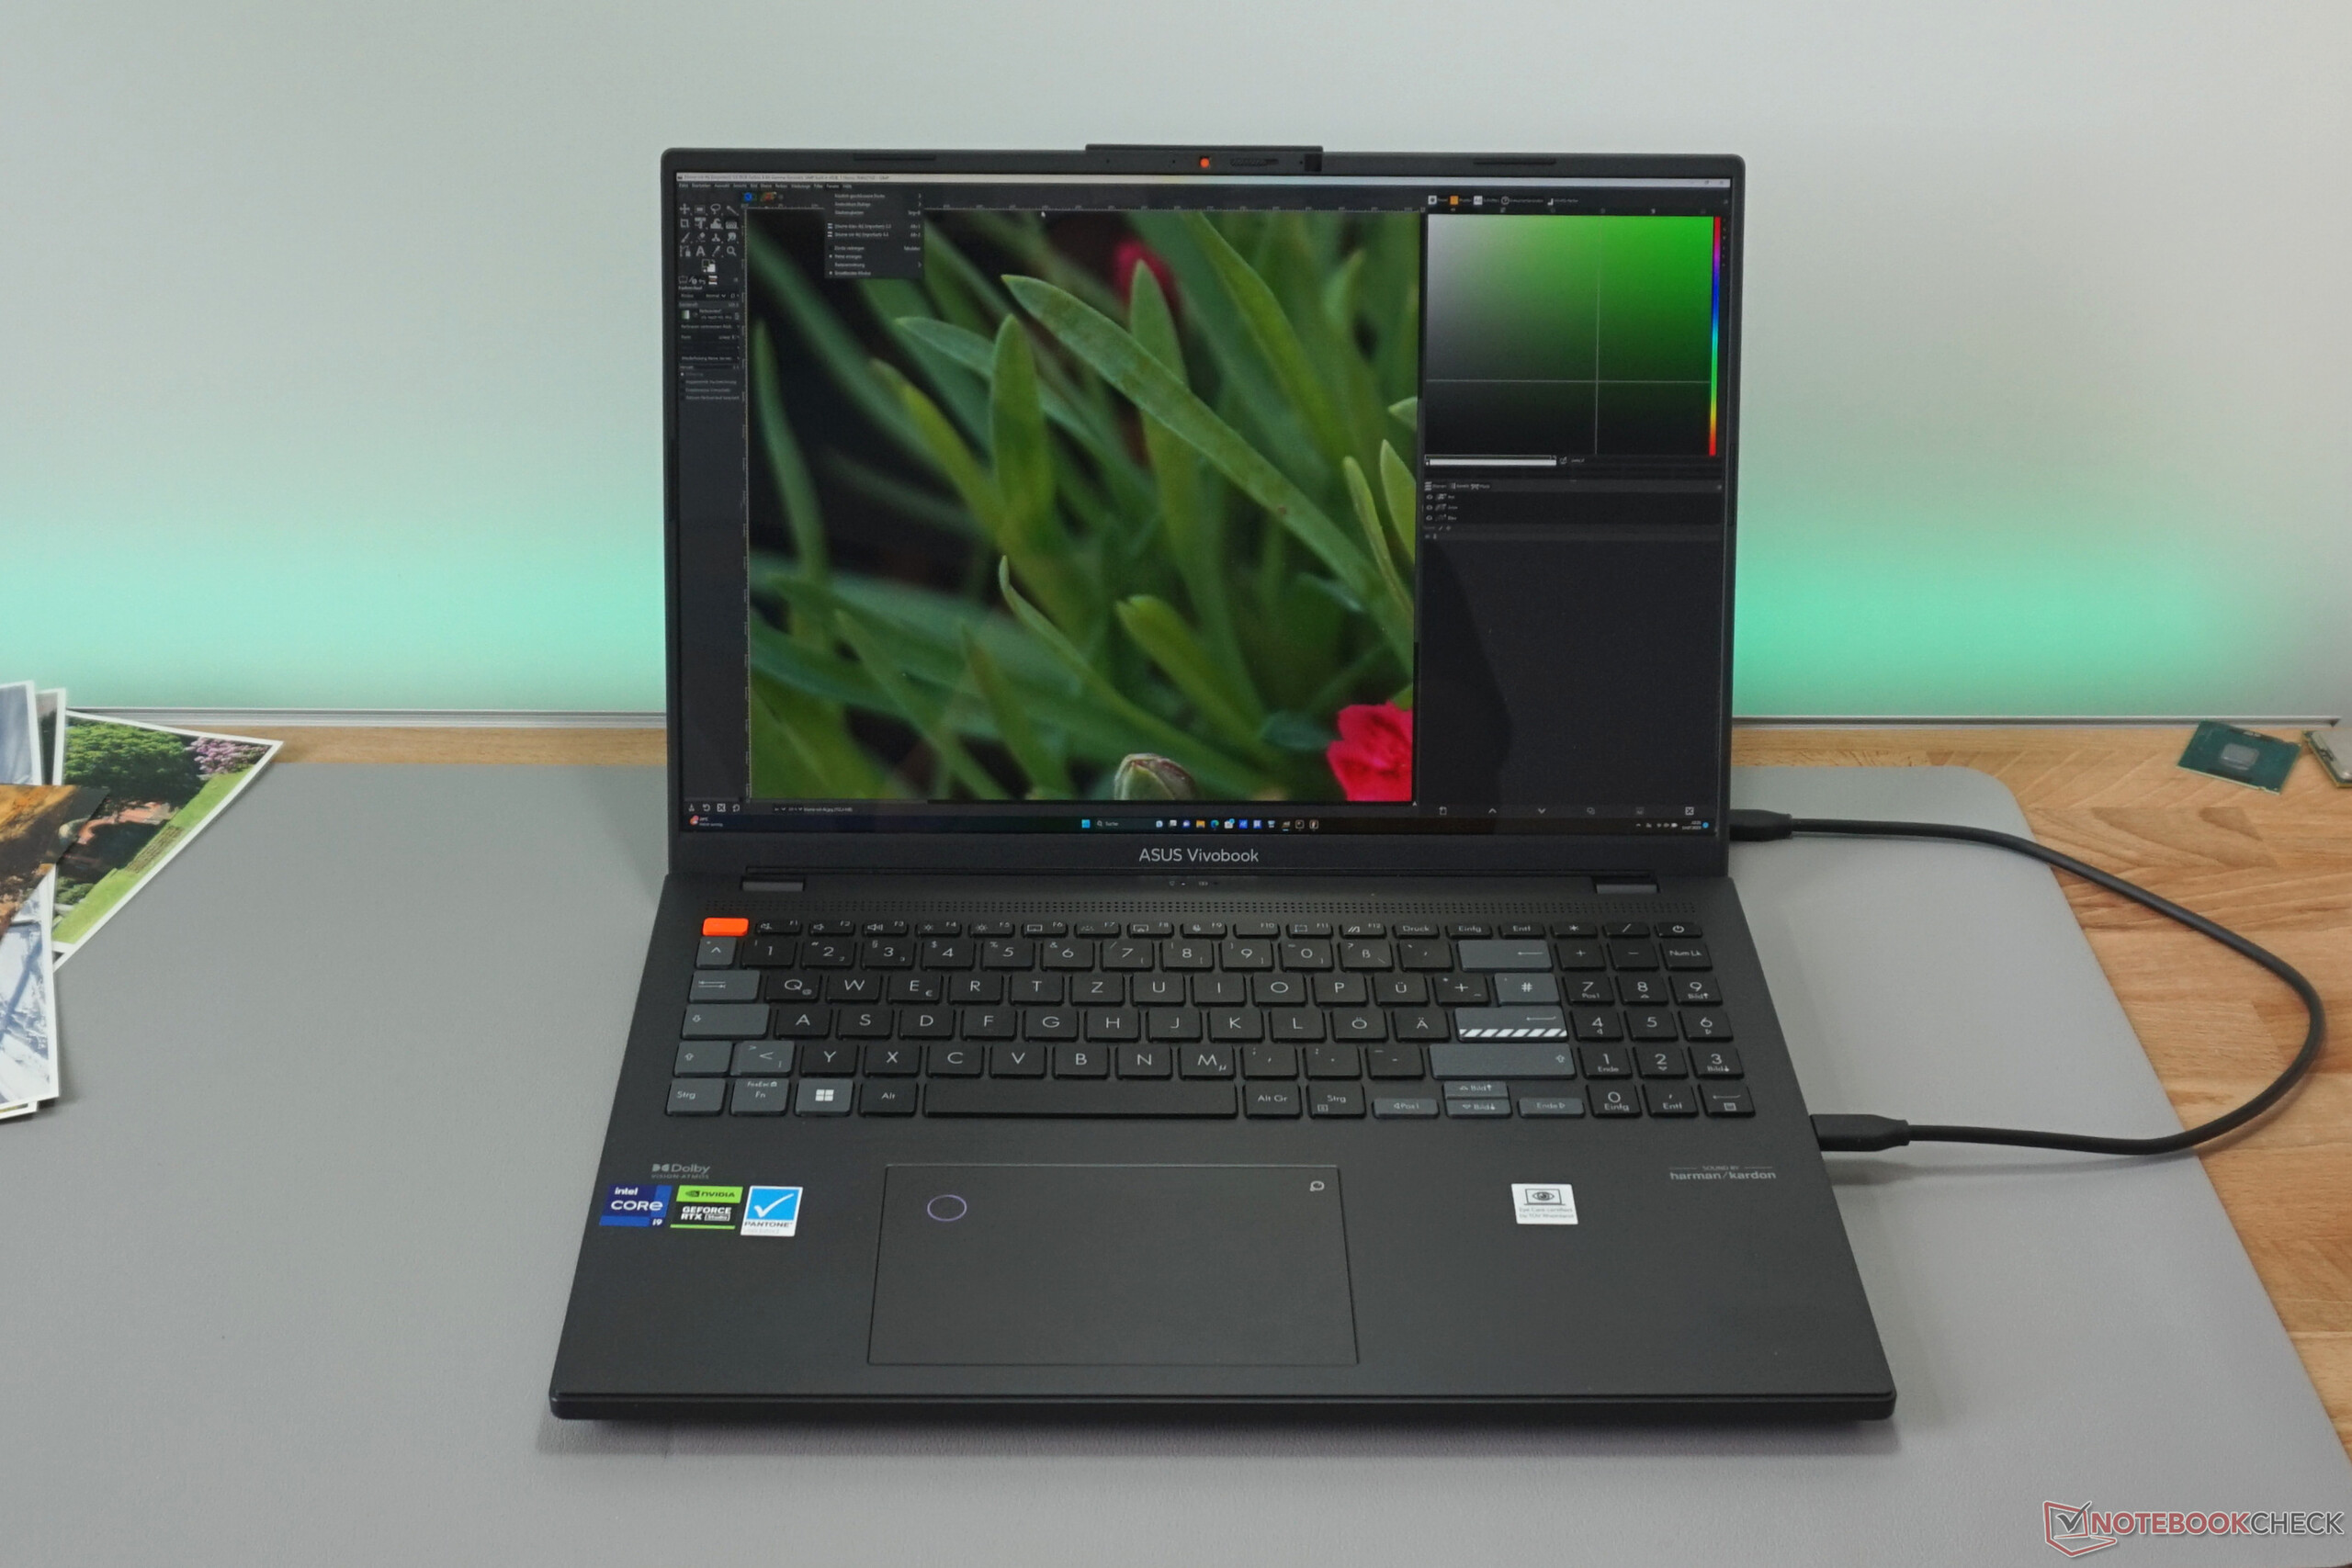
Dispositivos de entrada - Vivobook com mostrador prático
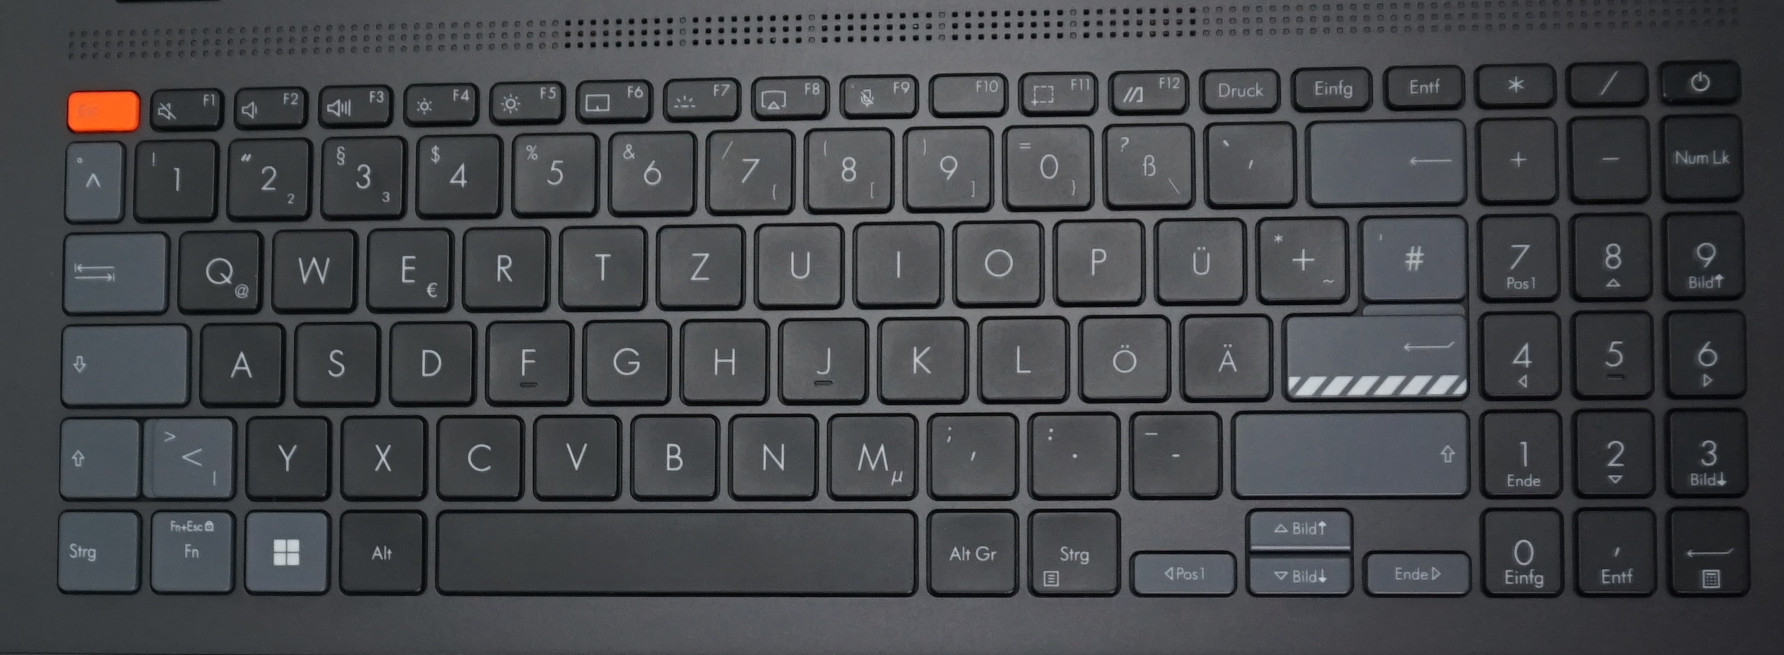
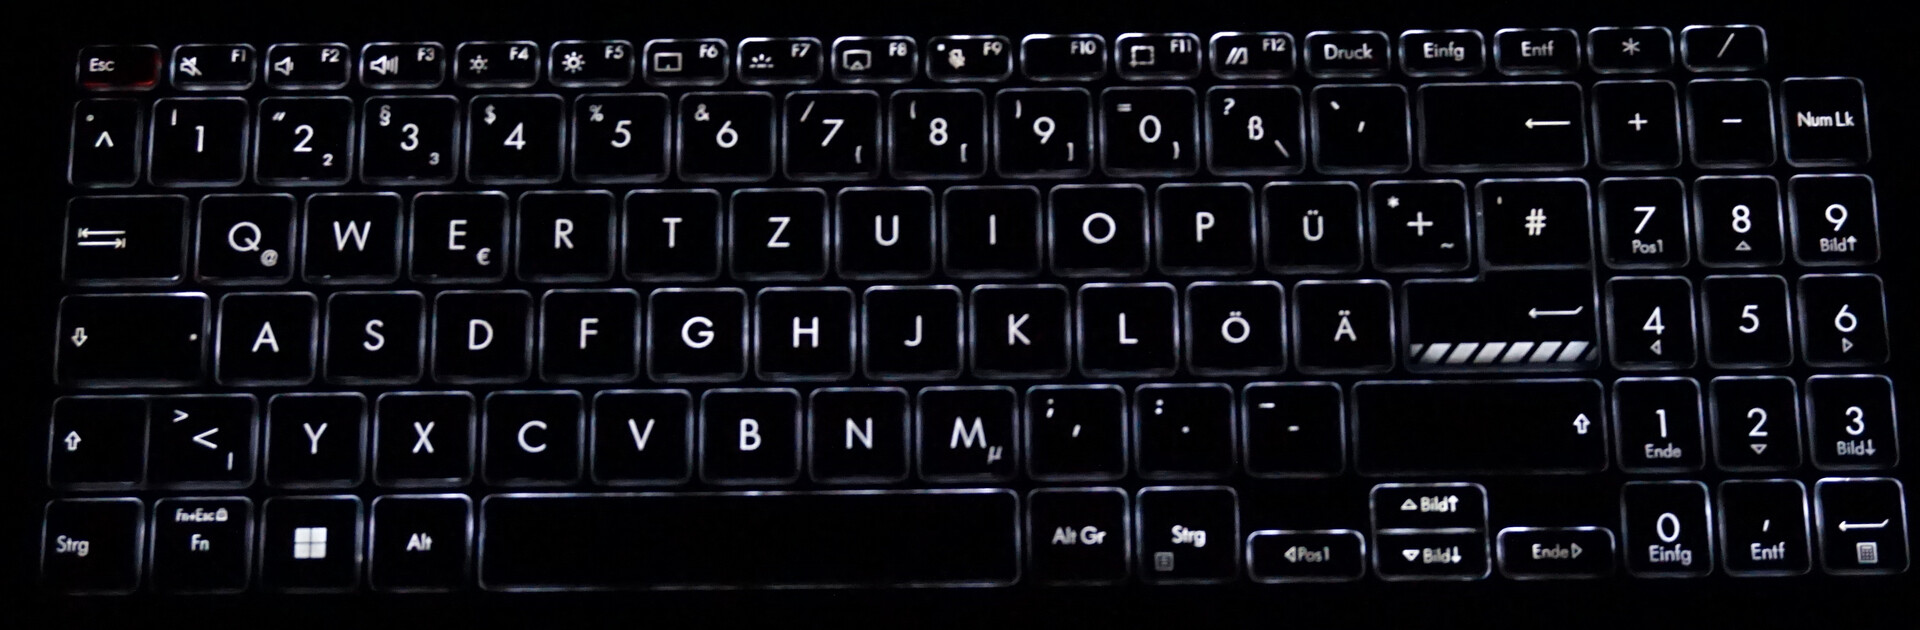
Teclado
Com um teclado numérico completo, um deslocamento de 1,4 mm (nossa medição) e uma contrapressão bem dosada, o teclado deixa uma excelente impressão, mesmo que os detalhes em cores certamente não agradem a todos. Além disso, há a luz de fundo uniforme de três estágios do teclado.
Infelizmente, a estrutura do teclado cede muito ao digitar. É provável que isso seja um fator incômodo, mesmo para digitadores frequentes que são menos sensíveis.
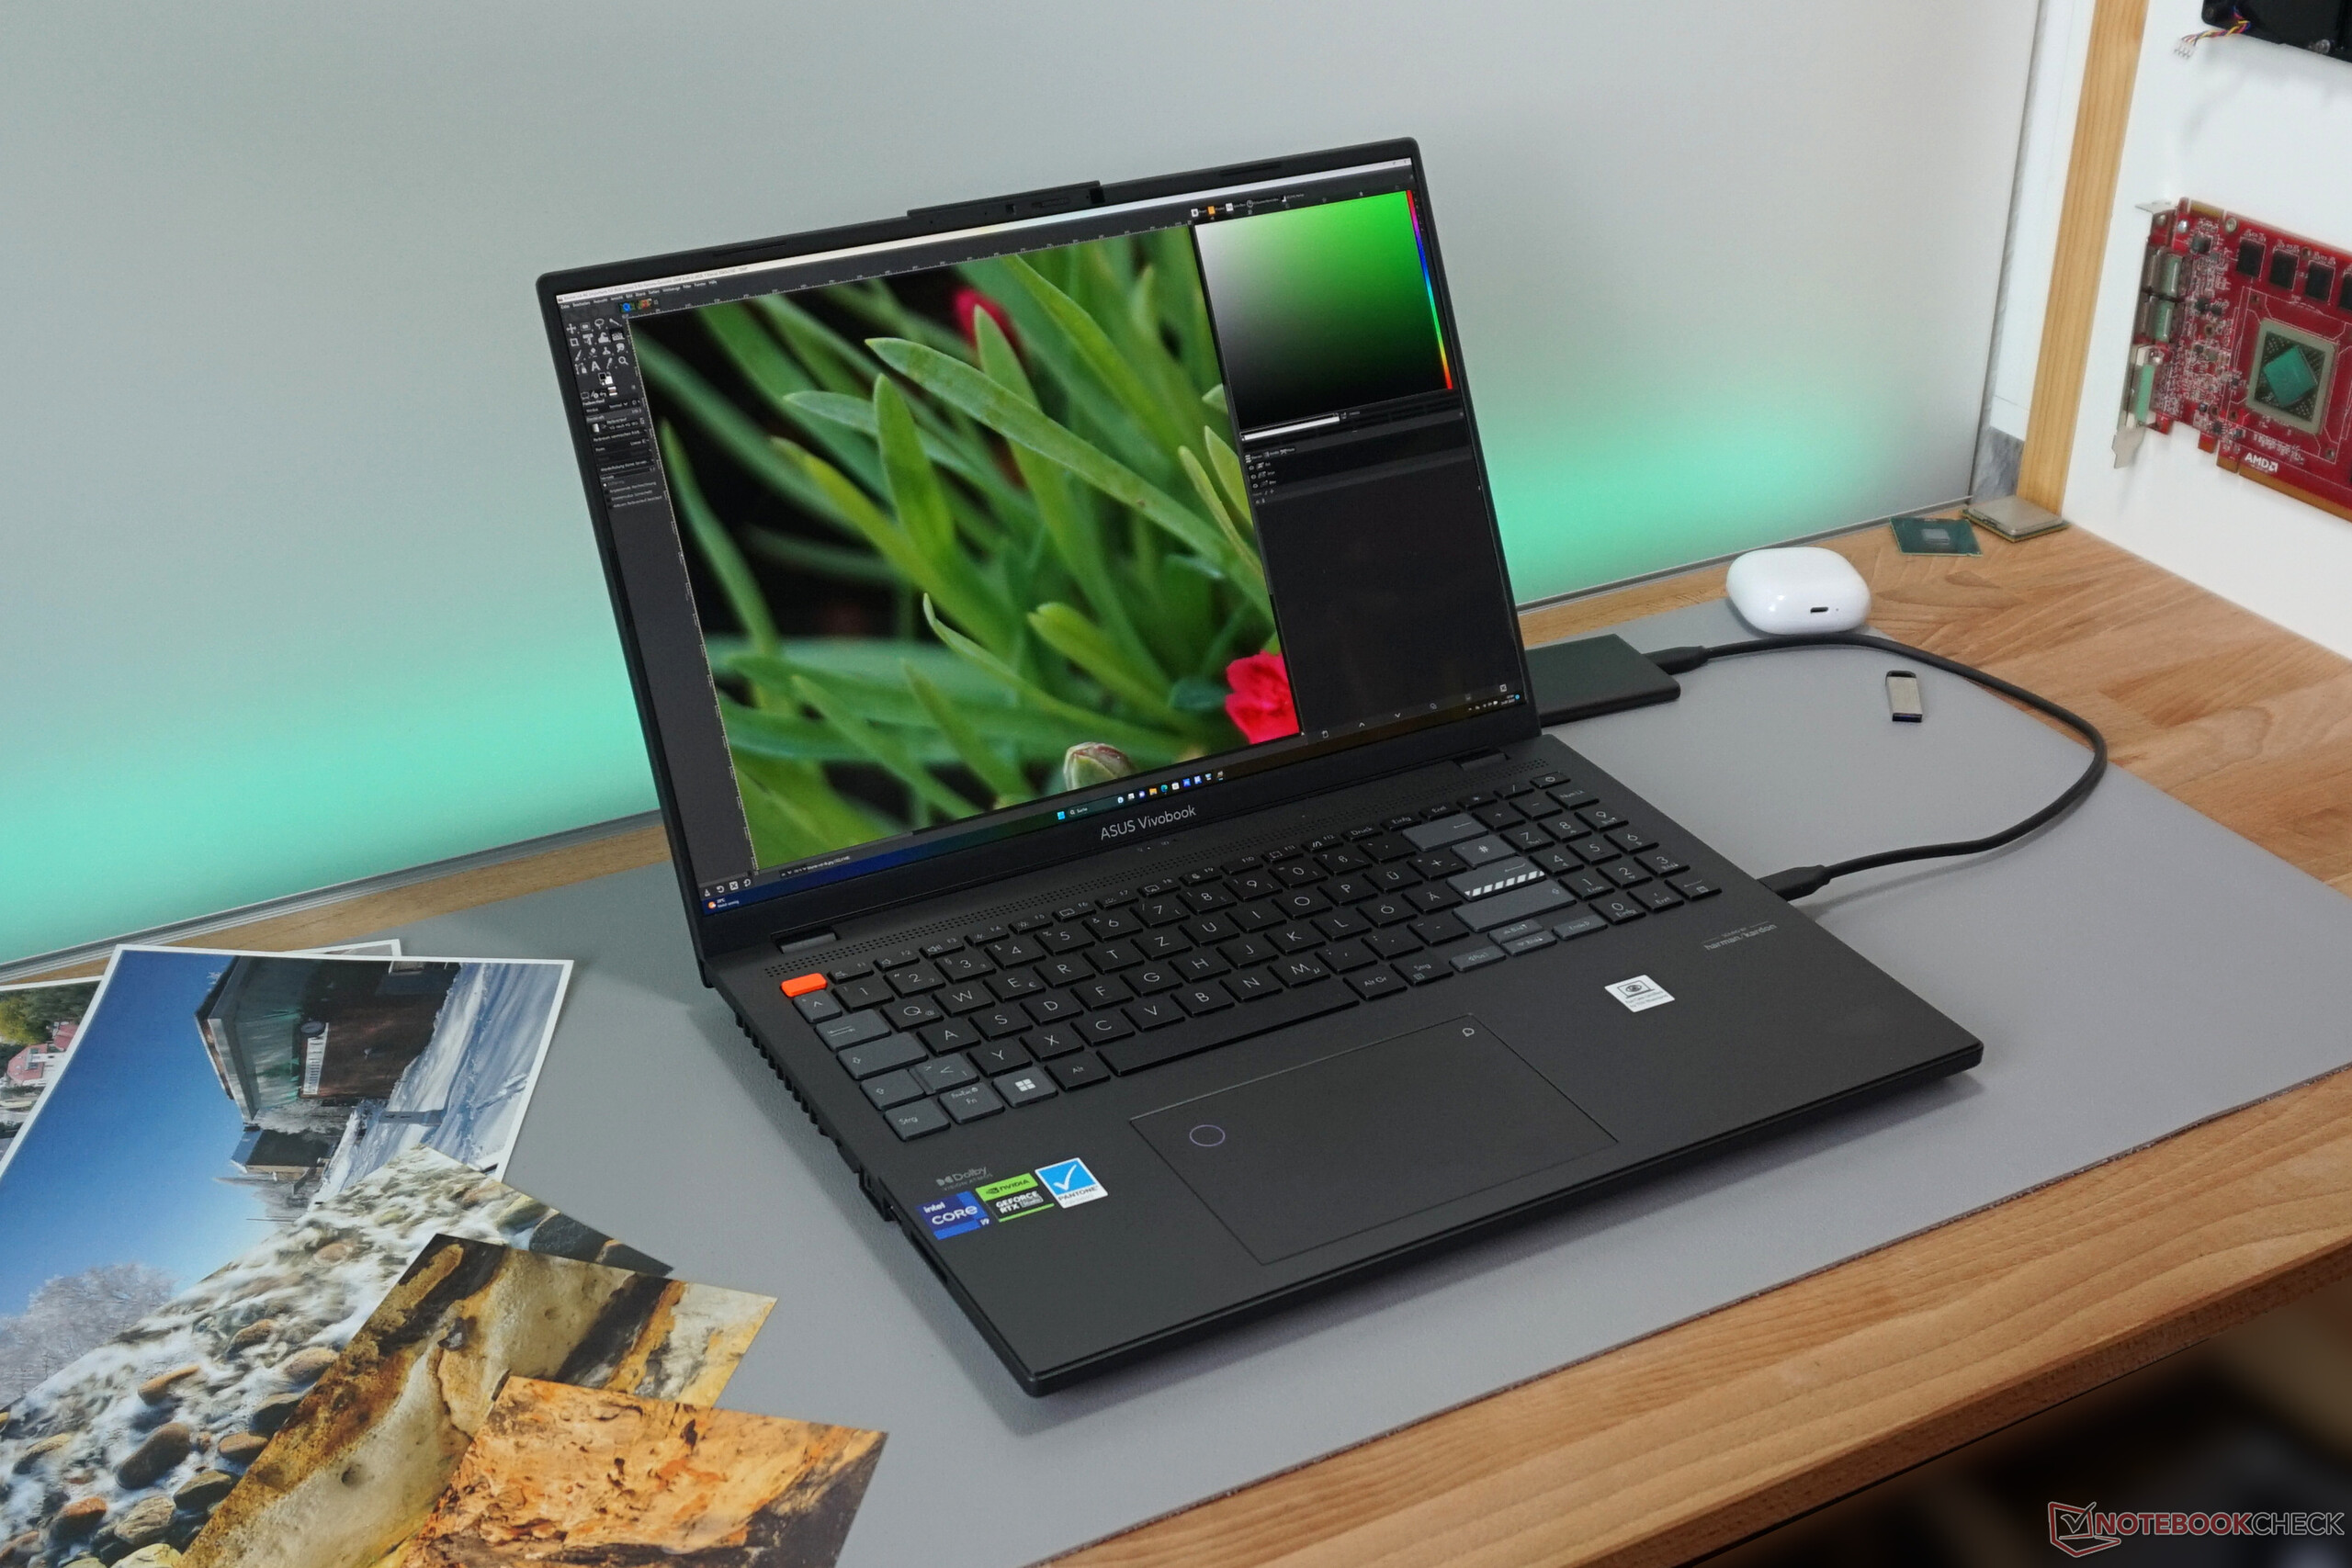
Touchpad
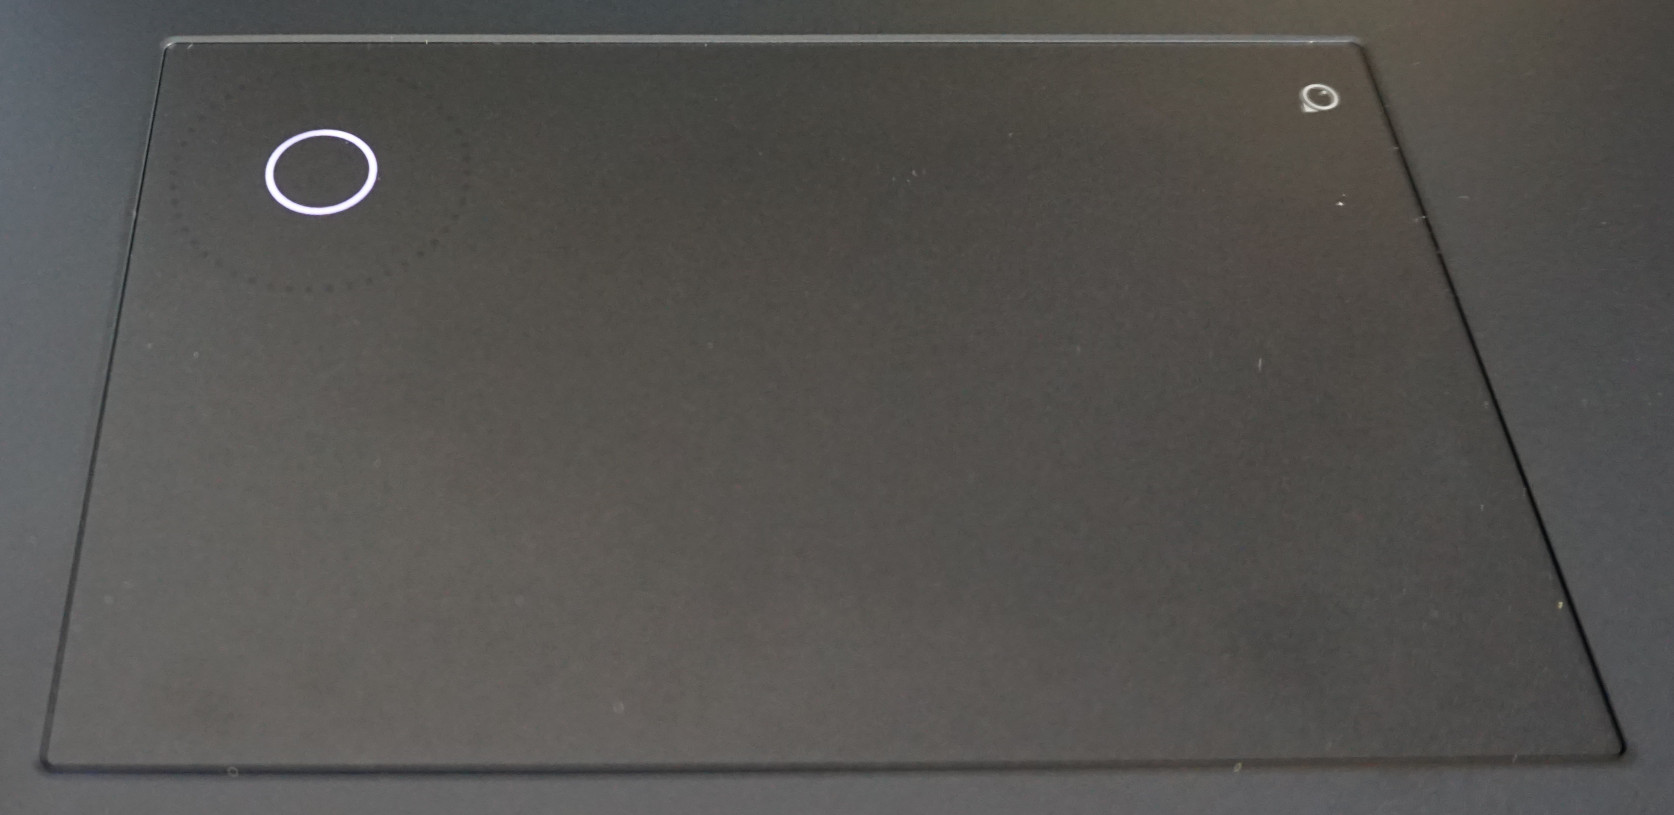
Com 8 por 13 cm, o touchpad é agradavelmente grande, preciso e abriga botões ocultos fáceis de pressionar, deixando uma sólida impressão geral.
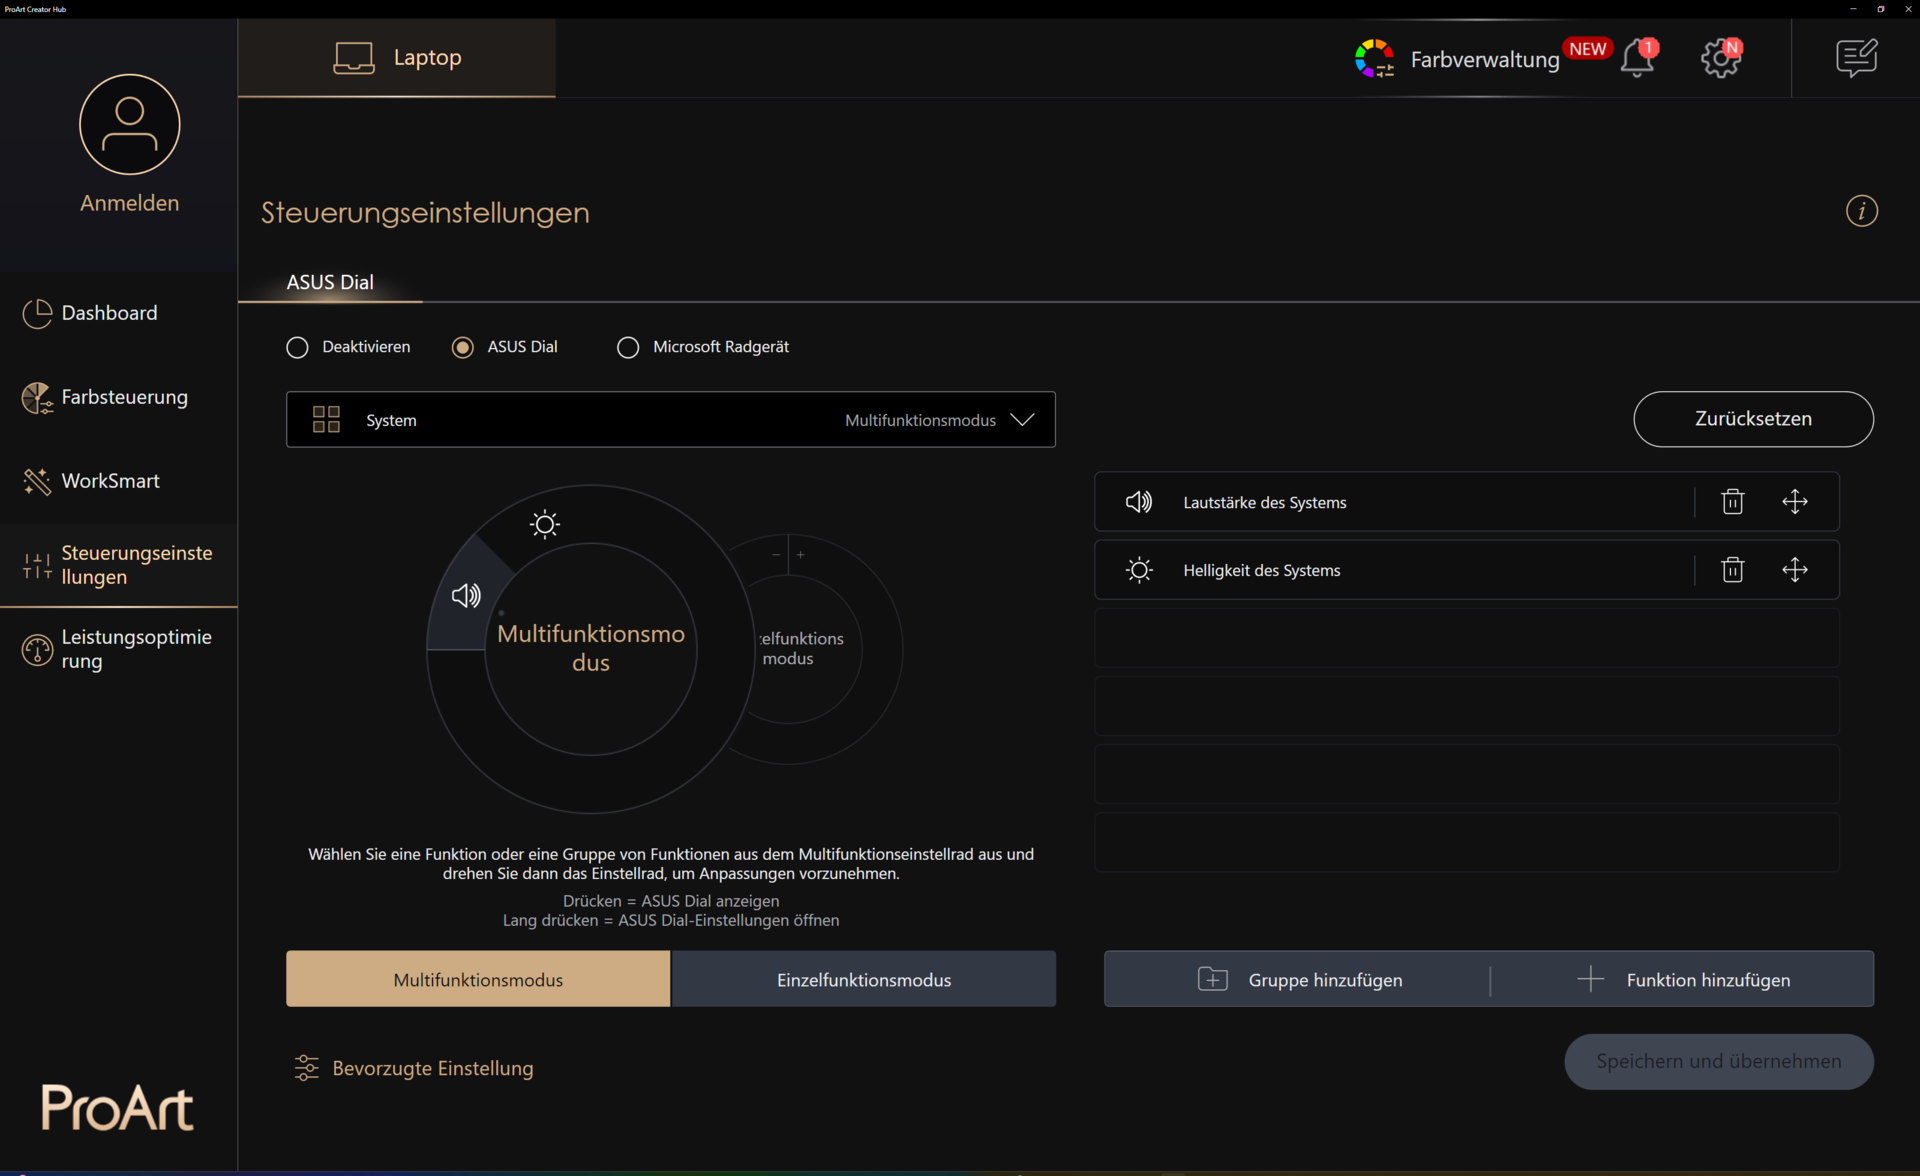
Uma roda de controle também pode ser exibida no canto superior esquerdo por meio de um botão no canto superior direito. Isso não funciona de forma tão precisa e confiável quanto a roda física instalada noAsus ProArt Studiobookno entanto, ele ganha seu lugar por meio de funções básicas para ajustar o brilho e o volume. O software ProArt também pode ser usado para adicionar uma ampla variedade de funções e, por exemplo, armazenar combinações de teclas para diferentes aplicativos.
Na edição de vídeo, por exemplo, é possível rolar de quadro a quadro. Na edição de imagens, as configurações de contraste e cor podem ser acessadas diretamente. E, é claro, tudo o mais pode ser controlado por meio do painel de controle, desde que a combinação de teclas seja conhecida.
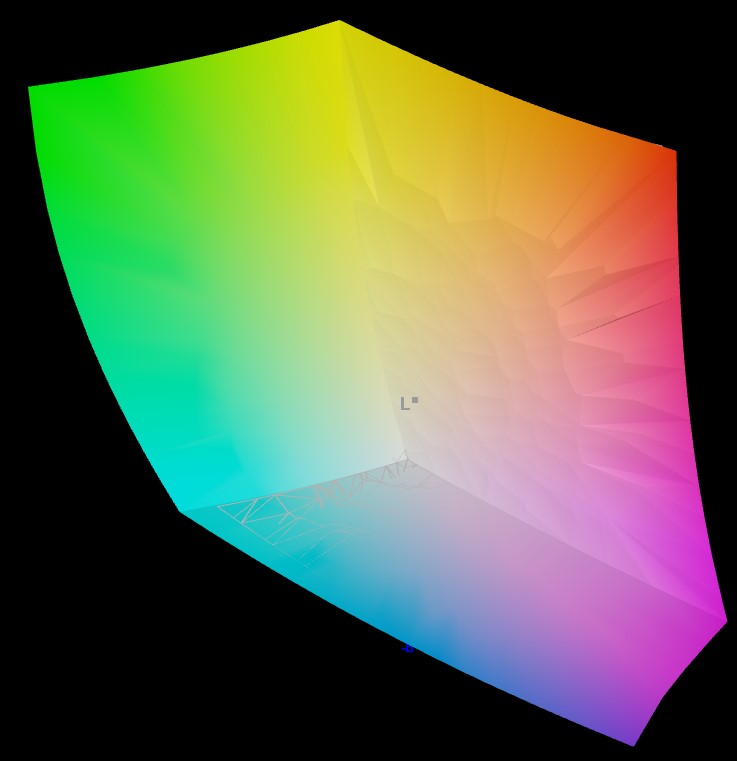
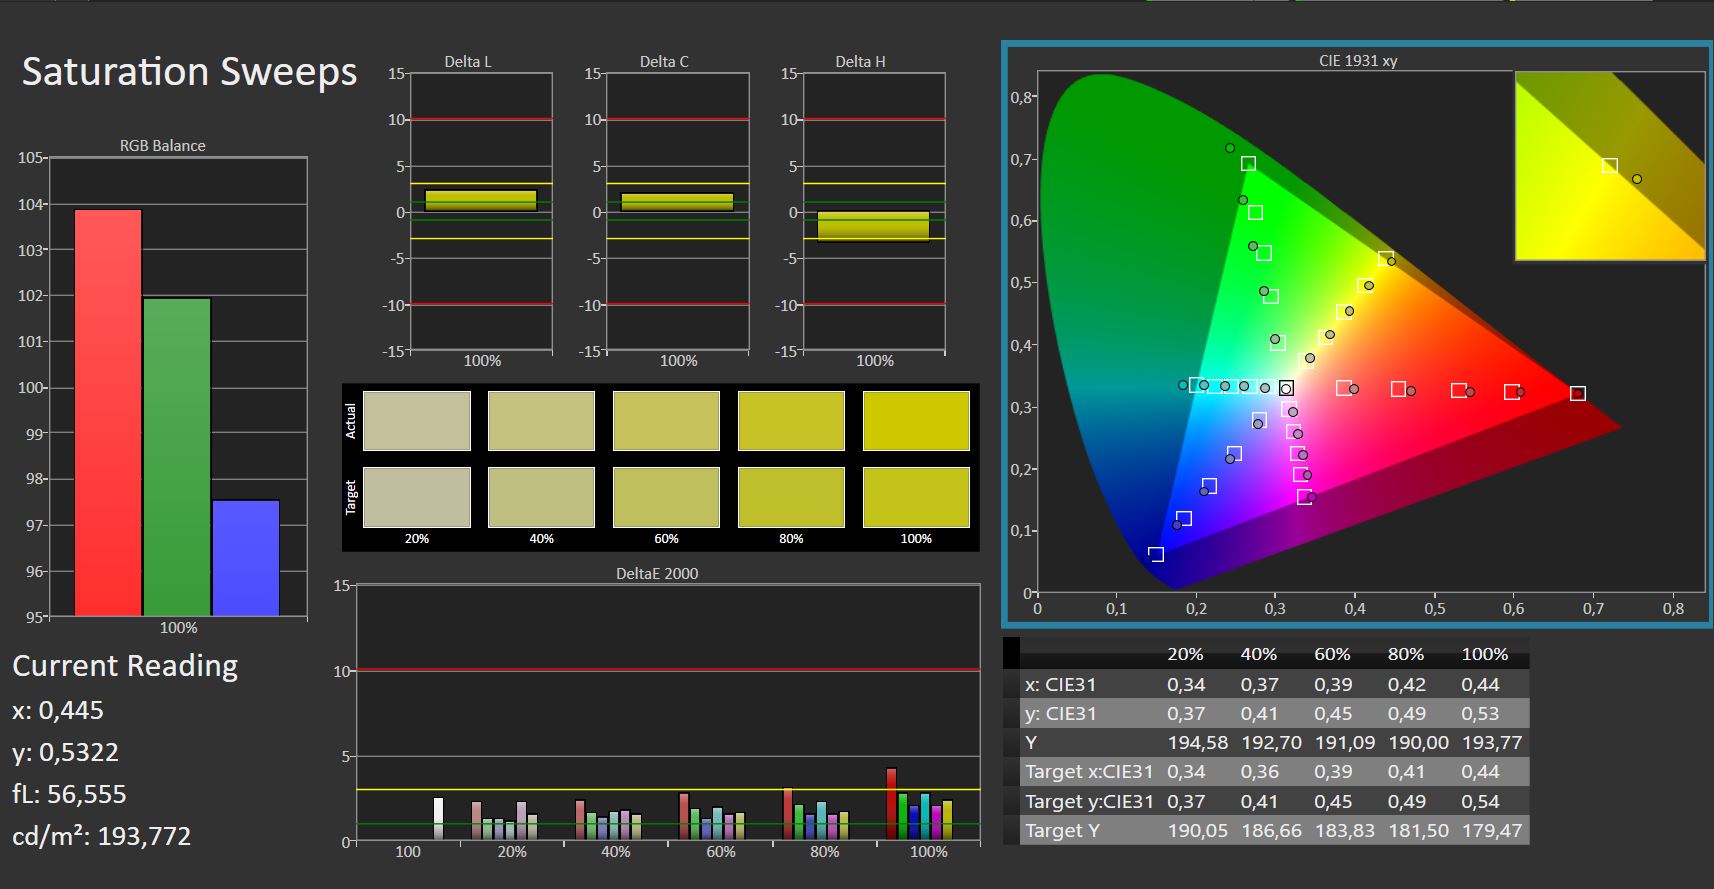
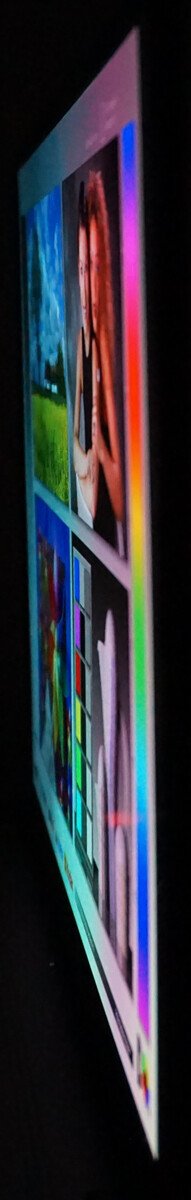
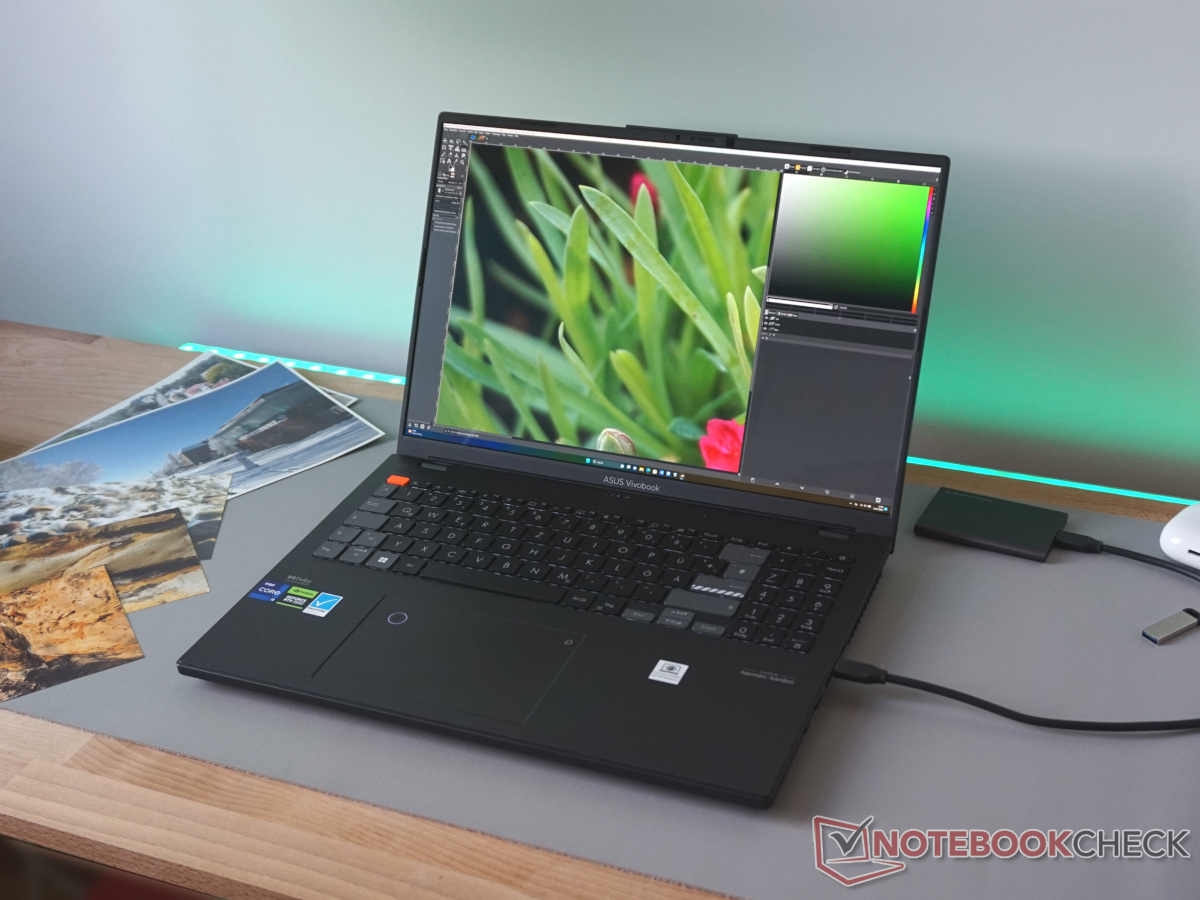
Tela - OLED com muitas cores e sem toque
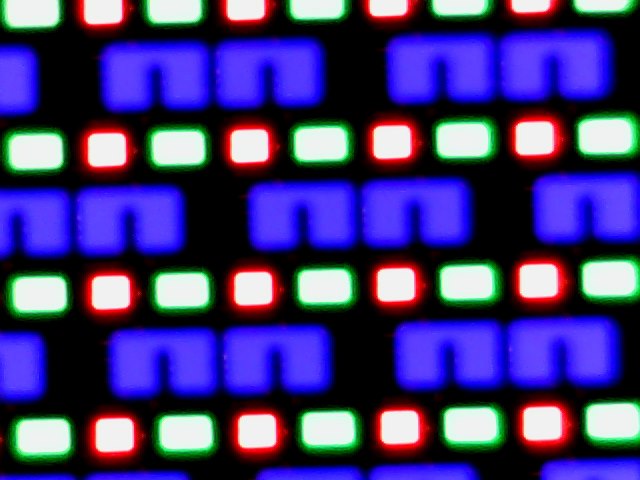
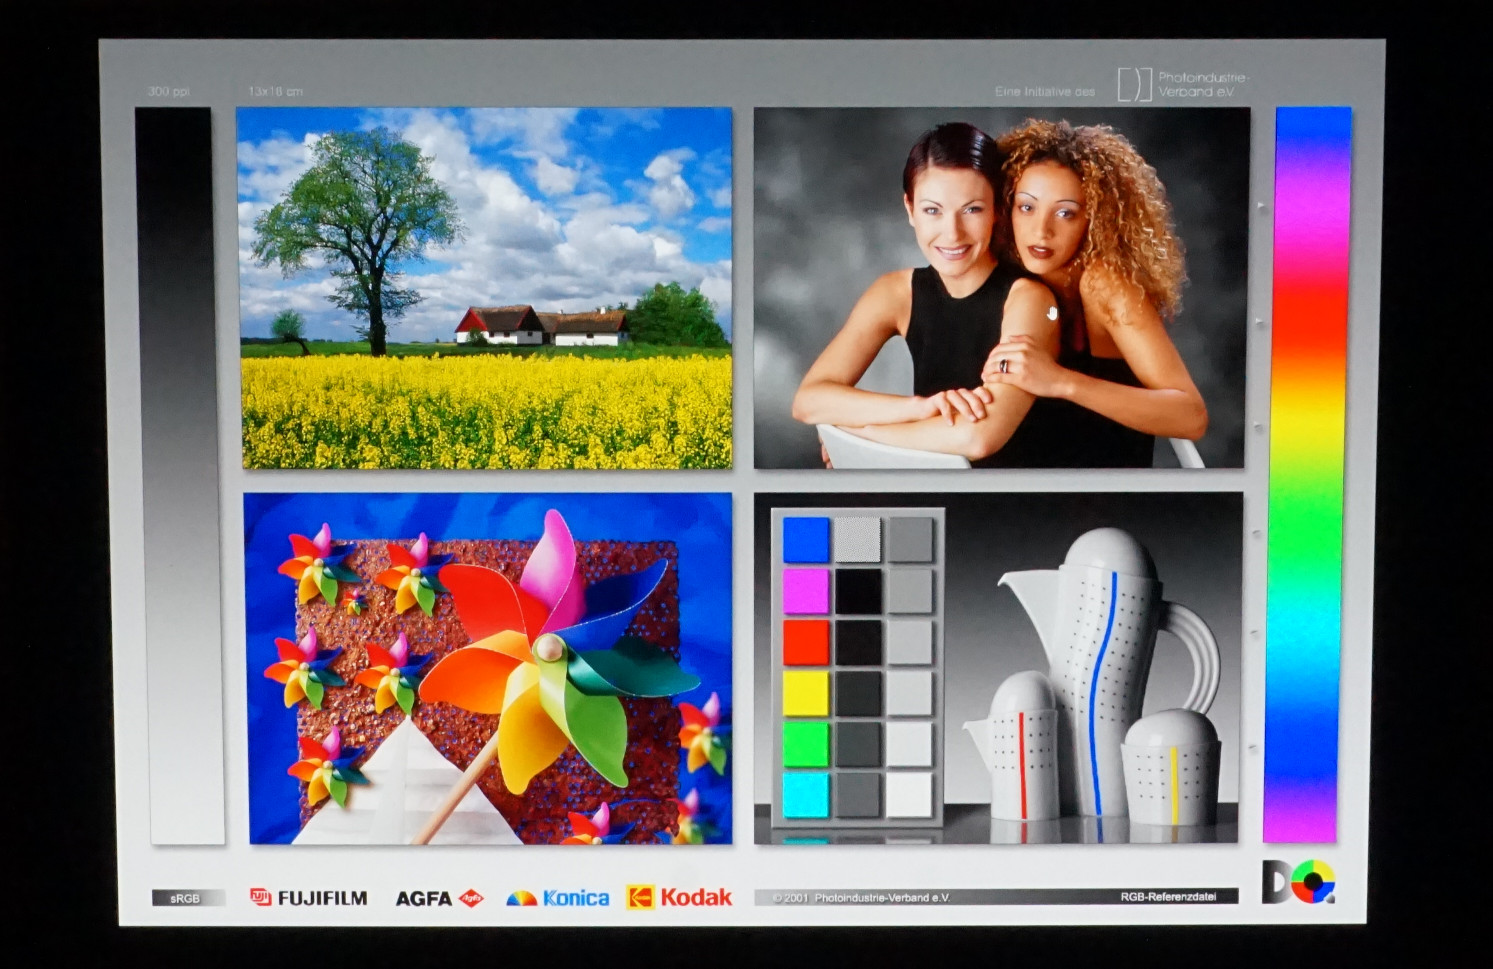
A tela OLED também é um ponto forte do VivoBook Pro 16X. O preto profundo e o alto contraste resultante proporcionam cores vivas e brilhantes. Elas são reproduzidas quase perfeitamente, mesmo sem calibração adicional.
A resolução incomum de 3.200 por 2.000 pixels corresponde ao formato 16:10 e fica mais ou menos no meio entre QHD e 4K. Na tela de 16 polegadas, ela garante uma exibição detalhada de fotos digitais de alta resolução, pelo menos em seções, sem que as representações se tornem muito pequenas, como em 4K.
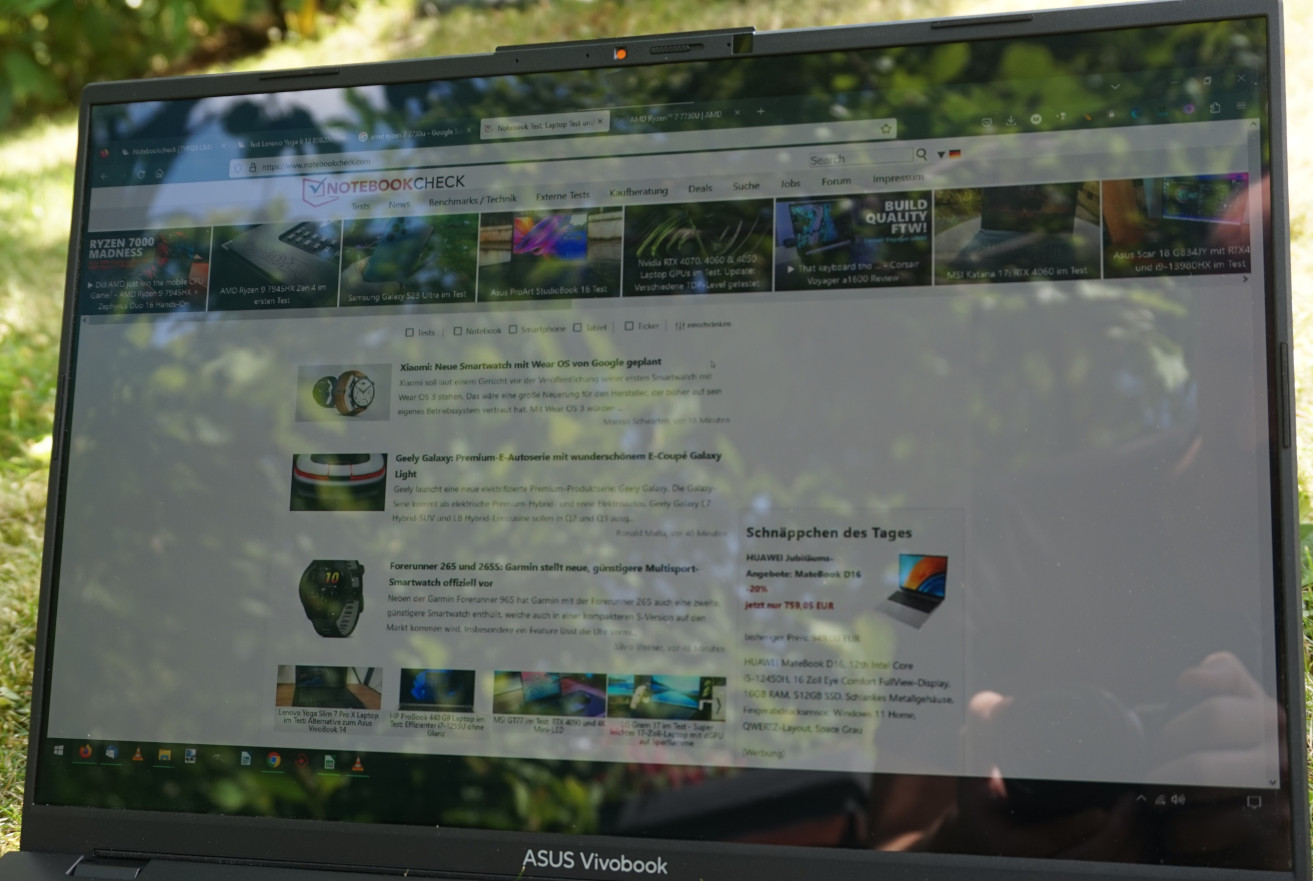
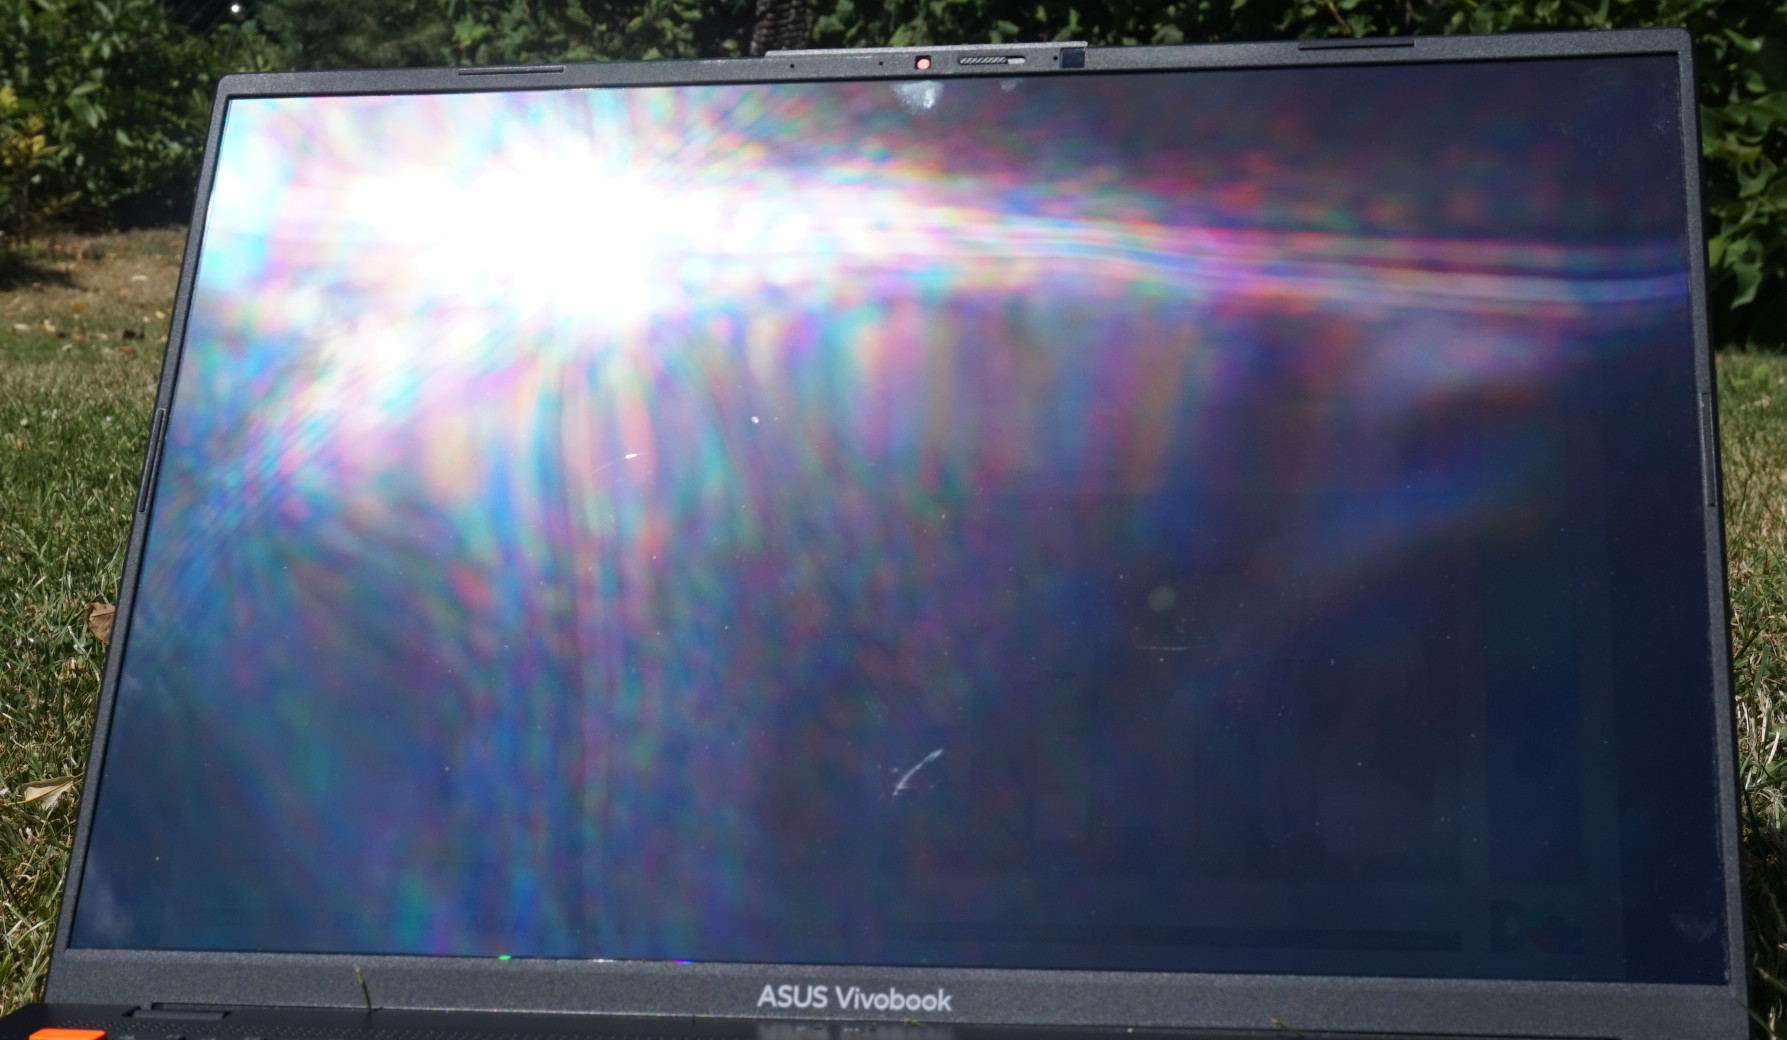
O brilho médio não apresenta nenhuma desvantagem, pelo menos em ambientes internos. Devido ao valor de preto muito baixo, a imagem parece mais brilhante do que em um painel IPS. No entanto, a superfície brilhante impede uma boa visibilidade em ambientes externos com pouco menos de 350 cd/m² no modo SDR.
Comparado com rivais similares com uma tela OLED, o Asus VivoBook só usa uma taxa de quadros de 120 Hz, que também corresponde à cintilação PWM medida de precisamente 120 Hz. Embora seja muito mais sutil do que nos painéis TN ou em alguns painéis IPS, ainda é perceptível para olhos sensíveis. Ela também aumenta para 240 Hz com 60% de brilho ou menos.
O sangramento da tela ou os halos não ocorrem em um monitor OLED.
| |||||||||||||||||||||||||
iluminação: 97 %
Contraste: 5783:1 (Preto: 0.06 cd/m²)
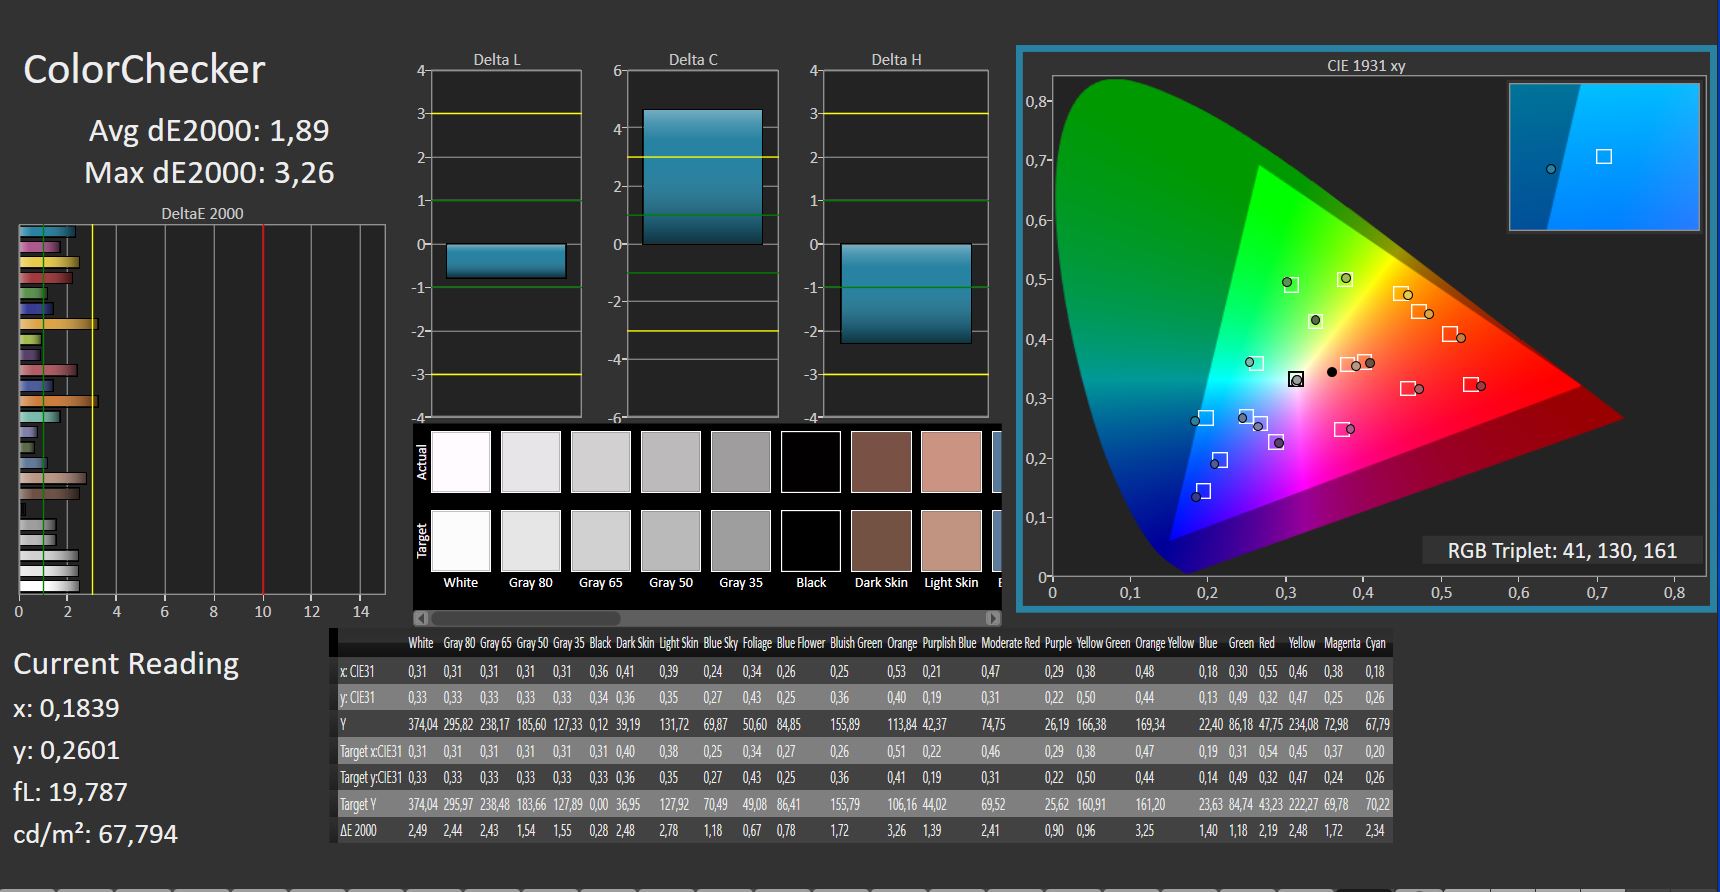
ΔE ColorChecker Calman: 1.89 | ∀{0.5-29.43 Ø4.71}
calibrated: 1.97
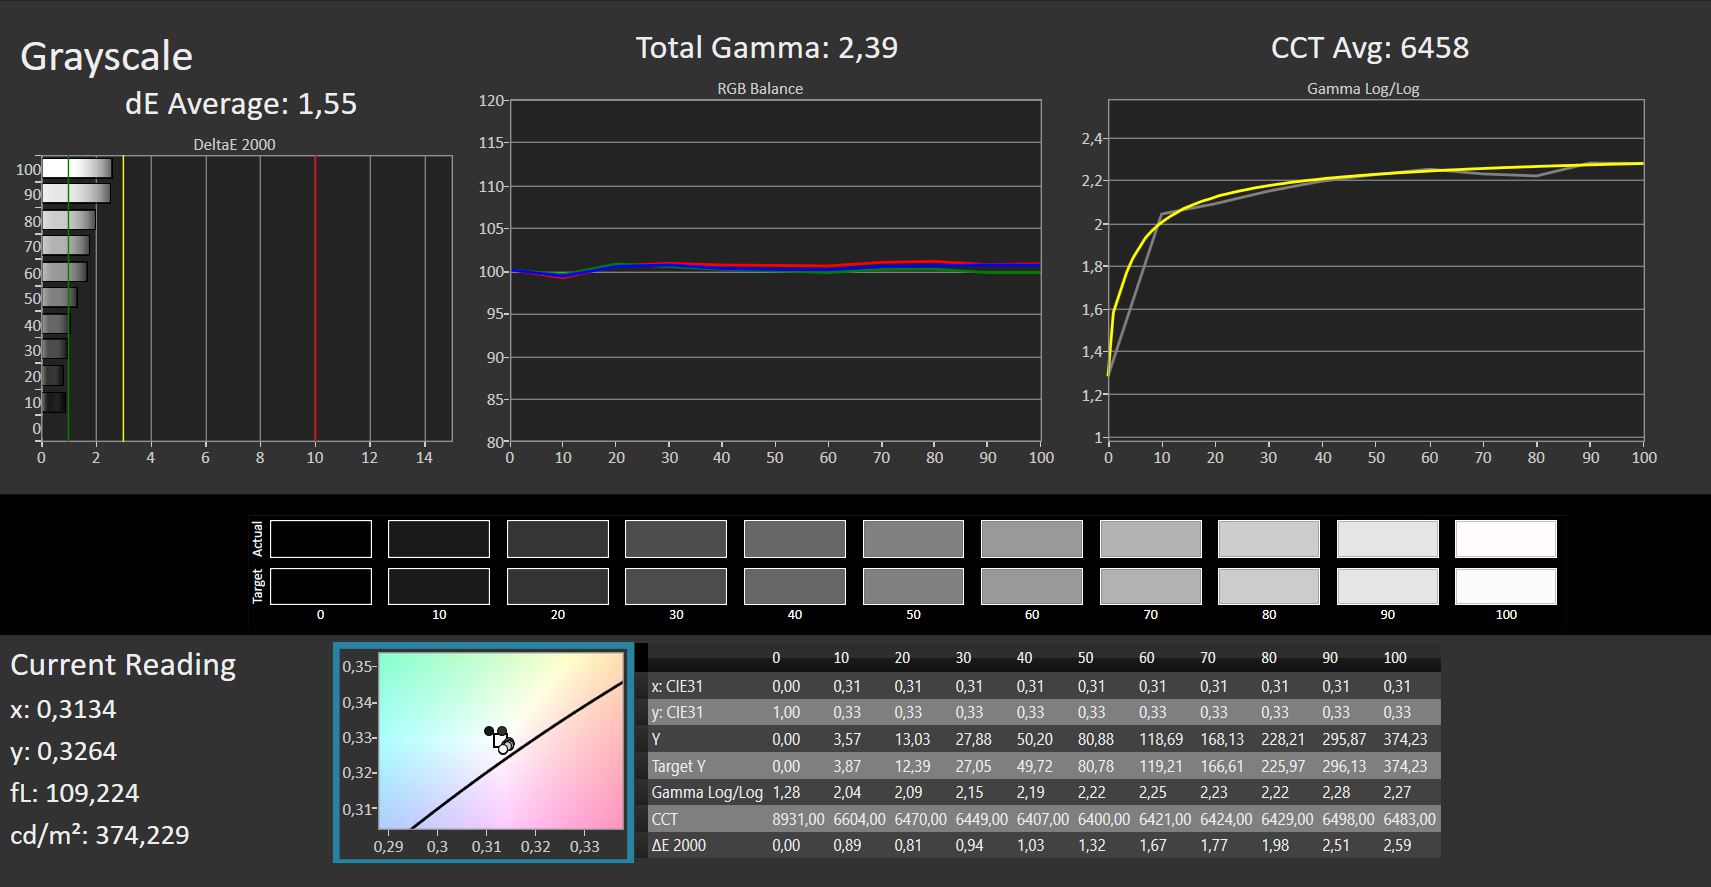
ΔE Greyscale Calman: 1.55 | ∀{0.09-98 Ø4.96}
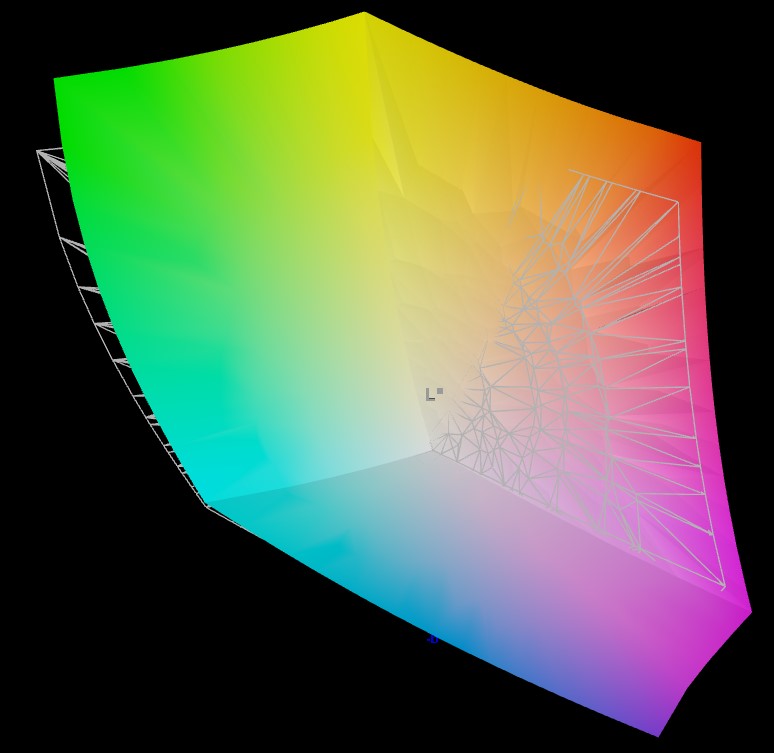
95.8% AdobeRGB 1998 (Argyll 3D)
99.7% sRGB (Argyll 3D)
98.4% Display P3 (Argyll 3D)
Gamma: 2.39
CCT: 6458 K
| Asus Vivobook Pro 16X K6604JV-MX016W Samsung SDC4178 ATNA60BX01-1, OLED, 3200x2000, 16" | Dell XPS 15 9530 RTX 4070 Samsung 156XG01, OLED, 3456x2160, 15.6" | Samsung Galaxy Book3 Ultra 16 Samsung ATNA60CL03-0, AMOLED, 2880x1800, 16" | Asus ProArt Studiobook 16 OLED H7604 ATNA60BX01-1, OLED, 3200x2000, 16" | Schenker VISION 16 Pro (M23) NE160QDM-NZ1, IPS, 2560x1600, 16" | MSI Creator Z17 A12UGST-054 AUO3C9B (B170QAN01.0), IPS, 2560x1600, 17" | |
|---|---|---|---|---|---|---|
| Display | 1% | 1% | -2% | -19% | -3% | |
| Display P3 Coverage (%) | 98.4 | 99.8 1% | 99.9 2% | 99.6 1% | 68.8 -30% | 98.9 1% |
| sRGB Coverage (%) | 99.7 | 100 0% | 100 0% | 100 0% | 98.8 -1% | 99.9 0% |
| AdobeRGB 1998 Coverage (%) | 95.8 | 98.4 3% | 96.3 1% | 89.4 -7% | 70 -27% | 86.4 -10% |
| Response Times | -22% | 62% | 54% | -618% | -423% | |
| Response Time Grey 50% / Grey 80% * (ms) | 1.6 ? | 1.68 ? -5% | 0.49 ? 69% | 0.59 ? 63% | 13.7 ? -756% | 11 ? -588% |
| Response Time Black / White * (ms) | 1.4 ? | 1.94 ? -39% | 0.65 ? 54% | 0.79 ? 44% | 8.1 ? -479% | 5 ? -257% |
| PWM Frequency (Hz) | 120 ? | 239 | 240 ? | 240 ? | ||
| Screen | -44% | 11% | 23% | -91% | -147% | |
| Brightness middle (cd/m²) | 347 | 389.5 12% | 400 15% | 349 1% | 384 11% | 444 28% |
| Brightness (cd/m²) | 346 | 392 13% | 399 15% | 350 1% | 371 7% | 415 20% |
| Brightness Distribution (%) | 97 | 98 1% | 93 -4% | 95 -2% | 88 -9% | 88 -9% |
| Black Level * (cd/m²) | 0.06 | 0.03 50% | 0.02 67% | 0.3 -400% | 0.7 -1067% | |
| Contrast (:1) | 5783 | 13333 131% | 17450 202% | 1280 -78% | 634 -89% | |
| Colorchecker dE 2000 * | 1.89 | 4.95 -162% | 2.3 -22% | 2.1 -11% | 3.4 -80% | 2.48 -31% |
| Colorchecker dE 2000 max. * | 3.26 | 8.65 -165% | 4.15 -27% | 5.5 -69% | 9.2 -182% | 3.52 -8% |
| Colorchecker dE 2000 calibrated * | 1.97 | 1.53 22% | 1.66 16% | 2.1 -7% | 1.3 34% | 2.91 -48% |
| Greyscale dE 2000 * | 1.55 | 2 -29% | 2.7 -74% | 1.2 23% | 3.4 -119% | 3.33 -115% |
| Gamma | 2.39 92% | 2.27 97% | 2.266 97% | 2.19 100% | 2.16 102% | 2.33 94% |
| CCT | 6458 101% | 6265 104% | 7047 92% | 6545 99% | 7462 87% | 6230 104% |
| Média Total (Programa/Configurações) | -22% /
-29% | 25% /
16% | 25% /
22% | -243% /
-151% | -191% /
-155% |
* ... menor é melhor
Não muito perfeita nos tons muito escuros, a tela não cobre totalmente o espaço de cores sRGB, embora 99,7% também seja totalmente suficiente. O mesmo pode ser dito sobre o espaço de cores AdobeRGB, que é coberto em quase 96%. Aqui, o VivoBook Pro 16X também está claramente à frente doAsus Studiobook 16que só consegue 89% no AdobeRGB, de acordo com nossas medições.
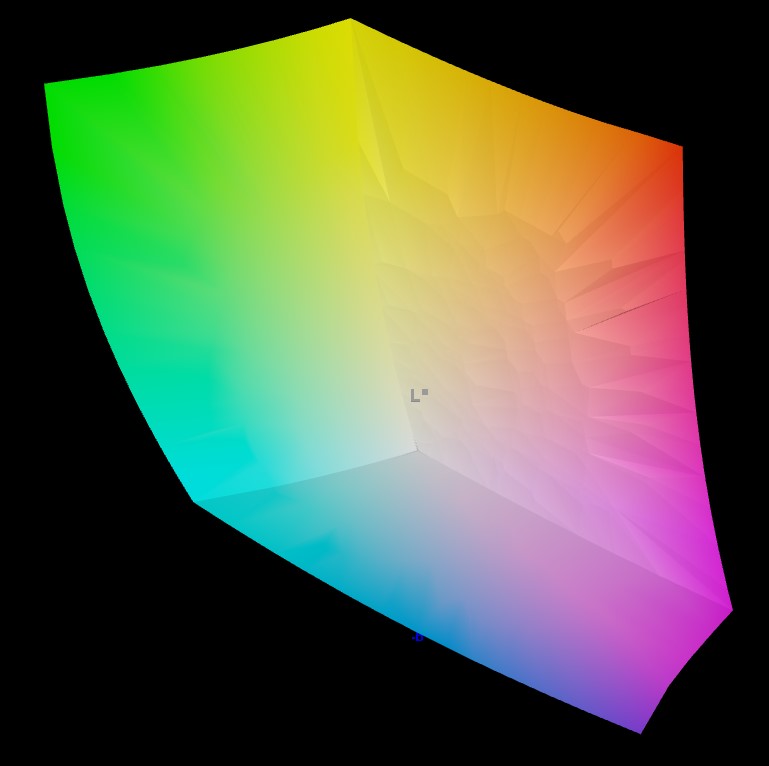
Com um DeltaE médio de menos de 2, a reprodução de cores é quase natural. É improvável que até mesmo olhos treinados consigam notar a diferença. Isso se aplica sem calibrações adicionais, que não trouxeram nenhuma melhoria. Em vista dos desvios mínimos, isso é desnecessário de qualquer forma.
Exibir tempos de resposta
| ↔ Tempo de resposta preto para branco | ||
|---|---|---|
| 1.4 ms ... ascensão ↗ e queda ↘ combinadas | ↗ 0.6 ms ascensão | 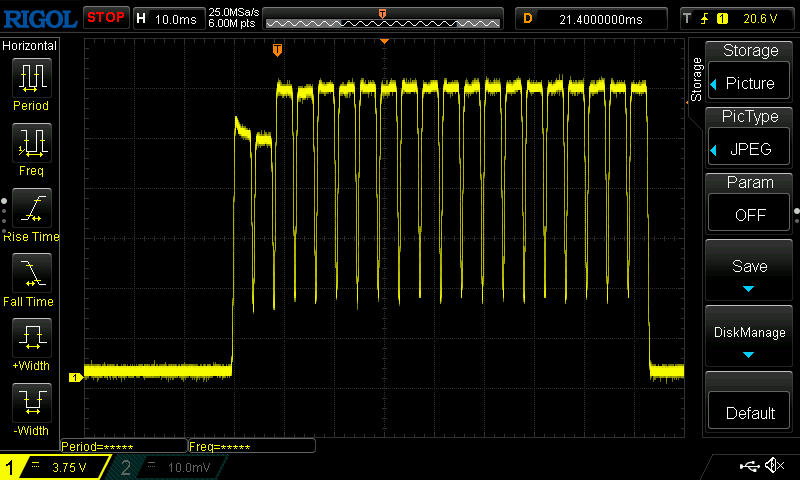 |
| ↘ 0.8 ms queda | ||
| A tela mostra taxas de resposta muito rápidas em nossos testes e deve ser muito adequada para jogos em ritmo acelerado. Em comparação, todos os dispositivos testados variam de 0.1 (mínimo) a 240 (máximo) ms. » 8 % de todos os dispositivos são melhores. Isso significa que o tempo de resposta medido é melhor que a média de todos os dispositivos testados (19.8 ms). | ||
| ↔ Tempo de resposta 50% cinza a 80% cinza | ||
| 1.6 ms ... ascensão ↗ e queda ↘ combinadas | ↗ 0.8 ms ascensão | 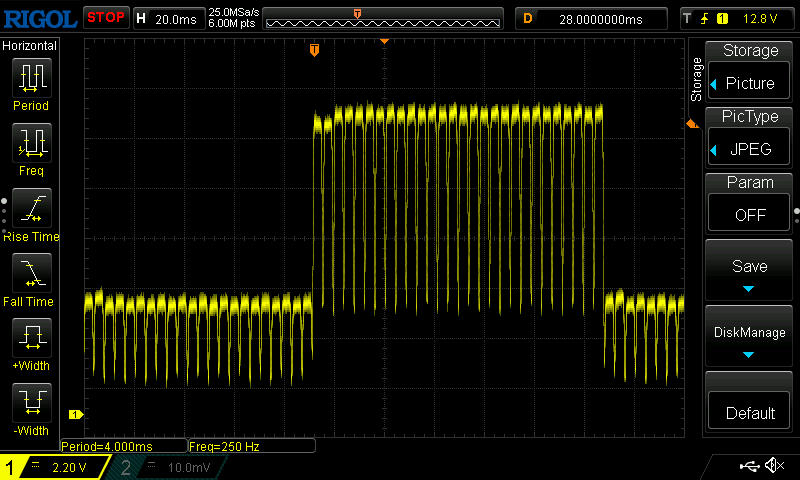 |
| ↘ 0.8 ms queda | ||
| A tela mostra taxas de resposta muito rápidas em nossos testes e deve ser muito adequada para jogos em ritmo acelerado. Em comparação, todos os dispositivos testados variam de 0.165 (mínimo) a 636 (máximo) ms. » 8 % de todos os dispositivos são melhores. Isso significa que o tempo de resposta medido é melhor que a média de todos os dispositivos testados (31 ms). | ||
Cintilação da tela / PWM (modulação por largura de pulso)
| Tela tremeluzindo/PWM detectado | 120 Hz | ≤ 100 % configuração de brilho |  |
A luz de fundo da tela pisca em 120 Hz (pior caso, por exemplo, utilizando PWM) Cintilação detectada em uma configuração de brilho de 100 % e abaixo. Não deve haver cintilação ou PWM acima desta configuração de brilho. A frequência de 120 Hz é muito baixa, portanto a oscilação pode causar fadiga ocular e dores de cabeça após uso prolongado. [pwm_comparison] Em comparação: 52 % de todos os dispositivos testados não usam PWM para escurecer a tela. Se PWM foi detectado, uma média de 7754 (mínimo: 5 - máximo: 343500) Hz foi medida. | |||


A superfície brilhante da tela, em particular, significa que os reflexos tornam a legibilidade muito mais difícil em um ambiente claro e quase impossível sob a luz do sol. Por outro lado, você pode trabalhar com o VivoBook Pro em ambientes externos, desde que fique na sombra. Mas você deve se sentar em um local fechado para editar imagens.
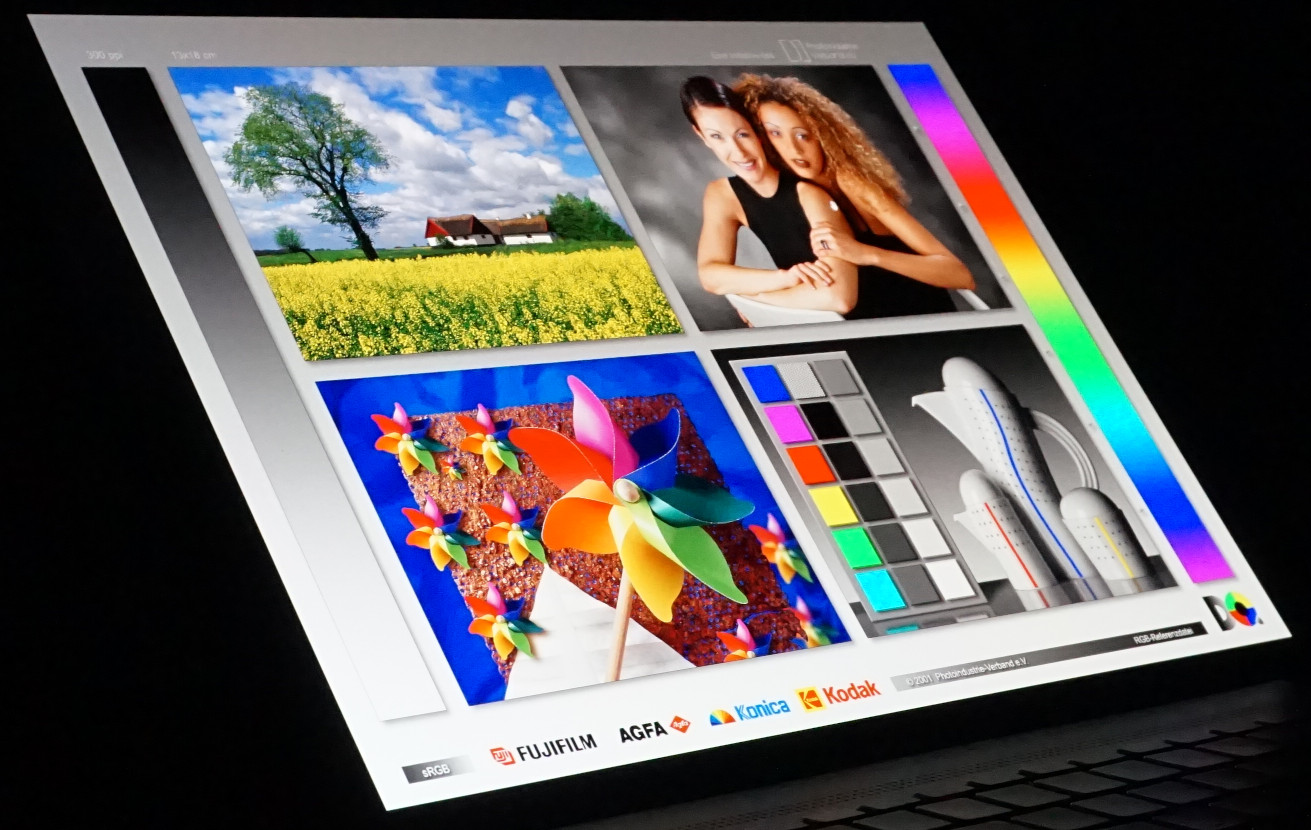
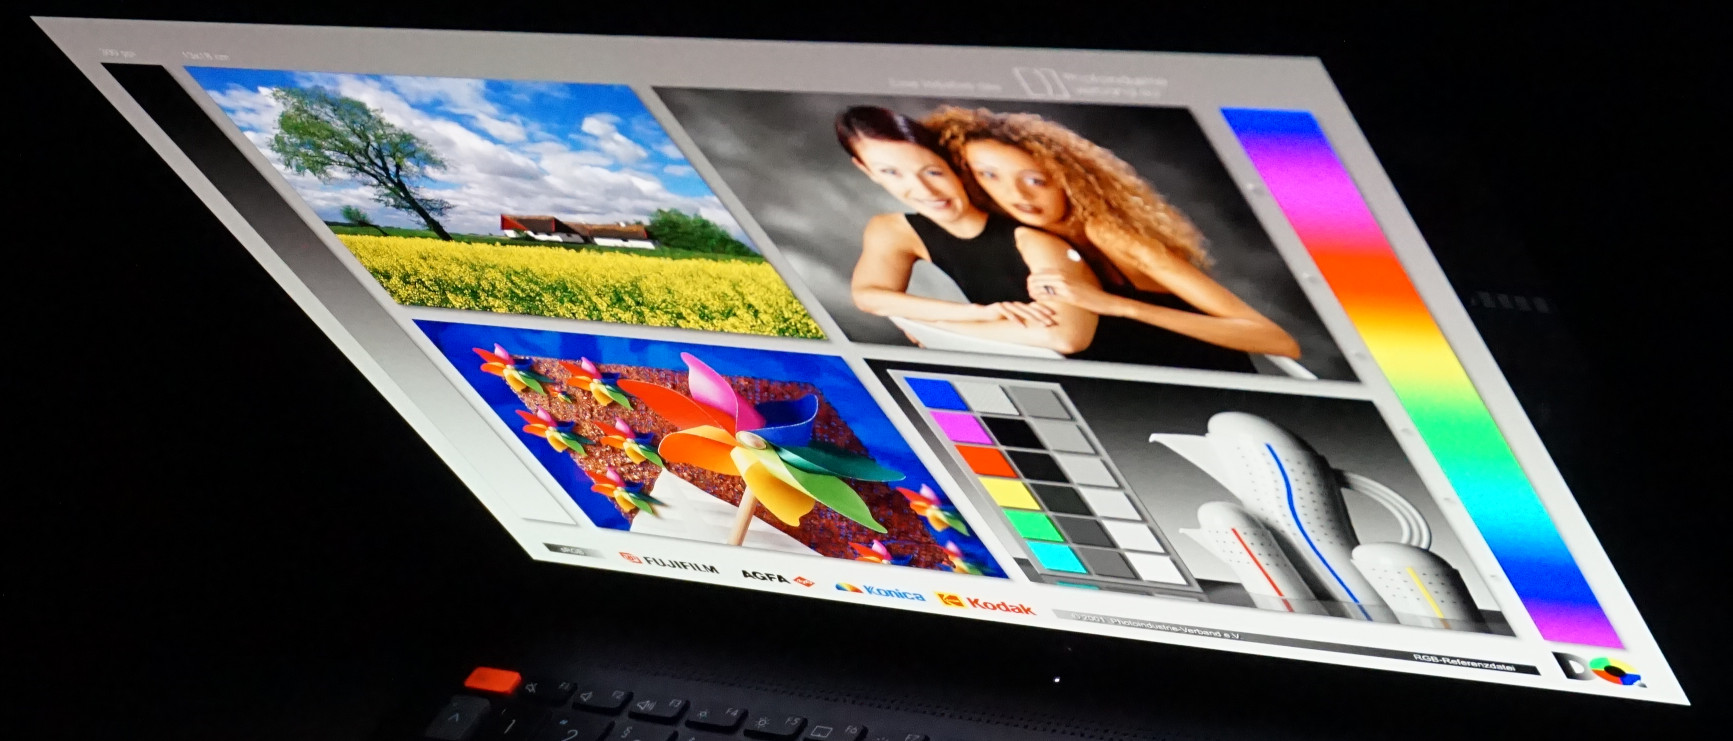
Como esperado para um painel OLED, o brilho e a reprodução de cores permanecem estáveis em todos os ângulos de visão normais. Também são típicos dos OLEDs os desvios significativos de cor em um ângulo muito acentuado de mais de 80°.
Desempenho - Velocidade de trabalho no VivoBook no máximo
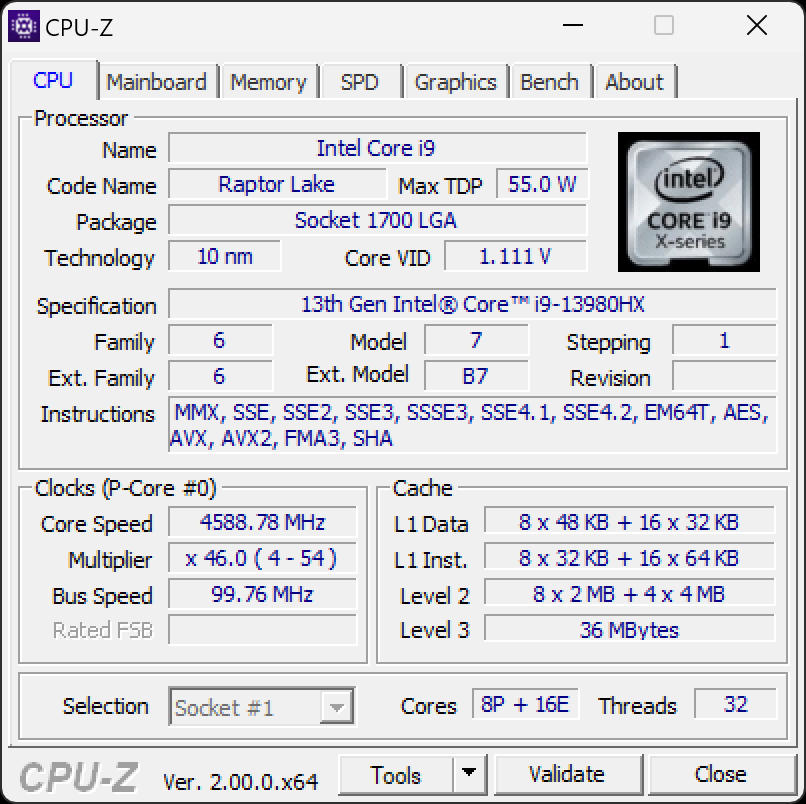
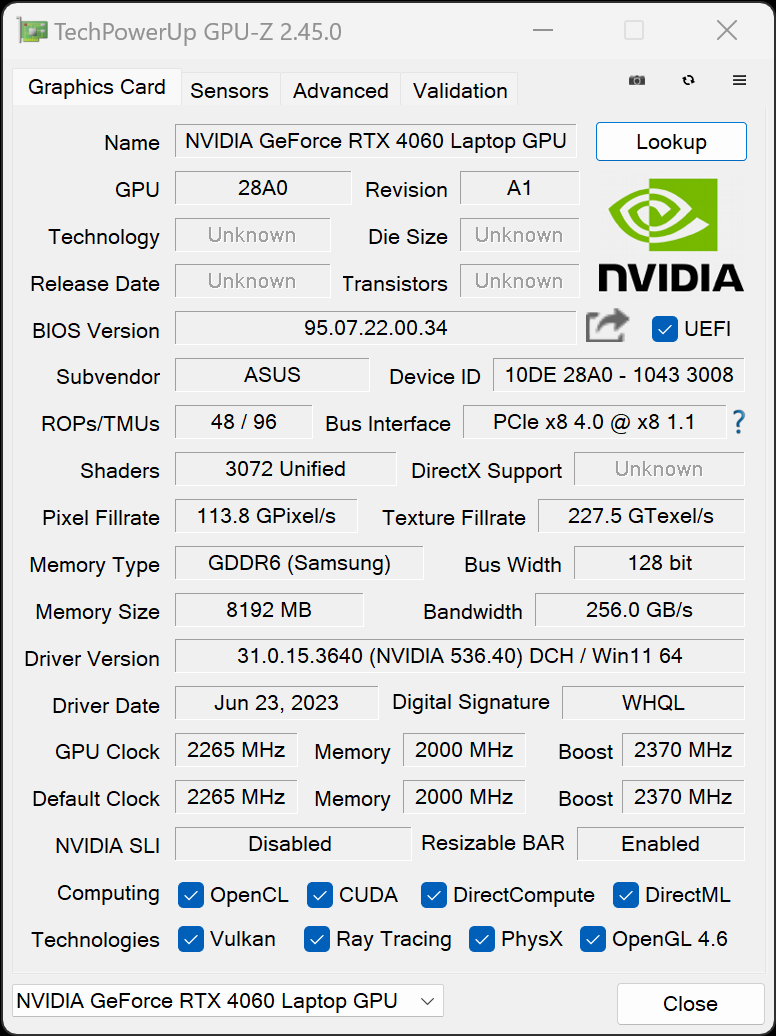
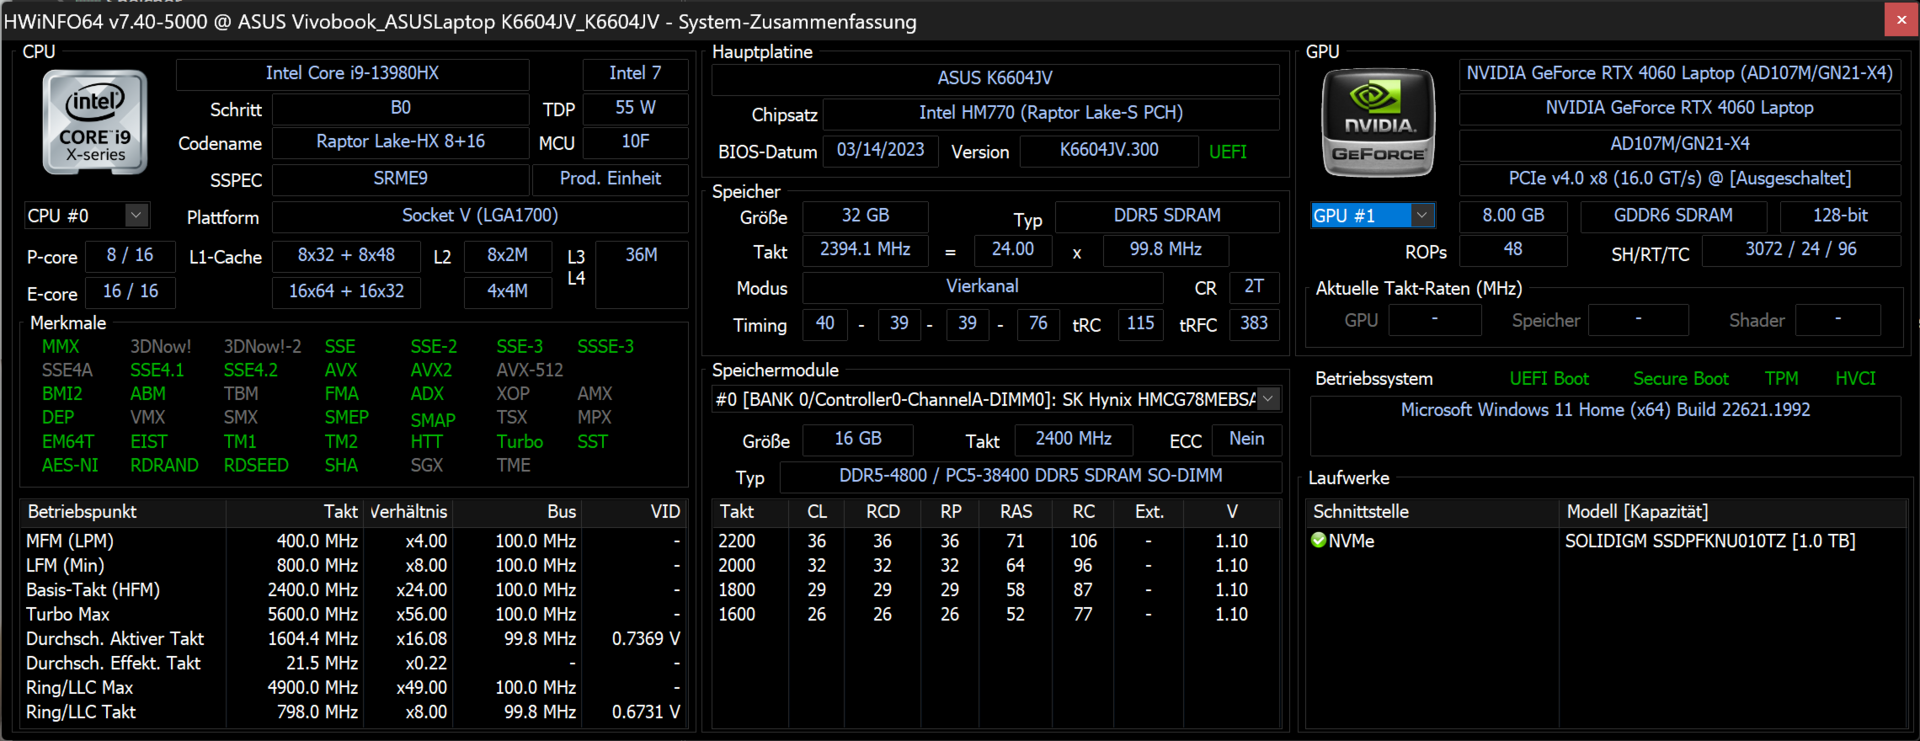
Nossa forte impressão geral se deve principalmente aoIntel Core i9-13980HXum dos melhores processadores móveis do momento. O opcional Nvidia GeForce RTX 4060opcional, como em nossa unidade de teste, ou o RTX 4070têm como objetivo principal acelerar o processamento de imagens, a edição de vídeo, a renderização e, é claro, os aplicativos 3D.
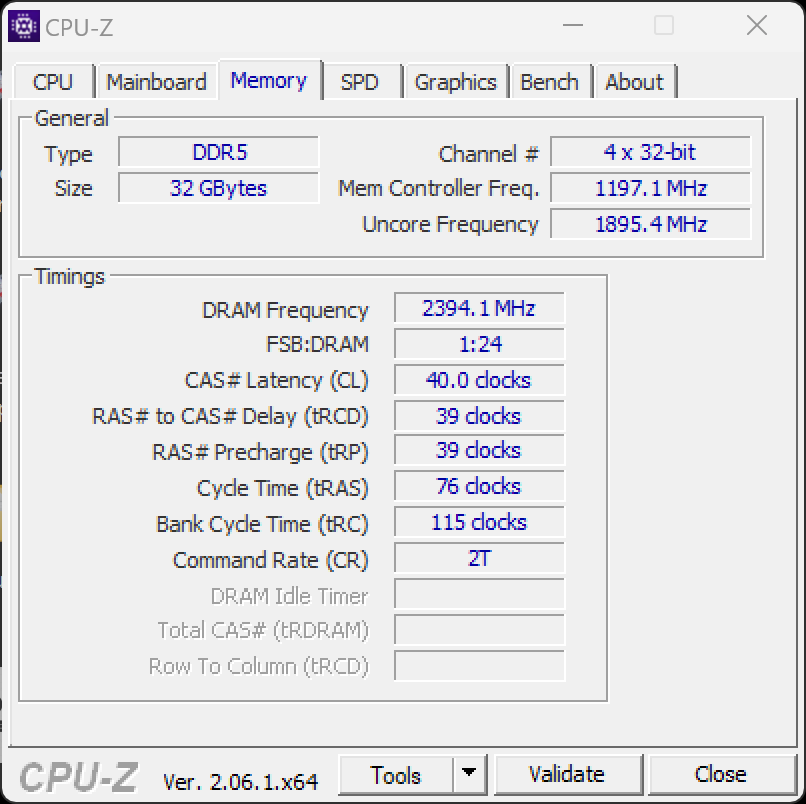
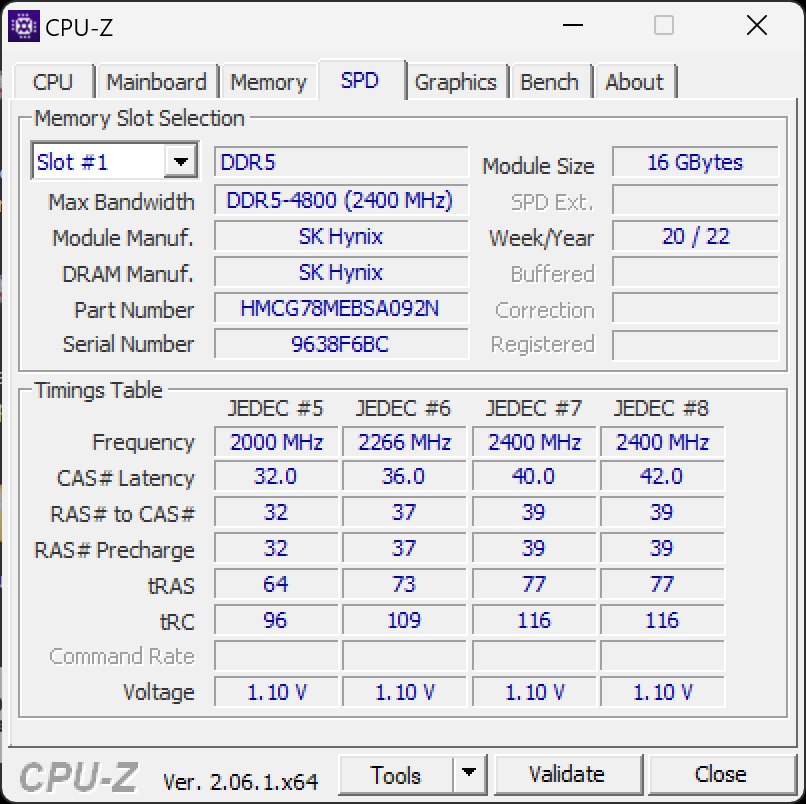
O Asus VivoBook Pro 16X impressiona com suas enormes velocidades de trabalho. Ele lida com aplicativos complexos e graficamente exigentes sem esforço e gosta de realizar multitarefas. 32 GB de RAM, que não esgota o clock máximo possível de 5.600 MHz, mas 4.800 MHz, complementa bem o sistema.
Condições de teste
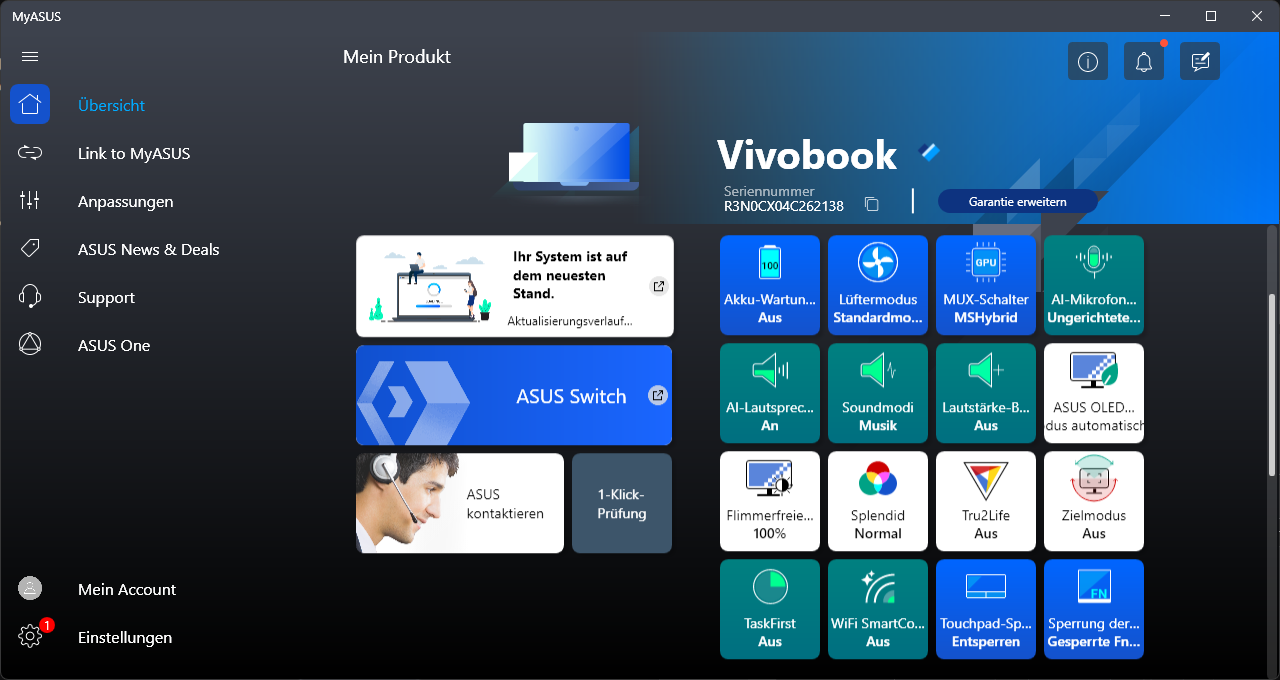
As opções de configuração no VivoBook Pro 16X são limitadas a três modos. O desempenho máximo também resulta em ruído máximo do ventilador, enquanto o ganho de desempenho é perceptível em situações extremas, mas desempenha apenas um papel secundário no trabalho diário.
Por esse motivo, o modo "Standard" foi usado em todos os testes, nos quais a fonte de alimentação do processador e da placa de vídeo é ligeiramente reduzida. Além disso, o modo "Silencioso" foi adicionado como um complemento. Aqui, o foco é o trabalho quase silencioso, de modo que o desempenho computacional máximo possível sempre precisa ser reduzido após cargas curtas. Mesmo assim, não registramos nenhum estrangulamento grave no modo Standard .
O consumo máximo de energia da CPU e da GPU, bem como o ruído medido da ventoinha, estão resumidos na tabela abaixo.
| Perfil de energia | Carga da CPU | Carga da GPU | Volume máximo do ventilador |
|---|---|---|---|
| Padrão | 157/80 watts | 90 watts | 37,0 dB(A) |
| Desempenho | 157/157 watts | 115 watts | 56,7 dB(A) |
| Silencioso | 105/55 watts | 80 watts | 29,2 dB(A) |
Processador
Não há muitos notebooks que superem o Asus VivoBook Pro com seu Intel Core i9-13980HXem termos de potência de computação pura. Notebooks maiores e mais pesados para jogos, como o Lenovo Legion Pro 7 ou o Asus ROG Strix G17 estão no mesmo nível ou são melhores graças ao processador AMD Ryzen 9 7945HX. Com 8 núcleos de desempenho e um total de 32 threads, uma taxa de clock máxima de 5,6 GHz e um controlador externo, o i9-13980HX está certamente bem equipado.
O Asus ProArt Studiobook 16 também está no mesmo nível, desde que o modo Desempenho esteja definido. E isso apesar do fato de que o VivoBook "só" pode consumir 157 W em vez de 170 W. Nossos benchmarks são geralmente 10% melhores. Devido ao aumento significativo da potência do ventilador, os valores de desempenho sustentado também são ligeiramente melhores, como pode ser visto claramente no loop do Cinebench R15. Os valores para Padrão e Desempenho estão no diagrama.
No modo Padrão com ruído moderado da ventoinha, os valores medidos são mais fracos, mas ainda excelentes. Notebooks multimídia posicionados de forma semelhante com CPUs menores, como oIntel Core i7-13700H são claramente superados. Isso se reflete na avaliação de vários benchmarks de CPU, onde há uma clara diferença para o VivoBook.
No modo Silencioso , a CPU é acelerada com relativa rapidez porque, caso contrário, ficaria muito quente devido ao resfriamento reduzido. Quando o plugue da rede elétrica é retirado, há uma queda significativa no desempenho. Por exemplo, o teste multi-core Cinebench R23 atinge pouco menos de 11.000 pontos. Isso representa pouco menos de um terço da pontuação no modo Padrão , mas não está muito longe da média de todos os notebooks multimídia que analisamos nos últimos dois anos.
Mais benchmarks e informações podem ser encontrados em nossa Lista de benchmarks de CPU.
Cinebench R15 Multi Sustained Load
Cinebench R23: Multi Core | Single Core
Cinebench R20: CPU (Multi Core) | CPU (Single Core)
Cinebench R15: CPU Multi 64Bit | CPU Single 64Bit
Blender: v2.79 BMW27 CPU
7-Zip 18.03: 7z b 4 | 7z b 4 -mmt1
Geekbench 5.5: Multi-Core | Single-Core
HWBOT x265 Benchmark v2.2: 4k Preset
LibreOffice : 20 Documents To PDF
R Benchmark 2.5: Overall mean
| CPU Performance rating | |
| Asus ProArt Studiobook 16 OLED H7604 | |
| Média Intel Core i9-13980HX | |
| Asus Vivobook Pro 16X K6604JV-MX016W | |
| MSI Creator Z17 A12UGST-054 | |
| Dell XPS 15 9530 RTX 4070 | |
| Média da turma Multimedia | |
| Schenker VISION 16 Pro (M23) | |
| Samsung Galaxy Book3 Ultra 16 | |
| Cinebench R23 / Multi Core | |
| Asus ProArt Studiobook 16 OLED H7604 | |
| Média Intel Core i9-13980HX (28301 - 33052, n=11) | |
| Asus Vivobook Pro 16X K6604JV-MX016W | |
| Média da turma Multimedia (4861 - 33362, n=74, últimos 2 anos) | |
| MSI Creator Z17 A12UGST-054 | |
| Dell XPS 15 9530 RTX 4070 | |
| Samsung Galaxy Book3 Ultra 16 | |
| Schenker VISION 16 Pro (M23) | |
| Cinebench R23 / Single Core | |
| Asus ProArt Studiobook 16 OLED H7604 | |
| Média Intel Core i9-13980HX (1825 - 2169, n=9) | |
| Média da turma Multimedia (1128 - 2459, n=66, últimos 2 anos) | |
| Schenker VISION 16 Pro (M23) | |
| MSI Creator Z17 A12UGST-054 | |
| Dell XPS 15 9530 RTX 4070 | |
| Asus Vivobook Pro 16X K6604JV-MX016W | |
| Samsung Galaxy Book3 Ultra 16 | |
| Cinebench R20 / CPU (Multi Core) | |
| Asus ProArt Studiobook 16 OLED H7604 | |
| Média Intel Core i9-13980HX (10353 - 12437, n=10) | |
| Asus Vivobook Pro 16X K6604JV-MX016W | |
| Média da turma Multimedia (1887 - 12912, n=57, últimos 2 anos) | |
| MSI Creator Z17 A12UGST-054 | |
| Dell XPS 15 9530 RTX 4070 | |
| Samsung Galaxy Book3 Ultra 16 | |
| Schenker VISION 16 Pro (M23) | |
| Cinebench R20 / CPU (Single Core) | |
| Asus ProArt Studiobook 16 OLED H7604 | |
| Média Intel Core i9-13980HX (717 - 825, n=10) | |
| Média da turma Multimedia (425 - 853, n=57, últimos 2 anos) | |
| Schenker VISION 16 Pro (M23) | |
| Asus Vivobook Pro 16X K6604JV-MX016W | |
| MSI Creator Z17 A12UGST-054 | |
| Dell XPS 15 9530 RTX 4070 | |
| Samsung Galaxy Book3 Ultra 16 | |
| Cinebench R15 / CPU Multi 64Bit | |
| Média Intel Core i9-13980HX (4358 - 5172, n=11) | |
| Asus Vivobook Pro 16X K6604JV-MX016W | |
| Asus ProArt Studiobook 16 OLED H7604 | |
| Dell XPS 15 9530 RTX 4070 | |
| MSI Creator Z17 A12UGST-054 | |
| Média da turma Multimedia (856 - 5224, n=61, últimos 2 anos) | |
| Samsung Galaxy Book3 Ultra 16 | |
| Schenker VISION 16 Pro (M23) | |
| Cinebench R15 / CPU Single 64Bit | |
| Asus ProArt Studiobook 16 OLED H7604 | |
| Média Intel Core i9-13980HX (289 - 312, n=11) | |
| Asus Vivobook Pro 16X K6604JV-MX016W | |
| Média da turma Multimedia (184.8 - 326, n=59, últimos 2 anos) | |
| Schenker VISION 16 Pro (M23) | |
| Dell XPS 15 9530 RTX 4070 | |
| MSI Creator Z17 A12UGST-054 | |
| Samsung Galaxy Book3 Ultra 16 | |
| Blender / v2.79 BMW27 CPU | |
| Média da turma Multimedia (100 - 557, n=58, últimos 2 anos) | |
| Schenker VISION 16 Pro (M23) | |
| Samsung Galaxy Book3 Ultra 16 | |
| Dell XPS 15 9530 RTX 4070 | |
| MSI Creator Z17 A12UGST-054 | |
| Asus Vivobook Pro 16X K6604JV-MX016W | |
| Média Intel Core i9-13980HX (97 - 136, n=10) | |
| Asus ProArt Studiobook 16 OLED H7604 | |
| 7-Zip 18.03 / 7z b 4 | |
| Asus ProArt Studiobook 16 OLED H7604 | |
| Média Intel Core i9-13980HX (104616 - 129804, n=10) | |
| Asus Vivobook Pro 16X K6604JV-MX016W | |
| MSI Creator Z17 A12UGST-054 | |
| Schenker VISION 16 Pro (M23) | |
| Samsung Galaxy Book3 Ultra 16 | |
| Dell XPS 15 9530 RTX 4070 | |
| Média da turma Multimedia (26062 - 130368, n=55, últimos 2 anos) | |
| 7-Zip 18.03 / 7z b 4 -mmt1 | |
| Asus ProArt Studiobook 16 OLED H7604 | |
| Asus Vivobook Pro 16X K6604JV-MX016W | |
| Média Intel Core i9-13980HX (6230 - 7163, n=10) | |
| Schenker VISION 16 Pro (M23) | |
| Dell XPS 15 9530 RTX 4070 | |
| Média da turma Multimedia (3666 - 7545, n=56, últimos 2 anos) | |
| MSI Creator Z17 A12UGST-054 | |
| Samsung Galaxy Book3 Ultra 16 | |
| Geekbench 5.5 / Multi-Core | |
| Média Intel Core i9-13980HX (18475 - 22200, n=10) | |
| Asus ProArt Studiobook 16 OLED H7604 | |
| Asus Vivobook Pro 16X K6604JV-MX016W | |
| MSI Creator Z17 A12UGST-054 | |
| Dell XPS 15 9530 RTX 4070 | |
| Média da turma Multimedia (4652 - 20422, n=56, últimos 2 anos) | |
| Schenker VISION 16 Pro (M23) | |
| Samsung Galaxy Book3 Ultra 16 | |
| Geekbench 5.5 / Single-Core | |
| Asus ProArt Studiobook 16 OLED H7604 | |
| Média Intel Core i9-13980HX (1796 - 2139, n=10) | |
| Asus Vivobook Pro 16X K6604JV-MX016W | |
| Média da turma Multimedia (805 - 2974, n=56, últimos 2 anos) | |
| Dell XPS 15 9530 RTX 4070 | |
| Schenker VISION 16 Pro (M23) | |
| MSI Creator Z17 A12UGST-054 | |
| Samsung Galaxy Book3 Ultra 16 | |
| HWBOT x265 Benchmark v2.2 / 4k Preset | |
| Média Intel Core i9-13980HX (27 - 33.4, n=9) | |
| Asus ProArt Studiobook 16 OLED H7604 | |
| Asus Vivobook Pro 16X K6604JV-MX016W | |
| Média da turma Multimedia (5.26 - 36.1, n=56, últimos 2 anos) | |
| MSI Creator Z17 A12UGST-054 | |
| Dell XPS 15 9530 RTX 4070 | |
| Samsung Galaxy Book3 Ultra 16 | |
| Schenker VISION 16 Pro (M23) | |
| LibreOffice / 20 Documents To PDF | |
| Asus Vivobook Pro 16X K6604JV-MX016W | |
| Média da turma Multimedia (23.9 - 146.7, n=57, últimos 2 anos) | |
| Samsung Galaxy Book3 Ultra 16 | |
| Schenker VISION 16 Pro (M23) | |
| Asus ProArt Studiobook 16 OLED H7604 | |
| Dell XPS 15 9530 RTX 4070 | |
| Média Intel Core i9-13980HX (35 - 51.4, n=10) | |
| MSI Creator Z17 A12UGST-054 | |
| R Benchmark 2.5 / Overall mean | |
| Samsung Galaxy Book3 Ultra 16 | |
| Média da turma Multimedia (0.3604 - 0.947, n=56, últimos 2 anos) | |
| MSI Creator Z17 A12UGST-054 | |
| Dell XPS 15 9530 RTX 4070 | |
| Schenker VISION 16 Pro (M23) | |
| Asus Vivobook Pro 16X K6604JV-MX016W | |
| Média Intel Core i9-13980HX (0.3793 - 0.4462, n=10) | |
| Asus ProArt Studiobook 16 OLED H7604 | |
* ... menor é melhor
AIDA64: FP32 Ray-Trace | FPU Julia | CPU SHA3 | CPU Queen | FPU SinJulia | FPU Mandel | CPU AES | CPU ZLib | FP64 Ray-Trace | CPU PhotoWorxx
| Performance rating | |
| Asus ProArt Studiobook 16 OLED H7604 | |
| Média Intel Core i9-13980HX | |
| Asus Vivobook Pro 16X K6604JV-MX016W | |
| Média da turma Multimedia | |
| Samsung Galaxy Book3 Ultra 16 | |
| Schenker VISION 16 Pro (M23) | |
| Dell XPS 15 9530 RTX 4070 | |
| MSI Creator Z17 A12UGST-054 | |
| AIDA64 / FP32 Ray-Trace | |
| Asus ProArt Studiobook 16 OLED H7604 | |
| Média Intel Core i9-13980HX (21332 - 29553, n=9) | |
| Asus Vivobook Pro 16X K6604JV-MX016W | |
| Média da turma Multimedia (2214 - 50388, n=53, últimos 2 anos) | |
| Samsung Galaxy Book3 Ultra 16 | |
| Dell XPS 15 9530 RTX 4070 | |
| Schenker VISION 16 Pro (M23) | |
| MSI Creator Z17 A12UGST-054 | |
| AIDA64 / FPU Julia | |
| Asus ProArt Studiobook 16 OLED H7604 | |
| Média Intel Core i9-13980HX (108001 - 148168, n=9) | |
| Asus Vivobook Pro 16X K6604JV-MX016W | |
| Média da turma Multimedia (12867 - 201874, n=54, últimos 2 anos) | |
| Schenker VISION 16 Pro (M23) | |
| Samsung Galaxy Book3 Ultra 16 | |
| Dell XPS 15 9530 RTX 4070 | |
| MSI Creator Z17 A12UGST-054 | |
| AIDA64 / CPU SHA3 | |
| Asus ProArt Studiobook 16 OLED H7604 | |
| Média Intel Core i9-13980HX (5264 - 7142, n=9) | |
| Asus Vivobook Pro 16X K6604JV-MX016W | |
| Média da turma Multimedia (626 - 8623, n=54, últimos 2 anos) | |
| Samsung Galaxy Book3 Ultra 16 | |
| Schenker VISION 16 Pro (M23) | |
| Dell XPS 15 9530 RTX 4070 | |
| MSI Creator Z17 A12UGST-054 | |
| AIDA64 / CPU Queen | |
| Média Intel Core i9-13980HX (126758 - 143409, n=9) | |
| Asus ProArt Studiobook 16 OLED H7604 | |
| Asus Vivobook Pro 16X K6604JV-MX016W | |
| MSI Creator Z17 A12UGST-054 | |
| Dell XPS 15 9530 RTX 4070 | |
| Samsung Galaxy Book3 Ultra 16 | |
| Schenker VISION 16 Pro (M23) | |
| Média da turma Multimedia (13483 - 181505, n=41, últimos 2 anos) | |
| AIDA64 / FPU SinJulia | |
| Média Intel Core i9-13980HX (13785 - 17117, n=9) | |
| Asus ProArt Studiobook 16 OLED H7604 | |
| Asus Vivobook Pro 16X K6604JV-MX016W | |
| MSI Creator Z17 A12UGST-054 | |
| Samsung Galaxy Book3 Ultra 16 | |
| Schenker VISION 16 Pro (M23) | |
| Média da turma Multimedia (886 - 28794, n=54, últimos 2 anos) | |
| Dell XPS 15 9530 RTX 4070 | |
| AIDA64 / FPU Mandel | |
| Asus ProArt Studiobook 16 OLED H7604 | |
| Média Intel Core i9-13980HX (53398 - 73758, n=9) | |
| Asus Vivobook Pro 16X K6604JV-MX016W | |
| Média da turma Multimedia (6395 - 105740, n=53, últimos 2 anos) | |
| Samsung Galaxy Book3 Ultra 16 | |
| Dell XPS 15 9530 RTX 4070 | |
| Schenker VISION 16 Pro (M23) | |
| MSI Creator Z17 A12UGST-054 | |
| AIDA64 / CPU AES | |
| Asus ProArt Studiobook 16 OLED H7604 | |
| Média Intel Core i9-13980HX (105169 - 136520, n=9) | |
| Asus Vivobook Pro 16X K6604JV-MX016W | |
| MSI Creator Z17 A12UGST-054 | |
| Samsung Galaxy Book3 Ultra 16 | |
| Schenker VISION 16 Pro (M23) | |
| Média da turma Multimedia (8171 - 126790, n=54, últimos 2 anos) | |
| Dell XPS 15 9530 RTX 4070 | |
| AIDA64 / CPU ZLib | |
| Asus ProArt Studiobook 16 OLED H7604 | |
| Média Intel Core i9-13980HX (1513 - 2039, n=9) | |
| Asus Vivobook Pro 16X K6604JV-MX016W | |
| Samsung Galaxy Book3 Ultra 16 | |
| Média da turma Multimedia (143.8 - 2022, n=54, últimos 2 anos) | |
| MSI Creator Z17 A12UGST-054 | |
| Schenker VISION 16 Pro (M23) | |
| Dell XPS 15 9530 RTX 4070 | |
| AIDA64 / FP64 Ray-Trace | |
| Média Intel Core i9-13980HX (11431 - 16325, n=9) | |
| Asus ProArt Studiobook 16 OLED H7604 | |
| Asus Vivobook Pro 16X K6604JV-MX016W | |
| Média da turma Multimedia (1014 - 26875, n=54, últimos 2 anos) | |
| Samsung Galaxy Book3 Ultra 16 | |
| Dell XPS 15 9530 RTX 4070 | |
| Schenker VISION 16 Pro (M23) | |
| MSI Creator Z17 A12UGST-054 | |
| AIDA64 / CPU PhotoWorxx | |
| Média da turma Multimedia (8187 - 88154, n=54, últimos 2 anos) | |
| Asus ProArt Studiobook 16 OLED H7604 | |
| Samsung Galaxy Book3 Ultra 16 | |
| Média Intel Core i9-13980HX (37069 - 52949, n=9) | |
| Schenker VISION 16 Pro (M23) | |
| Dell XPS 15 9530 RTX 4070 | |
| Asus Vivobook Pro 16X K6604JV-MX016W | |
| MSI Creator Z17 A12UGST-054 | |
Desempenho do sistema
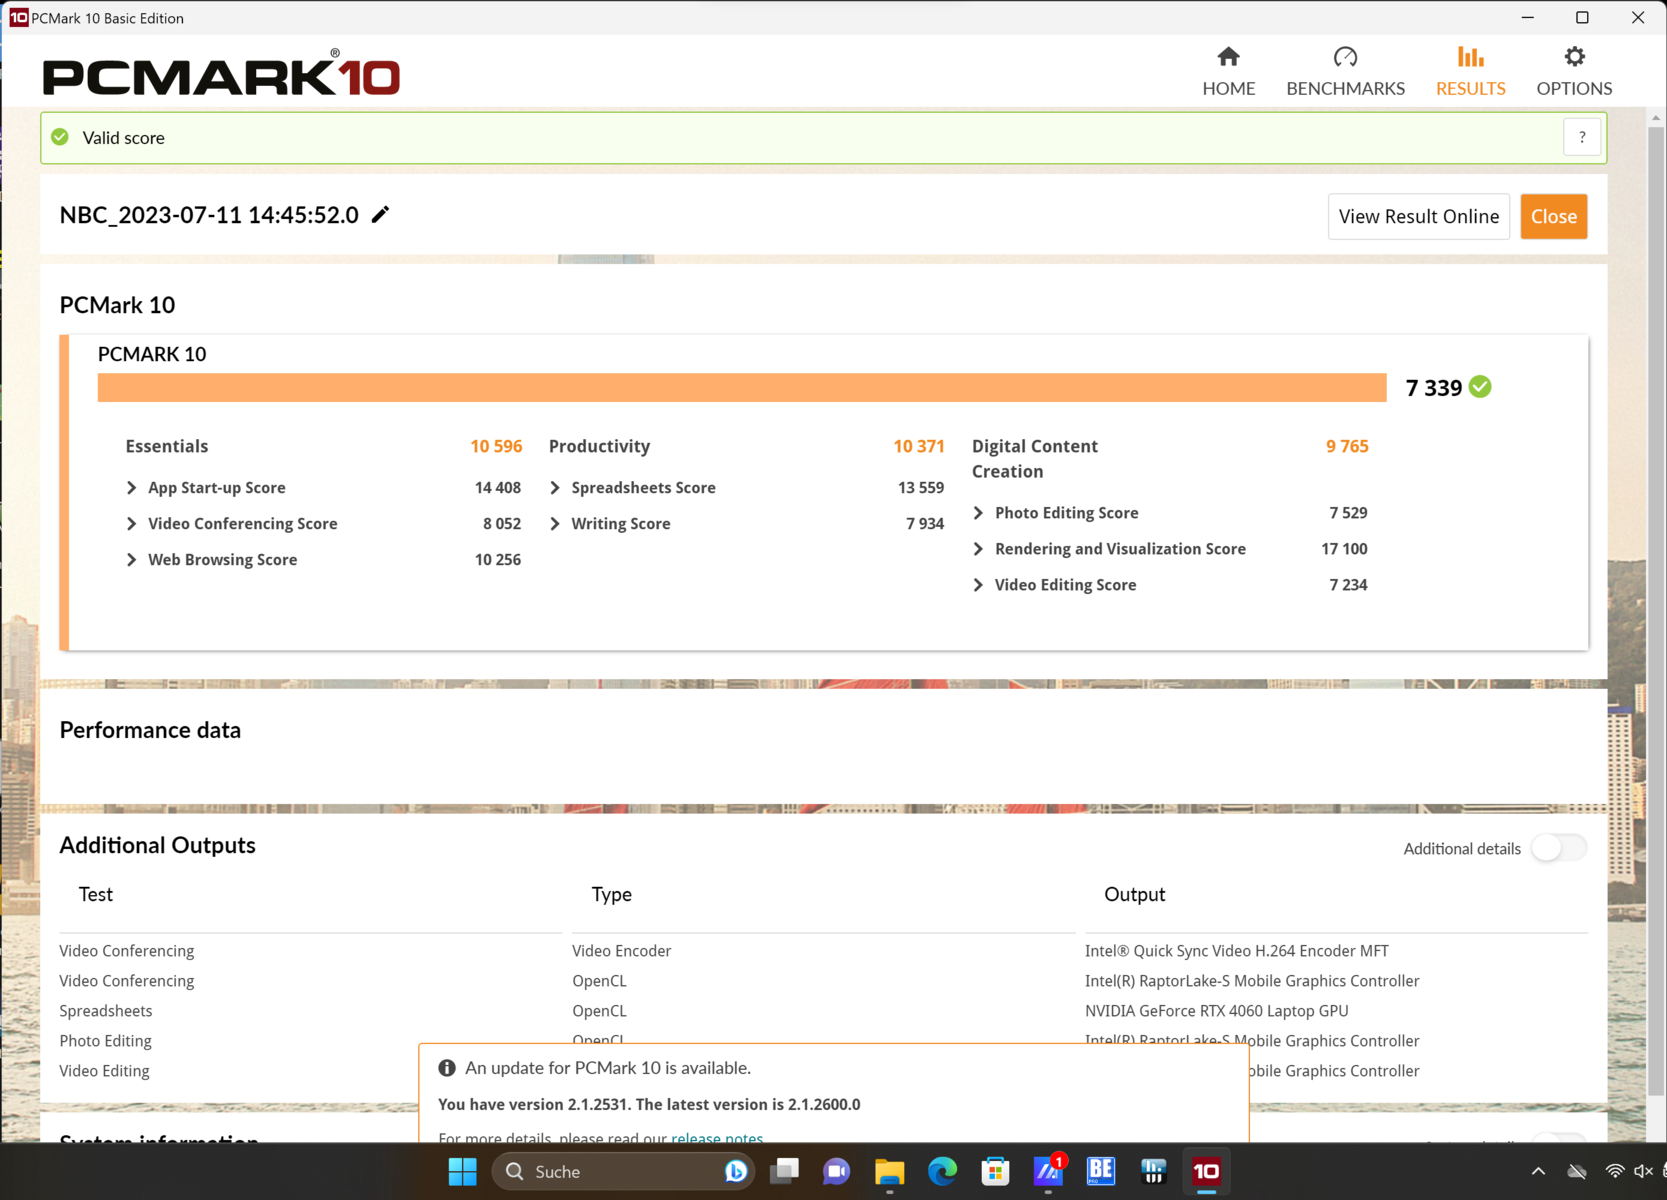
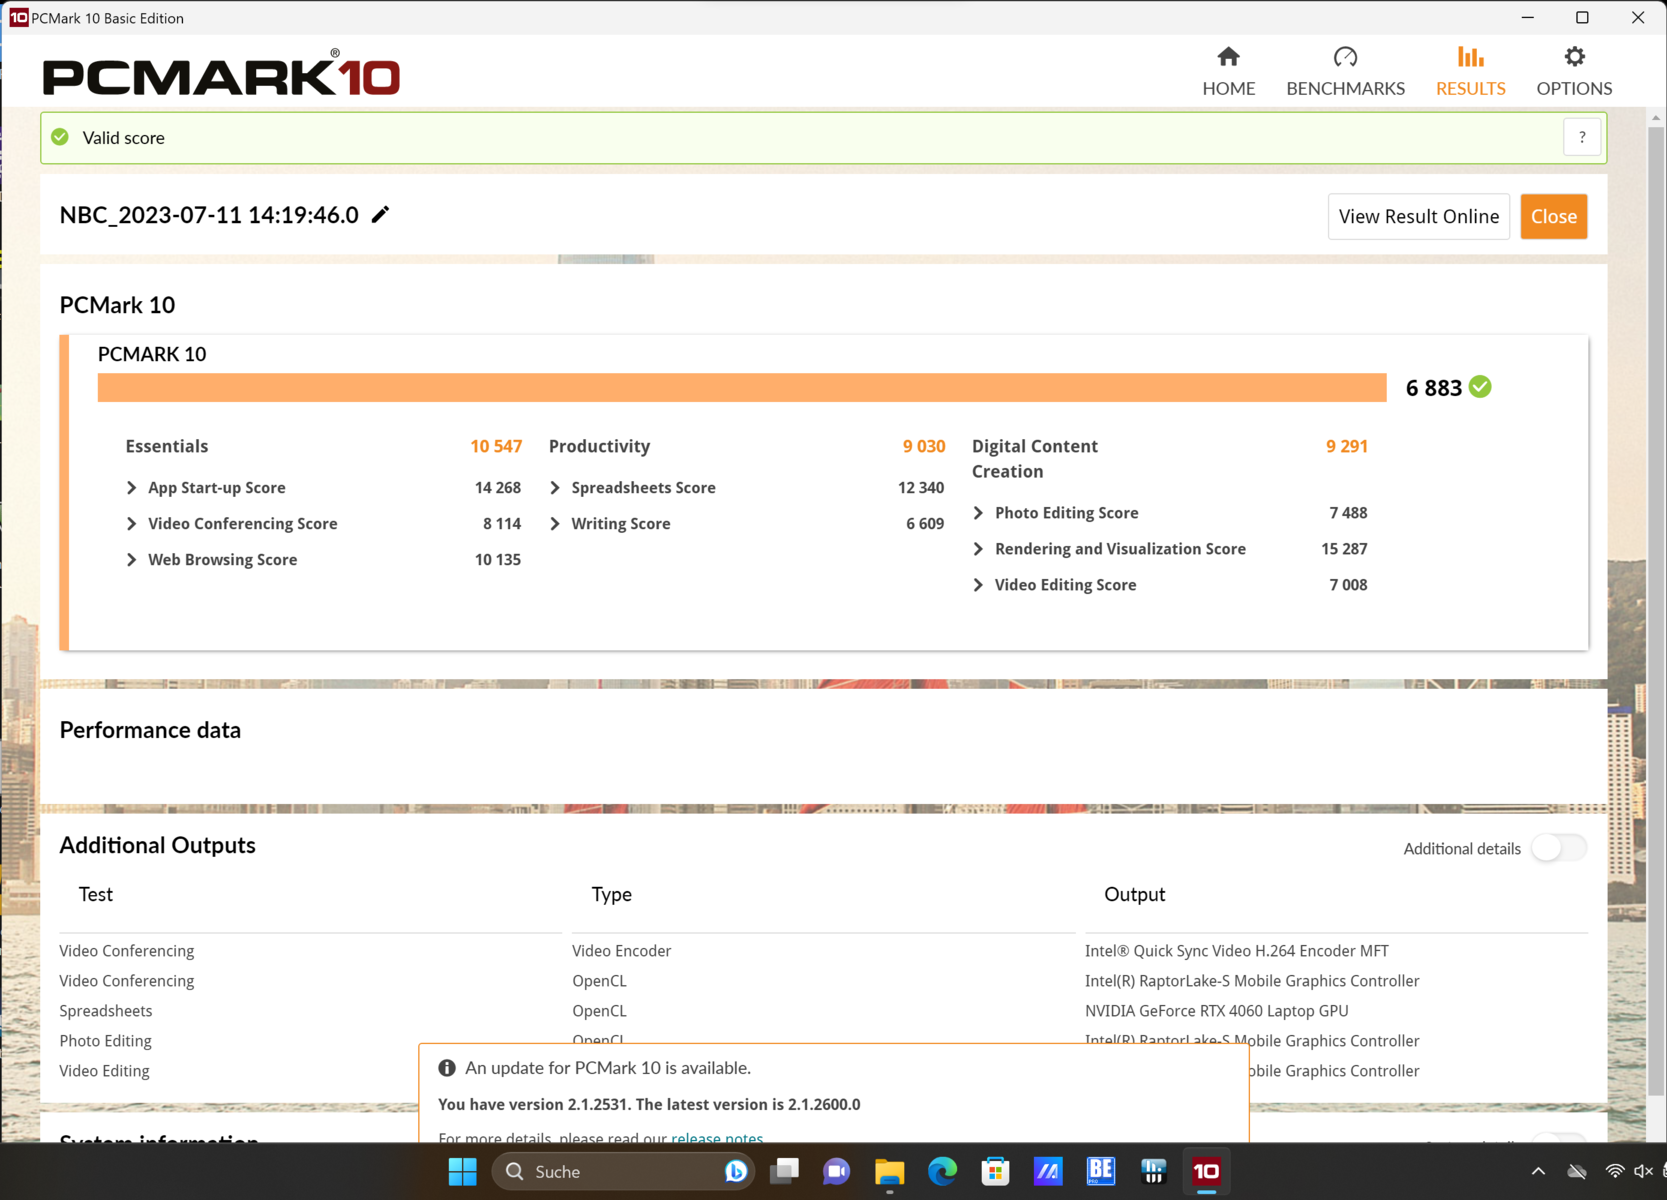

Em contraste com os testes puros de CPU, a classificação com o PCMark 10 é um pouco mais fraca. Entretanto, se o modo Desempenho for selecionado aqui, haverá apenas uma pequena diferença em relação aos melhores modelos. No CrossMark, o laptop da Asus está muito à frente, mesmo nas configurações padrão.
De modo geral, o Vivobook Pro é consistentemente rápido. Os aplicativos exigentes não o esgotam completamente, de modo que o notebook sempre permanece utilizável. Instalações, inicializações paralelas de programas e coisas do gênero não representam um problema.
CrossMark: Overall | Productivity | Creativity | Responsiveness
| PCMark 10 / Score | |
| Média da turma Multimedia (4325 - 10386, n=52, últimos 2 anos) | |
| Asus ProArt Studiobook 16 OLED H7604 | |
| Schenker VISION 16 Pro (M23) | |
| Dell XPS 15 9530 RTX 4070 | |
| MSI Creator Z17 A12UGST-054 | |
| Asus Vivobook Pro 16X K6604JV-MX016W | |
| Média Intel Core i9-13980HX, NVIDIA GeForce RTX 4060 Laptop GPU (n=1) | |
| Samsung Galaxy Book3 Ultra 16 | |
| PCMark 10 / Essentials | |
| Dell XPS 15 9530 RTX 4070 | |
| Asus ProArt Studiobook 16 OLED H7604 | |
| Schenker VISION 16 Pro (M23) | |
| Asus Vivobook Pro 16X K6604JV-MX016W | |
| Média Intel Core i9-13980HX, NVIDIA GeForce RTX 4060 Laptop GPU (n=1) | |
| Samsung Galaxy Book3 Ultra 16 | |
| Média da turma Multimedia (8025 - 11664, n=51, últimos 2 anos) | |
| MSI Creator Z17 A12UGST-054 | |
| PCMark 10 / Productivity | |
| Média da turma Multimedia (7323 - 18233, n=51, últimos 2 anos) | |
| Asus ProArt Studiobook 16 OLED H7604 | |
| Schenker VISION 16 Pro (M23) | |
| MSI Creator Z17 A12UGST-054 | |
| Asus Vivobook Pro 16X K6604JV-MX016W | |
| Média Intel Core i9-13980HX, NVIDIA GeForce RTX 4060 Laptop GPU (n=1) | |
| Samsung Galaxy Book3 Ultra 16 | |
| Dell XPS 15 9530 RTX 4070 | |
| PCMark 10 / Digital Content Creation | |
| Schenker VISION 16 Pro (M23) | |
| Dell XPS 15 9530 RTX 4070 | |
| Asus ProArt Studiobook 16 OLED H7604 | |
| Média da turma Multimedia (3651 - 16240, n=51, últimos 2 anos) | |
| MSI Creator Z17 A12UGST-054 | |
| Samsung Galaxy Book3 Ultra 16 | |
| Asus Vivobook Pro 16X K6604JV-MX016W | |
| Média Intel Core i9-13980HX, NVIDIA GeForce RTX 4060 Laptop GPU (n=1) | |
| CrossMark / Overall | |
| Asus ProArt Studiobook 16 OLED H7604 | |
| Asus Vivobook Pro 16X K6604JV-MX016W | |
| Média Intel Core i9-13980HX, NVIDIA GeForce RTX 4060 Laptop GPU (n=1) | |
| MSI Creator Z17 A12UGST-054 | |
| Schenker VISION 16 Pro (M23) | |
| Dell XPS 15 9530 RTX 4070 | |
| Média da turma Multimedia (866 - 2728, n=60, últimos 2 anos) | |
| Samsung Galaxy Book3 Ultra 16 | |
| CrossMark / Productivity | |
| Asus ProArt Studiobook 16 OLED H7604 | |
| Asus Vivobook Pro 16X K6604JV-MX016W | |
| Média Intel Core i9-13980HX, NVIDIA GeForce RTX 4060 Laptop GPU (n=1) | |
| MSI Creator Z17 A12UGST-054 | |
| Schenker VISION 16 Pro (M23) | |
| Média da turma Multimedia (931 - 2489, n=60, últimos 2 anos) | |
| Dell XPS 15 9530 RTX 4070 | |
| Samsung Galaxy Book3 Ultra 16 | |
| CrossMark / Creativity | |
| Asus ProArt Studiobook 16 OLED H7604 | |
| Asus Vivobook Pro 16X K6604JV-MX016W | |
| Média Intel Core i9-13980HX, NVIDIA GeForce RTX 4060 Laptop GPU (n=1) | |
| Média da turma Multimedia (907 - 3465, n=60, últimos 2 anos) | |
| MSI Creator Z17 A12UGST-054 | |
| Dell XPS 15 9530 RTX 4070 | |
| Schenker VISION 16 Pro (M23) | |
| Samsung Galaxy Book3 Ultra 16 | |
| CrossMark / Responsiveness | |
| MSI Creator Z17 A12UGST-054 | |
| Asus ProArt Studiobook 16 OLED H7604 | |
| Schenker VISION 16 Pro (M23) | |
| Asus Vivobook Pro 16X K6604JV-MX016W | |
| Média Intel Core i9-13980HX, NVIDIA GeForce RTX 4060 Laptop GPU (n=1) | |
| Dell XPS 15 9530 RTX 4070 | |
| Média da turma Multimedia (605 - 2024, n=60, últimos 2 anos) | |
| Samsung Galaxy Book3 Ultra 16 | |
| PCMark 10 Score | 6883 pontos | |
Ajuda | ||
| AIDA64 / Memory Copy | |
| Média da turma Multimedia (11299 - 132135, n=54, últimos 2 anos) | |
| Asus ProArt Studiobook 16 OLED H7604 | |
| Samsung Galaxy Book3 Ultra 16 | |
| Média Intel Core i9-13980HX (62189 - 80776, n=9) | |
| Asus Vivobook Pro 16X K6604JV-MX016W | |
| Dell XPS 15 9530 RTX 4070 | |
| Schenker VISION 16 Pro (M23) | |
| MSI Creator Z17 A12UGST-054 | |
| AIDA64 / Memory Read | |
| Média da turma Multimedia (11624 - 174586, n=54, últimos 2 anos) | |
| Asus ProArt Studiobook 16 OLED H7604 | |
| Média Intel Core i9-13980HX (62624 - 89096, n=9) | |
| Asus Vivobook Pro 16X K6604JV-MX016W | |
| Schenker VISION 16 Pro (M23) | |
| Dell XPS 15 9530 RTX 4070 | |
| Samsung Galaxy Book3 Ultra 16 | |
| MSI Creator Z17 A12UGST-054 | |
| AIDA64 / Memory Write | |
| Samsung Galaxy Book3 Ultra 16 | |
| Média da turma Multimedia (11755 - 134998, n=54, últimos 2 anos) | |
| Asus ProArt Studiobook 16 OLED H7604 | |
| Média Intel Core i9-13980HX (59912 - 79917, n=9) | |
| Asus Vivobook Pro 16X K6604JV-MX016W | |
| Dell XPS 15 9530 RTX 4070 | |
| Schenker VISION 16 Pro (M23) | |
| MSI Creator Z17 A12UGST-054 | |
| AIDA64 / Memory Latency | |
| Média da turma Multimedia (7 - 535, n=53, últimos 2 anos) | |
| Samsung Galaxy Book3 Ultra 16 | |
| MSI Creator Z17 A12UGST-054 | |
| Asus Vivobook Pro 16X K6604JV-MX016W | |
| Média Intel Core i9-13980HX (79.4 - 93.2, n=9) | |
| Dell XPS 15 9530 RTX 4070 | |
| Asus ProArt Studiobook 16 OLED H7604 | |
| Schenker VISION 16 Pro (M23) | |
* ... menor é melhor
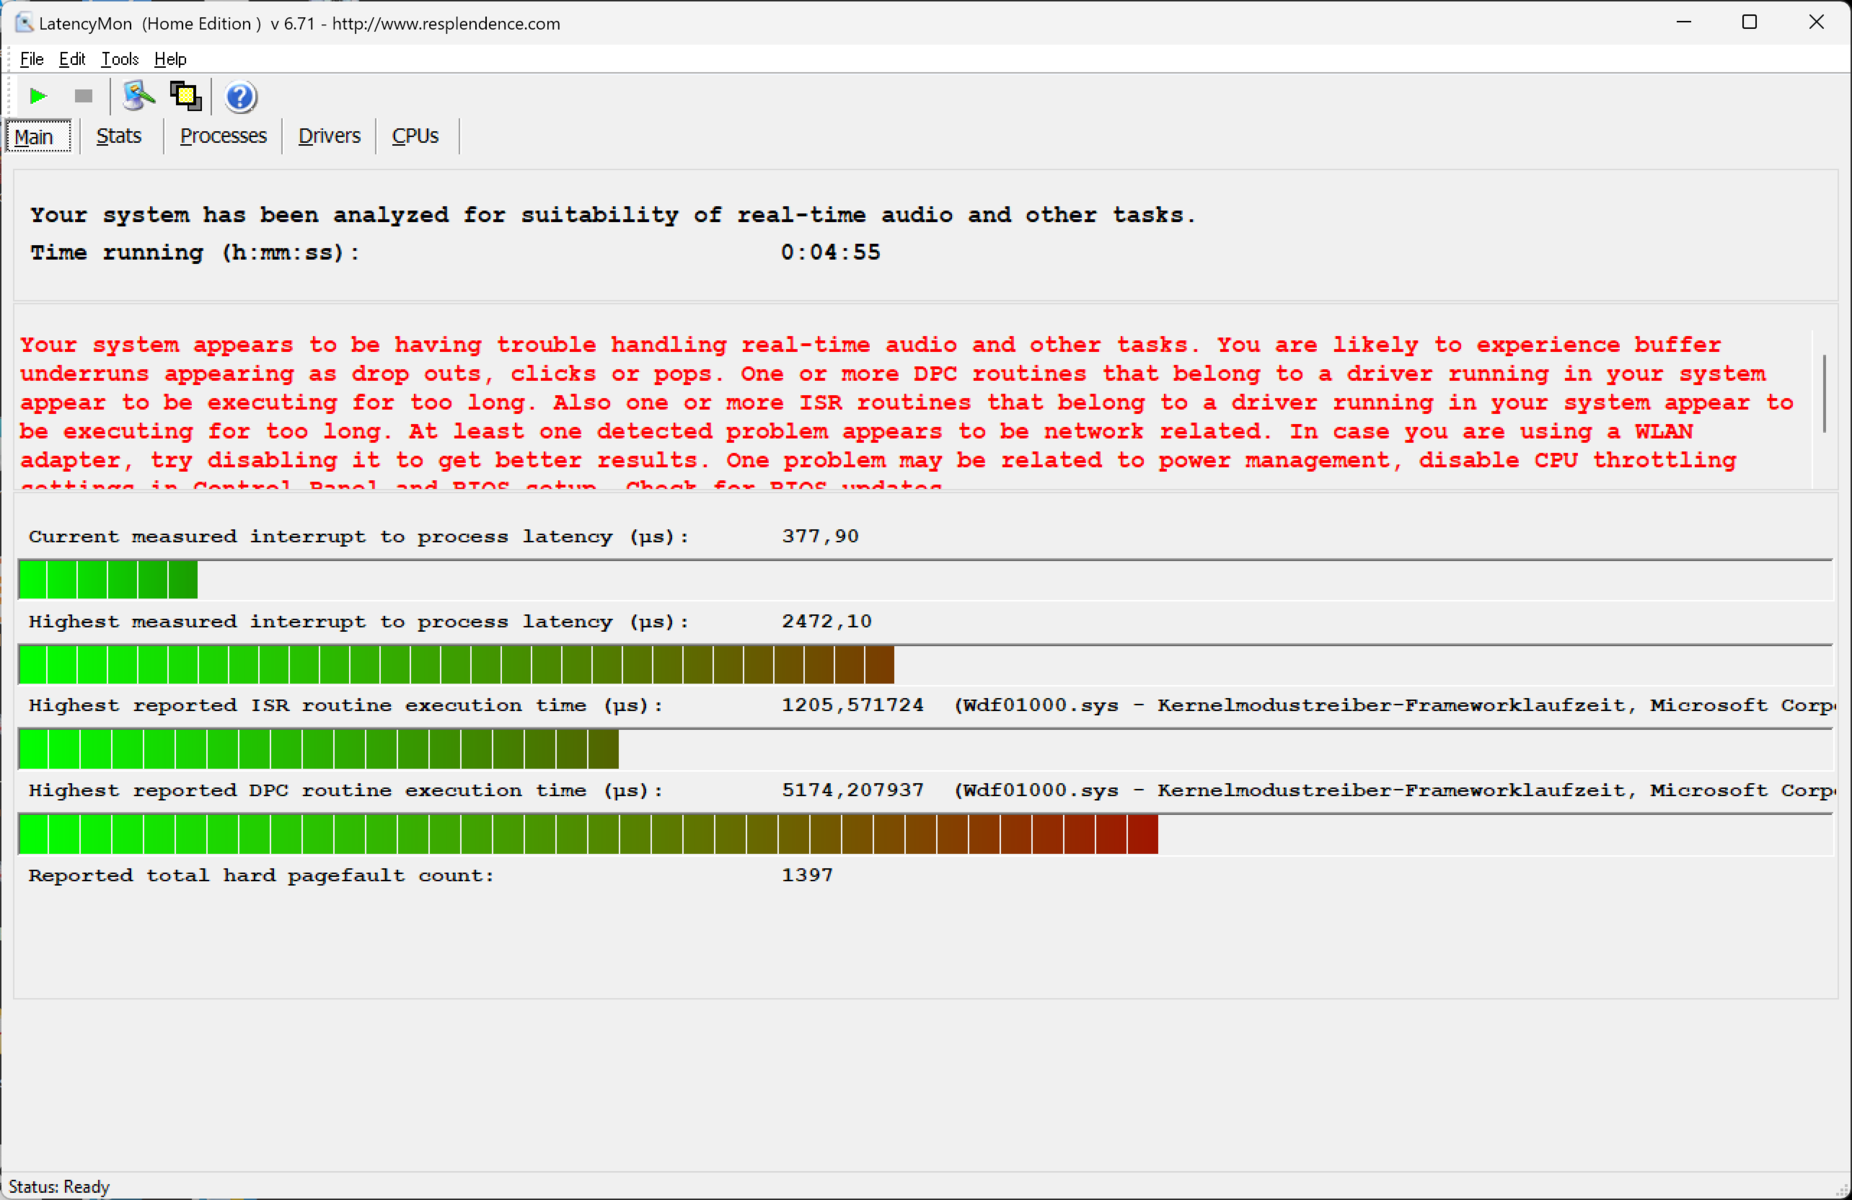
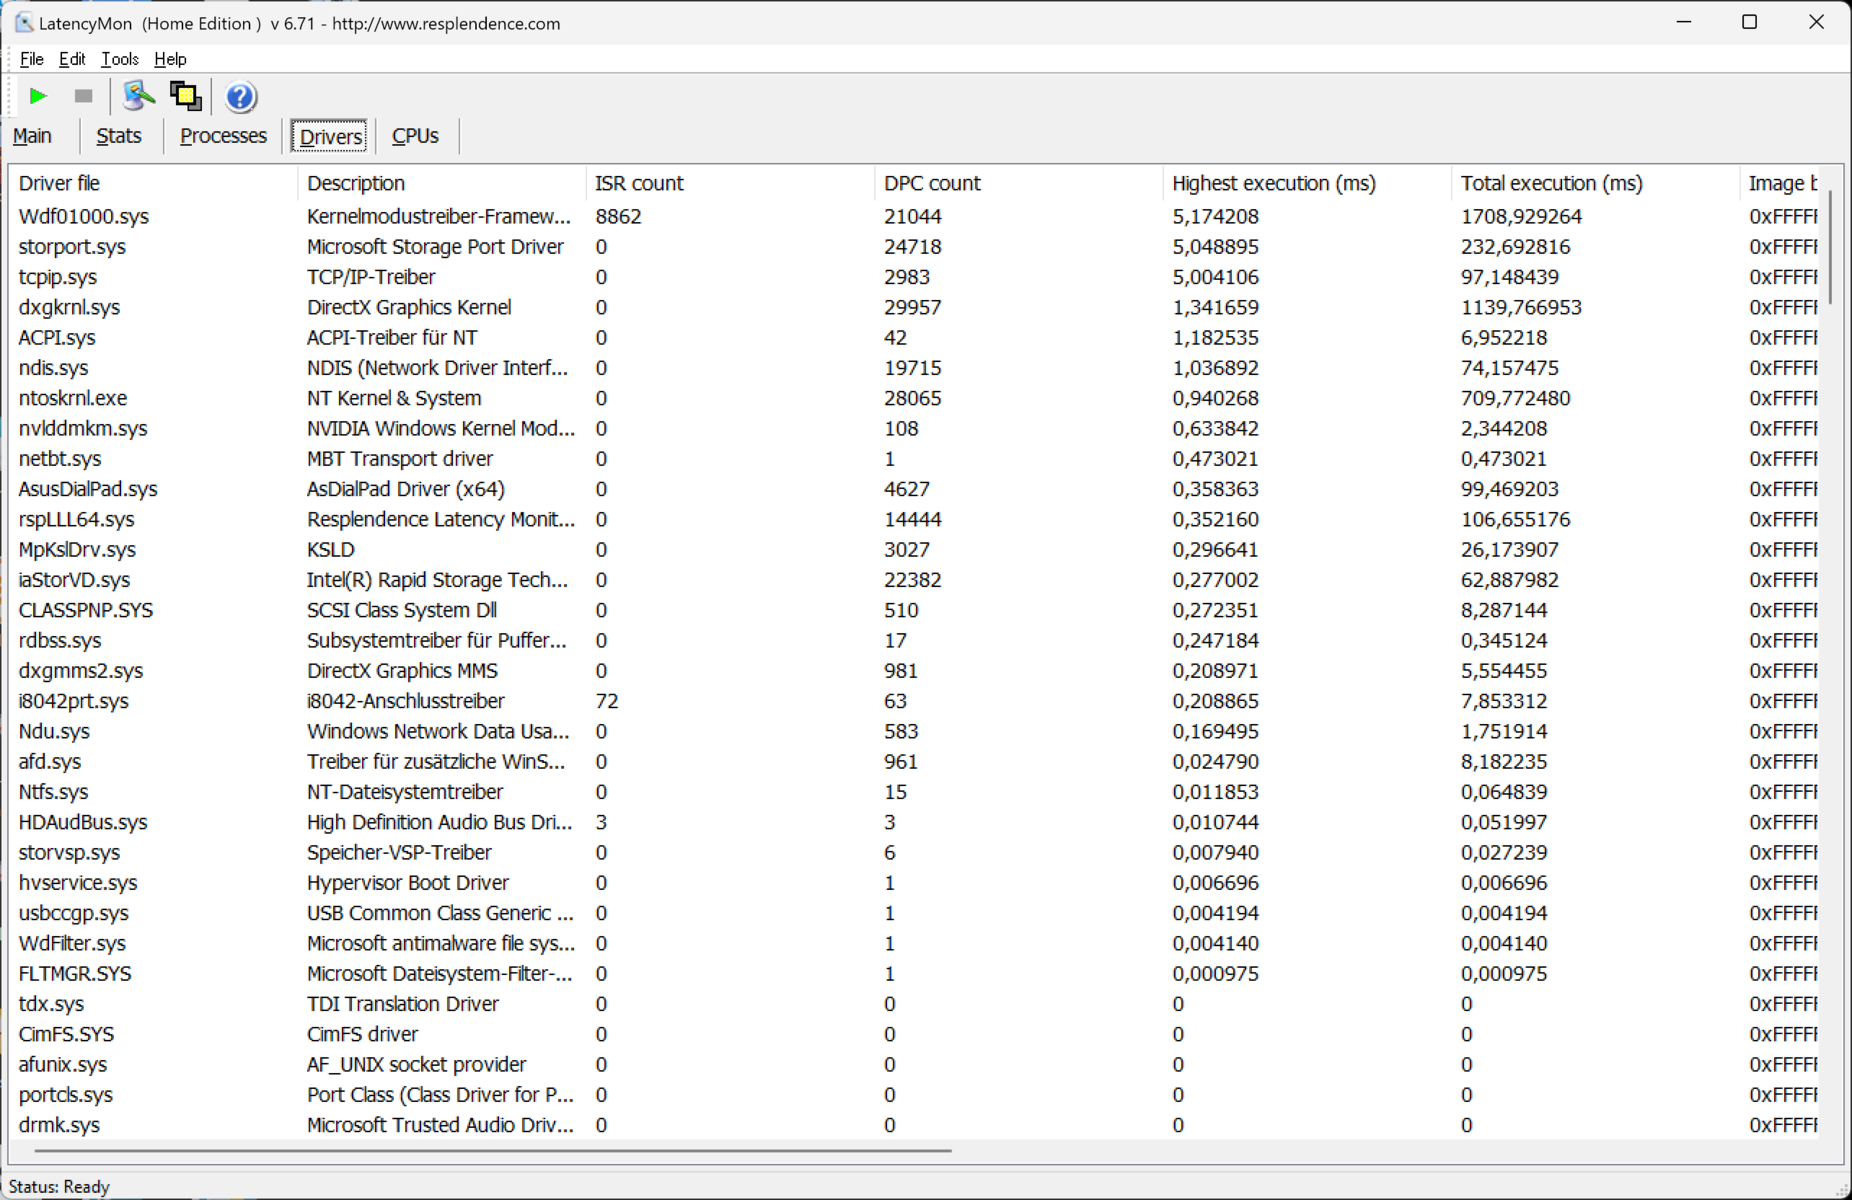
Latência DPC
A edição de áudio em tempo real não está entre os pontos fortes do Asus VivoBook Pro 16X. Na configuração atual, o driver do modo kernel e o driver Studio da Nvidia, entre outros, causam latências muito altas. No entanto, isso pode ser bem diferente com drivers modificados e outros softwares.
Apenas 3 quadros perdidos foram registrados durante a transmissão de vídeo 4K; um notebook multimídia não deveria perder nenhum quadro.
| DPC Latencies / LatencyMon - interrupt to process latency (max), Web, Youtube, Prime95 | |
| Samsung Galaxy Book3 Ultra 16 | |
| Asus Vivobook Pro 16X K6604JV-MX016W | |
| Asus ProArt Studiobook 16 OLED H7604 | |
| MSI Creator Z17 A12UGST-054 | |
| Dell XPS 15 9530 RTX 4070 | |
| Schenker VISION 16 Pro (M23) | |
* ... menor é melhor
Dispositivos de armazenamento
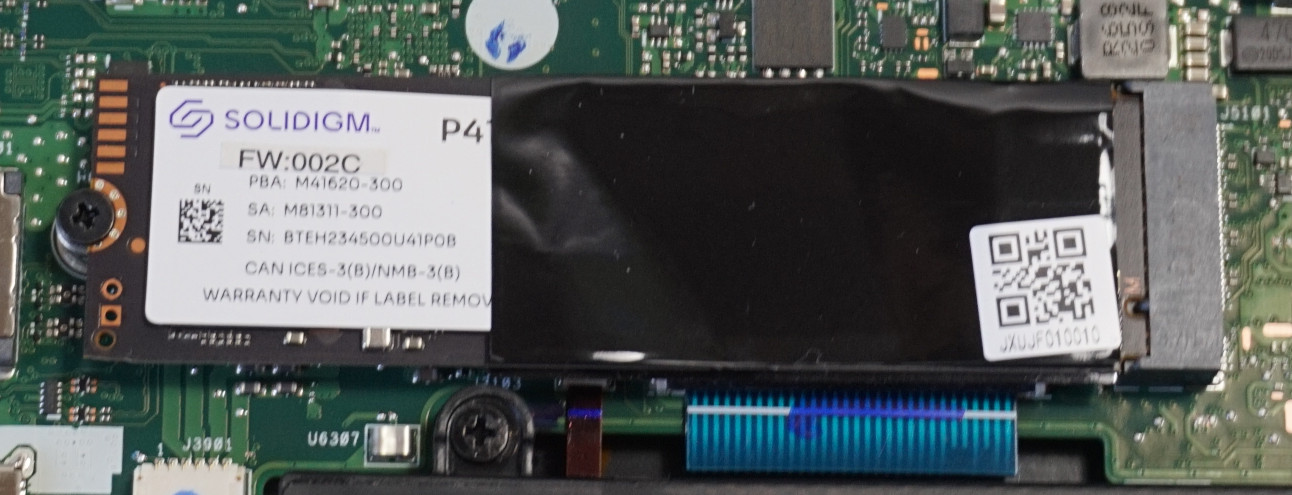
Para um SSD PCIe 4.0, os valores que registramos são consistentemente fracos, embora o fabricante especifique uma taxa de transferência máxima de pouco mais de 4.000 MB/s, que é apenas dois terços do máximo teórico. Também medimos valores abaixo da média em outros testes de leitura e gravação.
Durante os processos intensivos de leitura e gravação que ocorrem ao editar dados brutos, esse comportamento pode ter um impacto negativo no desempenho do sistema. Por outro lado, nenhum efeito negativo deve ser observado em todas as outras tarefas.
O Samsung Galaxy Book3 Ultra ou o Schenker Vision 16 Pro estão claramente na frente aqui. Mas, pelo menos, a SSD pode ser substituída com pouco esforço.

* ... menor é melhor
Sustained Read Performance: DiskSpd Read Loop, Queue Depth 8
Placa gráfica
Além do chip Intel UHD Graphics integrado, aNvidia GeForce RTX 4060está instalado. Em teoria, ambos têm uma potência máxima possível de 140 W à sua disposição, o que o fabricante de fato permite.
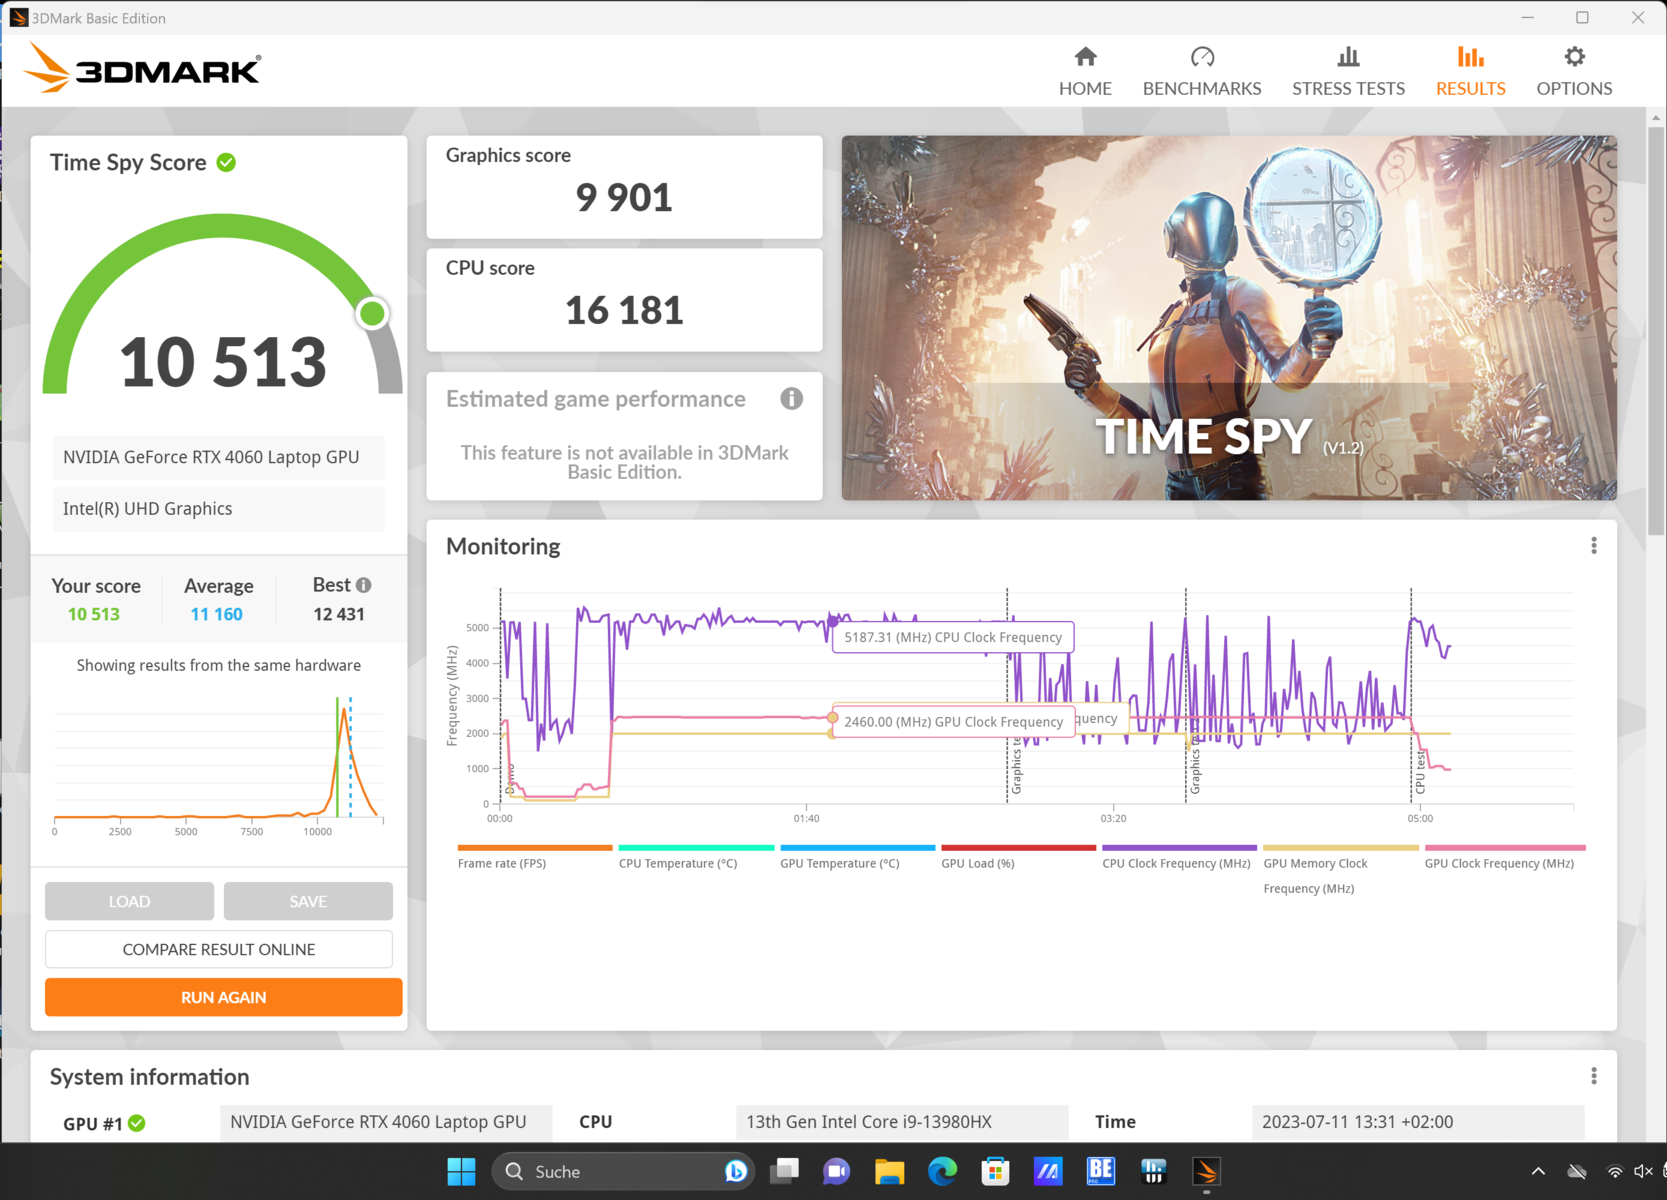
No entanto, apenas 115 W são alcançados, mesmo em tarefas exigentes, o que corresponde à carga máxima sem o aumento dinâmico da CPU. Somente no teste de estresse observamos saídas de mais de 130 W por curtos períodos de tempo.
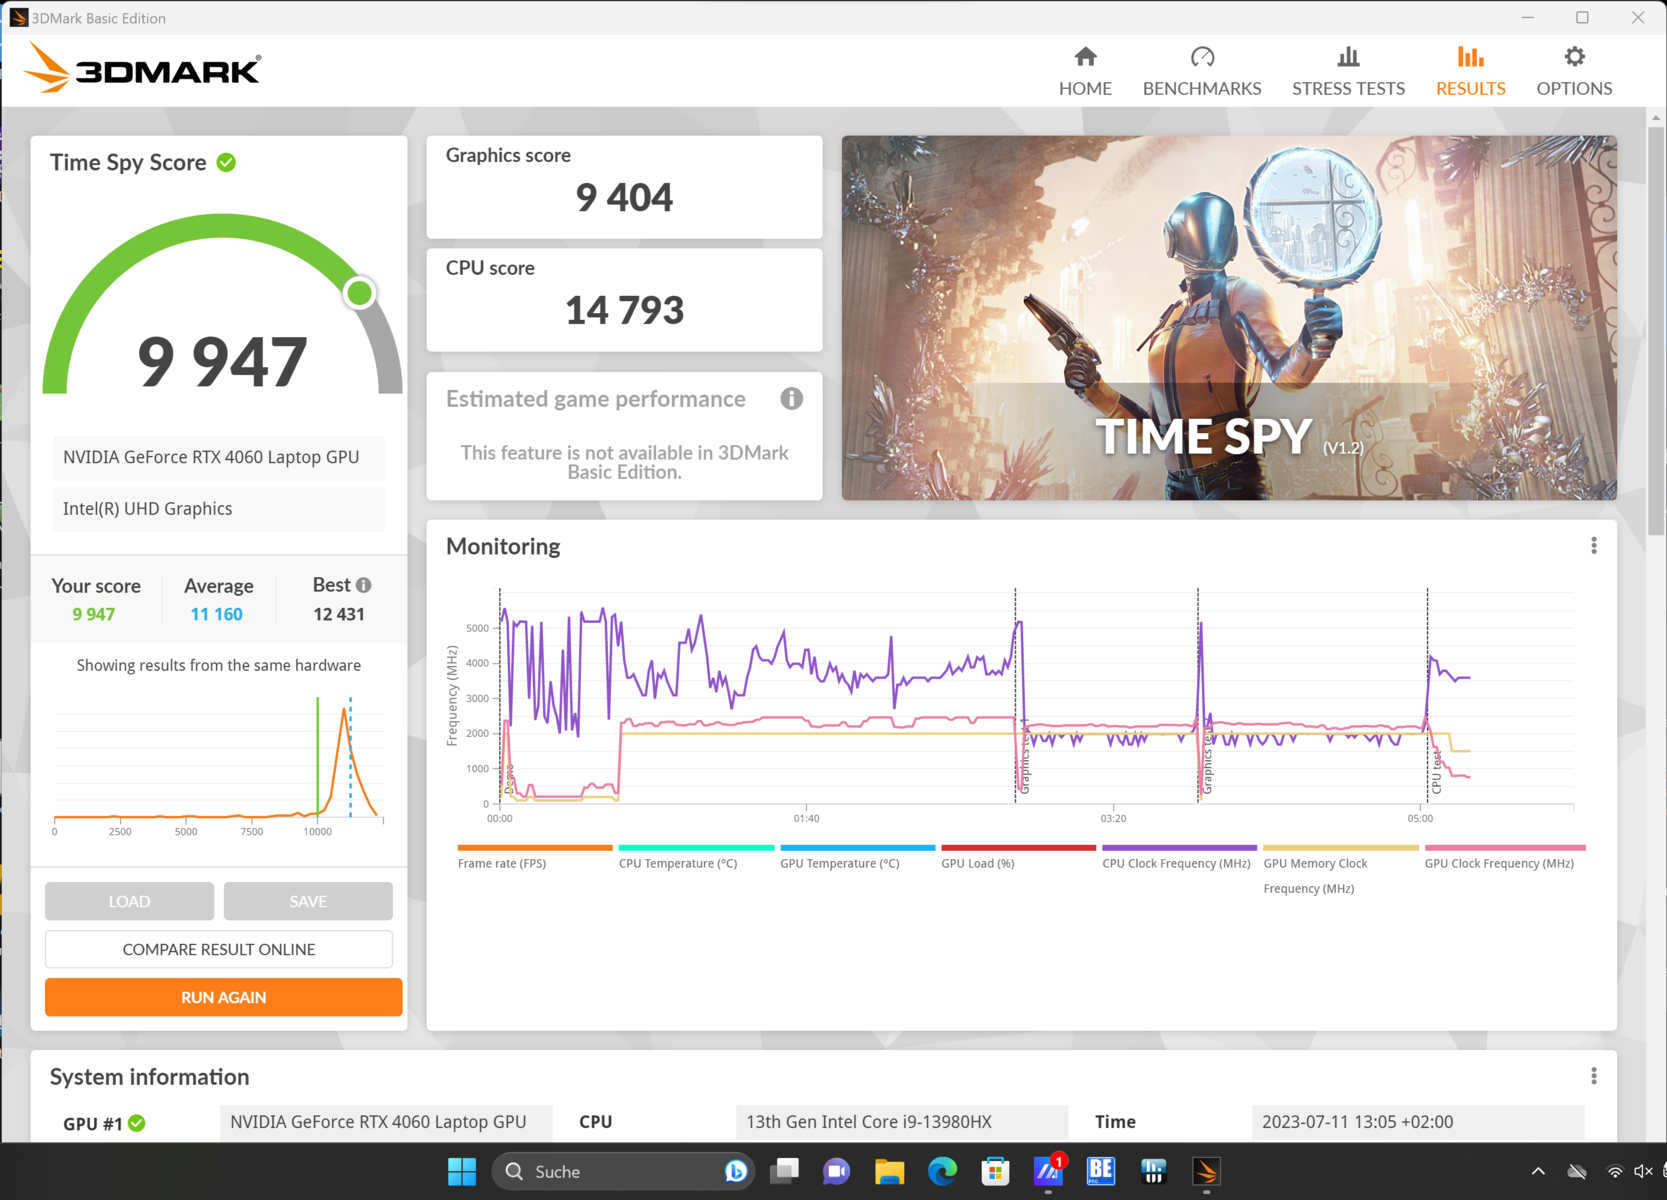
No entanto, isso não desempenha um papel importante na avaliação de desempenho. Tanto o 3DMark Time Spy quanto as taxas do HWiNFO mostram que o desempenho gráfico não aumenta mais. No modo Padrão , no qual apenas um total de 90 W é permitido, o clock da GPU é quase tão alto quanto quando a potência máxima é permitida. No artigo vinculadoaquirevelamos em detalhes por que a carga máxima dificilmente beneficia os pequenos RTX 4050 e RTX 4060.
Em comparação com outros notebooks multimídia, o desempenho está mais ou menos de acordo com as expectativas da GPU instalada. O Samsung Galaxy Book3 Ultra com sua RTX 4050 tem um desempenho significativamente pior. No entanto, um MSI Creator Z17 com a RTX 3070 Ti também é ligeiramente pior nas pontuações do 3DMark. No Blender, apenas os notebooks Creator com a RTX 4070, mais potente, têm um desempenho melhor.
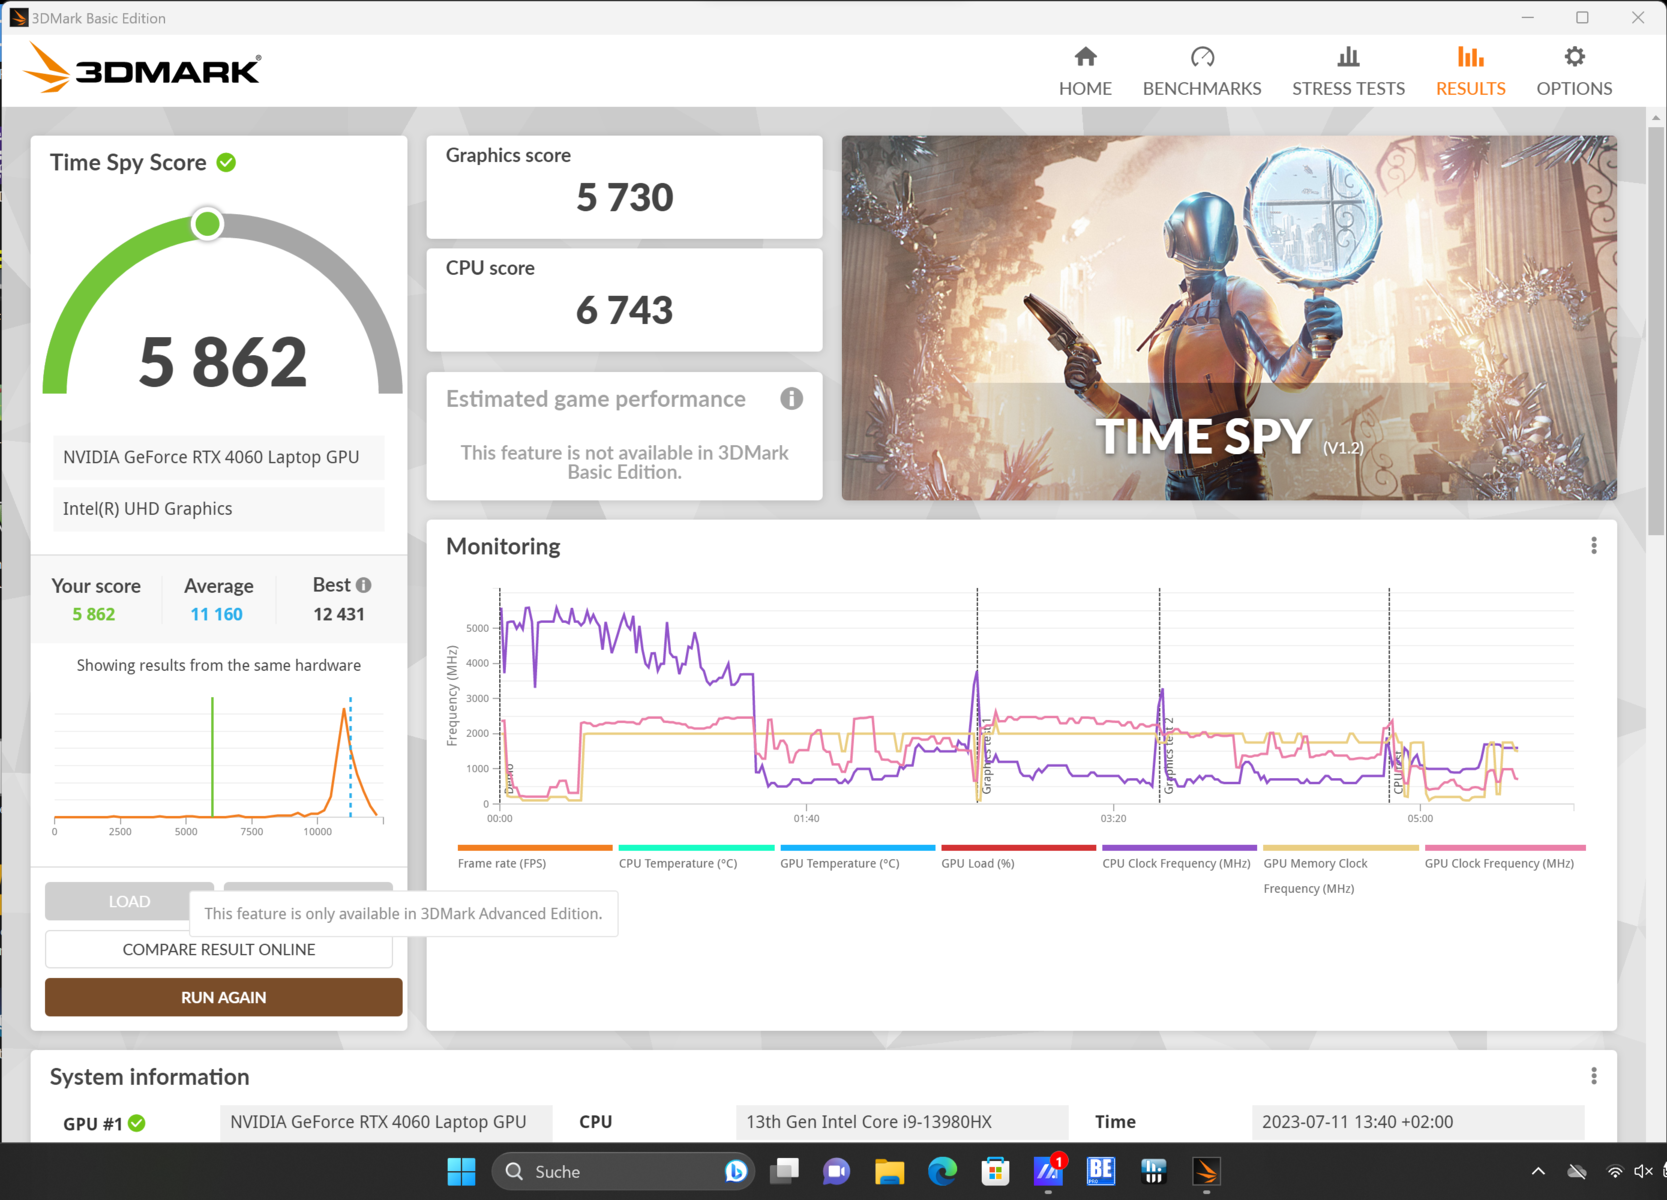
O desempenho gráfico total pode ser quase totalmente utilizado no modo Standard . No modo Silencioso , a fonte de alimentação cai gradualmente para pouco mais de 20 W. As opções limitadas de resfriamento resultam em uma queda perceptível no desempenho.
Pelo menos isso não aumenta no modo de bateria. Entre outras coisas, Witcher 3 permanece jogável nas configurações mais altas, e é por isso que todas as outras tarefas graficamente exigentes também devem ser executáveis.
Mais benchmarks e informações podem ser encontrados em nossa Lista de benchmarks de GPU.
| 3DMark 11 Performance | 25913 pontos | |
| 3DMark Cloud Gate Standard Score | 42137 pontos | |
| 3DMark Fire Strike Score | 20396 pontos | |
| 3DMark Time Spy Score | 9947 pontos | |
Ajuda | ||
* ... menor é melhor
Desempenho em jogos
Como o chip gráfico, como já mencionado acima, não precisa ser totalmente utilizado para obter o melhor desempenho, o VivoBook Pro 16X também tem um desempenho sólido em jogos, apesar do gabinete fino e da fonte de alimentação limitada. Na presença de ruído moderado do ventilador, ele consegue acompanhar oAcer Predator Helios 16para jogos e sua GPU idêntica.
Portanto, é possível jogar títulos atuais e exigentes sem problemas. Se a resolução for definida como Full HD, o novo F1 23 pode ser reproduzido sem problemas no mais alto nível de detalhes.
| The Witcher 3 - 1920x1080 Ultra Graphics & Postprocessing (HBAO+) | |
| Asus ProArt Studiobook 16 OLED H7604 | |
| Schenker VISION 16 Pro (M23) | |
| Acer Predator Helios 16 PH16-71-731Q | |
| Asus Vivobook Pro 16X K6604JV-MX016W | |
| MSI Creator Z17 A12UGST-054 | |
| Dell XPS 15 9530 RTX 4070 | |
| Samsung Galaxy Book3 Ultra 16 | |
| Média da turma Multimedia (11 - 121, n=7, últimos 2 anos) | |
| Star Wars Jedi Survivor | |
| 1920x1080 High Preset | |
| Schenker VISION 16 Pro (M23) | |
| Média NVIDIA GeForce RTX 4060 Laptop GPU (50.1 - 77.6, n=8) | |
| Asus Vivobook Pro 16X K6604JV-MX016W | |
| 1920x1080 Epic Preset | |
| Schenker VISION 16 Pro (M23) | |
| Média NVIDIA GeForce RTX 4060 Laptop GPU (45.5 - 66.7, n=10) | |
| Asus Vivobook Pro 16X K6604JV-MX016W | |
O Asus VivoBook Pro não consegue manter a taxa de quadros no teste de resistência Witcher 3. Embora as flutuações típicas do dia e da noite possam ser vistas na curva, as taxas caem um pouco mais de 5% no total. Supondo que um notebook multimídia raramente precise usar o desempenho máximo por longos períodos de tempo, isso não parece ser um problema. Especialmente porque pouco mais de 90 FPS ainda é um valor excelente.
Witcher 3 FPS chart
| baixo | média | alto | ultra | QHD | |
|---|---|---|---|---|---|
| GTA V (2015) | 168.3 | 105.4 | 82 | ||
| The Witcher 3 (2015) | 180 | 98 | |||
| Dota 2 Reborn (2015) | 181.4 | 165.2 | |||
| Final Fantasy XV Benchmark (2018) | 84.4 | 65.2 | |||
| X-Plane 11.11 (2018) | 108.8 | ||||
| Far Cry 5 (2018) | 129 | 123 | 94 | ||
| Strange Brigade (2018) | 199.3 | 165.4 | 120.5 | ||
| Call of Duty Modern Warfare 2 2022 (2022) | 88 | 61 | |||
| Star Wars Jedi Survivor (2023) | 59 | 55 | 36 | ||
| F1 23 (2023) | 168.1 | 51.7 | 32.2 | ||
| Cyberpunk 2077 (2023) | 72.33 | 42.41 |
Emissões - Muito resfriamento para o notebook Creator
Ruído
O volume muito alto que medimos sob carga máxima é dificilmente alcançável no uso prático. No modo Padrão , quase tudo no escritório deve abafar o VivoBook, já que as ventoinhas são apenas um quarto do volume. O notebook é basicamente inaudível quando as ventoinhas estão silenciosas. Medimos então um sétimo do volume máximo possível.
O trabalho silencioso é, portanto, muito possível com o Asus VivoBook, mesmo que você possa ouvir as ventoinhas ao escutar atentamente. O fato de isso não ser um dado adquirido é demonstrado, por exemplo, pelo MSI Creator Z17onde até mesmo o modo Silencioso pode ser incômodo em ambientes silenciosos.
Barulho
| Ocioso |
| 26.6 / 26.6 / 29.2 dB |
| Carga |
| 53.4 / 56.9 dB |
 | ||
30 dB silencioso 40 dB(A) audível 50 dB(A) ruidosamente alto |
||
min: | ||
| Asus Vivobook Pro 16X K6604JV-MX016W GeForce RTX 4060 Laptop GPU, i9-13980HX, Solidigm P41 Plus SSDPFKNU010TZ | Dell XPS 15 9530 RTX 4070 GeForce RTX 4070 Laptop GPU, i7-13700H, SK hynix PC801 HFS001TEJ9X101N | Samsung Galaxy Book3 Ultra 16 GeForce RTX 4050 Laptop GPU, i7-13700H, Samsung PM9A1 MZVL2512HCJQ | Asus ProArt Studiobook 16 OLED H7604 GeForce RTX 4070 Laptop GPU, i9-13980HX, Phison EM2804TBMTCB47 | Schenker VISION 16 Pro (M23) GeForce RTX 4070 Laptop GPU, i7-13700H, Samsung 990 Pro 1 TB | MSI Creator Z17 A12UGST-054 GeForce RTX 3070 Ti Laptop GPU, i9-12900H, Micron 3400 1TB MTFDKBA1T0TFH | |
|---|---|---|---|---|---|---|
| Noise | 20% | 10% | 8% | 2% | -8% | |
| desligado / ambiente * (dB) | 25.2 | 23.1 8% | 25 1% | 24.5 3% | 25.9 -3% | 26 -3% |
| Idle Minimum * (dB) | 26.6 | 23.1 13% | 26 2% | 24.5 8% | 25.9 3% | 31.8 -20% |
| Idle Average * (dB) | 26.6 | 23.1 13% | 27 -2% | 24.5 8% | 25.9 3% | 31.8 -20% |
| Idle Maximum * (dB) | 29.2 | 24.2 17% | 28 4% | 24.5 16% | 32 -10% | 31.8 -9% |
| Load Average * (dB) | 53.4 | 27.1 49% | 40 25% | 47.6 11% | 47.2 12% | 53.9 -1% |
| Load Maximum * (dB) | 56.9 | 44.6 22% | 41 28% | 56.7 -0% | 53.1 7% | 54.9 4% |
| Witcher 3 ultra * (dB) | 40.1 | 39 | 55.9 | 53.1 | 53.9 |
* ... menor é melhor
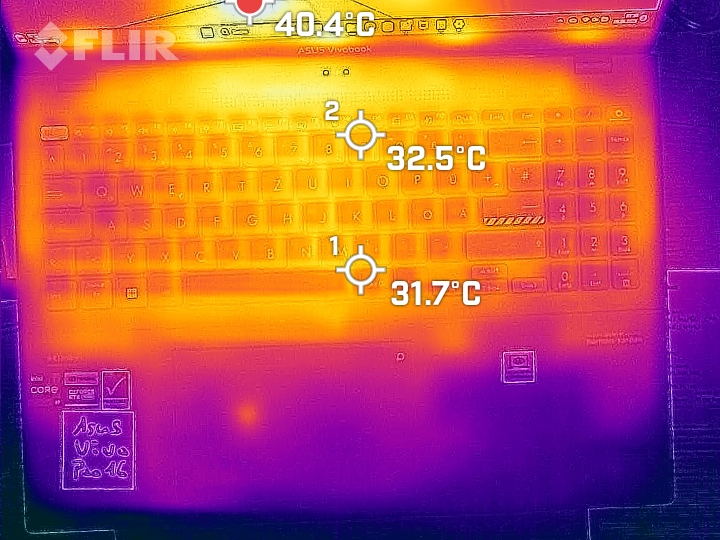
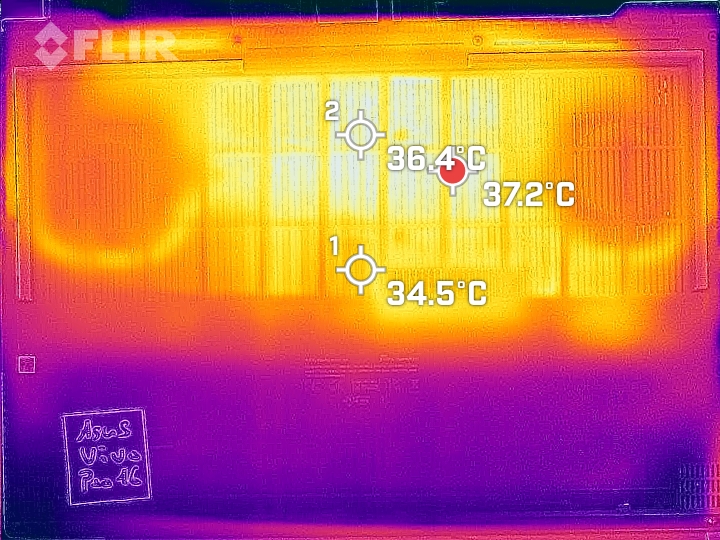
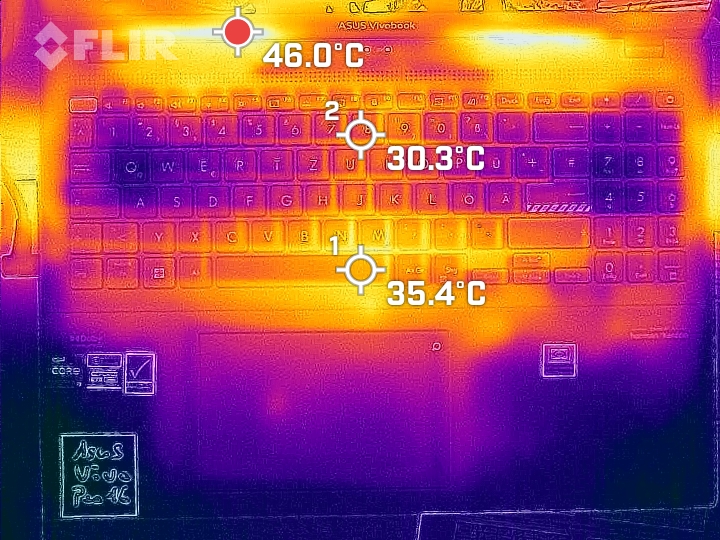
Temperatura

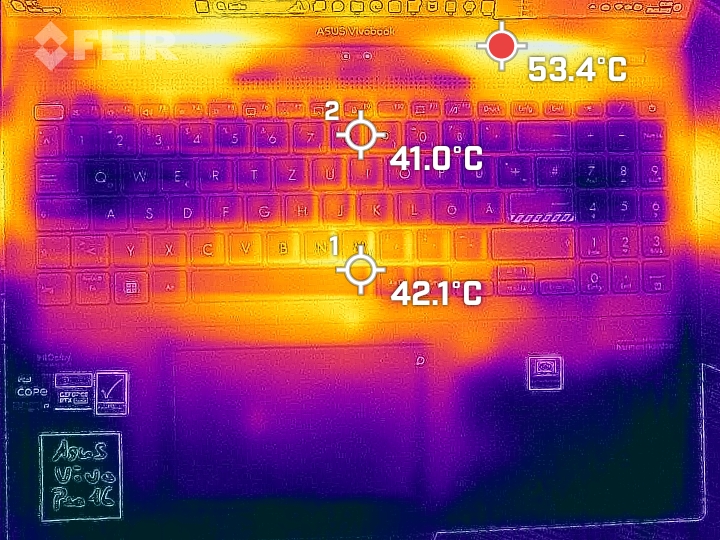
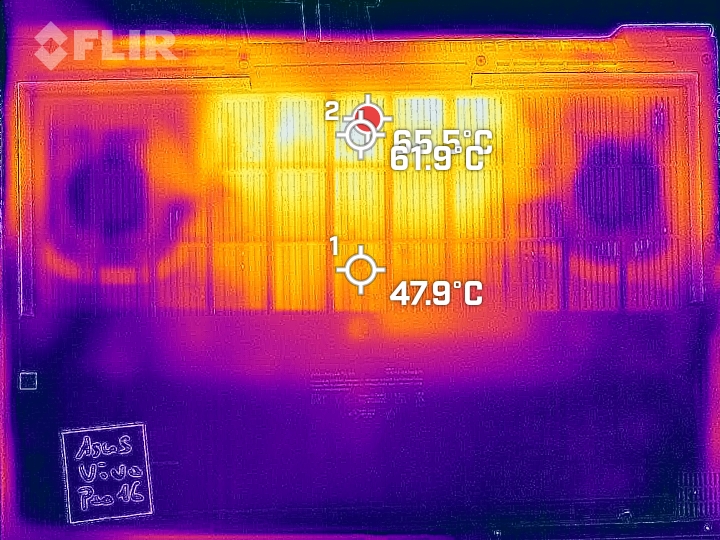
O touchpad aquece até 34 °C no teste de estresse. Também medimos 60 °C na parte inferior. O gabinete comparativamente fino definitivamente esquenta demais em um cenário excepcional.
O teste de resistência do Witcher 3 simula uma carga um pouco mais realista. O apoio para as mãos permanece abaixo de 30 °C e a parte inferior atinge um máximo de 47 °C. Embora o VivoBook deva ser sempre colocado em uma superfície firme, ele não fica muito quente para trabalhar, mesmo quando as demandas do hardware são altas.
(+) A temperatura máxima no lado superior é 39.7 °C / 103 F, em comparação com a média de 36.8 °C / 98 F , variando de 21 a 71 °C para a classe Multimedia.
(-) A parte inferior aquece até um máximo de 60 °C / 140 F, em comparação com a média de 39.1 °C / 102 F
(+) Em uso inativo, a temperatura média para o lado superior é 28.2 °C / 83 F, em comparação com a média do dispositivo de 31.3 °C / ### class_avg_f### F.
(+) Jogando The Witcher 3, a temperatura média para o lado superior é 30.8 °C / 87 F, em comparação com a média do dispositivo de 31.3 °C / ## #class_avg_f### F.
(+) Os apoios para as mãos e o touchpad estão atingindo a temperatura máxima da pele (33.8 °C / 92.8 F) e, portanto, não estão quentes.
(-) A temperatura média da área do apoio para as mãos de dispositivos semelhantes foi 28.7 °C / 83.7 F (-5.1 °C / -9.1 F).
| Asus Vivobook Pro 16X K6604JV-MX016W Intel Core i9-13980HX, NVIDIA GeForce RTX 4060 Laptop GPU | Dell XPS 15 9530 RTX 4070 Intel Core i7-13700H, NVIDIA GeForce RTX 4070 Laptop GPU | Samsung Galaxy Book3 Ultra 16 Intel Core i7-13700H, NVIDIA GeForce RTX 4050 Laptop GPU | Asus ProArt Studiobook 16 OLED H7604 Intel Core i9-13980HX, NVIDIA GeForce RTX 4070 Laptop GPU | Schenker VISION 16 Pro (M23) Intel Core i7-13700H, NVIDIA GeForce RTX 4070 Laptop GPU | MSI Creator Z17 A12UGST-054 Intel Core i9-12900H, NVIDIA GeForce RTX 3070 Ti Laptop GPU | |
|---|---|---|---|---|---|---|
| Heat | 2% | 19% | 1% | 7% | -13% | |
| Maximum Upper Side * (°C) | 39.7 | 45.6 -15% | 41 -3% | 44.1 -11% | 46.7 -18% | 63.9 -61% |
| Maximum Bottom * (°C) | 60 | 42 30% | 44 27% | 48 20% | 54.1 10% | 68 -13% |
| Idle Upper Side * (°C) | 30.9 | 34.4 -11% | 23 26% | 32.7 -6% | 26.5 14% | 28.3 8% |
| Idle Bottom * (°C) | 34.7 | 33.2 4% | 26 25% | 34.9 -1% | 26.8 23% | 30.2 13% |
* ... menor é melhor
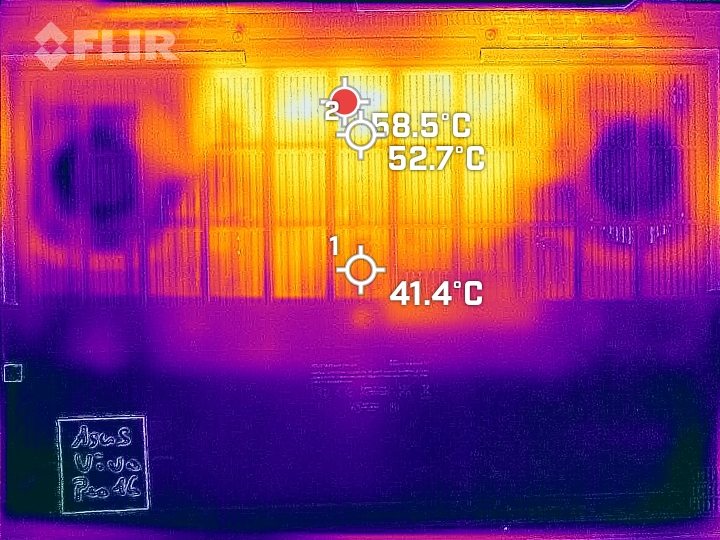
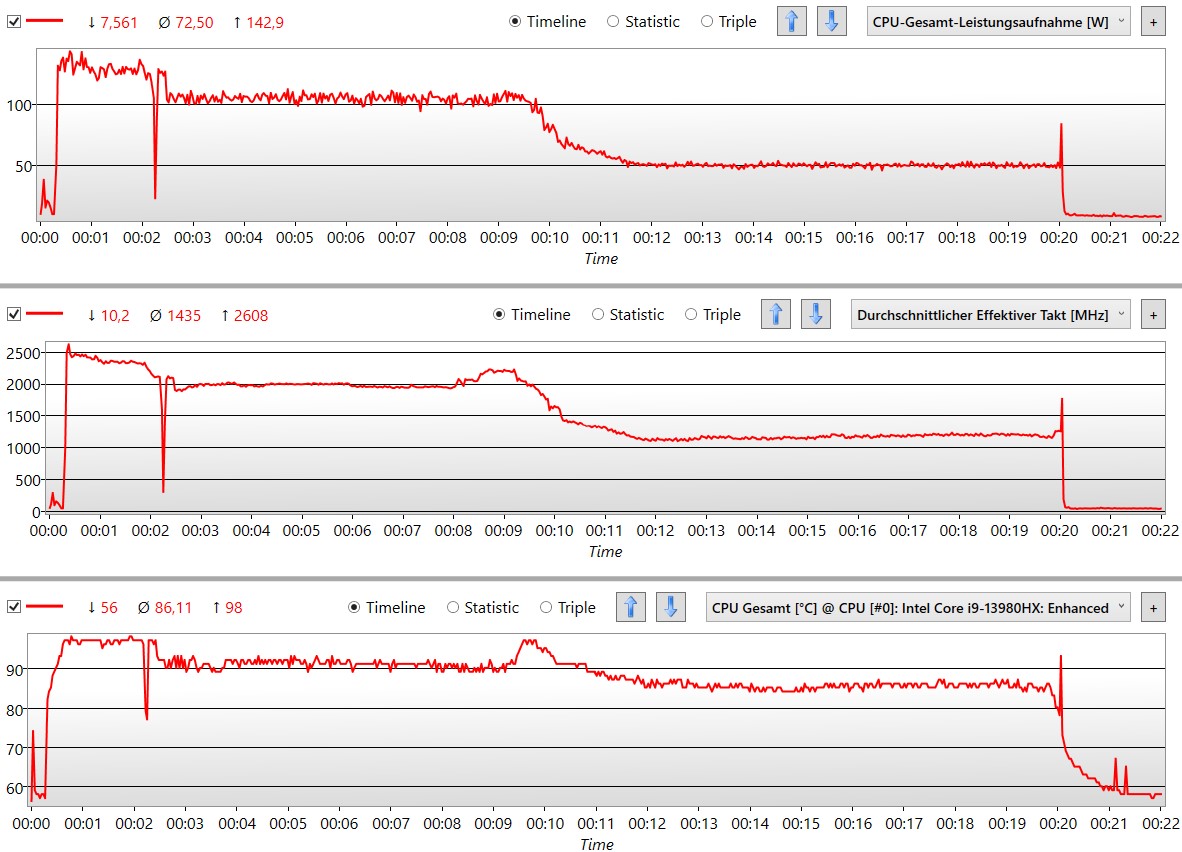
Teste de estresse
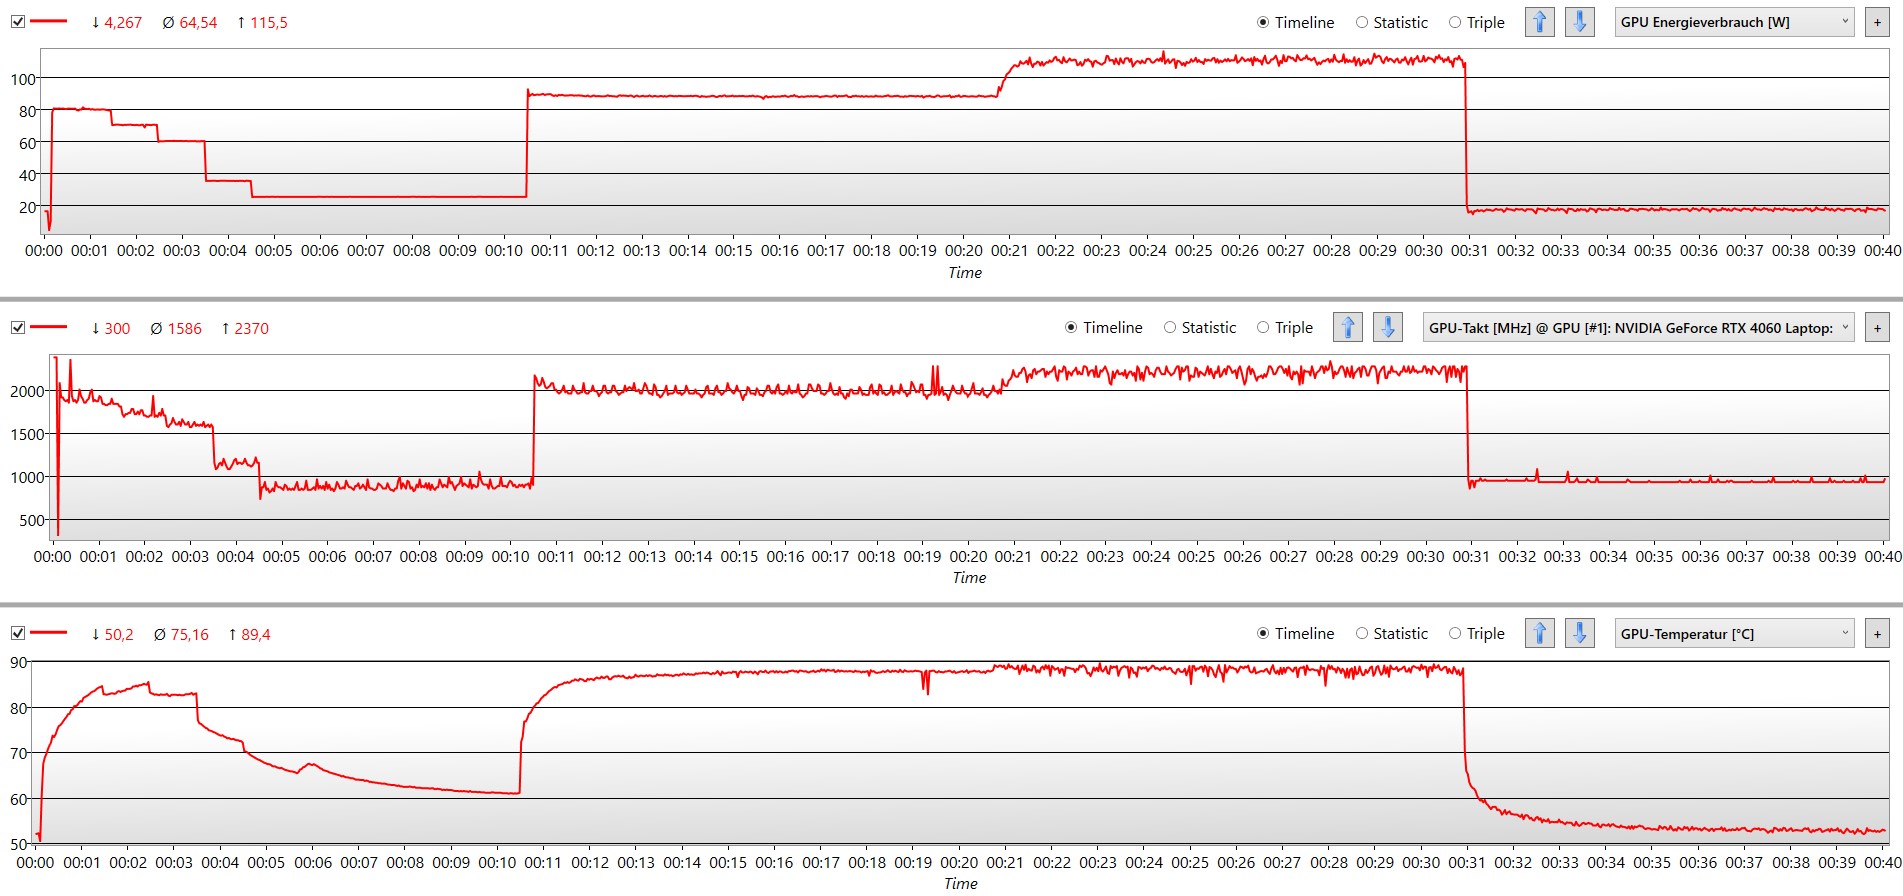
Com a potência máxima do ventilador e a carga máxima, a temperatura da CPU sobe para quase 100 °C, e a GPU fica mais quente do que 90 °C. Portanto, o processador, em particular, precisa ser acelerado muito rapidamente. Sua taxa de clock permanece estável em 2,0 GHz após cerca de 2 minutos.
Se a GPU também for necessária, a fonte de alimentação máxima para o processador cai de pouco mais de 100 W para 50 W. Ao mesmo tempo, o chip gráfico pode continuar a funcionar em sua frequência máxima, mas ocasionalmente precisa ser acelerado de 2,4 para 2,0 GHz.

Alto-falantes
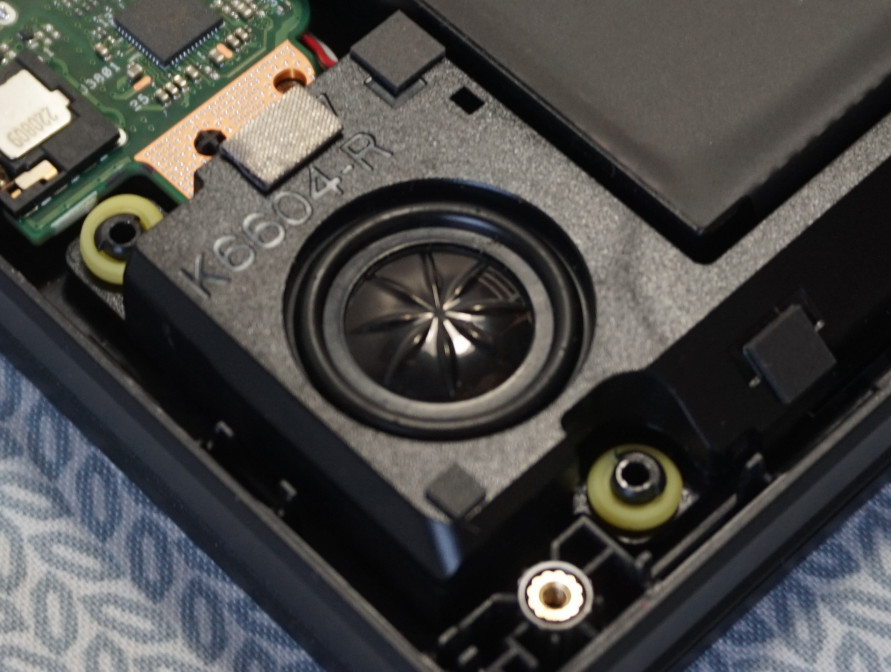
Os alto-falantes são incapazes de reproduzir graves e médios mais baixos, o que não é surpreendente para um notebook. Por outro lado, os médios e agudos, que são importantes para a reprodução de voz, são sólidos.
Portanto, músicas que não tenham muitos graves soam bem. A precisão da reprodução poderia ser um pouco melhor, pois é possível ouvir que alguns elementos estão faltando em músicas acima da qualidade MP3. Mas essa é uma crítica no nível de uma discussão.
Asus Vivobook Pro 16X K6604JV-MX016W análise de áudio
(+) | os alto-falantes podem tocar relativamente alto (###valor### dB)
Graves 100 - 315Hz
(±) | graves reduzidos - em média 14% menor que a mediana
(±) | a linearidade dos graves é média (12.4% delta para a frequência anterior)
Médios 400 - 2.000 Hz
(+) | médios equilibrados - apenas 1.2% longe da mediana
(+) | médios são lineares (3.7% delta para frequência anterior)
Altos 2 - 16 kHz
(±) | máximos mais altos - em média 7.1% maior que a mediana
(+) | os máximos são lineares (4.8% delta da frequência anterior)
Geral 100 - 16.000 Hz
(+) | o som geral é linear (12.7% diferença em relação à mediana)
Comparado com a mesma classe
» 24% de todos os dispositivos testados nesta classe foram melhores, 5% semelhantes, 71% piores
» O melhor teve um delta de 5%, a média foi 17%, o pior foi 45%
Comparado com todos os dispositivos testados
» 12% de todos os dispositivos testados foram melhores, 3% semelhantes, 86% piores
» O melhor teve um delta de 4%, a média foi 23%, o pior foi 134%
Apple MacBook Pro 16 2021 M1 Pro análise de áudio
(+) | os alto-falantes podem tocar relativamente alto (###valor### dB)
Graves 100 - 315Hz
(+) | bons graves - apenas 3.8% longe da mediana
(+) | o baixo é linear (5.2% delta para a frequência anterior)
Médios 400 - 2.000 Hz
(+) | médios equilibrados - apenas 1.3% longe da mediana
(+) | médios são lineares (2.1% delta para frequência anterior)
Altos 2 - 16 kHz
(+) | agudos equilibrados - apenas 1.9% longe da mediana
(+) | os máximos são lineares (2.7% delta da frequência anterior)
Geral 100 - 16.000 Hz
(+) | o som geral é linear (4.6% diferença em relação à mediana)
Comparado com a mesma classe
» 0% de todos os dispositivos testados nesta classe foram melhores, 0% semelhantes, 100% piores
» O melhor teve um delta de 5%, a média foi 17%, o pior foi 45%
Comparado com todos os dispositivos testados
» 0% de todos os dispositivos testados foram melhores, 0% semelhantes, 100% piores
» O melhor teve um delta de 4%, a média foi 23%, o pior foi 134%
Gerenciamento de energia - i9 faminto no Vivobook
Consumo de energia
Acima de tudo, o extremamente potente i9-13980HX aumenta o consumo de energia sem carga. Medimos uma média de 16 W. Para comparação, o Samsung Galaxy Book3 Ultra, cujo processador i7-13700H não é muito pior e cuja tela também é OLED de 16 polegadas, consome 5 W. Consequentemente, o VivoBook não é realmente eficiente em tarefas simples.
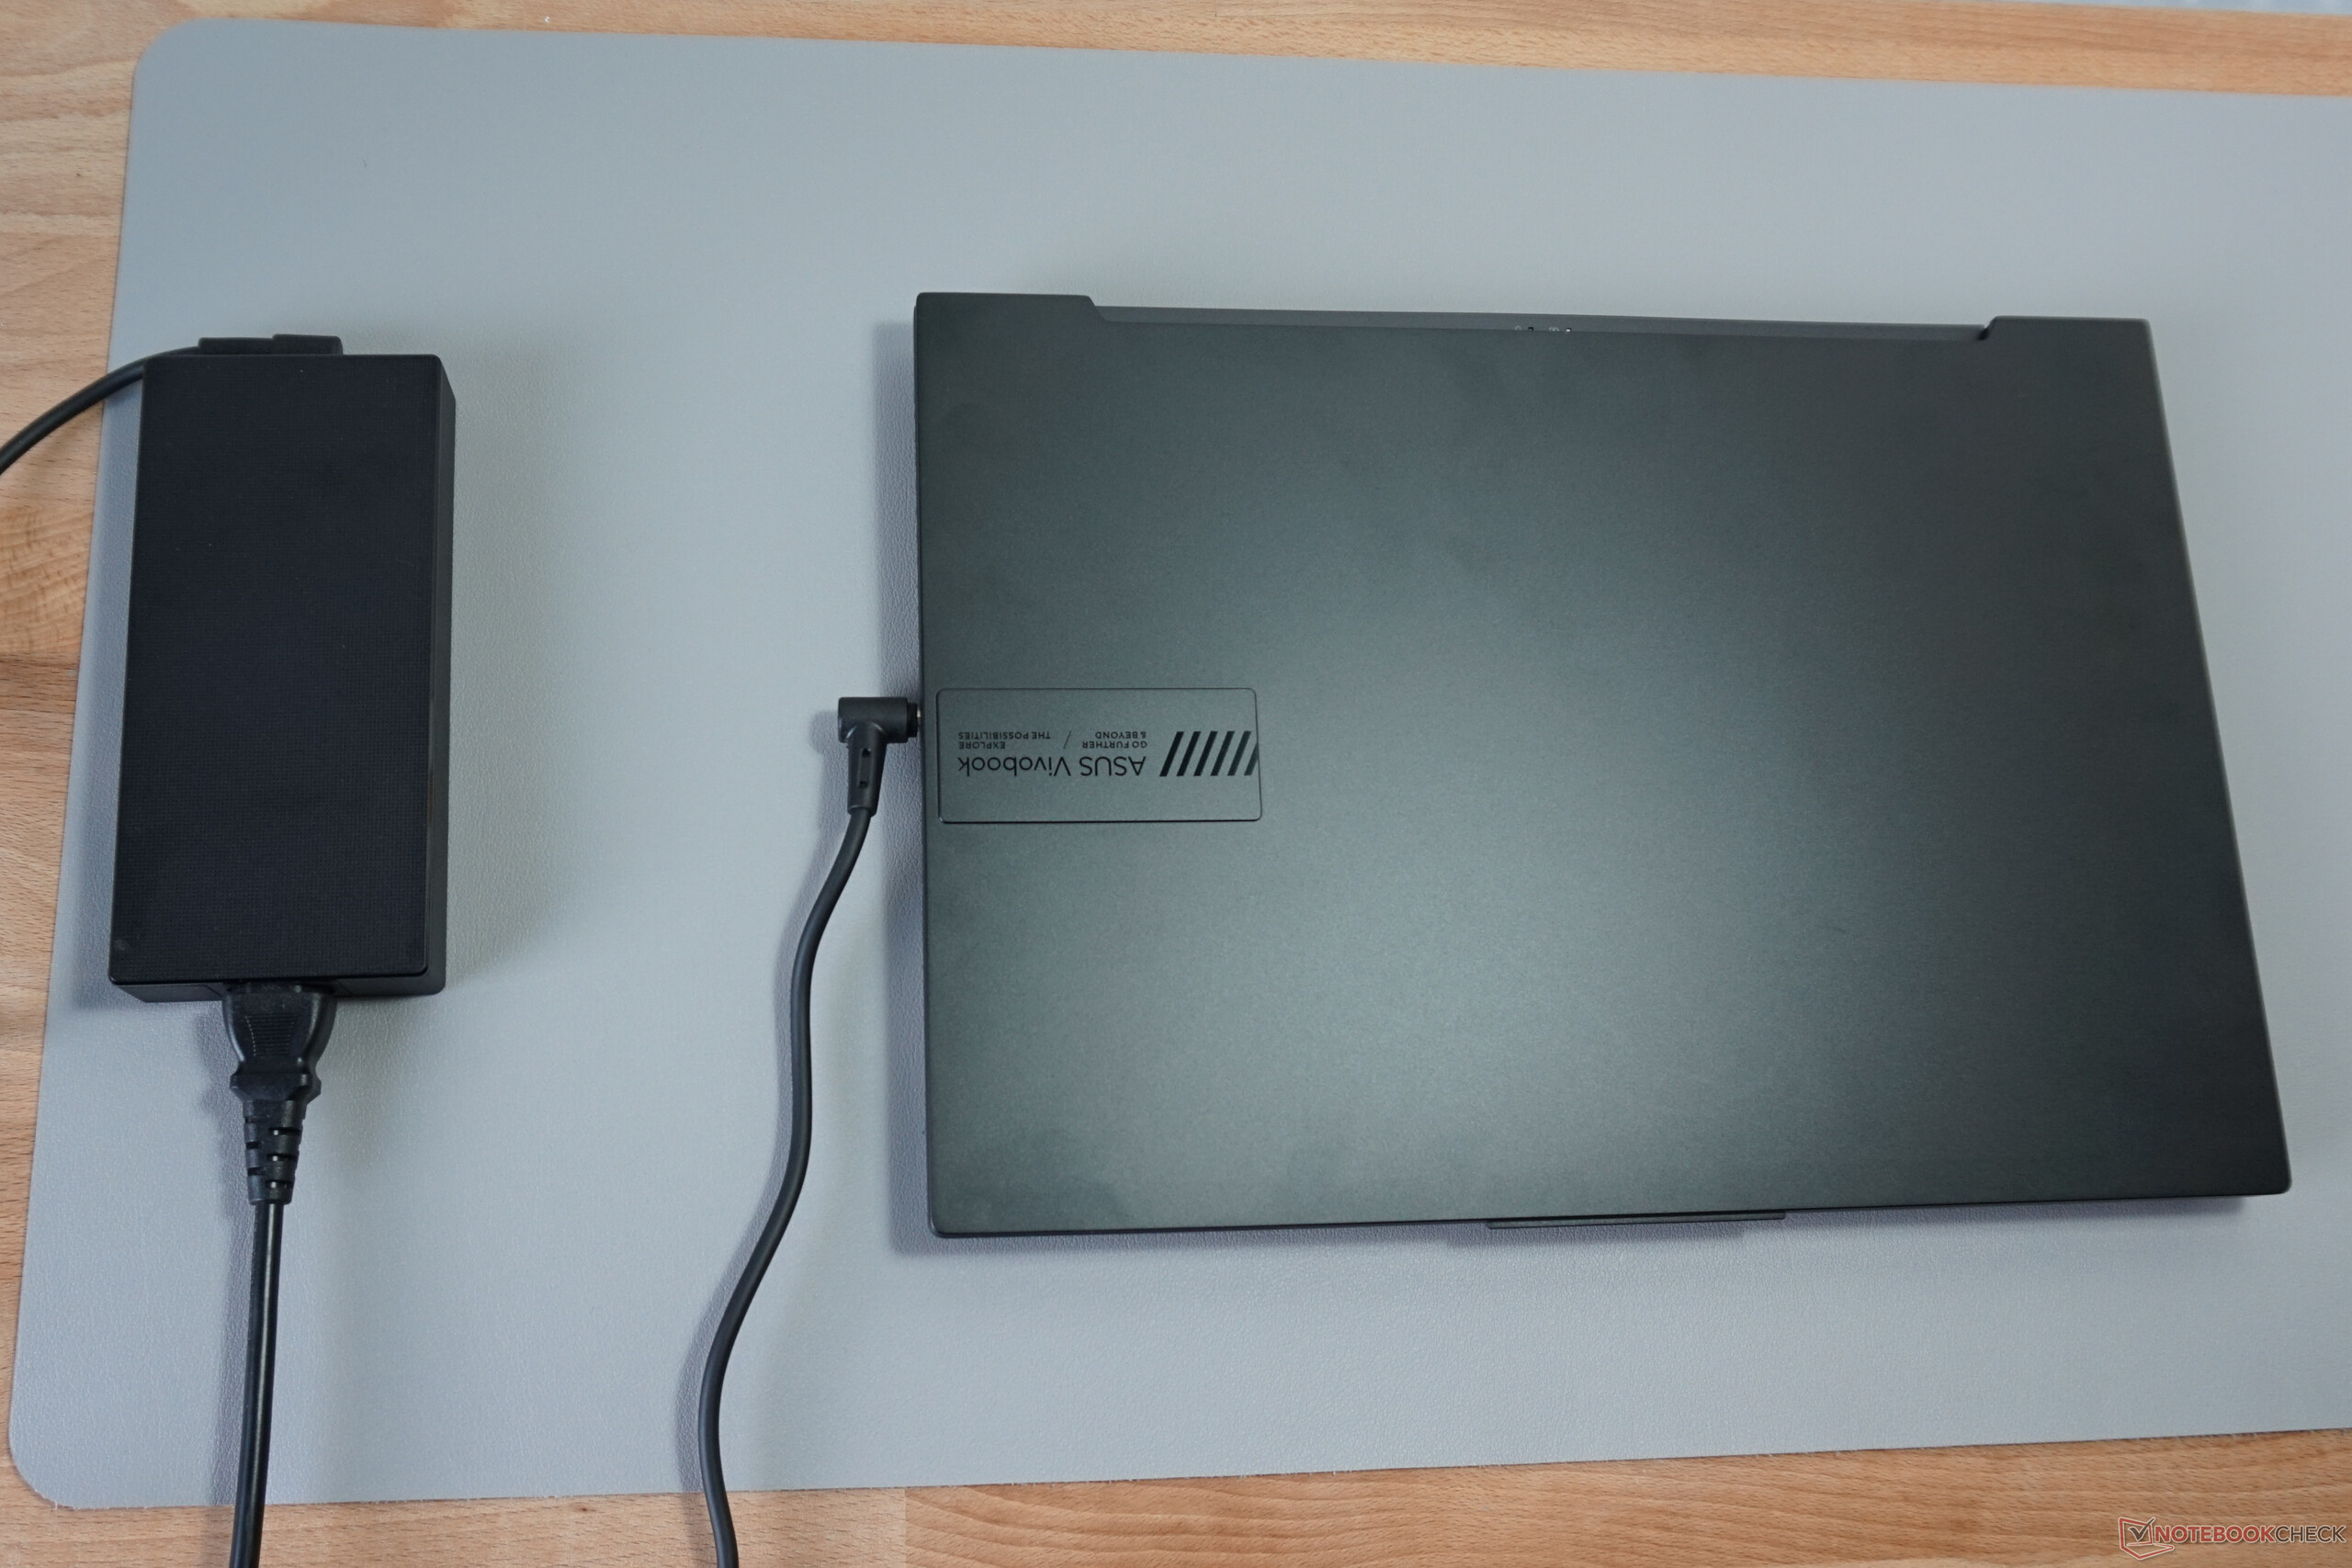
O consumo máximo de energia chega a 244 W, mas apenas por pouco tempo. Uma carga típica é de cerca de 150 W, portanto a fonte de alimentação de 240 watts está bem dimensionada.
| desligado | |
| Ocioso | |
| Carga |
|
Key:
min: | |
| Asus Vivobook Pro 16X K6604JV-MX016W i9-13980HX, GeForce RTX 4060 Laptop GPU, Solidigm P41 Plus SSDPFKNU010TZ, OLED, 3200x2000, 16" | Dell XPS 15 9530 RTX 4070 i7-13700H, GeForce RTX 4070 Laptop GPU, SK hynix PC801 HFS001TEJ9X101N, OLED, 3456x2160, 15.6" | Samsung Galaxy Book3 Ultra 16 i7-13700H, GeForce RTX 4050 Laptop GPU, Samsung PM9A1 MZVL2512HCJQ, AMOLED, 2880x1800, 16" | Asus ProArt Studiobook 16 OLED H7604 i9-13980HX, GeForce RTX 4070 Laptop GPU, Phison EM2804TBMTCB47, OLED, 3200x2000, 16" | Schenker VISION 16 Pro (M23) i7-13700H, GeForce RTX 4070 Laptop GPU, Samsung 990 Pro 1 TB, IPS, 2560x1600, 16" | MSI Creator Z17 A12UGST-054 i9-12900H, GeForce RTX 3070 Ti Laptop GPU, Micron 3400 1TB MTFDKBA1T0TFH, IPS, 2560x1600, 17" | Média NVIDIA GeForce RTX 4060 Laptop GPU | Média da turma Multimedia | |
|---|---|---|---|---|---|---|---|---|
| Power Consumption | 6% | 58% | -8% | 29% | -75% | 12% | 48% | |
| Idle Minimum * (Watt) | 13.8 | 20 -45% | 3 78% | 12.8 7% | 8.6 38% | 34.6 -151% | 11.5 ? 17% | 5.66 ? 59% |
| Idle Average * (Watt) | 16 | 20.7 -29% | 5 69% | 19.9 -24% | 12 25% | 43 -169% | 16 ? -0% | 10.2 ? 36% |
| Idle Maximum * (Watt) | 19 | 22.4 -18% | 11 42% | 20.3 -7% | 12.4 35% | 44.9 -136% | 20.3 ? -7% | 12.5 ? 34% |
| Load Average * (Watt) | 147 | 77.1 48% | 72 51% | 131.4 11% | 80 46% | 145 1% | 92.9 ? 37% | 65.2 ? 56% |
| Witcher 3 ultra * (Watt) | 147.8 | 95.4 35% | 69.7 53% | 196.5 -33% | 147.7 -0% | 152.4 -3% | ||
| Load Maximum * (Watt) | 244 | 133.4 45% | 108 56% | 246.8 -1% | 173.1 29% | 220 10% | 210 ? 14% | 113.5 ? 53% |
* ... menor é melhor
Power consumption Witcher 3 / Stress test
Power consumption with an external monitor
Duração da bateria
O VivoBook só consegue extrair tempos de execução curtos da grande bateria de 90 Wh, o que se deve principalmente ao alto consumo de energia de 13,8 W sem carga. Em termos puramente matemáticos, isso deve resultar em um tempo de execução máximo de 6,5 horas, o que é realmente alcançado ao navegar na Web com brilho reduzido.
A navegação no modo escuro proporciona um adicional de três quartos de hora, mas o plano de fundo do site sempre precisa ser preto. A reprodução de vídeo no modo de voo só é possível por pouco menos de 5 horas.
Muito mais seria possível com um processador mais eficiente e configurações mais moderadas em geral. Por exemplo, oSamsung Galaxy Book3 Ultracom sua bateria menor, consegue 13 horas de reprodução de vídeo e quase 10 horas em nosso teste de navegação na Web.
A Asus anuncia que a bateria é carregada em 50% após 30 minutos, o que foi confirmado em nossos testes.
| Asus Vivobook Pro 16X K6604JV-MX016W i9-13980HX, GeForce RTX 4060 Laptop GPU, 90 Wh | Dell XPS 15 9530 RTX 4070 i7-13700H, GeForce RTX 4070 Laptop GPU, 86 Wh | Samsung Galaxy Book3 Ultra 16 i7-13700H, GeForce RTX 4050 Laptop GPU, 76 Wh | Asus ProArt Studiobook 16 OLED H7604 i9-13980HX, GeForce RTX 4070 Laptop GPU, 90 Wh | Schenker VISION 16 Pro (M23) i7-13700H, GeForce RTX 4070 Laptop GPU, 80 Wh | MSI Creator Z17 A12UGST-054 i9-12900H, GeForce RTX 3070 Ti Laptop GPU, 90 Wh | Média da turma Multimedia | |
|---|---|---|---|---|---|---|---|
| Duração da bateria | 12% | 74% | -9% | 18% | 12% | 107% | |
| H.264 (h) | 5.3 | 13.4 153% | 6 13% | 7.8 47% | 5.5 4% | 17.1 ? 223% | |
| WiFi v1.3 (h) | 6.5 | 8 23% | 9.6 48% | 5.6 -14% | 7.8 20% | 5.5 -15% | 12.2 ? 88% |
| Load (h) | 1.5 | 1.5 0% | 1.8 20% | 1.1 -27% | 1.3 -13% | 2.2 47% | 1.664 ? 11% |
Pro
Contra
Veredicto - Um pouco básico, mas muito rápido
Graças a uma tela OLED com cores precisas e 6 milhões de pixels, uma RTX 4060 bem ajustada e um i9-13980HX extremamente potente, o Asus VivoBook Pro 16X oferece as qualidades perfeitas para um notebook multimídia ambicioso. Além disso, o resfriamento no gabinete relativamente compacto é sólido, não é incômodo nas configurações padrão e é quase imperceptível no modo Silencioso .
Talvez não seja tão elegante, mas certamente está no mesmo nível do modelo premium Asus Studiobook em termos de competências essenciais.
Há também a roda de controle, que não está fisicamente presente, mas integrada ao touchpad. As funções básicas e a programação adicional do software "Asus ProArt" ampliam enormemente as opções operacionais. E também não há lacunas na conectividade.
As diferenças com o consideravelmente mais caro Asus ProArt Studiobook 16 OLED são encontradas fora da tela e dos valores de desempenho. O gabinete não tem uma construção muito sólida, o que também afeta negativamente o teclado. Além disso, o resfriamento não é tão convincente em situações extremas, mas não precisa ser assim. De um ponto de vista pragmático, o VivoBook Pro 16X é, portanto, a escolha preferível.
O Samsung Galaxy Book3 Ultra 16 não é tão rápido, mas tem muito mais resistência e é ainda mais fino.
Preço e disponibilidade
Nos EUA, o Asus Vivobook Pro 16X vem em várias configurações. A Amazon, por exemplo, oferece a variante mais potente (CPU Intel Core i9-13980HX, GPU RTX 4070, 32 GB de RAM, SSD de 1 TB) a um preço com desconto de US$ 1.994,99. A Best Buy oferece uma variante idêntica, mas com apenas 16 GB de RAM, por US$ 1.999,99. Troque a RTX 4070 por uma RTX 4060 e você terá outra variante por US$ 1.799,99.
Os preços são de 26.07.2023 e estão sujeitos a alterações.
Asus Vivobook Pro 16X K6604JV-MX016W
- 07/25/2023 v7 (old)
Mario Petzold
Transparência
A seleção dos dispositivos a serem analisados é feita pela nossa equipe editorial. A amostra de teste foi fornecida ao autor como empréstimo pelo fabricante ou varejista para fins desta revisão. O credor não teve influência nesta revisão, nem o fabricante recebeu uma cópia desta revisão antes da publicação. Não houve obrigação de publicar esta revisão. Como empresa de mídia independente, a Notebookcheck não está sujeita à autoridade de fabricantes, varejistas ou editores.
É assim que o Notebookcheck está testando
Todos os anos, o Notebookcheck analisa de forma independente centenas de laptops e smartphones usando procedimentos padronizados para garantir que todos os resultados sejam comparáveis. Desenvolvemos continuamente nossos métodos de teste há cerca de 20 anos e definimos padrões da indústria no processo. Em nossos laboratórios de teste, equipamentos de medição de alta qualidade são utilizados por técnicos e editores experientes. Esses testes envolvem um processo de validação em vários estágios. Nosso complexo sistema de classificação é baseado em centenas de medições e benchmarks bem fundamentados, o que mantém a objetividade.Price comparison

