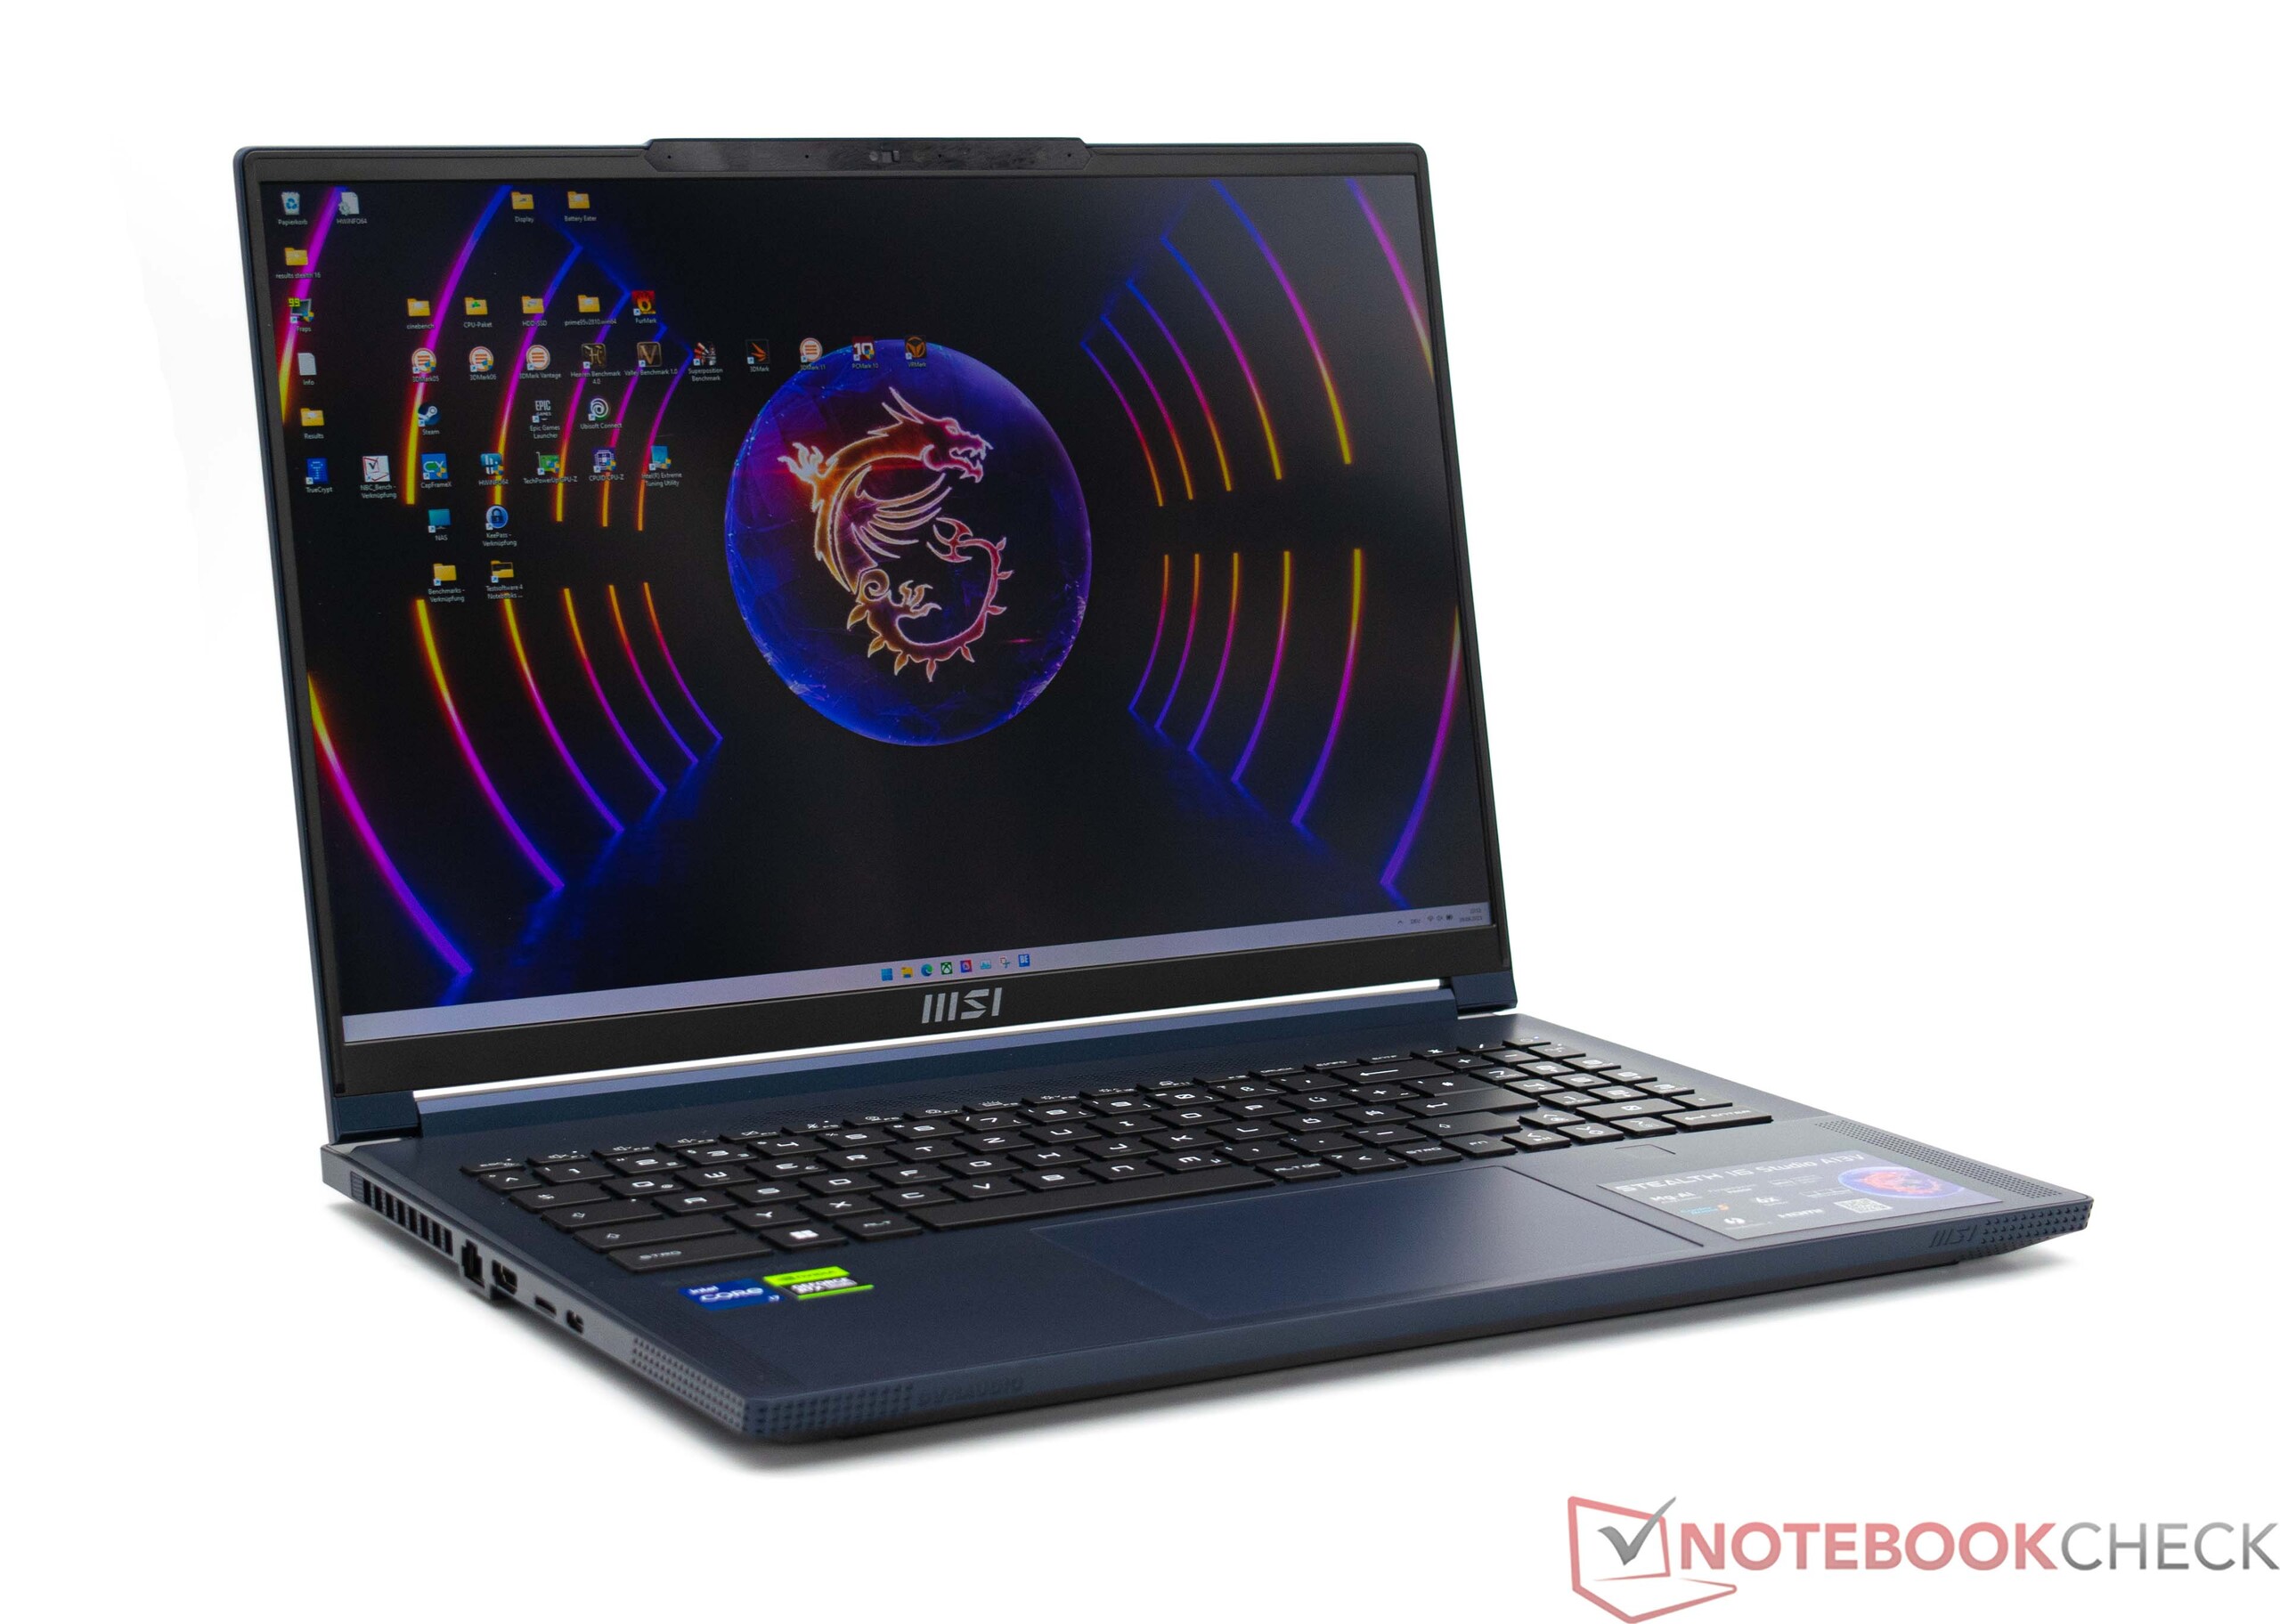
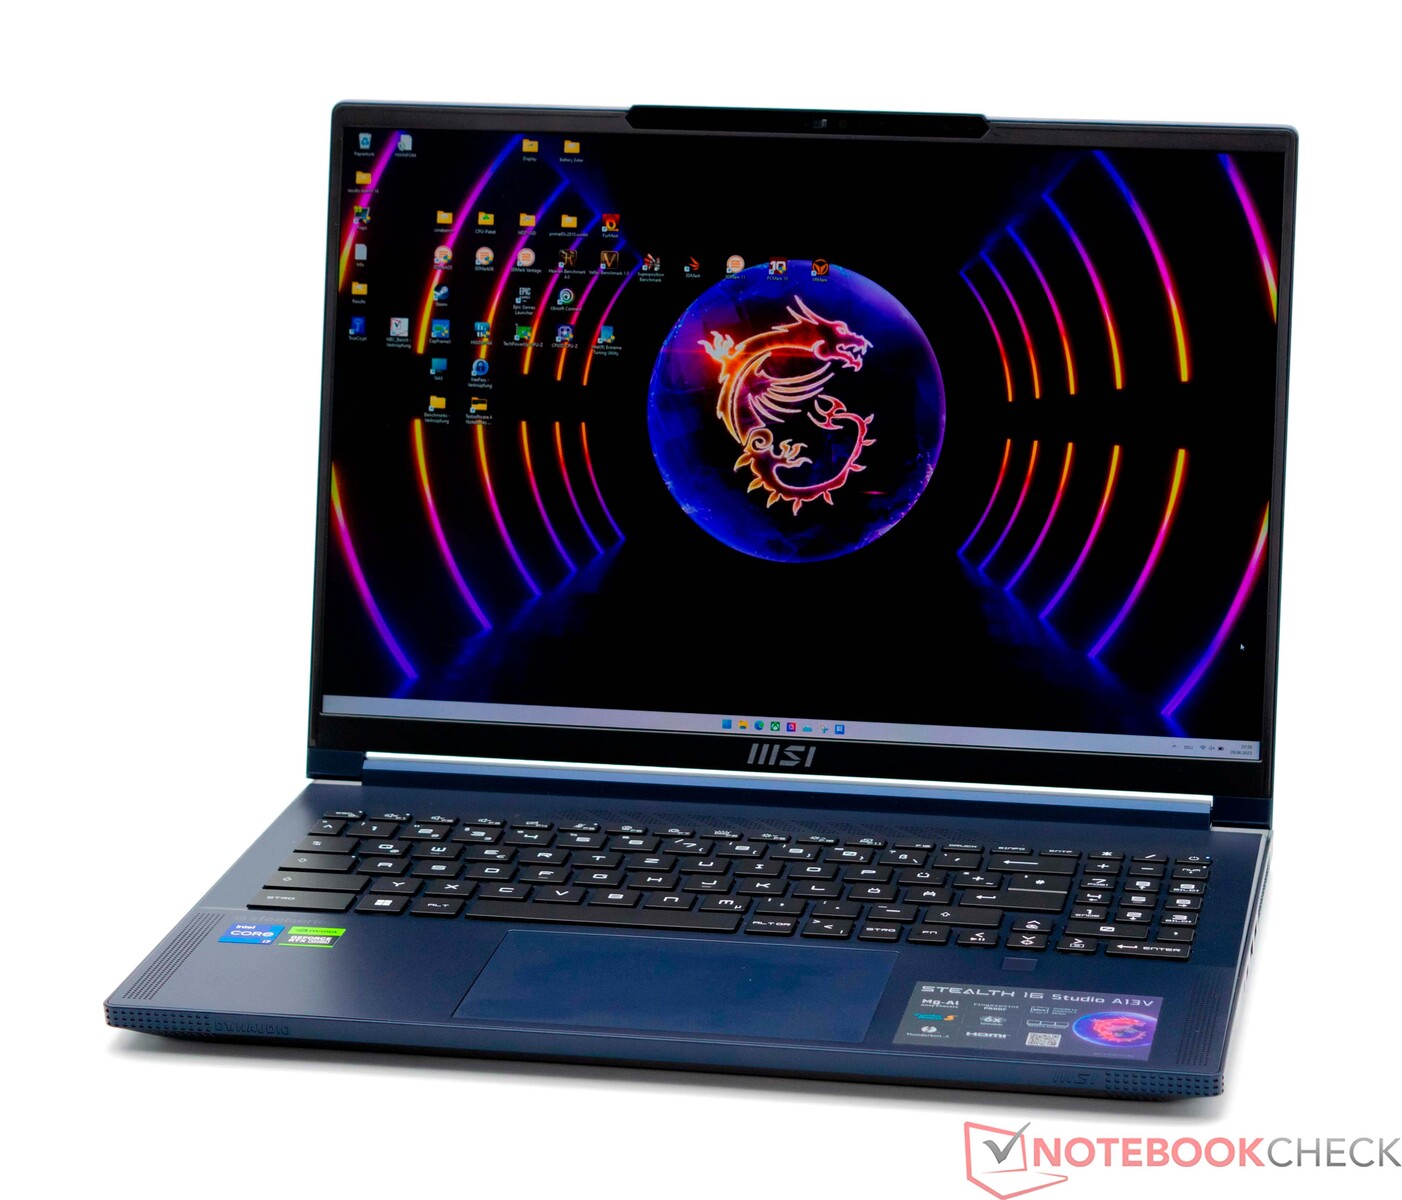
Análise do laptop MSI Stealth 16 Studio: Um dispositivo extremamente leve, de 16 polegadas, com Core i7 e RTX 4070 para gamers e criadores
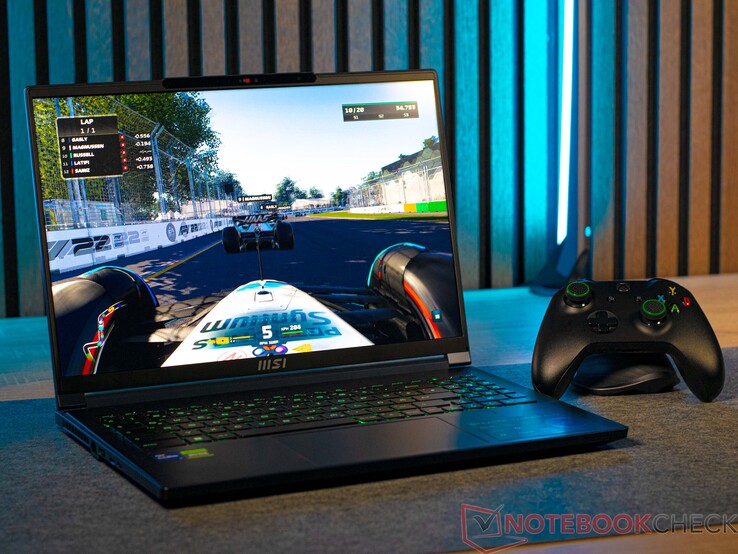
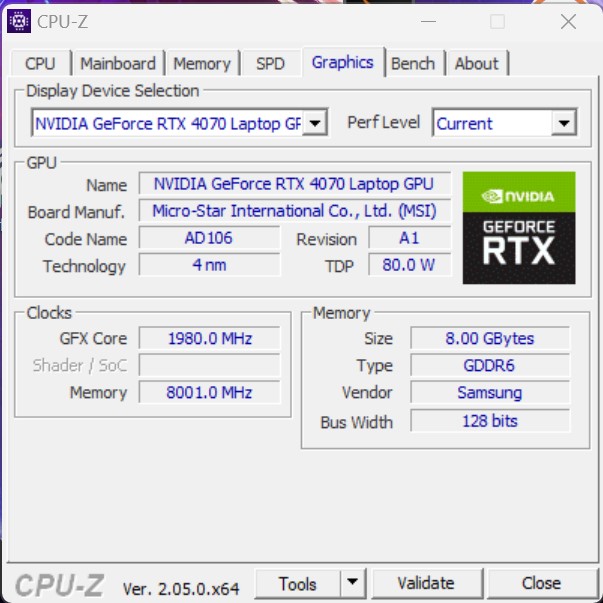
O novo MSI Stealth 16 Studio A13VG é baseado em um processador Processador Intel Raptor Lake H e uma GPU móvel Nvidia atual. Em termos de detalhes, nosso dispositivo de análise tem um processadorIntel Core i7-13700Hemparelhado com umaGPU para laptop Nvidia GeForce RTX 4070. No entanto, visualmente falando, o MSI Stealth 16 Studio A13VG é muito discreto e consegue se situar na linha entre um laptop de negócios poderoso e um laptop para jogos. Basicamente, também vemos esse dispositivo como uma excelente base para criadores que podem se ver aproveitando os pontos fortes do MSI Stealth 16 Studio A13VG por causa de seus componentes poderosos e boa portabilidade.
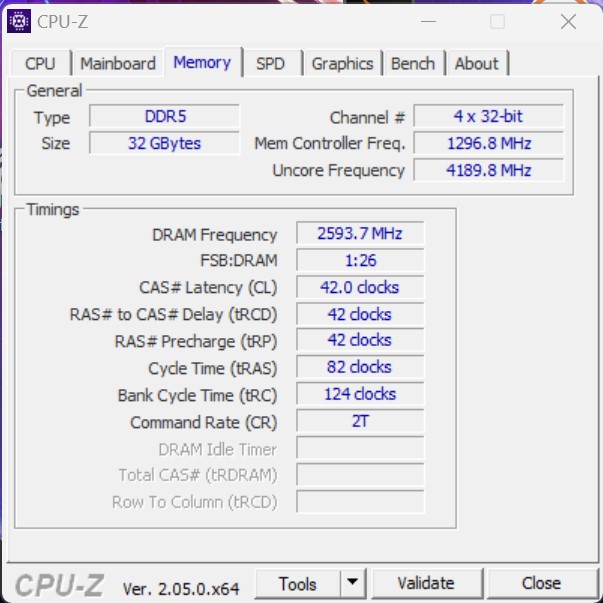
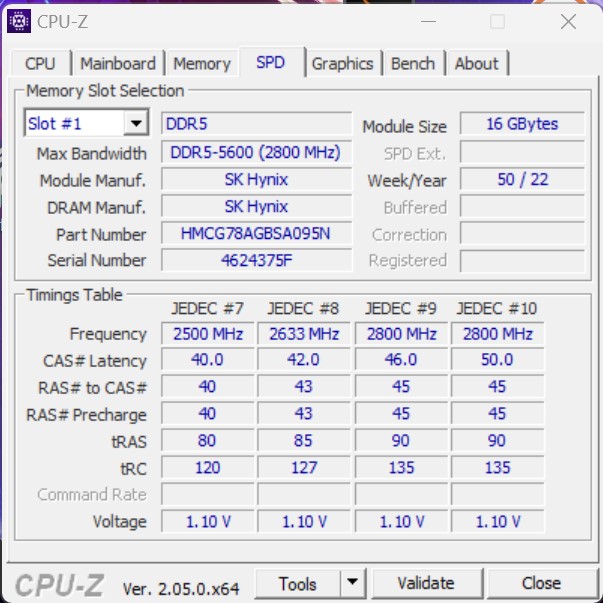
No entanto, em termos de preço, o MSI Stealth 16 Studio A13VG se encontra no segmento de alta qualidade. Mas, além dos componentes já mencionados, há 32 GB de RAM DDR5 e um SSD com 2 TB de armazenamento. Da mesma forma, não devemos esquecer a tela QHD+ de 16 polegadas. Com sua taxa de atualização de 240 Hz, ela é voltada diretamente para a comunidade de jogos.
Nesta análise, o MSI Stealth 16 Studio A13VG terá de provar seu valor em relação aos laptops de 16 polegadas atuais. Consulte a tabela abaixo para obter mais detalhes.
Possíveis concorrentes em comparação
Avaliação | Data | Modelo | Peso | Altura | Size | Resolução | Preço |
|---|---|---|---|---|---|---|---|
| 88.8 % v7 (old) | 07/2023 | MSI Stealth 16 Studio A13VG i7-13700H, GeForce RTX 4070 Laptop GPU | 2 kg | 19.95 mm | 16.00" | 2560x1600 | |
| 89.7 % v7 (old) | 06/2023 | Asus ROG Flow X16 GV601V i9-13900H, GeForce RTX 4060 Laptop GPU | 2.1 kg | 19.4 mm | 16.00" | 2560x1600 | |
| 89 % v7 (old) | 04/2023 | Medion Erazer Major X20 i9-13900HX, GeForce RTX 4070 Laptop GPU | 2.4 kg | 29 mm | 16.00" | 2560x1600 | |
| 88.1 % v7 (old) | 06/2023 | Acer Nitro 16 AN16-41 R7 7735HS, GeForce RTX 4070 Laptop GPU | 2.7 kg | 27.9 mm | 16.00" | 2560x1600 | |
| 86.6 % v7 (old) | 12/2022 | Corsair Voyager a1600 R9 6900HS, Radeon RX 6800M | 2.4 kg | 19.9 mm | 16.00" | 2560x1600 | |
| 86.2 % v7 (old) | 03/2023 | Gigabyte AERO 16 OLED BSF i9-13900H, GeForce RTX 4070 Laptop GPU | 2.1 kg | 18 mm | 16.00" | 3840x2400 |
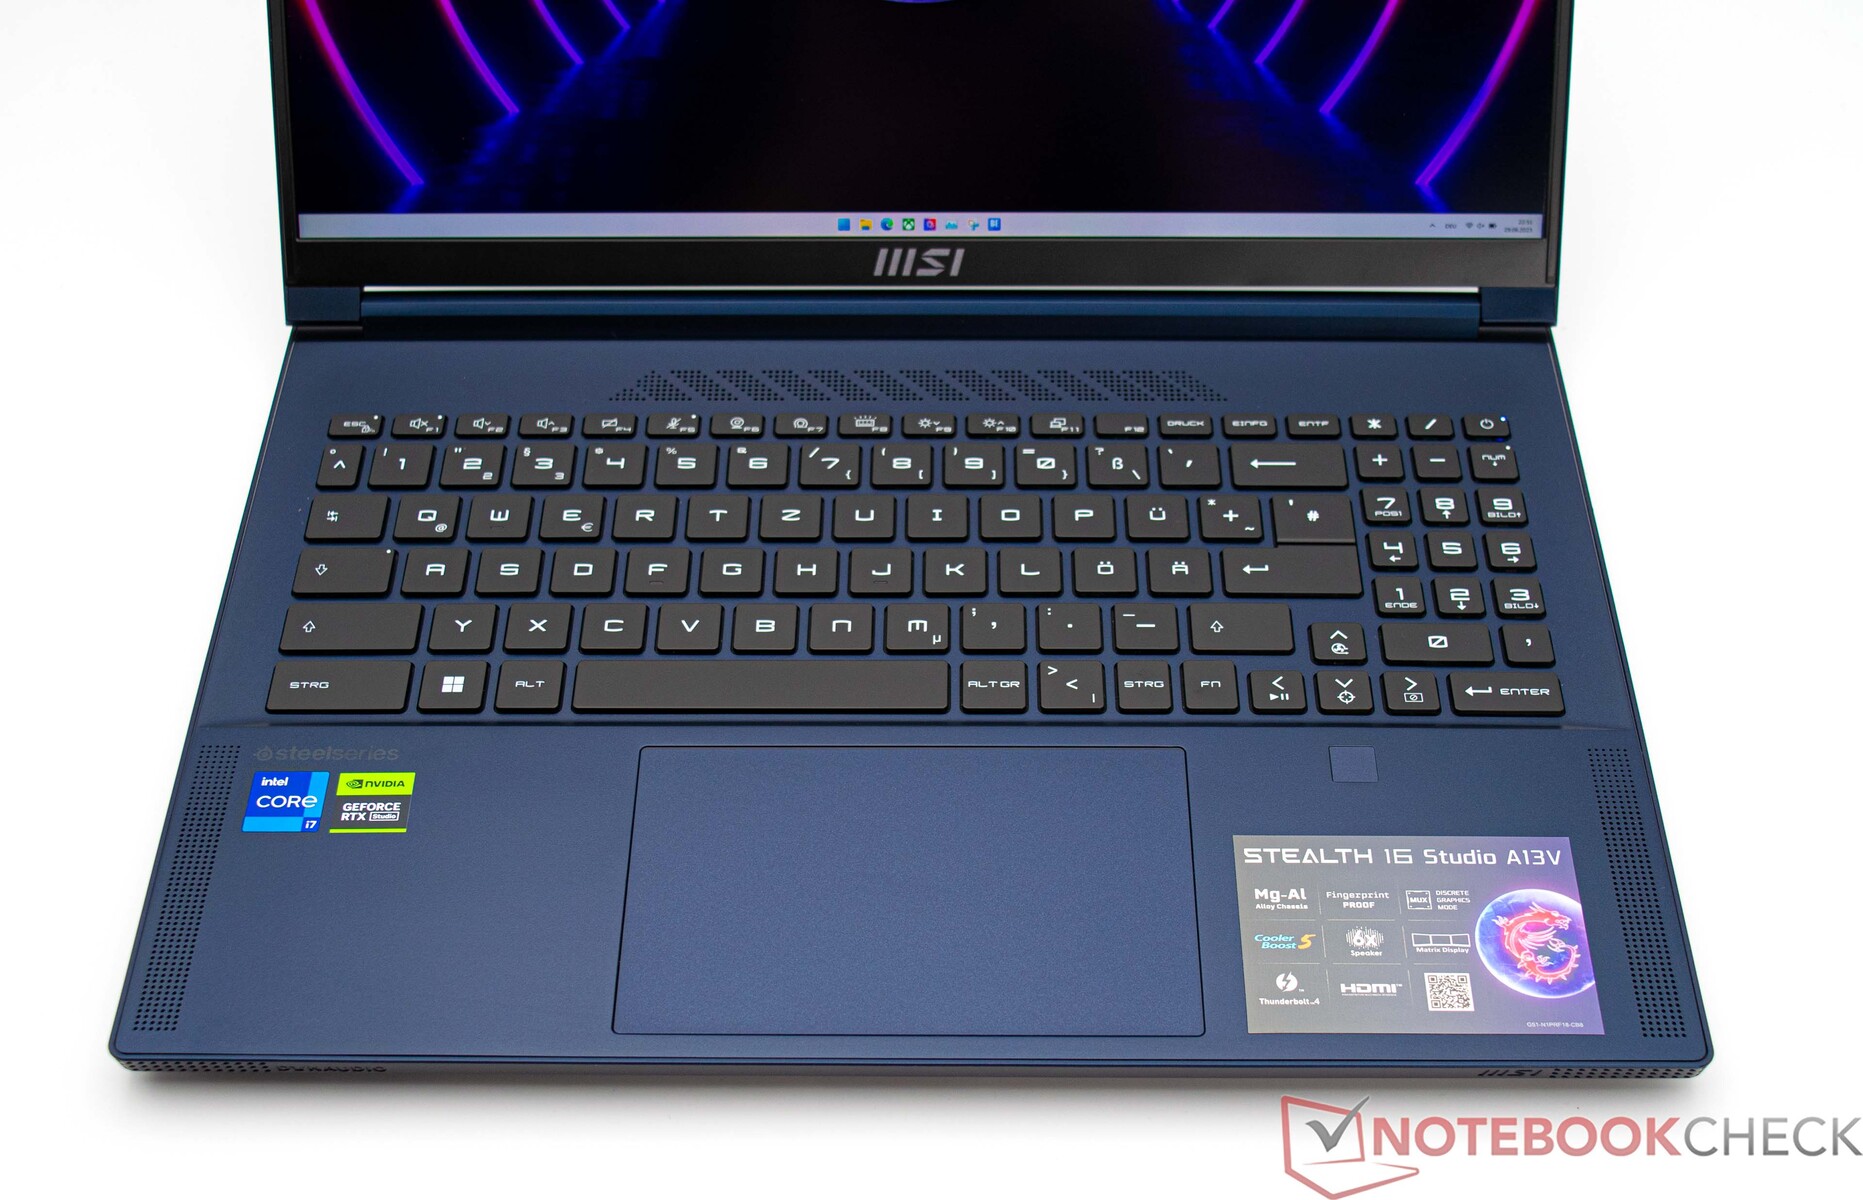
Caixa - Alumínio e magnésio proporcionam robustez
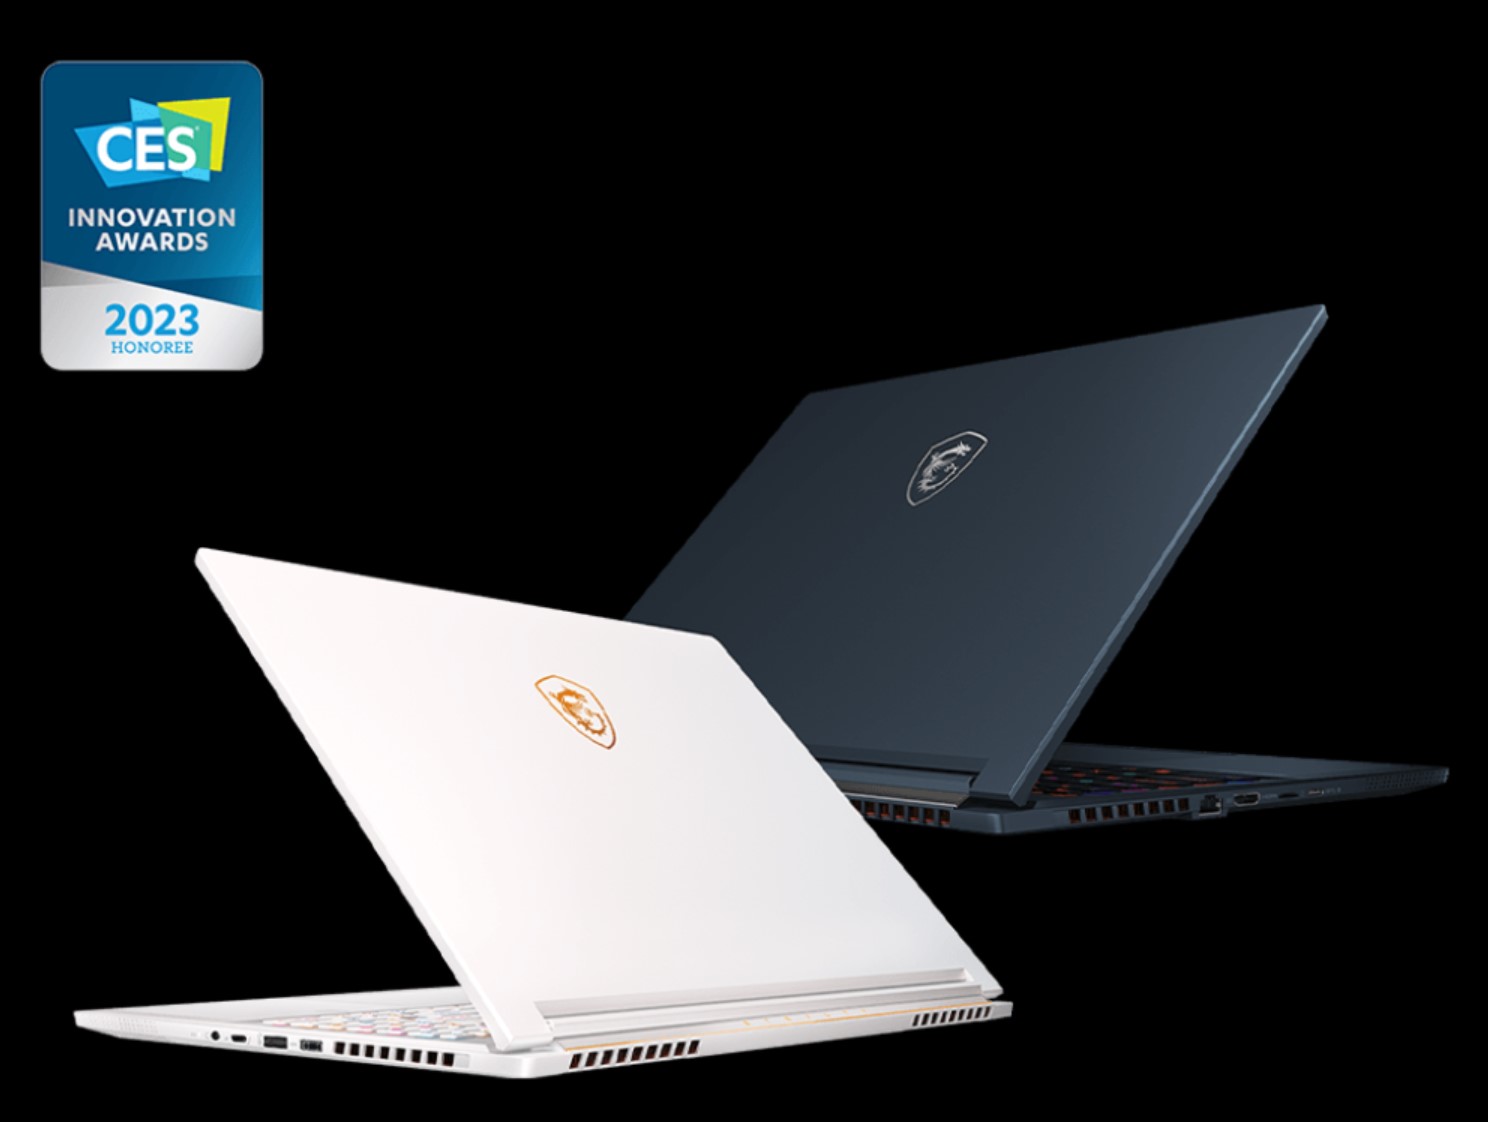
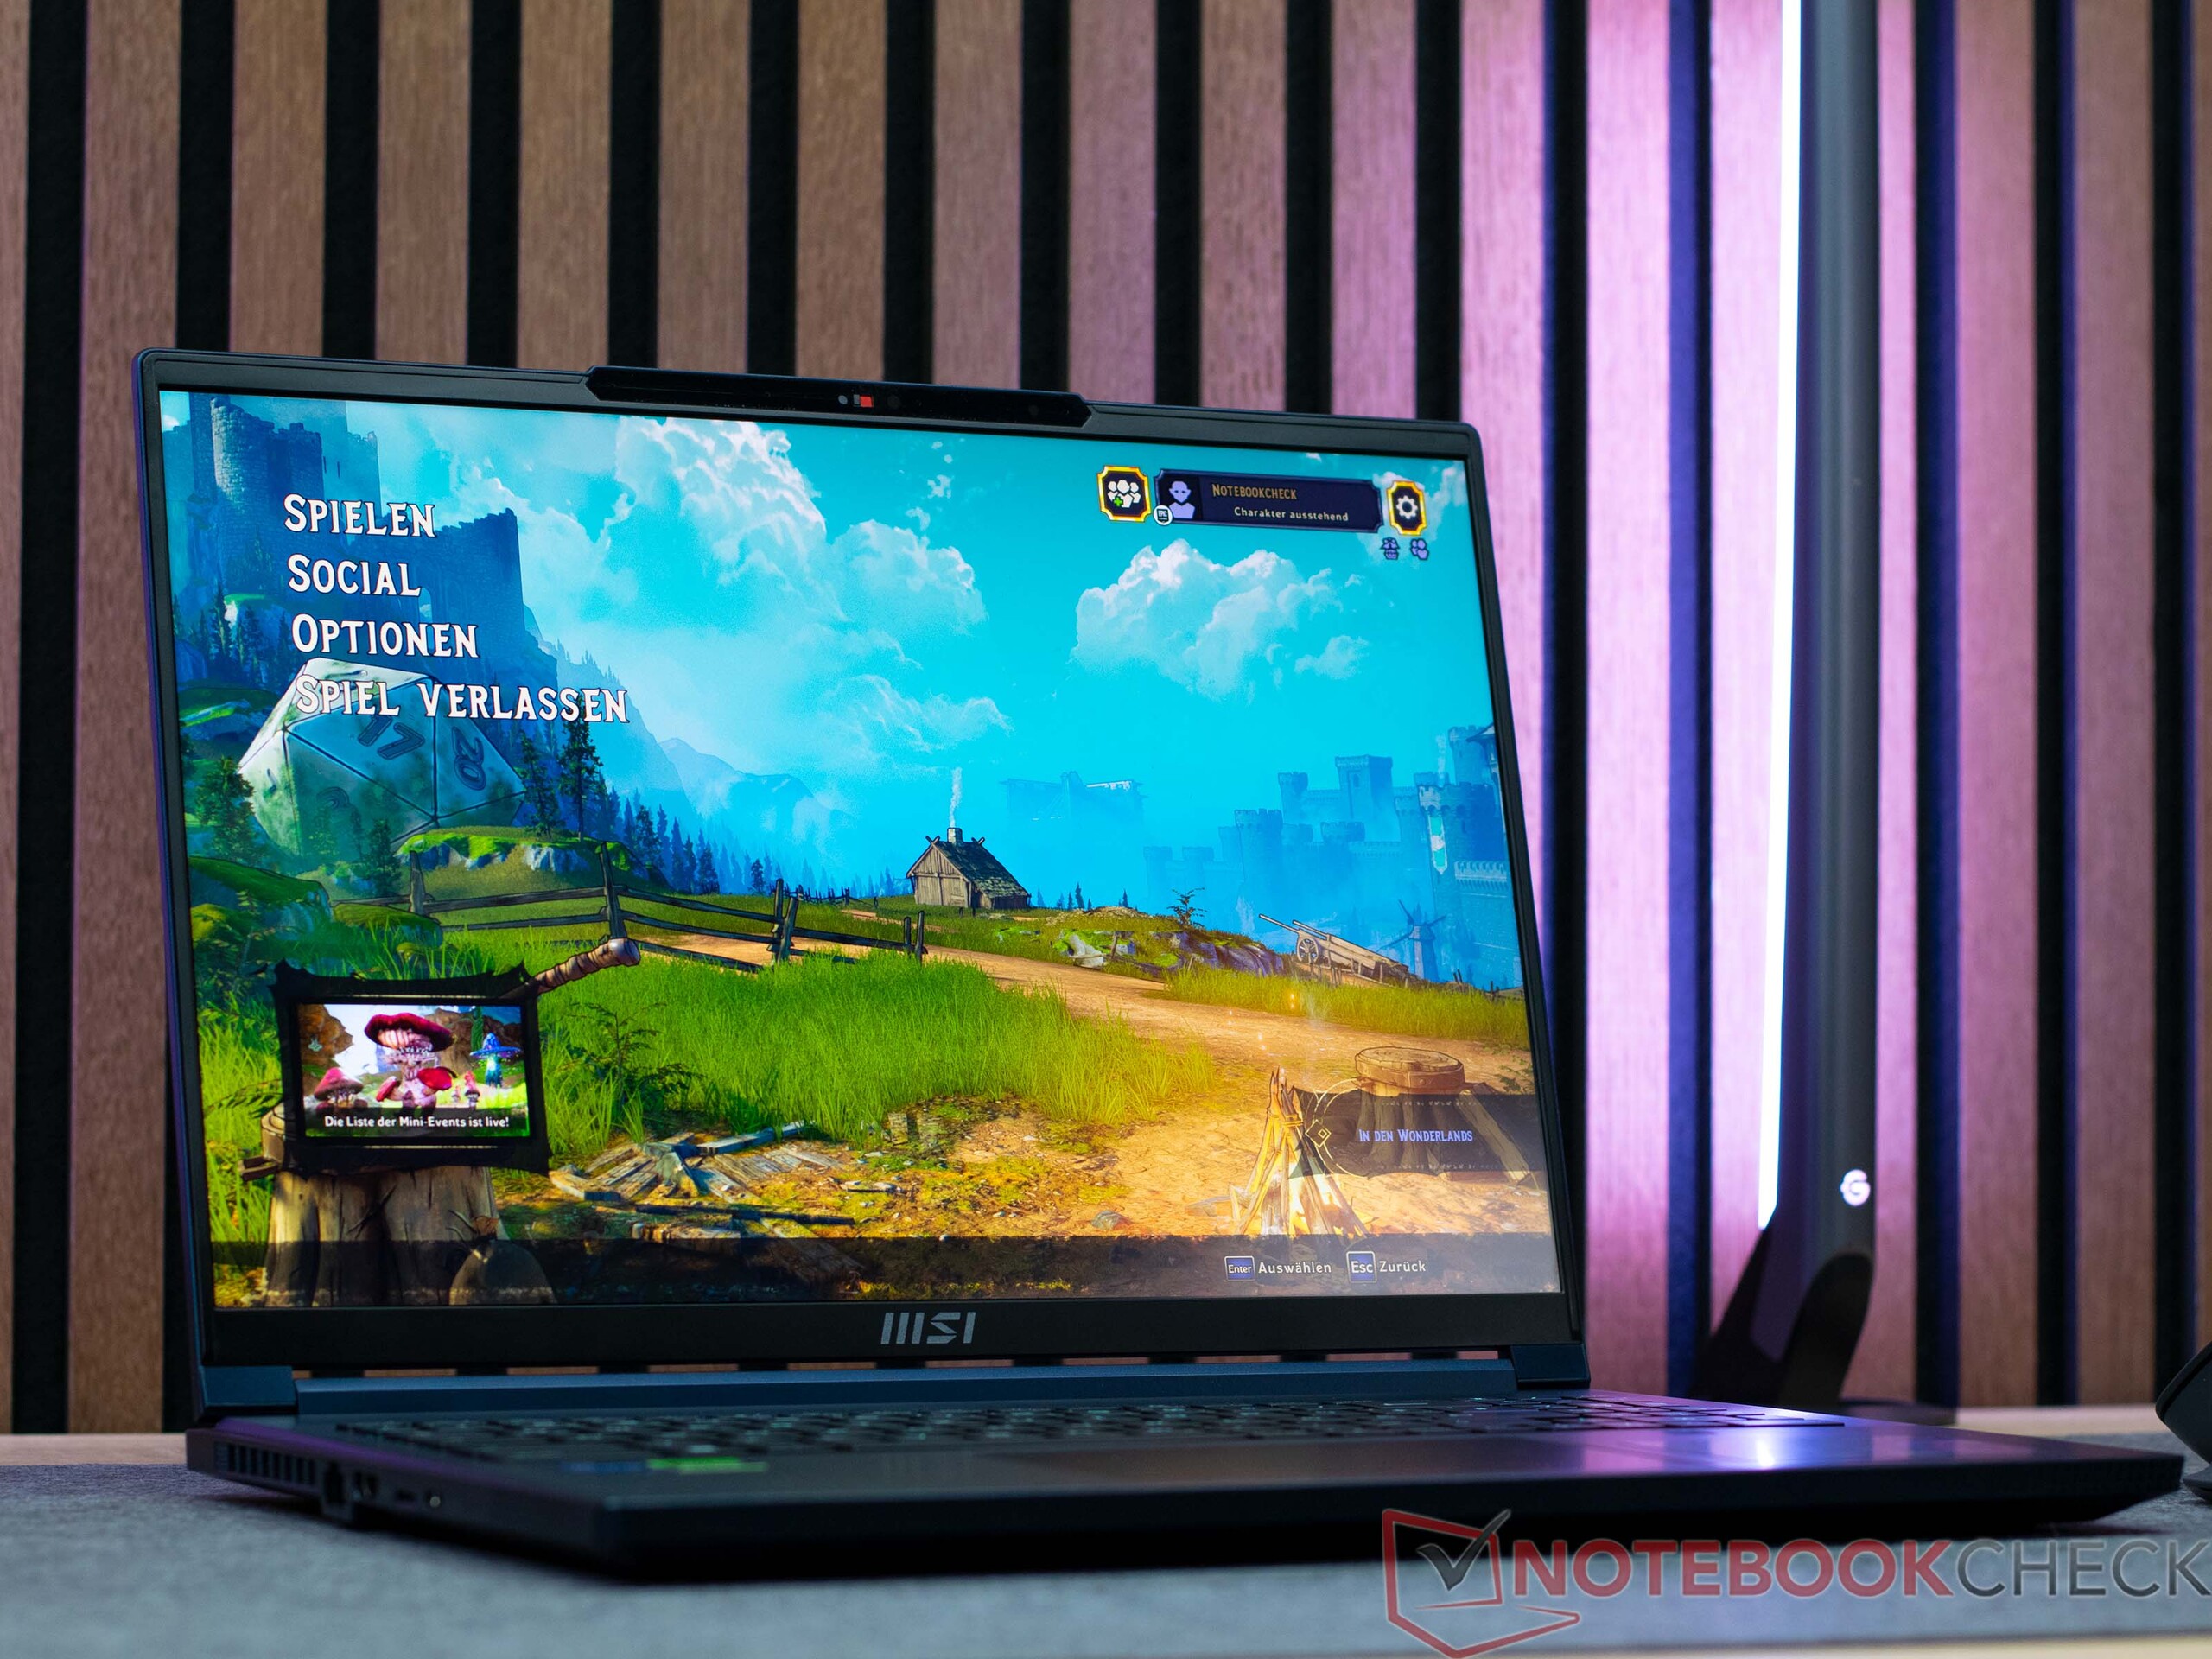
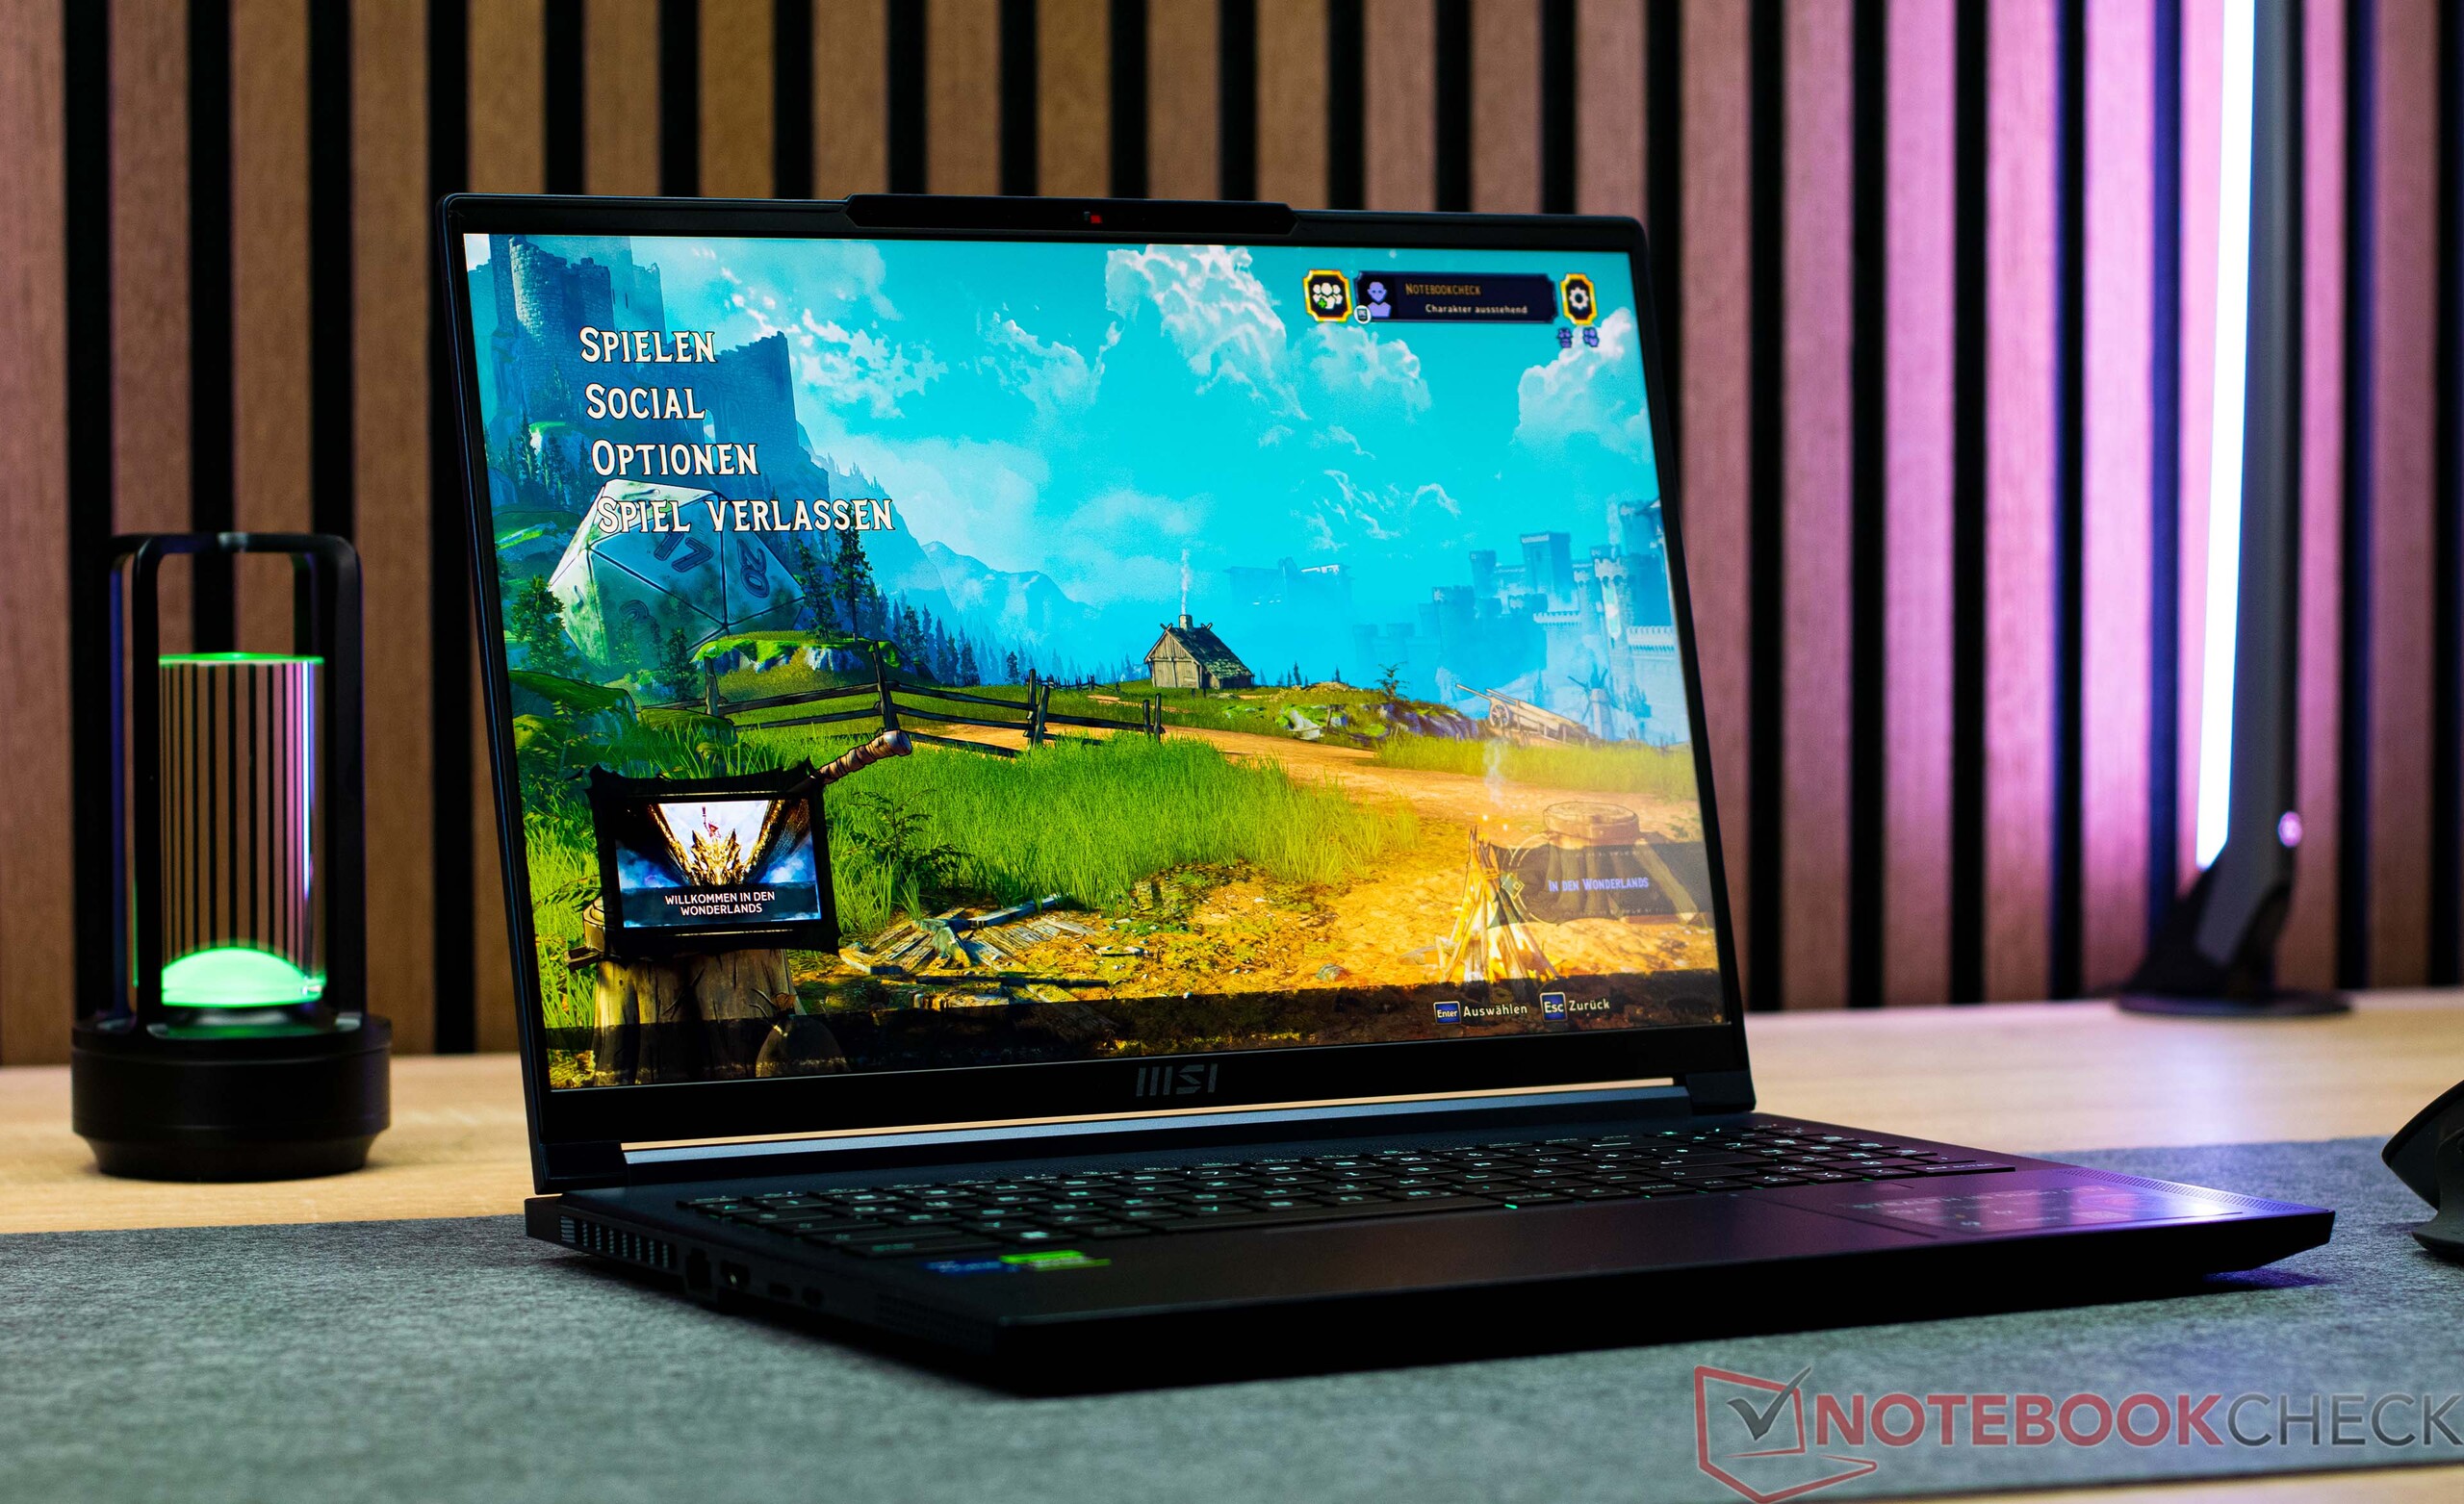
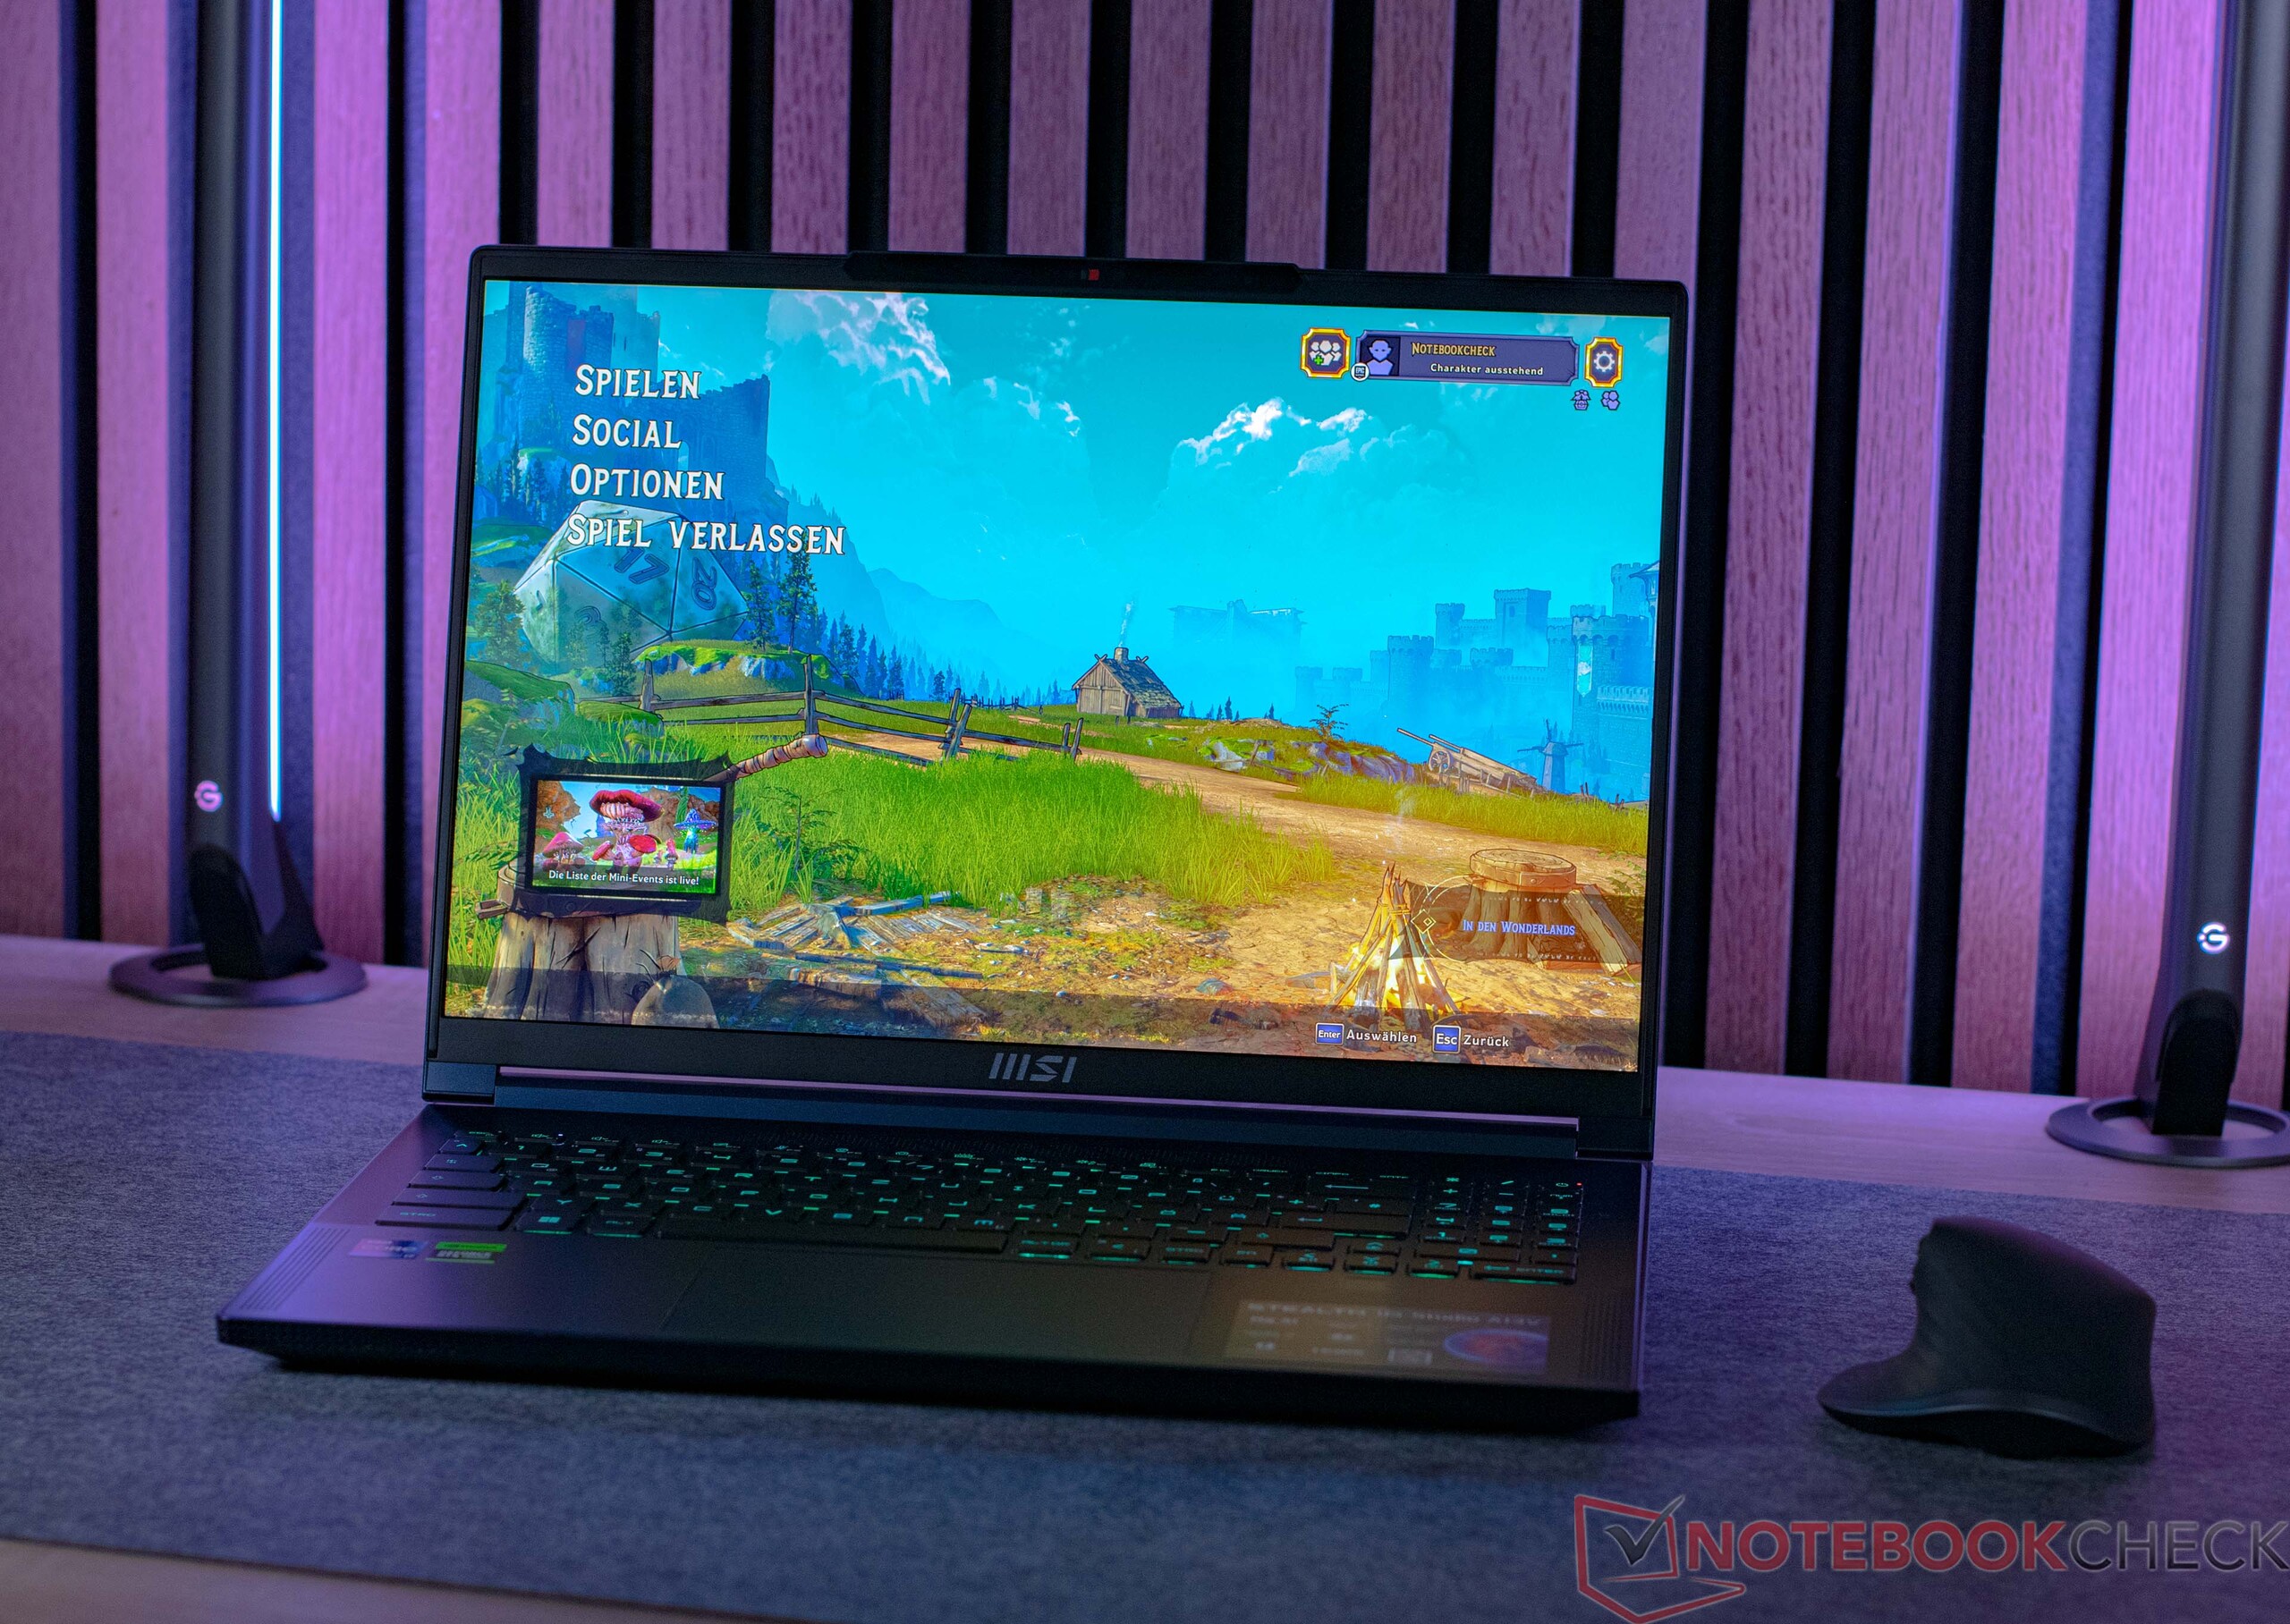
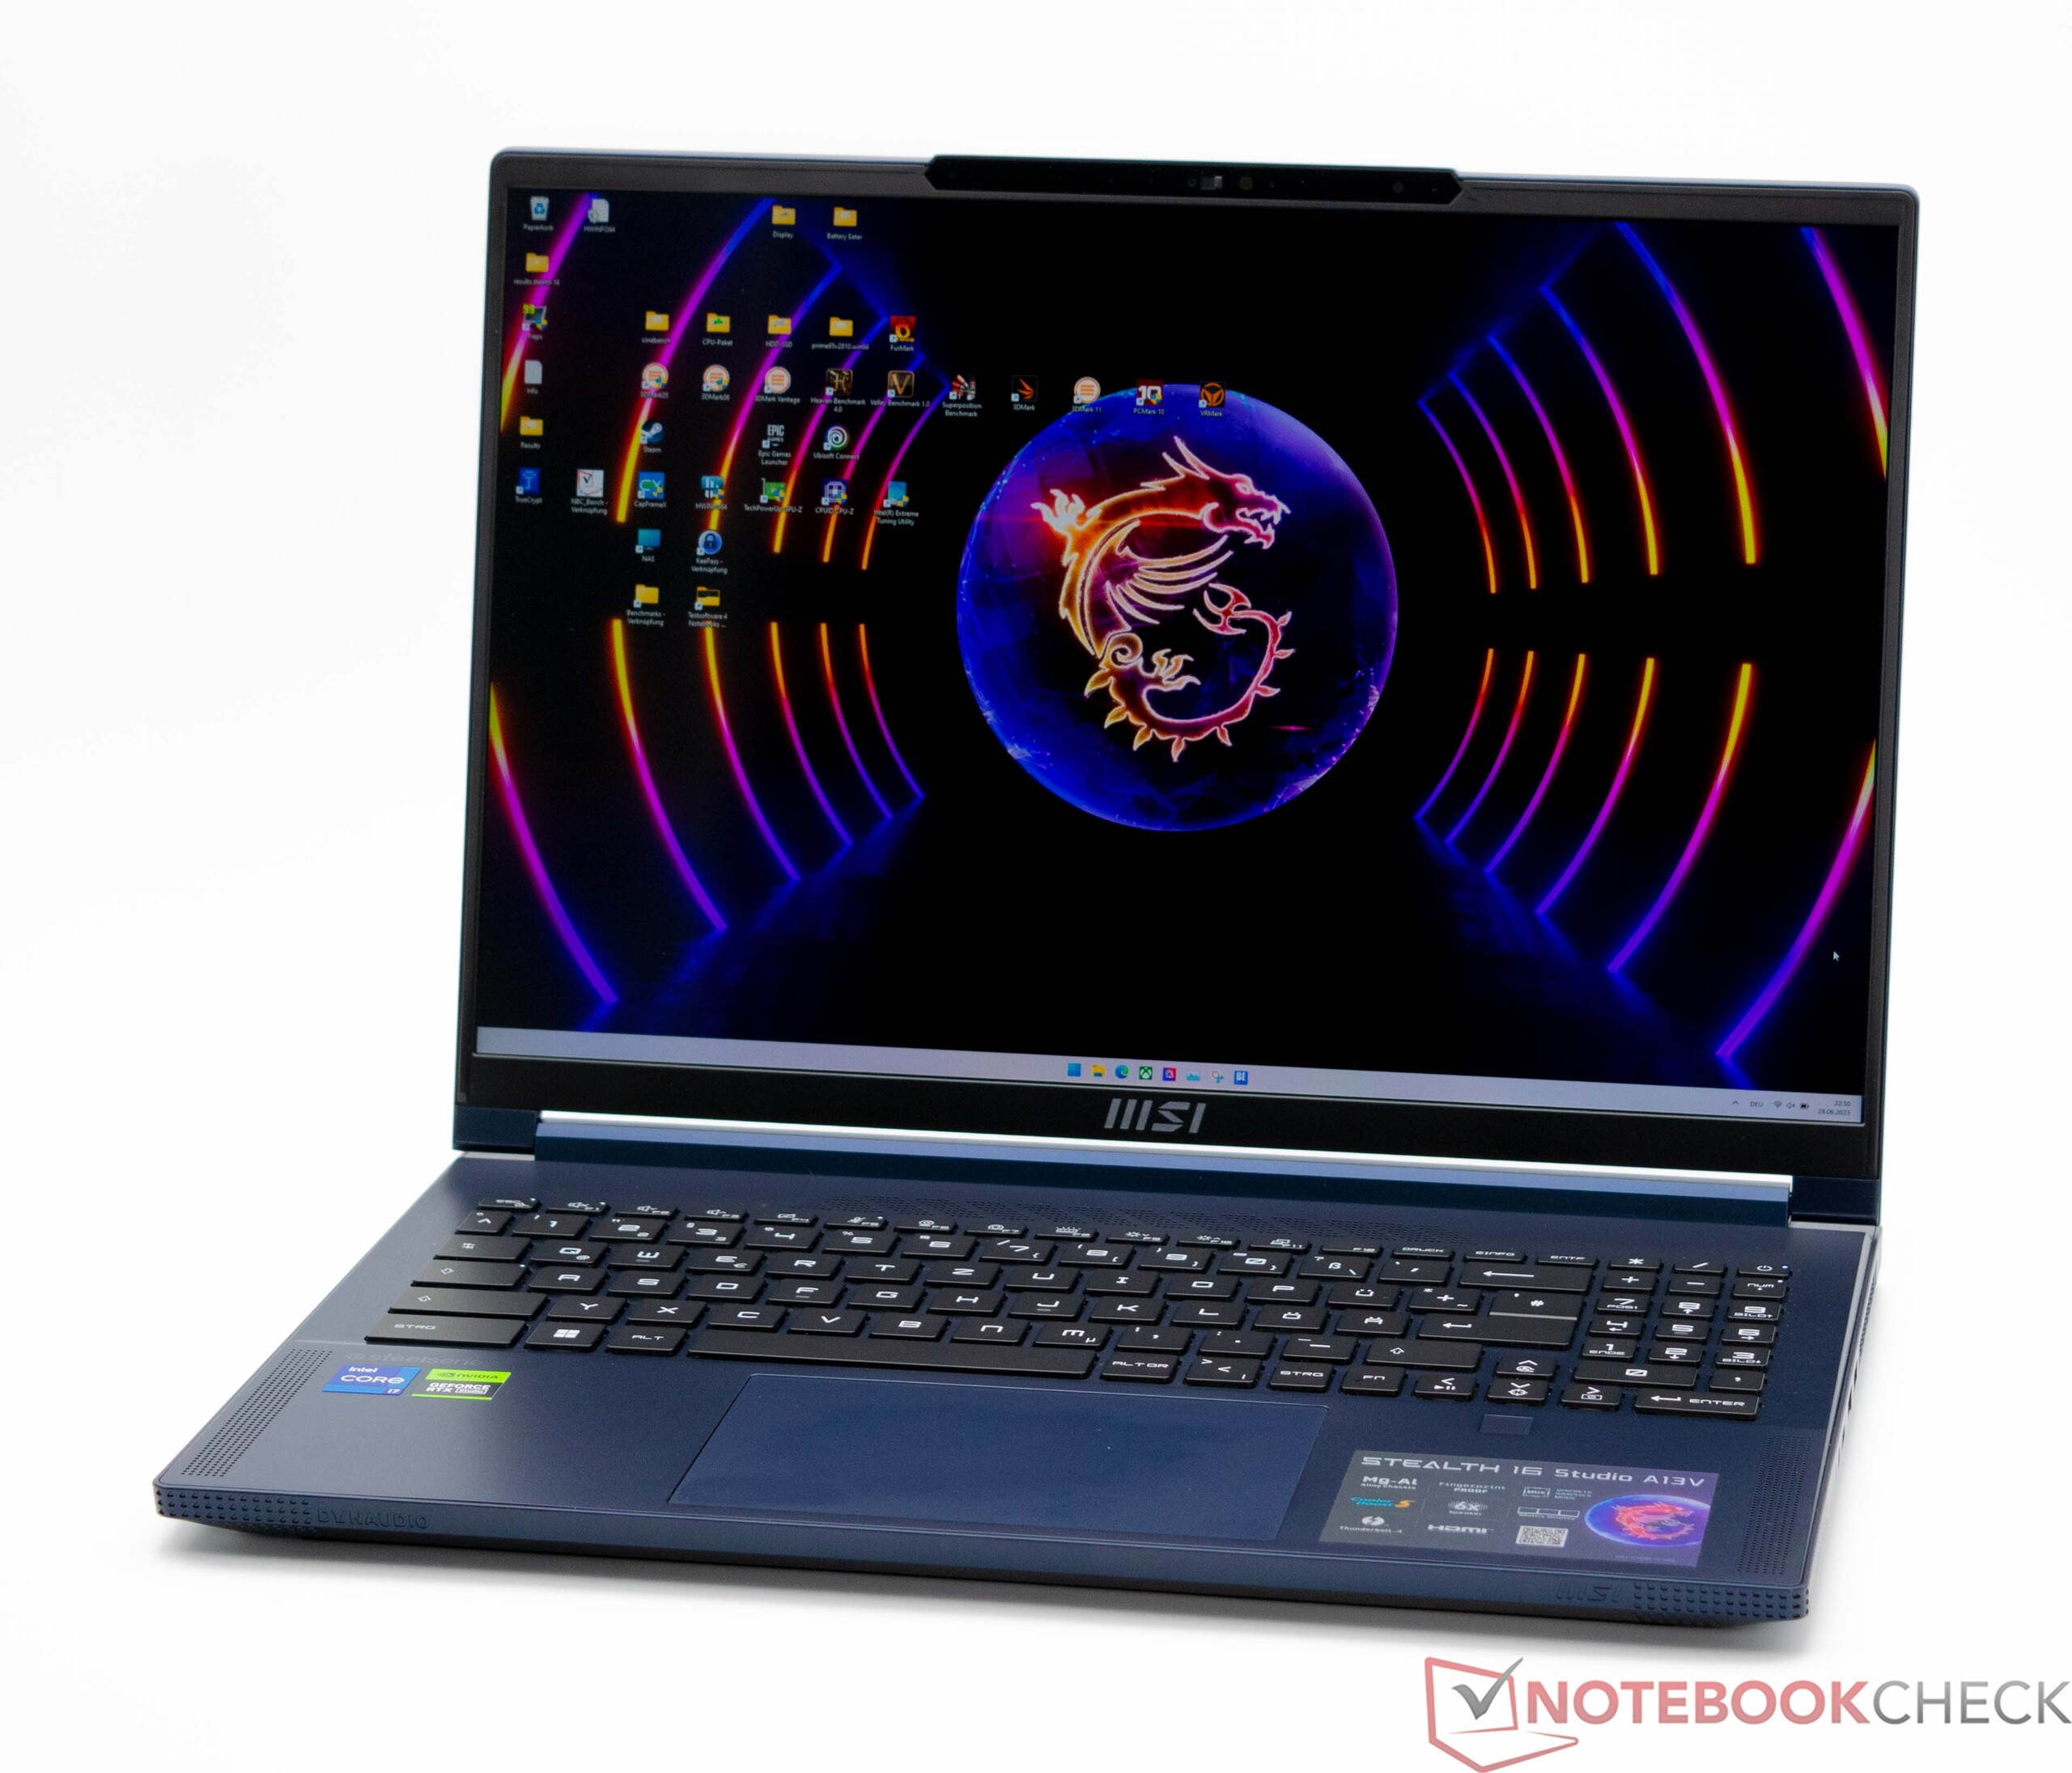
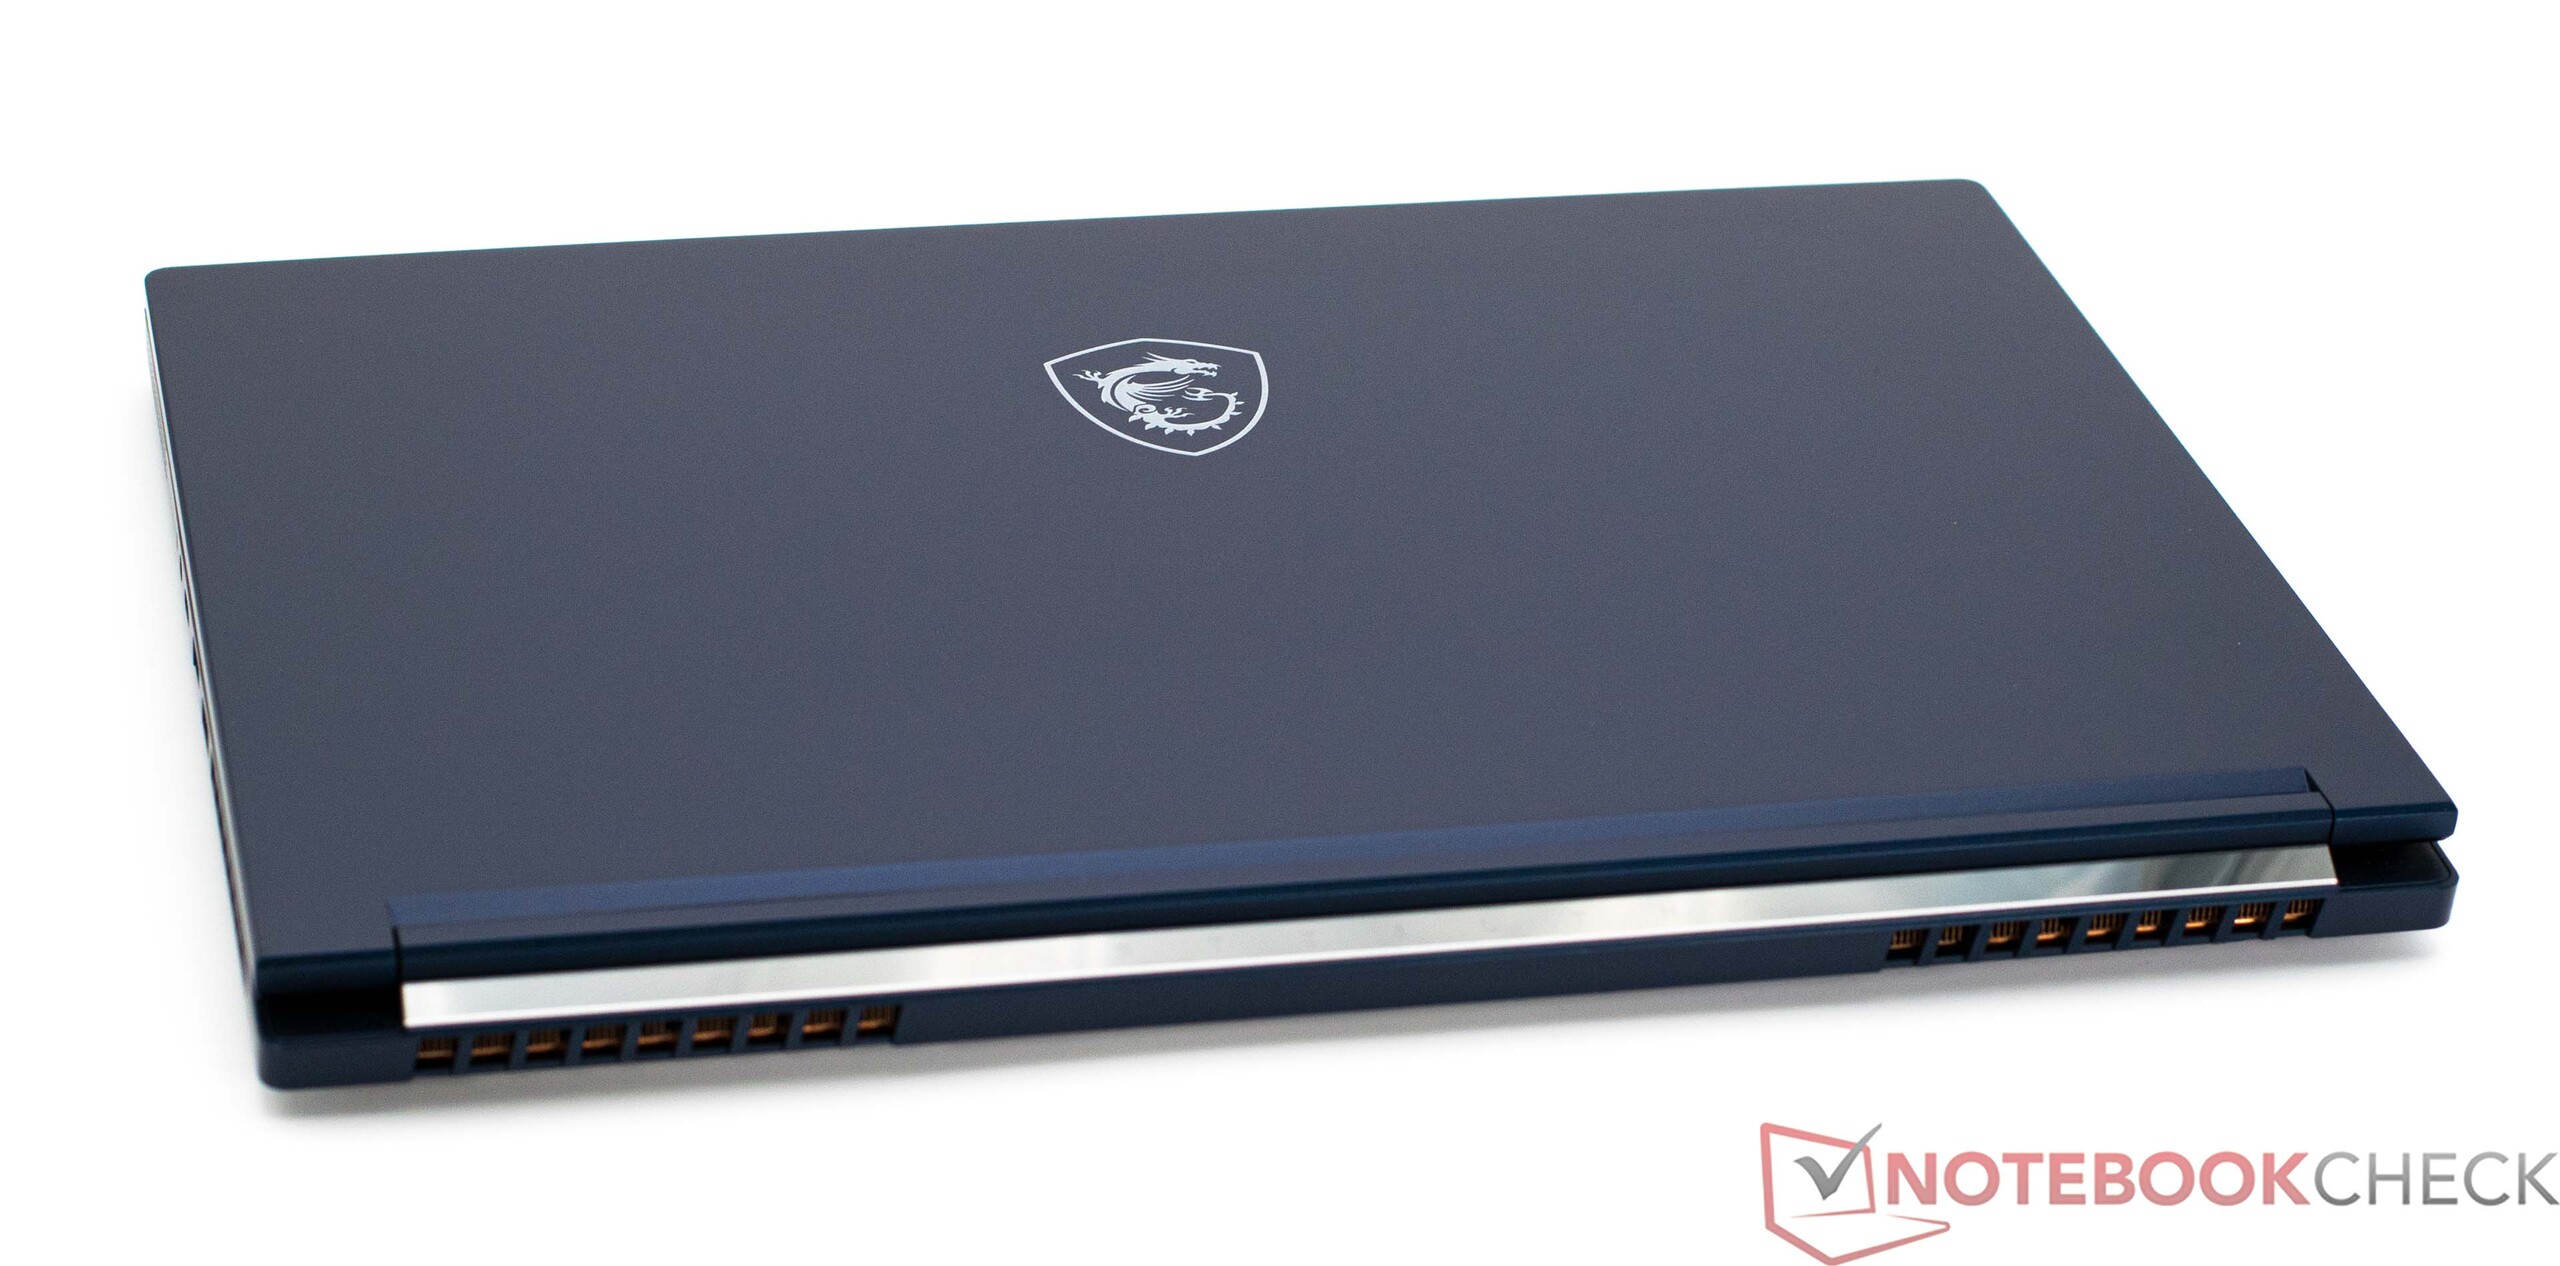
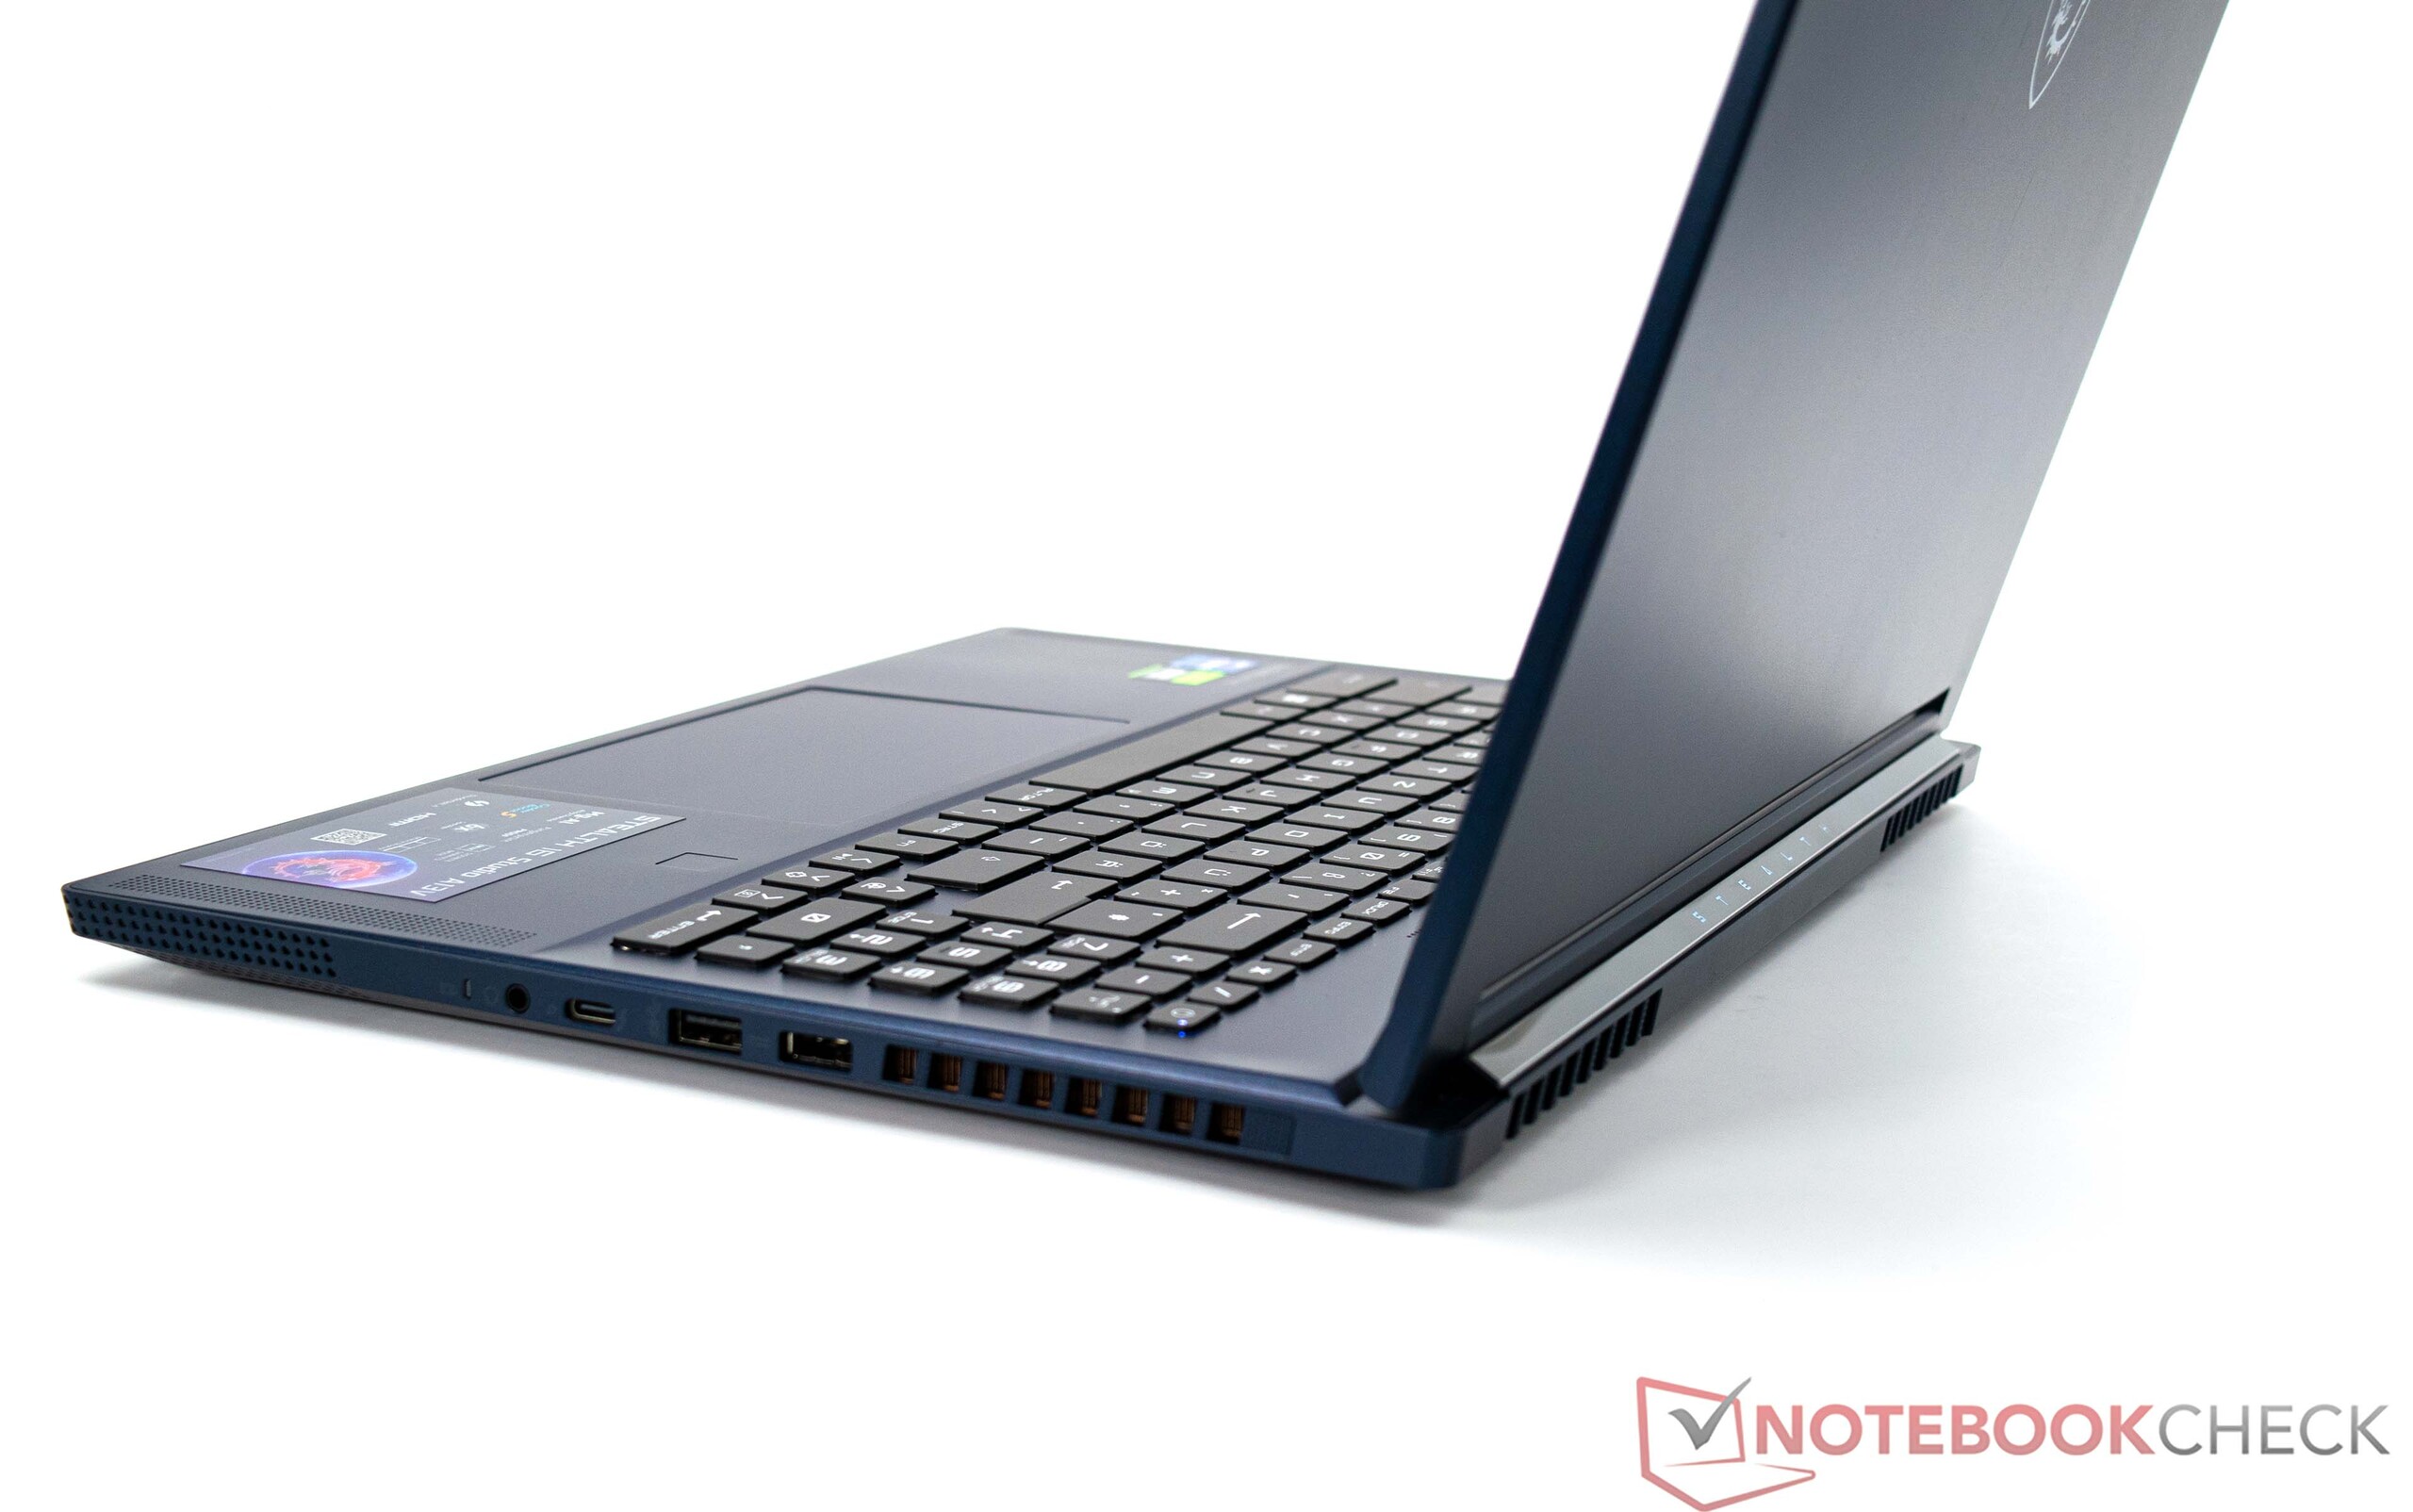
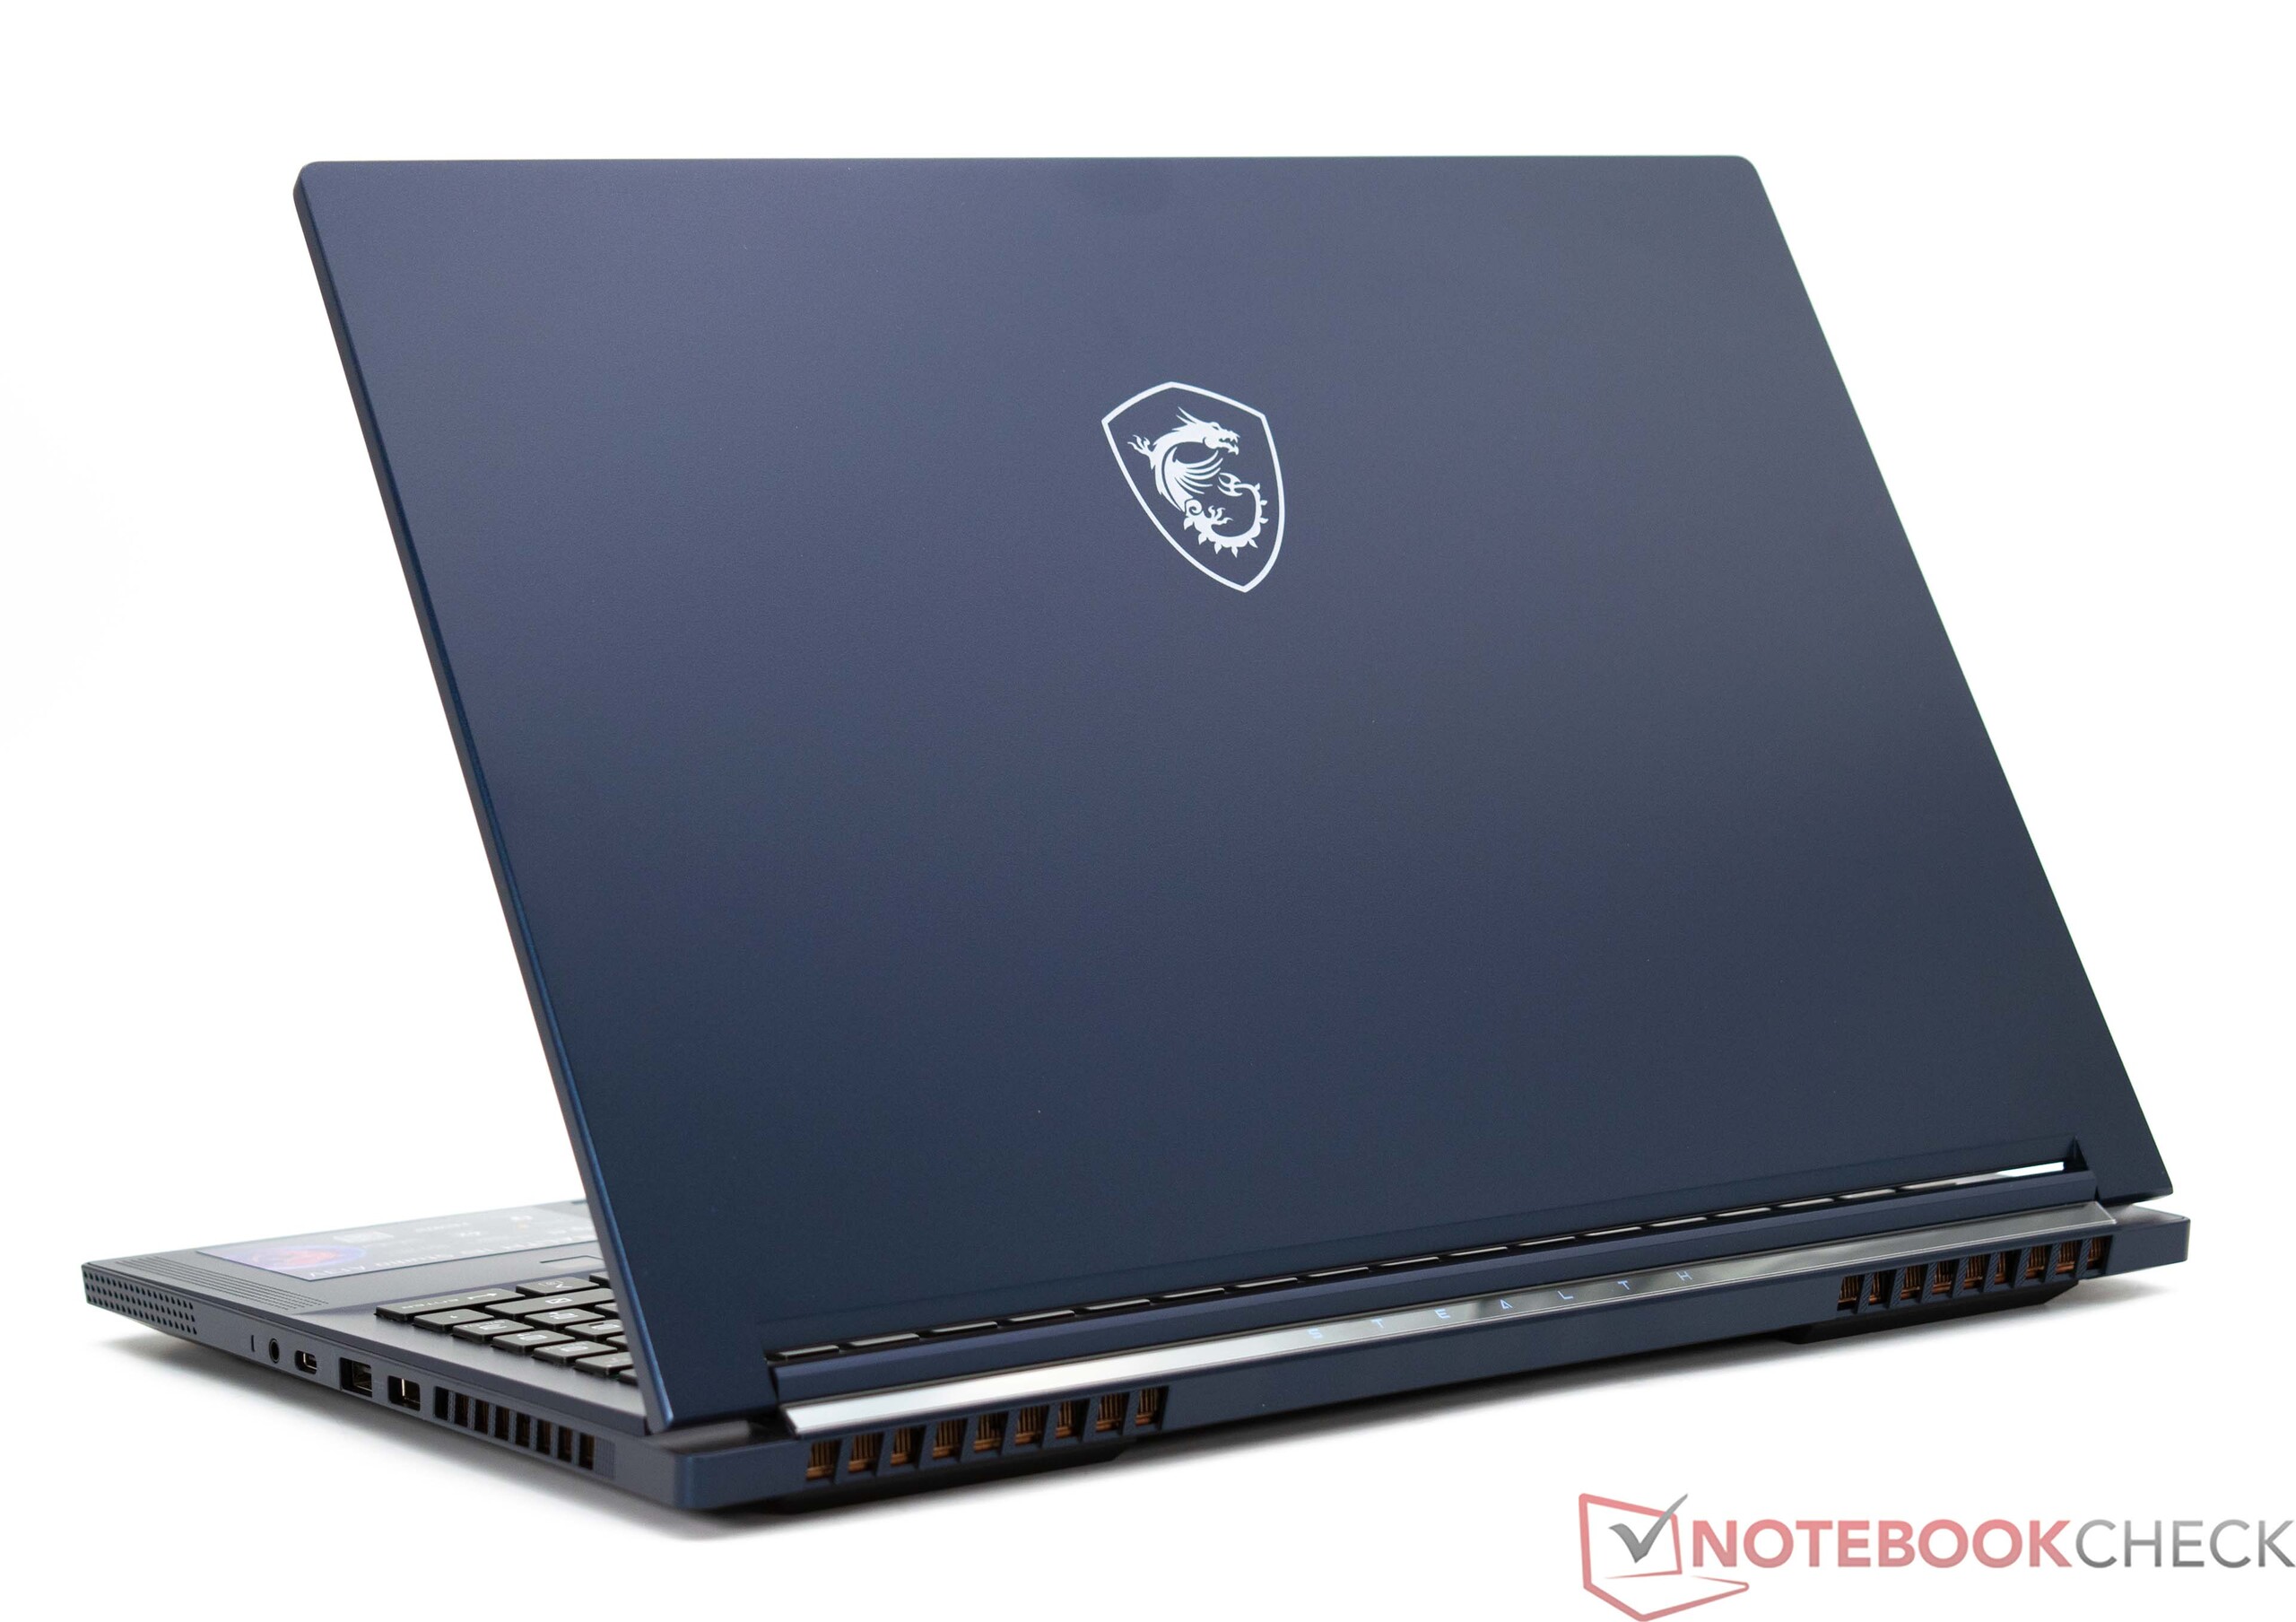
O MSI Stealth 16 Studio A13VG utiliza principalmente materiais de alta qualidade. A combinação de alumínio e magnésio confere ao dispositivo não apenas um ar de delicadeza e boa estabilidade, mas também reduz seu peso. A aplicação de pressão seletiva resulta em uma flexão mínima da base, mas somente se for aplicada uma pressão modesta. Por outro lado, a tampa do gabinete pode ser levemente torcida, embora isso não pareça ser um aspecto extremamente negativo no MSI Stealth 16 Studio A13VG. As dobradiças fazem um bom trabalho e ajudam a evitar que a tampa fique balançando para frente e para trás. No entanto, o dispositivo pode ser aberto com uma mão. Do ponto de vista do design, o laptop é discreto e não tem muita iluminação RGB. Na parte traseira, apenas a inscrição "Stealth" é sutilmente iluminada. Nosso dispositivo de análise é azul, mas, alternativamente, o MSI Stealth 16 Studio também vem completamente em branco.
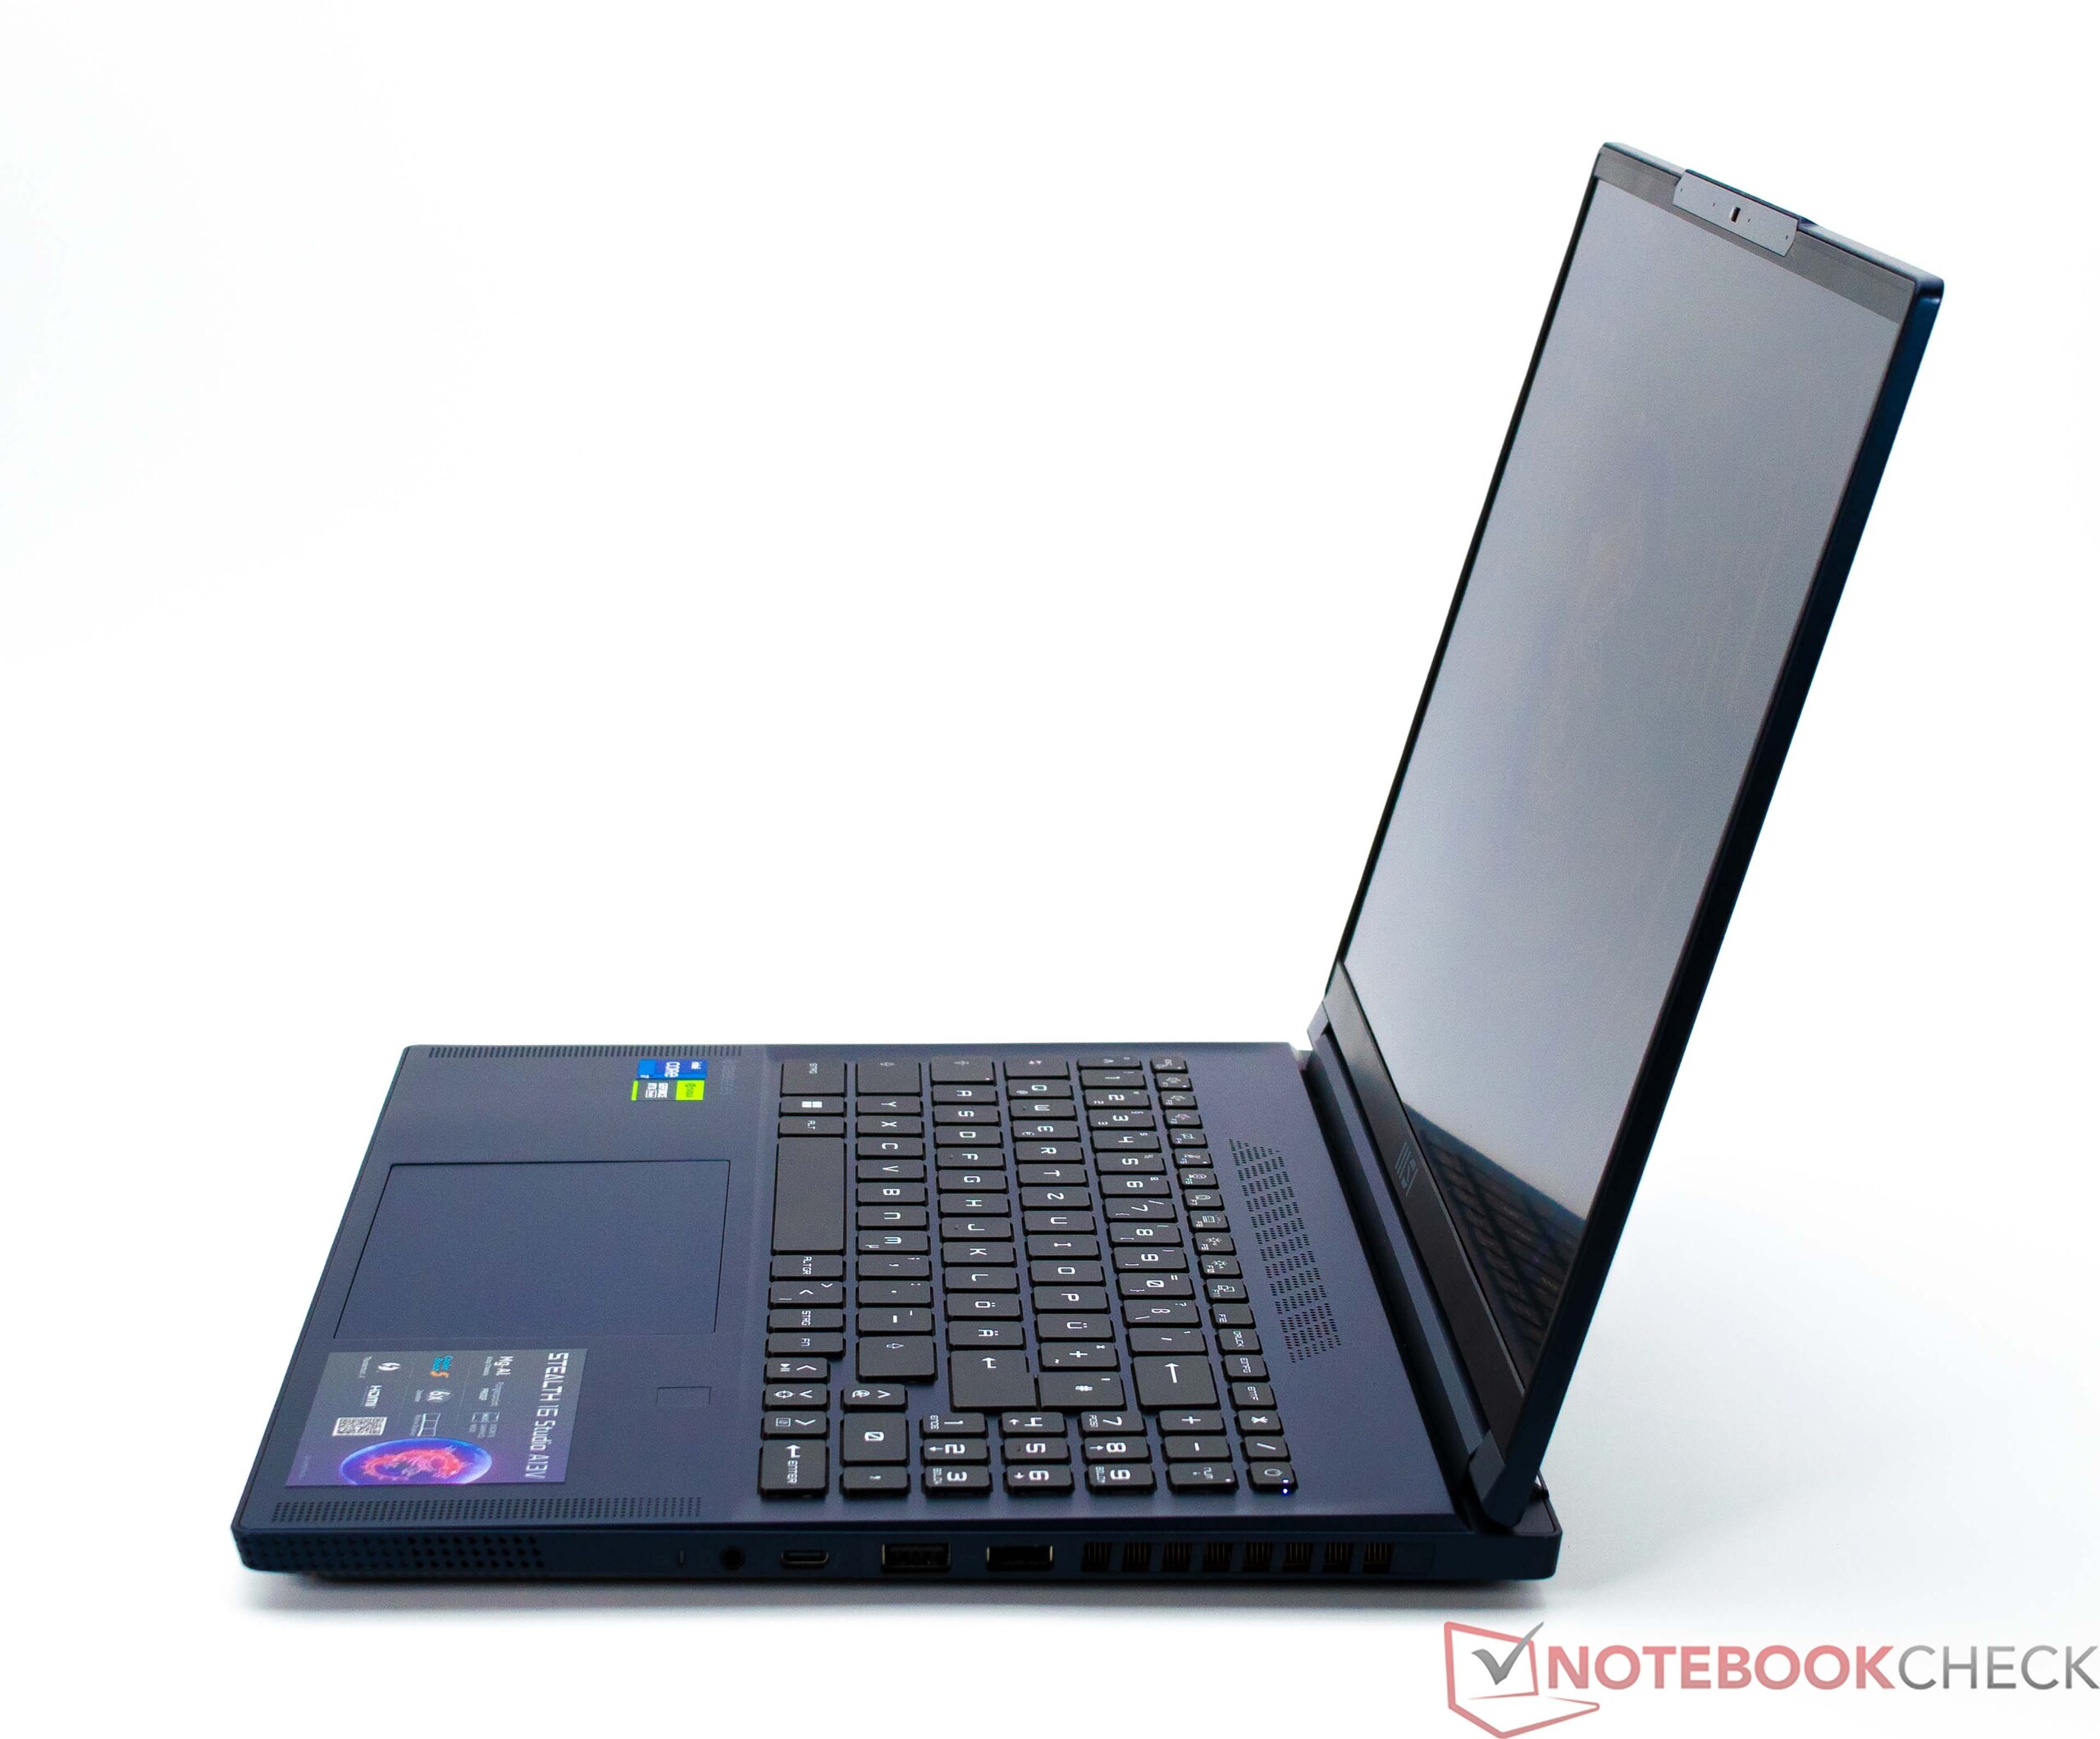
Quando se trata do espaço ocupado pelo laptop, todos os dispositivos aqui ocupam mais ou menos a mesma quantidade de espaço. Por outro lado, em termos de peso, o MSI Stealth 16 Studio A13VG é um dos candidatos mais leves em nossa comparação, com o dispositivo chegando à balança com pouco mais de 2 kg. A PSU pesa 576 gramas.
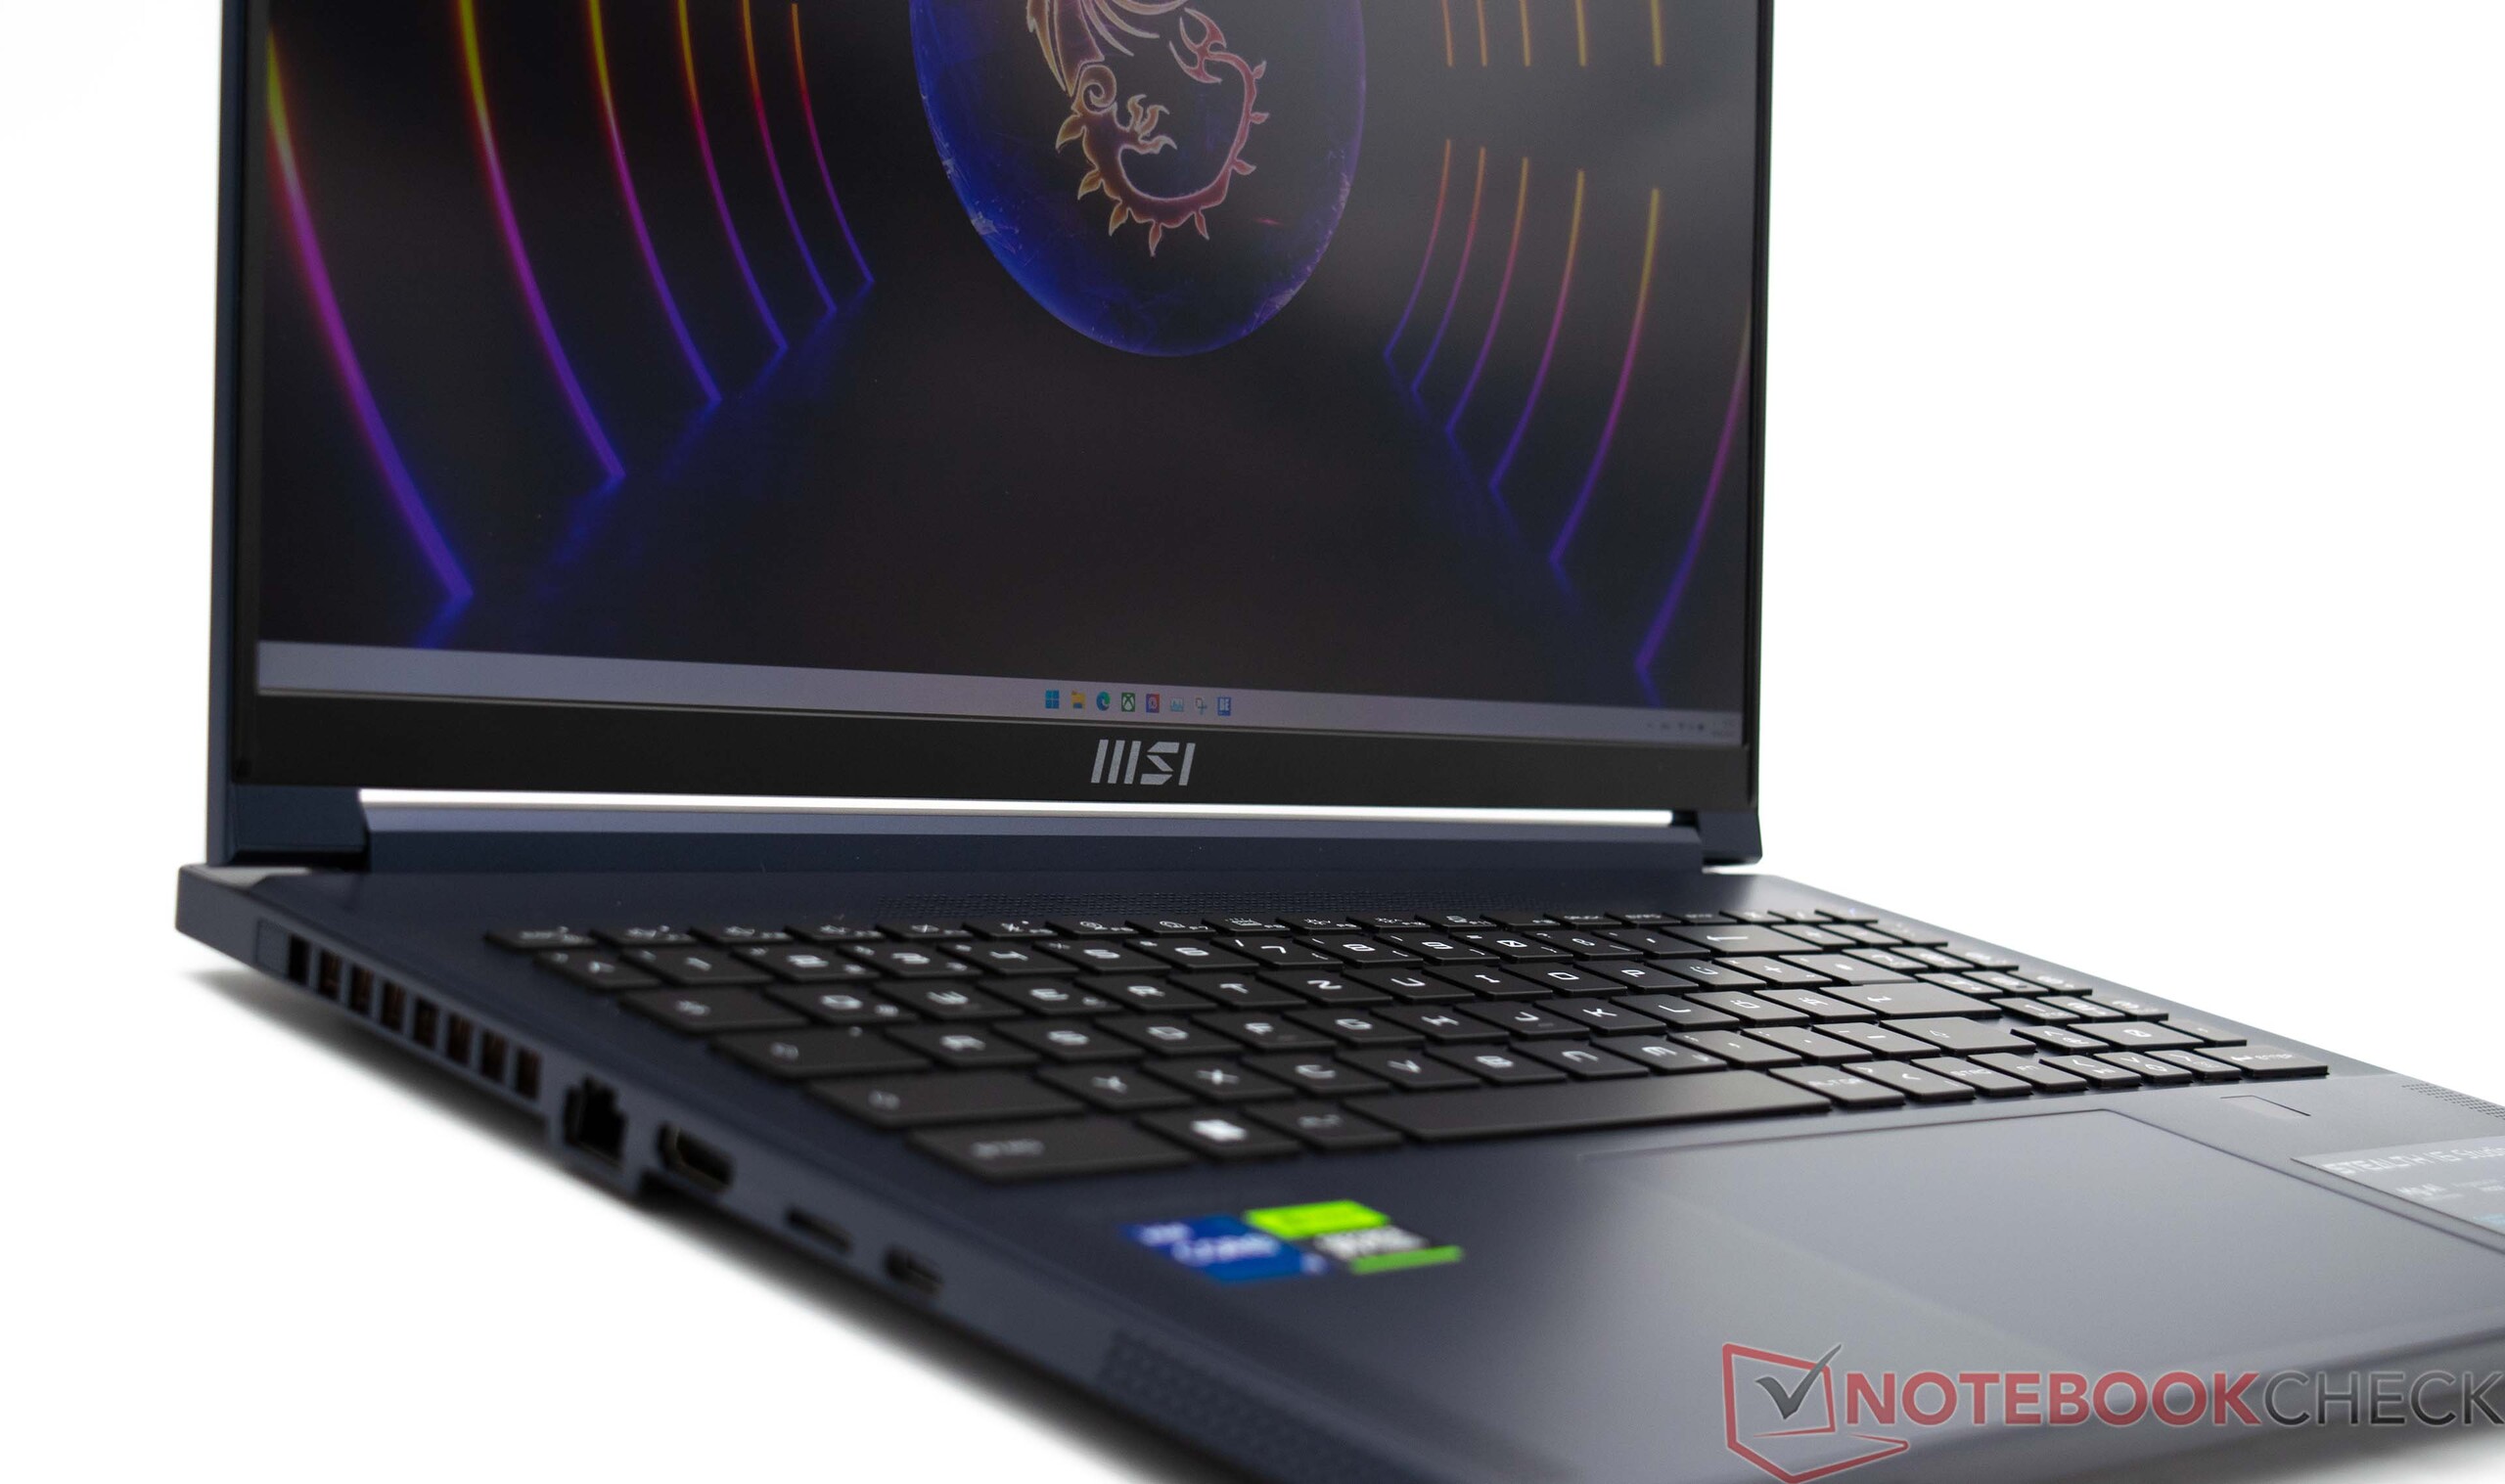
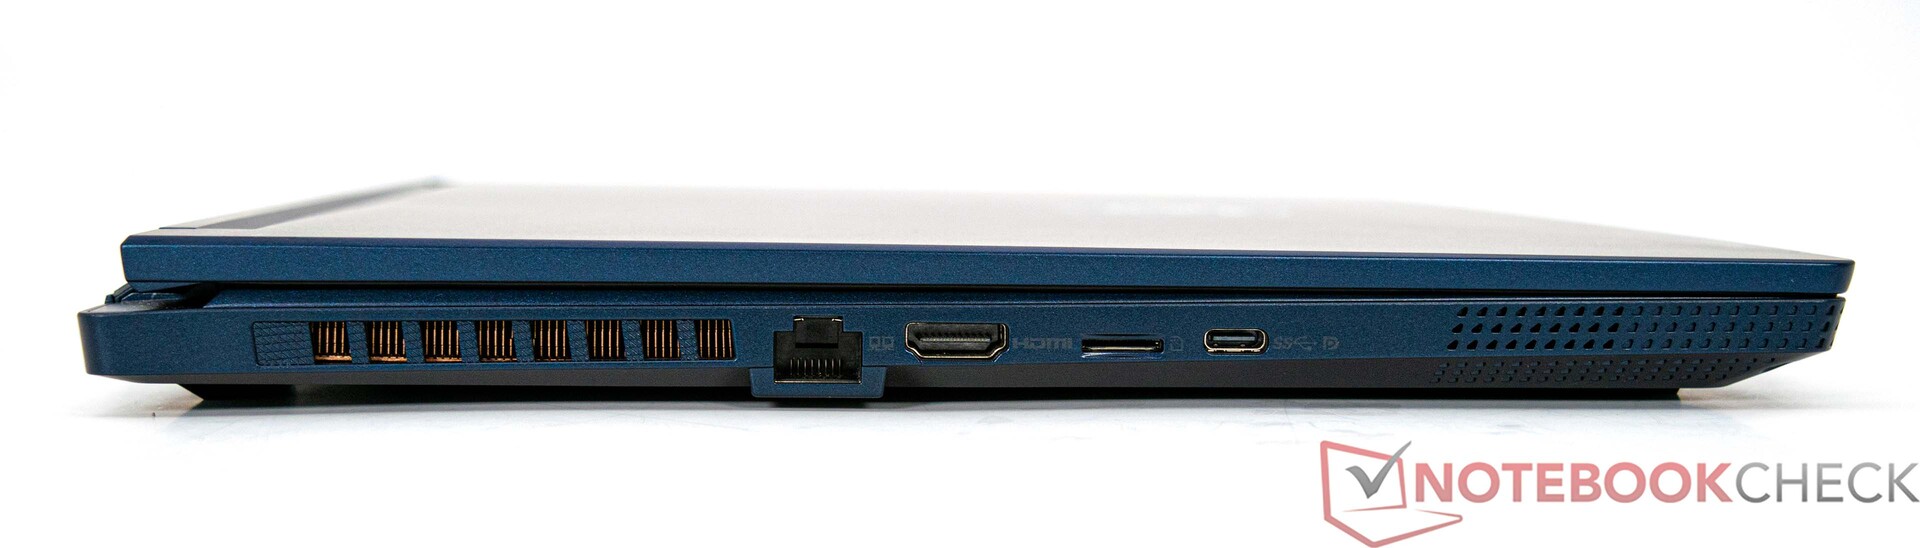
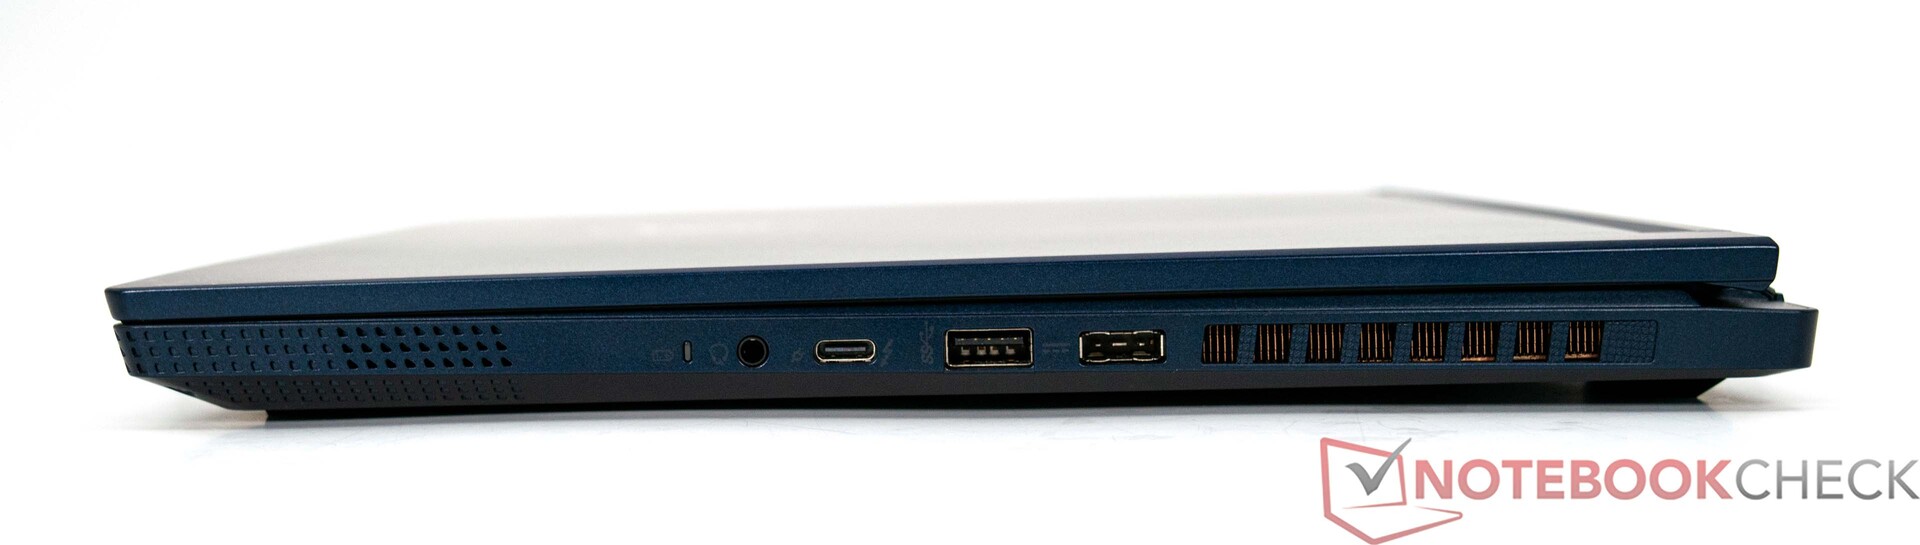
Recursos - organizado e com Thunderbolt 4
Infelizmente, o MSI Stealth 16 Studio A13VG não vem com uma quantidade particularmente generosa de portas. No entanto, as interfaces fornecidas devem ser suficientes para a maioria dos usuários em situações cotidianas. Pelo menos uma porta Thunderbolt 4 moderna com Power Delivery (PD) está incluída. Porém, os usuários estão limitados a apenas uma porta USB-A. Monitores externos podem ser conectados ao laptop via HDMI ou USB-C, o que significa que um total de três monitores pode ser usado simultaneamente.
Leitor de cartão SD
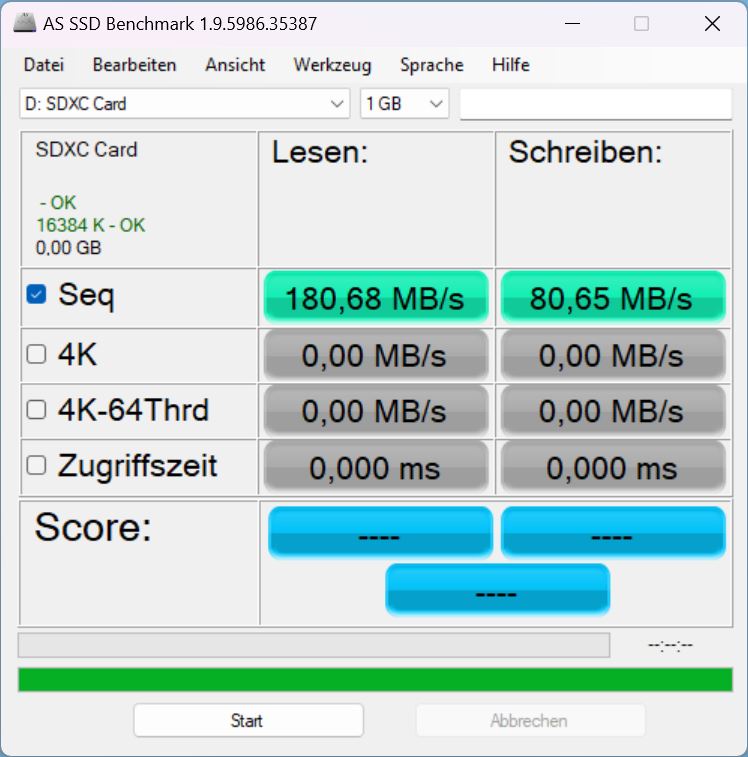
O MSI Stealth 16 Studio A13VG é equipado com um leitor de cartão que pode receber cartões de memória microSD. O leitor de cartão suporta o rápido padrão UHS-II. Em nossos testes, registramos excelentes resultados usando nosso cartão de referência, o AV PRO microSD 128 GB V60. No entanto, os concorrentes da Asus e da Gigabyte também são impressionantes e obtiveram resultados ainda melhores na área de dados sequenciais.
| SD Card Reader | |
| average JPG Copy Test (av. of 3 runs) | |
| Gigabyte AERO 16 OLED BSF | |
| MSI Stealth 16 Studio A13VG | |
| Média da turma Gaming (20.9 - 210, n=53, últimos 2 anos) | |
| Asus ROG Flow X16 GV601V | |
| Corsair Voyager a1600 (AV Pro SD microSD 128 GB V60) | |
| Acer Nitro 16 AN16-41 (AV Pro SD microSD 128 GB V60) | |
| Medion Erazer Major X20 (AV PRO microSD 128 GB V60) | |
| maximum AS SSD Seq Read Test (1GB) | |
| Asus ROG Flow X16 GV601V | |
| Gigabyte AERO 16 OLED BSF | |
| MSI Stealth 16 Studio A13VG | |
| Média da turma Gaming (25.5 - 261, n=50, últimos 2 anos) | |
| Corsair Voyager a1600 (AV Pro SD microSD 128 GB V60) | |
| Medion Erazer Major X20 (AV PRO microSD 128 GB V60) | |
| Acer Nitro 16 AN16-41 (AV Pro SD microSD 128 GB V60) | |
Comunicação
Essencialmente, o módulo Wi-Fi instalado tem um desempenho decente. Comparado com seus concorrentes, o MSI Stealth 16 Studio A13VG não consegue se impor, embora nosso dispositivo de análise não tenha nada a esconder em termos do desempenho demonstrado aqui. Para isso, usamos nosso roteador de teste Asus ROG Rapture GT-AXE11000. Como alternativa, o MSI Stealth 16 Studio A13VG também oferece uma porta ethernet. São possíveis velocidades de transferência de até 2,5 GBit/s.
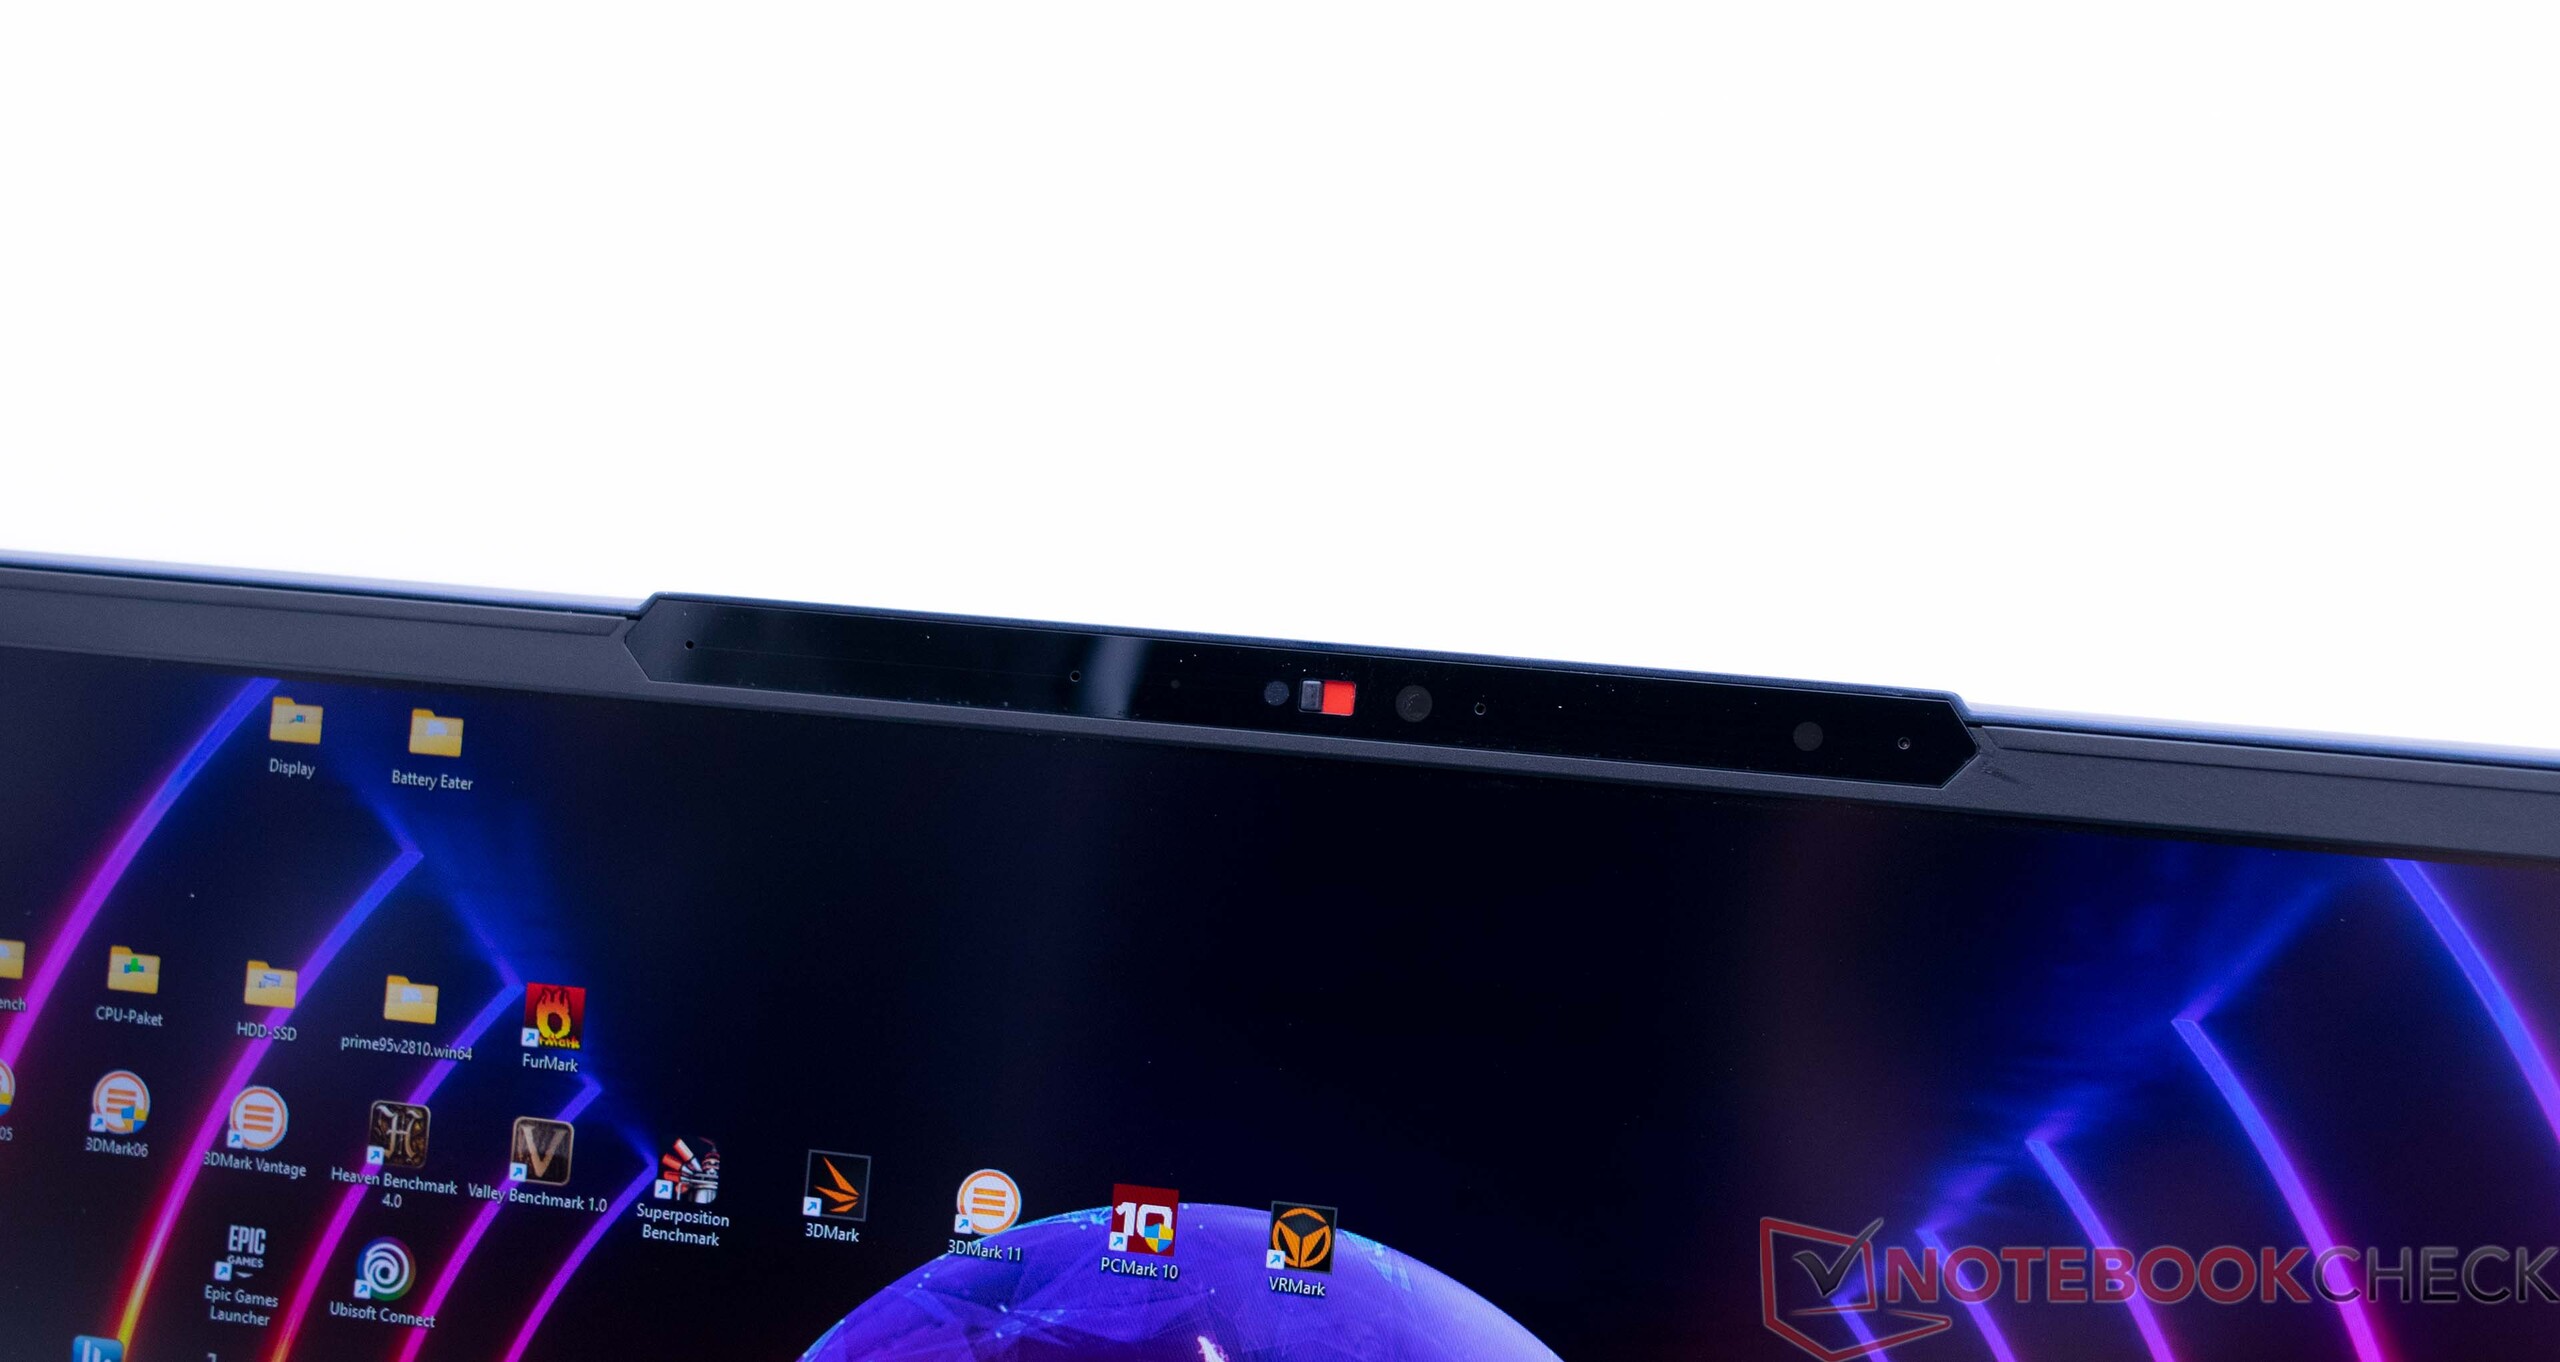
Webcam
O MSI Stealth 16 Studio A13VG vem com uma webcam FHD que é adequada para chamadas de vídeo simples. Alguns pontos foram deduzidos devido à baixa precisão das cores.


Segurança
O sensor de impressão digital integrado do MSI Stealth 16 Studio A13VG faz um bom trabalho e garante a autenticação descomplicada do sistema.
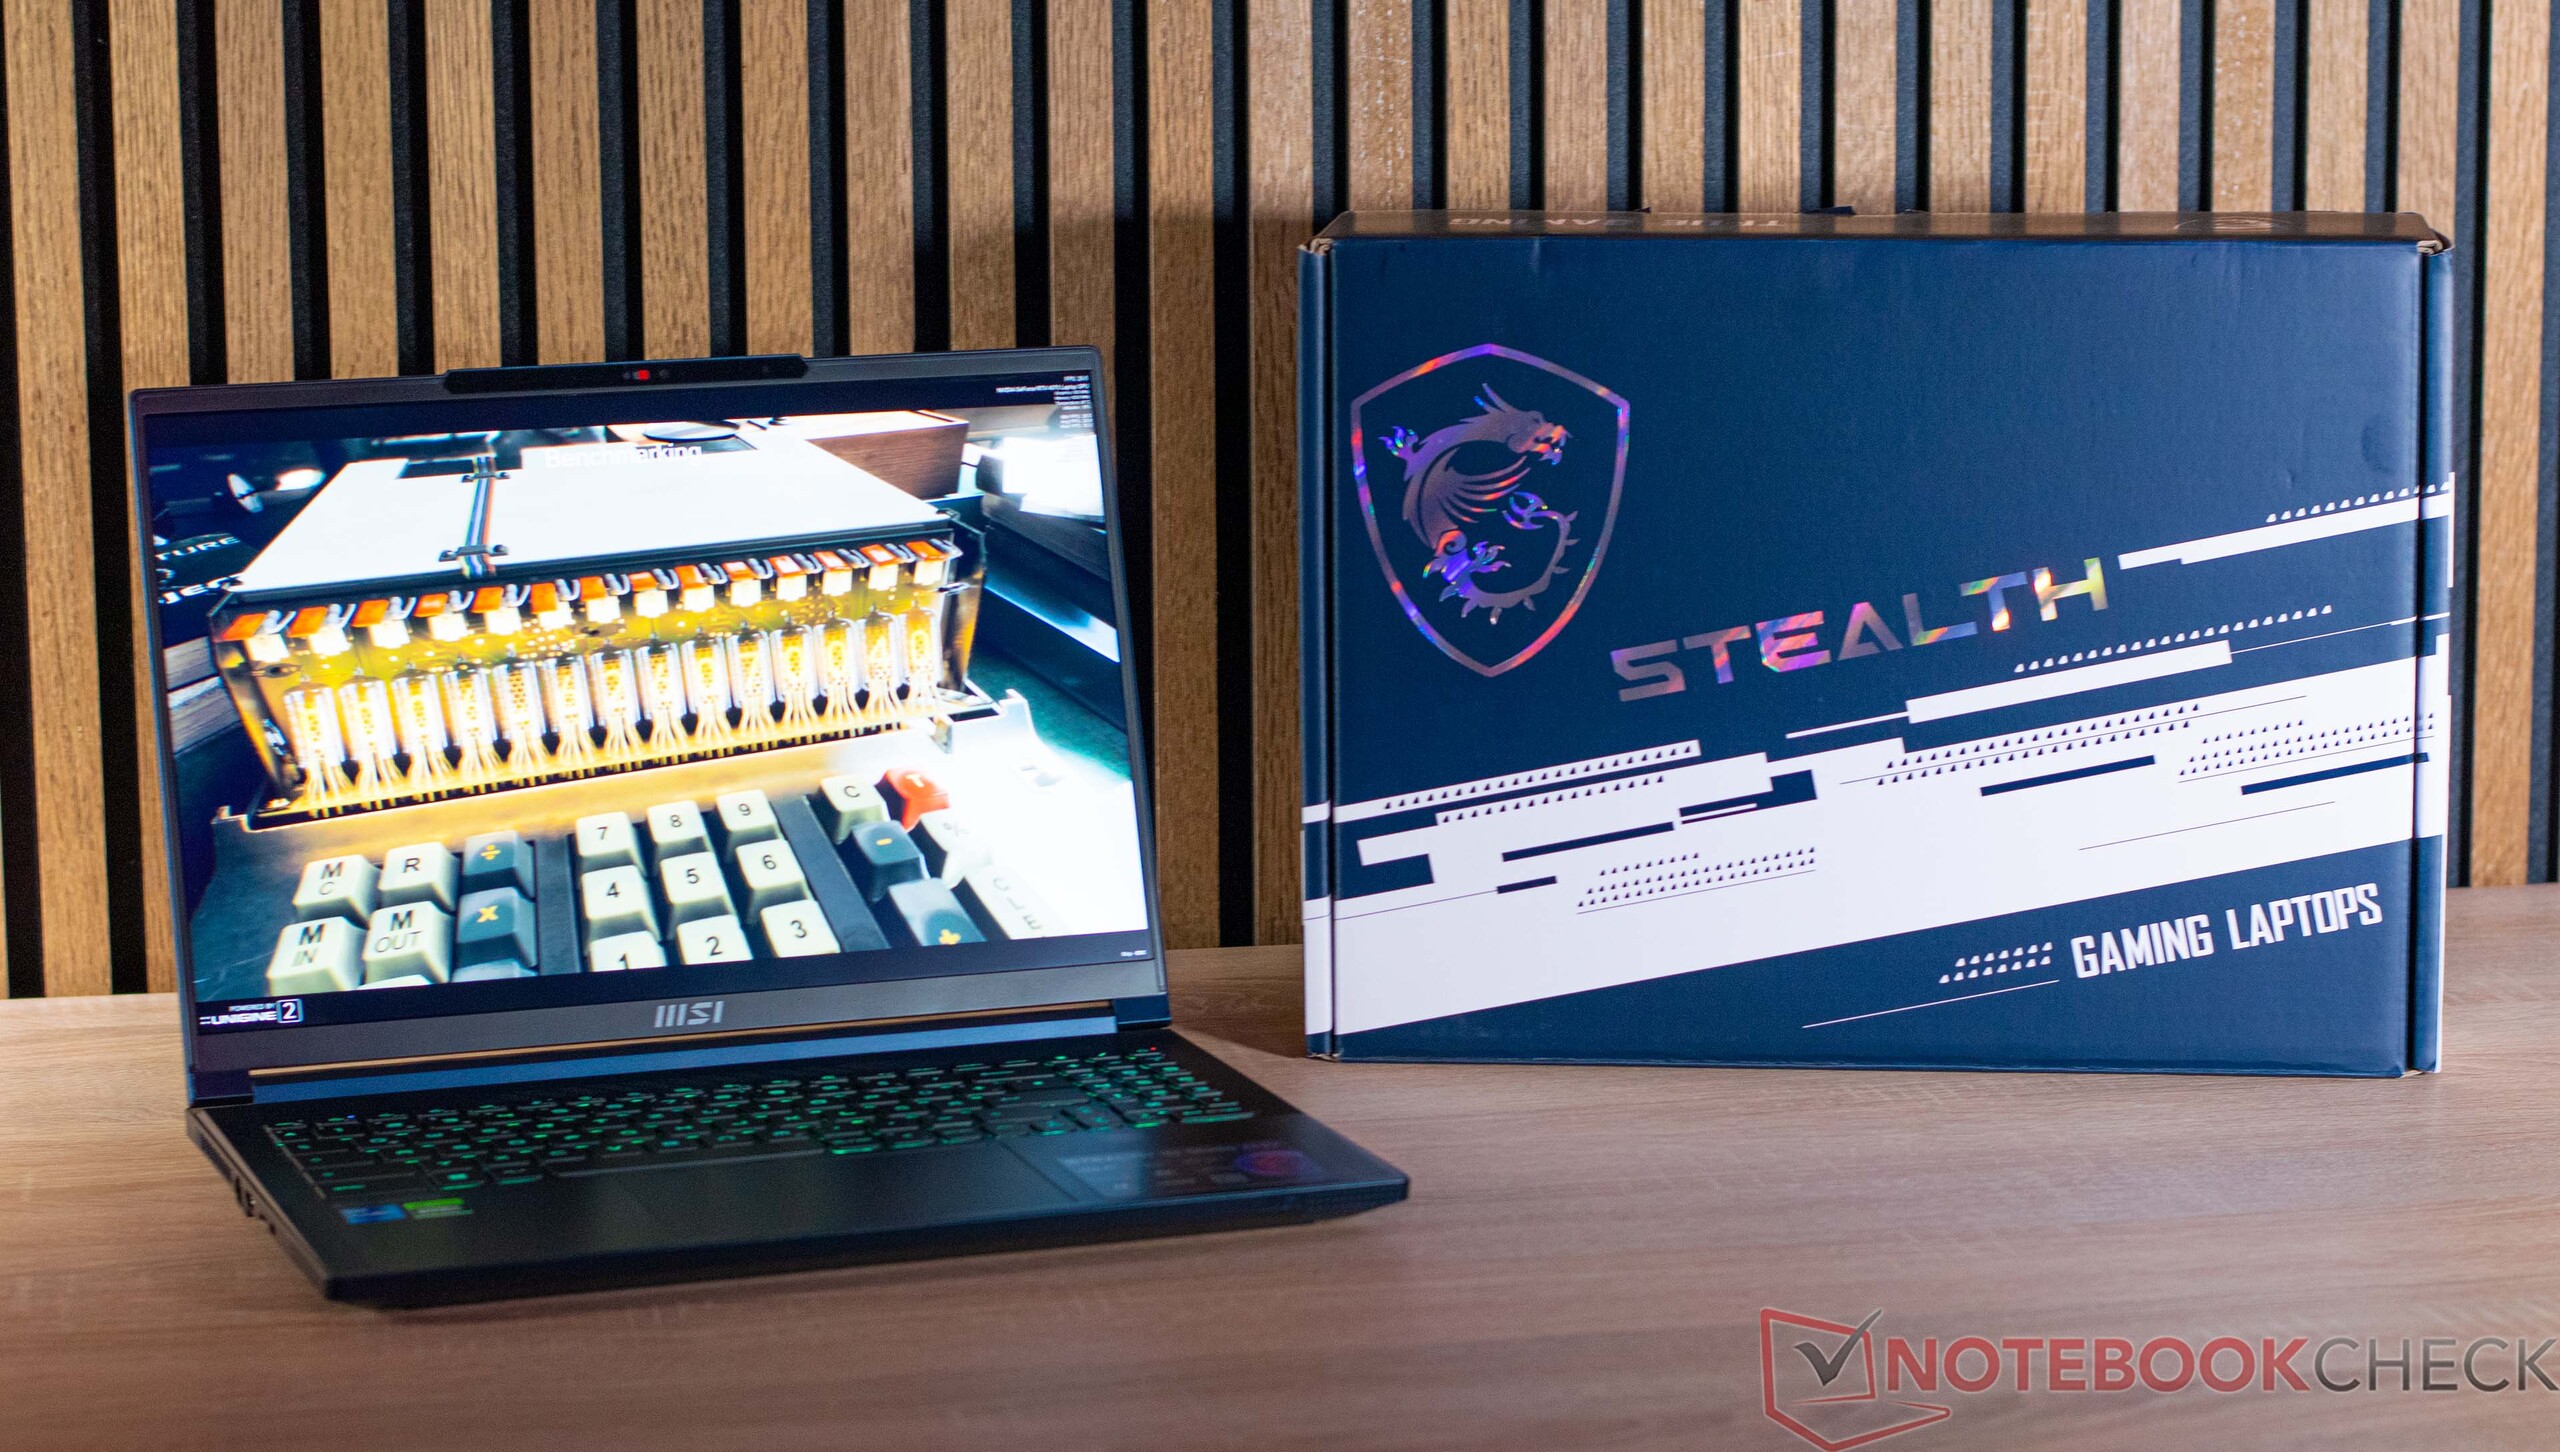
Acessórios
Na caixa, além do próprio dispositivo, há também uma fonte de alimentação de 240 watts e a documentação obrigatória.
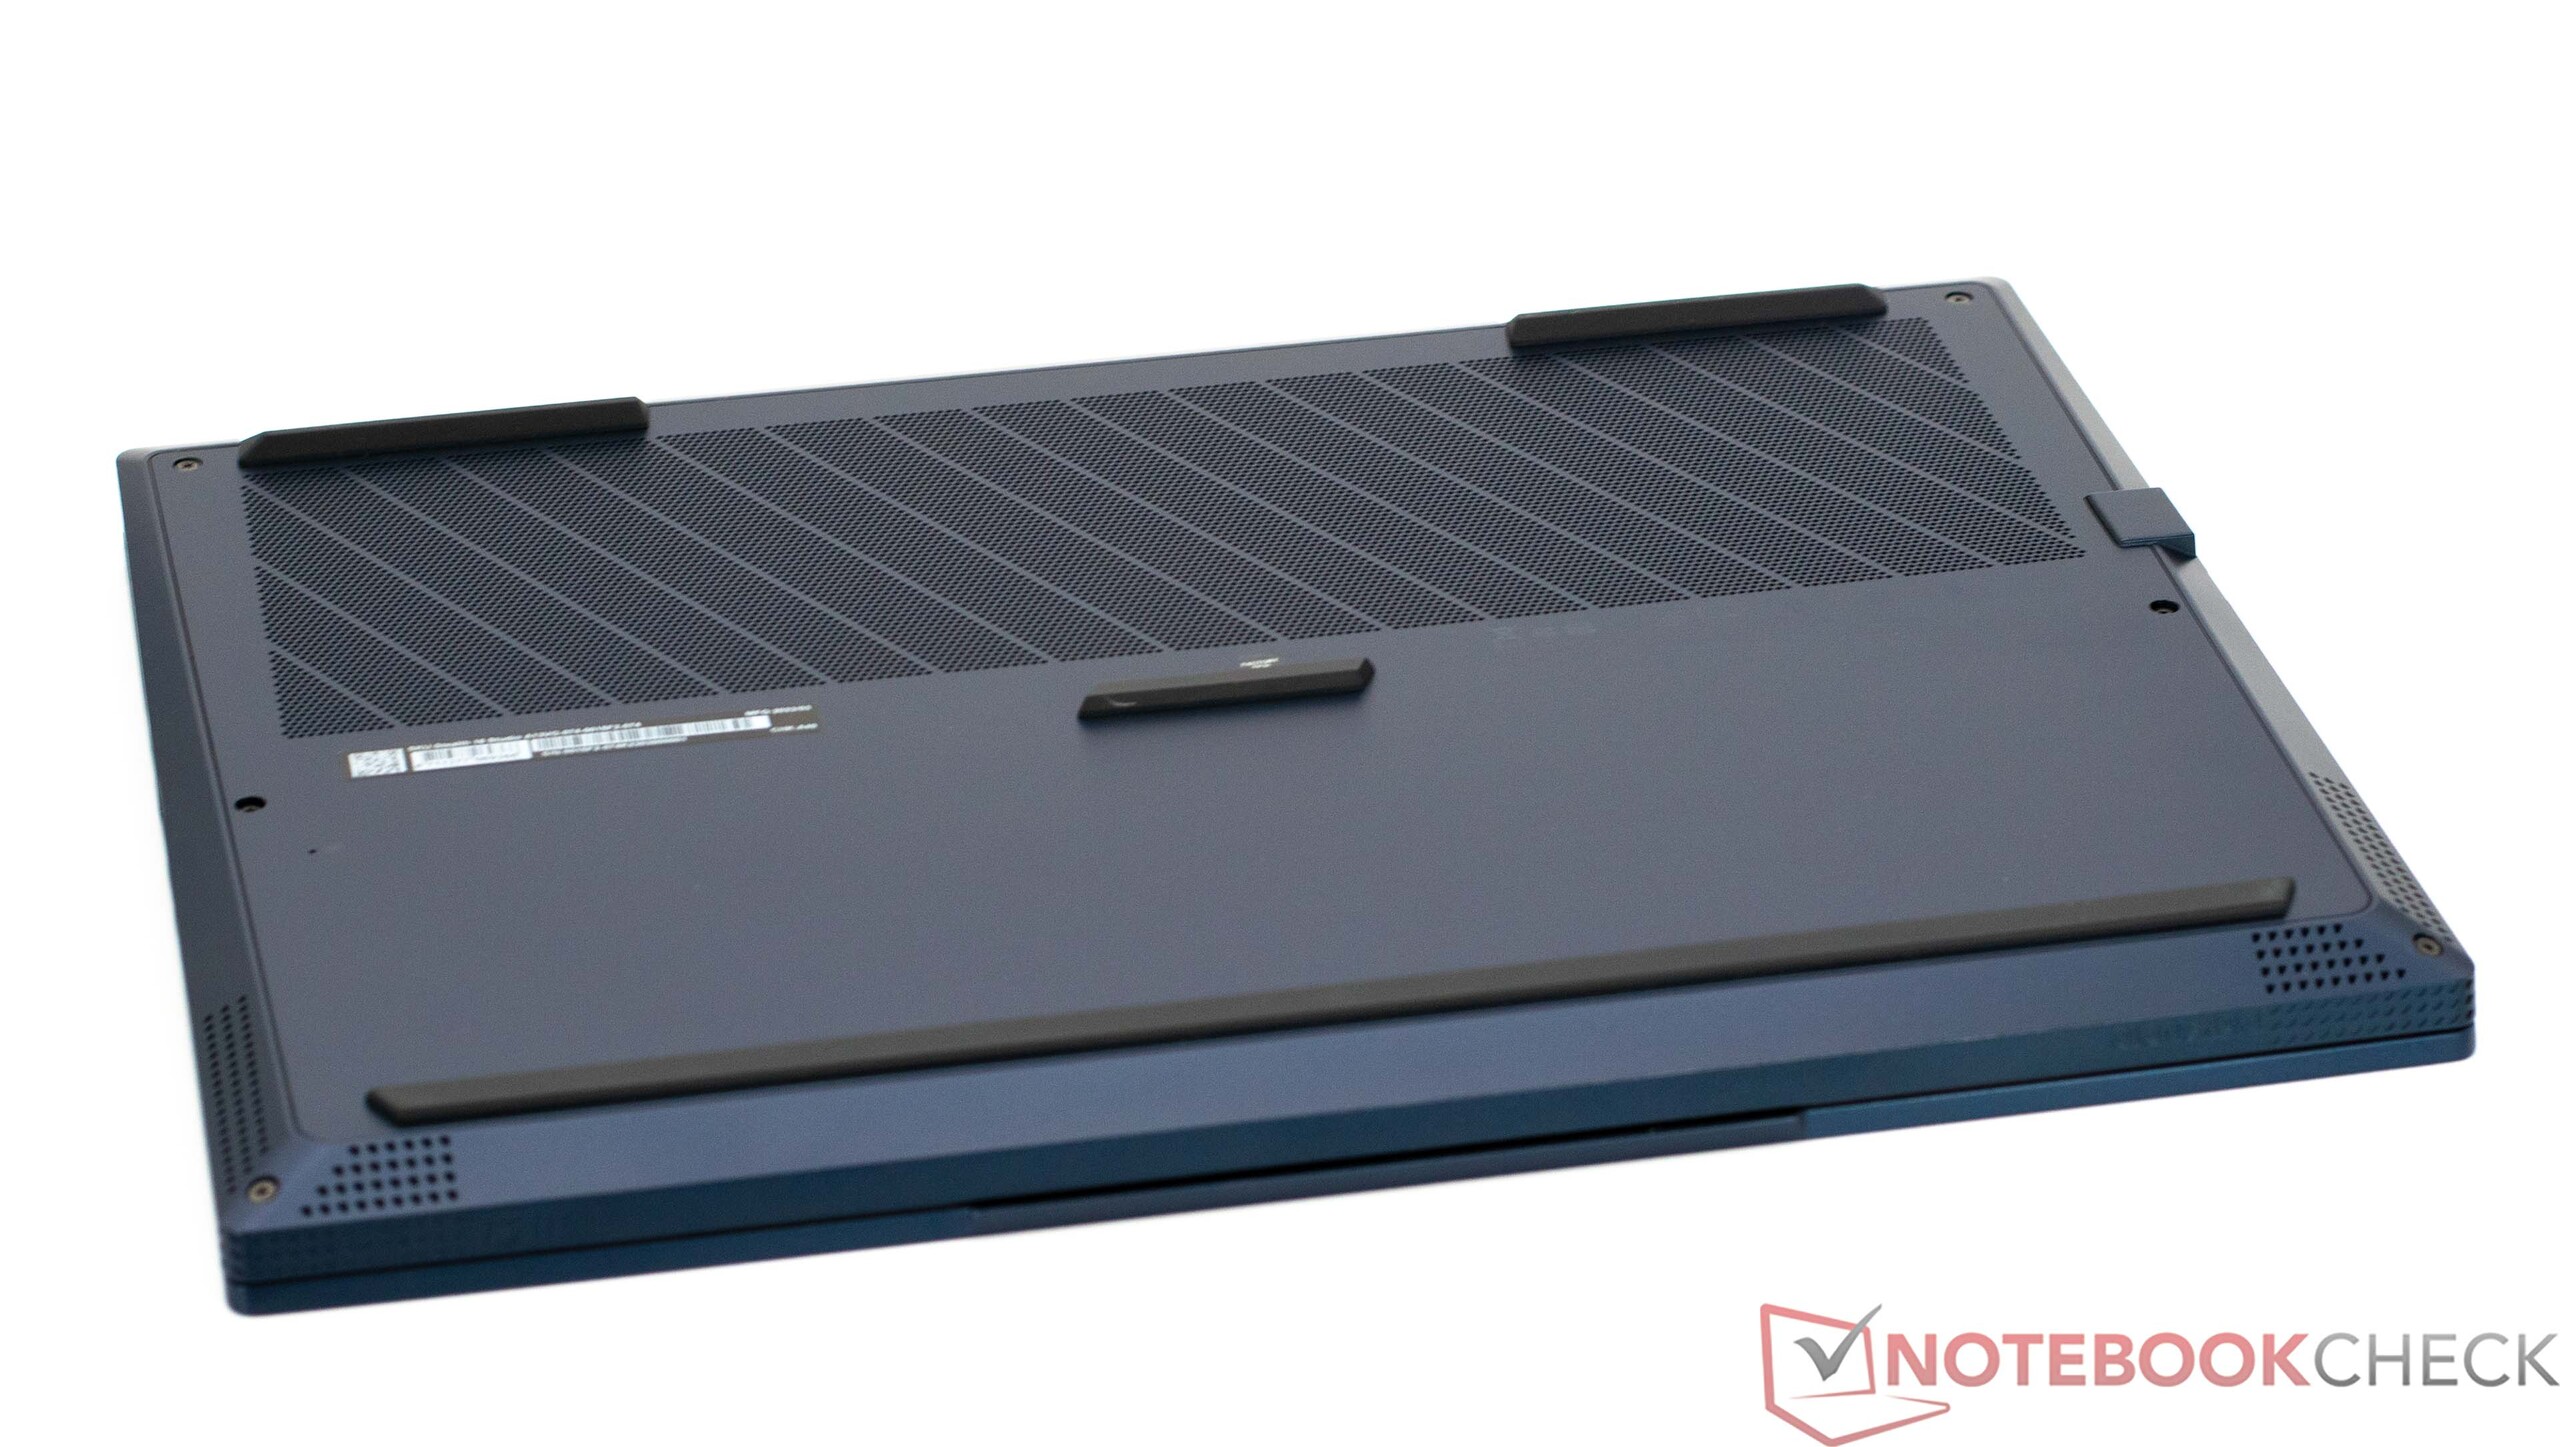
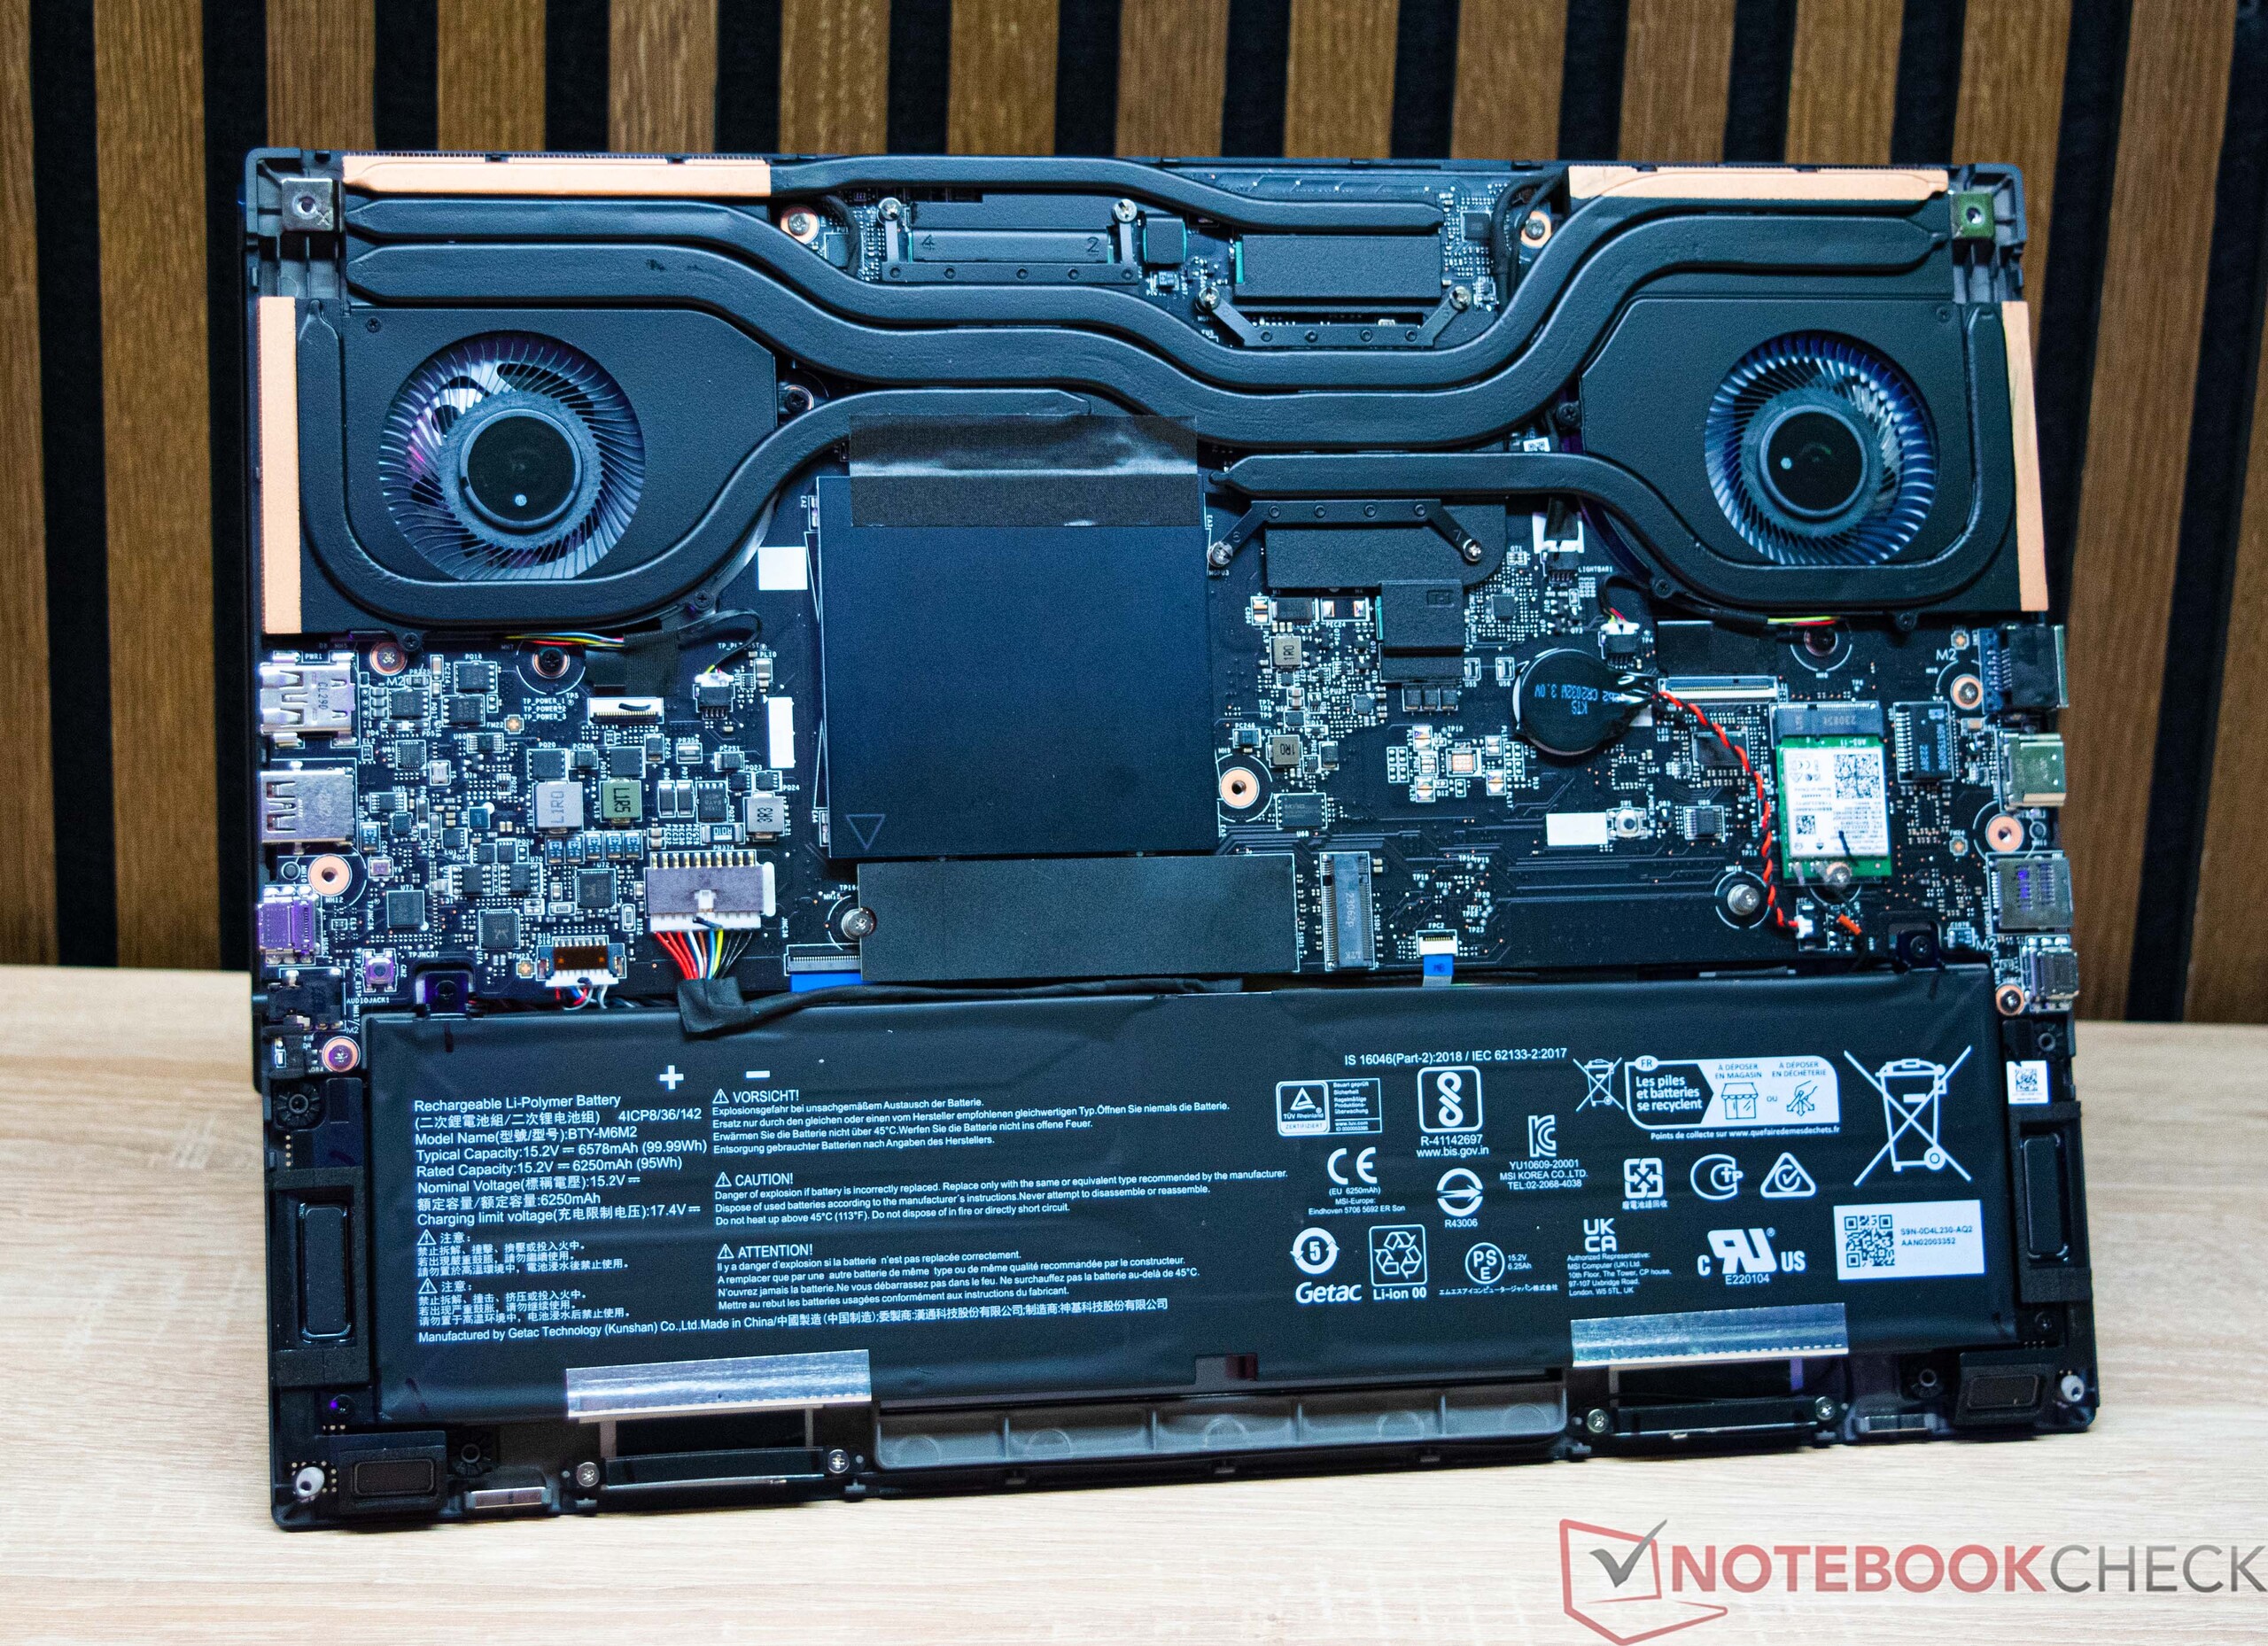
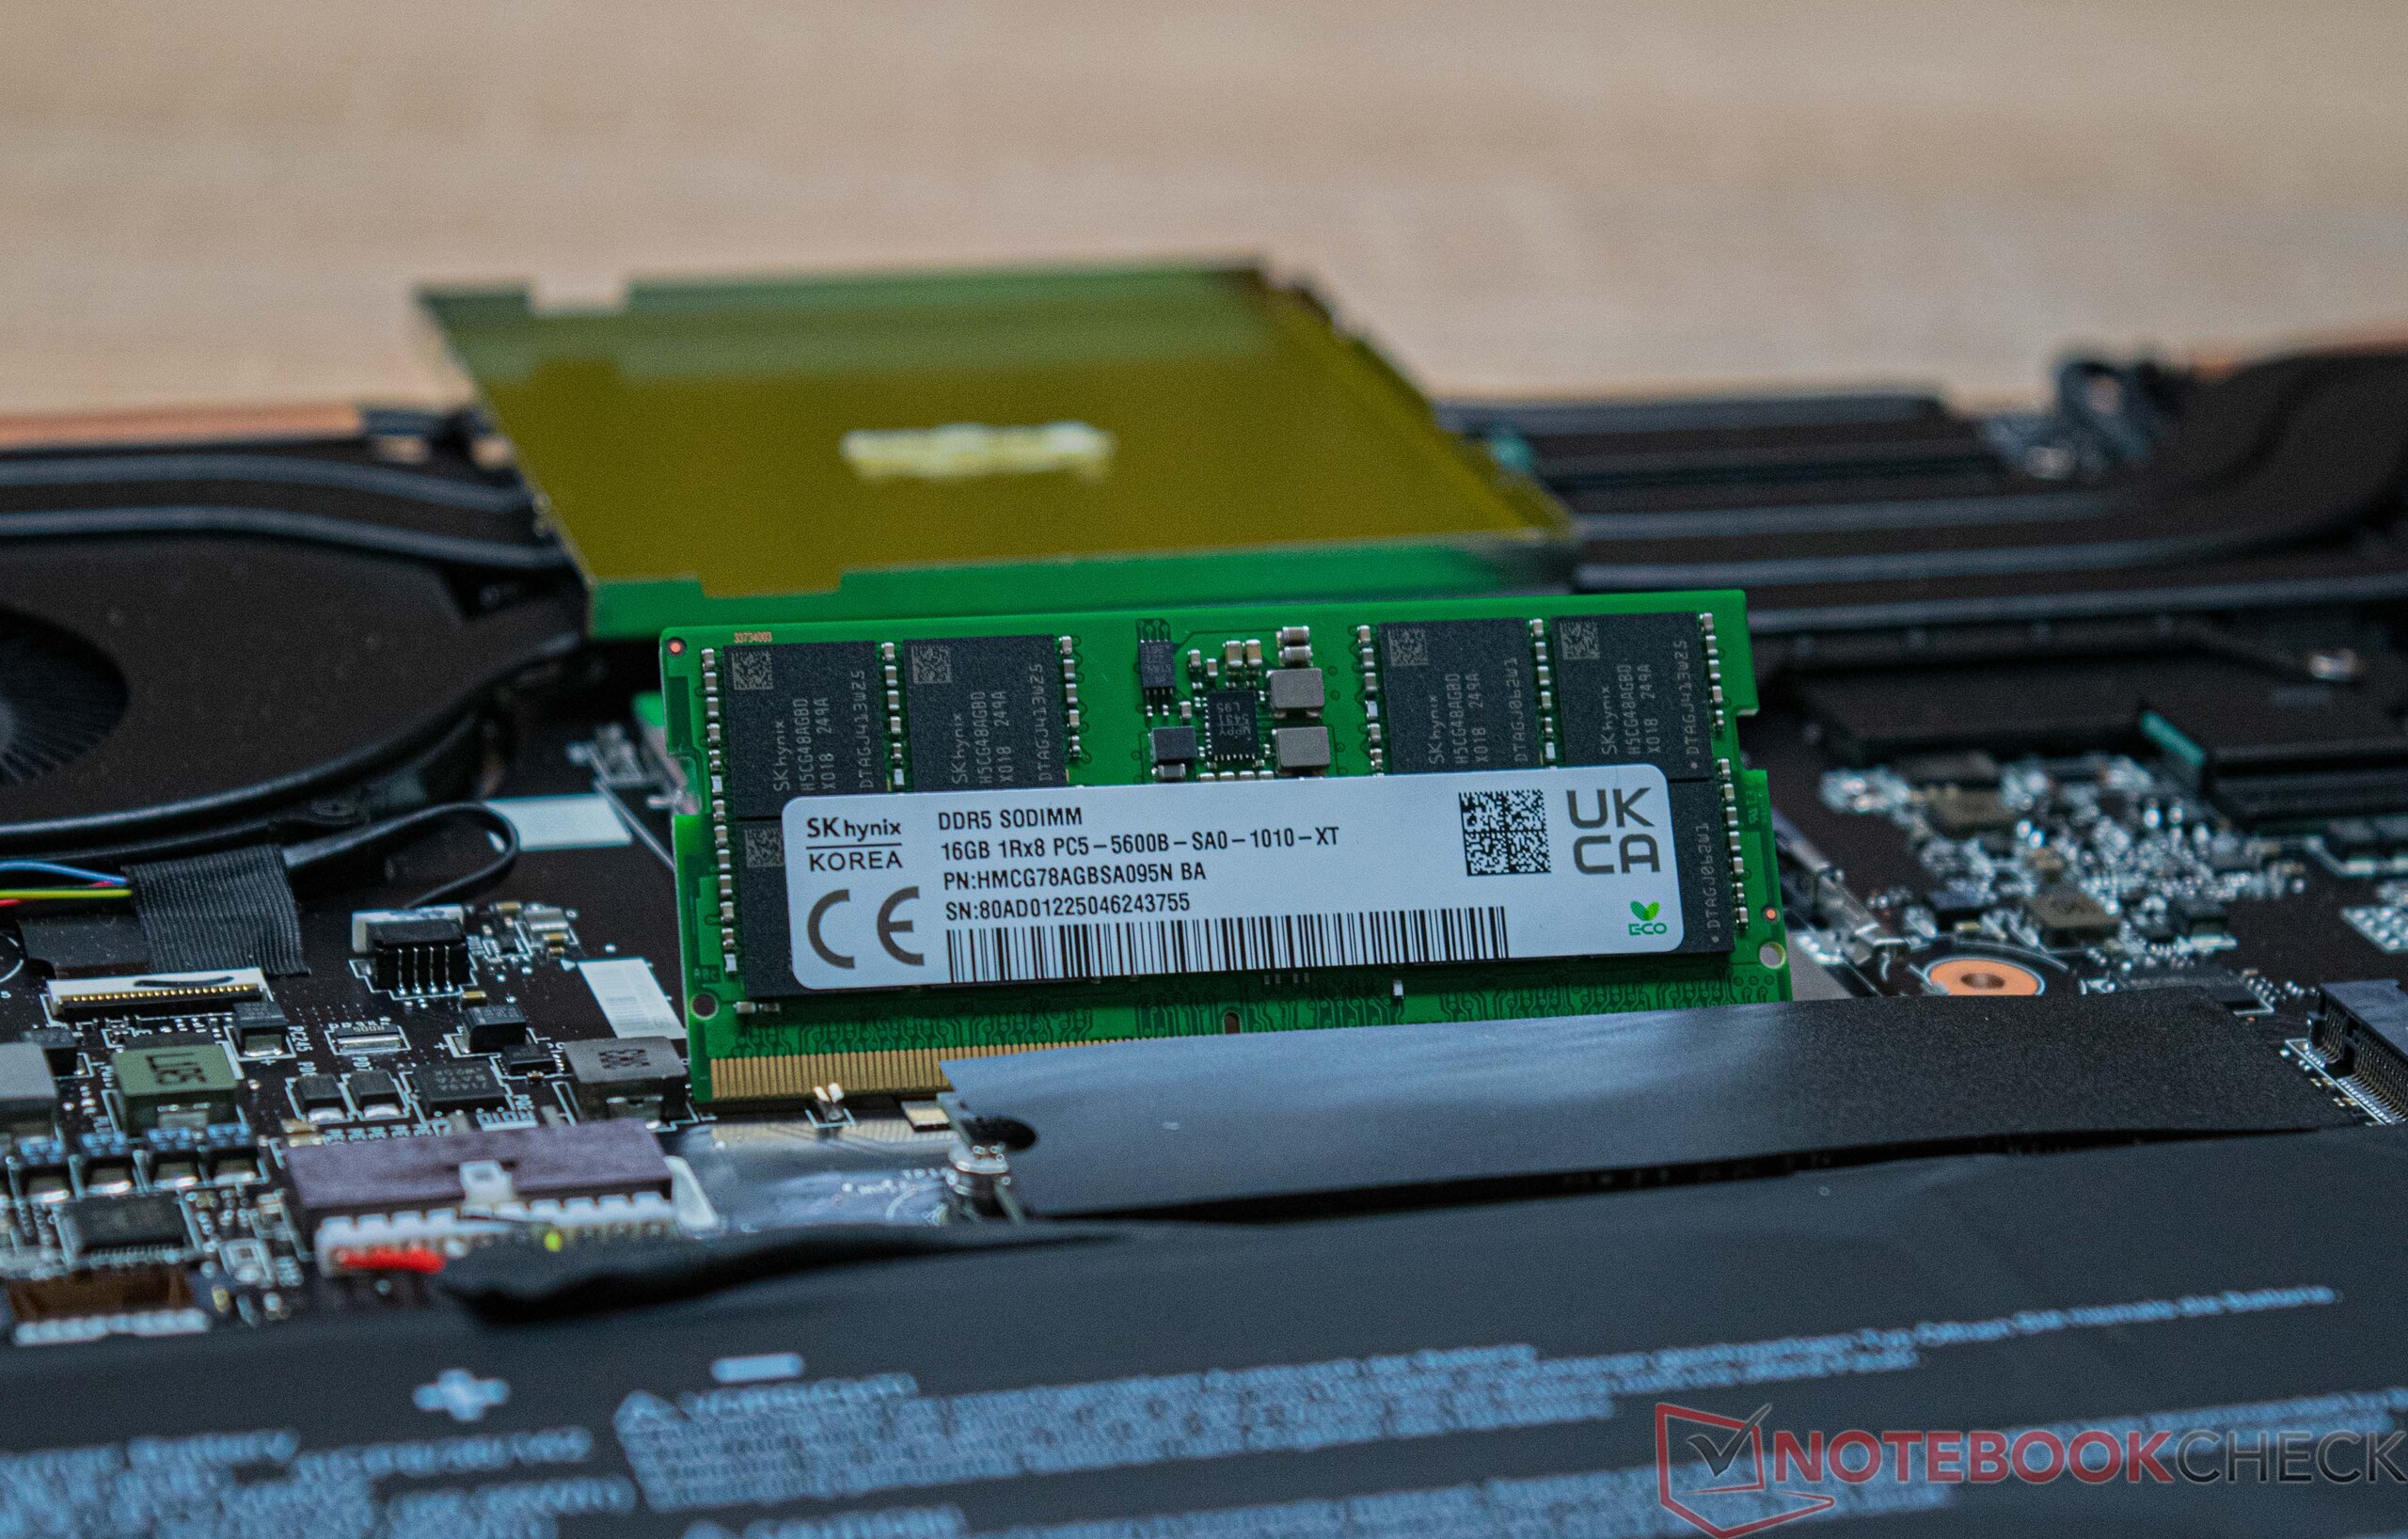
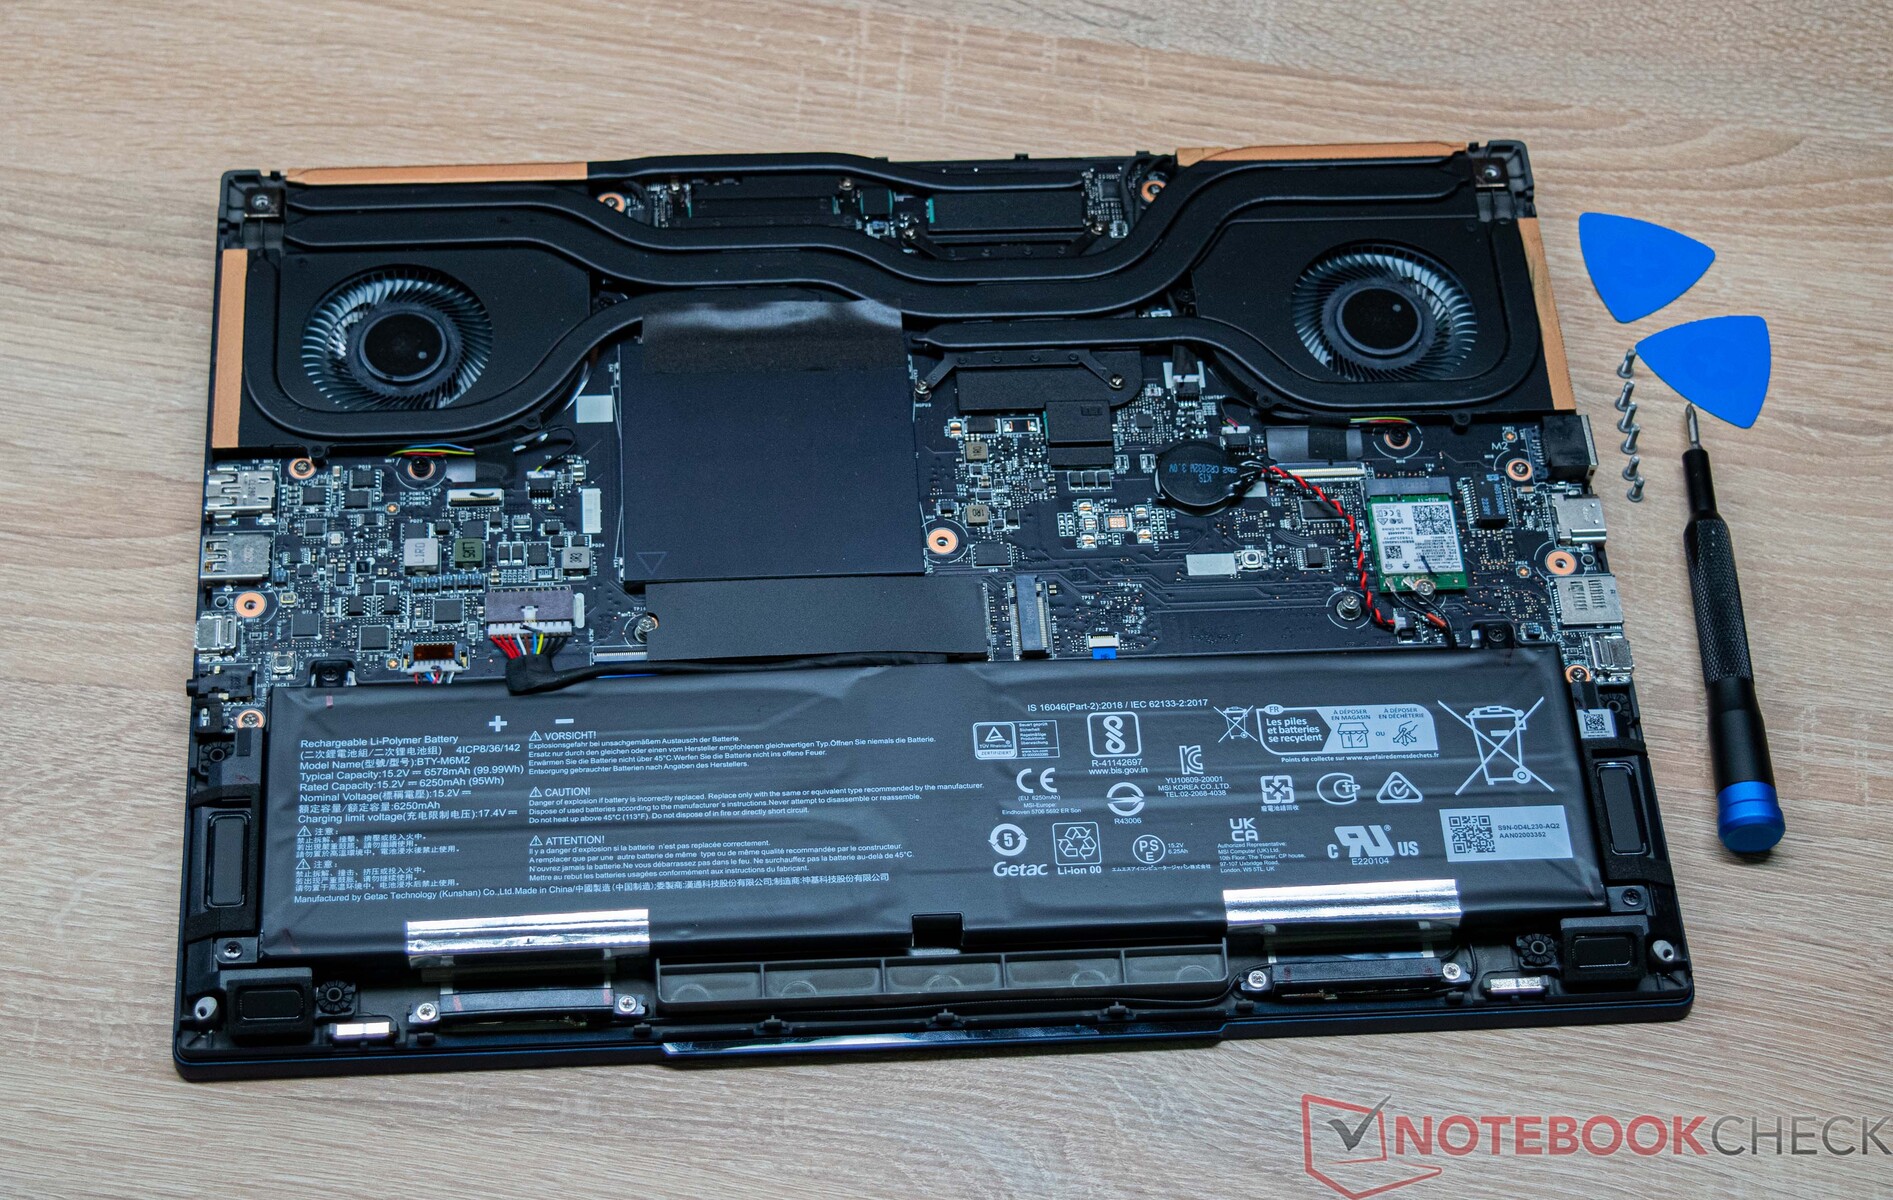
Manutenção
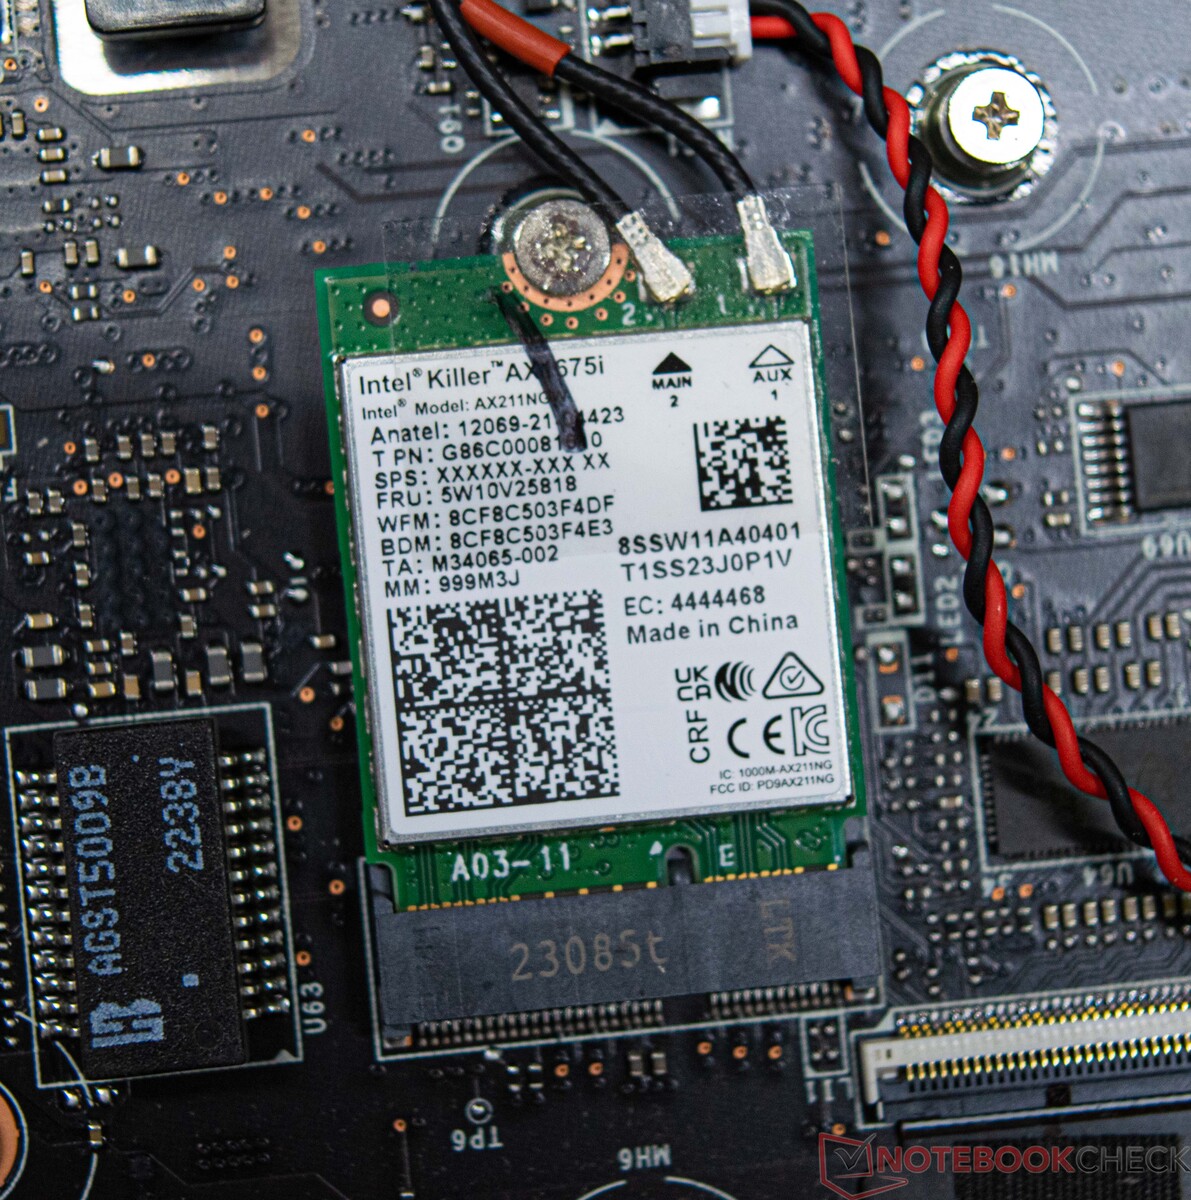
É possível realizar trabalhos de manutenção no MSI Stealth 16 Studio A13VG. No entanto, para fazer isso, é necessário desmontar a placa de base, que é fixada por vários parafusos. Depois de remover os parafusos, a placa de base permanece firmemente presa à base. Entretanto, com as ferramentas adequadas, foi possível remover a placa de base. No entanto, é preciso ter cuidado para evitar danos. Em princípio, componentes como a RAM ou o dispositivo de armazenamento em massa podem ser trocados ou expandidos, pois há um slot M.2 2280 adicional disponível. Da mesma forma, o Wi-Fi não é fixo e também pode ser trocado ou substituído.
Garantia
O MSI Stealth 16 Studio A13VG vem com uma garantia de 24 meses que inclui o serviço de coleta e devolução.
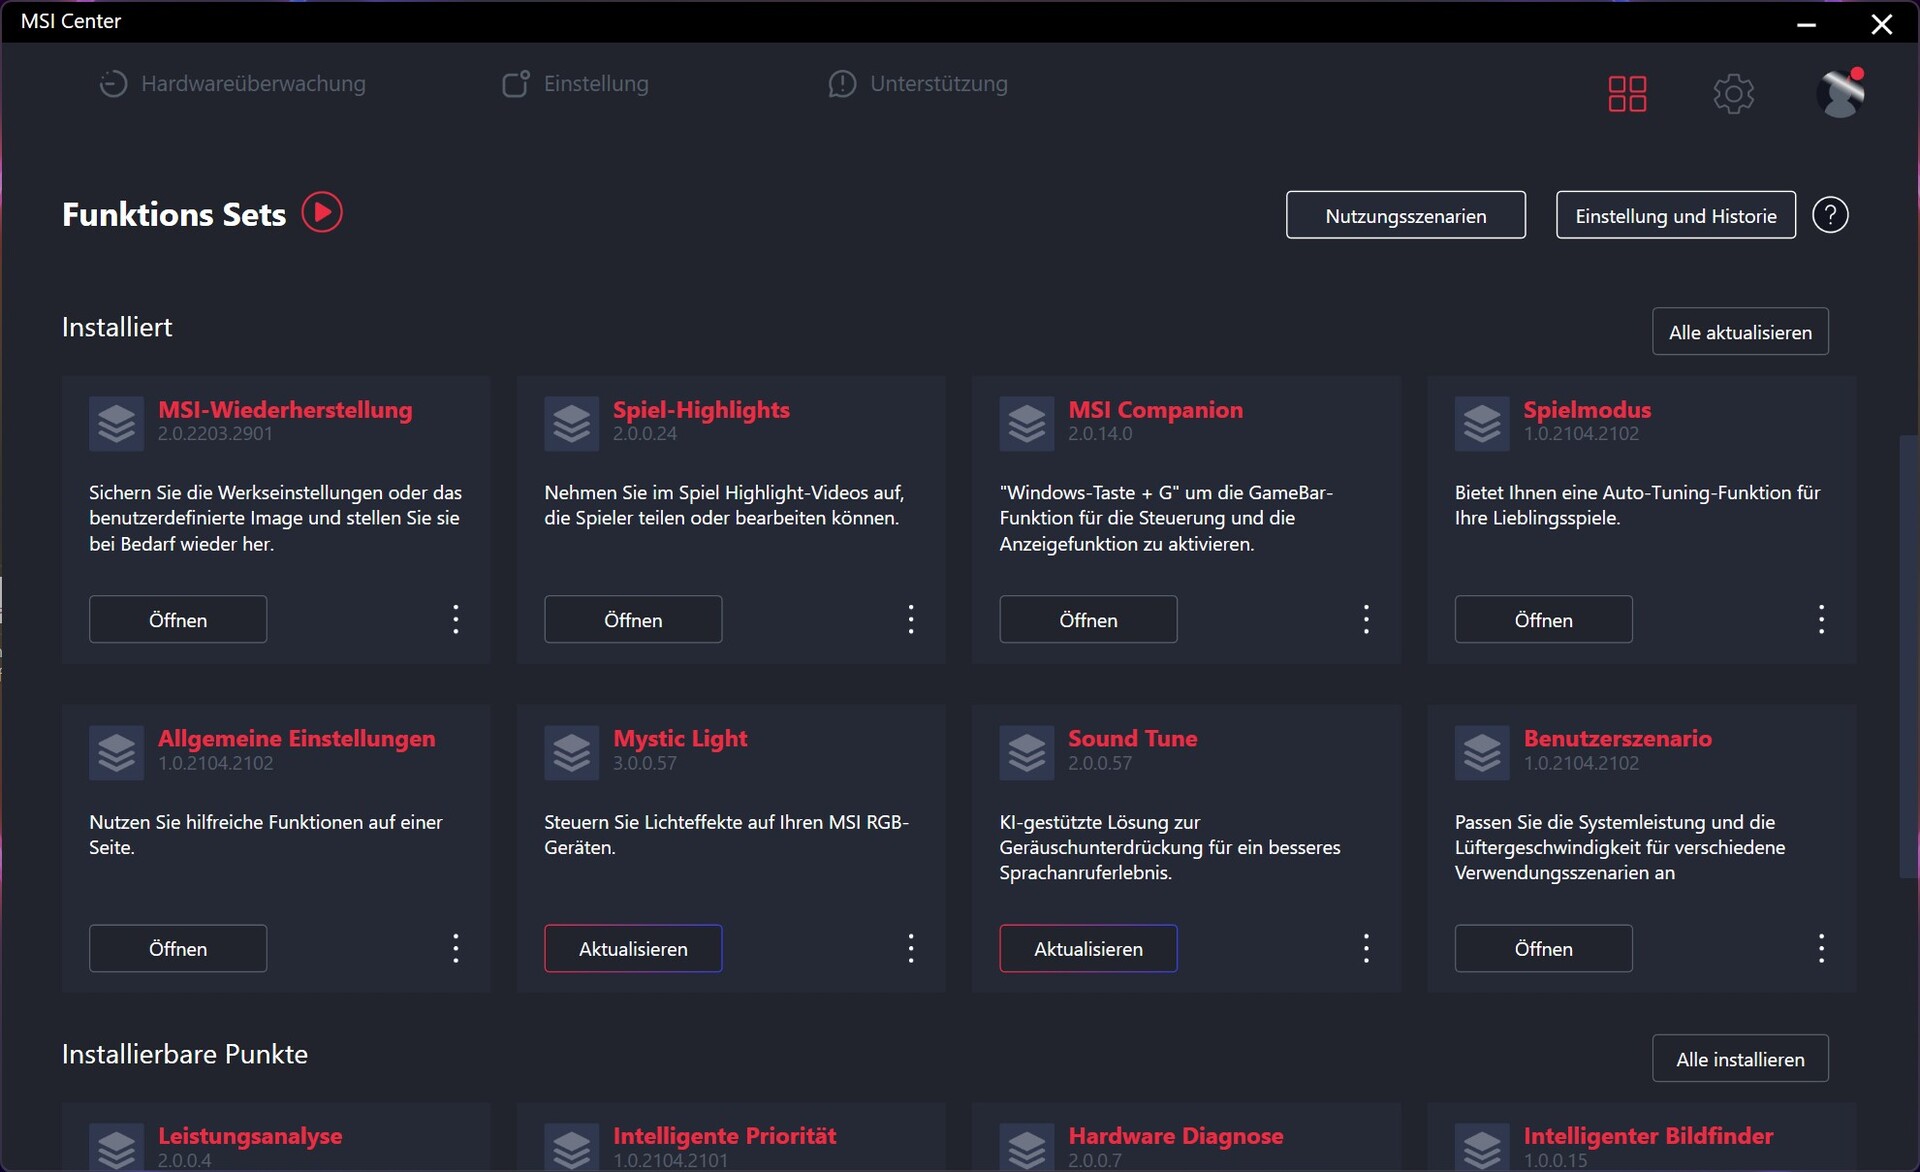
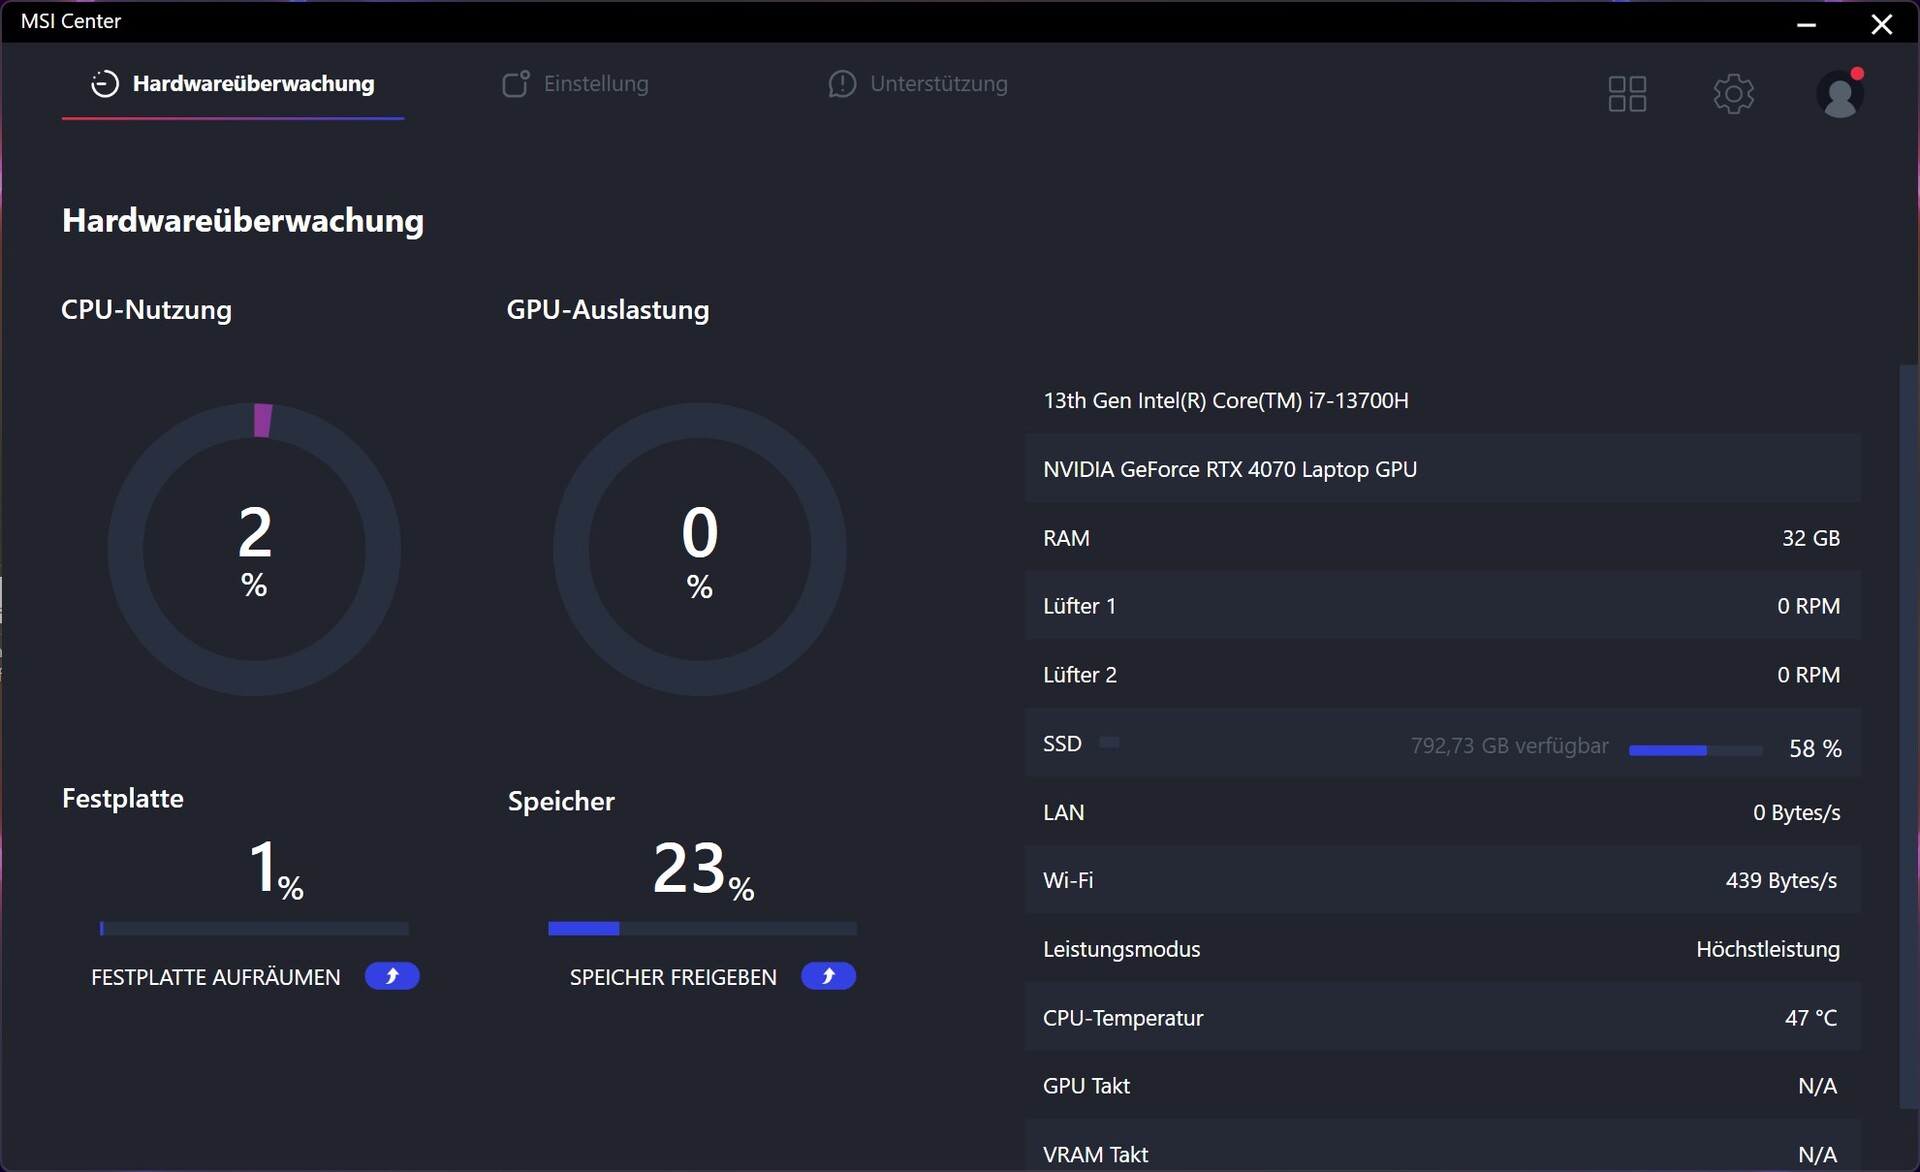
Software - O MSI Center é seu escritório principal
Com o MSI Center, o fabricante tem uma ferramenta adequada para controlar e monitorar o MSI Stealth 16 Studio A13VG. Nos testes, não encontramos problemas ao usar o MSI Center. O uso dessa ferramenta permite que o usuário regule o desempenho do laptop, o que, entre outras coisas, influencia muito a quantidade de ruído de fundo. Há também diferenças claras, também do ponto de vista do desempenho, devido aos limites de energia variáveis nos modos variados.
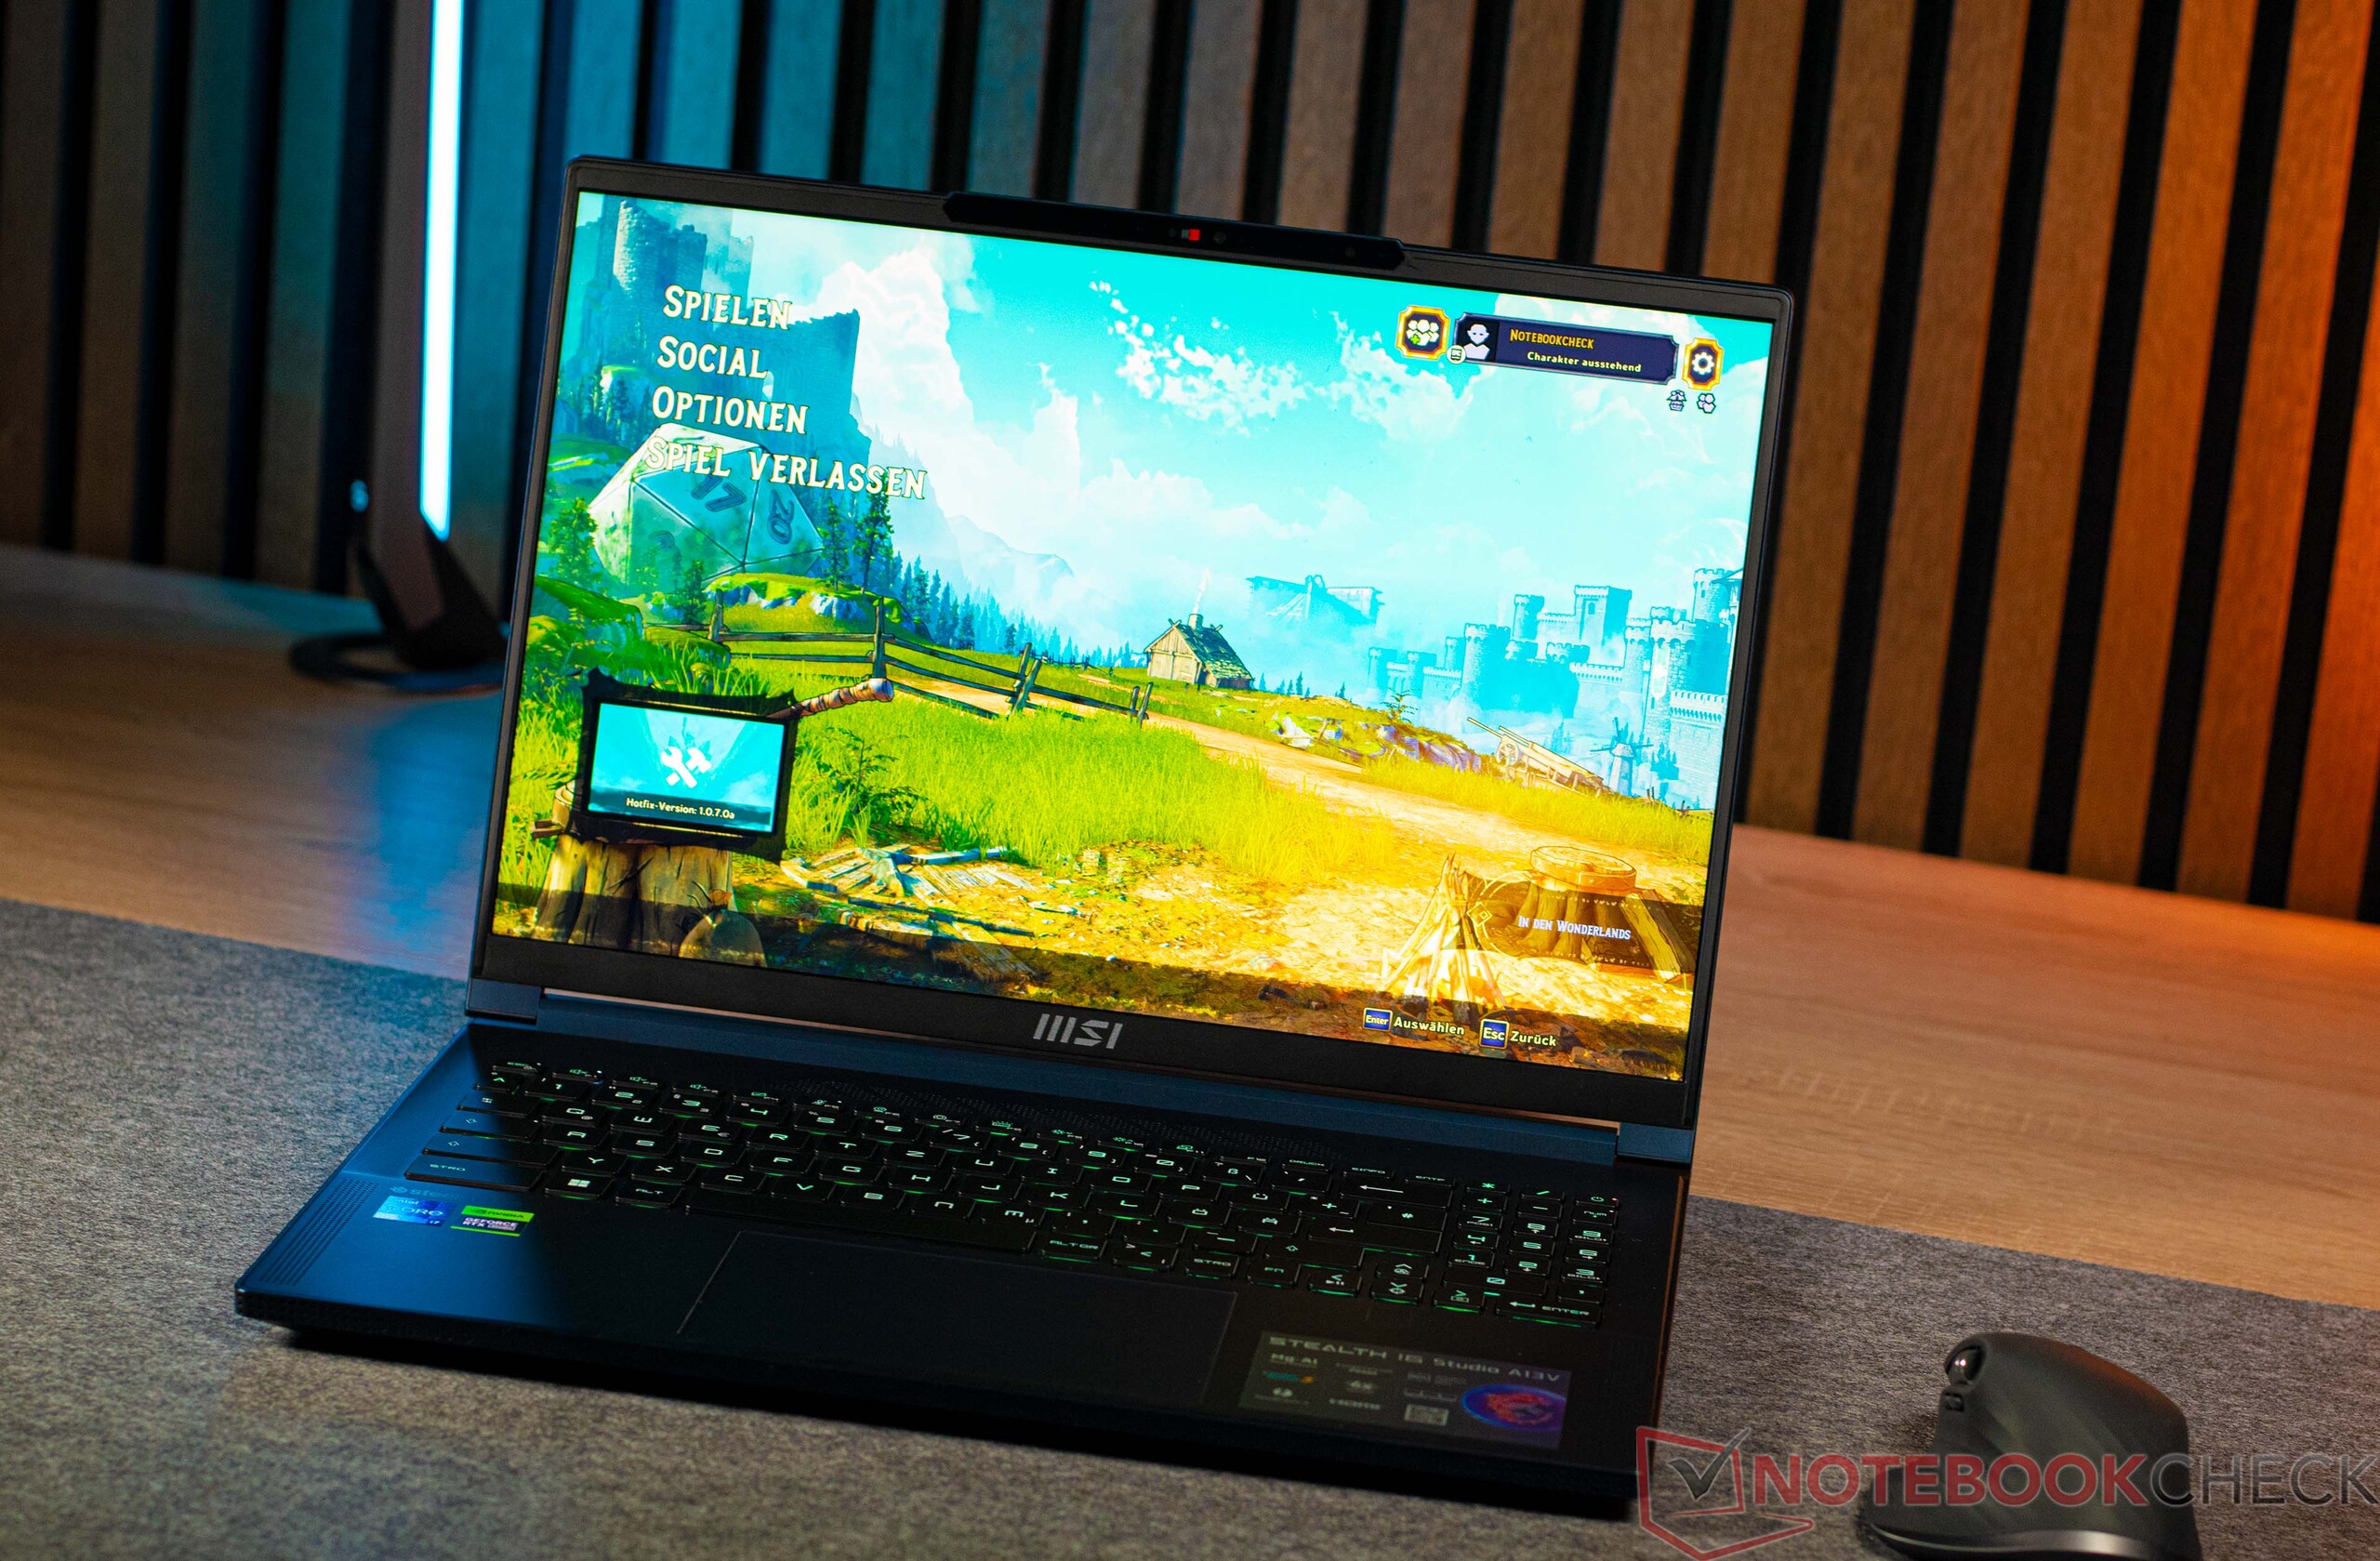
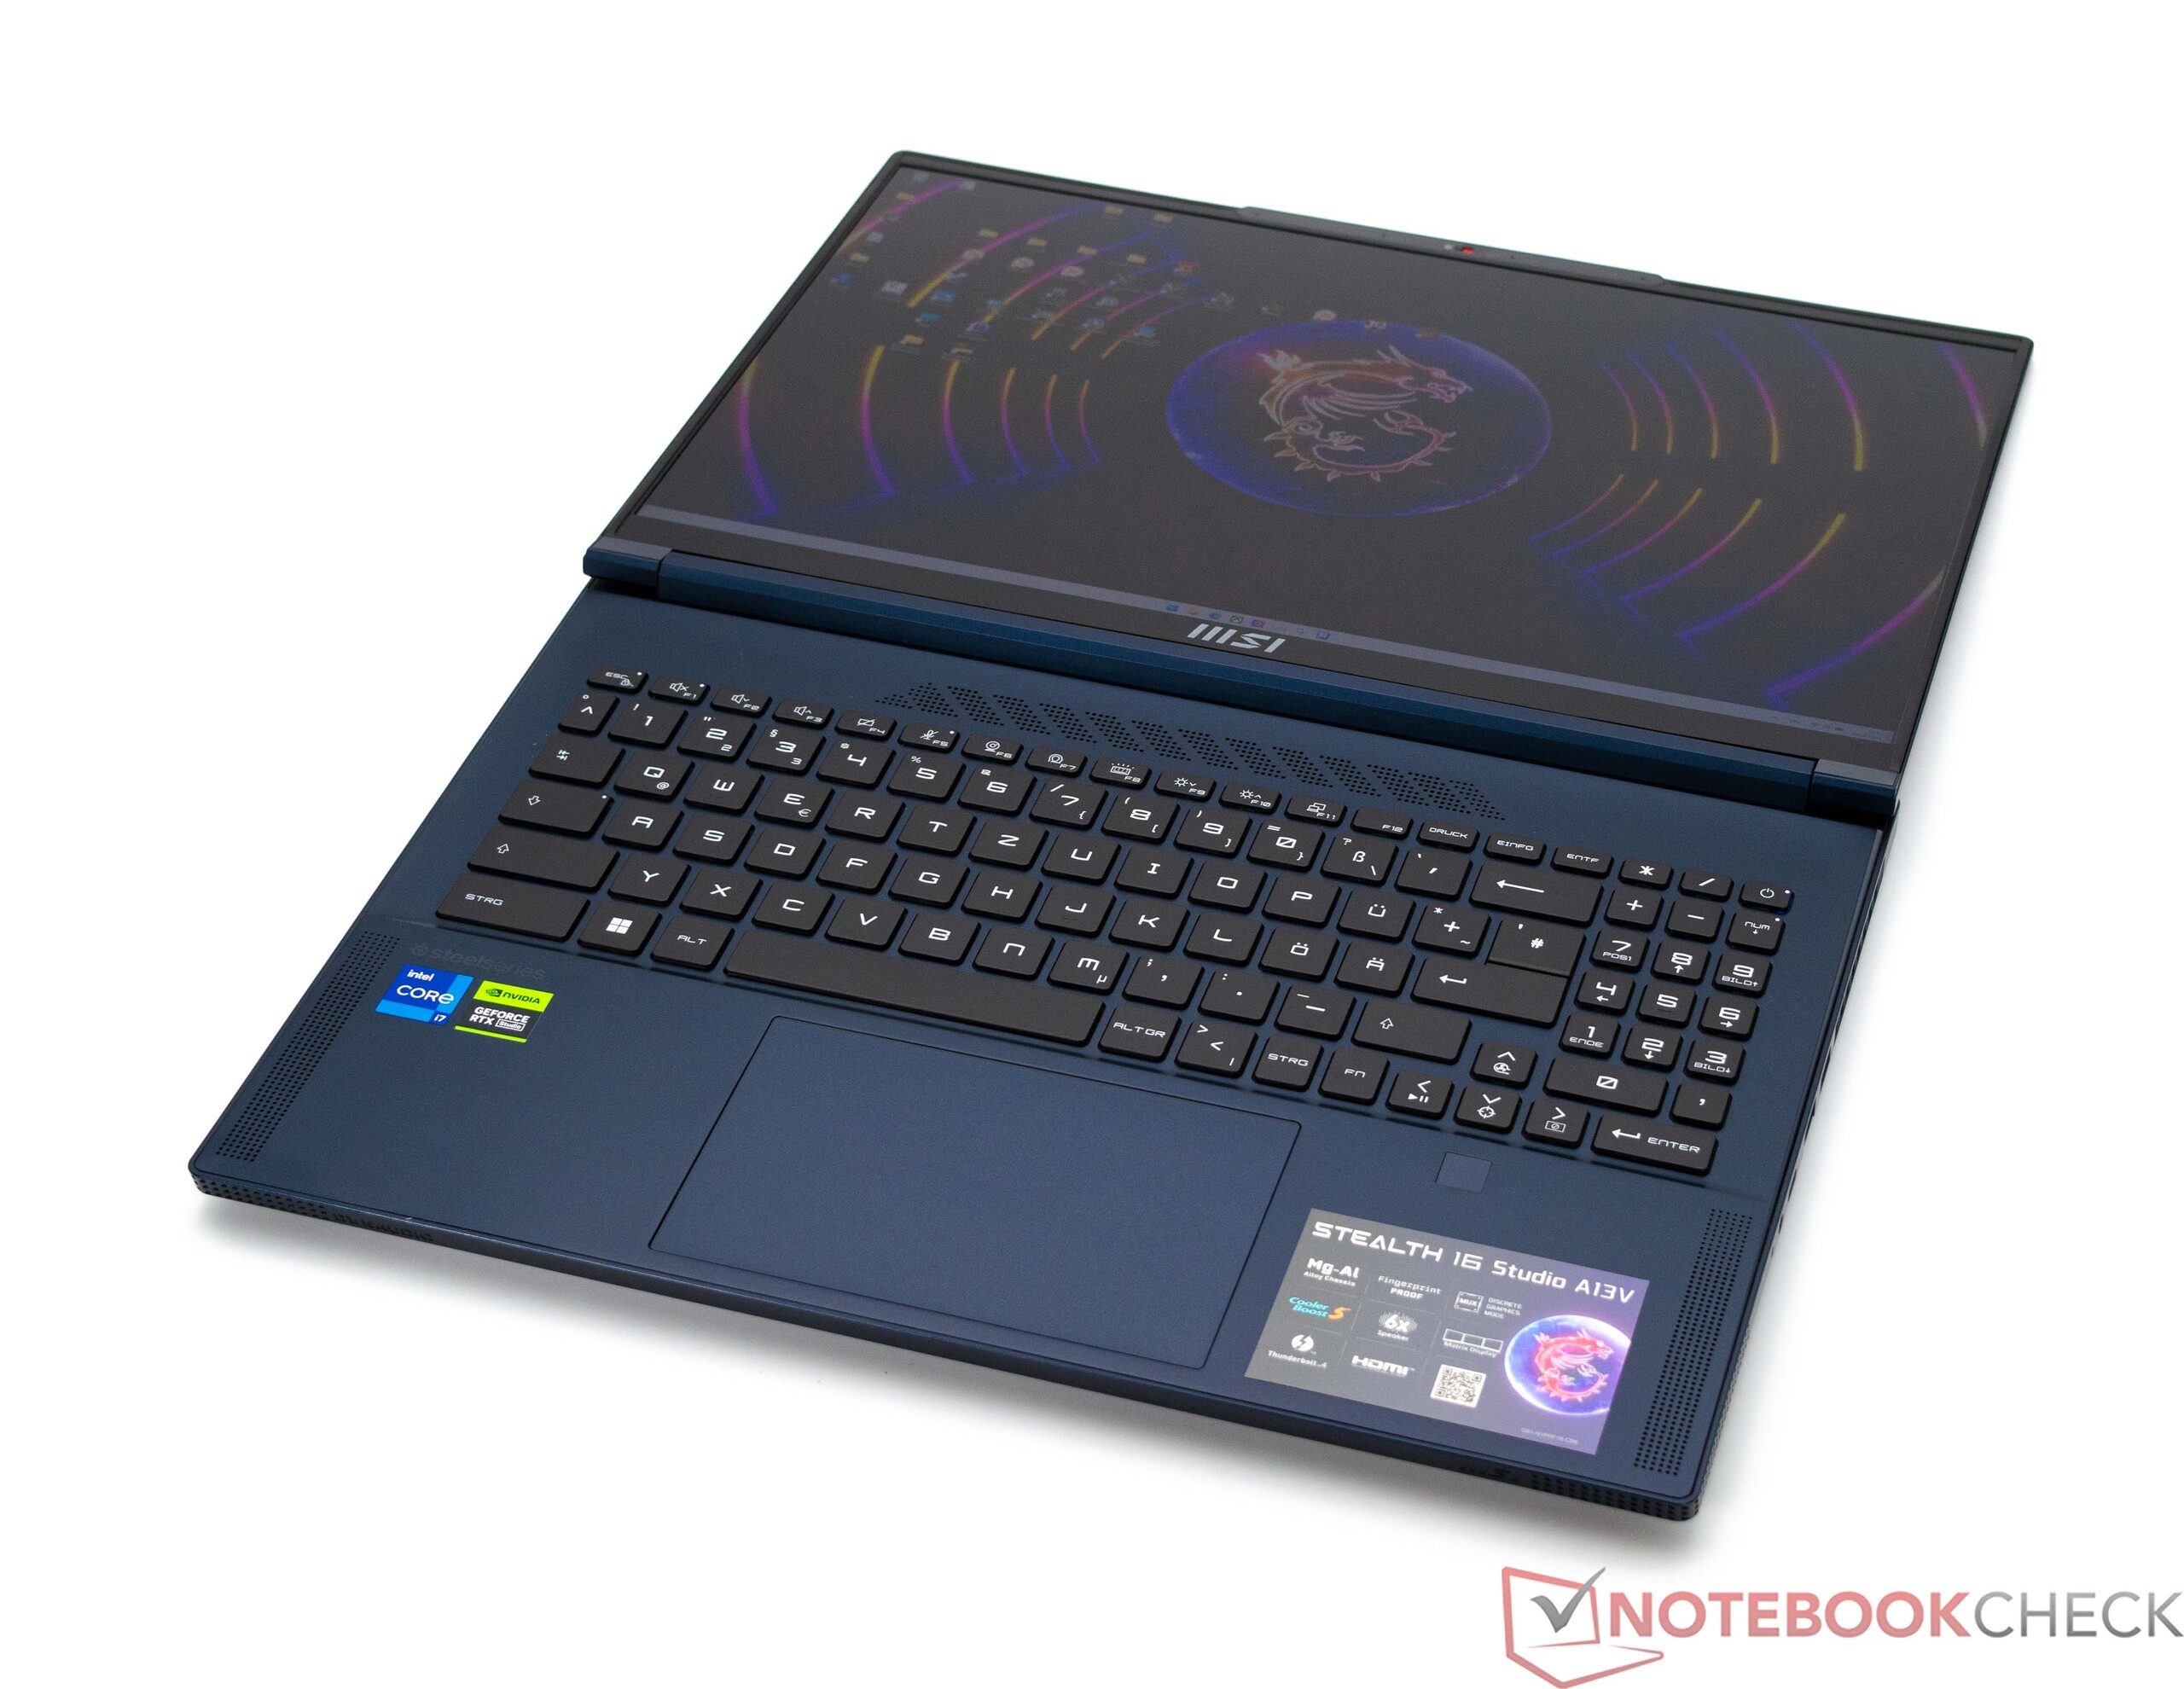
Dispositivos de entrada - design familiar e agradável no uso diário
Teclado
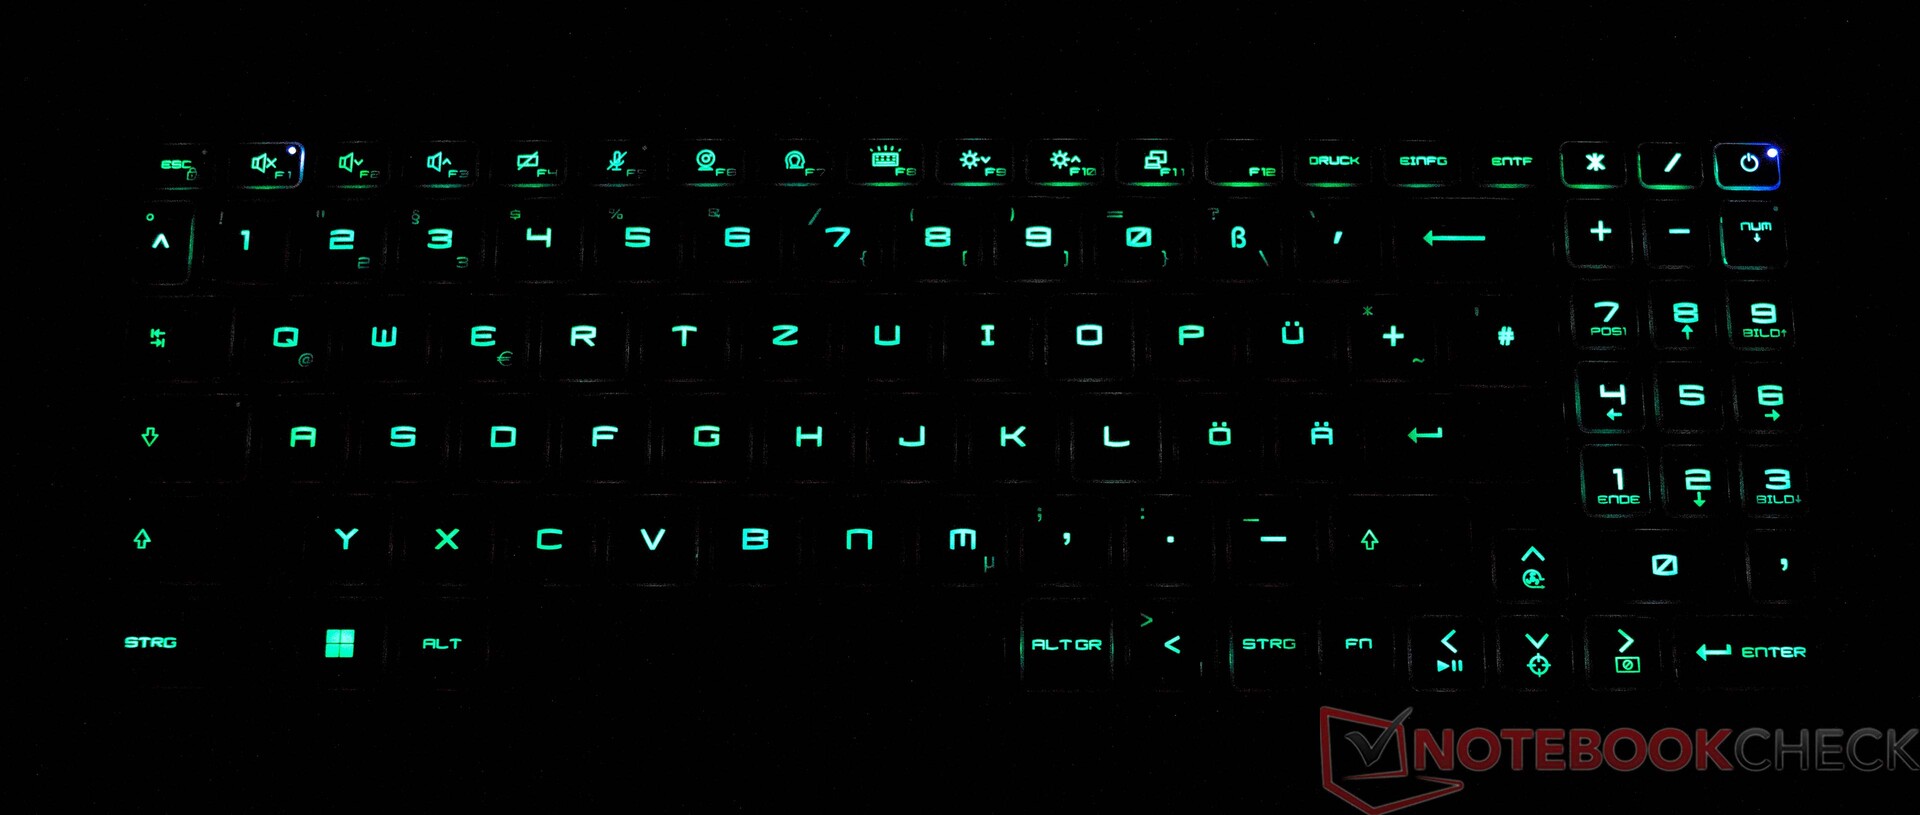
Em cooperação com a SteelSeries, o MSI Stealth 16 Studio A13VG foi equipado com um teclado chiclet de 6 linhas, incluindo um teclado numérico. As letras são típicas da MSI, embora as teclas lisas ofereçam um toque significativamente silencioso. O deslocamento das teclas é muito curto e o ponto de pressão é claramente definido. Portanto, você não deve esperar receber olhares de raiva ao digitar rapidamente no escritório, pois o ruído de fundo é muito baixo. A luz de fundo pode ser alterada para um dos três níveis de brilho diferentes por meio de uma combinação de teclas. O que se nota é que a MSI decidiu não colocar a tecla Fn no lado esquerdo. No entanto, usando o MSI Center, é possível contornar a situação trocando a atribuição da tecla Windows com a tecla Fn no lado direito. Isso permite que o usuário escolha sua própria configuração ideal.
Touchpad
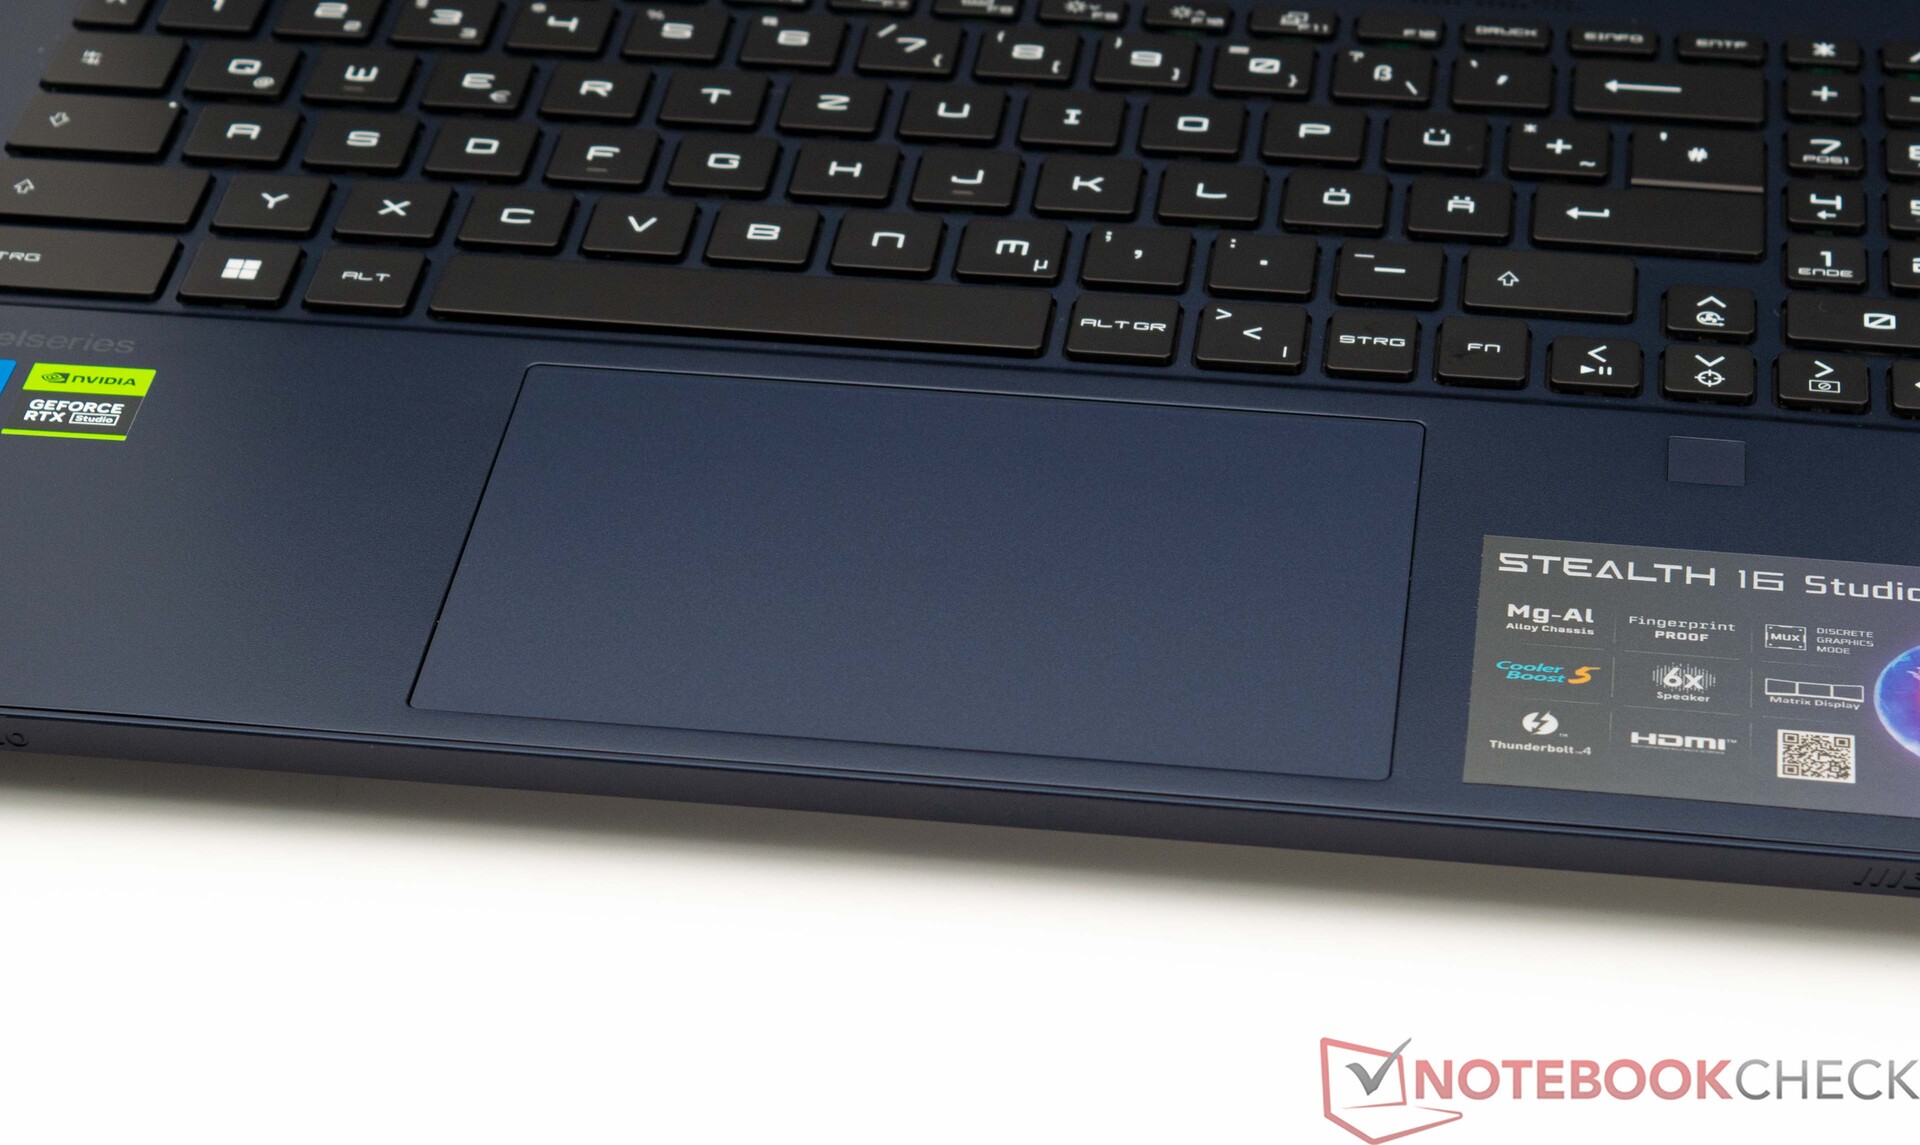
Uma alternativa ao mouse pode ser encontrada na forma de um touchpad com capacidade multitoque. Com 13,1 x 8,2 cm, ele tem um tamanho maravilhoso. Em termos de design, o touchpad combina perfeitamente com a superfície superior da base. Essa superfície tem uma sensação visivelmente mais suave do que o apoio para as mãos. Isso resulta em ótimas propriedades de deslizamento. O touchpad é ágil e muito preciso, mesmo nas bordas. O touchpad oferece um curso curto para as entradas e ajuda a fornecer ao usuário um ponto de pressão claro e um feedback nítido.
Tela - 240 Hz em uma relação de aspecto 16:10 de fácil utilização
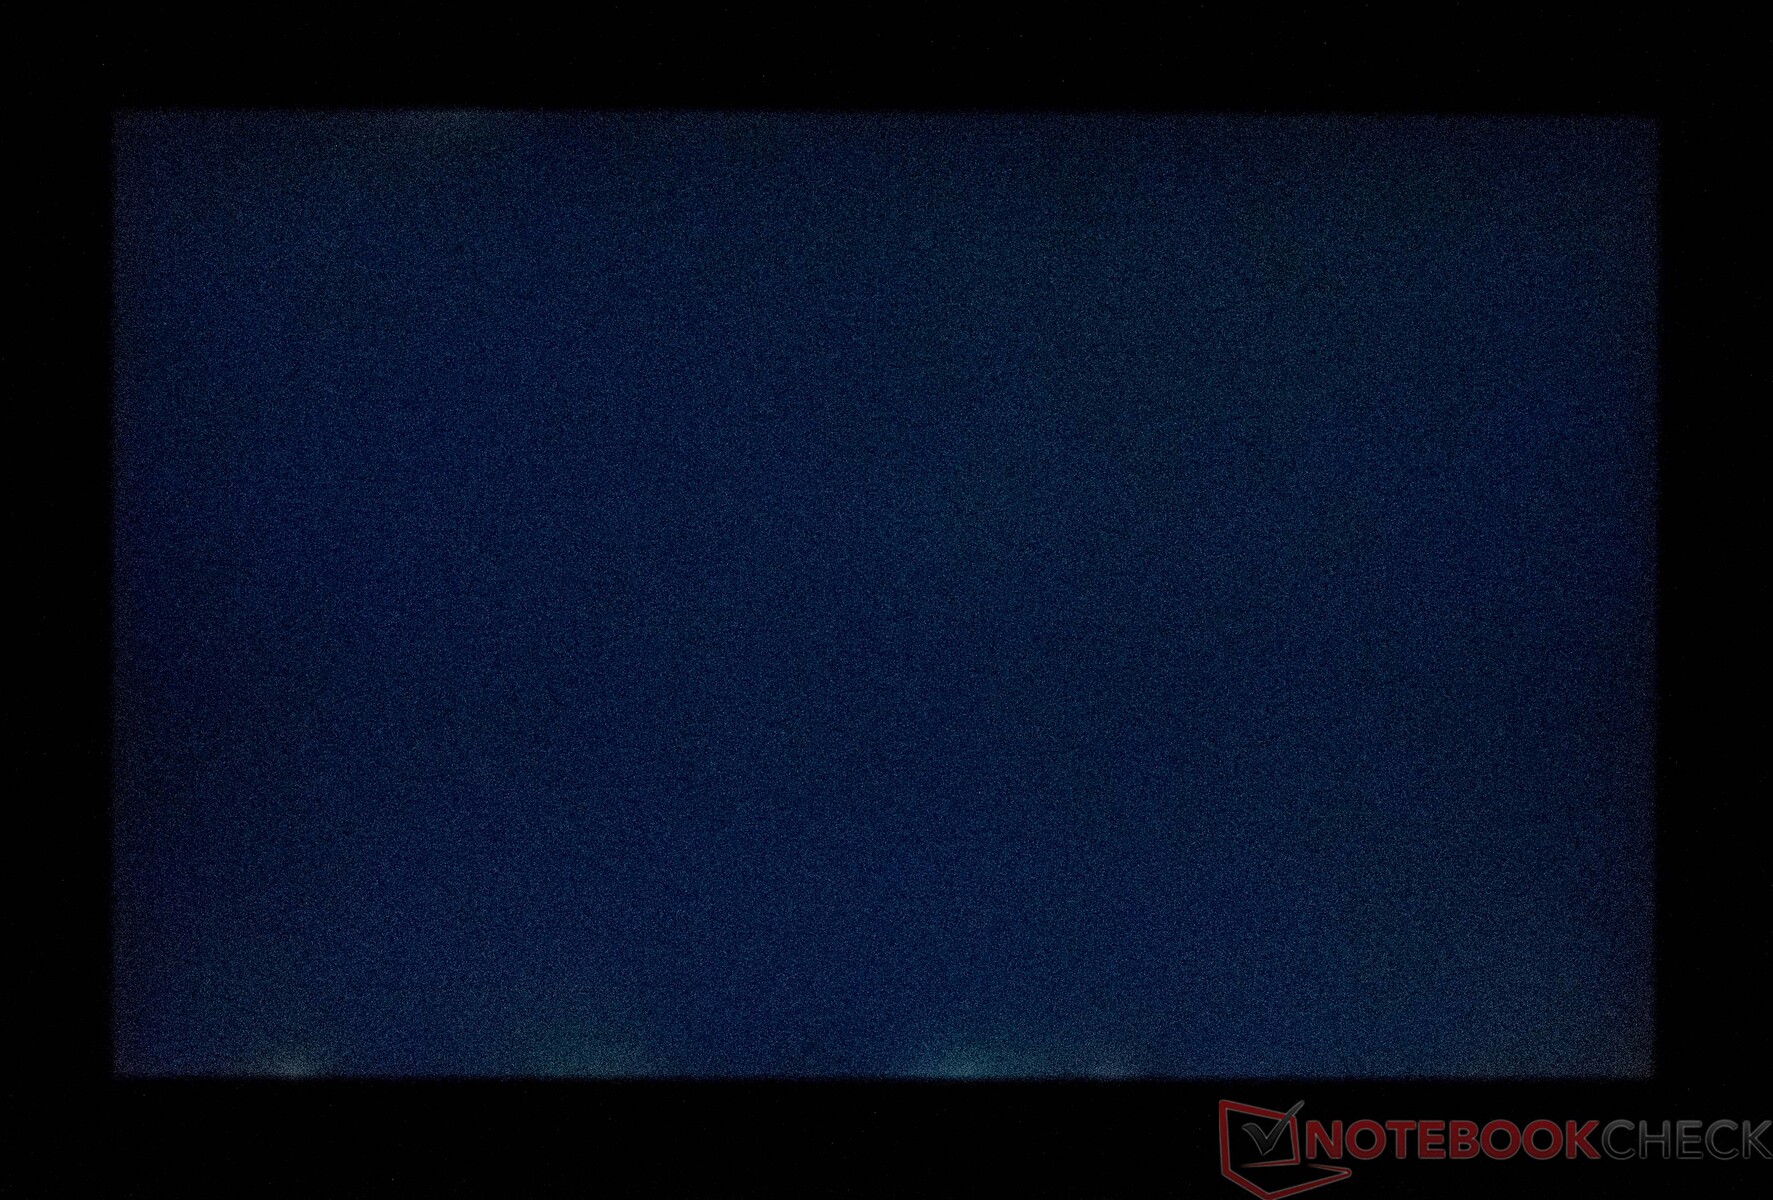
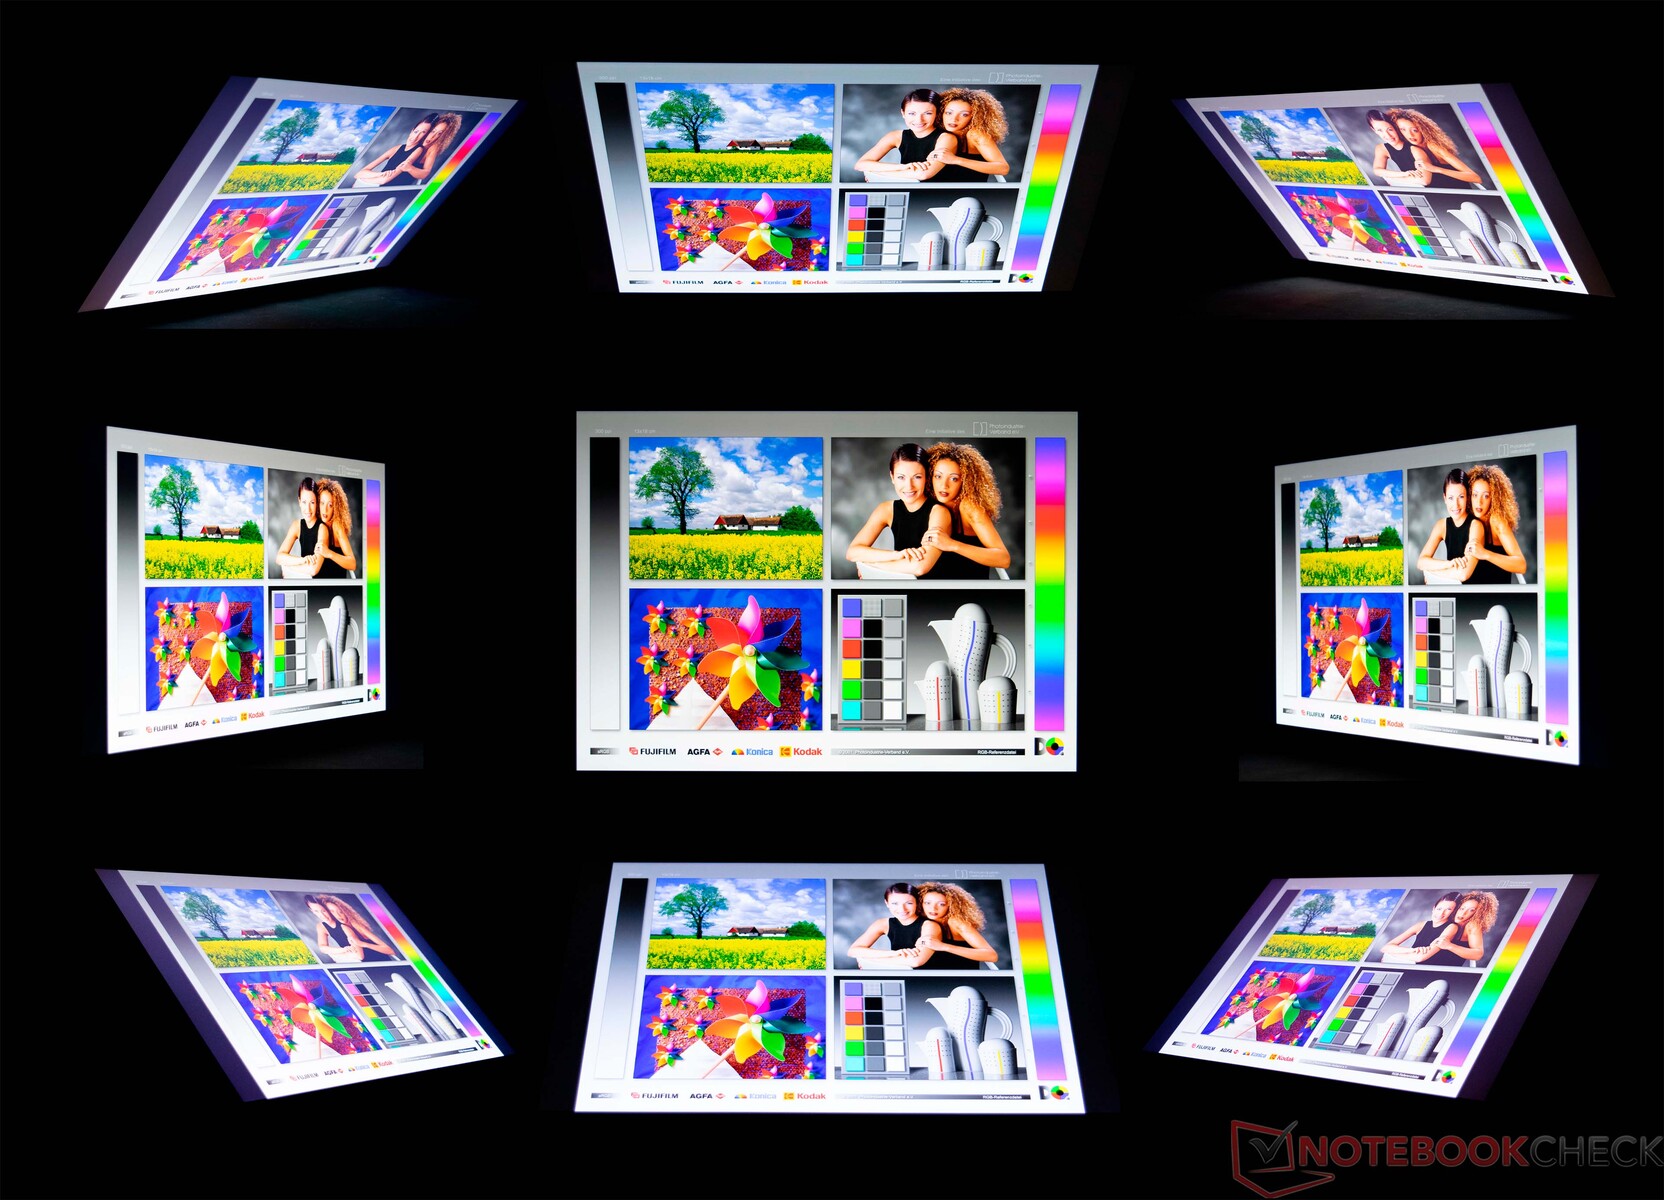
O MSI Stealth 16 Studio A13VG vem com um bom painel QHD+ de 16 polegadas e sua taxa de atualização de 240 Hz deve satisfazer os desejos da maioria dos jogadores. Medimos um brilho médio da tela de 424 cd/m². Isso significa que a tela é relativamente brilhante e ainda consegue ser melhor do que a maioria dos concorrentes. Apenas o Acer Nitro 16 e o Asus ROG Flow X16 oferecem telas mais brilhantes. Nosso dispositivo de análise teve que lutar contra um leve sangramento da tela e isso é algo que tivemos que levar em consideração ao atribuir nossa pontuação de tela. Por outro lado, não foi detectado nenhum PWM, o que pode evitar sinais de fadiga durante o uso prolongado.
Opções alternativas de tela, como um painel 4K, não estão previstas para o MSI Stealth 16 Studio A13VG.
| |||||||||||||||||||||||||
iluminação: 88 %
iluminação com acumulador: 428 cd/m²
Contraste: 1146:1 (Preto: 0.37 cd/m²)
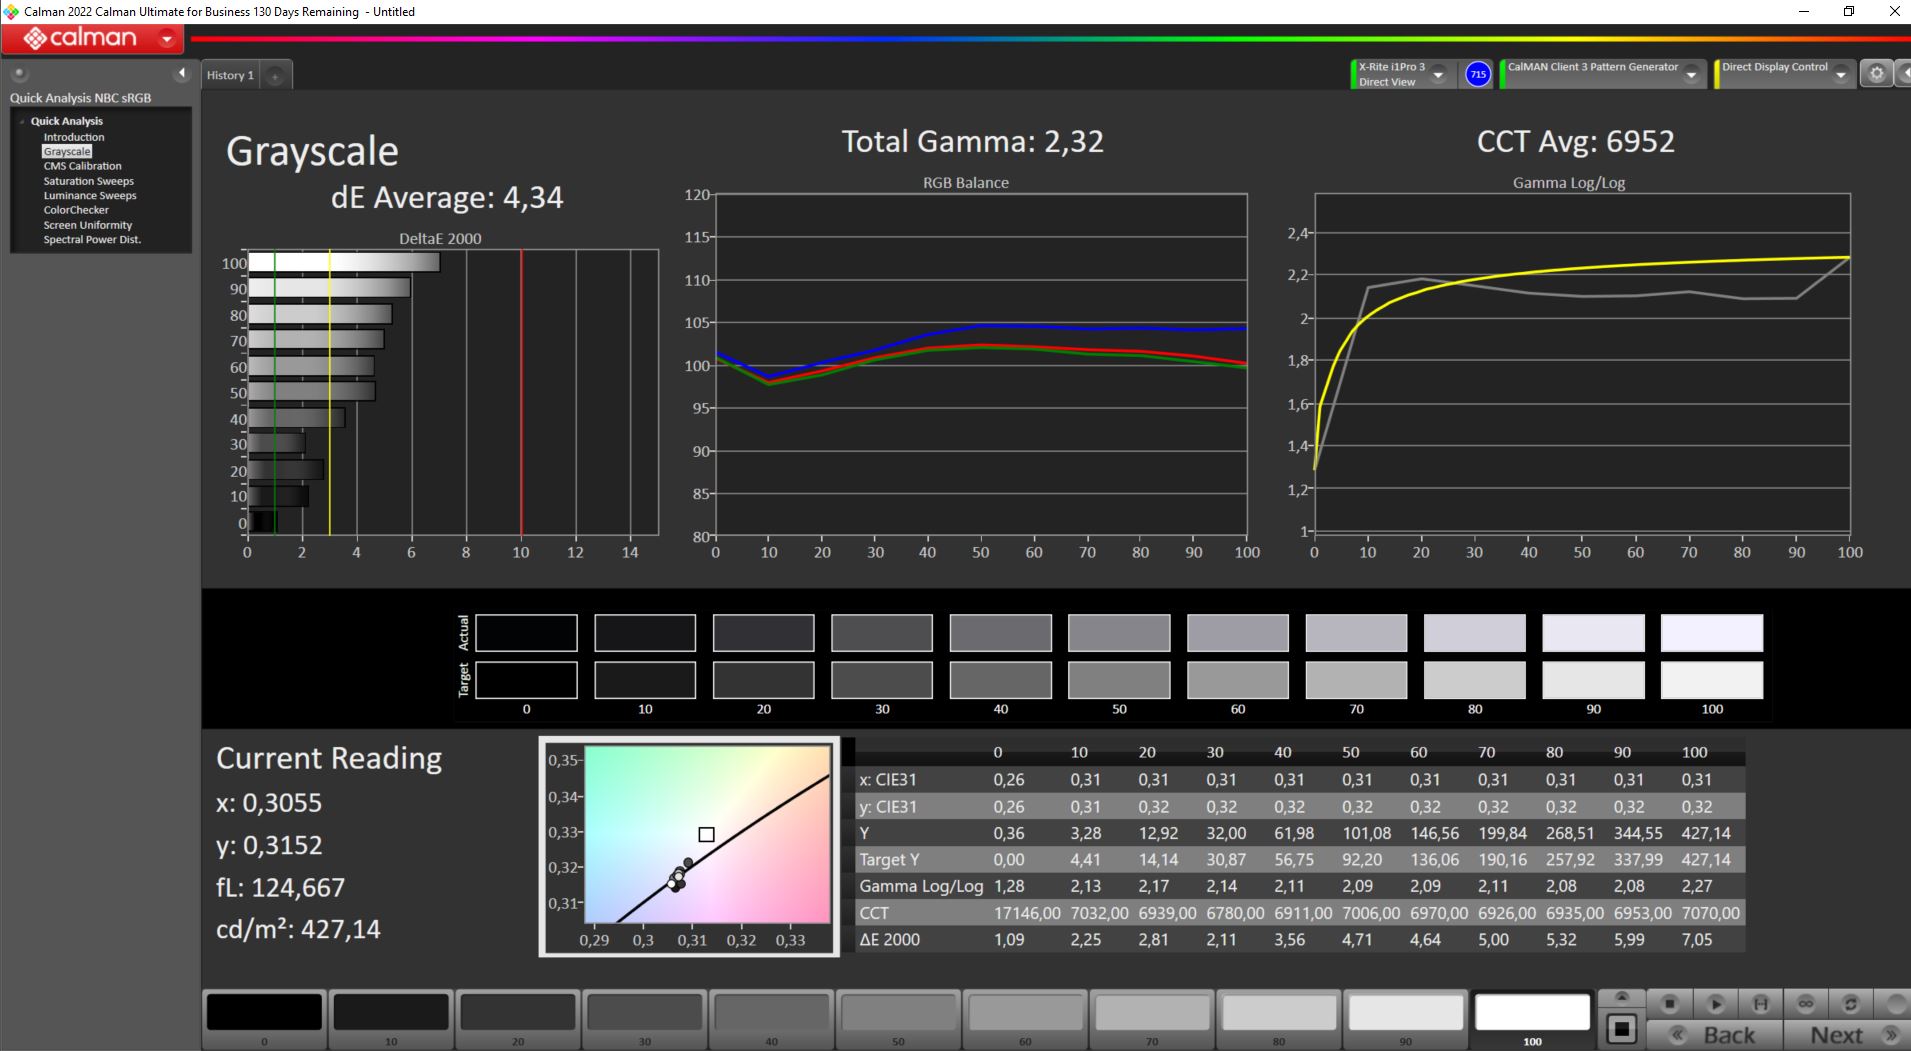
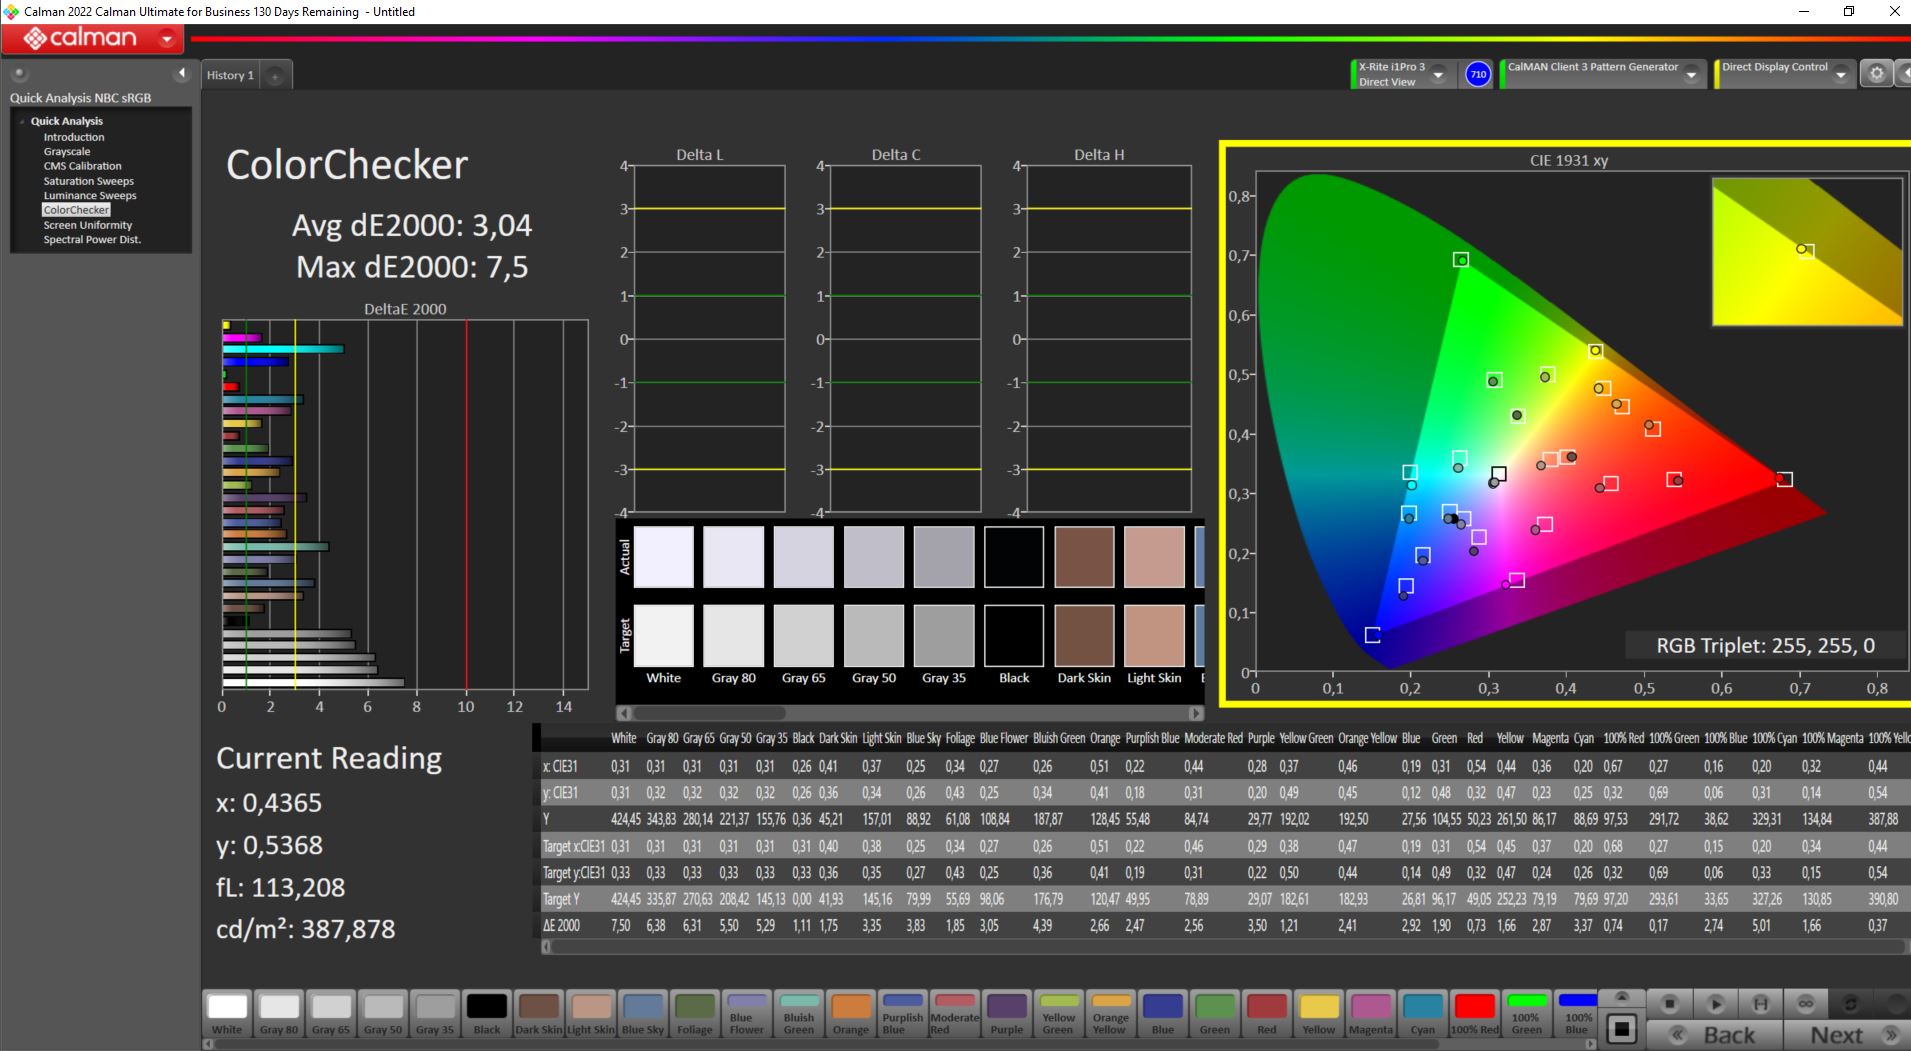
ΔE ColorChecker Calman: 3.04 | ∀{0.5-29.43 Ø4.72}
calibrated: 3.04
ΔE Greyscale Calman: 4.34 | ∀{0.09-98 Ø4.97}
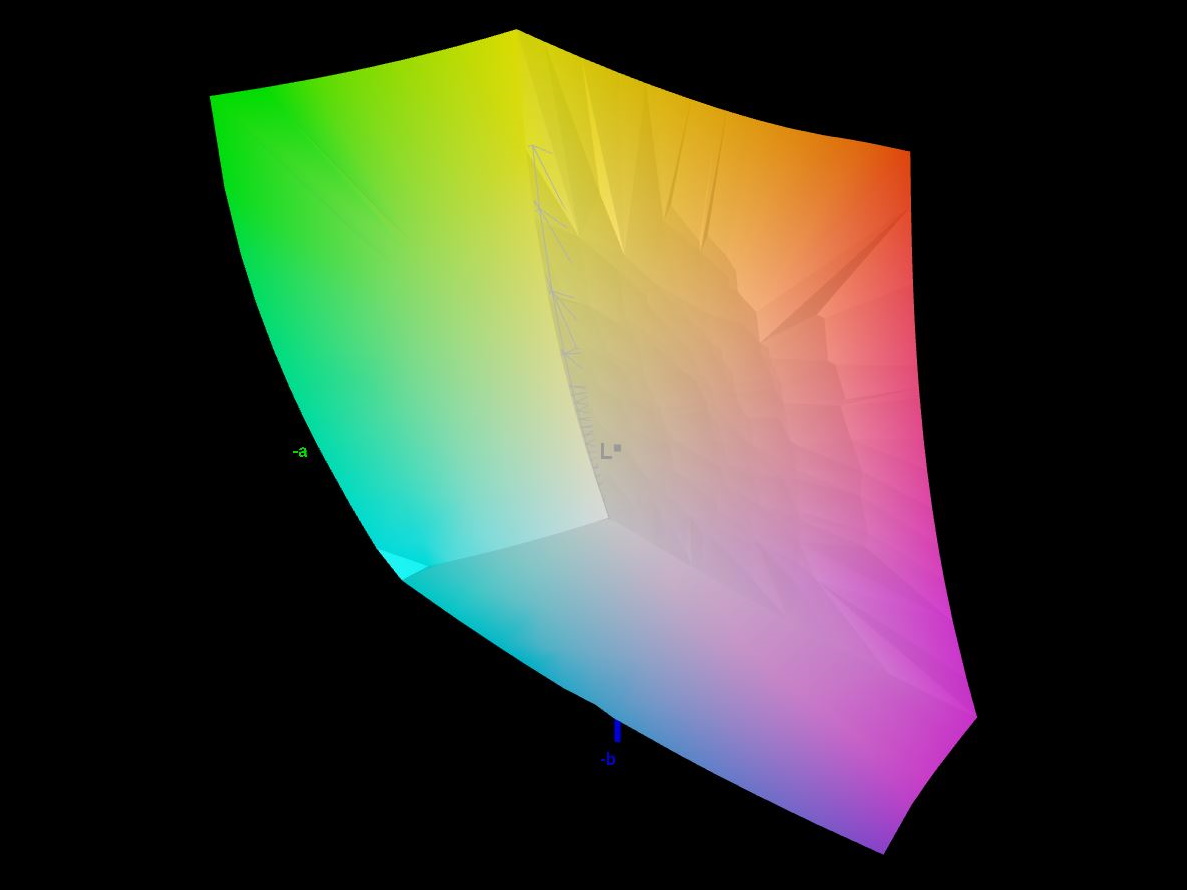
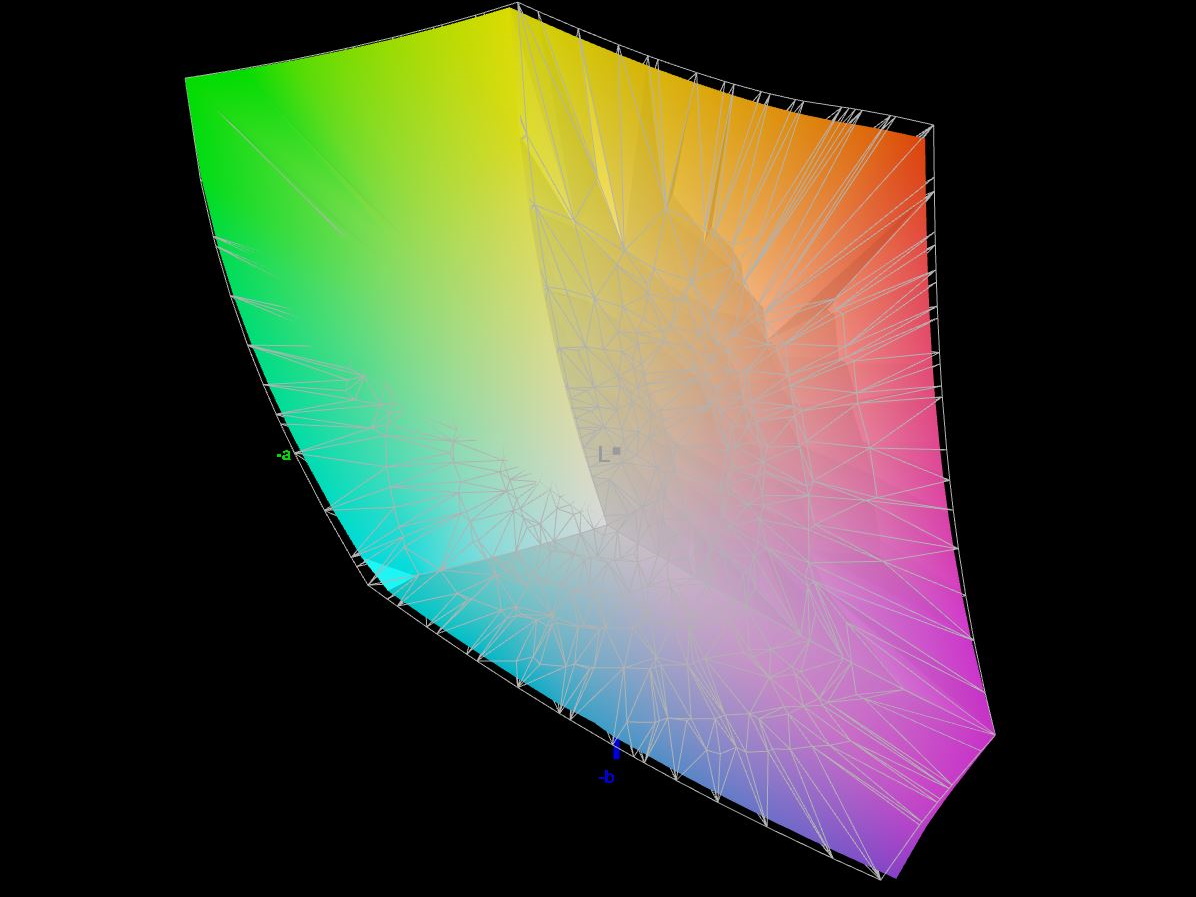
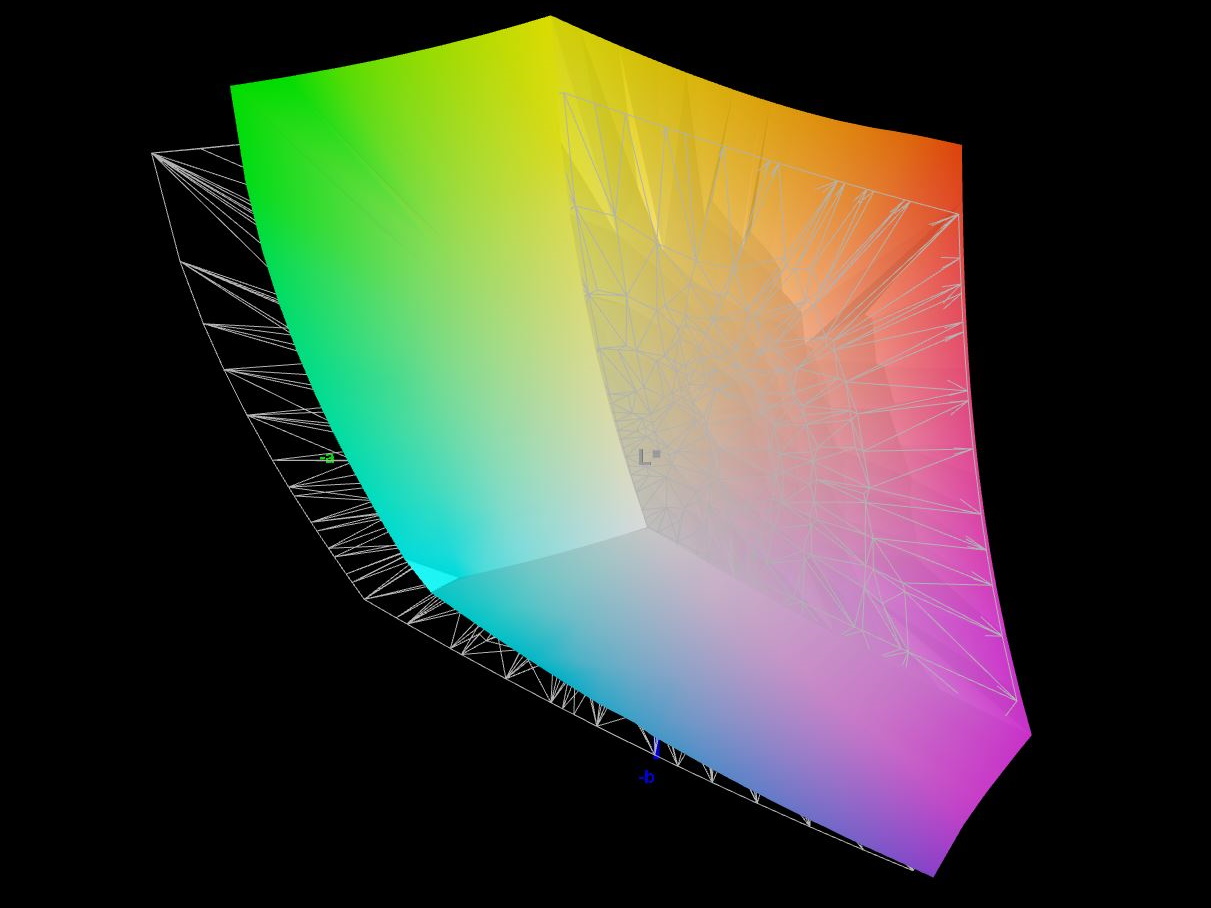
84.8% AdobeRGB 1998 (Argyll 3D)
99.7% sRGB (Argyll 3D)
96.4% Display P3 (Argyll 3D)
Gamma: 2.32
CCT: 6952 K
| MSI Stealth 16 Studio A13VG AUO26A9, IPS, 2560x1600, 16" | Asus ROG Flow X16 GV601V TMX1603 (TL160ADMP03-0), IPS, 2560x1600, 16" | Medion Erazer Major X20 BOE CQ NE160QDM-NZ1, IPS, 2560x1600, 16" | Acer Nitro 16 AN16-41 BOE CQ NE16QDM-NY1, IPS, 2560x1600, 16" | Corsair Voyager a1600 BOE0A3B, IPS, 2560x1600, 16" | Gigabyte AERO 16 OLED BSF Samsung SDC4191 (ATNA60YV09-0, OLED, 3840x2400, 16" | |
|---|---|---|---|---|---|---|
| Display | 0% | -15% | -16% | -16% | 6% | |
| Display P3 Coverage (%) | 96.4 | 96.61 0% | 69.4 -28% | 67.9 -30% | 68.7 -29% | 99.9 4% |
| sRGB Coverage (%) | 99.7 | 99.92 0% | 98 -2% | 99.1 -1% | 98.2 -2% | 100 0% |
| AdobeRGB 1998 Coverage (%) | 84.8 | 84.63 0% | 70.9 -16% | 69.9 -18% | 70.1 -17% | 96.4 14% |
| Response Times | -11% | -114% | -70% | -137% | 60% | |
| Response Time Grey 50% / Grey 80% * (ms) | 4.4 ? | 3.8 ? 14% | 13.1 ? -198% | 11 ? -150% | 13 ? -195% | 2 ? 55% |
| Response Time Black / White * (ms) | 5.6 ? | 7.6 ? -36% | 7.3 ? -30% | 5 ? 11% | 10 ? -79% | 1.98 ? 65% |
| PWM Frequency (Hz) | 60 | |||||
| Screen | 21% | 16% | 25% | 6% | 144% | |
| Brightness middle (cd/m²) | 424 | 486 15% | 374 -12% | 520 23% | 355 -16% | 389.97 -8% |
| Brightness (cd/m²) | 411 | 469 14% | 357 -13% | 494 20% | 340 -17% | 395 -4% |
| Brightness Distribution (%) | 88 | 91 3% | 92 5% | 91 3% | 91 3% | 97 10% |
| Black Level * (cd/m²) | 0.37 | 0.39 -5% | 0.33 11% | 0.39 -5% | 0.53 -43% | 0.03 92% |
| Contrast (:1) | 1146 | 1246 9% | 1133 -1% | 1333 16% | 670 -42% | 12999 1034% |
| Colorchecker dE 2000 * | 3.04 | 2.27 25% | 2.43 20% | 1.94 36% | 2.43 20% | 2 34% |
| Colorchecker dE 2000 max. * | 7.5 | 5.73 24% | 3.97 47% | 5.62 25% | 4.31 43% | 4.1 45% |
| Colorchecker dE 2000 calibrated * | 3.04 | 0.6 80% | 1.4 54% | 0.74 76% | 1.14 63% | 1.68 45% |
| Greyscale dE 2000 * | 4.34 | 3.36 23% | 3.1 29% | 2.94 32% | 2.62 40% | 2.23 49% |
| Gamma | 2.32 95% | 2.46 89% | 2.191 100% | 2.37 93% | 2.28 96% | 2.41 91% |
| CCT | 6952 93% | 6625 98% | 6194 105% | 6443 101% | 6909 94% | 6323 103% |
| Média Total (Programa/Configurações) | 3% /
12% | -38% /
-10% | -20% /
3% | -49% /
-19% | 70% /
103% |
* ... menor é melhor
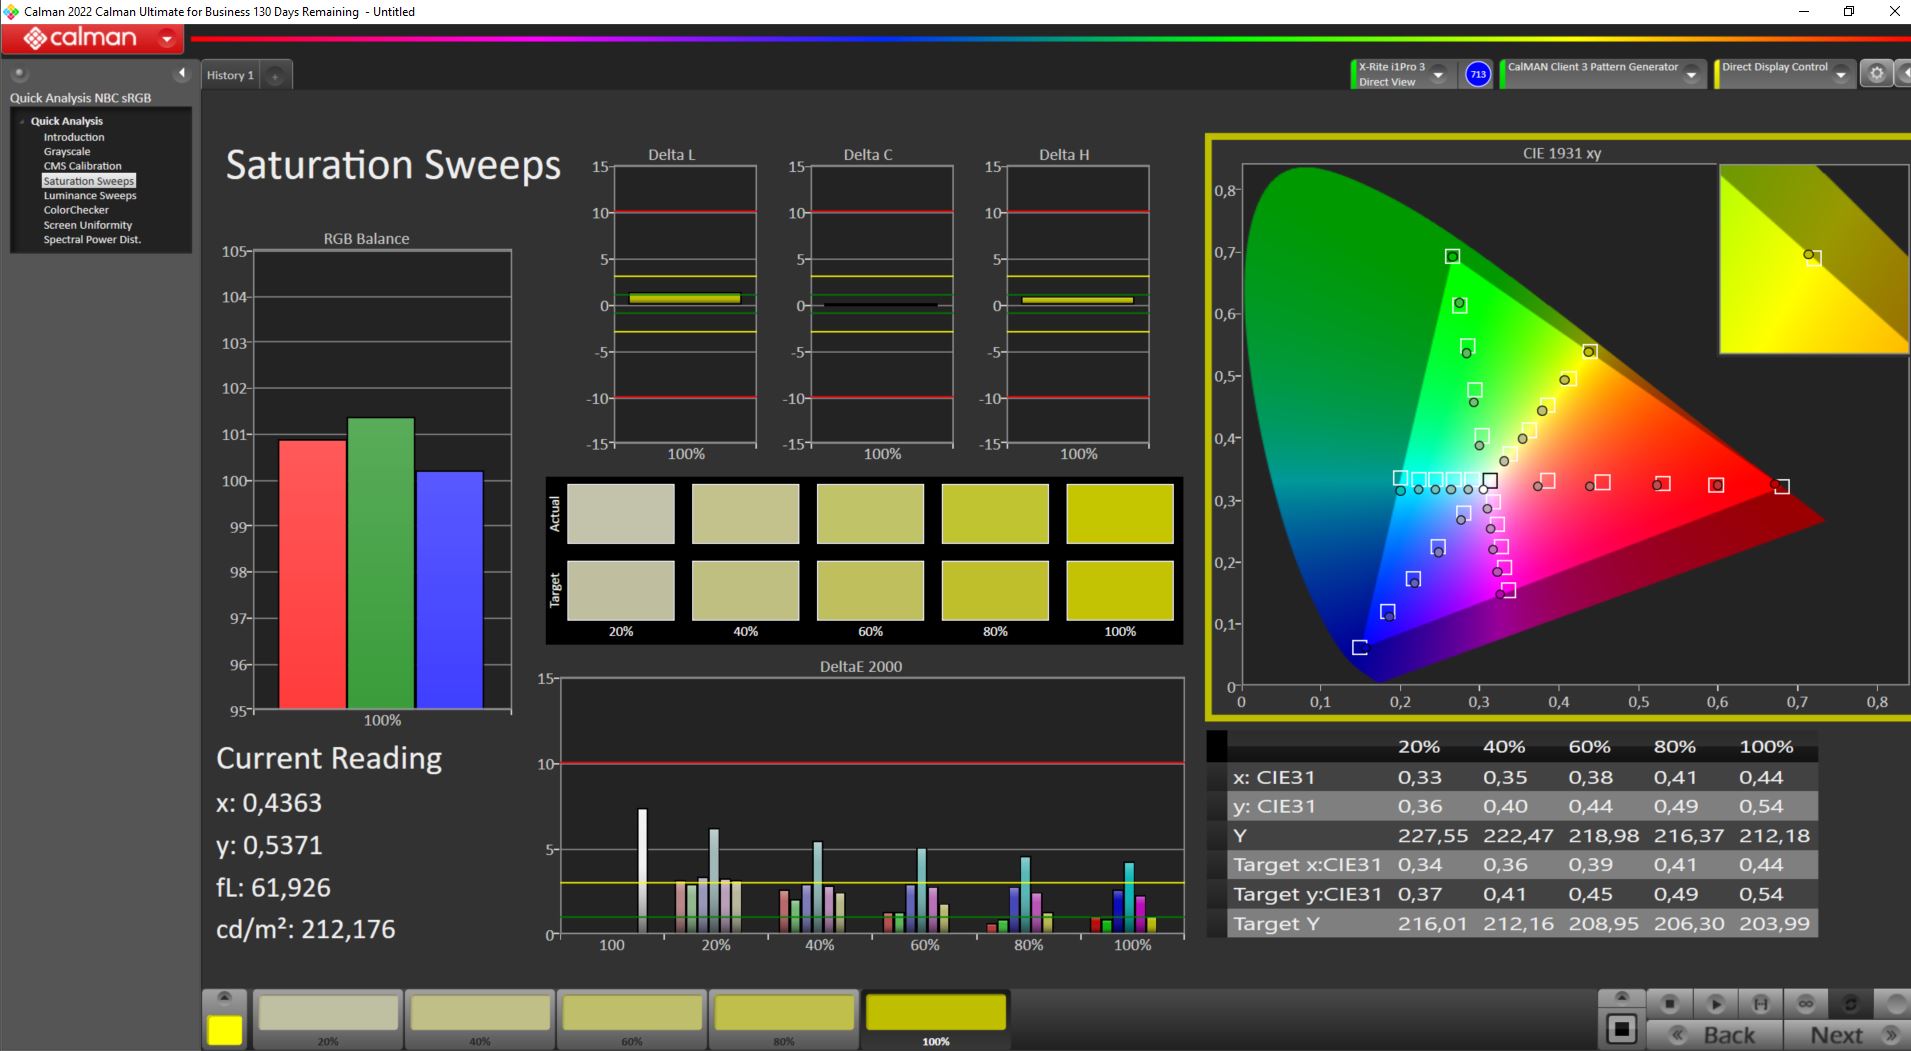
Nossas medições revelaram uma boa cobertura do espaço de cores no espaço de cores sRGB, que é coberto em quase 100%. Além disso, em termos do espaço de cores P3, vimos um resultado maravilhoso de mais de 96%, embora o espaço de cores AdobeRGB estendido só possa ser reproduzido em 84,8%. Com esses números, o IPS tem uma boa pontuação e só perde para oGigabyte AERO 16da Gigabyte AERO 16. No entanto, é certo que esse laptop pode ser usado para edição semiprofissional de imagens ou vídeos.
Subjetivamente, a qualidade da imagem da tela integrada é excelente. A superfície fosca evita reflexos e a granulação visível também está ausente. Em resumo, ao sair da caixa, os valores de cor DeltaE-2000 medidos estão relativamente próximos do valor alvo de <3. No entanto, a concorrência prova que é possível melhorar. Como é típico do IPS, observamos uma leve, mas não muito pronunciada, tonalidade azul no MSI Stealth 16 Studio A13VG.
Nossa calibração manual não levou a nenhuma melhoria. Também pretendemos fornecer o perfil ICC para essa tela.
Exibir tempos de resposta
| ↔ Tempo de resposta preto para branco | ||
|---|---|---|
| 5.6 ms ... ascensão ↗ e queda ↘ combinadas | ↗ 2.2 ms ascensão | 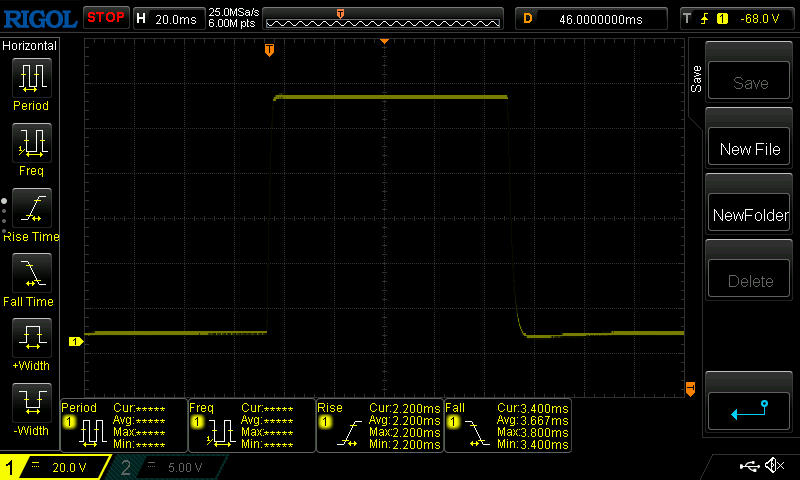 |
| ↘ 3.4 ms queda | ||
| A tela mostra taxas de resposta muito rápidas em nossos testes e deve ser muito adequada para jogos em ritmo acelerado. Em comparação, todos os dispositivos testados variam de 0.1 (mínimo) a 240 (máximo) ms. » 18 % de todos os dispositivos são melhores. Isso significa que o tempo de resposta medido é melhor que a média de todos os dispositivos testados (19.8 ms). | ||
| ↔ Tempo de resposta 50% cinza a 80% cinza | ||
| 4.4 ms ... ascensão ↗ e queda ↘ combinadas | ↗ 2.2 ms ascensão | 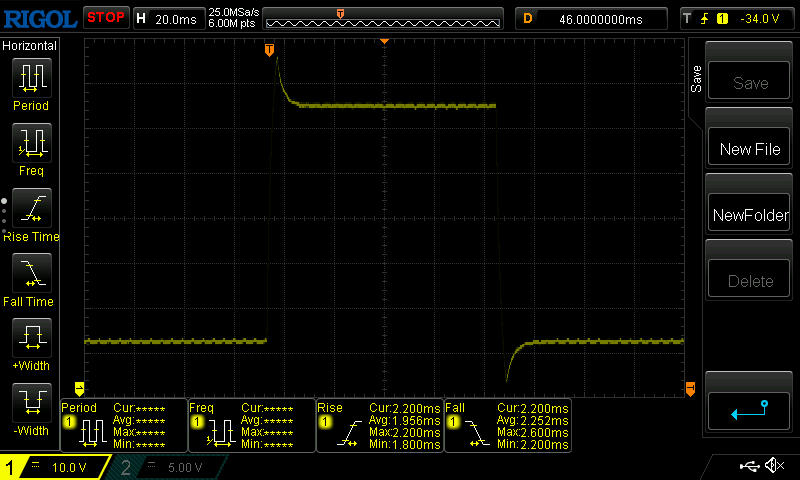 |
| ↘ 2.2 ms queda | ||
| A tela mostra taxas de resposta muito rápidas em nossos testes e deve ser muito adequada para jogos em ritmo acelerado. Em comparação, todos os dispositivos testados variam de 0.165 (mínimo) a 636 (máximo) ms. » 16 % de todos os dispositivos são melhores. Isso significa que o tempo de resposta medido é melhor que a média de todos os dispositivos testados (31 ms). | ||
Cintilação da tela / PWM (modulação por largura de pulso)
| Tela tremeluzindo / PWM não detectado | 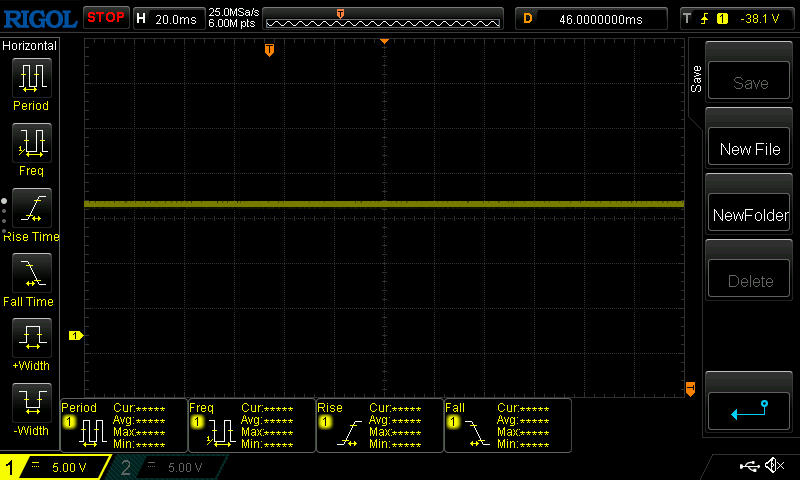 | ||
[pwm_comparison] Em comparação: 52 % de todos os dispositivos testados não usam PWM para escurecer a tela. Se PWM foi detectado, uma média de 7753 (mínimo: 5 - máximo: 343500) Hz foi medida. | |||
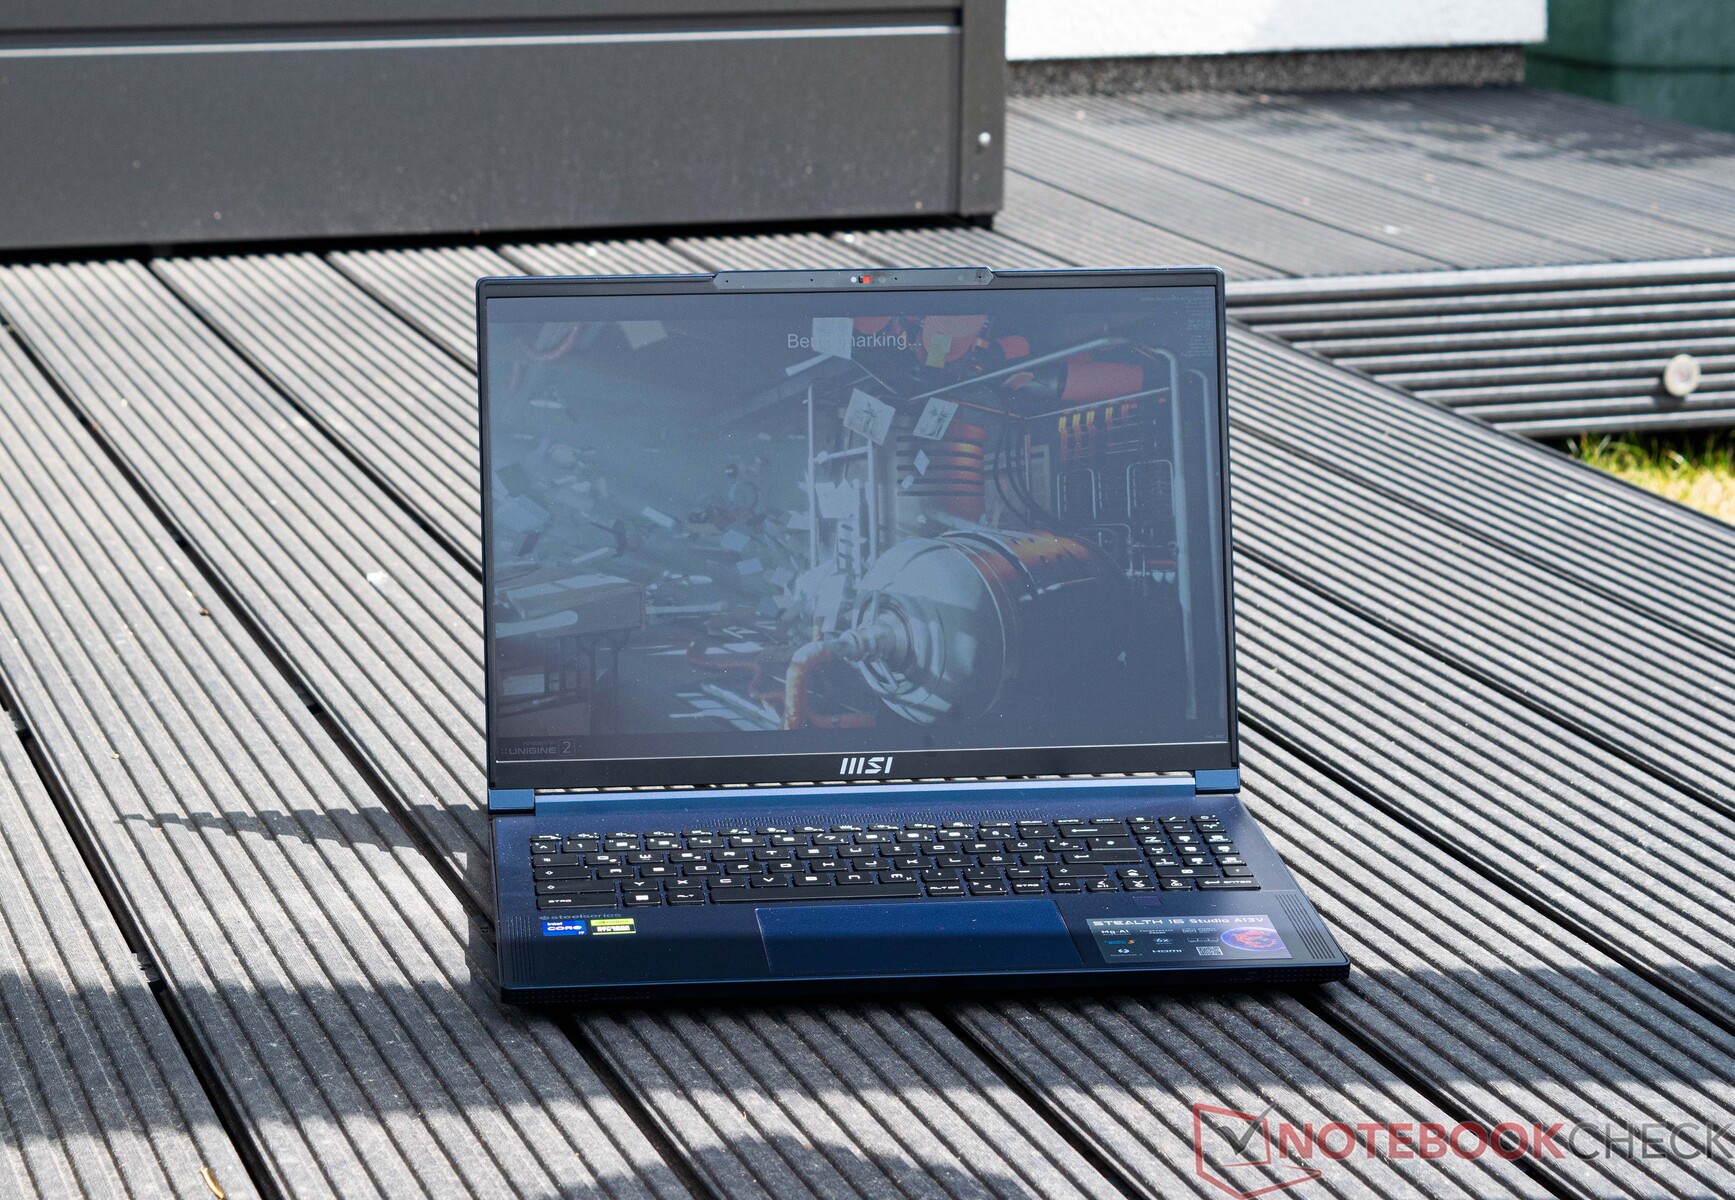
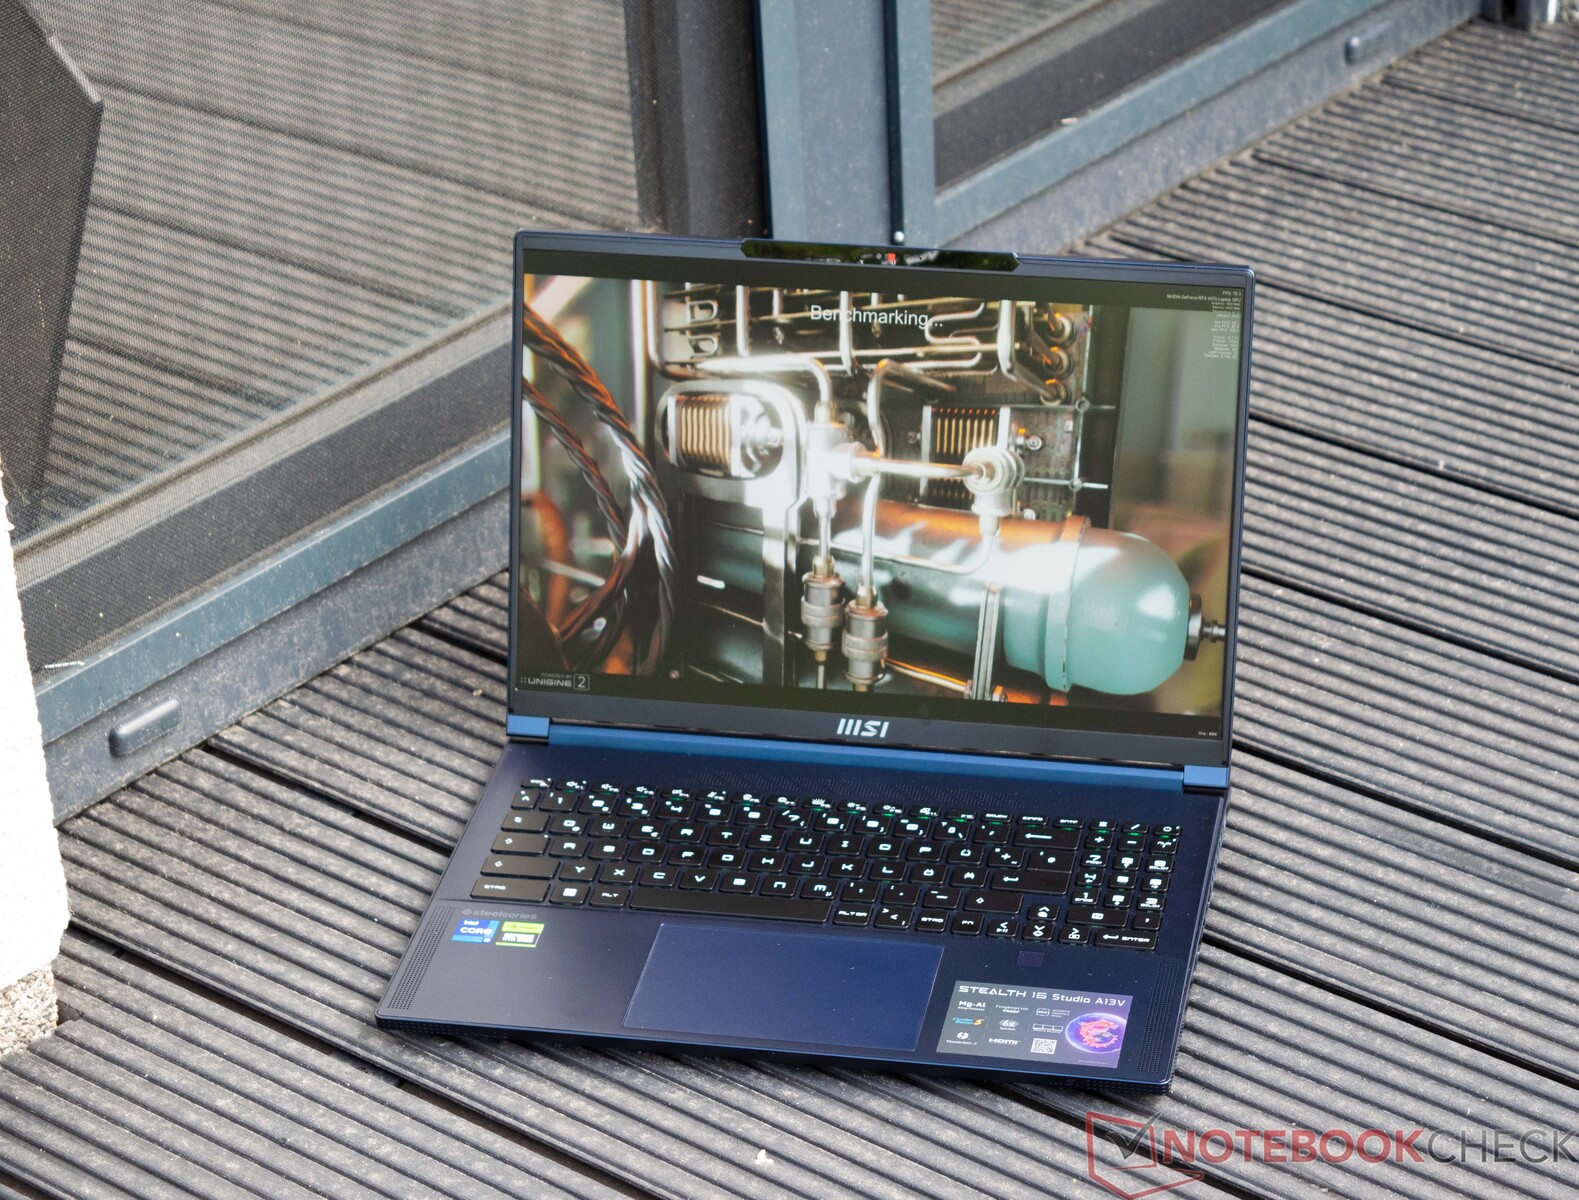
O brilho comparativamente bom da tela é suficiente para uso externo. No entanto, os usuários devem ter preferência por um local na sombra. Não há reflexos incômodos graças à superfície fosca da tela.
Em uso normal, o painel IPS integrado é uma tela maravilhosa. Como visto nas imagens dos quatro cantos, as mudanças de cor só são visíveis quando vistas de um ângulo amplo e inclinado.
Desempenho - a potência de 14 núcleos - Intel Core i7-13700H
O MSI Stealth 16 Studio A13VG, que é baseado no processadorIntel Core i7-13700H e a GPU de laptopGPU para laptop Nvidia GeForce RTX 4070oferece um nível de potência que significa que ele se classifica bem como um poderoso laptop para jogos. No entanto, os jogos não são a única capacidade principal do dispositivo, pois a tela maravilhosa e sua aparência elegante também o tornam uma perspectiva convidativa para os criadores. Uma alternativa ao nosso modelo de análise pode ser encontrada na forma do MSI Stealth 16 Studio A13V, que também vem com umaGPU para laptop Nvidia GeForce RTX 4060.
Condições de teste
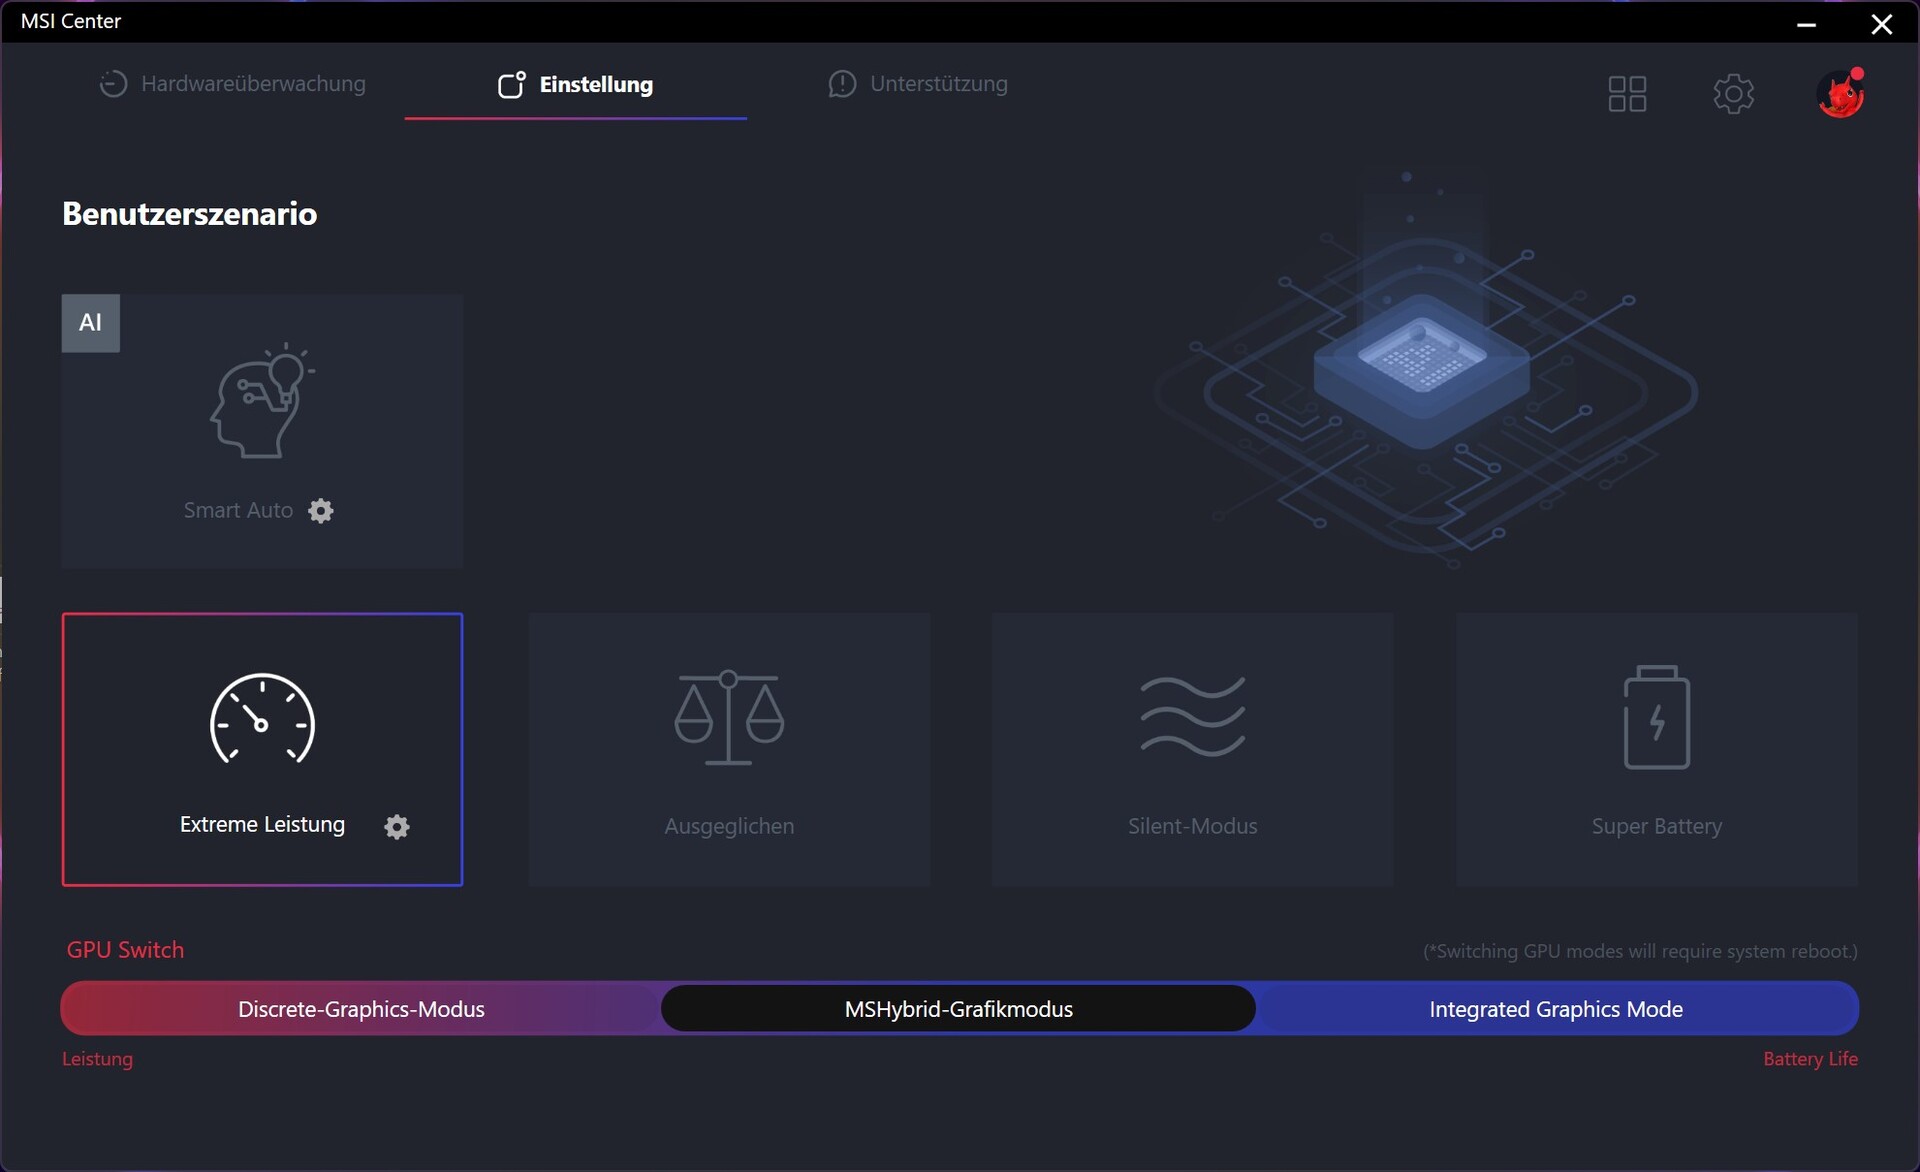
Vários perfis de desempenho que afetam a CPU e a GPU podem ser selecionados usando o MSI Center. Salvo indicação em contrário, os testes de desempenho foram realizados usando o perfil Extreme Performance
. Além disso, fizemos os desvios de medição de energia e volume de acordo com nossos critérios de teste.
| Modo | Potência da CPU PL1 | Potência da CPU PL2 | Potência da GPU |
|---|---|---|---|
| Super bateria | 15 W | 15 W | 80 W |
| Modo silencioso | 25 W | 45 W | 80 W |
| Balanceado | 45 W | 45 W | 80 W |
| Desempenho extremo | 115 W | 160 W | 105 W |
Processador
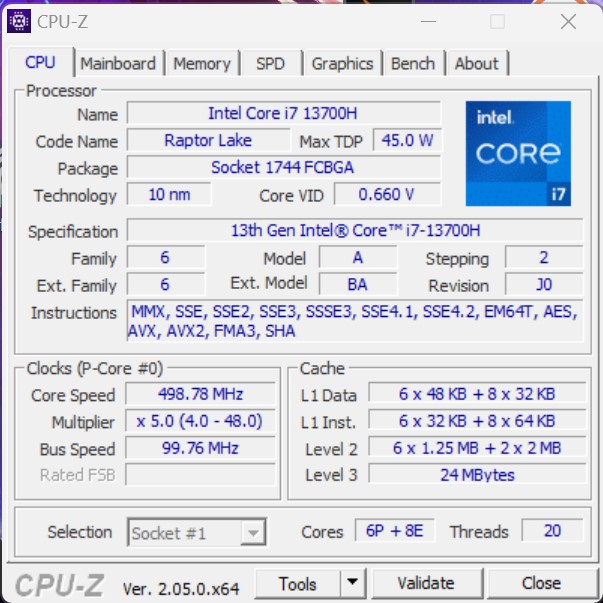
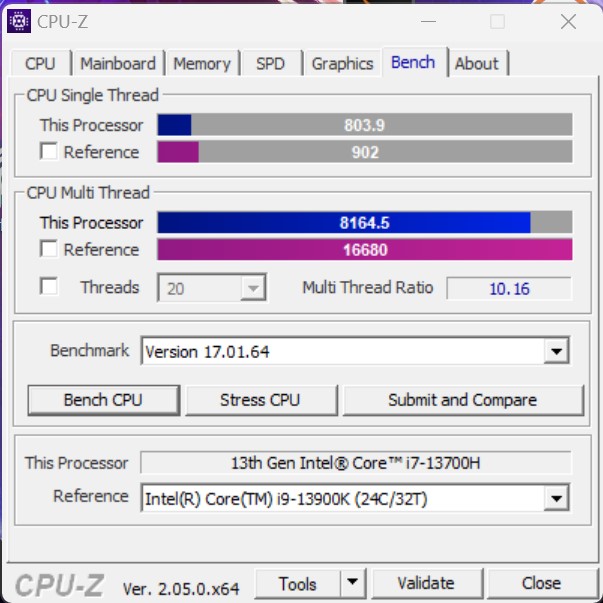
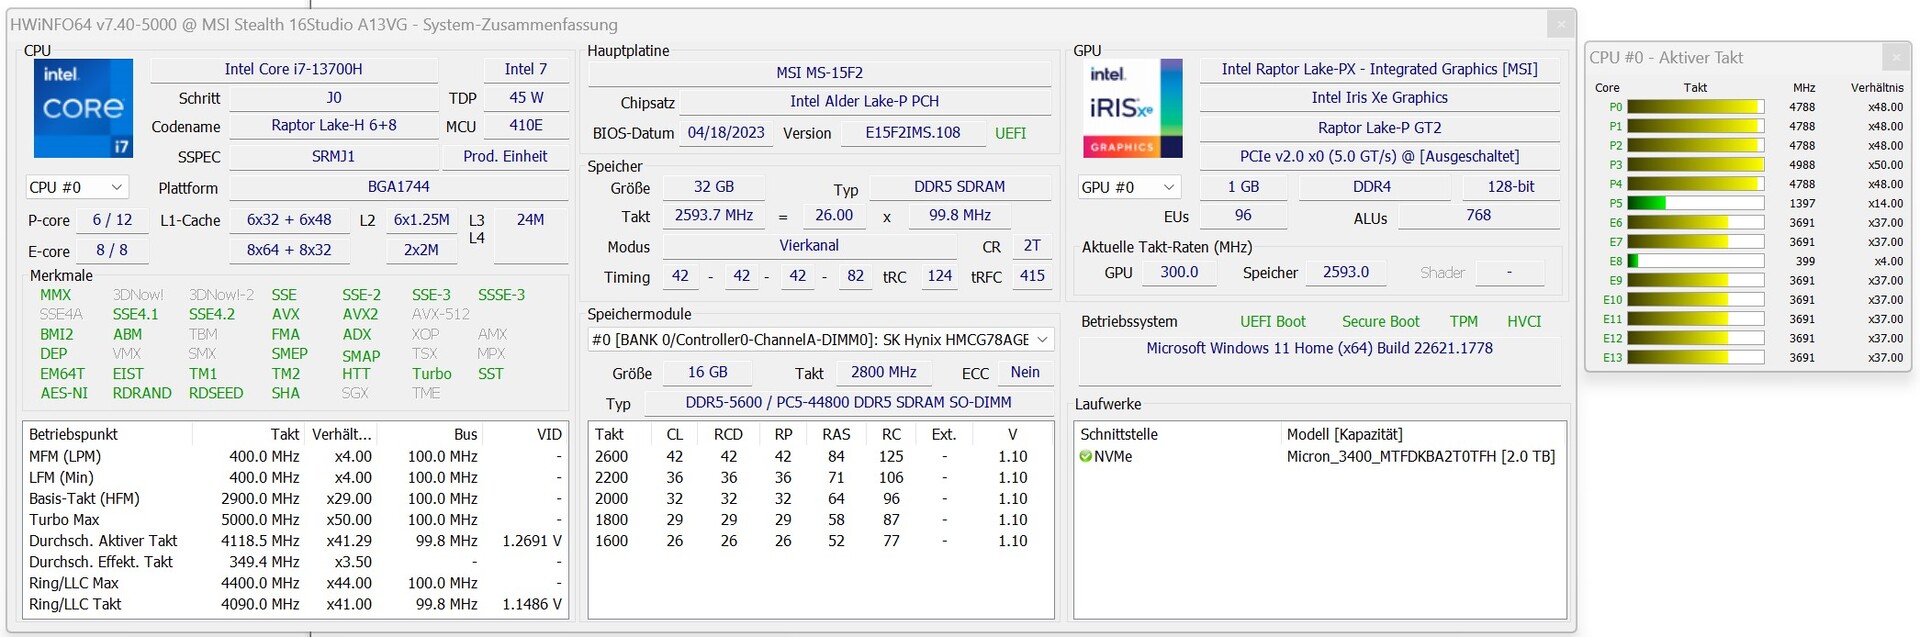
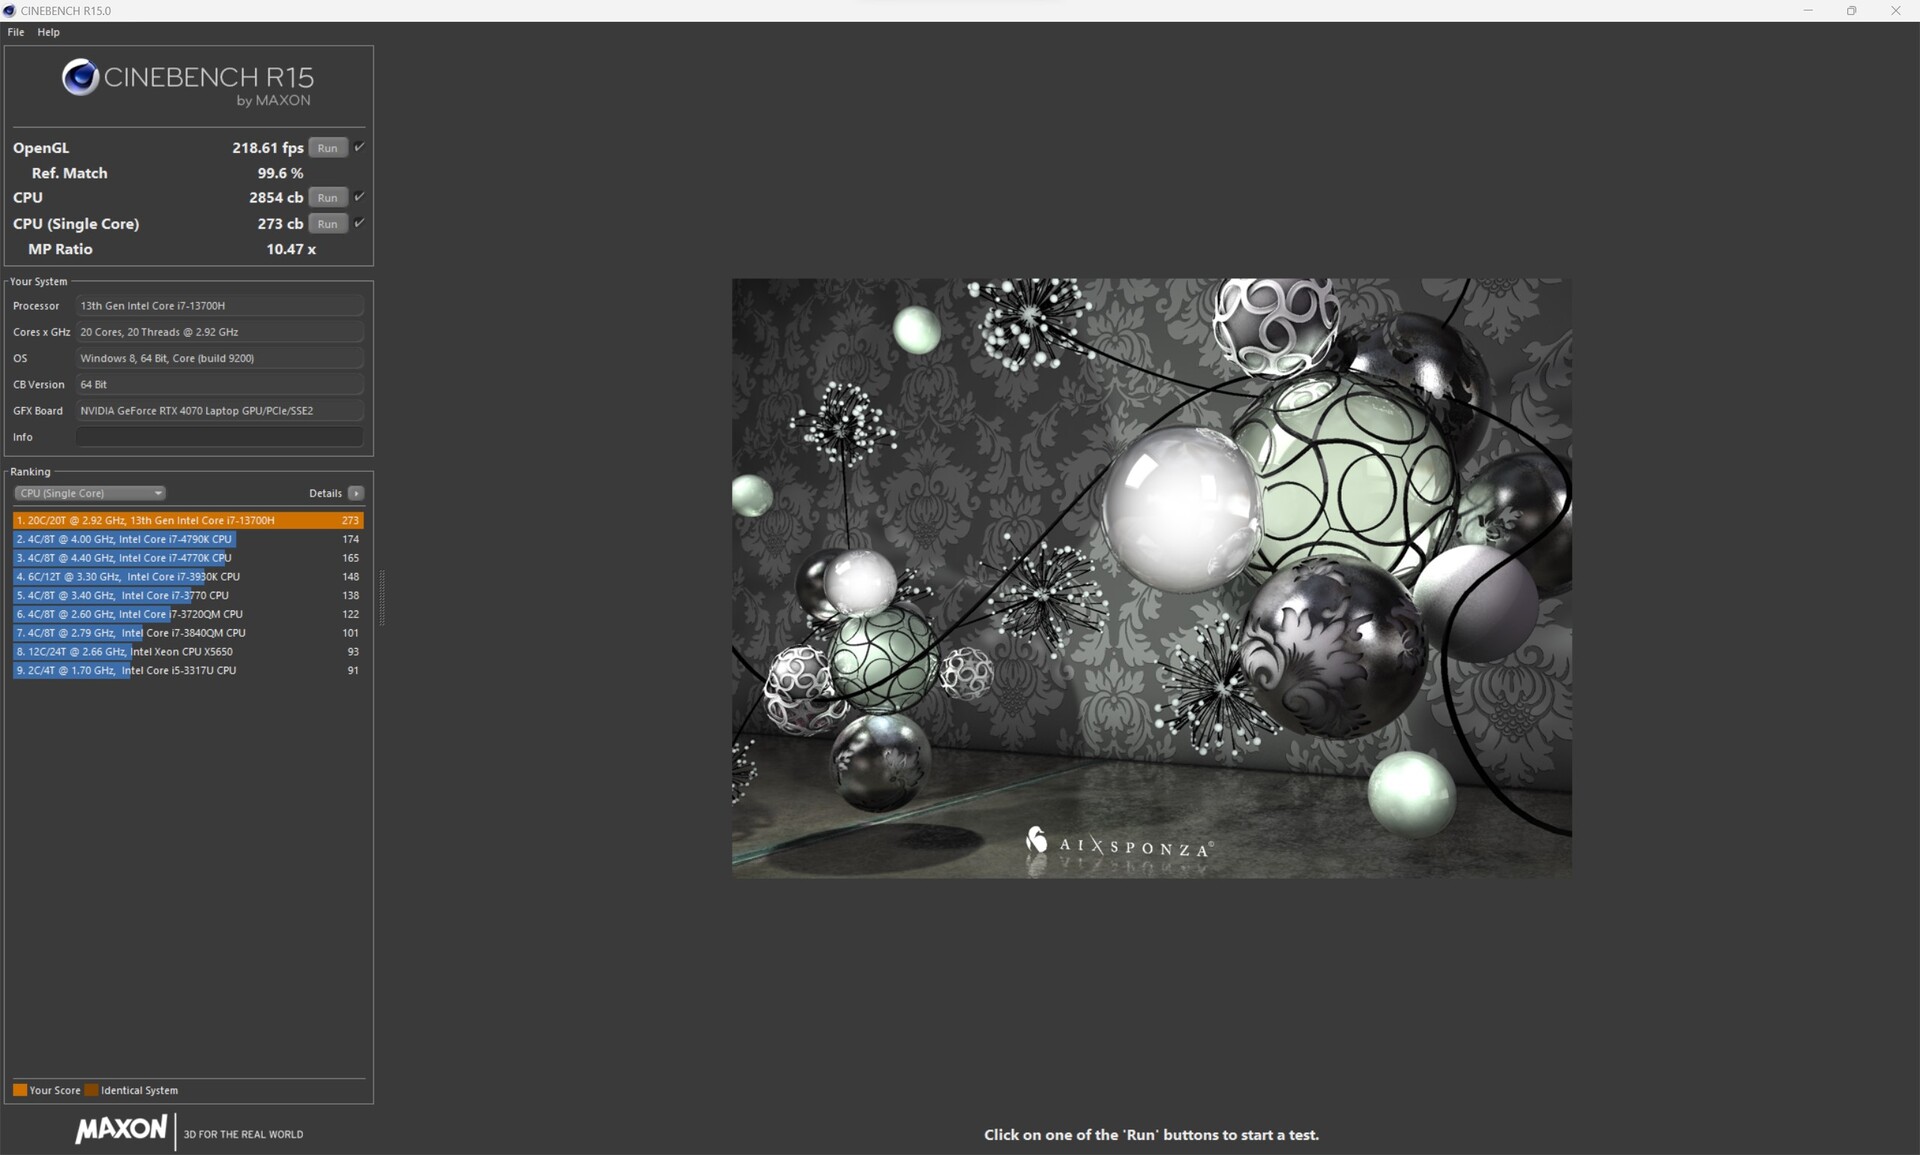
O processador Intel Core-i7-13700H (Raptor Lake) consiste em oito núcleos de eficiência (sem hyper-threading, 1,8 a 3,7 GHz) e seis núcleos de desempenho (hyper-threading, 2,4 a 5,0 GHz). No total, isso resulta em 20 núcleos lógicos de CPU. Com base no Core i7-13700H, o MSI Stealth 16 Studio A13VG alcança um bom desempenho que está à frente do desempenho documentado anteriormente com o Intel Core i7-13700H. Até mesmo o Gigabyte AERO 16, que é equipado com um Intel Core i9-13900H, tem que dar lugar à nossa amostra de análise. O Medion Erazer Major X20 é o líder indiscutível do grupo. Mas, em comparação com o Intel Core i9-13900HX, o MSI Stealth 16 Studio A13VG tem desempenho cerca de 30% inferior.
O teste de loop Cinebench R15 mostra que, no início, o aumento da CPU foi relativamente bem mantido, mas, após a 11ª execução, o SoC não consegue fornecer sua potência total. Registramos uma perda de desempenho de cerca de 15% em comparação com a primeira execução.
Cinebench R15 Multi Continuous Test
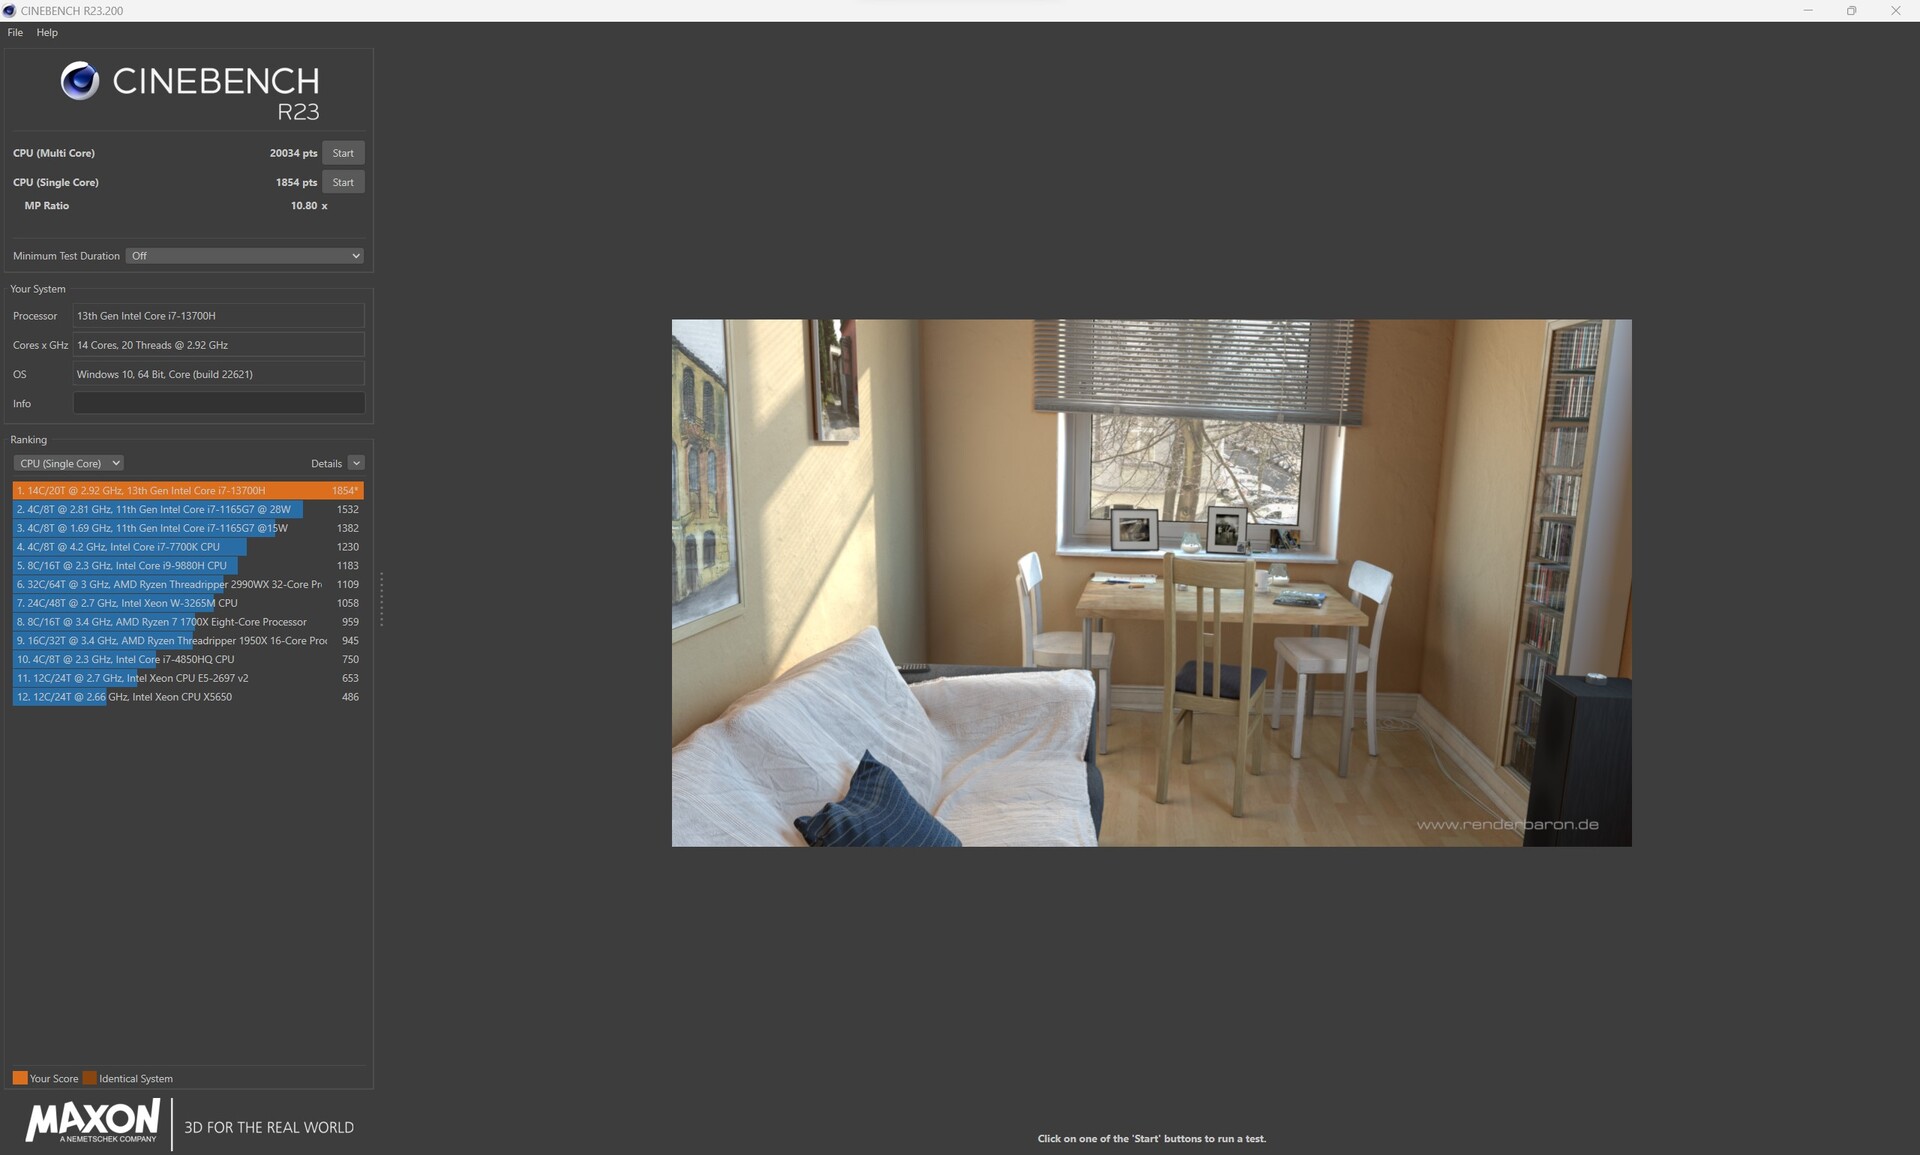
Cinebench R23: Multi Core | Single Core
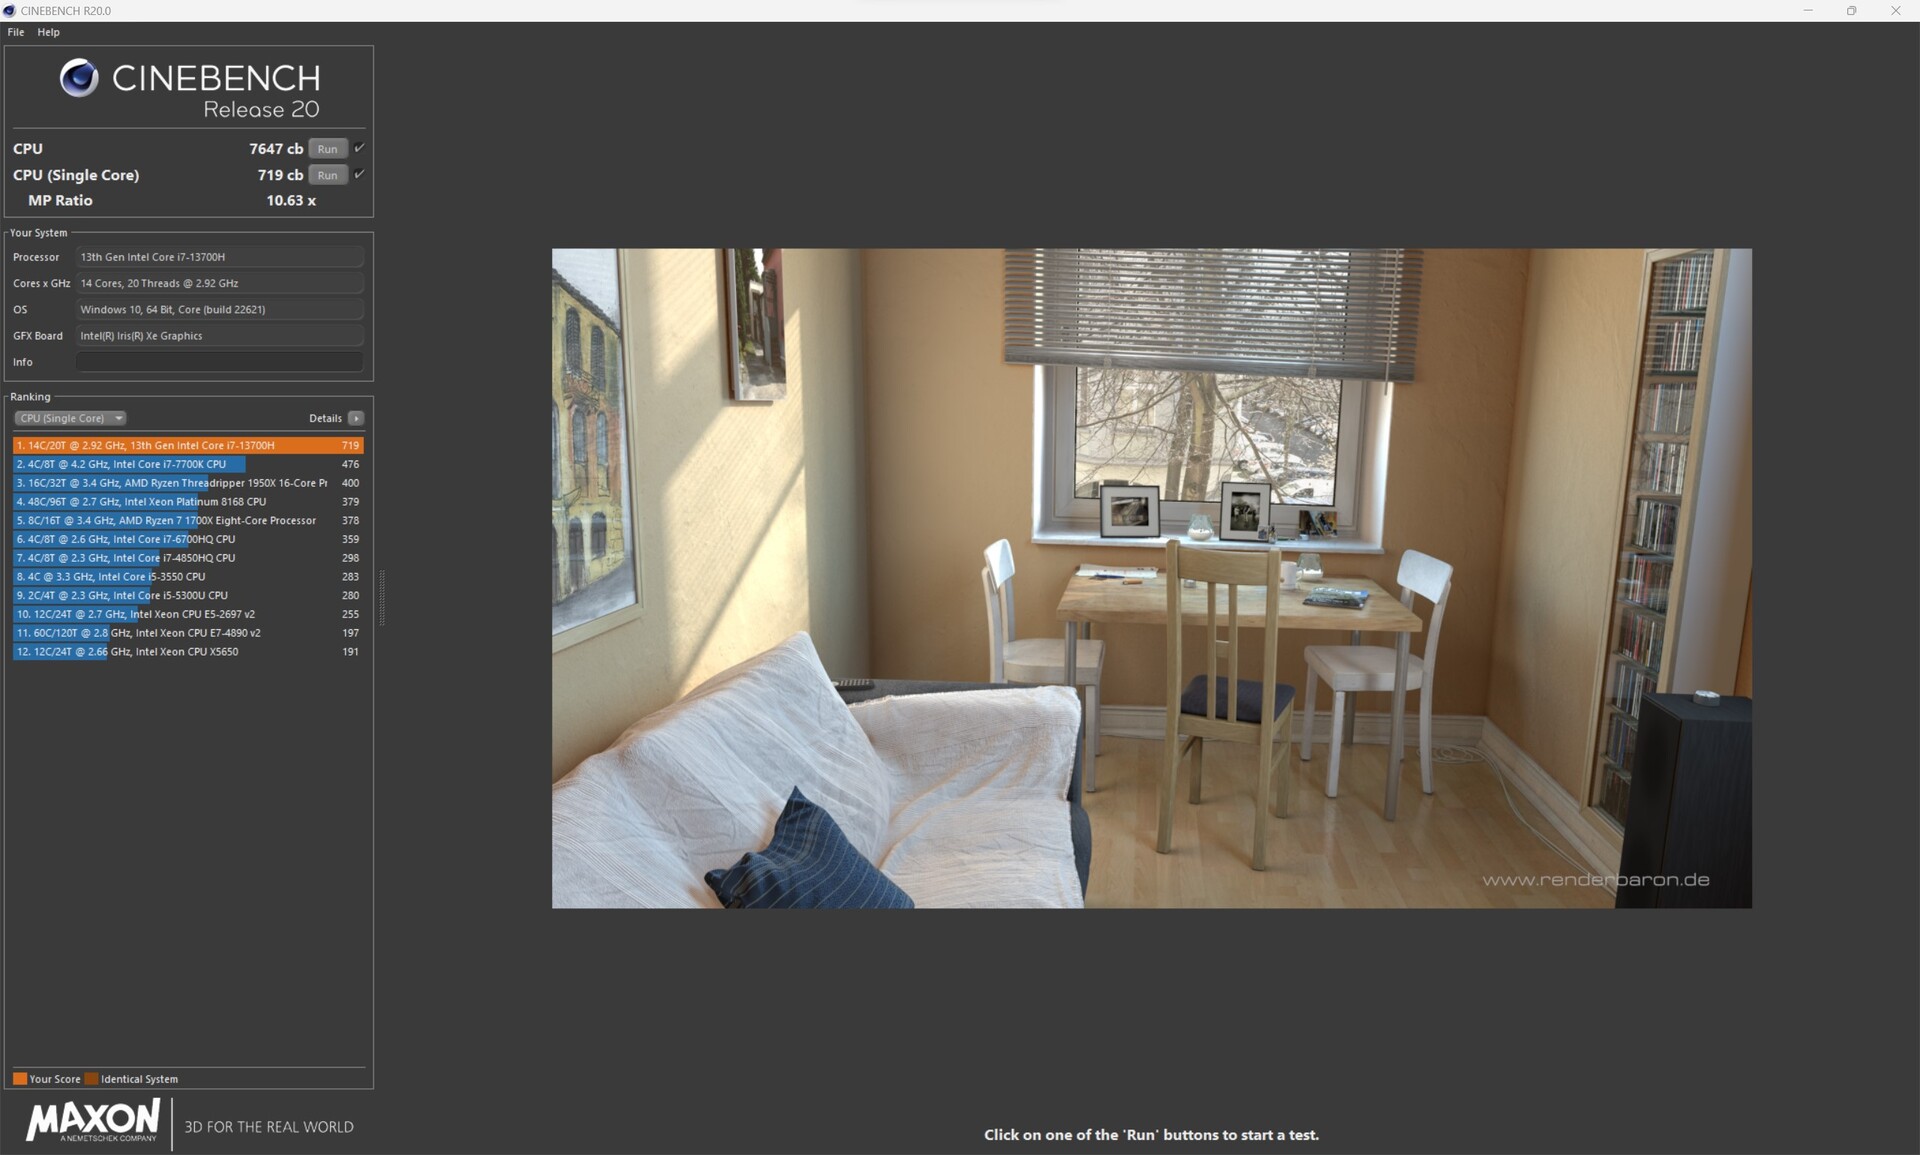
Cinebench R20: CPU (Multi Core) | CPU (Single Core)
Cinebench R15: CPU Multi 64Bit | CPU Single 64Bit
Blender: v2.79 BMW27 CPU
7-Zip 18.03: 7z b 4 | 7z b 4 -mmt1
Geekbench 5.5: Multi-Core | Single-Core
HWBOT x265 Benchmark v2.2: 4k Preset
LibreOffice : 20 Documents To PDF
R Benchmark 2.5: Overall mean
| CPU Performance rating | |
| Medion Erazer Major X20 | |
| Média da turma Gaming | |
| Asus ROG Flow X16 GV601V | |
| MSI Stealth 16 Studio A13VG | |
| Gigabyte AERO 16 OLED BSF | |
| Média Intel Core i7-13700H | |
| Acer Nitro 16 AN16-41 | |
| Corsair Voyager a1600 | |
| Cinebench R23 / Multi Core | |
| Medion Erazer Major X20 | |
| Média da turma Gaming (10488 - 40970, n=108, últimos 2 anos) | |
| MSI Stealth 16 Studio A13VG | |
| Asus ROG Flow X16 GV601V | |
| Gigabyte AERO 16 OLED BSF | |
| Média Intel Core i7-13700H (5890 - 20034, n=29) | |
| Acer Nitro 16 AN16-41 | |
| Corsair Voyager a1600 | |
| Cinebench R23 / Single Core | |
| Medion Erazer Major X20 | |
| Asus ROG Flow X16 GV601V | |
| Média da turma Gaming (1166 - 2356, n=108, últimos 2 anos) | |
| MSI Stealth 16 Studio A13VG | |
| Média Intel Core i7-13700H (1323 - 1914, n=29) | |
| Gigabyte AERO 16 OLED BSF | |
| Corsair Voyager a1600 | |
| Acer Nitro 16 AN16-41 | |
| Cinebench R20 / CPU (Multi Core) | |
| Medion Erazer Major X20 | |
| Média da turma Gaming (4029 - 16108, n=107, últimos 2 anos) | |
| MSI Stealth 16 Studio A13VG | |
| Asus ROG Flow X16 GV601V | |
| Gigabyte AERO 16 OLED BSF | |
| Média Intel Core i7-13700H (2322 - 7674, n=29) | |
| Acer Nitro 16 AN16-41 | |
| Corsair Voyager a1600 | |
| Cinebench R20 / CPU (Single Core) | |
| Medion Erazer Major X20 | |
| Média da turma Gaming (442 - 895, n=107, últimos 2 anos) | |
| Asus ROG Flow X16 GV601V | |
| MSI Stealth 16 Studio A13VG | |
| Média Intel Core i7-13700H (508 - 741, n=29) | |
| Gigabyte AERO 16 OLED BSF | |
| Acer Nitro 16 AN16-41 | |
| Corsair Voyager a1600 | |
| Cinebench R15 / CPU Multi 64Bit | |
| Medion Erazer Major X20 | |
| Média da turma Gaming (1578 - 6271, n=106, últimos 2 anos) | |
| Asus ROG Flow X16 GV601V | |
| Gigabyte AERO 16 OLED BSF | |
| MSI Stealth 16 Studio A13VG | |
| Média Intel Core i7-13700H (905 - 2982, n=29) | |
| Acer Nitro 16 AN16-41 | |
| Corsair Voyager a1600 | |
| Cinebench R15 / CPU Single 64Bit | |
| Medion Erazer Major X20 | |
| Média da turma Gaming (188.8 - 343, n=107, últimos 2 anos) | |
| Asus ROG Flow X16 GV601V | |
| MSI Stealth 16 Studio A13VG | |
| Média Intel Core i7-13700H (213 - 278, n=29) | |
| Acer Nitro 16 AN16-41 | |
| Corsair Voyager a1600 | |
| Gigabyte AERO 16 OLED BSF | |
| Blender / v2.79 BMW27 CPU | |
| Média Intel Core i7-13700H (169 - 555, n=29) | |
| Corsair Voyager a1600 | |
| Acer Nitro 16 AN16-41 | |
| Asus ROG Flow X16 GV601V | |
| Gigabyte AERO 16 OLED BSF | |
| MSI Stealth 16 Studio A13VG | |
| Média da turma Gaming (80 - 330, n=105, últimos 2 anos) | |
| Medion Erazer Major X20 | |
| 7-Zip 18.03 / 7z b 4 | |
| Medion Erazer Major X20 | |
| Média da turma Gaming (33491 - 148086, n=106, últimos 2 anos) | |
| MSI Stealth 16 Studio A13VG | |
| Gigabyte AERO 16 OLED BSF | |
| Asus ROG Flow X16 GV601V | |
| Corsair Voyager a1600 | |
| Acer Nitro 16 AN16-41 | |
| Média Intel Core i7-13700H (27322 - 76344, n=29) | |
| 7-Zip 18.03 / 7z b 4 -mmt1 | |
| Medion Erazer Major X20 | |
| Média da turma Gaming (4199 - 7436, n=106, últimos 2 anos) | |
| Asus ROG Flow X16 GV601V | |
| MSI Stealth 16 Studio A13VG | |
| Média Intel Core i7-13700H (4825 - 6238, n=29) | |
| Corsair Voyager a1600 | |
| Acer Nitro 16 AN16-41 | |
| Gigabyte AERO 16 OLED BSF | |
| Geekbench 5.5 / Multi-Core | |
| Medion Erazer Major X20 | |
| Média da turma Gaming (6460 - 27010, n=106, últimos 2 anos) | |
| Asus ROG Flow X16 GV601V | |
| Gigabyte AERO 16 OLED BSF | |
| MSI Stealth 16 Studio A13VG | |
| Média Intel Core i7-13700H (6165 - 14215, n=29) | |
| Corsair Voyager a1600 | |
| Acer Nitro 16 AN16-41 | |
| Geekbench 5.5 / Single-Core | |
| Média da turma Gaming (986 - 2474, n=106, últimos 2 anos) | |
| Medion Erazer Major X20 | |
| Asus ROG Flow X16 GV601V | |
| MSI Stealth 16 Studio A13VG | |
| Média Intel Core i7-13700H (1362 - 1919, n=29) | |
| Gigabyte AERO 16 OLED BSF | |
| Acer Nitro 16 AN16-41 | |
| Corsair Voyager a1600 | |
| HWBOT x265 Benchmark v2.2 / 4k Preset | |
| Medion Erazer Major X20 | |
| Média da turma Gaming (11.5 - 44.3, n=106, últimos 2 anos) | |
| Asus ROG Flow X16 GV601V | |
| Gigabyte AERO 16 OLED BSF | |
| MSI Stealth 16 Studio A13VG | |
| Acer Nitro 16 AN16-41 | |
| Corsair Voyager a1600 | |
| Média Intel Core i7-13700H (6.72 - 21.2, n=29) | |
| LibreOffice / 20 Documents To PDF | |
| Gigabyte AERO 16 OLED BSF | |
| Corsair Voyager a1600 | |
| MSI Stealth 16 Studio A13VG | |
| Acer Nitro 16 AN16-41 | |
| Média da turma Gaming (33.2 - 88.8, n=106, últimos 2 anos) | |
| Média Intel Core i7-13700H (31.3 - 62.4, n=29) | |
| Medion Erazer Major X20 | |
| Asus ROG Flow X16 GV601V | |
| R Benchmark 2.5 / Overall mean | |
| Acer Nitro 16 AN16-41 | |
| Gigabyte AERO 16 OLED BSF | |
| Corsair Voyager a1600 | |
| Média Intel Core i7-13700H (0.4308 - 0.607, n=29) | |
| MSI Stealth 16 Studio A13VG | |
| Média da turma Gaming (0.3439 - 0.759, n=107, últimos 2 anos) | |
| Asus ROG Flow X16 GV601V | |
| Medion Erazer Major X20 | |
* ... menor é melhor
AIDA64: FP32 Ray-Trace | FPU Julia | CPU SHA3 | CPU Queen | FPU SinJulia | FPU Mandel | CPU AES | CPU ZLib | FP64 Ray-Trace | CPU PhotoWorxx
| Performance rating | |
| Média da turma Gaming | |
| Medion Erazer Major X20 | |
| Gigabyte AERO 16 OLED BSF | |
| Corsair Voyager a1600 | |
| MSI Stealth 16 Studio A13VG | |
| Asus ROG Flow X16 GV601V | |
| Acer Nitro 16 AN16-41 | |
| Média Intel Core i7-13700H | |
| AIDA64 / FP32 Ray-Trace | |
| Média da turma Gaming (10227 - 85542, n=105, últimos 2 anos) | |
| Medion Erazer Major X20 | |
| Gigabyte AERO 16 OLED BSF | |
| MSI Stealth 16 Studio A13VG | |
| Acer Nitro 16 AN16-41 | |
| Corsair Voyager a1600 | |
| Média Intel Core i7-13700H (4986 - 18908, n=29) | |
| Asus ROG Flow X16 GV601V | |
| AIDA64 / FPU Julia | |
| Média da turma Gaming (51376 - 238426, n=105, últimos 2 anos) | |
| Medion Erazer Major X20 | |
| Acer Nitro 16 AN16-41 | |
| Corsair Voyager a1600 | |
| Gigabyte AERO 16 OLED BSF | |
| Asus ROG Flow X16 GV601V | |
| MSI Stealth 16 Studio A13VG | |
| Média Intel Core i7-13700H (25360 - 92359, n=29) | |
| AIDA64 / CPU SHA3 | |
| Medion Erazer Major X20 | |
| Média da turma Gaming (2180 - 9817, n=105, últimos 2 anos) | |
| Asus ROG Flow X16 GV601V | |
| Gigabyte AERO 16 OLED BSF | |
| MSI Stealth 16 Studio A13VG | |
| Acer Nitro 16 AN16-41 | |
| Corsair Voyager a1600 | |
| Média Intel Core i7-13700H (1339 - 4224, n=29) | |
| AIDA64 / CPU Queen | |
| Medion Erazer Major X20 | |
| Média da turma Gaming (49785 - 173351, n=92, últimos 2 anos) | |
| Asus ROG Flow X16 GV601V | |
| Acer Nitro 16 AN16-41 | |
| MSI Stealth 16 Studio A13VG | |
| Corsair Voyager a1600 | |
| Média Intel Core i7-13700H (59324 - 107159, n=29) | |
| Gigabyte AERO 16 OLED BSF | |
| AIDA64 / FPU SinJulia | |
| Medion Erazer Major X20 | |
| Média da turma Gaming (4424 - 33636, n=105, últimos 2 anos) | |
| Acer Nitro 16 AN16-41 | |
| Corsair Voyager a1600 | |
| Asus ROG Flow X16 GV601V | |
| MSI Stealth 16 Studio A13VG | |
| Gigabyte AERO 16 OLED BSF | |
| Média Intel Core i7-13700H (4800 - 11050, n=29) | |
| AIDA64 / FPU Mandel | |
| Média da turma Gaming (25115 - 128721, n=105, últimos 2 anos) | |
| Medion Erazer Major X20 | |
| Acer Nitro 16 AN16-41 | |
| Corsair Voyager a1600 | |
| Gigabyte AERO 16 OLED BSF | |
| MSI Stealth 16 Studio A13VG | |
| Asus ROG Flow X16 GV601V | |
| Média Intel Core i7-13700H (12321 - 45118, n=29) | |
| AIDA64 / CPU AES | |
| Gigabyte AERO 16 OLED BSF | |
| Corsair Voyager a1600 | |
| Medion Erazer Major X20 | |
| Média da turma Gaming (39258 - 247074, n=105, últimos 2 anos) | |
| Asus ROG Flow X16 GV601V | |
| MSI Stealth 16 Studio A13VG | |
| Média Intel Core i7-13700H (28769 - 151254, n=29) | |
| Acer Nitro 16 AN16-41 | |
| AIDA64 / CPU ZLib | |
| Medion Erazer Major X20 | |
| Média da turma Gaming (574 - 2531, n=105, últimos 2 anos) | |
| Asus ROG Flow X16 GV601V | |
| Gigabyte AERO 16 OLED BSF | |
| MSI Stealth 16 Studio A13VG | |
| Média Intel Core i7-13700H (389 - 1215, n=29) | |
| Acer Nitro 16 AN16-41 | |
| Corsair Voyager a1600 | |
| AIDA64 / FP64 Ray-Trace | |
| Média da turma Gaming (5509 - 45446, n=105, últimos 2 anos) | |
| Medion Erazer Major X20 | |
| Gigabyte AERO 16 OLED BSF | |
| Asus ROG Flow X16 GV601V | |
| MSI Stealth 16 Studio A13VG | |
| Acer Nitro 16 AN16-41 | |
| Corsair Voyager a1600 | |
| Média Intel Core i7-13700H (2540 - 10135, n=29) | |
| AIDA64 / CPU PhotoWorxx | |
| MSI Stealth 16 Studio A13VG | |
| Gigabyte AERO 16 OLED BSF | |
| Média da turma Gaming (12271 - 89891, n=105, últimos 2 anos) | |
| Medion Erazer Major X20 | |
| Média Intel Core i7-13700H (12872 - 52727, n=29) | |
| Asus ROG Flow X16 GV601V | |
| Corsair Voyager a1600 | |
| Acer Nitro 16 AN16-41 | |
Desempenho do sistema
em termos de desempenho do sistema, o MSI Stealth 16 Studio A13VG garantiu uma colocação no meio da tabela em nossos testes de benchmark. Com seis e nove por cento, respectivamente, a diferença para o primeiro lugar é relativamente pequena. No entanto, o desempenho do sistema é excelente e está acima da média dos notebooks para jogos lançados nos últimos dois anos. Quando se trata dos benchmarks AIDA64, o MSI Stealth 16 Studio A13VG oferece resultados consistentemente impecáveis devido à sua rápida RAM DDR5, e nosso dispositivo de análise conseguiu até mesmo garantir o primeiro lugar.
CrossMark: Overall | Productivity | Creativity | Responsiveness
| PCMark 10 / Score | |
| Média da turma Gaming (5828 - 11574, n=94, últimos 2 anos) | |
| Gigabyte AERO 16 OLED BSF | |
| Asus ROG Flow X16 GV601V | |
| Medion Erazer Major X20 | |
| Média Intel Core i7-13700H, NVIDIA GeForce RTX 4070 Laptop GPU (7158 - 7956, n=8) | |
| MSI Stealth 16 Studio A13VG | |
| Acer Nitro 16 AN16-41 | |
| Corsair Voyager a1600 | |
| PCMark 10 / Essentials | |
| Medion Erazer Major X20 | |
| Asus ROG Flow X16 GV601V | |
| Gigabyte AERO 16 OLED BSF | |
| Média Intel Core i7-13700H, NVIDIA GeForce RTX 4070 Laptop GPU (10252 - 11449, n=8) | |
| Média da turma Gaming (8810 - 11935, n=98, últimos 2 anos) | |
| Acer Nitro 16 AN16-41 | |
| MSI Stealth 16 Studio A13VG | |
| Corsair Voyager a1600 | |
| PCMark 10 / Productivity | |
| Média da turma Gaming (6845 - 21327, n=96, últimos 2 anos) | |
| Asus ROG Flow X16 GV601V | |
| Medion Erazer Major X20 | |
| Média Intel Core i7-13700H, NVIDIA GeForce RTX 4070 Laptop GPU (8501 - 10769, n=8) | |
| MSI Stealth 16 Studio A13VG | |
| Gigabyte AERO 16 OLED BSF | |
| Acer Nitro 16 AN16-41 | |
| Corsair Voyager a1600 | |
| PCMark 10 / Digital Content Creation | |
| Média da turma Gaming (7602 - 19657, n=96, últimos 2 anos) | |
| Gigabyte AERO 16 OLED BSF | |
| Corsair Voyager a1600 | |
| Asus ROG Flow X16 GV601V | |
| Média Intel Core i7-13700H, NVIDIA GeForce RTX 4070 Laptop GPU (10358 - 12908, n=8) | |
| MSI Stealth 16 Studio A13VG | |
| Acer Nitro 16 AN16-41 | |
| Medion Erazer Major X20 | |
| CrossMark / Overall | |
| Média da turma Gaming (1366 - 2409, n=94, últimos 2 anos) | |
| Asus ROG Flow X16 GV601V | |
| Média Intel Core i7-13700H, NVIDIA GeForce RTX 4070 Laptop GPU (1768 - 2073, n=6) | |
| Gigabyte AERO 16 OLED BSF | |
| Medion Erazer Major X20 | |
| MSI Stealth 16 Studio A13VG | |
| Acer Nitro 16 AN16-41 | |
| Corsair Voyager a1600 | |
| CrossMark / Productivity | |
| Asus ROG Flow X16 GV601V | |
| Média da turma Gaming (1386 - 2254, n=94, últimos 2 anos) | |
| Média Intel Core i7-13700H, NVIDIA GeForce RTX 4070 Laptop GPU (1645 - 2006, n=6) | |
| Gigabyte AERO 16 OLED BSF | |
| MSI Stealth 16 Studio A13VG | |
| Medion Erazer Major X20 | |
| Acer Nitro 16 AN16-41 | |
| Corsair Voyager a1600 | |
| CrossMark / Creativity | |
| Média da turma Gaming (1343 - 2729, n=94, últimos 2 anos) | |
| Asus ROG Flow X16 GV601V | |
| Medion Erazer Major X20 | |
| Média Intel Core i7-13700H, NVIDIA GeForce RTX 4070 Laptop GPU (1936 - 2137, n=6) | |
| Gigabyte AERO 16 OLED BSF | |
| MSI Stealth 16 Studio A13VG | |
| Acer Nitro 16 AN16-41 | |
| Corsair Voyager a1600 | |
| CrossMark / Responsiveness | |
| Gigabyte AERO 16 OLED BSF | |
| Média Intel Core i7-13700H, NVIDIA GeForce RTX 4070 Laptop GPU (1451 - 2202, n=6) | |
| Asus ROG Flow X16 GV601V | |
| Média da turma Gaming (1226 - 2334, n=94, últimos 2 anos) | |
| MSI Stealth 16 Studio A13VG | |
| Medion Erazer Major X20 | |
| Acer Nitro 16 AN16-41 | |
| Corsair Voyager a1600 | |
| PCMark 10 Score | 7329 pontos | |
Ajuda | ||
| AIDA64 / Memory Copy | |
| Média da turma Gaming (21750 - 129946, n=105, últimos 2 anos) | |
| MSI Stealth 16 Studio A13VG | |
| Medion Erazer Major X20 | |
| Gigabyte AERO 16 OLED BSF | |
| Média Intel Core i7-13700H (24334 - 78081, n=29) | |
| Asus ROG Flow X16 GV601V | |
| Corsair Voyager a1600 | |
| Acer Nitro 16 AN16-41 | |
| AIDA64 / Memory Read | |
| Medion Erazer Major X20 | |
| MSI Stealth 16 Studio A13VG | |
| Média da turma Gaming (22956 - 118858, n=105, últimos 2 anos) | |
| Gigabyte AERO 16 OLED BSF | |
| Asus ROG Flow X16 GV601V | |
| Média Intel Core i7-13700H (23681 - 79656, n=29) | |
| Corsair Voyager a1600 | |
| Acer Nitro 16 AN16-41 | |
| AIDA64 / Memory Write | |
| Média da turma Gaming (22297 - 135096, n=105, últimos 2 anos) | |
| MSI Stealth 16 Studio A13VG | |
| Gigabyte AERO 16 OLED BSF | |
| Média Intel Core i7-13700H (22986 - 99898, n=29) | |
| Medion Erazer Major X20 | |
| Asus ROG Flow X16 GV601V | |
| Corsair Voyager a1600 | |
| Acer Nitro 16 AN16-41 | |
| AIDA64 / Memory Latency | |
| Média da turma Gaming (75.3 - 259, n=105, últimos 2 anos) | |
| Corsair Voyager a1600 | |
| Gigabyte AERO 16 OLED BSF | |
| Média Intel Core i7-13700H (82.4 - 136.8, n=29) | |
| Acer Nitro 16 AN16-41 | |
| Asus ROG Flow X16 GV601V | |
| Medion Erazer Major X20 | |
| MSI Stealth 16 Studio A13VG | |
* ... menor é melhor
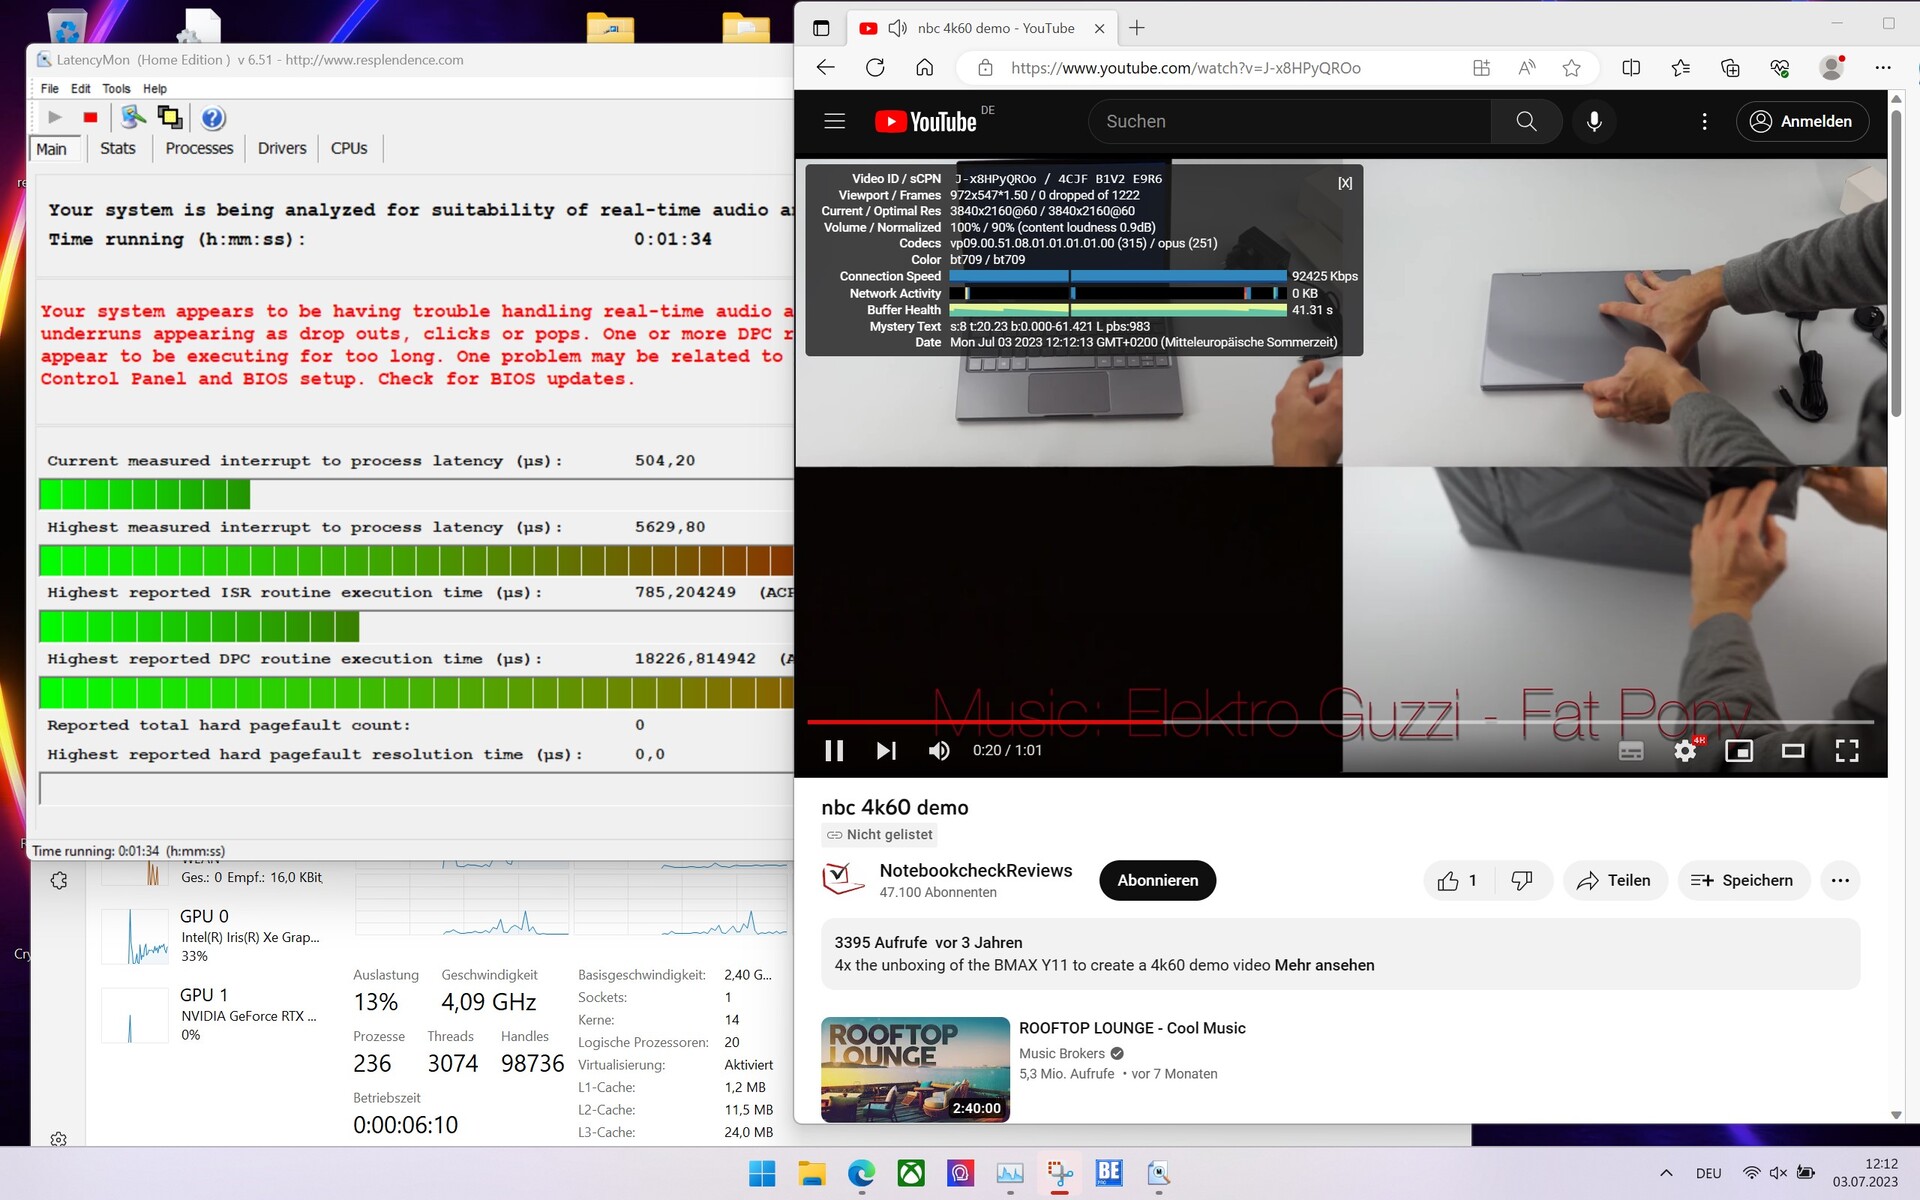
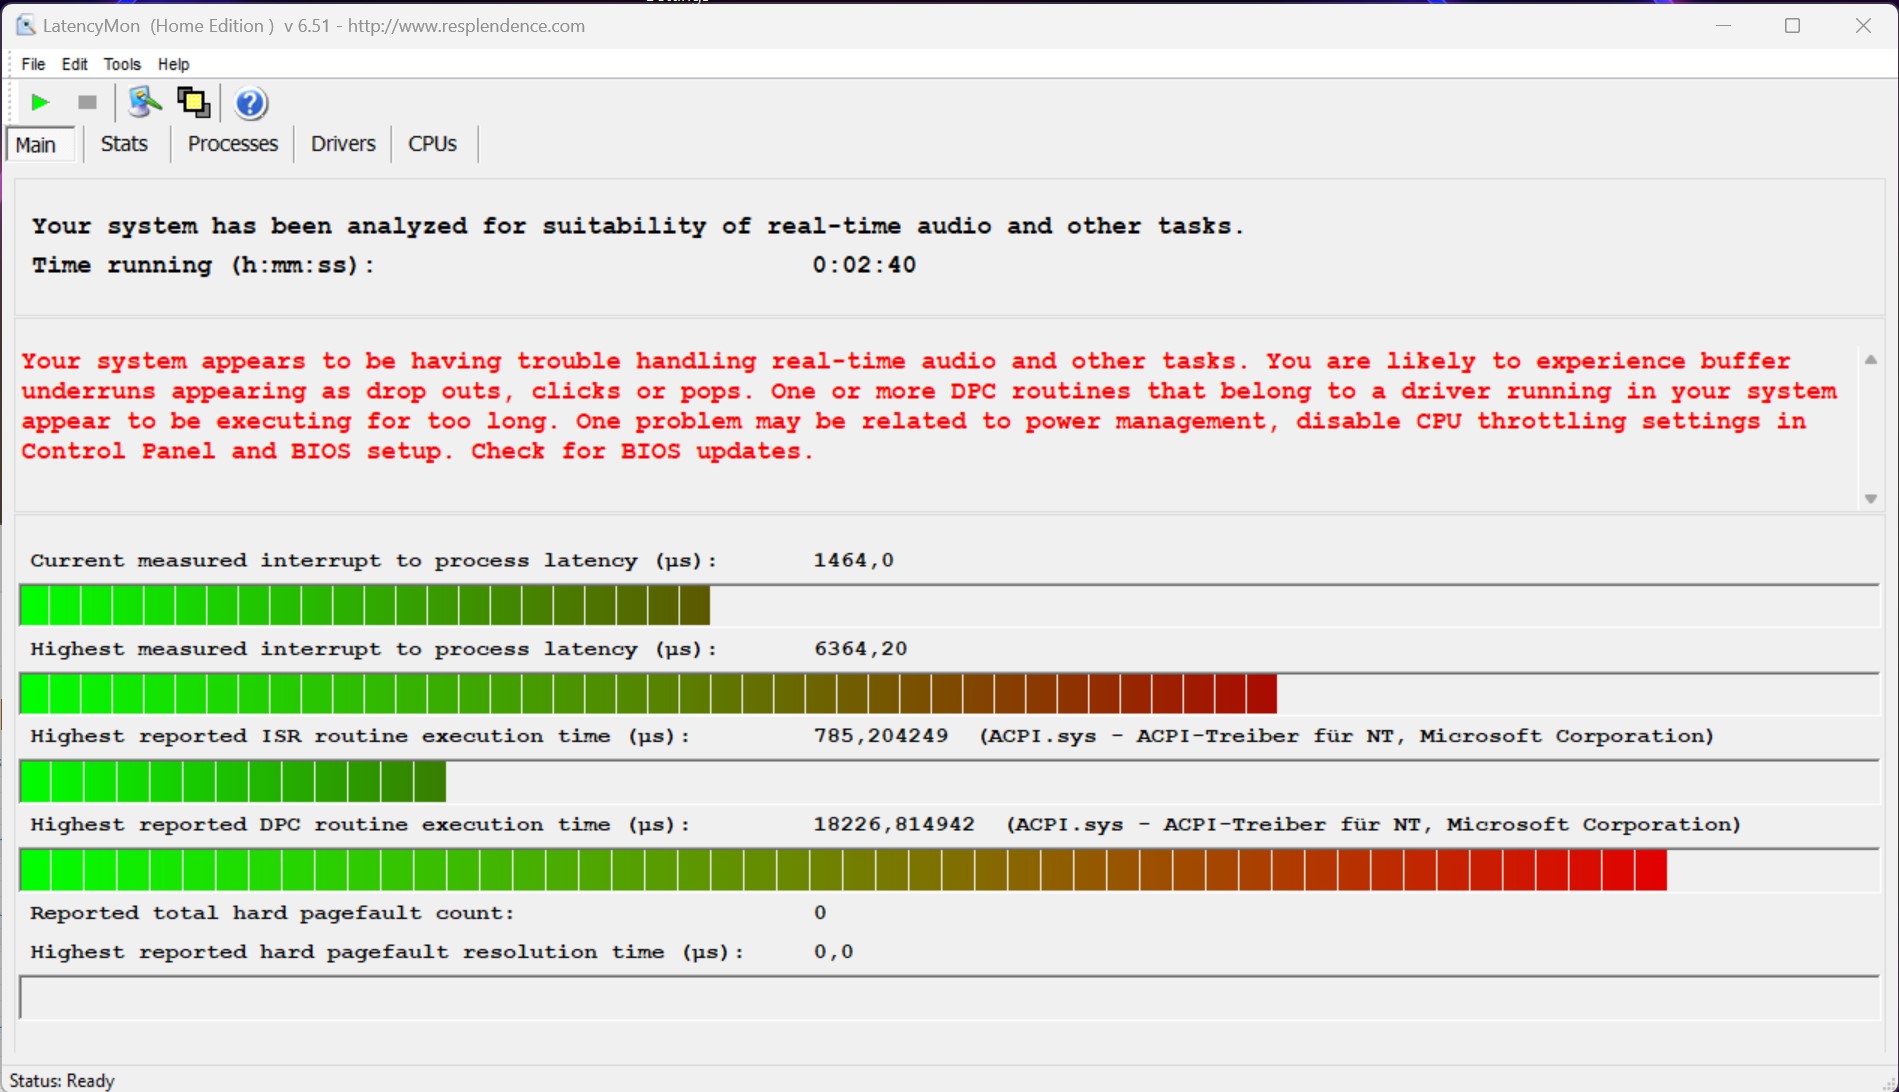
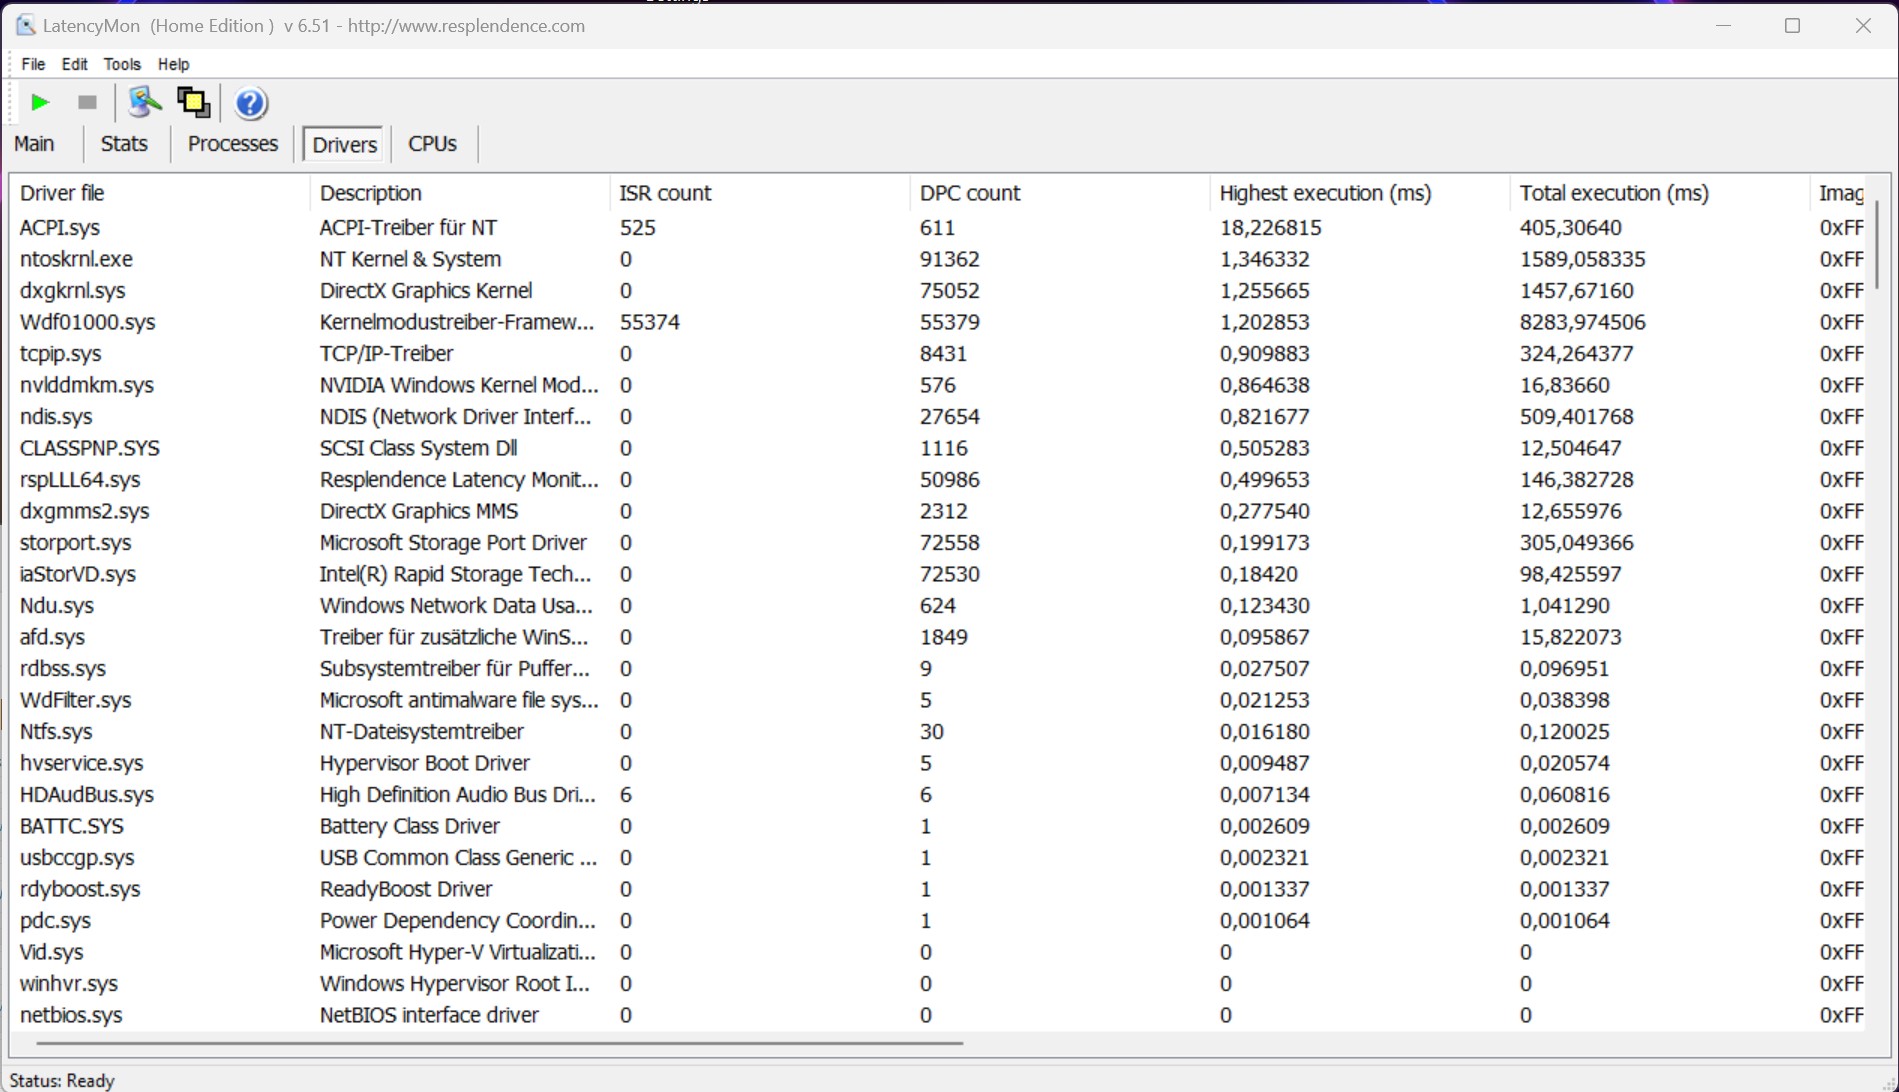
Latências de DPC
O teste padronizado do MSI Stealth 16 Studio A13VG Latency Monitor (navegação na Internet, reprodução de vídeo 4K, alta carga do Prime95) apresentou valores extremos. Espera-se que as futuras atualizações de software garantam melhorias para que o sistema possa ser considerado totalmente adequado para o processamento de vídeo e áudio em tempo real. No entanto, vale a pena mencionar que não foram detectados quadros pulados durante a reprodução de vídeo 4K.
| DPC Latencies / LatencyMon - interrupt to process latency (max), Web, Youtube, Prime95 | |
| MSI Stealth 16 Studio A13VG | |
| Medion Erazer Major X20 | |
| Acer Nitro 16 AN16-41 | |
| Asus ROG Flow X16 GV601V | |
| Gigabyte AERO 16 OLED BSF | |
| Corsair Voyager a1600 | |
* ... menor é melhor
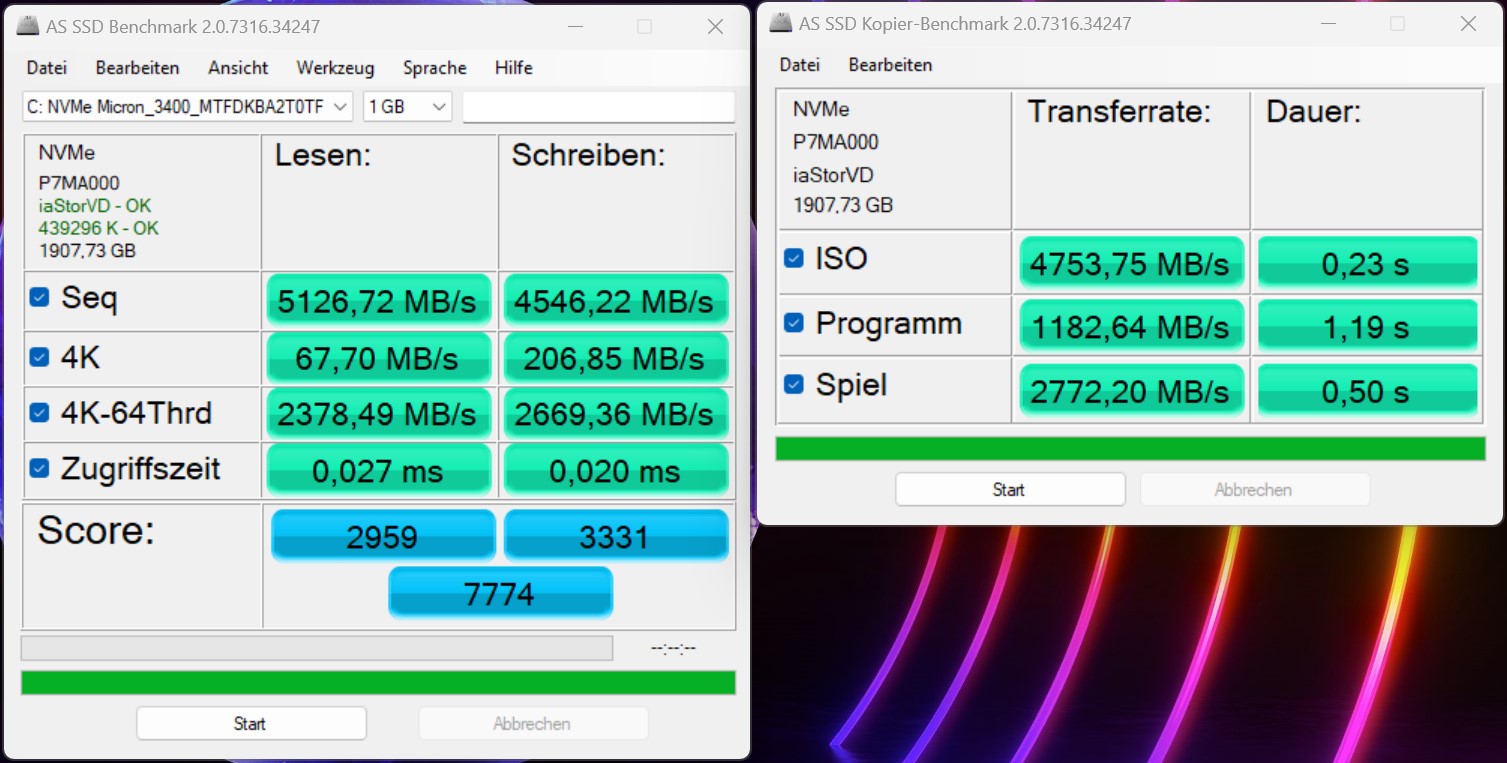
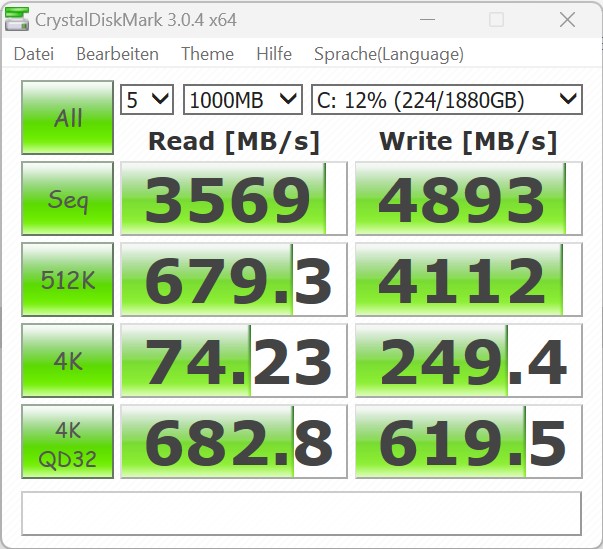
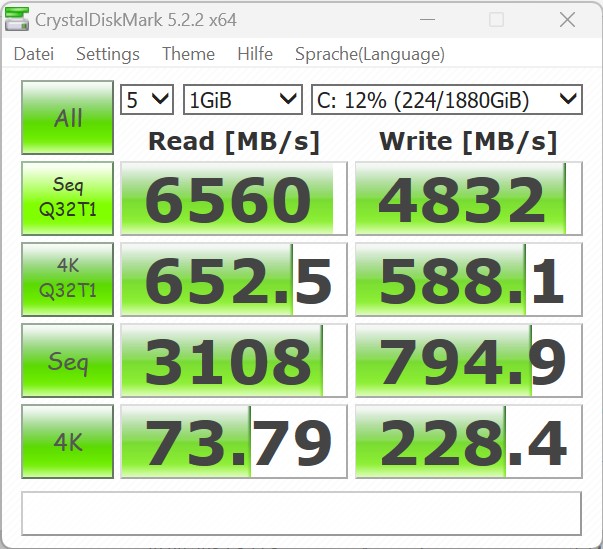
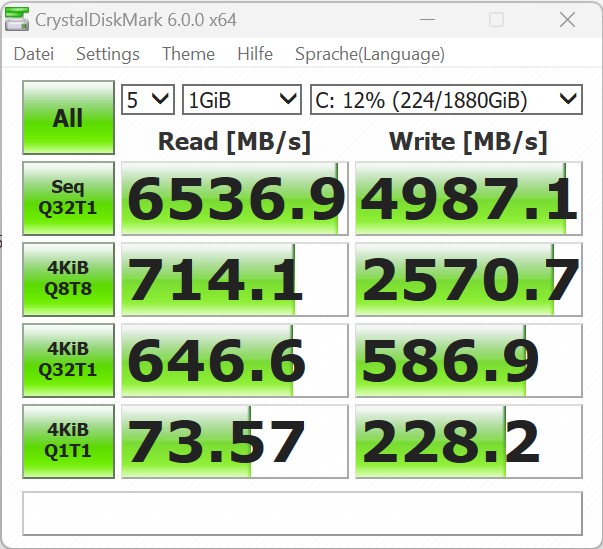
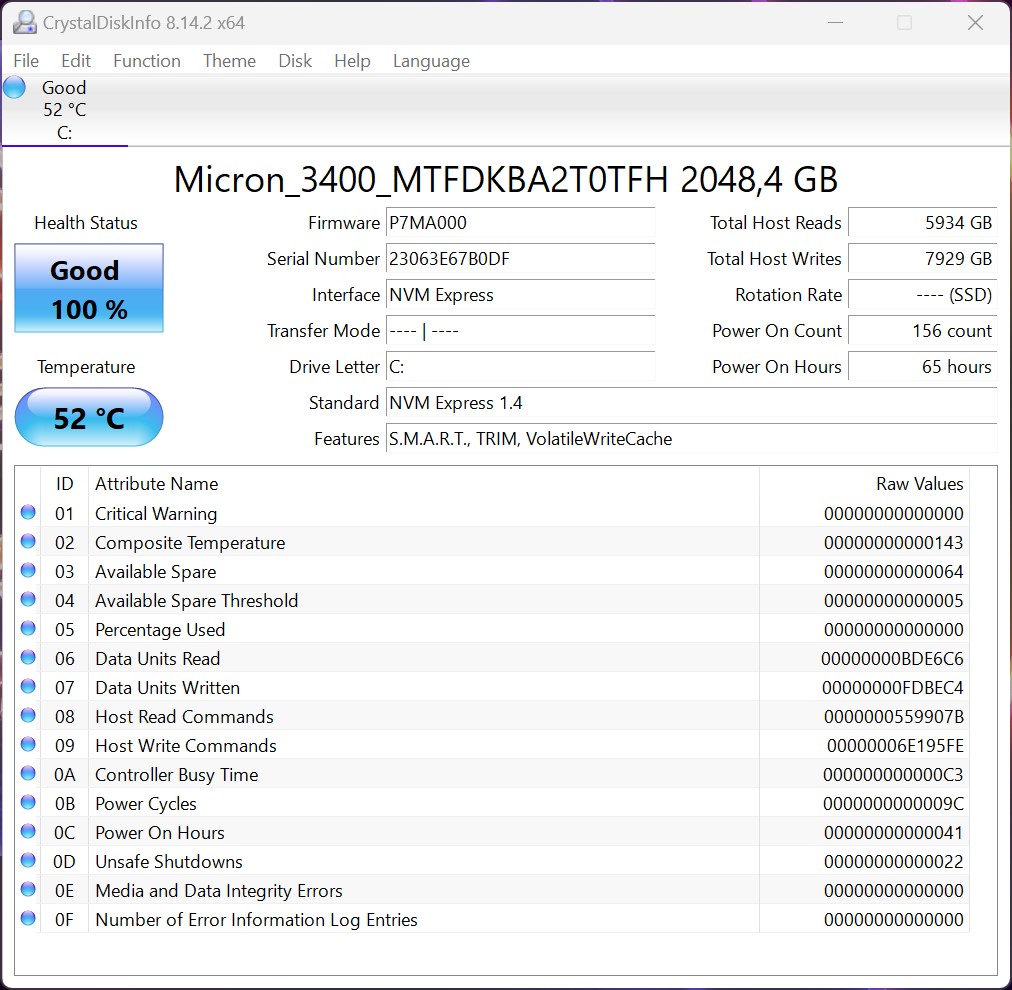
Armazenamento em massa
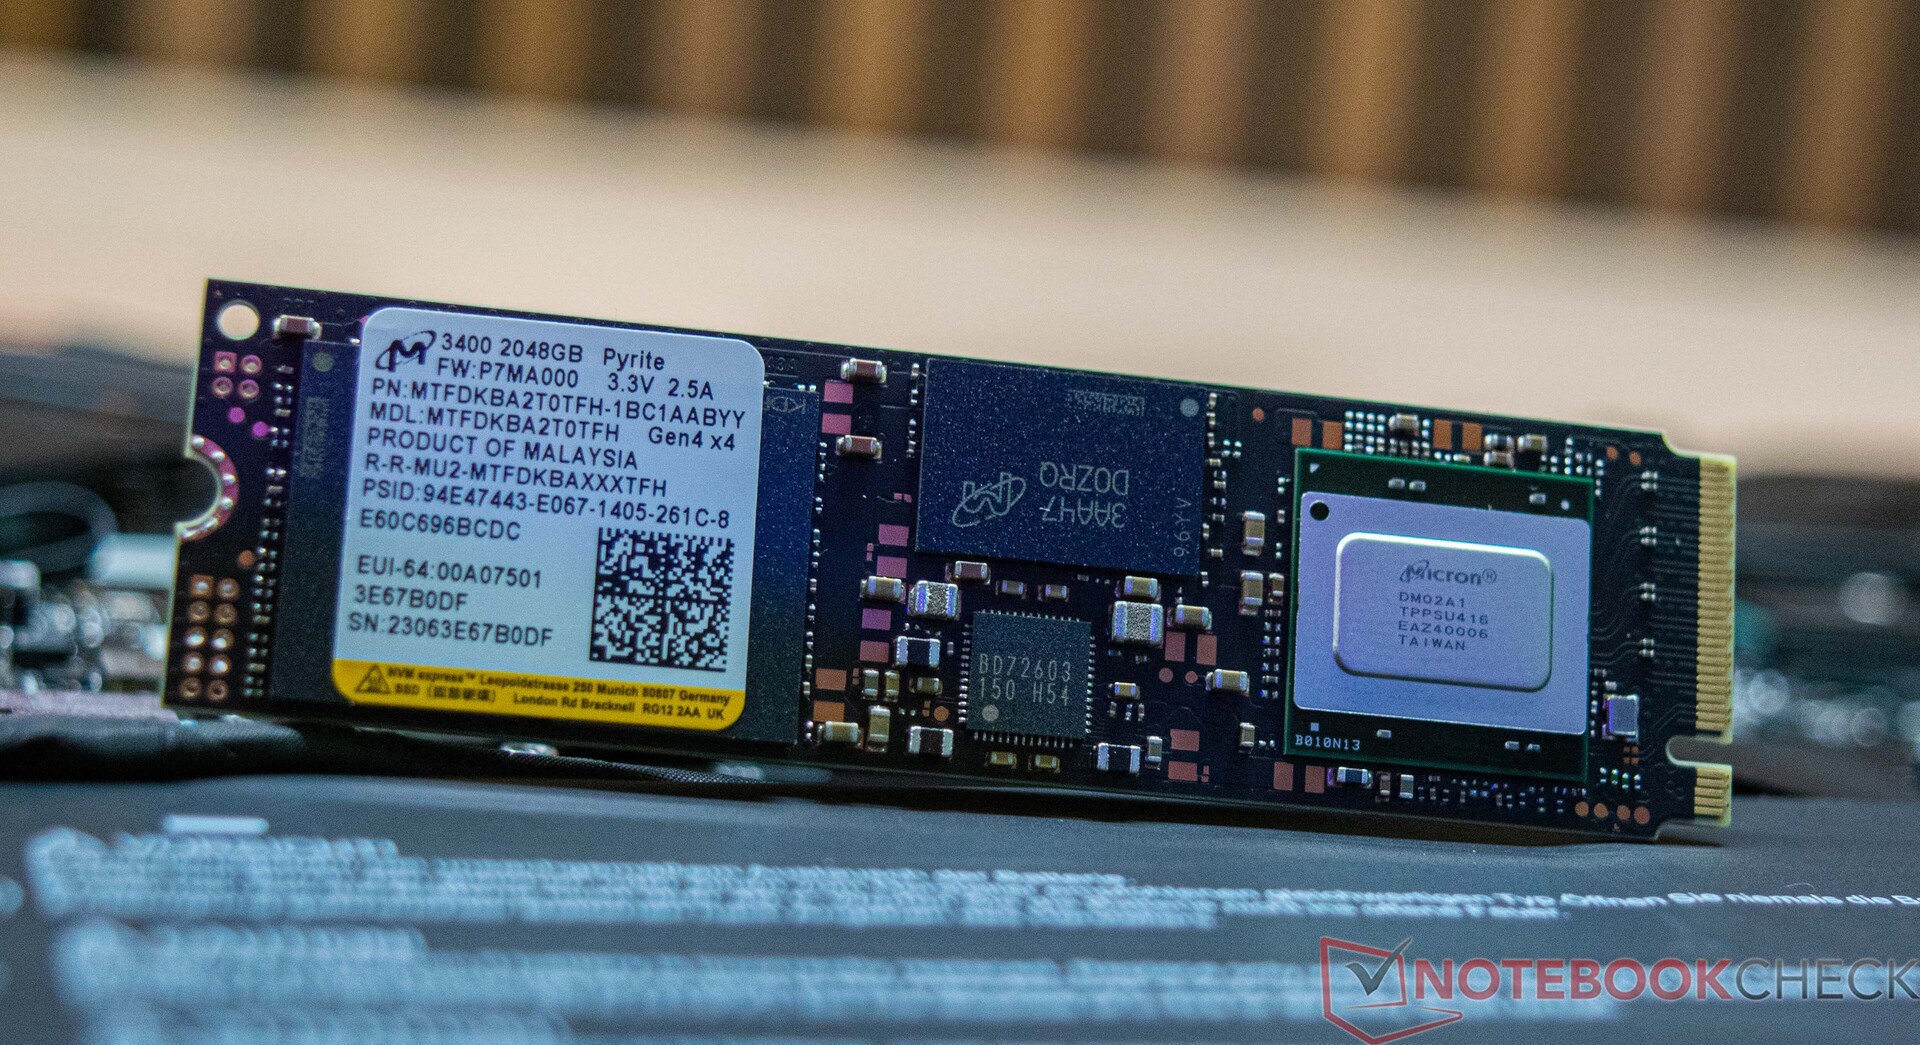
O armazenamento em massa do MSI Stealth 16 Studio A13VG vem na forma de um SSD da Micron. Com 2 TB, o modelo instalado oferece muito espaço de armazenamento, sustentando assim o uso pretendido. Nos testes, o SSD apresentou valores excelentes graças à sua conexão PCIe. Mais uma vez, isso ajudou nosso dispositivo de análise a garantir o primeiro lugar. No entanto, o MSI Stealth 16 Studio A13VG teve problemas permanentes de leitura e gravação de e para o SSD, com o desempenho de leitura caindo significativamente após apenas um curto período de carga contínua. OAcer Nitro 16foi o único outro dispositivo em que observamos uma queda de desempenho igualmente grande. O MSI Stealth 16 Studio A13VG pode abrigar um total de dois SSDs.
Para obter mais comparações e benchmarks, dê uma olhada em nossa tabela de comparação

* ... menor é melhor
Continuous Performance Read: DiskSpd Read Loop, Queue Depth 8
Placa de vídeo
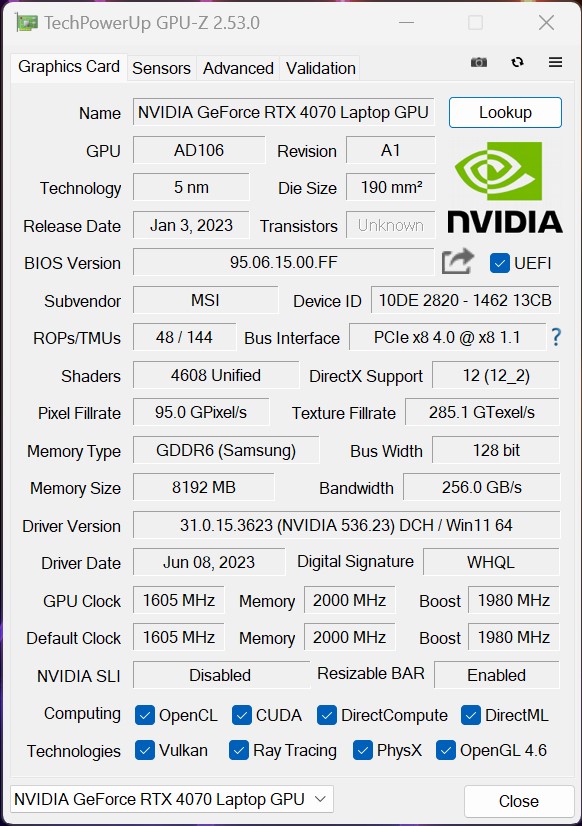
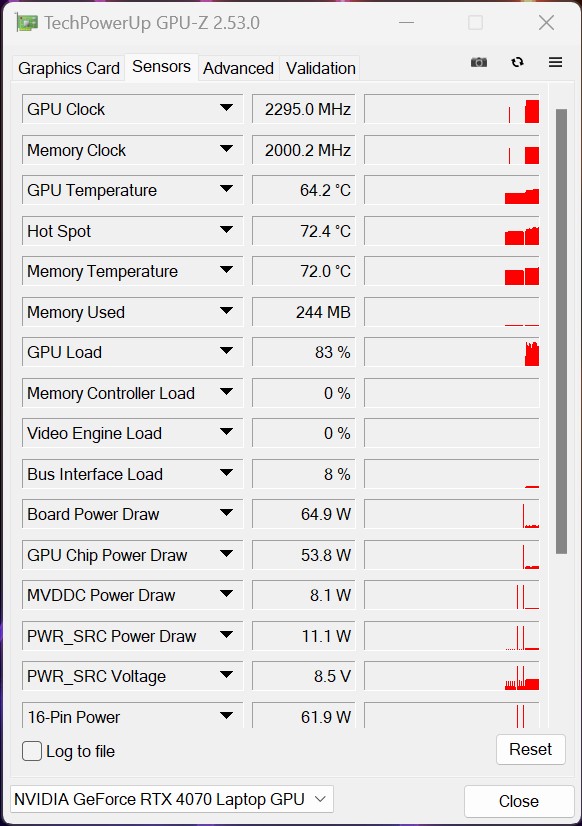
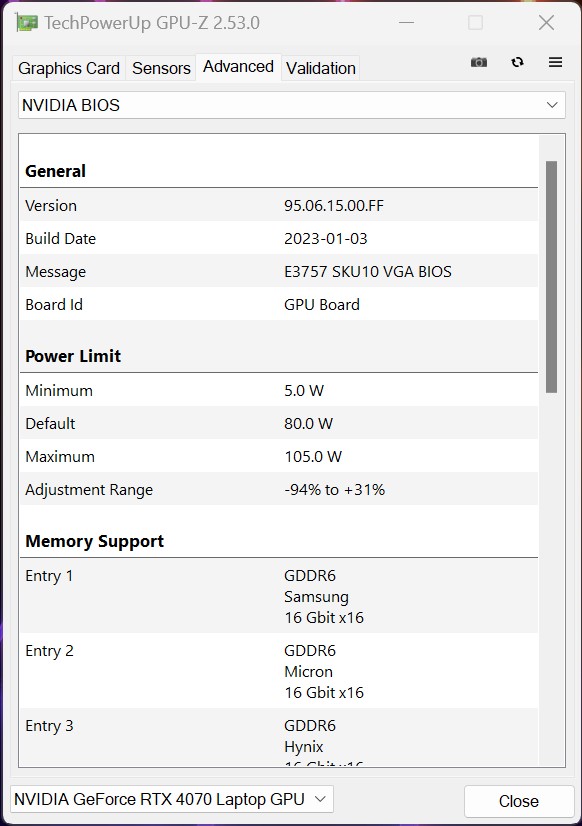
O MSI Stealth 16 Studio A13VG conta com umaGPU para laptop Nvidia GeForce RTX 4070que tem um TGP disponível de até 105 watts. Isso significa que a placa de vídeo não recebe o TGP máximo possível de até 115 watts. Entretanto, em nossa comparação, vimos que nossa amostra de análise apresentou um bom desempenho 3D em testes sintéticos e sua classificação de desempenho no 3DMark foi quase suficiente para garantir o primeiro lugar.
Outros benchmarks da GPU para laptop Nvidia GeForce RTX 4070 podem ser encontrados aqui.
| 3DMark 05 Standard | 53254 pontos | |
| 3DMark 06 Standard Score | 63808 pontos | |
| 3DMark Vantage P Result | 94245 pontos | |
| 3DMark 11 Performance | 34960 pontos | |
| 3DMark Ice Storm Standard Score | 94921 pontos | |
| 3DMark Cloud Gate Standard Score | 63781 pontos | |
| 3DMark Fire Strike Score | 26244 pontos | |
| 3DMark Fire Strike Extreme Score | 13736 pontos | |
| 3DMark Time Spy Score | 11980 pontos | |
Ajuda | ||
* ... menor é melhor
Desempenho em jogos
A GPU para laptop Nvidia GeForce RTX 4070empregada aqui é rápida o suficiente para poder jogar vários jogos sem problemas e exibi-los na revolução nativa. Nossos testes mostram que o Medion Erazer Major X20 oferece melhor desempenho gráfico com o mesmo adaptador gráfico. Em comparação com o Gigabyte AERO 16, o MSI Stealth 16 Studio A13VG apresentou um nível de desempenho quase idêntico. Além disso, também notamos que o AcerNitro 16da Acer, que também é equipado com uma placaGPU para laptop Nvidia GeForce RTX 4070da Nvidia, é claramente inferior. No entanto, não gostaríamos de ser privados dos benefícios da arquitetura Ada Lovelace, que também está presente nas GPUs móveis. Isso significa que você pode usar recursos como DLSS 3 e Frame Generation, desde que os próprios jogos suportem essa tecnologia. Às vezes, isso pode levar a um aumento significativo na taxa de quadros.
| Performance rating - Percent | |
| Média da turma Gaming | |
| Medion Erazer Major X20 | |
| Gigabyte AERO 16 OLED BSF | |
| MSI Stealth 16 Studio A13VG | |
| Asus ROG Flow X16 GV601V | |
| Acer Nitro 16 AN16-41 | |
| Corsair Voyager a1600 | |
| The Witcher 3 - 1920x1080 Ultra Graphics & Postprocessing (HBAO+) | |
| Média da turma Gaming (95 - 240, n=7, últimos 2 anos) | |
| Medion Erazer Major X20 | |
| MSI Stealth 16 Studio A13VG | |
| Gigabyte AERO 16 OLED BSF | |
| Acer Nitro 16 AN16-41 | |
| Corsair Voyager a1600 | |
| Asus ROG Flow X16 GV601V | |
| GTA V - 1920x1080 Highest AA:4xMSAA + FX AF:16x | |
| Média da turma Gaming (48.3 - 186.9, n=95, últimos 2 anos) | |
| Medion Erazer Major X20 | |
| Gigabyte AERO 16 OLED BSF | |
| MSI Stealth 16 Studio A13VG | |
| Asus ROG Flow X16 GV601V | |
| Acer Nitro 16 AN16-41 | |
| Corsair Voyager a1600 | |
| Final Fantasy XV Benchmark - 1920x1080 High Quality | |
| Média da turma Gaming (41 - 215, n=96, últimos 2 anos) | |
| Medion Erazer Major X20 | |
| Gigabyte AERO 16 OLED BSF | |
| MSI Stealth 16 Studio A13VG | |
| Acer Nitro 16 AN16-41 | |
| Asus ROG Flow X16 GV601V | |
| Corsair Voyager a1600 | |
| Strange Brigade - 1920x1080 ultra AA:ultra AF:16 | |
| Média da turma Gaming (76.3 - 456, n=86, últimos 2 anos) | |
| Medion Erazer Major X20 | |
| Corsair Voyager a1600 | |
| Gigabyte AERO 16 OLED BSF | |
| MSI Stealth 16 Studio A13VG | |
| Acer Nitro 16 AN16-41 | |
| Asus ROG Flow X16 GV601V | |
| Dota 2 Reborn - 1920x1080 ultra (3/3) best looking | |
| Medion Erazer Major X20 | |
| MSI Stealth 16 Studio A13VG | |
| Média da turma Gaming (84.8 - 248, n=108, últimos 2 anos) | |
| Asus ROG Flow X16 GV601V | |
| Gigabyte AERO 16 OLED BSF | |
| Corsair Voyager a1600 | |
| Acer Nitro 16 AN16-41 | |
Para verificar a estabilidade das taxas de quadros em períodos de tempo mais longos, executamos o jogo The Witcher 3 por cerca de 60 minutos com resolução Full HD e predefinições máximas. Durante o processo, o personagem do jogo não foi movido. O diagrama mostra um desempenho relativamente consistente da taxa de quadros.
Witcher 3 FPS diagram
| baixo | média | alto | ultra | QHD | |
|---|---|---|---|---|---|
| GTA V (2015) | 187 | 184.7 | 180.3 | 119.7 | 92.8 |
| The Witcher 3 (2015) | 452.3 | 390.5 | 226.7 | 119 | |
| Dota 2 Reborn (2015) | 189.6 | 169 | 160.5 | 154.7 | |
| Final Fantasy XV Benchmark (2018) | 202 | 154.2 | 115 | 83.8 | |
| X-Plane 11.11 (2018) | 158.5 | 142.4 | 110.2 | ||
| Far Cry 5 (2018) | 190 | 157 | 150 | 143 | 113 |
| Strange Brigade (2018) | 470 | 286 | 230 | 200 | 132 |
| Shadow of the Tomb Raider (2018) | 206 | 163.4 | 158.1 | 145.9 | 104 |
| Far Cry New Dawn (2019) | 165 | 140 | 135 | 120 | 105 |
| Metro Exodus (2019) | 221 | 141.3 | 109.8 | 87.2 | 69.1 |
| Borderlands 3 (2019) | 175.9 | 145.9 | 119.7 | 98.6 | 71.5 |
| F1 2020 (2020) | 331 | 276 | 235 | 183 | 142.6 |
| F1 2021 (2021) | 378 | 300 | 238 | 139.5 | 108.5 |
| Far Cry 6 (2021) | 168.8 | 143 | 126.5 | 114.5 | 86.7 |
| God of War (2022) | 143.1 | 119.5 | 95.6 | 68.8 | 58.5 |
| GRID Legends (2022) | 182.9 | 164.1 | 150.1 | 131.7 | 112.1 |
| Tiny Tina's Wonderlands (2022) | 230 | 190.1 | 130.3 | 101.7 | 70.5 |
| F1 22 (2022) | 256 | 246 | 183.4 | 76.7 | 49.7 |
| Uncharted Legacy of Thieves Collection (2022) | 94 | 92.4 | 86.2 | 82.7 | 61.2 |
| High On Life (2023) | 220 | 178.7 | 134.1 | 110.6 | 66.9 |
| Dead Space Remake (2023) | 102.8 | 98.2 | 86.7 | 86.5 | 56.5 |
| Returnal (2023) | 115 | 111 | 102 | 88 | 63 |
| Company of Heroes 3 (2023) | 211.8 | 191.4 | 156.5 | 153.9 | 114.8 |
| Resident Evil 4 Remake (2023) | 160.1 | 123.4 | 113.1 | 82.4 | 61.3 |
| The Last of Us (2023) | 114.4 | 96.5 | 85.5 | 75 | 43.9 |
| Star Wars Jedi Survivor (2023) | 92.1 | 80.6 | 75.6 | 71.1 | 47 |
| Diablo 4 (2023) | 255 | 233 | 208 | 177.8 | 105.4 |
| F1 23 (2023) | 230 | 232 | 189 | 71 | 45 |
Emissões - Boa duração da bateria, mas altas temperaturas
Emissões de ruído
Em marcha lenta e no uso diário do escritório, trabalhando com o Office e realizando tarefas baseadas na Internet, o MSI Stealth 16 Studio A13VG é silencioso. Medimos apenas um pouco menos de 35 dB(A) sob carga média, onde um ruído de zumbido silencioso, mas audível, pode ser ouvido. Sob carga, ele pode ficar muito barulhento, com valores máximos de 51,5 dB(A) no teste de estresse. Com 62 dB(A), o Acer Nitro 16 AN16-41 demonstra que é possível ficar significativamente mais alto.
Basicamente, o MSI Stealth 16 Studio A13VG também permite uma operação quase silenciosa. Para isso, é necessário selecionar os perfis de energia do modo "Silent" (Silencioso) ou "Super Battery" (Super Bateria), ambos selecionados no MSI Center.
Também é possível assumir o controle da ventoinha por meio do MSI Center. Além dos perfis predefinidos, você pode criar suas próprias curvas de ventoinha.
Barulho
| Ocioso |
| 24 / 24 / 24 dB |
| Carga |
| 34.81 / 51.57 dB |
 | ||
30 dB silencioso 40 dB(A) audível 50 dB(A) ruidosamente alto |
||
min: | ||
| MSI Stealth 16 Studio A13VG GeForce RTX 4070 Laptop GPU, i7-13700H, Micron 3400 2TB MTFDKBA2T0TFH | Asus ROG Flow X16 GV601V GeForce RTX 4060 Laptop GPU, i9-13900H, WD PC SN560 SDDPNQE-1T00 | Medion Erazer Major X20 GeForce RTX 4070 Laptop GPU, i9-13900HX, Phison E18-1TB-PHISON-SSD-B47R | Acer Nitro 16 AN16-41 GeForce RTX 4070 Laptop GPU, R7 7735HS, Samsung PM9A1 MZVL21T0HCLR | Corsair Voyager a1600 Radeon RX 6800M, R9 6900HS, Samsung PM9A1 MZVL22T0HBLB | Gigabyte AERO 16 OLED BSF GeForce RTX 4070 Laptop GPU, i9-13900H, Gigabyte AG470S1TB-SI B10 | |
|---|---|---|---|---|---|---|
| Noise | -3% | -18% | -8% | -23% | -15% | |
| desligado / ambiente * (dB) | 24 | 24 -0% | 24 -0% | 25.7 -7% | 29.9 -25% | 23 4% |
| Idle Minimum * (dB) | 24 | 24 -0% | 25 -4% | 25.7 -7% | 30.5 -27% | 23 4% |
| Idle Average * (dB) | 24 | 24 -0% | 29 -21% | 25.7 -7% | 30.6 -28% | 23 4% |
| Idle Maximum * (dB) | 24 | 24 -0% | 31 -29% | 26.3 -10% | 30.7 -28% | 33.64 -40% |
| Load Average * (dB) | 34.81 | 36.71 -5% | 50 -44% | 33.9 3% | 44.5 -28% | 51.49 -48% |
| Witcher 3 ultra * (dB) | 44.05 | 50.92 -16% | 53 -20% | 55.27 -25% | ||
| Load Maximum * (dB) | 51.57 | 50.92 1% | 57 -11% | 62 -20% | 51.1 1% | 55.24 -7% |
* ... menor é melhor
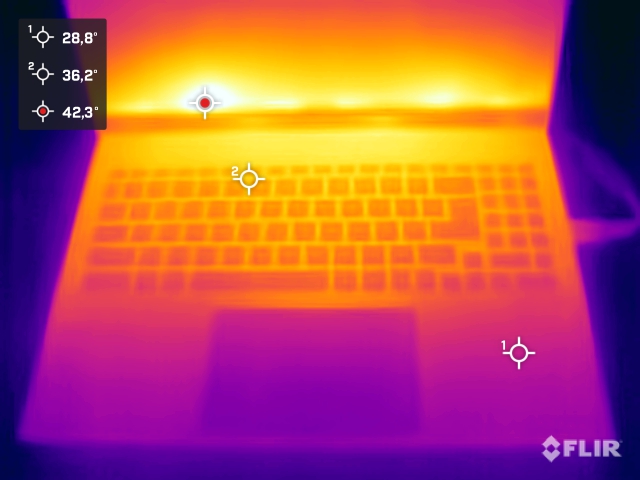
Temperatura
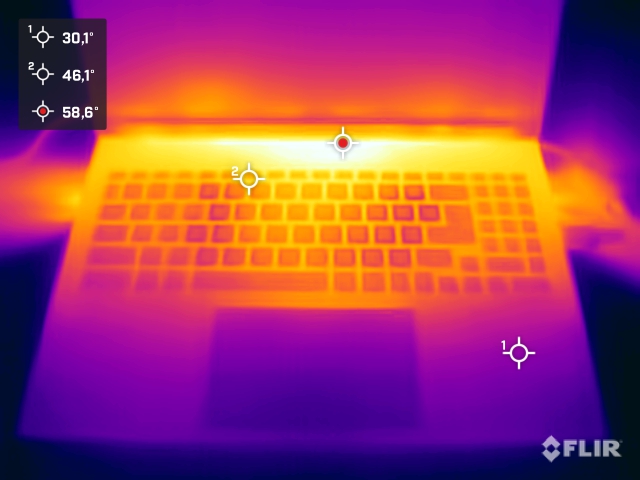
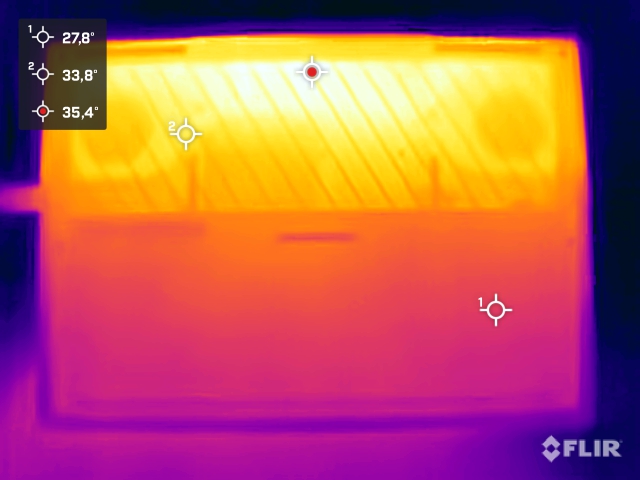
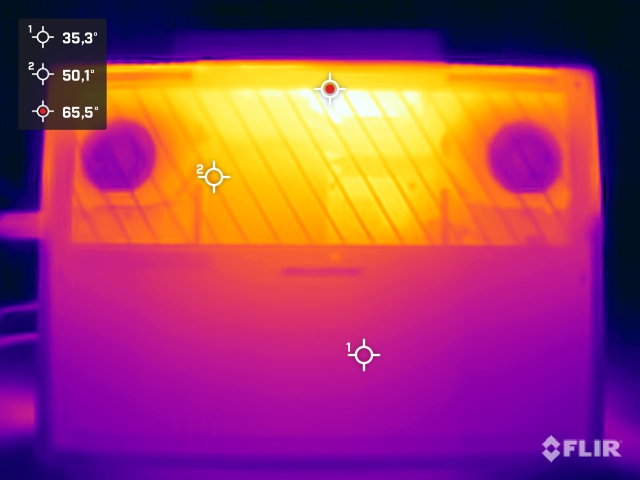
No teste de estresse, registramos altas temperaturas do gabinete sob carga e também durante os jogos. Com mais de 60 °C, as temperaturas são mais altas na parte superior e inferior do laptop do que em seus pares. Como resultado, pode ser desconfortável usar o dispositivo no colo sob carga.
(-) A temperatura máxima no lado superior é 60 °C / 140 F, em comparação com a média de 40.4 °C / 105 F , variando de 21.2 a 68.8 °C para a classe Gaming.
(-) A parte inferior aquece até um máximo de 61 °C / 142 F, em comparação com a média de 43.2 °C / 110 F
(±) Em uso inativo, a temperatura média para o lado superior é 33.2 °C / 92 F, em comparação com a média do dispositivo de 33.9 °C / ### class_avg_f### F.
(-) Jogando The Witcher 3, a temperatura média para o lado superior é 44.7 °C / 112 F, em comparação com a média do dispositivo de 33.9 °C / ## #class_avg_f### F.
(±) Os apoios para as mãos e o touchpad podem ficar muito quentes ao toque, com um máximo de 36 °C / 96.8 F.
(-) A temperatura média da área do apoio para as mãos de dispositivos semelhantes foi 28.8 °C / 83.8 F (-7.2 °C / -13 F).
| MSI Stealth 16 Studio A13VG Intel Core i7-13700H, NVIDIA GeForce RTX 4070 Laptop GPU | Asus ROG Flow X16 GV601V Intel Core i9-13900H, NVIDIA GeForce RTX 4060 Laptop GPU | Medion Erazer Major X20 Intel Core i9-13900HX, NVIDIA GeForce RTX 4070 Laptop GPU | Acer Nitro 16 AN16-41 AMD Ryzen 7 7735HS, NVIDIA GeForce RTX 4070 Laptop GPU | Corsair Voyager a1600 AMD Ryzen 9 6900HS, AMD Radeon RX 6800M | Gigabyte AERO 16 OLED BSF Intel Core i9-13900H, NVIDIA GeForce RTX 4070 Laptop GPU | |
|---|---|---|---|---|---|---|
| Heat | 19% | 11% | 18% | 11% | 34% | |
| Maximum Upper Side * (°C) | 60 | 46 23% | 46 23% | 41.5 31% | 50.7 15% | 41 32% |
| Maximum Bottom * (°C) | 61 | 41 33% | 49 20% | 51.8 15% | 54.2 11% | 47 23% |
| Idle Upper Side * (°C) | 38.2 | 36 6% | 37 3% | 31.6 17% | 35.8 6% | 23 40% |
| Idle Bottom * (°C) | 37.7 | 33 12% | 38 -1% | 34.5 8% | 33 12% | 23 39% |
* ... menor é melhor
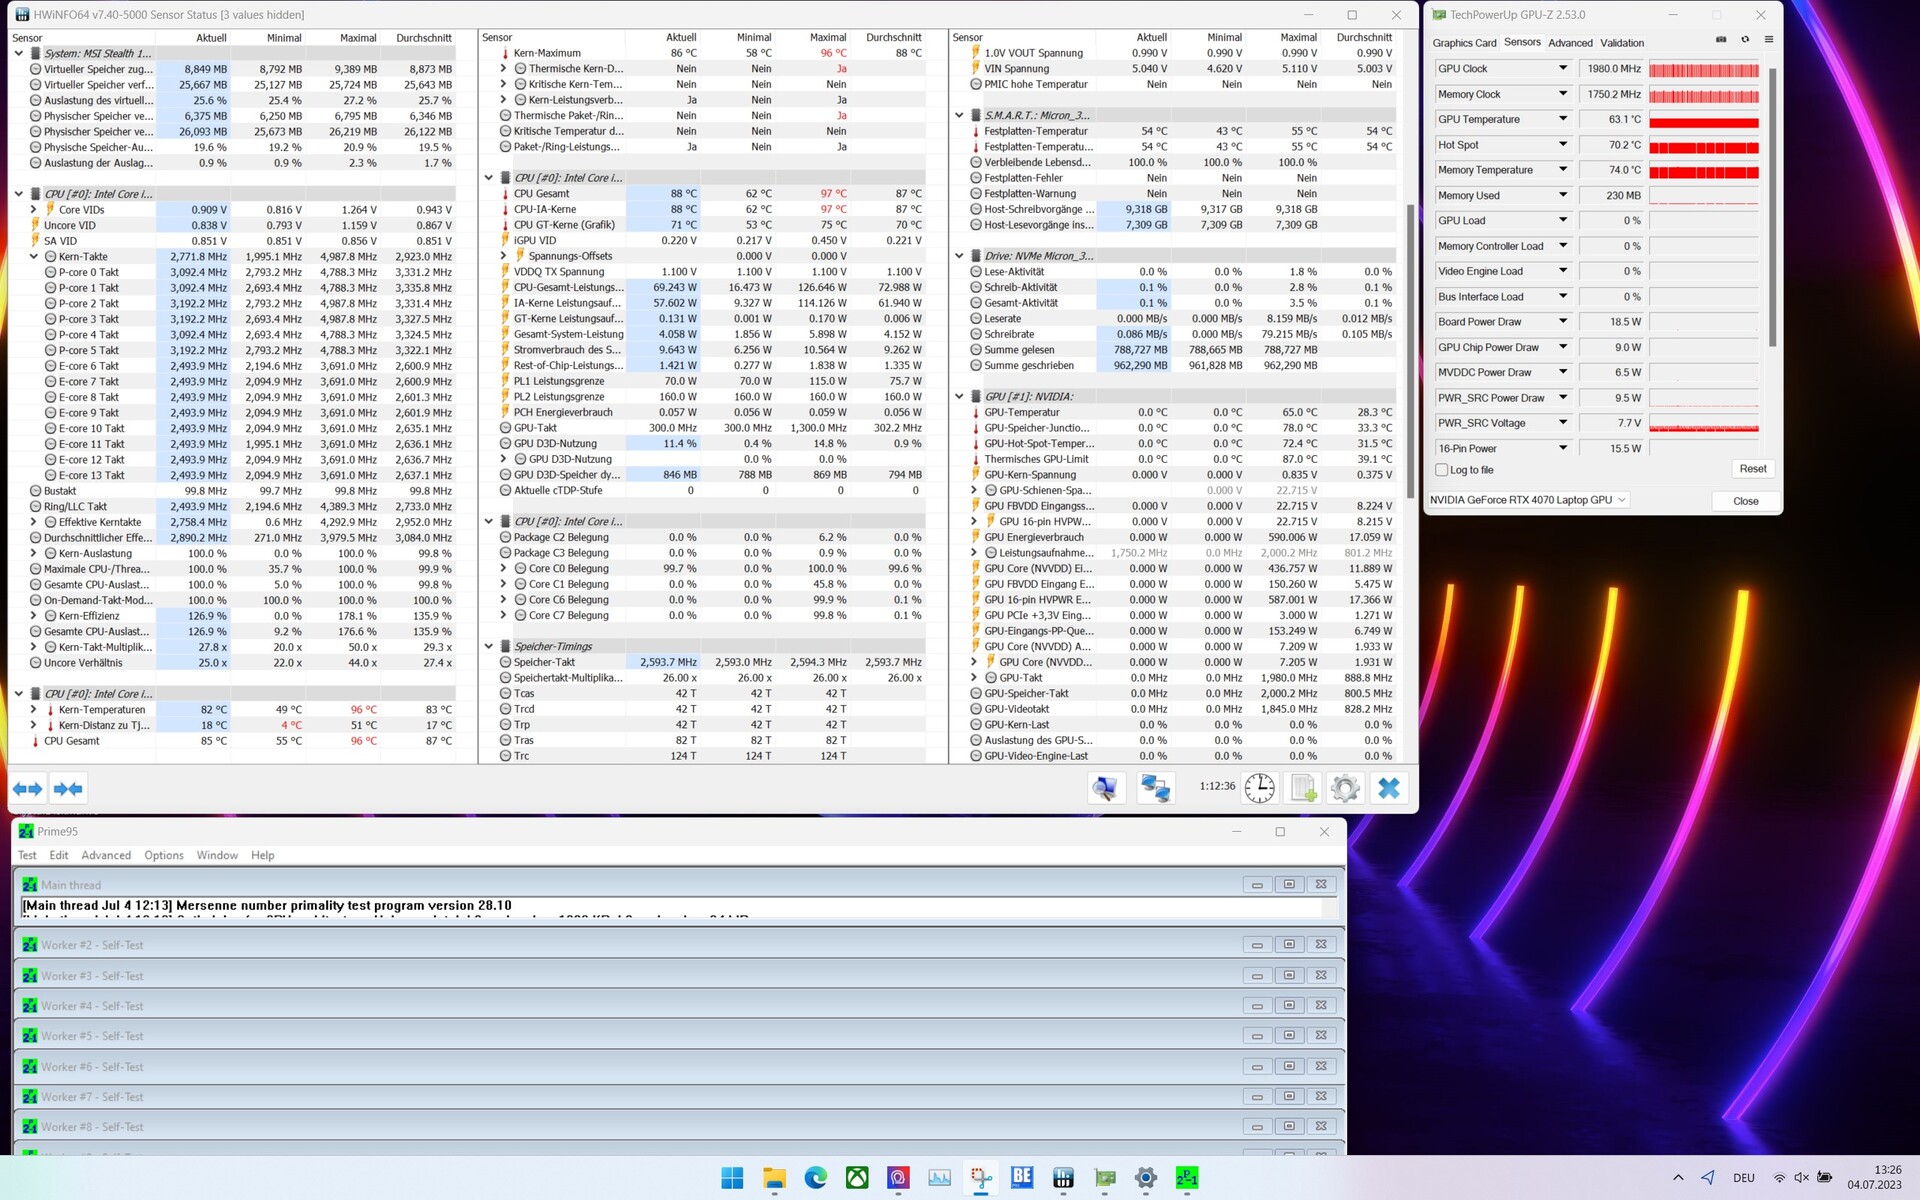
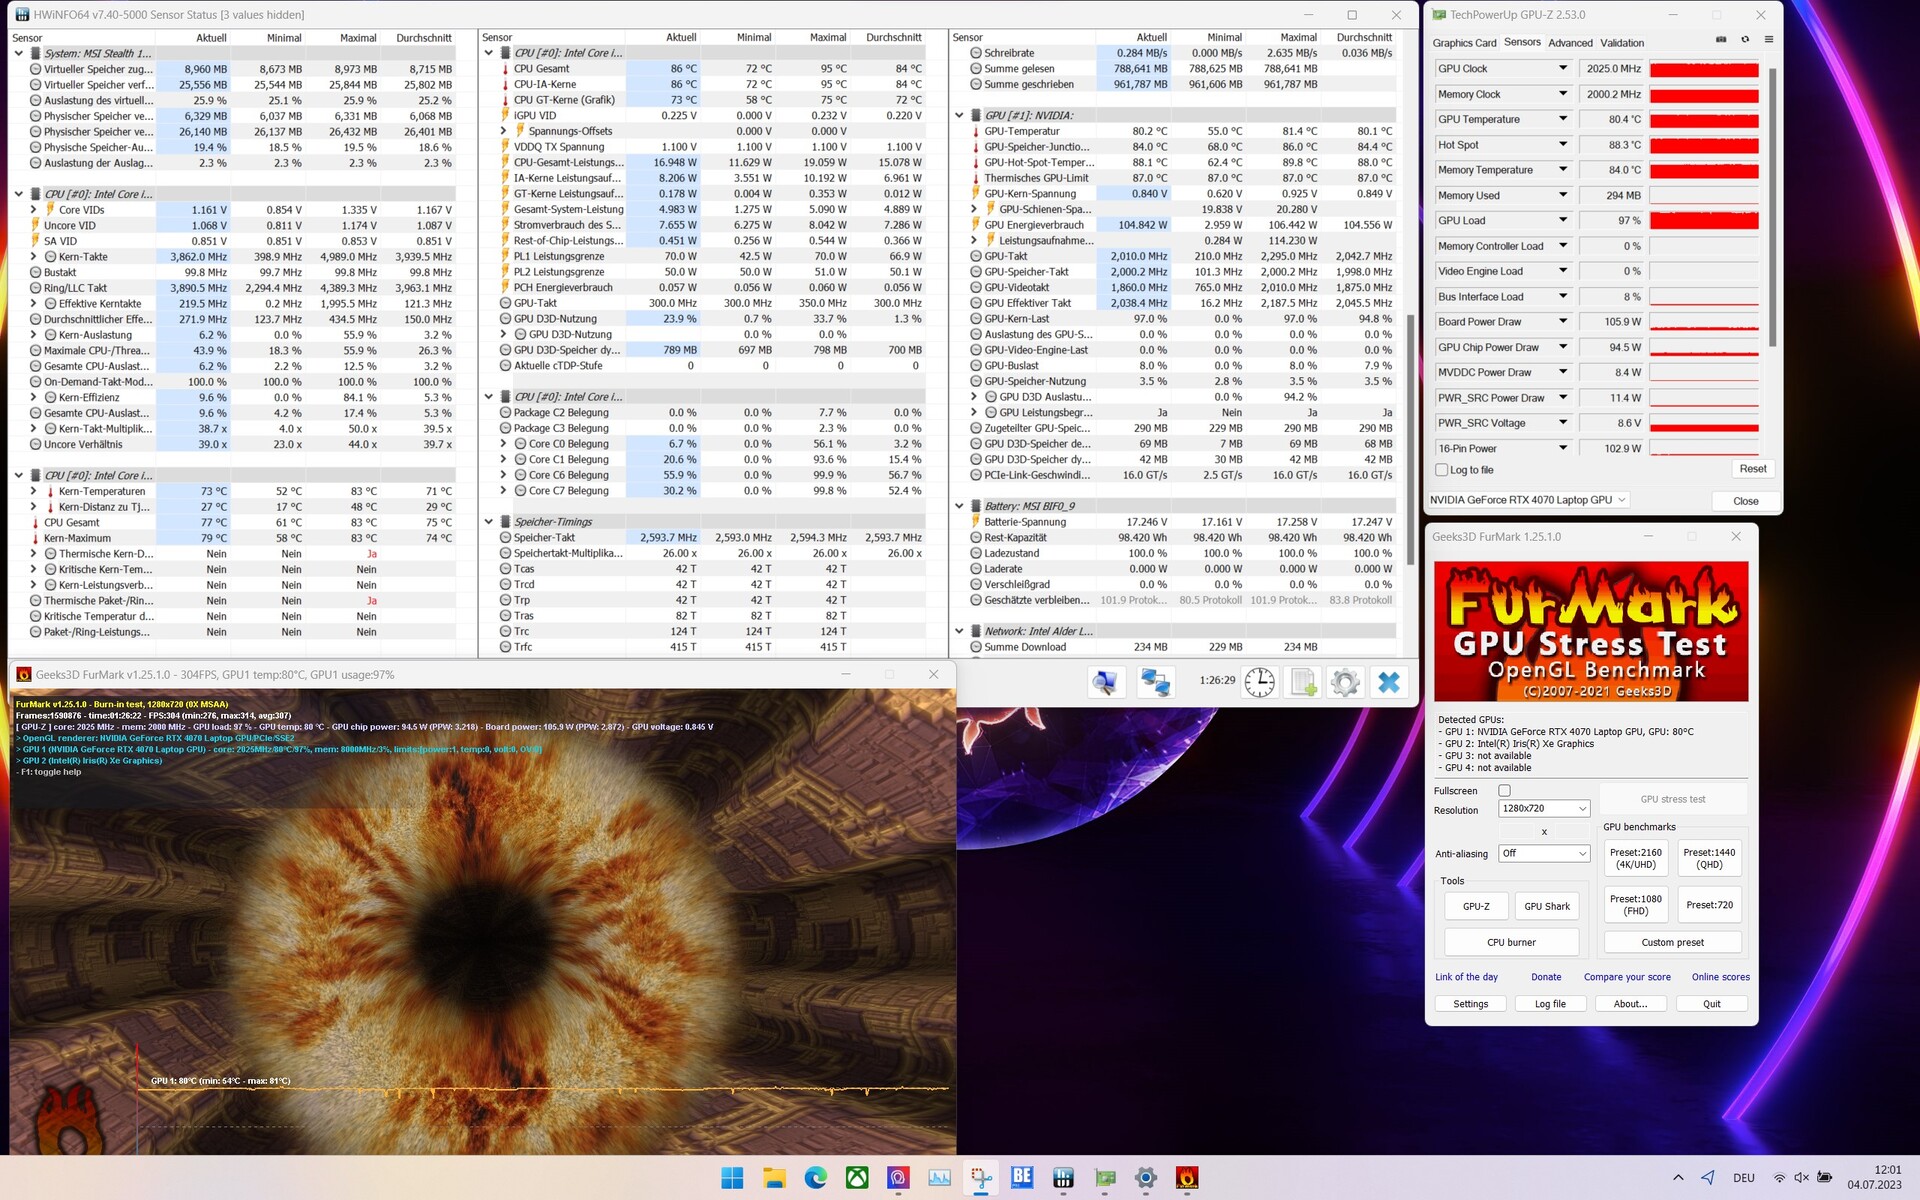
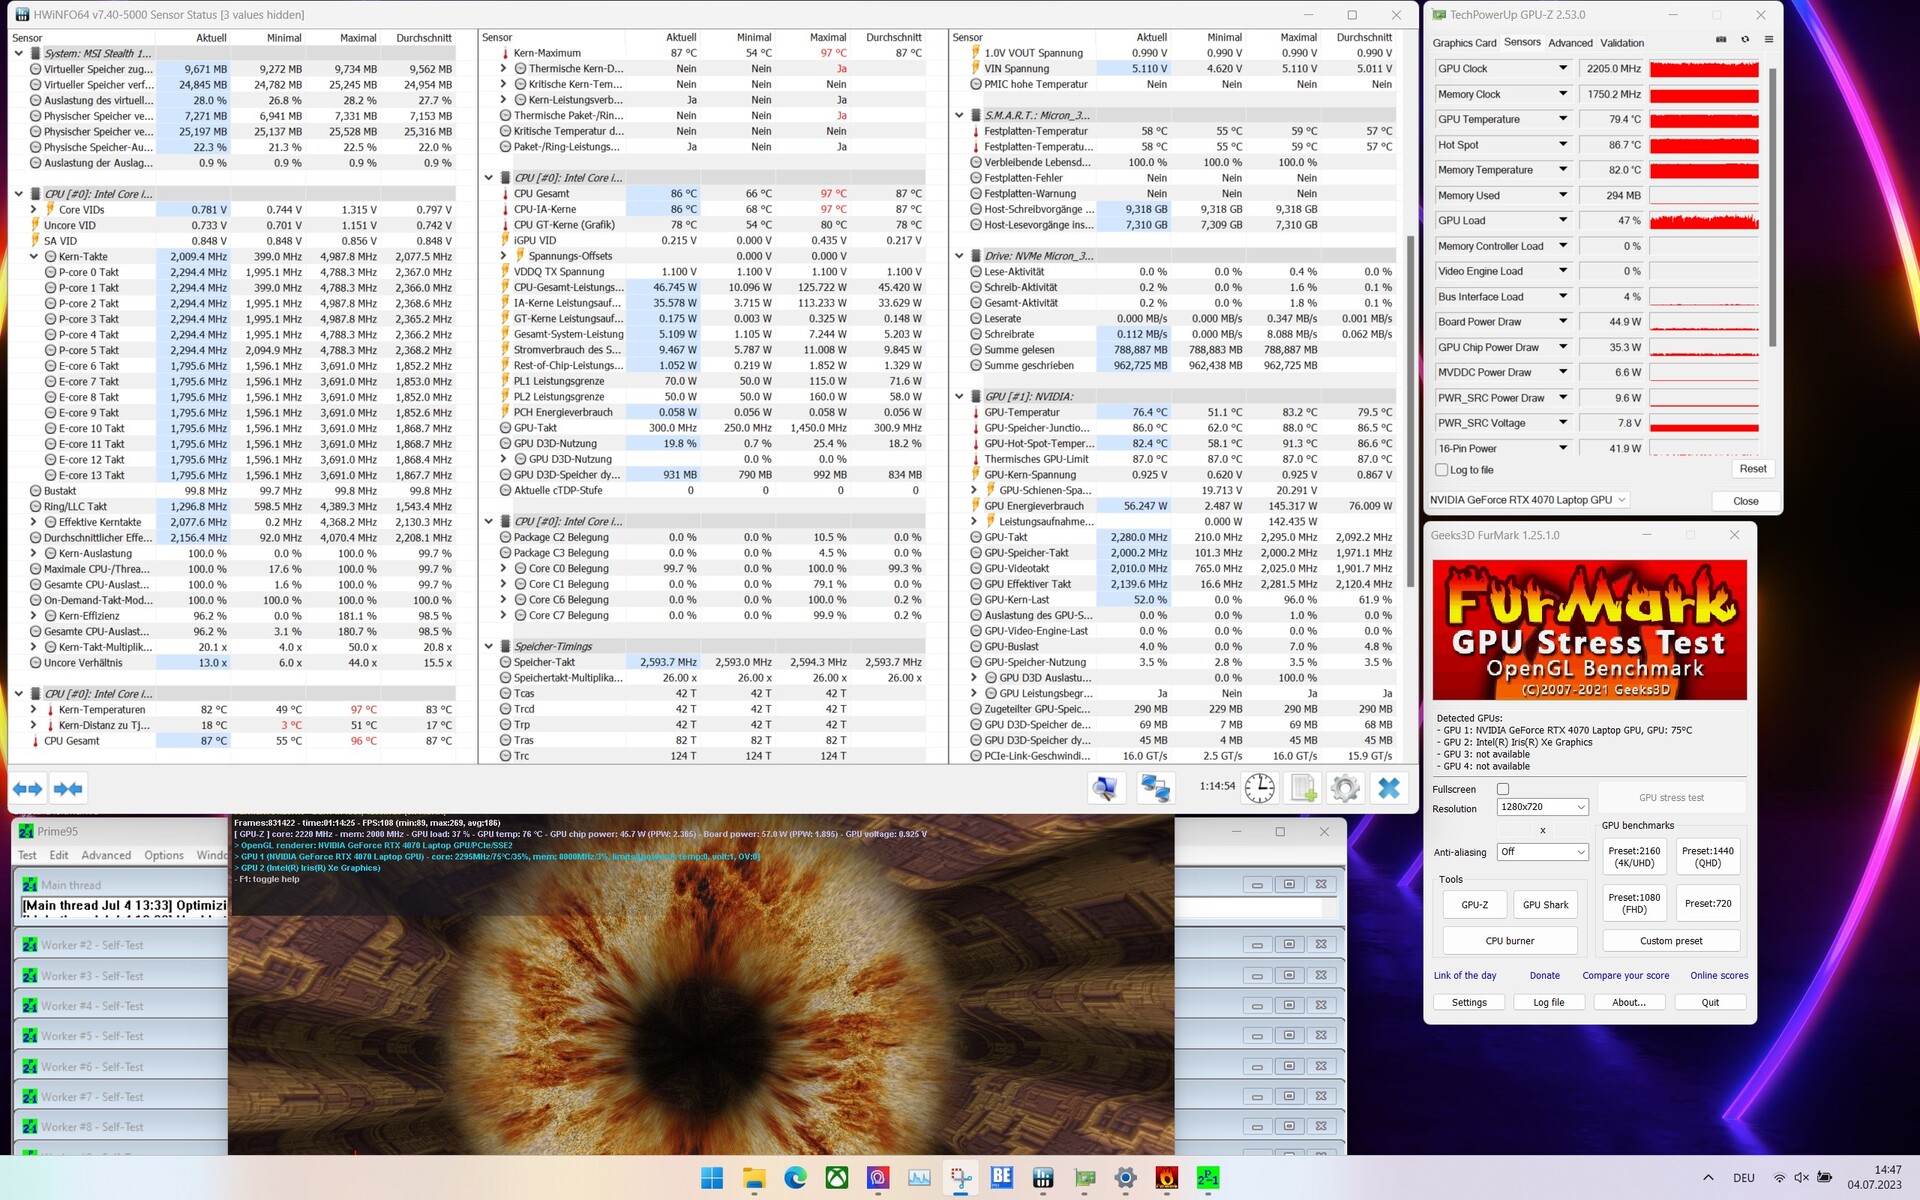
Teste de estresse
Usamos o Prime95 e o FurMark em operação contínua para simular o teste de estresse. Ele representa um cenário extremo e serve para verificar a estabilidade do sistema sob carga total. Em termos de processador, o valor mais alto que observamos foi 97 °C, que foi atingido logo no início. Em um período de tempo mais longo, a temperatura da CPU se estabilizou em torno de 87 °C. No que diz respeito ao adaptador gráfico, registramos um valor máximo de ponto quente de 91 °C. Em uma média de cerca de 80 °C, observamos temperaturas consideravelmente mais baixas sob carga. Isso significa que o limite térmico da placa de vídeo (87 °C) não foi atingido.
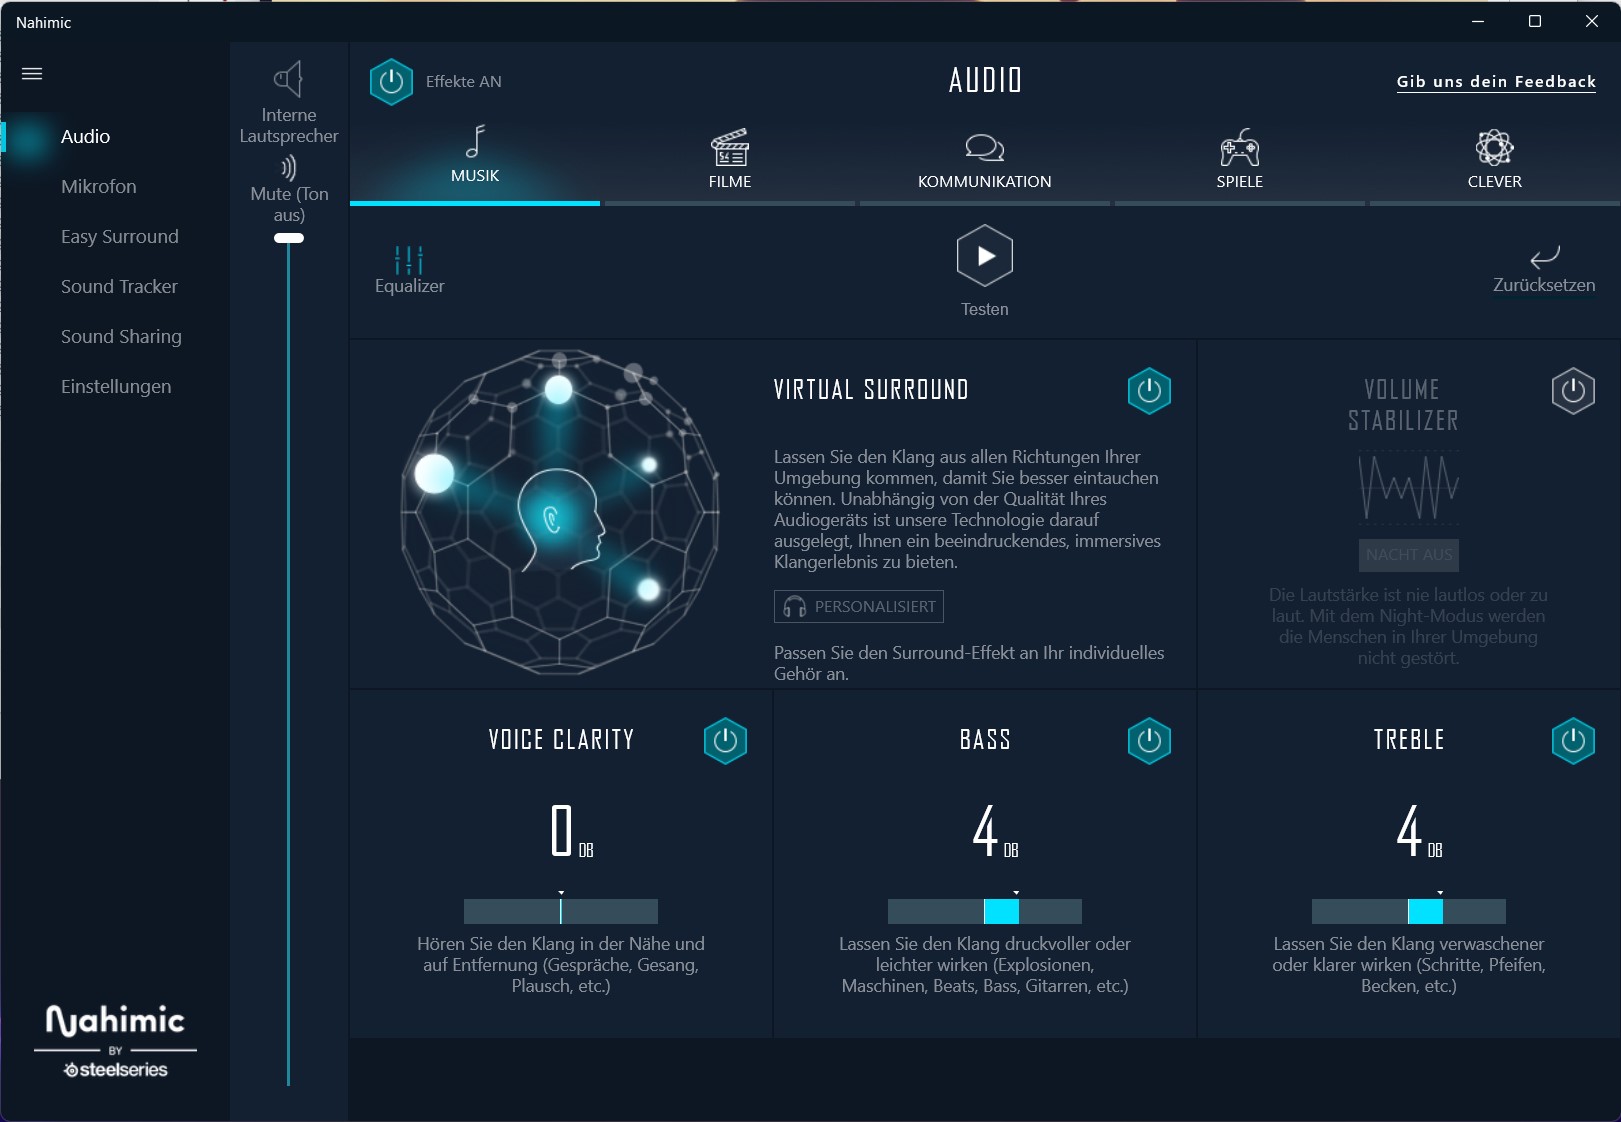
Alto-falantes
O sistema de som do MSI Stealth 16 Studio A13VG é baseado em seis alto-falantes que produzem uma boa experiência de áudio. A reprodução até o volume máximo é clara e sem interferência, mas não substitui um sistema externo.
MSI Stealth 16 Studio A13VG análise de áudio
(+) | os alto-falantes podem tocar relativamente alto (###valor### dB)
Graves 100 - 315Hz
(±) | graves reduzidos - em média 9% menor que a mediana
(±) | a linearidade dos graves é média (8.7% delta para a frequência anterior)
Médios 400 - 2.000 Hz
(+) | médios equilibrados - apenas 4.6% longe da mediana
(+) | médios são lineares (5.4% delta para frequência anterior)
Altos 2 - 16 kHz
(+) | agudos equilibrados - apenas 2.7% longe da mediana
(+) | os máximos são lineares (5.1% delta da frequência anterior)
Geral 100 - 16.000 Hz
(+) | o som geral é linear (9.3% diferença em relação à mediana)
Comparado com a mesma classe
» 3% de todos os dispositivos testados nesta classe foram melhores, 2% semelhantes, 95% piores
» O melhor teve um delta de 6%, a média foi 18%, o pior foi 132%
Comparado com todos os dispositivos testados
» 3% de todos os dispositivos testados foram melhores, 1% semelhantes, 96% piores
» O melhor teve um delta de 4%, a média foi 23%, o pior foi 134%
Asus ROG Flow X16 GV601V análise de áudio
(±) | o volume do alto-falante é médio, mas bom (###valor### dB)
Graves 100 - 315Hz
(±) | graves reduzidos - em média 9.6% menor que a mediana
(±) | a linearidade dos graves é média (9.2% delta para a frequência anterior)
Médios 400 - 2.000 Hz
(+) | médios equilibrados - apenas 4.7% longe da mediana
(±) | a linearidade dos médios é média (7.5% delta para frequência anterior)
Altos 2 - 16 kHz
(+) | agudos equilibrados - apenas 2.2% longe da mediana
(+) | os máximos são lineares (6.1% delta da frequência anterior)
Geral 100 - 16.000 Hz
(+) | o som geral é linear (12% diferença em relação à mediana)
Comparado com a mesma classe
» 12% de todos os dispositivos testados nesta classe foram melhores, 4% semelhantes, 84% piores
» O melhor teve um delta de 6%, a média foi 18%, o pior foi 132%
Comparado com todos os dispositivos testados
» 9% de todos os dispositivos testados foram melhores, 2% semelhantes, 88% piores
» O melhor teve um delta de 4%, a média foi 23%, o pior foi 134%
Gerenciamento de energia - uma bateria maior e requisitos de energia moderados
Consumo de energia
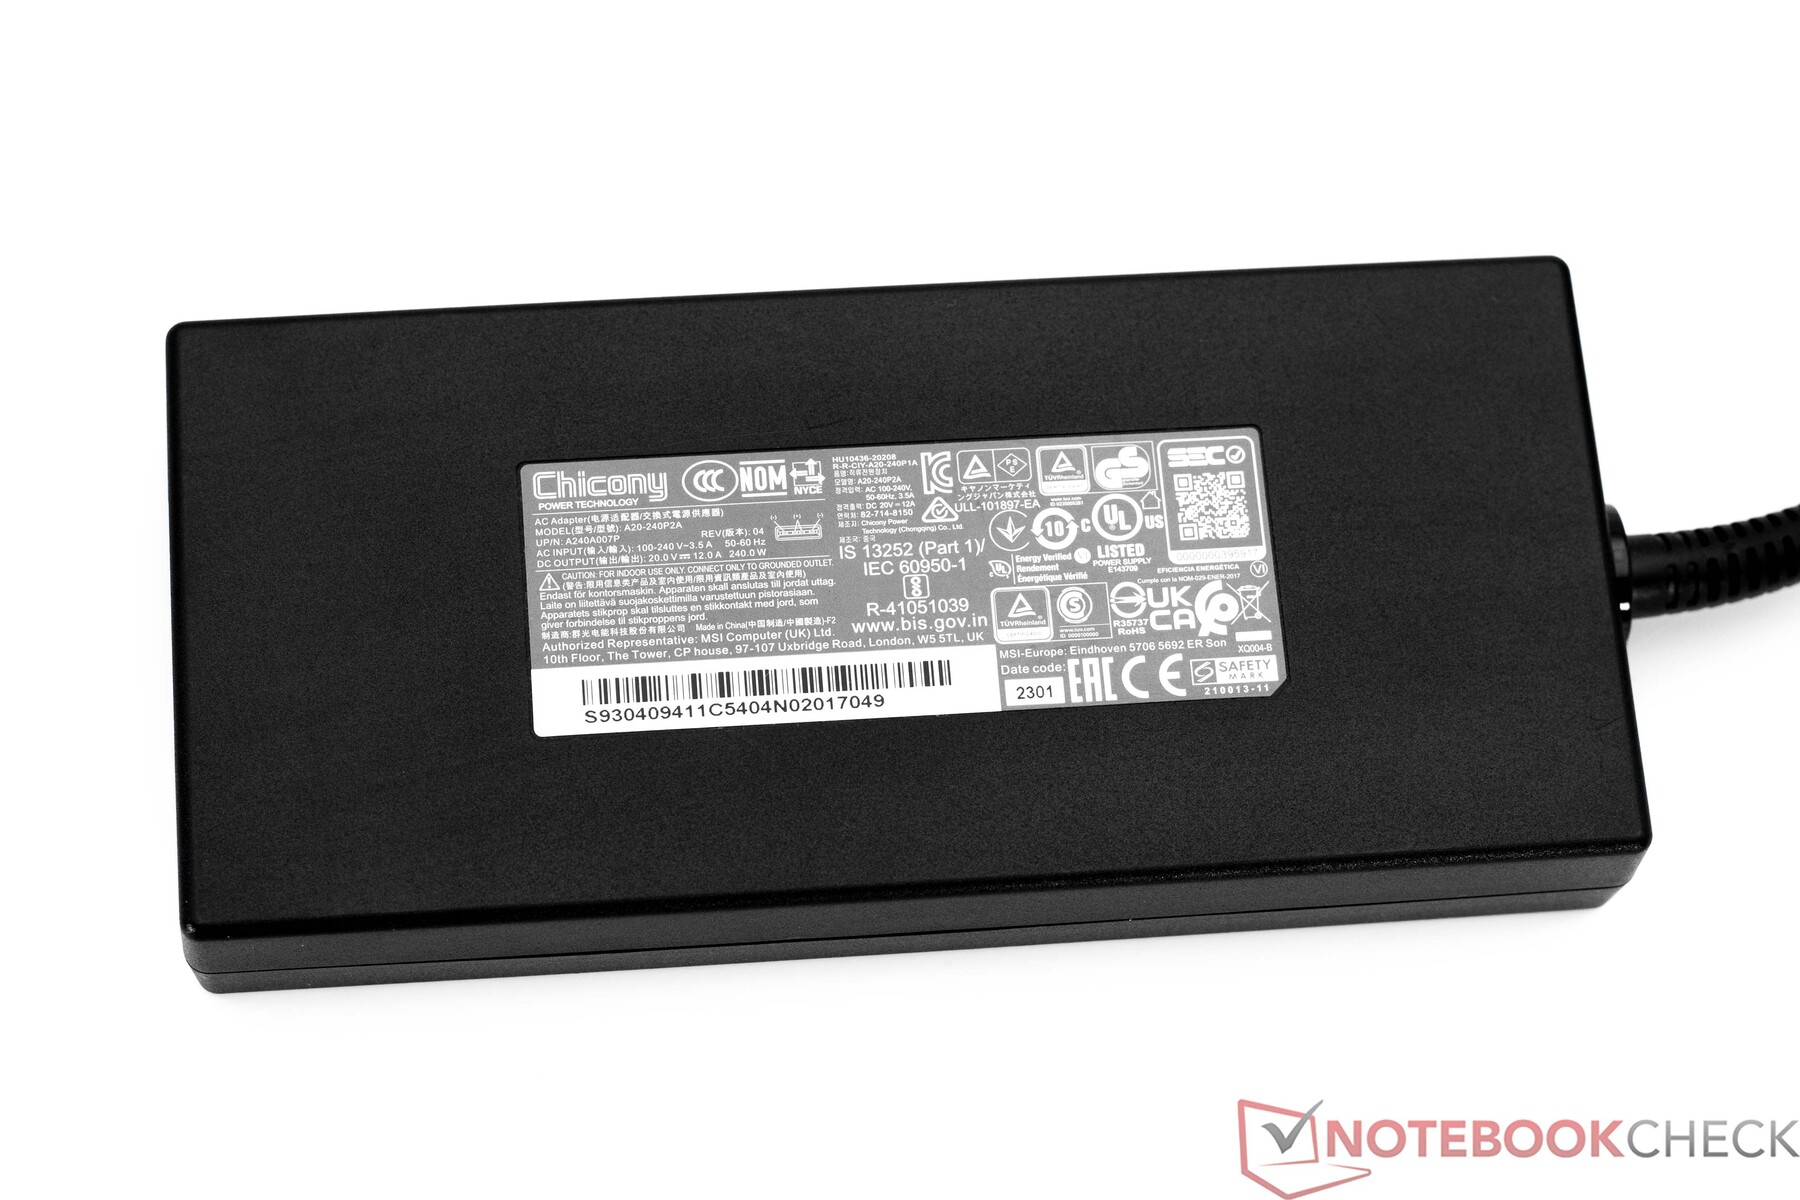
O MSI Stealth 16 Studio A13VG não apresentou nenhuma anormalidade em termos de consumo de energia. Os valores registrados em uso ocioso são realmente muito bons, embora a concorrência às vezes consiga apresentar resultados melhores. No entanto, o consumo de energia minimamente mais alto é muito baixo. Sob carga, observamos valores normais que você associaria a esse hardware básico. Com 240 watts, a PSU é bem dimensionada e não fica sobrecarregada com um máximo de 228 watts.
| desligado | |
| Ocioso | |
| Carga |
|
Key:
min: | |
| MSI Stealth 16 Studio A13VG i7-13700H, GeForce RTX 4070 Laptop GPU, Micron 3400 2TB MTFDKBA2T0TFH, IPS, 2560x1600, 16" | Asus ROG Flow X16 GV601V i9-13900H, GeForce RTX 4060 Laptop GPU, WD PC SN560 SDDPNQE-1T00, IPS, 2560x1600, 16" | Medion Erazer Major X20 i9-13900HX, GeForce RTX 4070 Laptop GPU, Phison E18-1TB-PHISON-SSD-B47R, IPS, 2560x1600, 16" | Acer Nitro 16 AN16-41 R7 7735HS, GeForce RTX 4070 Laptop GPU, Samsung PM9A1 MZVL21T0HCLR, IPS, 2560x1600, 16" | Corsair Voyager a1600 R9 6900HS, Radeon RX 6800M, Samsung PM9A1 MZVL22T0HBLB, IPS, 2560x1600, 16" | Gigabyte AERO 16 OLED BSF i9-13900H, GeForce RTX 4070 Laptop GPU, Gigabyte AG470S1TB-SI B10, OLED, 3840x2400, 16" | Média NVIDIA GeForce RTX 4070 Laptop GPU | Média da turma Gaming | |
|---|---|---|---|---|---|---|---|---|
| Power Consumption | 3% | -25% | -10% | -38% | -0% | -11% | -15% | |
| Idle Minimum * (Watt) | 11 | 9.6 13% | 12 -9% | 11.6 -5% | 16.9 -54% | 11.8 -7% | 13.2 ? -20% | 12.9 ? -17% |
| Idle Average * (Watt) | 18 | 16 11% | 16 11% | 15.6 13% | 20.3 -13% | 16.1 11% | 18.2 ? -1% | 18.5 ? -3% |
| Idle Maximum * (Watt) | 19 | 16.9 11% | 26 -37% | 16.5 13% | 22.2 -17% | 17 11% | 24.6 ? -29% | 24.1 ? -27% |
| Load Average * (Watt) | 91 | 104 -14% | 115 -26% | 155 -70% | 133.4 -47% | 100.6 -11% | 97 ? -7% | 108.4 ? -19% |
| Witcher 3 ultra * (Watt) | 130 | 142 -9% | 191.6 -47% | 154.8 -19% | 206 -58% | 158 -22% | ||
| Load Maximum * (Watt) | 228 | 214 6% | 319 -40% | 205 10% | 192 16% | 221 ? 3% | 254 ? -11% |
* ... menor é melhor
Power consumption Witcher 3 / stress test
Power consumption with an external monitor
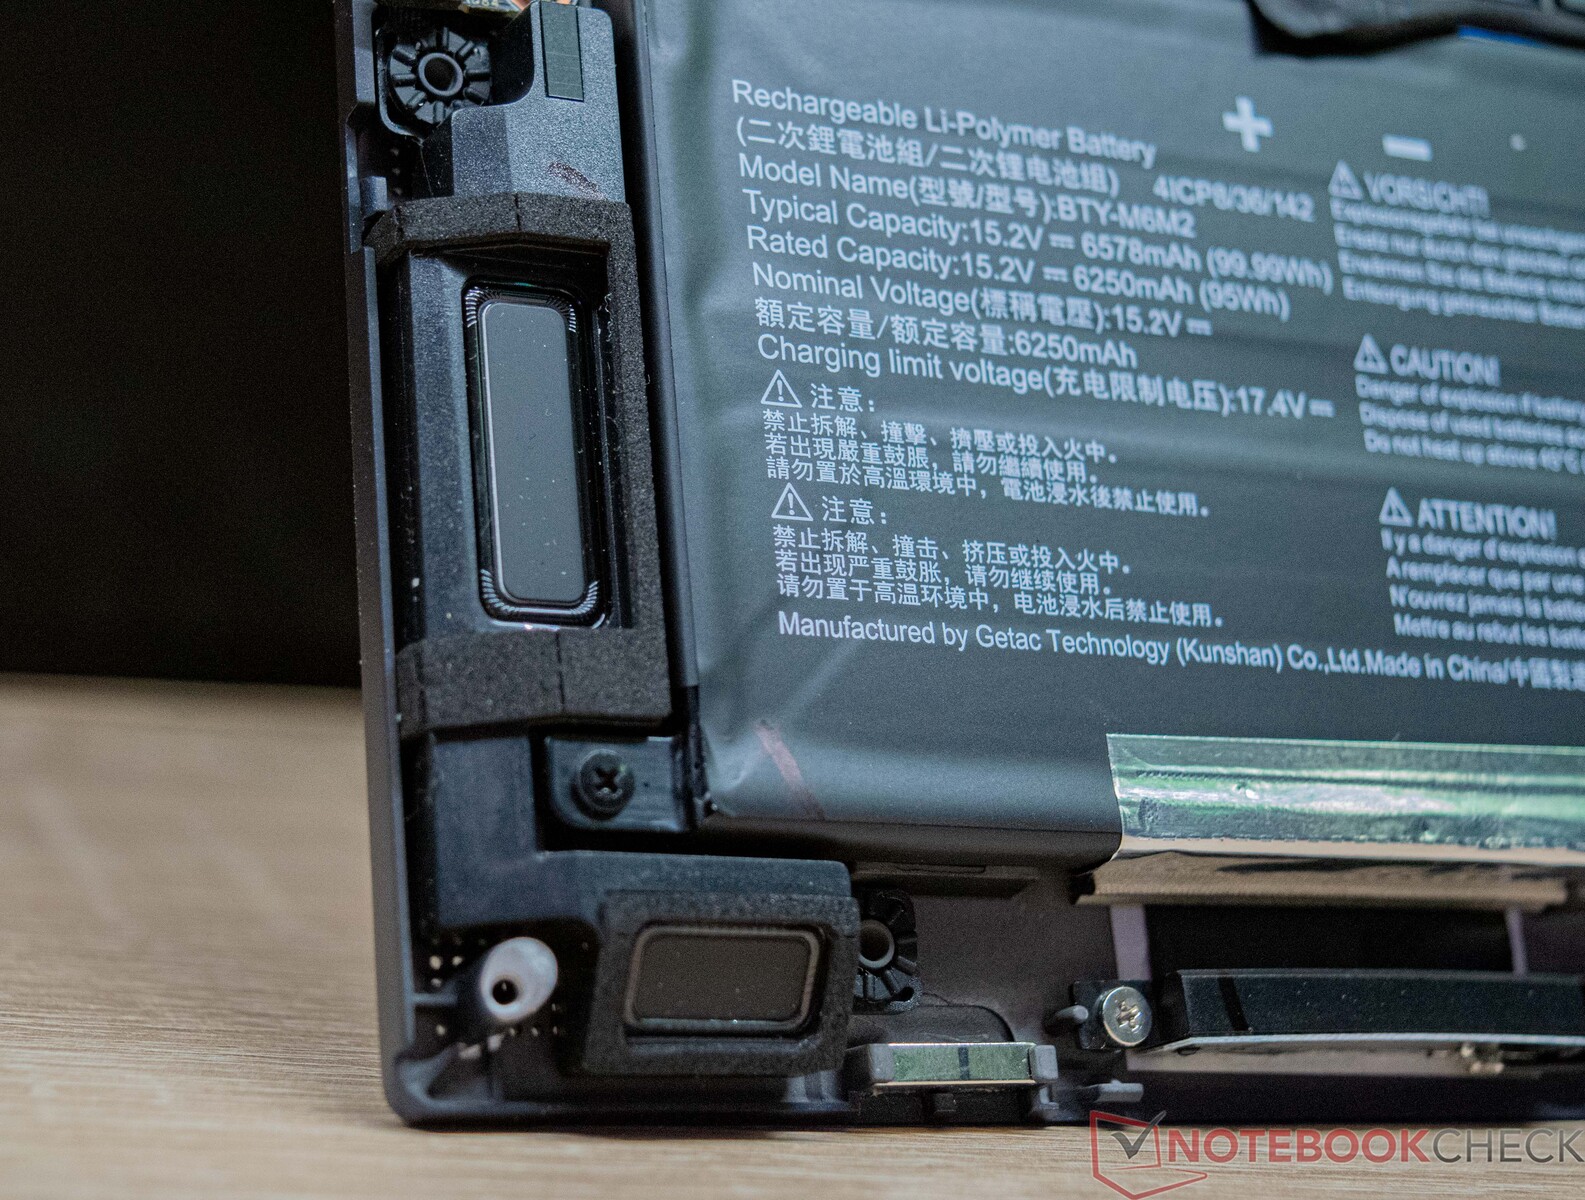
Duração da bateria
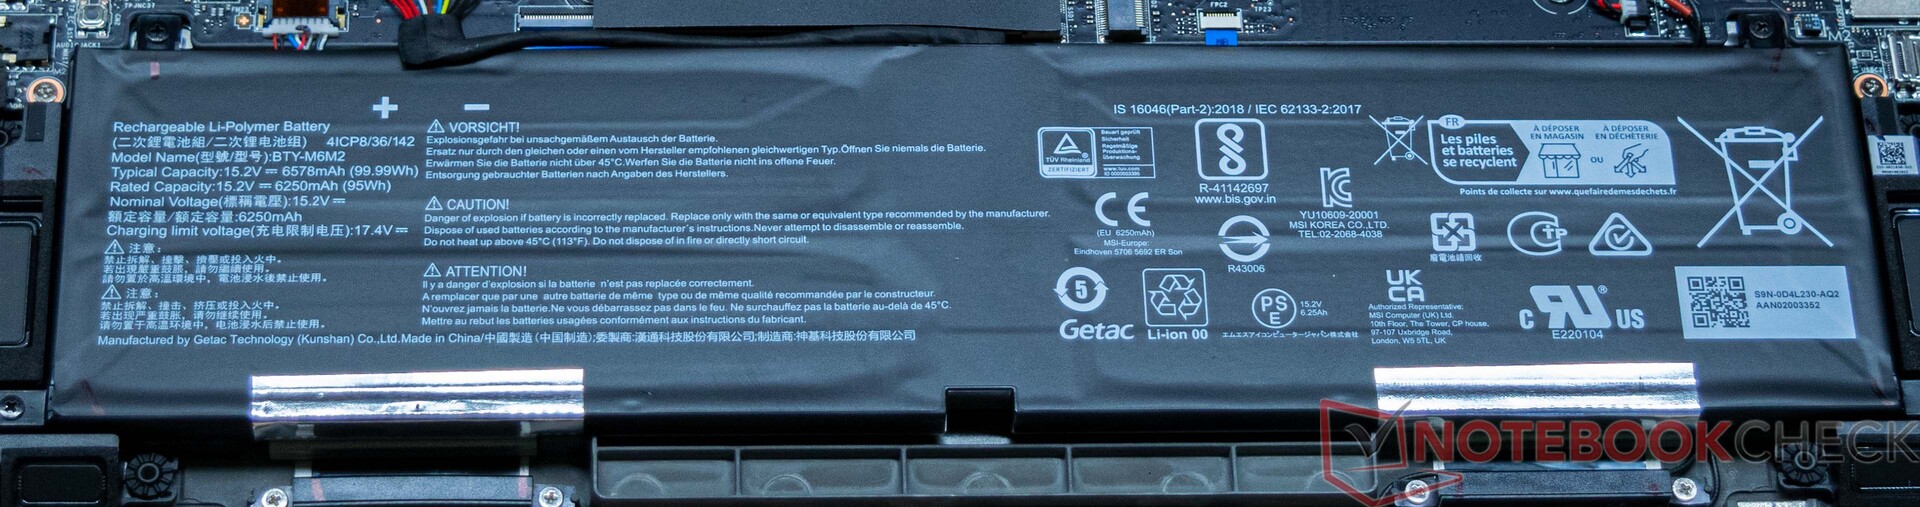
O MSI Stealth 16 Studio A13VG tem uma bateria de 99 Wh, que é o tamanho máximo que um laptop pode suportar. Devido à sua capacidade, nossa amostra de análise conseguiu 7 horas e 46 minutos e 7 horas e 42 minutos, respectivamente, em nosso loop de teste de Wi-Fi (usando um script para carregar um site) e teste de vídeo do curta-metragem Big Buck Bunny (codificação H.264, FHD). Isso significa que o MSI Stealth 16 Studio A13VG tem uma excelente duração de bateria para um notebook para jogos. Durante os dois testes, o brilho da tela foi definido para 150 cd/m². No nosso caso, isso significou reduzir o brilho para 37%.
Uma carga completa leva exatamente três horas. Entretanto, depois de aproximadamente metade desse tempo, a bateria é carregada até 70%.

| MSI Stealth 16 Studio A13VG i7-13700H, GeForce RTX 4070 Laptop GPU, 99.9 Wh | Asus ROG Flow X16 GV601V i9-13900H, GeForce RTX 4060 Laptop GPU, 90 Wh | Medion Erazer Major X20 i9-13900HX, GeForce RTX 4070 Laptop GPU, 62.3 Wh | Acer Nitro 16 AN16-41 R7 7735HS, GeForce RTX 4070 Laptop GPU, 90 Wh | Corsair Voyager a1600 R9 6900HS, Radeon RX 6800M, 99 Wh | Gigabyte AERO 16 OLED BSF i9-13900H, GeForce RTX 4070 Laptop GPU, 88 Wh | Média da turma Gaming | |
|---|---|---|---|---|---|---|---|
| Duração da bateria | -7% | -44% | 8% | -24% | -7% | -13% | |
| Reader / Idle (h) | 11 | 5.8 -47% | 12.2 11% | 7 -36% | 8.71 ? -21% | ||
| H.264 (h) | 7.7 | 8.9 16% | 4.2 -45% | 10.2 32% | 6 -22% | 7.4 -4% | 8.9 ? 16% |
| WiFi v1.3 (h) | 7.8 | 7.9 1% | 3.9 -50% | 9 15% | 5.8 -26% | 7.5 -4% | 7.08 ? -9% |
| Load (h) | 2.4 | 1.5 -37% | 1.6 -33% | 1.8 -25% | 2.1 -12% | 2.1 -12% | 1.51 ? -37% |
Pro
Contra
Veredicto - um laptop premium para criadores de conteúdo
Em termos de CPU e GPU integradas, o MSI Stealth 16 Studio A13VG é um laptop para jogos por completo. Do ponto de vista puramente visual, o MSI Stealth 16 Studio A13VG se apresenta como um laptop de negócios de bom gosto com ambições de jogos. Ao fazer isso, o dispositivo cobre uma ampla gama de necessidades, a fim de atrair muitos usuários. O laptop é voltado para criadores que dependem de um desempenho de sistema de alto nível. O desempenho do Intel Core i7-13700H combinado com a GPU para laptop NvidiaGeForce RTX 4070 é consistentemente bom. A tela também precisa atender aos requisitos necessários e isso é algo que ela consegue com sua alta cobertura de espaço de cores.
Também ficamos impressionados com o restante das especificações - 32 GB de RAM DDR5 e um total de 2 TB de armazenamento SSD é uma base excelente que garante que o laptop não precisará ser atualizado tão cedo. A tela de 16 polegadas oferece resolução QHD+, uma proporção de 16:10 e uma taxa de atualização de 240 Hz, o que comprova suas credenciais para jogos.
O MSI Stealth 16 Studio A13VG é, ao mesmo tempo, um laptop muito potente e muito leve para criadores de conteúdo e jogadores.
Por outro lado, as limitações de som vêm na forma de volume, que, no entanto, é típico de um laptop para jogos. Também consideramos a seleção de portas bastante crítica, pois apenas uma porta USB-A simplesmente não é suficiente para essa classe de dispositivo. No entanto, há uma porta Thunderbolt 4 moderna que permite que o laptop seja expandido de forma útil. A implementação do leitor de cartões é boa e, em termos de desempenho, não há motivo para se esconder.
Quando se trata de mobilidade, o MSI Stealth 16 Studio A13VG é um bom exemplo, pois tanto o baixo peso quanto a boa duração da bateria estão acima da média. Muitas configurações podem ser realizadas por meio do MSI Center e, com as configurações certas, o dispositivo funciona quase silenciosamente.
No entanto, em termos de preço, o MSI Stealth 16 Studio A13VG tem dificuldades com um preço atual de cerca de US$ 2549. Para uma alternativa mais barata, vale a pena dar uma olhada no Medion Erazer Major X20que está equipado com uma placaGPU para laptop Nvidia GeForce RTX 4070e também oferece excelente desempenho.
Preço e disponibilidade
O MSI Stealth 16 Studio A13VG com um SSD de 1 TB e 64 GB de RAM está atualmente disponível na BestBuy por US$ 2.549,99.
MSI Stealth 16 Studio A13VG
- 11/28/2023 v7 (old)
Sebastian Bade
Transparência
A seleção dos dispositivos a serem analisados é feita pela nossa equipe editorial. A amostra de teste foi fornecida ao autor como empréstimo pelo fabricante ou varejista para fins desta revisão. O credor não teve influência nesta revisão, nem o fabricante recebeu uma cópia desta revisão antes da publicação. Não houve obrigação de publicar esta revisão. Como empresa de mídia independente, a Notebookcheck não está sujeita à autoridade de fabricantes, varejistas ou editores.
É assim que o Notebookcheck está testando
Todos os anos, o Notebookcheck analisa de forma independente centenas de laptops e smartphones usando procedimentos padronizados para garantir que todos os resultados sejam comparáveis. Desenvolvemos continuamente nossos métodos de teste há cerca de 20 anos e definimos padrões da indústria no processo. Em nossos laboratórios de teste, equipamentos de medição de alta qualidade são utilizados por técnicos e editores experientes. Esses testes envolvem um processo de validação em vários estágios. Nosso complexo sistema de classificação é baseado em centenas de medições e benchmarks bem fundamentados, o que mantém a objetividade.Price comparison

