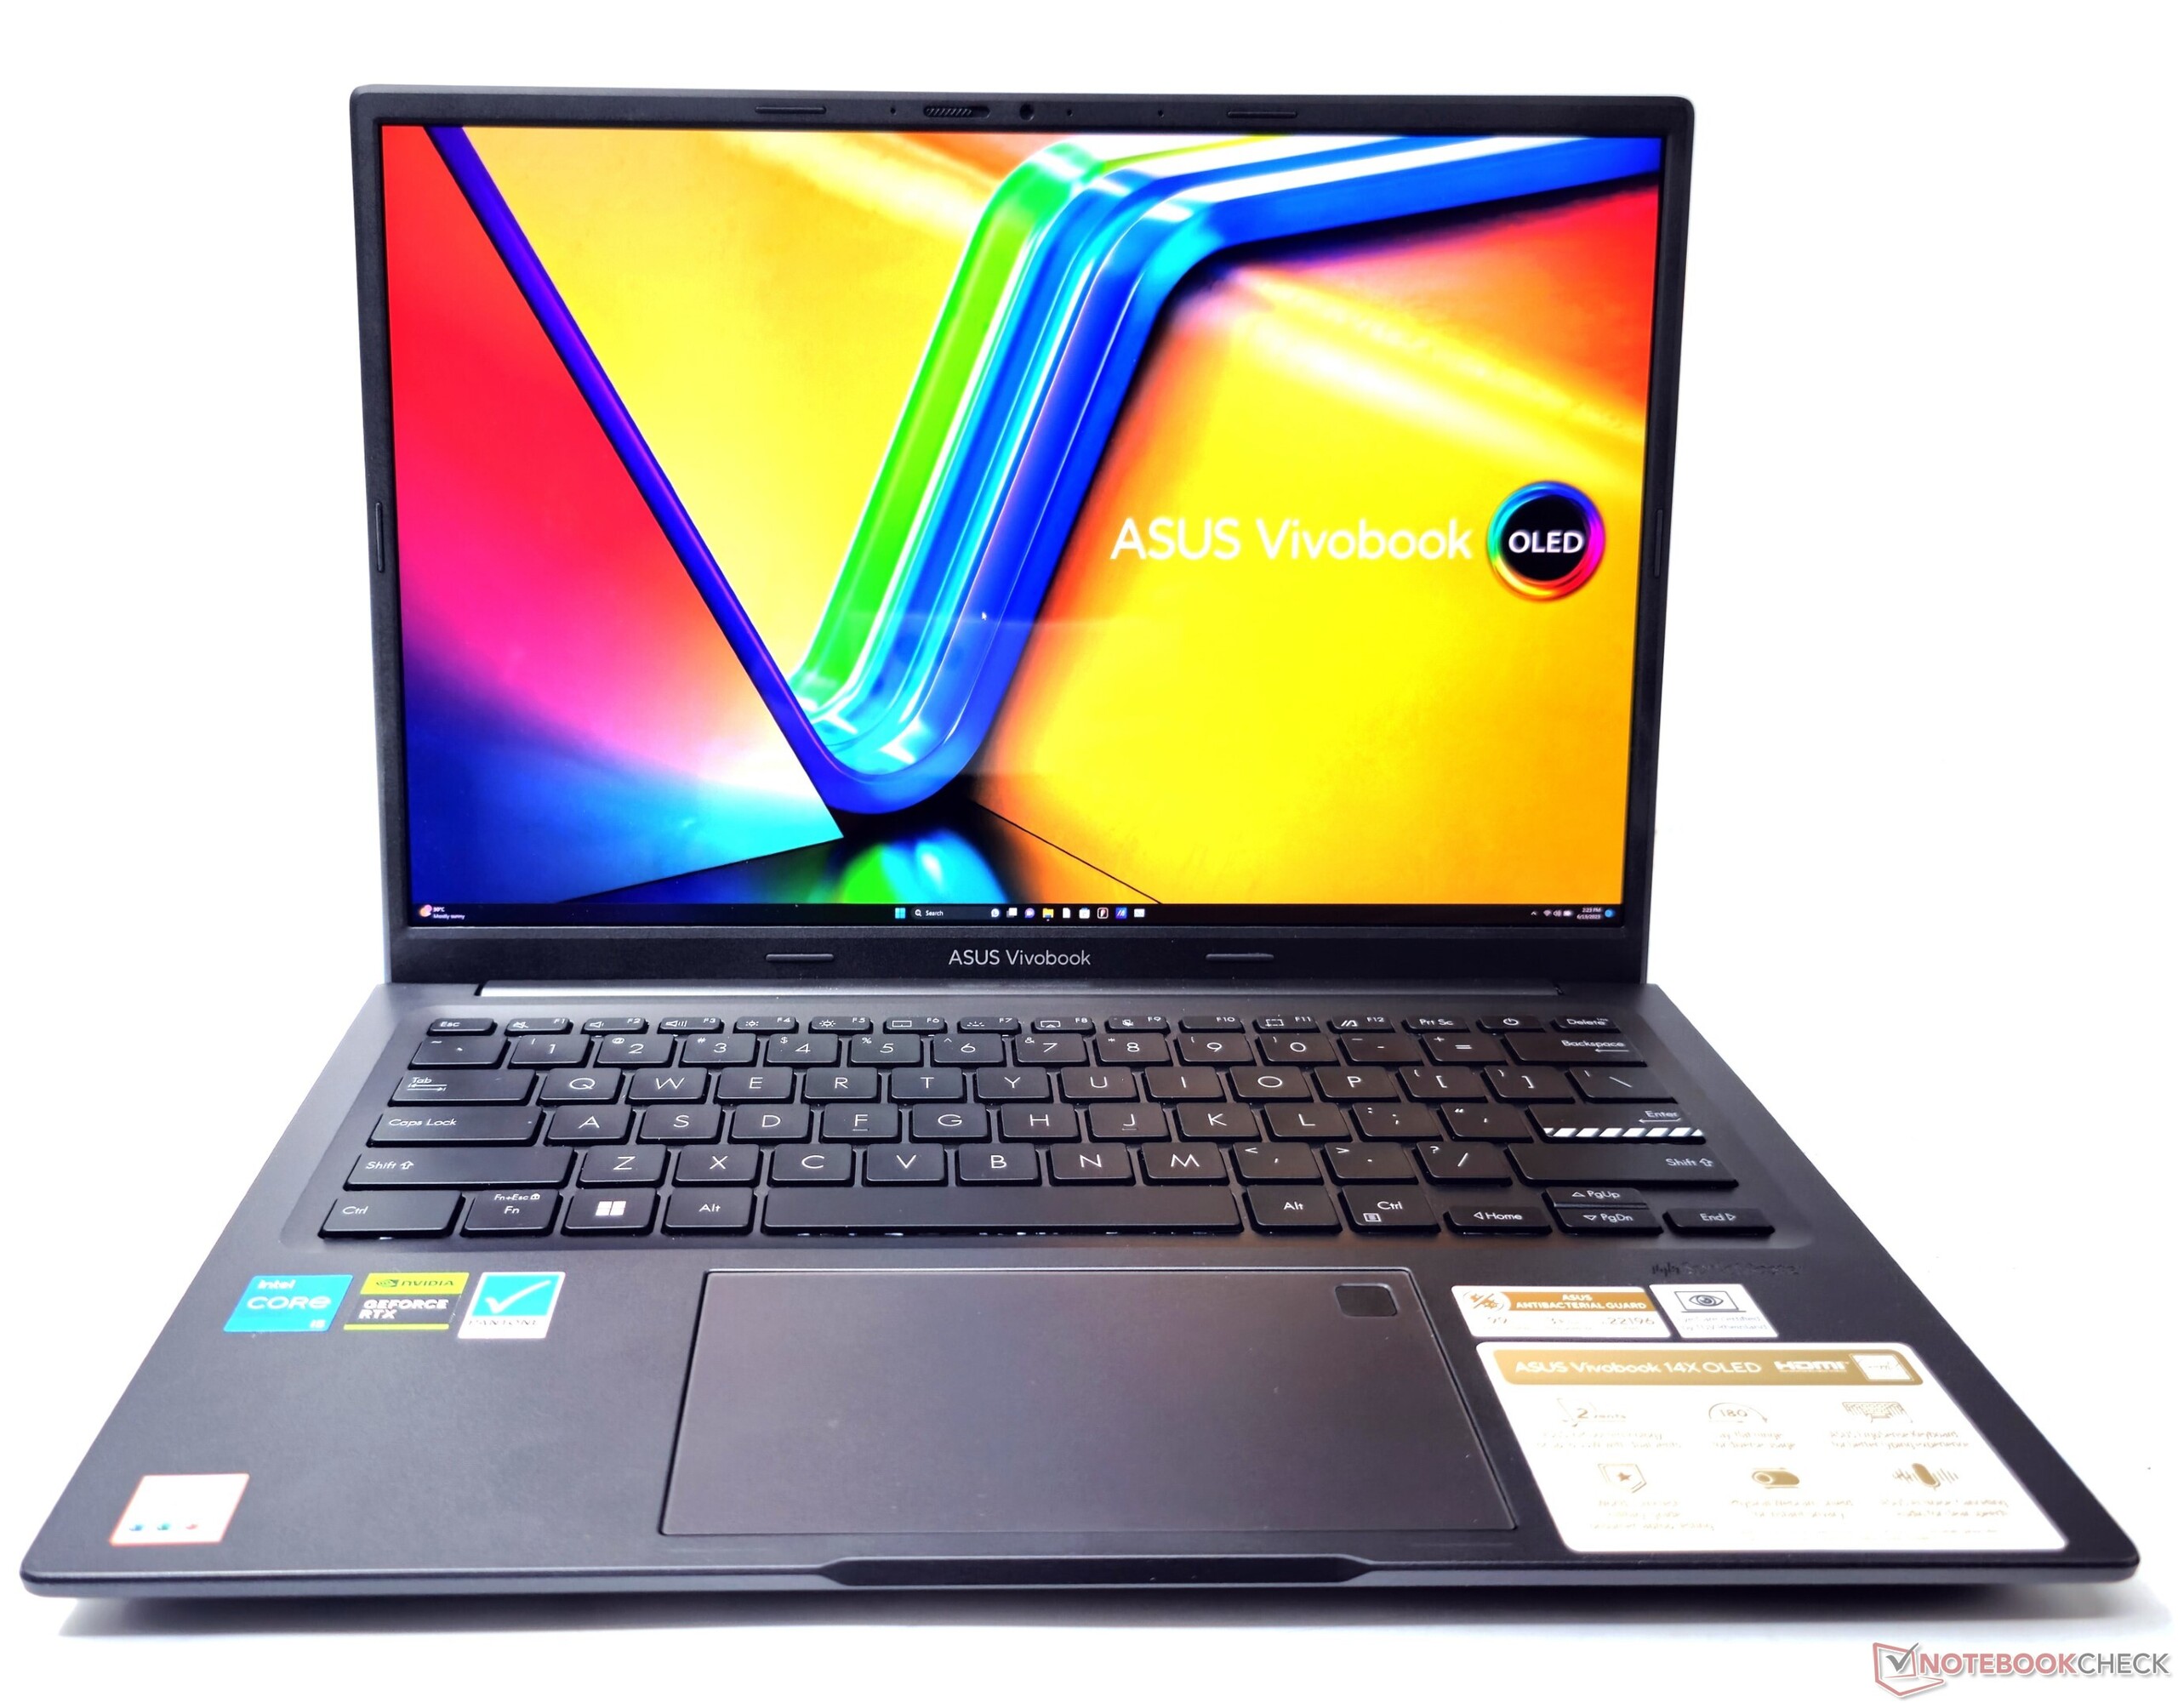
Análise do laptop Asus VivoBook 14X OLED K3405: Laptop multimídia simples com Core i5-13500H e tela OLED 2.8K vibrante

A Asus lançou vários VivoBooks atualizados este ano. Enquanto o novo VivoBook 15X oferece as opções Intel Raptor Lake-P e AMD Ryzen 7030U Barcelo-R, o VivoBook Pro 16Xaumenta o nível até o Core i9-13980HX. Agora voltamos nosso foco para o VivoBook 14X que vem com uma CPU Raptor Lake-H45.
O VivoBook 14X nos oferece o primeiro vislumbre doIntel Core i5-13500Hjuntamente com um processadorGPU para laptop Nvidia GeForce RTX 3050. Os OLEDs agora se tornaram mais ou menos a base dos VivoBooks, excluindo alguns SKUs de baixo custo. Nesse caso, o VivoBook 14X possui uma tela OLED 2.8K de 14 polegadas com uma taxa de atualização de 90 Hz.
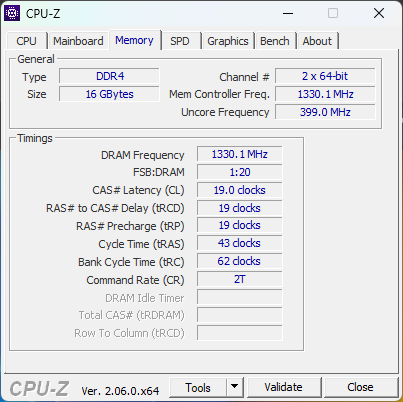
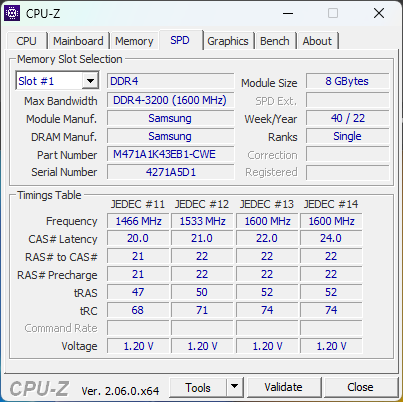
A Asus também equipa o laptop com 16 GB de RAM DDR4-3200, Wi-Fi 6E e um SSD NVMe de 512 GB. Essa configuração custará ₹96.990 (US$ 1.172).
Possíveis concorrentes em comparação
Avaliação | Data | Modelo | Peso | Altura | Size | Resolução | Preço |
|---|---|---|---|---|---|---|---|
| 85.6 % v7 (old) | 08/2023 | Asus VivoBook 14X K3405 i5-13500H, GeForce RTX 3050 4GB Laptop GPU | 1.4 kg | 18.9 mm | 14.00" | 2880x1800 | |
| 86.3 % v7 (old) | 07/2023 | Acer Swift X SFX14-71G i7-13700H, GeForce RTX 4050 Laptop GPU | 1.5 kg | 17.9 mm | 14.50" | 2880x1800 | |
| 85.4 % v7 (old) | 07/2023 | MSI Stealth 14 Studio A13V i7-13700H, GeForce RTX 4050 Laptop GPU | 1.7 kg | 19 mm | 14.00" | 2560x1600 | |
| 89.4 % v7 (old) | 05/2023 | Gigabyte Aero 14 OLED BMF i7-13700H, GeForce RTX 4050 Laptop GPU | 1.4 kg | 17 mm | 14.00" | 2880x1800 | |
| 89.2 % v7 (old) | 04/2023 | Lenovo Slim Pro 7 14ARP8 R7 7735HS, GeForce RTX 3050 6GB Laptop GPU | 1.6 kg | 15.6 mm | 14.50" | 2560x1600 | |
| 88.8 % v7 (old) | 10/2022 | Schenker Vision 14 2022 RTX 3050 Ti i7-12700H, GeForce RTX 3050 Ti Laptop GPU | 1.3 kg | 16.6 mm | 14.00" | 2880x1800 |
Chassi: Leve, porém utilitário
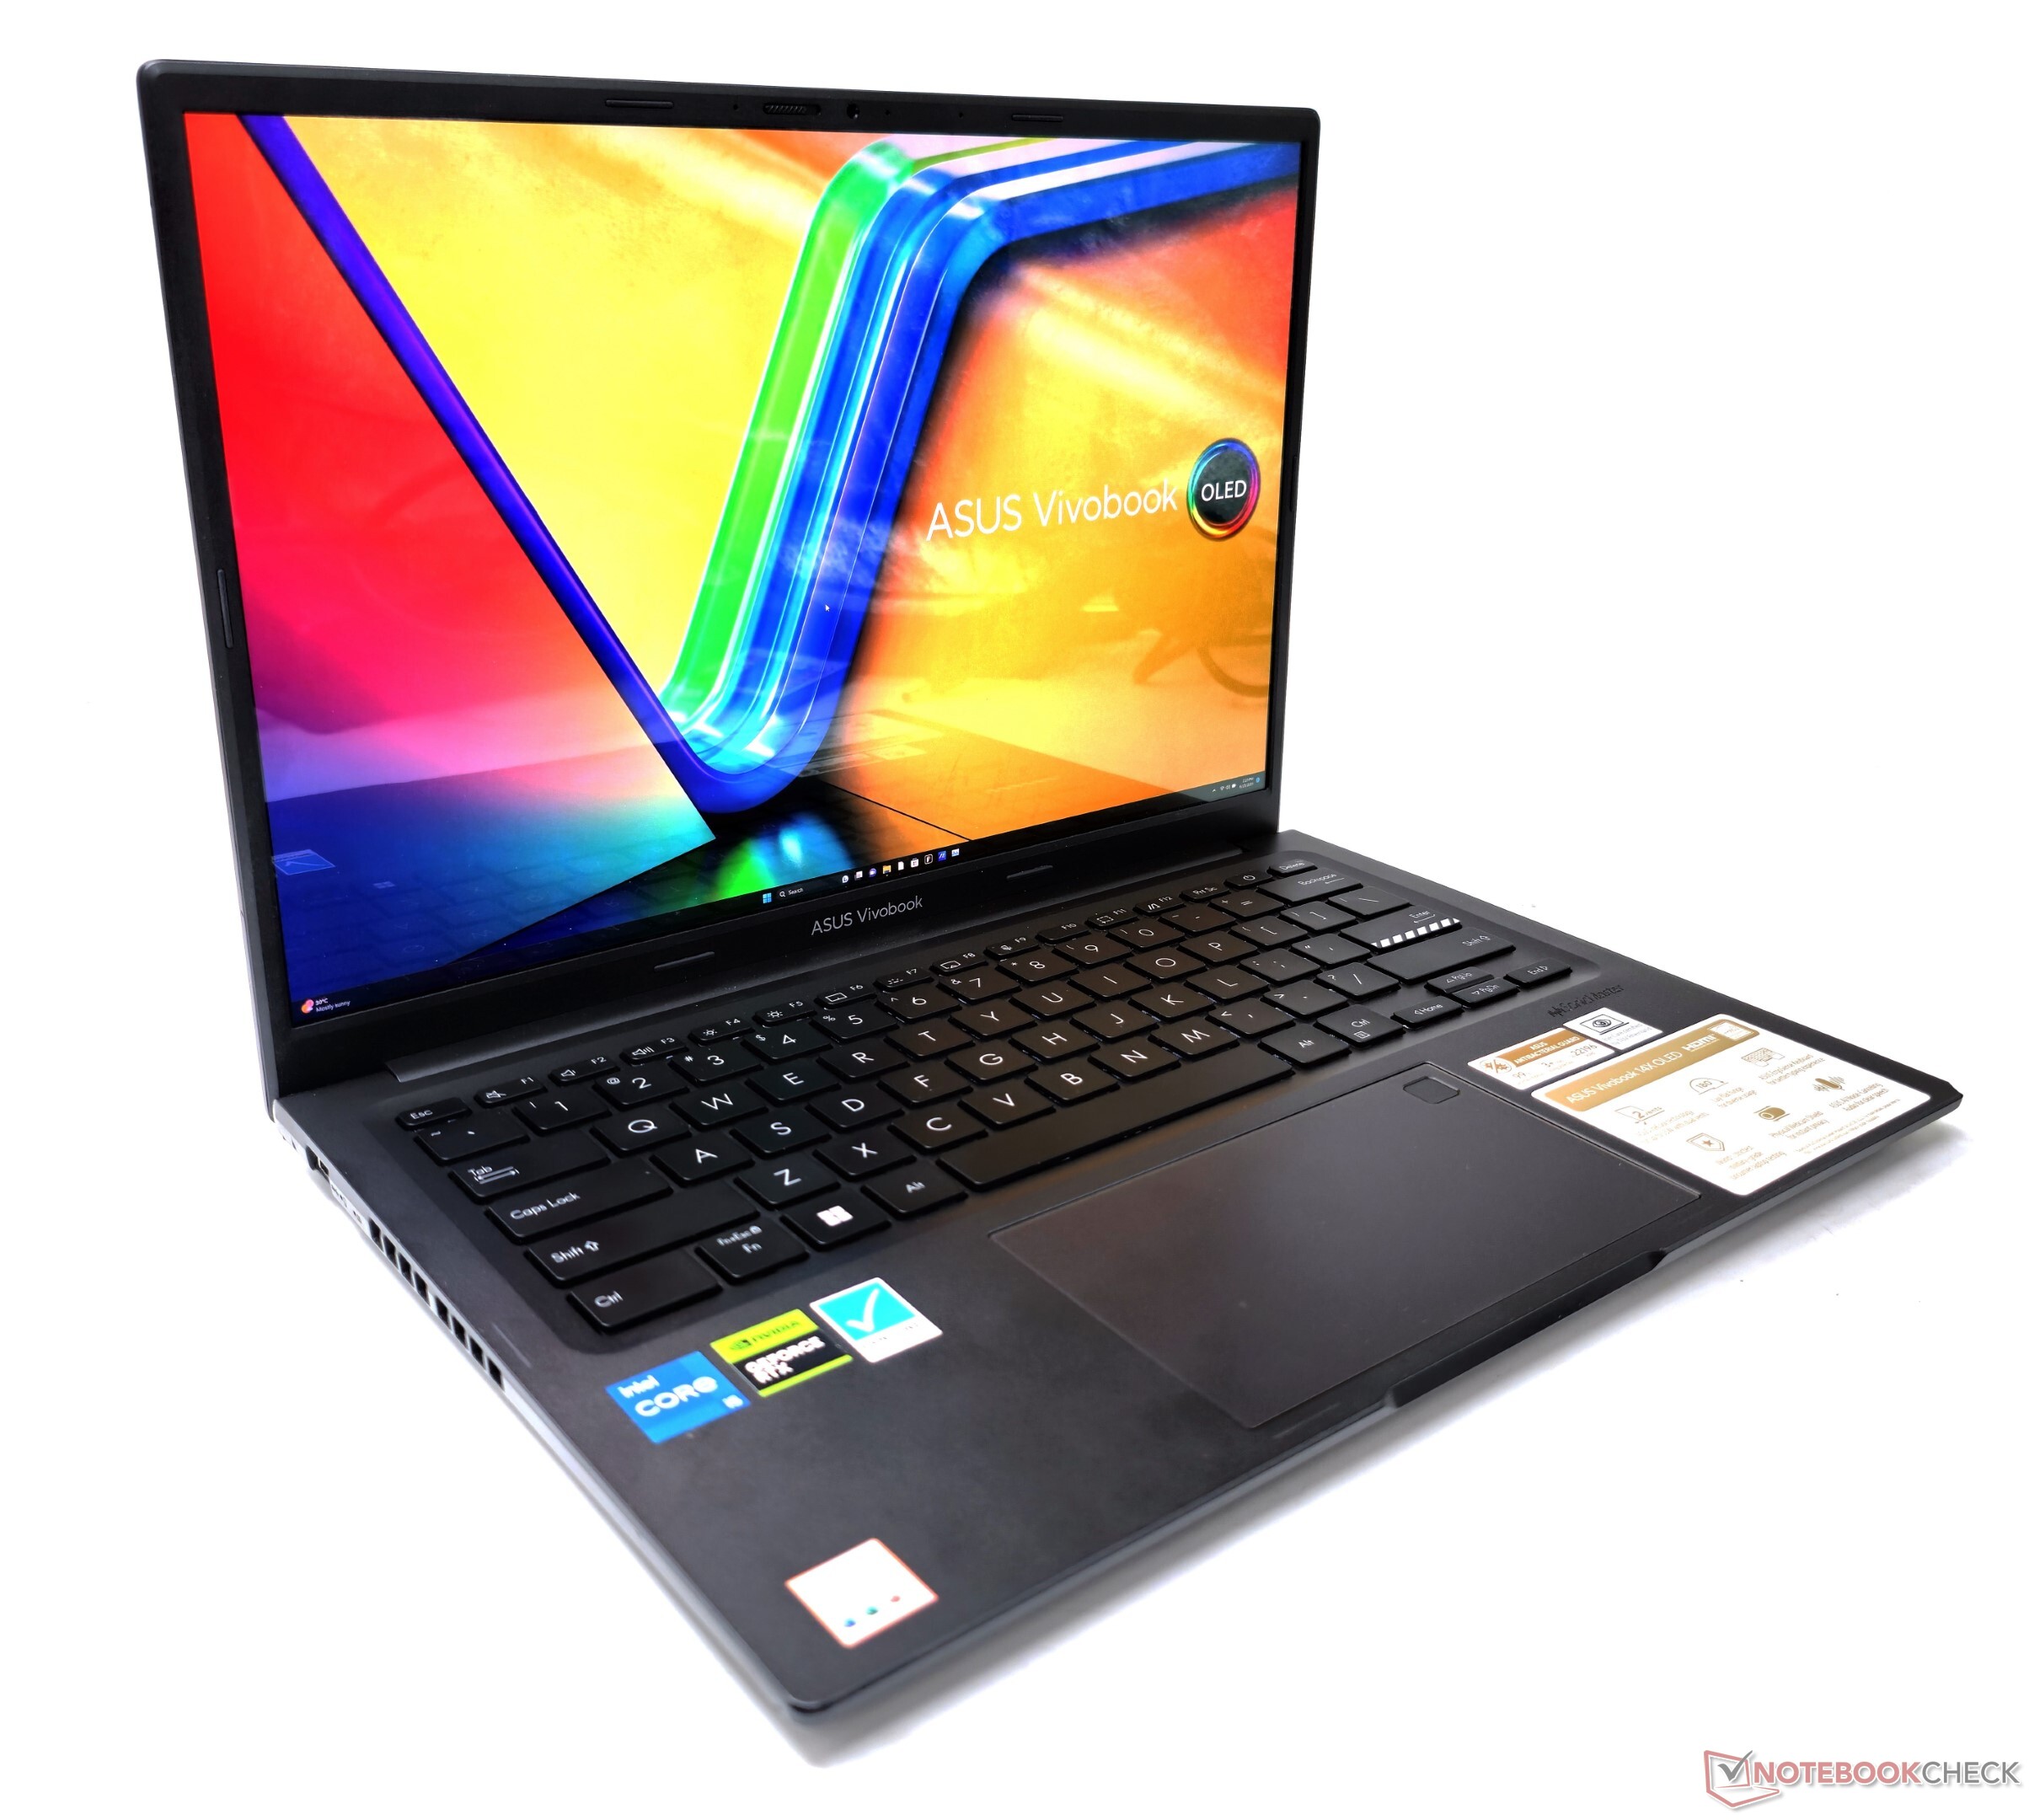
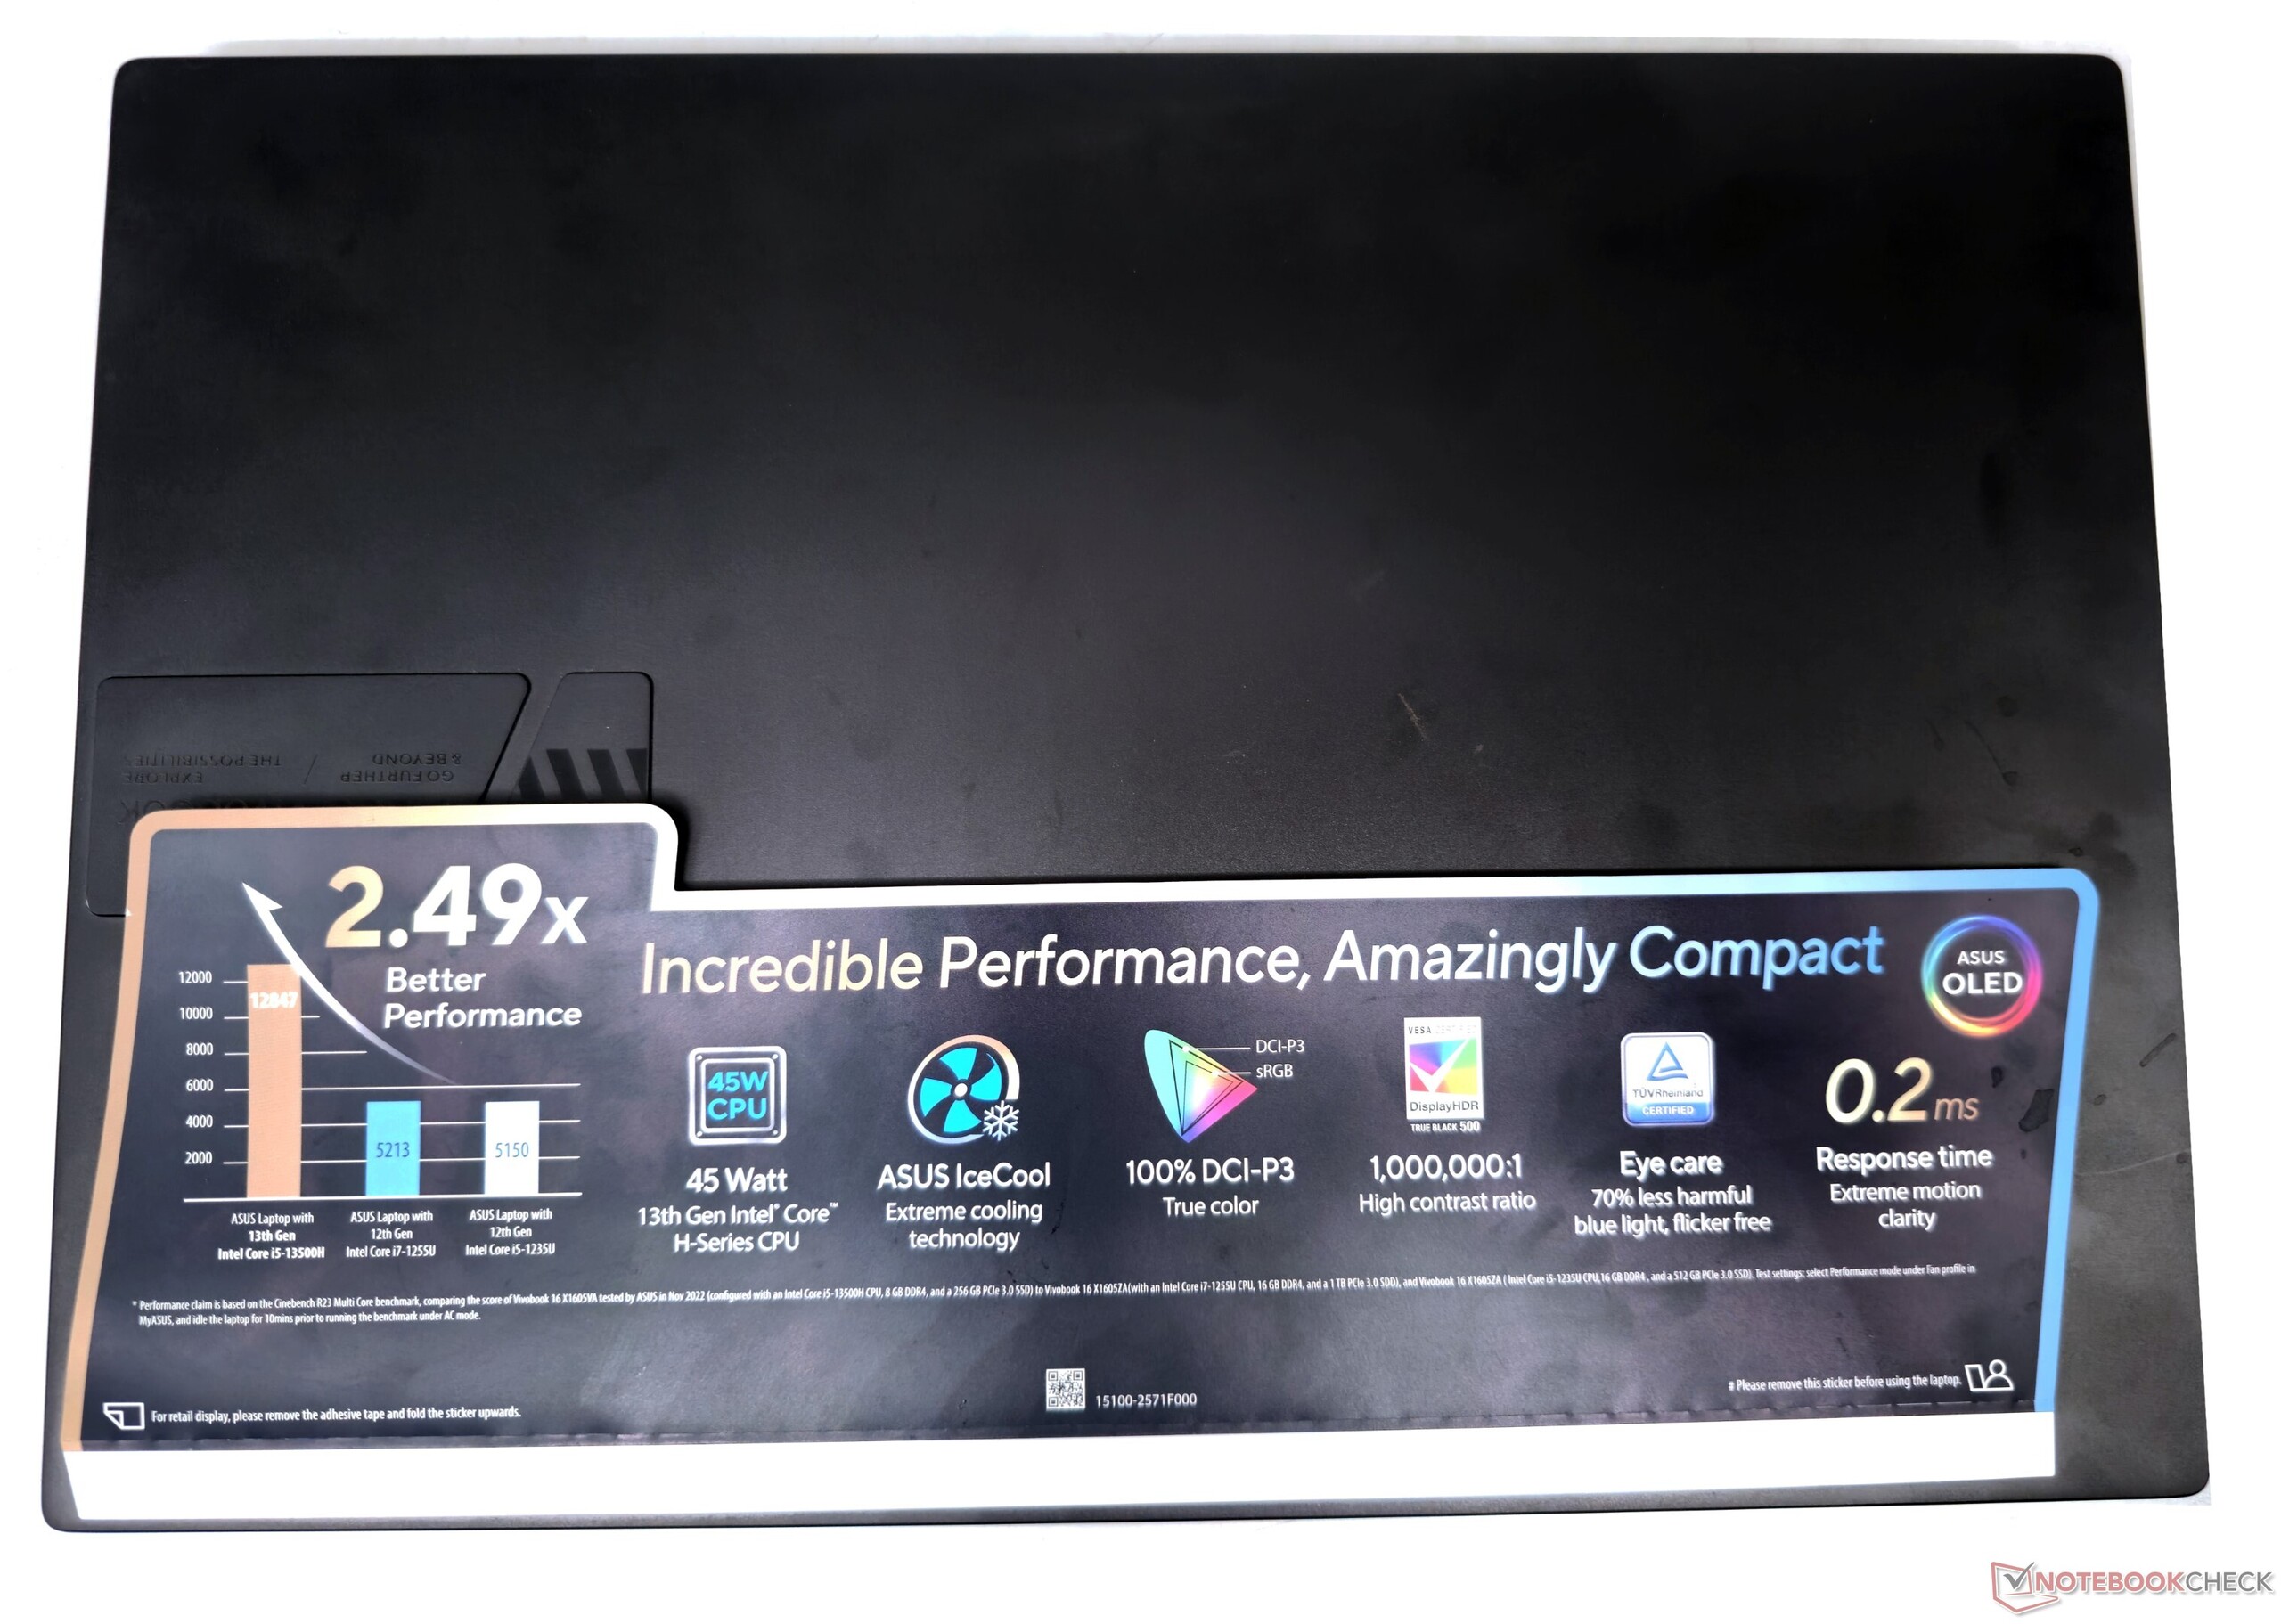
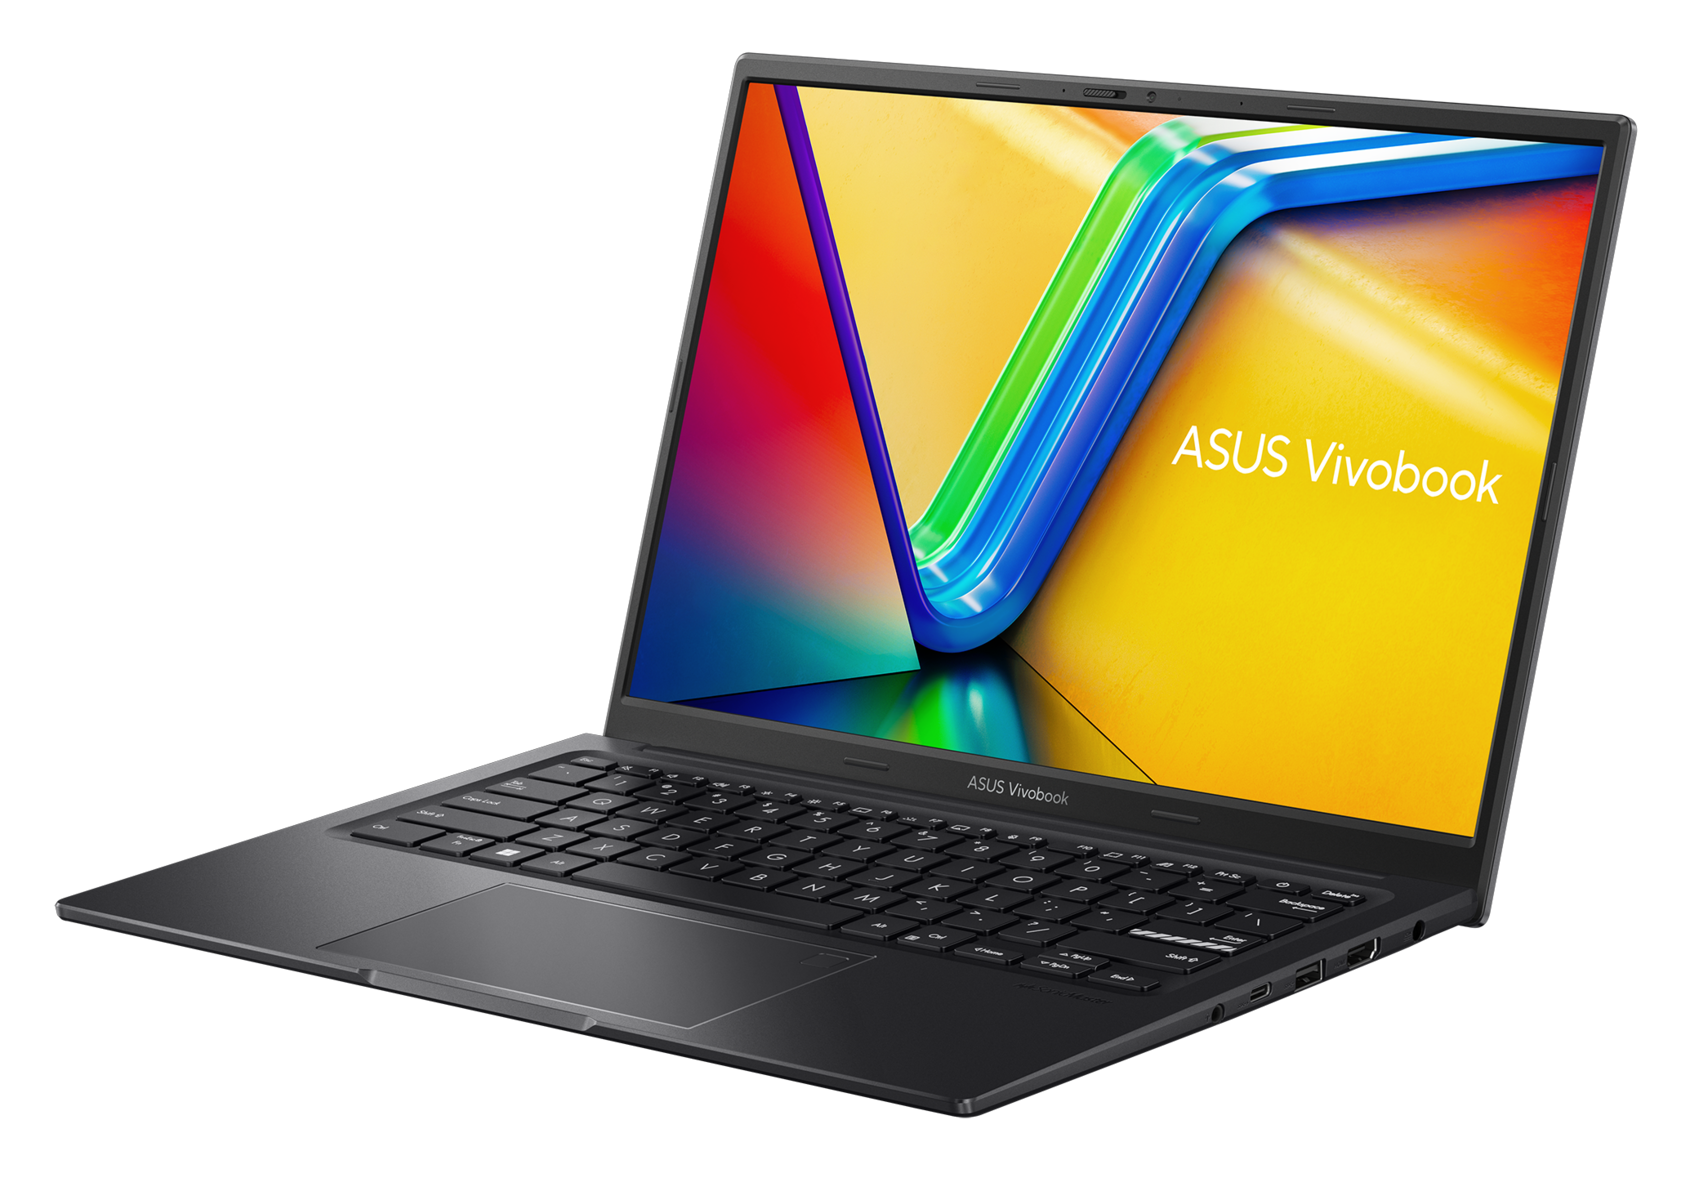
Semelhante ao VivoBook 15X, a Asus oferece o VivoBook 14X em duas opções de cores: Cool Silver e Indie Black (nossa variante). Como geralmente é a norma com os VivoBooks, o chassi de 1,4 kg tem uma construção principalmente de plástico, enquanto a tampa metálica apresenta o logotipo distinto do VivoBook.
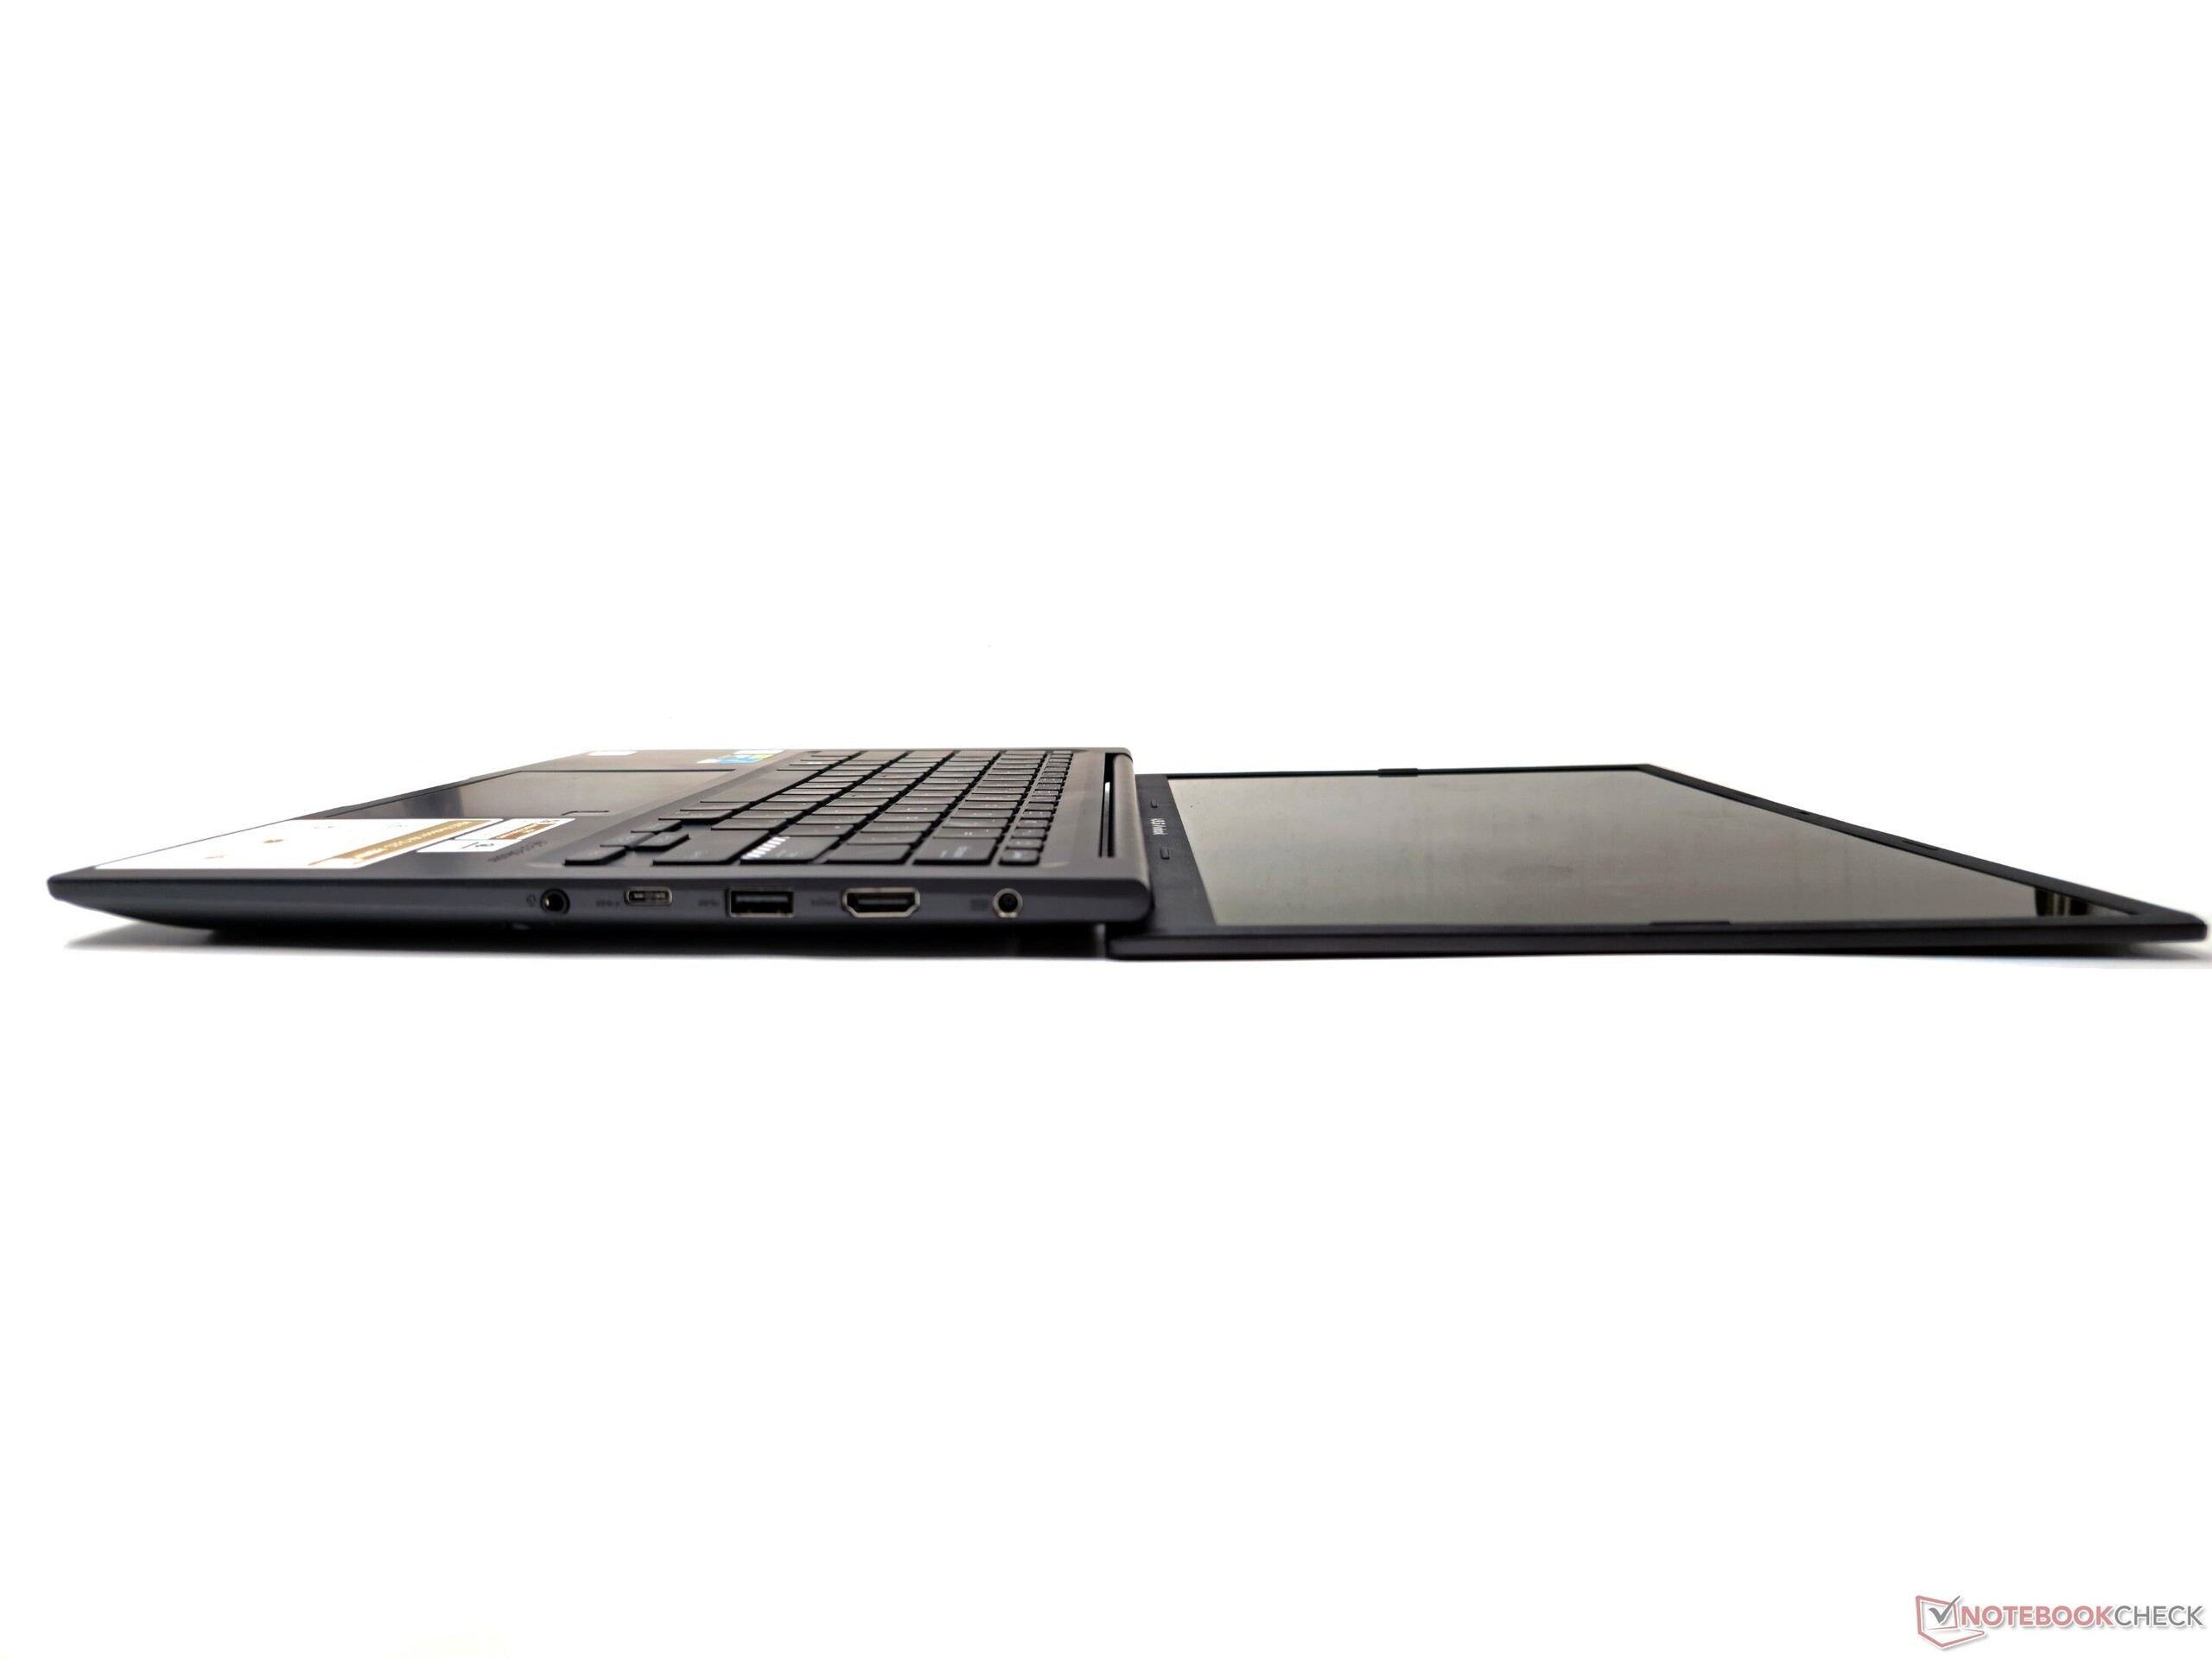
Abrir a tampa da tela é muito fácil, exigindo apenas um dedo, e o laptop permanece estável sem deslizar. A tela pode ser colocada na horizontal em um ângulo de 180°. Há alguma flexão na tela e na plataforma do teclado, mas isso não deve ser uma preocupação durante o uso normal.
As dobradiças parecem sólidas, sem rangidos ou resistência excessiva. Há também a proteção antimicrobiana da Asus, que supostamente inibe o crescimento bacteriano por pelo menos três anos. A Asus também afirma que o laptop atende aos padrões de durabilidade MIL-STD-810H.
Conectividade: O desempenho do Wi-Fi 6E não está à altura da marca
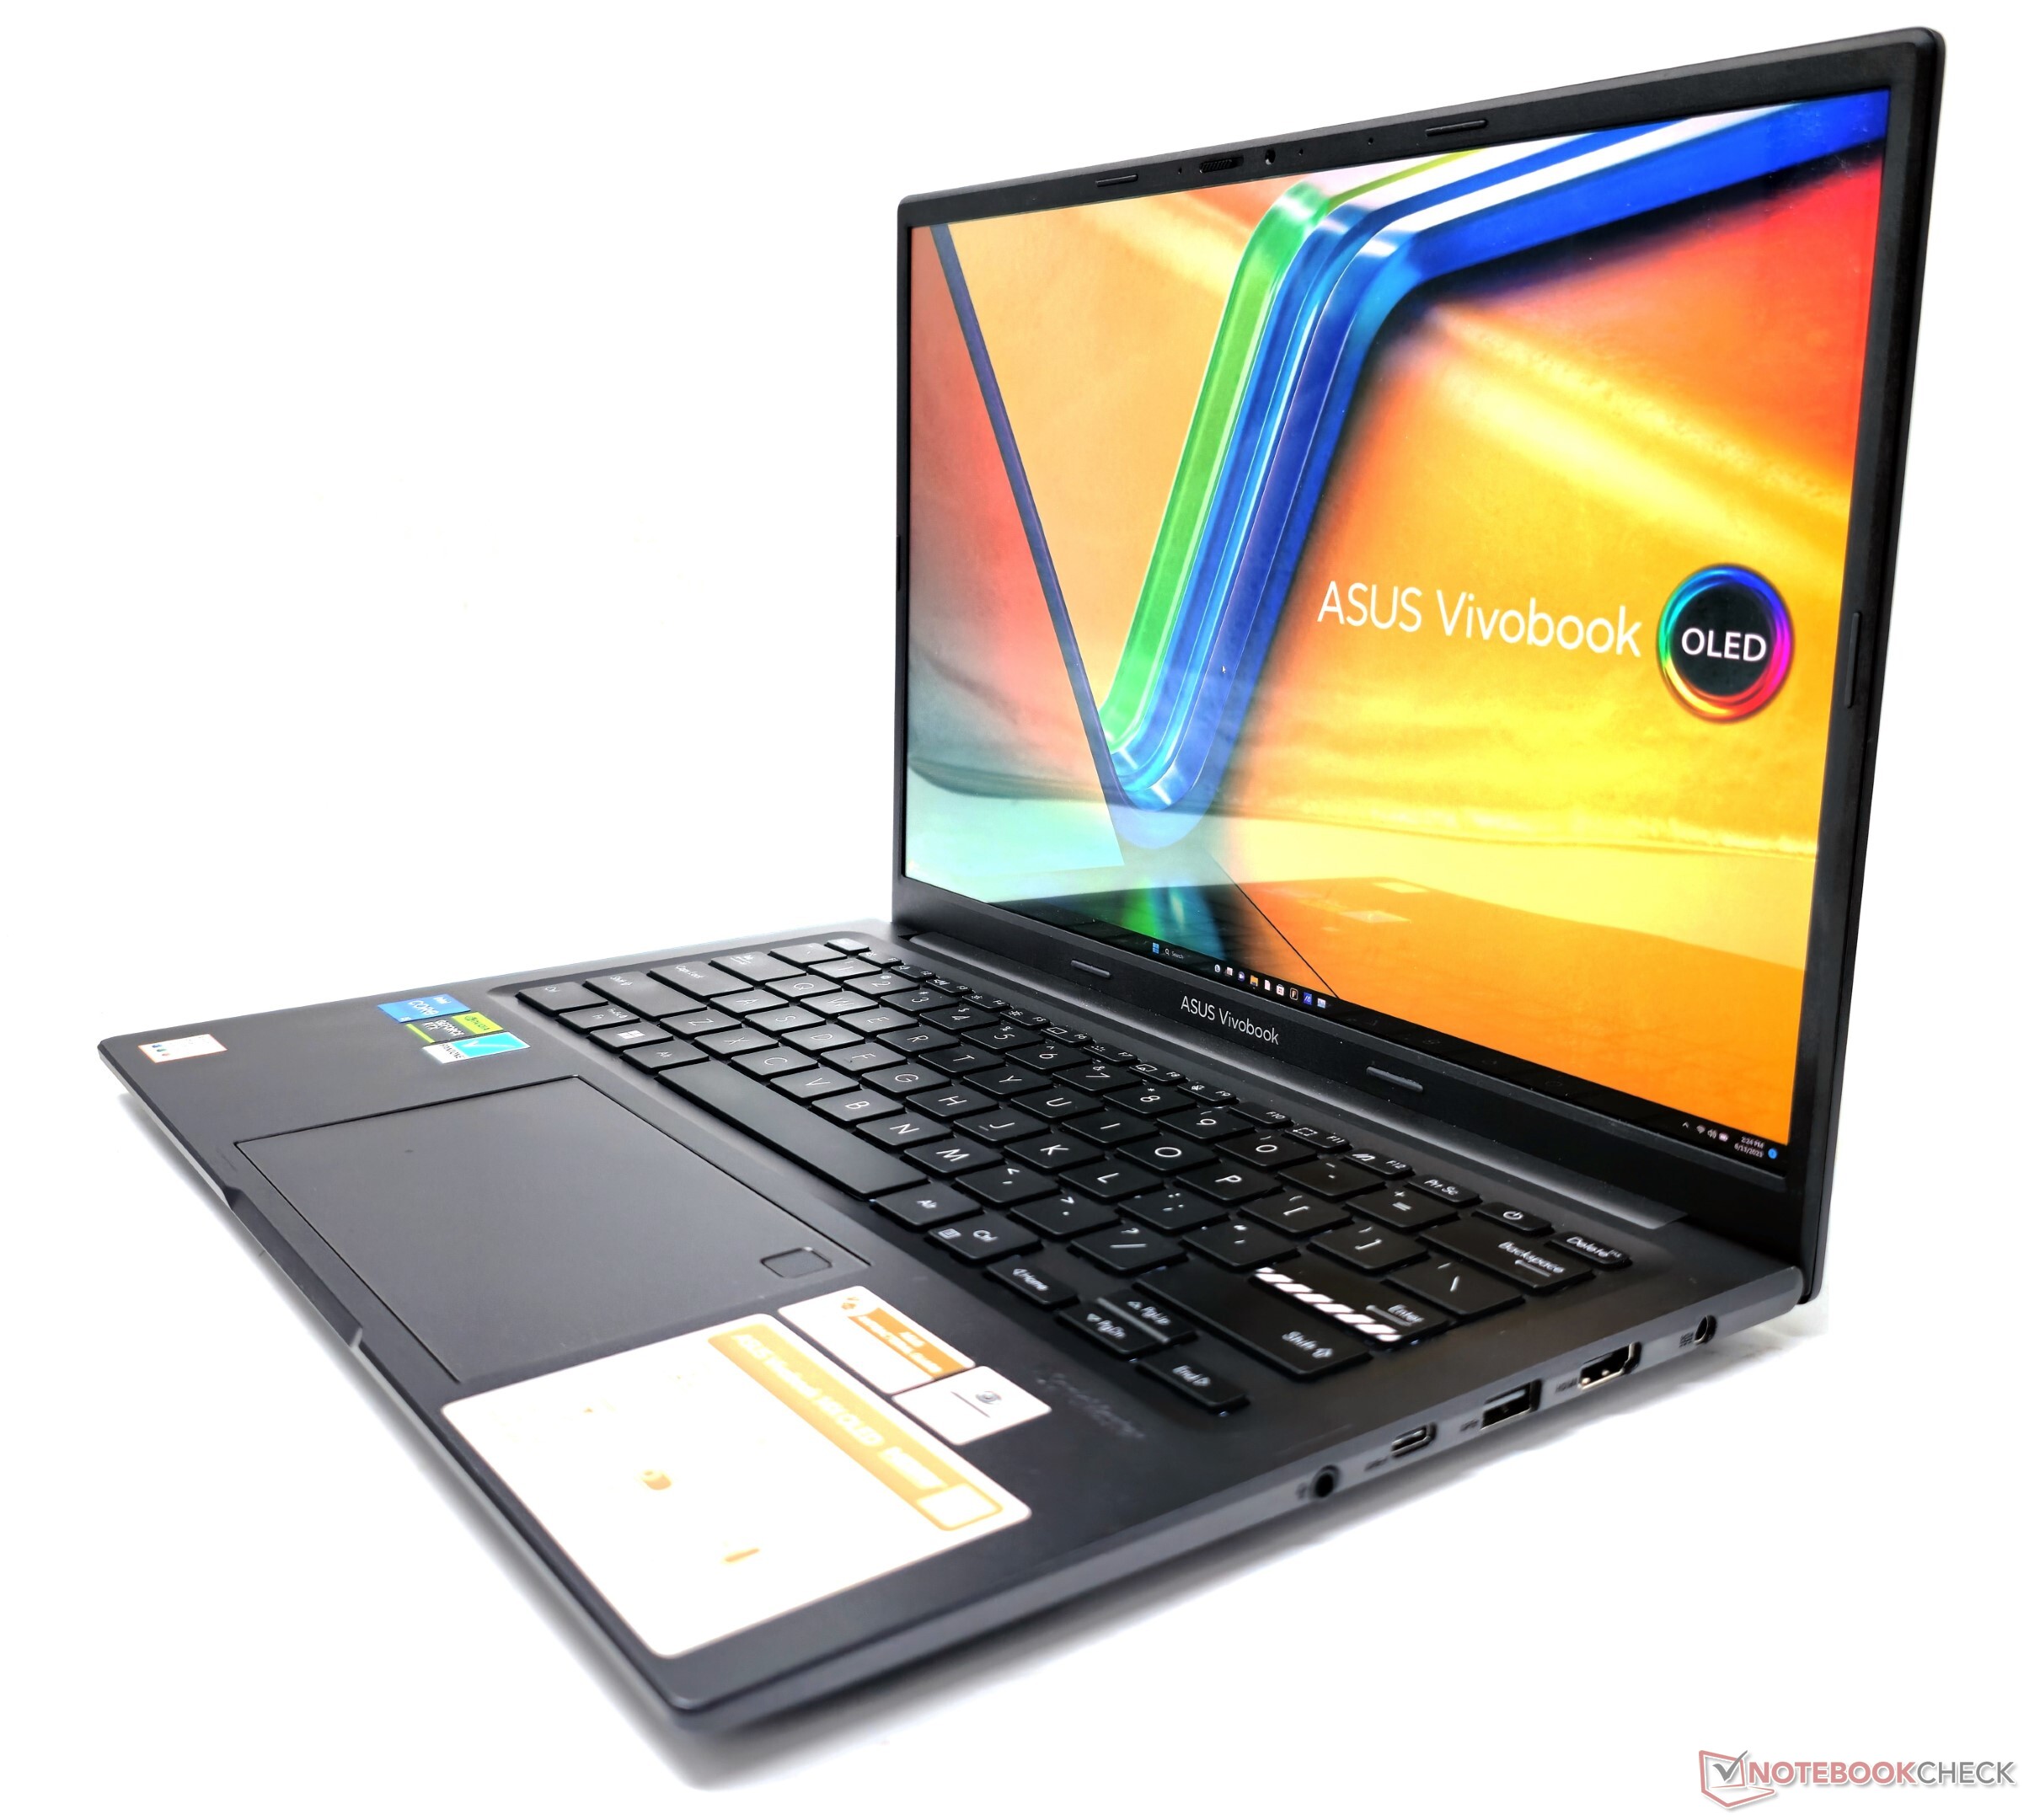
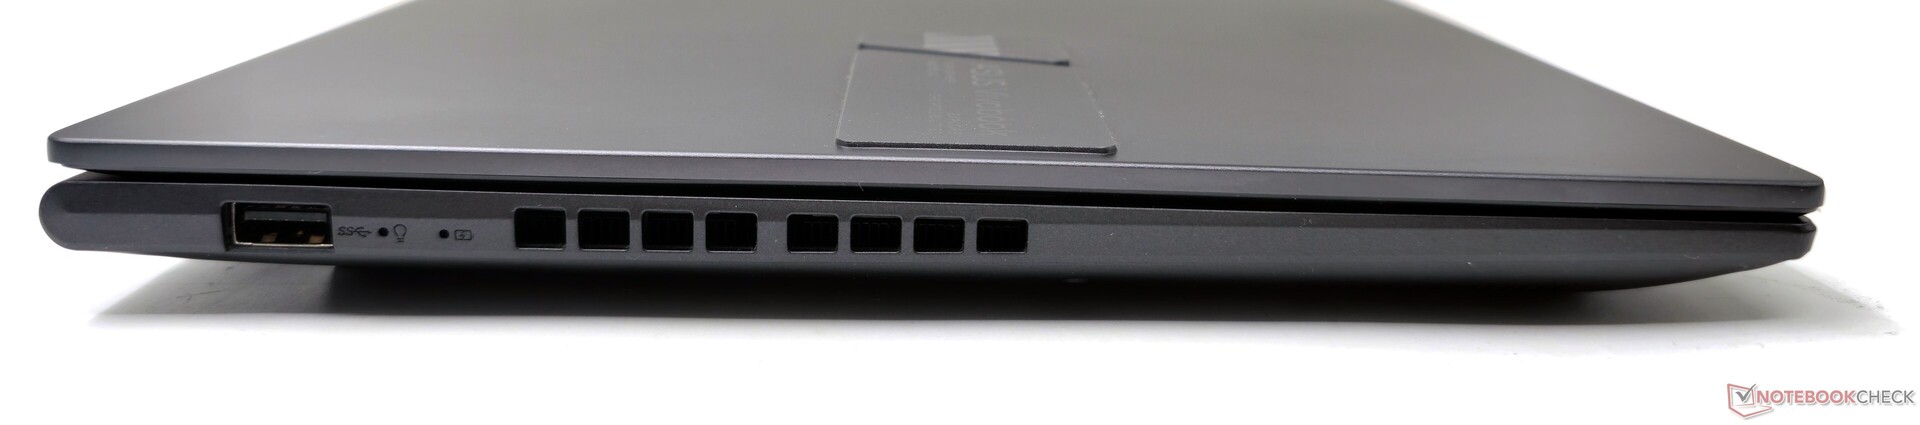
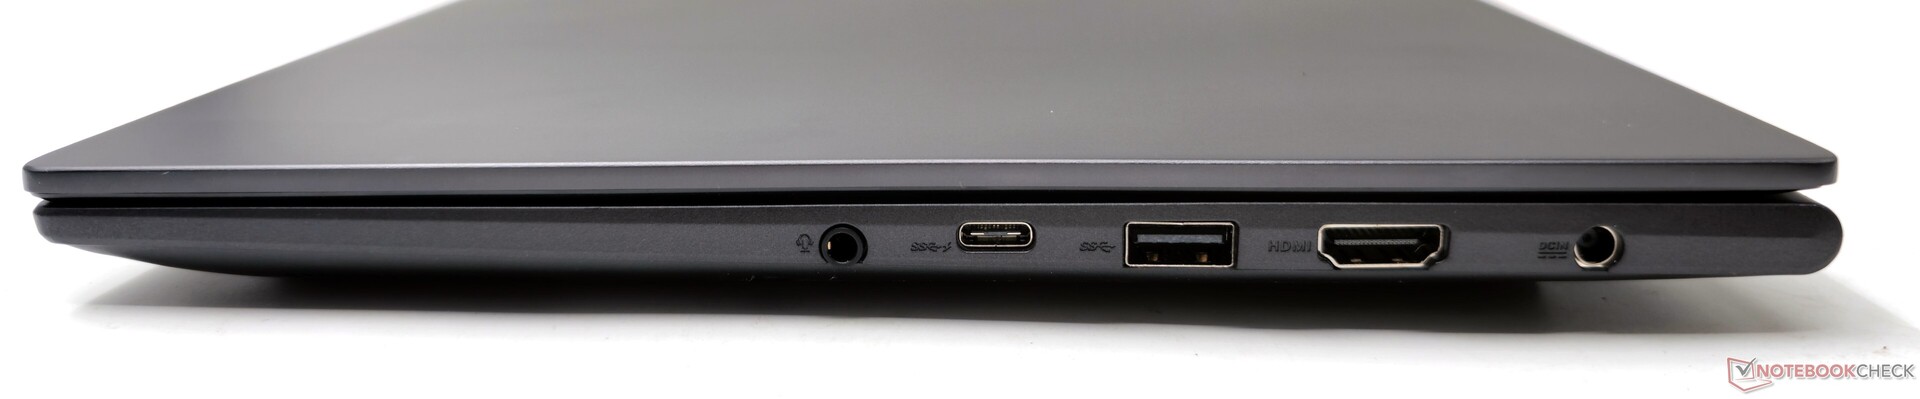
A disposição das portas se assemelha ao que já vimos no VivoBook 15X. No lado esquerdo, há uma única porta USB 3.2 Gen1 Tipo A, enquanto as demais estão posicionadas no lado direito.
Essa distribuição unilateral das portas pode ser incômoda, especialmente quando se usa um mouse externo e se pretende conectar vários periféricos. Entretanto, o espaçamento entre as portas é suficiente e não causará nenhum problema de conectividade.
Comunicação
A placa Intel Wi-Fi 6E AX211 apresenta excelente desempenho na banda de 5 GHz, sem quedas perceptíveis quando testada com nosso roteador de referência Asus ROG Rapture GT-AXE11000.
No entanto, o mesmo não pode ser dito sobre a banda de 6 GHz, que mostra um desempenho inconsistente com quedas regulares na taxa de transferência durante o teste.
Em comparação, o roteador Gigabyte Aero 14 OLED com uma placa Intel Wi-Fi 6E AX210 tem bom desempenho em ambas as bandas.
| Networking / iperf3 transmit AXE11000 | |
| Asus VivoBook 14X K3405 (iperf 3.1.3) | |
| Acer Swift X SFX14-71G | |
| Gigabyte Aero 14 OLED BMF (iperf 3.1.3) | |
| MSI Stealth 14 Studio A13V | |
| Schenker Vision 14 2022 RTX 3050 Ti (iperf 3.1.3) | |
| Lenovo Slim Pro 7 14ARP8 (iperf 3.1.3) | |
| Média da turma Multimedia (606 - 1978, n=54, últimos 2 anos) | |
| Média Intel Wi-Fi 6E AX211 (64 - 1921, n=276) | |
| Networking / iperf3 receive AXE11000 | |
| Asus VivoBook 14X K3405 (iperf 3.1.3) | |
| Gigabyte Aero 14 OLED BMF (iperf 3.1.3) | |
| Schenker Vision 14 2022 RTX 3050 Ti (iperf 3.1.3) | |
| MSI Stealth 14 Studio A13V | |
| Acer Swift X SFX14-71G | |
| Lenovo Slim Pro 7 14ARP8 (iperf 3.1.3) | |
| Média Intel Wi-Fi 6E AX211 (582 - 1890, n=276) | |
| Média da turma Multimedia (682 - 1818, n=54, últimos 2 anos) | |
| Networking / iperf3 transmit AXE11000 6GHz | |
| Gigabyte Aero 14 OLED BMF (iperf 3.1.3) | |
| Média da turma Multimedia (869 - 2373, n=23, últimos 2 anos) | |
| Asus VivoBook 14X K3405 (iperf 3.1.3) | |
| Média Intel Wi-Fi 6E AX211 (385 - 1851, n=226) | |
| Networking / iperf3 receive AXE11000 6GHz | |
| Gigabyte Aero 14 OLED BMF (iperf 3.1.3) | |
| Média da turma Multimedia (1212 - 2361, n=23, últimos 2 anos) | |
| Asus VivoBook 14X K3405 (iperf 3.1.3) | |
| Média Intel Wi-Fi 6E AX211 (700 - 1857, n=226) | |
Webcam
A webcam 720p integrada no VivoBook 14X apresenta baixa nitidez e desvios de cor significativos. O teste X-Rite ColorChecker Passport revela o Delta E mais alto de 22,45 com a cor Purplish Blue.
Embora a webcam possa ser suficiente para chamadas de vídeo ocasionais, o ideal seria que a Asus tivesse equipado o laptop com um módulo de 1080p para melhorar a qualidade.
Um obturador físico da webcam é fornecido para maior privacidade.


Segurança
Os logins biométricos são facilitados por um scanner de impressão digital incorporado ao touchpad. Além disso, um módulo TPM 2.0 também está presente.
Acessórios e garantia
Não há acessórios adicionais na caixa, além do adaptador de energia de 90 W e a documentação habitual.
Na Índia, a Asus oferece o VivoBook 14X com uma garantia padrão de um ano. Aqueles que comprarem o laptop antes de 31 de agosto de 2023 também poderão aproveitar os benefícios do Back to College que incluem várias opções de extensão de garantia e proteção local contra danos acidentais que variam de ₹99 a ₹2.999.
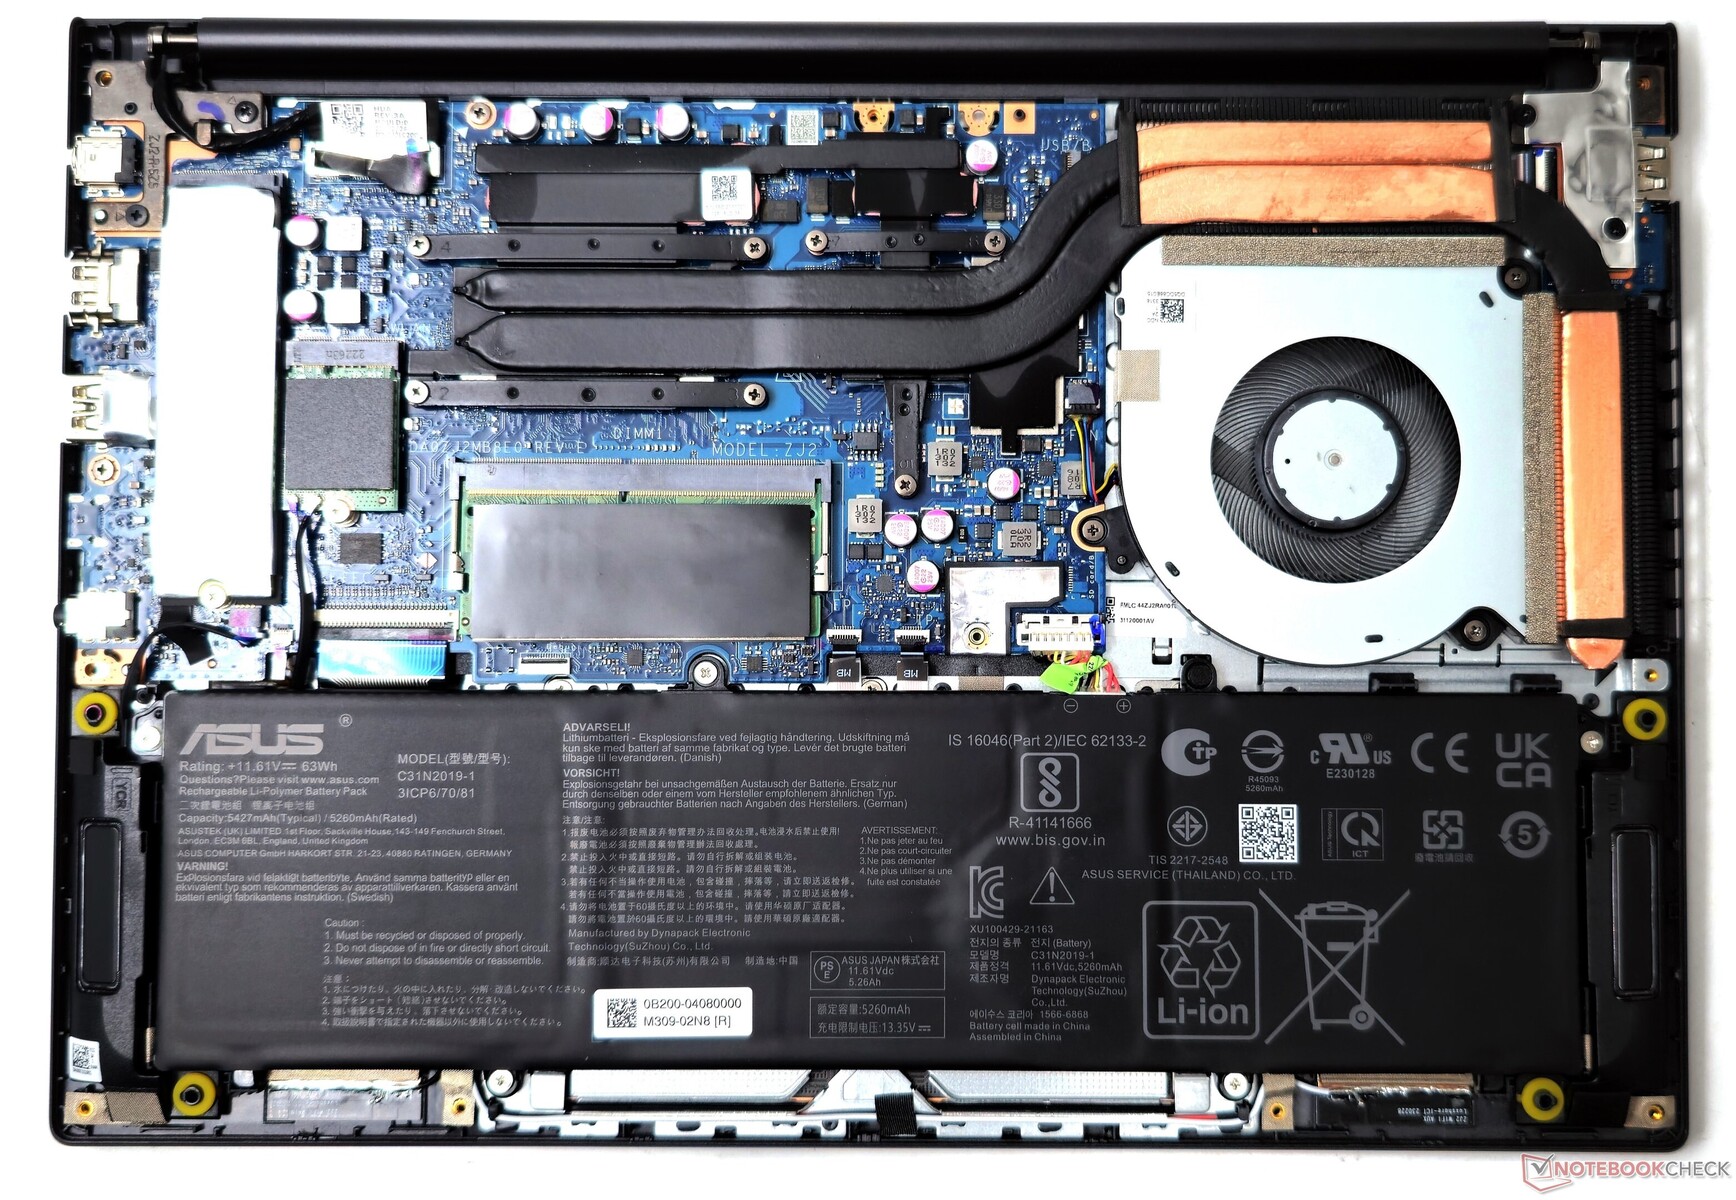
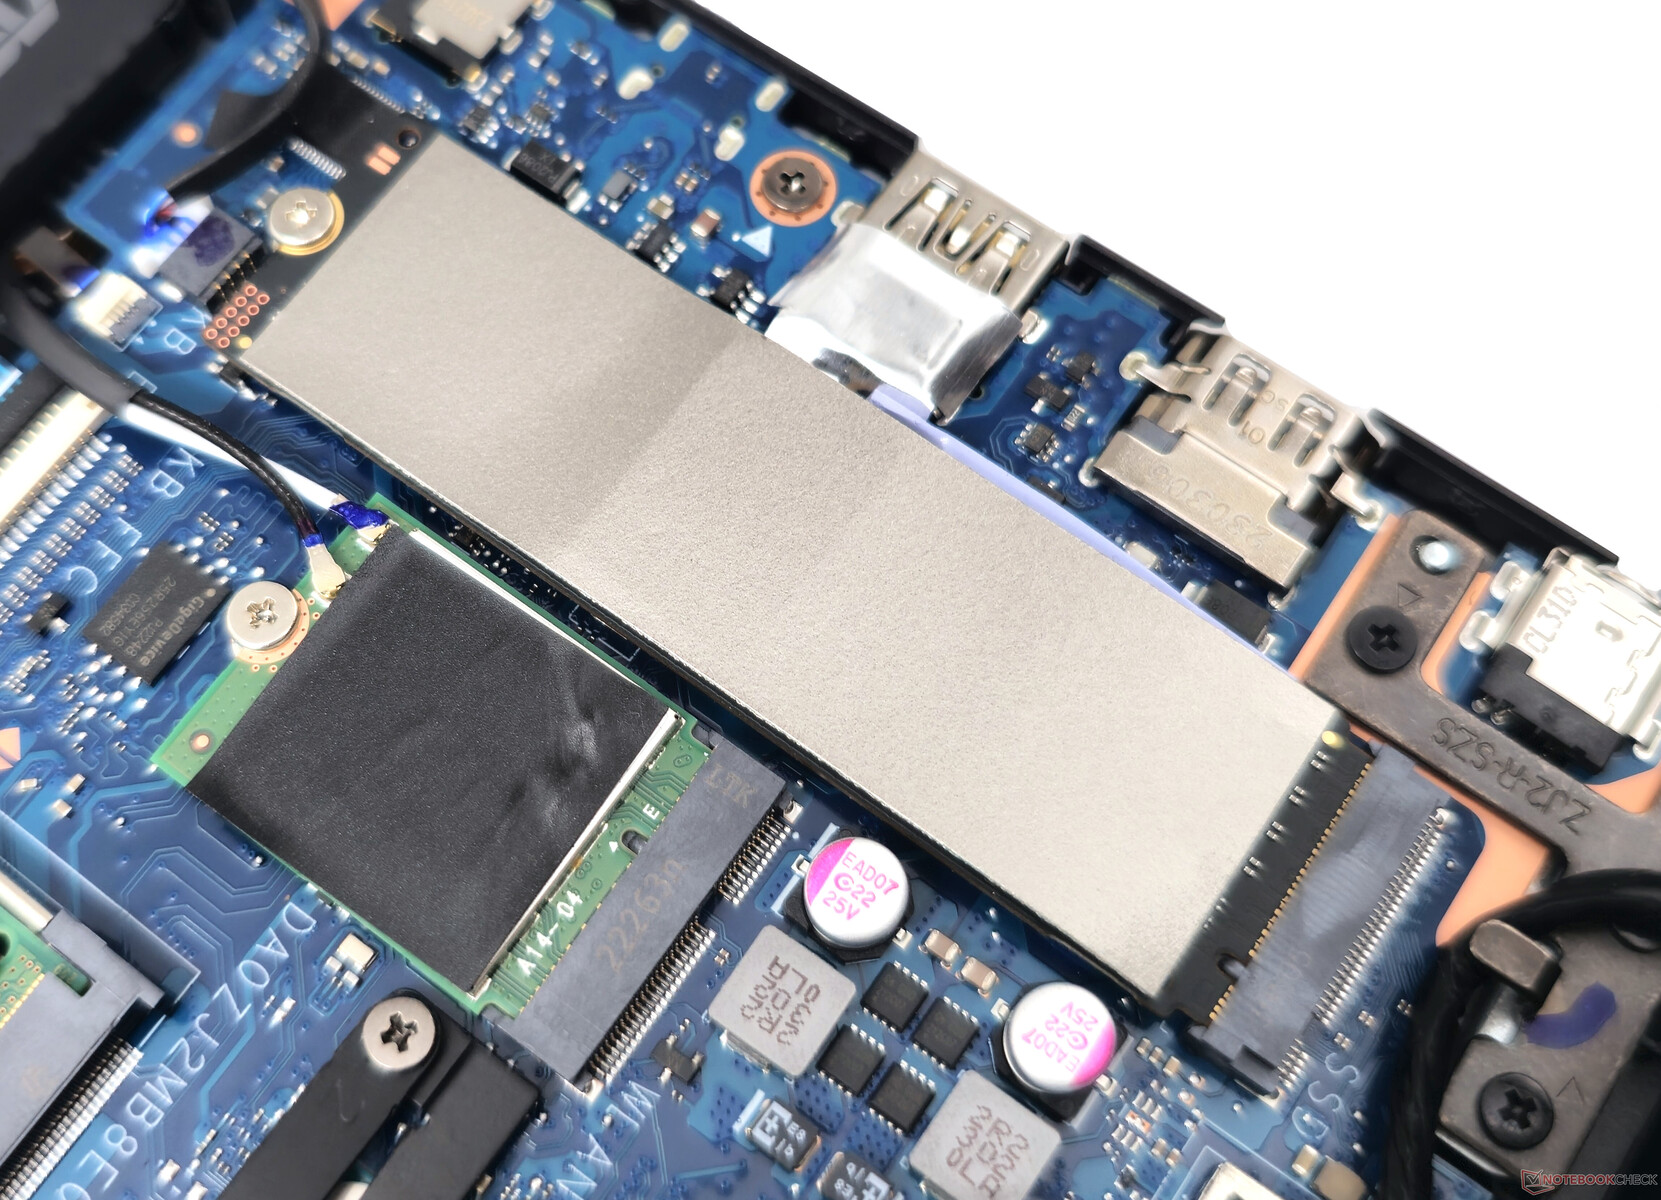
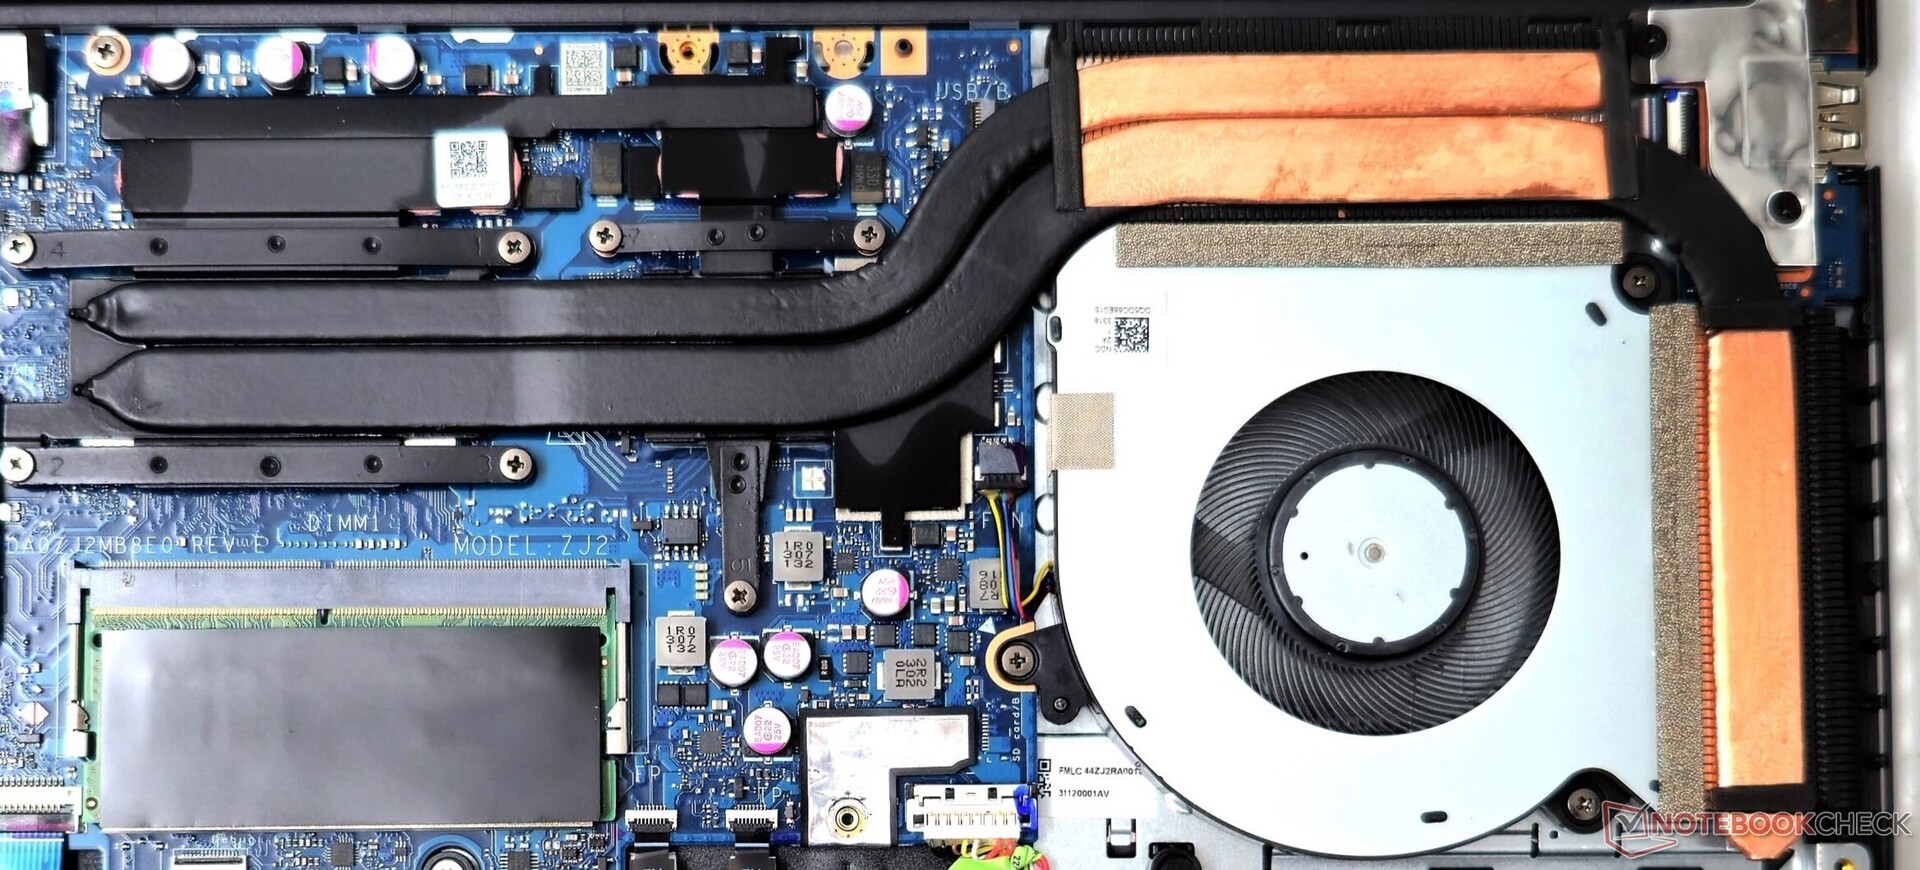
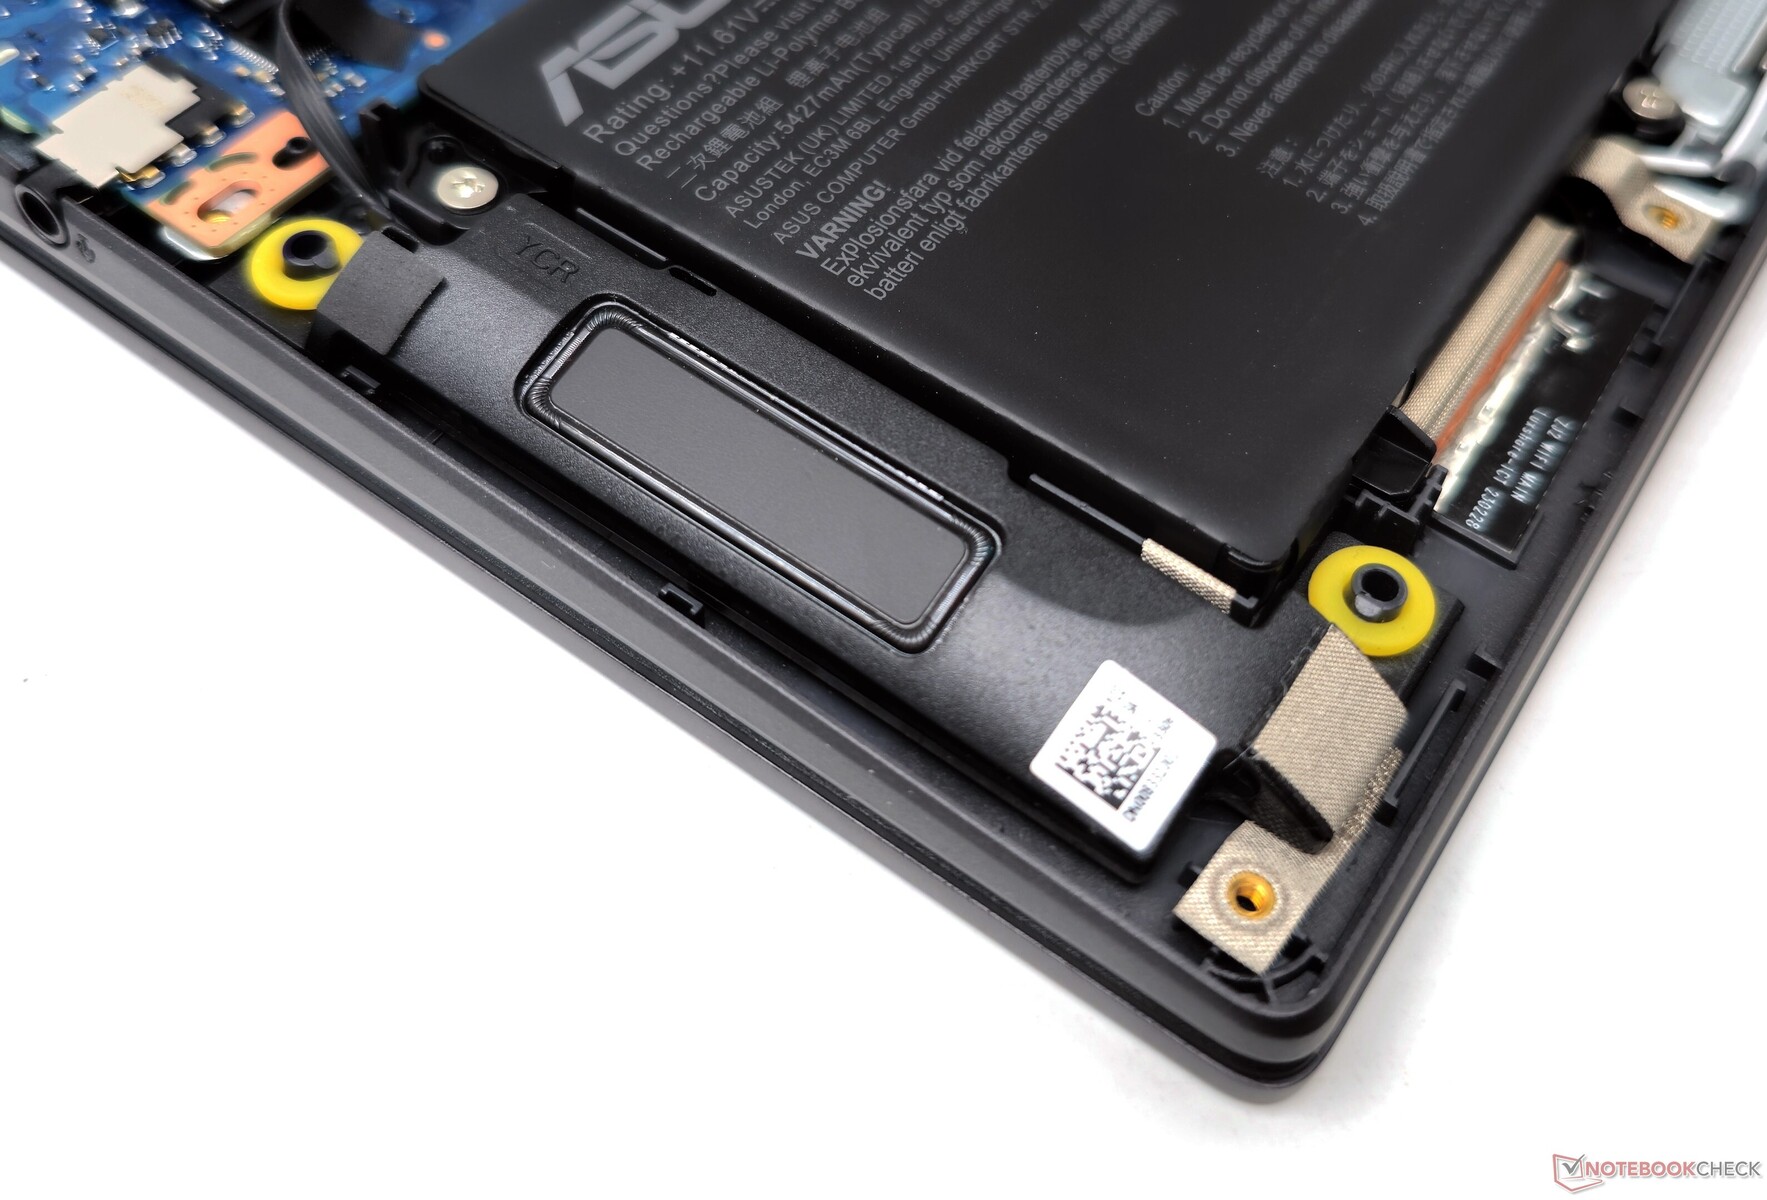
Manutenção
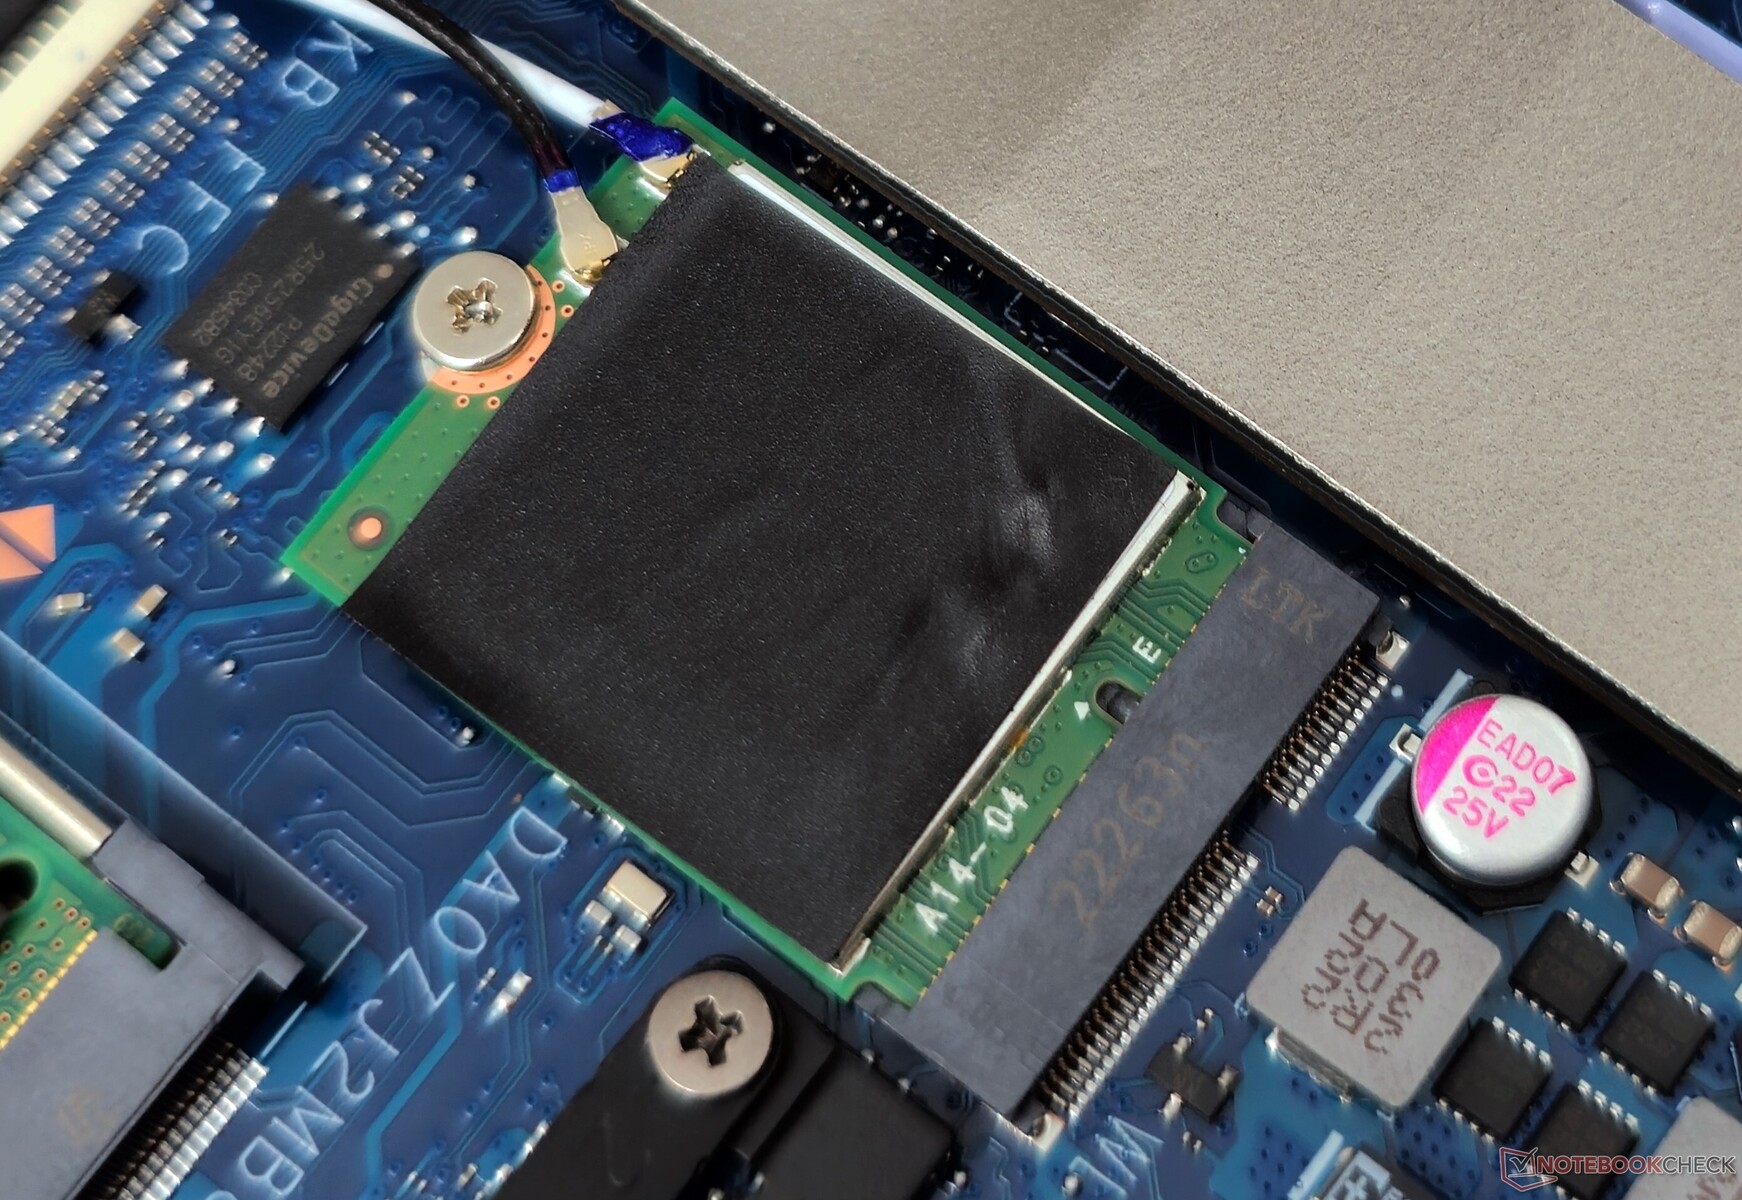
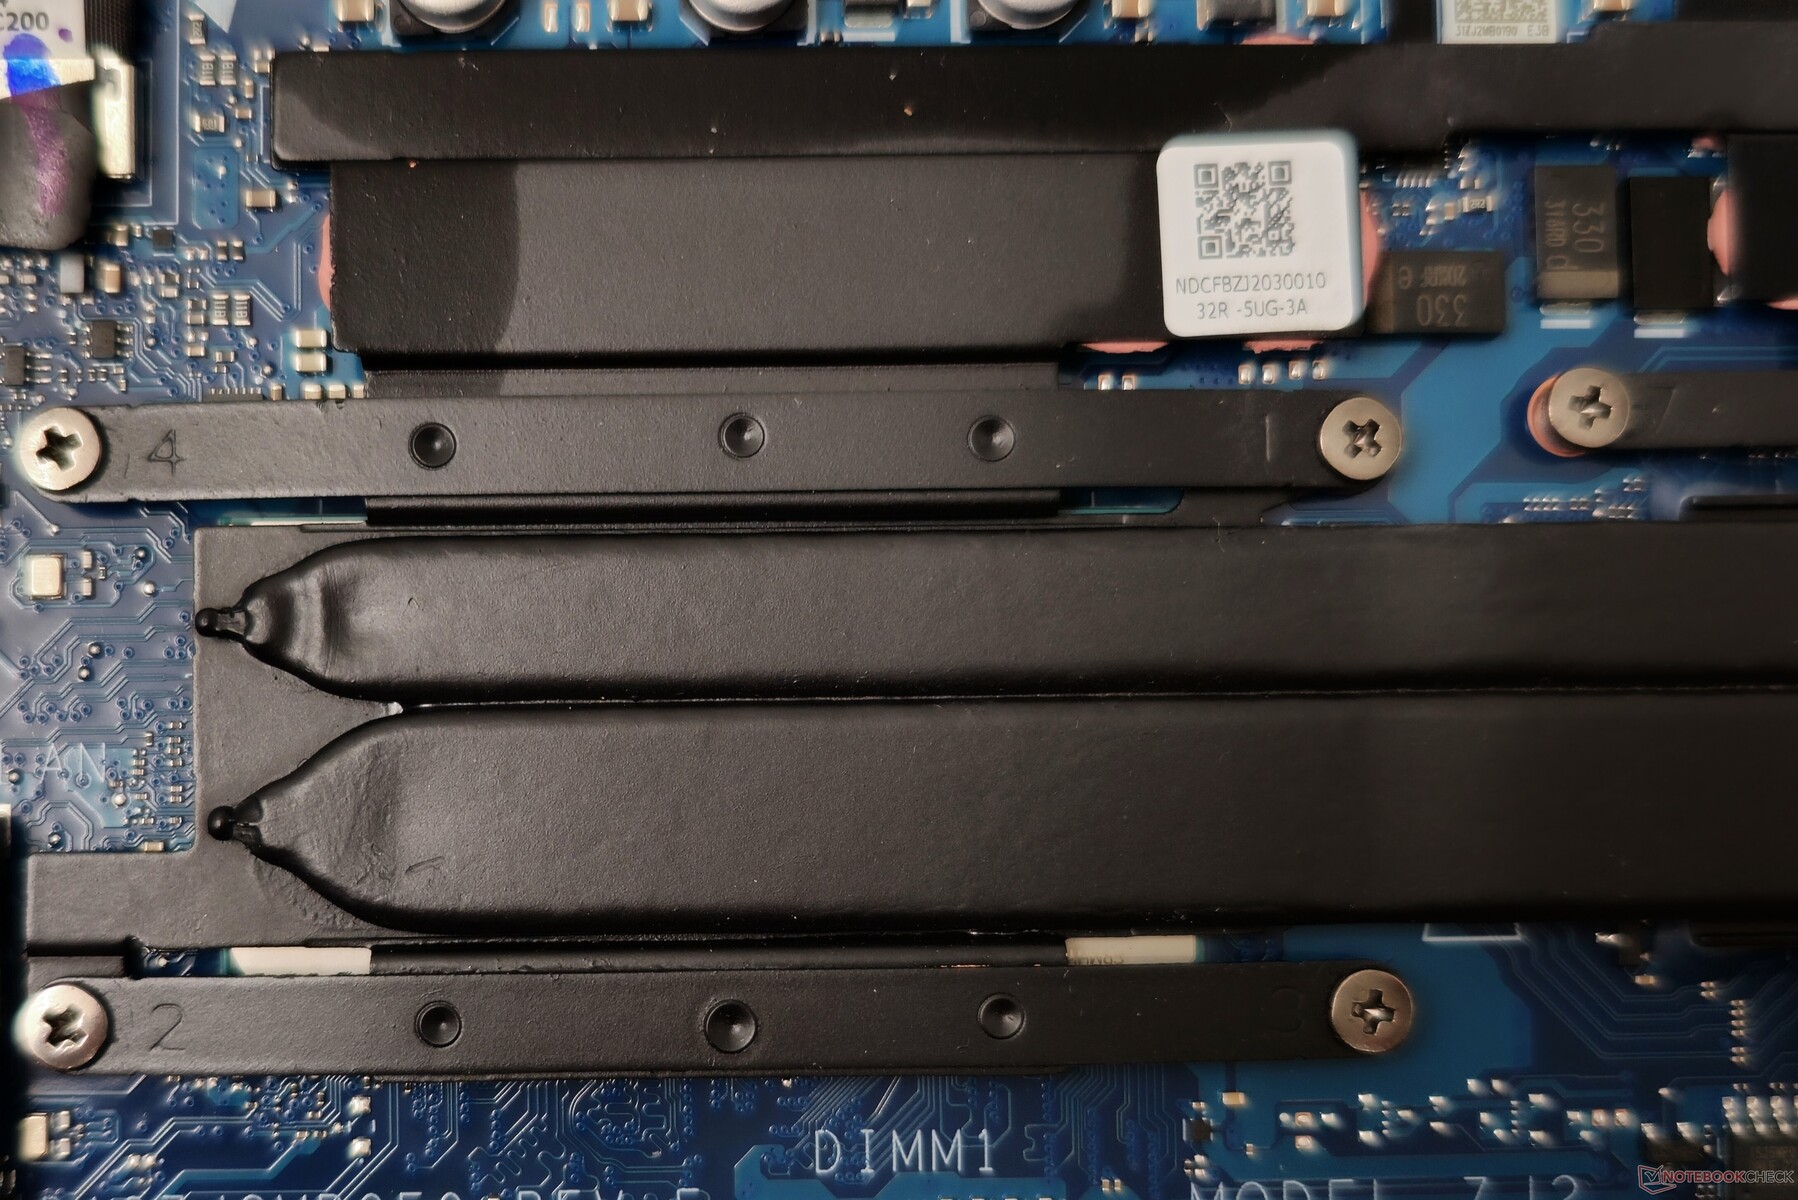
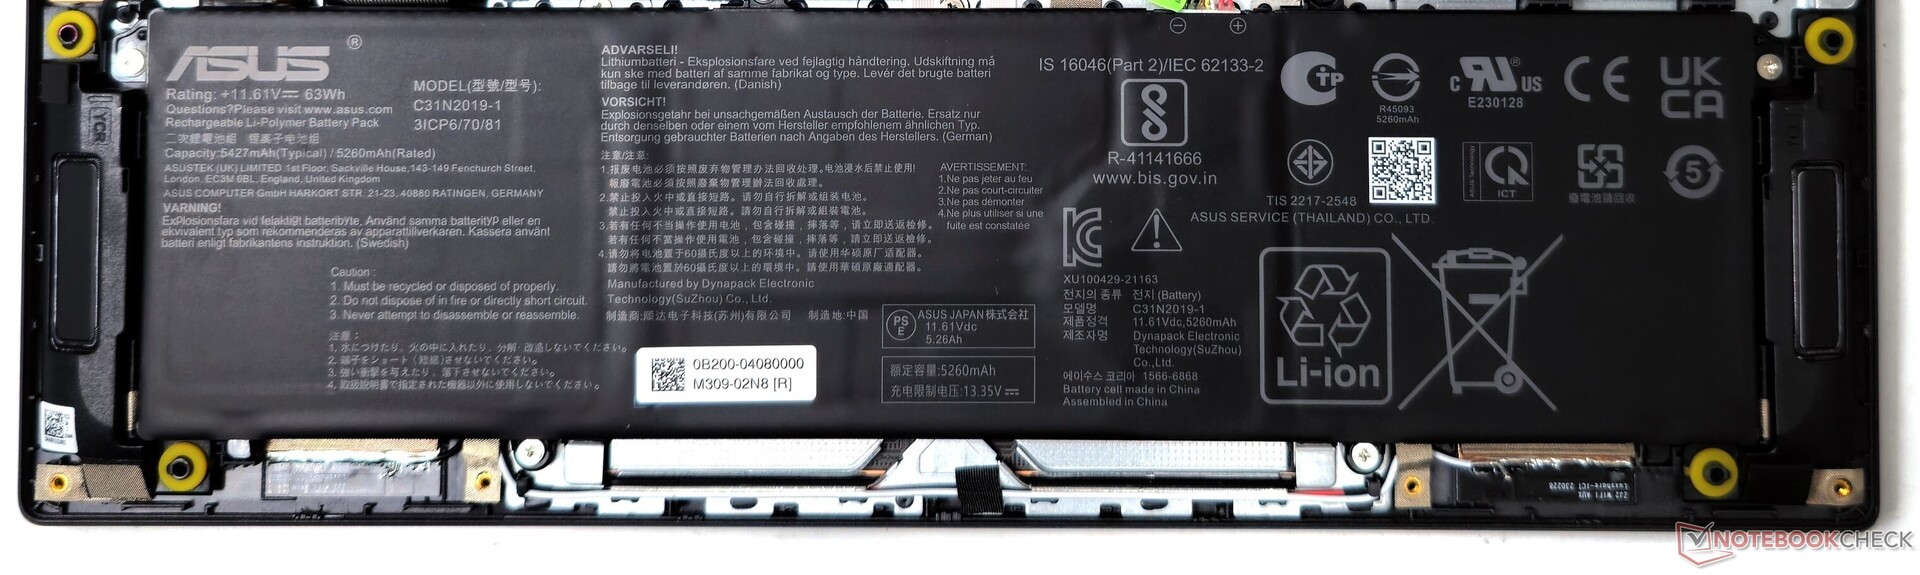
Para acessar os componentes internos, é necessário remover sete parafusos PH0 do painel traseiro. Uma vez dentro, você pode trocar facilmente a placa WLAN e o SSD NVMe.
É importante observar que 8 GB de RAM são soldados na placa-mãe, o que significa que você só pode fazer upgrade de um slot SO-DIMM. A bateria pode ser desparafusada e substituída, se necessário.
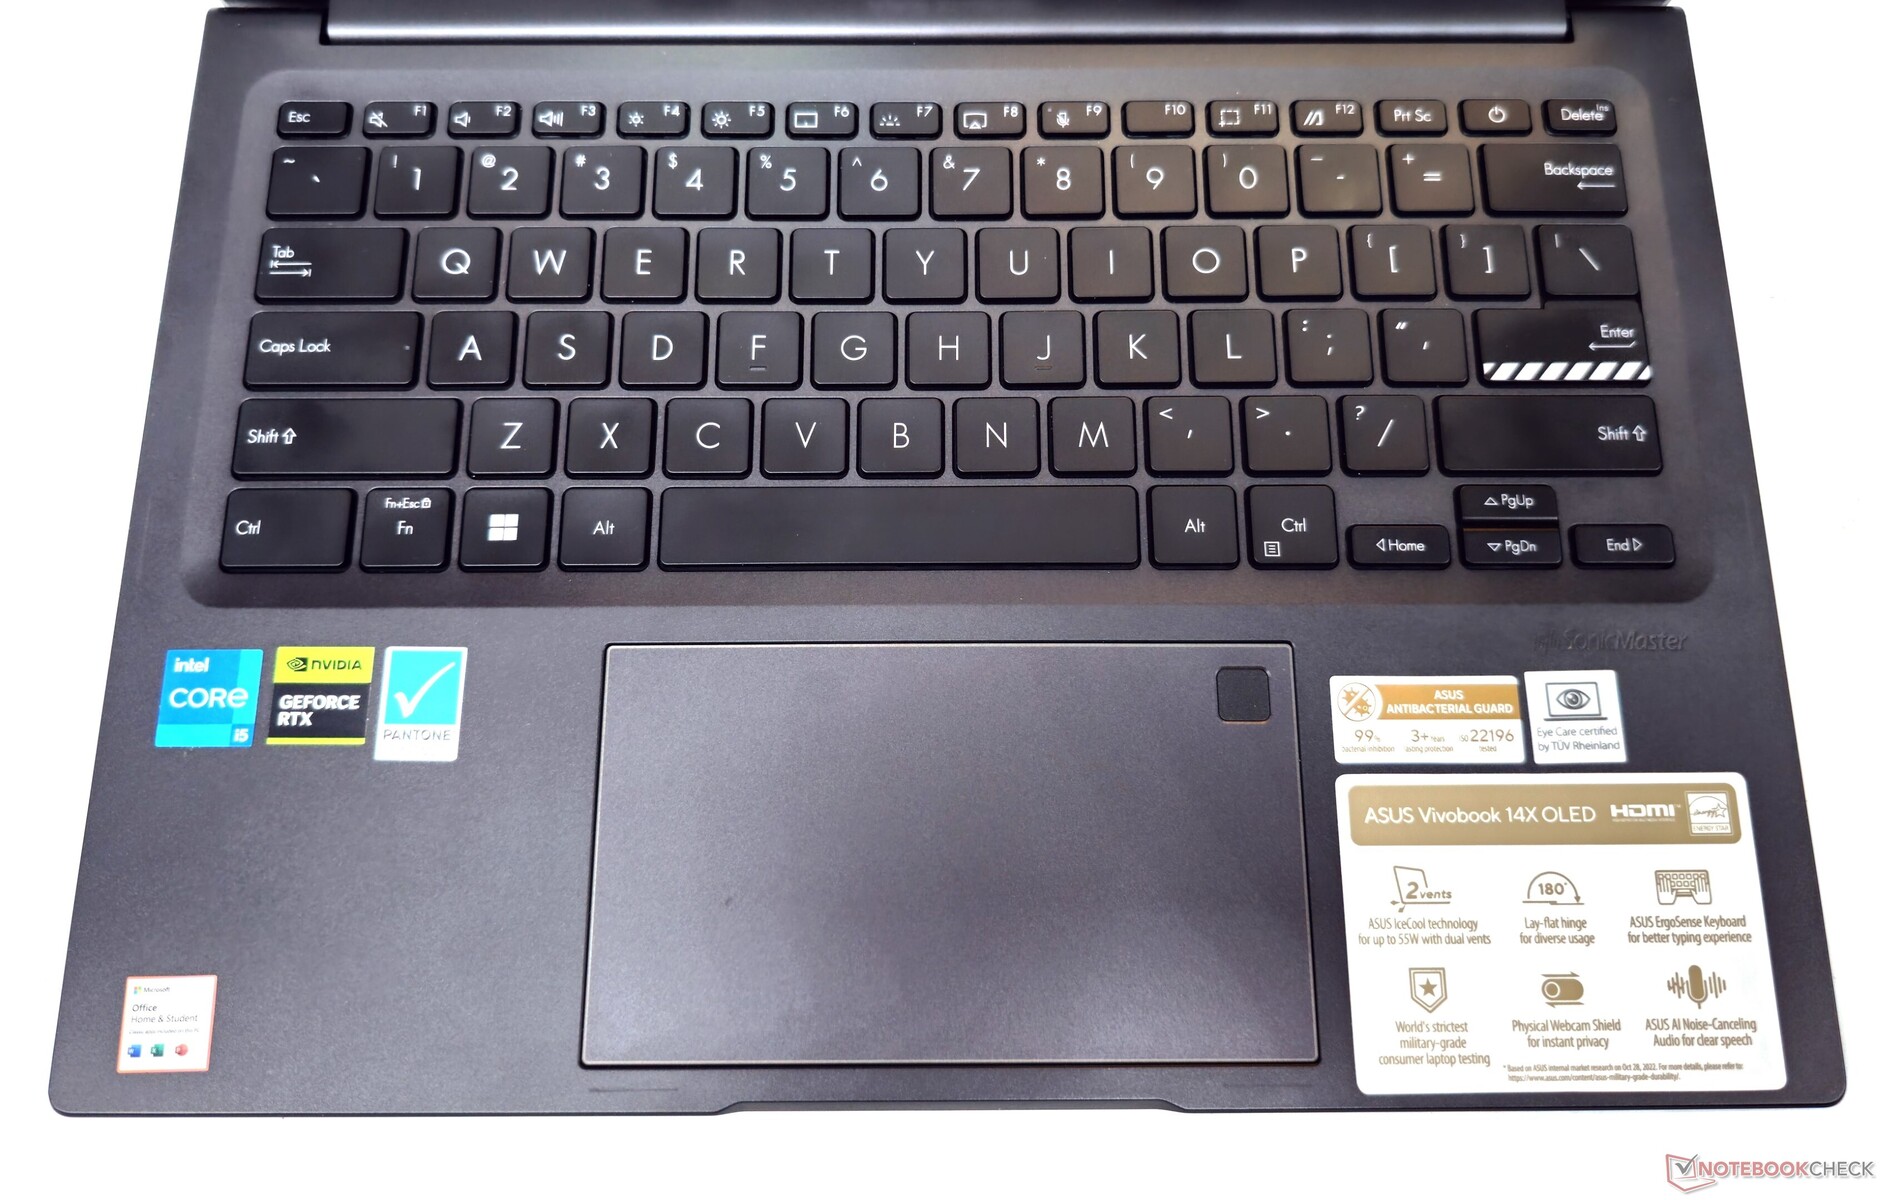
Dispositivos de entrada: Teclado e touchpad decentes
Teclado
O VivoBook 14X é equipado com o que a Asus chama de teclado ErgoSense, que oferece um deslocamento das teclas de 1,4 mm. A digitação nesse teclado é uma experiência confortável, graças às teclas arredondadas e às teclas bem espaçadas.
A linha superior contém as teclas F1-F12 e as teclas especiais, cujas funções principais podem ser configuradas usando o aplicativo MyAsus. As teclas de seta podem parecer um pouco apertadas, mas isso é típico de um laptop com esse formato. A luz de fundo de três estágios oferece boa legibilidade em ambientes escuros.
Touchpad
O touchpad do VivoBook 14X mede 7,5 cm x 13 cm, proporcionando amplo espaço para navegação, e oferece uma experiência de deslizamento suave.
Toda a superfície serve como botão esquerdo do mouse, e os cliques são responsivos e relativamente silenciosos.
Tela: OLED de 2,8K com HDR e PWM de 90 Hz
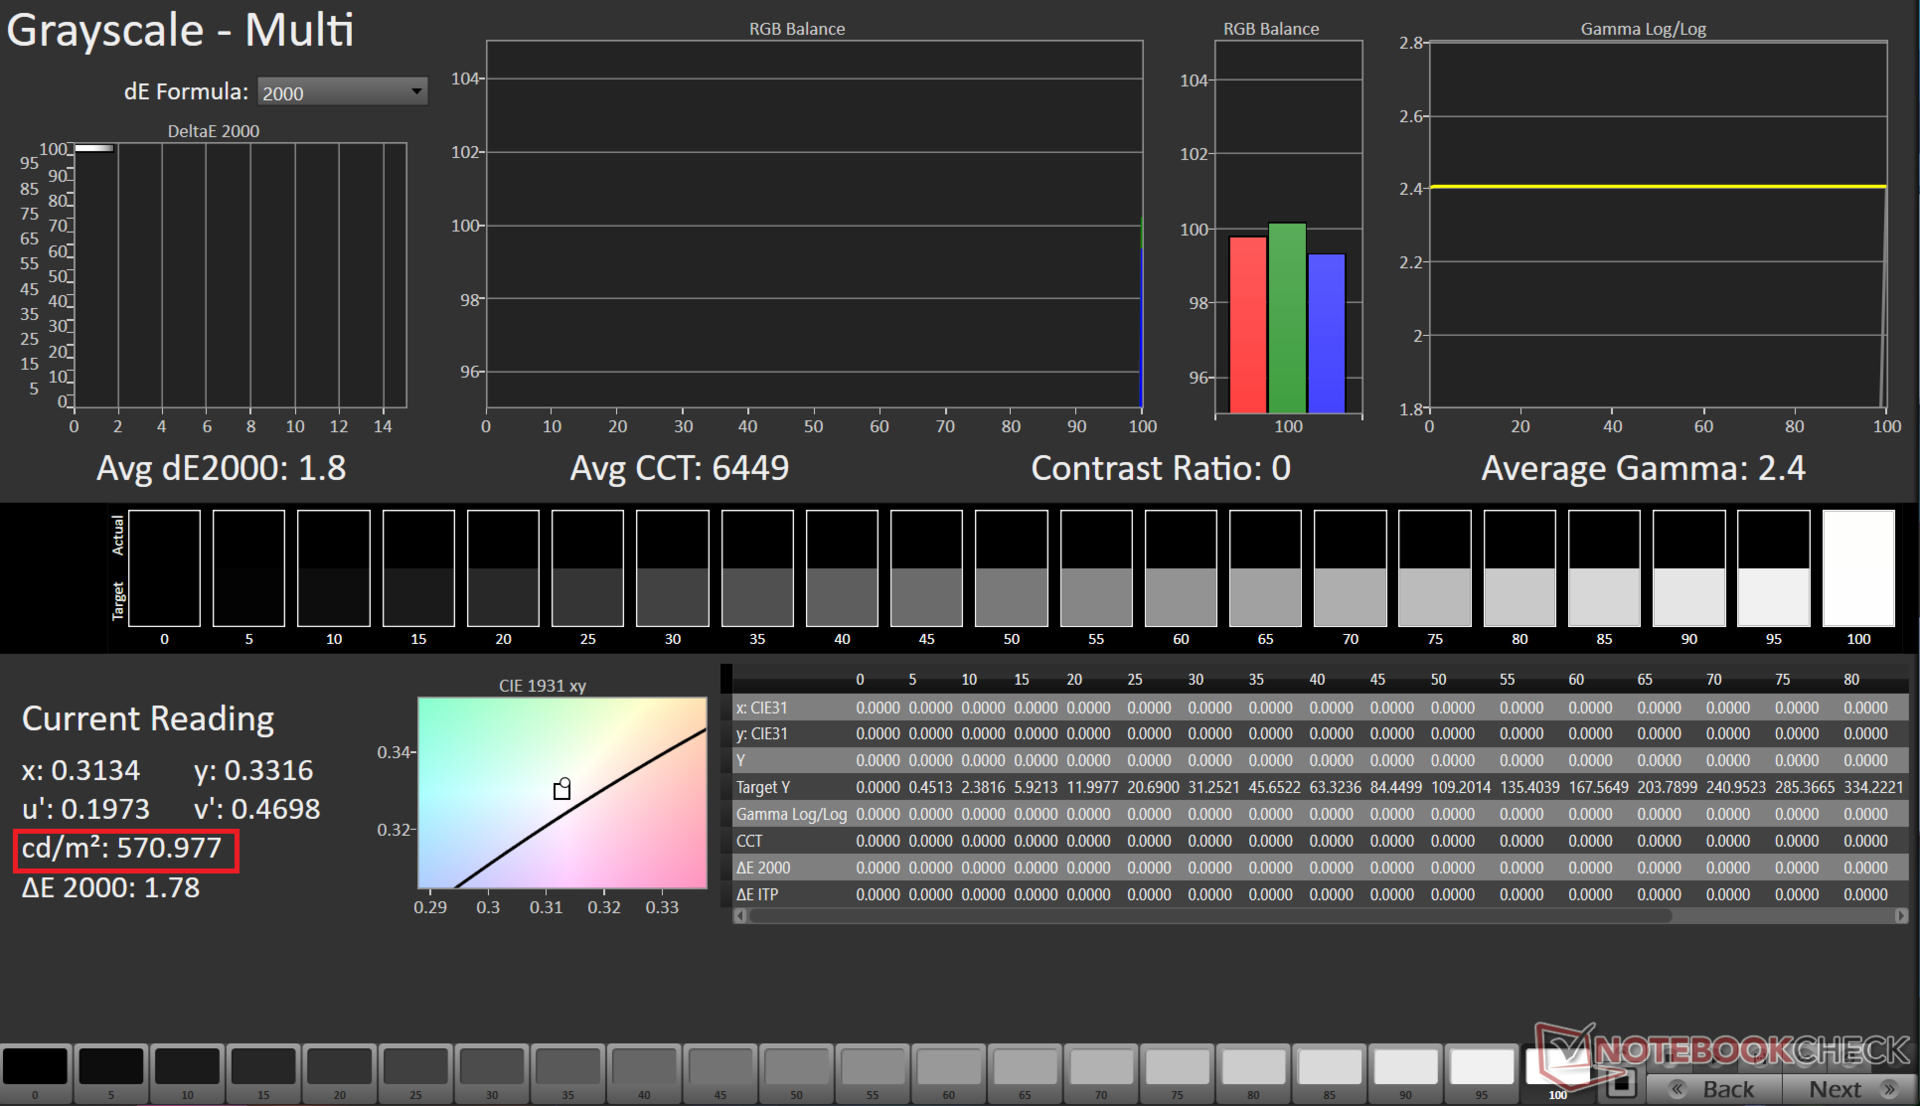
O painel OLED Samsung 2880 x 1800 16:10 90 Hz do VivoBook 14X oferece uma boa distribuição de brilho e uma taxa de contraste essencialmente infinita.
Medimos um brilho máximo de 373 nits no modo SDR. A tela é certificada para VESA DisplayHDR True Black 600, e pudemos medir até 571 nits ao reproduzir conteúdo HDR. Não há sangramento da luz de fundo, já que se trata de uma tela OLED.
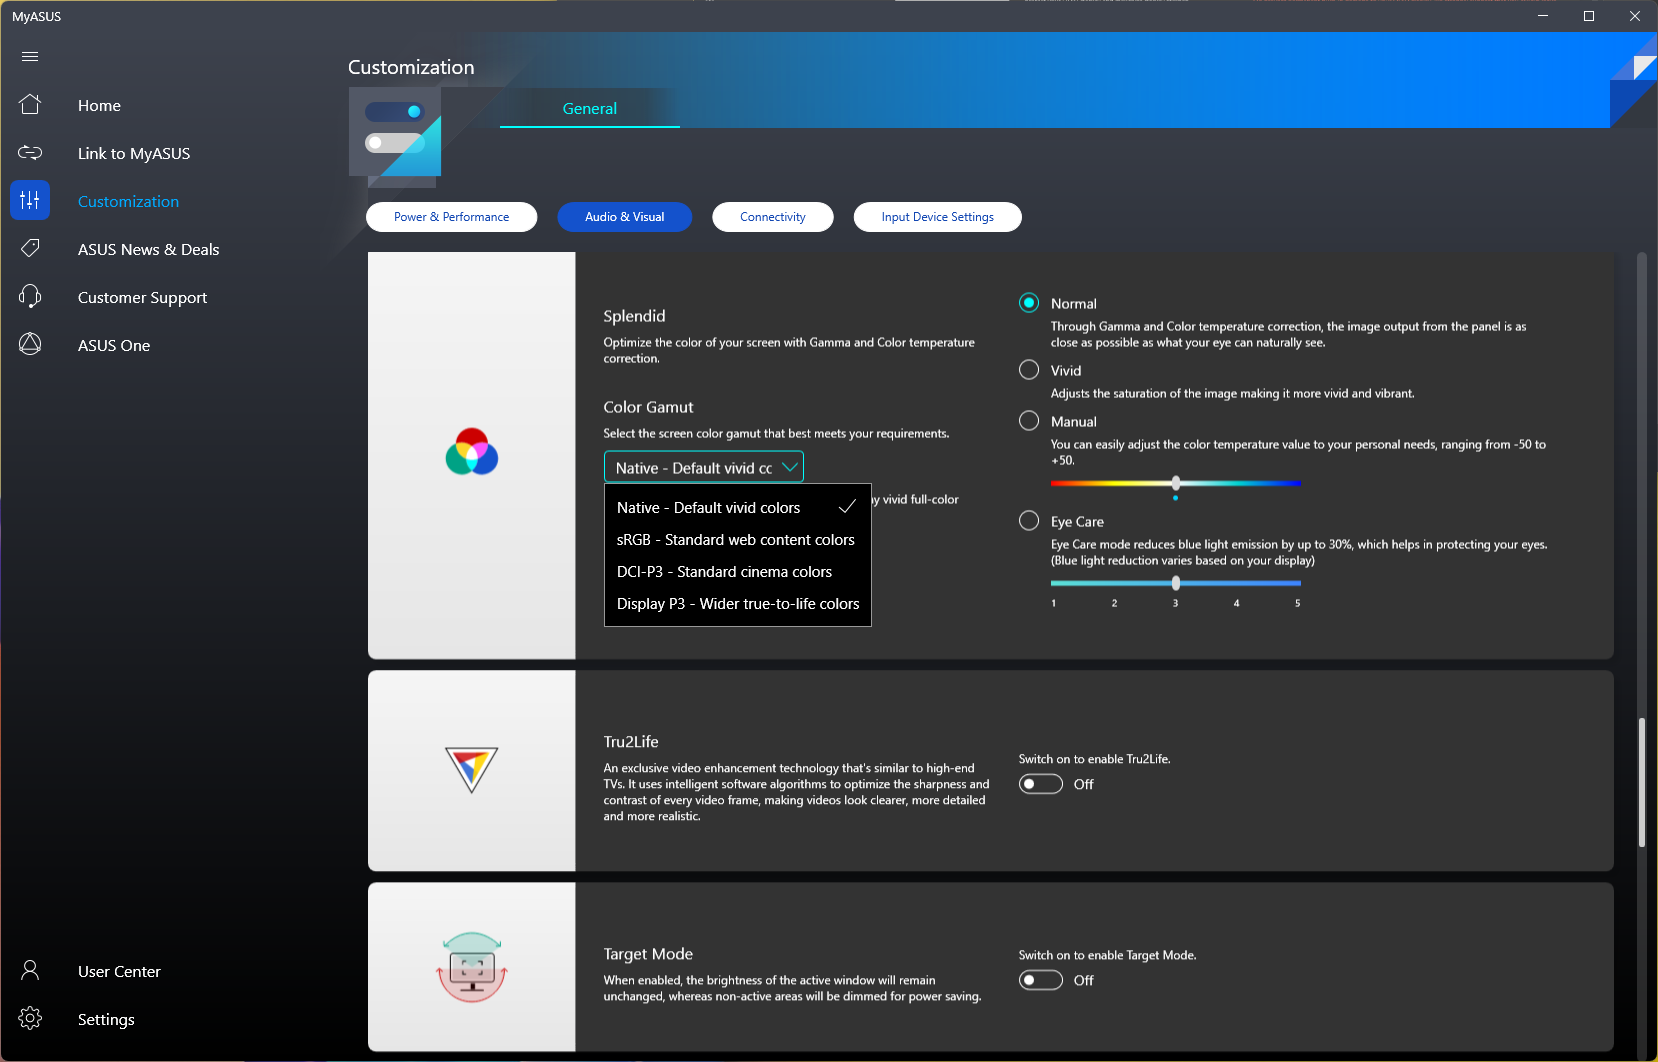
O aplicativo MyAsus oferece várias opções de tela. Realizamos todos os testes usando o modo Normal padrão de fábrica com uma gama de cores nativa.

| |||||||||||||||||||||||||
iluminação: 85 %
iluminação com acumulador: 367 cd/m²
Contraste: ∞:1 (Preto: 0 cd/m²)
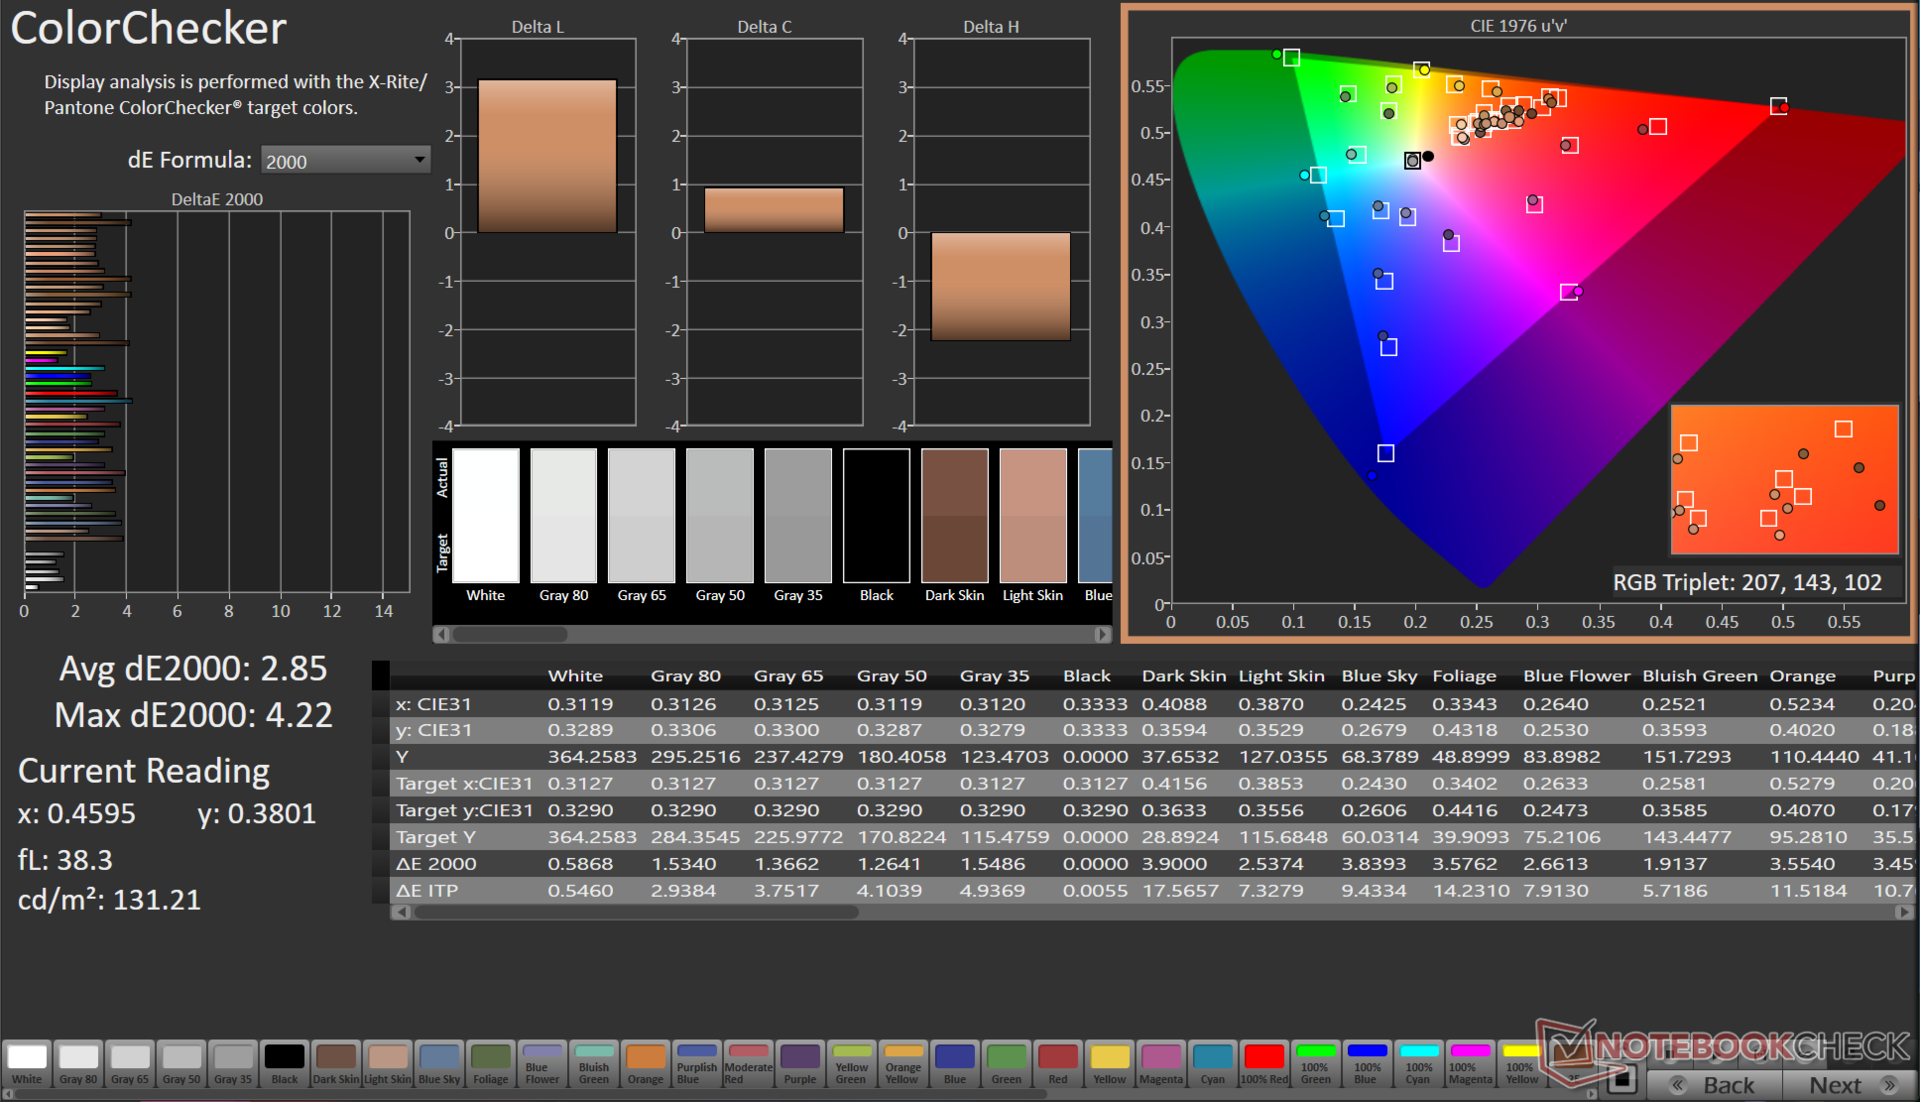
ΔE ColorChecker Calman: 2.85 | ∀{0.5-29.43 Ø4.71}
calibrated: 2.18
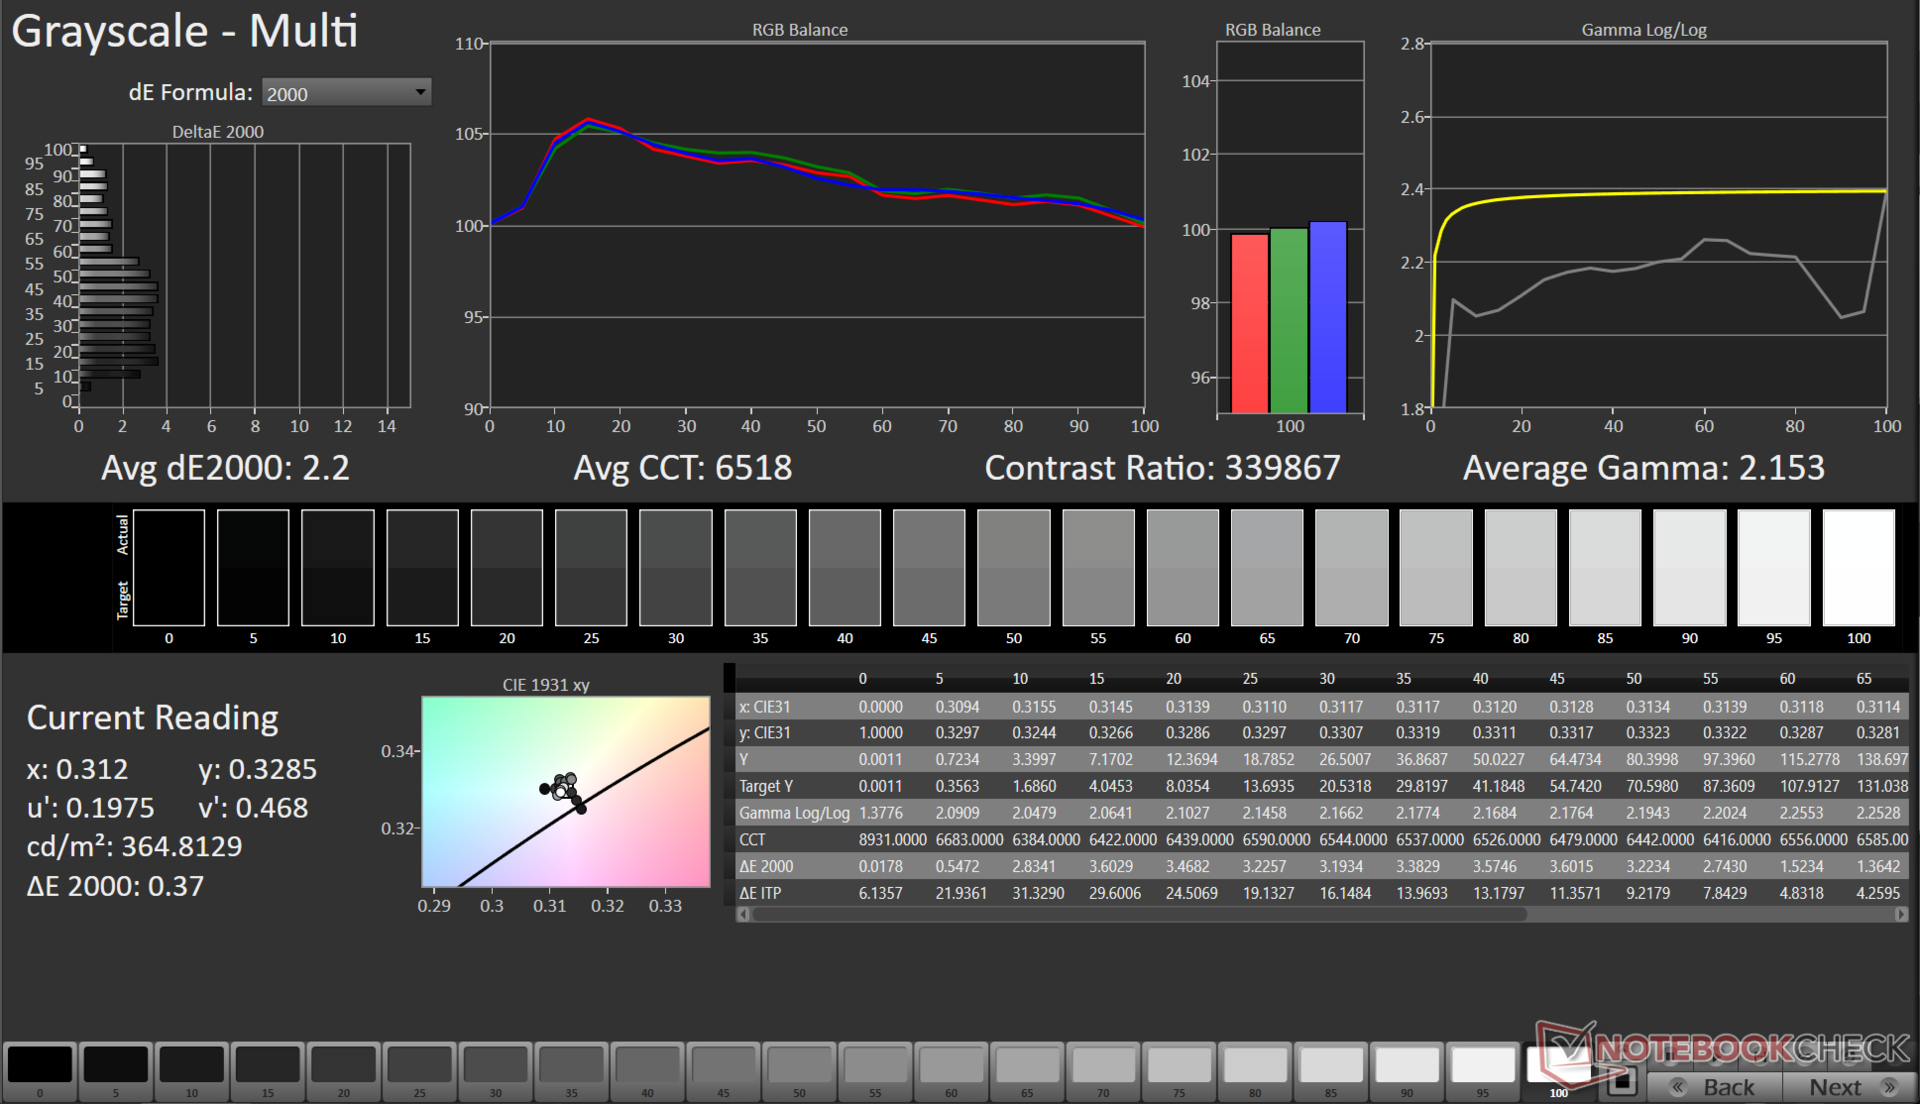
ΔE Greyscale Calman: 2.2 | ∀{0.09-98 Ø4.96}
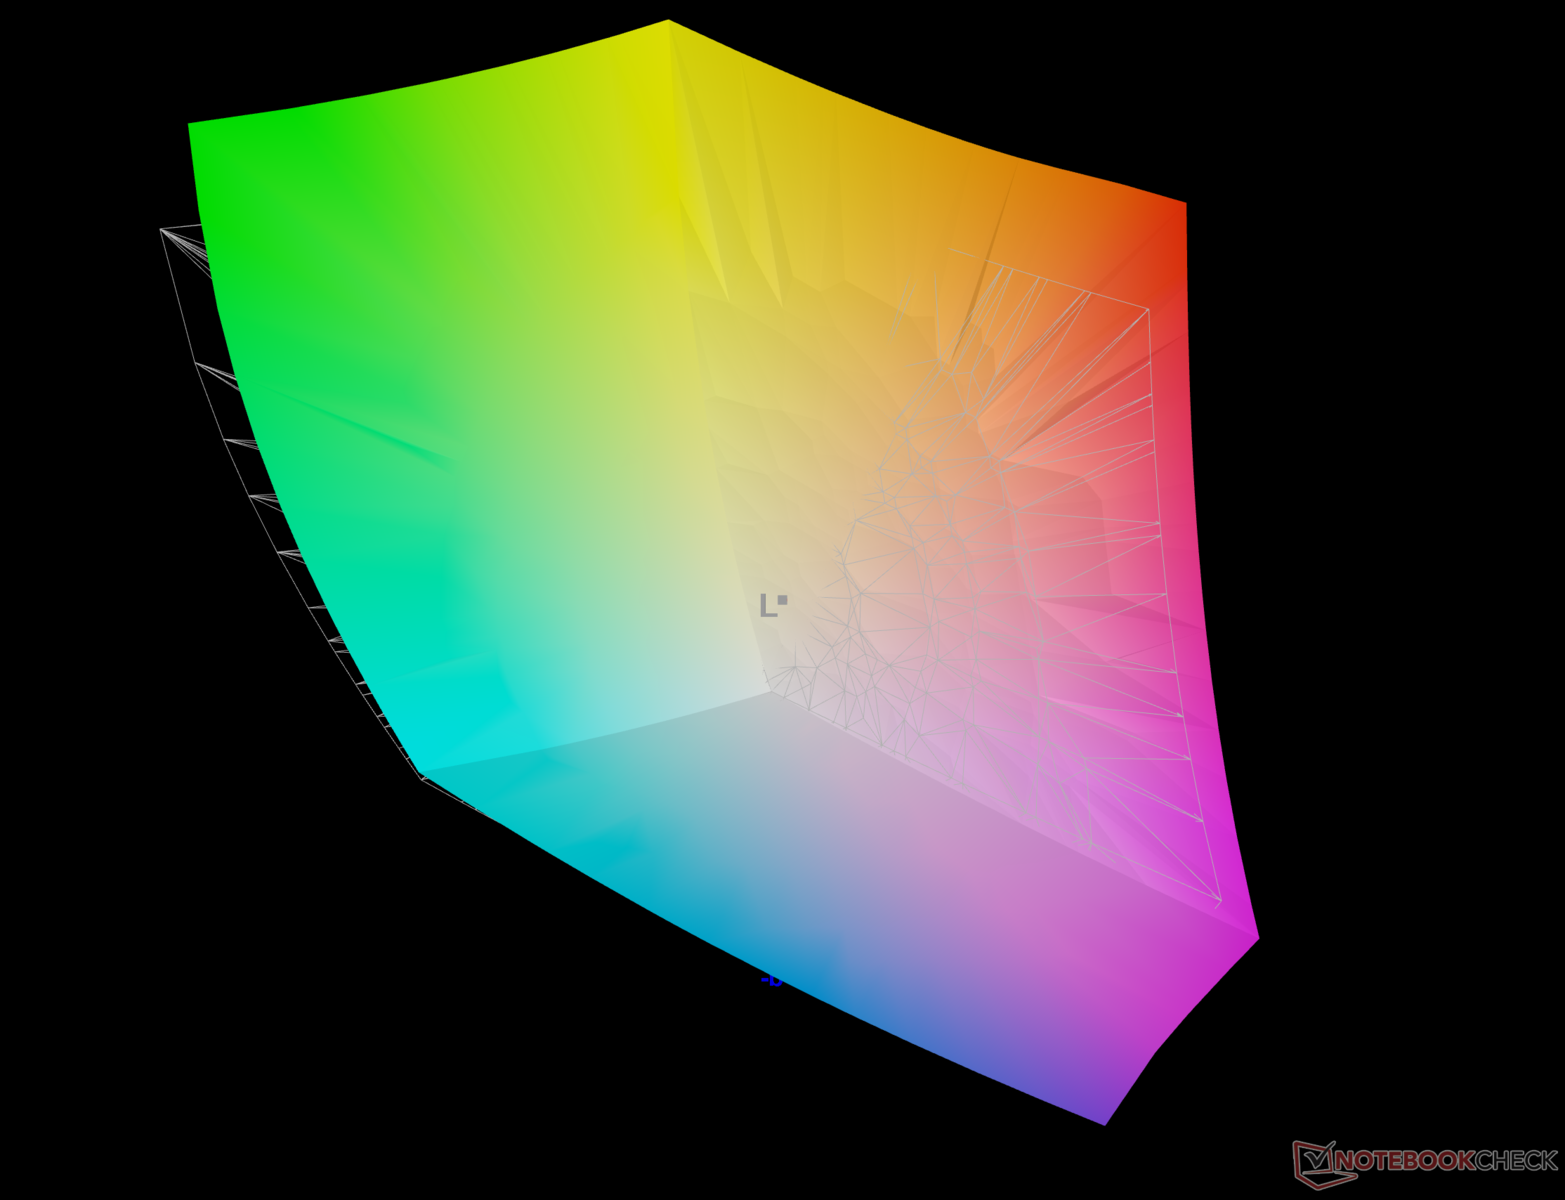
96.5% AdobeRGB 1998 (Argyll 3D)
100% sRGB (Argyll 3D)
99.9% Display P3 (Argyll 3D)
Gamma: 2.15
CCT: 6518 K
| Asus VivoBook 14X K3405 Samsung ATNA40YK07-1, , 2880x1800, 14" | Acer Swift X SFX14-71G ATNA45AF03-0, OLED, 2880x1800, 14.5" | MSI Stealth 14 Studio A13V B140QAN06.T, IPS, 2560x1600, 14" | Gigabyte Aero 14 OLED BMF Samsung SDC4192 (ATNA40YK14-0), OLED, 2880x1800, 14" | Lenovo Slim Pro 7 14ARP8 LEN89C1, IPS, 2560x1600, 14.5" | Schenker Vision 14 2022 RTX 3050 Ti MNE007ZA1-1, IPS, 2880x1800, 14" | |
|---|---|---|---|---|---|---|
| Display | 0% | -5% | -3% | -17% | -17% | |
| Display P3 Coverage (%) | 99.9 | 99.9 0% | 96.2 -4% | 99.8 0% | 72.9 -27% | 74.1 -26% |
| sRGB Coverage (%) | 100 | 99.9 0% | 99.6 0% | 100 0% | 98.2 -2% | 97.4 -3% |
| AdobeRGB 1998 Coverage (%) | 96.5 | 96.2 0% | 85.3 -12% | 88.7 -8% | 74.6 -23% | 75.3 -22% |
| Response Times | 81% | -159% | -13% | -1350% | -1320% | |
| Response Time Grey 50% / Grey 80% * (ms) | 1.15 ? | 0.4 ? 65% | 5.5 ? -378% | 2.4 ? -109% | 31.8 ? -2665% | 31.5 ? -2639% |
| Response Time Black / White * (ms) | 14.4 ? | 0.6 ? 96% | 5.8 ? 60% | 2.4 ? 83% | 19.3 ? -34% | 14.5 ? -1% |
| PWM Frequency (Hz) | 90.02 ? | 240 ? | 300 | |||
| Screen | 15% | 3% | 45% | -16% | -14% | |
| Brightness middle (cd/m²) | 369 | 388 5% | 419 14% | 423 15% | 344.7 -7% | 421 14% |
| Brightness (cd/m²) | 364 | 390 7% | 402 10% | 427 17% | 334 -8% | 416 14% |
| Brightness Distribution (%) | 85 | 98 15% | 89 5% | 98 15% | 92 8% | 89 5% |
| Black Level * (cd/m²) | 0.43 | 0.1 | 0.31 | 0.28 | ||
| Colorchecker dE 2000 * | 2.85 | 2.2 23% | 2.3 19% | 0.55 81% | 3.01 -6% | 3.2 -12% |
| Colorchecker dE 2000 max. * | 4.22 | 3.9 8% | 5.8 -37% | 1.15 73% | 6.3 -49% | 5.5 -30% |
| Colorchecker dE 2000 calibrated * | 2.18 | 1.9 13% | 0.9 59% | 1.15 47% | 0.83 62% | 2 8% |
| Greyscale dE 2000 * | 2.2 | 1.4 36% | 3.3 -50% | 0.69 69% | 4.6 -109% | 4.4 -100% |
| Gamma | 2.15 102% | 2.22 99% | 2.14 103% | 2.42 91% | 2.28 96% | 2.22 99% |
| CCT | 6518 100% | 6380 102% | 6550 99% | 6479 100% | 6420 101% | 6384 102% |
| Contrast (:1) | 974 | 4230 | 1112 | 1504 | ||
| Média Total (Programa/Configurações) | 32% /
22% | -54% /
-26% | 10% /
24% | -461% /
-238% | -450% /
-233% |
* ... menor é melhor
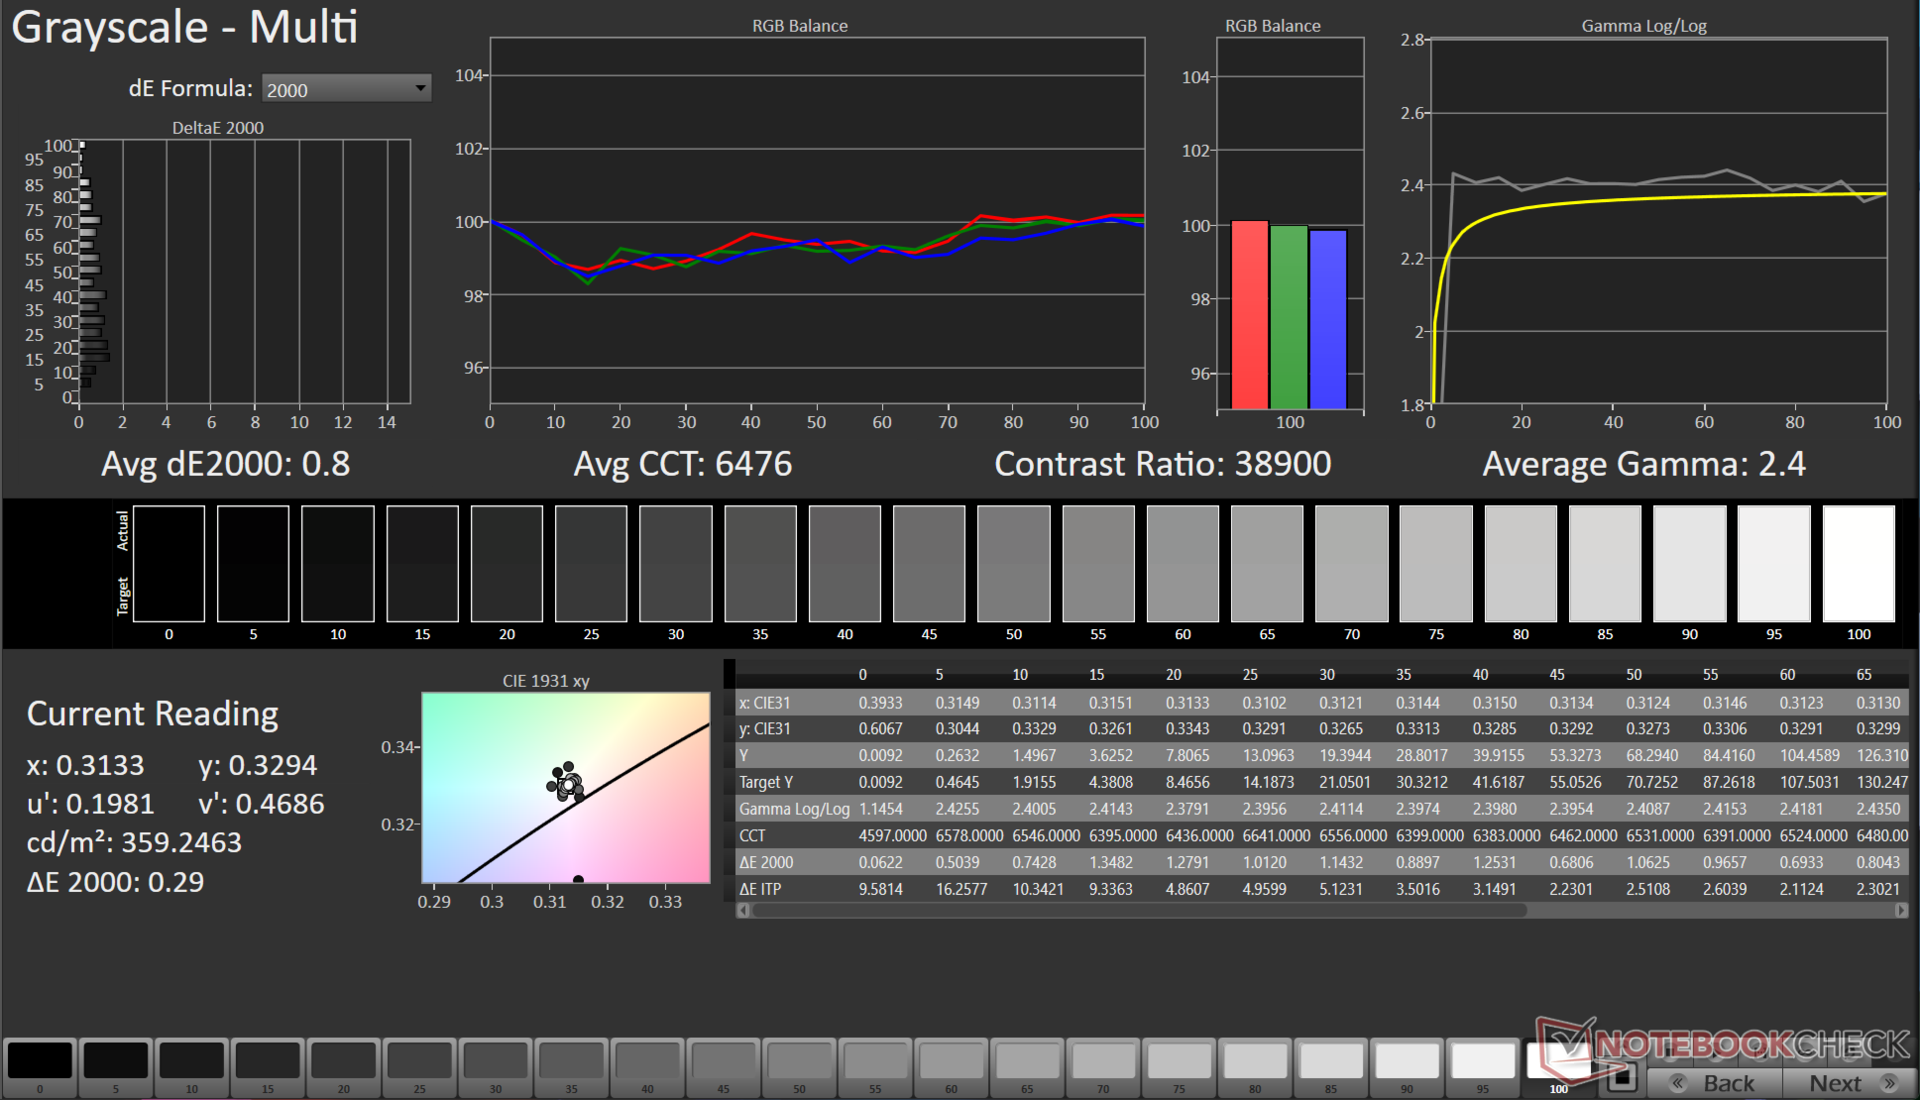
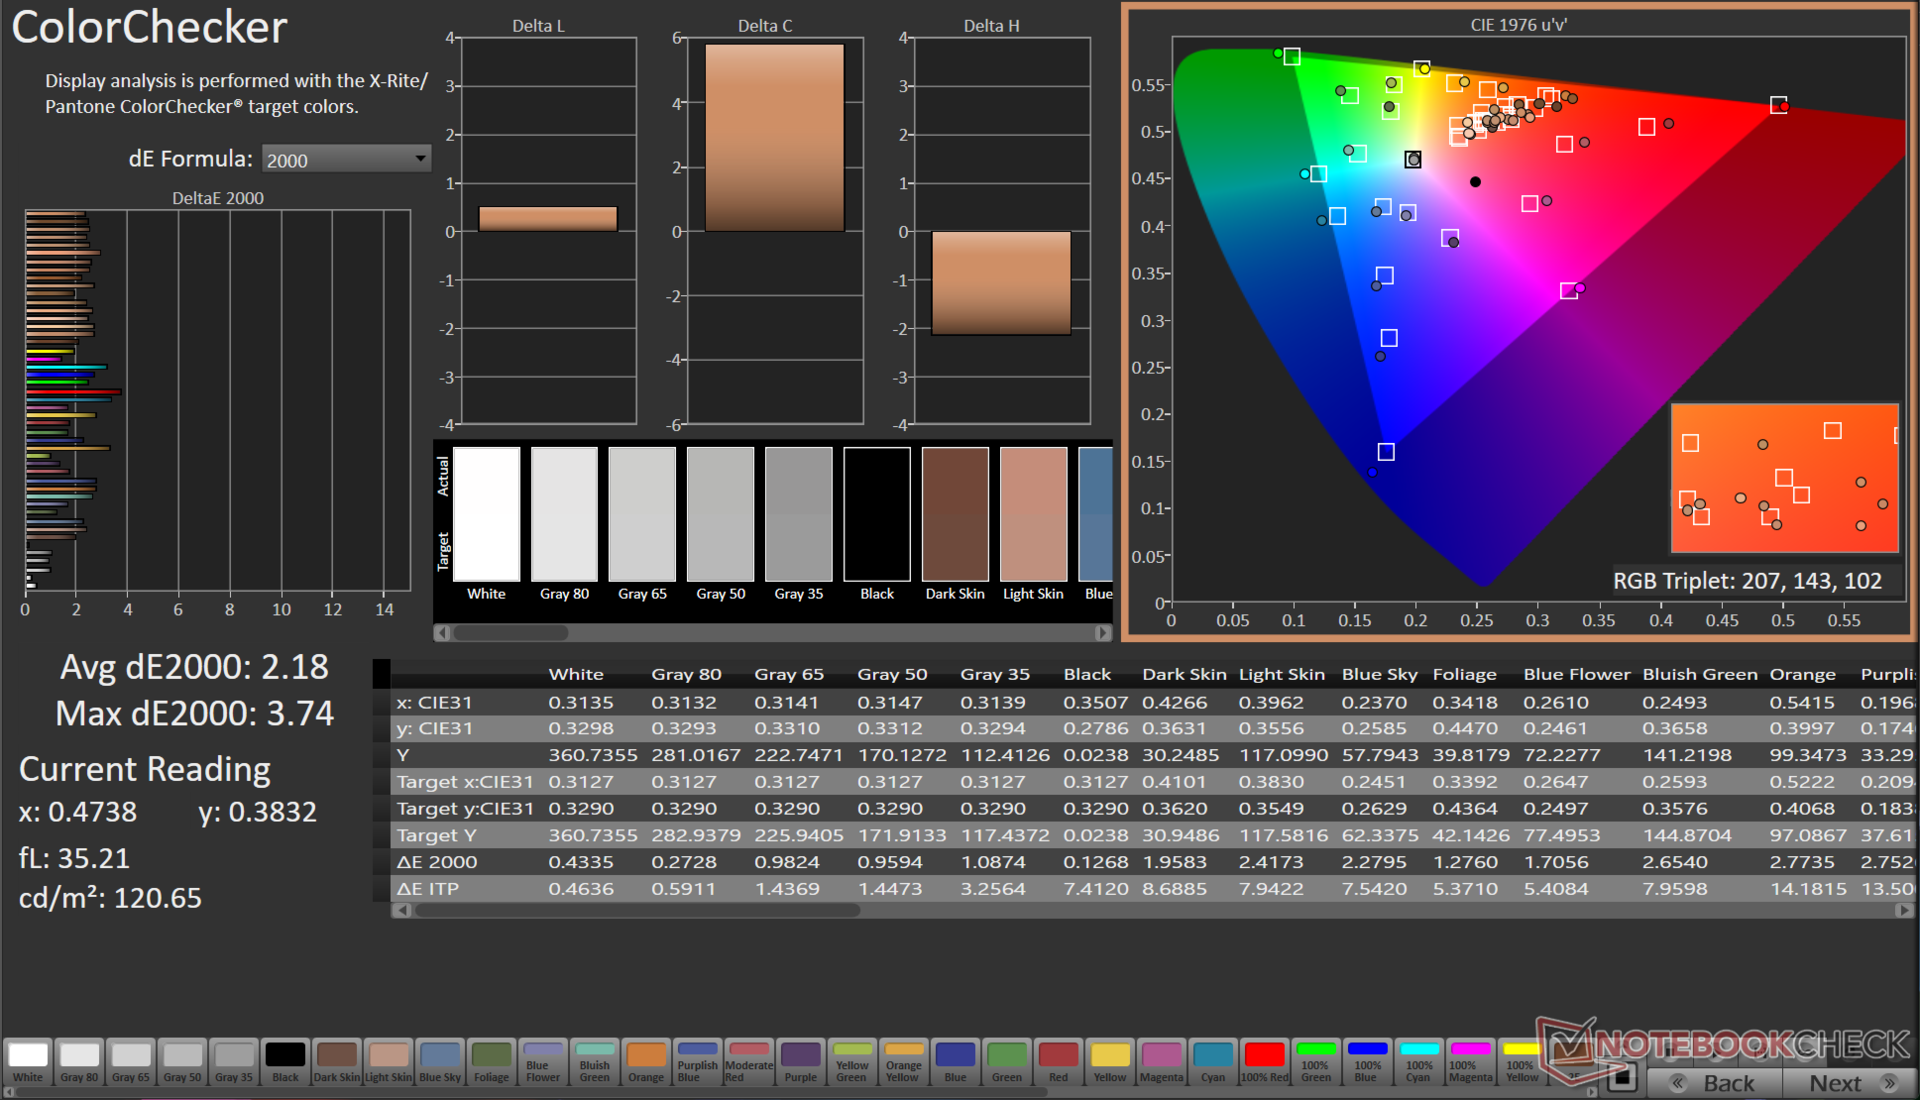
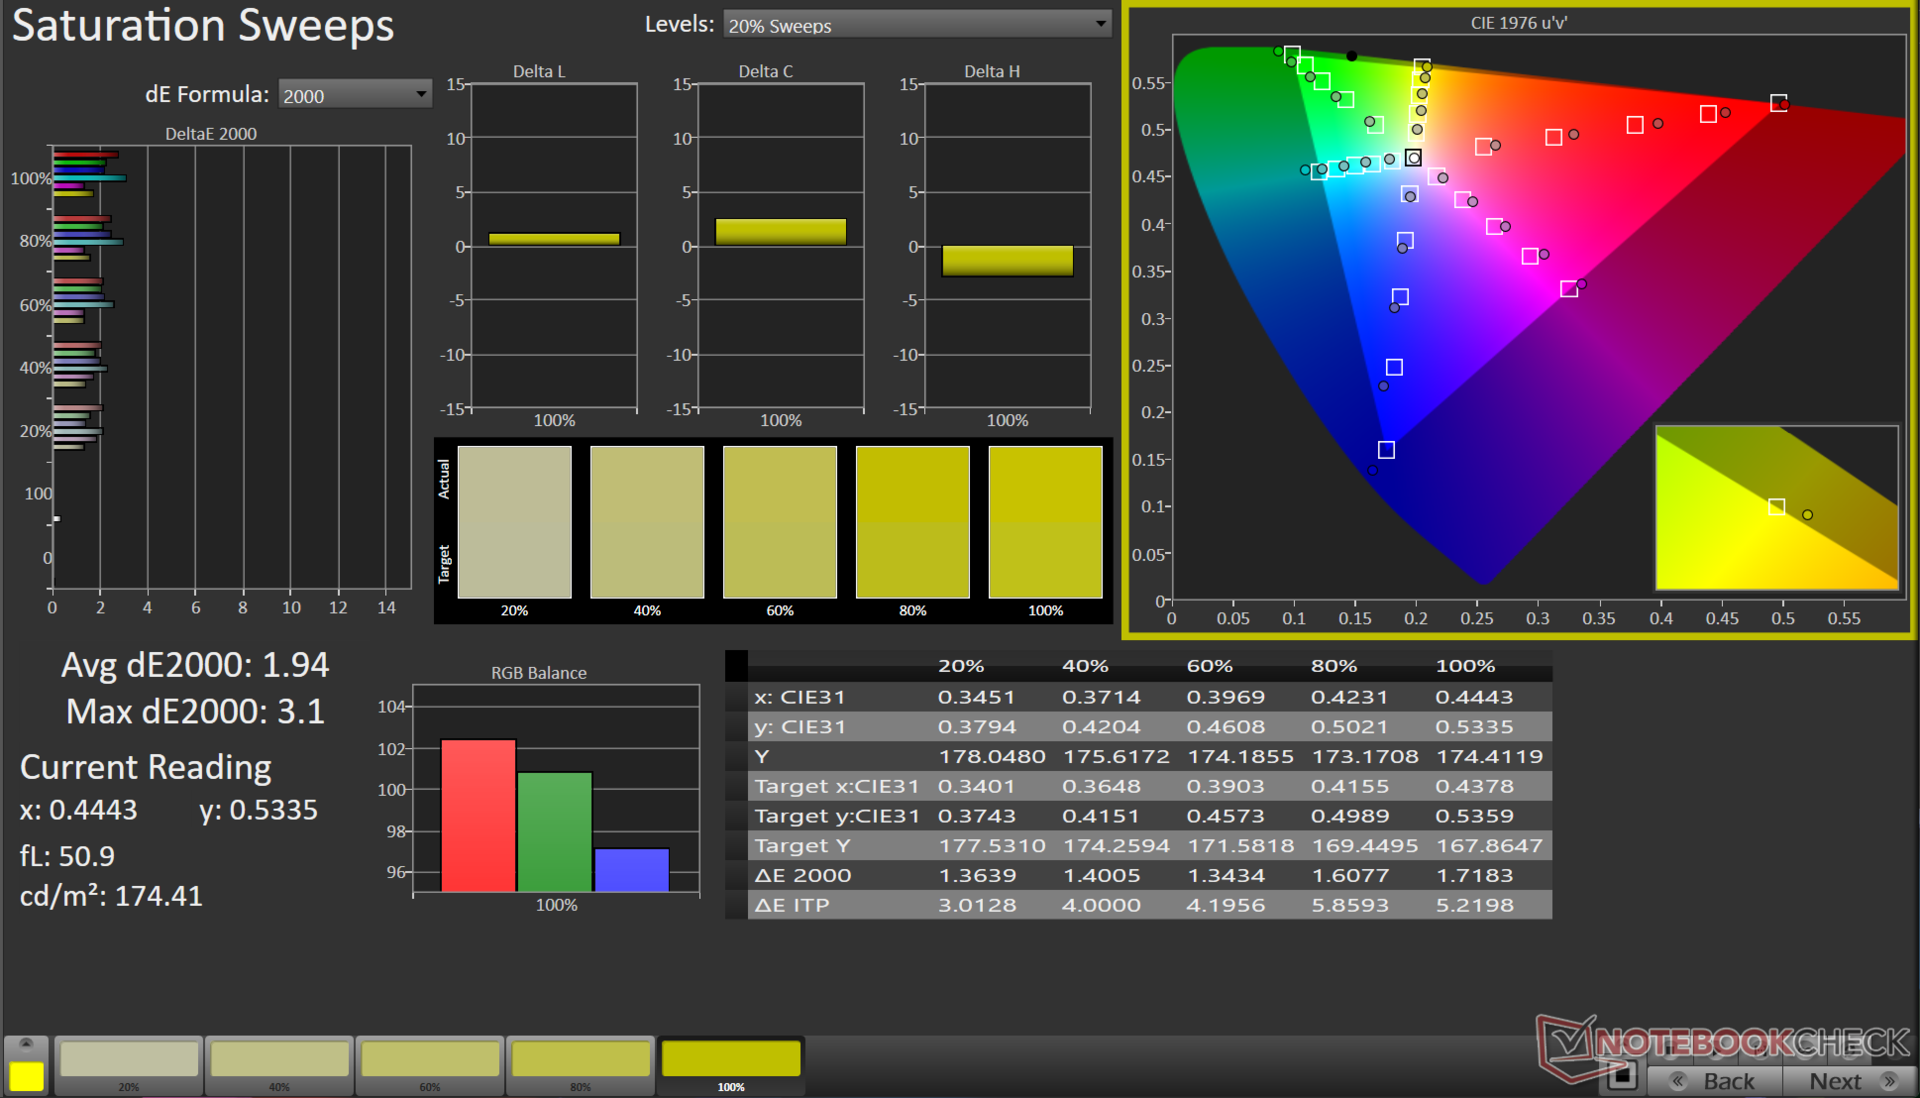
Os criadores de conteúdo ficarão satisfeitos com a impressionante cobertura do VivoBook 14X de todo o espaço de cores sRGB (100%), juntamente com uma cobertura quase completa das gamas de cores Adobe RGB (96,5%) e Display P3 (99,9%).


Executamos a calibração de cores no espaço de cores Display P3. O VivoBook 14X já apresenta baixos valores de Delta E em tons de cinza e no ColorChecker prontos para uso. Você também pode usar o ProArt Creator Hub e um calibrador X-Rite i1Display compatível para realizar sua própria calibração.
Usando nosso espectrofotômetro X-Rite i1Basic Pro 3 e o software Calman Ultimate da Portrait Displays, conseguimos obter um Delta E significativamente menor de 0,8 em tons de cinza. No entanto, apenas melhorias marginais foram observadas nos valores do ColorChecker.
O arquivo ICC calibrado pode ser baixado no link acima.
Exibir tempos de resposta
| ↔ Tempo de resposta preto para branco | ||
|---|---|---|
| 14.4 ms ... ascensão ↗ e queda ↘ combinadas | ↗ 12.8 ms ascensão | 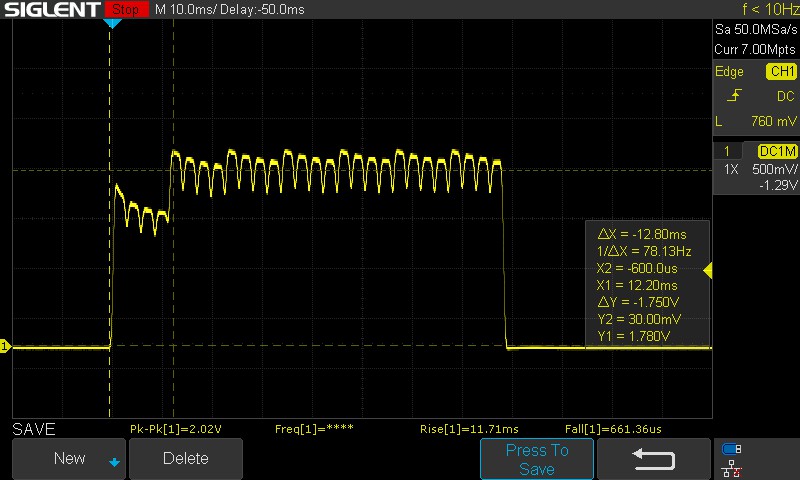 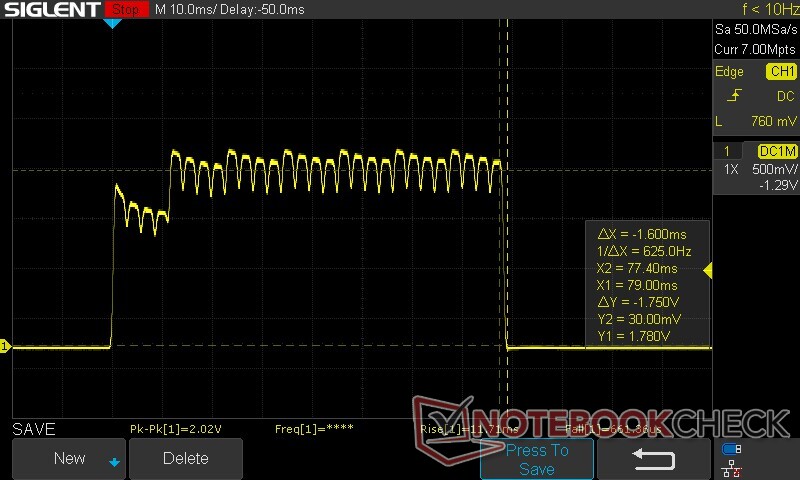 |
| ↘ 1.6 ms queda | ||
| A tela mostra boas taxas de resposta em nossos testes, mas pode ser muito lenta para jogadores competitivos. Em comparação, todos os dispositivos testados variam de 0.1 (mínimo) a 240 (máximo) ms. » 36 % de todos os dispositivos são melhores. Isso significa que o tempo de resposta medido é melhor que a média de todos os dispositivos testados (19.8 ms). | ||
| ↔ Tempo de resposta 50% cinza a 80% cinza | ||
| 1.15 ms ... ascensão ↗ e queda ↘ combinadas | ↗ 0.57 ms ascensão | 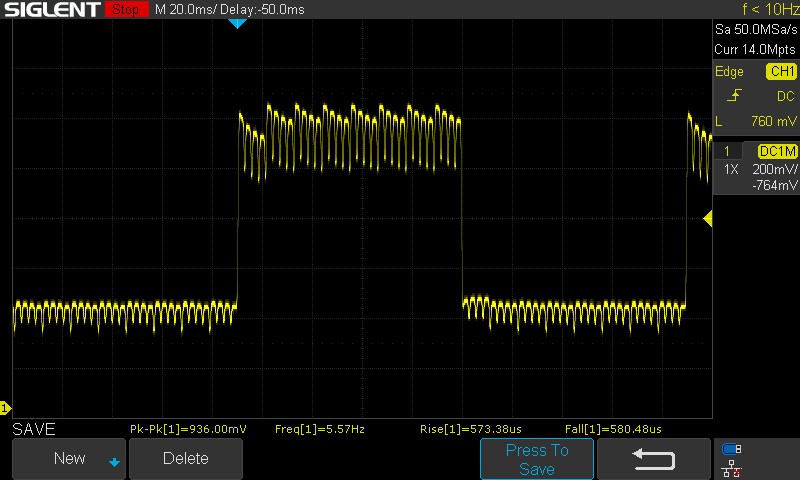 |
| ↘ 0.58 ms queda | ||
| A tela mostra taxas de resposta muito rápidas em nossos testes e deve ser muito adequada para jogos em ritmo acelerado. Em comparação, todos os dispositivos testados variam de 0.165 (mínimo) a 636 (máximo) ms. » 5 % de todos os dispositivos são melhores. Isso significa que o tempo de resposta medido é melhor que a média de todos os dispositivos testados (31 ms). | ||
A medição manual foi necessária para estimar os tempos de resposta devido à cintilação de fundo. Uma transição de 100% preto para 100% branco leva 14,4 ms, o que é um pouco mais alto para um painel OLED. No entanto, as transições de 50% cinza para 80% cinza são muito mais rápidas, com 1,15 ms.
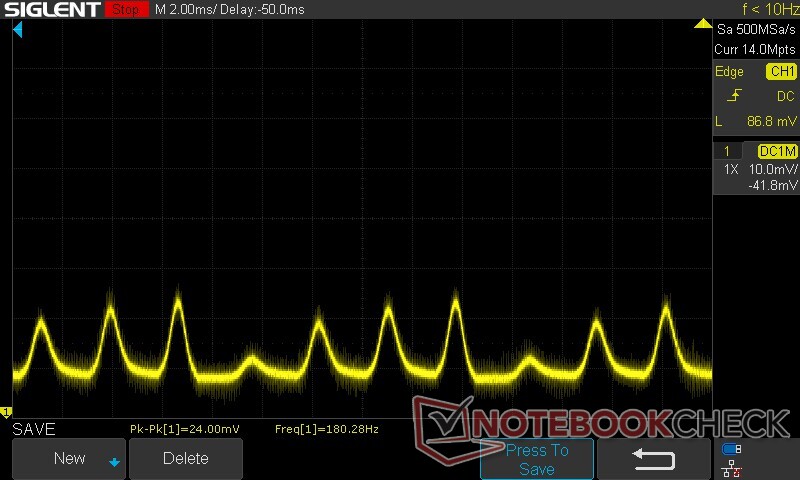
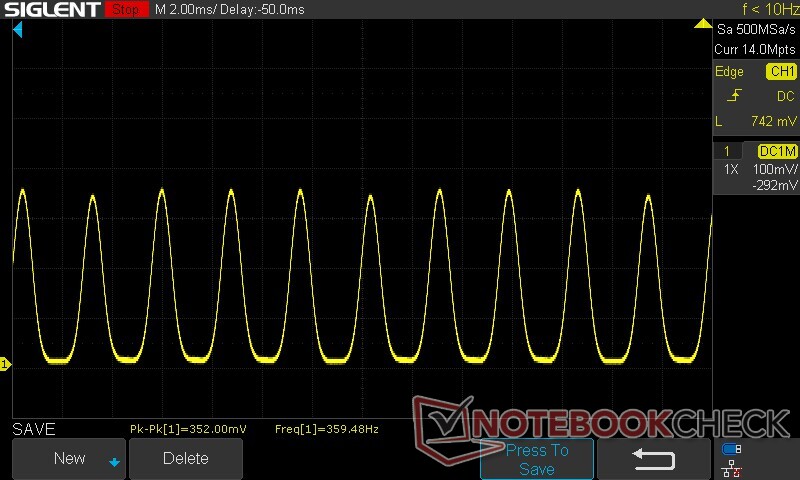
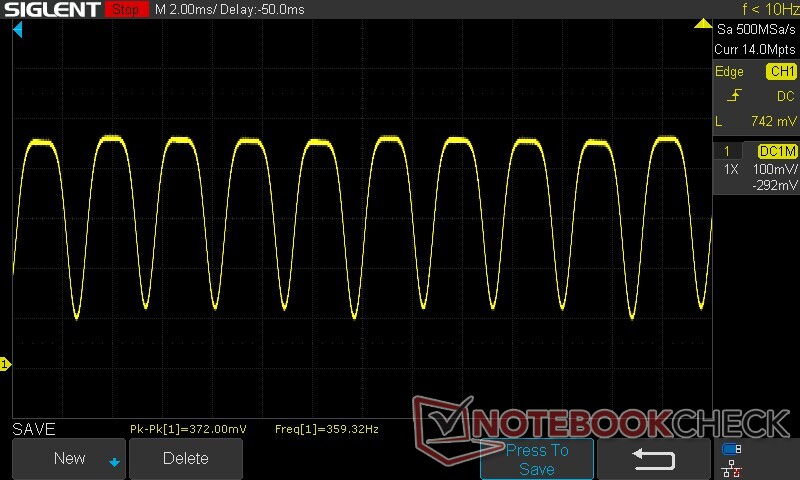
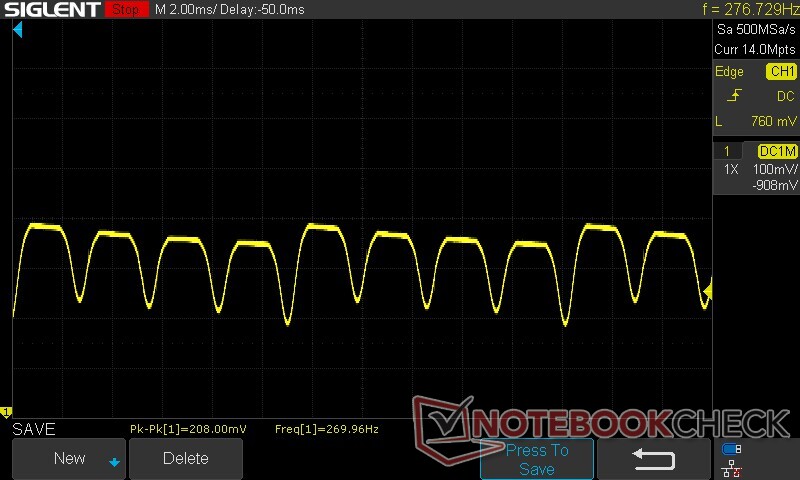
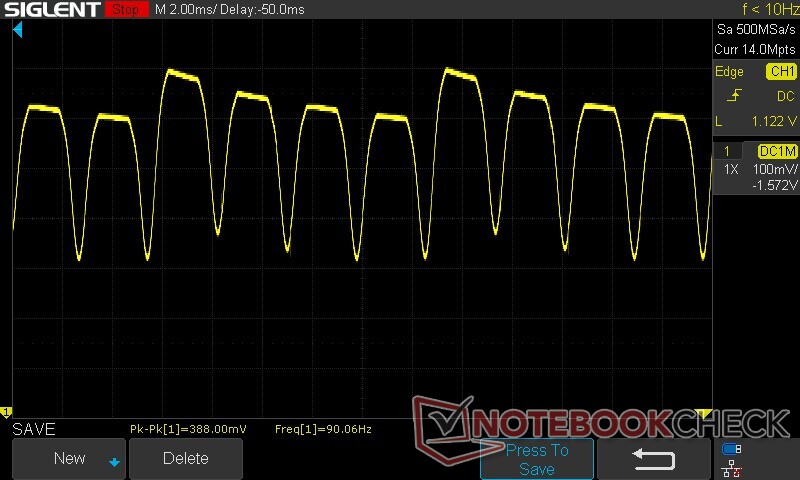
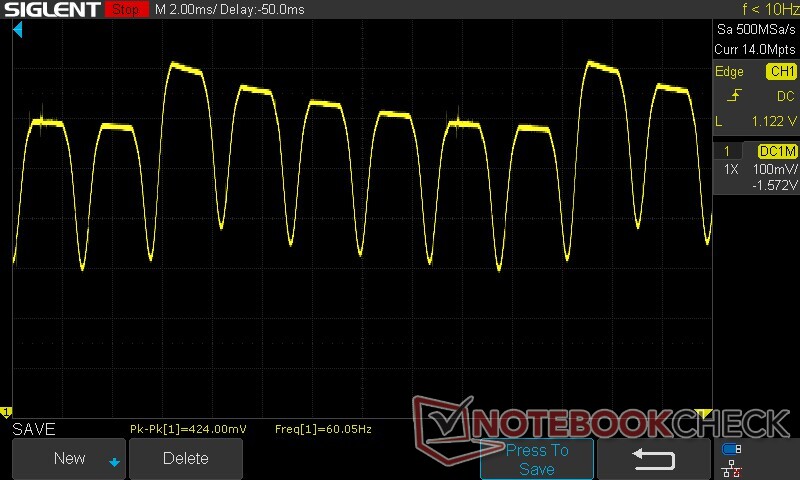
Cintilação da tela / PWM (modulação por largura de pulso)
| Tela tremeluzindo/PWM detectado | 90.02 Hz | 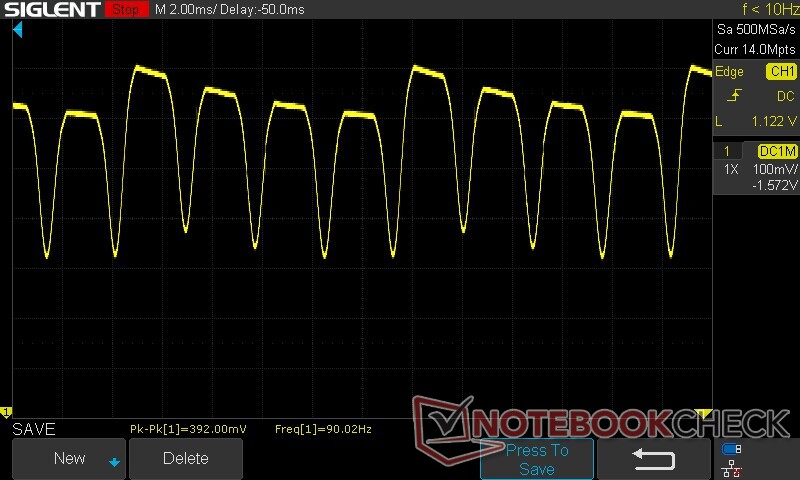 | |
| ≤ 100 brilho cd/m² | |||
A luz de fundo da tela pisca em 90.02 Hz (pior caso, por exemplo, utilizando PWM) Cintilação detectada em uma configuração de brilho de 100 cd/m² e abaixo. Não deve haver cintilação ou PWM acima desta configuração de brilho. A frequência de 90.02 Hz é muito baixa, portanto a oscilação pode causar fadiga ocular e dores de cabeça após uso prolongado. A cintilação ocorre em configurações de brilho relativamente baixas, portanto, o uso prolongado nesta configuração de brilho ou inferior pode causar fadiga ocular. [pwm_comparison] Em comparação: 52 % de todos os dispositivos testados não usam PWM para escurecer a tela. Se PWM foi detectado, uma média de 7757 (mínimo: 5 - máximo: 343500) Hz foi medida. | |||
O painel usa 90 Hz DC Dimming entre 75% e 100% de brilho. Abaixo de 75%, o painel muda para uma frequência PWM de aproximadamente 360 Hz.
O escurecimento de 90 Hz DC deve ser relativamente menos cansativo para os olhos em comparação com a cintilação PWM. Essa frequência cai para 60 Hz na taxa de atualização correspondente.
Recomendamos definir os níveis de brilho acima de 50% para minimizar a fadiga visual.
Para obter mais informações, consulte "Por que o PWM é uma dor de cabeça" e "Análise: Dimerização DC vs. PWM - É possível escurecer telas AMOLED sem cintilação?". Uma visão geral do PWM medido em todos os dispositivos analisados pode ser encontrada em nossa Tabela de classificação de PWM.
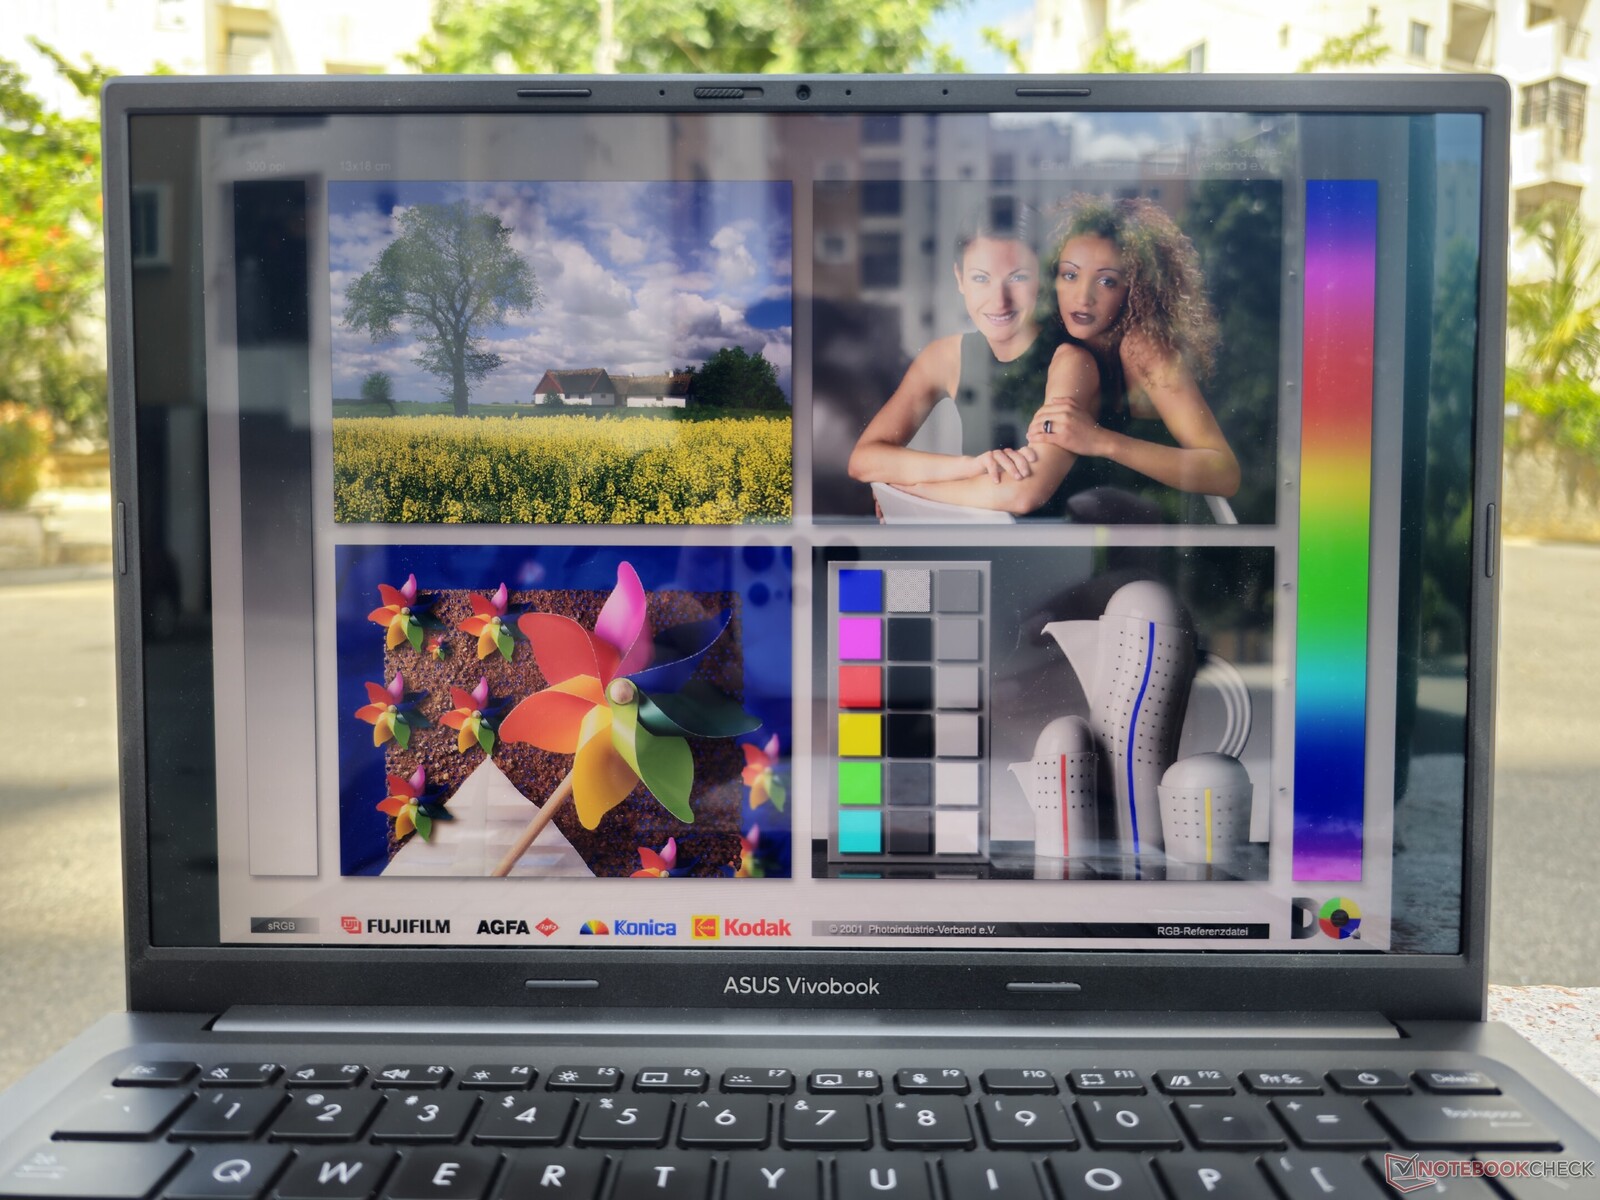
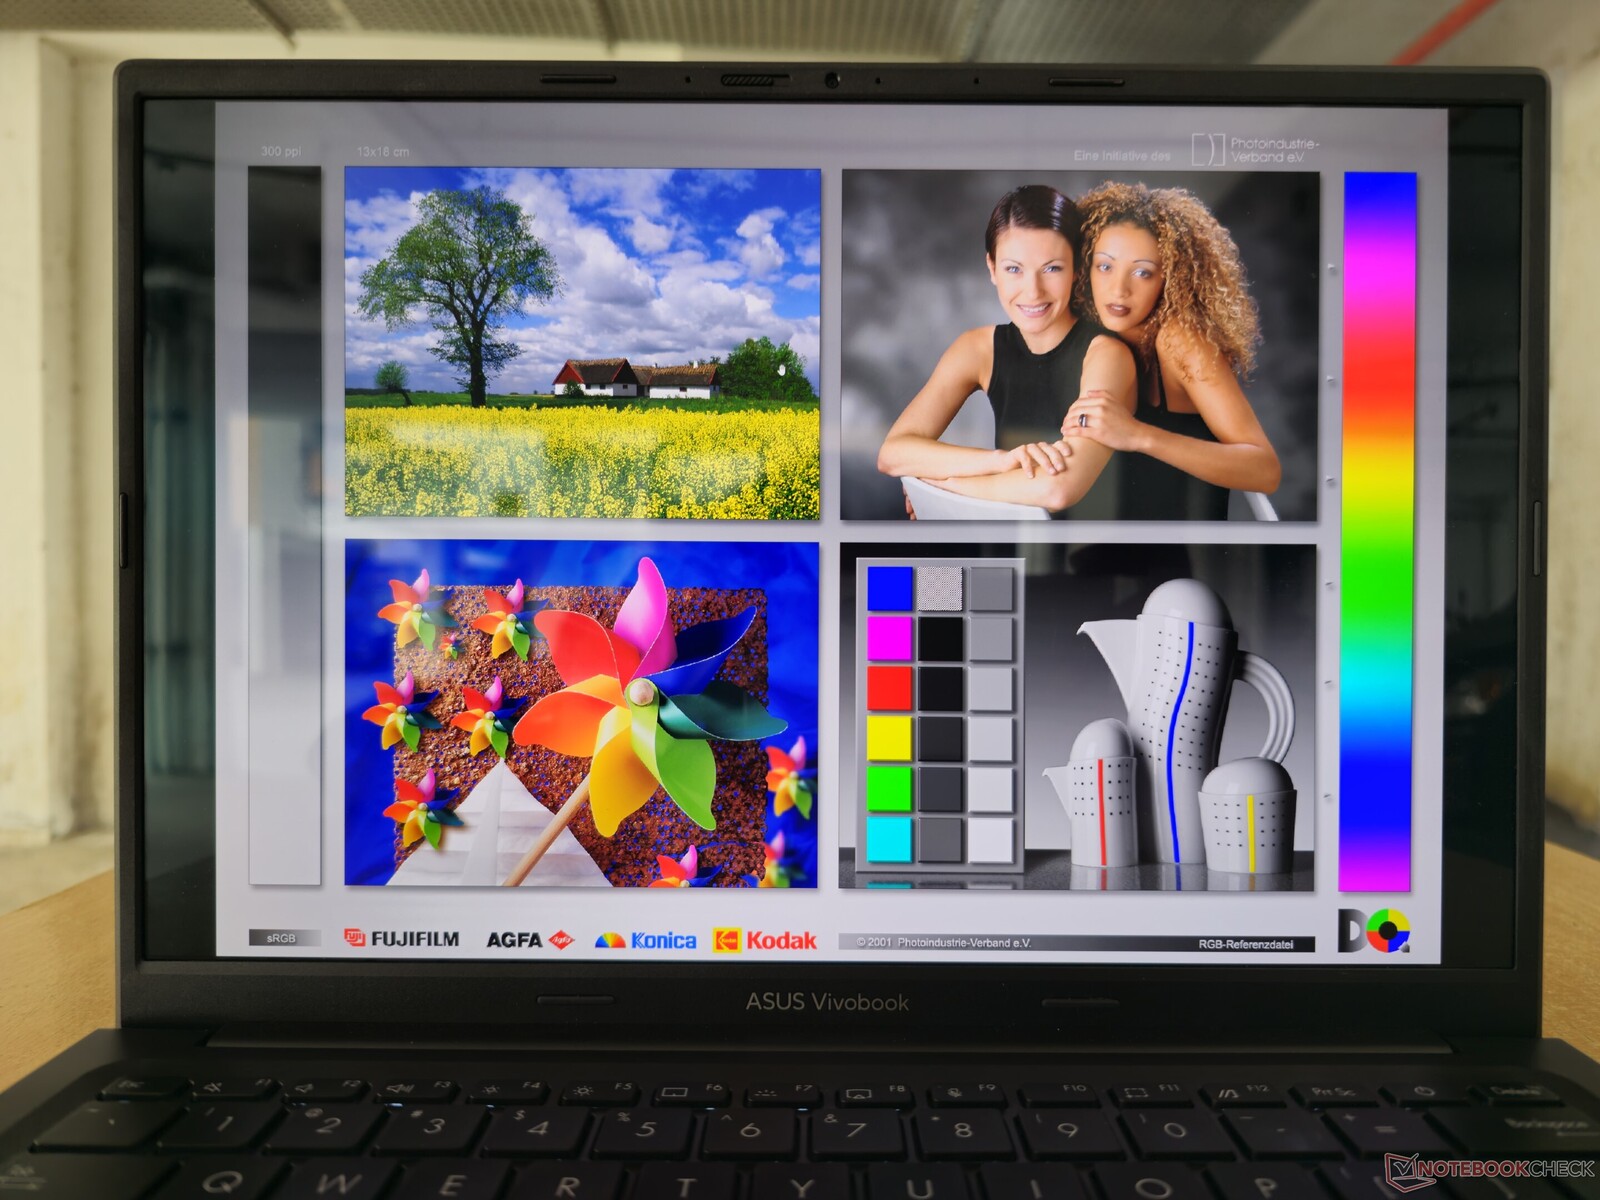
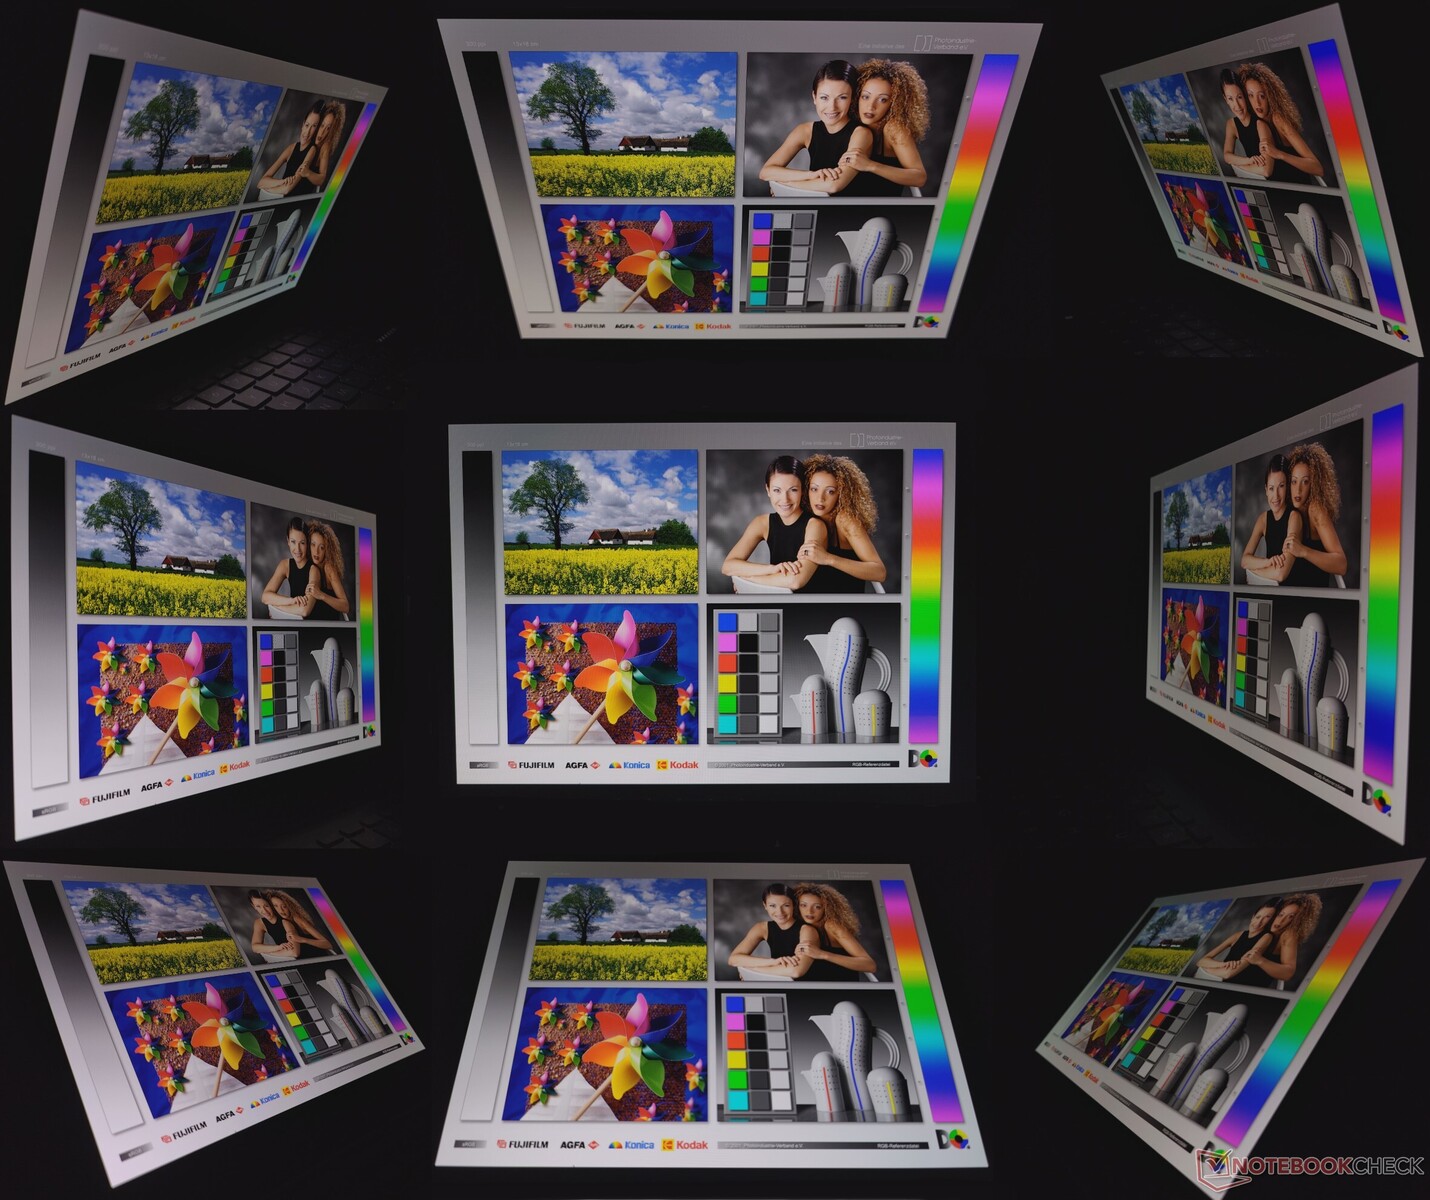
A visualização ao ar livre sob a luz do sol pode ser incômoda devido à tela brilhante. Os ângulos de visão são bons, com perda mínima de brilho em ângulos extremos e sem coloração verde visível.
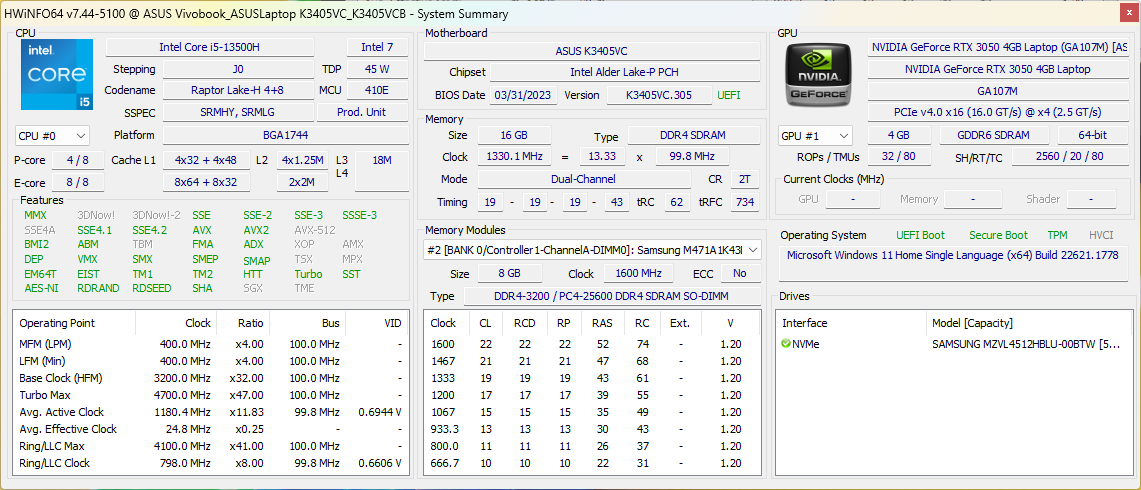
Desempenho: Core i5-13500H com um pouco de estrangulamento
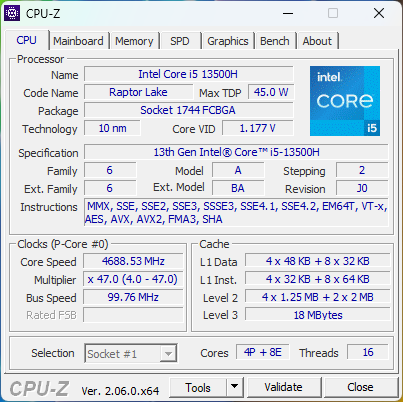
Nosso Asus VivoBook 14X OLED é equipado com o Intel Core i5-13500H E pela GPU para laptop Nvidia GeForce RTX 3050 4 GB. As SKUs RTX 3050 podem ser configuradas com um Core i5-13500H ou um Core i9-13900H.
Um RTX 2050 Mobile também está disponível, mas somente com um Core i5-13500H.
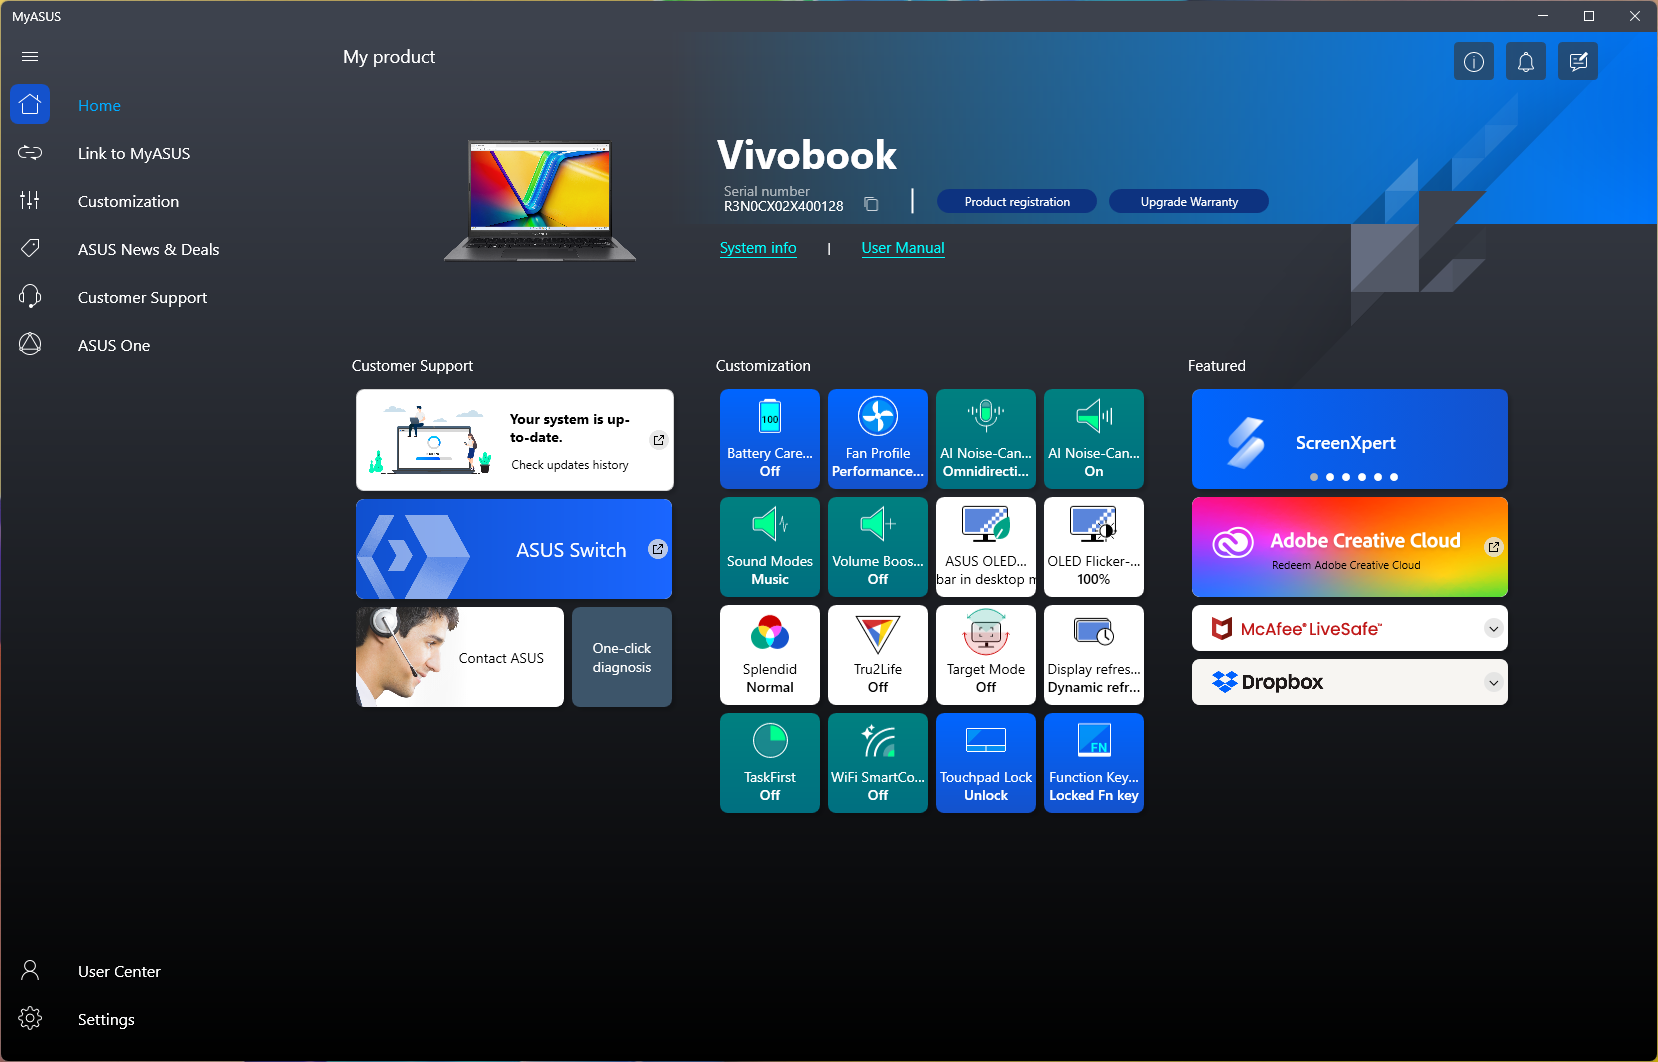
Condições de teste
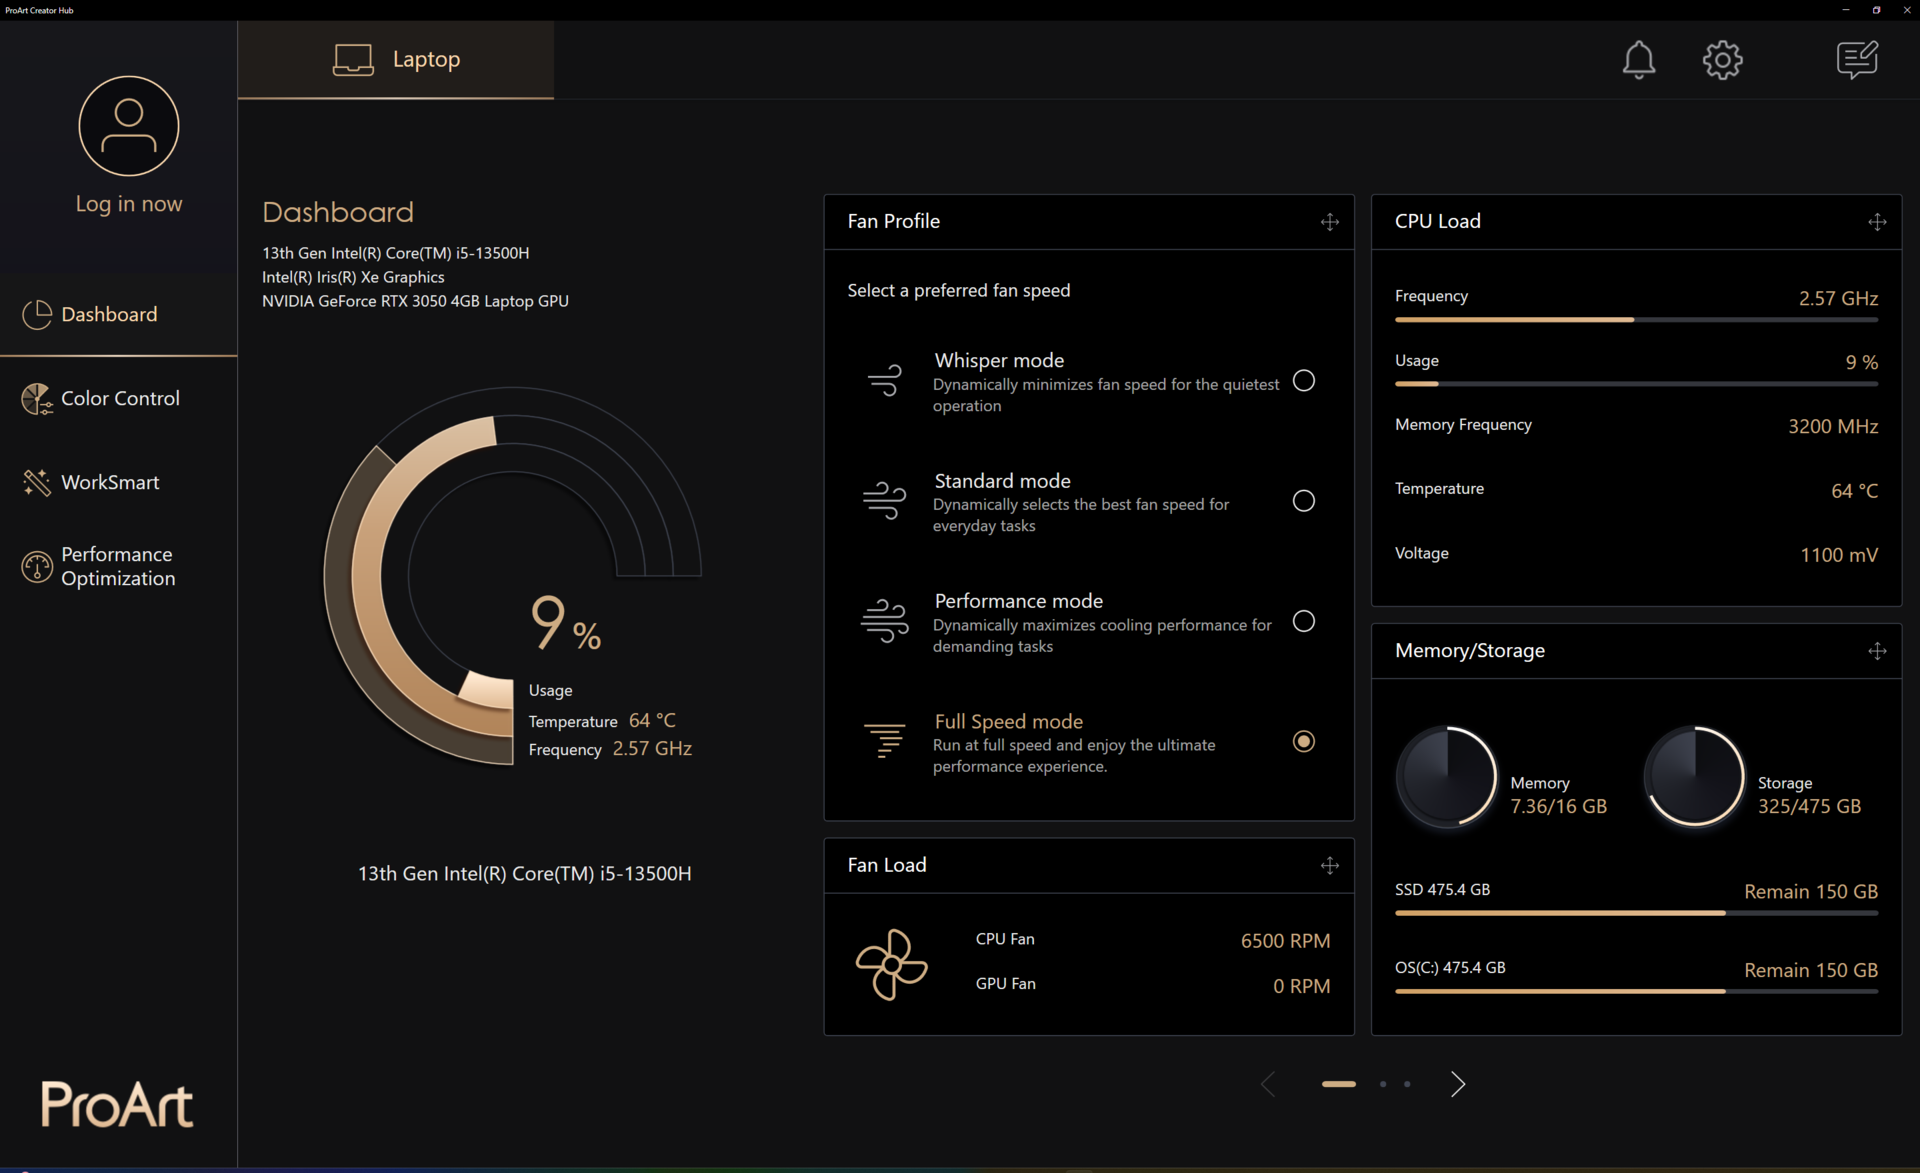
A Asus divide de forma redundante as configurações de desempenho entre o aplicativo MyAsus e o ProArt Creator Hub, embora o aplicativo MyAsus deva ser suficiente na maioria dos casos. No entanto, você precisará usar o ProArt Creator Hub para acessar o modo Full Speed.
Utilizamos o modo Full Speed para todos os benchmarks de desempenho e o modo Standard para os testes de bateria.
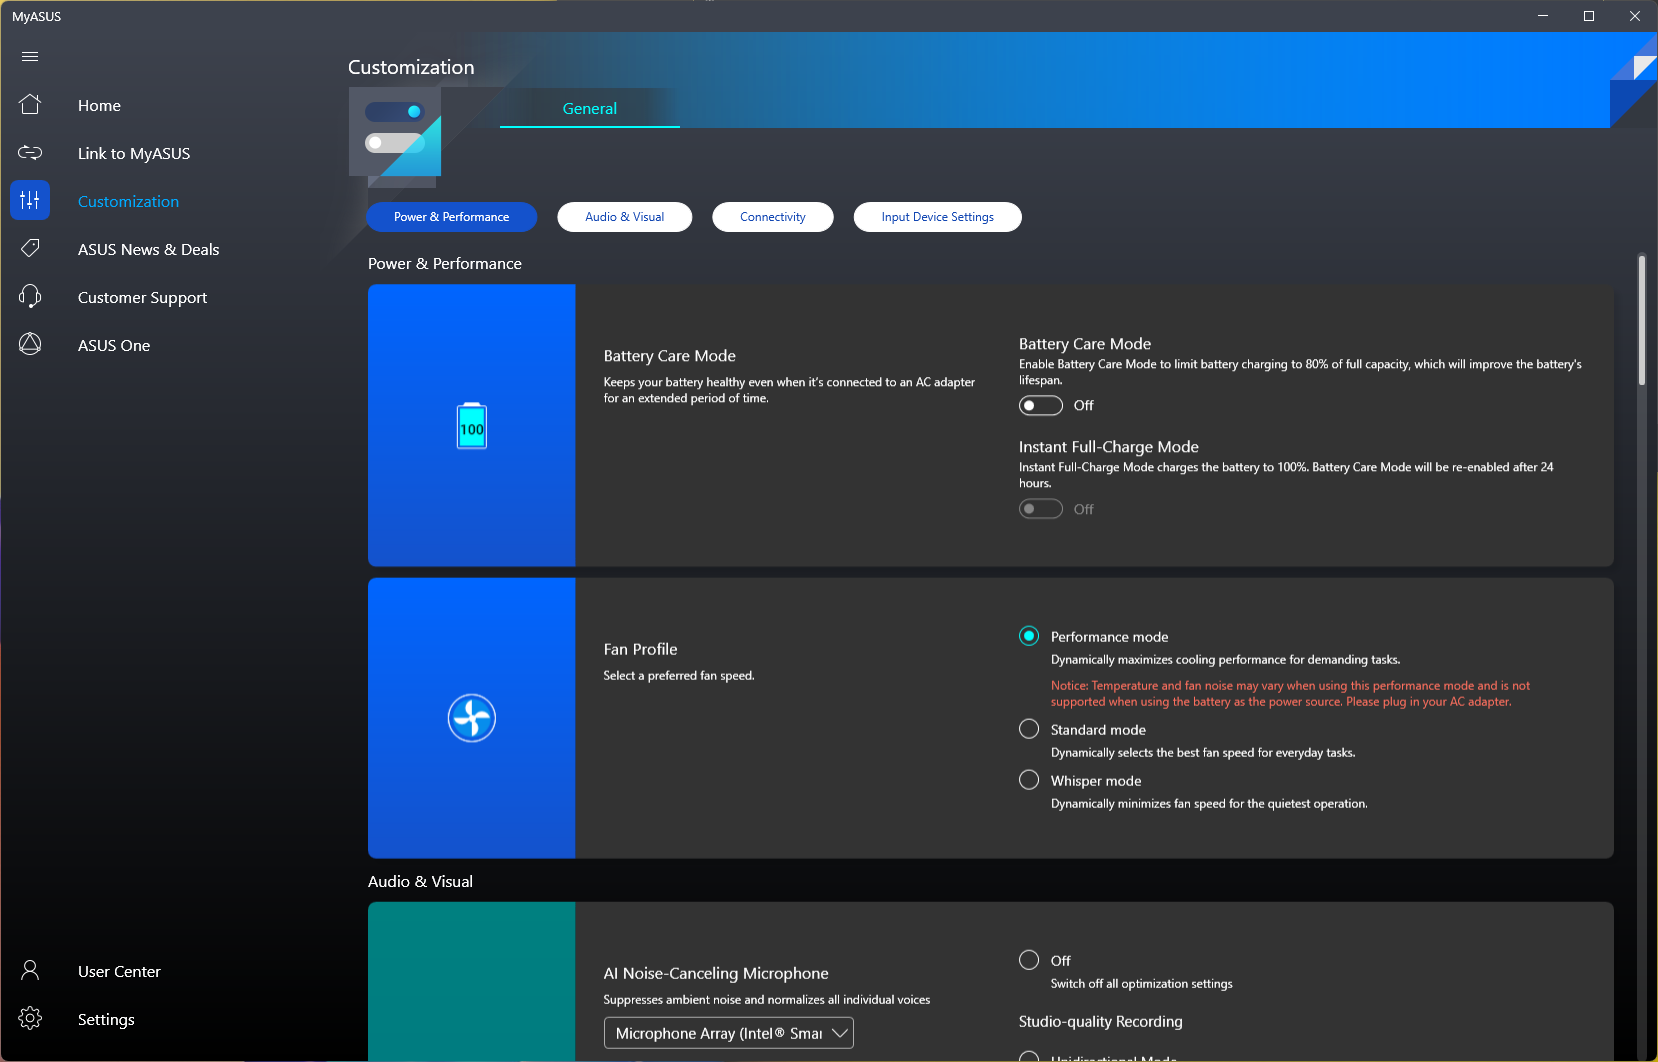
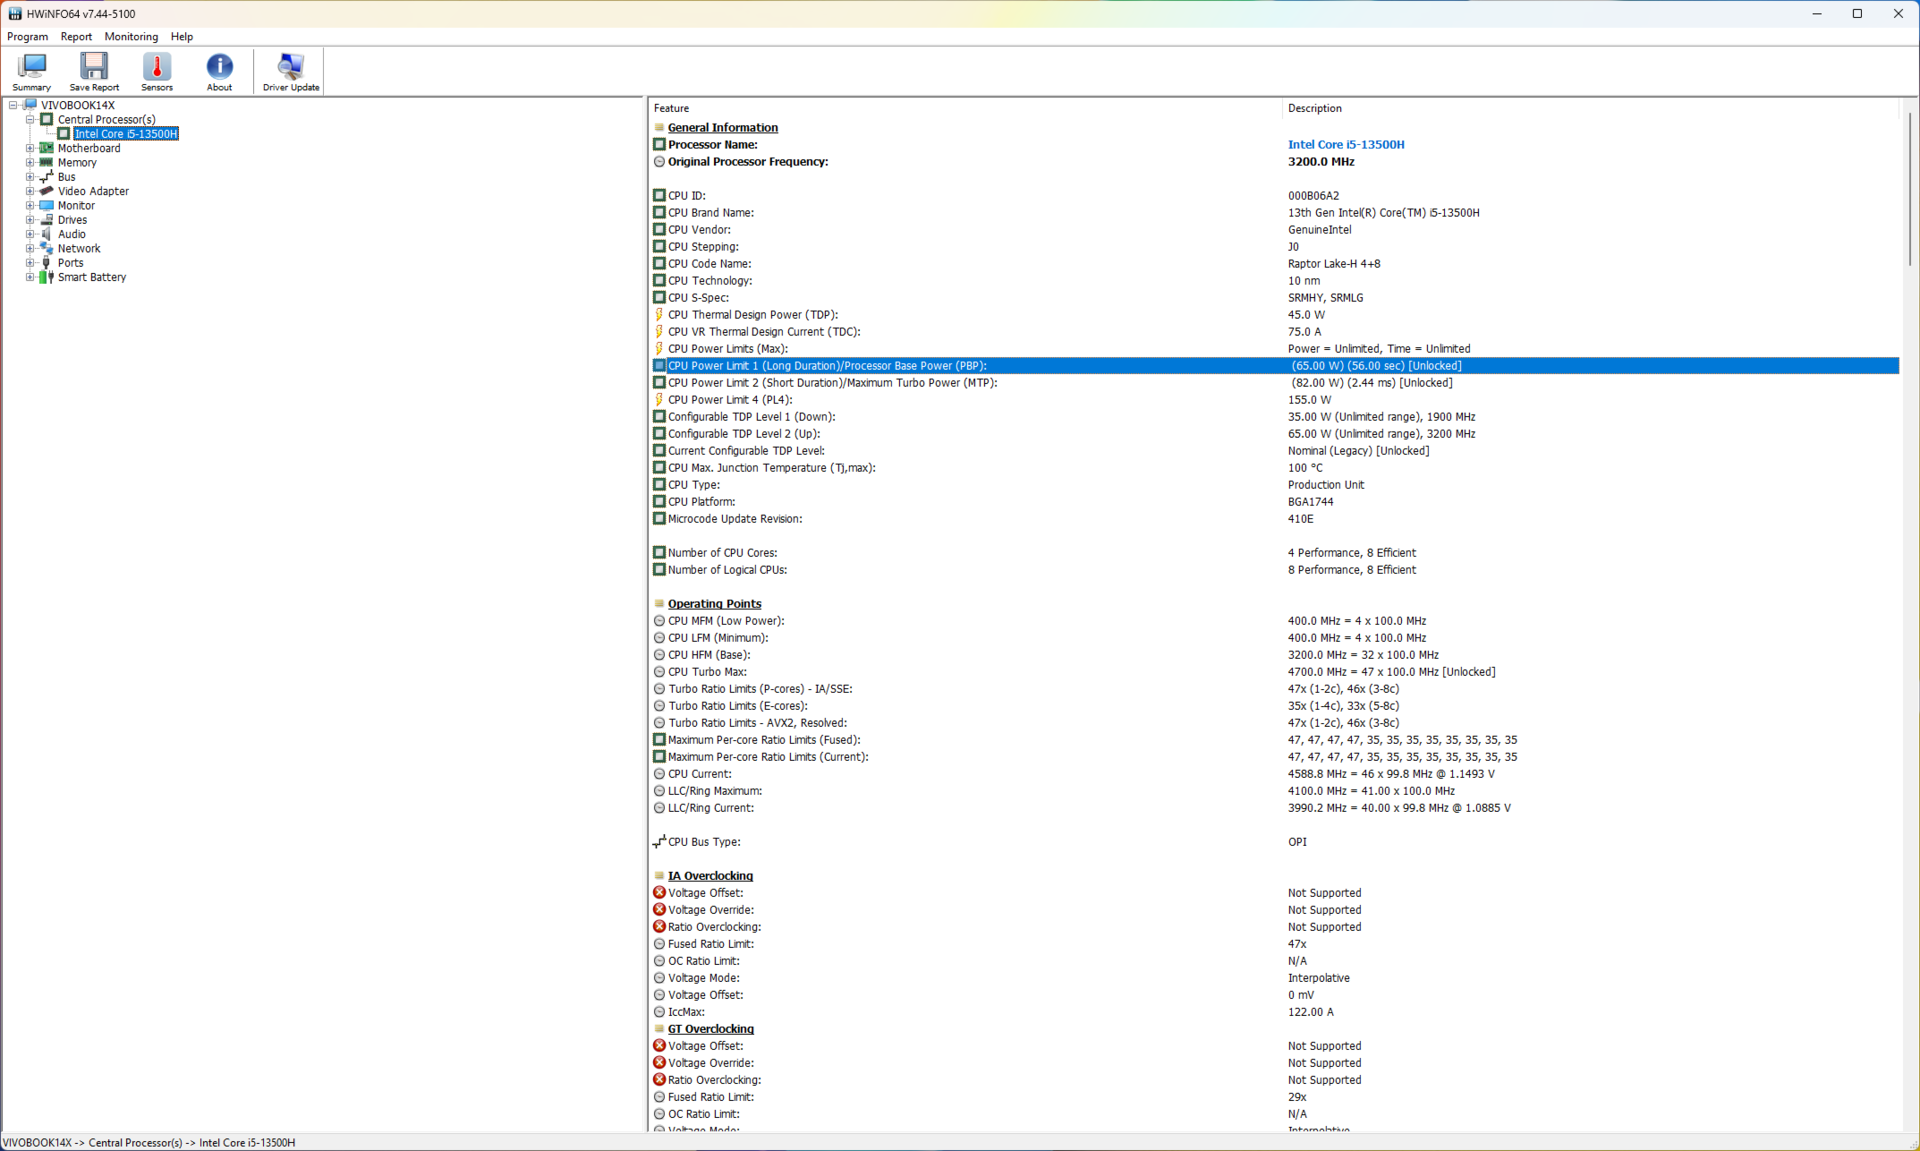
A tabela abaixo ilustra como os valores PL1 e PL2 do Core i5-13500H variam de acordo com a configuração de desempenho escolhida.
| Modo de desempenho | PL1 (PBP) / Tau | PL2 (MTP) / Tau |
|---|---|---|
| Whisper | 30 W / 56 s | 54 W / 2,44 ms |
| Padrão | 50 W / 56 s | 82 W / 2,44 ms |
| Desempenho | 55 W / 56 s | 82 W / 2,44 ms |
| Velocidade máxima | 65 W / 56 s | 82 W / 2,44 ms |
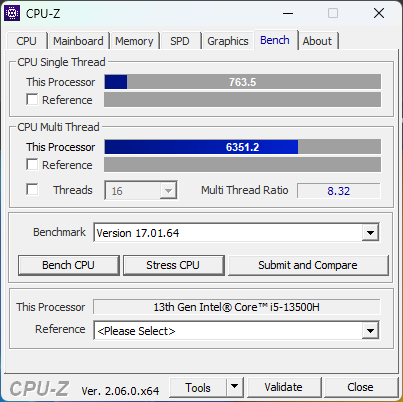
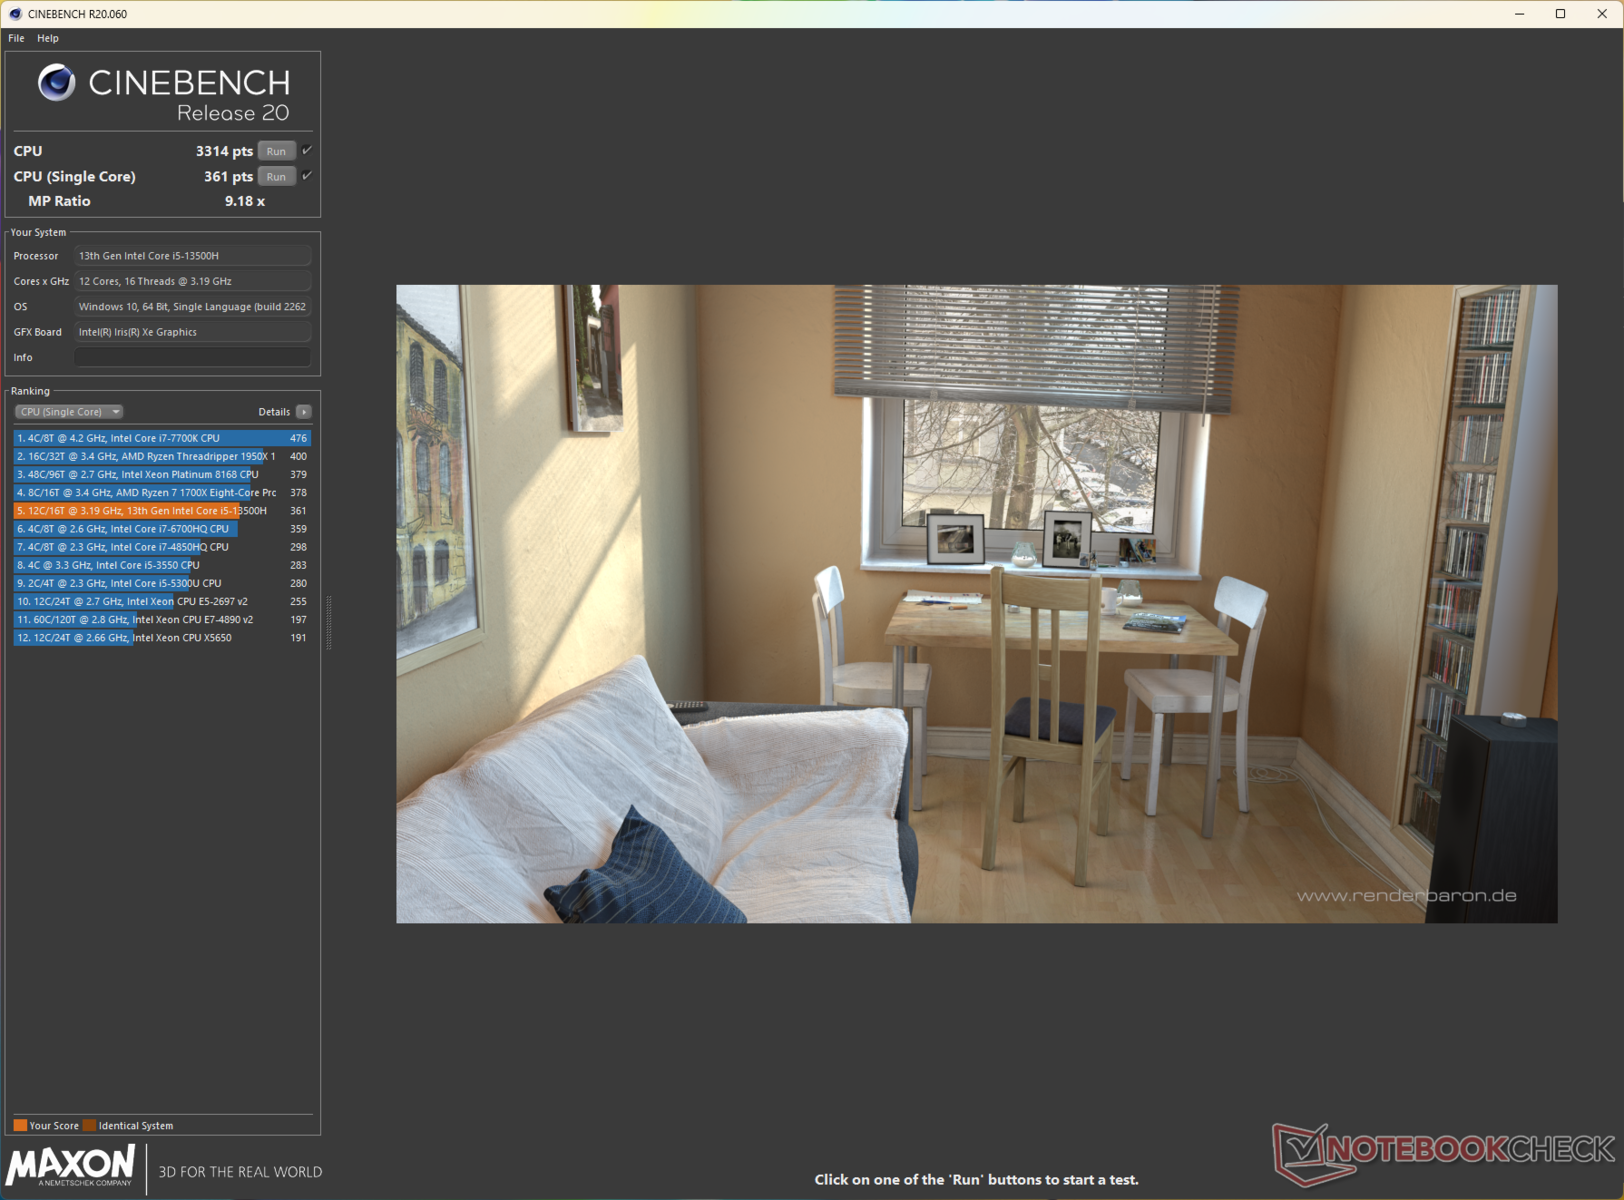
Processador
O Core i5-13500H oferece 12 núcleos (4P + 8E) e 16 threads com aumentos de núcleo único de até 4,7 GHz e um TDP de 45 W. O desempenho geral da CPU está amplamente alinhado com um Core i7-12700Hmas fica cerca de 10% atrás doCore i7-13700H no MSI Stealth 14 Studio.
Dito isso, o desempenho da CPU cai cerca de 18% no final do teste de loop de vários núcleos do Cinebench R15. No entanto, esse estrangulamento não é tão drástico em comparação com o que observamos com o Core i7-13700H noAcer Swift X SFX14.
Cinebench R15 Multi Loop
Cinebench R23: Multi Core | Single Core
Cinebench R20: CPU (Multi Core) | CPU (Single Core)
Cinebench R15: CPU Multi 64Bit | CPU Single 64Bit
Blender: v2.79 BMW27 CPU
7-Zip 18.03: 7z b 4 | 7z b 4 -mmt1
Geekbench 5.5: Multi-Core | Single-Core
HWBOT x265 Benchmark v2.2: 4k Preset
LibreOffice : 20 Documents To PDF
R Benchmark 2.5: Overall mean
| CPU Performance rating | |
| Média da turma Multimedia | |
| MSI Stealth 14 Studio A13V | |
| Gigabyte Aero 14 OLED BMF | |
| Acer Swift X SFX14-71G | |
| Schenker Vision 14 2022 RTX 3050 Ti | |
| Média Intel Core i5-13500H | |
| Asus VivoBook 14X K3405 | |
| Lenovo Slim Pro 7 14ARP8 | |
| Cinebench R23 / Multi Core | |
| MSI Stealth 14 Studio A13V | |
| Média da turma Multimedia (4861 - 33362, n=74, últimos 2 anos) | |
| Acer Swift X SFX14-71G | |
| Schenker Vision 14 2022 RTX 3050 Ti | |
| Média Intel Core i5-13500H (13542 - 16335, n=5) | |
| Asus VivoBook 14X K3405 | |
| Gigabyte Aero 14 OLED BMF | |
| Lenovo Slim Pro 7 14ARP8 | |
| Cinebench R23 / Single Core | |
| Média da turma Multimedia (1128 - 2459, n=66, últimos 2 anos) | |
| Acer Swift X SFX14-71G | |
| Gigabyte Aero 14 OLED BMF | |
| Média Intel Core i5-13500H (1704 - 1799, n=5) | |
| Asus VivoBook 14X K3405 | |
| Schenker Vision 14 2022 RTX 3050 Ti | |
| MSI Stealth 14 Studio A13V | |
| Lenovo Slim Pro 7 14ARP8 | |
| Cinebench R20 / CPU (Multi Core) | |
| MSI Stealth 14 Studio A13V | |
| Média da turma Multimedia (1887 - 12912, n=57, últimos 2 anos) | |
| Acer Swift X SFX14-71G | |
| Schenker Vision 14 2022 RTX 3050 Ti | |
| Asus VivoBook 14X K3405 | |
| Média Intel Core i5-13500H (5108 - 6212, n=5) | |
| Gigabyte Aero 14 OLED BMF | |
| Lenovo Slim Pro 7 14ARP8 | |
| Cinebench R20 / CPU (Single Core) | |
| Acer Swift X SFX14-71G | |
| Média da turma Multimedia (425 - 853, n=57, últimos 2 anos) | |
| Gigabyte Aero 14 OLED BMF | |
| Schenker Vision 14 2022 RTX 3050 Ti | |
| Média Intel Core i5-13500H (655 - 687, n=5) | |
| Asus VivoBook 14X K3405 | |
| MSI Stealth 14 Studio A13V | |
| Lenovo Slim Pro 7 14ARP8 | |
| Cinebench R15 / CPU Multi 64Bit | |
| MSI Stealth 14 Studio A13V | |
| Média da turma Multimedia (856 - 5224, n=61, últimos 2 anos) | |
| Gigabyte Aero 14 OLED BMF | |
| Acer Swift X SFX14-71G | |
| Média Intel Core i5-13500H (2234 - 2475, n=5) | |
| Asus VivoBook 14X K3405 | |
| Schenker Vision 14 2022 RTX 3050 Ti | |
| Lenovo Slim Pro 7 14ARP8 | |
| Cinebench R15 / CPU Single 64Bit | |
| Média da turma Multimedia (184.8 - 326, n=59, últimos 2 anos) | |
| Acer Swift X SFX14-71G | |
| Gigabyte Aero 14 OLED BMF | |
| Schenker Vision 14 2022 RTX 3050 Ti | |
| Média Intel Core i5-13500H (243 - 261, n=5) | |
| Asus VivoBook 14X K3405 | |
| MSI Stealth 14 Studio A13V | |
| Lenovo Slim Pro 7 14ARP8 | |
| Blender / v2.79 BMW27 CPU | |
| Acer Swift X SFX14-71G | |
| Schenker Vision 14 2022 RTX 3050 Ti | |
| Média da turma Multimedia (100 - 557, n=58, últimos 2 anos) | |
| Lenovo Slim Pro 7 14ARP8 | |
| Média Intel Core i5-13500H (205 - 263, n=6) | |
| Asus VivoBook 14X K3405 | |
| Gigabyte Aero 14 OLED BMF | |
| MSI Stealth 14 Studio A13V | |
| 7-Zip 18.03 / 7z b 4 | |
| MSI Stealth 14 Studio A13V | |
| Gigabyte Aero 14 OLED BMF | |
| Média da turma Multimedia (26062 - 130368, n=55, últimos 2 anos) | |
| Acer Swift X SFX14-71G | |
| Lenovo Slim Pro 7 14ARP8 | |
| Média Intel Core i5-13500H (50846 - 58567, n=6) | |
| Asus VivoBook 14X K3405 | |
| Schenker Vision 14 2022 RTX 3050 Ti | |
| 7-Zip 18.03 / 7z b 4 -mmt1 | |
| Acer Swift X SFX14-71G | |
| Gigabyte Aero 14 OLED BMF | |
| Média da turma Multimedia (3666 - 7545, n=56, últimos 2 anos) | |
| Schenker Vision 14 2022 RTX 3050 Ti | |
| Média Intel Core i5-13500H (5500 - 5885, n=6) | |
| Asus VivoBook 14X K3405 | |
| MSI Stealth 14 Studio A13V | |
| Lenovo Slim Pro 7 14ARP8 | |
| Geekbench 5.5 / Multi-Core | |
| Média da turma Multimedia (4652 - 20422, n=56, últimos 2 anos) | |
| MSI Stealth 14 Studio A13V | |
| Acer Swift X SFX14-71G | |
| Schenker Vision 14 2022 RTX 3050 Ti | |
| Gigabyte Aero 14 OLED BMF | |
| Média Intel Core i5-13500H (9312 - 11465, n=5) | |
| Asus VivoBook 14X K3405 | |
| Lenovo Slim Pro 7 14ARP8 | |
| Geekbench 5.5 / Single-Core | |
| Média da turma Multimedia (805 - 2974, n=56, últimos 2 anos) | |
| Gigabyte Aero 14 OLED BMF | |
| Acer Swift X SFX14-71G | |
| Schenker Vision 14 2022 RTX 3050 Ti | |
| Média Intel Core i5-13500H (1674 - 1762, n=5) | |
| MSI Stealth 14 Studio A13V | |
| Asus VivoBook 14X K3405 | |
| Lenovo Slim Pro 7 14ARP8 | |
| HWBOT x265 Benchmark v2.2 / 4k Preset | |
| Média da turma Multimedia (5.26 - 36.1, n=56, últimos 2 anos) | |
| MSI Stealth 14 Studio A13V | |
| Lenovo Slim Pro 7 14ARP8 | |
| Asus VivoBook 14X K3405 | |
| Média Intel Core i5-13500H (14.4 - 17.9, n=6) | |
| Gigabyte Aero 14 OLED BMF | |
| Schenker Vision 14 2022 RTX 3050 Ti | |
| Acer Swift X SFX14-71G | |
| LibreOffice / 20 Documents To PDF | |
| Lenovo Slim Pro 7 14ARP8 | |
| MSI Stealth 14 Studio A13V | |
| Média Intel Core i5-13500H (44 - 65.5, n=5) | |
| Média da turma Multimedia (23.9 - 146.7, n=57, últimos 2 anos) | |
| Asus VivoBook 14X K3405 | |
| Schenker Vision 14 2022 RTX 3050 Ti | |
| Gigabyte Aero 14 OLED BMF | |
| Acer Swift X SFX14-71G | |
| R Benchmark 2.5 / Overall mean | |
| Lenovo Slim Pro 7 14ARP8 | |
| MSI Stealth 14 Studio A13V | |
| Asus VivoBook 14X K3405 | |
| Média Intel Core i5-13500H (0.471 - 0.51, n=6) | |
| Média da turma Multimedia (0.3604 - 0.947, n=56, últimos 2 anos) | |
| Schenker Vision 14 2022 RTX 3050 Ti | |
| Gigabyte Aero 14 OLED BMF | |
| Acer Swift X SFX14-71G | |
* ... menor é melhor
A execução do loop de vários núcleos do Cinebench R15 em diferentes modos de desempenho revela que a implementação do Core i5-13500H do VivoBook 14X não pode utilizar totalmente o orçamento de TDP alocado. Nos perfis Standard e Full Speed, o pico de potência do pacote observado é de apenas 70 W contra os 82 W permitidos.
Além disso, esse nível de potência é atingido somente durante o loop inicial, com o clock máximo em torno da marca de 3,5 GHz. No modo Whisper, o processador pode utilizar até 54 W de pico, mas a média é de apenas 16 W durante o teste.
O Cinebench R20 cai drasticamente no modo de bateria, com quedas de 45% e 41% no desempenho de núcleo único e de vários núcleos, respectivamente.
AIDA64: FP32 Ray-Trace | FPU Julia | CPU SHA3 | CPU Queen | FPU SinJulia | FPU Mandel | CPU AES | CPU ZLib | FP64 Ray-Trace | CPU PhotoWorxx
| Performance rating | |
| MSI Stealth 14 Studio A13V | |
| Média da turma Multimedia | |
| Lenovo Slim Pro 7 14ARP8 | |
| Gigabyte Aero 14 OLED BMF | |
| Asus VivoBook 14X K3405 | |
| Média Intel Core i5-13500H | |
| Schenker Vision 14 2022 RTX 3050 Ti | |
| Acer Swift X SFX14-71G | |
| AIDA64 / FP32 Ray-Trace | |
| Média da turma Multimedia (2214 - 50388, n=53, últimos 2 anos) | |
| MSI Stealth 14 Studio A13V | |
| Lenovo Slim Pro 7 14ARP8 | |
| Asus VivoBook 14X K3405 | |
| Média Intel Core i5-13500H (11081 - 15390, n=6) | |
| Gigabyte Aero 14 OLED BMF | |
| Schenker Vision 14 2022 RTX 3050 Ti | |
| Acer Swift X SFX14-71G | |
| AIDA64 / FPU Julia | |
| Lenovo Slim Pro 7 14ARP8 | |
| MSI Stealth 14 Studio A13V | |
| Média da turma Multimedia (12867 - 201874, n=54, últimos 2 anos) | |
| Asus VivoBook 14X K3405 | |
| Média Intel Core i5-13500H (56813 - 74251, n=6) | |
| Gigabyte Aero 14 OLED BMF | |
| Schenker Vision 14 2022 RTX 3050 Ti | |
| Acer Swift X SFX14-71G | |
| AIDA64 / CPU SHA3 | |
| Média da turma Multimedia (626 - 8623, n=54, últimos 2 anos) | |
| MSI Stealth 14 Studio A13V | |
| Asus VivoBook 14X K3405 | |
| Lenovo Slim Pro 7 14ARP8 | |
| Média Intel Core i5-13500H (2621 - 3623, n=6) | |
| Gigabyte Aero 14 OLED BMF | |
| Schenker Vision 14 2022 RTX 3050 Ti | |
| Acer Swift X SFX14-71G | |
| AIDA64 / CPU Queen | |
| Gigabyte Aero 14 OLED BMF | |
| MSI Stealth 14 Studio A13V | |
| Acer Swift X SFX14-71G | |
| Schenker Vision 14 2022 RTX 3050 Ti | |
| Lenovo Slim Pro 7 14ARP8 | |
| Média Intel Core i5-13500H (77835 - 85727, n=6) | |
| Asus VivoBook 14X K3405 | |
| Média da turma Multimedia (13483 - 181505, n=41, últimos 2 anos) | |
| AIDA64 / FPU SinJulia | |
| Lenovo Slim Pro 7 14ARP8 | |
| MSI Stealth 14 Studio A13V | |
| Média da turma Multimedia (886 - 28794, n=54, últimos 2 anos) | |
| Gigabyte Aero 14 OLED BMF | |
| Schenker Vision 14 2022 RTX 3050 Ti | |
| Média Intel Core i5-13500H (7249 - 8086, n=6) | |
| Asus VivoBook 14X K3405 | |
| Acer Swift X SFX14-71G | |
| AIDA64 / FPU Mandel | |
| Lenovo Slim Pro 7 14ARP8 | |
| Média da turma Multimedia (6395 - 105740, n=53, últimos 2 anos) | |
| MSI Stealth 14 Studio A13V | |
| Asus VivoBook 14X K3405 | |
| Média Intel Core i5-13500H (27820 - 38336, n=6) | |
| Gigabyte Aero 14 OLED BMF | |
| Schenker Vision 14 2022 RTX 3050 Ti | |
| Acer Swift X SFX14-71G | |
| AIDA64 / CPU AES | |
| Gigabyte Aero 14 OLED BMF | |
| Asus VivoBook 14X K3405 | |
| Média Intel Core i5-13500H (62657 - 120493, n=6) | |
| Acer Swift X SFX14-71G | |
| MSI Stealth 14 Studio A13V | |
| Schenker Vision 14 2022 RTX 3050 Ti | |
| Média da turma Multimedia (8171 - 126790, n=54, últimos 2 anos) | |
| Lenovo Slim Pro 7 14ARP8 | |
| AIDA64 / CPU ZLib | |
| MSI Stealth 14 Studio A13V | |
| Média da turma Multimedia (143.8 - 2022, n=54, últimos 2 anos) | |
| Schenker Vision 14 2022 RTX 3050 Ti | |
| Asus VivoBook 14X K3405 | |
| Média Intel Core i5-13500H (782 - 992, n=6) | |
| Gigabyte Aero 14 OLED BMF | |
| Lenovo Slim Pro 7 14ARP8 | |
| Acer Swift X SFX14-71G | |
| AIDA64 / FP64 Ray-Trace | |
| Média da turma Multimedia (1014 - 26875, n=54, últimos 2 anos) | |
| MSI Stealth 14 Studio A13V | |
| Lenovo Slim Pro 7 14ARP8 | |
| Asus VivoBook 14X K3405 | |
| Média Intel Core i5-13500H (5955 - 8495, n=6) | |
| Gigabyte Aero 14 OLED BMF | |
| Schenker Vision 14 2022 RTX 3050 Ti | |
| Acer Swift X SFX14-71G | |
| AIDA64 / CPU PhotoWorxx | |
| Gigabyte Aero 14 OLED BMF | |
| Média da turma Multimedia (8187 - 88154, n=54, últimos 2 anos) | |
| Acer Swift X SFX14-71G | |
| MSI Stealth 14 Studio A13V | |
| Média Intel Core i5-13500H (20212 - 37618, n=6) | |
| Schenker Vision 14 2022 RTX 3050 Ti | |
| Lenovo Slim Pro 7 14ARP8 | |
| Asus VivoBook 14X K3405 | |
Desempenho do sistema
O VivoBook 14X fica atrás do MSI Stealth 14 nos testes PCMark 10 e CrossMark, mas não muito. O desempenho geral do sistema no uso diário típico é suave e responsivo.
CrossMark: Overall | Productivity | Creativity | Responsiveness
AIDA64: Memory Copy | Memory Read | Memory Write | Memory Latency
| PCMark 10 / Score | |
| Média da turma Multimedia (4325 - 10386, n=52, últimos 2 anos) | |
| Gigabyte Aero 14 OLED BMF | |
| Acer Swift X SFX14-71G | |
| MSI Stealth 14 Studio A13V | |
| Asus VivoBook 14X K3405 | |
| Média Intel Core i5-13500H, NVIDIA GeForce RTX 3050 4GB Laptop GPU (n=1) | |
| Schenker Vision 14 2022 RTX 3050 Ti | |
| Lenovo Slim Pro 7 14ARP8 | |
| PCMark 10 / Essentials | |
| Gigabyte Aero 14 OLED BMF | |
| Acer Swift X SFX14-71G | |
| Média da turma Multimedia (8025 - 11664, n=51, últimos 2 anos) | |
| Schenker Vision 14 2022 RTX 3050 Ti | |
| MSI Stealth 14 Studio A13V | |
| Asus VivoBook 14X K3405 | |
| Média Intel Core i5-13500H, NVIDIA GeForce RTX 3050 4GB Laptop GPU (n=1) | |
| Lenovo Slim Pro 7 14ARP8 | |
| PCMark 10 / Productivity | |
| Média da turma Multimedia (7323 - 18233, n=51, últimos 2 anos) | |
| Acer Swift X SFX14-71G | |
| Gigabyte Aero 14 OLED BMF | |
| Asus VivoBook 14X K3405 | |
| Média Intel Core i5-13500H, NVIDIA GeForce RTX 3050 4GB Laptop GPU (n=1) | |
| Schenker Vision 14 2022 RTX 3050 Ti | |
| MSI Stealth 14 Studio A13V | |
| Lenovo Slim Pro 7 14ARP8 | |
| PCMark 10 / Digital Content Creation | |
| Média da turma Multimedia (3651 - 16240, n=51, últimos 2 anos) | |
| MSI Stealth 14 Studio A13V | |
| Acer Swift X SFX14-71G | |
| Gigabyte Aero 14 OLED BMF | |
| Lenovo Slim Pro 7 14ARP8 | |
| Schenker Vision 14 2022 RTX 3050 Ti | |
| Asus VivoBook 14X K3405 | |
| Média Intel Core i5-13500H, NVIDIA GeForce RTX 3050 4GB Laptop GPU (n=1) | |
| CrossMark / Overall | |
| Acer Swift X SFX14-71G | |
| Média da turma Multimedia (866 - 2728, n=60, últimos 2 anos) | |
| Gigabyte Aero 14 OLED BMF | |
| MSI Stealth 14 Studio A13V | |
| Schenker Vision 14 2022 RTX 3050 Ti | |
| Asus VivoBook 14X K3405 | |
| Média Intel Core i5-13500H, NVIDIA GeForce RTX 3050 4GB Laptop GPU (n=1) | |
| Lenovo Slim Pro 7 14ARP8 | |
| CrossMark / Productivity | |
| Acer Swift X SFX14-71G | |
| Gigabyte Aero 14 OLED BMF | |
| Média da turma Multimedia (931 - 2489, n=60, últimos 2 anos) | |
| MSI Stealth 14 Studio A13V | |
| Schenker Vision 14 2022 RTX 3050 Ti | |
| Asus VivoBook 14X K3405 | |
| Média Intel Core i5-13500H, NVIDIA GeForce RTX 3050 4GB Laptop GPU (n=1) | |
| Lenovo Slim Pro 7 14ARP8 | |
| CrossMark / Creativity | |
| Média da turma Multimedia (907 - 3465, n=60, últimos 2 anos) | |
| Acer Swift X SFX14-71G | |
| Gigabyte Aero 14 OLED BMF | |
| MSI Stealth 14 Studio A13V | |
| Schenker Vision 14 2022 RTX 3050 Ti | |
| Asus VivoBook 14X K3405 | |
| Média Intel Core i5-13500H, NVIDIA GeForce RTX 3050 4GB Laptop GPU (n=1) | |
| Lenovo Slim Pro 7 14ARP8 | |
| CrossMark / Responsiveness | |
| Acer Swift X SFX14-71G | |
| Gigabyte Aero 14 OLED BMF | |
| MSI Stealth 14 Studio A13V | |
| Schenker Vision 14 2022 RTX 3050 Ti | |
| Média da turma Multimedia (605 - 2024, n=60, últimos 2 anos) | |
| Asus VivoBook 14X K3405 | |
| Média Intel Core i5-13500H, NVIDIA GeForce RTX 3050 4GB Laptop GPU (n=1) | |
| Lenovo Slim Pro 7 14ARP8 | |
| AIDA64 / Memory Copy | |
| Média da turma Multimedia (11299 - 132135, n=54, últimos 2 anos) | |
| Gigabyte Aero 14 OLED BMF | |
| Acer Swift X SFX14-71G | |
| MSI Stealth 14 Studio A13V | |
| Lenovo Slim Pro 7 14ARP8 | |
| Schenker Vision 14 2022 RTX 3050 Ti | |
| Asus VivoBook 14X K3405 | |
| Média Intel Core i5-13500H, NVIDIA GeForce RTX 3050 4GB Laptop GPU (n=1) | |
| AIDA64 / Memory Read | |
| Média da turma Multimedia (11624 - 174586, n=54, últimos 2 anos) | |
| Gigabyte Aero 14 OLED BMF | |
| MSI Stealth 14 Studio A13V | |
| Acer Swift X SFX14-71G | |
| Lenovo Slim Pro 7 14ARP8 | |
| Asus VivoBook 14X K3405 | |
| Média Intel Core i5-13500H, NVIDIA GeForce RTX 3050 4GB Laptop GPU (n=1) | |
| Schenker Vision 14 2022 RTX 3050 Ti | |
| AIDA64 / Memory Write | |
| Gigabyte Aero 14 OLED BMF | |
| Média da turma Multimedia (11755 - 134998, n=54, últimos 2 anos) | |
| Acer Swift X SFX14-71G | |
| Lenovo Slim Pro 7 14ARP8 | |
| MSI Stealth 14 Studio A13V | |
| Schenker Vision 14 2022 RTX 3050 Ti | |
| Asus VivoBook 14X K3405 | |
| Média Intel Core i5-13500H, NVIDIA GeForce RTX 3050 4GB Laptop GPU (n=1) | |
| AIDA64 / Memory Latency | |
| Média da turma Multimedia (7 - 535, n=53, últimos 2 anos) | |
| Lenovo Slim Pro 7 14ARP8 | |
| Acer Swift X SFX14-71G | |
| Gigabyte Aero 14 OLED BMF | |
| Schenker Vision 14 2022 RTX 3050 Ti | |
| Asus VivoBook 14X K3405 | |
| Média Intel Core i5-13500H, NVIDIA GeForce RTX 3050 4GB Laptop GPU (n=1) | |
| MSI Stealth 14 Studio A13V | |
* ... menor é melhor
| PCMark 8 Home Score Accelerated v2 | 5514 pontos | |
| PCMark 8 Work Score Accelerated v2 | 6078 pontos | |
| PCMark 10 Score | 6645 pontos | |
Ajuda | ||
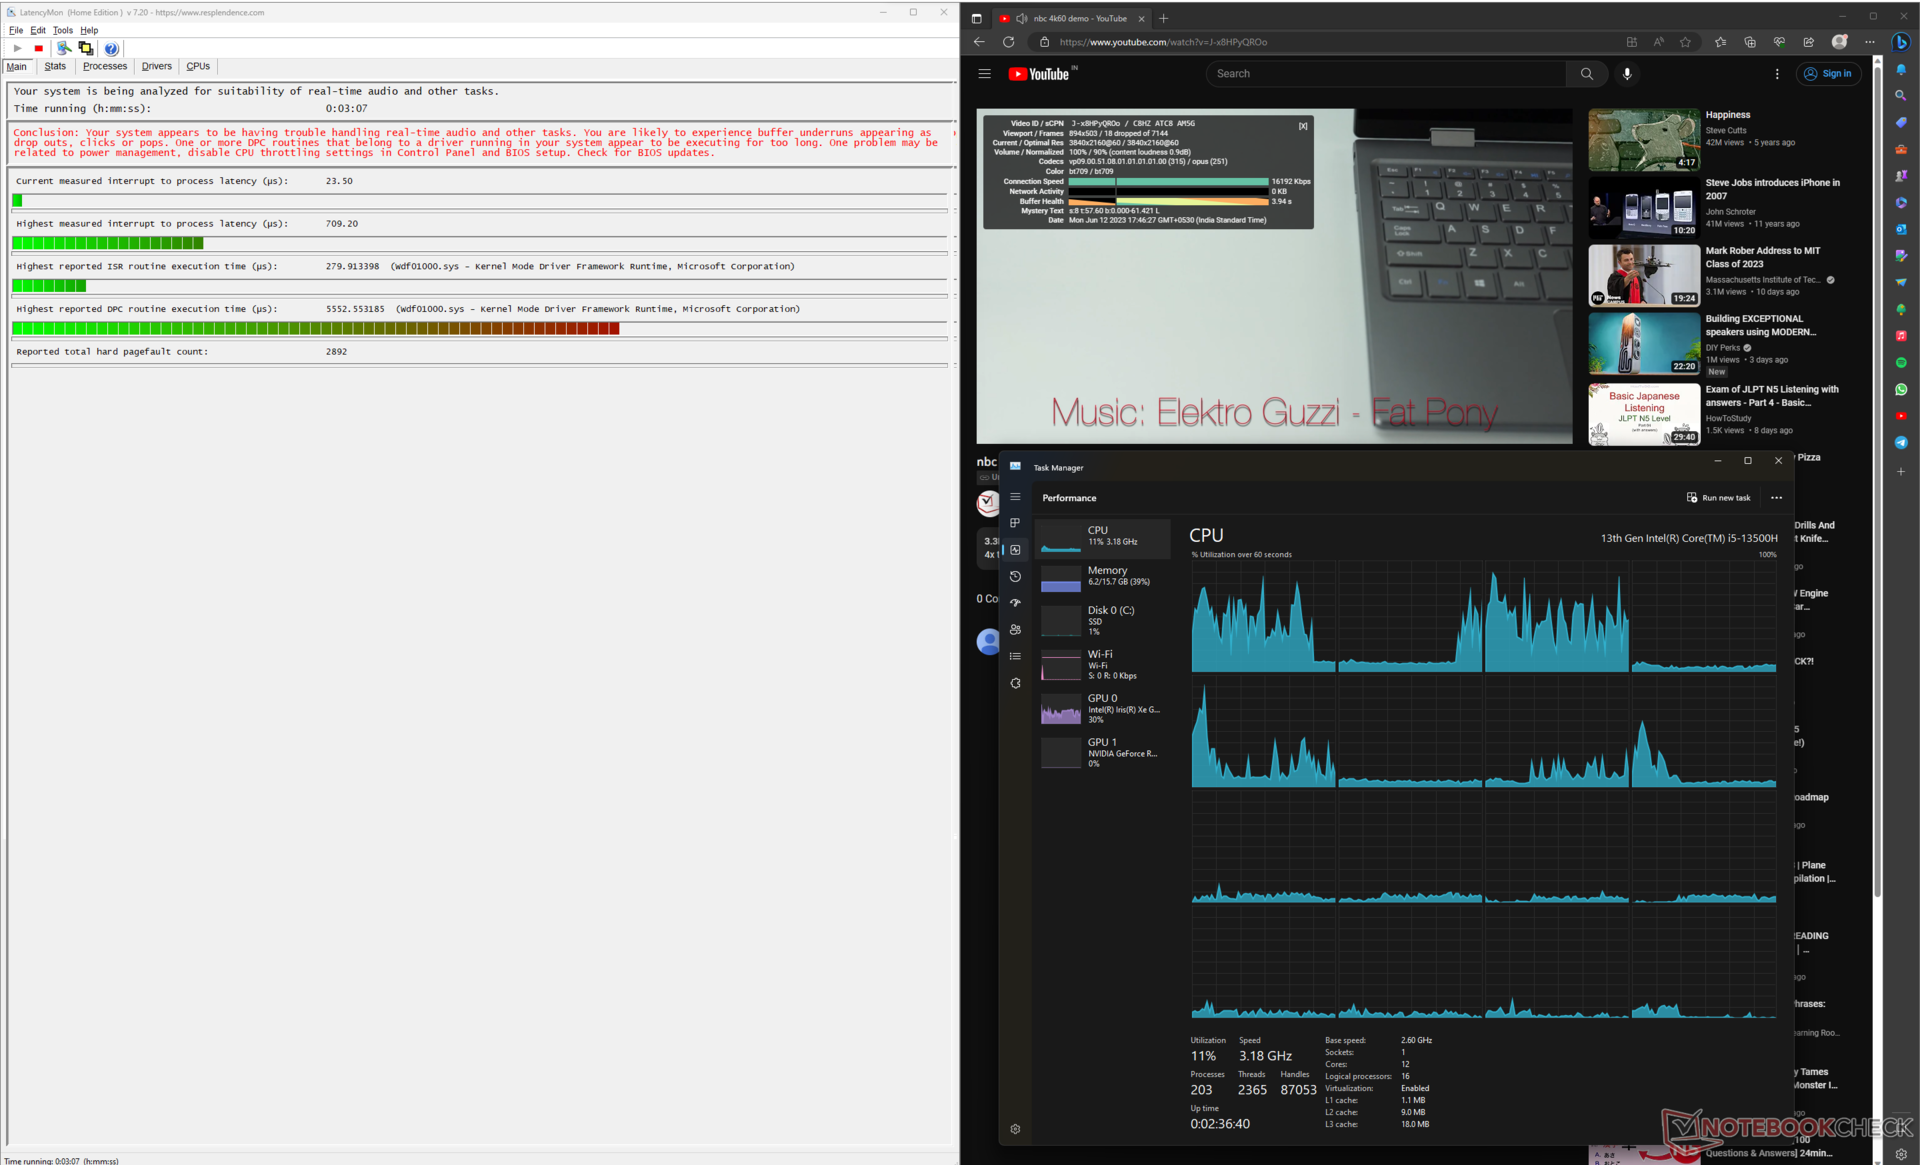
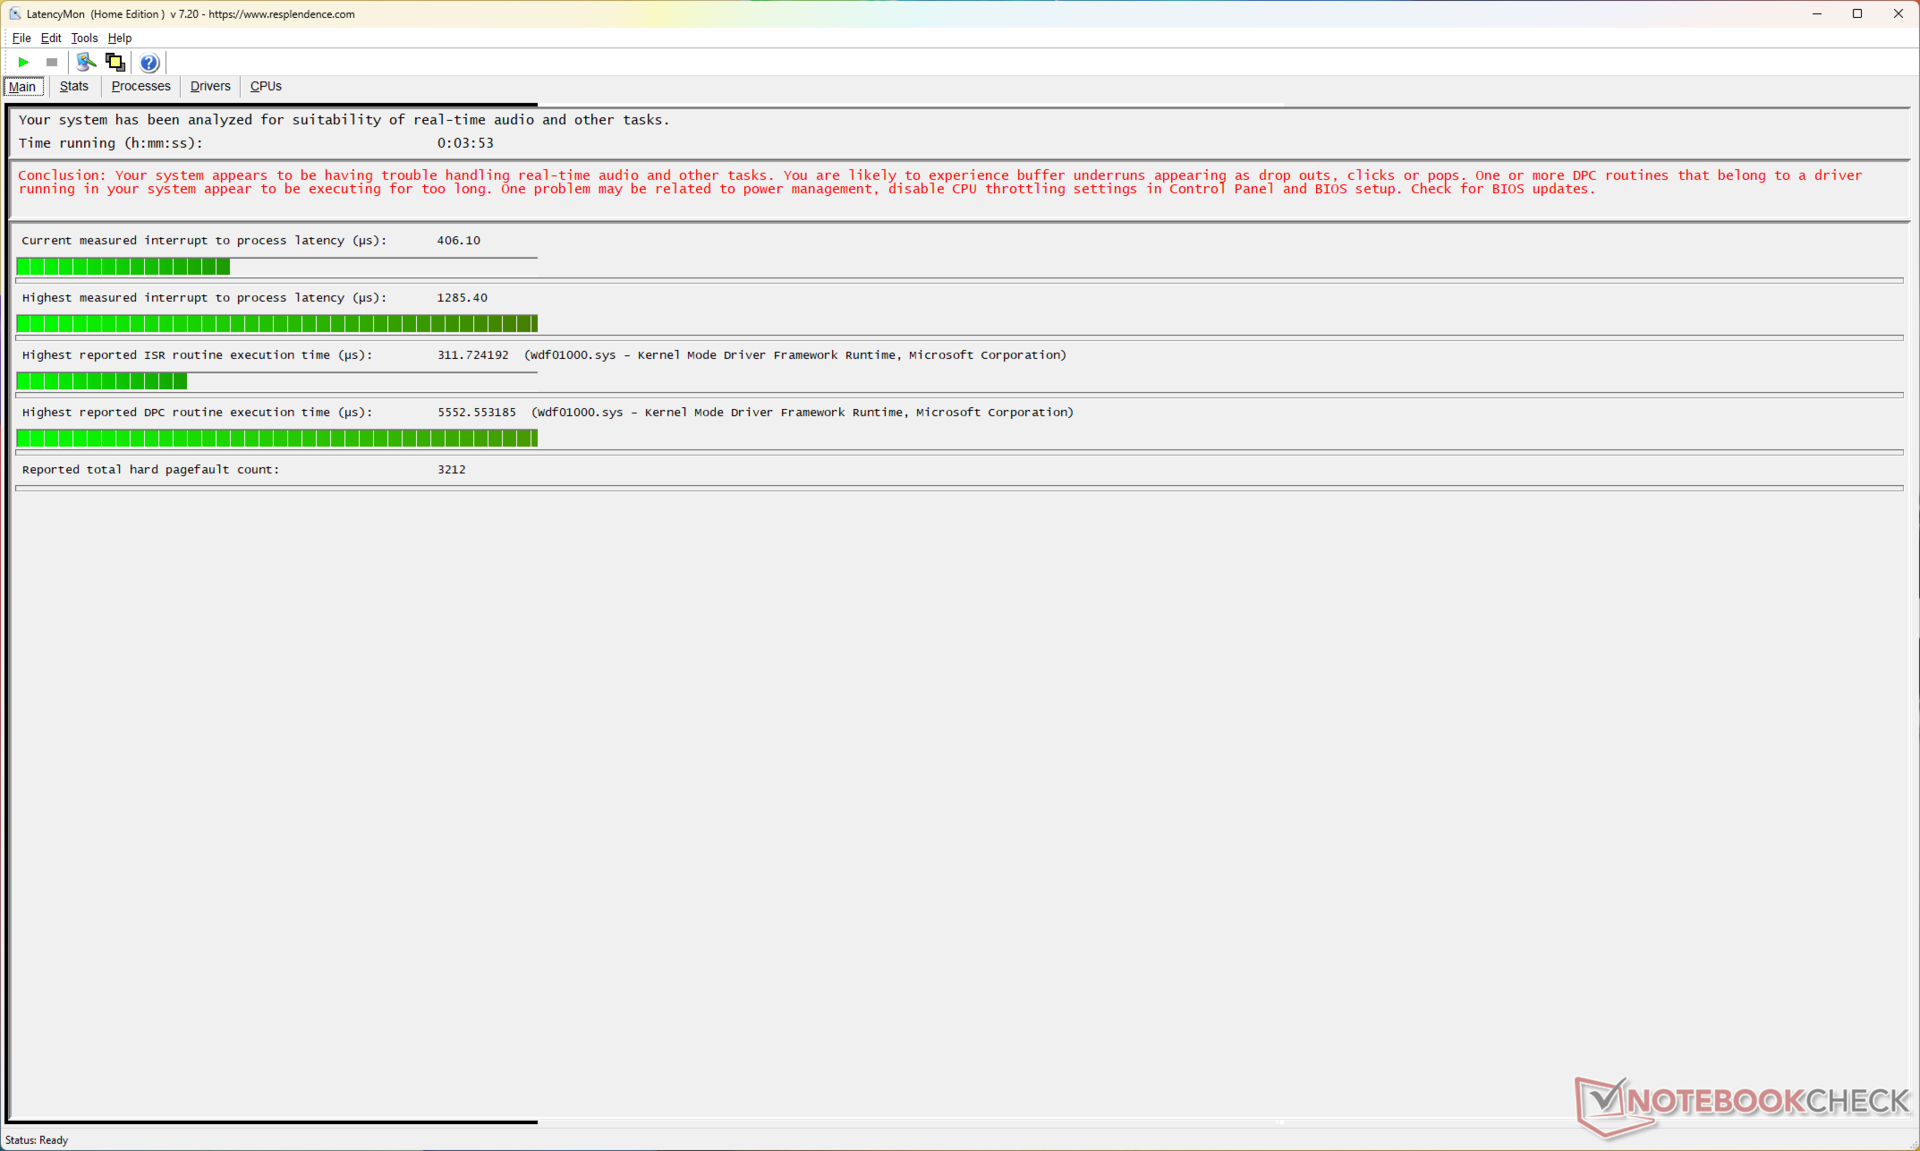
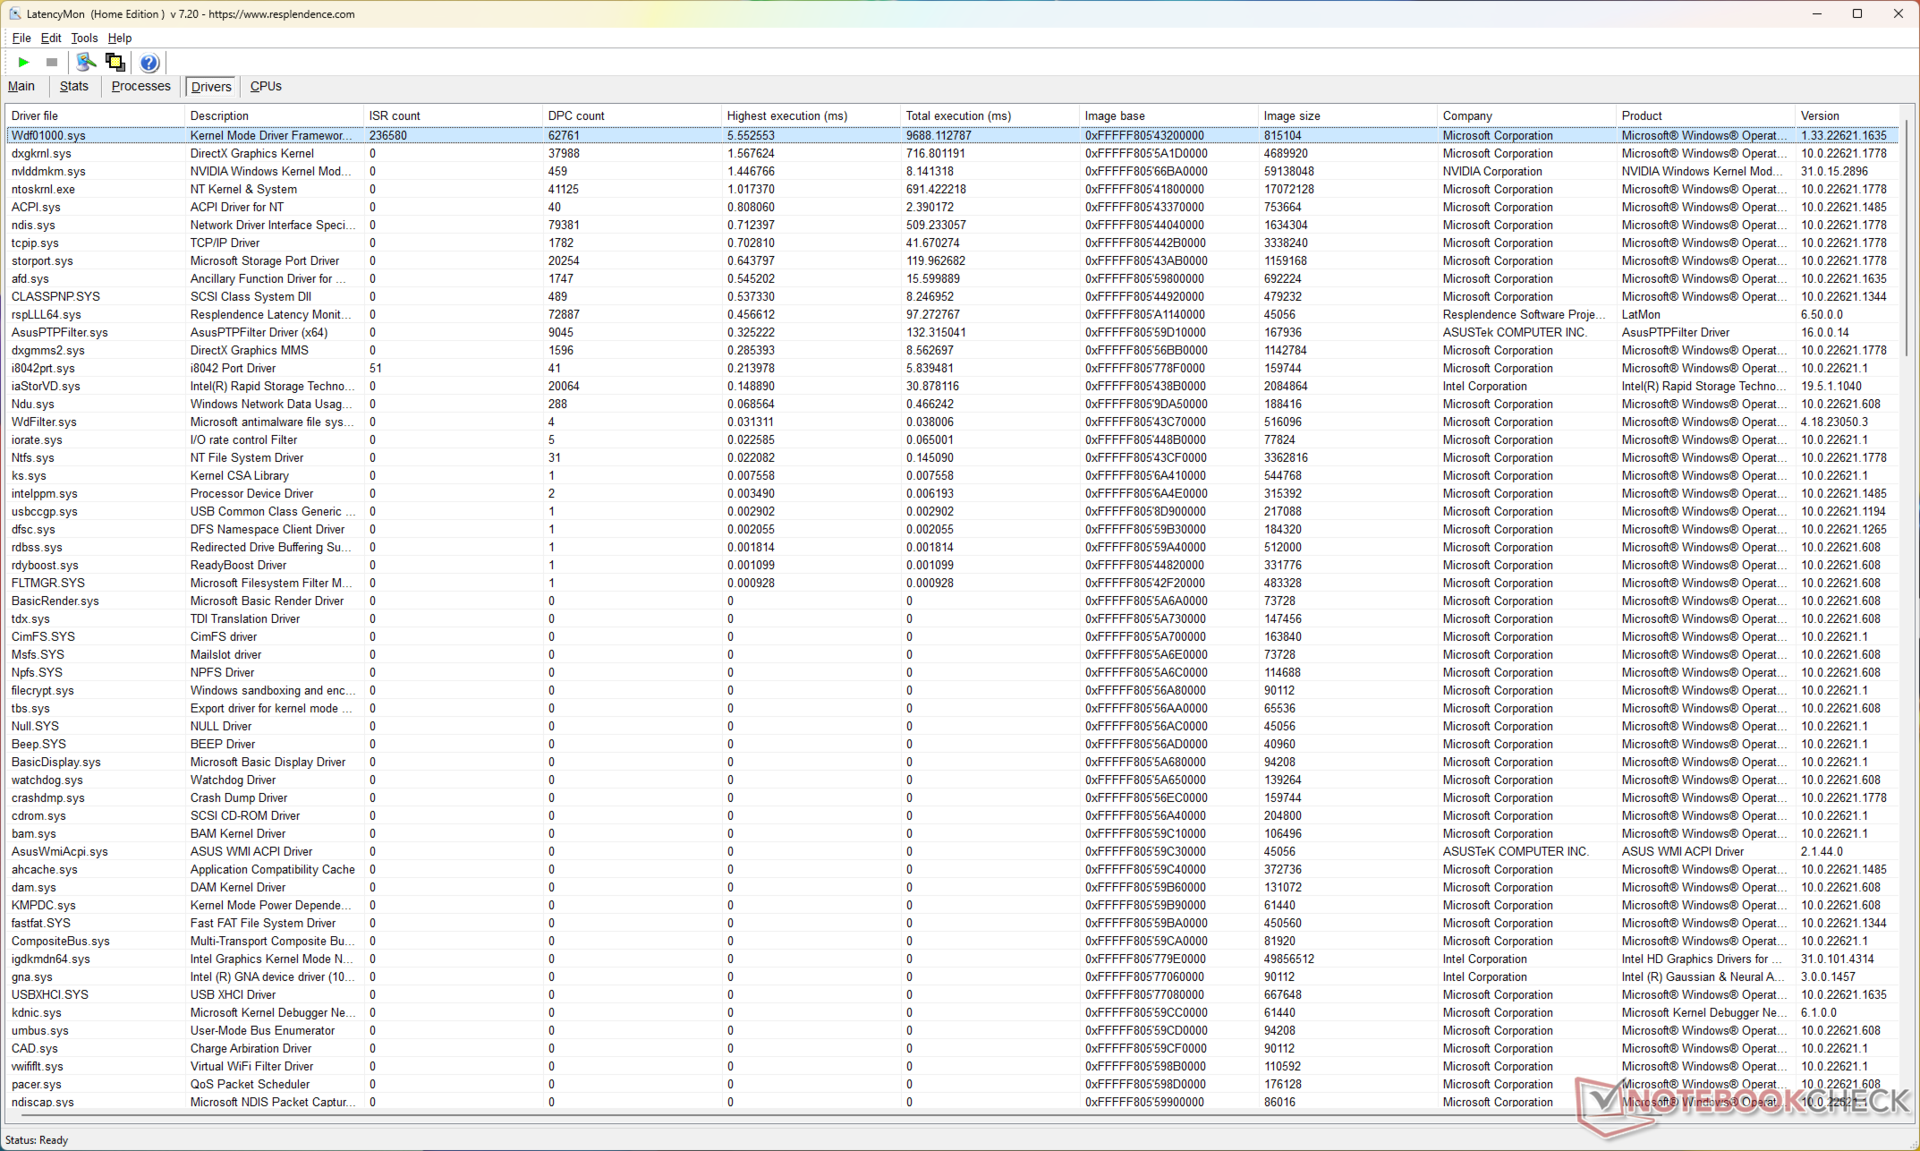
Latência DPC
A latência do DPC parece estar no lado mais alto. A latência de interrupção para processo medida foi inicialmente de 709,20 µs durante a reprodução de um vídeo 4K do YouTube.
Esse valor aumentou para 1285,40 µs após um estresse de 10 segundos do Prime95, sugerindo que os fluxos de trabalho em tempo real podem ser afetados sob carga pesada.
| DPC Latencies / LatencyMon - interrupt to process latency (max), Web, Youtube, Prime95 | |
| Acer Swift X SFX14-71G | |
| Gigabyte Aero 14 OLED BMF | |
| MSI Stealth 14 Studio A13V | |
| Lenovo Slim Pro 7 14ARP8 | |
| Asus VivoBook 14X K3405 | |
| Schenker Vision 14 2022 RTX 3050 Ti | |
* ... menor é melhor
NossaClassificação de latência DPCoferece mais comparações de latência entre os dispositivos analisados.
Dispositivos de armazenamento
O SSD Samsung PM9B1 NVMe instalado oferece desempenho satisfatório para a maioria dos aplicativos. A Asus forneceu uma almofada térmica embaixo da unidade, o que ajuda a manter um desempenho relativamente estável durante o teste de loop de leitura do DiskSpd.
Dito isso, o SSD PM9B1 fica significativamente atrás da concorrência em quase todos os aspectos, exceto nas gravações em 4K. Não há espaço para expansão do armazenamento.

* ... menor é melhor
Disk Throttling: DiskSpd Read Loop, Queue Depth 8
Mais comparações de desempenho de armazenamento podem ser encontradas em nossos Benchmarks de HDD e SSD página.
Desempenho da GPU
A Asus implementa uma GPU de laptop de 40 W GPU para laptop Nvidia GeForce RTX 3050 4 GB no VivoBook 14X. A RTX 3050 de 4 GB está desatualizada para um dispositivo de 2023 com um processador Intel de 13ª geração, e vemos que isso se reflete em benchmarks sintéticos e de jogos.
O desempenho cumulativo do 3DMark cai 23% em comparação com a RTX 3050 Ti no Schenker Vision 14e em 26% em comparação com a RTX 3050 6 GB no Lenovo Slim Pro 7.
O VivoBook 14X também fica para trás em 38% em relação ao mais novo modelo de 35 W RTX 4050 no Gigabyte Aero 14 OLED.
| 3DMark 11 Performance | 13942 pontos | |
| 3DMark Ice Storm Standard Score | 70334 pontos | |
| 3DMark Cloud Gate Standard Score | 36793 pontos | |
| 3DMark Fire Strike Score | 8504 pontos | |
| 3DMark Fire Strike Extreme Score | 4371 pontos | |
| 3DMark Time Spy Score | 3832 pontos | |
Ajuda | ||
| Blender / v3.3 Classroom OPTIX/RTX | |
| Asus VivoBook 14X K3405 | |
| Média NVIDIA GeForce RTX 3050 4GB Laptop GPU (53 - 99, n=12) | |
| Lenovo Slim Pro 7 14ARP8 | |
| Schenker Vision 14 2022 RTX 3050 Ti | |
| Média da turma Multimedia (12 - 105, n=22, últimos 2 anos) | |
| Gigabyte Aero 14 OLED BMF | |
| Acer Swift X SFX14-71G | |
| MSI Stealth 14 Studio A13V | |
| Blender / v3.3 Classroom CUDA | |
| Asus VivoBook 14X K3405 | |
| Asus VivoBook 14X K3405 | |
| Média NVIDIA GeForce RTX 3050 4GB Laptop GPU (97 - 152, n=13) | |
| Lenovo Slim Pro 7 14ARP8 | |
| Schenker Vision 14 2022 RTX 3050 Ti | |
| Gigabyte Aero 14 OLED BMF | |
| Média da turma Multimedia (20 - 186, n=22, últimos 2 anos) | |
| Acer Swift X SFX14-71G | |
| Blender / v3.3 Classroom CPU | |
| Média NVIDIA GeForce RTX 3050 4GB Laptop GPU (388 - 937, n=11) | |
| Acer Swift X SFX14-71G | |
| Schenker Vision 14 2022 RTX 3050 Ti | |
| Gigabyte Aero 14 OLED BMF | |
| Asus VivoBook 14X K3405 | |
| Lenovo Slim Pro 7 14ARP8 | |
| Média da turma Multimedia (134.5 - 1042, n=62, últimos 2 anos) | |
| MSI Stealth 14 Studio A13V | |
* ... menor é melhor
Desempenho em jogos
O VivoBook 14X não é voltado para o público de jogos, mas ainda assim é capaz de oferecer jogos decentes em 1080p Ultra, principalmente com títulos de eSports menos exigentes.
Aumentos perceptíveis nas taxas de quadros podem ser obtidos com o uso de algoritmos de upscaling em jogos compatíveis.
| The Witcher 3 - 1920x1080 Ultra Graphics & Postprocessing (HBAO+) | |
| MSI Stealth 14 Studio A13V | |
| Gigabyte Aero 14 OLED BMF | |
| Gigabyte Aero 14 OLED BMF | |
| Acer Swift X SFX14-71G | |
| Média da turma Multimedia (11 - 121, n=7, últimos 2 anos) | |
| Lenovo Slim Pro 7 14ARP8 | |
| Schenker Vision 14 2022 RTX 3050 Ti | |
| Asus VivoBook 14X K3405 | |
| Final Fantasy XV Benchmark - 1920x1080 High Quality | |
| MSI Stealth 14 Studio A13V | |
| Acer Swift X SFX14-71G | |
| Gigabyte Aero 14 OLED BMF | |
| Média da turma Multimedia (7.61 - 144.4, n=57, últimos 2 anos) | |
| Lenovo Slim Pro 7 14ARP8 | |
| Schenker Vision 14 2022 RTX 3050 Ti | |
| Asus VivoBook 14X K3405 | |
| Strange Brigade - 1920x1080 ultra AA:ultra AF:16 | |
| MSI Stealth 14 Studio A13V | |
| Acer Swift X SFX14-71G | |
| Gigabyte Aero 14 OLED BMF | |
| Média da turma Multimedia (13.3 - 303, n=57, últimos 2 anos) | |
| Schenker Vision 14 2022 RTX 3050 Ti | |
| Asus VivoBook 14X K3405 | |
| Dota 2 Reborn - 1920x1080 ultra (3/3) best looking | |
| MSI Stealth 14 Studio A13V | |
| Gigabyte Aero 14 OLED BMF | |
| Acer Swift X SFX14-71G | |
| Asus VivoBook 14X K3405 | |
| Schenker Vision 14 2022 RTX 3050 Ti | |
| Lenovo Slim Pro 7 14ARP8 | |
| Média da turma Multimedia (29 - 179.9, n=59, últimos 2 anos) | |
O gráfico Witcher 3 FPS
Não há grandes problemas com o resfriamento da GPU, pois observamos taxas de quadros relativamente estáveis ao executar The Witcher 3 a 1080p Ultra.
Witcher 3 FPS Chart
| baixo | média | alto | ultra | QHD | 4K | |
|---|---|---|---|---|---|---|
| GTA V (2015) | 175 | 167.8 | 100.4 | 48.4 | 33.7 | 32 |
| The Witcher 3 (2015) | 150.4 | 68.8 | 70.6 | 40 | 24.4 | |
| Dota 2 Reborn (2015) | 163.4 | 141 | 135.3 | 115.3 | 57.1 | |
| Final Fantasy XV Benchmark (2018) | 99.4 | 52.5 | 37.7 | 27.3 | 15 | |
| X-Plane 11.11 (2018) | 111 | 95.2 | 78.9 | 66.1 | ||
| Far Cry 5 (2018) | 127 | 68 | 61 | 57 | 39 | 19 |
| Strange Brigade (2018) | 179.7 | 78.6 | 65.2 | 57.9 | 41.1 | 23.4 |
| F1 2021 (2021) | 232 | 123.6 | 96 | 44.1 | 32.1 | 12.7 |
| Cyberpunk 2077 1.6 (2022) | 51.7 | 38.2 | 28.4 | 25.3 | 15.6 | 5.57 |
| F1 22 (2022) | 119.4 | 108.5 | 75.2 | 21.3 | 13.2 | 5.9 |
Confira nossa GPU para laptop Nvidia GeForce RTX 3050 para obter mais informações e comparações de desempenho.
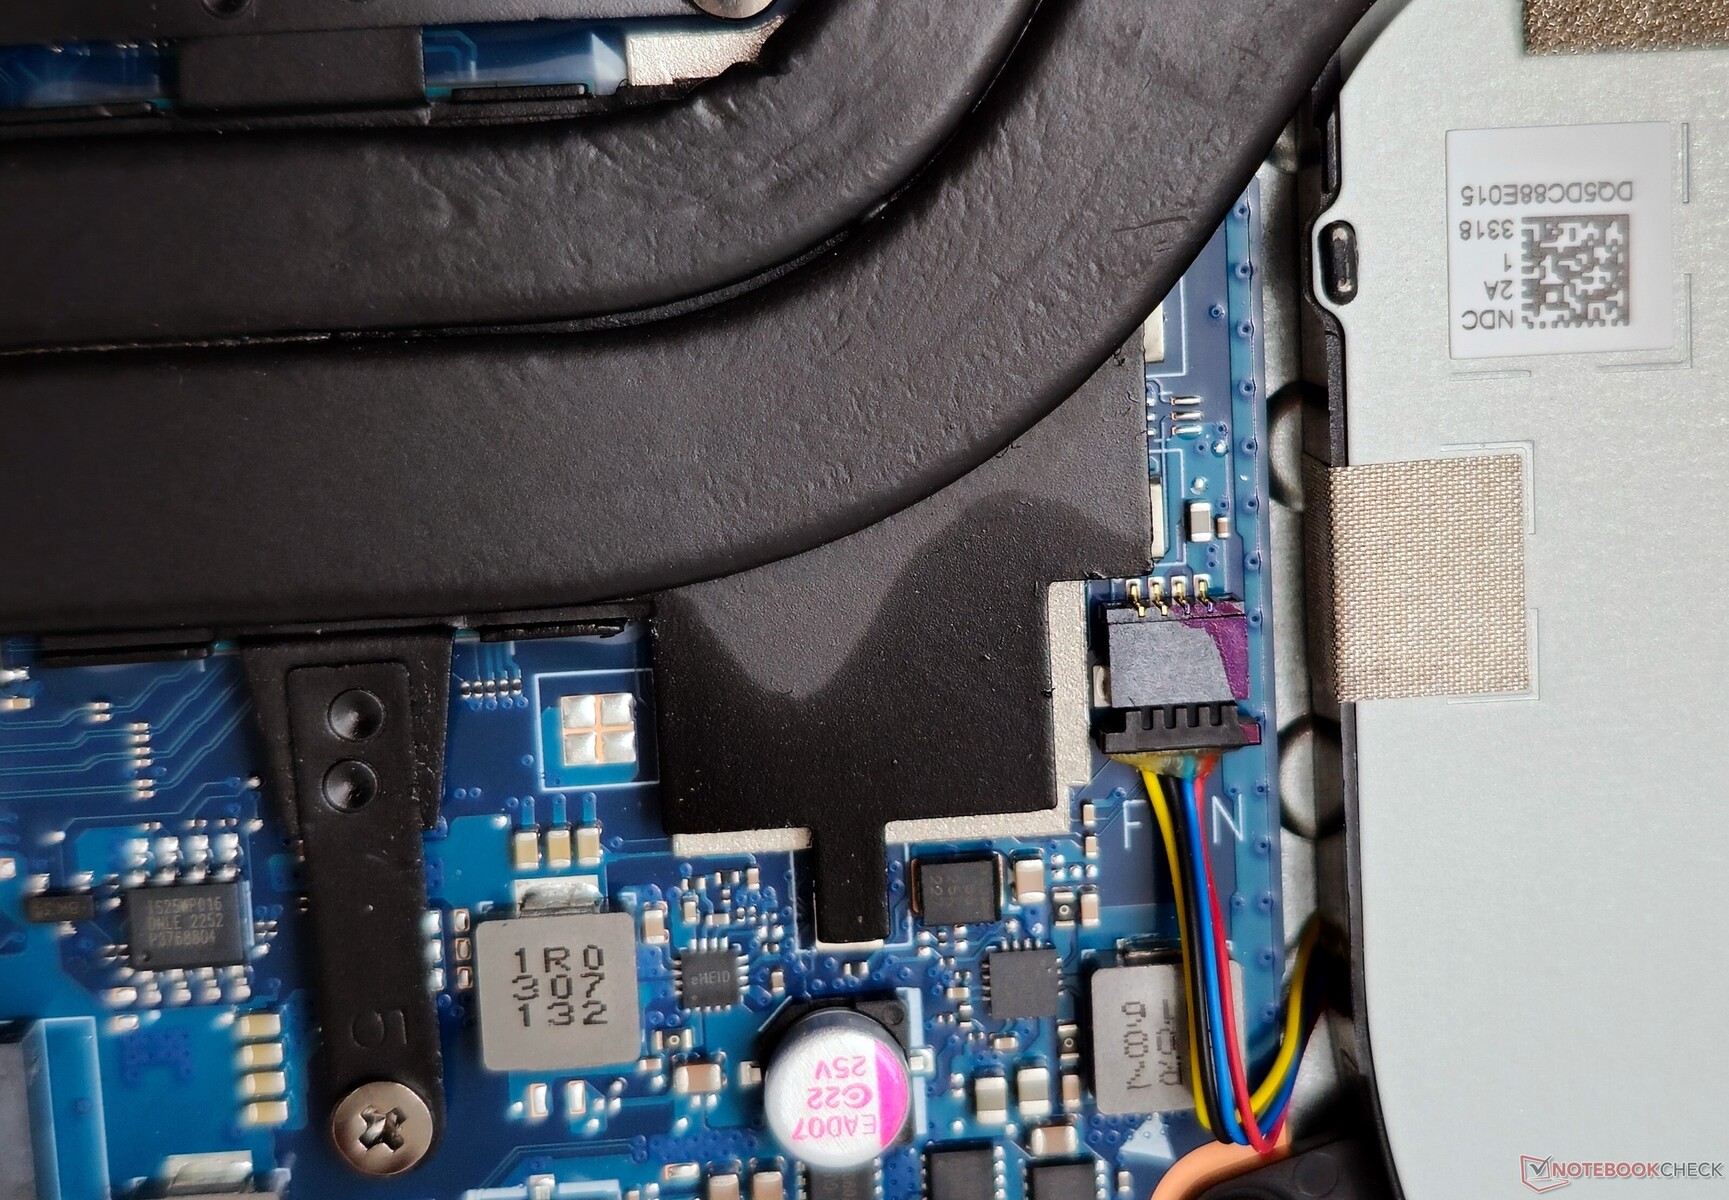
Emissões: Combinação de ventilador único e tubo de aquecimento duplo levada ao máximo
Ruído do sistema
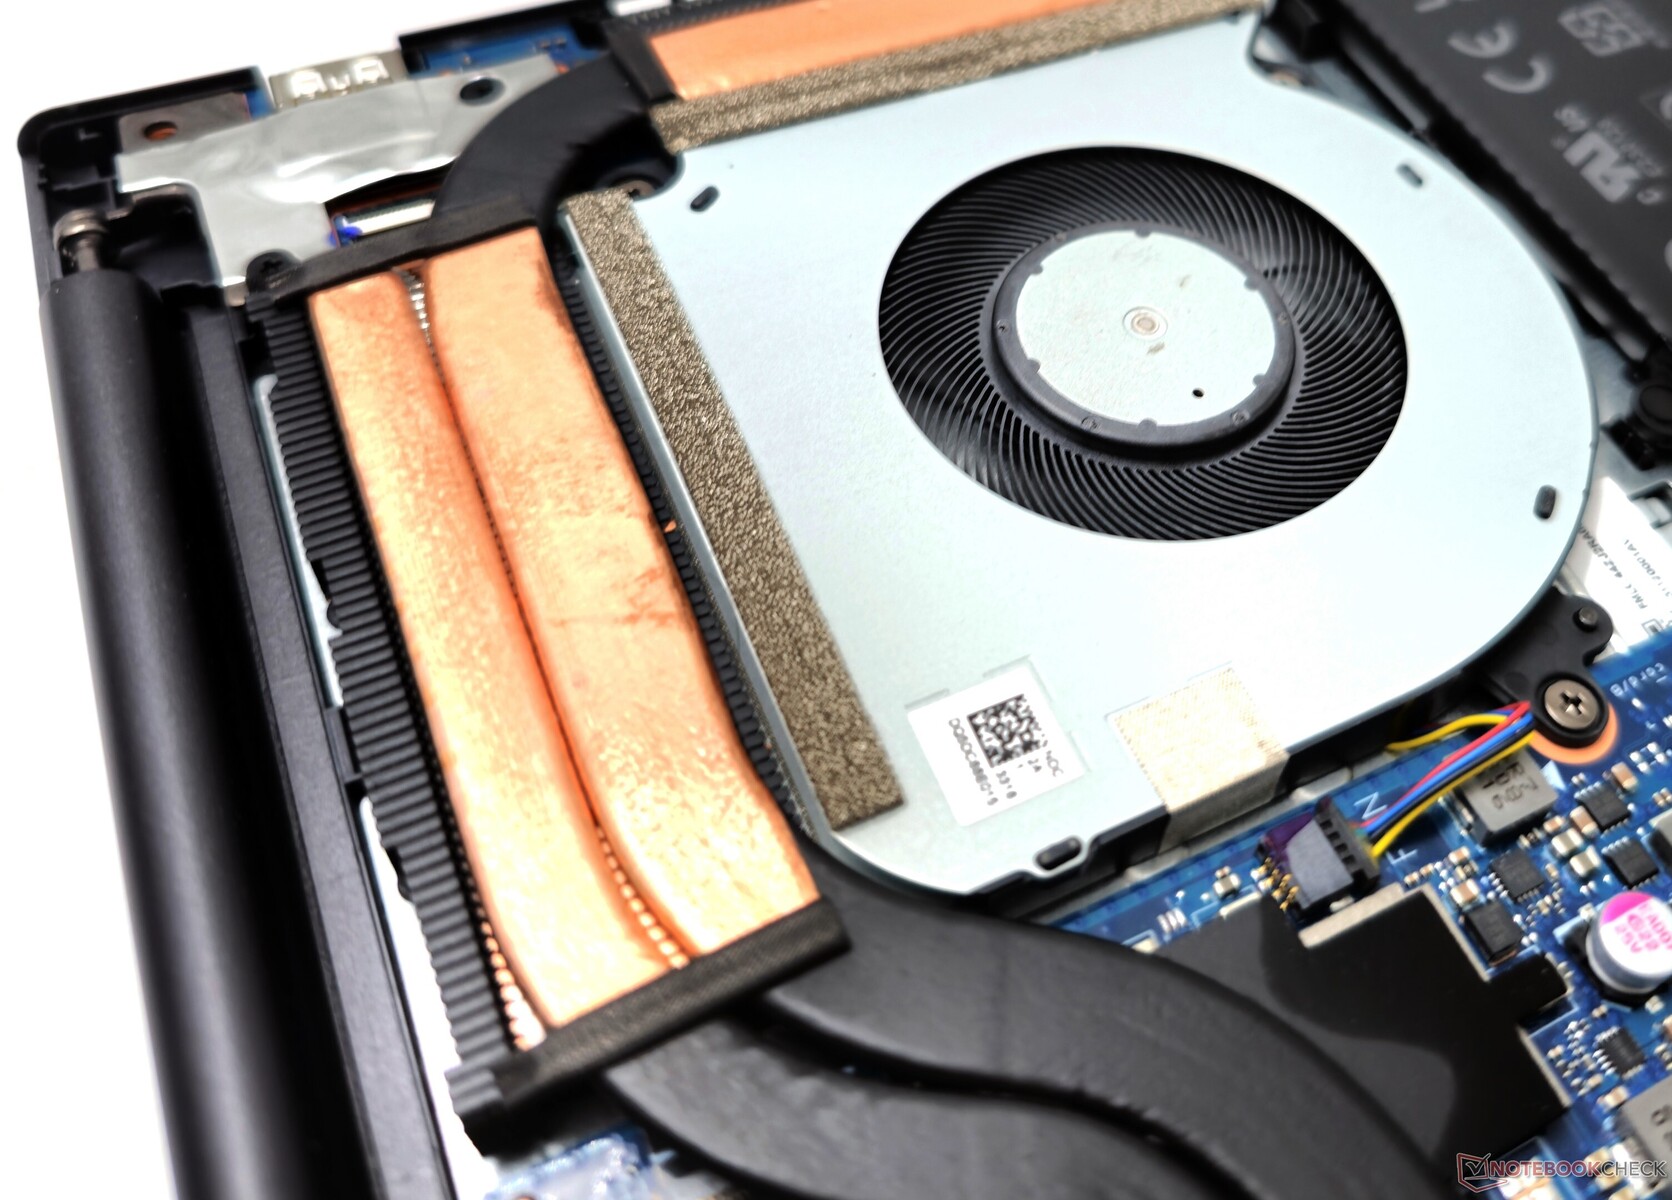
A Asus equipa o VivoBook 14X com uma única ventoinha para resfriar a CPU e a GPU. Semelhante às nossas descobertas com outros modelos VivoBook, a Asus parece ter estabelecido um limite para o ruído máximo da ventoinha para cada perfil de desempenho.
A empresa afirma que o ruído da ventoinha é inferior a 40 dB(A) no perfil Padrão. Registramos níveis de pressão sonora de 31 dB(A) no modo Whisper, 42 dB(A) no modo Standard e quase 53 dB(A) no modo Performance.
O perfil do modo Full Speed mantém um SPL consistente de quase 53 dB(A), independentemente da carga.
Barulho
| Ocioso |
| 22.08 / 22.08 / 22.08 dB |
| Carga |
| 52.98 / 52.67 dB |
 | ||
30 dB silencioso 40 dB(A) audível 50 dB(A) ruidosamente alto |
||
min: | ||
| Modo de desempenho | Idle dB(A) | Load average dB(A) | Load maximum dB(A) | The Witcher 3 1080p Ultra dB(A) |
|---|---|---|---|---|
| Whisper | 21.73 | 30.61 | 31.13 | 30.67 / 34 fps |
| Padrão | 21.62 | 42.33 | 42.12 | 42.23 / 38 fps |
| Desempenho | 22.08 | 52.98 | 52.67 | 52.65 / 40 fps |
| Asus VivoBook 14X K3405 i5-13500H, GeForce RTX 3050 4GB Laptop GPU | Acer Swift X SFX14-71G i7-13700H, GeForce RTX 4050 Laptop GPU | MSI Stealth 14 Studio A13V i7-13700H, GeForce RTX 4050 Laptop GPU | Gigabyte Aero 14 OLED BMF i7-13700H, GeForce RTX 4050 Laptop GPU | Lenovo Slim Pro 7 14ARP8 R7 7735HS, GeForce RTX 3050 6GB Laptop GPU | Schenker Vision 14 2022 RTX 3050 Ti i7-12700H, GeForce RTX 3050 Ti Laptop GPU | |
|---|---|---|---|---|---|---|
| Noise | -14% | -10% | -11% | 4% | -4% | |
| desligado / ambiente * (dB) | 21.46 | 24.8 -16% | 25.3 -18% | 24 -12% | 22.7 -6% | 24.4 -14% |
| Idle Minimum * (dB) | 22.08 | 28.2 -28% | 25.3 -15% | 24 -9% | 22.8 -3% | 24.4 -11% |
| Idle Average * (dB) | 22.08 | 31.8 -44% | 25 -13% | 24 -9% | 22.8 -3% | 24.4 -11% |
| Idle Maximum * (dB) | 22.08 | 31.8 -44% | 33.7 -53% | 35.71 -62% | 22.8 -3% | 27.8 -26% |
| Load Average * (dB) | 52.98 | 38.2 28% | 42.2 20% | 43.8 17% | 43.3 18% | |
| Witcher 3 ultra * (dB) | 52.7 | 50 5% | 51 3% | 40.22 24% | 43.8 17% | 48.2 9% |
| Load Maximum * (dB) | 52.67 | 52.2 1% | 51 3% | 51.93 1% | 47.1 11% | 48.8 7% |
* ... menor é melhor
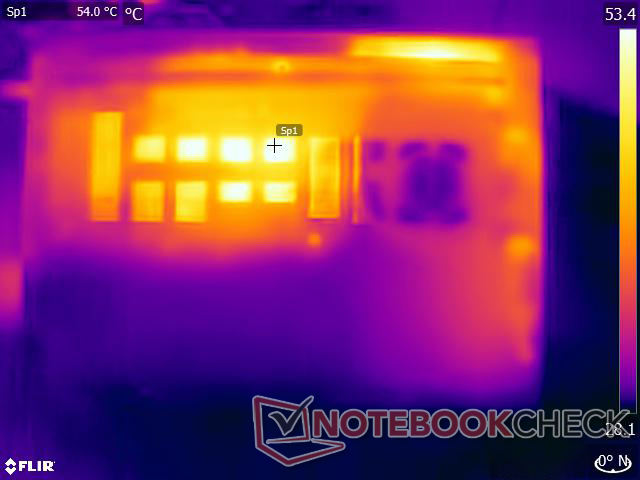
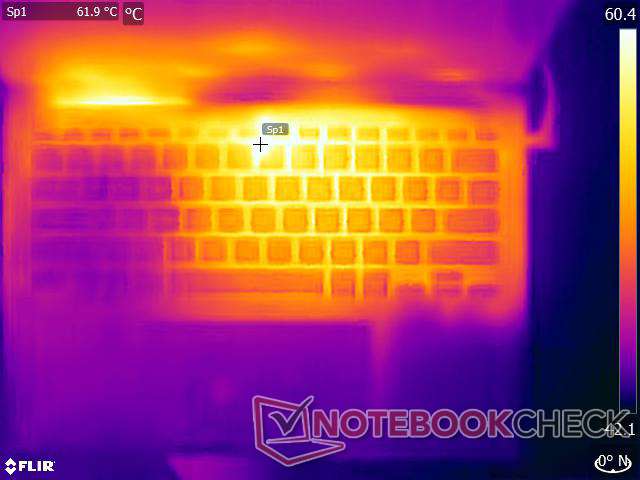
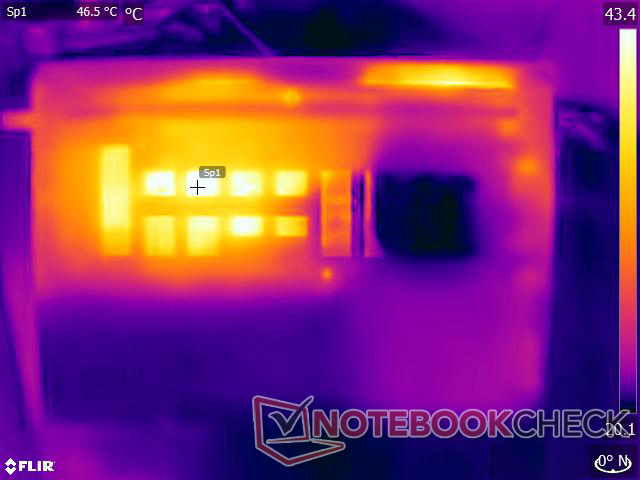
Temperatura
A Asus afirma que o desempenho térmico foi aprimorado com o novo design da ventoinha, mas a combinação de ventoinha única e tubo de calor duplo tem seus limites para manter as temperaturas da superfície sob controle quando sob tensão.
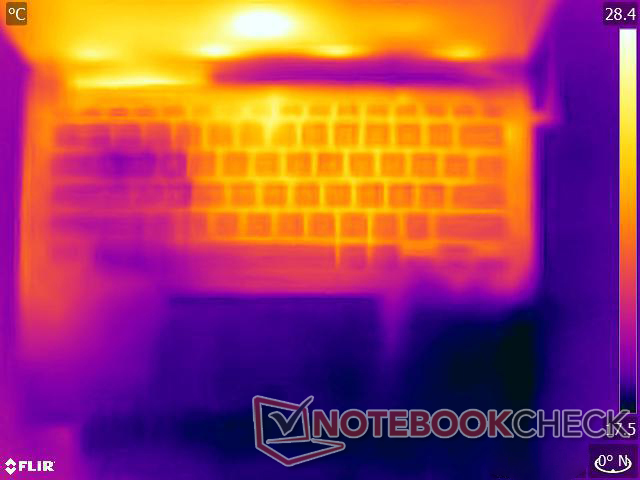
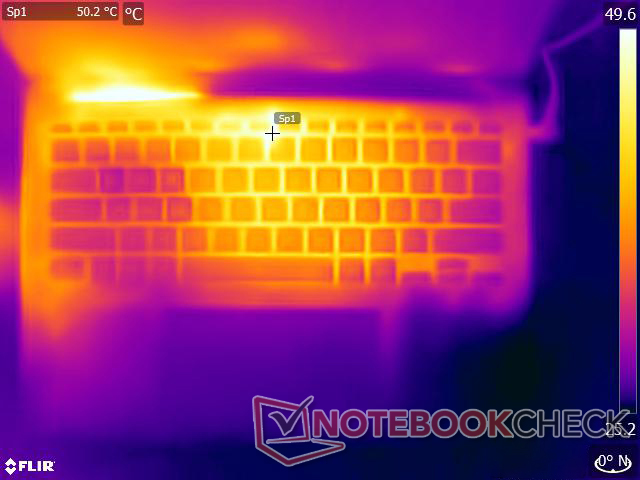
Registramos temperaturas de até 49 °C na parte superior e de até 54 °C na parte inferior sob carga máxima. No entanto, as áreas do touchpad e do apoio para a palma da mão direita permanecem relativamente frias.
(-) A temperatura máxima no lado superior é 49.2 °C / 121 F, em comparação com a média de 36.8 °C / 98 F , variando de 21 a 71 °C para a classe Multimedia.
(-) A parte inferior aquece até um máximo de 54 °C / 129 F, em comparação com a média de 39.1 °C / 102 F
(+) Em uso inativo, a temperatura média para o lado superior é 30.6 °C / 87 F, em comparação com a média do dispositivo de 31.3 °C / ### class_avg_f### F.
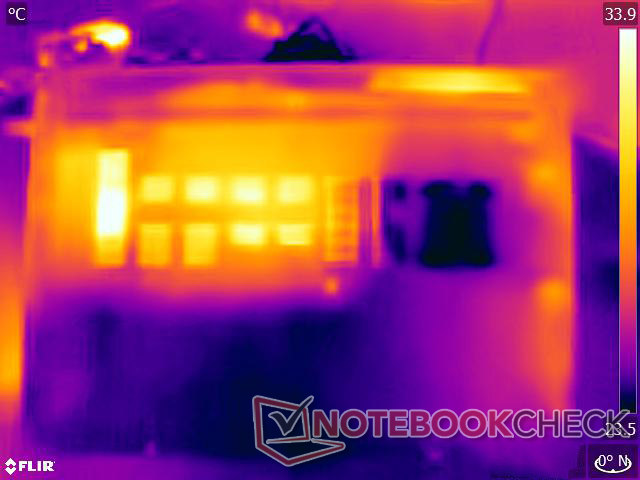
(±) Jogando The Witcher 3, a temperatura média para o lado superior é 37.8 °C / 100 F, em comparação com a média do dispositivo de 31.3 °C / ## #class_avg_f### F.
(+) Os apoios para as mãos e o touchpad estão atingindo a temperatura máxima da pele (35.4 °C / 95.7 F) e, portanto, não estão quentes.
(-) A temperatura média da área do apoio para as mãos de dispositivos semelhantes foi 28.7 °C / 83.7 F (-6.7 °C / -12 F).
| Asus VivoBook 14X K3405 Intel Core i5-13500H, NVIDIA GeForce RTX 3050 4GB Laptop GPU | Acer Swift X SFX14-71G Intel Core i7-13700H, NVIDIA GeForce RTX 4050 Laptop GPU | MSI Stealth 14 Studio A13V Intel Core i7-13700H, NVIDIA GeForce RTX 4050 Laptop GPU | Gigabyte Aero 14 OLED BMF Intel Core i7-13700H, NVIDIA GeForce RTX 4050 Laptop GPU | Lenovo Slim Pro 7 14ARP8 AMD Ryzen 7 7735HS, NVIDIA GeForce RTX 3050 6GB Laptop GPU | Schenker Vision 14 2022 RTX 3050 Ti Intel Core i7-12700H, NVIDIA GeForce RTX 3050 Ti Laptop GPU | |
|---|---|---|---|---|---|---|
| Heat | 16% | -0% | 18% | 21% | 9% | |
| Maximum Upper Side * (°C) | 49.2 | 46.4 6% | 46.9 5% | 42 15% | 42.2 14% | 48.4 2% |
| Maximum Bottom * (°C) | 54 | 49 9% | 56.1 -4% | 52 4% | 49 9% | 57.1 -6% |
| Idle Upper Side * (°C) | 33.6 | 26.5 21% | 33.8 -1% | 26 23% | 24.4 27% | 28.1 16% |
| Idle Bottom * (°C) | 37.6 | 26.6 29% | 37.9 -1% | 27 28% | 25.2 33% | 29 23% |
* ... menor é melhor
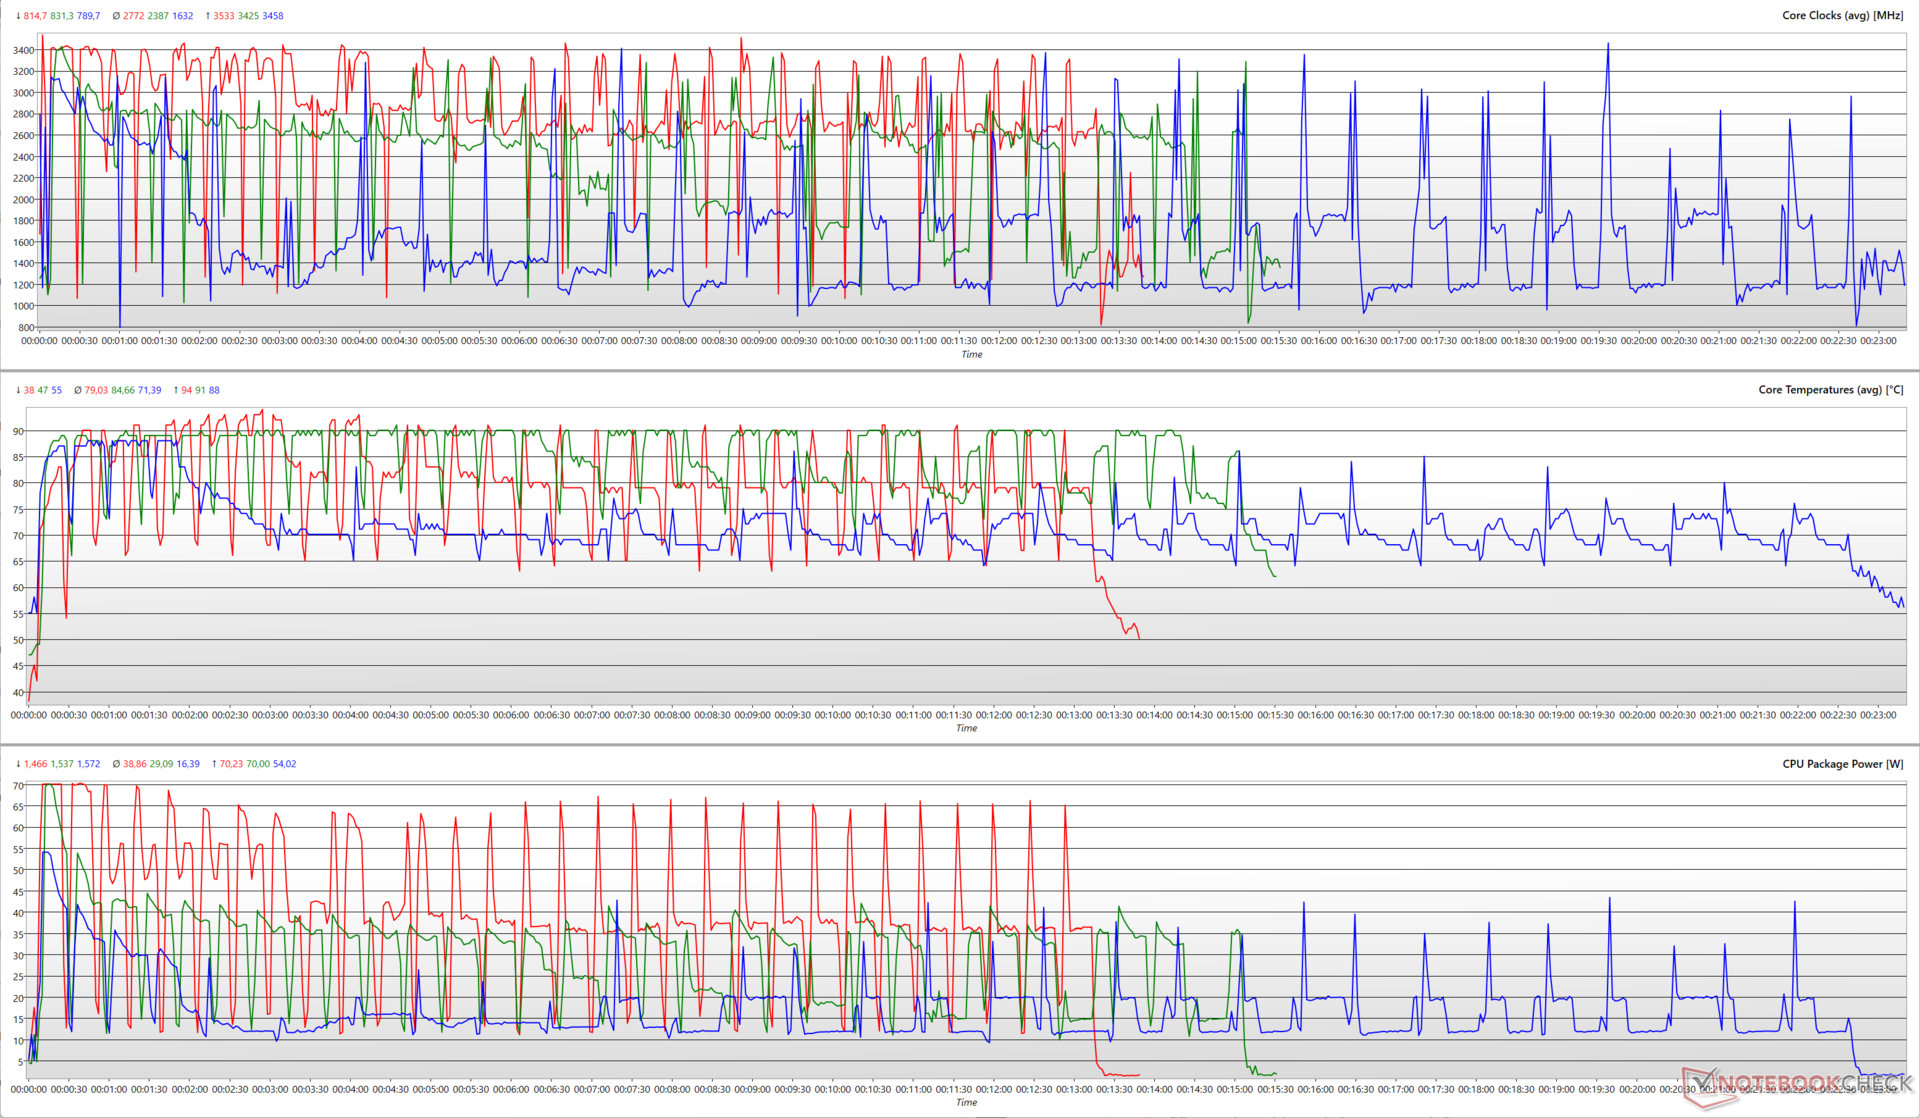
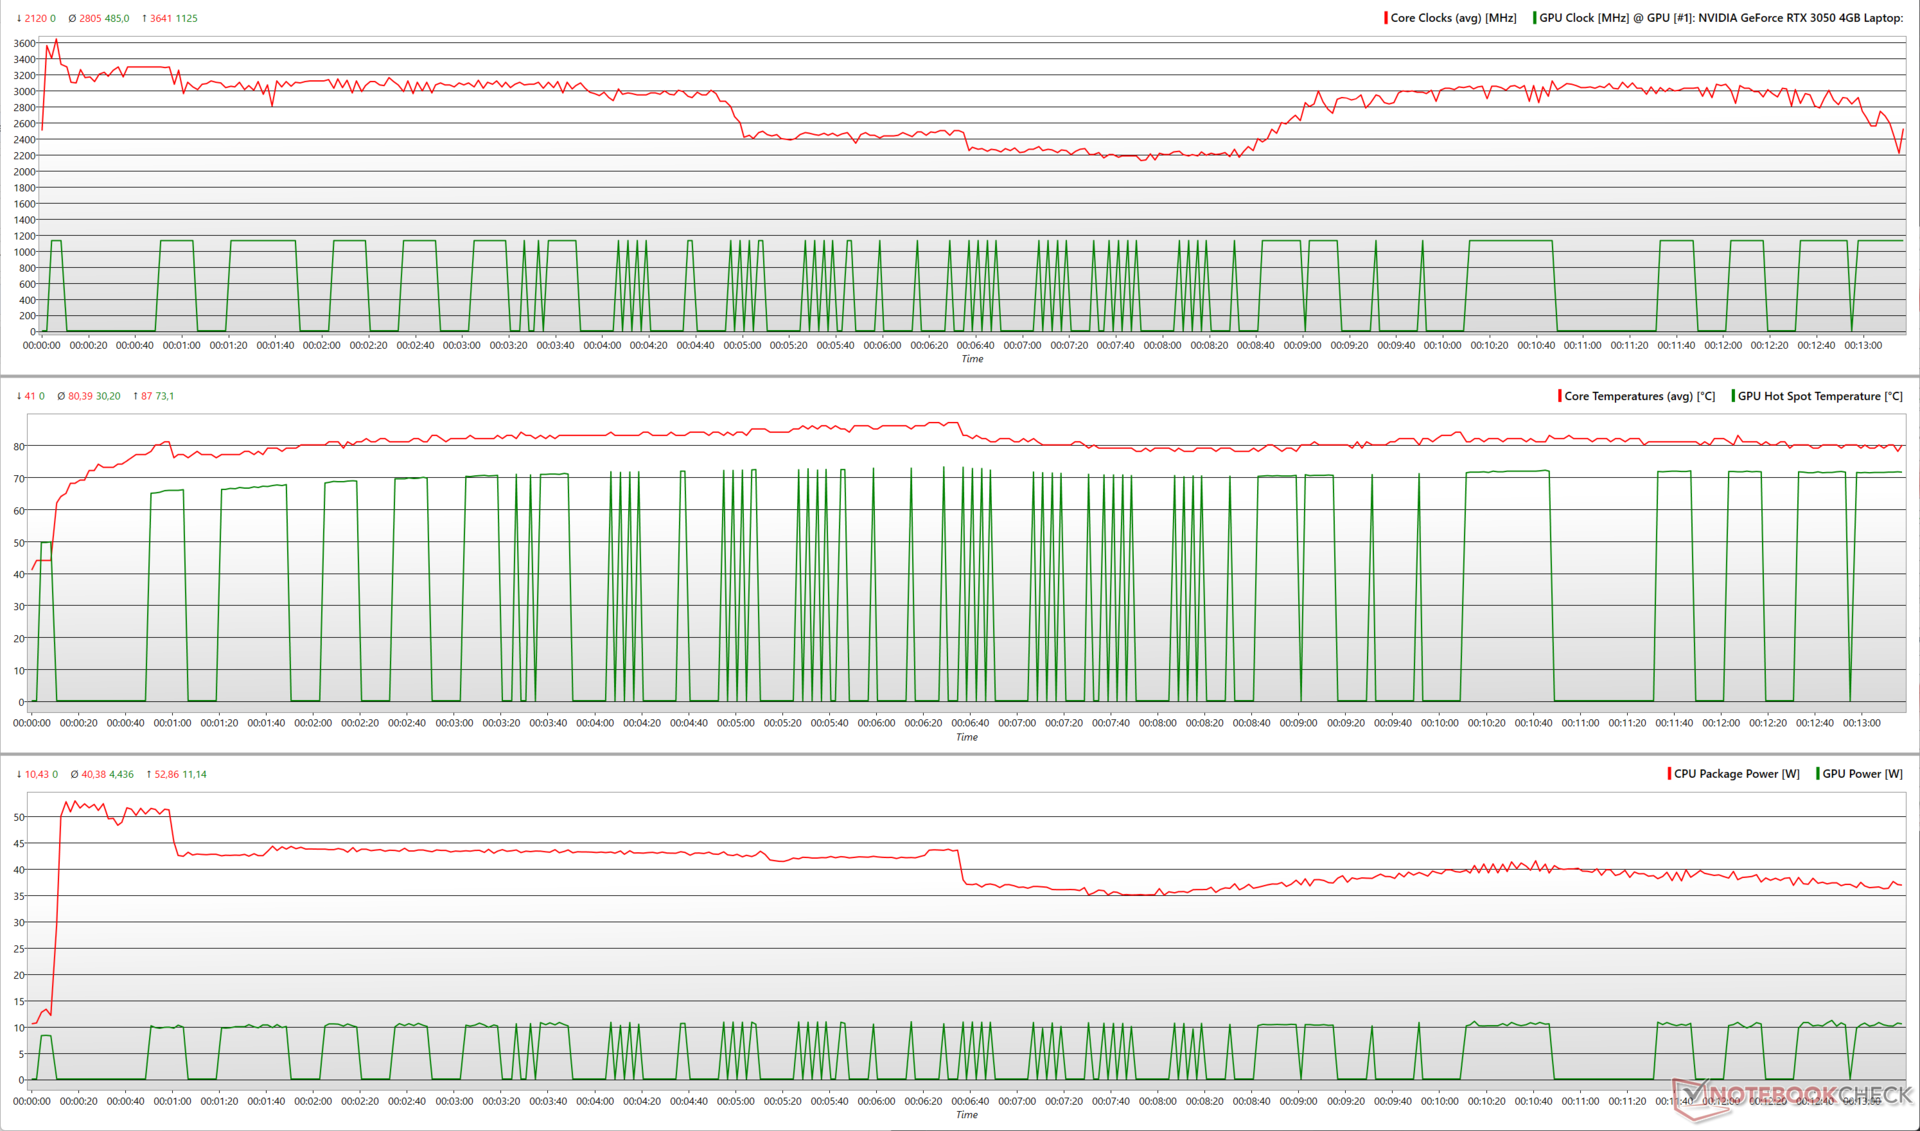
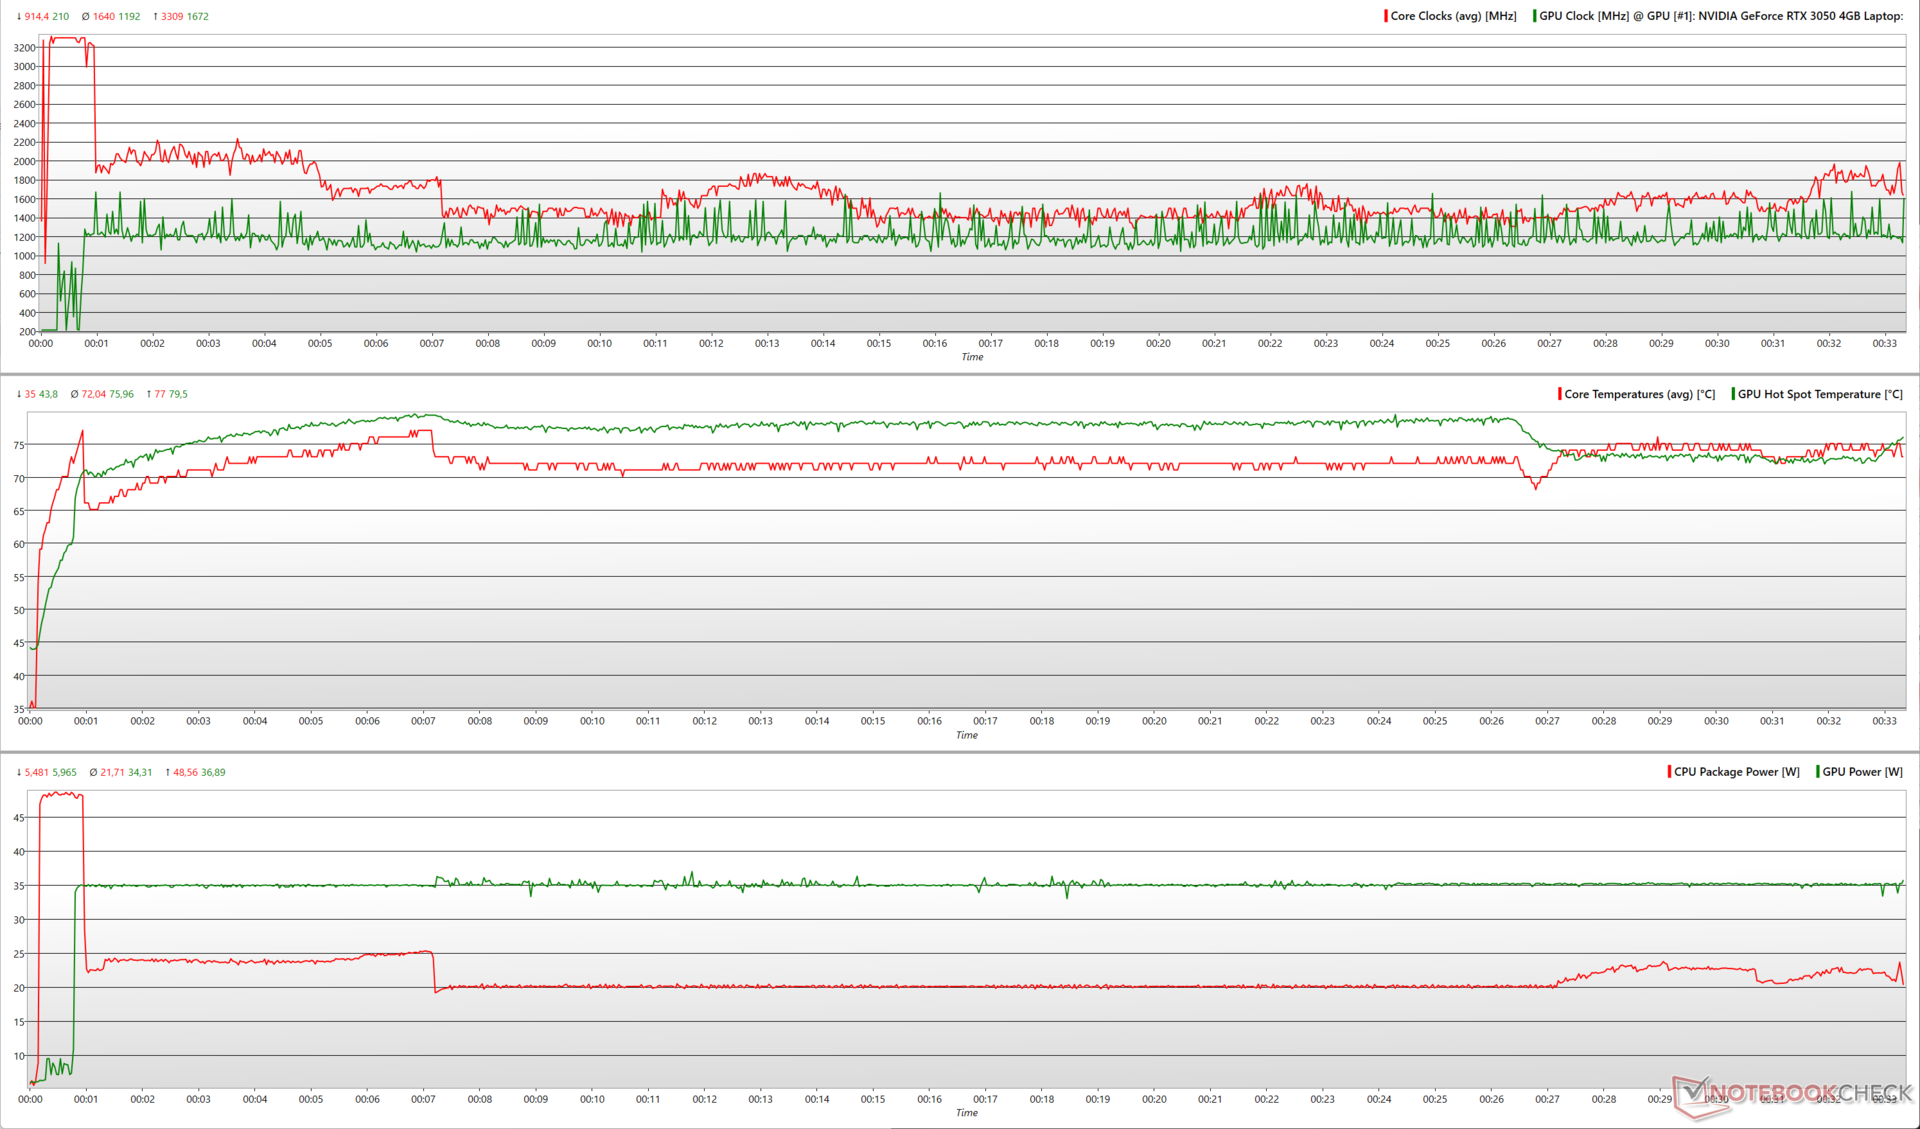
Teste de estresse
Ao estressar o VivoBook 14X com FFTs grandes no local do Prime95, o Core i5-13500H atinge o pico de 3,6 GHz e consome quase 53 W de energia.
Ao adicionar o FurMark à mistura, a potência do pacote de pico da CPU cai para 48,6 W e se mantém em 22 W. O RTX 3050 mostra clocks médios de 1.192 MHz com o consumo de energia mantido em 34 W consistentes.
| Teste de estresse | Relógio da CPU (GHz) | Relógio da GPU (MHz) | Temperatura média da CPU (°C) | Temperatura média da GPU (°C) |
| Sistema ocioso | 3.8 | 0 | 40 | 25.1 |
| Prime95 | 2.95 | 0 | 80 | 25.3 |
| Prime95 + FurMark | 1.75 | 1,177 | 72 | 68.3 |
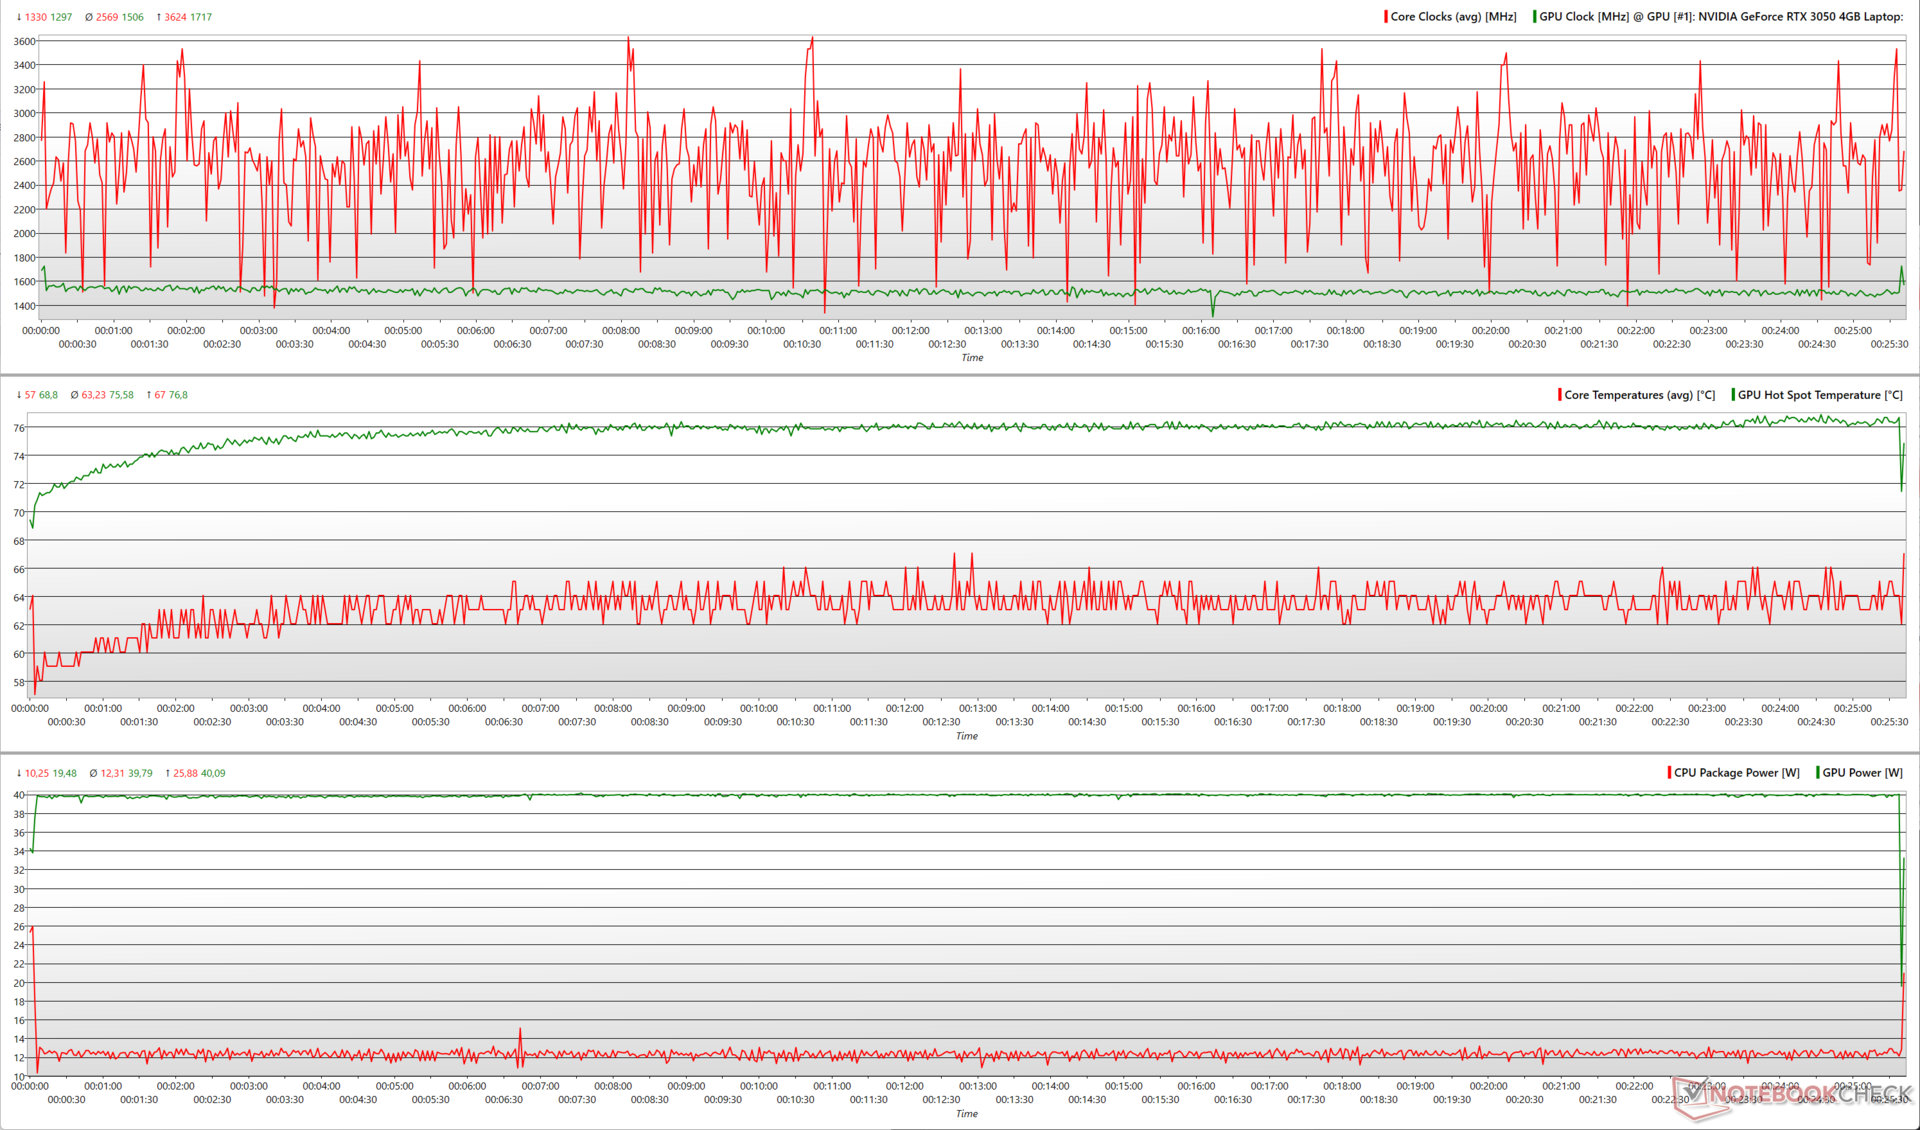
| O Witcher 3 1080p Ultra | 2.56 | 1.506 | 63.2 | 75.6 |
Com o Witcher 3 em 1080p Ultra, a RTX 3050 pode atingir o pico de 1.717 MHz enquanto consome 40 W. O Core i5-13500H tem uma média de 12 W enquanto produz clocks médios de cerca de 2,6 GHz.
De acordo com a Asus, o sistema de resfriamento do VivoBook 14X pode suportar um TDP combinado de 55 W da CPU e da GPU. Nossos testes de estresse confirmam essa afirmação, pois observamos um consumo médio de energia de 56 W durante a execução do Prime95 + FurMark e 52 W durante o teste de estresse do Witcher 3.
Alto-falantes
Com um pico de intensidade de 70,7 db(A), os alto-falantes estéreo do VivoBook 14X não são adequadamente altos. Dito isso, o ajuste Dirac pode proporcionar uma certa quantidade de graves, mantendo os médios e agudos equilibrados.
Os usuários podem obter uma experiência de áudio muito melhor conectando dispositivos de áudio externos usando o conector de áudio de 3,5 mm ou via Bluetooth 5.3.
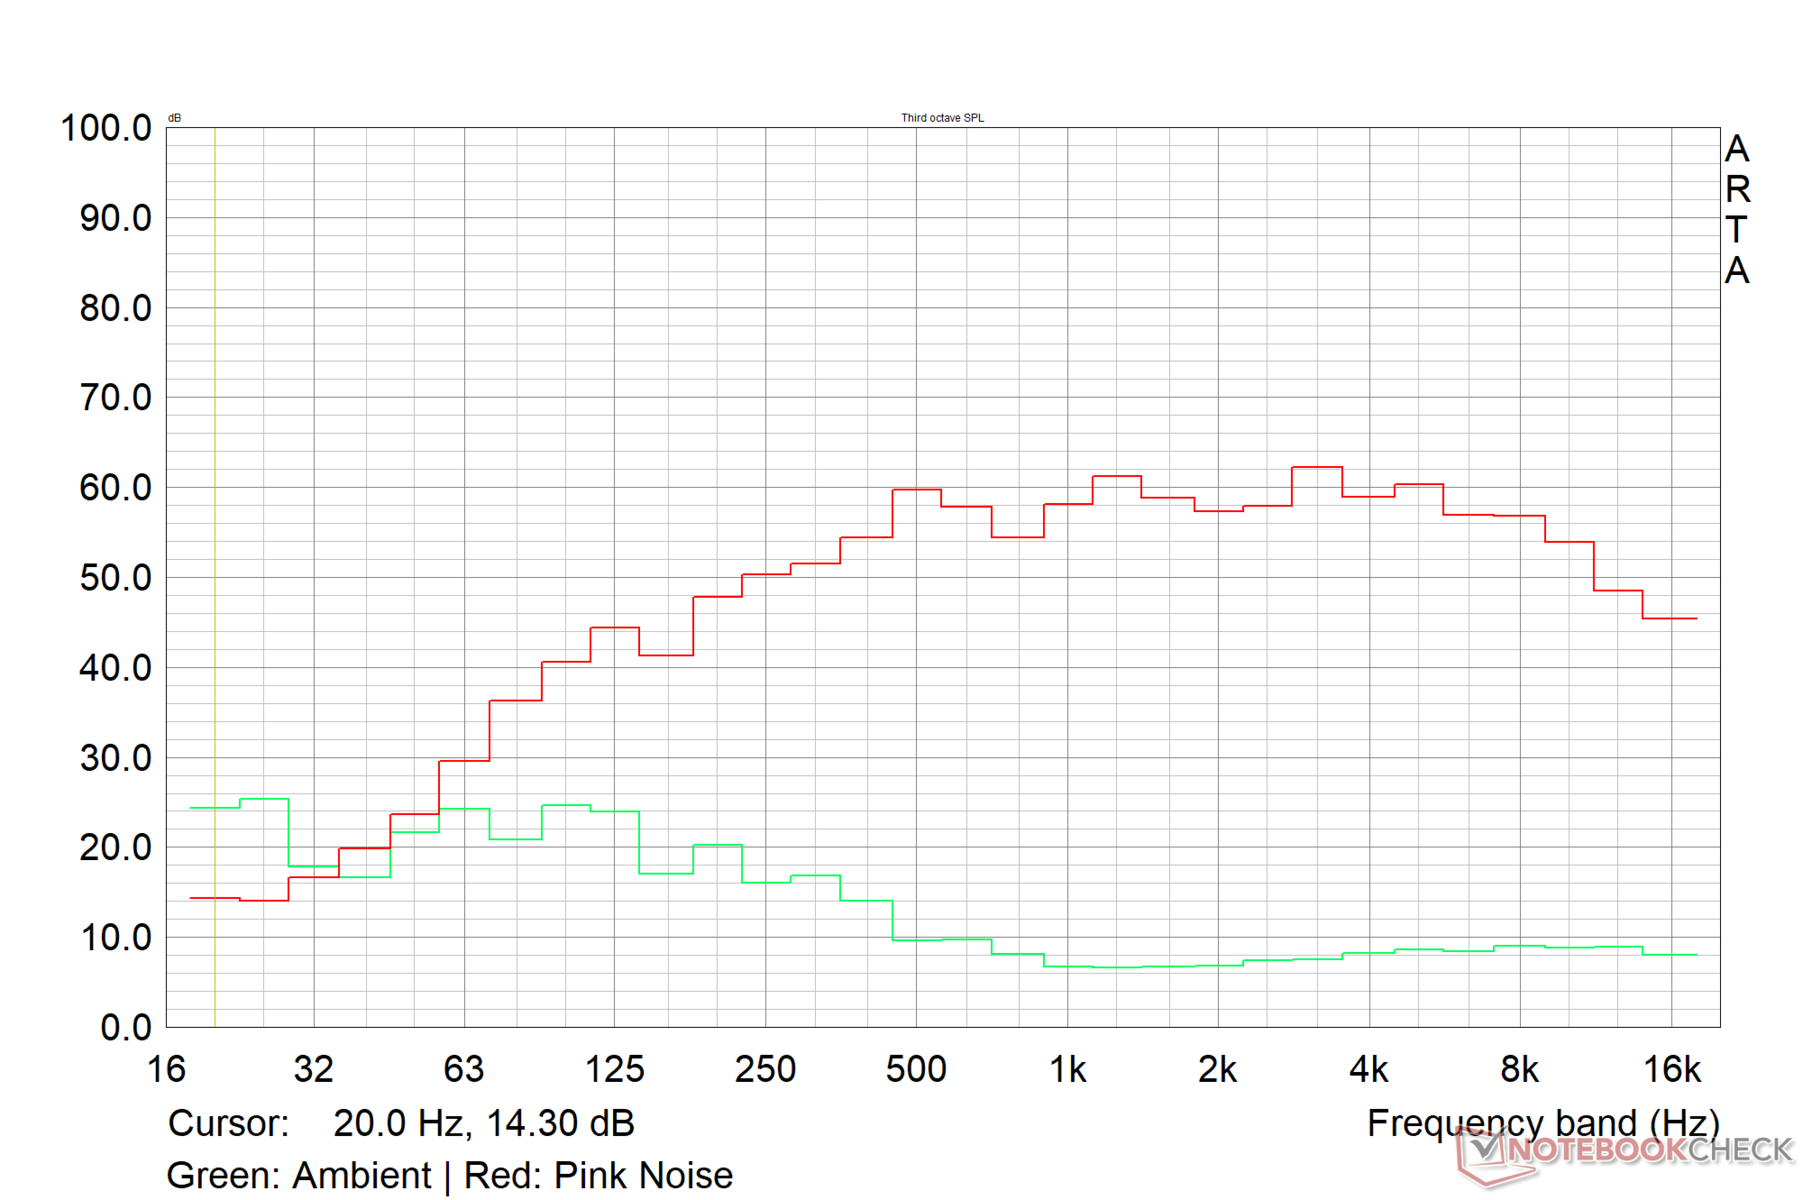
Asus VivoBook 14X K3405 análise de áudio
(-) | alto-falantes não muito altos (###valor### dB)
Graves 100 - 315Hz
(±) | graves reduzidos - em média 10.8% menor que a mediana
(±) | a linearidade dos graves é média (7.4% delta para a frequência anterior)
Médios 400 - 2.000 Hz
(+) | médios equilibrados - apenas 2.1% longe da mediana
(+) | médios são lineares (6.3% delta para frequência anterior)
Altos 2 - 16 kHz
(+) | agudos equilibrados - apenas 2.2% longe da mediana
(+) | os máximos são lineares (4.8% delta da frequência anterior)
Geral 100 - 16.000 Hz
(+) | o som geral é linear (13.2% diferença em relação à mediana)
Comparado com a mesma classe
» 27% de todos os dispositivos testados nesta classe foram melhores, 5% semelhantes, 68% piores
» O melhor teve um delta de 5%, a média foi 17%, o pior foi 45%
Comparado com todos os dispositivos testados
» 13% de todos os dispositivos testados foram melhores, 3% semelhantes, 84% piores
» O melhor teve um delta de 4%, a média foi 23%, o pior foi 134%
Apple MacBook Pro 16 2021 M1 Pro análise de áudio
(+) | os alto-falantes podem tocar relativamente alto (###valor### dB)
Graves 100 - 315Hz
(+) | bons graves - apenas 3.8% longe da mediana
(+) | o baixo é linear (5.2% delta para a frequência anterior)
Médios 400 - 2.000 Hz
(+) | médios equilibrados - apenas 1.3% longe da mediana
(+) | médios são lineares (2.1% delta para frequência anterior)
Altos 2 - 16 kHz
(+) | agudos equilibrados - apenas 1.9% longe da mediana
(+) | os máximos são lineares (2.7% delta da frequência anterior)
Geral 100 - 16.000 Hz
(+) | o som geral é linear (4.6% diferença em relação à mediana)
Comparado com a mesma classe
» 0% de todos os dispositivos testados nesta classe foram melhores, 0% semelhantes, 100% piores
» O melhor teve um delta de 5%, a média foi 17%, o pior foi 45%
Comparado com todos os dispositivos testados
» 0% de todos os dispositivos testados foram melhores, 0% semelhantes, 100% piores
» O melhor teve um delta de 4%, a média foi 23%, o pior foi 134%
Gerenciamento de energia: Frugal sipper em marcha lenta e em carga
Consumo de energia
A combinação Core i5-13500H e RTX 3050 é bastante econômica em termos de consumo de energia em comparação com a concorrência. O VivoBook 14X OLED é capaz de utilizar totalmente o adaptador de energia de 90 W fornecido sob carga máxima.
Enquanto o Lenovo Slim Pro 7 com umRyzen 7 7735HSe uma RTX 3050 de 6 GB demonstre um consumo de energia 8% menor na média de carga, ele apresenta consumos mais altos durante a inatividade, os jogos e a carga máxima.
| desligado | |
| Ocioso | |
| Carga |
|
Key:
min: | |
| Asus VivoBook 14X K3405 i5-13500H, GeForce RTX 3050 4GB Laptop GPU, , 2880x1800, 14" | Acer Swift X SFX14-71G i7-13700H, GeForce RTX 4050 Laptop GPU, OLED, 2880x1800, 14.5" | MSI Stealth 14 Studio A13V i7-13700H, GeForce RTX 4050 Laptop GPU, IPS, 2560x1600, 14" | Gigabyte Aero 14 OLED BMF i7-13700H, GeForce RTX 4050 Laptop GPU, OLED, 2880x1800, 14" | Lenovo Slim Pro 7 14ARP8 R7 7735HS, GeForce RTX 3050 6GB Laptop GPU, IPS, 2560x1600, 14.5" | Schenker Vision 14 2022 RTX 3050 Ti i7-12700H, GeForce RTX 3050 Ti Laptop GPU, IPS, 2880x1800, 14" | Média NVIDIA GeForce RTX 3050 4GB Laptop GPU | Média da turma Multimedia | |
|---|---|---|---|---|---|---|---|---|
| Power Consumption | -30% | -100% | -14% | -36% | -26% | -37% | -17% | |
| Idle Minimum * (Watt) | 4.96 | 8.4 -69% | 10.4 -110% | 7.4 -49% | 7.6 -53% | 7.5 -51% | 7.17 ? -45% | 5.66 ? -14% |
| Idle Average * (Watt) | 7.54 | 11.5 -53% | 19.1 -153% | 8.3 -10% | 12.2 -62% | 10.4 -38% | 10.4 ? -38% | 10.2 ? -35% |
| Idle Maximum * (Watt) | 9.31 | 11.9 -28% | 19.4 -108% | 8.7 7% | 12.8 -37% | 11.4 -22% | 14.8 ? -59% | 12.5 ? -34% |
| Load Average * (Watt) | 83.4 | 84.9 -2% | 95.9 -15% | 76 9% | 76.5 8% | 83.3 -0% | 89.7 ? -8% | 65.2 ? 22% |
| Witcher 3 ultra * (Watt) | 73.3 | 83.6 -14% | 141.6 -93% | 70 5% | 89.5 -22% | 92.7 -26% | ||
| Load Maximum * (Watt) | 91.74 | 104.2 -14% | 203 -121% | 132 -44% | 135.7 -48% | 110.3 -20% | 124.8 ? -36% | 113.5 ? -24% |
* ... menor é melhor
Power Consumption: The Witcher 3 / Stress test
Power Consumption: External monitor
Duração da bateria
A bateria de 63 WHr do VivoBook 14X não oferece uma longevidade extraordinária, mas deve ser capaz de suportar a maior parte de um dia de trabalho padrão antes de precisar ser recarregada.
A bateria dura quase 10,5 horas durante a reprodução de um vídeo H.264 de 1080p com 150 nits de brilho, o que é impressionante. Entretanto, a resistência do laptop para jogos é consideravelmente menor, com pouco mais de uma hora.
O adaptador de energia incluído é capaz de recarregar a bateria do laptop de 0% a 60% em cerca de 50 minutos.
| Asus VivoBook 14X K3405 i5-13500H, GeForce RTX 3050 4GB Laptop GPU, 63 Wh | Acer Swift X SFX14-71G i7-13700H, GeForce RTX 4050 Laptop GPU, 76 Wh | MSI Stealth 14 Studio A13V i7-13700H, GeForce RTX 4050 Laptop GPU, 72 Wh | Gigabyte Aero 14 OLED BMF i7-13700H, GeForce RTX 4050 Laptop GPU, 63 Wh | Lenovo Slim Pro 7 14ARP8 R7 7735HS, GeForce RTX 3050 6GB Laptop GPU, 73 Wh | Schenker Vision 14 2022 RTX 3050 Ti i7-12700H, GeForce RTX 3050 Ti Laptop GPU, 99.8 Wh | Média da turma Multimedia | |
|---|---|---|---|---|---|---|---|
| Duração da bateria | -17% | -17% | 15% | 30% | 41% | 55% | |
| H.264 (h) | 10.4 | 9.5 -9% | 6.6 -37% | 11.1 7% | 17.1 ? 64% | ||
| WiFi v1.3 (h) | 8.1 | 7.7 -5% | 6.3 -22% | 7.6 -6% | 10.5 30% | 10.1 25% | 12.2 ? 51% |
| Witcher 3 ultra (h) | 1.3 | ||||||
| Load (h) | 1.1 | 0.7 -36% | 1.2 9% | 1.5 36% | 2.1 91% | 1.664 ? 51% | |
| Reader / Idle (h) | 11.3 | 24.9 ? |
Pro
Contra
Veredicto: Laptop multimídia versátil com muito espaço para melhorias
O Asus VivoBook 14X K3405 apresenta as vantagens de desempenho e eficiência do processador Intel Core i5-13500Hem um chassi leve e elegante.
O laptop oferece conectividade decente, mas o desempenho do Wi-Fi 6E precisa de mais refinamentos. O Thunderbolt 4 também está ausente.
A Asus usa um painel OLED Samsung 2.8K 90 Hz no VivoBook 14X que apresenta excelentes características de cor para editores iniciantes. O painel sofre com o PWM em níveis de brilho mais baixos, mas usa o DC Dimming para compensar um pouco a cintilação em uma iluminação mais alta.
O Asus VivoBook 14X não é exatamente muito potente e certamente pode se beneficiar de melhorias na GPU e no resfriamento, mas é um laptop multimídia bem equipado que também permite alguns jogos leves."
O Core i5-13500H tem alguns méritos em nossos testes, mas o chassi e as restrições de resfriamento do VivoBook 14X não permitem que a CPU flexione totalmente seus músculos. Uma RTX 4050 de 35 W teria sido a cereja do bolo, mas é provável que a Asus tenha optado pela antiga RTX 3050 para manter os custos baixos.
Também gostaríamos de ver a Asus fazer a transição para um sistema de resfriamento de ventilador duplo nas próximas iterações, pois a solução de ventilador único no VivoBook 14X pode atingir rapidamente seus limites.
Apesar dessas limitações, o Asus VivoBook 14X continua sendo um laptop multimídia de médio porte superior atraente, próximo à marca de €1.100 (menos de ₹1.00.000). Uma alternativa viável é o Lenovo Slim Pro 7 que oferece uma tela sensível ao toque IPS de 2,5K e o Ryzen 7 7735HS.
O Gigabyte Aero 14 OLED com um RTX 4050 de 35 W e Core i7-13700H oferece uma configuração mais atualizada, desde que você esteja disposto a pagar o preço mais alto.
Preço e disponibilidade
A combinação testada de Core i5-13500 e RTX 3050 do VivoBook 14X OLED é vendida por ₹96.990, e a única maneira de adquiri-lo é por meio da loja on-line Asus India.
A Amazon Índia e a Flipkart só estocam a SKU Core i5-13500H e RTX 2050, que custa cerca de ₹82.000. A Amazon US e a Best Buy US também parecem ter apenas as SKUs do RTX 2050 com painéis OLED FHD+ por cerca de US$ 850.
Asus VivoBook 14X K3405
- 08/07/2023 v7 (old)
Vaidyanathan Subramaniam
Transparência
A seleção dos dispositivos a serem analisados é feita pela nossa equipe editorial. A amostra de teste foi fornecida ao autor como empréstimo pelo fabricante ou varejista para fins desta revisão. O credor não teve influência nesta revisão, nem o fabricante recebeu uma cópia desta revisão antes da publicação. Não houve obrigação de publicar esta revisão. Como empresa de mídia independente, a Notebookcheck não está sujeita à autoridade de fabricantes, varejistas ou editores.
É assim que o Notebookcheck está testando
Todos os anos, o Notebookcheck analisa de forma independente centenas de laptops e smartphones usando procedimentos padronizados para garantir que todos os resultados sejam comparáveis. Desenvolvemos continuamente nossos métodos de teste há cerca de 20 anos e definimos padrões da indústria no processo. Em nossos laboratórios de teste, equipamentos de medição de alta qualidade são utilizados por técnicos e editores experientes. Esses testes envolvem um processo de validação em vários estágios. Nosso complexo sistema de classificação é baseado em centenas de medições e benchmarks bem fundamentados, o que mantém a objetividade.Price comparison

