Análise do MSI Stealth 14 Studio - Um laptop para jogos caro que fez muitas concessões
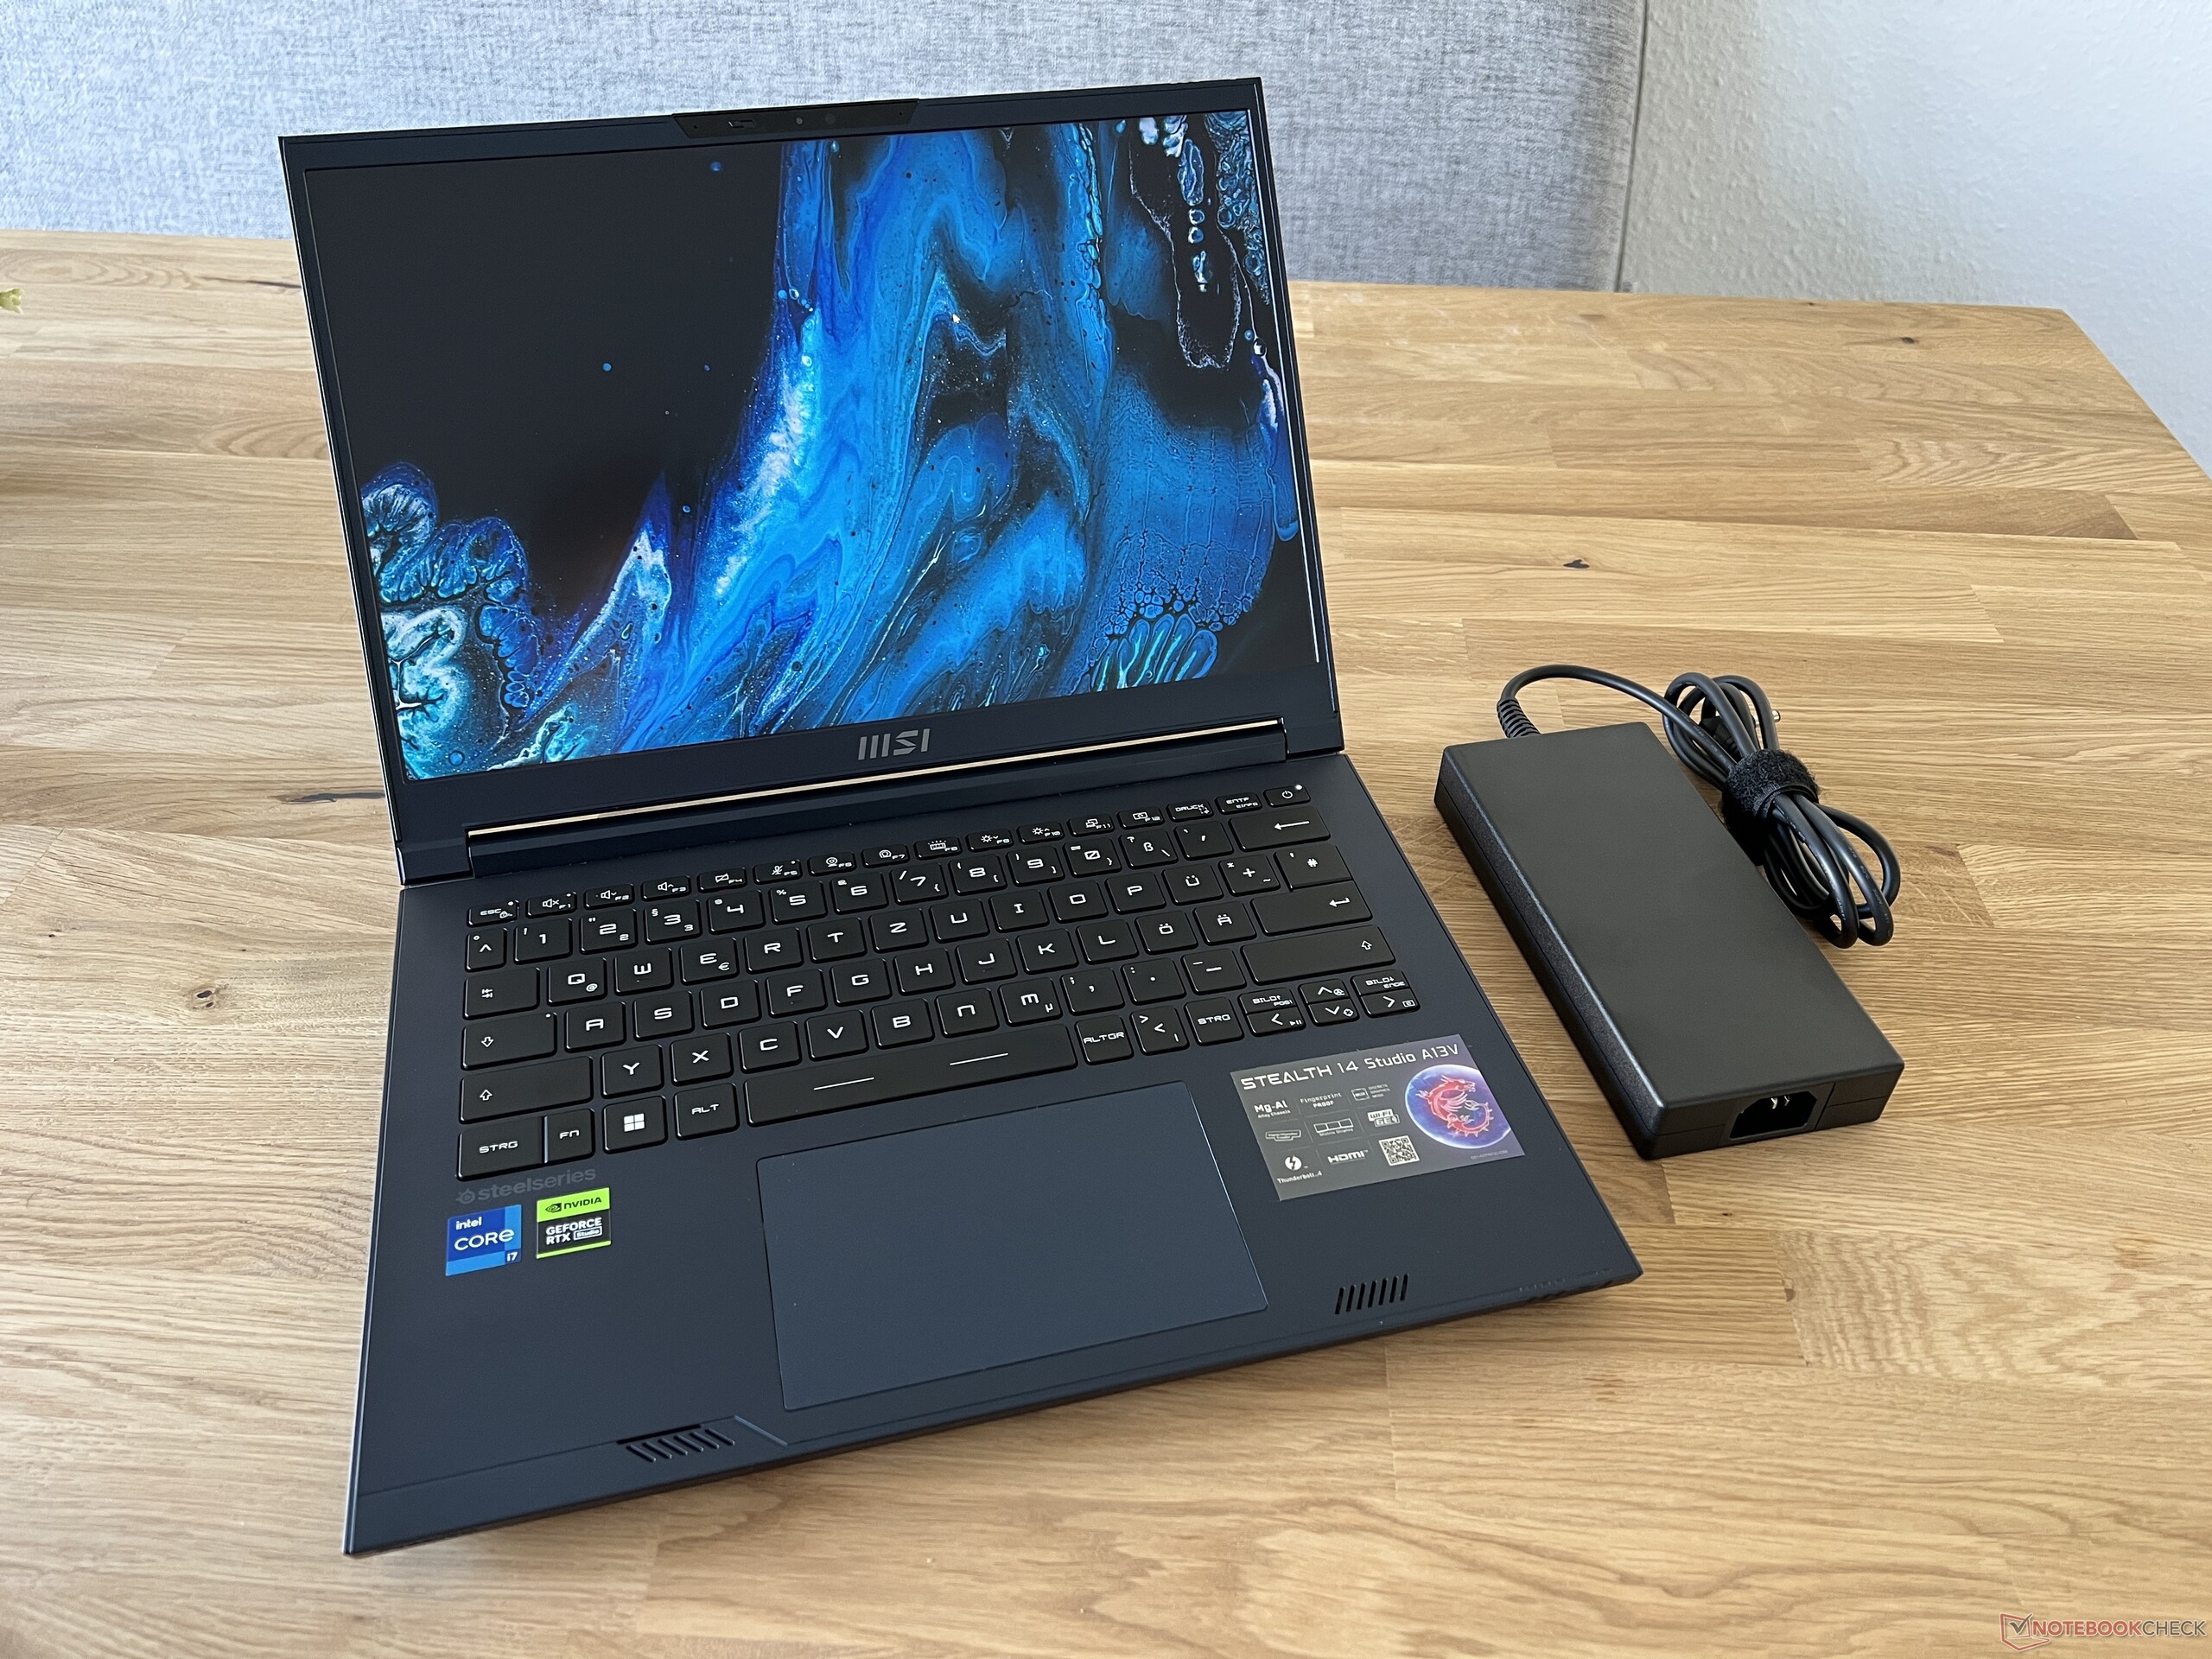
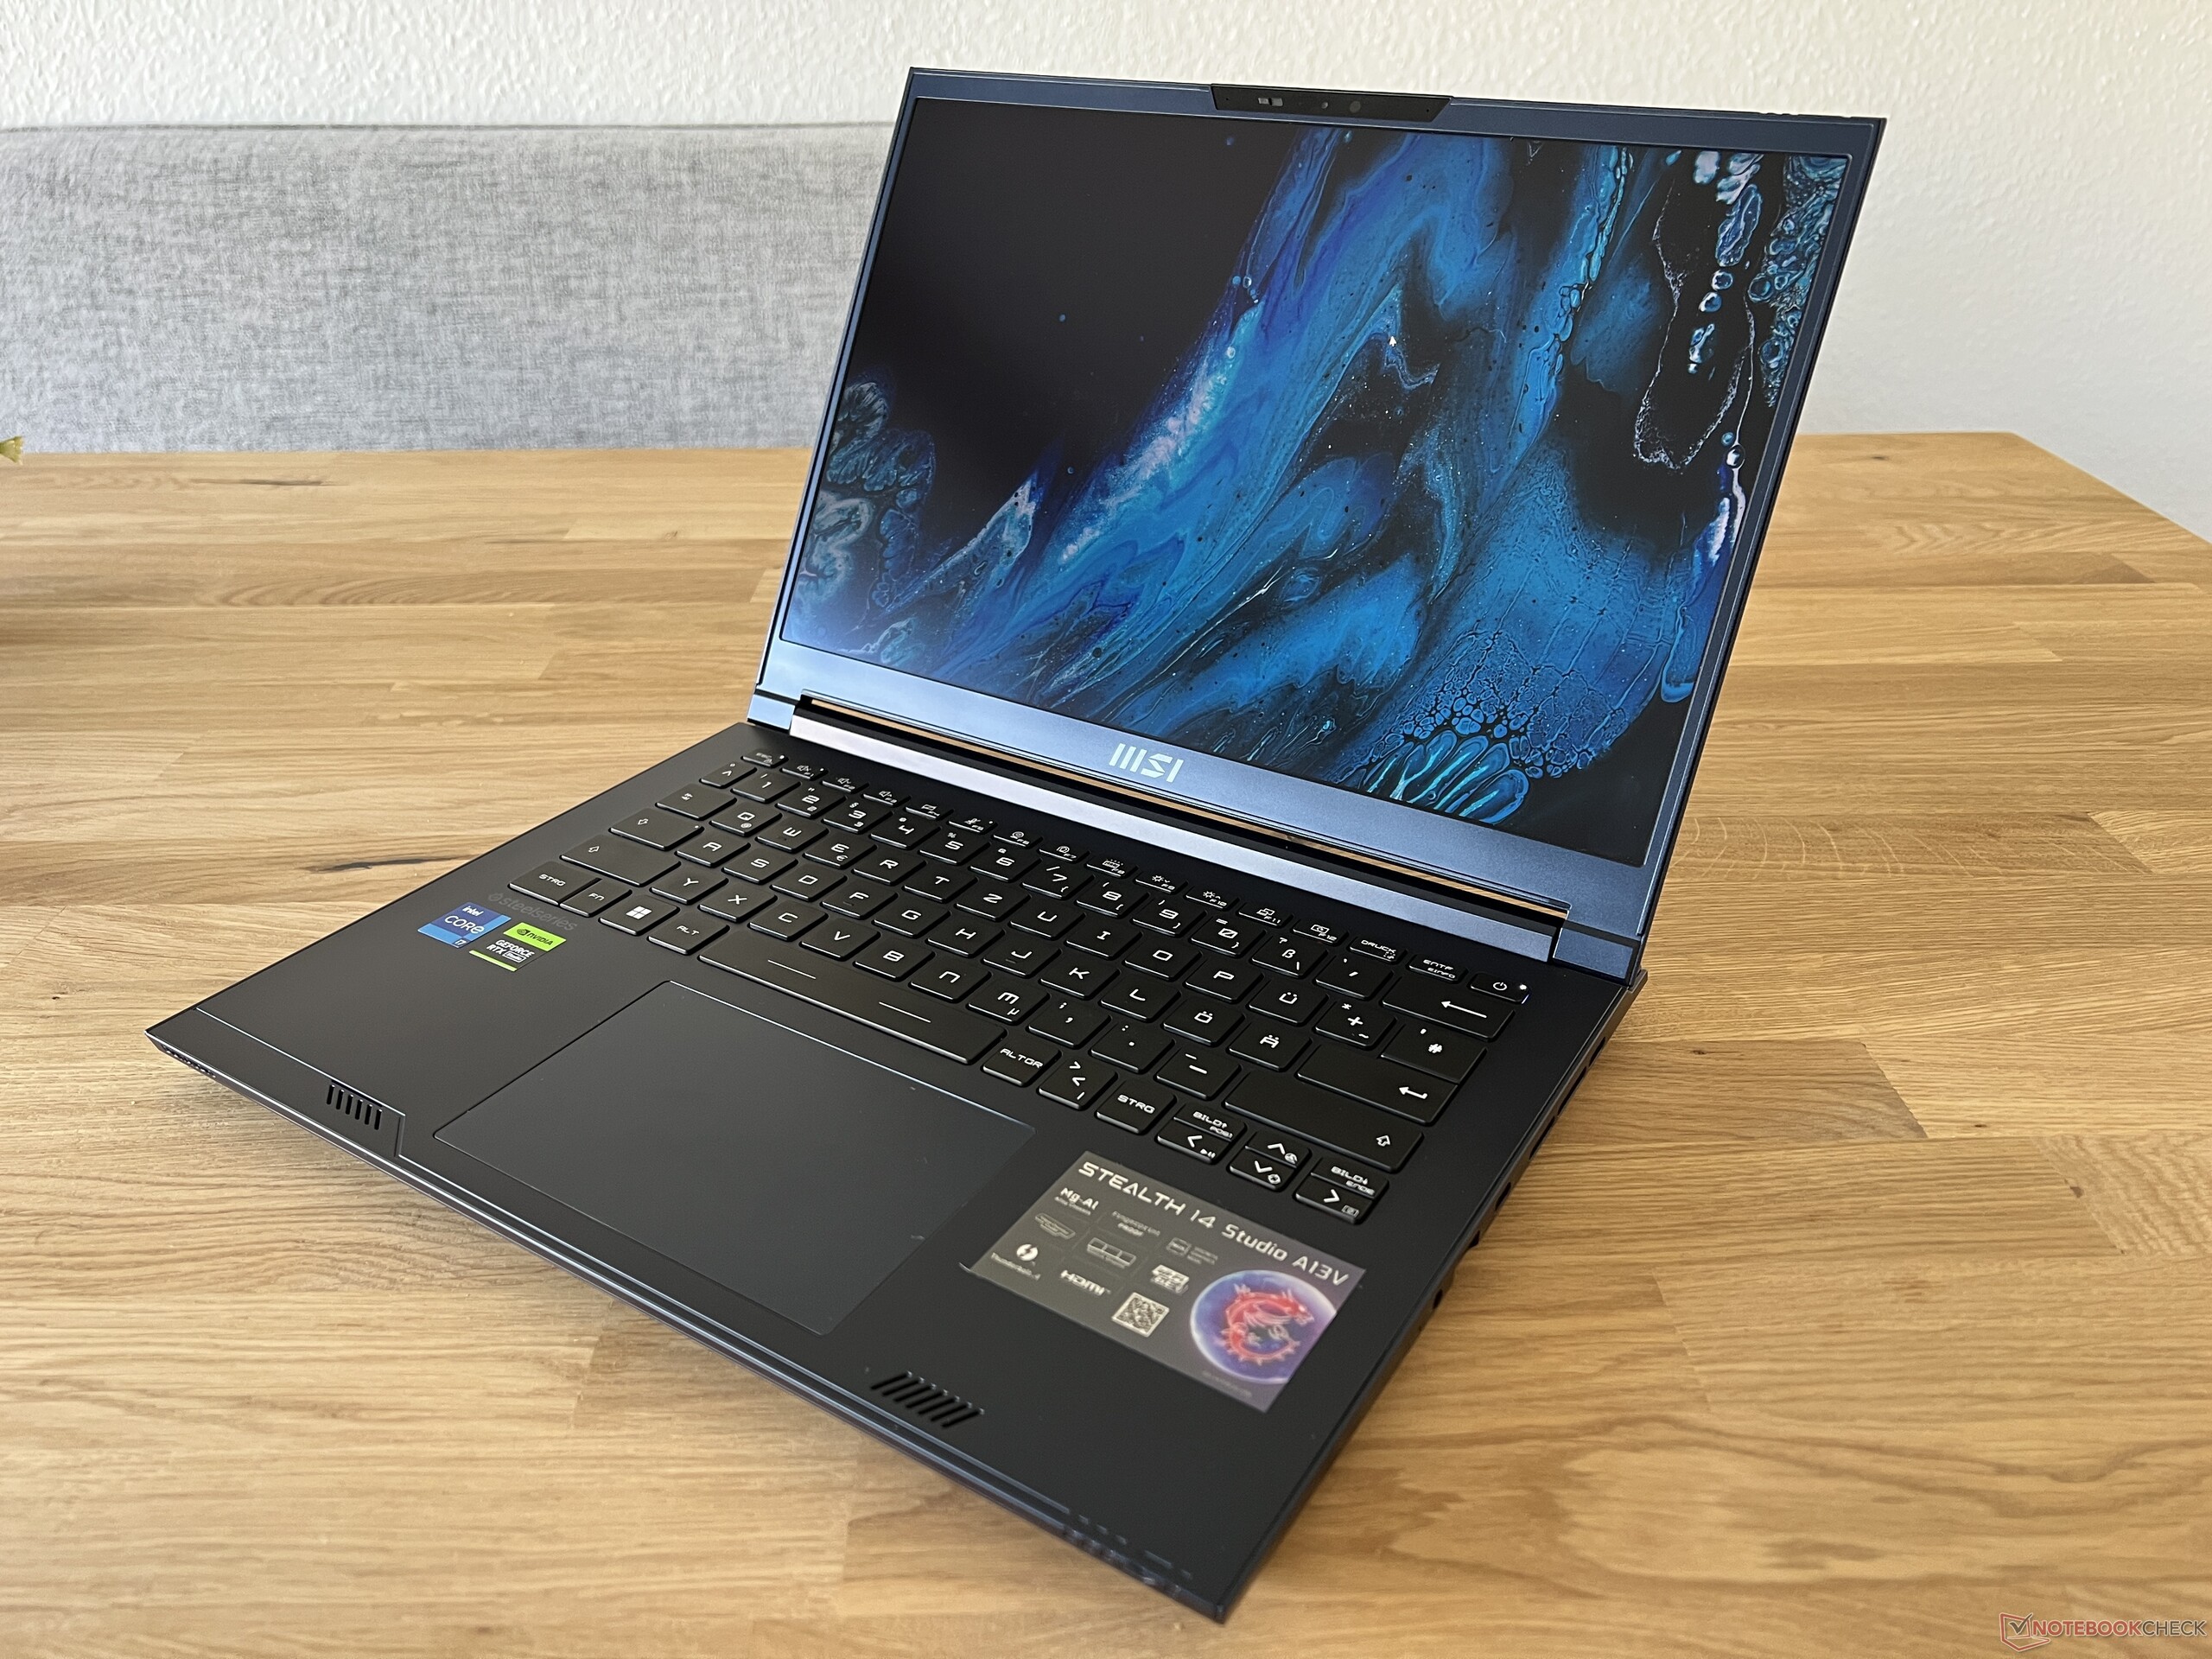
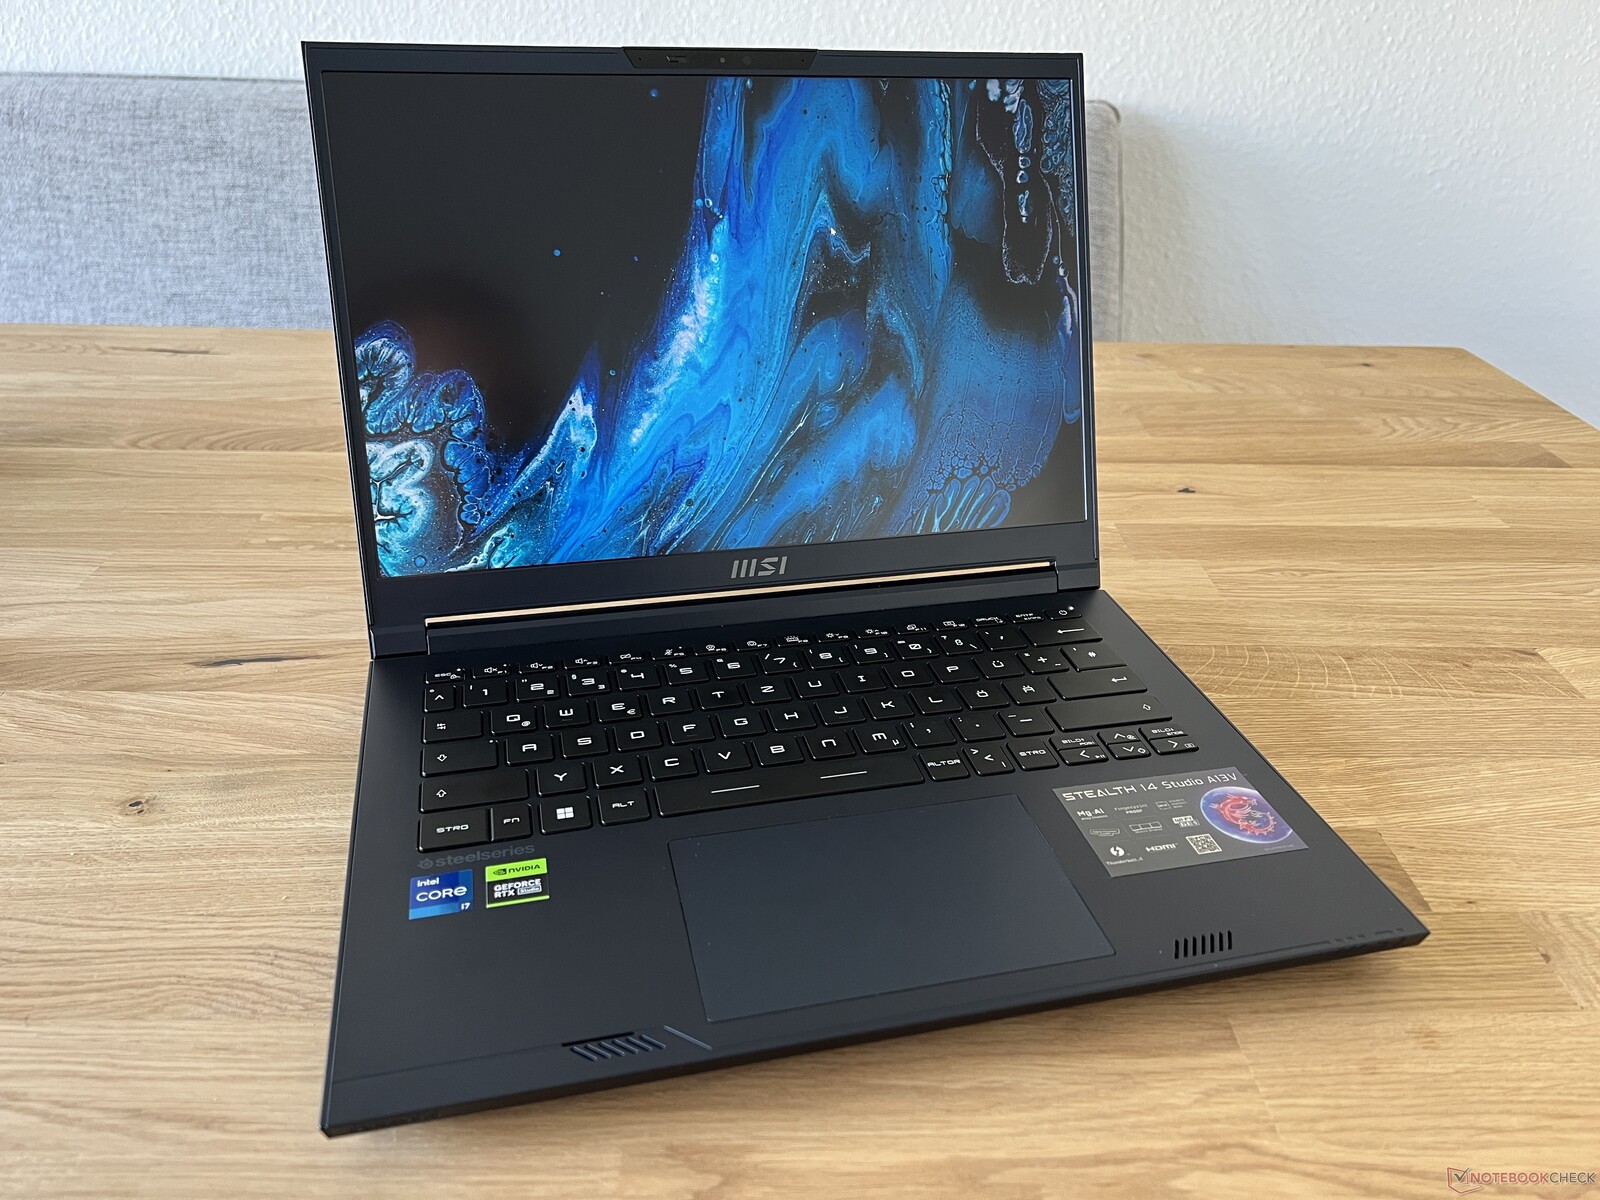
O MSI Stealth 14 Studio tem como objetivo ser um laptop para jogos compacto, porém potente, de 14 polegadas, que também tem como objetivo falar com criadores de conteúdo - ou qualquer usuário que esteja procurando bons níveis de desempenho em um gabinete pequeno. O fabricante confiou em sua receita testada e comprovada, combinando os chips Intel Raptor Lake da série de construção H45 com os novos laptops RTX 4000 da Nvidia. Nosso dispositivo de teste é um Stealth 14 Studio A13VE-029 e, por US$ 1.699,99, ele oferece umCore i7-13700He oGeForce Laptop RTX 405016 GB de RAM, além de um SSD NVMe de 1 TB. Ele apresenta um painel IPS fosco (2.560 x 1.600 pixels) com uma taxa de atualização de 240 Hz. Opcionalmente, o Stealth 14 Studio pode ser adquirido com oLaptop RTX 4070e 32 GB de RAM.
Possíveis concorrentes em comparação
Avaliação | Data | Modelo | Peso | Altura | Size | Resolução | Preço |
|---|---|---|---|---|---|---|---|
| 85.4 % v7 (old) | 07/2023 | MSI Stealth 14 Studio A13V i7-13700H, GeForce RTX 4050 Laptop GPU | 1.7 kg | 19 mm | 14.00" | 2560x1600 | |
| 89.4 % v7 (old) | 05/2023 | Gigabyte Aero 14 OLED BMF i7-13700H, GeForce RTX 4050 Laptop GPU | 1.4 kg | 17 mm | 14.00" | 2880x1800 | |
| 88.8 % v7 (old) | 10/2022 | Schenker Vision 14 2022 RTX 3050 Ti i7-12700H, GeForce RTX 3050 Ti Laptop GPU | 1.3 kg | 16.6 mm | 14.00" | 2880x1800 | |
| 86.8 % v7 (old) | 03/2022 | Asus ROG Flow Z13 GZ301ZE i9-12900H, GeForce RTX 3050 Ti Laptop GPU | 1.2 kg | 12 mm | 13.40" | 1920x1200 | |
| 86.7 % v7 (old) | 03/2022 | Alienware x14 i7 RTX 3060 i7-12700H, GeForce RTX 3060 Laptop GPU | 1.8 kg | 14.5 mm | 14.00" | 1920x1080 | |
| 89.4 % v7 (old) | 05/2022 | Razer Blade 14 Ryzen 9 6900HX R9 6900HX, GeForce RTX 3070 Ti Laptop GPU | 1.8 kg | 16.8 mm | 14.00" | 2560x1440 | |
| 86 % v7 (old) | 11/2022 | Acer Predator Triton 300 SE i9-12900H, GeForce RTX 3060 Laptop GPU | 1.7 kg | 19.8 mm | 14.00" | 2880x1800 |
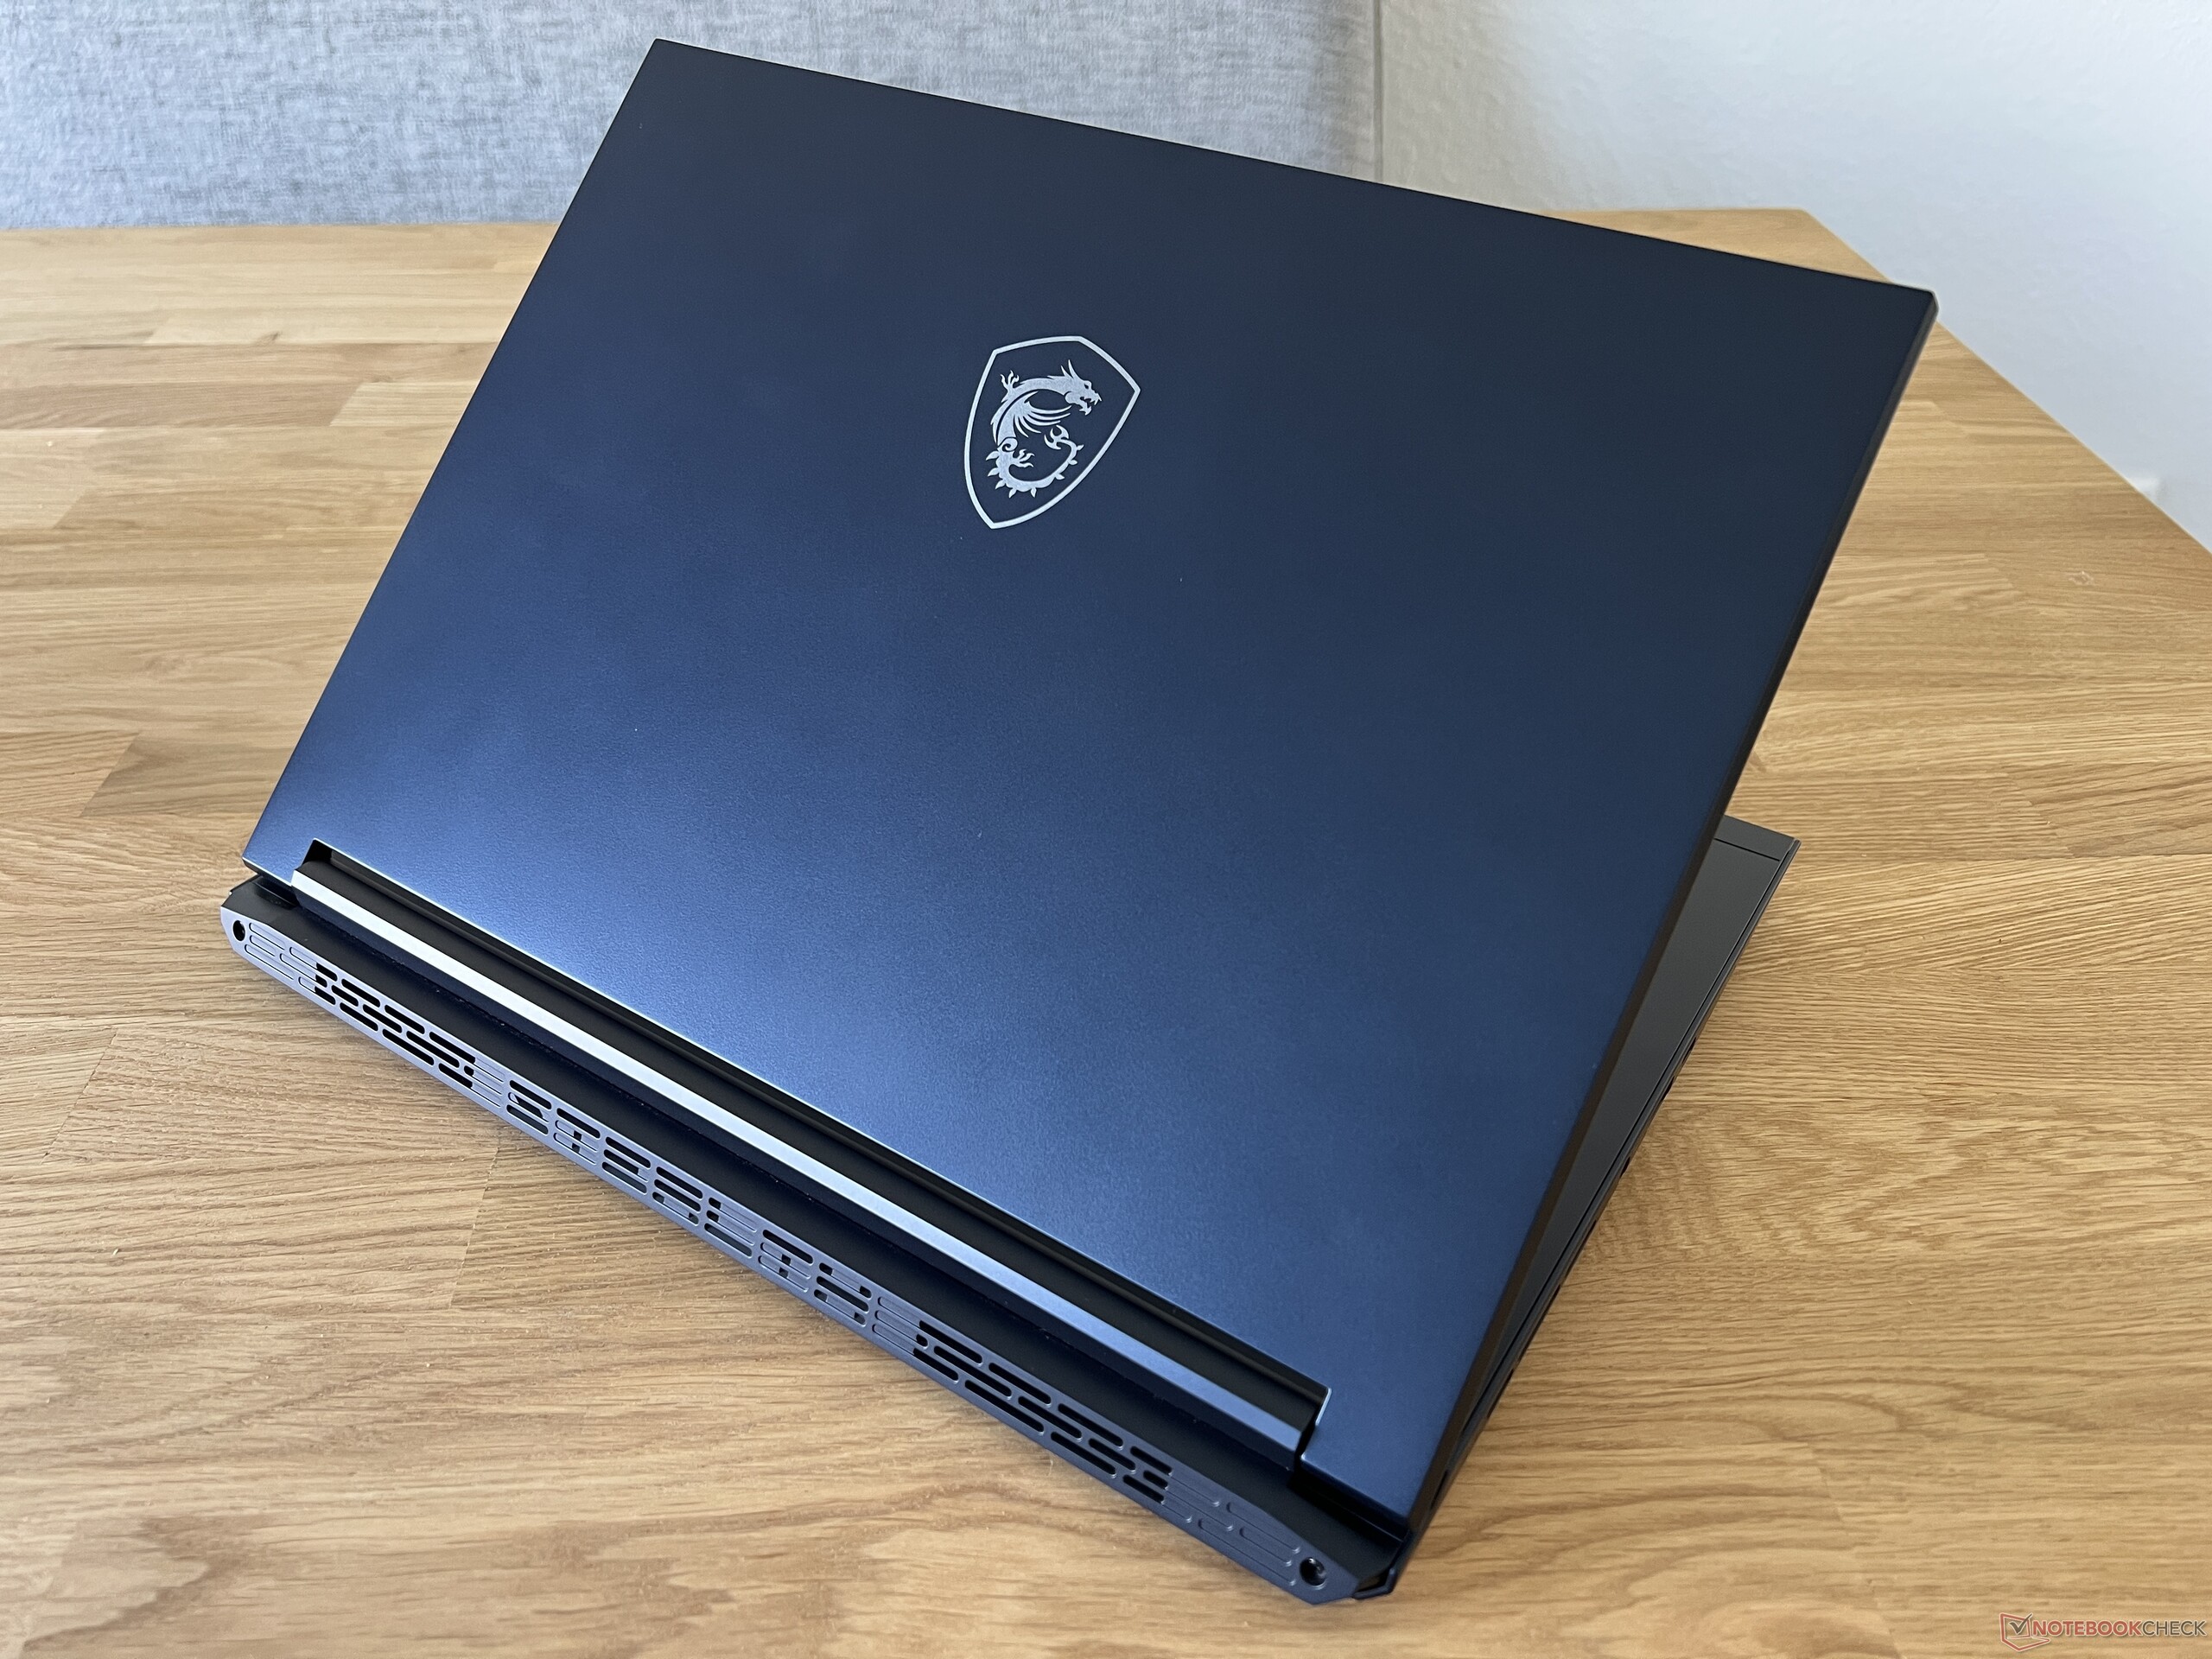
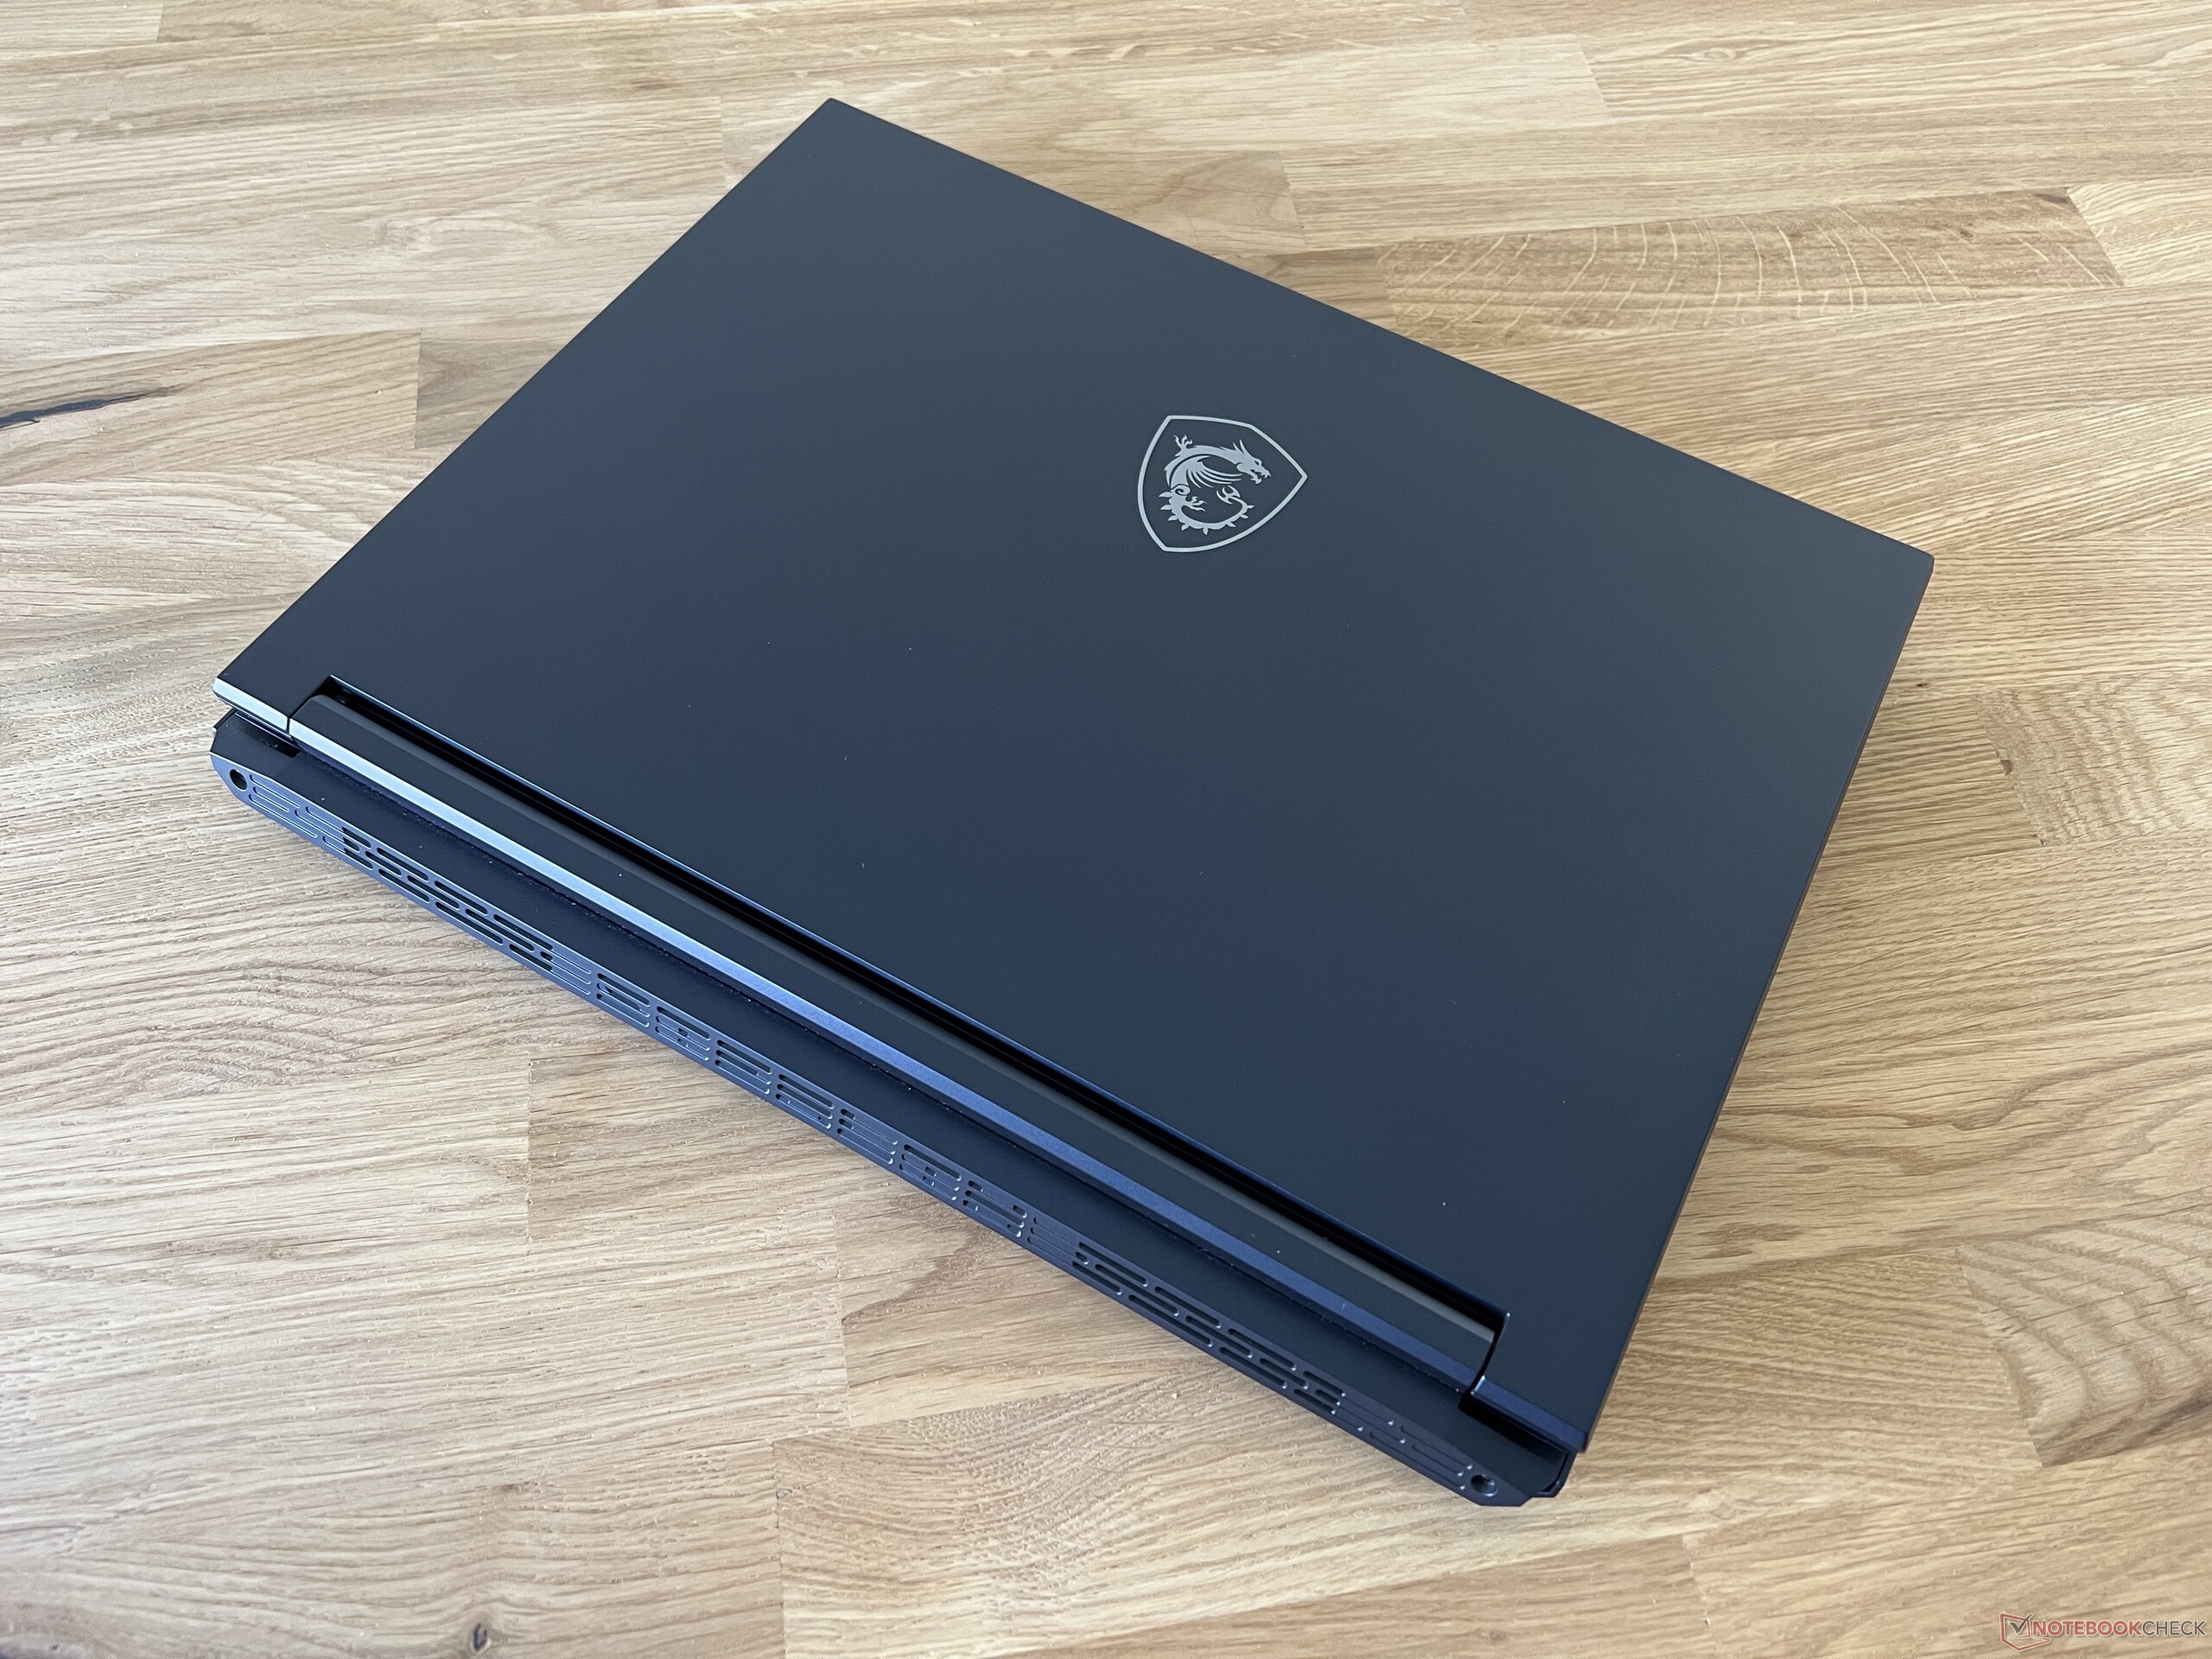
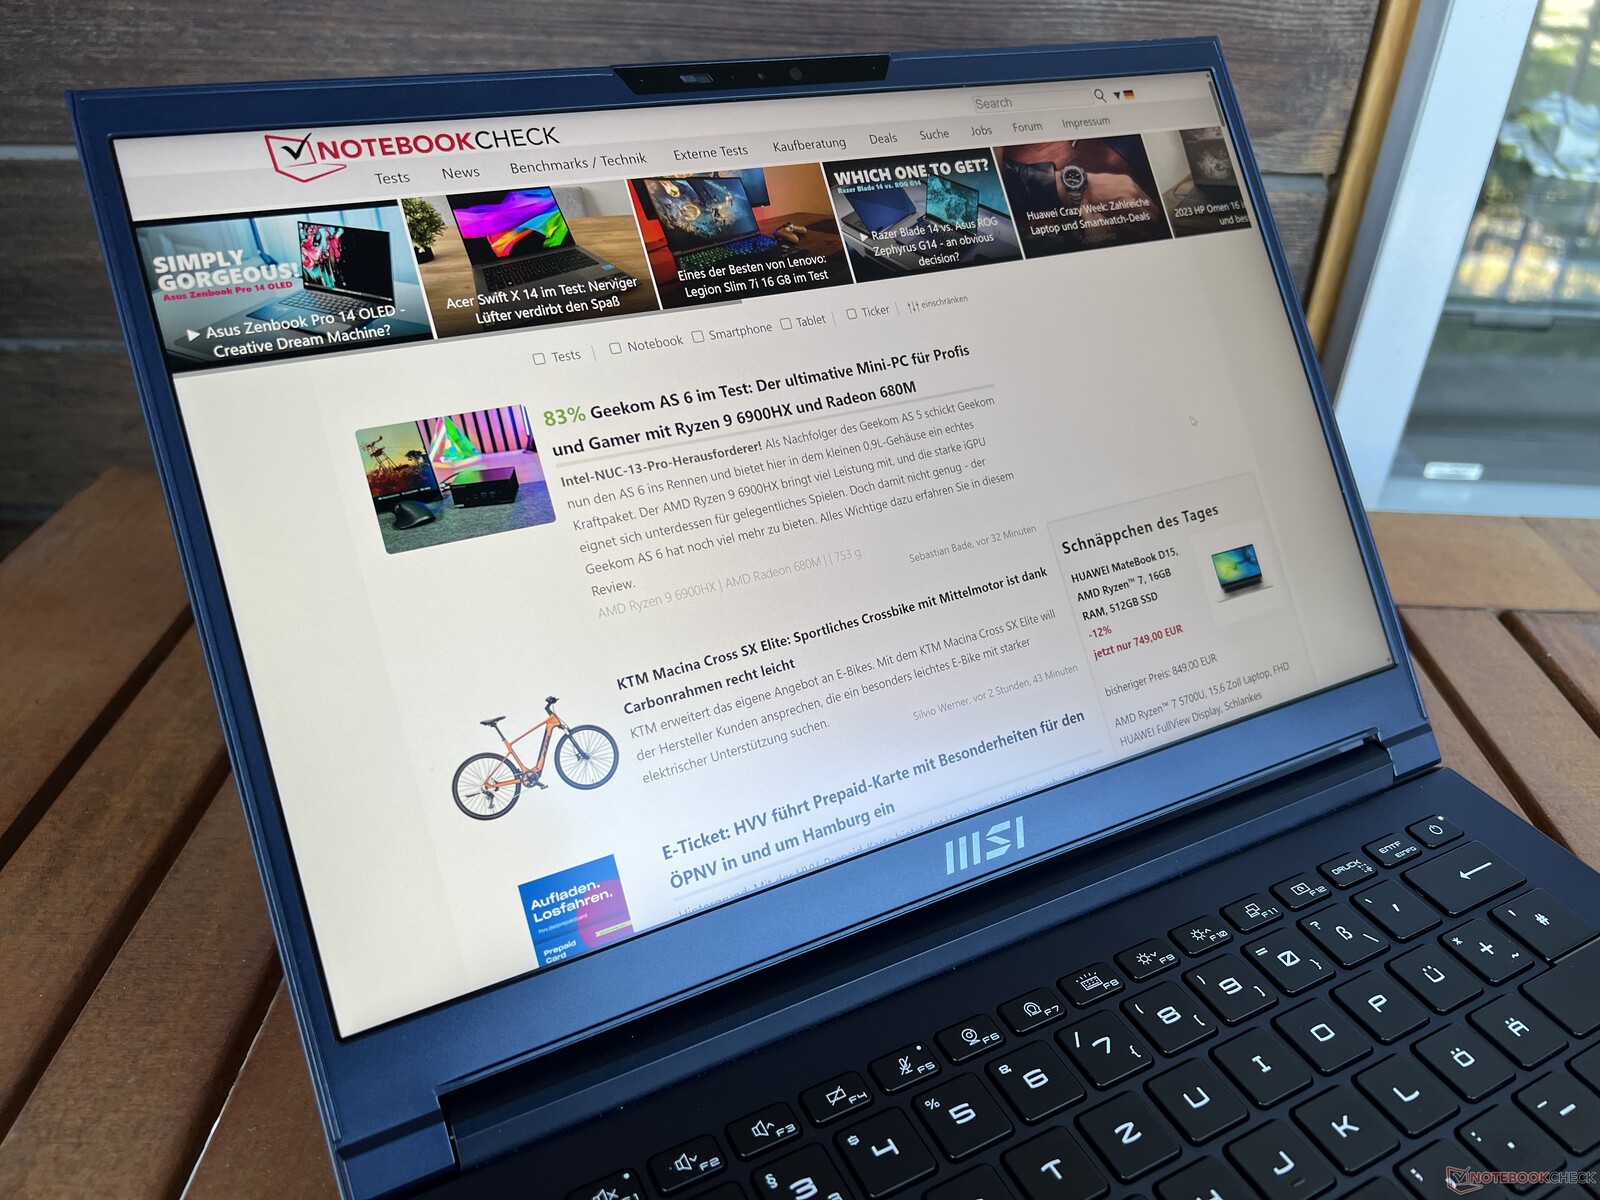
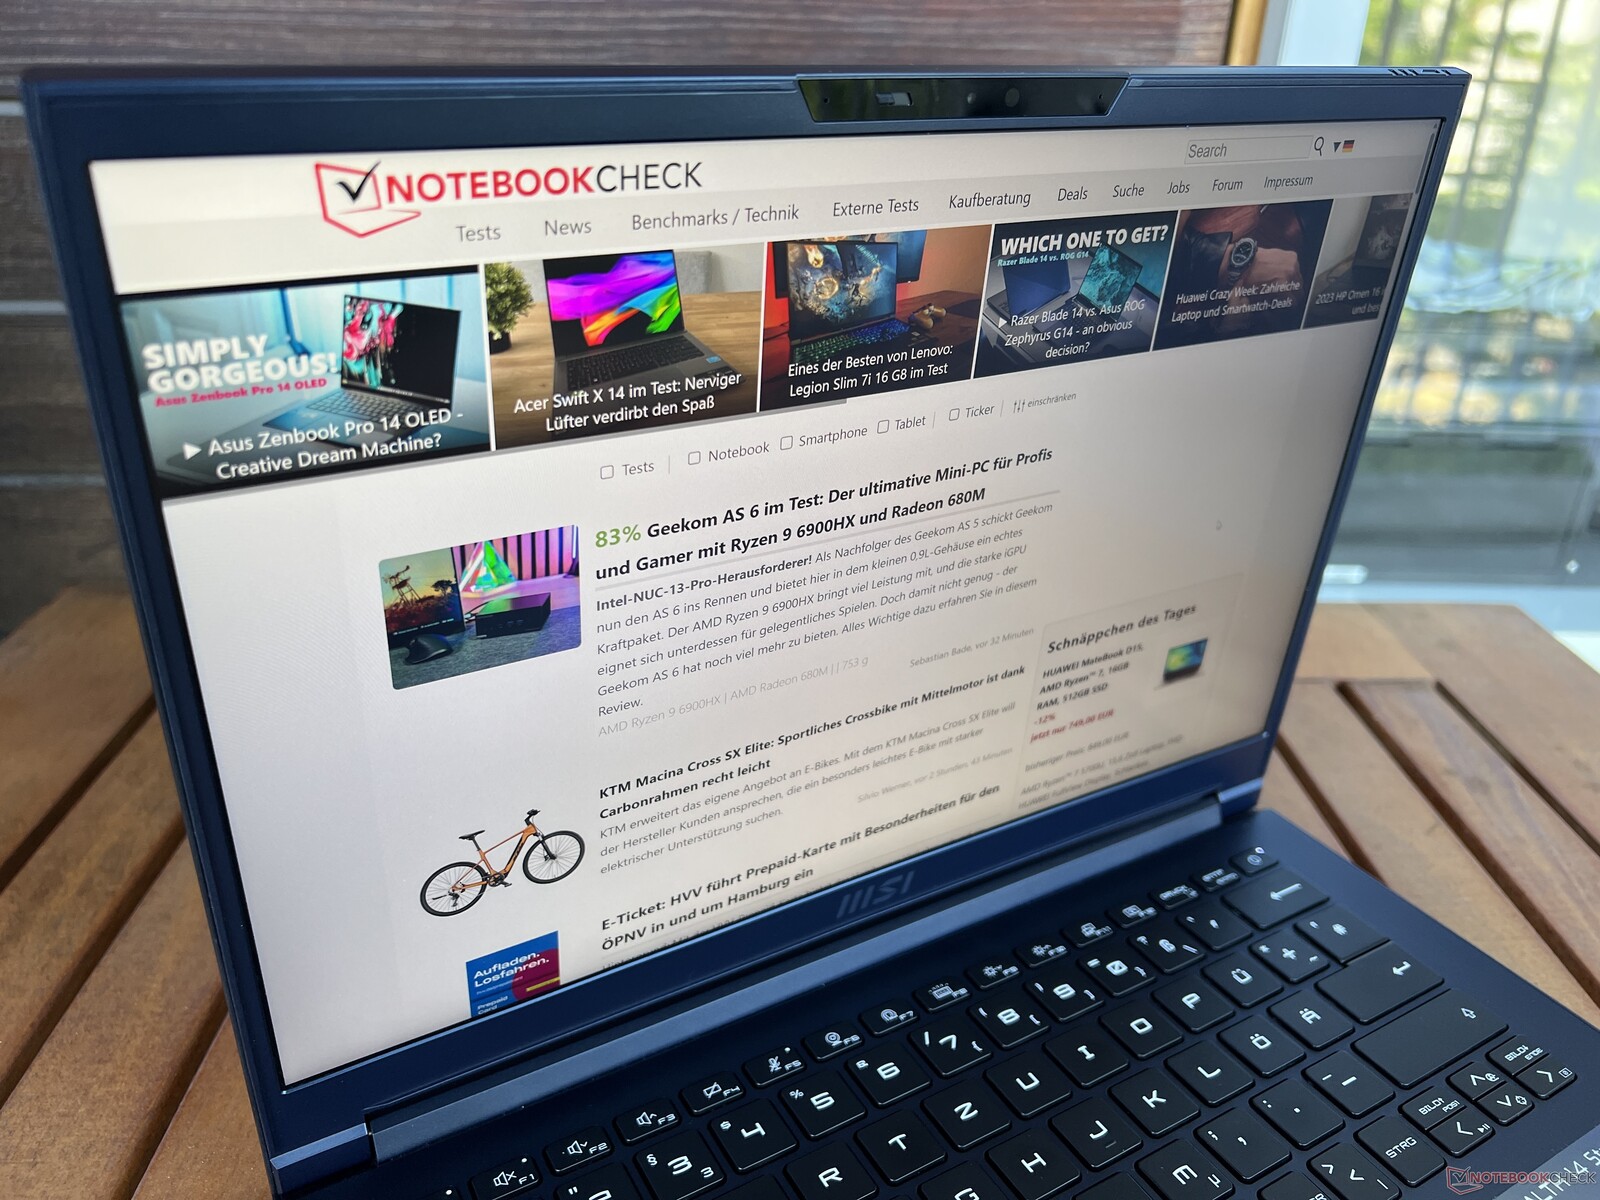
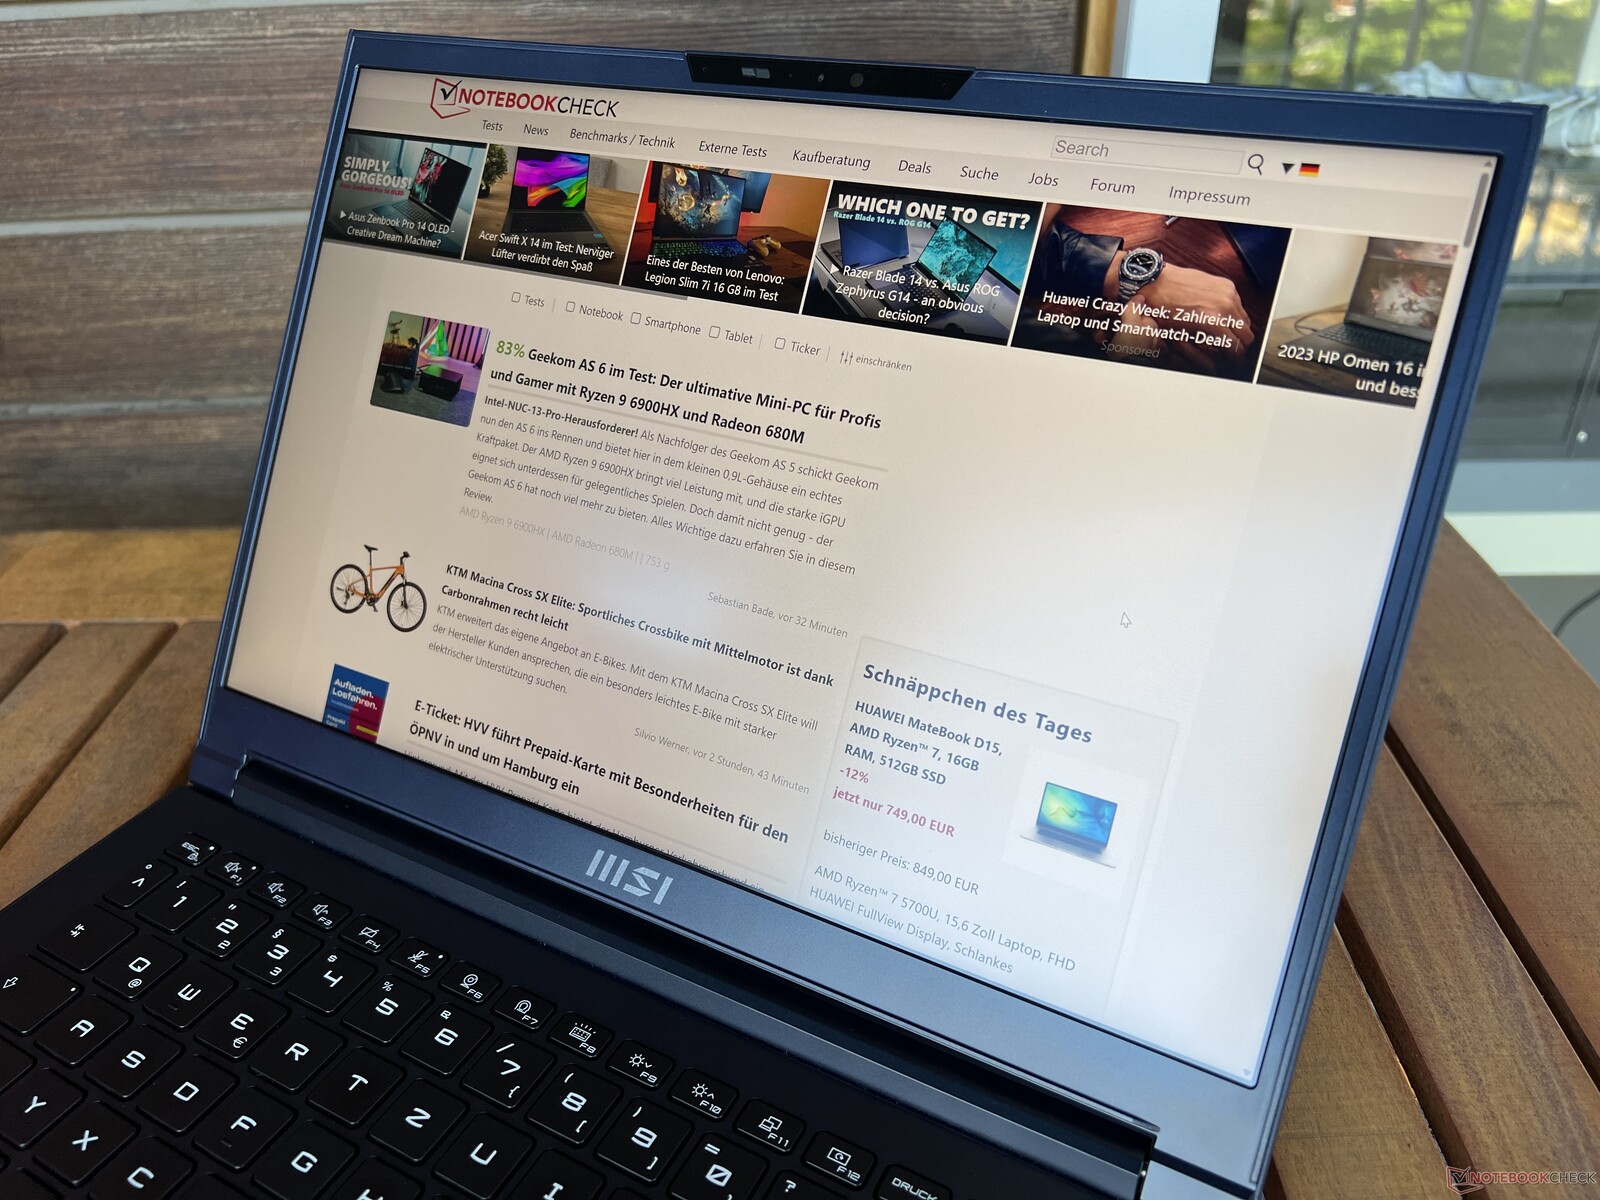
Caixa - Metal azul ou branco
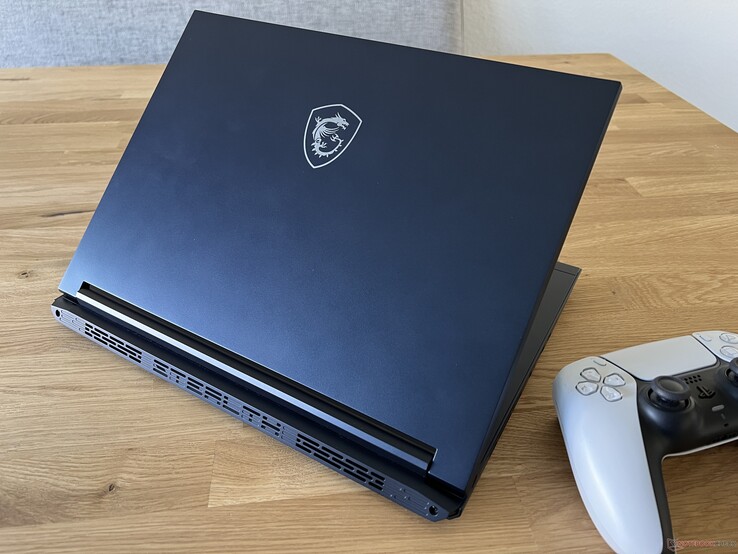
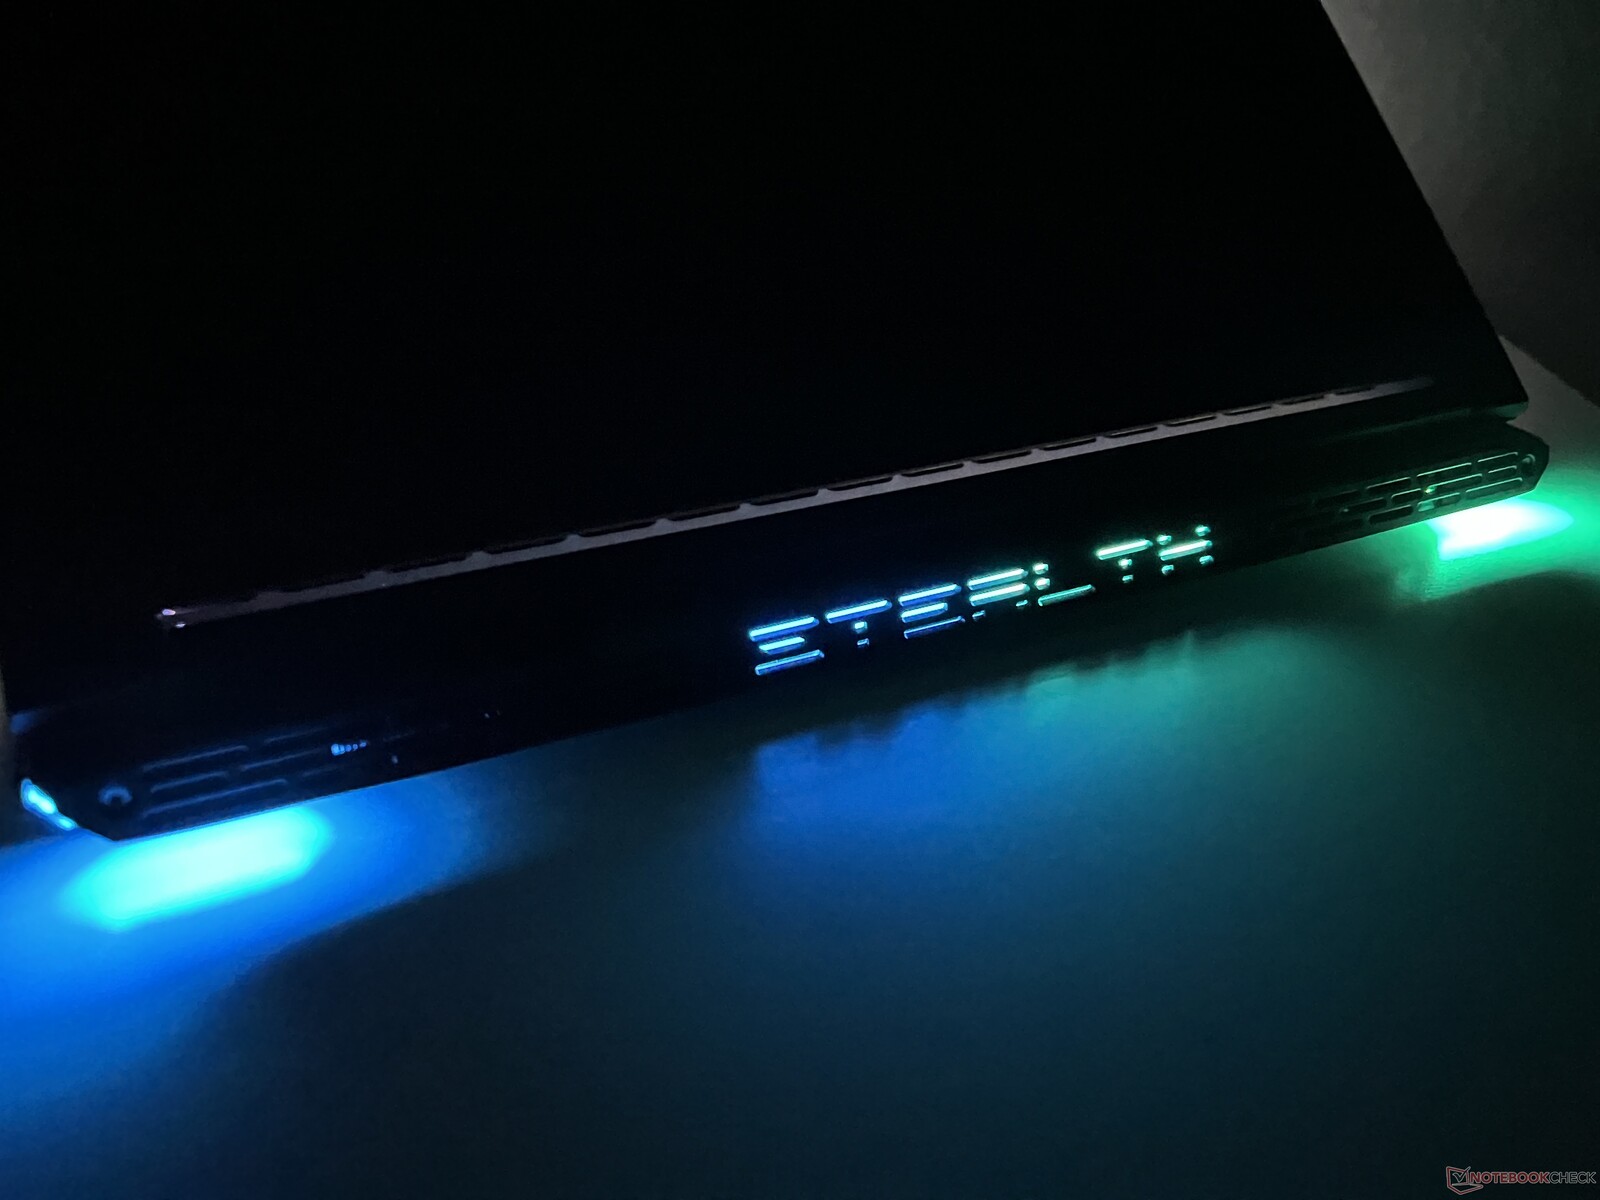
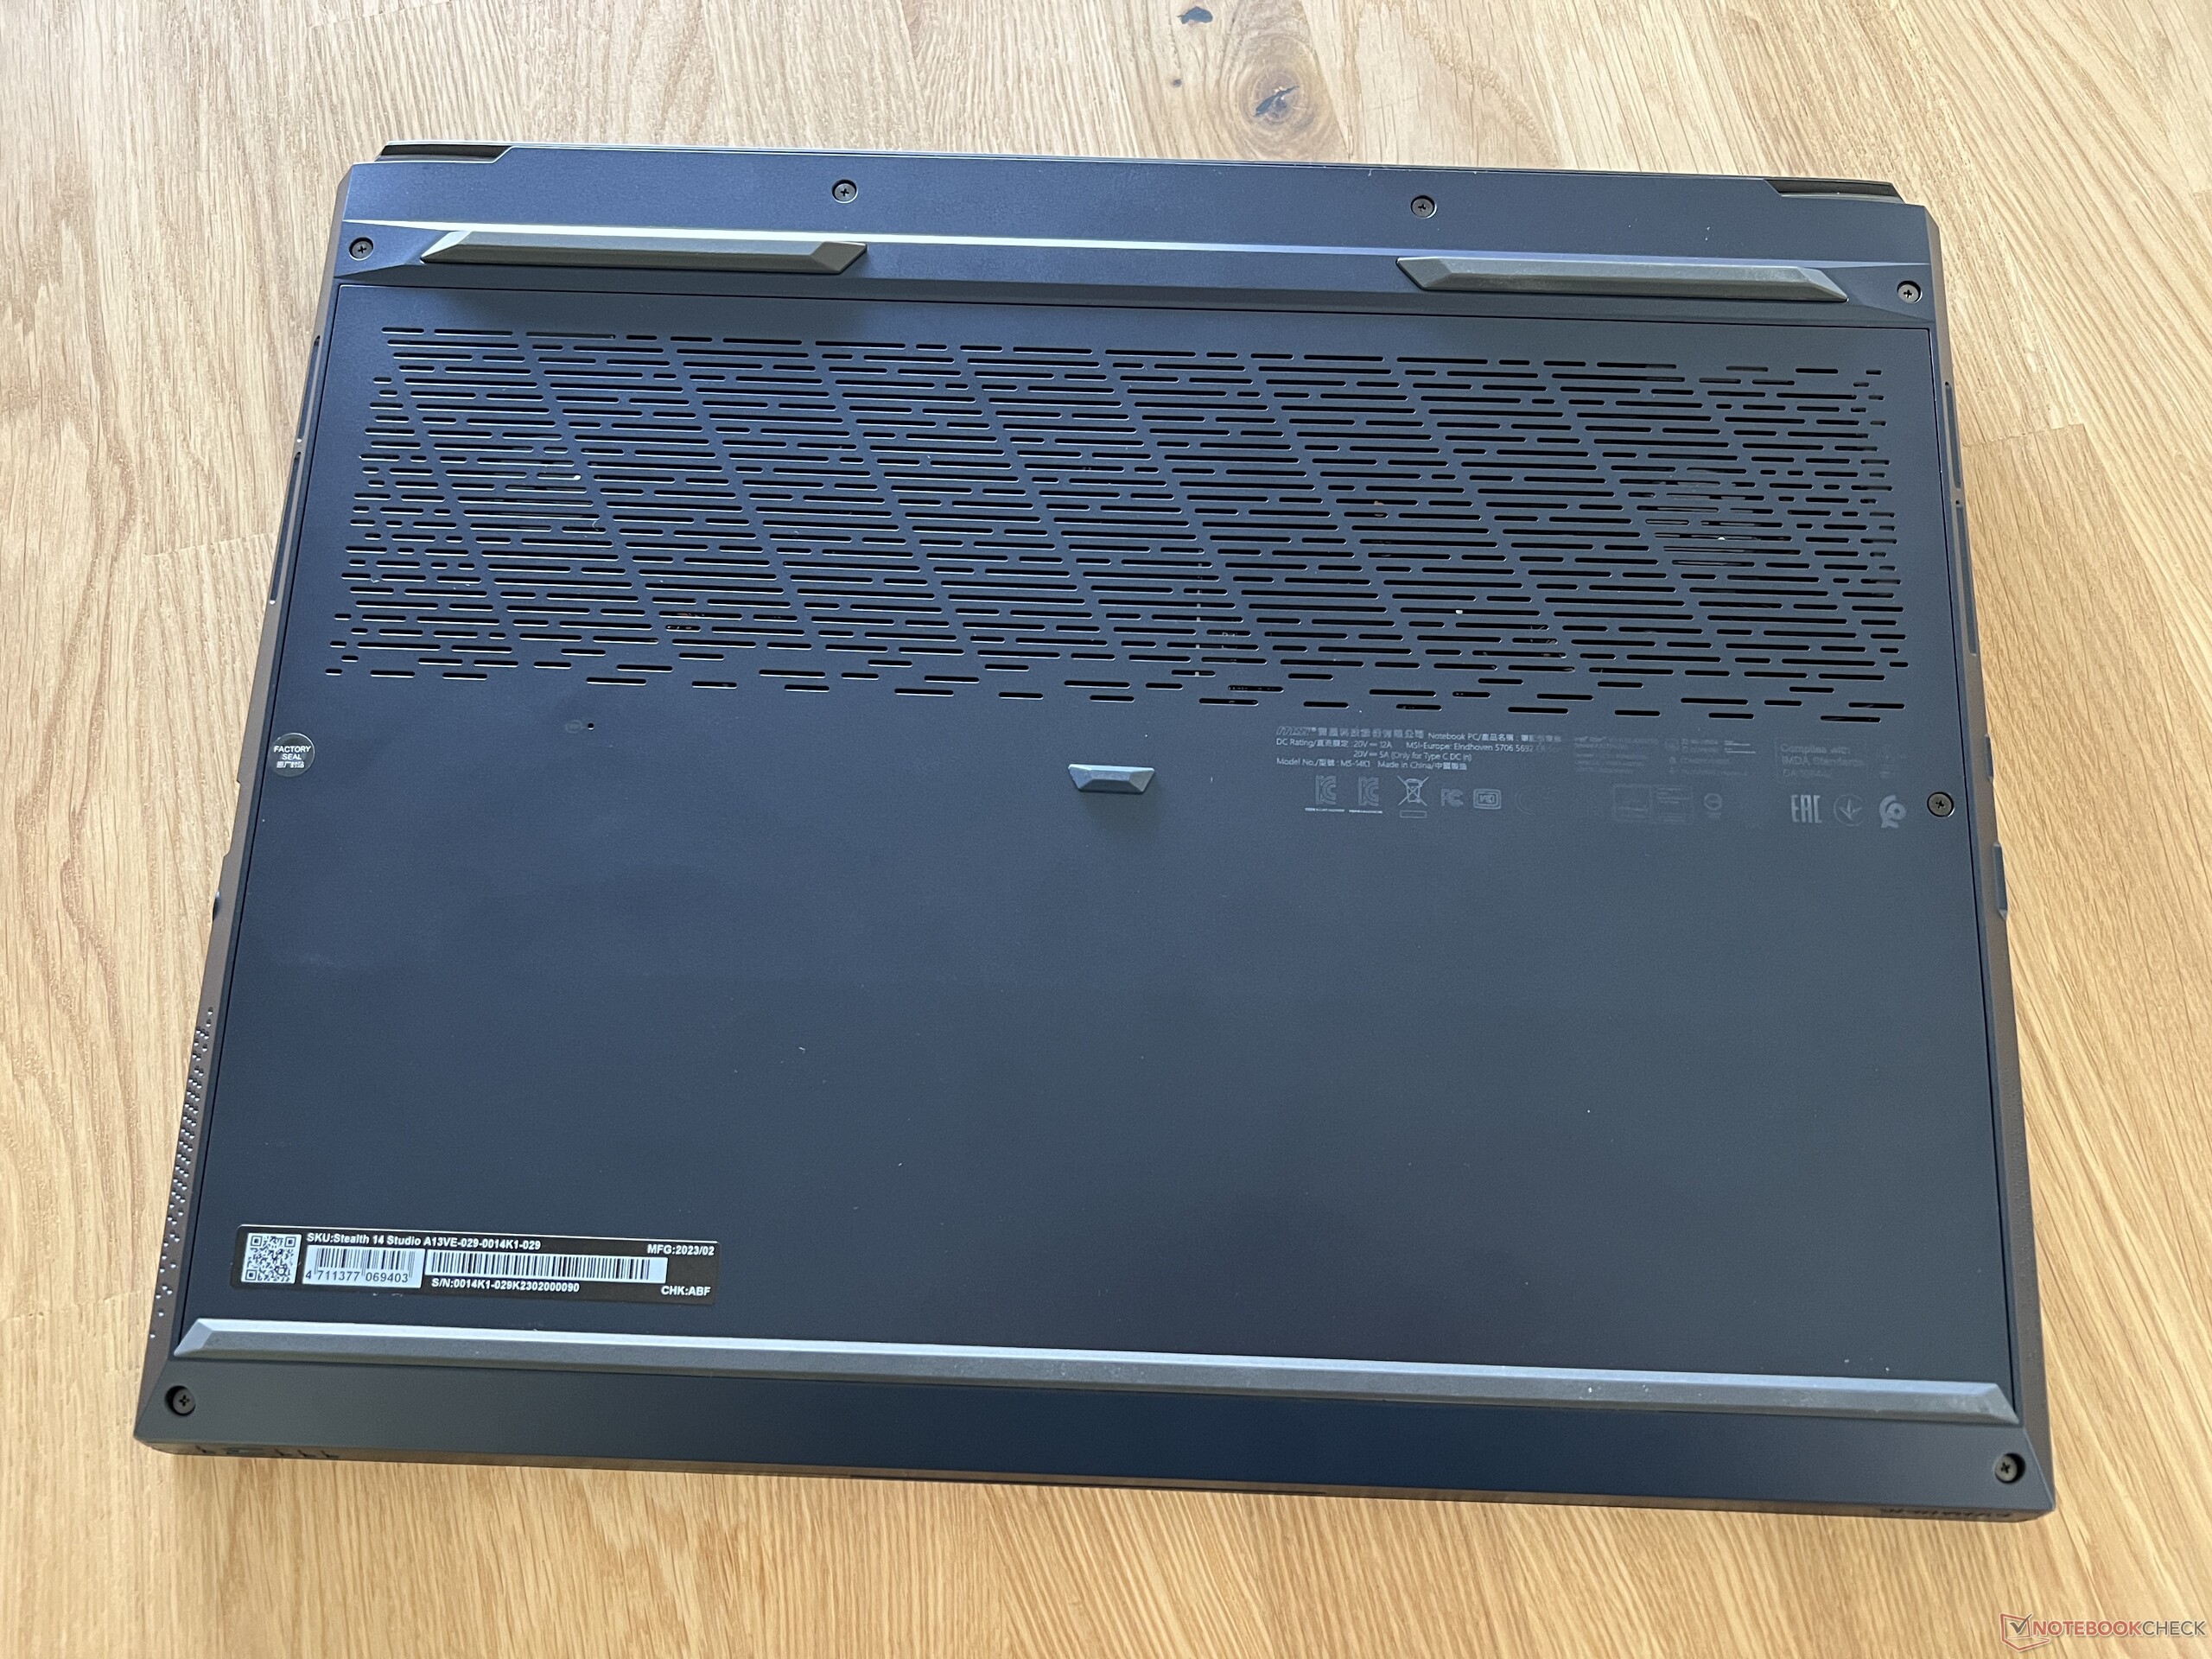
A MSI oferece o Stealth 14 Studio em azul escuro ou branco. Estamos testando o modelo azul, que parece bastante elegante, mas tem a tendência de mostrar algumas marcas de impressões digitais. Para um laptop para jogos, esse design é, na verdade, bastante reservado - o logotipo do dragão na tampa é a única coisa que chama a atenção para a série do dispositivo. Na parte traseira, há alguns elementos de iluminação adicionais (que podem ser ativados por meio do MSI Center) - os dois cantos, bem como o logotipo Stealth, podem ser iluminados. Infelizmente, não é possível alterar a cor ou a intensidade da iluminação.
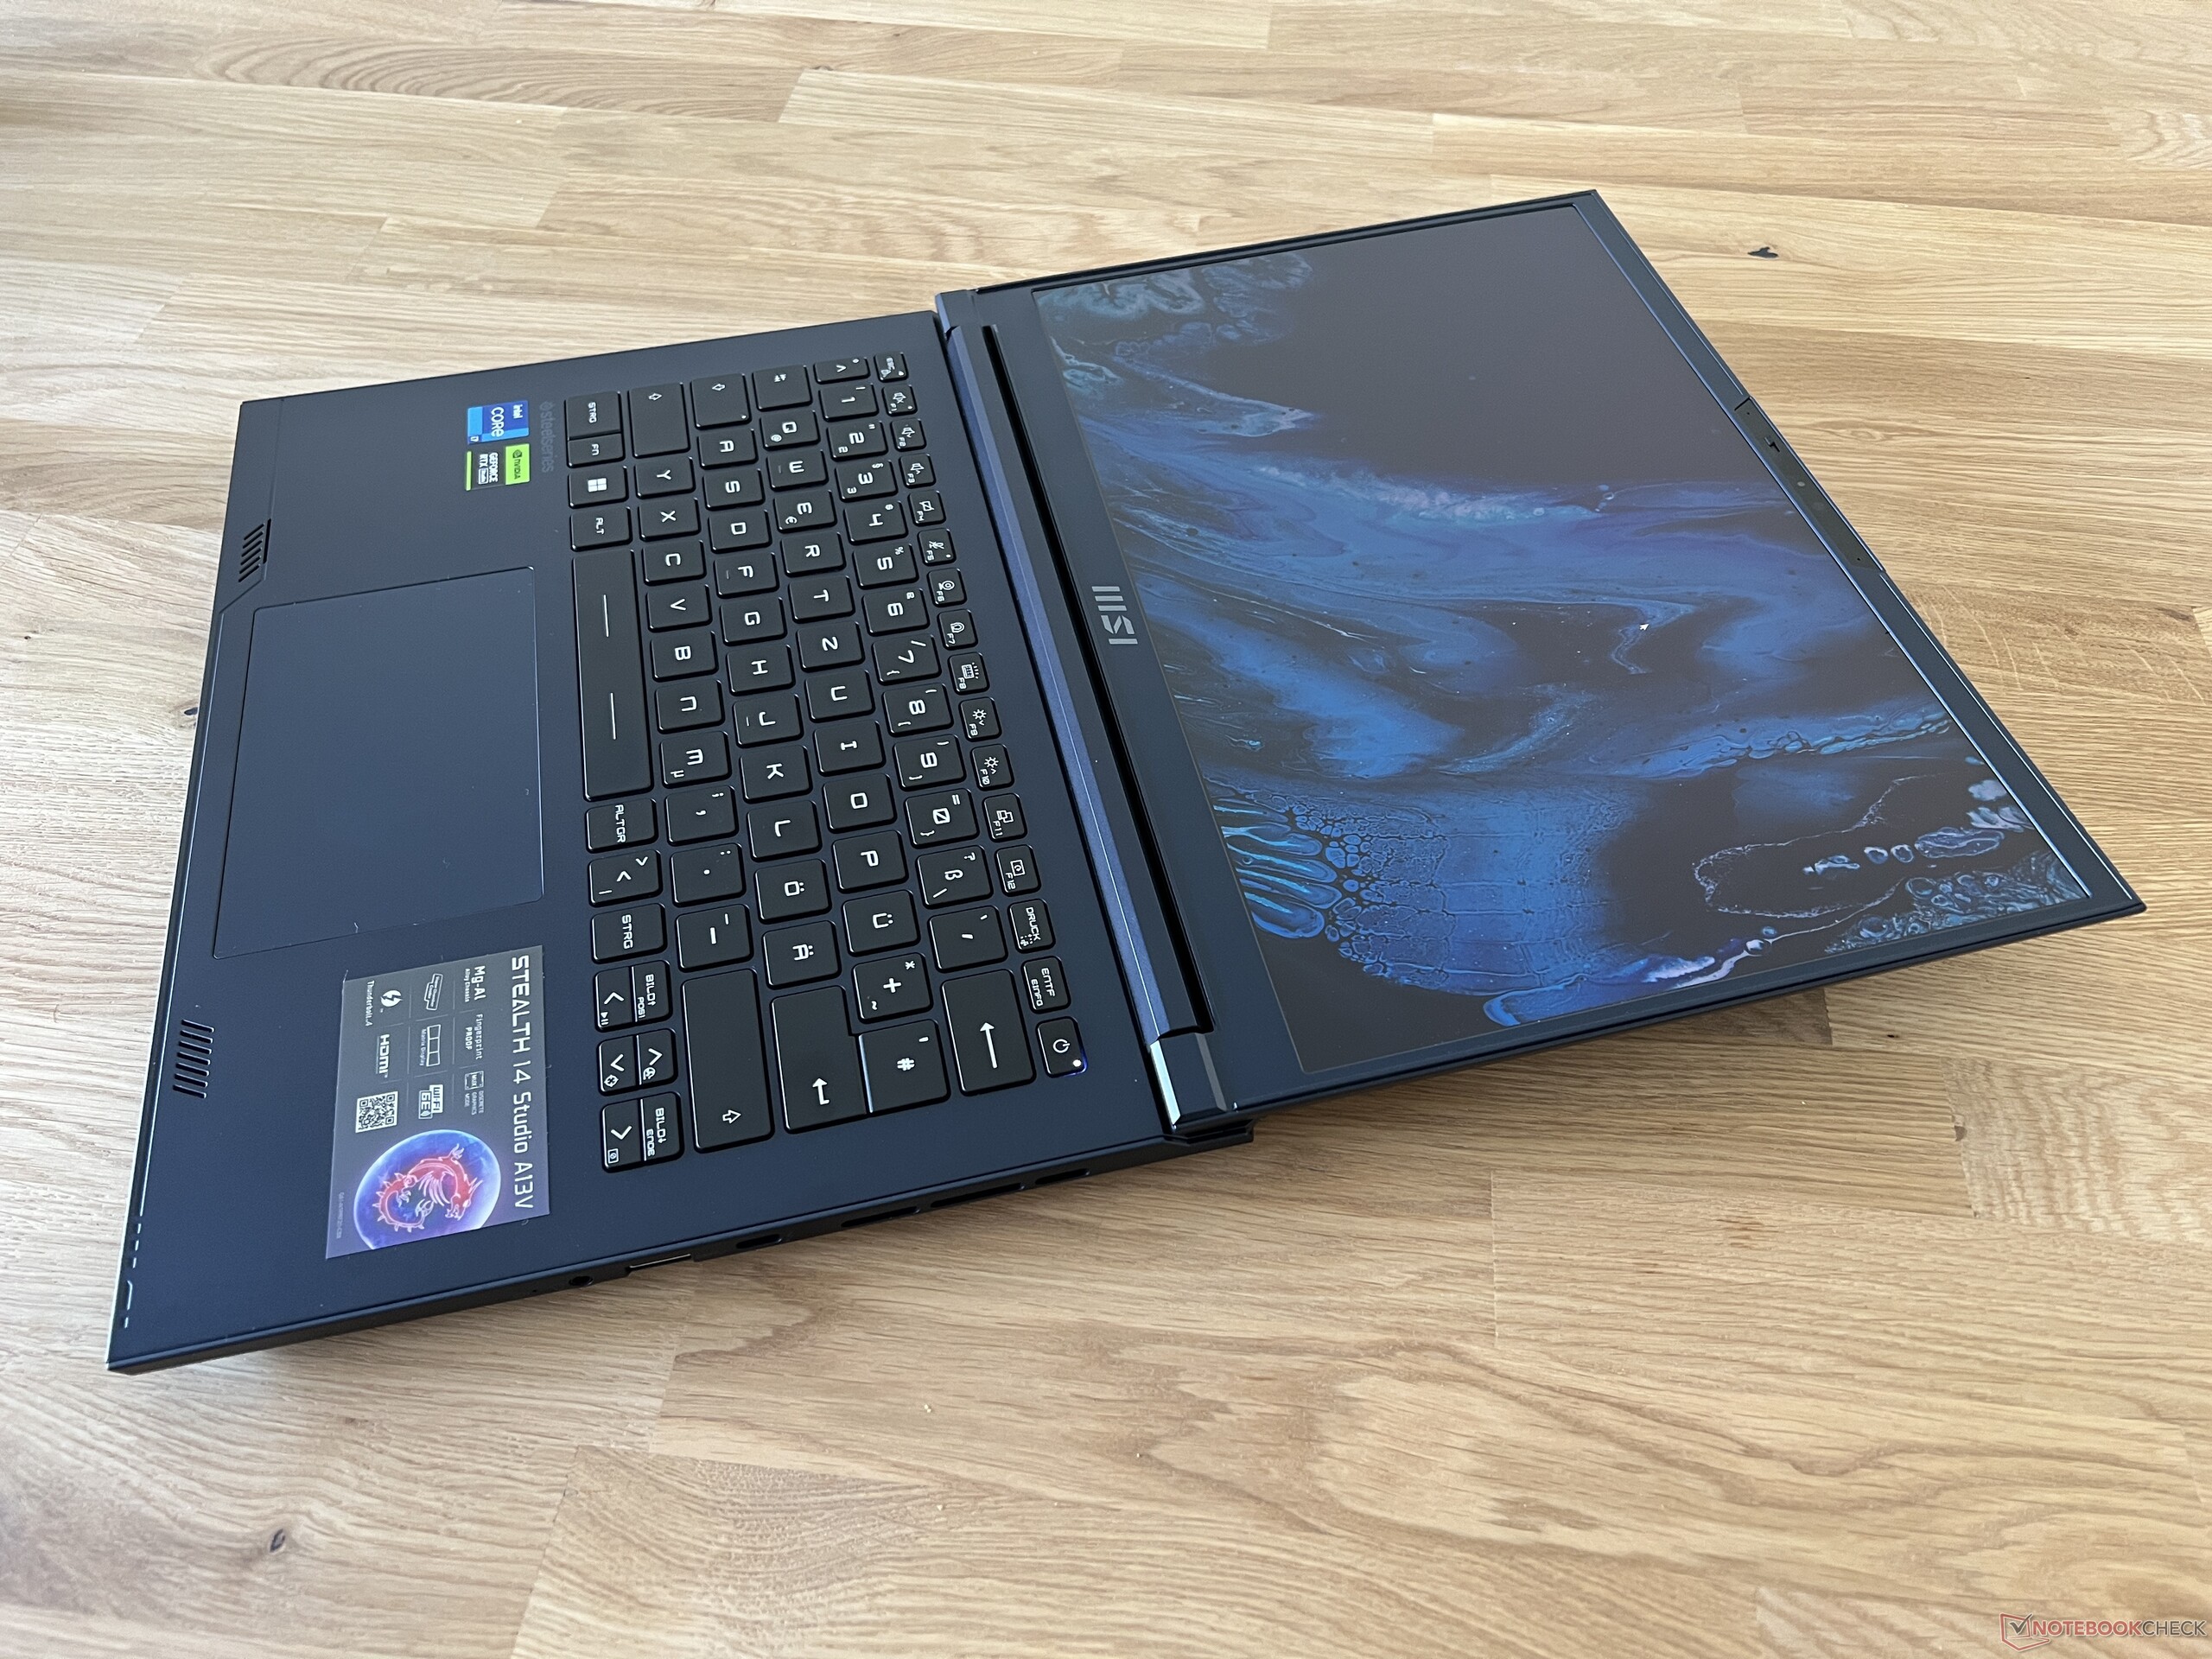
O gabinete é feito de uma liga de magnésio e alumínio e a unidade de base é extremamente estável. Ela não pode ser dobrada ou torcida e não há ruídos de rangidos. Infelizmente, o mesmo não pode ser dito da tampa do dispositivo, que é consideravelmente mais flexível e pode até mesmo ser dobrada levemente, causando ruídos audíveis de rangidos. Normalmente, esses problemas são esquecidos há muito tempo nos dispositivos modernos, portanto, é preciso ter cuidado para não pegar o laptop pela tela para evitar danos permanentes. As duas dobradiças são bem ajustadas e permitem um ângulo de abertura máximo de 180 graus. Os engastes são bastante espessos para um dispositivo moderno - a proporção entre a tela e o corpo é de apenas 73%.
O Stealth 14 Studio é um dos maiores dispositivos em nosso grupo de comparação - somente oAlienware x14ocupa ainda mais espaço. Com pouco mais de 1,7 kg, seu peso é médio. A fonte de alimentação de 240 watts acrescenta mais 700 gramas à balança.
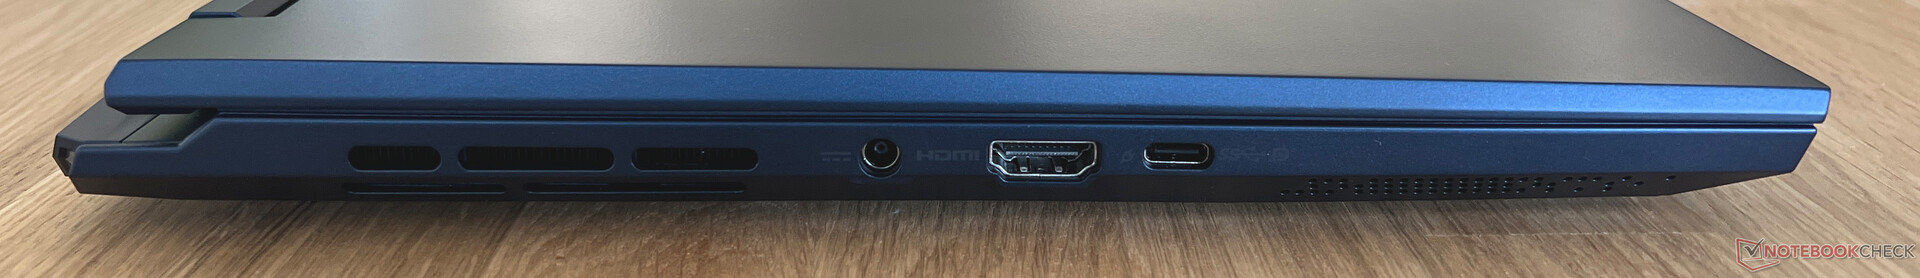
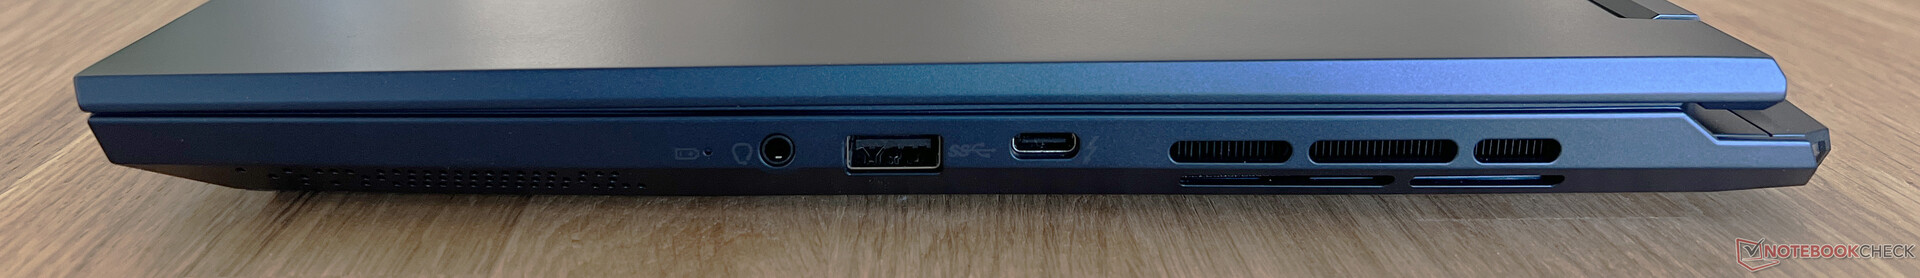
Conectividade - Thunderbolt 4, mas sem leitor de cartão SD
As portas do Stealth 14 Studio estão no meio, em ambos os lados do dispositivo, embora haja apenas três em cada lado. Você só conseguirá encontrar as conexões mais necessárias, mas as portas do laptop estão pelo menos atualizadas, pois incluem Thunderbolt 4 e HDMI 2.1. Infelizmente, um leitor de cartão SD e uma porta Ethernet não estão incluídos - em vez disso, você terá que contar com um adaptador.
Comunicação
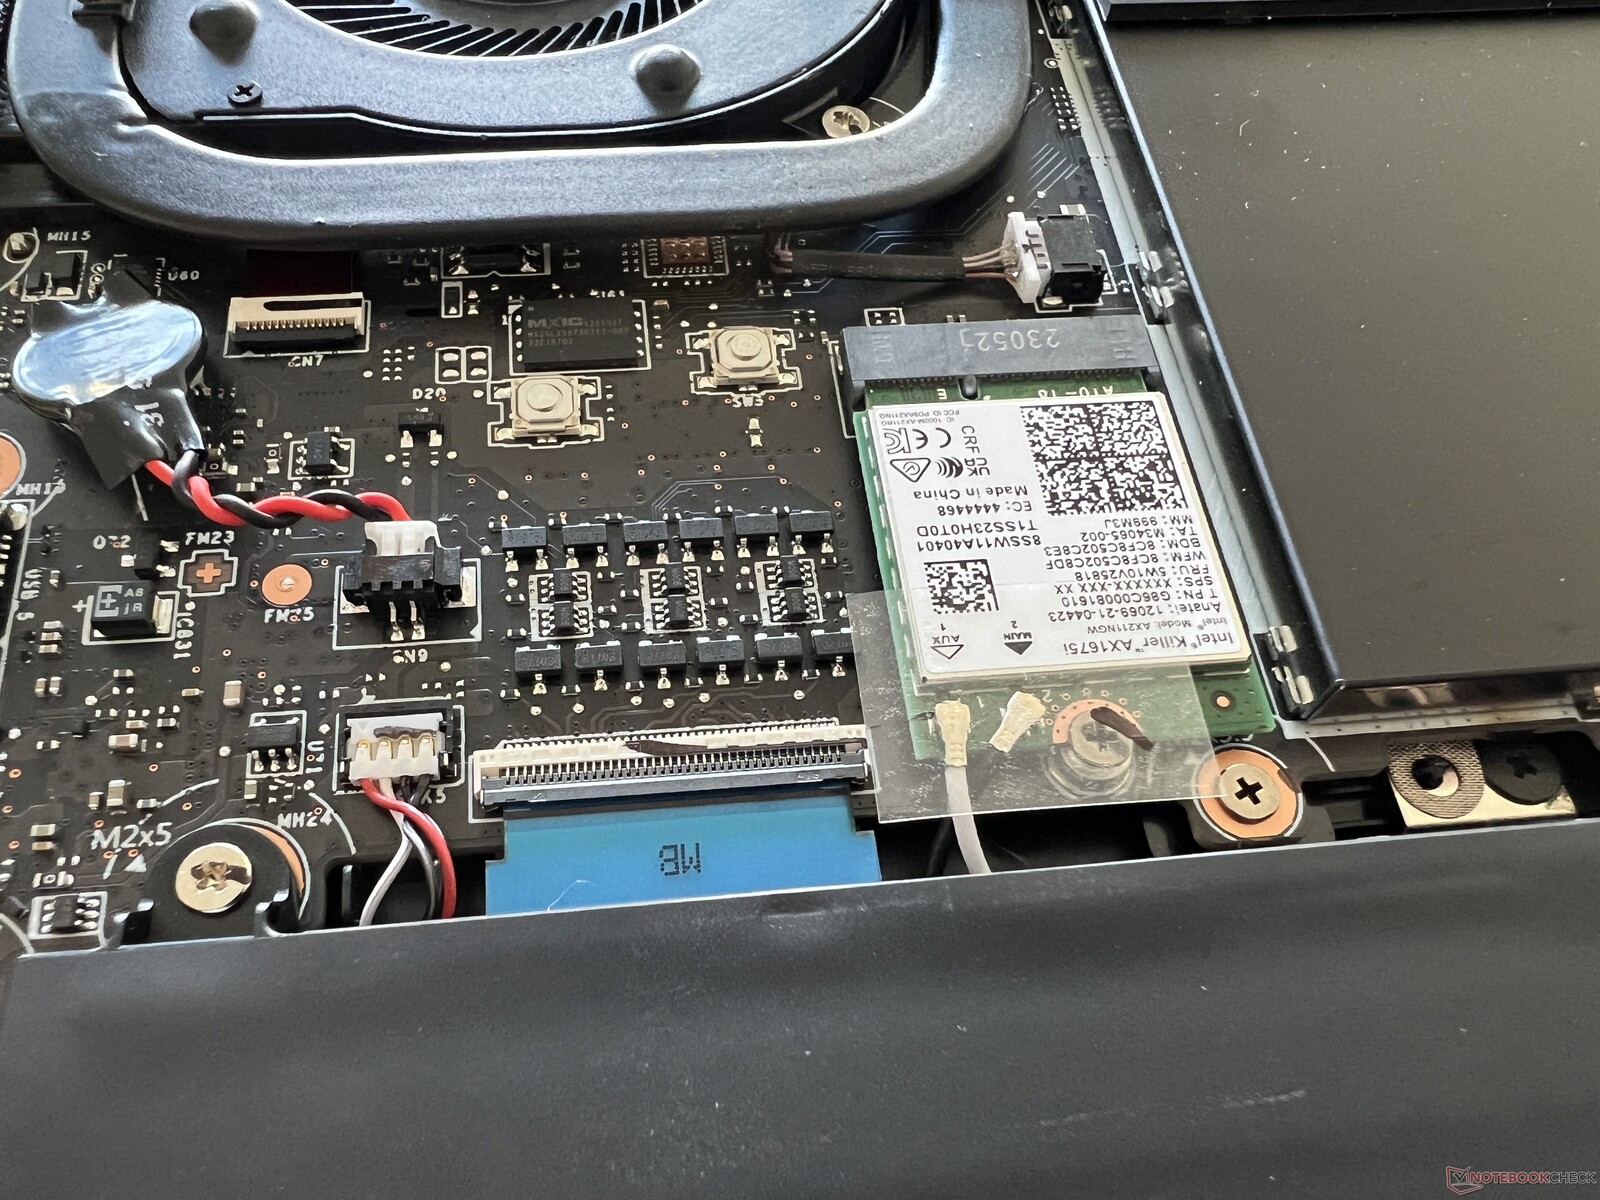
O laptop conta com um Killer AX1675i como seu módulo WLAN, que também suporta conexões modernas de 6 GHz (Wi-Fi 6E). Usando nosso roteador de referência da Asus, obtivemos bons (mas não ótimos) resultados de transferência. No uso diário, isso não deve causar nenhum problema e também não tivemos nenhum problema de estabilidade de sinal em nosso teste.
| Networking | |
| MSI Stealth 14 Studio A13V | |
| iperf3 transmit AXE11000 | |
| iperf3 receive AXE11000 | |
| Gigabyte Aero 14 OLED BMF | |
| iperf3 transmit AXE11000 | |
| iperf3 receive AXE11000 | |
| iperf3 transmit AXE11000 6GHz | |
| iperf3 receive AXE11000 6GHz | |
| Schenker Vision 14 2022 RTX 3050 Ti | |
| iperf3 transmit AXE11000 | |
| iperf3 receive AXE11000 | |
| Asus ROG Flow Z13 GZ301ZE | |
| iperf3 transmit AX12 | |
| iperf3 receive AX12 | |
| Alienware x14 i7 RTX 3060 | |
| iperf3 transmit AX12 | |
| iperf3 receive AX12 | |
| Razer Blade 14 Ryzen 9 6900HX | |
| iperf3 transmit AX12 | |
| iperf3 receive AX12 | |
| Acer Predator Triton 300 SE | |
| iperf3 transmit AXE11000 6GHz | |
| iperf3 receive AXE11000 6GHz | |
Webcam
Um pouco surpreendente é a webcam de 720p do Stealth 14 Studio, que se esforça para fornecer uma imagem decente mesmo em boas condições de iluminação. Além disso, há um módulo IR instalado - o reconhecimento facial é suportado pelo Windows Hello.


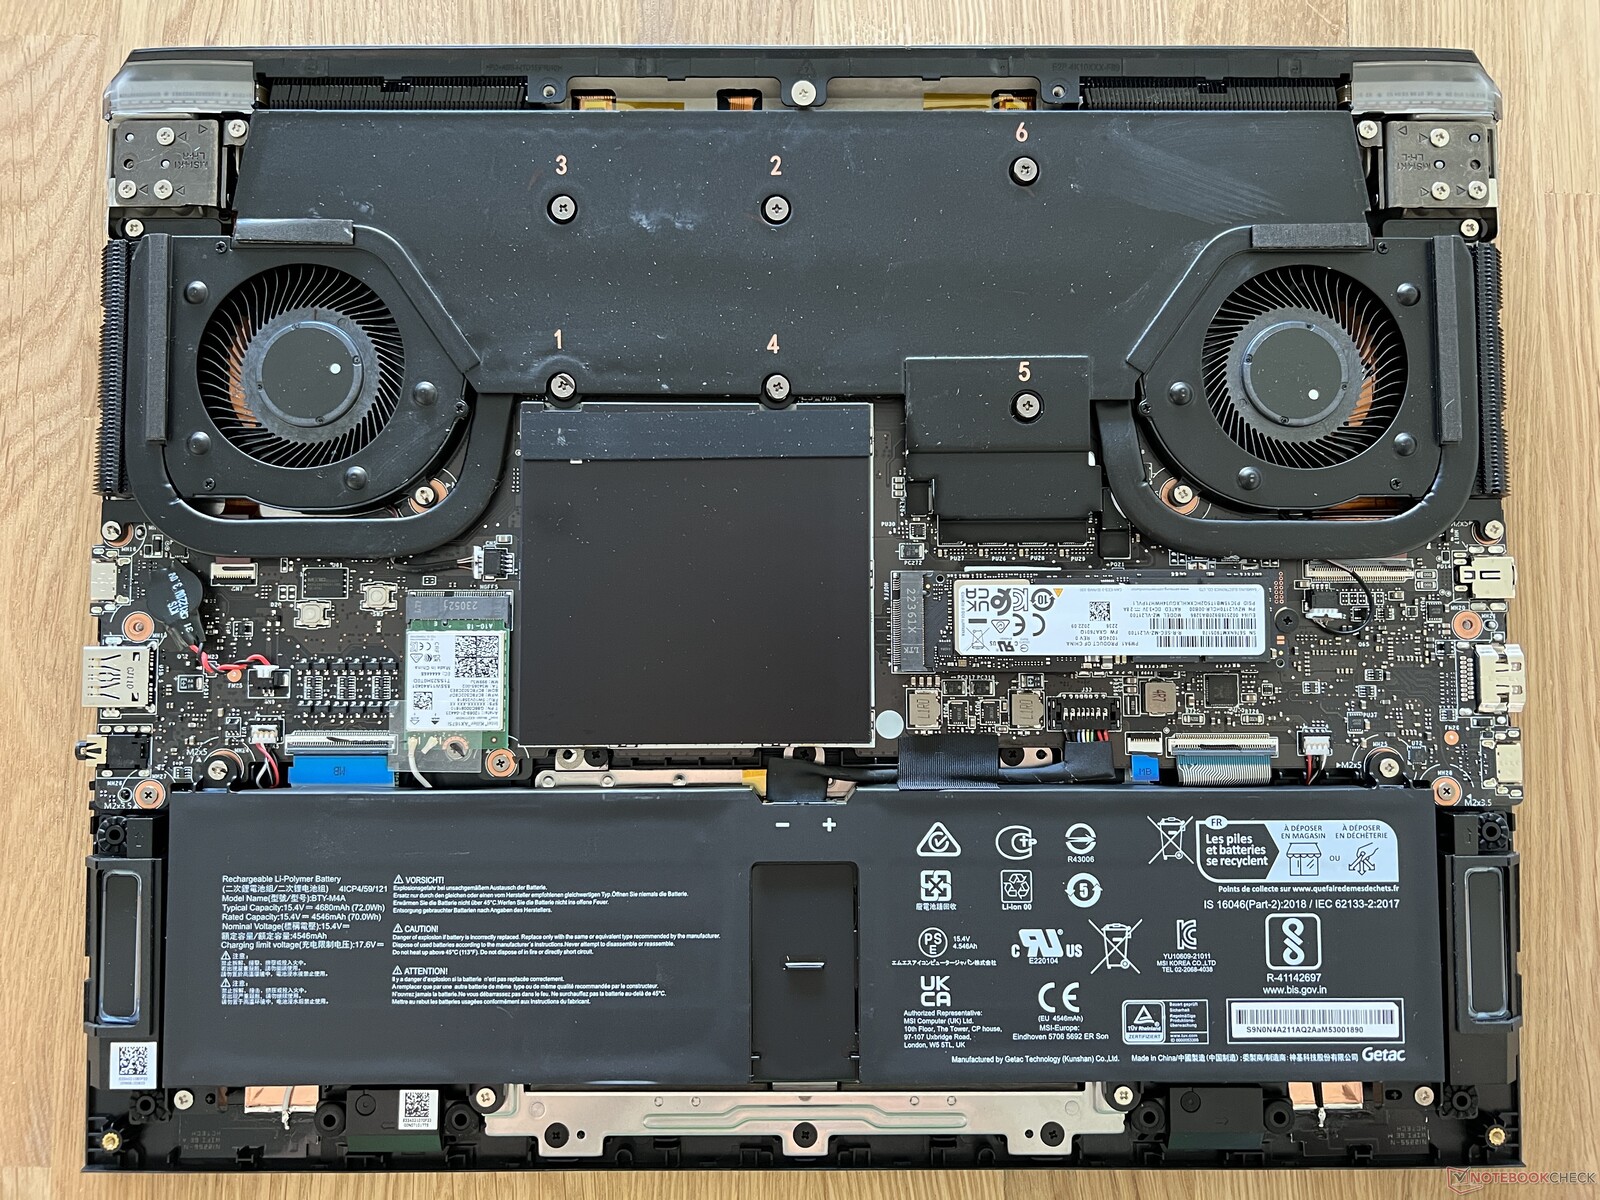
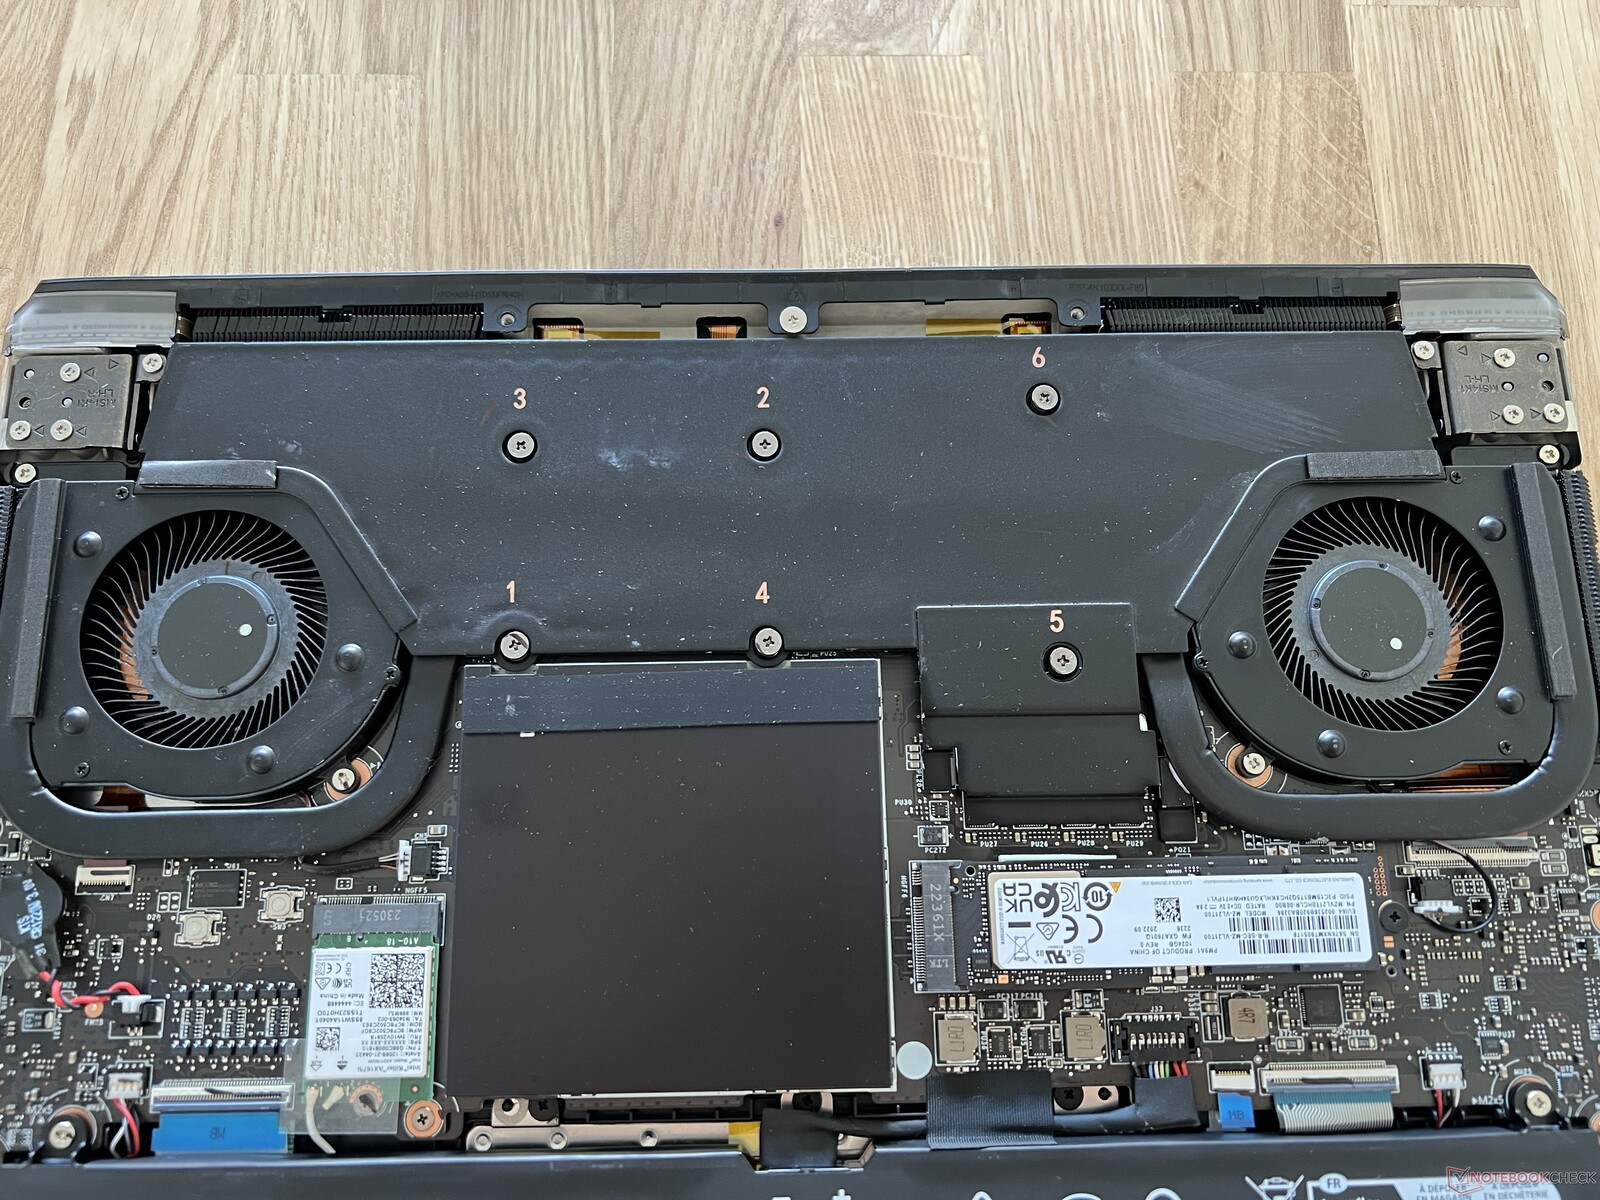
Manutenção
Para acessar os componentes do laptop, é necessário desmontar toda a parte inferior do gabinete. Um dos parafusos de cabeça cruzada é coberto por um lacre, pelo menos na Alemanha (onde estamos realizando este teste); o uso adequado desse lacre não deve afetar a garantia. No interior, você pode limpar as ventoinhas e trocar o módulo WLAN e o SSD M.2 2280. Teoricamente, você também poderia trocar o módulo de RAM; no entanto, a tampa adicional foi fixada com tanta firmeza que não conseguimos removê-la (e não queríamos causar nenhum dano à nossa amostra de teste). Provavelmente, há uma almofada de cola adicional que a mantém no lugar, o que dificulta ainda mais a sua remoção pelo usuário.
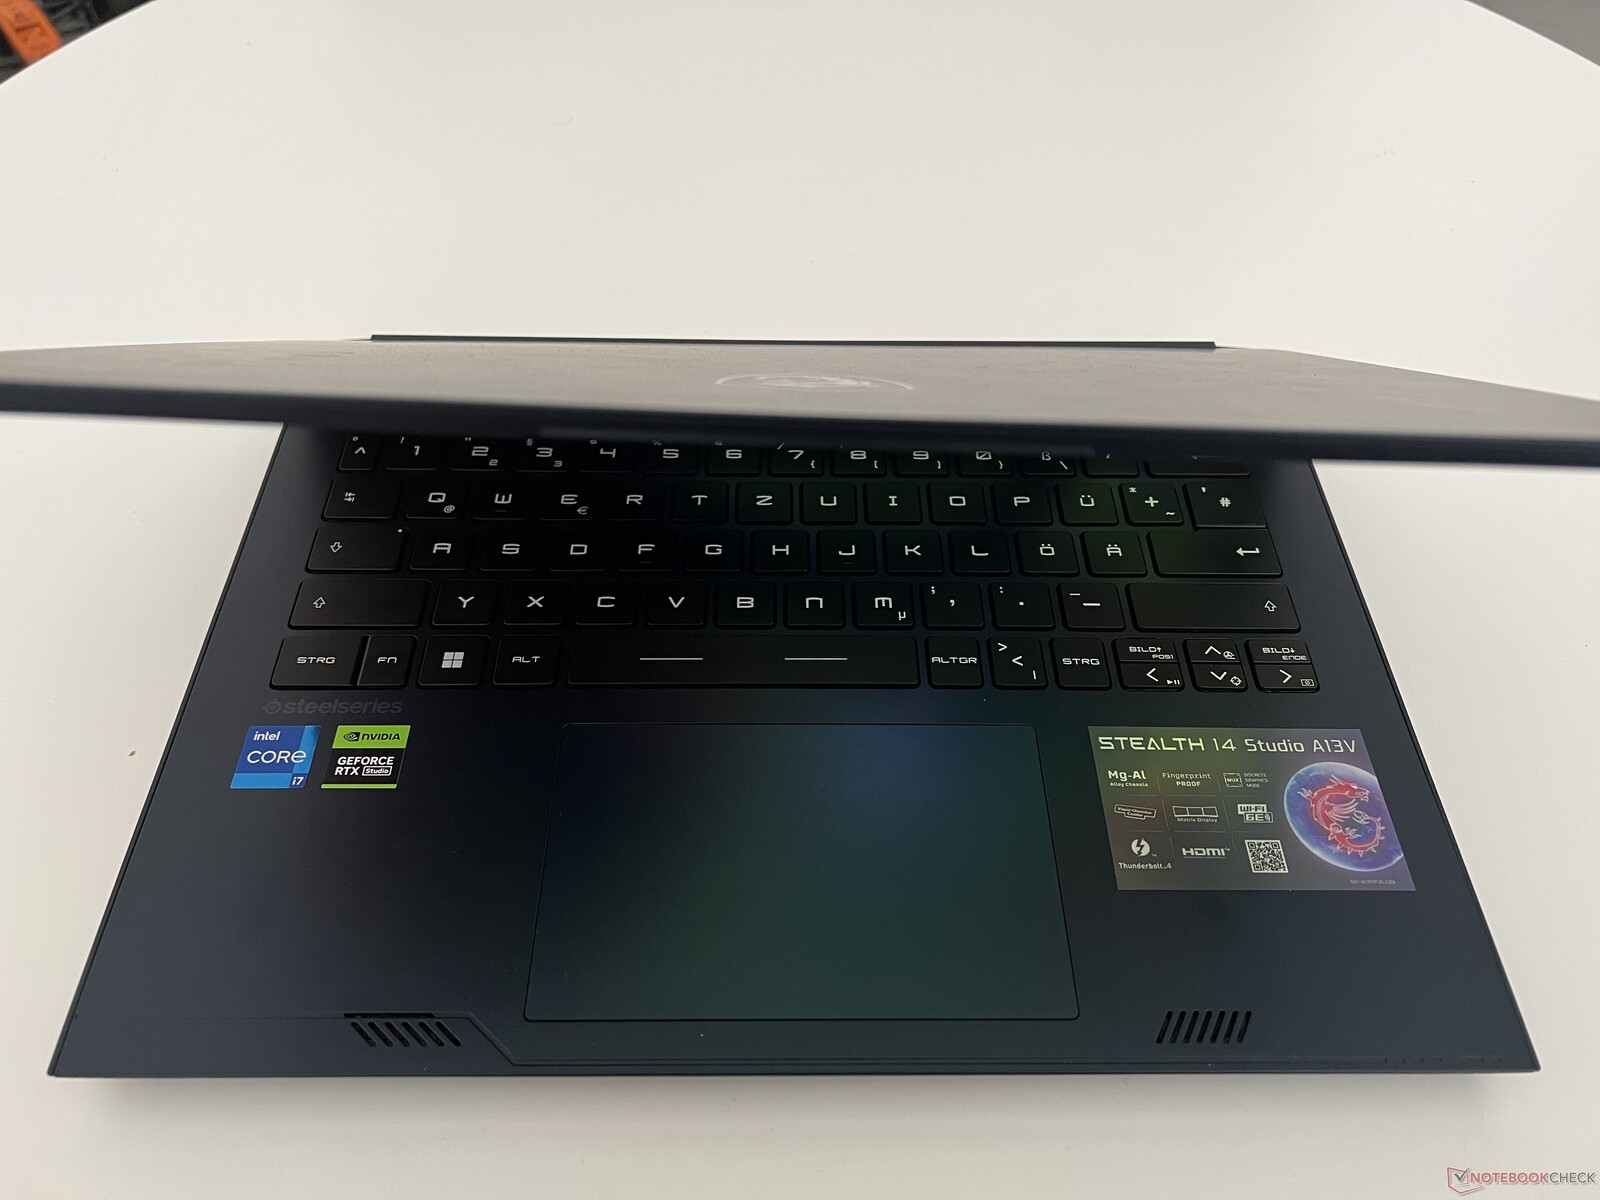
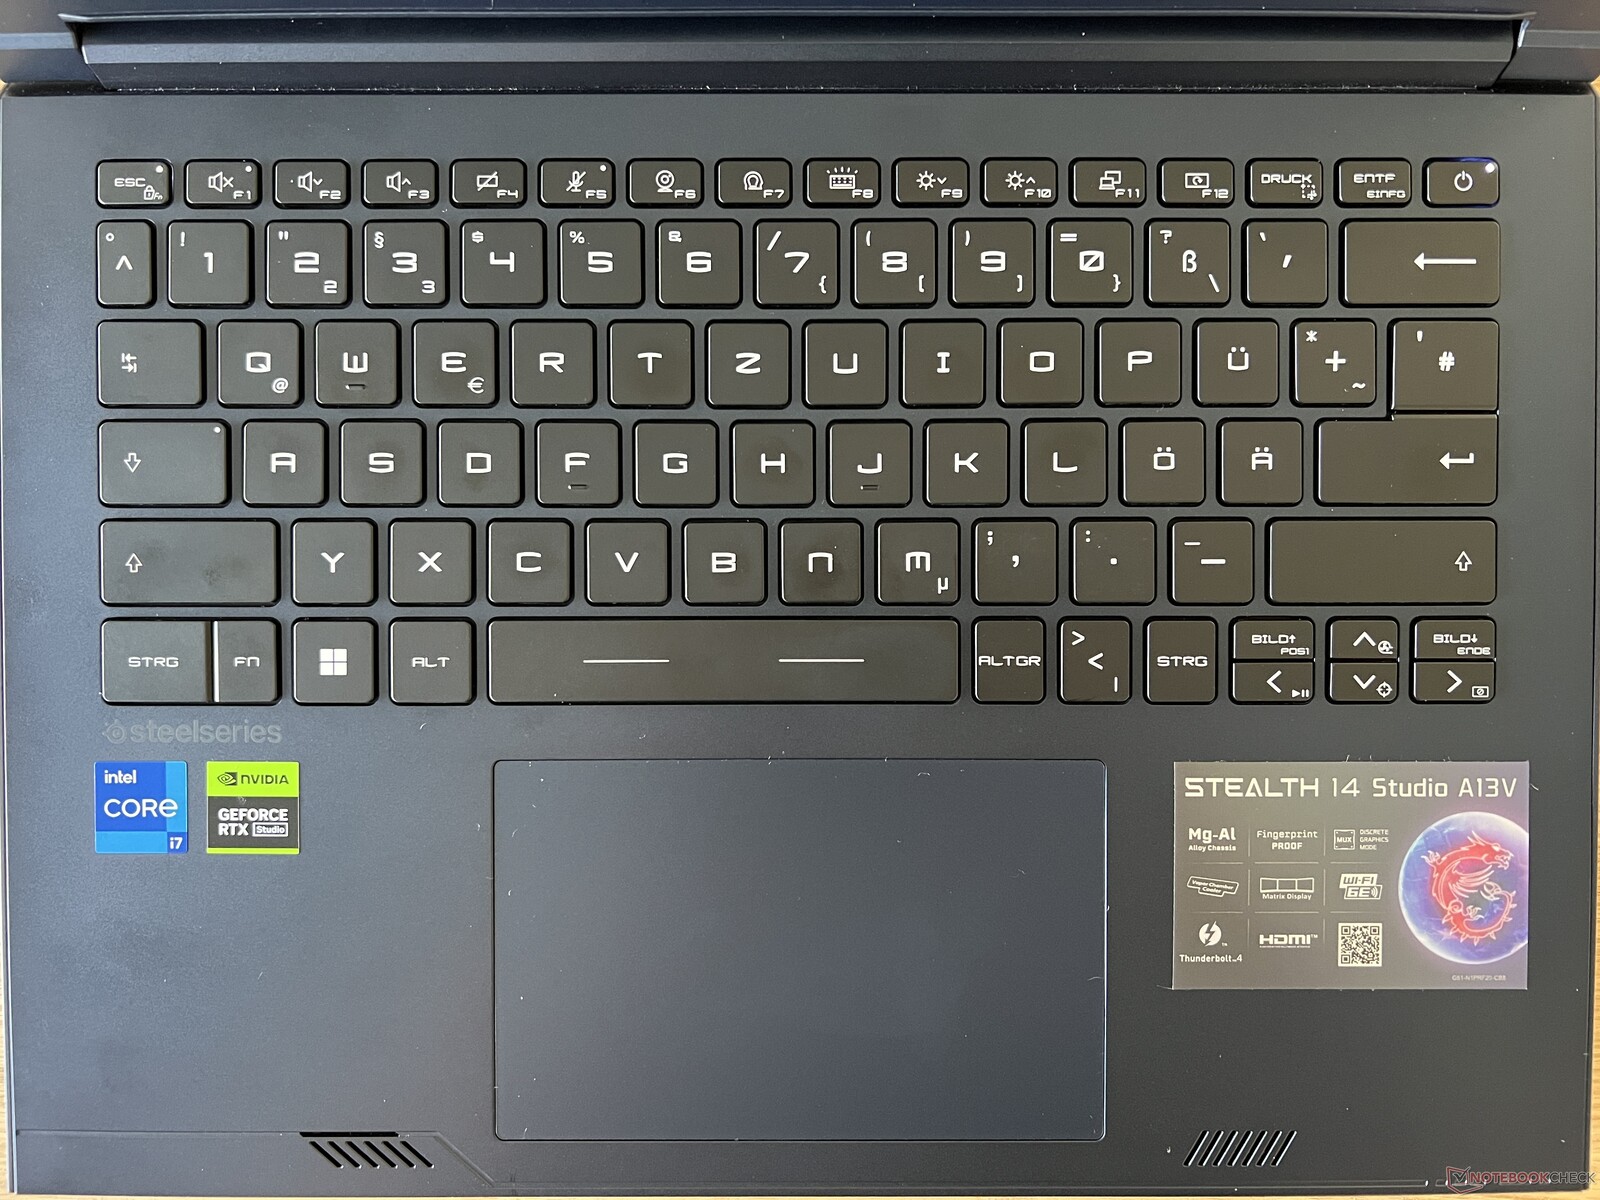
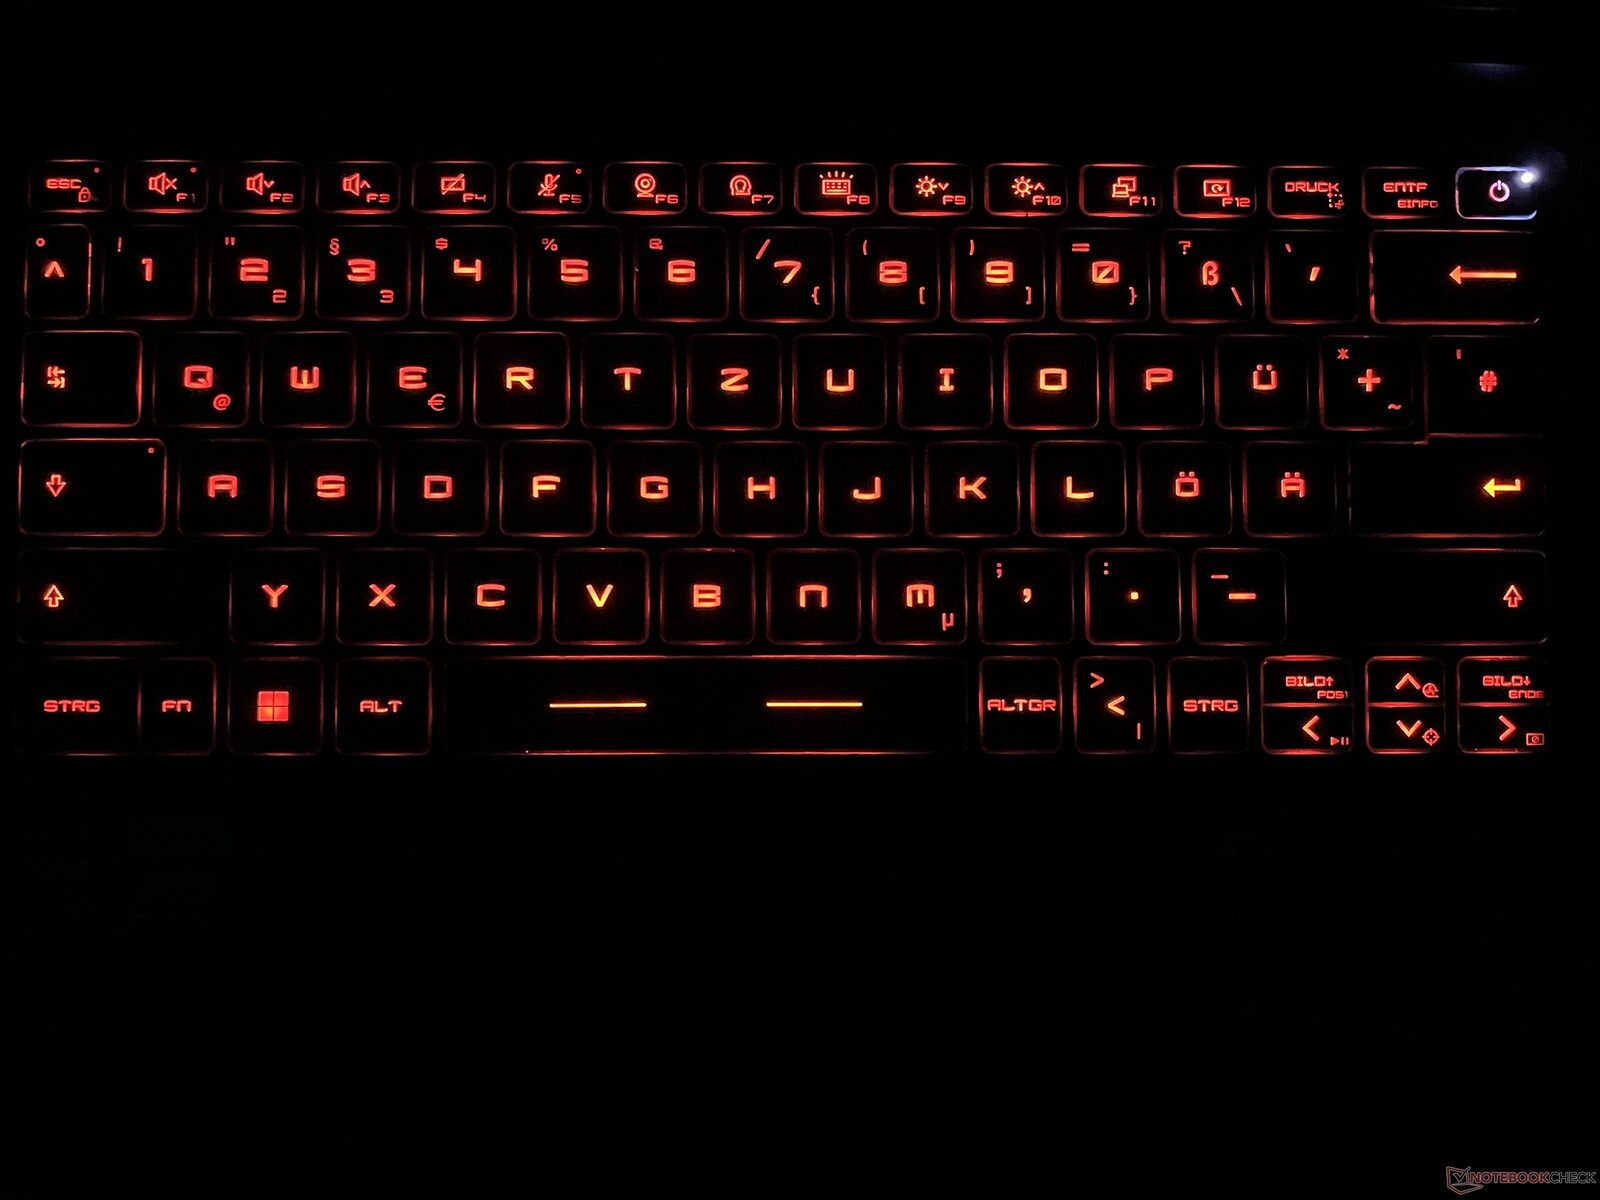
Dispositivos de entrada - Um teclado com teclas iluminadas individualmente
O teclado pode ser considerado um dos pontos fracos do Stealth 14 Studio, pois a elevação das teclas é muito rasa e as teclas têm uma sensação bastante frágil. Mesmo assim, o toque nas teclas acaba sendo bastante preciso e não notamos nenhuma entrada falsa. Você só precisa se acostumar com o layout, pois ele tem uma tecla enter de linha única e a tecla "|<>" está em um local um pouco incomum. As quatro teclas de seta também são bem pequenas, mas pelo menos há teclas designadas como "picture up" e "picture down". A iluminação de cada tecla individual pode ser ajustada usando o software Steelseries, mas não é muito intuitivo.
O teclado de clique suave (12 x 7,5 cm) funciona bem no uso diário, mas recomendamos apenas tocá-lo para inserir comandos. Se você realmente pressionar a parte inferior do teclado, o resultado será um ruído de clique muito alto e de som barato.
Tela - Um painel rápido de 240 Hz
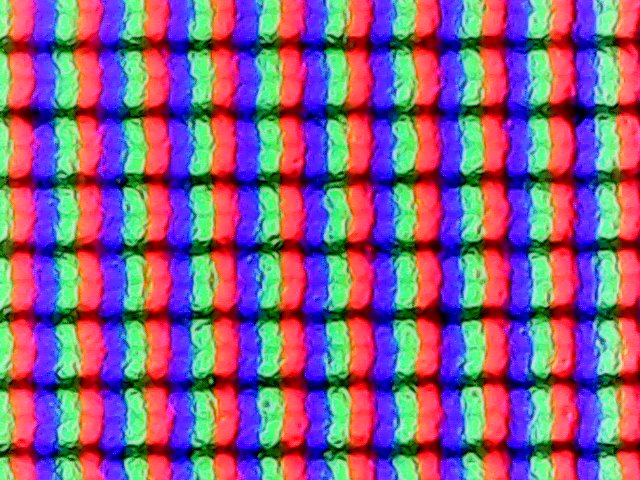
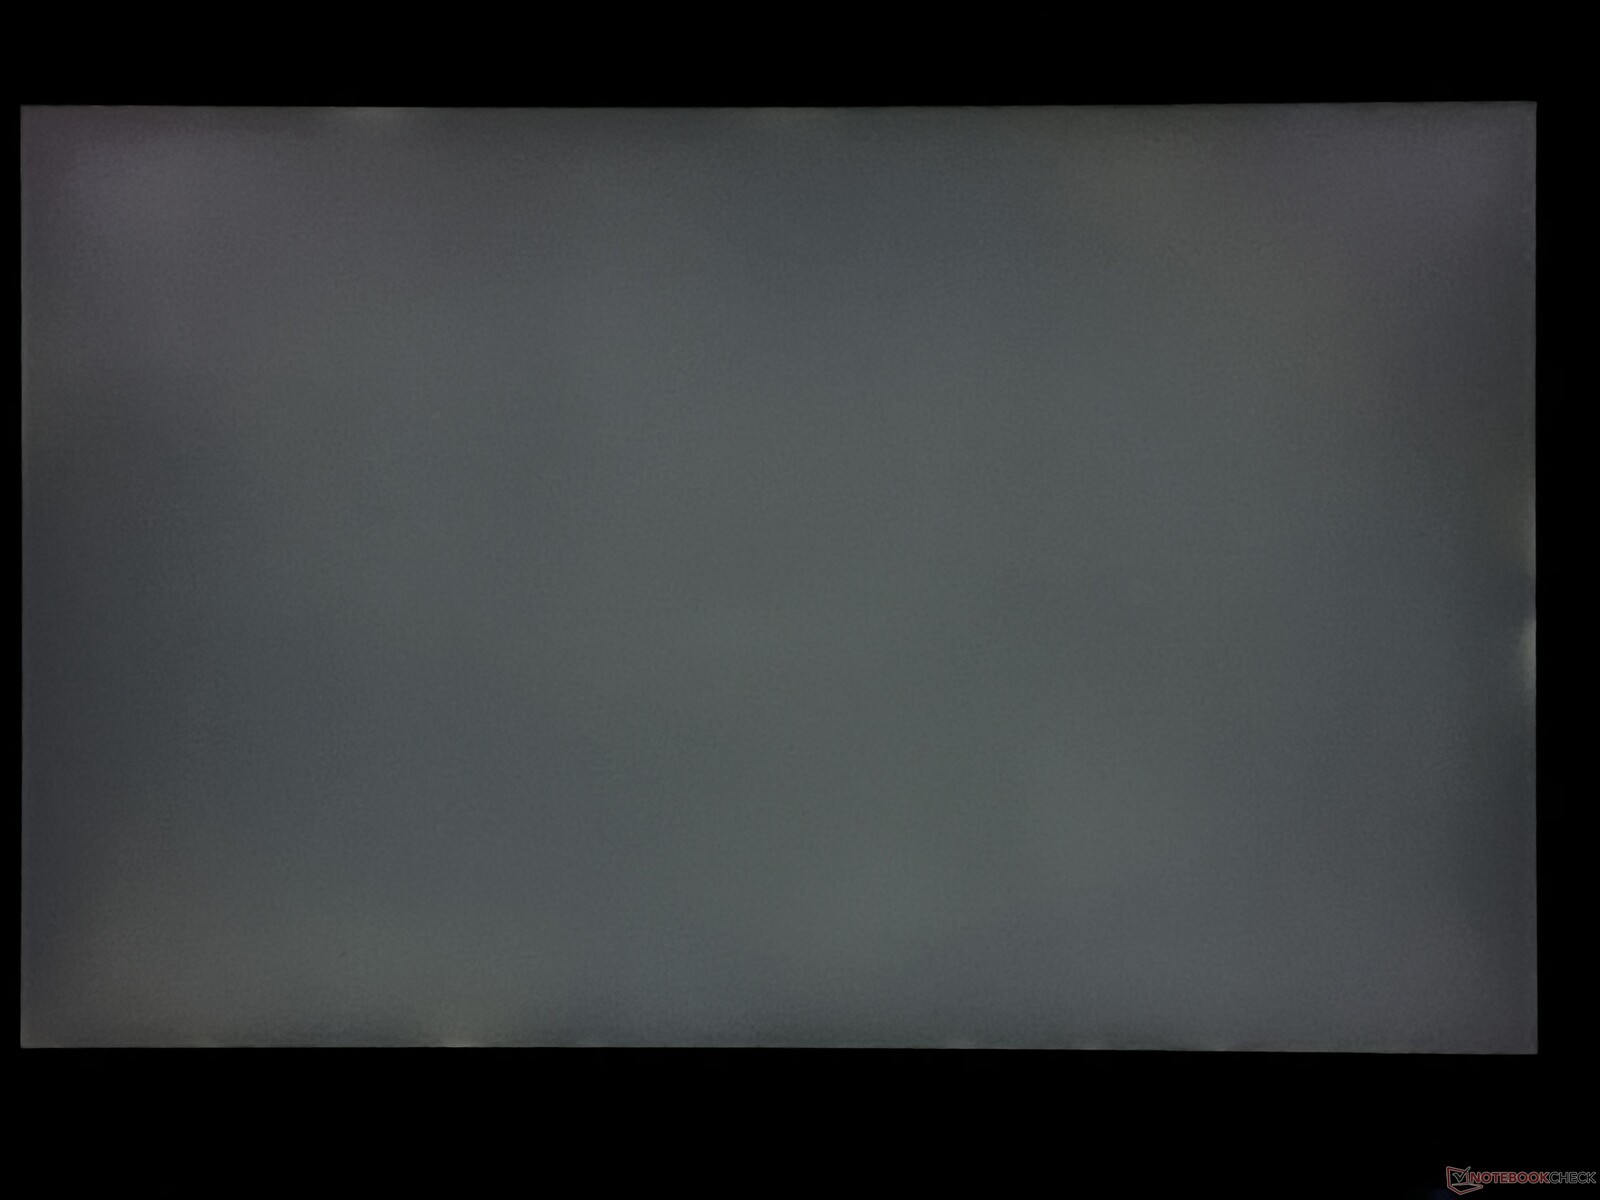
A MSI optou por um painel IPS de 14 polegadas com uma resolução de 2.560 x 1.600 pixels. O principal destaque é a taxa de atualização de 240 Hz, bem como os tempos de reação rápidos, embora, subjetivamente, não tenhamos ficado totalmente impressionados com a qualidade da imagem. Seus níveis de nitidez são bons, mas as áreas escuras sempre parecem um pouco como se tivessem um véu cinza sobre elas.
O alto valor de preto da tela de 0,43 cd/m² é responsável por isso, o que, mesmo em combinação com o brilho decente de cerca de 400 cd/m², leva a uma relação de contraste medíocre de menos de 1.000:1. A tela não é de forma alguma ruim, mas especialmente em tempos de Mini LEDs e OLEDs, o painel instalado deixa muito a desejar subjetivamente. O sangramento da luz de fundo não parece ser um problema muito grande e não notamos nenhuma oscilação de PWM.
| |||||||||||||||||||||||||
iluminação: 89 %
iluminação com acumulador: 422 cd/m²
Contraste: 974:1 (Preto: 0.43 cd/m²)
ΔE ColorChecker Calman: 2.3 | ∀{0.5-29.43 Ø4.71}
calibrated: 0.9
ΔE Greyscale Calman: 3.3 | ∀{0.09-98 Ø4.96}
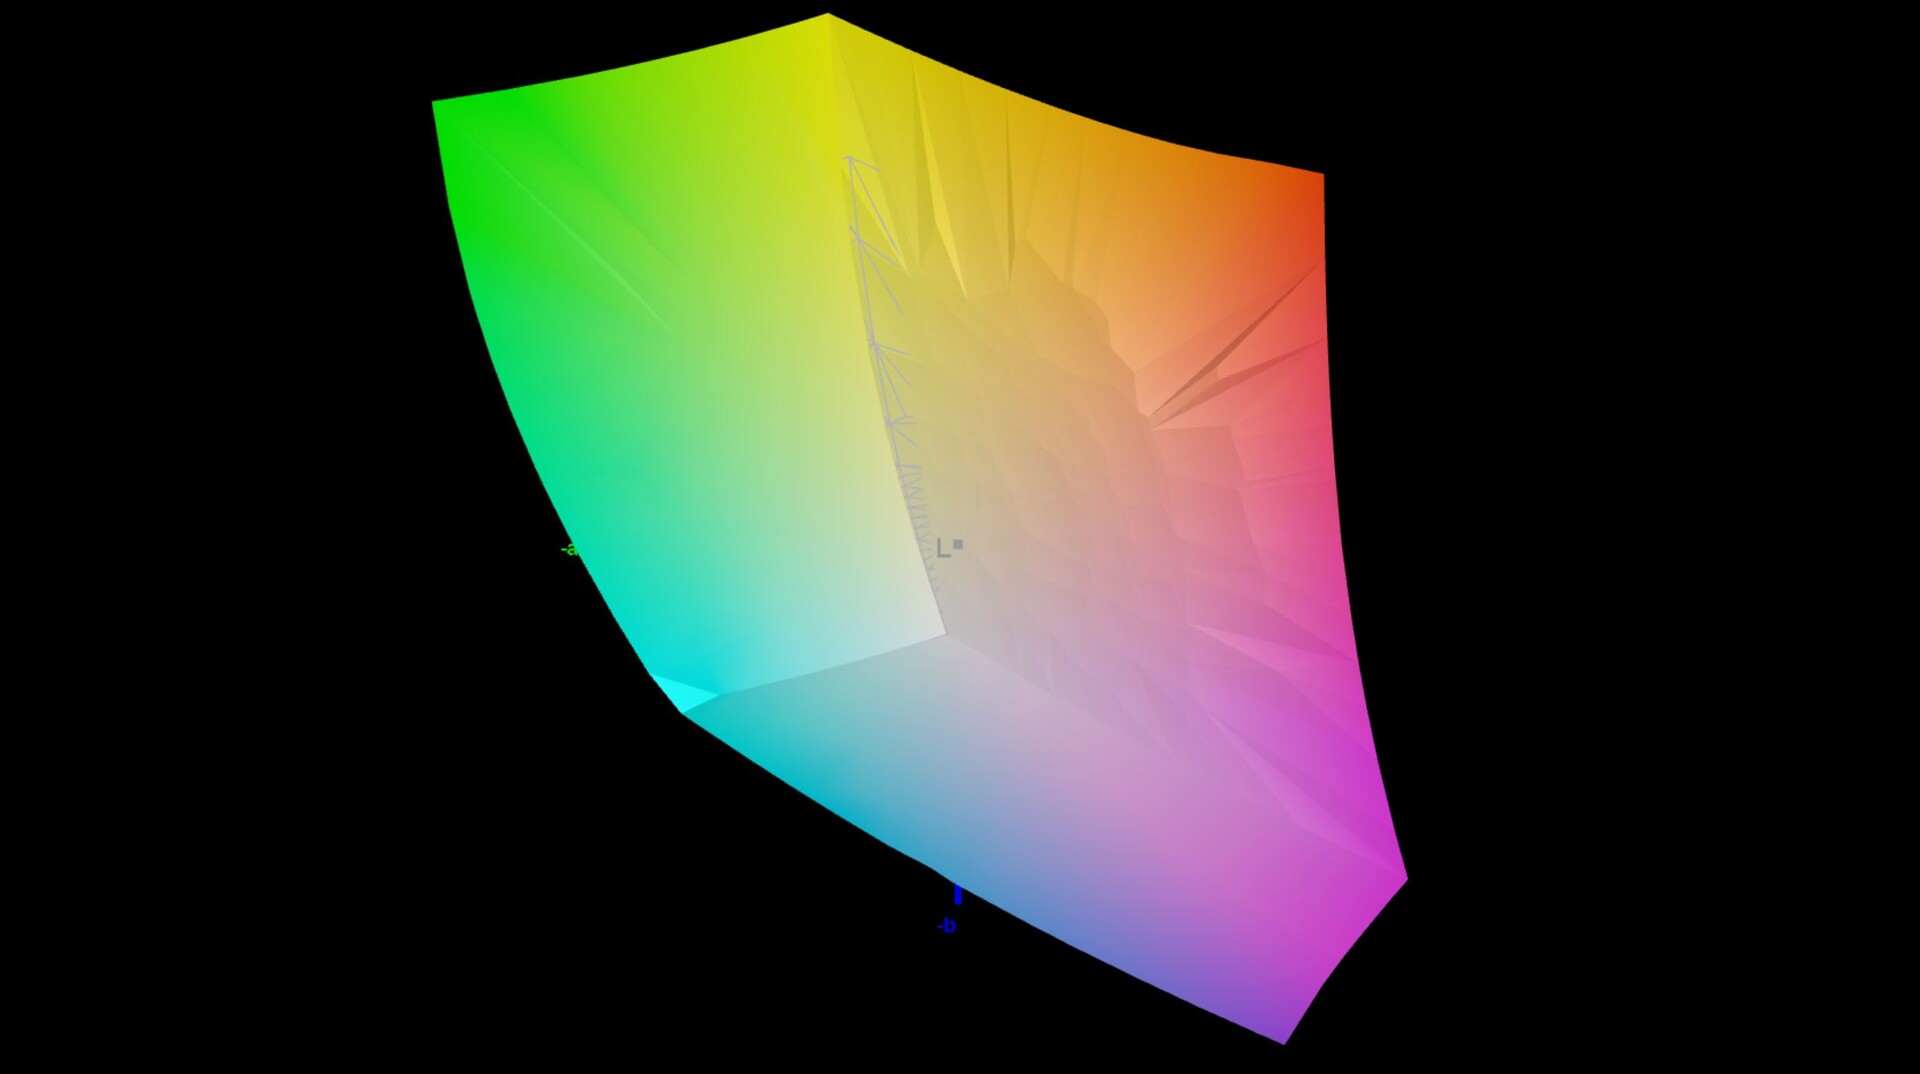
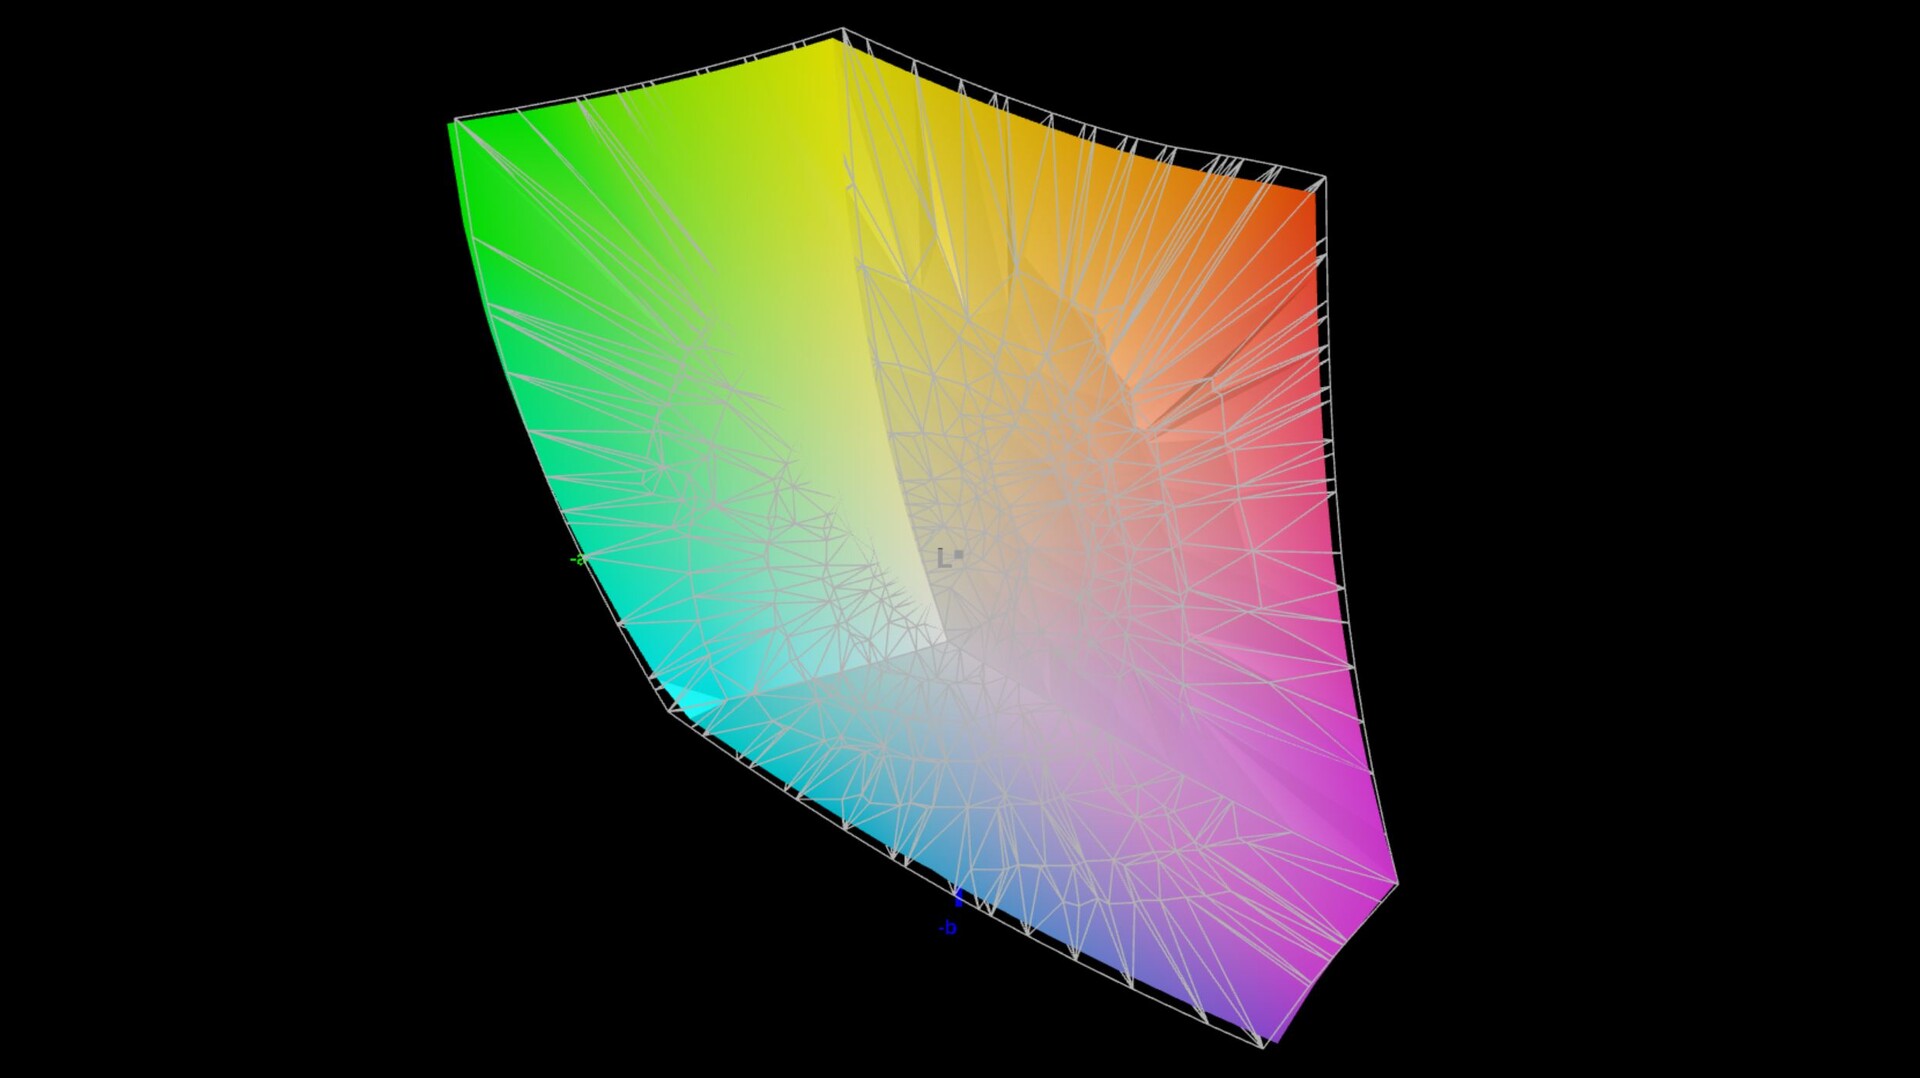
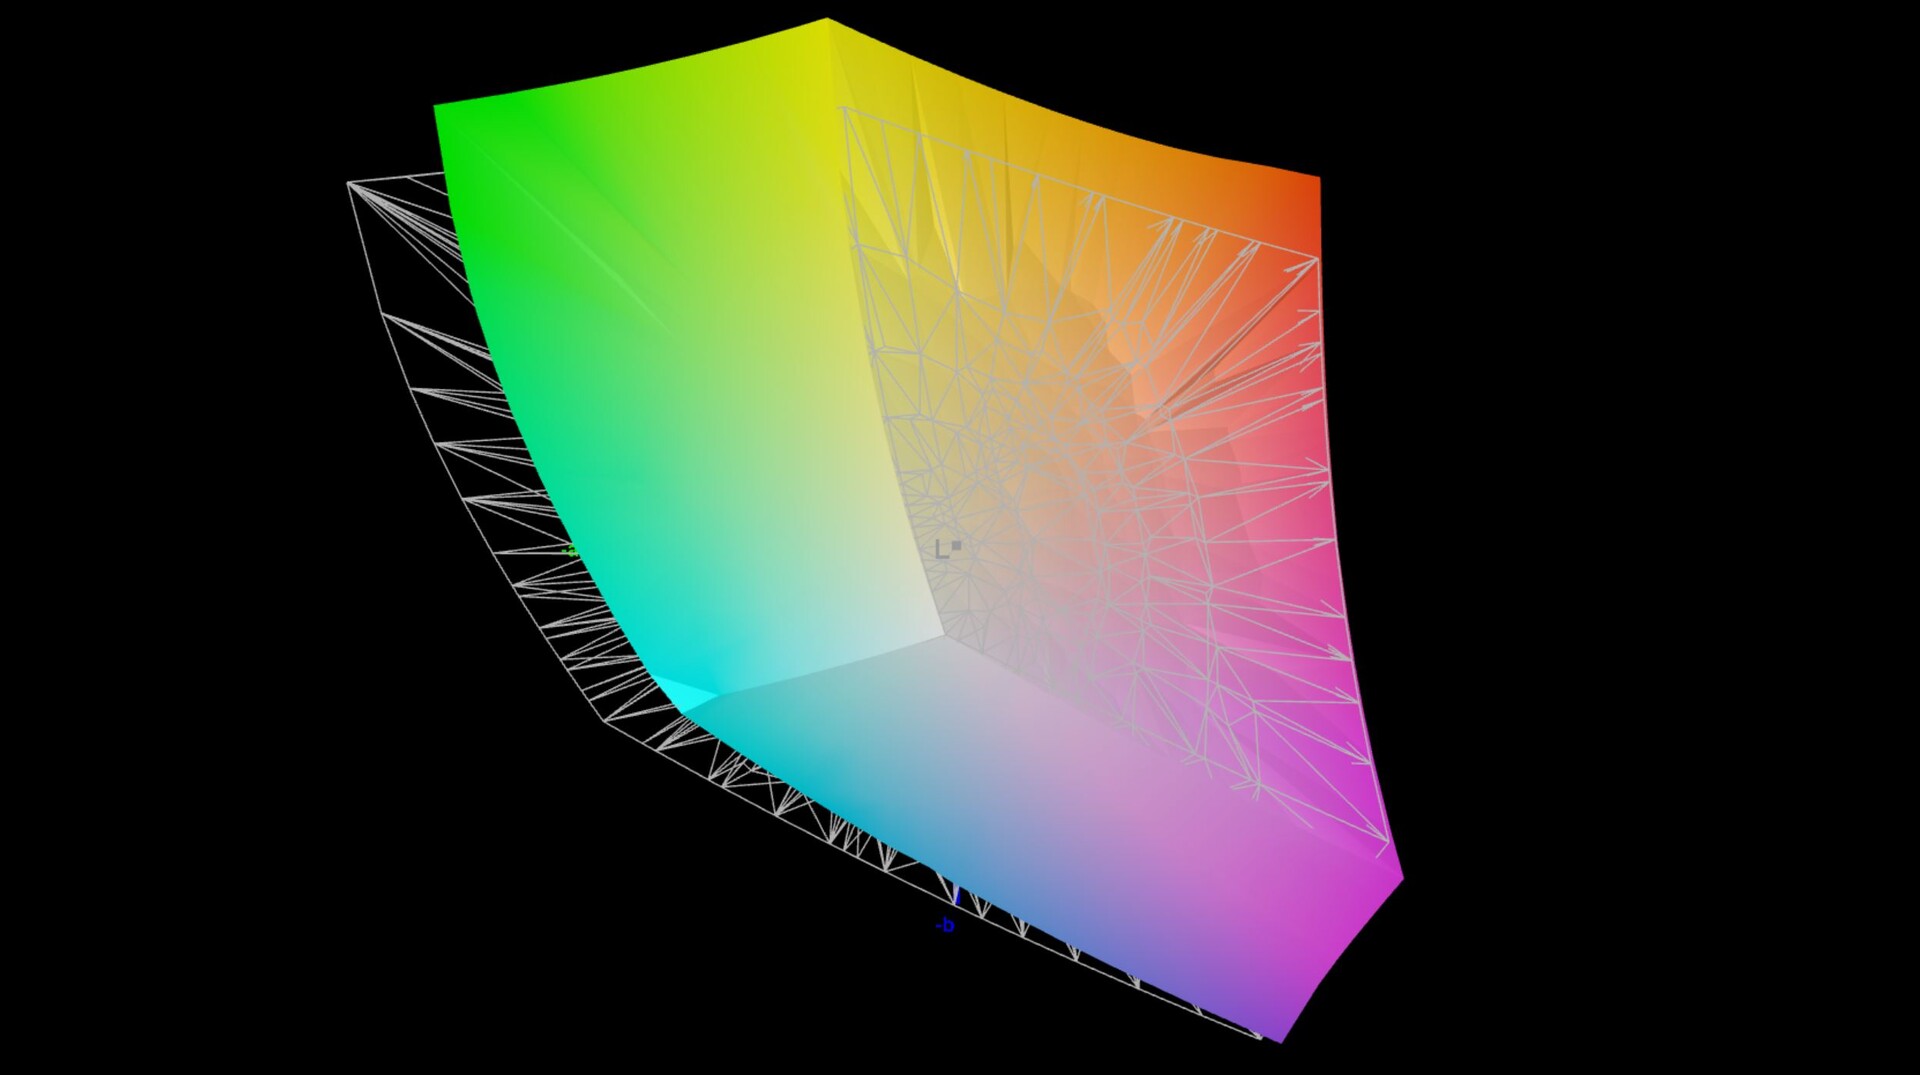
85.3% AdobeRGB 1998 (Argyll 3D)
99.6% sRGB (Argyll 3D)
96.2% Display P3 (Argyll 3D)
Gamma: 2.14
CCT: 6550 K
| MSI Stealth 14 Studio A13V B140QAN06.T, IPS, 2560x1600, 14" | Gigabyte Aero 14 OLED BMF Samsung SDC4192 (ATNA40YK14-0), OLED, 2880x1800, 14" | Schenker Vision 14 2022 RTX 3050 Ti MNE007ZA1-1, IPS, 2880x1800, 14" | Asus ROG Flow Z13 GZ301ZE LQ134N1JW54, IPS, 1920x1200, 13.4" | Alienware x14 i7 RTX 3060 SHP154D, IPS, 1920x1080, 14" | Razer Blade 14 Ryzen 9 6900HX TL140BDXP02-0, IPS, 2560x1440, 14" | Acer Predator Triton 300 SE Samsung ATNA40YK07-0, OLED, 2880x1800, 14" | |
|---|---|---|---|---|---|---|---|
| Display | 3% | -12% | -17% | 2% | 0% | 7% | |
| Display P3 Coverage (%) | 96.2 | 99.8 4% | 74.1 -23% | 67.5 -30% | 99.6 4% | 97.2 1% | 99.9 4% |
| sRGB Coverage (%) | 99.6 | 100 0% | 97.4 -2% | 97.1 -3% | 100 0% | 99.9 0% | 100 0% |
| AdobeRGB 1998 Coverage (%) | 85.3 | 88.7 4% | 75.3 -12% | 69.3 -19% | 87.6 3% | 85.7 0% | 99 16% |
| Response Times | 58% | -312% | -452% | -53% | -184% | 76% | |
| Response Time Grey 50% / Grey 80% * (ms) | 5.5 ? | 2.4 ? 56% | 31.5 ? -473% | 44 ? -700% | 9.6 ? -75% | 16.8 ? -205% | 1.36 ? 75% |
| Response Time Black / White * (ms) | 5.8 ? | 2.4 ? 59% | 14.5 ? -150% | 17.6 ? -203% | 7.6 ? -31% | 15.2 ? -162% | 1.36 ? 77% |
| PWM Frequency (Hz) | 300 | 367.6 ? | |||||
| Screen | 71% | -11% | 18% | 5% | 11% | -13% | |
| Brightness middle (cd/m²) | 419 | 423 1% | 421 0% | 515 23% | 434 4% | 354 -16% | 414.3 -1% |
| Brightness (cd/m²) | 402 | 427 6% | 416 3% | 476 18% | 411 2% | 328 -18% | 416 3% |
| Brightness Distribution (%) | 89 | 98 10% | 89 0% | 87 -2% | 89 0% | 86 -3% | 99 11% |
| Black Level * (cd/m²) | 0.43 | 0.1 77% | 0.28 35% | 0.35 19% | 0.25 42% | 0.37 14% | |
| Contrast (:1) | 974 | 4230 334% | 1504 54% | 1471 51% | 1736 78% | 957 -2% | |
| Colorchecker dE 2000 * | 2.3 | 0.55 76% | 3.2 -39% | 1.6 30% | 3 -30% | 1.66 28% | 4.68 -103% |
| Colorchecker dE 2000 max. * | 5.8 | 1.15 80% | 5.5 5% | 4 31% | 7.1 -22% | 3.83 34% | 7.78 -34% |
| Colorchecker dE 2000 calibrated * | 0.9 | 1.15 -28% | 2 -122% | 1.2 -33% | 0.7 22% | ||
| Greyscale dE 2000 * | 3.3 | 0.69 79% | 4.4 -33% | 2.5 24% | 5.1 -55% | 1.6 52% | 1.8 45% |
| Gamma | 2.14 103% | 2.42 91% | 2.22 99% | 2.2 100% | 2.19 100% | 2.23 99% | 2.22 99% |
| CCT | 6550 99% | 6479 100% | 6384 102% | 6939 94% | 6204 105% | 6542 99% | 6207 105% |
| Média Total (Programa/Configurações) | 44% /
54% | -112% /
-54% | -150% /
-57% | -15% /
-4% | -58% /
-21% | 23% /
8% |
* ... menor é melhor
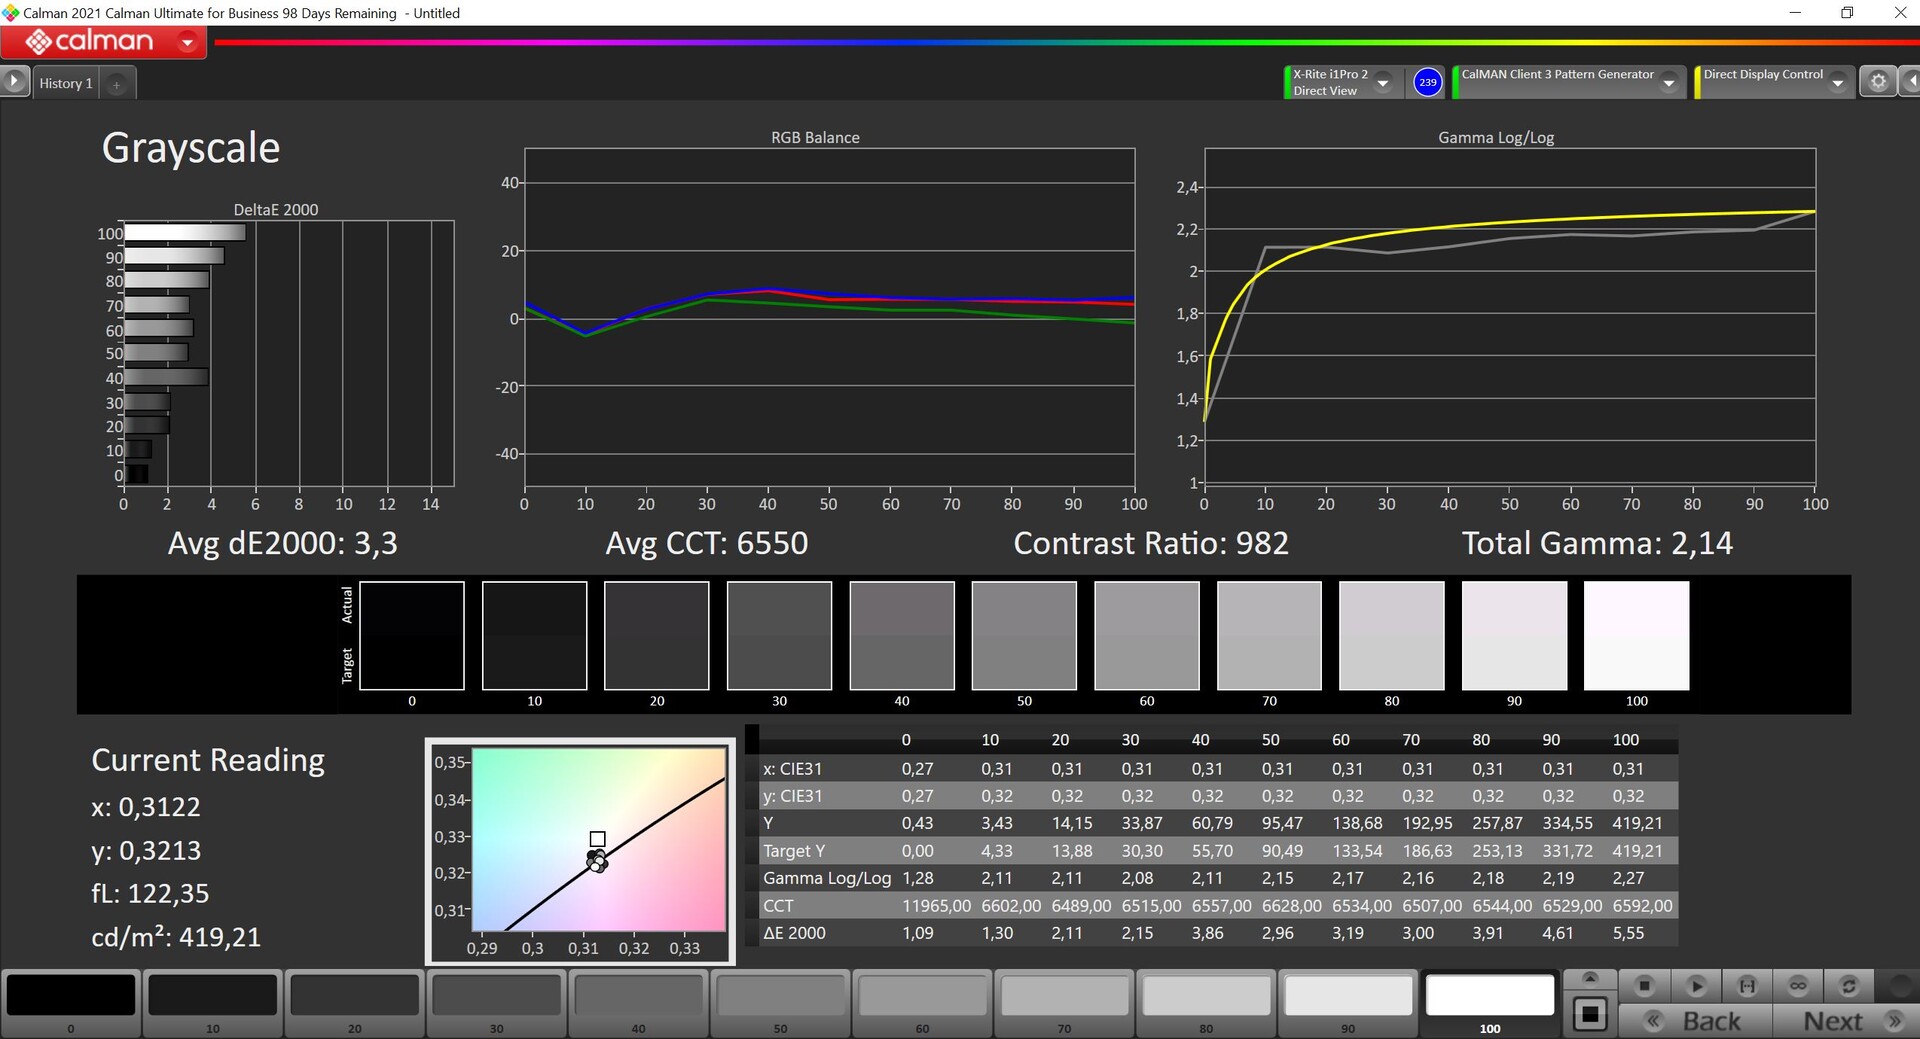
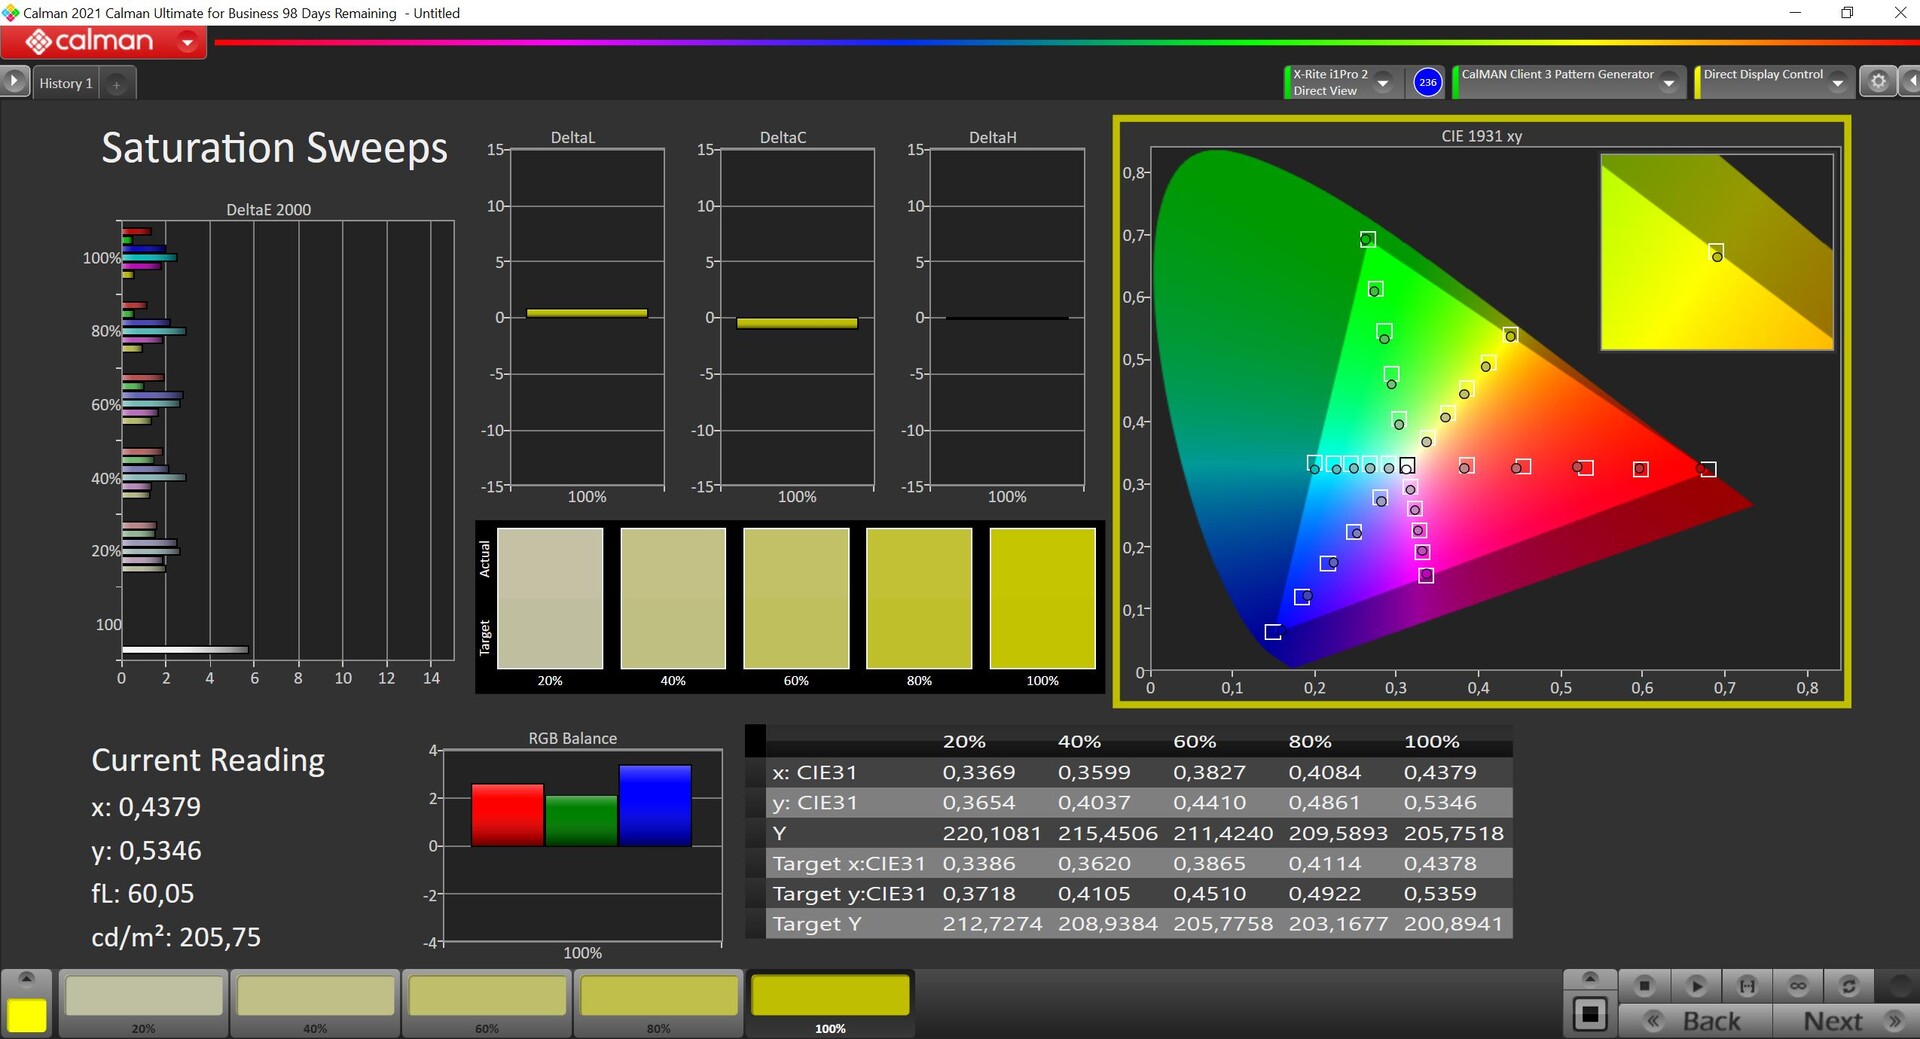
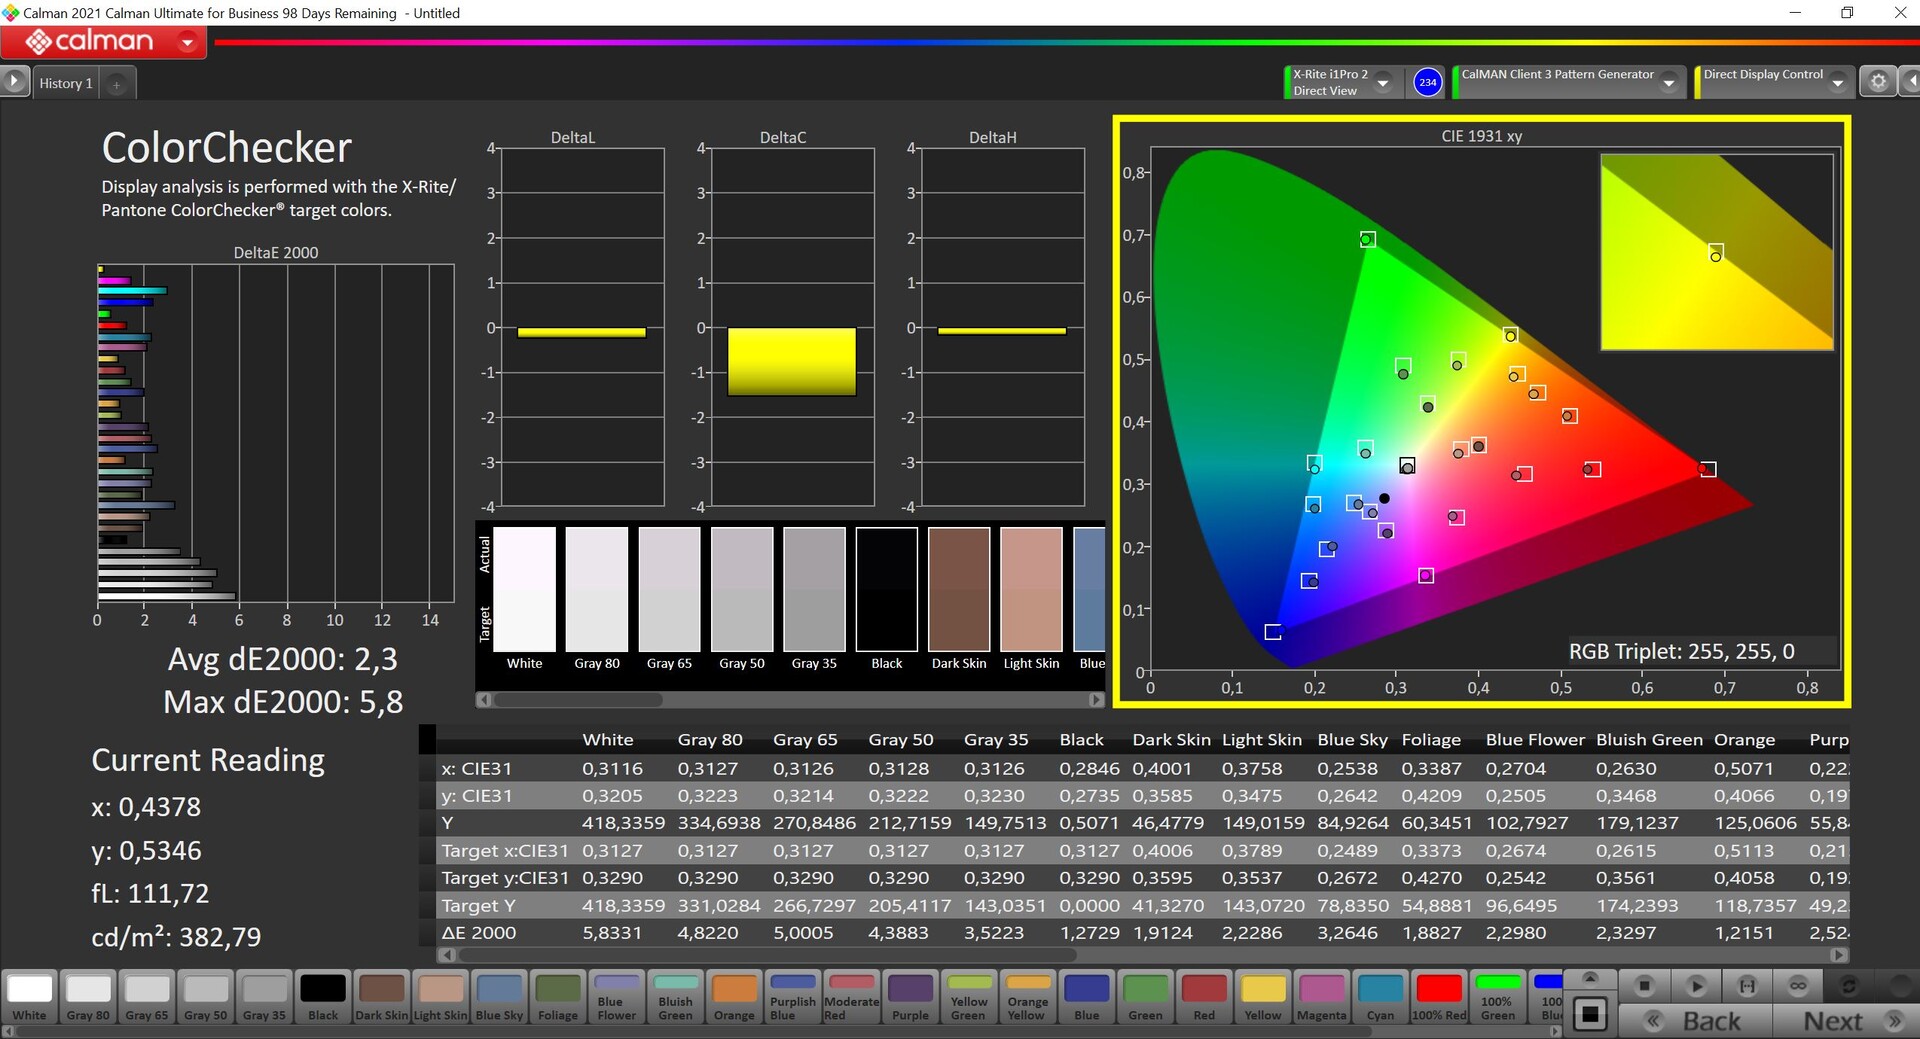
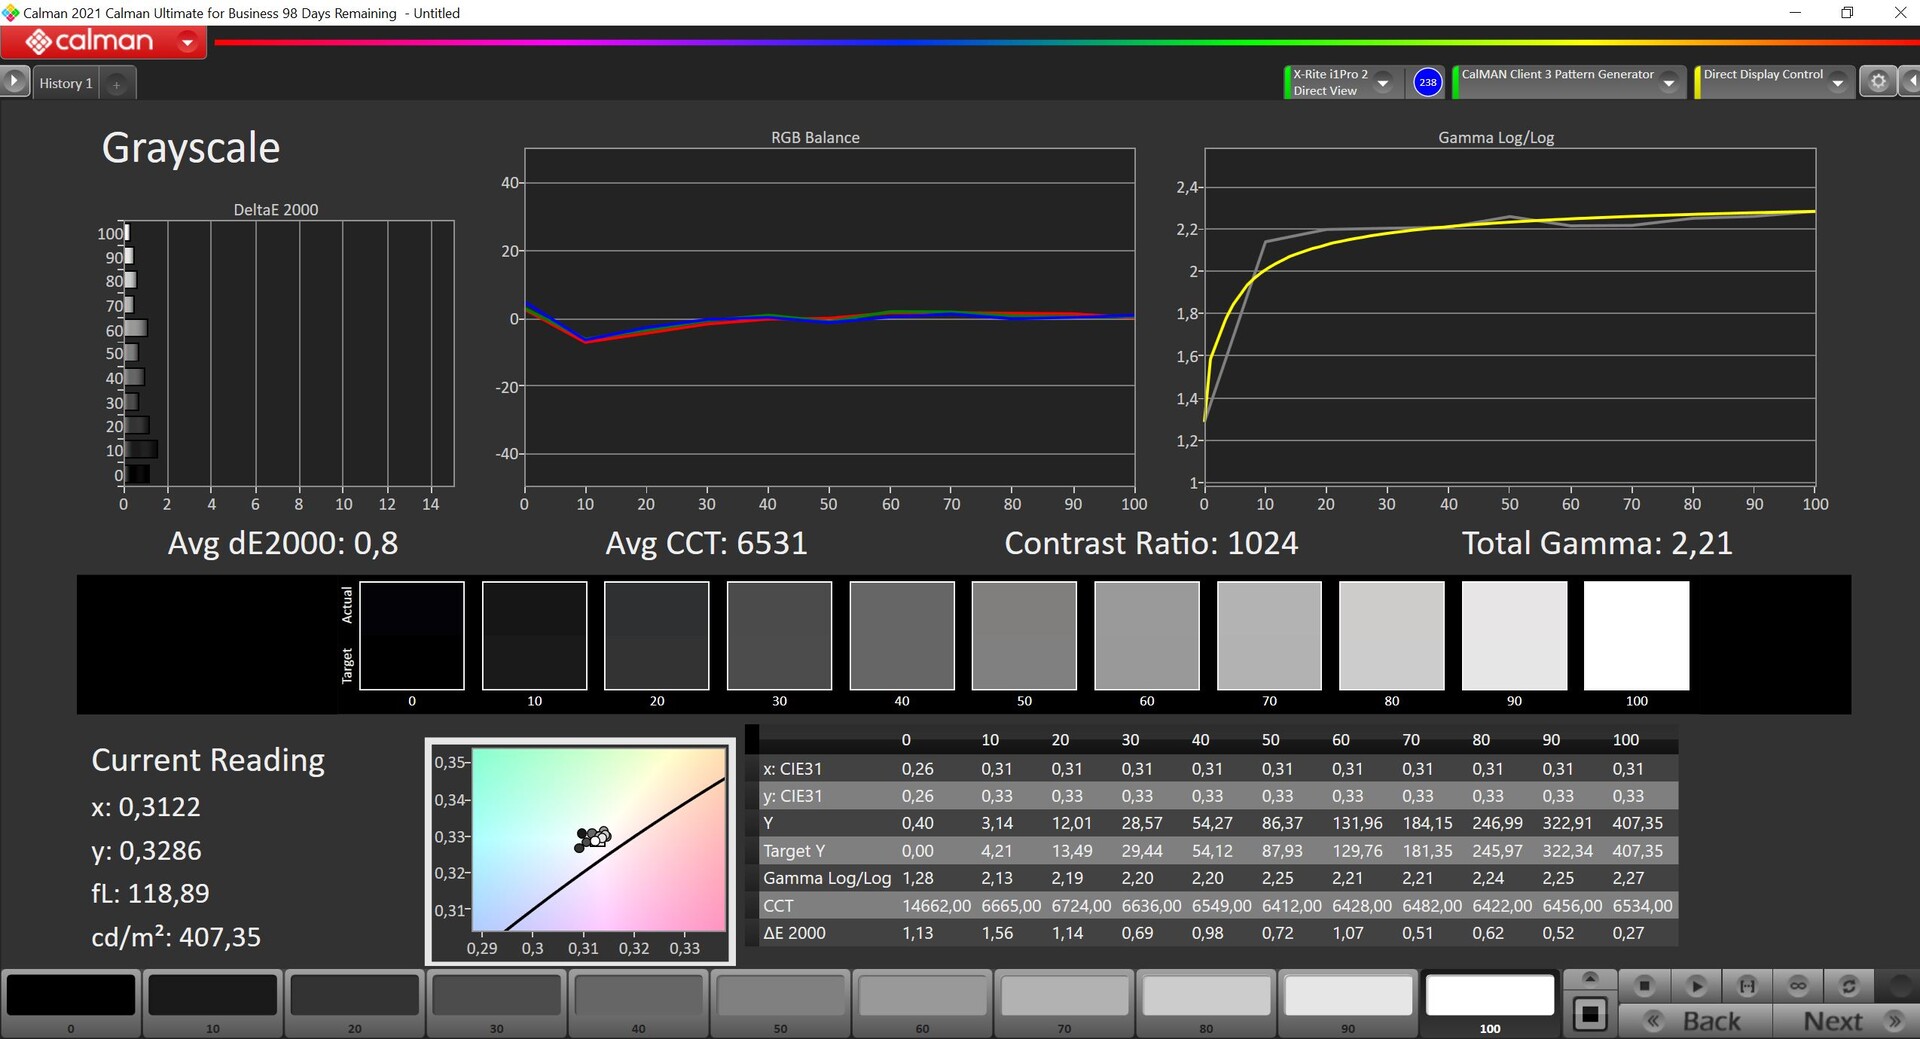
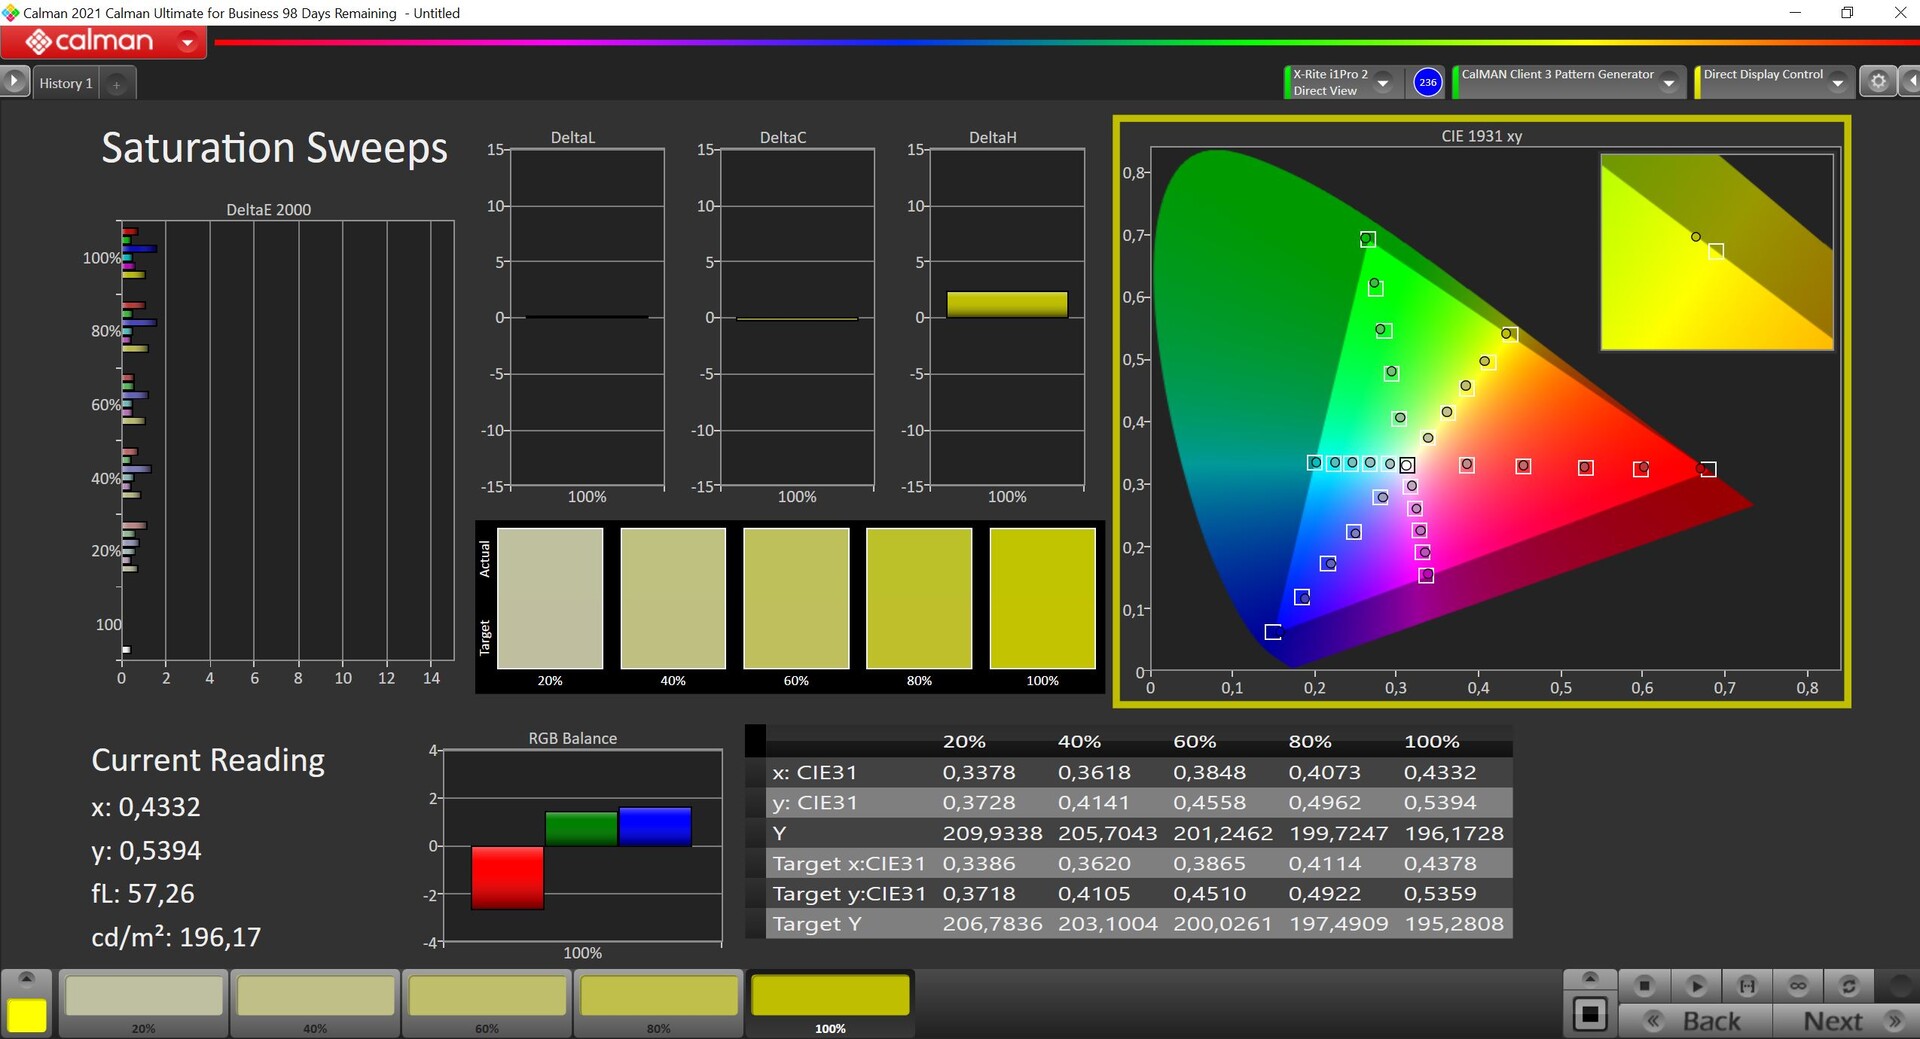
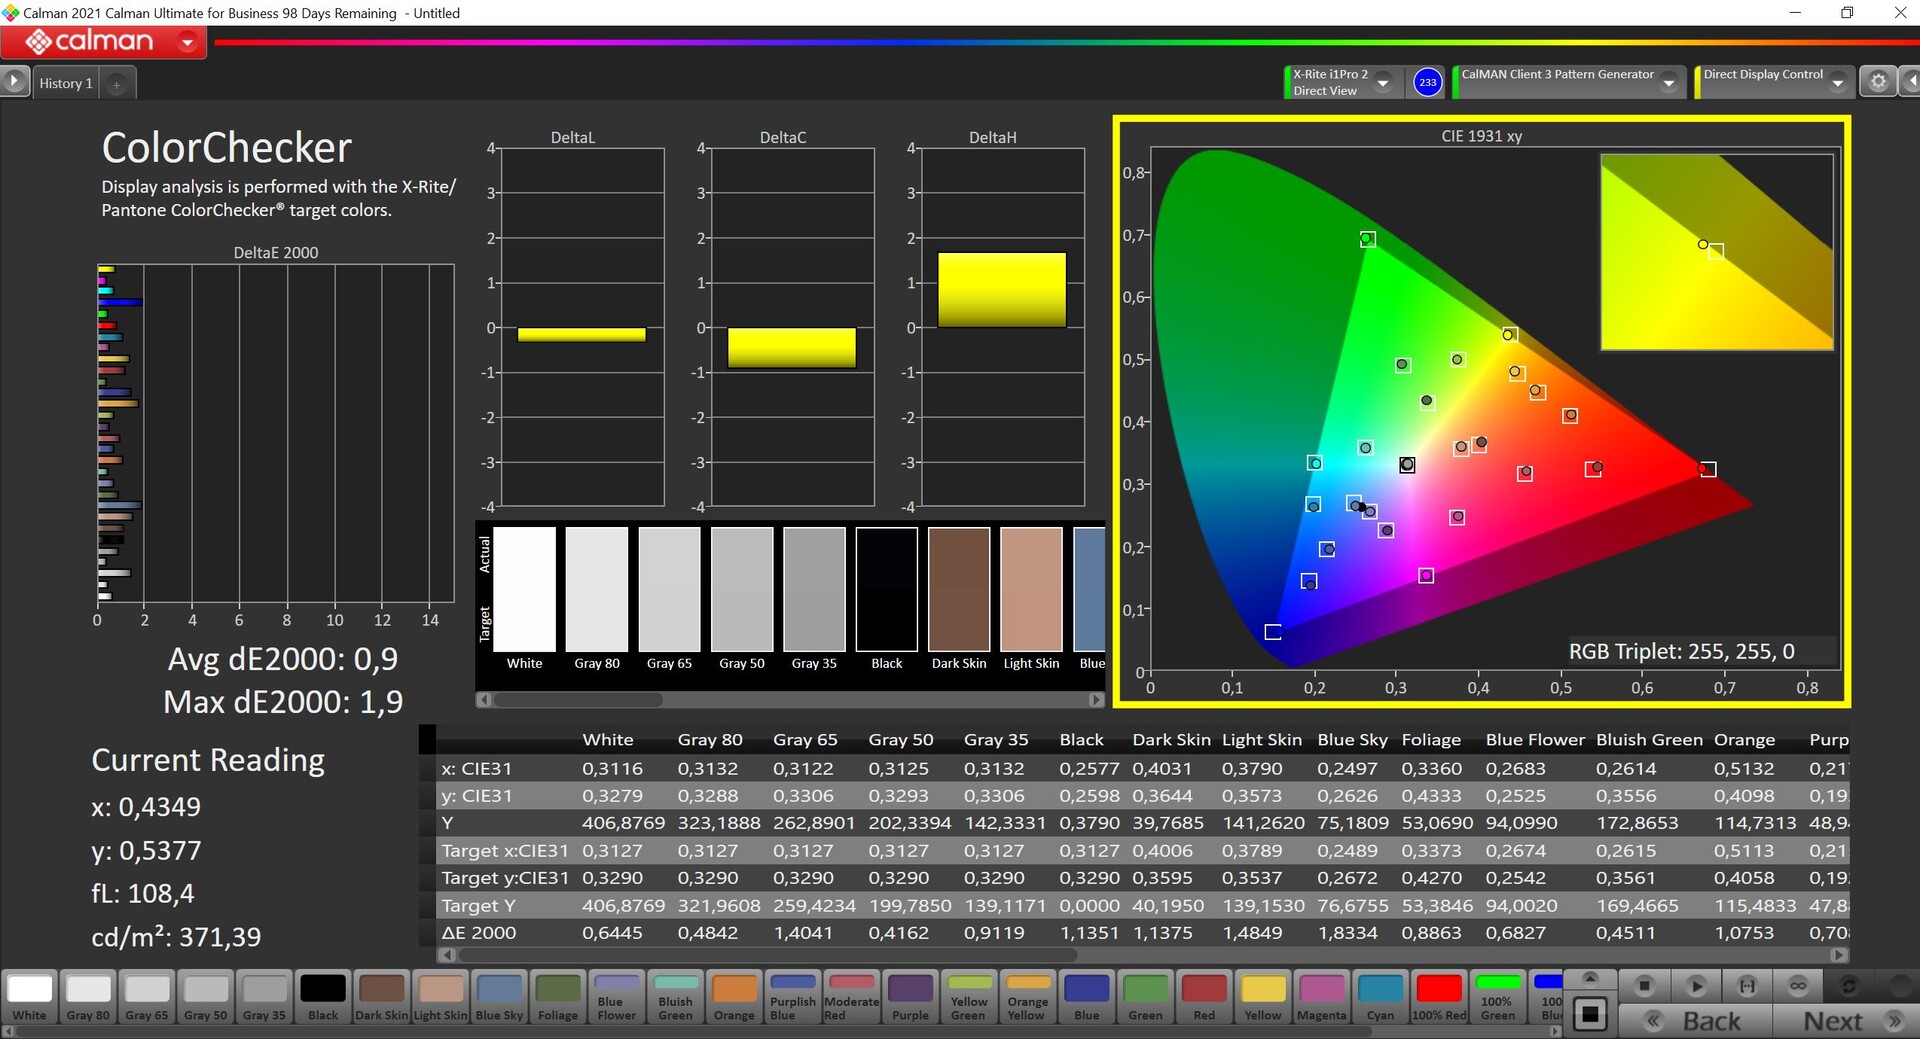
A MSI oferece vários perfis de cores diferentes por meio de seu software TrueColor e escolhemos o modo Display P3 para nossas medições usando o software profissional CalMAN (X-Rite i1 Pro2). Esse é o modo que é ativado por padrão. As cores que medimos estavam abaixo do importante desvio de 3 do DeltaE 2000 em comparação com a referência P3; no entanto, os tons de cinza pareciam mostrar uma leve tonalidade roxa. Usando nossa própria calibração (você pode baixar nosso perfil gratuitamente acima), conseguimos controlar isso facilmente. O espaço de cores P3 pôde ser representado quase em sua totalidade.
Exibir tempos de resposta
| ↔ Tempo de resposta preto para branco | ||
|---|---|---|
| 5.8 ms ... ascensão ↗ e queda ↘ combinadas | ↗ 2.1 ms ascensão | 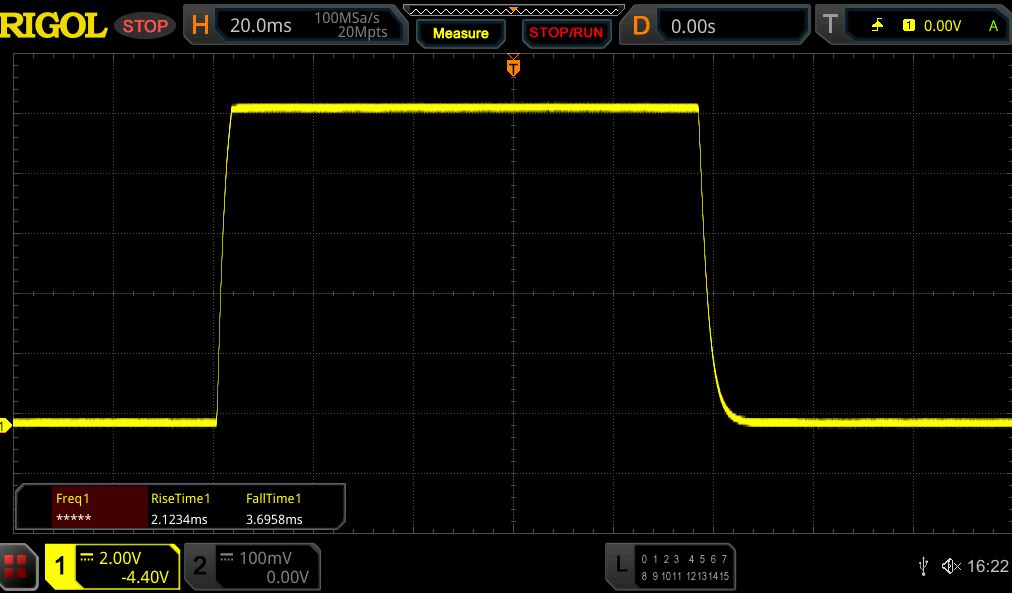 |
| ↘ 3.7 ms queda | ||
| A tela mostra taxas de resposta muito rápidas em nossos testes e deve ser muito adequada para jogos em ritmo acelerado. Em comparação, todos os dispositivos testados variam de 0.1 (mínimo) a 240 (máximo) ms. » 18 % de todos os dispositivos são melhores. Isso significa que o tempo de resposta medido é melhor que a média de todos os dispositivos testados (19.8 ms). | ||
| ↔ Tempo de resposta 50% cinza a 80% cinza | ||
| 5.5 ms ... ascensão ↗ e queda ↘ combinadas | ↗ 2.7 ms ascensão | 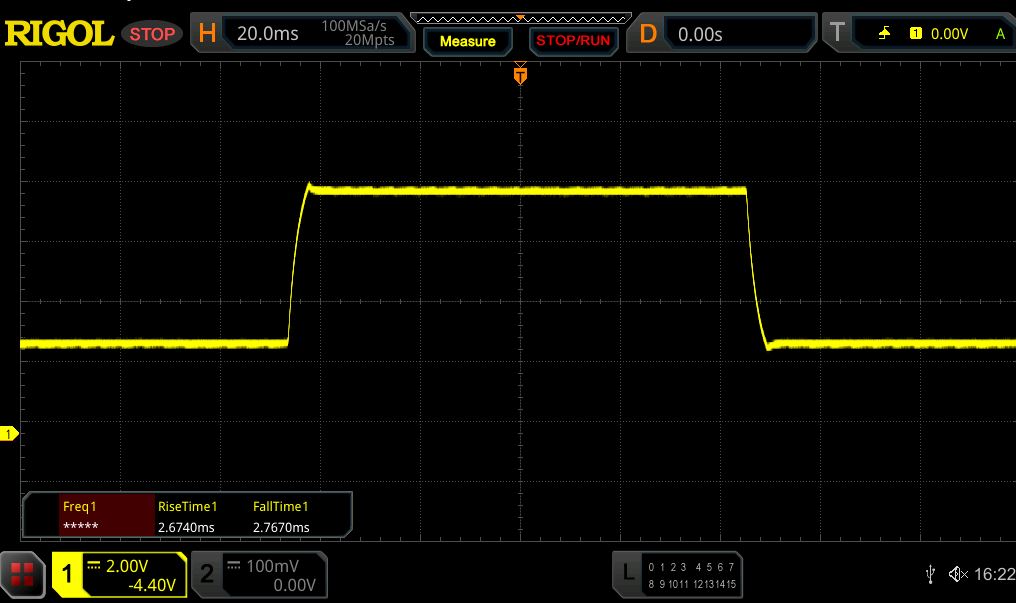 |
| ↘ 2.8 ms queda | ||
| A tela mostra taxas de resposta muito rápidas em nossos testes e deve ser muito adequada para jogos em ritmo acelerado. Em comparação, todos os dispositivos testados variam de 0.165 (mínimo) a 636 (máximo) ms. » 18 % de todos os dispositivos são melhores. Isso significa que o tempo de resposta medido é melhor que a média de todos os dispositivos testados (31 ms). | ||
Cintilação da tela / PWM (modulação por largura de pulso)
| Tela tremeluzindo / PWM não detectado |  | ||
[pwm_comparison] Em comparação: 52 % de todos os dispositivos testados não usam PWM para escurecer a tela. Se PWM foi detectado, uma média de 7754 (mínimo: 5 - máximo: 343500) Hz foi medida. | |||

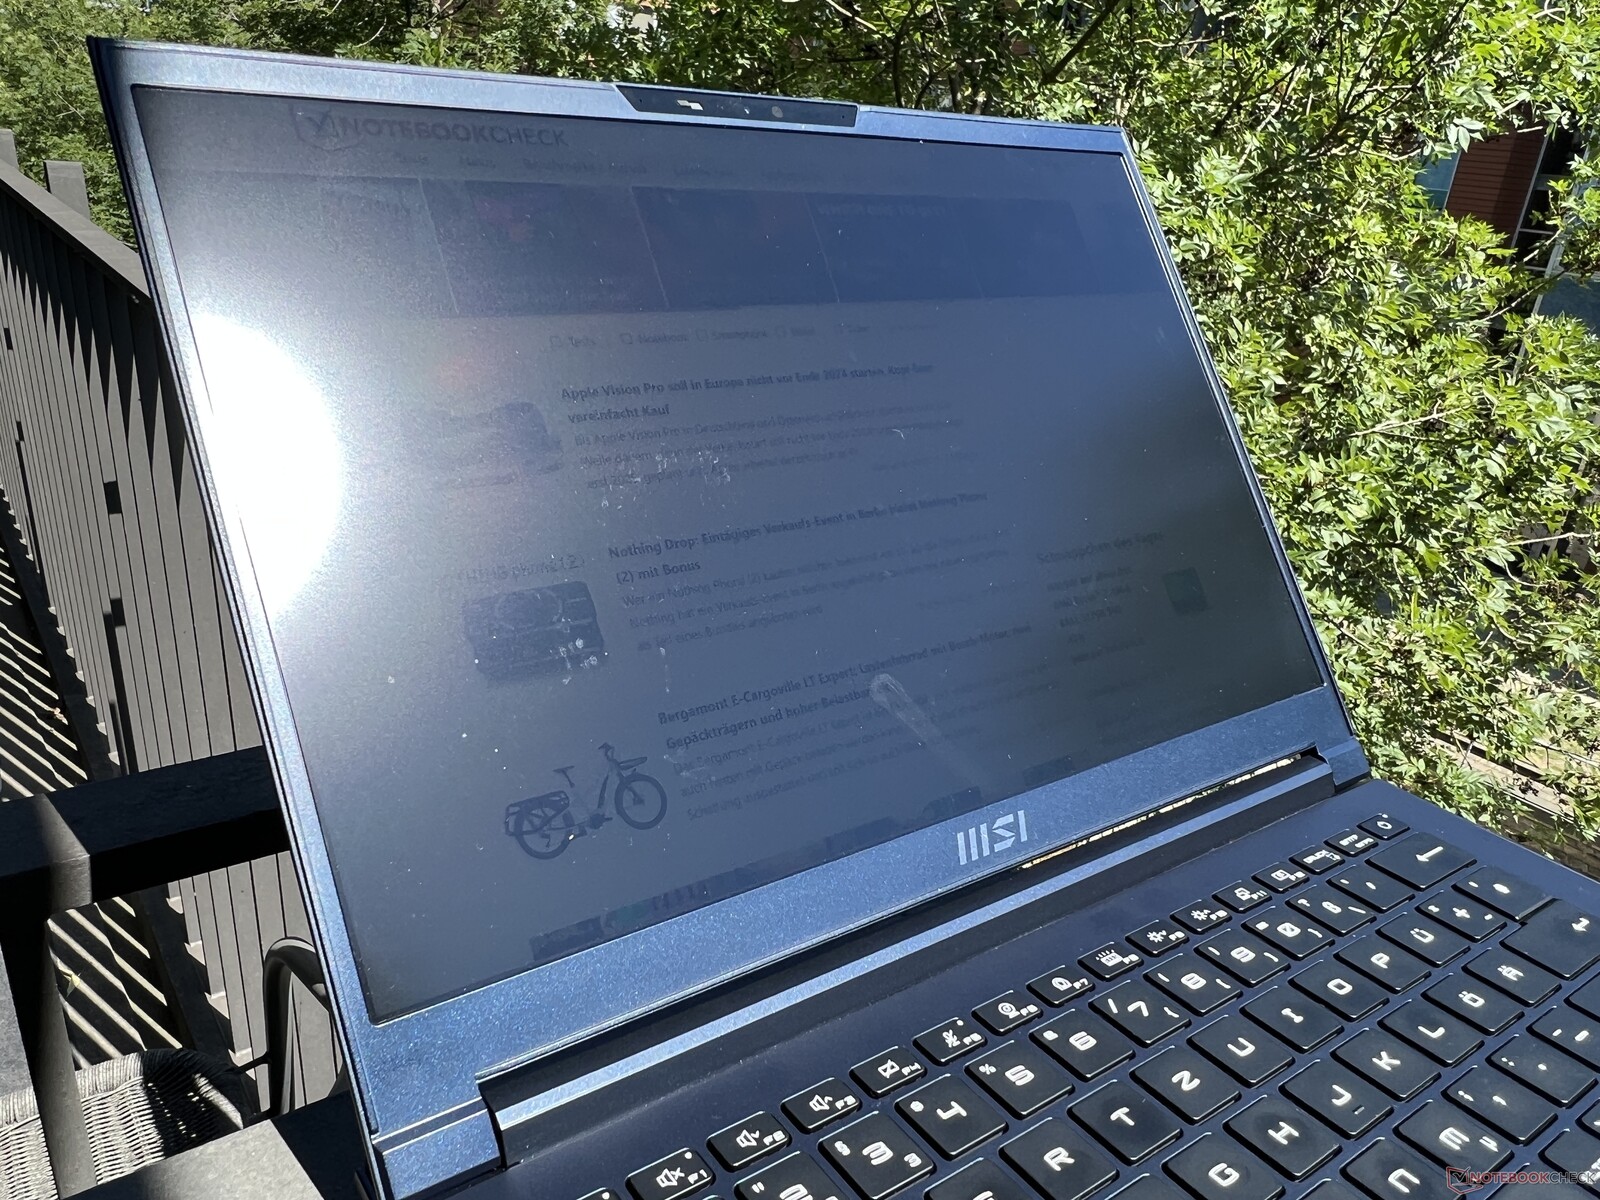
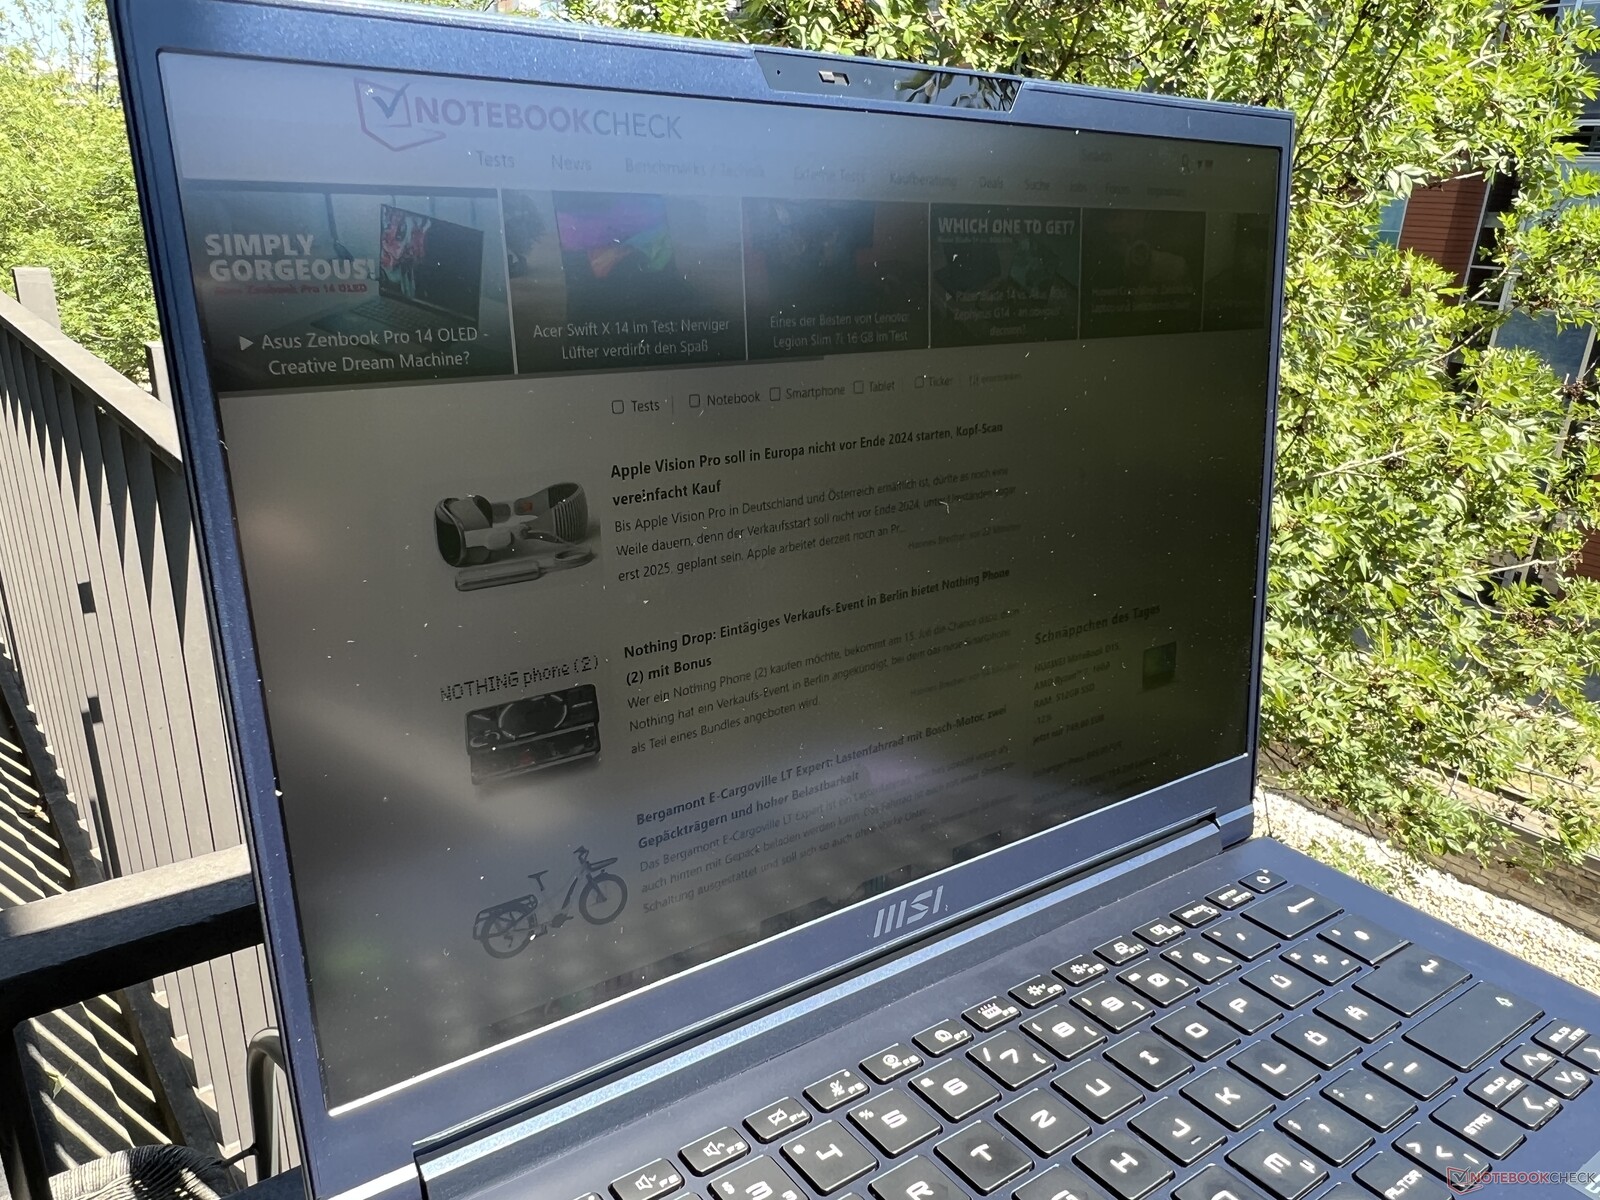
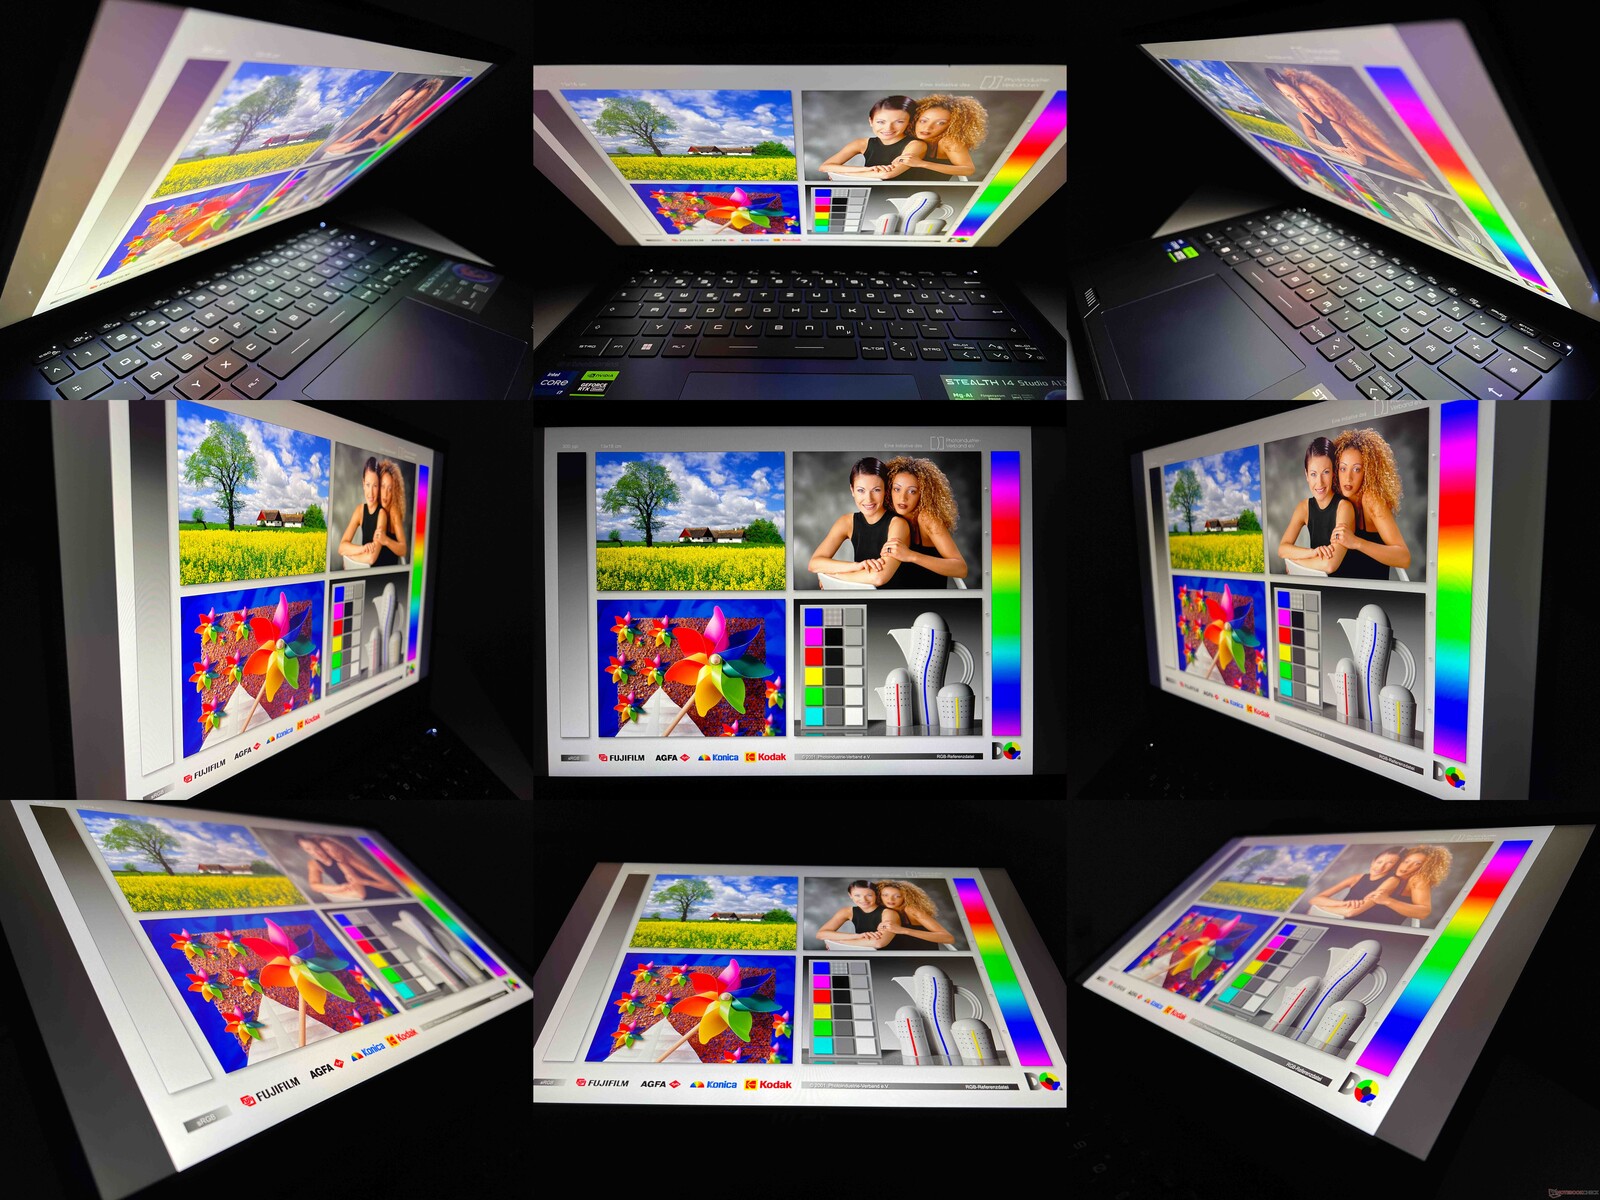
Desde que você não coloque o Stealth 14 Studio sob a luz direta do sol, não deverá ter problemas para ler na tela fosca do lado de fora, mesmo em dias bastante claros. A estabilidade do ângulo de visão é boa, mas poderia ser melhor. Especialmente ao visualizar na diagonal acima, a imagem rapidamente se torna muito clara e perde um pouco do contraste.
Desempenho - Raptor Lake e um laptop RTX 4050
Condições de teste
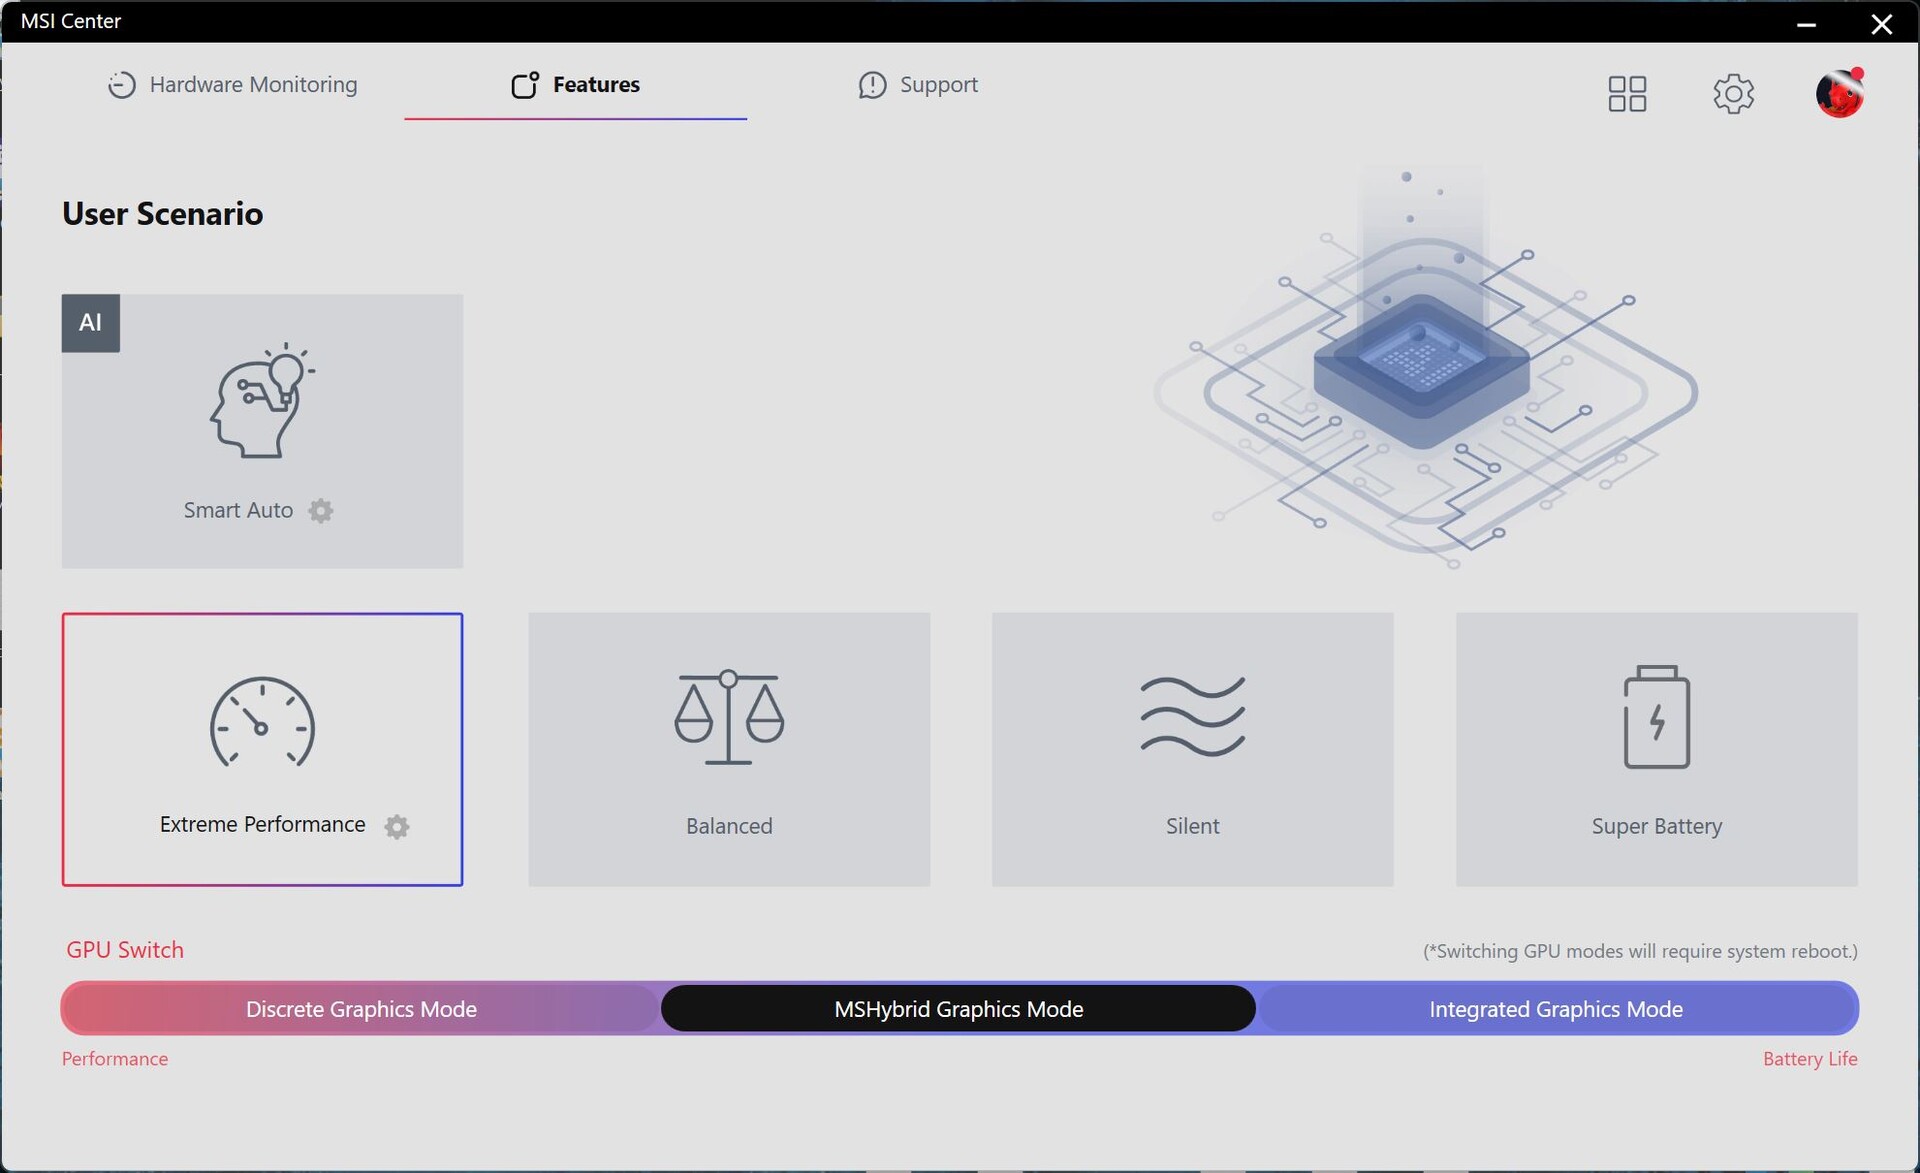
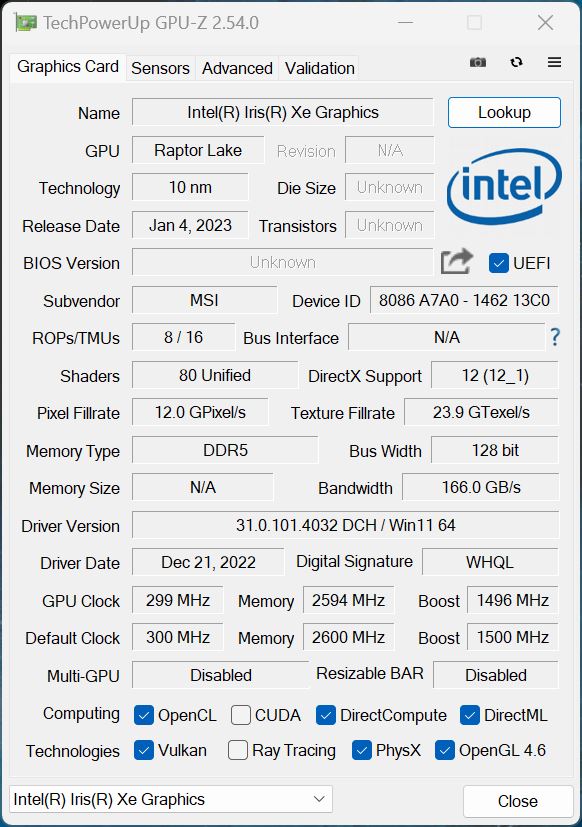
Há diferentes perfis de energia para escolher no MSI Center pré-instalado. O modo Smart Auto deve adaptar dinamicamente os níveis de desempenho de acordo com os requisitos do laptop com a ajuda de alguns parâmetros diferentes - em nosso teste, os resultados nem sempre pareceram consistentes. Como resultado, decidimos usar o modo de energia Extreme Performance para nossos benchmarks e medições, a fim de maximizar os níveis de desempenho, especialmente durante períodos de carga combinada de CPU/GPU. Usamos o perfil Balanced para nossos testes de bateria. Ao mesmo tempo, o Modo Gráfico Híbrido da MSI estava sempre ativado, que alterna para a GPU dedicada da Nvidia quando necessário. Um controle MUX está disponível, mas a troca requer uma reinicialização. Com relação ao preço, gostaríamos que a tecnologia Advanced Optimus tivesse sido utilizada aqui.
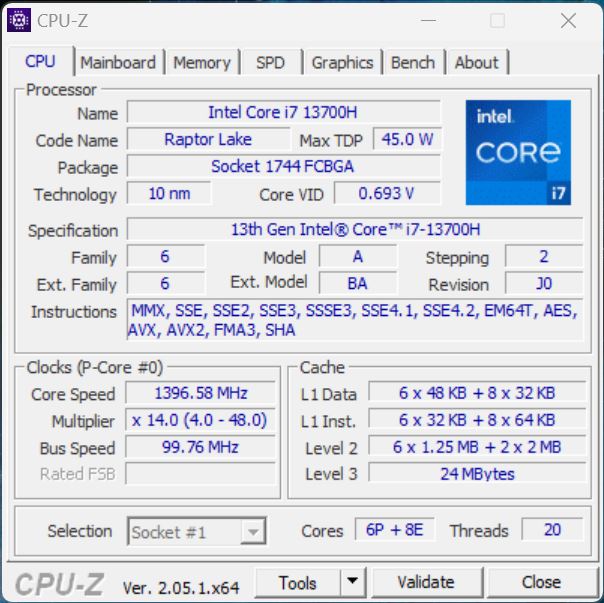
Prozessor - Core i7-13700H
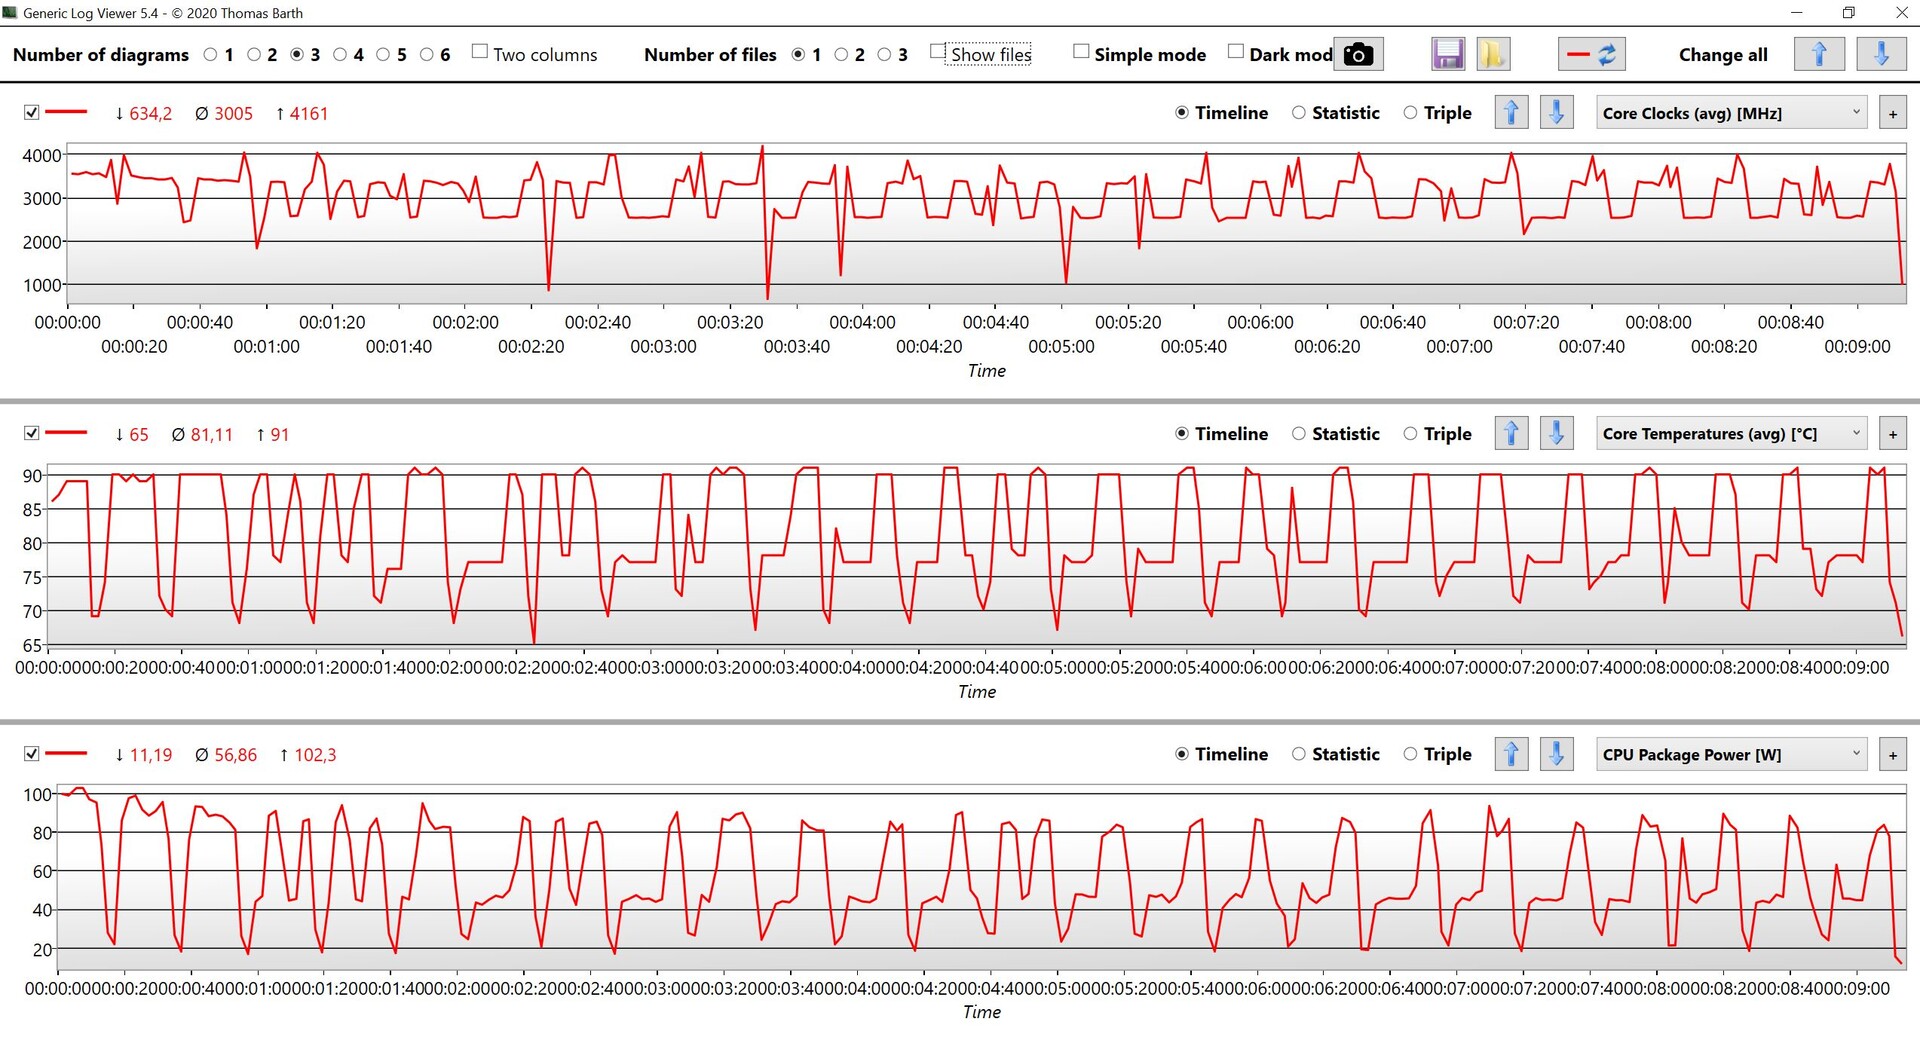
O Stealth 14 Studio está equipado com o processador atual da Intel, o Core i7-13700H- projetado para laptops multimídia e para jogos. Ele tem 6 núcleos de desempenho rápido e 8 núcleos de eficiência, o que significa que pode processar um total de 20 threads ao mesmo tempo. Em comparação com seu antecessor, ele apresenta apenas pequenas melhorias, incluindo um clock turbo ligeiramente mais alto. Seu rendimento energético é muito bom, pois o processador consome muita energia. Medimos picos de 115 watts e, durante a carga contínua, o laptop ainda consome um pouco mais de 80 watts, embora tenhamos medido algumas flutuações. Nos testes de núcleo único, o desempenho do laptop não atendeu às nossas expectativas.
Durante o uso da bateria, o desempenho de vários núcleos é consideravelmente reduzido, pois o processador consome no máximo 35 watts, o que leva a um déficit de cerca de 33%. Mais benchmarks de CPU podem ser encontrados em aqui.
Cinebench R15 Multi continuous test
Cinebench R23: Multi Core | Single Core
Cinebench R20: CPU (Multi Core) | CPU (Single Core)
Cinebench R15: CPU Multi 64Bit | CPU Single 64Bit
Blender: v2.79 BMW27 CPU
7-Zip 18.03: 7z b 4 | 7z b 4 -mmt1
Geekbench 5.5: Multi-Core | Single-Core
HWBOT x265 Benchmark v2.2: 4k Preset
LibreOffice : 20 Documents To PDF
R Benchmark 2.5: Overall mean
| CPU Performance rating | |
| Média da turma Gaming | |
| Asus ROG Flow Z13 GZ301ZE | |
| Acer Predator Triton 300 SE | |
| Alienware x14 i7 RTX 3060 | |
| Gigabyte Aero 14 OLED BMF | |
| MSI Stealth 14 Studio A13V | |
| Média Intel Core i7-13700H | |
| Schenker Vision 14 2022 RTX 3050 Ti | |
| Razer Blade 14 Ryzen 9 6900HX | |
| Cinebench R23 / Multi Core | |
| Média da turma Gaming (10488 - 42661, n=107, últimos 2 anos) | |
| MSI Stealth 14 Studio A13V | |
| Acer Predator Triton 300 SE | |
| Alienware x14 i7 RTX 3060 | |
| Asus ROG Flow Z13 GZ301ZE | |
| Média Intel Core i7-13700H (5890 - 20034, n=29) | |
| Schenker Vision 14 2022 RTX 3050 Ti | |
| Gigabyte Aero 14 OLED BMF | |
| Razer Blade 14 Ryzen 9 6900HX | |
| Cinebench R23 / Single Core | |
| Média da turma Gaming (1166 - 2415, n=107, últimos 2 anos) | |
| Asus ROG Flow Z13 GZ301ZE | |
| Acer Predator Triton 300 SE | |
| Gigabyte Aero 14 OLED BMF | |
| Média Intel Core i7-13700H (1323 - 1914, n=29) | |
| Alienware x14 i7 RTX 3060 | |
| Schenker Vision 14 2022 RTX 3050 Ti | |
| MSI Stealth 14 Studio A13V | |
| Razer Blade 14 Ryzen 9 6900HX | |
| Cinebench R20 / CPU (Multi Core) | |
| Média da turma Gaming (4029 - 16433, n=106, últimos 2 anos) | |
| MSI Stealth 14 Studio A13V | |
| Acer Predator Triton 300 SE | |
| Alienware x14 i7 RTX 3060 | |
| Média Intel Core i7-13700H (2322 - 7674, n=29) | |
| Schenker Vision 14 2022 RTX 3050 Ti | |
| Asus ROG Flow Z13 GZ301ZE | |
| Razer Blade 14 Ryzen 9 6900HX | |
| Gigabyte Aero 14 OLED BMF | |
| Cinebench R20 / CPU (Single Core) | |
| Média da turma Gaming (442 - 913, n=106, últimos 2 anos) | |
| Asus ROG Flow Z13 GZ301ZE | |
| Acer Predator Triton 300 SE | |
| Gigabyte Aero 14 OLED BMF | |
| Schenker Vision 14 2022 RTX 3050 Ti | |
| Média Intel Core i7-13700H (508 - 741, n=29) | |
| Alienware x14 i7 RTX 3060 | |
| MSI Stealth 14 Studio A13V | |
| Razer Blade 14 Ryzen 9 6900HX | |
| Cinebench R15 / CPU Multi 64Bit | |
| Média da turma Gaming (1578 - 6330, n=105, últimos 2 anos) | |
| Asus ROG Flow Z13 GZ301ZE | |
| MSI Stealth 14 Studio A13V | |
| Alienware x14 i7 RTX 3060 | |
| Gigabyte Aero 14 OLED BMF | |
| Média Intel Core i7-13700H (905 - 2982, n=29) | |
| Acer Predator Triton 300 SE | |
| Razer Blade 14 Ryzen 9 6900HX | |
| Schenker Vision 14 2022 RTX 3050 Ti | |
| Cinebench R15 / CPU Single 64Bit | |
| Média da turma Gaming (188.8 - 350, n=106, últimos 2 anos) | |
| Asus ROG Flow Z13 GZ301ZE | |
| Acer Predator Triton 300 SE | |
| Gigabyte Aero 14 OLED BMF | |
| Schenker Vision 14 2022 RTX 3050 Ti | |
| Média Intel Core i7-13700H (213 - 278, n=29) | |
| Alienware x14 i7 RTX 3060 | |
| Razer Blade 14 Ryzen 9 6900HX | |
| MSI Stealth 14 Studio A13V | |
| Blender / v2.79 BMW27 CPU | |
| Schenker Vision 14 2022 RTX 3050 Ti | |
| Gigabyte Aero 14 OLED BMF | |
| Média Intel Core i7-13700H (169 - 555, n=29) | |
| Alienware x14 i7 RTX 3060 | |
| Razer Blade 14 Ryzen 9 6900HX | |
| Asus ROG Flow Z13 GZ301ZE | |
| Acer Predator Triton 300 SE | |
| MSI Stealth 14 Studio A13V | |
| Média da turma Gaming (79 - 330, n=104, últimos 2 anos) | |
| 7-Zip 18.03 / 7z b 4 | |
| Média da turma Gaming (33491 - 148086, n=105, últimos 2 anos) | |
| MSI Stealth 14 Studio A13V | |
| Alienware x14 i7 RTX 3060 | |
| Acer Predator Triton 300 SE | |
| Asus ROG Flow Z13 GZ301ZE | |
| Razer Blade 14 Ryzen 9 6900HX | |
| Média Intel Core i7-13700H (27322 - 76344, n=29) | |
| Gigabyte Aero 14 OLED BMF | |
| Schenker Vision 14 2022 RTX 3050 Ti | |
| 7-Zip 18.03 / 7z b 4 -mmt1 | |
| Média da turma Gaming (4199 - 7436, n=105, últimos 2 anos) | |
| Asus ROG Flow Z13 GZ301ZE | |
| Gigabyte Aero 14 OLED BMF | |
| Média Intel Core i7-13700H (4825 - 6238, n=29) | |
| Razer Blade 14 Ryzen 9 6900HX | |
| Schenker Vision 14 2022 RTX 3050 Ti | |
| Alienware x14 i7 RTX 3060 | |
| Acer Predator Triton 300 SE | |
| MSI Stealth 14 Studio A13V | |
| Geekbench 5.5 / Multi-Core | |
| Média da turma Gaming (6460 - 28263, n=105, últimos 2 anos) | |
| Asus ROG Flow Z13 GZ301ZE | |
| Alienware x14 i7 RTX 3060 | |
| MSI Stealth 14 Studio A13V | |
| Acer Predator Triton 300 SE | |
| Média Intel Core i7-13700H (6165 - 14215, n=29) | |
| Schenker Vision 14 2022 RTX 3050 Ti | |
| Gigabyte Aero 14 OLED BMF | |
| Razer Blade 14 Ryzen 9 6900HX | |
| Geekbench 5.5 / Single-Core | |
| Média da turma Gaming (986 - 2474, n=105, últimos 2 anos) | |
| Asus ROG Flow Z13 GZ301ZE | |
| Gigabyte Aero 14 OLED BMF | |
| Acer Predator Triton 300 SE | |
| Alienware x14 i7 RTX 3060 | |
| Média Intel Core i7-13700H (1362 - 1919, n=29) | |
| Schenker Vision 14 2022 RTX 3050 Ti | |
| MSI Stealth 14 Studio A13V | |
| Razer Blade 14 Ryzen 9 6900HX | |
| HWBOT x265 Benchmark v2.2 / 4k Preset | |
| Média da turma Gaming (11.5 - 44.4, n=105, últimos 2 anos) | |
| Acer Predator Triton 300 SE | |
| MSI Stealth 14 Studio A13V | |
| Razer Blade 14 Ryzen 9 6900HX | |
| Alienware x14 i7 RTX 3060 | |
| Asus ROG Flow Z13 GZ301ZE | |
| Média Intel Core i7-13700H (6.72 - 21.2, n=29) | |
| Gigabyte Aero 14 OLED BMF | |
| Schenker Vision 14 2022 RTX 3050 Ti | |
| LibreOffice / 20 Documents To PDF | |
| MSI Stealth 14 Studio A13V | |
| Razer Blade 14 Ryzen 9 6900HX | |
| Média da turma Gaming (33.2 - 88.8, n=105, últimos 2 anos) | |
| Média Intel Core i7-13700H (31.3 - 62.4, n=29) | |
| Schenker Vision 14 2022 RTX 3050 Ti | |
| Asus ROG Flow Z13 GZ301ZE | |
| Acer Predator Triton 300 SE | |
| Gigabyte Aero 14 OLED BMF | |
| Alienware x14 i7 RTX 3060 | |
| R Benchmark 2.5 / Overall mean | |
| MSI Stealth 14 Studio A13V | |
| Razer Blade 14 Ryzen 9 6900HX | |
| Média Intel Core i7-13700H (0.4308 - 0.607, n=29) | |
| Schenker Vision 14 2022 RTX 3050 Ti | |
| Alienware x14 i7 RTX 3060 | |
| Gigabyte Aero 14 OLED BMF | |
| Acer Predator Triton 300 SE | |
| Média da turma Gaming (0.3439 - 0.759, n=106, últimos 2 anos) | |
| Asus ROG Flow Z13 GZ301ZE | |
* ... menor é melhor
AIDA64: FP32 Ray-Trace | FPU Julia | CPU SHA3 | CPU Queen | FPU SinJulia | FPU Mandel | CPU AES | CPU ZLib | FP64 Ray-Trace | CPU PhotoWorxx
| Performance rating | |
| Média da turma Gaming | |
| Razer Blade 14 Ryzen 9 6900HX | |
| Acer Predator Triton 300 SE | |
| MSI Stealth 14 Studio A13V | |
| Gigabyte Aero 14 OLED BMF | |
| Média Intel Core i7-13700H | |
| Alienware x14 i7 RTX 3060 | |
| Schenker Vision 14 2022 RTX 3050 Ti | |
| Asus ROG Flow Z13 GZ301ZE | |
| AIDA64 / FP32 Ray-Trace | |
| Média da turma Gaming (10227 - 85542, n=105, últimos 2 anos) | |
| MSI Stealth 14 Studio A13V | |
| Razer Blade 14 Ryzen 9 6900HX | |
| Acer Predator Triton 300 SE | |
| Média Intel Core i7-13700H (4986 - 18908, n=29) | |
| Gigabyte Aero 14 OLED BMF | |
| Schenker Vision 14 2022 RTX 3050 Ti | |
| Alienware x14 i7 RTX 3060 | |
| Asus ROG Flow Z13 GZ301ZE | |
| AIDA64 / FPU Julia | |
| Média da turma Gaming (51376 - 238426, n=105, últimos 2 anos) | |
| Razer Blade 14 Ryzen 9 6900HX | |
| MSI Stealth 14 Studio A13V | |
| Acer Predator Triton 300 SE | |
| Média Intel Core i7-13700H (25360 - 92359, n=29) | |
| Gigabyte Aero 14 OLED BMF | |
| Schenker Vision 14 2022 RTX 3050 Ti | |
| Alienware x14 i7 RTX 3060 | |
| Asus ROG Flow Z13 GZ301ZE | |
| AIDA64 / CPU SHA3 | |
| Média da turma Gaming (2180 - 10115, n=105, últimos 2 anos) | |
| MSI Stealth 14 Studio A13V | |
| Acer Predator Triton 300 SE | |
| Razer Blade 14 Ryzen 9 6900HX | |
| Média Intel Core i7-13700H (1339 - 4224, n=29) | |
| Gigabyte Aero 14 OLED BMF | |
| Alienware x14 i7 RTX 3060 | |
| Schenker Vision 14 2022 RTX 3050 Ti | |
| Asus ROG Flow Z13 GZ301ZE | |
| AIDA64 / CPU Queen | |
| Média da turma Gaming (49785 - 173351, n=90, últimos 2 anos) | |
| Acer Predator Triton 300 SE | |
| Gigabyte Aero 14 OLED BMF | |
| MSI Stealth 14 Studio A13V | |
| Asus ROG Flow Z13 GZ301ZE | |
| Razer Blade 14 Ryzen 9 6900HX | |
| Alienware x14 i7 RTX 3060 | |
| Média Intel Core i7-13700H (59324 - 107159, n=29) | |
| Schenker Vision 14 2022 RTX 3050 Ti | |
| AIDA64 / FPU SinJulia | |
| Média da turma Gaming (4424 - 33636, n=105, últimos 2 anos) | |
| Razer Blade 14 Ryzen 9 6900HX | |
| MSI Stealth 14 Studio A13V | |
| Acer Predator Triton 300 SE | |
| Alienware x14 i7 RTX 3060 | |
| Asus ROG Flow Z13 GZ301ZE | |
| Média Intel Core i7-13700H (4800 - 11050, n=29) | |
| Gigabyte Aero 14 OLED BMF | |
| Schenker Vision 14 2022 RTX 3050 Ti | |
| AIDA64 / FPU Mandel | |
| Média da turma Gaming (25115 - 128721, n=105, últimos 2 anos) | |
| Razer Blade 14 Ryzen 9 6900HX | |
| MSI Stealth 14 Studio A13V | |
| Acer Predator Triton 300 SE | |
| Média Intel Core i7-13700H (12321 - 45118, n=29) | |
| Gigabyte Aero 14 OLED BMF | |
| Schenker Vision 14 2022 RTX 3050 Ti | |
| Alienware x14 i7 RTX 3060 | |
| Asus ROG Flow Z13 GZ301ZE | |
| AIDA64 / CPU AES | |
| Razer Blade 14 Ryzen 9 6900HX | |
| Acer Predator Triton 300 SE | |
| Gigabyte Aero 14 OLED BMF | |
| Média da turma Gaming (39258 - 247074, n=105, últimos 2 anos) | |
| Alienware x14 i7 RTX 3060 | |
| Asus ROG Flow Z13 GZ301ZE | |
| MSI Stealth 14 Studio A13V | |
| Média Intel Core i7-13700H (28769 - 151254, n=29) | |
| Schenker Vision 14 2022 RTX 3050 Ti | |
| AIDA64 / CPU ZLib | |
| Média da turma Gaming (574 - 2531, n=105, últimos 2 anos) | |
| MSI Stealth 14 Studio A13V | |
| Acer Predator Triton 300 SE | |
| Alienware x14 i7 RTX 3060 | |
| Schenker Vision 14 2022 RTX 3050 Ti | |
| Média Intel Core i7-13700H (389 - 1215, n=29) | |
| Asus ROG Flow Z13 GZ301ZE | |
| Razer Blade 14 Ryzen 9 6900HX | |
| Gigabyte Aero 14 OLED BMF | |
| AIDA64 / FP64 Ray-Trace | |
| Média da turma Gaming (5509 - 45446, n=105, últimos 2 anos) | |
| MSI Stealth 14 Studio A13V | |
| Razer Blade 14 Ryzen 9 6900HX | |
| Acer Predator Triton 300 SE | |
| Média Intel Core i7-13700H (2540 - 10135, n=29) | |
| Gigabyte Aero 14 OLED BMF | |
| Schenker Vision 14 2022 RTX 3050 Ti | |
| Alienware x14 i7 RTX 3060 | |
| Asus ROG Flow Z13 GZ301ZE | |
| AIDA64 / CPU PhotoWorxx | |
| Gigabyte Aero 14 OLED BMF | |
| Acer Predator Triton 300 SE | |
| Alienware x14 i7 RTX 3060 | |
| Média da turma Gaming (12271 - 89891, n=105, últimos 2 anos) | |
| Asus ROG Flow Z13 GZ301ZE | |
| Média Intel Core i7-13700H (12872 - 52727, n=29) | |
| MSI Stealth 14 Studio A13V | |
| Schenker Vision 14 2022 RTX 3050 Ti | |
| Razer Blade 14 Ryzen 9 6900HX | |
Desempenho do sistema
Subjetivamente (e sem surpresa), esse componente nos deixou uma ótima impressão em termos de desempenho, embora nosso dispositivo de teste tenha obtido apenas resultados médios durante os benchmarks sintéticos. Não notamos nenhum problema durante o teste.
CrossMark: Overall | Productivity | Creativity | Responsiveness
| PCMark 10 / Score | |
| Média da turma Gaming (5828 - 12414, n=93, últimos 2 anos) | |
| Acer Predator Triton 300 SE | |
| Razer Blade 14 Ryzen 9 6900HX | |
| Gigabyte Aero 14 OLED BMF | |
| Média Intel Core i7-13700H, NVIDIA GeForce RTX 4050 Laptop GPU (6822 - 7556, n=7) | |
| Alienware x14 i7 RTX 3060 | |
| MSI Stealth 14 Studio A13V | |
| Schenker Vision 14 2022 RTX 3050 Ti | |
| Asus ROG Flow Z13 GZ301ZE | |
| PCMark 10 / Essentials | |
| Gigabyte Aero 14 OLED BMF | |
| Acer Predator Triton 300 SE | |
| Razer Blade 14 Ryzen 9 6900HX | |
| Média Intel Core i7-13700H, NVIDIA GeForce RTX 4050 Laptop GPU (10283 - 11549, n=7) | |
| Asus ROG Flow Z13 GZ301ZE | |
| Média da turma Gaming (8810 - 11935, n=97, últimos 2 anos) | |
| Schenker Vision 14 2022 RTX 3050 Ti | |
| Alienware x14 i7 RTX 3060 | |
| MSI Stealth 14 Studio A13V | |
| PCMark 10 / Productivity | |
| Média da turma Gaming (6845 - 25323, n=95, últimos 2 anos) | |
| Acer Predator Triton 300 SE | |
| Asus ROG Flow Z13 GZ301ZE | |
| Alienware x14 i7 RTX 3060 | |
| Gigabyte Aero 14 OLED BMF | |
| Média Intel Core i7-13700H, NVIDIA GeForce RTX 4050 Laptop GPU (8368 - 9836, n=7) | |
| Razer Blade 14 Ryzen 9 6900HX | |
| Schenker Vision 14 2022 RTX 3050 Ti | |
| MSI Stealth 14 Studio A13V | |
| PCMark 10 / Digital Content Creation | |
| Média da turma Gaming (7602 - 19954, n=95, últimos 2 anos) | |
| Razer Blade 14 Ryzen 9 6900HX | |
| Acer Predator Triton 300 SE | |
| MSI Stealth 14 Studio A13V | |
| Média Intel Core i7-13700H, NVIDIA GeForce RTX 4050 Laptop GPU (9527 - 10643, n=7) | |
| Alienware x14 i7 RTX 3060 | |
| Gigabyte Aero 14 OLED BMF | |
| Schenker Vision 14 2022 RTX 3050 Ti | |
| Asus ROG Flow Z13 GZ301ZE | |
| CrossMark / Overall | |
| Asus ROG Flow Z13 GZ301ZE | |
| Média da turma Gaming (1366 - 2409, n=94, últimos 2 anos) | |
| Acer Predator Triton 300 SE | |
| Alienware x14 i7 RTX 3060 | |
| Gigabyte Aero 14 OLED BMF | |
| MSI Stealth 14 Studio A13V | |
| Média Intel Core i7-13700H, NVIDIA GeForce RTX 4050 Laptop GPU (1205 - 1937, n=9) | |
| Schenker Vision 14 2022 RTX 3050 Ti | |
| CrossMark / Productivity | |
| Asus ROG Flow Z13 GZ301ZE | |
| Acer Predator Triton 300 SE | |
| Média da turma Gaming (1386 - 2254, n=94, últimos 2 anos) | |
| Alienware x14 i7 RTX 3060 | |
| Gigabyte Aero 14 OLED BMF | |
| Média Intel Core i7-13700H, NVIDIA GeForce RTX 4050 Laptop GPU (1158 - 1877, n=9) | |
| MSI Stealth 14 Studio A13V | |
| Schenker Vision 14 2022 RTX 3050 Ti | |
| CrossMark / Creativity | |
| Média da turma Gaming (1343 - 2786, n=94, últimos 2 anos) | |
| Asus ROG Flow Z13 GZ301ZE | |
| Acer Predator Triton 300 SE | |
| Alienware x14 i7 RTX 3060 | |
| Gigabyte Aero 14 OLED BMF | |
| MSI Stealth 14 Studio A13V | |
| Média Intel Core i7-13700H, NVIDIA GeForce RTX 4050 Laptop GPU (1293 - 2044, n=9) | |
| Schenker Vision 14 2022 RTX 3050 Ti | |
| CrossMark / Responsiveness | |
| Asus ROG Flow Z13 GZ301ZE | |
| Acer Predator Triton 300 SE | |
| Alienware x14 i7 RTX 3060 | |
| Gigabyte Aero 14 OLED BMF | |
| Média da turma Gaming (1226 - 2334, n=94, últimos 2 anos) | |
| Média Intel Core i7-13700H, NVIDIA GeForce RTX 4050 Laptop GPU (1097 - 1929, n=9) | |
| MSI Stealth 14 Studio A13V | |
| Schenker Vision 14 2022 RTX 3050 Ti | |
| PCMark 10 Score | 6924 pontos | |
Ajuda | ||
| AIDA64 / Memory Copy | |
| Gigabyte Aero 14 OLED BMF | |
| Alienware x14 i7 RTX 3060 | |
| Asus ROG Flow Z13 GZ301ZE | |
| Acer Predator Triton 300 SE | |
| Média da turma Gaming (21750 - 129946, n=105, últimos 2 anos) | |
| Média Intel Core i7-13700H (24334 - 78081, n=29) | |
| MSI Stealth 14 Studio A13V | |
| Razer Blade 14 Ryzen 9 6900HX | |
| Schenker Vision 14 2022 RTX 3050 Ti | |
| AIDA64 / Memory Read | |
| Gigabyte Aero 14 OLED BMF | |
| Alienware x14 i7 RTX 3060 | |
| Acer Predator Triton 300 SE | |
| Média da turma Gaming (22956 - 118858, n=105, últimos 2 anos) | |
| Asus ROG Flow Z13 GZ301ZE | |
| MSI Stealth 14 Studio A13V | |
| Média Intel Core i7-13700H (23681 - 79656, n=29) | |
| Razer Blade 14 Ryzen 9 6900HX | |
| Schenker Vision 14 2022 RTX 3050 Ti | |
| AIDA64 / Memory Write | |
| Gigabyte Aero 14 OLED BMF | |
| Média da turma Gaming (22297 - 135096, n=105, últimos 2 anos) | |
| Média Intel Core i7-13700H (22986 - 99898, n=29) | |
| Alienware x14 i7 RTX 3060 | |
| Acer Predator Triton 300 SE | |
| Asus ROG Flow Z13 GZ301ZE | |
| Razer Blade 14 Ryzen 9 6900HX | |
| MSI Stealth 14 Studio A13V | |
| Schenker Vision 14 2022 RTX 3050 Ti | |
| AIDA64 / Memory Latency | |
| Alienware x14 i7 RTX 3060 | |
| Média da turma Gaming (75.3 - 259, n=105, últimos 2 anos) | |
| Asus ROG Flow Z13 GZ301ZE | |
| Acer Predator Triton 300 SE | |
| Média Intel Core i7-13700H (82.4 - 136.8, n=29) | |
| Gigabyte Aero 14 OLED BMF | |
| Schenker Vision 14 2022 RTX 3050 Ti | |
| MSI Stealth 14 Studio A13V | |
| Razer Blade 14 Ryzen 9 6900HX | |
* ... menor é melhor
Latência DPC
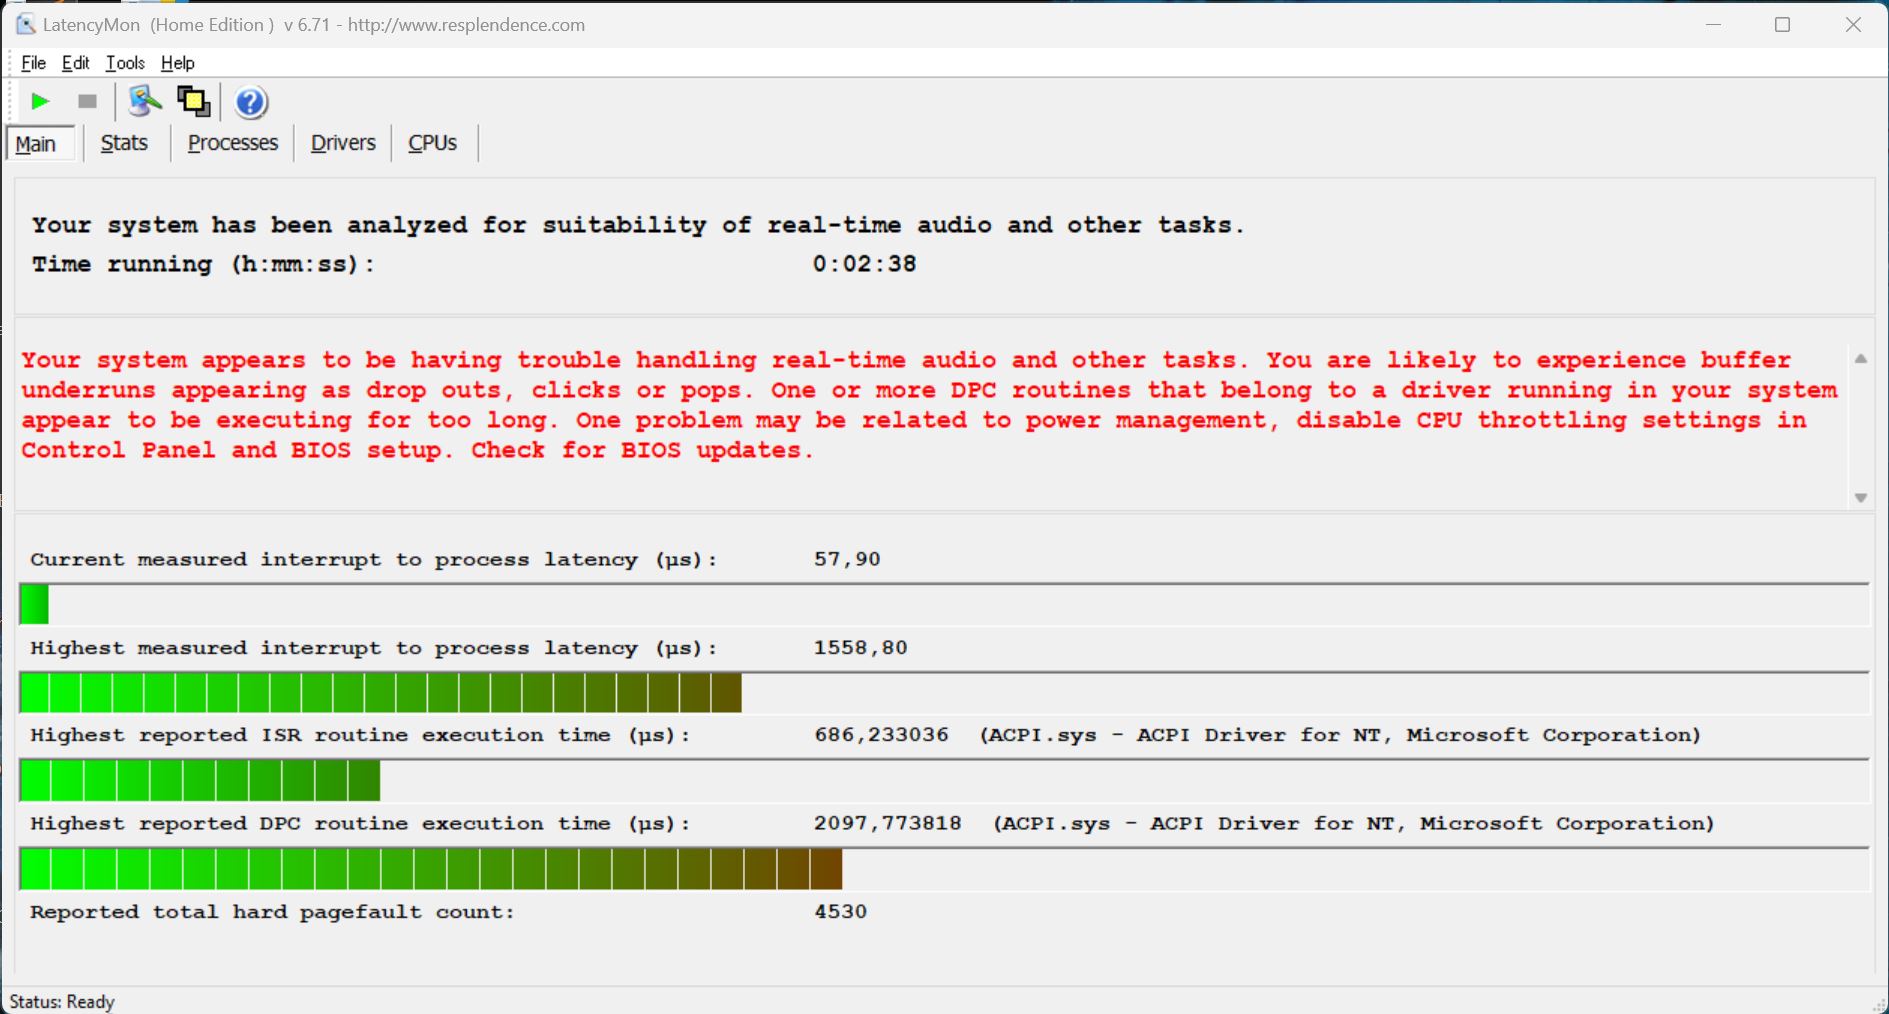
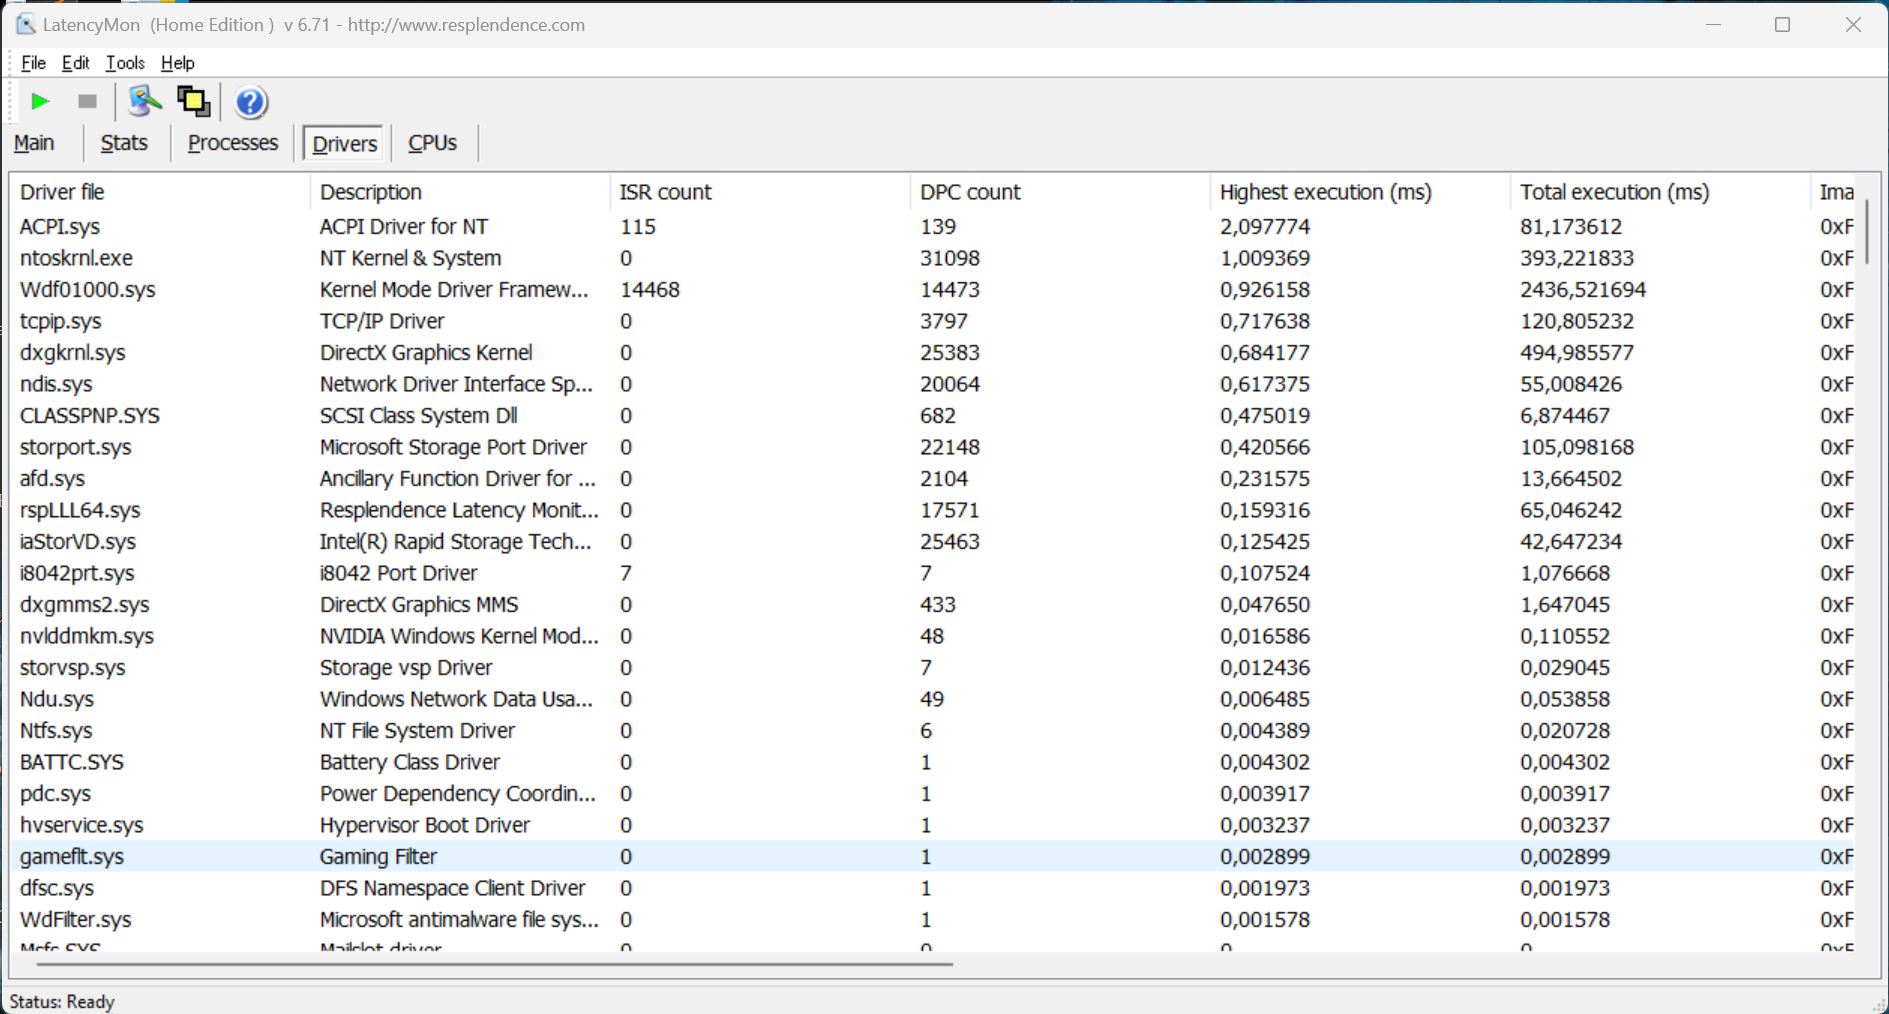
Nosso dispositivo de teste é apenas parcialmente adequado para usos de áudio em tempo real usando a versão atual do BIOS, pois nosso teste de latência padronizado (navegação na Internet, reprodução do YouTube em 4K, carga da CPU) apontou alguns problemas menores.
| DPC Latencies / LatencyMon - interrupt to process latency (max), Web, Youtube, Prime95 | |
| Acer Predator Triton 300 SE | |
| Gigabyte Aero 14 OLED BMF | |
| MSI Stealth 14 Studio A13V | |
| Asus ROG Flow Z13 GZ301ZE | |
| Razer Blade 14 Ryzen 9 6900HX | |
| Alienware x14 i7 RTX 3060 | |
| Schenker Vision 14 2022 RTX 3050 Ti | |
* ... menor é melhor
Dispositivos de armazenamento
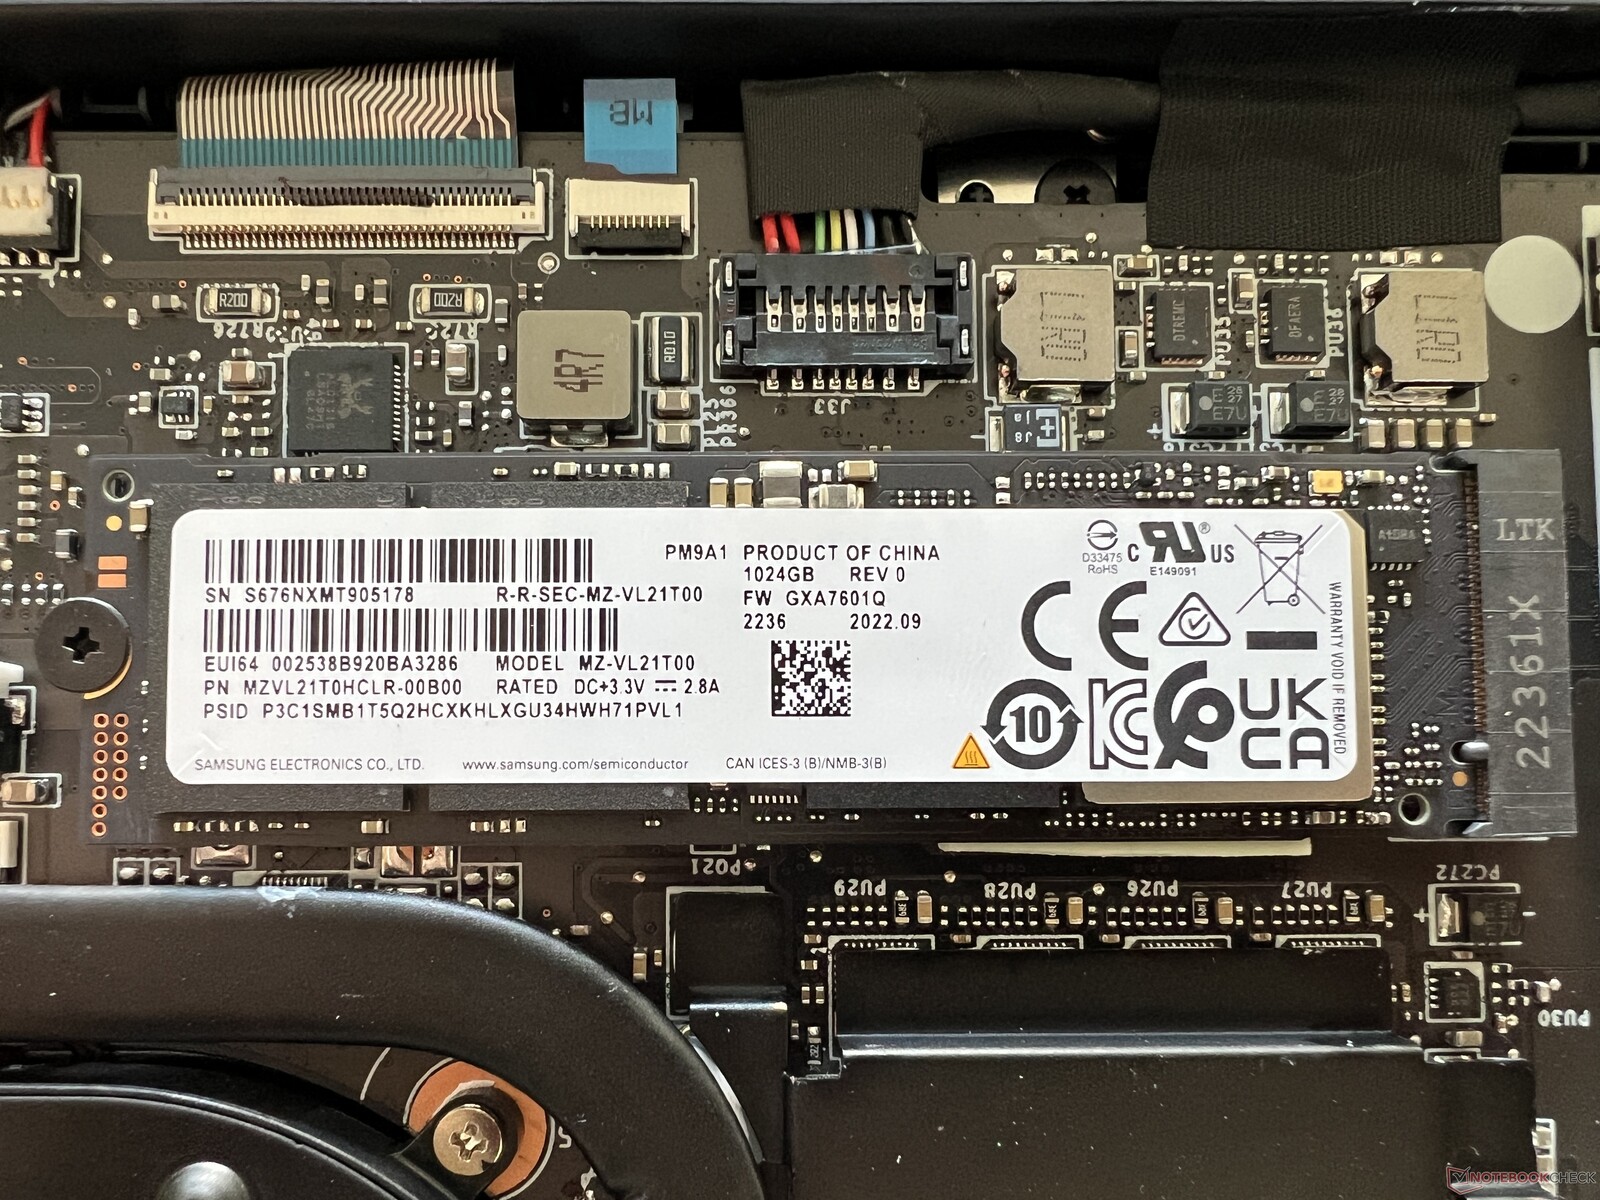
Nossa amostra de teste foi equipada com a versão de 1 TB do Samsung PM9A1. Essa é uma unidade PCIe 4.0 rápida e as taxas de transferência em nossos benchmarks foram muito boas, com resultados de até 7 GB/s. No entanto, seu desempenho não permaneceu estável. Após alguns minutos, a SSD teve que reduzir seu desempenho em cerca de 50%, o que não deve ser tão perceptível no uso diário. O fato de a SSD estar posicionada bem ao lado do tubo de calor certamente não é bom para as temperaturas da SSD. Outros benchmarks de SSDs podem ser encontradosaqui.

* ... menor é melhor
Reading continuous performance: DiskSpd Read Loop, Queue Depth 8
Placa de vídeo - GeForce RTX 4050 Laptop
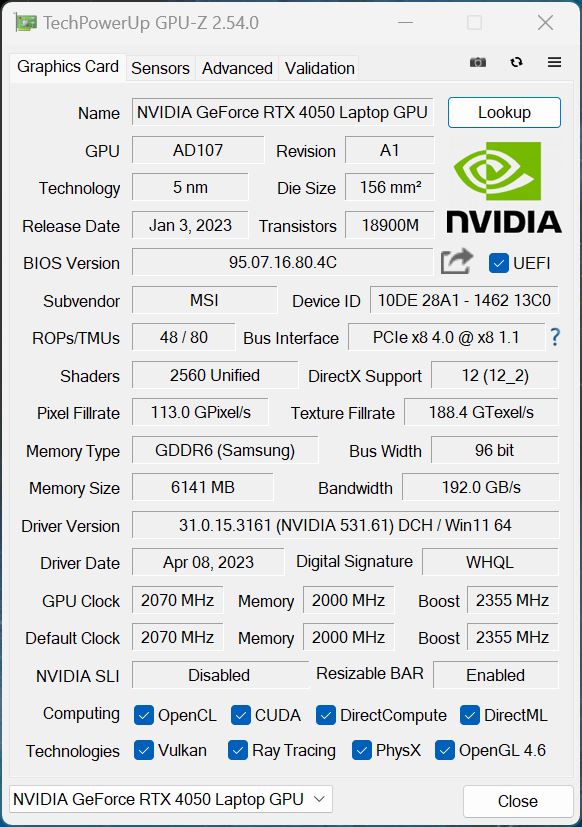
Como já mencionado, o Stealth 14 Studio pode ter um controle MUX com o qual é possível desativar completamente a GPU integrada; no entanto, isso requer uma reinicialização que pode ser irritante durante o uso diário em algum momento. Teríamos preferido ver a tecnologia Advanced Optimus da Nvidia. Como resultado, confiamos no método normal de alternar os gráficos via Optimus. O laptopGeForce Laptop RTX 4050é a nova GPU de médio porte da Nvidia e, ao contrário de muitos outros laptops multimídia atuais (a maioria com TGPs entre 40 e 50 watts), uma das variantes mais rápidas está em uso, com um TGP de 90 watts.
Posteriormente, os resultados de benchmark do laptop foram bons e quase no mesmo nível daRTX 3060noAcer Predator Triton 300 SE. Também incluímos modelos adicionais com aRTX 4060e oLaptop RTX 4070e que têm valores de TGP semelhantes em nossa comparação, para que pudéssemos ter uma ideia melhor do desempenho dos modelos mais rápidos do Stealth 14 Studio. Em geral, você pode esperar um desempenho gráfico cerca de 20 a 35% melhor.
Sob carga contínua, o desempenho gráfico permaneceu estável, mas durante o uso da bateria, a GPU consumiu apenas 35 watts, o que significa que o desempenho da GPU diminui, em média, cerca de 35% se você não estiver conectado a uma tomada. Outros benchmarks de GPU podem ser encontrados em nossa seção de tecnologia.
| 3DMark 11 Performance | 26475 pontos | |
| 3DMark Cloud Gate Standard Score | 48584 pontos | |
| 3DMark Fire Strike Score | 19121 pontos | |
| 3DMark Time Spy Score | 7845 pontos | |
Ajuda | ||
| Blender / v3.3 Classroom OPTIX/RTX | |
| Schenker Vision 14 2022 RTX 3050 Ti | |
| Acer Predator Triton 300 SE | |
| Gigabyte Aero 14 OLED BMF | |
| Média NVIDIA GeForce RTX 4050 Laptop GPU (25 - 37, n=40) | |
| MSI Stealth 14 Studio A13V | |
| Média da turma Gaming (9 - 32, n=106, últimos 2 anos) | |
| Blender / v3.3 Classroom CUDA | |
| Schenker Vision 14 2022 RTX 3050 Ti | |
| Gigabyte Aero 14 OLED BMF | |
| Acer Predator Triton 300 SE | |
| Média NVIDIA GeForce RTX 4050 Laptop GPU (47 - 68, n=39) | |
| Média da turma Gaming (15 - 228, n=106, últimos 2 anos) | |
| Blender / v3.3 Classroom CPU | |
| Schenker Vision 14 2022 RTX 3050 Ti | |
| Gigabyte Aero 14 OLED BMF | |
| Média NVIDIA GeForce RTX 4050 Laptop GPU (243 - 907, n=40) | |
| Acer Predator Triton 300 SE | |
| MSI Stealth 14 Studio A13V | |
| Média da turma Gaming (122 - 565, n=102, últimos 2 anos) | |
* ... menor é melhor
Desempenho em jogos
O desempenho real em jogos do Stealth 14 Studio está à frente de seu concorrente, o Gigabyte Aero 14, que também é equipado com o laptop RTX 4050. Por sua vez, a antigaRTX 3060(por exemplo, oAlienware x14,Acer Triton 300 SE) tem uma clara vantagem quando se trata de jogos. É claro que o mesmo pode ser dito das GPUs mais rápidasLaptop RTX 4060eLaptop RTX 4070. Em geral, você pode jogar a maioria dos jogos sem problemas em QHD usando o laptop RTX 4050 - apenas alguns jogos mais complexos podem exigir que você reduza as configurações de detalhe/resolução ou use a tecnologia de upsampling, como DLSS (se o jogo suportar isso). O mesmo vale para o traçado de raios, para o qual o laptop RTX 4050 não seria suficientemente potente. Além disso, é preciso observar que, especialmente em resoluções mais altas, a pequena memória gráfica de 6 GB do laptop não é totalmente à prova de futuro. Da mesma forma que nos testes de GPU pura, o desempenho de jogos do Stealth 14 Studio também permaneceu completamente estável durante sessões mais longas.
| F1 2021 - 1920x1080 Ultra High Preset + Raytracing AA:T AF:16x | |
| MSI Katana 17 B13VFK (874931) | |
| Asus Zenbook Pro 14 OLED UX6404VI (874931) | |
| MSI Stealth 14 Studio A13V (874931) | |
| Média NVIDIA GeForce RTX 4050 Laptop GPU (70.7 - 119.5, n=7) | |
| Alienware x14 i7 RTX 3060 | |
| Schenker Vision 14 2022 RTX 3050 Ti (874931) | |
| Asus ROG Flow Z13 GZ301ZE (843175) | |
| F1 22 - 1920x1080 Ultra High Preset AA:T AF:16x | |
| Razer Blade 14 RTX 4070 (959964) | |
| Média da turma Gaming (40.1 - 121.2, n=4, últimos 2 anos) | |
| Asus Zenbook Pro 14 OLED UX6404VI (959964) | |
| MSI Katana 17 B13VFK (946728) | |
| MSI Stealth 14 Studio A13V (959964) | |
| Média NVIDIA GeForce RTX 4050 Laptop GPU (10.9 - 56.4, n=24) | |
| Gigabyte Aero 14 OLED BMF (959964) | |
| Schenker Vision 14 2022 RTX 3050 Ti (923650) | |
| Call of Duty Modern Warfare 2 2022 - 1920x1080 Extreme Quality Preset AA:T2X Filmic SM | |
| Razer Blade 14 RTX 4070 | |
| MSI Katana 17 B13VFK | |
| MSI Stealth 14 Studio A13V | |
| Média NVIDIA GeForce RTX 4050 Laptop GPU (54 - 77, n=3) | |
Witcher 3 FPS diagram
| baixo | média | alto | ultra | QHD | 4K | |
|---|---|---|---|---|---|---|
| GTA V (2015) | 161.7 | 142.4 | 55.9 | 55.7 | ||
| The Witcher 3 (2015) | 168.5 | 121.7 | 76.7 | |||
| Dota 2 Reborn (2015) | 172.1 | 157.1 | 142.8 | 135.3 | 101.2 | |
| Final Fantasy XV Benchmark (2018) | 180.2 | 116.2 | 82 | 59.7 | ||
| X-Plane 11.11 (2018) | 141.6 | 124.7 | 97.8 | |||
| Strange Brigade (2018) | 277 | 191.9 | 145.3 | 123.1 | 79.8 | |
| Shadow of the Tomb Raider (2018) | 102 | 95 | 86 | 60 | ||
| F1 2021 (2021) | 323 | 245 | 194.5 | 105.4 | 74.3 | |
| Cyberpunk 2077 1.6 (2022) | 72.78 | 60.72 | 57.77 | 37.66 | ||
| F1 22 (2022) | 156.5 | 149.6 | 133.6 | 48.4 | 29.9 | |
| Call of Duty Modern Warfare 2 2022 (2022) | 101 | 75 | 70 | 47 |
Emissões - Câmara de vapor com taxas de sucesso moderadas
Emissões de ruído
O sistema de resfriamento do laptop consiste em uma grande câmara de vapor, bem como duas ventoinhas que são particularmente irritantes durante o uso diário. Sob carga baixa e, às vezes, até mesmo no modo inativo, notamos ruídos de zumbido de até quase 34 dB(A), que podem ser ouvidos com certeza. Às vezes, notamos até mesmo picos curtos de mais de 40 dB(A) quando os ventiladores começaram a funcionar, o que é totalmente desnecessário. Sob carga, o modo Extreme Performance foi o mais barulhento, medindo 51 dB(A), embora os 47 dB(A) que medimos usando o modo Balanced não sejam exatamente muito mais silenciosos. Definitivamente, recomendamos o uso de fones de ouvido durante os jogos. Não notamos nenhum outro ruído eletrônico.
| Uso | Silencioso | Balanceado | Desempenho extremo |
|---|---|---|---|
| 3DMark 06 | 36,6 dB(A) | 42,2 dB(A) | 42,2 dB(A) |
| Witcher 3 | 42.2 dB(A) | 47,3 dB(A) | 51 dB(A) |
| Teste de estresse | 42,2 dB(A) | 47,3 dB(A) | 51 dB(A) |
Barulho
| Ocioso |
| 25.3 / 25 / 33.7 dB |
| Carga |
| 42.2 / 51 dB |
 | ||
30 dB silencioso 40 dB(A) audível 50 dB(A) ruidosamente alto |
||
min: | ||
| MSI Stealth 14 Studio A13V GeForce RTX 4050 Laptop GPU, i7-13700H, Samsung PM9A1 MZVL21T0HCLR | Gigabyte Aero 14 OLED BMF GeForce RTX 4050 Laptop GPU, i7-13700H, Gigabyte AG470S1TB-SI B10 | Schenker Vision 14 2022 RTX 3050 Ti GeForce RTX 3050 Ti Laptop GPU, i7-12700H, Samsung SSD 980 Pro 1TB MZ-V8P1T0BW | Asus ROG Flow Z13 GZ301ZE GeForce RTX 3050 Ti Laptop GPU, i9-12900H, Micron 2450 1TB MTFDKBK1T0TFK | Alienware x14 i7 RTX 3060 GeForce RTX 3060 Laptop GPU, i7-12700H, WDC PC SN810 1TB | Razer Blade 14 Ryzen 9 6900HX GeForce RTX 3070 Ti Laptop GPU, R9 6900HX, Samsung PM9A1 MZVL21T0HCLR | Acer Predator Triton 300 SE GeForce RTX 3060 Laptop GPU, i9-12900H, Micron 3400 1TB MTFDKBA1T0TFH | |
|---|---|---|---|---|---|---|---|
| Noise | 5% | 5% | 11% | 2% | 15% | -2% | |
| desligado / ambiente * (dB) | 25.3 | 24 5% | 24.4 4% | 24.5 3% | 24.7 2% | 23.3 8% | 23.8 6% |
| Idle Minimum * (dB) | 25.3 | 24 5% | 24.4 4% | 24.5 3% | 24.7 2% | 23.3 8% | 23.8 6% |
| Idle Average * (dB) | 25 | 24 4% | 24.4 2% | 24.5 2% | 24.7 1% | 23.3 7% | 23.8 5% |
| Idle Maximum * (dB) | 33.7 | 35.71 -6% | 27.8 18% | 24.5 27% | 30.9 8% | 23.3 31% | 30.6 9% |
| Load Average * (dB) | 42.2 | 43.3 -3% | 41 3% | 40 5% | 34.7 18% | 44.2 -5% | |
| Witcher 3 ultra * (dB) | 51 | 40.22 21% | 48.2 5% | 41 20% | 51.5 -1% | 42.1 17% | 60.1 -18% |
| Load Maximum * (dB) | 51 | 51.93 -2% | 48.8 4% | 41 20% | 51.5 -1% | 42.1 17% | 60 -18% |
* ... menor é melhor
Temperatura
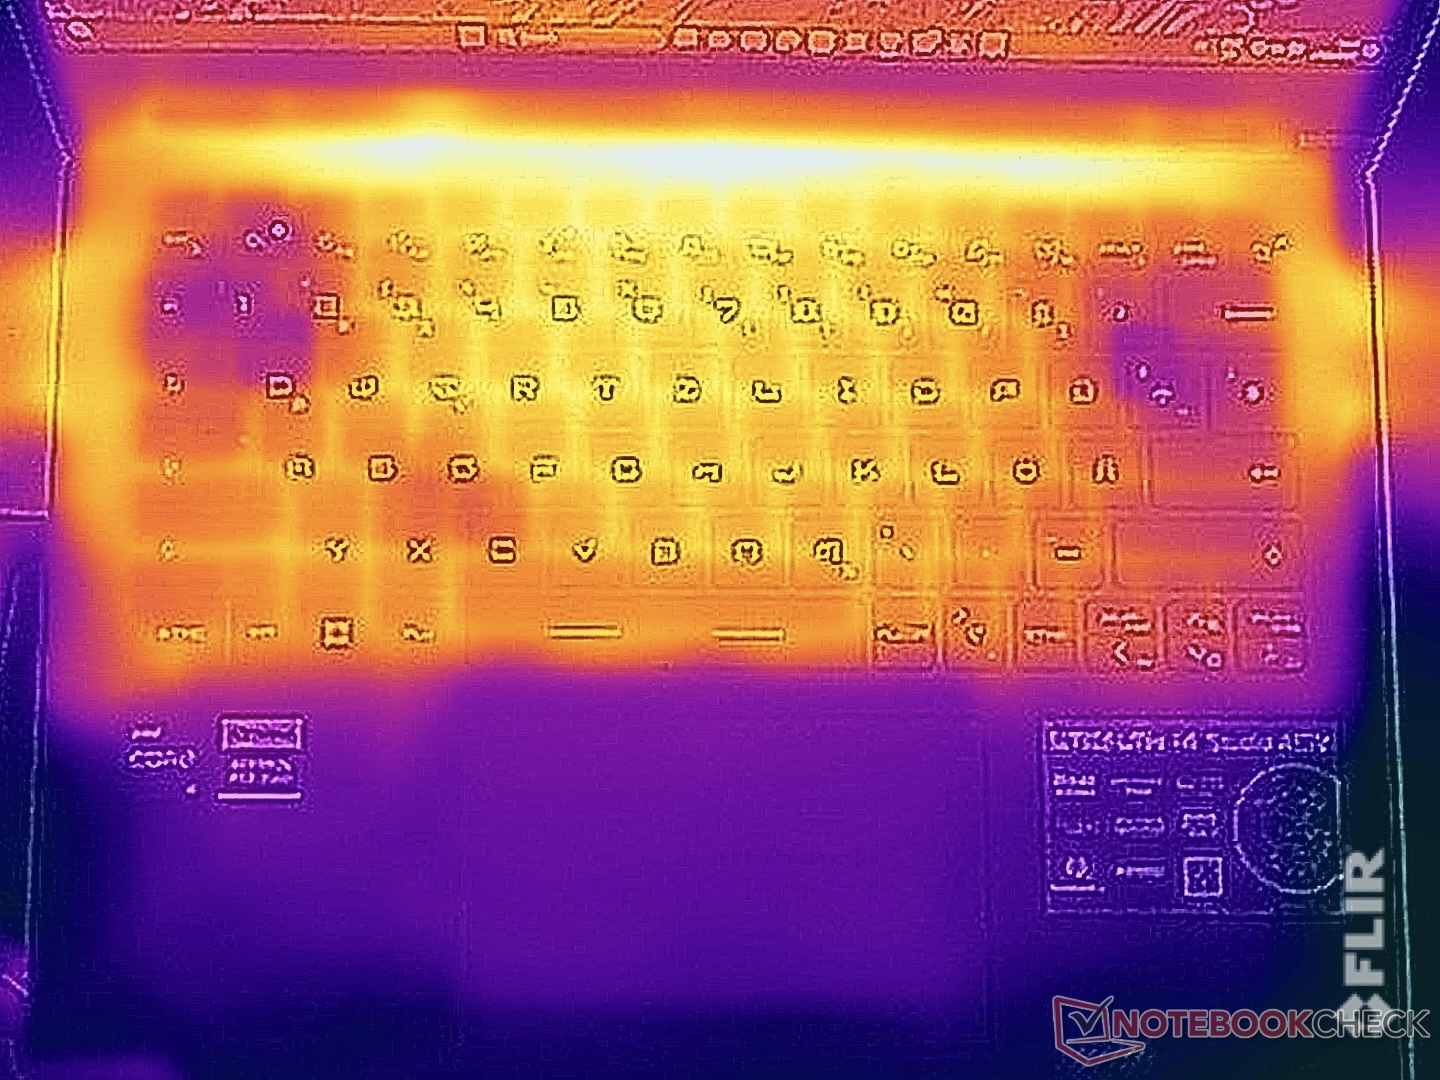
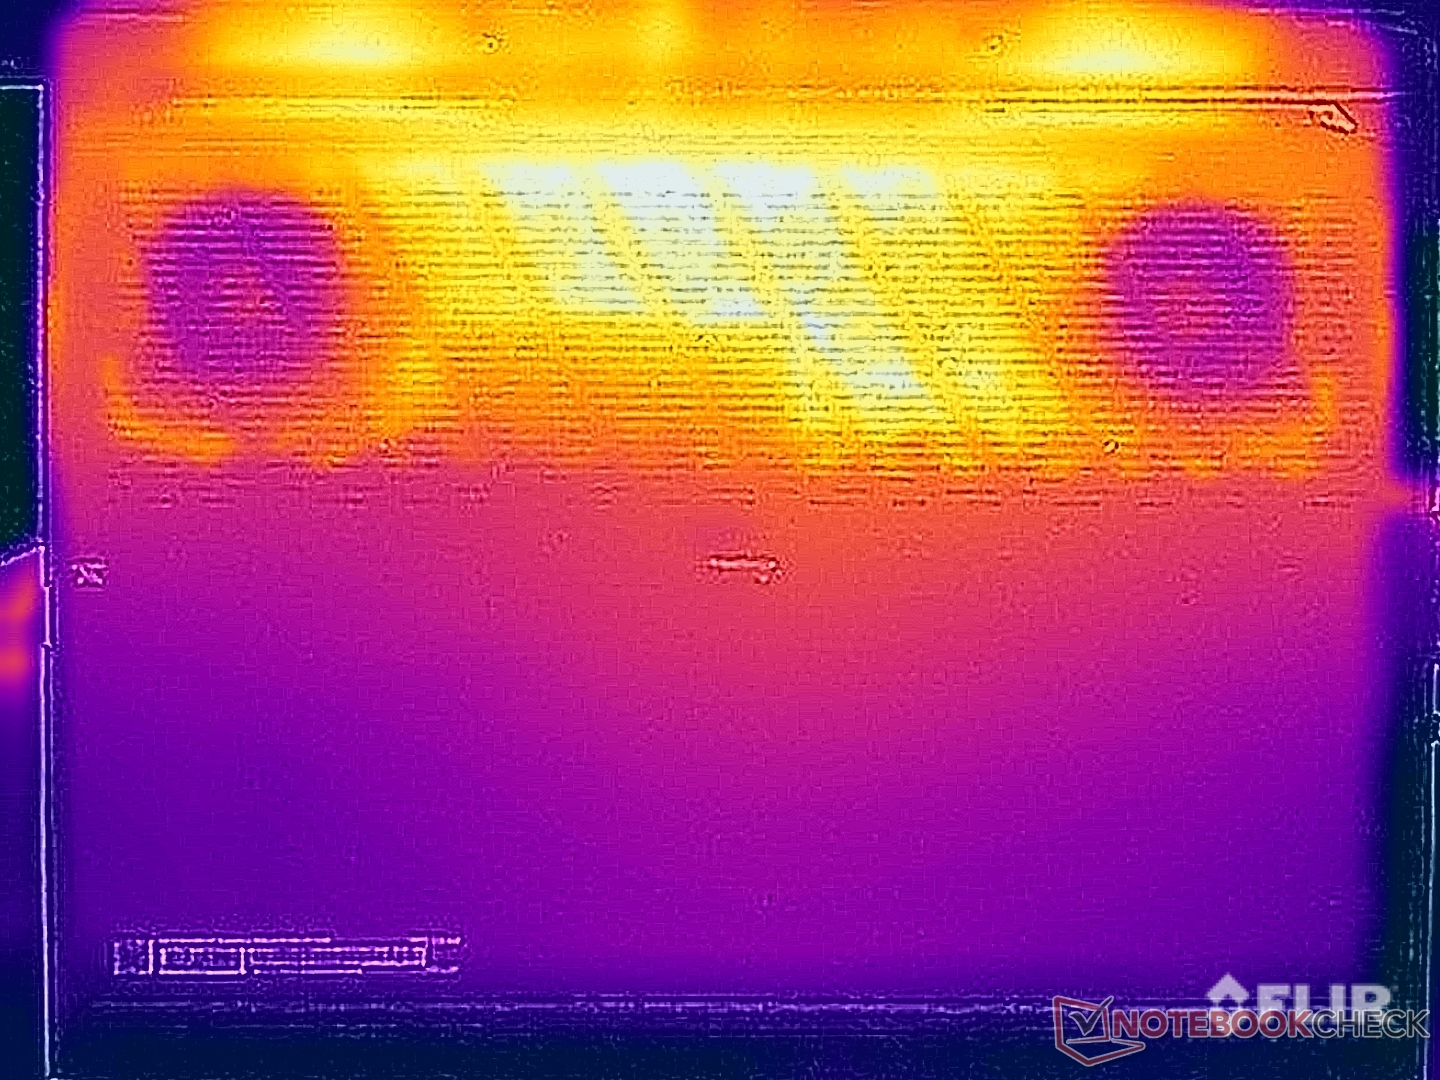
Já notamos que o Stealth 14 Studio esquenta bastante quando está ocioso, especialmente na parte inferior do dispositivo. Durante tarefas simples do dia a dia, ainda é possível sentar o laptop confortavelmente sobre as coxas. Assim que o dispositivo for colocado sob grandes quantidades de carga ou quando você começar a jogar, provavelmente deverá evitar fazer isso, pois rapidamente começará a ficar desconfortável. Medimos mais de 55 °C na parte inferior do dispositivo. Até mesmo o teclado aqueceu e atingiu até 45 °C, o que pode ser notado durante os jogos e, após um longo período de tempo, começa a ficar um pouco desconfortável.
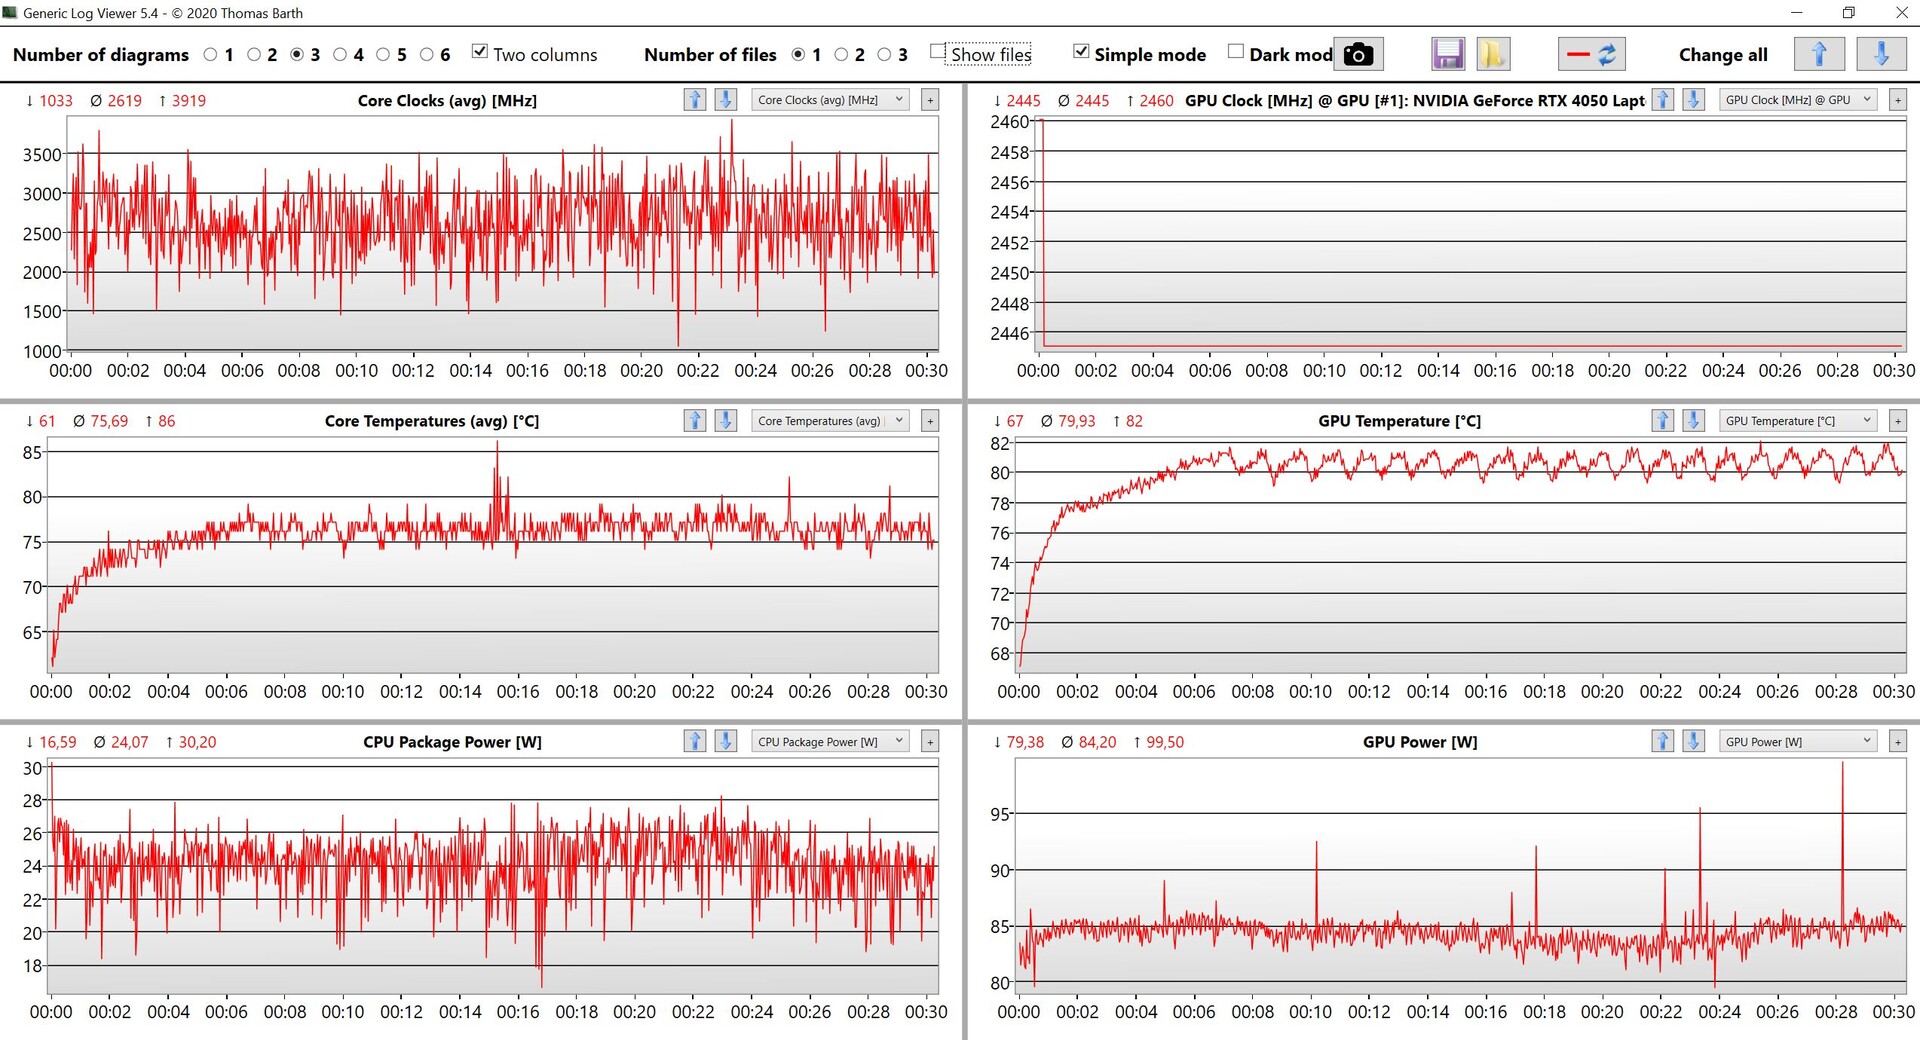
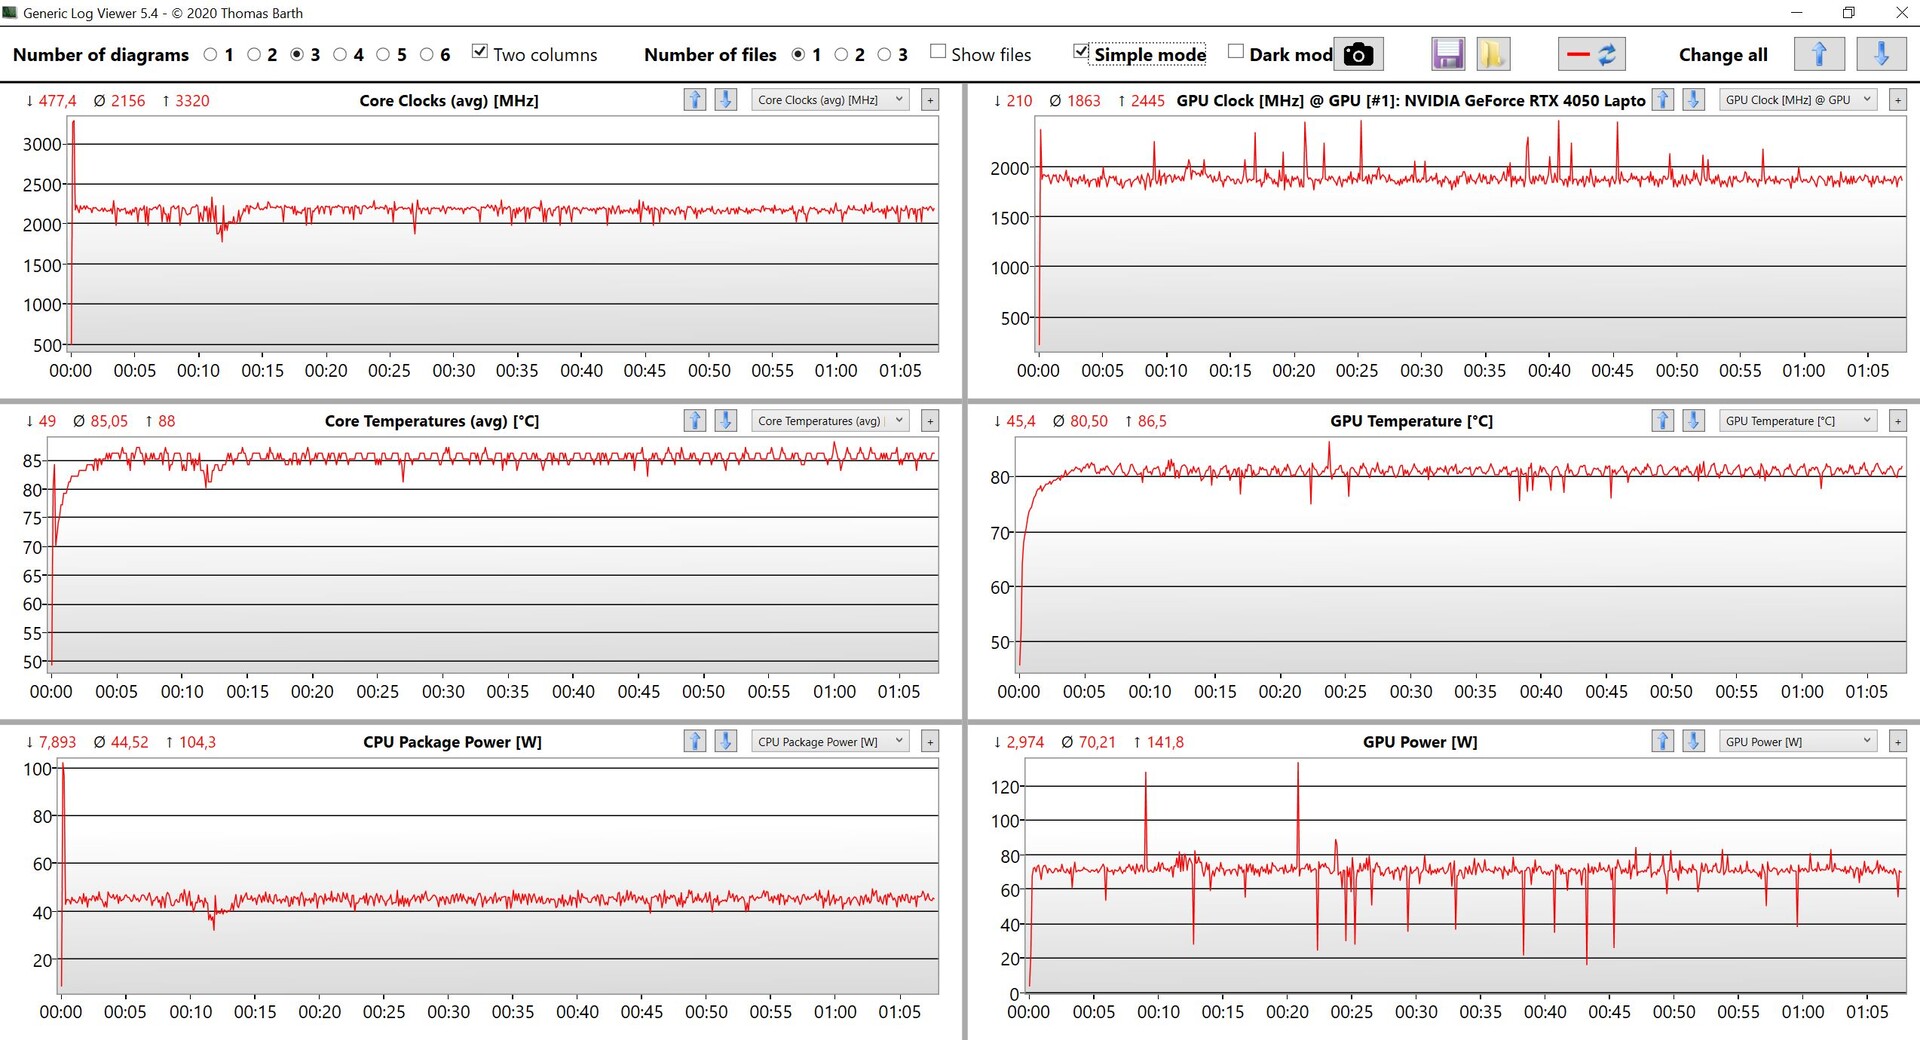
Durante o teste de estresse, a CPU e a GPU se estabilizaram rapidamente em 45 e 70 watts, respectivamente, o que significa que o laptop precisa resfriar 115 watts ao longo do tempo. Logo após o teste de estresse, não notamos nenhuma redução no desempenho.
(-) A temperatura máxima no lado superior é 46.9 °C / 116 F, em comparação com a média de 40.4 °C / 105 F , variando de 21.2 a 68.8 °C para a classe Gaming.
(-) A parte inferior aquece até um máximo de 56.1 °C / 133 F, em comparação com a média de 43.2 °C / 110 F
(+) Em uso inativo, a temperatura média para o lado superior é 29.7 °C / 85 F, em comparação com a média do dispositivo de 33.9 °C / ### class_avg_f### F.
(-) Jogando The Witcher 3, a temperatura média para o lado superior é 38.3 °C / 101 F, em comparação com a média do dispositivo de 33.9 °C / ## #class_avg_f### F.
(+) Os apoios para as mãos e o touchpad são mais frios que a temperatura da pele, com um máximo de 27.5 °C / 81.5 F e, portanto, são frios ao toque.
(±) A temperatura média da área do apoio para as mãos de dispositivos semelhantes foi 28.8 °C / 83.8 F (+1.3 °C / 2.3 F).
| MSI Stealth 14 Studio A13V Intel Core i7-13700H, NVIDIA GeForce RTX 4050 Laptop GPU | Gigabyte Aero 14 OLED BMF Intel Core i7-13700H, NVIDIA GeForce RTX 4050 Laptop GPU | Schenker Vision 14 2022 RTX 3050 Ti Intel Core i7-12700H, NVIDIA GeForce RTX 3050 Ti Laptop GPU | Asus ROG Flow Z13 GZ301ZE Intel Core i9-12900H, NVIDIA GeForce RTX 3050 Ti Laptop GPU | Alienware x14 i7 RTX 3060 Intel Core i7-12700H, NVIDIA GeForce RTX 3060 Laptop GPU | Razer Blade 14 Ryzen 9 6900HX AMD Ryzen 9 6900HX, NVIDIA GeForce RTX 3070 Ti Laptop GPU | Acer Predator Triton 300 SE Intel Core i9-12900H, NVIDIA GeForce RTX 3060 Laptop GPU | |
|---|---|---|---|---|---|---|---|
| Heat | 17% | 9% | 13% | 16% | 7% | 17% | |
| Maximum Upper Side * (°C) | 46.9 | 42 10% | 48.4 -3% | 45.3 3% | 51.3 -9% | 40.6 13% | 43 8% |
| Maximum Bottom * (°C) | 56.1 | 52 7% | 57.1 -2% | 48.3 14% | 44.4 21% | 42.6 24% | 46.4 17% |
| Idle Upper Side * (°C) | 33.8 | 26 23% | 28.1 17% | 29.2 14% | 27.2 20% | 38 -12% | 28.2 17% |
| Idle Bottom * (°C) | 37.9 | 27 29% | 29 23% | 30 21% | 26.6 30% | 37 2% | 28.4 25% |
* ... menor é melhor
Alto-falantes
A MSI equipou o Stealth 14 Studio com quatro alto-falantes, incluindo o software Nahimic Audio. Esse software oferece diferentes perfis que podem ser adaptados (por exemplo, com mais graves ou vocais mais pronunciados) e, com certeza, recomendamos o uso desse software. No geral, observamos bons resultados e definitivamente melhores do que os dispositivos de comparação - os únicos dispositivos dos quais o laptop MSI não se aproximou foram alguns dos laptops multimídia com sistemas de som realmente bons. Infelizmente, os alto-falantes não são realmente os melhores para jogos, pois as ventoinhas altas do laptop abafam quase tudo.
MSI Stealth 14 Studio A13V análise de áudio
(±) | o volume do alto-falante é médio, mas bom (###valor### dB)
Graves 100 - 315Hz
(±) | graves reduzidos - em média 11.2% menor que a mediana
(+) | o baixo é linear (6.7% delta para a frequência anterior)
Médios 400 - 2.000 Hz
(+) | médios equilibrados - apenas 1.6% longe da mediana
(+) | médios são lineares (2.9% delta para frequência anterior)
Altos 2 - 16 kHz
(±) | máximos mais altos - em média 5.3% maior que a mediana
(±) | a linearidade dos máximos é média (7.5% delta para frequência anterior)
Geral 100 - 16.000 Hz
(+) | o som geral é linear (11.9% diferença em relação à mediana)
Comparado com a mesma classe
» 12% de todos os dispositivos testados nesta classe foram melhores, 4% semelhantes, 84% piores
» O melhor teve um delta de 6%, a média foi 18%, o pior foi 132%
Comparado com todos os dispositivos testados
» 9% de todos os dispositivos testados foram melhores, 2% semelhantes, 89% piores
» O melhor teve um delta de 4%, a média foi 23%, o pior foi 134%
Acer Predator Triton 300 SE análise de áudio
(±) | o volume do alto-falante é médio, mas bom (###valor### dB)
Graves 100 - 315Hz
(±) | graves reduzidos - em média 10.3% menor que a mediana
(±) | a linearidade dos graves é média (9.7% delta para a frequência anterior)
Médios 400 - 2.000 Hz
(±) | médios mais altos - em média 5% maior que a mediana
(+) | médios são lineares (4% delta para frequência anterior)
Altos 2 - 16 kHz
(±) | máximos mais altos - em média 5.5% maior que a mediana
(±) | a linearidade dos máximos é média (7.6% delta para frequência anterior)
Geral 100 - 16.000 Hz
(±) | a linearidade do som geral é média (15.1% diferença em relação à mediana)
Comparado com a mesma classe
» 32% de todos os dispositivos testados nesta classe foram melhores, 6% semelhantes, 62% piores
» O melhor teve um delta de 6%, a média foi 18%, o pior foi 132%
Comparado com todos os dispositivos testados
» 21% de todos os dispositivos testados foram melhores, 4% semelhantes, 75% piores
» O melhor teve um delta de 4%, a média foi 23%, o pior foi 134%
Gerenciamento de energia - Pouca resistência
Consumo de energia
Especialmente no modo inativo, ficamos surpresos com a quantidade de energia que o dispositivo usa, apesar de sua comutação de gráficos. Sem dúvida, notamos uma grande desvantagem em relação aos seus concorrentes nesse aspecto. Com brilho total, medimos cerca de 20 watts no modo inativo, o que é muito para um dispositivo compacto de 14 polegadas com um brilho de 400 cd/m². O laptop MSI consome muito durante os jogos também; o fabricante poderia realmente dar uma olhada nisso. Durante nosso teste de estresse, medimos um máximo de 200 watts, que rapidamente se estabilizou em cerca de 150 watts. Como resultado, a fonte de alimentação de 240 watts fornecida é totalmente suficiente, talvez até um pouco potente demais.
| desligado | |
| Ocioso | |
| Carga |
|
Key:
min: | |
| MSI Stealth 14 Studio A13V i7-13700H, GeForce RTX 4050 Laptop GPU, Samsung PM9A1 MZVL21T0HCLR, IPS, 2560x1600, 14" | Gigabyte Aero 14 OLED BMF i7-13700H, GeForce RTX 4050 Laptop GPU, Gigabyte AG470S1TB-SI B10, OLED, 2880x1800, 14" | Schenker Vision 14 2022 RTX 3050 Ti i7-12700H, GeForce RTX 3050 Ti Laptop GPU, Samsung SSD 980 Pro 1TB MZ-V8P1T0BW, IPS, 2880x1800, 14" | Asus ROG Flow Z13 GZ301ZE i9-12900H, GeForce RTX 3050 Ti Laptop GPU, Micron 2450 1TB MTFDKBK1T0TFK, IPS, 1920x1200, 13.4" | Alienware x14 i7 RTX 3060 i7-12700H, GeForce RTX 3060 Laptop GPU, WDC PC SN810 1TB, IPS, 1920x1080, 14" | Razer Blade 14 Ryzen 9 6900HX R9 6900HX, GeForce RTX 3070 Ti Laptop GPU, Samsung PM9A1 MZVL21T0HCLR, IPS, 2560x1440, 14" | Acer Predator Triton 300 SE i9-12900H, GeForce RTX 3060 Laptop GPU, Micron 3400 1TB MTFDKBA1T0TFH, OLED, 2880x1800, 14" | Média NVIDIA GeForce RTX 4050 Laptop GPU | Média da turma Gaming | |
|---|---|---|---|---|---|---|---|---|---|
| Power Consumption | 41% | 35% | 34% | 24% | -15% | 9% | 8% | -19% | |
| Idle Minimum * (Watt) | 10.4 | 7.4 29% | 7.5 28% | 8.8 15% | 7.9 24% | 10.2 2% | 7.6 27% | 9.95 ? 4% | 13 ? -25% |
| Idle Average * (Watt) | 19.1 | 8.3 57% | 10.4 46% | 12.1 37% | 11.1 42% | 26 -36% | 12.3 36% | 15.8 ? 17% | 19 ? 1% |
| Idle Maximum * (Watt) | 19.4 | 8.7 55% | 11.4 41% | 12.7 35% | 11.8 39% | 26.7 -38% | 17.6 9% | 20.1 ? -4% | 24.6 ? -27% |
| Load Average * (Watt) | 95.9 | 76 21% | 83.3 13% | 72.3 25% | 107.4 -12% | 89.3 7% | 111 -16% | 88 ? 8% | 110.7 ? -15% |
| Witcher 3 ultra * (Watt) | 141.6 | 70 51% | 92.7 35% | 77.3 45% | 111 22% | 158.7 -12% | 117.1 17% | ||
| Load Maximum * (Watt) | 203 | 132 35% | 110.3 46% | 103.1 49% | 140.4 31% | 227.5 -12% | 245.8 -21% | 176.3 ? 13% | 259 ? -28% |
* ... menor é melhor
Power consumption Witcher 3 / stress test
Power consumption with external monitor
Tempos de execução
Apesar da capacidade da bateria de 72 Wh, os tempos de execução do laptop MSI não são especialmente bons, mesmo no modo de 60 Hz. Com um brilho adaptado de 150 cd/m² (o que significa cerca de 36% do brilho de nossa amostra de teste), nosso teste de WLAN terminou após pouco mais de 6 horas. Em 240 Hz, o teste não durou nem 5 horas. Quando repetimos o teste usando o brilho total do notebook, ele durou apenas 5 horas a 60 Hz e 4 horas a 240 Hz. Até mesmo o teste de vídeo a 150 cd/m² e 60 Hz durou pouco mais de 6,5 horas. Para um dispositivo compacto de 14 polegadas com uma bateria relativamente grande e comutação de gráficos, esse é um resultado decepcionante. São necessárias cerca de 2 horas para carregar totalmente o dispositivo, e 75% de sua capacidade é atingida após 45 minutos. O laptop também pode ser carregado via USB-C em qualquer lugar.
| MSI Stealth 14 Studio A13V i7-13700H, GeForce RTX 4050 Laptop GPU, 72 Wh | Gigabyte Aero 14 OLED BMF i7-13700H, GeForce RTX 4050 Laptop GPU, 63 Wh | Schenker Vision 14 2022 RTX 3050 Ti i7-12700H, GeForce RTX 3050 Ti Laptop GPU, 99.8 Wh | Asus ROG Flow Z13 GZ301ZE i9-12900H, GeForce RTX 3050 Ti Laptop GPU, 56 Wh | Alienware x14 i7 RTX 3060 i7-12700H, GeForce RTX 3060 Laptop GPU, 80 Wh | Razer Blade 14 Ryzen 9 6900HX R9 6900HX, GeForce RTX 3070 Ti Laptop GPU, 62 Wh | Acer Predator Triton 300 SE i9-12900H, GeForce RTX 3060 Laptop GPU, 76 Wh | Média da turma Gaming | |
|---|---|---|---|---|---|---|---|---|
| Duração da bateria | 23% | 68% | -7% | 17% | 42% | 3% | 21% | |
| H.264 (h) | 6.6 | 11.1 68% | 6 -9% | 9.4 42% | 8.32 ? 26% | |||
| WiFi v1.3 (h) | 6.3 | 7.6 21% | 10.1 60% | 5.6 -11% | 8.9 41% | 9.5 51% | 6.2 -2% | 7.11 ? 13% |
| Load (h) | 1.2 | 1.5 25% | 2.1 75% | 1.2 0% | 0.8 -33% | 1.6 33% | 1.3 8% | 1.502 ? 25% |
| Reader / Idle (h) | 11.3 | 12.2 | 8.1 | 8.27 ? | ||||
| Witcher 3 ultra (h) | 0.8 | 0.8 |
Pro
Contra
Veredicto - O MSI Stealth 14 Studio deixou impressões mistas

O MSI Stealth 14 Studio se propõe a ser um laptop potente e compacto para jogadores e usuários criativos. Durante nosso teste, observamos alguns pontos negativos que provam ser um problema para um laptop que custa US$ 1.699,99. Em primeiro lugar, o dispositivo é "apenas" equipado com a pequenaLaptop RTX 4050sem o Advanced Optimus - esse desempenho é simplesmente insuficiente para o preço. Embora sua potência seja boa em teoria, o sistema de resfriamento não nos impressionou no uso diário. Espera-se que as ventoinhas sejam barulhentas sob carga máxima, mas ficamos confusos com o fato de as ventoinhas parecerem estar sempre funcionando de forma audível - até notamos picos de emissão de ruído de mais de 40 dB(A) ao usar os modos de energia mais fracos. Isso simplesmente atrapalha o uso do laptop. Em geral, seu consumo de energia também é muito alto (apesar da comutação de gráficos), o que, por sua vez, também contribui para tempos de execução mais curtos.
O gabinete do laptop também nos deixou uma impressão mista - em comparação com a unidade base extremamente estável, a tampa da tela pode ser torcida um pouco e é preciso ter muito cuidado para não causar danos permanentes. Também temos alguns pontos negativos a observar em relação ao teclado. Embora a iluminação individual das teclas seja agradável (mesmo que o software de controle não seja nada intuitivo), a elevação das teclas é muito rasa e, em geral, o teclado tem uma sensação bastante frágil.
O MSI Stealth 14 Studio quer ser o computador compacto e versátil perfeito que oferece excelente desempenho para jogadores e usuários criativos. Infelizmente, embora seu desempenho em jogos seja bom, o laptop apresenta muitas falhas, como ventoinhas irritantes, um teclado medíocre e uma tampa de tela flexível. Por US$ 1.699,99, isso simplesmente não é suficiente.
A tela do dispositivo também é uma faca de dois gumes, pois apresenta aspectos positivos, como a velocidade de reação rápida, a taxa de atualização de 240 Hz e a excelente precisão de cores. Por outro lado, seu valor de preto é bastante alto. Isso faz com que o conteúdo em preto seja representado mais como um cinza escuro, e os níveis de contraste nem sempre são muito bons. É claro que isso é uma reclamação no mais alto nível, mas, no total, subjetivamente, ele não parece tão bom quanto os OLEDs ou mesmo os painéis IPS/mini LED muito bons. No final das contas, o laptop MSI simplesmente tem muitos pontos fracos - levando em conta seu preço premium - para que possamos recomendá-lo com confiança.
Preço e disponibilidade
O MSI Stealth 14 Studio pode ser adquirido na Best Buy por US$ 1.699,99.
MSI Stealth 14 Studio A13V
- 07/12/2023 v7 (old)
Andreas Osthoff
Transparência
A seleção dos dispositivos a serem analisados é feita pela nossa equipe editorial. A amostra de teste foi fornecida ao autor como empréstimo pelo fabricante ou varejista para fins desta revisão. O credor não teve influência nesta revisão, nem o fabricante recebeu uma cópia desta revisão antes da publicação. Não houve obrigação de publicar esta revisão. Como empresa de mídia independente, a Notebookcheck não está sujeita à autoridade de fabricantes, varejistas ou editores.
É assim que o Notebookcheck está testando
Todos os anos, o Notebookcheck analisa de forma independente centenas de laptops e smartphones usando procedimentos padronizados para garantir que todos os resultados sejam comparáveis. Desenvolvemos continuamente nossos métodos de teste há cerca de 20 anos e definimos padrões da indústria no processo. Em nossos laboratórios de teste, equipamentos de medição de alta qualidade são utilizados por técnicos e editores experientes. Esses testes envolvem um processo de validação em vários estágios. Nosso complexo sistema de classificação é baseado em centenas de medições e benchmarks bem fundamentados, o que mantém a objetividade.Price comparison

