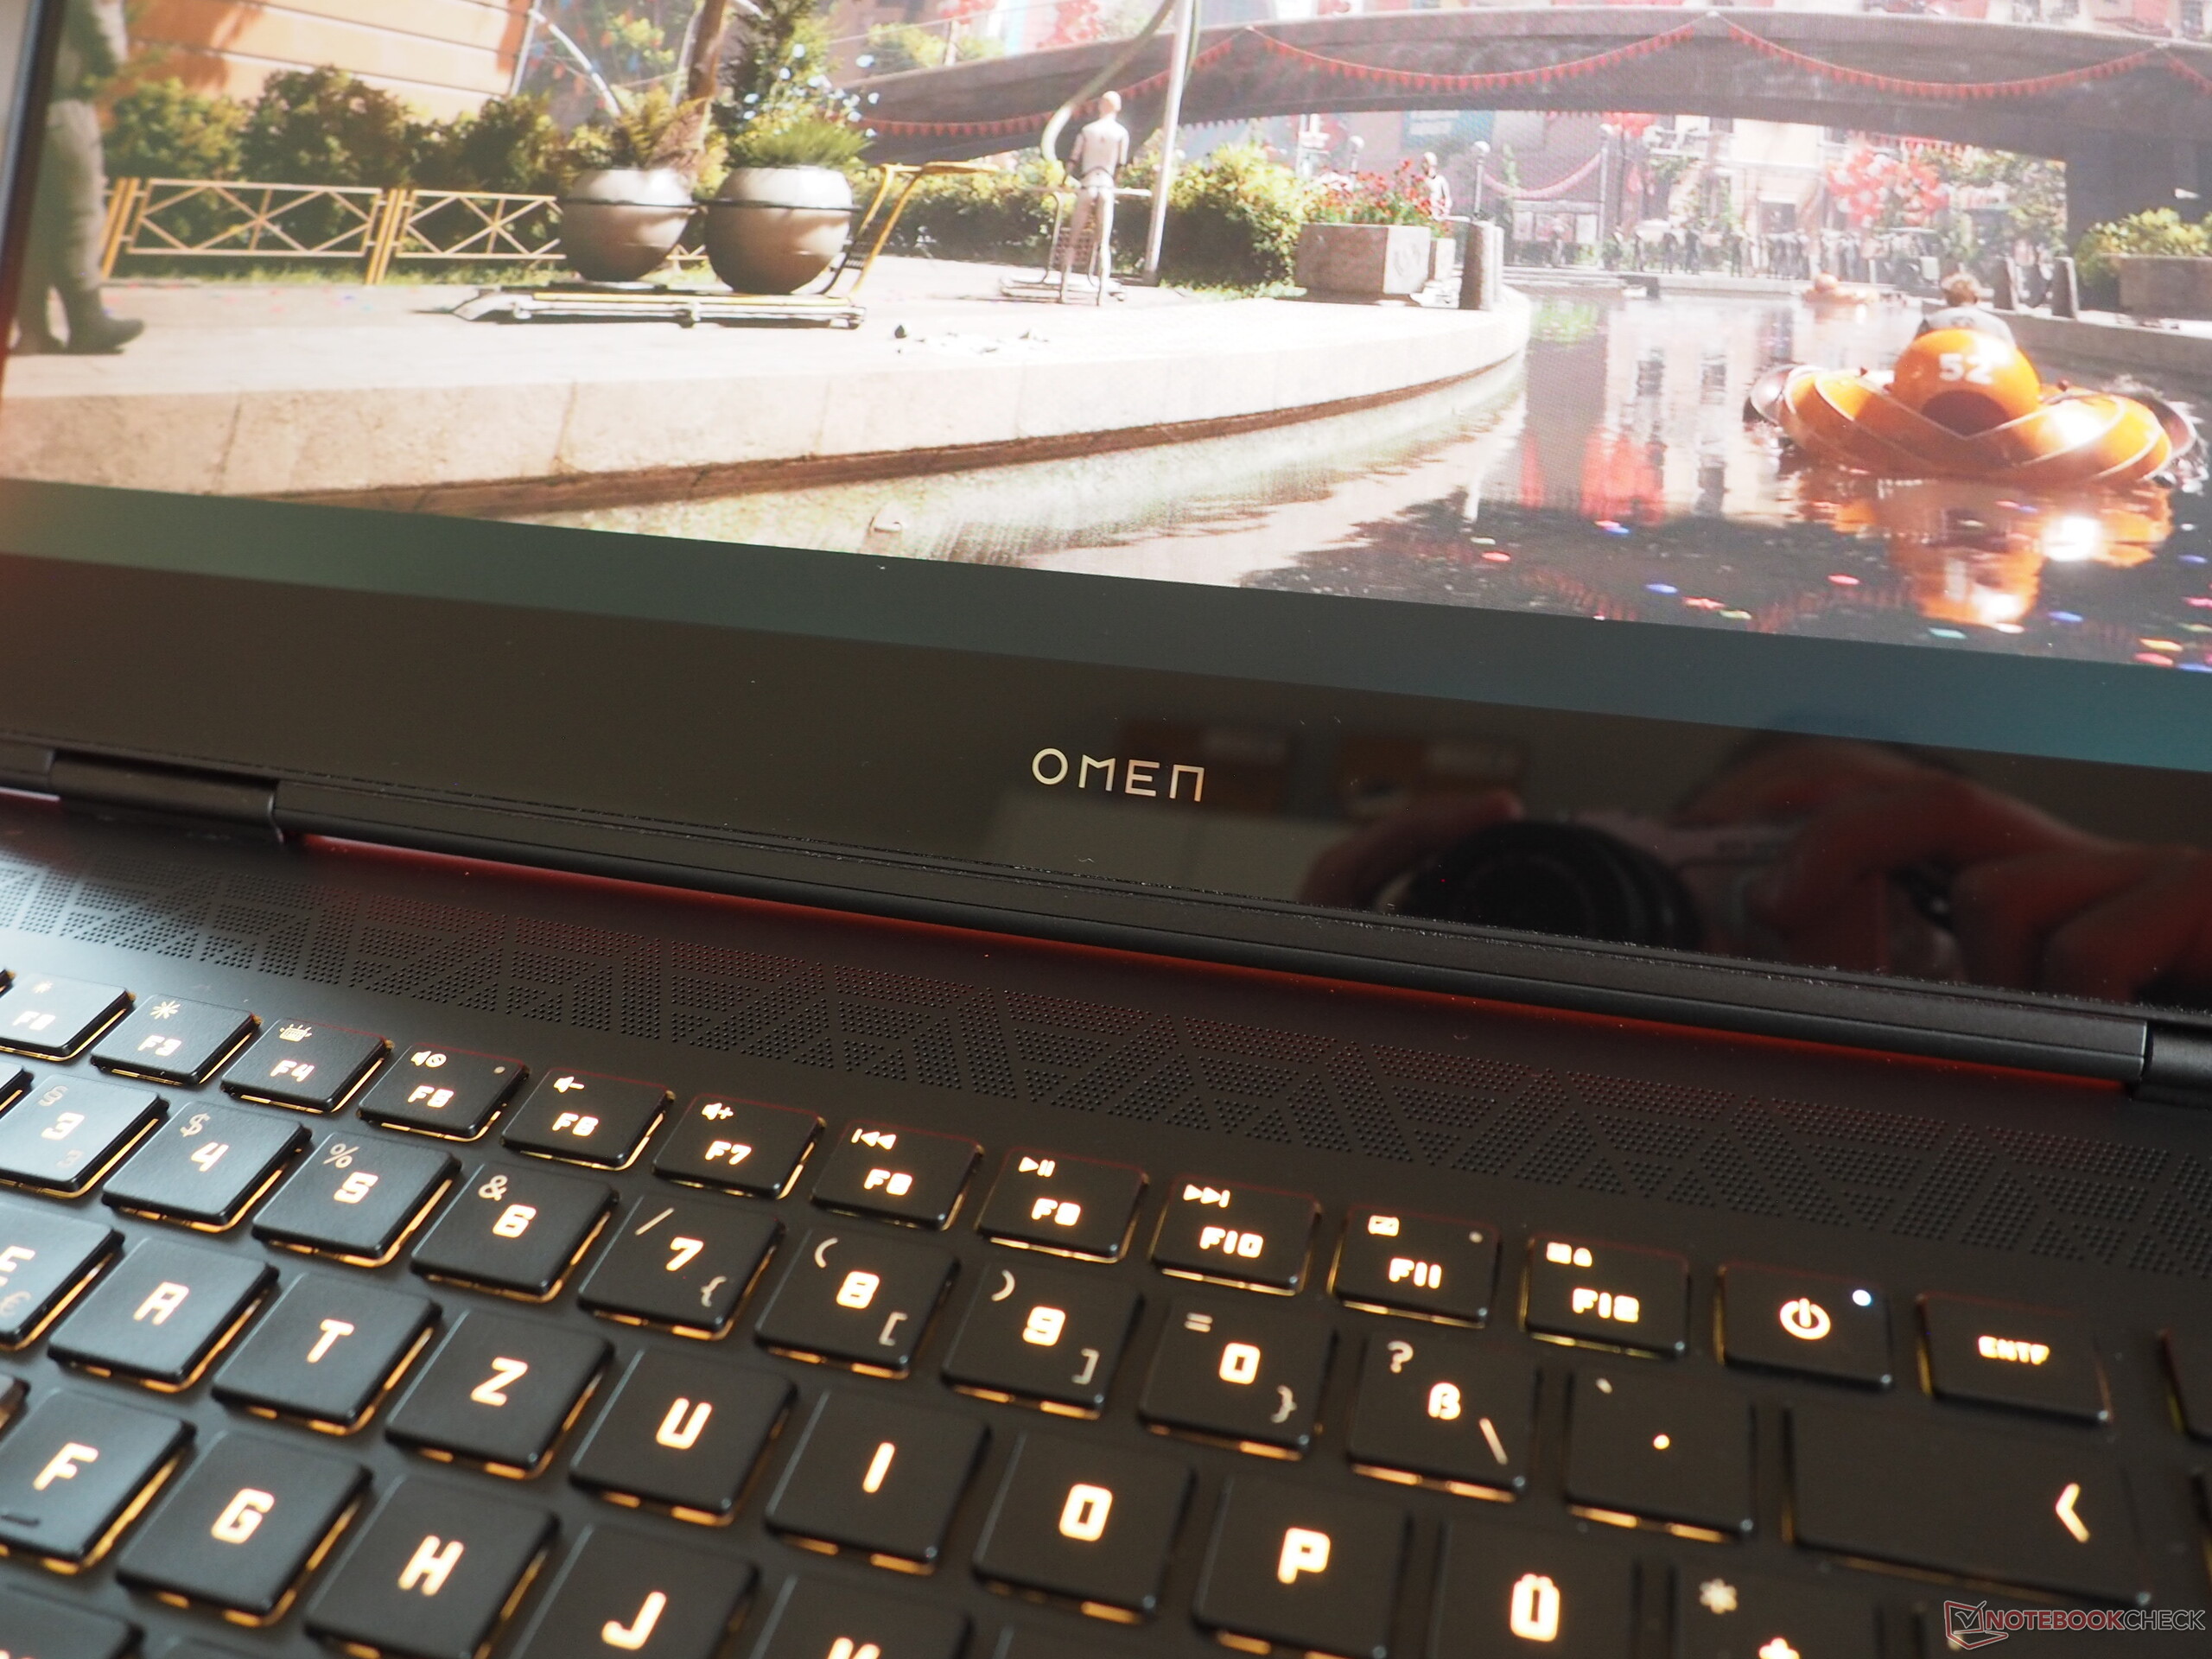
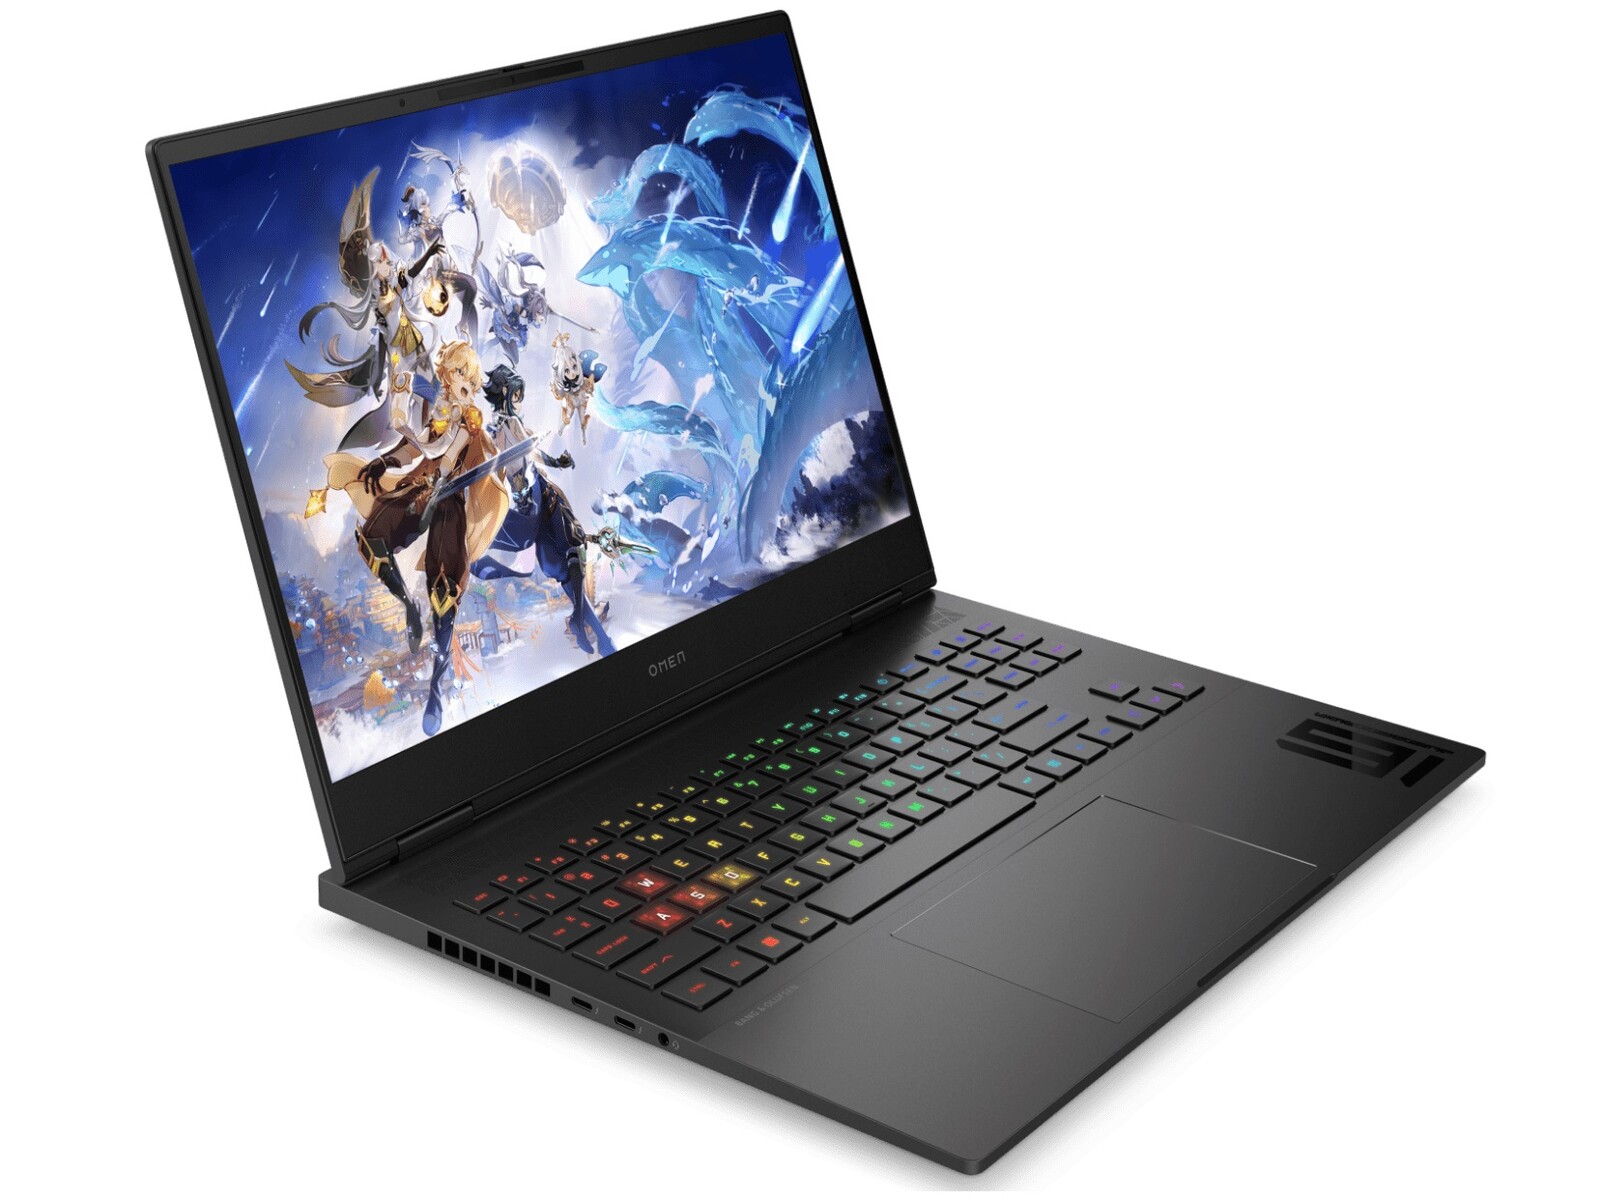
Análise do laptop HP Omen Transcend 16 (2024): Uma máquina para jogos RTX 4070 com tela OLED

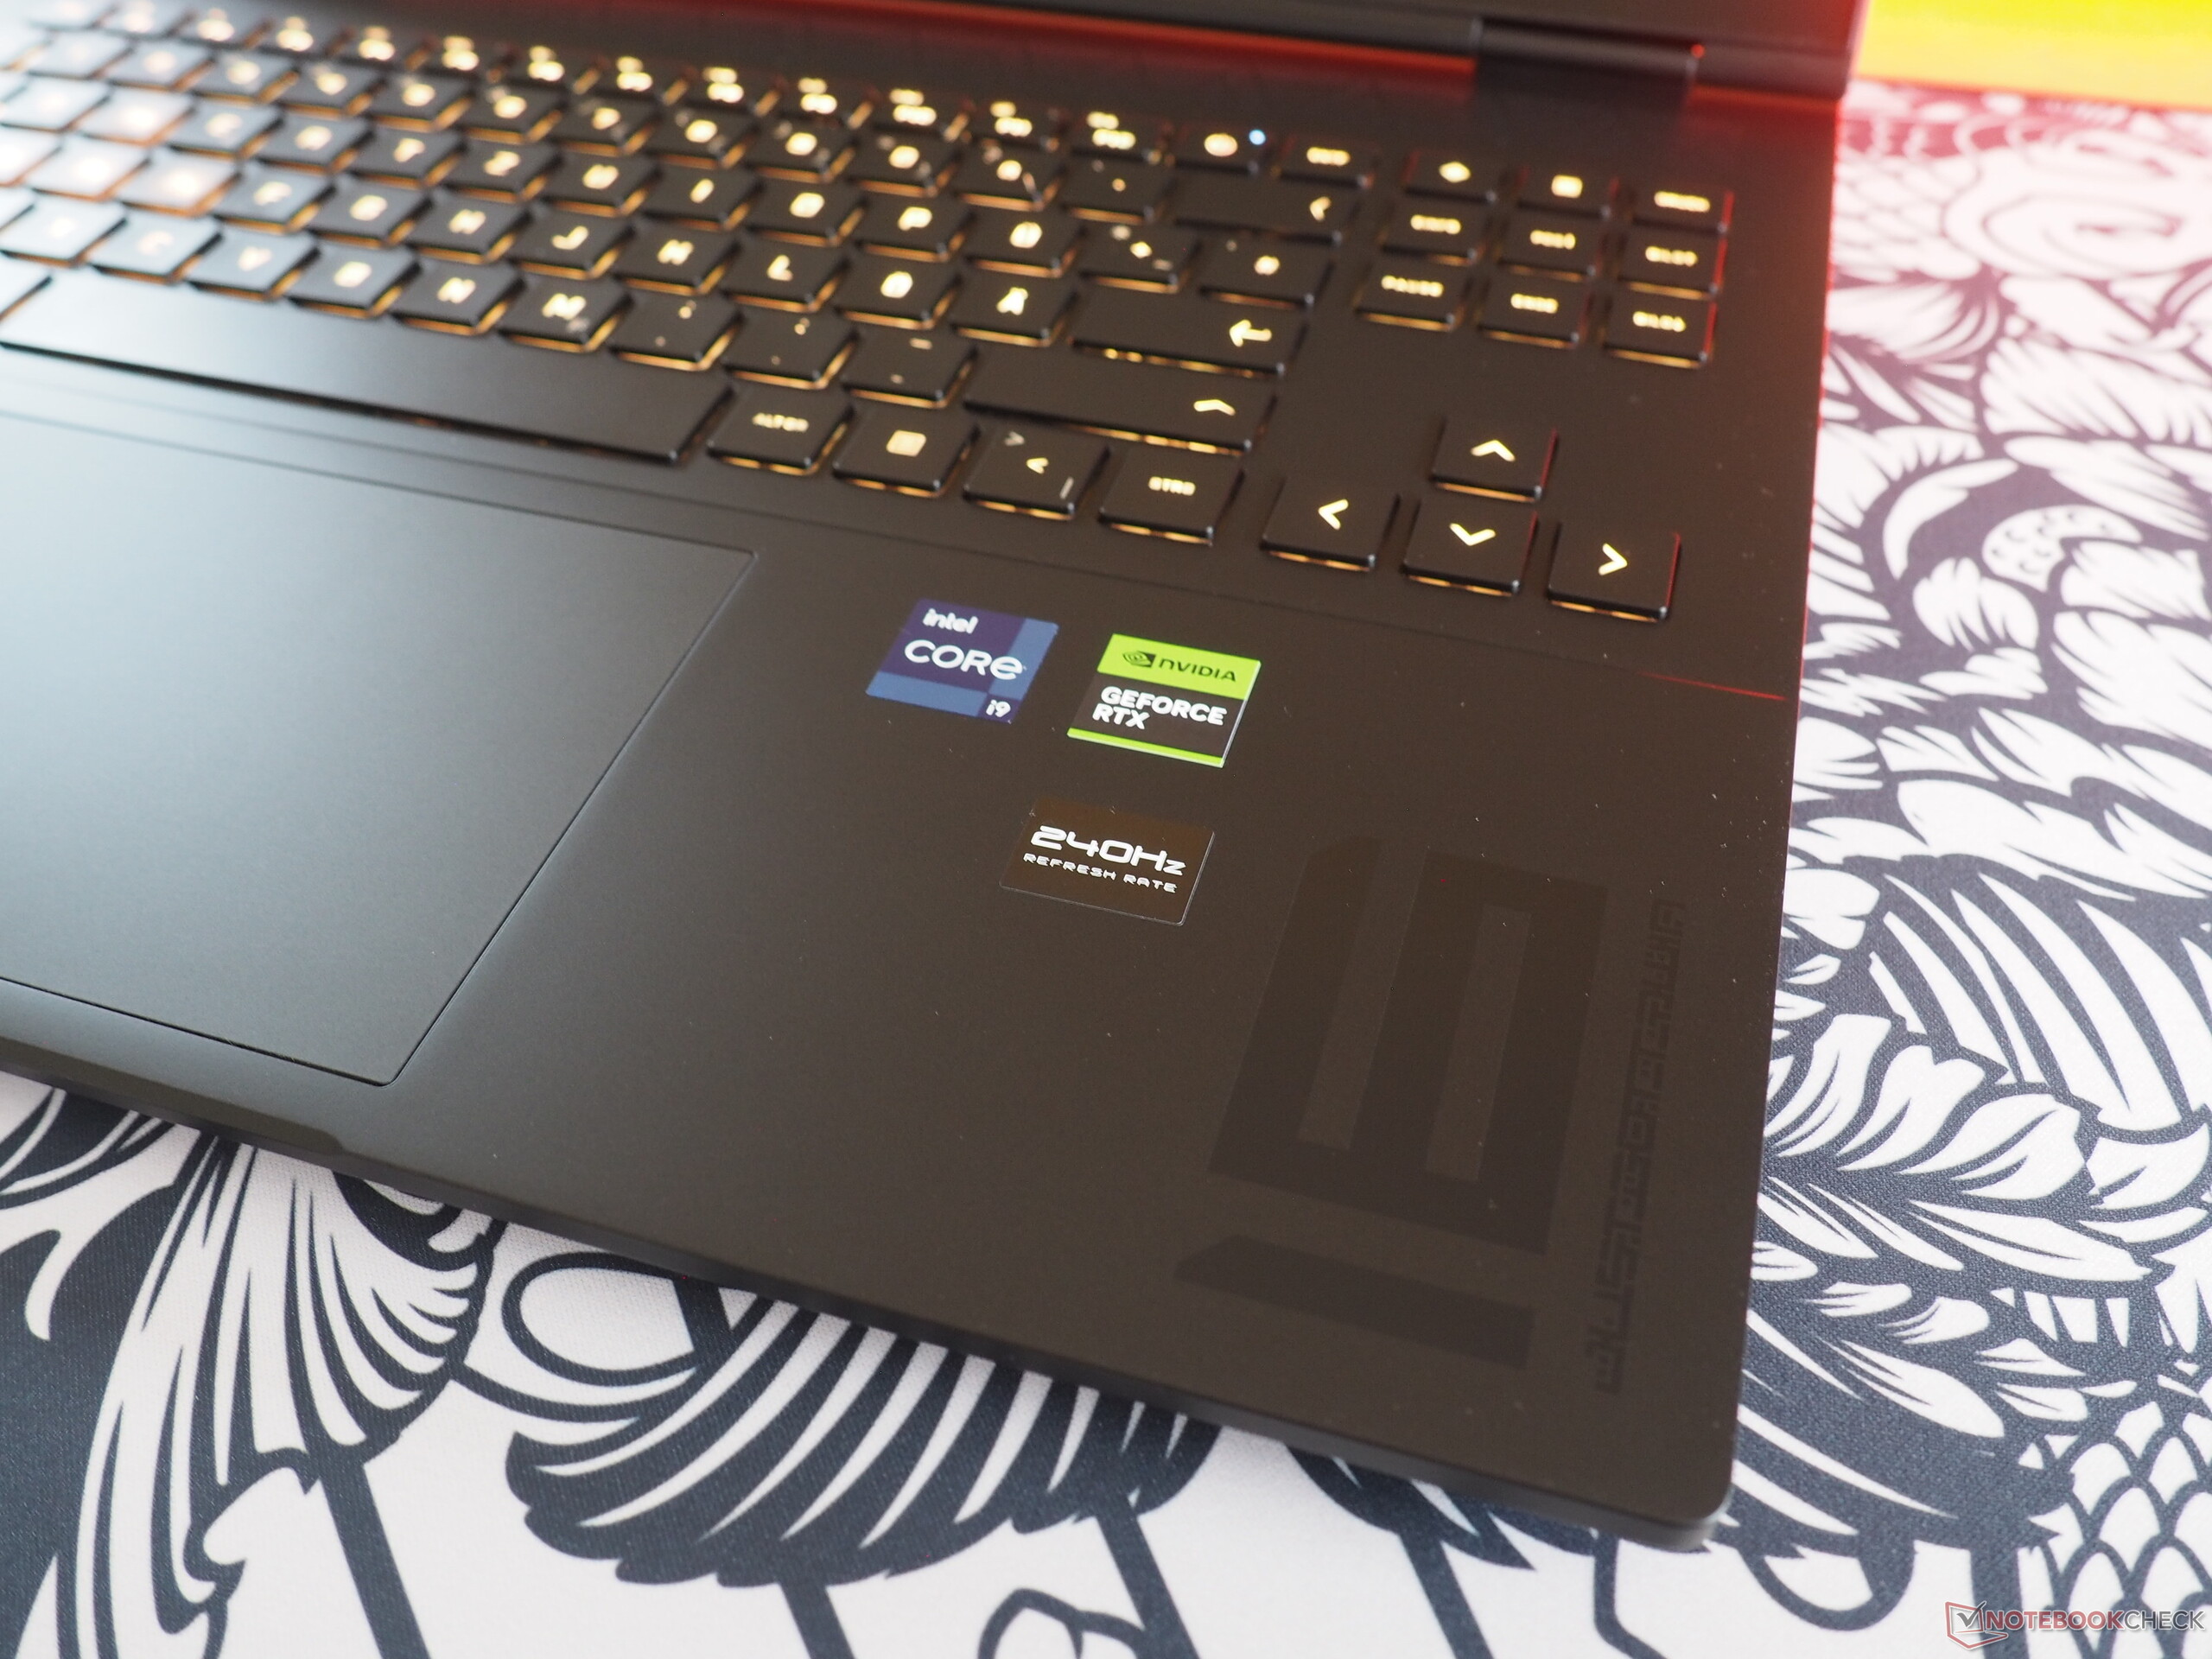
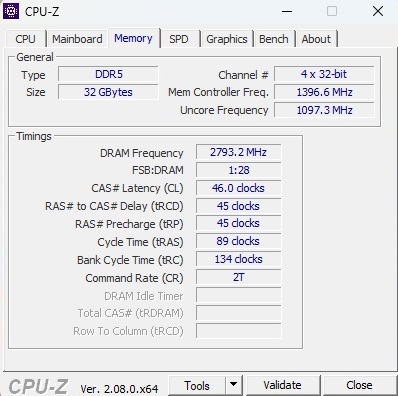
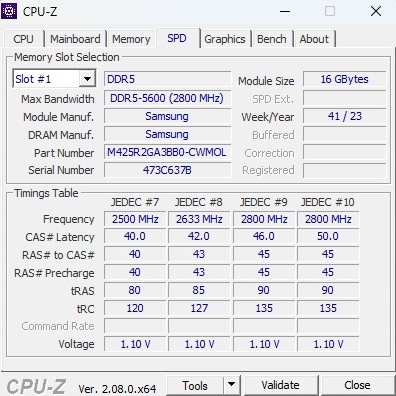
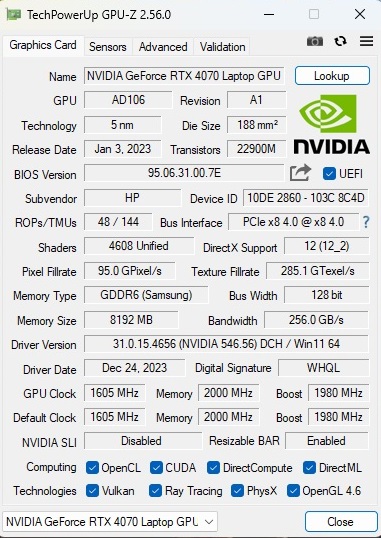
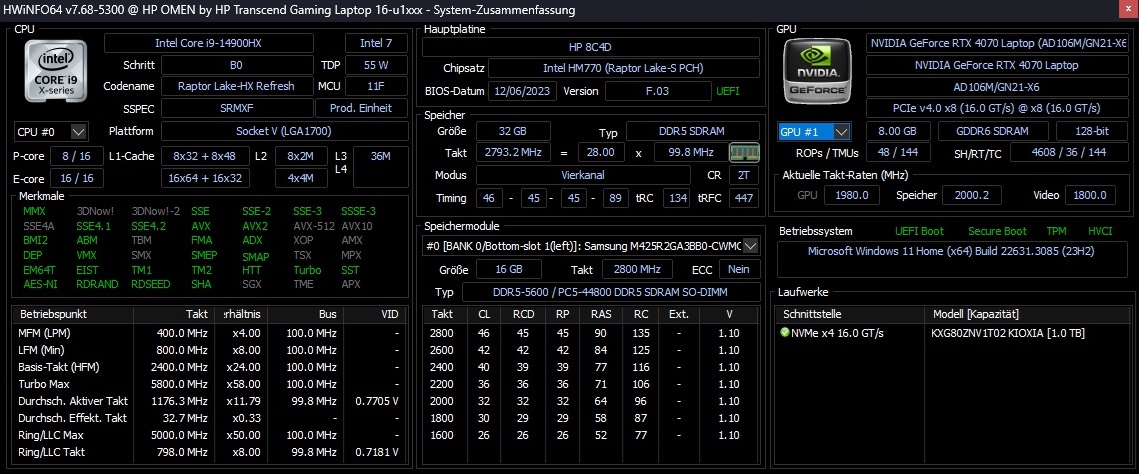
O modelo de análise Omen Transcend 16 - terminado em u1095ng - pode ser adquirido atualmente por pouco menos de US$ 3.000. Por esse preço, o comprador recebe um Core i9-14900HX combinado com uma GeForce RTX 4070 que tende a pertencer mais à categoria de médio porte e não à de alto nível devido aos seus escassos 8 GB de VRAM. A isso se juntam 32 GB de RAM DDR5-5600 (2x 16 GB SO-DIMM) e um SSD M.2 NVMe de 1 TB. O destaque é o vibrante painel OLED com 2.560 x 1.600 pixels, 240 Hz, 400 cd/m² e 100% DCI P3. O pacote é completado com o Windows 11 Home.
O concorrente do Omen Transcend 16 pode ser encontrado na forma de outros gamers de 16 polegadas equipados com o GeForce RTX 4070, bem como o Asus ROG Zephyrus G16 2024 (Ultra 7 155H), o Schenker XMG Core 16 L23 (Ryzen 7 7840HS) e o Lenovo Legion Pro 5 16ARX8 (Ryzen 7 7745HX), todos os quais aparecem em nossa tabela de dispositivos de comparação.
Como o chassi é praticamente idêntico ao do antecessor, que tinha um Core i9-13900HX (veja nossa análise), abordaremos brevemente as categorias de gabinete, recursos e dispositivo de entrada.
Possíveis concorrentes em comparação
Avaliação | Data | Modelo | Peso | Altura | Size | Resolução | Preço |
|---|---|---|---|---|---|---|---|
| 88.4 % v7 (old) | 02/2024 | HP Omen Transcend 16-u1095ng i9-14900HX, GeForce RTX 4070 Laptop GPU | 2.3 kg | 20 mm | 16.00" | 2560x1600 | |
| 87.9 % v7 (old) | 08/2023 | HP Omen Transcend 16 i9-13900HX, GeForce RTX 4070 Laptop GPU | 2.3 kg | 19.8 mm | 16.00" | 2560x1600 | |
| 92.3 % v7 (old) | 02/2024 | Asus ROG Zephyrus G16 2024 GU605M Ultra 7 155H, GeForce RTX 4070 Laptop GPU | 1.8 kg | 16.4 mm | 16.00" | 2560x1600 | |
| 89.2 % v7 (old) | 10/2023 | Schenker XMG CORE 16 (L23) R7 7840HS, GeForce RTX 4070 Laptop GPU | 2.4 kg | 26.1 mm | 16.00" | 2560x1600 | |
| 88.4 % v7 (old) | 05/2023 | Lenovo Legion Pro 5 16ARX8 R7 7745HX, GeForce RTX 4070 Laptop GPU | 2.5 kg | 26.8 mm | 16.00" | 2560x1600 |
Caso
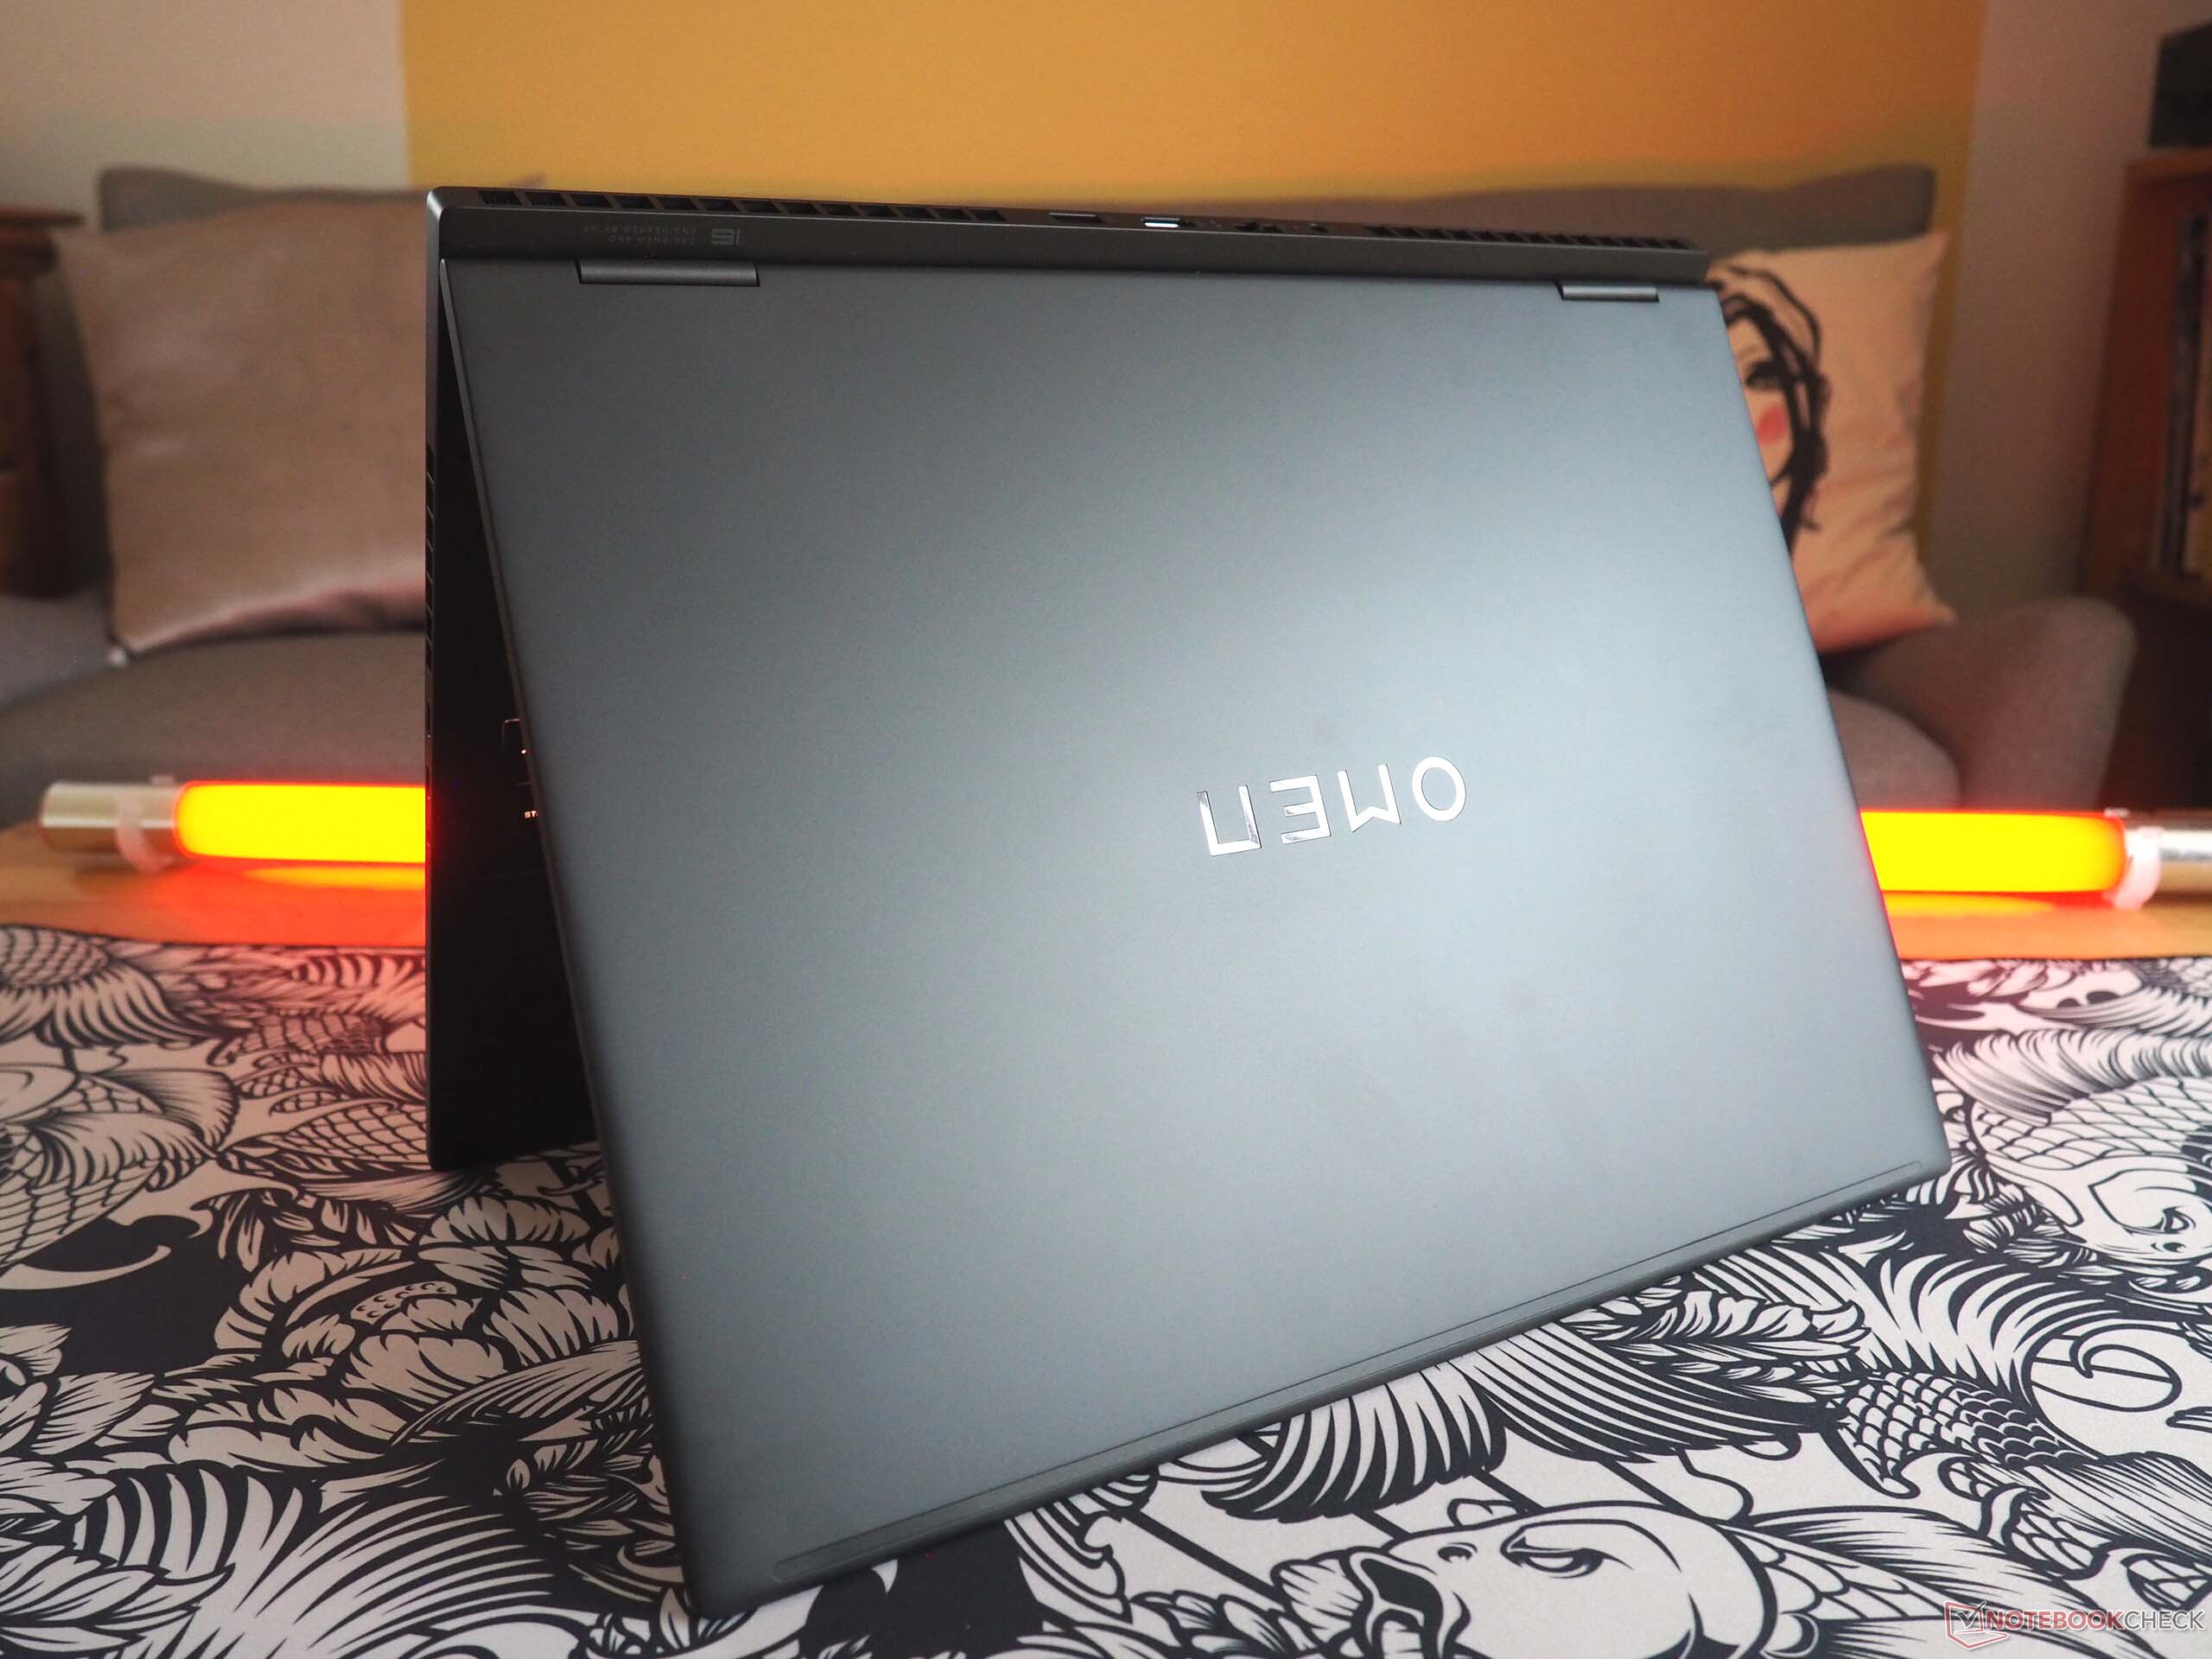
O Transcend 16 oferece um design atraente e, do ponto de vista visual, é impressionantemente fino (todos os dispositivos concorrentes são mais grossos, exceto o Zephyrus G16). No que diz respeito à estabilidade, a unidade básica consegue, pelo menos, oferecer um desempenho sólido. Por outro lado, a tampa - como em muitos dispositivos - poderia ter sido melhorada em termos de rigidez de torção. À primeira vista, a superfície fosca tem um aspecto premium, no entanto, a HP utilizou principalmente plástico. Não se pode reclamar em termos de qualidade de construção. O fabricante merece elogios pelo generoso ângulo de abertura de 180°, embora as dobradiças pudessem ser mais fortes. Quando se trata de peso, com 2,3 kg, o dispositivo fica no meio do pacote, o que faz com que o computador de 16 polegadas não seja nem particularmente leve nem pesado.

Recursos
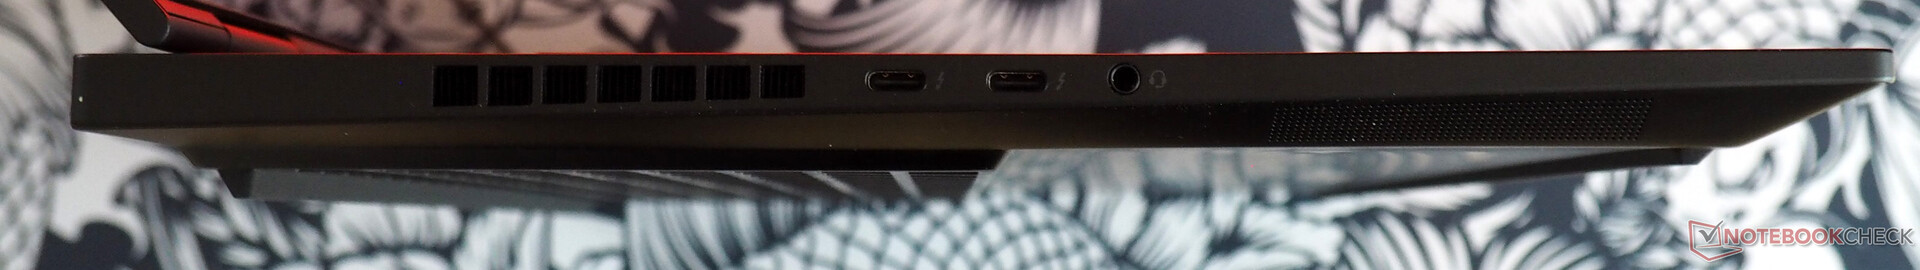
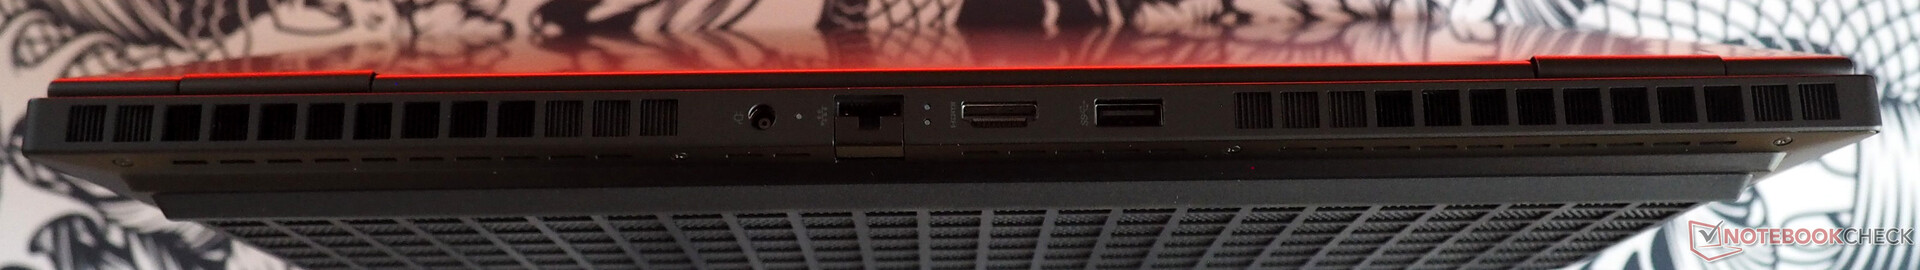
A seleção de portas pode ser descrita como muito moderna. Enquanto a parte traseira abriga uma porta RJ45 (infelizmente não é uma LAN de 2,5 Gbit), uma saída HDMI 2.1 e uma porta USB 3.0 (tipo A), o lado esquerdo abriga duas portas Thunderbolt 4 (incluindo Power Delivery) e um conector de áudio. No lado direito, há apenas uma porta USB 3.0 solitária (tipo A). Os compradores terão que se contentar com uma trava Kensington e um leitor de cartão.

Comunicação
O desempenho do Wi-Fi é de alto nível e com uma velocidade de envio de quase 1.400 Mbit/s e cerca de 1.700 Mbit/s quando se trata de receber dados (1 m de distância do roteador de referência), o desempenho está entre bom e muito bom. Com o Wi-Fi 6E AX211, a HP instalou um módulo sem fio Intel atualizado.
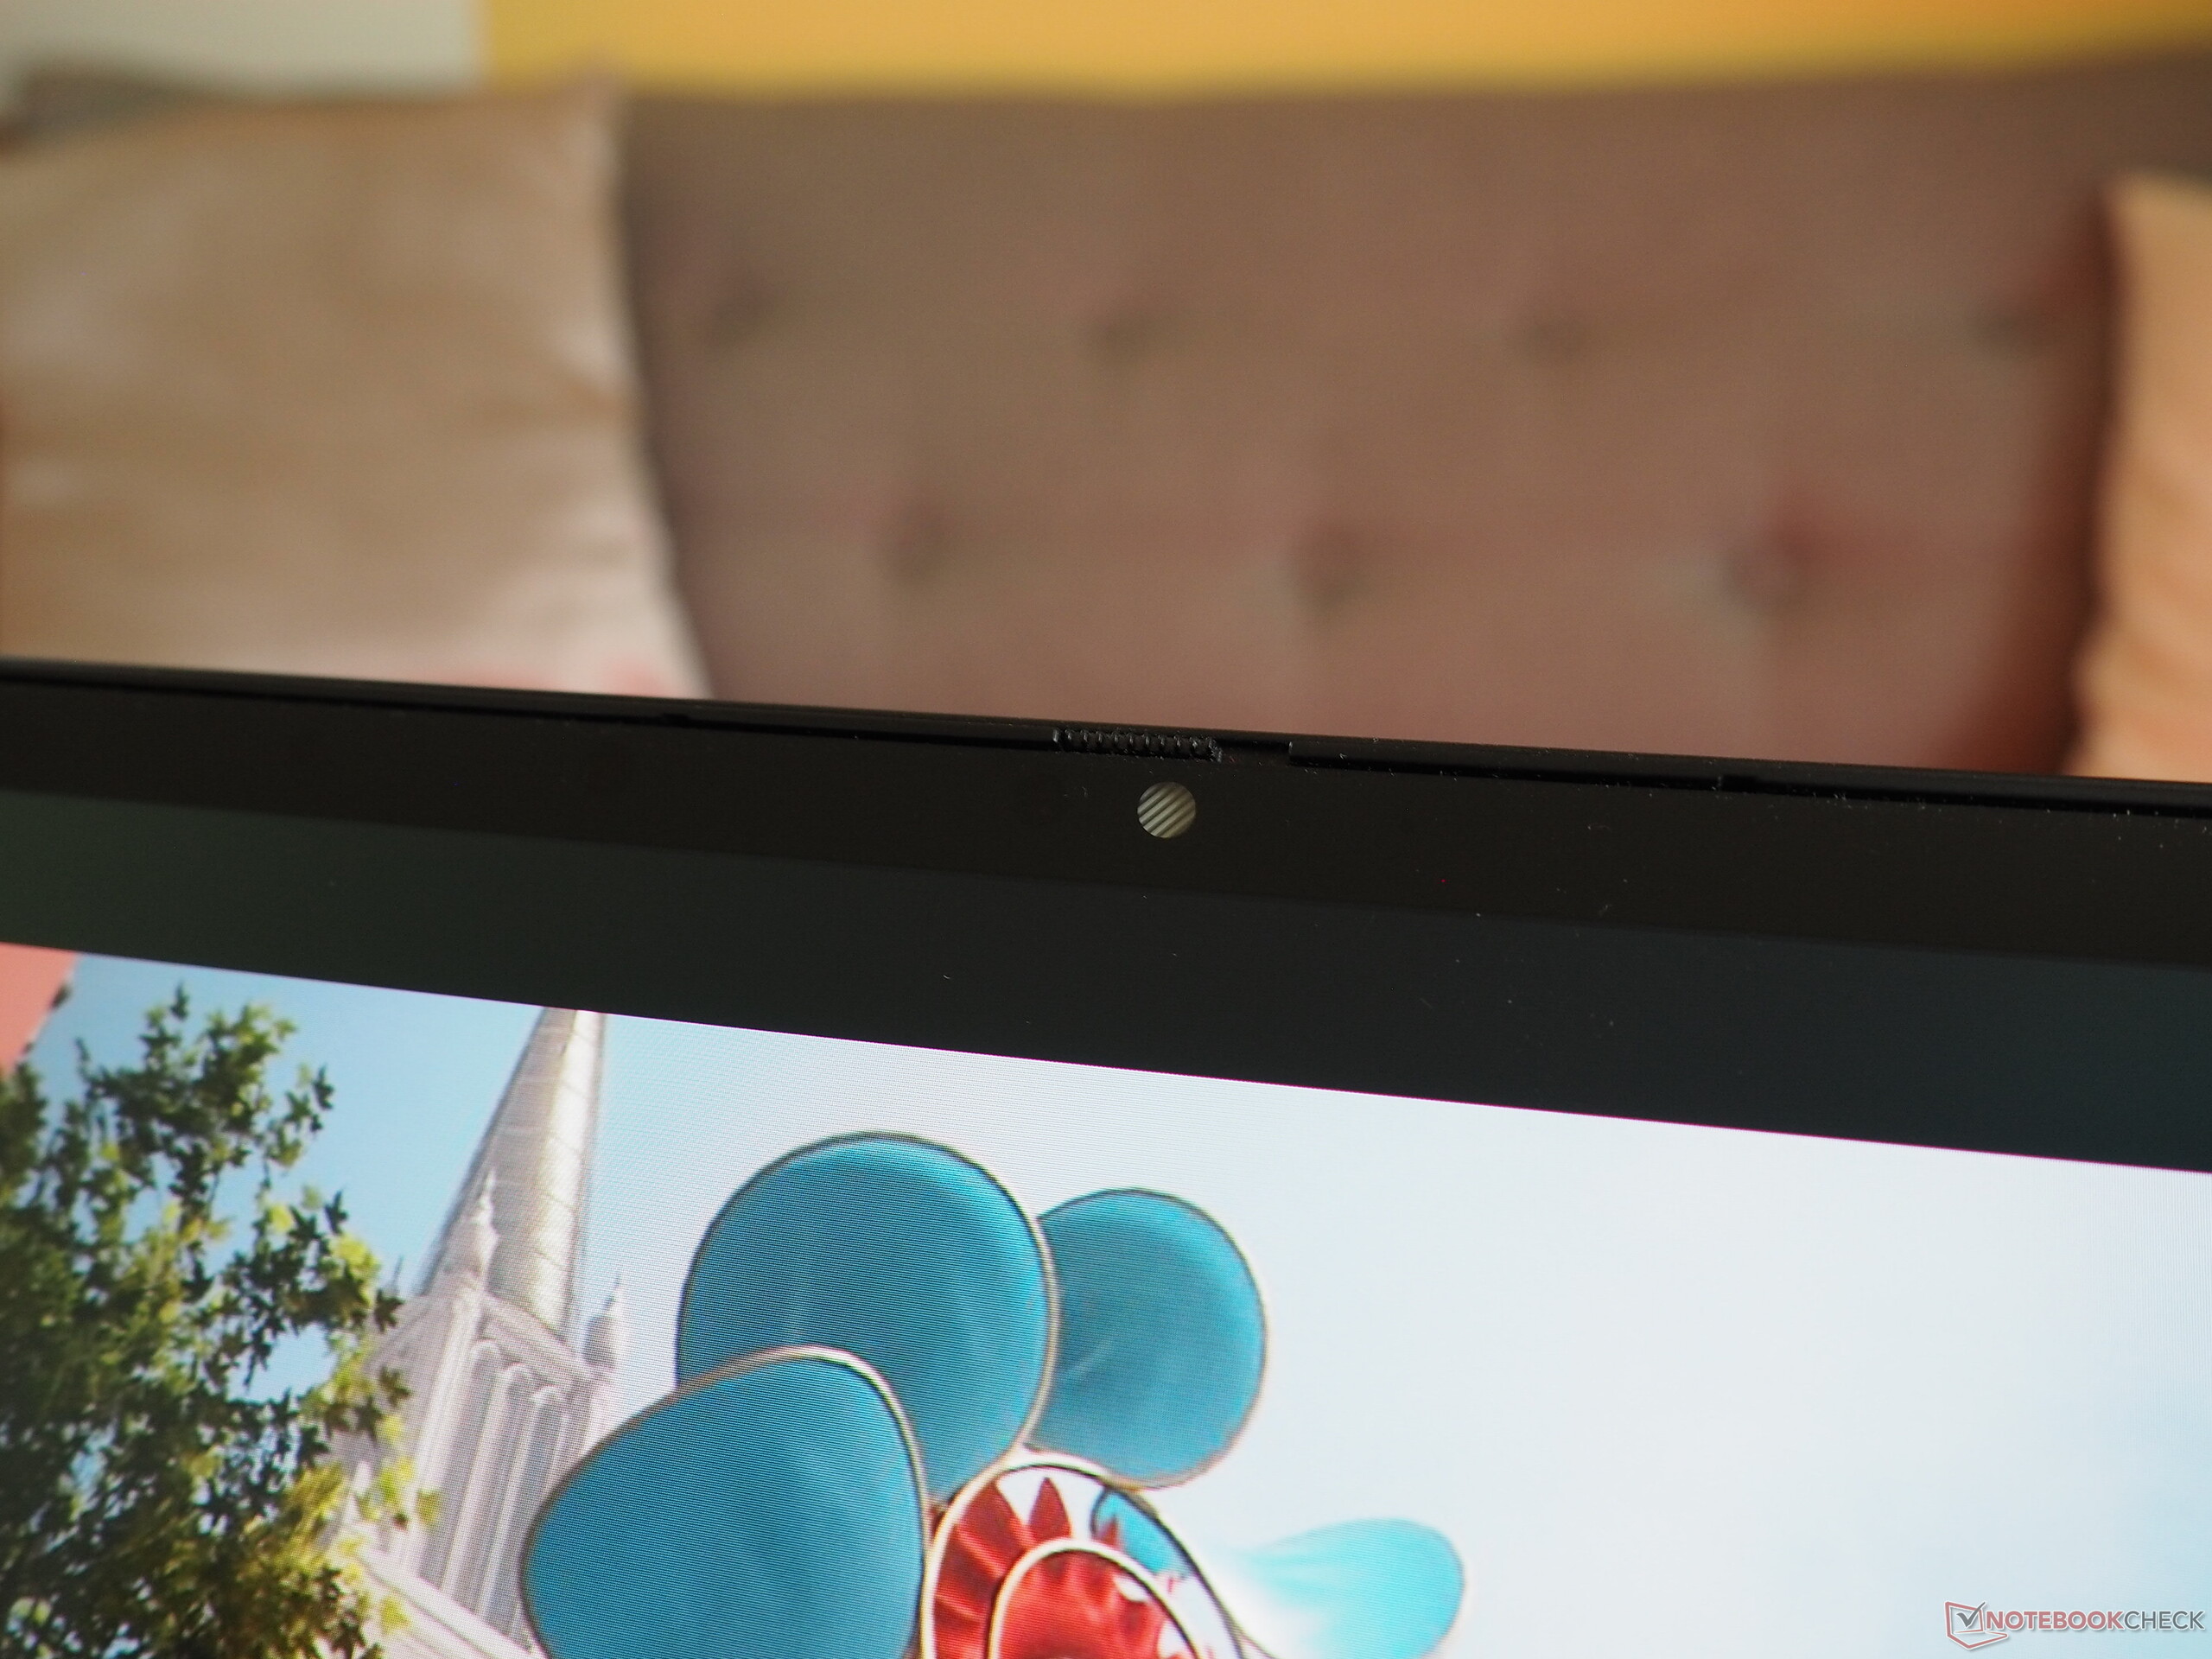
Webcam
Temos sentimentos contraditórios com relação à webcam de 2 MP. Embora a nitidez da imagem esteja acima da média, a precisão das cores deixa muito a desejar. O que é bom é o obturador manual para privacidade.


Acessórios
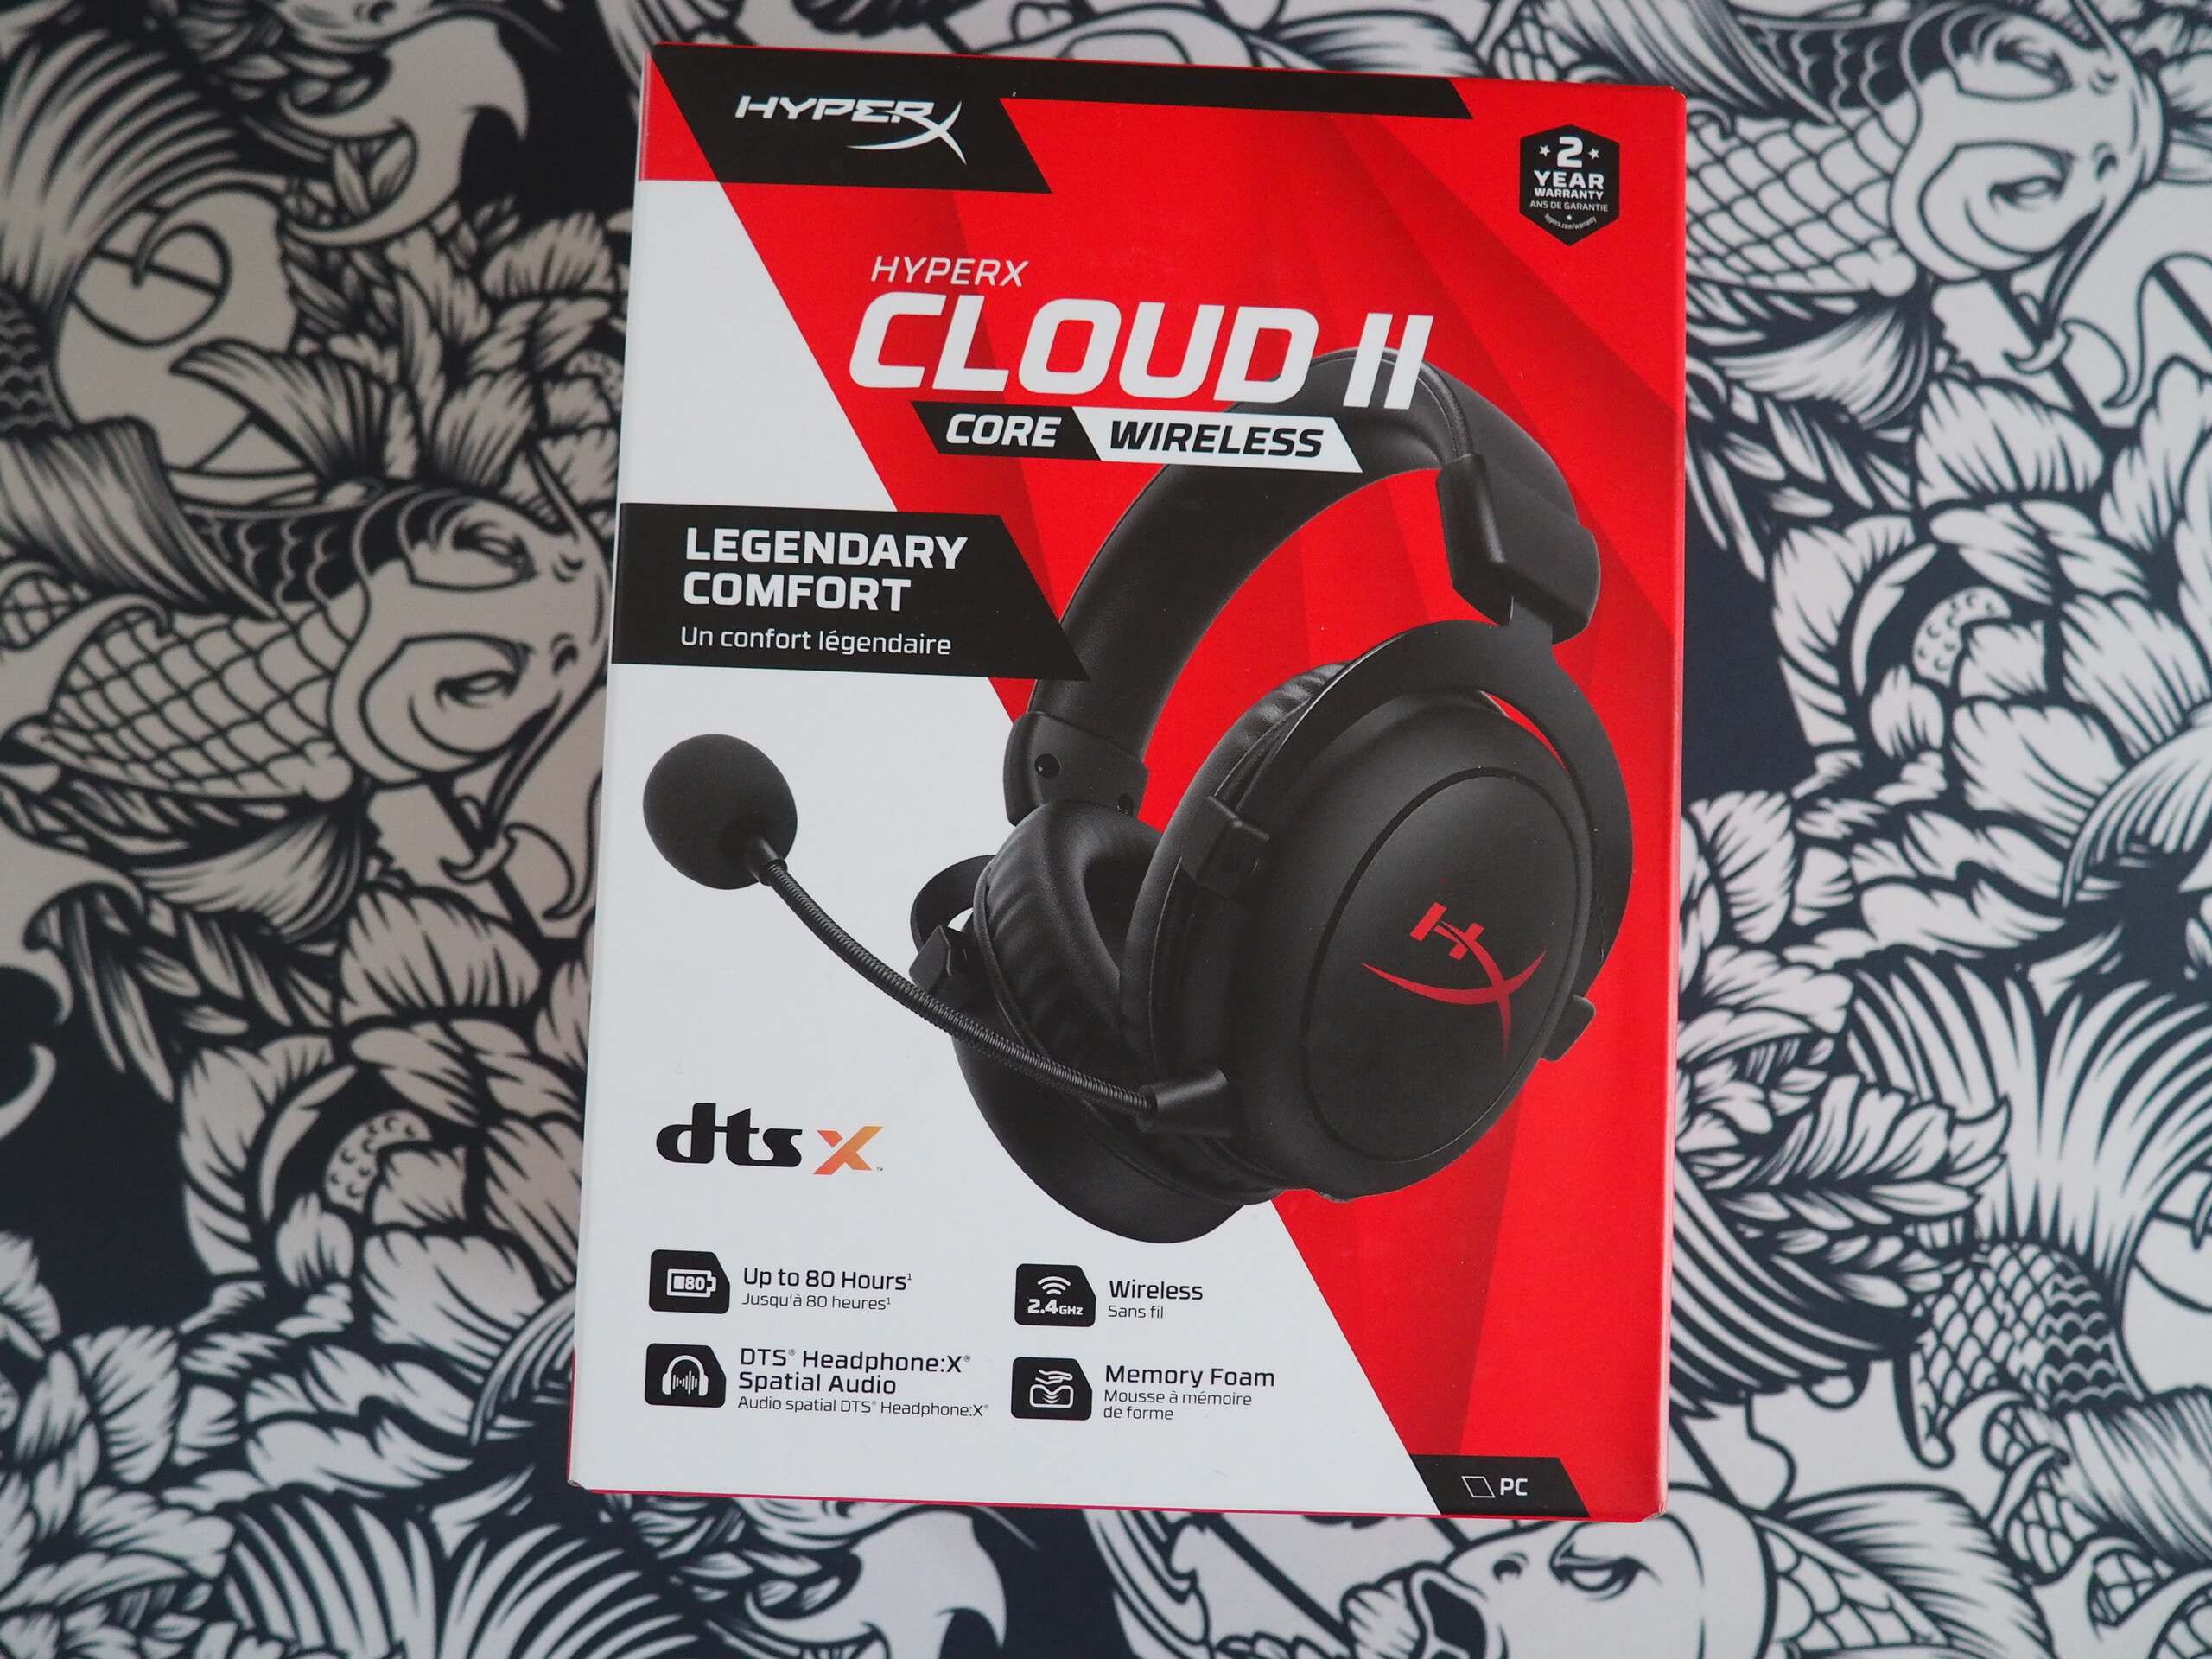
Nosso dispositivo de análise também veio com uma PSU muito fina de 230 watts, bem como um headset HyperX (Cloud II Core sem fio).
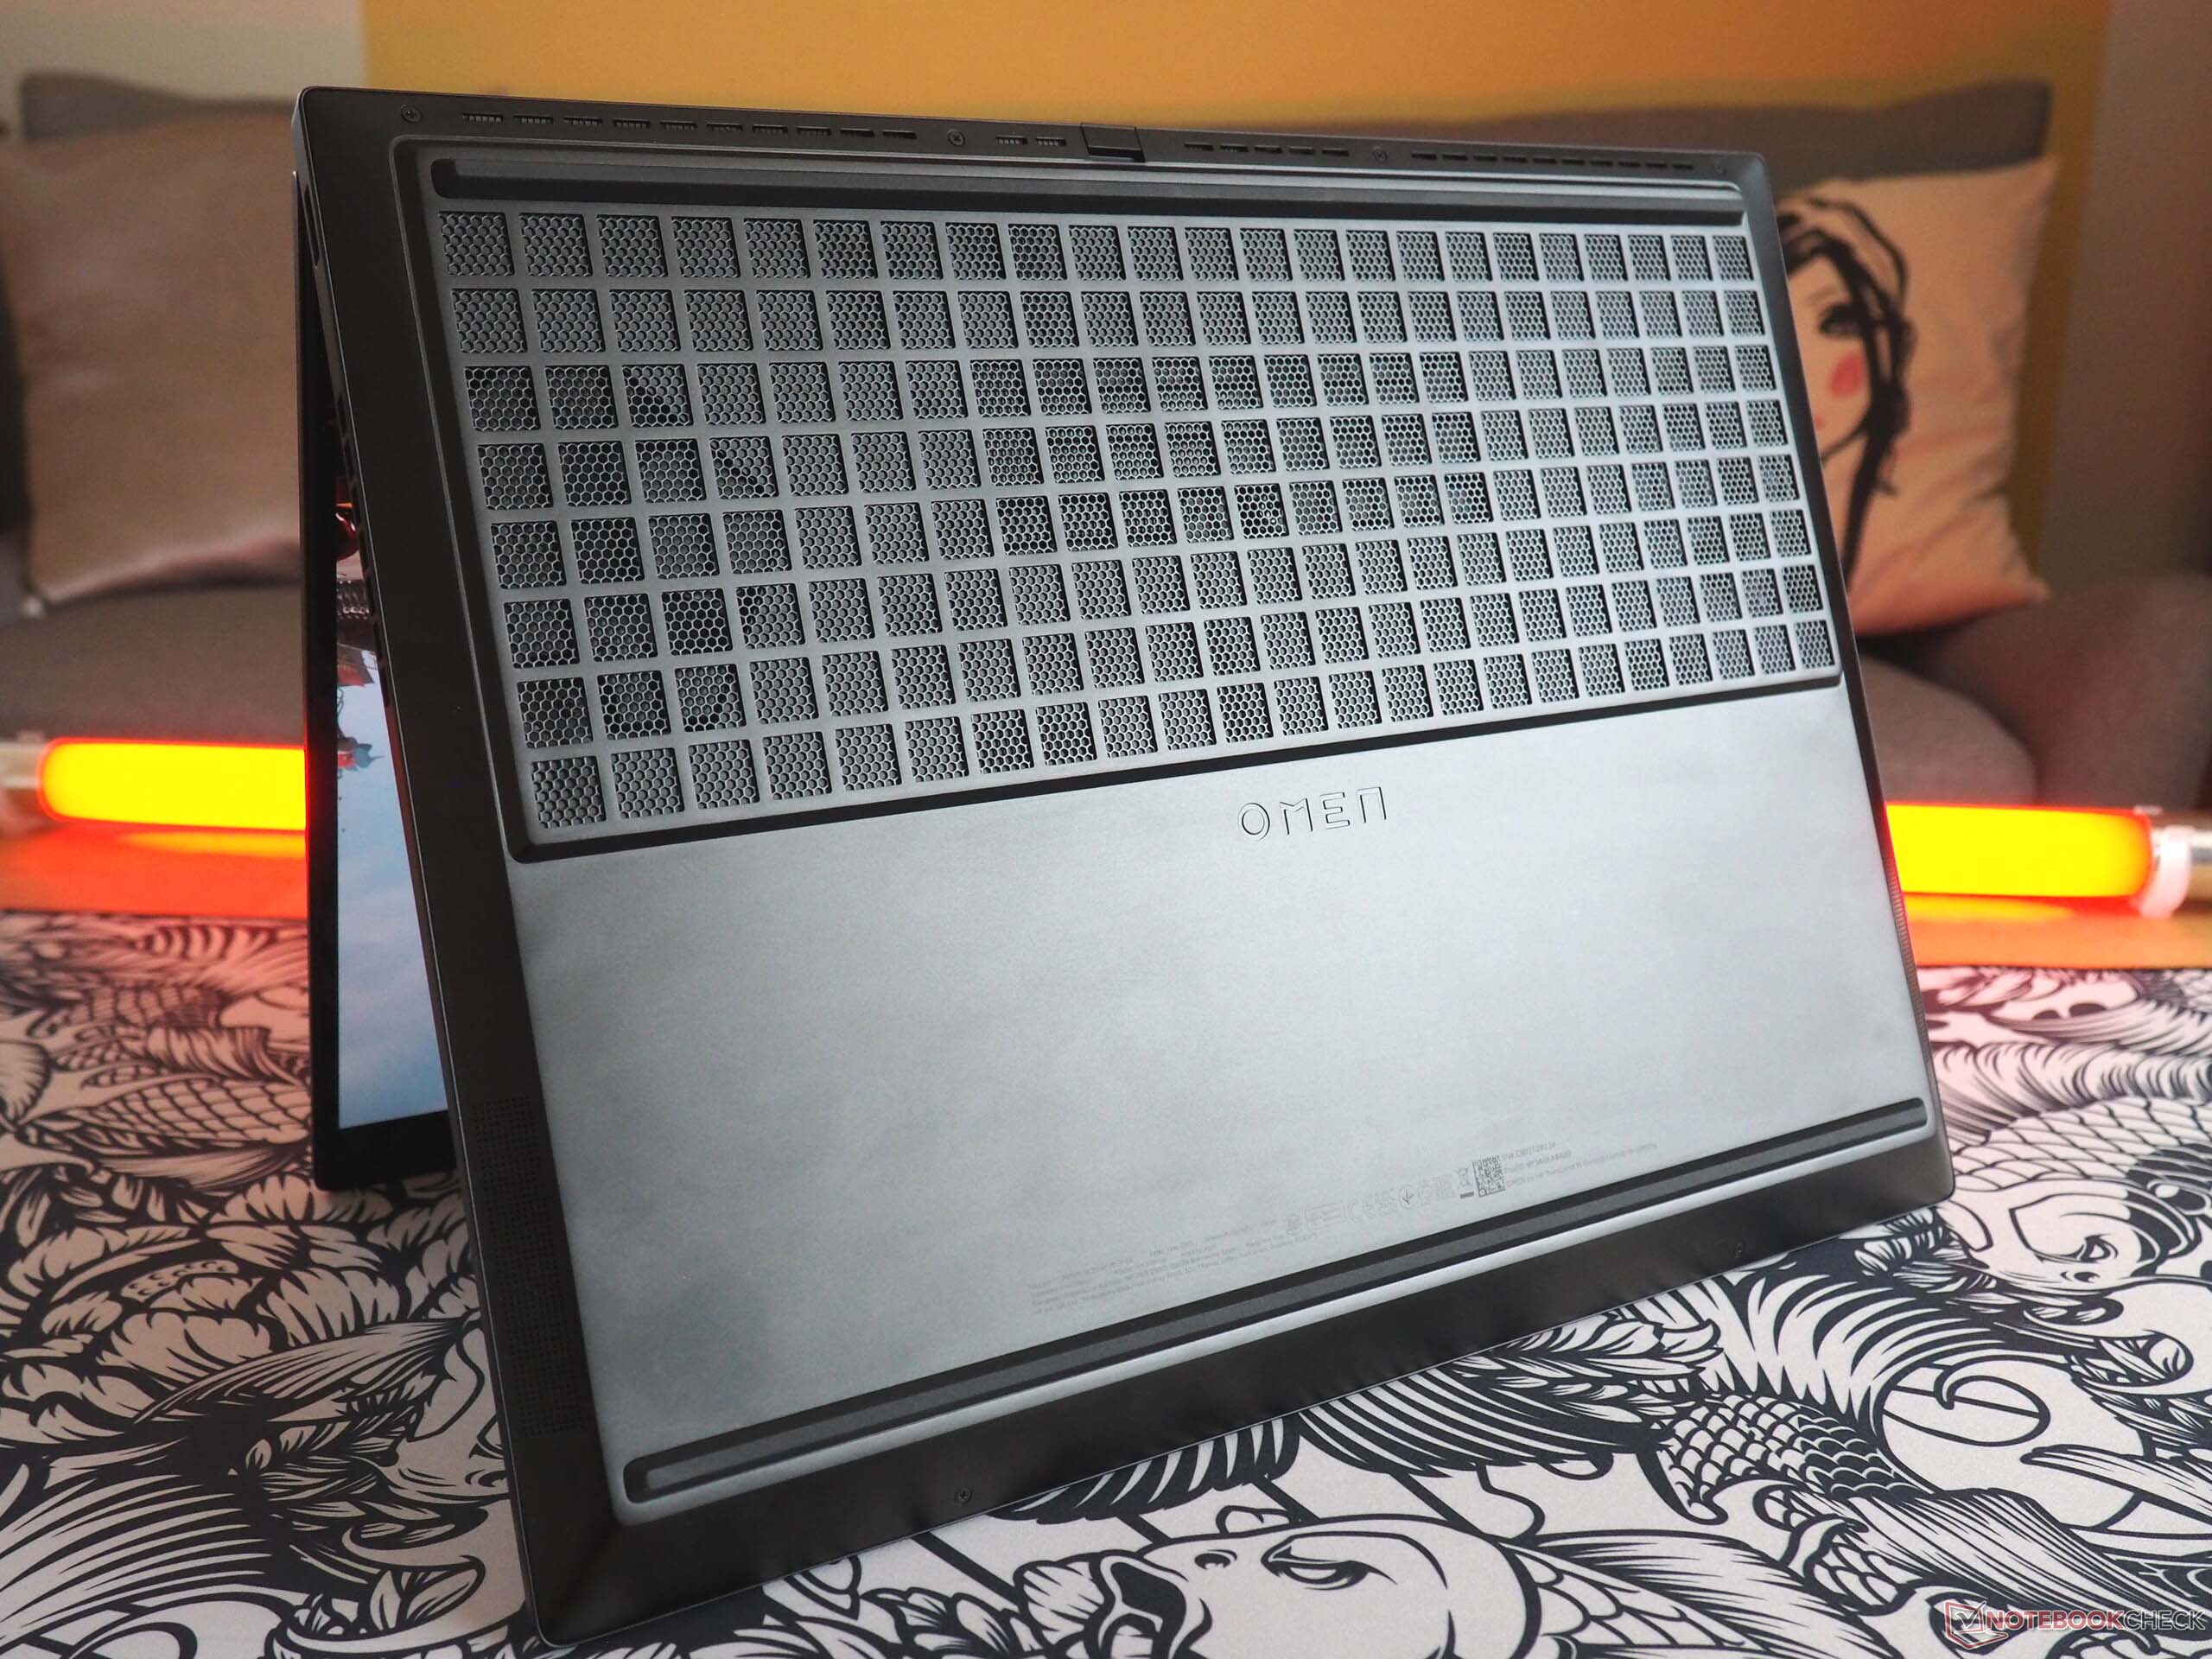
Manutenção
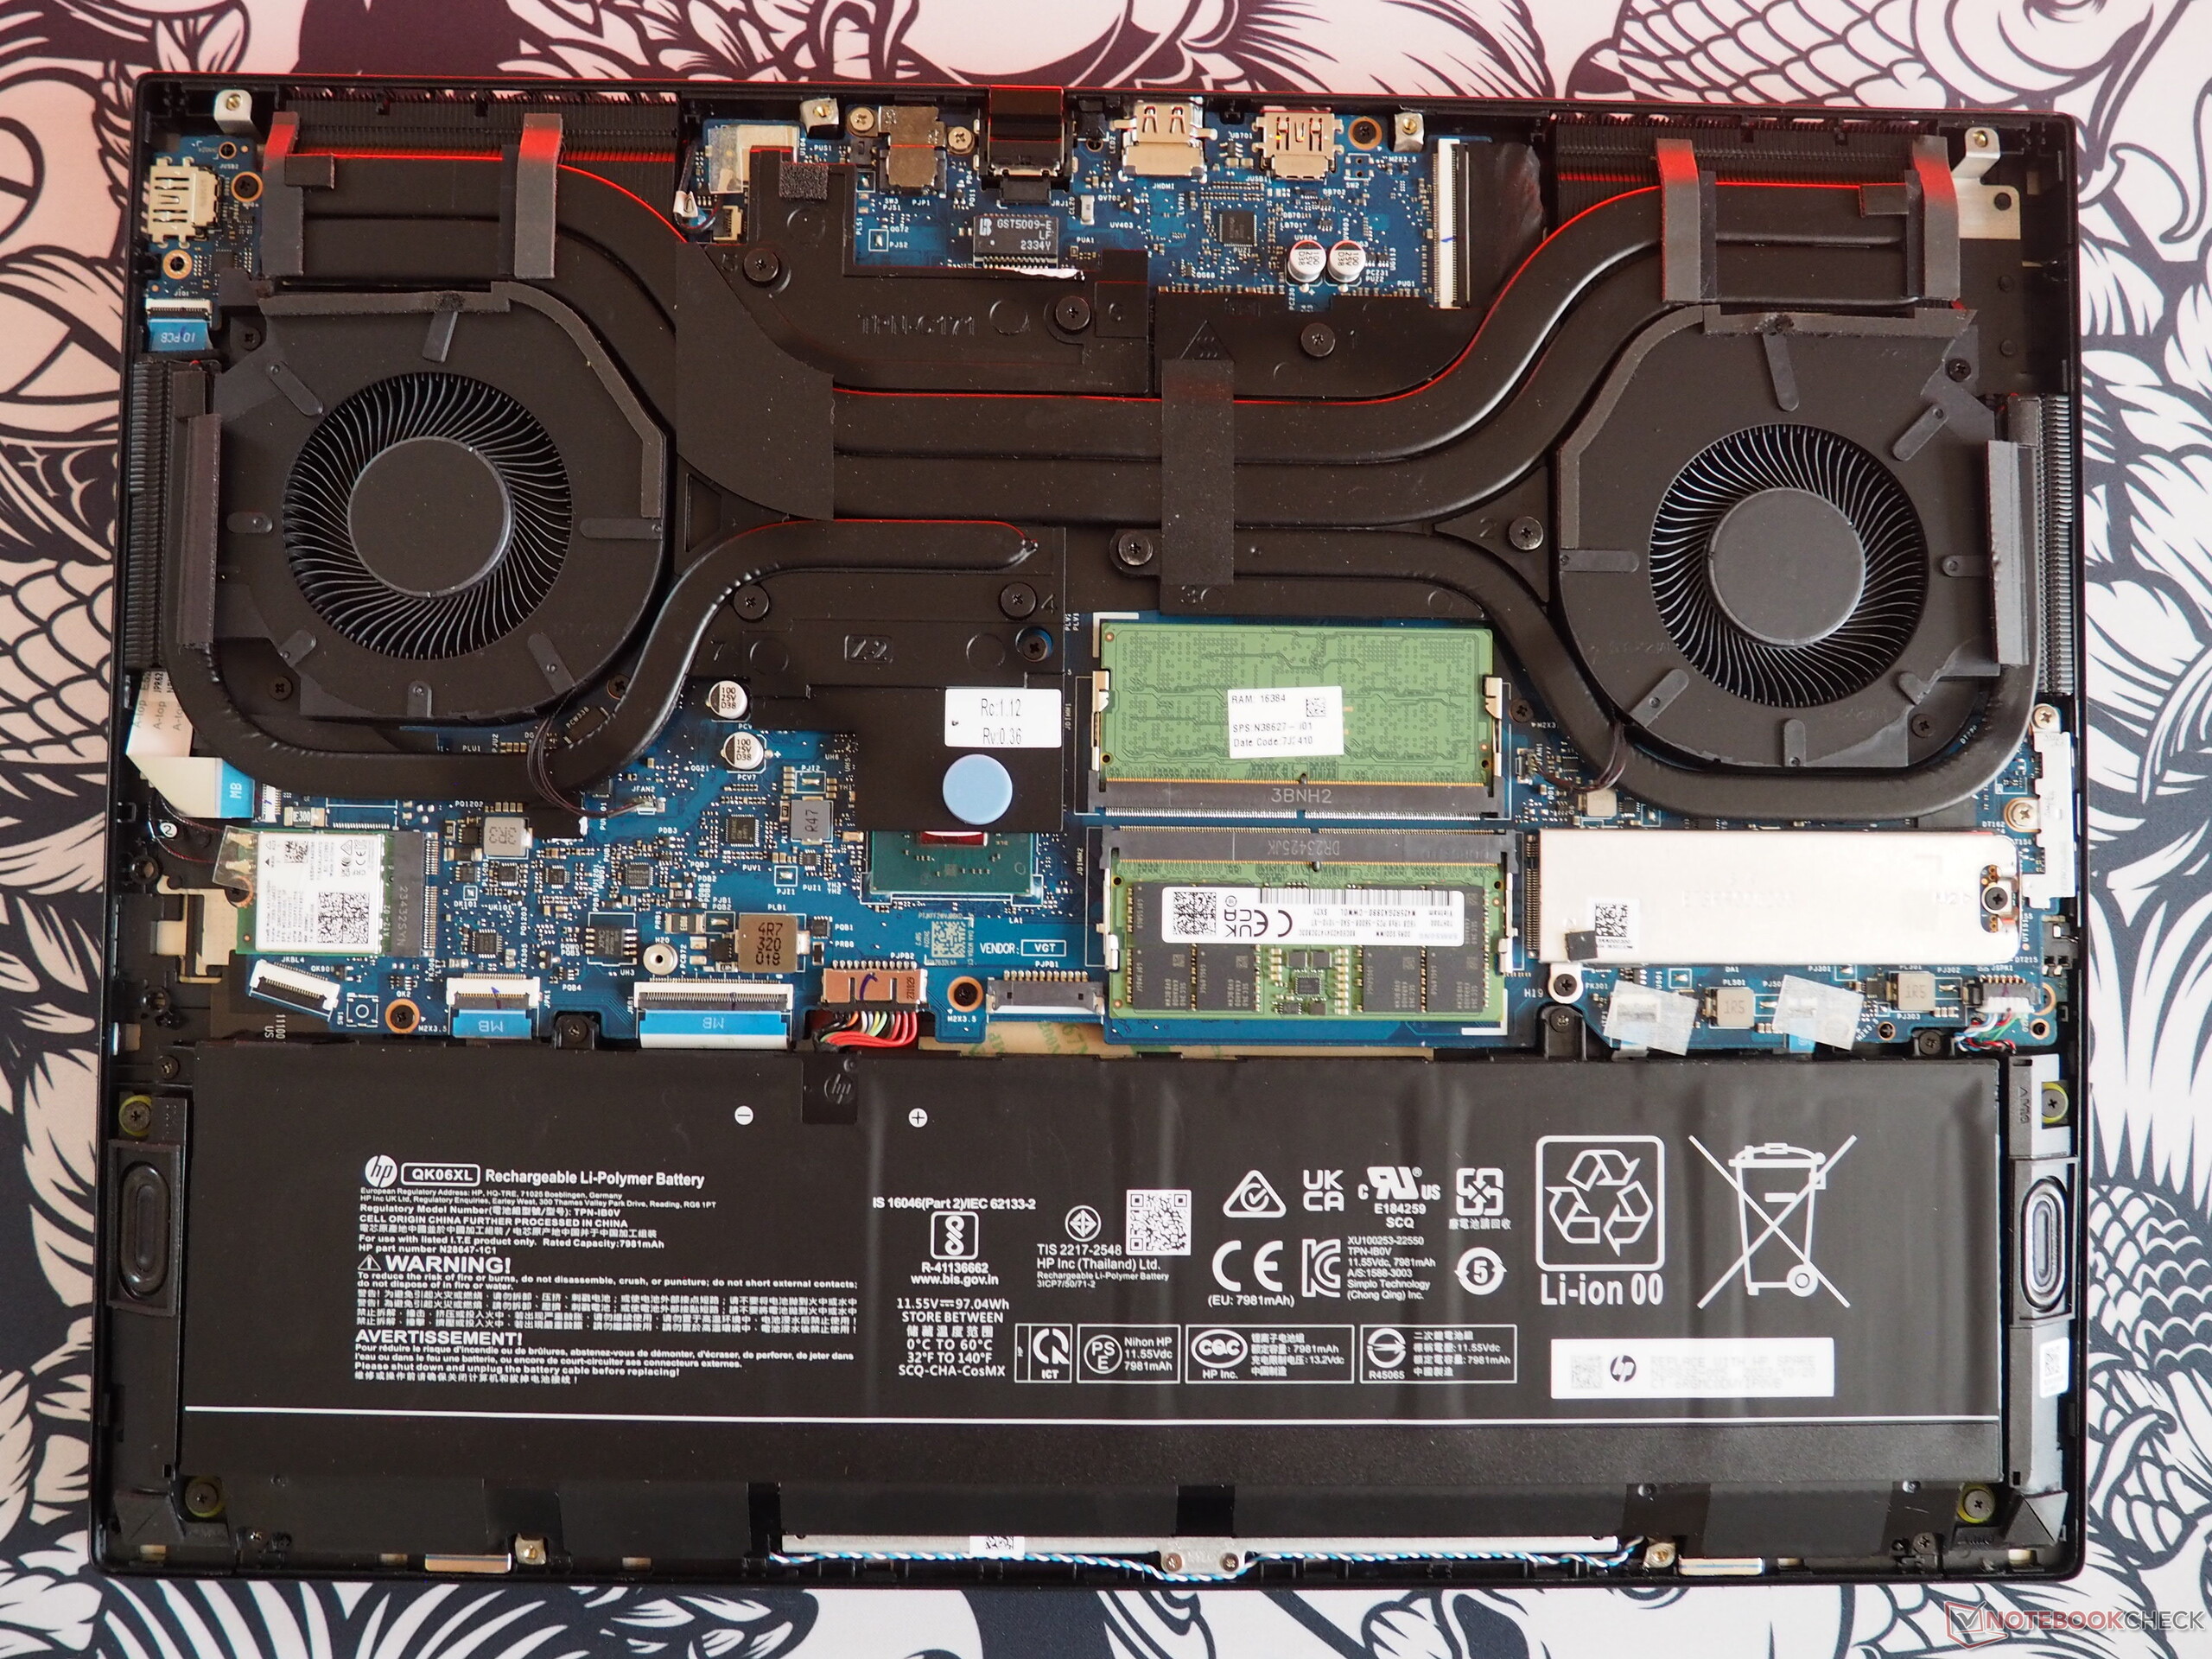
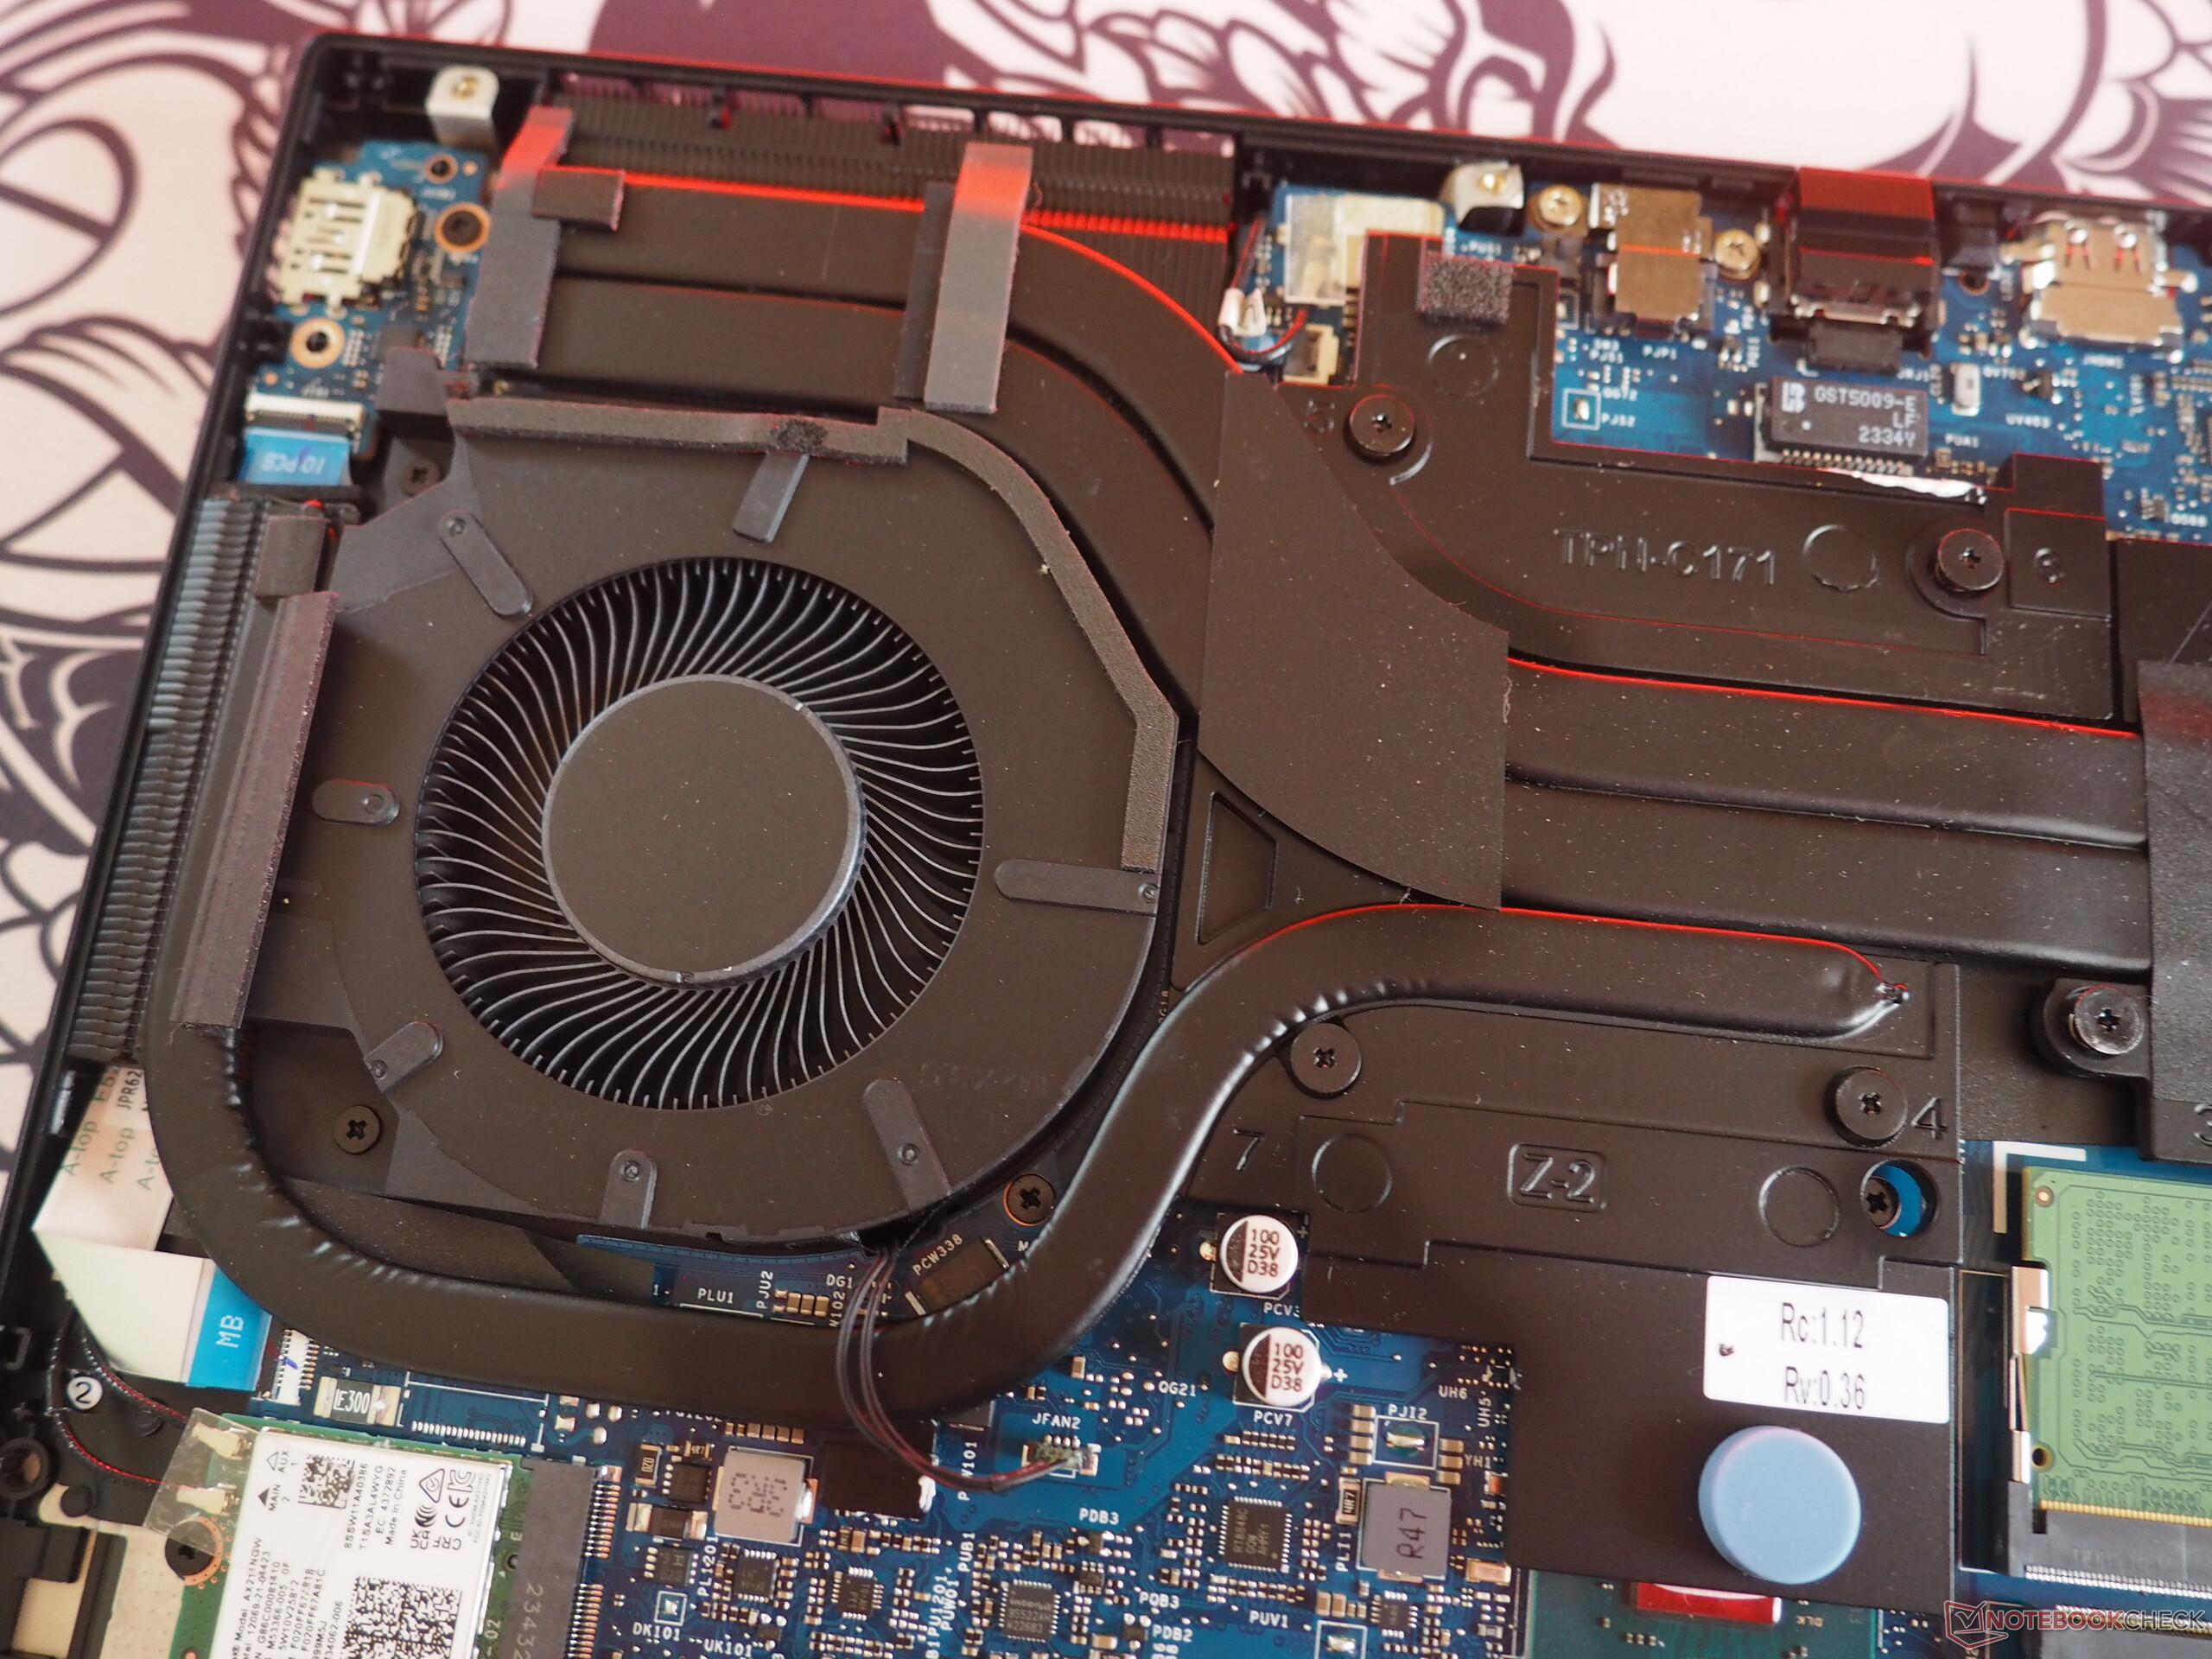
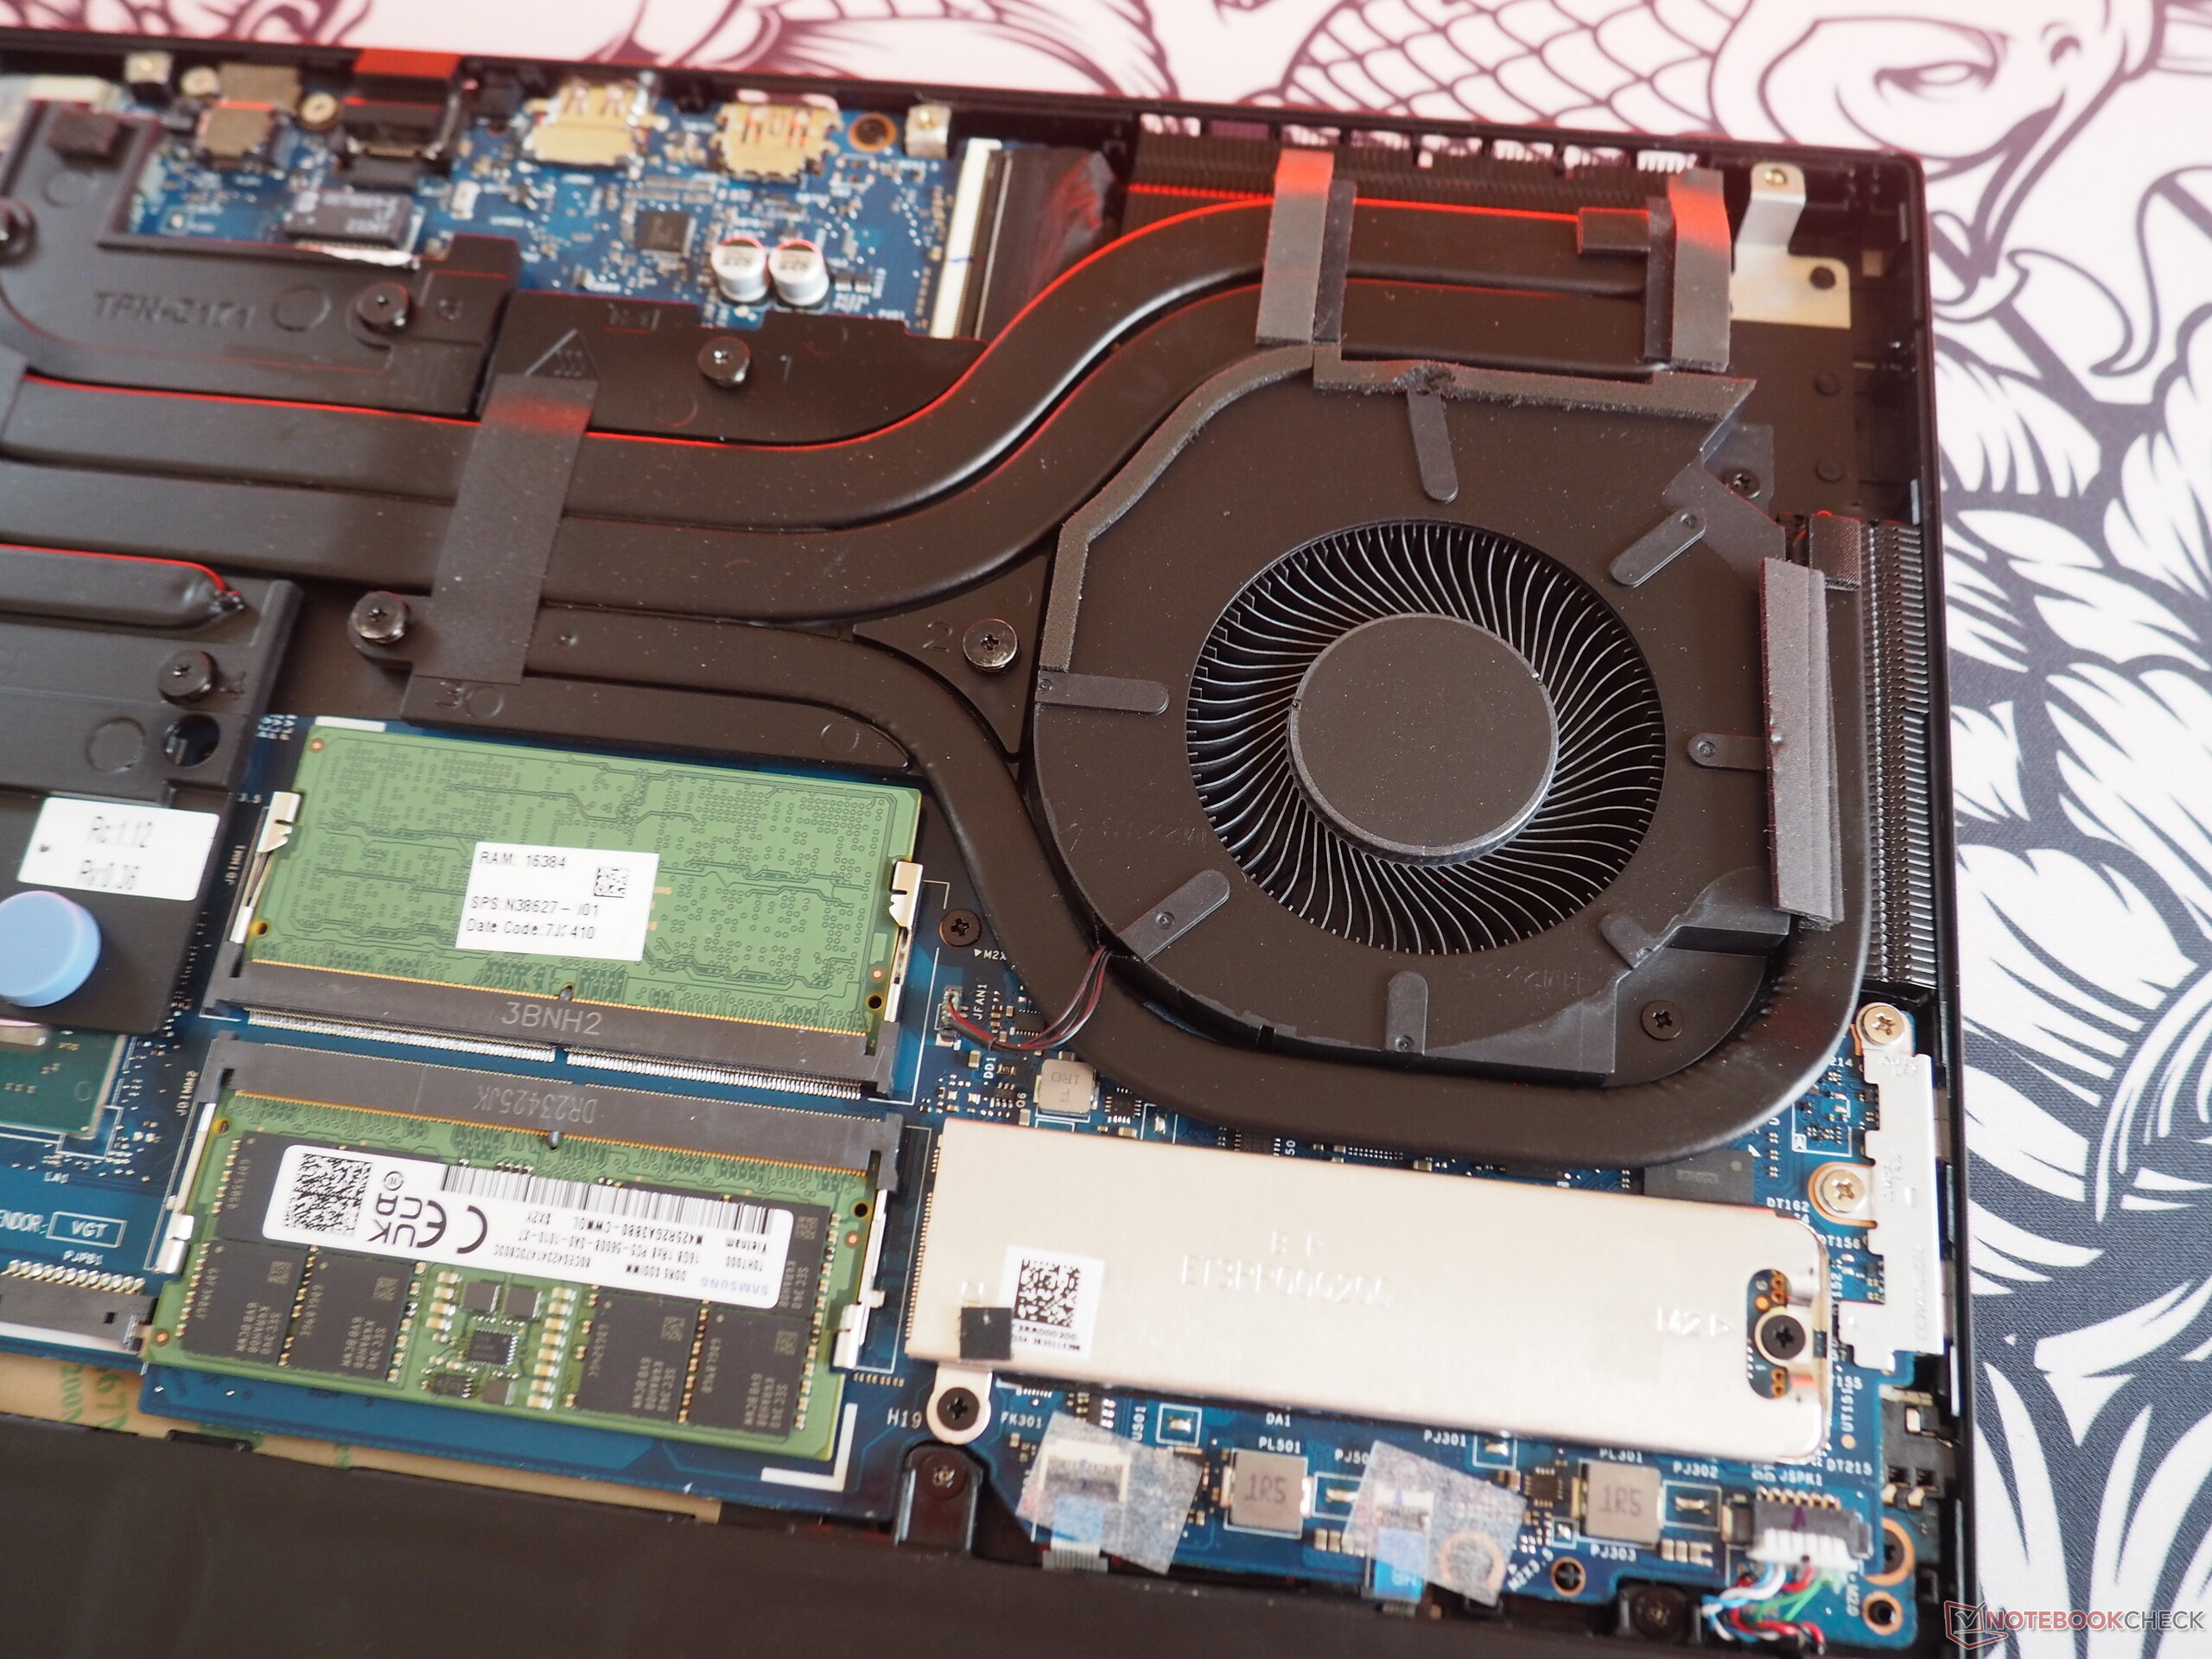
Em termos de manutenção, o Omen 16 não é particularmente complicado. Depois de cuidar de seis pequenos parafusos de cabeça cruzada, a placa de base pode ser levantada de sua posição ancorada com a ajuda de uma ferramenta plana. Dentro do dispositivo, todos os componentes importantes estão acessíveis, sejam eles os bancos de RAM, a bateria, o slot M.2, as ventoinhas ou o módulo sem fio.
Garantia
A garantia é de 24 meses.
Dispositivos de entrada
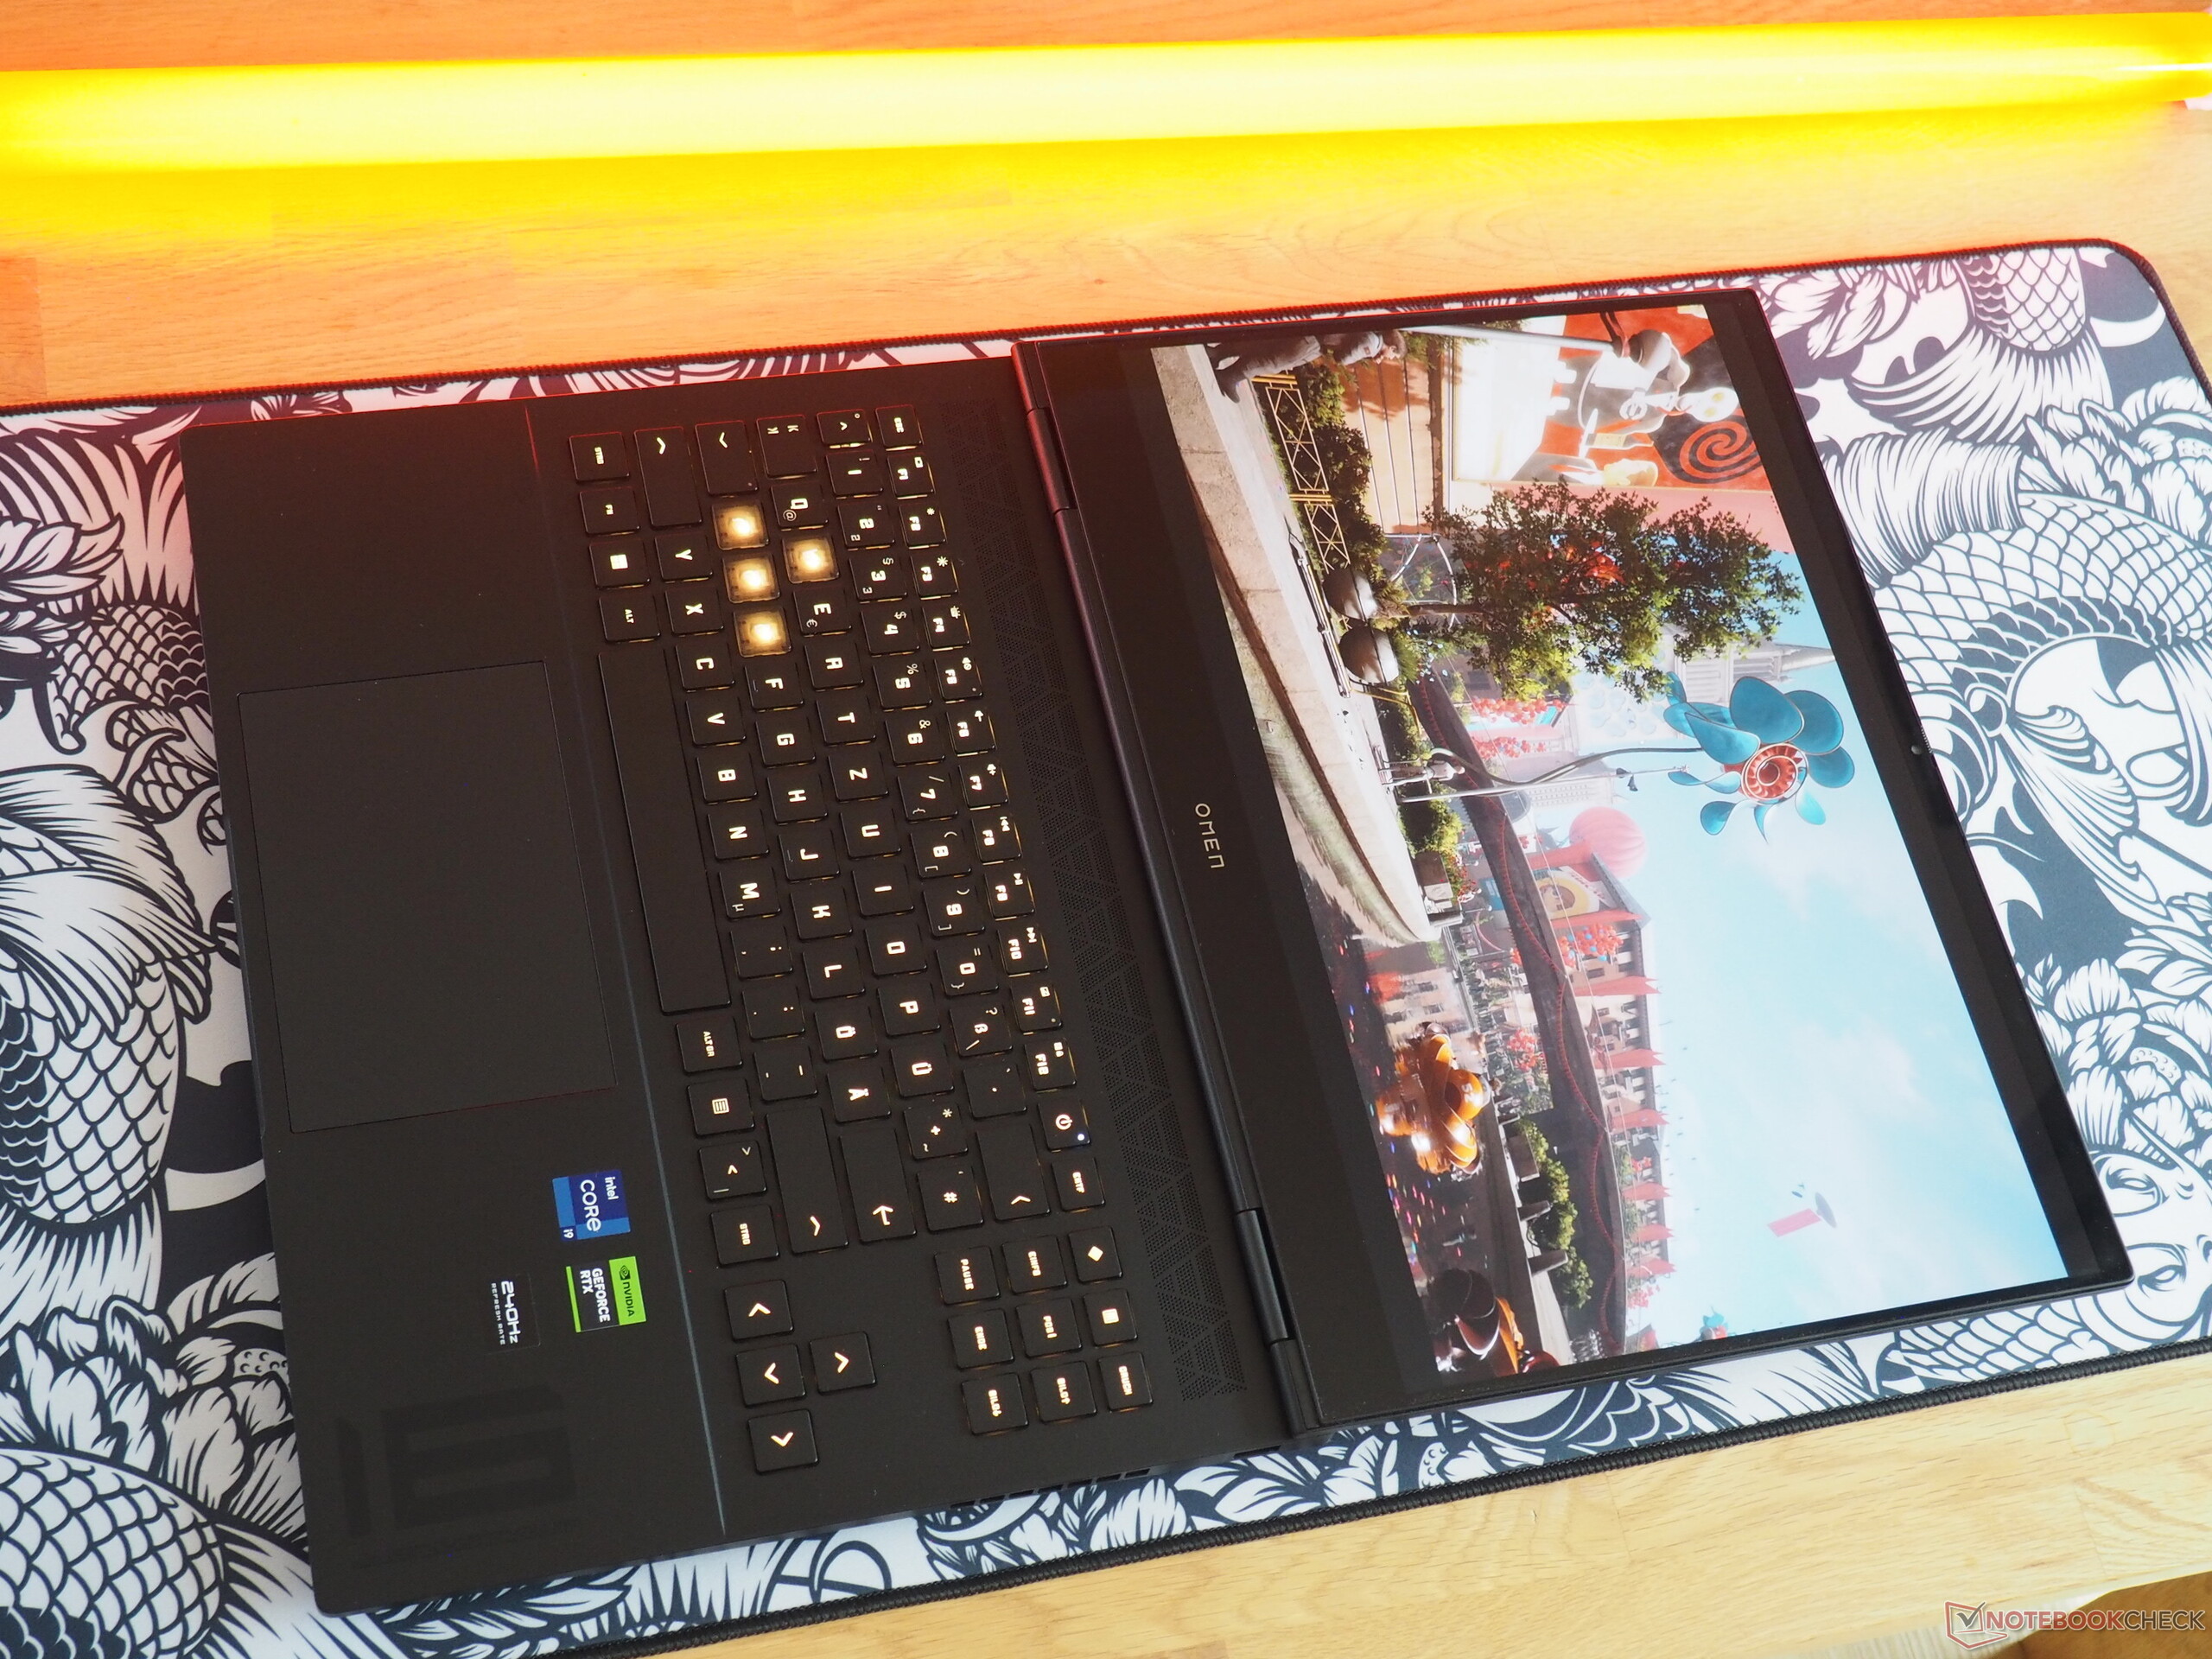
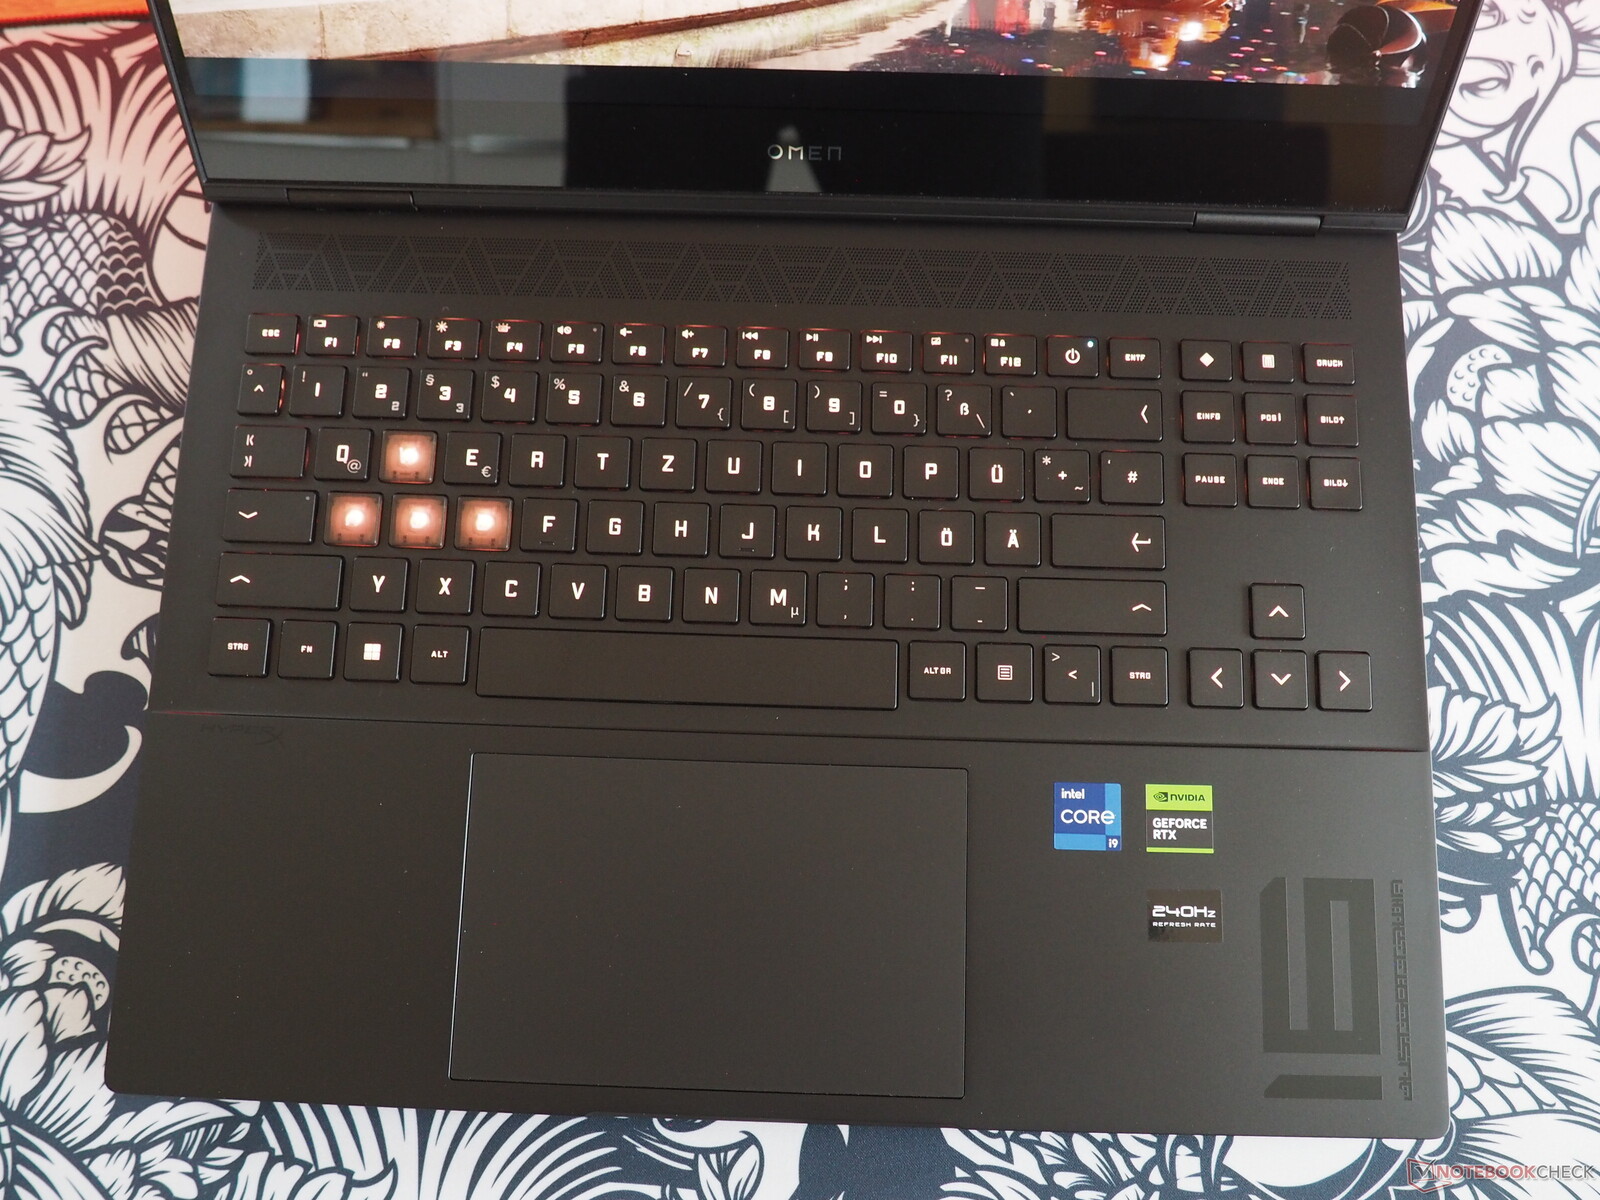
Teclado
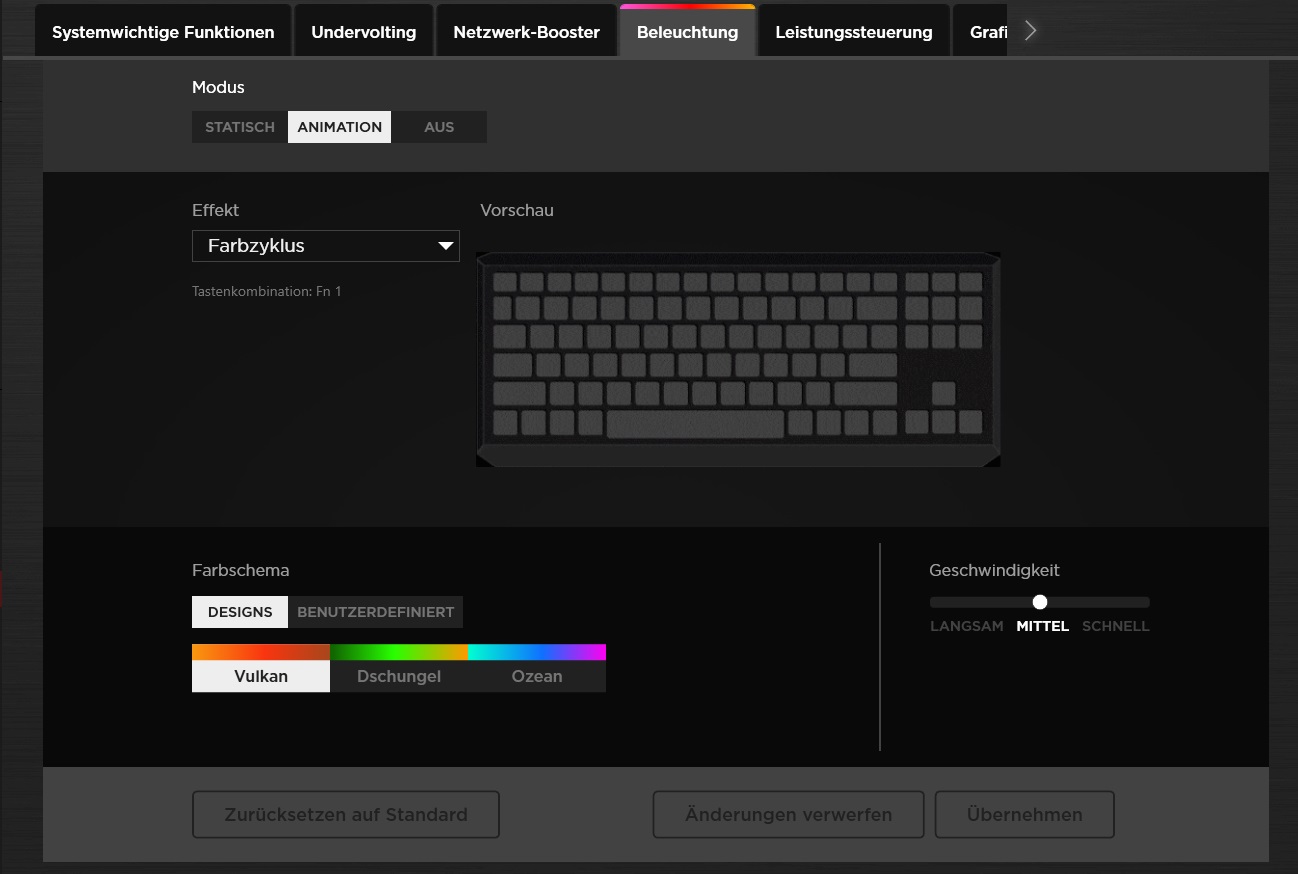
Com suas teclas WASD transparentes, a HP adotou um certo visual de jogador. O layout é muito exclusivo e leva algum tempo para o senhor se acostumar. O fabricante optou por não instalar um teclado numérico e, em vez disso, deu ao dispositivo de 16 polegadas teclas de seta separadas e de bom tamanho. Outras decisões (por exemplo, a localização do botão liga/desliga) são realmente difíceis de entender. A experiência de digitação é medíocre e a HP teve que usar um modelo mecânico para obter melhor feedback. Os fãs de teclas retroiluminadas podem esperar por várias cores.
Touchpad
Com cerca de 13,5 x 8,5 cm, o touchpad agradavelmente grande pode ser descrito como despretensioso no que se refere à precisão, suavidade e áreas de clique. Da mesma forma, o suporte a gestos é intuitivo.
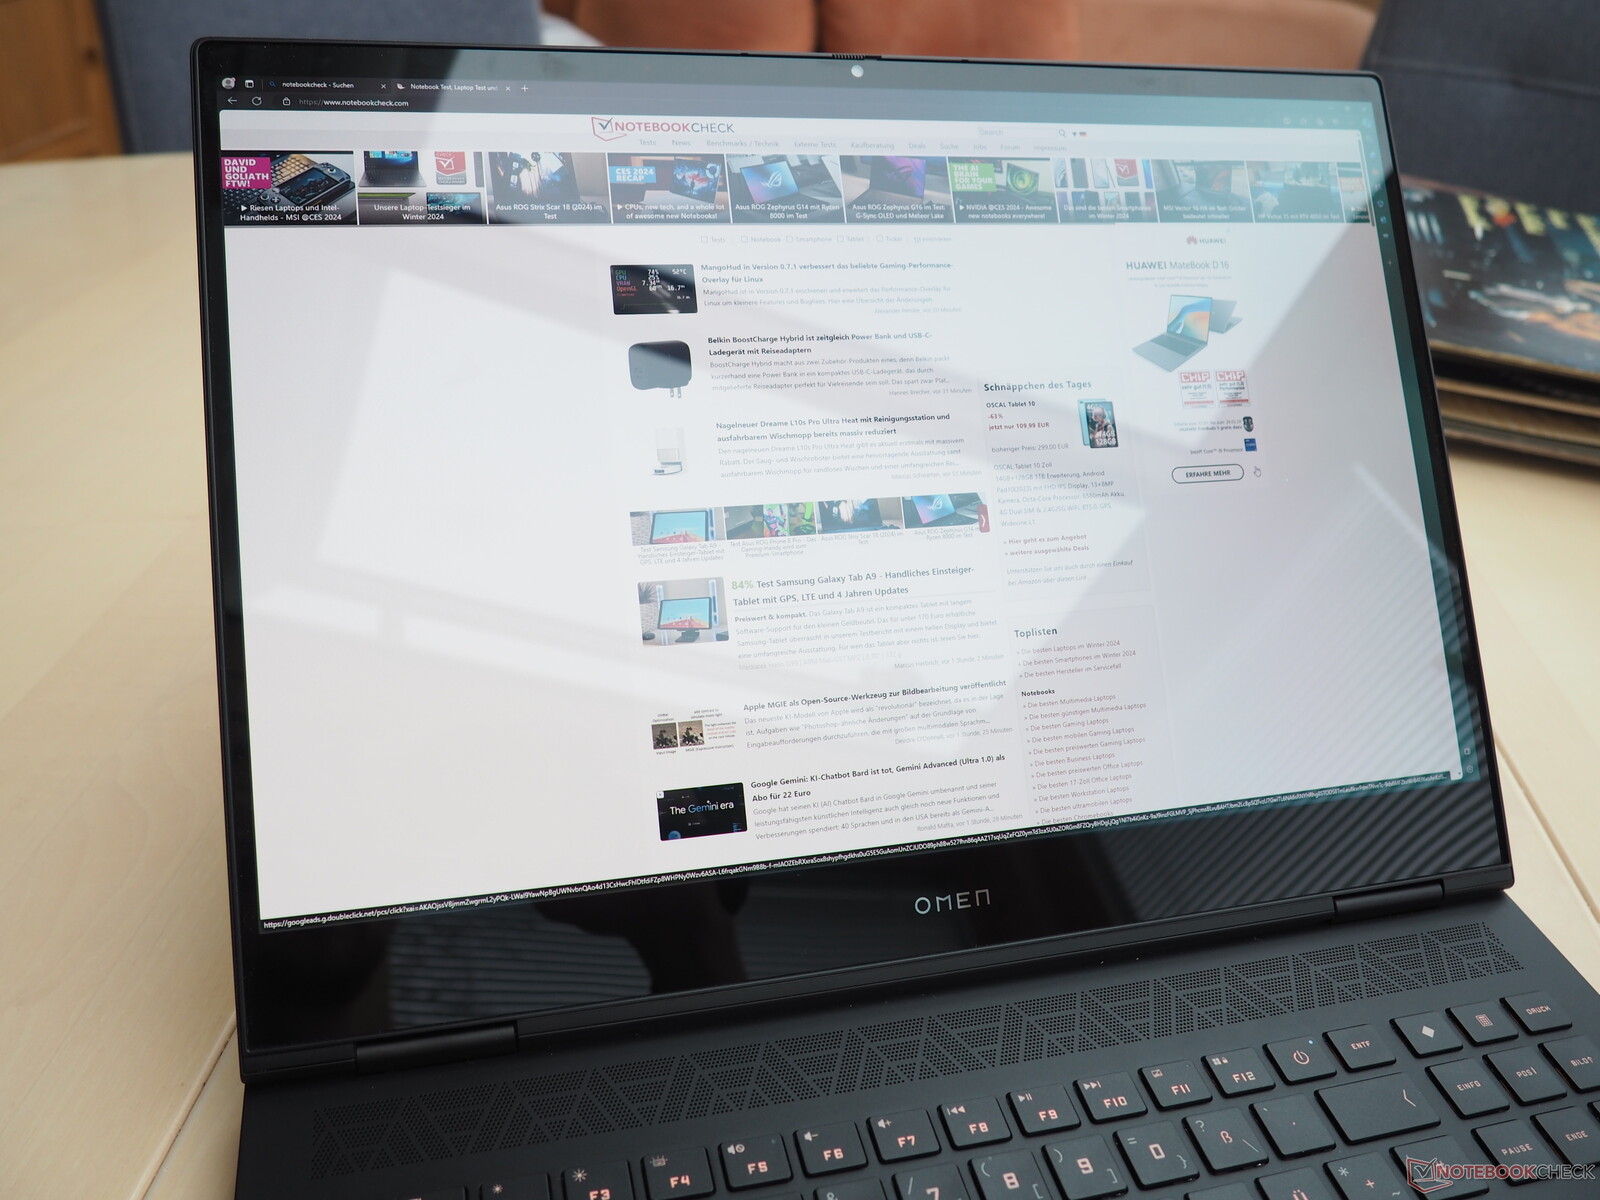
Tela
As opiniões divergem quando se trata de painéis OLED. Do lado negativo, alguns problemas são as superfícies muito reflexivas (que podem tornar o uso em ambientes externos tortuoso), a cintilação da tela em todos os níveis de brilho e a questão do possível burn-in.
| |||||||||||||||||||||||||
iluminação: 98 %
iluminação com acumulador: 390 cd/m²
Contraste: 19500:1 (Preto: 0.02 cd/m²)
ΔE ColorChecker Calman: 1.94 | ∀{0.5-29.43 Ø4.71}
calibrated: 4.21
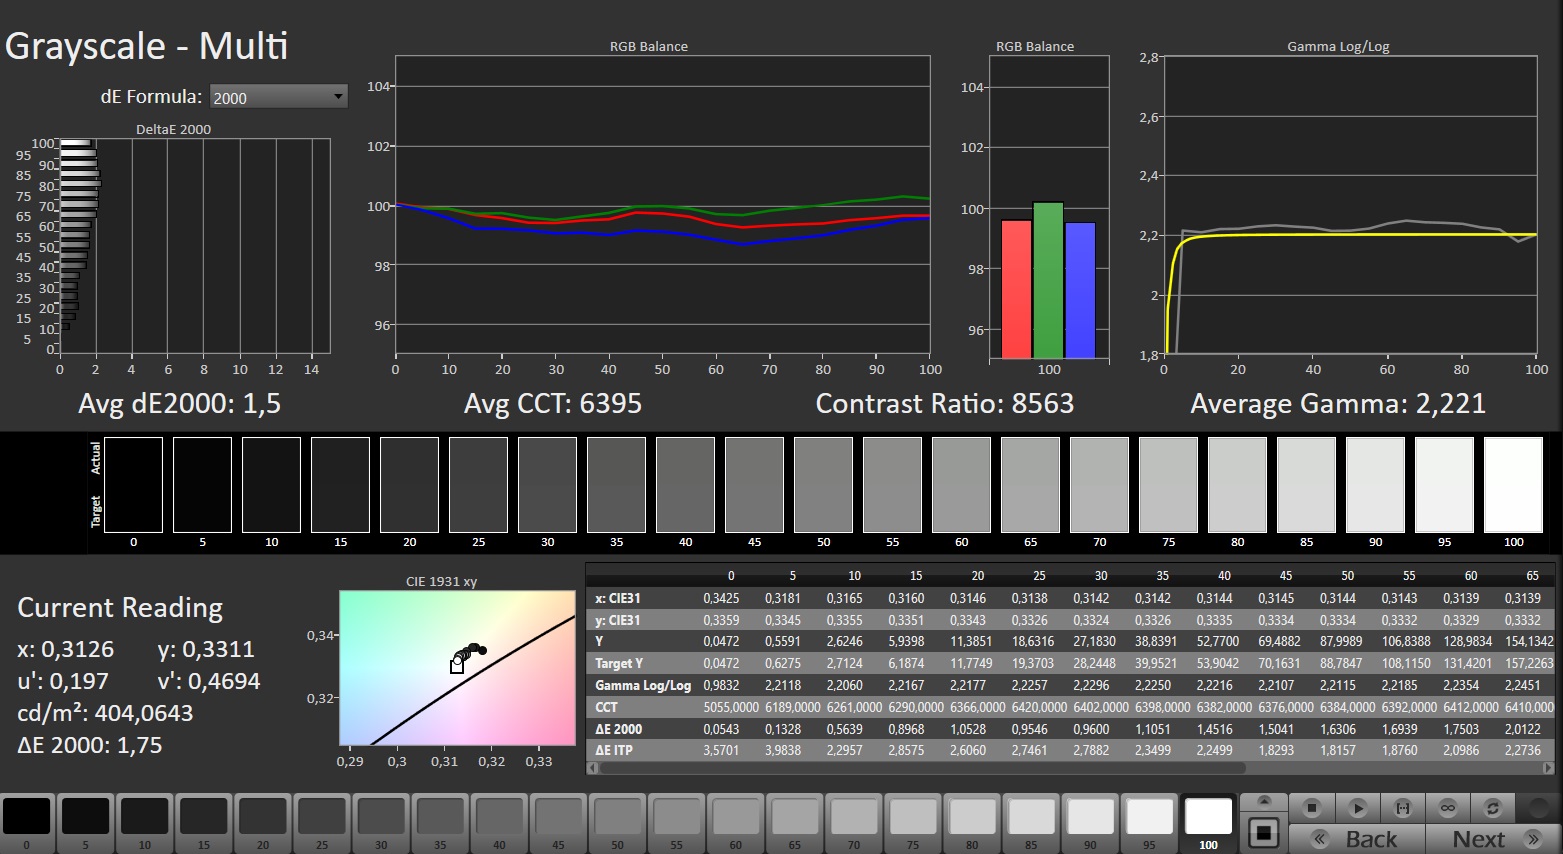
ΔE Greyscale Calman: 1.5 | ∀{0.09-98 Ø4.96}
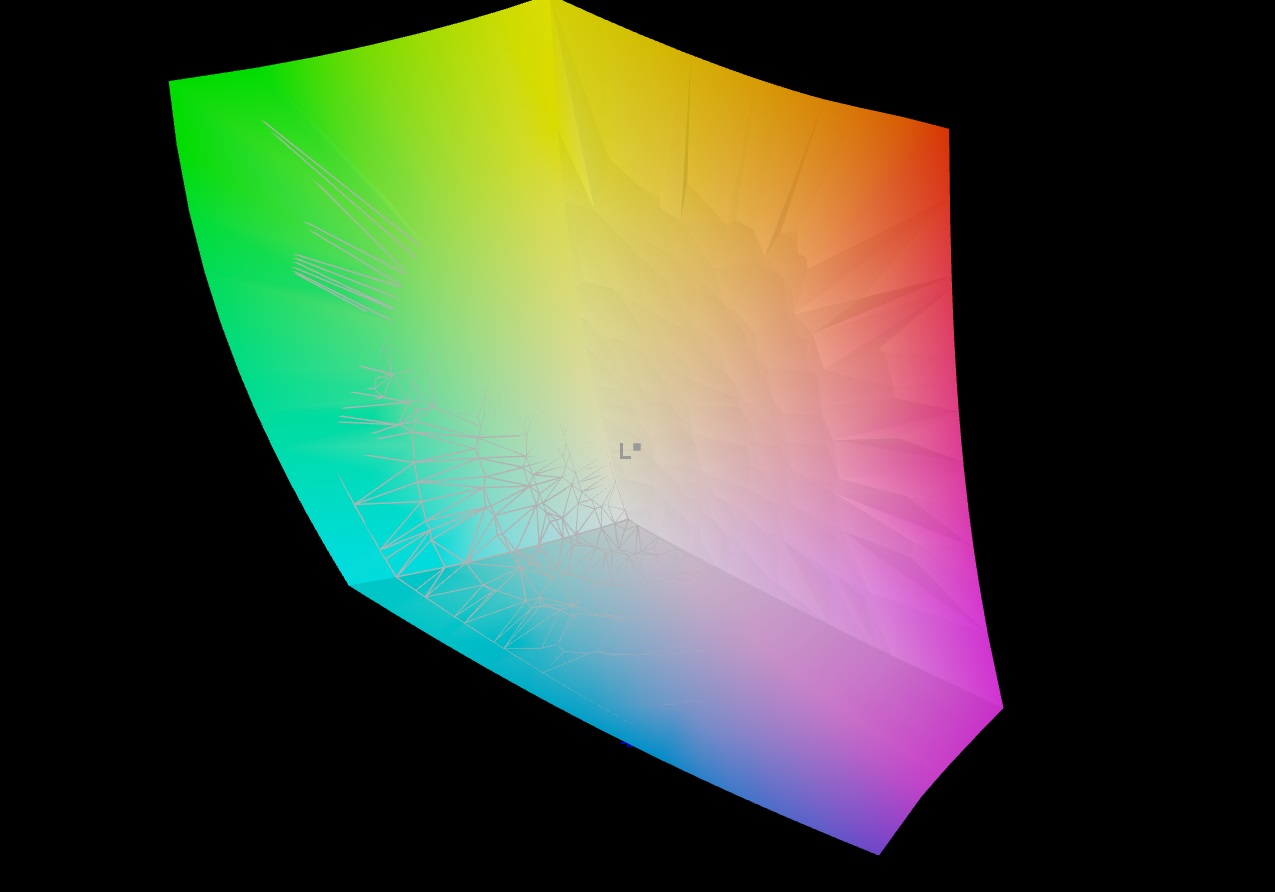
97% AdobeRGB 1998 (Argyll 3D)
100% sRGB (Argyll 3D)
99.8% Display P3 (Argyll 3D)
Gamma: 2.221
CCT: 6395 K
| HP Omen Transcend 16-u1095ng ATNA60DL02-0 (SDC41A4), OLED, 2560x1600, 16" | HP Omen Transcend 16 AUOA3A6, Mini-LED, 2560x1600, 16" | Asus ROG Zephyrus G16 2024 GU605M ATNA60DL01-0, OLED, 2560x1600, 16" | Schenker XMG CORE 16 (L23) BOE0AF0 (), IPS, 2560x1600, 16" | Lenovo Legion Pro 5 16ARX8 CSOT T3 MNG007DA1-Q, IPS, 2560x1600, 16" | |
|---|---|---|---|---|---|
| Display | -4% | 0% | -20% | -18% | |
| Display P3 Coverage (%) | 99.8 | 99.2 -1% | 99.9 0% | 68.3 -32% | 70.4 -29% |
| sRGB Coverage (%) | 100 | 100 0% | 100 0% | 98.6 -1% | 99.6 0% |
| AdobeRGB 1998 Coverage (%) | 97 | 87.6 -10% | 96.9 0% | 69.6 -28% | 72.6 -25% |
| Response Times | -13550% | -18% | -4850% | -3925% | |
| Response Time Grey 50% / Grey 80% * (ms) | 0.2 ? | 26.4 ? -13100% | 0.22 ? -10% | 13.2 ? -6500% | 7 ? -3400% |
| Response Time Black / White * (ms) | 0.2 ? | 28.2 ? -14000% | 0.25 ? -25% | 6.6 ? -3200% | 9.1 ? -4450% |
| PWM Frequency (Hz) | 120 ? | 3506 ? | 960 ? | ||
| Screen | -47% | 0% | -203% | -161% | |
| Brightness middle (cd/m²) | 390 | 791.1 103% | 416 7% | 376 -4% | 355.3 -9% |
| Brightness (cd/m²) | 392 | 800 104% | 418 7% | 358 -9% | 340 -13% |
| Brightness Distribution (%) | 98 | 95 -3% | 96 -2% | 88 -10% | 91 -7% |
| Black Level * (cd/m²) | 0.02 | 0.04 -100% | 0.33 -1550% | 0.32 -1500% | |
| Contrast (:1) | 19500 | 19778 1% | 1139 -94% | 1110 -94% | |
| Colorchecker dE 2000 * | 1.94 | 4.37 -125% | 1.6 18% | 2.74 -41% | 1.13 42% |
| Colorchecker dE 2000 max. * | 4.26 | 10.39 -144% | 2.1 51% | 6.78 -59% | 2.78 35% |
| Colorchecker dE 2000 calibrated * | 4.21 | 1.04 75% | 0.88 79% | 0.32 92% | |
| Greyscale dE 2000 * | 1.5 | 6.5 -333% | 2.7 -80% | 3.57 -138% | 1.4 7% |
| Gamma | 2.221 99% | 2.28 96% | 2.16 102% | 2.4 92% | 2.24 98% |
| CCT | 6395 102% | 6000 108% | 6331 103% | 7246 90% | 6372 102% |
| Média Total (Programa/Configurações) | -4534% /
-1967% | -6% /
-3% | -1691% /
-828% | -1368% /
-668% |
* ... menor é melhor
Em contrapartida, a tecnologia OLED tem um bom desempenho com níveis de preto maravilhosos (quase 0,0 cd/m²), o que leva a uma excelente taxa de contraste da qual os painéis IPS não se aproximam. O mesmo se aplica à estabilidade do ângulo de visão.
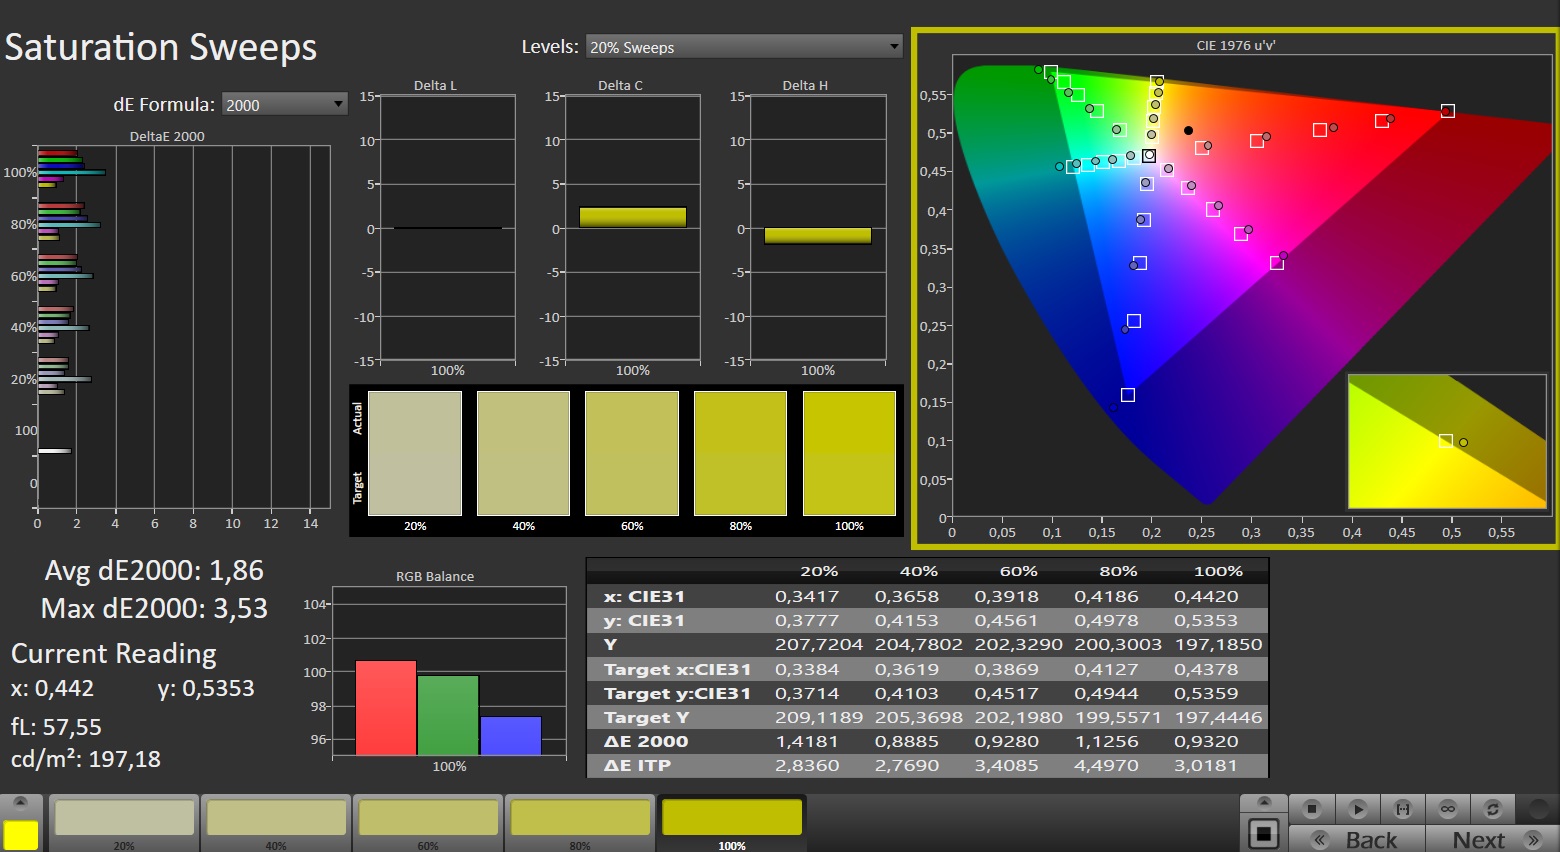
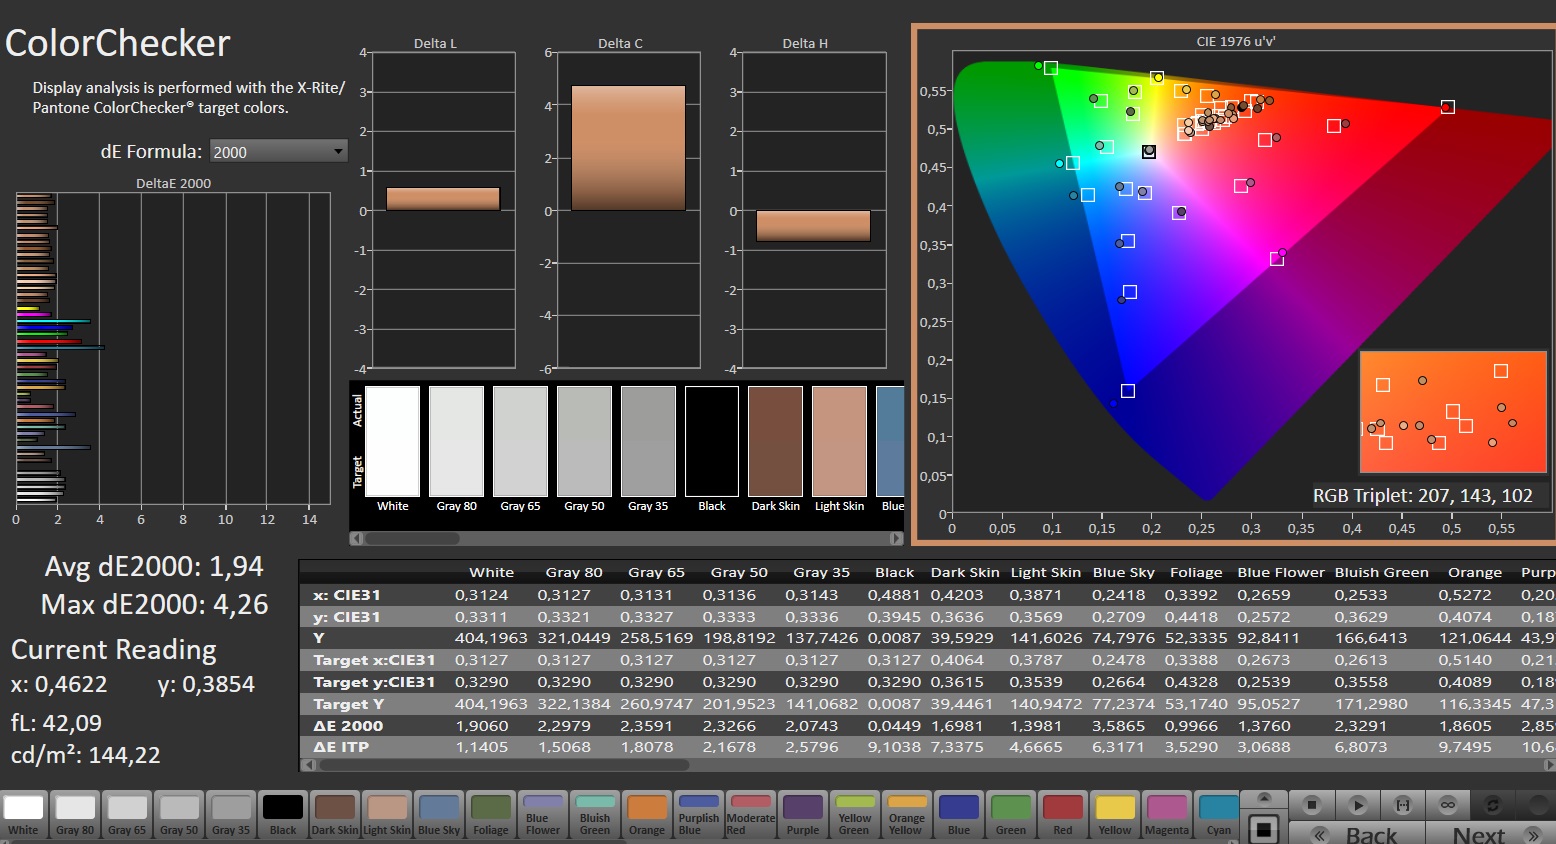
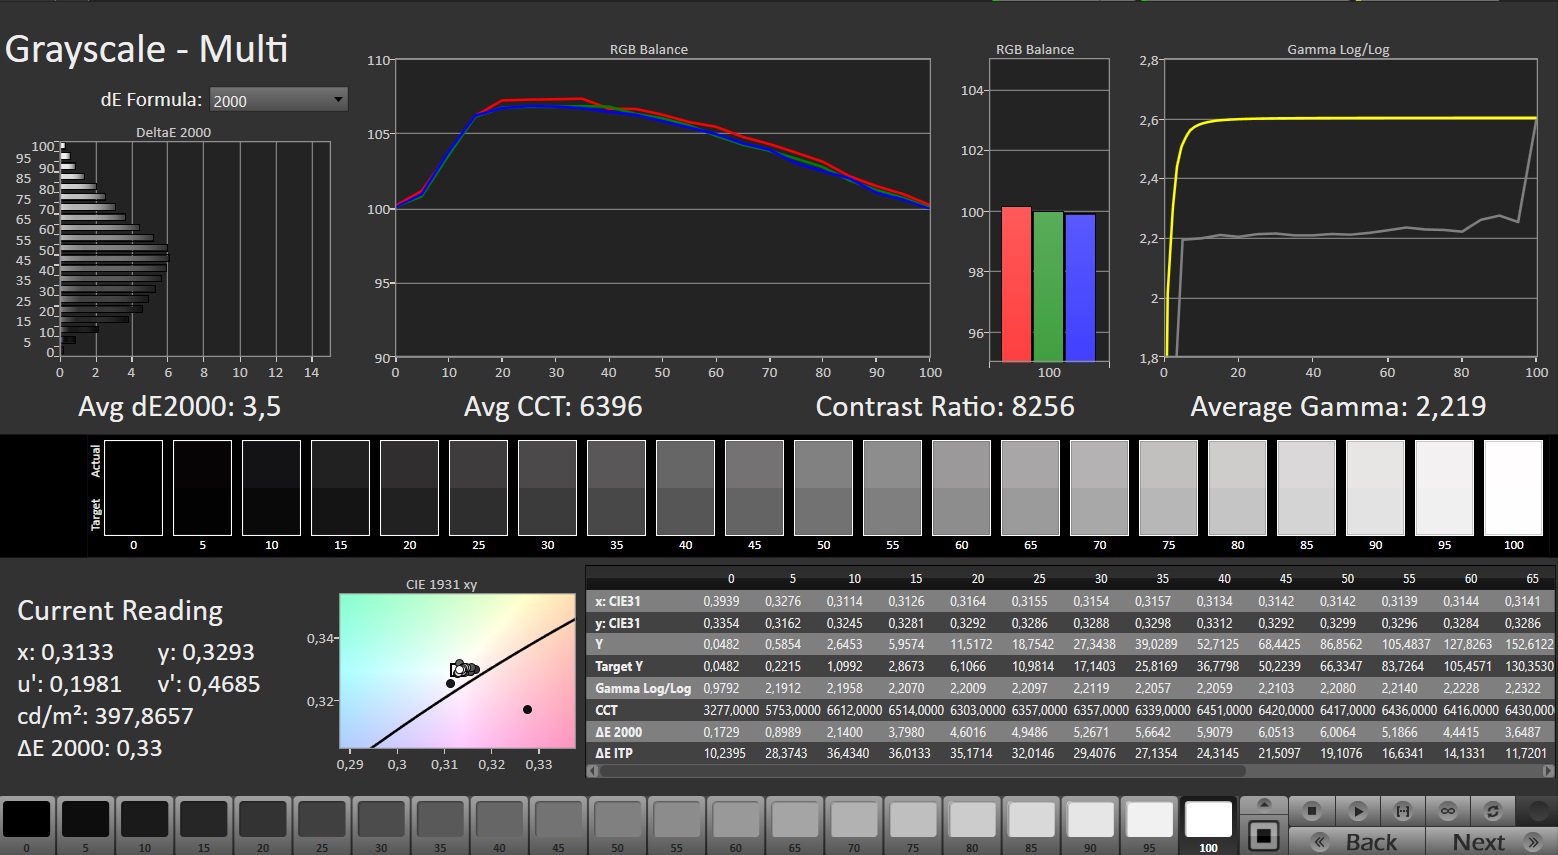
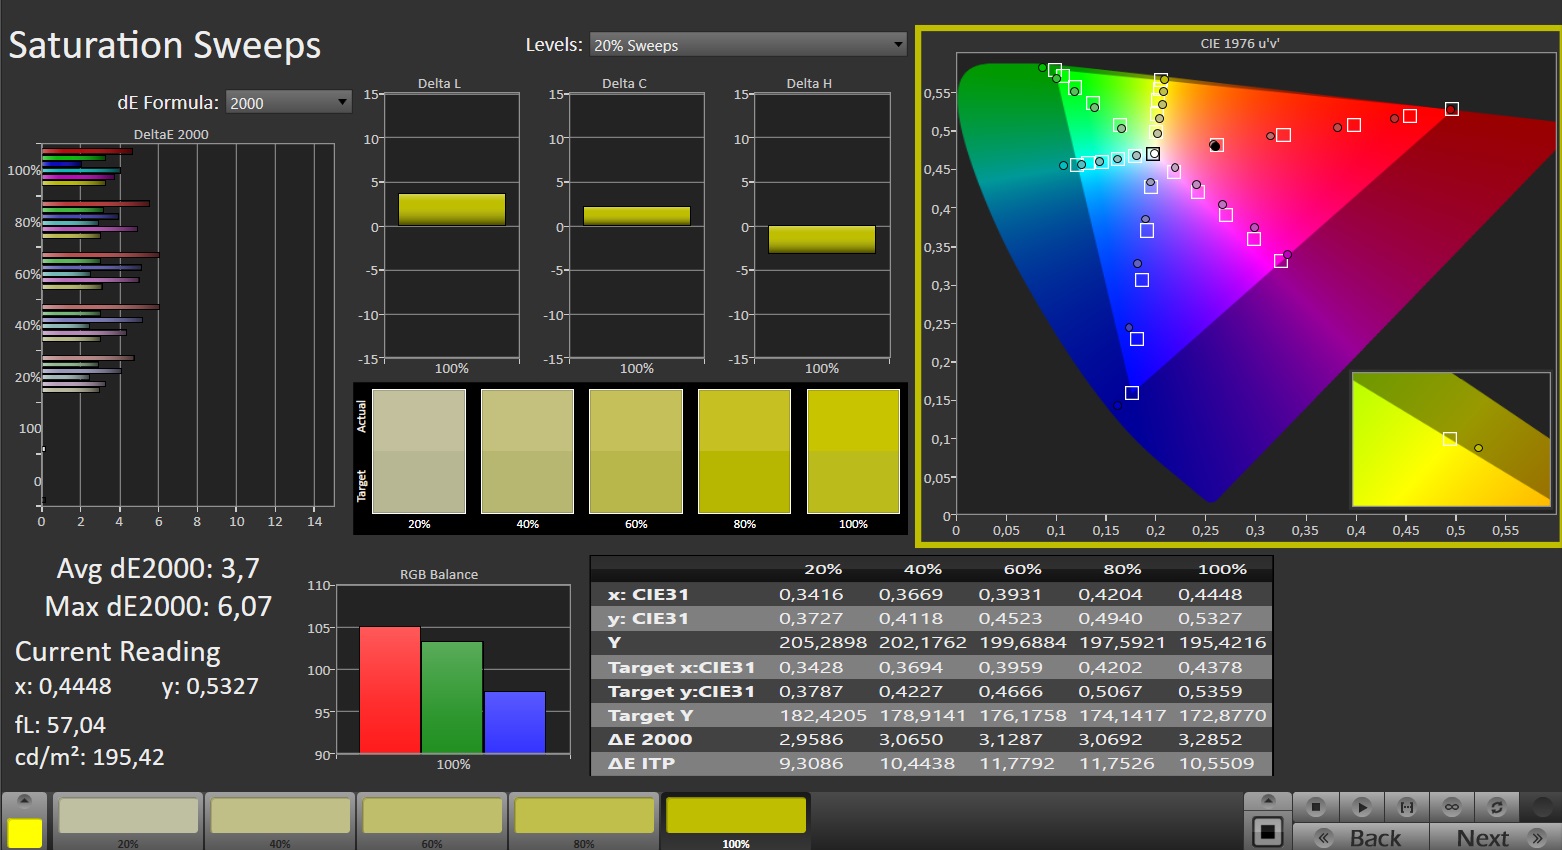
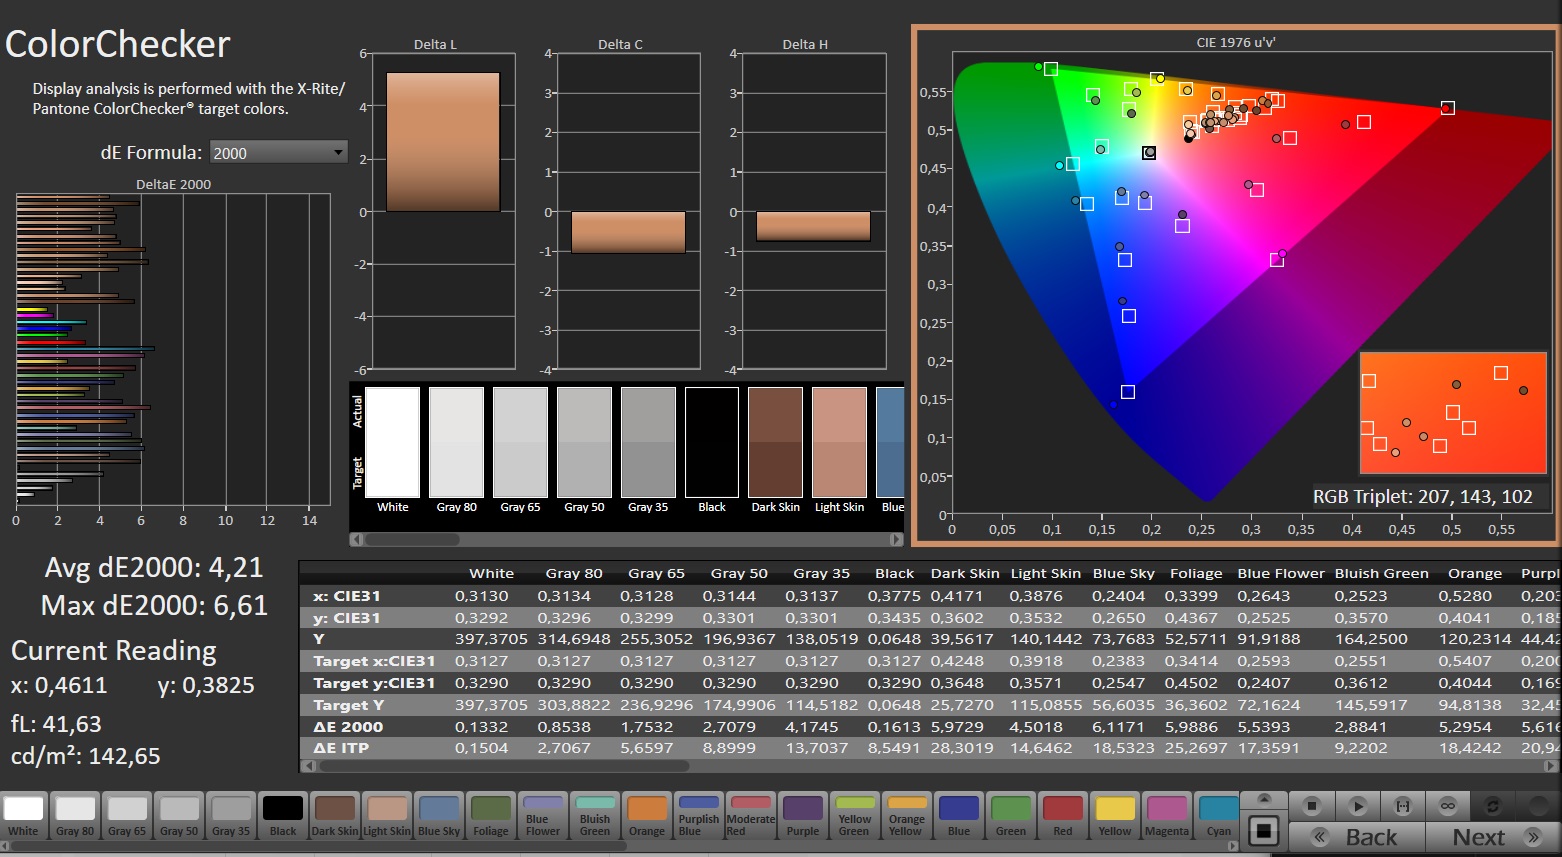
Um destaque adicional é a riqueza do espaço de cores: 100% DCI P3 e 97% AdobeRGB não são algo garantido no mundo dos jogos. As coisas são semelhantes na área de precisão de cores, que já era impressionante antes da calibração.


Os elogios também são reservados para os tempos de resposta curtos: Os painéis IPS clássicos só podem sonhar com 0,2 ms. A tela mini LED do antecessor era consideravelmente mais brilhante (800 vs. 392 cd/m²), mas também significativamente mais lenta.

Exibir tempos de resposta
| ↔ Tempo de resposta preto para branco | ||
|---|---|---|
| 0.2 ms ... ascensão ↗ e queda ↘ combinadas | ↗ 0.1 ms ascensão | 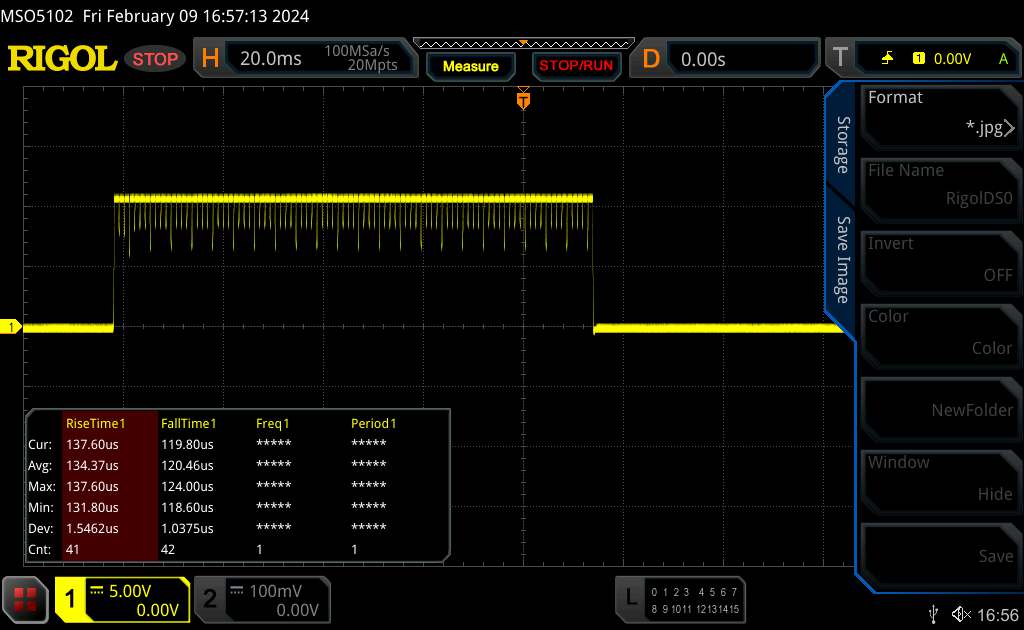 |
| ↘ 0.1 ms queda | ||
| A tela mostra taxas de resposta muito rápidas em nossos testes e deve ser muito adequada para jogos em ritmo acelerado. Em comparação, todos os dispositivos testados variam de 0.1 (mínimo) a 240 (máximo) ms. » 0 % de todos os dispositivos são melhores. Isso significa que o tempo de resposta medido é melhor que a média de todos os dispositivos testados (19.8 ms). | ||
| ↔ Tempo de resposta 50% cinza a 80% cinza | ||
| 0.2 ms ... ascensão ↗ e queda ↘ combinadas | ↗ 0.1 ms ascensão | 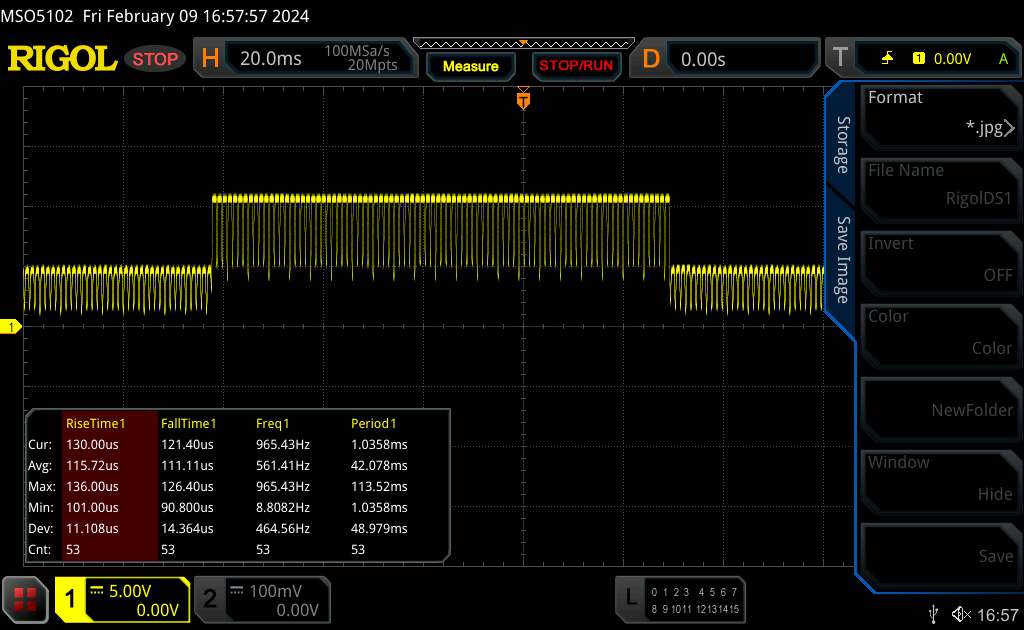 |
| ↘ 0.1 ms queda | ||
| A tela mostra taxas de resposta muito rápidas em nossos testes e deve ser muito adequada para jogos em ritmo acelerado. Em comparação, todos os dispositivos testados variam de 0.165 (mínimo) a 636 (máximo) ms. » 0 % de todos os dispositivos são melhores. Isso significa que o tempo de resposta medido é melhor que a média de todos os dispositivos testados (31 ms). | ||
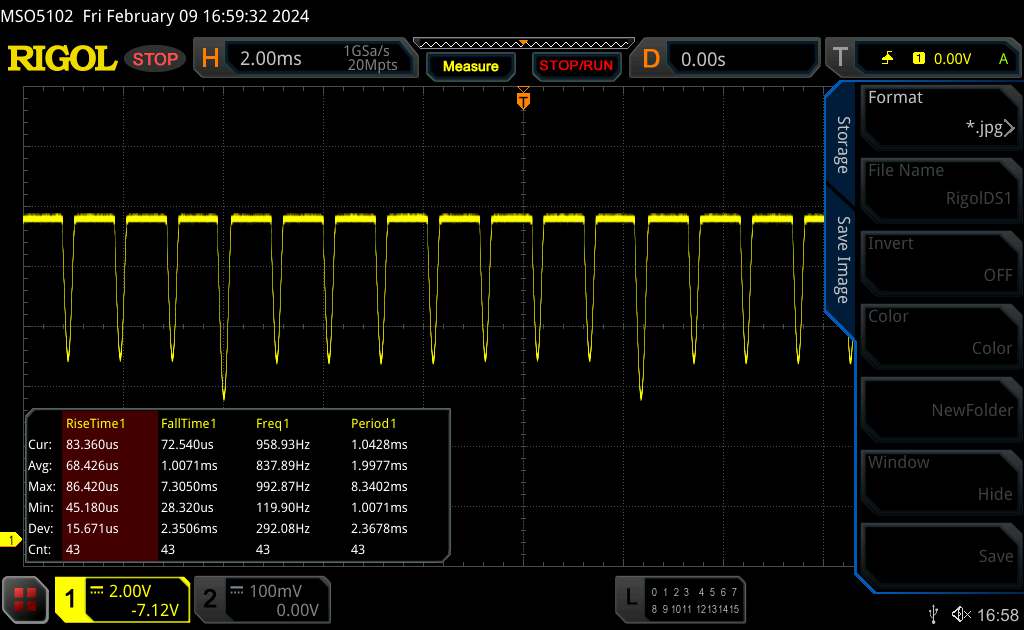
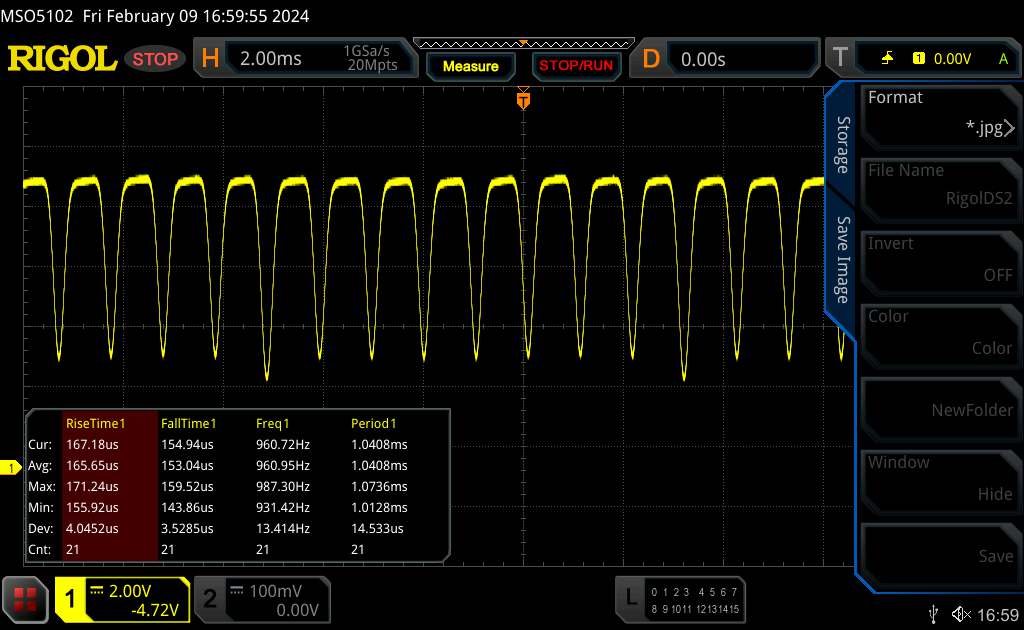
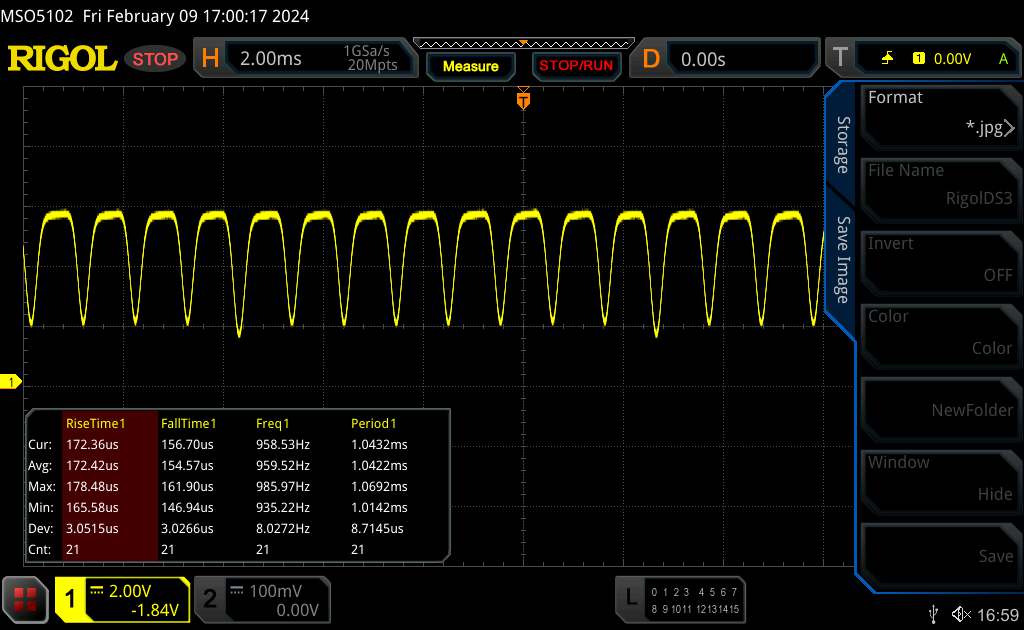
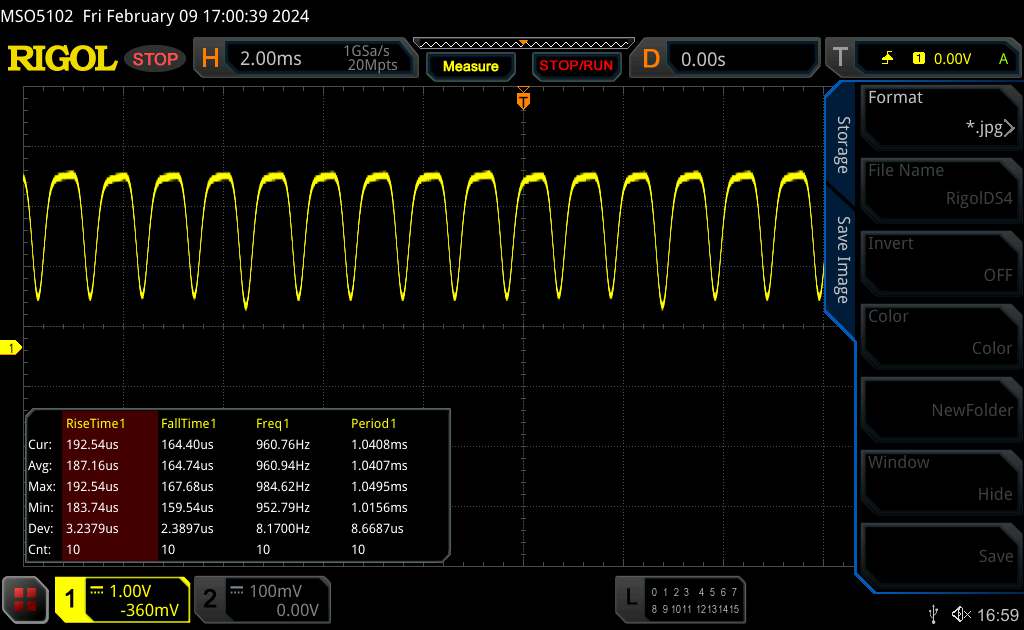
Cintilação da tela / PWM (modulação por largura de pulso)
| Tela tremeluzindo/PWM detectado | 120 Hz | ≤ 100 % configuração de brilho | 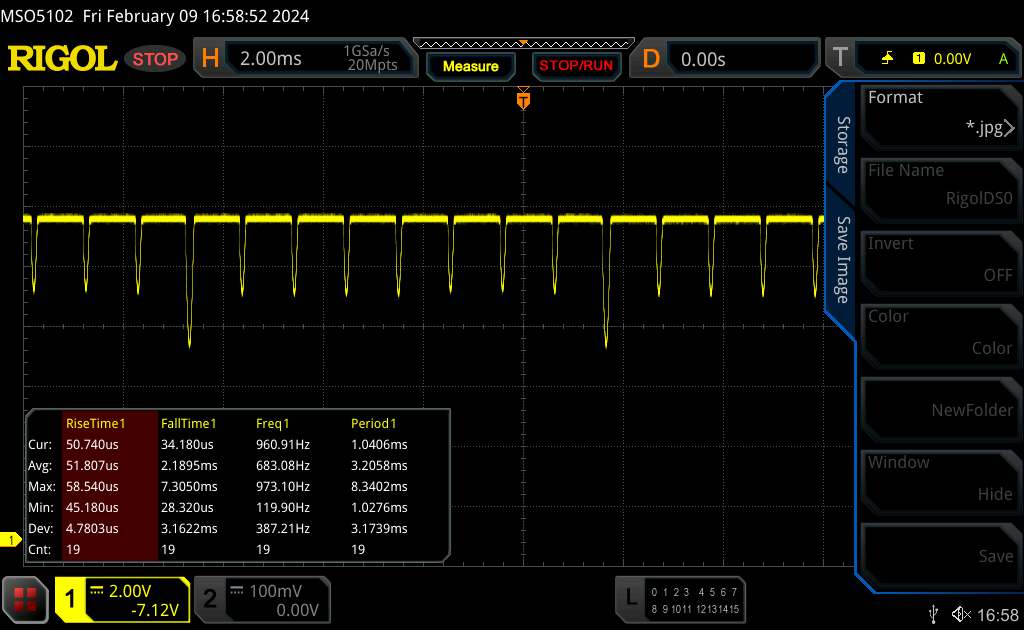 |
A luz de fundo da tela pisca em 120 Hz (pior caso, por exemplo, utilizando PWM) Cintilação detectada em uma configuração de brilho de 100 % e abaixo. Não deve haver cintilação ou PWM acima desta configuração de brilho. A frequência de 120 Hz é muito baixa, portanto a oscilação pode causar fadiga ocular e dores de cabeça após uso prolongado. [pwm_comparison] Em comparação: 52 % de todos os dispositivos testados não usam PWM para escurecer a tela. Se PWM foi detectado, uma média de 7747 (mínimo: 5 - máximo: 343500) Hz foi medida. | |||
Desempenho
Em termos de preço, o Omen Transcend 16 custa a partir de US$ 1.600. A variante de nível básico é equipada com um Core i7-13700HX, a GeForce RTX 406016 GB de RAM e uma tela IPS de baixa resolução. Nosso modelo de análise se encontra mais na extremidade superior da escala de preços e especificações.
Condições de teste
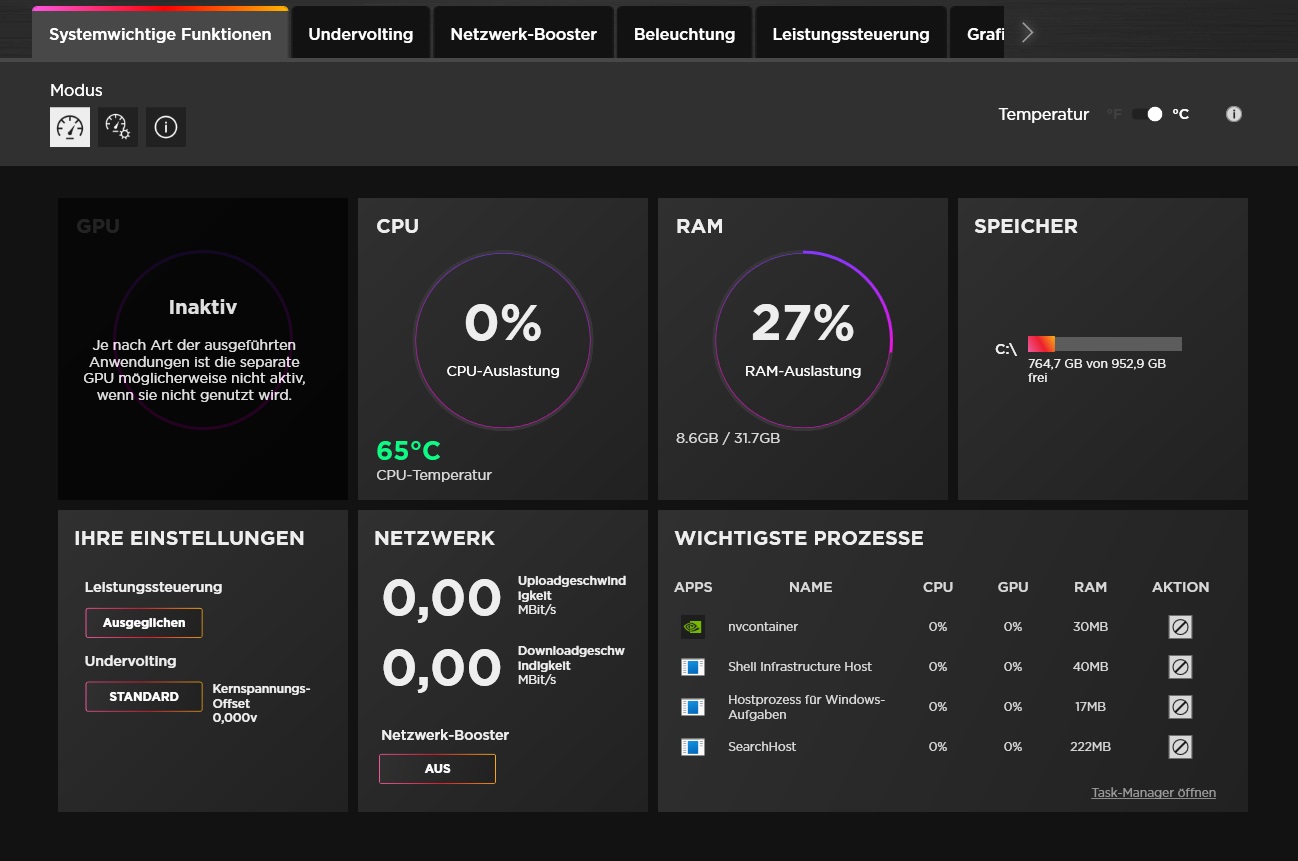
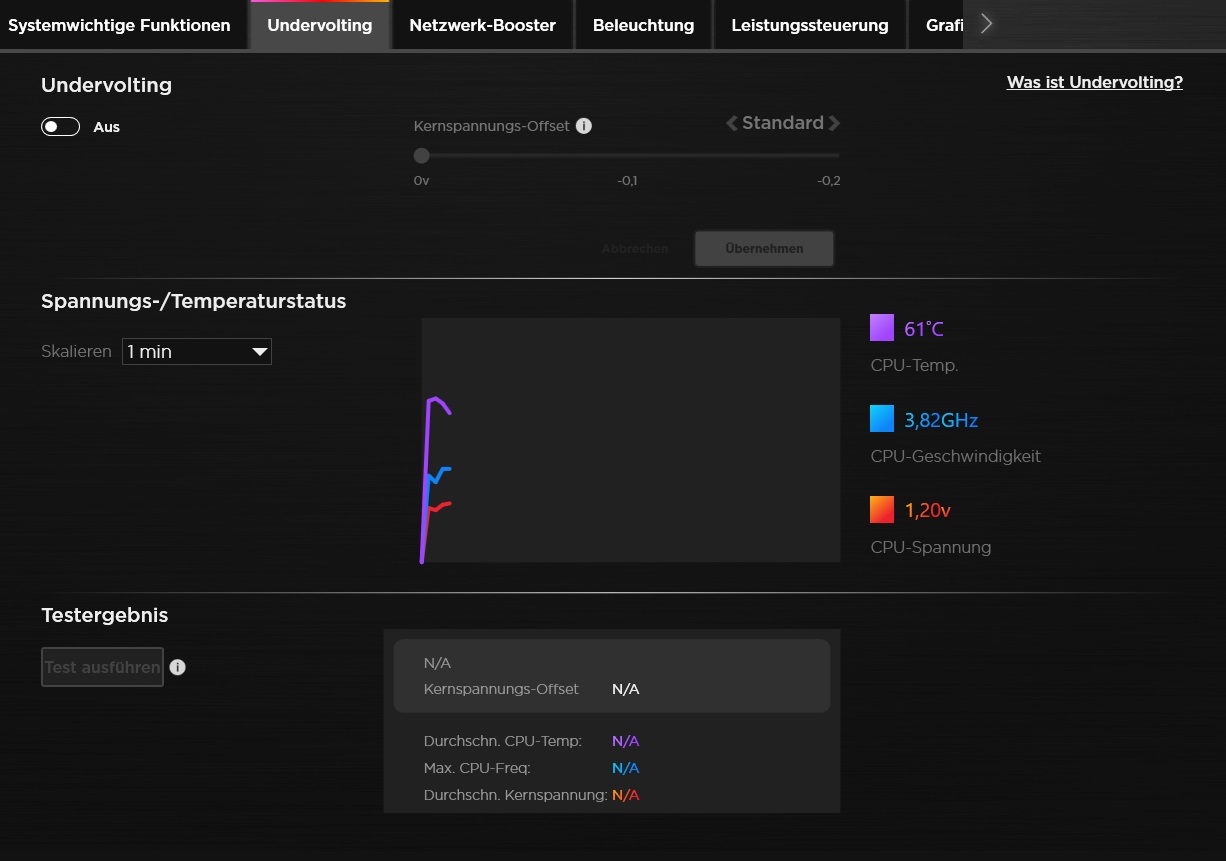
O gerenciamento de desempenho do hub de jogos pré-instalado é um pouco difícil de acessar. No menu correspondente, o senhor encontrará três modos de energia e um gerenciador de calor. Como o modo de desempenho - análogo à maioria dos laptops para jogos - garante um melhor desempenho, mas também uma produção de ruído desproporcional, todas as medições foram realizadas usando o modo balanceado. Portanto, os valores determinados só podem ser comparados com o antecessor até certo ponto. Além disso, o controle automático da ventoinha e a comutação automática de gráficos estavam ativos.
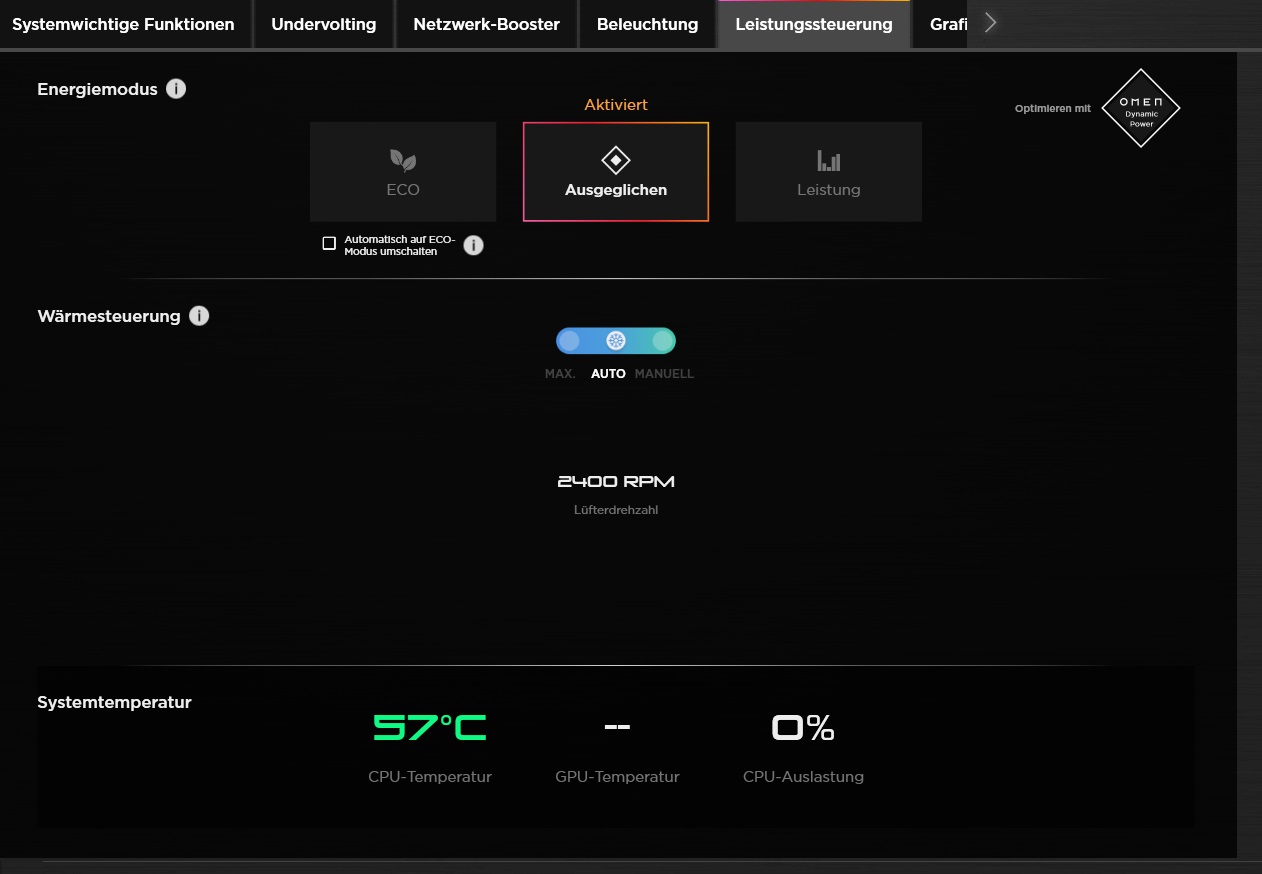

| Witcher 3 (FHD/Ultra) | Eco | Ausgegleichen | Leistung |
| Ruído | 39 dB(A) | 44 dB(A) | 53 dB(A) |
| Desempenho | 60 fps lock | 114 fps | 126 fps |
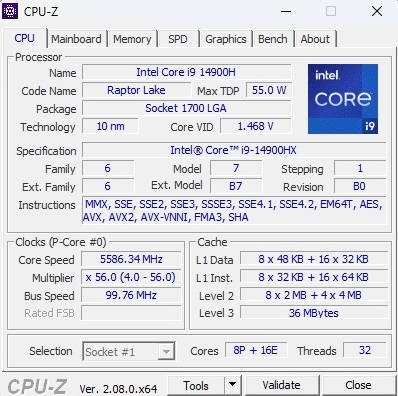
Processador
O Core i9-14900HX é quase desproporcional em comparação com a potência da GPU e a espessura do gabinete. O modelo de 10 nm da série Raptor Lake oferece 8 núcleos de desempenho com hyper threading e 16 núcleos de eficiência sem HT, o que resulta em um total de 32 threads. No modo balanceado, a CPU atinge seu potencial apenas de forma limitada. O melhor exemplo é o nosso loop Cinebench: Embora o desempenho tenha sido relativamente alto nas primeiras execuções, após um curto período, a pontuação caiu bastante (mas depois permaneceu em um nível constante). Em suma, ele só é suficiente para atingir o nível do Ultra 7 155H (ROG Zephyrus G16) ou do Ryzen 7 7840HS (Schenker XMG Core 16).
Cinebench R15 Multi Continuous Test
* ... menor é melhor
AIDA64: FP32 Ray-Trace | FPU Julia | CPU SHA3 | CPU Queen | FPU SinJulia | FPU Mandel | CPU AES | CPU ZLib | FP64 Ray-Trace | CPU PhotoWorxx
| Performance rating | |
| Média da turma Gaming | |
| Média Intel Core i9-14900HX | |
| HP Omen Transcend 16 | |
| Lenovo Legion Pro 5 16ARX8 | |
| Schenker XMG CORE 16 (L23) | |
| HP Omen Transcend 16-u1095ng | |
| Asus ROG Zephyrus G16 2024 GU605M | |
| AIDA64 / FP32 Ray-Trace | |
| Média da turma Gaming (10227 - 85542, n=105, últimos 2 anos) | |
| Lenovo Legion Pro 5 16ARX8 | |
| Schenker XMG CORE 16 (L23) | |
| Média Intel Core i9-14900HX (13098 - 33474, n=36) | |
| HP Omen Transcend 16 | |
| HP Omen Transcend 16-u1095ng | |
| Asus ROG Zephyrus G16 2024 GU605M | |
| AIDA64 / FPU Julia | |
| Média da turma Gaming (51376 - 238426, n=105, últimos 2 anos) | |
| Média Intel Core i9-14900HX (67573 - 166040, n=36) | |
| Lenovo Legion Pro 5 16ARX8 | |
| Schenker XMG CORE 16 (L23) | |
| HP Omen Transcend 16 | |
| HP Omen Transcend 16-u1095ng | |
| Asus ROG Zephyrus G16 2024 GU605M | |
| AIDA64 / CPU SHA3 | |
| Média da turma Gaming (2180 - 10115, n=105, últimos 2 anos) | |
| Média Intel Core i9-14900HX (3589 - 7979, n=36) | |
| HP Omen Transcend 16 | |
| Lenovo Legion Pro 5 16ARX8 | |
| Schenker XMG CORE 16 (L23) | |
| HP Omen Transcend 16-u1095ng | |
| Asus ROG Zephyrus G16 2024 GU605M | |
| AIDA64 / CPU Queen | |
| Média Intel Core i9-14900HX (118405 - 148966, n=36) | |
| Lenovo Legion Pro 5 16ARX8 | |
| HP Omen Transcend 16 | |
| HP Omen Transcend 16-u1095ng | |
| Média da turma Gaming (49785 - 173351, n=90, últimos 2 anos) | |
| Schenker XMG CORE 16 (L23) | |
| Asus ROG Zephyrus G16 2024 GU605M | |
| AIDA64 / FPU SinJulia | |
| Lenovo Legion Pro 5 16ARX8 | |
| Média Intel Core i9-14900HX (10475 - 18517, n=36) | |
| Schenker XMG CORE 16 (L23) | |
| Média da turma Gaming (4424 - 33636, n=105, últimos 2 anos) | |
| HP Omen Transcend 16 | |
| HP Omen Transcend 16-u1095ng | |
| Asus ROG Zephyrus G16 2024 GU605M | |
| AIDA64 / FPU Mandel | |
| Média da turma Gaming (25115 - 128721, n=105, últimos 2 anos) | |
| Lenovo Legion Pro 5 16ARX8 | |
| Schenker XMG CORE 16 (L23) | |
| Média Intel Core i9-14900HX (32543 - 83662, n=36) | |
| HP Omen Transcend 16 | |
| HP Omen Transcend 16-u1095ng | |
| Asus ROG Zephyrus G16 2024 GU605M | |
| AIDA64 / CPU AES | |
| Média Intel Core i9-14900HX (86964 - 241777, n=36) | |
| HP Omen Transcend 16 | |
| Média da turma Gaming (39258 - 247074, n=105, últimos 2 anos) | |
| Schenker XMG CORE 16 (L23) | |
| HP Omen Transcend 16-u1095ng | |
| Asus ROG Zephyrus G16 2024 GU605M | |
| Lenovo Legion Pro 5 16ARX8 | |
| AIDA64 / CPU ZLib | |
| Média Intel Core i9-14900HX (1054 - 2292, n=36) | |
| HP Omen Transcend 16 | |
| Média da turma Gaming (574 - 2531, n=105, últimos 2 anos) | |
| HP Omen Transcend 16-u1095ng | |
| Lenovo Legion Pro 5 16ARX8 | |
| Asus ROG Zephyrus G16 2024 GU605M | |
| Schenker XMG CORE 16 (L23) | |
| AIDA64 / FP64 Ray-Trace | |
| Média da turma Gaming (5509 - 45446, n=105, últimos 2 anos) | |
| Lenovo Legion Pro 5 16ARX8 | |
| Schenker XMG CORE 16 (L23) | |
| Média Intel Core i9-14900HX (6809 - 18349, n=36) | |
| HP Omen Transcend 16 | |
| HP Omen Transcend 16-u1095ng | |
| Asus ROG Zephyrus G16 2024 GU605M | |
| AIDA64 / CPU PhotoWorxx | |
| HP Omen Transcend 16 | |
| HP Omen Transcend 16-u1095ng | |
| Asus ROG Zephyrus G16 2024 GU605M | |
| Média Intel Core i9-14900HX (23903 - 54702, n=36) | |
| Média da turma Gaming (12271 - 89891, n=105, últimos 2 anos) | |
| Schenker XMG CORE 16 (L23) | |
| Lenovo Legion Pro 5 16ARX8 | |
Desempenho do sistema
O desempenho do sistema é bom, mas não está entre os primeiros colocados. Quando se trata da velocidade da RAM, o Transcend garante o segundo lugar no campo de comparação.
CrossMark: Overall | Productivity | Creativity | Responsiveness
WebXPRT 3: Overall
WebXPRT 4: Overall
Mozilla Kraken 1.1: Total
| PCMark 10 / Score | |
| Média da turma Gaming (5828 - 12414, n=93, últimos 2 anos) | |
| Lenovo Legion Pro 5 16ARX8 | |
| Média Intel Core i9-14900HX, NVIDIA GeForce RTX 4070 Laptop GPU (7768 - 8550, n=8) | |
| Schenker XMG CORE 16 (L23) | |
| HP Omen Transcend 16 | |
| HP Omen Transcend 16-u1095ng | |
| Asus ROG Zephyrus G16 2024 GU605M | |
| PCMark 10 / Essentials | |
| HP Omen Transcend 16 | |
| Lenovo Legion Pro 5 16ARX8 | |
| Schenker XMG CORE 16 (L23) | |
| Média Intel Core i9-14900HX, NVIDIA GeForce RTX 4070 Laptop GPU (10104 - 11815, n=8) | |
| Média da turma Gaming (8810 - 11935, n=97, últimos 2 anos) | |
| HP Omen Transcend 16-u1095ng | |
| Asus ROG Zephyrus G16 2024 GU605M | |
| PCMark 10 / Productivity | |
| Média da turma Gaming (6845 - 25323, n=95, últimos 2 anos) | |
| Schenker XMG CORE 16 (L23) | |
| Média Intel Core i9-14900HX, NVIDIA GeForce RTX 4070 Laptop GPU (9577 - 11103, n=8) | |
| HP Omen Transcend 16-u1095ng | |
| Lenovo Legion Pro 5 16ARX8 | |
| HP Omen Transcend 16 | |
| Asus ROG Zephyrus G16 2024 GU605M | |
| PCMark 10 / Digital Content Creation | |
| Média da turma Gaming (7602 - 19954, n=95, últimos 2 anos) | |
| HP Omen Transcend 16 | |
| Lenovo Legion Pro 5 16ARX8 | |
| Média Intel Core i9-14900HX, NVIDIA GeForce RTX 4070 Laptop GPU (12114 - 14827, n=8) | |
| Schenker XMG CORE 16 (L23) | |
| HP Omen Transcend 16-u1095ng | |
| Asus ROG Zephyrus G16 2024 GU605M | |
| CrossMark / Overall | |
| Média Intel Core i9-14900HX, NVIDIA GeForce RTX 4070 Laptop GPU (2002 - 2312, n=7) | |
| Lenovo Legion Pro 5 16ARX8 | |
| Média da turma Gaming (1366 - 2409, n=94, últimos 2 anos) | |
| HP Omen Transcend 16 | |
| Asus ROG Zephyrus G16 2024 GU605M | |
| Schenker XMG CORE 16 (L23) | |
| CrossMark / Productivity | |
| Média Intel Core i9-14900HX, NVIDIA GeForce RTX 4070 Laptop GPU (1827 - 2191, n=7) | |
| Lenovo Legion Pro 5 16ARX8 | |
| Média da turma Gaming (1386 - 2254, n=94, últimos 2 anos) | |
| HP Omen Transcend 16 | |
| Schenker XMG CORE 16 (L23) | |
| Asus ROG Zephyrus G16 2024 GU605M | |
| CrossMark / Creativity | |
| Média Intel Core i9-14900HX, NVIDIA GeForce RTX 4070 Laptop GPU (2258 - 2458, n=7) | |
| HP Omen Transcend 16 | |
| Média da turma Gaming (1343 - 2786, n=94, últimos 2 anos) | |
| Lenovo Legion Pro 5 16ARX8 | |
| Asus ROG Zephyrus G16 2024 GU605M | |
| Schenker XMG CORE 16 (L23) | |
| CrossMark / Responsiveness | |
| Média Intel Core i9-14900HX, NVIDIA GeForce RTX 4070 Laptop GPU (1734 - 2330, n=7) | |
| Lenovo Legion Pro 5 16ARX8 | |
| Média da turma Gaming (1226 - 2334, n=94, últimos 2 anos) | |
| HP Omen Transcend 16 | |
| Schenker XMG CORE 16 (L23) | |
| Asus ROG Zephyrus G16 2024 GU605M | |
| WebXPRT 3 / Overall | |
| Lenovo Legion Pro 5 16ARX8 | |
| HP Omen Transcend 16-u1095ng | |
| HP Omen Transcend 16 | |
| Média Intel Core i9-14900HX, NVIDIA GeForce RTX 4070 Laptop GPU (269 - 342, n=8) | |
| Média da turma Gaming (220 - 532, n=98, últimos 2 anos) | |
| Schenker XMG CORE 16 (L23) | |
| Asus ROG Zephyrus G16 2024 GU605M | |
| WebXPRT 4 / Overall | |
| HP Omen Transcend 16 | |
| Média Intel Core i9-14900HX, NVIDIA GeForce RTX 4070 Laptop GPU (291 - 304, n=6) | |
| Média da turma Gaming (165 - 354, n=98, últimos 2 anos) | |
| Lenovo Legion Pro 5 16ARX8 | |
| Asus ROG Zephyrus G16 2024 GU605M | |
| Mozilla Kraken 1.1 / Total | |
| Asus ROG Zephyrus G16 2024 GU605M | |
| Schenker XMG CORE 16 (L23) | |
| Lenovo Legion Pro 5 16ARX8 | |
| Média da turma Gaming (391 - 590, n=100, últimos 2 anos) | |
| HP Omen Transcend 16 | |
| Média Intel Core i9-14900HX, NVIDIA GeForce RTX 4070 Laptop GPU (431 - 469, n=8) | |
| HP Omen Transcend 16-u1095ng | |
* ... menor é melhor
| PCMark 10 Score | 7866 pontos | |
Ajuda | ||
| AIDA64 / Memory Copy | |
| Asus ROG Zephyrus G16 2024 GU605M | |
| HP Omen Transcend 16-u1095ng | |
| HP Omen Transcend 16 | |
| Média Intel Core i9-14900HX (38028 - 83392, n=36) | |
| Média da turma Gaming (21750 - 129946, n=105, últimos 2 anos) | |
| Schenker XMG CORE 16 (L23) | |
| Lenovo Legion Pro 5 16ARX8 | |
| AIDA64 / Memory Read | |
| Asus ROG Zephyrus G16 2024 GU605M | |
| HP Omen Transcend 16-u1095ng | |
| HP Omen Transcend 16 | |
| Média Intel Core i9-14900HX (43306 - 87568, n=36) | |
| Média da turma Gaming (22956 - 118858, n=105, últimos 2 anos) | |
| Schenker XMG CORE 16 (L23) | |
| Lenovo Legion Pro 5 16ARX8 | |
| AIDA64 / Memory Write | |
| Schenker XMG CORE 16 (L23) | |
| HP Omen Transcend 16-u1095ng | |
| Média da turma Gaming (22297 - 135096, n=105, últimos 2 anos) | |
| HP Omen Transcend 16 | |
| Asus ROG Zephyrus G16 2024 GU605M | |
| Média Intel Core i9-14900HX (37146 - 80589, n=36) | |
| Lenovo Legion Pro 5 16ARX8 | |
| AIDA64 / Memory Latency | |
| Asus ROG Zephyrus G16 2024 GU605M | |
| Média da turma Gaming (75.3 - 259, n=105, últimos 2 anos) | |
| Schenker XMG CORE 16 (L23) | |
| HP Omen Transcend 16 | |
| Lenovo Legion Pro 5 16ARX8 | |
| HP Omen Transcend 16-u1095ng | |
| Média Intel Core i9-14900HX (76.1 - 105, n=36) | |
* ... menor é melhor
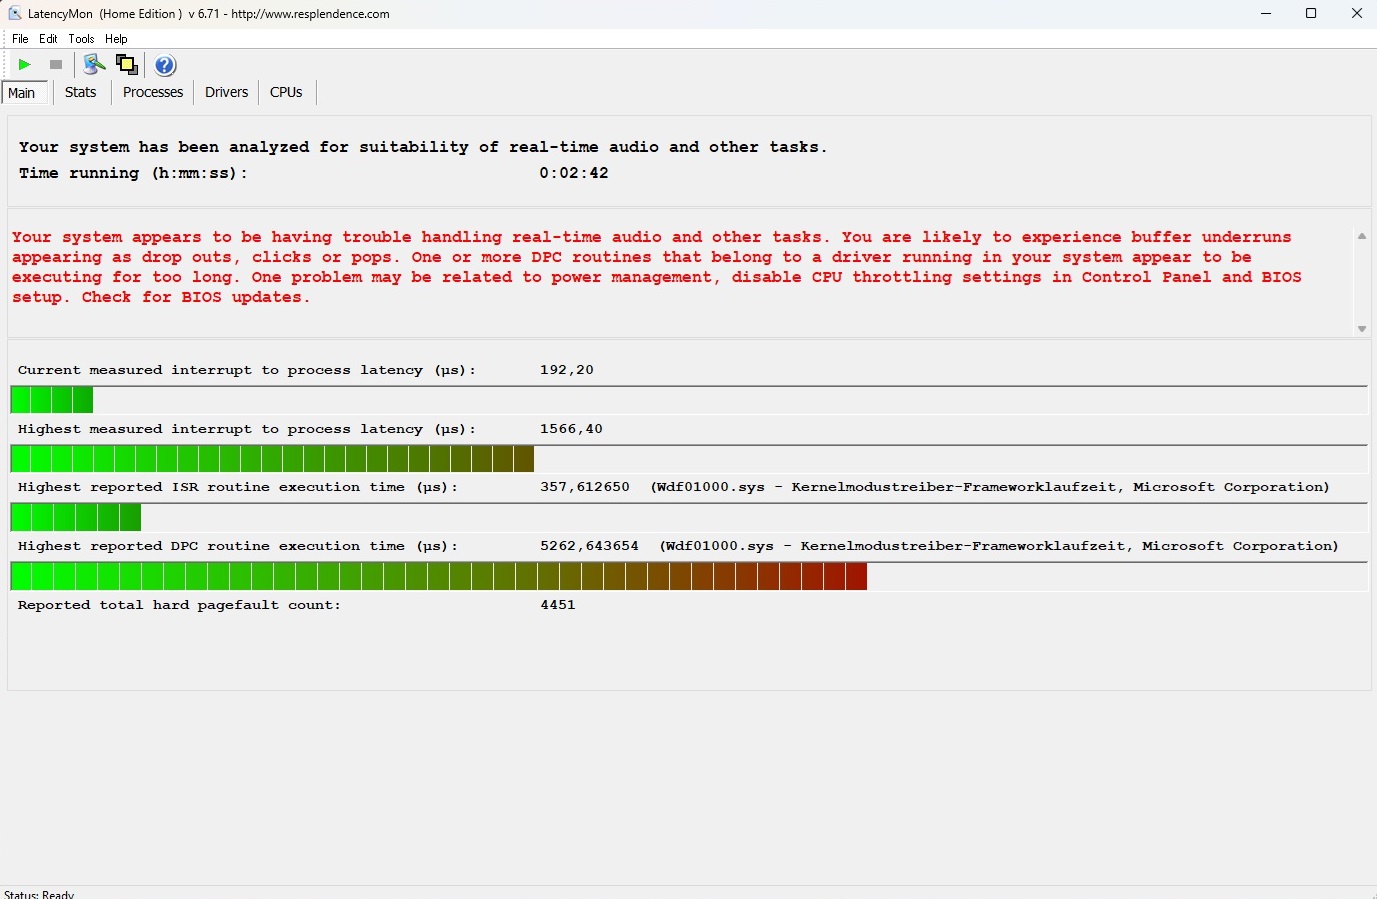
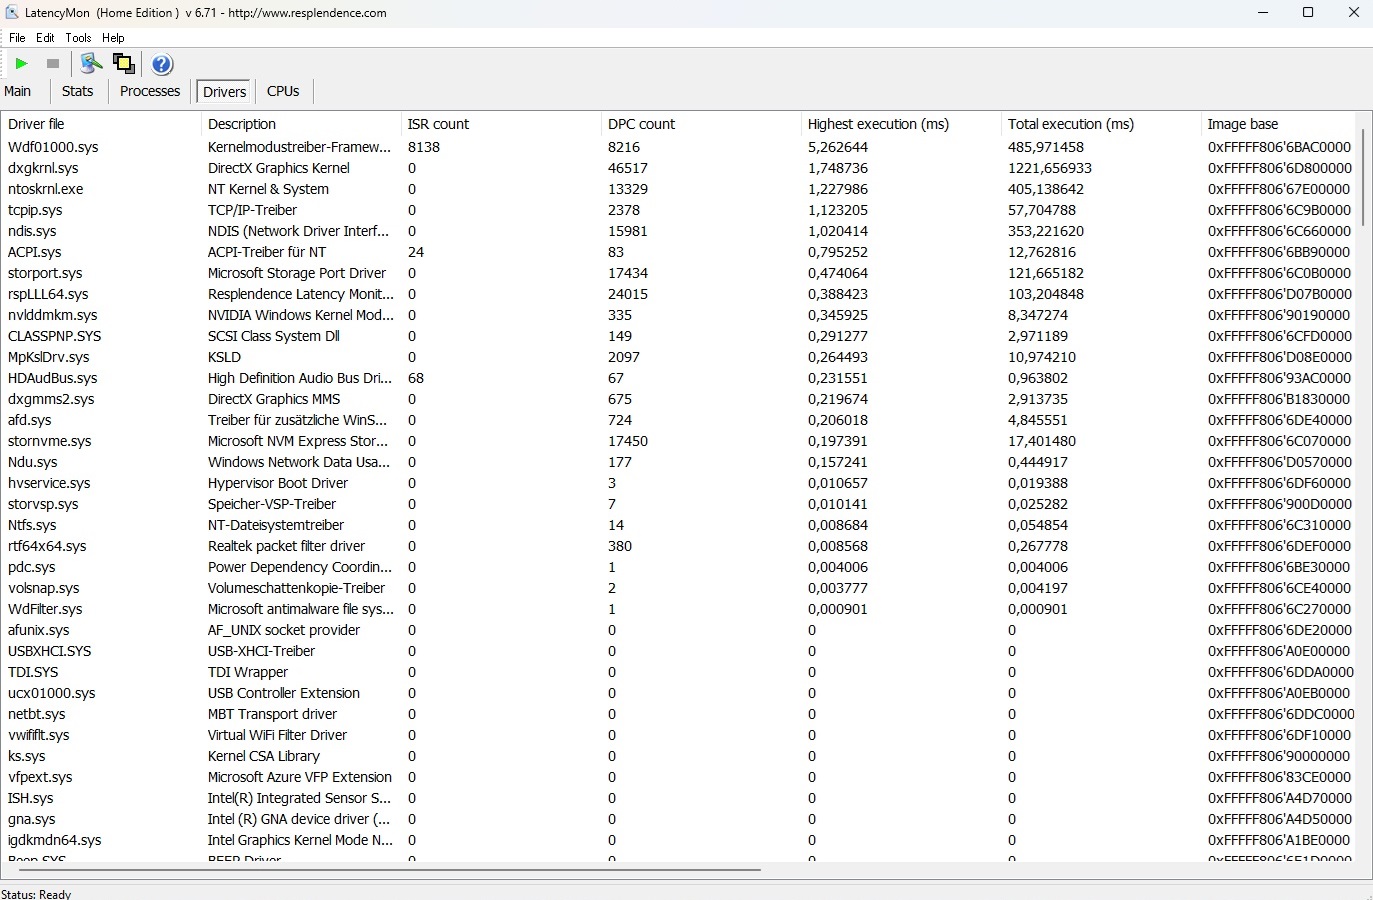
Latências de DPC
Assim como o antecessor, o novo Omen 16 também precisa lidar com latências relativamente altas e isso pode causar problemas em alguns cenários de aplicativos (por exemplo, processamento de áudio e vídeo em tempo real).
| DPC Latencies / LatencyMon - interrupt to process latency (max), Web, Youtube, Prime95 | |
| Asus ROG Zephyrus G16 2024 GU605M | |
| HP Omen Transcend 16-u1095ng | |
| HP Omen Transcend 16 | |
| Schenker XMG CORE 16 (L23) | |
| Lenovo Legion Pro 5 16ARX8 | |
* ... menor é melhor
Armazenamento em massa
Em comparação com o desempenho da CPU, não observamos nenhuma queda no desempenho da SSD. A unidade Kioxia instalada é um pouco mais lenta do que a unidade SK hynix encontrada no antigo Transcend, mas, apesar disso, oferece velocidades suficientemente altas. É uma pena que o dispositivo de 16 polegadas tenha apenas um slot M.2, o que significa que a SSD integrada terá que ser substituída para expandir o armazenamento.

* ... menor é melhor
Continuous Performance Read: DiskSpd Read Loop, Queue Depth 8
Placa de vídeo
A GeForce RTX 4070 é baseada na arquitetura Ada Lovelace e, em termos de desempenho, está mais próxima da RTX 4060 do que da RTX 4080. Apesar do generoso TGP de 130 watts, o Omen 16 navegou em nosso curso de benchmark de maneira ligeiramente abaixo da média, embora a diferença em relação à concorrência seja, às vezes, muito pequena. A preparação para o futuro da RTX 4070 é bastante ruim devido à baixa quantidade de VRAM. Em alguns jogos, 8 GB já pode se tornar um fator limitante. Em nossa opinião, a Nvidia deveria ter dado à GPU pelo menos 12 GB, especialmente porque laptops desse tipo não são exatamente baratos.
| 3DMark Performance rating - Percent | |
| Média da turma Gaming | |
| Schenker XMG CORE 16 (L23) | |
| Lenovo Legion Pro 5 16ARX8 -1! | |
| Média NVIDIA GeForce RTX 4070 Laptop GPU | |
| HP Omen Transcend 16 -1! | |
| HP Omen Transcend 16-u1095ng | |
| Asus ROG Zephyrus G16 2024 GU605M -1! | |
| 3DMark 11 Performance | 32528 pontos | |
| 3DMark Cloud Gate Standard Score | 53528 pontos | |
| 3DMark Fire Strike Score | 23683 pontos | |
| 3DMark Time Spy Score | 11682 pontos | |
Ajuda | ||
* ... menor é melhor
Desempenho em jogos
O Transcend 16 é rápido o suficiente para poder jogar quase todos os jogos em sua resolução nativa de 2.560 x 1.600 e em configurações altas ou máximas. As coisas só ficam problemáticas em jogos muito exigentes ou mal otimizados, como o Enshrouded. Para monitores 4K, recomendamos pelo menos uma RTX 4080.
| The Witcher 3 - 1920x1080 Ultra Graphics & Postprocessing (HBAO+) | |
| Média da turma Gaming (104.7 - 240, n=6, últimos 2 anos) | |
| Schenker XMG CORE 16 (L23) | |
| Lenovo Legion Pro 5 16ARX8 | |
| HP Omen Transcend 16-u1095ng | |
| Média NVIDIA GeForce RTX 4070 Laptop GPU (69.8 - 133.7, n=57) | |
| HP Omen Transcend 16 | |
| Asus ROG Zephyrus G16 2024 GU605M | |
| Final Fantasy XV Benchmark - 1920x1080 High Quality | |
| Média da turma Gaming (41 - 215, n=95, últimos 2 anos) | |
| Schenker XMG CORE 16 (L23) | |
| Lenovo Legion Pro 5 16ARX8 | |
| Média NVIDIA GeForce RTX 4070 Laptop GPU (41 - 131.9, n=65) | |
| HP Omen Transcend 16-u1095ng | |
| Asus ROG Zephyrus G16 2024 GU605M | |
| Enshrouded - 2560x1440 Max. Quality AA:FX | |
| HP Omen Transcend 16-u1095ng | |
| Média NVIDIA GeForce RTX 4070 Laptop GPU (38.9 - 42.3, n=2) | |
| XMG Pro 15 E23 | |
| Palworld - 2560x1440 Epic Preset AA:TSR | |
| XMG Pro 15 E23 | |
| Média NVIDIA GeForce RTX 4070 Laptop GPU (69.1 - 81.3, n=2) | |
| HP Omen Transcend 16-u1095ng | |
| Prince of Persia The Lost Crown - 2560x1440 Ultra Preset AA:SM | |
| Média da turma Gaming (352 - 357, n=4, últimos 2 anos) | |
| XMG Pro 15 E23 | |
| Média NVIDIA GeForce RTX 4070 Laptop GPU (325 - 354, n=2) | |
| HP Omen Transcend 16-u1095ng | |
| Ready or Not - 2560x1440 Epic Preset | |
| XMG Pro 15 E23 | |
| Média NVIDIA GeForce RTX 4070 Laptop GPU (84.8 - 95.6, n=2) | |
| HP Omen Transcend 16-u1095ng | |
| The Finals - 2560x1440 Epic Preset | |
| XMG Pro 15 E23 | |
| Média NVIDIA GeForce RTX 4070 Laptop GPU (82.8 - 94.6, n=3) | |
| HP Omen Transcend 16-u1095ng | |
| Média da turma Gaming (n=1últimos 2 anos) | |
Usamos o jogo de interpretação de papéis, The Witcher 3 (FHD/Ultra) para ver como o desempenho 3D se comporta em um período de tempo mais longo e, mesmo depois de aproximadamente uma hora, a taxa de quadros permaneceu muito estável.
Witcher 3 FPS diagram
| baixo | média | alto | ultra | QHD | |
|---|---|---|---|---|---|
| GTA V (2015) | 181.2 | 175.3 | 115.8 | ||
| The Witcher 3 (2015) | 114 | ||||
| Dota 2 Reborn (2015) | 202 | 178.9 | 167 | 154.1 | |
| Final Fantasy XV Benchmark (2018) | 147.5 | 108.3 | |||
| X-Plane 11.11 (2018) | 166.6 | 141.7 | 114.9 | ||
| Strange Brigade (2018) | 272 | 220 | 194.2 | ||
| The Finals (2023) | 168 | 130.2 | 82.8 | ||
| Ready or Not (2023) | 194.2 | 134 | 84.8 | ||
| Prince of Persia The Lost Crown (2024) | 358 | 358 | 325 | ||
| Palworld (2024) | 102.2 | 96.6 | 69.1 | ||
| Enshrouded (2024) | 66.6 | 56.5 | 42.3 | ||
| Helldivers 2 (2024) | 91.5 | 91.1 | 69.2 |
Emissões
Emissões de ruído
Se o senhor se limitar a usar o modo balanceado, o dispositivo de 16 polegadas não fica muito alto. O nível de ruído 3D de 44 a 47 dB(A) é audível, mas não irritante (o último se aplica ao modo de desempenho com uma gravação de mais de 50 dB). No modo ocioso, as ventoinhas estão continuamente ativas e funcionam a um nível audível de 29 a 31 dB(A), o que não é o ideal.
Barulho
| Ocioso |
| 29 / 30 / 31 dB |
| Carga |
| 45 / 47 dB |
 | ||
30 dB silencioso 40 dB(A) audível 50 dB(A) ruidosamente alto |
||
min: | ||
| HP Omen Transcend 16-u1095ng i9-14900HX, GeForce RTX 4070 Laptop GPU | HP Omen Transcend 16 i9-13900HX, GeForce RTX 4070 Laptop GPU | Asus ROG Zephyrus G16 2024 GU605M Ultra 7 155H, GeForce RTX 4070 Laptop GPU | Schenker XMG CORE 16 (L23) R7 7840HS, GeForce RTX 4070 Laptop GPU | Lenovo Legion Pro 5 16ARX8 R7 7745HX, GeForce RTX 4070 Laptop GPU | |
|---|---|---|---|---|---|
| Noise | -4% | 7% | 5% | 10% | |
| desligado / ambiente * (dB) | 24 | 22.9 5% | 23.9 -0% | 23 4% | 23.2 3% |
| Idle Minimum * (dB) | 29 | 29.1 -0% | 23.9 18% | 23 21% | 23.2 20% |
| Idle Average * (dB) | 30 | 29.1 3% | 27.8 7% | 28.48 5% | 23.2 23% |
| Idle Maximum * (dB) | 31 | 29.1 6% | 30.1 3% | 28.48 8% | 26.2 15% |
| Load Average * (dB) | 45 | 45.7 -2% | 34.2 24% | 30 33% | 31.4 30% |
| Witcher 3 ultra * (dB) | 44 | 54.3 -23% | 46.4 -5% | 54.12 -23% | 48.4 -10% |
| Load Maximum * (dB) | 47 | 54.3 -16% | 46.4 1% | 54.12 -15% | 53.8 -14% |
* ... menor é melhor
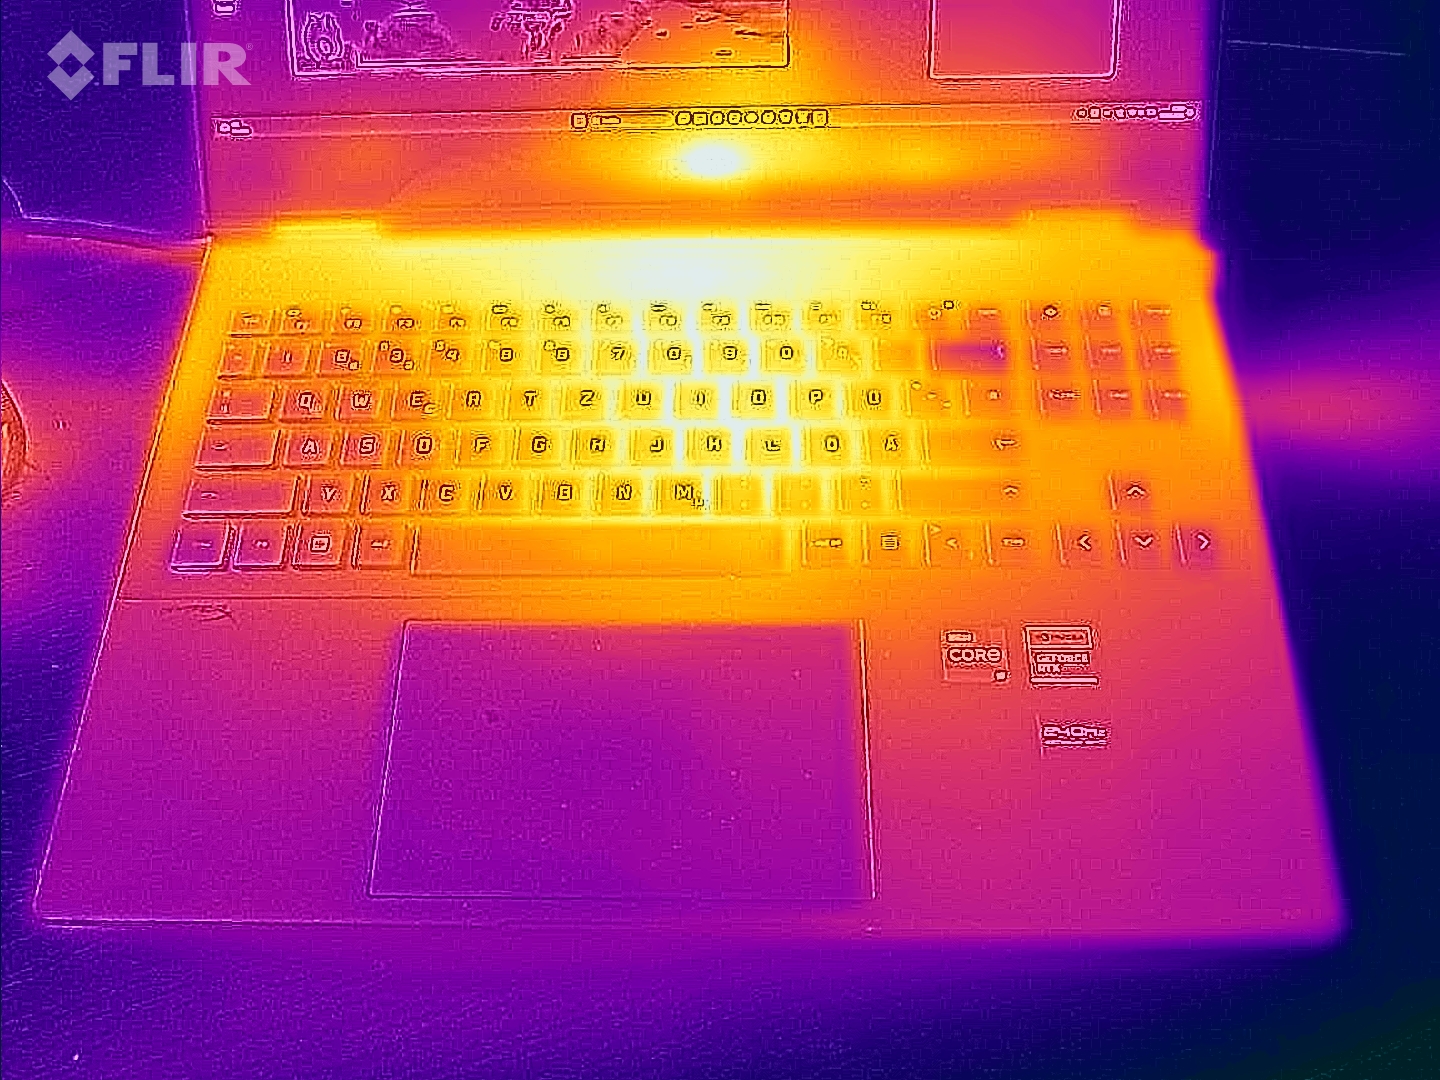
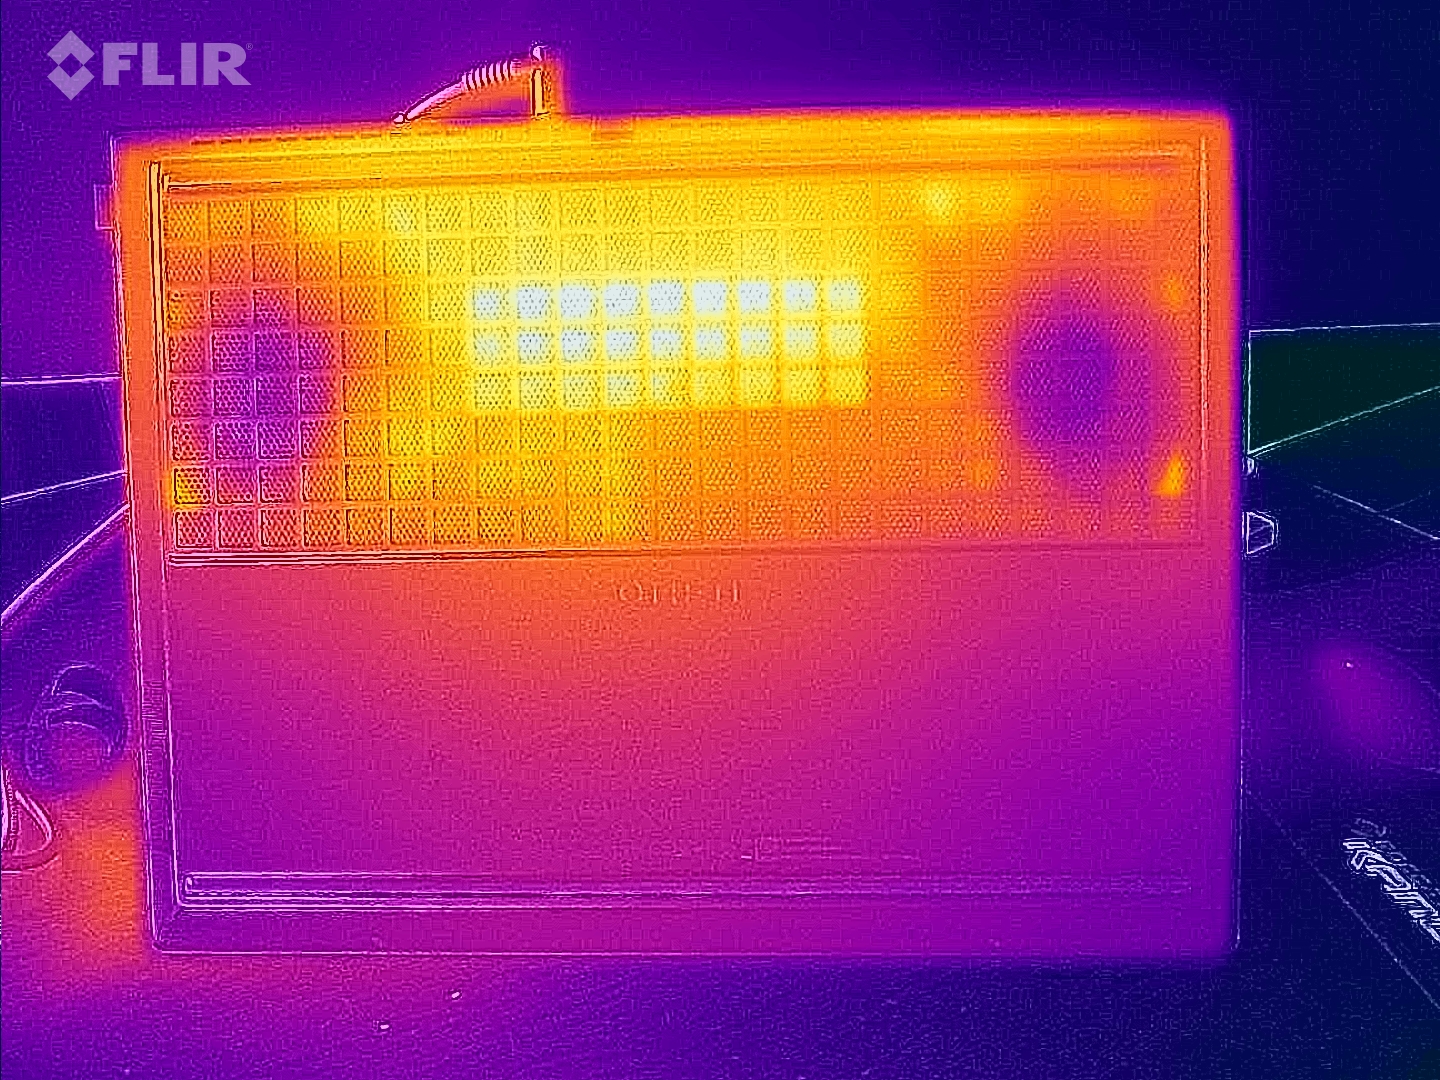
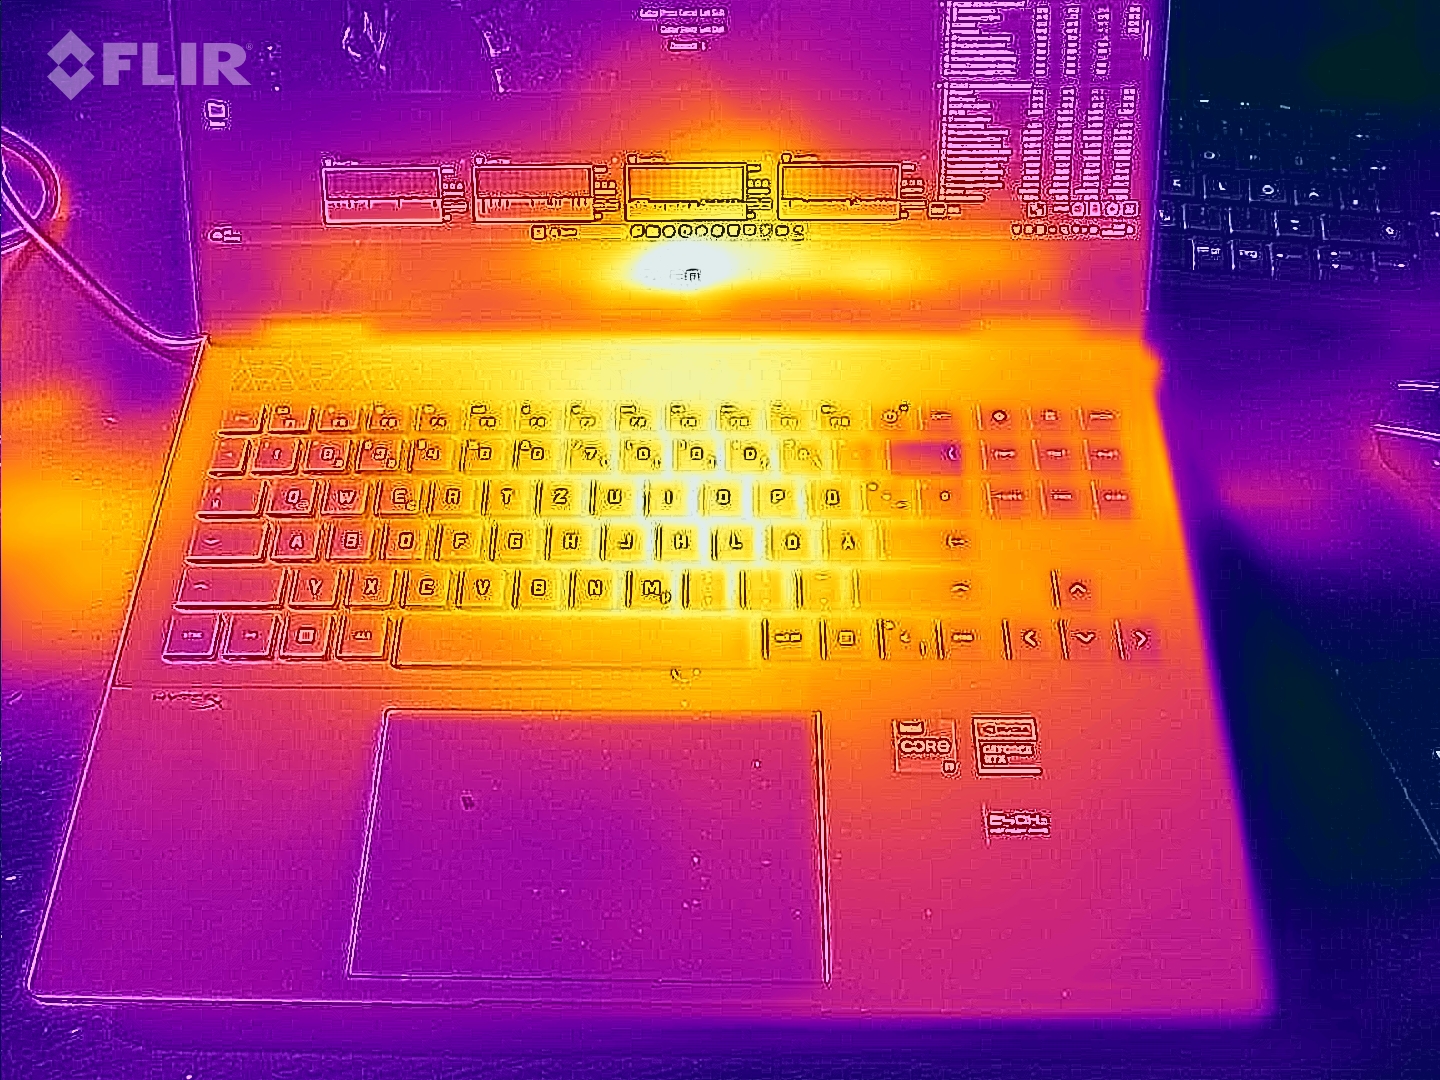
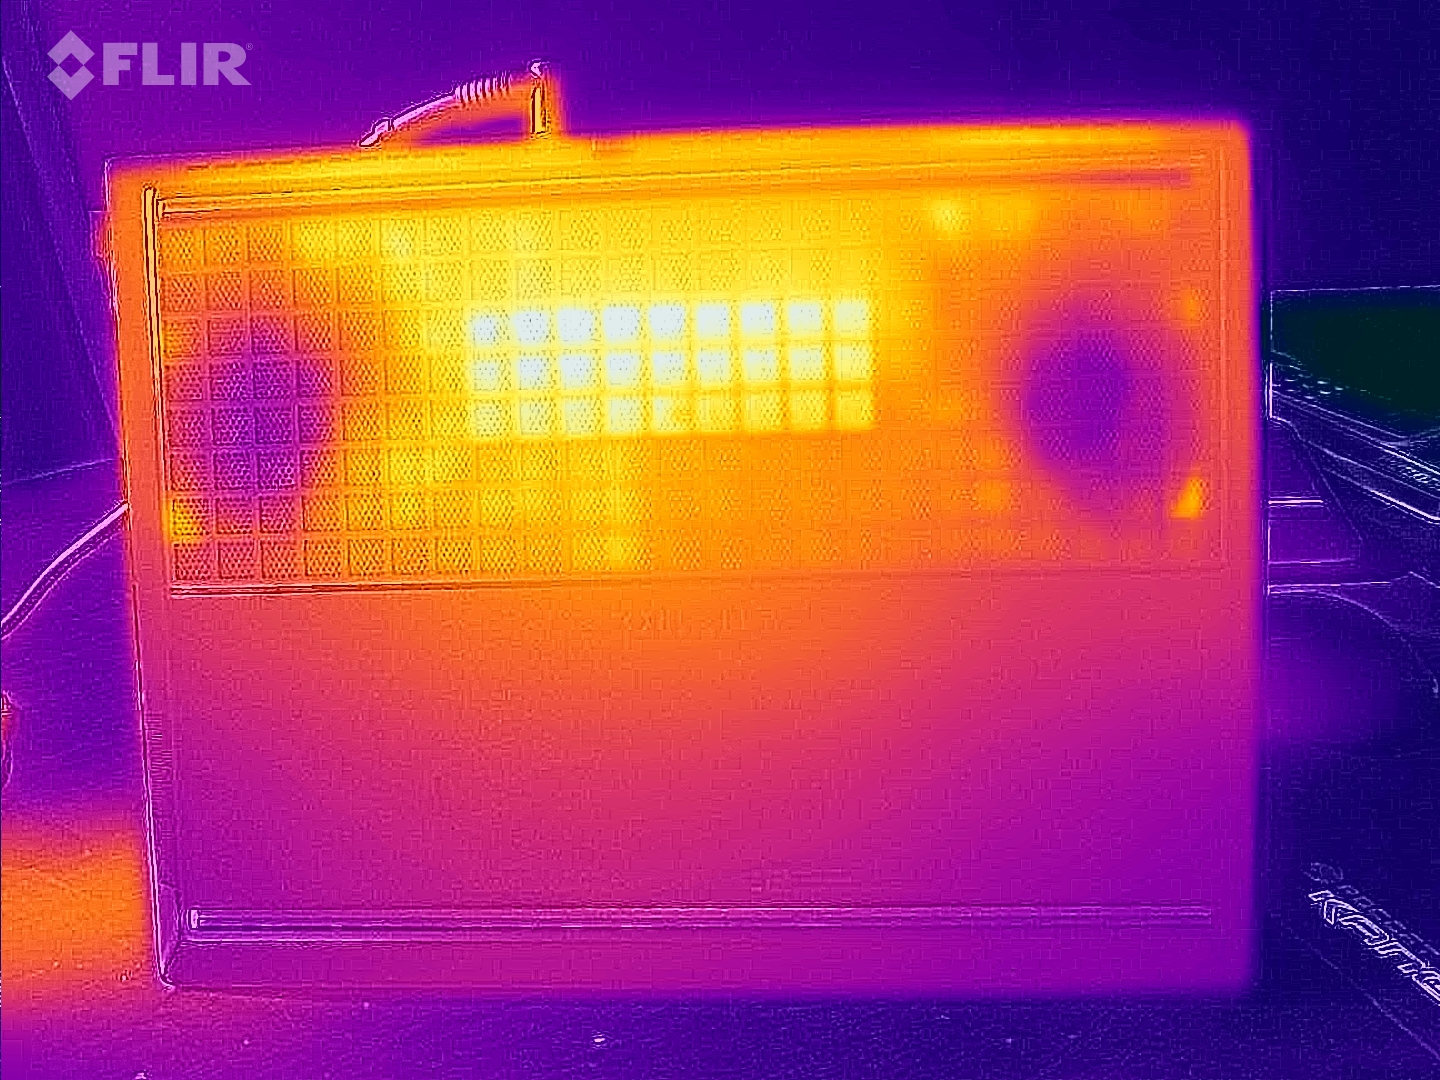
Temperatura
Embora as temperaturas na parte superior do laptop estejam no meio do pacote, a base do gabinete fica mais quente do que a concorrência sob carga. Um máximo de 63 °C (em jogos) impedirá que os usuários usem o dispositivo colocado no colo. Em operação inativa, a situação é significativamente mais confortável, com o chassi permanecendo agradavelmente frio a um máximo de 30 °C.
(-) A temperatura máxima no lado superior é 49 °C / 120 F, em comparação com a média de 40.4 °C / 105 F , variando de 21.2 a 68.8 °C para a classe Gaming.
(-) A parte inferior aquece até um máximo de 63 °C / 145 F, em comparação com a média de 43.2 °C / 110 F
(+) Em uso inativo, a temperatura média para o lado superior é 26.6 °C / 80 F, em comparação com a média do dispositivo de 33.9 °C / ### class_avg_f### F.
(-) Jogando The Witcher 3, a temperatura média para o lado superior é 40.3 °C / 105 F, em comparação com a média do dispositivo de 33.9 °C / ## #class_avg_f### F.
(+) Os apoios para as mãos e o touchpad estão atingindo a temperatura máxima da pele (35 °C / 95 F) e, portanto, não estão quentes.
(-) A temperatura média da área do apoio para as mãos de dispositivos semelhantes foi 28.8 °C / 83.8 F (-6.2 °C / -11.2 F).
| HP Omen Transcend 16-u1095ng i9-14900HX, GeForce RTX 4070 Laptop GPU | HP Omen Transcend 16 i9-13900HX, GeForce RTX 4070 Laptop GPU | Asus ROG Zephyrus G16 2024 GU605M Ultra 7 155H, GeForce RTX 4070 Laptop GPU | Schenker XMG CORE 16 (L23) R7 7840HS, GeForce RTX 4070 Laptop GPU | Lenovo Legion Pro 5 16ARX8 R7 7745HX, GeForce RTX 4070 Laptop GPU | |
|---|---|---|---|---|---|
| Heat | 5% | 6% | 4% | 12% | |
| Maximum Upper Side * (°C) | 49 | 47.4 3% | 50.3 -3% | 46 6% | 41.8 15% |
| Maximum Bottom * (°C) | 63 | 54.4 14% | 48 24% | 44 30% | 41.4 34% |
| Idle Upper Side * (°C) | 30 | 28.4 5% | 28.8 4% | 32 -7% | 29 3% |
| Idle Bottom * (°C) | 29 | 29.2 -1% | 29.8 -3% | 33 -14% | 30.4 -5% |
* ... menor é melhor
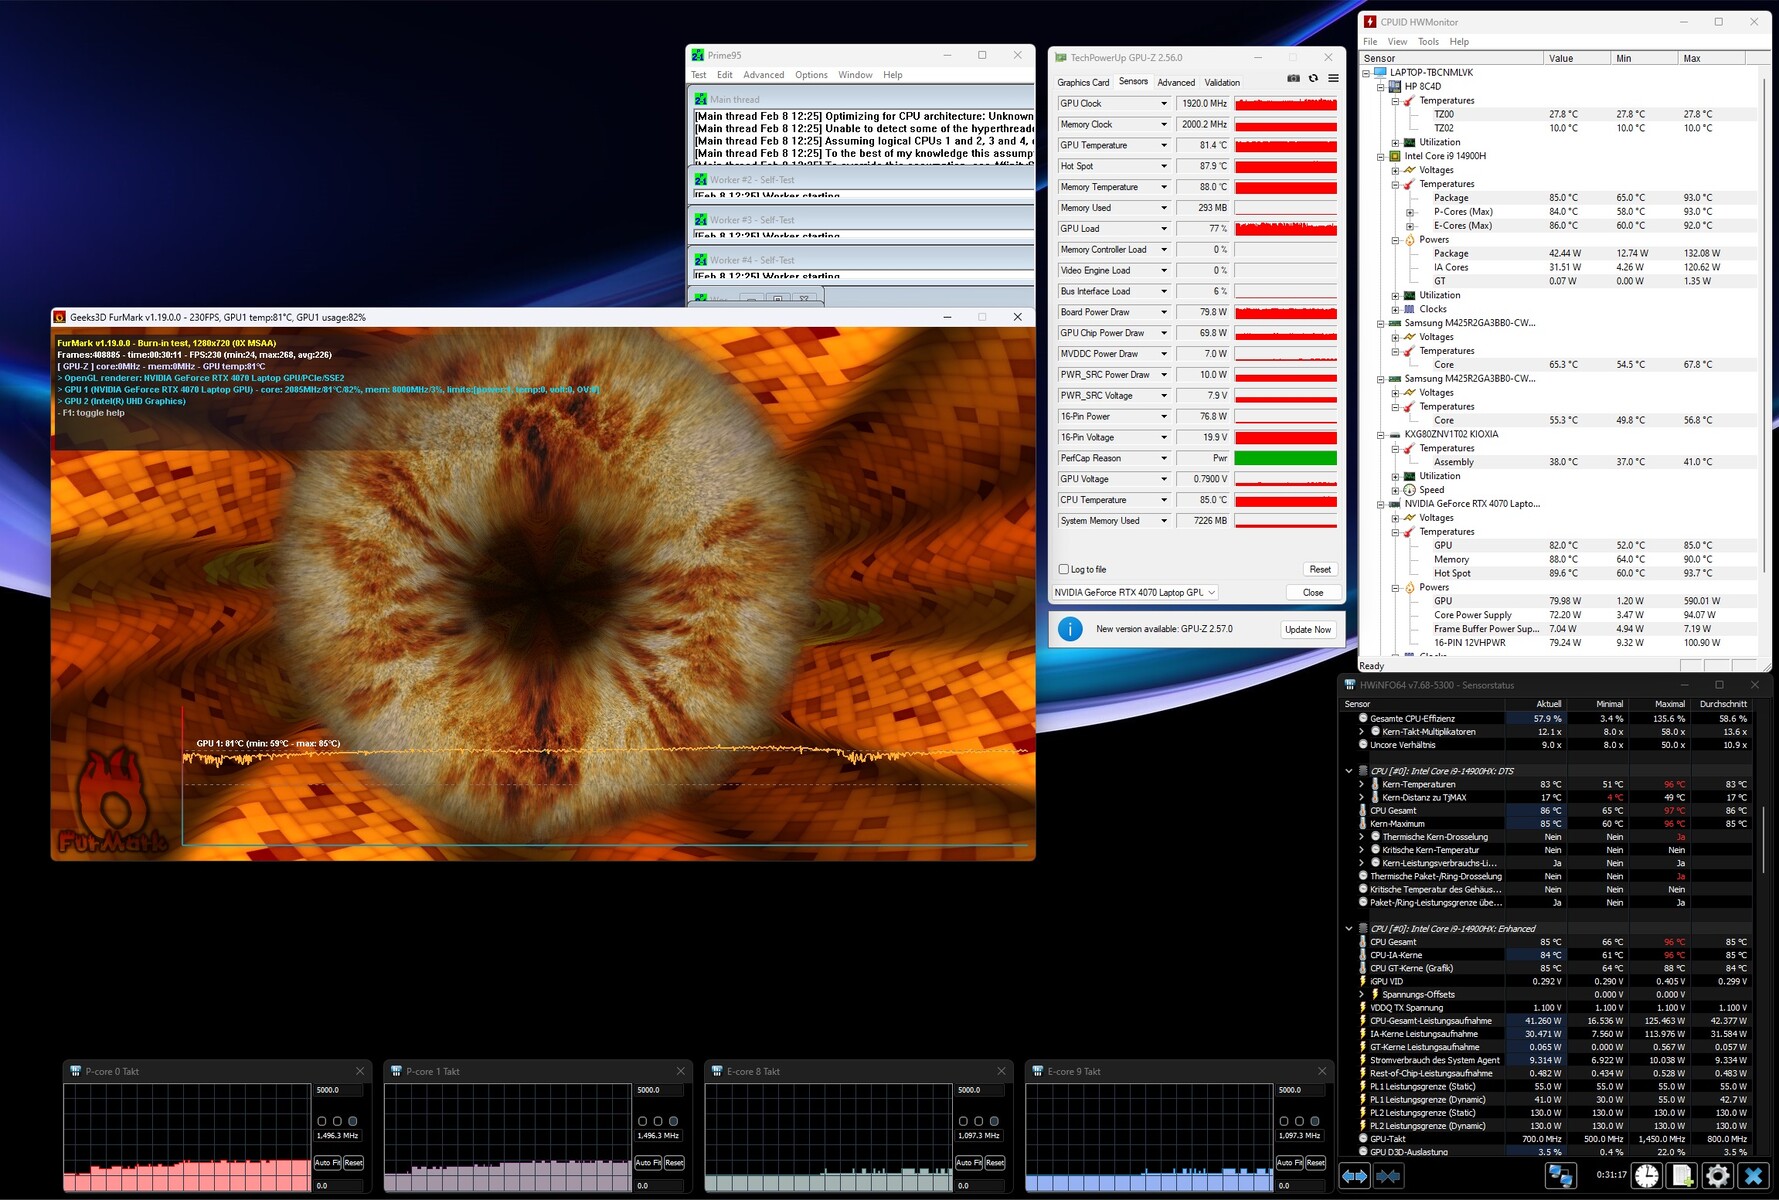
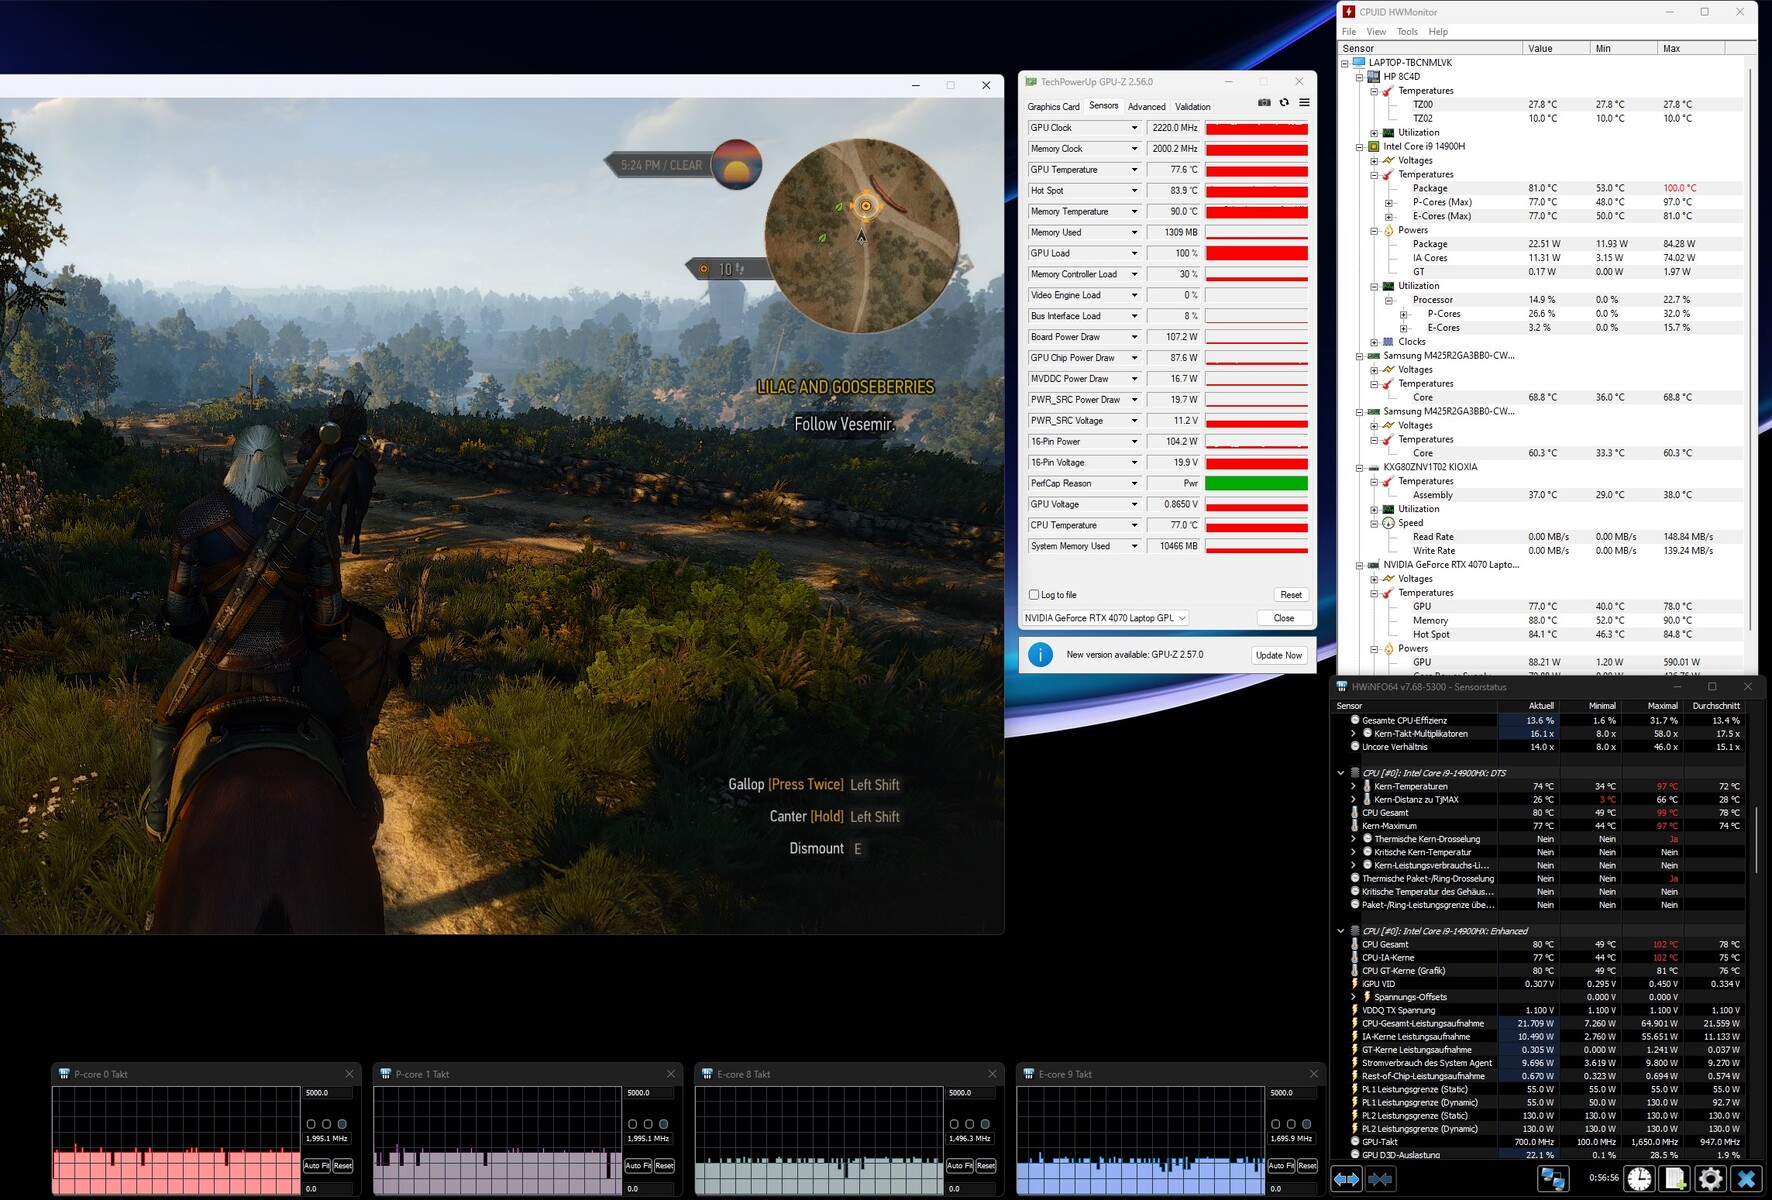
Teste de estresse
No teste de estresse usando as ferramentas Furmark e Prime95, após 60 minutos, a CPU ficou em torno de 85 °C, enquanto a GPU atingiu 81 °C (um ponto de acesso de 88 °C) - ambos valores relativamente altos, mas inofensivos.
Alto-falantes
A qualidade do som é um pouco melhor do que a média geral dos notebooks para jogos, embora, como geralmente acontece, os graves tenham dificuldades e poderiam ser mais potentes e precisos. O volume máximo de 82 dB(A) é mais do que decente.
HP Omen Transcend 16-u1095ng análise de áudio
(+) | os alto-falantes podem tocar relativamente alto (###valor### dB)
Graves 100 - 315Hz
(-) | quase nenhum baixo - em média 21.9% menor que a mediana
(±) | a linearidade dos graves é média (11% delta para a frequência anterior)
Médios 400 - 2.000 Hz
(+) | médios equilibrados - apenas 3.2% longe da mediana
(+) | médios são lineares (5.3% delta para frequência anterior)
Altos 2 - 16 kHz
(+) | agudos equilibrados - apenas 1.4% longe da mediana
(+) | os máximos são lineares (5.2% delta da frequência anterior)
Geral 100 - 16.000 Hz
(+) | o som geral é linear (14.5% diferença em relação à mediana)
Comparado com a mesma classe
» 27% de todos os dispositivos testados nesta classe foram melhores, 7% semelhantes, 66% piores
» O melhor teve um delta de 6%, a média foi 18%, o pior foi 132%
Comparado com todos os dispositivos testados
» 18% de todos os dispositivos testados foram melhores, 4% semelhantes, 77% piores
» O melhor teve um delta de 4%, a média foi 23%, o pior foi 134%
Asus ROG Zephyrus G16 2024 GU605M análise de áudio
(+) | os alto-falantes podem tocar relativamente alto (###valor### dB)
Graves 100 - 315Hz
(+) | bons graves - apenas 3.8% longe da mediana
(±) | a linearidade dos graves é média (8.1% delta para a frequência anterior)
Médios 400 - 2.000 Hz
(+) | médios equilibrados - apenas 3.5% longe da mediana
(+) | médios são lineares (2.4% delta para frequência anterior)
Altos 2 - 16 kHz
(+) | agudos equilibrados - apenas 2.2% longe da mediana
(+) | os máximos são lineares (3.7% delta da frequência anterior)
Geral 100 - 16.000 Hz
(+) | o som geral é linear (7.3% diferença em relação à mediana)
Comparado com a mesma classe
» 1% de todos os dispositivos testados nesta classe foram melhores, 0% semelhantes, 99% piores
» O melhor teve um delta de 6%, a média foi 18%, o pior foi 132%
Comparado com todos os dispositivos testados
» 1% de todos os dispositivos testados foram melhores, 0% semelhantes, 99% piores
» O melhor teve um delta de 4%, a média foi 23%, o pior foi 134%
Gerenciamento de energia
Consumo de energia
Os requisitos de energia são semelhantes aos valores padrão encontrados nessa categoria de desempenho. o consumo de 10 a 32 watts em modo inativo e o consumo de 128 a 242 watts sob carga não são particularmente altos nem baixos.
| desligado | |
| Ocioso | |
| Carga |
|
Key:
min: | |
| HP Omen Transcend 16-u1095ng i9-14900HX, GeForce RTX 4070 Laptop GPU | HP Omen Transcend 16 i9-13900HX, GeForce RTX 4070 Laptop GPU | Asus ROG Zephyrus G16 2024 GU605M Ultra 7 155H, GeForce RTX 4070 Laptop GPU | Schenker XMG CORE 16 (L23) R7 7840HS, GeForce RTX 4070 Laptop GPU | Lenovo Legion Pro 5 16ARX8 R7 7745HX, GeForce RTX 4070 Laptop GPU | Média da turma Gaming | |
|---|---|---|---|---|---|---|
| Power Consumption | -42% | 33% | 12% | 1% | -1% | |
| Idle Minimum * (Watt) | 10 | 19.2 -92% | 8.3 17% | 11 -10% | 8.1 19% | 13 ? -30% |
| Idle Average * (Watt) | 18 | 22.7 -26% | 12.5 31% | 15.2 16% | 15.9 12% | 18.7 ? -4% |
| Idle Maximum * (Watt) | 32 | 55.4 -73% | 12.8 60% | 16 50% | 37.2 -16% | 24.3 ? 24% |
| Load Average * (Watt) | 128 | 128.4 -0% | 71.3 44% | 64 50% | 90.9 29% | 110.2 ? 14% |
| Witcher 3 ultra * (Watt) | 148.4 | 206 -39% | 127.5 14% | 179 -21% | 189.6 -28% | |
| Load Maximum * (Watt) | 242 | 292 -21% | 169.1 30% | 280 -16% | 263.5 -9% | 258 ? -7% |
* ... menor é melhor
Power consumption Witcher 3 / stress test
Power consumption with an external monitor
Duração da bateria
No que diz respeito aos requisitos de energia no modo de bateria, a HP ainda tem algum trabalho a fazer. Apesar da potente bateria de 97 Wh, a máquina de 16 polegadas só conseguiu durar pouco menos de 5 horas em nosso teste de Wi-Fi com um brilho reduzido de 150 cd/m². Como comparação: O ROG Zyphrus G16 conseguiu mais de 7 horas e o XMG Core 16 chegou a durar mais de 8 horas.
| HP Omen Transcend 16-u1095ng i9-14900HX, GeForce RTX 4070 Laptop GPU, 97 Wh | HP Omen Transcend 16 i9-13900HX, GeForce RTX 4070 Laptop GPU, 97 Wh | Asus ROG Zephyrus G16 2024 GU605M Ultra 7 155H, GeForce RTX 4070 Laptop GPU, 90 Wh | Schenker XMG CORE 16 (L23) R7 7840HS, GeForce RTX 4070 Laptop GPU, 99 Wh | Lenovo Legion Pro 5 16ARX8 R7 7745HX, GeForce RTX 4070 Laptop GPU, 80 Wh | Média da turma Gaming | |
|---|---|---|---|---|---|---|
| Duração da bateria | -14% | 49% | 71% | -18% | 45% | |
| WiFi v1.3 (h) | 4.9 | 4.2 -14% | 7.3 49% | 8.4 71% | 4 -18% | 7.11 ? 45% |
| Reader / Idle (h) | 6.3 | 6.5 | 8.71 ? | |||
| Load (h) | 1.2 | 1.2 | 2.4 | 1 | 1.502 ? | |
| H.264 (h) | 11.2 | 10.2 | 8.64 ? |
Pro
Contra
Veredicto
Antes de mais nada, o Omen Transcend 16-u1095ng tenta atrair clientes em potencial com uma tela OLED brilhante que agrada tanto aos jogadores quanto aos criadores.
Se o senhor puder lidar com uma tela muito reflexiva e não tiver problemas com cintilação, terá uma tela colorida com uma excelente taxa de contraste e ótimos tempos de resposta, além de excelentes níveis de preto e ângulos de visão.
Há alguns pontos negativos em relação às emissões e à velocidade. Enquanto a máquina de 16 polegadas fica desagradavelmente barulhenta no modo de desempenho, o desempenho do modo equilibrado parece um pouco abaixo da média. Fora isso, o Omen Transcend 16 é semelhante a outros laptops para jogos no que diz respeito à qualidade do gabinete, dispositivos de entrada e seleção de portas.
De modo geral, a pontuação total é comparável à do XMG Core 16 L23 ou do Legion Pro 5 16ARX8. Quem procura um dispositivo especialmente leve e compacto na categoria de 16 polegadas deve dar uma olhada no novo ROG Zeyphrus G16.
Preço e disponibilidade
No momento de nossa análise, o HP Omen Transcend 16-u1095ng com o Core i9-14900HX e o GeForce RTX 4070 não está disponível na loja on-line da HP, na Amazon ou na Best Buy.
HP Omen Transcend 16-u1095ng
- 02/12/2024 v7 (old)
Florian Glaser
Transparência
A seleção dos dispositivos a serem analisados é feita pela nossa equipe editorial. A amostra de teste foi fornecida ao autor como empréstimo pelo fabricante ou varejista para fins desta revisão. O credor não teve influência nesta revisão, nem o fabricante recebeu uma cópia desta revisão antes da publicação. Não houve obrigação de publicar esta revisão. Como empresa de mídia independente, a Notebookcheck não está sujeita à autoridade de fabricantes, varejistas ou editores.
É assim que o Notebookcheck está testando
Todos os anos, o Notebookcheck analisa de forma independente centenas de laptops e smartphones usando procedimentos padronizados para garantir que todos os resultados sejam comparáveis. Desenvolvemos continuamente nossos métodos de teste há cerca de 20 anos e definimos padrões da indústria no processo. Em nossos laboratórios de teste, equipamentos de medição de alta qualidade são utilizados por técnicos e editores experientes. Esses testes envolvem um processo de validação em vários estágios. Nosso complexo sistema de classificação é baseado em centenas de medições e benchmarks bem fundamentados, o que mantém a objetividade.Price comparison

