Estreia do desempenho do Ryzen 7 7745HX: Análise do laptop Lenovo Legion Pro 5 16 Gen 8

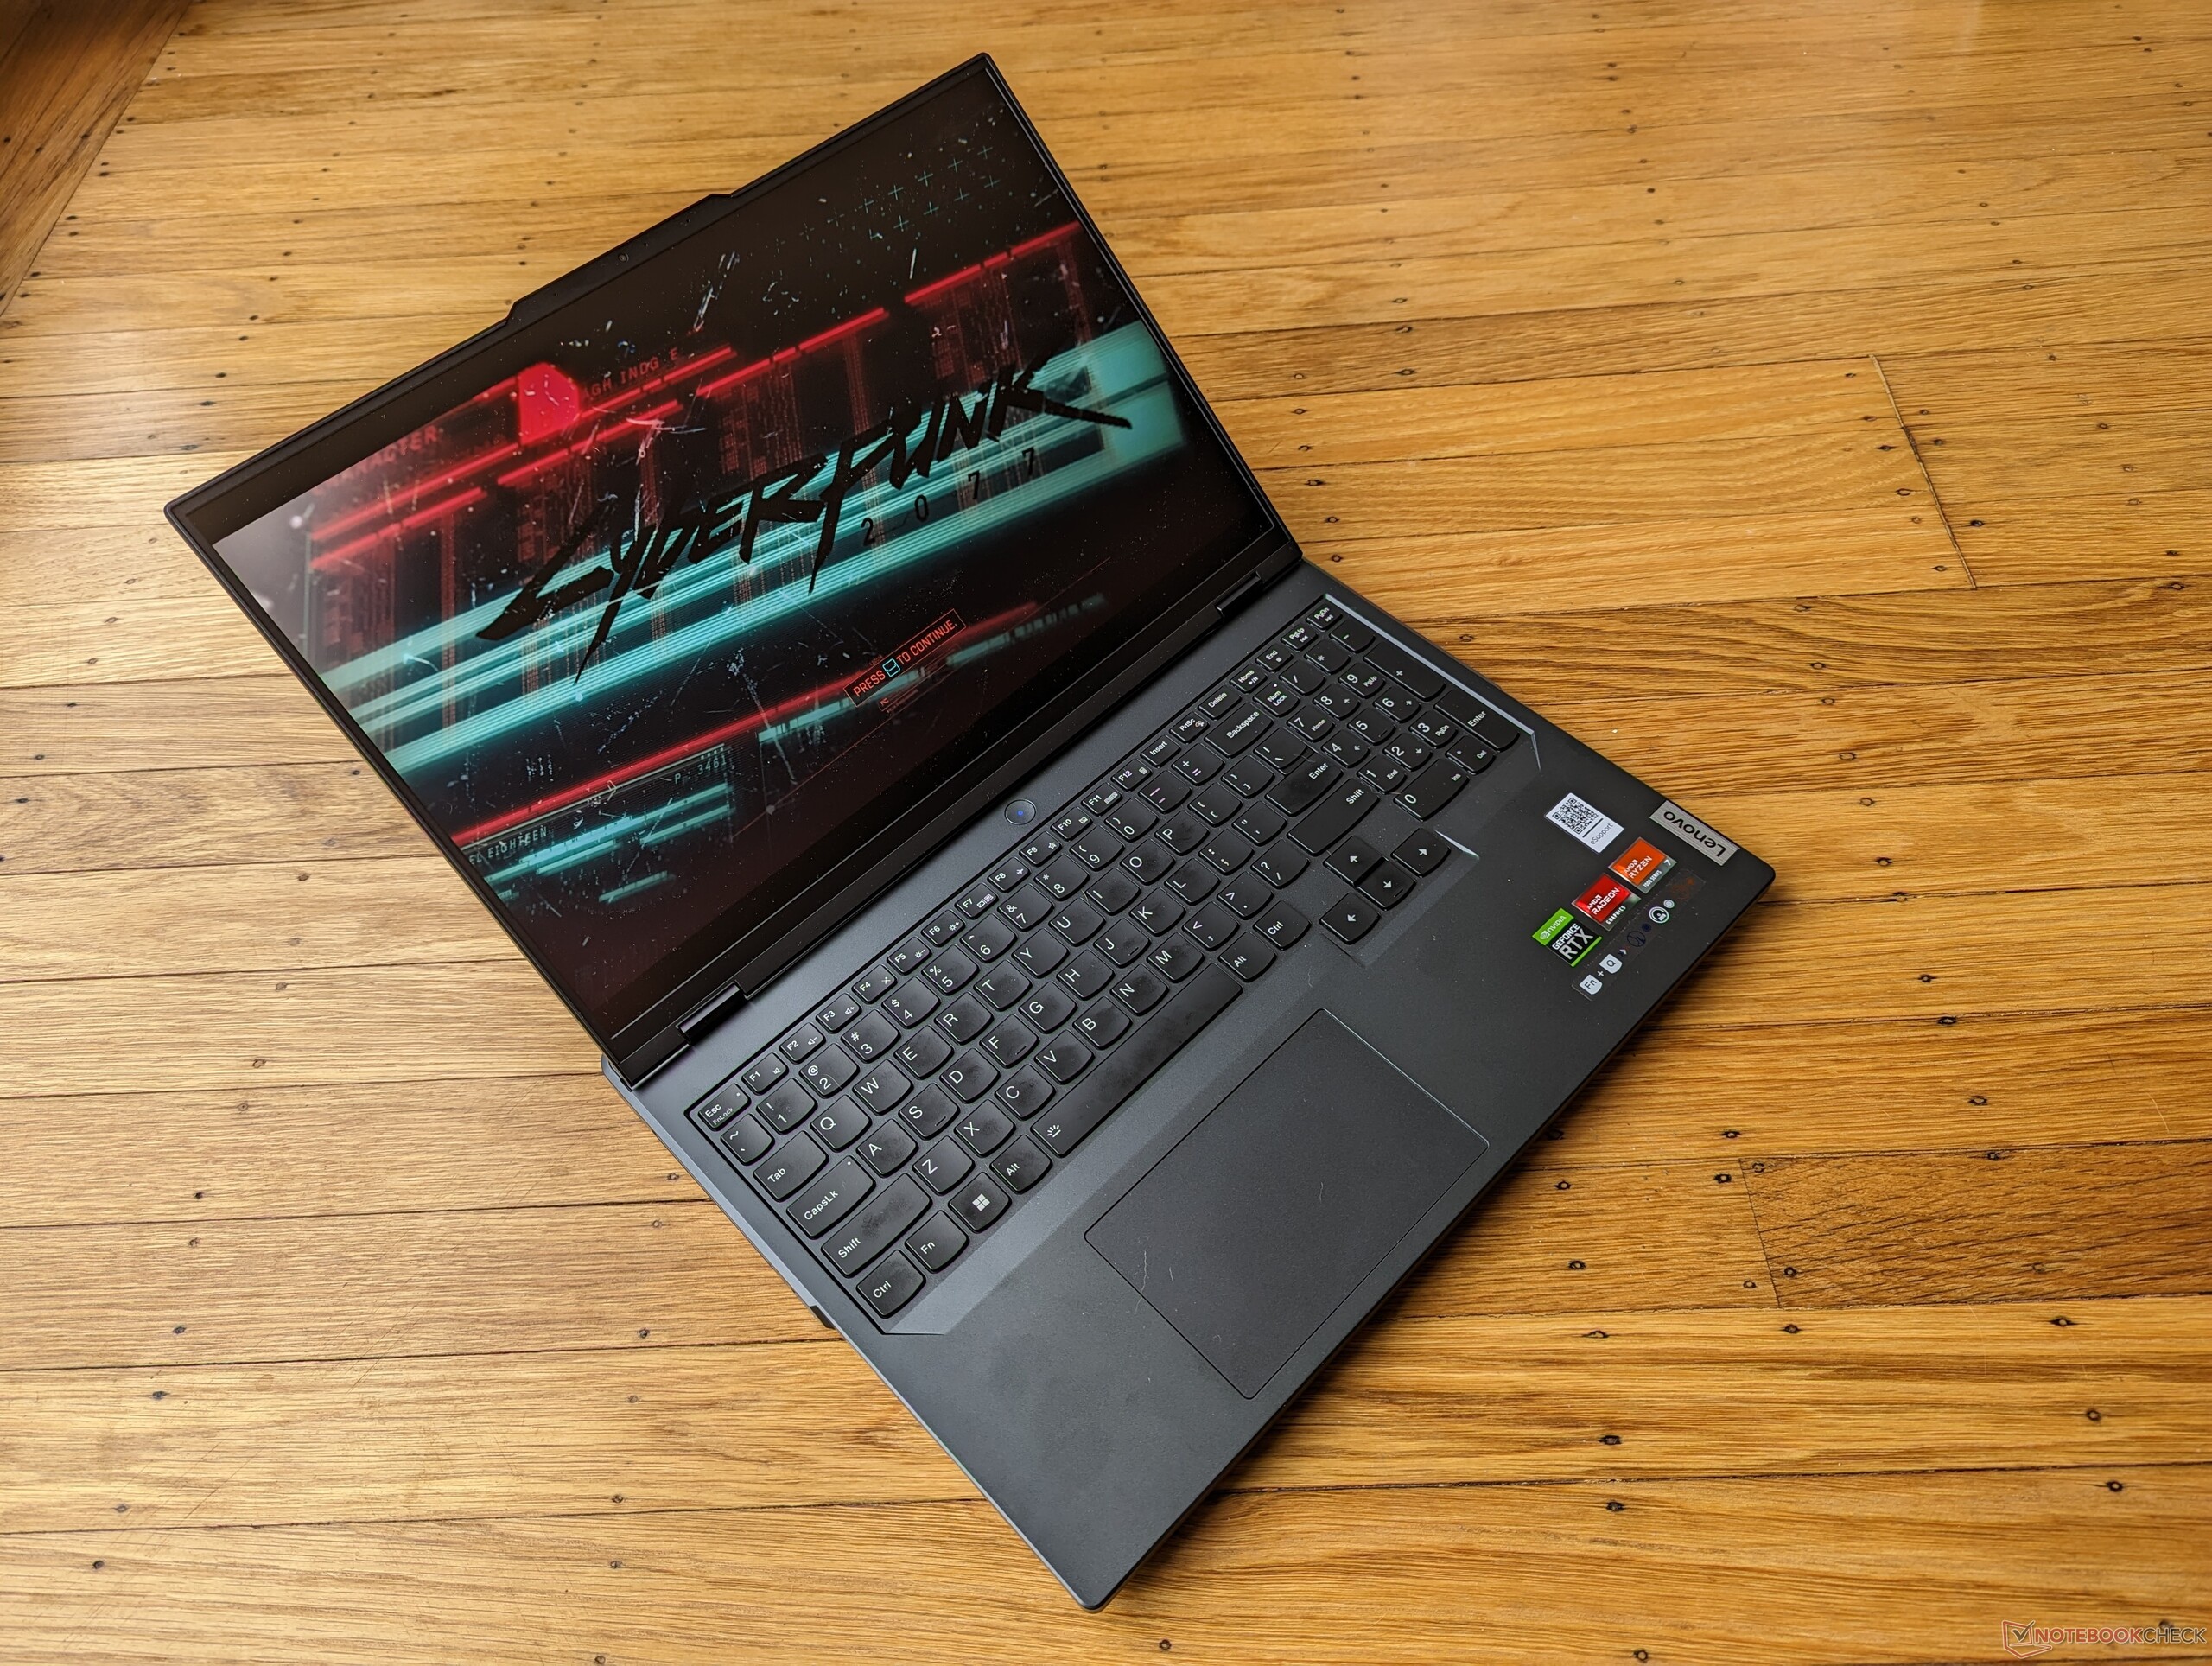
O Lenovo Legion Pro 5 16ARX8 é a versão AMD do Intel Legion Pro 5 16IRX8. Ambos os modelos utilizam o mesmo chassi Legion Pro 5 16 Gen 8 e são visualmente idênticos. Recomendamos que você dê uma olhada em nossa análise existente sobre o Legion Pro 5 16IRX8 para saber mais sobre os recursos físicos do modelo, pois muitos de nossos comentários ainda se aplicam ao Legion Pro 5 16ARX8.
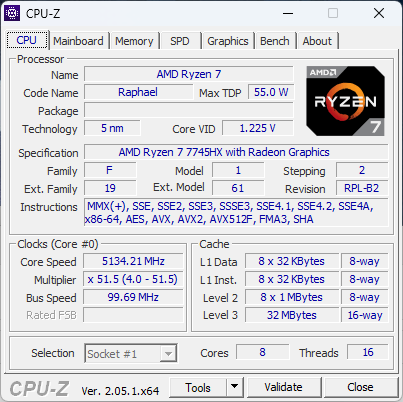
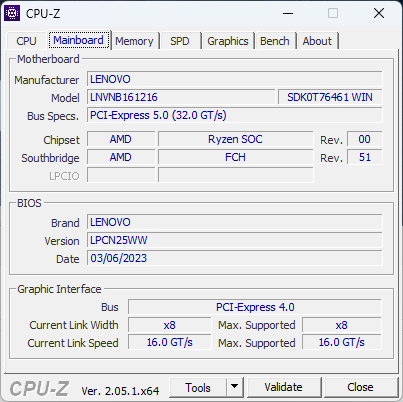
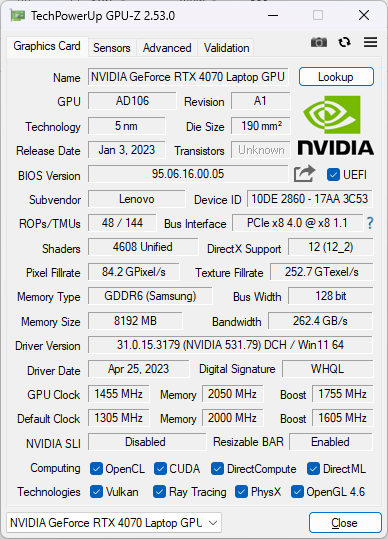
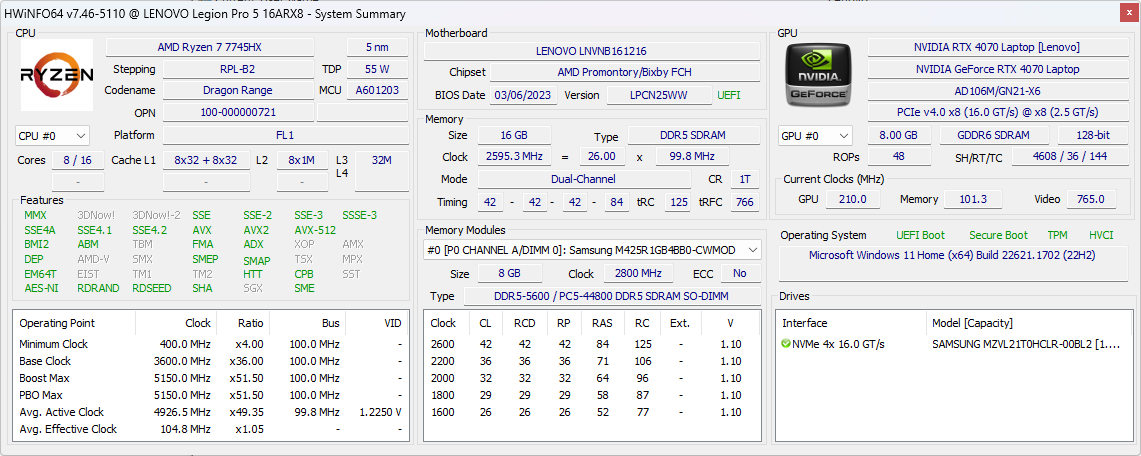
Nossa unidade de teste é uma configuração de ponta com a CPU Zen 4 Ryzen 7 7745HX, GPU GeForce RTX 4070 de 140 W e tela IPS 1600p de 165 Hz, vendida no varejo por aproximadamente US$ 1.600. Outras SKUs podem incluir o Ryzen 5 7645HX, GeForce RTX 4050 ou tela IPS de 240 Hz. Esse modelo específico é um dos primeiros a ser fornecido com o Ryzen 7 7745HX de médio porte, enquanto os laptops Zen 4 anteriores estavam disponíveis apenas com o Ryzen 9 7945HX mais caro.
Os concorrentes nesse espaço incluem outros laptops para jogos de médio e alto padrão, como o Asus ROG Strix G16, Razer Blade 16, Uniwill GM6PX7Xou MSI Pulse GL76. A série Legion 7 está um passo acima do nosso Legion Pro 5, com opções de CPU e GPU muito mais rápidas para seleção.
Mais análises da Lenovo:
Possíveis concorrentes em comparação
Avaliação | Data | Modelo | Peso | Altura | Size | Resolução | Preço |
|---|---|---|---|---|---|---|---|
| 88.4 % v7 (old) | 05/2023 | Lenovo Legion Pro 5 16ARX8 R7 7745HX, GeForce RTX 4070 Laptop GPU | 2.5 kg | 26.8 mm | 16.00" | 2560x1600 | |
| 87.9 % v7 (old) | 05/2023 | Lenovo Legion Pro 5 16IRX8 i7-13700HX, GeForce RTX 4060 Laptop GPU | 2.5 kg | 26.8 mm | 16.00" | 2560x1600 | |
| 88.2 % v7 (old) | 03/2023 | Uniwill GM6PX7X RTX 4070 i7-13700HX, GeForce RTX 4070 Laptop GPU | 2.2 kg | 22 mm | 16.00" | 2560x1600 | |
| 87.7 % v7 (old) | 04/2023 | Schenker XMG Neo 16 E23 i9-13900HX, GeForce RTX 4090 Laptop GPU | 2.5 kg | 29.9 mm | 16.00" | 2560x1600 | |
| 88.4 % v7 (old) | 03/2023 | Asus ROG Strix G16 G614JZ i9-13980HX, GeForce RTX 4080 Laptop GPU | 2.4 kg | 30.4 mm | 16.00" | 2560x1600 | |
| 88 % v7 (old) | 04/2023 | Asus Zephyrus Duo 16 GX650PY-NM006W R9 7945HX, GeForce RTX 4090 Laptop GPU | 2.7 kg | 29.7 mm | 16.00" | 2560x1600 |
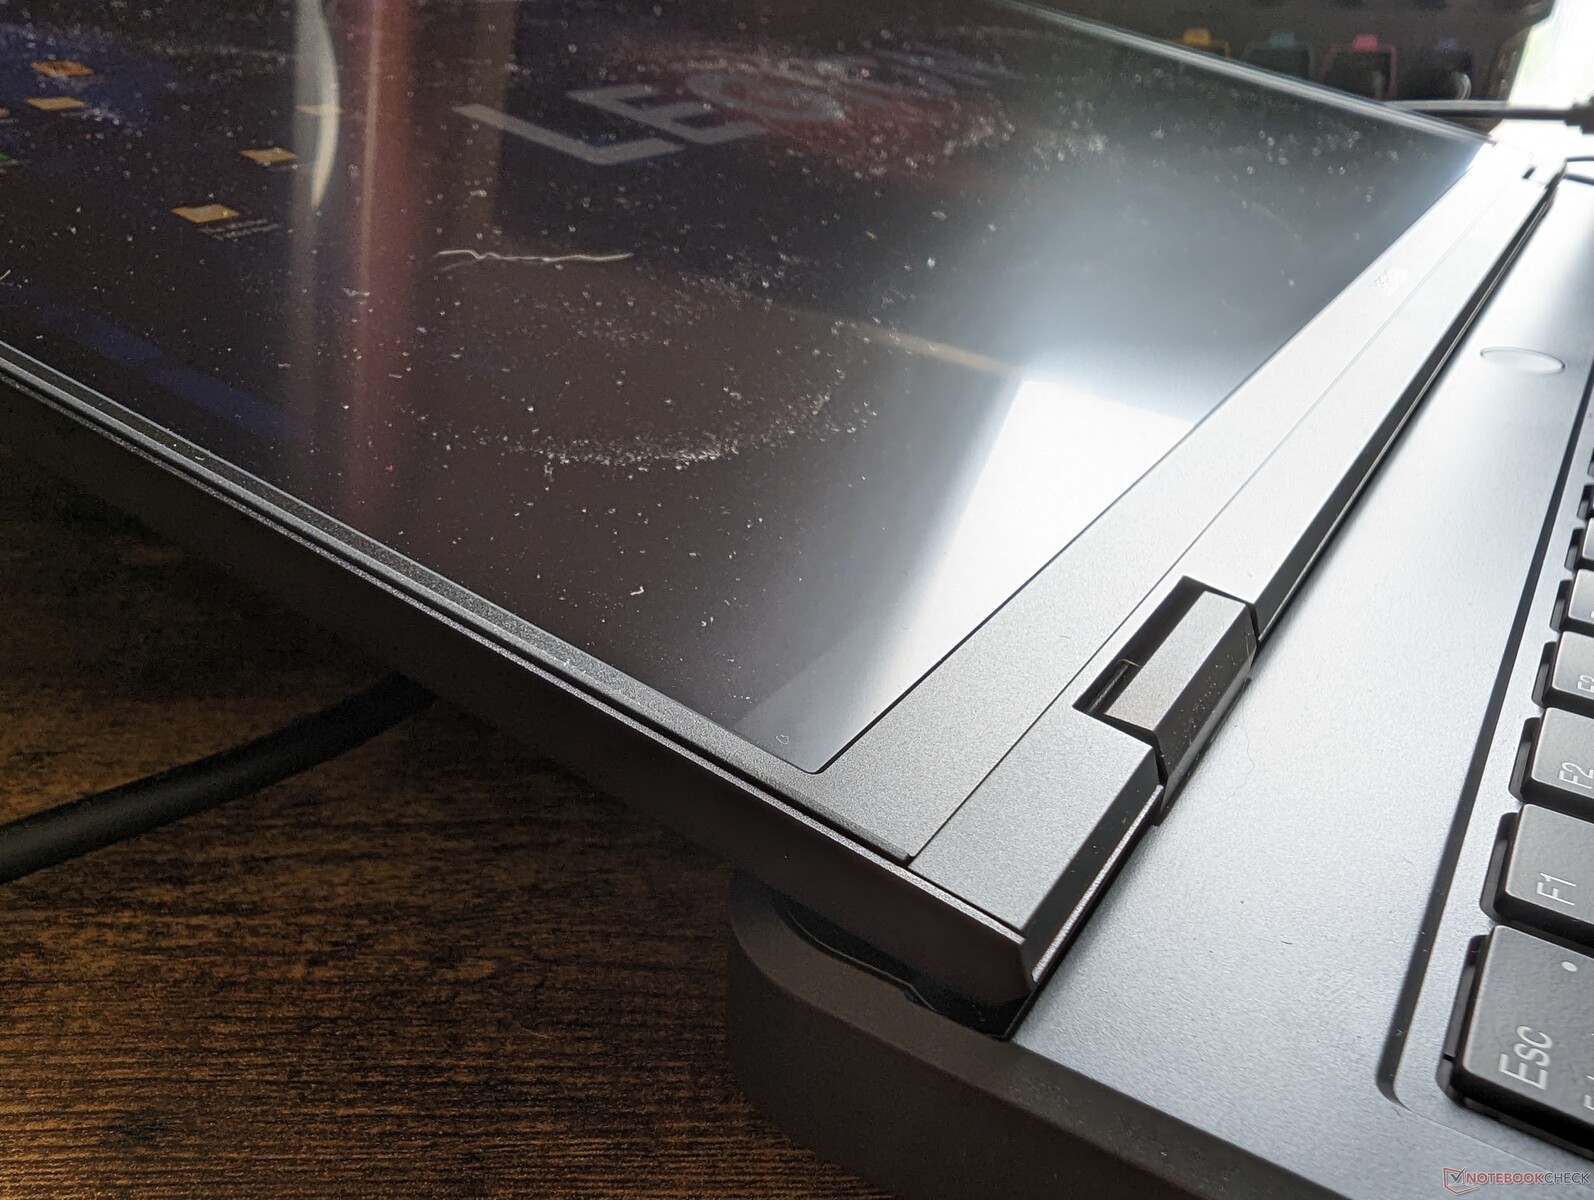
Case - mesmo visual com portas idênticas
O AMD Legion Pro 5 16ARX8 compartilha o mesmo chassi que o Intel Legion Pro 5 16IRX8. Embora normalmente haja algumas diferenças de porta entre a maioria das variantes da AMD e da Intel, na verdade não há nenhuma entre esses dois modelos, pois a Lenovo optou por excluir o suporte a USB 4 e Thunderbolt em todas as SKUs do Legion 5 Pro, independentemente da opção de CPU. Isso pode ser visto como uma forma de forçar os usuários a considerar a série Legion 7, mais cara, que inclui suporte a Thunderbolt por padrão.
Comunicação
O modelo AMD troca o Intel AX211 comum pelo MediaTek MT7922 menos comum. O desempenho é estável e confiável quando emparelhado com nossa rede de 6 GHz.
| Networking | |
| iperf3 transmit AXE11000 | |
| Schenker XMG Neo 16 E23 | |
| Asus ROG Strix G16 G614JZ | |
| Lenovo Legion Pro 5 16ARX8 | |
| Uniwill GM6PX7X RTX 4070 | |
| Lenovo Legion Pro 5 16IRX8 | |
| iperf3 receive AXE11000 | |
| Schenker XMG Neo 16 E23 | |
| Asus ROG Strix G16 G614JZ | |
| Lenovo Legion Pro 5 16ARX8 | |
| Uniwill GM6PX7X RTX 4070 | |
| Lenovo Legion Pro 5 16IRX8 | |
| iperf3 transmit AXE11000 6GHz | |
| Asus Zephyrus Duo 16 GX650PY-NM006W | |
| Lenovo Legion Pro 5 16ARX8 | |
| Lenovo Legion Pro 5 16IRX8 | |
| iperf3 receive AXE11000 6GHz | |
| Asus Zephyrus Duo 16 GX650PY-NM006W | |
| Lenovo Legion Pro 5 16ARX8 | |
| Lenovo Legion Pro 5 16IRX8 | |
Webcam


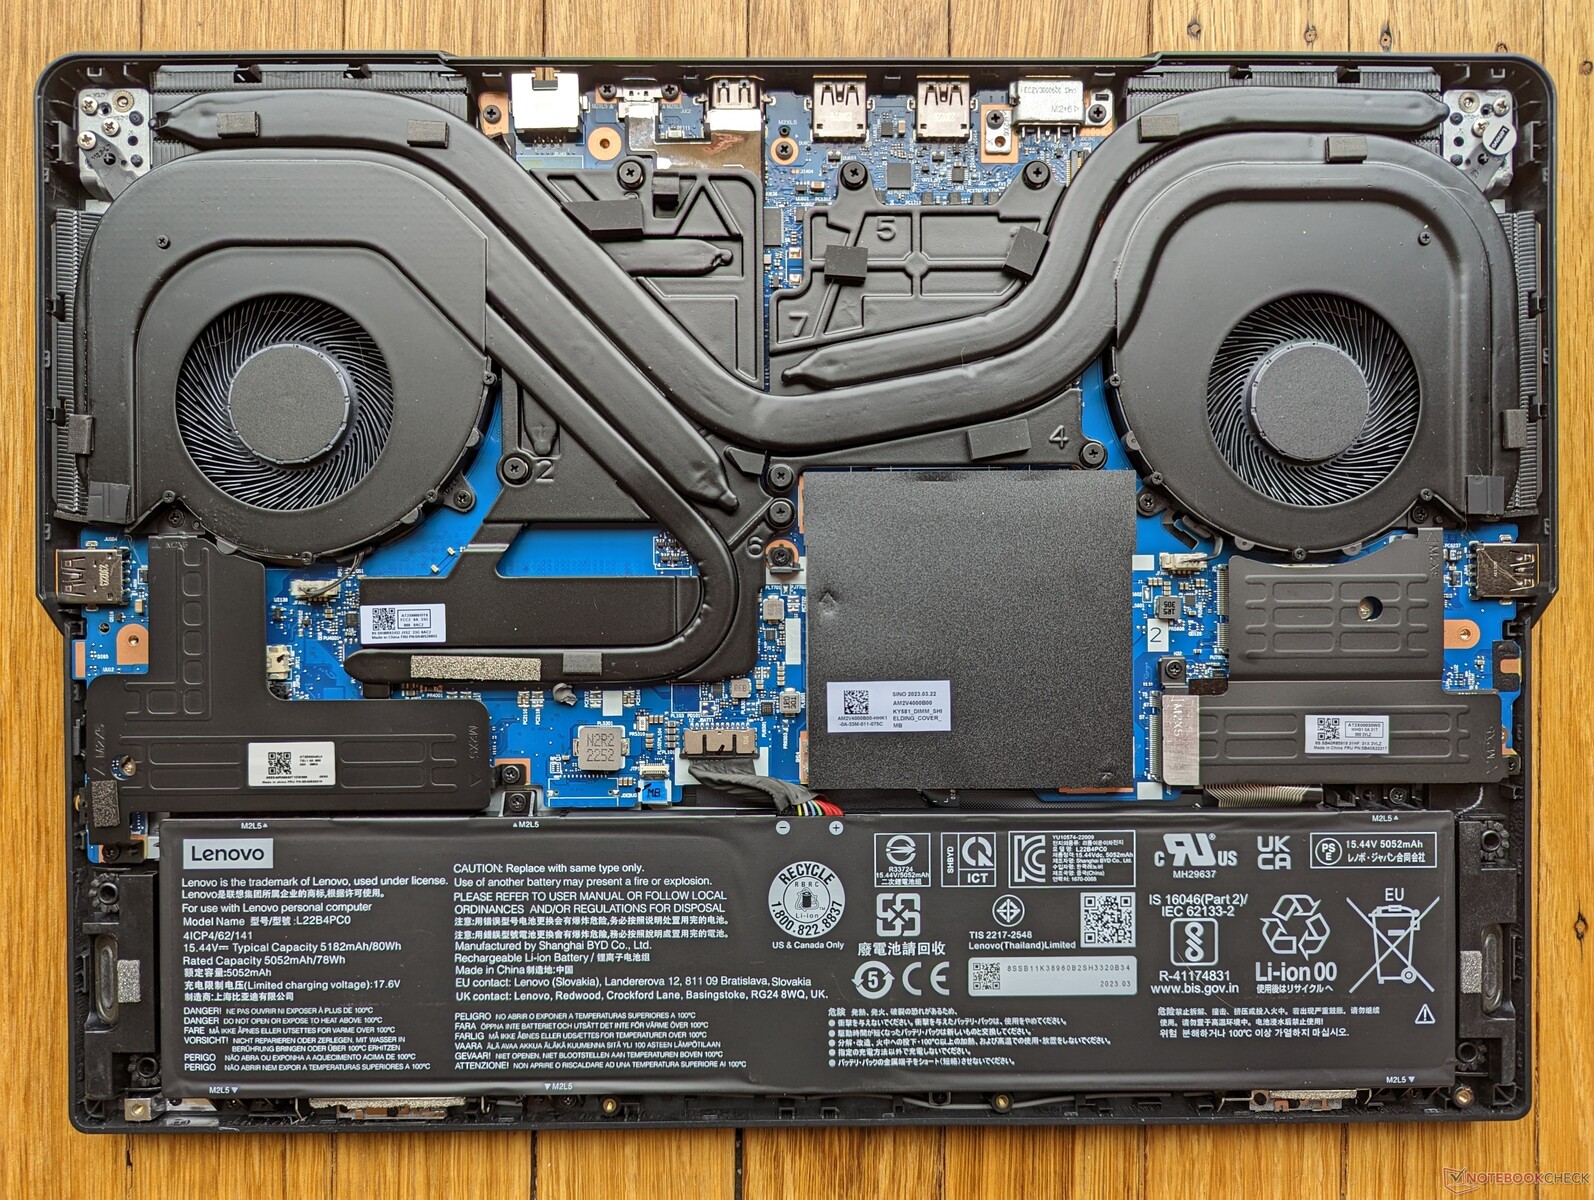
Manutenção
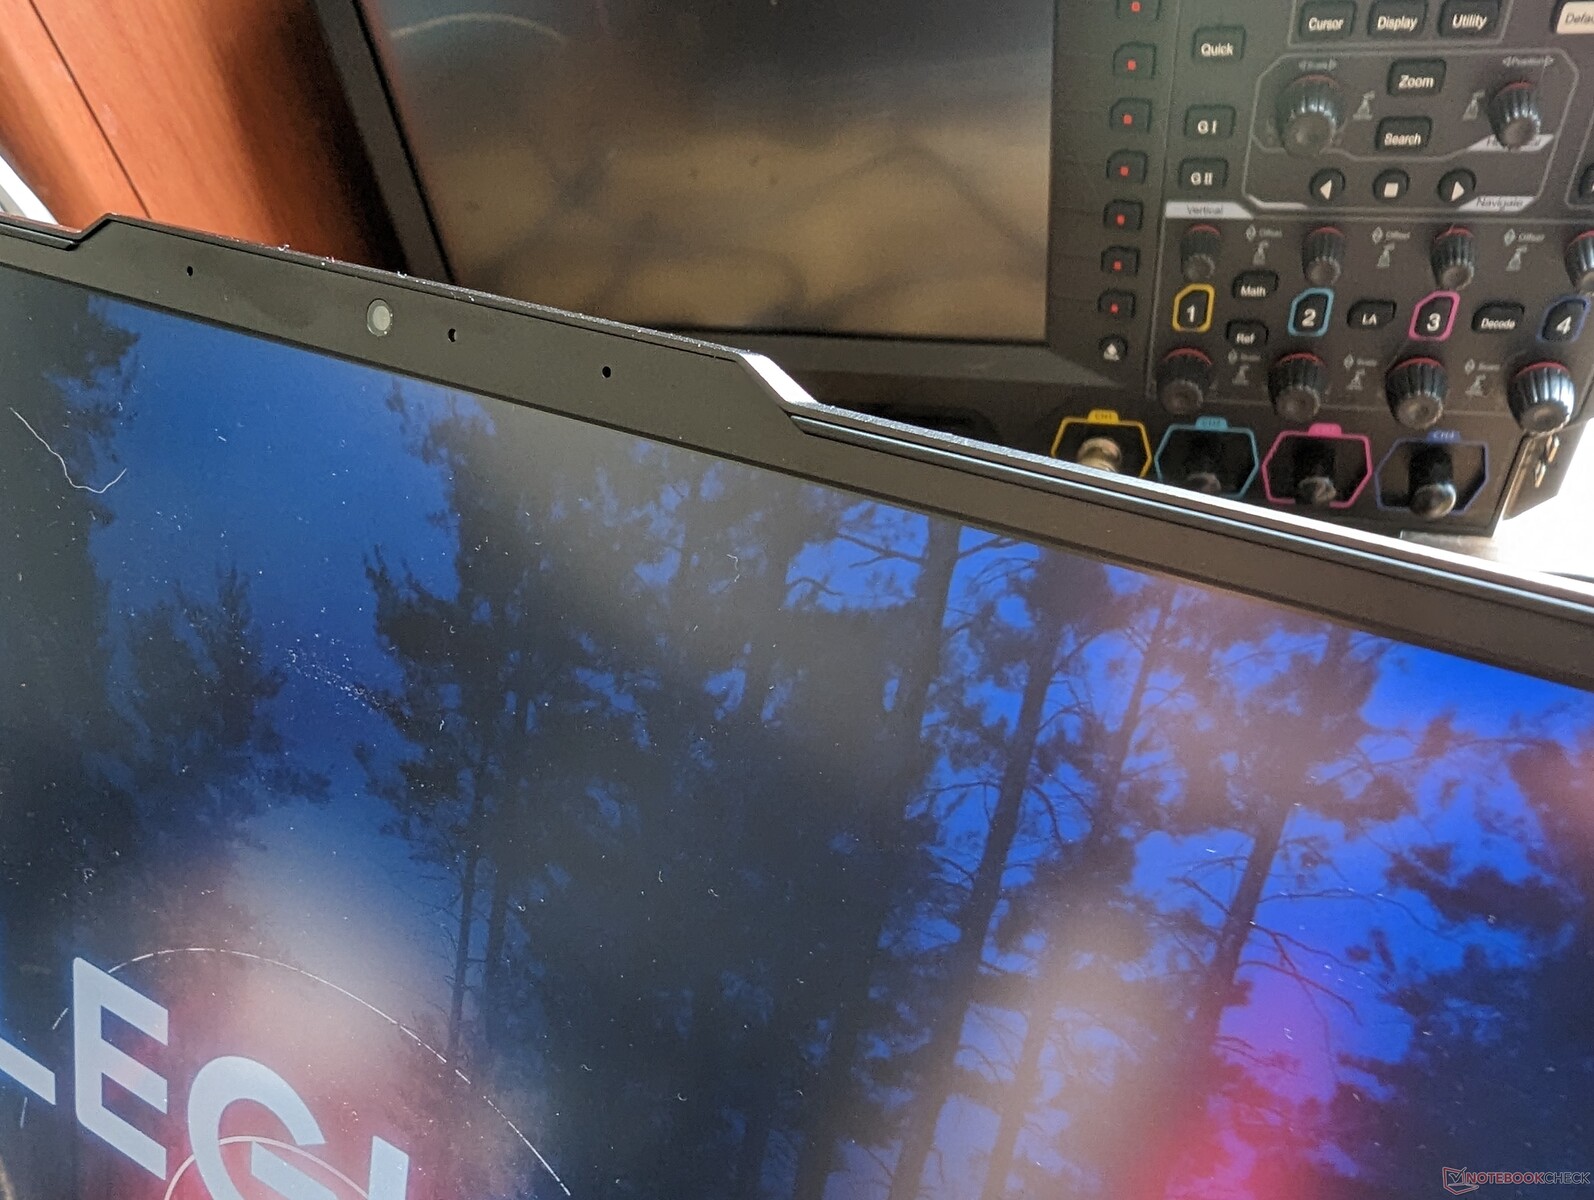
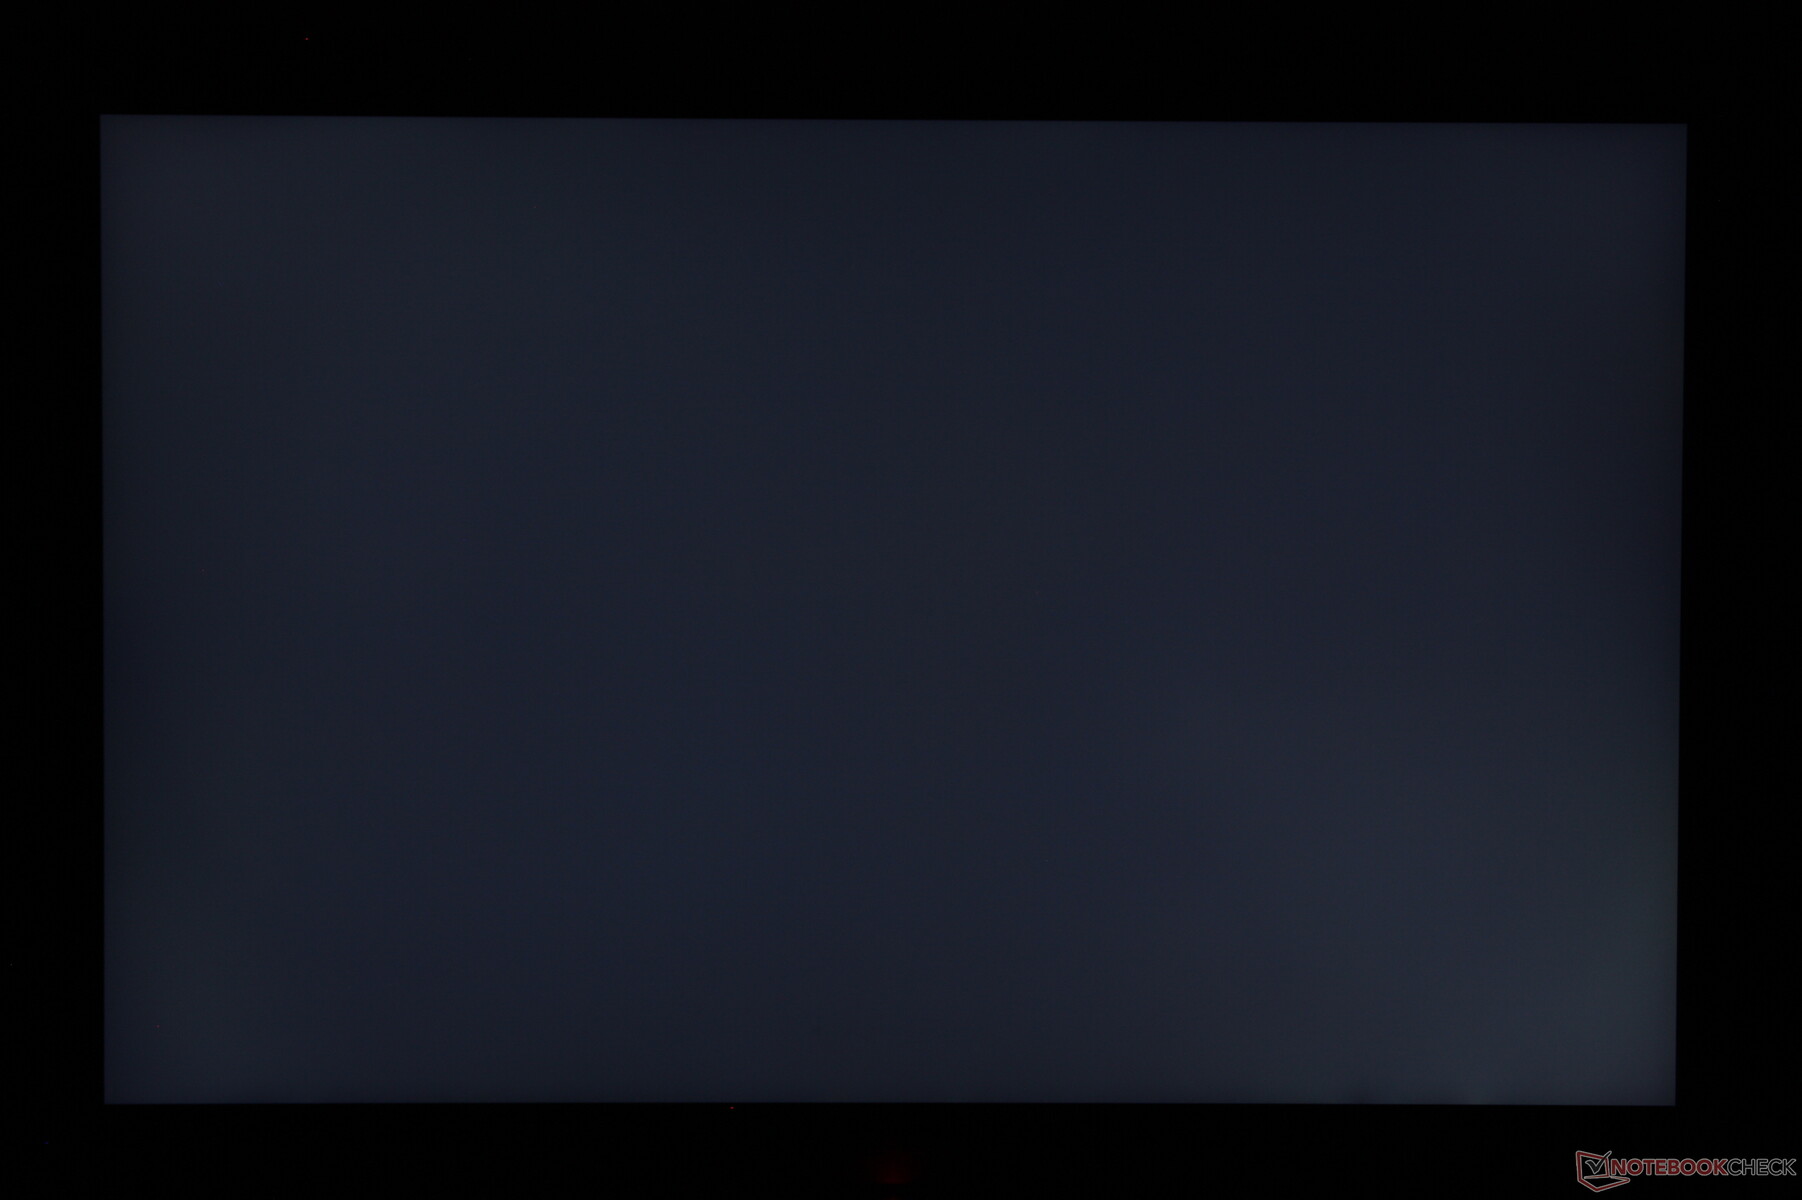
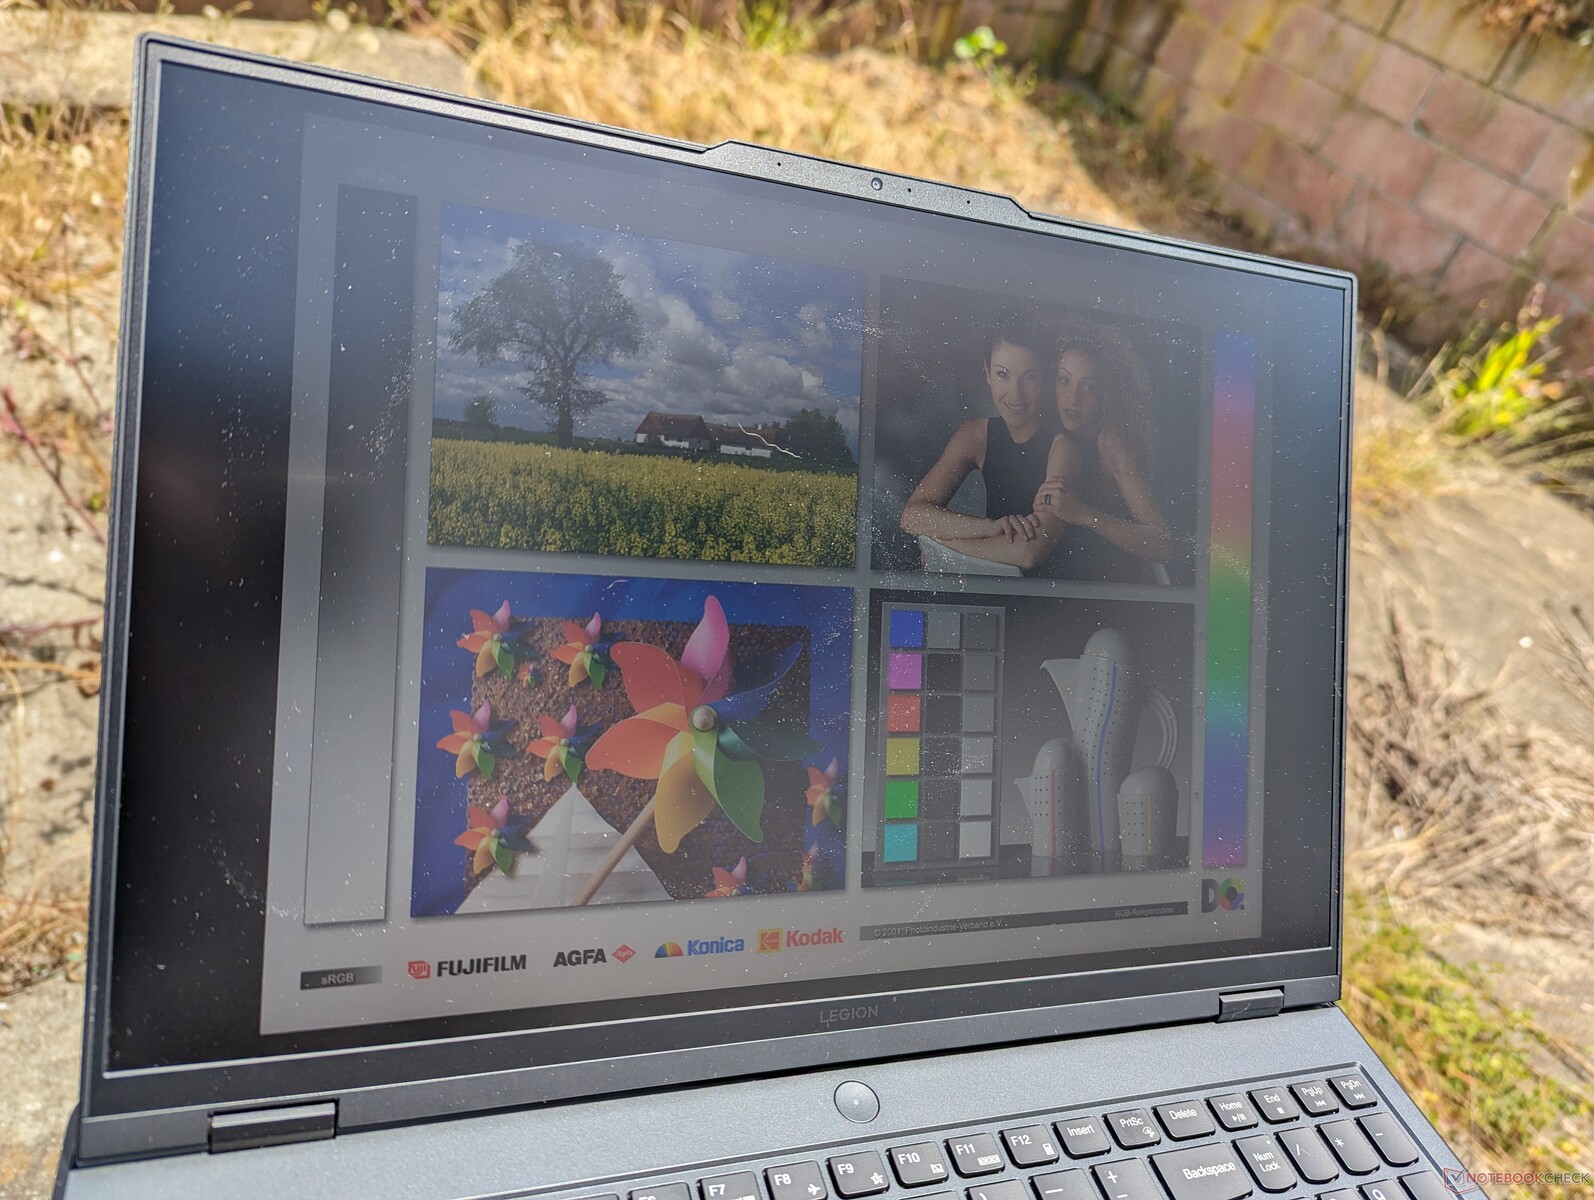
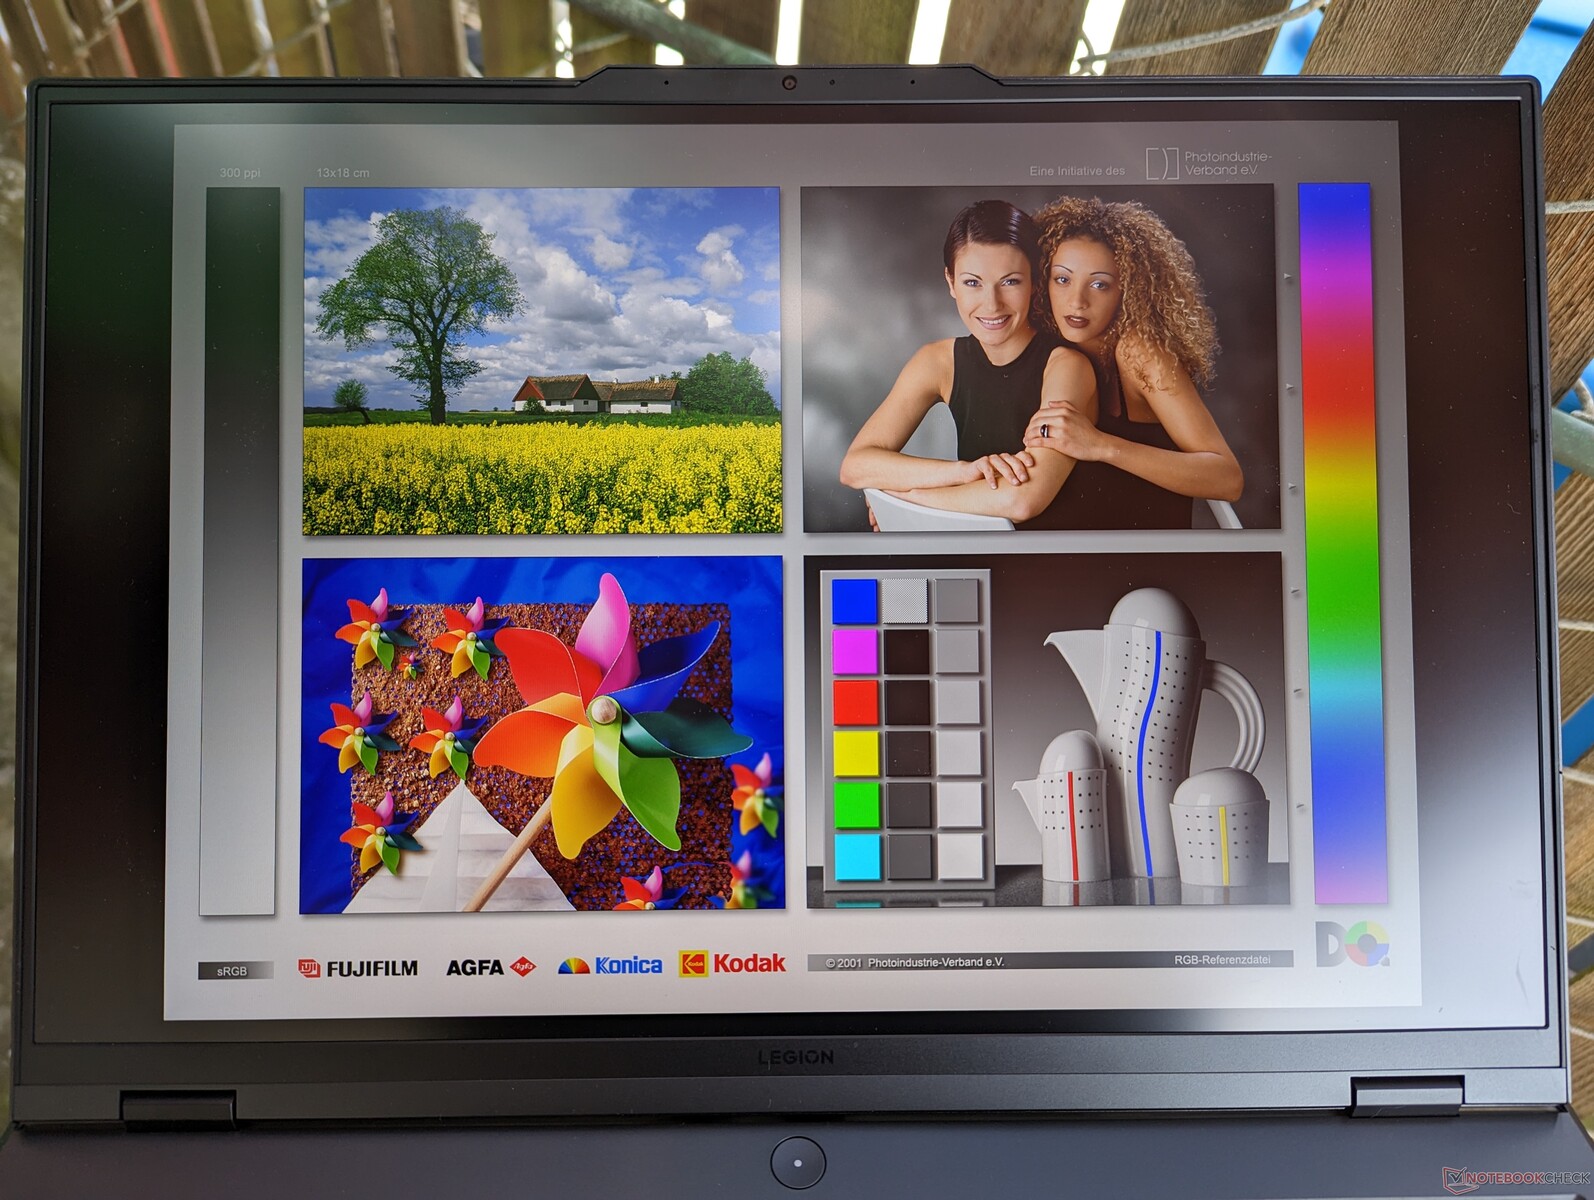
Tela - 165 Hz, 1600p e Full sRGB
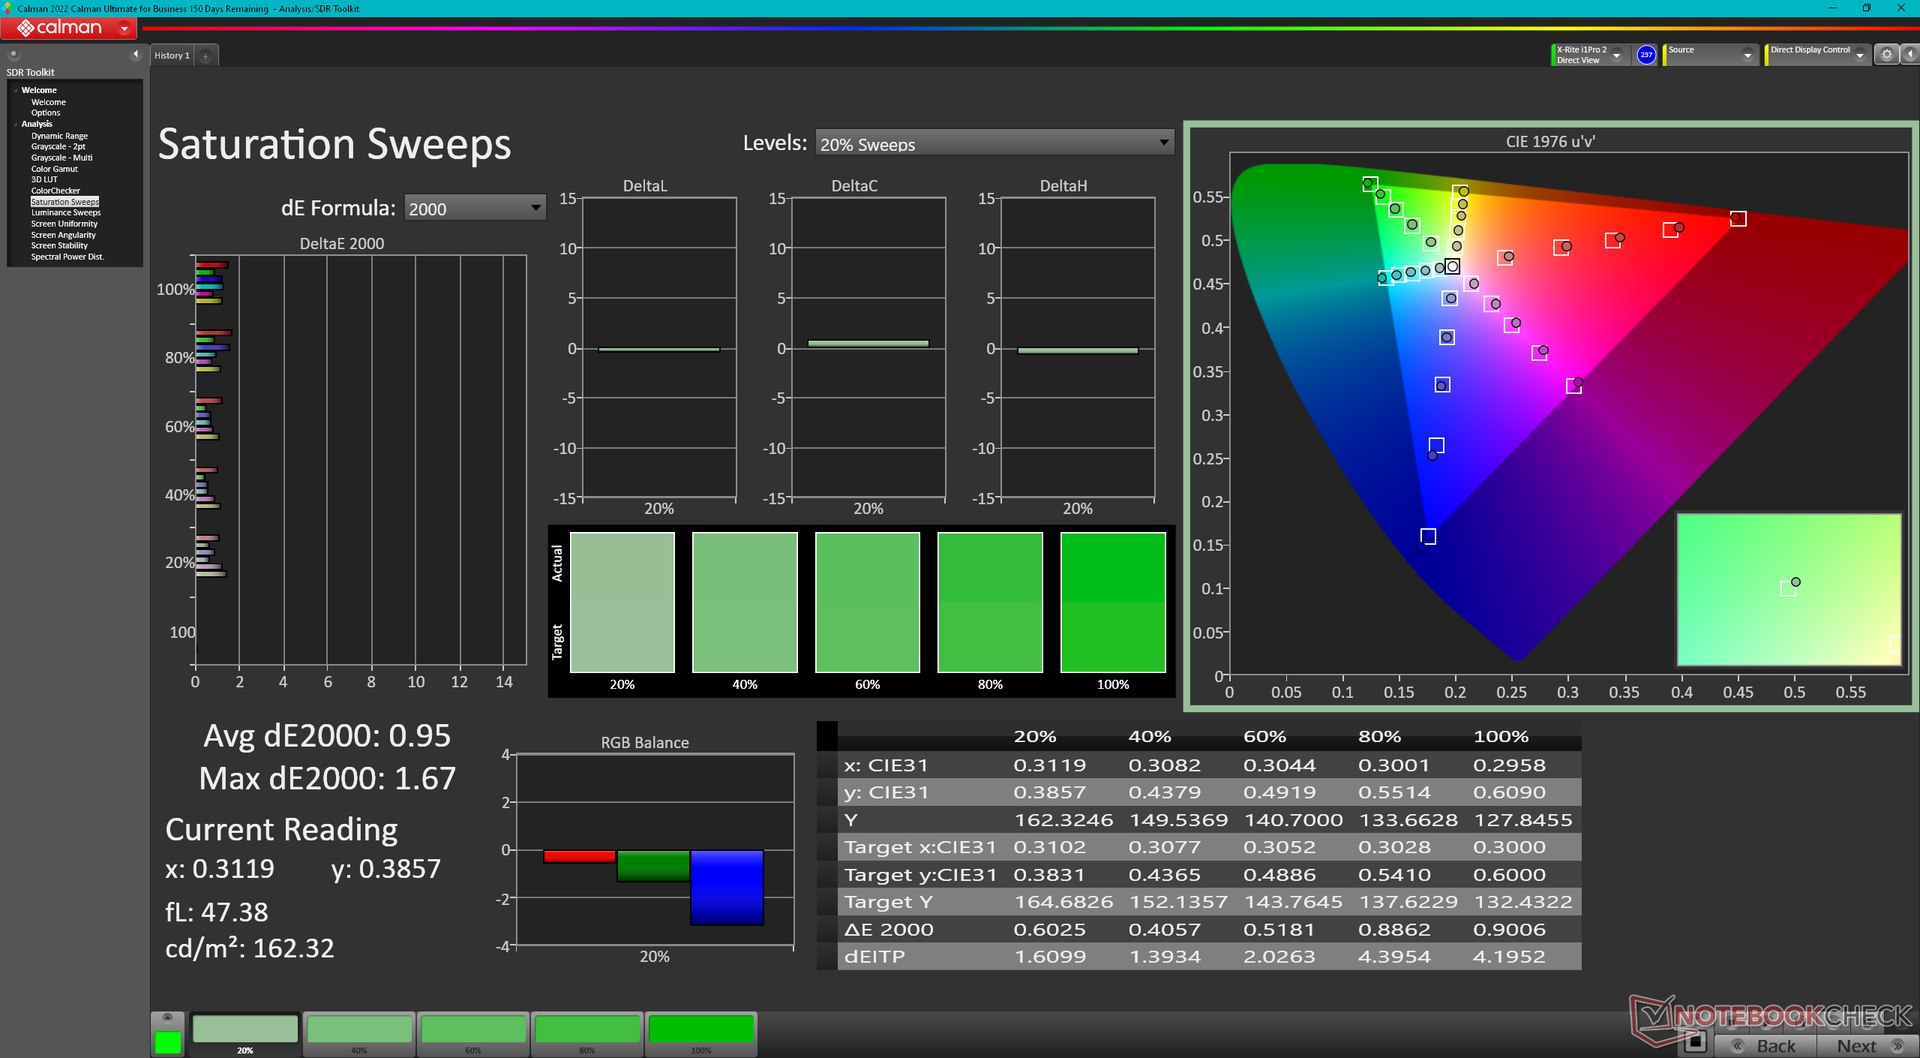
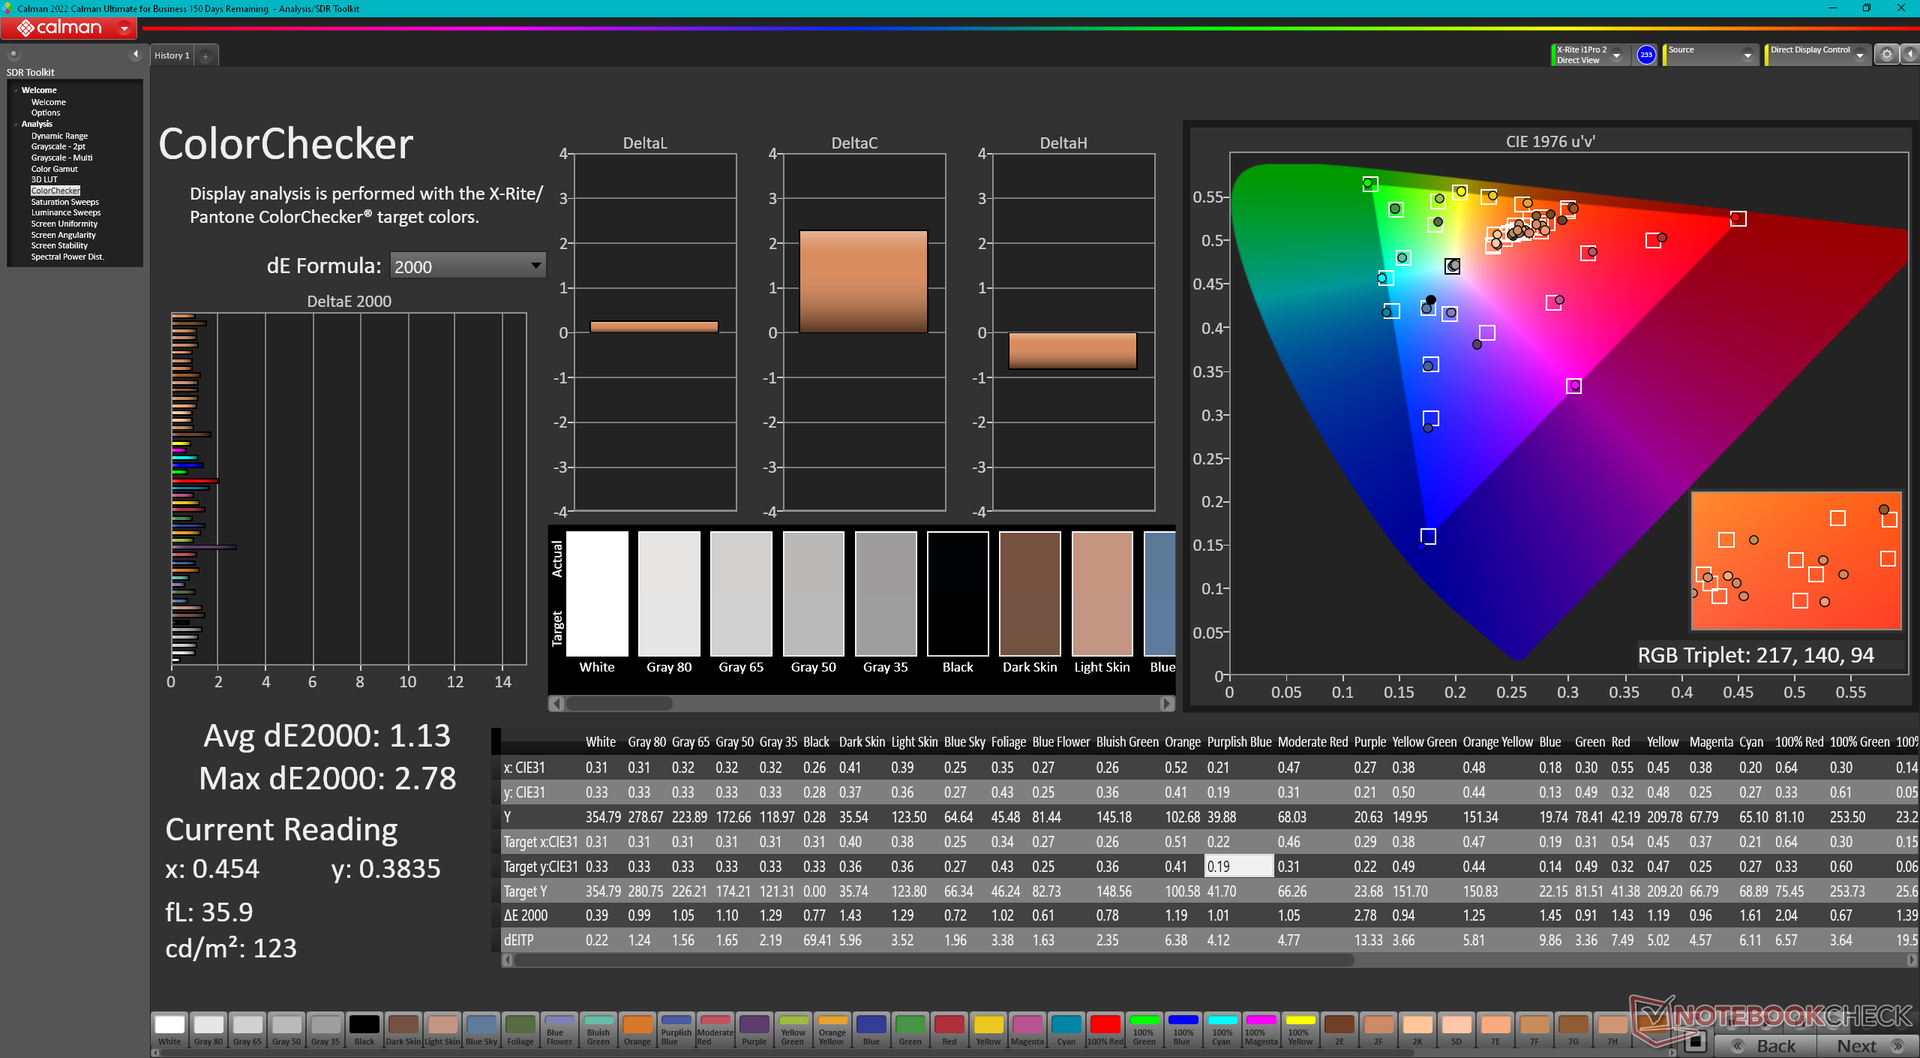
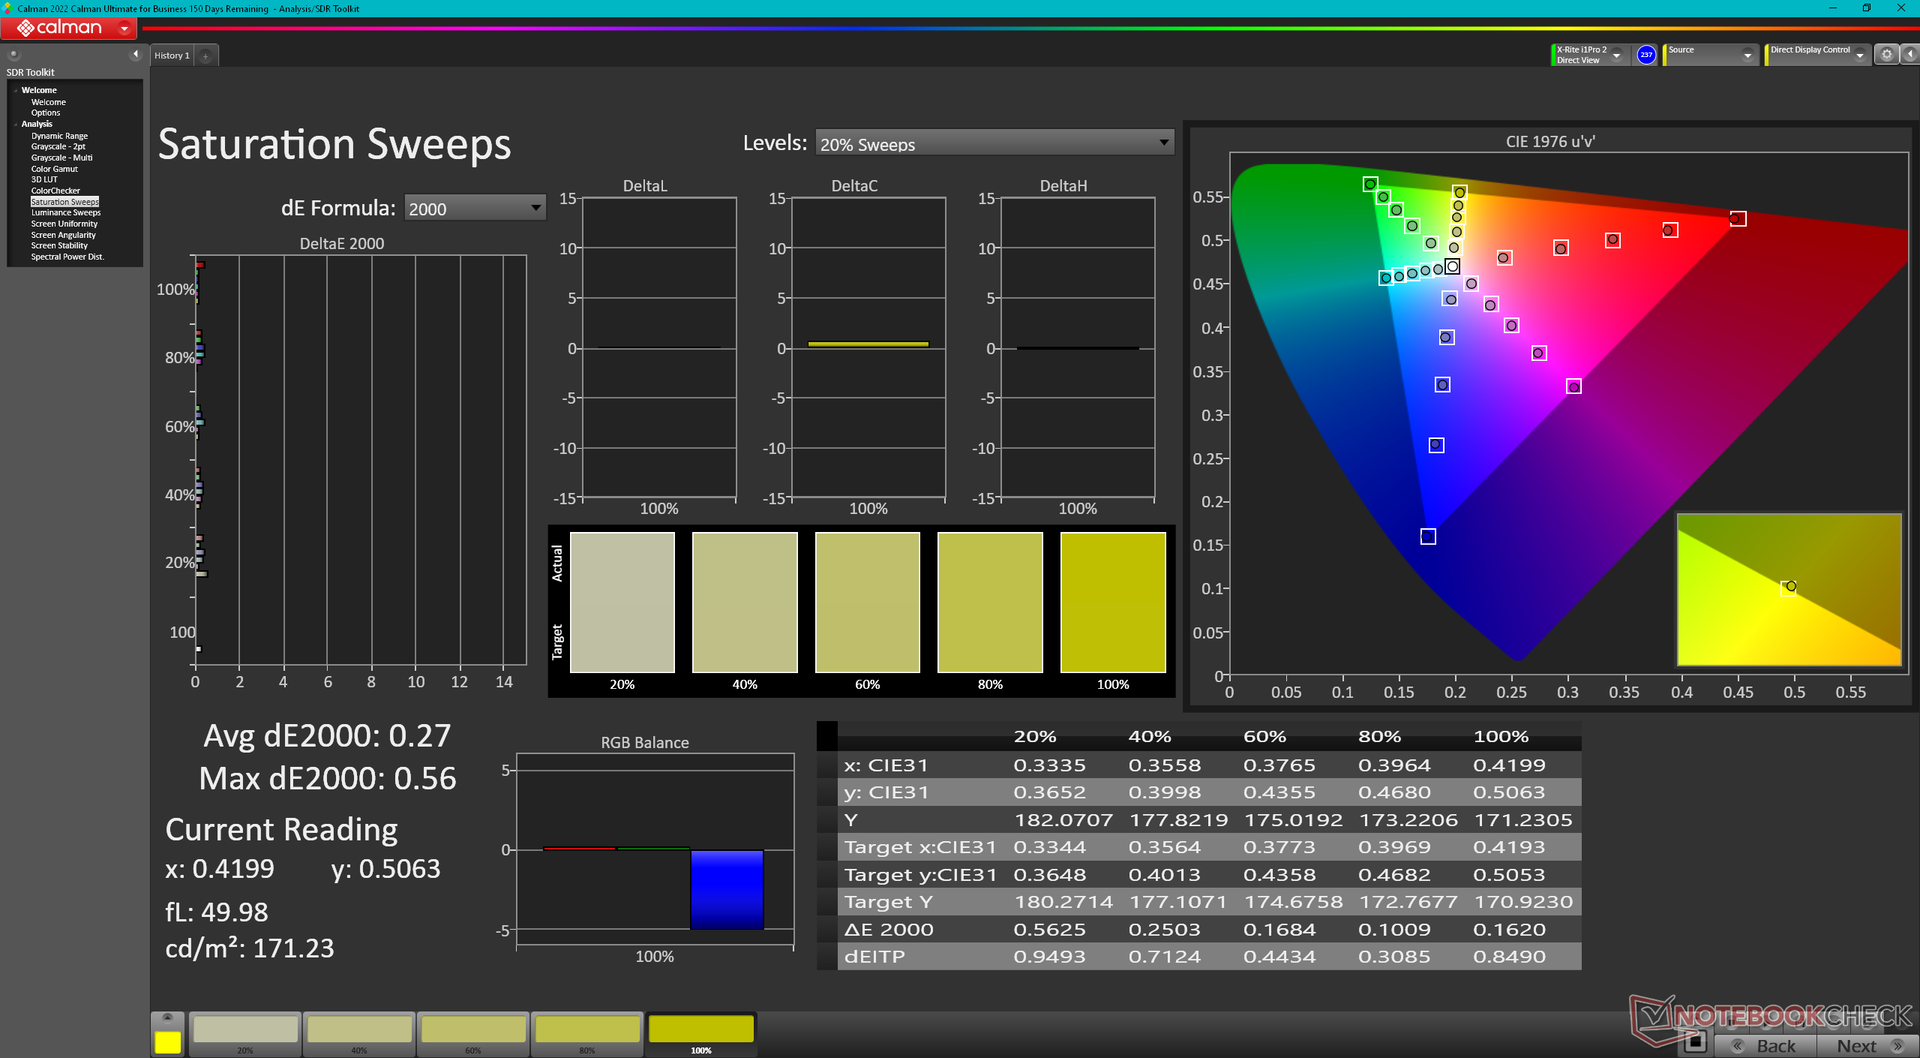
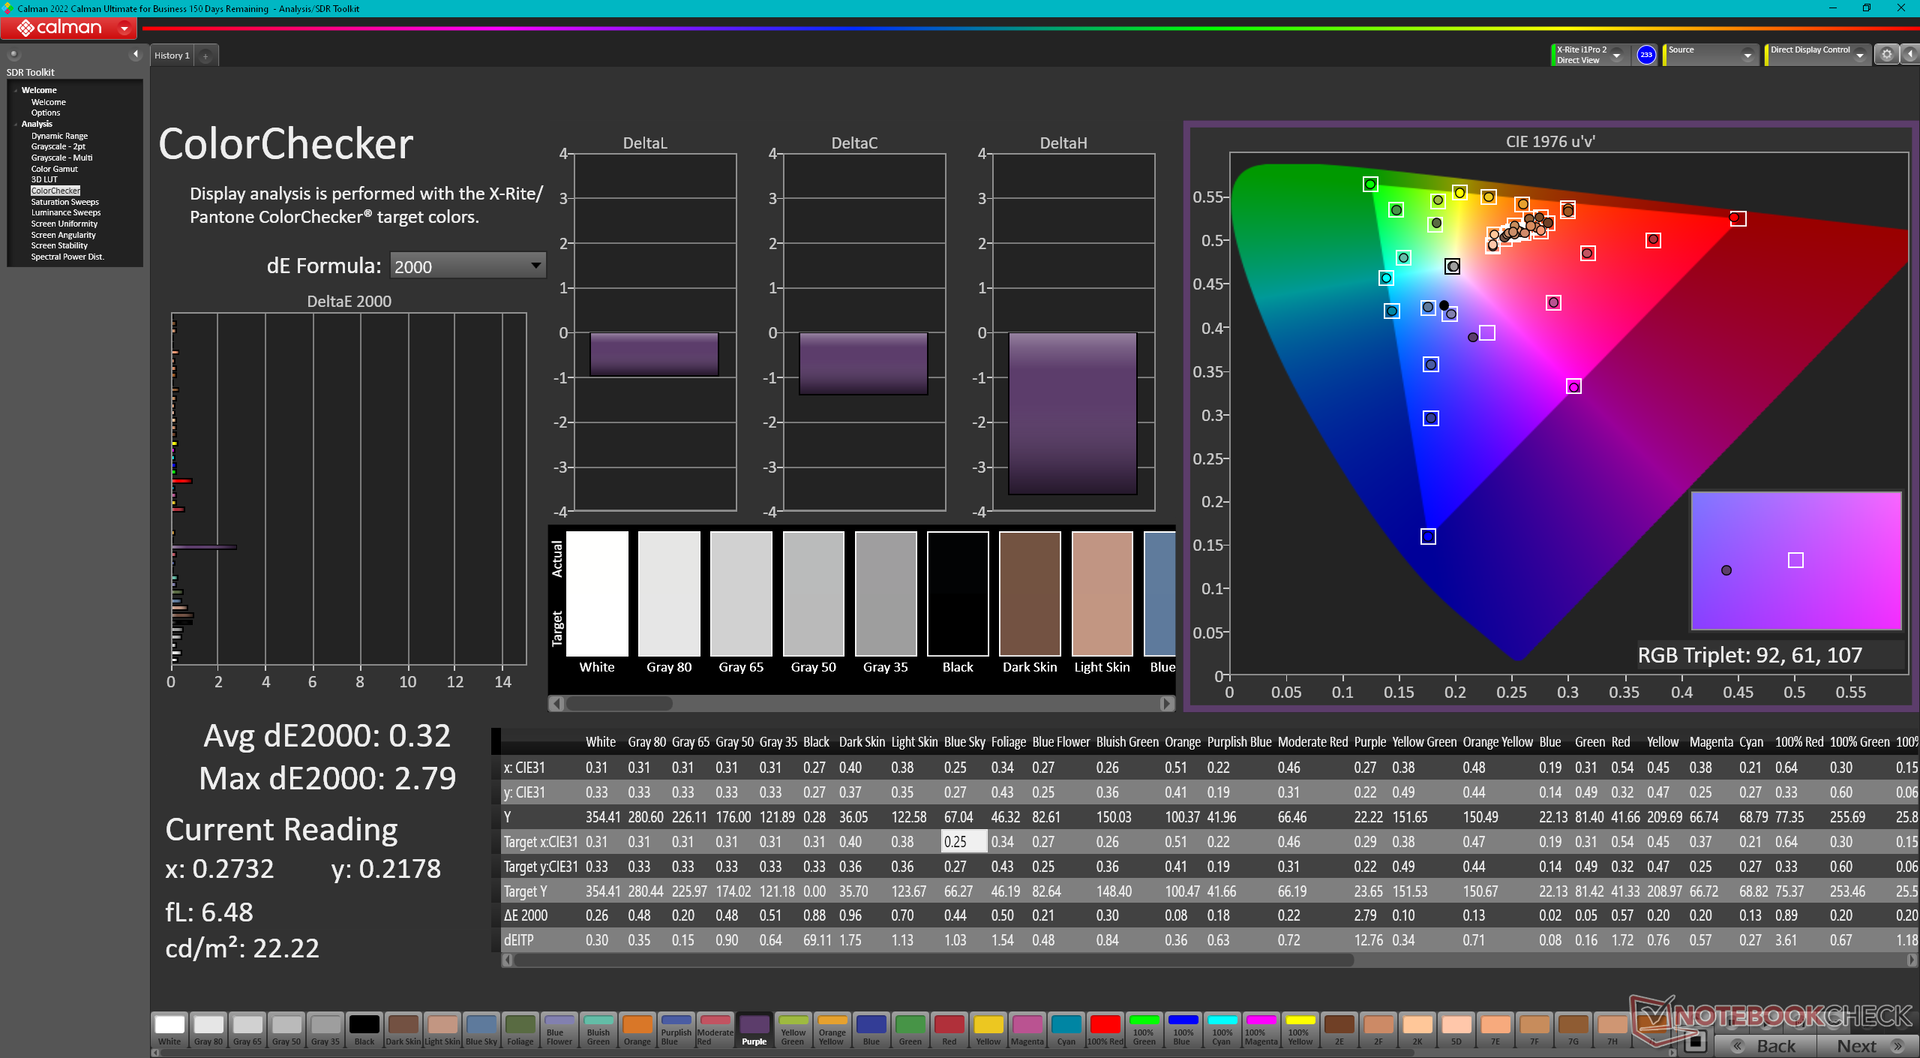
É interessante notar que o nosso Legion Pro 5 16ARX8 com tecnologia AMD utiliza um painel IPS diferente do Legion Pro 5 16IRX8 com tecnologia Intel (CSOT MNG007DA1-Q vs. AU Optronics B160QAN03.1), embora ambos os painéis tenham uma taxa de atualização nativa semelhante de 165 Hz, resolução nativa de 1600p, taxa de contraste de aproximadamente 1000:1 e cobertura total de 100% sRGB. O painel CSOT tem tempos de resposta preto-branco e cinza-cinza ligeiramente mais rápidos, mas as diferenças são marginais, na melhor das hipóteses, para uma experiência de visualização essencialmente idêntica.
Está disponível um segundo painel que promete uma luz de fundo de 500 nits ainda mais brilhante e uma taxa de atualização de 240 Hz mais rápida. Nossas medições abaixo refletem apenas o painel básico de 165 Hz.

| |||||||||||||||||||||||||
iluminação: 91 %
iluminação com acumulador: 355.3 cd/m²
Contraste: 1110:1 (Preto: 0.32 cd/m²)
ΔE ColorChecker Calman: 1.13 | ∀{0.5-29.43 Ø4.72}
calibrated: 0.32
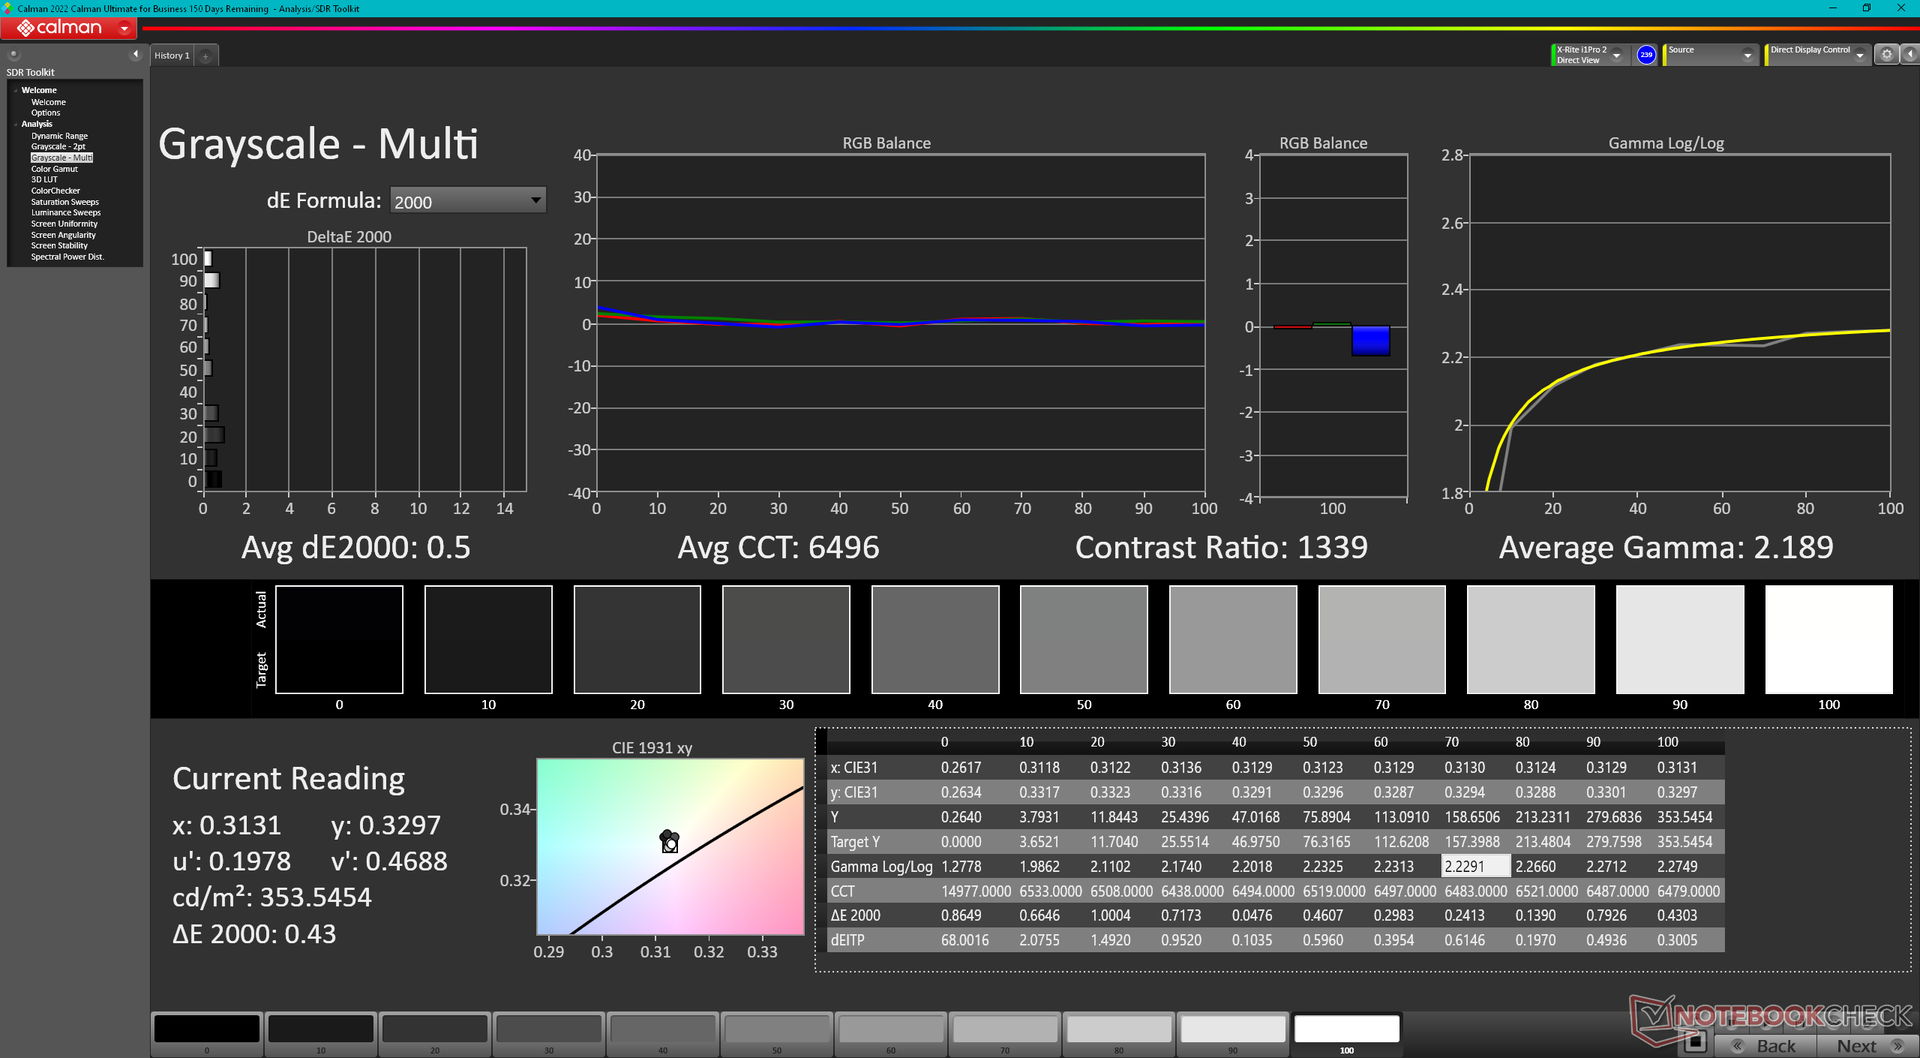
ΔE Greyscale Calman: 1.4 | ∀{0.09-98 Ø4.97}
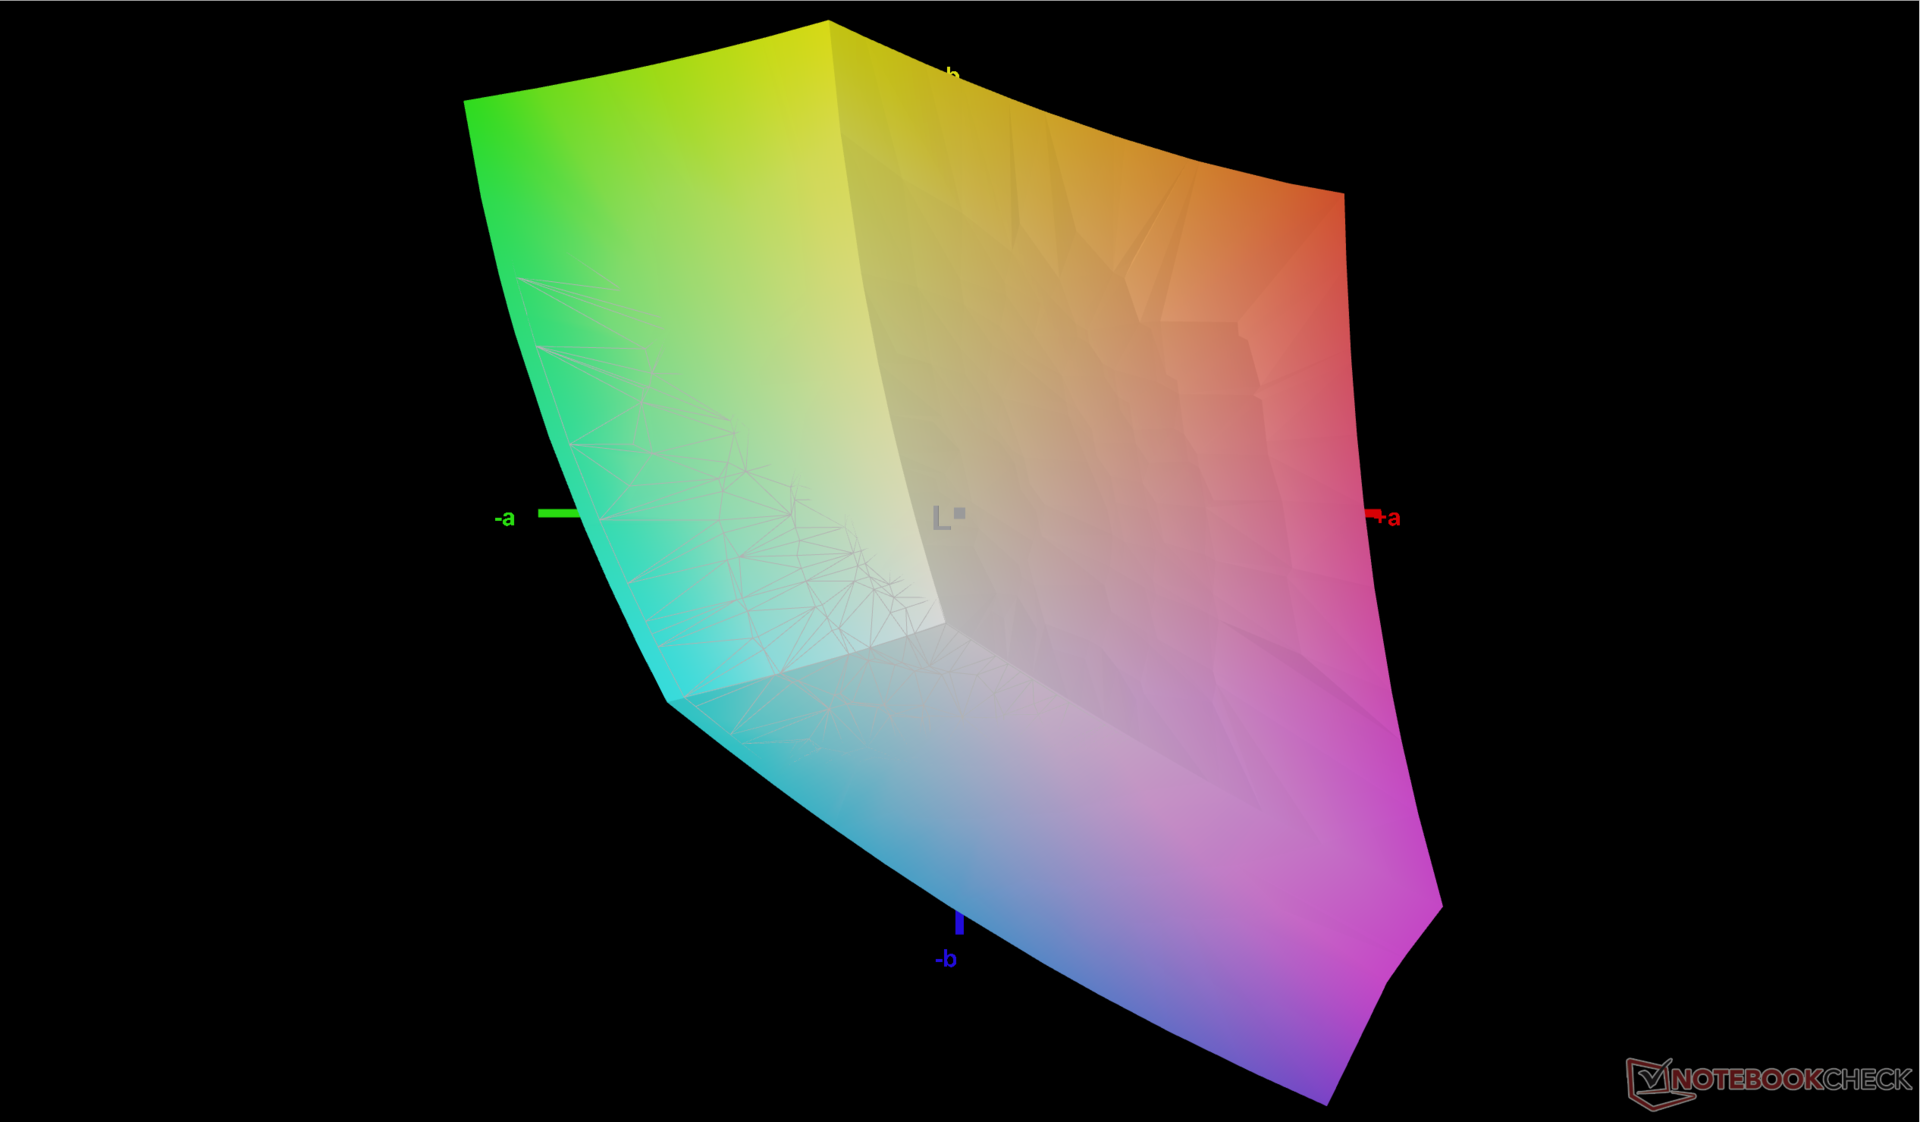
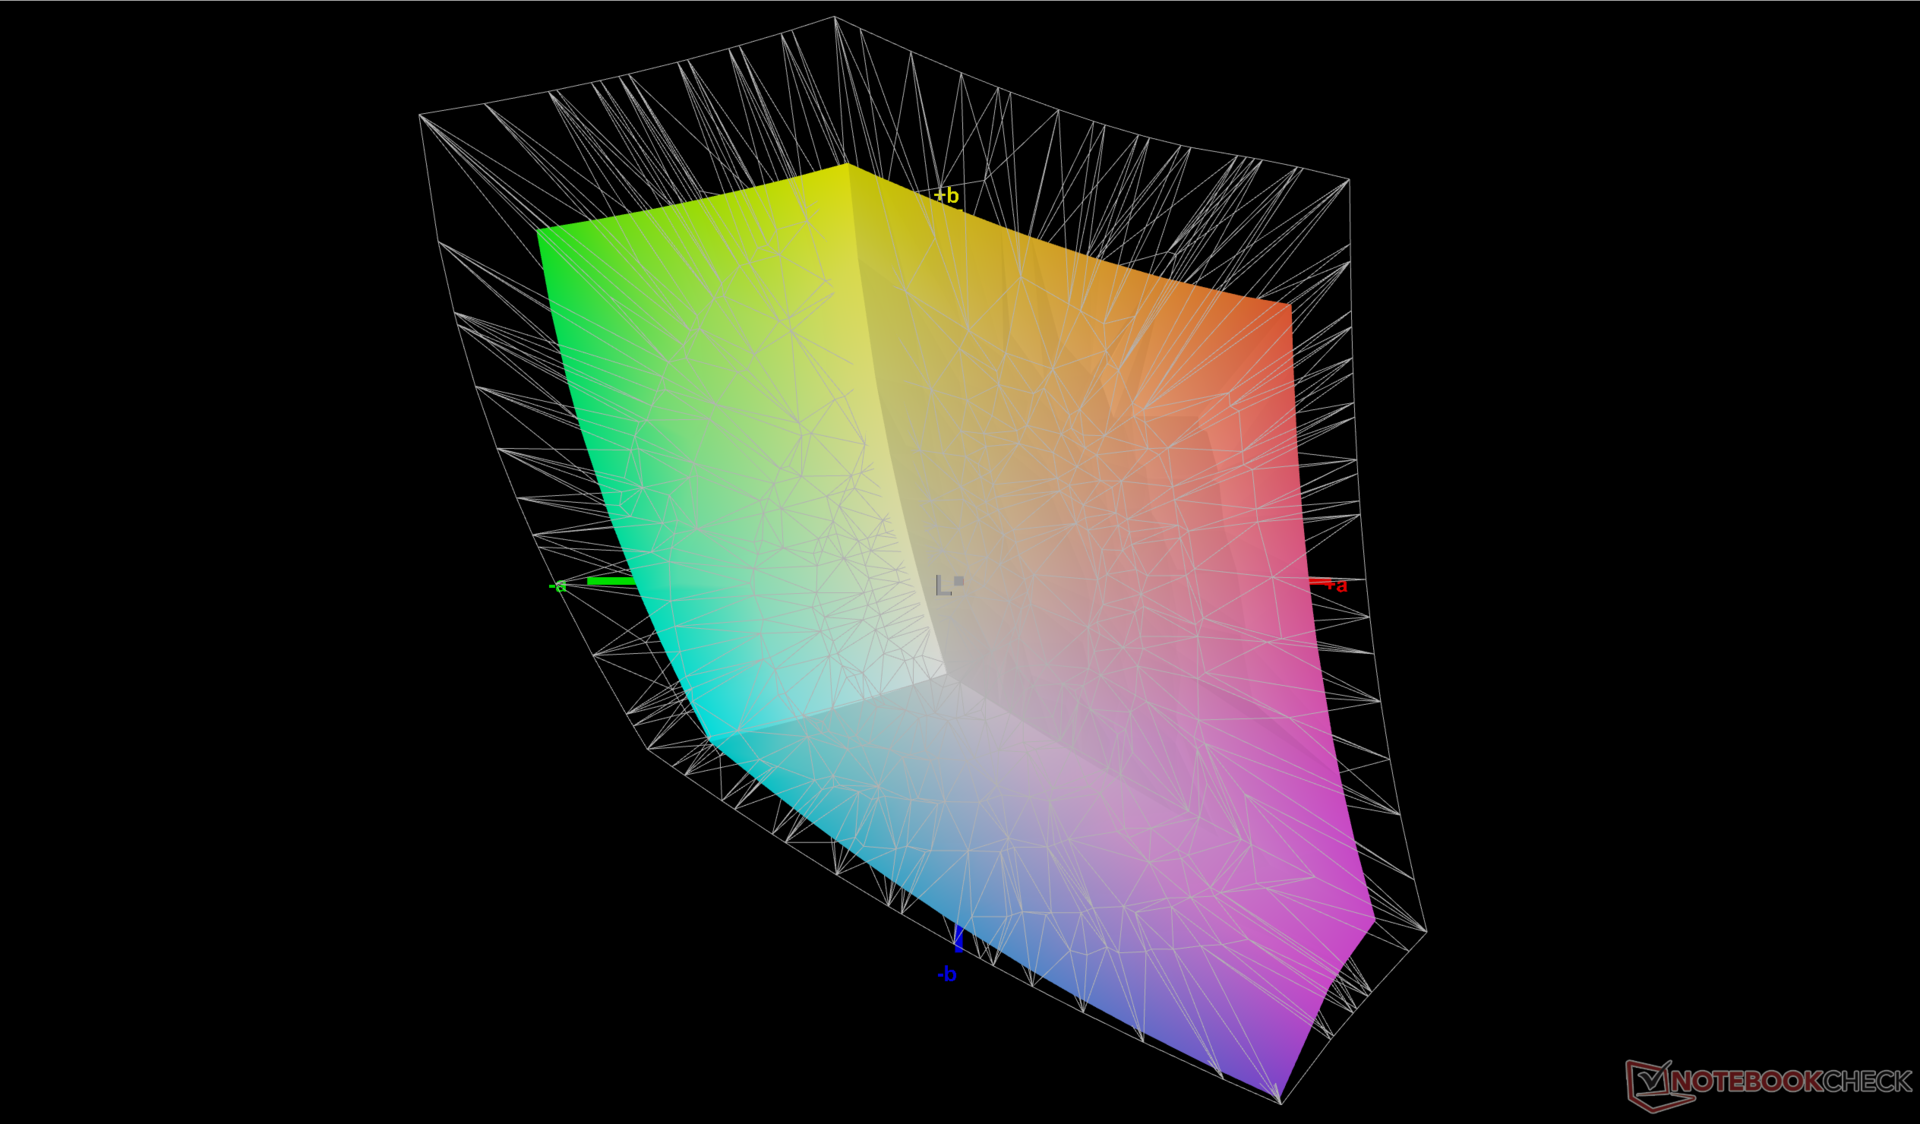
72.6% AdobeRGB 1998 (Argyll 3D)
99.6% sRGB (Argyll 3D)
70.4% Display P3 (Argyll 3D)
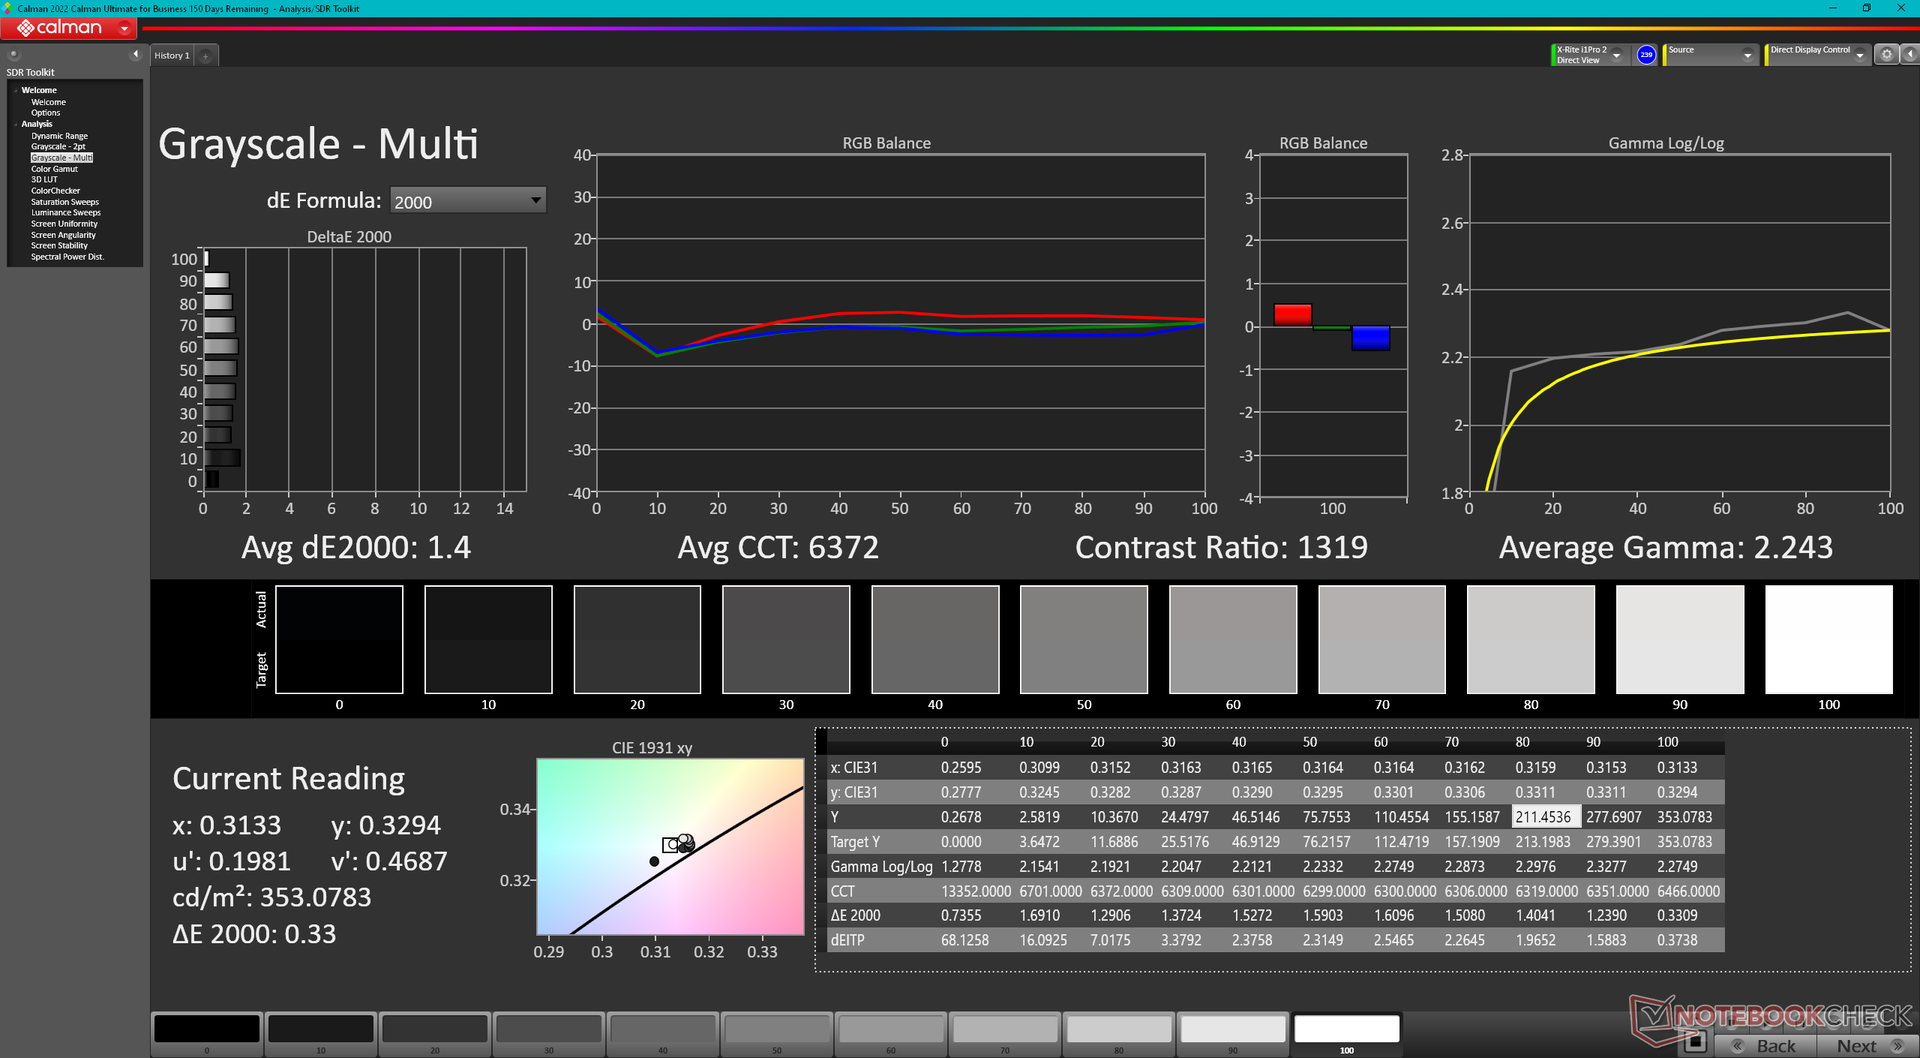
Gamma: 2.24
CCT: 6372 K
| Lenovo Legion Pro 5 16ARX8 CSOT T3 MNG007DA1-Q, IPS, 2560x1600, 16" | Lenovo Legion Pro 5 16IRX8 AU Optronics B160QAN03.1, IPS, 2560x1600, 16" | Uniwill GM6PX7X RTX 4070 BOE CQ NE160QDM-NZ1, IPS, 2560x1600, 16" | Schenker XMG Neo 16 E23 BOE0AF0 NE160QDM-NZ1, IPS, 2560x1600, 16" | Asus ROG Strix G16 G614JZ TL160ADMP03-0, IPS, 2560x1600, 16" | Asus Zephyrus Duo 16 GX650PY-NM006W NE160QDM-NM4, MiniLED, 2560x1600, 16" | |
|---|---|---|---|---|---|---|
| Display | 0% | -4% | -4% | 18% | 22% | |
| Display P3 Coverage (%) | 70.4 | 71.2 1% | 67.5 -4% | 67.3 -4% | 97 38% | 99.4 41% |
| sRGB Coverage (%) | 99.6 | 98.8 -1% | 96.4 -3% | 96.7 -3% | 99.9 0% | 100 0% |
| AdobeRGB 1998 Coverage (%) | 72.6 | 73.3 1% | 68.6 -6% | 68.9 -5% | 84.9 17% | 90.8 25% |
| Response Times | -61% | -44% | -51% | 27% | -113% | |
| Response Time Grey 50% / Grey 80% * (ms) | 7 ? | 14.5 ? -107% | 12.6 ? -80% | 14.5 ? -107% | 5.1 ? 27% | 15.2 ? -117% |
| Response Time Black / White * (ms) | 9.1 ? | 10.4 ? -14% | 9.8 ? -8% | 8.6 ? 5% | 6.6 ? 27% | 19 ? -109% |
| PWM Frequency (Hz) | 12000 ? | |||||
| Screen | -17% | -69% | -54% | -39% | 71% | |
| Brightness middle (cd/m²) | 355.3 | 405.7 14% | 338.6 -5% | 372 5% | 470 32% | 712 100% |
| Brightness (cd/m²) | 340 | 368 8% | 328 -4% | 349 3% | 459 35% | 703 107% |
| Brightness Distribution (%) | 91 | 87 -4% | 89 -2% | 88 -3% | 93 2% | 95 4% |
| Black Level * (cd/m²) | 0.32 | 0.38 -19% | 0.32 -0% | 0.32 -0% | 0.42 -31% | 0.07 78% |
| Contrast (:1) | 1110 | 1068 -4% | 1058 -5% | 1163 5% | 1119 1% | 10171 816% |
| Colorchecker dE 2000 * | 1.13 | 1.65 -46% | 2.18 -93% | 2.06 -82% | 1.86 -65% | 1.7 -50% |
| Colorchecker dE 2000 max. * | 2.78 | 4.2 -51% | 7.14 -157% | 3 -8% | 3.87 -39% | 4 -44% |
| Colorchecker dE 2000 calibrated * | 0.32 | 0.53 -66% | 0.93 -191% | 1.5 -369% | 0.93 -191% | 1.2 -275% |
| Greyscale dE 2000 * | 1.4 | 1.2 14% | 3.7 -164% | 1.9 -36% | 2.7 -93% | 2.8 -100% |
| Gamma | 2.24 98% | 2.3 96% | 2.18 101% | 2.312 95% | 2.246 98% | 2.21 100% |
| CCT | 6372 102% | 6453 101% | 7245 90% | 6747 96% | 6711 97% | 6978 93% |
| Média Total (Programa/Configurações) | -26% /
-20% | -39% /
-52% | -36% /
-43% | 2% /
-17% | -7% /
34% |
* ... menor é melhor
A tela vem pré-calibrada, com excelentes valores DeltaE médios de escala de cinza e cor de apenas 1,4 e 1,13, respectivamente. A tentativa de calibrar ainda mais a tela com o nosso colorímetro X-Rite melhoraria os valores de escala de cinza e cor DeltaE para apenas <0,5 cada. Mesmo assim, uma calibração do usuário final geralmente não é necessária se os valores deltaE já forem <2.
Exibir tempos de resposta
| ↔ Tempo de resposta preto para branco | ||
|---|---|---|
| 9.1 ms ... ascensão ↗ e queda ↘ combinadas | ↗ 4.9 ms ascensão | 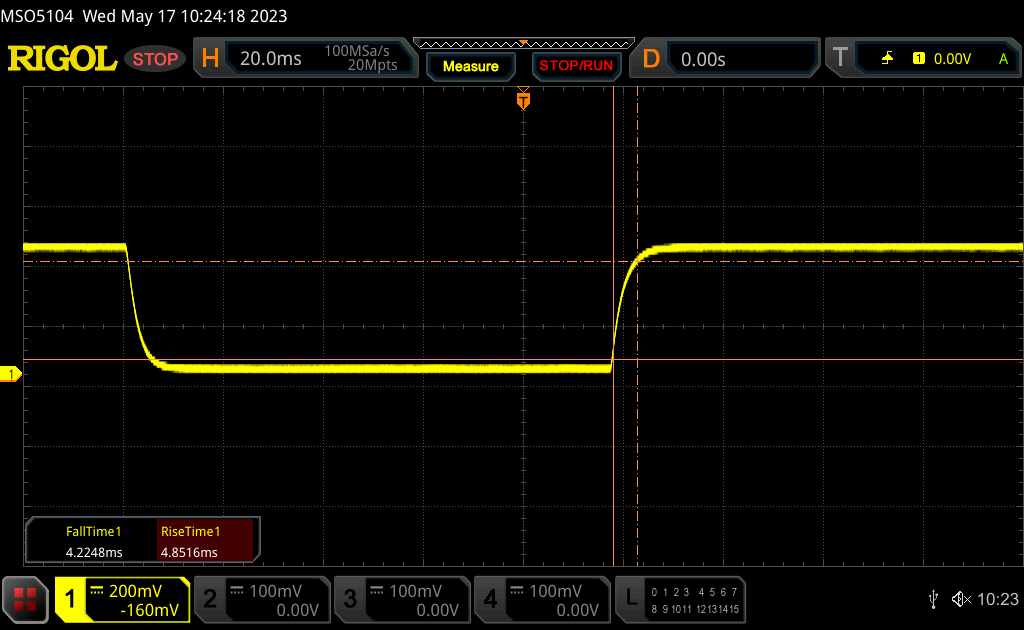 |
| ↘ 4.2 ms queda | ||
| A tela mostra taxas de resposta rápidas em nossos testes e deve ser adequada para jogos. Em comparação, todos os dispositivos testados variam de 0.1 (mínimo) a 240 (máximo) ms. » 25 % de todos os dispositivos são melhores. Isso significa que o tempo de resposta medido é melhor que a média de todos os dispositivos testados (19.8 ms). | ||
| ↔ Tempo de resposta 50% cinza a 80% cinza | ||
| 7 ms ... ascensão ↗ e queda ↘ combinadas | ↗ 3.2 ms ascensão | 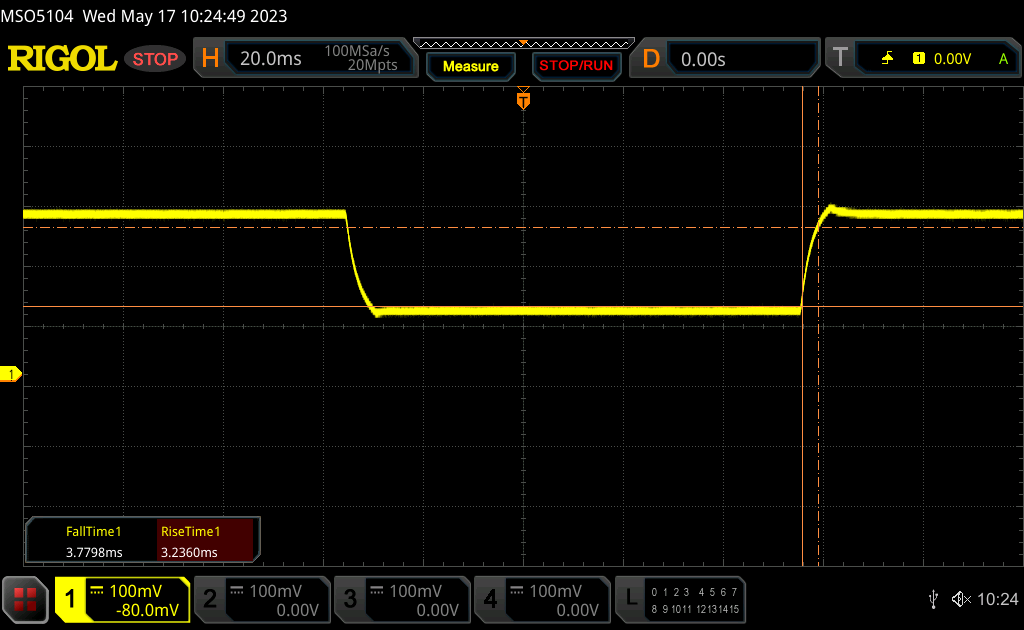 |
| ↘ 3.8 ms queda | ||
| A tela mostra taxas de resposta muito rápidas em nossos testes e deve ser muito adequada para jogos em ritmo acelerado. Em comparação, todos os dispositivos testados variam de 0.165 (mínimo) a 636 (máximo) ms. » 20 % de todos os dispositivos são melhores. Isso significa que o tempo de resposta medido é melhor que a média de todos os dispositivos testados (31 ms). | ||
Cintilação da tela / PWM (modulação por largura de pulso)
| Tela tremeluzindo / PWM não detectado | 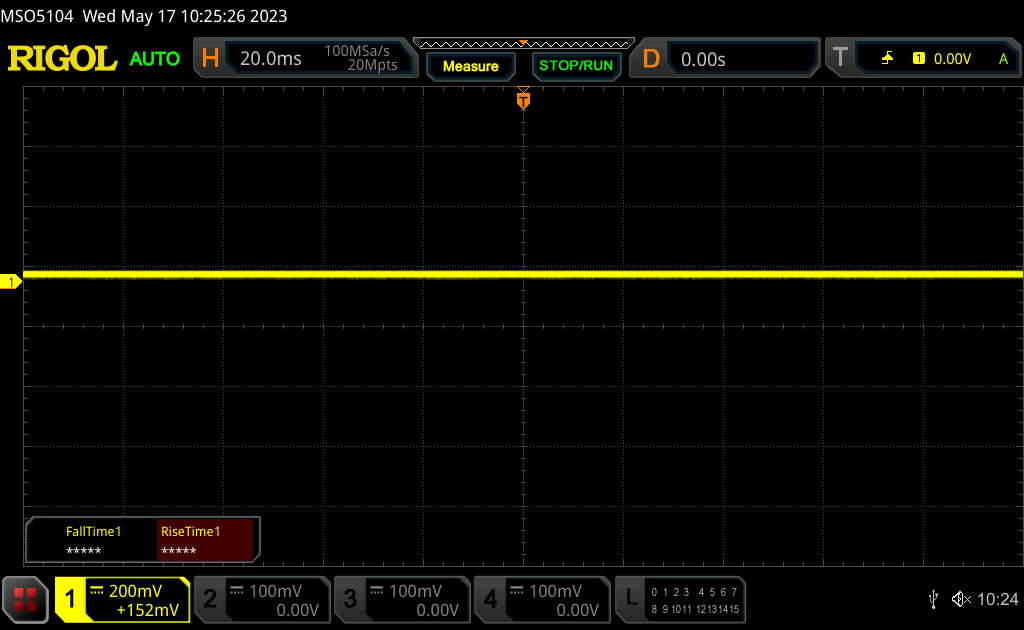 | ||
[pwm_comparison] Em comparação: 52 % de todos os dispositivos testados não usam PWM para escurecer a tela. Se PWM foi detectado, uma média de 7781 (mínimo: 5 - máximo: 343500) Hz foi medida. | |||
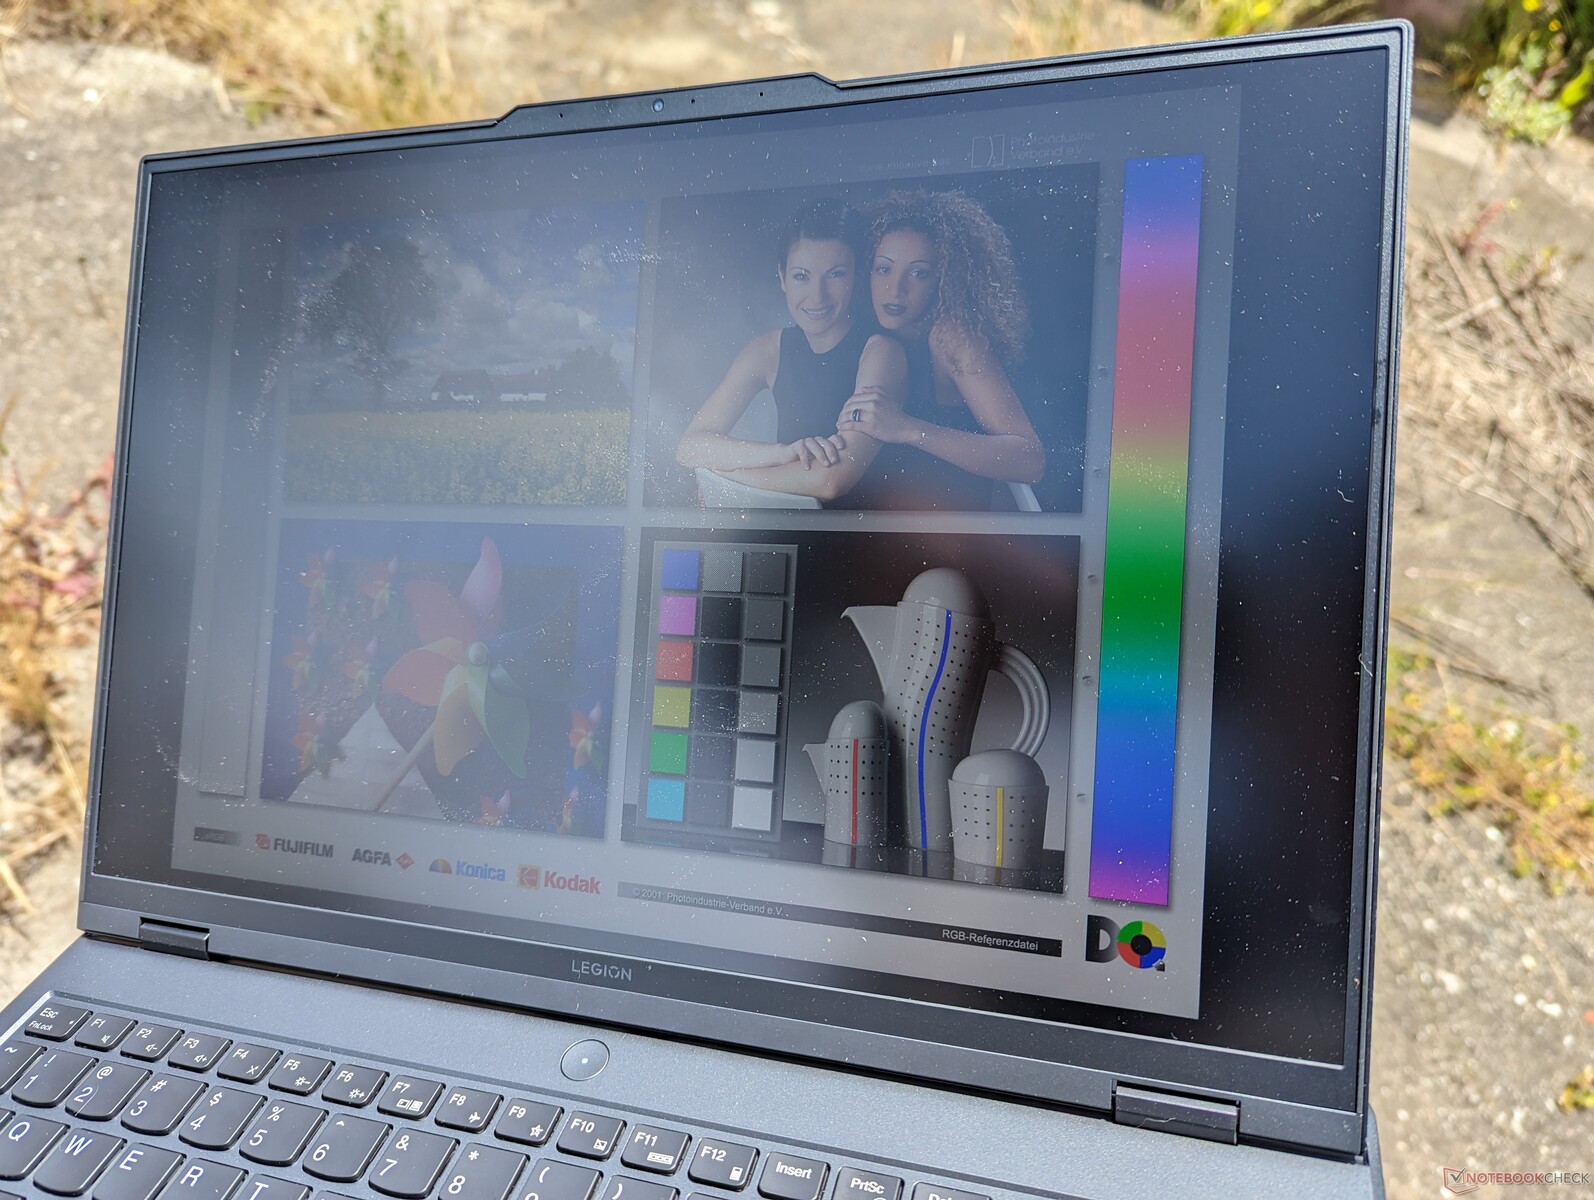
A visibilidade em ambientes externos é média para a categoria, pois as telas da maioria dos notebooks para jogos normalmente variam entre 300 e 400 nits. A opção de painel de 240 Hz promete ser de 500 nits ou cerca de 200 nits mais brilhante do que o nosso painel de 165 Hz, o que deve melhorar a visibilidade em ambientes externos, se isso for uma preocupação. De qualquer forma, você deverá trabalhar à sombra sempre que possível para minimizar o brilho e preservar as cores.

Desempenho - Zen 4 Ryzen 7 de médio porte
Condições de teste
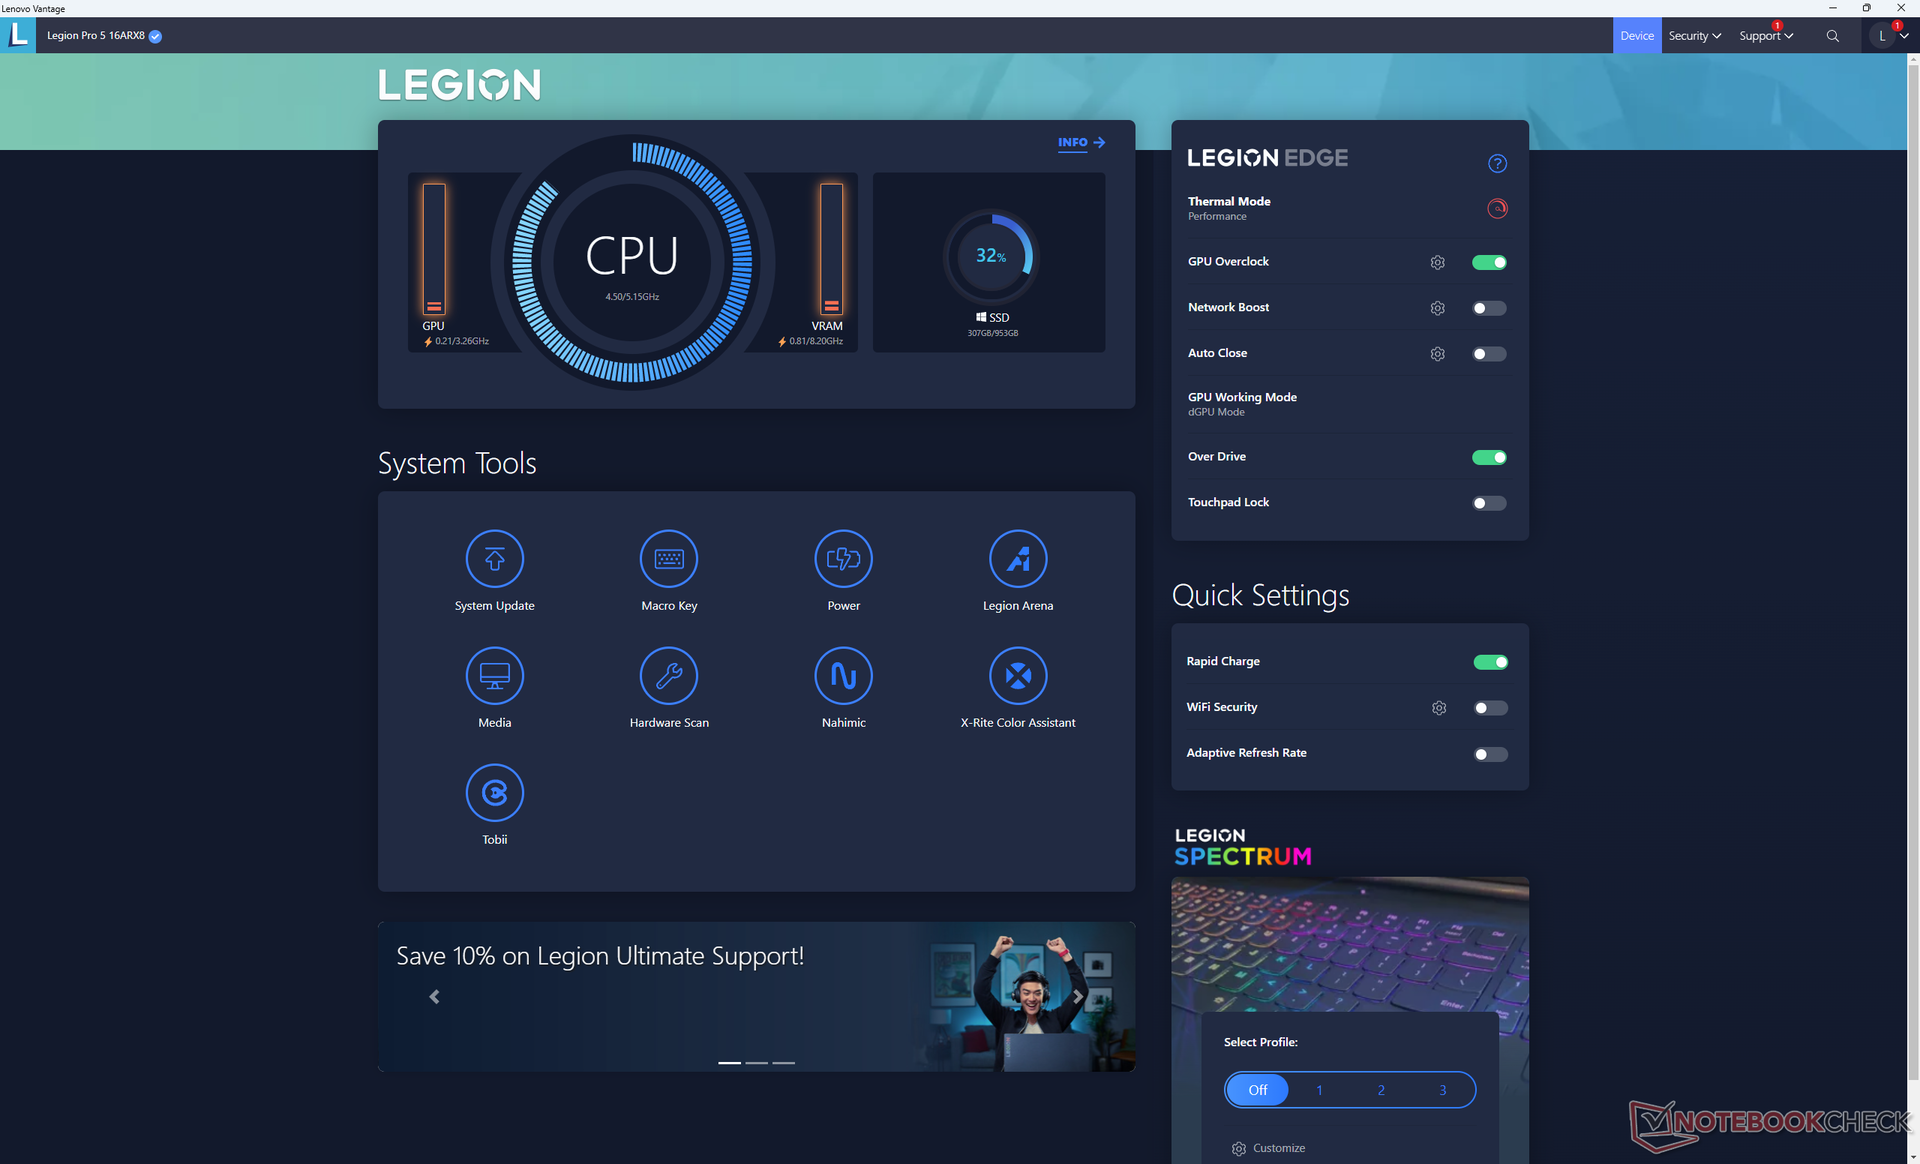
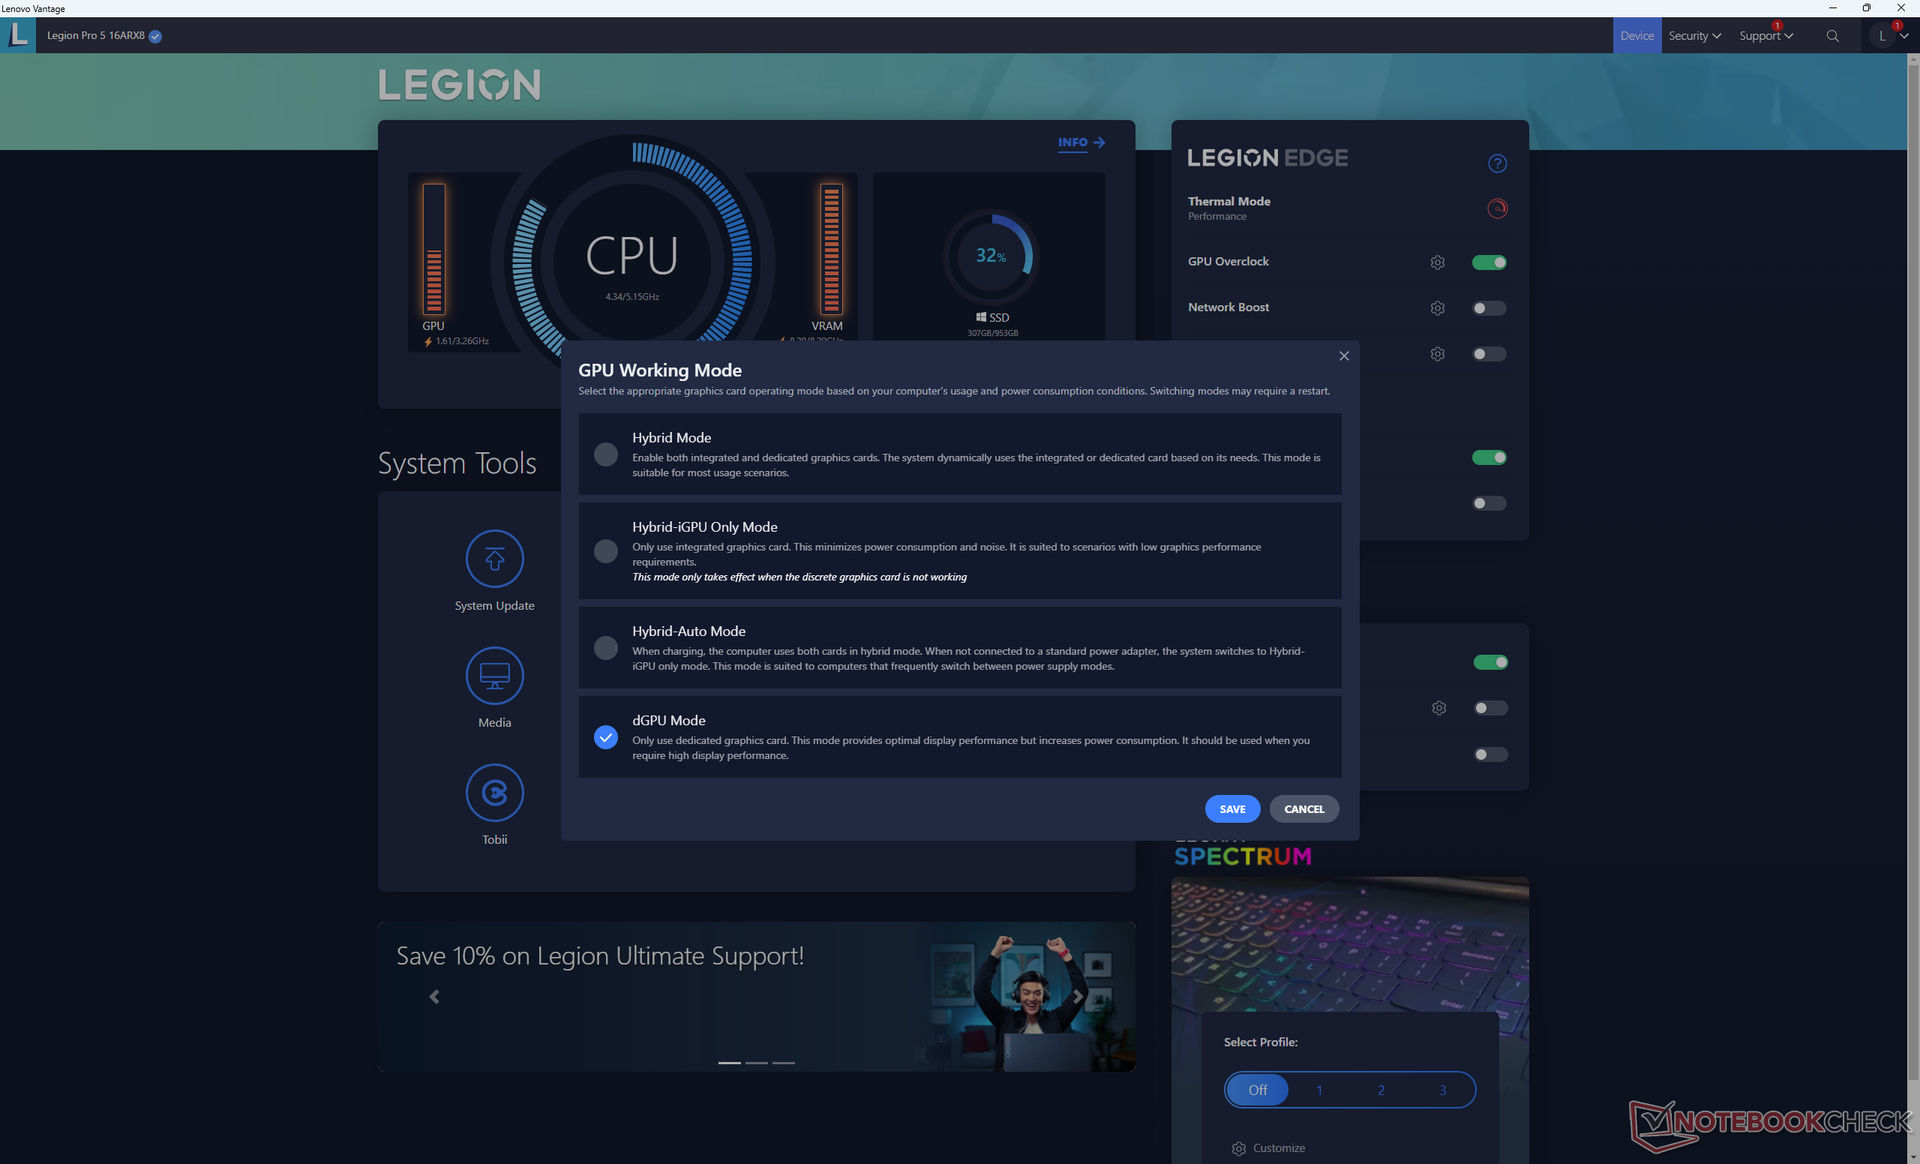
Configuramos nossa unidade para o modo Desempenho por meio do Windows e do software Lenovo Vantage antes de executar os benchmarks abaixo. Também nos certificamos de configurar os gráficos para o modo dGPU com o recurso predefinido GPU Overclock ativo. Recomenda-se que você se familiarize com o Vantage, pois ele é a principal interface para controlar os recursos de iluminação do teclado, as atualizações específicas da Lenovo, o comportamento da GPU e muito mais.
O MUX é compatível com a alternância entre Optimus (iGPU + dGPU) ou somente dGPU. O G-Sync é compatível com a tela interna somente no modo dGPU. É necessário reiniciar o sistema ao alternar entre os modos Optimus e dGPU, pois o modo Advanced Optimus não é suportado. É irritante o fato de o processo de reinicialização ao alternar entre os modos gráficos ser muito mais longo do que uma reinicialização normal.
Processador
Depois de experimentar o incrível Zen 4Ryzen 9 7945HX e depois de se decepcionar com o decepcionante Zen 3Ryzen 7 7735HSnão tínhamos certeza do que esperar do Zen 4Ryzen 7 7745HX. Felizmente, os resultados são excelentes para uma CPU de médio porte, com pontuações de desempenho single-thread e multi-thread 15% e 30% mais altas, respectivamente, do que o Ryzen 7 7735HS. O Ryzen 7 7745HX está, portanto, ao alcance do concorrente Core i7-13700HX por apenas 5 a 15% na maioria dos benchmarks, incluindo o LibreOffice e o HWBOT x265 4K. Sem dúvida, é uma atualização razoável em relação aoRyzen 7 6800H ou Ryzen 9 6900HX quando comparado ao Ryzen 7 7735HX.
A Lenovo oferece uma opção mais lenta do Ryzen 5 7645HX com menos núcleos do que o Ryzen 7 7745HX (6 vs. 8). No entanto, até o momento, ainda não testamos pessoalmente o Ryzen 5 7645HX e, portanto, as diferenças de desempenho entre as duas opções são desconhecidas por enquanto.
Cinebench R15 Multi Loop
Cinebench R23: Multi Core | Single Core
Cinebench R20: CPU (Multi Core) | CPU (Single Core)
Cinebench R15: CPU Multi 64Bit | CPU Single 64Bit
Blender: v2.79 BMW27 CPU
7-Zip 18.03: 7z b 4 | 7z b 4 -mmt1
Geekbench 5.5: Multi-Core | Single-Core
HWBOT x265 Benchmark v2.2: 4k Preset
LibreOffice : 20 Documents To PDF
R Benchmark 2.5: Overall mean
| CPU Performance rating | |
| Schenker XMG SECTOR, i9 13900K, RTX 4090 | |
| Alienware m18 R1 | |
| Schenker XMG Neo 16 E23 | |
| Média AMD Ryzen 7 7745HX | |
| Lenovo Legion Pro 5 16ARX8 | |
| MSI GE67 HX 12UGS | |
| Lenovo Legion Pro 5 16IRX8 | |
| MSI Pulse GL76 12UGK | |
| Asus TUF Gaming A16 FA617 | |
| Schenker XMG Core 15 (M22) | |
| Asus ROG Strix G15 G513RW | |
| MSI Alpha 15 B5EEK-008 | |
| Cinebench R23 / Multi Core | |
| Schenker XMG SECTOR, i9 13900K, RTX 4090 | |
| Alienware m18 R1 | |
| Schenker XMG Neo 16 E23 | |
| MSI GE67 HX 12UGS | |
| Lenovo Legion Pro 5 16IRX8 | |
| Média AMD Ryzen 7 7745HX (18060 - 18845, n=2) | |
| Lenovo Legion Pro 5 16ARX8 | |
| MSI Pulse GL76 12UGK | |
| Schenker XMG Core 15 (M22) | |
| Asus TUF Gaming A16 FA617 | |
| Asus ROG Strix G15 G513RW | |
| MSI Alpha 15 B5EEK-008 | |
| Cinebench R23 / Single Core | |
| Schenker XMG SECTOR, i9 13900K, RTX 4090 | |
| Alienware m18 R1 | |
| Schenker XMG Neo 16 E23 | |
| Média AMD Ryzen 7 7745HX (1846 - 1854, n=2) | |
| Lenovo Legion Pro 5 16ARX8 | |
| MSI GE67 HX 12UGS | |
| MSI Pulse GL76 12UGK | |
| Lenovo Legion Pro 5 16IRX8 | |
| Asus TUF Gaming A16 FA617 | |
| Schenker XMG Core 15 (M22) | |
| Asus ROG Strix G15 G513RW | |
| MSI Alpha 15 B5EEK-008 | |
| Cinebench R20 / CPU (Multi Core) | |
| Schenker XMG SECTOR, i9 13900K, RTX 4090 | |
| Alienware m18 R1 | |
| Schenker XMG Neo 16 E23 | |
| MSI GE67 HX 12UGS | |
| Média AMD Ryzen 7 7745HX (7072 - 7399, n=2) | |
| Lenovo Legion Pro 5 16ARX8 | |
| Lenovo Legion Pro 5 16IRX8 | |
| MSI Pulse GL76 12UGK | |
| Schenker XMG Core 15 (M22) | |
| Asus TUF Gaming A16 FA617 | |
| Asus ROG Strix G15 G513RW | |
| MSI Alpha 15 B5EEK-008 | |
| Cinebench R20 / CPU (Single Core) | |
| Schenker XMG SECTOR, i9 13900K, RTX 4090 | |
| Alienware m18 R1 | |
| Schenker XMG Neo 16 E23 | |
| Média AMD Ryzen 7 7745HX (717 - 719, n=2) | |
| Lenovo Legion Pro 5 16ARX8 | |
| MSI GE67 HX 12UGS | |
| MSI Pulse GL76 12UGK | |
| Lenovo Legion Pro 5 16IRX8 | |
| Asus TUF Gaming A16 FA617 | |
| Schenker XMG Core 15 (M22) | |
| Asus ROG Strix G15 G513RW | |
| MSI Alpha 15 B5EEK-008 | |
| Cinebench R15 / CPU Multi 64Bit | |
| Schenker XMG SECTOR, i9 13900K, RTX 4090 | |
| Alienware m18 R1 | |
| Schenker XMG Neo 16 E23 | |
| MSI GE67 HX 12UGS | |
| Lenovo Legion Pro 5 16IRX8 | |
| Média AMD Ryzen 7 7745HX (2978 - 2994, n=2) | |
| Lenovo Legion Pro 5 16ARX8 | |
| MSI Pulse GL76 12UGK | |
| Schenker XMG Core 15 (M22) | |
| Asus TUF Gaming A16 FA617 | |
| Asus ROG Strix G15 G513RW | |
| MSI Alpha 15 B5EEK-008 | |
| Cinebench R15 / CPU Single 64Bit | |
| Schenker XMG SECTOR, i9 13900K, RTX 4090 | |
| Alienware m18 R1 | |
| Schenker XMG Neo 16 E23 | |
| Média AMD Ryzen 7 7745HX (294 - 295, n=2) | |
| Lenovo Legion Pro 5 16ARX8 | |
| Lenovo Legion Pro 5 16IRX8 | |
| MSI GE67 HX 12UGS | |
| MSI Pulse GL76 12UGK | |
| Schenker XMG Core 15 (M22) | |
| Asus TUF Gaming A16 FA617 | |
| Asus ROG Strix G15 G513RW | |
| MSI Alpha 15 B5EEK-008 | |
| Blender / v2.79 BMW27 CPU | |
| MSI Alpha 15 B5EEK-008 | |
| Asus ROG Strix G15 G513RW | |
| Asus TUF Gaming A16 FA617 | |
| Schenker XMG Core 15 (M22) | |
| MSI Pulse GL76 12UGK | |
| Lenovo Legion Pro 5 16ARX8 | |
| Média AMD Ryzen 7 7745HX (169 - 174, n=2) | |
| MSI GE67 HX 12UGS | |
| Lenovo Legion Pro 5 16IRX8 | |
| Schenker XMG Neo 16 E23 | |
| Alienware m18 R1 | |
| Schenker XMG SECTOR, i9 13900K, RTX 4090 | |
| 7-Zip 18.03 / 7z b 4 | |
| Schenker XMG SECTOR, i9 13900K, RTX 4090 | |
| Alienware m18 R1 | |
| Schenker XMG Neo 16 E23 | |
| Média AMD Ryzen 7 7745HX (75557 - 83268, n=2) | |
| Lenovo Legion Pro 5 16IRX8 | |
| MSI GE67 HX 12UGS | |
| Lenovo Legion Pro 5 16ARX8 | |
| MSI Pulse GL76 12UGK | |
| Schenker XMG Core 15 (M22) | |
| Asus TUF Gaming A16 FA617 | |
| Asus ROG Strix G15 G513RW | |
| MSI Alpha 15 B5EEK-008 | |
| 7-Zip 18.03 / 7z b 4 -mmt1 | |
| Média AMD Ryzen 7 7745HX (7244 - 7275, n=2) | |
| Lenovo Legion Pro 5 16ARX8 | |
| Schenker XMG SECTOR, i9 13900K, RTX 4090 | |
| Schenker XMG Neo 16 E23 | |
| Alienware m18 R1 | |
| Asus ROG Strix G15 G513RW | |
| Schenker XMG Core 15 (M22) | |
| Asus TUF Gaming A16 FA617 | |
| Lenovo Legion Pro 5 16IRX8 | |
| MSI Pulse GL76 12UGK | |
| MSI GE67 HX 12UGS | |
| MSI Alpha 15 B5EEK-008 | |
| Geekbench 5.5 / Multi-Core | |
| Schenker XMG SECTOR, i9 13900K, RTX 4090 | |
| Alienware m18 R1 | |
| Schenker XMG Neo 16 E23 | |
| MSI GE67 HX 12UGS | |
| Lenovo Legion Pro 5 16IRX8 | |
| Média AMD Ryzen 7 7745HX (12378 - 13462, n=2) | |
| Lenovo Legion Pro 5 16ARX8 | |
| MSI Pulse GL76 12UGK | |
| Schenker XMG Core 15 (M22) | |
| Asus TUF Gaming A16 FA617 | |
| Asus ROG Strix G15 G513RW | |
| MSI Alpha 15 B5EEK-008 | |
| Geekbench 5.5 / Single-Core | |
| Schenker XMG SECTOR, i9 13900K, RTX 4090 | |
| Alienware m18 R1 | |
| Média AMD Ryzen 7 7745HX (2040 - 2067, n=2) | |
| Schenker XMG Neo 16 E23 | |
| Lenovo Legion Pro 5 16ARX8 | |
| Lenovo Legion Pro 5 16IRX8 | |
| MSI GE67 HX 12UGS | |
| MSI Pulse GL76 12UGK | |
| Asus ROG Strix G15 G513RW | |
| Asus TUF Gaming A16 FA617 | |
| Schenker XMG Core 15 (M22) | |
| MSI Alpha 15 B5EEK-008 | |
| HWBOT x265 Benchmark v2.2 / 4k Preset | |
| Schenker XMG SECTOR, i9 13900K, RTX 4090 | |
| Alienware m18 R1 | |
| Schenker XMG Neo 16 E23 | |
| MSI GE67 HX 12UGS | |
| Lenovo Legion Pro 5 16IRX8 | |
| Média AMD Ryzen 7 7745HX (23.2 - 24.1, n=2) | |
| Lenovo Legion Pro 5 16ARX8 | |
| MSI Pulse GL76 12UGK | |
| Schenker XMG Core 15 (M22) | |
| Asus TUF Gaming A16 FA617 | |
| Asus ROG Strix G15 G513RW | |
| MSI Alpha 15 B5EEK-008 | |
| LibreOffice / 20 Documents To PDF | |
| Schenker XMG Core 15 (M22) | |
| Asus ROG Strix G15 G513RW | |
| Asus TUF Gaming A16 FA617 | |
| MSI Alpha 15 B5EEK-008 | |
| Alienware m18 R1 | |
| MSI Pulse GL76 12UGK | |
| MSI GE67 HX 12UGS | |
| Média AMD Ryzen 7 7745HX (37.9 - 41.4, n=2) | |
| Lenovo Legion Pro 5 16ARX8 | |
| Schenker XMG Neo 16 E23 | |
| Schenker XMG SECTOR, i9 13900K, RTX 4090 | |
| Lenovo Legion Pro 5 16IRX8 | |
| R Benchmark 2.5 / Overall mean | |
| MSI Alpha 15 B5EEK-008 | |
| Asus TUF Gaming A16 FA617 | |
| Asus ROG Strix G15 G513RW | |
| Schenker XMG Core 15 (M22) | |
| Lenovo Legion Pro 5 16IRX8 | |
| MSI Pulse GL76 12UGK | |
| MSI GE67 HX 12UGS | |
| Lenovo Legion Pro 5 16ARX8 | |
| Média AMD Ryzen 7 7745HX (0.4141 - 0.421, n=2) | |
| Alienware m18 R1 | |
| Schenker XMG Neo 16 E23 | |
| Schenker XMG SECTOR, i9 13900K, RTX 4090 | |
* ... menor é melhor
AIDA64: FP32 Ray-Trace | FPU Julia | CPU SHA3 | CPU Queen | FPU SinJulia | FPU Mandel | CPU AES | CPU ZLib | FP64 Ray-Trace | CPU PhotoWorxx
| Performance rating | |
| Asus ROG Strix G16 G614JZ | |
| Schenker XMG Neo 16 E23 | |
| Média AMD Ryzen 7 7745HX | |
| Lenovo Legion Pro 5 16ARX8 | |
| Uniwill GM6PX7X RTX 4070 | |
| Lenovo Legion Pro 5 16IRX8 | |
| AIDA64 / FP32 Ray-Trace | |
| Lenovo Legion Pro 5 16ARX8 | |
| Média AMD Ryzen 7 7745HX (29066 - 29656, n=2) | |
| Asus ROG Strix G16 G614JZ | |
| Schenker XMG Neo 16 E23 | |
| Uniwill GM6PX7X RTX 4070 | |
| Lenovo Legion Pro 5 16IRX8 | |
| AIDA64 / FPU Julia | |
| Asus ROG Strix G16 G614JZ | |
| Média AMD Ryzen 7 7745HX (120974 - 123689, n=2) | |
| Lenovo Legion Pro 5 16ARX8 | |
| Schenker XMG Neo 16 E23 | |
| Uniwill GM6PX7X RTX 4070 | |
| Lenovo Legion Pro 5 16IRX8 | |
| AIDA64 / CPU SHA3 | |
| Asus ROG Strix G16 G614JZ | |
| Schenker XMG Neo 16 E23 | |
| Média AMD Ryzen 7 7745HX (4974 - 5204, n=2) | |
| Lenovo Legion Pro 5 16ARX8 | |
| Uniwill GM6PX7X RTX 4070 | |
| Lenovo Legion Pro 5 16IRX8 | |
| AIDA64 / CPU Queen | |
| Asus ROG Strix G16 G614JZ | |
| Schenker XMG Neo 16 E23 | |
| Média AMD Ryzen 7 7745HX (126954 - 128143, n=2) | |
| Lenovo Legion Pro 5 16ARX8 | |
| Lenovo Legion Pro 5 16IRX8 | |
| Uniwill GM6PX7X RTX 4070 | |
| AIDA64 / FPU SinJulia | |
| Asus ROG Strix G16 G614JZ | |
| Média AMD Ryzen 7 7745HX (15887 - 16221, n=2) | |
| Lenovo Legion Pro 5 16ARX8 | |
| Schenker XMG Neo 16 E23 | |
| Lenovo Legion Pro 5 16IRX8 | |
| Uniwill GM6PX7X RTX 4070 | |
| AIDA64 / FPU Mandel | |
| Asus ROG Strix G16 G614JZ | |
| Média AMD Ryzen 7 7745HX (64255 - 64969, n=2) | |
| Lenovo Legion Pro 5 16ARX8 | |
| Schenker XMG Neo 16 E23 | |
| Uniwill GM6PX7X RTX 4070 | |
| Lenovo Legion Pro 5 16IRX8 | |
| AIDA64 / CPU AES | |
| Schenker XMG Neo 16 E23 | |
| Uniwill GM6PX7X RTX 4070 | |
| Asus ROG Strix G16 G614JZ | |
| Lenovo Legion Pro 5 16IRX8 | |
| Média AMD Ryzen 7 7745HX (71191 - 95481, n=2) | |
| Lenovo Legion Pro 5 16ARX8 | |
| AIDA64 / CPU ZLib | |
| Asus ROG Strix G16 G614JZ | |
| Schenker XMG Neo 16 E23 | |
| Uniwill GM6PX7X RTX 4070 | |
| Lenovo Legion Pro 5 16IRX8 | |
| Média AMD Ryzen 7 7745HX (1147 - 1176, n=2) | |
| Lenovo Legion Pro 5 16ARX8 | |
| AIDA64 / FP64 Ray-Trace | |
| Média AMD Ryzen 7 7745HX (15975 - 16358, n=2) | |
| Lenovo Legion Pro 5 16ARX8 | |
| Asus ROG Strix G16 G614JZ | |
| Schenker XMG Neo 16 E23 | |
| Lenovo Legion Pro 5 16IRX8 | |
| Uniwill GM6PX7X RTX 4070 | |
| AIDA64 / CPU PhotoWorxx | |
| Schenker XMG Neo 16 E23 | |
| Uniwill GM6PX7X RTX 4070 | |
| Asus ROG Strix G16 G614JZ | |
| Lenovo Legion Pro 5 16IRX8 | |
| Média AMD Ryzen 7 7745HX (28499 - 33304, n=2) | |
| Lenovo Legion Pro 5 16ARX8 | |
Desempenho do sistema
CrossMark: Overall | Productivity | Creativity | Responsiveness
| PCMark 10 / Score | |
| Asus Zephyrus Duo 16 GX650PY-NM006W | |
| Uniwill GM6PX7X RTX 4070 | |
| Schenker XMG Neo 16 E23 | |
| Lenovo Legion Pro 5 16ARX8 | |
| Lenovo Legion Pro 5 16IRX8 | |
| Asus ROG Strix G16 G614JZ | |
| PCMark 10 / Essentials | |
| Asus Zephyrus Duo 16 GX650PY-NM006W | |
| Asus ROG Strix G16 G614JZ | |
| Uniwill GM6PX7X RTX 4070 | |
| Lenovo Legion Pro 5 16ARX8 | |
| Schenker XMG Neo 16 E23 | |
| Lenovo Legion Pro 5 16IRX8 | |
| PCMark 10 / Productivity | |
| Asus Zephyrus Duo 16 GX650PY-NM006W | |
| Uniwill GM6PX7X RTX 4070 | |
| Lenovo Legion Pro 5 16ARX8 | |
| Schenker XMG Neo 16 E23 | |
| Lenovo Legion Pro 5 16IRX8 | |
| Asus ROG Strix G16 G614JZ | |
| PCMark 10 / Digital Content Creation | |
| Schenker XMG Neo 16 E23 | |
| Asus Zephyrus Duo 16 GX650PY-NM006W | |
| Uniwill GM6PX7X RTX 4070 | |
| Lenovo Legion Pro 5 16ARX8 | |
| Lenovo Legion Pro 5 16IRX8 | |
| Asus ROG Strix G16 G614JZ | |
| CrossMark / Overall | |
| Asus ROG Strix G16 G614JZ | |
| Schenker XMG Neo 16 E23 | |
| Asus Zephyrus Duo 16 GX650PY-NM006W | |
| Lenovo Legion Pro 5 16ARX8 | |
| Uniwill GM6PX7X RTX 4070 | |
| Lenovo Legion Pro 5 16IRX8 | |
| CrossMark / Productivity | |
| Asus ROG Strix G16 G614JZ | |
| Schenker XMG Neo 16 E23 | |
| Asus Zephyrus Duo 16 GX650PY-NM006W | |
| Lenovo Legion Pro 5 16ARX8 | |
| Uniwill GM6PX7X RTX 4070 | |
| Lenovo Legion Pro 5 16IRX8 | |
| CrossMark / Creativity | |
| Schenker XMG Neo 16 E23 | |
| Asus ROG Strix G16 G614JZ | |
| Asus Zephyrus Duo 16 GX650PY-NM006W | |
| Lenovo Legion Pro 5 16ARX8 | |
| Uniwill GM6PX7X RTX 4070 | |
| Lenovo Legion Pro 5 16IRX8 | |
| CrossMark / Responsiveness | |
| Asus ROG Strix G16 G614JZ | |
| Lenovo Legion Pro 5 16ARX8 | |
| Uniwill GM6PX7X RTX 4070 | |
| Schenker XMG Neo 16 E23 | |
| Asus Zephyrus Duo 16 GX650PY-NM006W | |
| Lenovo Legion Pro 5 16IRX8 | |
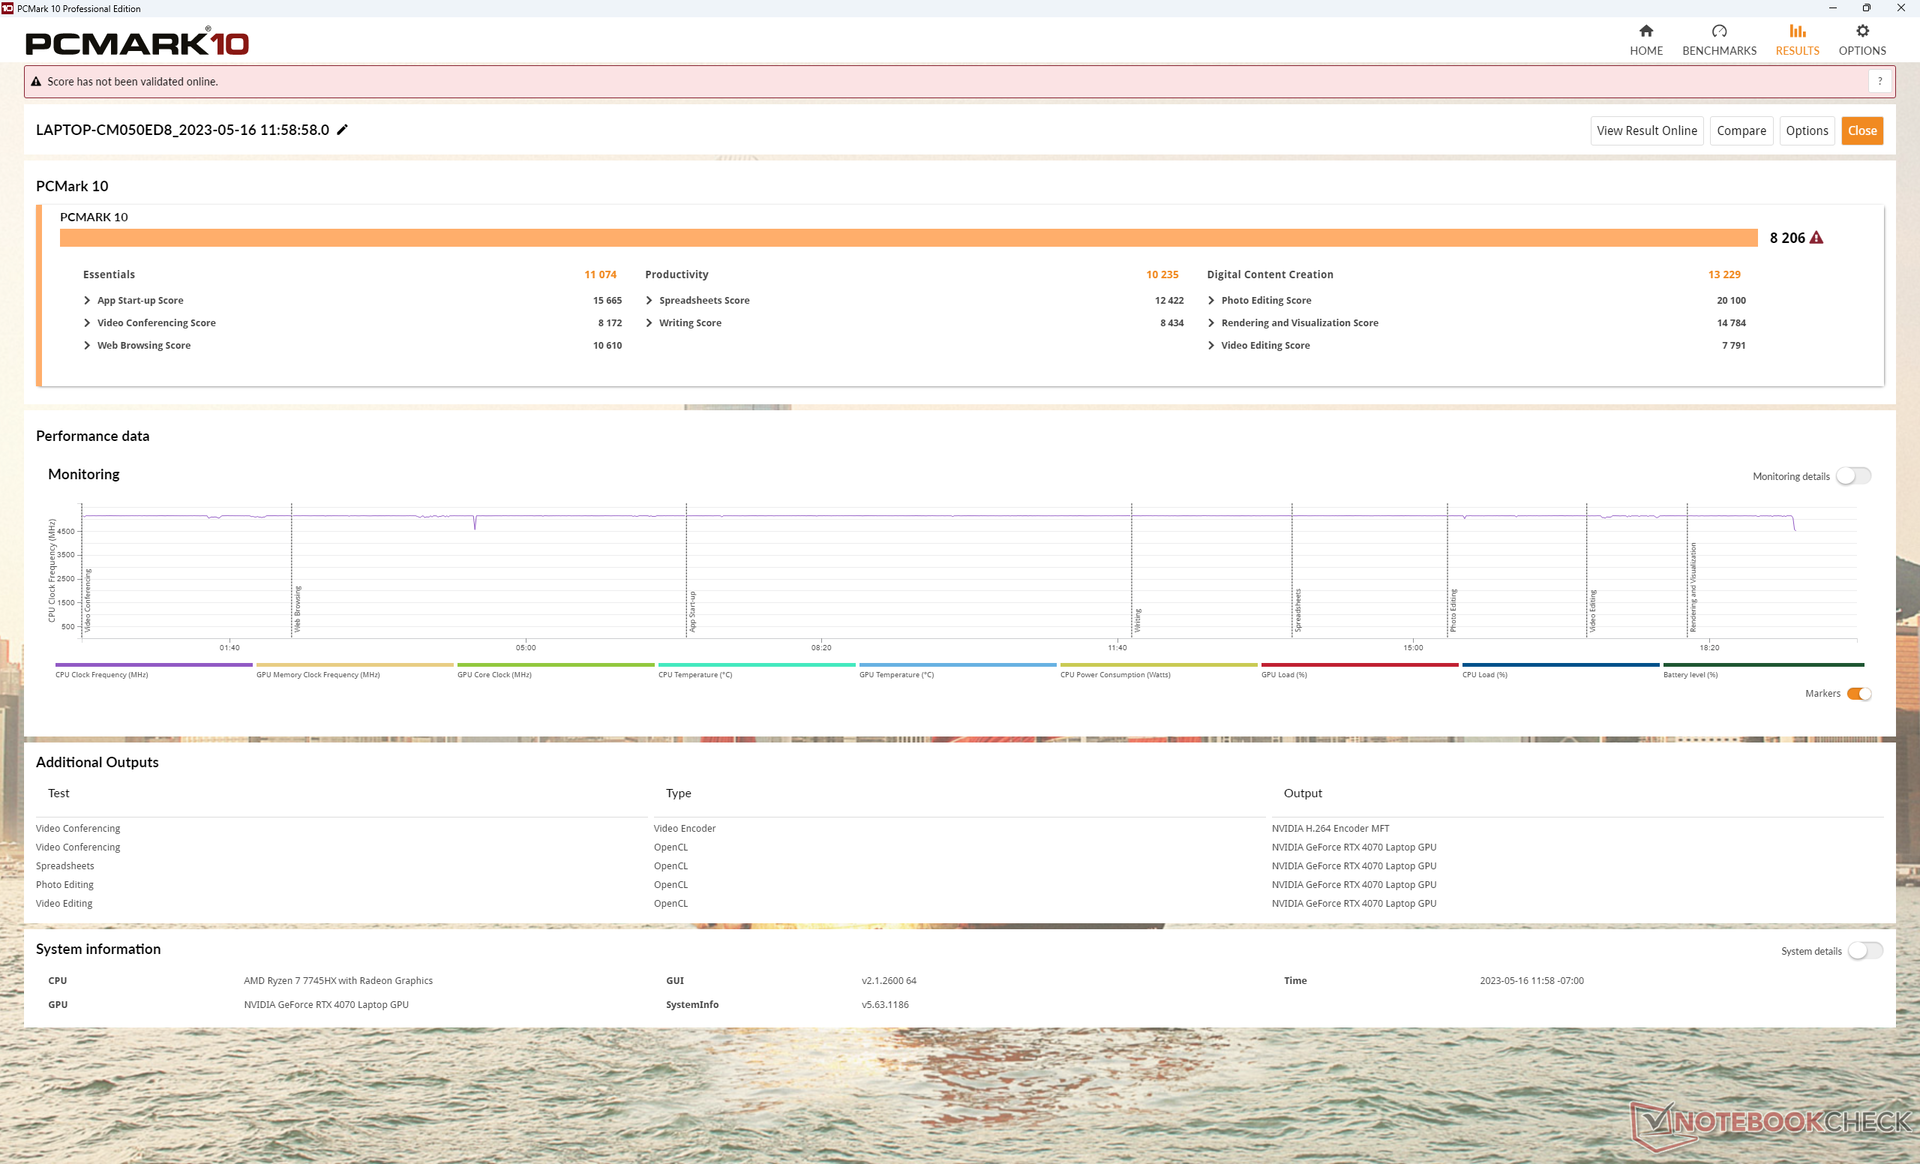
| PCMark 10 Score | 8206 pontos | |
Ajuda | ||
| AIDA64 / Memory Copy | |
| Schenker XMG Neo 16 E23 | |
| Uniwill GM6PX7X RTX 4070 | |
| Asus ROG Strix G16 G614JZ | |
| Lenovo Legion Pro 5 16IRX8 | |
| Média AMD Ryzen 7 7745HX (50007 - 53867, n=2) | |
| Lenovo Legion Pro 5 16ARX8 | |
| AIDA64 / Memory Read | |
| Schenker XMG Neo 16 E23 | |
| Asus ROG Strix G16 G614JZ | |
| Uniwill GM6PX7X RTX 4070 | |
| Lenovo Legion Pro 5 16IRX8 | |
| Média AMD Ryzen 7 7745HX (50703 - 54278, n=2) | |
| Lenovo Legion Pro 5 16ARX8 | |
| AIDA64 / Memory Write | |
| Schenker XMG Neo 16 E23 | |
| Lenovo Legion Pro 5 16IRX8 | |
| Uniwill GM6PX7X RTX 4070 | |
| Média AMD Ryzen 7 7745HX (54587 - 70803, n=2) | |
| Asus ROG Strix G16 G614JZ | |
| Lenovo Legion Pro 5 16ARX8 | |
| AIDA64 / Memory Latency | |
| Asus ROG Strix G16 G614JZ | |
| Uniwill GM6PX7X RTX 4070 | |
| Lenovo Legion Pro 5 16ARX8 | |
| Schenker XMG Neo 16 E23 | |
| Média AMD Ryzen 7 7745HX (80.7 - 86.5, n=2) | |
| Lenovo Legion Pro 5 16IRX8 | |
* ... menor é melhor
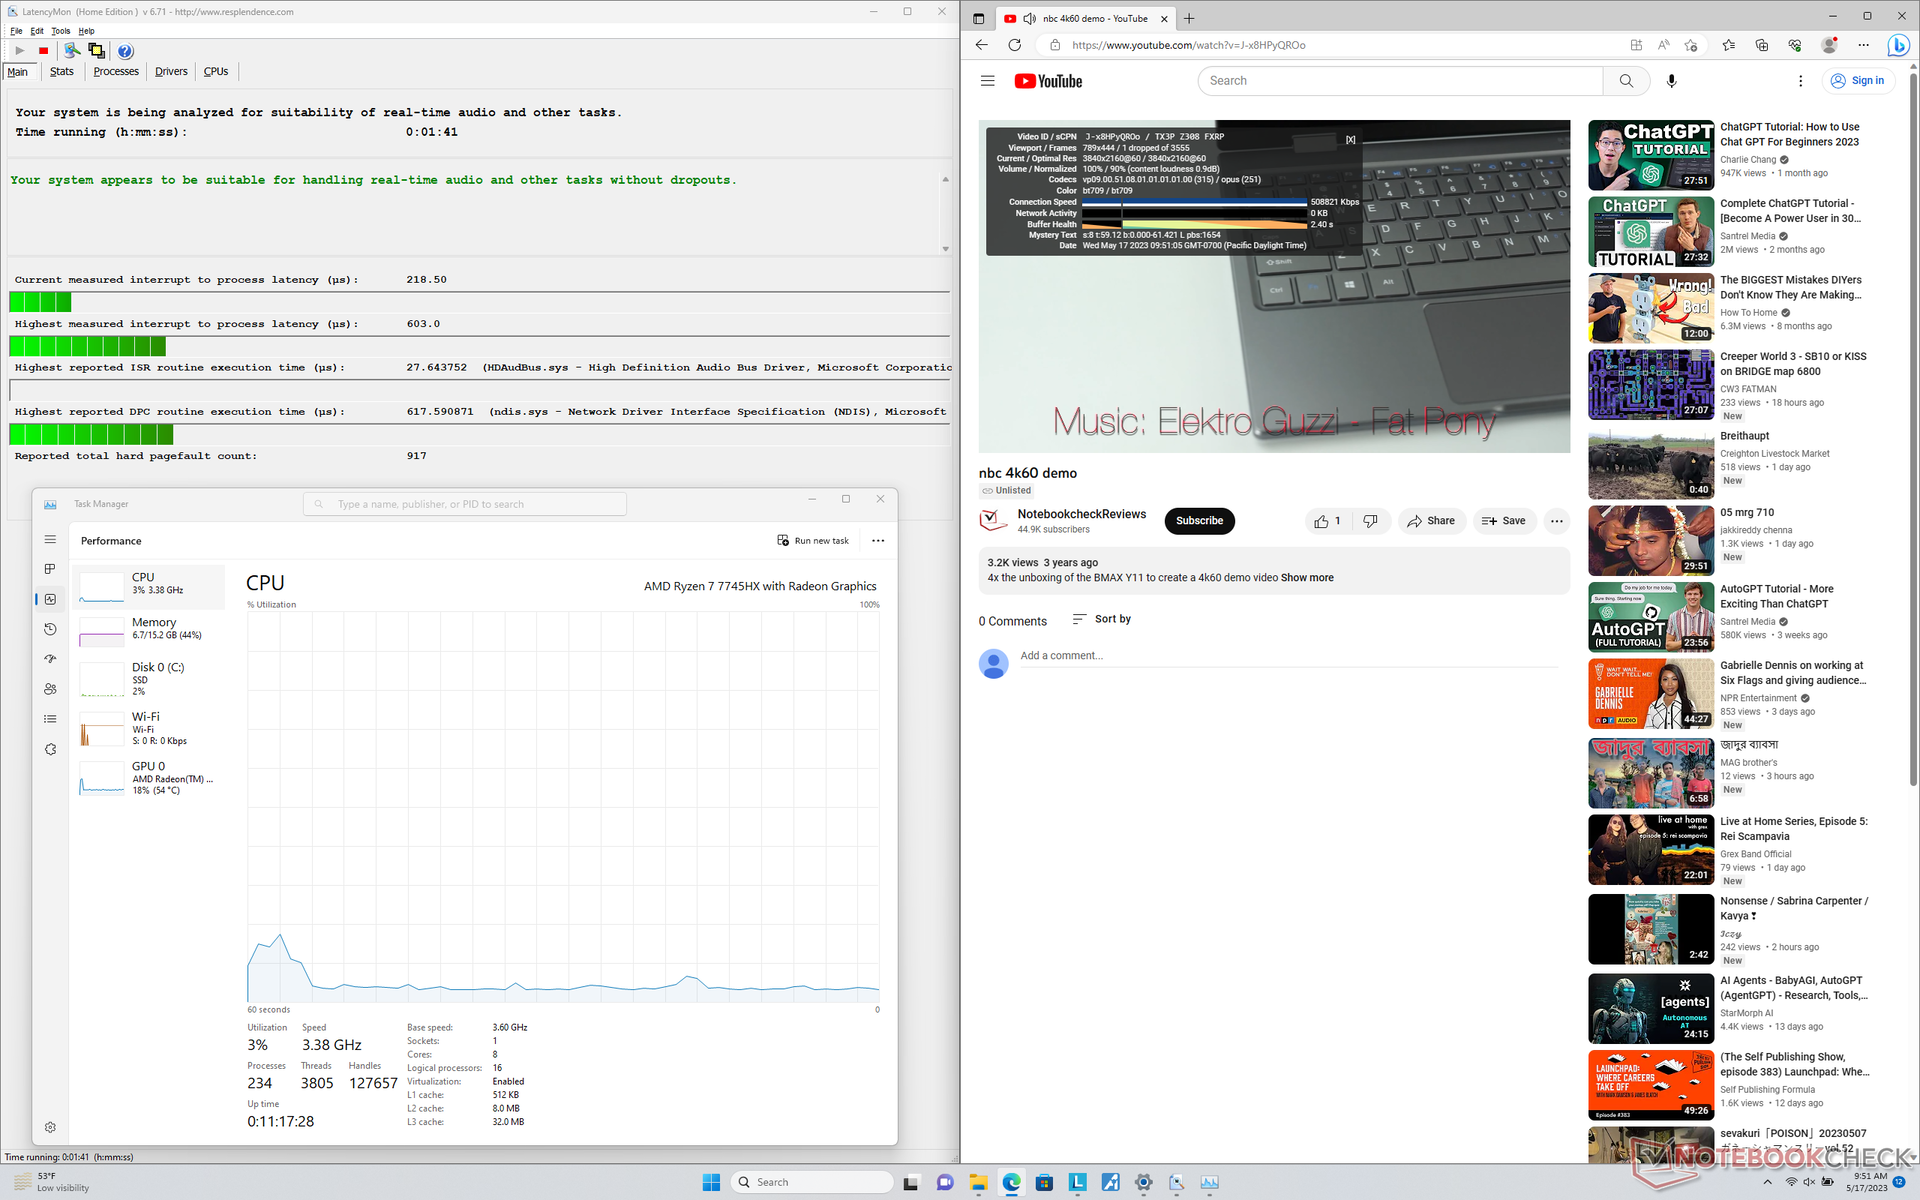
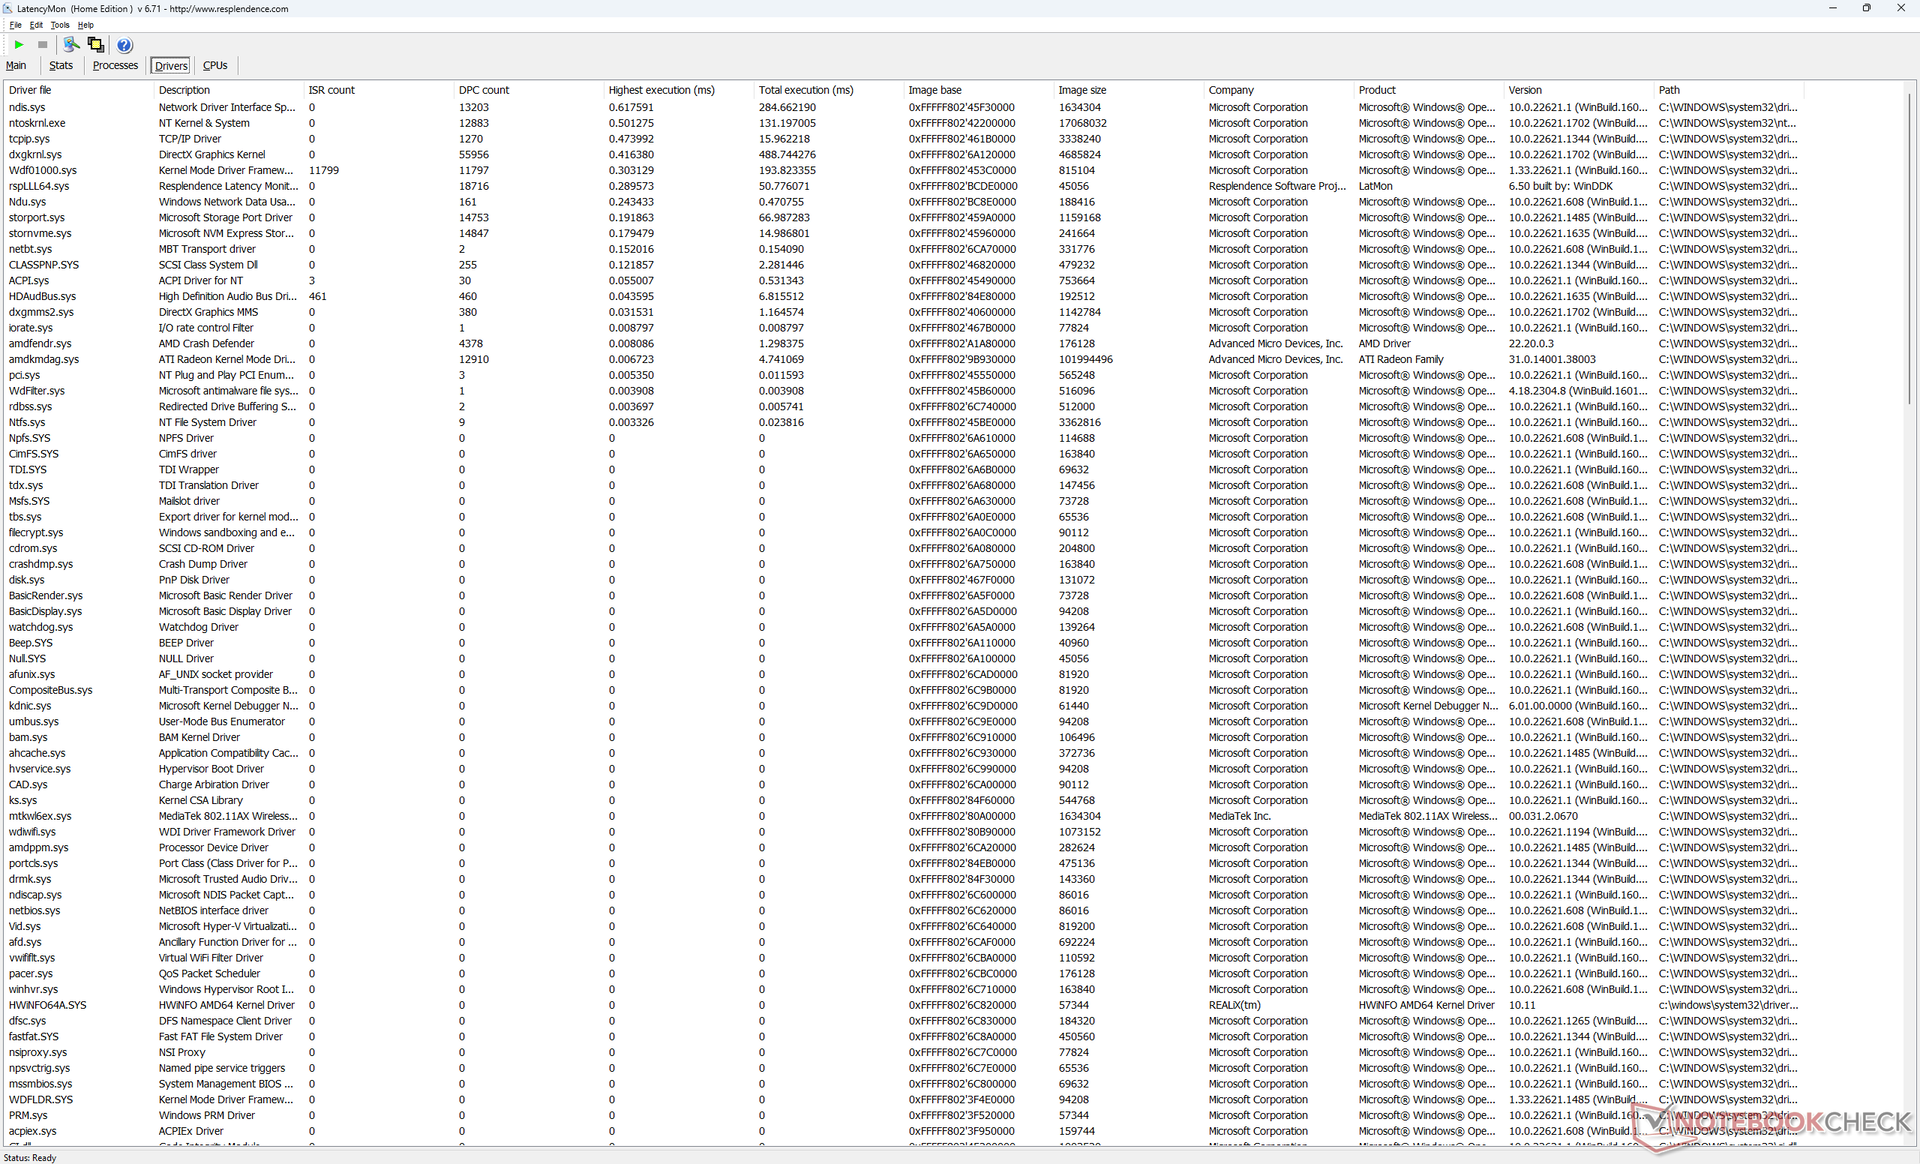
Latência DPC
O LatencyMon não revela grandes problemas de DPC ao abrir várias guias do navegador da nossa página inicial ou ao executar o estresse do Prime95. a reprodução de vídeo 4K a 60 FPS é excelente, com apenas um quadro perdido durante nosso vídeo de teste.
| DPC Latencies / LatencyMon - interrupt to process latency (max), Web, Youtube, Prime95 | |
| Asus Zephyrus Duo 16 GX650PY-NM006W | |
| Schenker XMG Neo 16 E23 | |
| Asus ROG Strix G16 G614JZ | |
| Uniwill GM6PX7X RTX 4070 | |
| Lenovo Legion Pro 5 16IRX8 | |
| Lenovo Legion Pro 5 16ARX8 | |
* ... menor é melhor
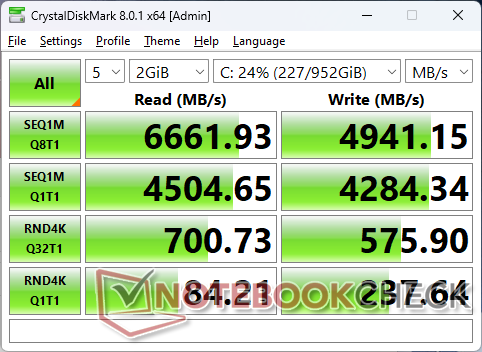
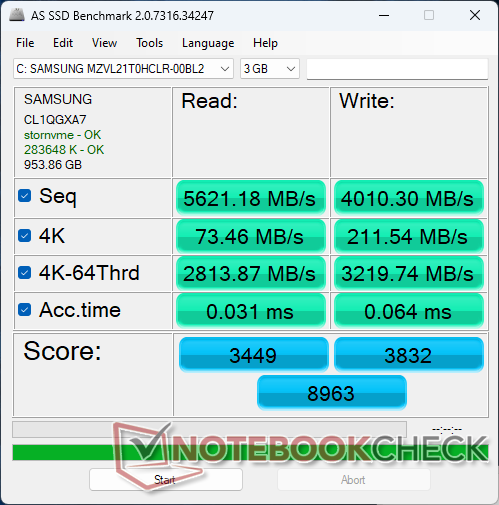
Dispositivos de armazenamento - até duas unidades PCIe4 x4
Nossa unidade é fornecida com uma unidade de 1 TB Samsung PM9A1 NVMe de 1 TB, que é um dos SSDs PCIe4 x4 mais rápidos disponíveis para o consumidor. As taxas de transferência atingem o máximo em cerca de 6600 MB/s, mas o desempenho cairia para 3300 MB/s após apenas alguns minutos do nosso teste de estresse, conforme mostrado no gráfico abaixo. Os resultados sugerem que a SSD do Lenovo não está sendo resfriada adequadamente, assim como a mesma SSD em outros notebooks, como o Uniwill GM6PX7X pode sustentar taxas de transferência mais altas por períodos muito mais longos.

| Drive Performance rating - Percent | |
| Lenovo Legion Pro 5 16ARX8 | |
| Lenovo Legion Pro 5 16IRX8 | |
| Uniwill GM6PX7X RTX 4070 | |
| Asus Zephyrus Duo 16 GX650PY-NM006W | |
| Asus ROG Strix G16 G614JZ | |
| Schenker XMG Neo 16 E23 | |
* ... menor é melhor
Disk Throttling: DiskSpd Read Loop, Queue Depth 8
Desempenho da GPU - Uma placa de vídeo de médio porte
O desempenho gráfico bruto é comparável ao da eForce RTX 3070 Ti móvel do ano passado. A meta de TGP de 140 W permite que a RTX 4070 móvel do Lenovo supere marginalmente a maioria dos outros notebooks com a mesma GPU.
O downgrade para a rTX 4060 móvel ou rTX 4050 móvel Deverá diminuir o desempenho em 15% e 20%, respectivamente. Infelizmente, não há rTX 4080 móvel que teria aumentado o desempenho significativamente em 40 a 50% em relação à nossa RTX 4070 móvel. Em vez disso, essas opções de GPU de ponta são reservadas para a série Legion 7 de ponta da Lenovo.
A execução da dGPU no perfil de energia balanceado sem overclocking reduziria o desempenho gráfico em cerca de 13%, de acordo com o 3DMark Time Spy.
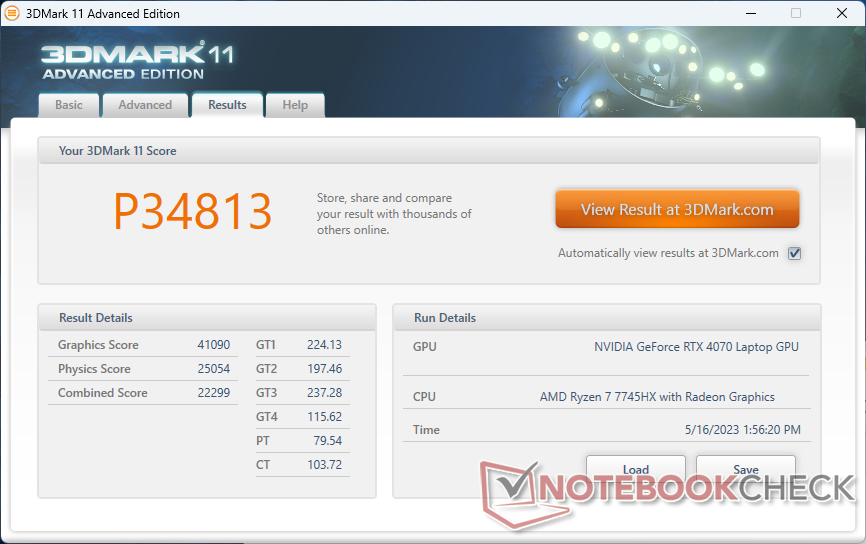
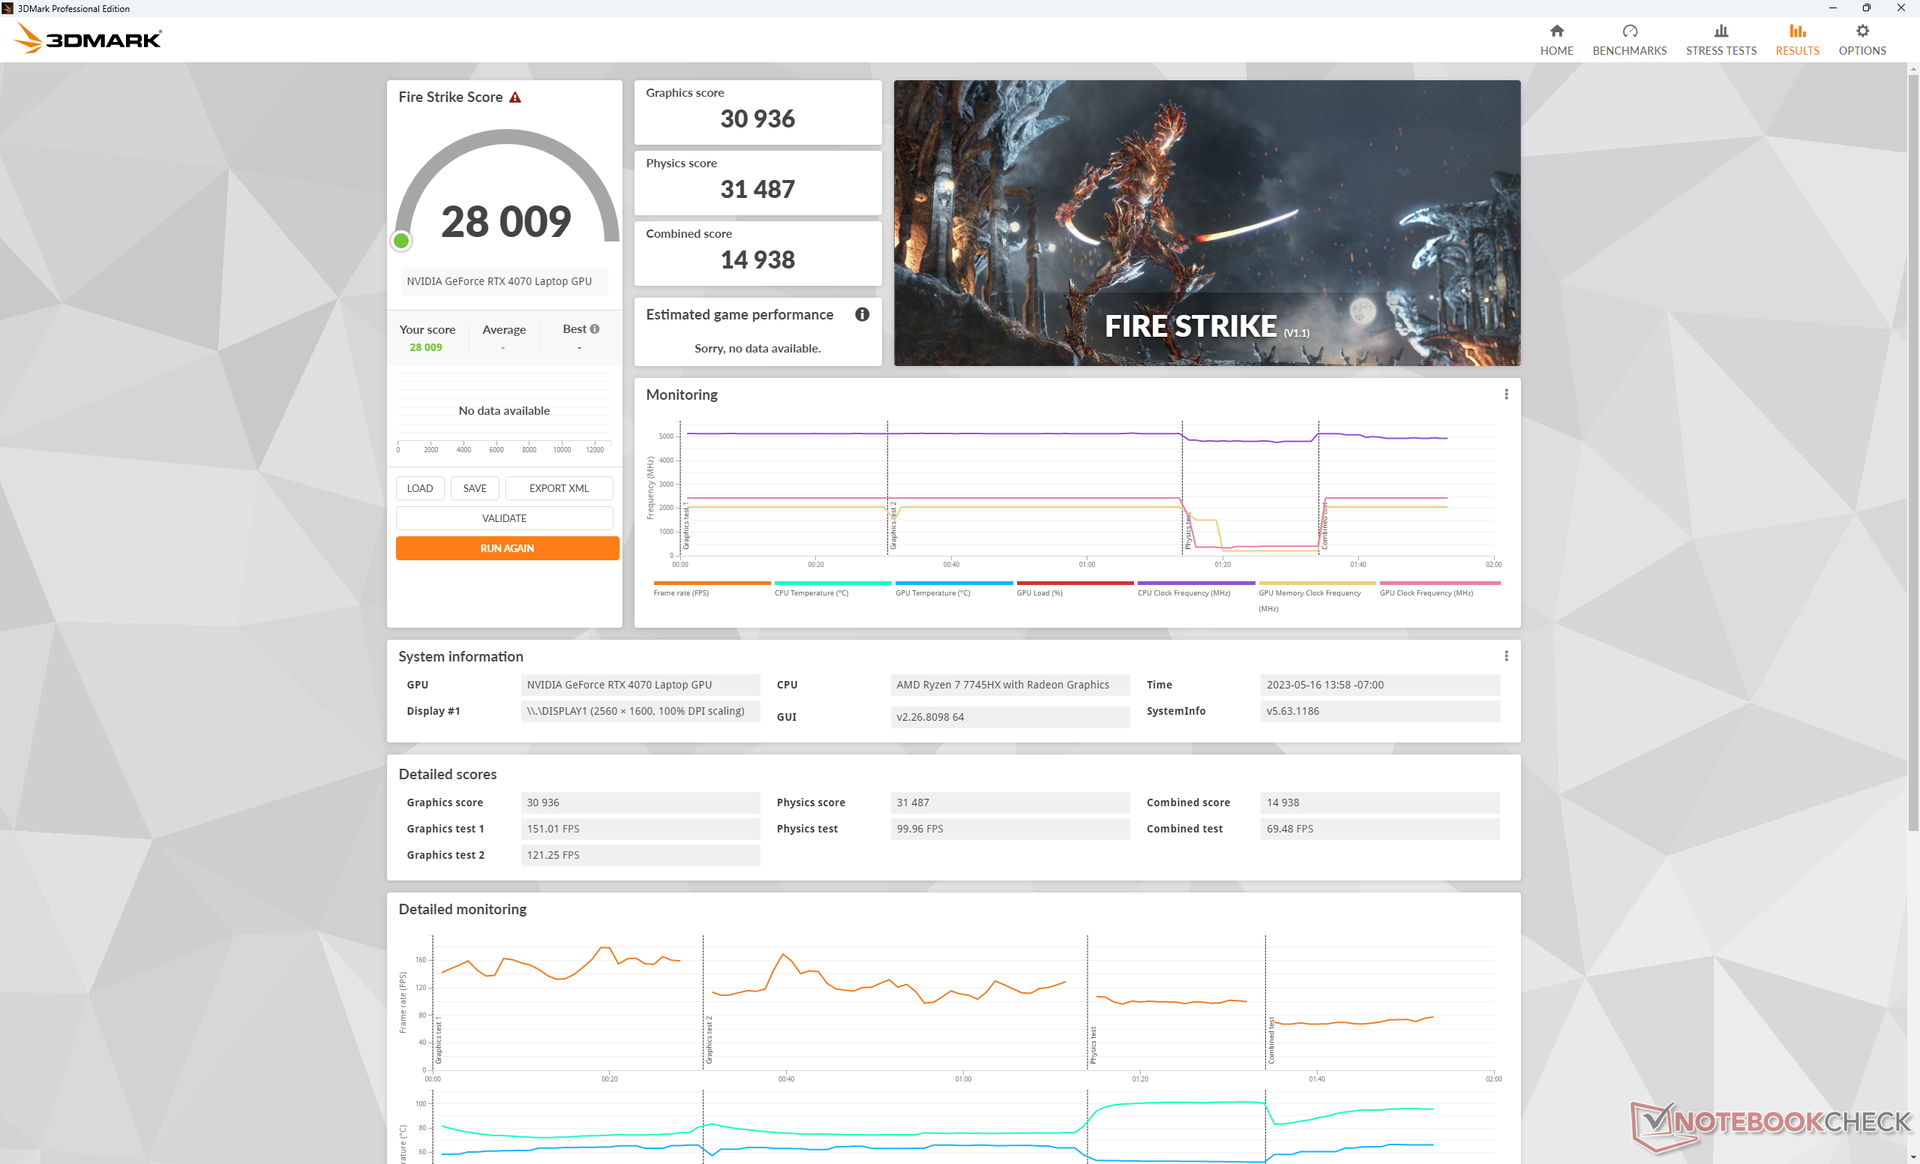
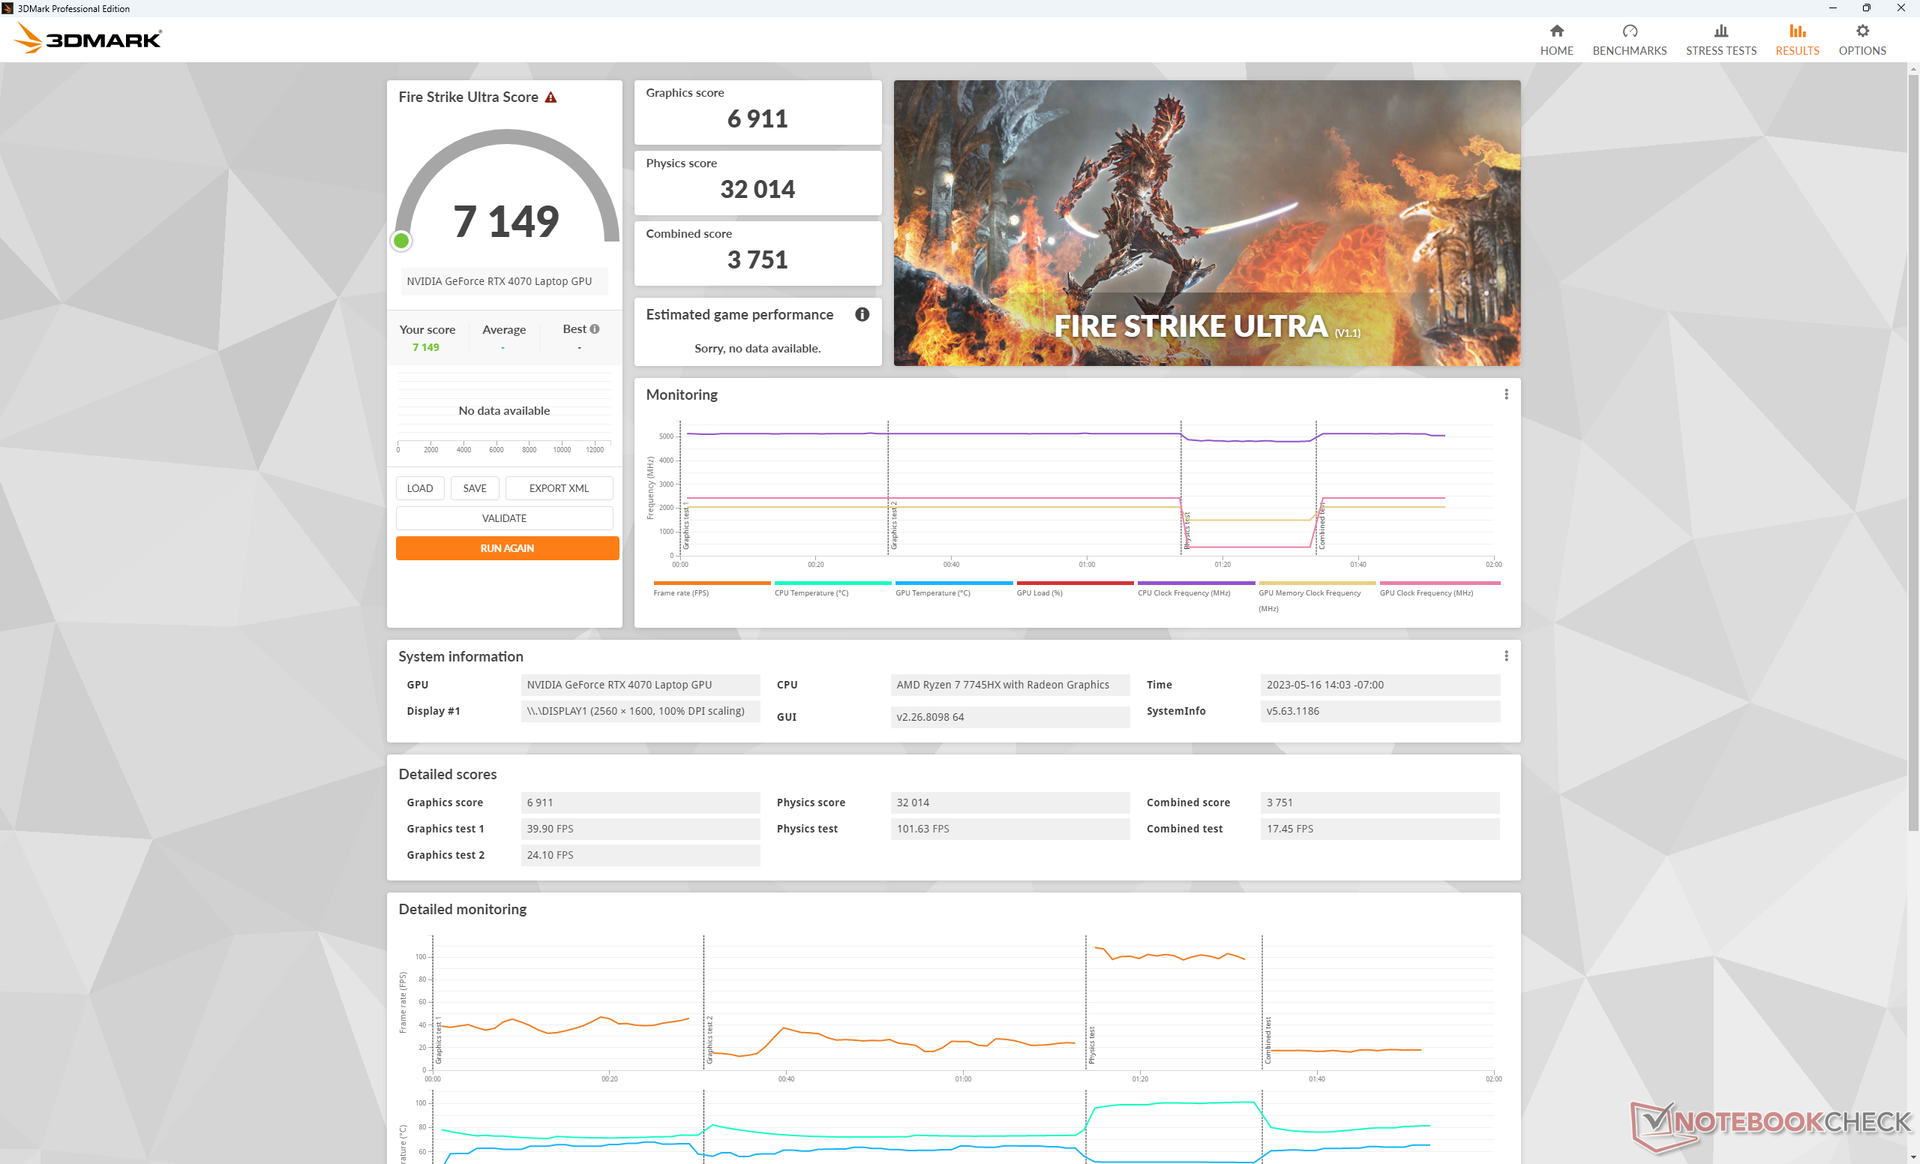
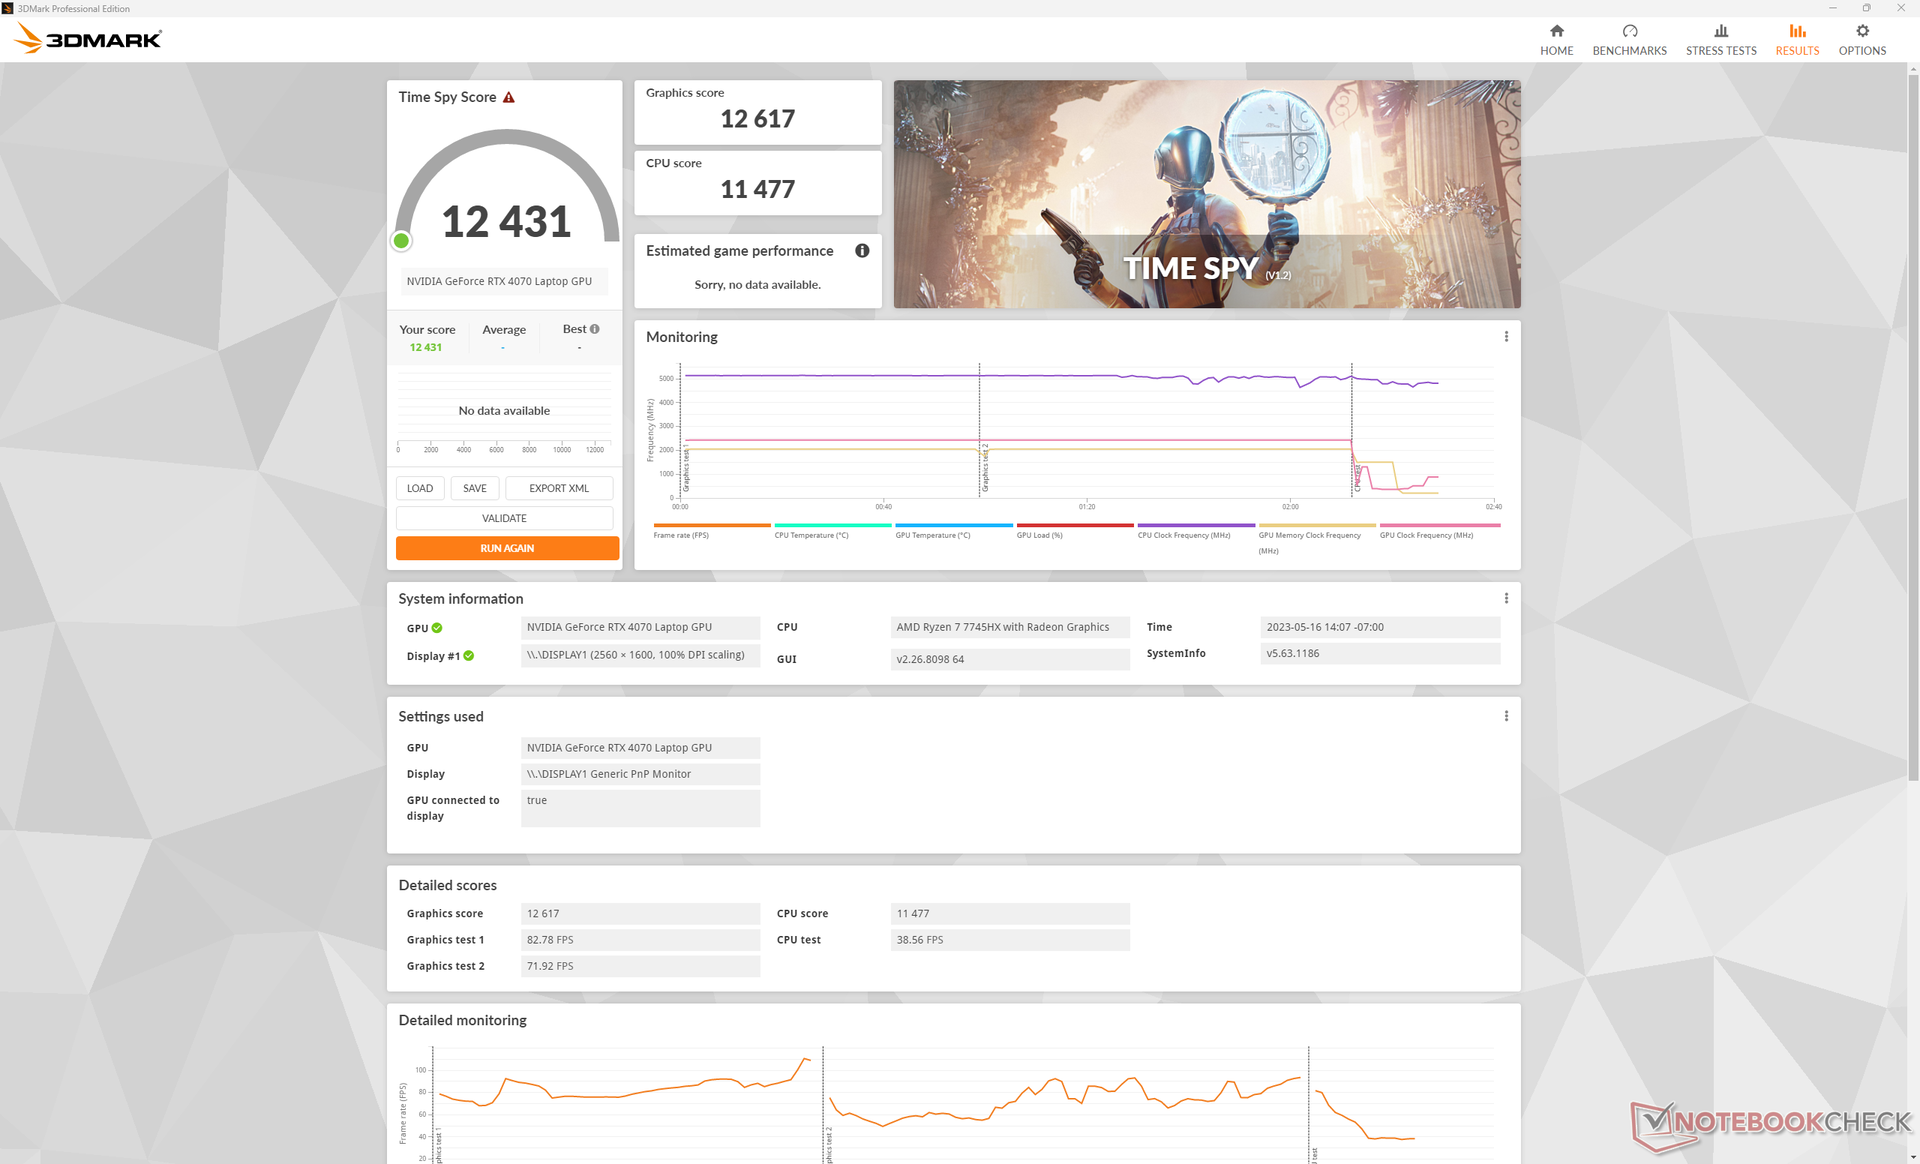
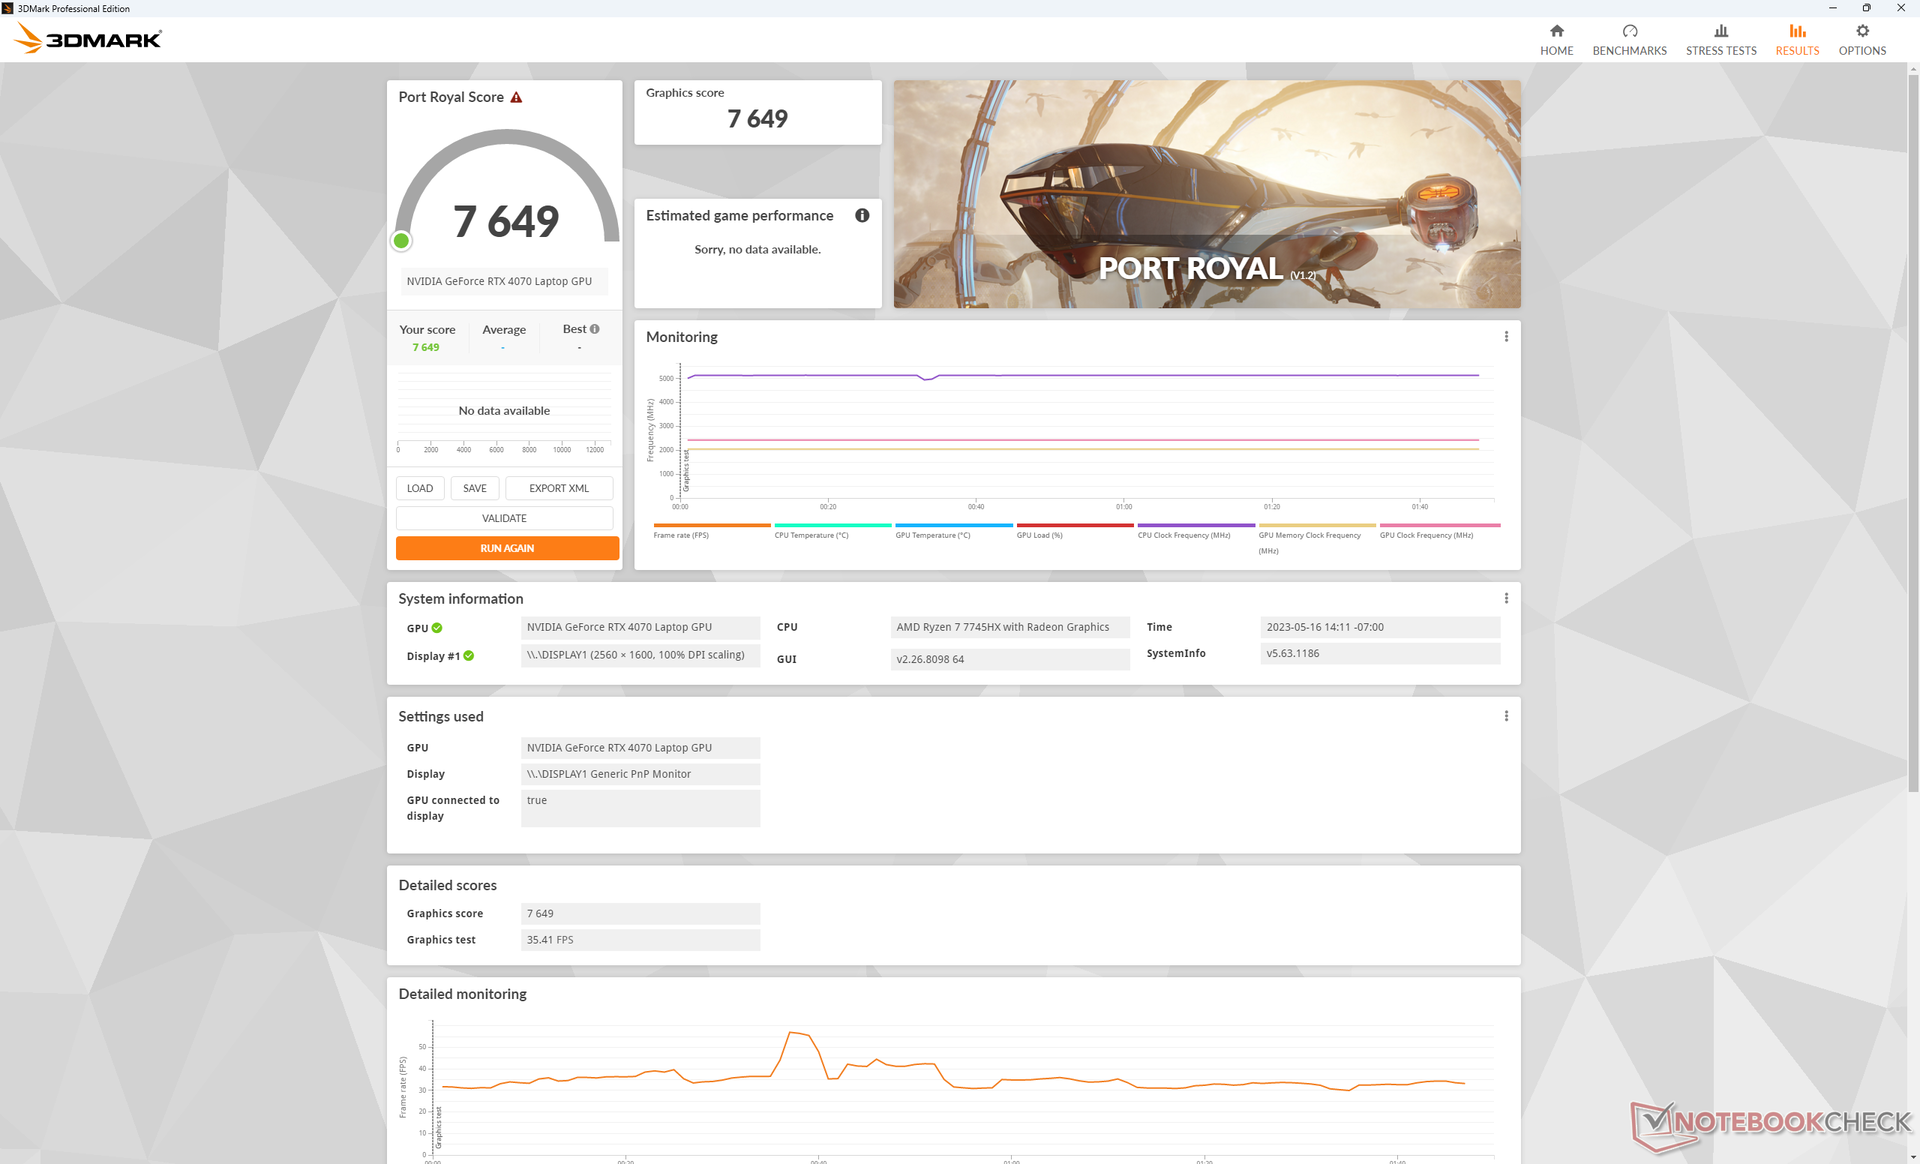
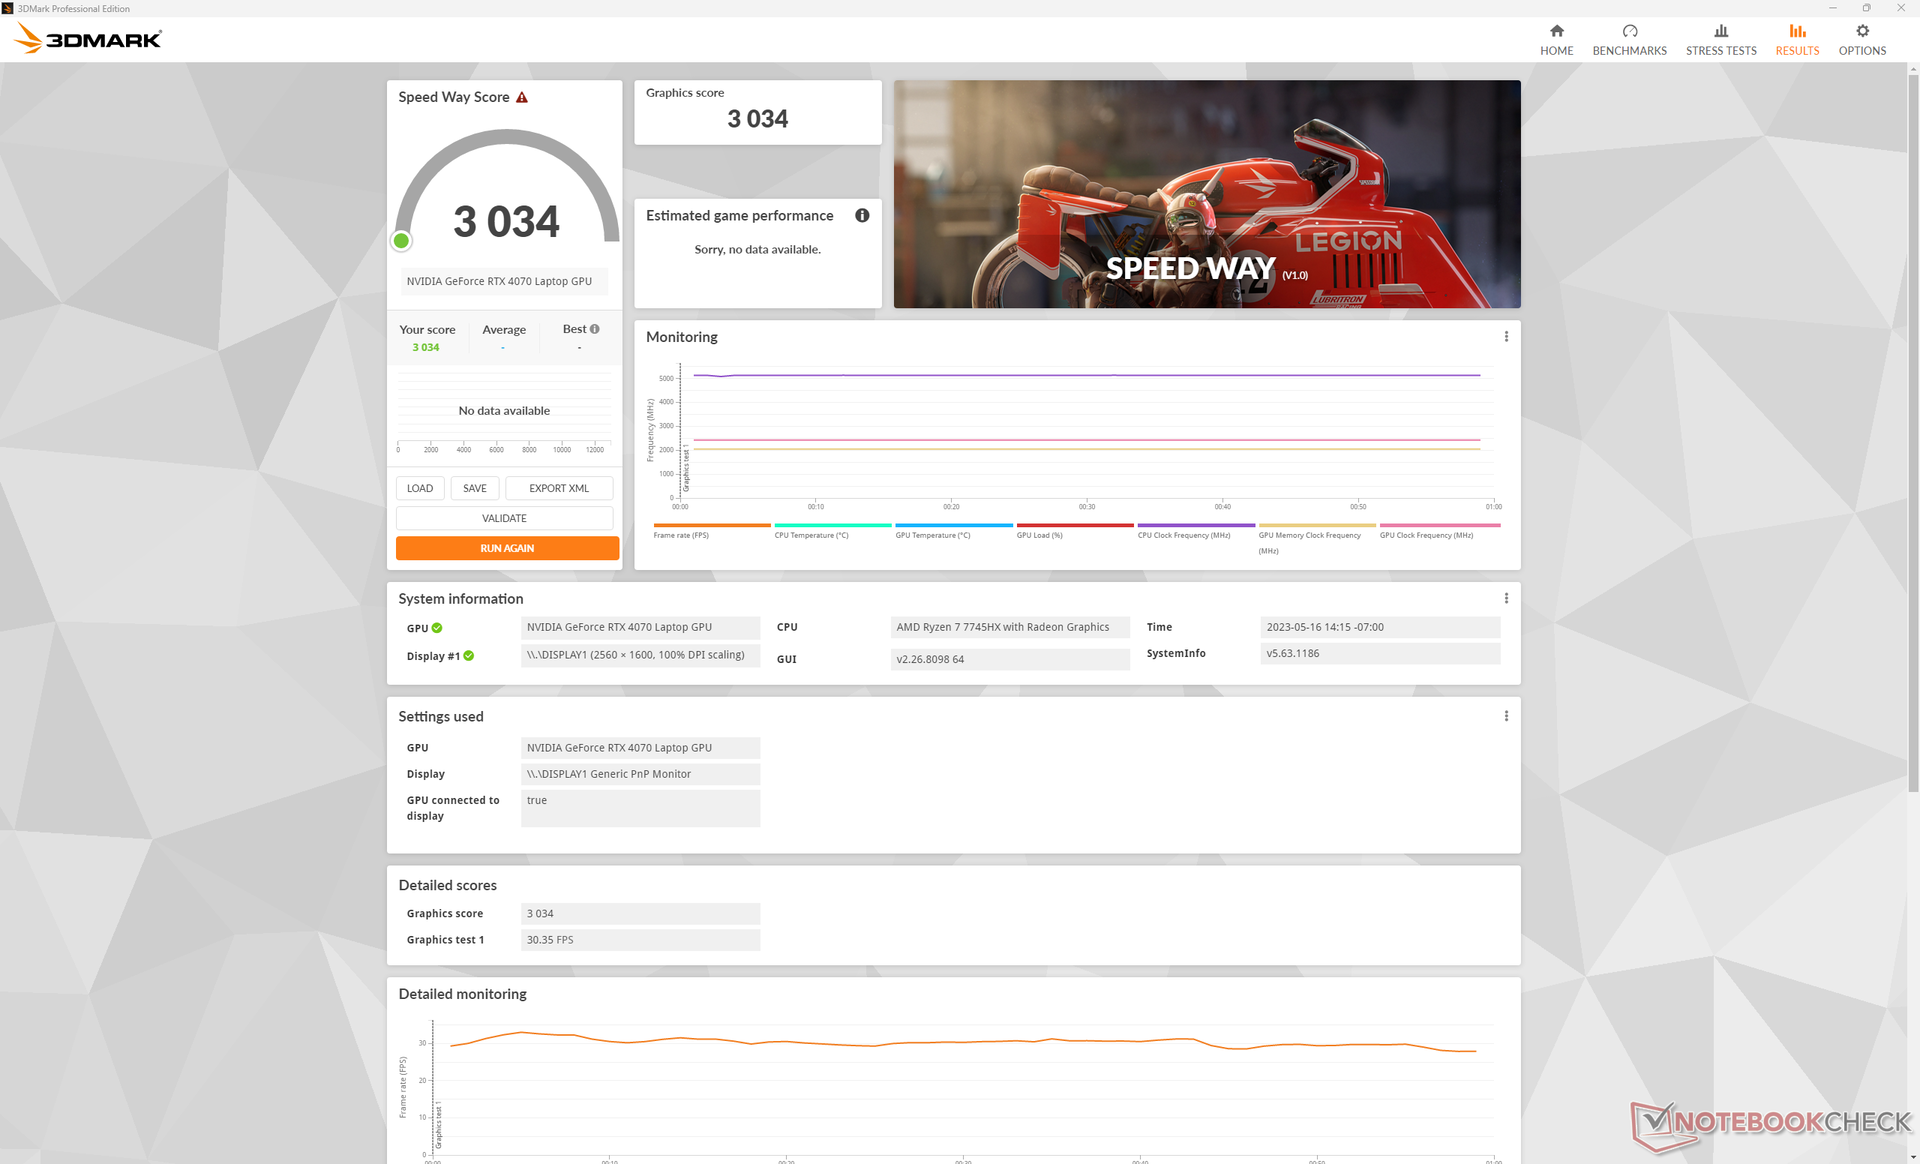
| 3DMark 11 Performance | 34813 pontos | |
| 3DMark Fire Strike Score | 28009 pontos | |
| 3DMark Time Spy Score | 12431 pontos | |
Ajuda | ||
* ... menor é melhor
Desempenho em jogos
Nosso modelo RTX 4070 com tecnologia AMD teria o mesmo desempenho que o modelo RTX 4060 com tecnologia Intel na pior das hipóteses e até 20% mais rápido na melhor. Como era de se esperar, a diferença de desempenho entre as duas GPUs tende a aumentar ao jogar títulos mais exigentes em resoluções e configurações mais altas. Por exemplo, F1 22 e Returnal são executados cerca de 15% a 20% mais rápido em nosso modelo AMD Legion, enquanto títulos mais antigos, como GTA V , apresentam vantagens menores na taxa de quadros, de apenas 5% a 10%. Portanto, você deverá jogar mais títulos mais recentes para explorar melhor a RTX 4070 móvel.
Em geral, a RTX 4070 móvel combina bem com a tela nativa de resolução 2560 x 1600, especialmente porque há suporte para o G-Sync. Embora a versão móvel seja muito mais fraca do que a versão para desktop em cerca de 30%, ela ainda é potente o suficiente para executar os jogos mais recentes a 1600p e 60+ FPS em configurações altas. Os jogadores que não se incomodam com as desvantagens da geração de quadros podem ativar o DLSS3 em títulos compatíveis para obter taxas de quadros ainda mais altas.
Witcher 3 FPS Chart
| baixo | média | alto | ultra | QHD | 4K | |
|---|---|---|---|---|---|---|
| GTA V (2015) | 185.8 | 185.1 | 178.6 | 119.9 | 93.2 | 93.7 |
| The Witcher 3 (2015) | 597 | 415.1 | 257.3 | 119.8 | 76.2 | |
| Dota 2 Reborn (2015) | 238 | 203 | 191.8 | 182 | 151.5 | |
| Final Fantasy XV Benchmark (2018) | 229 | 172.5 | 119.9 | 119.9 | 49.2 | |
| X-Plane 11.11 (2018) | 186.3 | 155.2 | 117.8 | 99.5 | ||
| Strange Brigade (2018) | 636 | 334 | 260 | 223 | 146.4 | 76.8 |
| Shadow of the Tomb Raider (2018) | 168 | 110 | 53 | |||
| Far Cry 6 (2021) | 110 | 88 | 43 | |||
| Cyberpunk 2077 1.6 (2022) | 185.8 | 157.6 | 121.3 | 98.9 | 58.1 | 24.7 |
| Tiny Tina's Wonderlands (2022) | 263.6 | 217.3 | 144.5 | 112.1 | 76.9 | 39.7 |
| F1 22 (2022) | 311 | 300 | 235 | 84.1 | 54.8 | 26.4 |
| Call of Duty Modern Warfare 2 2022 (2022) | 108 | 77 | 44 | |||
| Returnal (2023) | 93 | 90 | 85 | 77 | 55 | 29 |
| Star Wars Jedi Survivor (2023) | 77.9 | 50.4 | 24.2 |
Emissões
Ruído do sistema - Cerca de 50 dB(A) em jogos
O ruído da ventoinha durante os jogos é praticamente o mesmo entre os modelos da AMD e da Intel, em torno de 48 dB(A). No entanto, se a CPU for submetida a um estresse consideravelmente maior, o ruído do ventilador pode chegar a um máximo de 54 dB(A). A faixa baixa de 50 dB(A) é típica da maioria dos notebooks para jogos, incluindo oAsus ROG Strix G16 ouRazer Blade 16.
É interessante notar que o ruído da ventoinha é um pouco mais baixo e com pulsação menos frequente ao executar cargas não exigentes, como trabalho de escritório ou reprodução de vídeo. A CPU da AMD consome menos energia do que a CPU da Intel ao aumentar a potência, o que pode contribuir para o ruído mais estável da ventoinha.
Barulho
| Ocioso |
| 23.2 / 23.2 / 26.2 dB |
| Carga |
| 31.4 / 53.8 dB |
 | ||
30 dB silencioso 40 dB(A) audível 50 dB(A) ruidosamente alto |
||
min: | ||
| Lenovo Legion Pro 5 16ARX8 GeForce RTX 4070 Laptop GPU, R7 7745HX, Samsung PM9A1 MZVL21T0HCLR | Lenovo Legion Pro 5 16IRX8 GeForce RTX 4060 Laptop GPU, i7-13700HX, SK hynix PC801 HFS512GEJ9X115N | Uniwill GM6PX7X RTX 4070 GeForce RTX 4070 Laptop GPU, i7-13700HX, Samsung PM9A1 MZVL2512HCJQ | Schenker XMG Neo 16 E23 GeForce RTX 4090 Laptop GPU, i9-13900HX, Crucial P5 Plus 1TB CT1000P5PSSD8 | Asus ROG Strix G16 G614JZ GeForce RTX 4080 Laptop GPU, i9-13980HX, WD PC SN560 SDDPNQE-1T00 | Asus Zephyrus Duo 16 GX650PY-NM006W GeForce RTX 4090 Laptop GPU, R9 7945HX, SK hynix PC801 HFS002TEJ9X101N | |
|---|---|---|---|---|---|---|
| Noise | -2% | -9% | -37% | -15% | -19% | |
| desligado / ambiente * (dB) | 23.2 | 23 1% | 22.4 3% | 25 -8% | 25 -8% | 23.9 -3% |
| Idle Minimum * (dB) | 23.2 | 23.1 -0% | 22.9 1% | 31 -34% | 26 -12% | 23.9 -3% |
| Idle Average * (dB) | 23.2 | 23.1 -0% | 29 -25% | 33 -42% | 28 -21% | 32.9 -42% |
| Idle Maximum * (dB) | 26.2 | 26.6 -2% | 29 -11% | 42 -60% | 30 -15% | 36.5 -39% |
| Load Average * (dB) | 31.4 | 34.7 -11% | 40.2 -28% | 58 -85% | 48 -53% | 42.9 -37% |
| Witcher 3 ultra * (dB) | 48.4 | 47.6 2% | 48.7 -1% | 57 -18% | 49 -1% | 51.2 -6% |
| Load Maximum * (dB) | 53.8 | 54.8 -2% | 55 -2% | 59 -10% | 52 3% | 56 -4% |
* ... menor é melhor
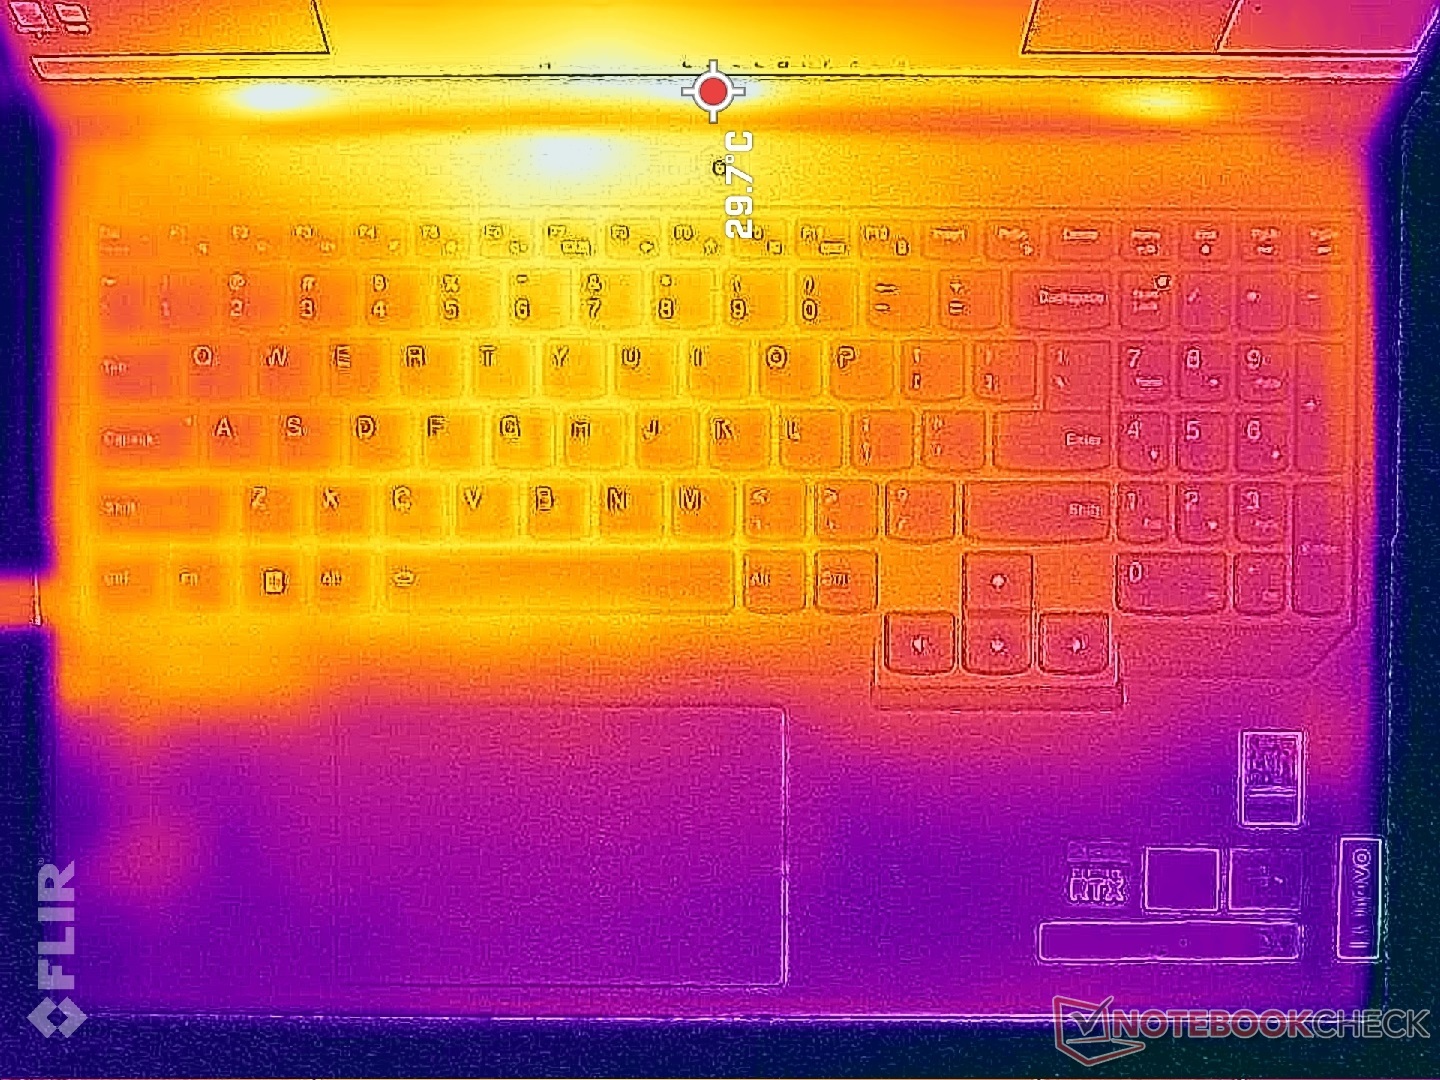
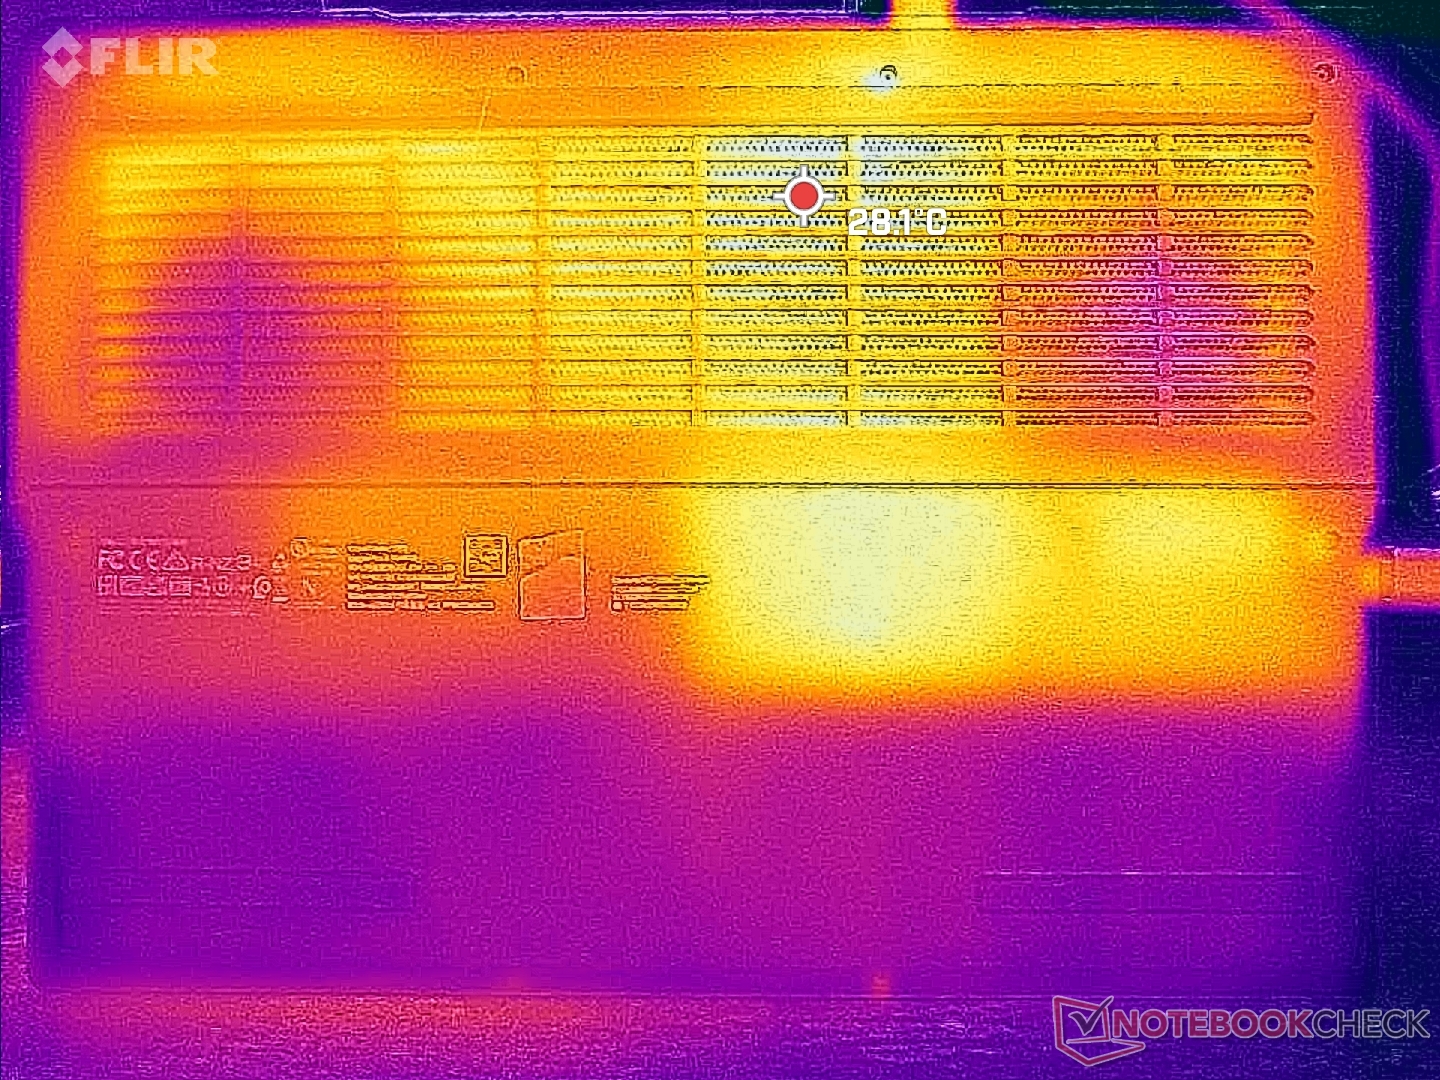
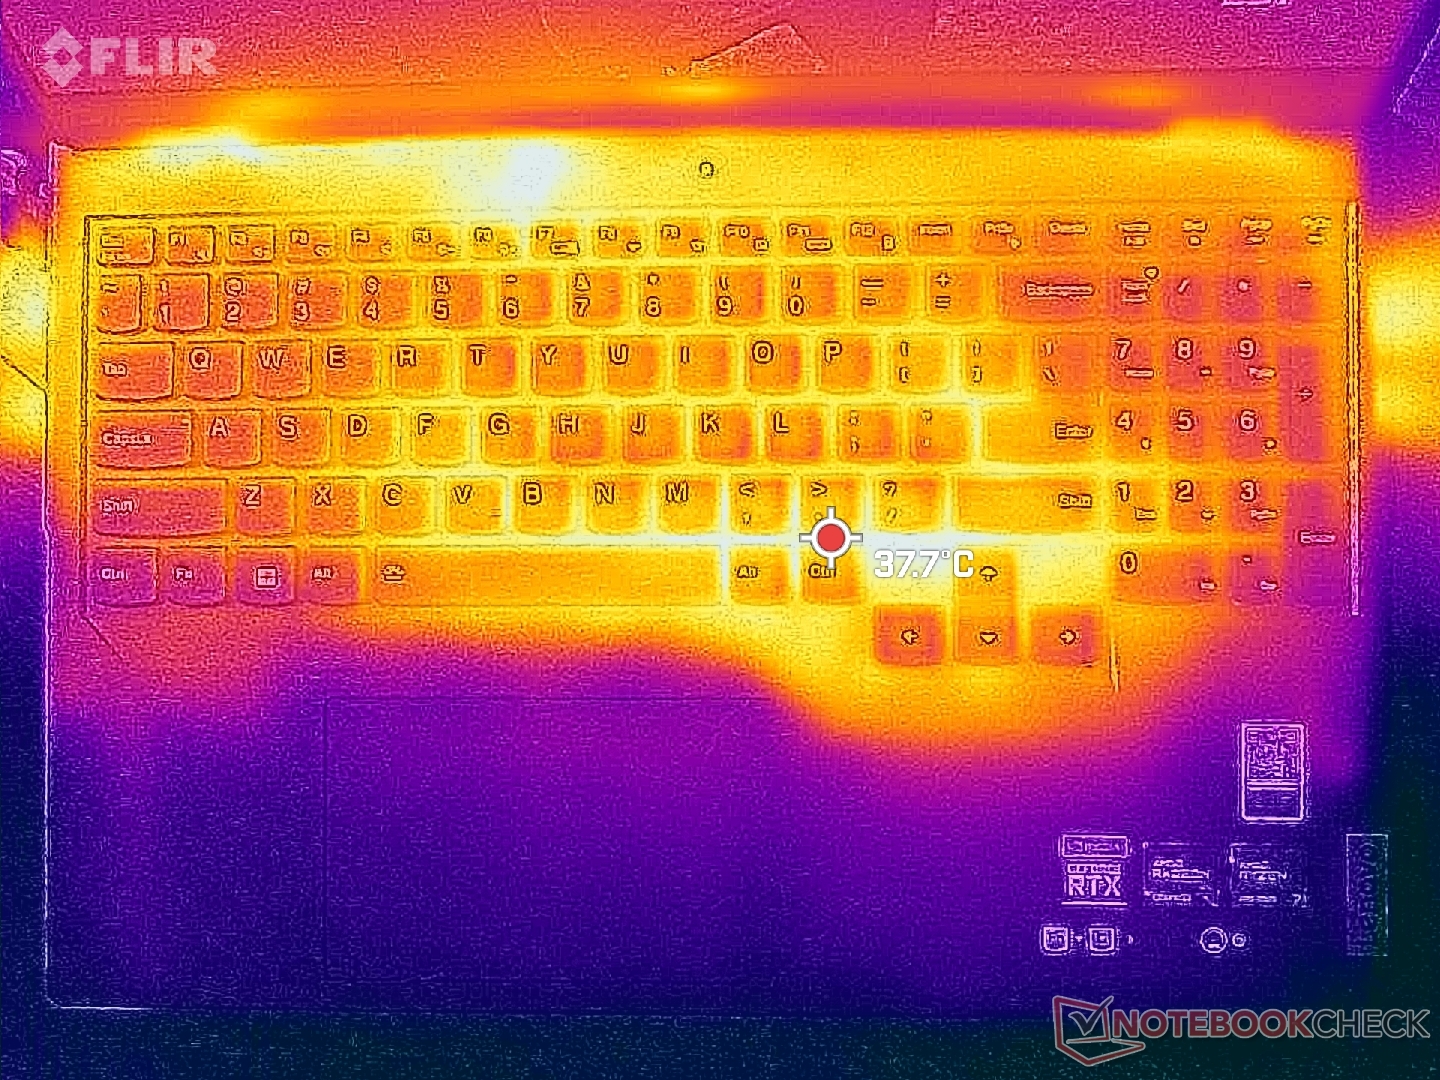
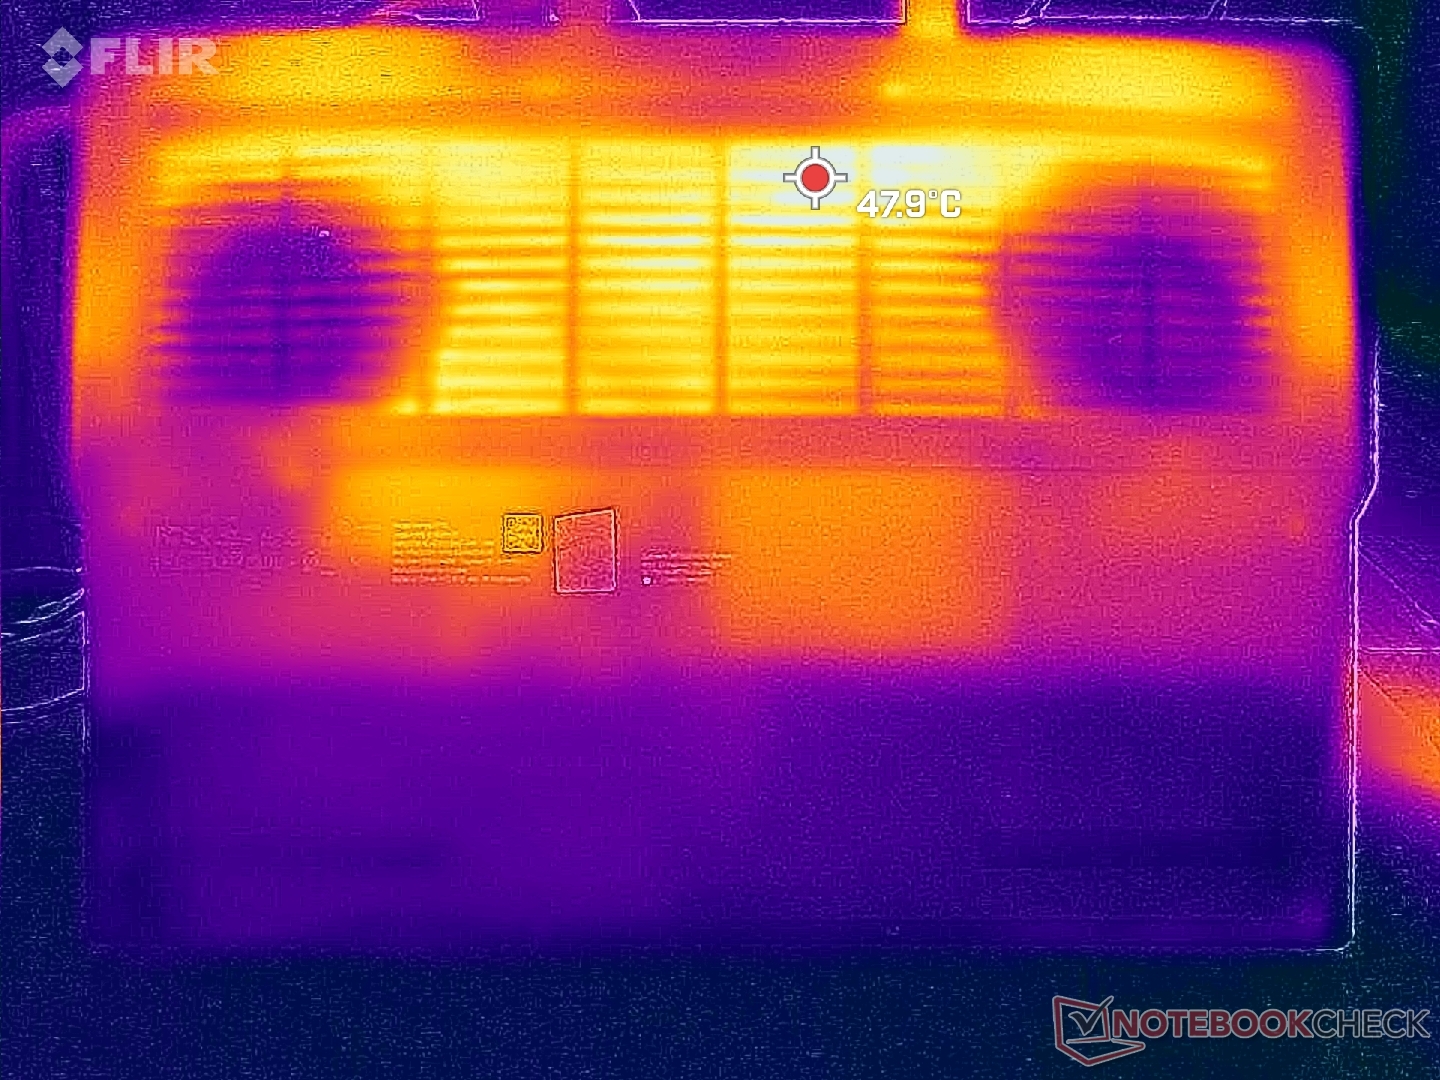
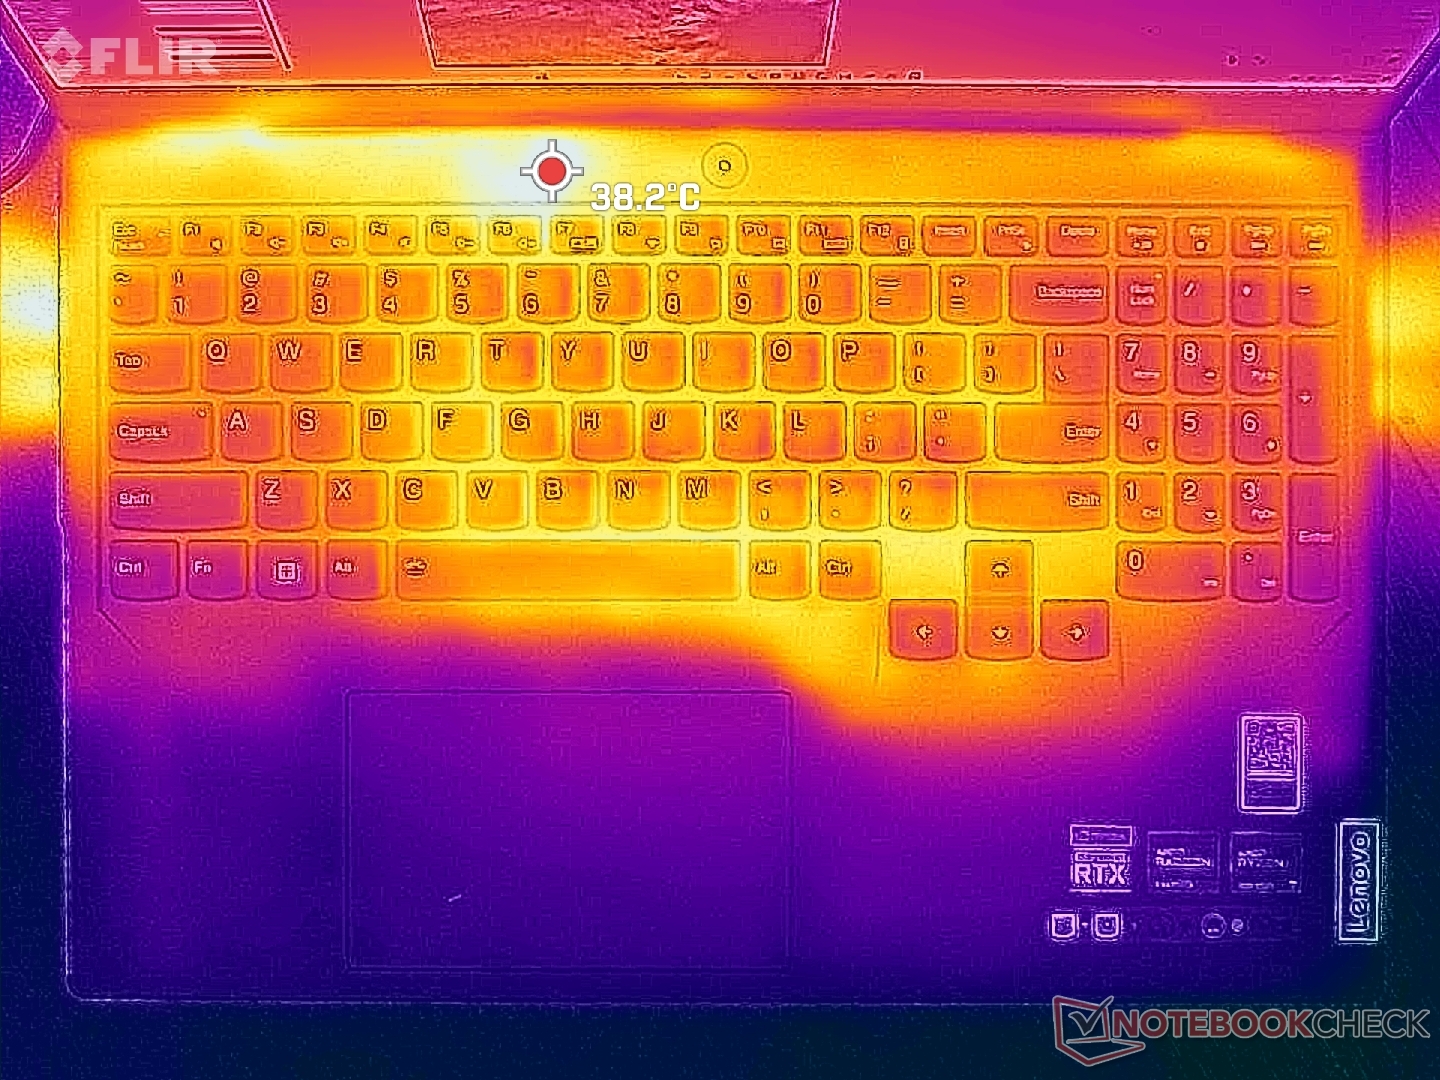
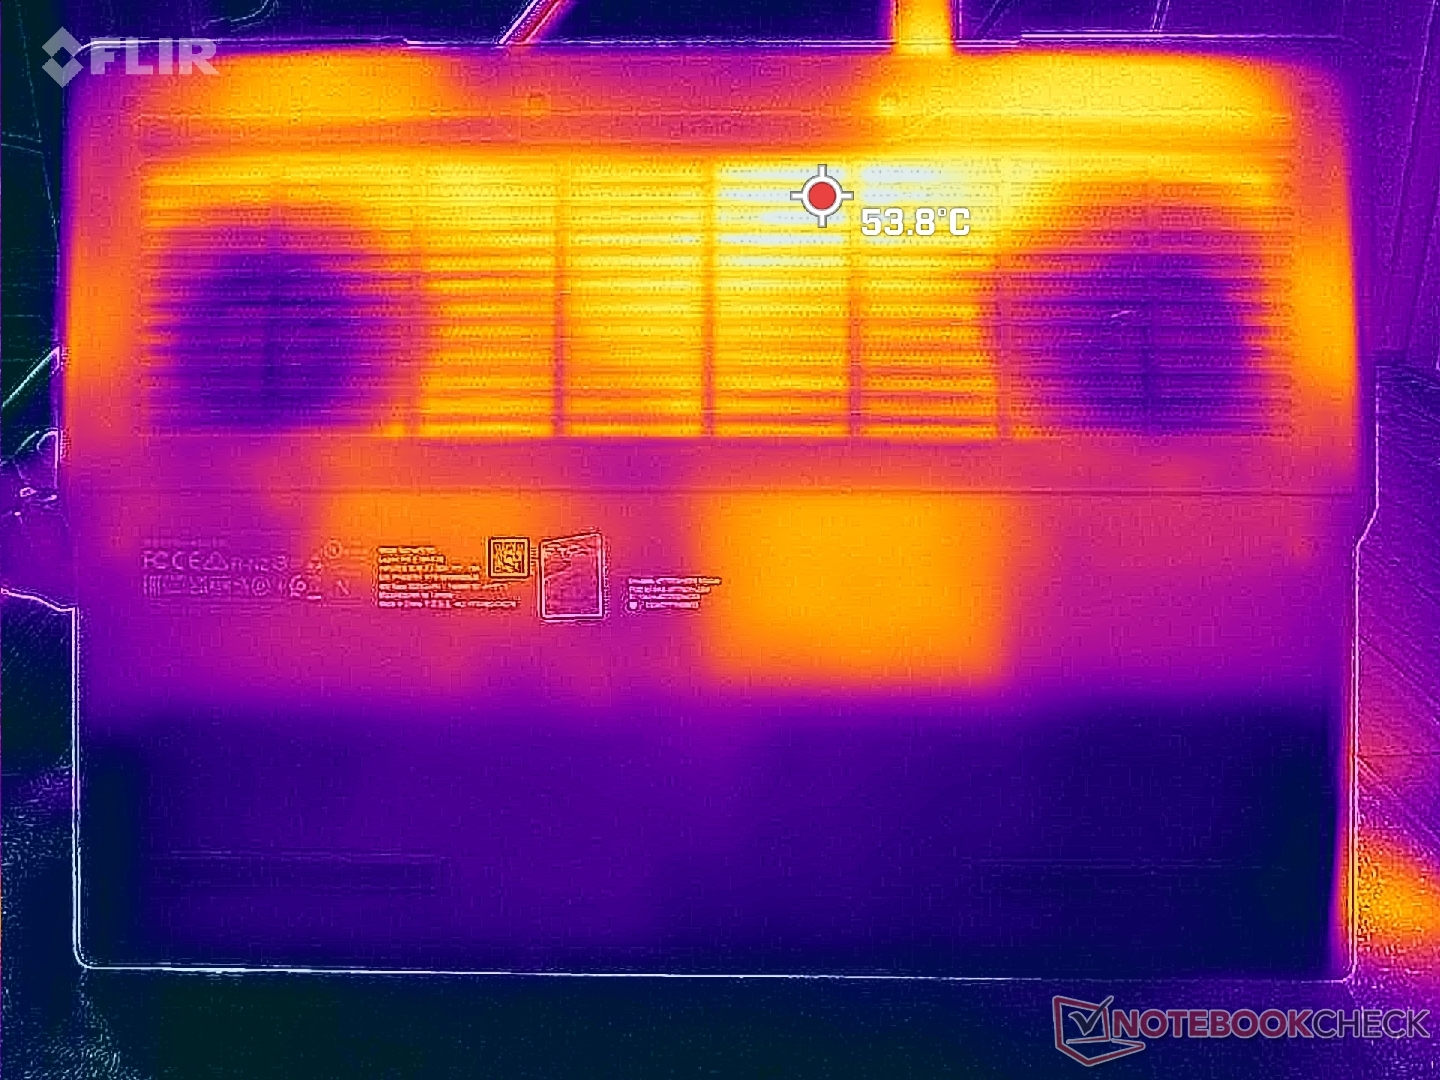
Temperatura
As temperaturas da superfície são mais quentes perto do centro e da parte traseira do chassi, onde os pontos quentes podem chegar a pouco mais de 40 °C durante os jogos. Modelos concorrentes, como oAsus ROG Zephyrus M16 funcionaria ainda mais quente, com pouco mais de 50 °C, em condições de teste semelhantes. Não há dúvida de que as grades de ventilação comparativamente maiores no design do Legion são parcialmente responsáveis pelas melhores temperaturas.
Os apoios para as mãos quase não esquentam, independentemente da carga na tela, para manter as mãos confortáveis durante os jogos.
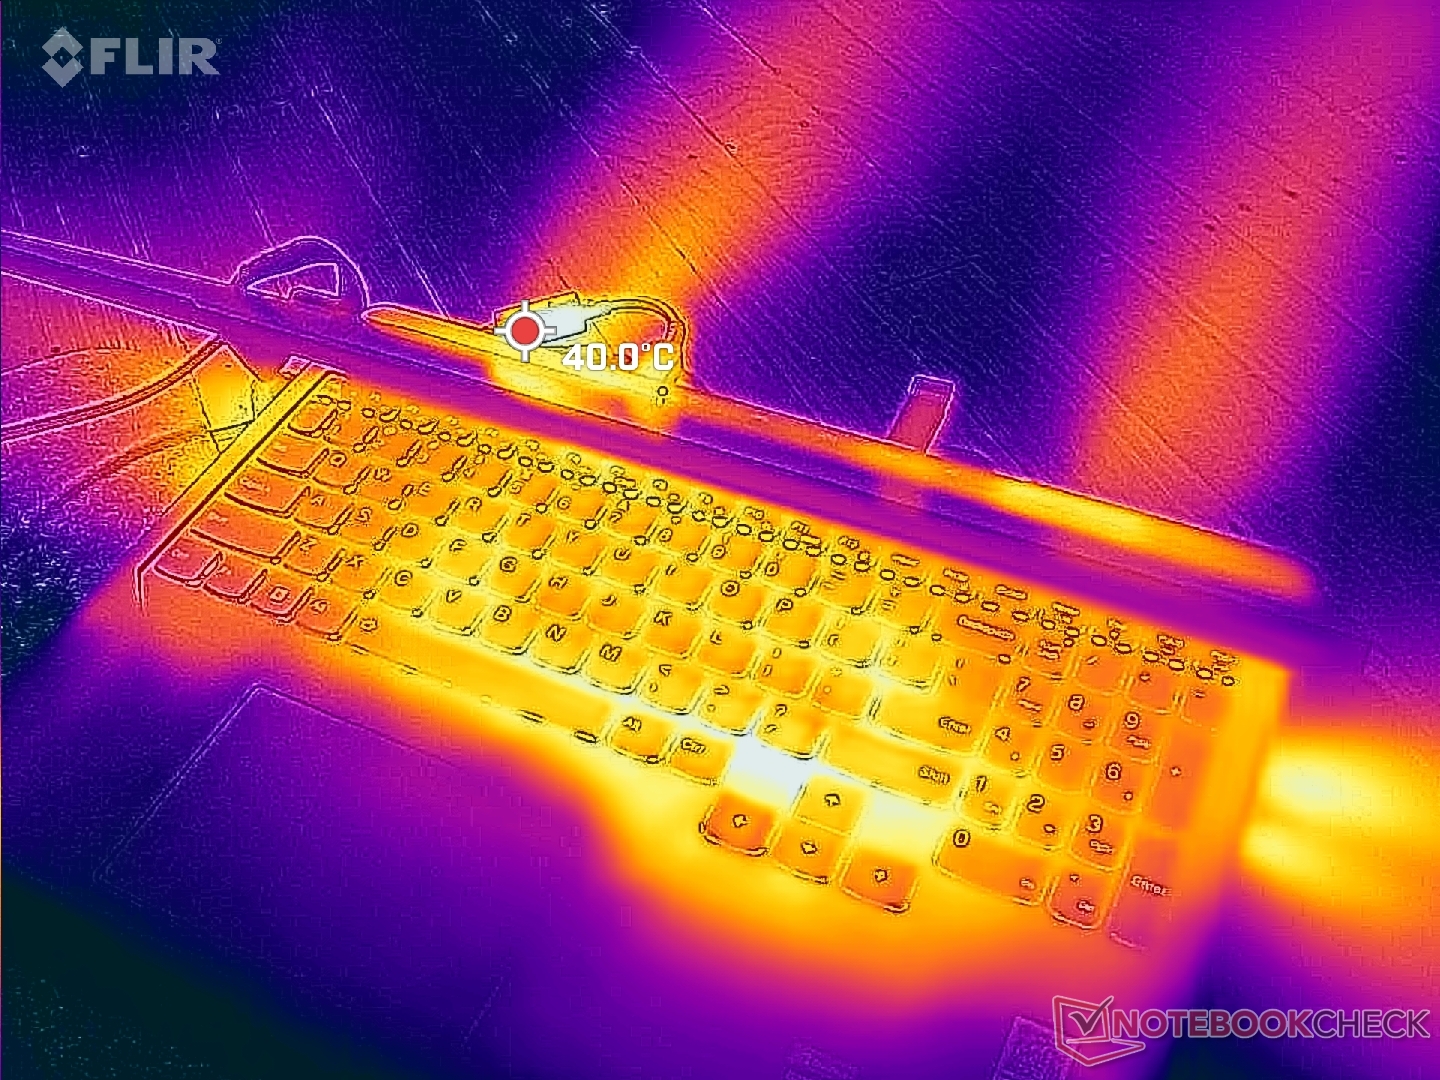
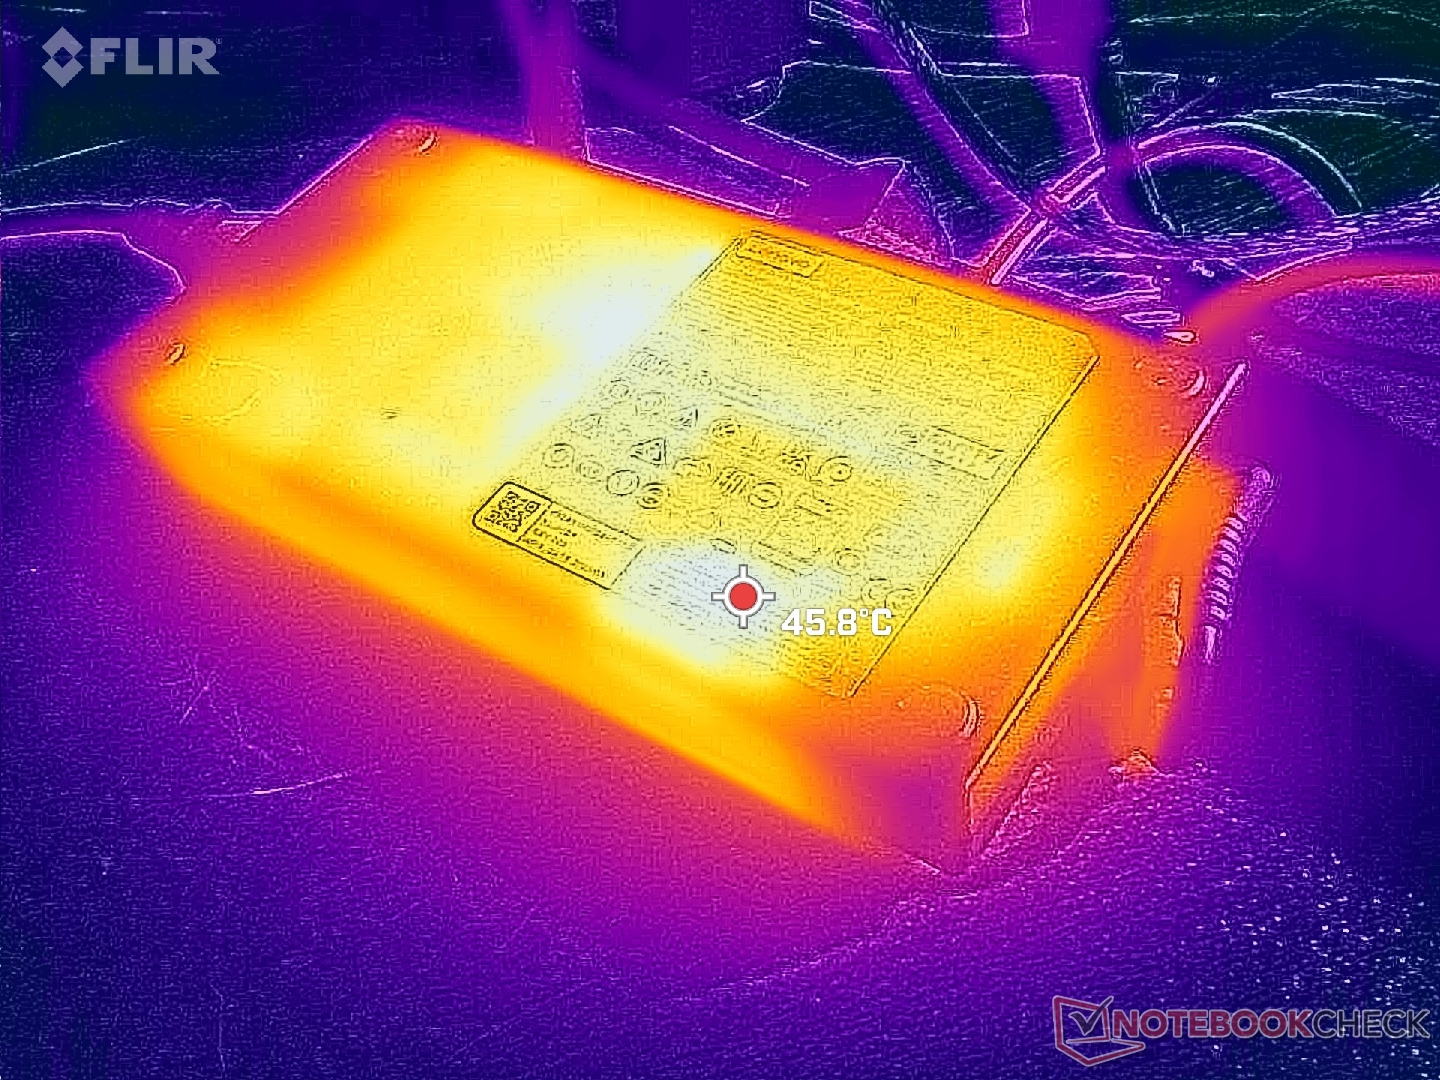
(±) A temperatura máxima no lado superior é 41.8 °C / 107 F, em comparação com a média de 40.4 °C / 105 F , variando de 21.2 a 68.8 °C para a classe Gaming.
(±) A parte inferior aquece até um máximo de 41.4 °C / 107 F, em comparação com a média de 43.2 °C / 110 F
(+) Em uso inativo, a temperatura média para o lado superior é 26.2 °C / 79 F, em comparação com a média do dispositivo de 33.9 °C / ### class_avg_f### F.
(±) Jogando The Witcher 3, a temperatura média para o lado superior é 34.2 °C / 94 F, em comparação com a média do dispositivo de 33.9 °C / ## #class_avg_f### F.
(+) Os apoios para as mãos e o touchpad são mais frios que a temperatura da pele, com um máximo de 30.4 °C / 86.7 F e, portanto, são frios ao toque.
(±) A temperatura média da área do apoio para as mãos de dispositivos semelhantes foi 28.8 °C / 83.8 F (-1.6 °C / -2.9 F).
| Lenovo Legion Pro 5 16ARX8 AMD Ryzen 7 7745HX, NVIDIA GeForce RTX 4070 Laptop GPU | Lenovo Legion Pro 5 16IRX8 Intel Core i7-13700HX, NVIDIA GeForce RTX 4060 Laptop GPU | Uniwill GM6PX7X RTX 4070 Intel Core i7-13700HX, NVIDIA GeForce RTX 4070 Laptop GPU | Schenker XMG Neo 16 E23 Intel Core i9-13900HX, NVIDIA GeForce RTX 4090 Laptop GPU | Asus ROG Strix G16 G614JZ Intel Core i9-13980HX, NVIDIA GeForce RTX 4080 Laptop GPU | Asus Zephyrus Duo 16 GX650PY-NM006W AMD Ryzen 9 7945HX, NVIDIA GeForce RTX 4090 Laptop GPU | |
|---|---|---|---|---|---|---|
| Heat | -9% | -12% | -7% | -18% | -5% | |
| Maximum Upper Side * (°C) | 41.8 | 42.8 -2% | 38.2 9% | 50 -20% | 54 -29% | 44.2 -6% |
| Maximum Bottom * (°C) | 41.4 | 50 -21% | 45 -9% | 51 -23% | 55 -33% | 46.8 -13% |
| Idle Upper Side * (°C) | 29 | 29.6 -2% | 33.6 -16% | 28 3% | 29 -0% | 29.2 -1% |
| Idle Bottom * (°C) | 30.4 | 34 -12% | 39.6 -30% | 26 14% | 33 -9% | 30.2 1% |
* ... menor é melhor
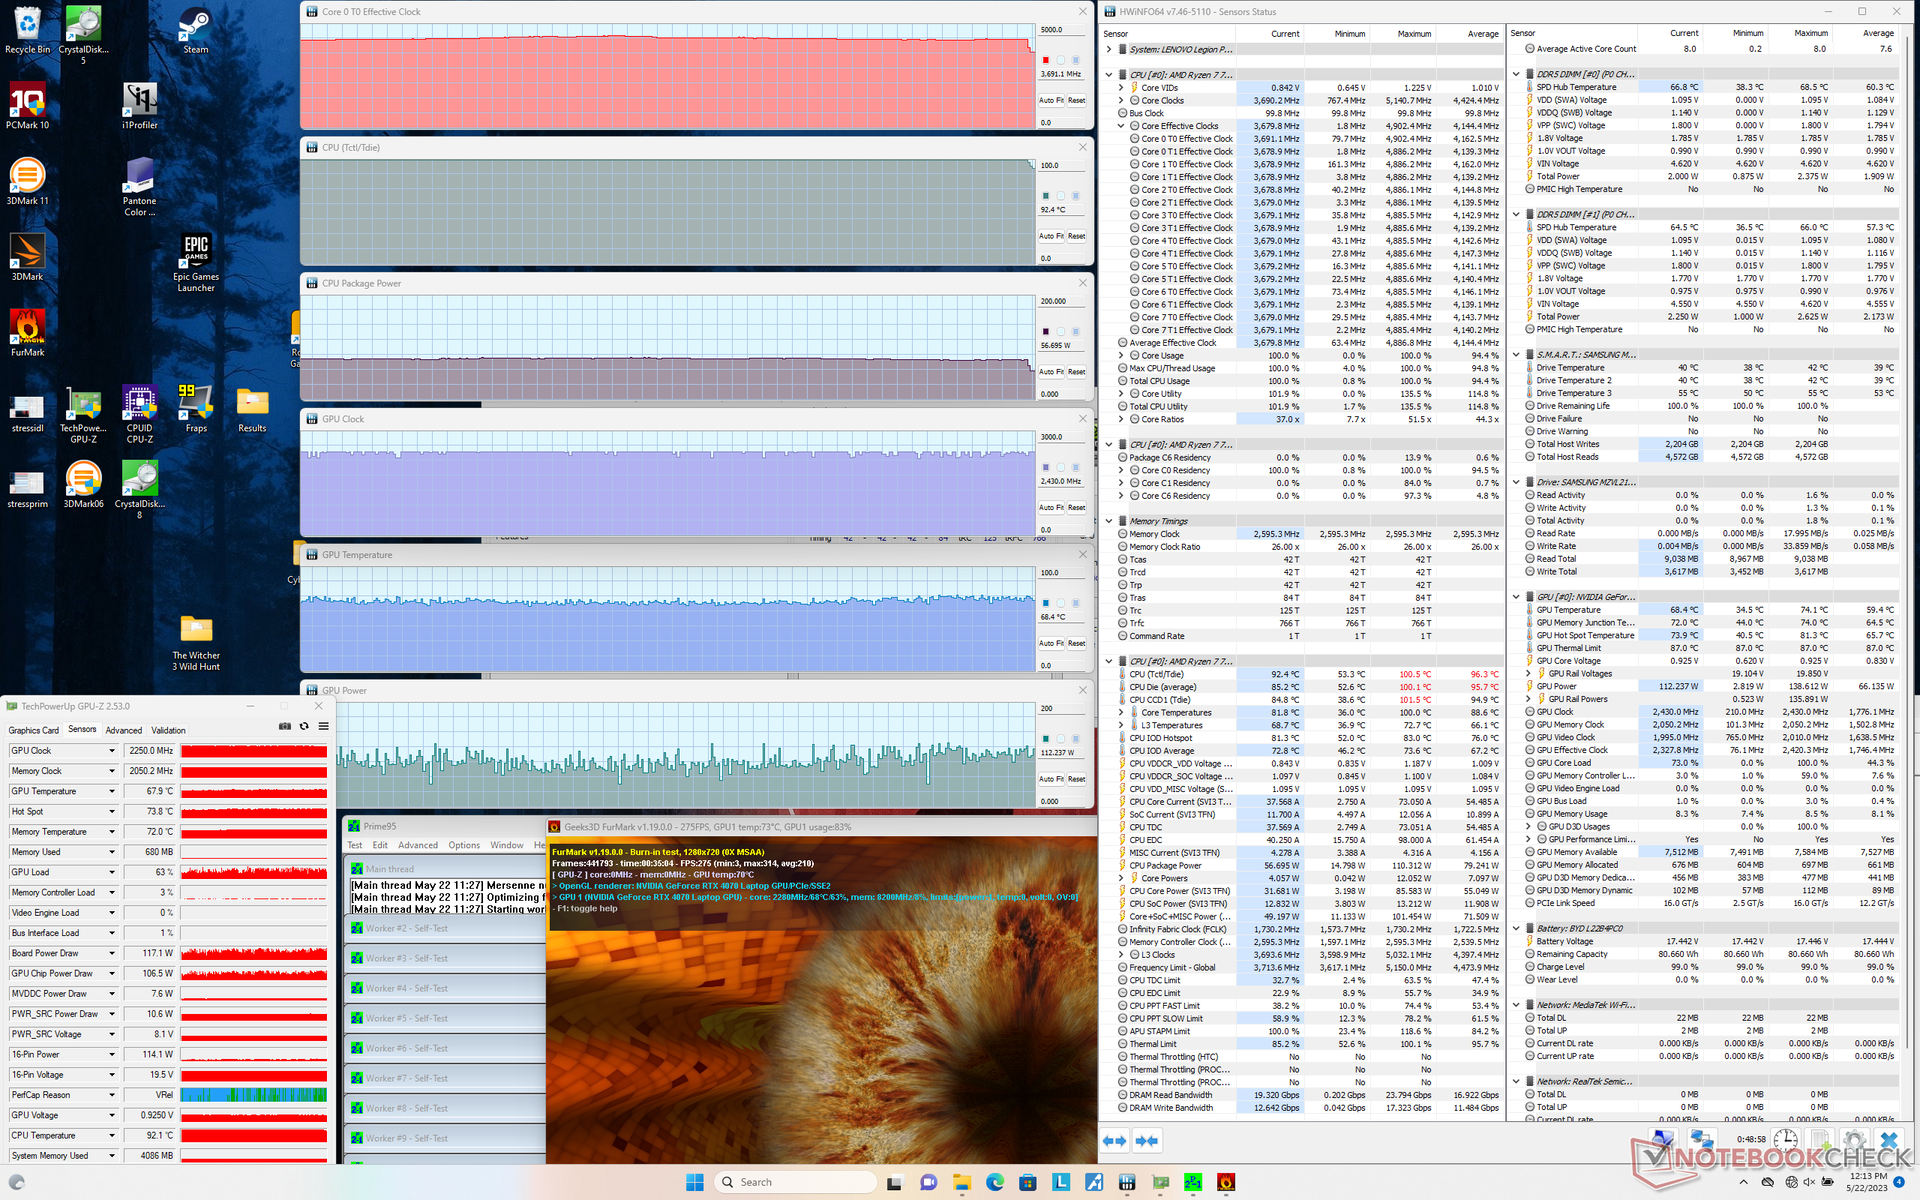
Teste de estresse - Uma CPU tostada
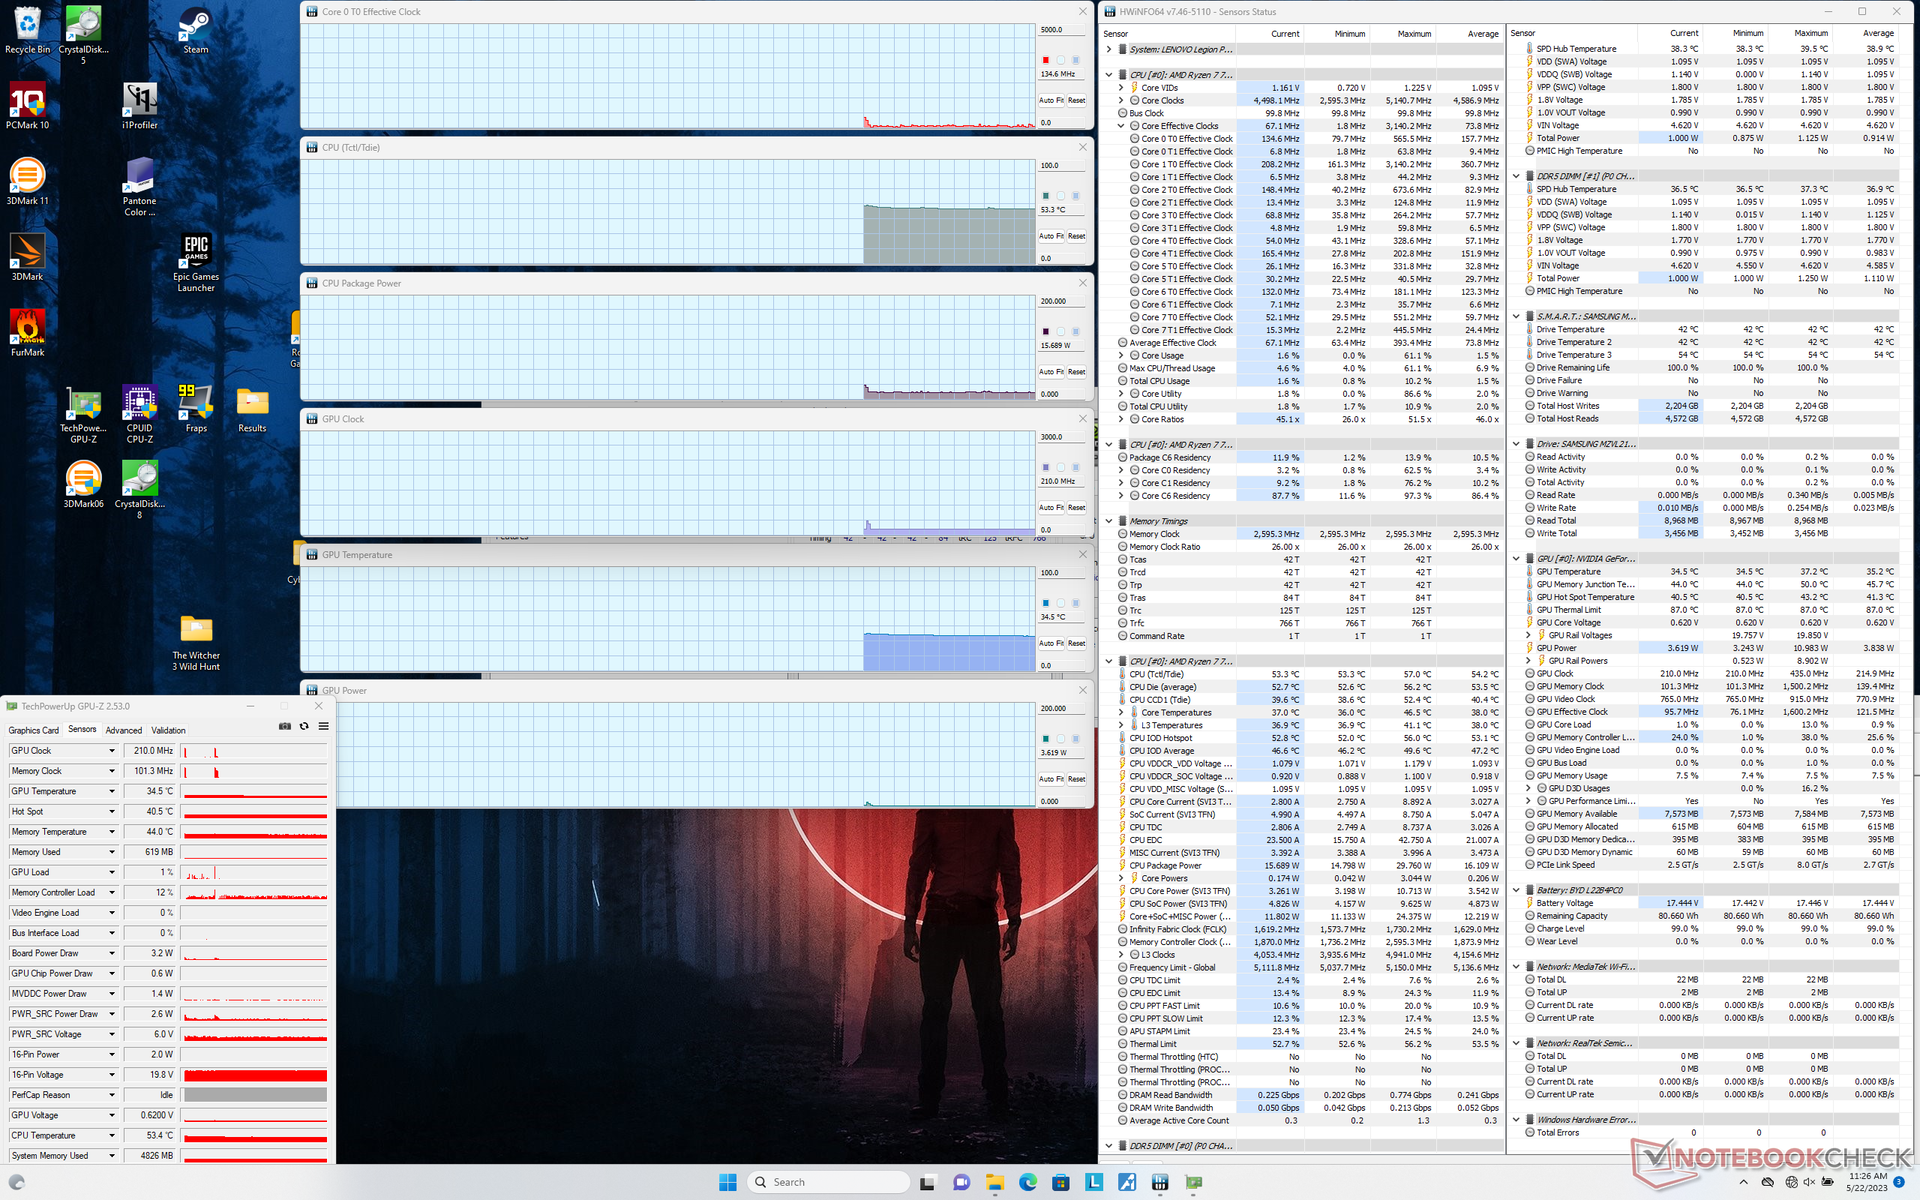
Ao executar o Prime95 para estressar a CPU, as taxas de clock e o consumo de energia da placa aumentavam para 4,9 GHz e 110 W, respectivamente, antes de cair rapidamente para 4,6 GHz e 90 W apenas alguns segundos depois. A temperatura do núcleo se estabilizaria na faixa muito alta de 90 C a 100 C, que é ainda mais quente em alguns graus do que o já quente Core i7-13700HX no modelo modelo alternativo da Intel Legion . Está claro que a CPU Ryzen 7 está ultrapassando os limites da solução de resfriamento do chassi e que uma solução Ryzen 9 mais rápida teria exigido compromissos.
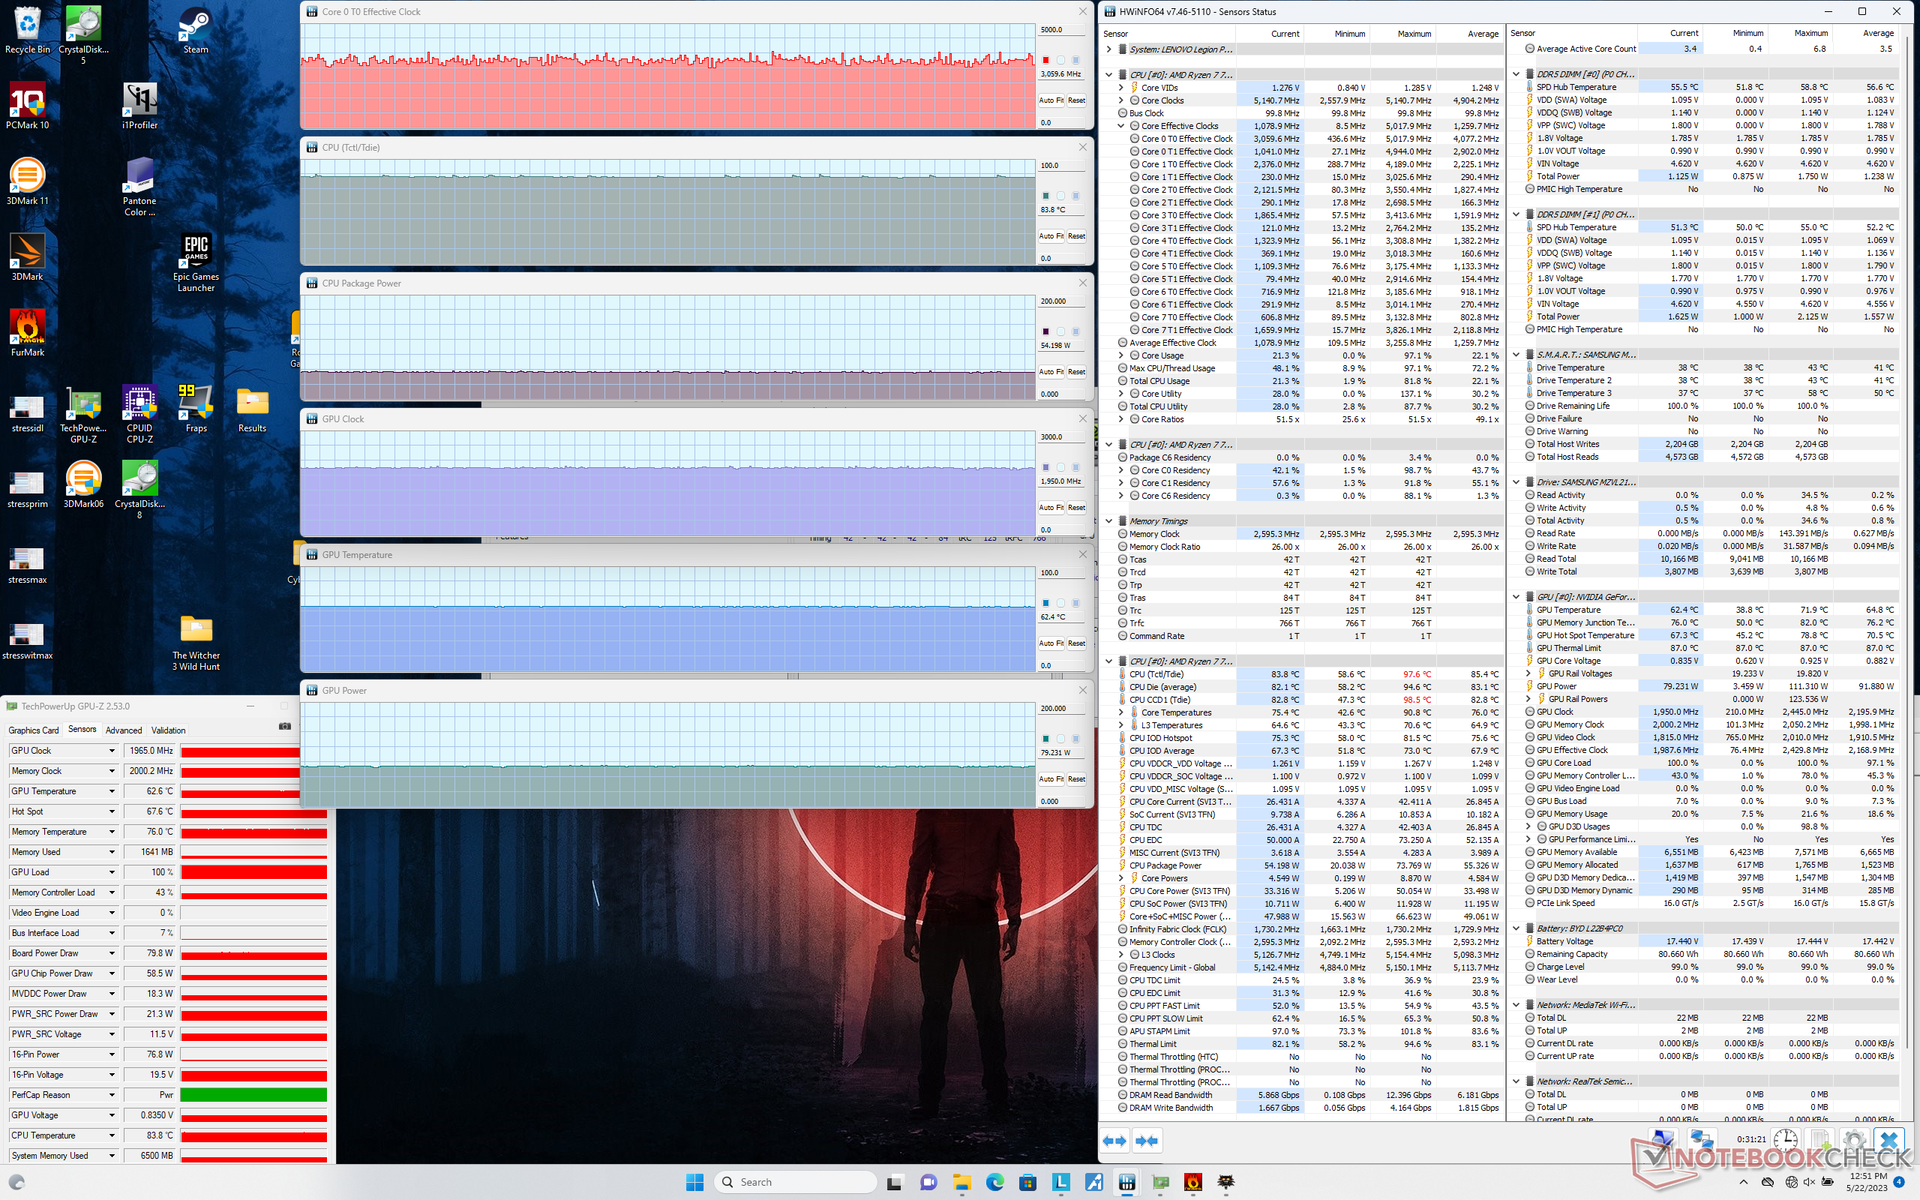
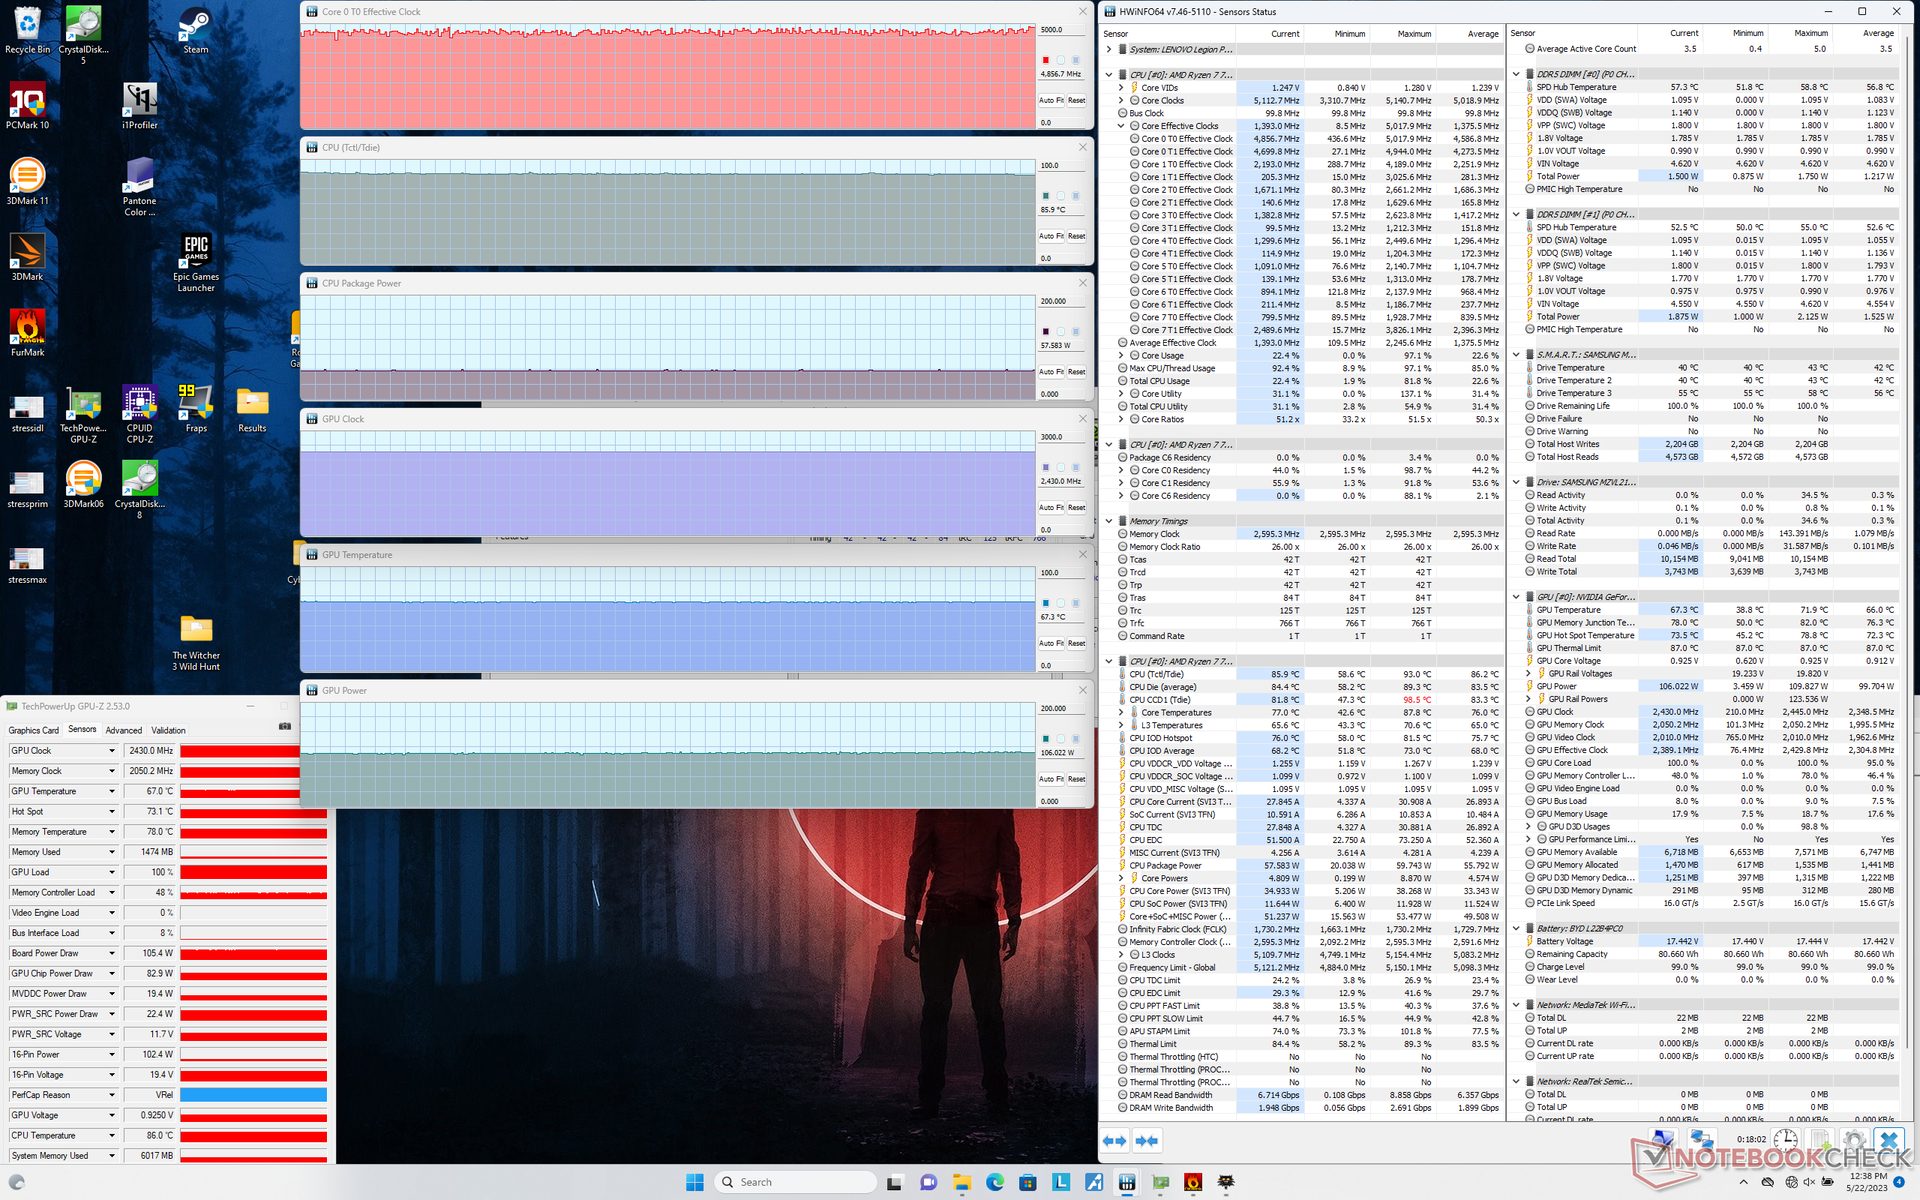
A dGPU se estabilizaria em 2430 MHz de núcleo, 2050 MHz de memória, 67 °C e 105 W contra uma meta de TGP de 140 W ao ser executada no modo Desempenho Witcher 3 no modo Desempenho. A RTX 4060 no modelo Intel Legion também se estabilizaria entre 105 W e 110 W, pois ambas as GPUs estão sob envelopes de energia semelhantes, apesar de suas diferenças de desempenho. Jogar no modo Balanced com o recurso GPU Overclock desativado resultaria em um clock de GPU mais lento de 1965 MHz e um consumo de energia da placa muito menor, de apenas 80 W. O déficit de desempenho entre os modos Balanced e Performance é de cerca de 10 a 15%, conforme mencionado acima.
A execução com a energia da bateria reduz o desempenho. Um teste no site Fire Strike com baterias retornaria pontuações de Física e Gráficos de 10865 e 9334 pontos, respectivamente, em comparação com 11477 e 12617 pontos quando ligado à rede elétrica.
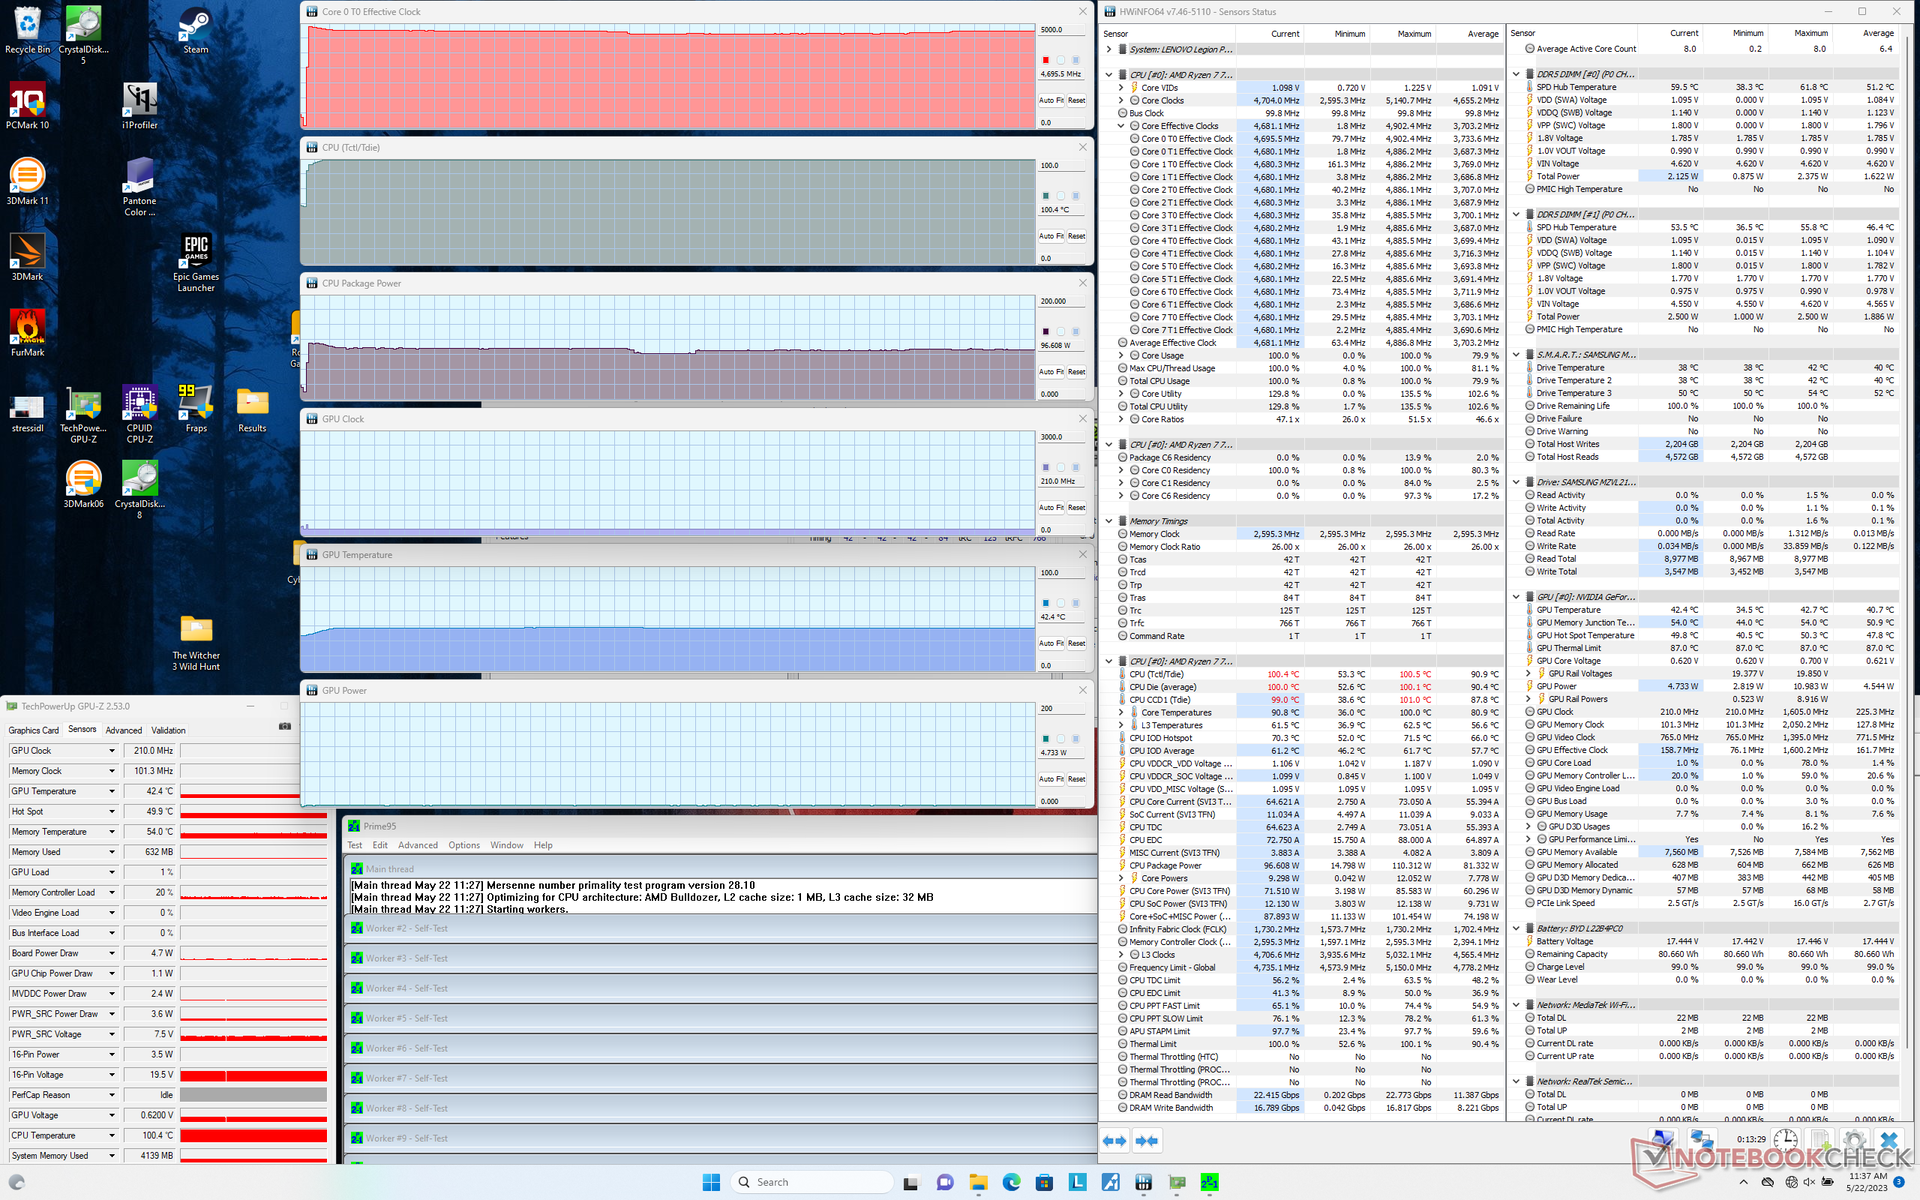
| Relógio da CPU (GHz) | Relógio da GPU (MHz) | Temperatura média da CPU (°C) | Temperatura média da GPU (°C) | |
| Sistema ocioso | -- | -- | 53 | 35 |
| Estresse doPrime95 | 4.6 - 4.7 | -- | 100 | 42 |
| Estresse doPrime95 + FurMark | 3,7 - 4,3 | 2250 | 92 - 100 | 69 |
| Witcher 3 Estresse(modo de desempenho) | 4.9 | 2430 | 86 | 67 |
| Witcher 3 Estresse (modo balanceado) | 3.1 | 1965 | 84 | 62 |
Alto-falantes
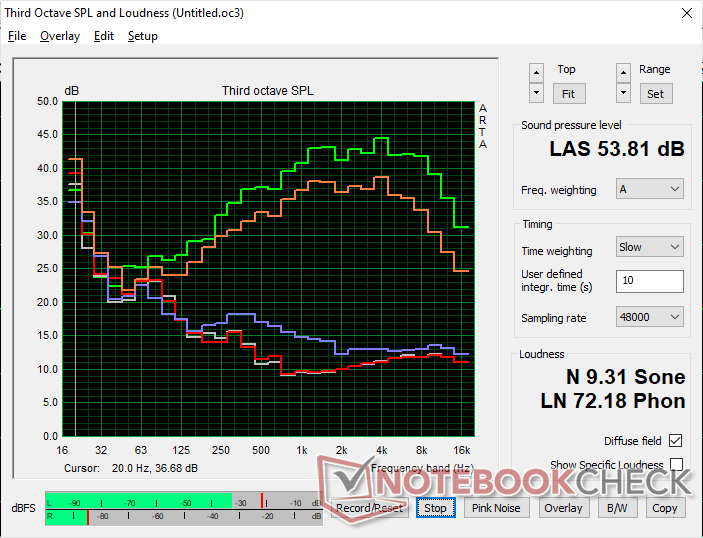
Lenovo Legion Pro 5 16ARX8 análise de áudio
(±) | o volume do alto-falante é médio, mas bom (###valor### dB)
Graves 100 - 315Hz
(-) | quase nenhum baixo - em média 24% menor que a mediana
(±) | a linearidade dos graves é média (13.4% delta para a frequência anterior)
Médios 400 - 2.000 Hz
(+) | médios equilibrados - apenas 4.7% longe da mediana
(+) | médios são lineares (6.2% delta para frequência anterior)
Altos 2 - 16 kHz
(+) | agudos equilibrados - apenas 2.5% longe da mediana
(+) | os máximos são lineares (6.2% delta da frequência anterior)
Geral 100 - 16.000 Hz
(±) | a linearidade do som geral é média (21.9% diferença em relação à mediana)
Comparado com a mesma classe
» 79% de todos os dispositivos testados nesta classe foram melhores, 6% semelhantes, 16% piores
» O melhor teve um delta de 6%, a média foi 18%, o pior foi 132%
Comparado com todos os dispositivos testados
» 63% de todos os dispositivos testados foram melhores, 7% semelhantes, 31% piores
» O melhor teve um delta de 4%, a média foi 24%, o pior foi 134%
Apple MacBook Pro 16 2021 M1 Pro análise de áudio
(+) | os alto-falantes podem tocar relativamente alto (###valor### dB)
Graves 100 - 315Hz
(+) | bons graves - apenas 3.8% longe da mediana
(+) | o baixo é linear (5.2% delta para a frequência anterior)
Médios 400 - 2.000 Hz
(+) | médios equilibrados - apenas 1.3% longe da mediana
(+) | médios são lineares (2.1% delta para frequência anterior)
Altos 2 - 16 kHz
(+) | agudos equilibrados - apenas 1.9% longe da mediana
(+) | os máximos são lineares (2.7% delta da frequência anterior)
Geral 100 - 16.000 Hz
(+) | o som geral é linear (4.6% diferença em relação à mediana)
Comparado com a mesma classe
» 0% de todos os dispositivos testados nesta classe foram melhores, 0% semelhantes, 100% piores
» O melhor teve um delta de 5%, a média foi 17%, o pior foi 45%
Comparado com todos os dispositivos testados
» 0% de todos os dispositivos testados foram melhores, 0% semelhantes, 100% piores
» O melhor teve um delta de 4%, a média foi 24%, o pior foi 134%
Gerenciamento de energia
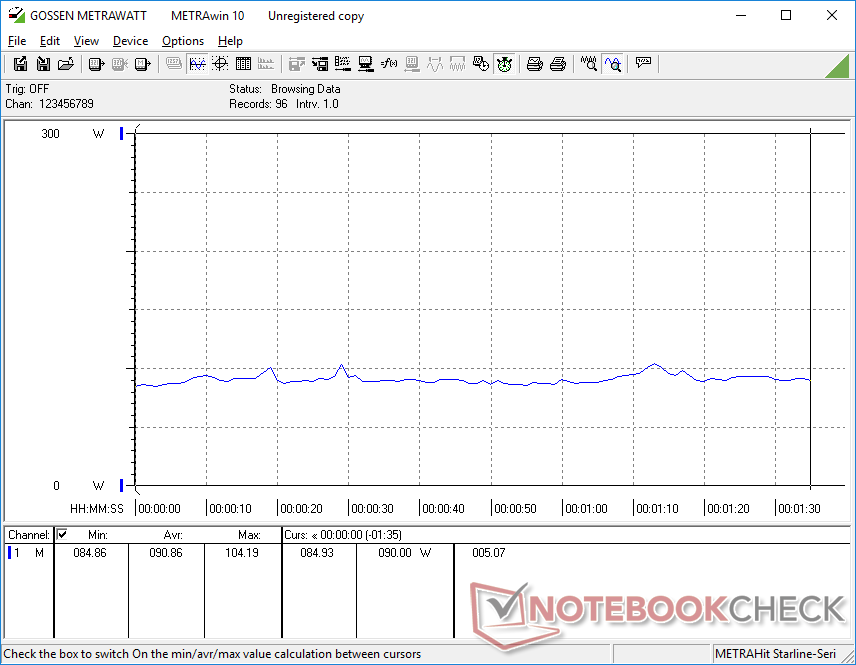
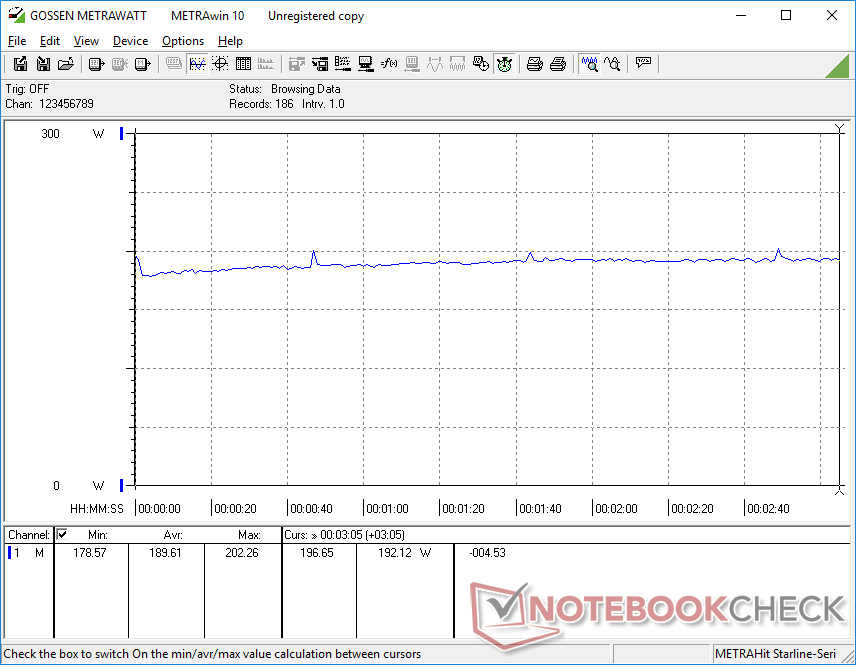
Consumo de energia - menor impulso da CPU do que o Core i7-13700HX
O modelo da AMD é mais eficiente em termos de consumo de energia do que o modelo da Intel quando está ocioso no desktop. Caso contrário, os dois modelos exigem aproximadamente a mesma quantidade de energia ao executar cargas mais altas, como jogos. Os dois modelos também são fornecidos com o mesmo adaptador CA de 300 W, que oferece espaço mais do que suficiente para a GPU de ~140 W e a CPU de ~100 W.
Vale a pena observar que o Core i7-13700HX no modelo Intel pode aumentar o consumo de energia da placa para 159 W em comparação com apenas 110 W em nosso Ryzen 7 7745HX, o que explicaria em parte sua vantagem de desempenho sobre a CPU AMD. No entanto, quando as taxas de clock do Turbo Boost se estabilizam após alguns minutos de estresse, o consumo de energia entre os dois modelos fica muito mais próximo, como mostram os gráficos de comparação abaixo. Por exemplo, ao executar o Prime95 por alguns minutos, os modelos da Intel e da AMD se estabilizariam em 158 W e 149 W, respectivamente, embora o modelo da Intel possa atingir até 220 W durante o início do teste.
| desligado | |
| Ocioso | |
| Carga |
|
Key:
min: | |
| Lenovo Legion Pro 5 16ARX8 R7 7745HX, GeForce RTX 4070 Laptop GPU, Samsung PM9A1 MZVL21T0HCLR, IPS, 2560x1600, 16" | Lenovo Legion Pro 5 16IRX8 i7-13700HX, GeForce RTX 4060 Laptop GPU, SK hynix PC801 HFS512GEJ9X115N, IPS, 2560x1600, 16" | Uniwill GM6PX7X RTX 4070 i7-13700HX, GeForce RTX 4070 Laptop GPU, Samsung PM9A1 MZVL2512HCJQ, IPS, 2560x1600, 16" | Schenker XMG Neo 16 E23 i9-13900HX, GeForce RTX 4090 Laptop GPU, Crucial P5 Plus 1TB CT1000P5PSSD8, IPS, 2560x1600, 16" | Asus ROG Strix G16 G614JZ i9-13980HX, GeForce RTX 4080 Laptop GPU, WD PC SN560 SDDPNQE-1T00, IPS, 2560x1600, 16" | Asus Zephyrus Duo 16 GX650PY-NM006W R9 7945HX, GeForce RTX 4090 Laptop GPU, SK hynix PC801 HFS002TEJ9X101N, MiniLED, 2560x1600, 16" | |
|---|---|---|---|---|---|---|
| Power Consumption | -46% | -13% | -23% | -17% | -51% | |
| Idle Minimum * (Watt) | 8.1 | 24.5 -202% | 12.6 -56% | 8 1% | 10 -23% | 19.2 -137% |
| Idle Average * (Watt) | 15.9 | 29.2 -84% | 17.7 -11% | 18 -13% | 16 -1% | 29.7 -87% |
| Idle Maximum * (Watt) | 37.2 | 34.3 8% | 31.8 15% | 28 25% | 27 27% | 30.8 17% |
| Load Average * (Watt) | 90.9 | 98.7 -9% | 101.4 -12% | 133 -46% | 129 -42% | 126 -39% |
| Witcher 3 ultra * (Watt) | 189.6 | 178.6 6% | 185.3 2% | 294 -55% | 247 -30% | 258 -36% |
| Load Maximum * (Watt) | 263.5 | 249.6 5% | 298 -13% | 399 -51% | 342 -30% | 330 -25% |
* ... menor é melhor
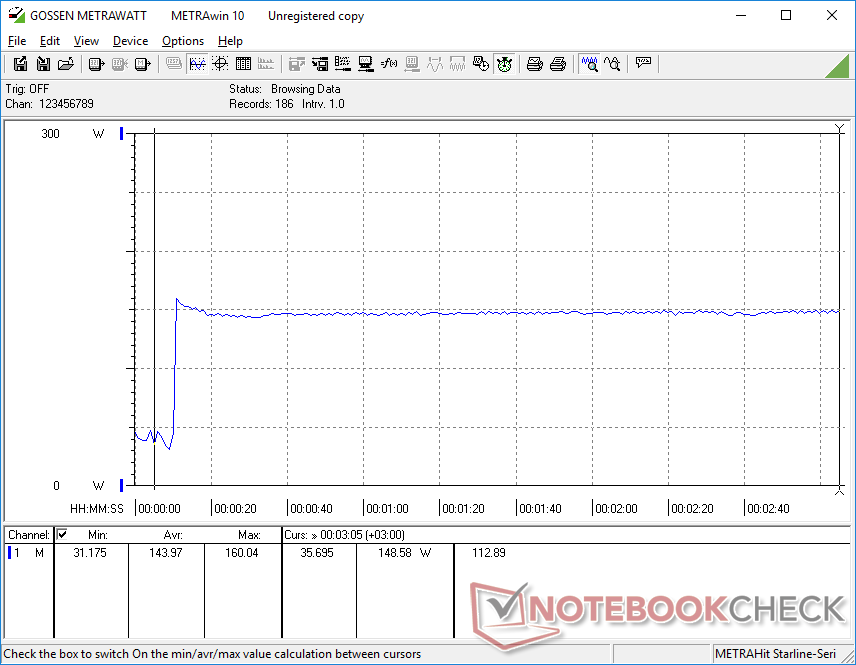
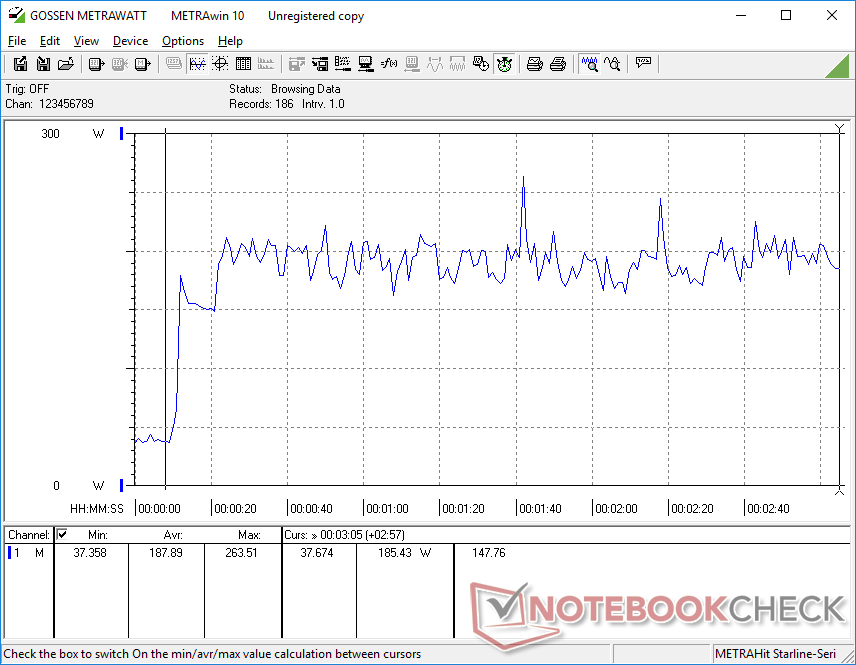
Power Consumption Witcher 3 / Stresstest
Power Consumption external Monitor
Duração da bateria
O tempo de execução da WLAN é apenas um pouco mais longo do que a versão Intel em cerca de 30 minutos quando configurado para o perfil de energia balanceada com a iGPU ativa. Embora não seja ruim para um notebook para jogos, alternativas como o Schenker XMG Neo 16 ou oAsus ROG Strix G16 têm baterias de maior capacidade e tempos de execução mais longos, de mais de duas horas cada.
O carregamento de uma bateria vazia até a capacidade total com o adaptador CA incluído é rápido, com cerca de 1 a 1,5 horas. O carregamento rápido é ativado por padrão, ao contrário dos modelos mais antigos do Legion ou do Yoga, em que ele pode estar desativado. O carregamento com adaptadores USB-C de terceiros é compatível apenas com a porta USB-C na parte traseira.
| Lenovo Legion Pro 5 16ARX8 R7 7745HX, GeForce RTX 4070 Laptop GPU, 80 Wh | Lenovo Legion Pro 5 16IRX8 i7-13700HX, GeForce RTX 4060 Laptop GPU, 80 Wh | Uniwill GM6PX7X RTX 4070 i7-13700HX, GeForce RTX 4070 Laptop GPU, 62 Wh | Schenker XMG Neo 16 E23 i9-13900HX, GeForce RTX 4090 Laptop GPU, 99 Wh | Asus ROG Strix G16 G614JZ i9-13980HX, GeForce RTX 4080 Laptop GPU, 90 Wh | Asus Zephyrus Duo 16 GX650PY-NM006W R9 7945HX, GeForce RTX 4090 Laptop GPU, 90 Wh | |
|---|---|---|---|---|---|---|
| Duração da bateria | -14% | 0% | 68% | 76% | 0% | |
| Reader / Idle (h) | 6.5 | 6.7 3% | ||||
| WiFi v1.3 (h) | 4 | 3.4 -15% | 4 0% | 6.7 68% | 9.7 142% | 4 0% |
| Load (h) | 1 | 0.7 -30% | 1.1 10% | 1 0% | ||
| H.264 (h) | 5.8 | 3.8 | ||||
| Witcher 3 ultra (h) | 1.4 |
Pro
Contra
Veredicto - A AMD é a melhor opção para os jogadores
A Lenovo tem duas opções muito interessantes aqui: O Intel Core i7-13700HX Legion Pro 5 16 com gráficos RTX 4060 por US$ 1.600 ou o AMD Ryzen 7 7745HX Legion Pro 5 16 com gráficos RTX 4070 - também por US$ 1.600. O primeiro oferece um desempenho de CPU cerca de 10% mais rápido ao custo de um desempenho de GPU 15% mais lento, enquanto o segundo é o oposto. Quase todo o resto das duas opções é idêntico, pois ambas compartilham o mesmo design de chassi. Portanto, os usuários que valorizam o desempenho da CPU em detrimento da GPU podem preferir a opção da Intel, enquanto os usuários que valorizam mais a GPU podem preferir a opção da AMD.
Como o Legion Pro 5 16 é, antes de tudo, um notebook para jogos, a maioria dos usuários escolherá a opção da AMD para obter os gráficos RTX 4070 mais rápidos. Quase todos os jogos mais recentes estão vinculados à GPU e, portanto, qualquer vantagem adicional de desempenho da CPU acima do Ryzen 7 7745HX teria um impacto mínimo na experiência de jogo. Nesse cenário, o preço relativamente alto de US$ 1.600 é mais bem justificado, pois os usuários estão adquirindo um RTX 4070 em vez do mais lento RTX 4060.
Preço e disponibilidade
Atualmente, a Lenovo está enviando seu Legion Pro 5 16 Gen 8 a partir de US$ 1.280 para a configuração básica Ryzen 5/RTX 4050 até US$ 1.600 para nossa configuração Ryzen 7/RTX 4070. O modelo ainda não está amplamente disponível nos principais revendedores, como Best Buy ou Amazon, até o momento em que este texto foi escrito.
Lenovo Legion Pro 5 16ARX8
- 05/24/2023 v7 (old)
Allen Ngo
Transparência
A seleção dos dispositivos a serem analisados é feita pela nossa equipe editorial. A amostra de teste foi fornecida ao autor como empréstimo pelo fabricante ou varejista para fins desta revisão. O credor não teve influência nesta revisão, nem o fabricante recebeu uma cópia desta revisão antes da publicação. Não houve obrigação de publicar esta revisão. Como empresa de mídia independente, a Notebookcheck não está sujeita à autoridade de fabricantes, varejistas ou editores.
É assim que o Notebookcheck está testando
Todos os anos, o Notebookcheck analisa de forma independente centenas de laptops e smartphones usando procedimentos padronizados para garantir que todos os resultados sejam comparáveis. Desenvolvemos continuamente nossos métodos de teste há cerca de 20 anos e definimos padrões da indústria no processo. Em nossos laboratórios de teste, equipamentos de medição de alta qualidade são utilizados por técnicos e editores experientes. Esses testes envolvem um processo de validação em vários estágios. Nosso complexo sistema de classificação é baseado em centenas de medições e benchmarks bem fundamentados, o que mantém a objetividade.Price comparison

