Análise do laptop para jogos SCHENKER XMG Core 16 - Um verdadeiro concorrente para o Lenovo Legion Pro 5 16

O último XMG Core, que também testamos, foi oXMG Core 15(88%) de um ano atrás - na época, com umaRTX 3060. Agora, a Schenker lançou uma versão de 16 polegadas do Core. Vamos dar uma olhada em tudo o que mudou, além do tamanho da tela.
Vamos comparar o Core 16 com o Lenovo Legion Pro 5 16 Gen 8, o Acer Nitro 16 AN16-41, o HP Omen Transcend 16, o MSI Stealth 16 Studio e o HP Victus 16.
Possíveis concorrentes em comparação
Avaliação | Data | Modelo | Peso | Altura | Size | Resolução | Preço |
|---|---|---|---|---|---|---|---|
| 89.2 % v7 (old) | 10/2023 | Schenker XMG CORE 16 (L23) R7 7840HS, GeForce RTX 4070 Laptop GPU | 2.4 kg | 26.1 mm | 16.00" | 2560x1600 | |
| 88.4 % v7 (old) | 05/2023 | Lenovo Legion Pro 5 16ARX8 R7 7745HX, GeForce RTX 4070 Laptop GPU | 2.5 kg | 26.8 mm | 16.00" | 2560x1600 | |
| 88.1 % v7 (old) | 06/2023 | Acer Nitro 16 AN16-41 R7 7735HS, GeForce RTX 4070 Laptop GPU | 2.7 kg | 27.9 mm | 16.00" | 2560x1600 | |
| 87.9 % v7 (old) | 08/2023 | HP Omen Transcend 16 i9-13900HX, GeForce RTX 4070 Laptop GPU | 2.3 kg | 19.8 mm | 16.00" | 2560x1600 | |
| 88.8 % v7 (old) | 07/2023 | MSI Stealth 16 Studio A13VG i7-13700H, GeForce RTX 4070 Laptop GPU | 2 kg | 19.95 mm | 16.00" | 2560x1600 | |
| 85.1 % v7 (old) | 09/2023 | HP Victus 16-r0077ng i7-13700H, GeForce RTX 4070 Laptop GPU | 2.4 kg | 24 mm | 16.10" | 1920x1080 |
Case e conectividade - O elegante Core 16
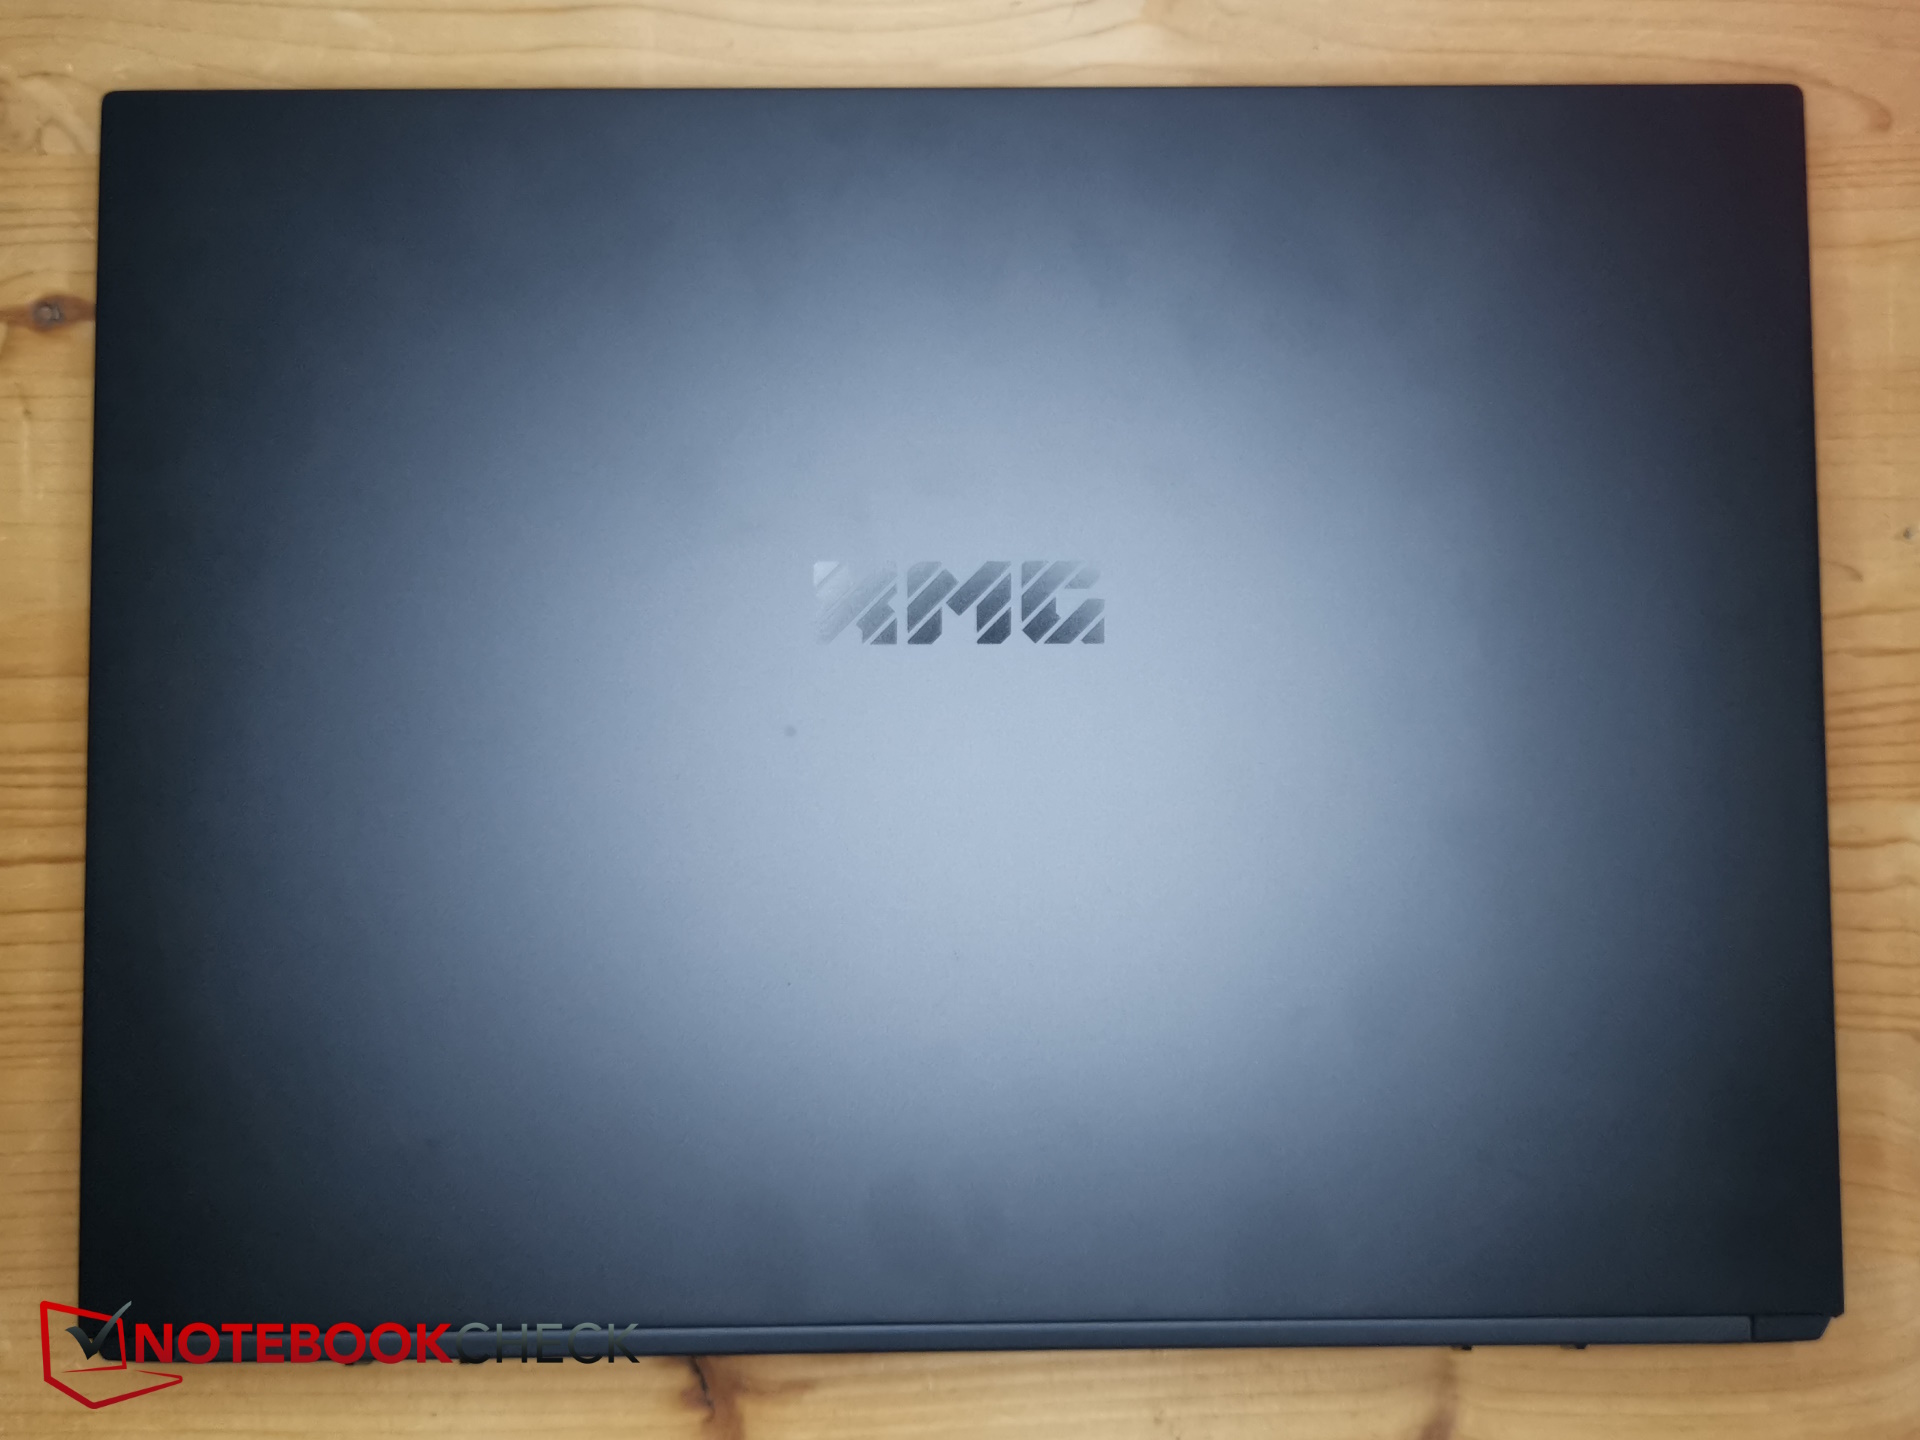
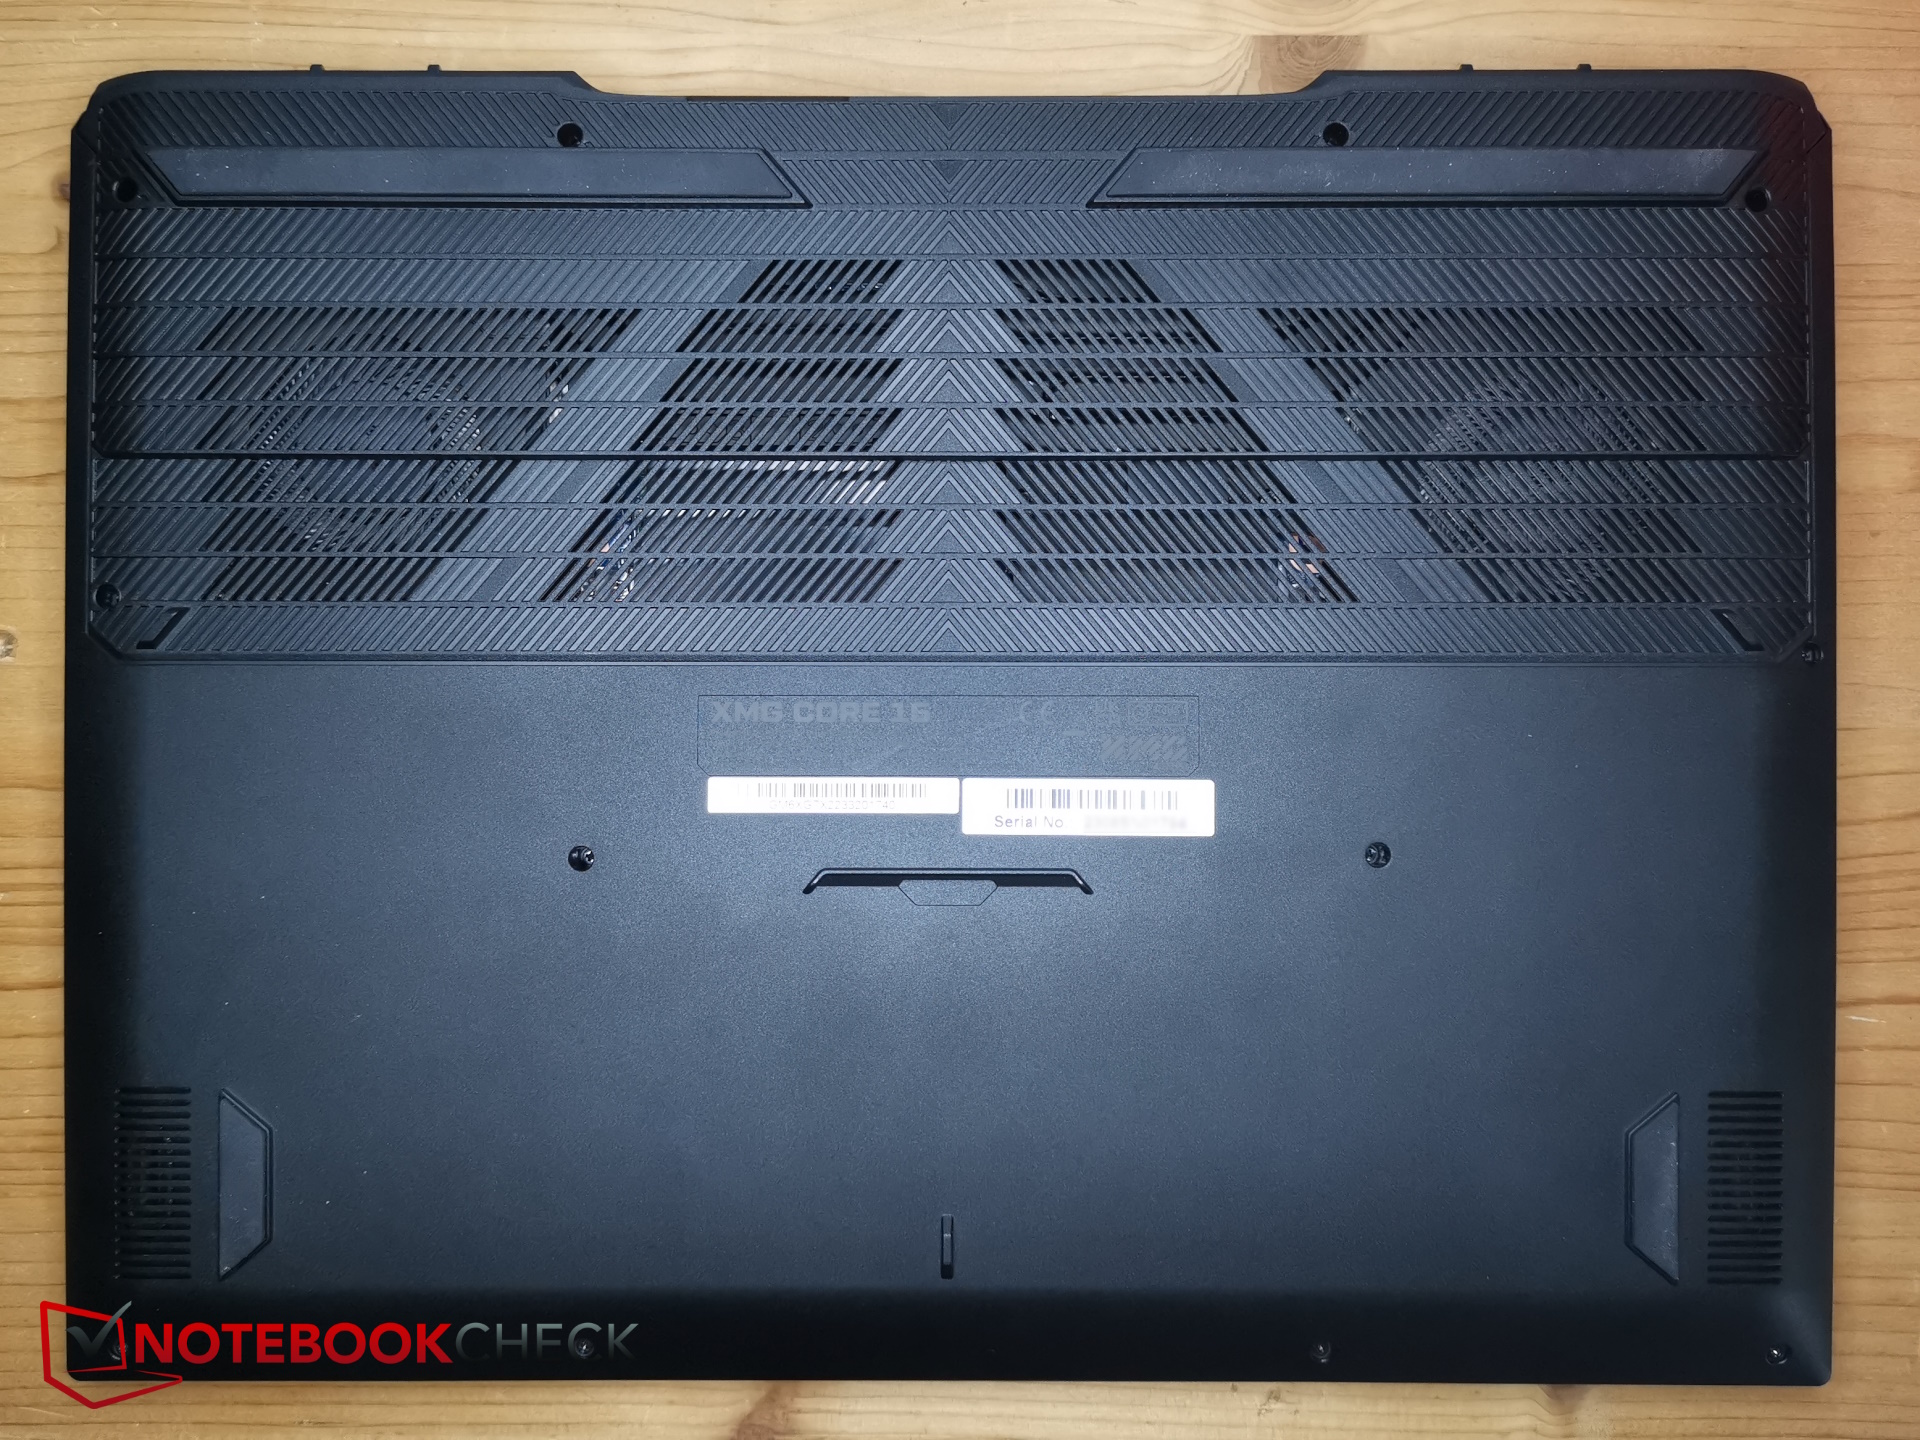
Esse laptop adotou a abordagem elegante típica de Schenker - tudo é mantido em cinza escuro. A base mais rígida e a placa inferior mais macia são feitas de plástico, e a tampa brilhante da tela é feita de metal. Essa última é um ímã de impressões digitais. A tampa pode ser aberta em até 135 graus.
Tudo parece bastante estável e sua construção é boa. O lado esquerdo da base só rangeu na primeira vez que tentamos girá-lo.
Seu tamanho e peso são médios - comparáveis aos do Lenovo Legion Pro 5 16.
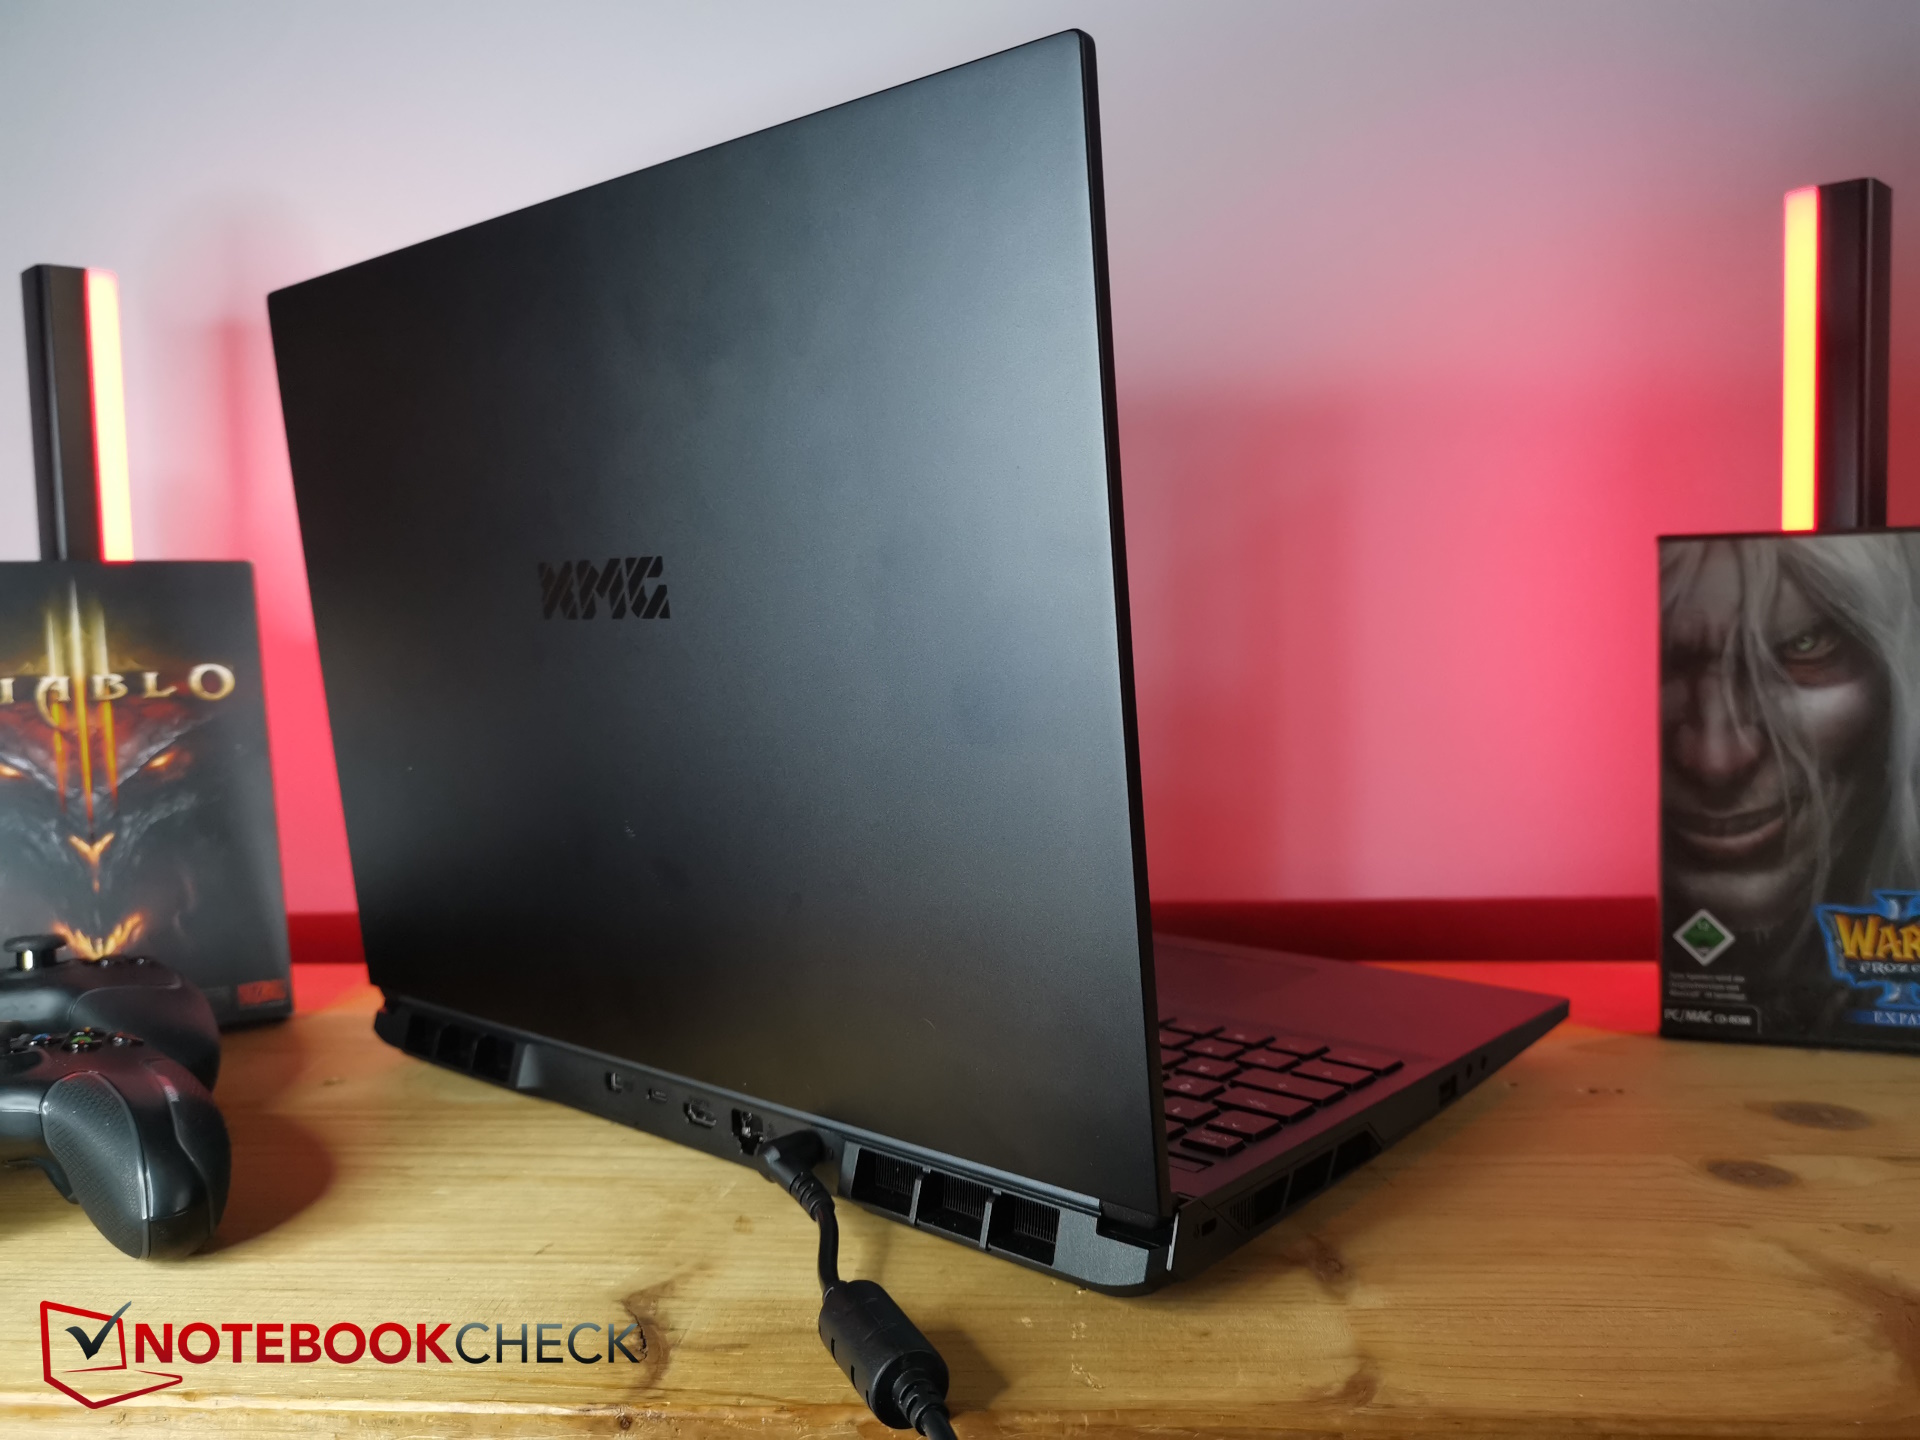

O laptop para jogos inclui todas as portas mais importantes, inclusive um leitor de cartão SD completo. Infelizmente, a porta USB-C não é compatível com Thunderbolt, Power Delivery ou DisplayPort. Para este último, o laptop apresenta uma MiniDisplayPort dedicada. O dispositivo não pode ser carregado via USB-C e a porta USB-A no lado esquerdo ainda é do tipo 2.0!
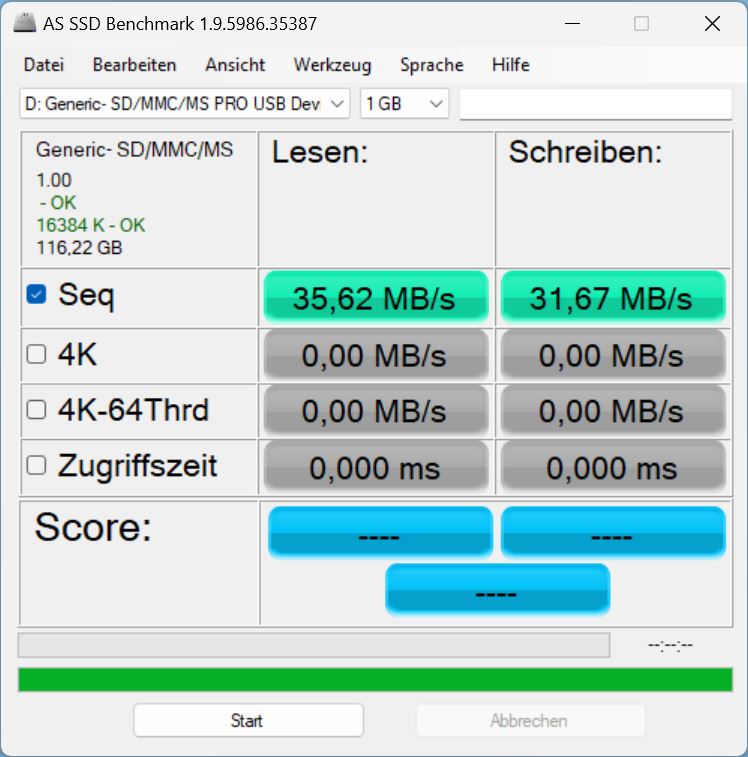
Infelizmente, o leitor de cartão SD mencionado anteriormente é muito lento - mais lento do que em todos os antecessores e concorrentes. Pelo menos ele possui um.
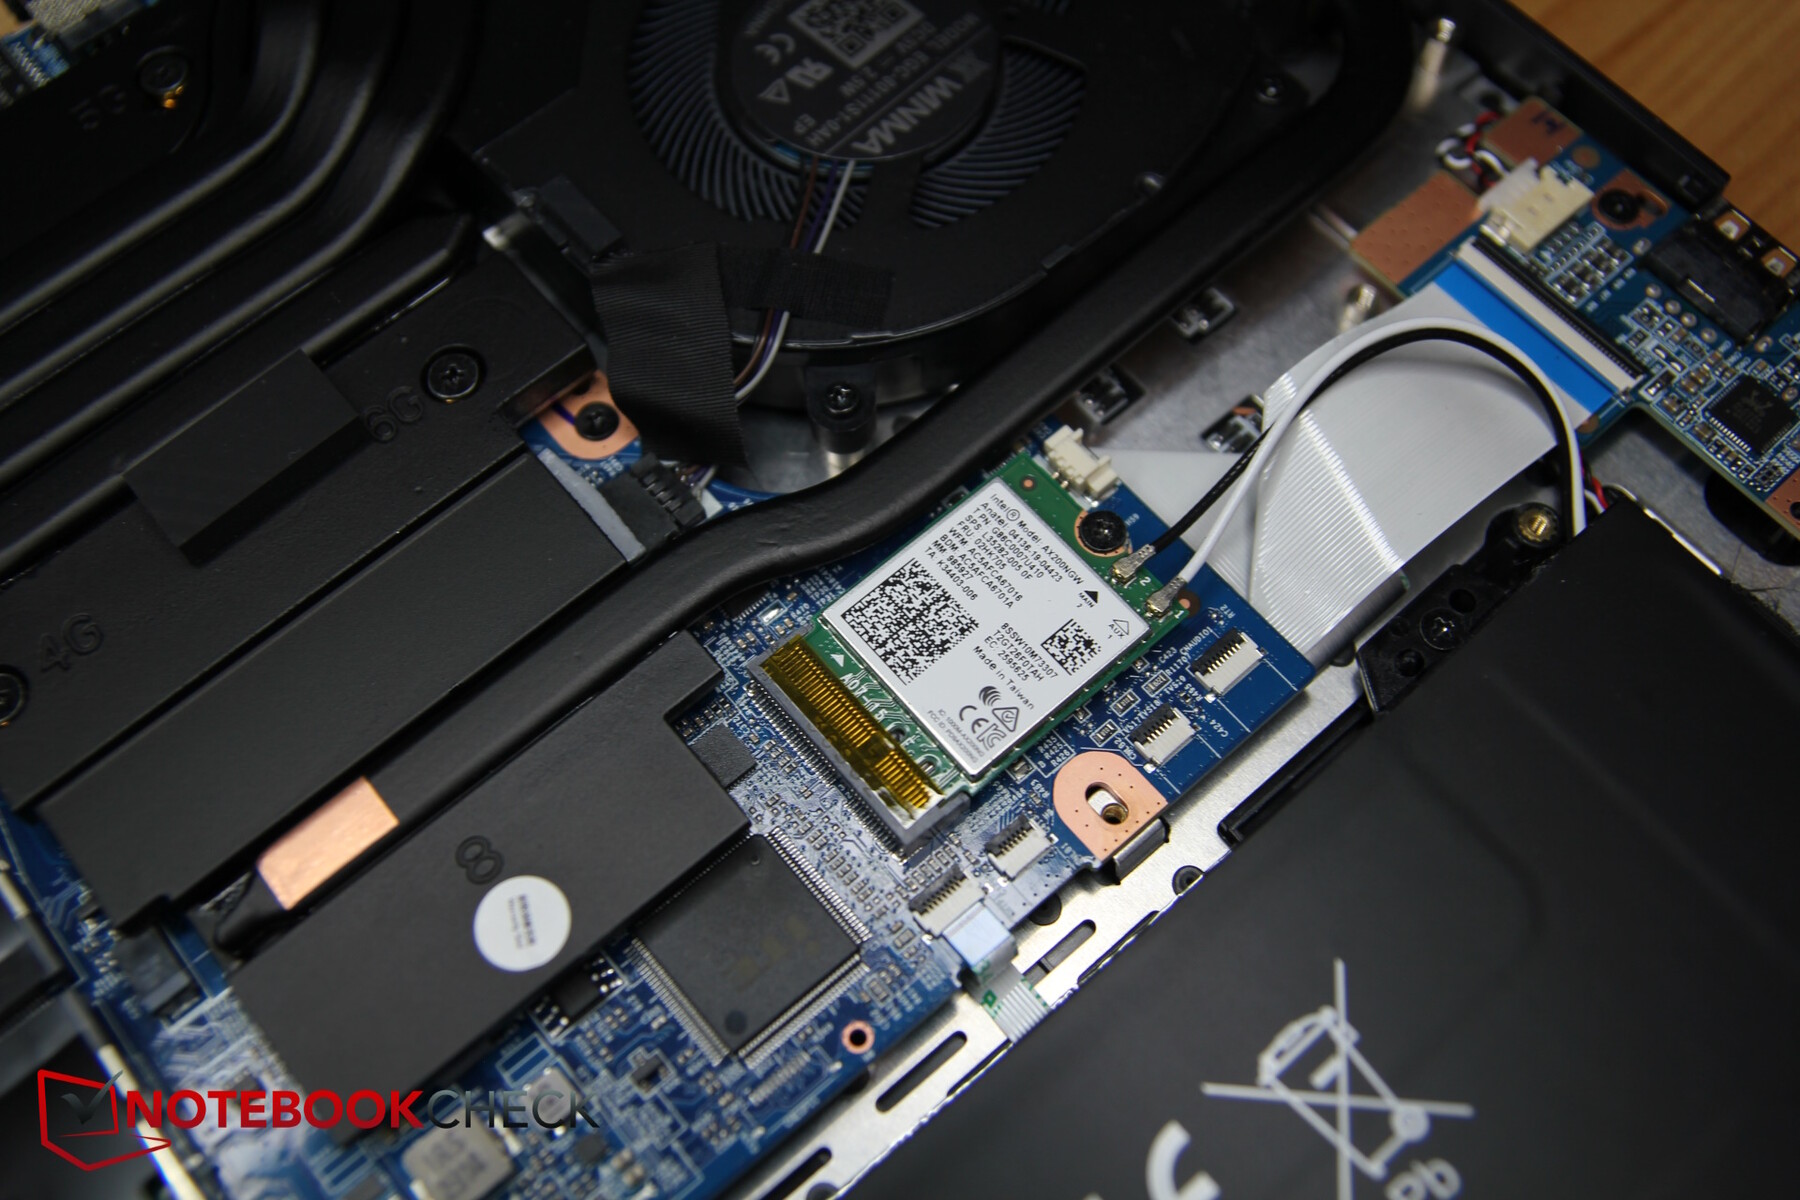
O Intel AX200 suporta WiFi 6, mas apenas na frequência de 5 GHz. Suas taxas de transferência são boas e relativamente estáveis.
| SD Card Reader | |
| average JPG Copy Test (av. of 3 runs) | |
| MSI Stealth 16 Studio A13VG | |
| Média da turma Gaming (20.9 - 210, n=54, últimos 2 anos) | |
| Acer Nitro 16 AN16-41 (AV Pro SD microSD 128 GB V60) | |
| Schenker XMG CORE 16 (L23) | |
| maximum AS SSD Seq Read Test (1GB) | |
| MSI Stealth 16 Studio A13VG | |
| Média da turma Gaming (25.5 - 261, n=51, últimos 2 anos) | |
| Acer Nitro 16 AN16-41 (AV Pro SD microSD 128 GB V60) | |
| Schenker XMG CORE 16 (L23) | |

 GeForce RTX 4070 Laptop GPU, R7 7840HS, Samsung 990 Pro 1 TB")
 GeForce RTX 4070 Laptop GPU, R7 7840HS, Samsung 990 Pro 1 TB")
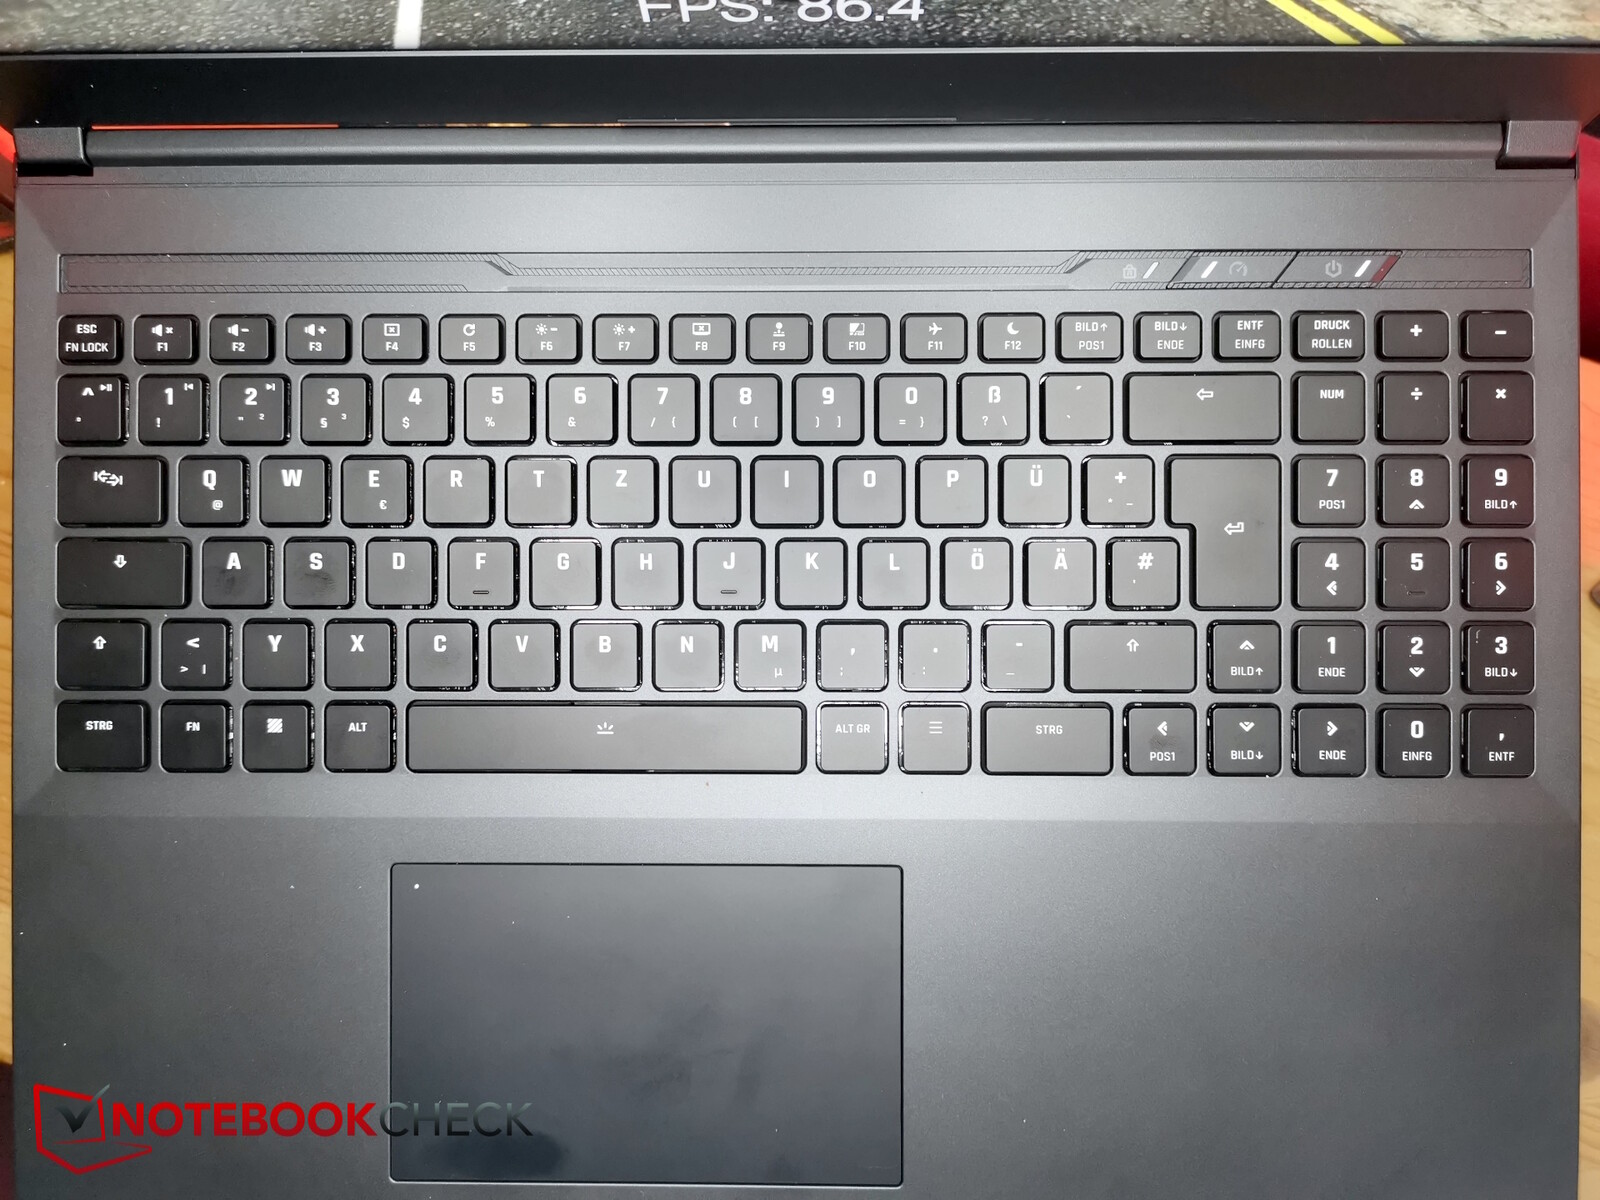
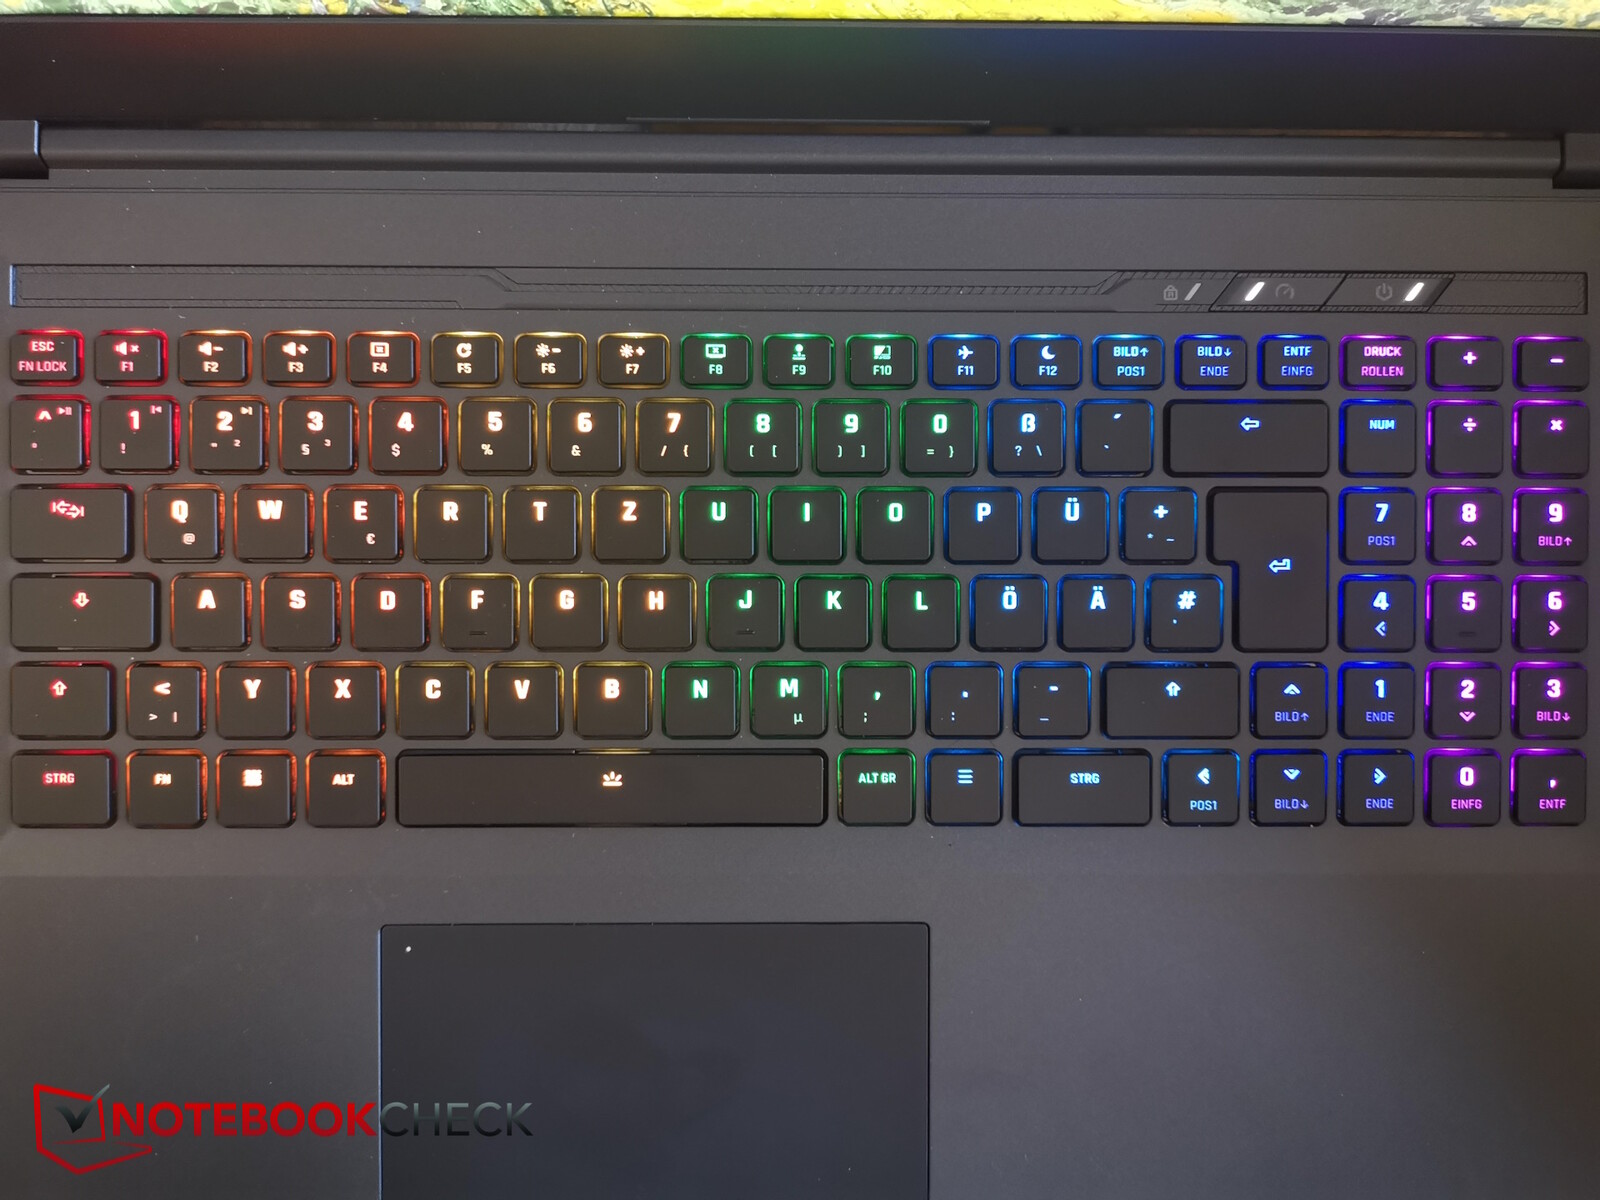
Dispositivos de entrada - Teclas mecânicas ou de membrana
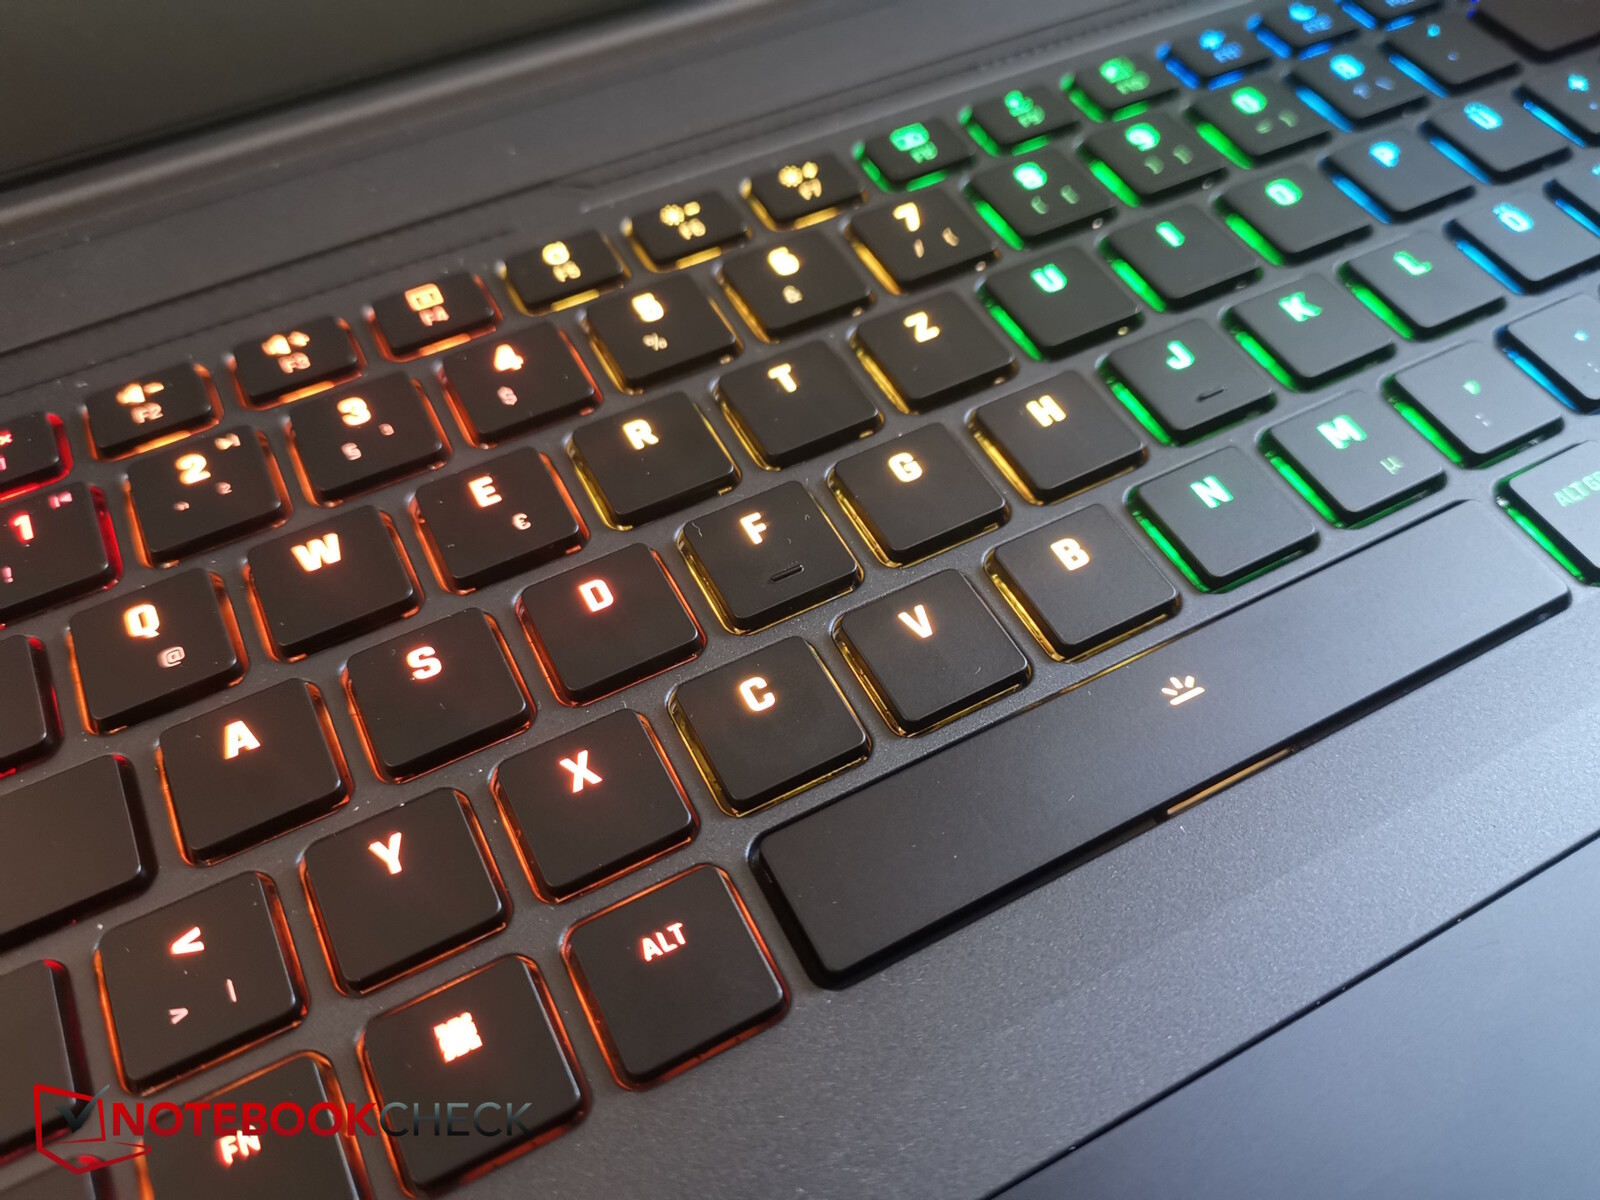
Neste laptop, o senhor pode escolher entre teclas mecânicas, como as que o nosso modelo de teste apresenta, ou um "teclado de membrana silencioso". Ambos vêm com iluminação de fundo RGB, mas somente o teclado mecânico apresenta teclas iluminadas individualmente com RGB. A versão de membrana mais silenciosa tem apenas iluminação RGB de zona única.
O teclado mecânico só tem interruptores de membrana mais silenciosos quando se trata das teclas de função. Todas as outras teclas têm um ótimo ponto de pressão e fornecem um feedback nítido. É preciso gostar do barulho alto ao digitar e certamente não é adequado para levar com o senhor para uma biblioteca.
Como de costume, a Schenker implementou um layout muito organizado, sem acentos. Tudo se encaixa em seis fileiras de teclas retas, inclusive o teclado numérico. Isso significa que o senhor pode encontrar tudo com muita facilidade - normalmente, as teclas são bem pequenas (cerca de 1,45 x 1,45 cm).
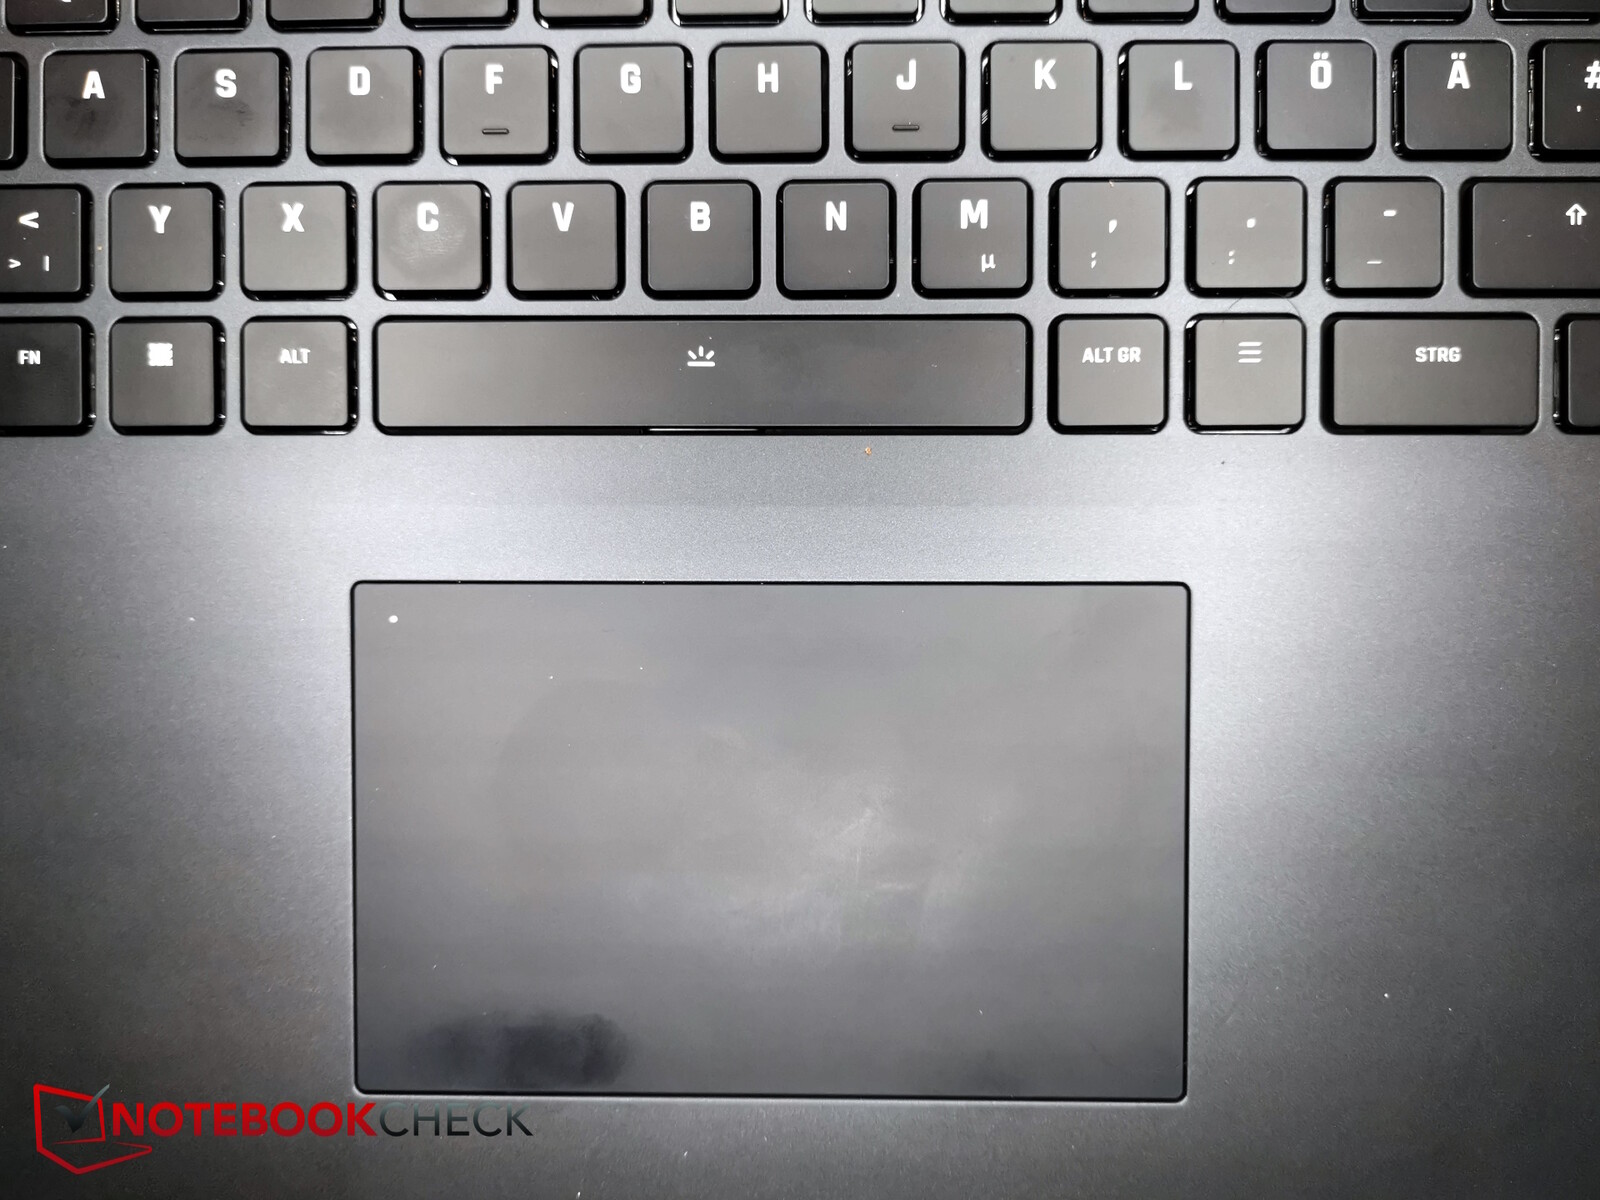
O touchpad é um pouco pequeno (cerca de 11,7 x 7,2 cm), mas é agradável e suave, mesmo que os dedos não estejam completamente secos. É possível (des)ativar o touchpad clicando duas vezes no canto superior esquerdo e um mini LED mostra o status atual. Os botões de clique integrados fornecem um feedback decente, mas não são muito altos. Às vezes, o clique fica um pouco preso, o que significa que não é liberado imediatamente depois que o usuário solta o botão de arrastar e soltar.
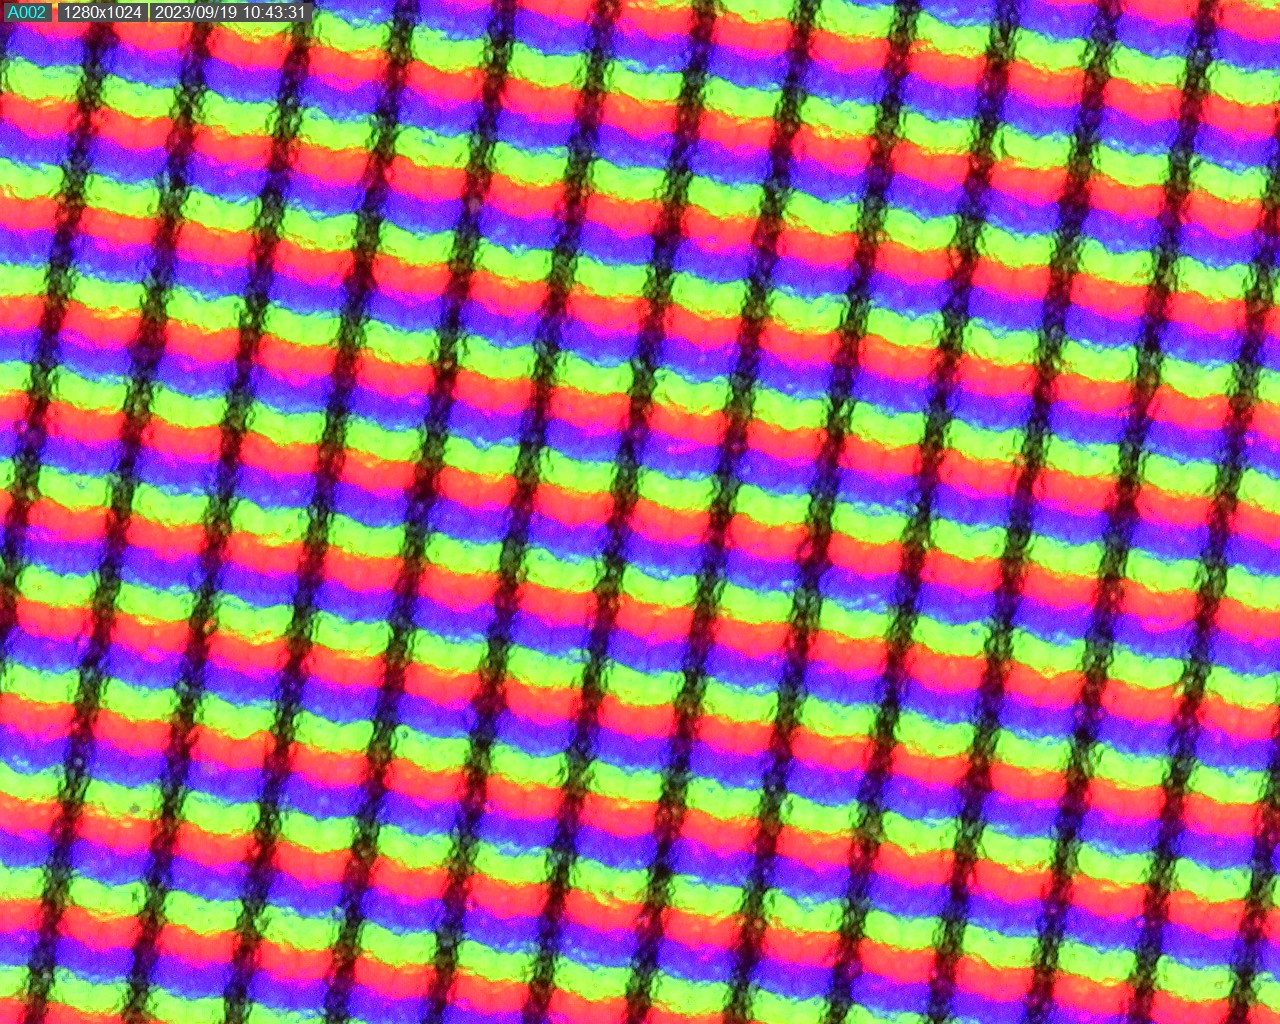
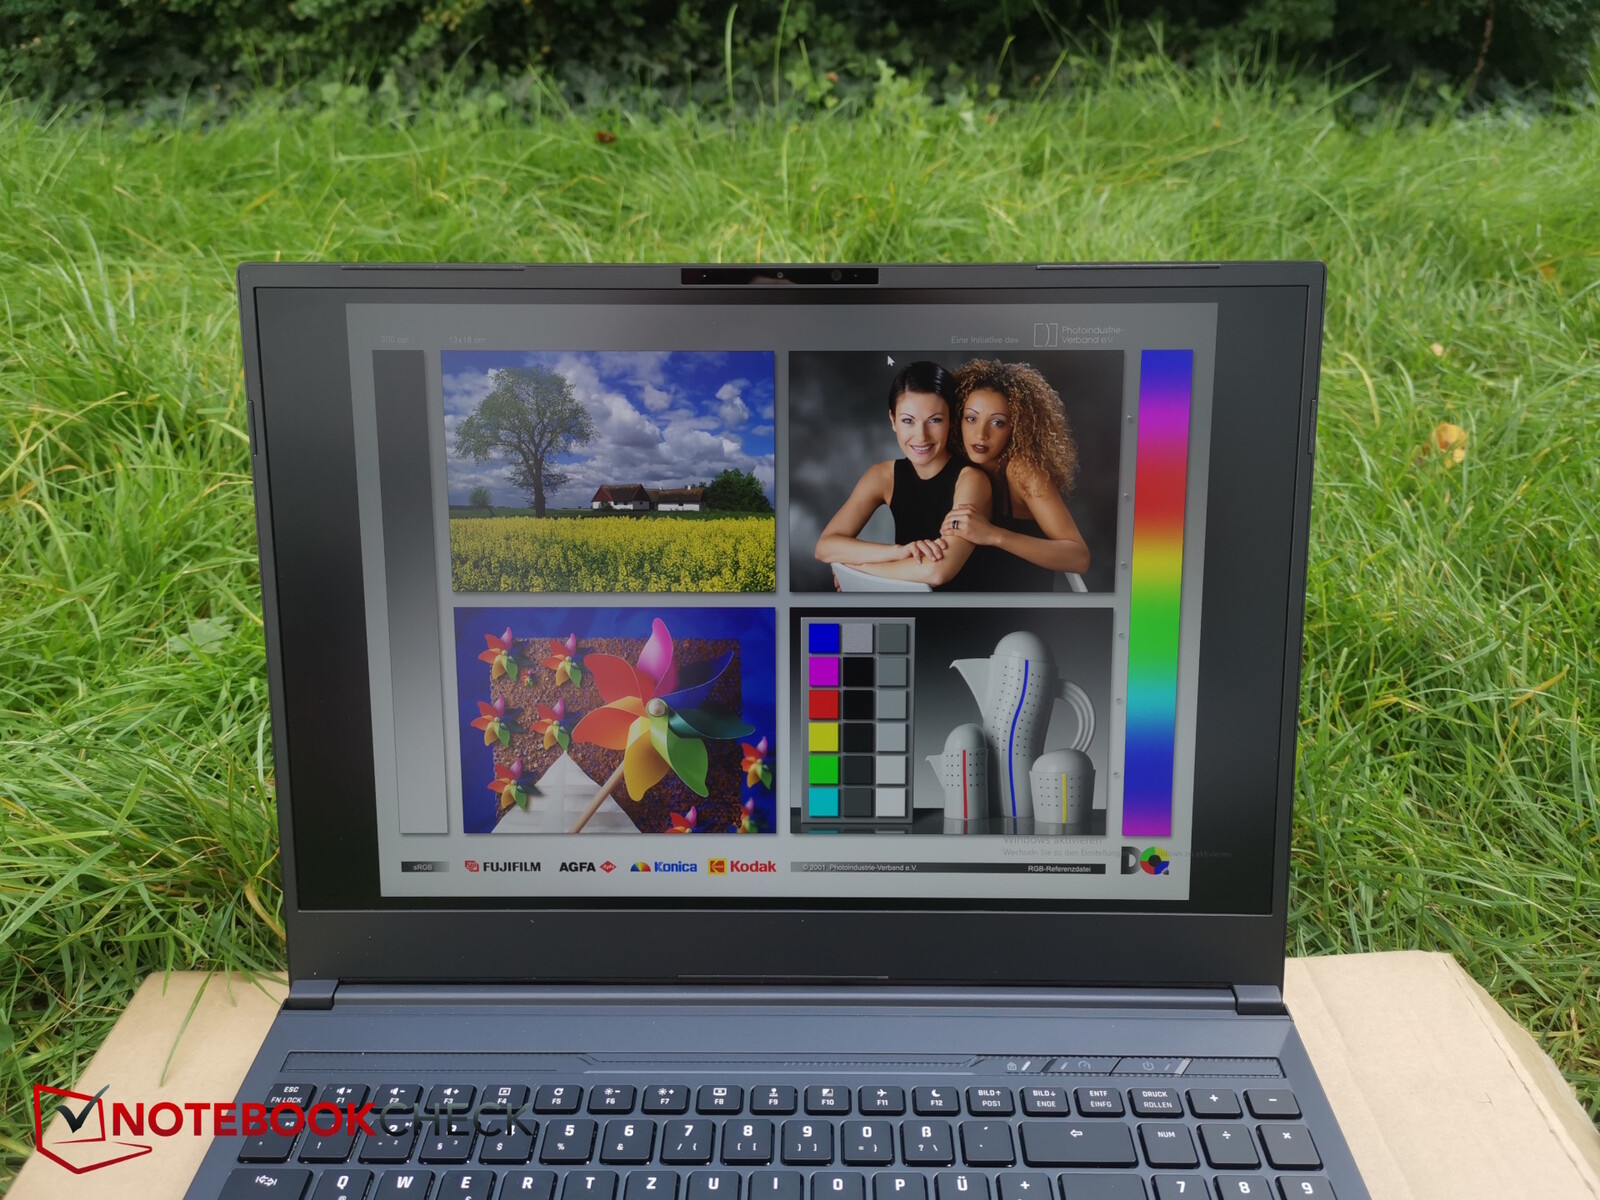
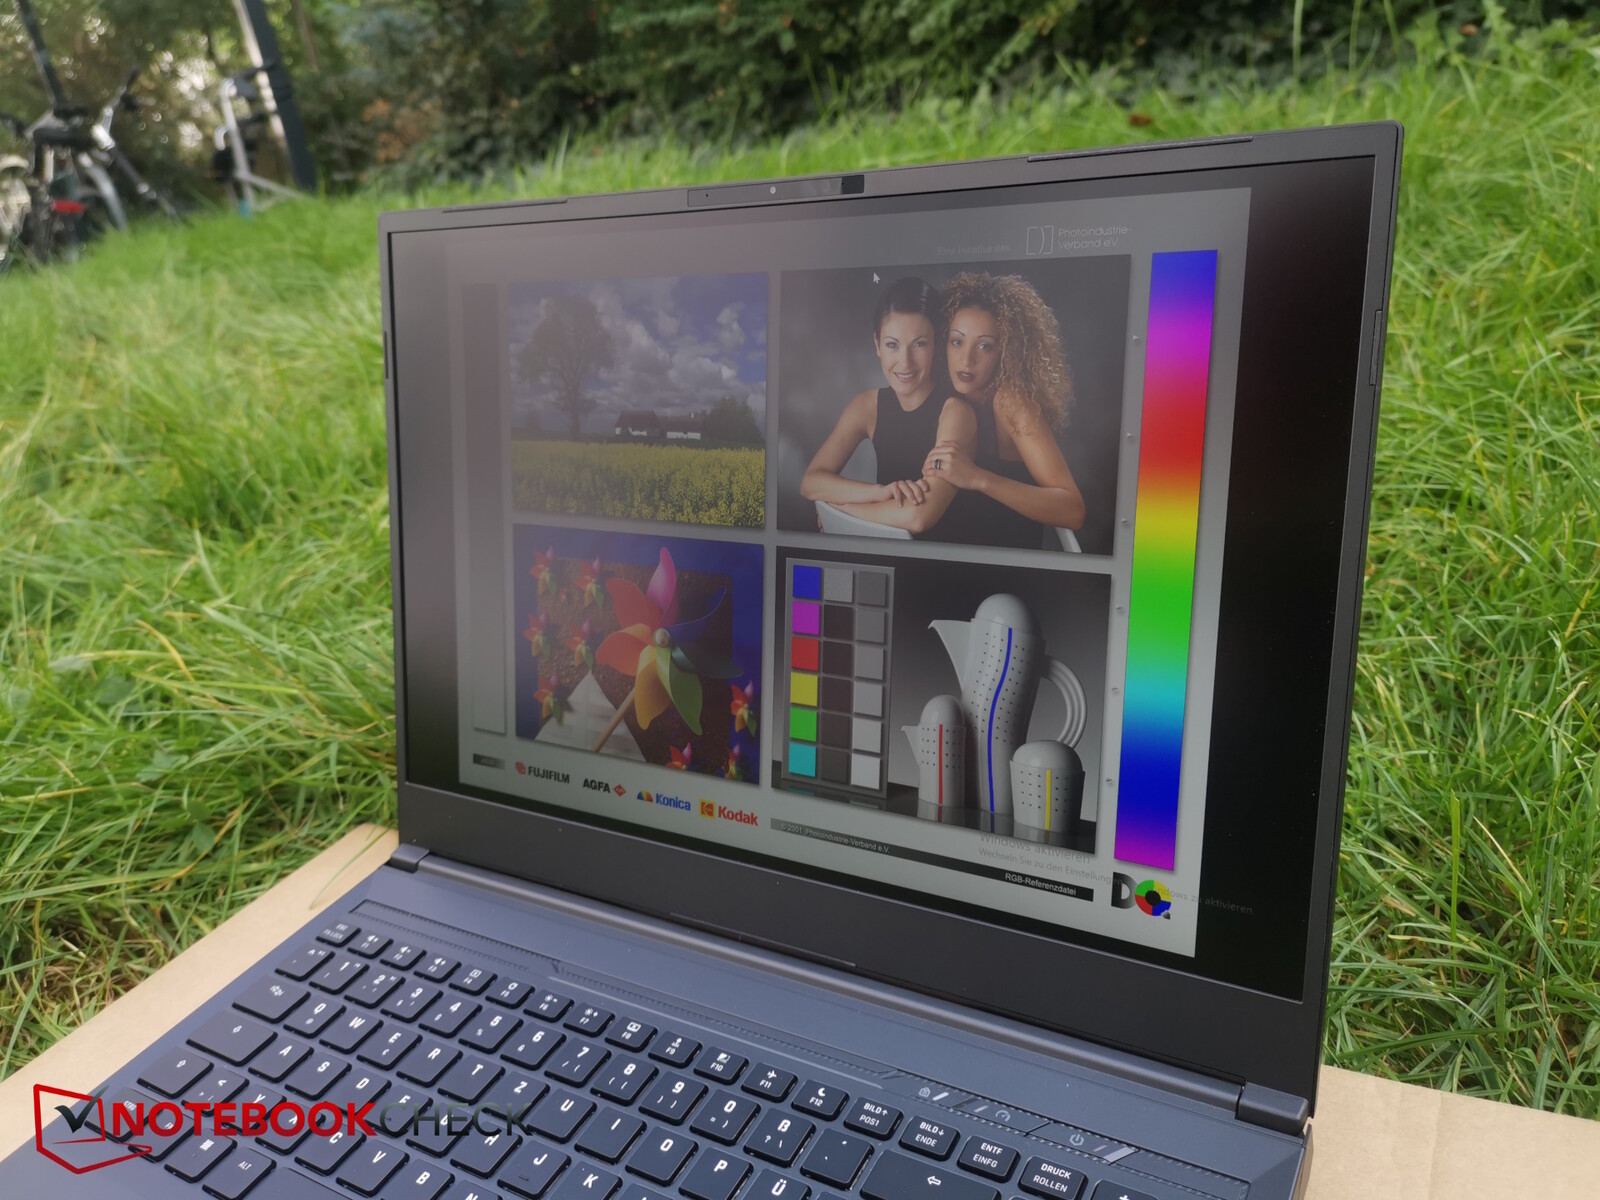
Tela - O conhecido painel IPS 16:10 1.600p
Pelo que parece, a Schenker usa a mesma tela fosca 1:10 de 240 Hz com resolução de 1.600p em todos os seus modelos de 16 polegadas. Isso significa que vimos o mesmo painel BOE noSchenker Vision 16 Proe noXMG Neo 16.
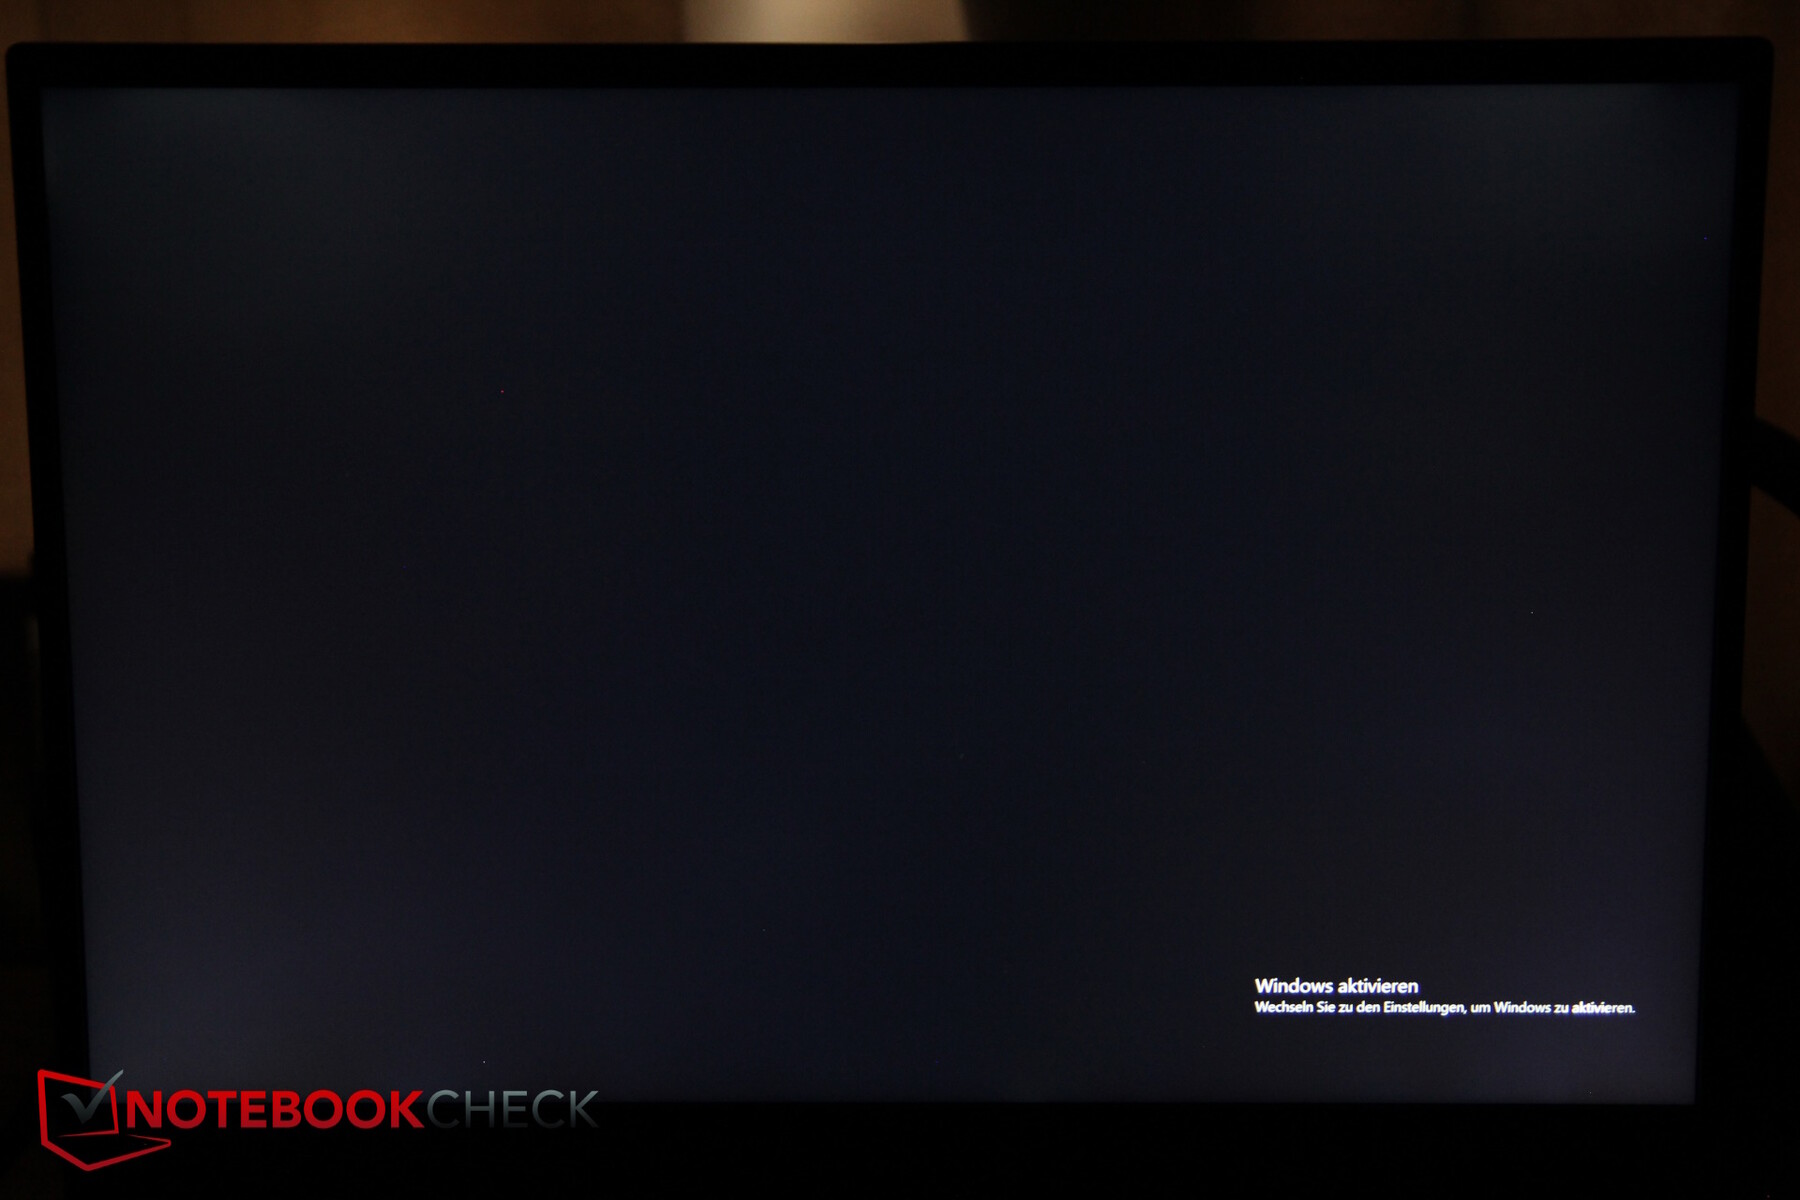
A tela certamente atinge bons valores. Ela tem um brilho de 350 nits e um valor de contraste de pouco mais de 1.000:1. A tela sRGB é suficientemente rápida e não notamos nenhum PWM. É possível ver um pouco de sangramento da luz de fundo, mas nada muito grave.
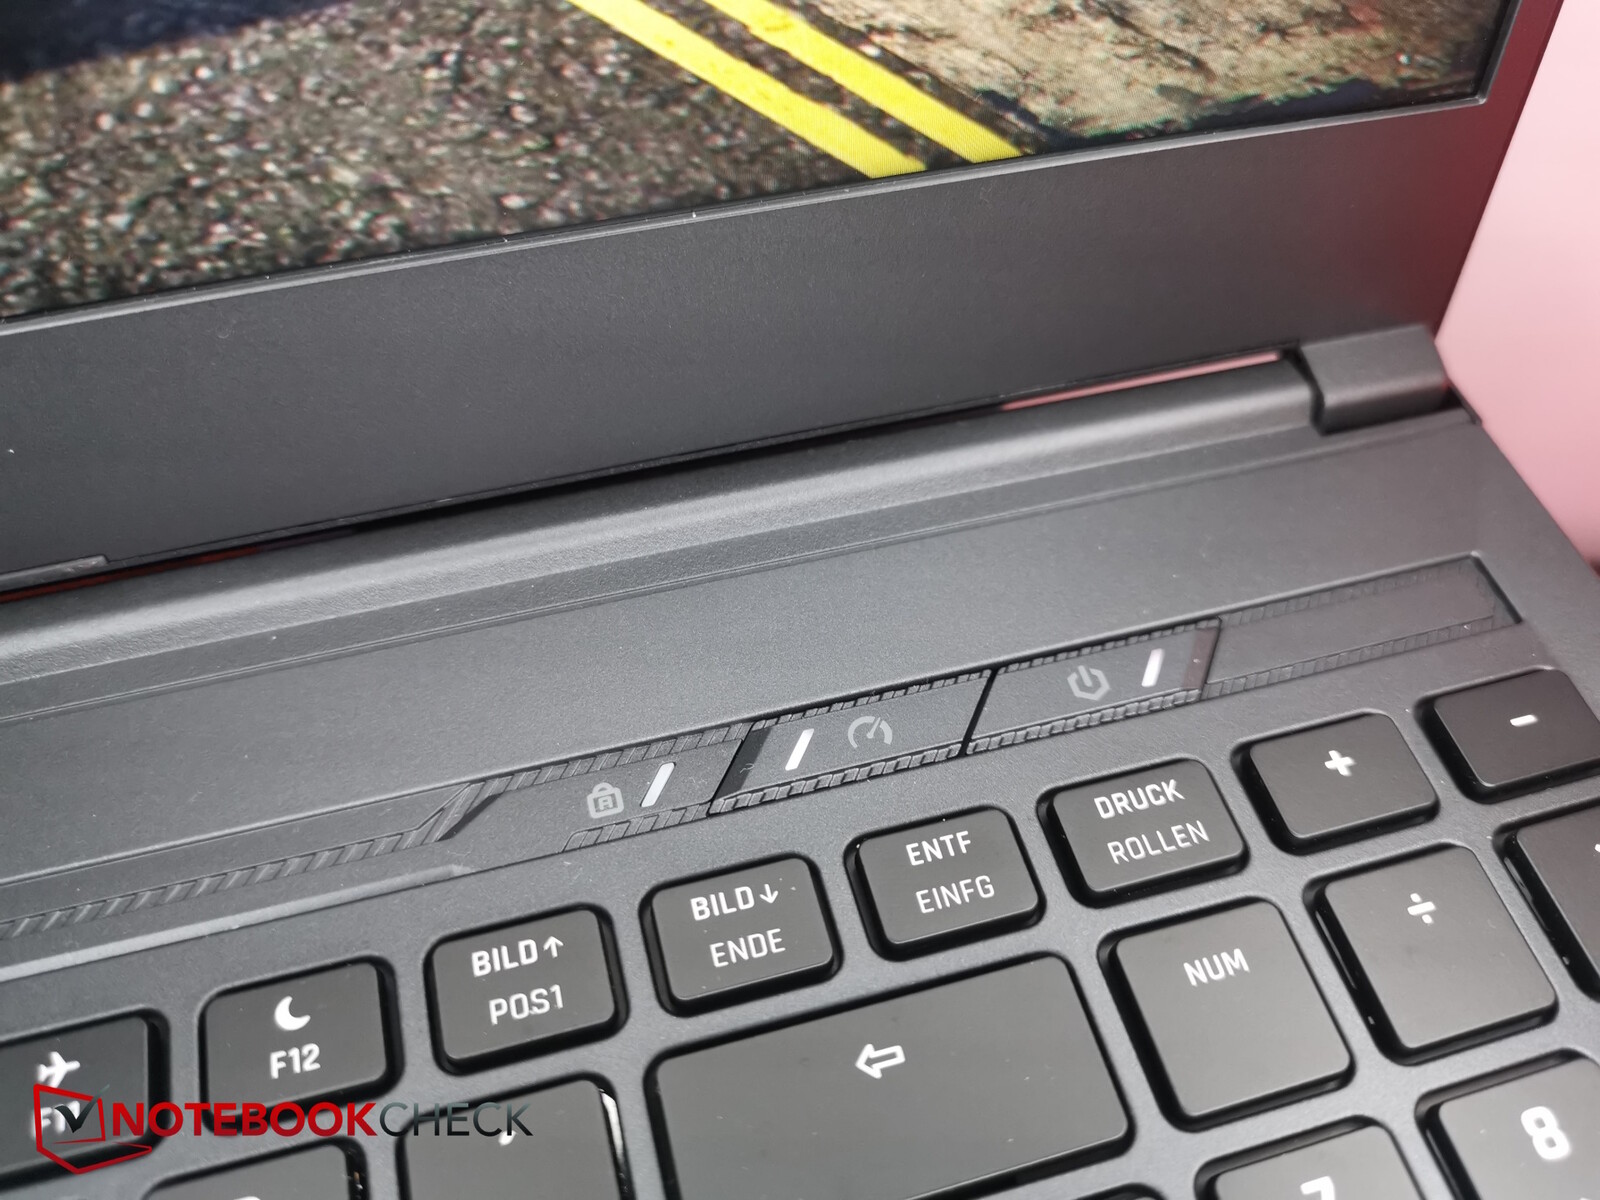
Uma coisa que notamos é que a alteração do brilho por meio das teclas especiais só entra em vigor quando o usuário solta as teclas novamente, o que é um pouco irritante.
| |||||||||||||||||||||||||
iluminação: 88 %
iluminação com acumulador: 372 cd/m²
Contraste: 1139:1 (Preto: 0.33 cd/m²)
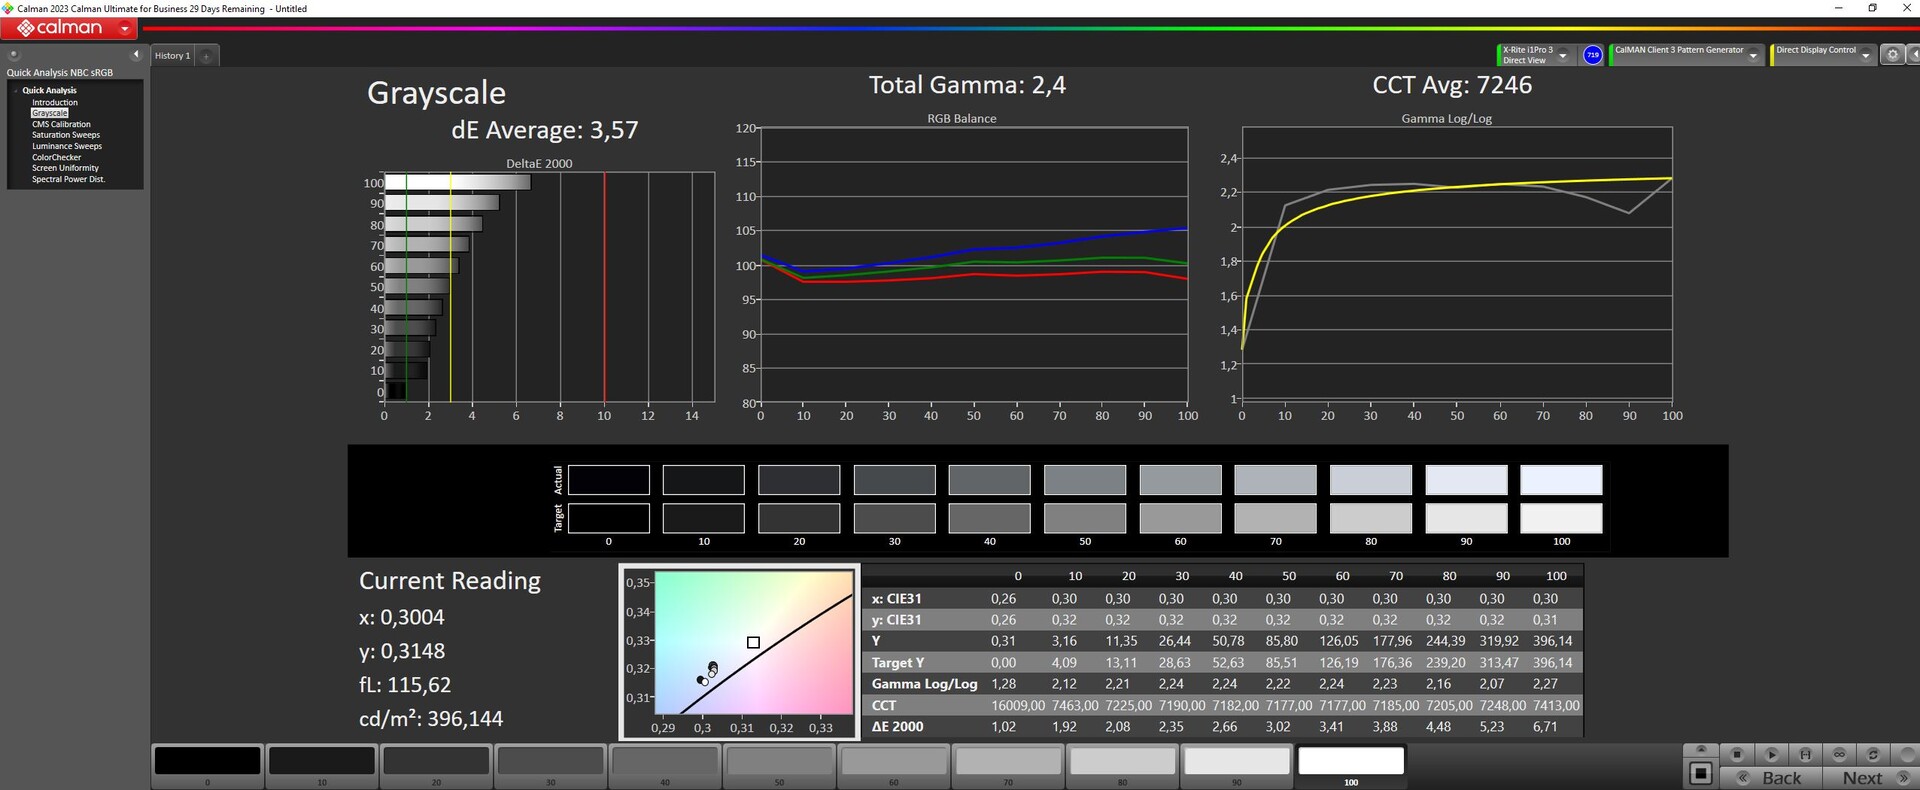
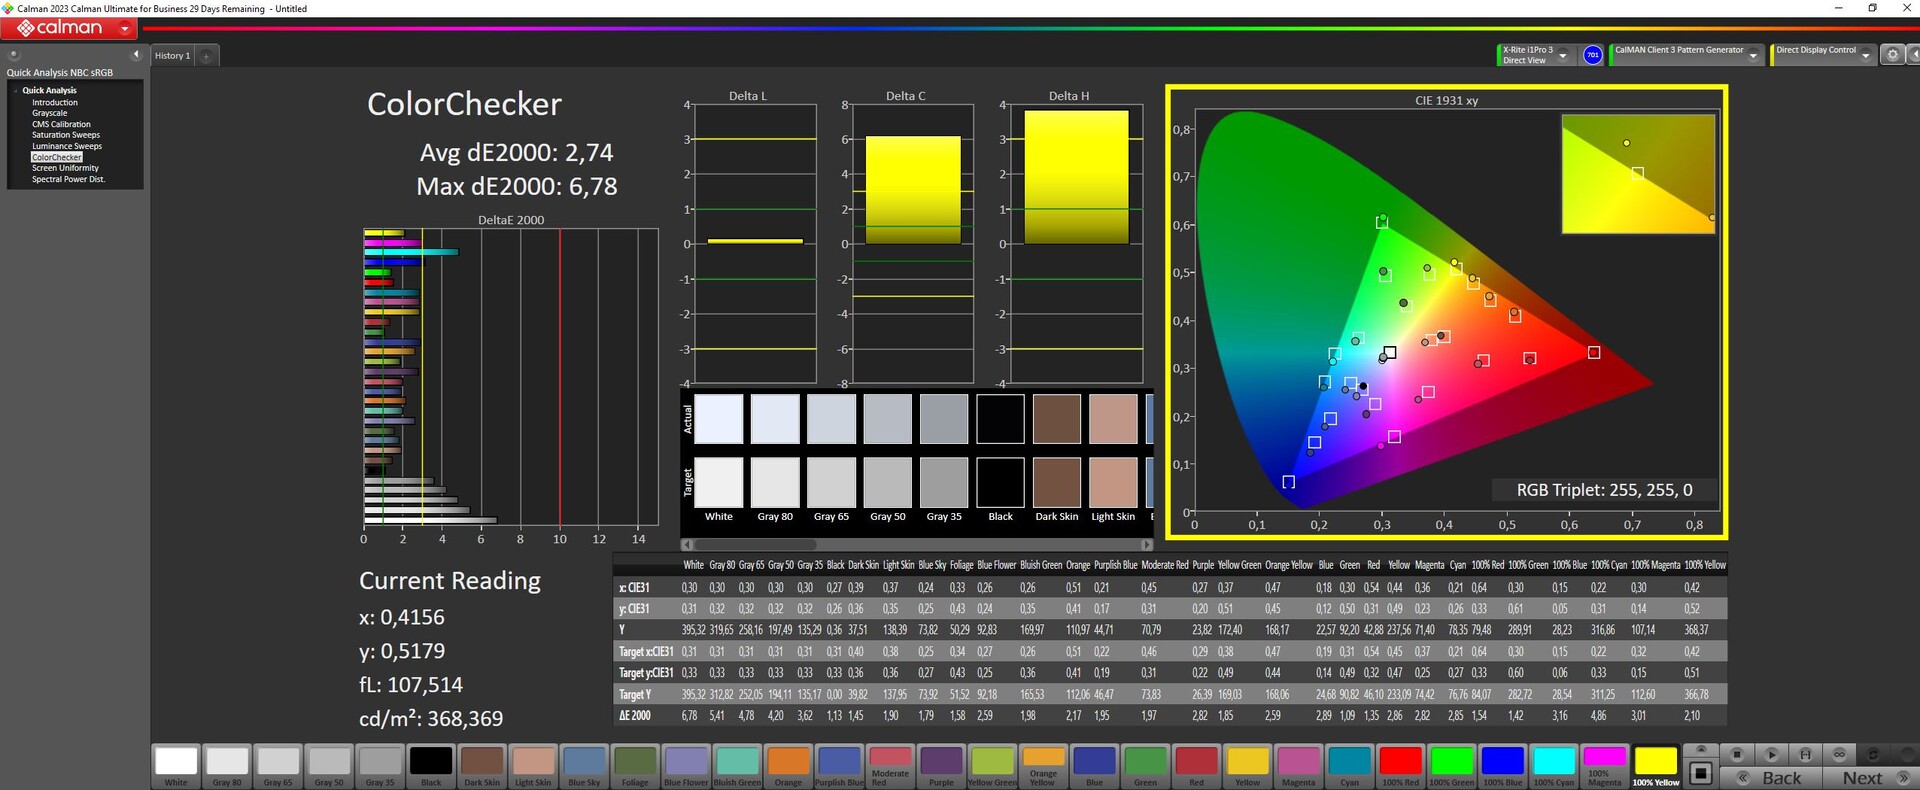
ΔE ColorChecker Calman: 2.74 | ∀{0.5-29.43 Ø4.71}
calibrated: 0.88
ΔE Greyscale Calman: 3.57 | ∀{0.09-98 Ø4.96}
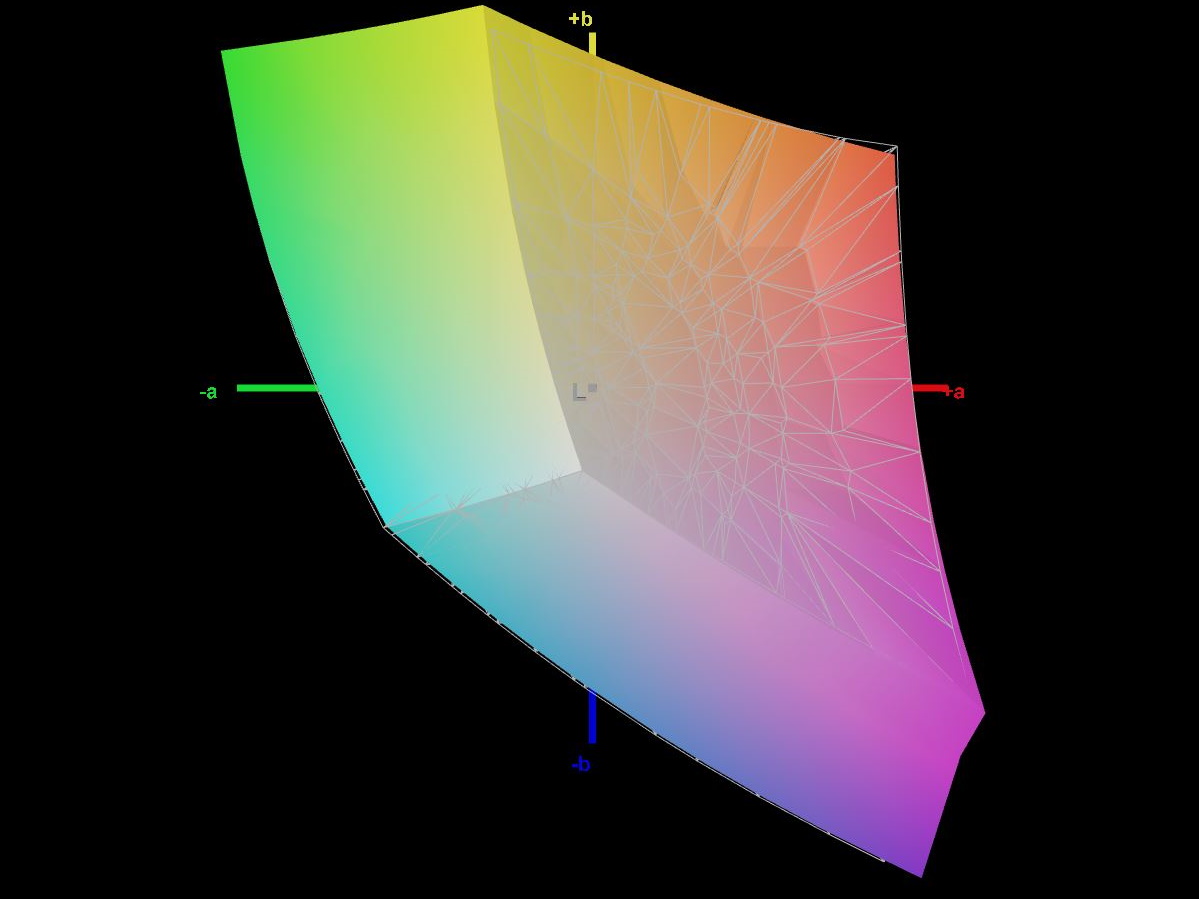
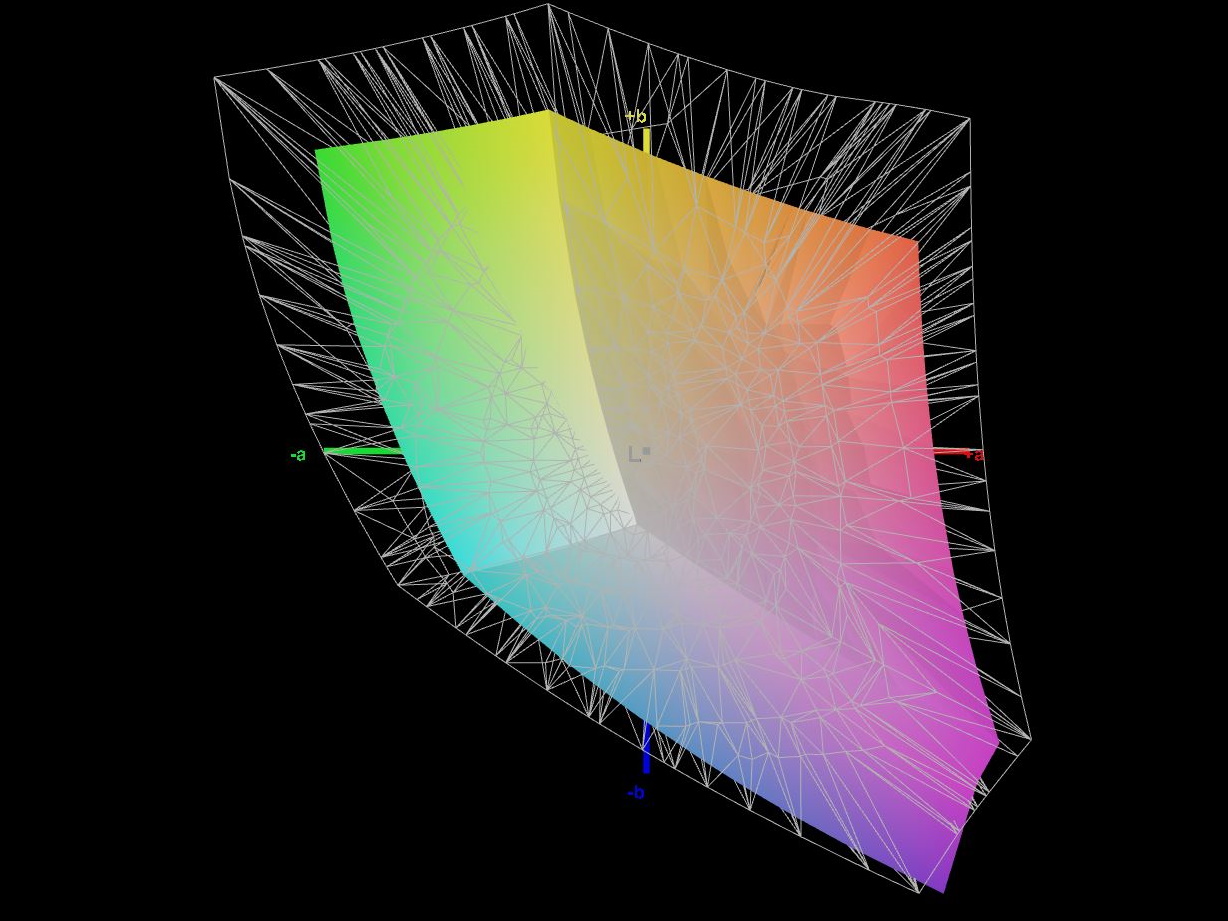
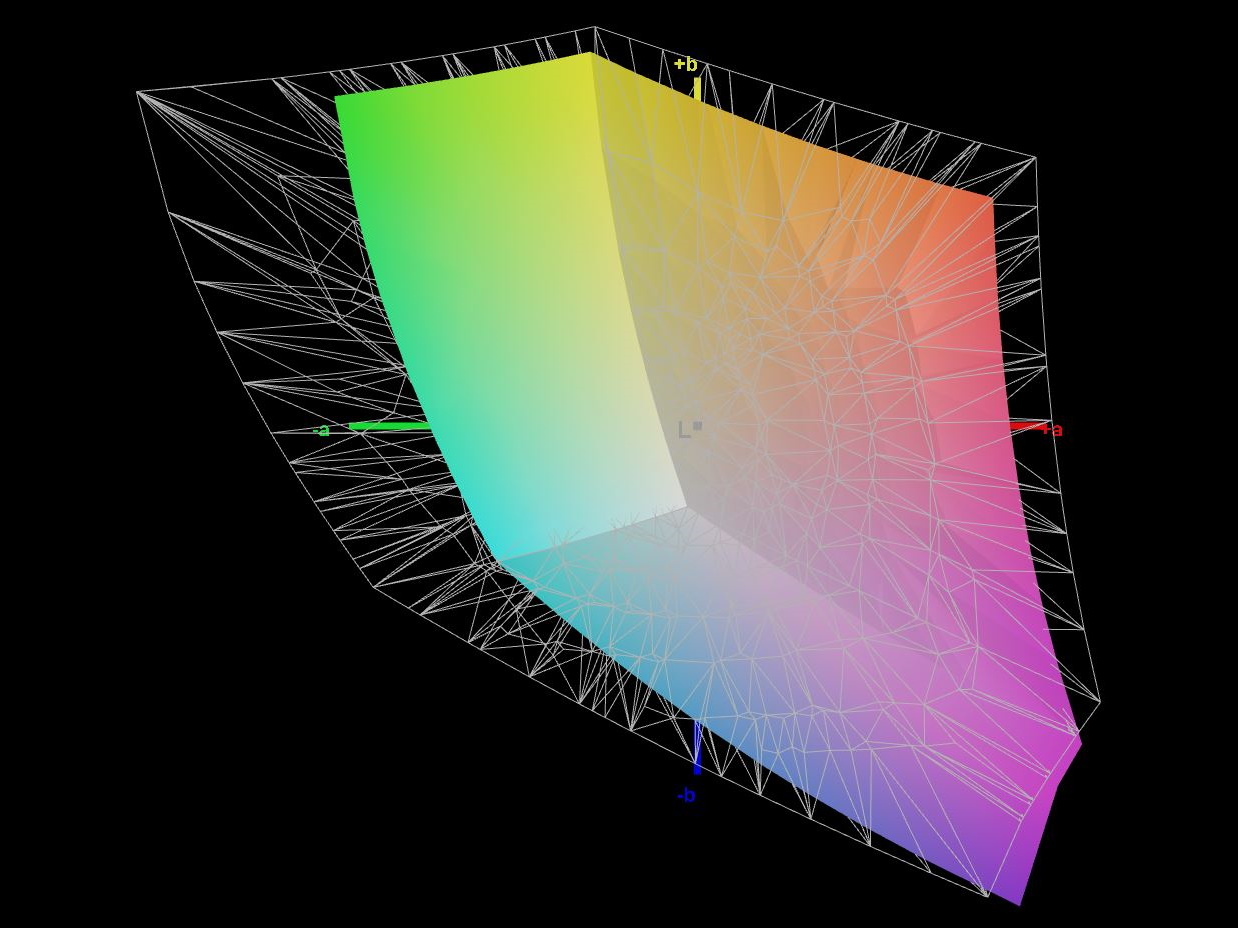
69.6% AdobeRGB 1998 (Argyll 3D)
98.6% sRGB (Argyll 3D)
68.3% Display P3 (Argyll 3D)
Gamma: 2.4
CCT: 7246 K
| Schenker XMG CORE 16 (L23) BOE0AF0 (), IPS, 2560x1600, 16" | Lenovo Legion Pro 5 16ARX8 CSOT T3 MNG007DA1-Q, IPS, 2560x1600, 16" | Acer Nitro 16 AN16-41 BOE CQ NE16QDM-NY1, IPS, 2560x1600, 16" | HP Omen Transcend 16 AUOA3A6, Mini-LED, 2560x1600, 16" | MSI Stealth 16 Studio A13VG AUO26A9, IPS, 2560x1600, 16" | HP Victus 16-r0077ng CMN162D, IPS, 1920x1080, 16.1" | |
|---|---|---|---|---|---|---|
| Display | 3% | 0% | 24% | 21% | -1% | |
| Display P3 Coverage (%) | 68.3 | 70.4 3% | 67.9 -1% | 99.2 45% | 96.4 41% | 66.7 -2% |
| sRGB Coverage (%) | 98.6 | 99.6 1% | 99.1 1% | 100 1% | 99.7 1% | 98 -1% |
| AdobeRGB 1998 Coverage (%) | 69.6 | 72.6 4% | 69.9 0% | 87.6 26% | 84.8 22% | 69 -1% |
| Response Times | 5% | 21% | -214% | 41% | -13% | |
| Response Time Grey 50% / Grey 80% * (ms) | 13.2 ? | 7 ? 47% | 11 ? 17% | 26.4 ? -100% | 4.4 ? 67% | 13.3 ? -1% |
| Response Time Black / White * (ms) | 6.6 ? | 9.1 ? -38% | 5 ? 24% | 28.2 ? -327% | 5.6 ? 15% | 8.2 ? -24% |
| PWM Frequency (Hz) | 3506 ? | |||||
| Screen | 26% | 18% | 195% | -30% | 17% | |
| Brightness middle (cd/m²) | 376 | 355.3 -6% | 520 38% | 791.1 110% | 424 13% | 308 -18% |
| Brightness (cd/m²) | 358 | 340 -5% | 494 38% | 800 123% | 411 15% | 285 -20% |
| Brightness Distribution (%) | 88 | 91 3% | 91 3% | 95 8% | 88 0% | 85 -3% |
| Black Level * (cd/m²) | 0.33 | 0.32 3% | 0.39 -18% | 0.04 88% | 0.37 -12% | 0.25 24% |
| Contrast (:1) | 1139 | 1110 -3% | 1333 17% | 19778 1636% | 1146 1% | 1232 8% |
| Colorchecker dE 2000 * | 2.74 | 1.13 59% | 1.94 29% | 4.37 -59% | 3.04 -11% | 1.3 53% |
| Colorchecker dE 2000 max. * | 6.78 | 2.78 59% | 5.62 17% | 10.39 -53% | 7.5 -11% | 2.76 59% |
| Colorchecker dE 2000 calibrated * | 0.88 | 0.32 64% | 0.74 16% | 1.04 -18% | 3.04 -245% | 0.92 -5% |
| Greyscale dE 2000 * | 3.57 | 1.4 61% | 2.94 18% | 6.5 -82% | 4.34 -22% | 1.7 52% |
| Gamma | 2.4 92% | 2.24 98% | 2.37 93% | 2.28 96% | 2.32 95% | 2.167 102% |
| CCT | 7246 90% | 6372 102% | 6443 101% | 6000 108% | 6952 93% | 6767 96% |
| Média Total (Programa/Configurações) | 11% /
18% | 13% /
14% | 2% /
100% | 11% /
-9% | 1% /
9% |
* ... menor é melhor
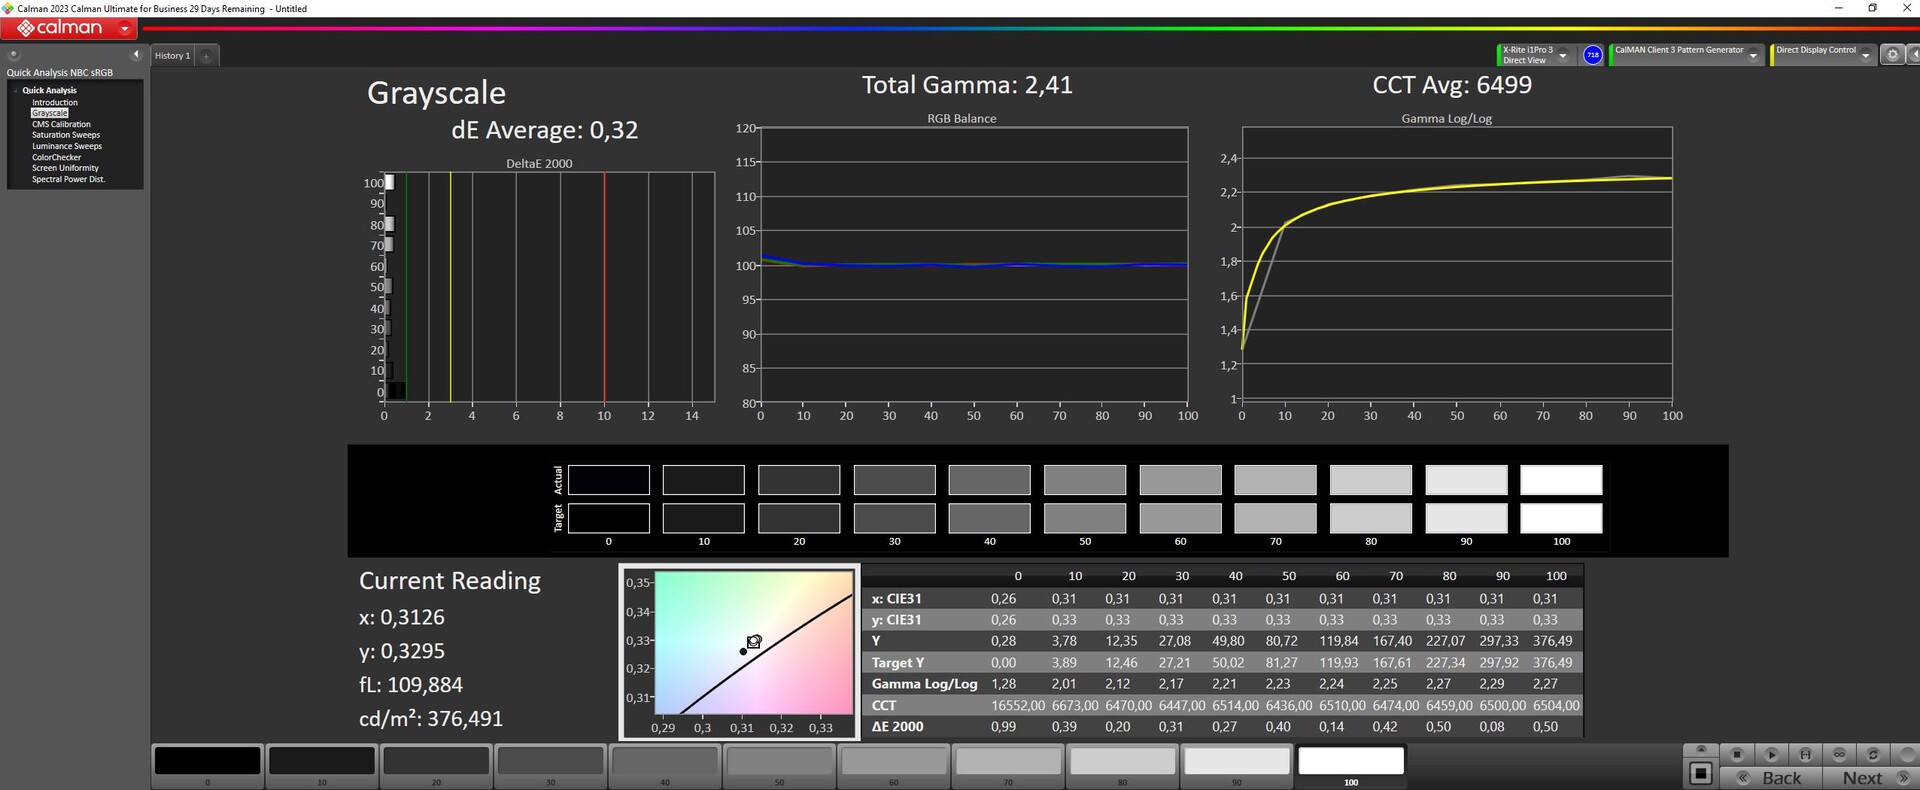
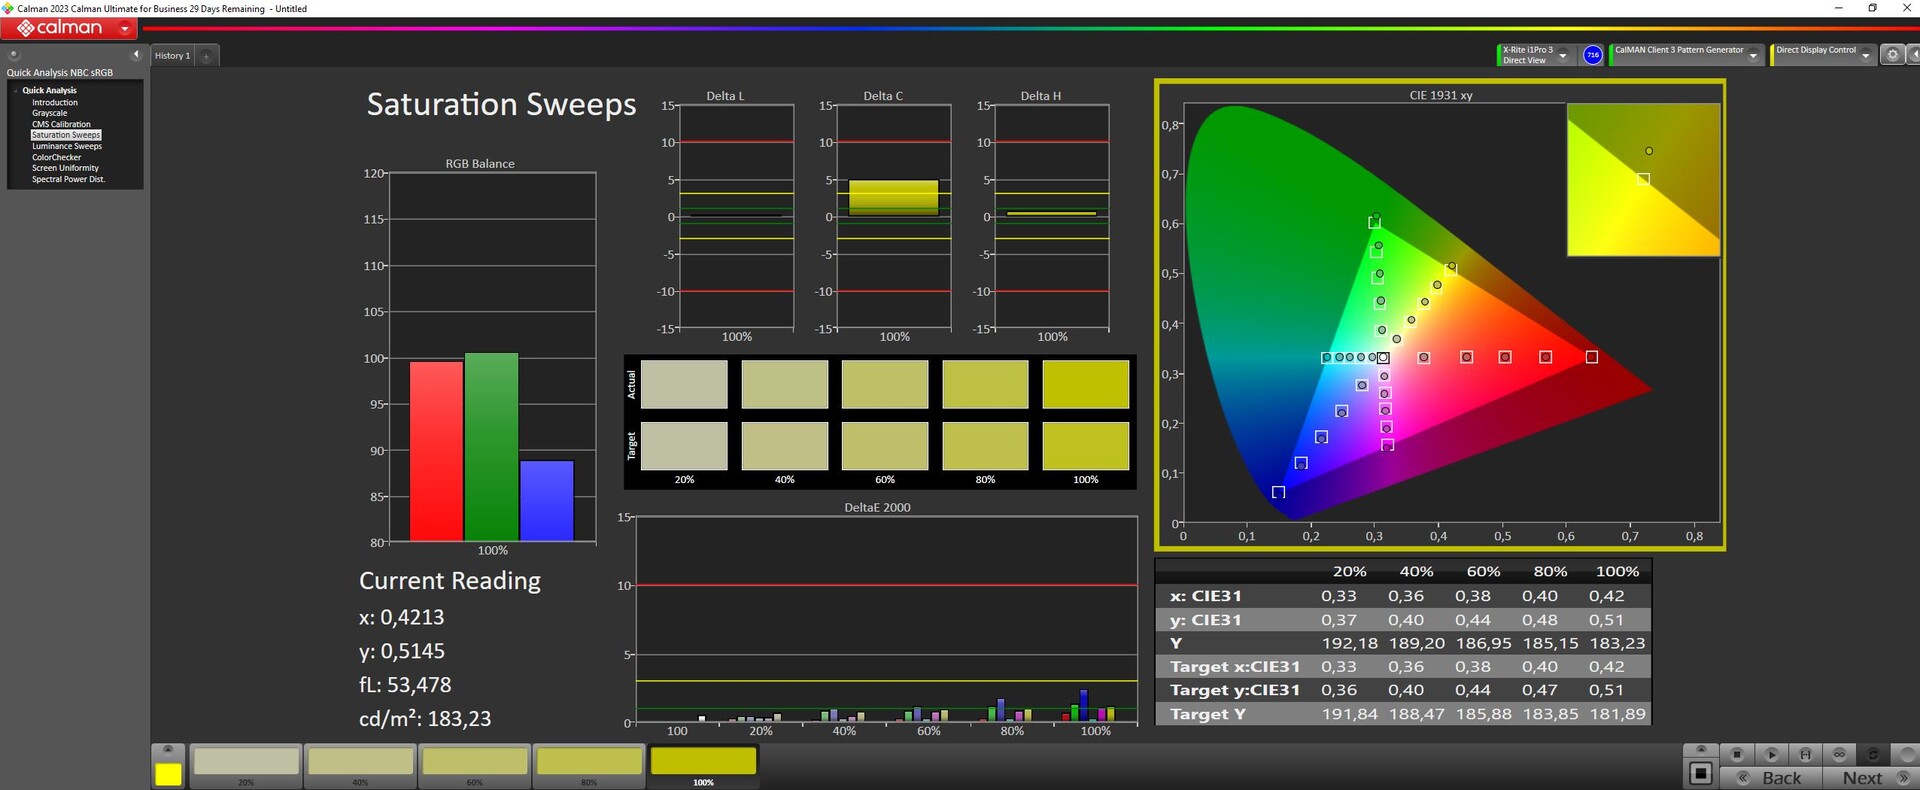
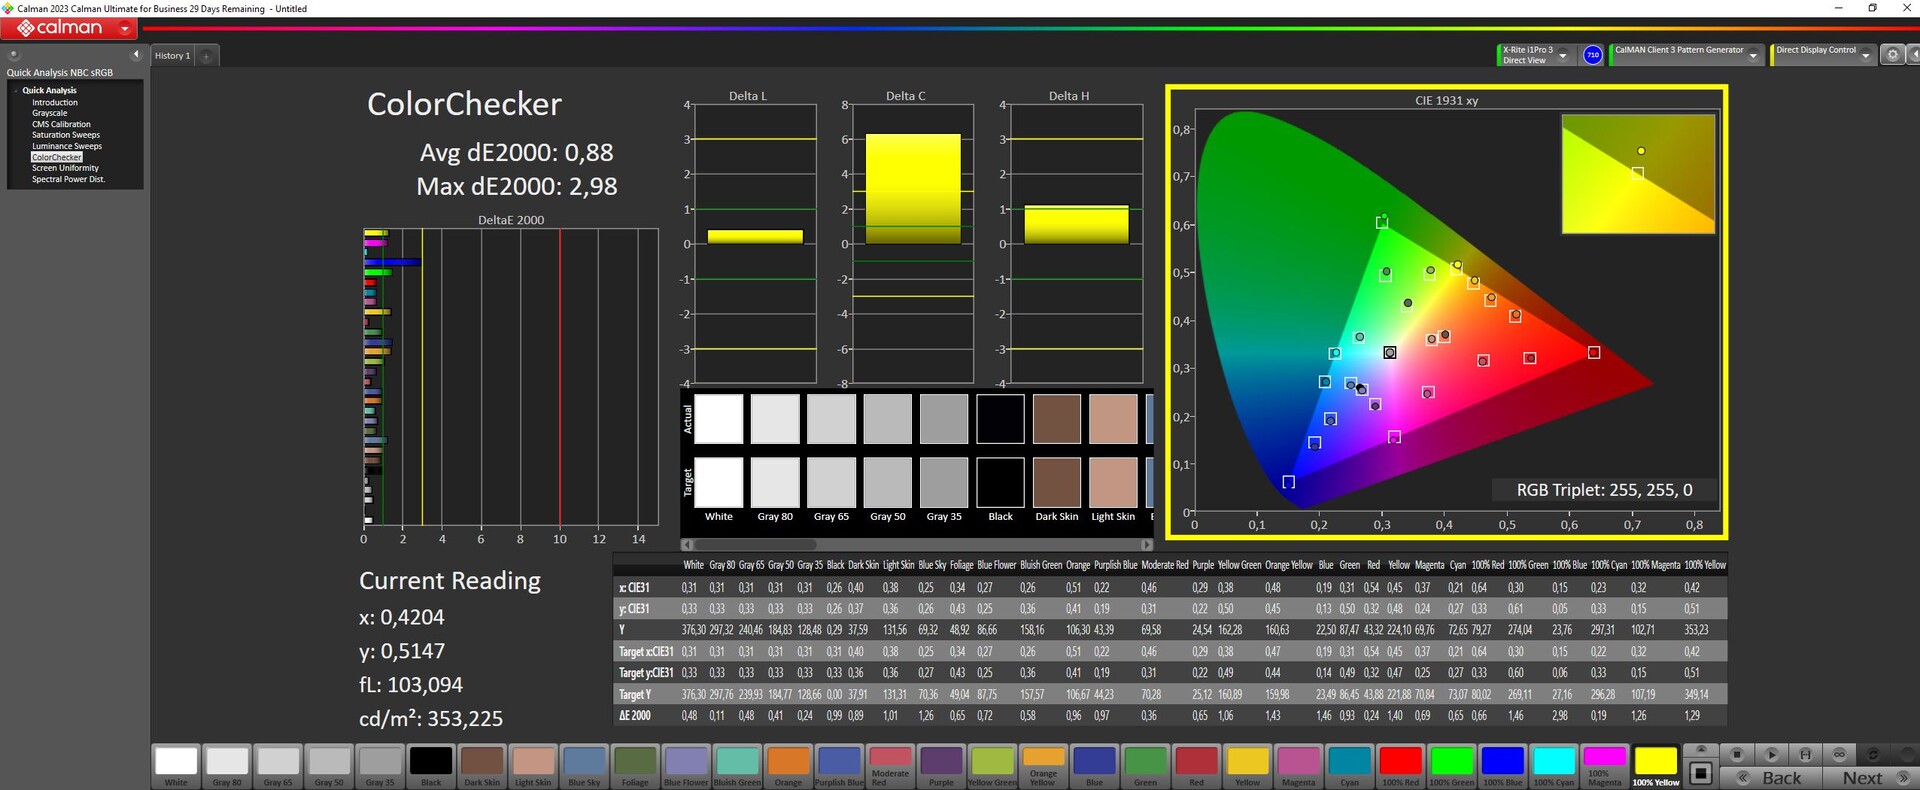
Usando nosso dispositivo de medição de cores Xrite e o software Calman, conseguimos melhorar muito a boa (mas não totalmente ideal) representação de cores da tela assim que ela saiu da caixa, fazendo com que os valores DeltaE (desvios padrão) de cores e de escala de cinza caíssem para 1. Isso significa que a tela é adequada para a edição de fotos, pelo menos no espaço de cores sRGB.

Exibir tempos de resposta
| ↔ Tempo de resposta preto para branco | ||
|---|---|---|
| 6.6 ms ... ascensão ↗ e queda ↘ combinadas | ↗ 2.5 ms ascensão | 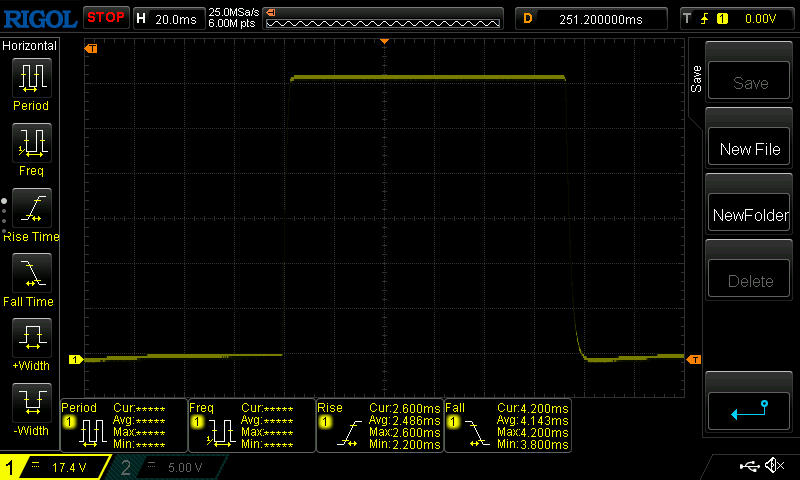 |
| ↘ 4.1 ms queda | ||
| A tela mostra taxas de resposta muito rápidas em nossos testes e deve ser muito adequada para jogos em ritmo acelerado. Em comparação, todos os dispositivos testados variam de 0.1 (mínimo) a 240 (máximo) ms. » 21 % de todos os dispositivos são melhores. Isso significa que o tempo de resposta medido é melhor que a média de todos os dispositivos testados (19.8 ms). | ||
| ↔ Tempo de resposta 50% cinza a 80% cinza | ||
| 13.2 ms ... ascensão ↗ e queda ↘ combinadas | ↗ 6.1 ms ascensão | 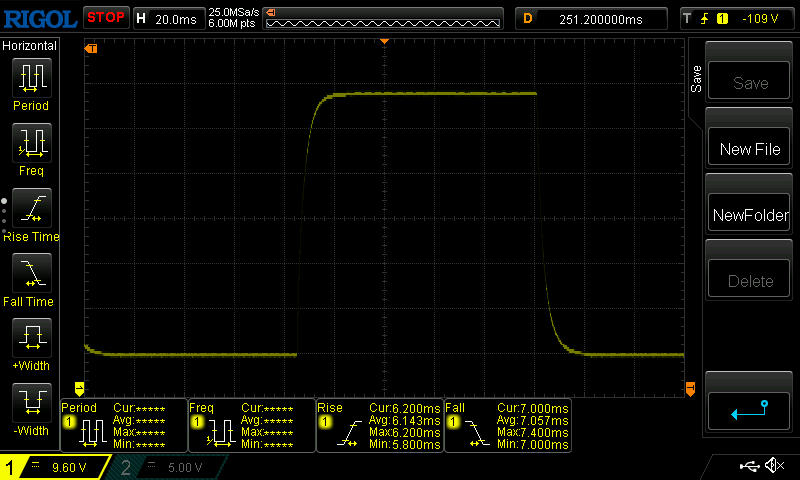 |
| ↘ 7.1 ms queda | ||
| A tela mostra boas taxas de resposta em nossos testes, mas pode ser muito lenta para jogadores competitivos. Em comparação, todos os dispositivos testados variam de 0.165 (mínimo) a 636 (máximo) ms. » 27 % de todos os dispositivos são melhores. Isso significa que o tempo de resposta medido é melhor que a média de todos os dispositivos testados (30.9 ms). | ||
Cintilação da tela / PWM (modulação por largura de pulso)
| Tela tremeluzindo / PWM não detectado | 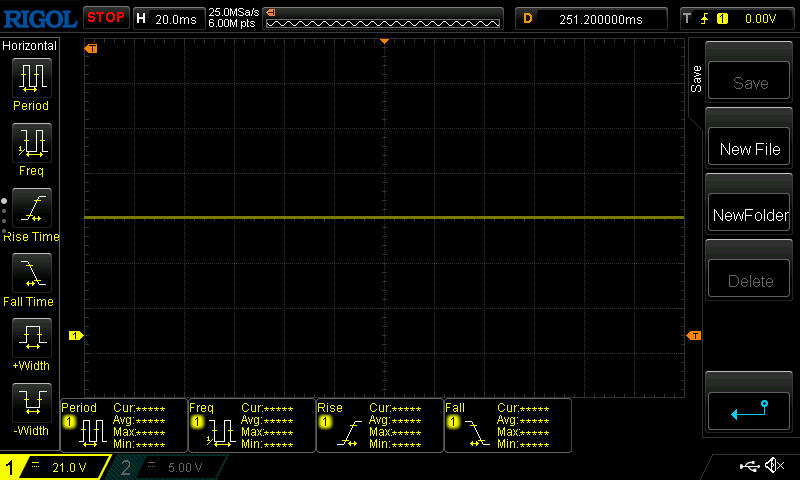 | ||
[pwm_comparison] Em comparação: 52 % de todos os dispositivos testados não usam PWM para escurecer a tela. Se PWM foi detectado, uma média de 7748 (mínimo: 5 - máximo: 343500) Hz foi medida. | |||
Na parte externa, o senhor pode ler bem o visor em áreas sombreadas quando estiver diretamente de frente para ele.

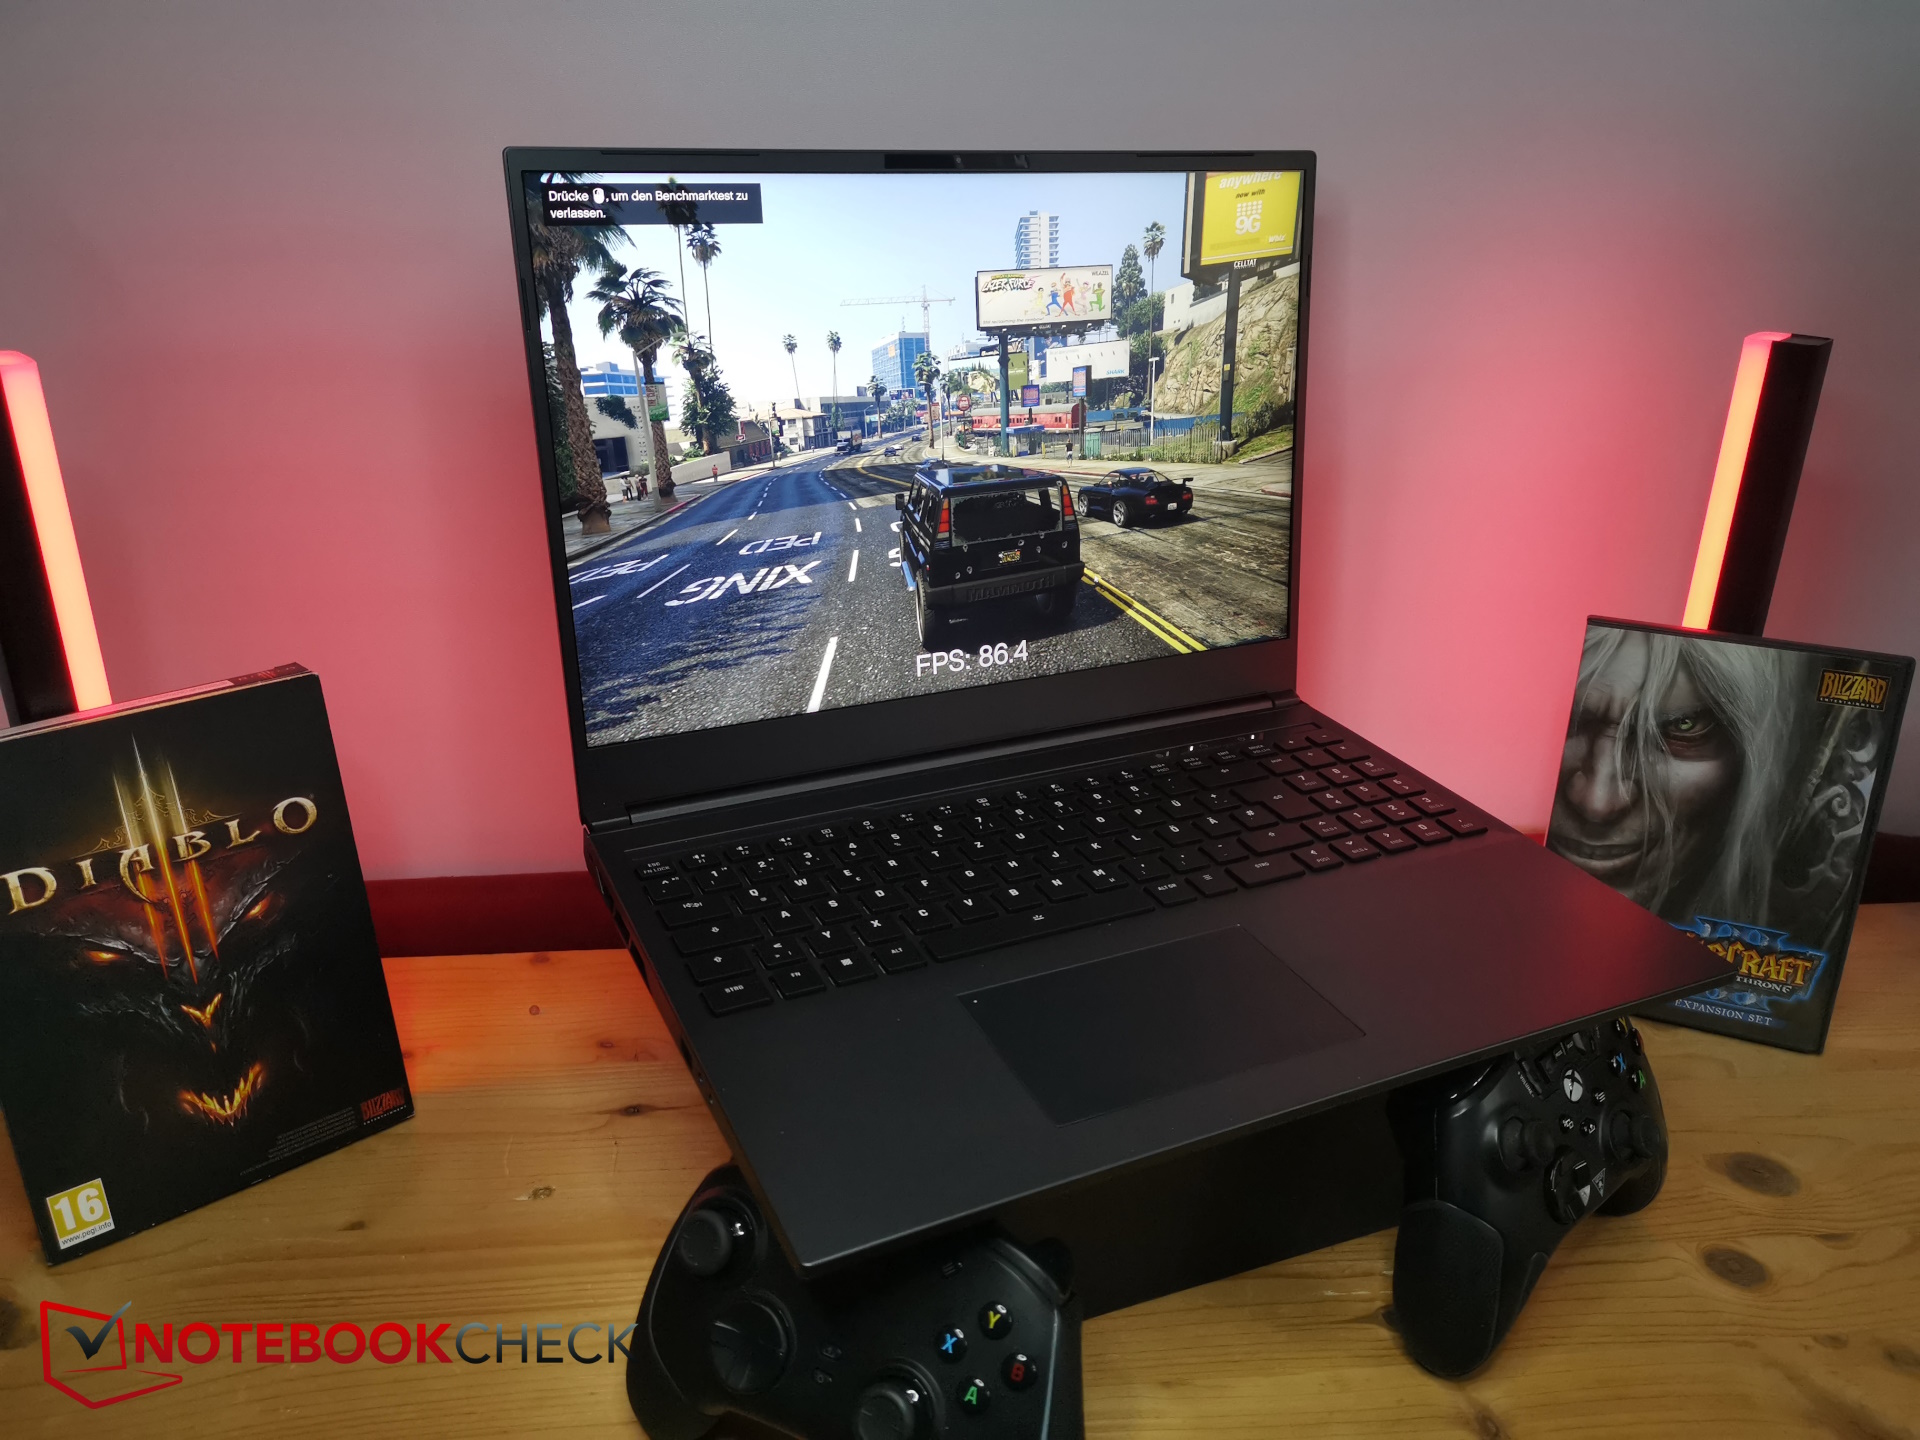
Desempenho - RTX 4070 forte com Ryzen 7
ARTX 4070é o que torna o Core 16 um laptop para jogos. O dispositivo também pode ser do interesse de profissionais e criativos - no entanto, o espaço de cores sRGB pode não ser suficiente para essas pessoas e o DisplayP3 não é coberto.
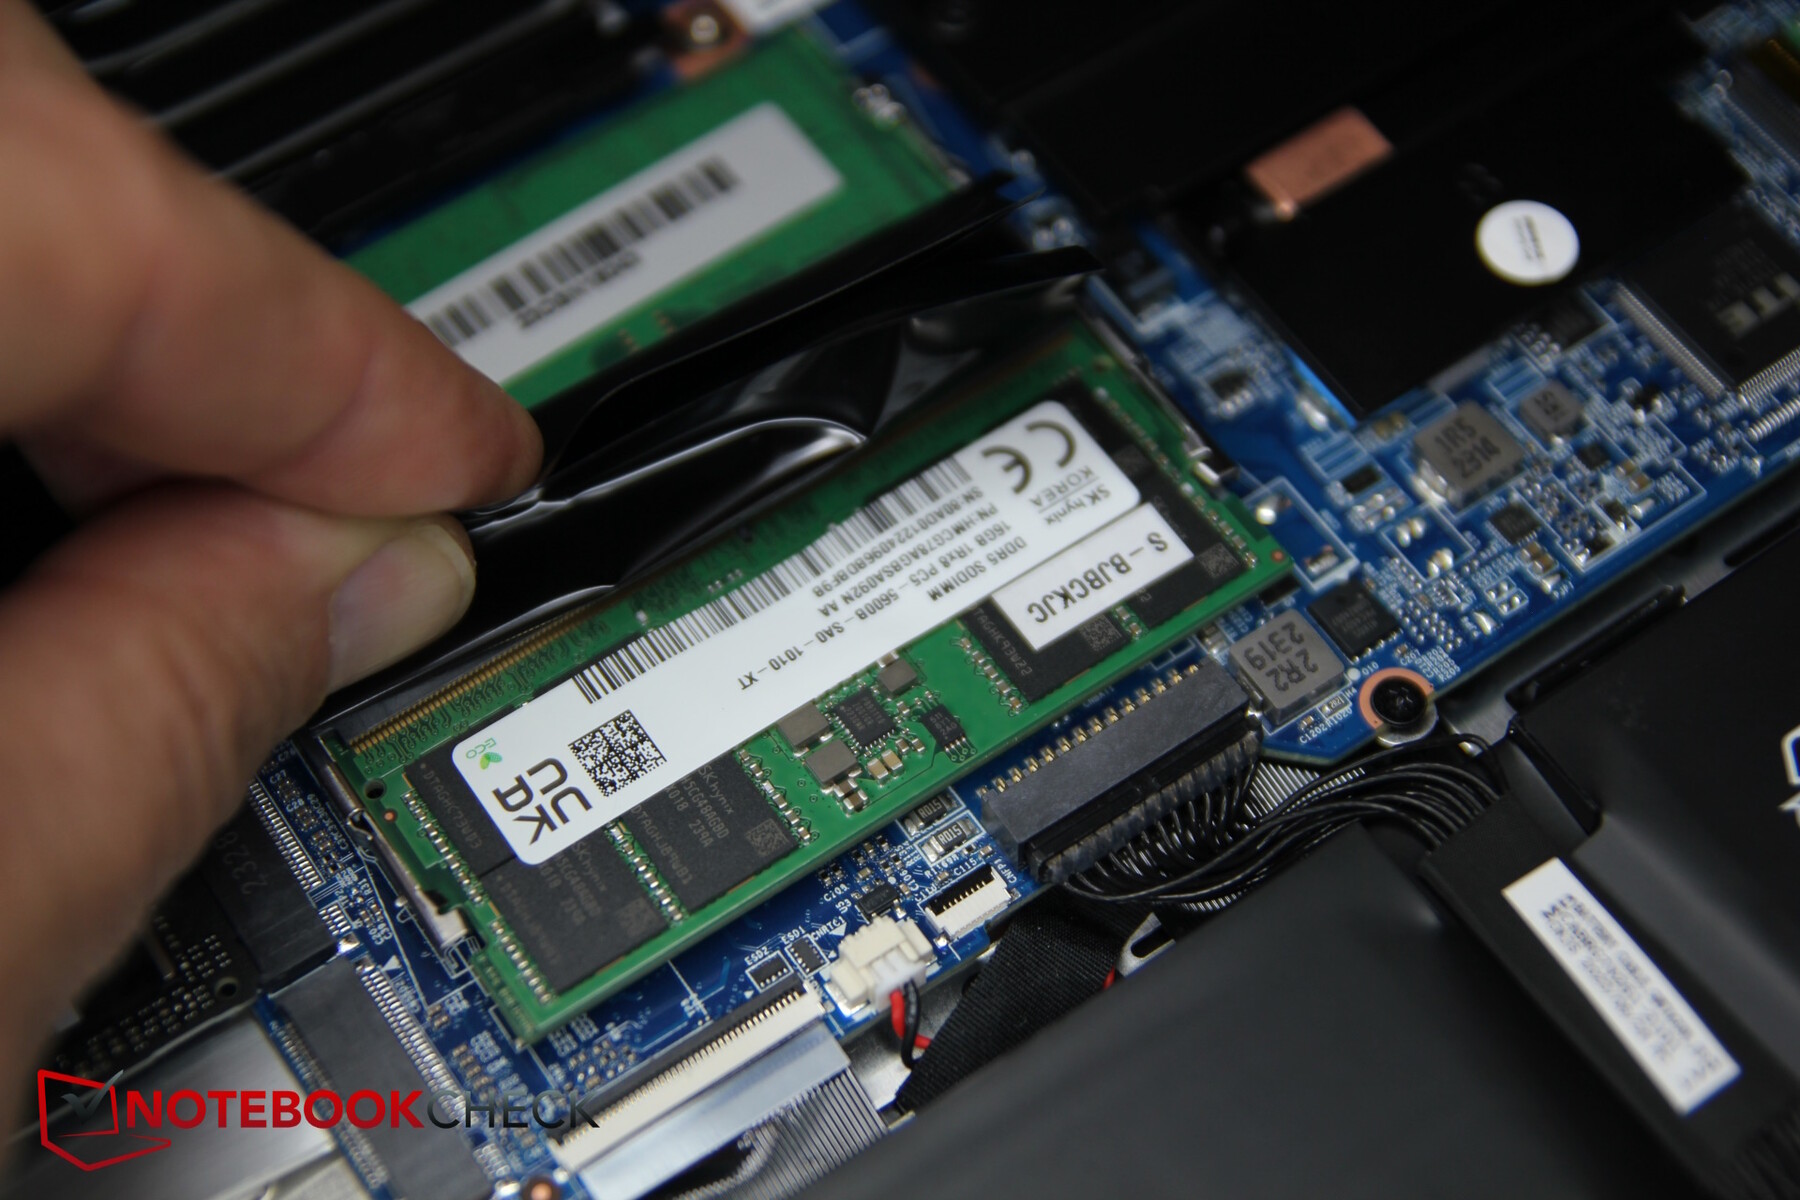
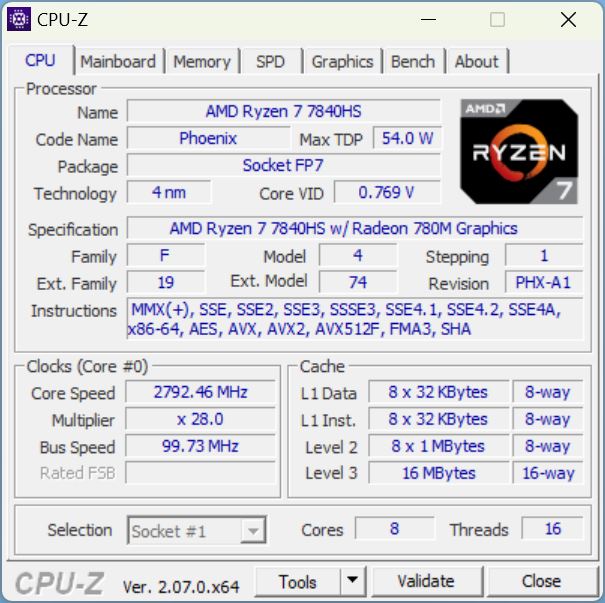
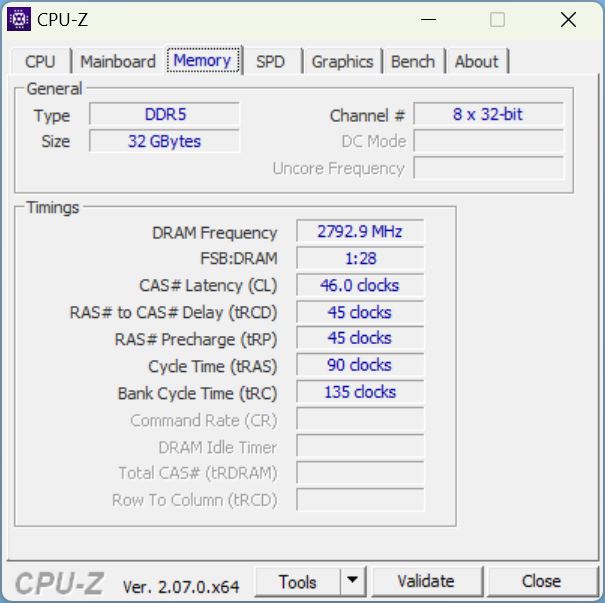
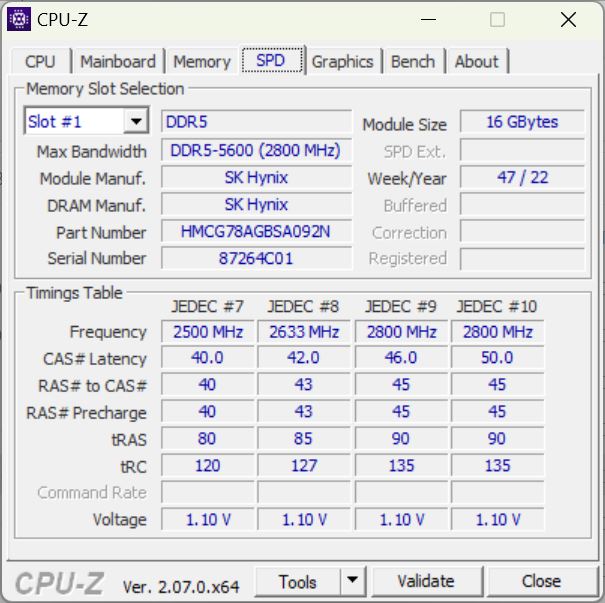
Em comparação com a combinação mais comum com uma CPU Intel, esse dispositivo tem um AMD Ryzen 7 7840HSinstalada. A CPU de última geração, juntamente com a RAM de 32 GB e a placa de vídeo, torna o dispositivo mais um laptop de última geração para jogos. Quase todos os jogos atuais podem ser jogados sem problemas em sua resolução nativa de 1.600p e com o máximo de detalhes.
No bestware.com, o site de pedidos da Schenker, o senhor pode configurar o laptop extensivamente, escolher entre vários fabricantes de SSDs e RAM e muito mais. É preciso ter isso em mente, pois nosso teste leva em conta apenas nossa configuração específica.
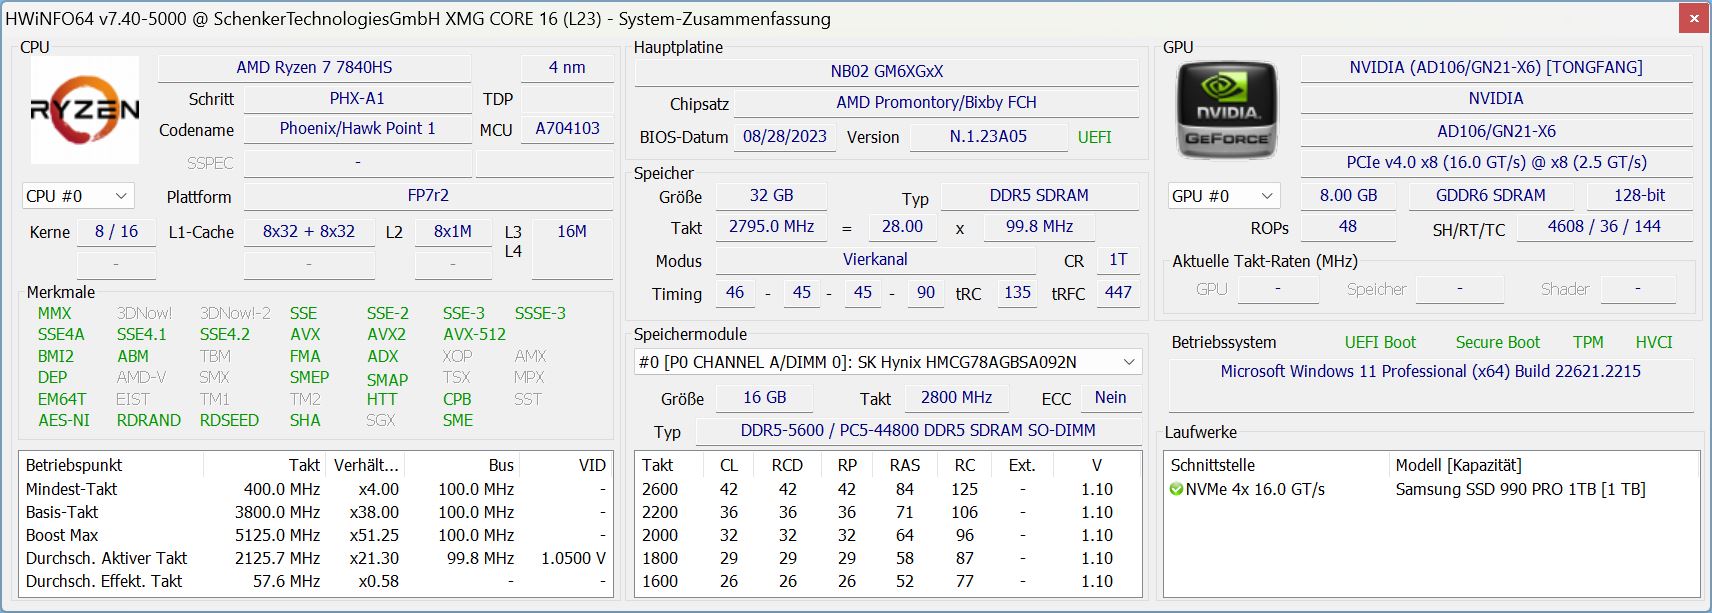
Condições de teste
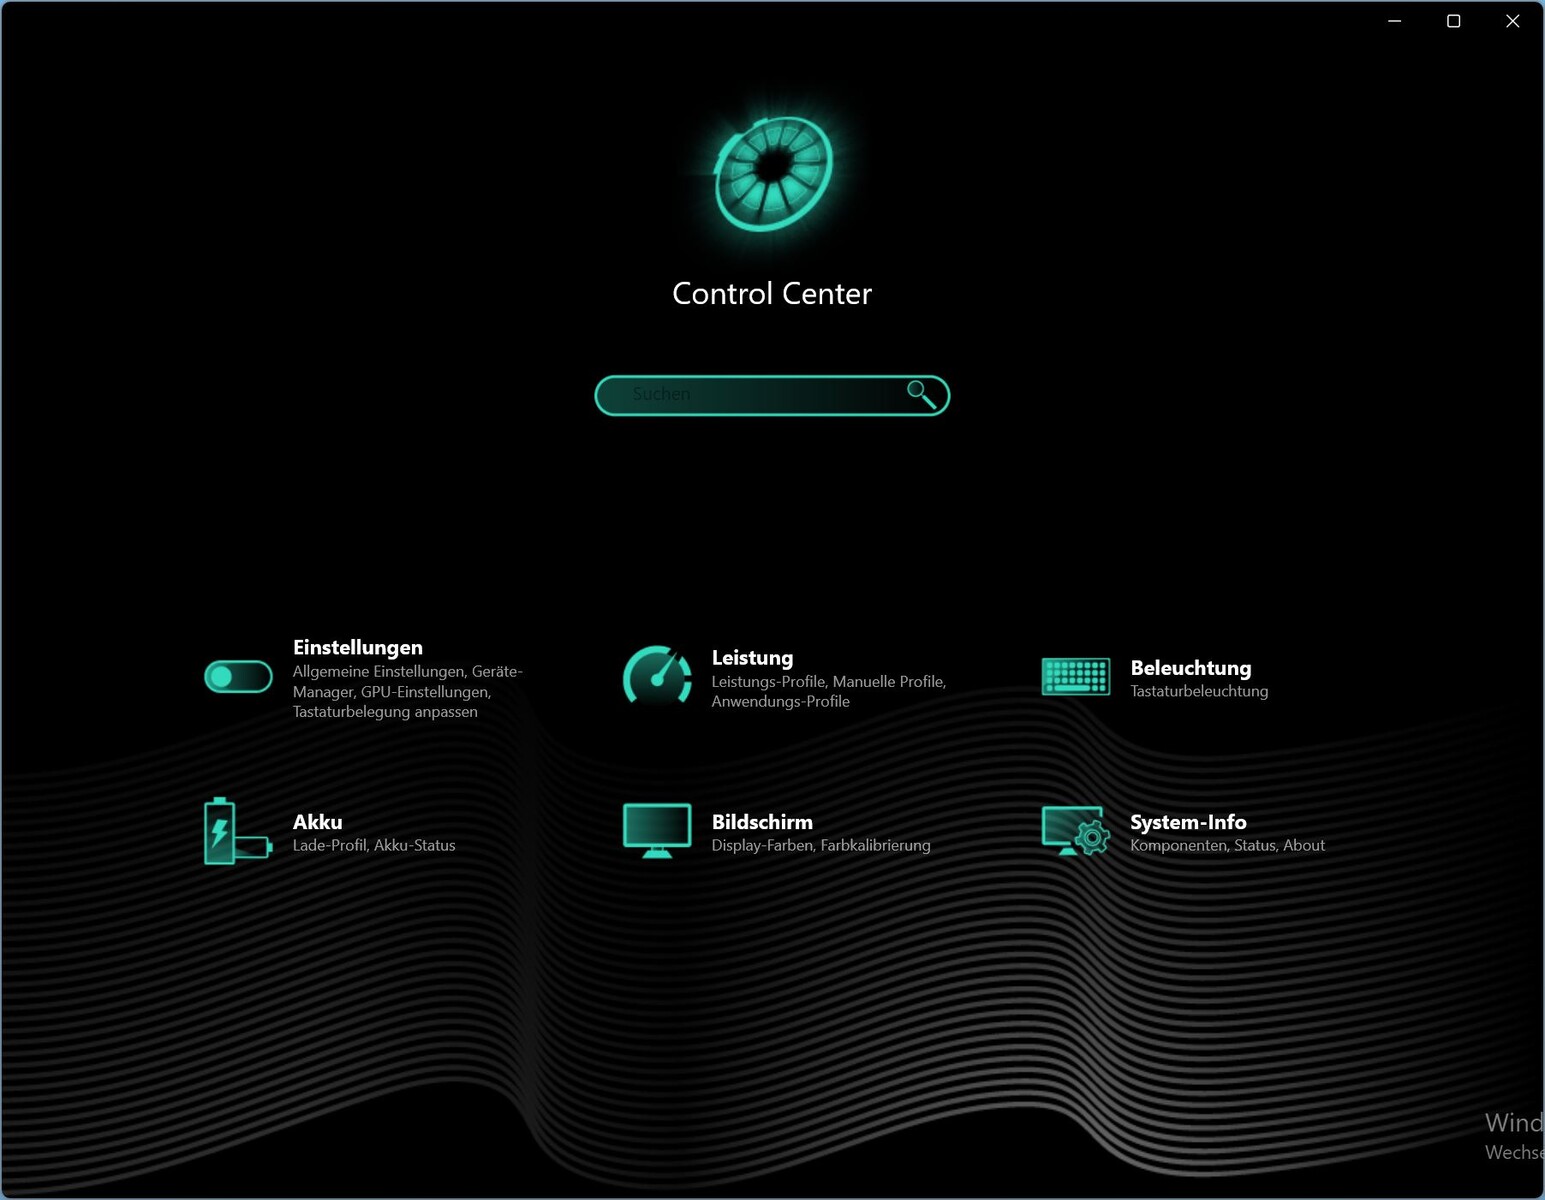
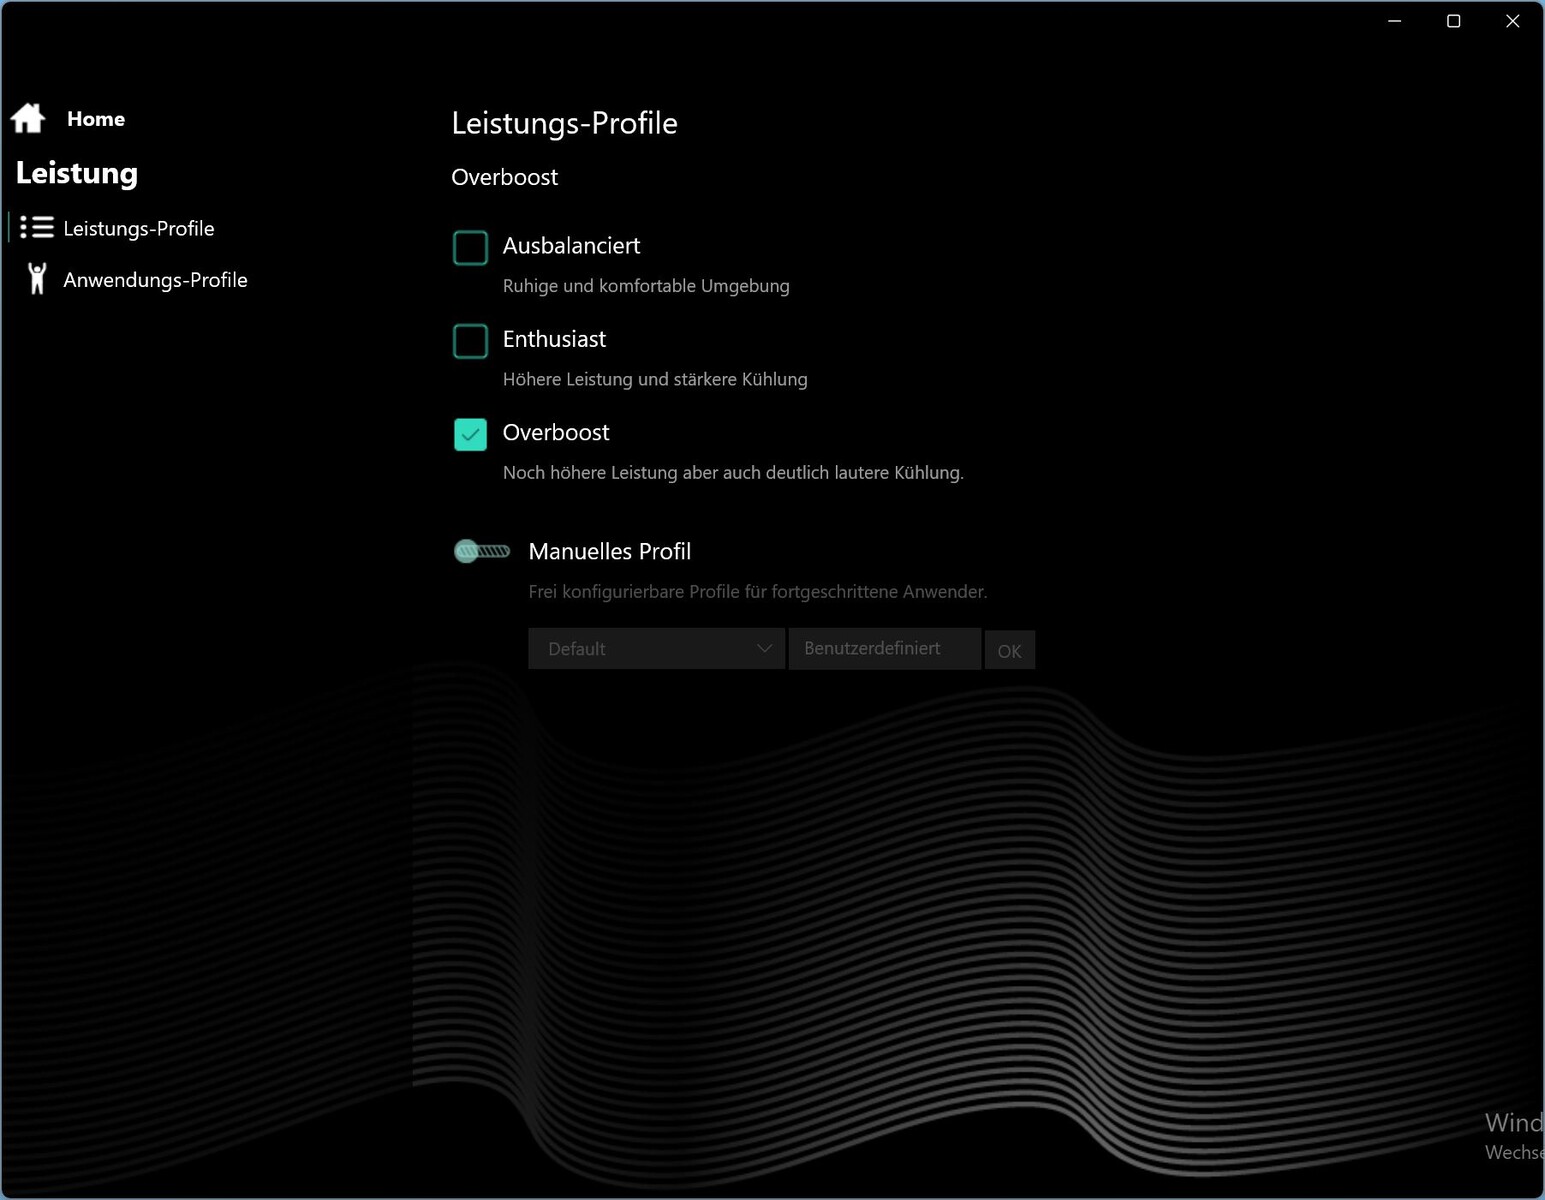
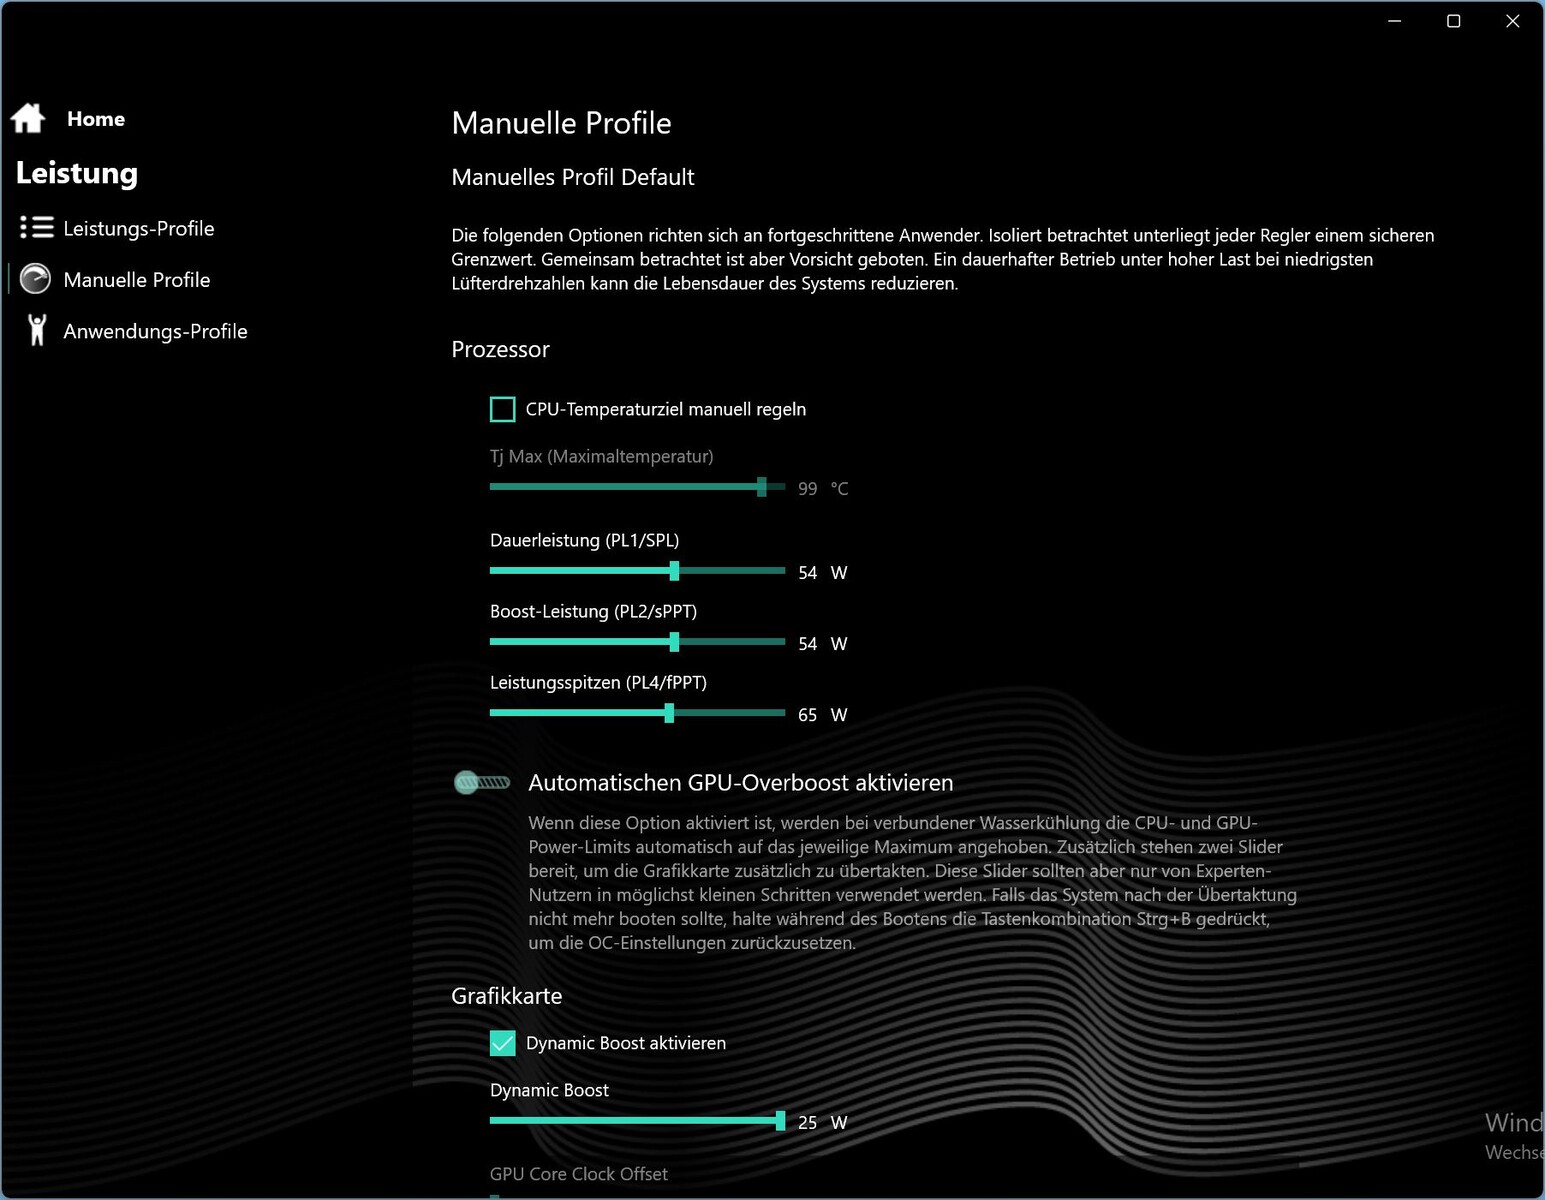
O Control Center dos dispositivos Schenker permite que o senhor defina predefinições de desempenho, bem como parâmetros de desempenho individuais definidos manualmente. Isso significa que o senhor pode alterar o comportamento do laptop para jogos de acordo com suas necessidades individuais. O mesmo pode ser dito de outras configurações, como iluminação do teclado, comportamento de carregamento e tela.
Processador
O Ryzen 7 7840HS da AMDapresenta 8 núcleos Zen 4 e, graças ao SMT, soma 16 threads. Os núcleos têm clock de 3,8 GHz (clock base) até 5,1 GHz (aumento de núcleo único). Isso o torna a segunda CPU mais rápida da série Pheonix, atrás doRyzen 9 7940HS.

Em comparação, seu desempenho está em um nível semelhante ao doCore i7-13700H. O HPVictus 16é mais lento com essa CPU e oMSI Stealth 16 Studiocom a mesma CPU é mais rápido. Os processadores HX da Intel, especialmente o muito mais caroi9-13900HXmuito mais caro, assumem claramente a liderança.
Durante o teste contínuo do Cinebench R15, não notamos nenhuma perda de desempenho - ele permaneceu consistentemente alto mesmo após as primeiras execuções. Ao fazer isso, a CPU atingiu um TDP constante de 80 watts.
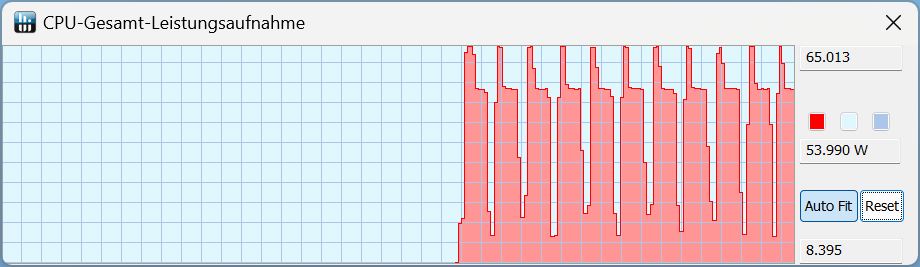
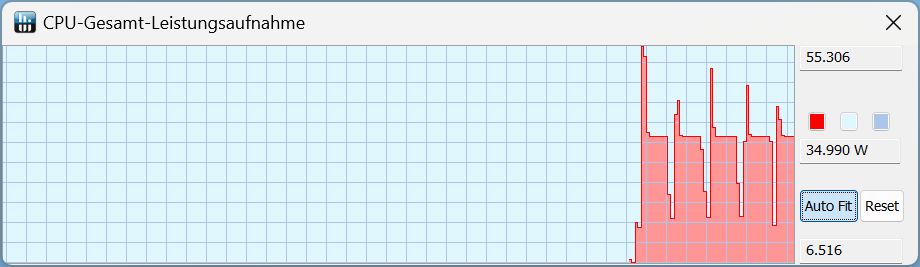
No modo Entusiasta, as execuções foram iniciadas com 65 watts e depois caíram para 55 watts. No modo Equilibrado, ela manteve apenas 50 a 55 watts por um curto período de tempo e depois caiu para 35 watts.
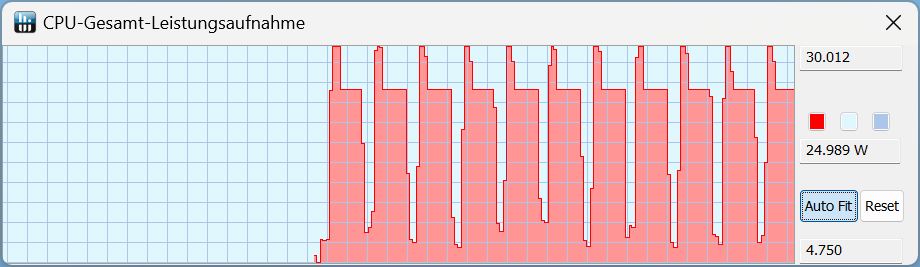
No modo de bateria, medimos 30 watts por um curto espaço de tempo no início e, em seguida, 25 watts. Sua pontuação no Cinebench R15 caiu de 2.681 para 1.730 - uma queda de 35%.
Cinebench R15 Multi continuous test
Cinebench R23: Multi Core | Single Core
Cinebench R20: CPU (Multi Core) | CPU (Single Core)
Cinebench R15: CPU Multi 64Bit | CPU Single 64Bit
Blender: v2.79 BMW27 CPU
7-Zip 18.03: 7z b 4 | 7z b 4 -mmt1
Geekbench 5.5: Multi-Core | Single-Core
HWBOT x265 Benchmark v2.2: 4k Preset
LibreOffice : 20 Documents To PDF
R Benchmark 2.5: Overall mean
| CPU Performance rating | |
| HP Omen Transcend 16 | |
| Média da turma Gaming | |
| Lenovo Legion Pro 5 16ARX8 | |
| MSI Stealth 16 Studio A13VG | |
| Média AMD Ryzen 7 7840HS | |
| Schenker XMG CORE 16 (L23) | |
| HP Victus 16-r0077ng | |
| Acer Nitro 16 AN16-41 | |
| Cinebench R23 / Multi Core | |
| Média da turma Gaming (10488 - 42661, n=104, últimos 2 anos) | |
| HP Omen Transcend 16 | |
| MSI Stealth 16 Studio A13VG | |
| Lenovo Legion Pro 5 16ARX8 | |
| Schenker XMG CORE 16 (L23) | |
| Média AMD Ryzen 7 7840HS (14784 - 17214, n=19) | |
| HP Victus 16-r0077ng | |
| Acer Nitro 16 AN16-41 | |
| Cinebench R23 / Single Core | |
| HP Omen Transcend 16 | |
| Média da turma Gaming (1601 - 2415, n=104, últimos 2 anos) | |
| MSI Stealth 16 Studio A13VG | |
| Lenovo Legion Pro 5 16ARX8 | |
| Média AMD Ryzen 7 7840HS (1718 - 1812, n=19) | |
| Schenker XMG CORE 16 (L23) | |
| HP Victus 16-r0077ng | |
| Acer Nitro 16 AN16-41 | |
| Cinebench R20 / CPU (Multi Core) | |
| Média da turma Gaming (4029 - 16433, n=103, últimos 2 anos) | |
| HP Omen Transcend 16 | |
| MSI Stealth 16 Studio A13VG | |
| Lenovo Legion Pro 5 16ARX8 | |
| Schenker XMG CORE 16 (L23) | |
| Média AMD Ryzen 7 7840HS (5761 - 6744, n=19) | |
| HP Victus 16-r0077ng | |
| Acer Nitro 16 AN16-41 | |
| Cinebench R20 / CPU (Single Core) | |
| HP Omen Transcend 16 | |
| Média da turma Gaming (622 - 913, n=103, últimos 2 anos) | |
| MSI Stealth 16 Studio A13VG | |
| Lenovo Legion Pro 5 16ARX8 | |
| Schenker XMG CORE 16 (L23) | |
| Média AMD Ryzen 7 7840HS (661 - 705, n=19) | |
| HP Victus 16-r0077ng | |
| Acer Nitro 16 AN16-41 | |
| Cinebench R15 / CPU Multi 64Bit | |
| Média da turma Gaming (1578 - 6330, n=102, últimos 2 anos) | |
| HP Omen Transcend 16 | |
| Lenovo Legion Pro 5 16ARX8 | |
| MSI Stealth 16 Studio A13VG | |
| Schenker XMG CORE 16 (L23) | |
| Média AMD Ryzen 7 7840HS (2300 - 2729, n=19) | |
| Acer Nitro 16 AN16-41 | |
| HP Victus 16-r0077ng | |
| Cinebench R15 / CPU Single 64Bit | |
| HP Omen Transcend 16 | |
| Média da turma Gaming (188.8 - 350, n=103, últimos 2 anos) | |
| Lenovo Legion Pro 5 16ARX8 | |
| Média AMD Ryzen 7 7840HS (270 - 286, n=19) | |
| MSI Stealth 16 Studio A13VG | |
| Schenker XMG CORE 16 (L23) | |
| Acer Nitro 16 AN16-41 | |
| HP Victus 16-r0077ng | |
| Blender / v2.79 BMW27 CPU | |
| Acer Nitro 16 AN16-41 | |
| HP Victus 16-r0077ng | |
| Média AMD Ryzen 7 7840HS (185 - 231, n=20) | |
| Schenker XMG CORE 16 (L23) | |
| Lenovo Legion Pro 5 16ARX8 | |
| MSI Stealth 16 Studio A13VG | |
| Média da turma Gaming (79 - 330, n=101, últimos 2 anos) | |
| HP Omen Transcend 16 | |
| 7-Zip 18.03 / 7z b 4 | |
| HP Omen Transcend 16 | |
| Média da turma Gaming (33491 - 148086, n=102, últimos 2 anos) | |
| MSI Stealth 16 Studio A13VG | |
| Lenovo Legion Pro 5 16ARX8 | |
| Schenker XMG CORE 16 (L23) | |
| Média AMD Ryzen 7 7840HS (59538 - 73035, n=20) | |
| HP Victus 16-r0077ng | |
| Acer Nitro 16 AN16-41 | |
| 7-Zip 18.03 / 7z b 4 -mmt1 | |
| Lenovo Legion Pro 5 16ARX8 | |
| HP Omen Transcend 16 | |
| Schenker XMG CORE 16 (L23) | |
| Média AMD Ryzen 7 7840HS (6049 - 6754, n=20) | |
| Média da turma Gaming (4824 - 7436, n=102, últimos 2 anos) | |
| MSI Stealth 16 Studio A13VG | |
| Acer Nitro 16 AN16-41 | |
| HP Victus 16-r0077ng | |
| Geekbench 5.5 / Multi-Core | |
| HP Omen Transcend 16 | |
| Média da turma Gaming (6460 - 28263, n=102, últimos 2 anos) | |
| MSI Stealth 16 Studio A13VG | |
| Lenovo Legion Pro 5 16ARX8 | |
| Schenker XMG CORE 16 (L23) | |
| Média AMD Ryzen 7 7840HS (8446 - 12339, n=23) | |
| HP Victus 16-r0077ng | |
| Acer Nitro 16 AN16-41 | |
| Geekbench 5.5 / Single-Core | |
| Média da turma Gaming (1403 - 2474, n=102, últimos 2 anos) | |
| HP Omen Transcend 16 | |
| Lenovo Legion Pro 5 16ARX8 | |
| Média AMD Ryzen 7 7840HS (1837 - 2017, n=23) | |
| Schenker XMG CORE 16 (L23) | |
| MSI Stealth 16 Studio A13VG | |
| HP Victus 16-r0077ng | |
| Acer Nitro 16 AN16-41 | |
| HWBOT x265 Benchmark v2.2 / 4k Preset | |
| Média da turma Gaming (11.5 - 44.4, n=102, últimos 2 anos) | |
| HP Omen Transcend 16 | |
| Lenovo Legion Pro 5 16ARX8 | |
| Schenker XMG CORE 16 (L23) | |
| Média AMD Ryzen 7 7840HS (11.7 - 21.8, n=20) | |
| MSI Stealth 16 Studio A13VG | |
| Acer Nitro 16 AN16-41 | |
| HP Victus 16-r0077ng | |
| LibreOffice / 20 Documents To PDF | |
| Schenker XMG CORE 16 (L23) | |
| HP Victus 16-r0077ng | |
| MSI Stealth 16 Studio A13VG | |
| Acer Nitro 16 AN16-41 | |
| Média da turma Gaming (33.2 - 88.8, n=102, últimos 2 anos) | |
| Média AMD Ryzen 7 7840HS (38.3 - 68.3, n=20) | |
| HP Omen Transcend 16 | |
| Lenovo Legion Pro 5 16ARX8 | |
| R Benchmark 2.5 / Overall mean | |
| HP Victus 16-r0077ng | |
| Acer Nitro 16 AN16-41 | |
| MSI Stealth 16 Studio A13VG | |
| Média AMD Ryzen 7 7840HS (0.4184 - 0.4739, n=20) | |
| Schenker XMG CORE 16 (L23) | |
| Média da turma Gaming (0.3439 - 0.59, n=102, últimos 2 anos) | |
| Lenovo Legion Pro 5 16ARX8 | |
| HP Omen Transcend 16 | |
* ... menor é melhor
AIDA64: FP32 Ray-Trace | FPU Julia | CPU SHA3 | CPU Queen | FPU SinJulia | FPU Mandel | CPU AES | CPU ZLib | FP64 Ray-Trace | CPU PhotoWorxx
| Performance rating | |
| Média da turma Gaming | |
| HP Omen Transcend 16 | |
| Média AMD Ryzen 7 7840HS | |
| Lenovo Legion Pro 5 16ARX8 | |
| Schenker XMG CORE 16 (L23) | |
| MSI Stealth 16 Studio A13VG | |
| Acer Nitro 16 AN16-41 | |
| HP Victus 16-r0077ng | |
| AIDA64 / FP32 Ray-Trace | |
| Média da turma Gaming (10227 - 85542, n=102, últimos 2 anos) | |
| Lenovo Legion Pro 5 16ARX8 | |
| Schenker XMG CORE 16 (L23) | |
| Média AMD Ryzen 7 7840HS (22845 - 28921, n=21) | |
| HP Omen Transcend 16 | |
| MSI Stealth 16 Studio A13VG | |
| Acer Nitro 16 AN16-41 | |
| HP Victus 16-r0077ng | |
| AIDA64 / FPU Julia | |
| Média da turma Gaming (51376 - 372155, n=102, últimos 2 anos) | |
| Lenovo Legion Pro 5 16ARX8 | |
| Schenker XMG CORE 16 (L23) | |
| HP Omen Transcend 16 | |
| Média AMD Ryzen 7 7840HS (97164 - 123167, n=21) | |
| Acer Nitro 16 AN16-41 | |
| MSI Stealth 16 Studio A13VG | |
| HP Victus 16-r0077ng | |
| AIDA64 / CPU SHA3 | |
| Média da turma Gaming (2180 - 10115, n=102, últimos 2 anos) | |
| HP Omen Transcend 16 | |
| Lenovo Legion Pro 5 16ARX8 | |
| Schenker XMG CORE 16 (L23) | |
| Média AMD Ryzen 7 7840HS (4293 - 5155, n=21) | |
| MSI Stealth 16 Studio A13VG | |
| Acer Nitro 16 AN16-41 | |
| HP Victus 16-r0077ng | |
| AIDA64 / CPU Queen | |
| Lenovo Legion Pro 5 16ARX8 | |
| HP Omen Transcend 16 | |
| Média da turma Gaming (49785 - 173351, n=86, últimos 2 anos) | |
| Média AMD Ryzen 7 7840HS (102271 - 125820, n=21) | |
| Acer Nitro 16 AN16-41 | |
| MSI Stealth 16 Studio A13VG | |
| Schenker XMG CORE 16 (L23) | |
| HP Victus 16-r0077ng | |
| AIDA64 / FPU SinJulia | |
| Lenovo Legion Pro 5 16ARX8 | |
| Schenker XMG CORE 16 (L23) | |
| Média da turma Gaming (4424 - 33636, n=102, últimos 2 anos) | |
| Média AMD Ryzen 7 7840HS (13767 - 15525, n=21) | |
| HP Omen Transcend 16 | |
| Acer Nitro 16 AN16-41 | |
| MSI Stealth 16 Studio A13VG | |
| HP Victus 16-r0077ng | |
| AIDA64 / FPU Mandel | |
| Média da turma Gaming (25115 - 196829, n=102, últimos 2 anos) | |
| Lenovo Legion Pro 5 16ARX8 | |
| Schenker XMG CORE 16 (L23) | |
| Média AMD Ryzen 7 7840HS (52084 - 65812, n=21) | |
| HP Omen Transcend 16 | |
| Acer Nitro 16 AN16-41 | |
| MSI Stealth 16 Studio A13VG | |
| HP Victus 16-r0077ng | |
| AIDA64 / CPU AES | |
| Média AMD Ryzen 7 7840HS (67389 - 177158, n=21) | |
| HP Omen Transcend 16 | |
| Média da turma Gaming (39258 - 247074, n=102, últimos 2 anos) | |
| Schenker XMG CORE 16 (L23) | |
| MSI Stealth 16 Studio A13VG | |
| Lenovo Legion Pro 5 16ARX8 | |
| HP Victus 16-r0077ng | |
| Acer Nitro 16 AN16-41 | |
| AIDA64 / CPU ZLib | |
| HP Omen Transcend 16 | |
| Média da turma Gaming (574 - 2531, n=102, últimos 2 anos) | |
| Lenovo Legion Pro 5 16ARX8 | |
| Schenker XMG CORE 16 (L23) | |
| Média AMD Ryzen 7 7840HS (944 - 1123, n=21) | |
| MSI Stealth 16 Studio A13VG | |
| HP Victus 16-r0077ng | |
| Acer Nitro 16 AN16-41 | |
| AIDA64 / FP64 Ray-Trace | |
| Média da turma Gaming (5509 - 45446, n=102, últimos 2 anos) | |
| Lenovo Legion Pro 5 16ARX8 | |
| Schenker XMG CORE 16 (L23) | |
| Média AMD Ryzen 7 7840HS (12248 - 15599, n=21) | |
| HP Omen Transcend 16 | |
| MSI Stealth 16 Studio A13VG | |
| Acer Nitro 16 AN16-41 | |
| HP Victus 16-r0077ng | |
| AIDA64 / CPU PhotoWorxx | |
| HP Omen Transcend 16 | |
| MSI Stealth 16 Studio A13VG | |
| Média da turma Gaming (12271 - 89891, n=102, últimos 2 anos) | |
| Schenker XMG CORE 16 (L23) | |
| HP Victus 16-r0077ng | |
| Média AMD Ryzen 7 7840HS (17615 - 41516, n=21) | |
| Lenovo Legion Pro 5 16ARX8 | |
| Acer Nitro 16 AN16-41 | |
Desempenho do sistema
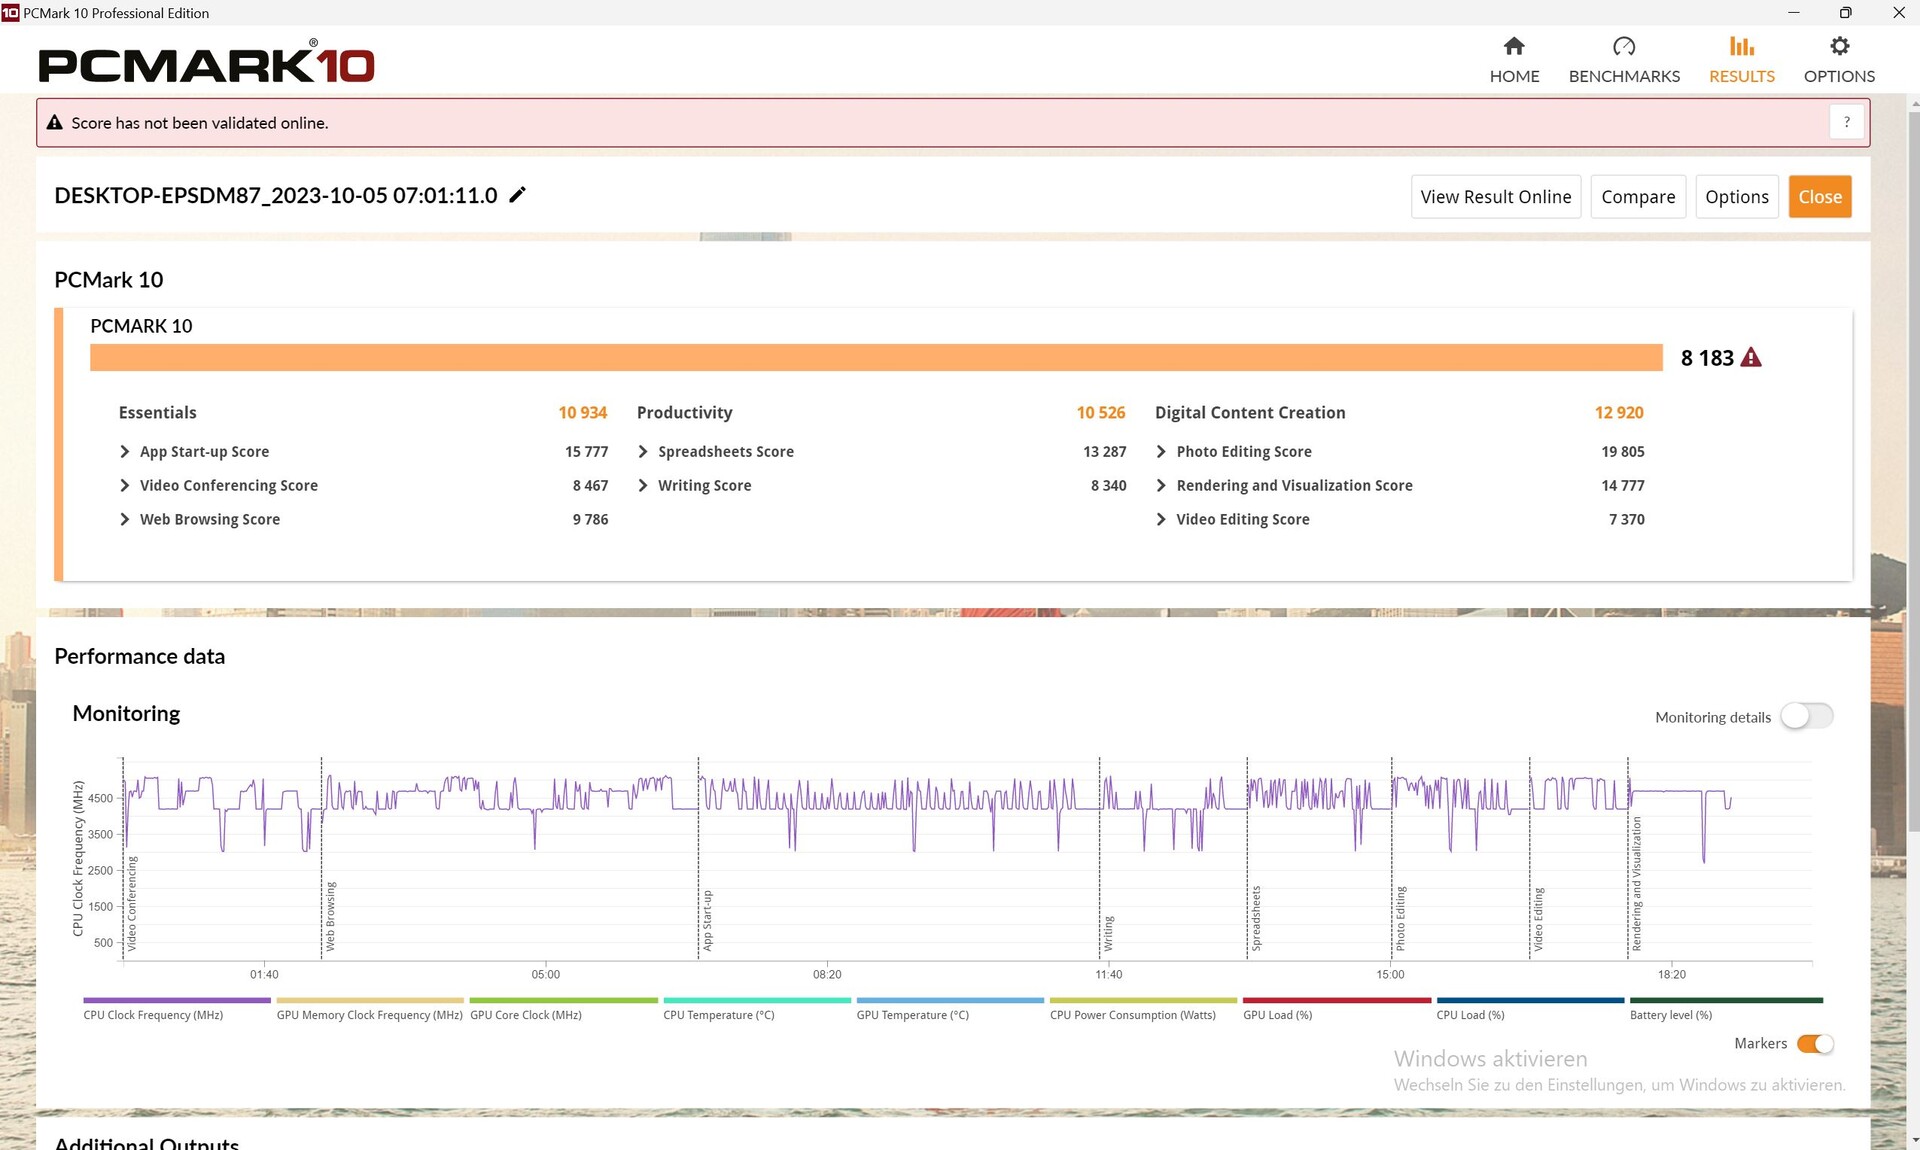
Juntamente com o Lenovo Legion Pro 5 16e o HP Omen Transcend 16o Core 16 ficou em primeiro lugar no que diz respeito ao desempenho do sistema. Subjetivamente, tudo funciona sem problemas também.
CrossMark: Overall | Productivity | Creativity | Responsiveness
| PCMark 10 / Score | |
| Média da turma Gaming (5828 - 12414, n=93, últimos 2 anos) | |
| Lenovo Legion Pro 5 16ARX8 | |
| Schenker XMG CORE 16 (L23) | |
| Média AMD Ryzen 7 7840HS, NVIDIA GeForce RTX 4070 Laptop GPU (8167 - 8183, n=2) | |
| HP Omen Transcend 16 | |
| MSI Stealth 16 Studio A13VG | |
| Acer Nitro 16 AN16-41 | |
| HP Victus 16-r0077ng | |
| PCMark 10 / Essentials | |
| HP Omen Transcend 16 | |
| Média AMD Ryzen 7 7840HS, NVIDIA GeForce RTX 4070 Laptop GPU (10934 - 11250, n=2) | |
| Lenovo Legion Pro 5 16ARX8 | |
| Schenker XMG CORE 16 (L23) | |
| HP Victus 16-r0077ng | |
| Média da turma Gaming (8810 - 11935, n=97, últimos 2 anos) | |
| Acer Nitro 16 AN16-41 | |
| MSI Stealth 16 Studio A13VG | |
| PCMark 10 / Productivity | |
| Média da turma Gaming (6845 - 25323, n=95, últimos 2 anos) | |
| Schenker XMG CORE 16 (L23) | |
| Média AMD Ryzen 7 7840HS, NVIDIA GeForce RTX 4070 Laptop GPU (10179 - 10526, n=2) | |
| Lenovo Legion Pro 5 16ARX8 | |
| HP Omen Transcend 16 | |
| MSI Stealth 16 Studio A13VG | |
| Acer Nitro 16 AN16-41 | |
| HP Victus 16-r0077ng | |
| PCMark 10 / Digital Content Creation | |
| Média da turma Gaming (7602 - 19954, n=95, últimos 2 anos) | |
| HP Omen Transcend 16 | |
| Lenovo Legion Pro 5 16ARX8 | |
| Schenker XMG CORE 16 (L23) | |
| Média AMD Ryzen 7 7840HS, NVIDIA GeForce RTX 4070 Laptop GPU (12908 - 12920, n=2) | |
| MSI Stealth 16 Studio A13VG | |
| Acer Nitro 16 AN16-41 | |
| HP Victus 16-r0077ng | |
| CrossMark / Overall | |
| Lenovo Legion Pro 5 16ARX8 | |
| Média da turma Gaming (1366 - 2409, n=94, últimos 2 anos) | |
| HP Omen Transcend 16 | |
| MSI Stealth 16 Studio A13VG | |
| Schenker XMG CORE 16 (L23) | |
| Média AMD Ryzen 7 7840HS, NVIDIA GeForce RTX 4070 Laptop GPU (n=1) | |
| Acer Nitro 16 AN16-41 | |
| CrossMark / Productivity | |
| Lenovo Legion Pro 5 16ARX8 | |
| Média da turma Gaming (1386 - 2254, n=94, últimos 2 anos) | |
| HP Omen Transcend 16 | |
| MSI Stealth 16 Studio A13VG | |
| Schenker XMG CORE 16 (L23) | |
| Média AMD Ryzen 7 7840HS, NVIDIA GeForce RTX 4070 Laptop GPU (n=1) | |
| Acer Nitro 16 AN16-41 | |
| CrossMark / Creativity | |
| HP Omen Transcend 16 | |
| Média da turma Gaming (1343 - 2786, n=94, últimos 2 anos) | |
| Lenovo Legion Pro 5 16ARX8 | |
| MSI Stealth 16 Studio A13VG | |
| Schenker XMG CORE 16 (L23) | |
| Média AMD Ryzen 7 7840HS, NVIDIA GeForce RTX 4070 Laptop GPU (n=1) | |
| Acer Nitro 16 AN16-41 | |
| CrossMark / Responsiveness | |
| Lenovo Legion Pro 5 16ARX8 | |
| Média da turma Gaming (1226 - 2334, n=94, últimos 2 anos) | |
| MSI Stealth 16 Studio A13VG | |
| HP Omen Transcend 16 | |
| Schenker XMG CORE 16 (L23) | |
| Média AMD Ryzen 7 7840HS, NVIDIA GeForce RTX 4070 Laptop GPU (n=1) | |
| Acer Nitro 16 AN16-41 | |
| PCMark 10 Score | 8183 pontos | |
Ajuda | ||
| AIDA64 / Memory Copy | |
| HP Omen Transcend 16 | |
| Média da turma Gaming (21750 - 129946, n=102, últimos 2 anos) | |
| MSI Stealth 16 Studio A13VG | |
| Schenker XMG CORE 16 (L23) | |
| Média AMD Ryzen 7 7840HS (30937 - 72158, n=21) | |
| HP Victus 16-r0077ng | |
| Lenovo Legion Pro 5 16ARX8 | |
| Acer Nitro 16 AN16-41 | |
| AIDA64 / Memory Read | |
| HP Omen Transcend 16 | |
| Média da turma Gaming (22956 - 118858, n=102, últimos 2 anos) | |
| MSI Stealth 16 Studio A13VG | |
| HP Victus 16-r0077ng | |
| Schenker XMG CORE 16 (L23) | |
| Média AMD Ryzen 7 7840HS (30497 - 62147, n=21) | |
| Lenovo Legion Pro 5 16ARX8 | |
| Acer Nitro 16 AN16-41 | |
| AIDA64 / Memory Write | |
| Schenker XMG CORE 16 (L23) | |
| Média AMD Ryzen 7 7840HS (34590 - 93323, n=21) | |
| Média da turma Gaming (22297 - 135096, n=102, últimos 2 anos) | |
| HP Omen Transcend 16 | |
| MSI Stealth 16 Studio A13VG | |
| HP Victus 16-r0077ng | |
| Acer Nitro 16 AN16-41 | |
| Lenovo Legion Pro 5 16ARX8 | |
| AIDA64 / Memory Latency | |
| Média da turma Gaming (75.3 - 165.4, n=102, últimos 2 anos) | |
| HP Victus 16-r0077ng | |
| Acer Nitro 16 AN16-41 | |
| Média AMD Ryzen 7 7840HS (85.1 - 112, n=21) | |
| Schenker XMG CORE 16 (L23) | |
| HP Omen Transcend 16 | |
| MSI Stealth 16 Studio A13VG | |
| Lenovo Legion Pro 5 16ARX8 | |
* ... menor é melhor
Latência DPC
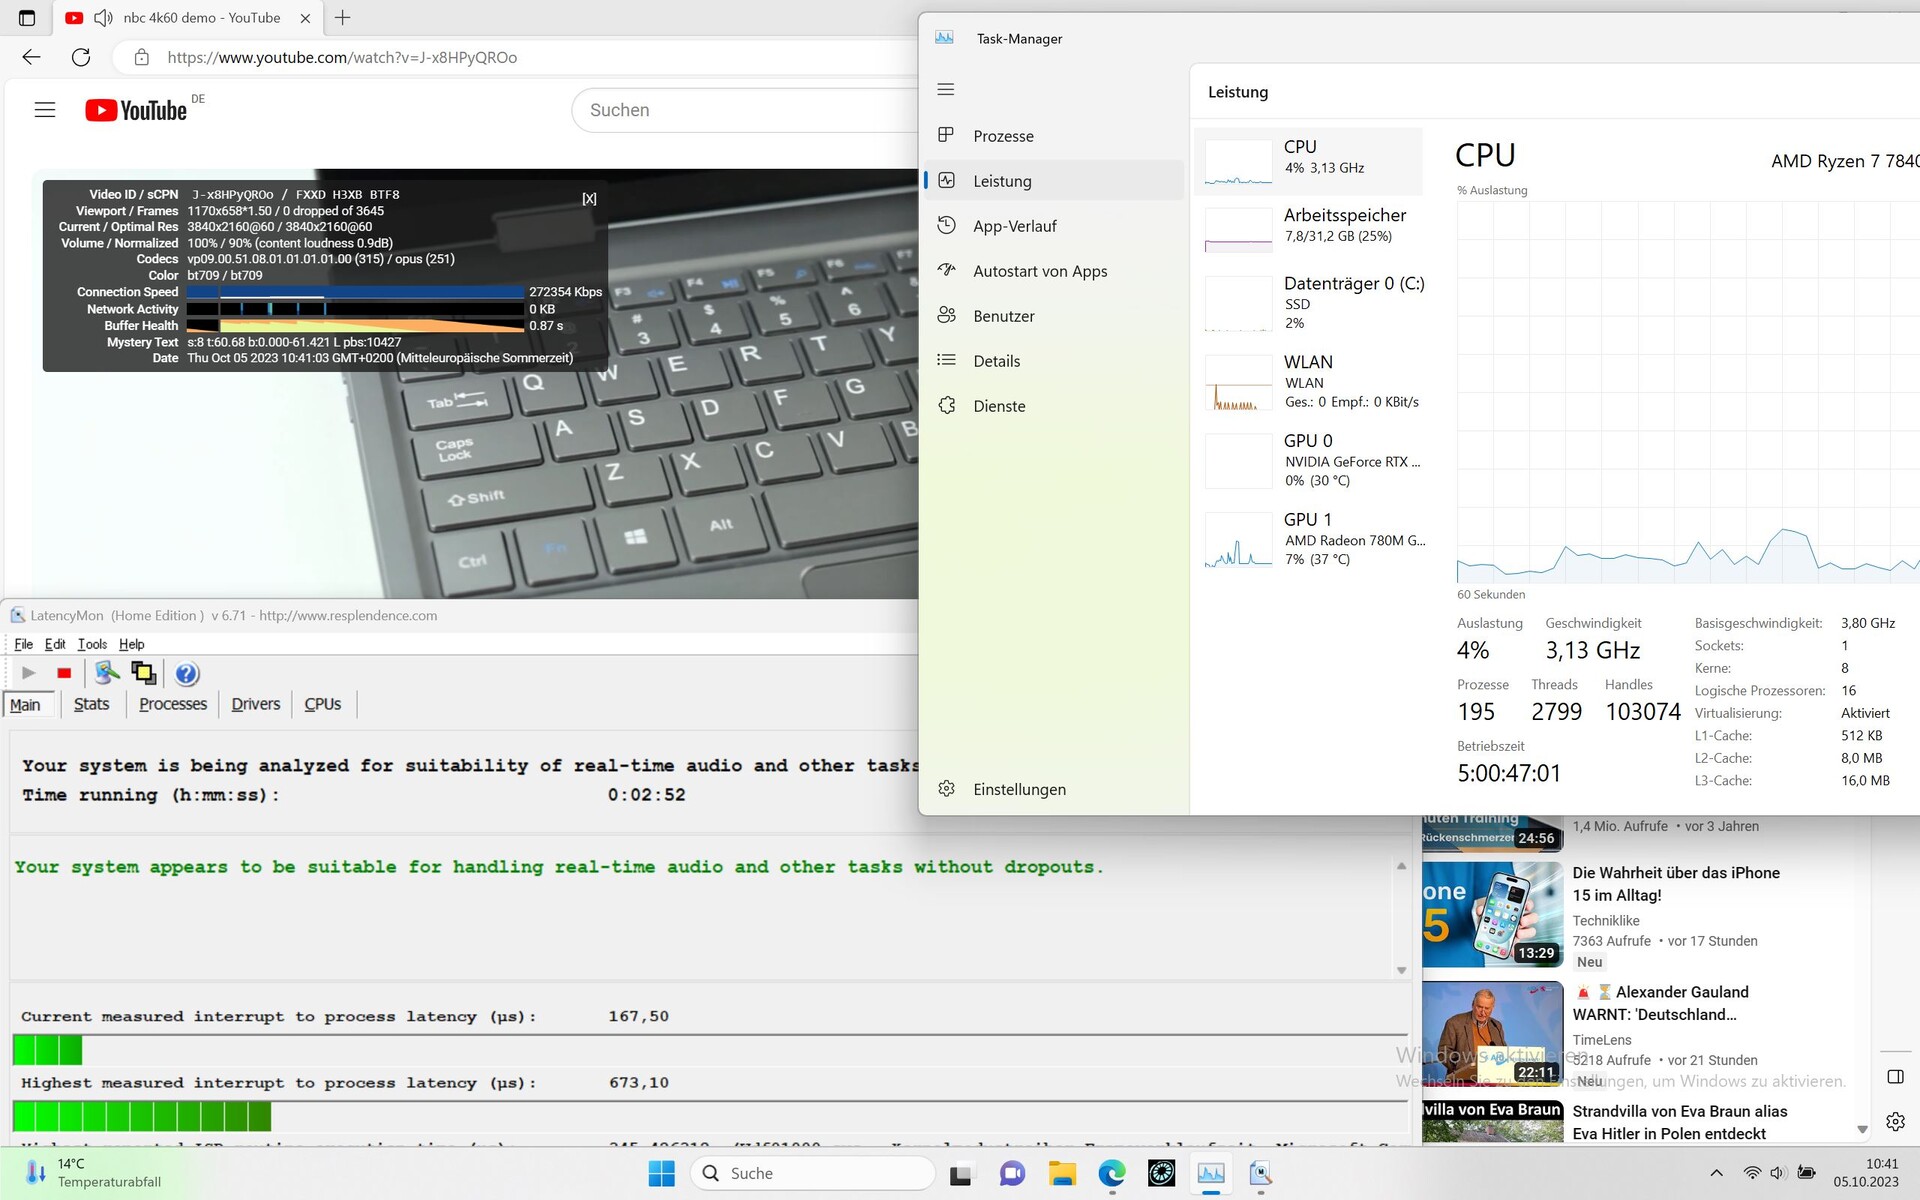
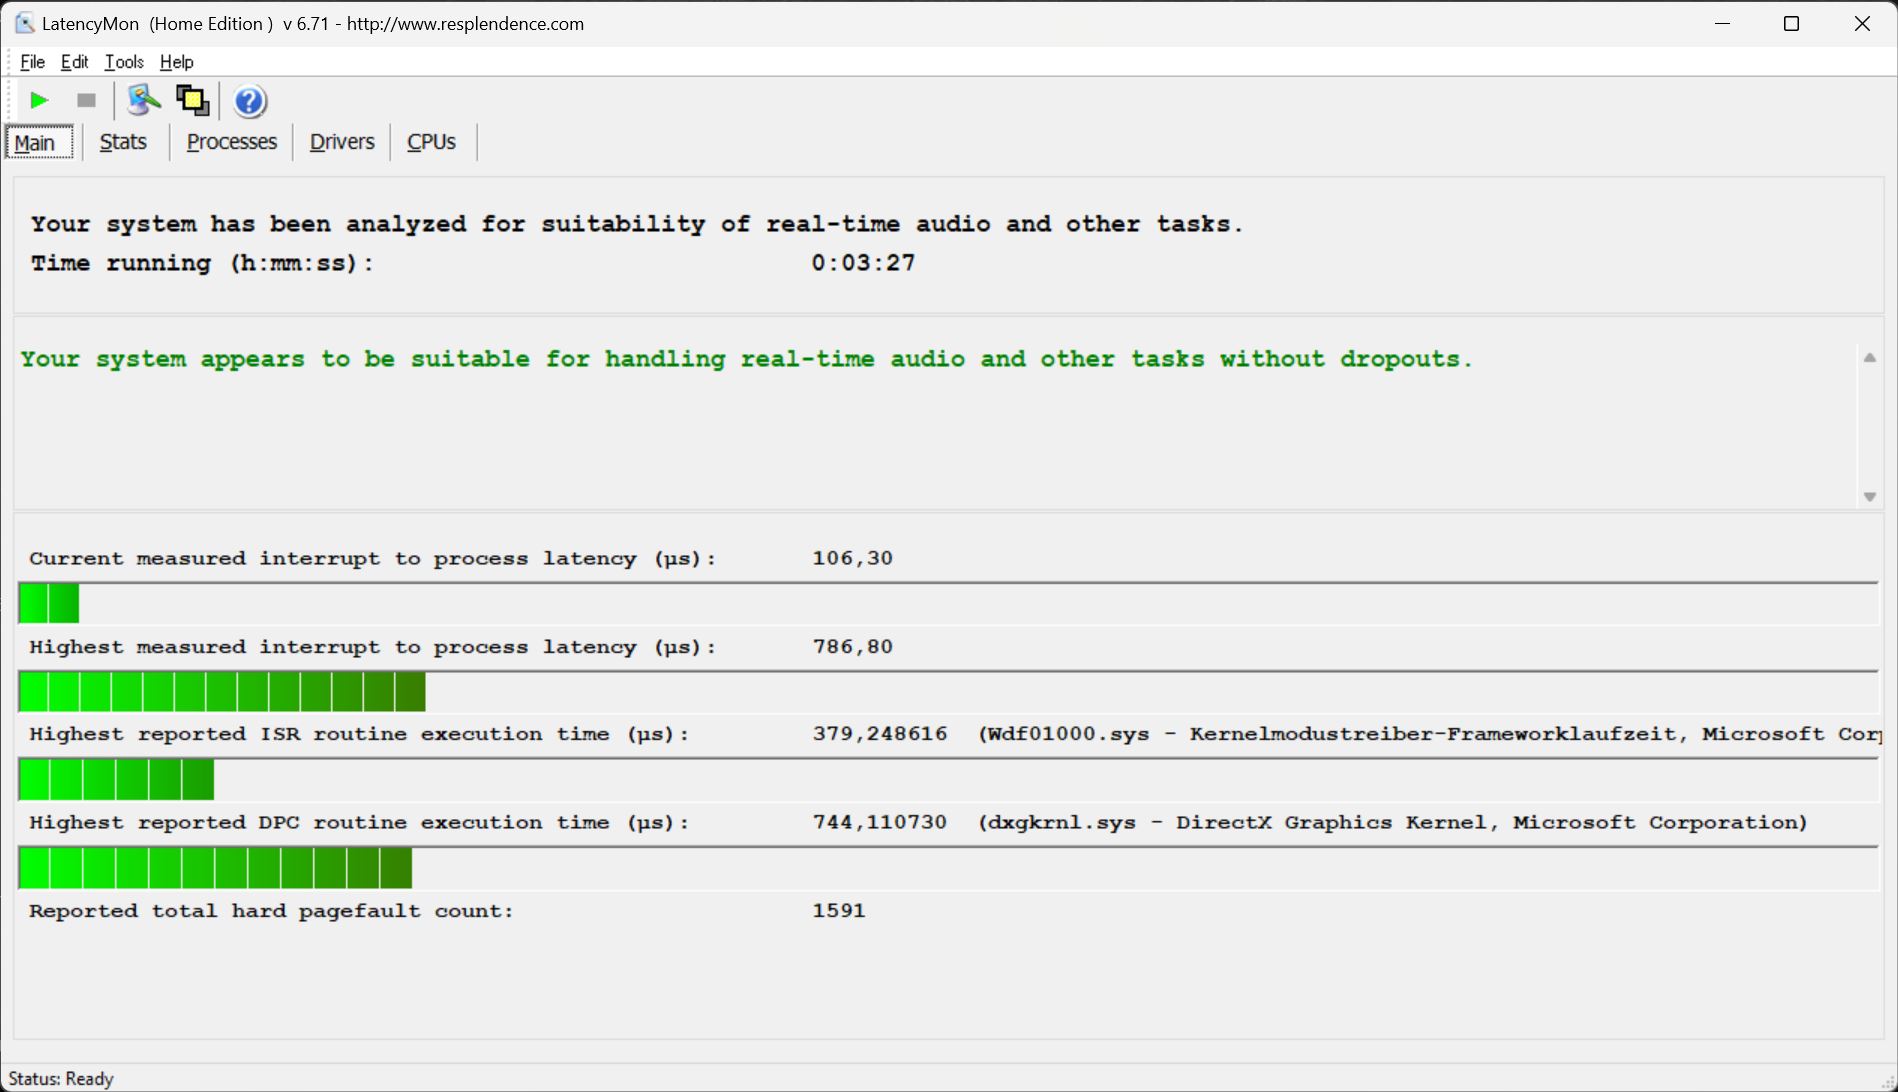
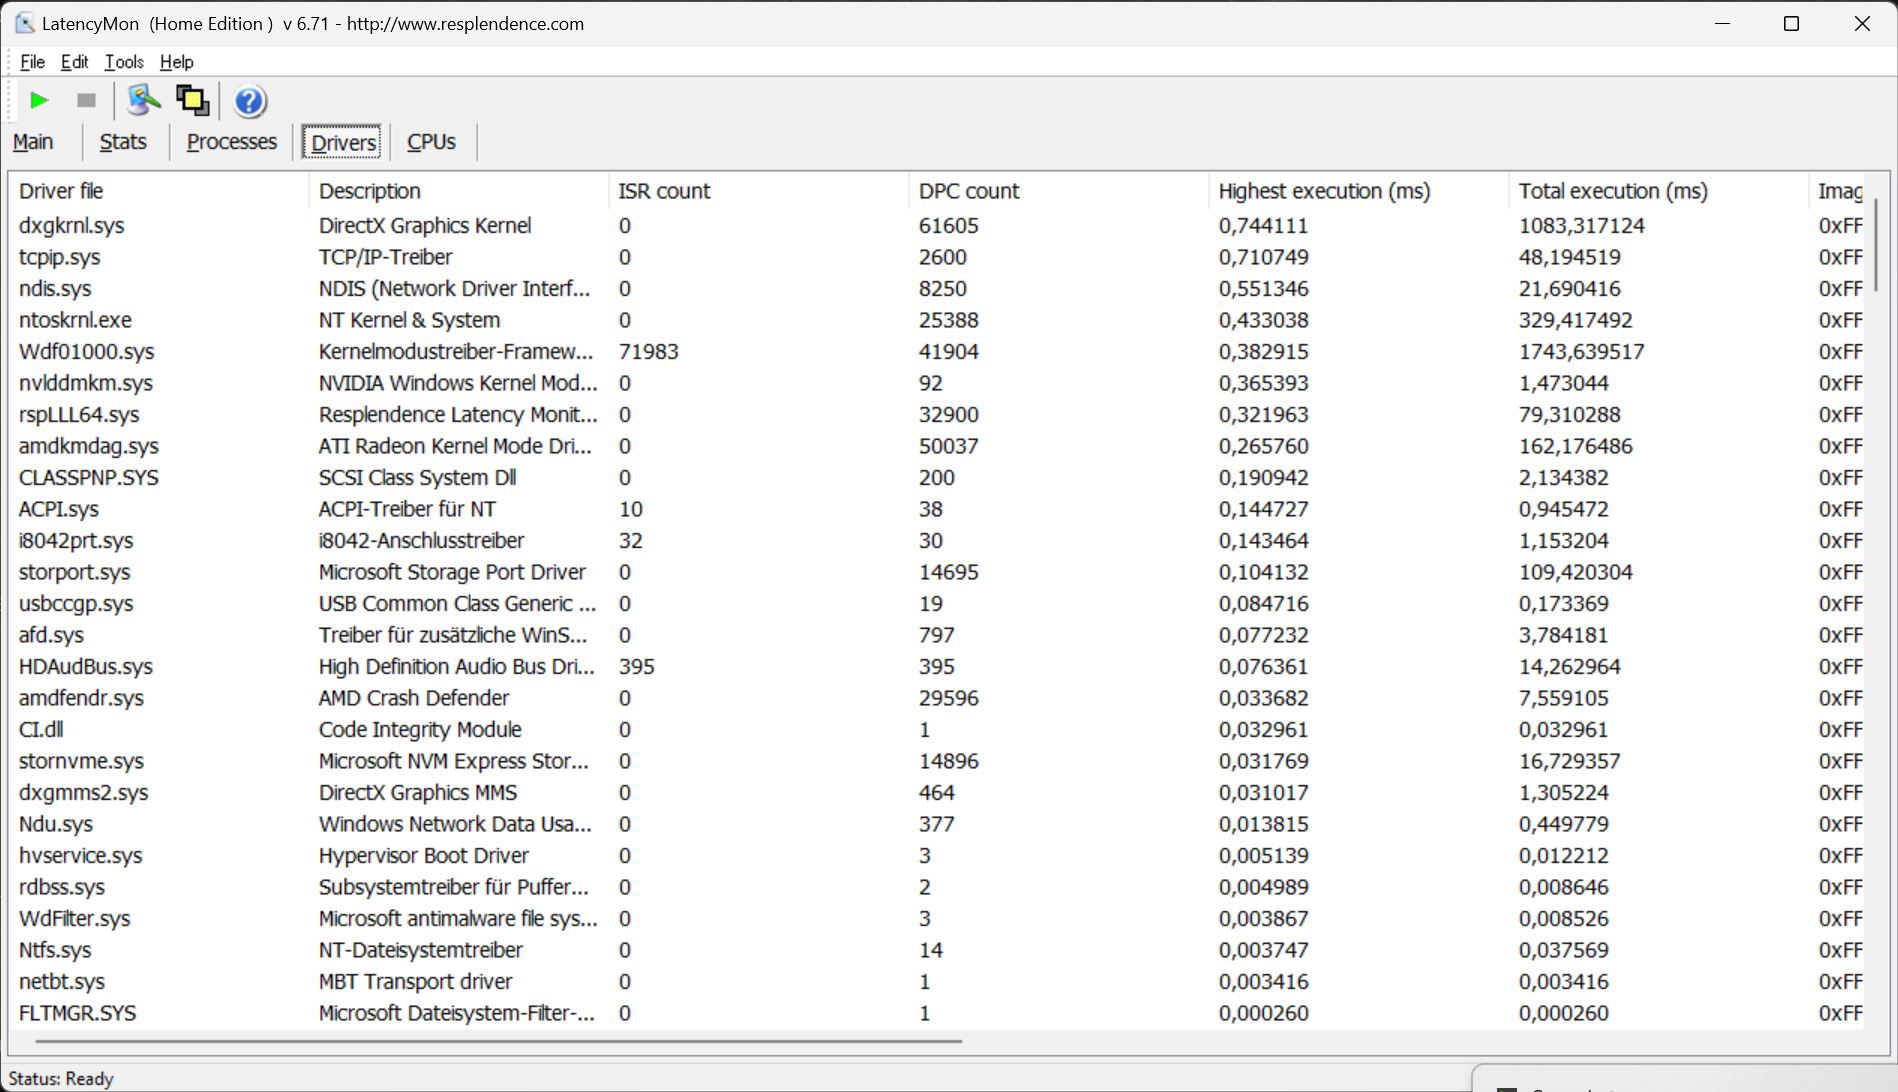
Em comparação, o Core 16 é um dos poucos notebooks para jogos que não precisa combater nenhuma latência de acordo com o LatencyMon. Pelo menos, a ferramenta não foi capaz de identificar nenhuma latência excepcionalmente alta em nosso teste - muito bom! Nosso vídeo 4K/60 fps do YouTube foi reproduzido sem problemas e sem queda de quadros. Somente o Lenovo Legion Pro 5 16teve um desempenho semelhante nesse campo.
| DPC Latencies / LatencyMon - interrupt to process latency (max), Web, Youtube, Prime95 | |
| MSI Stealth 16 Studio A13VG | |
| HP Victus 16-r0077ng | |
| HP Omen Transcend 16 | |
| Acer Nitro 16 AN16-41 | |
| Schenker XMG CORE 16 (L23) | |
| Lenovo Legion Pro 5 16ARX8 | |
* ... menor é melhor
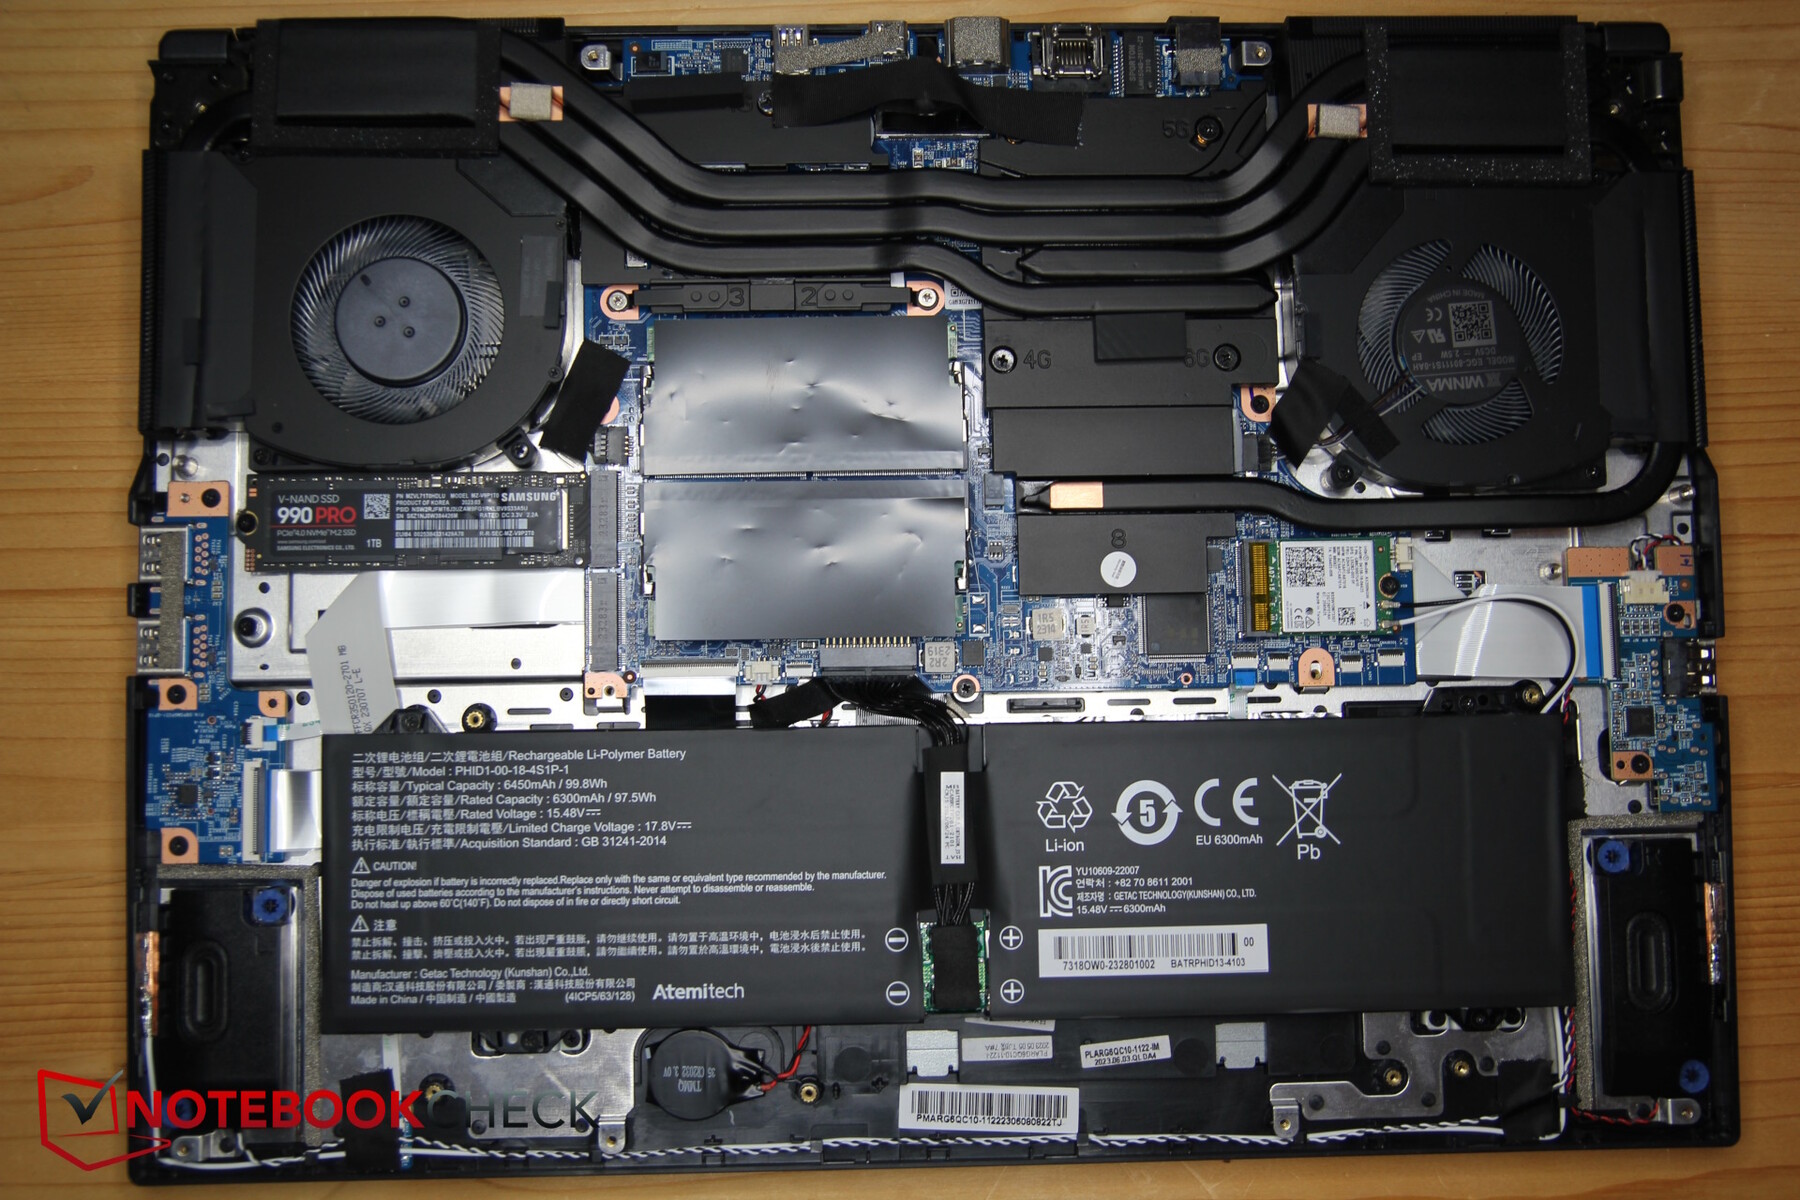
Dispositivos de armazenamento
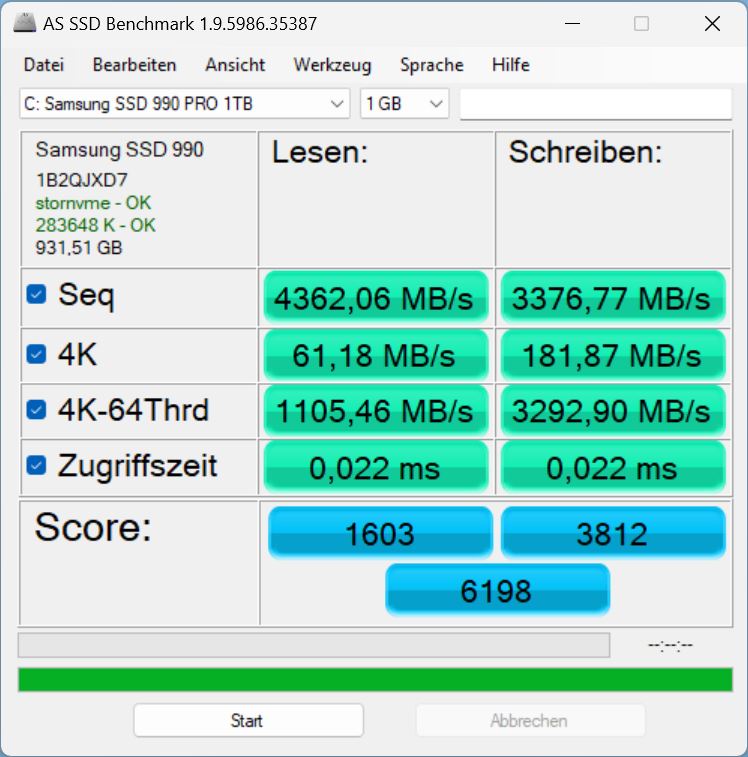
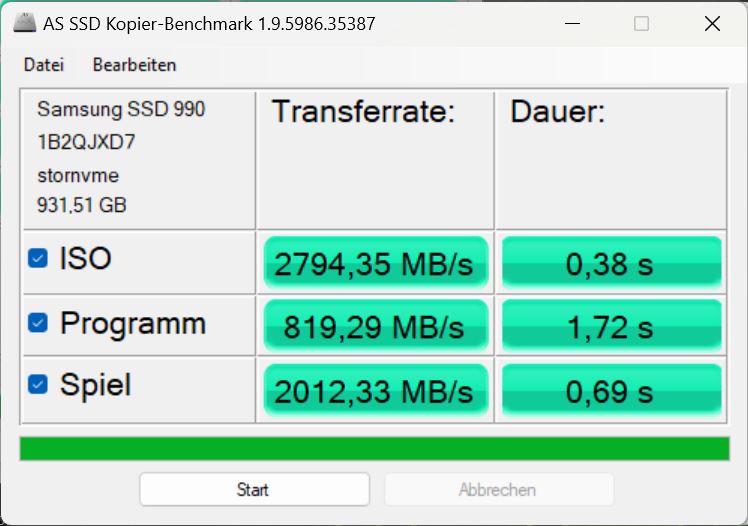
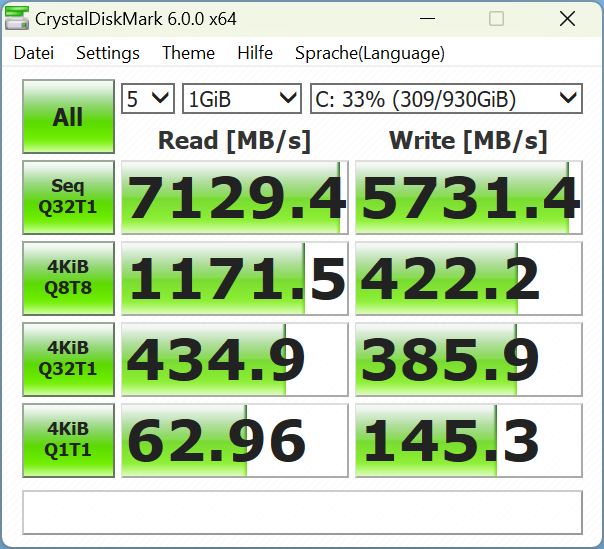
A Schenker instalou um Samsung 990 Pro de 1 TB no dispositivo. Esse SSD é um dos modelos mais rápidos disponíveis - em nossaLista dos melhores SSDs,ele ocupa o 4º lugar. No Core 16, ele não é usado em todo o seu potencial, mas ainda é extremamente rápido. Além disso, seu desempenho permanece consistente durante um longo período de tempo, em contraste com a SSD igualmente rápida doLenovo Legion Pro 5 16.

* ... menor é melhor
Reading continuous performance: DiskSpd Read Loop, Queue Depth 8
Placa de vídeo
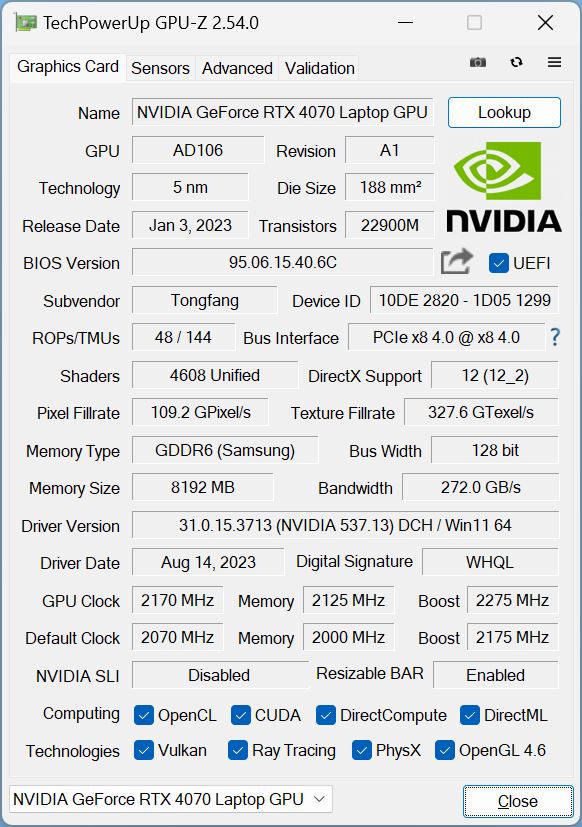
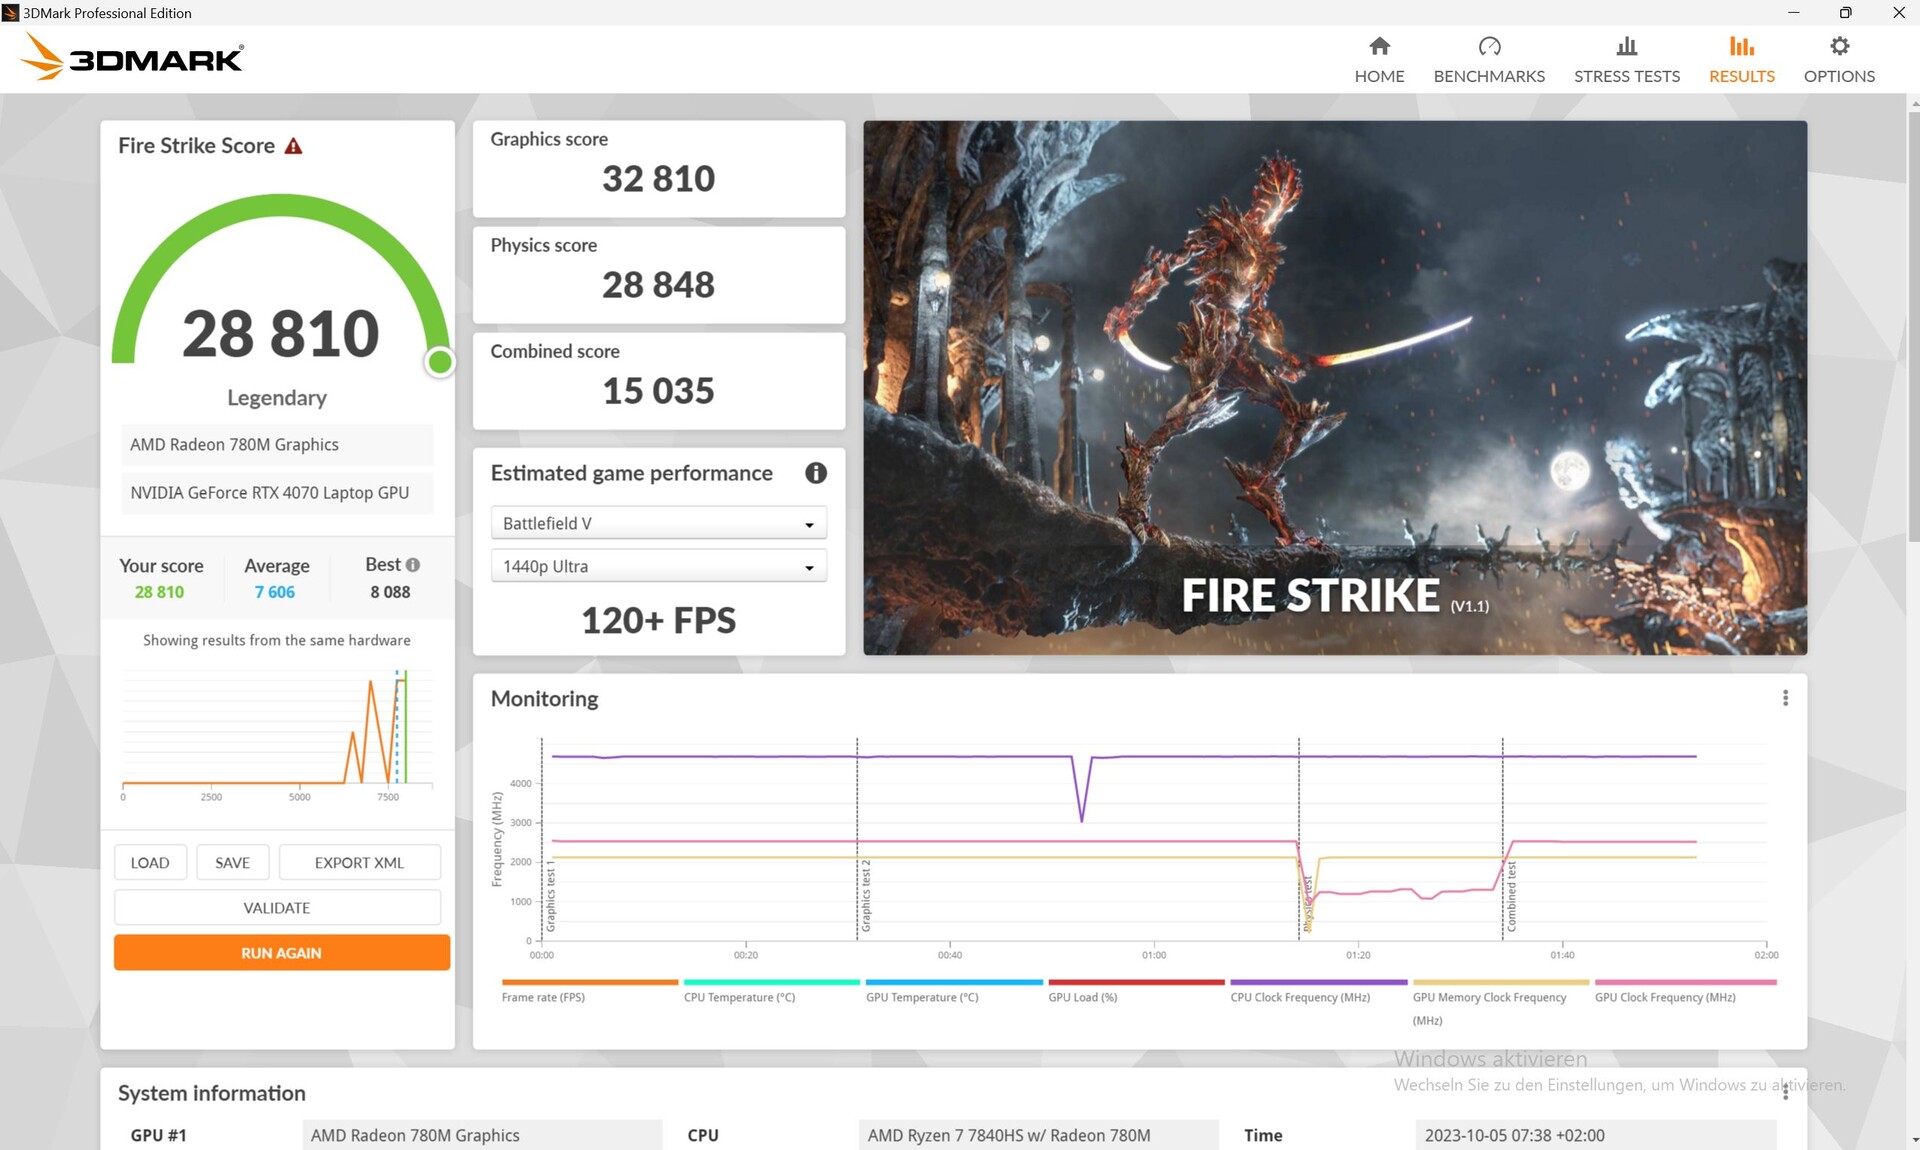
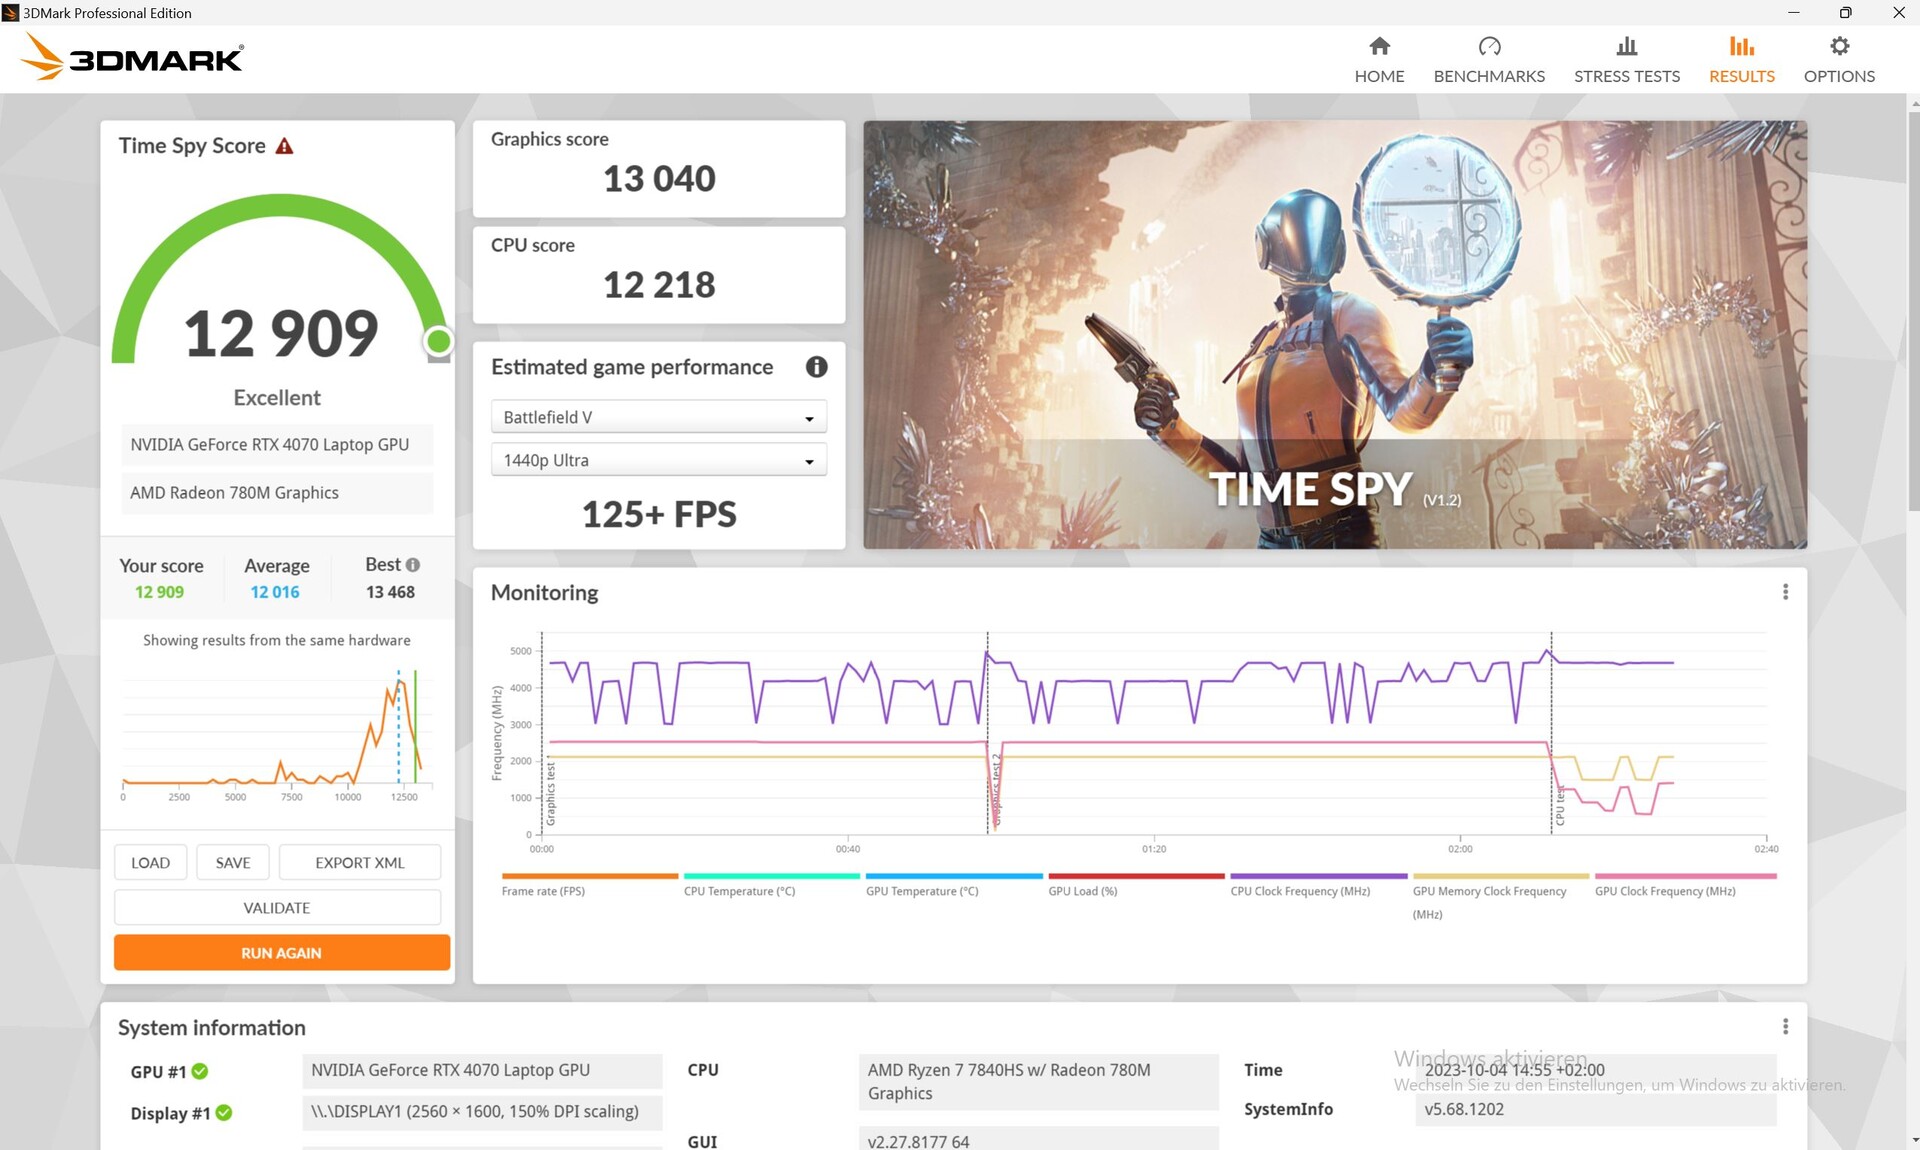
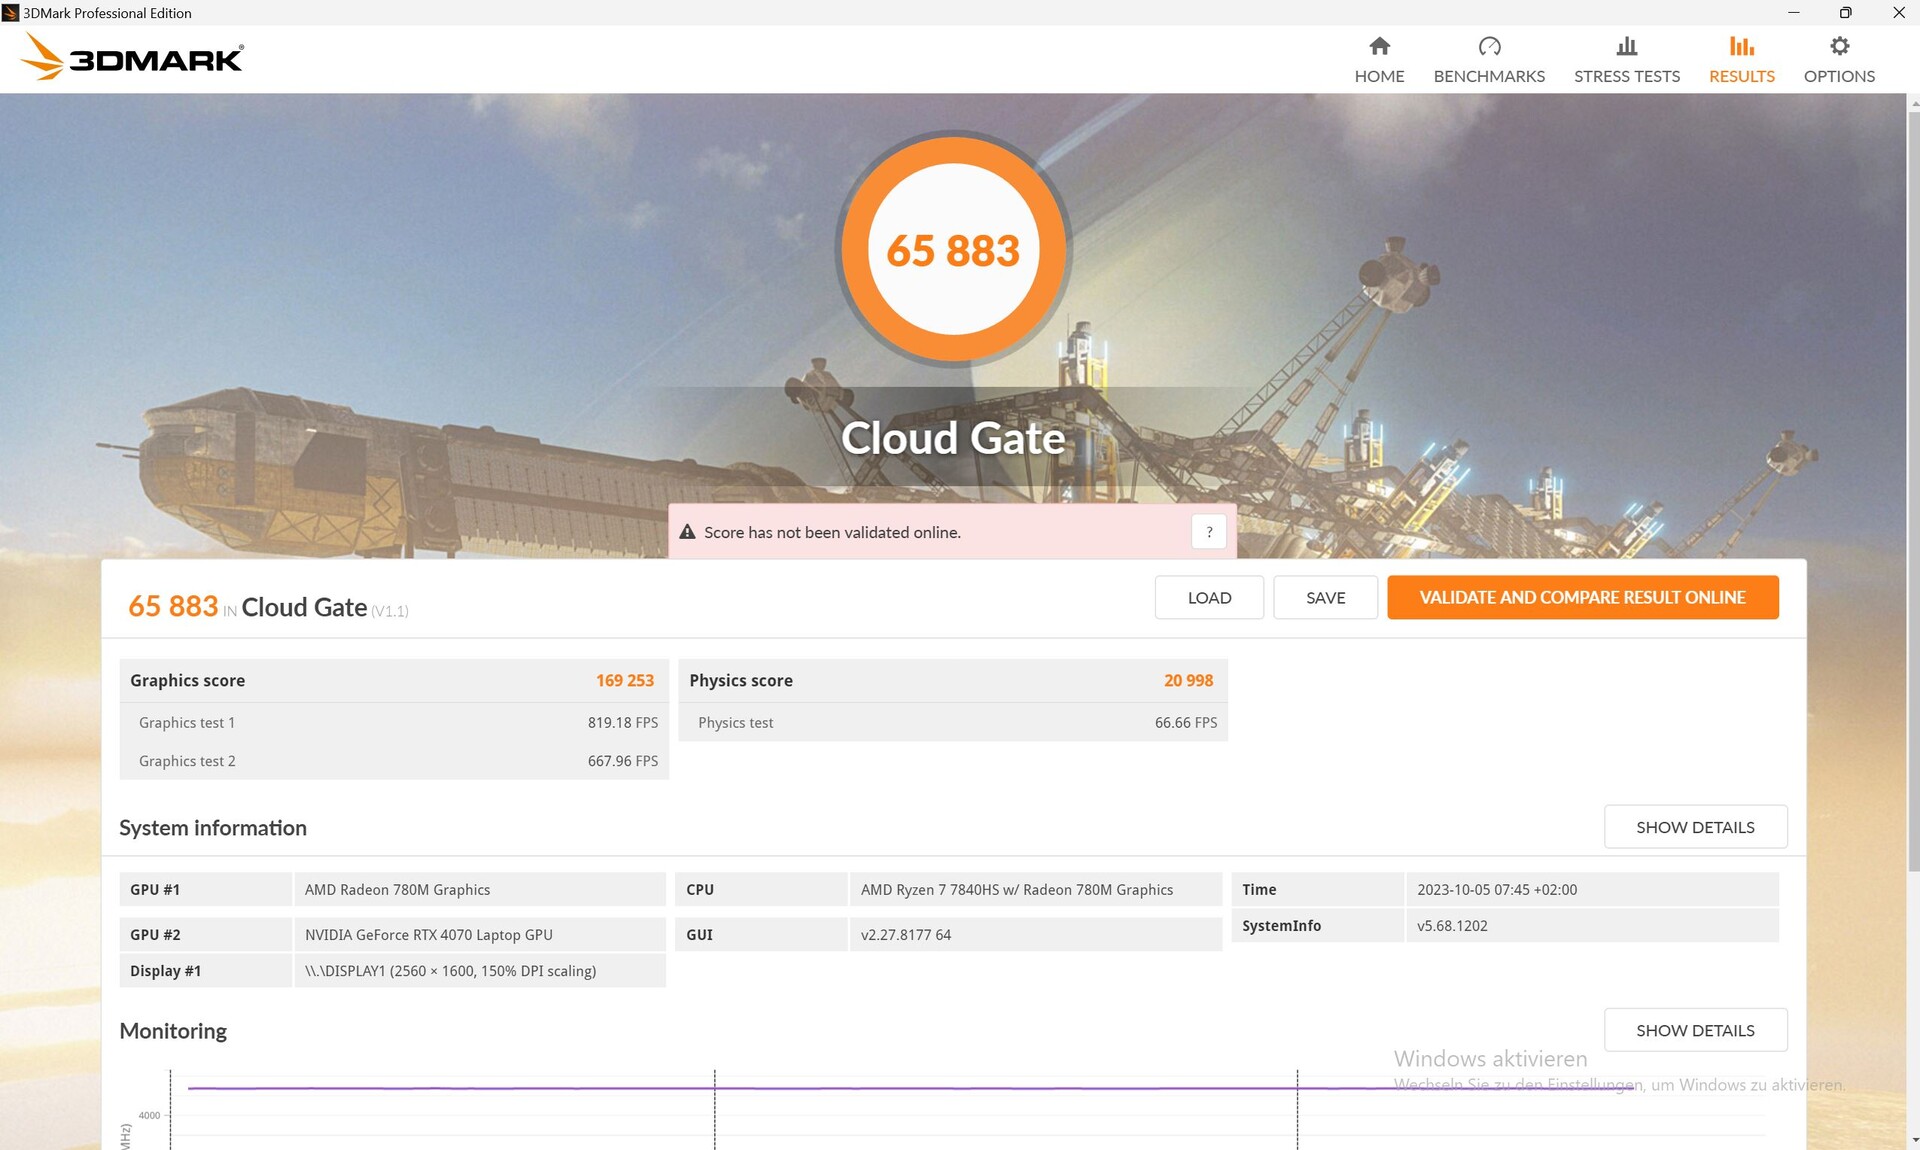
AGPU para laptop NVIDIA GeForce RTX 4070é capaz de aproveitar a potência total de 140 watts (115 watts + 25 watts de Dynamic Boost). Como alternativa, o senhor pode obter o laptop por um pouco menos com umaRTX 4060. No 3DMarks sintético, o Core 16 assumiu a liderança sobre seus concorrentes - seu desempenho ficou cerca de 13% acima da média típica do RTX 4070 em nosso banco de dados.
No modo de bateria, restaram apenas 16.407 pontos dos 32.810 pontos originais alcançados quando executamos o Fire Strike novamente - um declínio de 50 por cento.
O Core 16 também é rápido nos jogos, mas não ficou em primeiro lugar desta vez. Isso provavelmente se deve aos jogos que exigem muito da CPU, como o DOTA 2. Aqui, vários concorrentes obtiveram melhor desempenho da CPU.
No modo Balanced, ele se comportou de forma estranha ao executar o The Witcher 3: o jogo rodou a cerca de 117 fps, o que é quase tão rápido quanto em overdrive. Isso também significa que as ventoinhas não ficaram mais silenciosas. Após cerca de um minuto, a taxa de quadros caiu repentinamente para 30 e as ventoinhas produziram apenas emissões de ruído de 28 dB. Parece que esse modo não está totalmente otimizado.
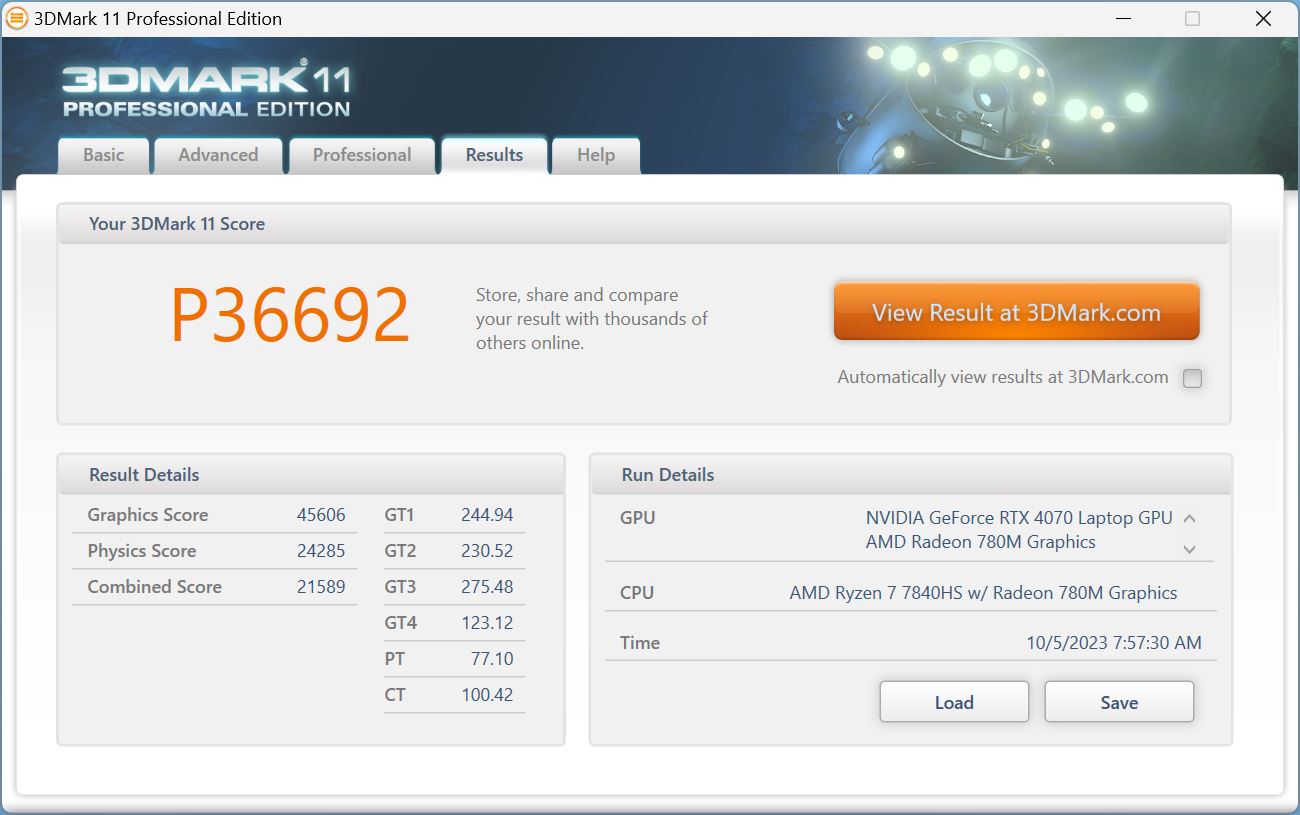
| 3DMark 11 Performance | 36692 pontos | |
| 3DMark Cloud Gate Standard Score | 65883 pontos | |
| 3DMark Fire Strike Score | 28810 pontos | |
| 3DMark Time Spy Score | 12909 pontos | |
Ajuda | ||
* ... menor é melhor
| Performance rating - Percent | |
| Média da turma Gaming | |
| Lenovo Legion Pro 5 16ARX8 | |
| HP Omen Transcend 16 -2! | |
| MSI Stealth 16 Studio A13VG | |
| Schenker XMG CORE 16 (L23) | |
| HP Victus 16-r0077ng | |
| Acer Nitro 16 AN16-41 | |
| The Witcher 3 - 1920x1080 Ultra Graphics & Postprocessing (HBAO+) | |
| Média da turma Gaming (104.7 - 240, n=7, últimos 2 anos) | |
| Schenker XMG CORE 16 (L23) | |
| Lenovo Legion Pro 5 16ARX8 | |
| MSI Stealth 16 Studio A13VG | |
| HP Victus 16-r0077ng | |
| Acer Nitro 16 AN16-41 | |
| HP Omen Transcend 16 | |
| GTA V - 1920x1080 Highest AA:4xMSAA + FX AF:16x | |
| Média da turma Gaming (67.1 - 186.9, n=90, últimos 2 anos) | |
| Lenovo Legion Pro 5 16ARX8 | |
| MSI Stealth 16 Studio A13VG | |
| Schenker XMG CORE 16 (L23) | |
| HP Victus 16-r0077ng | |
| Acer Nitro 16 AN16-41 | |
| Final Fantasy XV Benchmark - 1920x1080 High Quality | |
| Média da turma Gaming (64.2 - 215, n=91, últimos 2 anos) | |
| Schenker XMG CORE 16 (L23) | |
| Lenovo Legion Pro 5 16ARX8 | |
| MSI Stealth 16 Studio A13VG | |
| HP Victus 16-r0077ng | |
| Acer Nitro 16 AN16-41 | |
| Strange Brigade - 1920x1080 ultra AA:ultra AF:16 | |
| Média da turma Gaming (113.6 - 458, n=83, últimos 2 anos) | |
| Lenovo Legion Pro 5 16ARX8 | |
| Schenker XMG CORE 16 (L23) | |
| HP Omen Transcend 16 | |
| MSI Stealth 16 Studio A13VG | |
| Acer Nitro 16 AN16-41 | |
| HP Victus 16-r0077ng | |
| Dota 2 Reborn - 1920x1080 ultra (3/3) best looking | |
| Lenovo Legion Pro 5 16ARX8 | |
| HP Omen Transcend 16 | |
| Média da turma Gaming (84.8 - 252, n=104, últimos 2 anos) | |
| MSI Stealth 16 Studio A13VG | |
| Schenker XMG CORE 16 (L23) | |
| HP Victus 16-r0077ng | |
| Acer Nitro 16 AN16-41 | |
Witcher 3 FPS diagram
| baixo | média | alto | ultra | QHD | 4K | |
|---|---|---|---|---|---|---|
| GTA V (2015) | 185.4 | 174.1 | 116.1 | |||
| The Witcher 3 (2015) | 364.2 | 291.5 | 245.2 | 120 | 92 | |
| Dota 2 Reborn (2015) | 161.2 | 153.5 | 142.2 | 134.8 | 136.9 | |
| Final Fantasy XV Benchmark (2018) | 215 | 171.4 | 124.8 | 91 | ||
| X-Plane 11.11 (2018) | 123.7 | 108.3 | 85.5 | 85.7 | ||
| Strange Brigade (2018) | 367 | 302 | 249 | 218 | ||
| Hogwarts Legacy (2023) | 77.2 | 55.3 |
Emissões e potência - O Core 16 com resistência
Emissões de ruído
No modo inativo, as ventoinhas geralmente não giram, especialmente no modo Balanced. Mesmo em overdrive, esse é o caso, mas aqui, às vezes, as ventoinhas também giram rapidamente.
Sob carga, os níveis de ruído do Core 16 aumentam de forma constante e não em grandes saltos. Isso significa que seus níveis de ruído permanecem relativamente baixos sob carga média, como na primeira cena do benchmark 3DMark06.
Durante sessões contínuas de jogos, ele pode ficar um pouco mais barulhento, mas a concorrência atinge níveis de ruído semelhantes - o Acer Nitro 16 Análise do Acer Nitro 16 AN16-41: Um laptop para jogos RTX 4070 com boa duração da bateria realmente fica insuportavelmente alto. O MSI Stealth 16 Studio e especialmente o mais fraco HP Victus 16 permanecem mais silenciosos.
Barulho
| Ocioso |
| 23 / 28.48 / 28.48 dB |
| Carga |
| 30 / 54.12 dB |
 | ||
30 dB silencioso 40 dB(A) audível 50 dB(A) ruidosamente alto |
||
min: | ||
| Schenker XMG CORE 16 (L23) GeForce RTX 4070 Laptop GPU, R7 7840HS, Samsung 990 Pro 1 TB | Lenovo Legion Pro 5 16ARX8 GeForce RTX 4070 Laptop GPU, R7 7745HX, Samsung PM9A1 MZVL21T0HCLR | Acer Nitro 16 AN16-41 GeForce RTX 4070 Laptop GPU, R7 7735HS, Samsung PM9A1 MZVL21T0HCLR | HP Omen Transcend 16 GeForce RTX 4070 Laptop GPU, i9-13900HX, SK hynix PC801 HFS002TEJ9X101N | MSI Stealth 16 Studio A13VG GeForce RTX 4070 Laptop GPU, i7-13700H, Micron 3400 2TB MTFDKBA2T0TFH | HP Victus 16-r0077ng GeForce RTX 4070 Laptop GPU, i7-13700H, Kioxia XG8 KXG80ZNV1T02 | |
|---|---|---|---|---|---|---|
| Noise | 5% | -6% | -12% | 5% | -8% | |
| desligado / ambiente * (dB) | 23 | 23.2 -1% | 25.7 -12% | 22.9 -0% | 24 -4% | 25 -9% |
| Idle Minimum * (dB) | 23 | 23.2 -1% | 25.7 -12% | 29.1 -27% | 24 -4% | 28 -22% |
| Idle Average * (dB) | 28.48 | 23.2 19% | 25.7 10% | 29.1 -2% | 24 16% | 29 -2% |
| Idle Maximum * (dB) | 28.48 | 26.2 8% | 26.3 8% | 29.1 -2% | 24 16% | 30 -5% |
| Load Average * (dB) | 30 | 31.4 -5% | 33.9 -13% | 45.7 -52% | 34.81 -16% | 43 -43% |
| Witcher 3 ultra * (dB) | 54.12 | 48.4 11% | 54.3 -0% | 44.05 19% | 46 15% | |
| Load Maximum * (dB) | 54.12 | 53.8 1% | 62 -15% | 54.3 -0% | 51.57 5% | 48 11% |
* ... menor é melhor
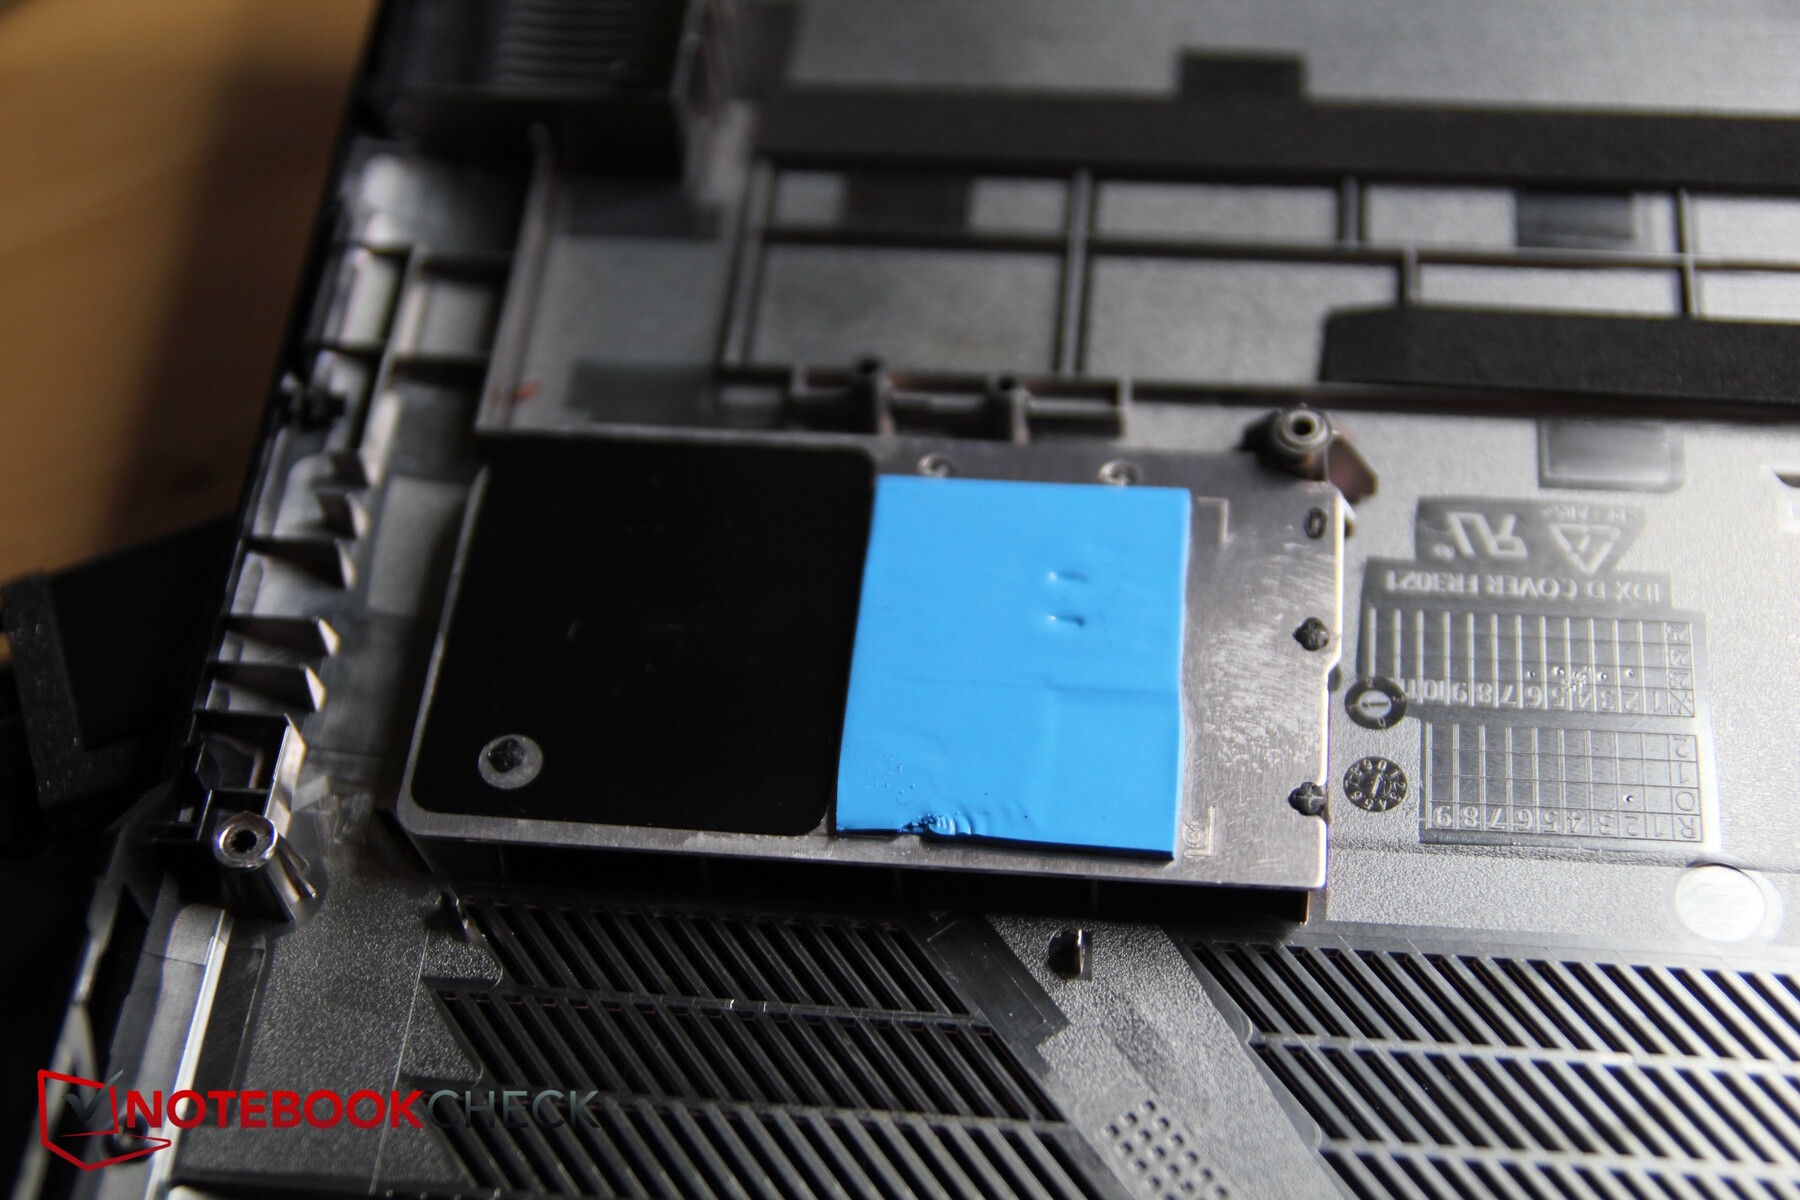
Temperatura
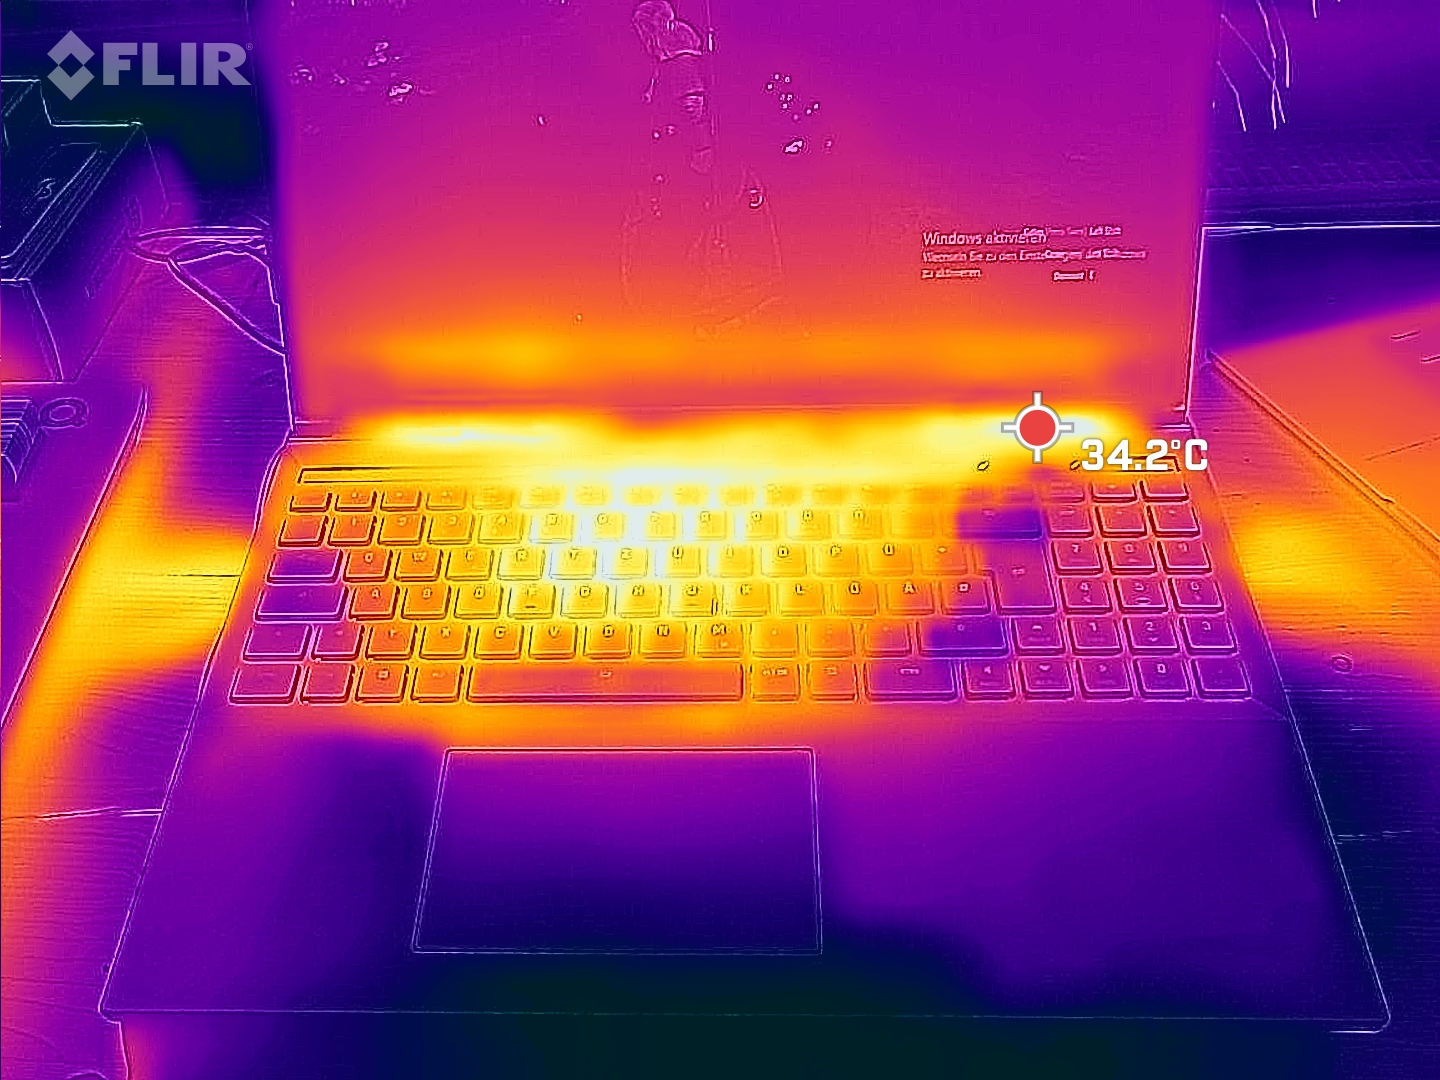
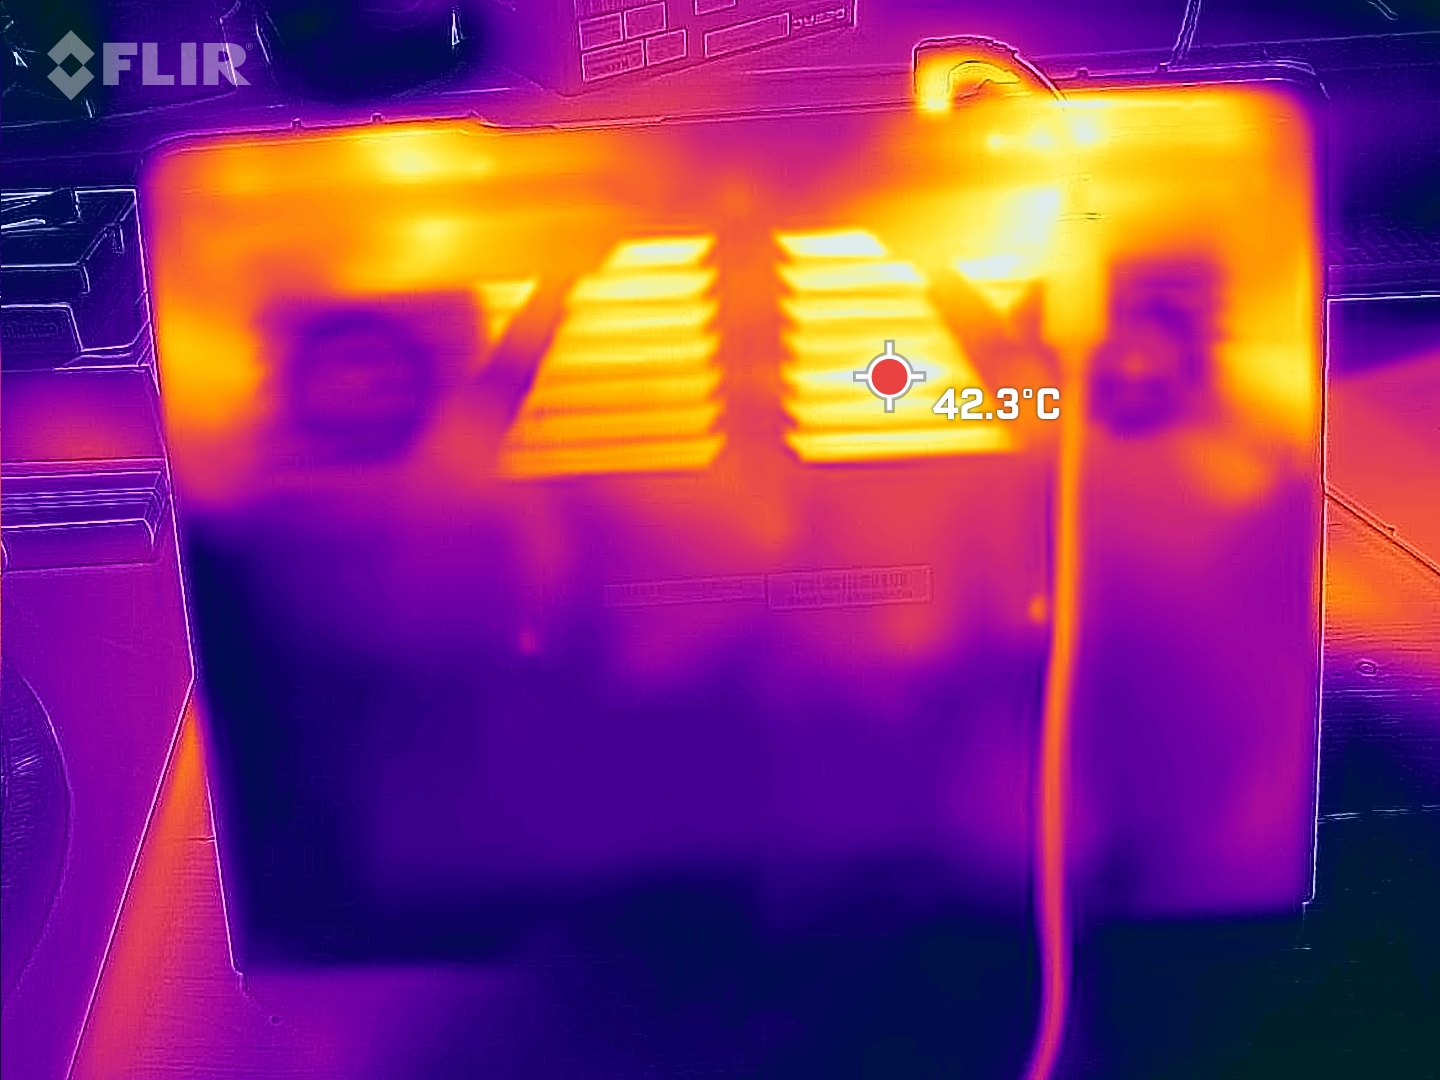
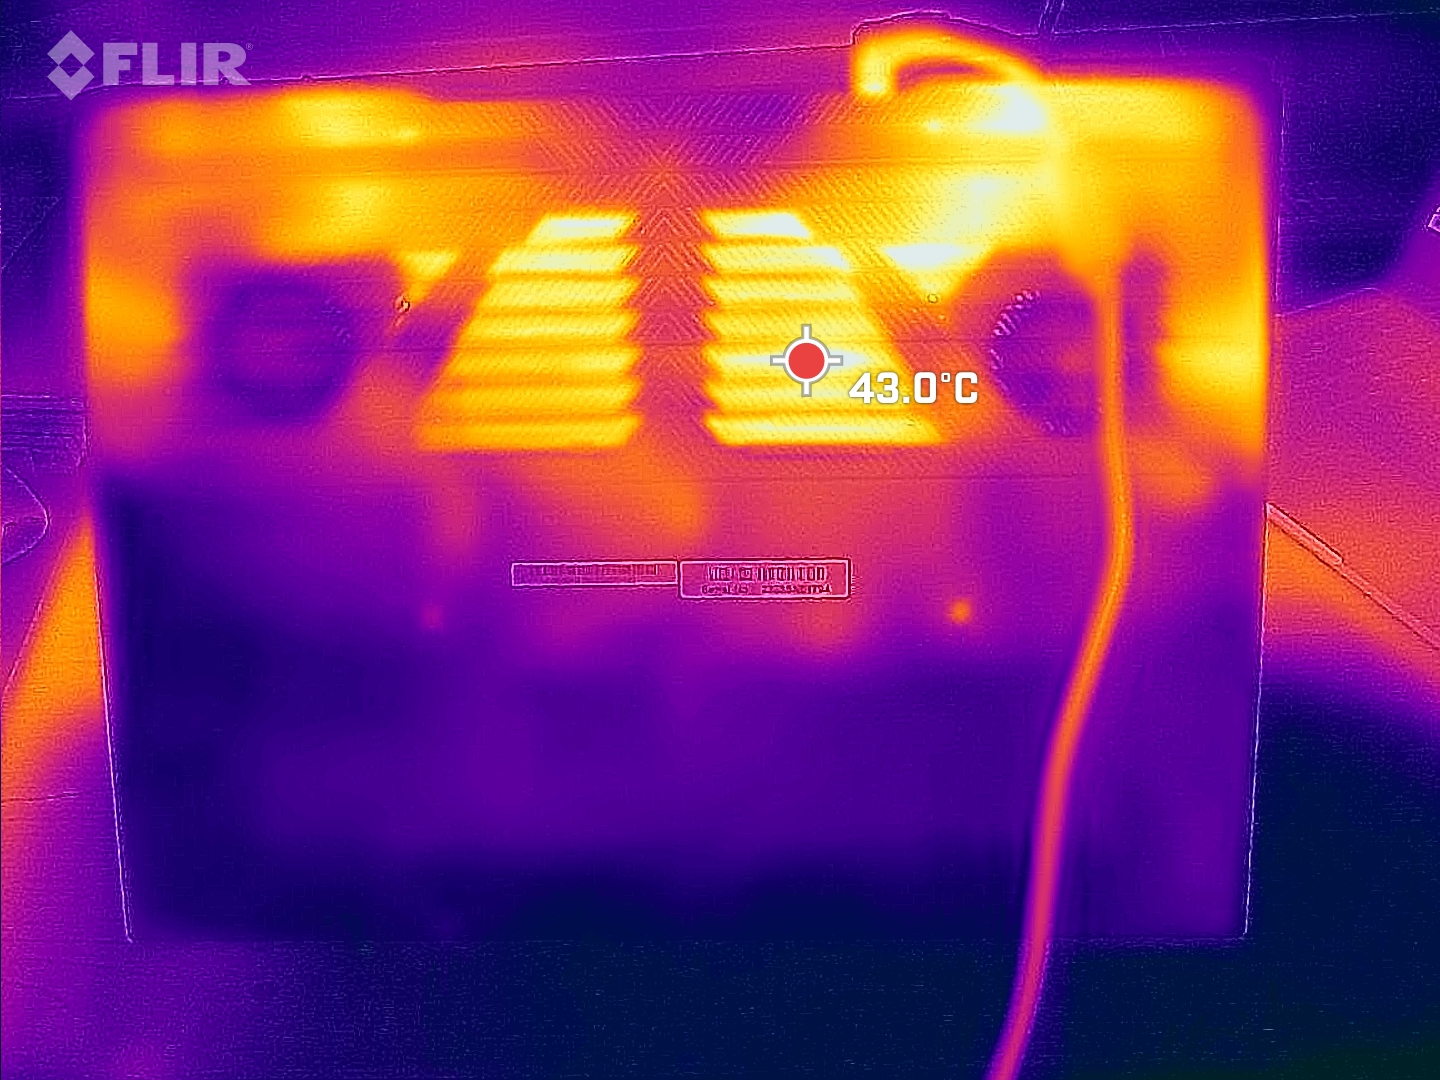
A Schenker enfatiza que usa pasta térmica de metal líquido. O Core 16 nunca aquece adequadamente - medimos pontos quentes de 46 °C em torno do centro da parte traseira sob carga contínua. O lado esquerdo e as teclas WASD parecem ficar um pouco mais quentes do que o lado direito. 39 °C sob carga ainda é suficiente.
(-) A temperatura máxima no lado superior é 46 °C / 115 F, em comparação com a média de 40.4 °C / 105 F , variando de 21.2 a 68.8 °C para a classe Gaming.
(±) A parte inferior aquece até um máximo de 44 °C / 111 F, em comparação com a média de 43.2 °C / 110 F
(+) Em uso inativo, a temperatura média para o lado superior é 29.7 °C / 85 F, em comparação com a média do dispositivo de 33.9 °C / ### class_avg_f### F.
(±) Jogando The Witcher 3, a temperatura média para o lado superior é 35 °C / 95 F, em comparação com a média do dispositivo de 33.9 °C / ## #class_avg_f### F.
(+) Os apoios para as mãos e o touchpad são mais frios que a temperatura da pele, com um máximo de 27 °C / 80.6 F e, portanto, são frios ao toque.
(±) A temperatura média da área do apoio para as mãos de dispositivos semelhantes foi 28.8 °C / 83.8 F (+1.8 °C / 3.2 F).

| Schenker XMG CORE 16 (L23) AMD Ryzen 7 7840HS, NVIDIA GeForce RTX 4070 Laptop GPU | Lenovo Legion Pro 5 16ARX8 AMD Ryzen 7 7745HX, NVIDIA GeForce RTX 4070 Laptop GPU | Acer Nitro 16 AN16-41 AMD Ryzen 7 7735HS, NVIDIA GeForce RTX 4070 Laptop GPU | HP Omen Transcend 16 Intel Core i9-13900HX, NVIDIA GeForce RTX 4070 Laptop GPU | MSI Stealth 16 Studio A13VG Intel Core i7-13700H, NVIDIA GeForce RTX 4070 Laptop GPU | HP Victus 16-r0077ng Intel Core i7-13700H, NVIDIA GeForce RTX 4070 Laptop GPU | |
|---|---|---|---|---|---|---|
| Heat | 8% | -3% | -1% | -26% | -10% | |
| Maximum Upper Side * (°C) | 46 | 41.8 9% | 41.5 10% | 47.4 -3% | 60 -30% | 51 -11% |
| Maximum Bottom * (°C) | 44 | 41.4 6% | 51.8 -18% | 54.4 -24% | 61 -39% | 54 -23% |
| Idle Upper Side * (°C) | 32 | 29 9% | 31.6 1% | 28.4 11% | 38.2 -19% | 37 -16% |
| Idle Bottom * (°C) | 33 | 30.4 8% | 34.5 -5% | 29.2 12% | 37.7 -14% | 29 12% |
* ... menor é melhor
Alto-falantes
Os alto-falantes estéreo não apresentam alto volume, muitos graves ou graves e médios equilibrados. Apenas os agudos são equilibrados e lineares. Deve-se usar fones de ouvido ou um sistema externo para obter uma melhor experiência de áudio. Há uma entrada para fone de ouvido e uma entrada para microfone disponíveis para conectar os primeiros.
Schenker XMG CORE 16 (L23) análise de áudio
(±) | o volume do alto-falante é médio, mas bom (###valor### dB)
Graves 100 - 315Hz
(-) | quase nenhum baixo - em média 21.6% menor que a mediana
(±) | a linearidade dos graves é média (11.4% delta para a frequência anterior)
Médios 400 - 2.000 Hz
(±) | médios mais altos - em média 5.4% maior que a mediana
(+) | médios são lineares (6.7% delta para frequência anterior)
Altos 2 - 16 kHz
(+) | agudos equilibrados - apenas 2.3% longe da mediana
(+) | os máximos são lineares (6.6% delta da frequência anterior)
Geral 100 - 16.000 Hz
(±) | a linearidade do som geral é média (17.1% diferença em relação à mediana)
Comparado com a mesma classe
» 46% de todos os dispositivos testados nesta classe foram melhores, 12% semelhantes, 42% piores
» O melhor teve um delta de 6%, a média foi 18%, o pior foi 132%
Comparado com todos os dispositivos testados
» 31% de todos os dispositivos testados foram melhores, 8% semelhantes, 61% piores
» O melhor teve um delta de 4%, a média foi 23%, o pior foi 134%
Lenovo Legion Pro 5 16ARX8 análise de áudio
(±) | o volume do alto-falante é médio, mas bom (###valor### dB)
Graves 100 - 315Hz
(-) | quase nenhum baixo - em média 24% menor que a mediana
(±) | a linearidade dos graves é média (13.4% delta para a frequência anterior)
Médios 400 - 2.000 Hz
(+) | médios equilibrados - apenas 4.7% longe da mediana
(+) | médios são lineares (6.2% delta para frequência anterior)
Altos 2 - 16 kHz
(+) | agudos equilibrados - apenas 2.5% longe da mediana
(+) | os máximos são lineares (6.2% delta da frequência anterior)
Geral 100 - 16.000 Hz
(±) | a linearidade do som geral é média (21.9% diferença em relação à mediana)
Comparado com a mesma classe
» 79% de todos os dispositivos testados nesta classe foram melhores, 6% semelhantes, 16% piores
» O melhor teve um delta de 6%, a média foi 18%, o pior foi 132%
Comparado com todos os dispositivos testados
» 63% de todos os dispositivos testados foram melhores, 7% semelhantes, 30% piores
» O melhor teve um delta de 4%, a média foi 23%, o pior foi 134%
Consumo de energia
No modo inativo, o consumo de energia é moderado - estamos acostumados a valores mais altos nos últimos modelos XMG. Durante os jogos, o consumo está vinculado ao desempenho, e é por isso que esse laptop está entre osLenovo Legion Pro 5e o HP Omen Transcend 16por um lado, e entre o MSI Stealth 16 Studioe o HP Victus 16por outro.
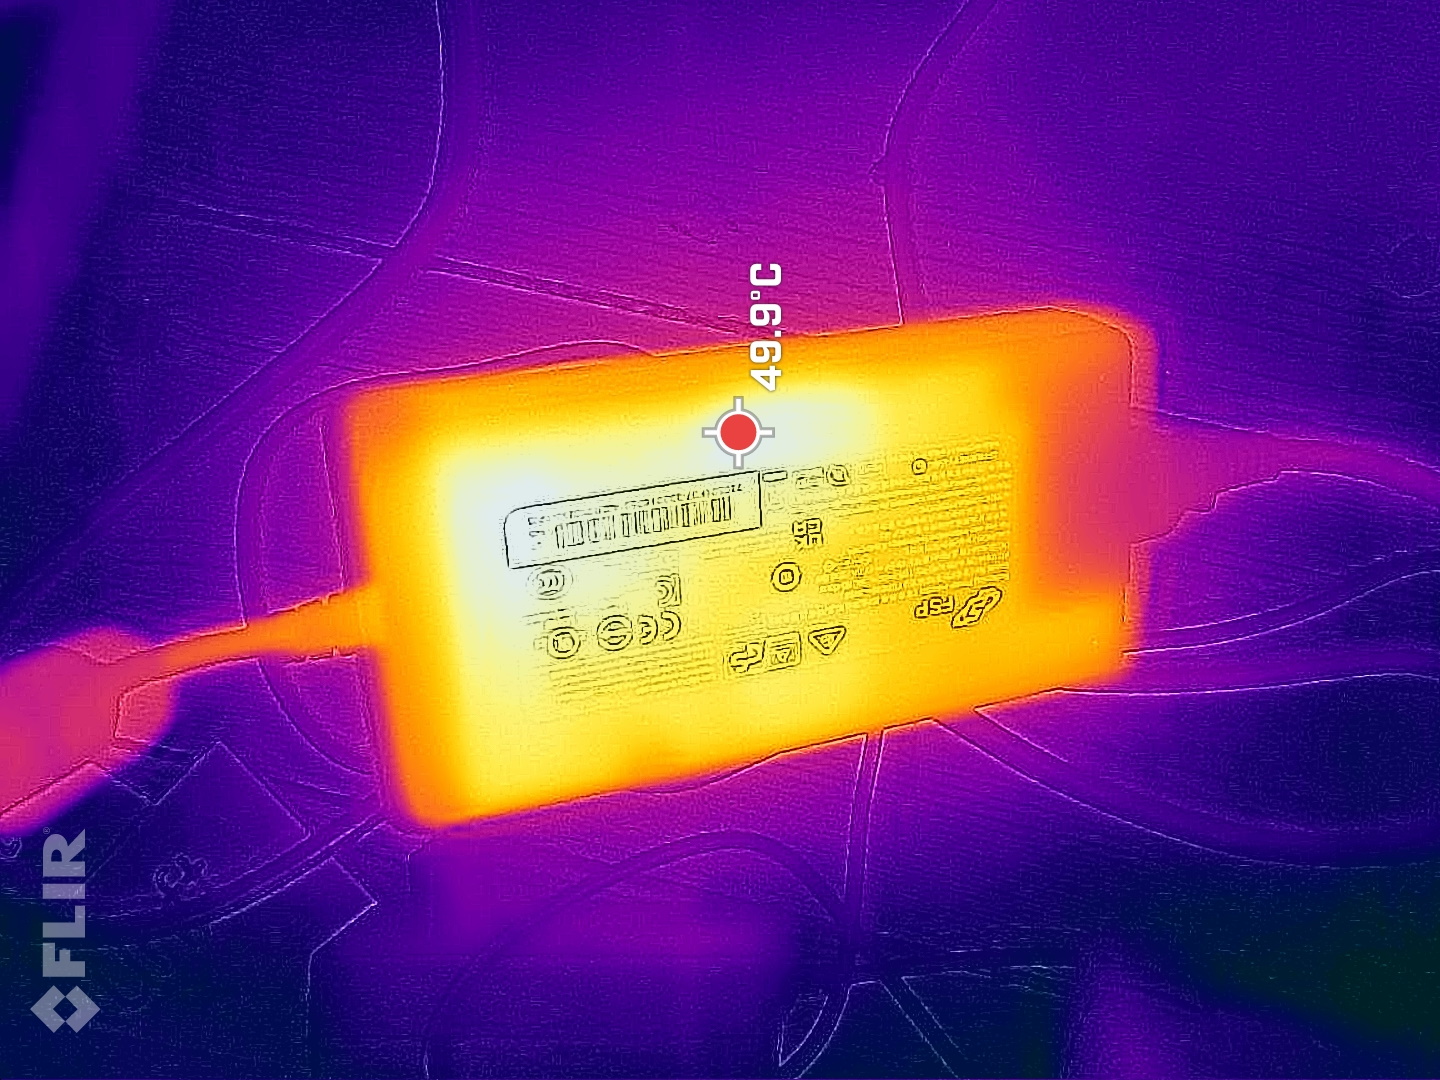
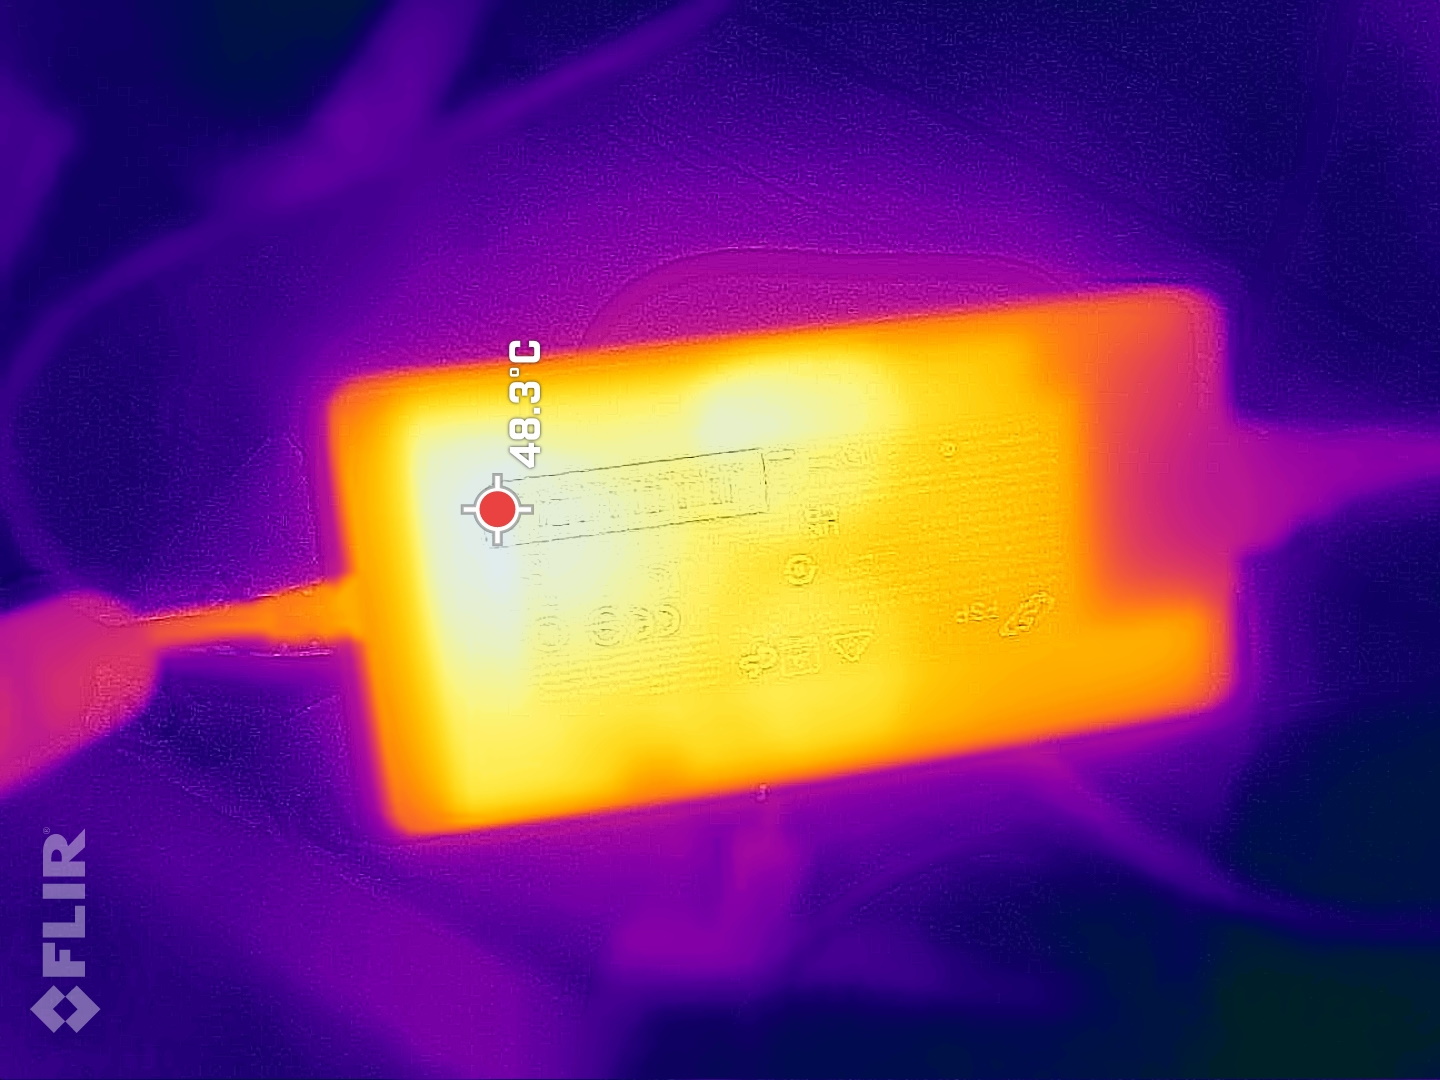
Medimos um consumo máximo a curto prazo de 280 watts - a fonte de alimentação de 230 watts (agora FSP em vez de LiteOn) pode ter um pouco de dificuldade com isso. No entanto, o Core consome uma média de 179 watts ao executar o Witcher 3 em Full HD Ultra, o que significa que a fonte de alimentação deve ter reservas suficientes para jogos e sempre pode carregar o laptop de forma confiável. No entanto, medimos um consumo que ficou constantemente acima de 230 watts nos primeiros minutos do teste de estresse - veja a curva abaixo.
| desligado | |
| Ocioso | |
| Carga |
|
Key:
min: | |
| Schenker XMG CORE 16 (L23) R7 7840HS, GeForce RTX 4070 Laptop GPU, Samsung 990 Pro 1 TB, IPS, 2560x1600, 16" | Lenovo Legion Pro 5 16ARX8 R7 7745HX, GeForce RTX 4070 Laptop GPU, Samsung PM9A1 MZVL21T0HCLR, IPS, 2560x1600, 16" | Acer Nitro 16 AN16-41 R7 7735HS, GeForce RTX 4070 Laptop GPU, Samsung PM9A1 MZVL21T0HCLR, IPS, 2560x1600, 16" | HP Omen Transcend 16 i9-13900HX, GeForce RTX 4070 Laptop GPU, SK hynix PC801 HFS002TEJ9X101N, Mini-LED, 2560x1600, 16" | MSI Stealth 16 Studio A13VG i7-13700H, GeForce RTX 4070 Laptop GPU, Micron 3400 2TB MTFDKBA2T0TFH, IPS, 2560x1600, 16" | HP Victus 16-r0077ng i7-13700H, GeForce RTX 4070 Laptop GPU, Kioxia XG8 KXG80ZNV1T02, IPS, 1920x1080, 16.1" | Média NVIDIA GeForce RTX 4070 Laptop GPU | Média da turma Gaming | |
|---|---|---|---|---|---|---|---|---|
| Power Consumption | -26% | -19% | -82% | -6% | 1% | -25% | -33% | |
| Idle Minimum * (Watt) | 11 | 8.1 26% | 11.6 -5% | 19.2 -75% | 11 -0% | 8 27% | 13.2 ? -20% | 13.1 ? -19% |
| Idle Average * (Watt) | 15.2 | 15.9 -5% | 15.6 -3% | 22.7 -49% | 18 -18% | 13 14% | 18.2 ? -20% | 19 ? -25% |
| Idle Maximum * (Watt) | 16 | 37.2 -133% | 16.5 -3% | 55.4 -246% | 19 -19% | 22 -38% | 24.6 ? -54% | 24.6 ? -54% |
| Load Average * (Watt) | 64 | 90.9 -42% | 155 -142% | 128.4 -101% | 91 -42% | 86 -34% | 97 ? -52% | 111.3 ? -74% |
| Witcher 3 ultra * (Watt) | 179 | 189.6 -6% | 154.8 14% | 206 -15% | 130 27% | 141.8 21% | ||
| Load Maximum * (Watt) | 280 | 263.5 6% | 205 27% | 292 -4% | 228 19% | 233 17% | 221 ? 21% | 260 ? 7% |
* ... menor é melhor
Power consumption Witcher 3 / stress test
Power consumption with external monitor
Tempos de execução
A Schenker instalou uma bateria de 99 Wh no laptop. OLenovo Legion Pro 5 16possui apenas um modelo de 80 Wh, mas alguns concorrentes, como o MSI Stealth 16ou o HP Omen Transcend 16têm baterias com a mesma capacidade.
Mesmo assim, não temos um modo de economia de energia no Control Center - o modo balanceado é o modo mais baixo disponível. Nosso filme codificado em H.264 foi reproduzido em um loop contínuo por mais de 8 horas com brilho reduzido. O Core também alcançou quase 8,5 horas no teste WLAN a 150 nits. Somente o Acer Nitro 16 conseguiu acompanhar o senhor.
| Schenker XMG CORE 16 (L23) R7 7840HS, GeForce RTX 4070 Laptop GPU, 99 Wh | Lenovo Legion Pro 5 16ARX8 R7 7745HX, GeForce RTX 4070 Laptop GPU, 80 Wh | Acer Nitro 16 AN16-41 R7 7735HS, GeForce RTX 4070 Laptop GPU, 90 Wh | HP Omen Transcend 16 i9-13900HX, GeForce RTX 4070 Laptop GPU, 97 Wh | MSI Stealth 16 Studio A13VG i7-13700H, GeForce RTX 4070 Laptop GPU, 99.9 Wh | HP Victus 16-r0077ng i7-13700H, GeForce RTX 4070 Laptop GPU, 83 Wh | Média da turma Gaming | |
|---|---|---|---|---|---|---|---|
| Duração da bateria | -55% | -6% | -50% | -11% | -15% | -24% | |
| H.264 (h) | 10.2 | 10.2 0% | 7.7 -25% | 8.27 ? -19% | |||
| WiFi v1.3 (h) | 8.4 | 4 -52% | 9 7% | 4.2 -50% | 7.8 -7% | 7.1 -15% | 7.08 ? -16% |
| Load (h) | 2.4 | 1 -58% | 1.8 -25% | 1.2 -50% | 2.4 0% | 1.496 ? -38% | |
| Reader / Idle (h) | 6.5 | 12.2 | 6.3 | 11 | 7.84 ? |
Pro
Contra
Veredicto - Um ótimo laptop para jogos sem nenhum ponto fraco importante
os notebooks de 16 polegadas com uma RTX 4070 começam a partir de cerca de US$ 1.600. Isso não torna o Core 16 totalmente barato (veja abaixo). Por outro lado, ele oferece bom desempenho 3D, um dos SSDs mais rápidos do mercado, um teclado mecânico opcional, um bom painel sRGB de 1.600p com baixos valores DeltaE e muito mais. É um laptop para jogos bem completo, cujo desempenho é perfeito. Para obter níveis de desempenho ainda melhores, teria de ser um processador HX, pois o RTX 4070 tem um desempenho excelente.
O senhor precisa examinar o dispositivo mais de perto para encontrar algum ponto digno de crítica. Sua fonte de alimentação de 230 watts pode ser sobrecarregada em cenários extremos - pelo menos, ela ultrapassou suas especificações por alguns minutos durante nosso teste de estresse. Durante os jogos, isso não foi um problema. Seu modo balanceado ainda não foi aperfeiçoado, o que só funcionou realmente após um minuto de jogo e o desempenho caiu para o nível da bateria.
O XMG Core 16 provou ser um bom laptop para jogos em todos os nossos testes, com sua potente RTX 4070 e tela sRGB muito bem calibrada.
O maior concorrente do Core 16 é oLenovo Legion Pro 5 16ARX8que se saiu igualmente bem em muitas áreas, mas custa menos. Por outro lado, ele não tem tempos de execução tão bons.
Preço e disponibilidade
O senhor pode comprar os laptops de Schenker pelo site bestware.com. Nossa configuração pode ser adquirida por cerca de US$ 2.360.
Schenker XMG CORE 16 (L23)
- 10/05/2023 v7 (old)
Christian Hintze
Transparência
A seleção dos dispositivos a serem analisados é feita pela nossa equipe editorial. A amostra de teste foi fornecida ao autor como empréstimo pelo fabricante ou varejista para fins desta revisão. O credor não teve influência nesta revisão, nem o fabricante recebeu uma cópia desta revisão antes da publicação. Não houve obrigação de publicar esta revisão. Como empresa de mídia independente, a Notebookcheck não está sujeita à autoridade de fabricantes, varejistas ou editores.
É assim que o Notebookcheck está testando
Todos os anos, o Notebookcheck analisa de forma independente centenas de laptops e smartphones usando procedimentos padronizados para garantir que todos os resultados sejam comparáveis. Desenvolvemos continuamente nossos métodos de teste há cerca de 20 anos e definimos padrões da indústria no processo. Em nossos laboratórios de teste, equipamentos de medição de alta qualidade são utilizados por técnicos e editores experientes. Esses testes envolvem um processo de validação em vários estágios. Nosso complexo sistema de classificação é baseado em centenas de medições e benchmarks bem fundamentados, o que mantém a objetividade.Price comparison

