Notebookcheck Logo

Intel Core i9-13900HX

Intel i9-13900HX

O Intel Core i9-13900HX é um processador móvel rápido e de alta qualidade da série Raptor Lake. Ele foi anunciado no início de 2023 e parece ser baseado no processador para desktop Core i9-13000K para desktop, com 24 núcleos e 32 threads combinados. Oito núcleos de desempenho rápido Raptor Cove (núcleos P) com HyperThreading com clock entre 2,2 GHz (base) e 5,4 GHz (aumento de um único núcleo, 4,9 GHz para todos os núcleos) e dezesseis núcleos de eficiência Gracemont sem Hyper-Threading (1,6 - 3,9 GHz).

Em comparação com o Alder Lake, o Raptor Lake oferece P-Cores aprimorados (microarquitetura Raptor Cove) com caches maiores e mais E-Cores (mesma microarquitetura Gracemont). Além disso, o chip suporta memória DDR5 mais rápida (até 5600 MHz para o 13900HX).

Desempenho

A média do 13900HX em nosso banco de dados está na mesma liga que o Core i9-13950HX e o Ryzen 9 7845HXno que diz respeito às pontuações de benchmark multithread. Isso é realmente impressionante, para dizer o mínimo.

Graças à sua solução de resfriamento decente e a um limite de potência da CPU de longo prazo de 99 W, o Eluktronics Mech-17 GP2 está entre os laptops mais rápidos construídos com o 13900HX que conhecemos. Ele pode ser cerca de 50% mais rápido em cargas de trabalho ligadas à CPU do que o sistema mais lento com o mesmo chip em nosso banco de dados, em agosto de 2023.

A CPU ainda é produzida em um processo FinFET de 10nm aprimorado (Intel 7) que permite velocidades de clock mais altas. O consumo de energia é especificado em 55 W de potência base até 157 W de potência máxima. Potência turbo.

SérieIntel Raptor Lake-HX
CodinomeRaptor Lake-HX

Serie: Raptor Lake-HX Raptor Lake-HX

Intel Core i9-13980HX1.6 - 5.6 GHz24 / 32 cores36 MB L3
Intel Core i9-13950HX1.6 - 5.5 GHz24 / 32 cores36 MB L3
Intel Core i9-13900HX « 1.6 - 5.4 GHz24 / 32 cores36 MB L3
Intel Core i7-13850HX1.5 - 5.3 GHz20 / 28 cores30 MB L3
Intel Core i7-13700HX1.5 - 5 GHz16 / 24 cores30 MB L3
Intel Core i7-13650HX1.9 - 4.9 GHz14 / 20 cores24 MB L3
Intel Core i5-13600HX1.9 - 4.8 GHz14 / 20 cores24 MB L3
Intel Core i5-13500HX1.8 - 4.7 GHz14 / 20 cores24 MB L3
Intel Core i5-13450HX1.8 - 4.6 GHz10 / 16 cores20 MB L3
Frequência1600 - 5400 MHz
Cache de Nível 232 MB
Cache de Nível 336 MB
Número de Núcelos / Subprocessos24 / 32
8 x 5.4 GHz Intel Raptor Cove P-Core
16 x 3.9 GHz Intel Gracemont E-Core
Consumo de Energia (TDP = Thermal Design Power)55 Watt
Tecnologia de Produção10 nm
Tamanho da Matriz257 mm2
Tempratura Máx.100 °C
ConectorBGA1964
CaracterísticasDDR4-3200/DDR5-5600 RAM, PCIe 5, Thr. Dir., DL B., GNA, MMX, SSE, SSE2, SSE3, SSSE3, SSE4.1, SSE4.2, AVX, AVX2, BMI2, ABM, FMA, ADX, VMX, SMEP, SMAP, EIST, TM1, TM2, HT, Turbo, SST, AES-NI, RDRAND, RDSEED, SHA
GPUIntel UHD Graphics Xe 32EUs (Tiger Lake-H) ( - 1650 MHz)
64 BitSuporte para 64 Bit
Architecturex86
Data do Anúncio01/04/2023
Link do Produto (externo)ark.intel.com

Benchmarks

Performance Rating - CB R15 + R20 + 7-Zip + X265 + Blender + 3DM11 CPU
53.1 pt (74%)
Cinebench R23 - Cinebench R23 Multi Core
min: 24270     avg: 28225     median: 27844 (26%)     max: 32623 Points
Cinebench R23 - Cinebench R23 Single Core
min: 1867     avg: 2044     median: 2055 (87%)     max: 2105 Points
Cinebench R20 - Cinebench R20 CPU (Single Core)
min: 722     avg: 784     median: 785.5 (87%)     max: 810 Points
Cinebench R20 - Cinebench R20 CPU (Multi Core)
min: 9152     avg: 10766     median: 10548 (26%)     max: 12541 Points
Cinebench R15 - Cinebench R15 CPU Multi 64 Bit
min: 3913     avg: 4522     median: 4487 (28%)     max: 4970 Points
02505007501000125015001750200022502500275030003250350037504000425045004750Tooltip
Cinebench R15 - Cinebench R15 CPU Single 64 Bit
min: 247     avg: 291.7     median: 295 (89%)     max: 304 Points
Cinebench R11.5 - Cinebench R11.5 CPU Multi 64 Bit
min: 49.5     avg: 52.3     median: 52.3 (68%)     max: 55.14 Points
Cinebench R11.5 - Cinebench R11.5 CPU Single 64 Bit
min: 3.64     avg: 3.7     median: 3.7 (91%)     max: 3.67 Points
Cinebench R10 - Cinebench R10 Rend. Single (32bit)
min: 11618     avg: 11700     median: 11699.5 (71%)     max: 11781 pontos
Cinebench R10 - Cinebench R10 Rend. Multi (32bit)
min: 76718     avg: 79300     median: 79299.5 (57%)     max: 81881 pontos
Cinebench R10 - Cinebench R10 Rend. Multi (64bit)
111582 Points (77%)
Cinebench R10 - Cinebench R10 Rend. Single (64bit)
17169 Points (21%)
wPrime 2.10 - wPrime 2.0 1024m *
215.7 s (3%)
wPrime 2.10 - wPrime 2.0 32m *
2.6 s (1%)
WinRAR - WinRAR 4.0
min: 12876     avg: 12916     median: 12916 (20%)     max: 12956 pontos
7-Zip 18.03 - 7-Zip 18.03 Multli Thread 4 runs
min: 90675     avg: 111796     median: 114430 (66%)     max: 127283 MIPS
7-Zip 18.03 - 7-Zip 18.03 Single Thread 4 runs
min: 6340     avg: 6848     median: 6892.5 (82%)     max: 7177 MIPS
X264 HD Benchmark 4.0 - x264 Pass 2
217.7 fps (76%)
X264 HD Benchmark 4.0 - x264 Pass 1
387.7 fps (89%)
HWBOT x265 Benchmark v2.2 - HWBOT x265 4k Preset
min: 23.5     avg: 29.1     median: 29.4 (52%)     max: 34.4 fps
051015202530354045Tooltip
TrueCrypt - TrueCrypt Serpent
min: 2.1     avg: 2.3     median: 2.3 (0%)     max: 2.4 GB/s
TrueCrypt - TrueCrypt Twofish
min: 4.1     avg: 4.3     median: 4.3 (73%)     max: 4.4 GB/s
TrueCrypt - TrueCrypt AES
min: 15.2     avg: 17     median: 17 (44%)     max: 18.8 GB/s
Blender - Blender 3.3 Classroom CPU *
min: 175     avg: 210.7     median: 202 (3%)     max: 275 Seconds
Blender - Blender 2.79 BMW27 CPU *
min: 101     avg: 117.9     median: 114 (1%)     max: 153 Seconds
R Benchmark 2.5 - R Benchmark 2.5 *
min: 0.375     avg: 0.4     median: 0.4 (9%)     max: 0.4564 sec
3DMark 06 - CPU - 3DMark 06 - CPU
min: 16591     avg: 17802     median: 18036.5 (38%)     max: 18235 Points
Super Pi mod 1.5 XS 1M - Super Pi mod 1.5 XS 1M *
min: 6.2     avg: 6.2     median: 6.2 (1%)     max: 6.215 s
Super Pi mod 1.5 XS 2M - Super Pi mod 1.5 XS 2M *
13.4 s (1%)
Super Pi Mod 1.5 XS 32M - Super Pi mod 1.5 XS 32M *
min: 315     avg: 315.1     median: 315.1 (1%)     max: 315.265 s
3DMark Vantage - 3DM Vant. Perf. CPU no Physx
min: 74788     avg: 76276     median: 76275.5 (67%)     max: 77763 Points
3DMark 11 - 3DM11 Performance Physics
min: 19090     avg: 23161     median: 23767 (64%)     max: 25681 Points
3DMark - 3DMark Ice Storm Physics
min: 77043     avg: 86045     median: 83045 (67%)     max: 101046 Points
3DMark - 3DMark Ice Storm Extreme Physics
82808 Points (67%)
3DMark - 3DMark Ice Storm Unlimited Physics
85007 Points (72%)
3DMark - 3DMark Cloud Gate Physics
min: 16532     avg: 21282     median: 21573 (55%)     max: 23984 Points
3DMark - 3DMark Fire Strike Standard Physics
min: 28693     avg: 37016     median: 37598.5 (67%)     max: 43004 Points
3DMark - 3DMark Time Spy CPU
min: 13288     avg: 15195     median: 14988 (63%)     max: 18304 Points
Geekbench 6.2 - Geekbench 6.2 Single-Core
min: 2548     avg: 2720     median: 2720 (83%)     max: 2892 pontos
Geekbench 6.2 - Geekbench 6.2 Multi-Core
min: 15031     avg: 16523     median: 16522.5 (65%)     max: 18014 pontos
Geekbench 5.5 - Geekbench 5.1 - 5.4 64 Bit Single-Core
min: 1345     avg: 1988     median: 2036 (86%)     max: 2093 pontos
Geekbench 5.5 - Geekbench 5.1 - 5.4 64 Bit Multi-Core
min: 17614     avg: 19809     median: 19982 (36%)     max: 21075 pontos
Geekbench 5.0 - Geekbench 5.0 64 Bit Single-Core
min: 1804     avg: 1964     median: 1982 (9%)     max: 2064 pontos
Geekbench 5.0 - Geekbench 5.0 64 Bit Multi-Core
min: 18612     avg: 19451     median: 19027 (60%)     max: 20594 pontos
Geekbench 4.4 - Geekbench 4.1 - 4.4 64 Bit Single-Core
min: 8706     avg: 8840     median: 8843 (88%)     max: 8936 pontos
Geekbench 4.4 - Geekbench 4.1 - 4.4 64 Bit Multi-Core
min: 66537     avg: 70316     median: 71143 (79%)     max: 71700 pontos
Mozilla Kraken 1.1 - Kraken 1.1 Total Score *
min: 453     avg: 471.3     median: 463.5 (1%)     max: 520 ms
Octane V2 - Octane V2 Total Score
min: 95898     avg: 101964     median: 104390 (94%)     max: 105526 Points
WebXPRT 4 - WebXPRT 4 Score
min: 243     avg: 288.7     median: 291 (84%)     max: 304 Points
WebXPRT 3 - WebXPRT 3 Score
min: 266     avg: 322.6     median: 322 (67%)     max: 358 Points
CrossMark - CrossMark Overall
min: 1825     avg: 2064     median: 2113 (81%)     max: 2295 Points
Power Consumption - Prime95 Power Consumption - external Monitor *
min: 106.1     avg: 171.8     median: 175.4 (30%)     max: 231 Watt
0153045607590105120135150165180195210225240255270Tooltip
Power Consumption - Cinebench R15 Multi Power Consumption - external Monitor *
min: 176     avg: 217.8     median: 223 (41%)     max: 266 Watt
0153045607590105120135150165180195210225240255270Tooltip
Power Consumption - Idle Power Consumption - external Monitor *
min: 13.9     avg: 23.8     median: 25 (17%)     max: 31.5 Watt
0510152025303540455055606570Tooltip
Power Consumption - Idle Power Consumption 150cd 1min *
min: 15     avg: 19.9     median: 19 (21%)     max: 29 Watt
05101520253035404550556065707580859095Tooltip
Power Consumption - Cinebench R15 Multi Power Efficiency - external Monitor
min: 19.5     avg: 20.7     median: 20.8 (15%)     max: 21.8 Points per Watt
- Gama de valores benchmark para essa solução gráfica
- Média de valores benchmark para essa solução gráfica
* Smaller numbers mean a higher performance

v1.26
log 24. 14:20:02

#0 no ids found in url (should be separated by "_") +0s ... 0s

#1 not redirecting to Ajax server +0s ... 0s

#2 did not recreate cache, as it is less than 5 days old! Created at Tue, 23 Apr 2024 05:40:15 +0200 +0.001s ... 0.001s

#3 no comparison url found in template nbc.compare_page_2 needed +0.015s ... 0.016s

#4 no comparison url found in template nbc.compare_page_2 needed +0s ... 0.016s

#5 no comparison url found in template nbc.compare_page_2 needed +0s ... 0.016s

#6 no comparison url found in template nbc.compare_page_2 needed +0s ... 0.017s

#7 no comparison url found in template nbc.compare_page_2 needed +0s ... 0.017s

#8 no comparison url found in template nbc.compare_page_2 needed +0s ... 0.017s

#9 no comparison url found in template nbc.compare_page_2 needed +0s ... 0.017s

#10 no comparison url found in template nbc.compare_page_2 needed +0s ... 0.018s

#11 composed specs +0.001s ... 0.019s

#12 did output specs +0s ... 0.019s

#13 getting avg benchmarks for device 14659 +0.019s ... 0.038s

#14 got single benchmarks 14659 +0.081s ... 0.118s

#15 got avg benchmarks for devices +0s ... 0.118s

#16 min, max, avg, median took s +1.025s ... 1.143s

#17 no comparison url found in template nbc.compare_page_2 needed +0.001s ... 1.144s

#18 return log +0s ... 1.144s

Análises para Intel Core i9-13900HX processador
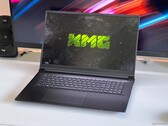
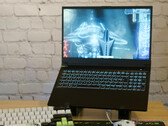
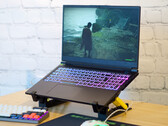
Análise do laptop Acer Predator Helios 18: RTX 4080 gamer com tela MiniLED de mais de 1.000 nits

Análise do laptop Acer Predator Helios 18: RTX 4080 gamer com tela MiniLED de mais de 1.000 nits

O Predator Helios 18 de 18 polegadas é um verdadeiro substituto do desktop, especialmente para gamers e profissionais criativos. Isso é garantido pela tela Mini...
Intel Core i9-13900HX | NVIDIA GeForce RTX 4080 Laptop GPU | 18.00" | 3.2 kg
Análise do laptop HP Omen Transcend 16: Mais do que apenas uma pequena diferença de nome

Análise do laptop HP Omen Transcend 16: Mais do que apenas uma pequena diferença de nome

Não deve ser confundido com o Omen 16 normal, o Omen Transcend 16 é o próximo passo da série, com recursos e opções mais recentes que provavelmente serão usados...
Intel Core i9-13900HX | NVIDIA GeForce RTX 4070 Laptop GPU | 16.00" | 2.3 kg
XMG Focus 15 em análise

Análise do laptop econômico para jogos Schenker XMG Focus 15 (E23): Muito desempenho por um preço menor que o do Pro 15

Se você pode dispensar um gabinete de metal e um teclado RGB completo, não precisa necessariamente optar pelo caro XMG Pro 15. Em nosso teste, o XMG Focus 15 te...
Intel Core i9-13900HX | NVIDIA GeForce RTX 4050 Laptop GPU | 15.60" | 2.4 kg
Análise do laptop para jogos Schenker XMG Pro 15 E23 (PD50SND-G): Um brinde ao equilíbrio entre trabalho e diversão!

Análise do laptop para jogos Schenker XMG Pro 15 E23 (PD50SND-G): Um brinde ao equilíbrio entre trabalho e diversão!

Um design sólido e discreto aliado à potência computacional. Esse é o resultado do XMG Pro 15 E23 em nossa análise. Seja como um laptop para criadores de conteú...
Intel Core i9-13900HX | NVIDIA GeForce RTX 4060 Laptop GPU | 15.60" | 2.4 kg
Análise do laptop Lenovo Legion Pro 7 16: Potência total para jogos graças à RTX 4090

Análise do laptop Lenovo Legion Pro 7 16: Potência total para jogos graças à RTX 4090

O modelo superior do Legion Pro 7 foi projetado para oferecer o máximo de desempenho. O Core i9-13900HX e o GeForce RTX 4090 prometem taxas de quadros suaves na...
Intel Core i9-13900HX | NVIDIA GeForce RTX 4090 Laptop GPU | 16.00" | 2.7 kg

SCHENKER XMG Focus 17 (E23): NVIDIA GeForce RTX 4070 Laptop GPU, 17.30", 2.9 kg
  ánalise » Schenker XMG Focus 17 (E23) em análise: O laptop para jogos com RTX 4070 não economiza no desempenho

SCHENKER Key 17 Pro (Early 23): NVIDIA GeForce RTX 4090 Laptop GPU, 17.30", 3.4 kg
  ánalise » Análise do Schenker Key 17 Pro (Early 23): notebook para jogos em 4k com Core i9 e RTX 4090

Eurocom Raptor X17: NVIDIA GeForce RTX 4090 Laptop GPU, 17.30", 3.5 kg
  ánalise » Análise do laptop Eurocom Raptor X17: A alternativa MSI e Asus ROG

Medion Erazer Major X20: NVIDIA GeForce RTX 4070 Laptop GPU, 16.00", 2.4 kg
  ánalise » Análise do Medion Erazer Major X20: Notebook para jogos com RTX 4070 e hardware sólido

Aorus 17X AZF: NVIDIA GeForce RTX 4090 Laptop GPU, 17.30", 2.9 kg
  ánalise » Revisão Aorus 17X AZF: Laptop para jogos de alta qualidade com i9-13900HX e RTX 4090 em um estojo fino

Eluktronics Mech-17 GP2 Liquid Propulsion Package G2: NVIDIA GeForce RTX 4090 Laptop GPU
  ánalise » Resfriamento de água um laptop GeForce RTX 4090: Revisão do pacote de propulsão líquida Eluktronics G2

HP Omen 17-ck2097ng: NVIDIA GeForce RTX 4080 Laptop GPU, 17.30", 2.8 kg
  ánalise » Revisão HP Omen 17 (2023): O laptop para jogos usa RTX 4080

Medion Erazer Beast X40: NVIDIA GeForce RTX 4090 Laptop GPU, 17.00", 2.9 kg
  ánalise » Revisão do Medion Erazer Beast X40: Caderno de jogos com RTX 4090

Eluktronics Mech-17 GP2: NVIDIA GeForce RTX 4090 Laptop GPU, 17.00", 2.9 kg
  ánalise » Eluktronics Mech-17 GP2 revisão de laptop: MSI GT77 Titan performance sem o tamanho

Lenovo Legion Pro 7 16IRX8H: NVIDIA GeForce RTX 4080 Laptop GPU, 16.00", 2.7 kg
  ánalise » Lenovo Legion Pro 7 16IRX8H Revisão: Potência de alto desempenho RTX 4080

SCHENKER XMG Neo 17 2023 Engineering Sample: NVIDIA GeForce RTX 4070 Laptop GPU
  ánalise » GeForce RTX 4070, 4060, 4050 Análise de Laptop - As novas GPUs de Laptop Mainstream da Nvidia em Análise

SCHENKER XMG Neo 16 Raptor Lake: NVIDIA GeForce RTX 4090 Laptop GPU, 16.00"
  ánalise » Análise da GPU Nvidia Ada RTX 40 Laptop: GPU portátil RTX 4090 de 175 W supera uma RTX 3090 de 350 W em desempenho e eficiência energética

Dell G16 7630, i9-13900HX RTX 4070: NVIDIA GeForce RTX 4070 Laptop GPU, 16.00", 2.9 kg
  ánalise externa » Dell G16 7630, i9-13900HX RTX 4070

Acer Predator Helios 3D 15 SpatialLabs Edition: NVIDIA GeForce RTX 4080 Laptop GPU, 15.60", 3 kg
  ánalise externa » Acer Predator Helios 3D 15 SpatialLabs Edition

Alienware m18 R1, RTX 4090: NVIDIA GeForce RTX 4090 Laptop GPU, 18.00", 4.2 kg
  ánalise externa » Alienware m18 R1, RTX 4090

Acer Predator Helios 16 PH16-71-97H2: NVIDIA GeForce RTX 4070 Laptop GPU, 16.00", 2.7 kg
  ánalise externa » Acer Predator Helios 16 PH16-71-97H2

SCHENKER XMG Neo 17 E23: NVIDIA GeForce RTX 4090 Laptop GPU, 17.30", 2.8 kg
  ánalise externa » SCHENKER XMG Neo 17 E23

HP Omen Transcend 16-u0000: NVIDIA GeForce RTX 4070 Laptop GPU, 16.00", 2.2 kg
  ánalise externa » HP Omen Transcend 16-u0000

Origin PC EON17-X 2023: NVIDIA GeForce RTX 4090 Laptop GPU, 17.30", 3.3 kg
  ánalise externa » Origin PC EON17-X 2023

HP Omen Transcend 16: NVIDIA GeForce RTX 4070 Laptop GPU, 16.00", 2.3 kg
  ánalise externa » HP Omen Transcend 16

HP Omen Transcend 16-u0095ng: NVIDIA GeForce RTX 4070 Laptop GPU, 16.00", 2.2 kg
  ánalise externa » HP Omen Transcend 16-u0095ng

HP Omen 17-ck2940nz: NVIDIA GeForce RTX 4080 Laptop GPU, 17.30", 2.8 kg
  ánalise externa » HP Omen 17-ck2940nz

Lenovo Legion Pro 7 16IRX8H, i9-13900HX RTX 4090: NVIDIA GeForce RTX 4090 Laptop GPU, 16.00", 2.8 kg
  ánalise externa » Lenovo Legion Pro 7 16IRX8H, i9-13900HX RTX 4090

HP Omen 17-ck2004TX: NVIDIA GeForce RTX 4080 Laptop GPU, 17.30", 2.8 kg
  ánalise externa » HP Omen 17-ck2004TX

Lenovo Legion Pro 5 16IRX8, i9-13900HX RTX 4070: NVIDIA GeForce RTX 4070 Laptop GPU, 16.00", 2.6 kg
  ánalise externa » Lenovo Legion Pro 5 16IRX8, i9-13900HX RTX 4070

Acer Predator Triton 17X PTX17-71-99W5: NVIDIA GeForce RTX 4090 Laptop GPU, 17.00", 3 kg
  ánalise externa » Acer Predator Triton 17X PTX17-71-99W5

Lenovo Legion Pro 7 16IRX8H, i9-13900HX RTX 4070: NVIDIA GeForce RTX 4070 Laptop GPU, 16.00", 2.5 kg
  ánalise externa » Lenovo Legion Pro 7 16IRX8H, i9-13900HX RTX 4070

Acer Predator Helios 16 PH16-71: NVIDIA GeForce RTX 4070 Laptop GPU, 16.00", 2.7 kg
  ánalise externa » Acer Predator Helios 16 PH16-71

SCHENKER XMG Focus 15 (E23): NVIDIA GeForce RTX 4050 Laptop GPU, 15.60", 2.4 kg
  ánalise externa » Schenker XMG Focus 15 (E23)

HP Omen 17-ck2097ng: NVIDIA GeForce RTX 4080 Laptop GPU, 17.30", 2.8 kg
  ánalise externa » HP Omen 17-ck2097ng

Medion Erazer Major X20: NVIDIA GeForce RTX 4070 Laptop GPU, 16.00", 2.4 kg
  ánalise externa » Medion Erazer Major X20

Alienware m16 R1: NVIDIA GeForce RTX 4080 Laptop GPU, 16.00", 3.3 kg
  ánalise externa » Alienware m16 R1

Aorus 17X AZF: NVIDIA GeForce RTX 4090 Laptop GPU, 17.30", 2.9 kg
  ánalise externa » Aorus 17X AZF

Lenovo Legion Pro 7 16IRX8H: NVIDIA GeForce RTX 4080 Laptop GPU, 16.00", 2.7 kg
  ánalise externa » Lenovo Legion Pro 7 16IRX8H

Acer Predator Helios 16 2023 PH16-71-9705: NVIDIA GeForce RTX 4080 Laptop GPU, 16.00", 2.7 kg
  ánalise externa » Acer Predator Helios 16 2023 PH16-71-9705

Acer Predator Helios 18 2023 PH18-71-91U5: NVIDIA GeForce RTX 4080 Laptop GPU, 18.00", 3.3 kg
  ánalise externa » Acer Predator Helios 18 2023 PH18-71-91U5

SCHENKER XMG Neo 16 E23: NVIDIA GeForce RTX 4090 Laptop GPU, 16.00", 2.5 kg
  ánalise externa » Schenker XMG Neo 16 E23

Medion Erazer Beast X40: NVIDIA GeForce RTX 4090 Laptop GPU, 17.00", 2.9 kg
  ánalise externa » Medion Erazer Beast X40

HP Omen Transcend 16: NVIDIA GeForce RTX 4070 Laptop GPU, 16.00", 2.3 kg
   » HP Omen Transcend 16 é três passos à frente e um passo atrás para a série

Please share our article, every link counts!

» Comparação de CPUs Móveis
Comparação de todas as séries de CPUs móveis

» Processadores Móveis - Benchmarklist
Benchmarklist de todos os CPUs conhecidos que são usados em portáteis (CPUs de desktop e laptop)

Outras CPUs da série Raptor Lake-HX

» Intel Core i9-14900HX
   24x 1.6 GHz - 5.8 GHz
» Intel Core i9-13980HX
   24x 1.6 GHz - 5.6 GHz
» Intel Core i9-13950HX
   24x 1.6 GHz - 5.5 GHz
» Intel Core i9-13900HX
   24x 1.6 GHz - 5.4 GHz
» Intel Core i7-14700HX
   20x 3.9 GHz - 5.5 GHz
» Intel Core i7-13850HX
   20x 1.5 GHz - 5.3 GHz
» Intel Core i7-14650HX
   16x 1.6 GHz - 5.2 GHz
» Intel Core i7-13700HX
   16x 1.5 GHz - 5 GHz
» Intel Core i5-14500HX
   14x 1.8 GHz - 5 GHz
» Intel Core i7-13650HX
   14x 1.9 GHz - 4.9 GHz
» Intel Core i5-13600HX
   14x 1.9 GHz - 4.8 GHz
» Intel Core i5-13500HX
   14x 1.8 GHz - 4.7 GHz
» Intel Core i5-14450HX
   10x 1.8 GHz - 4.8 GHz
» Intel Core i5-13450HX
   10x 1.8 GHz - 4.6 GHz

CPUs de ao redor

+ AMD Ryzen 9 7945HX3D
   16x 2.3 GHz - 5.4 GHz
+ AMD Ryzen 9 7945HX
   16x 2.5 GHz - 5.4 GHz
+ Intel Core i9-14900HX
   24x 1.6 GHz - 5.8 GHz
+ Intel Core i9-13980HX
   24x 1.6 GHz - 5.6 GHz
+ Intel Core i9-13950HX
   24x 1.6 GHz - 5.5 GHz
» Intel Core i9-13900HX
   24x 1.6 GHz - 5.4 GHz
- AMD Ryzen 9 7940HX
   16x 2.4 GHz - 5.2 GHz
- AMD Ryzen 9 7845HX
   12x 3 GHz - 5.2 GHz
- Intel Core i7-14700HX
   20x 3.9 GHz - 5.5 GHz
- AMD Ryzen 9 7840HX
   12x 2.9 GHz - 5.1 GHz
- Intel Core i7-13850HX
   20x 1.5 GHz - 5.3 GHz
> Análises e revisões de portáteis e celulares > FAQ/Técnica > Processadores de Notebook > Intel Raptor Lake-HX i9-13900HX Notebook Processor
Klaus Hinum (Update: 2023-11-26)