Análise do Medion Erazer Major X20: Notebook para jogos com RTX 4070 e hardware sólido
O Medion Erazer Major X20 é principalmente um notebook para jogos, mas também foi criado para outros cenários de aplicativos de computação intensiva. Em comparação com seu antecessor https://www.notebookcheck.net/Medion-Erazer-Major-X10-laptop-review-Debut-of-Intel-Arc-A730M.650477.0.htmlo X20 recebeu algumas atualizações úteis: o processador Arc A730M deu lugar a um núcleo gráfico significativamente mais potente, o GeForce RTX 4070. Além disso, um teclado mecânico substitui o modelo chiclet, enquanto uma das duas portas USB-C (USB 3.2 Gen 2) foi removida e a porta restante foi atualizada para uma porta Thunderbolt 4.
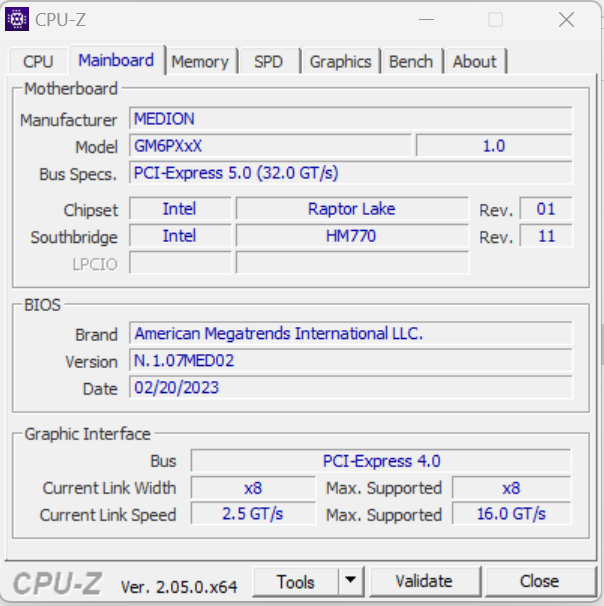
O X20 é baseado em um barebone da Tongfang (GM6PX7X), que é muito semelhante ao modelo conhecido do XMG Neo 16, mas a porta para o resfriamento a água está faltando. Os concorrentes incluem laptops como o Aorus 15X ASFe o Razer Blade 15 OLED (Early 22) e o Asus ROG Strix G17 G713PI.
Possíveis concorrentes em comparação
Avaliação | Data | Modelo | Peso | Altura | Size | Resolução | Preço |
|---|---|---|---|---|---|---|---|
| 89 % v7 (old) | 04/2023 | Medion Erazer Major X20 i9-13900HX, GeForce RTX 4070 Laptop GPU | 2.4 kg | 29 mm | 16.00" | 2560x1600 | |
| 86.2 % v7 (old) | 04/2023 | Aorus 15X ASF i7-13700HX, GeForce RTX 4070 Laptop GPU | 2.3 kg | 19.7 mm | 15.60" | 2560x1440 | |
| 89.9 % v7 (old) | 03/2023 | Razer Blade 15 OLED (Early 2022) i9-12900H, GeForce RTX 3070 Ti Laptop GPU | 2 kg | 16.99 mm | 15.60" | 2560x1440 | |
| 88.4 % v7 (old) | 04/2023 | Asus ROG Strix G17 G713PI R9 7945HX, GeForce RTX 4070 Laptop GPU | 2.8 kg | 30.7 mm | 17.30" | 2560x1440 |
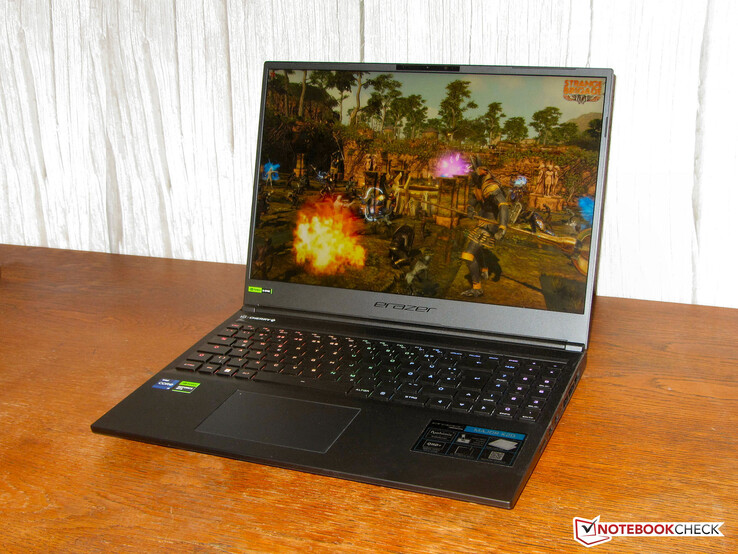
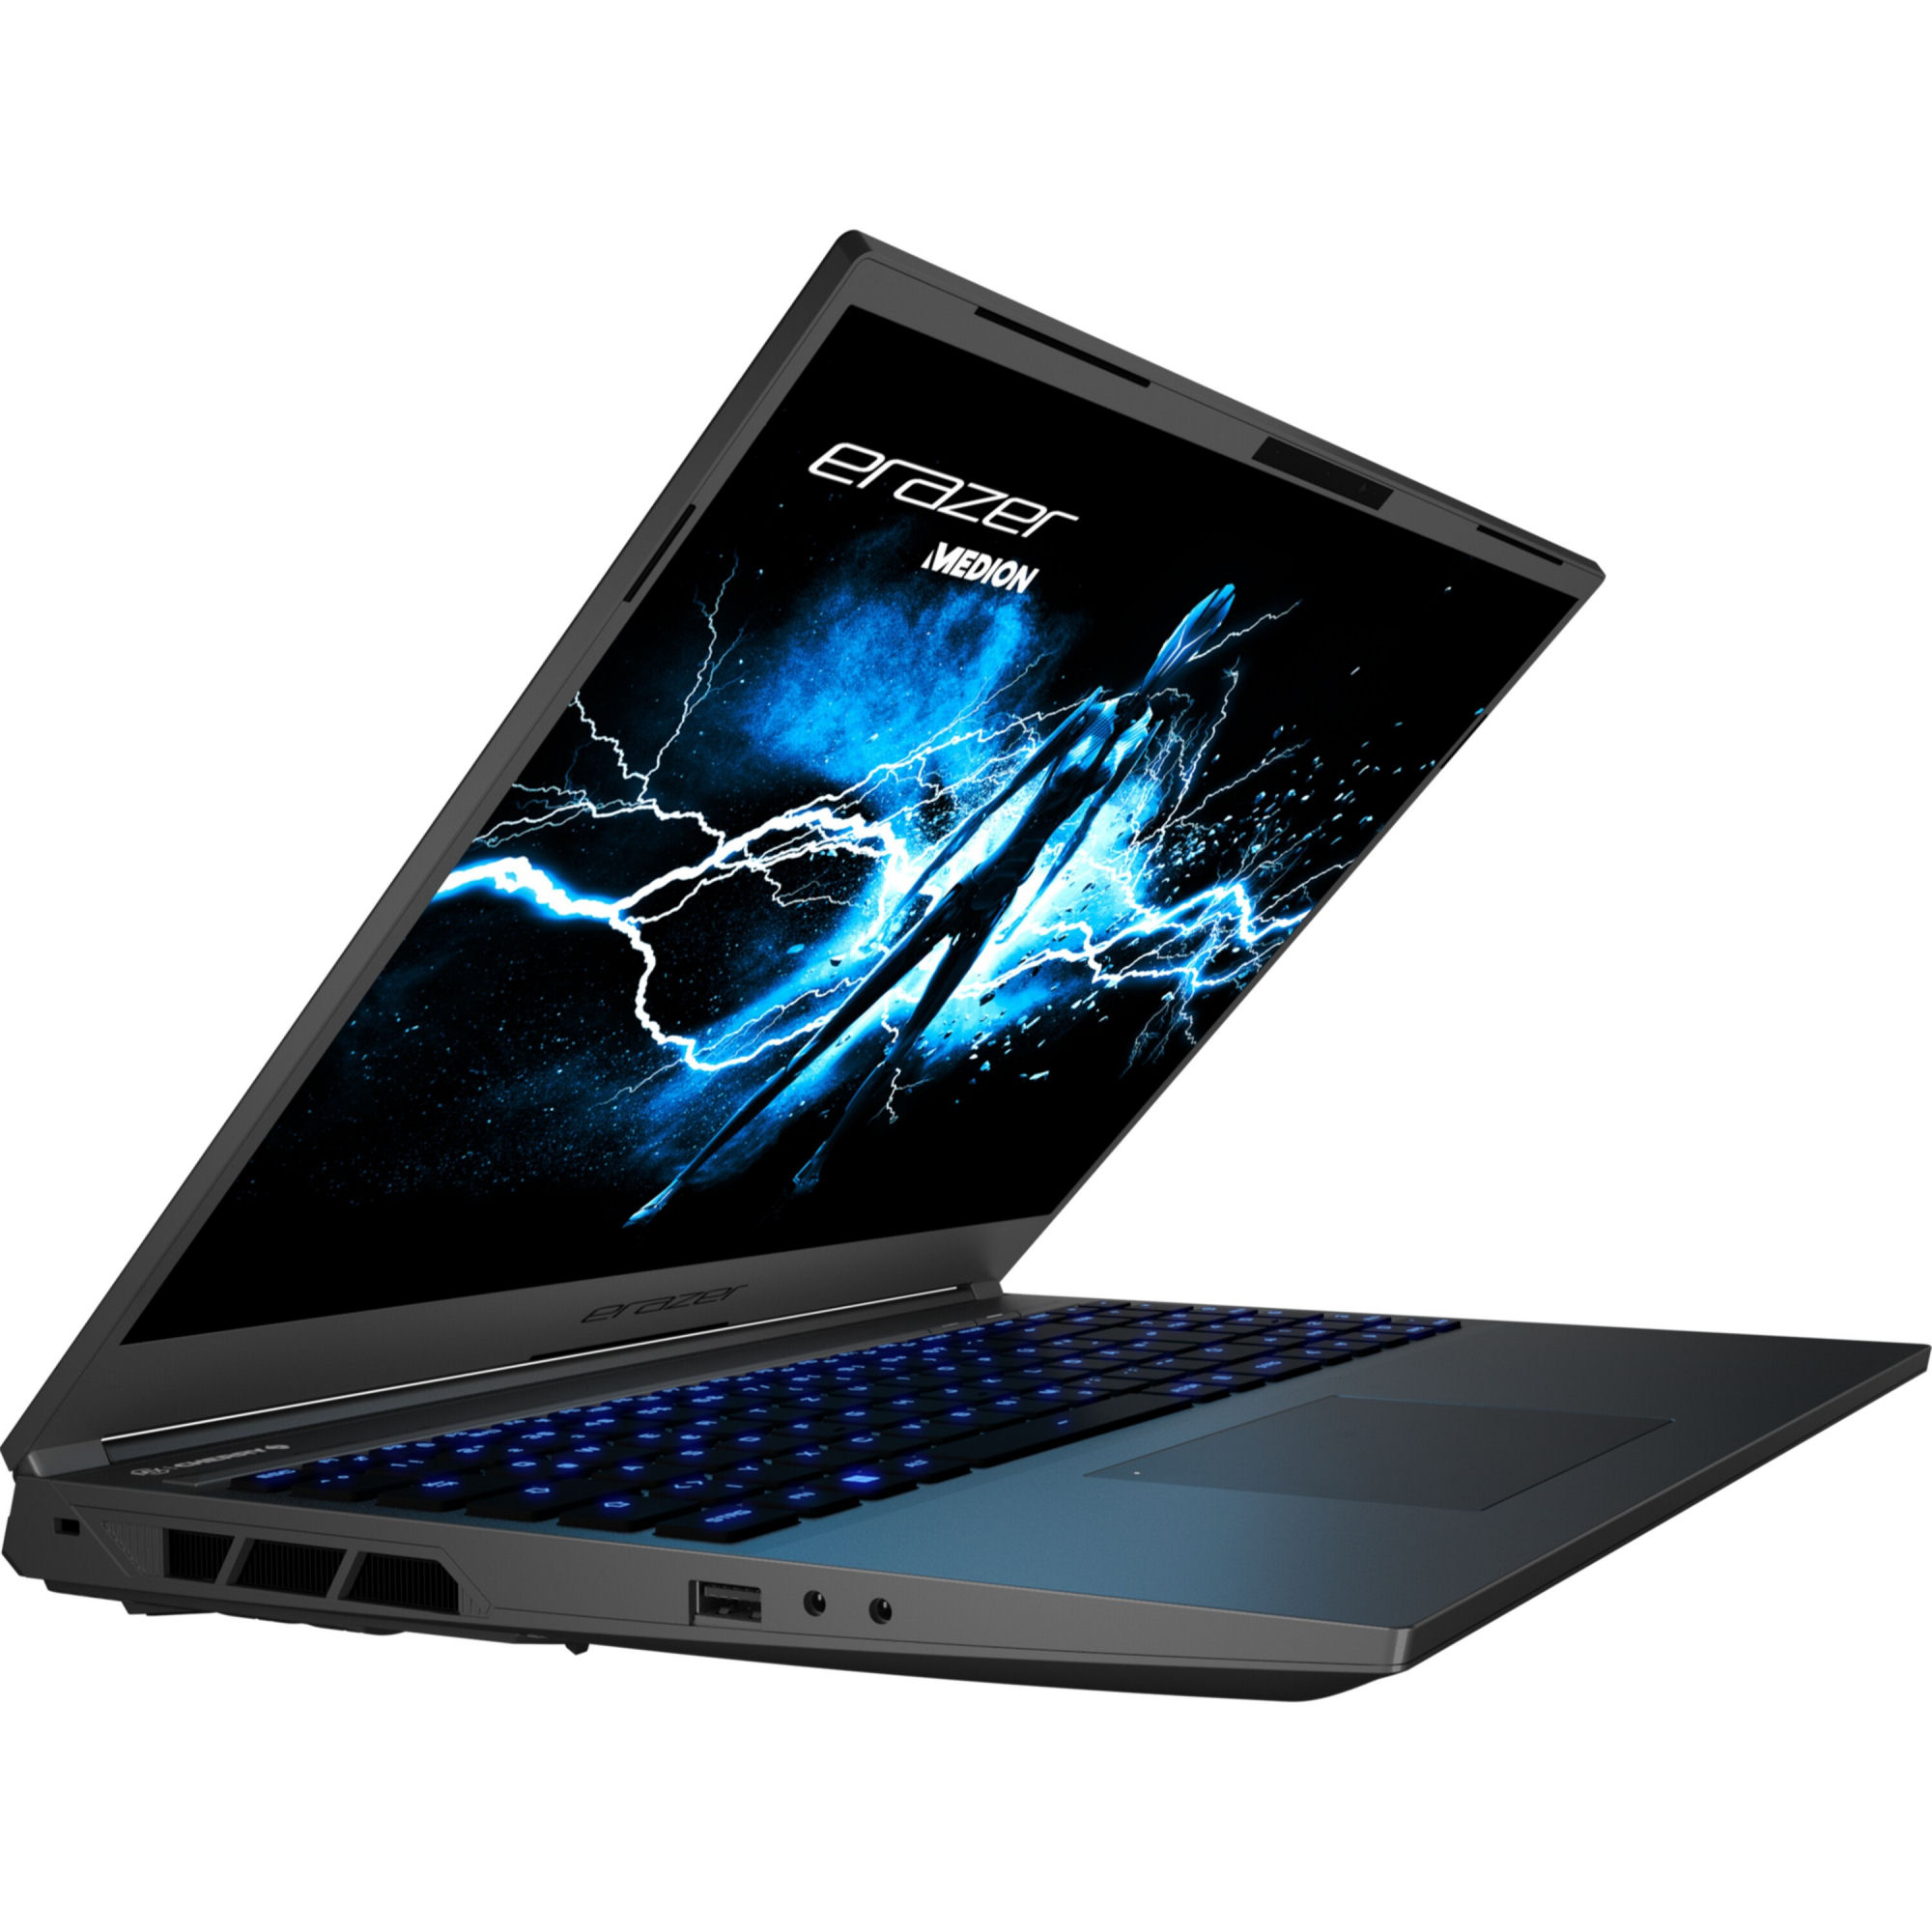
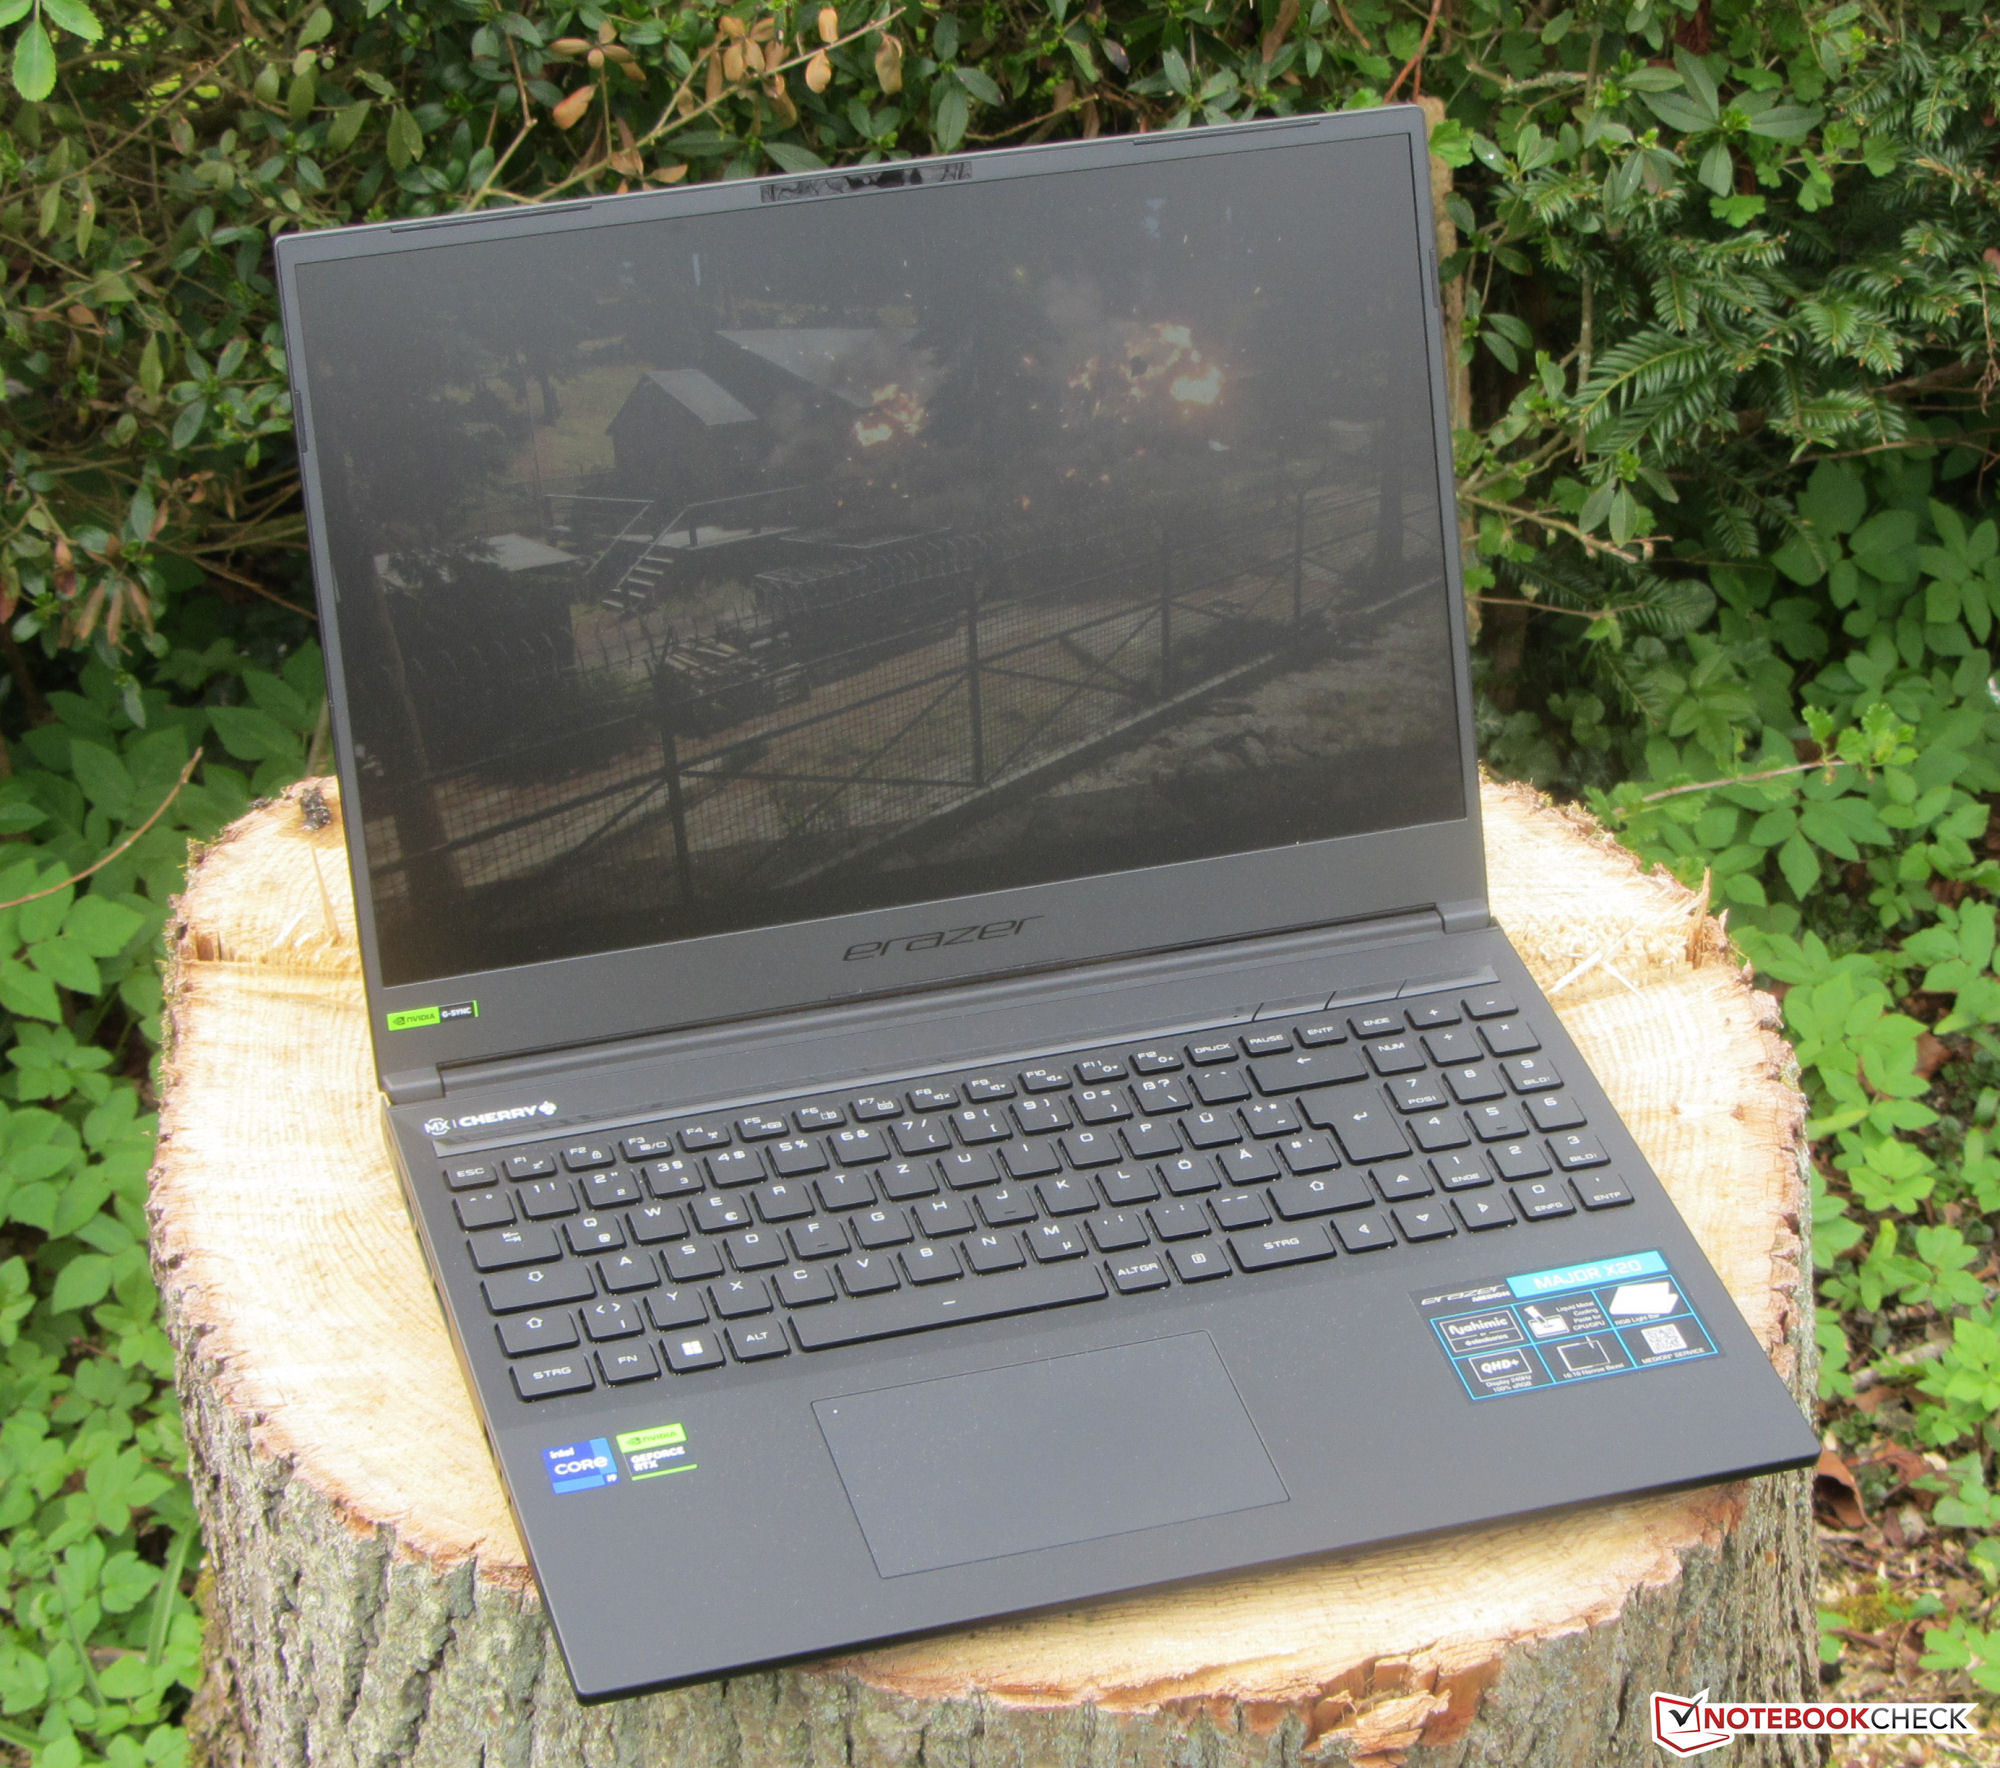
Estojo - Um exterior discreto para o laptop da Medion
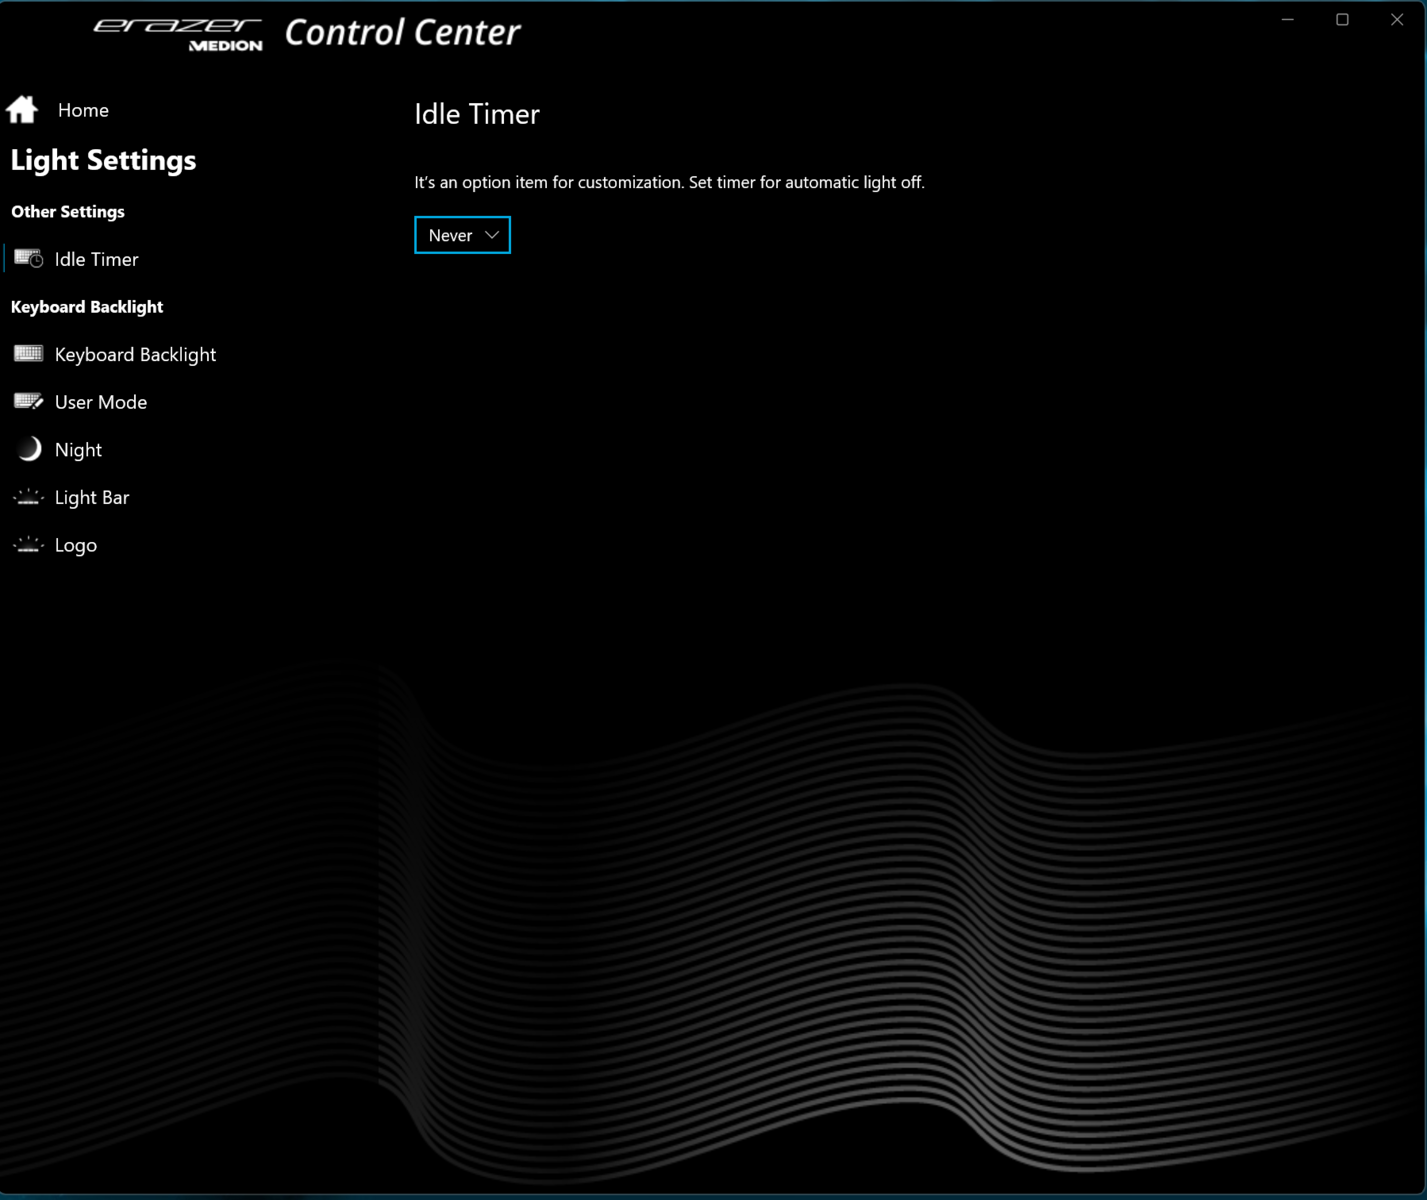
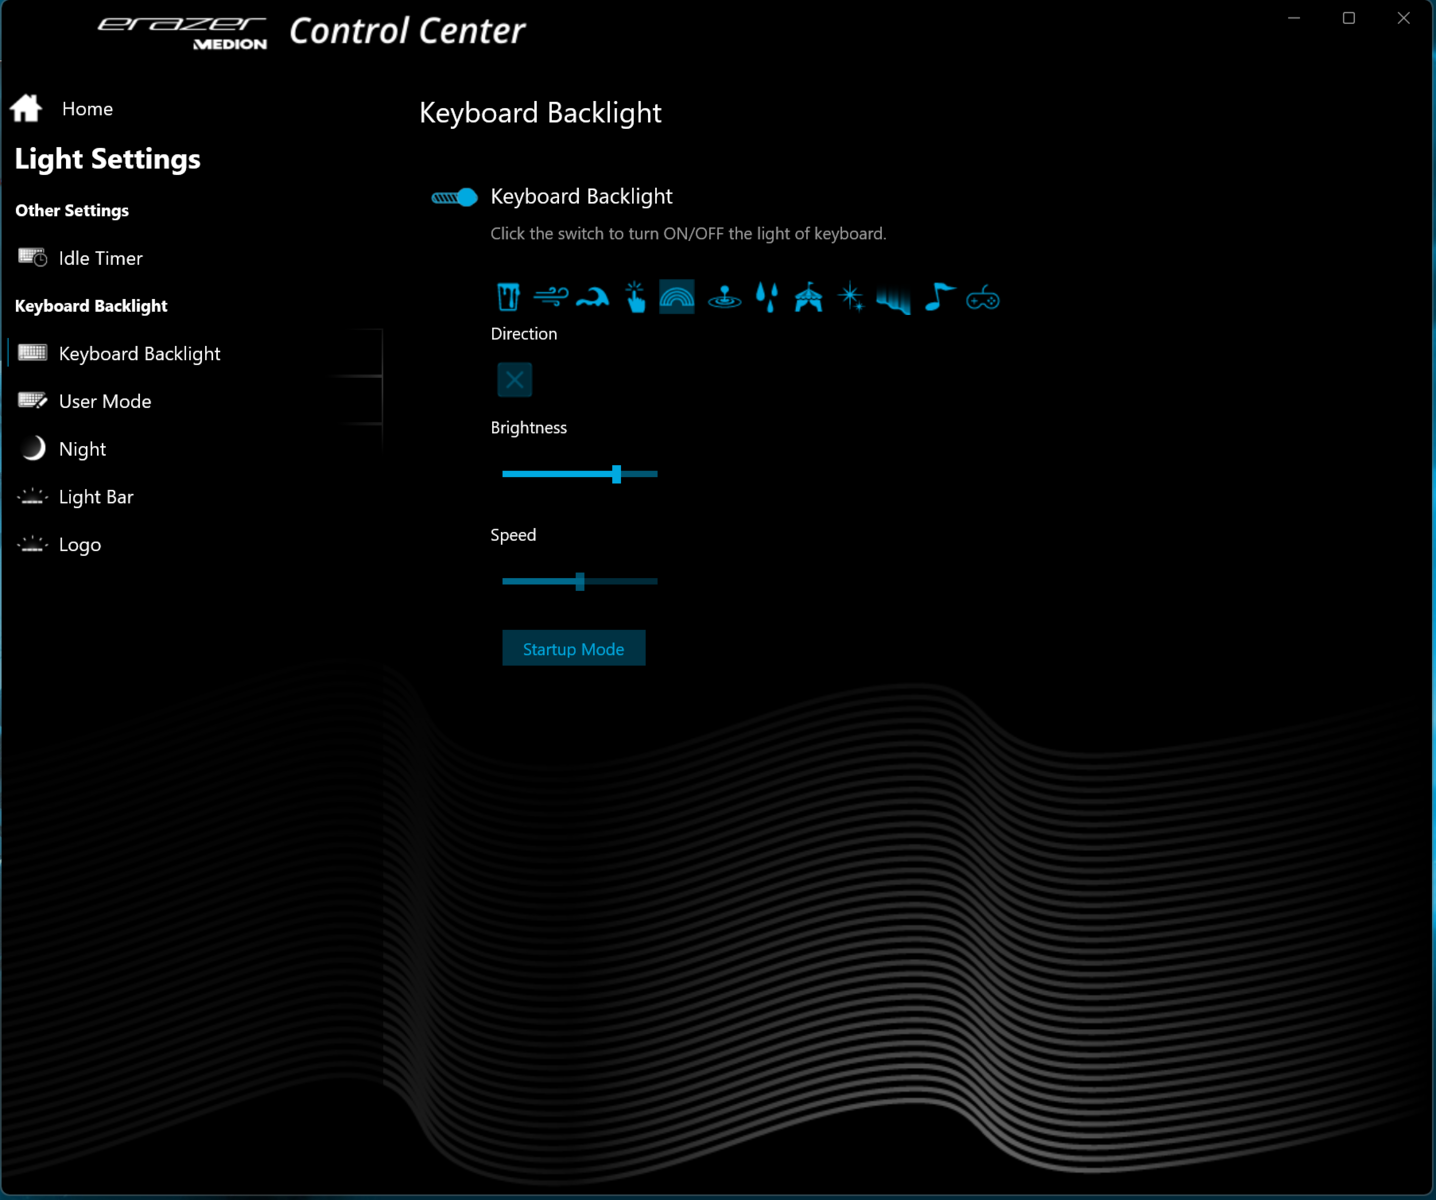
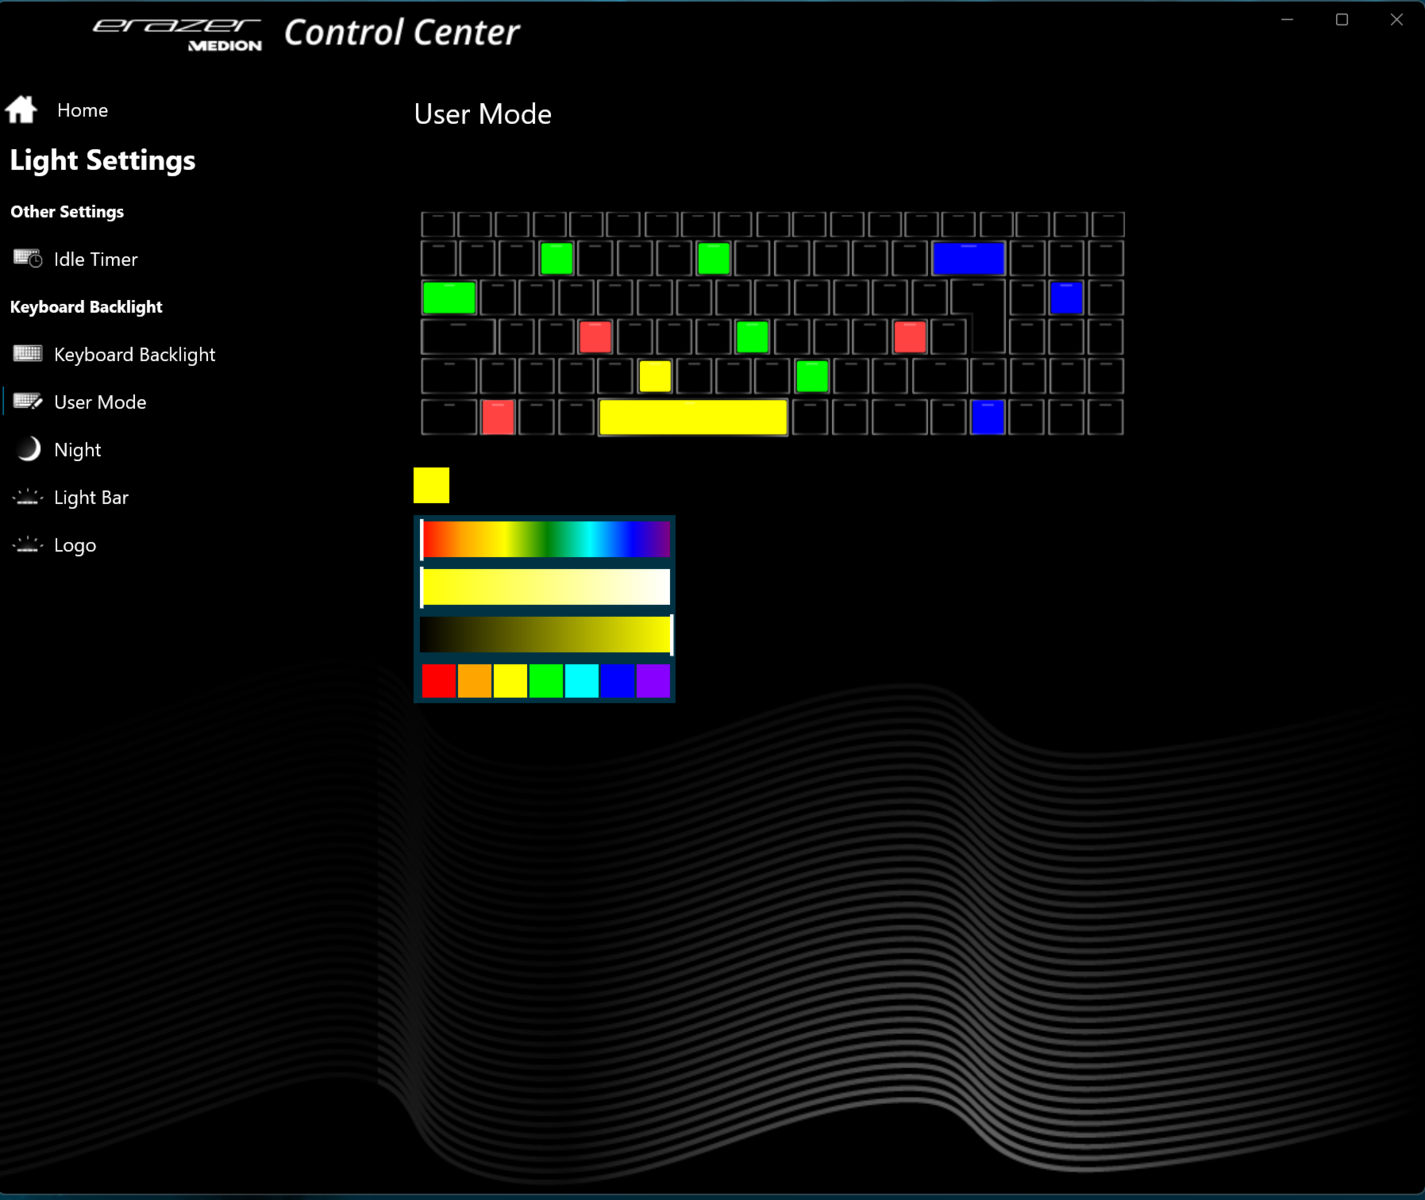
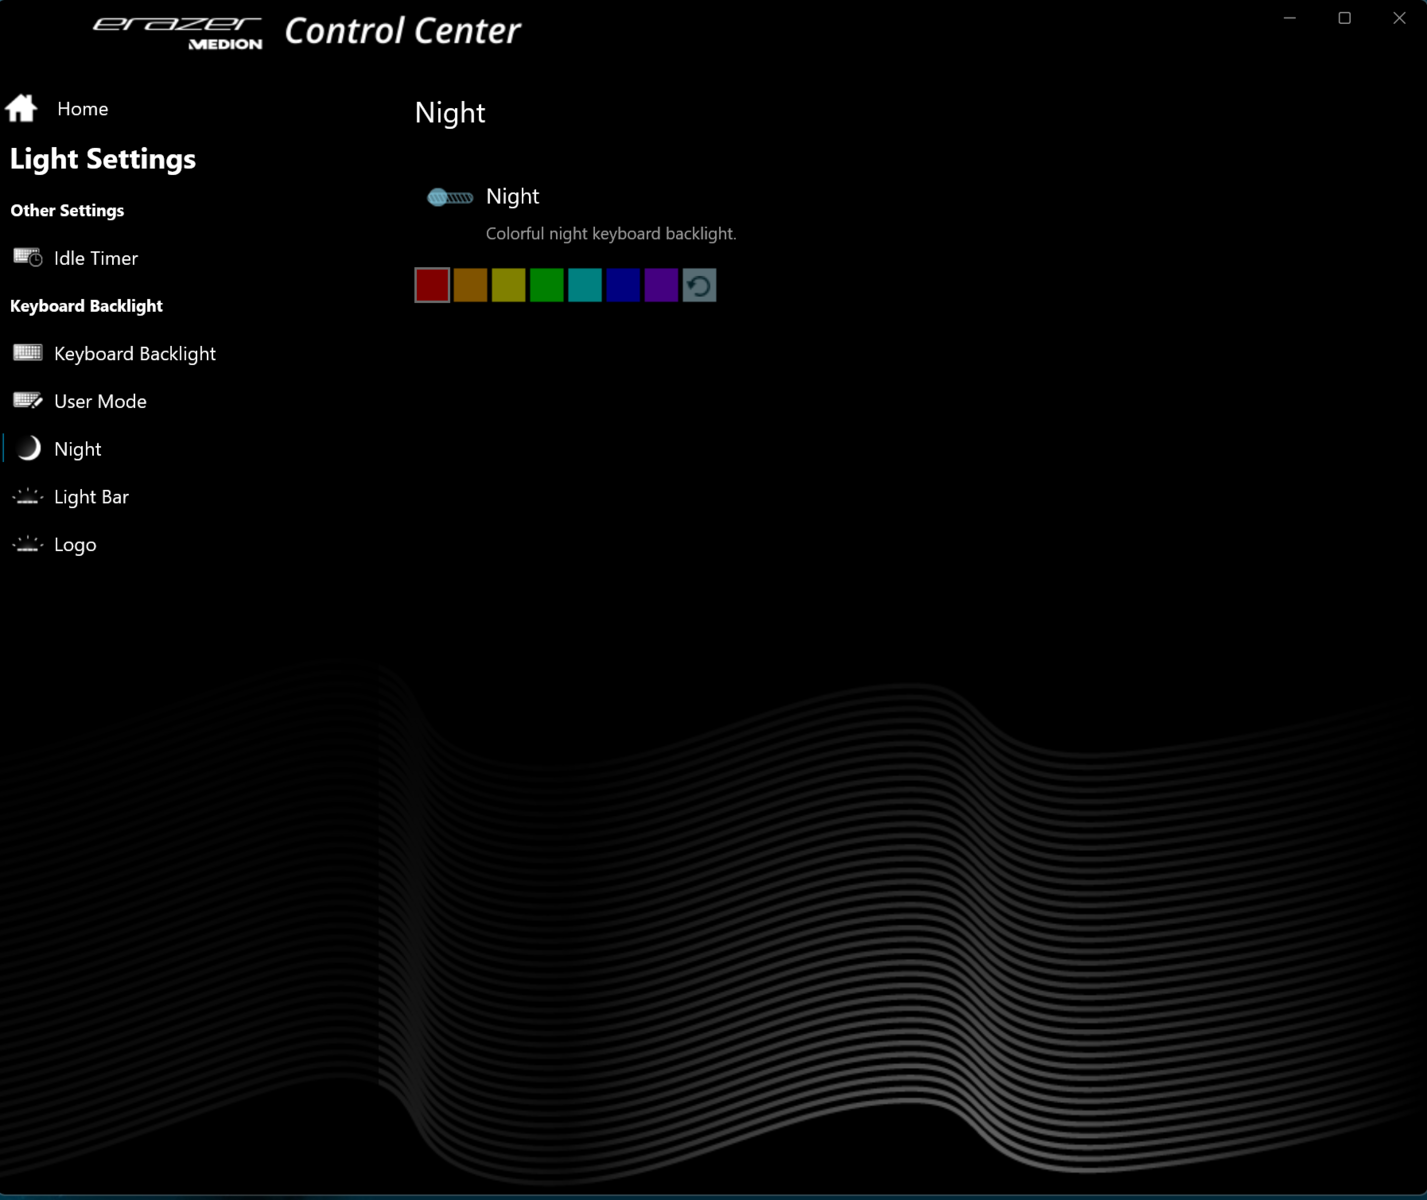
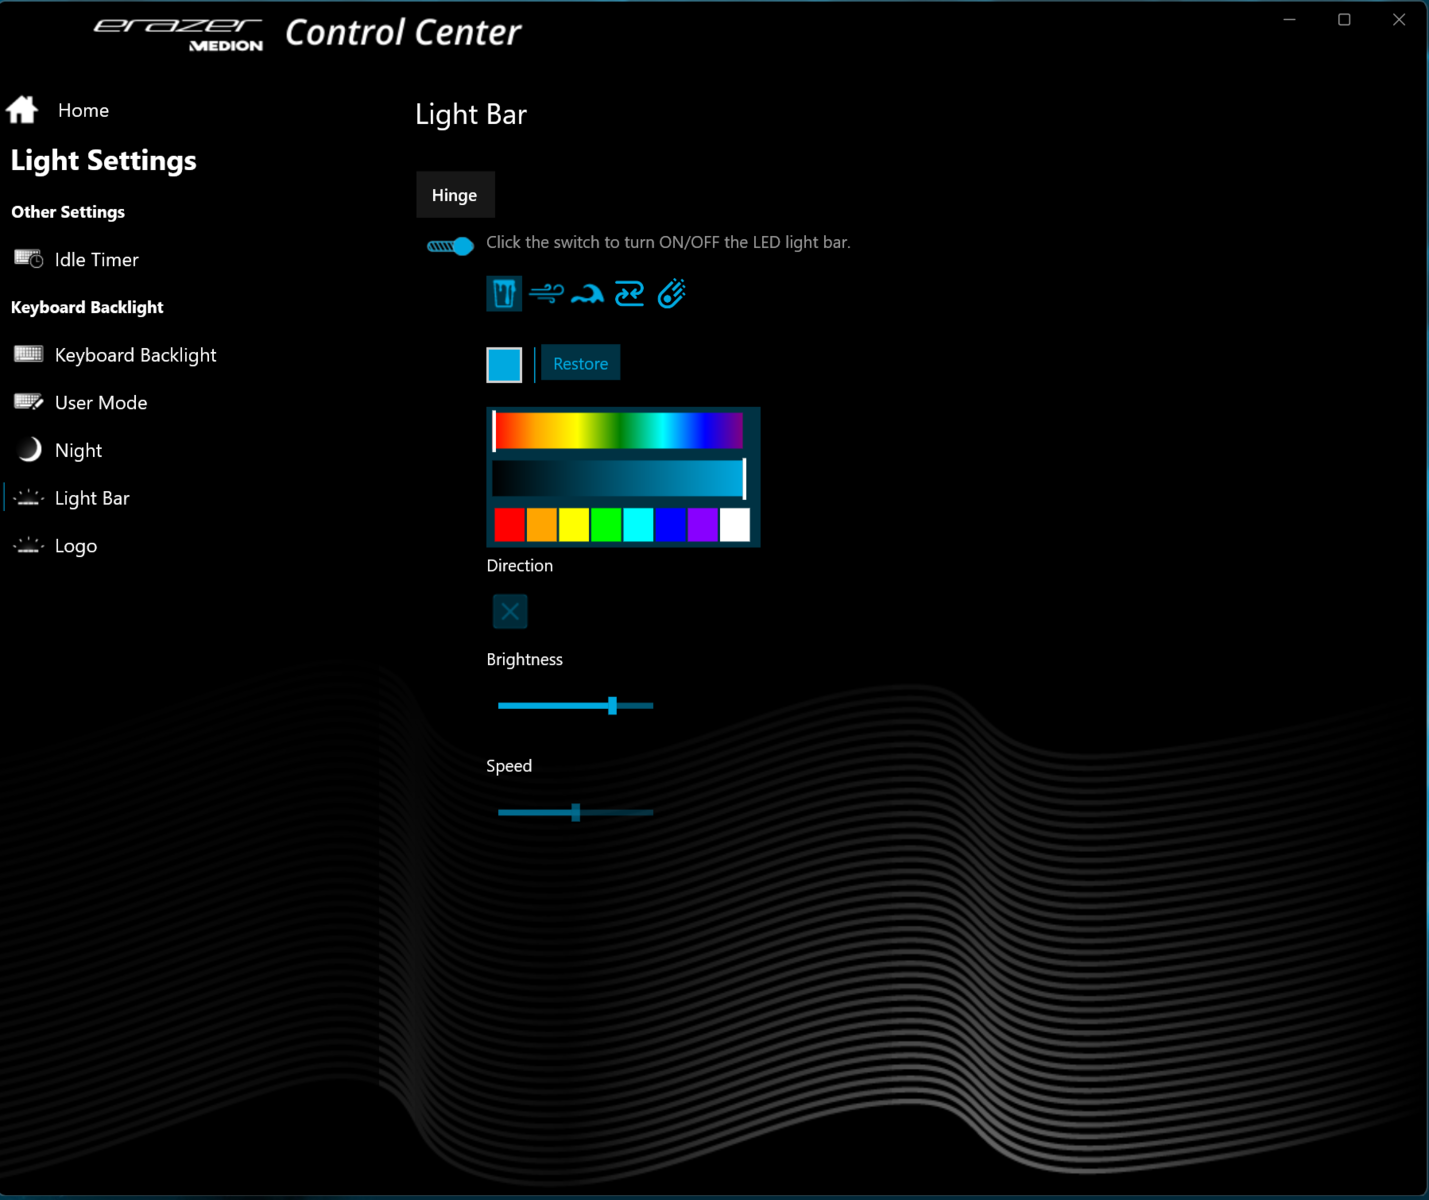
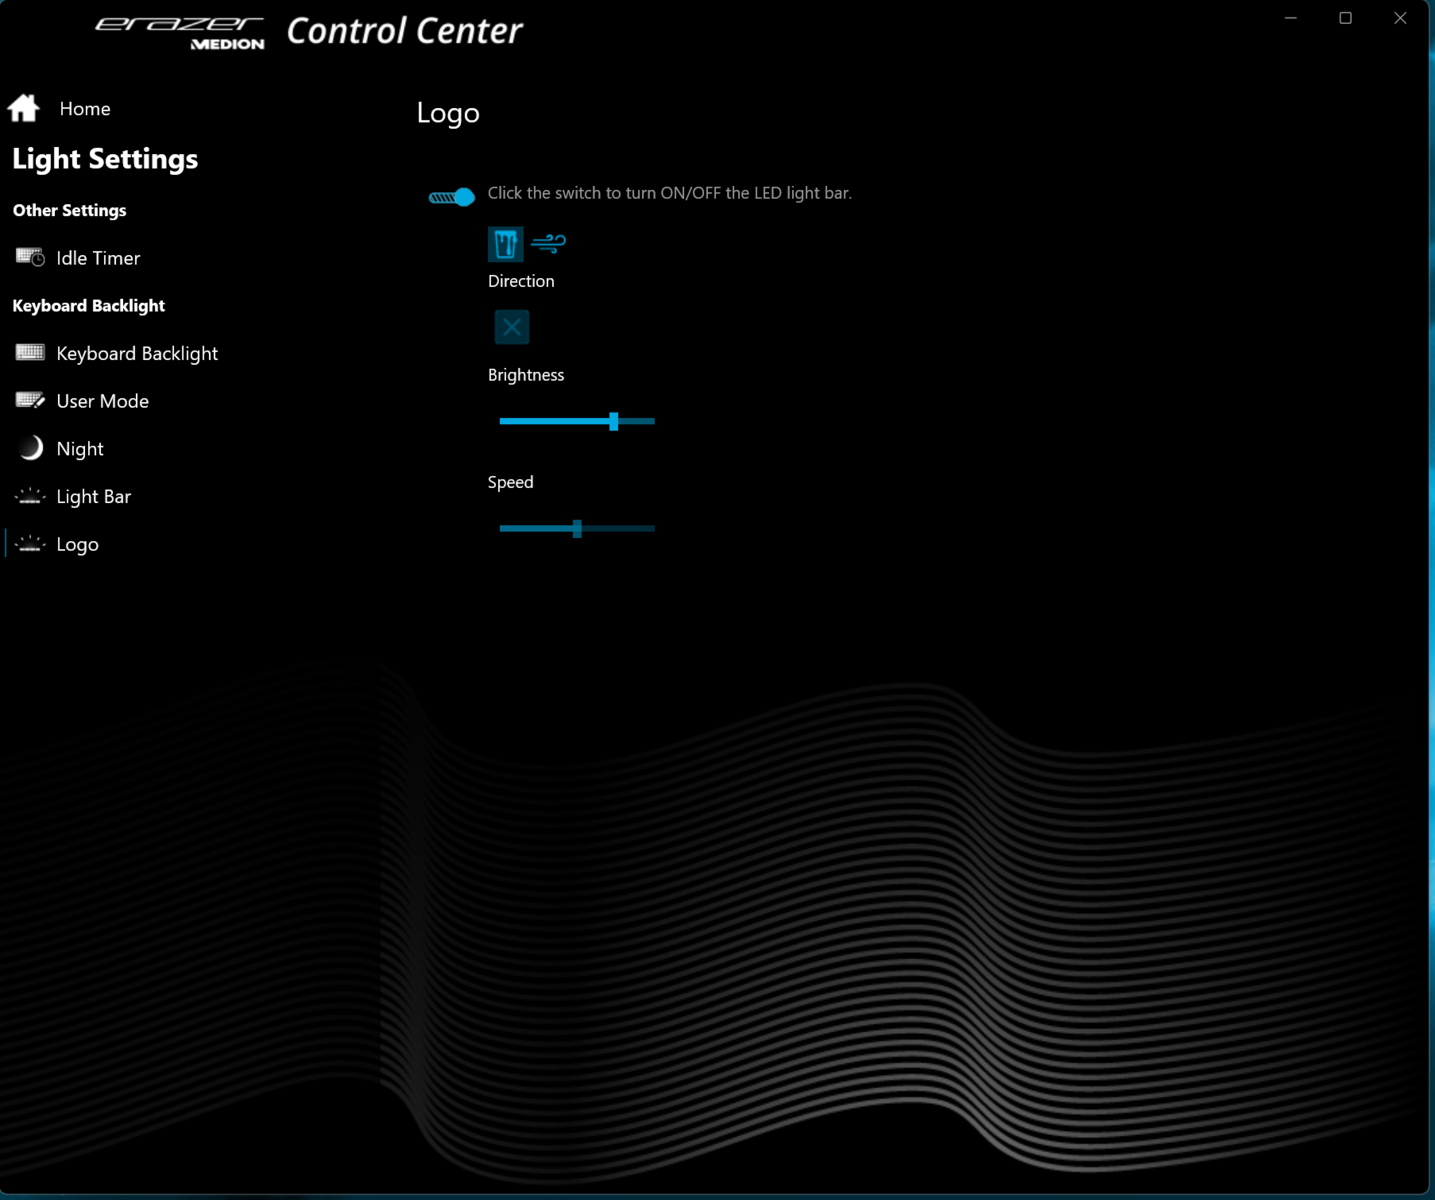
A Medion usa um chassi elegante e sóbrio que não se destaca, mesmo em um ambiente profissional. A parte de trás da tampa do gabinete preto fosco é feita de alumínio e a unidade de base é de plástico. Um revestimento de borracha antiderrapante cobre a parte superior da unidade de base. Além da luz de fundo das teclas (RGB), duas faixas de LEDs (RGB) livremente configuráveis dentro das saídas de ar traseiras e o logotipo iluminado da Erazer na tampa deixam o gabinete de aparência mais descontraída
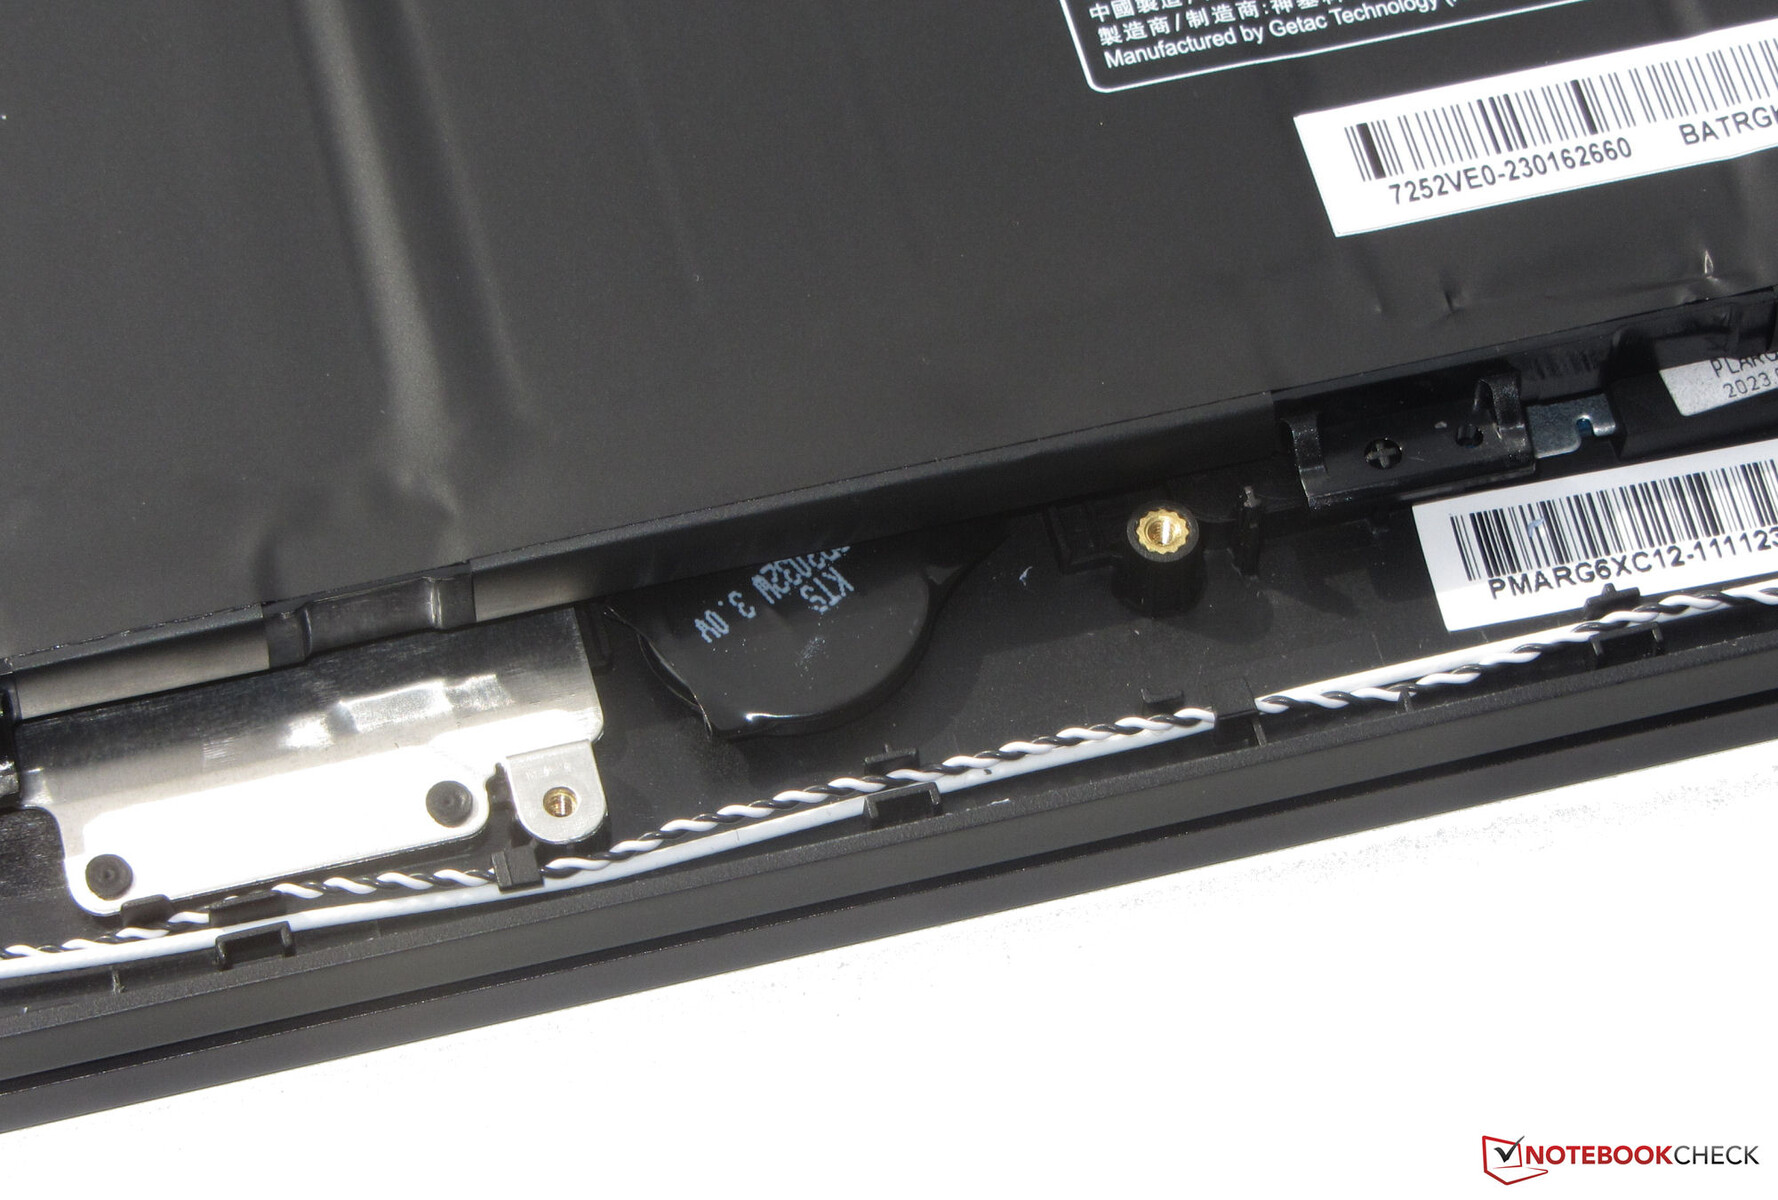
O gabinete de 16 polegadas não revela falhas de fabricação. As dimensões das folgas são uniformes e não há saliências de material. A unidade de base só pode ser ligeiramente torcida, a tampa mais claramente, mas todo o dispositivo está dentro de limites razoáveis. A bateria (parafusada, não colada) e outros componentes internos podem ser acessados após a remoção da parte inferior. As dobradiças mantêm a tampa firmemente na posição e o ângulo máximo de abertura é de cerca de 130 graus. É possível abrir a tampa com uma só mão.
No campo da comparação, o laptop da Medion é um dos dispositivos com a estrutura mais espessa. Em termos de peso, ele fica no meio termo.
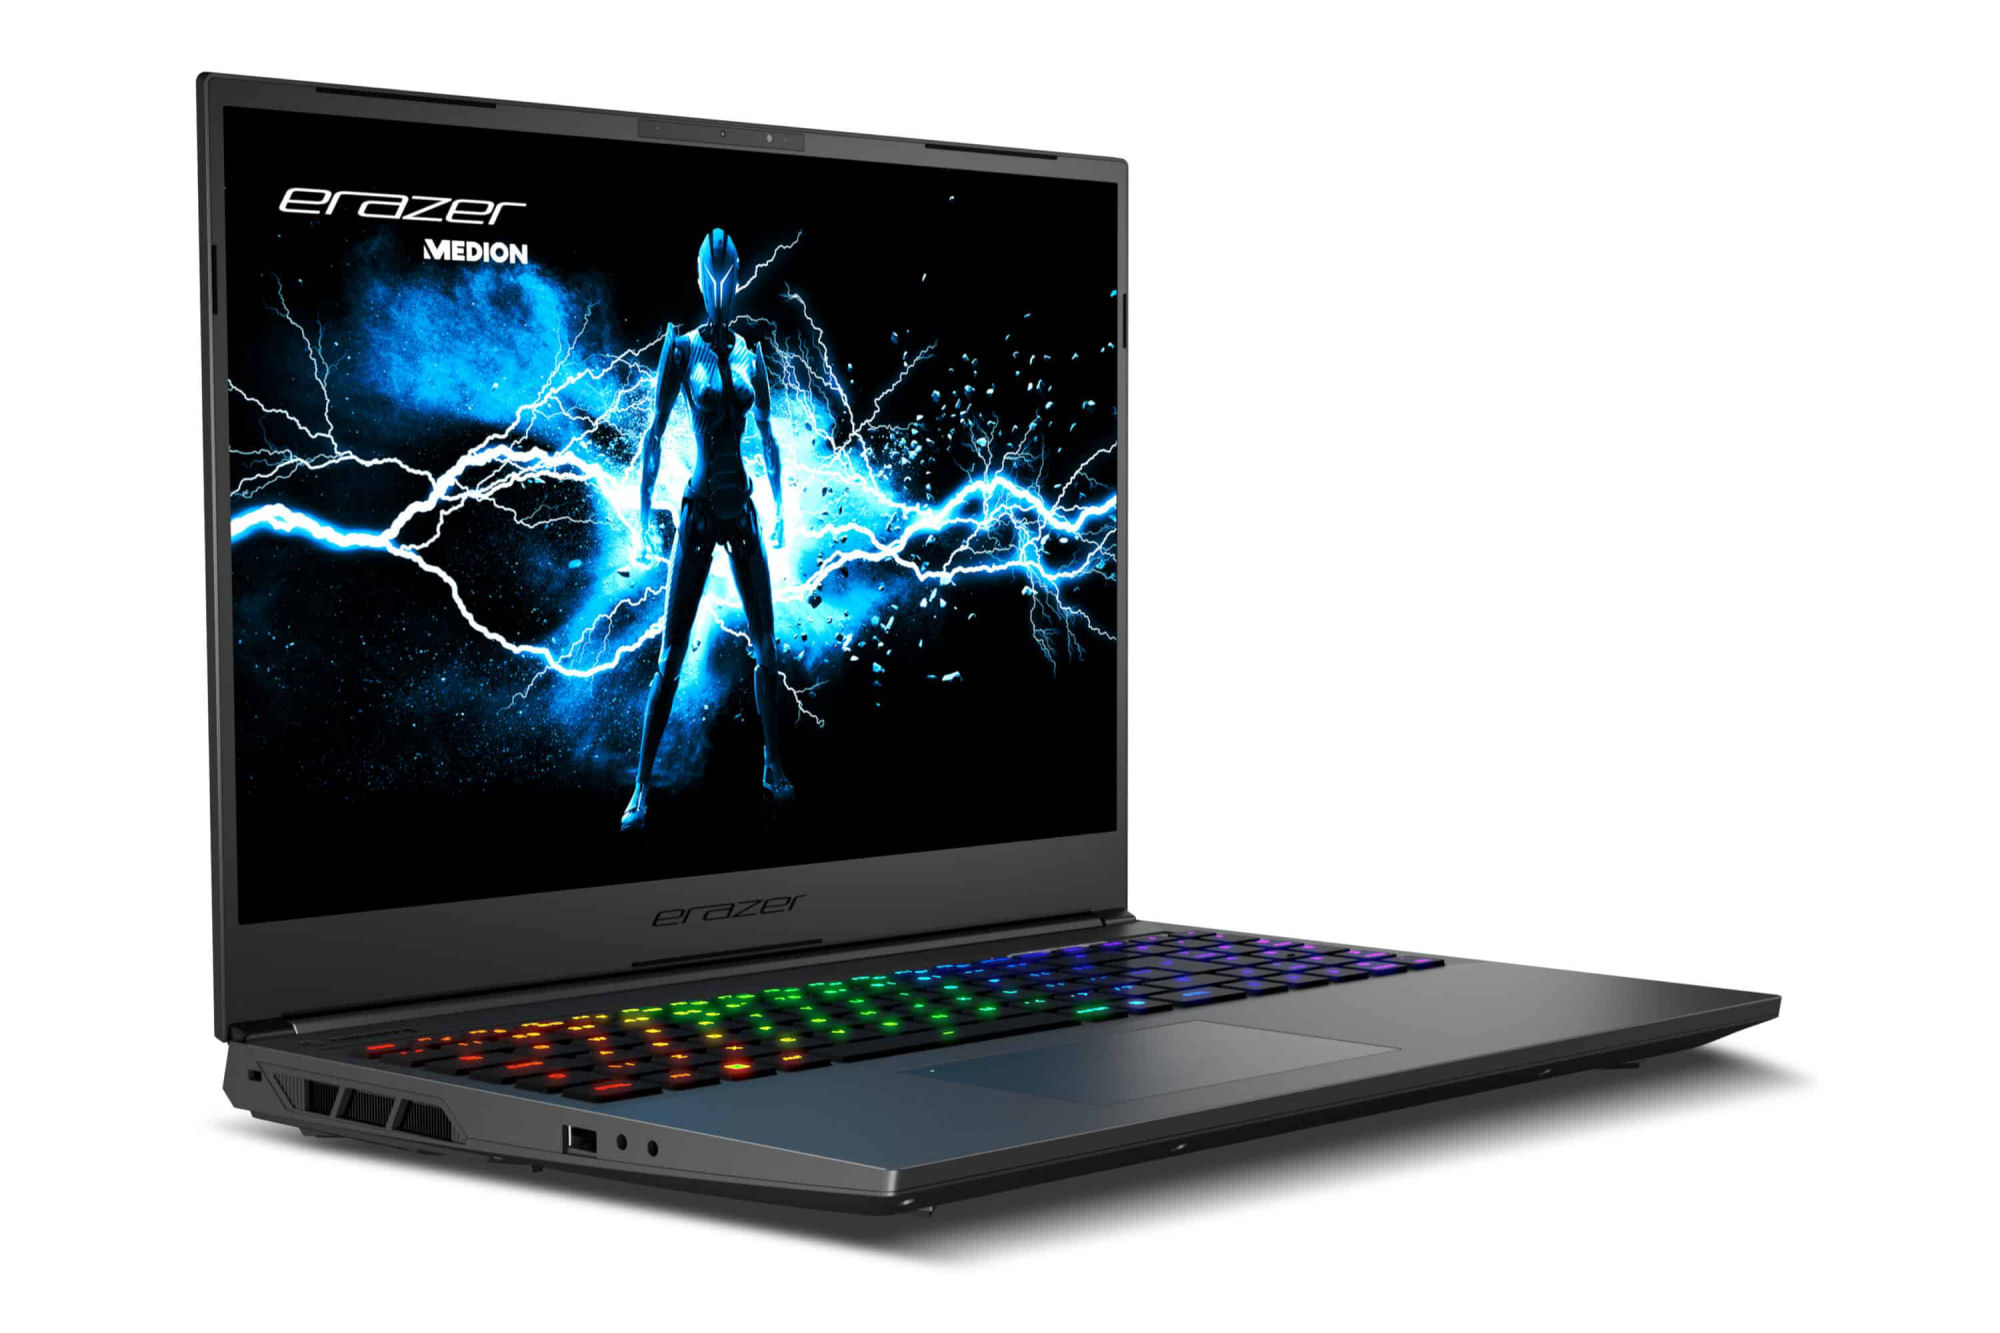
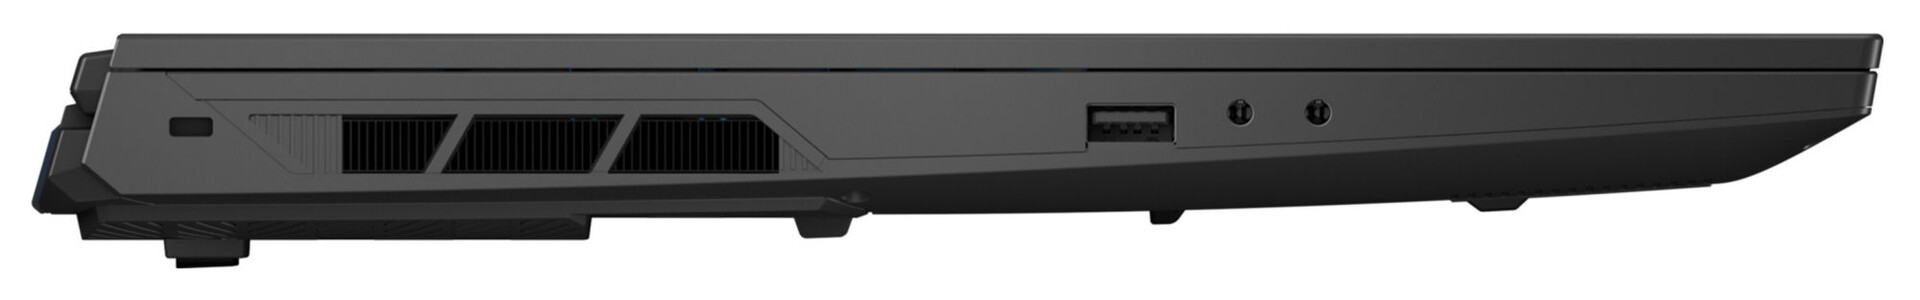
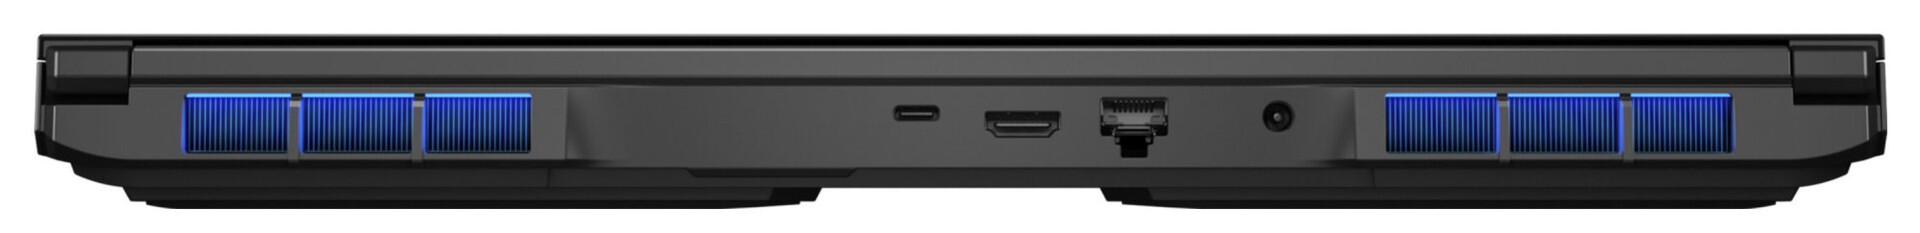
Equipamento - O Major X20 oferece Thunderbolt 4
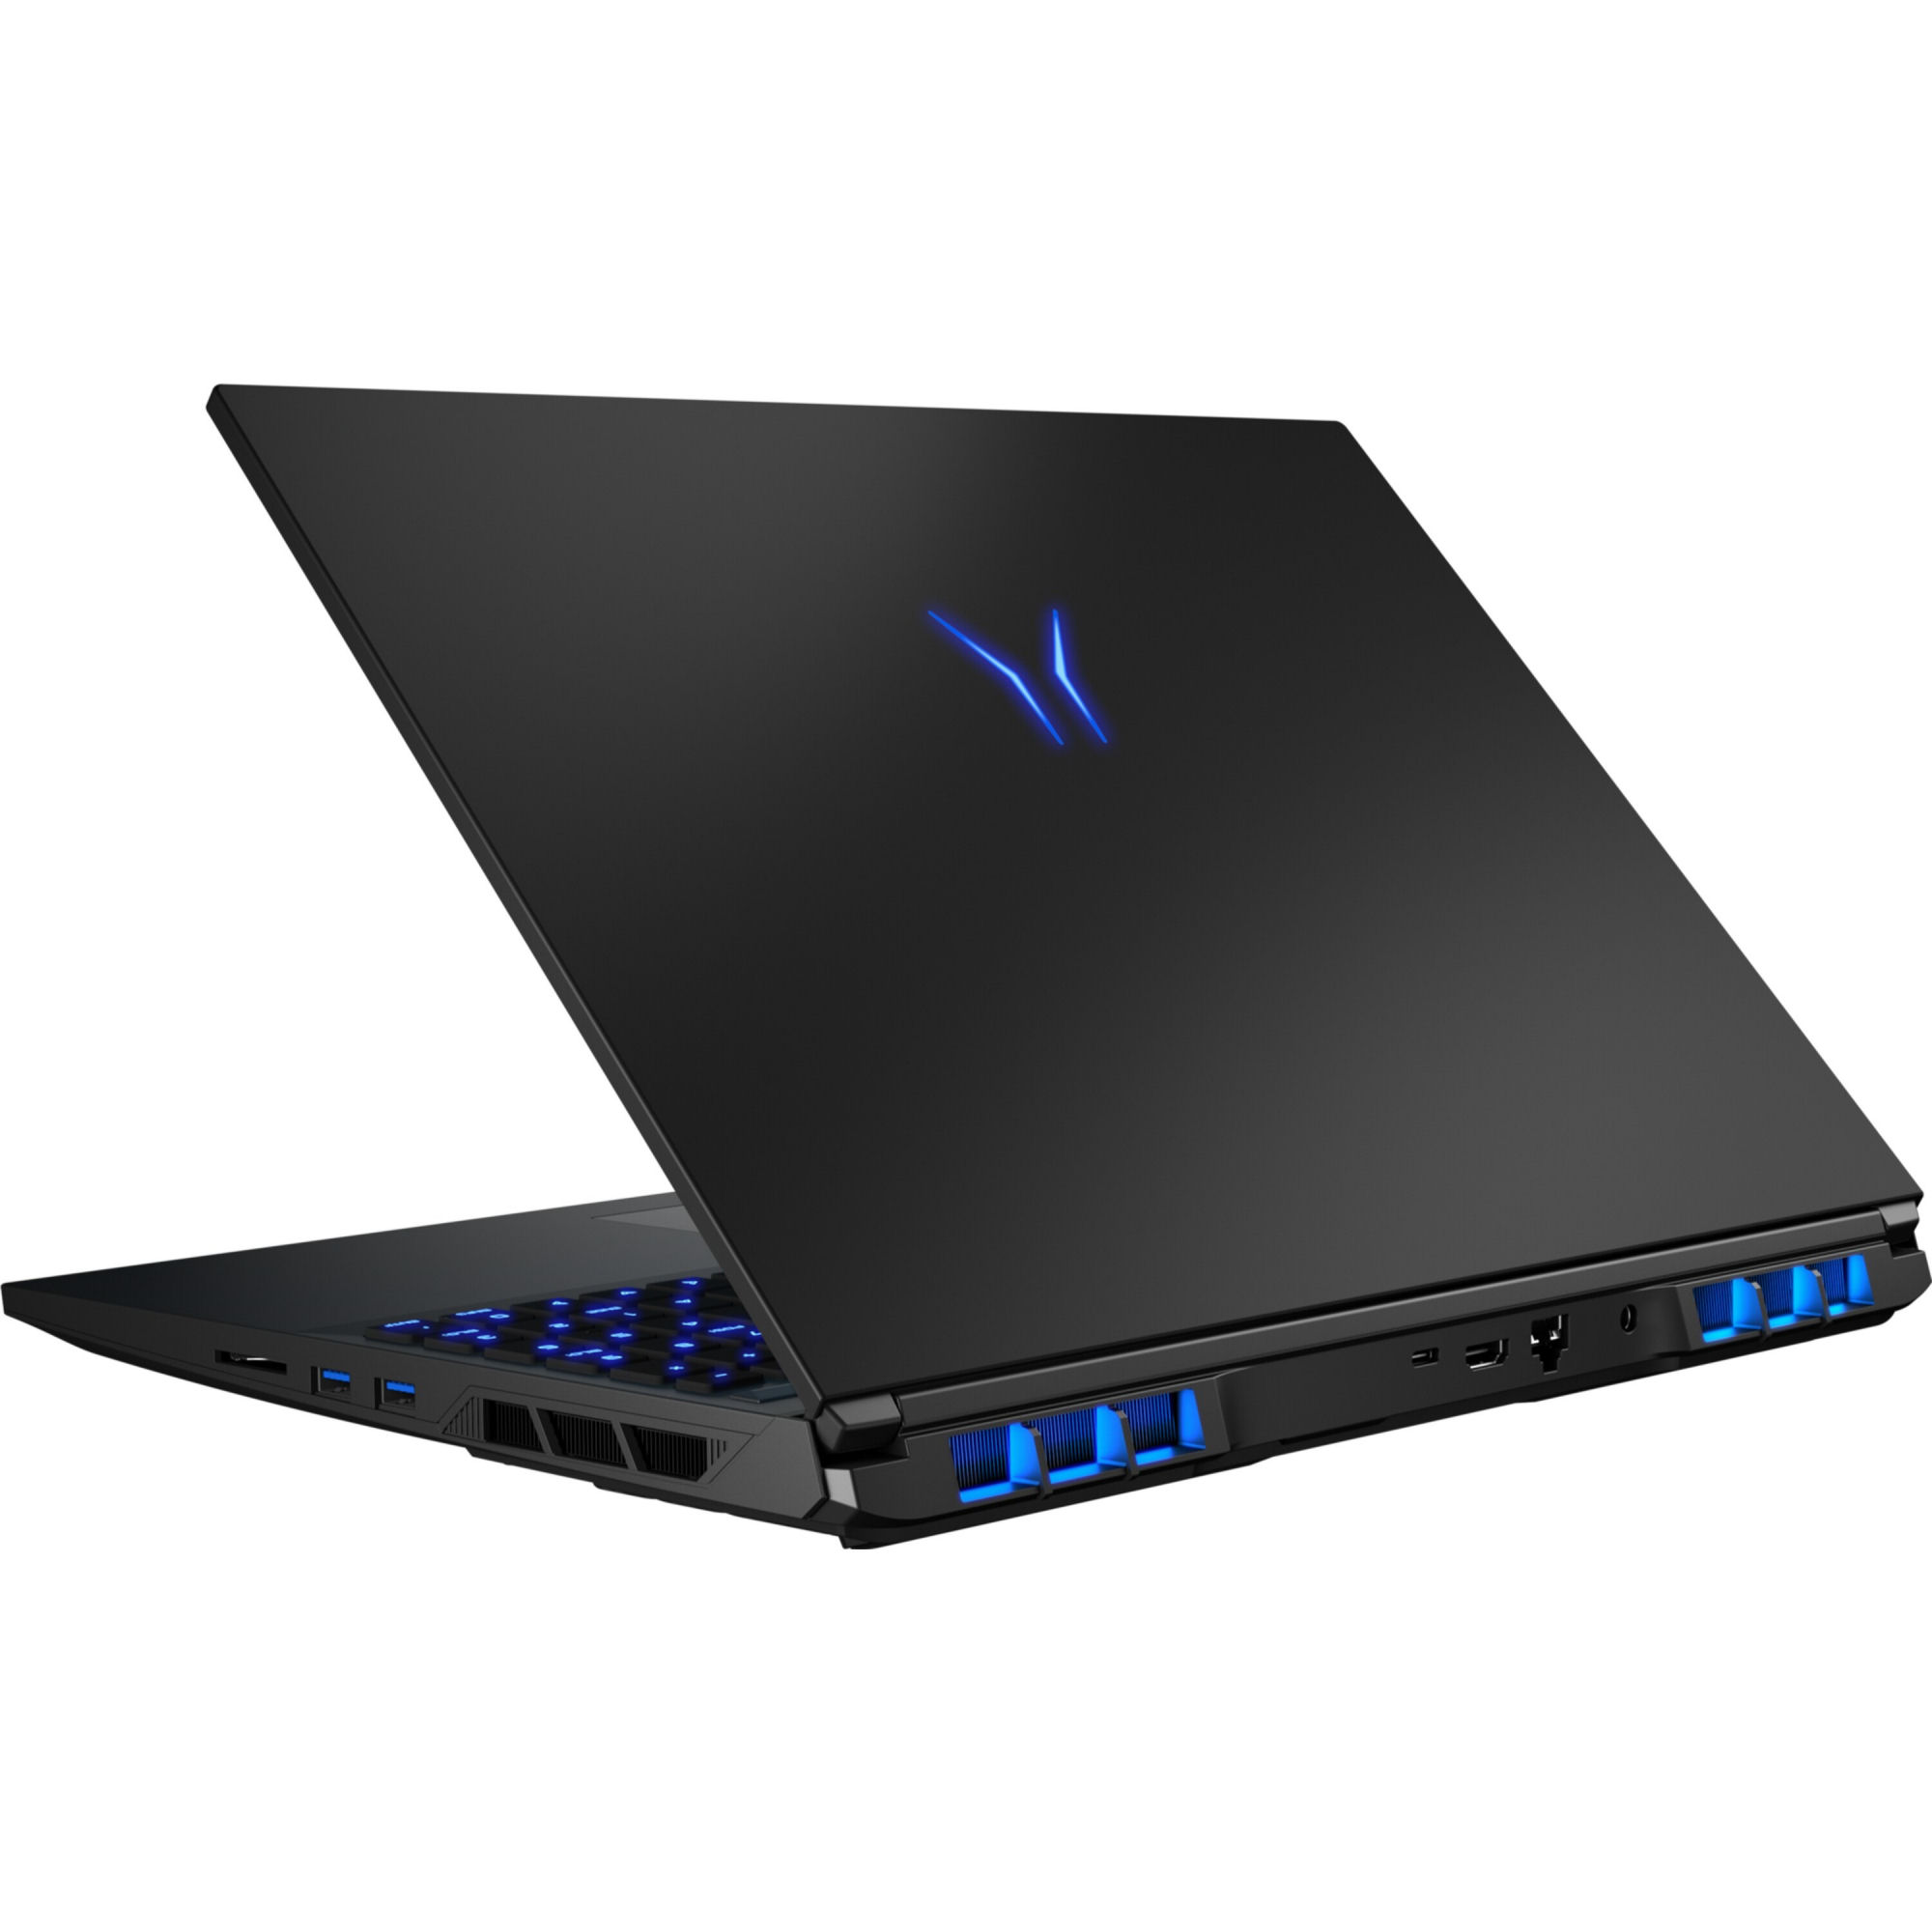
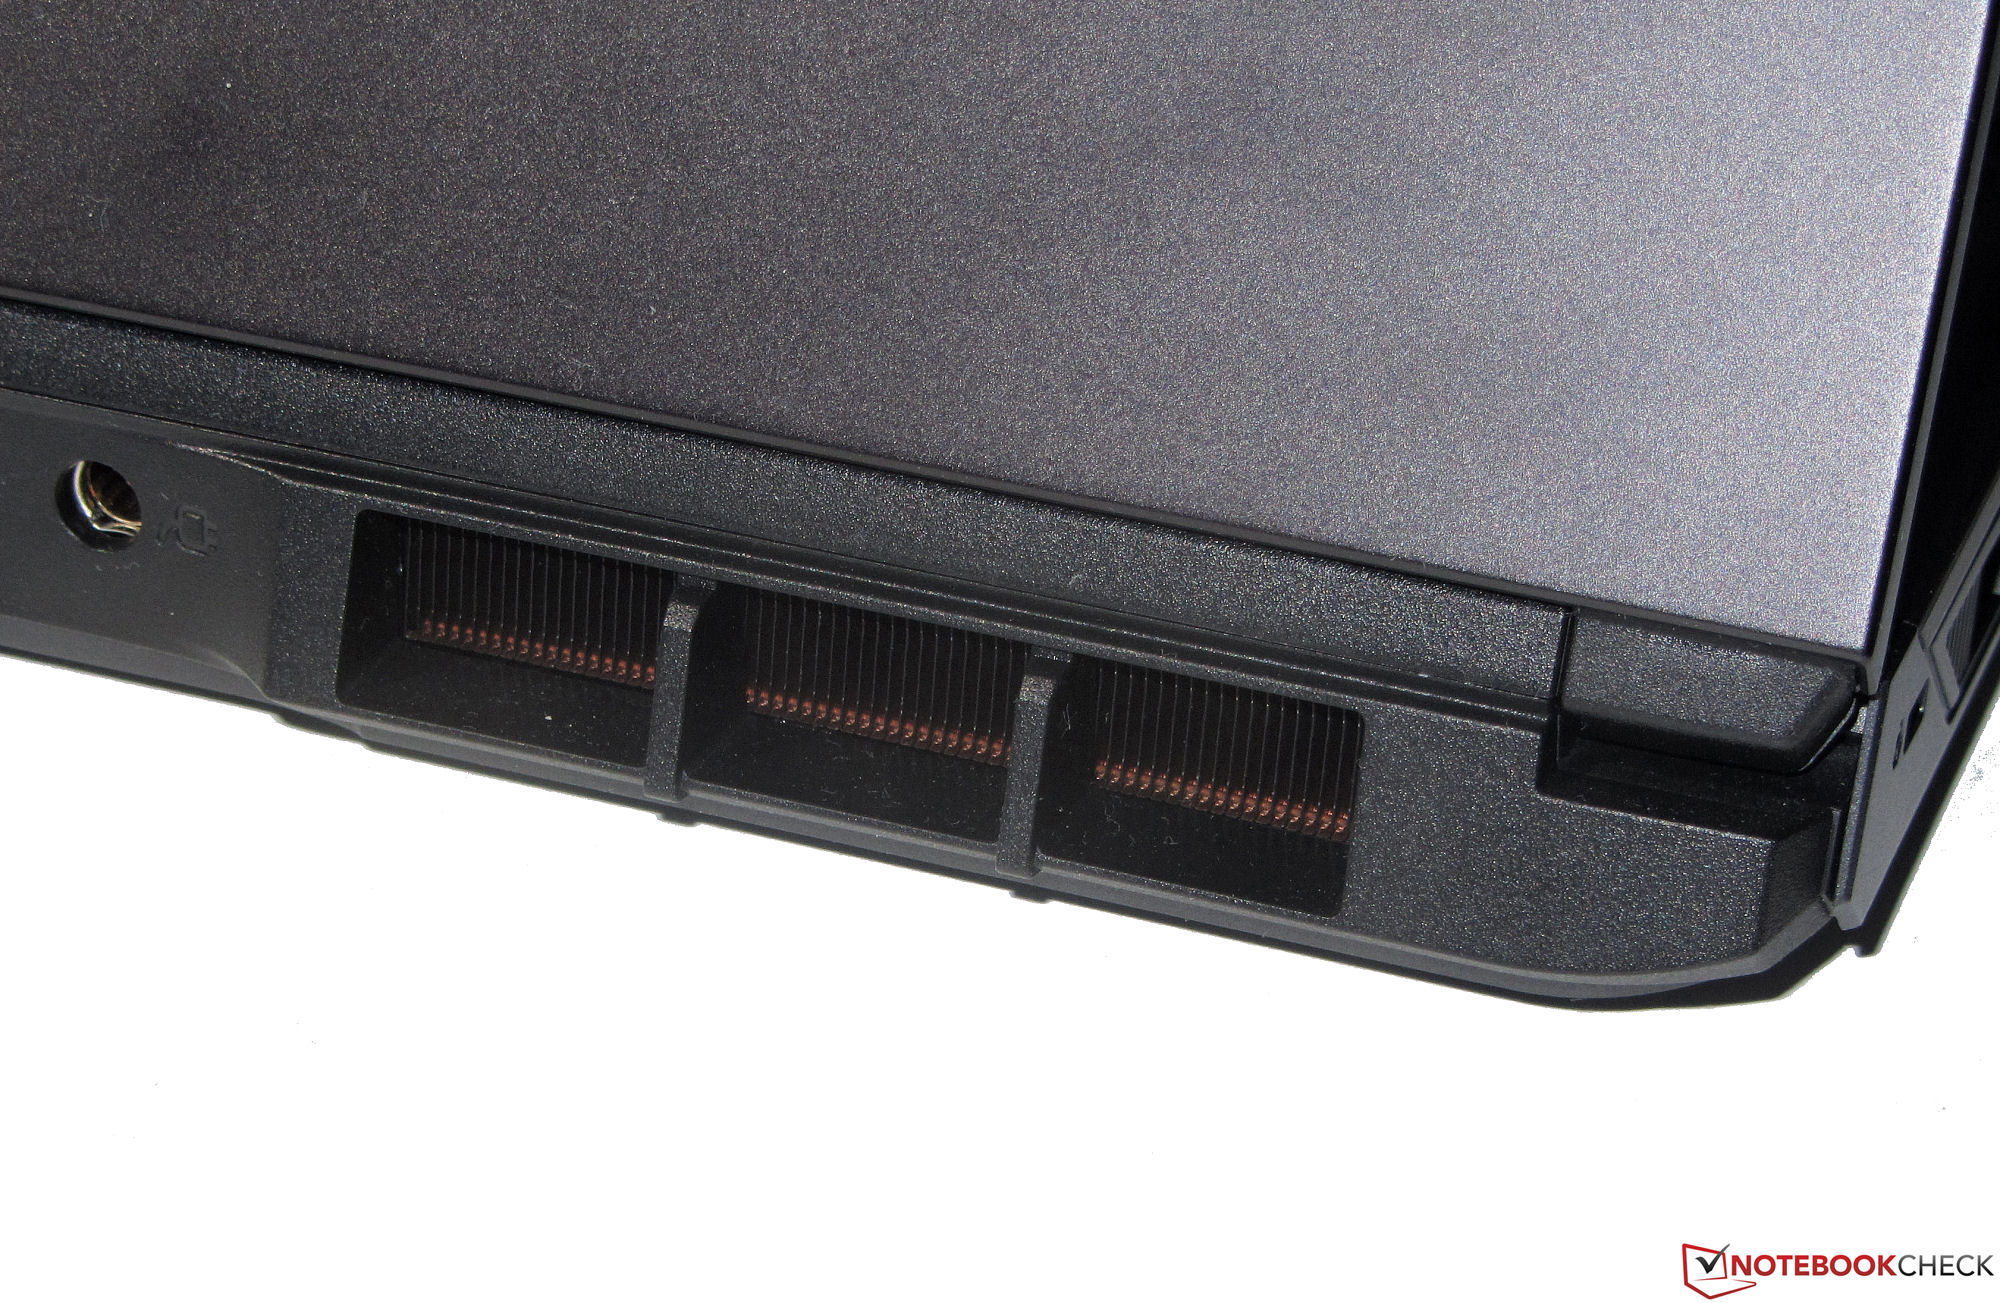
O Erazer tem três portas USB-A (1x USB 3.2 Gen 1, 2x USB 3.2 Gen 2) e uma porta USB-C (Thunderbolt 4). A última porta produz um sinal DisplayPort, mas não oferece suporte ao Power Delivery. O Major X20 também conta com um total de duas saídas de vídeo (HDMI 2.1, DP). Outras conexões incluem um slot para uma trava de cabo, dois conectores de áudio e uma porta Gigabit Ethernet (2,5 Gbps)
As saídas de vídeo, o slot de alimentação e a porta de rede estão localizados na parte traseira do dispositivo. Assim, os cabos correspondentes passam pela parte traseira e não atrapalham.
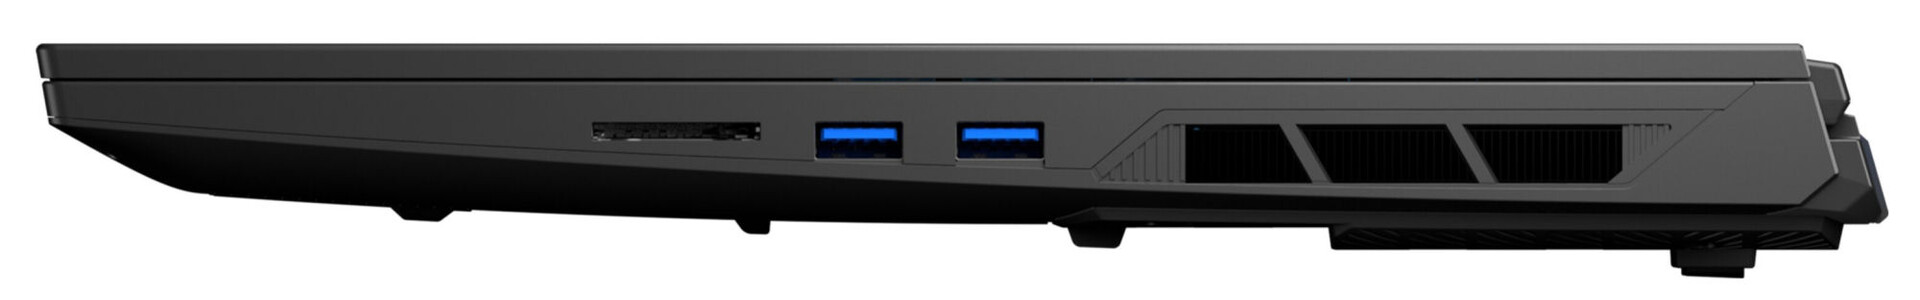
Leitor de cartão SD
O leitor de cartão de memória microSD (cartão de referência: AV PRO microSD 128 GB V60) está entre os modelos de média velocidade com taxas de transferência máxima de 78 MB/s (transferência de 250 arquivos de imagem jpg com cerca de 5 MB cada) e 88 MB/s (cópia de grandes blocos de dados).
| SD Card Reader | |
| average JPG Copy Test (av. of 3 runs) | |
| Média da turma Gaming (20.9 - 210, n=54, últimos 2 anos) | |
| Razer Blade 15 OLED (Early 2022) (AV Pro SD microSD 128 GB V60) | |
| Medion Erazer Major X20 (AV PRO microSD 128 GB V60) | |
| maximum AS SSD Seq Read Test (1GB) | |
| Média da turma Gaming (25.5 - 261, n=51, últimos 2 anos) | |
| Medion Erazer Major X20 (AV PRO microSD 128 GB V60) | |
| Razer Blade 15 OLED (Early 2022) (AV Pro SD microSD 128 GB V60) | |
Comunicação
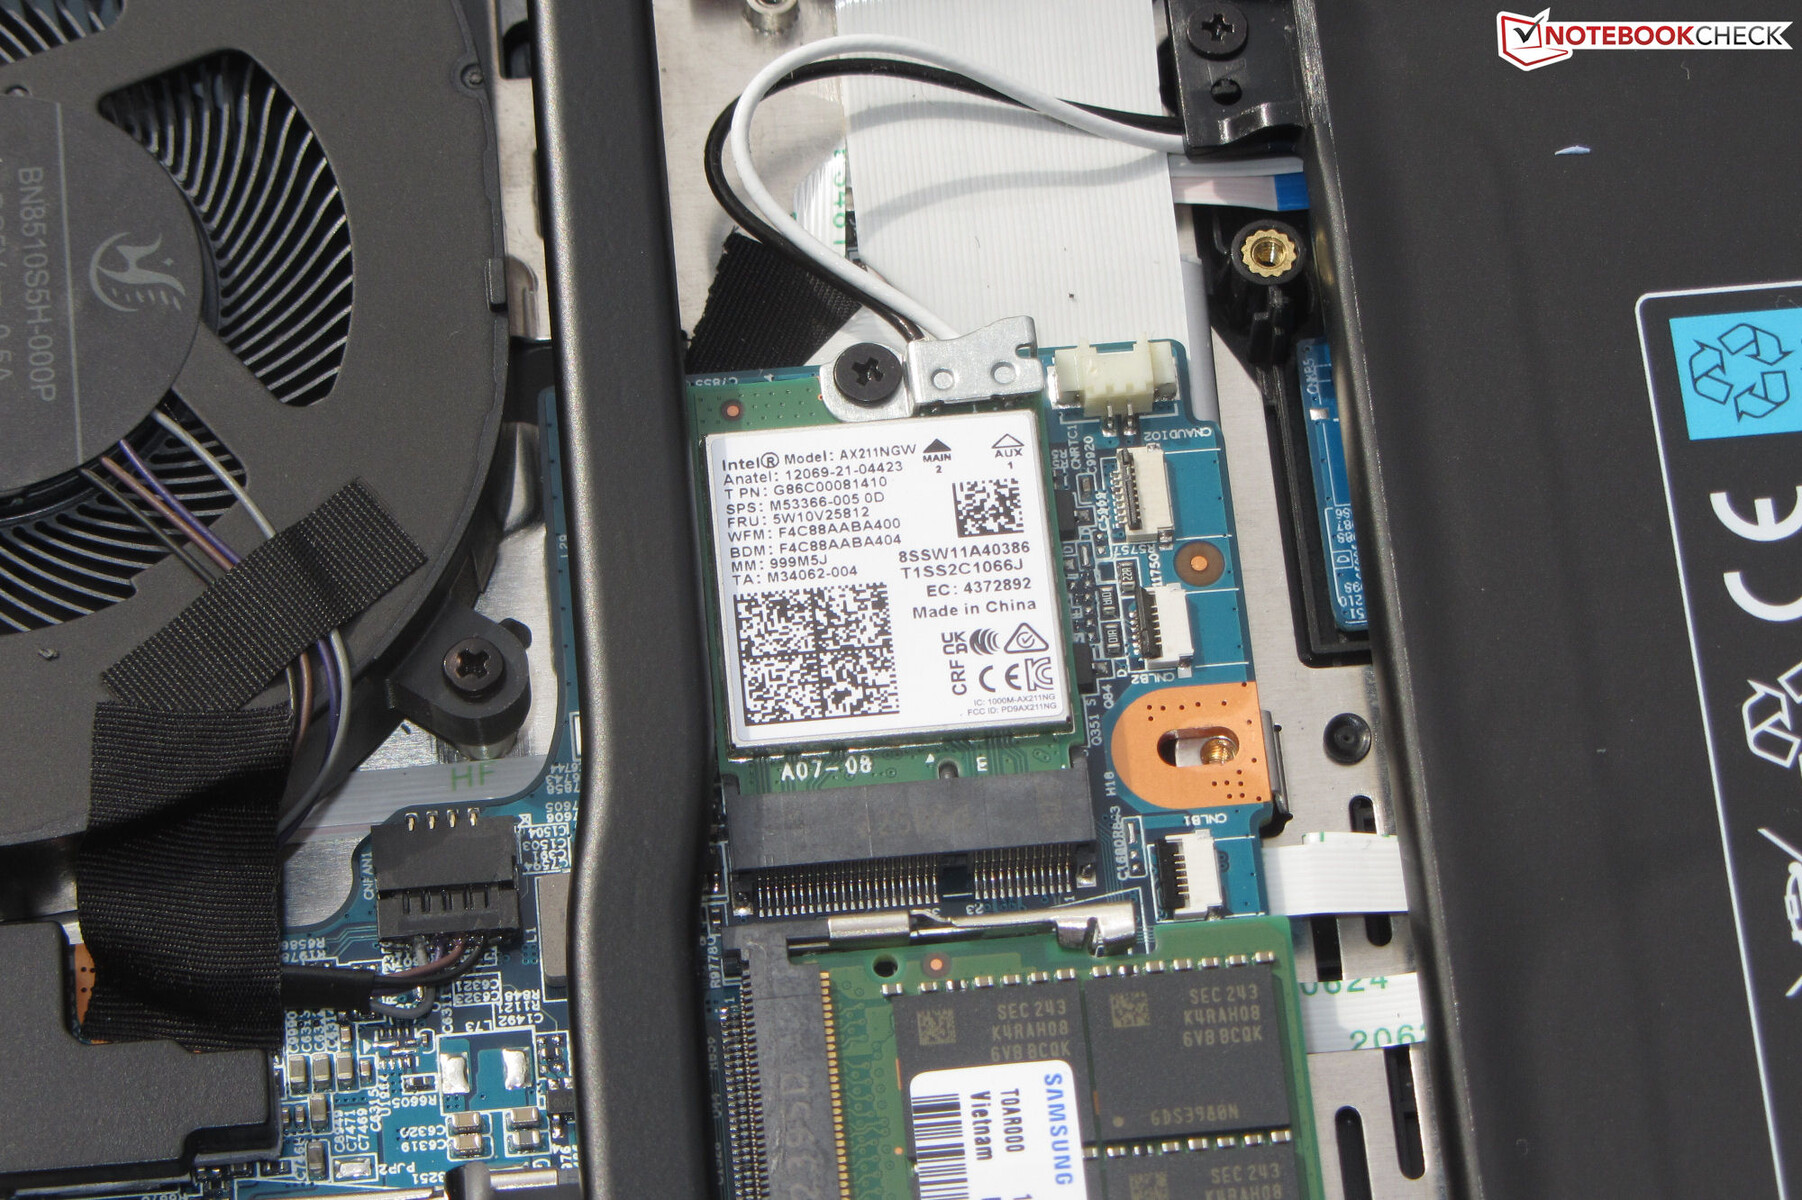
As taxas de dados WiFi são excelentes em condições ideais (sem dispositivos WLAN nas proximidades, pequena distância entre o laptop e o PC servidor). O X20 tem um chip WiFi 6E (Intel AX211) integrado. As conexões com fio são gerenciadas por um chip (RTL8125; 2,5 GBit/s) da Realtek.
Webcam
A webcam (2,1 MP, máx. 1.920 x 1.080) oferece qualidade padrão. Não há precisão de cores: em um desvio de cor de cerca de 11, a meta (DeltaE menor que 3) não é atingida. Não há obturador mecânico a bordo.


Acessórios
Além dos documentos habituais (guia de início rápido e informações sobre garantia), nenhum outro acessório é fornecido com o notebook.
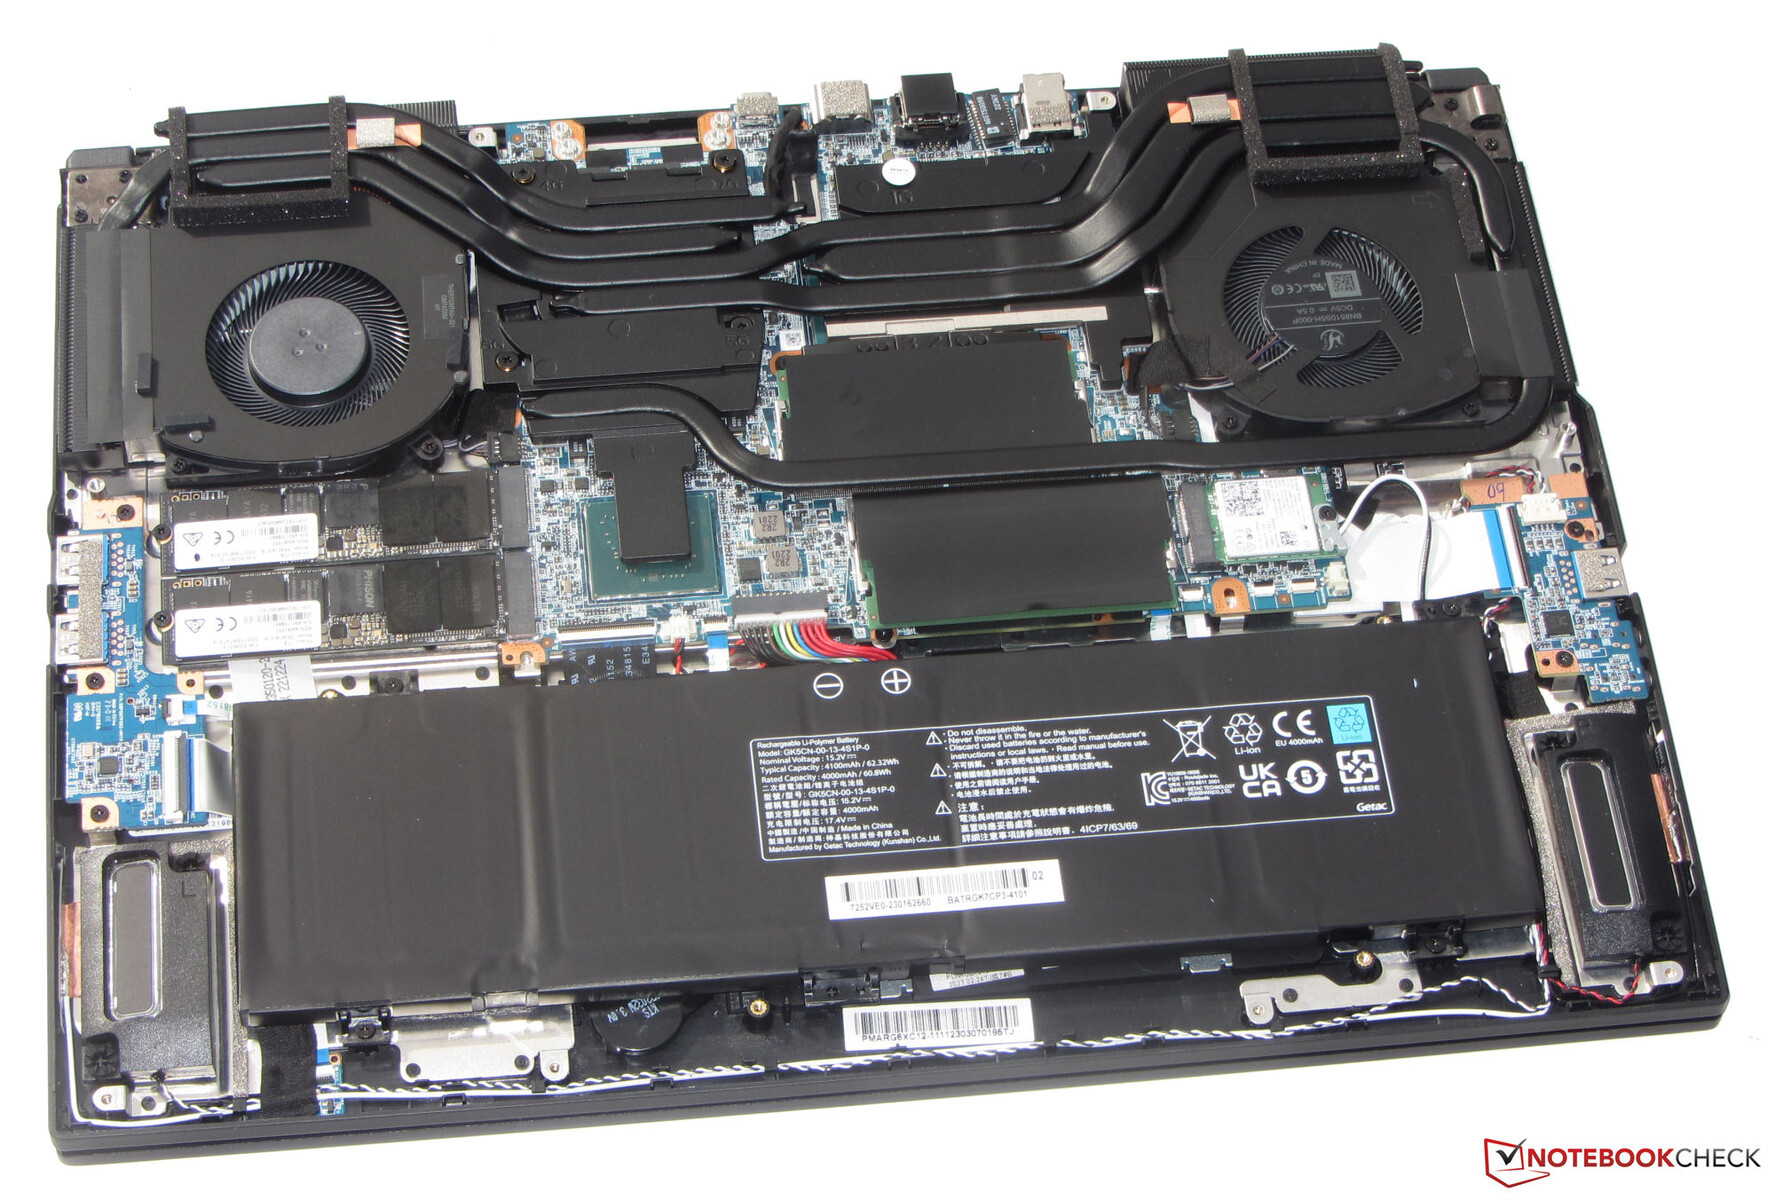
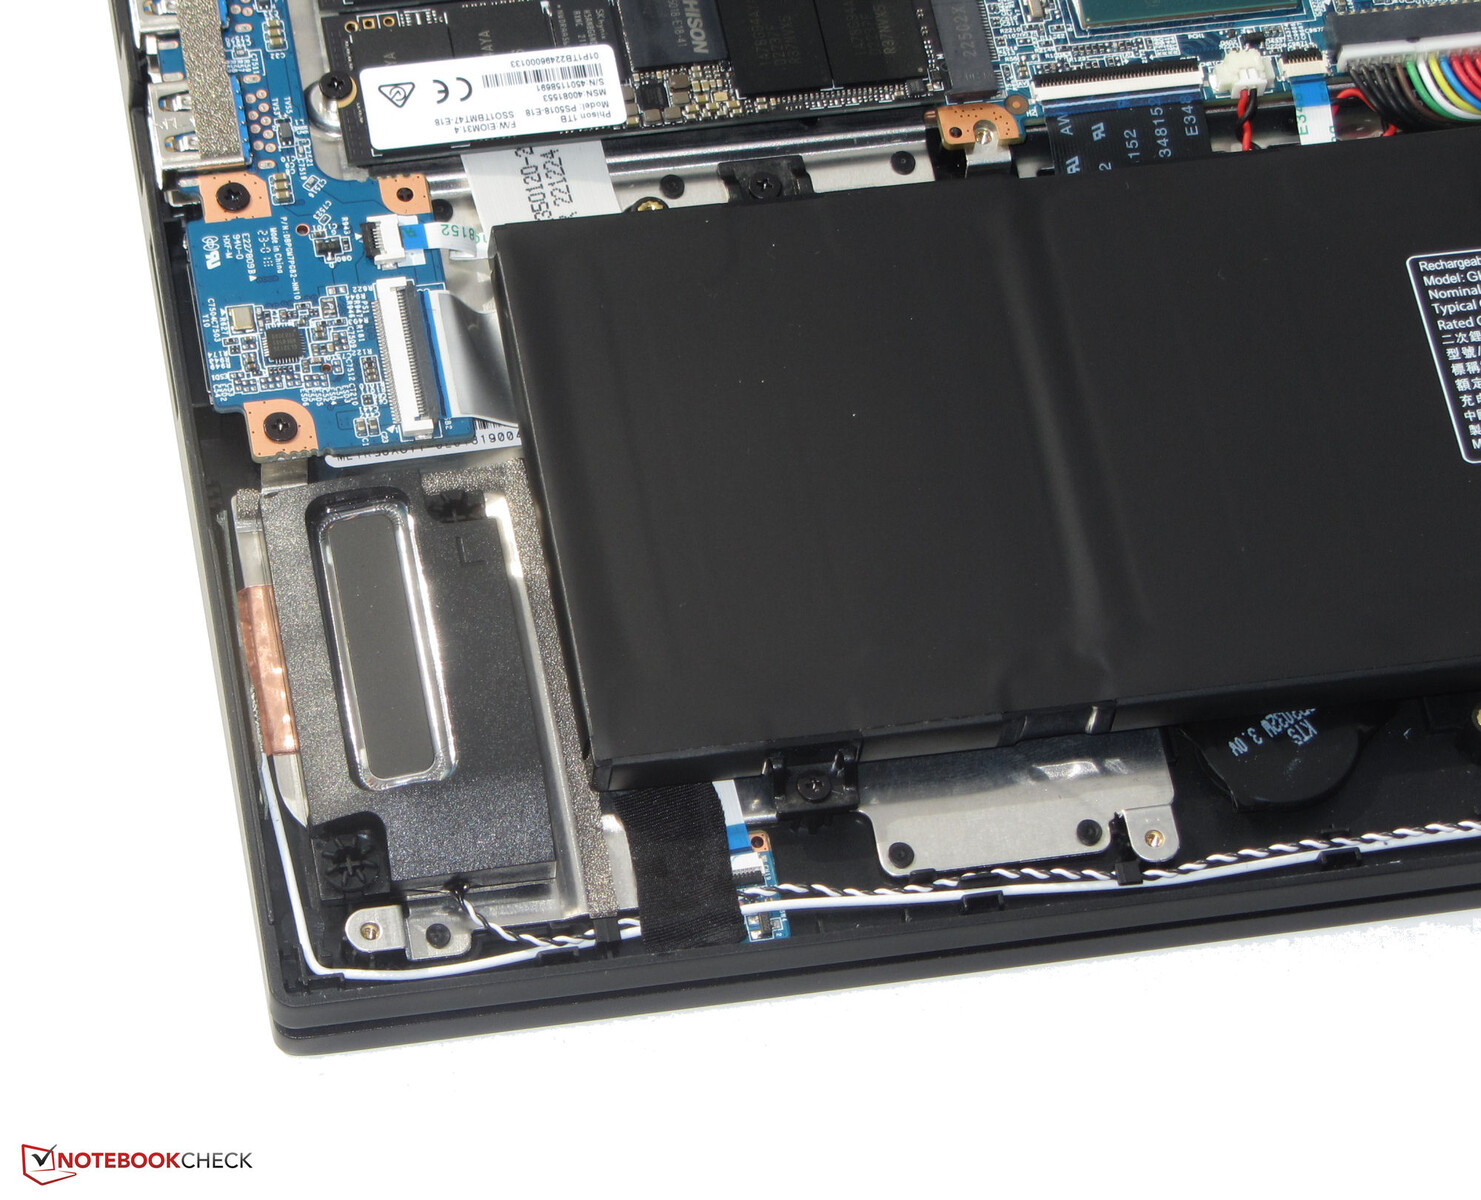
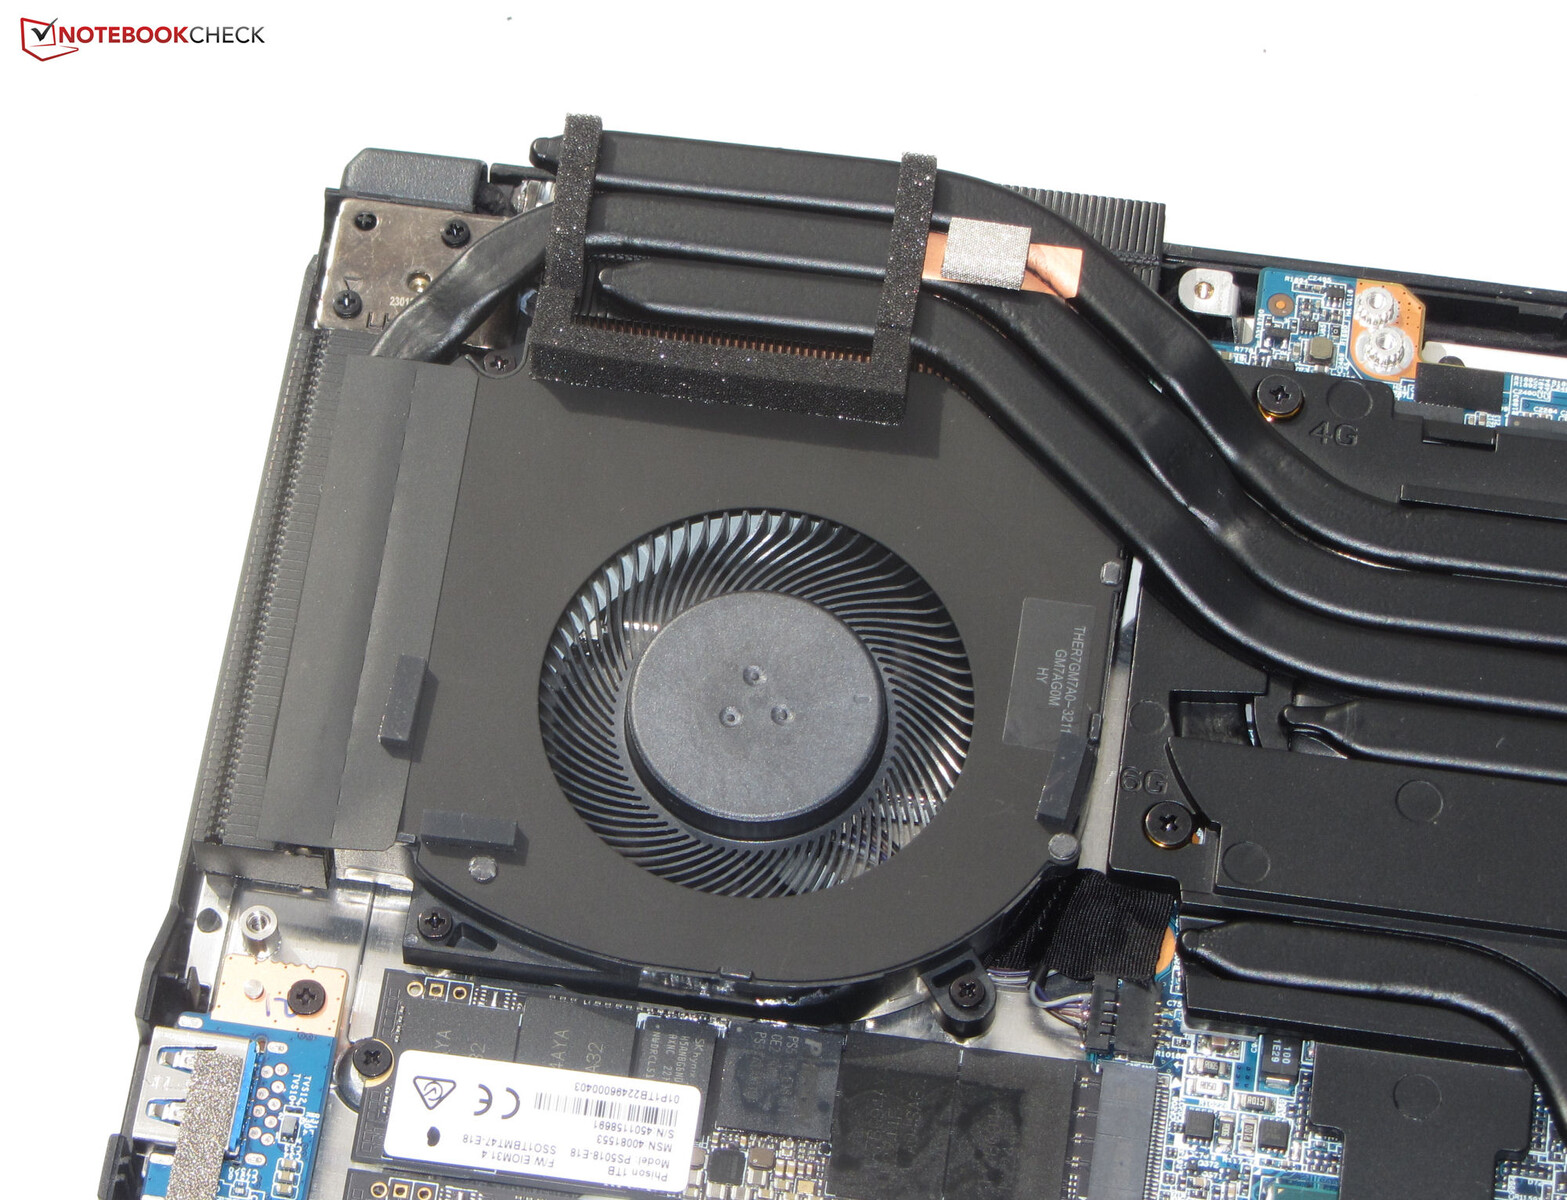
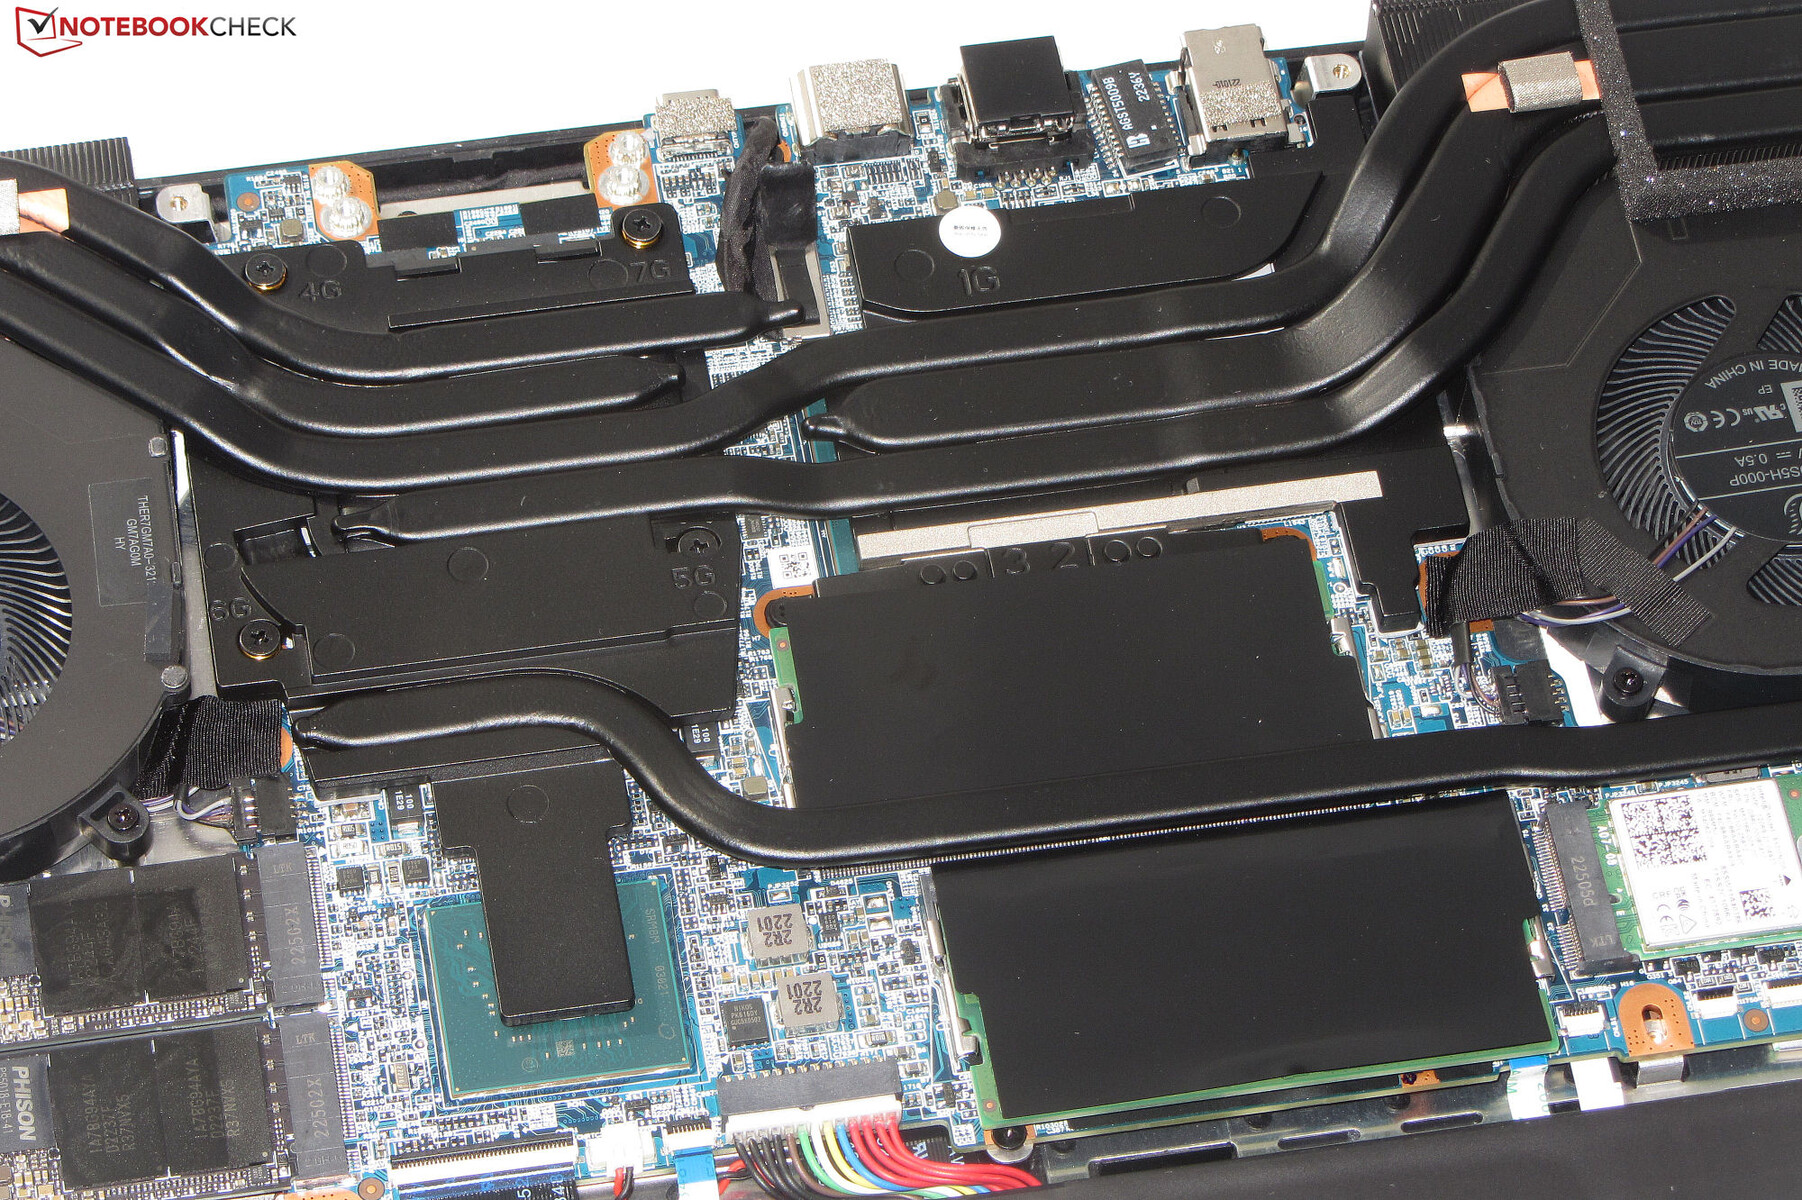
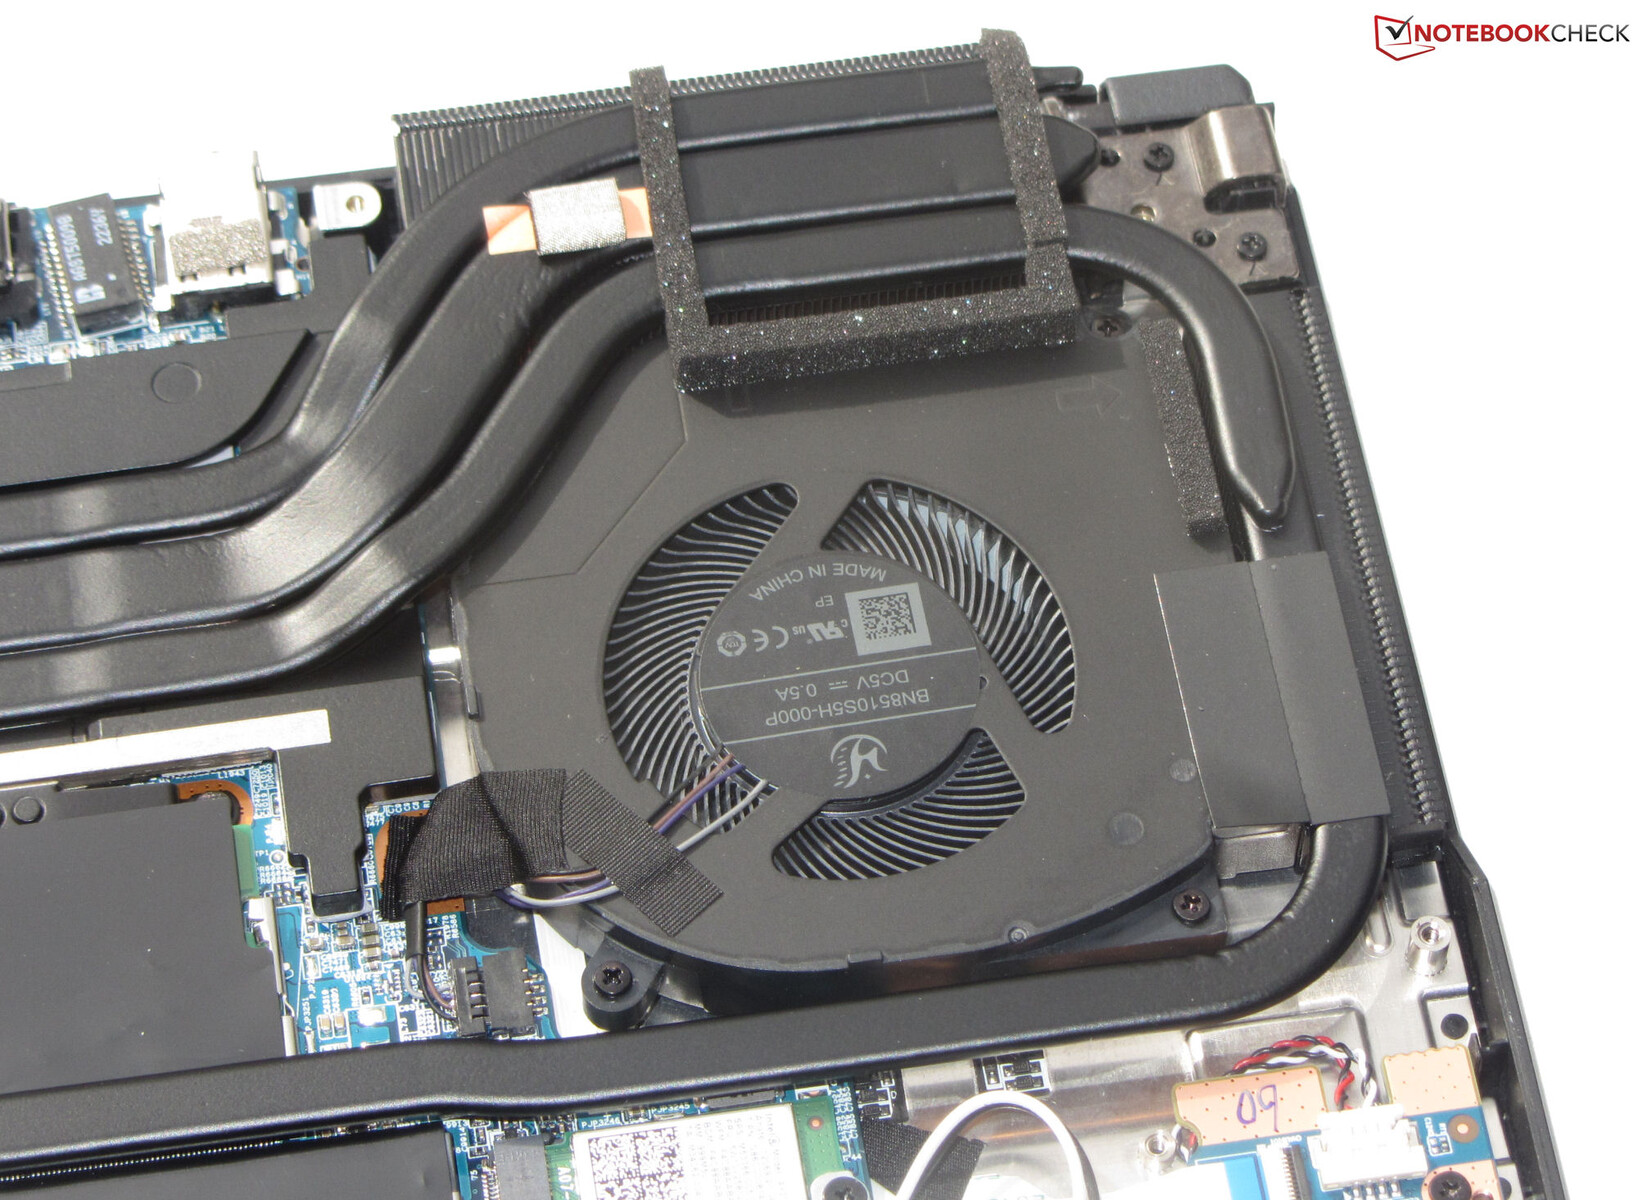
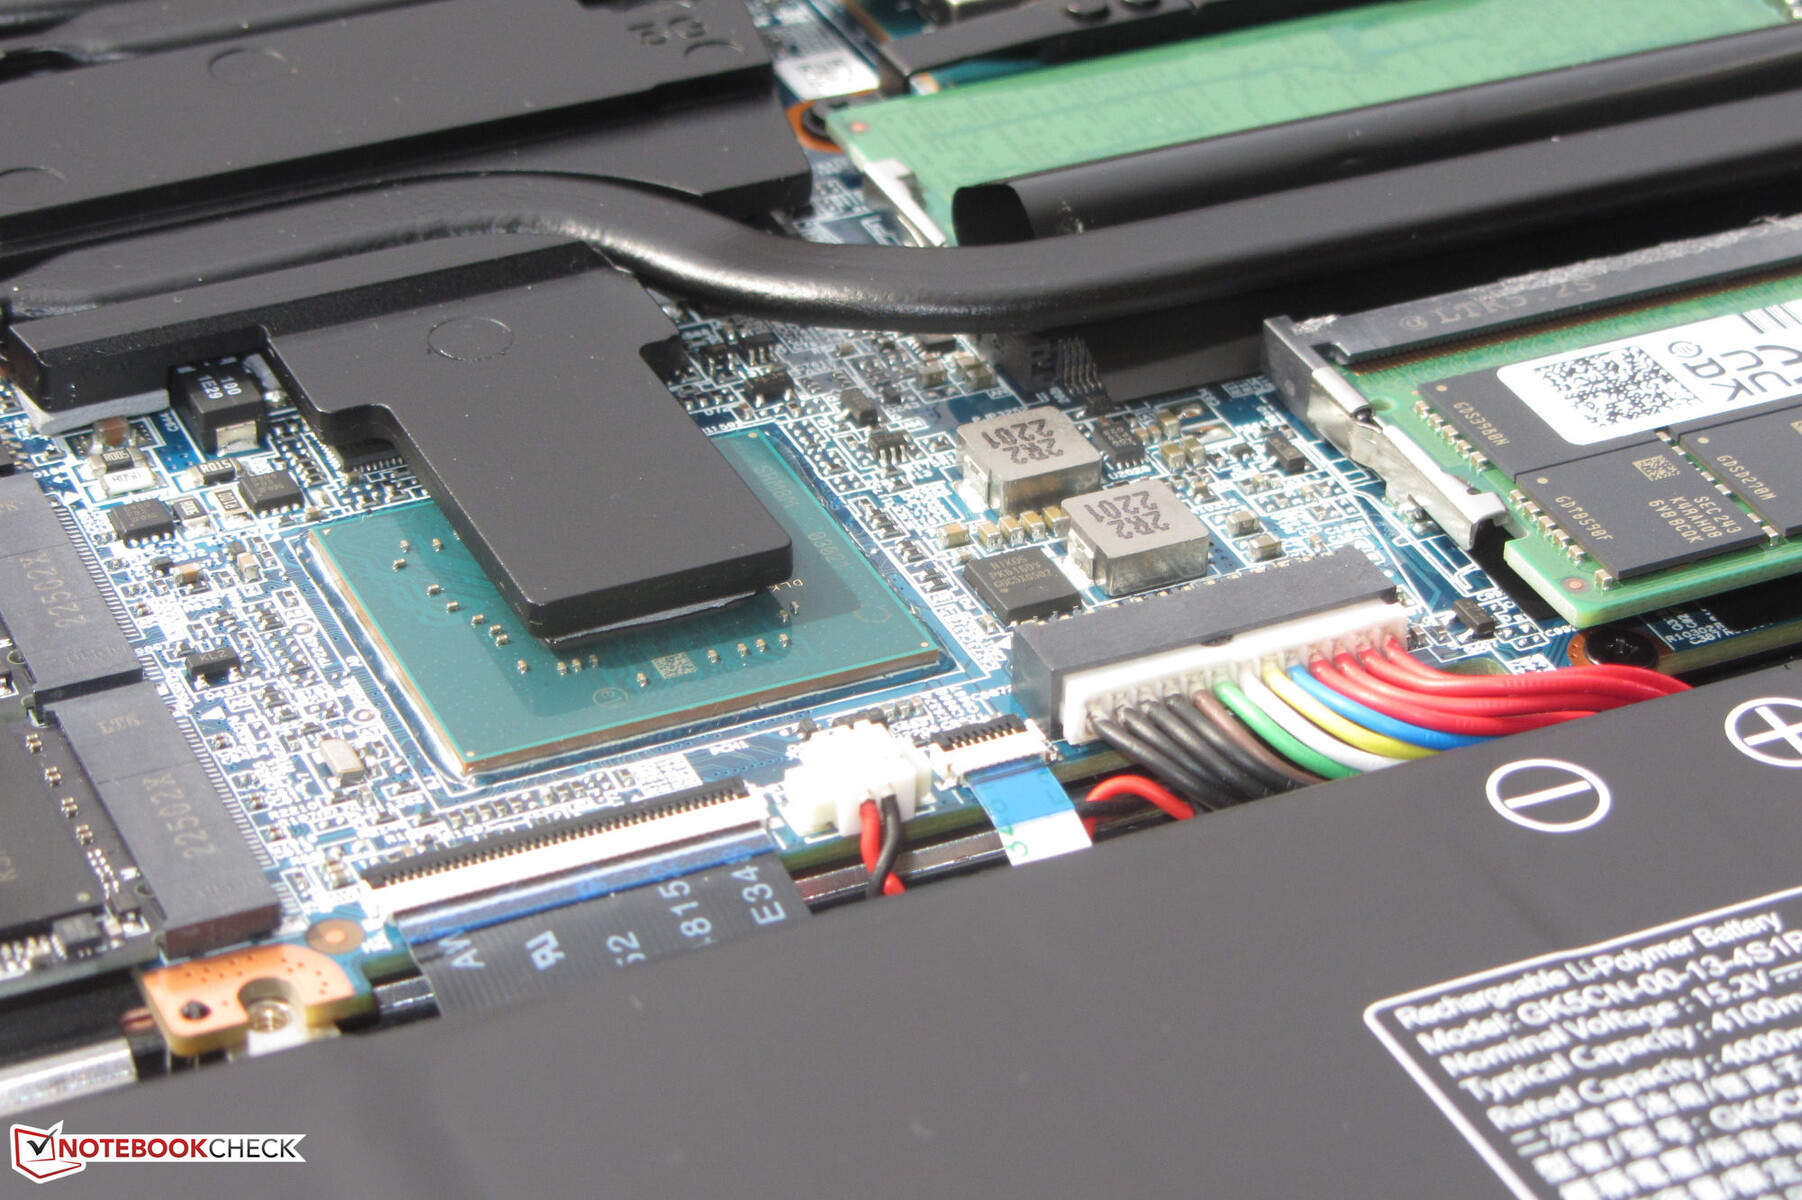
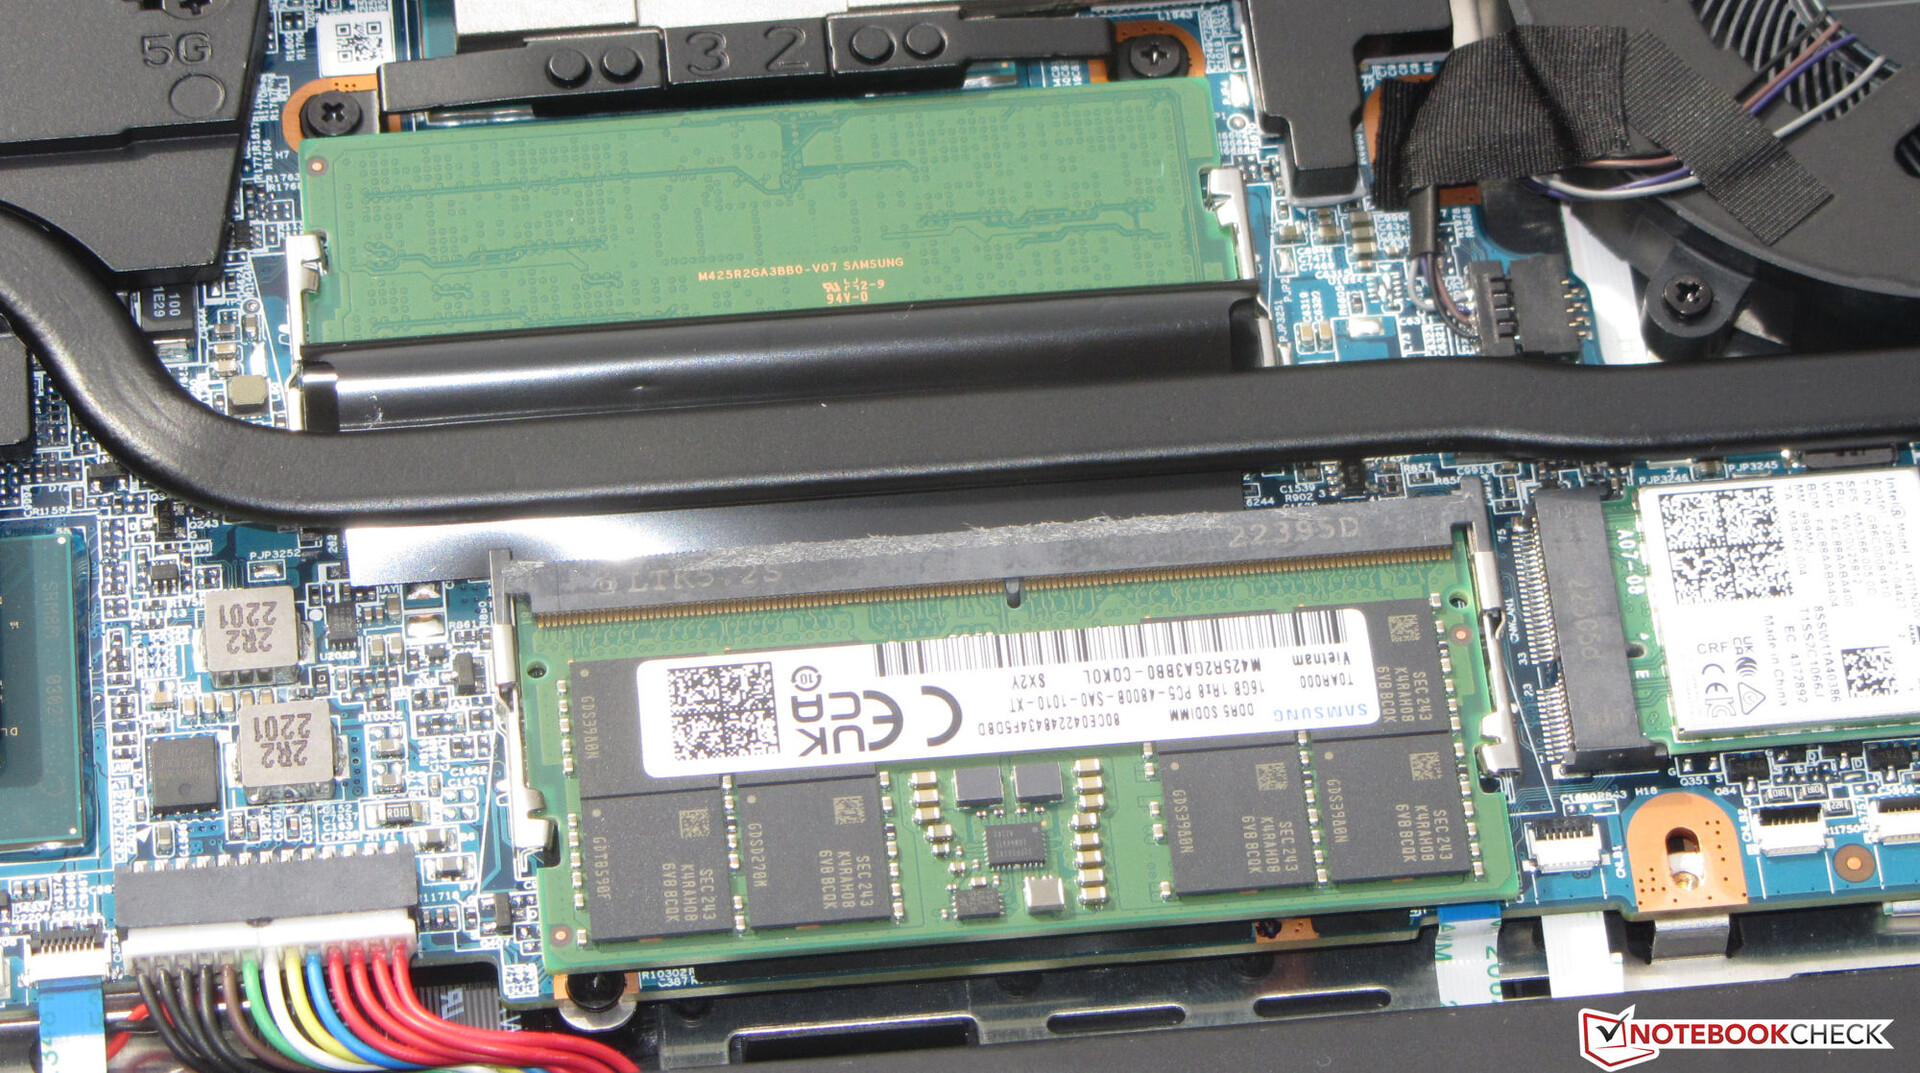
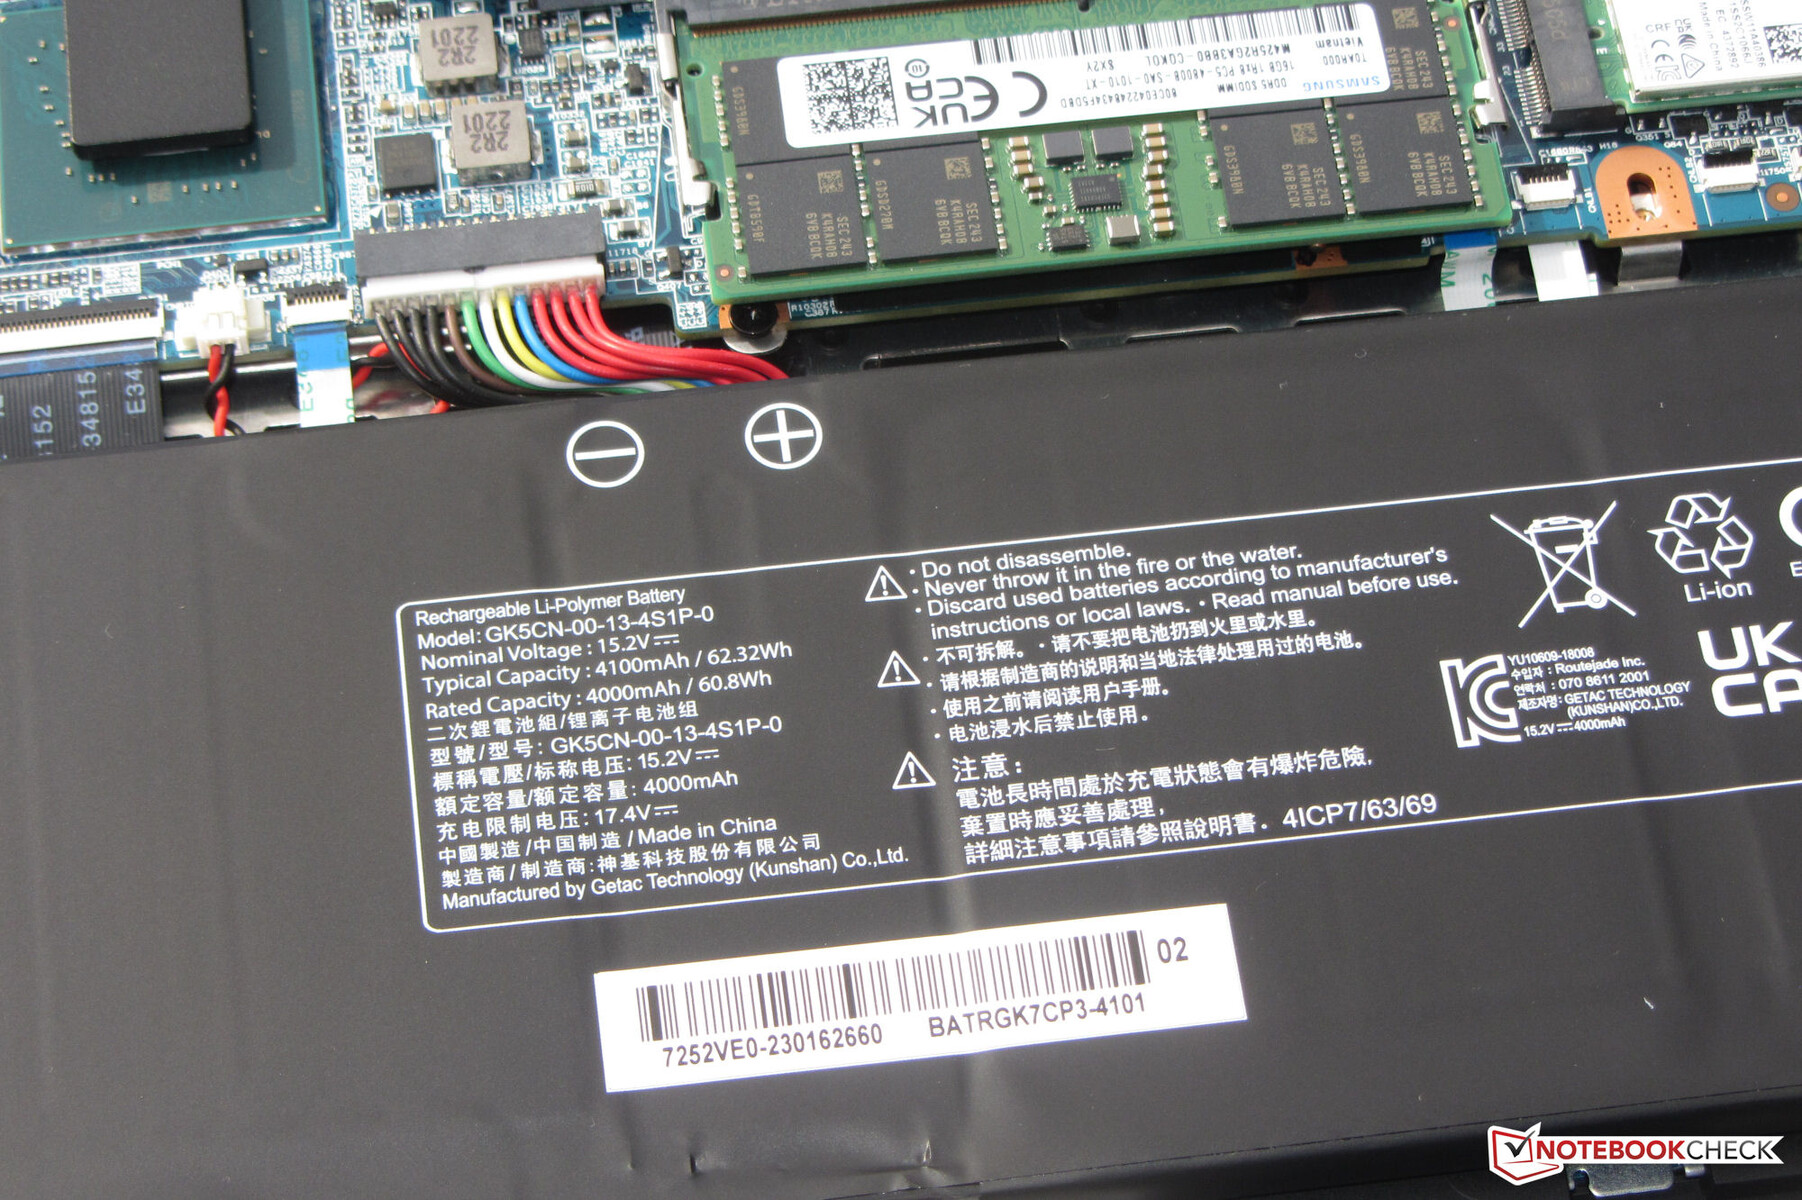
Manutenção
Depois de remover todos os parafusos na parte inferior do dispositivo, o invólucro inferior pode ser removido usando uma espátula plana ou um alisador de juntas. Assim, você terá acesso aos dois slots de RAM (ambos ocupados), aos dois SSDs (PCIe 4, M.2-2280), ao módulo WLAN, aos ventiladores, à bateria do BIOS e à bateria do laptop.
Garantia
A Medion oferece uma garantia de dois anos para o Erazer na Alemanha. Isso pode ser diferente em outros países, portanto, os compradores devem verificar antes de comprar.
As extensões de garantia estão disponíveis, mas devem ser compradas junto com o notebook na loja on-line da Medion. Não é possível fazer uma compra posterior.
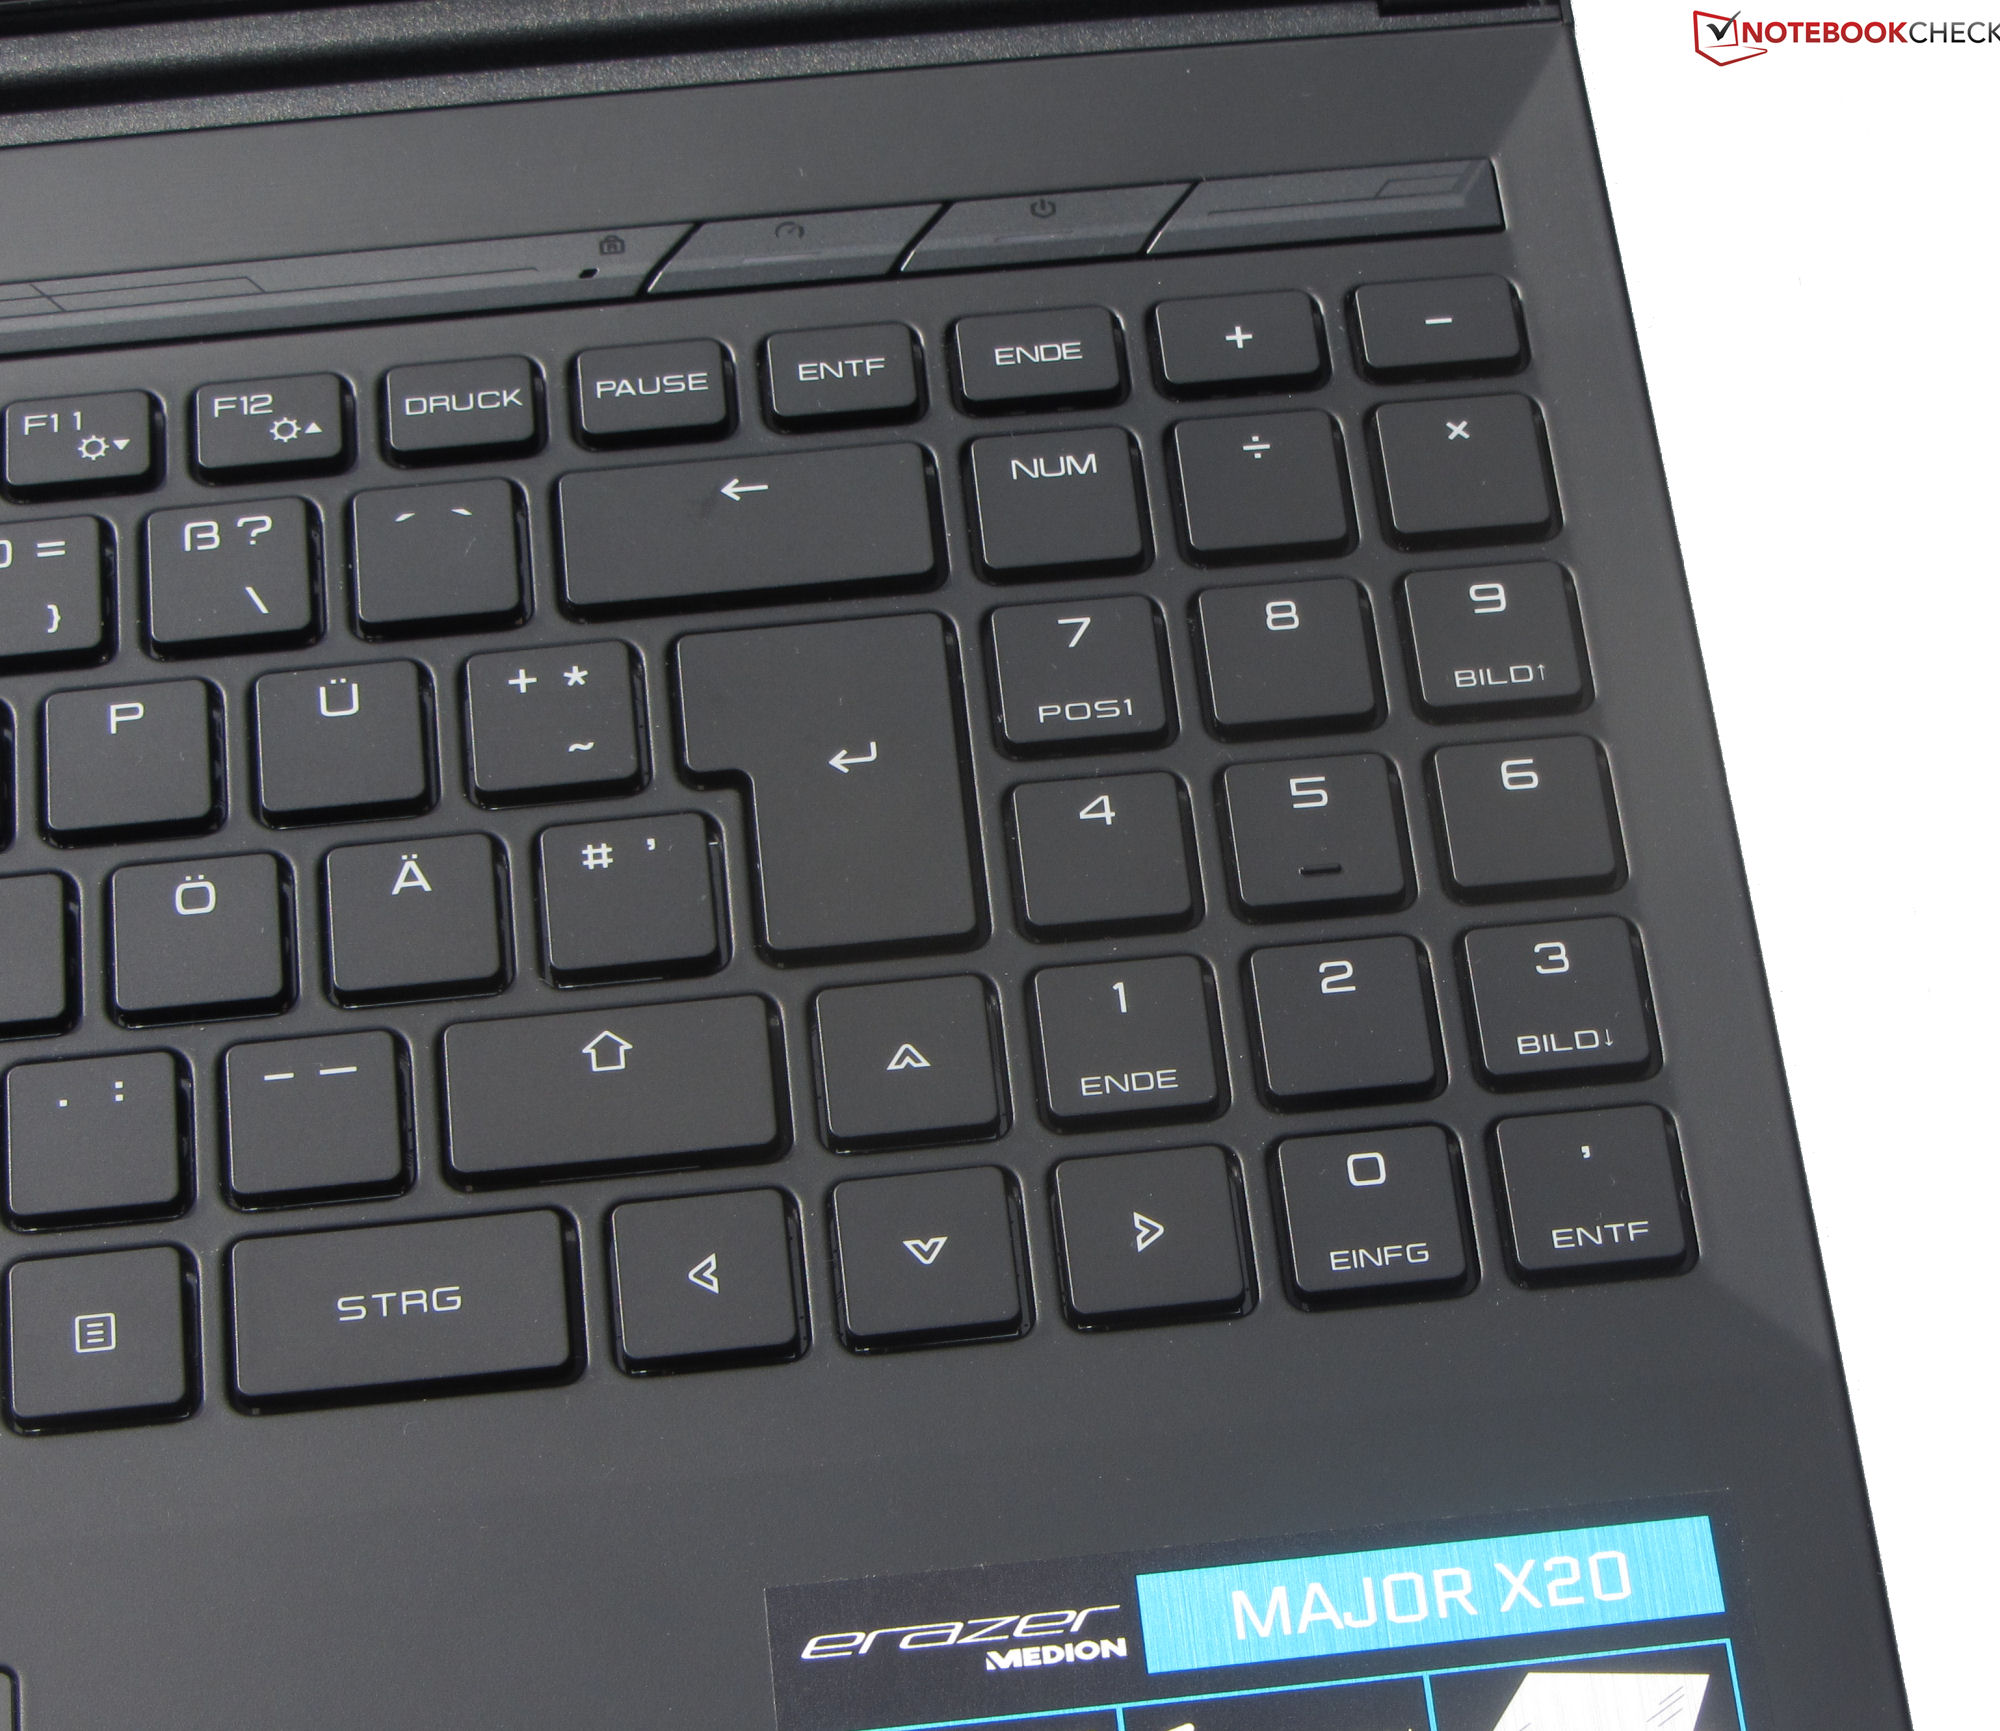
Dispositivos de entrada - Teclado mecânico com switches Cherry MX
Teclado
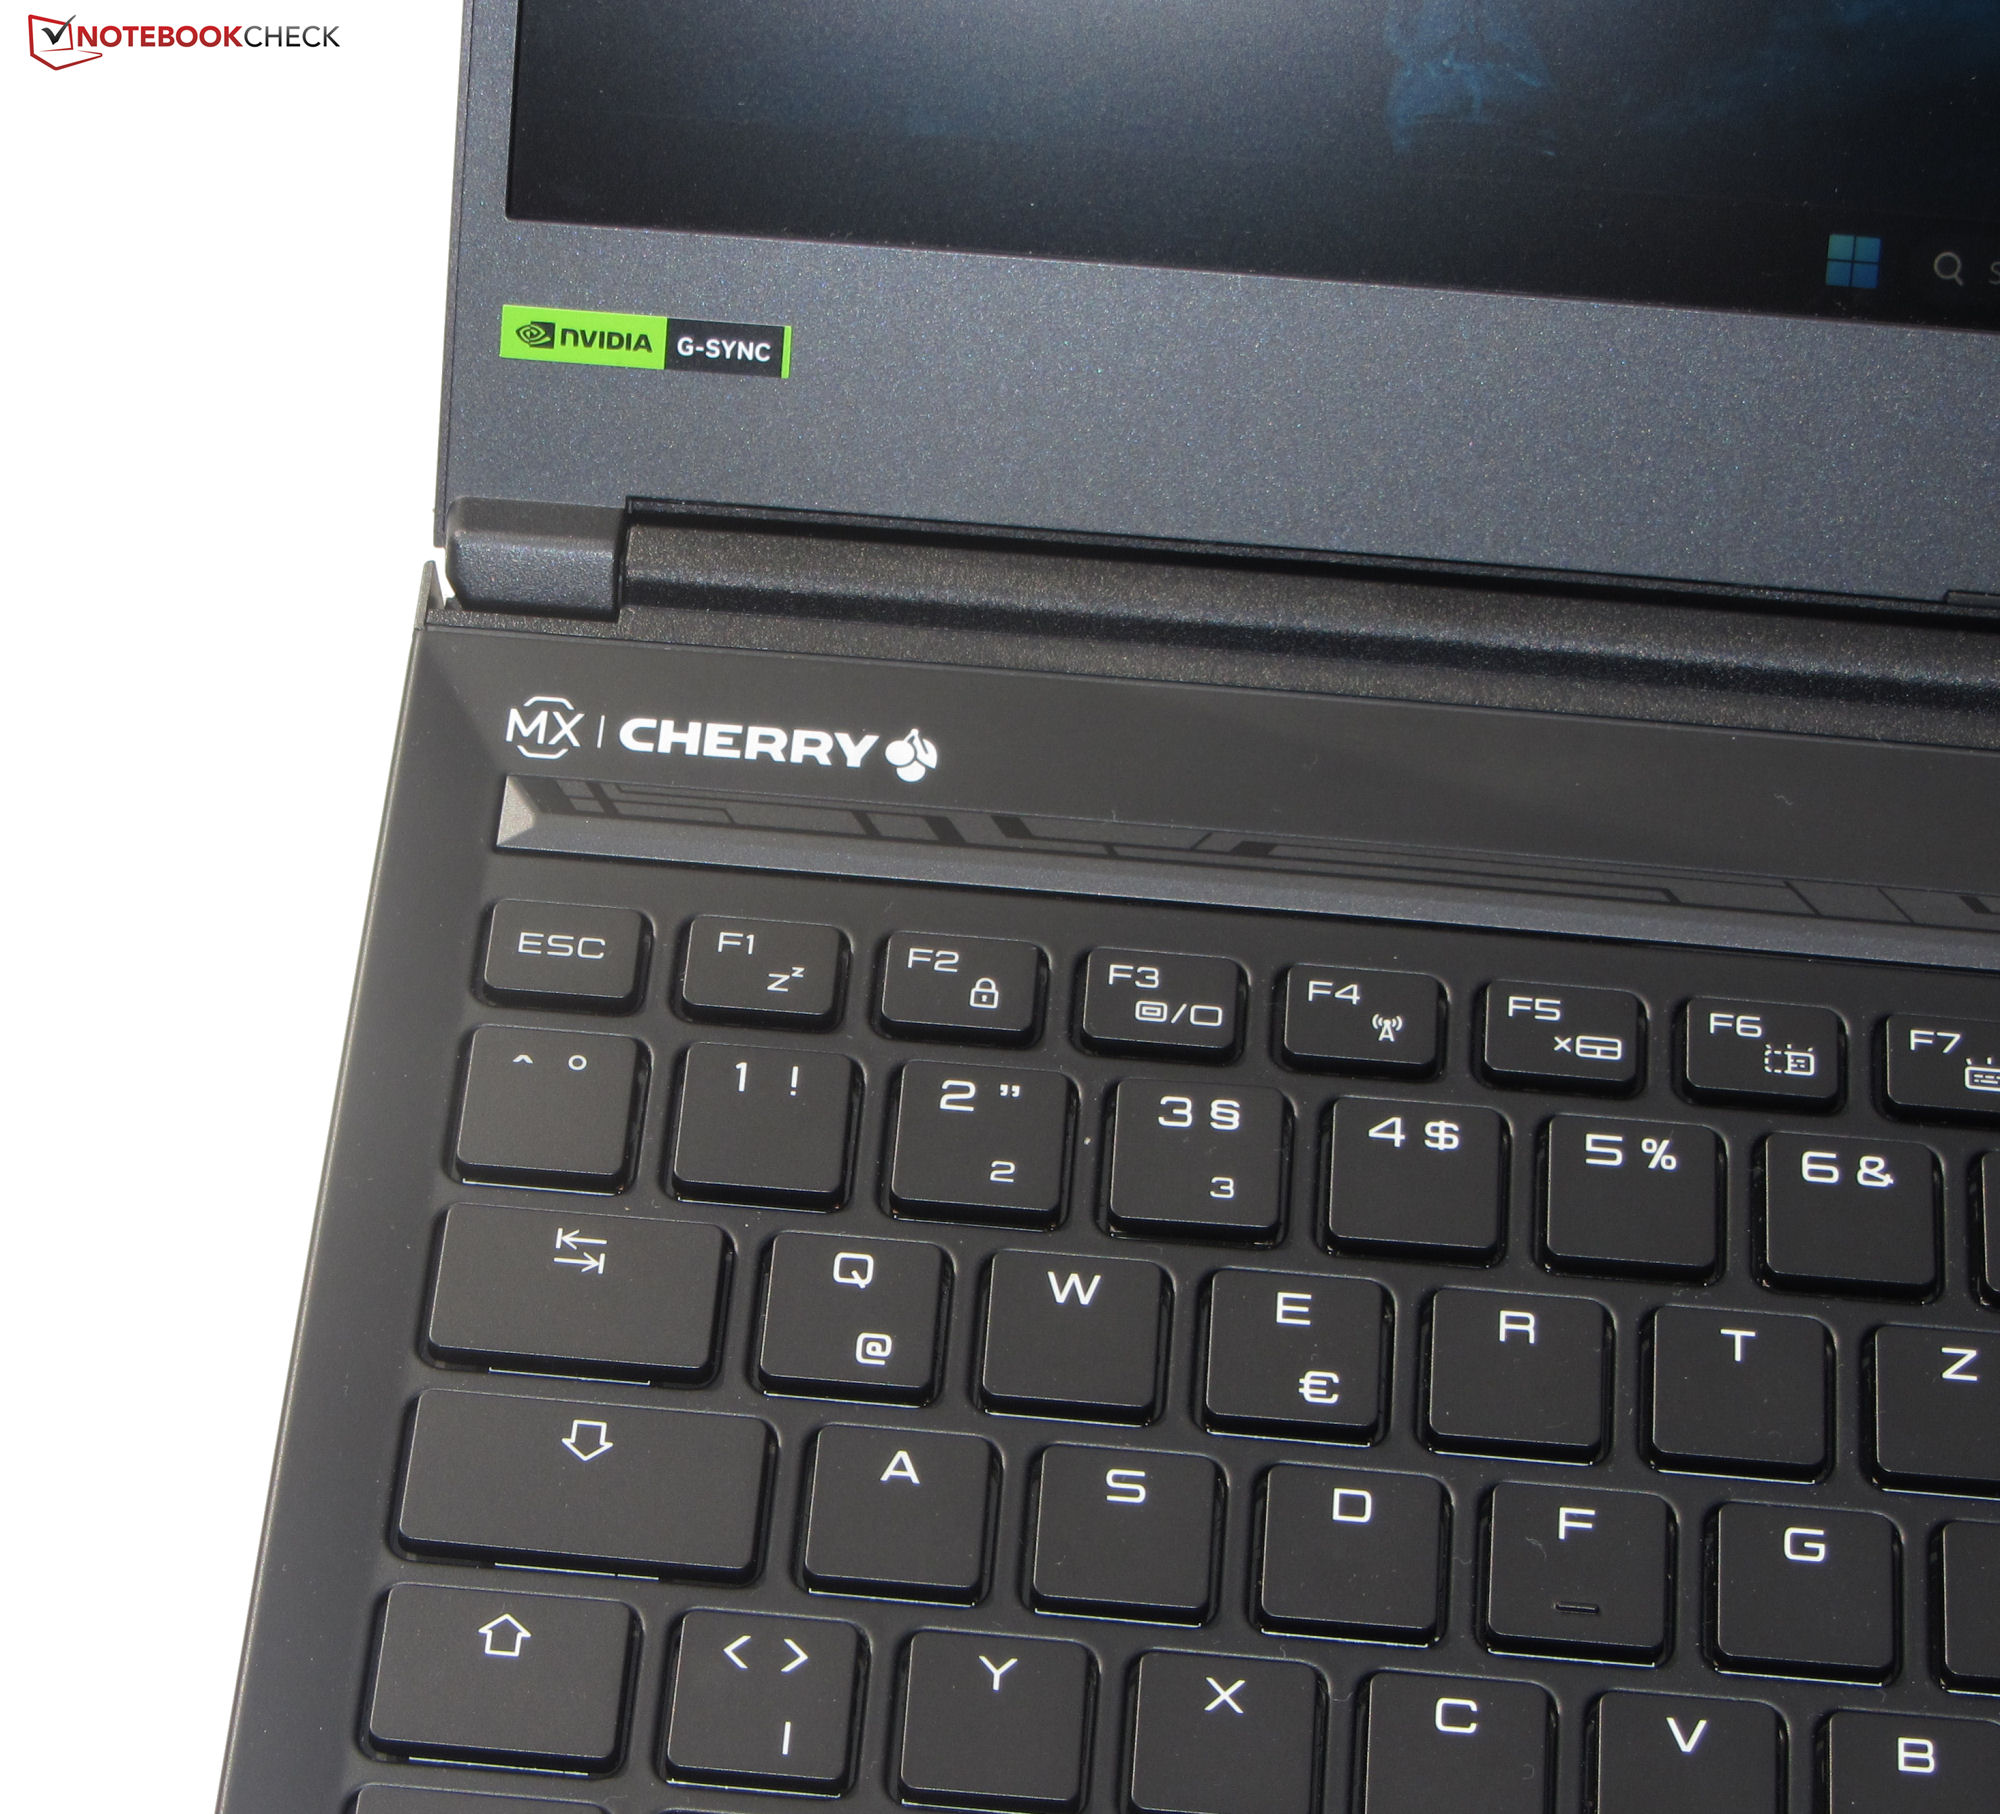
Em vez de um teclado chiclet, a Medion instalou um teclado mecânico no X20. Os switches Cherry MX têm um curso médio e um ponto de pressão claramente audível e perceptível. O usuário é mimado com uma sensação de digitação rica e feedback preciso, e o teclado não cede durante a digitação. Duas teclas de função regulam o brilho da iluminação individual das teclas em quatro estágios (RGB). No geral, podemos falar de um teclado sólido.
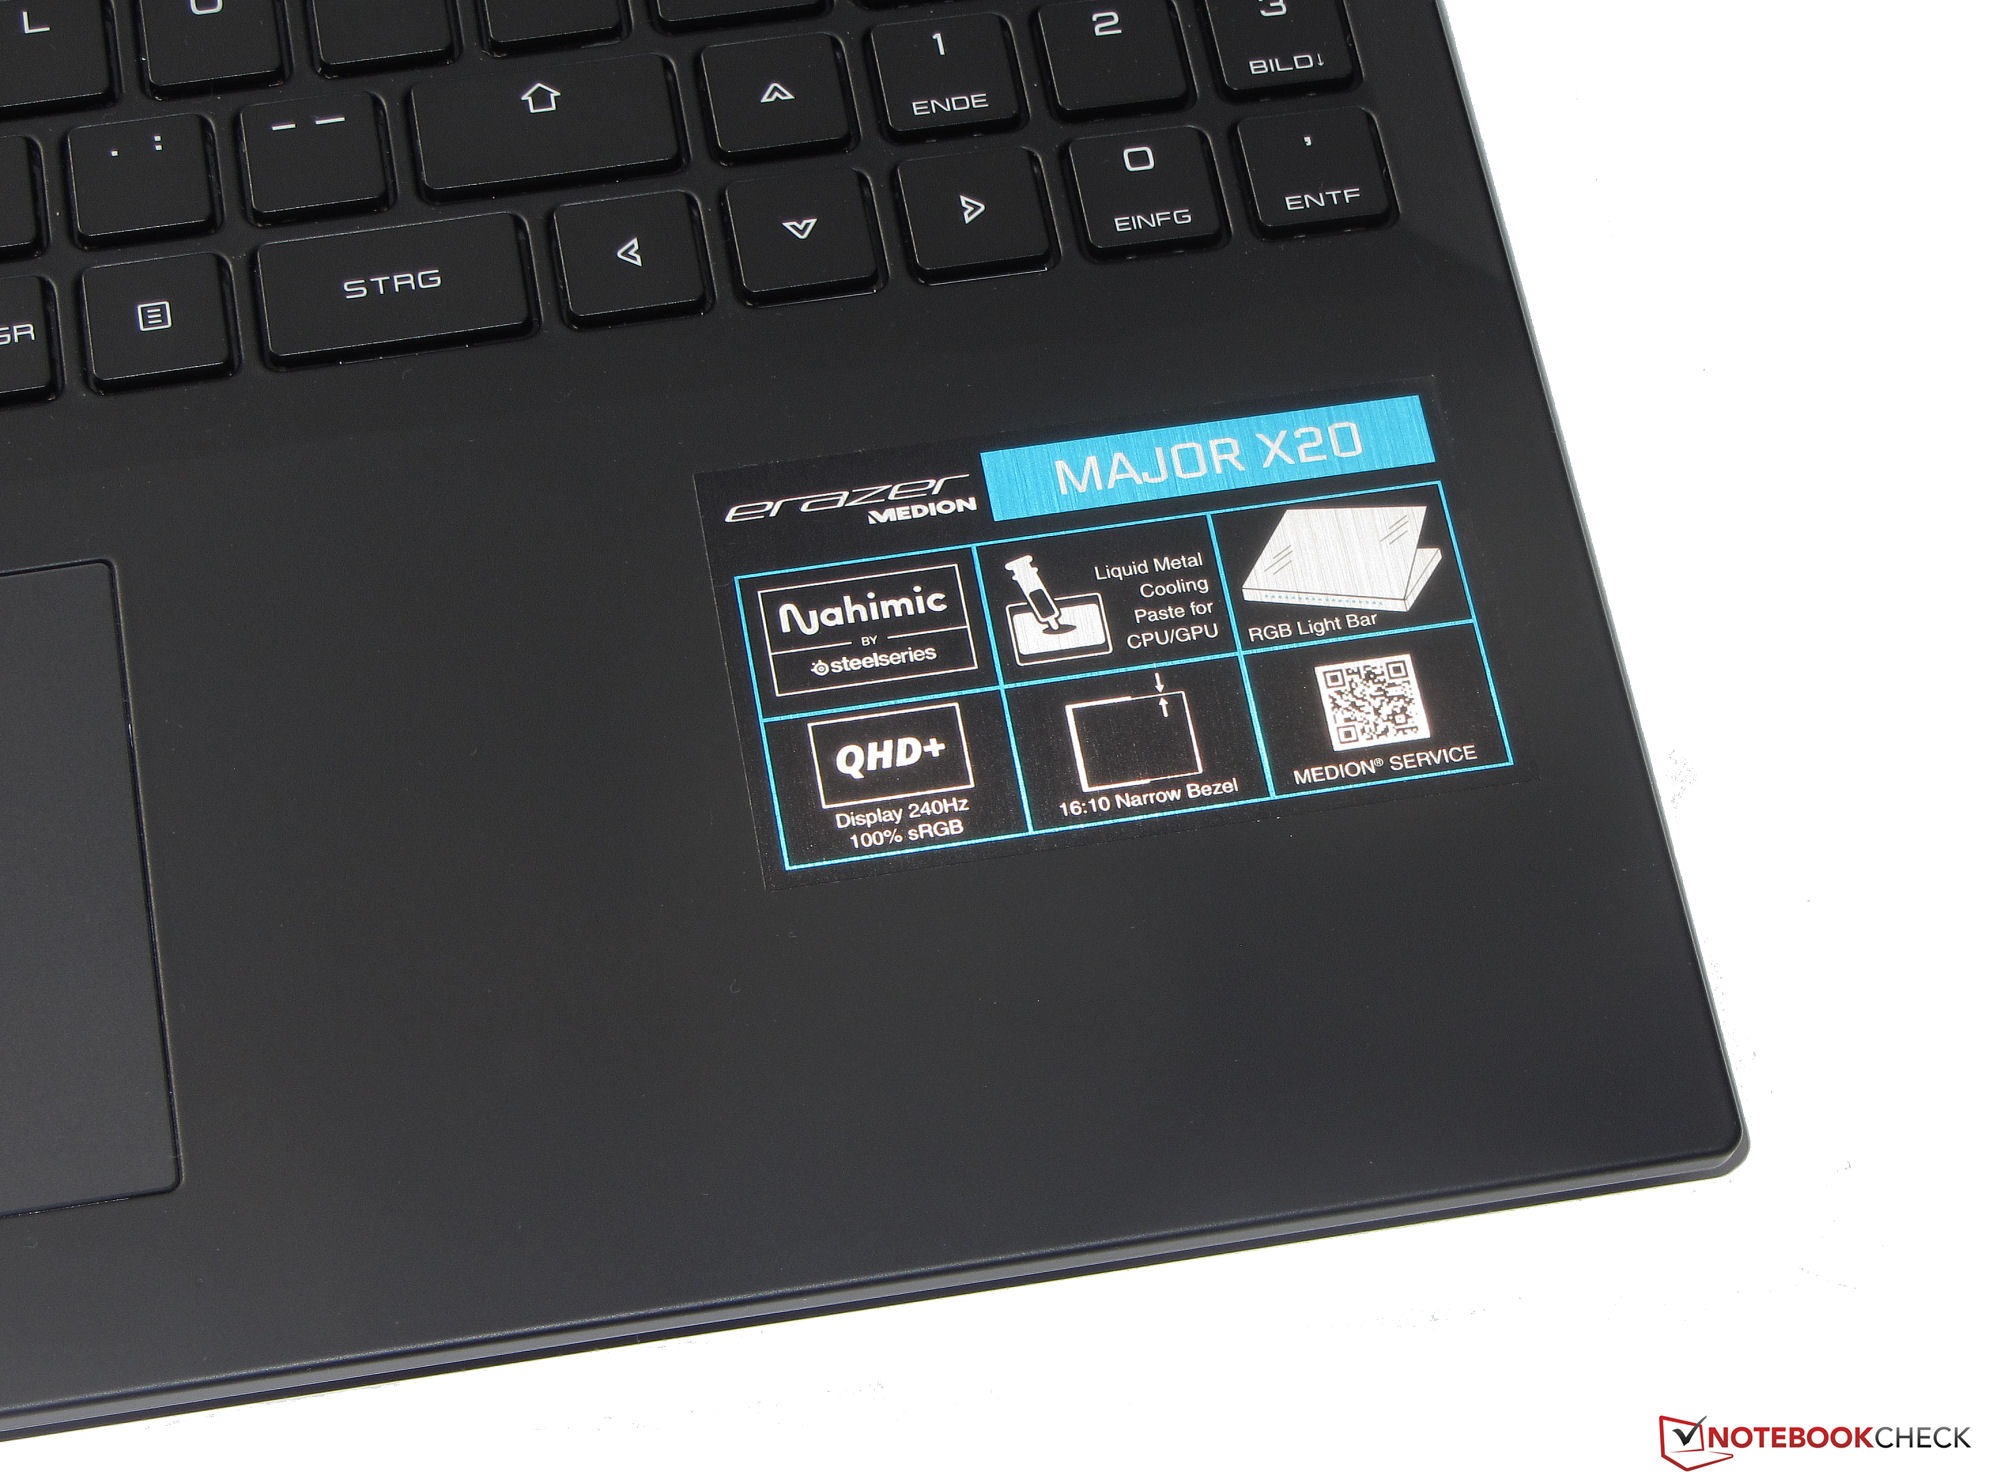
Touchpad
Um clickpad com capacidade multitoque (aprox. 11,6 x 7,2 cm) serve como substituto do mouse. Sua superfície lisa facilita o deslizamento dos dedos. Ele oferece um deslocamento curto e um ponto de pressão claro. Um toque com o dedo no LED no canto superior esquerdo ativa ou desativa todo o teclado.
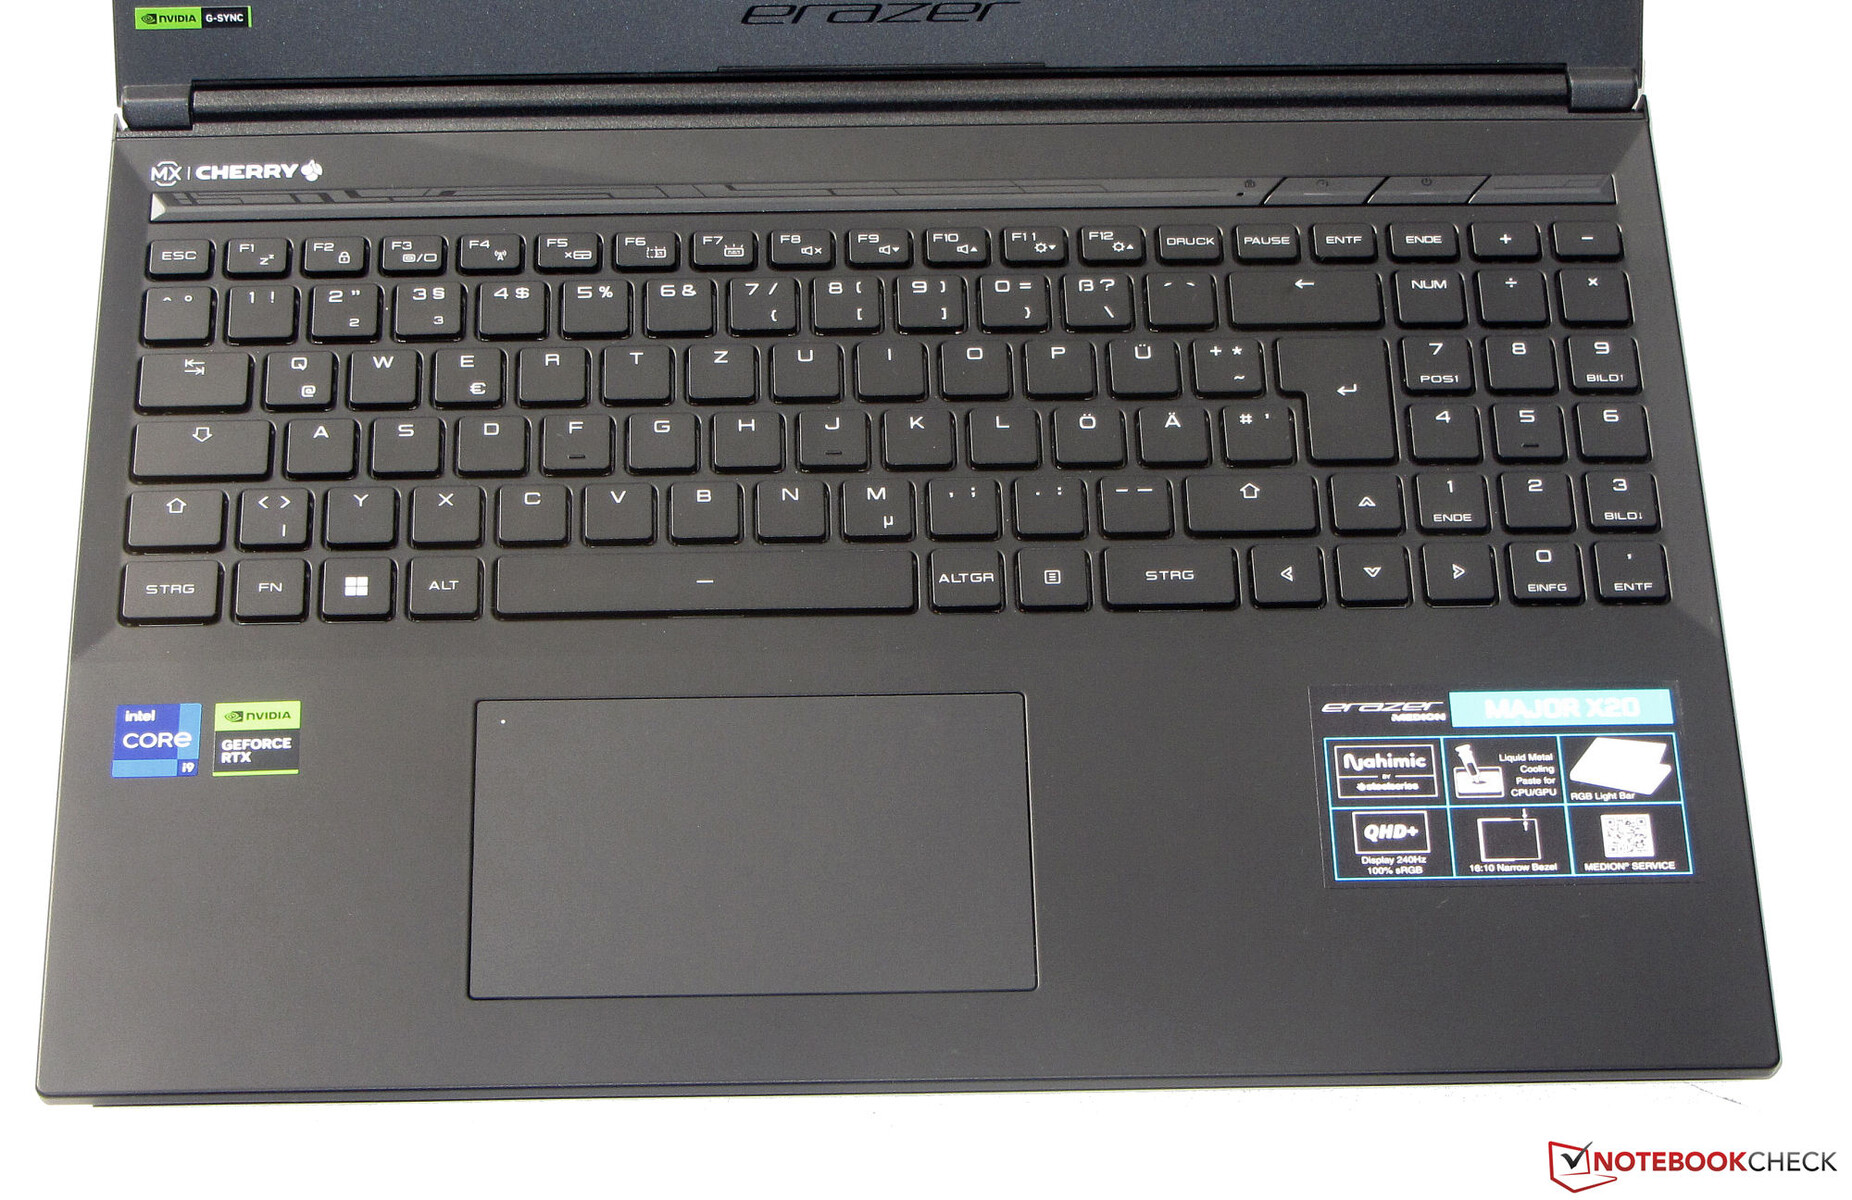
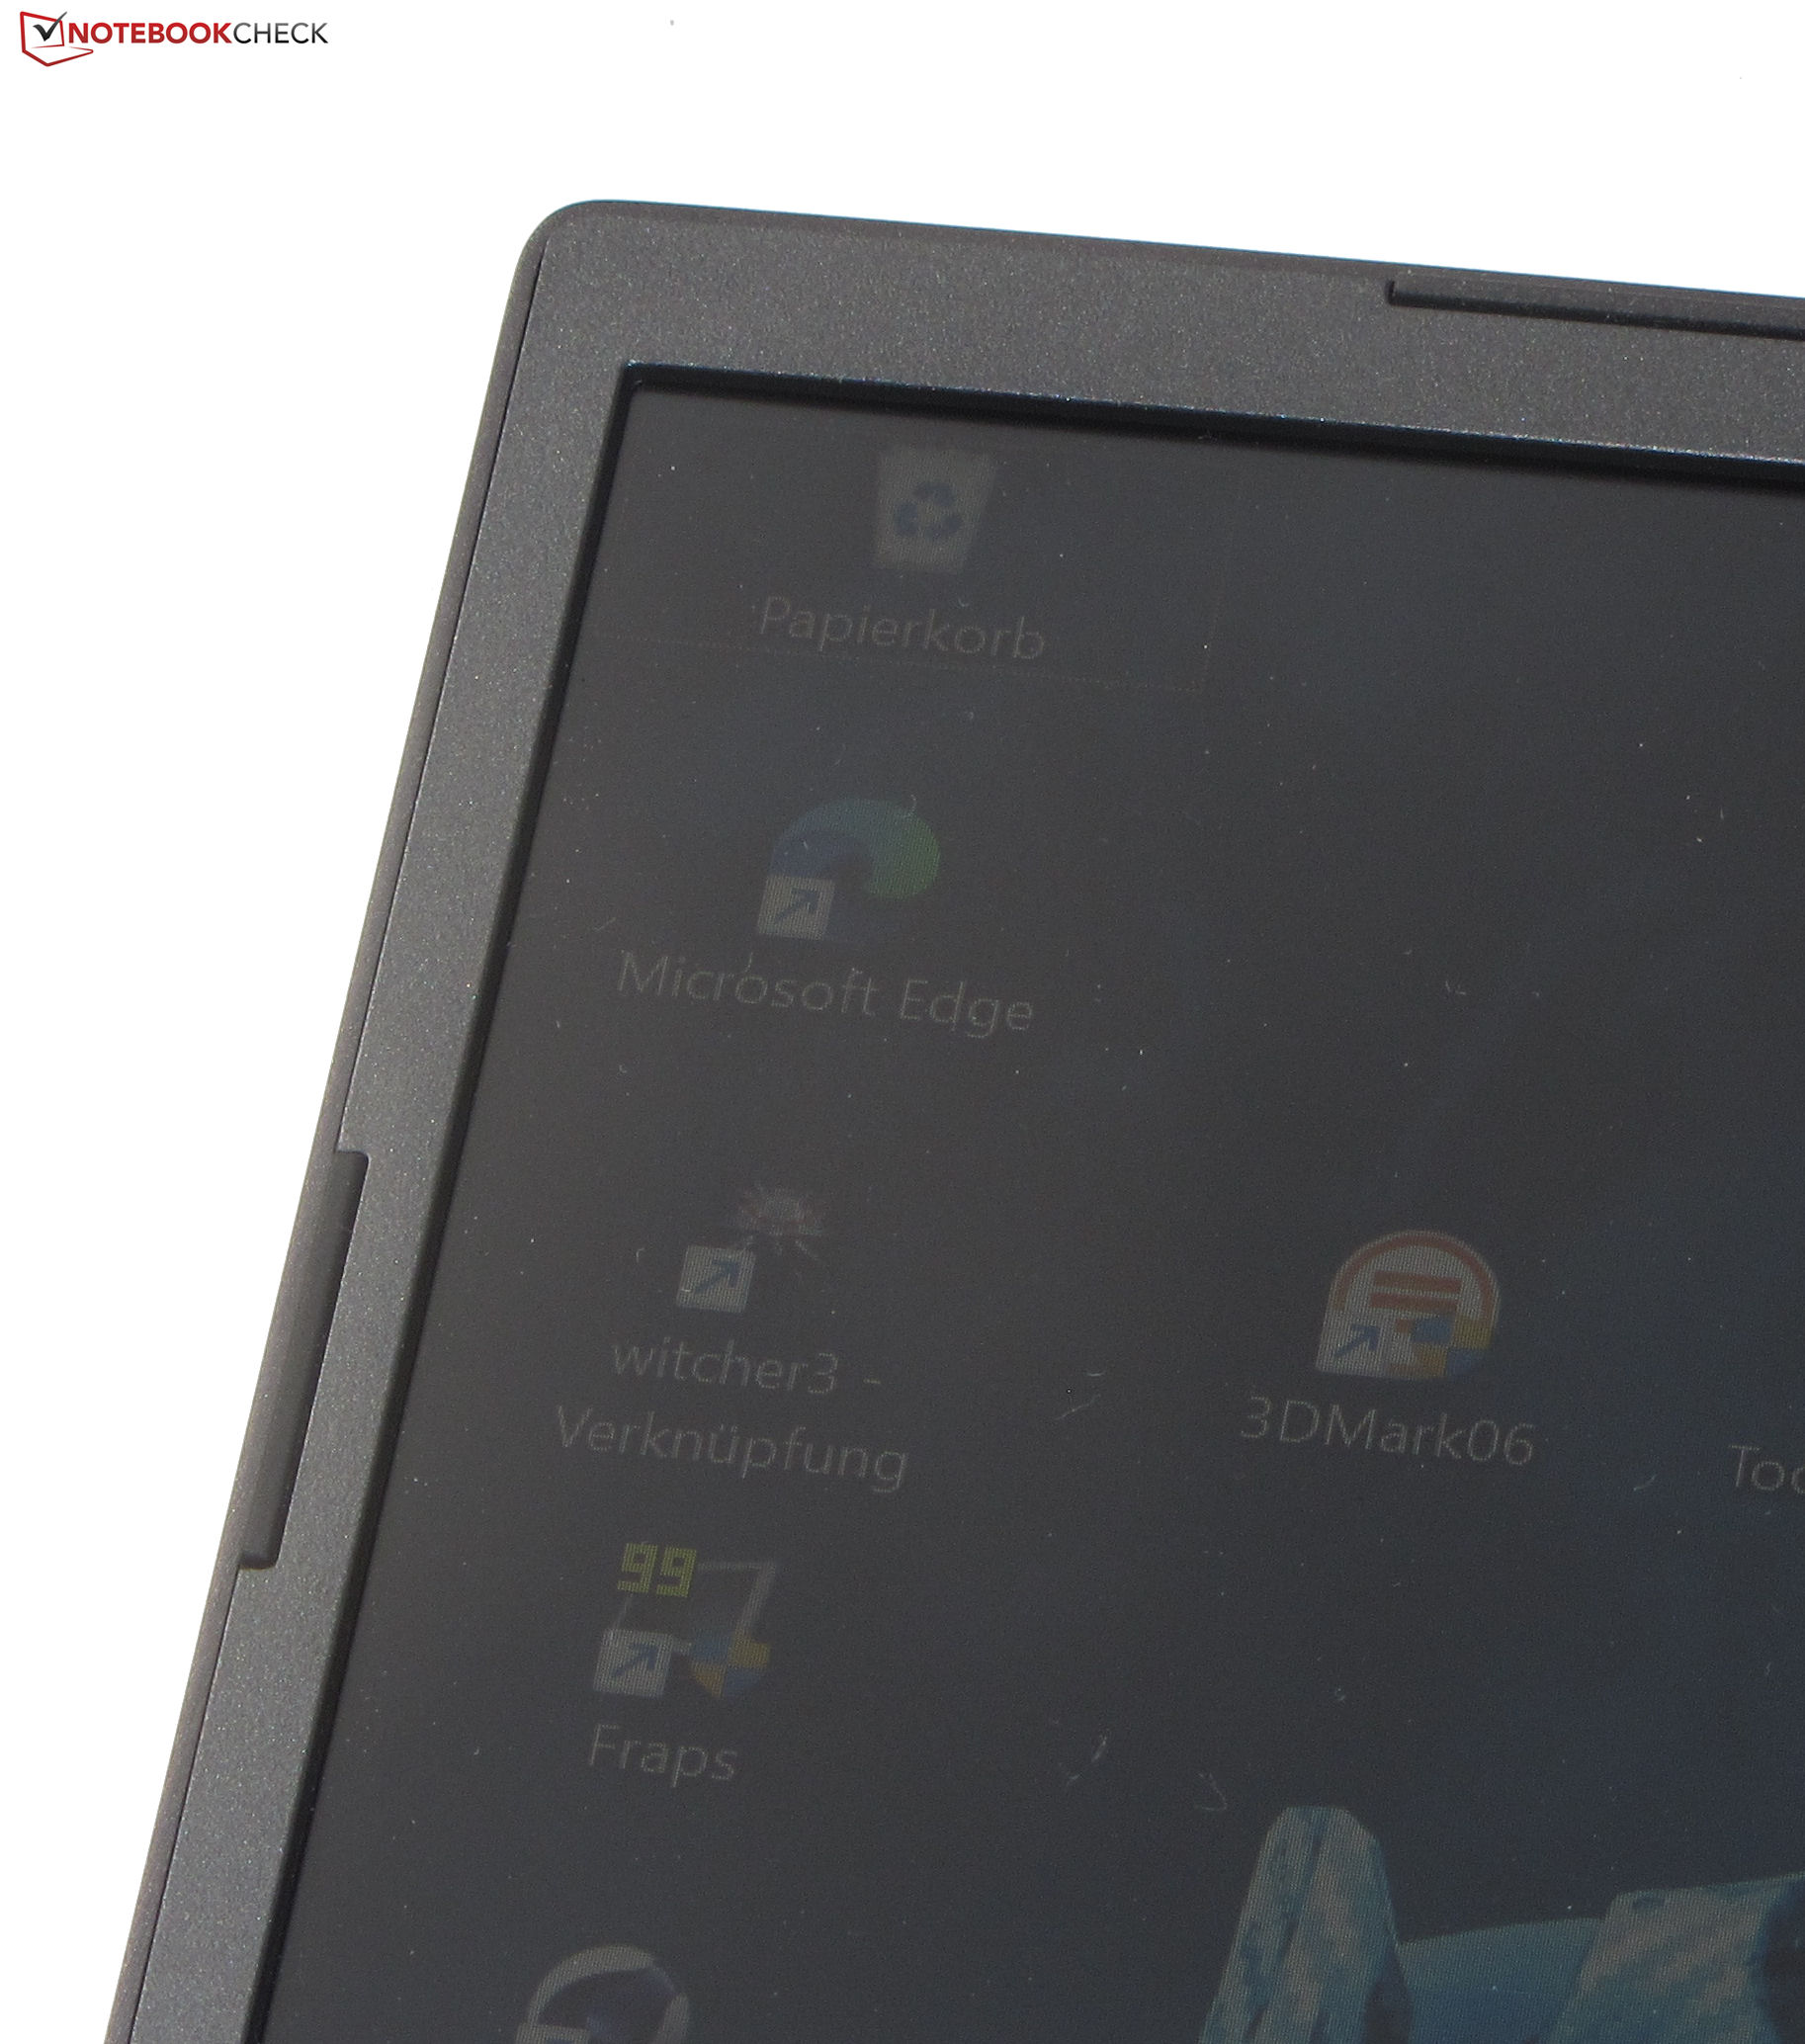
Tela - QHD+ no formato 16:10
A Medion instala um painel de 240 Hz com suporte a G-Sync. Este último ajusta dinamicamente as taxas de atualização da tela e da GPU para criar a qualidade de imagem mais suave possível, especialmente em jogos.
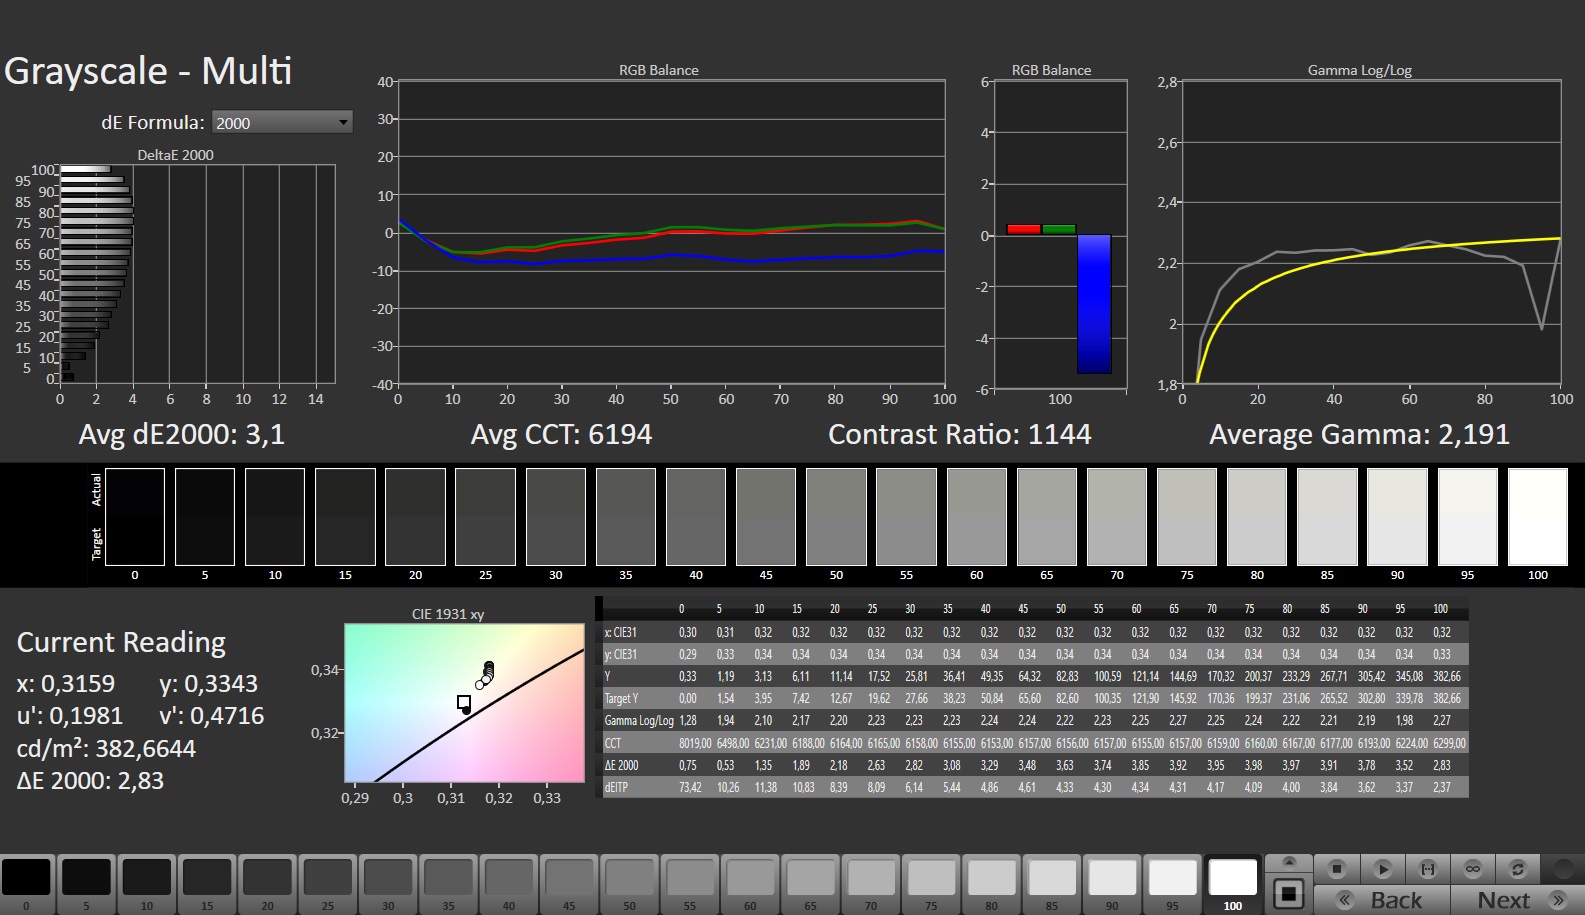
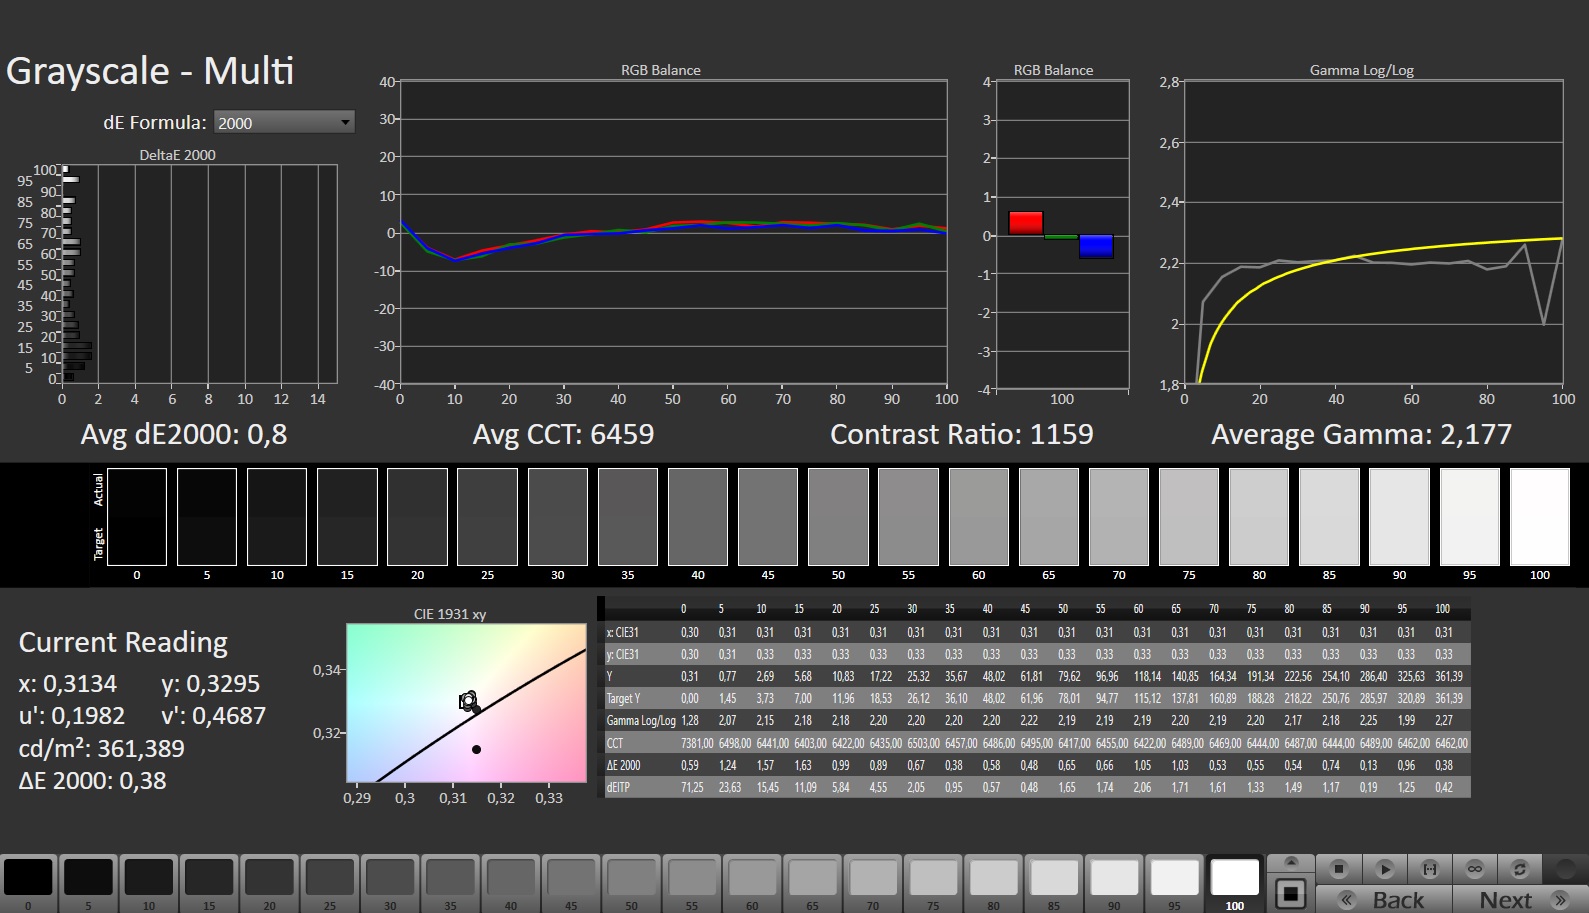
A cintilação PWM não está presente em nenhuma configuração de brilho. O brilho e o contraste do painel fosco de 16 polegadas (2560x1600) no formato 16:10 ideal para o trabalho atingem a respectiva meta (> 300 cd/m² ou 1000:1).
| |||||||||||||||||||||||||
iluminação: 92 %
iluminação com acumulador: 374 cd/m²
Contraste: 1133:1 (Preto: 0.33 cd/m²)
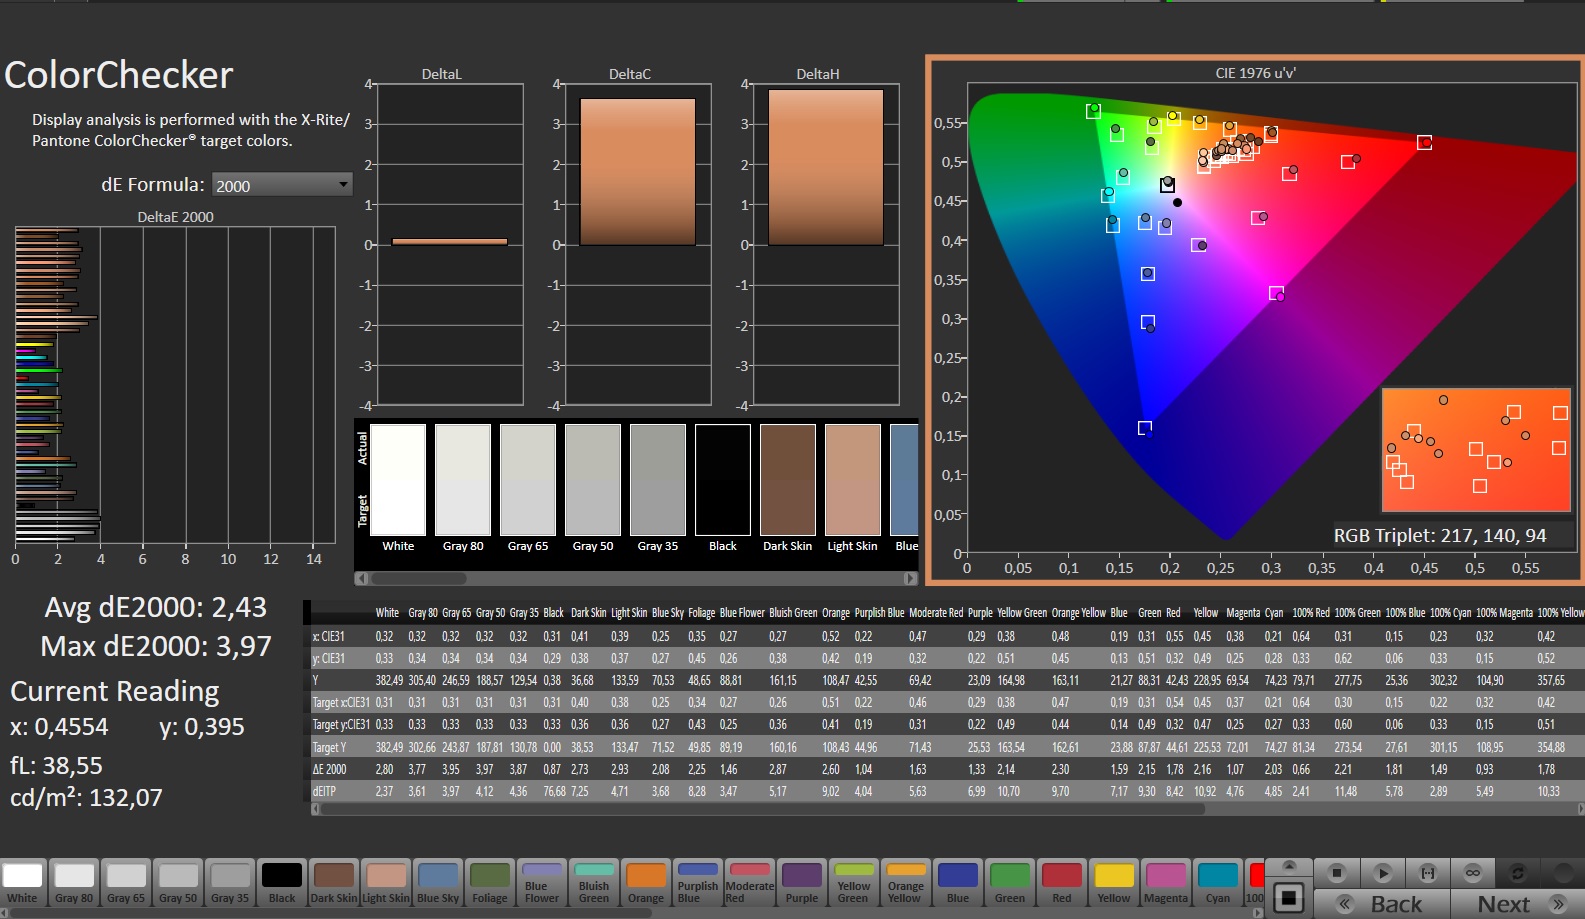
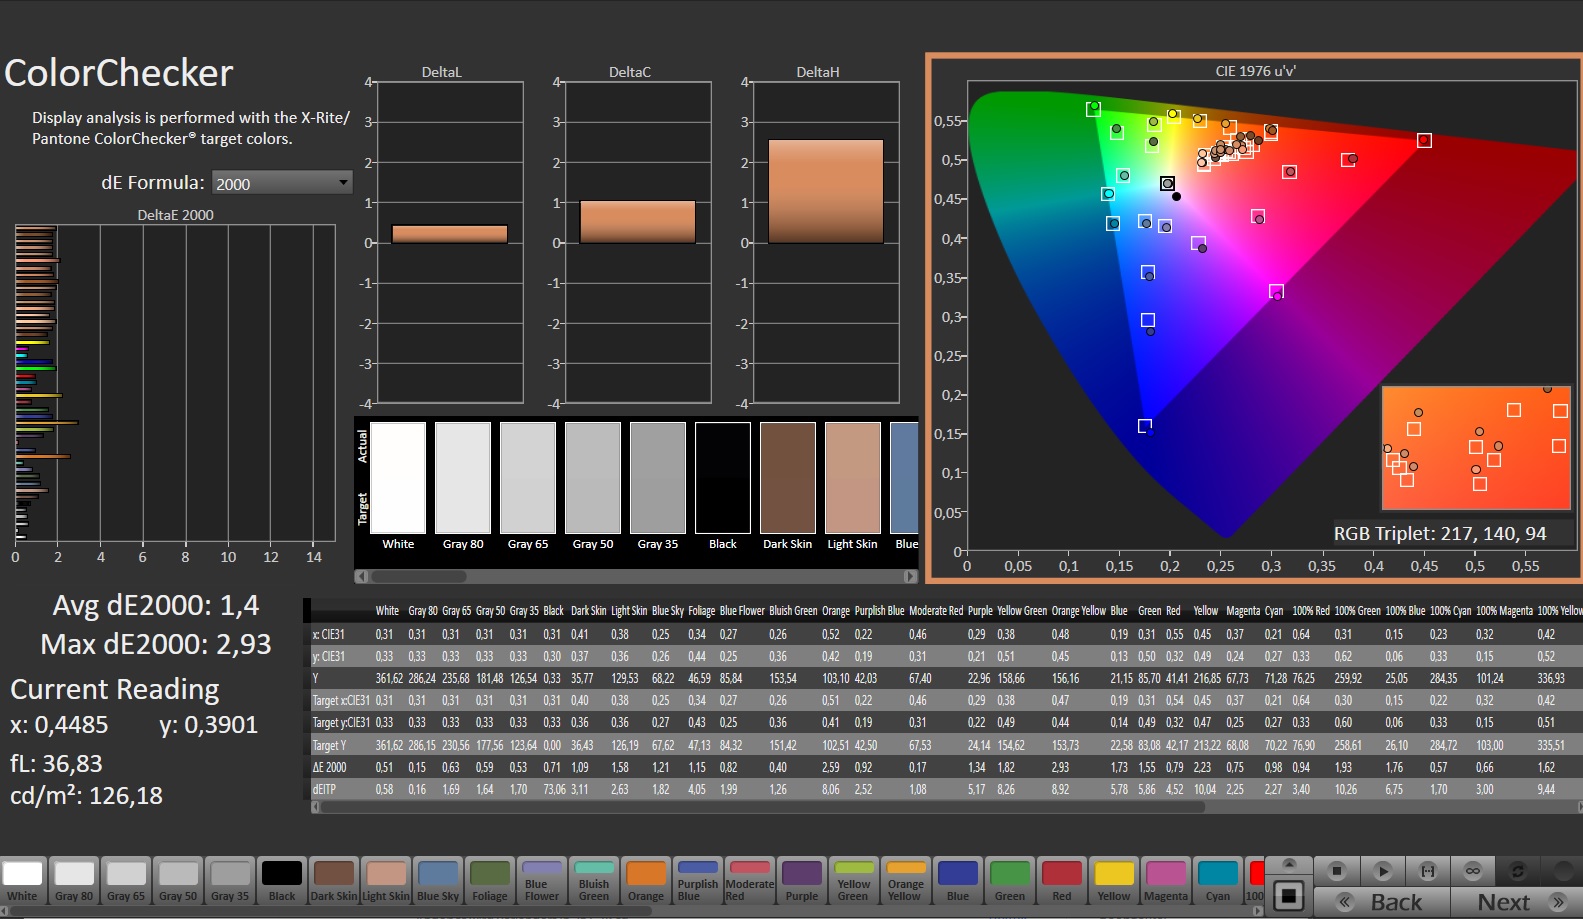
ΔE ColorChecker Calman: 2.43 | ∀{0.5-29.43 Ø4.71}
calibrated: 1.4
ΔE Greyscale Calman: 3.1 | ∀{0.09-98 Ø4.96}
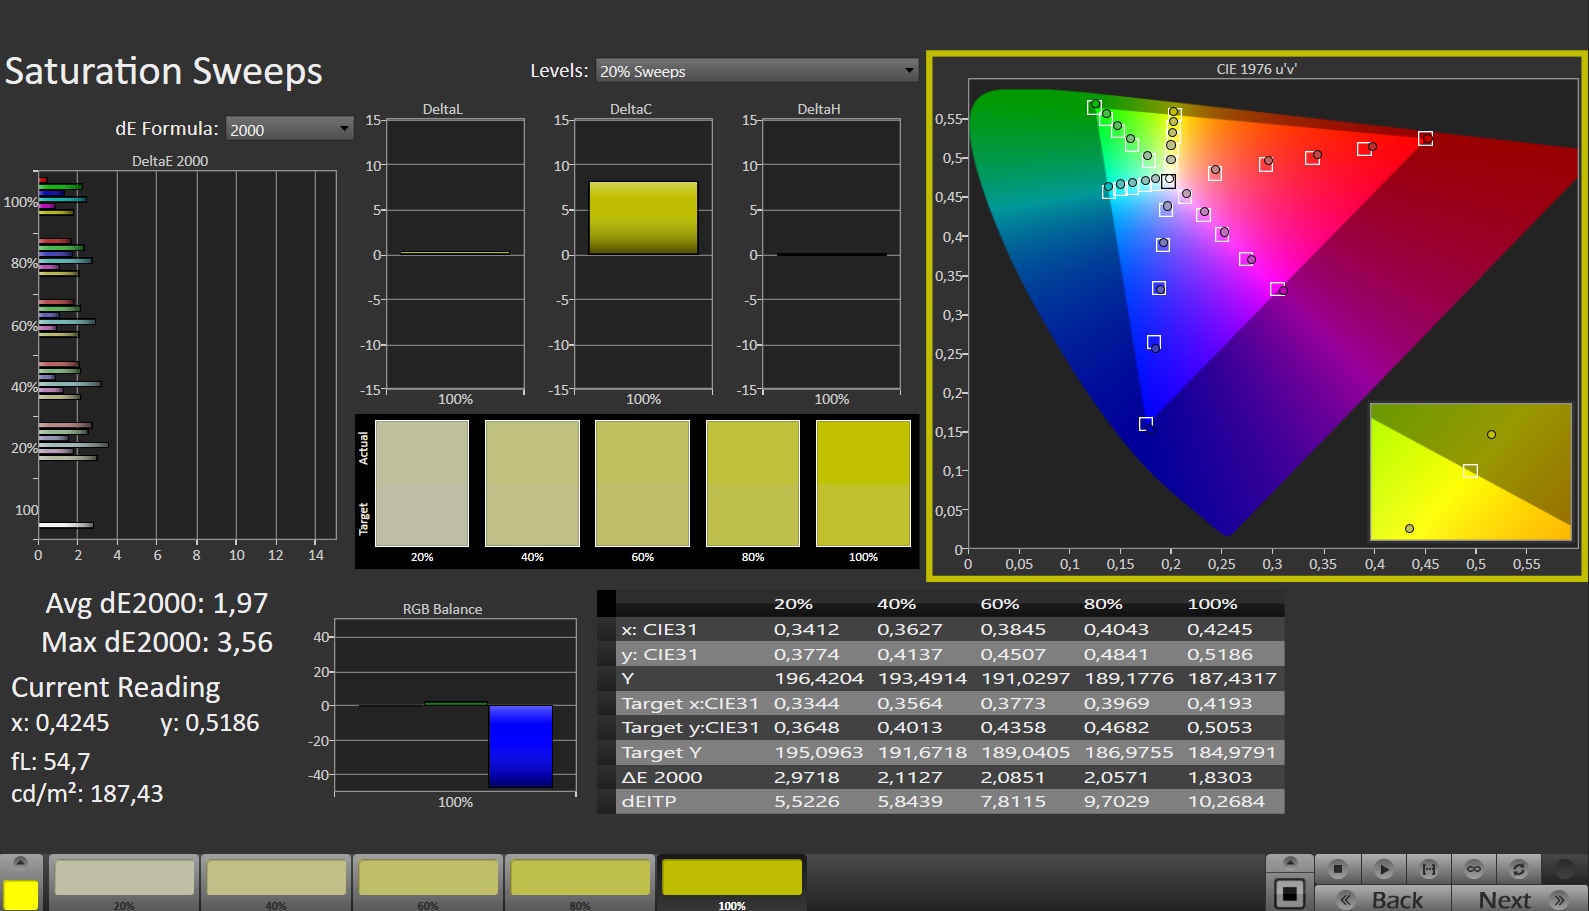
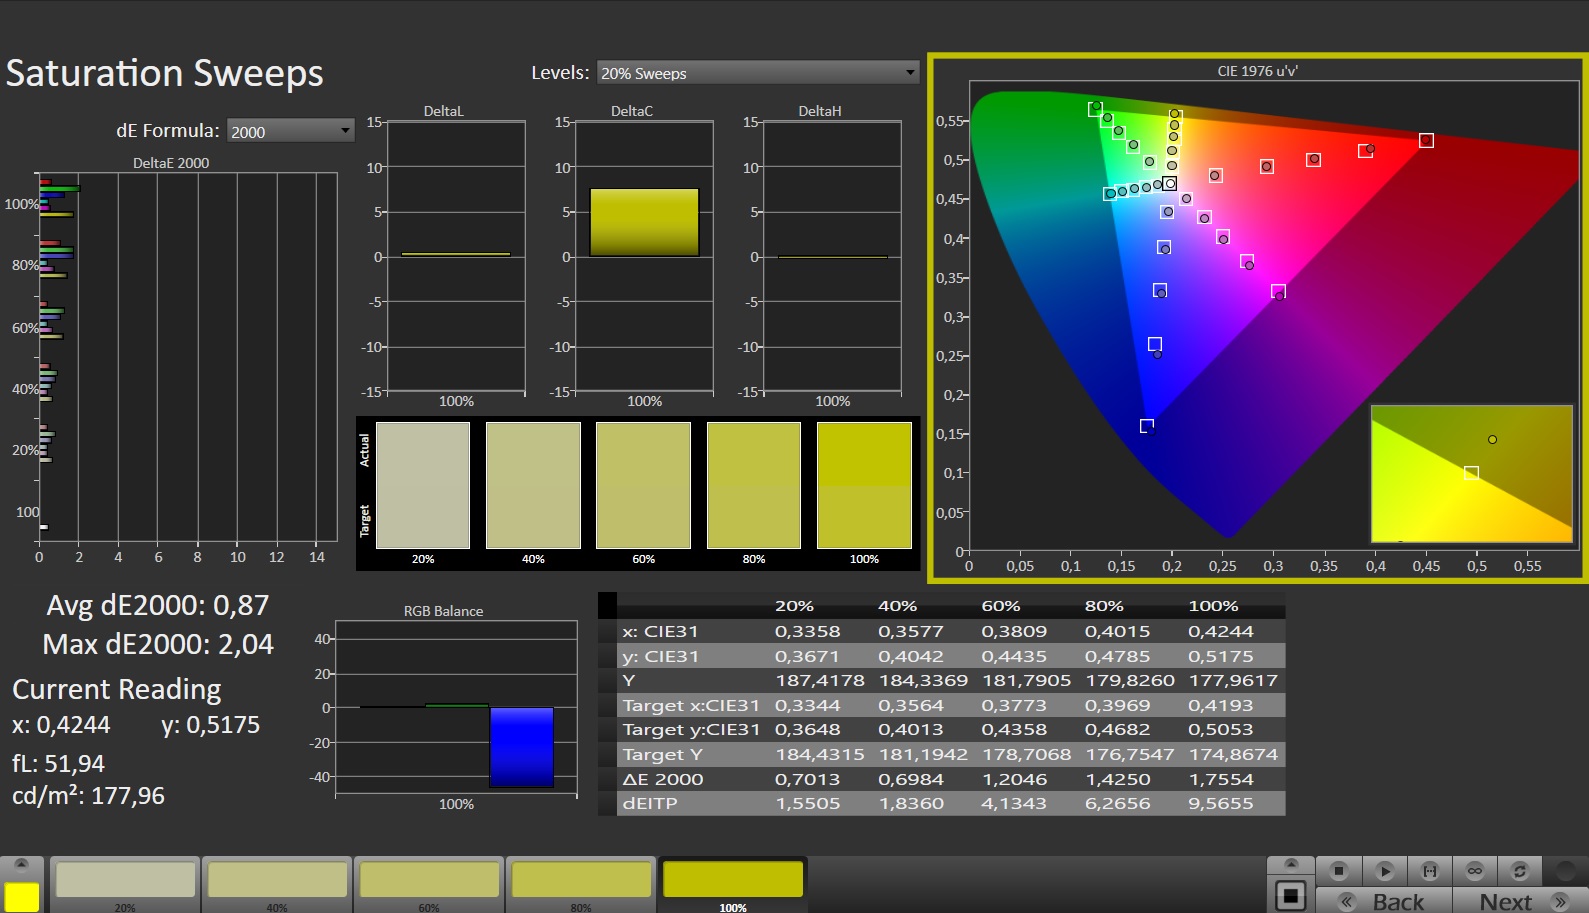
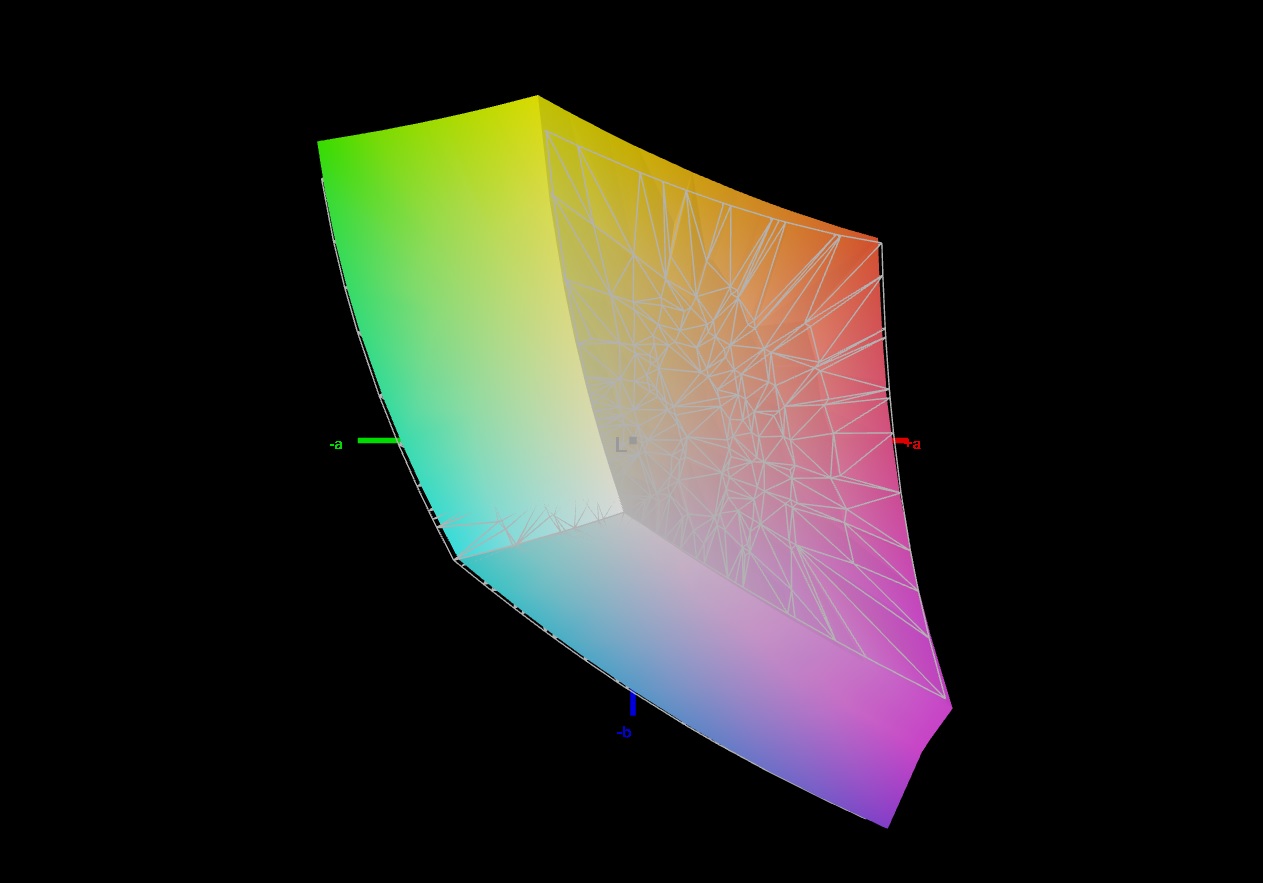
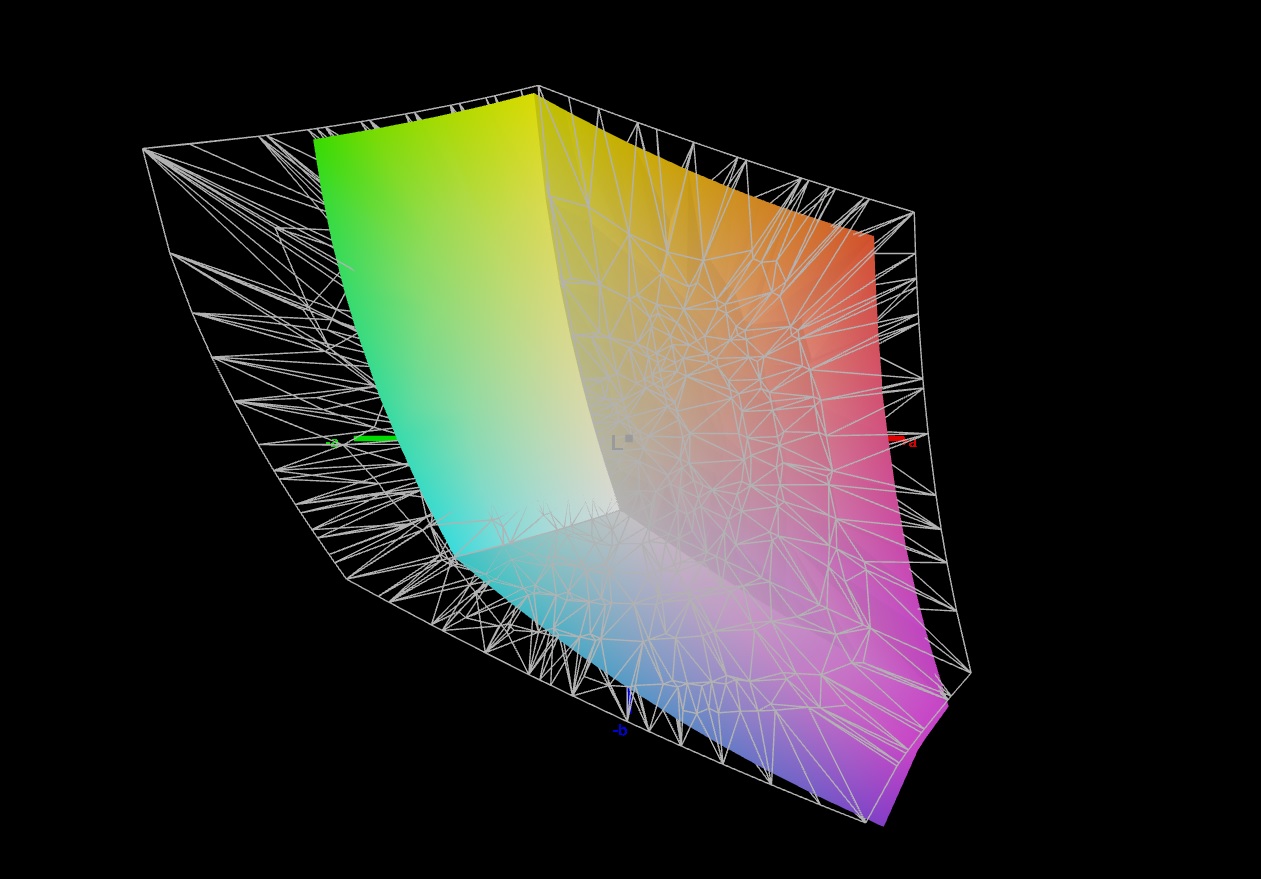
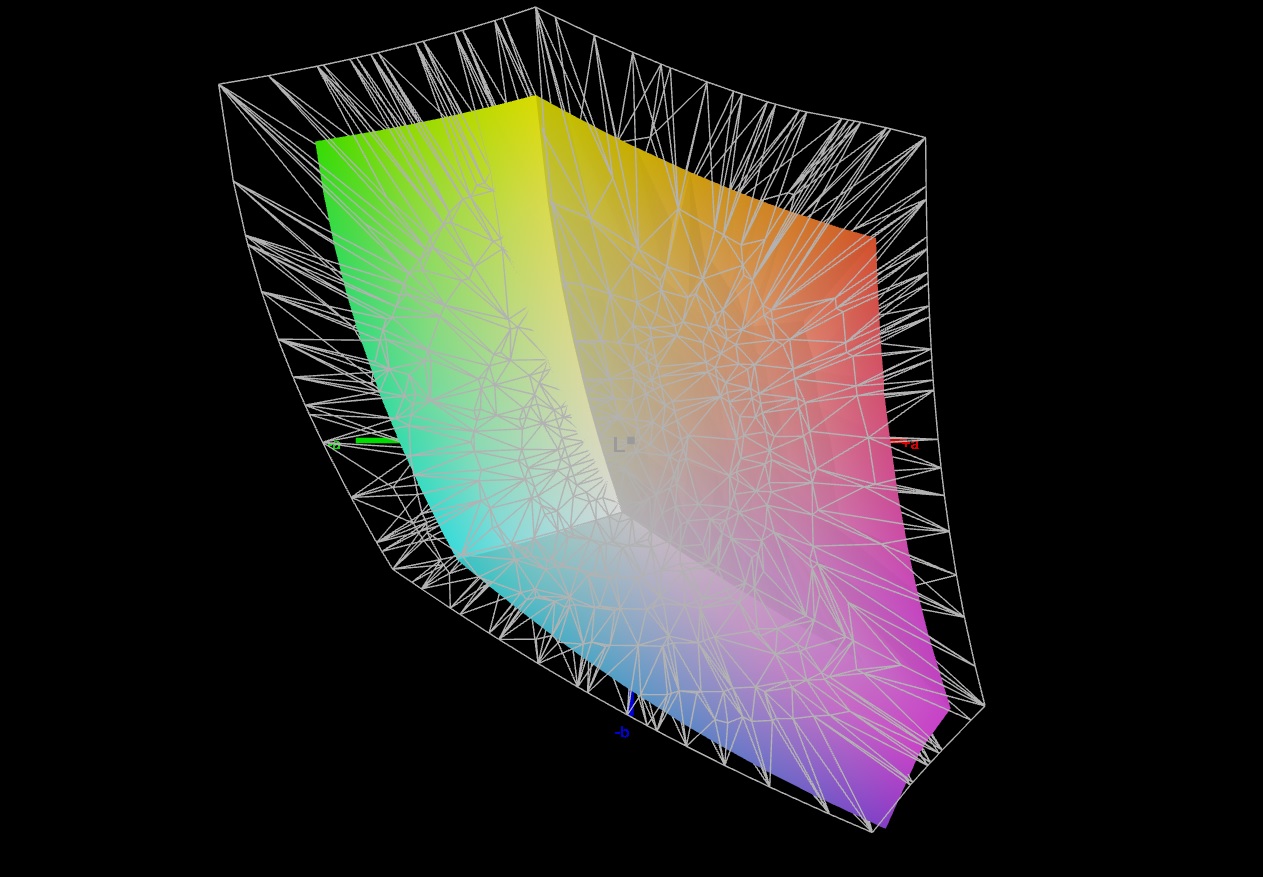
70.9% AdobeRGB 1998 (Argyll 3D)
98% sRGB (Argyll 3D)
69.4% Display P3 (Argyll 3D)
Gamma: 2.191
CCT: 6194 K
| Medion Erazer Major X20 BOE CQ NE160QDM-NZ1, IPS, 2560x1600, 16" | Aorus 15X ASF BOE CQ NE156QHM-NZ1, IPS, 2560x1440, 15.6" | Razer Blade 15 OLED (Early 2022) Samsung ATNA562P02-0, OLED, 2560x1440, 15.6" | Asus ROG Strix G17 G713PI BOE0B69, IPS, 2560x1440, 17.3" | |
|---|---|---|---|---|
| Display | -0% | 25% | 22% | |
| Display P3 Coverage (%) | 69.4 | 69.3 0% | 97.6 41% | 98.3 42% |
| sRGB Coverage (%) | 98 | 98.2 0% | 99.4 1% | 100 2% |
| AdobeRGB 1998 Coverage (%) | 70.9 | 70.5 -1% | 94 33% | 85.9 21% |
| Response Times | -12% | 79% | 21% | |
| Response Time Grey 50% / Grey 80% * (ms) | 13.1 ? | 12.4 ? 5% | 2 ? 85% | 5.3 ? 60% |
| Response Time Black / White * (ms) | 7.3 ? | 9.4 ? -29% | 2 ? 73% | 8.6 ? -18% |
| PWM Frequency (Hz) | 500 ? | |||
| Screen | 14% | 126% | 12% | |
| Brightness middle (cd/m²) | 374 | 316 -16% | 383 2% | 327 -13% |
| Brightness (cd/m²) | 357 | 301 -16% | 384 8% | 320 -10% |
| Brightness Distribution (%) | 92 | 90 -2% | 99 8% | 89 -3% |
| Black Level * (cd/m²) | 0.33 | 0.28 15% | 0.03 91% | 0.38 -15% |
| Contrast (:1) | 1133 | 1129 0% | 12767 1027% | 861 -24% |
| Colorchecker dE 2000 * | 2.43 | 1.54 37% | 1.89 22% | 1.01 58% |
| Colorchecker dE 2000 max. * | 3.97 | 2.46 38% | 3.76 5% | 4.01 -1% |
| Colorchecker dE 2000 calibrated * | 1.4 | 1.21 14% | 2.67 -91% | 0.41 71% |
| Greyscale dE 2000 * | 3.1 | 1.3 58% | 1.26 59% | 1.6 48% |
| Gamma | 2.191 100% | 2.307 95% | 2.41 91% | 2.168 101% |
| CCT | 6194 105% | 6456 101% | 6386 102% | 6659 98% |
| Média Total (Programa/Configurações) | 1% /
7% | 77% /
97% | 18% /
16% |
* ... menor é melhor
A tela produz uma boa representação de cores no estado de entrega: A meta (DeltaE < 3) é atingida com um desvio de cerca de 2,4. A calibração manual reduz o desvio para 1,4 e garante uma escala de cinza mais equilibrada
O painel cobre completamente o espaço de cores sRGB, mas não os espaços de cores AdobeRGB e DCI-P3. Se todos os três espaços de cores forem necessários, não há como contornar o problema.Blade 15a tela OLED do Blade 15.
Exibir tempos de resposta
| ↔ Tempo de resposta preto para branco | ||
|---|---|---|
| 7.3 ms ... ascensão ↗ e queda ↘ combinadas | ↗ 3.1 ms ascensão | 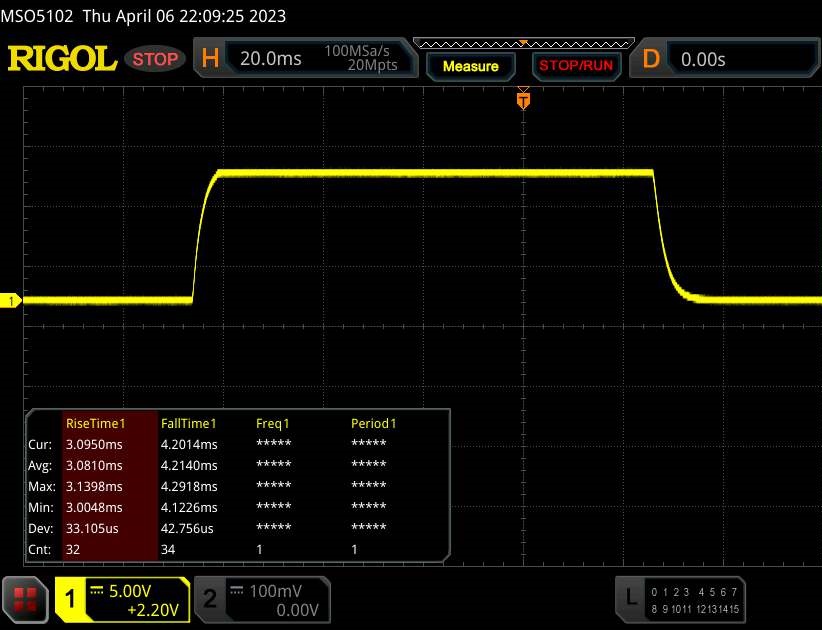 |
| ↘ 4.2 ms queda | ||
| A tela mostra taxas de resposta muito rápidas em nossos testes e deve ser muito adequada para jogos em ritmo acelerado. Em comparação, todos os dispositivos testados variam de 0.1 (mínimo) a 240 (máximo) ms. » 22 % de todos os dispositivos são melhores. Isso significa que o tempo de resposta medido é melhor que a média de todos os dispositivos testados (19.8 ms). | ||
| ↔ Tempo de resposta 50% cinza a 80% cinza | ||
| 13.1 ms ... ascensão ↗ e queda ↘ combinadas | ↗ 6 ms ascensão | 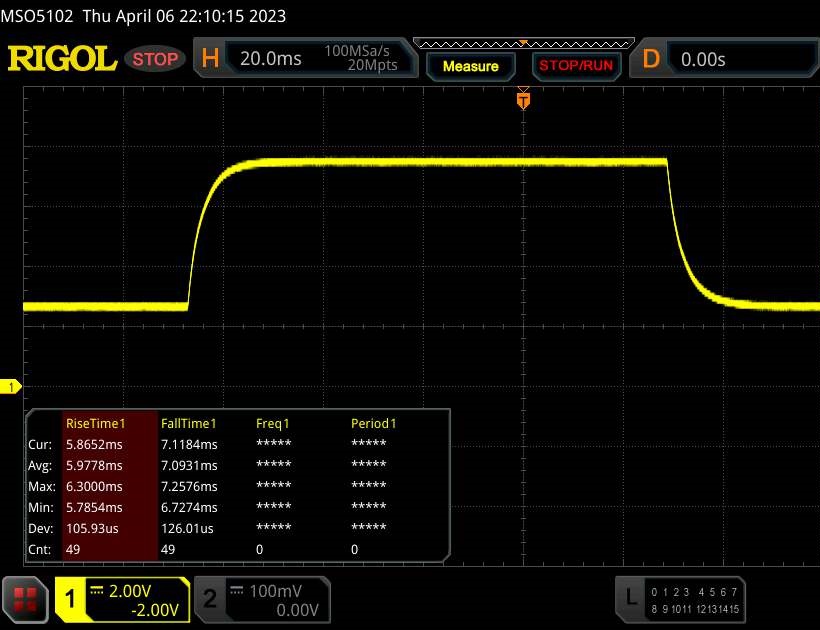 |
| ↘ 7.1 ms queda | ||
| A tela mostra boas taxas de resposta em nossos testes, mas pode ser muito lenta para jogadores competitivos. Em comparação, todos os dispositivos testados variam de 0.165 (mínimo) a 636 (máximo) ms. » 27 % de todos os dispositivos são melhores. Isso significa que o tempo de resposta medido é melhor que a média de todos os dispositivos testados (30.9 ms). | ||
Cintilação da tela / PWM (modulação por largura de pulso)
| Tela tremeluzindo / PWM não detectado |  | ||
[pwm_comparison] Em comparação: 52 % de todos os dispositivos testados não usam PWM para escurecer a tela. Se PWM foi detectado, uma média de 7741 (mínimo: 5 - máximo: 343500) Hz foi medida. | |||
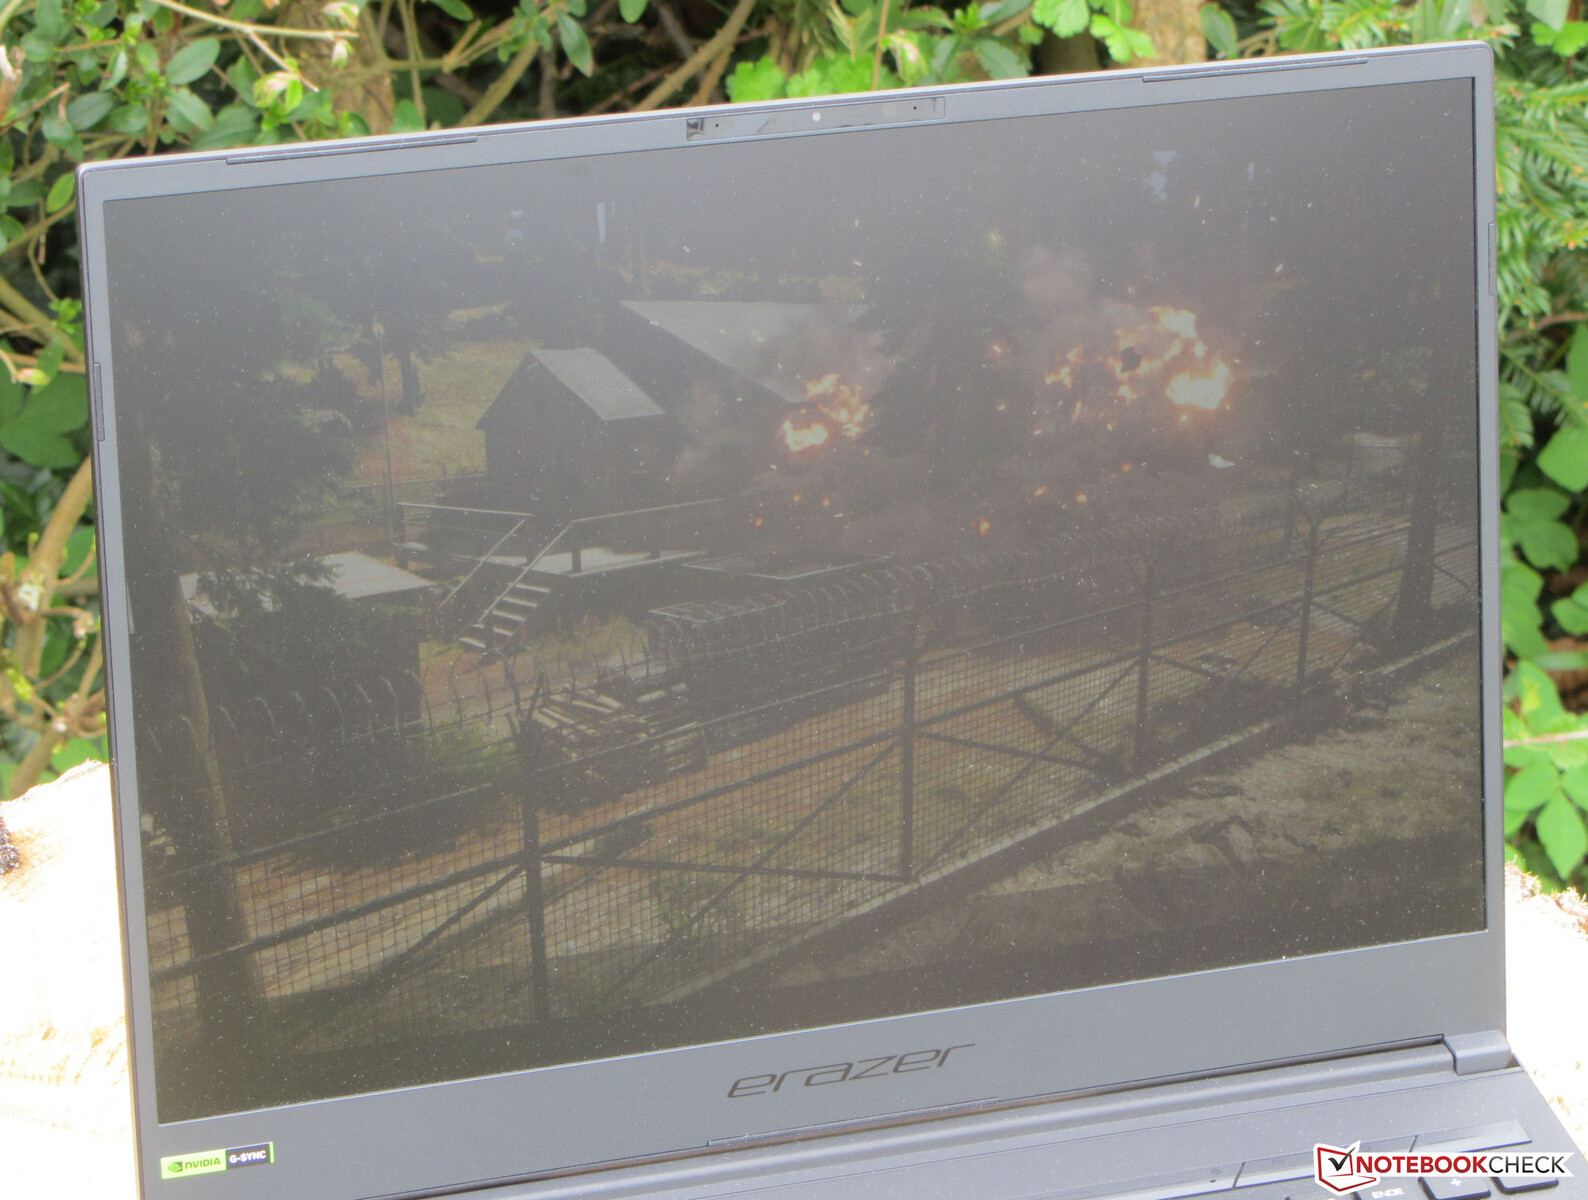
O painel IPS com ângulo de visão estável pode ser lido de qualquer posição. É possível ler a tela em ambientes externos se o sol não estiver muito forte.

Desempenho - Raptor Lake e Ada Lovelace alimentam o notebook para jogos
Jogos, renderização e, em geral, todas as áreas de aplicativos que exigem desempenho estão entre os cenários de aplicativos do Erazer Major X20. O Raptor Lake e o Ada Lovelace fornecem a potência de computação necessária. Esse modelo está disponível por cerca de 2.500 euros (~US$ 2.500).
Condições de teste
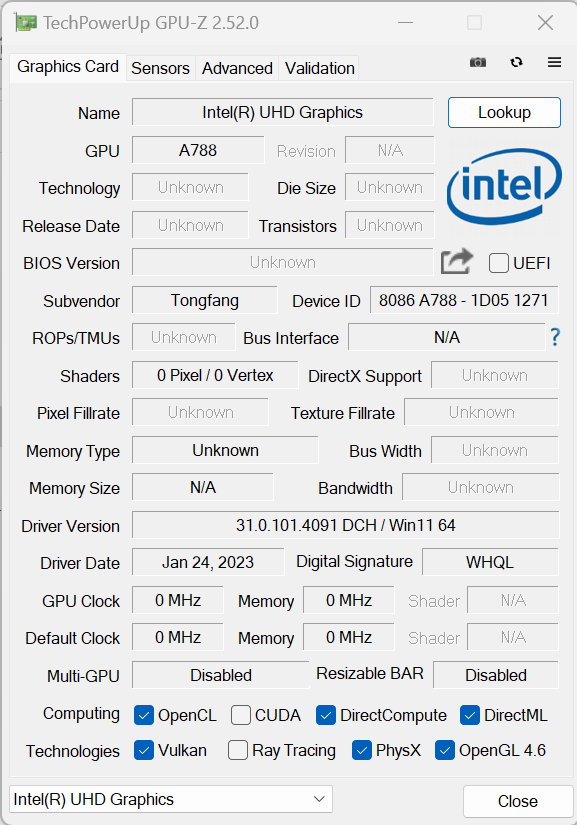
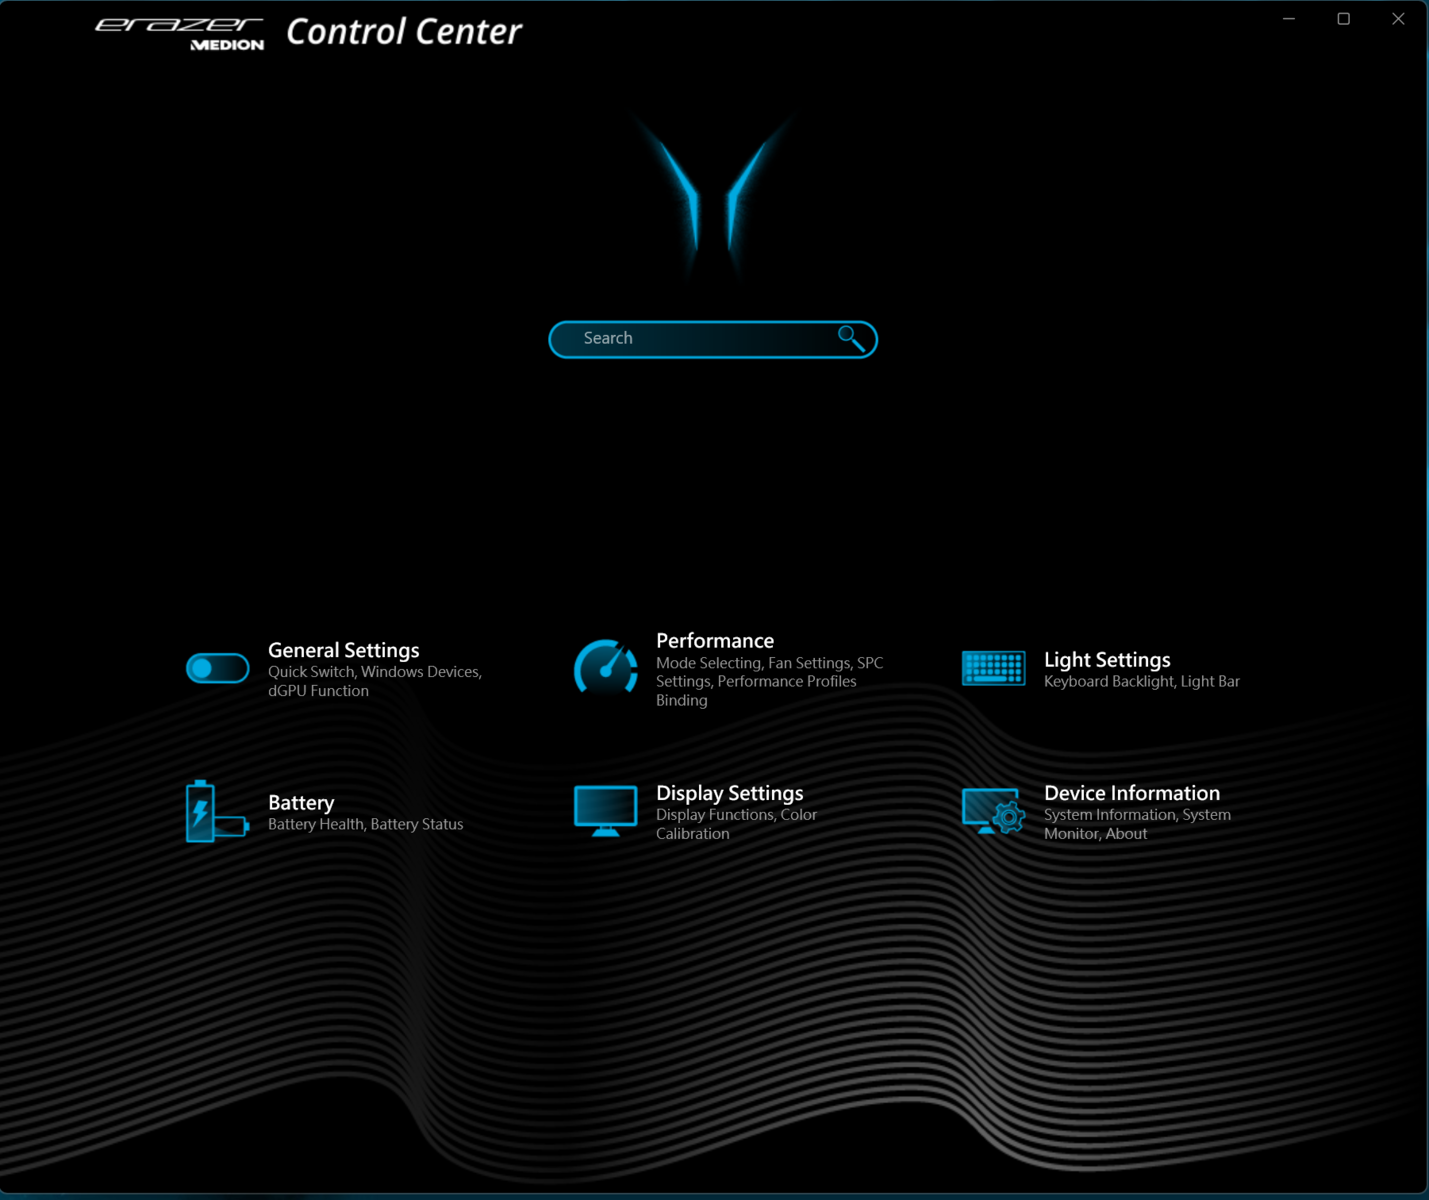
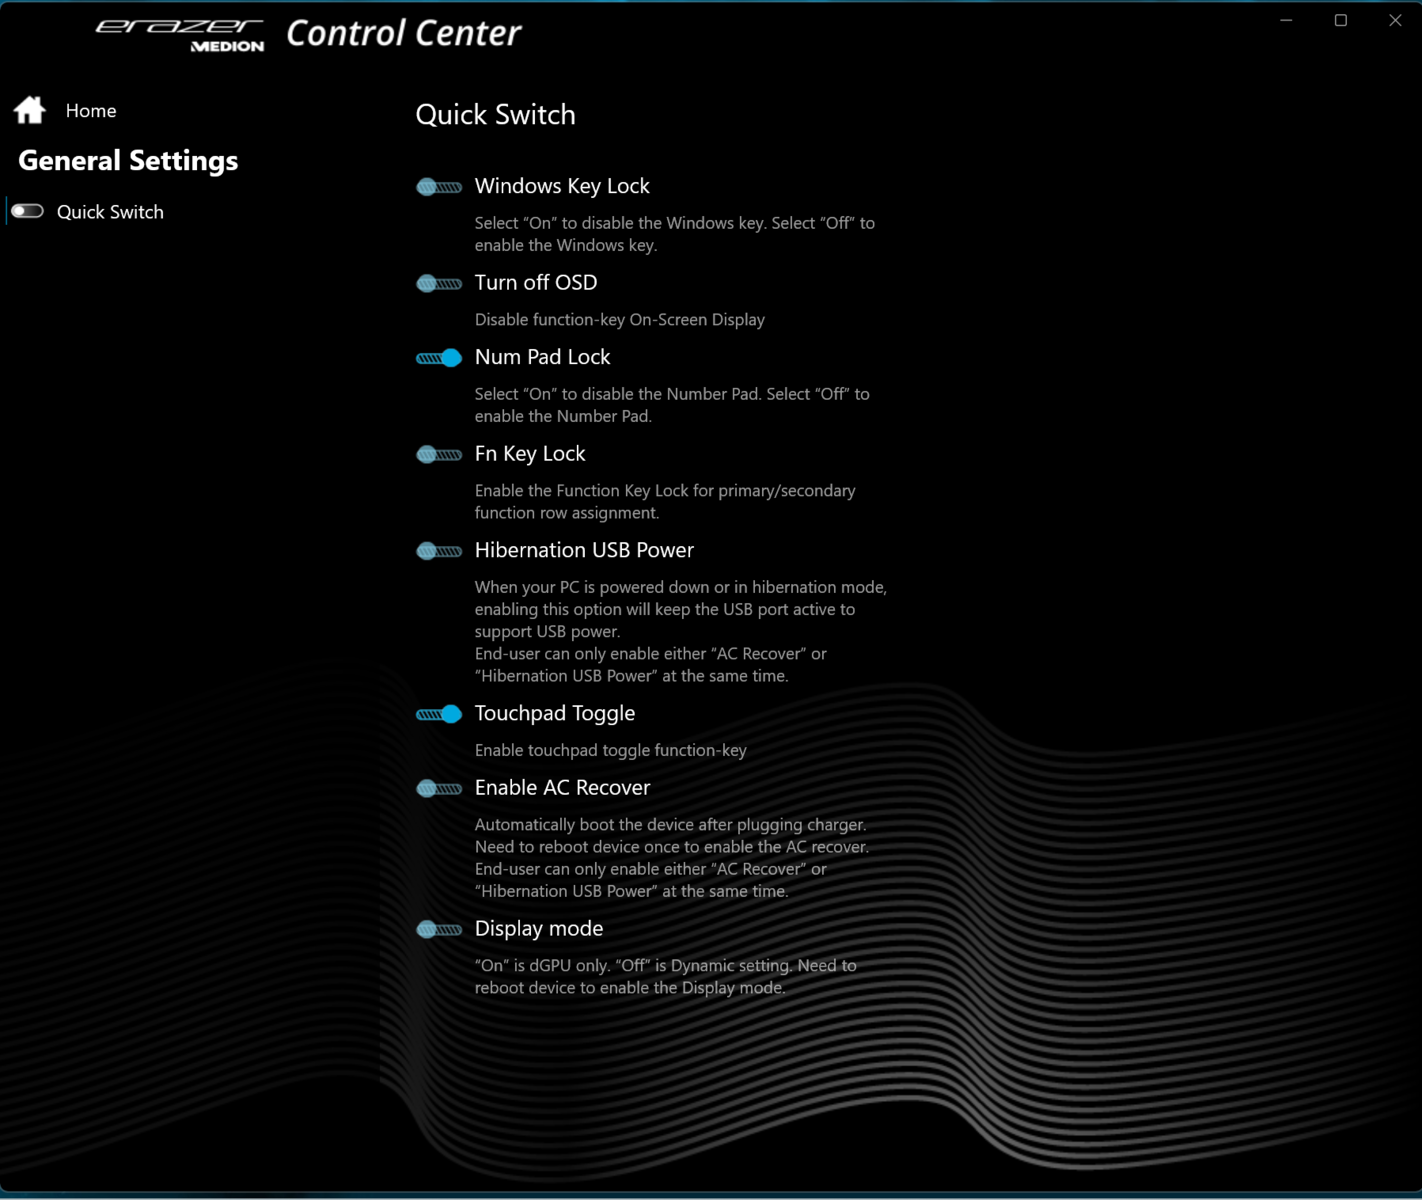
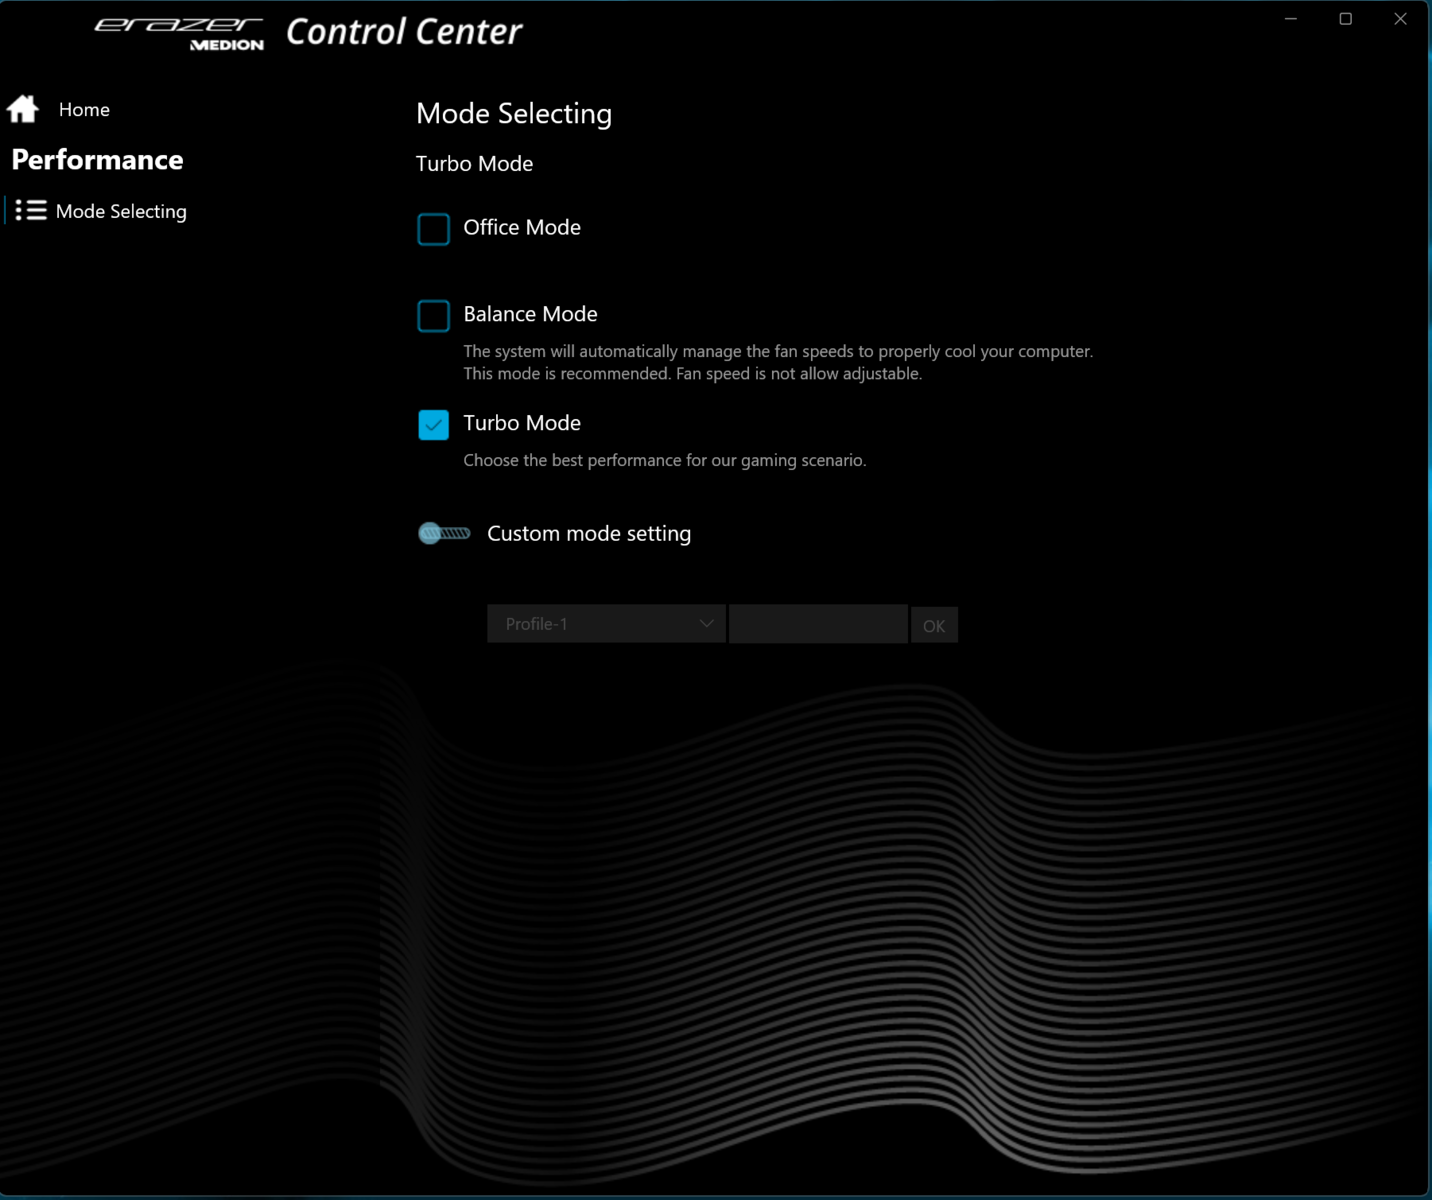
O X20 oferece três modos de energia específicos do fabricante (consulte a tabela), que podem ser selecionados por meio de um botão separado (ao lado do botão liga/desliga). Um LED de status revela qual modo está ativo. foram usados o "Modo Turbo" (benchmarks) e o "Modo Escritório" (testes de bateria). O Optimus estava ativo.
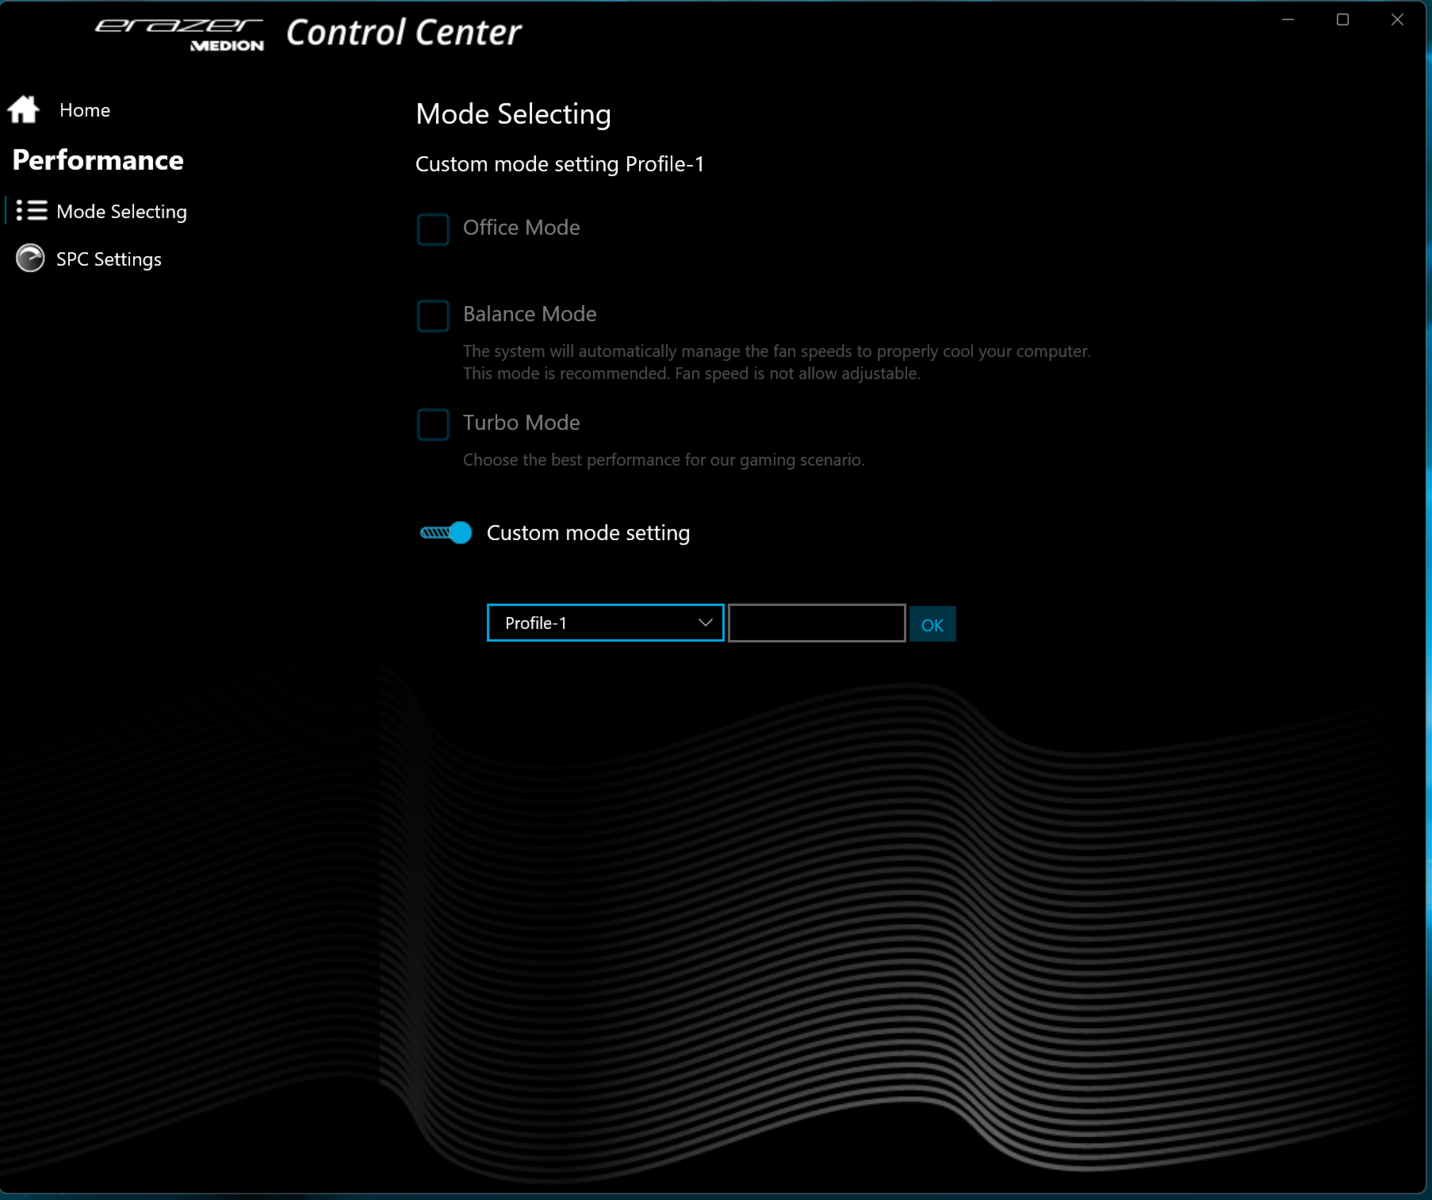
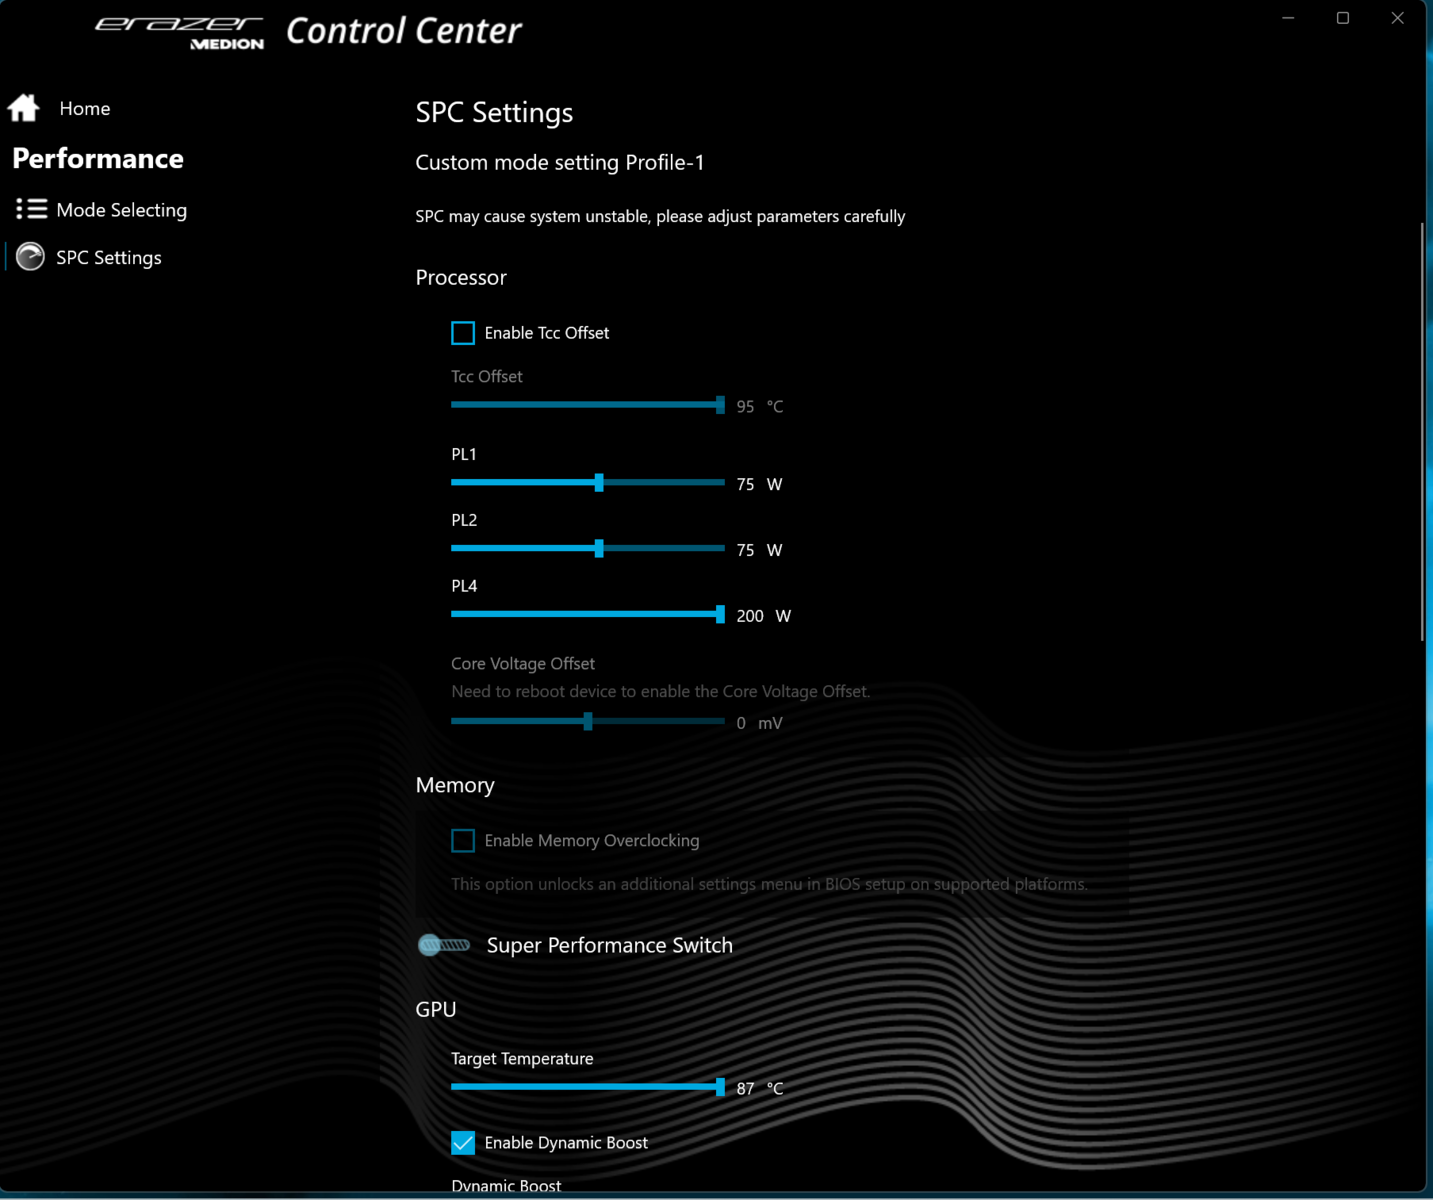
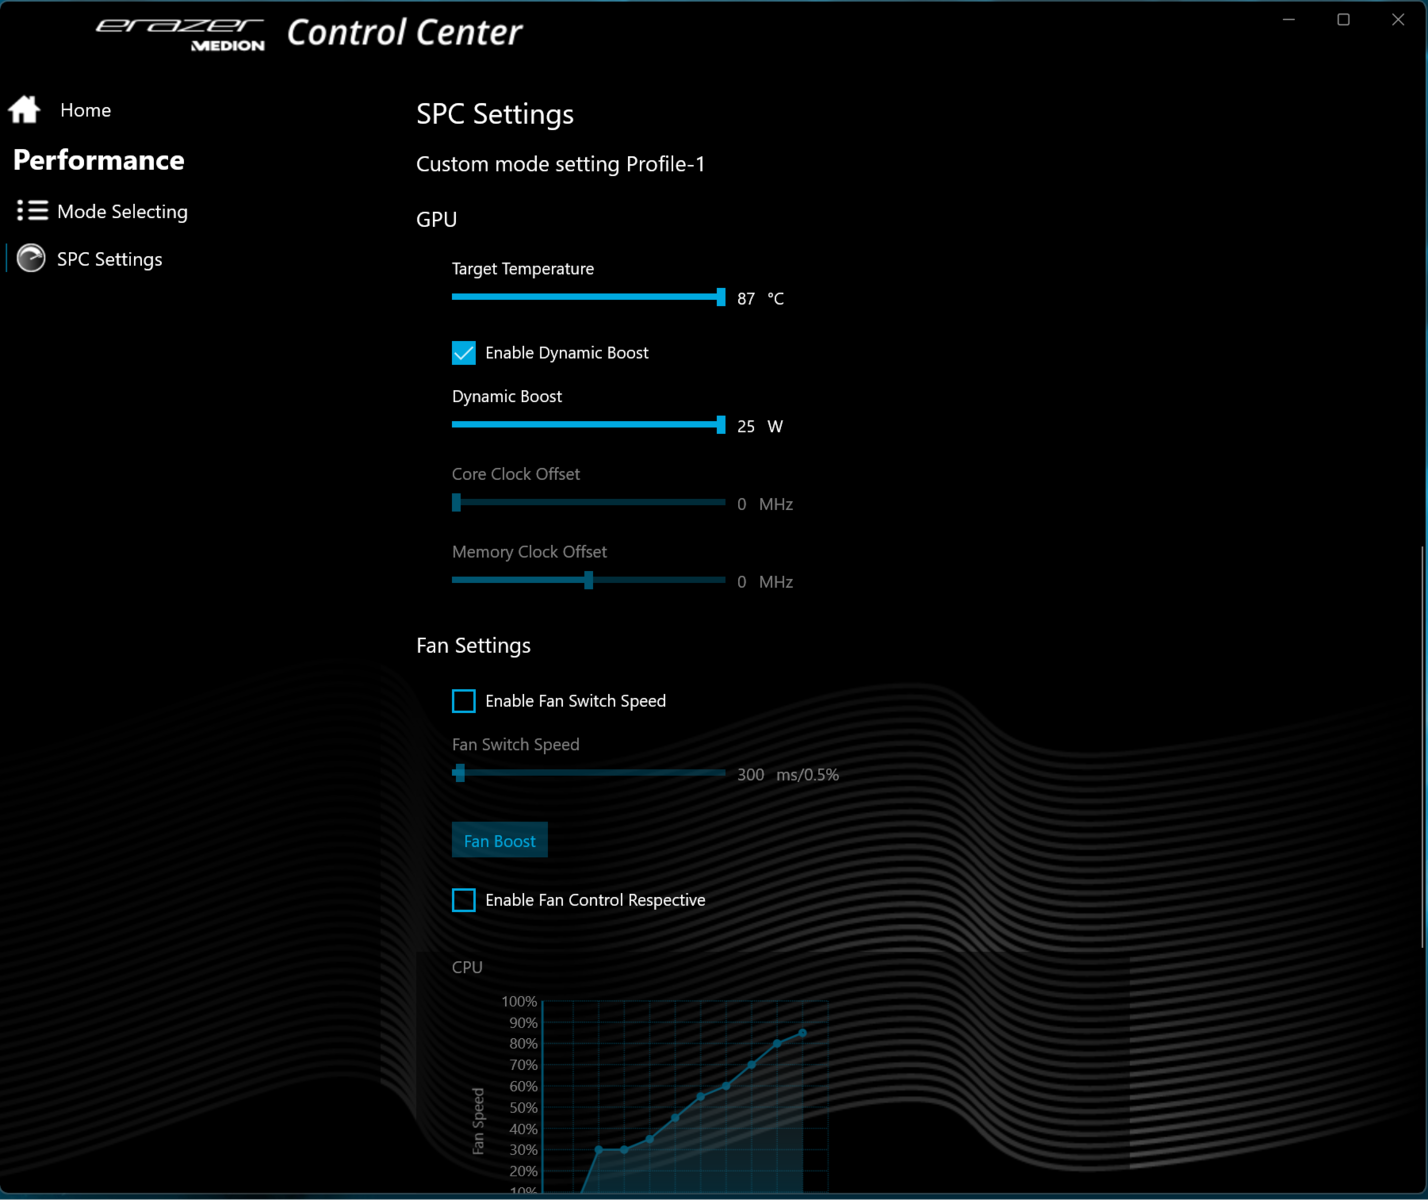
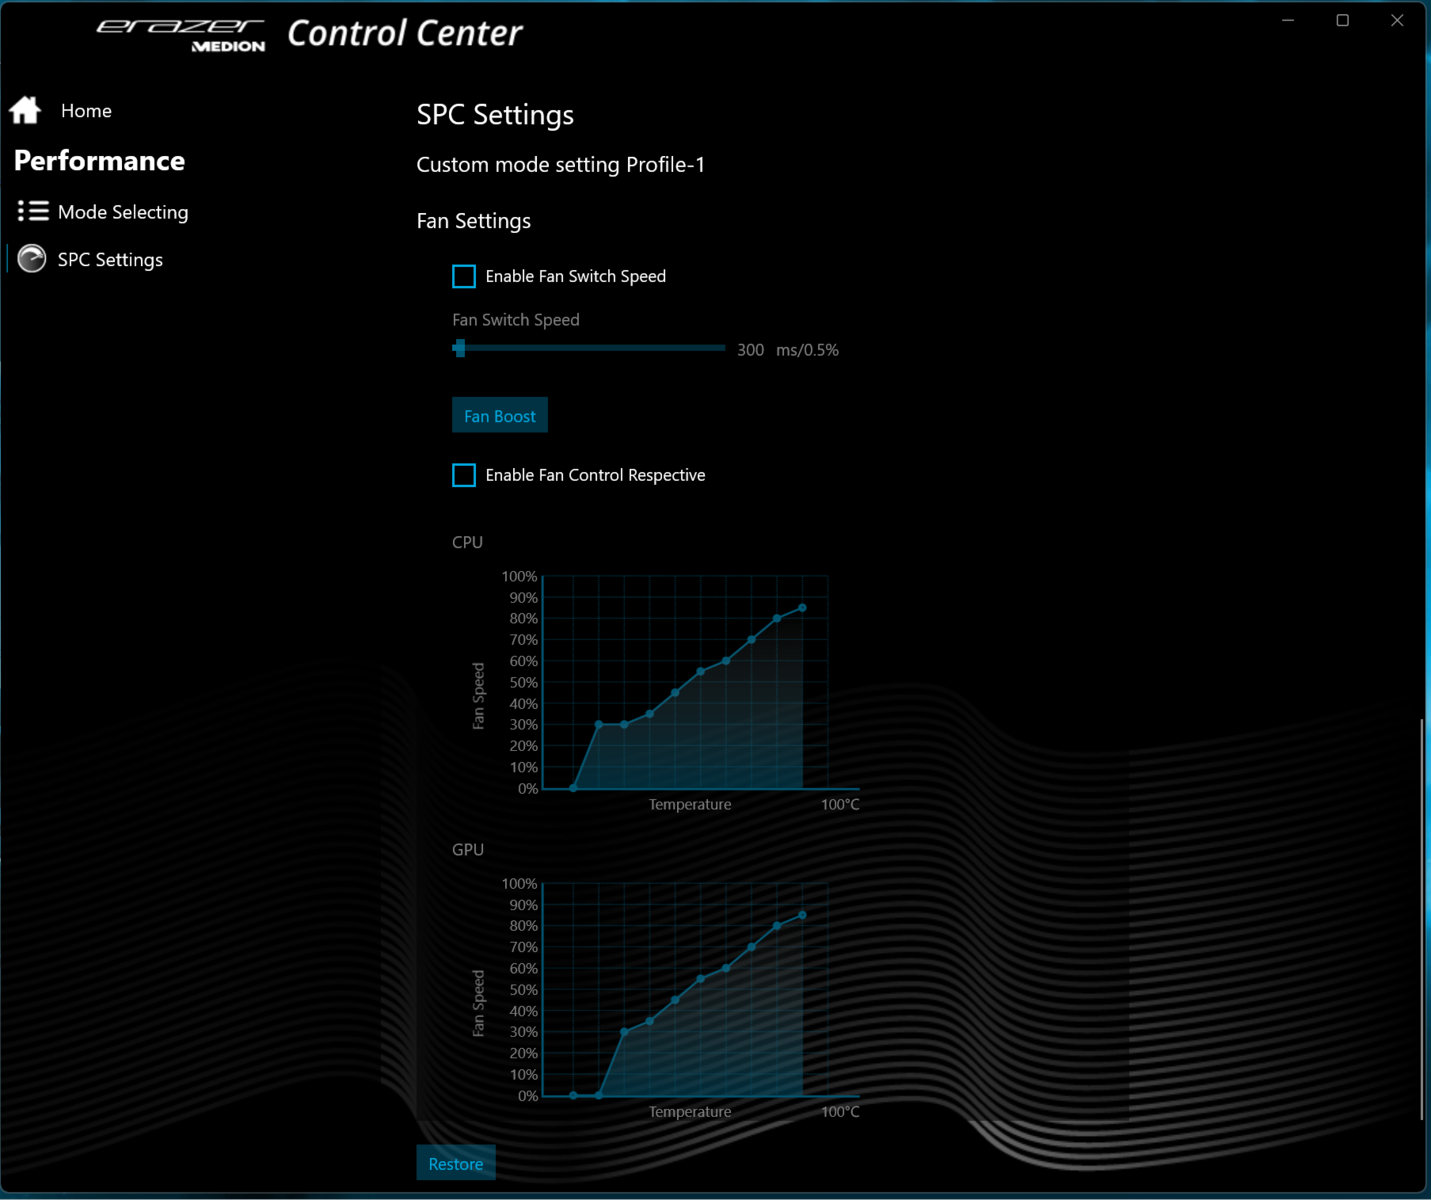
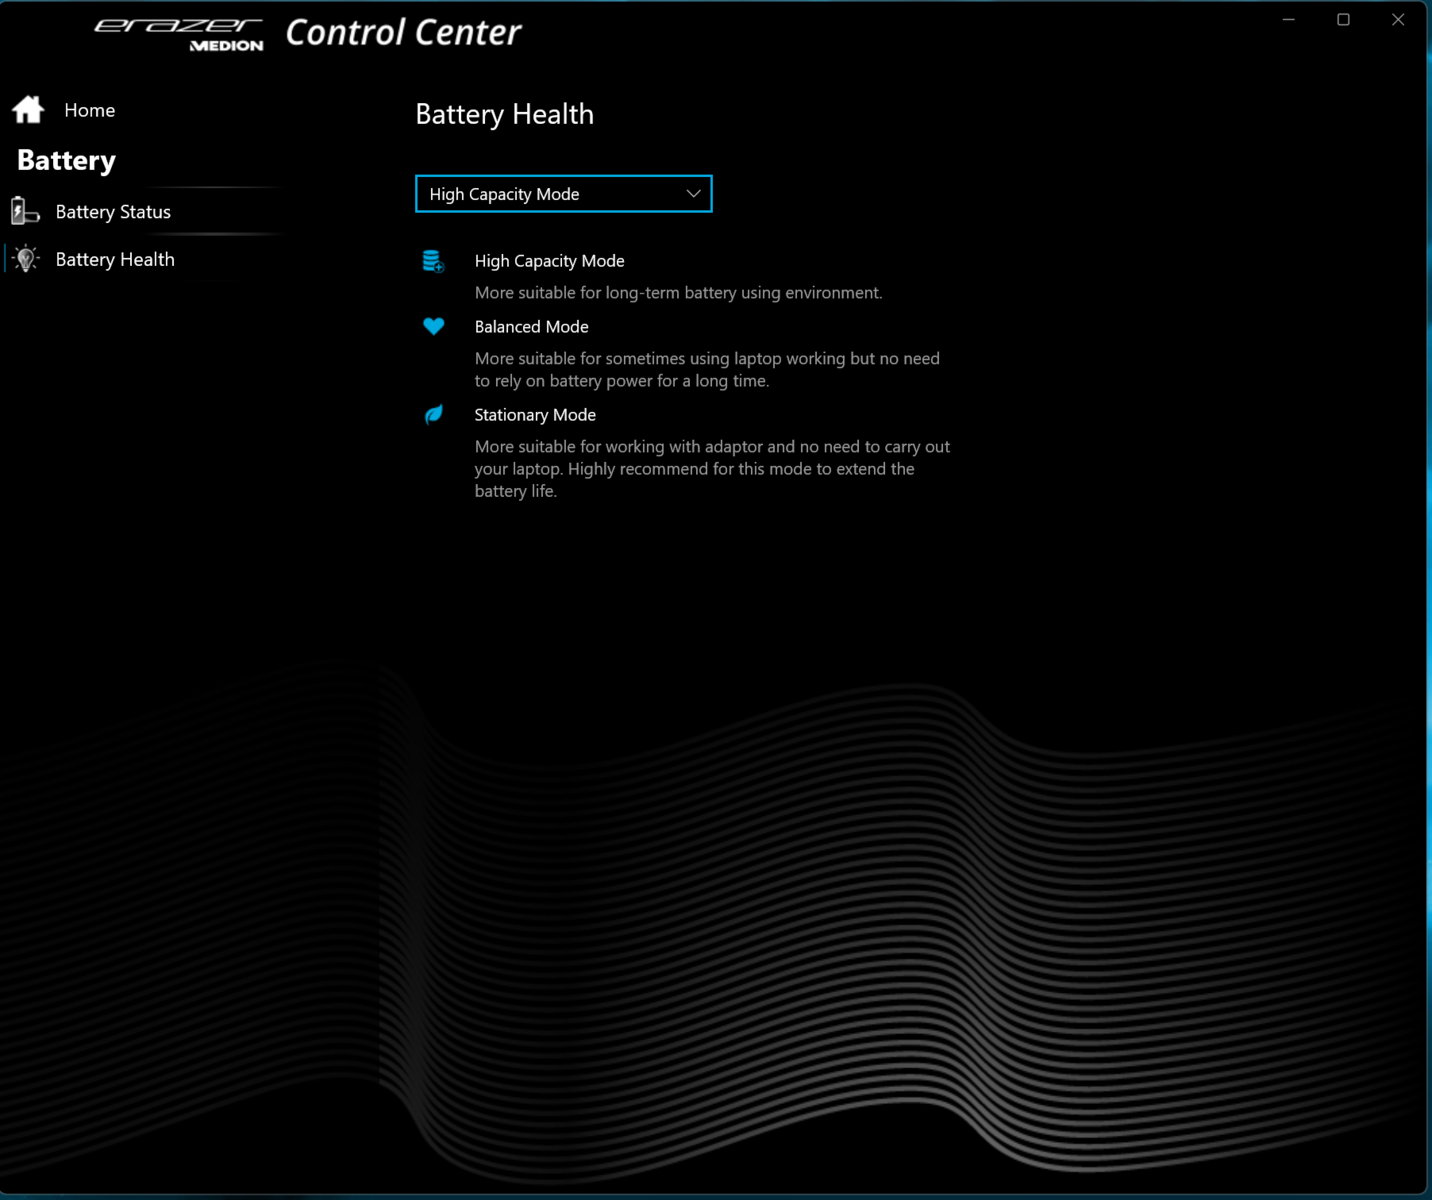
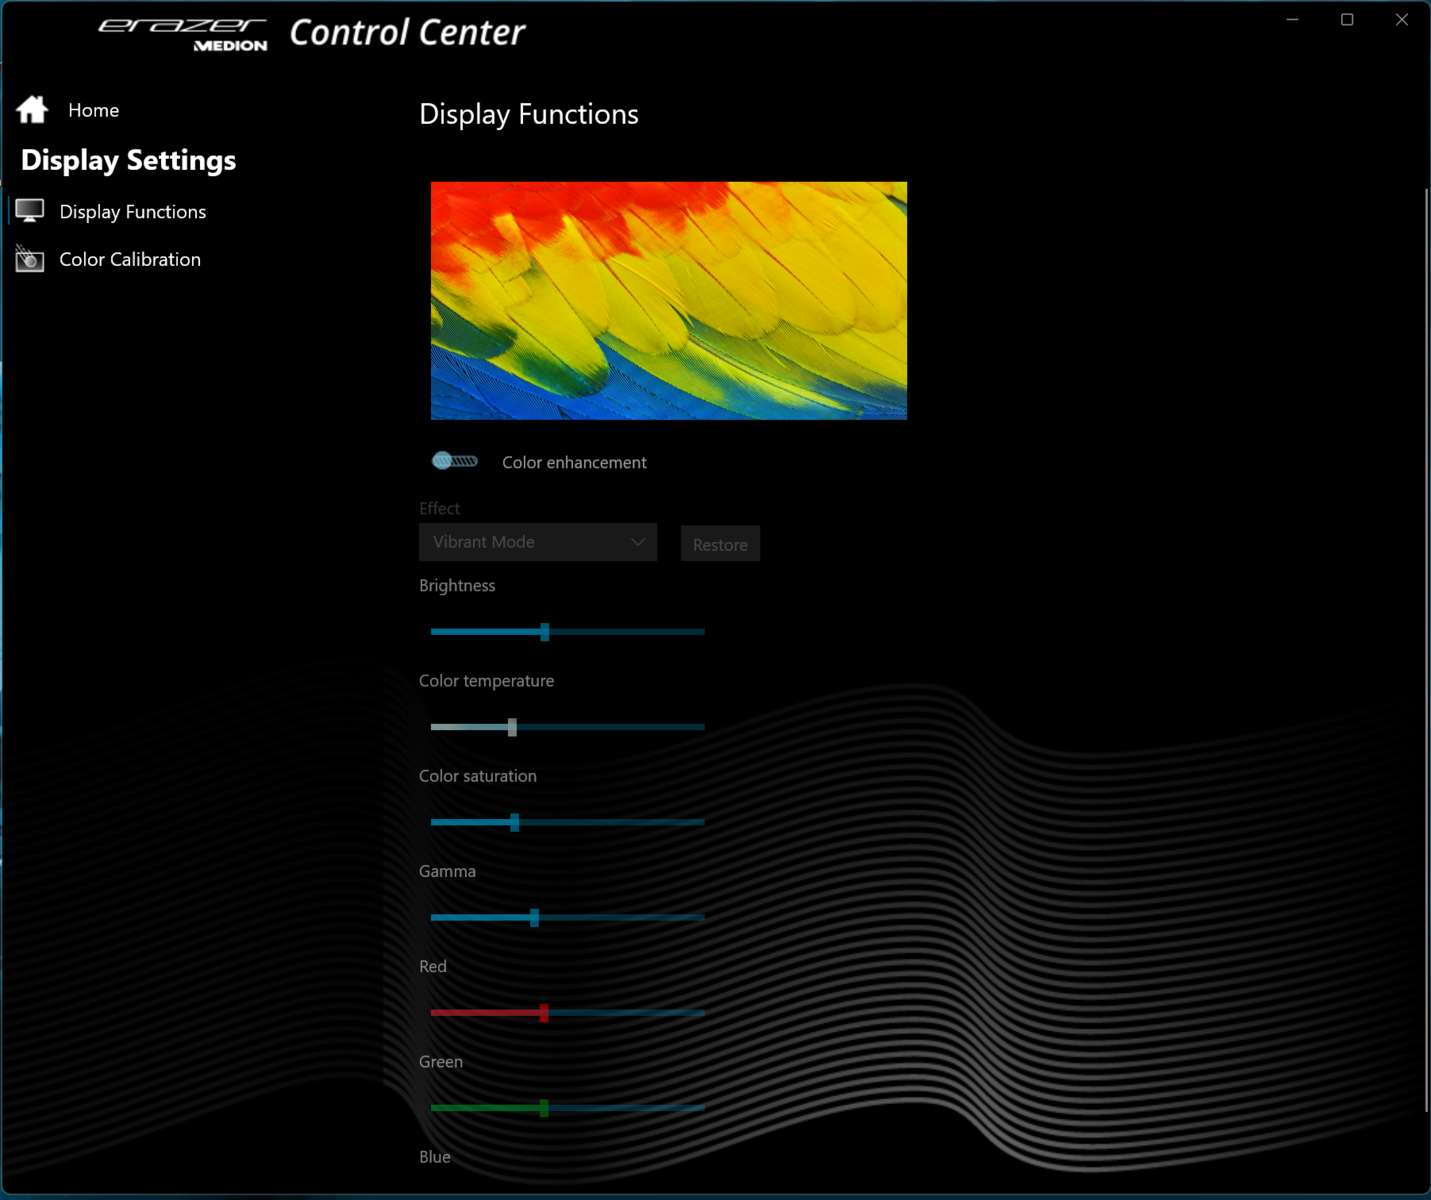
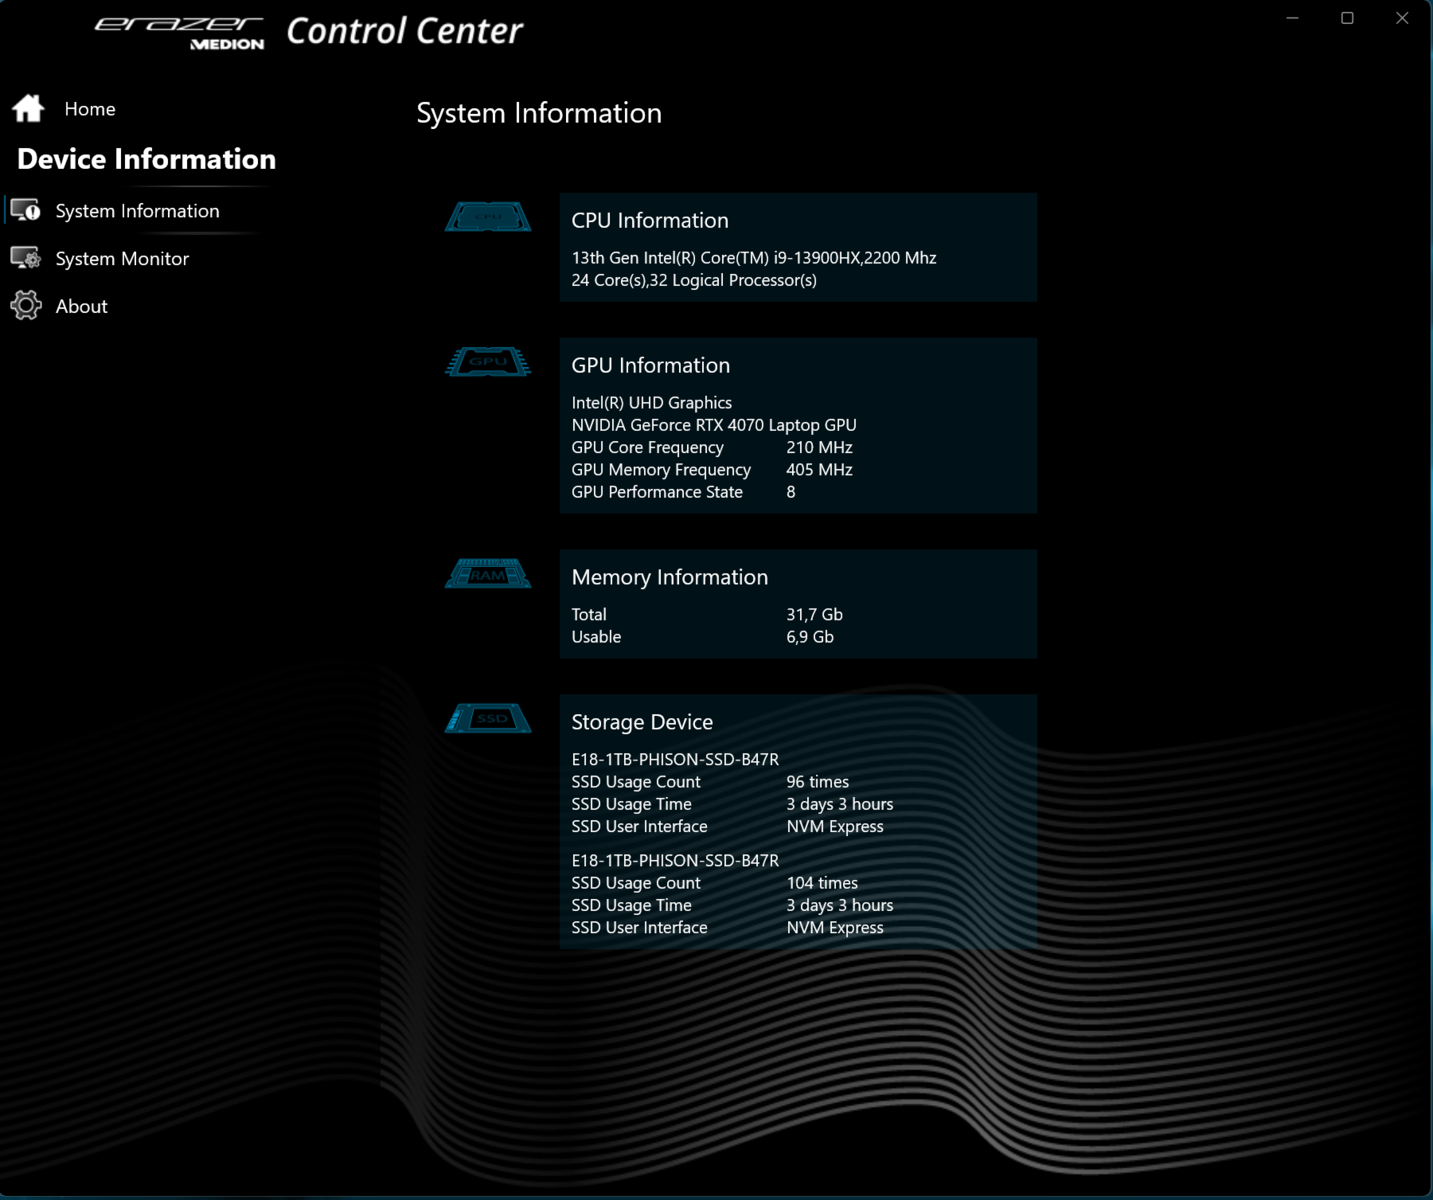
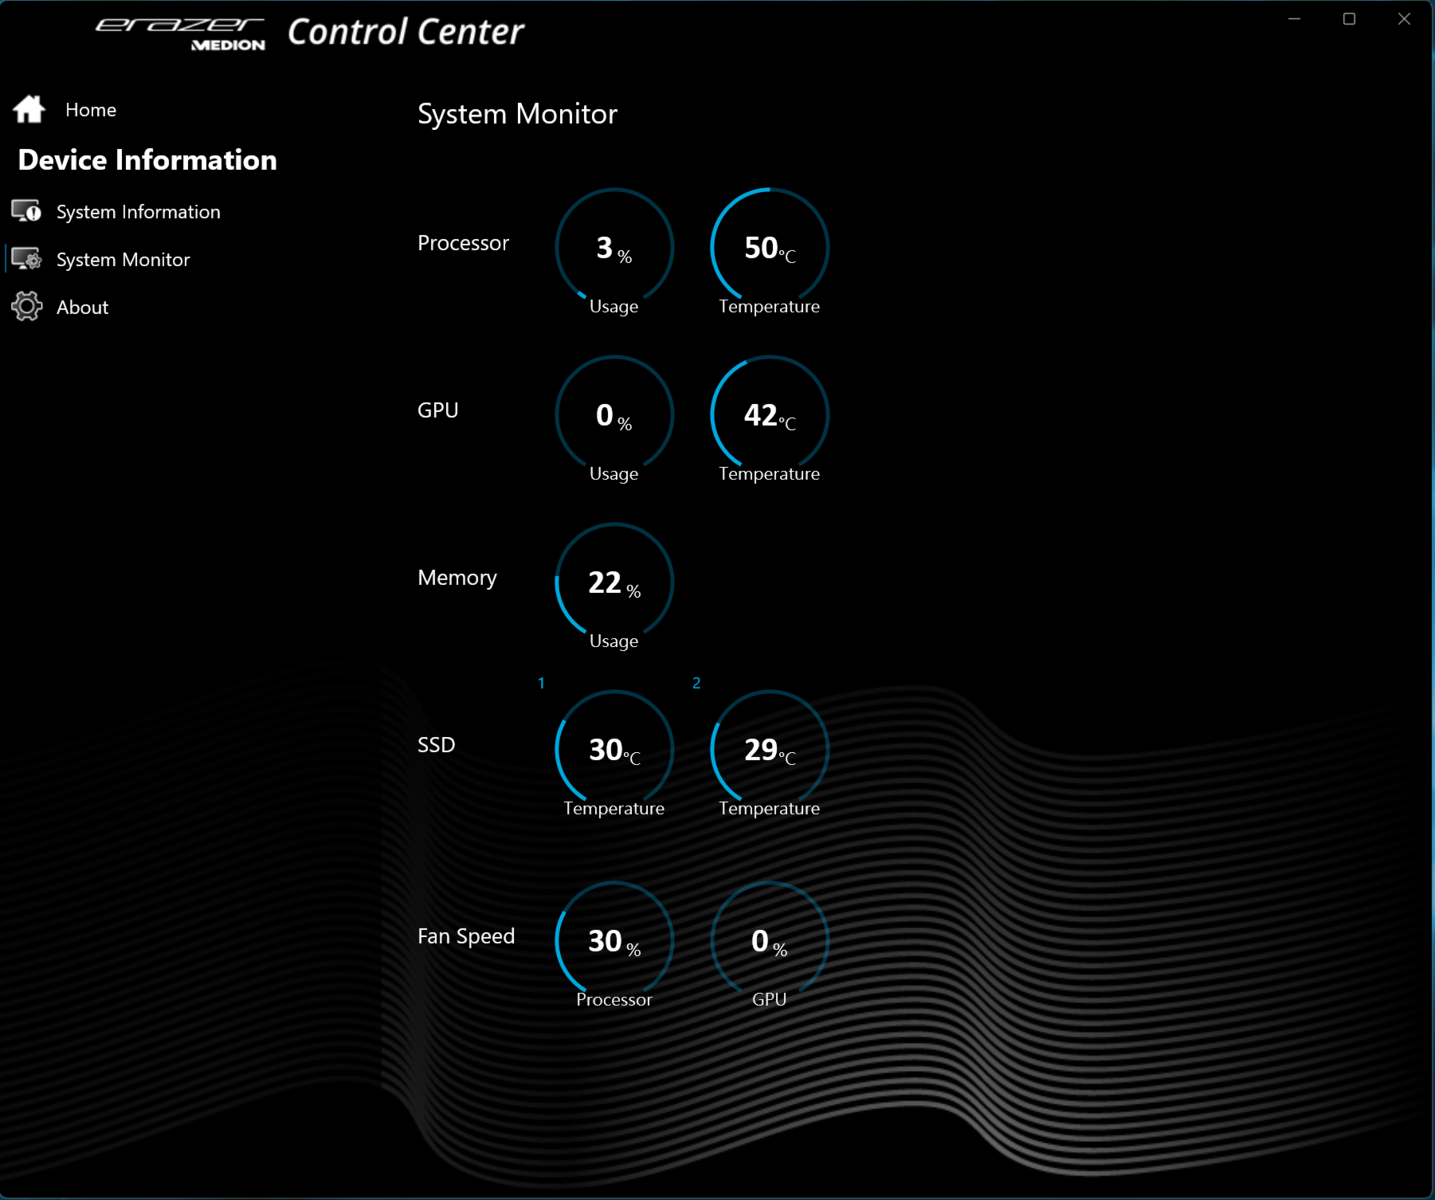
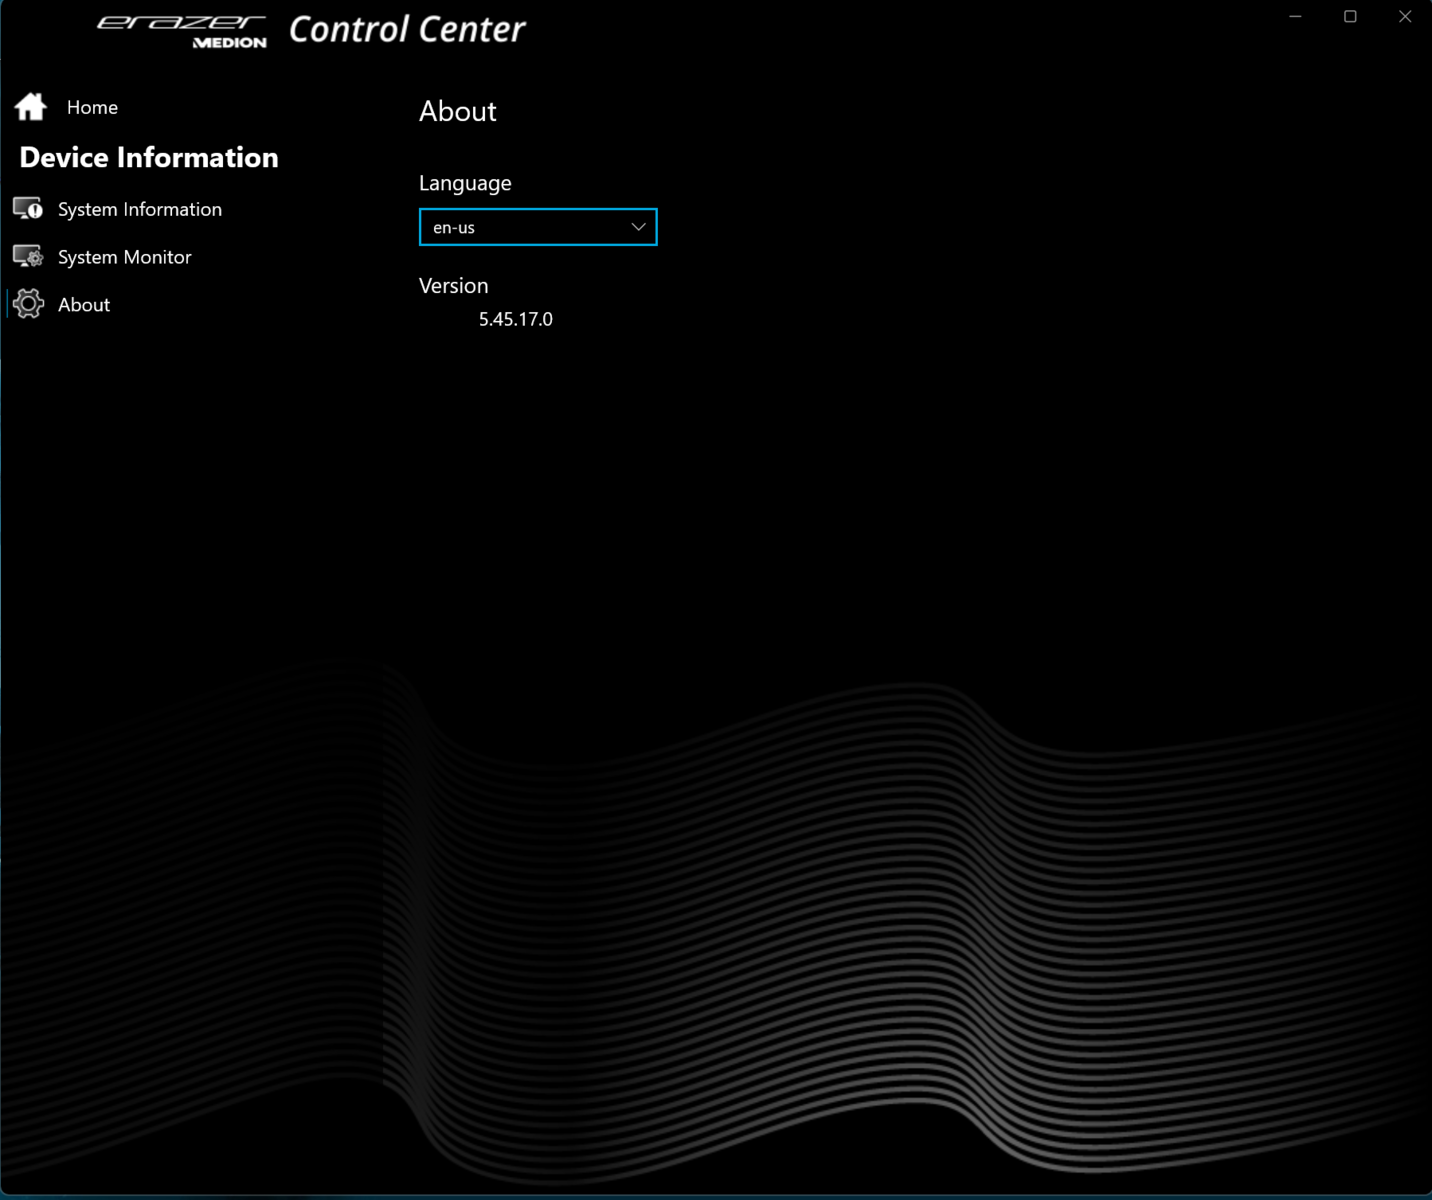
Perfis individuais podem ser criados usando o software pré-instalado Control Center. Por exemplo, os limites de energia da CPU, o TGP da GPU e/ou os limites superiores de temperatura podem ser ajustados.
Usamos a interface em inglês do software CC porque a tradução para o alemão foi parcialmente mal-sucedida. Você pode alternar entre os dois idiomas.
| Modo Turbo (dt: Overboost) | Modo Balance (dt: Balanced) | Modo Office (dt: Balanced) | |
|---|---|---|---|
| CPU PL1 (HWInfo) | 140 watts | 140 watts | 140 watts |
| CPU PL2 (HWInfo) | 140 watts | 140 watts | 140 watts |
| Ruído (Witcher 3 ) | 50-53 dB(A) | 48-51 dB(A) | 36-43 dB(A), posteriormente 32-34 dB(A) |
| Desempenho (Witcher 3 ) | 124 fps | 118 fps | 114-118 fps, mais tarde 30 fps lock |
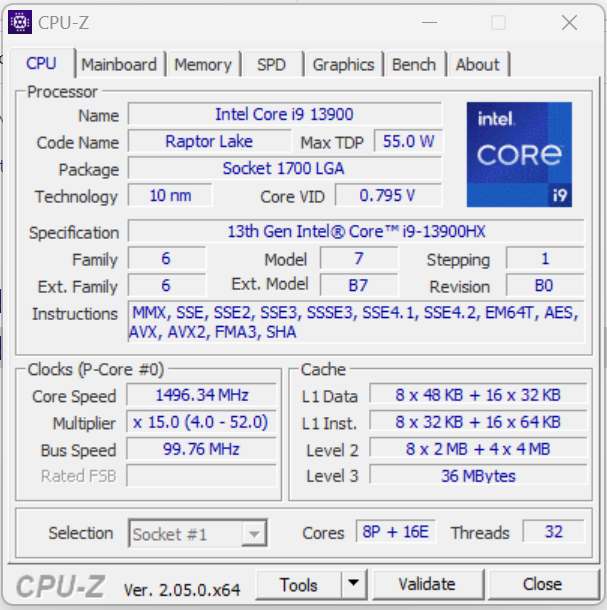
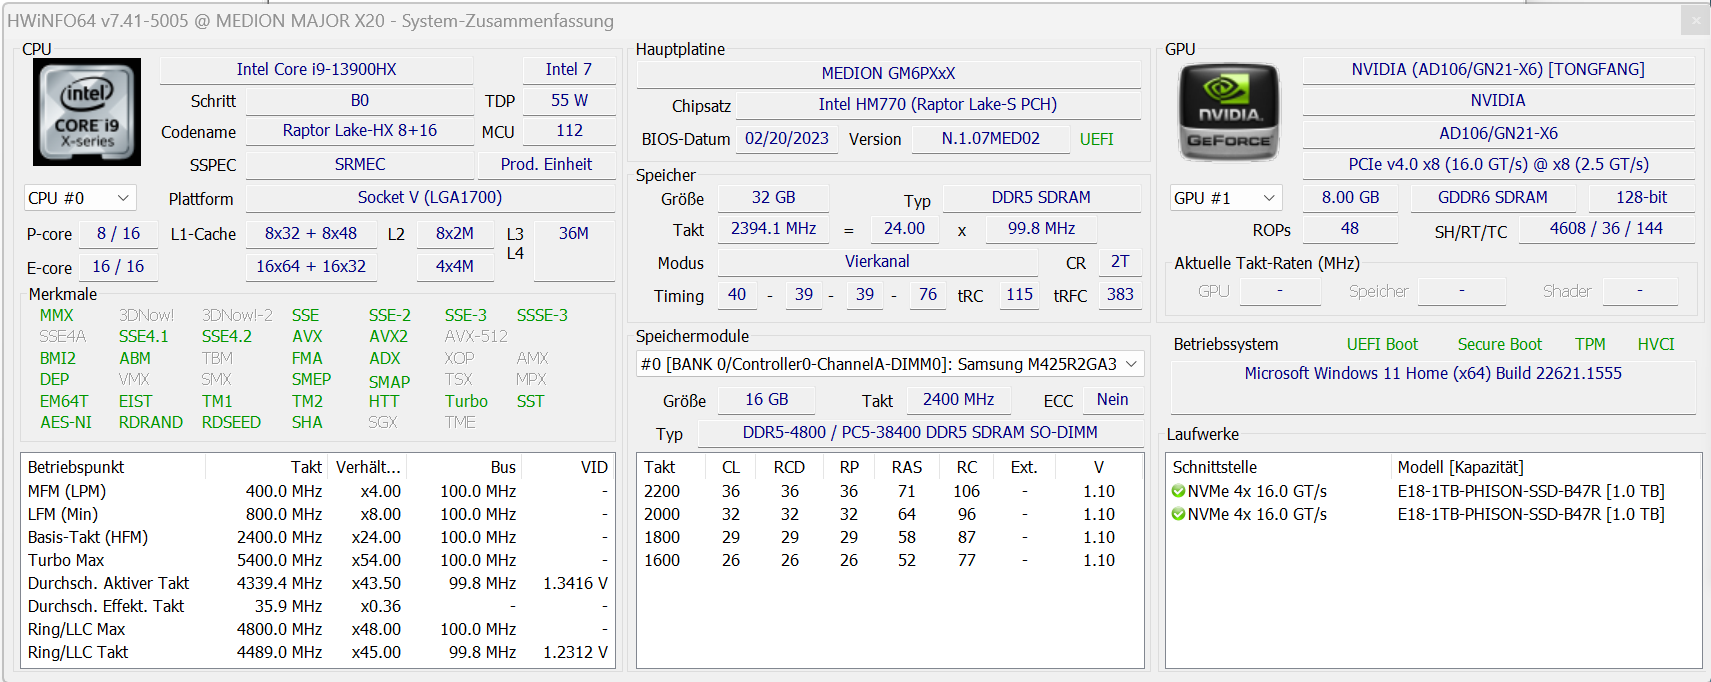
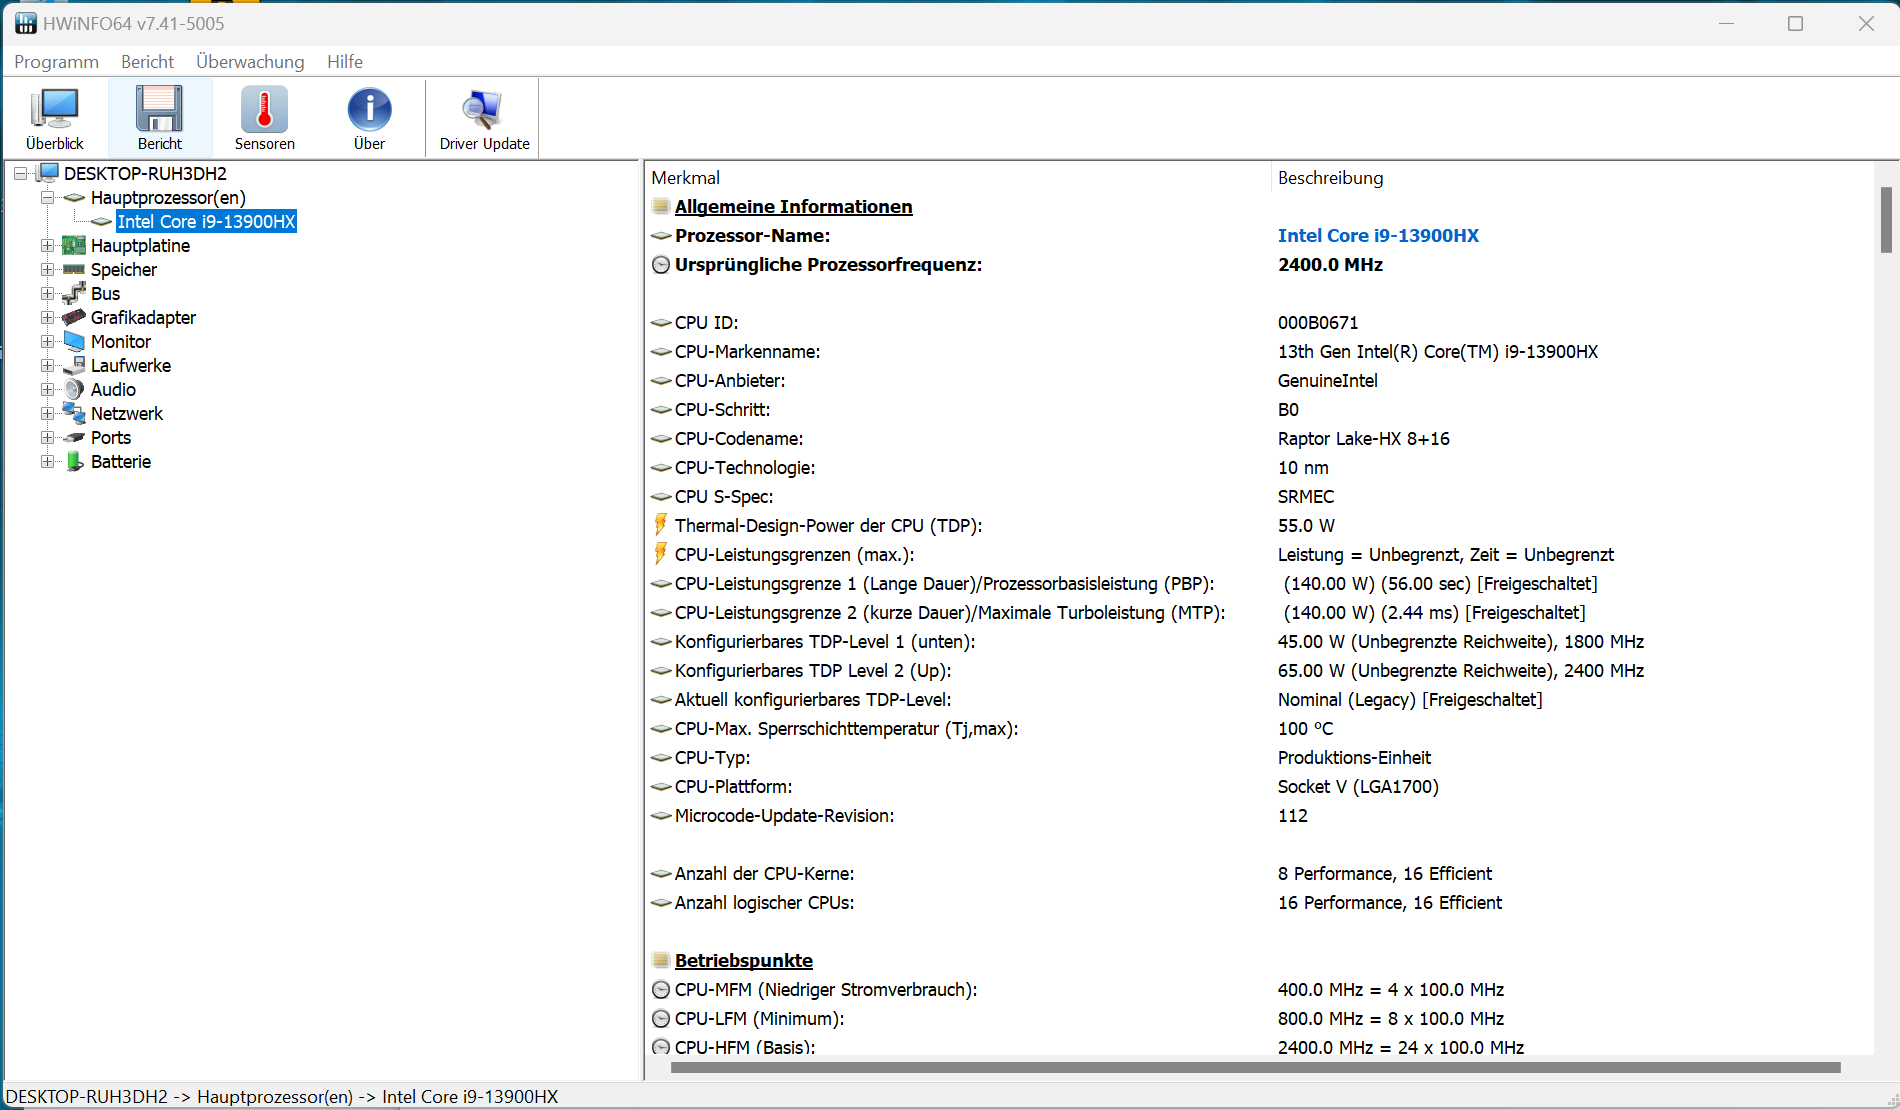
Processador
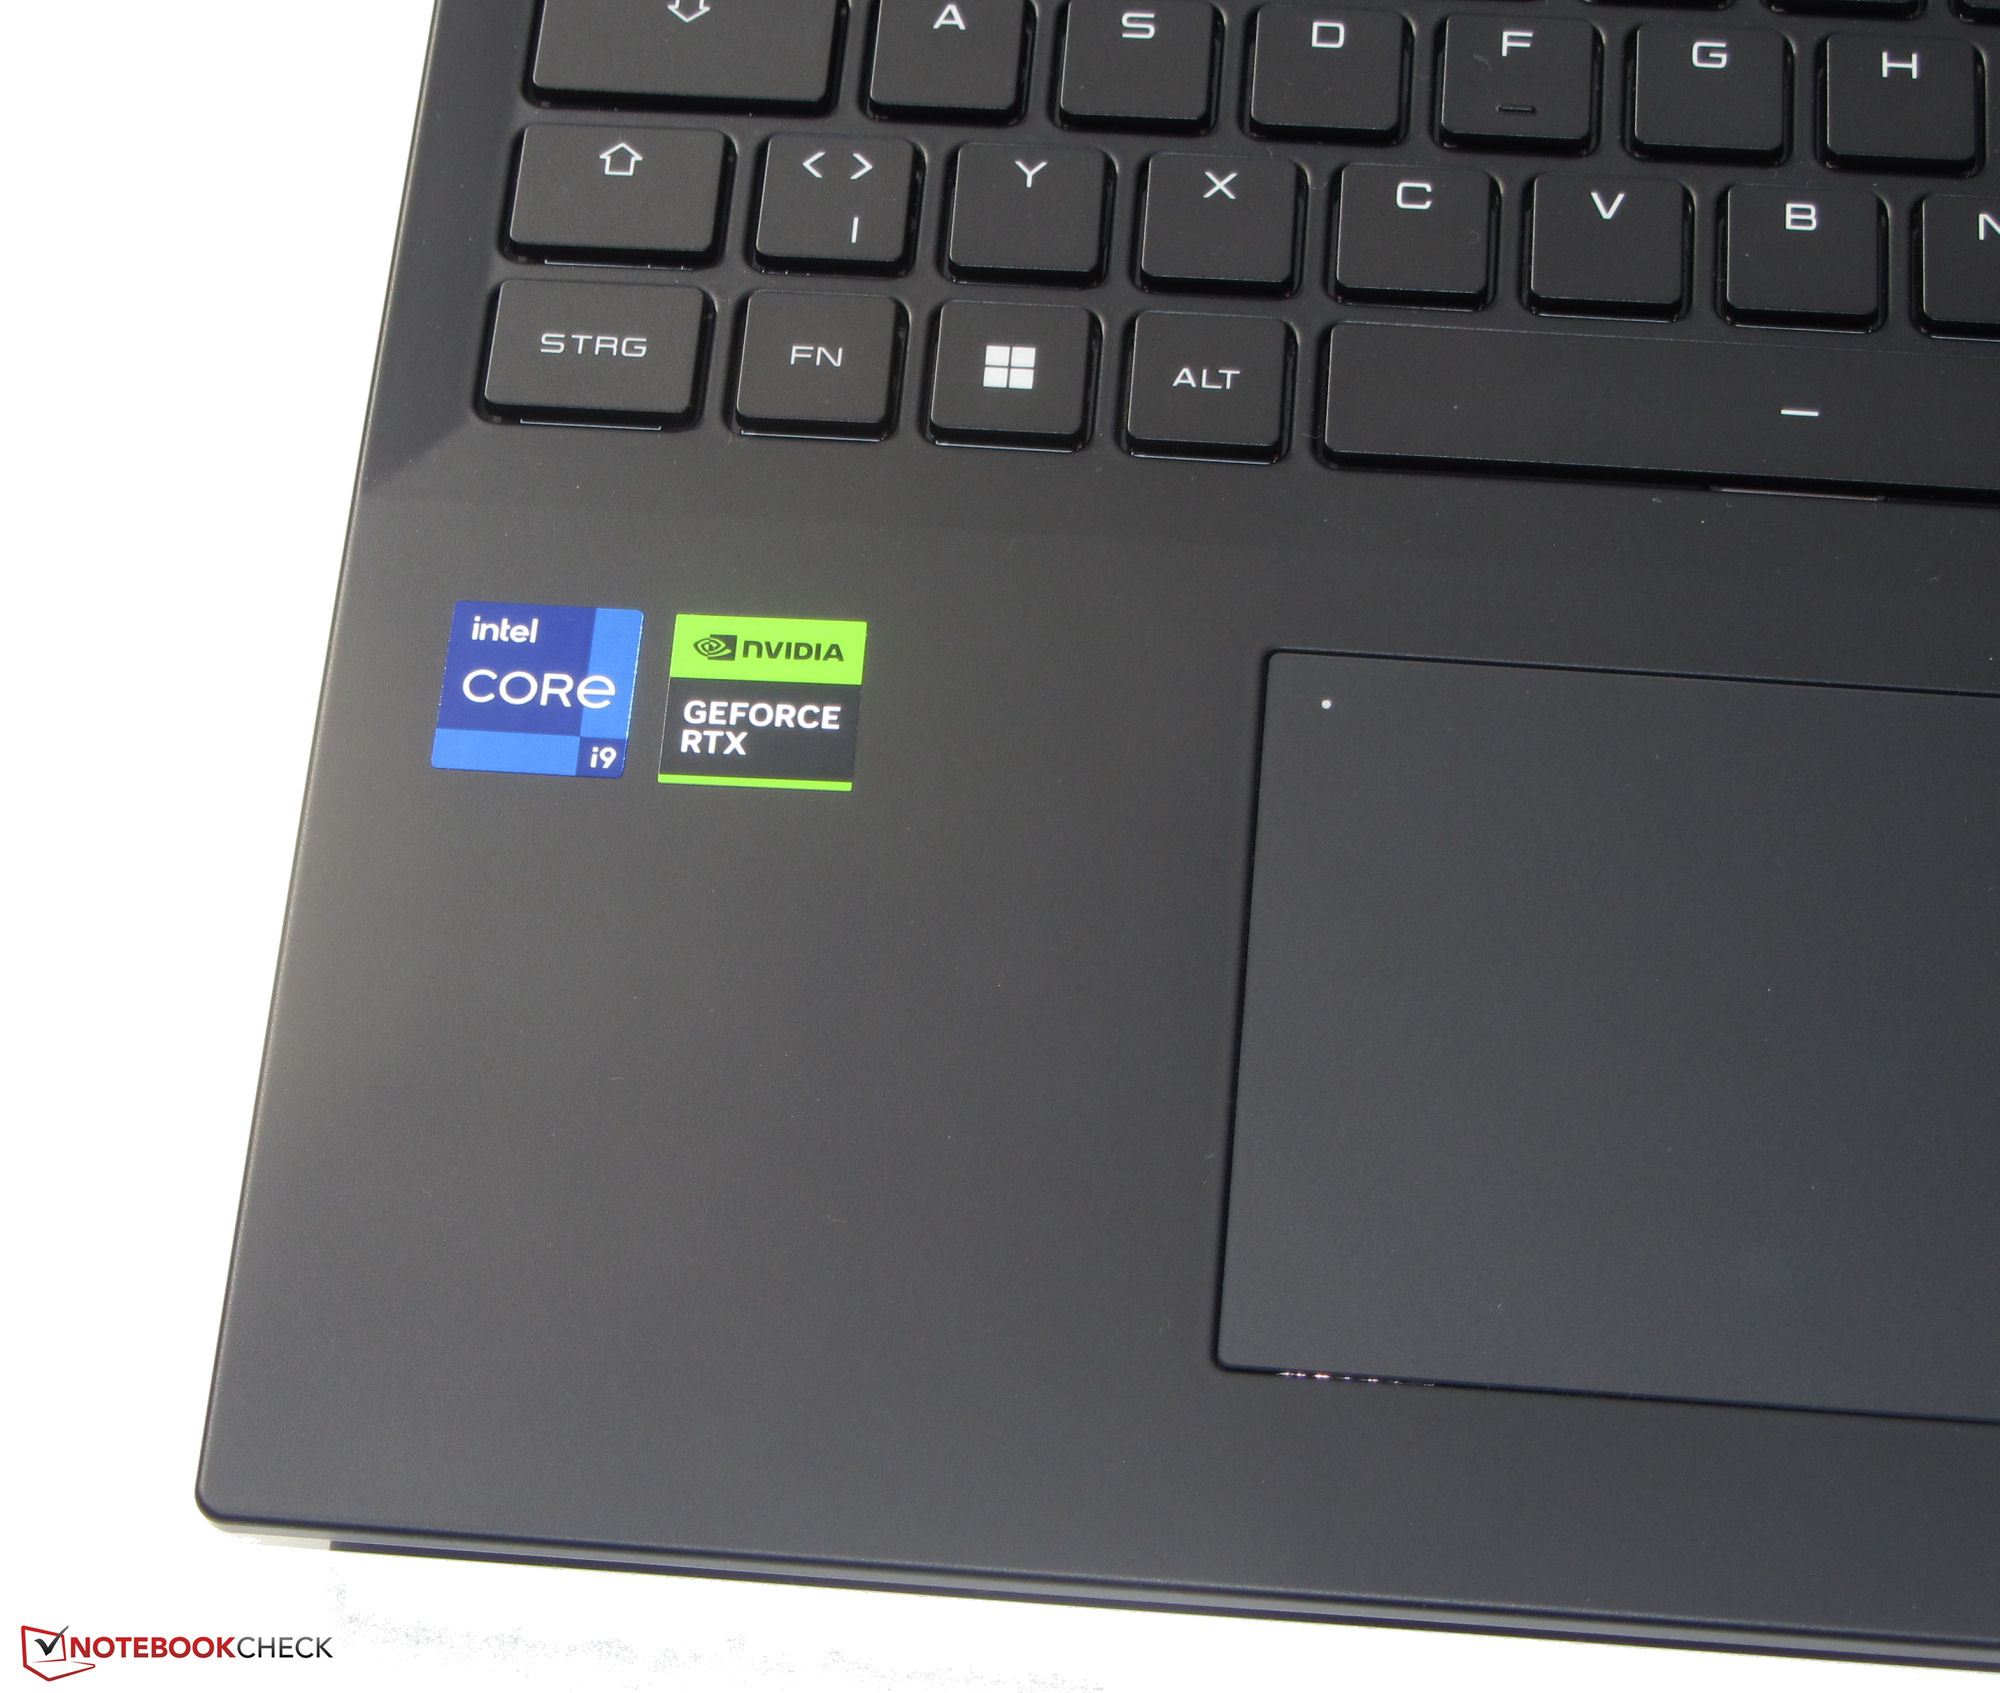
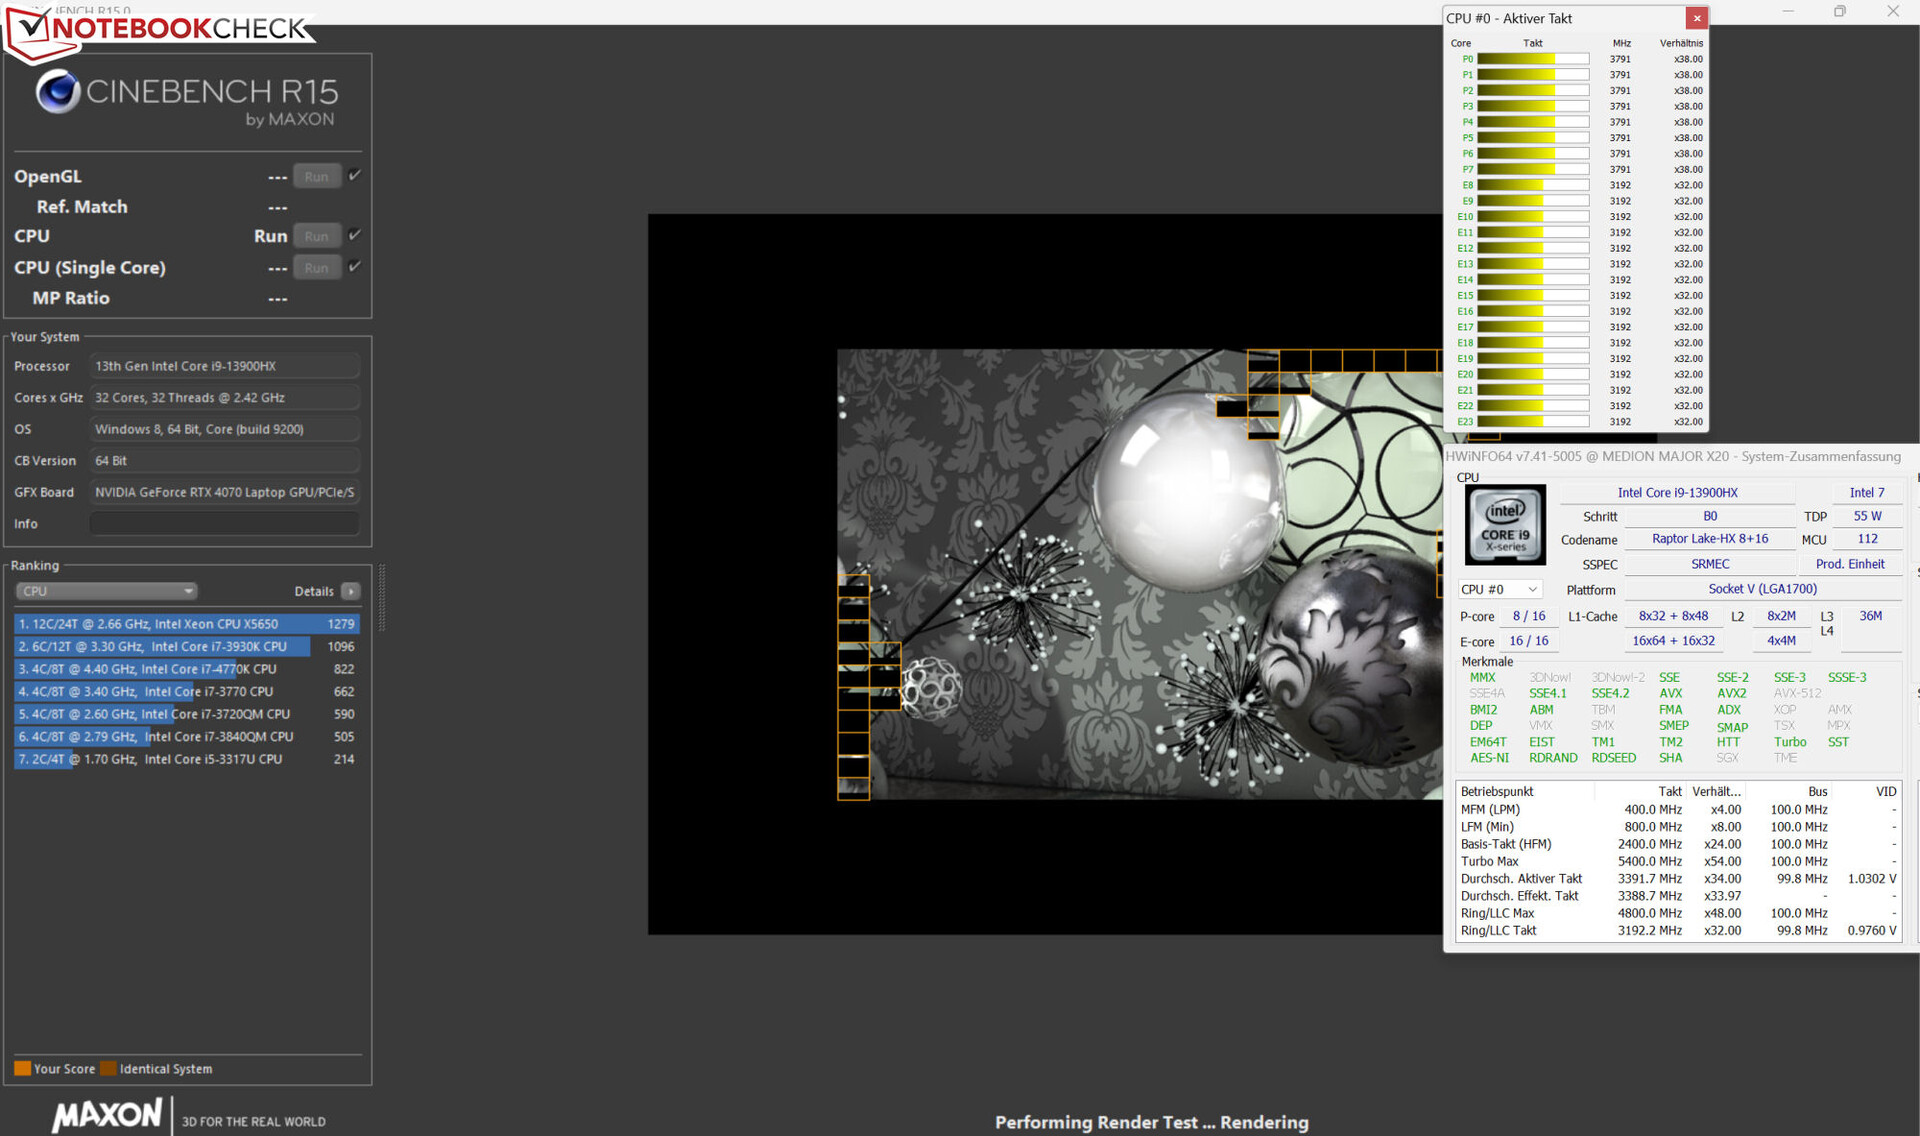
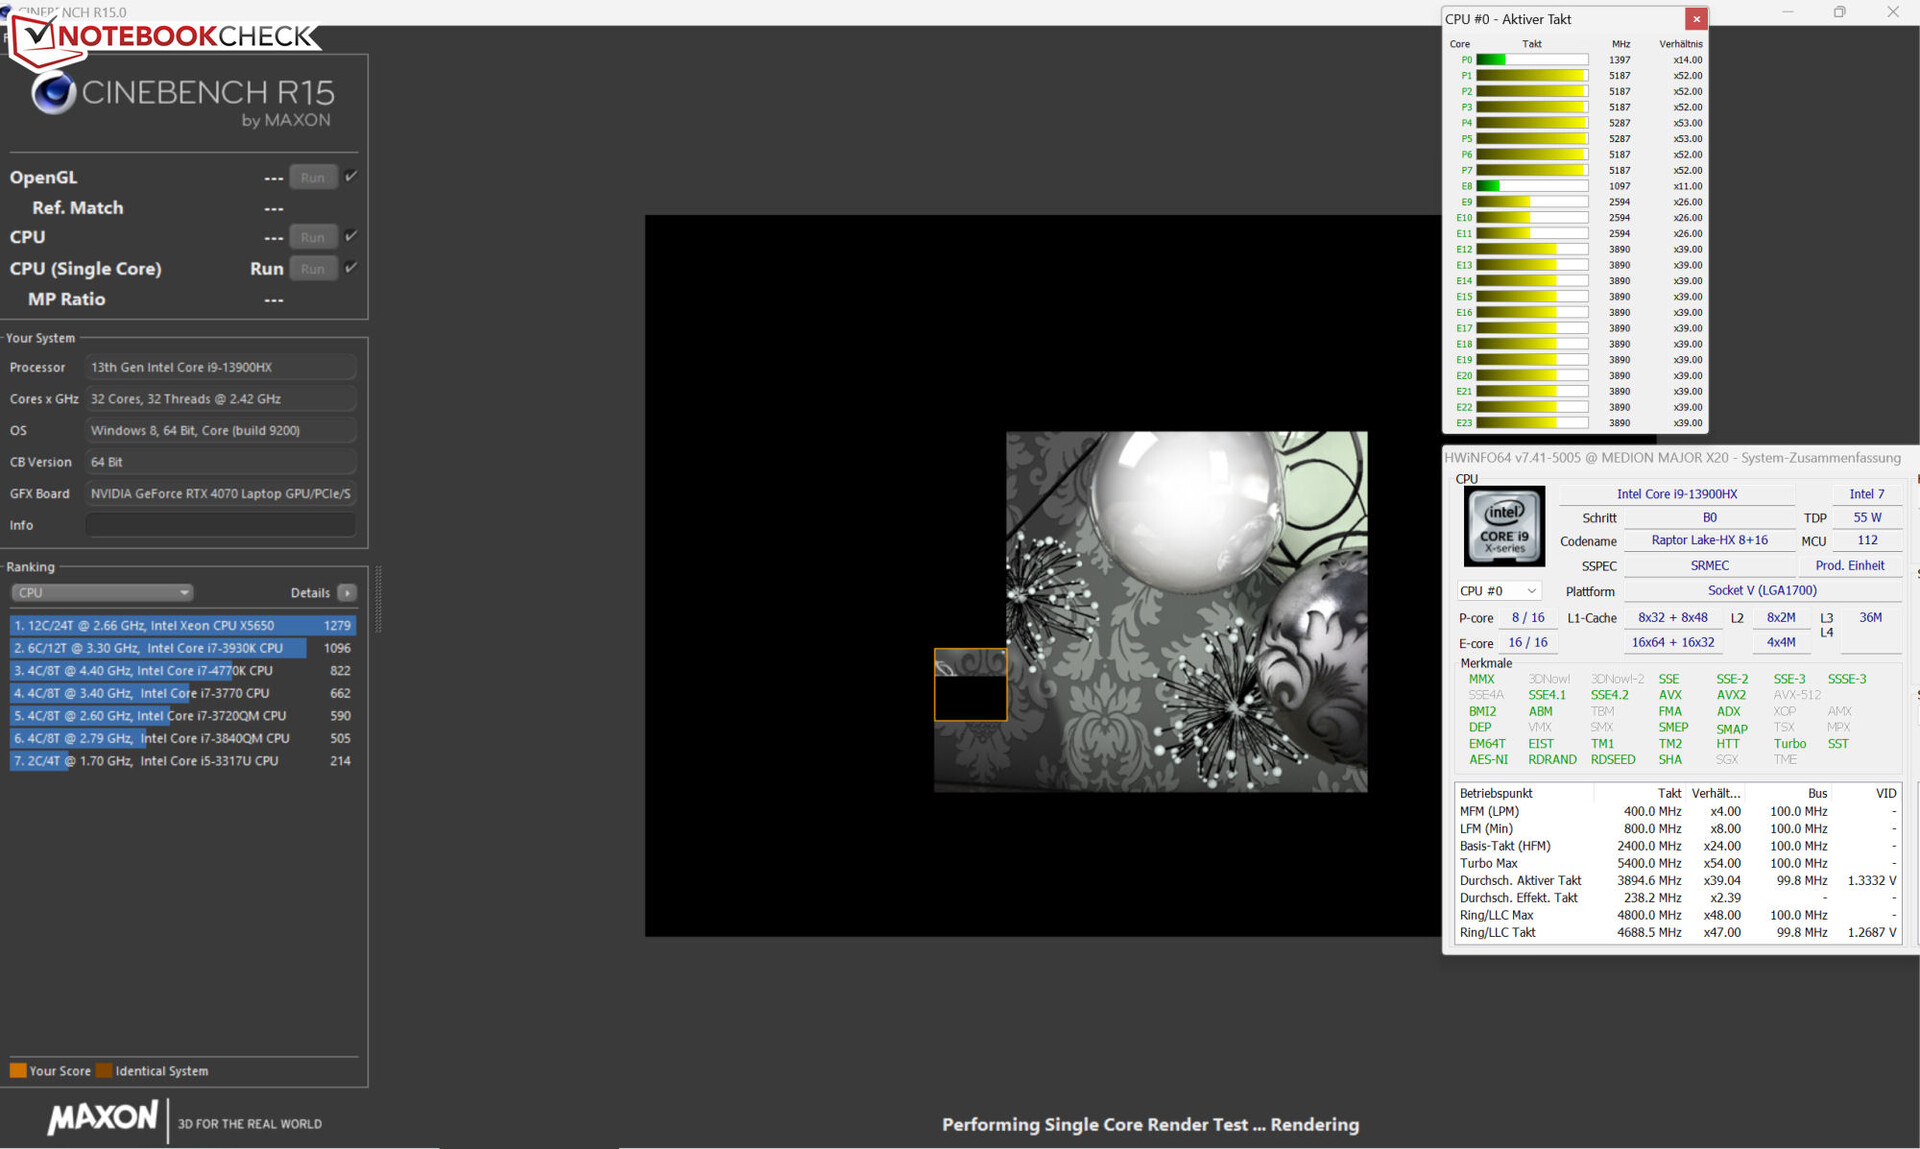
O Core-i9-13900HX (Raptor Lake) consiste em oito núcleos de desempenho (hyperthreading, 2,2 a 5,4 GHz) e dezesseis núcleos de eficiência (sem hyperthreading, 1,6 a 3,9 GHz). No total, há 32 núcleos lógicos de CPU. Os resultados do benchmark estão no mesmo nível das taxas médias da CPU.
Os testes de CPU do benchmark Cinebench R15 foram executados em taxas de clock altas a máximas em operação de rede elétrica. O desempenho de thread único (222 pontos), que é relevante para o uso diário, cai significativamente menos no modo de bateria do que o desempenho de multi-thread (1025 pontos).
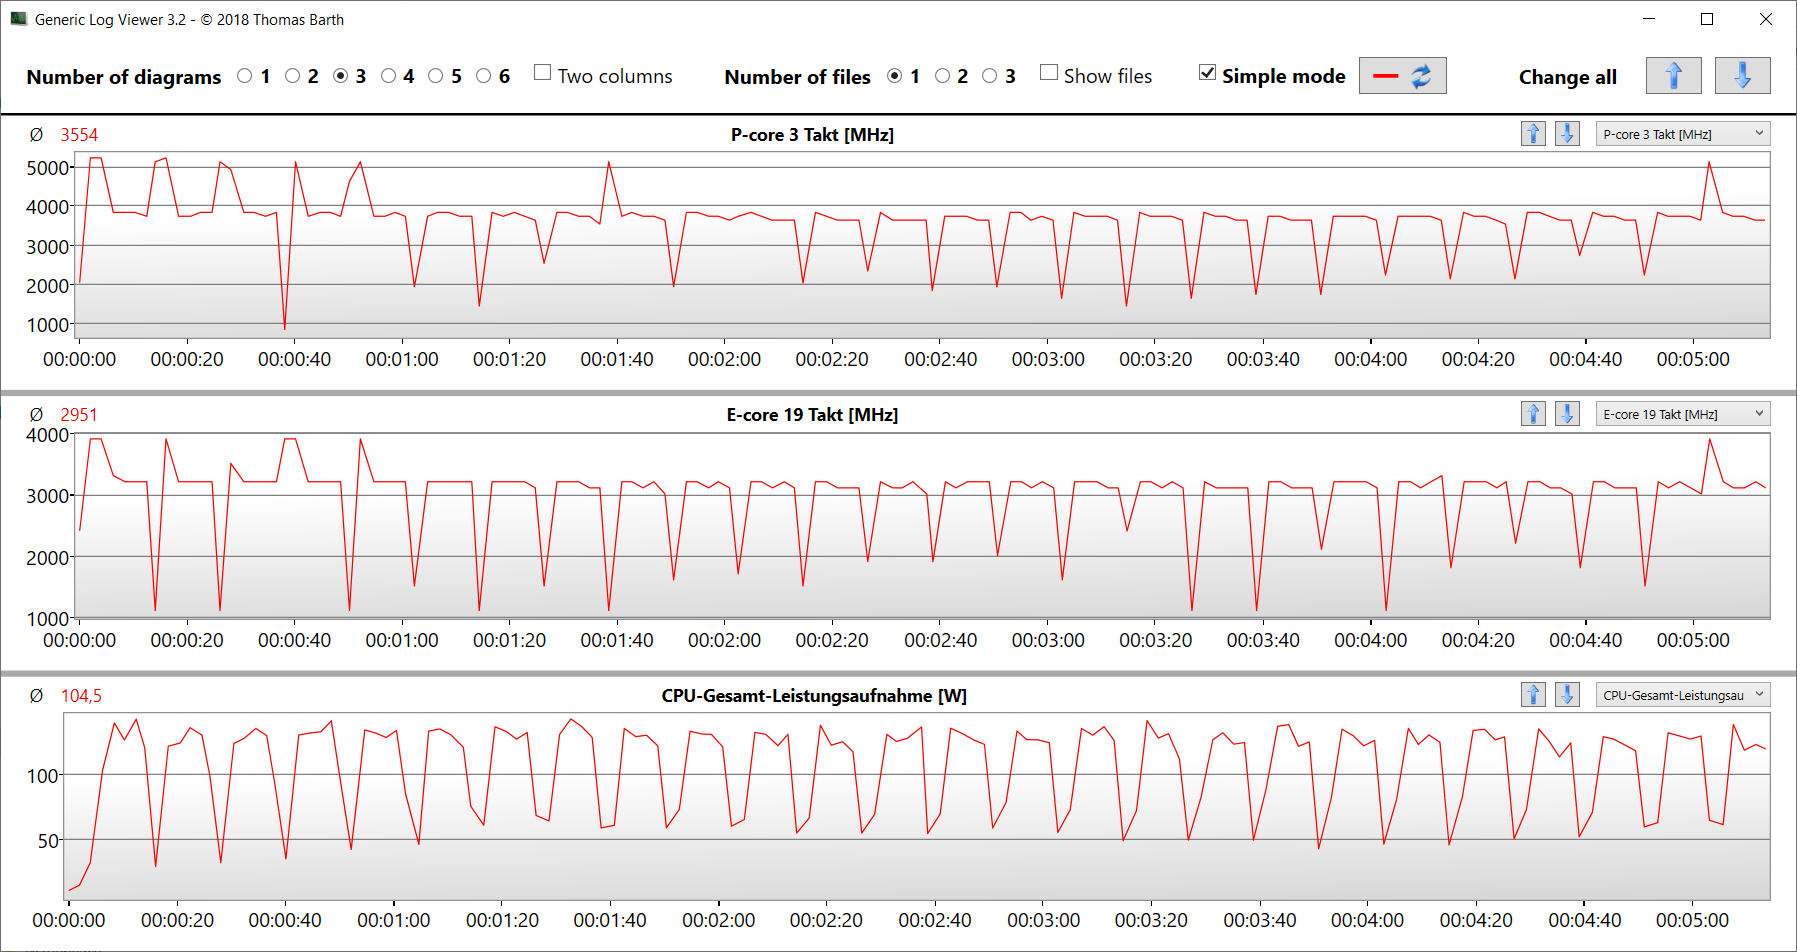
O teste de loop do CB15 revela que um clock turbo alto é mantido de forma consistente sob carga de vários threads na operação de rede elétrica. A taxa de clock cai apenas minimamente no decorrer do teste.
Cinebench R15 Multi Sustained Load
| CPU Performance rating - Percent | |
| Asus ROG Strix G17 G713PI | |
| Média Intel Core i9-13900HX | |
| Medion Erazer Major X20 | |
| Média da turma Gaming | |
| Aorus 15X ASF | |
| Razer Blade 15 OLED (Early 2022) | |
* ... menor é melhor
AIDA64: FP32 Ray-Trace | FPU Julia | CPU SHA3 | CPU Queen | FPU SinJulia | FPU Mandel | CPU AES | CPU ZLib | FP64 Ray-Trace | CPU PhotoWorxx
| Performance rating | |
| Asus ROG Strix G17 G713PI | |
| Média da turma Gaming | |
| Média Intel Core i9-13900HX | |
| Medion Erazer Major X20 | |
| Aorus 15X ASF | |
| Razer Blade 15 OLED (Early 2022) | |
| AIDA64 / FP32 Ray-Trace | |
| Asus ROG Strix G17 G713PI | |
| Média da turma Gaming (10227 - 85542, n=102, últimos 2 anos) | |
| Medion Erazer Major X20 | |
| Média Intel Core i9-13900HX (17589 - 27615, n=22) | |
| Aorus 15X ASF | |
| Razer Blade 15 OLED (Early 2022) | |
| AIDA64 / FPU Julia | |
| Asus ROG Strix G17 G713PI | |
| Média da turma Gaming (51376 - 372155, n=102, últimos 2 anos) | |
| Medion Erazer Major X20 | |
| Média Intel Core i9-13900HX (88686 - 137015, n=22) | |
| Aorus 15X ASF | |
| Razer Blade 15 OLED (Early 2022) | |
| AIDA64 / CPU SHA3 | |
| Asus ROG Strix G17 G713PI | |
| Média da turma Gaming (2180 - 10115, n=102, últimos 2 anos) | |
| Medion Erazer Major X20 | |
| Média Intel Core i9-13900HX (4362 - 7029, n=22) | |
| Aorus 15X ASF | |
| Razer Blade 15 OLED (Early 2022) | |
| AIDA64 / CPU Queen | |
| Asus ROG Strix G17 G713PI | |
| Medion Erazer Major X20 | |
| Média Intel Core i9-13900HX (125644 - 141385, n=22) | |
| Média da turma Gaming (49785 - 173351, n=86, últimos 2 anos) | |
| Aorus 15X ASF | |
| Razer Blade 15 OLED (Early 2022) | |
| AIDA64 / FPU SinJulia | |
| Asus ROG Strix G17 G713PI | |
| Medion Erazer Major X20 | |
| Média da turma Gaming (4424 - 33636, n=102, últimos 2 anos) | |
| Média Intel Core i9-13900HX (12334 - 17179, n=22) | |
| Aorus 15X ASF | |
| Razer Blade 15 OLED (Early 2022) | |
| AIDA64 / FPU Mandel | |
| Asus ROG Strix G17 G713PI | |
| Média da turma Gaming (25115 - 196829, n=102, últimos 2 anos) | |
| Medion Erazer Major X20 | |
| Média Intel Core i9-13900HX (43850 - 69202, n=22) | |
| Aorus 15X ASF | |
| Razer Blade 15 OLED (Early 2022) | |
| AIDA64 / CPU AES | |
| Asus ROG Strix G17 G713PI | |
| Aorus 15X ASF | |
| Média Intel Core i9-13900HX (89413 - 237881, n=22) | |
| Medion Erazer Major X20 | |
| Média da turma Gaming (39258 - 247074, n=102, últimos 2 anos) | |
| Razer Blade 15 OLED (Early 2022) | |
| AIDA64 / CPU ZLib | |
| Asus ROG Strix G17 G713PI | |
| Medion Erazer Major X20 | |
| Média Intel Core i9-13900HX (1284 - 1958, n=22) | |
| Média da turma Gaming (574 - 2531, n=102, últimos 2 anos) | |
| Aorus 15X ASF | |
| Razer Blade 15 OLED (Early 2022) | |
| AIDA64 / FP64 Ray-Trace | |
| Asus ROG Strix G17 G713PI | |
| Média da turma Gaming (5509 - 45446, n=102, últimos 2 anos) | |
| Medion Erazer Major X20 | |
| Média Intel Core i9-13900HX (9481 - 15279, n=22) | |
| Aorus 15X ASF | |
| Razer Blade 15 OLED (Early 2022) | |
| AIDA64 / CPU PhotoWorxx | |
| Média Intel Core i9-13900HX (42994 - 51994, n=22) | |
| Média da turma Gaming (12271 - 89891, n=102, últimos 2 anos) | |
| Medion Erazer Major X20 | |
| Aorus 15X ASF | |
| Razer Blade 15 OLED (Early 2022) | |
| Razer Blade 15 OLED (Early 2022) | |
| Asus ROG Strix G17 G713PI | |
Desempenho do sistema
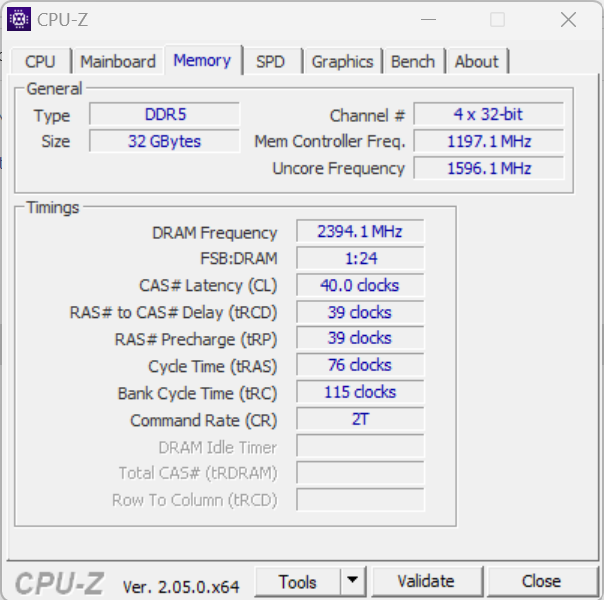
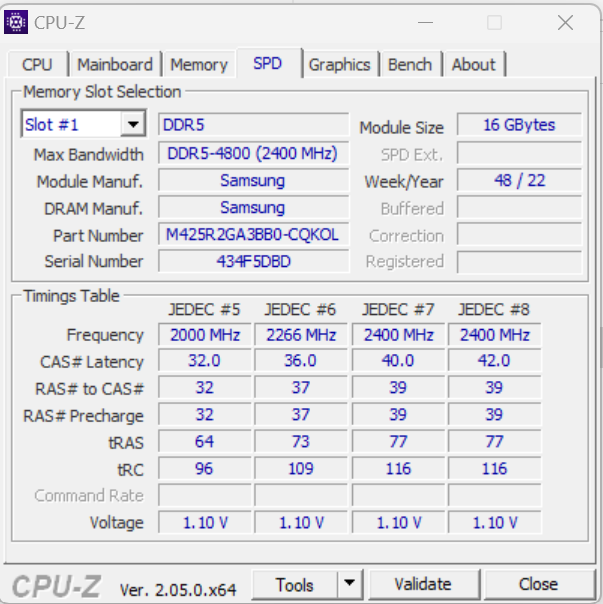
O sistema de funcionamento suave não carece de potência de computação. O laptop lida com jogos, renderização e edição de vídeo sem problemas, conforme confirmado pelos bons resultados do PCMark. As taxas de transferência da RAM estão em um nível normal para a memória DDR5-4800.
CrossMark: Overall | Productivity | Creativity | Responsiveness
| PCMark 10 / Score | |
| Média da turma Gaming (5828 - 12414, n=93, últimos 2 anos) | |
| Medion Erazer Major X20 | |
| Média Intel Core i9-13900HX, NVIDIA GeForce RTX 4070 Laptop GPU (6956 - 8153, n=3) | |
| Asus ROG Strix G17 G713PI | |
| Razer Blade 15 OLED (Early 2022) | |
| Aorus 15X ASF | |
| PCMark 10 / Essentials | |
| Medion Erazer Major X20 | |
| Asus ROG Strix G17 G713PI | |
| Média Intel Core i9-13900HX, NVIDIA GeForce RTX 4070 Laptop GPU (9865 - 11653, n=3) | |
| Aorus 15X ASF | |
| Média da turma Gaming (8810 - 11935, n=97, últimos 2 anos) | |
| Razer Blade 15 OLED (Early 2022) | |
| PCMark 10 / Productivity | |
| Média da turma Gaming (6845 - 25323, n=95, últimos 2 anos) | |
| Asus ROG Strix G17 G713PI | |
| Razer Blade 15 OLED (Early 2022) | |
| Medion Erazer Major X20 | |
| Média Intel Core i9-13900HX, NVIDIA GeForce RTX 4070 Laptop GPU (9470 - 9850, n=3) | |
| Aorus 15X ASF | |
| PCMark 10 / Digital Content Creation | |
| Média da turma Gaming (7602 - 19954, n=95, últimos 2 anos) | |
| Média Intel Core i9-13900HX, NVIDIA GeForce RTX 4070 Laptop GPU (9776 - 13370, n=3) | |
| Razer Blade 15 OLED (Early 2022) | |
| Medion Erazer Major X20 | |
| Aorus 15X ASF | |
| Asus ROG Strix G17 G713PI | |
| CrossMark / Overall | |
| Aorus 15X ASF | |
| Asus ROG Strix G17 G713PI | |
| Média da turma Gaming (1366 - 2409, n=94, últimos 2 anos) | |
| Média Intel Core i9-13900HX, NVIDIA GeForce RTX 4070 Laptop GPU (1842 - 2029, n=3) | |
| Medion Erazer Major X20 | |
| Razer Blade 15 OLED (Early 2022) | |
| CrossMark / Productivity | |
| Aorus 15X ASF | |
| Asus ROG Strix G17 G713PI | |
| Média da turma Gaming (1386 - 2254, n=94, últimos 2 anos) | |
| Média Intel Core i9-13900HX, NVIDIA GeForce RTX 4070 Laptop GPU (1700 - 1872, n=3) | |
| Medion Erazer Major X20 | |
| Razer Blade 15 OLED (Early 2022) | |
| CrossMark / Creativity | |
| Asus ROG Strix G17 G713PI | |
| Média da turma Gaming (1343 - 2786, n=94, últimos 2 anos) | |
| Média Intel Core i9-13900HX, NVIDIA GeForce RTX 4070 Laptop GPU (2088 - 2316, n=3) | |
| Aorus 15X ASF | |
| Medion Erazer Major X20 | |
| Razer Blade 15 OLED (Early 2022) | |
| CrossMark / Responsiveness | |
| Aorus 15X ASF | |
| Média da turma Gaming (1226 - 2334, n=94, últimos 2 anos) | |
| Asus ROG Strix G17 G713PI | |
| Média Intel Core i9-13900HX, NVIDIA GeForce RTX 4070 Laptop GPU (1557 - 1752, n=3) | |
| Medion Erazer Major X20 | |
| Razer Blade 15 OLED (Early 2022) | |
| PCMark 8 Home Score Accelerated v2 | 4889 pontos | |
| PCMark 8 Work Score Accelerated v2 | 6067 pontos | |
| PCMark 10 Score | 7575 pontos | |
Ajuda | ||
| AIDA64 / Memory Copy | |
| Média Intel Core i9-13900HX (67716 - 79193, n=22) | |
| Média da turma Gaming (21750 - 129946, n=102, últimos 2 anos) | |
| Medion Erazer Major X20 | |
| Aorus 15X ASF | |
| Razer Blade 15 OLED (Early 2022) | |
| Asus ROG Strix G17 G713PI | |
| AIDA64 / Memory Read | |
| Média Intel Core i9-13900HX (73998 - 88462, n=22) | |
| Média da turma Gaming (22956 - 118858, n=102, últimos 2 anos) | |
| Medion Erazer Major X20 | |
| Aorus 15X ASF | |
| Razer Blade 15 OLED (Early 2022) | |
| Asus ROG Strix G17 G713PI | |
| AIDA64 / Memory Write | |
| Média da turma Gaming (22297 - 135096, n=102, últimos 2 anos) | |
| Média Intel Core i9-13900HX (65472 - 77045, n=22) | |
| Medion Erazer Major X20 | |
| Asus ROG Strix G17 G713PI | |
| Razer Blade 15 OLED (Early 2022) | |
| Aorus 15X ASF | |
| AIDA64 / Memory Latency | |
| Média da turma Gaming (75.3 - 165.4, n=102, últimos 2 anos) | |
| Razer Blade 15 OLED (Early 2022) | |
| Medion Erazer Major X20 | |
| Asus ROG Strix G17 G713PI | |
| Aorus 15X ASF | |
| Média Intel Core i9-13900HX (75.3 - 91.1, n=22) | |
* ... menor é melhor
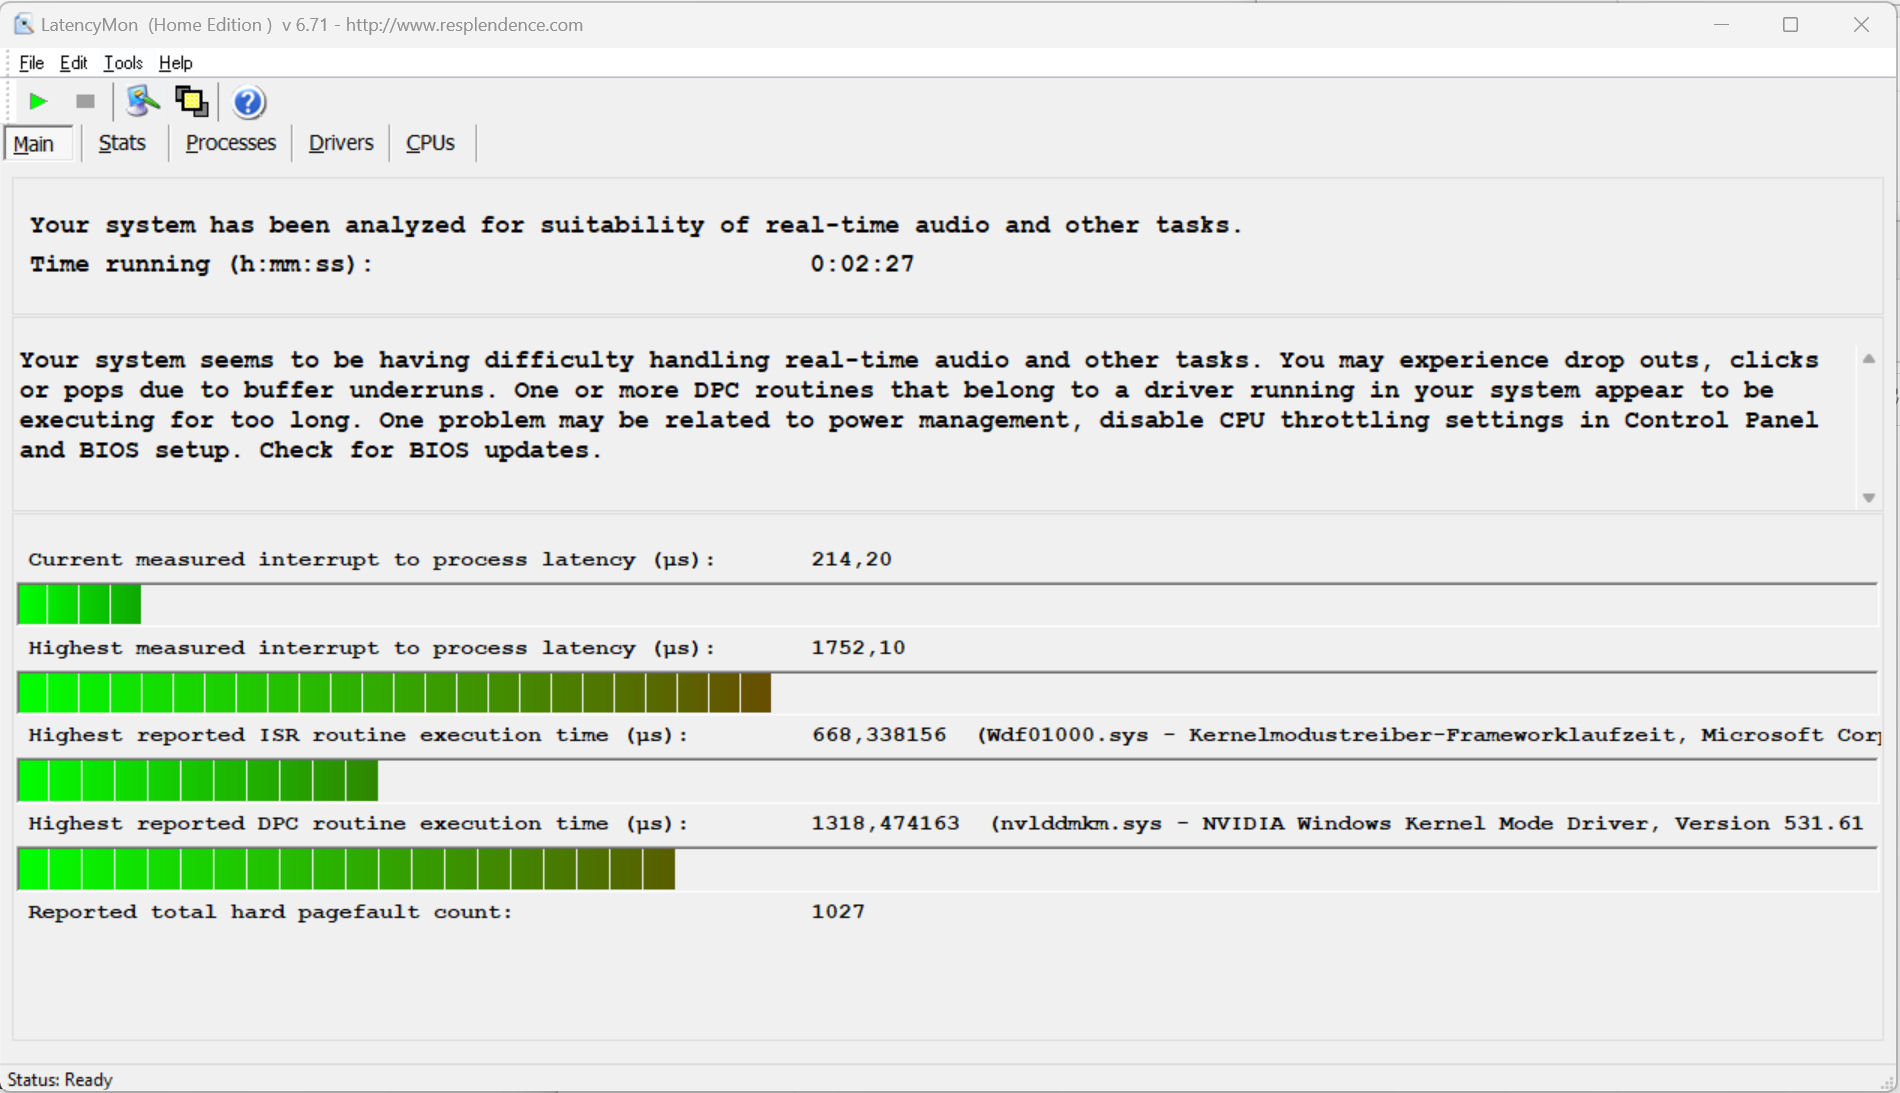
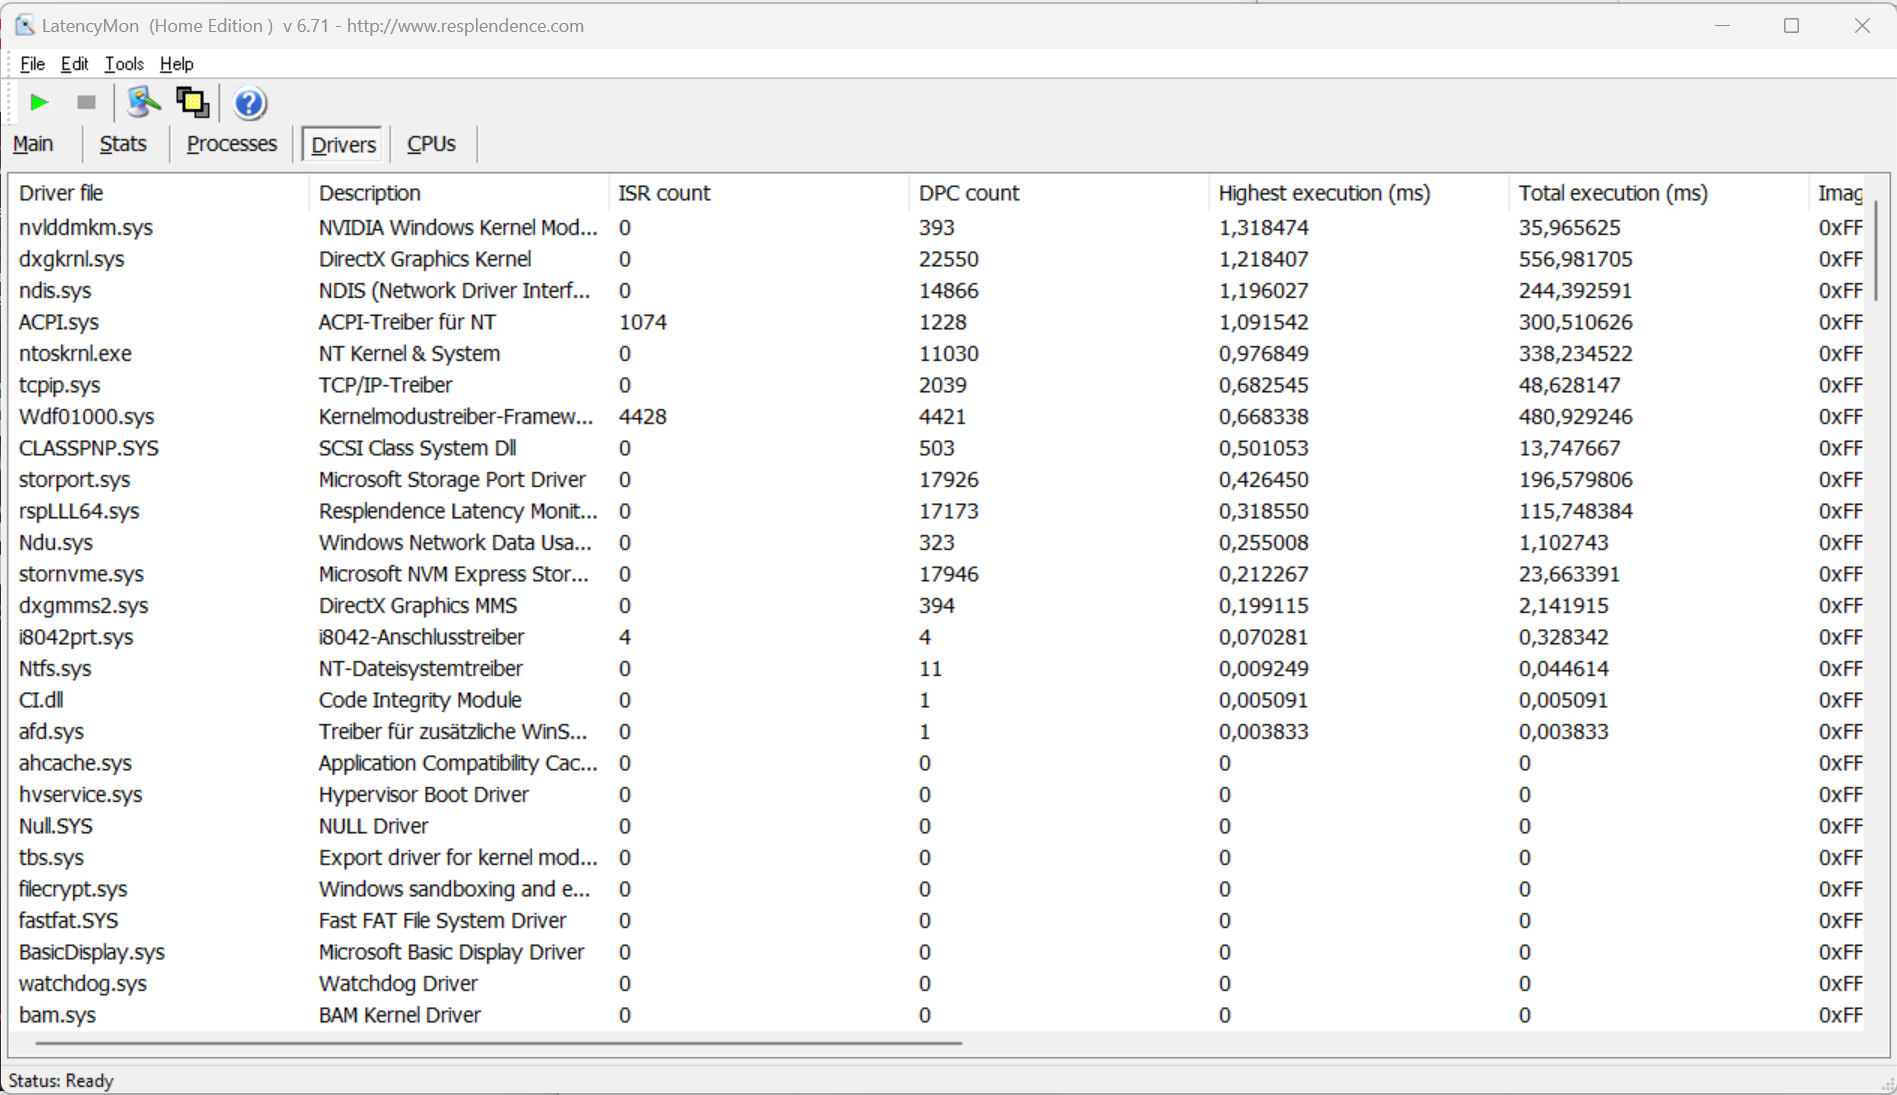
Latência DPC
O teste padronizado do monitor de latência (navegação na Web, reprodução de vídeo 4k, alta carga do Prime95) revelou anomalias. O sistema não parece ser adequado para edição de vídeo e áudio em tempo real. Futuras atualizações de software podem melhorar isso ou levar a uma deterioração ainda maior.
| DPC Latencies / LatencyMon - interrupt to process latency (max), Web, Youtube, Prime95 | |
| Aorus 15X ASF | |
| Medion Erazer Major X20 | |
| Asus ROG Strix G17 G713PI | |
| Razer Blade 15 OLED (Early 2022) | |
* ... menor é melhor
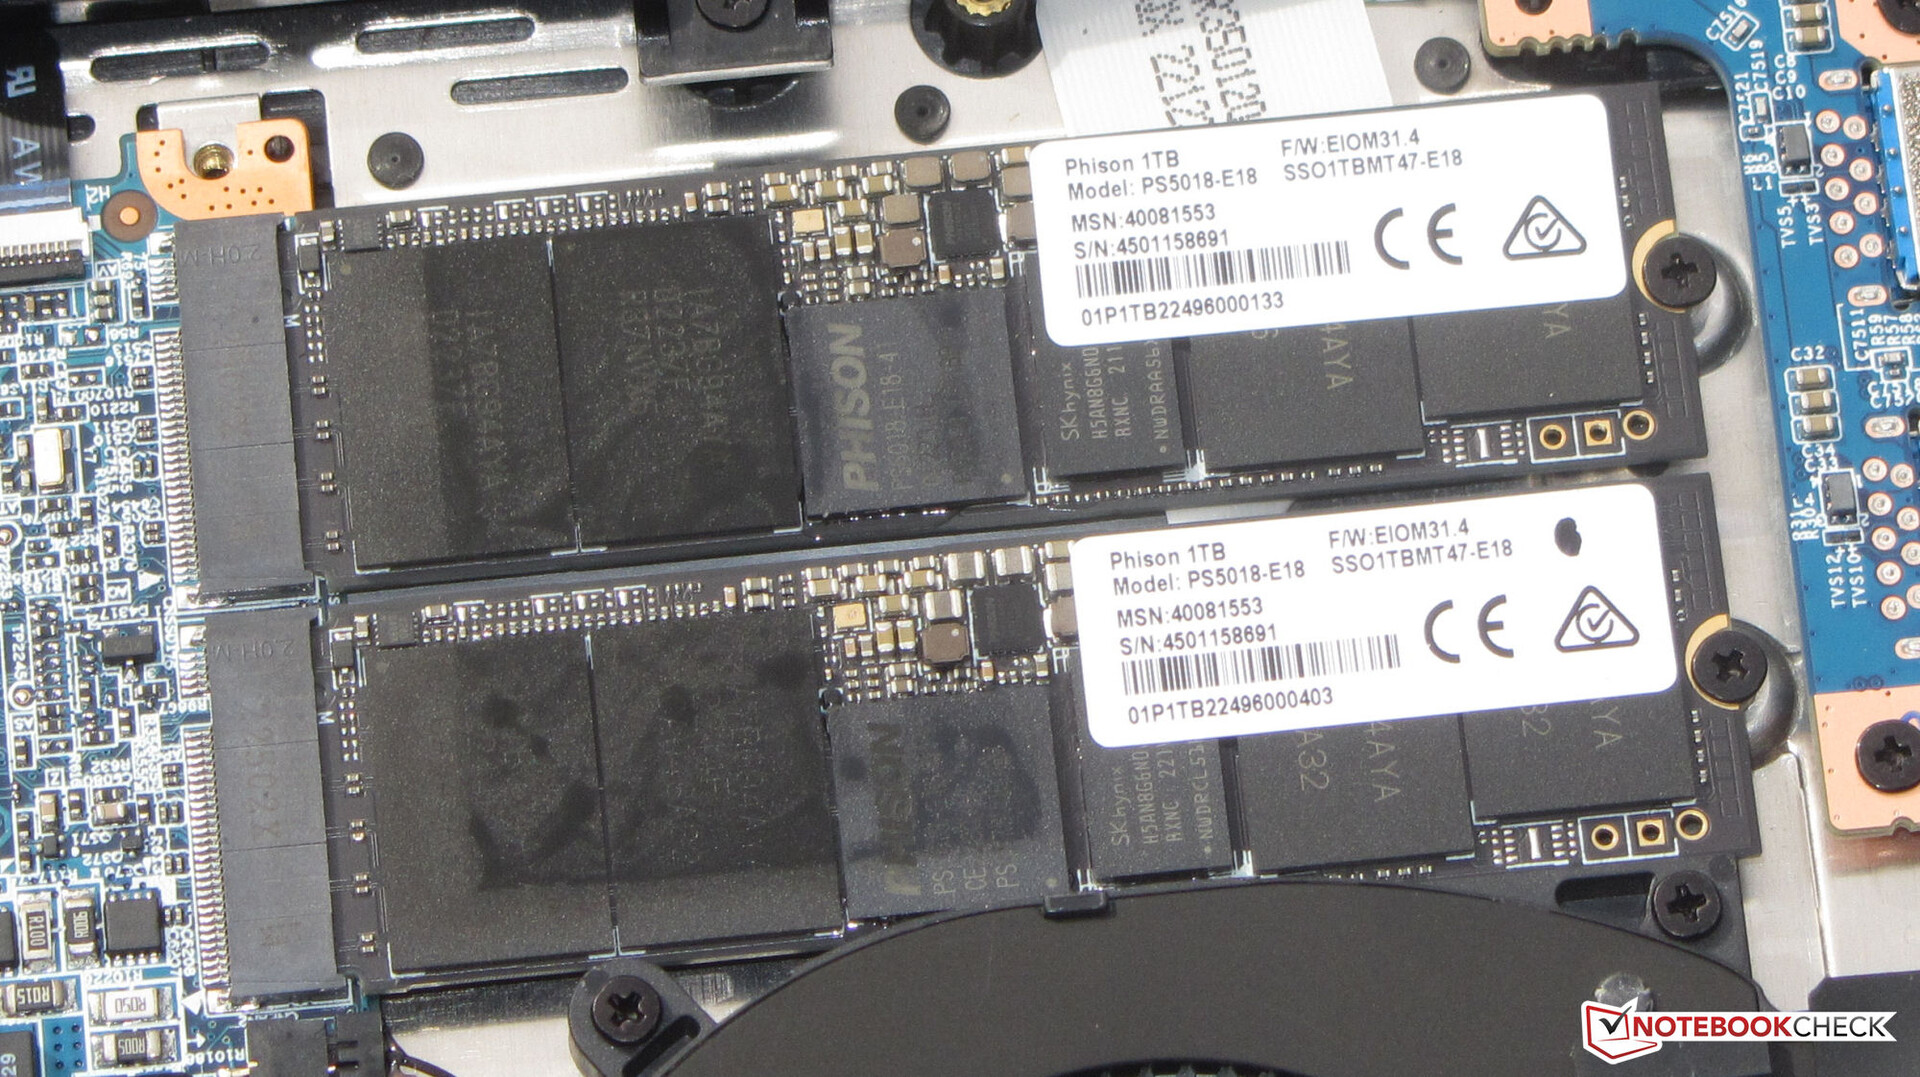
Dispositivos de armazenamento
O Erazer abriga dois SSDs de 1 TB (PCIe 4, M.2-2280) da Phison, que oferecem boas taxas de desempenho em geral. Os SSDs não formam uma matriz RAID, nem o X20 oferece suporte a RAID - um SSD serve como unidade do sistema e o outro como armazenamento de dados. Um aspecto positivo: não foi observado estrangulamento térmico.

| Drive Performance rating - Percent | |
| Aorus 15X ASF | |
| Média Phison E18-1TB-PHISON-SSD-B47R | |
| Medion Erazer Major X20 | |
| Razer Blade 15 OLED (Early 2022) | |
| Média da turma Gaming | |
| Asus ROG Strix G17 G713PI | |
* ... menor é melhor
Sustained Read Performance: DiskSpd Read Loop, Queue Depth 8
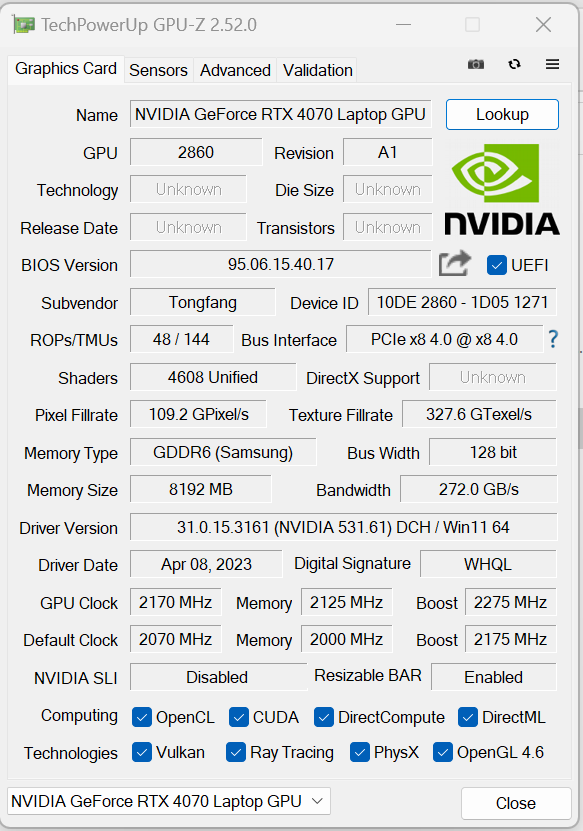
Placa gráfica
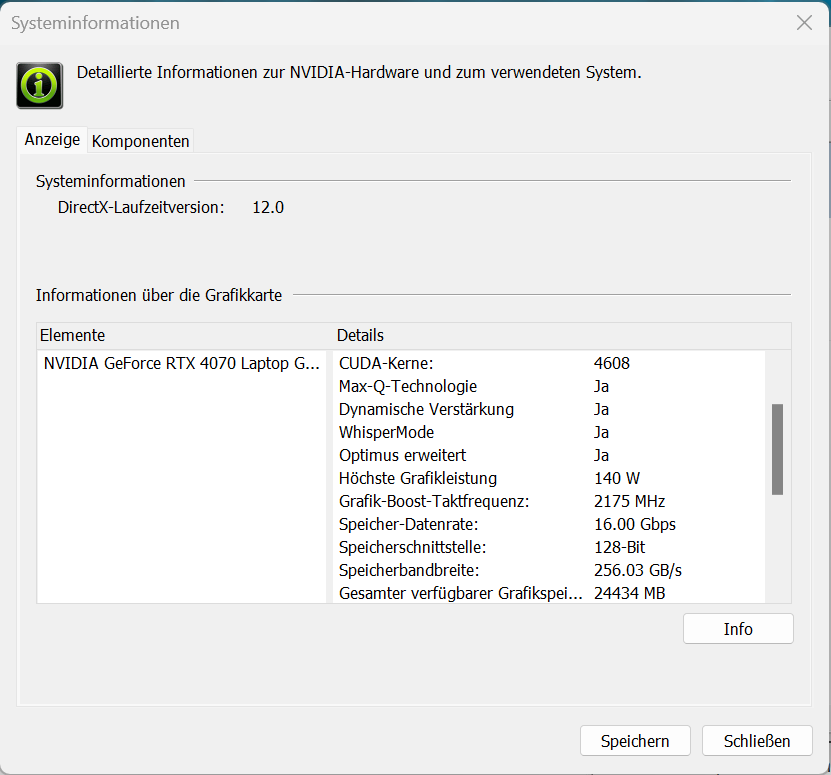
Sem (mais) experimentos: Enquanto a Medion instalava uma das então novas GPUs Arc da Intel noMajor X10o X20 vem com um laptop GeForce RTX 4070 para laptop (VRAM: 8.192 GB GDDR6) da Nvidia. Ela tem um TGP máximo possível de 140 watts (115 watts + 25 watts Dynamic Boost) à sua disposição, que não é totalmente utilizado de acordo com o teste Witcher 3.
Os resultados do benchmark estão acima da média anterior da RTX 4070 - nota-se um aumento significativo no desempenho em comparação com aArc A730M Do Major X10. O modo dGPU não traz nenhuma melhoria. A alternância entre dGPU e Optimus não requer uma reinicialização - o Optimus avançado é compatível.
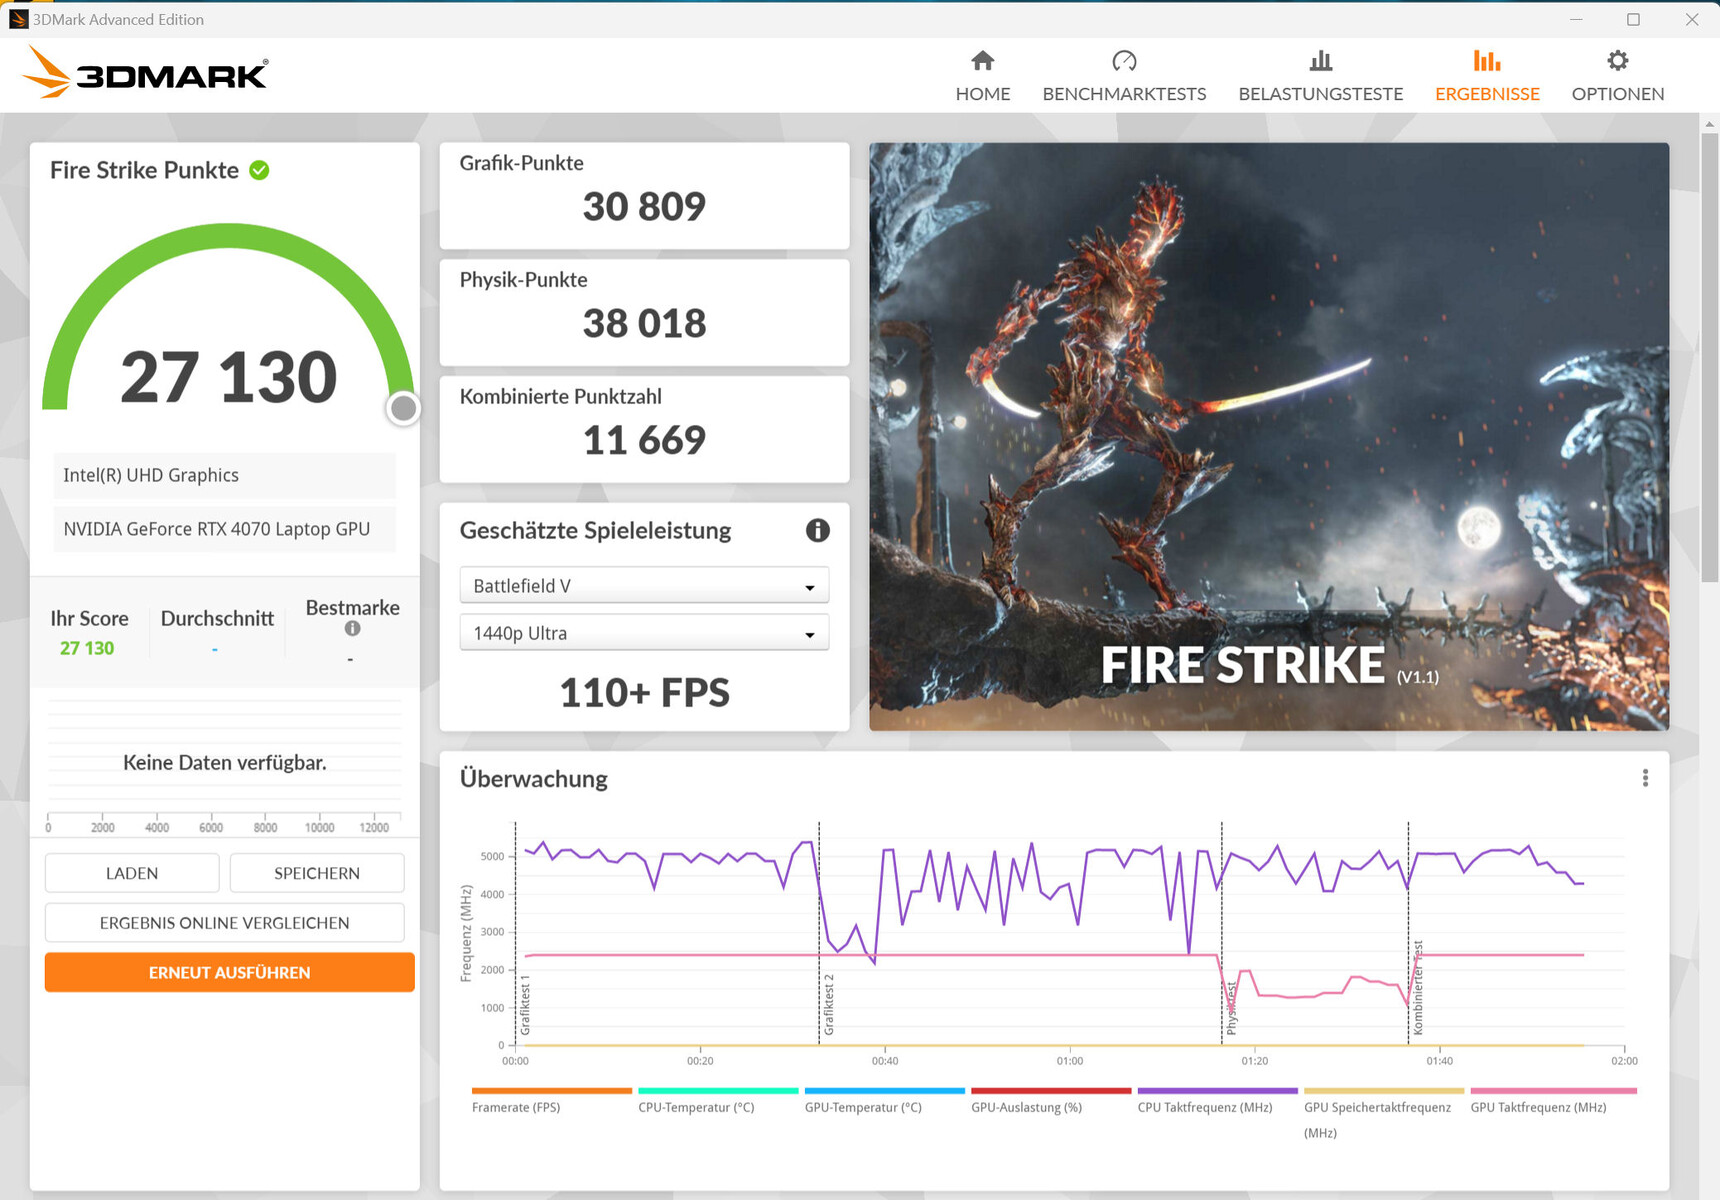

| 3DMark 06 Standard Score | 60496 pontos | |
| 3DMark 11 Performance | 35727 pontos | |
| 3DMark Cloud Gate Standard Score | 66380 pontos | |
| 3DMark Fire Strike Score | 27130 pontos | |
| 3DMark Time Spy Score | 12846 pontos | |
Ajuda | ||
* ... menor é melhor
Desempenho em jogos
O notebook permite jogos em QHD em configurações altas ou máximas. Resoluções mais altas seriam possíveis ao usar um monitor externo, possivelmente com configurações reduzidas. As taxas de quadros dos títulos testados estão acima da média determinada para a RTX 4070. O modo dGPU pode aumentar um pouco as taxas de quadros de alguns jogos.
| The Witcher 3 - 1920x1080 Ultra Graphics & Postprocessing (HBAO+) | |
| Média da turma Gaming (104.7 - 240, n=7, últimos 2 anos) | |
| Medion Erazer Major X20 | |
| Asus ROG Strix G17 G713PI | |
| Aorus 15X ASF | |
| Média NVIDIA GeForce RTX 4070 Laptop GPU (69.8 - 133.7, n=57) | |
| Razer Blade 15 OLED (Early 2022) | |
| Medion Erazer Major X10 | |
| Final Fantasy XV Benchmark - 1920x1080 High Quality | |
| Média da turma Gaming (64.2 - 215, n=91, últimos 2 anos) | |
| Medion Erazer Major X20 | |
| Aorus 15X ASF | |
| Asus ROG Strix G17 G713PI | |
| Média NVIDIA GeForce RTX 4070 Laptop GPU (41 - 131.9, n=65) | |
| Razer Blade 15 OLED (Early 2022) | |
| Medion Erazer Major X10 | |
| Dota 2 Reborn - 1920x1080 ultra (3/3) best looking | |
| Asus ROG Strix G17 G713PI | |
| Medion Erazer Major X20 | |
| Média da turma Gaming (84.8 - 252, n=104, últimos 2 anos) | |
| Aorus 15X ASF | |
| Média NVIDIA GeForce RTX 4070 Laptop GPU (89.7 - 191.2, n=67) | |
| Razer Blade 15 OLED (Early 2022) | |
| Medion Erazer Major X10 | |
Para verificar se a taxa de quadros permanece praticamente constante em um período mais longo, executamos o jogo "The Witcher 3" por cerca de 60 minutos em resolução Full HD e com as configurações de qualidade máxima. O personagem do jogo não foi movido. Não foi registrada uma queda na taxa de quadros.
Witcher 3 FPS chart
| baixo | média | alto | ultra | QHD | |
|---|---|---|---|---|---|
| GTA V (2015) | 187.3 | 187.2 | 183.8 | 128 | 72.6 |
| The Witcher 3 (2015) | 545 | 391.4 | 242.3 | 127 | |
| Dota 2 Reborn (2015) | 205 | 183.3 | 169.9 | 158.8 | |
| Final Fantasy XV Benchmark (2018) | 220 | 175.2 | 121.2 | 88.4 | |
| X-Plane 11.11 (2018) | 182.3 | 155.9 | 120.8 | ||
| Far Cry 5 (2018) | 188 | 161 | 153 | 144 | 122 |
| Strange Brigade (2018) | 490 | 310 | 244 | 208 | 131.4 |
| F1 22 (2022) | 262 | 264 | 206 | 83.9 | 53.3 |
Emissões - O laptop Erazer pode produzir muito ruído
Ruído
O X20 pode produzir muito ruído sob carga: valores de pico de até 57 dB(A) são atingidos quando o "Modo Turbo" está ativo. O ruído de fundo é algo semelhante a um som de assobio. Nenhum ruído de fundo incômodo é emitido pelos ventiladores. Um nível geral de ruído mais baixo pode ser obtido com o uso dos outros dois perfis de desempenho, às custas da potência de computação.
As emissões durante a marcha lenta e no uso diário (escritório, Internet) são agradáveis: os ventiladores operam em velocidades muito baixas e frequentemente estão ociosos - em todos os três perfis de desempenho.
| Modo Turbo (dt: Overboost) | Modo balanceado (dt: Balanced) | Modo Office (dt: Balanced) | |
|---|---|---|---|
| CPU PL1 (HWInfo) | 140 watts | 140 watts | 140 watts |
| CPU PL2 (HWInfo) | 140 watts | 140 watts | 140 watts |
| Ruído (Witcher 3 ) | 50-53 dB(A) | 48-51 dB(A) | 36-43 dB(A) later 32-34 dB(A) |
| Desempenho (Witcher 3 ) | 124 fps | 118 fps | 114-118 fps mais tarde 30 fps Bloqueio |
Barulho
| Ocioso |
| 25 / 29 / 31 dB |
| Carga |
| 50 / 57 dB |
 | ||
30 dB silencioso 40 dB(A) audível 50 dB(A) ruidosamente alto |
||
min: | ||
| Medion Erazer Major X20 i9-13900HX, GeForce RTX 4070 Laptop GPU | Aorus 15X ASF i7-13700HX, GeForce RTX 4070 Laptop GPU | Razer Blade 15 OLED (Early 2022) i9-12900H, GeForce RTX 3070 Ti Laptop GPU | Asus ROG Strix G17 G713PI R9 7945HX, GeForce RTX 4070 Laptop GPU | |
|---|---|---|---|---|
| Noise | -5% | 7% | 5% | |
| desligado / ambiente * (dB) | 24 | 25 -4% | 26 -8% | 25 -4% |
| Idle Minimum * (dB) | 25 | 28 -12% | 28 -12% | 26 -4% |
| Idle Average * (dB) | 29 | 29 -0% | 28 3% | 29 -0% |
| Idle Maximum * (dB) | 31 | 36 -16% | 28 10% | 30 3% |
| Load Average * (dB) | 50 | 50 -0% | 38.5 23% | 46 8% |
| Witcher 3 ultra * (dB) | 53 | 54 -2% | 46 13% | |
| Load Maximum * (dB) | 57 | 58 -2% | 43.9 23% | 47 18% |
* ... menor é melhor
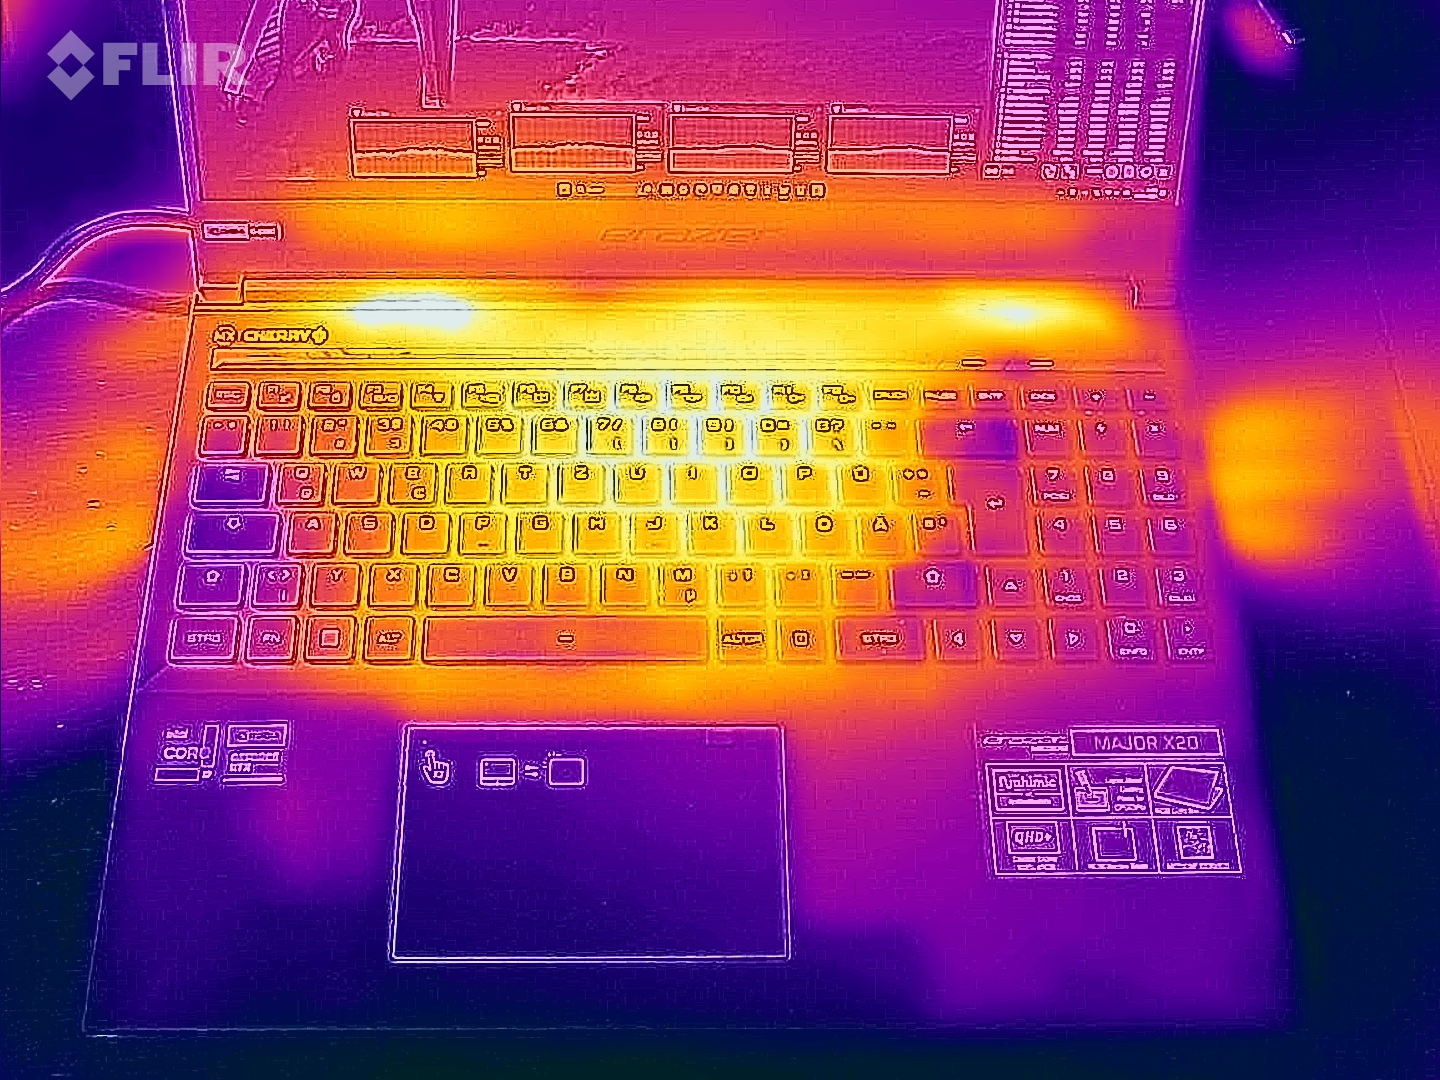
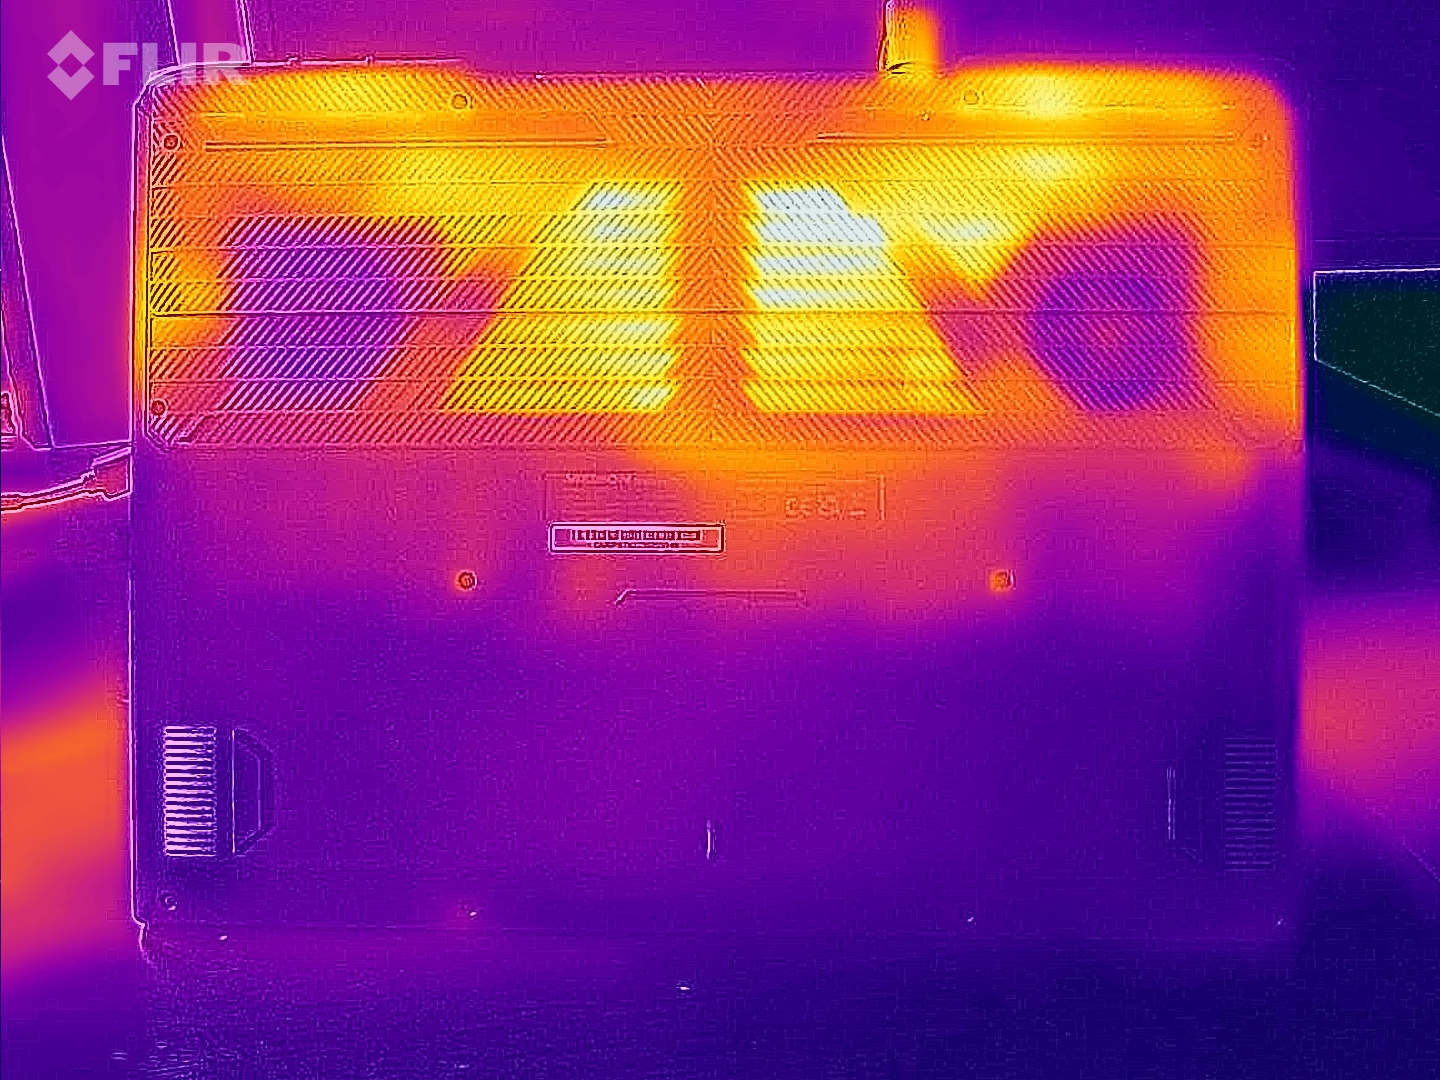
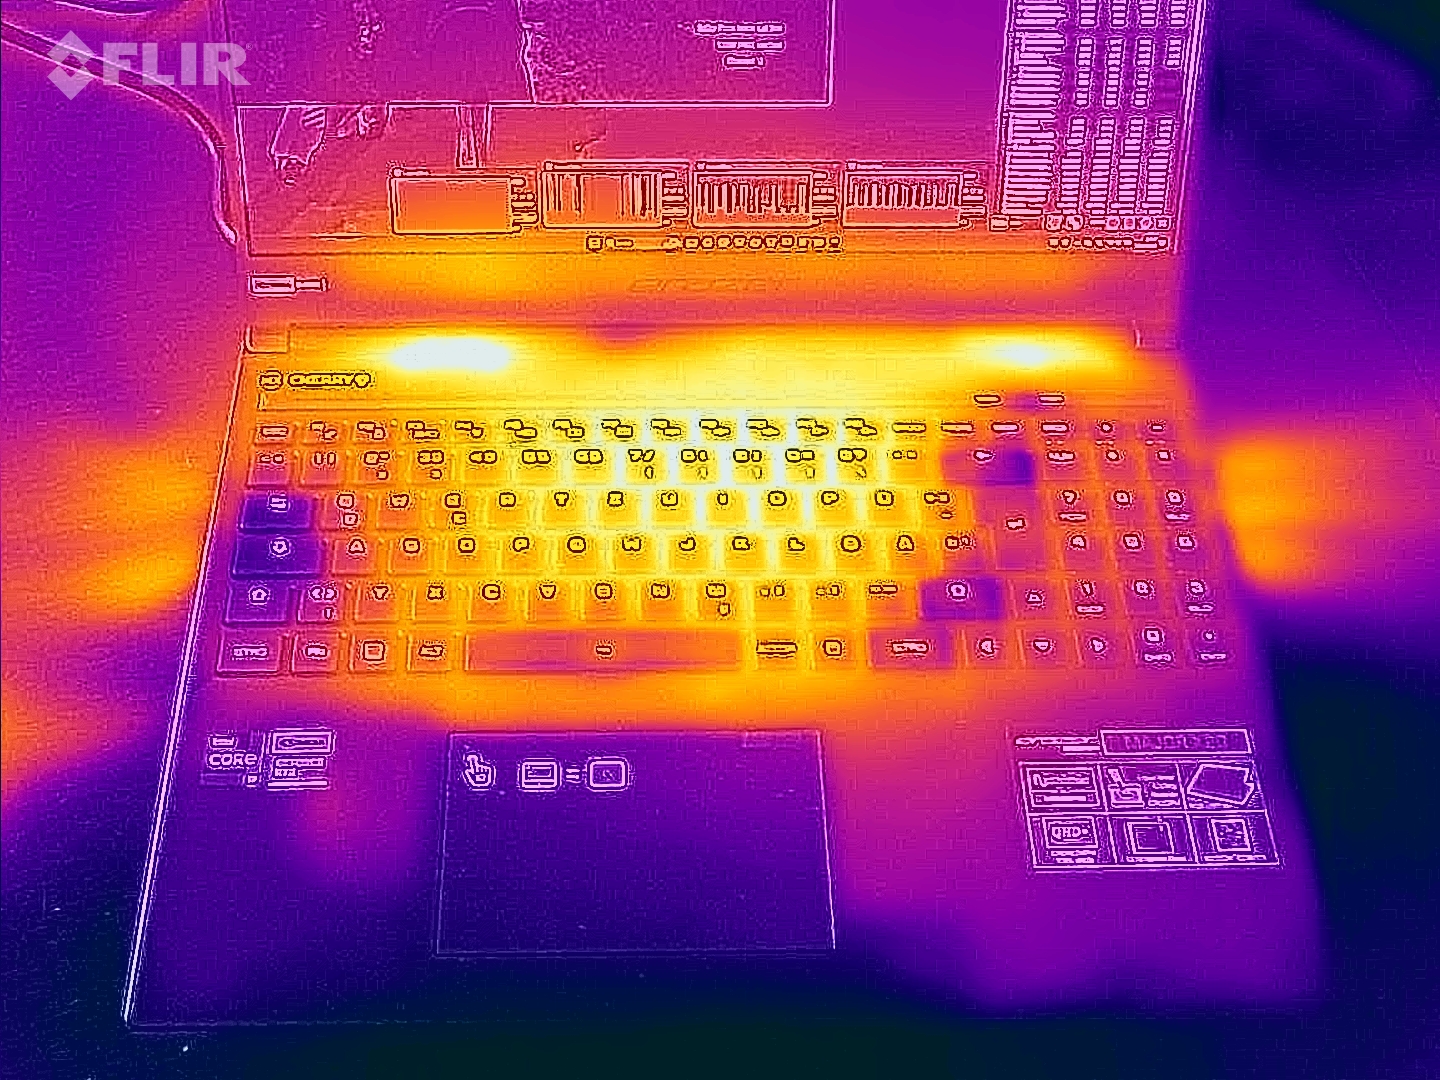
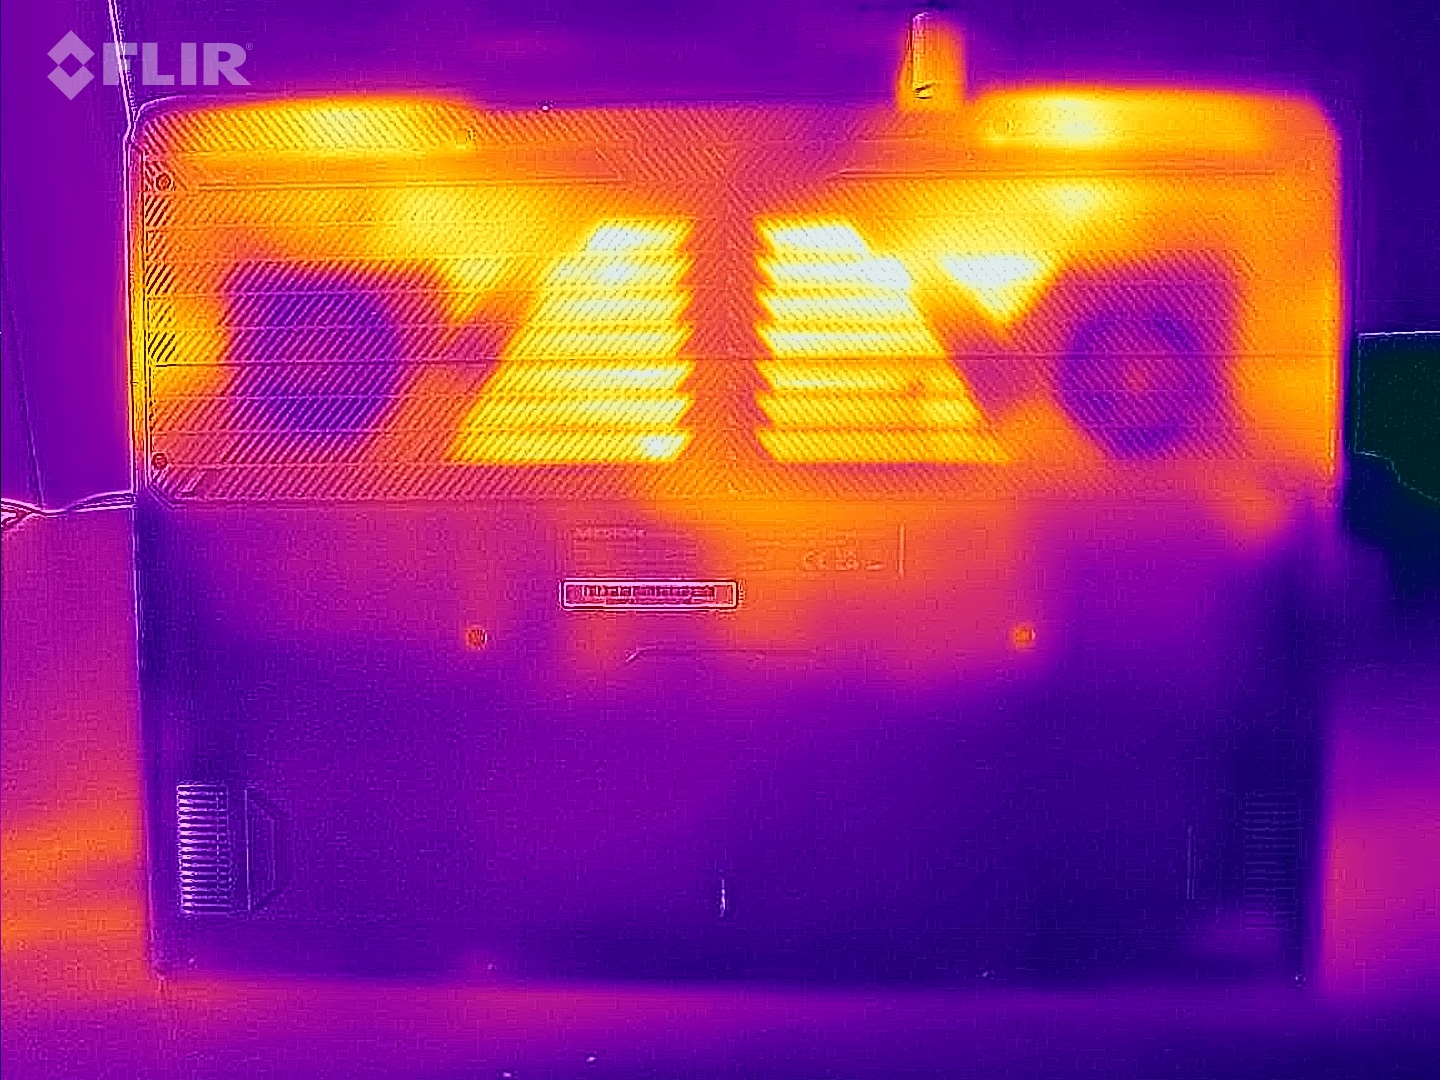
Temperatura
No uso diário (escritório, Internet), as temperaturas do notebook permanecem dentro da faixa verde. O notebook aquece visivelmente sob carga (teste de estresse, teste Witcher 3 ), mas não excessivamente. As temperaturas da CPU não são motivo de preocupação.
(-) A temperatura máxima no lado superior é 46 °C / 115 F, em comparação com a média de 40.4 °C / 105 F , variando de 21.2 a 68.8 °C para a classe Gaming.
(-) A parte inferior aquece até um máximo de 49 °C / 120 F, em comparação com a média de 43.2 °C / 110 F
(±) Em uso inativo, a temperatura média para o lado superior é 32 °C / 90 F, em comparação com a média do dispositivo de 33.9 °C / ### class_avg_f### F.
(±) Jogando The Witcher 3, a temperatura média para o lado superior é 37 °C / 99 F, em comparação com a média do dispositivo de 33.9 °C / ## #class_avg_f### F.
(+) Os apoios para as mãos e o touchpad são mais frios que a temperatura da pele, com um máximo de 31 °C / 87.8 F e, portanto, são frios ao toque.
(-) A temperatura média da área do apoio para as mãos de dispositivos semelhantes foi 28.8 °C / 83.8 F (-2.2 °C / -4 F).
| Medion Erazer Major X20 Intel Core i9-13900HX, NVIDIA GeForce RTX 4070 Laptop GPU | Aorus 15X ASF Intel Core i7-13700HX, NVIDIA GeForce RTX 4070 Laptop GPU | Razer Blade 15 OLED (Early 2022) Intel Core i9-12900H, NVIDIA GeForce RTX 3070 Ti Laptop GPU | Asus ROG Strix G17 G713PI AMD Ryzen 9 7945HX, NVIDIA GeForce RTX 4070 Laptop GPU | |
|---|---|---|---|---|
| Heat | 16% | 3% | 12% | |
| Maximum Upper Side * (°C) | 46 | 42 9% | 49.5 -8% | 42 9% |
| Maximum Bottom * (°C) | 49 | 51 -4% | 47.5 3% | 41 16% |
| Idle Upper Side * (°C) | 37 | 27 27% | 33.4 10% | 33 11% |
| Idle Bottom * (°C) | 38 | 26 32% | 35 8% | 34 11% |
* ... menor é melhor
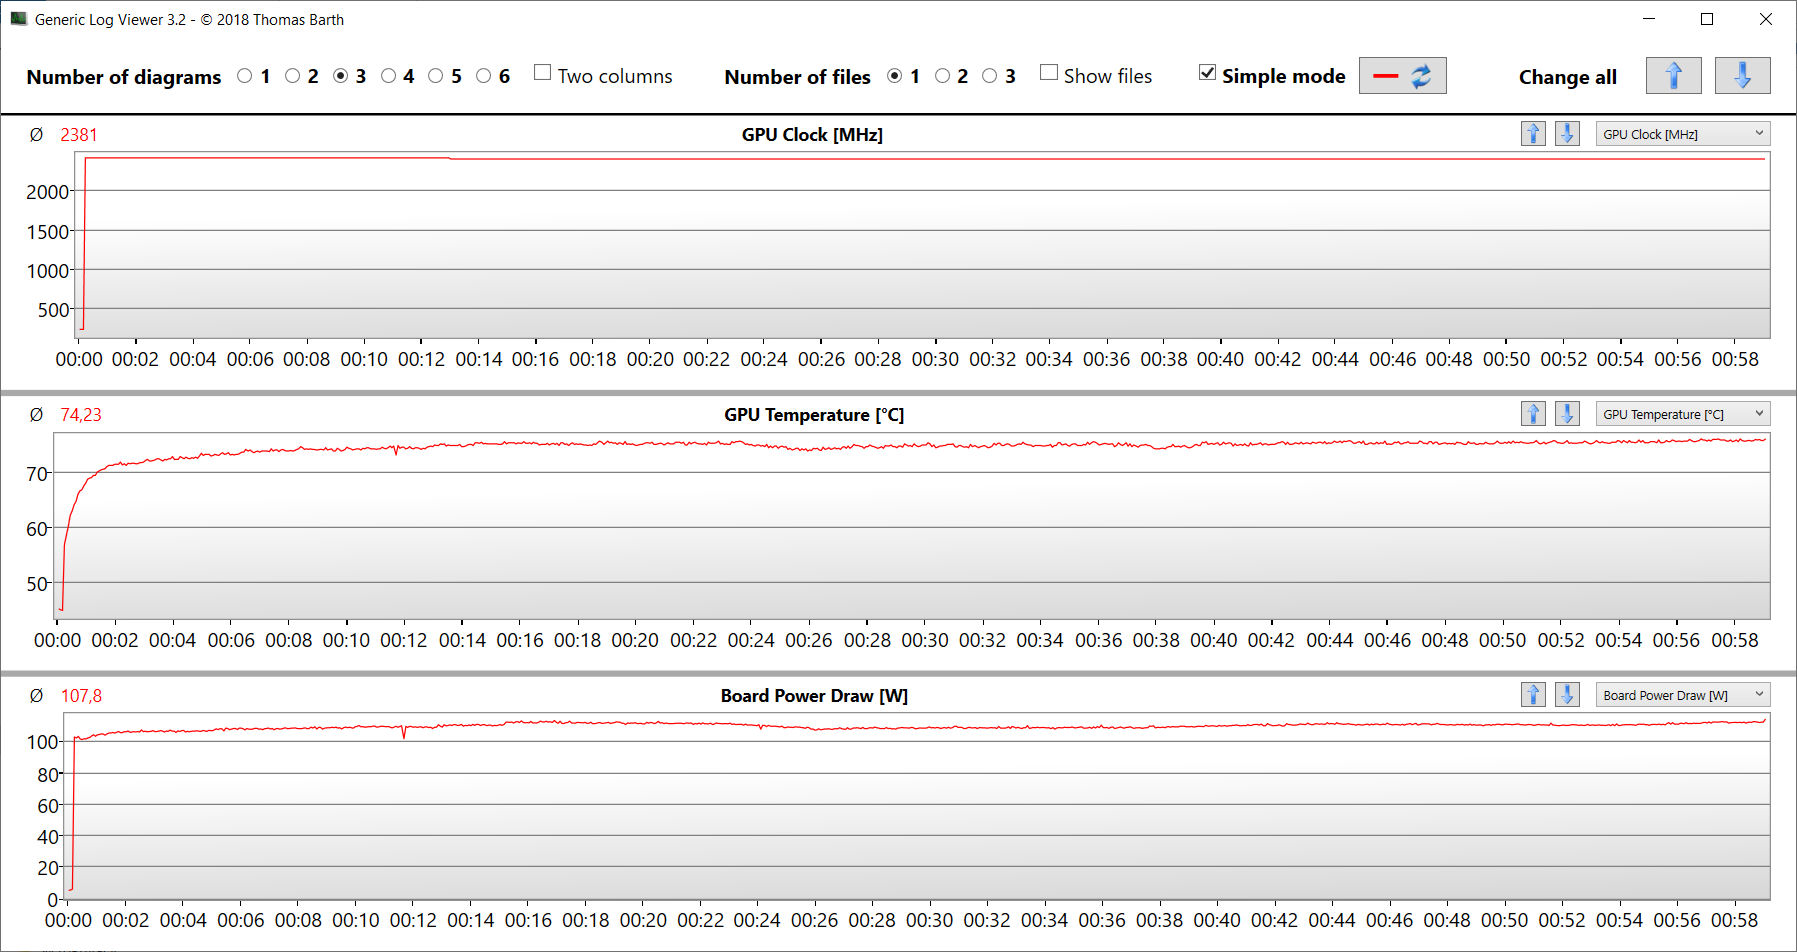
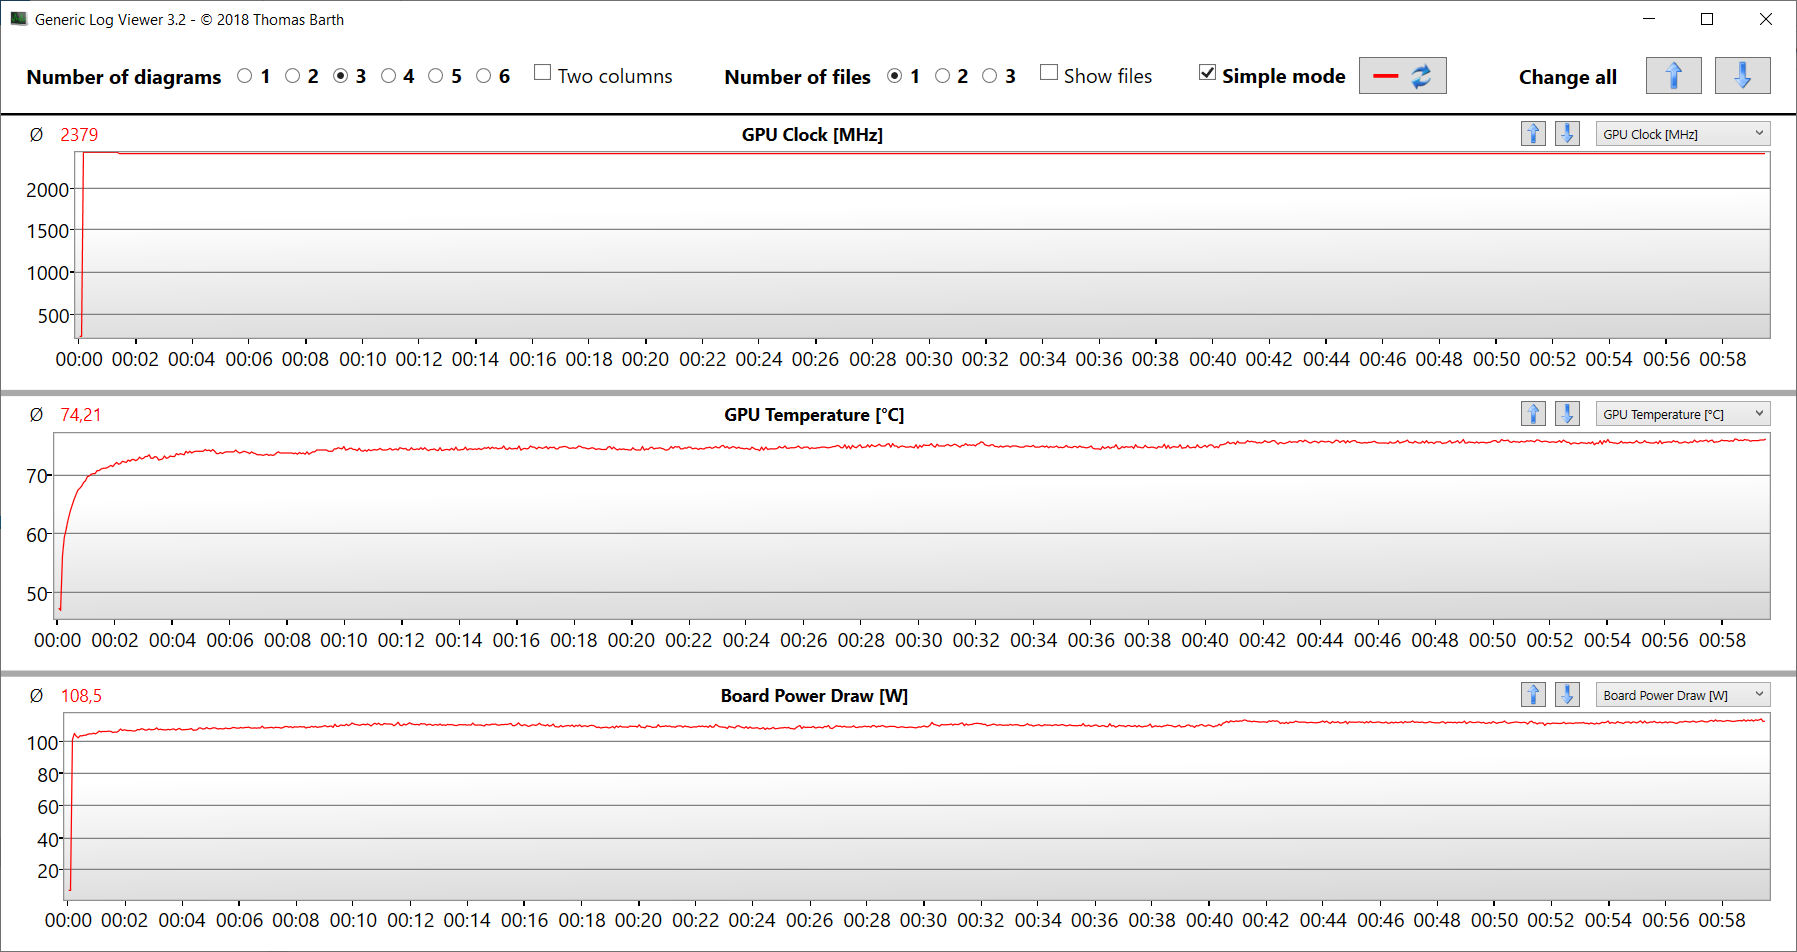
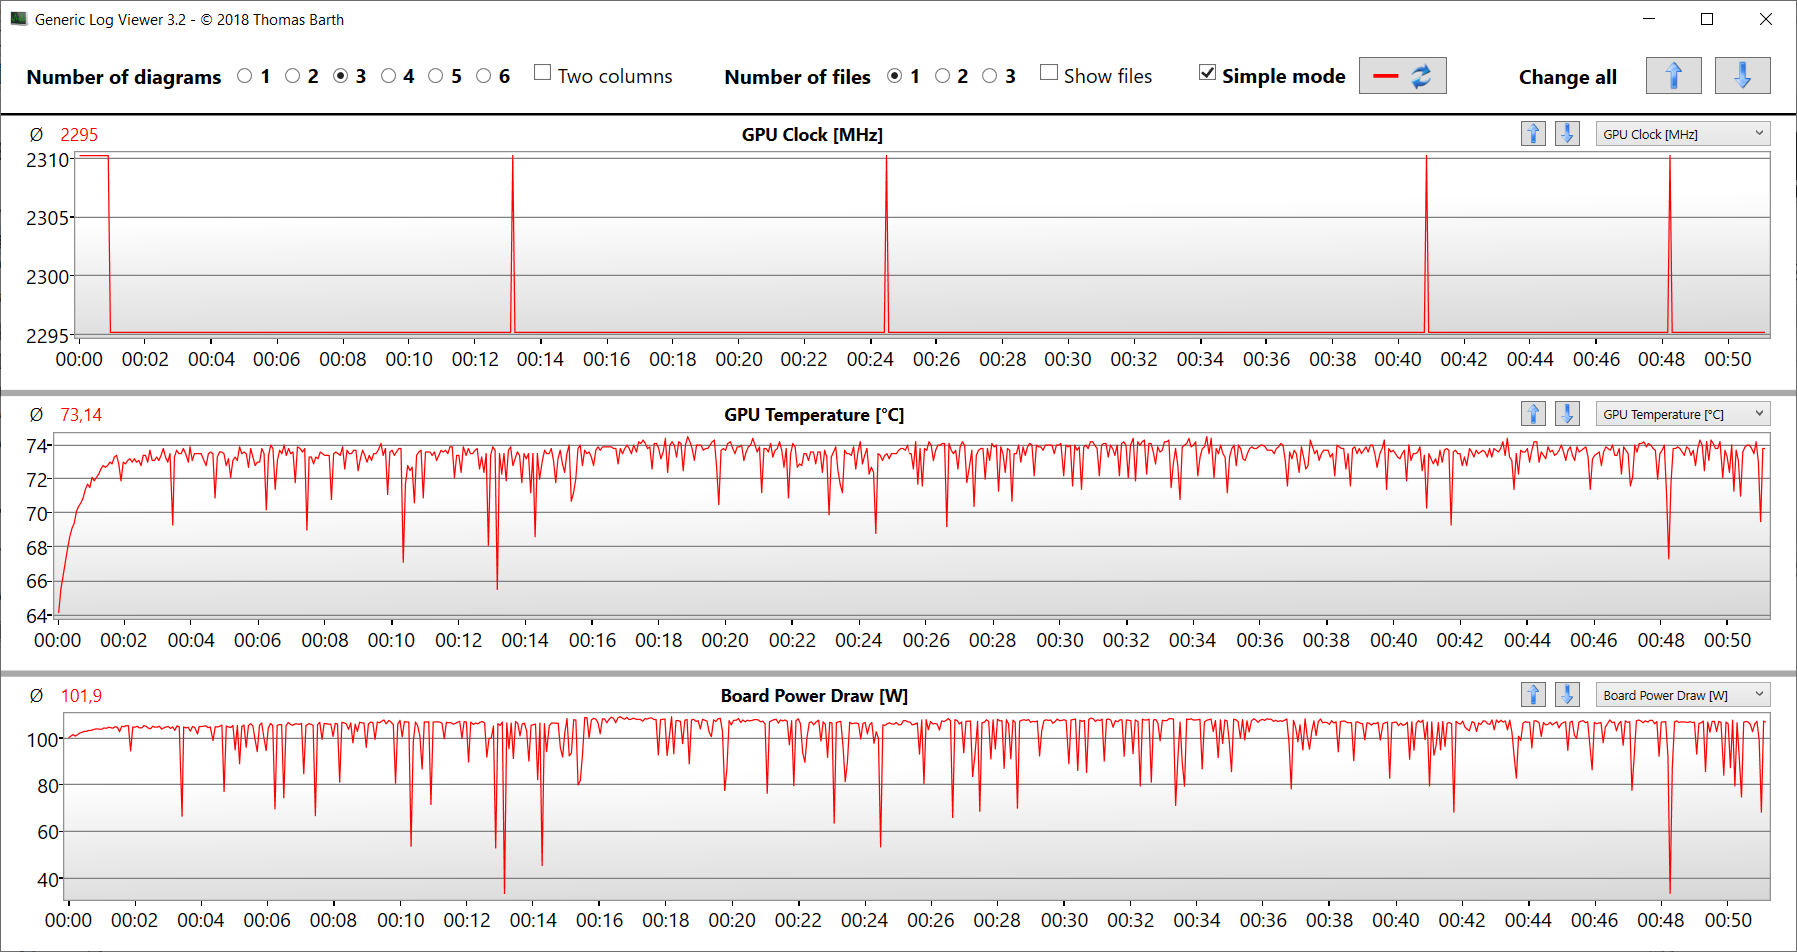
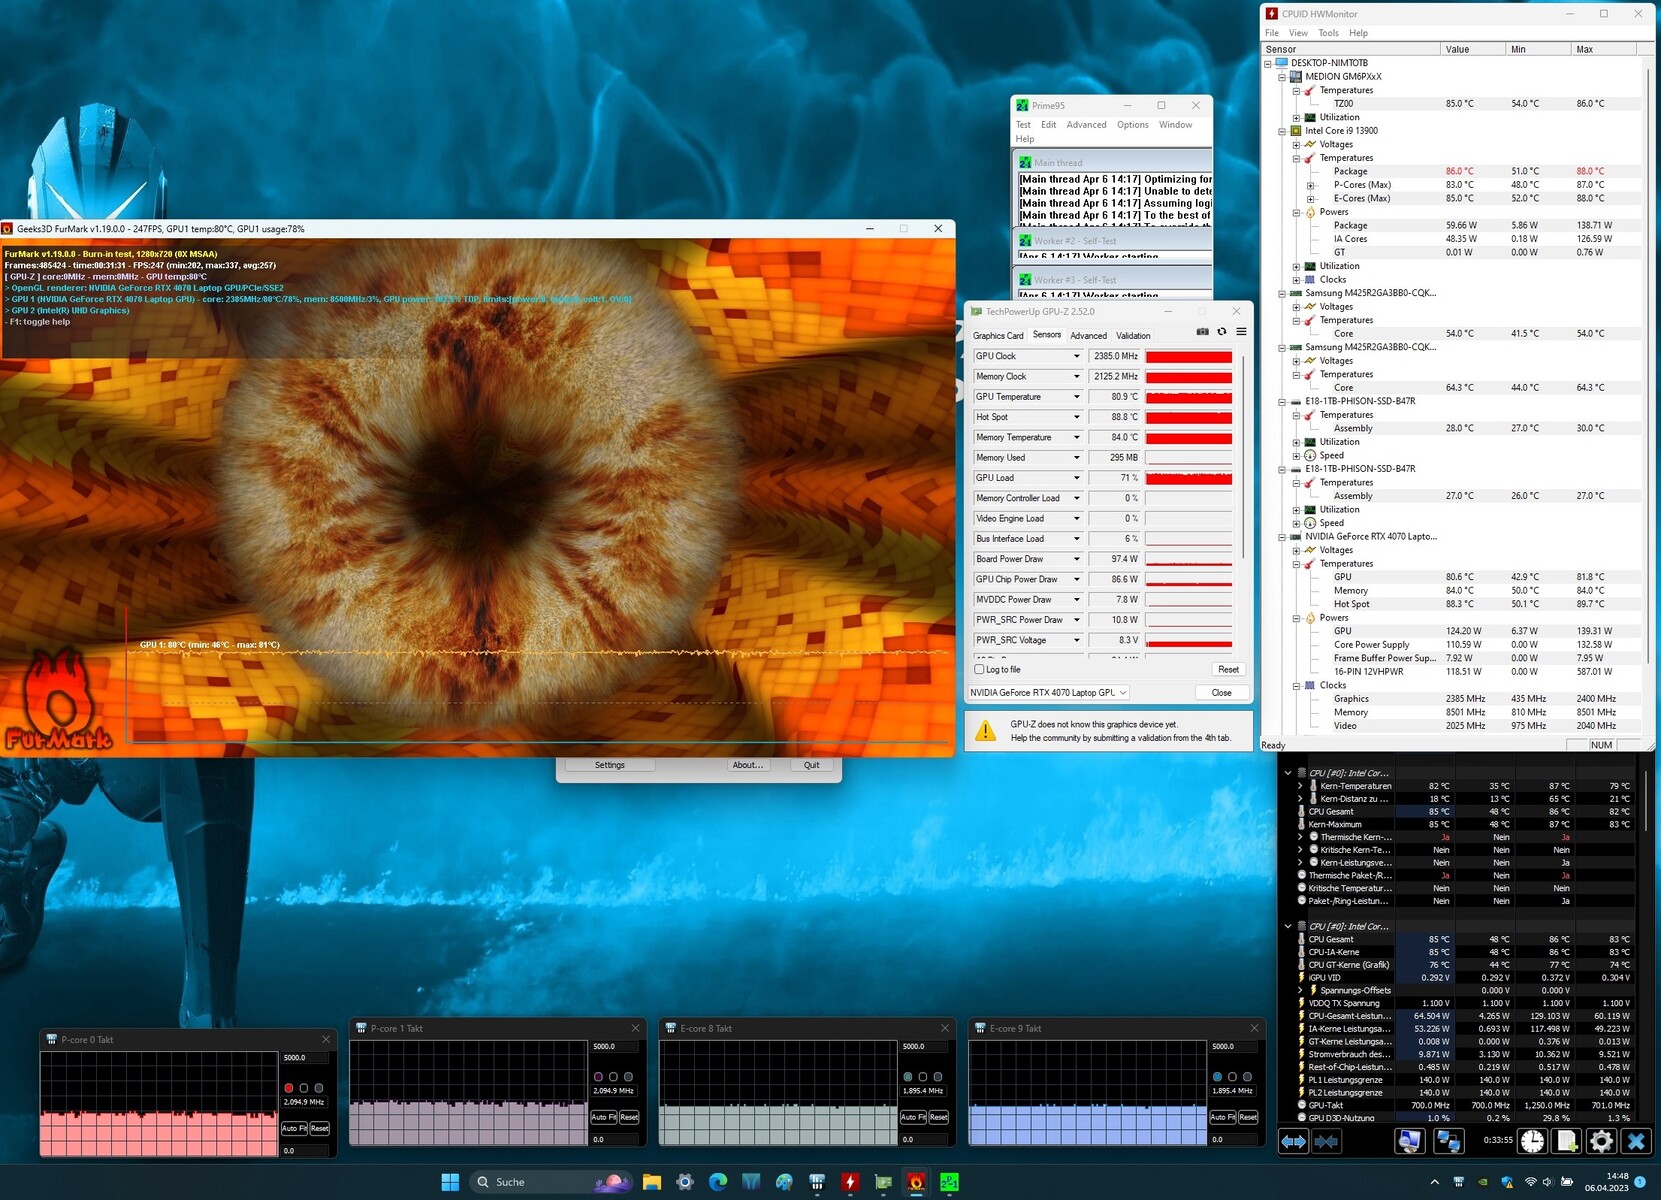
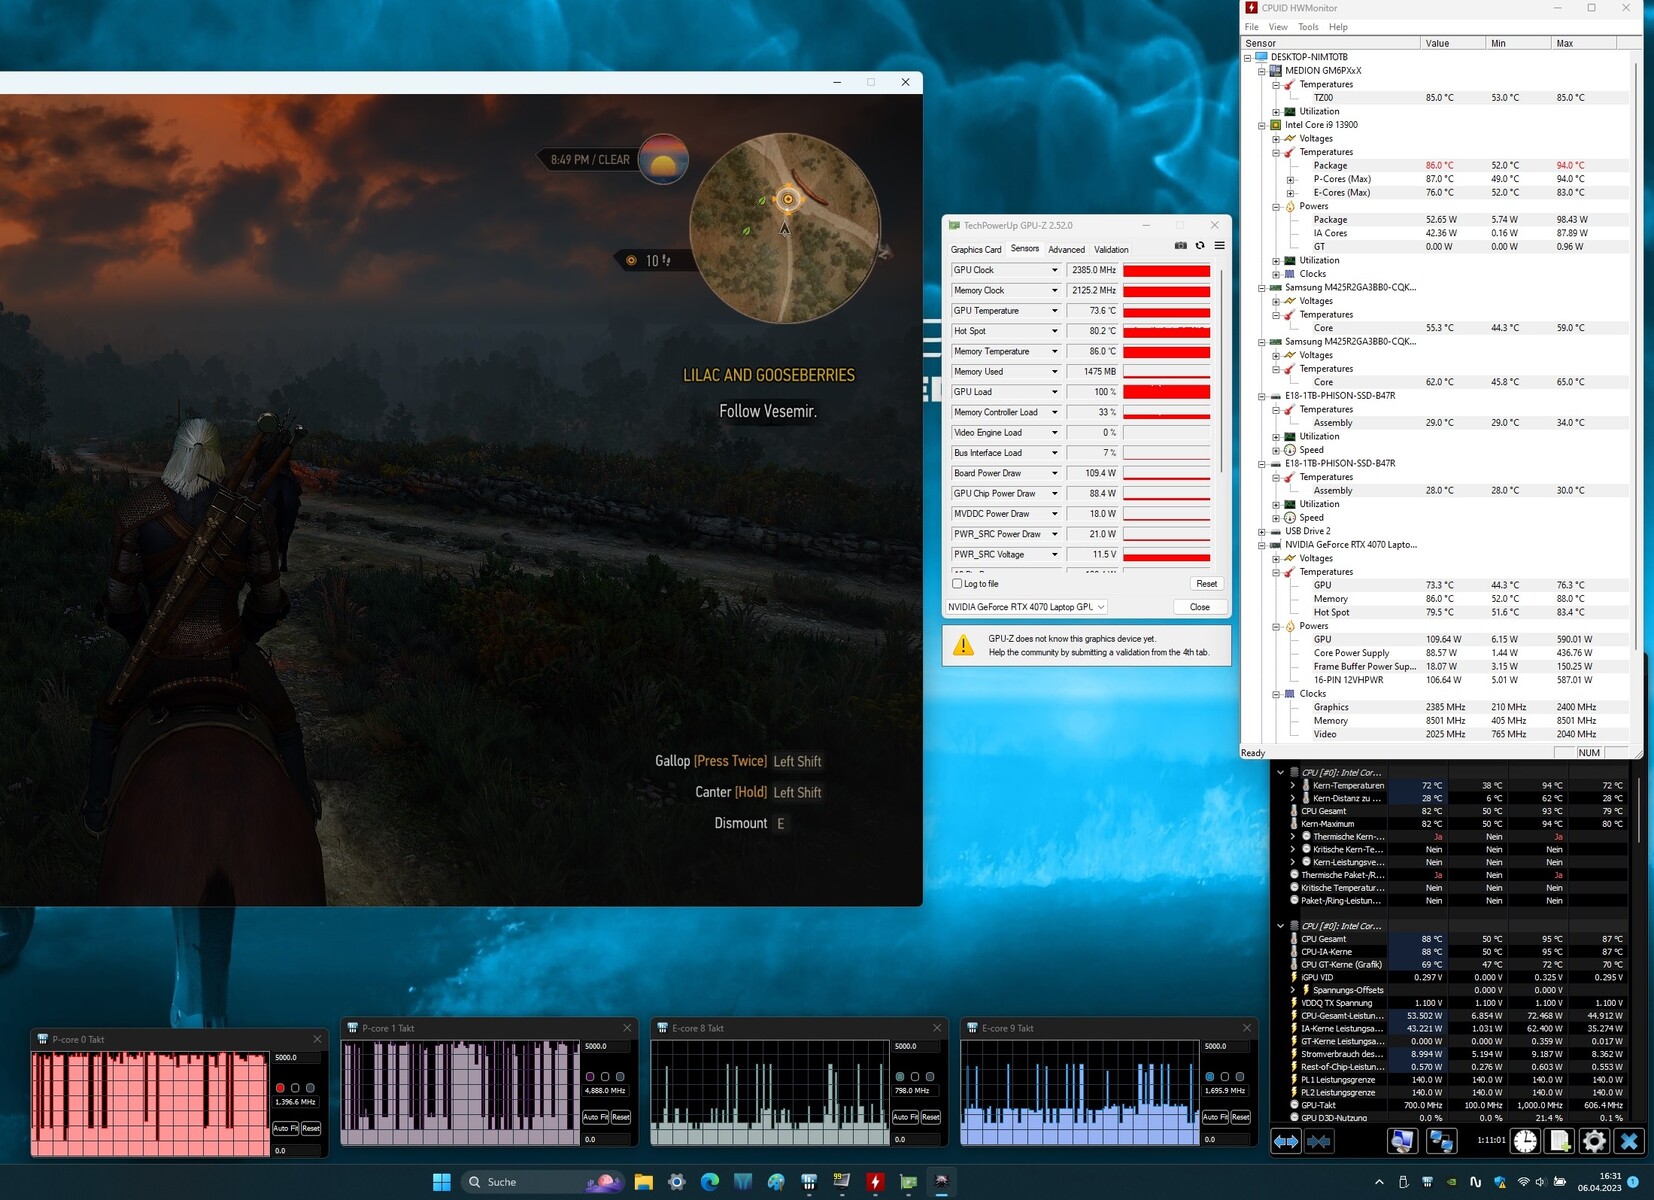
Teste de estresse
O teste de estresse (Prime95 e Furmark em operação contínua) representa um cenário extremo para testar a estabilidade do sistema sob carga total. A CPU inicia o teste com altas taxas de clock (P: 4 GHz, E: 3,3 GHz), enquanto a GPU inicia a 1,5 a 2 GHz. Nos primeiros 5 minutos, o clock da CPU cai gradualmente para 2 a 2,4 GHz (núcleos P) e 1,9 a 2,1 GHz (núcleos E). Ao mesmo tempo, o clock da GPU aumenta para 2,3 a 2,4 GHz.
Alto-falantes
Os alto-falantes estéreo produzem um som decente, mas poderiam ter mais graves. Recomenda-se o uso de fones de ouvido ou alto-falantes externos para obter melhor qualidade de som.
Medion Erazer Major X20 análise de áudio
(+) | os alto-falantes podem tocar relativamente alto (###valor### dB)
Graves 100 - 315Hz
(±) | graves reduzidos - em média 11.9% menor que a mediana
(±) | a linearidade dos graves é média (9.7% delta para a frequência anterior)
Médios 400 - 2.000 Hz
(+) | médios equilibrados - apenas 3.7% longe da mediana
(+) | médios são lineares (4.7% delta para frequência anterior)
Altos 2 - 16 kHz
(+) | agudos equilibrados - apenas 2.3% longe da mediana
(+) | os máximos são lineares (3.4% delta da frequência anterior)
Geral 100 - 16.000 Hz
(+) | o som geral é linear (10.4% diferença em relação à mediana)
Comparado com a mesma classe
» 6% de todos os dispositivos testados nesta classe foram melhores, 2% semelhantes, 92% piores
» O melhor teve um delta de 6%, a média foi 18%, o pior foi 132%
Comparado com todos os dispositivos testados
» 5% de todos os dispositivos testados foram melhores, 1% semelhantes, 93% piores
» O melhor teve um delta de 4%, a média foi 23%, o pior foi 134%
Aorus 15X ASF análise de áudio
(+) | os alto-falantes podem tocar relativamente alto (###valor### dB)
Graves 100 - 315Hz
(-) | quase nenhum baixo - em média 27.3% menor que a mediana
(-) | graves não são lineares (15.1% delta para frequência anterior)
Médios 400 - 2.000 Hz
(±) | médios mais altos - em média 5.8% maior que a mediana
(+) | médios são lineares (4.8% delta para frequência anterior)
Altos 2 - 16 kHz
(+) | agudos equilibrados - apenas 3.1% longe da mediana
(+) | os máximos são lineares (6.3% delta da frequência anterior)
Geral 100 - 16.000 Hz
(±) | a linearidade do som geral é média (20.1% diferença em relação à mediana)
Comparado com a mesma classe
» 71% de todos os dispositivos testados nesta classe foram melhores, 6% semelhantes, 23% piores
» O melhor teve um delta de 6%, a média foi 18%, o pior foi 132%
Comparado com todos os dispositivos testados
» 52% de todos os dispositivos testados foram melhores, 8% semelhantes, 40% piores
» O melhor teve um delta de 4%, a média foi 23%, o pior foi 134%
Gerenciamento de energia - O Medion X20 oferece tempos de execução reduzidos
Consumo de energia
O notebook Medion não apresenta nenhuma anormalidade em termos de consumo de energia. As taxas estão em um nível normal para o hardware instalado. O teste Witcher 3 e o teste de estresse foram executados com taxas de consumo de energia relativamente constantes. A fonte de alimentação (330 watts) é, portanto, suficientemente dimensionada.
| desligado | |
| Ocioso | |
| Carga |
|
Key:
min: | |
| Medion Erazer Major X20 i9-13900HX, GeForce RTX 4070 Laptop GPU | Aorus 15X ASF i7-13700HX, GeForce RTX 4070 Laptop GPU | Razer Blade 15 OLED (Early 2022) i9-12900H, GeForce RTX 3070 Ti Laptop GPU | Asus ROG Strix G17 G713PI R9 7945HX, GeForce RTX 4070 Laptop GPU | Média NVIDIA GeForce RTX 4070 Laptop GPU | Média da turma Gaming | |
|---|---|---|---|---|---|---|
| Power Consumption | 7% | -46% | -6% | 6% | -0% | |
| Idle Minimum * (Watt) | 12 | 11 8% | 31.6 -163% | 15 -25% | 13.2 ? -10% | 13.1 ? -9% |
| Idle Average * (Watt) | 16 | 16 -0% | 33.3 -108% | 20 -25% | 18.2 ? -14% | 19 ? -19% |
| Idle Maximum * (Watt) | 26 | 24 8% | 38.6 -48% | 29 -12% | 24.6 ? 5% | 24.6 ? 5% |
| Load Average * (Watt) | 115 | 104 10% | 149 -30% | 121 -5% | 97 ? 16% | 111.3 ? 3% |
| Witcher 3 ultra * (Watt) | 191.6 | 185.4 3% | 149.6 22% | 179.8 6% | ||
| Load Maximum * (Watt) | 319 | 272 15% | 160 50% | 246 23% | 221 ? 31% | 260 ? 18% |
* ... menor é melhor
Energieaufnahme Witcher 3 / Stresstest
Power consumption with an external monitor
Duração da bateria
No teste de WLAN, o notebook de 16 polegadas atinge tempos de execução de 3:52 h e 4:12 h (carregamento de sites usando um script) e teste de vídeo (curta-metragem Big Buck Bunny, codificação H.264, FHD, em um loop), respectivamente. As funções de economia de energia do notebook foram desativadas durante os dois testes e o brilho da tela foi ajustado para cerca de 150 cd/m². Os módulos de rádio também foram desativados para o teste de vídeo.
Os tempos de execução abaixo da média geral se devem à baixa capacidade da bateria (62,3 Wh) para um notebook para jogos. Teria sido possível obter mais com a bateria de 80 Wh do antecessor.
| Medion Erazer Major X20 i9-13900HX, GeForce RTX 4070 Laptop GPU, 62.3 Wh | Aorus 15X ASF i7-13700HX, GeForce RTX 4070 Laptop GPU, 99 Wh | Razer Blade 15 OLED (Early 2022) i9-12900H, GeForce RTX 3070 Ti Laptop GPU, 80 Wh | Asus ROG Strix G17 G713PI R9 7945HX, GeForce RTX 4070 Laptop GPU, 90 Wh | Média da turma Gaming | |
|---|---|---|---|---|---|
| Duração da bateria | 80% | 26% | -20% | 52% | |
| Reader / Idle (h) | 5.8 | 11.3 95% | 6.7 16% | 7.84 ? 35% | |
| H.264 (h) | 4.2 | 7.9 88% | 5.9 40% | 2.8 -33% | 8.27 ? 97% |
| WiFi v1.3 (h) | 3.9 | 8.2 110% | 4.6 18% | 4.3 10% | 7.08 ? 82% |
| Load (h) | 1.6 | 2 25% | 2.1 31% | 1 -37% | 1.496 ? -6% |
| Witcher 3 ultra (h) | 1.1 |
Pro
Contra
Veredicto: Muitos equipamentos

Esse notebook potente permite jogos em QHD+, mas também se destaca em outras áreas. A Core i9-13900HX e uma placa GeForce RTX 4070 operam com taxas de clock consistentemente altas, dois SSDs de 1 TB garantem tempos de carregamento curtos e espaço de armazenamento suficiente. O desenvolvimento de ruído e calor está na faixa alta, típica dessa classe de notebook.
No Erazer Major X20, a Medion apresenta um notebook para jogos de médio porte bem equipado, sem nenhum ponto fraco grave.
O teclado chiclet do modelo anterior deu lugar a um modelo mecânico (interruptores Cherry MX, iluminação RGB individual das teclas) - uma melhoria significativa. Os usuários que não estão familiarizados com esse tipo de teclado descobrirão uma nova experiência de digitação.
A tela fosca de 16 polegadas (QHD+, IPS, 240 Hz, G-Sync, sRGB) em um formato 16:10 ideal para o trabalho dá uma boa impressão geral. Uma porta Thunderbolt 4 garante opções de expansão (GPU externa, solução de encaixe, tela), mas não oferece suporte ao Power Delivery. A duração da bateria também não impressiona.
O Aorus 15X ASF é uma alternativa com tempos de execução significativamente melhores. Ele oferece o mesmo desempenho gráfico que o X20, mas menos potência de CPU.
Preço e disponibilidade
A configuração analisada do Medion Erazer Major X20 está listada na loja on-line da Medion a um preço de pouco menos de 2.500 euros, mas está esgotada no momento. A disponibilidade do modelo parece ser limitada fora da Alemanha no momento.
Medion Erazer Major X20
- 04/20/2023 v7 (old)
Sascha Mölck
Transparência
A seleção dos dispositivos a serem analisados é feita pela nossa equipe editorial. A amostra de teste foi fornecida ao autor como empréstimo pelo fabricante ou varejista para fins desta revisão. O credor não teve influência nesta revisão, nem o fabricante recebeu uma cópia desta revisão antes da publicação. Não houve obrigação de publicar esta revisão. Como empresa de mídia independente, a Notebookcheck não está sujeita à autoridade de fabricantes, varejistas ou editores.
É assim que o Notebookcheck está testando
Todos os anos, o Notebookcheck analisa de forma independente centenas de laptops e smartphones usando procedimentos padronizados para garantir que todos os resultados sejam comparáveis. Desenvolvemos continuamente nossos métodos de teste há cerca de 20 anos e definimos padrões da indústria no processo. Em nossos laboratórios de teste, equipamentos de medição de alta qualidade são utilizados por técnicos e editores experientes. Esses testes envolvem um processo de validação em vários estágios. Nosso complexo sistema de classificação é baseado em centenas de medições e benchmarks bem fundamentados, o que mantém a objetividade.Price comparison

