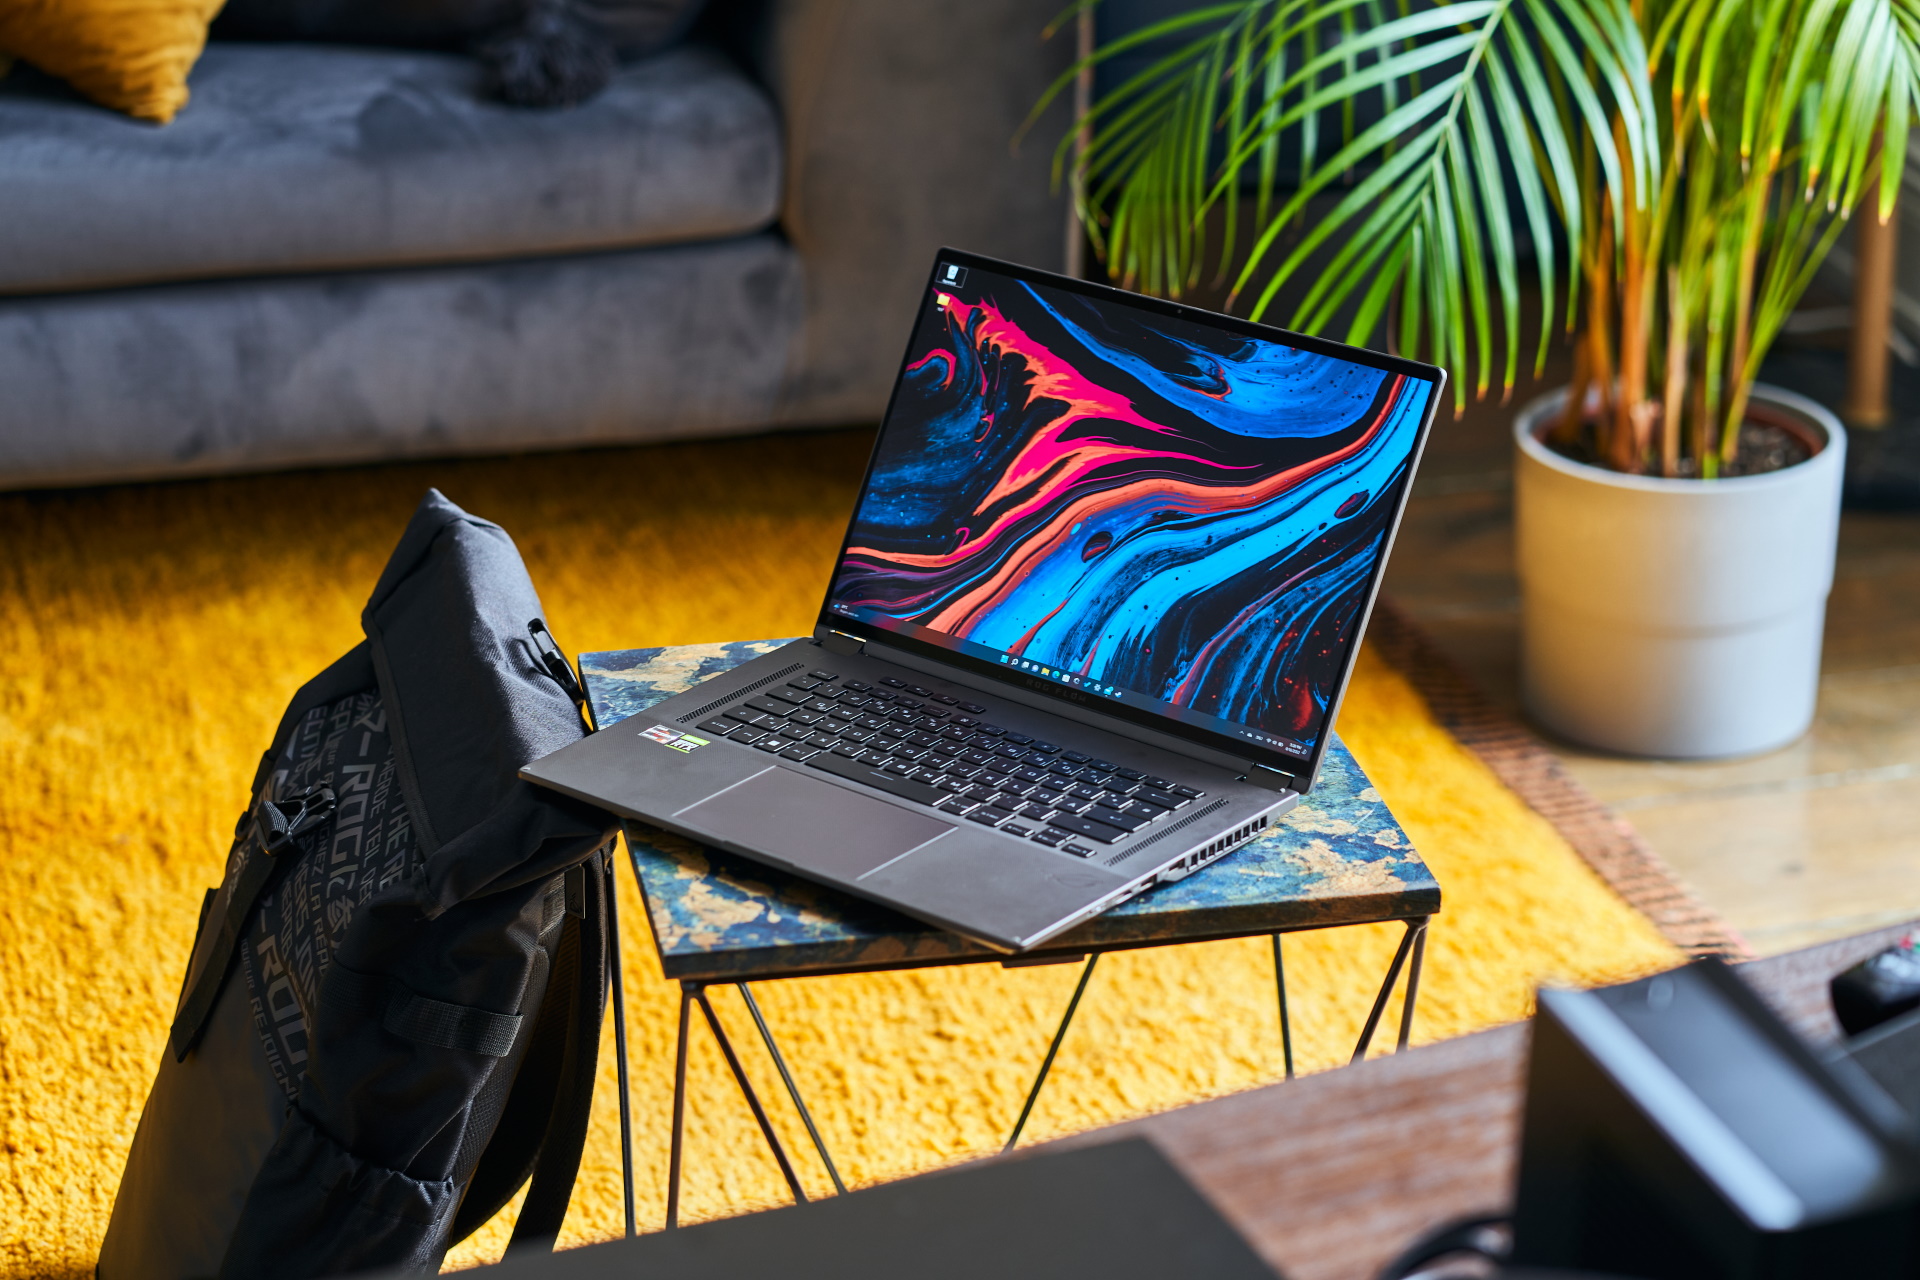
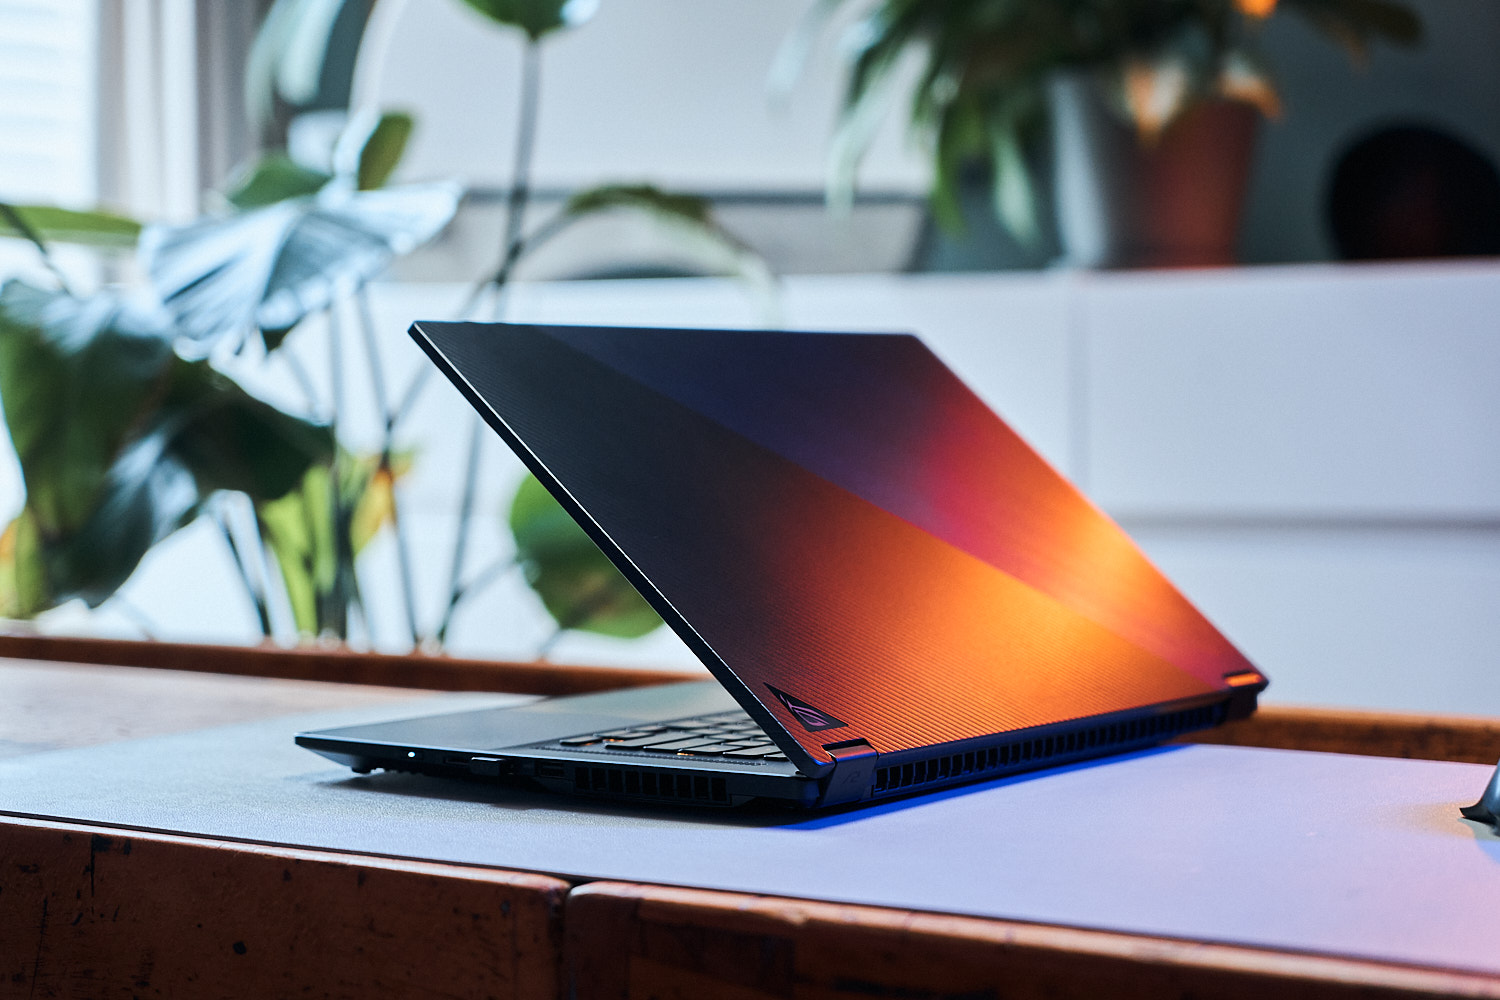
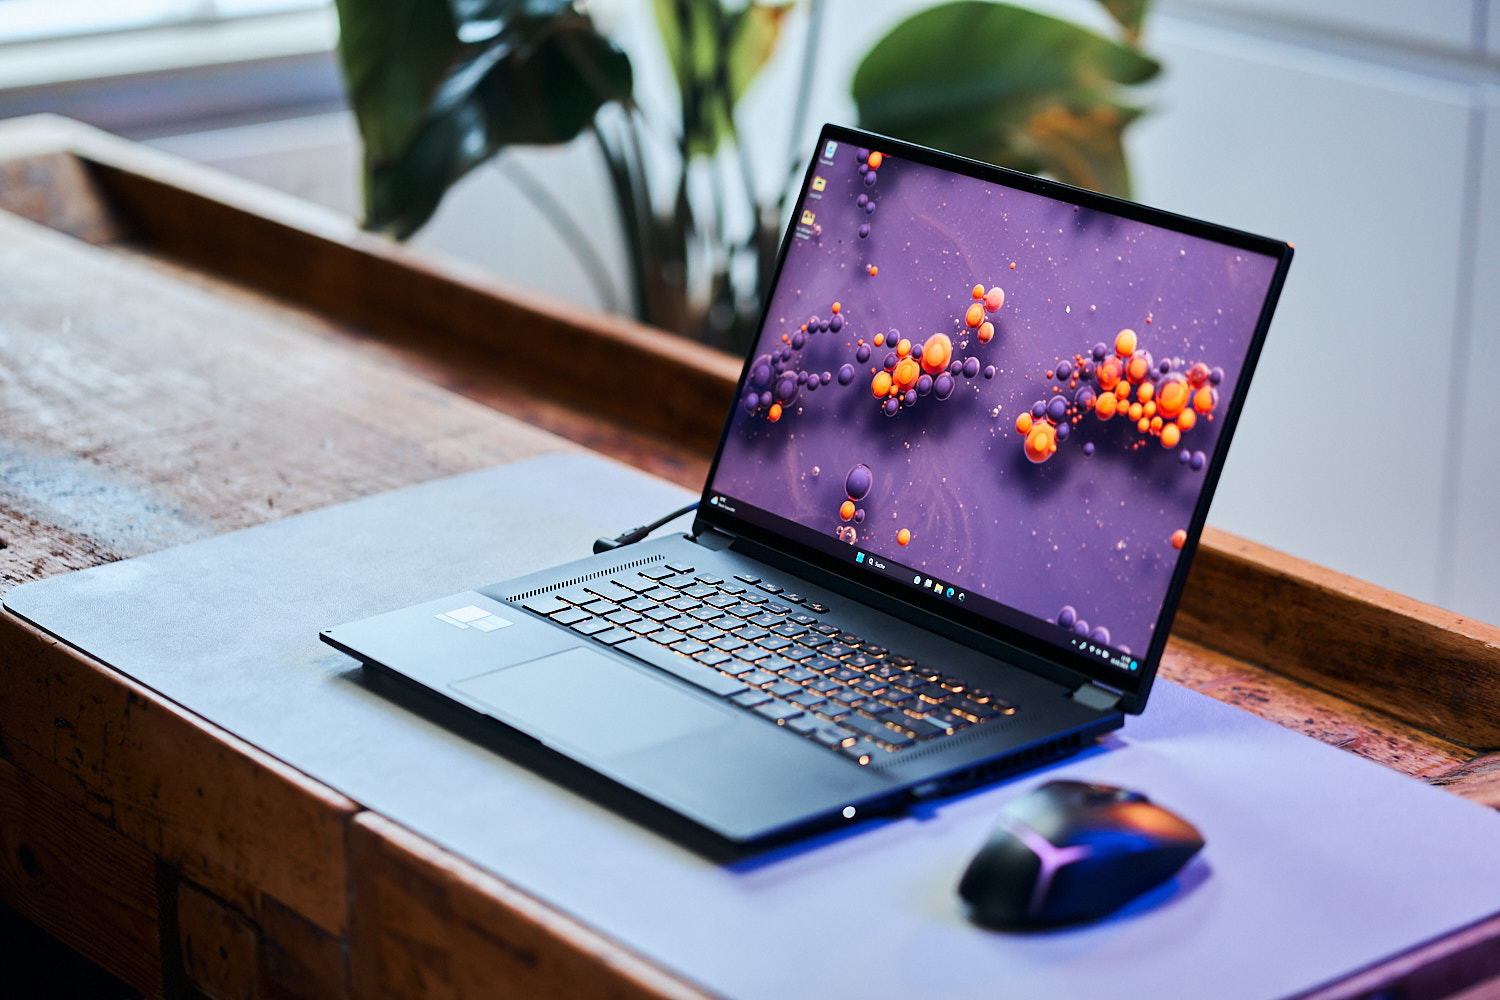
Análise do notebook fino Asus ROG Flow X16: Uma poderosa estação de trabalho para jogos 2 em 1 de 16 polegadas com tela sensível ao toque

No ano passado, o ROG Flow X16foi nosso primeiro laptop para jogos equipado com uma tela mini-LED. Naquele momento, o laptop estava à frente de seu tempo e, por esse motivo, a Asus parece não ter tido motivos para fazer uma revisão completa desse modelo. No entanto, a versão que estamos analisando aqui vem sem a tela mini-LED. No entanto, muitos recursos permanecem os mesmos, como o gabinete e as portas, com a Asus mudando apenas a geração da CPU/GPU.
Da mesma forma, a Asus também está atualmente à frente do jogo em sua realização de novos conceitos, como comprovado pelo novo Asus ROG Ally bem como oAsus ROG Flow Z13tablet para jogos. O X16 não é exatamente um dispositivo comum: O que temos aqui é um laptop para jogos ultrafino que é simultaneamente um 2 em 1. A tela pode ser girada em 360 graus, permitindo que o laptop seja usado como um tablet por meio da tela sensível ao toque. Como é difícil encontrar concorrência direta, é por isso que o estamos comparando com máquinas de jogos normais. Além de seu antecessor, também estamos usando oSamsung Galaxy Book3 Ultra 16e oLenovo Legion Pro 5, oLenovo Yoga Pro 7 14 G8e oMSI Katana 17 B13V para comparação.
Como vários recursos encontrados no modelo do ano passado permanecem os mesmos, não vamos dar atenção especial ao gabinete, aos acessórios, à manutenção e aos dispositivos de entrada, mas preferimos indicar a nossa análise do modelo do ano passado Asus ROG Flow X16 GV601RWdo ano passado, para obter informações adicionais.
Possíveis concorrentes em comparação
Avaliação | Data | Modelo | Peso | Altura | Size | Resolução | Preço |
|---|---|---|---|---|---|---|---|
| 89.7 % v7 (old) | 06/2023 | Asus ROG Flow X16 GV601V i9-13900H, GeForce RTX 4060 Laptop GPU | 2.1 kg | 19.4 mm | 16.00" | 2560x1600 | |
| 89.5 % v7 (old) | 08/2022 | Asus ROG Flow X16 GV601RW-M5082W R9 6900HS, GeForce RTX 3070 Ti Laptop GPU | 2.1 kg | 19.4 mm | 16.10" | 2560x1600 | |
| 88.8 % v7 (old) | 05/2023 | Samsung Galaxy Book3 Ultra 16, i9-13900H RTX 4070 i9-13900H, GeForce RTX 4070 Laptop GPU | 1.8 kg | 16.8 mm | 16.00" | 2880x1800 | |
| 87.9 % v7 (old) | 05/2023 | Lenovo Legion Pro 5 16IRX8 i7-13700HX, GeForce RTX 4060 Laptop GPU | 2.5 kg | 26.8 mm | 16.00" | 2560x1600 | |
| 90.2 % v7 (old) | 05/2023 | Lenovo Yoga Pro 7 14IRH G8 i7-13700H, GeForce RTX 4050 Laptop GPU | 1.5 kg | 15.6 mm | 14.50" | 3072x1920 | |
| 82.1 % v7 (old) | 02/2023 | MSI Katana 17 B13VFK i7-13620H, GeForce RTX 4060 Laptop GPU | 2.8 kg | 25.2 mm | 17.30" | 1920x1080 |
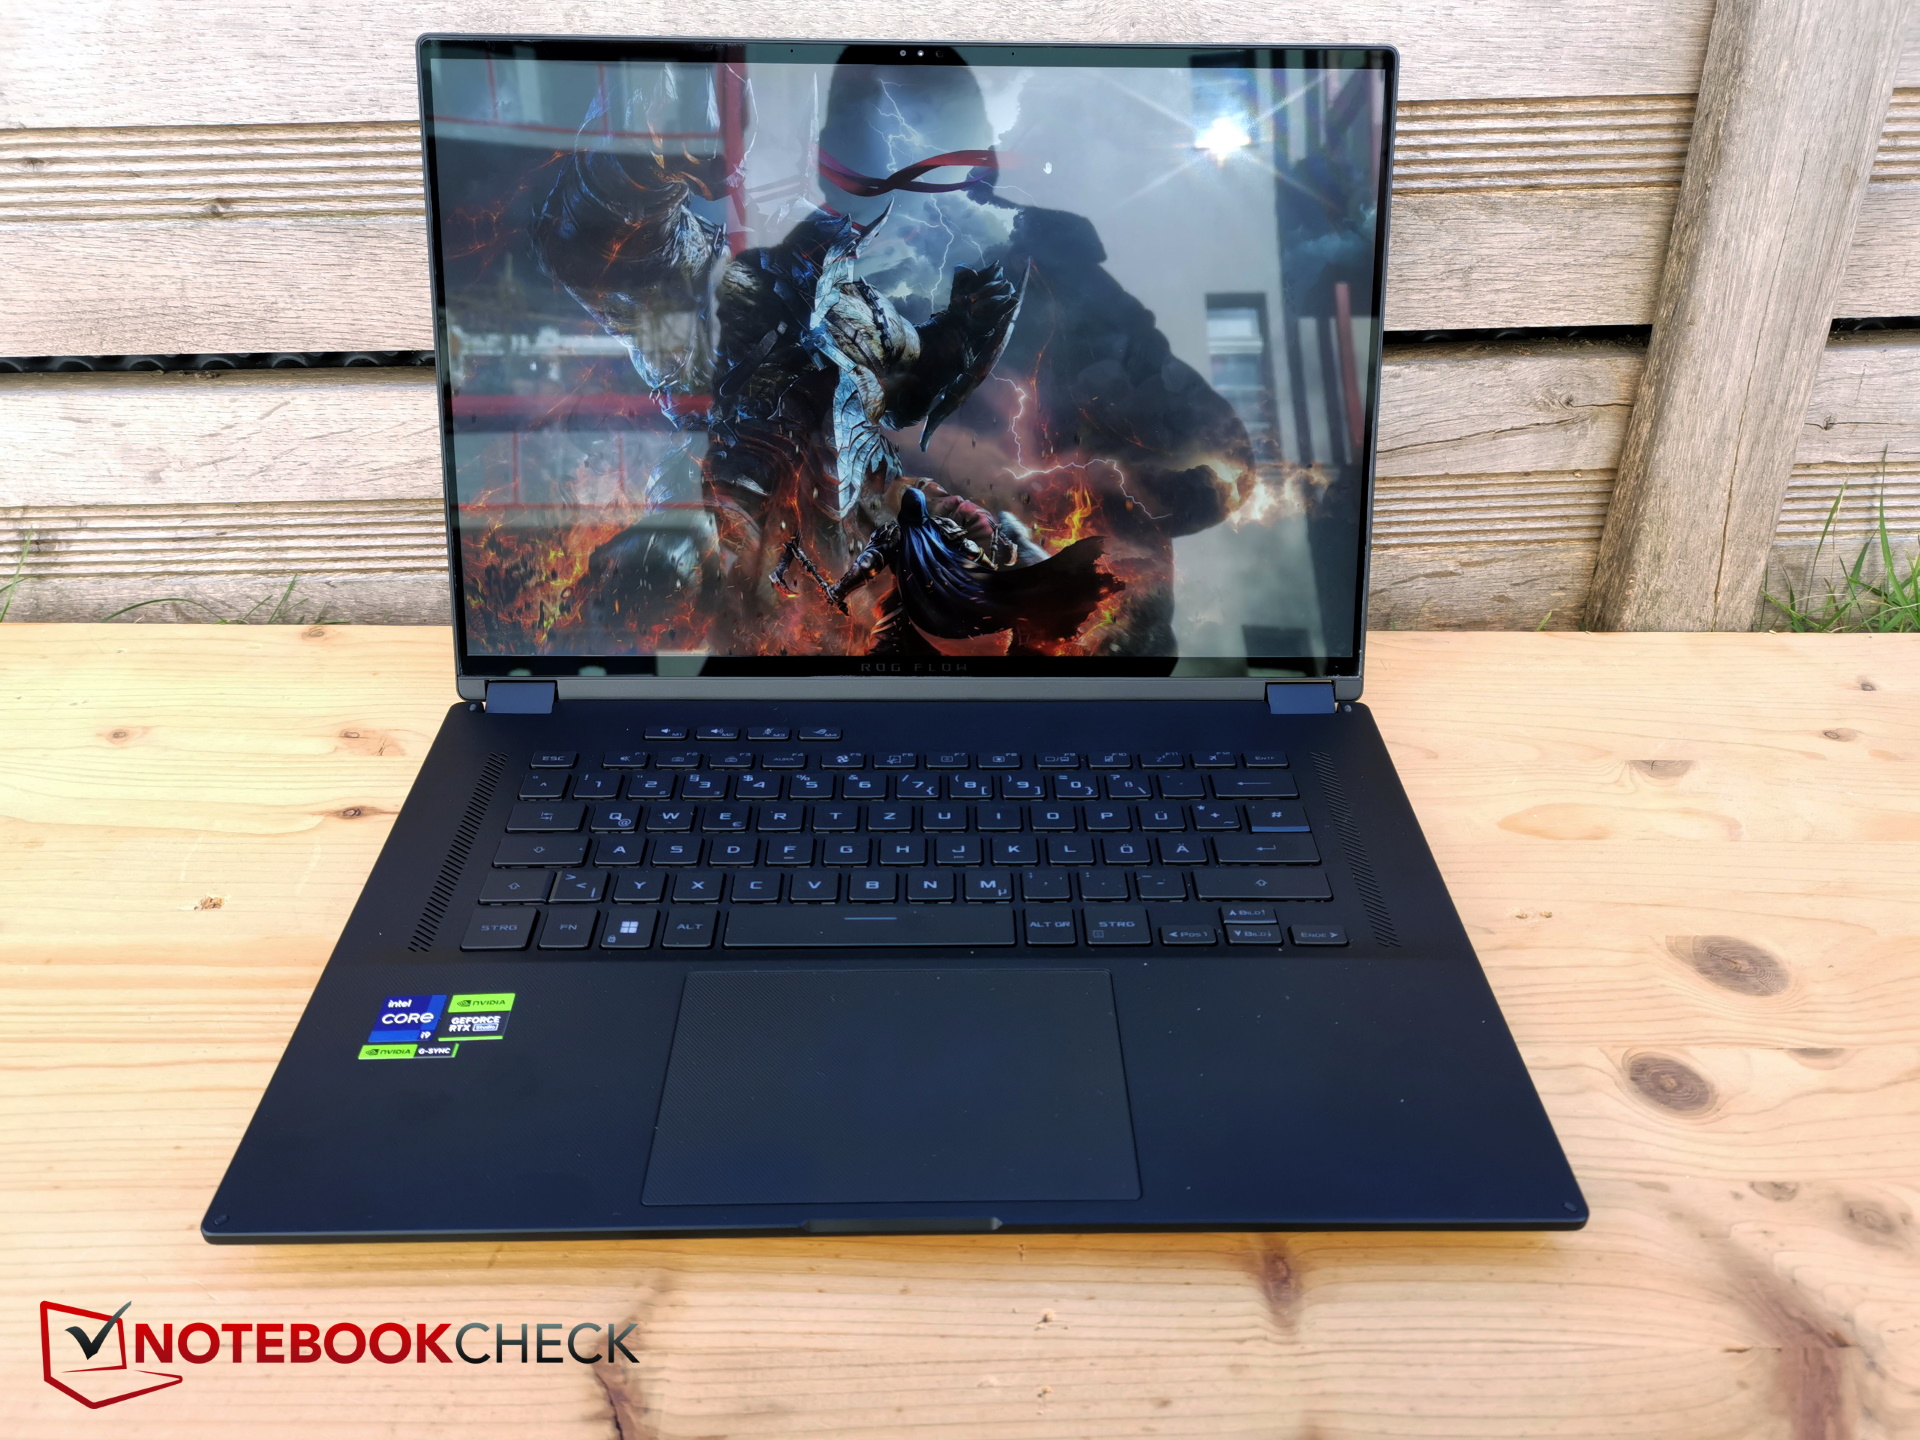
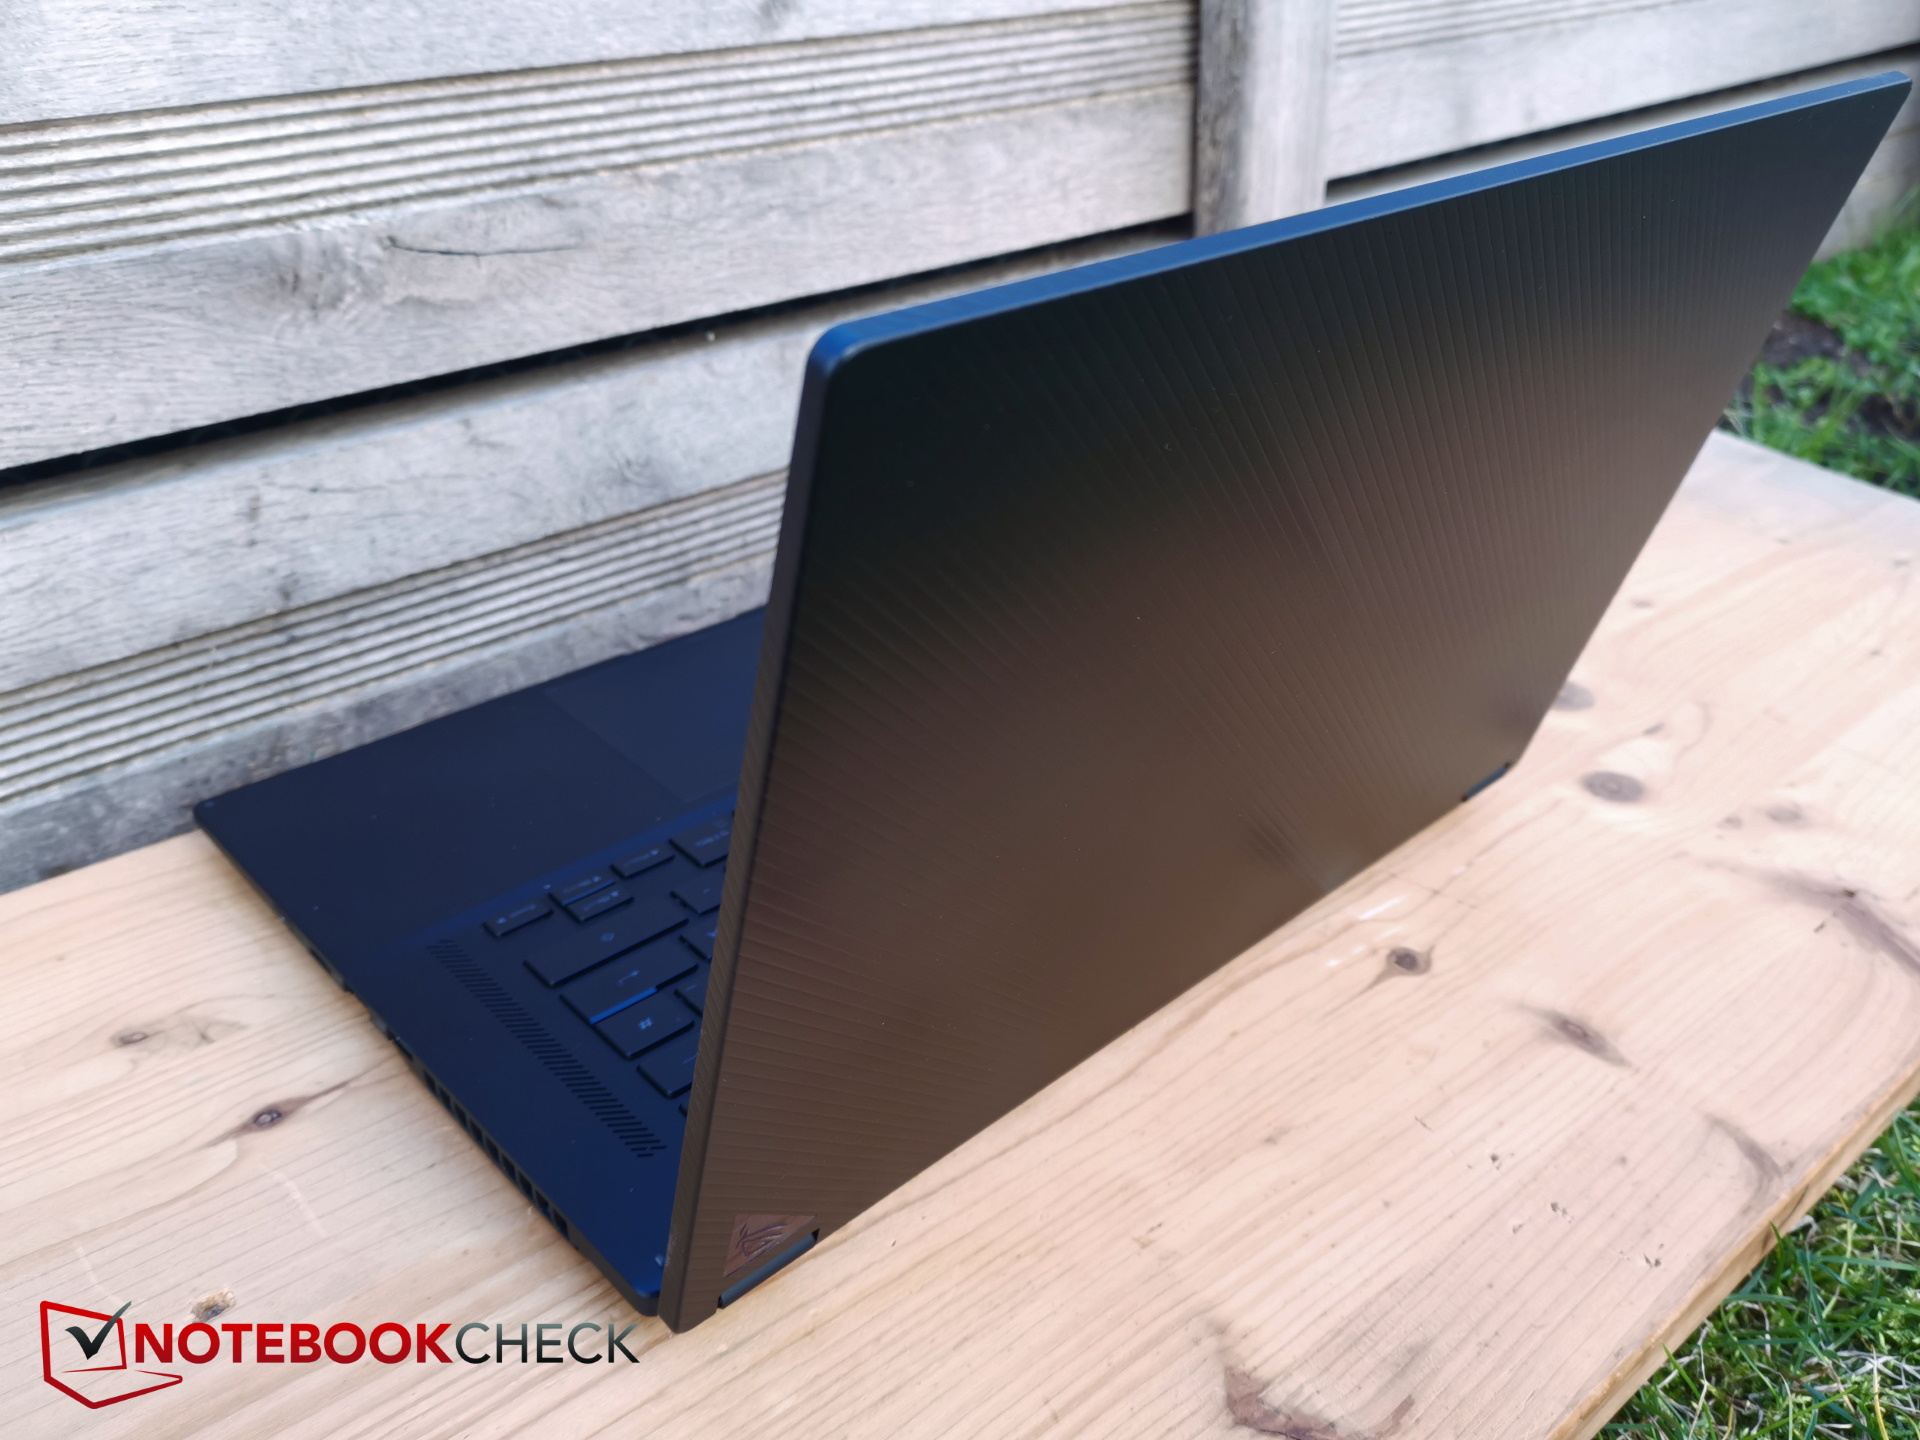
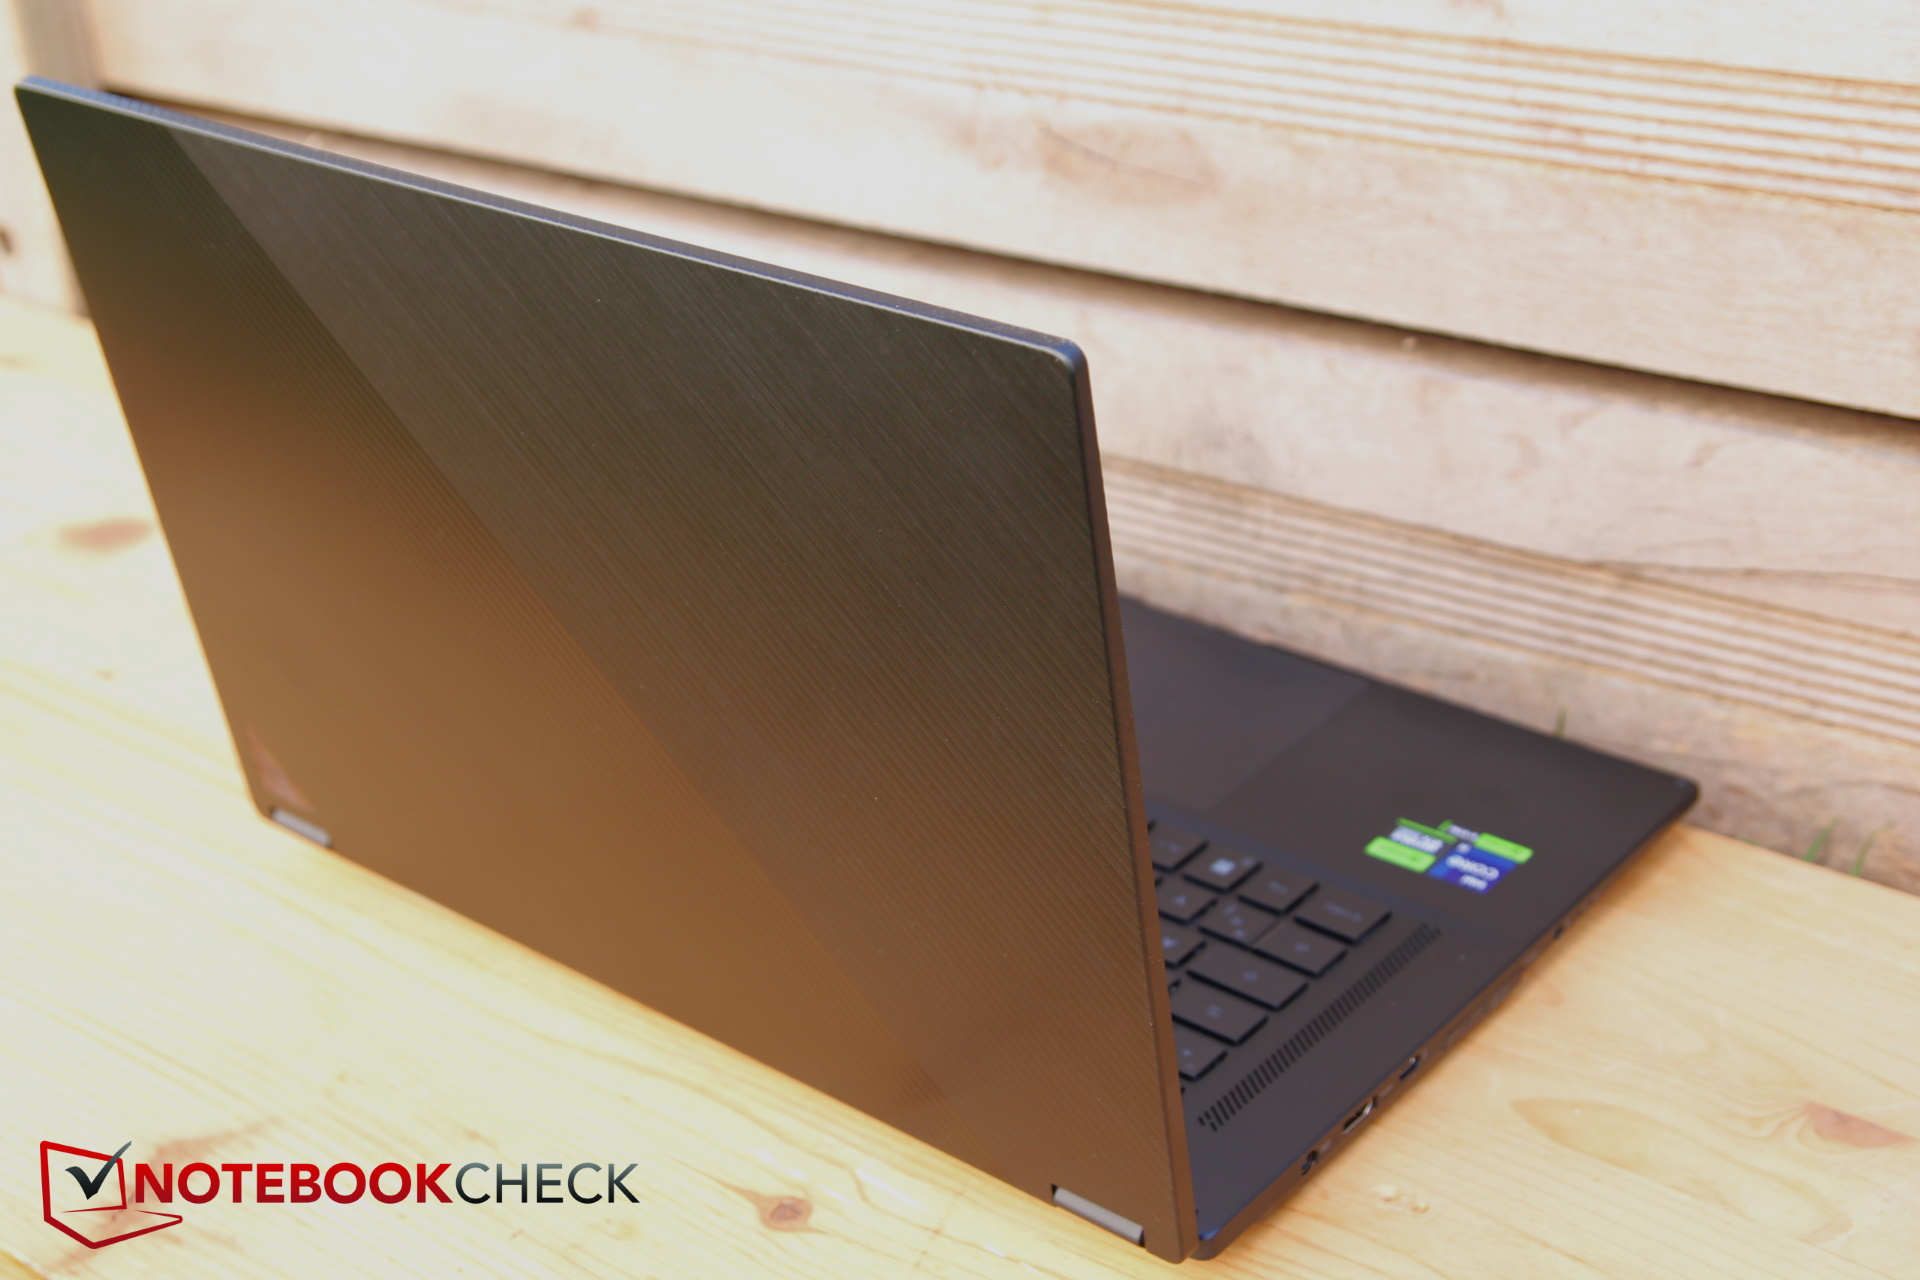
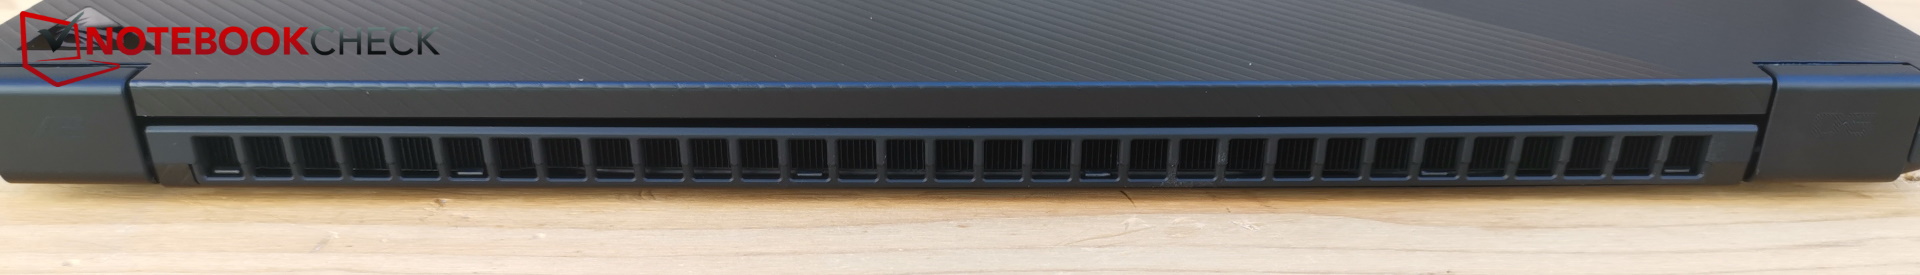
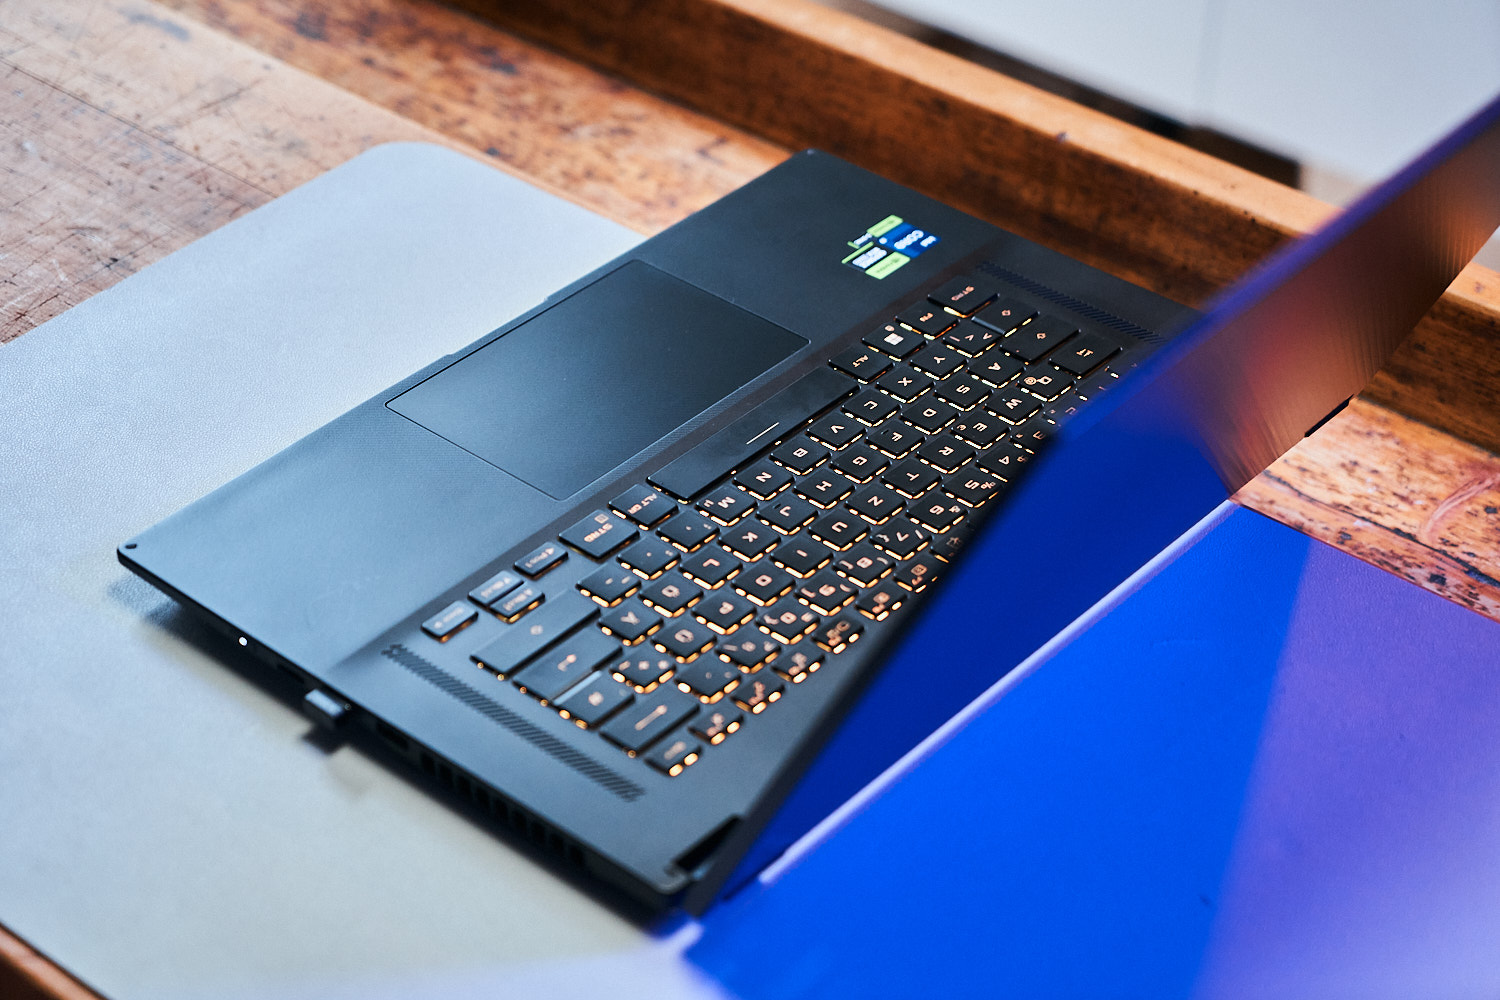
Case - Tão fino e bom quanto no ano passado
O logotipo na tampa do gabinete é um pouco diferente, mas, tirando isso, tudo permanece praticamente inalterado.

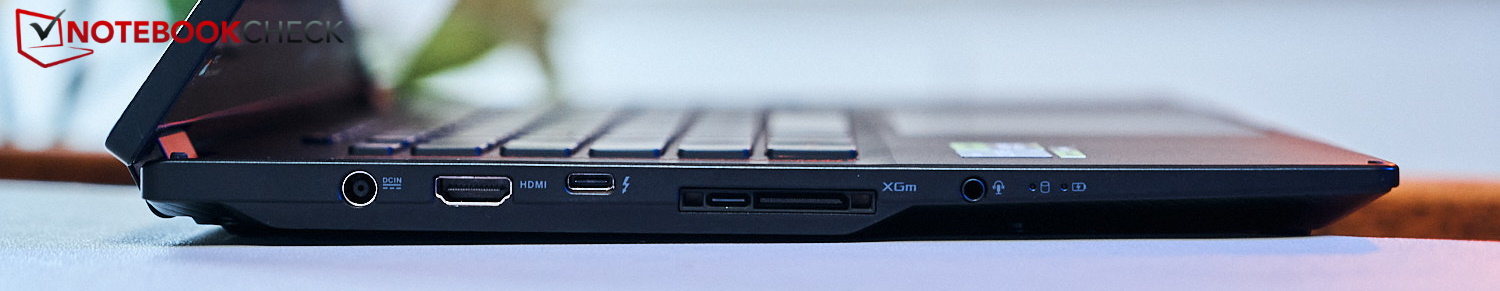
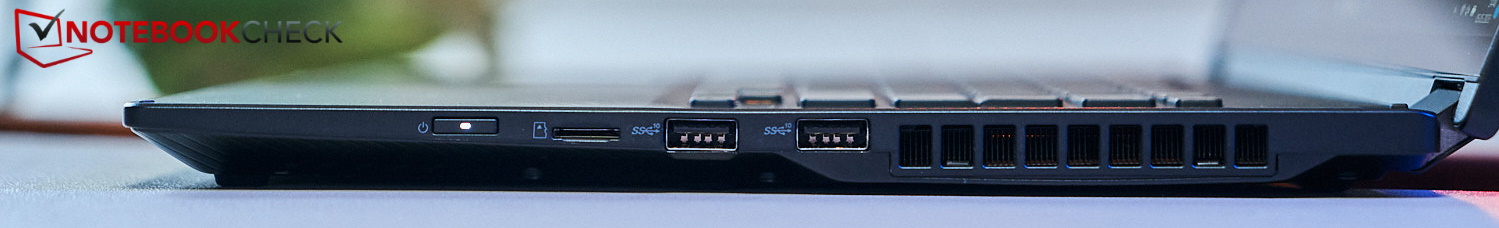
Recursos - Interface móvel TB4 e XG
Leitor de cartão SD
| SD Card Reader | |
| average JPG Copy Test (av. of 3 runs) | |
| Asus ROG Flow X16 GV601RW-M5082W (AV Pro SD microSD 128 GB V60) | |
| Média da turma Gaming (20.9 - 210, n=54, últimos 2 anos) | |
| Asus ROG Flow X16 GV601V | |
| Samsung Galaxy Book3 Ultra 16, i9-13900H RTX 4070 (AV Pro SD microSD 128 GB V60) | |
| maximum AS SSD Seq Read Test (1GB) | |
| Asus ROG Flow X16 GV601V | |
| Asus ROG Flow X16 GV601RW-M5082W (AV Pro SD microSD 128 GB V60) | |
| Média da turma Gaming (25.5 - 261, n=51, últimos 2 anos) | |
| Samsung Galaxy Book3 Ultra 16, i9-13900H RTX 4070 (AV Pro SD microSD 128 GB V60) | |
Comunicação
As taxas de transferência com o AX211 da Intel em uma rede de 6 GHz são muito altas e estáveis (aproximadamente 1,6 MBit/s) e, em uma rede de 5 GHz, são possíveis taxas de transferência baixas de apenas cerca de 1 MBit/s.
Webcam
Nessa área, a Asus atualizou a câmera de 720p encontrada no modelo do ano passado para uma câmera Full HD. As imagens são decentes, mas o desvio de cor é um pouco alto.


Segurança
O TPM está disponível graças ao chip Intel, no entanto, um sensor de impressão digital e até mesmo uma trava Kensington estão ausentes. A câmera é compatível com o Windows Hello.
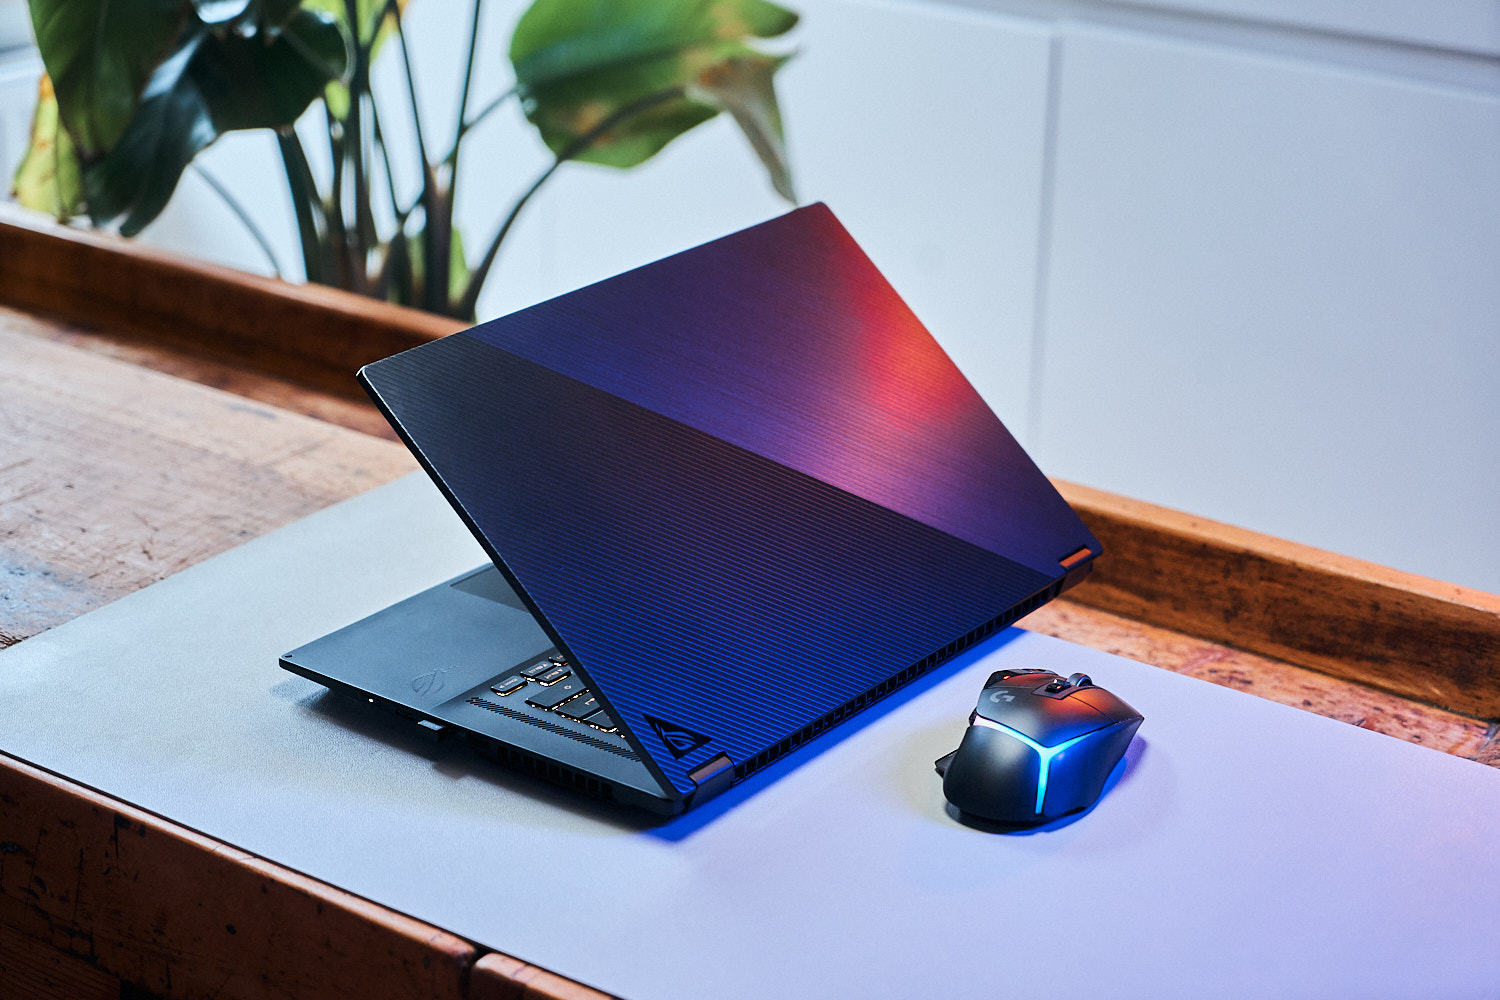
Acessórios
Infelizmente, a caneta não está incluída este ano e, teoricamente, você está recebendo um laptop sem nenhum acessório adicional. No entanto, dependendo do pacote, uma mochila para laptop com a marca ROG, o headset ROG Fusion II 300 e o mouse ROG Gladius III estão incluídos.
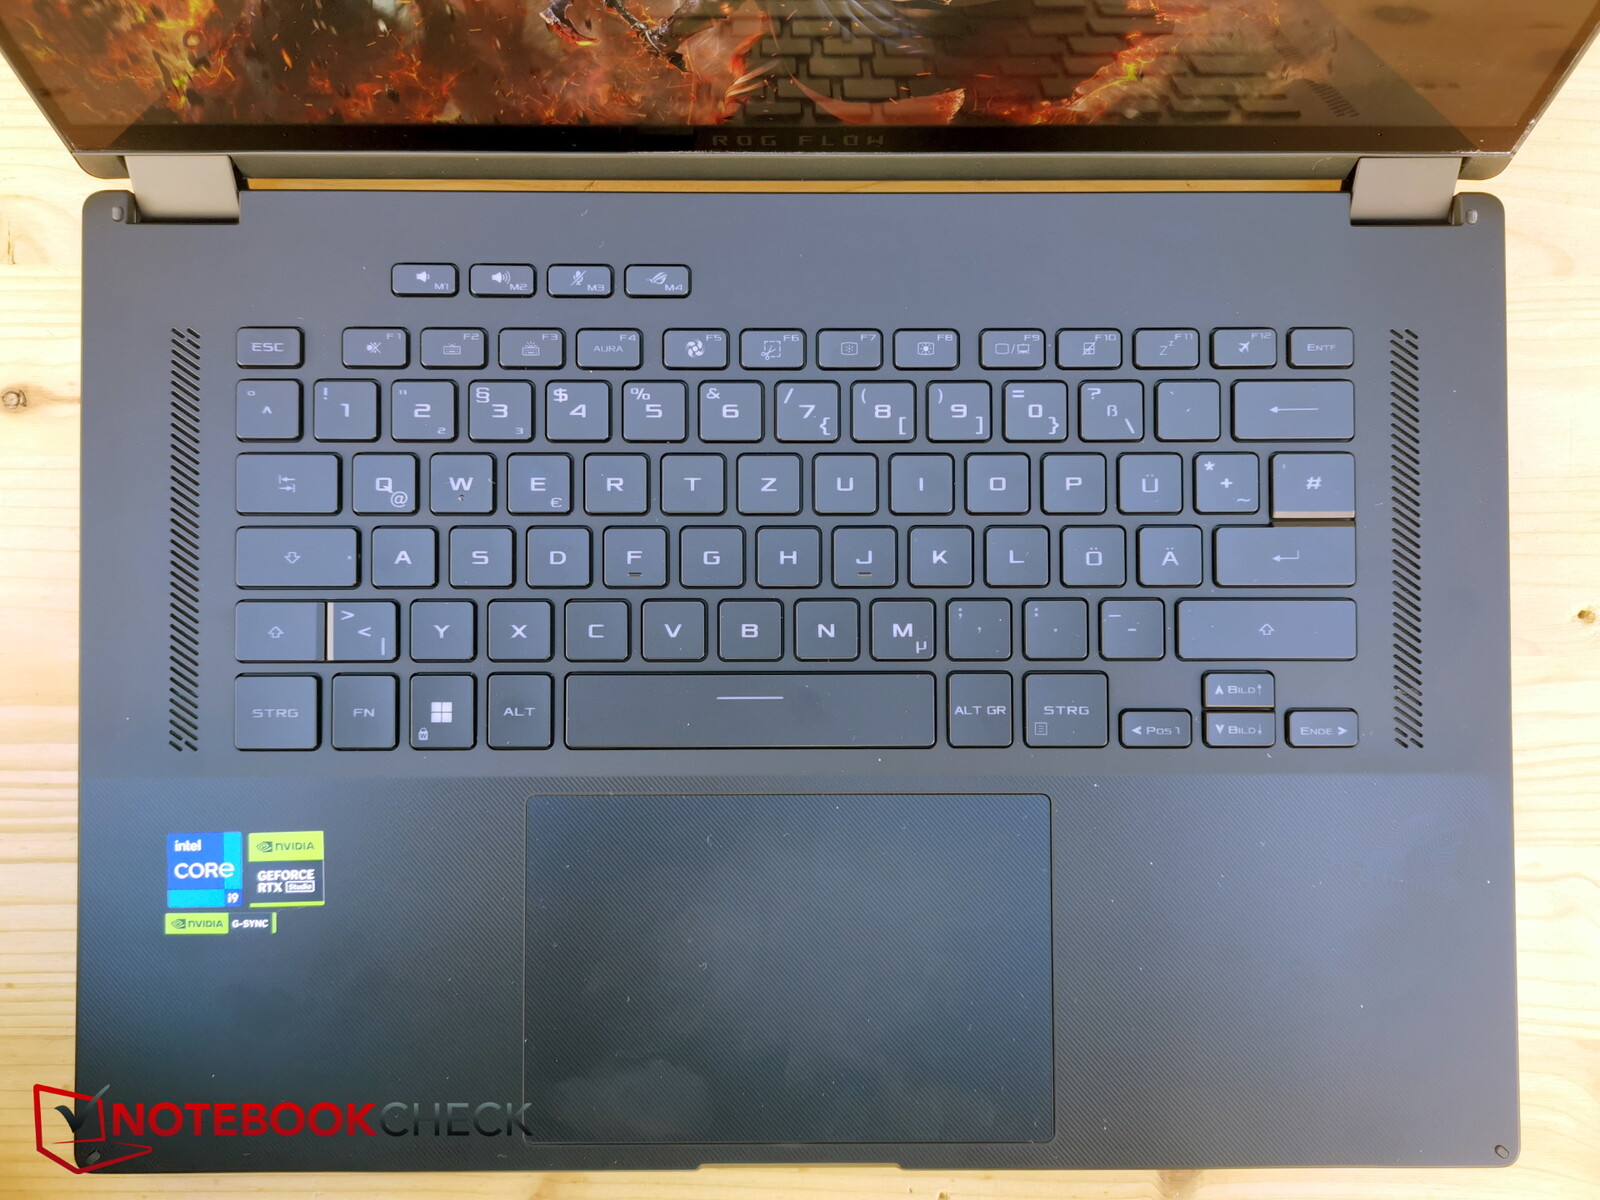
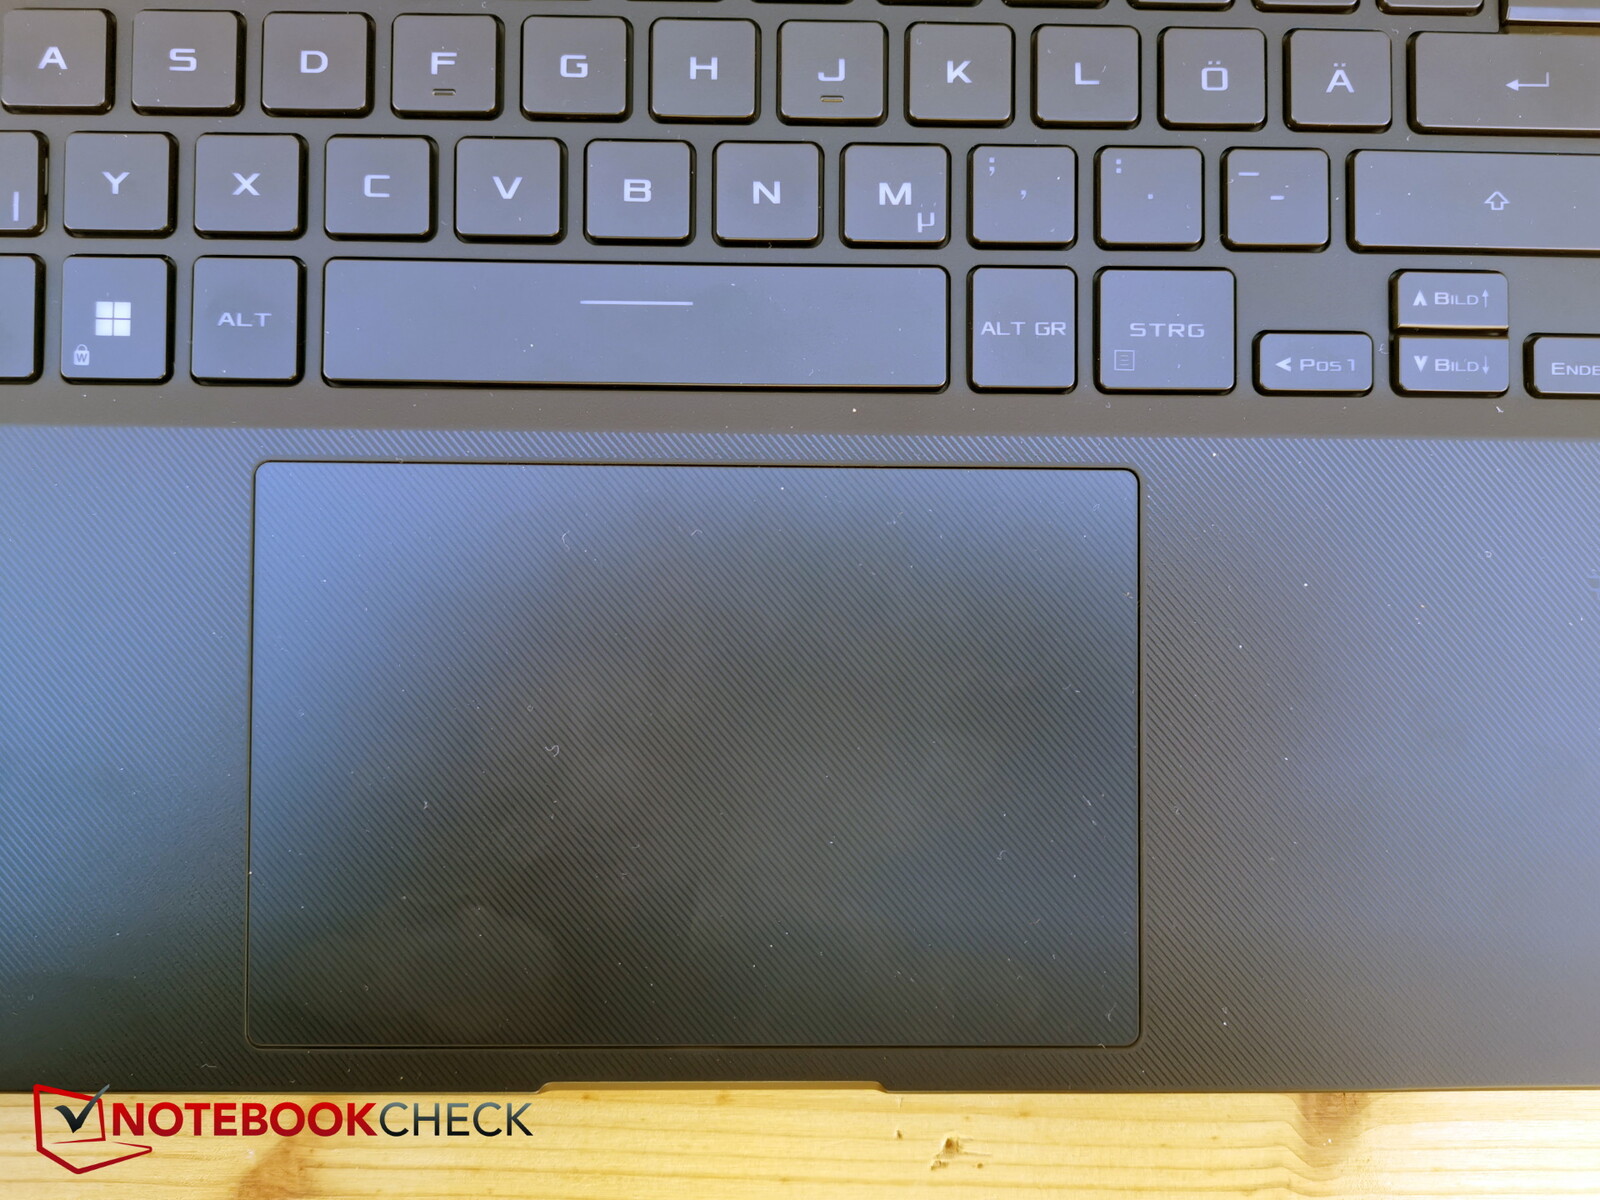
Dispositivos de entrada - O X16 tem um touchpad grande

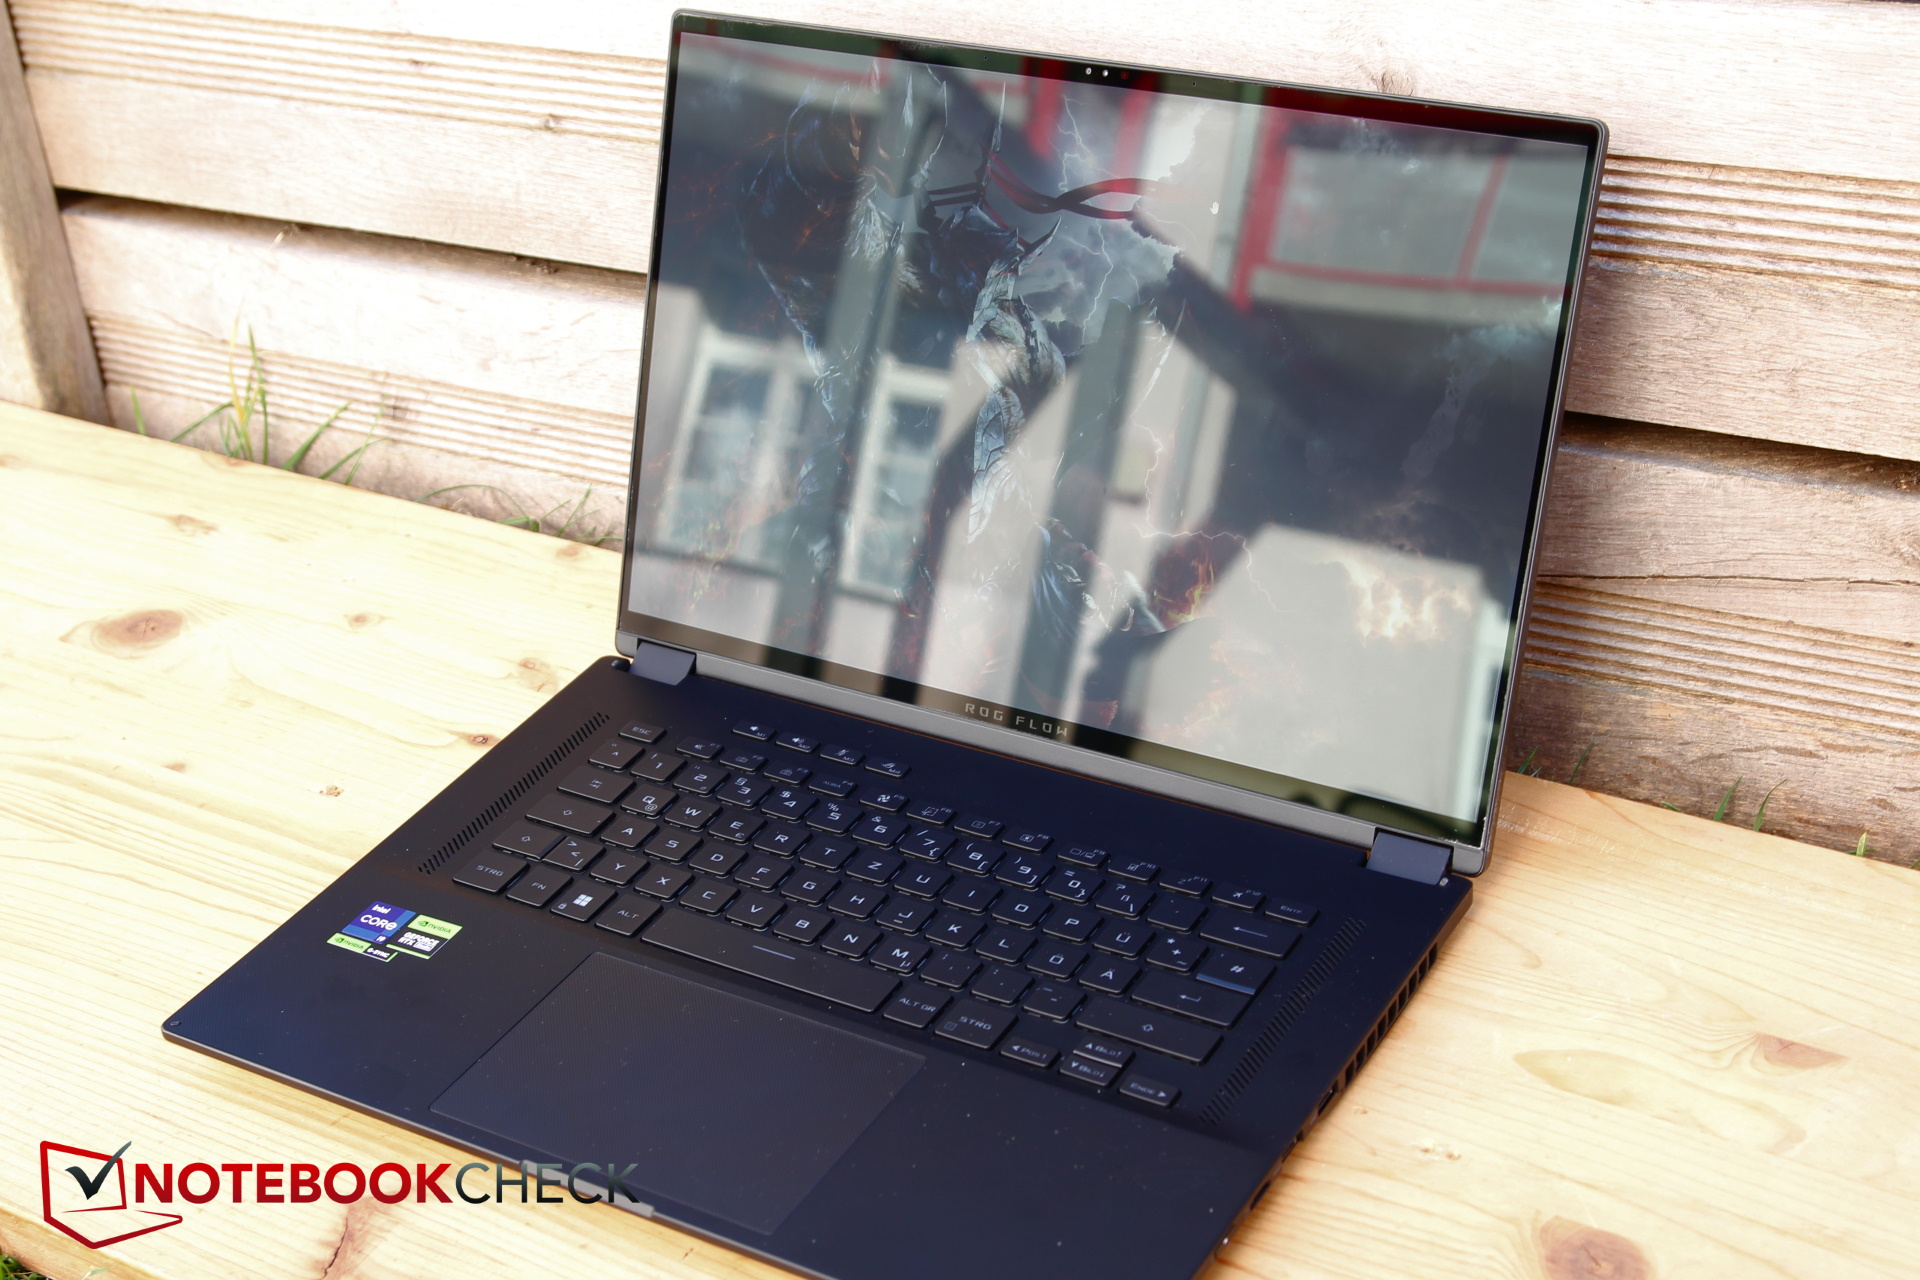
Tela - com ou sem mini-LED?
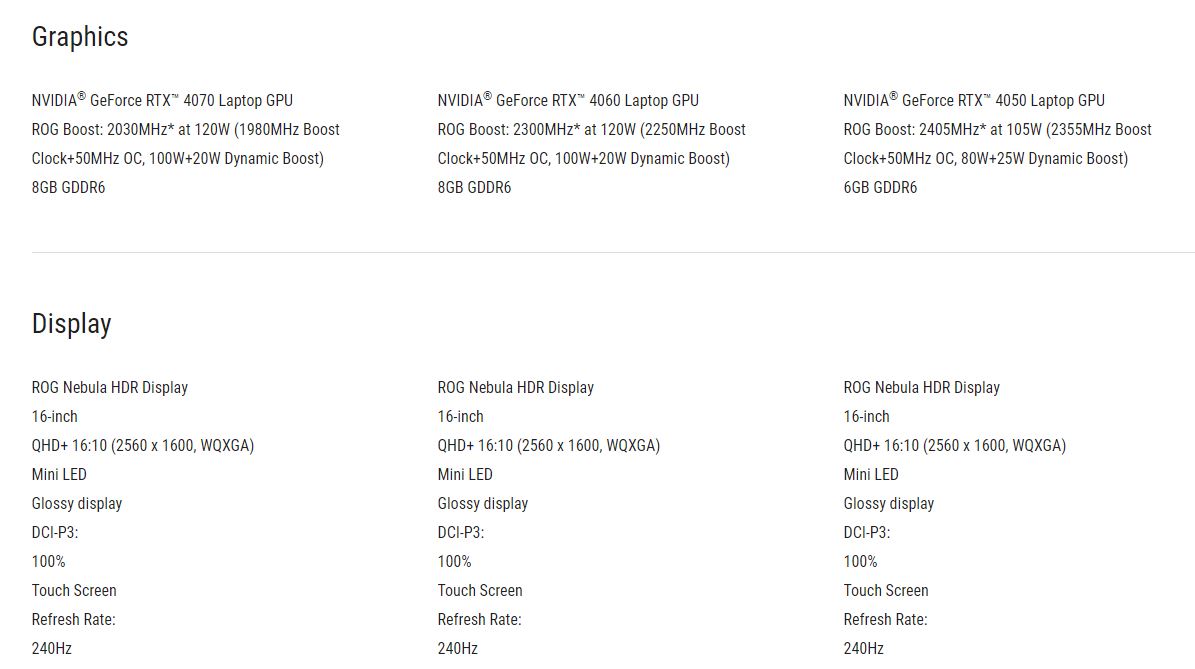
O X16 abriga o painel Asus TMX1603 ou o painel IPS TL160ADMP03-0 de 16 polegadas com funcionalidade de tela sensível ao toque, mas sem mini-LED. O mesmo painel, embora na variante não sensível ao toque, também pode ser encontrado no Asus ROG Strix G16. É uma tela de 2560 x 1600 pixels no formato 16:10 que suporta entrada de caneta stylus. Infelizmente, ao contrário do ano passado, quando a caneta stylus estava incluída, este ano ela precisa ser comprada separadamente.
Da mesma forma que no ano passado, há também a opção de escolher um painel com iluminação de fundo mini-LED, que foi aprimorada mais uma vez: O número de zonas de escurecimento foi dobrado para 1.024, a taxa de atualização aumentou de 165 para 240 Hz e o brilho máximo aumentou ligeiramente para 1.100 nits (HDR). Infelizmente, o painel mini-LED (analisado aqui) só está disponível na RTX 4070ou modelos com especificações mais altas e, portanto, não está presente em nosso modelo de análise.
No entanto, o site da Asus dá a impressão de que todos os modelos vêm com uma tela mini-LED, mesmo aqueles com RTX 4050 e RTX 4060. Portanto, preste muita atenção ao comprar!
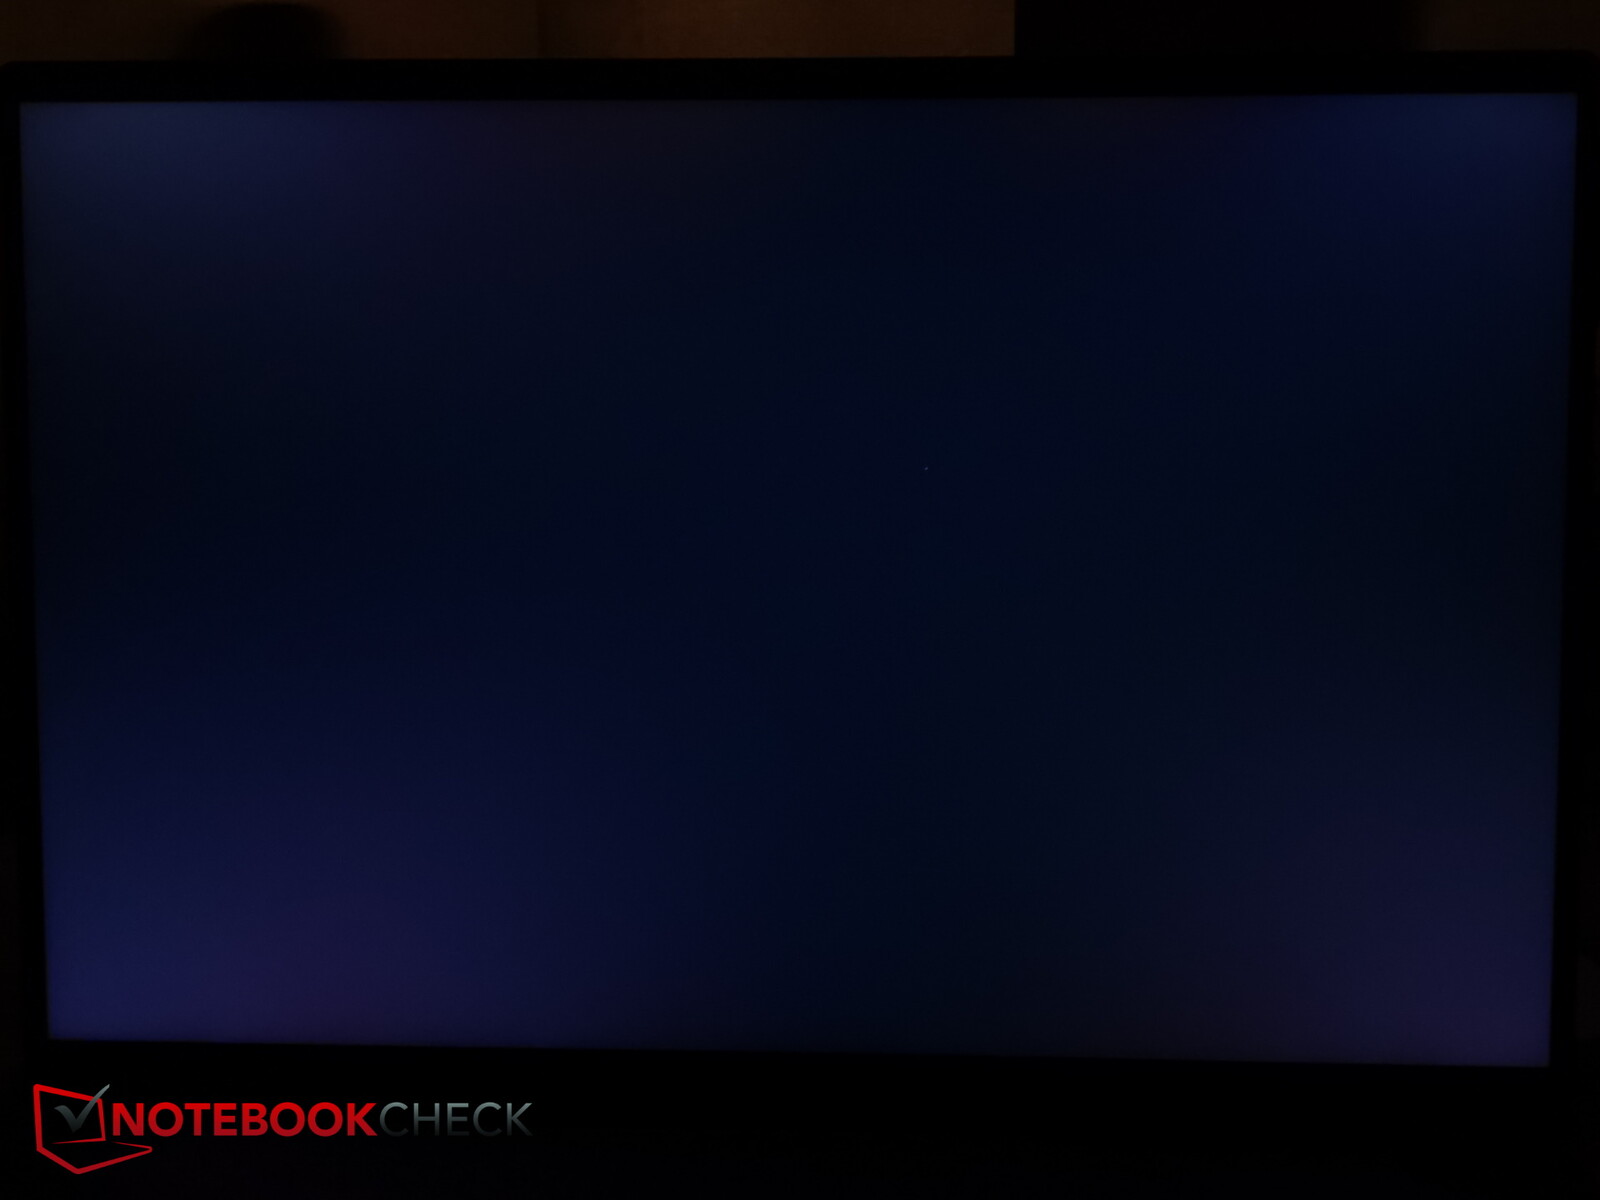
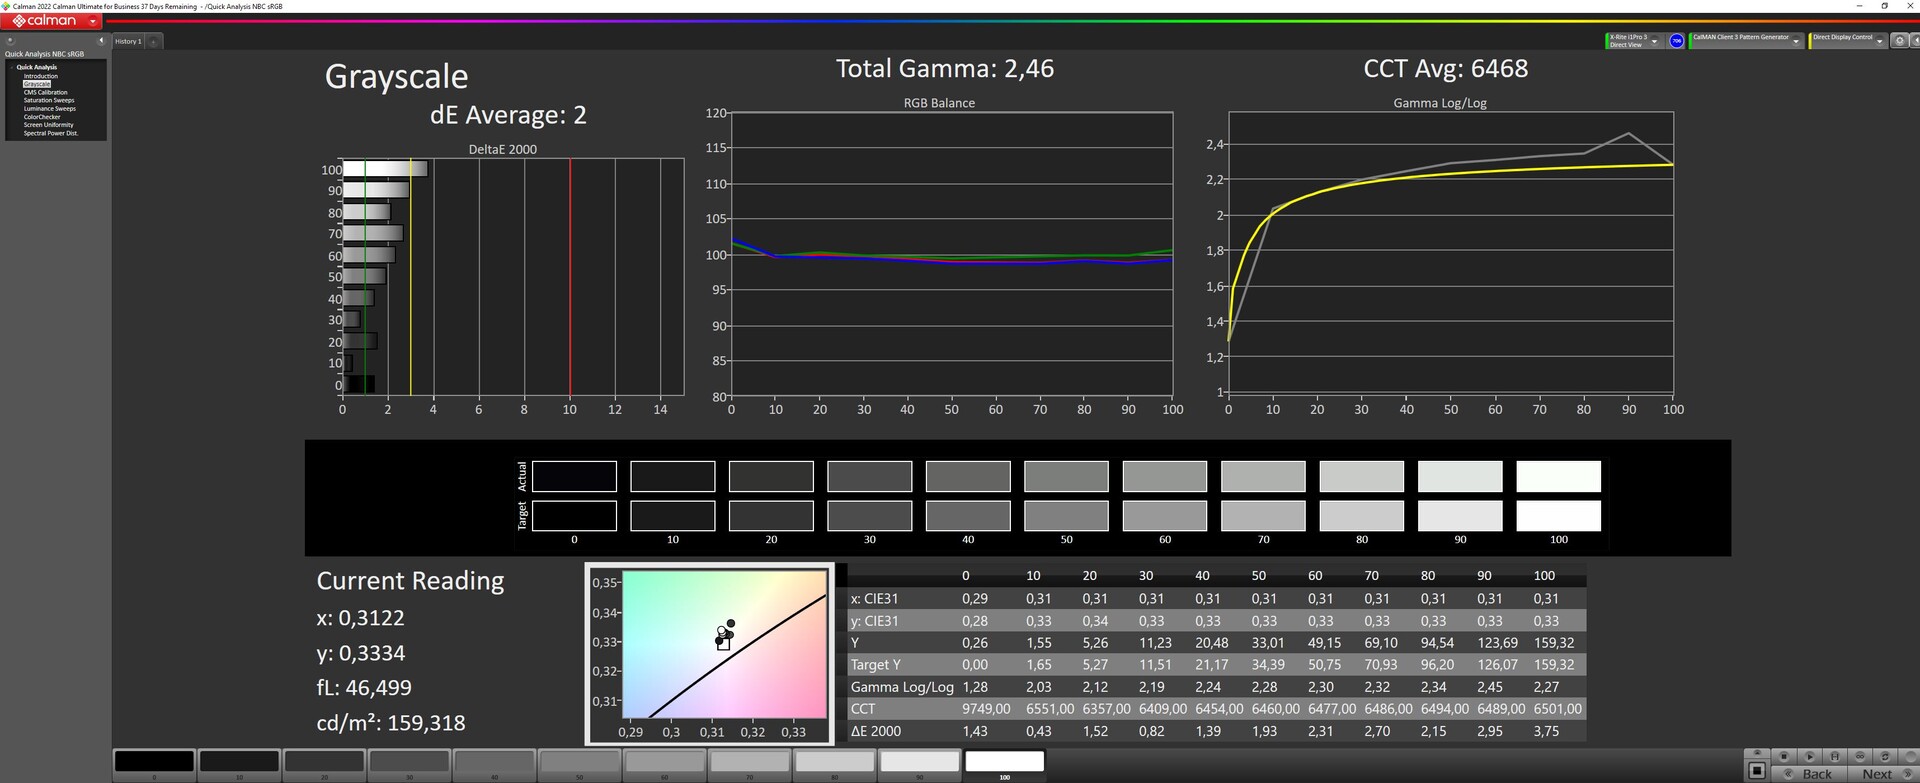
No entanto, mesmo sem o mini-LED, nosso modelo padrão mediu um brilho médio de cerca de 469 nits com uma iluminação de 91%. Os níveis de preto são de um aceitável 0,39, resultando em uma taxa de contraste de 1.246:1.
Os tempos de resposta são muito rápidos, não há necessidade de se preocupar com PWM e o sangramento da luz de fundo é mínimo, sendo visível apenas na borda superior.
| |||||||||||||||||||||||||
iluminação: 91 %
iluminação com acumulador: 487 cd/m²
Contraste: 1246:1 (Preto: 0.39 cd/m²)
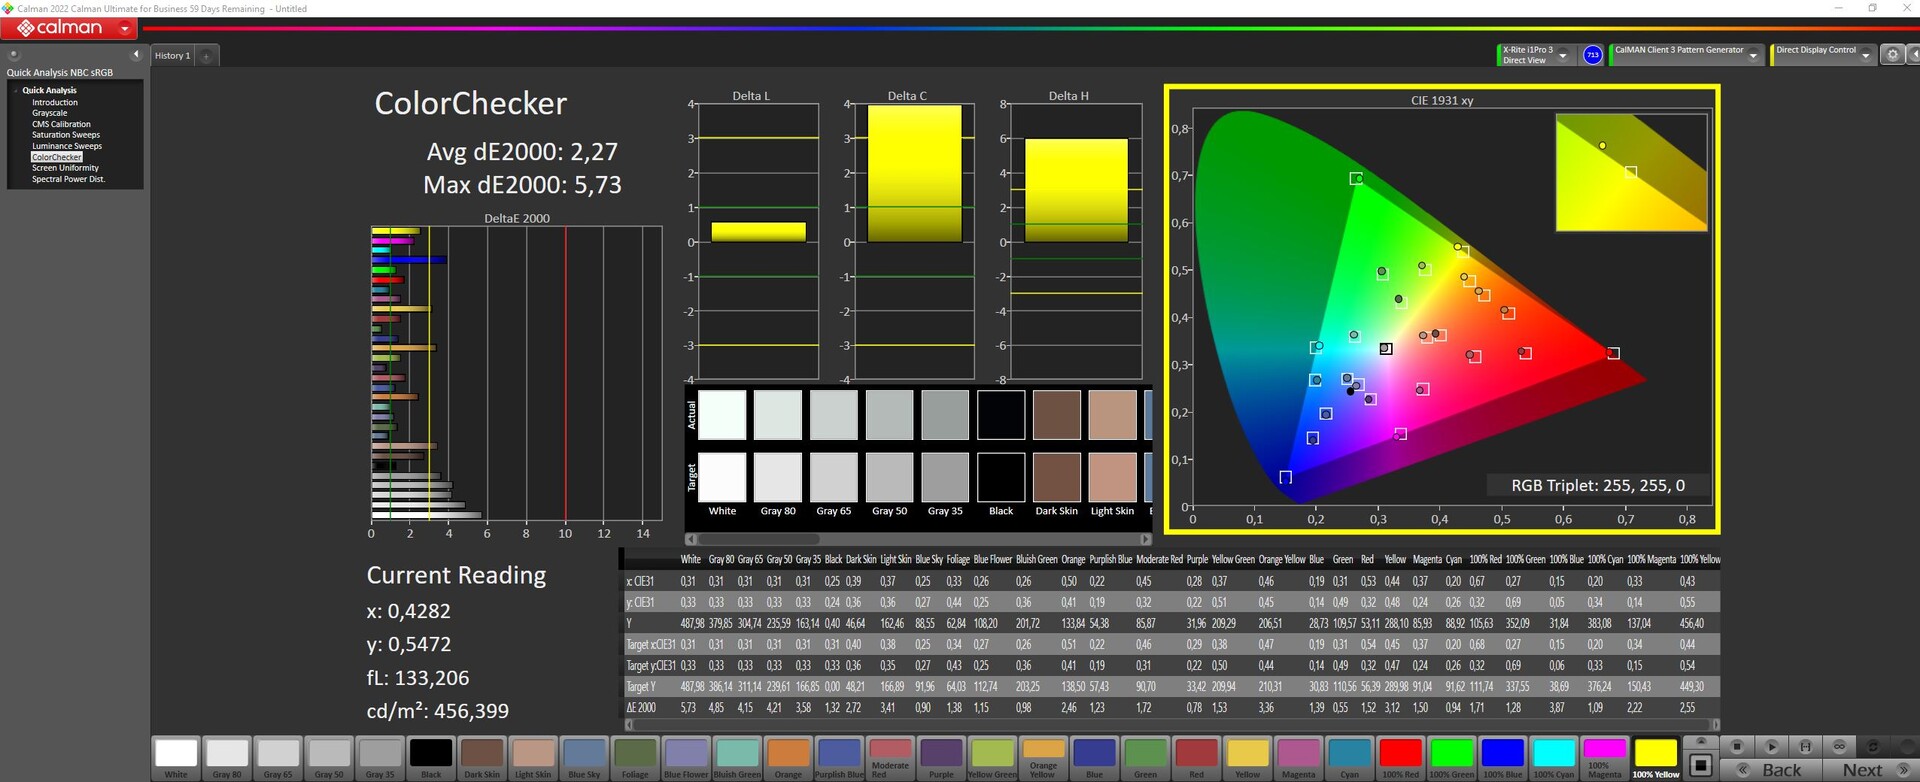
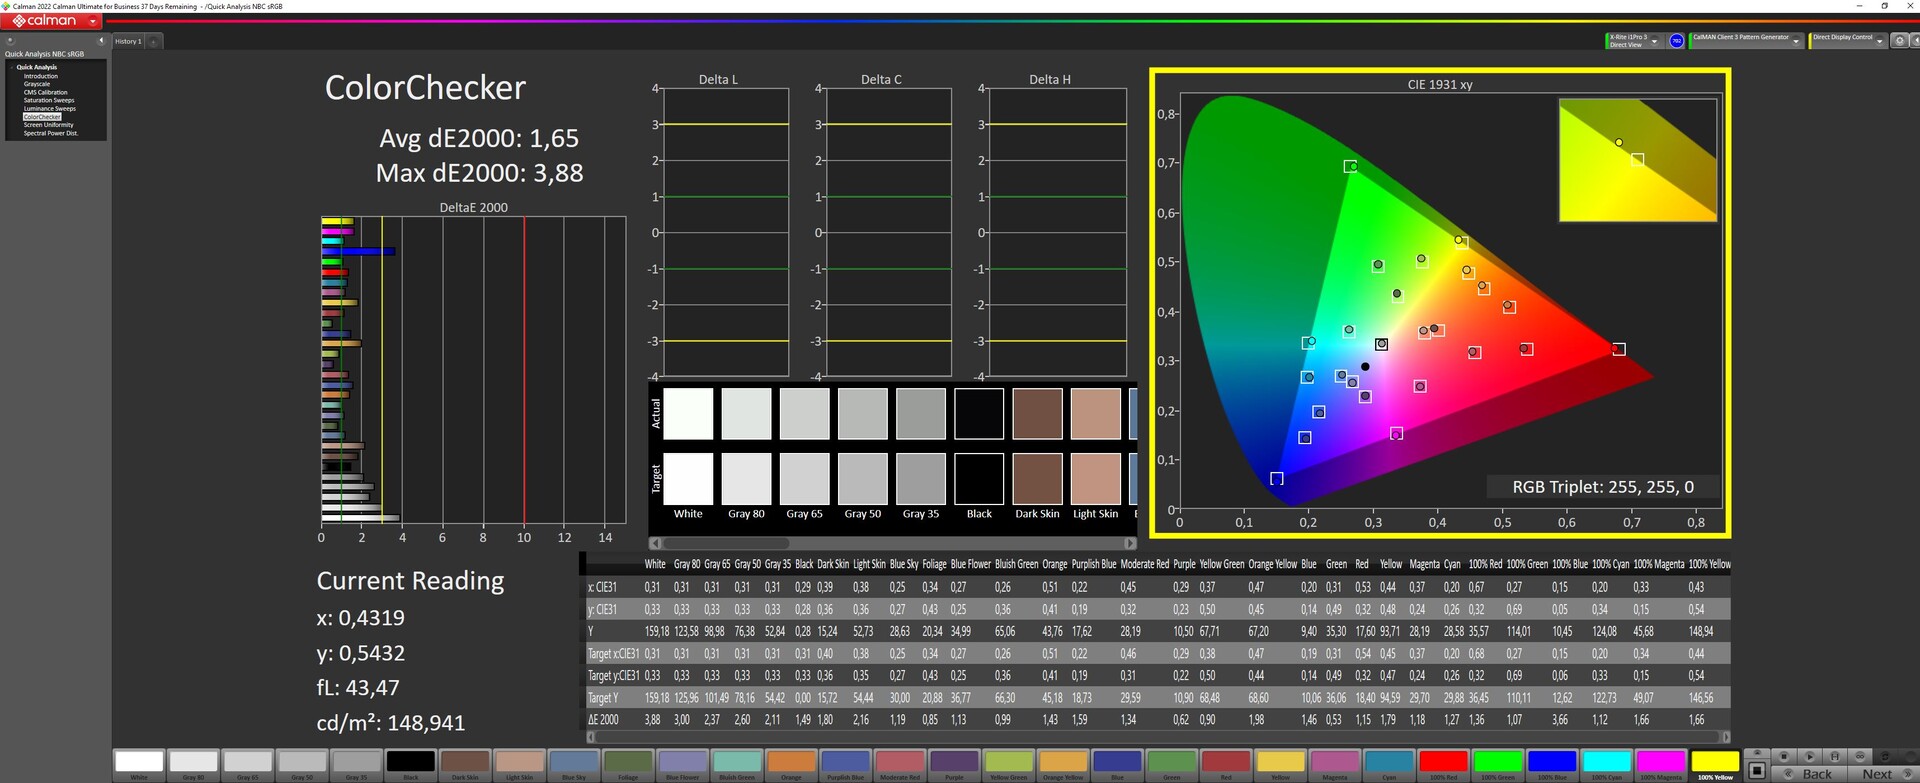
ΔE ColorChecker Calman: 2.27 | ∀{0.5-29.43 Ø4.71}
calibrated: 0.6
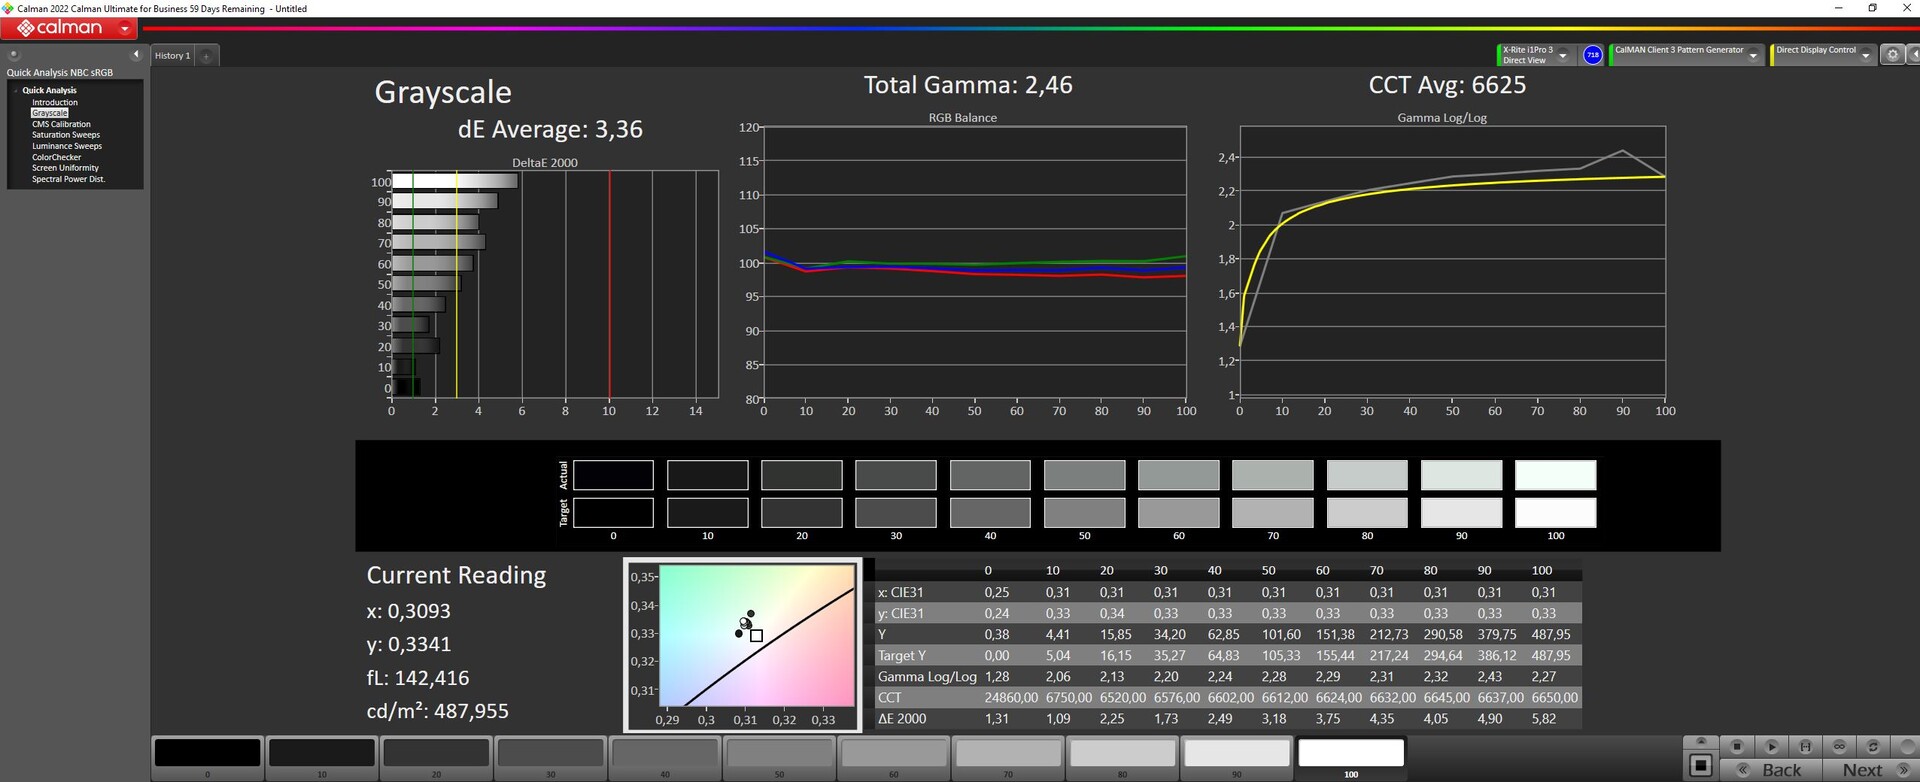
ΔE Greyscale Calman: 3.36 | ∀{0.09-98 Ø4.96}
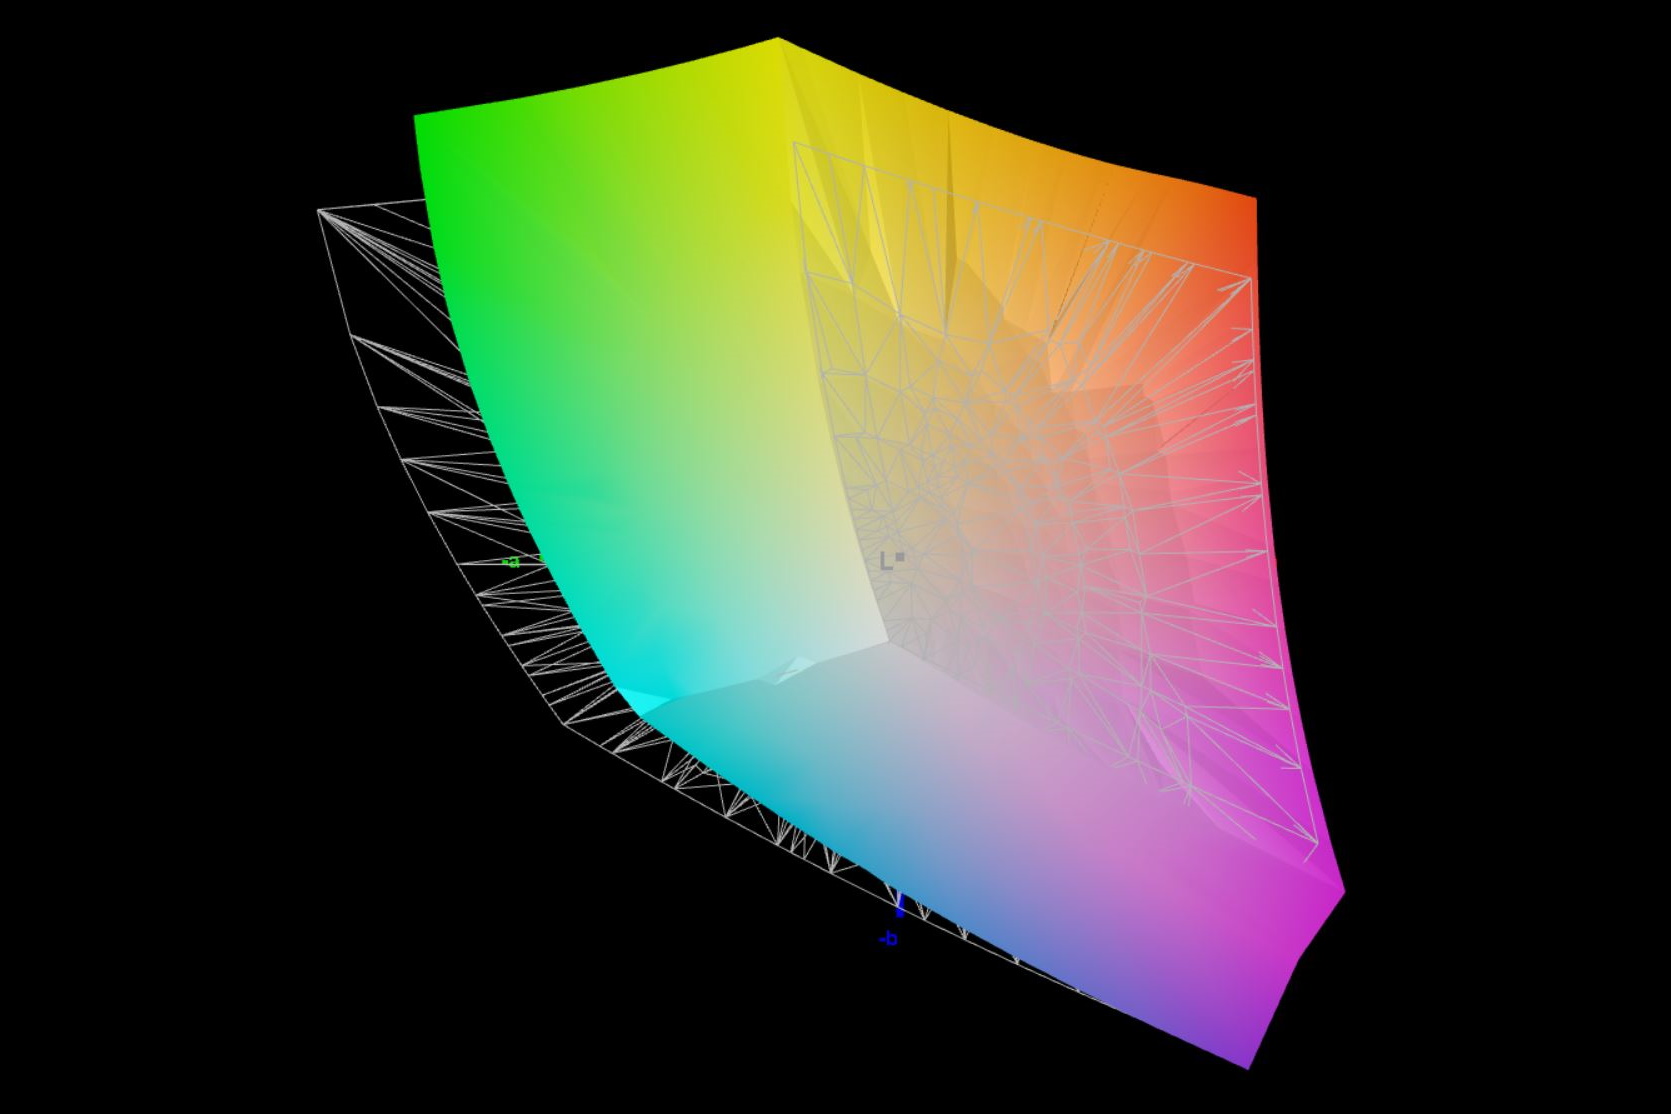
84.63% AdobeRGB 1998 (Argyll 3D)
99.92% sRGB (Argyll 3D)
96.61% Display P3 (Argyll 3D)
Gamma: 2.46
CCT: 6625 K
| Asus ROG Flow X16 GV601V TMX1603 (TL160ADMP03-0), IPS, 2560x1600, 16" | Asus ROG Flow X16 GV601RW-M5082W AUO B160QAN02.S, Mini LED, 2560x1600, 16.1" | Samsung Galaxy Book3 Ultra 16, i9-13900H RTX 4070 Samsung SDC4185 ATNA60CL03-0, OLED / AMOLED, 2880x1800, 16" | Lenovo Legion Pro 5 16IRX8 AU Optronics B160QAN03.1, IPS, 2560x1600, 16" | Lenovo Yoga Pro 7 14IRH G8 LEN145-3K, IPS, 3072x1920, 14.5" | MSI Katana 17 B13VFK B173HAN04.9, IPS LED, 1920x1080, 17.3" | |
|---|---|---|---|---|---|---|
| Display | 3% | 4% | -13% | 2% | -49% | |
| Display P3 Coverage (%) | 96.61 | 99.82 3% | 95.3 -1% | 71.2 -26% | 98.7 2% | 40.8 -58% |
| sRGB Coverage (%) | 99.92 | 99.99 0% | 99.1 -1% | 98.8 -1% | 100 0% | 61 -39% |
| AdobeRGB 1998 Coverage (%) | 84.63 | 90.21 7% | 97.4 15% | 73.3 -13% | 87.6 4% | 42.2 -50% |
| Response Times | -117% | 61% | -160% | -419% | -505% | |
| Response Time Grey 50% / Grey 80% * (ms) | 3.8 ? | 11 ? -189% | 2 ? 47% | 14.5 ? -282% | 31.5 ? -729% | 33 ? -768% |
| Response Time Black / White * (ms) | 7.6 ? | 11 ? -45% | 2 ? 74% | 10.4 ? -37% | 15.8 ? -108% | 26 ? -242% |
| PWM Frequency (Hz) | 7400 ? | 250 ? | ||||
| Screen | 16% | 2% | 8% | 26% | -111% | |
| Brightness middle (cd/m²) | 486 | 498 2% | 403 -17% | 405.7 -17% | 441 -9% | 267 -45% |
| Brightness (cd/m²) | 469 | 502 7% | 408 -13% | 368 -22% | 453 -3% | 256 -45% |
| Brightness Distribution (%) | 91 | 94 3% | 98 8% | 87 -4% | 92 1% | 93 2% |
| Black Level * (cd/m²) | 0.39 | 0.11 72% | 0.38 3% | 0.34 13% | 0.21 46% | |
| Contrast (:1) | 1246 | 4527 263% | 1068 -14% | 1297 4% | 1271 2% | |
| Colorchecker dE 2000 * | 2.27 | 1.87 18% | 2.63 -16% | 1.65 27% | 0.6 74% | 4.7 -107% |
| Colorchecker dE 2000 max. * | 5.73 | 6.15 -7% | 4.07 29% | 4.2 27% | 1.3 77% | 20.4 -256% |
| Colorchecker dE 2000 calibrated * | 0.6 | 1.94 -223% | 0.53 12% | 0.6 -0% | 4.5 -650% | |
| Greyscale dE 2000 * | 3.36 | 3.15 6% | 2.69 20% | 1.2 64% | 0.8 76% | 1.5 55% |
| Gamma | 2.46 89% | 330.95 1% | 2.48 89% | 2.3 96% | 2.2 100% | 2.12 104% |
| CCT | 6625 98% | 7294 89% | 6907 94% | 6453 101% | 6597 99% | 6552 99% |
| Média Total (Programa/Configurações) | -33% /
-6% | 22% /
13% | -55% /
-20% | -130% /
-43% | -222% /
-154% |
* ... menor é melhor
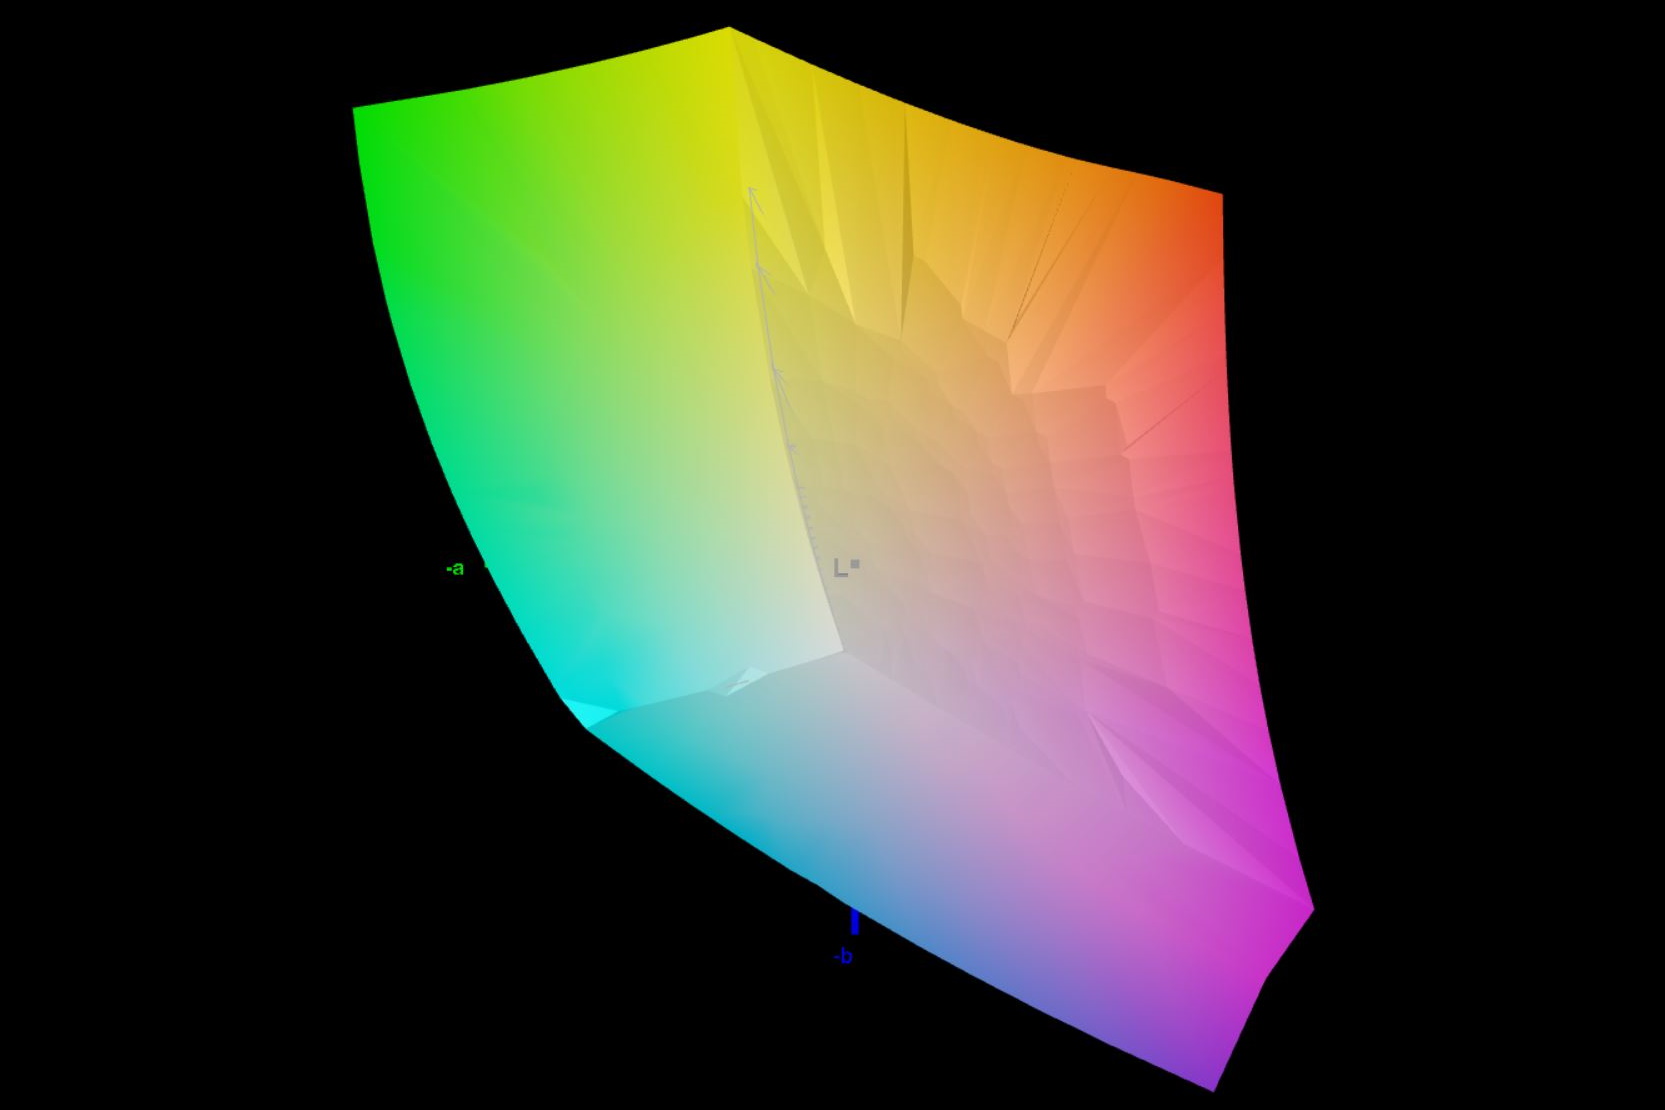
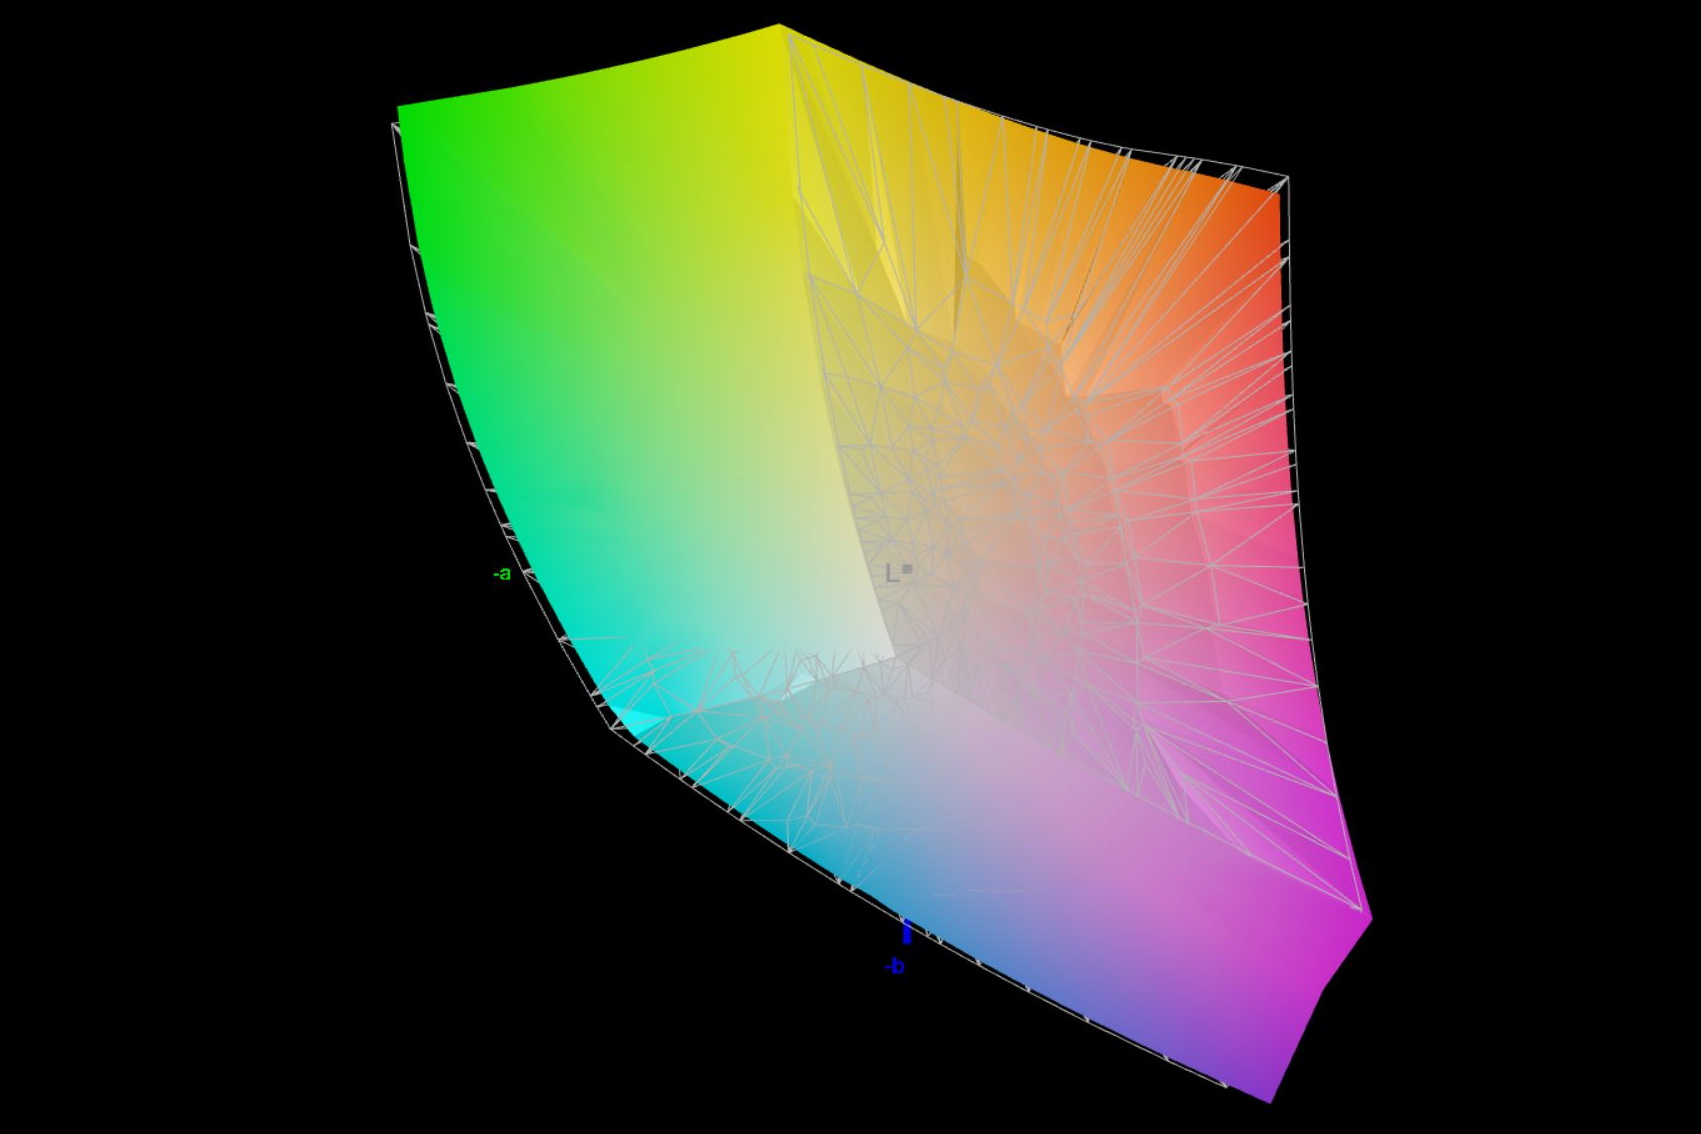
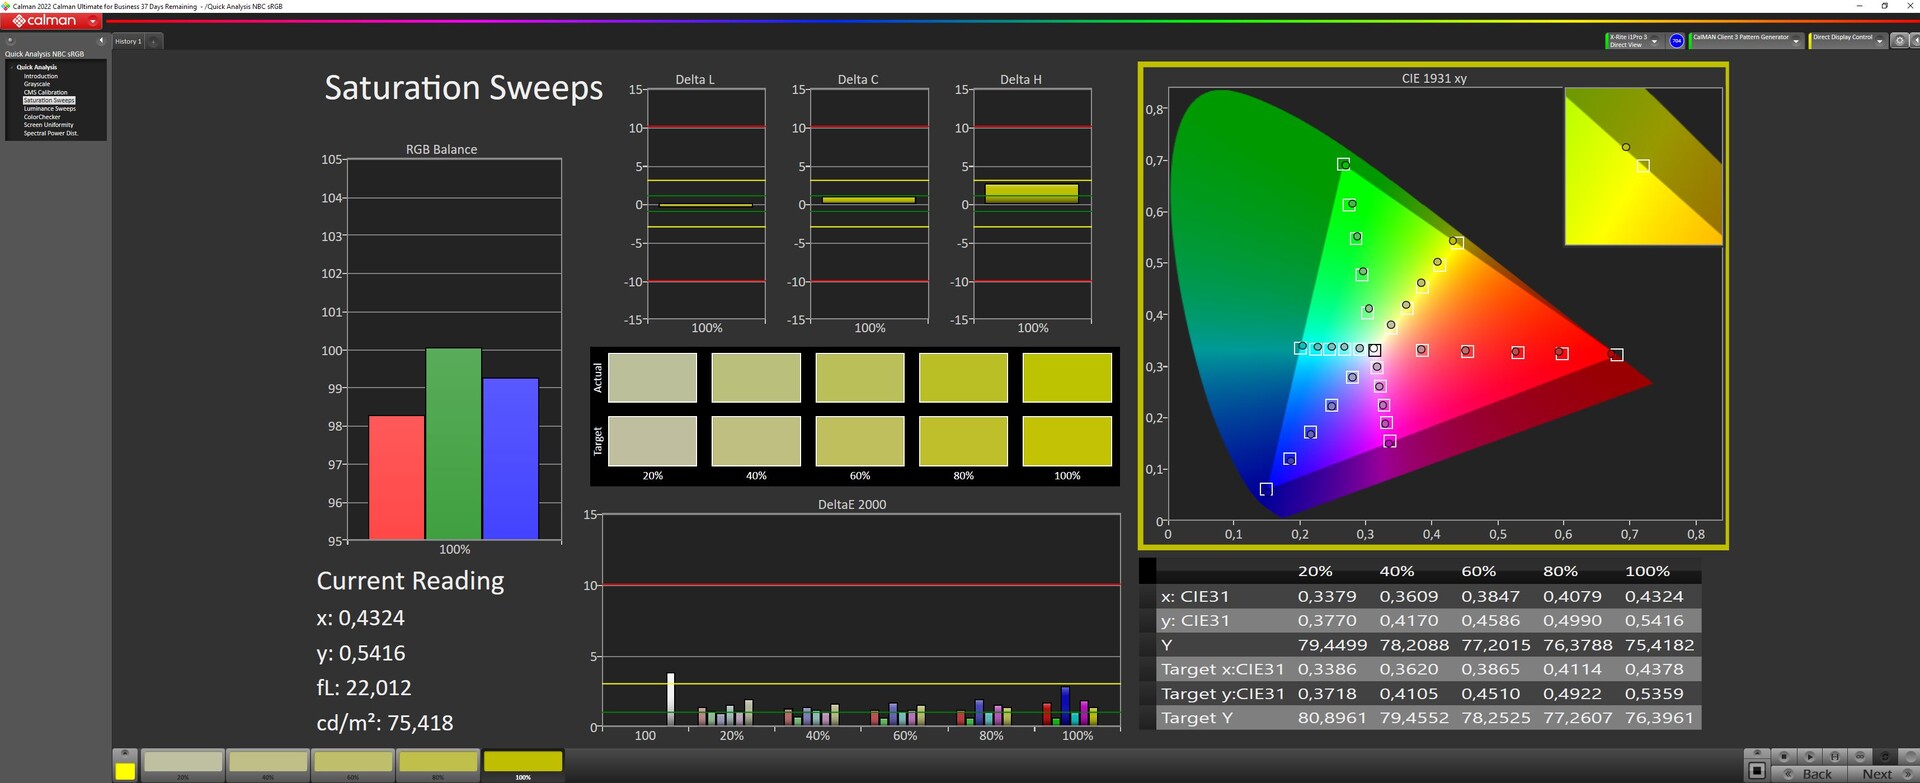
A Asus anuncia o dispositivo com 100% de DCI P3 e medimos cerca de 97%. O AdobeRGB é coberto em aproximadamente 85% e o sRGB completamente.
Para obter melhor precisão de cores, é útil reduzir o brilho da X16 para cerca de 50%. Posteriormente, o DeltaE em escala de cinza melhora de 3,36 para apenas 2. Além disso, o DeltaE do ColorChecker cai ainda mais. A nova calibração usando o i1Profiler não faz sentido.
Exibir tempos de resposta
| ↔ Tempo de resposta preto para branco | ||
|---|---|---|
| 7.6 ms ... ascensão ↗ e queda ↘ combinadas | ↗ 4 ms ascensão | 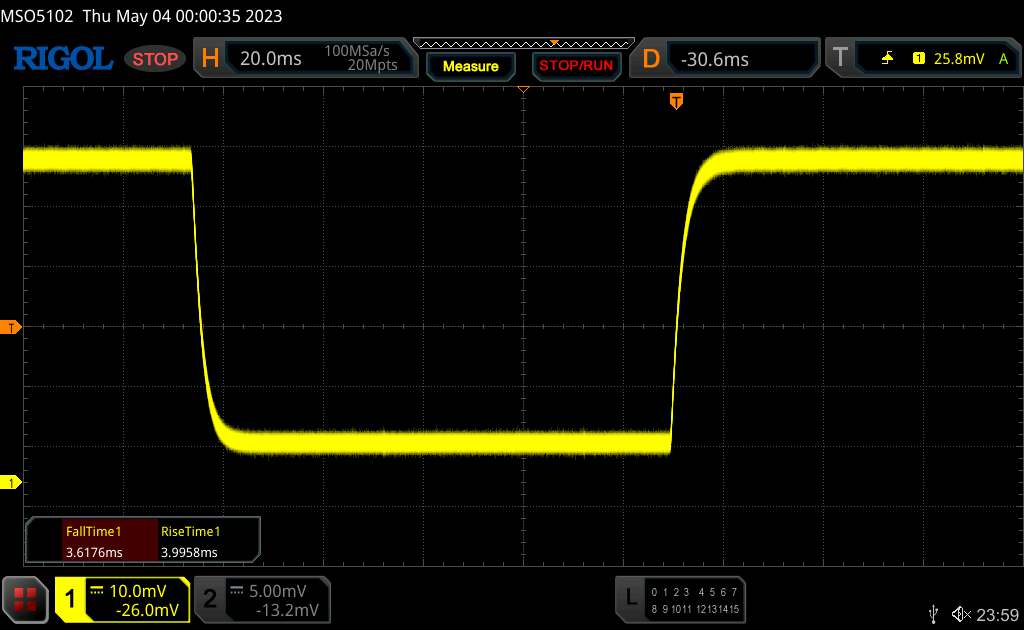 |
| ↘ 3.6 ms queda | ||
| A tela mostra taxas de resposta muito rápidas em nossos testes e deve ser muito adequada para jogos em ritmo acelerado. Em comparação, todos os dispositivos testados variam de 0.1 (mínimo) a 240 (máximo) ms. » 22 % de todos os dispositivos são melhores. Isso significa que o tempo de resposta medido é melhor que a média de todos os dispositivos testados (19.8 ms). | ||
| ↔ Tempo de resposta 50% cinza a 80% cinza | ||
| 3.8 ms ... ascensão ↗ e queda ↘ combinadas | ↗ 1.8 ms ascensão | 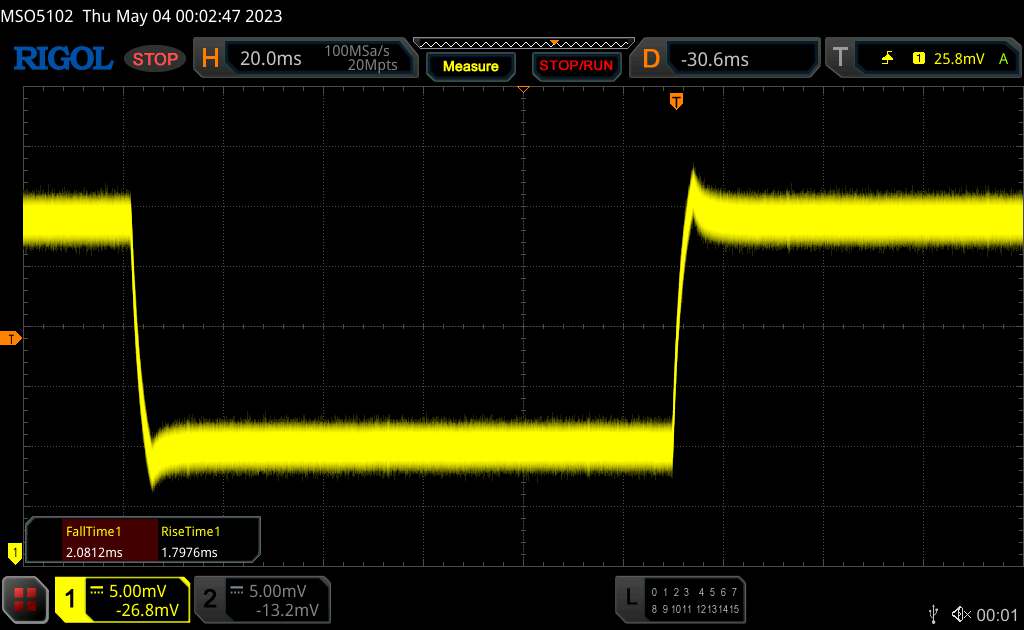 |
| ↘ 2 ms queda | ||
| A tela mostra taxas de resposta muito rápidas em nossos testes e deve ser muito adequada para jogos em ritmo acelerado. Em comparação, todos os dispositivos testados variam de 0.165 (mínimo) a 636 (máximo) ms. » 15 % de todos os dispositivos são melhores. Isso significa que o tempo de resposta medido é melhor que a média de todos os dispositivos testados (31 ms). | ||
Cintilação da tela / PWM (modulação por largura de pulso)
| Tela tremeluzindo / PWM não detectado | 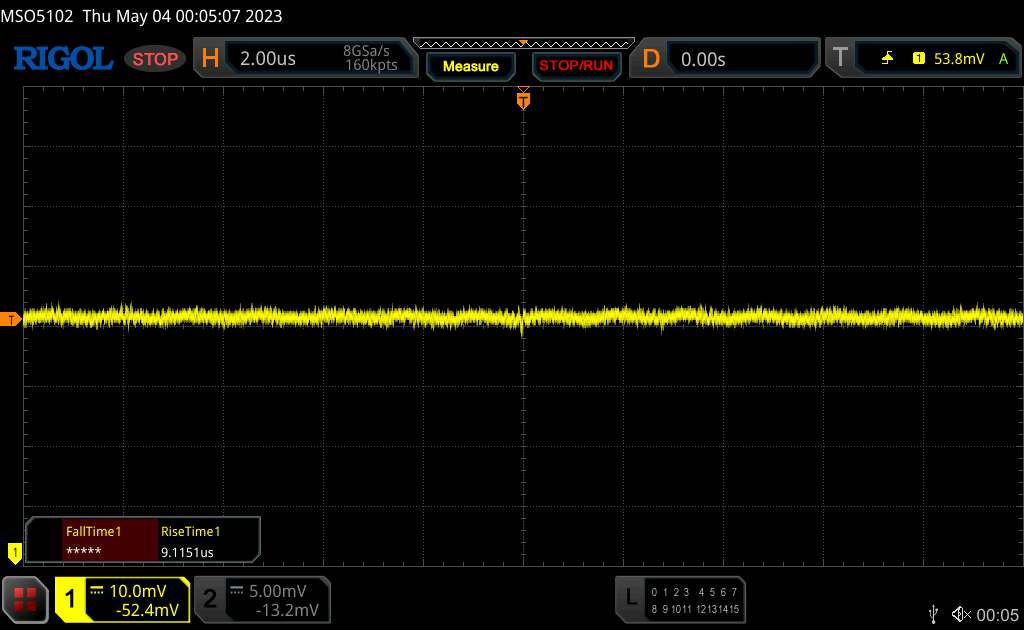 | ||
[pwm_comparison] Em comparação: 52 % de todos os dispositivos testados não usam PWM para escurecer a tela. Se PWM foi detectado, uma média de 7754 (mínimo: 5 - máximo: 343500) Hz foi medida. | |||
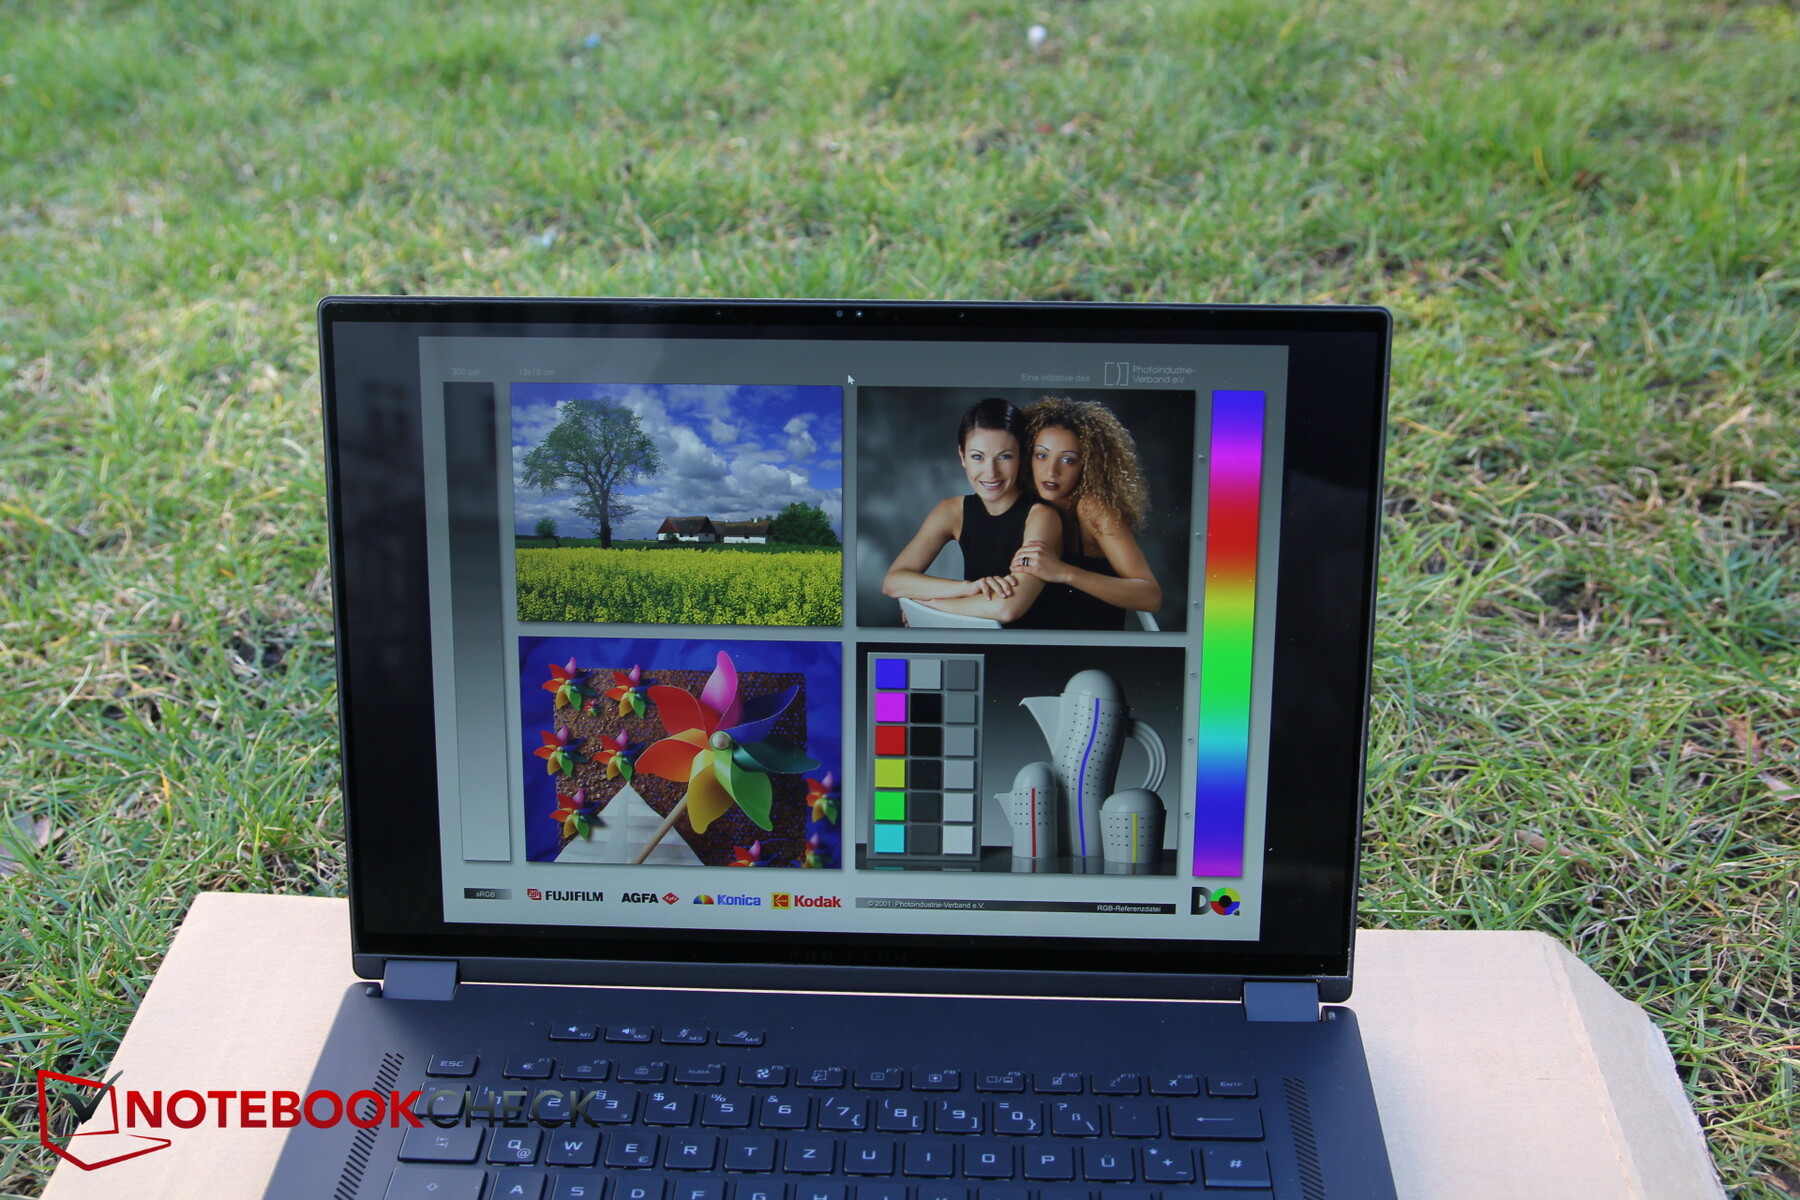
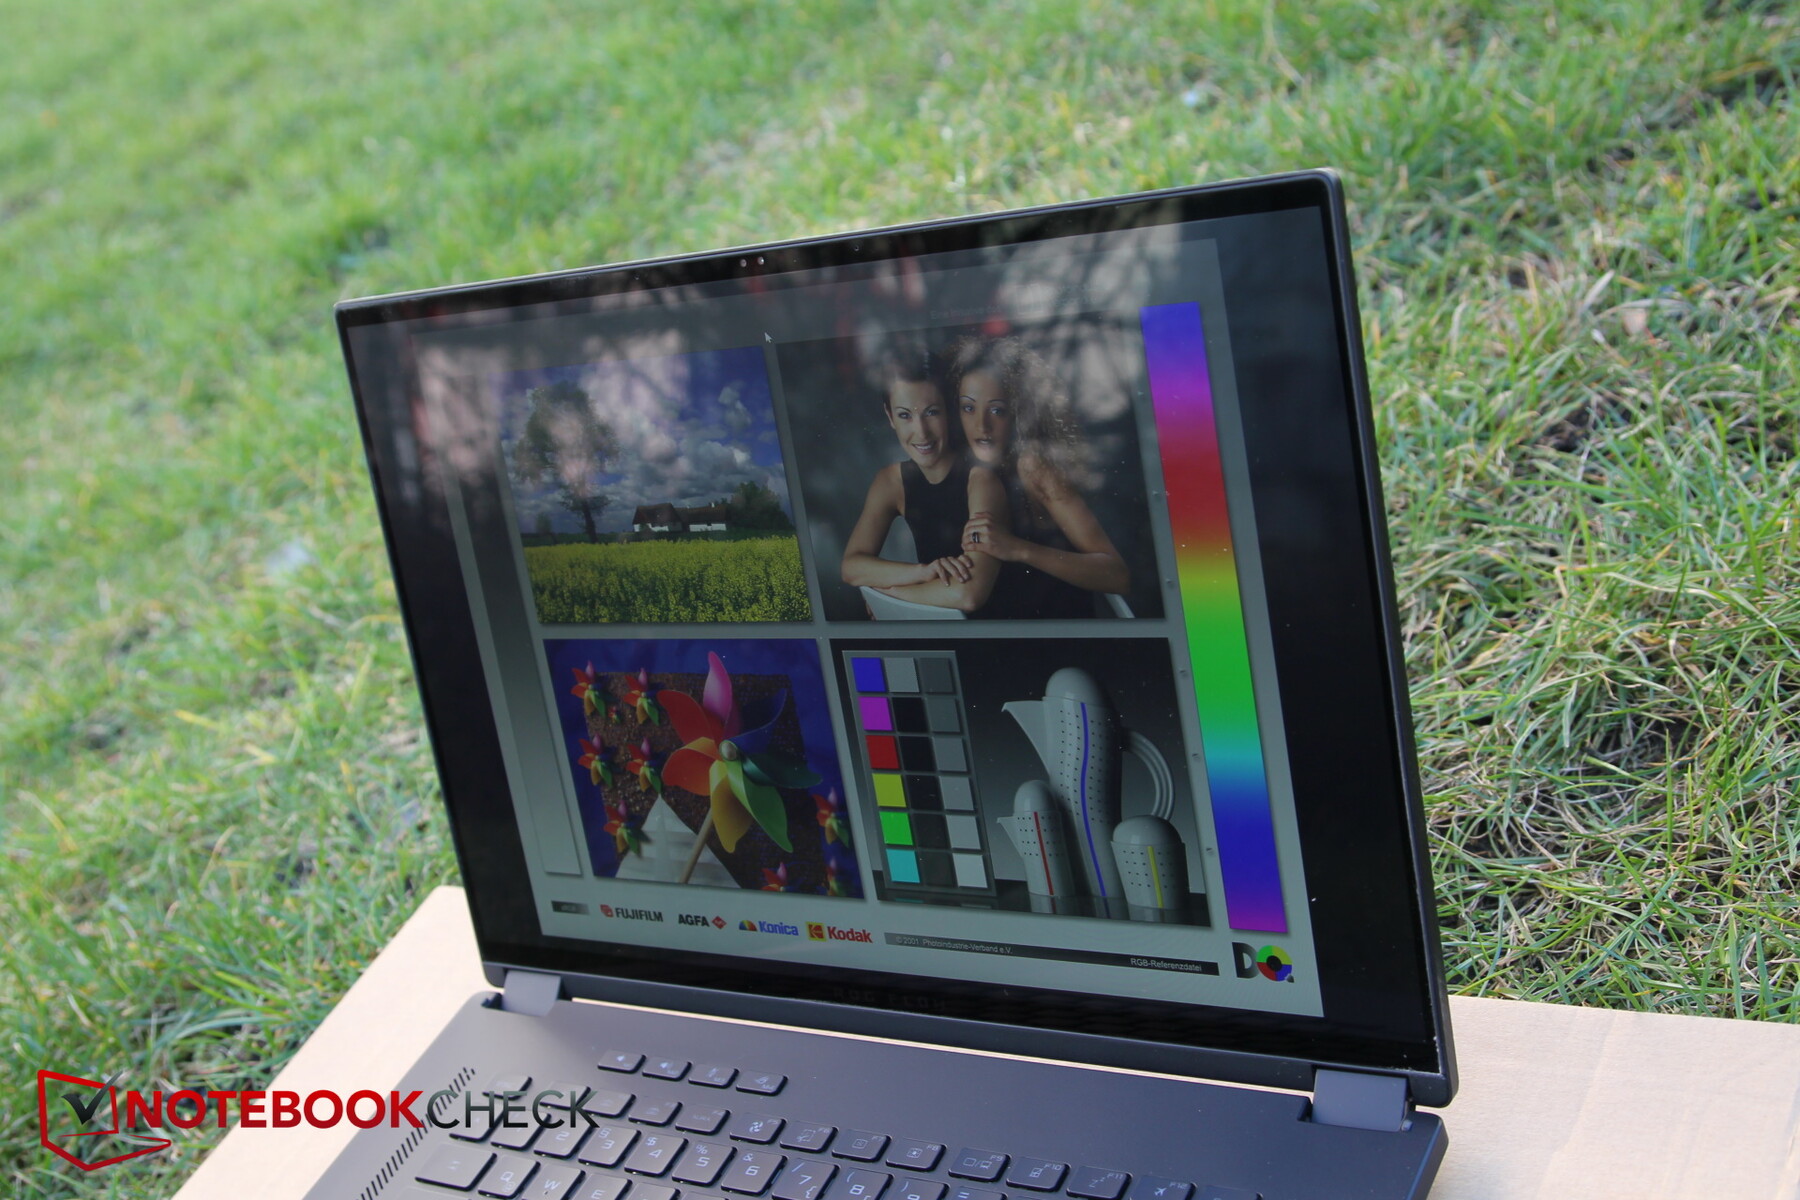
Em ambientes externos, o brilho muito alto ajuda tanto na luz solar direta quanto na sombra. Vista de ângulos amplos, a tela touchscreen brilhante dificulta a experiência de visualização.

Desempenho - Um slate poderoso da Asus
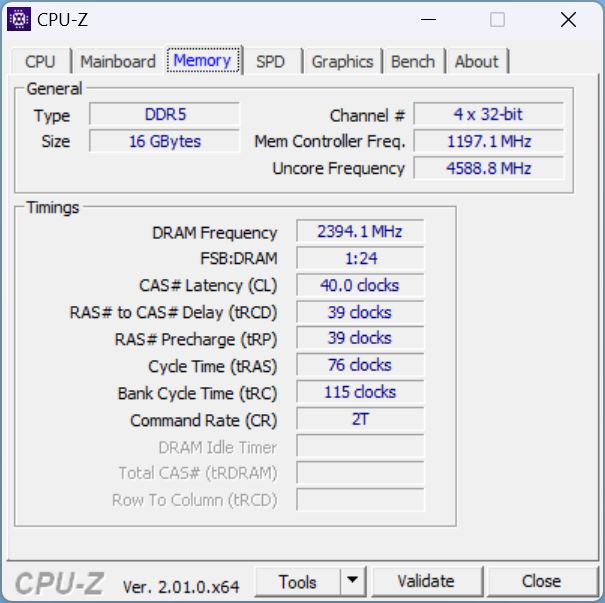
Todas as configurações têm em comum o Core i9-13900H. Opcionalmente, ele é combinado com umaRTX 4050, RTX 4060 ou RTX 4070. De acordo com o site, as SKUs com as duas placas de vídeo mais fracas são equipadas apenas com 8 GB de RAM, e a configuração da RTX 4070 vem com 16 GB. No entanto, nossa unidade de análise está equipada com uma RTX 4060 e 16 GB de RAM. Parece que a Asus pode ter atualizado nosso modelo de análise aqui. Além disso, o dispositivo pode ser equipado com até 64 GB de RAM.
Condições de teste
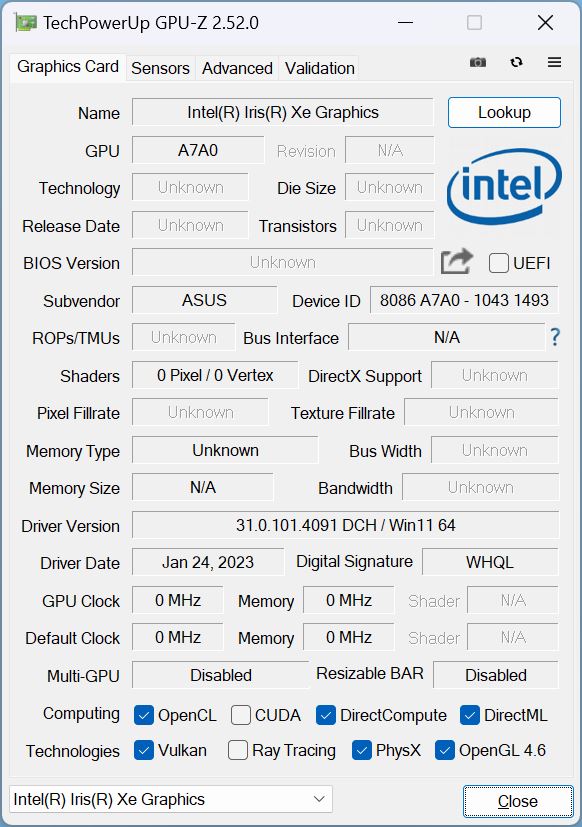
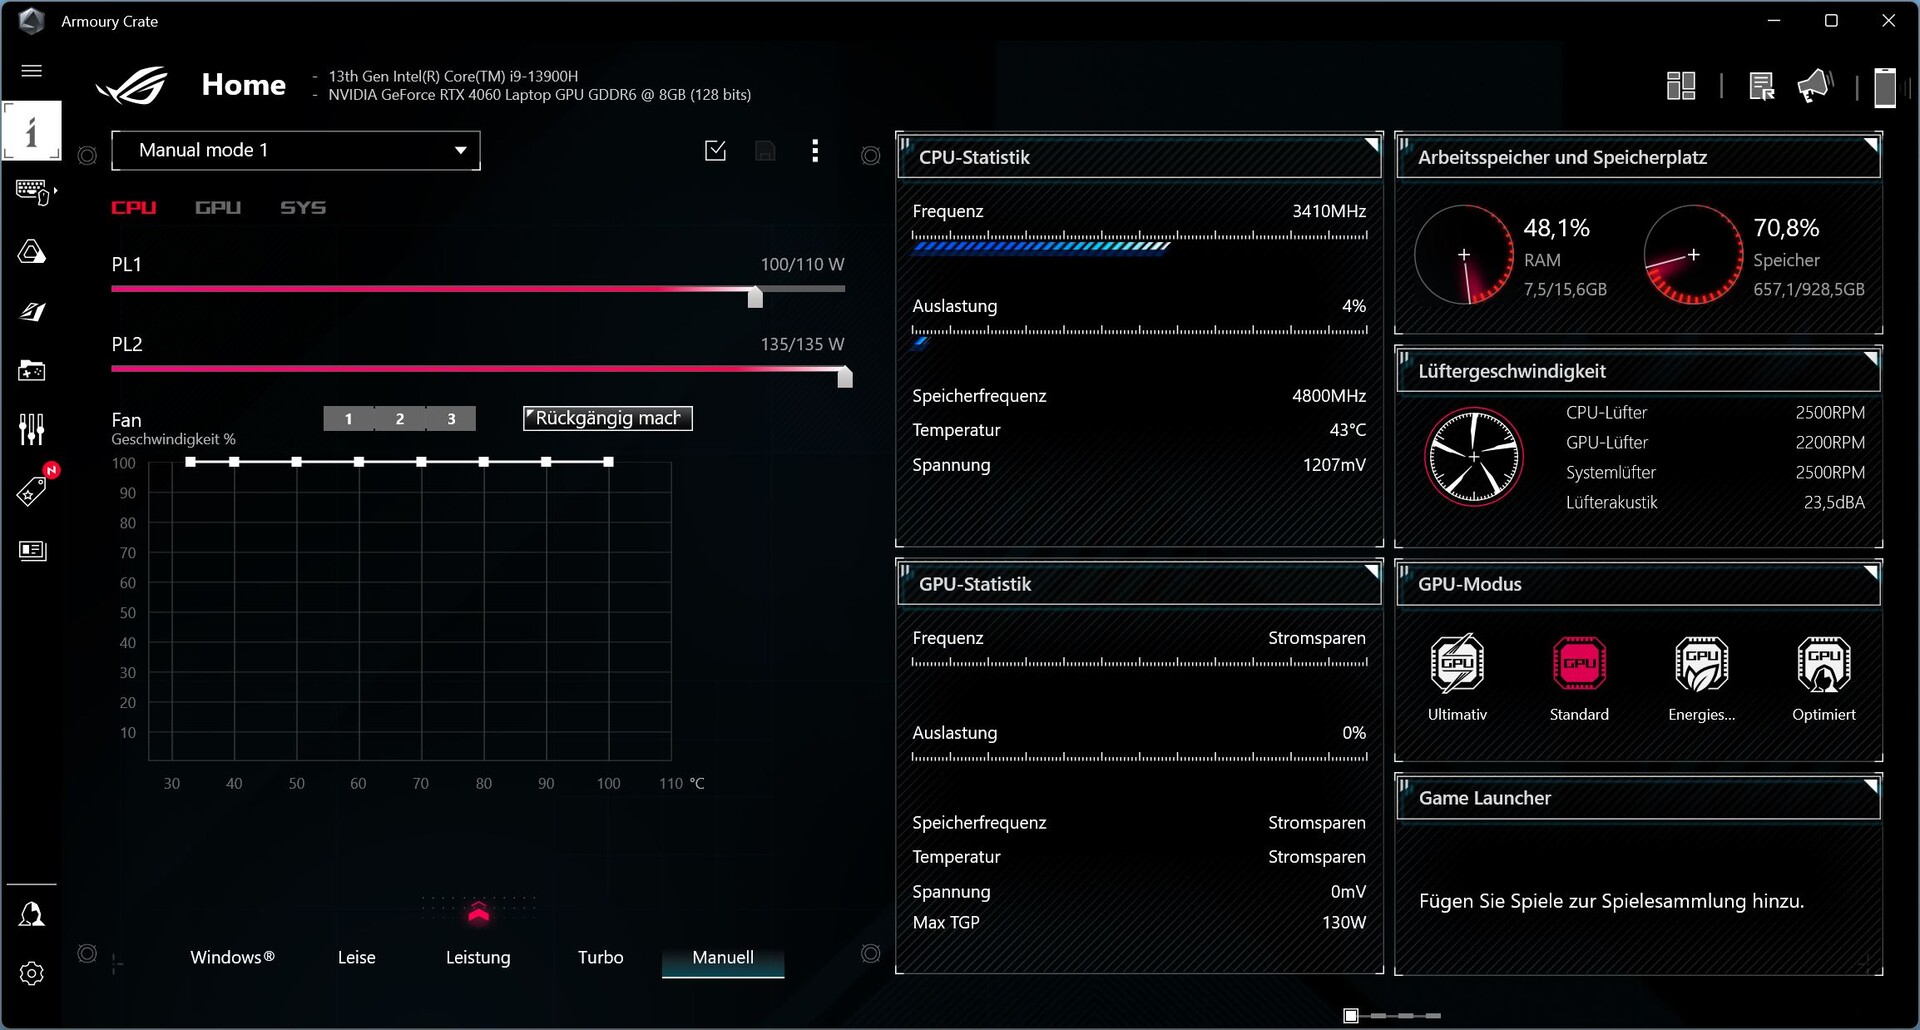
Os notebooks para jogos da Asus sempre têm dois aplicativos pré-instalados do fabricante que lembram um pouco o bloatware. O MyAsus é responsável pelas questões de suporte, enquanto o Armory Crate atua como centro de controle e, como infelizmente é de praxe hoje em dia, coleta de dados. O aplicativo ainda não está particularmente maduro, especialmente no que se refere à tradução. Constantemente há partes faltando ou cortadas. Além disso, o aplicativo às vezes se atualiza voluntariamente durante a inicialização, o que significa que o usuário precisa esperar muito tempo antes de ter acesso a itens como os modos de desempenho - irritante!
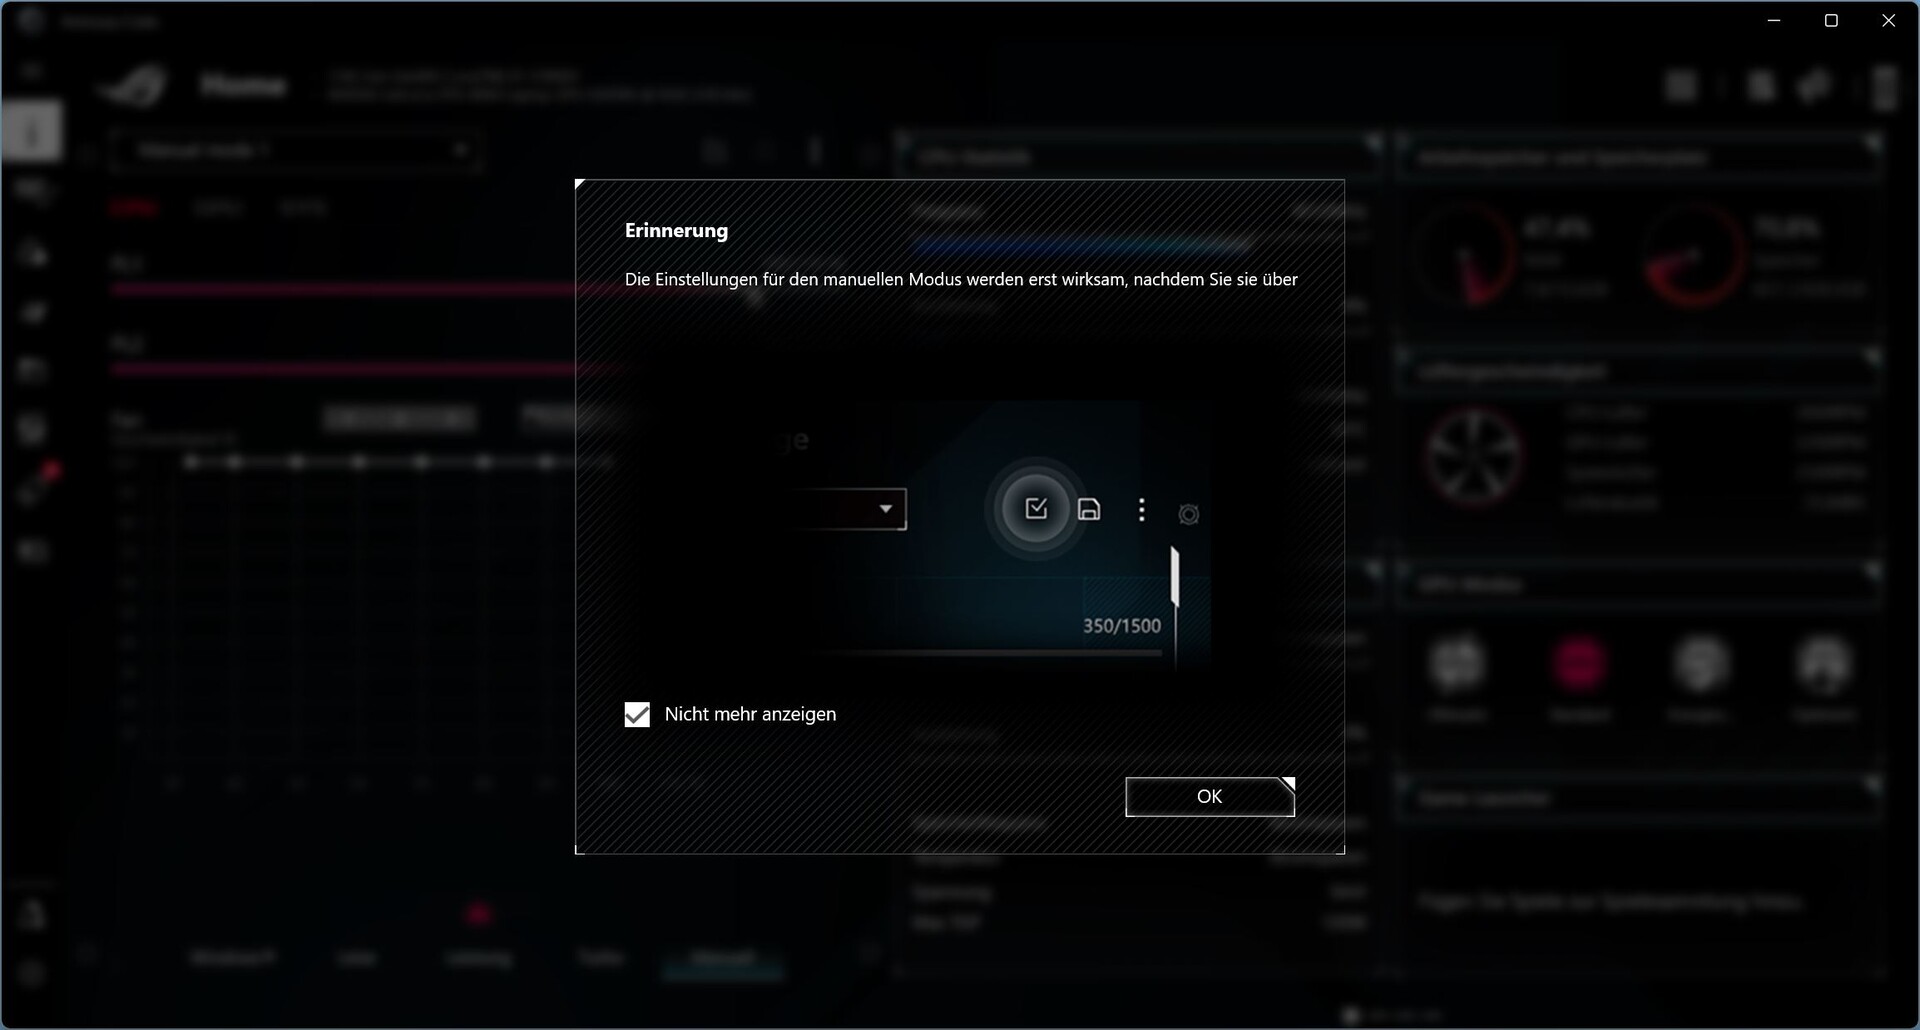

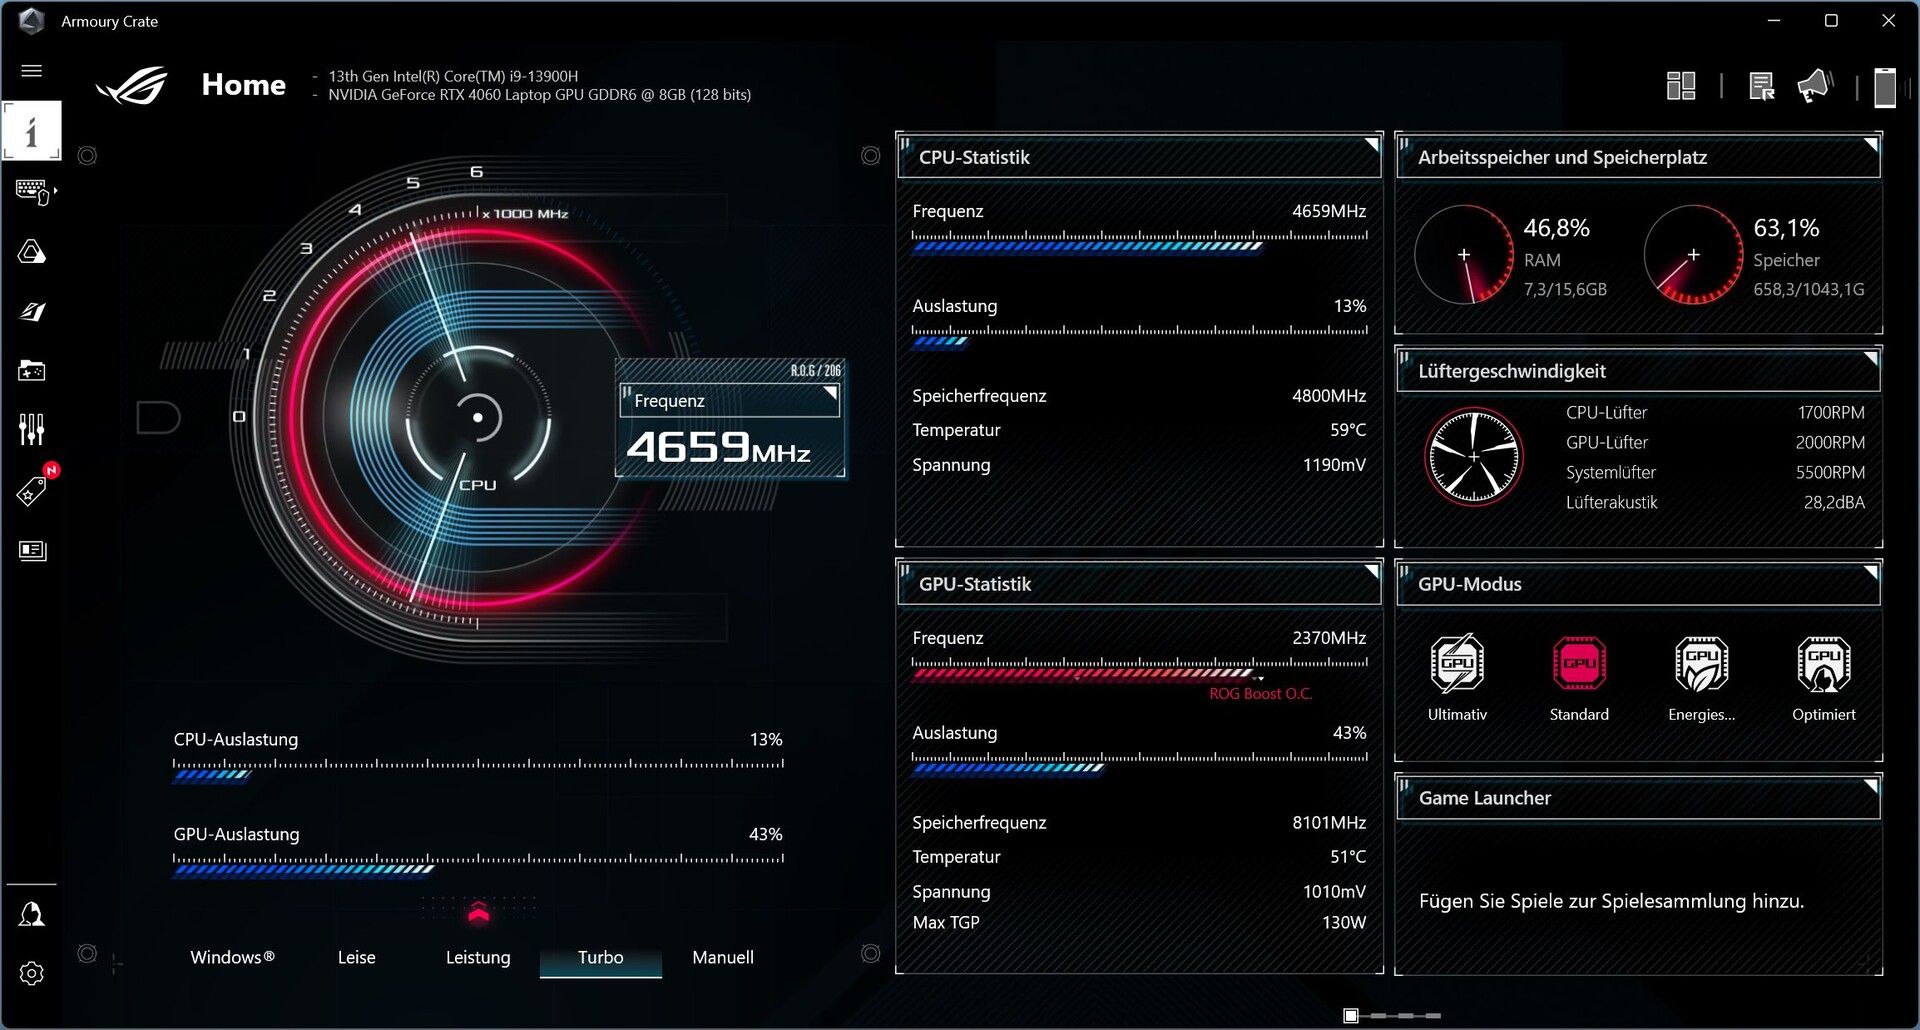
Há um total de quatro modos de desempenho (Windows, Silencioso, Desempenho, Turbo, Manual). Para obter os melhores resultados de benchmark, optamos pelo modo turbo. Entretanto, ainda apresentamos todos os resultados obtidos com o uso dos outros modos. Você também pode encontrar o interruptor MUX, em outras palavras, a alternância entre a iGPU e a dGPU aqui.
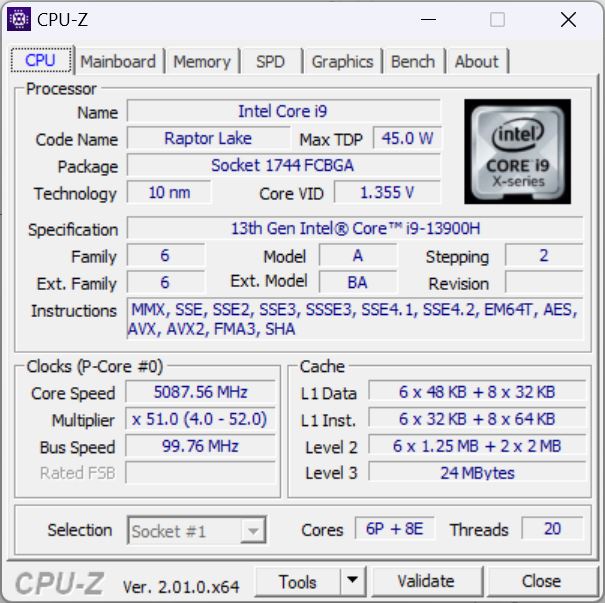
Processador
Apesar do gabinete fino, o X16 abriga um Intel Core i9-13900Huma CPU Raptor Lake de ponta com 6 núcleos P e 8 núcleos E, que pode funcionar de 1,9 GHz (velocidade de clock base do núcleo E) a 5,4 GHz (turbo de núcleo único).
Como a série H mais recente não apresenta praticamente nenhuma alteração em comparação com a série Alder Lake, não é de surpreender que o X16 não consiga se distanciar da concorrência do ano passado. O Lenovo Legion Pro 7com sua HX-CPU, está em uma liga diferente aqui. No entanto, é impressionante que a pontuação esteja 10% acima da média do i9-13900H do nosso banco de dados, apesar do formato fino.
Após as duas ou três primeiras execuções, o valor caiu um pouco. Abaixo, você pode encontrar o TDP da CPU dependendo do modo de desempenho selecionado, embora esses valores sejam mais teóricos (HWinfo). Como resultado, a CPU dificilmente consome mais de 100 watts, mesmo ao usar o modo turbo no CinebenchR15 e, durante uma execução no modo silencioso, o TDP caiu para menos de 60 watts.
No modo de bateria, o modo silencioso é selecionado automaticamente. O modo turbo está bloqueado, mas, teoricamente, você ainda pode ligar a energia.
| Leistungsmodus/TDP da CPU | PL1 | PL2 | Pontuação |
|---|---|---|---|
| Turbo | 110 | 135 | 3.100 |
| Leistung | 100 | 120 | 2.882 |
| Leise | 80 | 100 | 2.342 |
| Akku Leistung | 38 | 60 | 2.199 |
| Akku Leise | 30 | 30 | 1.604 |
Cinebench R15 Multi Continuous Test
Cinebench R23: Multi Core | Single Core
Cinebench R20: CPU (Multi Core) | CPU (Single Core)
Cinebench R15: CPU Multi 64Bit | CPU Single 64Bit
Blender: v2.79 BMW27 CPU
7-Zip 18.03: 7z b 4 | 7z b 4 -mmt1
Geekbench 5.5: Multi-Core | Single-Core
HWBOT x265 Benchmark v2.2: 4k Preset
LibreOffice : 20 Documents To PDF
R Benchmark 2.5: Overall mean
| HWBOT x265 Benchmark v2.2 / 4k Preset | |
| Lenovo Legion Pro 7 16IRX8H | |
| Média da turma Gaming (11.5 - 44.4, n=105, últimos 2 anos) | |
| Asus ROG Zephyrus M16 GU604VY-NM042X | |
| Asus ROG Flow X16 GV601V | |
| MSI Creator Z16P B12UHST | |
| Lenovo Legion Slim 7-16IAH 82TF004YGE | |
| Média Intel Core i9-13900H (14.1 - 22.3, n=25) | |
| Lenovo Legion S7 16ARHA7 | |
| Razer Blade 15 OLED (Early 2022) | |
| MSI Katana 17 B13VFK | |
| Corsair Voyager a1600 | |
| Asus ROG Flow X16 GV601RW-M5082W | |
| LibreOffice / 20 Documents To PDF | |
| Corsair Voyager a1600 | |
| MSI Katana 17 B13VFK | |
| Asus ROG Flow X16 GV601RW-M5082W | |
| Razer Blade 15 OLED (Early 2022) | |
| Asus ROG Zephyrus M16 GU604VY-NM042X | |
| Média da turma Gaming (33.2 - 88.8, n=105, últimos 2 anos) | |
| Lenovo Legion S7 16ARHA7 | |
| Média Intel Core i9-13900H (34.4 - 82.8, n=25) | |
| Lenovo Legion Pro 7 16IRX8H | |
| Lenovo Legion Slim 7-16IAH 82TF004YGE | |
| MSI Creator Z16P B12UHST | |
| Asus ROG Flow X16 GV601V | |
| R Benchmark 2.5 / Overall mean | |
| Razer Blade 15 OLED (Early 2022) | |
| Asus ROG Flow X16 GV601RW-M5082W | |
| Corsair Voyager a1600 | |
| Lenovo Legion Slim 7-16IAH 82TF004YGE | |
| Lenovo Legion S7 16ARHA7 | |
| Média Intel Core i9-13900H (0.4052 - 0.723, n=25) | |
| MSI Katana 17 B13VFK | |
| MSI Creator Z16P B12UHST | |
| Média da turma Gaming (0.3439 - 0.759, n=106, últimos 2 anos) | |
| Asus ROG Flow X16 GV601V | |
| Asus ROG Zephyrus M16 GU604VY-NM042X | |
| Lenovo Legion Pro 7 16IRX8H | |
* ... menor é melhor
AIDA64: FP32 Ray-Trace | FPU Julia | CPU SHA3 | CPU Queen | FPU SinJulia | FPU Mandel | CPU AES | CPU ZLib | FP64 Ray-Trace | CPU PhotoWorxx
| Performance rating | |
| Média da turma Gaming | |
| Asus ROG Flow X16 GV601RW-M5082W | |
| Lenovo Legion S7 16ARHA7 | |
| Corsair Voyager a1600 | |
| Asus ROG Flow X16 GV601V | |
| Lenovo Legion Slim 7-16IAH 82TF004YGE | |
| Média Intel Core i9-13900H | |
| Razer Blade 15 OLED (Early 2022) | |
| MSI Creator Z16P B12UHST | |
| MSI Katana 17 B13VFK | |
| AIDA64 / FP32 Ray-Trace | |
| Média da turma Gaming (10227 - 85542, n=105, últimos 2 anos) | |
| Lenovo Legion Slim 7-16IAH 82TF004YGE | |
| Asus ROG Flow X16 GV601RW-M5082W | |
| Lenovo Legion S7 16ARHA7 | |
| Corsair Voyager a1600 | |
| Média Intel Core i9-13900H (6788 - 19557, n=25) | |
| MSI Katana 17 B13VFK | |
| Razer Blade 15 OLED (Early 2022) | |
| Asus ROG Flow X16 GV601V | |
| MSI Creator Z16P B12UHST | |
| AIDA64 / FPU Julia | |
| Média da turma Gaming (51376 - 238426, n=105, últimos 2 anos) | |
| Lenovo Legion S7 16ARHA7 | |
| Asus ROG Flow X16 GV601RW-M5082W | |
| Corsair Voyager a1600 | |
| Asus ROG Flow X16 GV601V | |
| Lenovo Legion Slim 7-16IAH 82TF004YGE | |
| Média Intel Core i9-13900H (22551 - 95579, n=25) | |
| Razer Blade 15 OLED (Early 2022) | |
| MSI Katana 17 B13VFK | |
| MSI Creator Z16P B12UHST | |
| AIDA64 / CPU SHA3 | |
| Média da turma Gaming (2180 - 10115, n=105, últimos 2 anos) | |
| Asus ROG Flow X16 GV601V | |
| Lenovo Legion Slim 7-16IAH 82TF004YGE | |
| Asus ROG Flow X16 GV601RW-M5082W | |
| Lenovo Legion S7 16ARHA7 | |
| Média Intel Core i9-13900H (2491 - 4270, n=25) | |
| Corsair Voyager a1600 | |
| Razer Blade 15 OLED (Early 2022) | |
| MSI Creator Z16P B12UHST | |
| MSI Katana 17 B13VFK | |
| AIDA64 / CPU Queen | |
| Média da turma Gaming (49785 - 173351, n=90, últimos 2 anos) | |
| Asus ROG Flow X16 GV601V | |
| Lenovo Legion S7 16ARHA7 | |
| MSI Creator Z16P B12UHST | |
| Razer Blade 15 OLED (Early 2022) | |
| Corsair Voyager a1600 | |
| Média Intel Core i9-13900H (65121 - 120936, n=25) | |
| Asus ROG Flow X16 GV601RW-M5082W | |
| Lenovo Legion Slim 7-16IAH 82TF004YGE | |
| MSI Katana 17 B13VFK | |
| AIDA64 / FPU SinJulia | |
| Média da turma Gaming (4424 - 33636, n=105, últimos 2 anos) | |
| Corsair Voyager a1600 | |
| Lenovo Legion S7 16ARHA7 | |
| Asus ROG Flow X16 GV601RW-M5082W | |
| Asus ROG Flow X16 GV601V | |
| MSI Creator Z16P B12UHST | |
| Lenovo Legion Slim 7-16IAH 82TF004YGE | |
| Razer Blade 15 OLED (Early 2022) | |
| Média Intel Core i9-13900H (6108 - 11631, n=25) | |
| MSI Katana 17 B13VFK | |
| AIDA64 / FPU Mandel | |
| Média da turma Gaming (25115 - 128721, n=105, últimos 2 anos) | |
| Lenovo Legion S7 16ARHA7 | |
| Asus ROG Flow X16 GV601RW-M5082W | |
| Corsair Voyager a1600 | |
| Asus ROG Flow X16 GV601V | |
| Lenovo Legion Slim 7-16IAH 82TF004YGE | |
| Média Intel Core i9-13900H (11283 - 48474, n=25) | |
| Razer Blade 15 OLED (Early 2022) | |
| MSI Katana 17 B13VFK | |
| MSI Creator Z16P B12UHST | |
| AIDA64 / CPU AES | |
| Asus ROG Flow X16 GV601RW-M5082W | |
| Lenovo Legion Slim 7-16IAH 82TF004YGE | |
| Lenovo Legion S7 16ARHA7 | |
| Corsair Voyager a1600 | |
| Média da turma Gaming (39258 - 247074, n=105, últimos 2 anos) | |
| MSI Creator Z16P B12UHST | |
| Razer Blade 15 OLED (Early 2022) | |
| Média Intel Core i9-13900H (3691 - 149377, n=25) | |
| Asus ROG Flow X16 GV601V | |
| MSI Katana 17 B13VFK | |
| AIDA64 / CPU ZLib | |
| Média da turma Gaming (574 - 2531, n=105, últimos 2 anos) | |
| Asus ROG Flow X16 GV601V | |
| MSI Creator Z16P B12UHST | |
| Razer Blade 15 OLED (Early 2022) | |
| Média Intel Core i9-13900H (789 - 1254, n=25) | |
| Lenovo Legion Slim 7-16IAH 82TF004YGE | |
| Asus ROG Flow X16 GV601RW-M5082W | |
| Lenovo Legion S7 16ARHA7 | |
| Corsair Voyager a1600 | |
| MSI Katana 17 B13VFK | |
| AIDA64 / FP64 Ray-Trace | |
| Média da turma Gaming (5509 - 45446, n=105, últimos 2 anos) | |
| Asus ROG Flow X16 GV601V | |
| Asus ROG Flow X16 GV601RW-M5082W | |
| Lenovo Legion S7 16ARHA7 | |
| Lenovo Legion Slim 7-16IAH 82TF004YGE | |
| Corsair Voyager a1600 | |
| Média Intel Core i9-13900H (3655 - 10716, n=25) | |
| MSI Katana 17 B13VFK | |
| Razer Blade 15 OLED (Early 2022) | |
| MSI Creator Z16P B12UHST | |
| AIDA64 / CPU PhotoWorxx | |
| Média da turma Gaming (12271 - 89891, n=105, últimos 2 anos) | |
| MSI Creator Z16P B12UHST | |
| Média Intel Core i9-13900H (10871 - 50488, n=25) | |
| Asus ROG Flow X16 GV601V | |
| Lenovo Legion Slim 7-16IAH 82TF004YGE | |
| Razer Blade 15 OLED (Early 2022) | |
| Razer Blade 15 OLED (Early 2022) | |
| MSI Katana 17 B13VFK | |
| Corsair Voyager a1600 | |
| Asus ROG Flow X16 GV601RW-M5082W | |
| Lenovo Legion S7 16ARHA7 | |
Desempenho do sistema
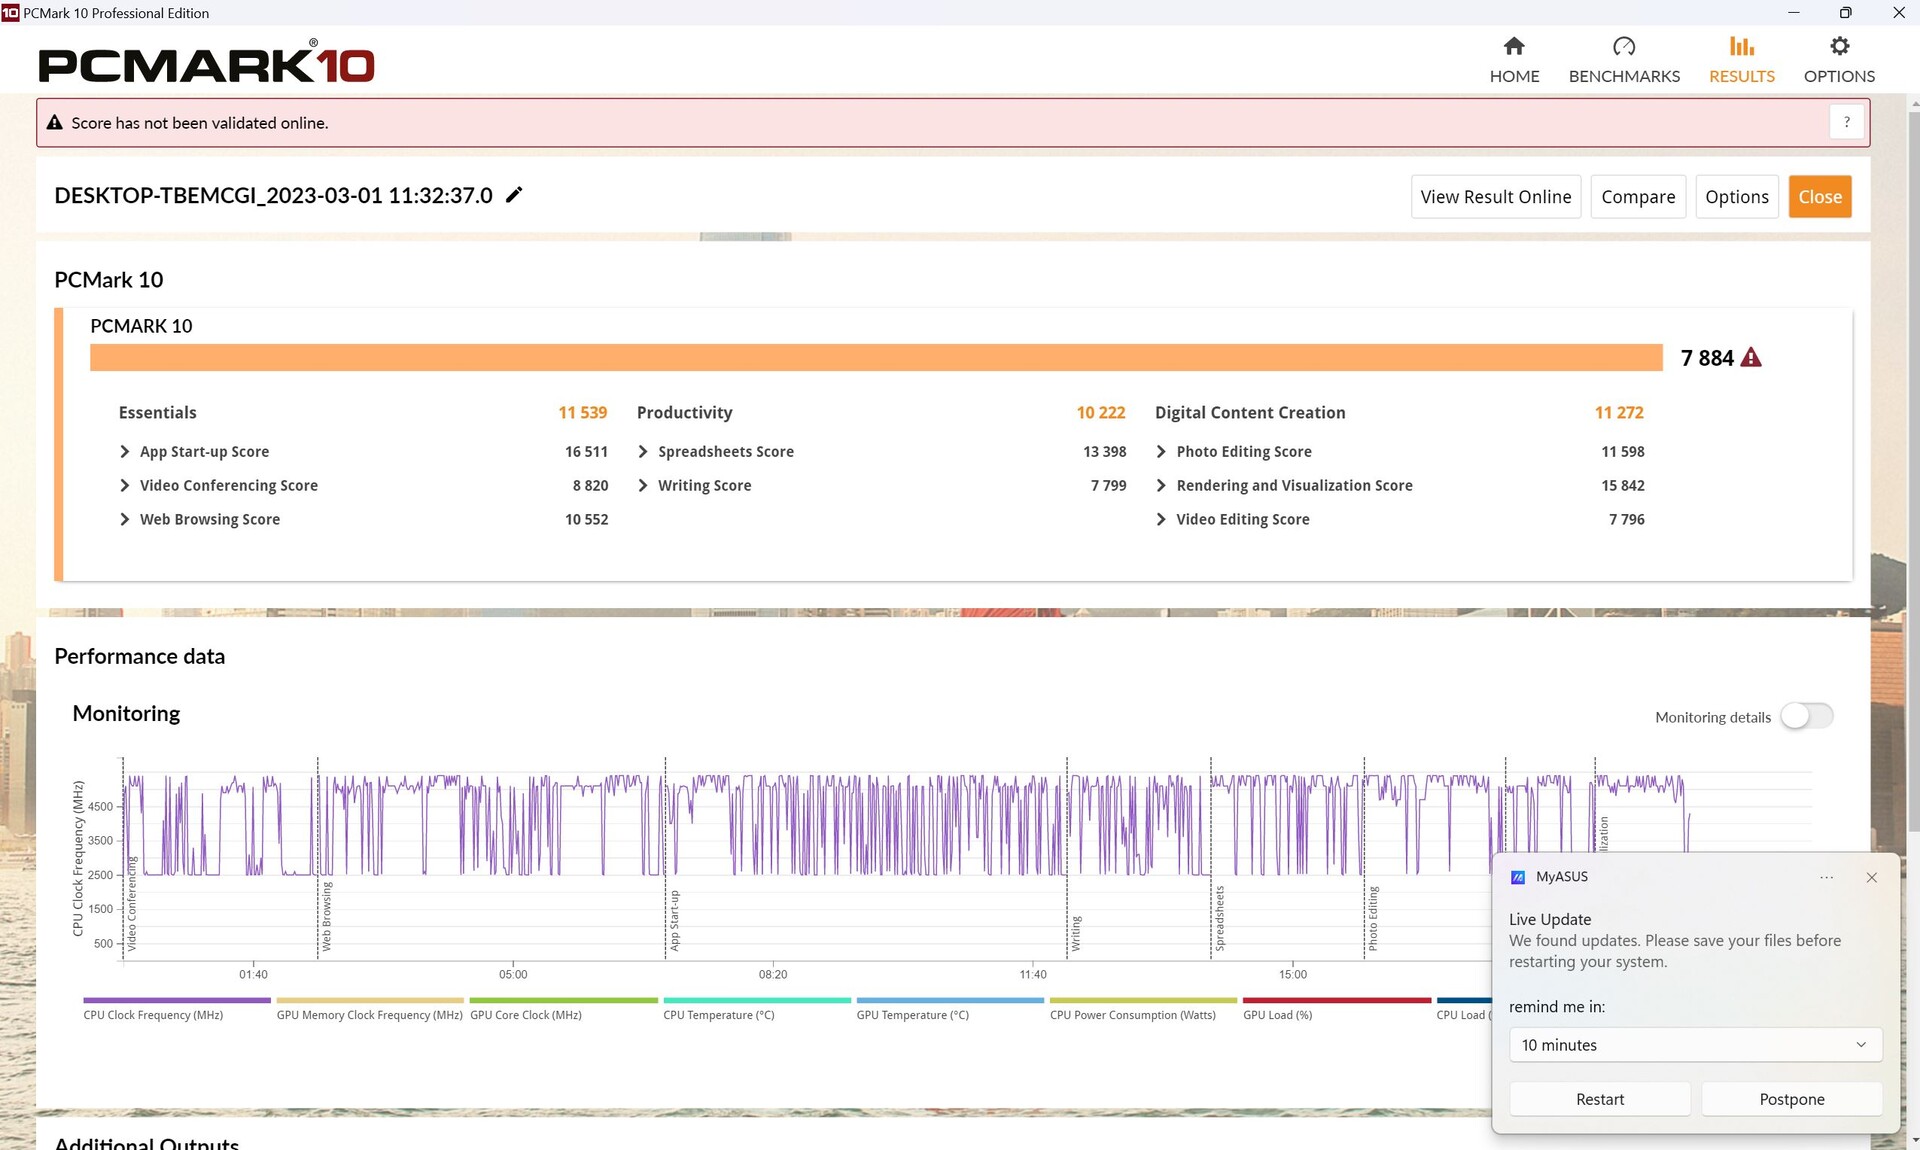
Nos testes do PCMark10, o X16 teve um desempenho igual, se não um pouco melhor, do que o esperado. Não houve exceções ou quedas em nenhum de nossos subtestes.
CrossMark: Overall | Productivity | Creativity | Responsiveness
| PCMark 10 / Score | |
| Média da turma Gaming (5828 - 12414, n=93, últimos 2 anos) | |
| Asus ROG Zephyrus M16 GU604VY-NM042X | |
| MSI Creator Z16P B12UHST | |
| Asus ROG Flow X16 GV601V | |
| Lenovo Legion Pro 7 16IRX8H | |
| Média Intel Core i9-13900H, NVIDIA GeForce RTX 4060 Laptop GPU (7578 - 7884, n=3) | |
| Lenovo Legion S7 16ARHA7 | |
| Lenovo Legion Slim 7-16IAH 82TF004YGE | |
| Razer Blade 15 OLED (Early 2022) | |
| Corsair Voyager a1600 | |
| MSI Katana 17 B13VFK | |
| Asus ROG Flow X16 GV601RW-M5082W | |
| PCMark 10 / Essentials | |
| Lenovo Legion Pro 7 16IRX8H | |
| Asus ROG Zephyrus M16 GU604VY-NM042X | |
| Asus ROG Flow X16 GV601V | |
| Média Intel Core i9-13900H, NVIDIA GeForce RTX 4060 Laptop GPU (11235 - 11539, n=3) | |
| MSI Creator Z16P B12UHST | |
| Lenovo Legion Slim 7-16IAH 82TF004YGE | |
| MSI Katana 17 B13VFK | |
| Lenovo Legion S7 16ARHA7 | |
| Média da turma Gaming (8810 - 11935, n=97, últimos 2 anos) | |
| Razer Blade 15 OLED (Early 2022) | |
| Corsair Voyager a1600 | |
| Asus ROG Flow X16 GV601RW-M5082W | |
| PCMark 10 / Productivity | |
| Média da turma Gaming (6845 - 25323, n=95, últimos 2 anos) | |
| MSI Creator Z16P B12UHST | |
| Asus ROG Zephyrus M16 GU604VY-NM042X | |
| Lenovo Legion Pro 7 16IRX8H | |
| Asus ROG Flow X16 GV601V | |
| Média Intel Core i9-13900H, NVIDIA GeForce RTX 4060 Laptop GPU (9888 - 10222, n=3) | |
| Razer Blade 15 OLED (Early 2022) | |
| Lenovo Legion S7 16ARHA7 | |
| Asus ROG Flow X16 GV601RW-M5082W | |
| Lenovo Legion Slim 7-16IAH 82TF004YGE | |
| MSI Katana 17 B13VFK | |
| Corsair Voyager a1600 | |
| PCMark 10 / Digital Content Creation | |
| Média da turma Gaming (7602 - 19954, n=95, últimos 2 anos) | |
| Asus ROG Zephyrus M16 GU604VY-NM042X | |
| MSI Creator Z16P B12UHST | |
| Lenovo Legion S7 16ARHA7 | |
| Corsair Voyager a1600 | |
| Asus ROG Flow X16 GV601V | |
| Média Intel Core i9-13900H, NVIDIA GeForce RTX 4060 Laptop GPU (10418 - 11272, n=3) | |
| Lenovo Legion Slim 7-16IAH 82TF004YGE | |
| Razer Blade 15 OLED (Early 2022) | |
| Lenovo Legion Pro 7 16IRX8H | |
| MSI Katana 17 B13VFK | |
| Asus ROG Flow X16 GV601RW-M5082W | |
| CrossMark / Overall | |
| Média da turma Gaming (1366 - 2409, n=94, últimos 2 anos) | |
| Asus ROG Zephyrus M16 GU604VY-NM042X | |
| Asus ROG Flow X16 GV601V | |
| Média Intel Core i9-13900H, NVIDIA GeForce RTX 4060 Laptop GPU (1874 - 1983, n=3) | |
| Apple MacBook Pro 16 2023 M2 Max | |
| Lenovo Legion Slim 7-16IAH 82TF004YGE | |
| MSI Katana 17 B13VFK | |
| Razer Blade 15 OLED (Early 2022) | |
| Lenovo Legion S7 16ARHA7 | |
| Asus ROG Flow X16 GV601RW-M5082W | |
| Corsair Voyager a1600 | |
| CrossMark / Productivity | |
| Asus ROG Flow X16 GV601V | |
| Média da turma Gaming (1386 - 2254, n=94, últimos 2 anos) | |
| Asus ROG Zephyrus M16 GU604VY-NM042X | |
| Média Intel Core i9-13900H, NVIDIA GeForce RTX 4060 Laptop GPU (1779 - 1889, n=3) | |
| Lenovo Legion Slim 7-16IAH 82TF004YGE | |
| MSI Katana 17 B13VFK | |
| Lenovo Legion S7 16ARHA7 | |
| Razer Blade 15 OLED (Early 2022) | |
| Apple MacBook Pro 16 2023 M2 Max | |
| Asus ROG Flow X16 GV601RW-M5082W | |
| Corsair Voyager a1600 | |
| CrossMark / Creativity | |
| Apple MacBook Pro 16 2023 M2 Max | |
| Média da turma Gaming (1343 - 2786, n=94, últimos 2 anos) | |
| Asus ROG Zephyrus M16 GU604VY-NM042X | |
| Asus ROG Flow X16 GV601V | |
| Média Intel Core i9-13900H, NVIDIA GeForce RTX 4060 Laptop GPU (2104 - 2195, n=3) | |
| MSI Katana 17 B13VFK | |
| Lenovo Legion Slim 7-16IAH 82TF004YGE | |
| Razer Blade 15 OLED (Early 2022) | |
| Lenovo Legion S7 16ARHA7 | |
| Asus ROG Flow X16 GV601RW-M5082W | |
| Corsair Voyager a1600 | |
| CrossMark / Responsiveness | |
| Lenovo Legion Slim 7-16IAH 82TF004YGE | |
| MSI Katana 17 B13VFK | |
| Média da turma Gaming (1226 - 2334, n=94, últimos 2 anos) | |
| Asus ROG Flow X16 GV601V | |
| Asus ROG Zephyrus M16 GU604VY-NM042X | |
| Média Intel Core i9-13900H, NVIDIA GeForce RTX 4060 Laptop GPU (1548 - 1698, n=3) | |
| Razer Blade 15 OLED (Early 2022) | |
| Lenovo Legion S7 16ARHA7 | |
| Asus ROG Flow X16 GV601RW-M5082W | |
| Apple MacBook Pro 16 2023 M2 Max | |
| Corsair Voyager a1600 | |
| PCMark 10 Score | 7884 pontos | |
Ajuda | ||
| AIDA64 / Memory Copy | |
| Média da turma Gaming (21750 - 129946, n=105, últimos 2 anos) | |
| Samsung Galaxy Book3 Ultra 16, i9-13900H RTX 4070 | |
| Lenovo Yoga Pro 7 14IRH G8 | |
| Média Intel Core i9-13900H (37448 - 74486, n=25) | |
| Asus ROG Flow X16 GV601V | |
| Lenovo Legion Pro 5 16IRX8 | |
| MSI Katana 17 B13VFK | |
| Asus ROG Flow X16 GV601RW-M5082W | |
| AIDA64 / Memory Read | |
| Média da turma Gaming (22956 - 118858, n=105, últimos 2 anos) | |
| Samsung Galaxy Book3 Ultra 16, i9-13900H RTX 4070 | |
| Lenovo Yoga Pro 7 14IRH G8 | |
| Asus ROG Flow X16 GV601V | |
| Lenovo Legion Pro 5 16IRX8 | |
| Média Intel Core i9-13900H (41599 - 75433, n=25) | |
| MSI Katana 17 B13VFK | |
| Asus ROG Flow X16 GV601RW-M5082W | |
| AIDA64 / Memory Write | |
| Samsung Galaxy Book3 Ultra 16, i9-13900H RTX 4070 | |
| Média da turma Gaming (22297 - 135096, n=105, últimos 2 anos) | |
| Lenovo Yoga Pro 7 14IRH G8 | |
| Lenovo Legion Pro 5 16IRX8 | |
| Média Intel Core i9-13900H (36152 - 88505, n=25) | |
| Asus ROG Flow X16 GV601V | |
| Asus ROG Flow X16 GV601RW-M5082W | |
| MSI Katana 17 B13VFK | |
| AIDA64 / Memory Latency | |
| Média da turma Gaming (75.3 - 259, n=105, últimos 2 anos) | |
| Lenovo Yoga Pro 7 14IRH G8 | |
| Samsung Galaxy Book3 Ultra 16, i9-13900H RTX 4070 | |
| MSI Katana 17 B13VFK | |
| Asus ROG Flow X16 GV601RW-M5082W | |
| Asus ROG Flow X16 GV601V | |
| Média Intel Core i9-13900H (75.8 - 102.3, n=25) | |
| Lenovo Legion Pro 5 16IRX8 | |
* ... menor é melhor
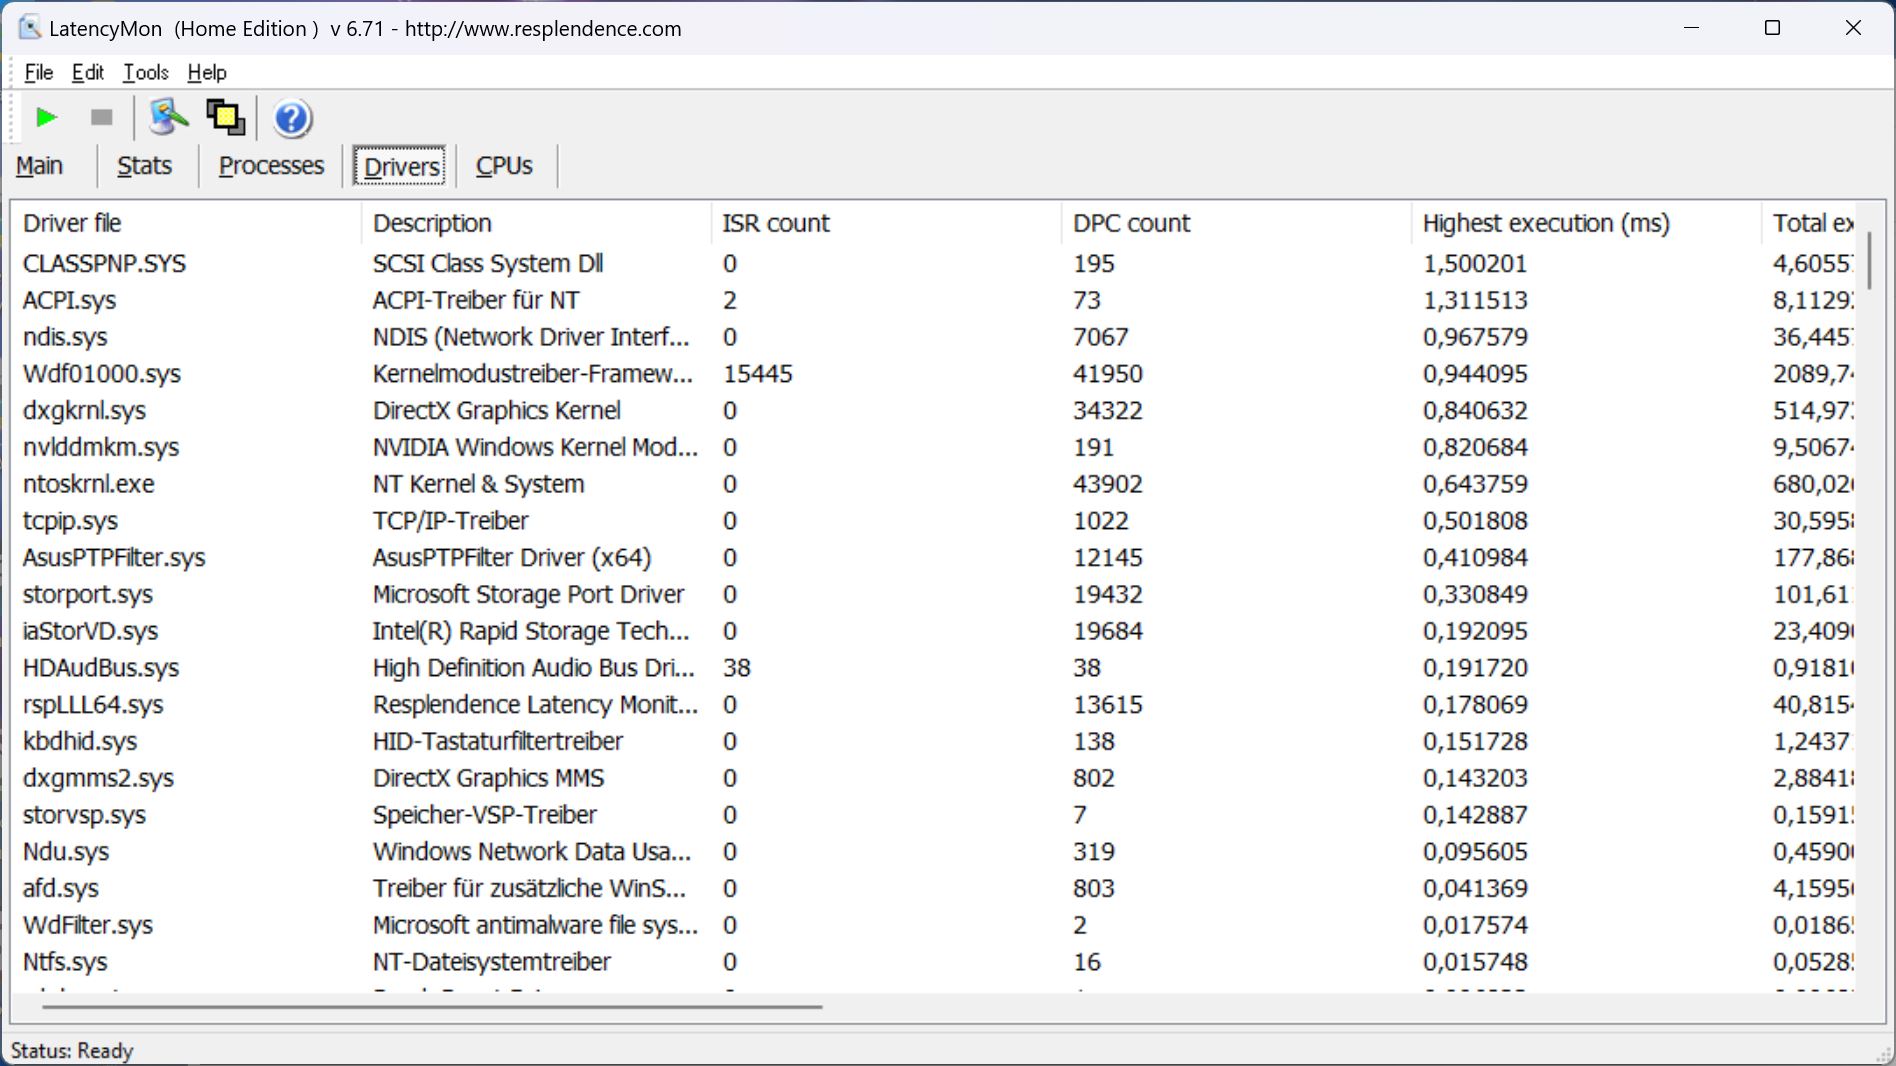
Latências de DPC
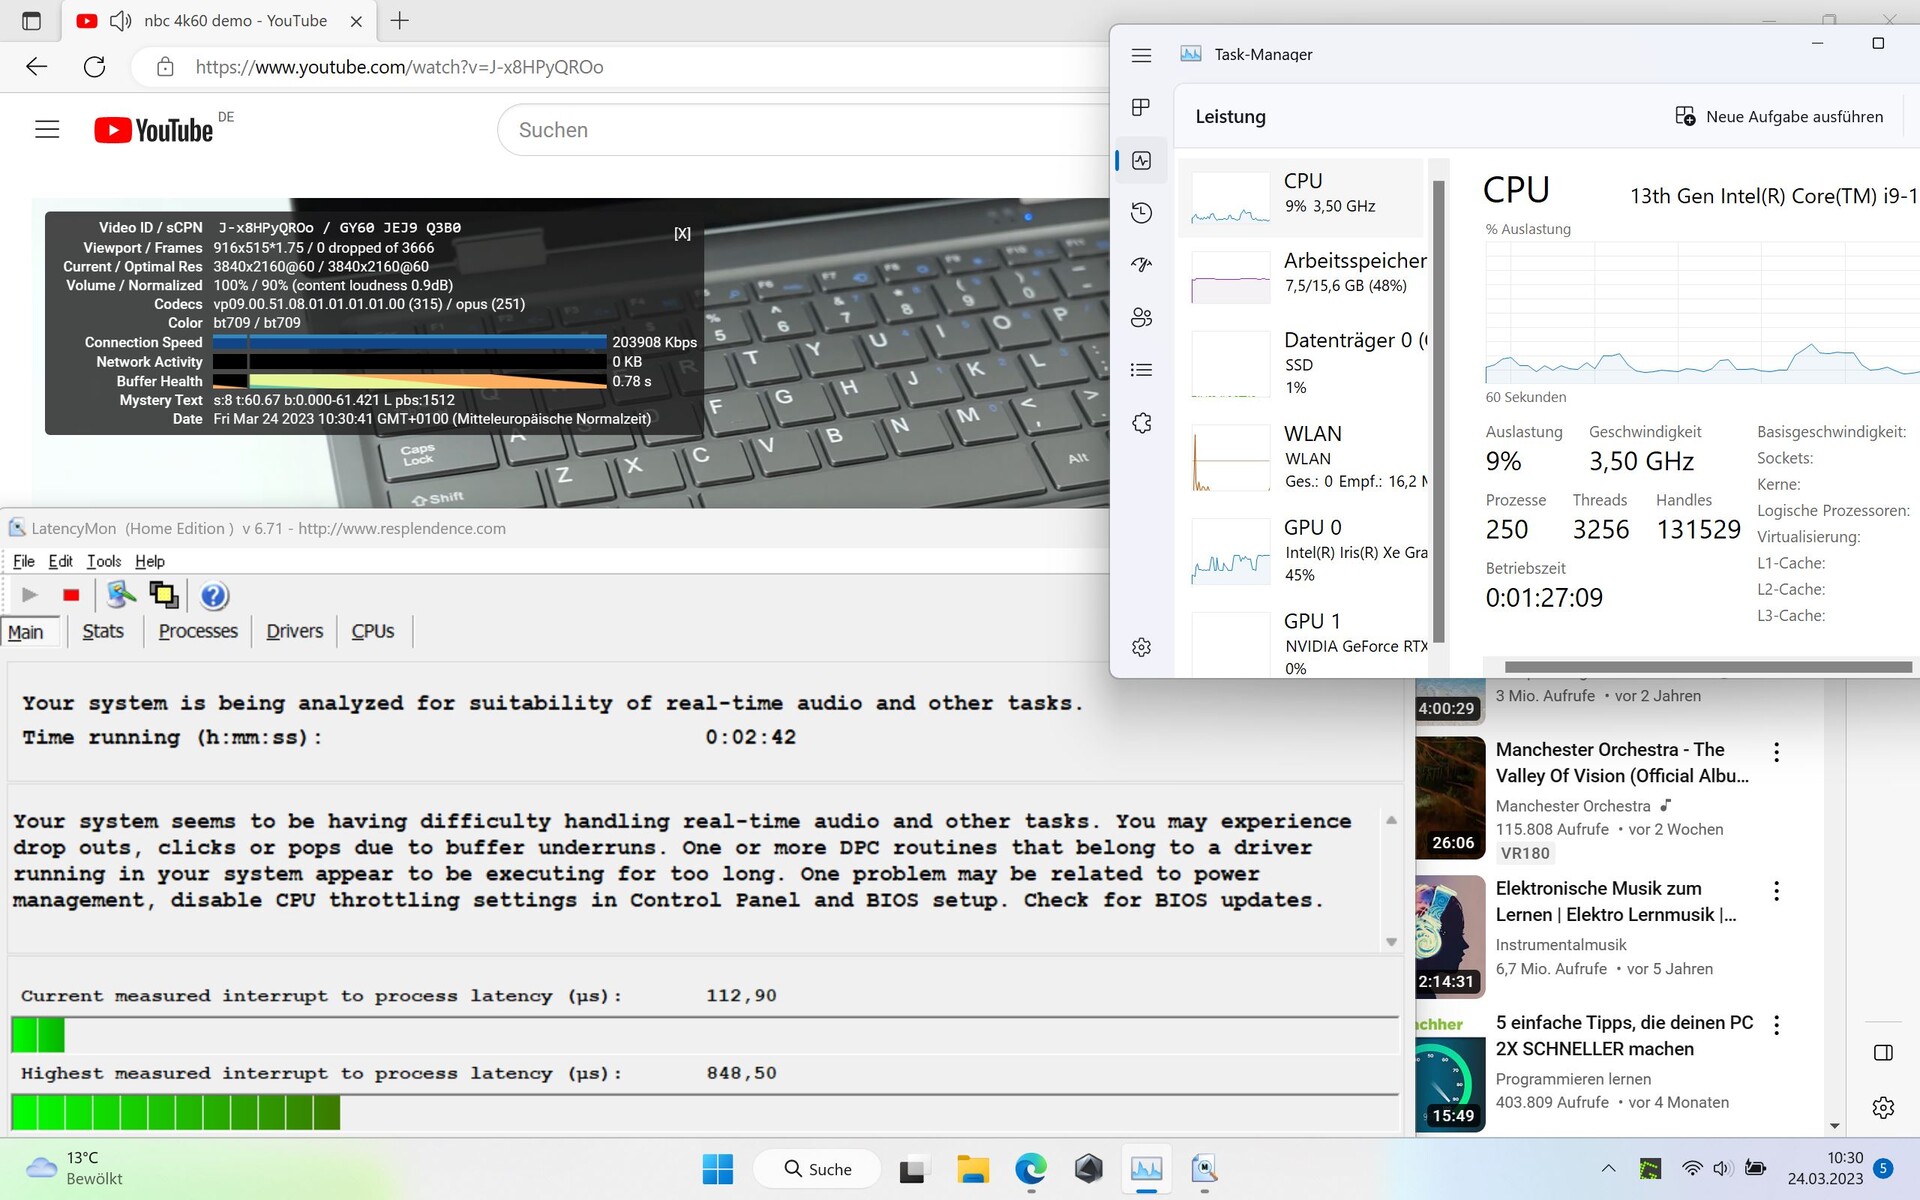
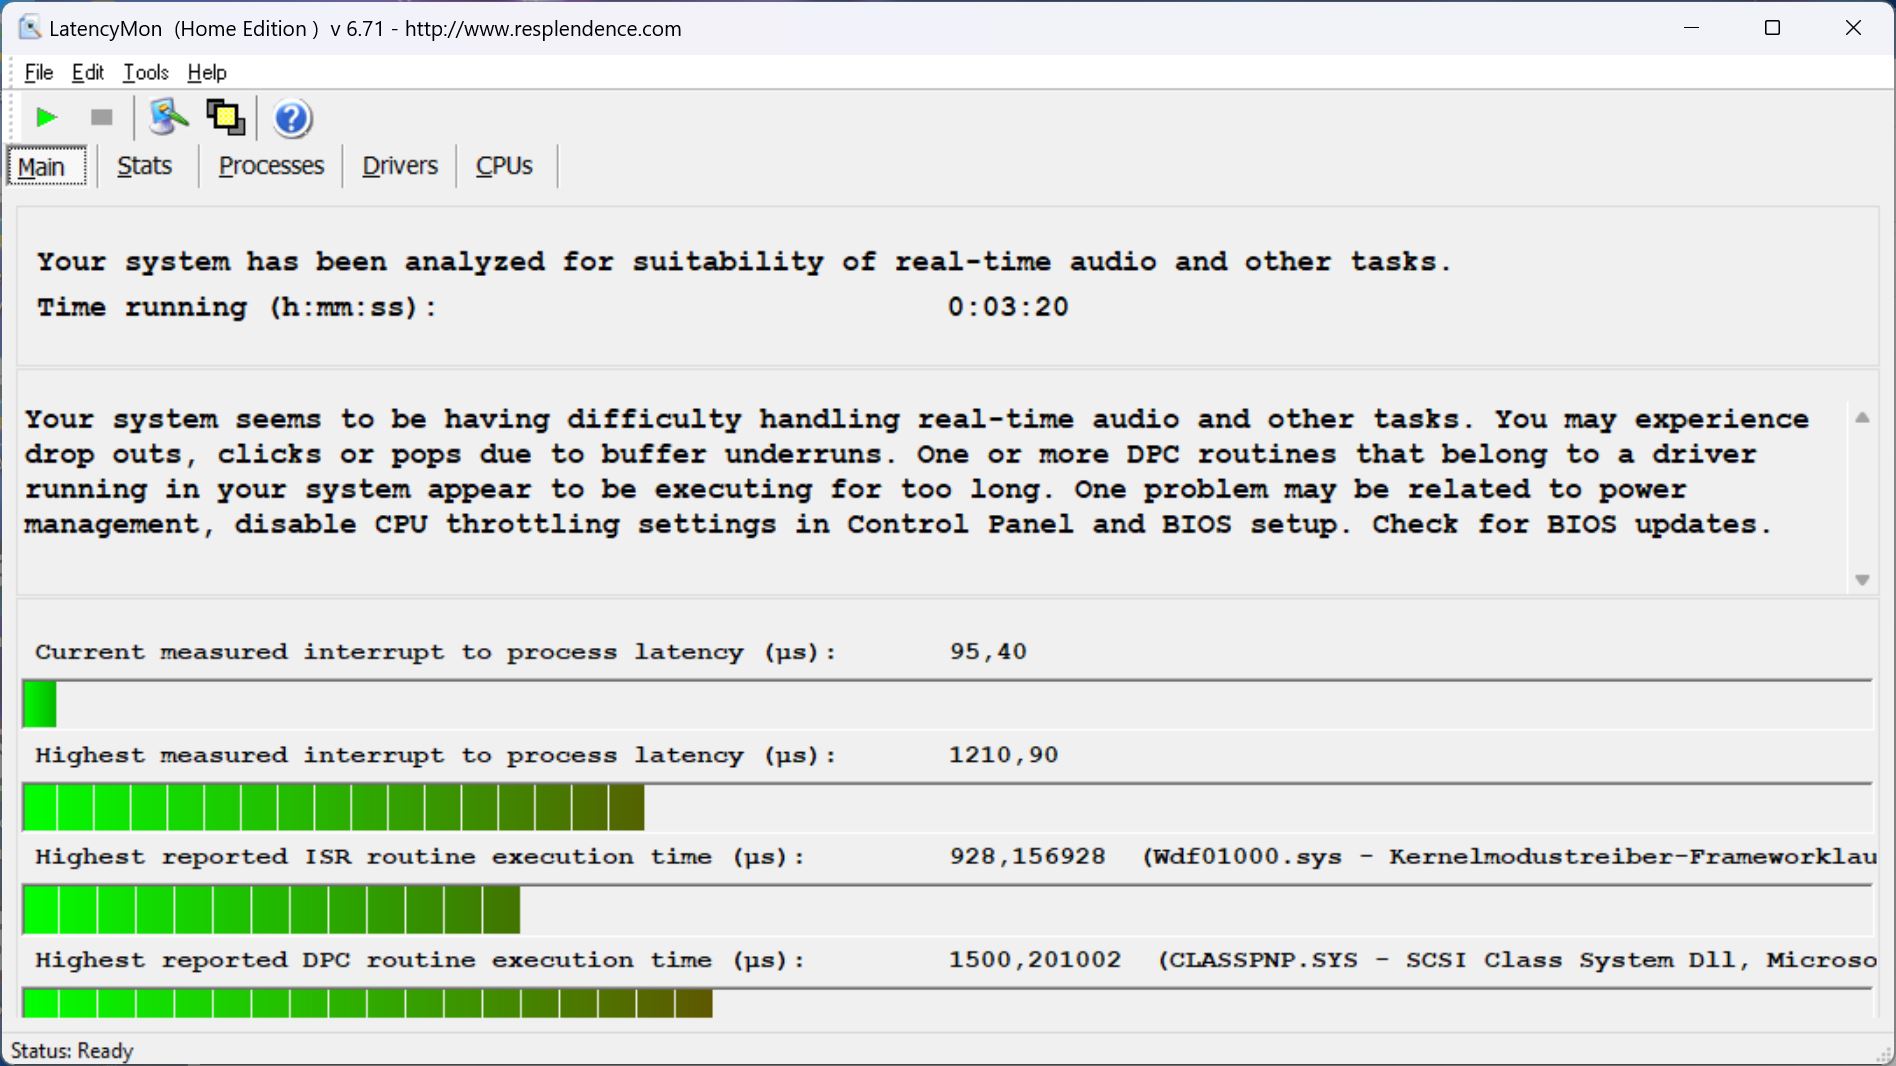
Ao abrir várias guias do navegador, o software exibiu latências do LatencyMon. No entanto, nosso vídeo 4K/60fps do YouTube foi executado sem problemas e sem nenhuma queda de quadros. No entanto, as pontuações poderiam ser um pouco mais baixas, especialmente para o grupo de criadores de conteúdo.
| DPC Latencies / LatencyMon - interrupt to process latency (max), Web, Youtube, Prime95 | |
| Samsung Galaxy Book3 Ultra 16, i9-13900H RTX 4070 | |
| MSI Katana 17 B13VFK | |
| Asus ROG Flow X16 GV601V | |
| Asus ROG Flow X16 GV601RW-M5082W | |
| Lenovo Yoga Pro 7 14IRH G8 | |
| Lenovo Legion Pro 5 16IRX8 | |
* ... menor é melhor
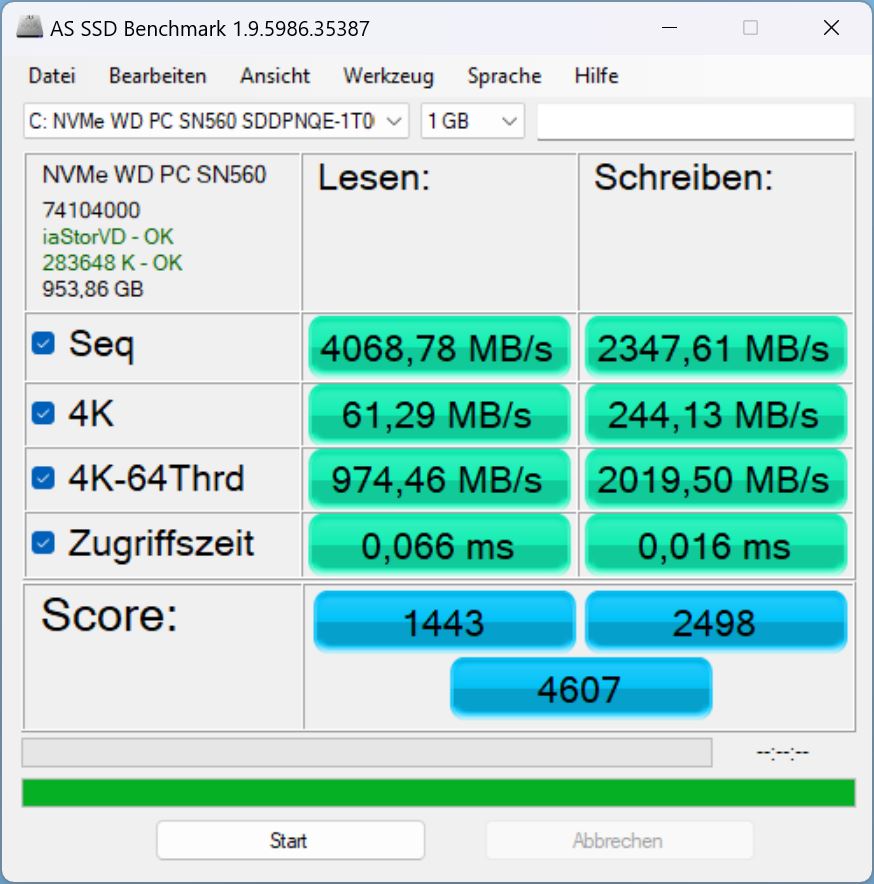
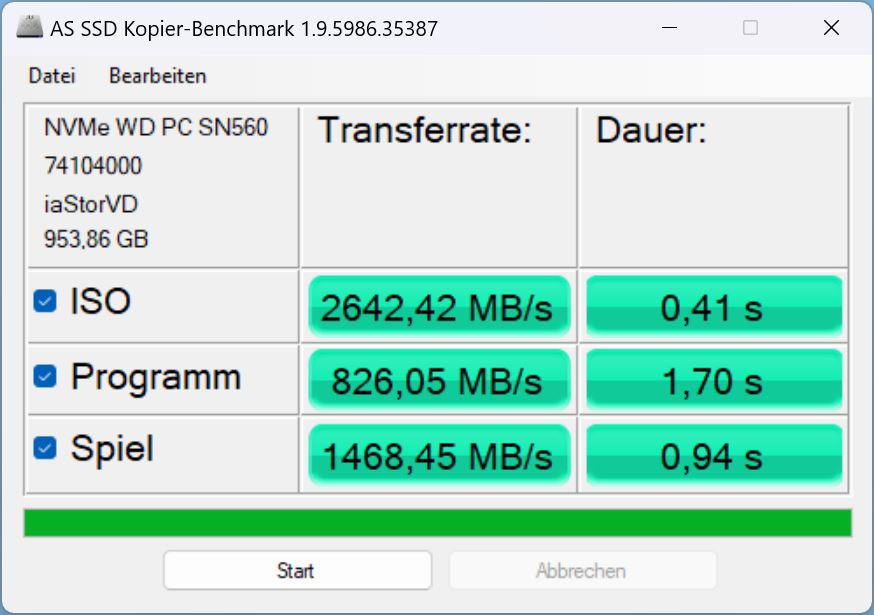
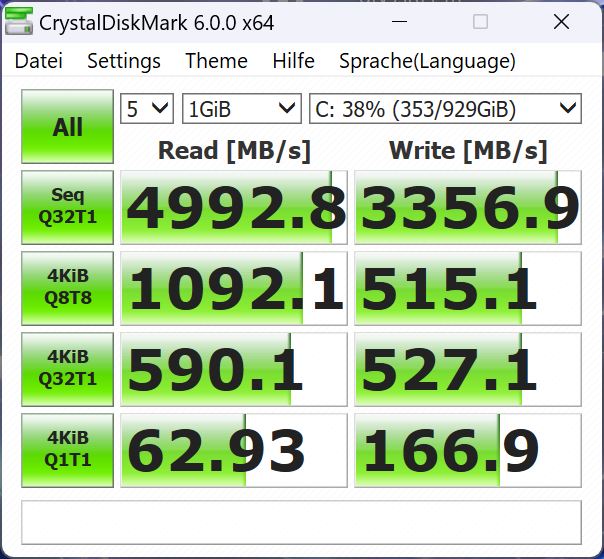
Armazenamento em massa
A Asus instalou um SSD PCIe-4.0-x4-NVMe de 1TB da Western Digital. Mais uma vez, a unidade de armazenamento se encontra perto do final de nossaLista dos melhores SSDs. A SSD Micron do modelo anterior era significativamente mais rápida, cerca de 42% em média!
É claro que, para uso doméstico, a SSD é suficientemente rápida, mas para usuários profissionais - a categoria à qual o X16 se destina - esse retrocesso no desempenho é um tanto lamentável.

* ... menor é melhor
Continuous performance Read: DiskSpd Read Loop, Queue Depth 8
Placa de vídeo
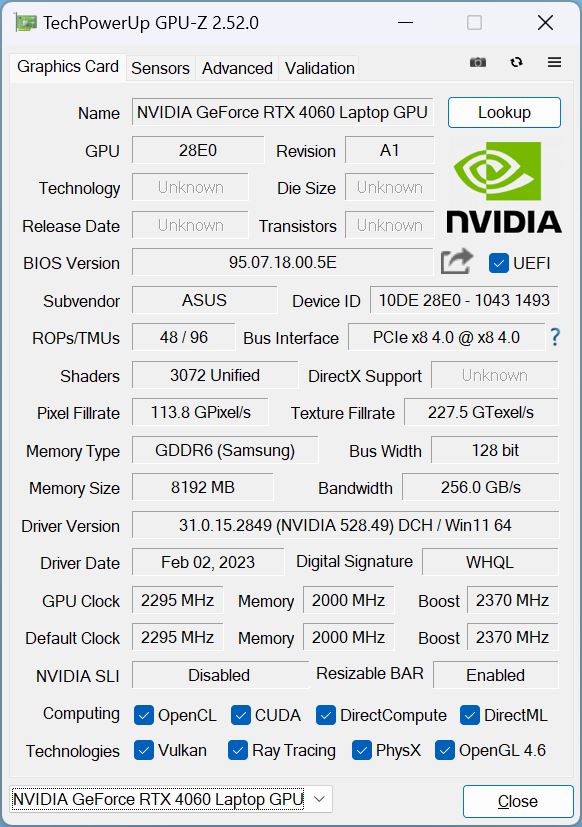
Nosso modelo de análise contém umaNvidia Geforce RTX 4060. UmaRTX 4050ou umaRTX 4070também estão disponíveis. A placa pode consumir um máximo de 120 watts, incluindo um aumento dinâmico de 20 watts.
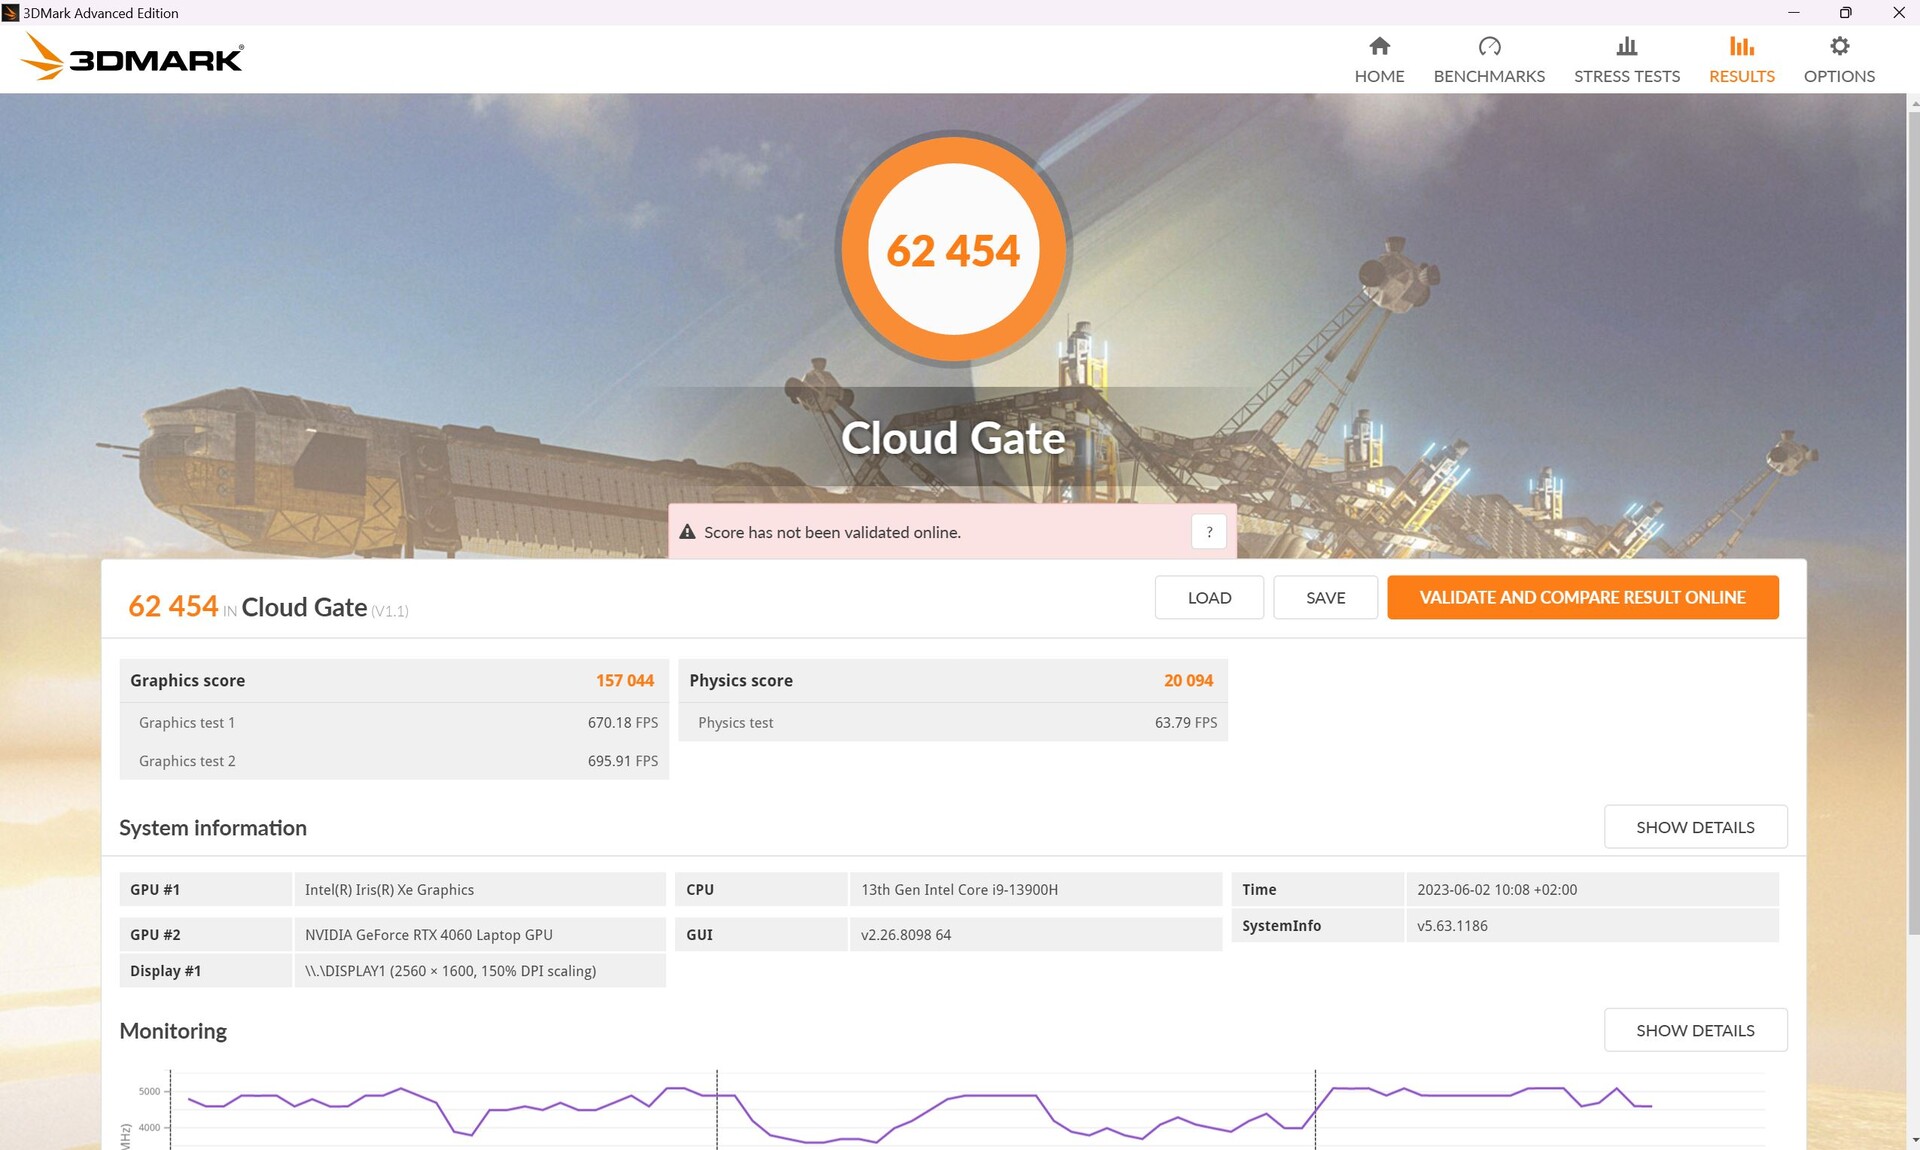
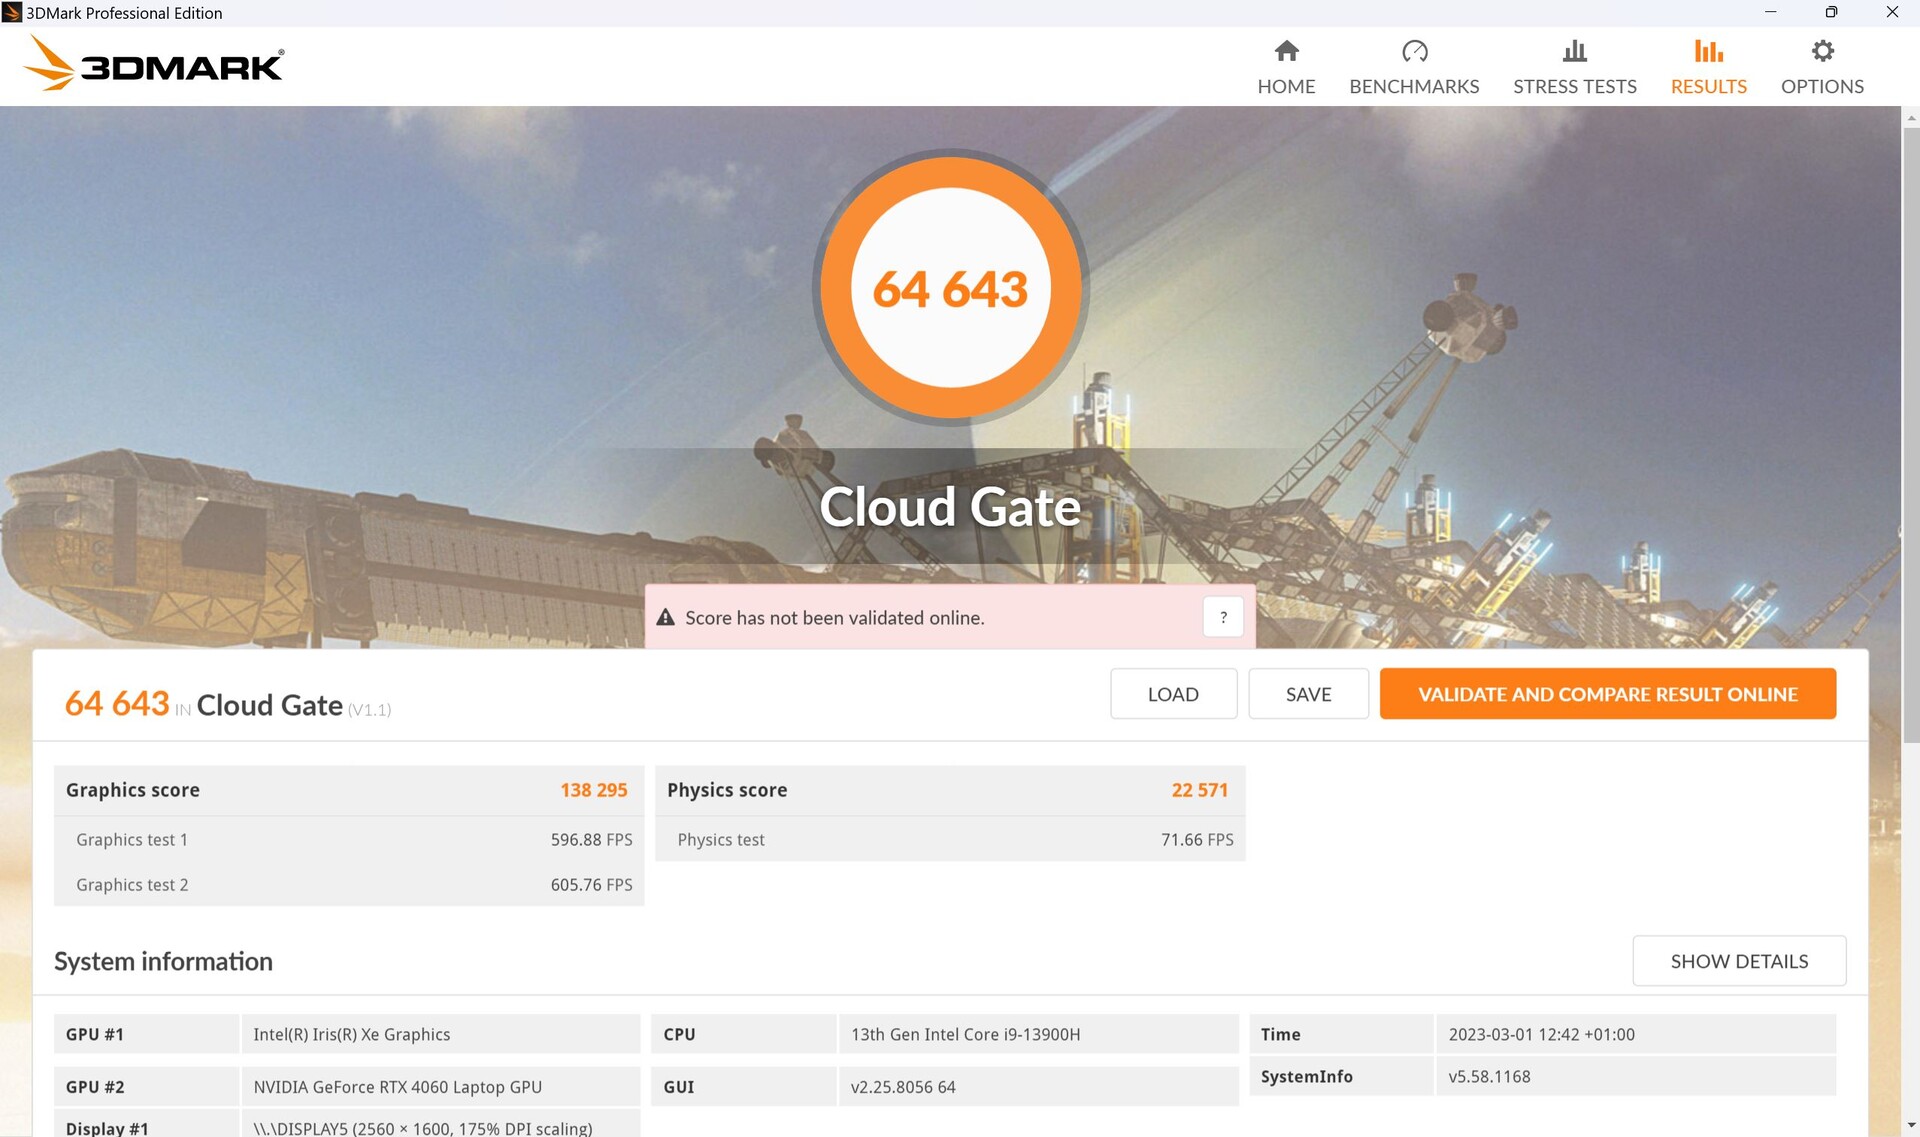
Nos benchmarks do 3DMark, ela teve um desempenho cerca de 10% melhor (turbo) do que a média dos notebooks RTX 4060 em nosso banco de dados.
Quando comparamos os resultados entre os modos turbo e de desempenho, fica especialmente evidente que o desempenho gráfico aumenta, mas o desempenho da CPU e da física tende a cair (consulte Cloud Gate ou Fire Strike).
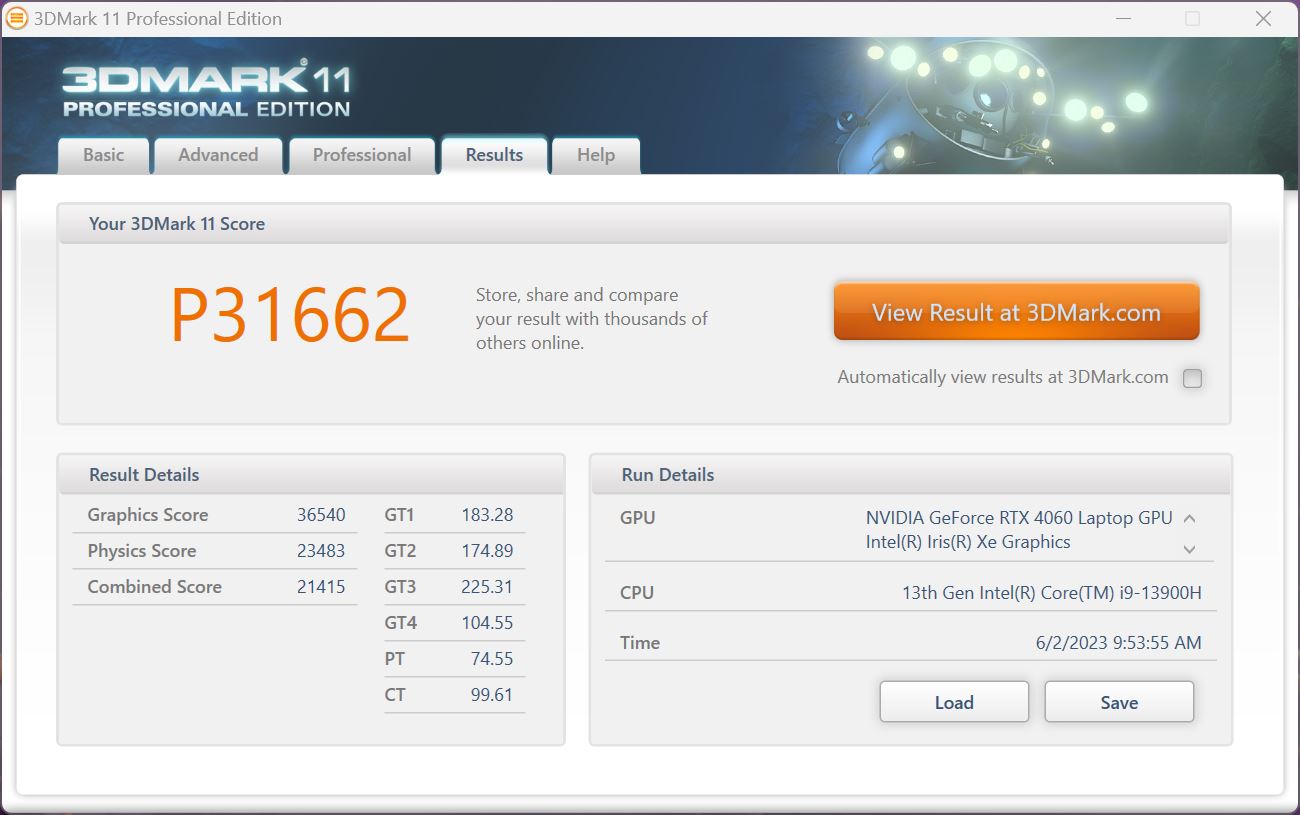
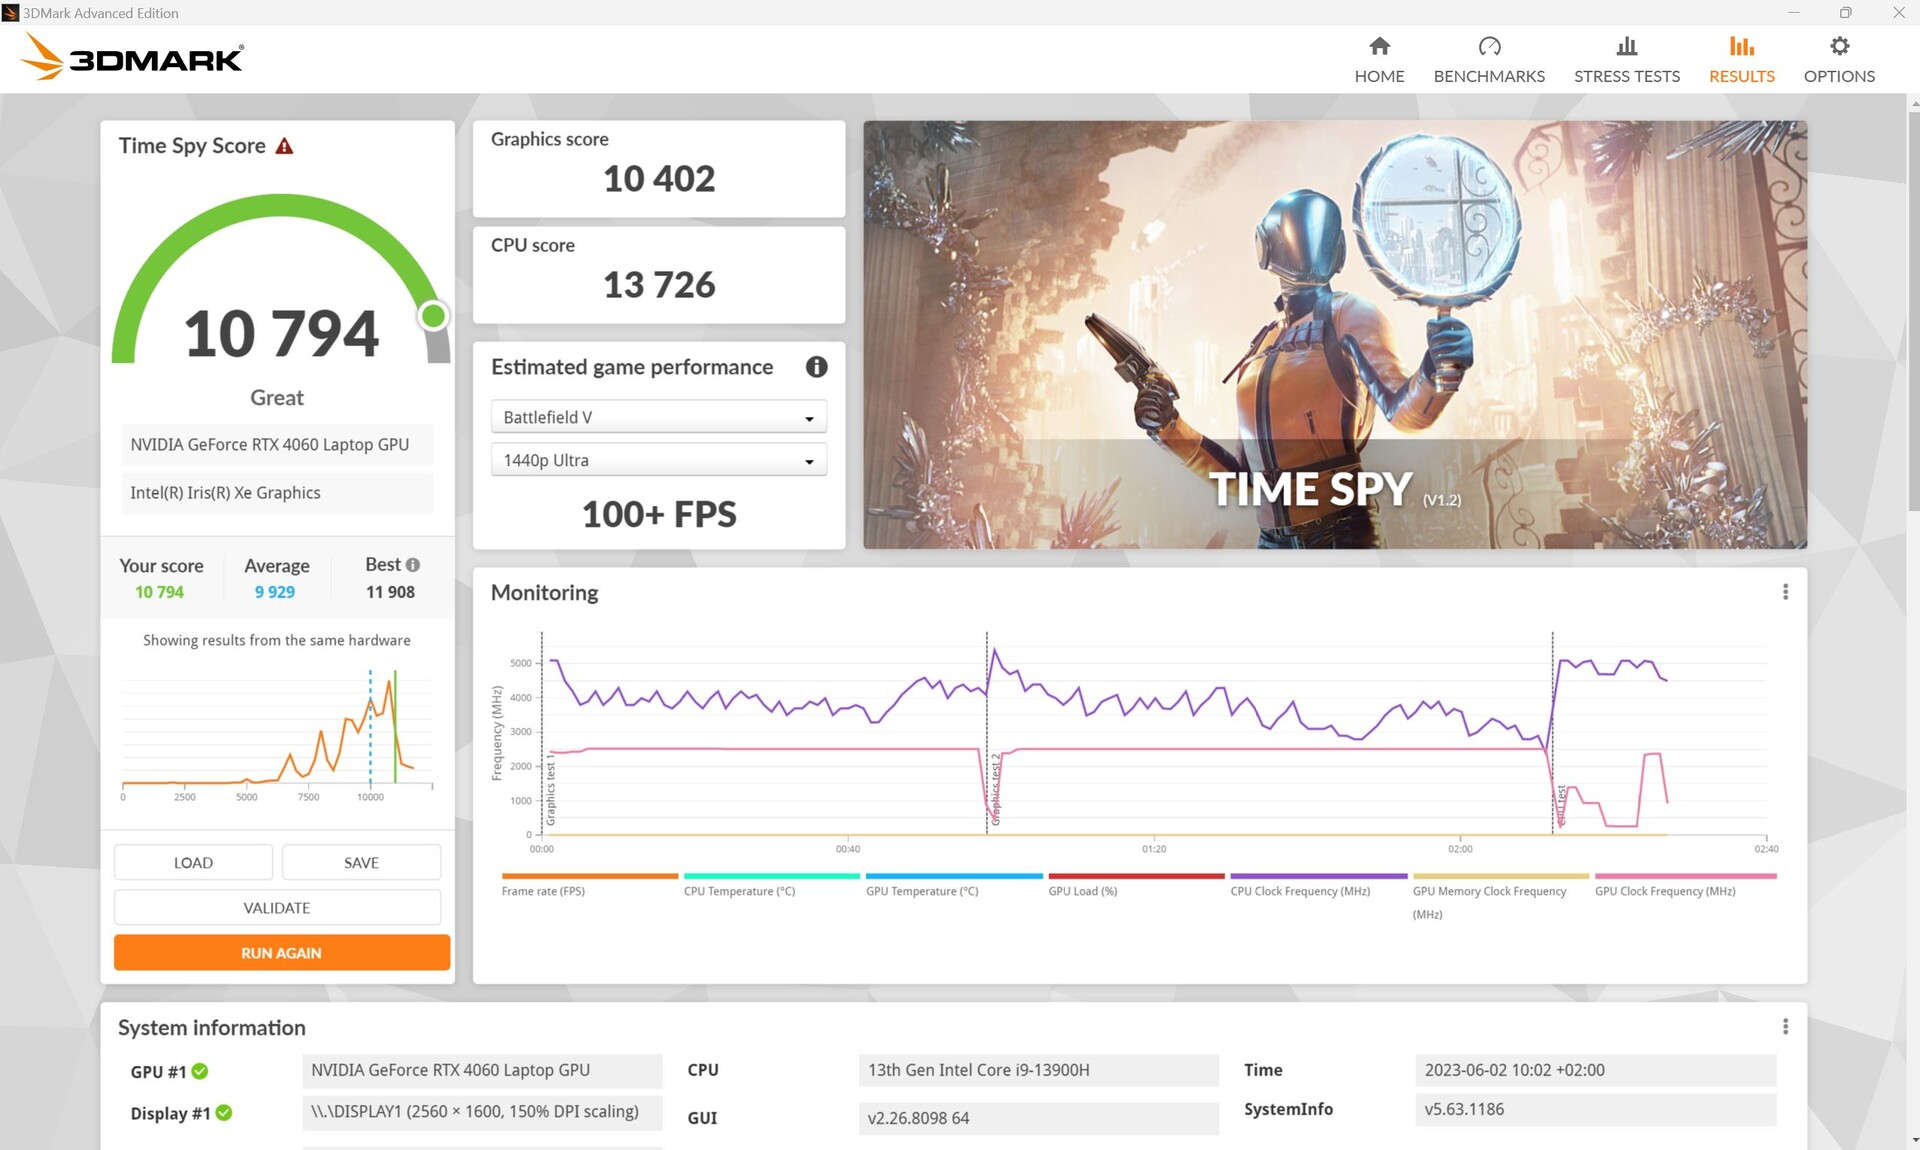
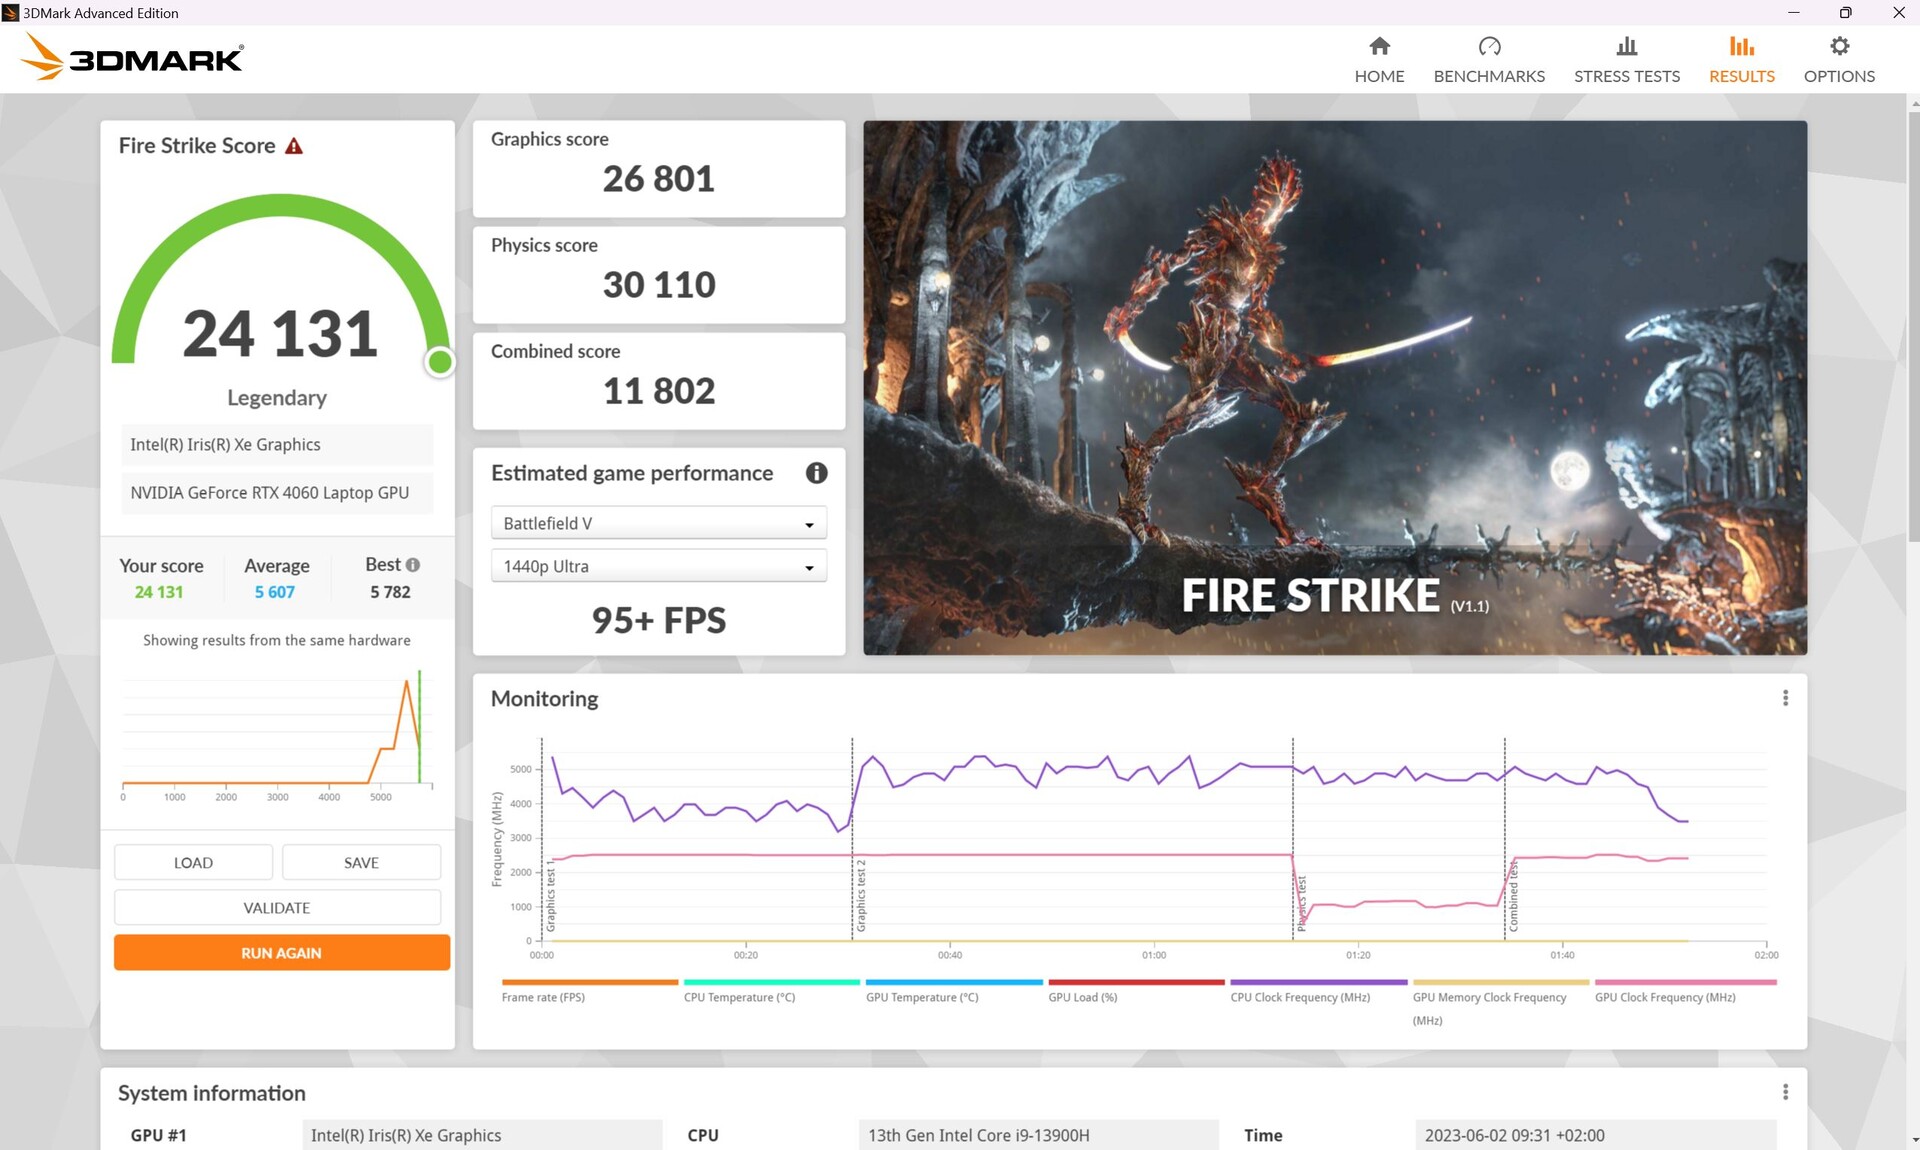
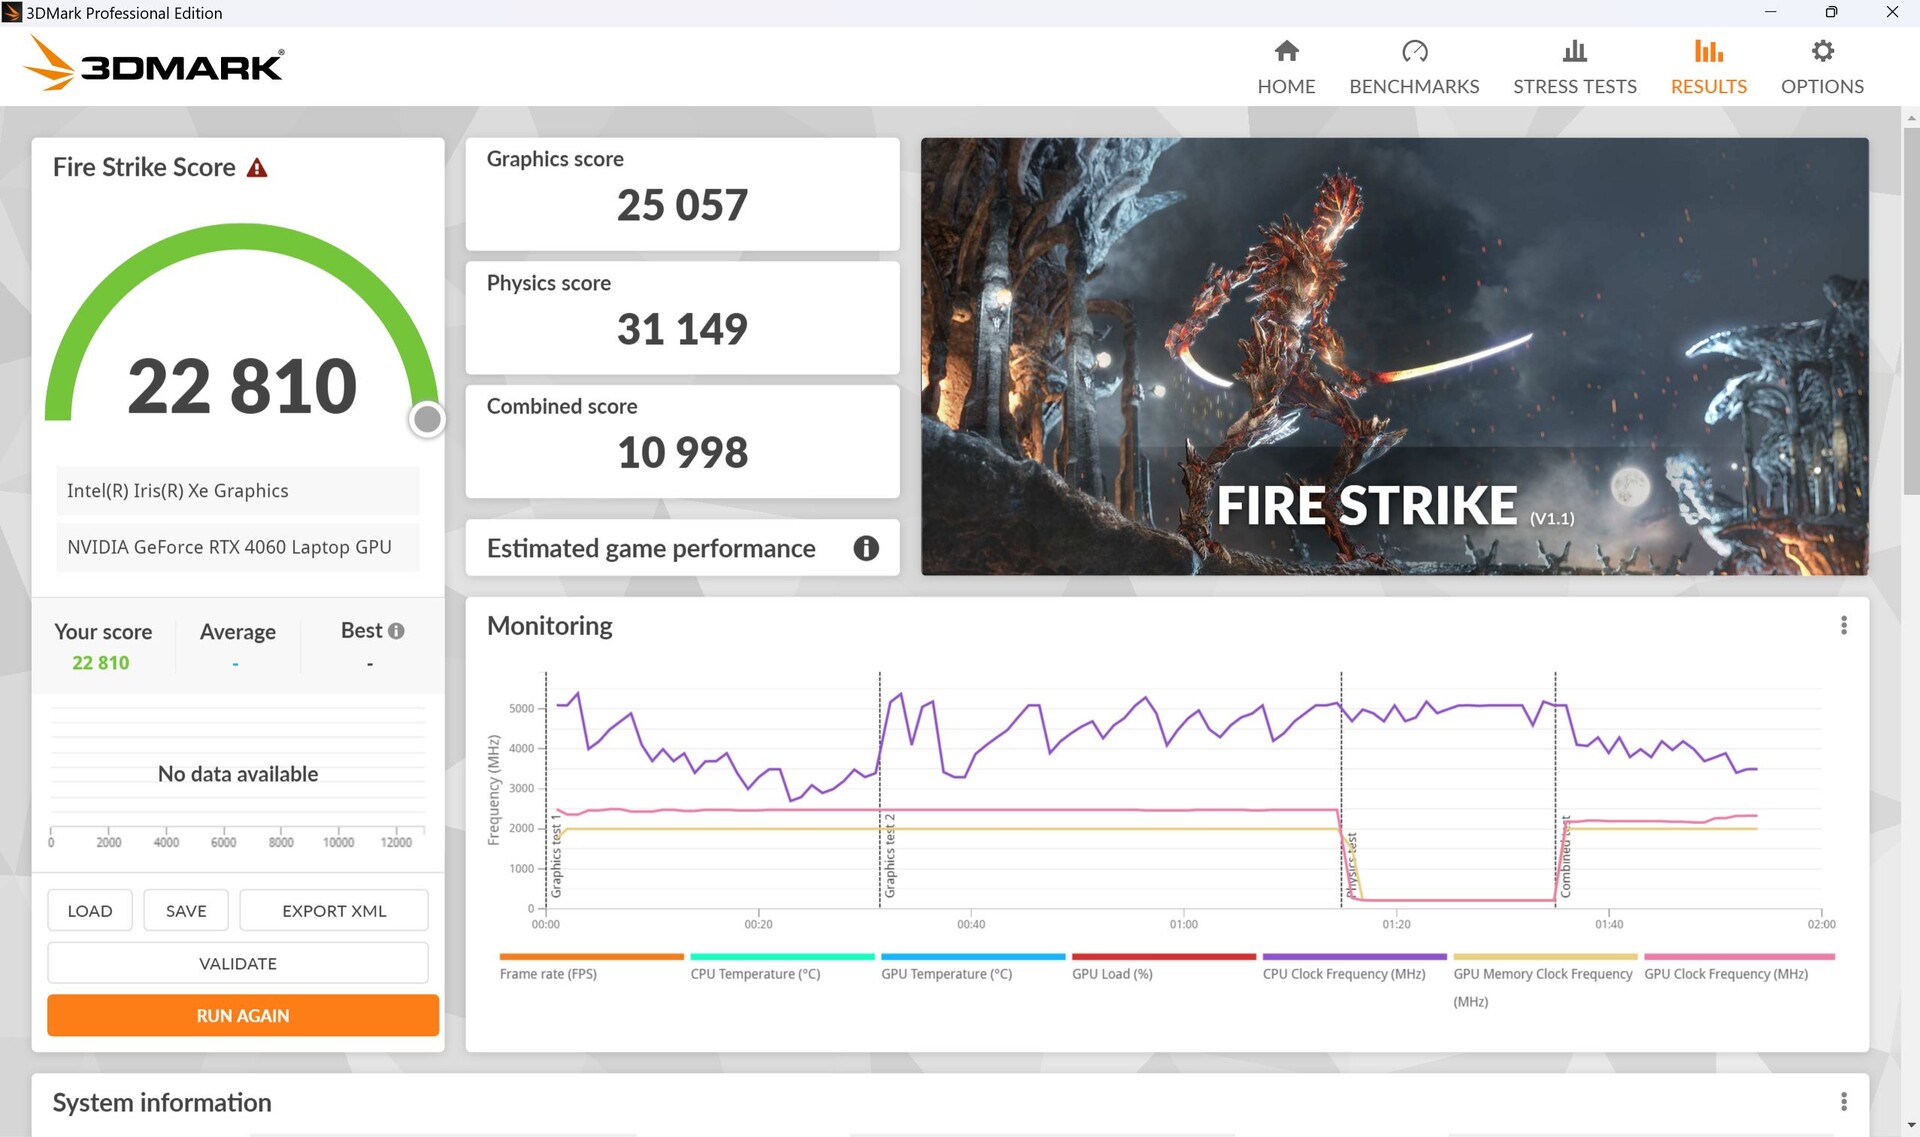
Longe da parede, o desempenho gráfico cai. No modo de desempenho, a pontuação gráfica do Fire Strike caiu cerca de 17% e, no modo silencioso, caiu 42%.


| 3DMark 11 Performance | 31662 pontos | |
| 3DMark Cloud Gate Standard Score | 62454 pontos | |
| 3DMark Fire Strike Score | 24131 pontos | |
| 3DMark Time Spy Score | 10794 pontos | |
Ajuda | ||
* ... menor é melhor
| Premiere Pro PugetBench - Overall Score 0.9 | |
| MSI Stealth 17 Studio A13VH-014 | |
| Asus ROG Flow X16 GV601V | |
| Asus Zephyrus Duo 16 GX650PY-NM006W | |
| MSI Titan GT77 HX 13VI | |
| Apple MacBook Pro 14 2023 M2 Pro | |
| Asus ROG Zephyrus G14 GA402XY | |
Desempenho em jogos
Em Full HD, quase todos os jogos que testamos foram executados sem problemas com o máximo de detalhes. Há até mesmo recursos suficientes disponíveis para QHD, sendo que apenas títulos muito exigentes, como The Last of Us, não estão funcionando a contento.
Em nossa comparação, o Flow X16 está no mesmo nível que o Katana 17, cujo RTX 4060 tem apenas um TGP máximo de 105 watts. Por outro lado, apenas 5% a separam da Legion 5, cuja RTX 4060 tem um TGP de 140 watts. Isso mostra novamente que a GPU dificilmente consegue se beneficiar de TGPs mais altos, conforme destacado por nosso colega em sua análise das novas placas Nvidia Geforce RTX 4000. A antecessora, com sua RTX 3070 Ti, a supera em 21%.
| The Witcher 3 - 1920x1080 Ultra Graphics & Postprocessing (HBAO+) | |
| Média da turma Gaming (104.7 - 240, n=7, últimos 2 anos) | |
| Lenovo Legion Pro 5 16IRX8 | |
| Asus ROG Flow X16 GV601V | |
| MSI Katana 17 B13VFK | |
| Asus ROG Flow X16 GV601RW-M5082W | |
| Samsung Galaxy Book3 Ultra 16, i9-13900H RTX 4070 | |
| Lenovo Yoga Pro 7 14IRH G8 | |
| Strange Brigade - 1920x1080 ultra AA:ultra AF:16 | |
| Média da turma Gaming (76.3 - 458, n=87, últimos 2 anos) | |
| Asus ROG Flow X16 GV601V | |
| MSI Katana 17 B13VFK | |
| Asus ROG Flow X16 GV601RW-M5082W | |
| Samsung Galaxy Book3 Ultra 16, i9-13900H RTX 4070 | |
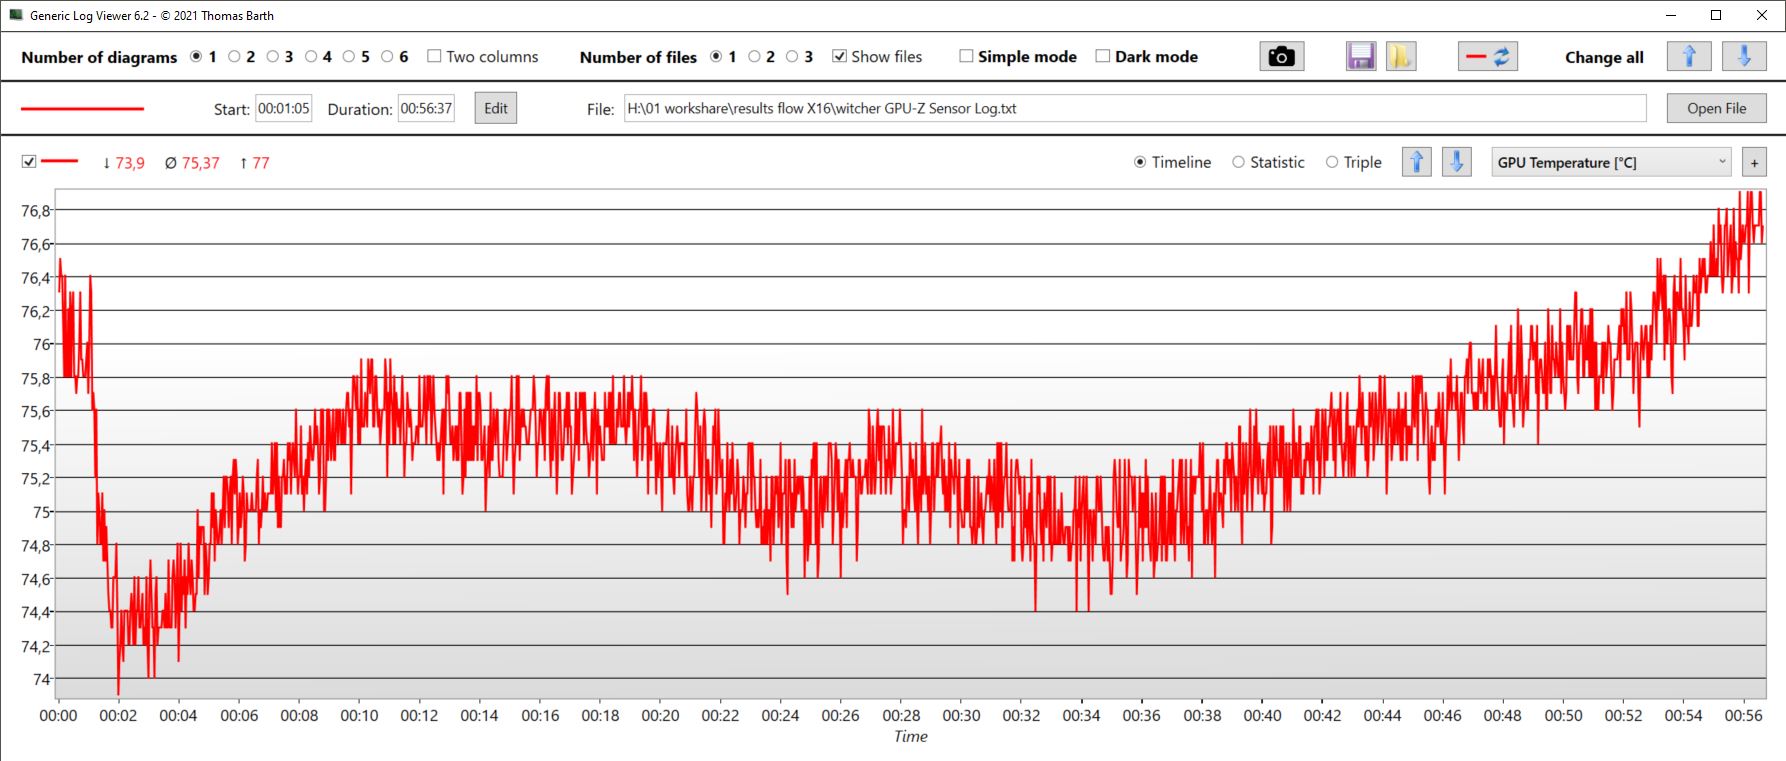
A taxa de quadros do site Witcher 3 exibe a curva dia/noite habitual, mas é muito estável. De acordo com o registro do GPU-Z, a velocidade do clock do núcleo está quase constante em 2.460 MHz e a velocidade do clock da memória também está estável (2 GHz).
A temperatura da GPU flutuou um pouco em uma média de cerca de 75 °C, mas aumentou continuamente no final da hora, o que significa que a velocidade do clock pode ser reduzida durante períodos mais longos de operação.
A placa consumiu apenas 92,5 watts em média e vimos picos extremamente curtos de 110 watts, mas os possíveis 120 watts nunca foram atingidos.
Com sua placaRTX 4070oGalaxy Book3 não tem nenhuma chance contra o nosso X16 que, do ponto de vista técnico, consegue até mesmo chegar perto do Legion 5.
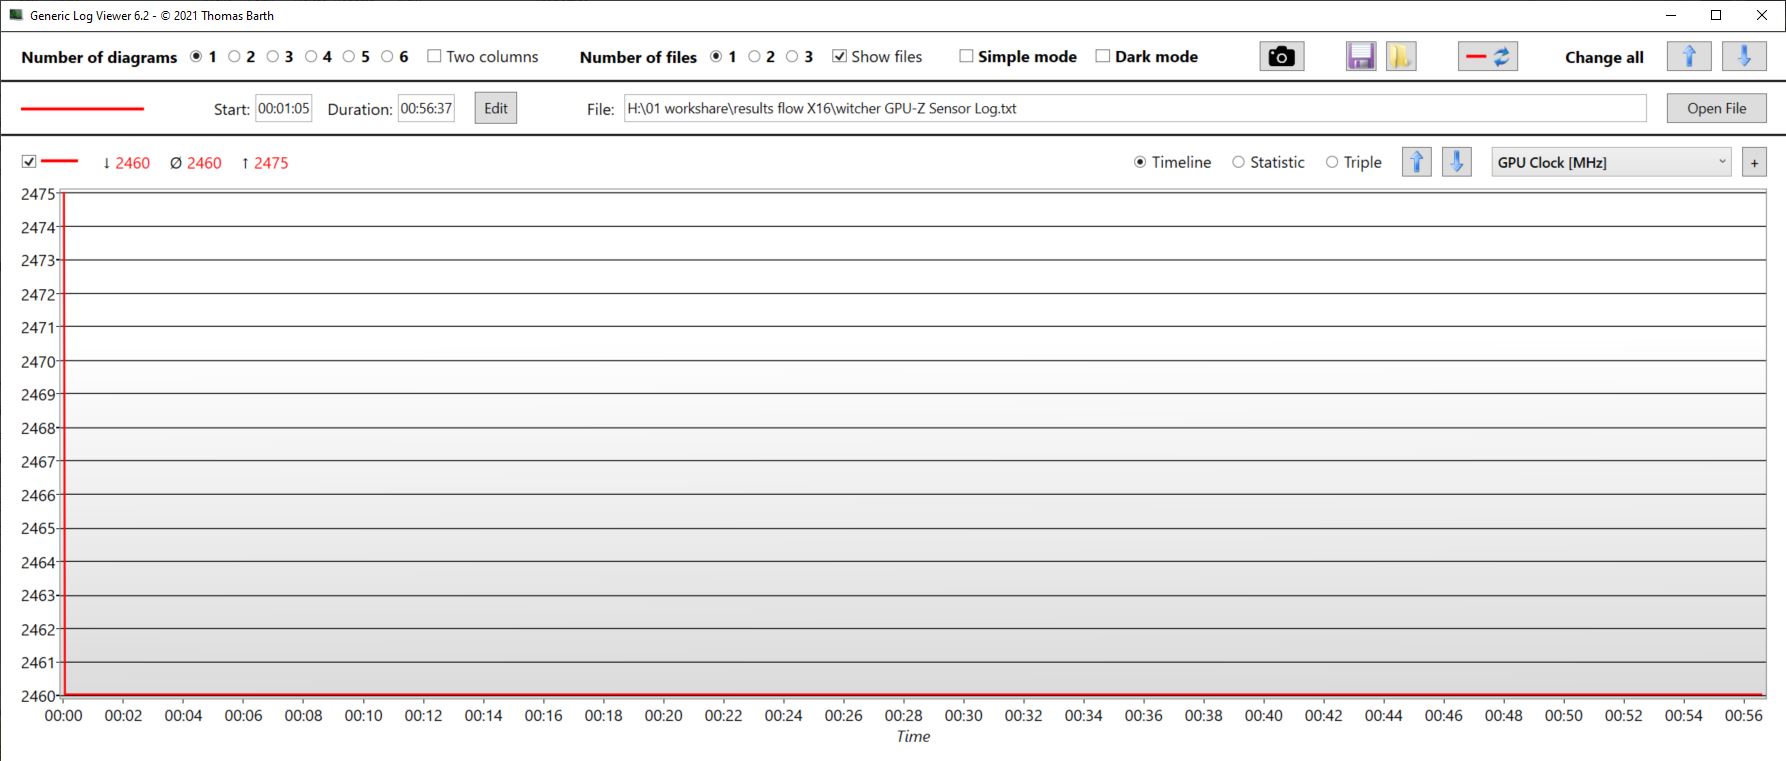
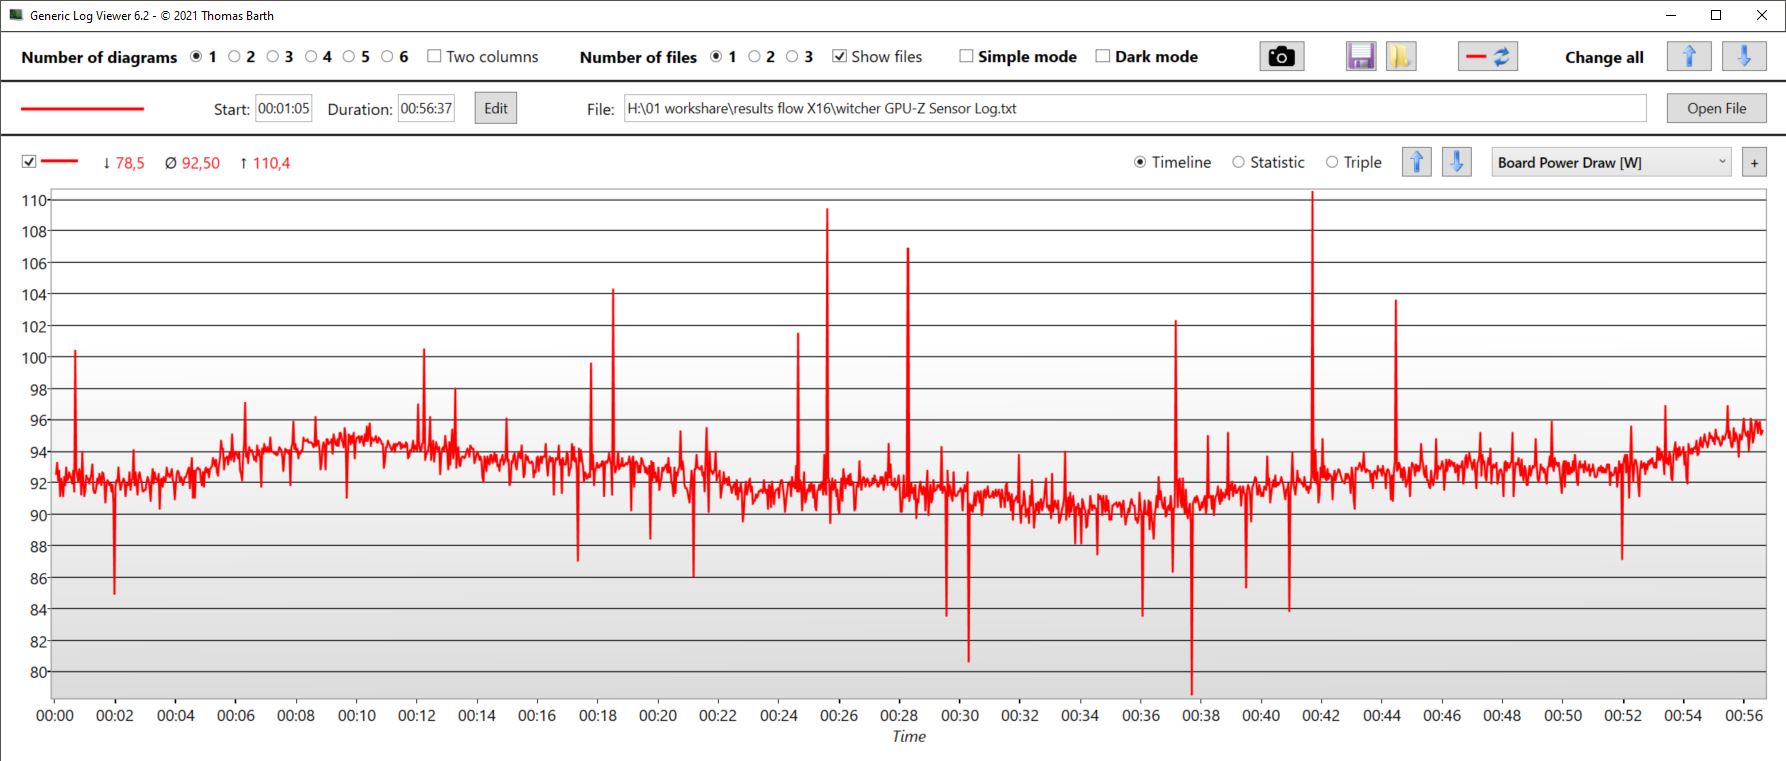
Witcher 3 FPS diagram
| baixo | média | alto | ultra | QHD | 4K | |
|---|---|---|---|---|---|---|
| GTA V (2015) | 184.4 | 179.8 | 173.9 | 110.3 | 79.4 | |
| The Witcher 3 (2015) | 214.8 | 106.5 | ||||
| Dota 2 Reborn (2015) | 188.3 | 166 | 162.8 | 149.2 | 115.5 | |
| Final Fantasy XV Benchmark (2018) | 100.8 | |||||
| X-Plane 11.11 (2018) | 174 | 145.4 | 116.4 | 105.6 | ||
| Far Cry 5 (2018) | 140 | 130 | 99 | |||
| Strange Brigade (2018) | 419 | 266 | 225 | 192.5 | 129.2 | |
| Shadow of the Tomb Raider (2018) | 150 | 137 | 93 | |||
| Assassin´s Creed Valhalla (2020) | 114 | 98 | 71 | |||
| Far Cry 6 (2021) | 120 | 108 | 79 | |||
| Cyberpunk 2077 1.6 (2022) | 84.25 | 76.64 | 48.71 | |||
| F1 22 (2022) | 257 | 218 | 183.9 | 64.8 | 42.3 | |
| Call of Duty Modern Warfare 2 2022 (2022) | 91 | 86 | 61 | |||
| Hogwarts Legacy (2023) | 106.9 | 91.9 | 42.8 | |||
| The Last of Us (2023) | 71.2 | 53.1 | 32.7 |
Emissões - Silencioso também é possível com o Flow X16
Emissões de ruído
Em marcha lenta, os ventiladores permaneceram quase sempre parados. Sob carga, o ruído depende claramente do modo de desempenho selecionado. Por exemplo, ao jogar no modo turbo, as ventoinhas aumentaram para mais de 50 dB, enquanto no modo de desempenho elas funcionaram a 44 dB, o que é muito mais tolerável. Essa diferença relativamente grande, por si só, deve tornar mais suportável a pequena queda de desempenho no modo de desempenho. No modo silencioso, o nível de decibéis caiu para cerca de apenas 37 dB.
No modo turbo, os ventiladores funcionaram por um bom tempo após a execução de tarefas exigentes, como jogos, se não na velocidade máxima. No entanto, mesmo em modo inativo, o X16 permaneceu barulhento por alguns minutos, se uma sessão de jogos tivesse sido realizada anteriormente.
Portanto, para os criadores de conteúdo, recomendamos usar o modo de desempenho (ou até mesmo o modo silencioso), pois eles são muito mais silenciosos com uma queda tolerável na potência disponível.
Durante a execução ociosa, os processos em segundo plano do Windows ou da Asus continuam perturbando os ventiladores silenciosos. Essas ventoinhas entram em ação, especialmente no modo turbo.
| Modus/Witcher 3 Ultra | FPS | Lautstärke em dB | Durchschnittsverbrauch em W |
|---|---|---|---|
| Turbo | 102 | 50.92 | 142 |
| Leistung | 92 | 44 | |
| Leise | 80 | 37.53 | 106 |
Barulho
| Ocioso |
| 24 / 24 / 24 dB |
| Carga |
| 36.71 / 50.92 dB |
 | ||
30 dB silencioso 40 dB(A) audível 50 dB(A) ruidosamente alto |
||
min: | ||
| Asus ROG Flow X16 GV601V GeForce RTX 4060 Laptop GPU, i9-13900H, WD PC SN560 SDDPNQE-1T00 | Asus ROG Flow X16 GV601RW-M5082W GeForce RTX 3070 Ti Laptop GPU, R9 6900HS, Micron 3400 1TB MTFDKBA1T0TFH | Samsung Galaxy Book3 Ultra 16, i9-13900H RTX 4070 GeForce RTX 4070 Laptop GPU, i9-13900H, Samsung PM9A1 MZVL21T0HCLR | Lenovo Legion Pro 5 16IRX8 GeForce RTX 4060 Laptop GPU, i7-13700HX, SK hynix PC801 HFS512GEJ9X115N | Lenovo Yoga Pro 7 14IRH G8 GeForce RTX 4050 Laptop GPU, i7-13700H, Samsung PM9A1 MZVL21T0HCLR | MSI Katana 17 B13VFK GeForce RTX 4060 Laptop GPU, i7-13620H, Micron 2400 MTFDKBA1T0QFM | |
|---|---|---|---|---|---|---|
| Noise | -13% | -9% | 1% | -6% | -19% | |
| desligado / ambiente * (dB) | 24 | 25.5 -6% | 25.2 -5% | 23 4% | 22.9 5% | 24.5 -2% |
| Idle Minimum * (dB) | 24 | 25.5 -6% | 25.2 -5% | 23.1 4% | 22.9 5% | 24.5 -2% |
| Idle Average * (dB) | 24 | 25.5 -6% | 25.2 -5% | 23.1 4% | 22.9 5% | 24.5 -2% |
| Idle Maximum * (dB) | 24 | 27.4 -14% | 31.3 -30% | 26.6 -11% | 36.8 -53% | 40 -67% |
| Load Average * (dB) | 36.71 | 49.9 -36% | 38.8 -6% | 34.7 5% | 43.7 -19% | 48.3 -32% |
| Witcher 3 ultra * (dB) | 50.92 | 47.6 7% | 46.2 9% | 56 -10% | ||
| Load Maximum * (dB) | 50.92 | 55 -8% | 51.2 -1% | 54.8 -8% | 46.2 9% | 59.1 -16% |
* ... menor é melhor
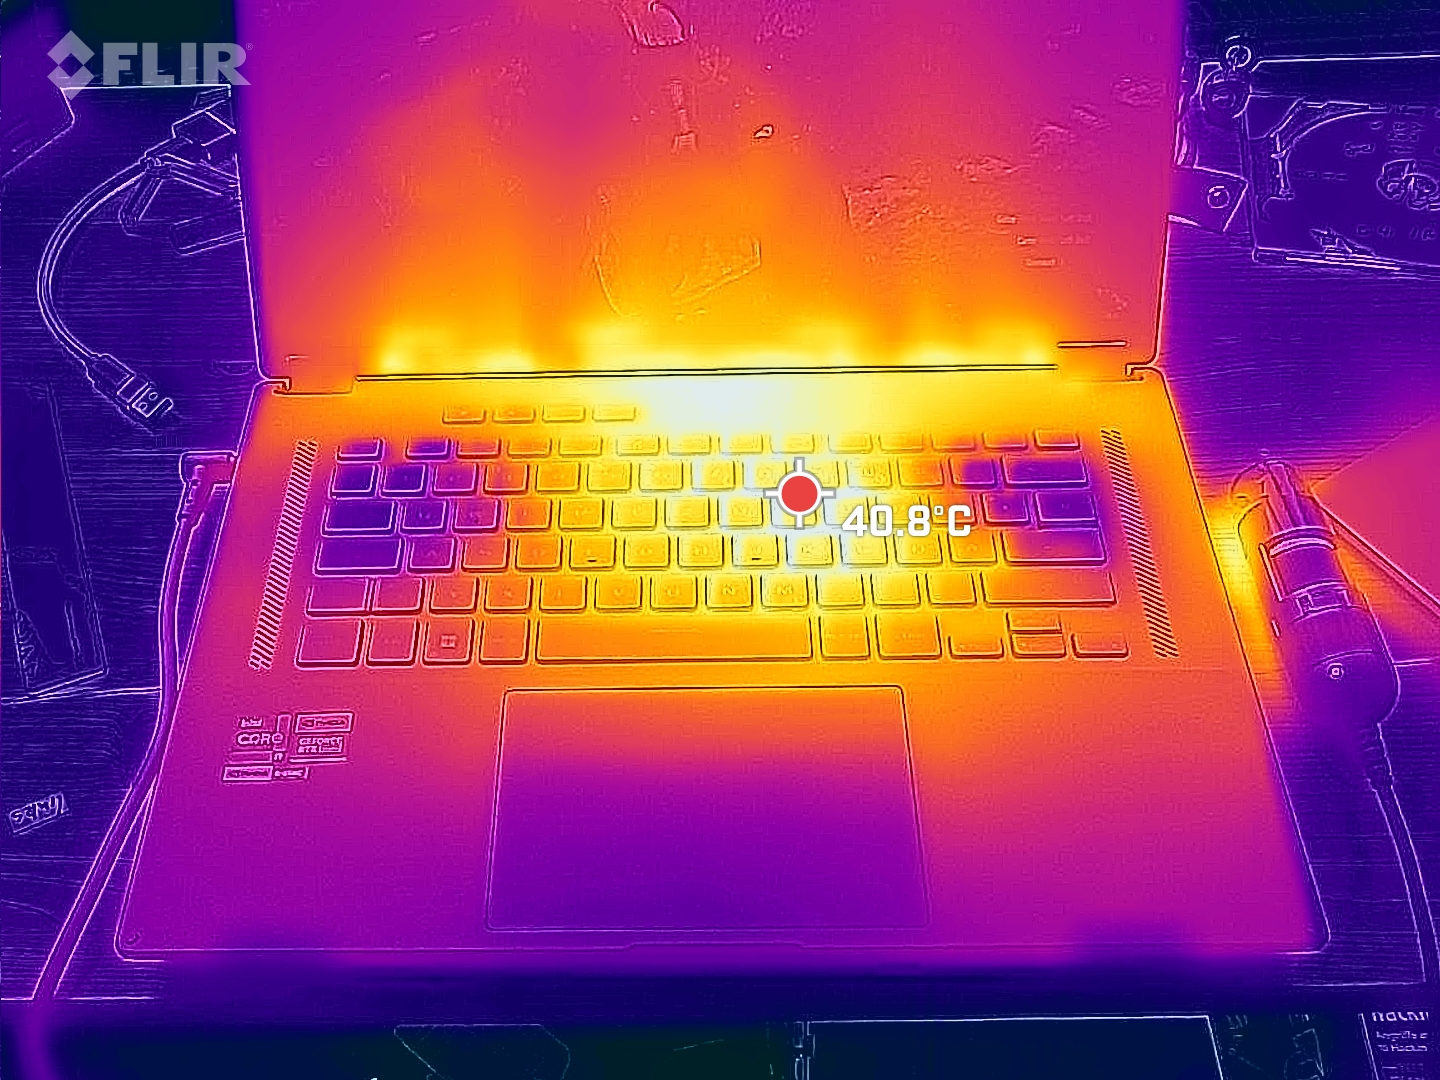
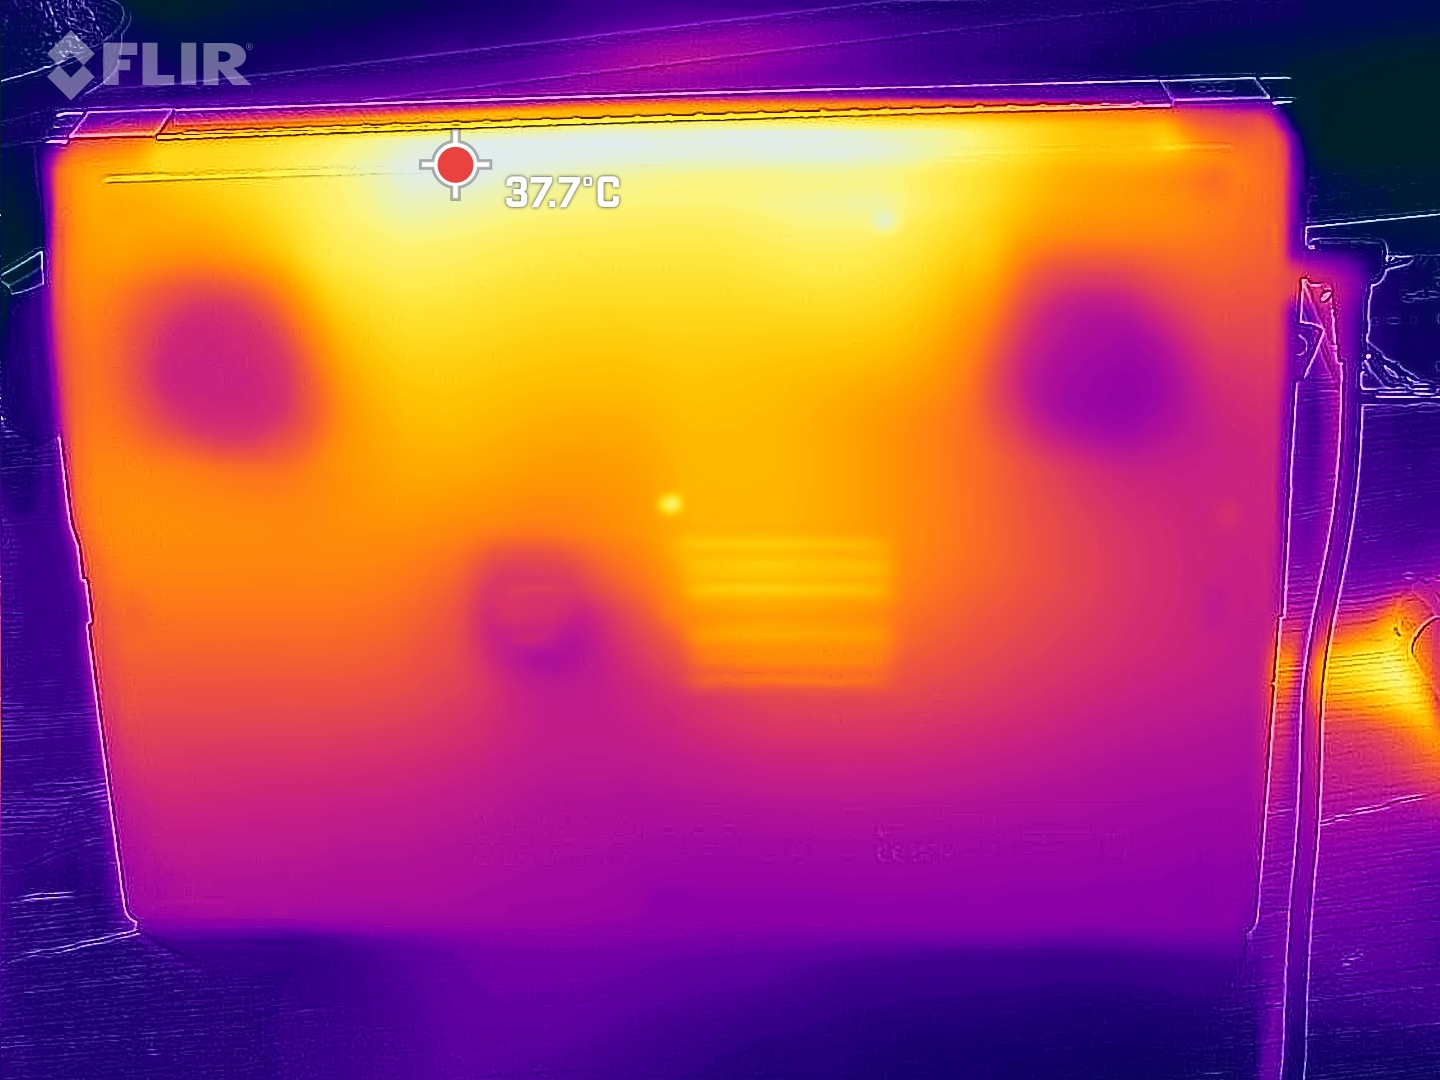
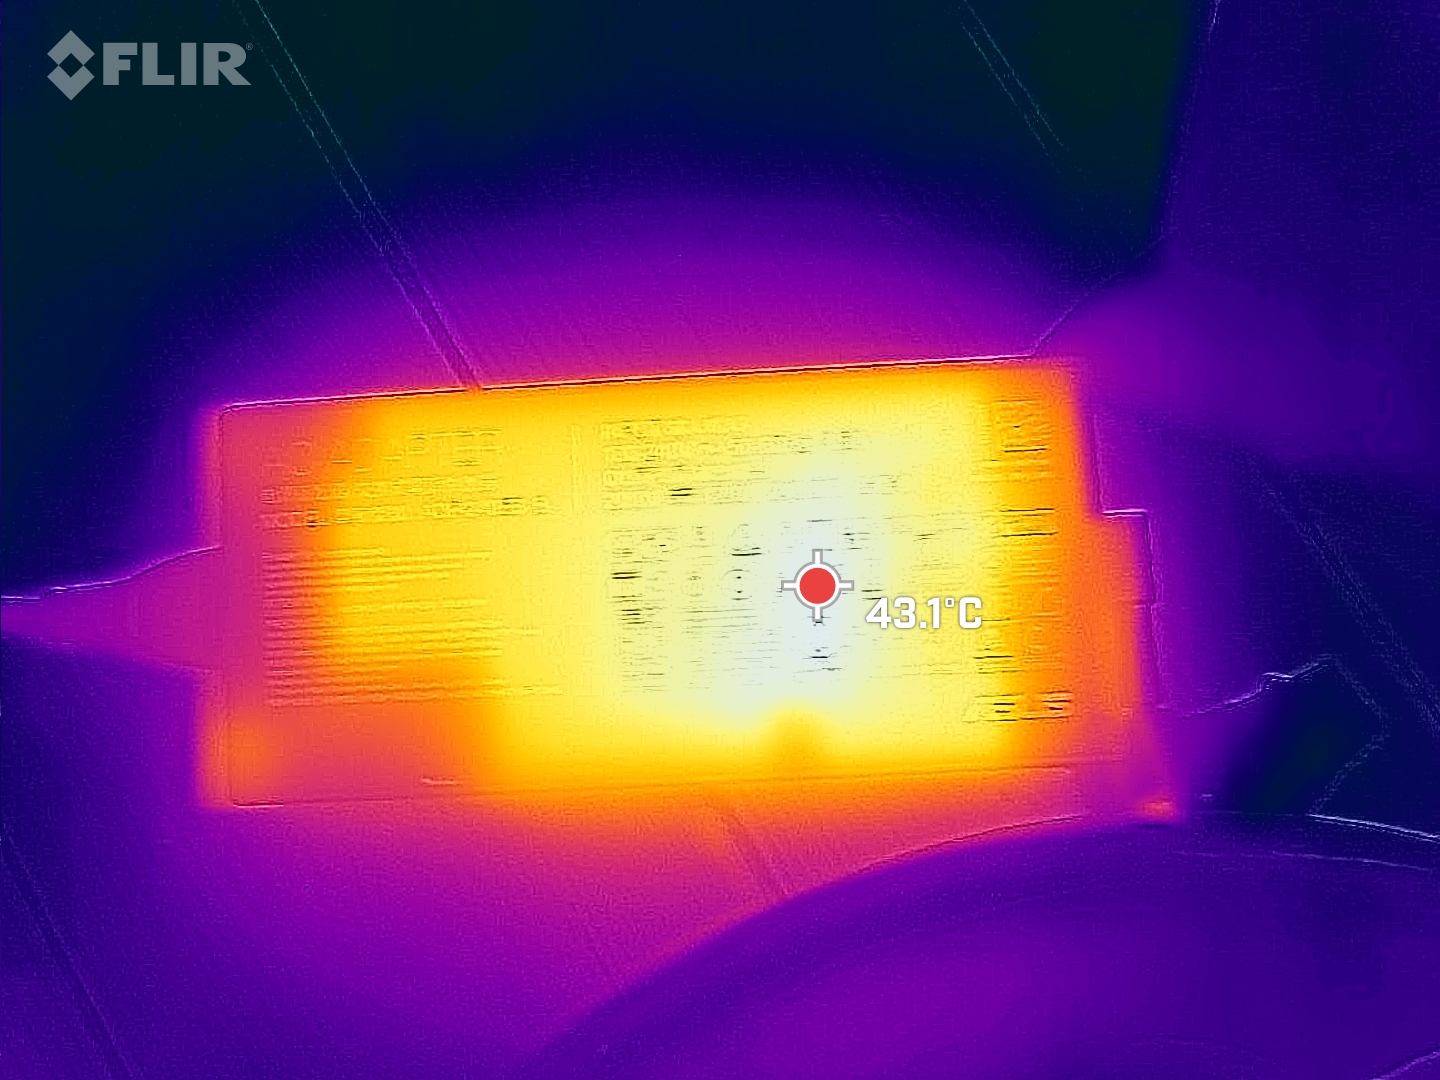
Temperatura
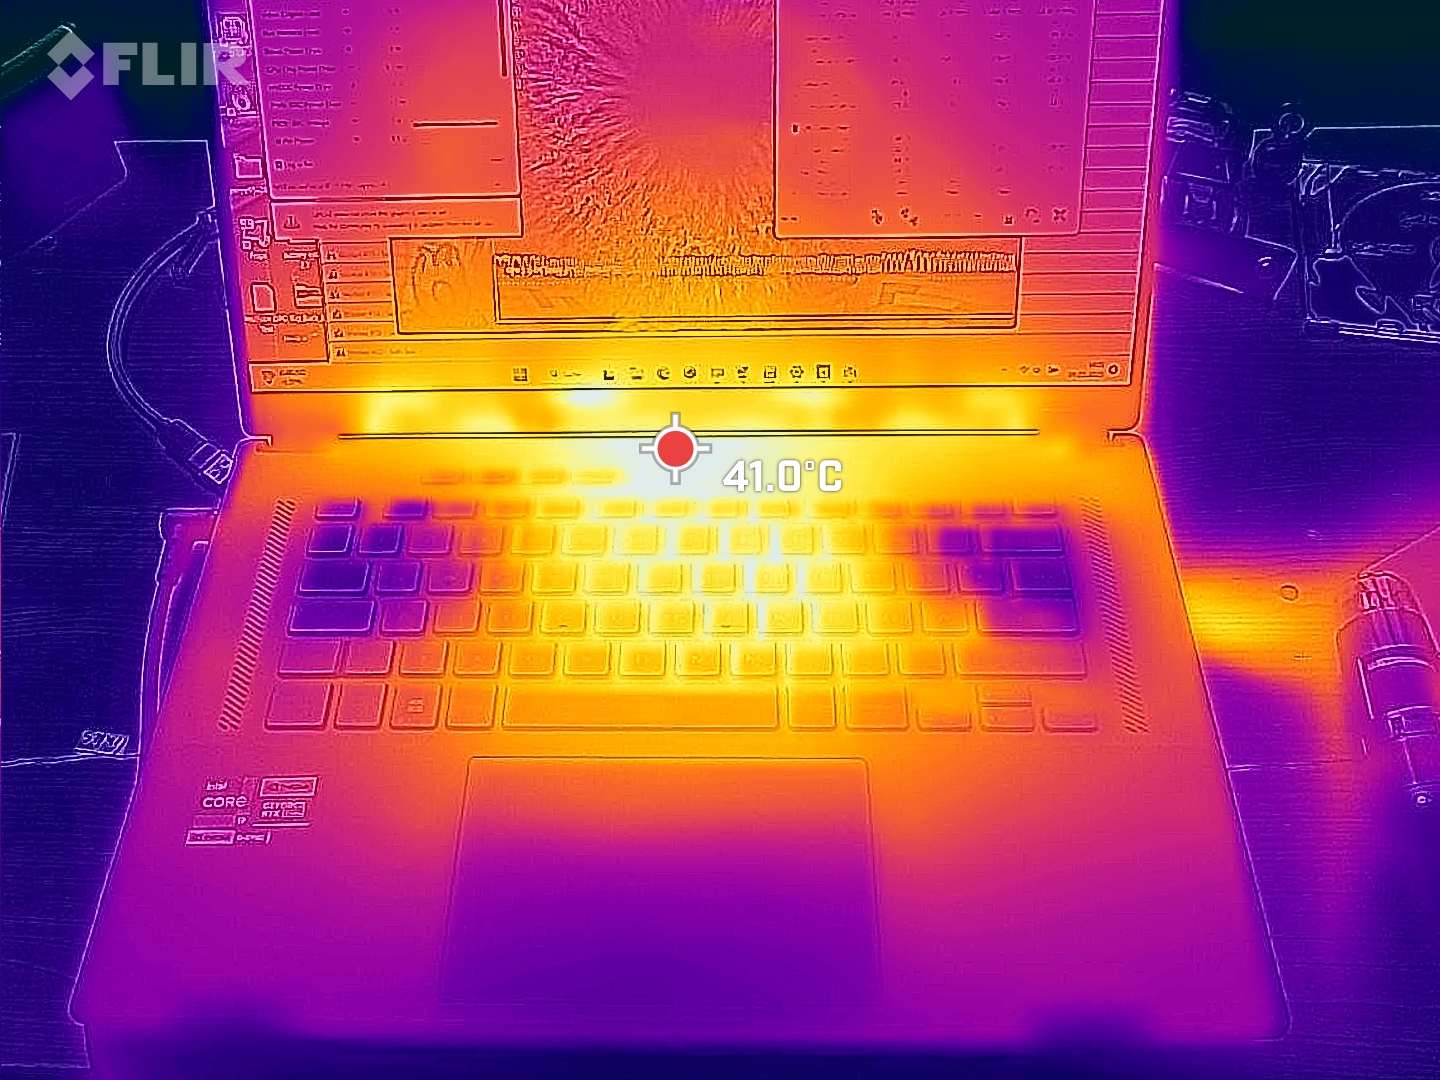
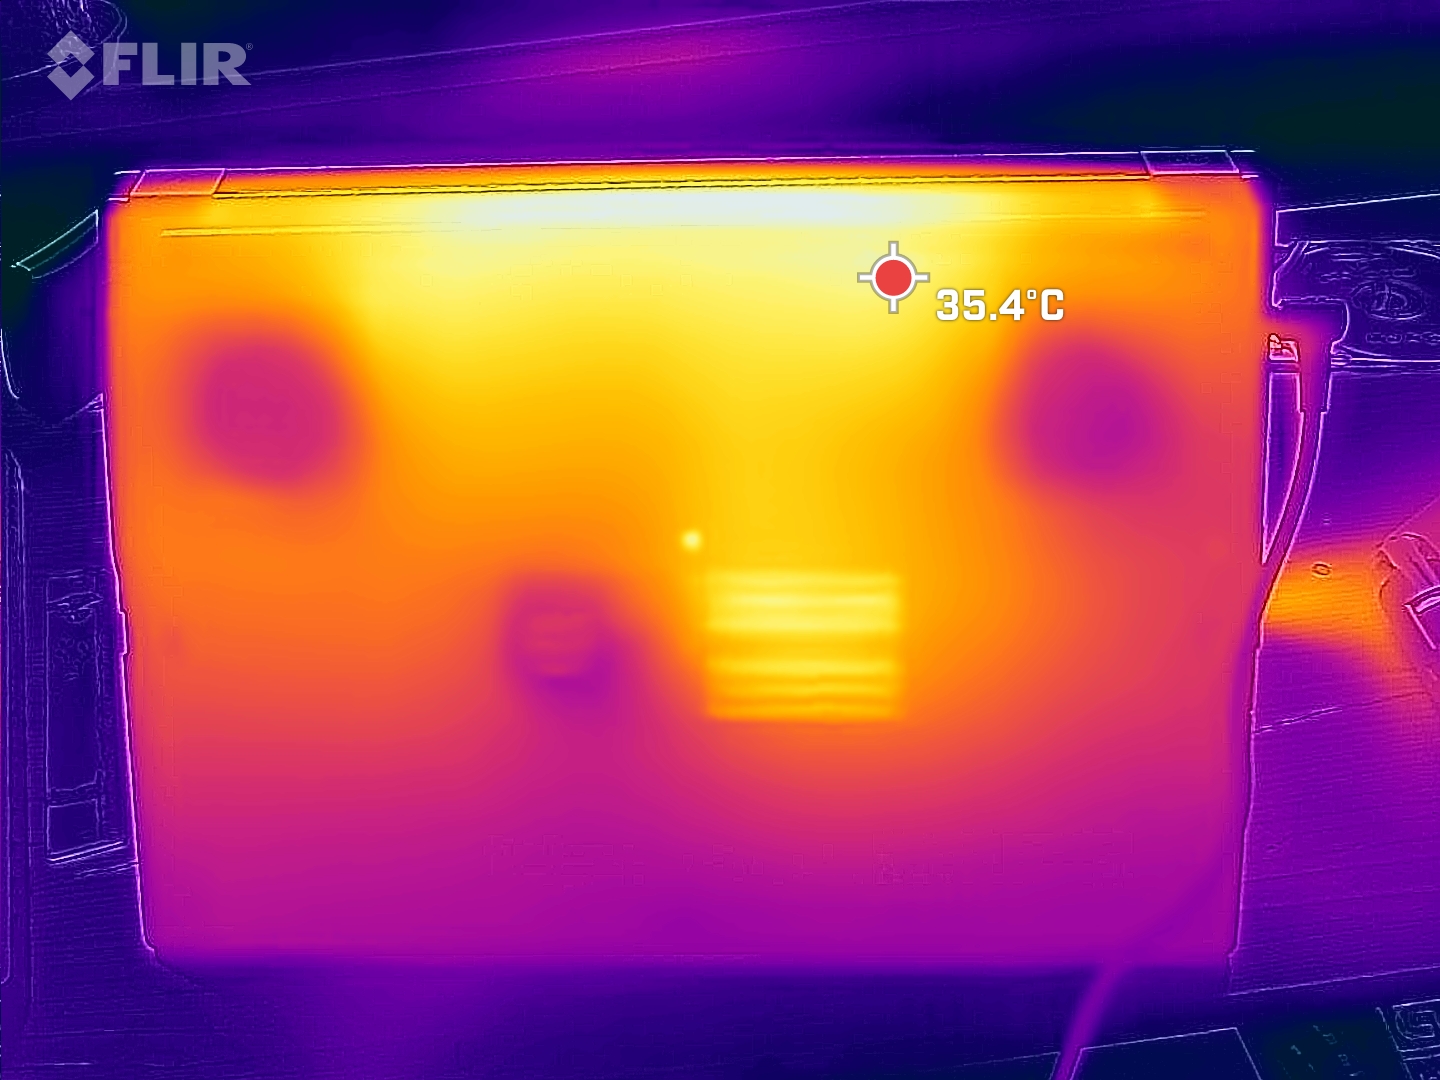
Durante os jogos, há pontos quentes de cerca de 50 °C que podem ser encontrados no meio, na parte superior do dispositivo e na parte traseira, com o apoio para as mãos e as teclas WASD permanecendo comparativamente frios. Na parte inferior do laptop, ele não fica muito quente.
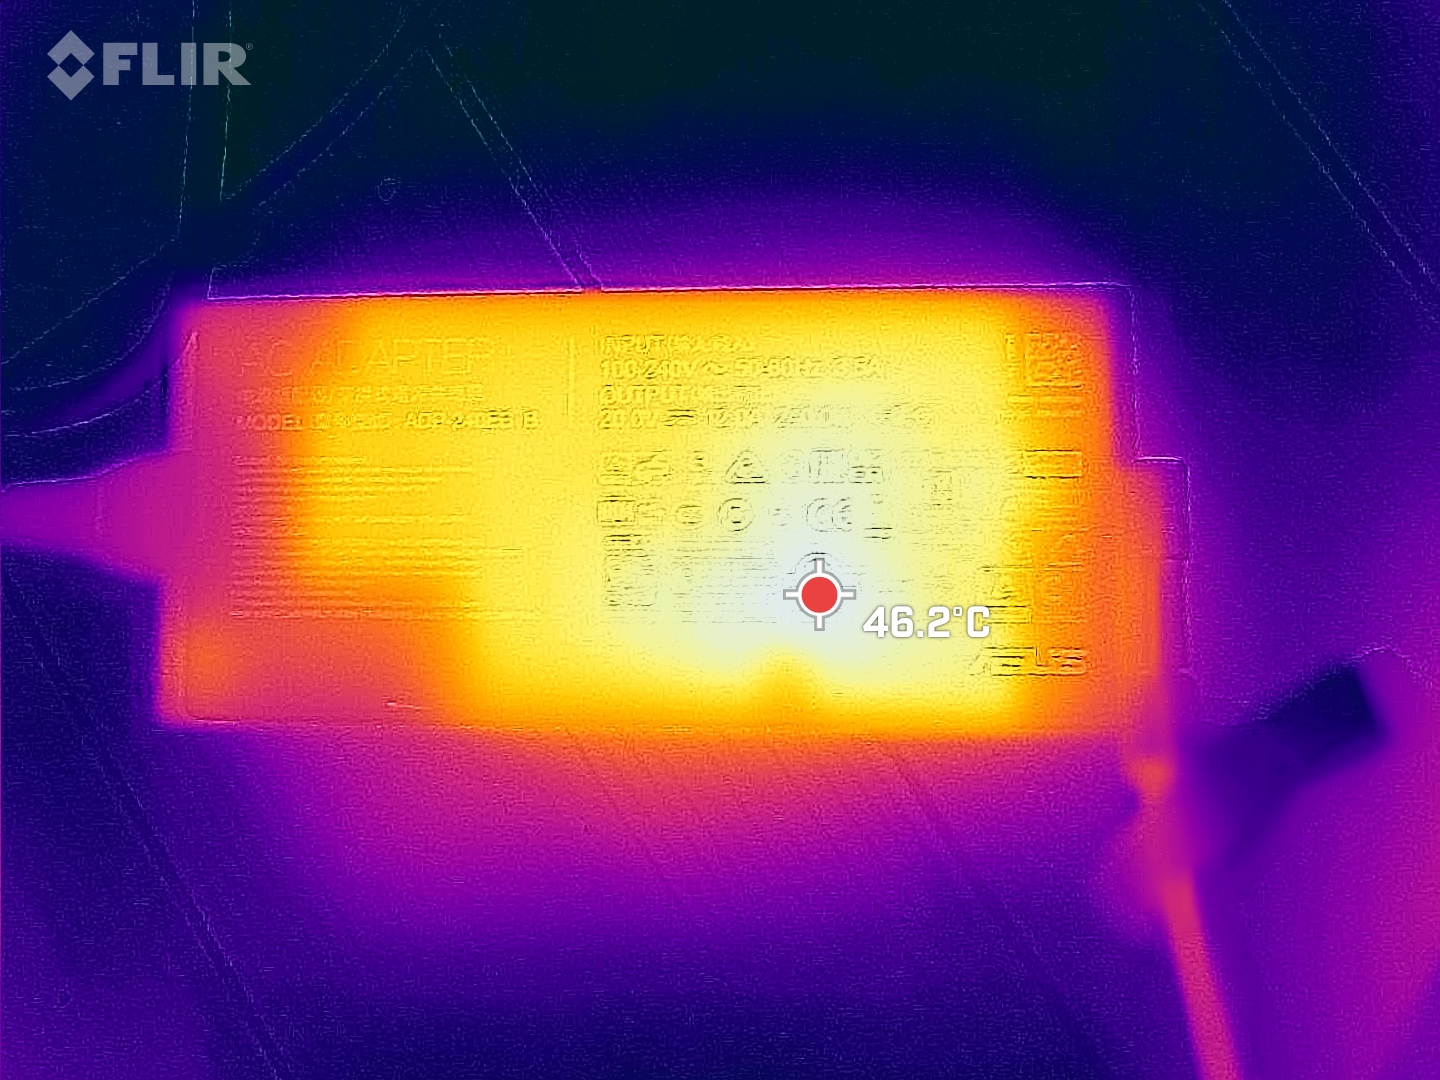
Entretanto, mesmo em uso ocioso, o adaptador de energia pode ficar muito quente. São necessários apenas alguns processos em segundo plano durante a execução ociosa para aquecer a PSU fina a uma temperatura de 45 °C!
(-) A temperatura máxima no lado superior é 46 °C / 115 F, em comparação com a média de 40.4 °C / 105 F , variando de 21.2 a 68.8 °C para a classe Gaming.
(±) A parte inferior aquece até um máximo de 41 °C / 106 F, em comparação com a média de 43.2 °C / 110 F
(+) Em uso inativo, a temperatura média para o lado superior é 31.9 °C / 89 F, em comparação com a média do dispositivo de 33.9 °C / ### class_avg_f### F.
(±) Jogando The Witcher 3, a temperatura média para o lado superior é 37.4 °C / 99 F, em comparação com a média do dispositivo de 33.9 °C / ## #class_avg_f### F.
(+) Os apoios para as mãos e o touchpad são mais frios que a temperatura da pele, com um máximo de 31 °C / 87.8 F e, portanto, são frios ao toque.
(-) A temperatura média da área do apoio para as mãos de dispositivos semelhantes foi 28.8 °C / 83.8 F (-2.2 °C / -4 F).
| Asus ROG Flow X16 GV601V Intel Core i9-13900H, NVIDIA GeForce RTX 4060 Laptop GPU | Asus ROG Flow X16 GV601RW-M5082W AMD Ryzen 9 6900HS, NVIDIA GeForce RTX 3070 Ti Laptop GPU | Samsung Galaxy Book3 Ultra 16, i9-13900H RTX 4070 Intel Core i9-13900H, NVIDIA GeForce RTX 4070 Laptop GPU | Lenovo Legion Pro 5 16IRX8 Intel Core i7-13700HX, NVIDIA GeForce RTX 4060 Laptop GPU | Lenovo Yoga Pro 7 14IRH G8 Intel Core i7-13700H, NVIDIA GeForce RTX 4050 Laptop GPU | MSI Katana 17 B13VFK Intel Core i7-13620H, NVIDIA GeForce RTX 4060 Laptop GPU | |
|---|---|---|---|---|---|---|
| Heat | -13% | -4% | 0% | 4% | 2% | |
| Maximum Upper Side * (°C) | 46 | 55.1 -20% | 45.9 -0% | 42.8 7% | 41.6 10% | 41.6 10% |
| Maximum Bottom * (°C) | 41 | 50.3 -23% | 50.9 -24% | 50 -22% | 55.7 -36% | 43.1 -5% |
| Idle Upper Side * (°C) | 36 | 35.5 1% | 31.6 12% | 29.6 18% | 25.9 28% | 32 11% |
| Idle Bottom * (°C) | 33 | 36.1 -9% | 34.2 -4% | 34 -3% | 28 15% | 35.8 -8% |
* ... menor é melhor
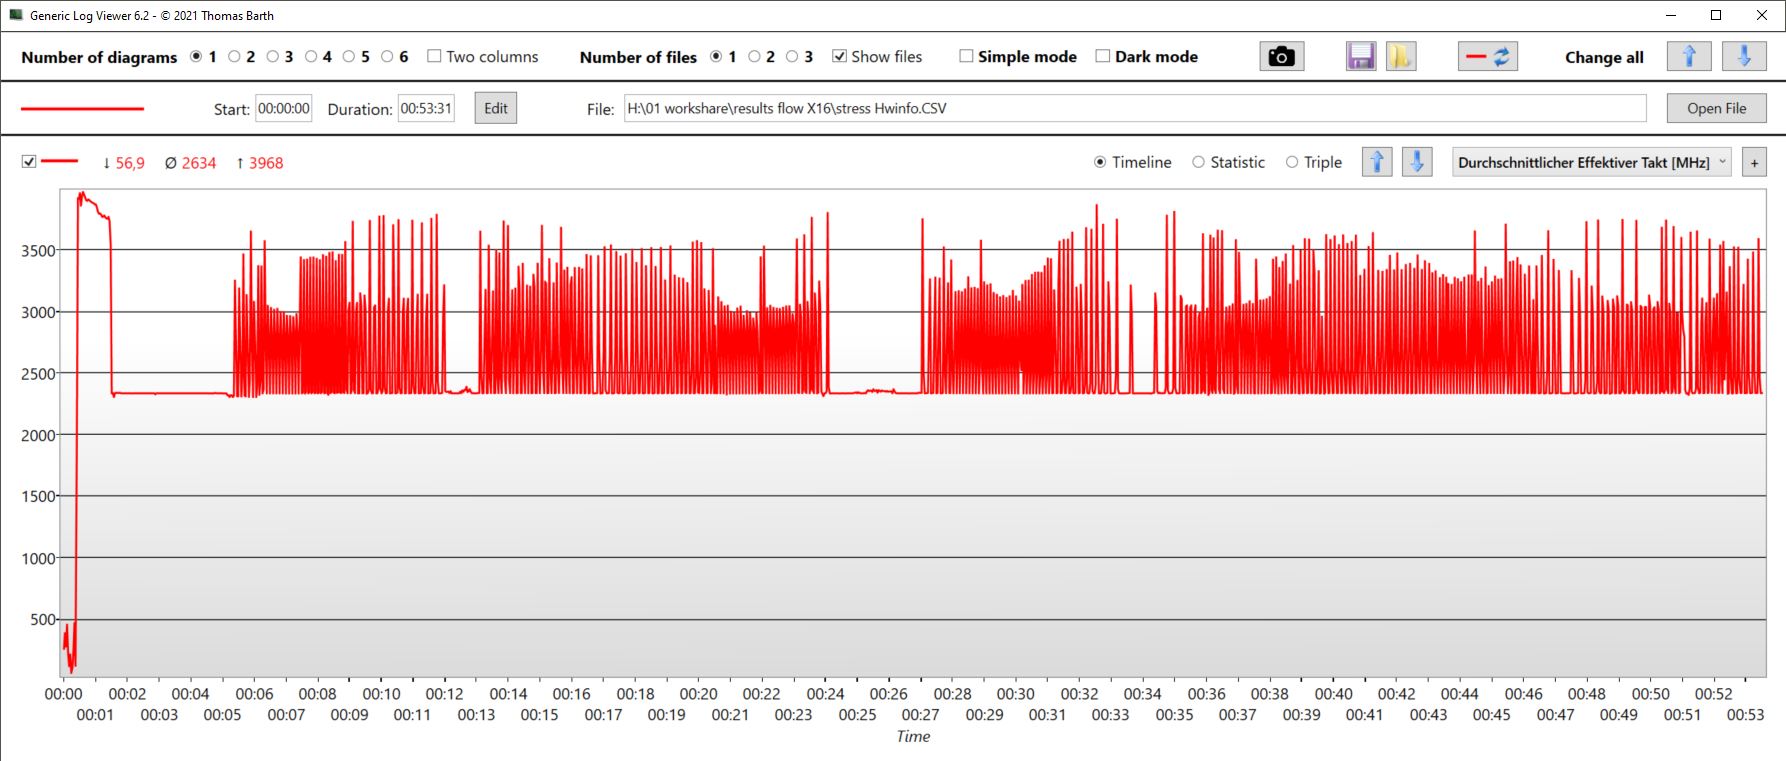
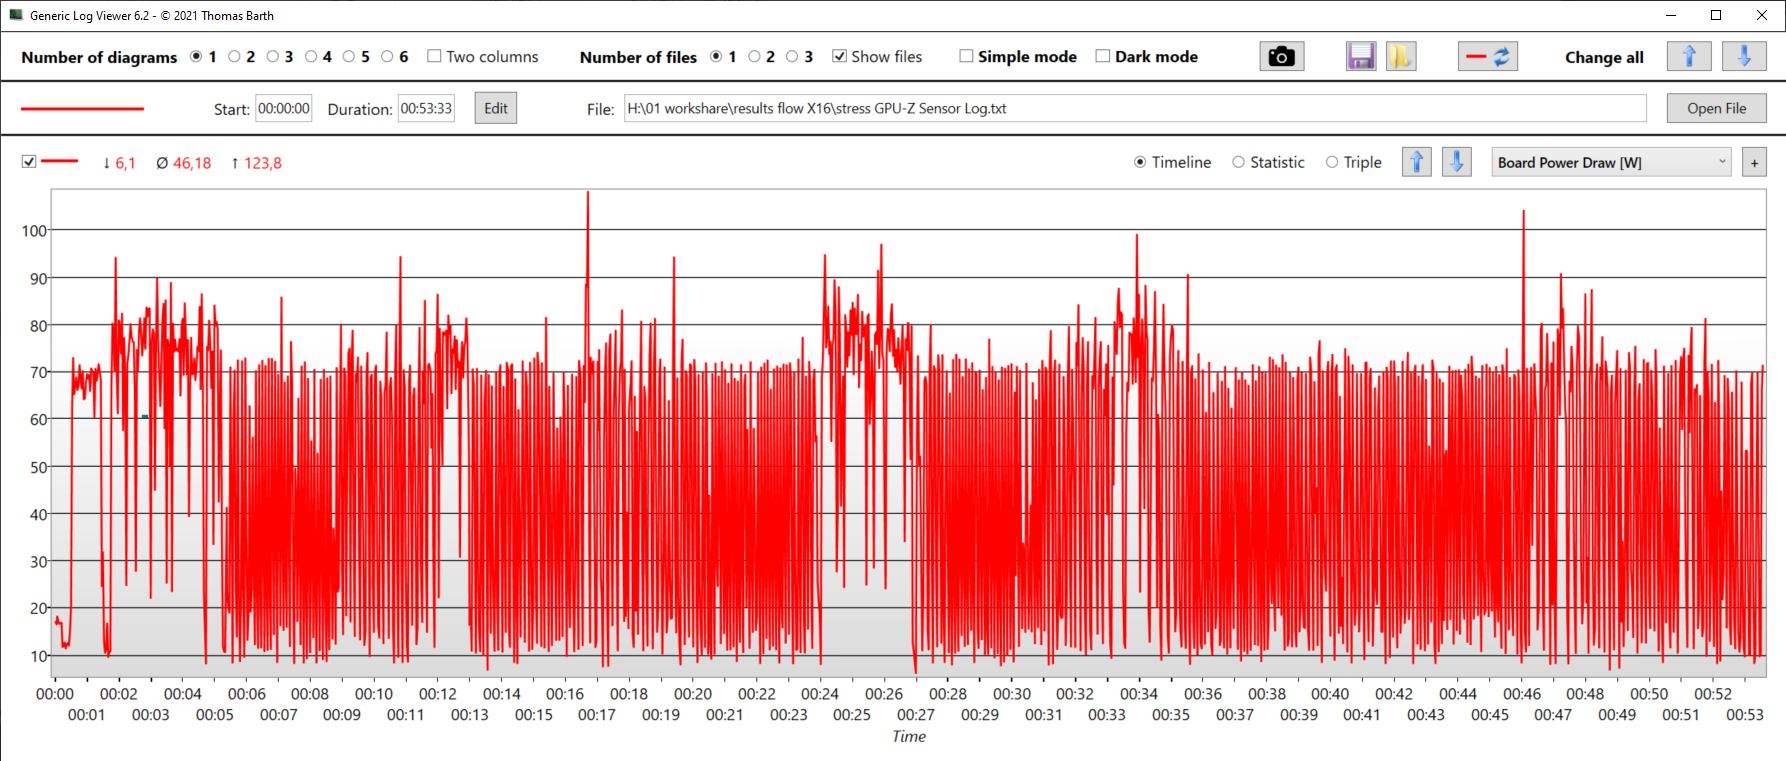
Teste de estresse
No início, os núcleos aumentaram para quase 4 GHz com a CPU consumindo 85 watts. No entanto, após cerca de um minuto, as temperaturas do núcleo atingiram 96 °C e o desempenho foi significativamente reduzido. As velocidades do clock do núcleo caíram para 2,4 GHz por alguns minutos e o TDP foi de apenas 35 watts. Isso resultou em uma queda ainda maior na temperatura. Após alguns minutos, a velocidade aumentou e flutuou consideravelmente, estabelecendo-se em uma média de cerca de 2,6 GHz. A redução do TDP para 35 watts por minutos seguidos foi um fenômeno que ocorreu regularmente, depois do qual ele flutuou periodicamente mais uma vez. Com a queda de temperatura igualmente rápida, esse não foi o único motivo para esse comportamento.
Em um grau menor, a GPU era semelhante. As fases relativamente estáveis eram consideravelmente mais curtas, com os valores gerais flutuando mais. A taxa de clock oscilou repetidamente de 2,4 GHz a 2,4 GHz para apenas 500 MHz e menos, com a velocidade do clock da memória exibindo flutuações extremas semelhantes. A temperatura média foi de 65 °C e subiu até um máximo de 82 °C. O consumo de energia ficou em uma média de 46 watts, mas saltou repetidamente para 90 watts ou mais de 100 watts.
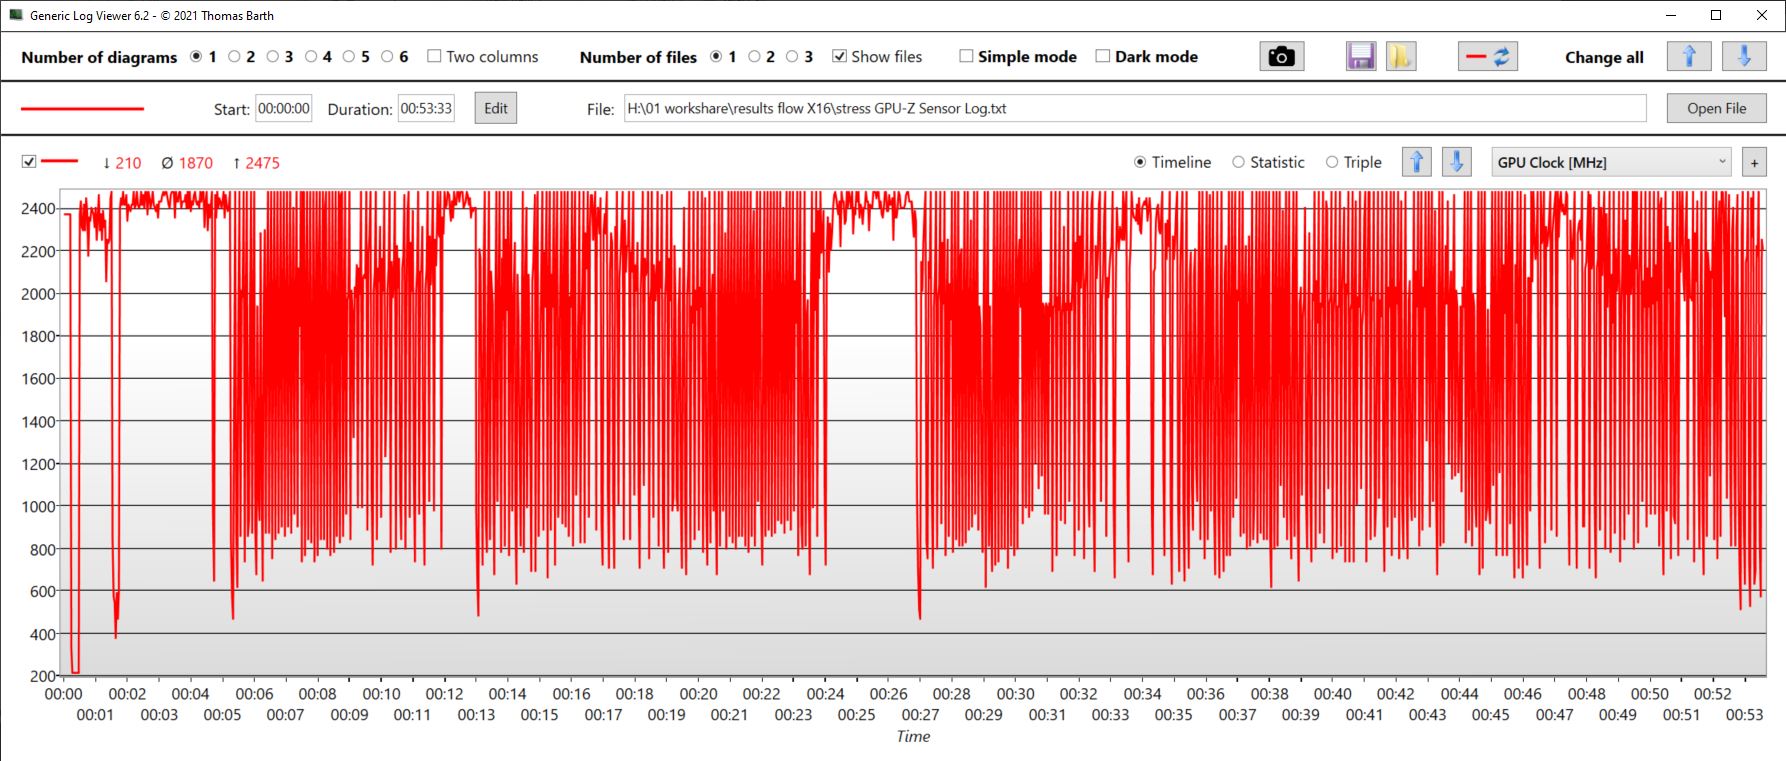
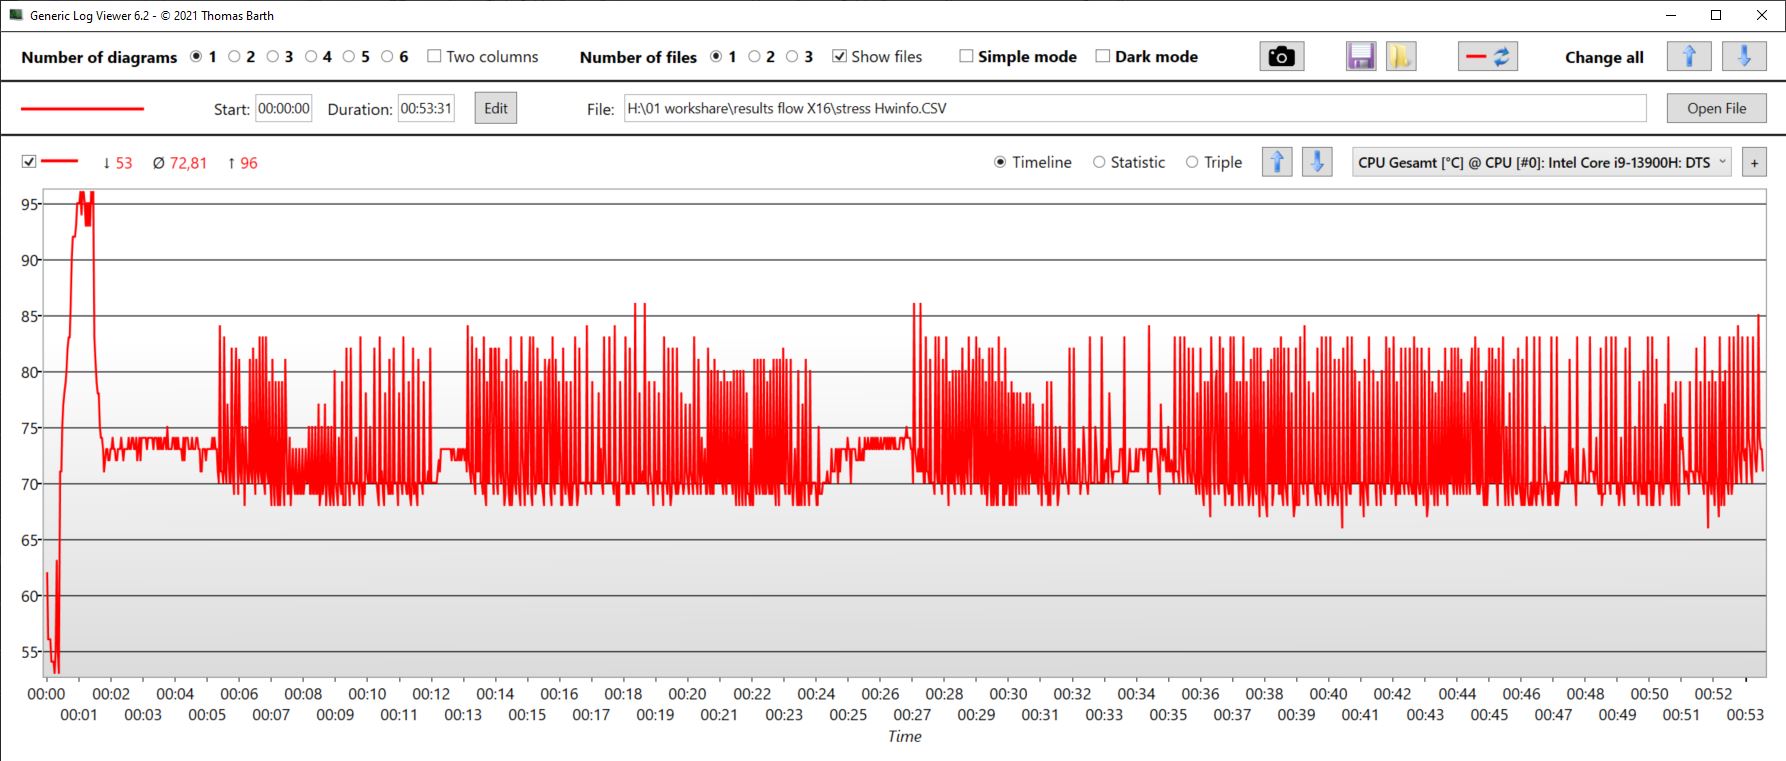
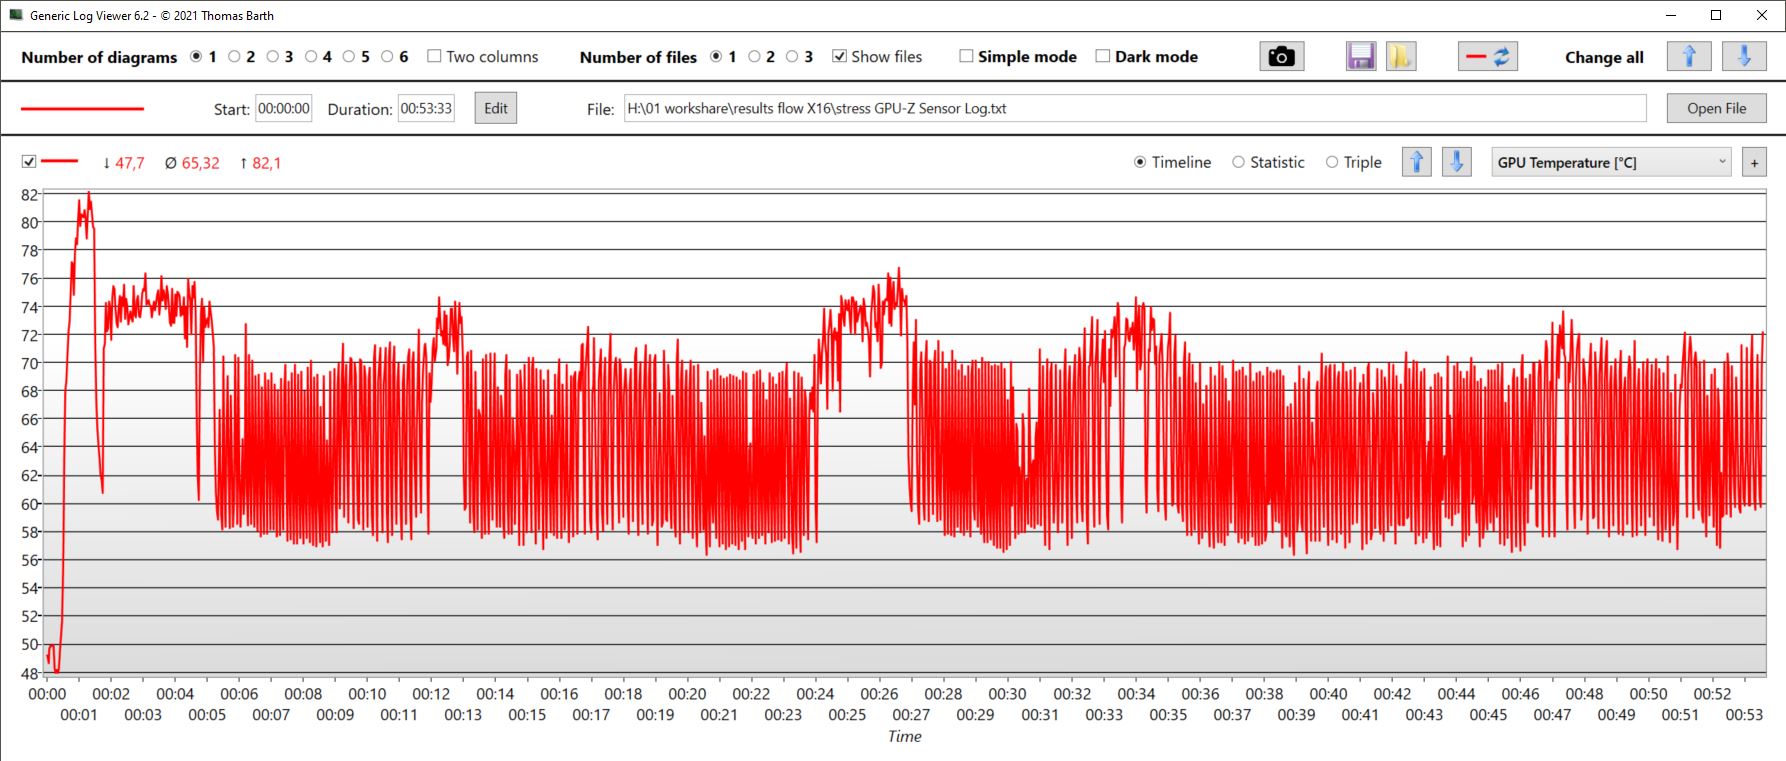
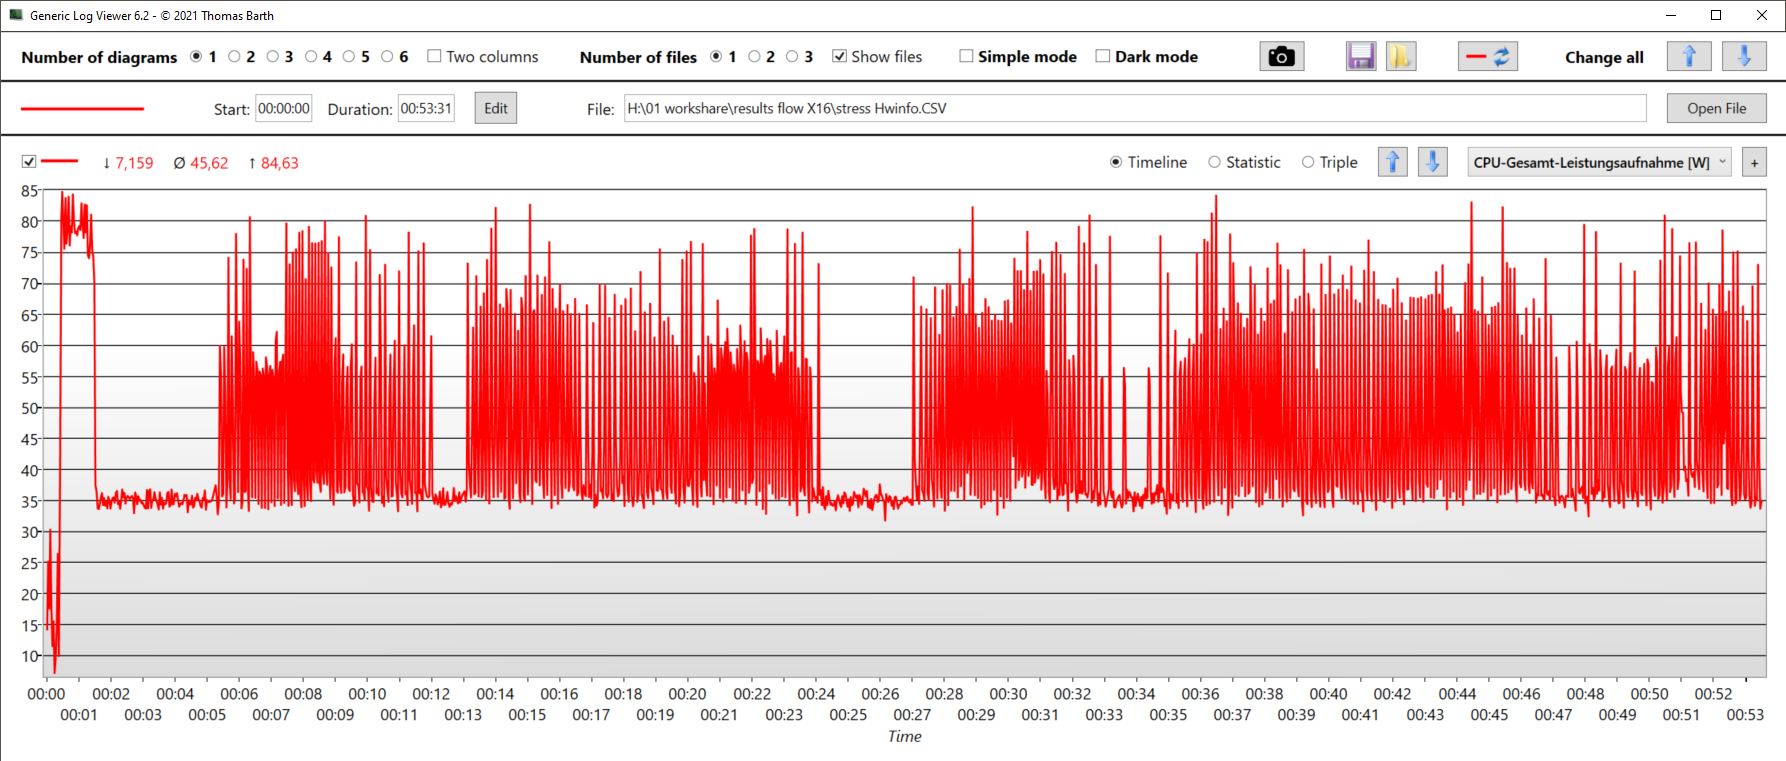
| Clock da CPU (GHz) | Clock da GPU (MHz) | Temperatura média da CPU (°C) | Temperatura média da GPU (°C) | |
| Prime95 + FurMark Stress | 2,6 | 1.870 | 73 | 65 |
| Witcher 3 StressAllerdings könnten die Boxen etwas lauter | 505 | 2.460 | 67,6 | 75 |
Alto-falantes
Os alto-falantes oferecem médios e agudos equilibrados e os graves são, obviamente, mais baixos, embora menos do que em alguns outros modelos. No entanto, os alto-falantes poderiam soar um pouco mais altos, no geral.
O conector de fone de ouvido de 3,5 mm é fornecido para permitir a conexão de dispositivos finais analógicos.
Asus ROG Flow X16 GV601V análise de áudio
(±) | o volume do alto-falante é médio, mas bom (###valor### dB)
Graves 100 - 315Hz
(±) | graves reduzidos - em média 9.6% menor que a mediana
(±) | a linearidade dos graves é média (9.2% delta para a frequência anterior)
Médios 400 - 2.000 Hz
(+) | médios equilibrados - apenas 4.7% longe da mediana
(±) | a linearidade dos médios é média (7.5% delta para frequência anterior)
Altos 2 - 16 kHz
(+) | agudos equilibrados - apenas 2.2% longe da mediana
(+) | os máximos são lineares (6.1% delta da frequência anterior)
Geral 100 - 16.000 Hz
(+) | o som geral é linear (12% diferença em relação à mediana)
Comparado com a mesma classe
» 12% de todos os dispositivos testados nesta classe foram melhores, 4% semelhantes, 84% piores
» O melhor teve um delta de 6%, a média foi 18%, o pior foi 132%
Comparado com todos os dispositivos testados
» 9% de todos os dispositivos testados foram melhores, 2% semelhantes, 88% piores
» O melhor teve um delta de 4%, a média foi 23%, o pior foi 134%
Lenovo Legion Pro 5 16IRX8 análise de áudio
(±) | o volume do alto-falante é médio, mas bom (###valor### dB)
Graves 100 - 315Hz
(-) | quase nenhum baixo - em média 23.7% menor que a mediana
(±) | a linearidade dos graves é média (10.7% delta para a frequência anterior)
Médios 400 - 2.000 Hz
(+) | médios equilibrados - apenas 3.8% longe da mediana
(±) | a linearidade dos médios é média (7.1% delta para frequência anterior)
Altos 2 - 16 kHz
(+) | agudos equilibrados - apenas 3.7% longe da mediana
(+) | os máximos são lineares (6.7% delta da frequência anterior)
Geral 100 - 16.000 Hz
(±) | a linearidade do som geral é média (21.9% diferença em relação à mediana)
Comparado com a mesma classe
» 79% de todos os dispositivos testados nesta classe foram melhores, 6% semelhantes, 16% piores
» O melhor teve um delta de 6%, a média foi 18%, o pior foi 132%
Comparado com todos os dispositivos testados
» 63% de todos os dispositivos testados foram melhores, 7% semelhantes, 30% piores
» O melhor teve um delta de 4%, a média foi 23%, o pior foi 134%
Gerenciamento de energia - Bom, mas não excelente
Gerenciamento de energia
Quando está ocioso, nosso X16 não é tão econômico quanto o Galaxy Book3, devido também à tela sensível ao toque brilhante. Apesar disso, durante o uso ocioso, o dispositivo é muito diferente quando comparado ao Legion 5. Mas, olhando para o Katana de 17 polegadas, fica claro que o Flow X16 poderia ser um pouco mais eficiente em termos de energia quando ocioso.
Em jogos, o consumo é comparável ao doKatana 17com desempenho ligeiramente melhor. Ao mesmo tempo, oLegion 5consome muito mais energia da parede. Isso também se aplica ao seu antecessorr, sendo que o novo Asus se tornou visivelmente mais eficiente.
| desligado | |
| Ocioso | |
| Carga |
|
Key:
min: | |
| Asus ROG Flow X16 GV601V i9-13900H, GeForce RTX 4060 Laptop GPU, WD PC SN560 SDDPNQE-1T00, IPS, 2560x1600, 16" | Asus ROG Flow X16 GV601RW-M5082W R9 6900HS, GeForce RTX 3070 Ti Laptop GPU, Micron 3400 1TB MTFDKBA1T0TFH, Mini LED, 2560x1600, 16.1" | Samsung Galaxy Book3 Ultra 16, i9-13900H RTX 4070 i9-13900H, GeForce RTX 4070 Laptop GPU, Samsung PM9A1 MZVL21T0HCLR, OLED / AMOLED, 2880x1800, 16" | Lenovo Legion Pro 5 16IRX8 i7-13700HX, GeForce RTX 4060 Laptop GPU, SK hynix PC801 HFS512GEJ9X115N, IPS, 2560x1600, 16" | Lenovo Yoga Pro 7 14IRH G8 i7-13700H, GeForce RTX 4050 Laptop GPU, Samsung PM9A1 MZVL21T0HCLR, IPS, 3072x1920, 14.5" | MSI Katana 17 B13VFK i7-13620H, GeForce RTX 4060 Laptop GPU, Micron 2400 MTFDKBA1T0QFM, IPS LED, 1920x1080, 17.3" | Média NVIDIA GeForce RTX 4060 Laptop GPU | Média da turma Gaming | |
|---|---|---|---|---|---|---|---|---|
| Power Consumption | -48% | 41% | -63% | 23% | 0% | -5% | -25% | |
| Idle Minimum * (Watt) | 9.6 | 12.2 -27% | 4.3 55% | 24.5 -155% | 7.6 21% | 12.2 -27% | 11.5 ? -20% | 13 ? -35% |
| Idle Average * (Watt) | 16 | 25.5 -59% | 4.6 71% | 29.2 -83% | 13.3 17% | 14.9 7% | 16 ? -0% | 19 ? -19% |
| Idle Maximum * (Watt) | 16.9 | 29.8 -76% | 11.4 33% | 34.3 -103% | 13.7 19% | 15.8 7% | 20.3 ? -20% | 24.6 ? -46% |
| Load Average * (Watt) | 104 | 183 -76% | 97 7% | 98.7 5% | 88.2 15% | 85.22 18% | 92.9 ? 11% | 110.7 ? -6% |
| Witcher 3 ultra * (Watt) | 142 | 183.6 -29% | 100.9 29% | 178.6 -26% | 94.2 34% | 151.1 -6% | ||
| Load Maximum * (Watt) | 214 | 253 -18% | 107 50% | 249.6 -17% | 143 33% | 212.8 1% | 210 ? 2% | 259 ? -21% |
* ... menor é melhor
Power consumption Witcher 3 / Stress test
Power consumption with an external monitor
Duração da bateria
Nosso modelo de análise manteve o mesmo tamanho de bateria (90 Wh) de seu antecessor. Ao fazer isso, a bateria do X16 slim é maior do que o tipo encontrado em máquinas de jogos de tamanho normal e de nível médio, como o Legion 5.
Portanto, pode-se esperar uma longa duração da bateria. Isso tornou nosso teste de Wi-Fi ainda mais surpreendente. Os concorrentes com baterias menores, como o Galaxy Book3 (76 Wh) ou também o Yoga Pro 7 (73 Wh), têm a mesma resistência. Essa é uma área em que o X16 poderia melhorar seu consumo de energia em modo inativo.
No entanto, a duração da bateria é boa, mas, considerando o tamanho grande da bateria, poderíamos esperar tempos de execução melhores, pelo menos quando se trata de tarefas pouco exigentes, como navegar na Internet. Além disso, ao navegar na Web no modo de bateria, certifique-se de que o modo silencioso esteja selecionado e não o modo de desempenho.
| Asus ROG Flow X16 GV601V i9-13900H, GeForce RTX 4060 Laptop GPU, 90 Wh | Asus ROG Flow X16 GV601RW-M5082W R9 6900HS, GeForce RTX 3070 Ti Laptop GPU, 90 Wh | Samsung Galaxy Book3 Ultra 16, i9-13900H RTX 4070 i9-13900H, GeForce RTX 4070 Laptop GPU, 76 Wh | Lenovo Legion Pro 5 16IRX8 i7-13700HX, GeForce RTX 4060 Laptop GPU, 80 Wh | Lenovo Yoga Pro 7 14IRH G8 i7-13700H, GeForce RTX 4050 Laptop GPU, 73 Wh | MSI Katana 17 B13VFK i7-13620H, GeForce RTX 4060 Laptop GPU, 53.5 Wh | Média da turma Gaming | |
|---|---|---|---|---|---|---|---|
| Duração da bateria | -34% | -13% | -55% | 6% | -48% | -6% | |
| H.264 (h) | 8.9 | 9 1% | 12.4 39% | 8.32 ? -7% | |||
| WiFi v1.3 (h) | 7.9 | 5.7 -28% | 8 1% | 3.4 -57% | 9.9 25% | 2.9 -63% | 7.11 ? -10% |
| Load (h) | 1.5 | 0.9 -40% | 0.9 -40% | 0.7 -53% | 0.8 -47% | 1 -33% | 1.502 ? 0% |
| Witcher 3 ultra (h) | 0.9 | ||||||
| Reader / Idle (h) | 6.7 | 8.27 ? |
Pro
Contra
Veredicto - Um dispositivo maravilhoso e muito versátil
Acima de tudo, o Asus ROG Flow X16 é versátil! Ele é um dispositivo de trabalho fino e móvel, é um tablet 2 em 1, uma estação de trabalho potente e até mesmo um PC para jogos. Mas algo ainda mais surpreendente: Ele faz todas essas coisas muito bem, sem cometer nenhum erro grave. É tudo menos um compromisso preguiçoso.
Porque, apesar de suas dimensões compactas e da funcionalidade 2 em 1, o hardware não é limitado e apresenta, pelo menos no modo turbo, um desempenho acima da média. Embora seja nesse ponto que ele se torna um pouco barulhento, não é mais barulhento do que os concorrentes voltados exclusivamente para jogos. Entretanto, mesmo depois de encerrar um período de carga pesada, os ventiladores continuam funcionando por um bom tempo.
Estamos mudando a categoria do produto para "Jogos", pois a pontuação aqui é aproximadamente 2,4 pontos percentuais mais alta do que a categoria "Conversível".
O Asus ROG Flow X16 é uma estação de trabalho para jogos 2 em 1 extremamente versátil e potente, com uma boa tela sensível ao toque.
Até agora, as alternativas desse tipo são poucas e distantes entre si. Atualmente, a própria Asus parece estar muito interessada em fazer experiências. Os compradores em potencial poderiam dar uma olhada em um dispositivo que mencionamos no início do artigo, o tablet para jogos Asus ROG Flow Z13. OSamsung Galaxy Book3 Ultra 16(89%) é igualmente bom, mas um pouco lento, apesar da GPU mais potente. O tablet com especificações mais fracasLenovo Yoga Pro 7 14 G8(90%), com especificações mais fracas, também vale a pena considerar.
Preço e disponibilidade
Atualmente, nossa configuração do Flow X16 com uma RTX 4060 não está disponível na Amazon ou na BestBuy. No entanto, na última loja, o modelo RTX 4070 pode ser adquirido por US$ 2699,99.
Asus ROG Flow X16 GV601V
- 06/08/2023 v7 (old)
Christian Hintze
Transparência
A seleção dos dispositivos a serem analisados é feita pela nossa equipe editorial. A amostra de teste foi fornecida ao autor como empréstimo pelo fabricante ou varejista para fins desta revisão. O credor não teve influência nesta revisão, nem o fabricante recebeu uma cópia desta revisão antes da publicação. Não houve obrigação de publicar esta revisão. Como empresa de mídia independente, a Notebookcheck não está sujeita à autoridade de fabricantes, varejistas ou editores.
É assim que o Notebookcheck está testando
Todos os anos, o Notebookcheck analisa de forma independente centenas de laptops e smartphones usando procedimentos padronizados para garantir que todos os resultados sejam comparáveis. Desenvolvemos continuamente nossos métodos de teste há cerca de 20 anos e definimos padrões da indústria no processo. Em nossos laboratórios de teste, equipamentos de medição de alta qualidade são utilizados por técnicos e editores experientes. Esses testes envolvem um processo de validação em vários estágios. Nosso complexo sistema de classificação é baseado em centenas de medições e benchmarks bem fundamentados, o que mantém a objetividade.Price comparison

