Revisão do laptop Slim Gigabyte AERO 16 OLED: Eficiente RTX 4070 para gamers e criativos
O Aero 16 OLED da Gigabyte é uma mistura interessante de laptop e estação de trabalho para os criativos. Além da troca de CPU Alder para Raptor Lake e de Nvidia RTX 30x para RTX 40x, outras mudanças também foram feitas, tais como a caixa e as portas.
Revisamos anteriormente o predecessor com o RTX 3080 Ti e nossa configuração atual tem um RTX 4070. Até agora, só revisamos o novo Razer Lâmina 18com a mesma GPU, portanto, o equipamento de 18 polegadas terá que servir como comparação nos padrões de referência 3D. Caso contrário, comparamos os concorrentes de 16 polegadas da geração anterior, incluindo o Asus Zenbook Pro 16X OLEDo Asus TUF Gaming A16 e o MSI CreatorPro Z16P com seu Nvidia A300.
Possíveis concorrentes em comparação
Avaliação | Data | Modelo | Peso | Altura | Size | Resolução | Preço |
|---|---|---|---|---|---|---|---|
| 86.2 % v7 (old) | 03/2023 | Gigabyte AERO 16 OLED BSF i9-13900H, GeForce RTX 4070 Laptop GPU | 2.1 kg | 18 mm | 16.00" | 3840x2400 | |
| 84.7 % v7 (old) | 03/2022 | Gigabyte Aero 16 YE5 i9-12900HK, GeForce RTX 3080 Ti Laptop GPU | 2.3 kg | 22.4 mm | 16.00" | 3840x2400 | |
| 91.4 % v7 (old) | 02/2023 | Razer Blade 18 RTX 4070 i9-13950HX, GeForce RTX 4070 Laptop GPU | 3 kg | 21.9 mm | 18.00" | 2560x1600 | |
| 88.4 % v7 (old) | 12/2022 | Asus ZenBook Pro 16X OLED UX7602ZM-ME115W i9-12900H, GeForce RTX 3060 Laptop GPU | 2.4 kg | 19.5 mm | 16.00" | 3840x2400 | |
| 86.2 % v7 (old) | 02/2023 | Asus TUF Gaming A16 FA617 R7 7735HS, Radeon RX 7600S | 2.2 kg | 27 mm | 16.00" | 1920x1200 | |
| 84.3 % v7 (old) | 11/2022 | MSI CreatorPro Z16P B12UKST i7-12700H, RTX A3000 Laptop GPU | 2.4 kg | 19 mm | 16.00" | 2560x1600 |
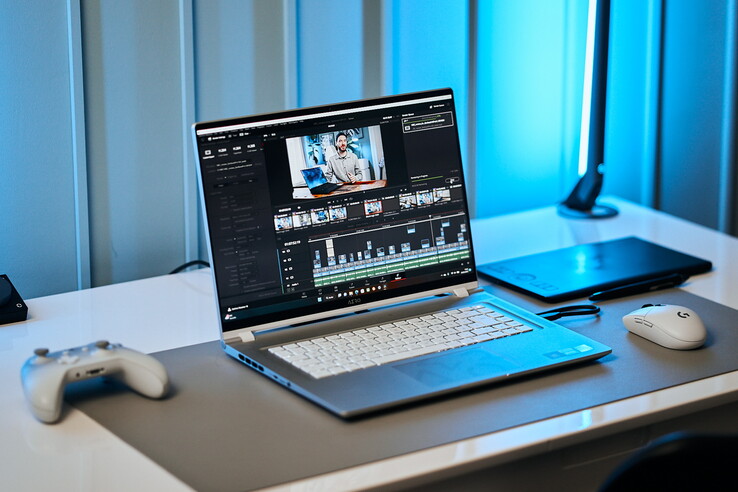
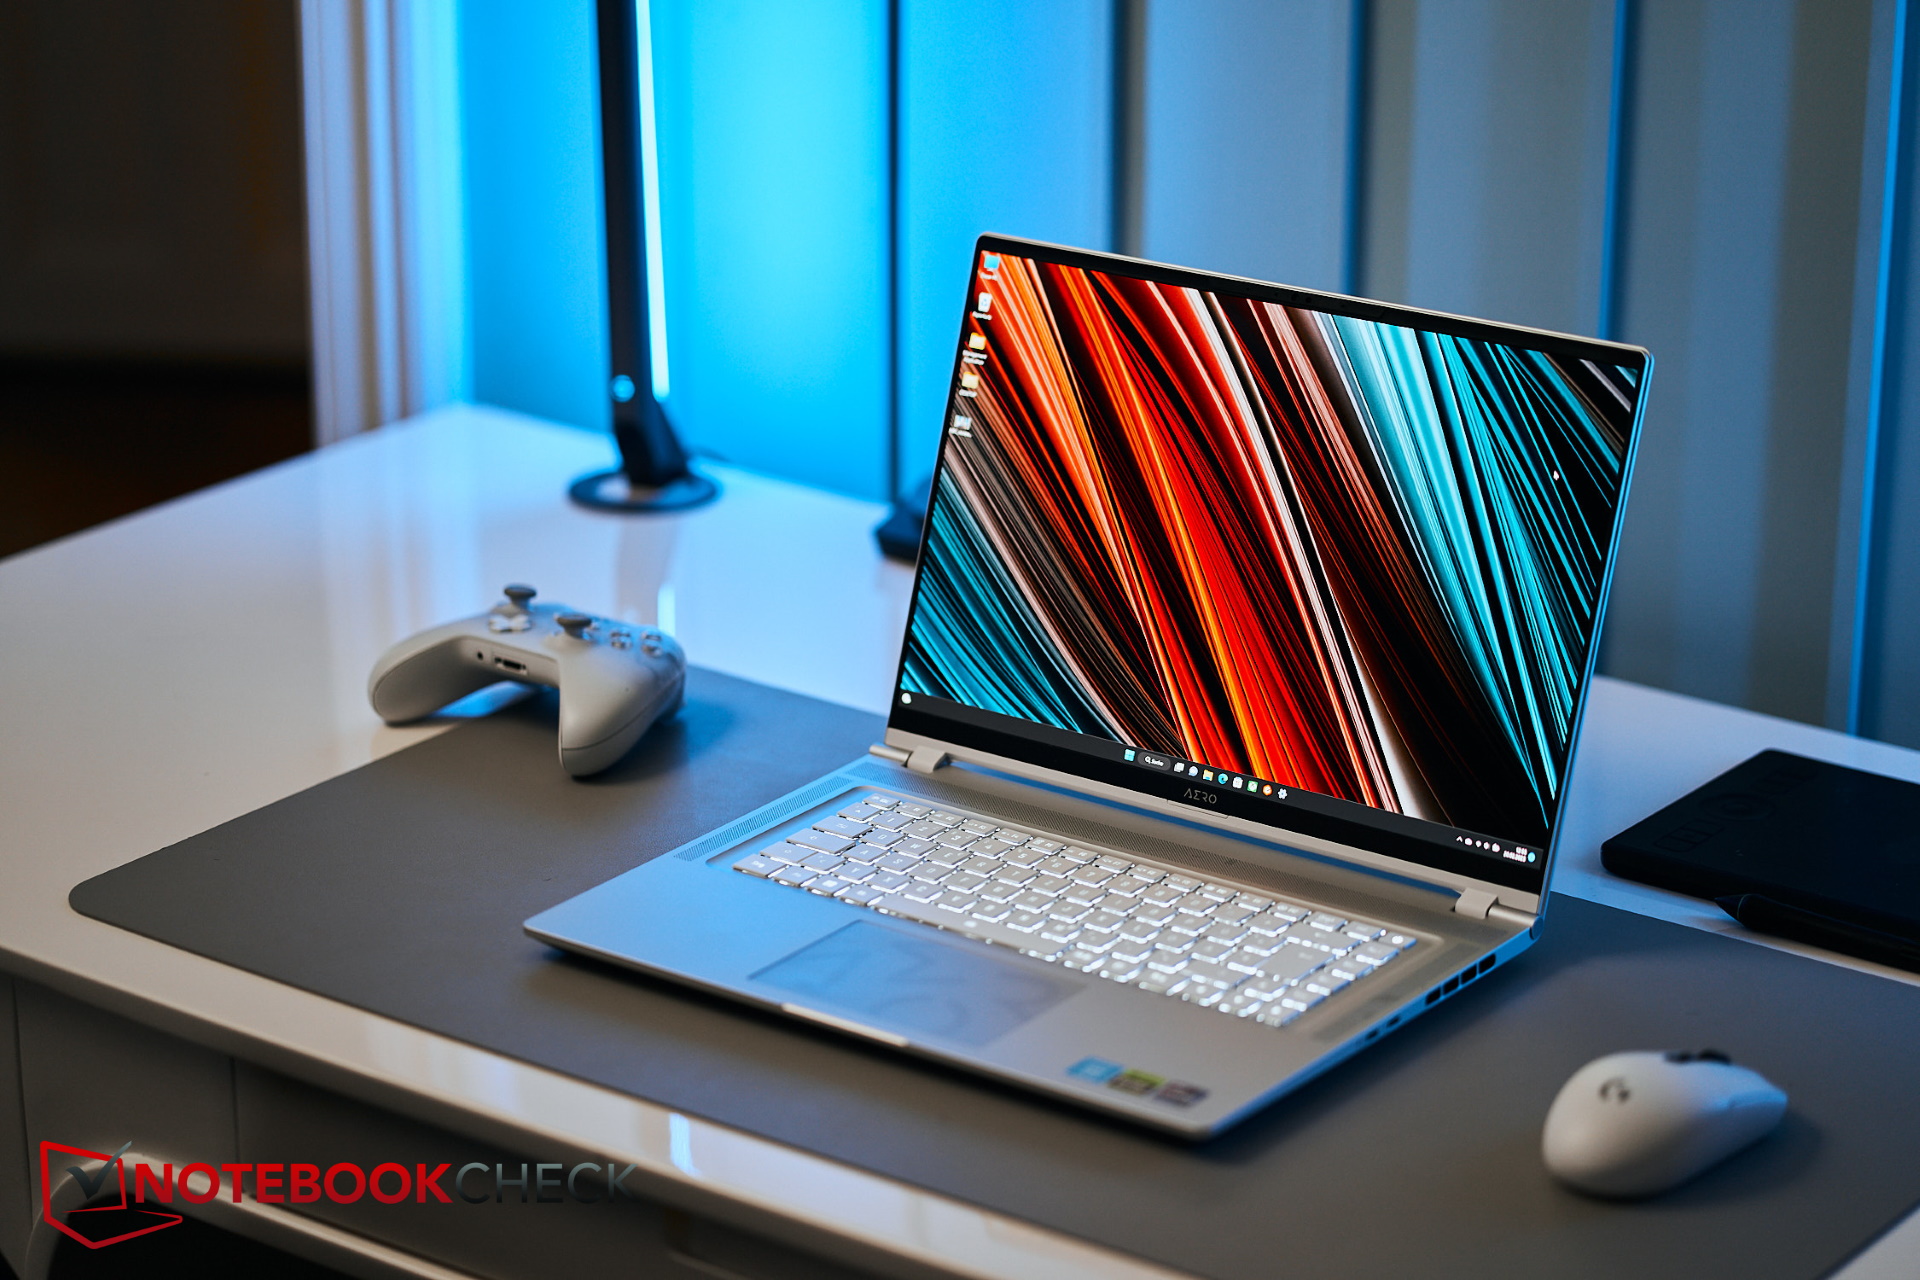
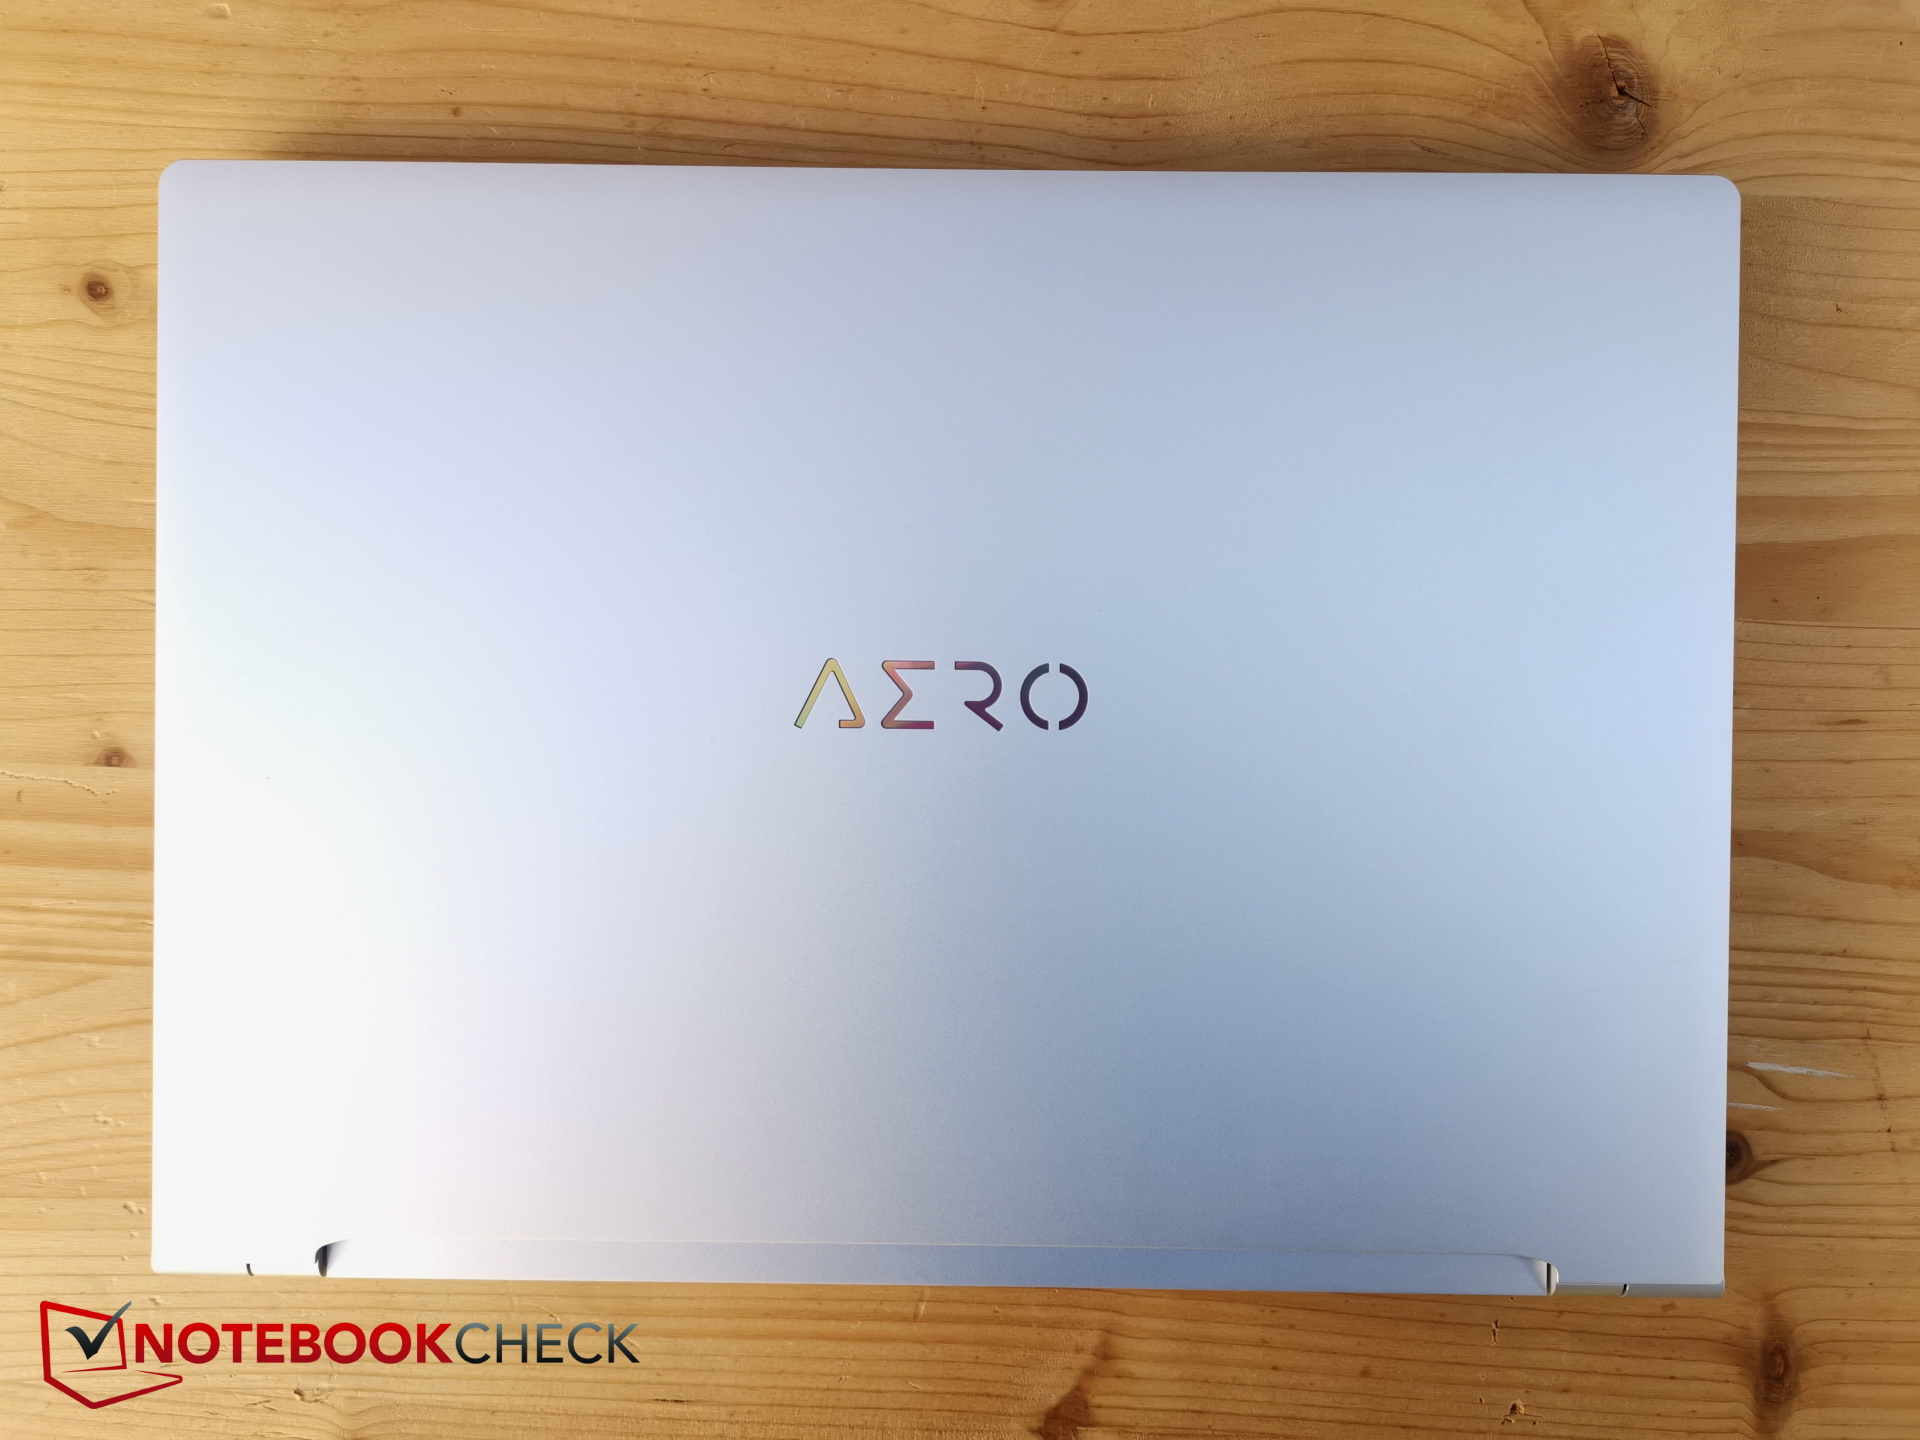
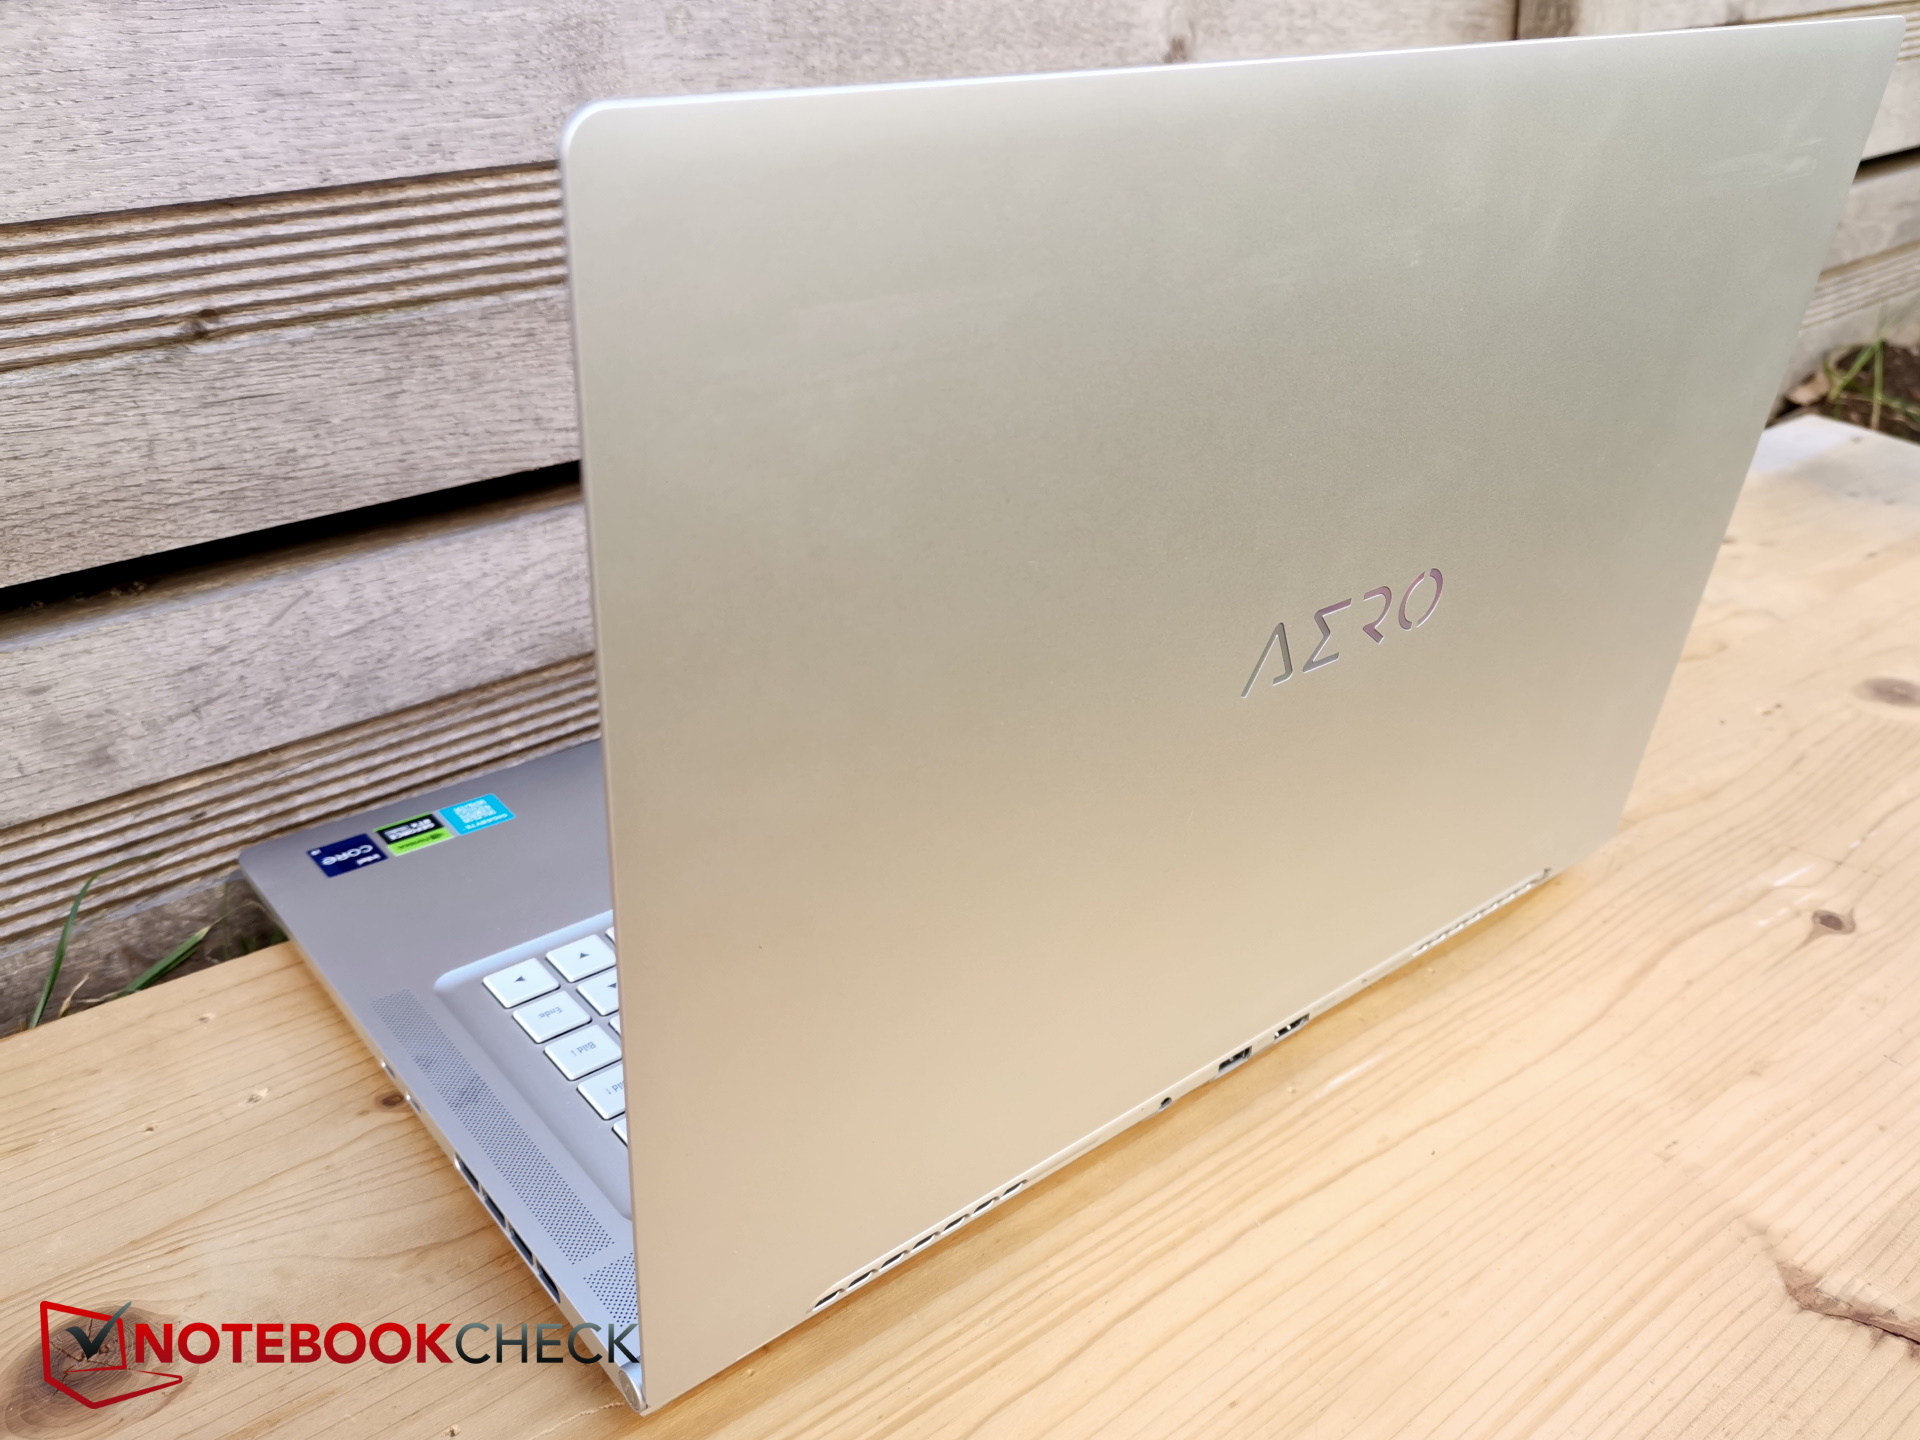
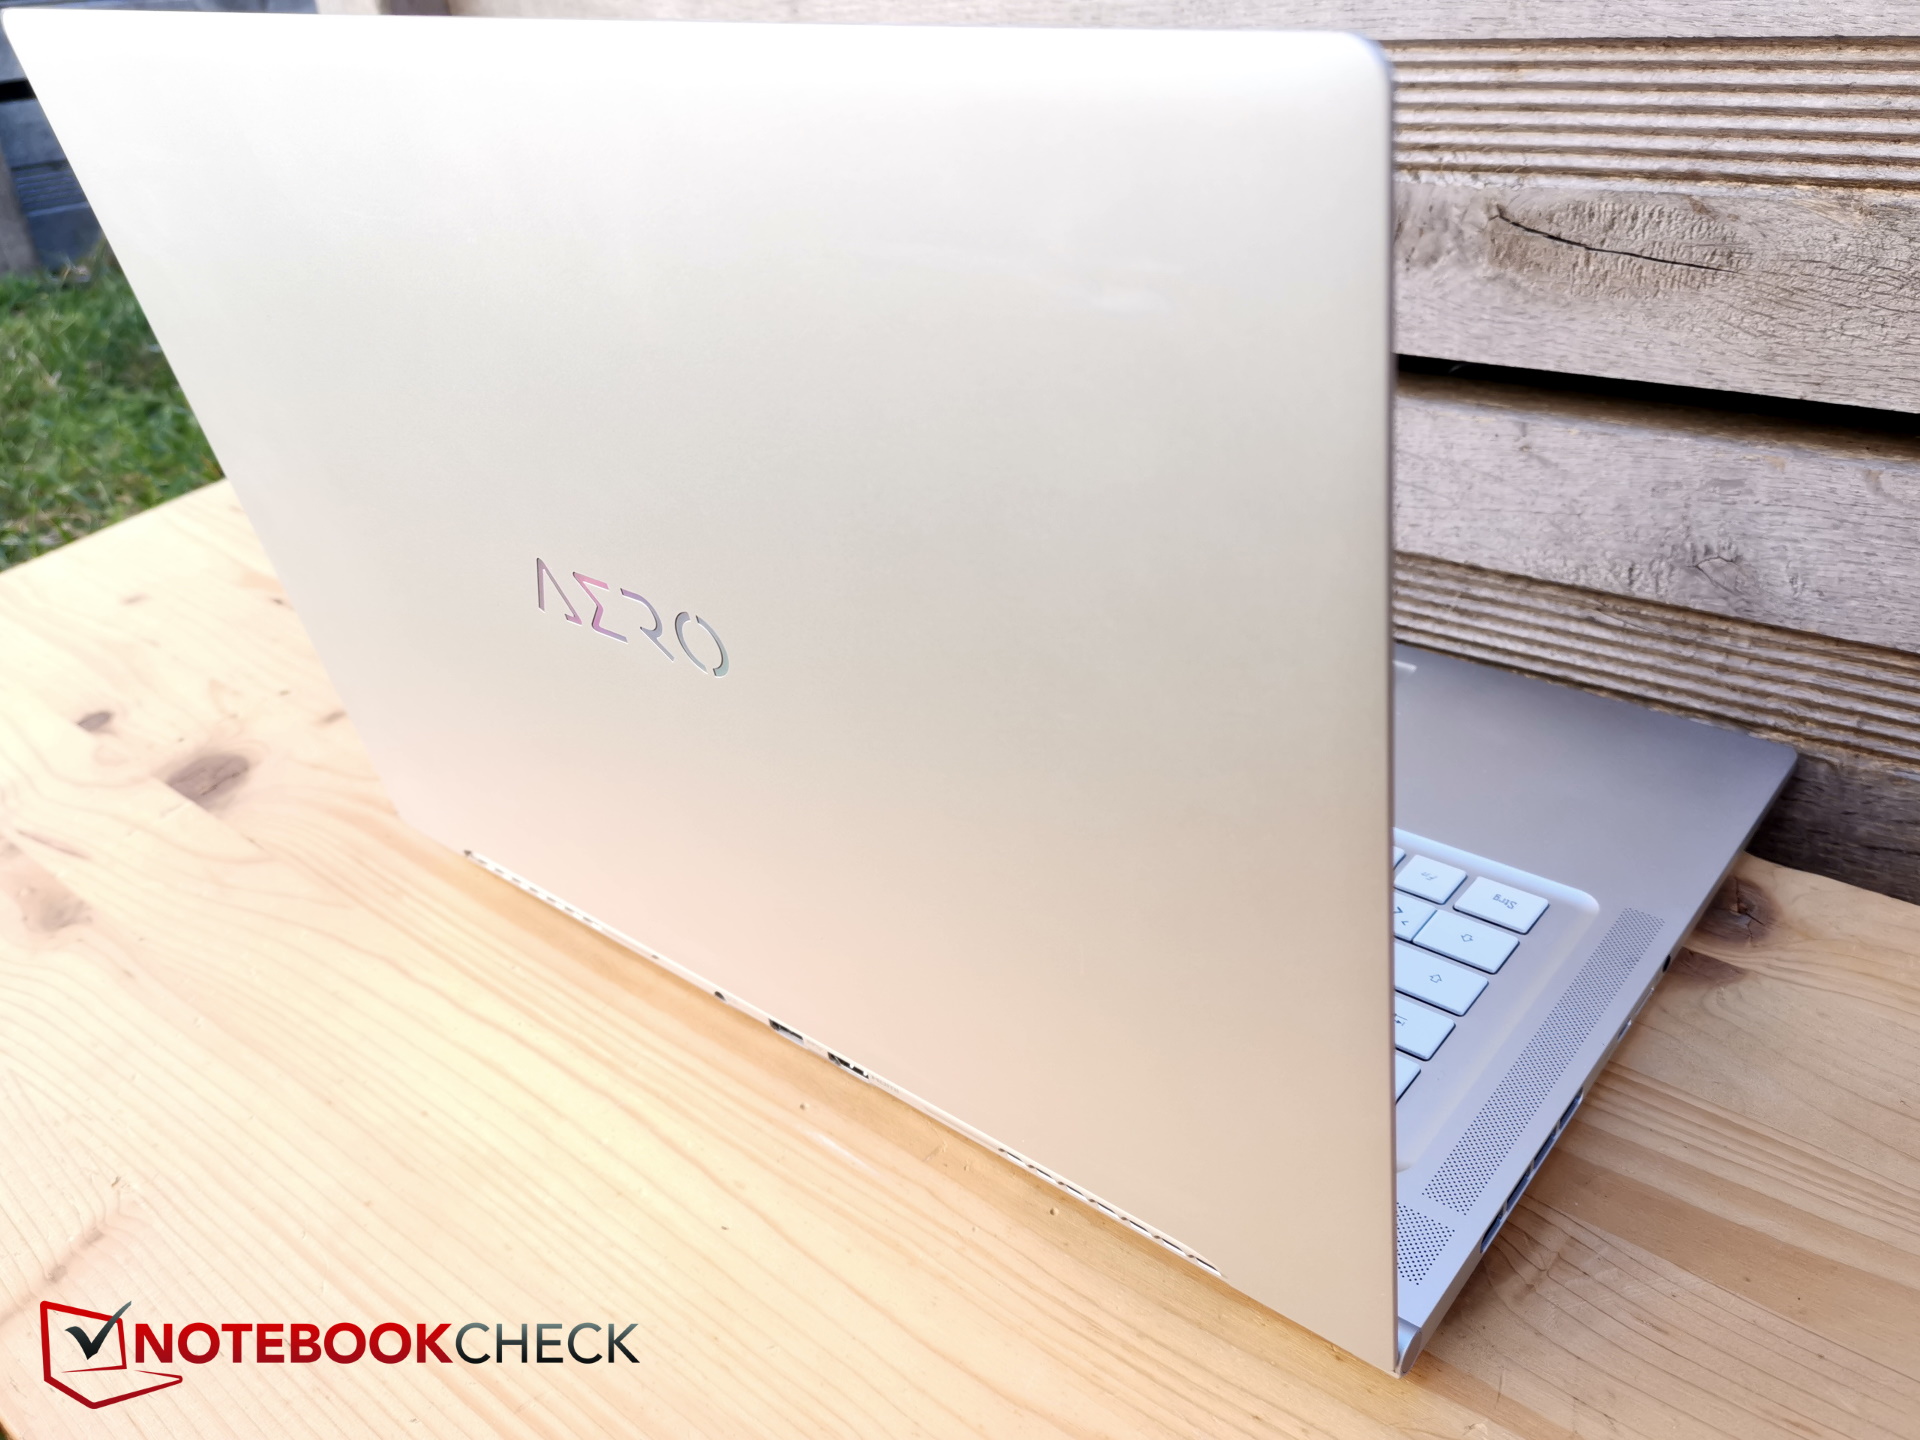
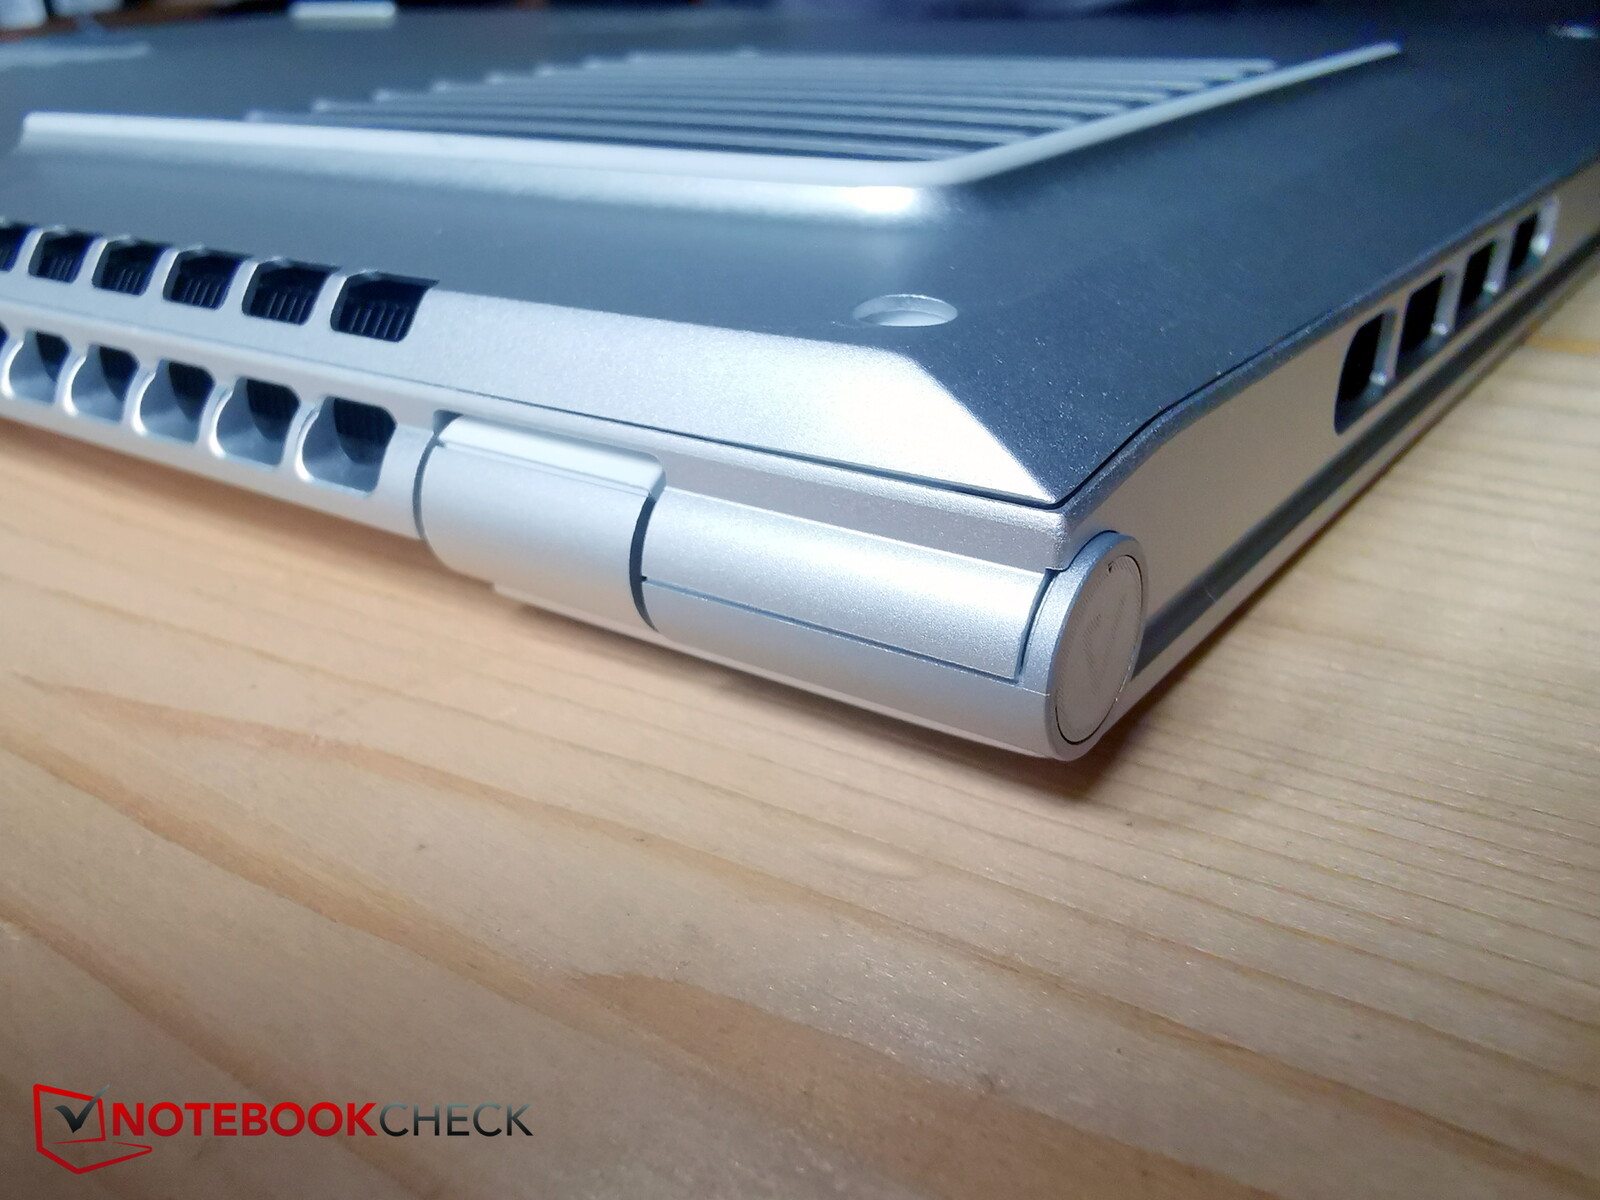
Caixa - Chassi metálico robusto na cor prata
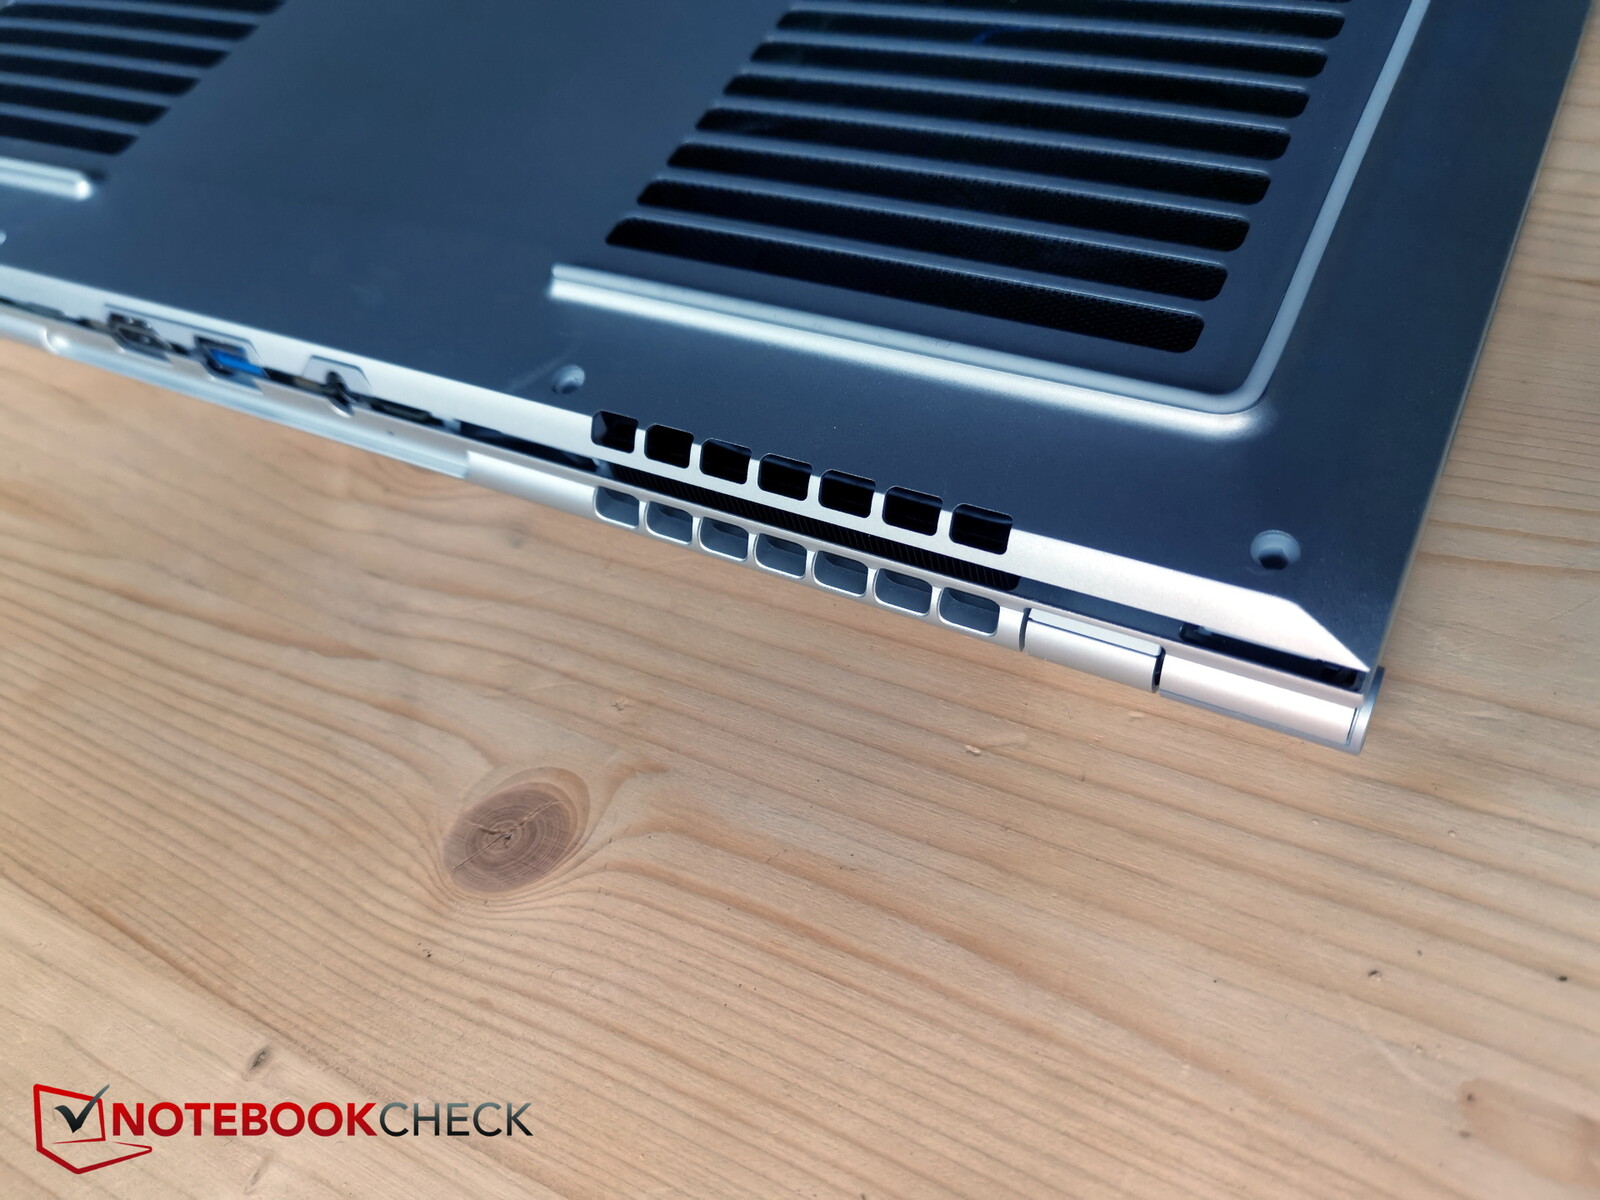
À primeira vista, o design parece estar inalterado, mas se você olhar mais de perto, você pode ver que o chassi metálico estreito e prateado mudou bastante. Por exemplo, tornou-se ainda mais fino e Gigabyte finalmente deslocou algumas das portas para a parte de trás. Em geral, o projeto do fabricante está mais na direção de um laptop comercial e de escritório do que de um laptop para jogos, o que certamente irá agradar ao grupo alvo. Portanto, o jogador oculto parece bastante discreto em um ambiente de escritório, mesmo ao lado de um MacBook.
O unibody de metal liso ainda é estável, especialmente na base, que dificilmente pode ser torcido. O teclado foi ligeiramente abaixado.
A tampa da tela, na qual o logotipo "Aero" iluminado é embelezado, é um pouco menos rígida. Apenas a moldura do display é feita de plástico.
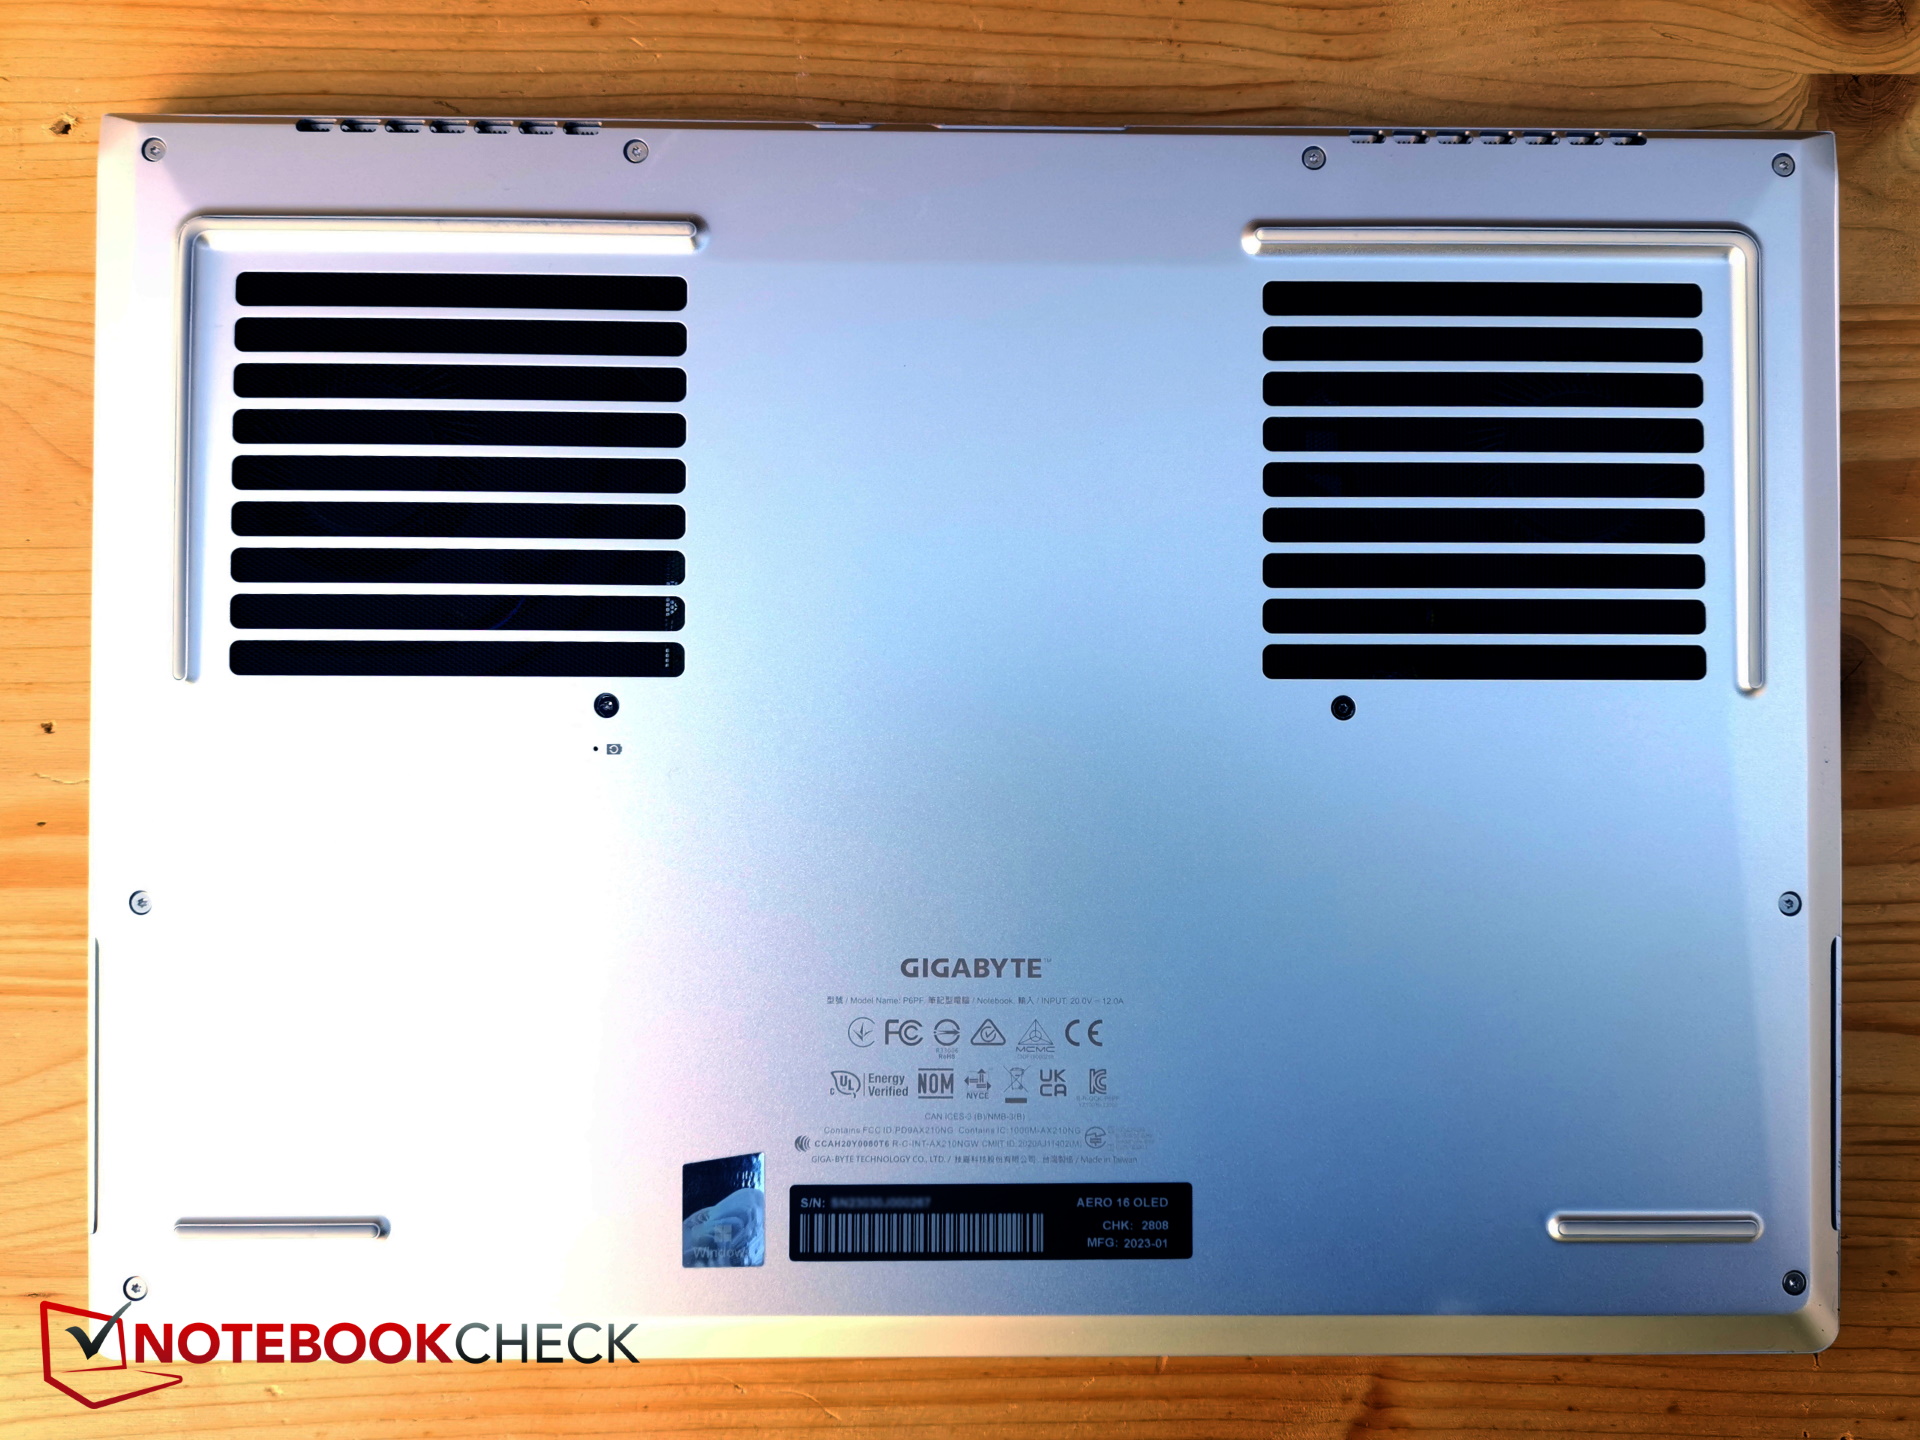
As grades de ventilação estão praticamente em toda parte, ou seja, na parte de trás, nos lados, abaixo e acima. A qualidade de construção parece estar em um bom nível e não foram encontradas lacunas.

Com apenas 18 mm, o Aero 16 é ligeiramente mais fino que oZenBook Pro 16X ou o MSI CreatorPro Z16Ptambém é mais leve, com o antecessor tendo pesado 200 g a mais.
Equipamentos - Aero 16 com portos finalmente!
Felizmente, muita coisa mudou nas portas, porque as parcas três portas USB-C do predecessor tiveram que ser expandidas com um Aero Hub para incluir HDMI, USB-A, etc.
Este ano, o novo Aero Hub abriga quase todas as portas necessárias. Para fazer isso, ele utiliza o espaço na parte de trás onde está a conexão à rede elétrica, por exemplo. Teríamos preferido um USB-A ao invés de uma das três portas USB-C laterais, e ainda falta uma porta LAN, mas pelo menos agora há uma porta HDMI e um leitor (microSD). A distribuição das portas é boa, exceto para USB-A na parte de trás em vez de na lateral.
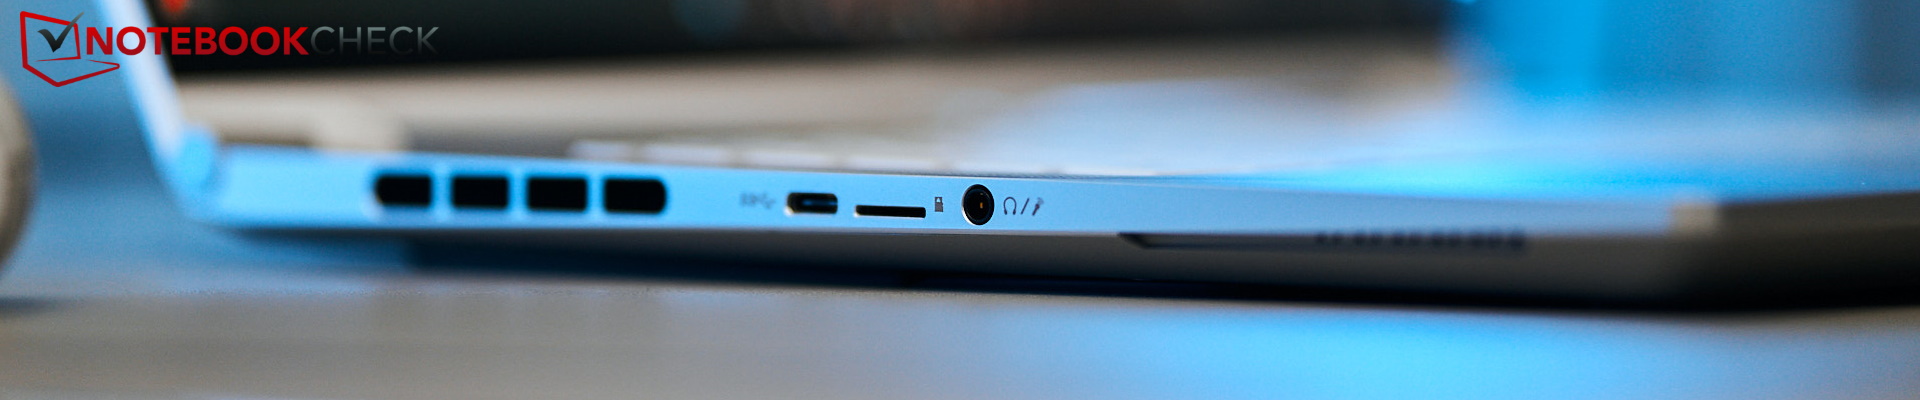


Leitor de cartões SD
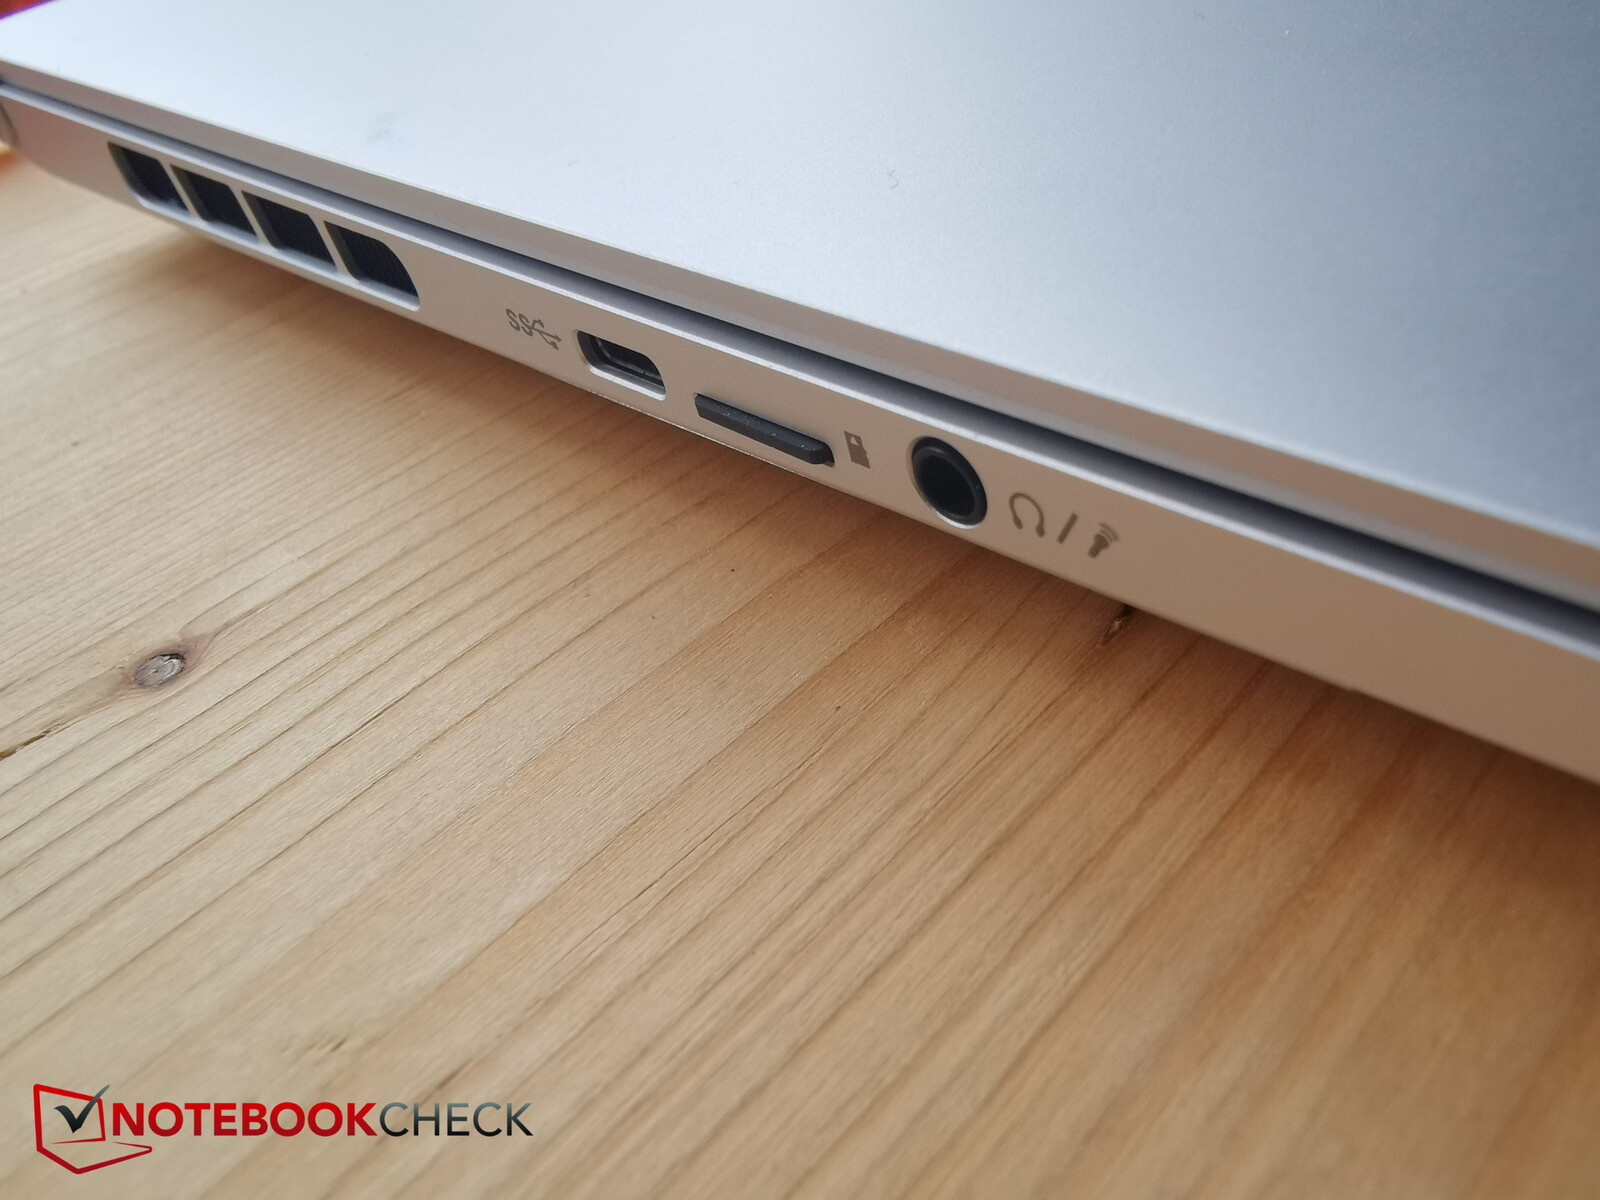
Os cartões MicroSD clicam no lugar e se projetam apenas minimamente (1 - 2 mm).
As taxas de transferência são boas; copiamos 1 GB de material de imagem de nosso AV PRO microSD 128 GB V60 para o desktop em cerca de 7 segundos.
Se a concorrência tiver um leitor, ele é mais lento.
| SD Card Reader | |
| average JPG Copy Test (av. of 3 runs) | |
| Razer Blade 18 RTX 4070 (Angelibird AV Pro V60) | |
| Gigabyte AERO 16 OLED BSF | |
| Média da turma Gaming (20.9 - 210, n=54, últimos 2 anos) | |
| MSI CreatorPro Z16P B12UKST (AV Pro V60) | |
| Asus ZenBook Pro 16X OLED UX7602ZM-ME115W (AV Pro SD microSD 128 GB V60) | |
| maximum AS SSD Seq Read Test (1GB) | |
| Razer Blade 18 RTX 4070 (Angelibird AV Pro V60) | |
| Gigabyte AERO 16 OLED BSF | |
| Média da turma Gaming (25.5 - 261, n=51, últimos 2 anos) | |
| MSI CreatorPro Z16P B12UKST (AV Pro V60) | |
| Asus ZenBook Pro 16X OLED UX7602ZM-ME115W (AV Pro SD microSD 128 GB V60) | |
Comunicação
O chip Intel AX210 também foi instalado no modelo do ano passado e novamente garante boas taxas de transferência, embora oMSI CreatorPro é ainda mais rápido.
O módulo suporta Wifi 6E e, portanto, a faixa de 6 GHz.
Webcam
Gigabyte finalmente instalou uma câmera Full HD no laptop criativo, com a imagem resultante sendo bastante utilizável, mesmo em condições de iluminação subótimas. Um olhar sobre o ColorChecker, no entanto, infelizmente mostra que as cores se desviam muito. O predecessor tinha uma câmera de 720p.


Segurança
O Aero não é realmente para os fanáticos por segurança. O TPM está a bordo, mas não há sensor de impressões digitais ou conexão Kensington.
Acessórios e Garantia
Nenhum acessório está incluído junto com o laptop no momento da compra.
Na Alemanha, o fabricante fornece uma garantia de 24 meses. Isto pode diferir em outras regiões, portanto os compradores interessados devem checar novamente antes da compra.
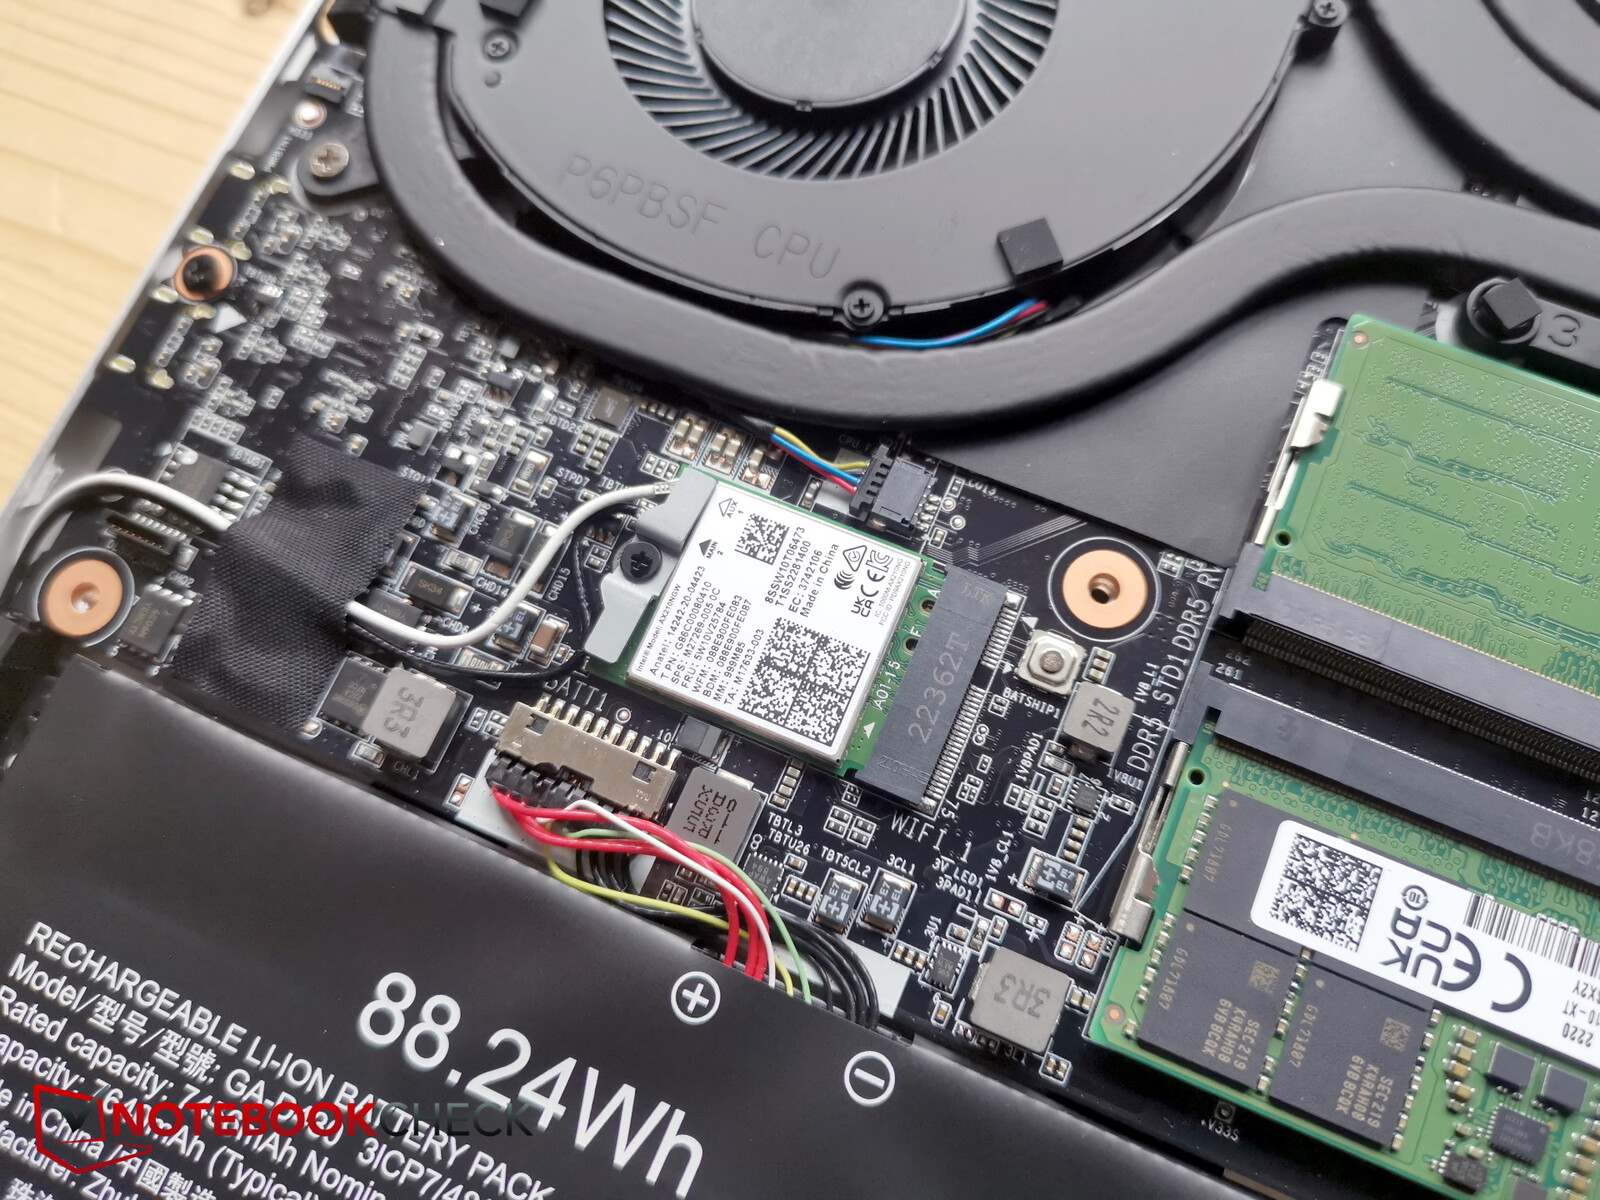
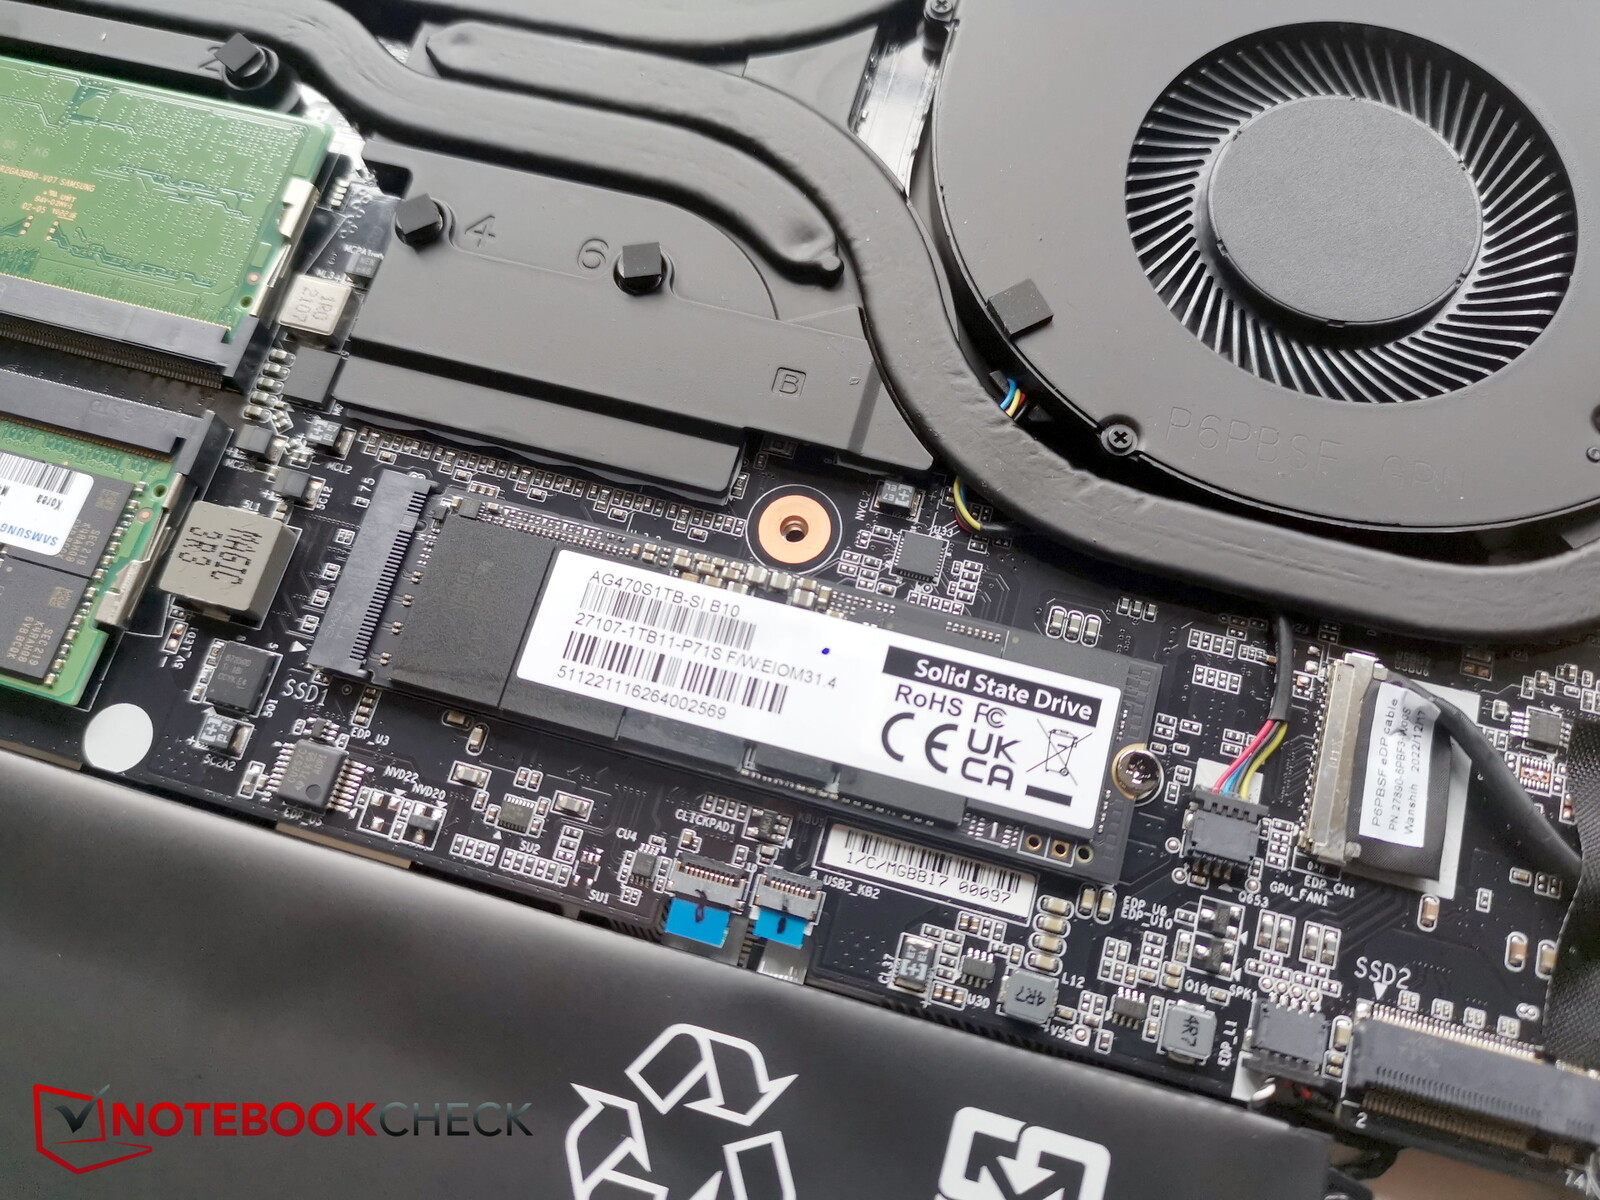
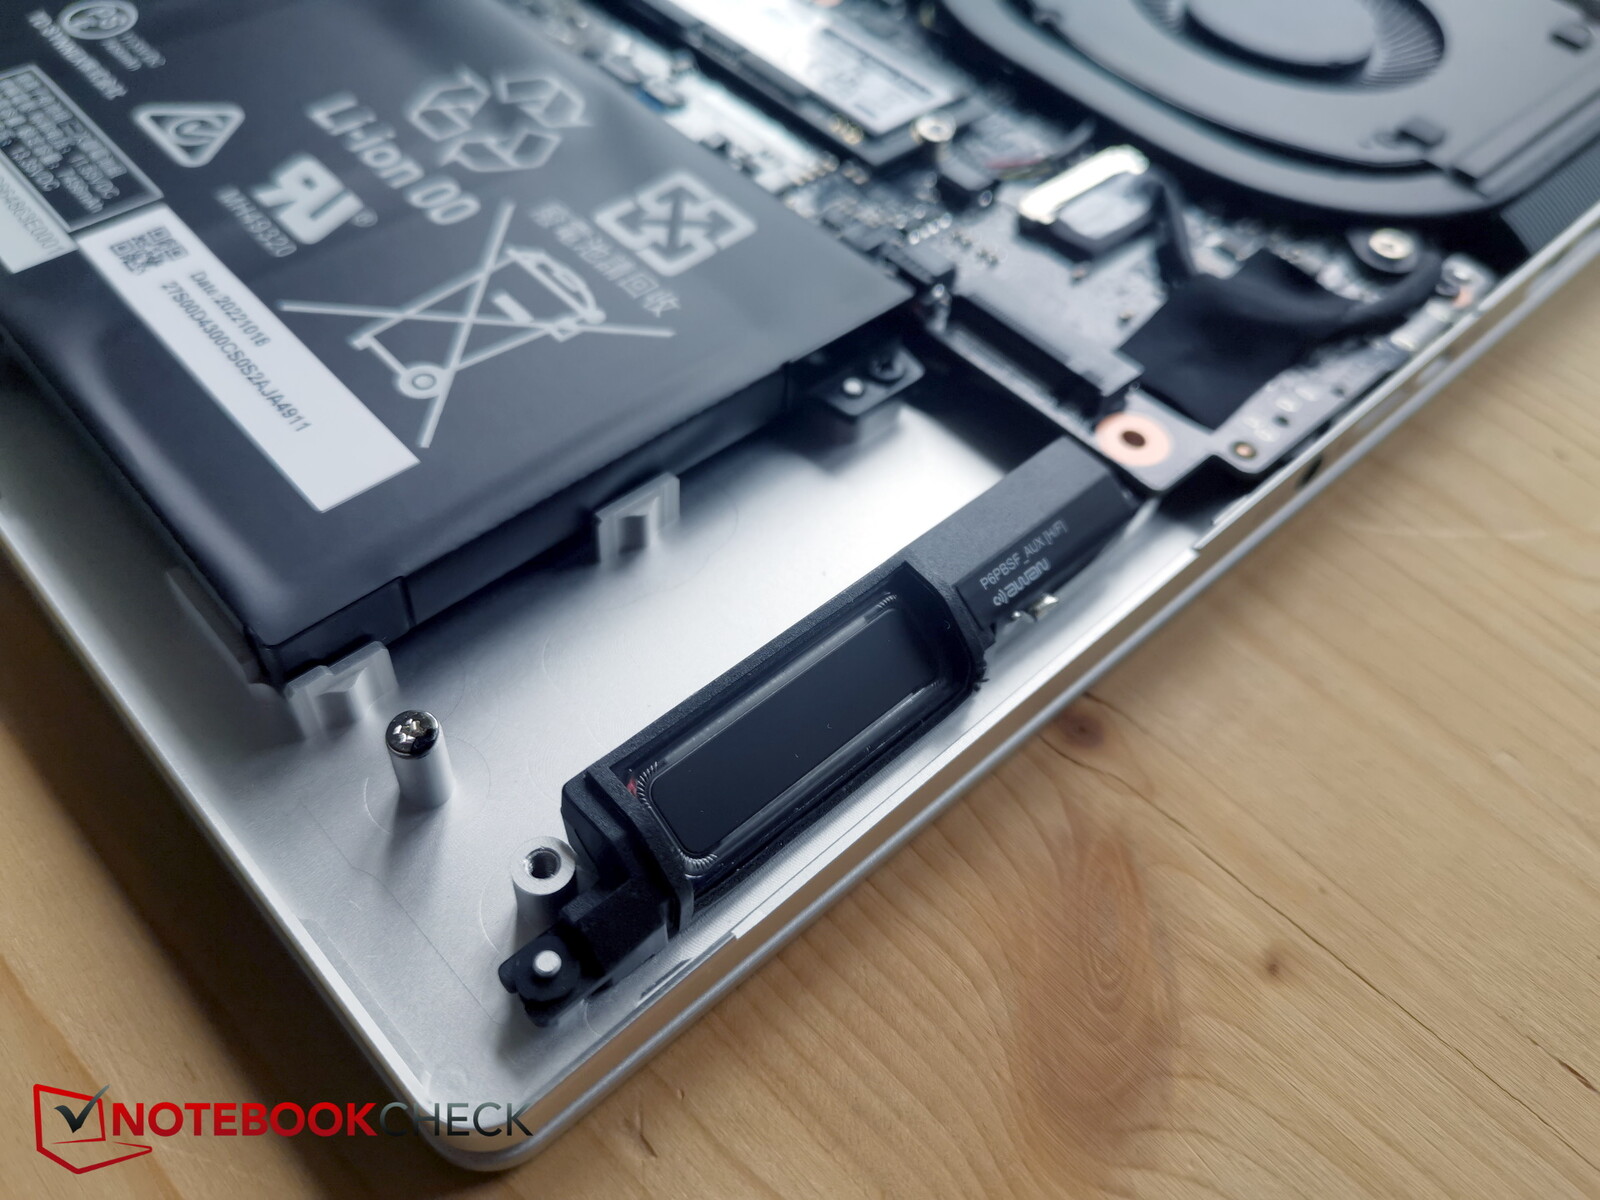
Manutenção
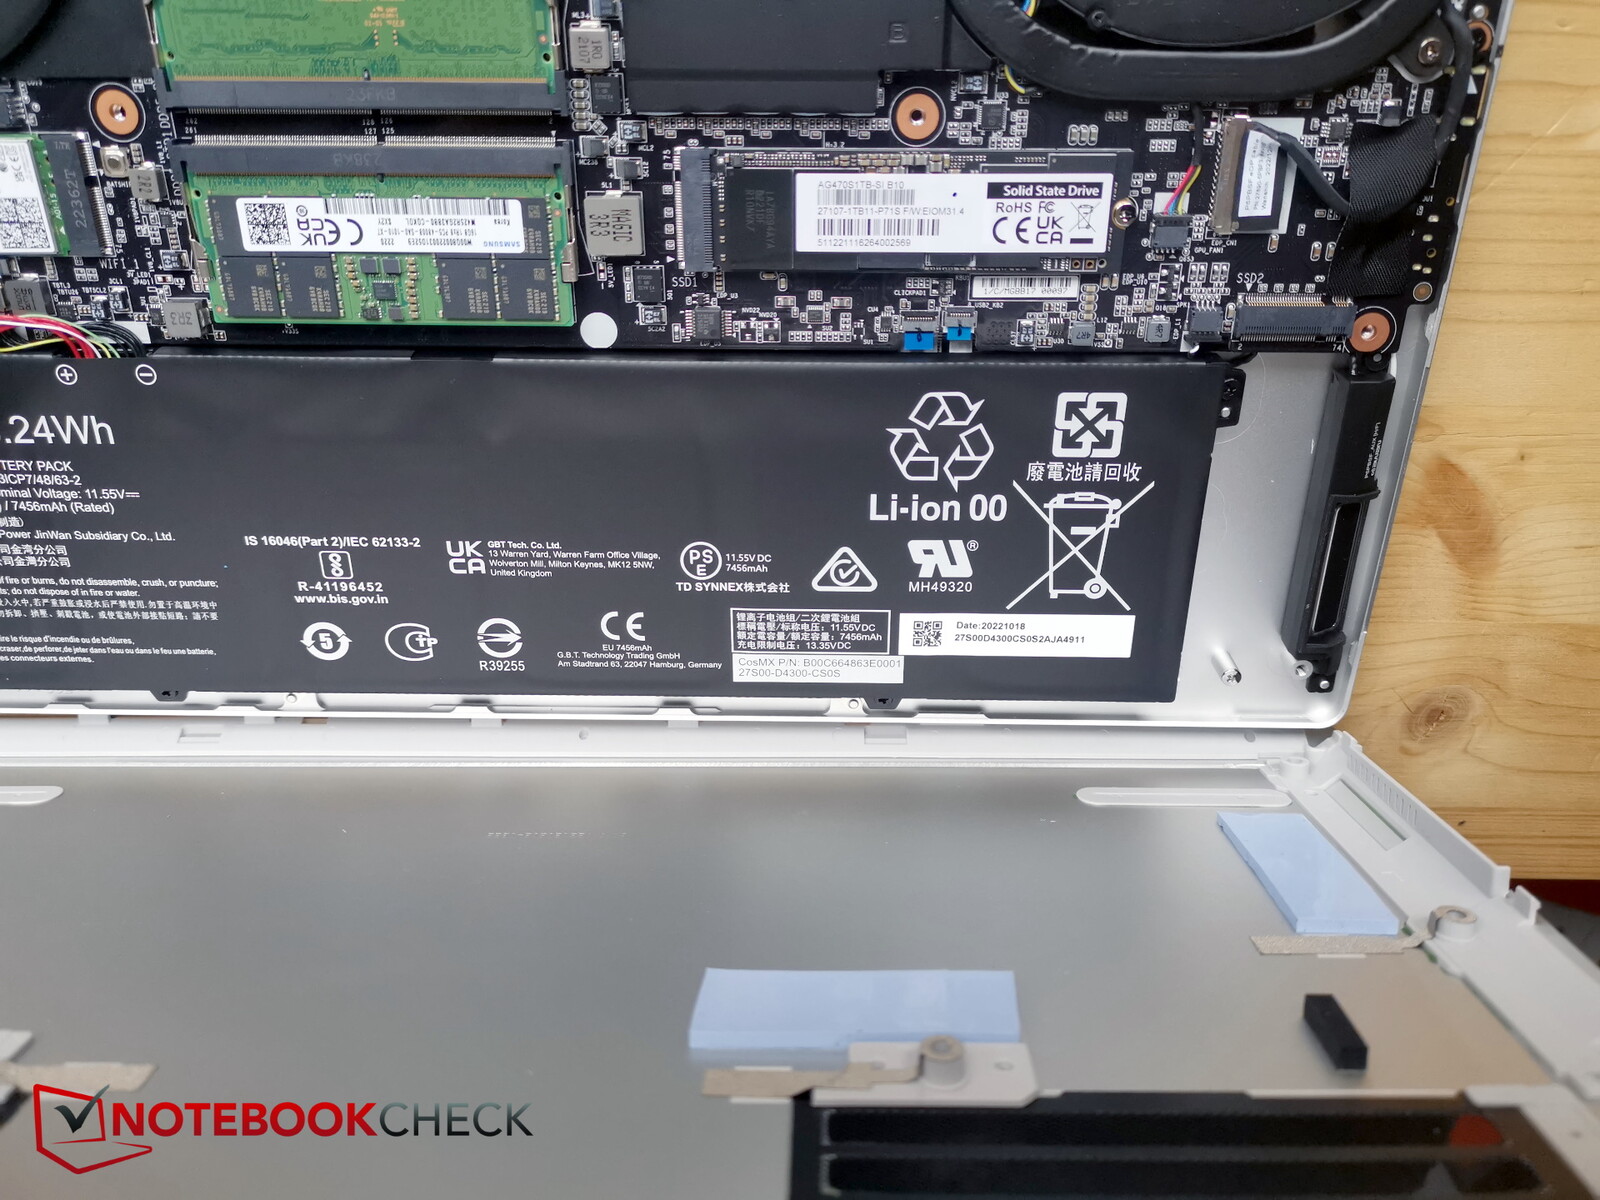
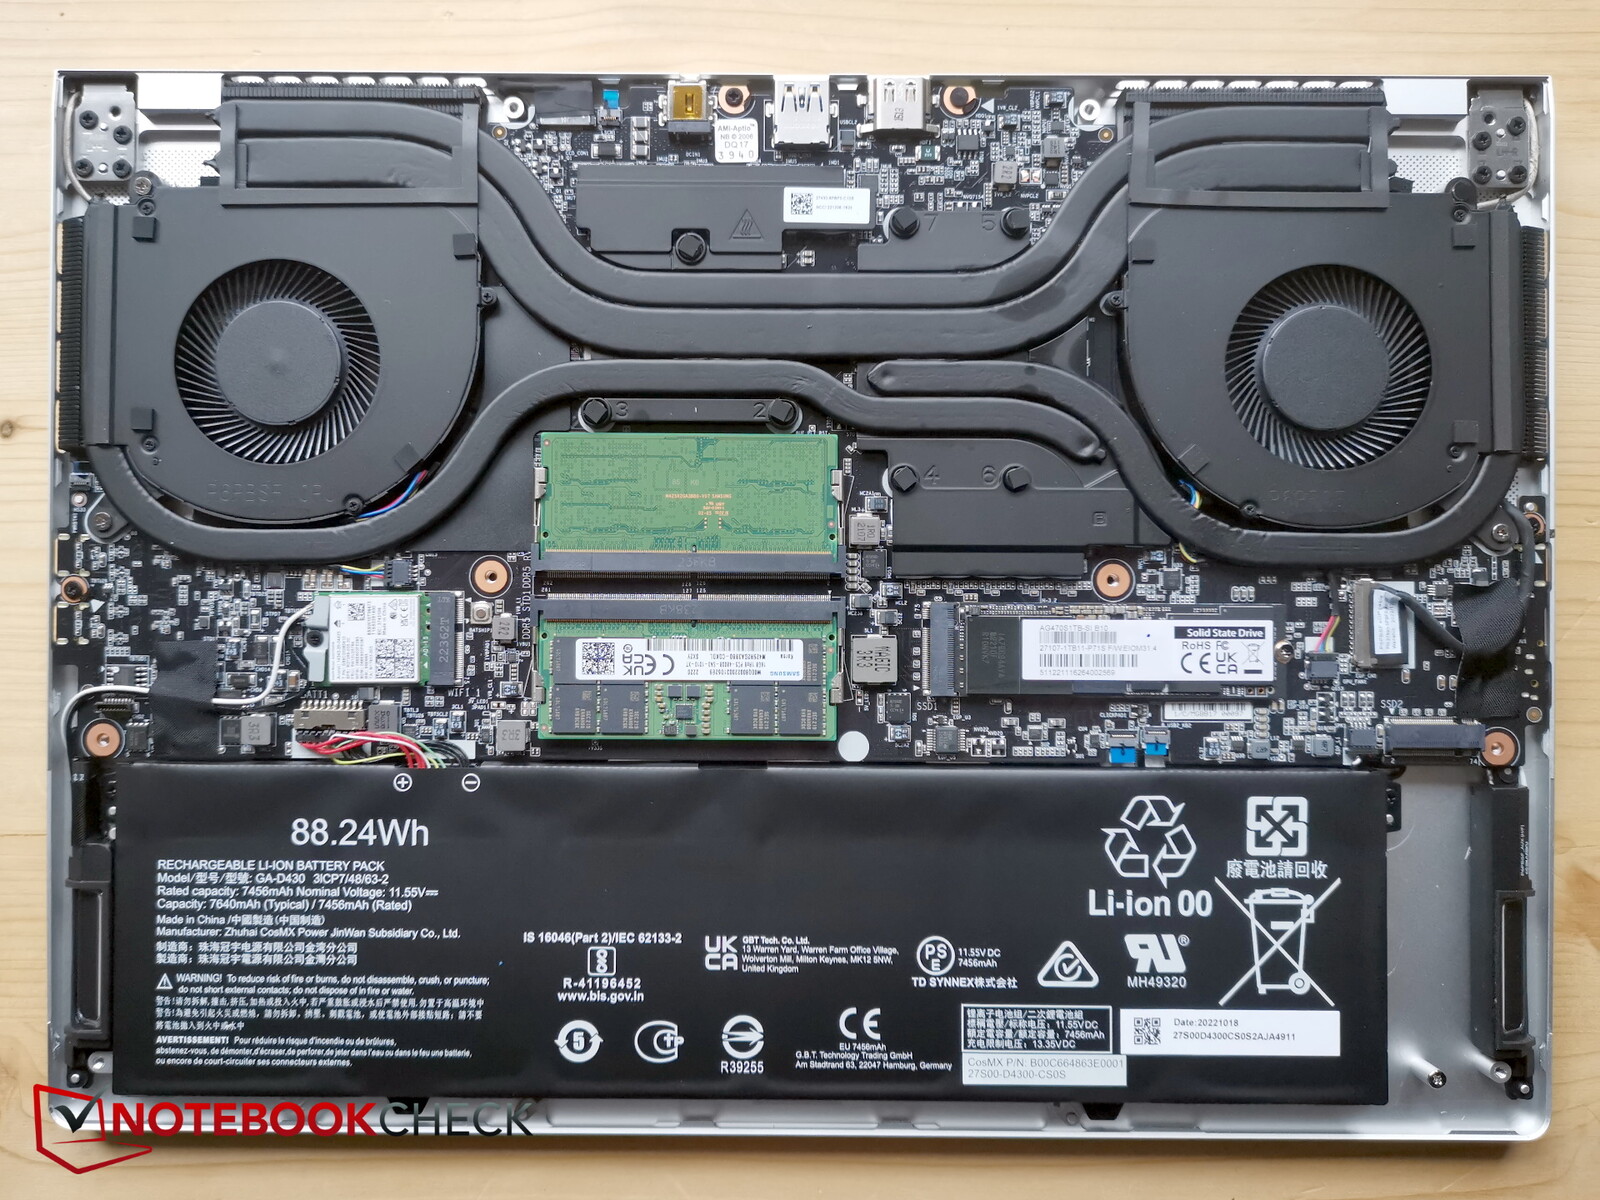
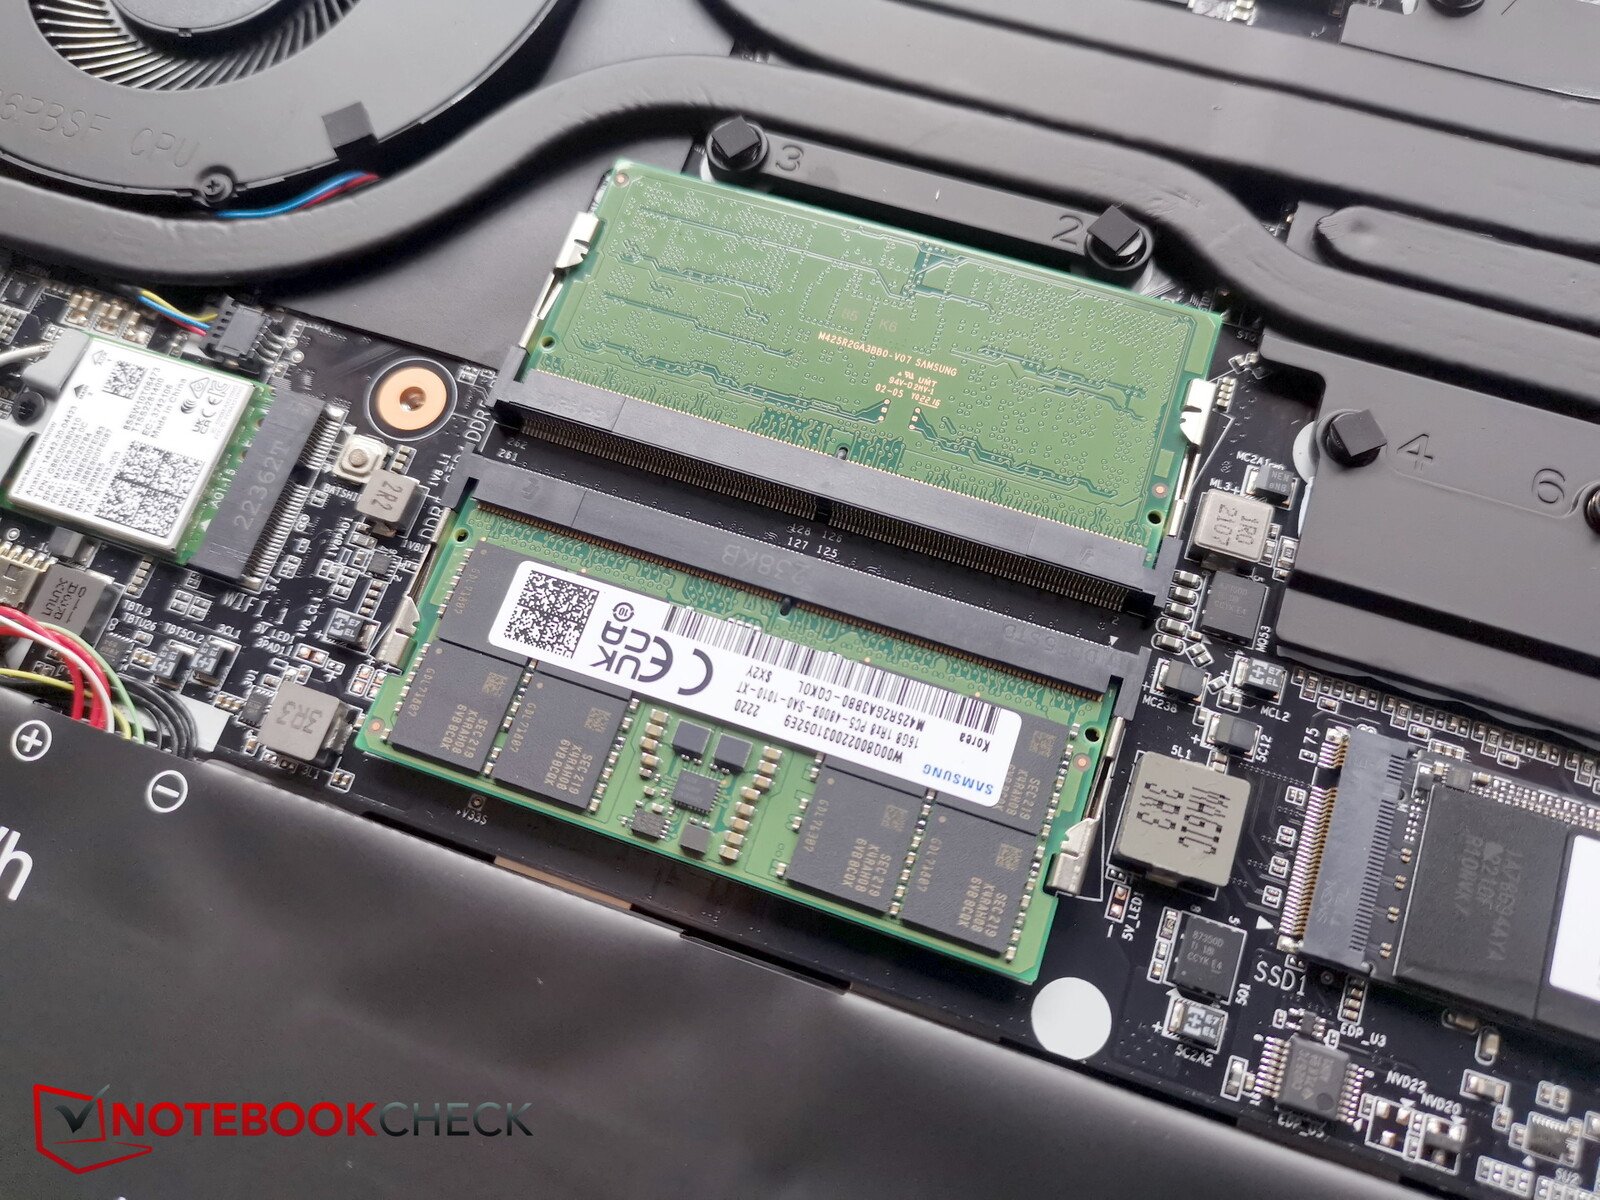
Primeiro, 10 parafusos torx precisam ser removidos. Depois, não é tão fácil encontrar uma folga no chassi apertado para a inserção de ferramentas de nível. A melhor maneira de fazer isso é em direção à parte de trás. Uma vez dado o primeiro passo, torna-se muito mais fácil e a placa de base pode ser removida sem esforço.
Dentro, você tem acesso aos ventiladores, à bateria, ao módulo WLAN substituível, aos dois slots de RAM e aos dois slots M.2 SSD, um dos quais está ocupado. Há almofadas de resfriamento na placa de base para os dois slots SSD.
Dispositivos de entrada - Entradas utilizáveis
Teclado
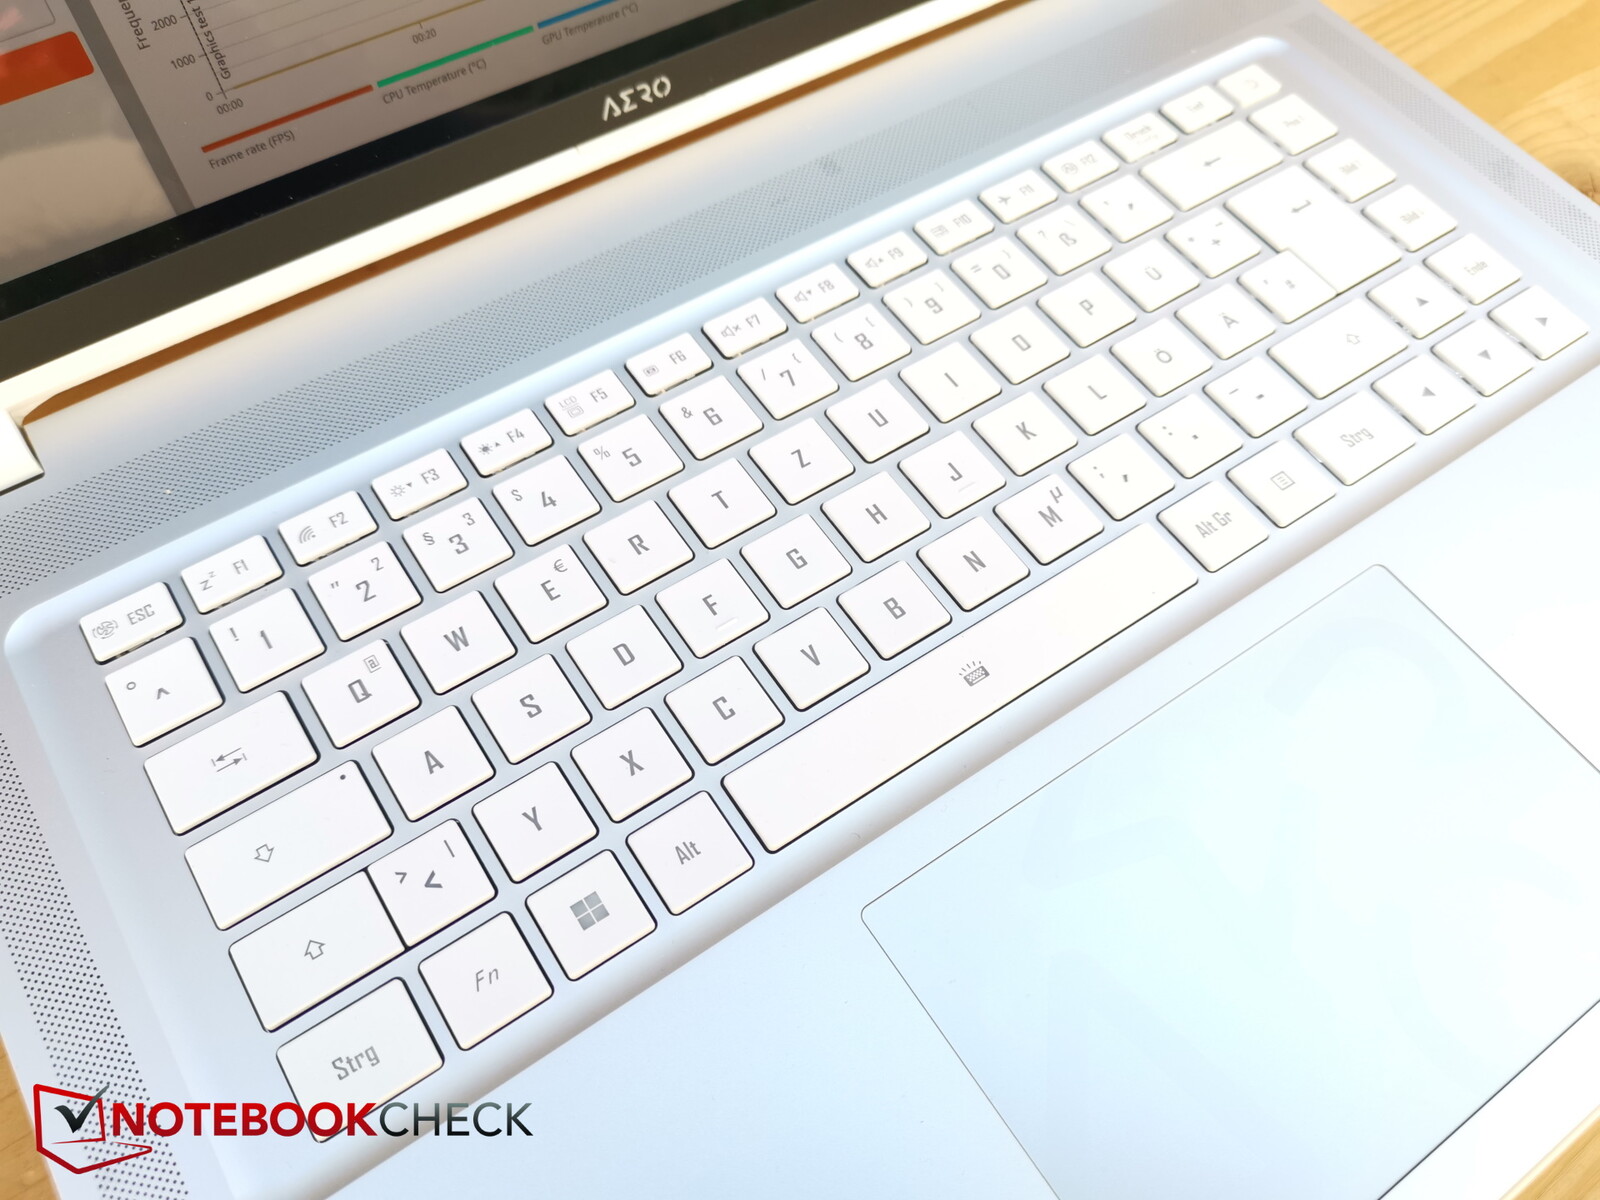
O teclado agora tem teclas brancas ao invés de pretas. Isto parece mais elegante, mas você deve se abster de ativar a luz de fundo branca do teclado em iluminação brilhante, caso contrário você não será mais capaz de discernir as letras - mas quem o faz?
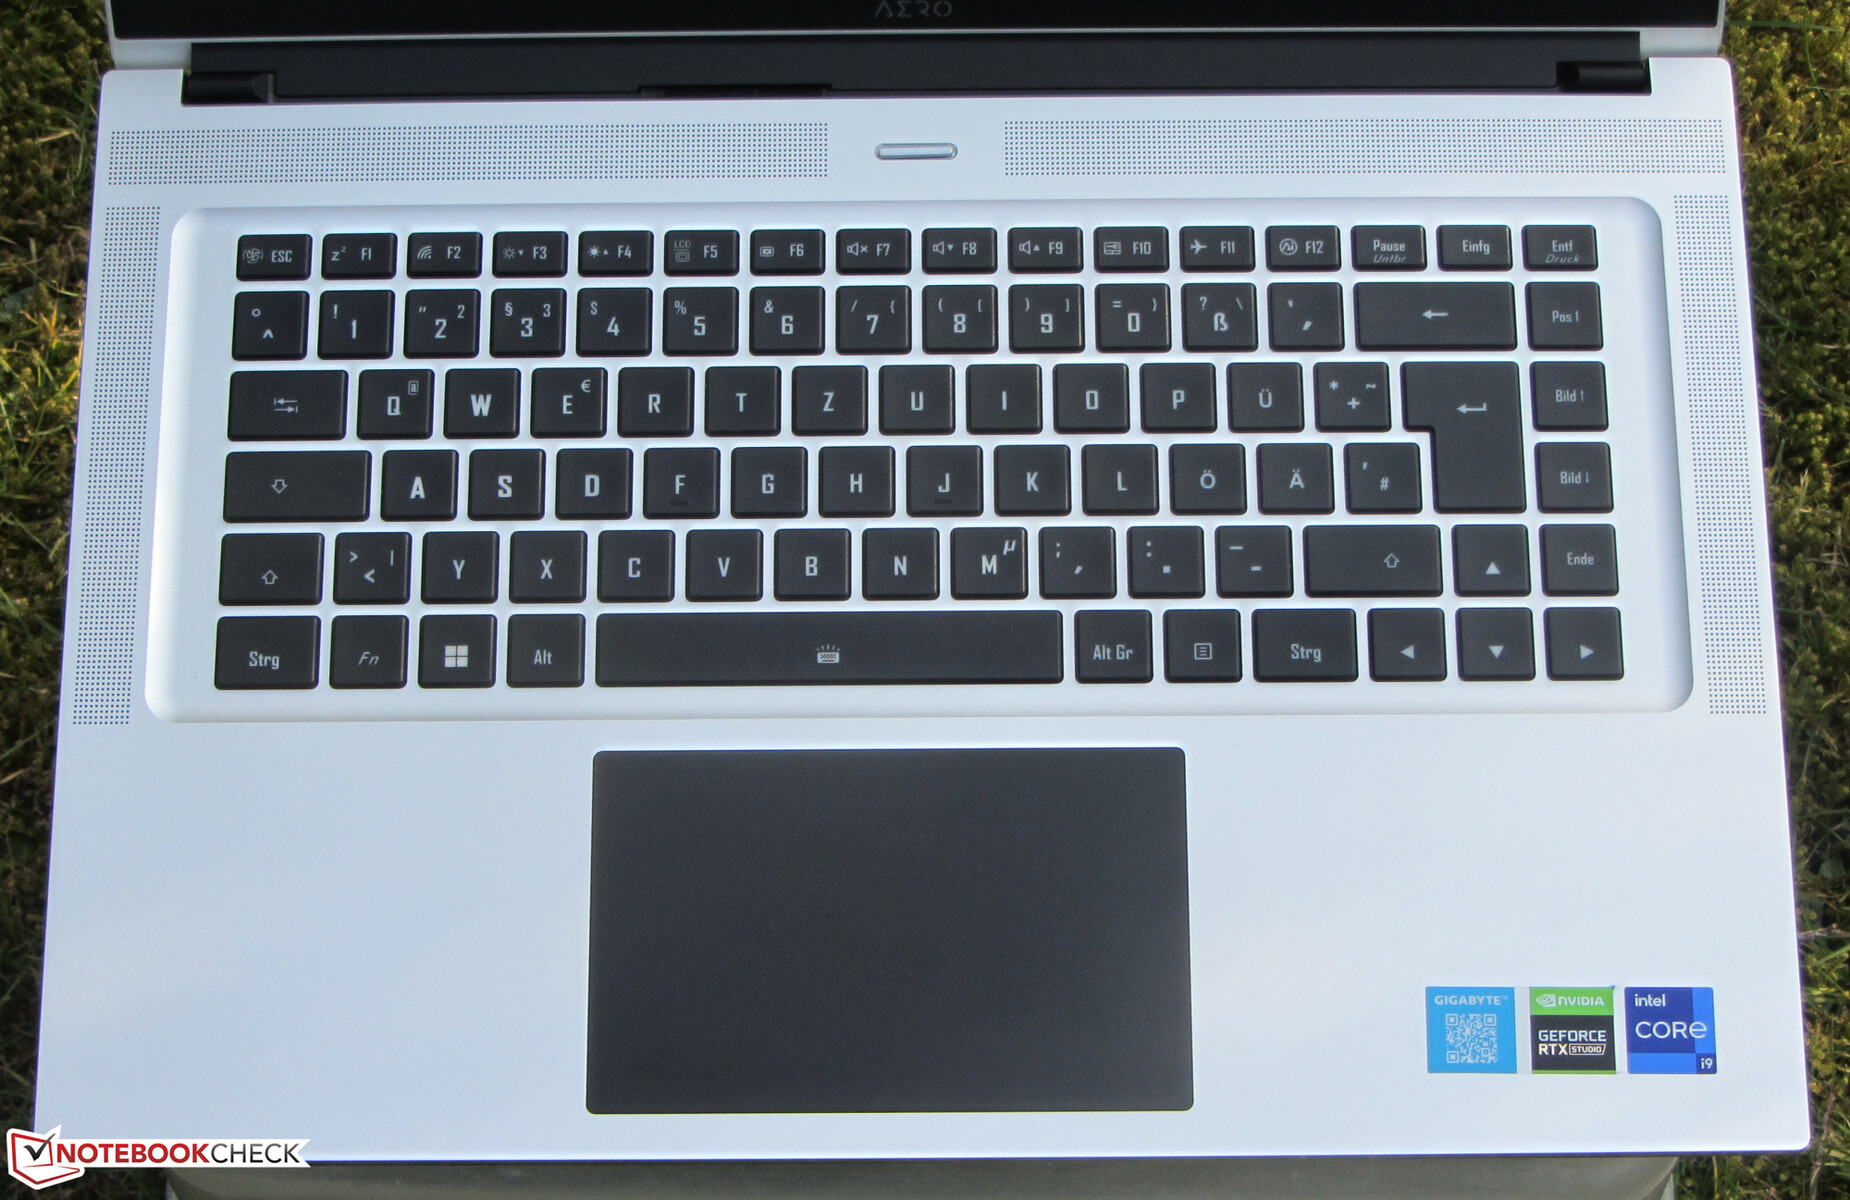
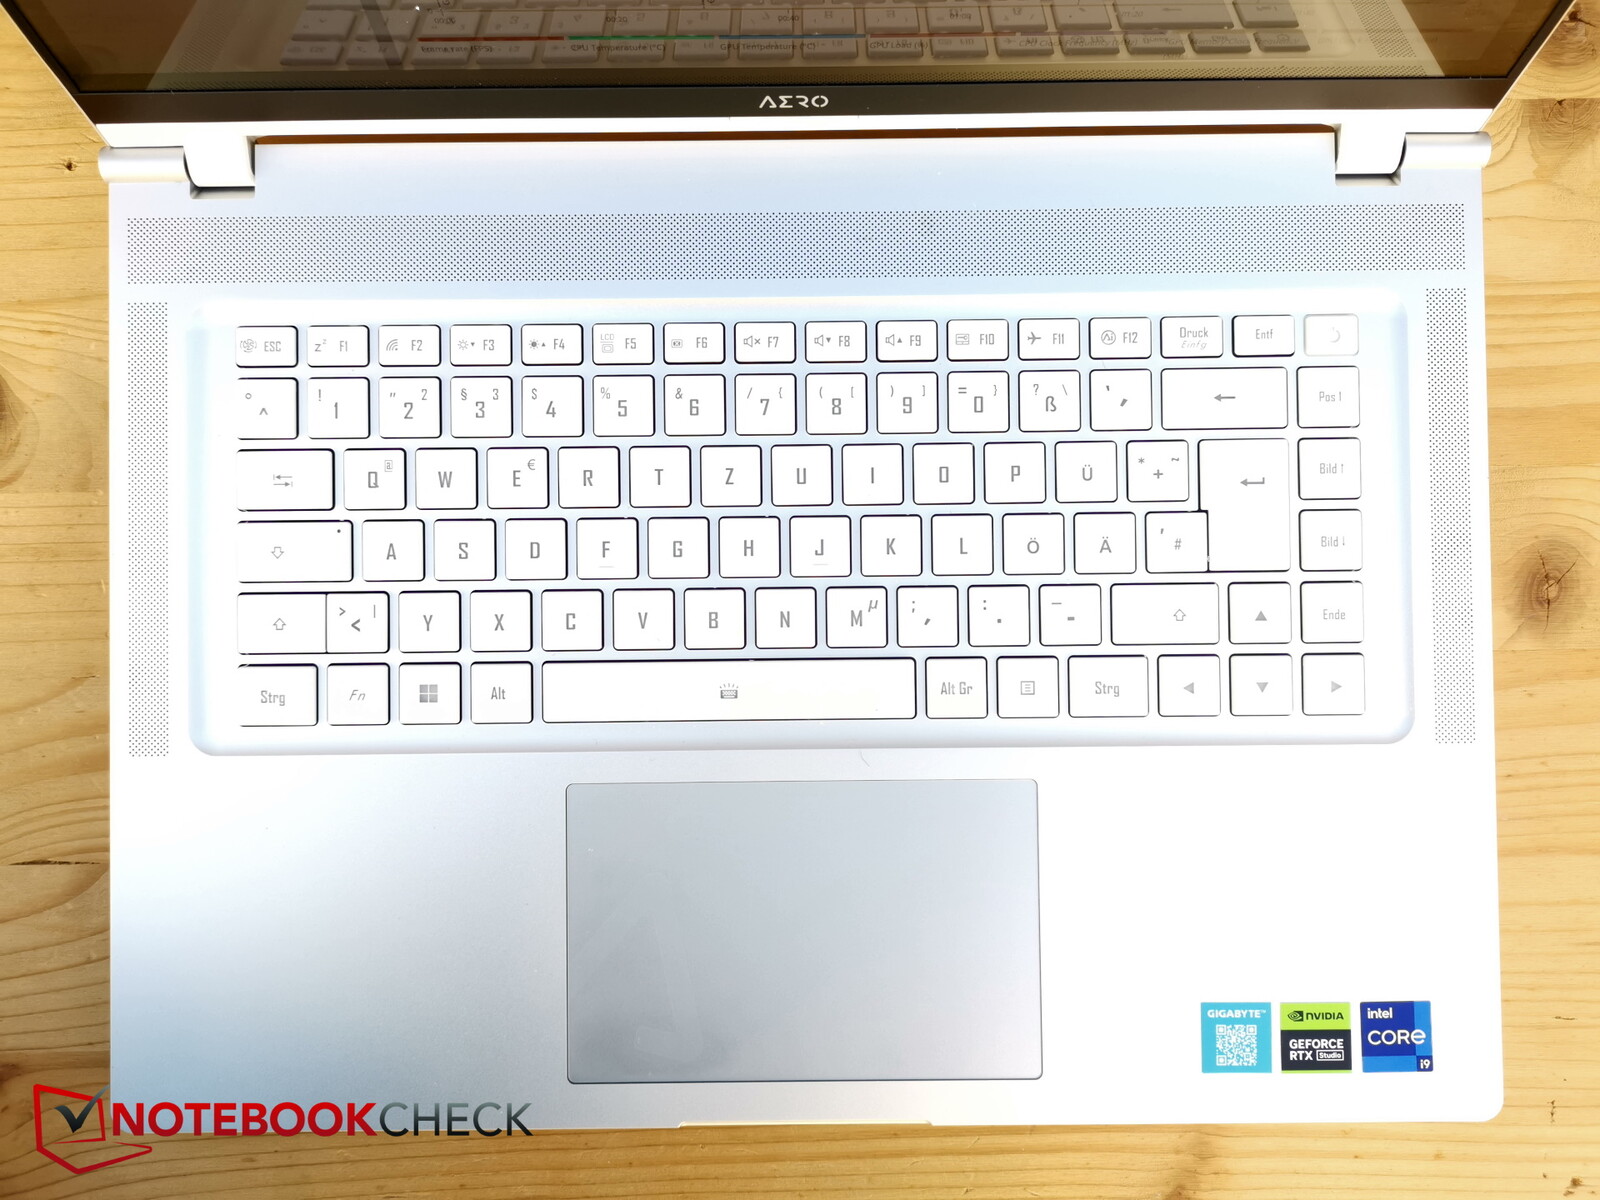
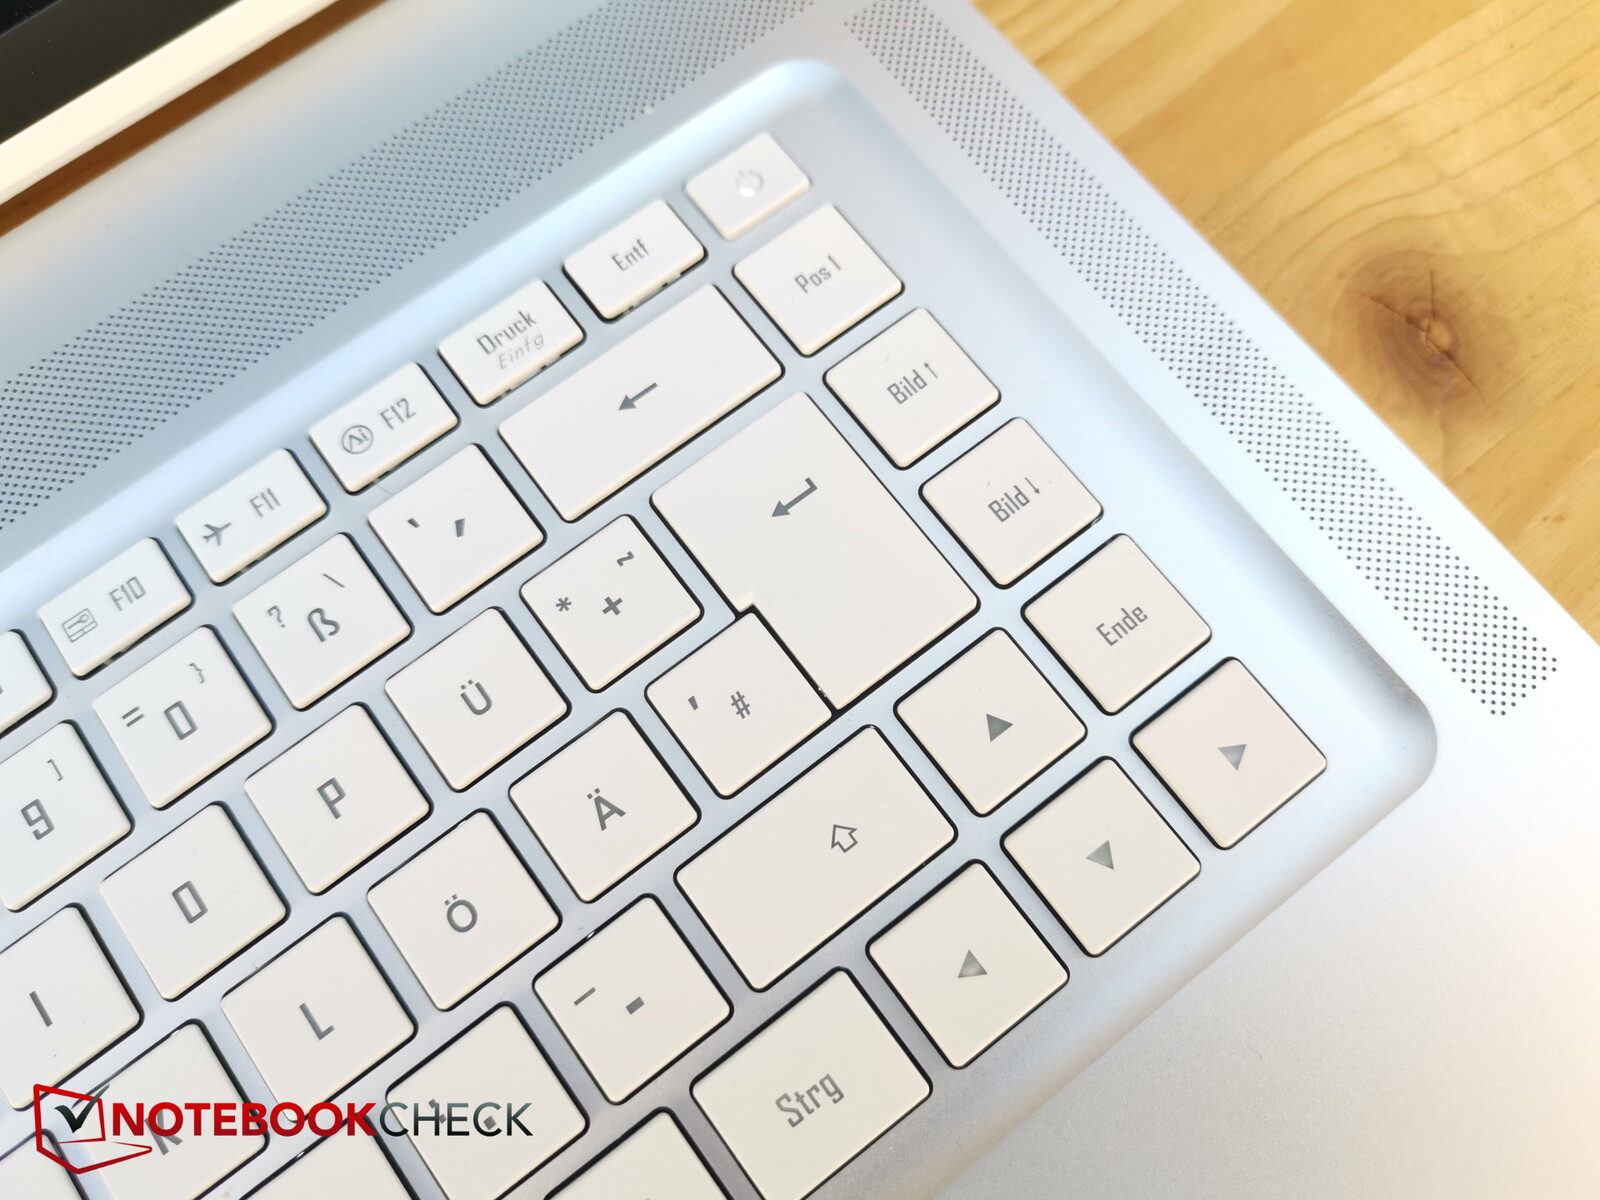
O layout parece muito arrumado. Nenhuma das teclas aparece fora do lugar, e mesmo as teclas de seta são de tamanho normal - muito bom. As teclas são de tamanho médio e estão todas bem espaçadas entre si.
O percurso das teclas é de cerca de 1,7 mm e o retorno é pouco perceptível. A digitação é rápida e o ruído moderado, mas a barra de espaço é um pouco mais alta.
Embora o interruptor on/off esteja integrado na parte superior direita do teclado, ele tem um ponto de pressão muito mais firme e é um pouco menor para que não seja tão fácil de pressionar acidentalmente. Em computadores portáteis Gigabyte, as teclas especiais para brilho (mais à esquerda aqui) e volume (mais à direita aqui) são normalmente trocadas, o que leva algum tempo para se acostumar.
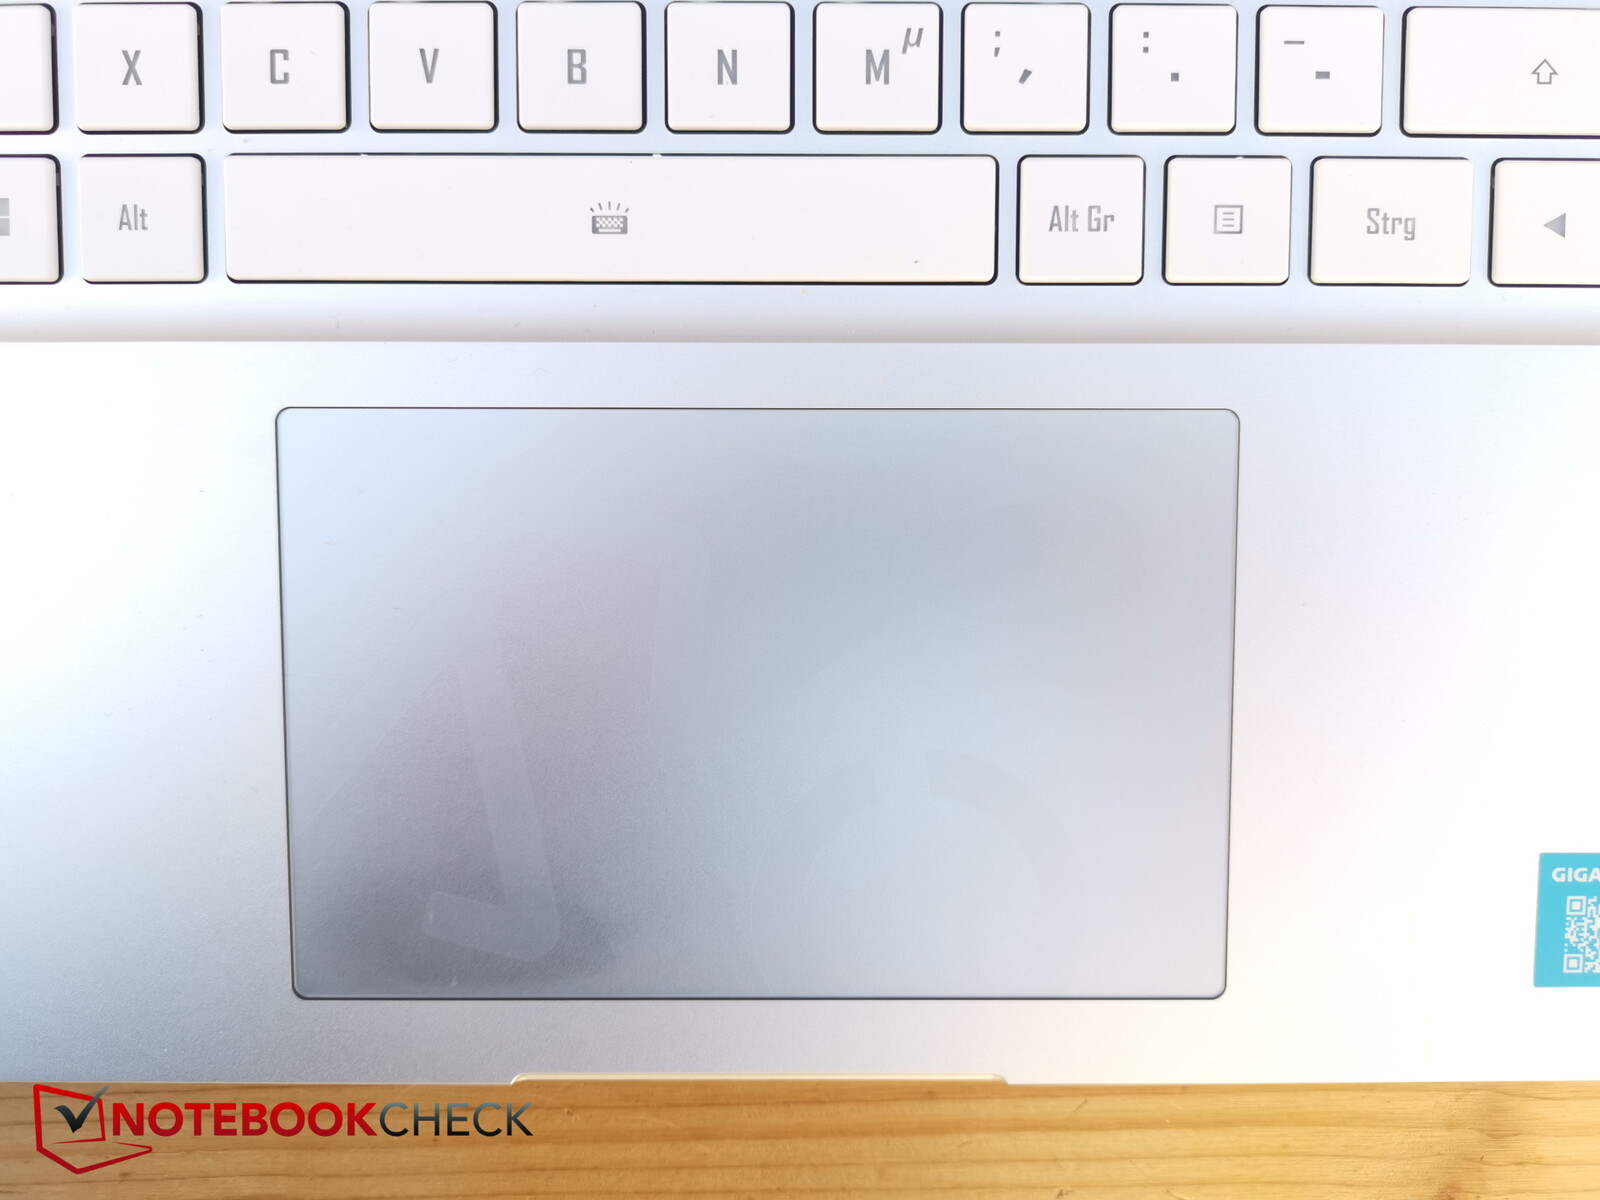
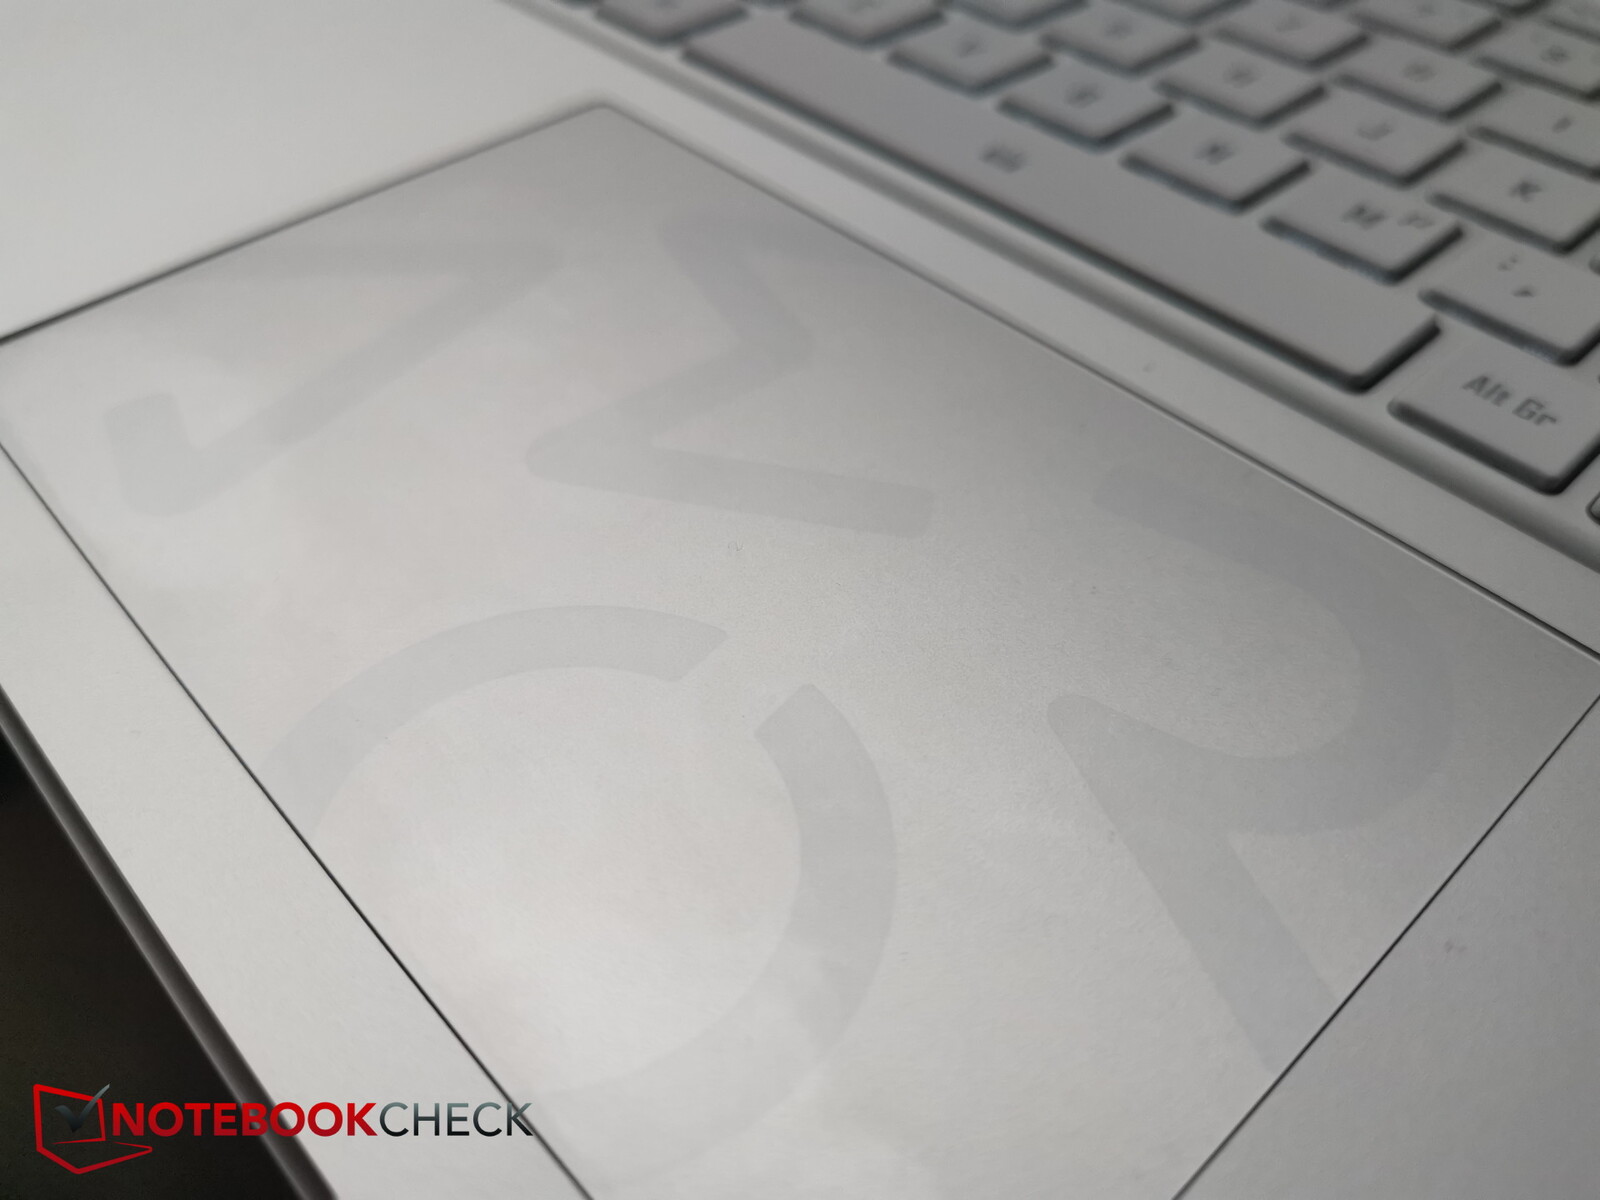
Touchpad
O touchpad permanece do mesmo tamanho de seu predecessor (aproximadamente 12,1 x 7,6 cm), mas agora é prateado ao invés de preto e oferece boas propriedades de deslizamento, mesmo com movimentos muito lentos.
As teclas integradas fornecem um feedback claro e são, portanto, ligeiramente mais altas que as teclas do teclado, mas ainda assim moderadas.
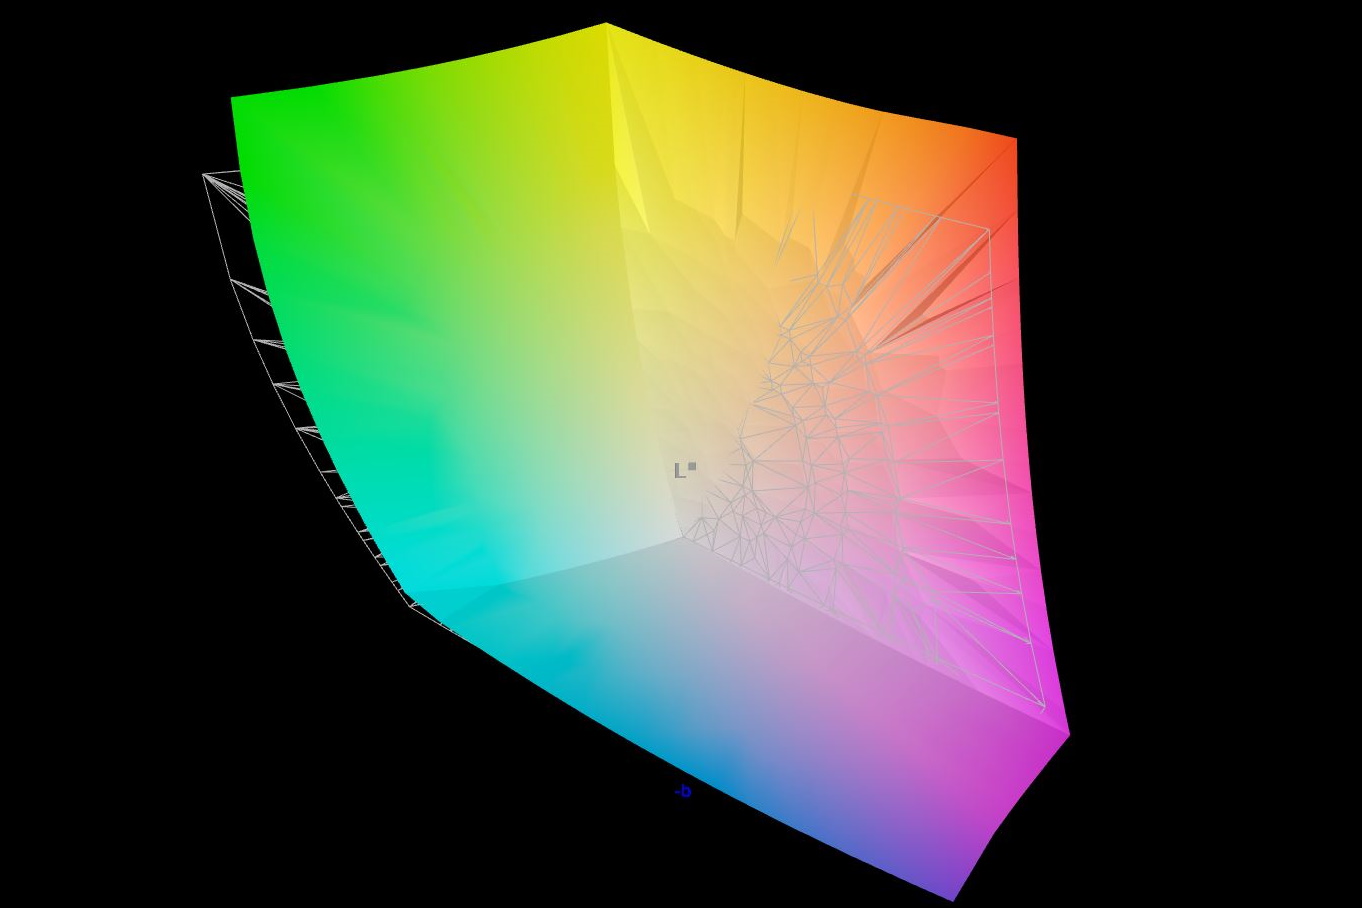
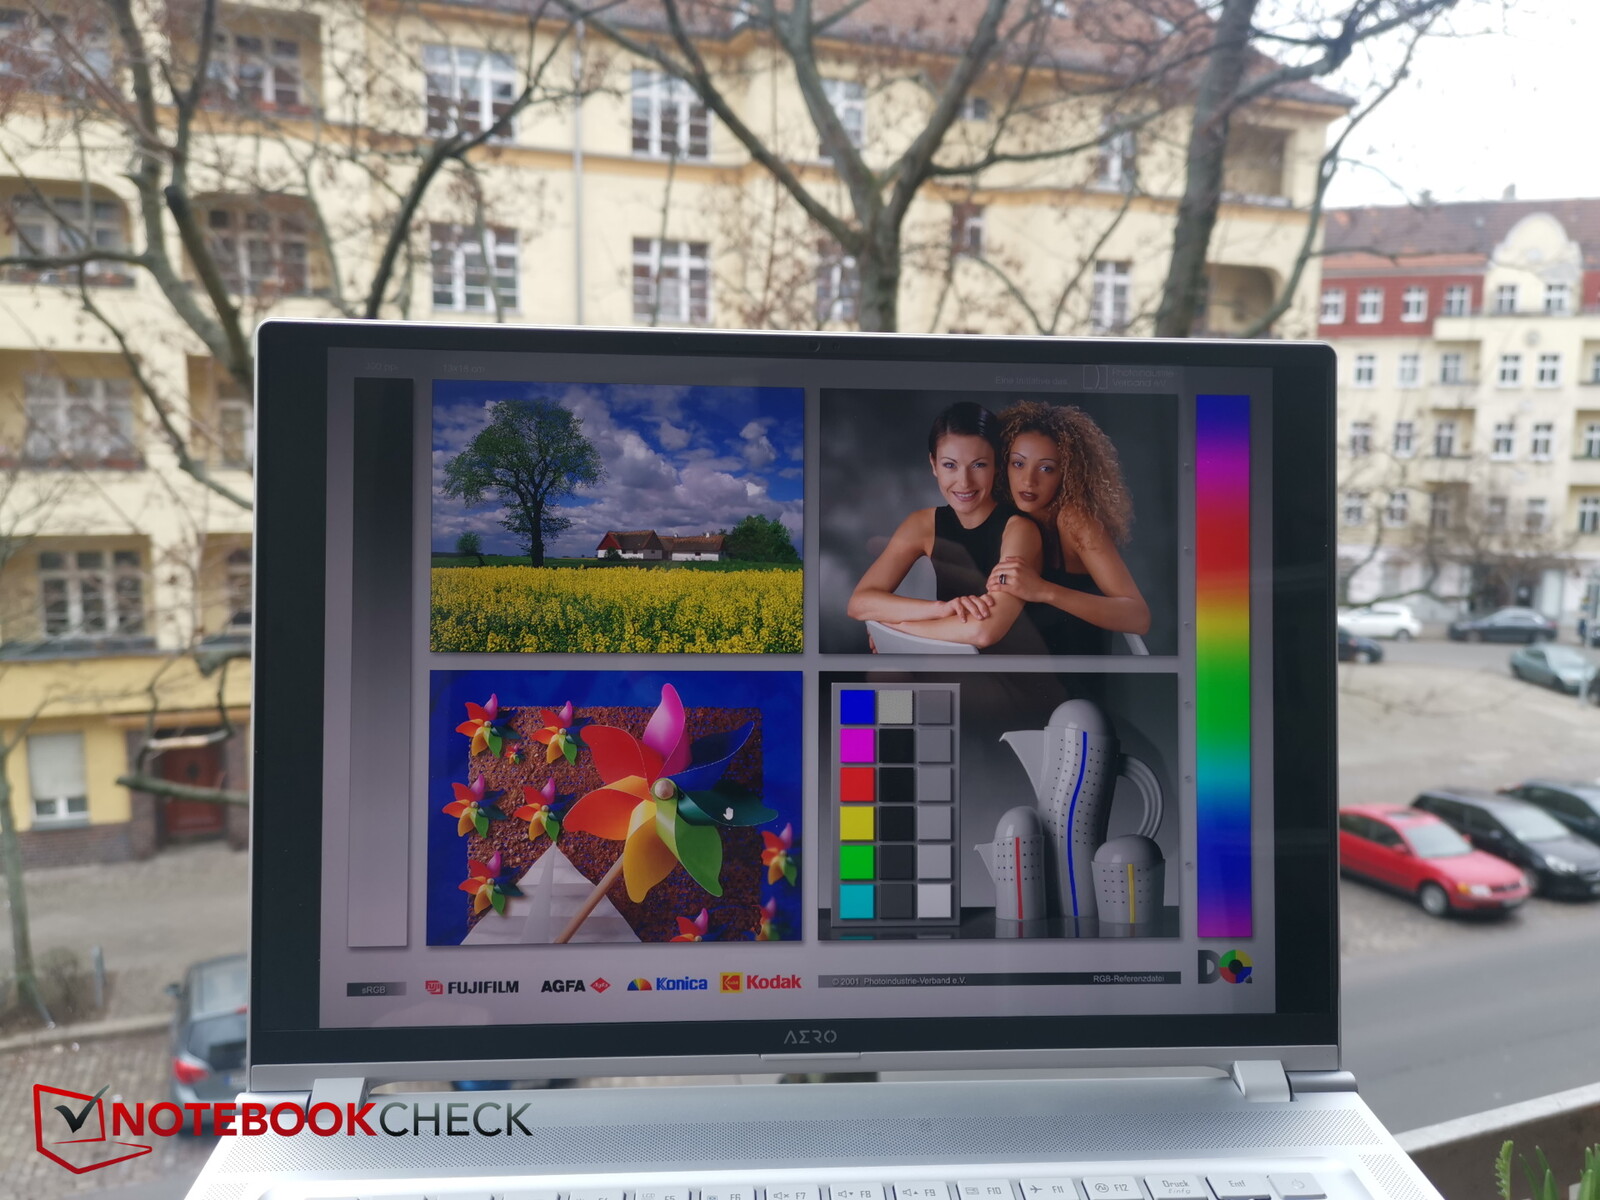
Visor - OLED de 16 polegadas, o destaque
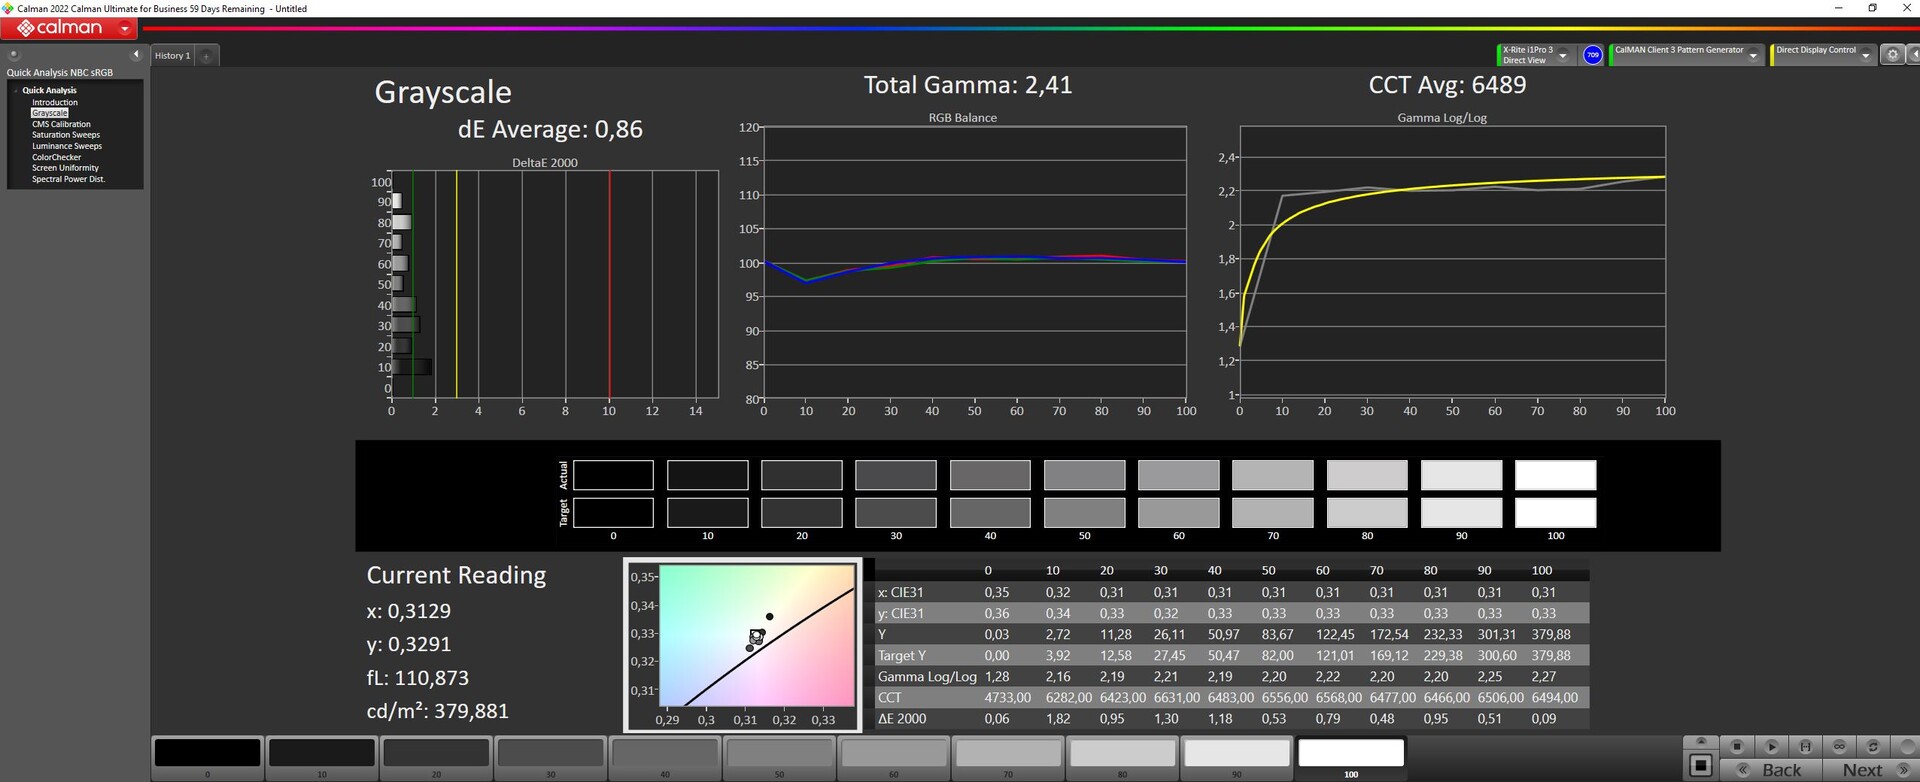
Gigabyte instala novamente um painel OLED de 16 polegadas da Samsung com uma relação de aspecto 16:10 e uma resolução de 4K de 3.840 x 2.400. O painel tem um novo número de versão, mas ainda oferece apenas 60 Hz - um lado negativo para os jogadores. Caso contrário, o painel OLED apresenta um rico contraste, um grande nível de preto e uma iluminação muito boa. A concorrência IPS não pode mais se manter aqui em cima.
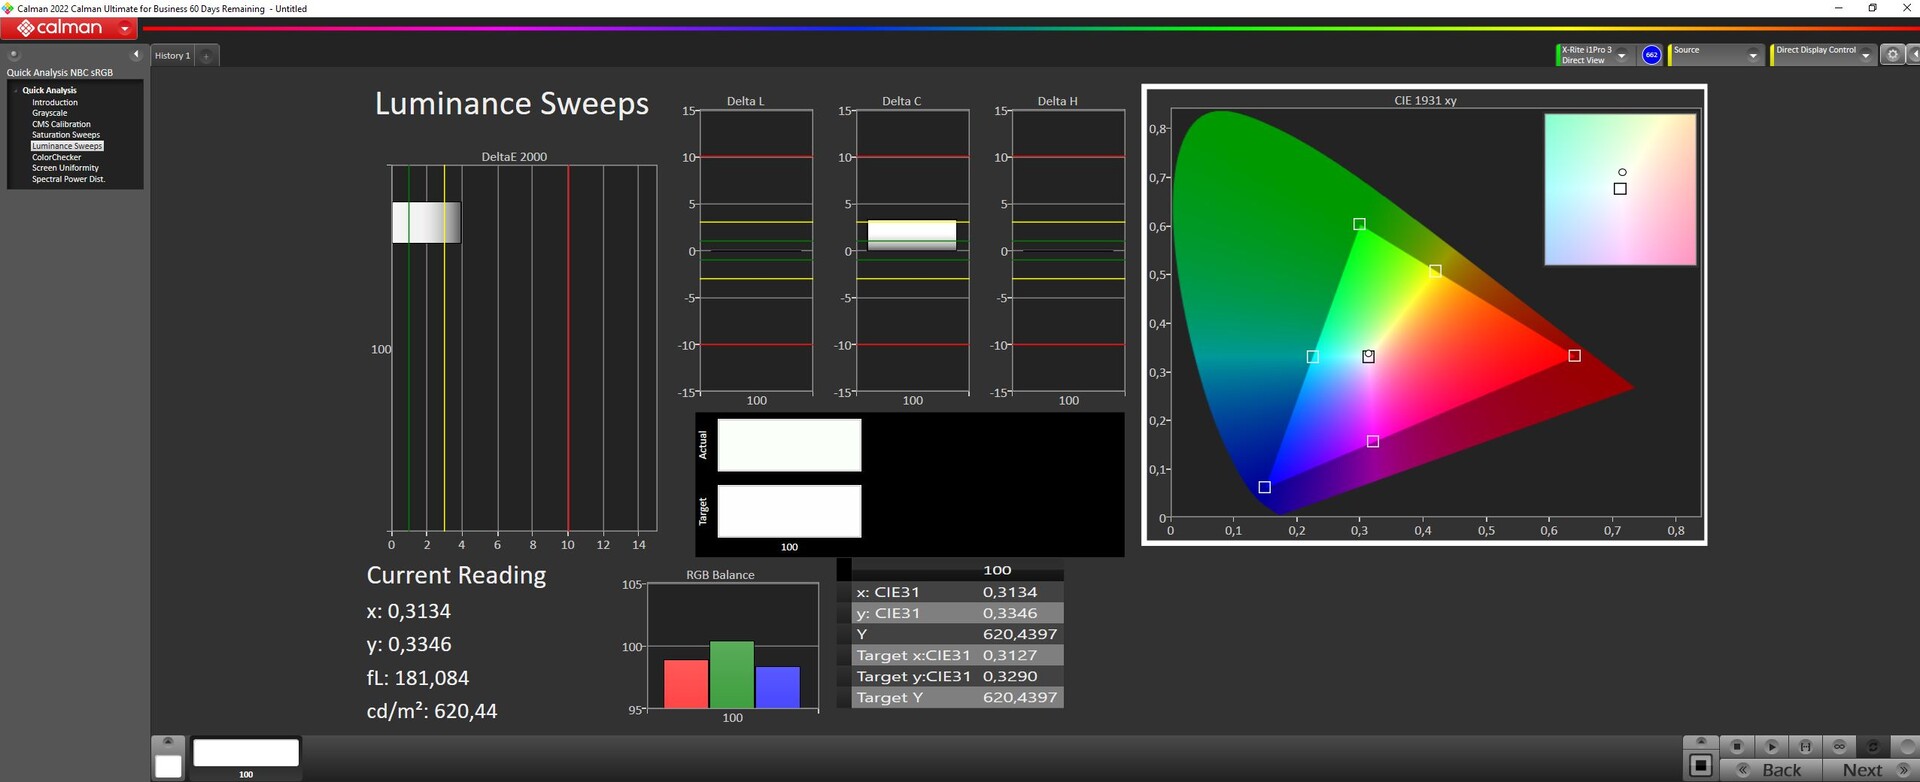
Medimos uma luminosidade de pouco menos de 400 lêndeas no modo de exibição SDR. Mas o painel também atende ao padrão HDR600. Assim, medimos no modo HDR e chegamos a um brilho de pico de 620 lêndeas. Isto só é possível com um pequeno campo de medição, já que os OLEDs escurecem rapidamente em áreas grandes e brilhantes.
O sangramento da tela não é um problema com os OLEDs. Os tempos de resposta também são excelentes.
| |||||||||||||||||||||||||
iluminação: 97 %
iluminação com acumulador: 387.56 cd/m²
Contraste: 12999:1 (Preto: 0.03 cd/m²)
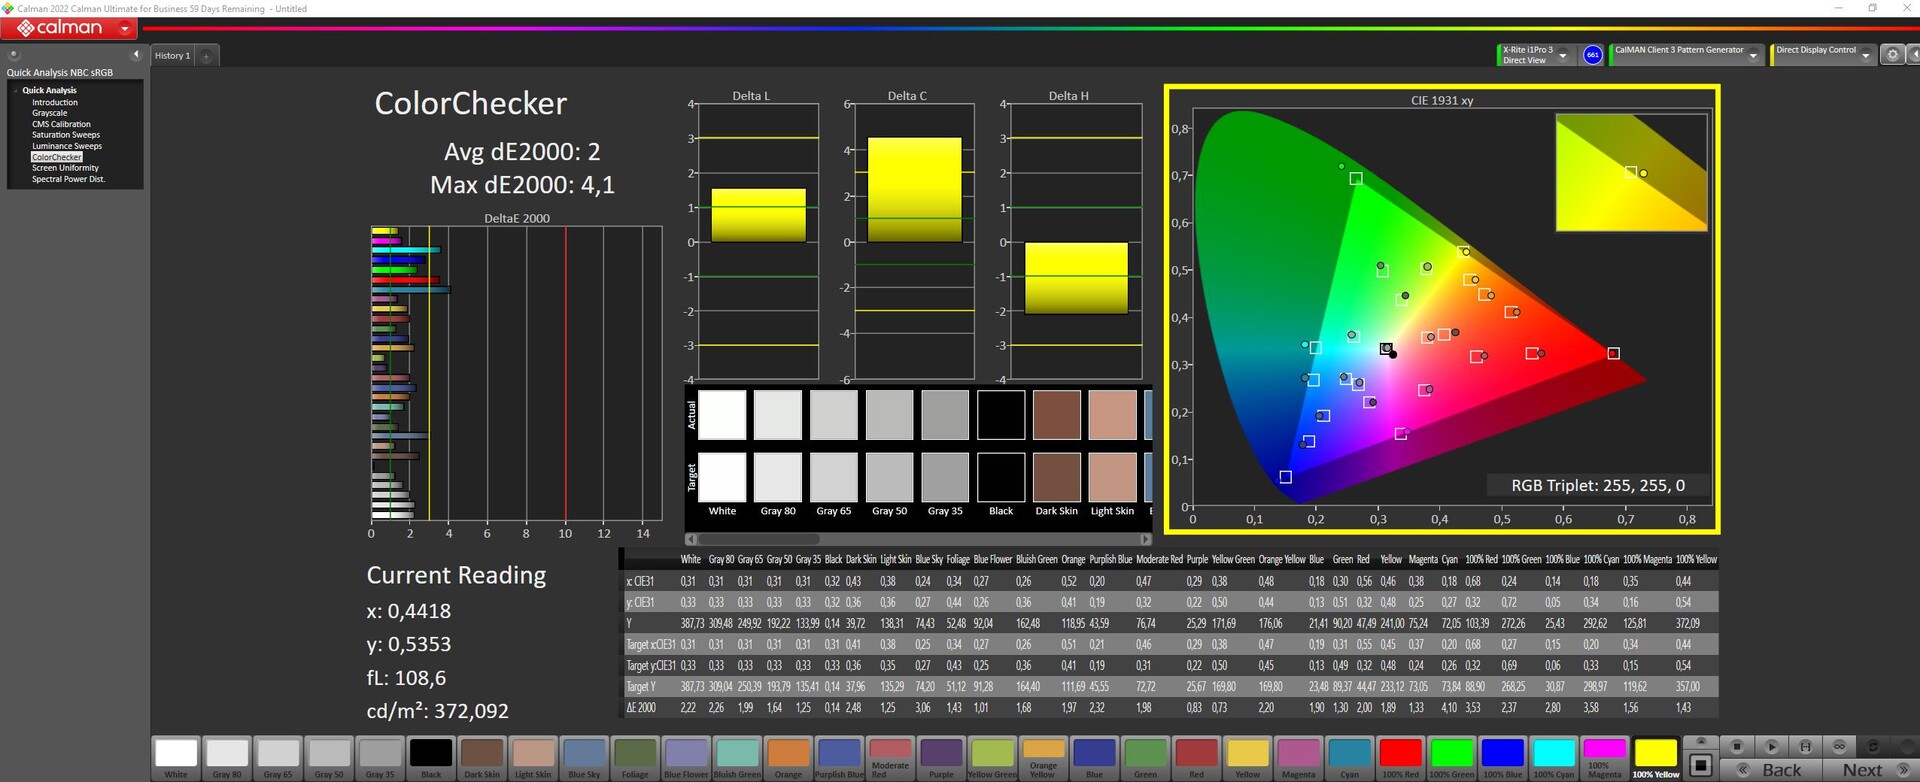
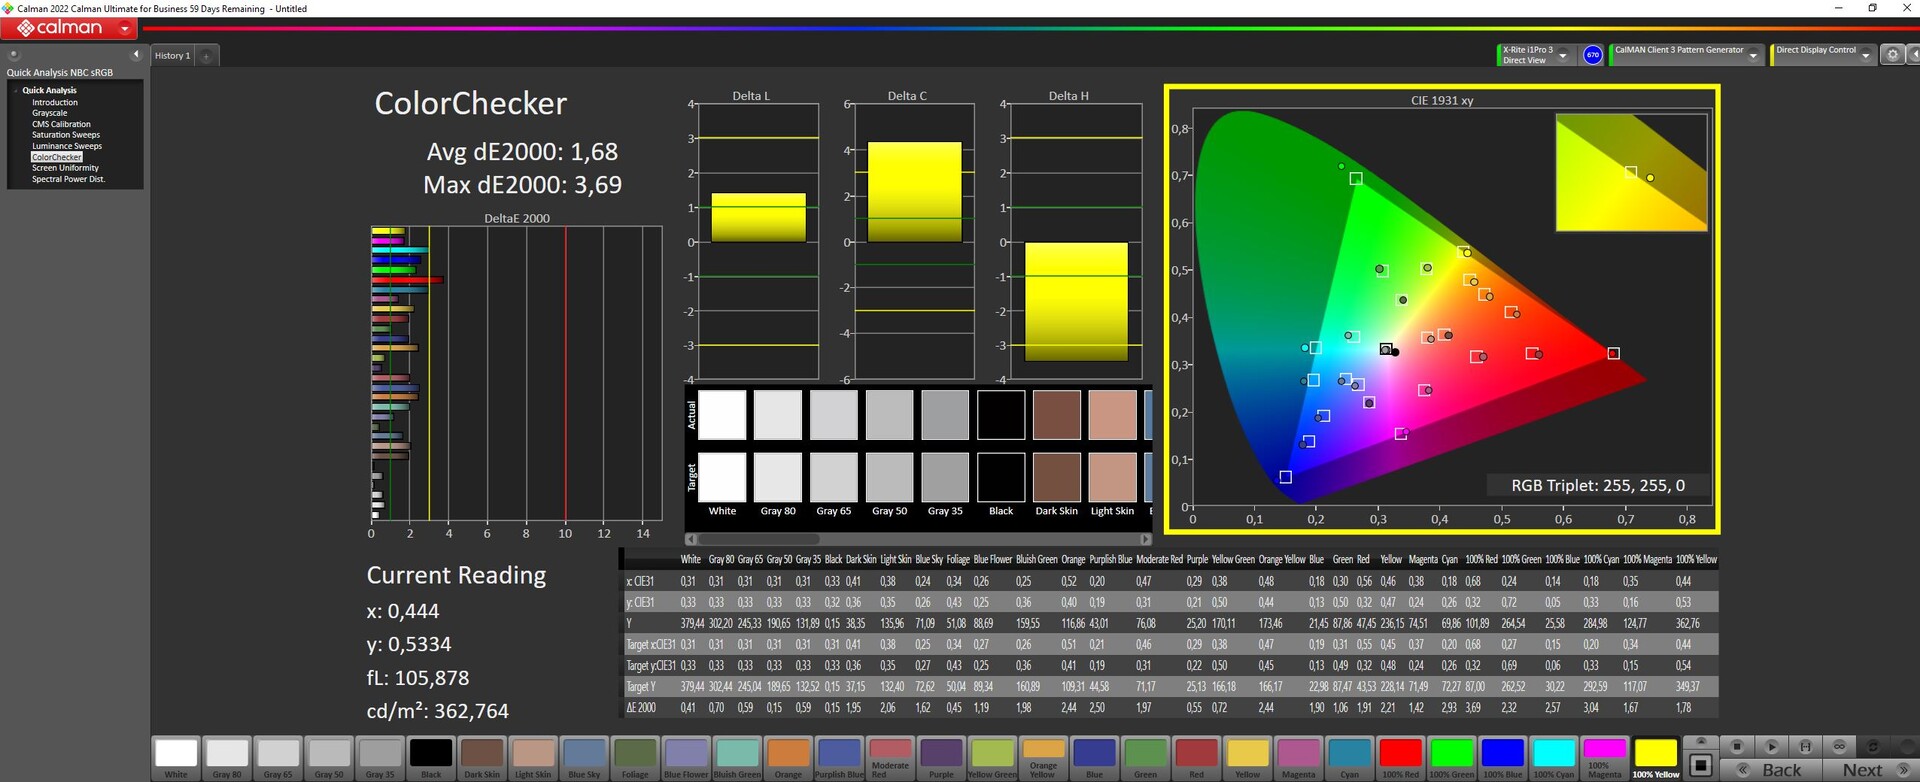
ΔE ColorChecker Calman: 2 | ∀{0.5-29.43 Ø4.71}
calibrated: 1.68
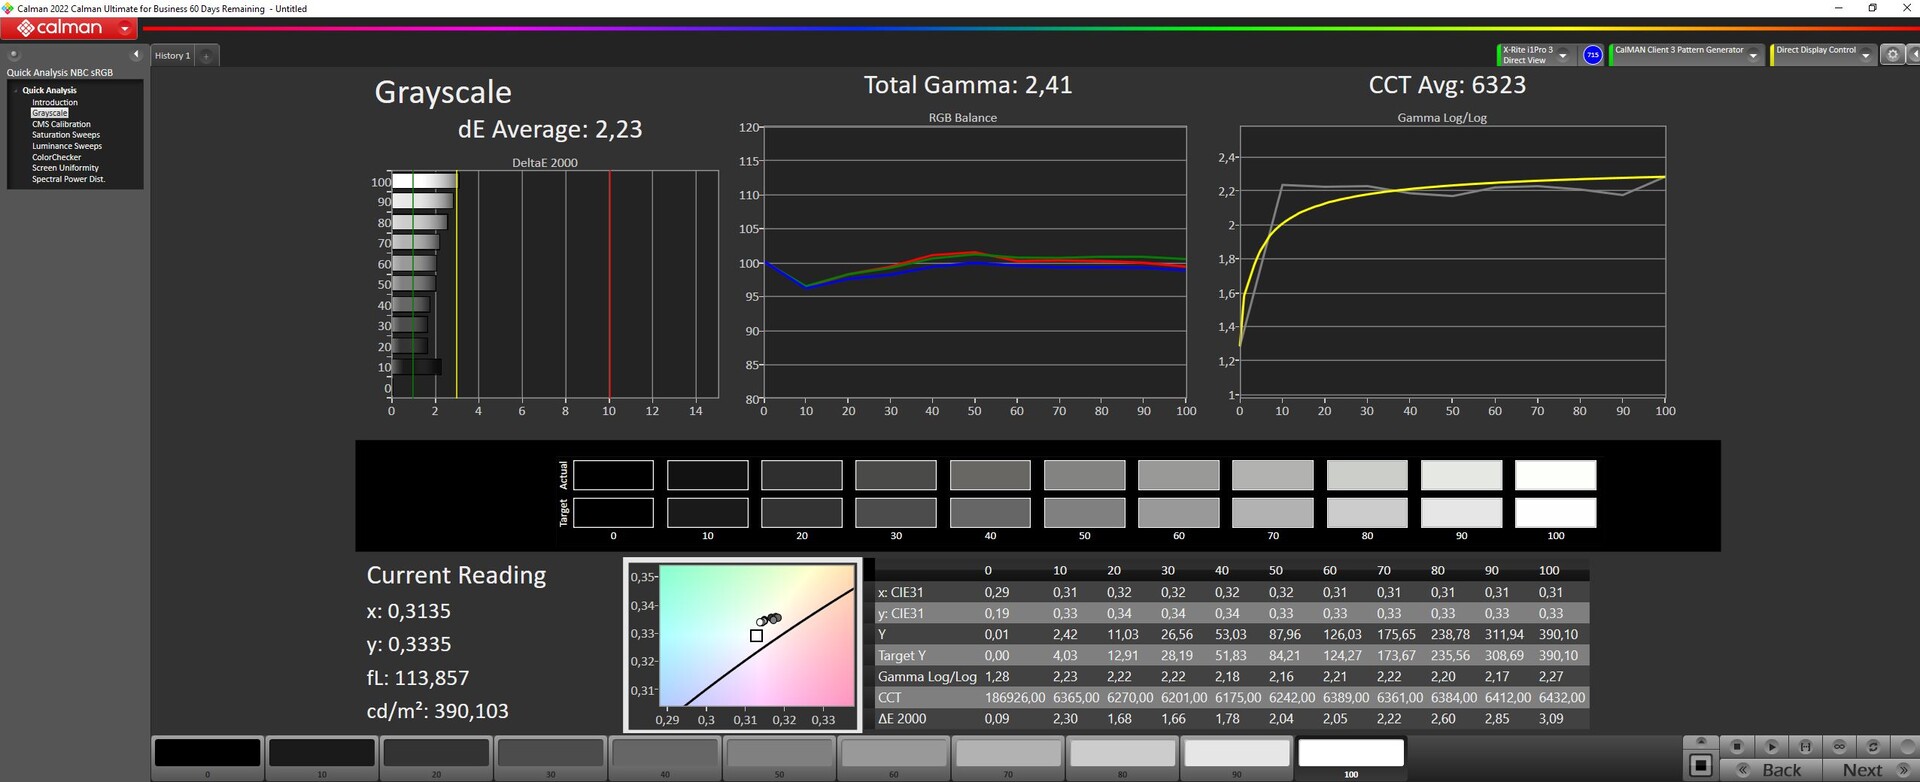
ΔE Greyscale Calman: 2.23 | ∀{0.09-98 Ø4.96}
96.4% AdobeRGB 1998 (Argyll 3D)
100% sRGB (Argyll 3D)
99.9% Display P3 (Argyll 3D)
Gamma: 2.41
CCT: 6323 K
| Gigabyte AERO 16 OLED BSF Samsung SDC4191 (ATNA60YV09-0, OLED, 3840x2400, 16" | Gigabyte Aero 16 YE5 Samsung SDC416B, AMOLED, 3840x2400, 16" | Razer Blade 18 RTX 4070 AU Optronics B180QAN01.0, IPS, 2560x1600, 18" | Asus ZenBook Pro 16X OLED UX7602ZM-ME115W Samsung SDC415D, OLED, 3840x2400, 16" | Asus TUF Gaming A16 FA617 NE160WUM-NX2 (BOE0B33), IPS-Level, 1920x1200, 16" | MSI CreatorPro Z16P B12UKST B160QAN02.N, IPS, 2560x1600, 16" | |
|---|---|---|---|---|---|---|
| Display | -5% | -3% | -20% | -4% | ||
| Display P3 Coverage (%) | 99.9 | 96.9 -3% | 99.84 0% | 69.4 -31% | 97.6 -2% | |
| sRGB Coverage (%) | 100 | 99.8 0% | 99.99 0% | 97.8 -2% | 99.9 0% | |
| AdobeRGB 1998 Coverage (%) | 96.4 | 85.3 -12% | 88.9 -8% | 70.9 -26% | 87.4 -9% | |
| Response Times | -11% | -207% | -1% | -580% | -407% | |
| Response Time Grey 50% / Grey 80% * (ms) | 2 ? | 2.4 ? -20% | 4.2 ? -110% | 2 ? -0% | 17 ? -750% | 12.8 ? -540% |
| Response Time Black / White * (ms) | 1.98 ? | 2 ? -1% | 8 ? -304% | 2 ? -1% | 10.1 ? -410% | 7.4 ? -274% |
| PWM Frequency (Hz) | 60 | 60 ? | 59 ? | |||
| Screen | 34% | -208% | -8% | -80% | -118% | |
| Brightness middle (cd/m²) | 389.97 | 368 -6% | 549.6 41% | 346 -11% | 308 -21% | 407 4% |
| Brightness (cd/m²) | 395 | 368 -7% | 524 33% | 354 -10% | 293 -26% | 388 -2% |
| Brightness Distribution (%) | 97 | 93 -4% | 89 -8% | 96 -1% | 90 -7% | 88 -9% |
| Black Level * (cd/m²) | 0.03 | 0.01 67% | 0.53 -1667% | 0.23 -667% | 0.36 -1100% | |
| Contrast (:1) | 12999 | 36800 183% | 1037 -92% | 1339 -90% | 1131 -91% | |
| Colorchecker dE 2000 * | 2 | 2.33 -17% | 3.32 -66% | 2.28 -14% | 1.47 26% | 1.3 35% |
| Colorchecker dE 2000 max. * | 4.1 | 4.34 -6% | 6.63 -62% | 4.94 -20% | 2.98 27% | 2.5 39% |
| Colorchecker dE 2000 calibrated * | 1.68 | 2.7 -61% | 2.16 -29% | 1.02 39% | 0.7 58% | |
| Greyscale dE 2000 * | 2.23 | 0.8 64% | 2 10% | 1.64 26% | 2.2 1% | 2.1 6% |
| Gamma | 2.41 91% | 2.119 104% | 2.29 96% | 2.37 93% | 2.228 99% | 2.26 97% |
| CCT | 6323 103% | 6569 99% | 6319 103% | 6384 102% | 6228 104% | 6437 101% |
| Média Total (Programa/Configurações) | 12% /
25% | -140% /
-164% | -4% /
-6% | -227% /
-138% | -176% /
-135% |
* ... menor é melhor
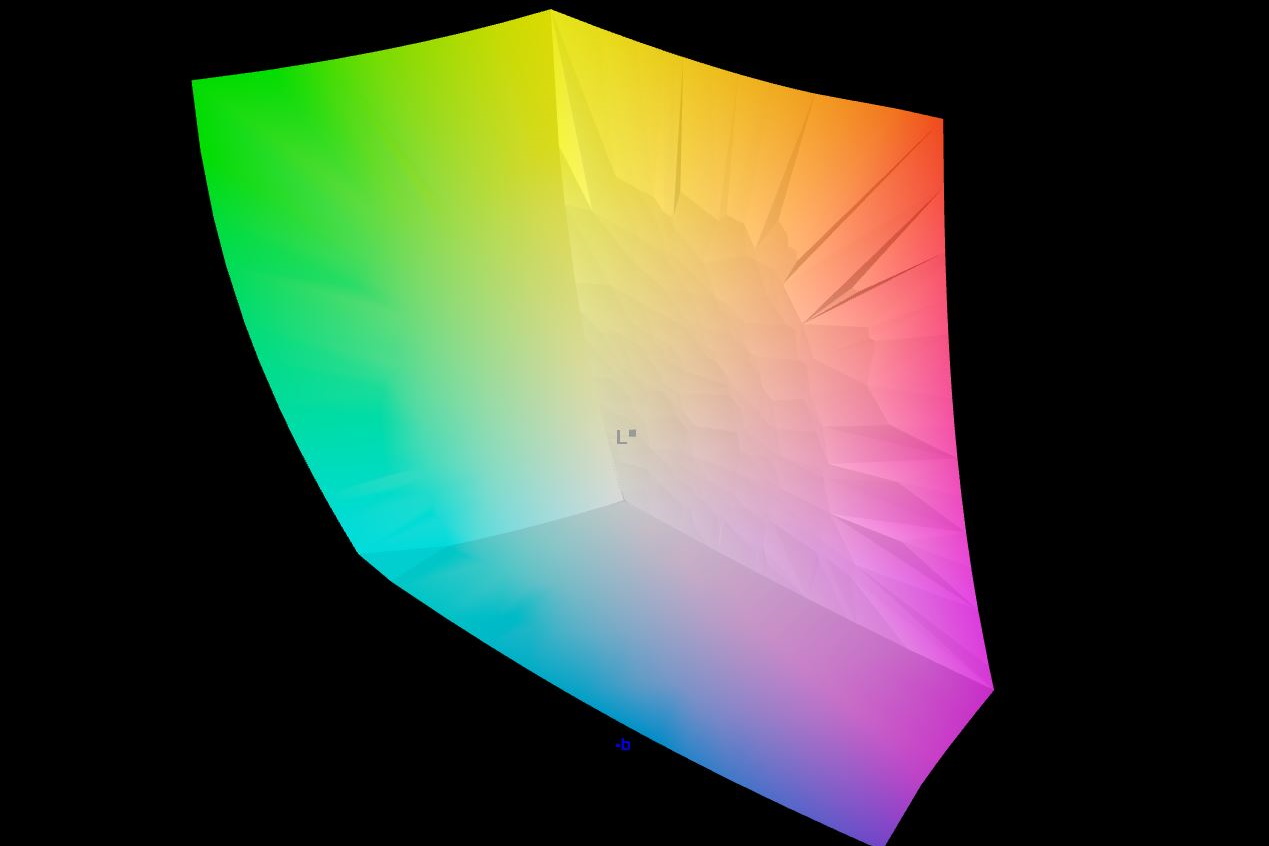
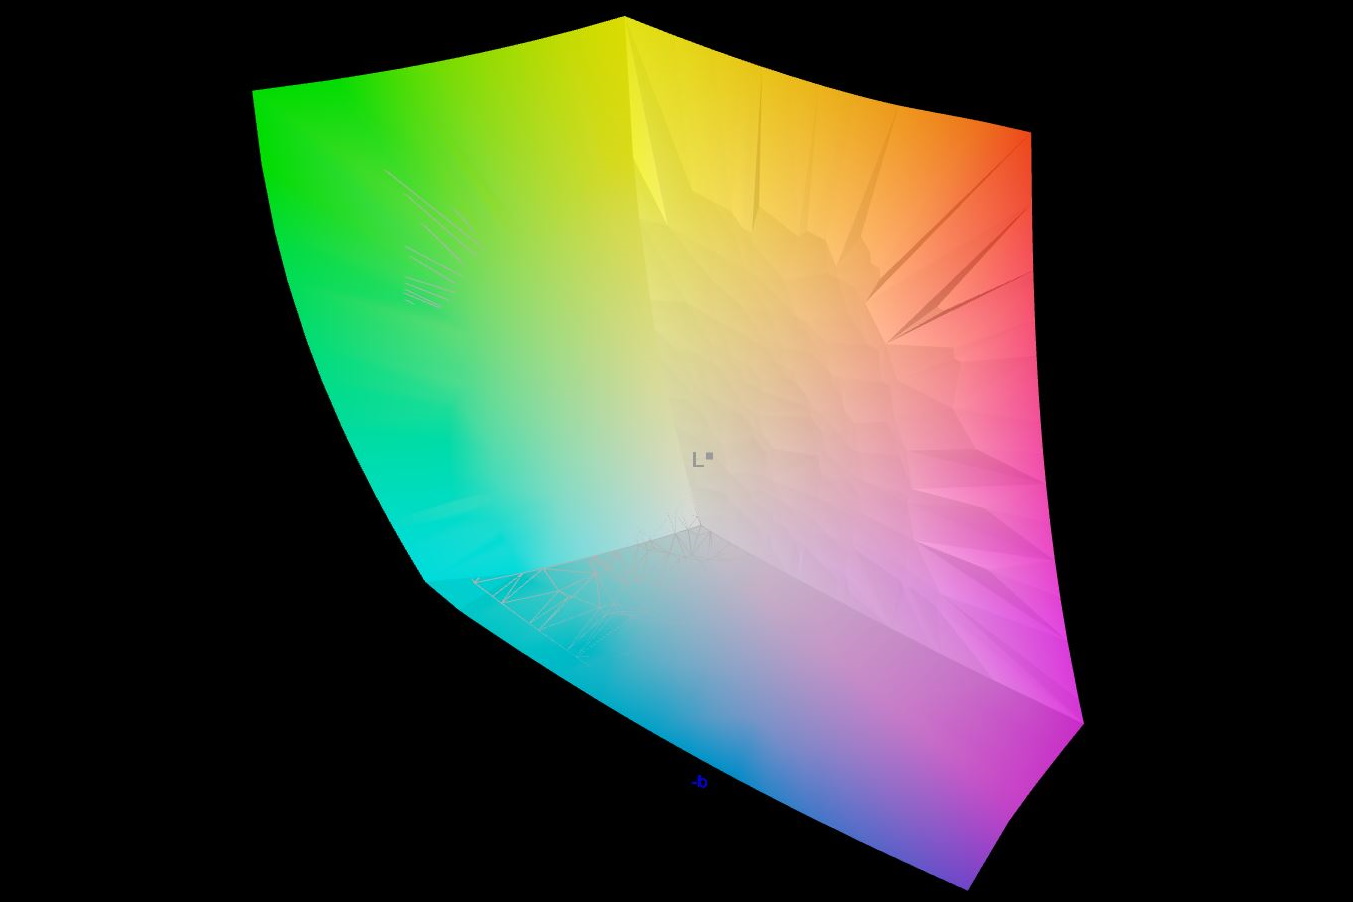
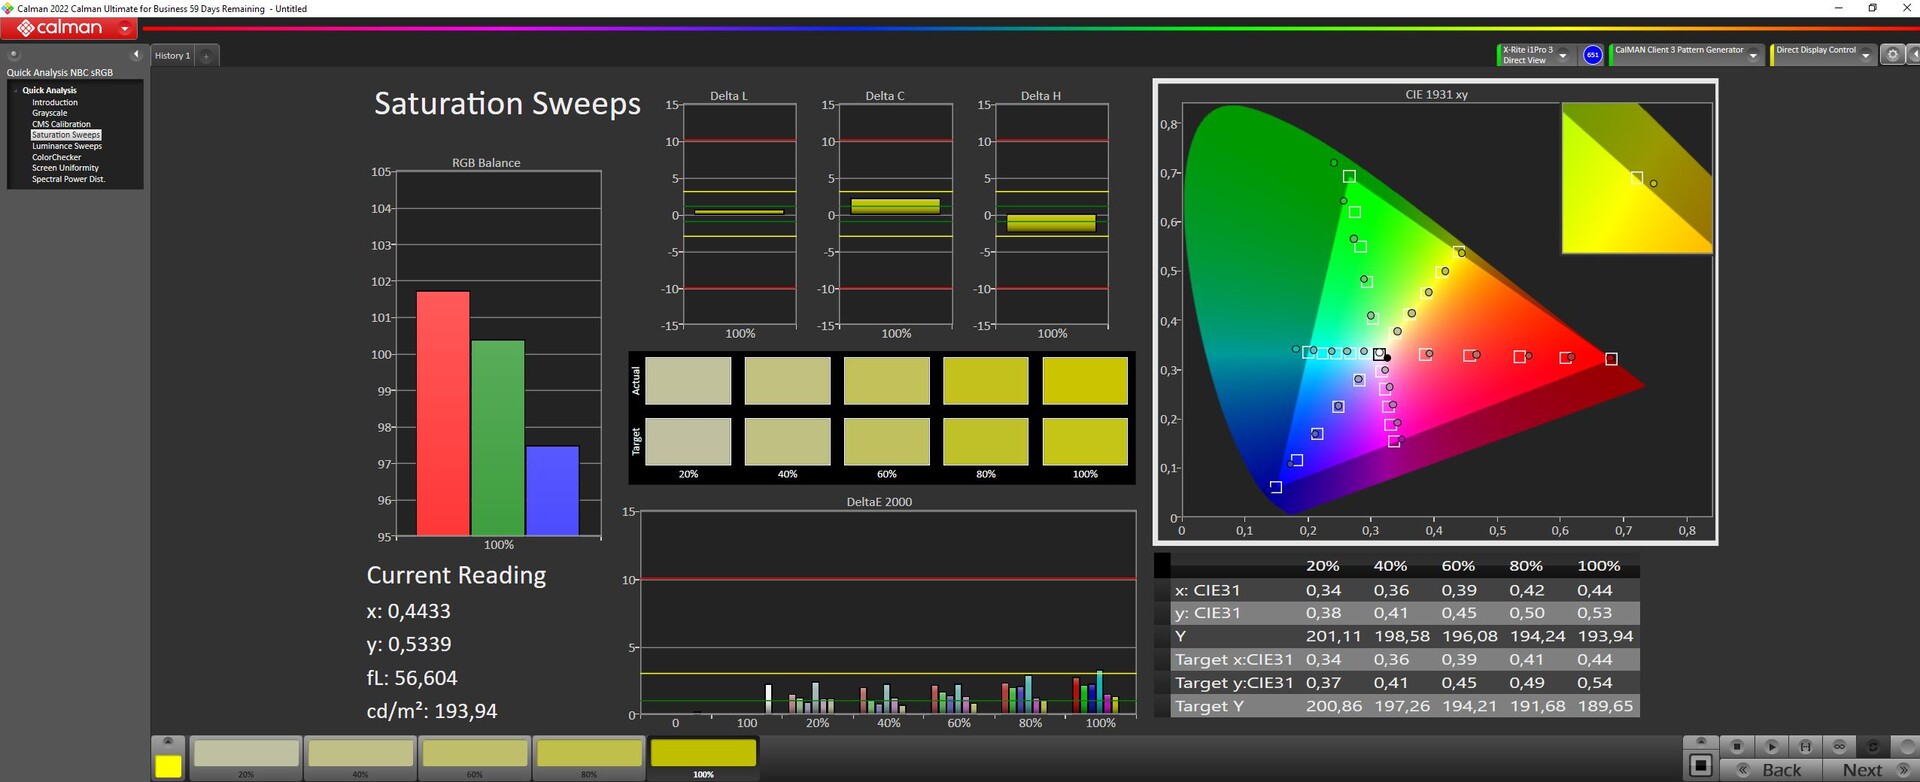
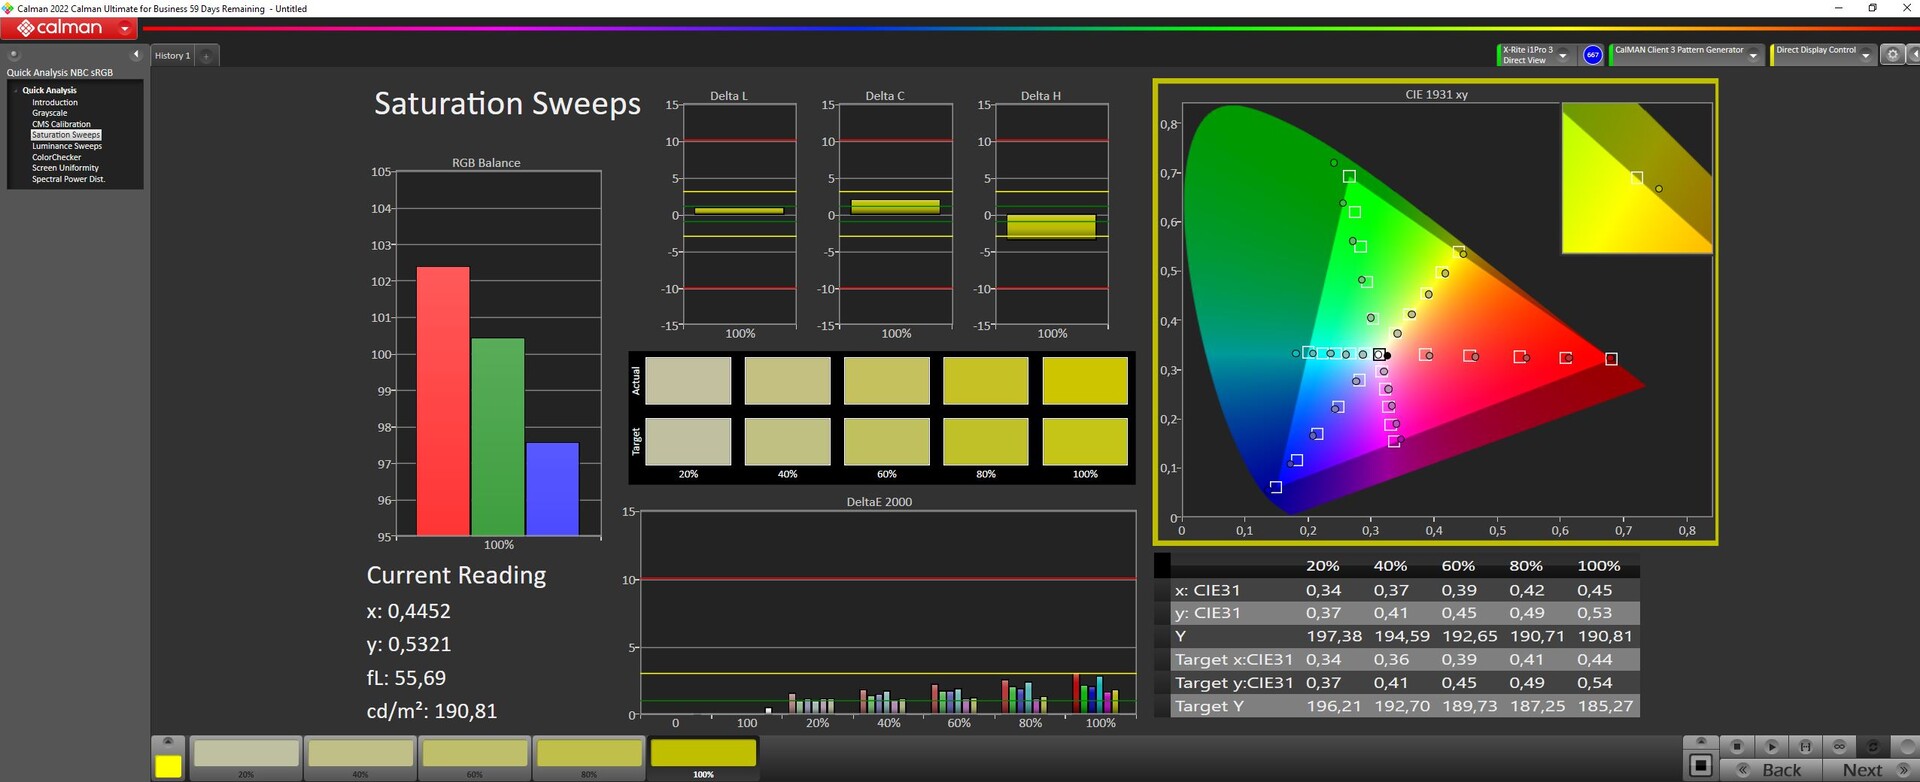
A Gigabyte anuncia o Aero 16 como fornecendo 100% de cobertura DCI-P3 e nossas medidas confirmam esta afirmação. Até o AdobeRGB está coberto a 96,4%. A tela OLED é, portanto, muito adequada para a edição de fotos e vídeos.
O visor já está bem calibrado ex works; nossa calibração via Portrait Displays Calman Color Calibration empurra os valores DeltaE para baixo um pouco mais ainda. Portanto, o visor tem apenas desvios muito leves de cor e escala de cinza. Nosso perfil ICC pode ser baixado acima.
Exibir tempos de resposta
| ↔ Tempo de resposta preto para branco | ||
|---|---|---|
| 1.98 ms ... ascensão ↗ e queda ↘ combinadas | ↗ 0.5 ms ascensão | 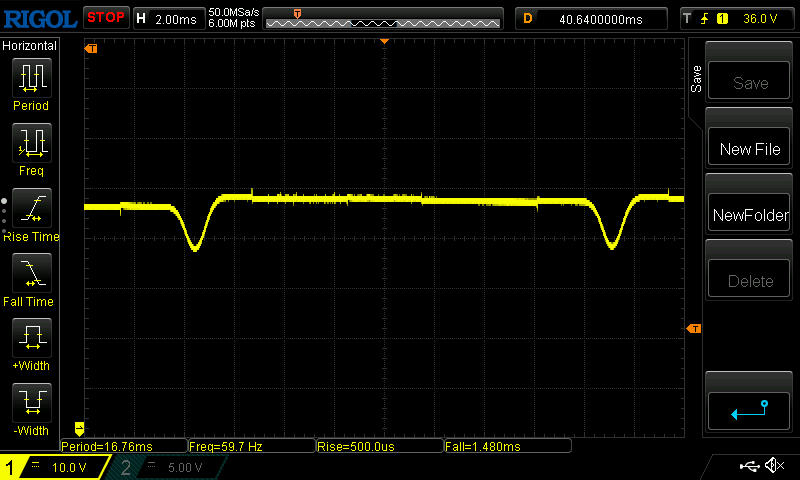 |
| ↘ 1.48 ms queda | ||
| A tela mostra taxas de resposta muito rápidas em nossos testes e deve ser muito adequada para jogos em ritmo acelerado. Em comparação, todos os dispositivos testados variam de 0.1 (mínimo) a 240 (máximo) ms. » 11 % de todos os dispositivos são melhores. Isso significa que o tempo de resposta medido é melhor que a média de todos os dispositivos testados (19.8 ms). | ||
| ↔ Tempo de resposta 50% cinza a 80% cinza | ||
| 2 ms ... ascensão ↗ e queda ↘ combinadas | ↗ 1 ms ascensão | 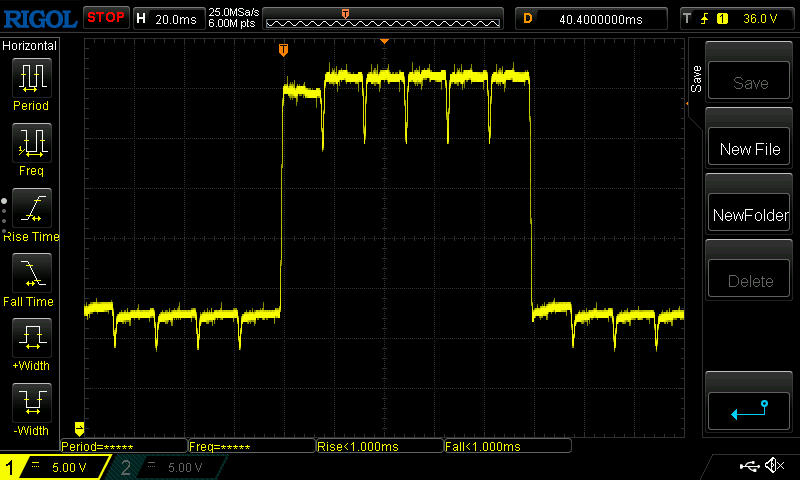 |
| ↘ 1 ms queda | ||
| A tela mostra taxas de resposta muito rápidas em nossos testes e deve ser muito adequada para jogos em ritmo acelerado. Em comparação, todos os dispositivos testados variam de 0.165 (mínimo) a 636 (máximo) ms. » 10 % de todos os dispositivos são melhores. Isso significa que o tempo de resposta medido é melhor que a média de todos os dispositivos testados (31 ms). | ||
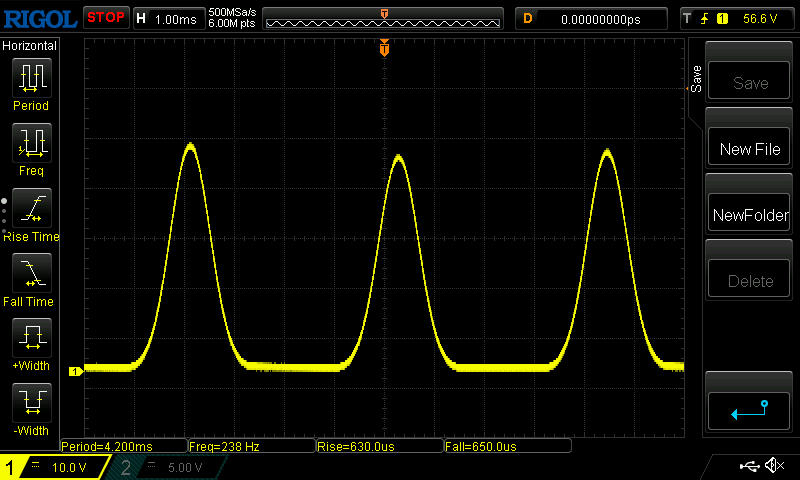
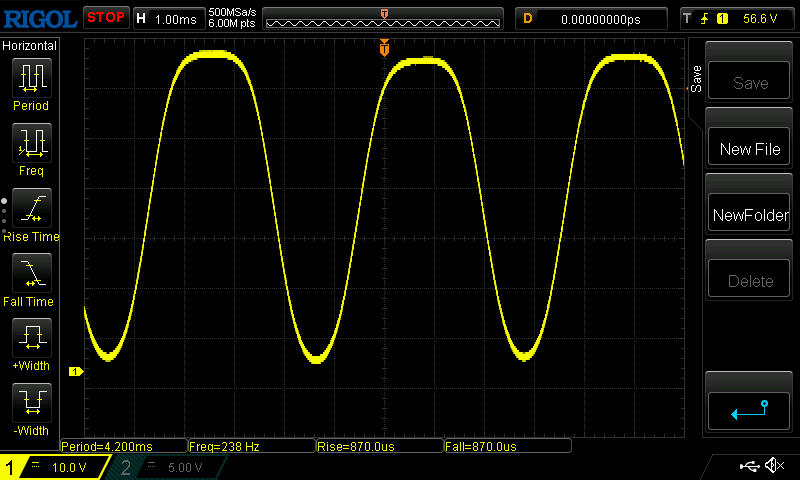
Cintilação da tela / PWM (modulação por largura de pulso)
| Tela tremeluzindo/PWM detectado | 60 Hz | 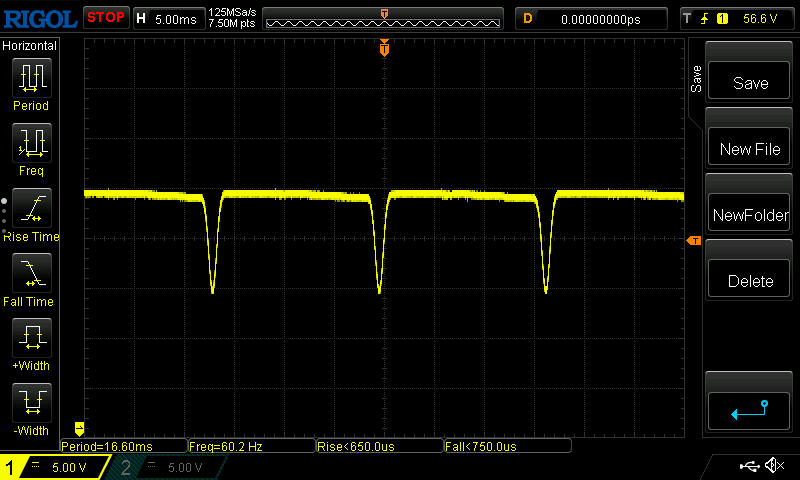 | |
A luz de fundo da tela pisca em 60 Hz (pior caso, por exemplo, utilizando PWM) . A frequência de 60 Hz é muito baixa, portanto a oscilação pode causar fadiga ocular e dores de cabeça após uso prolongado. [pwm_comparison] Em comparação: 52 % de todos os dispositivos testados não usam PWM para escurecer a tela. Se PWM foi detectado, uma média de 7754 (mínimo: 5 - máximo: 343500) Hz foi medida. | |||
Como é típico para OLEDs, a tela cintila a 60 Hz em pleno brilho. Com cerca de 50% de brilho e abaixo, a freqüência muda, e 238 Hz pode se mostrar irritante para pessoas sensíveis.

Ao ar livre, é claro, a superfície refletiva está distraindo. O brilho bastante médio dos DSE e os bons contrastes só podem equilibrar esta desvantagem em um grau limitado. Um ponto sombreado e um ângulo de visão direta são recomendados.
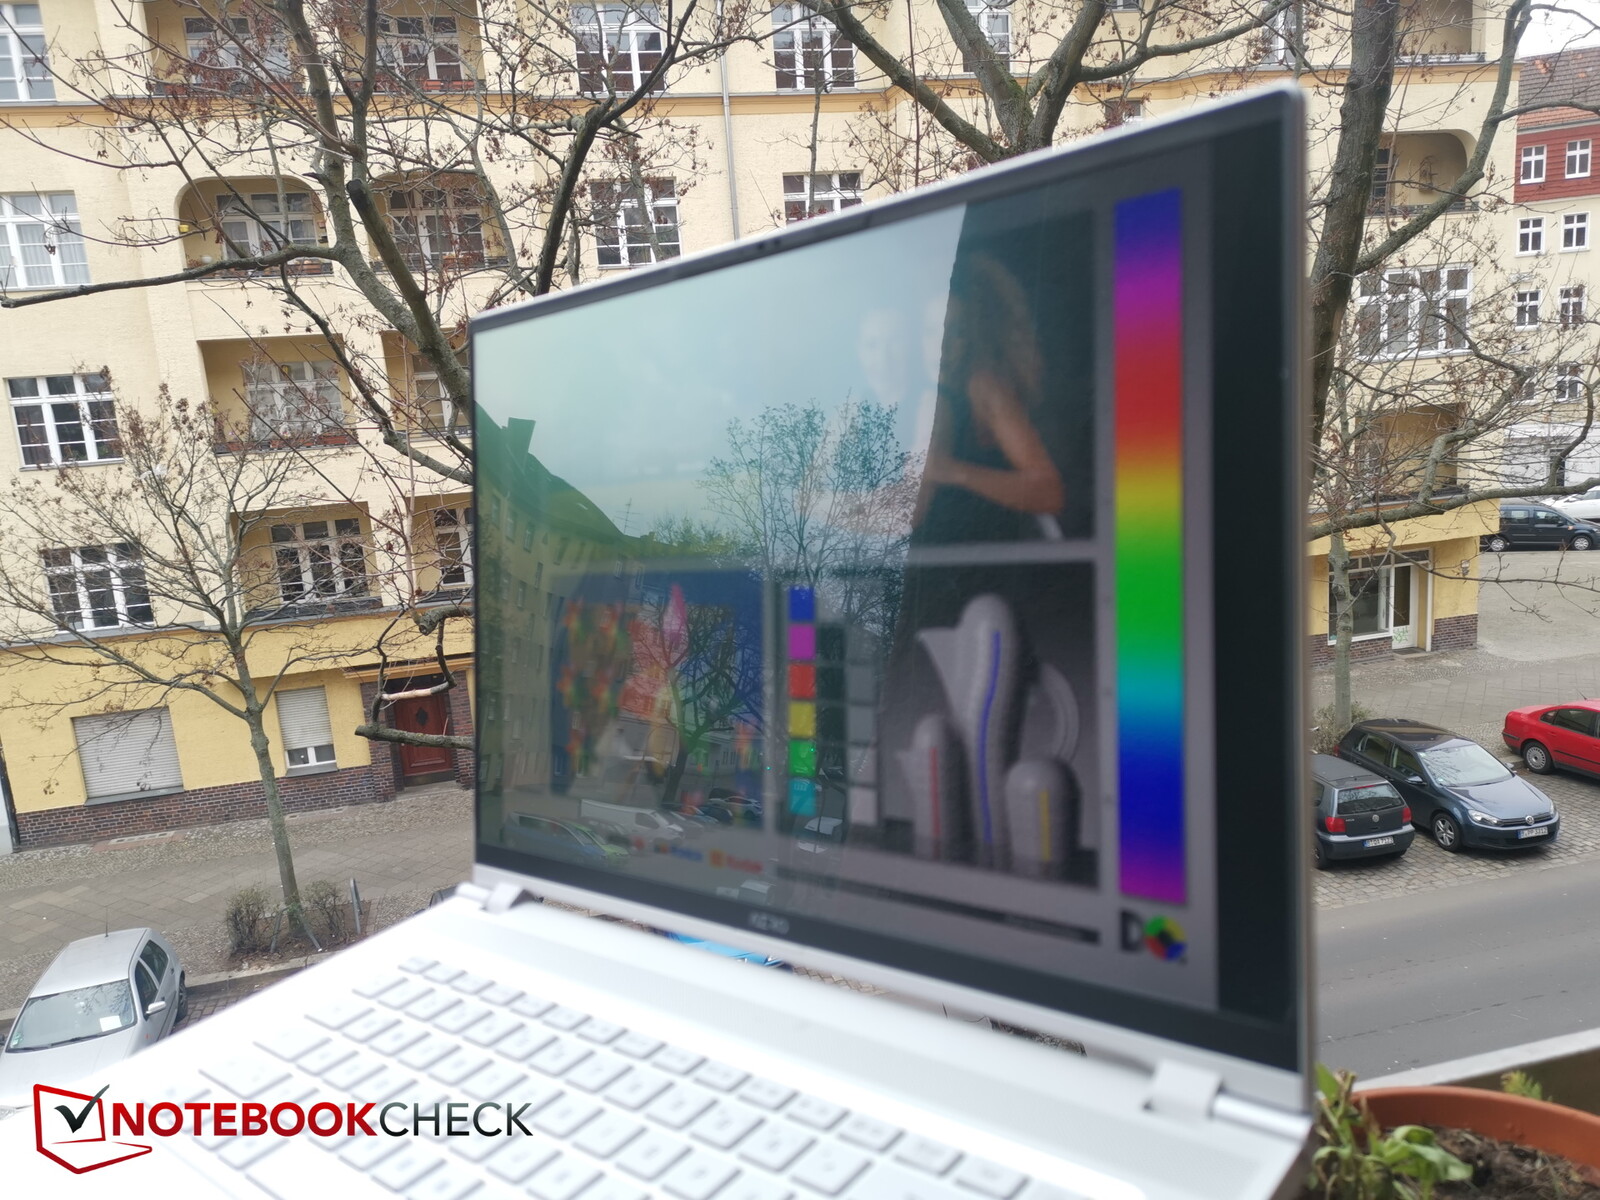
Uma perda de brilho só se torna perceptível quando se olha para a tela de ângulos extremos.

Desempenho - Bom desempenho 3D apesar dos 105 W
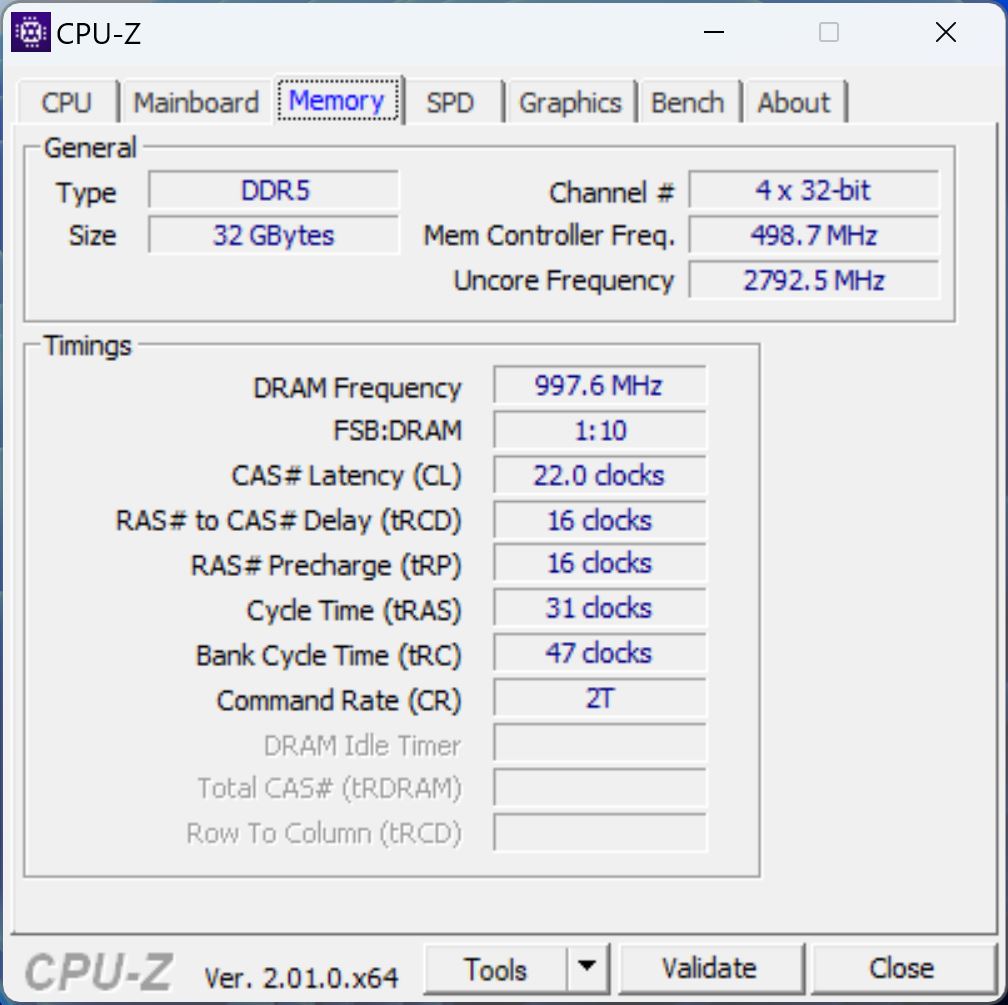
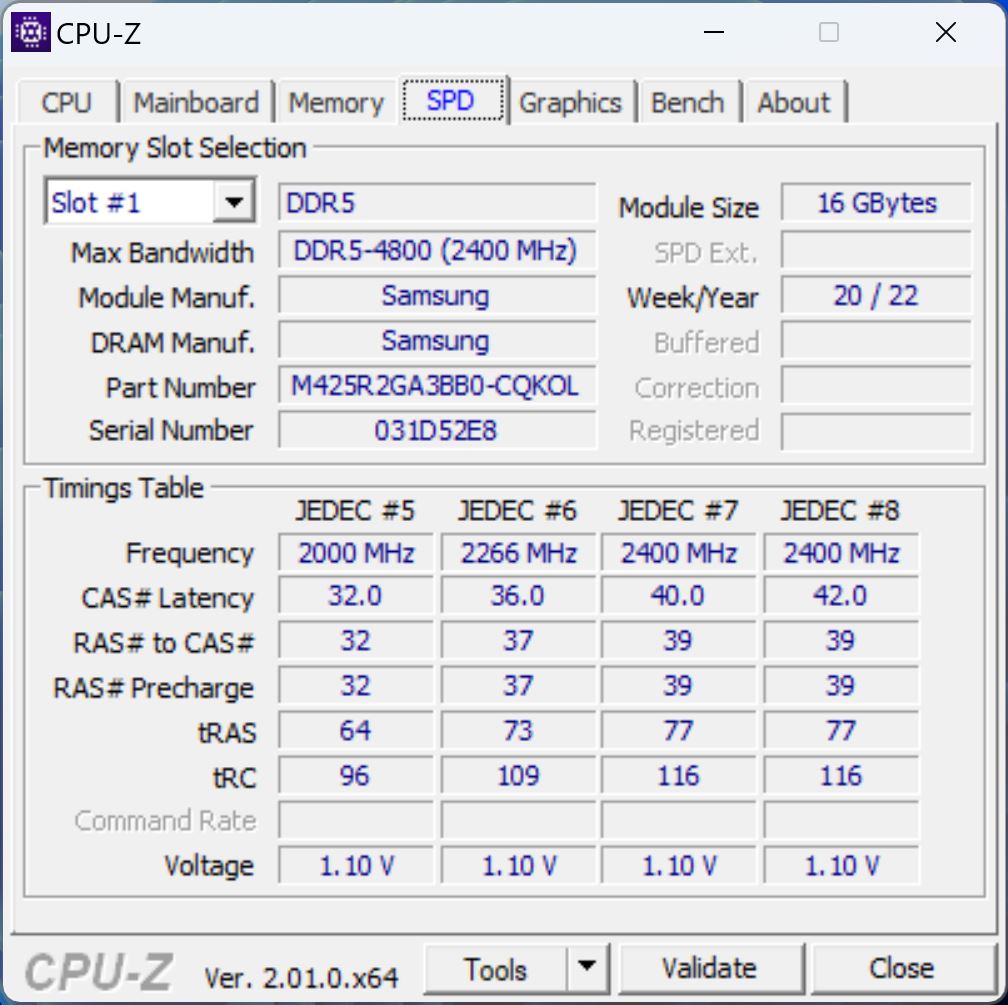
O Aero abriga hardware novinho em folha. A combinação dei9-13900H, RTX 4070e 32 GB DDR5-4800 não devem colocar nenhum problema para os usuários, quer se trate de jogos ou do uso de aplicações criativas.
Entretanto, todo este hardware está embalado em uma caixa fina, de modo que não funciona em plena potência, como será mostrado abaixo. Afinal, um laptop criativo não é suposto ser um laptop super-quente, então os gamers hardcore terão que sofrer um pouco aqui.
Condições de teste
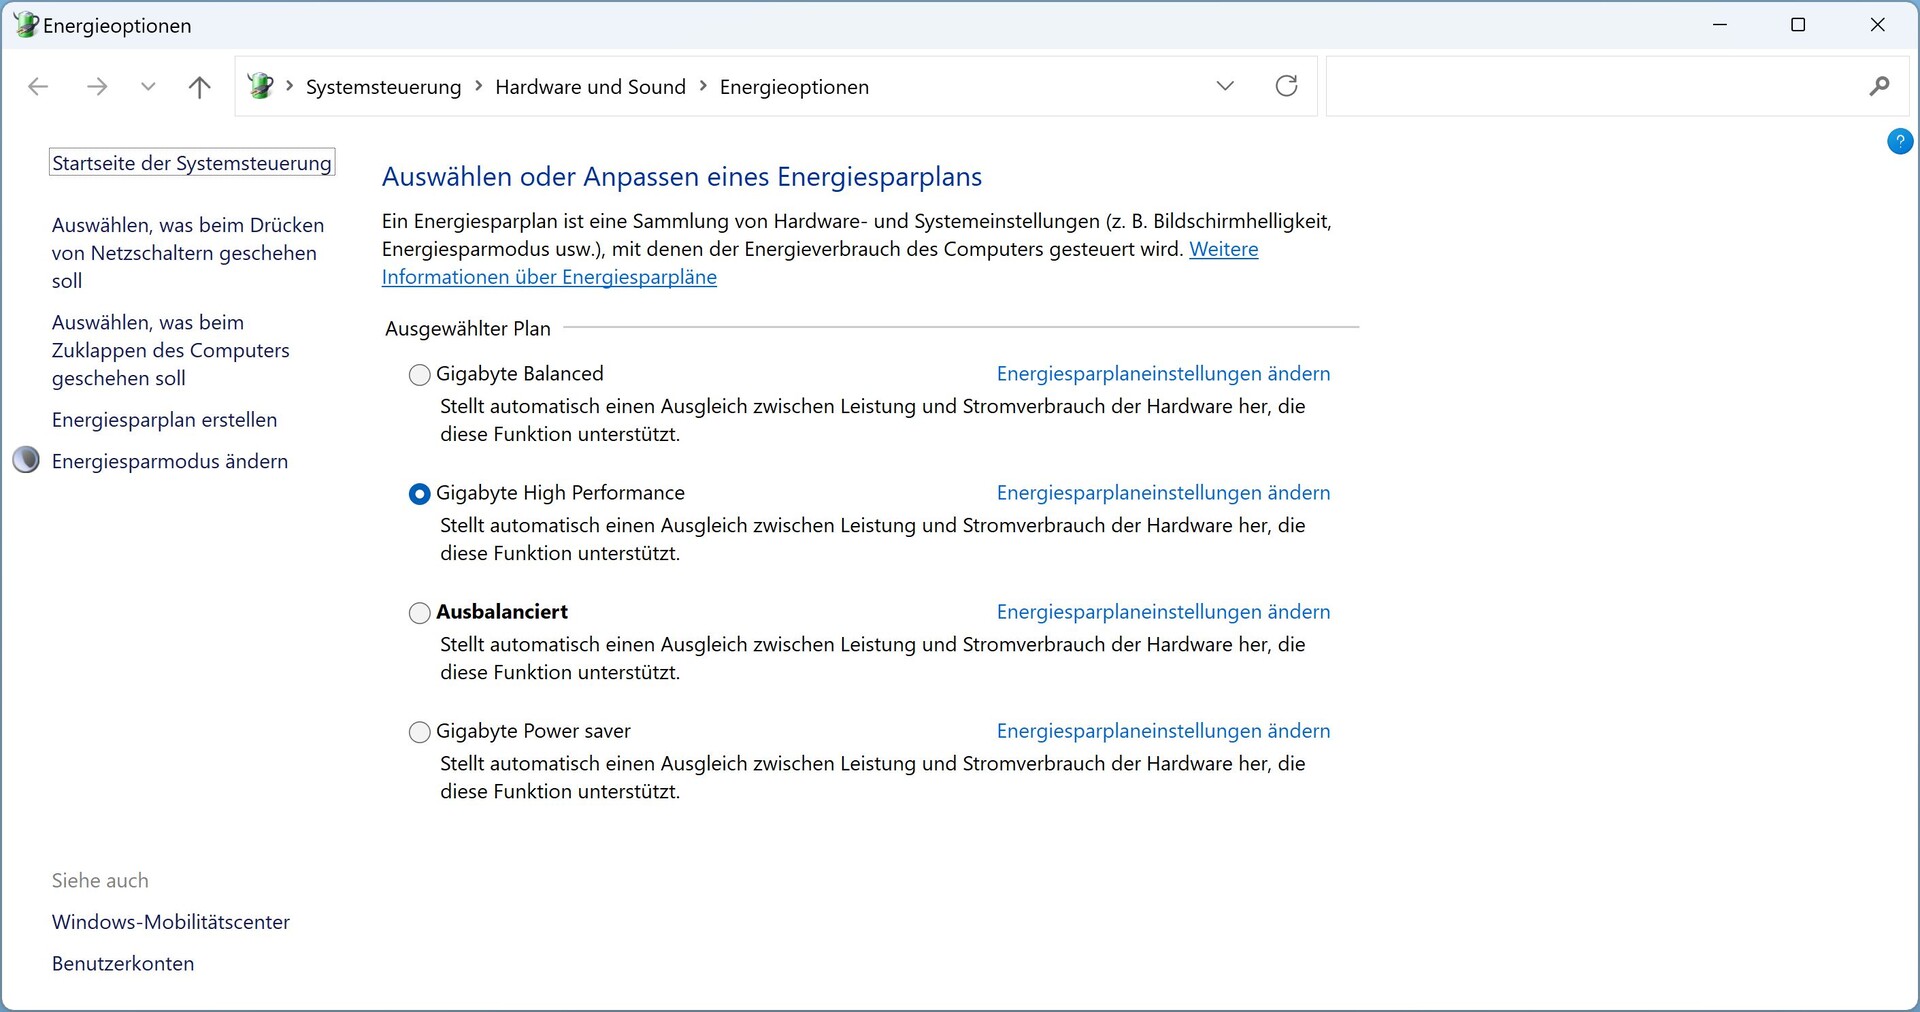
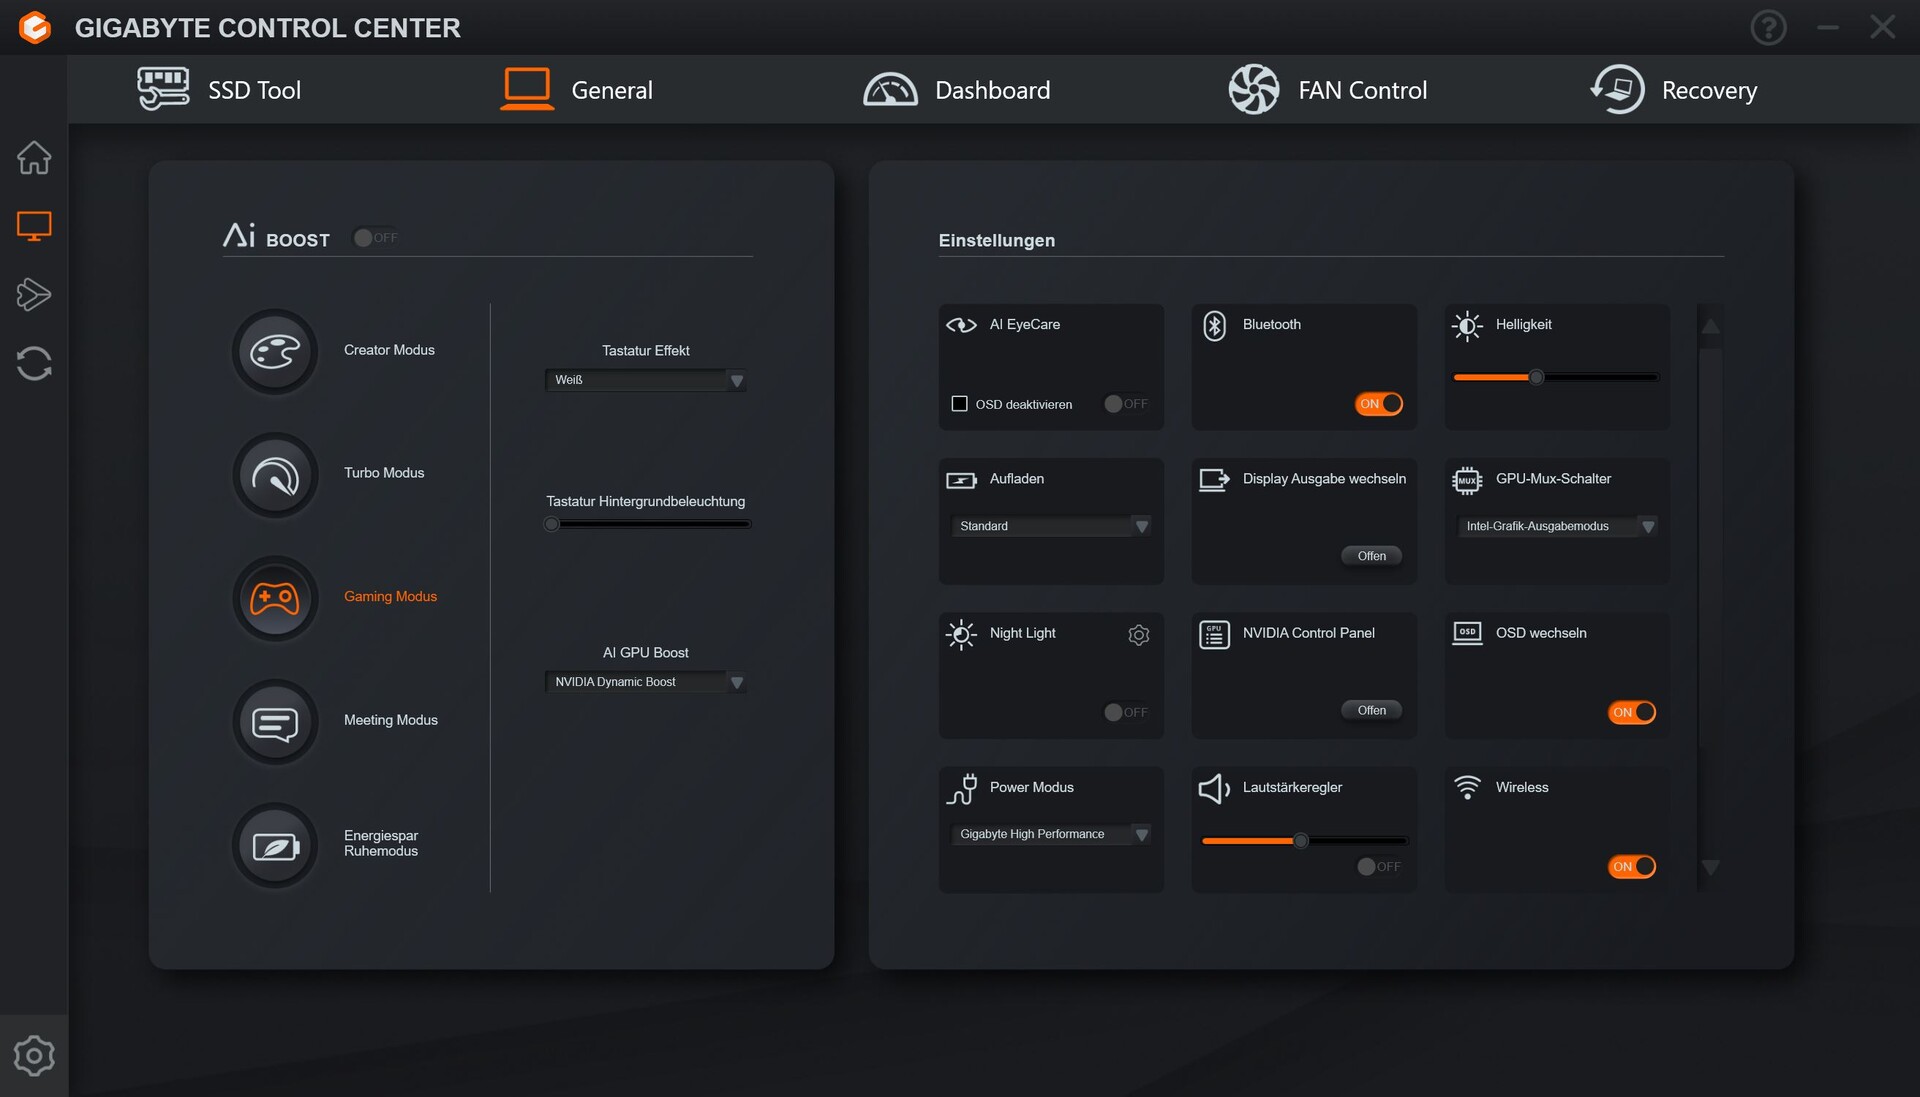
Nosso dispositivo de teste não tinha um Centro de Controle pré-instalado, portanto, não havia modos de desempenho para começar. Os modos de potência pré-instalados no Windows pela Gigabyte não tiveram praticamente nenhuma influência no desempenho da CPU no Cinebench R15.
Portanto, e porque os ventiladores nunca pararam no início, instalamos depois o Centro de Controle Gigabyte. Aqui fomos confrontados com a difícil escolha do modo de desempenho: há um total de cinco aqui, e tivemos dificuldade para escolher entre Content Creator e Gaming. Portanto, tivemos que decidir entre um bom desempenho mas ventiladores mais altos, ou uma operação mais silenciosa com um desempenho mais fraco.
No final, realizamos os benchmarks de CPU sem o Centro de Controle, ou seja, no estado de entrega. Os padrões de referência da GPU então funcionavam em modo de jogo.
O software nem sempre está totalmente livre de erros. Por exemplo, ele apenas exibia uma janela preta durante algumas partidas. Também é confuso que, além dos modos, há outra janela de seleção "Power Mode" com outras opções para o controle de potência. Estes provavelmente representam os modos de energia, porque se você definir isto como Personalizado, os modos de energia do Windows podem ser selecionados.
Há também um interruptor "AI" à esquerda dos modos principais. O "AI" seleciona independentemente o melhor modo dependendo da situação, por exemplo, o modo de economia de energia quando desligamos a tomada de energia.
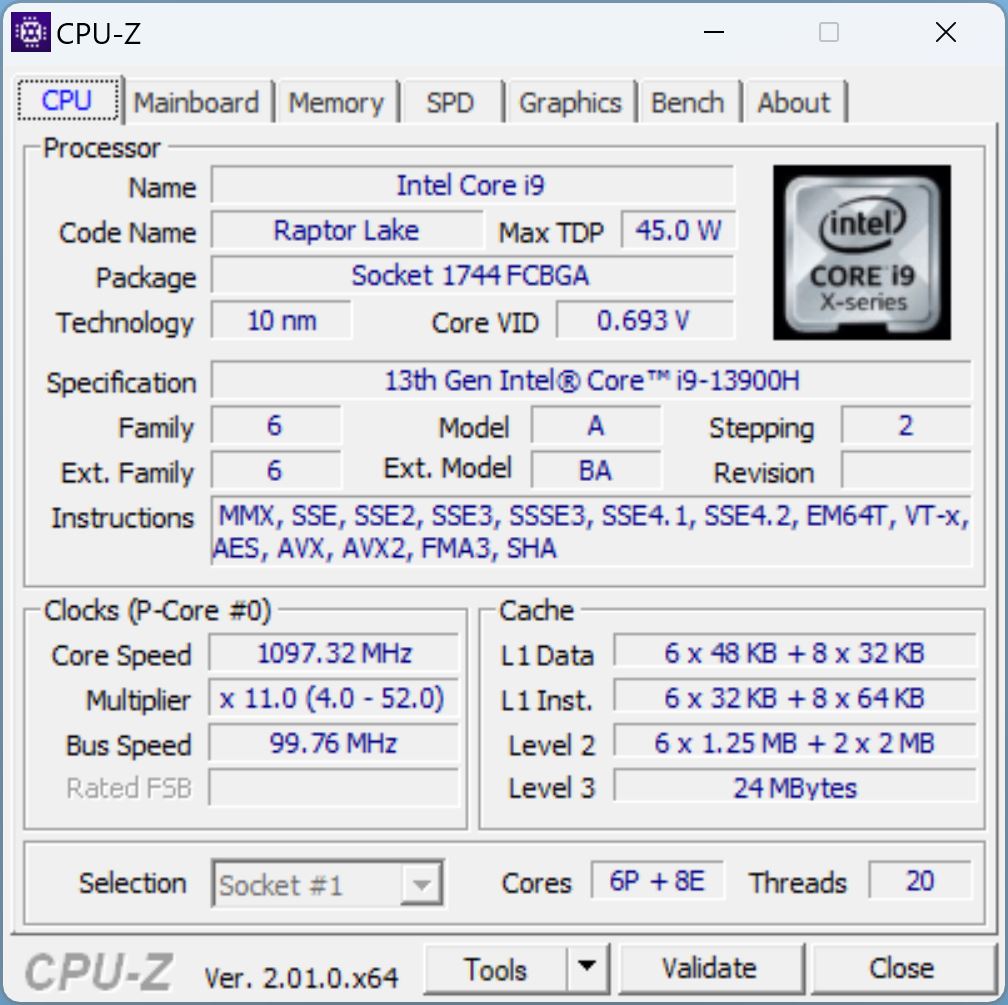
Processador
No coração do Aero está umIntel Core i9-13900H, um dos carros-chefe da novíssima série Raptor Lake da Intel. Isto proporciona 6 núcleos de desempenho e 8 núcleos de eficiência, com o antigo relógio a até 5,4 GHz em turbo! Alternativamente, o dispositivo também está disponível com um i7-13700H.
Em nosso loop Cinebench R15, o Aero sai em cima, mas a vantagem sobre oi9-12900Hda série Alder Lake é marginal e o predecessor dificilmente é mais lento em todos os testes de CPU.
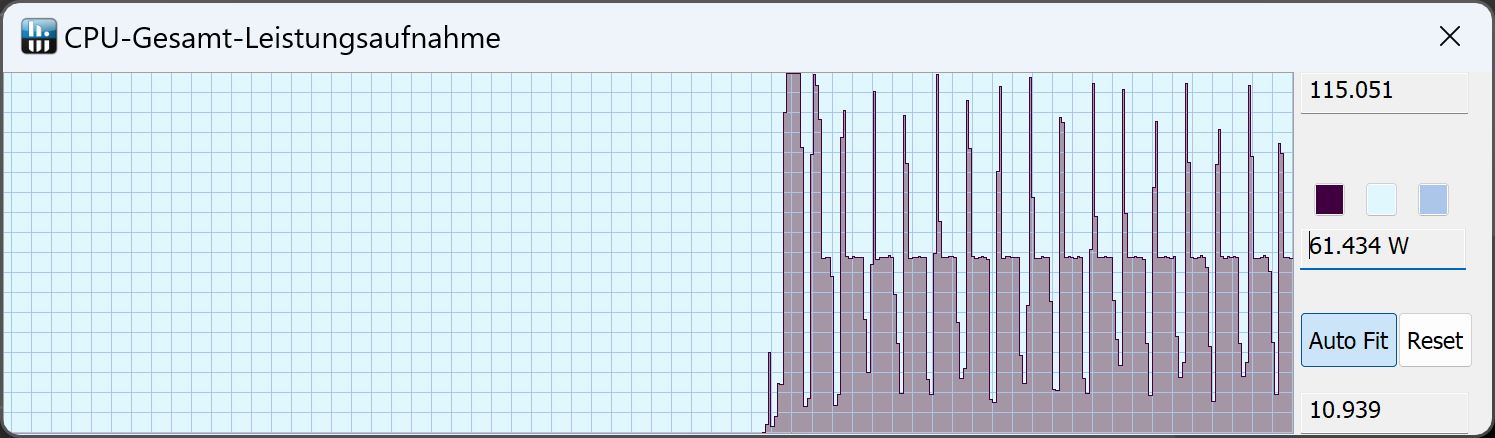
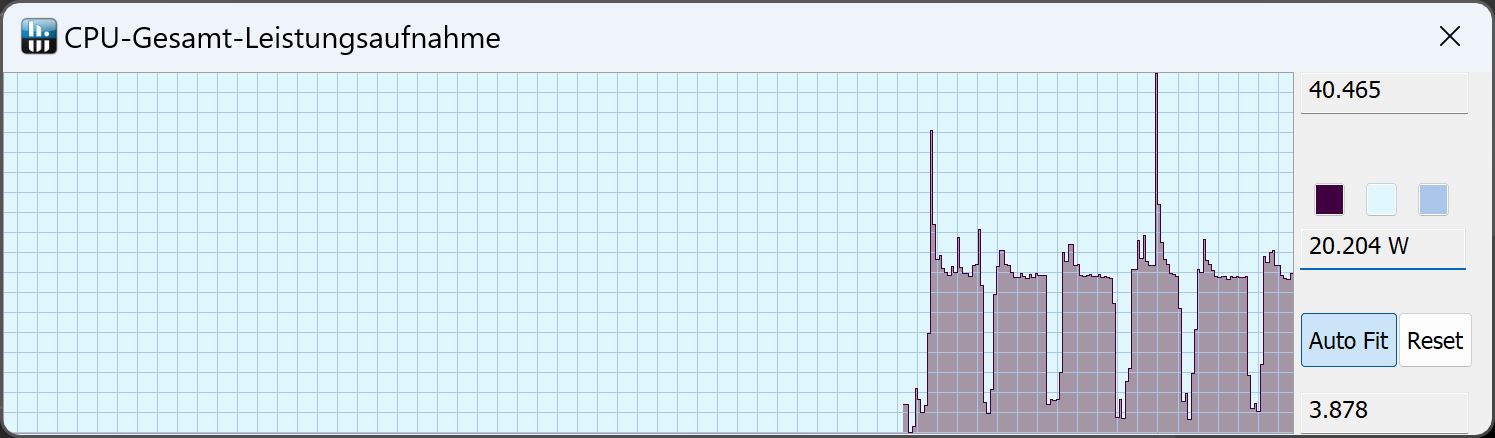
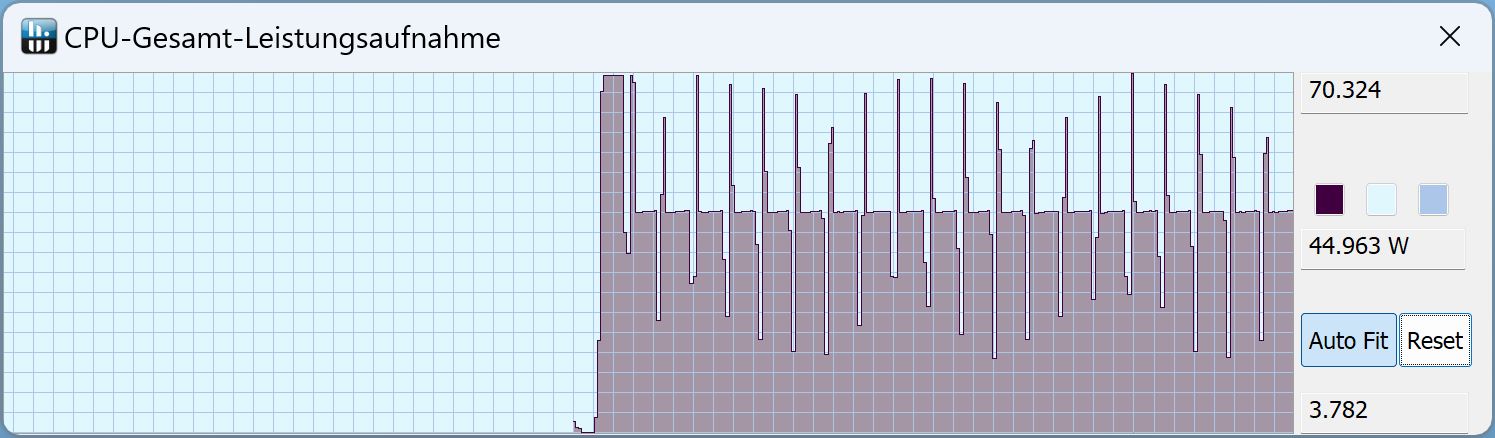
Um olhar sobre o consumo de energia mostra que você deve definitivamente instalar o Centro de Controle. Porque no estado de entrega, a CPU só se trata de 70 W por um curto período de tempo antes de cair para 45 W. Por outro lado, se você mudar para o Modo de Jogo no Centro de Controle, o TDP de curto prazo aumenta para 115 W, e depois fica pendurado em torno de 60 W para o resto de uma corrida Cinebench. Portanto, depende muito das configurações de potência.
Sem o modo de jogo, o novo Aero 16 não é mais rápido que seu predecessor em todos os benchmarks de CPU.
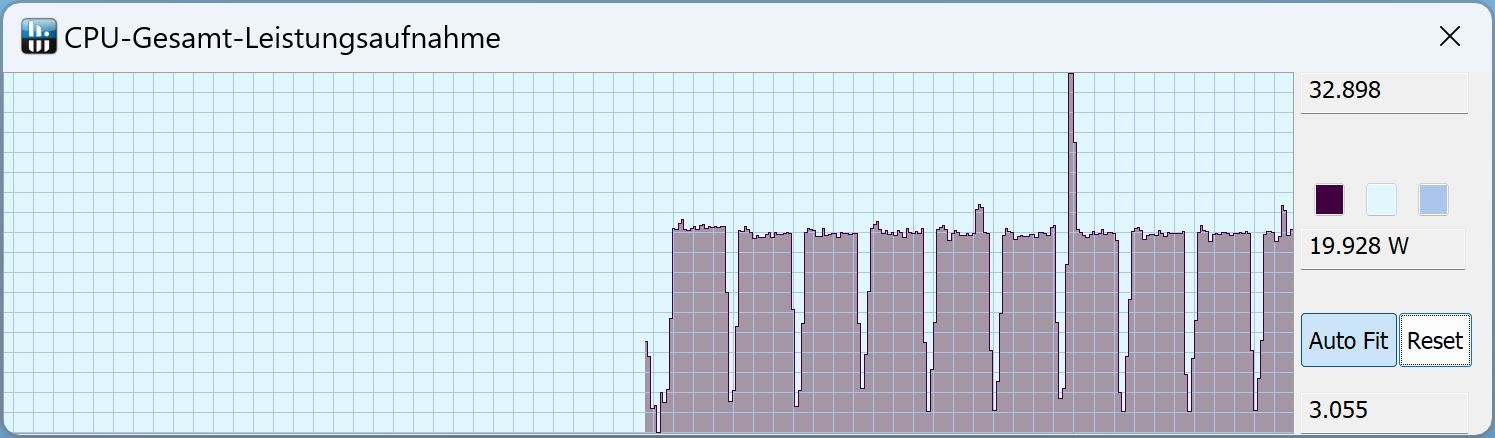
A CPU só pode empatar em cerca de 20 W no modo de bateria e a pontuação no Cinebench é correspondentemente mais baixa.
Cinebench R15 Multi Sustained Load
Cinebench R23: Multi Core | Single Core
Cinebench R20: CPU (Multi Core) | CPU (Single Core)
Cinebench R15: CPU Multi 64Bit | CPU Single 64Bit
Blender: v2.79 BMW27 CPU
7-Zip 18.03: 7z b 4 | 7z b 4 -mmt1
Geekbench 5.5: Multi-Core | Single-Core
HWBOT x265 Benchmark v2.2: 4k Preset
LibreOffice : 20 Documents To PDF
R Benchmark 2.5: Overall mean
| CPU Performance rating | |
| Razer Blade 18 RTX 4070 | |
| Média da turma Gaming | |
| Gigabyte Aero 16 YE5 | |
| Asus ZenBook Pro 16X OLED UX7602ZM-ME115W | |
| Média Intel Core i9-13900H | |
| Gigabyte AERO 16 OLED BSF | |
| MSI CreatorPro Z16P B12UKST | |
| Asus TUF Gaming A16 FA617 | |
| Cinebench R23 / Multi Core | |
| Razer Blade 18 RTX 4070 | |
| Média da turma Gaming (10488 - 42661, n=107, últimos 2 anos) | |
| Gigabyte AERO 16 OLED BSF | |
| Gigabyte Aero 16 YE5 | |
| MSI CreatorPro Z16P B12UKST | |
| Média Intel Core i9-13900H (11997 - 20385, n=28) | |
| Asus ZenBook Pro 16X OLED UX7602ZM-ME115W | |
| Asus TUF Gaming A16 FA617 | |
| Cinebench R23 / Single Core | |
| Razer Blade 18 RTX 4070 | |
| Média da turma Gaming (1166 - 2415, n=107, últimos 2 anos) | |
| Gigabyte Aero 16 YE5 | |
| Média Intel Core i9-13900H (1297 - 2054, n=26) | |
| MSI CreatorPro Z16P B12UKST | |
| Asus ZenBook Pro 16X OLED UX7602ZM-ME115W | |
| Gigabyte AERO 16 OLED BSF | |
| Asus TUF Gaming A16 FA617 | |
| Cinebench R20 / CPU (Multi Core) | |
| Razer Blade 18 RTX 4070 | |
| Média da turma Gaming (4029 - 16433, n=106, últimos 2 anos) | |
| Gigabyte AERO 16 OLED BSF | |
| Gigabyte Aero 16 YE5 | |
| MSI CreatorPro Z16P B12UKST | |
| Média Intel Core i9-13900H (4935 - 7716, n=25) | |
| Asus ZenBook Pro 16X OLED UX7602ZM-ME115W | |
| Asus TUF Gaming A16 FA617 | |
| Cinebench R20 / CPU (Single Core) | |
| Razer Blade 18 RTX 4070 | |
| Média da turma Gaming (442 - 913, n=106, últimos 2 anos) | |
| Média Intel Core i9-13900H (428 - 792, n=25) | |
| Gigabyte Aero 16 YE5 | |
| Asus ZenBook Pro 16X OLED UX7602ZM-ME115W | |
| MSI CreatorPro Z16P B12UKST | |
| Gigabyte AERO 16 OLED BSF | |
| Asus TUF Gaming A16 FA617 | |
| Cinebench R15 / CPU Multi 64Bit | |
| Razer Blade 18 RTX 4070 | |
| Média da turma Gaming (1578 - 6330, n=105, últimos 2 anos) | |
| Gigabyte AERO 16 OLED BSF | |
| Gigabyte Aero 16 YE5 | |
| Média Intel Core i9-13900H (2061 - 3100, n=26) | |
| Asus ZenBook Pro 16X OLED UX7602ZM-ME115W | |
| Asus TUF Gaming A16 FA617 | |
| MSI CreatorPro Z16P B12UKST | |
| Cinebench R15 / CPU Single 64Bit | |
| Razer Blade 18 RTX 4070 | |
| Média da turma Gaming (188.8 - 350, n=106, últimos 2 anos) | |
| Gigabyte Aero 16 YE5 | |
| Média Intel Core i9-13900H (211 - 297, n=26) | |
| Asus ZenBook Pro 16X OLED UX7602ZM-ME115W | |
| Asus ZenBook Pro 16X OLED UX7602ZM-ME115W | |
| Asus TUF Gaming A16 FA617 | |
| Gigabyte AERO 16 OLED BSF | |
| MSI CreatorPro Z16P B12UKST | |
| Blender / v2.79 BMW27 CPU | |
| Asus TUF Gaming A16 FA617 | |
| Média Intel Core i9-13900H (166 - 268, n=24) | |
| MSI CreatorPro Z16P B12UKST | |
| Gigabyte Aero 16 YE5 | |
| Asus ZenBook Pro 16X OLED UX7602ZM-ME115W | |
| Gigabyte AERO 16 OLED BSF | |
| Média da turma Gaming (79 - 330, n=104, últimos 2 anos) | |
| Razer Blade 18 RTX 4070 | |
| 7-Zip 18.03 / 7z b 4 | |
| Razer Blade 18 RTX 4070 | |
| Média da turma Gaming (33491 - 148086, n=105, últimos 2 anos) | |
| Gigabyte AERO 16 OLED BSF | |
| Asus ZenBook Pro 16X OLED UX7602ZM-ME115W | |
| Gigabyte Aero 16 YE5 | |
| MSI CreatorPro Z16P B12UKST | |
| Média Intel Core i9-13900H (45045 - 79032, n=25) | |
| Asus TUF Gaming A16 FA617 | |
| 7-Zip 18.03 / 7z b 4 -mmt1 | |
| Razer Blade 18 RTX 4070 | |
| Média da turma Gaming (4199 - 7436, n=105, últimos 2 anos) | |
| Gigabyte Aero 16 YE5 | |
| Média Intel Core i9-13900H (3665 - 6600, n=25) | |
| Asus ZenBook Pro 16X OLED UX7602ZM-ME115W | |
| Asus TUF Gaming A16 FA617 | |
| MSI CreatorPro Z16P B12UKST | |
| Gigabyte AERO 16 OLED BSF | |
| Geekbench 5.5 / Multi-Core | |
| Razer Blade 18 RTX 4070 | |
| Média da turma Gaming (6460 - 28263, n=105, últimos 2 anos) | |
| Gigabyte Aero 16 YE5 | |
| Gigabyte AERO 16 OLED BSF | |
| Asus ZenBook Pro 16X OLED UX7602ZM-ME115W | |
| Média Intel Core i9-13900H (9094 - 15410, n=26) | |
| MSI CreatorPro Z16P B12UKST | |
| Asus TUF Gaming A16 FA617 | |
| Geekbench 5.5 / Single-Core | |
| Média da turma Gaming (986 - 2474, n=105, últimos 2 anos) | |
| Razer Blade 18 RTX 4070 | |
| Média Intel Core i9-13900H (1140 - 2043, n=26) | |
| Gigabyte Aero 16 YE5 | |
| Asus ZenBook Pro 16X OLED UX7602ZM-ME115W | |
| MSI CreatorPro Z16P B12UKST | |
| Gigabyte AERO 16 OLED BSF | |
| Asus TUF Gaming A16 FA617 | |
| HWBOT x265 Benchmark v2.2 / 4k Preset | |
| Razer Blade 18 RTX 4070 | |
| Média da turma Gaming (11.5 - 44.4, n=105, últimos 2 anos) | |
| Gigabyte AERO 16 OLED BSF | |
| MSI CreatorPro Z16P B12UKST | |
| Asus ZenBook Pro 16X OLED UX7602ZM-ME115W | |
| Média Intel Core i9-13900H (14.1 - 22.3, n=25) | |
| Gigabyte Aero 16 YE5 | |
| Asus TUF Gaming A16 FA617 | |
| LibreOffice / 20 Documents To PDF | |
| Asus TUF Gaming A16 FA617 | |
| Gigabyte AERO 16 OLED BSF | |
| Média da turma Gaming (33.2 - 88.8, n=105, últimos 2 anos) | |
| Média Intel Core i9-13900H (34.4 - 82.8, n=25) | |
| Razer Blade 18 RTX 4070 | |
| Asus ZenBook Pro 16X OLED UX7602ZM-ME115W | |
| Gigabyte Aero 16 YE5 | |
| MSI CreatorPro Z16P B12UKST | |
| R Benchmark 2.5 / Overall mean | |
| Asus TUF Gaming A16 FA617 | |
| Gigabyte AERO 16 OLED BSF | |
| MSI CreatorPro Z16P B12UKST | |
| Média Intel Core i9-13900H (0.4052 - 0.723, n=25) | |
| Asus ZenBook Pro 16X OLED UX7602ZM-ME115W | |
| Média da turma Gaming (0.3439 - 0.759, n=106, últimos 2 anos) | |
| Gigabyte Aero 16 YE5 | |
| Razer Blade 18 RTX 4070 | |
* ... menor é melhor
AIDA64: FP32 Ray-Trace | FPU Julia | CPU SHA3 | CPU Queen | FPU SinJulia | FPU Mandel | CPU AES | CPU ZLib | FP64 Ray-Trace | CPU PhotoWorxx
| Performance rating | |
| Razer Blade 18 RTX 4070 | |
| Média da turma Gaming | |
| Gigabyte AERO 16 OLED BSF | |
| MSI CreatorPro Z16P B12UKST | |
| Asus TUF Gaming A16 FA617 | |
| Asus ZenBook Pro 16X OLED UX7602ZM-ME115W | |
| Média Intel Core i9-13900H | |
| Gigabyte Aero 16 YE5 | |
| AIDA64 / FP32 Ray-Trace | |
| Média da turma Gaming (10227 - 85542, n=105, últimos 2 anos) | |
| Razer Blade 18 RTX 4070 | |
| Gigabyte AERO 16 OLED BSF | |
| Asus TUF Gaming A16 FA617 | |
| Média Intel Core i9-13900H (6788 - 19557, n=25) | |
| MSI CreatorPro Z16P B12UKST | |
| Asus ZenBook Pro 16X OLED UX7602ZM-ME115W | |
| Gigabyte Aero 16 YE5 | |
| AIDA64 / FPU Julia | |
| Média da turma Gaming (51376 - 238426, n=105, últimos 2 anos) | |
| Razer Blade 18 RTX 4070 | |
| Asus TUF Gaming A16 FA617 | |
| Gigabyte AERO 16 OLED BSF | |
| Média Intel Core i9-13900H (22551 - 95579, n=25) | |
| Asus ZenBook Pro 16X OLED UX7602ZM-ME115W | |
| MSI CreatorPro Z16P B12UKST | |
| Gigabyte Aero 16 YE5 | |
| AIDA64 / CPU SHA3 | |
| Média da turma Gaming (2180 - 10115, n=105, últimos 2 anos) | |
| Razer Blade 18 RTX 4070 | |
| Gigabyte AERO 16 OLED BSF | |
| Asus ZenBook Pro 16X OLED UX7602ZM-ME115W | |
| MSI CreatorPro Z16P B12UKST | |
| Média Intel Core i9-13900H (2491 - 4270, n=25) | |
| Asus TUF Gaming A16 FA617 | |
| Gigabyte Aero 16 YE5 | |
| AIDA64 / CPU Queen | |
| Razer Blade 18 RTX 4070 | |
| Média da turma Gaming (49785 - 173351, n=90, últimos 2 anos) | |
| Asus ZenBook Pro 16X OLED UX7602ZM-ME115W | |
| Gigabyte Aero 16 YE5 | |
| Média Intel Core i9-13900H (65121 - 120936, n=25) | |
| Asus TUF Gaming A16 FA617 | |
| MSI CreatorPro Z16P B12UKST | |
| Gigabyte AERO 16 OLED BSF | |
| AIDA64 / FPU SinJulia | |
| Razer Blade 18 RTX 4070 | |
| Média da turma Gaming (4424 - 33636, n=105, últimos 2 anos) | |
| Asus TUF Gaming A16 FA617 | |
| Gigabyte AERO 16 OLED BSF | |
| Asus ZenBook Pro 16X OLED UX7602ZM-ME115W | |
| Média Intel Core i9-13900H (6108 - 11631, n=25) | |
| Gigabyte Aero 16 YE5 | |
| MSI CreatorPro Z16P B12UKST | |
| AIDA64 / FPU Mandel | |
| Média da turma Gaming (25115 - 128721, n=105, últimos 2 anos) | |
| Razer Blade 18 RTX 4070 | |
| Asus TUF Gaming A16 FA617 | |
| Gigabyte AERO 16 OLED BSF | |
| Média Intel Core i9-13900H (11283 - 48474, n=25) | |
| Asus ZenBook Pro 16X OLED UX7602ZM-ME115W | |
| MSI CreatorPro Z16P B12UKST | |
| Gigabyte Aero 16 YE5 | |
| AIDA64 / CPU AES | |
| Gigabyte AERO 16 OLED BSF | |
| MSI CreatorPro Z16P B12UKST | |
| Razer Blade 18 RTX 4070 | |
| Média da turma Gaming (39258 - 247074, n=105, últimos 2 anos) | |
| Gigabyte Aero 16 YE5 | |
| Média Intel Core i9-13900H (3691 - 149377, n=25) | |
| Asus ZenBook Pro 16X OLED UX7602ZM-ME115W | |
| Asus TUF Gaming A16 FA617 | |
| AIDA64 / CPU ZLib | |
| Razer Blade 18 RTX 4070 | |
| Média da turma Gaming (574 - 2531, n=105, últimos 2 anos) | |
| Gigabyte AERO 16 OLED BSF | |
| Média Intel Core i9-13900H (789 - 1254, n=25) | |
| Asus ZenBook Pro 16X OLED UX7602ZM-ME115W | |
| MSI CreatorPro Z16P B12UKST | |
| Gigabyte Aero 16 YE5 | |
| Asus TUF Gaming A16 FA617 | |
| AIDA64 / FP64 Ray-Trace | |
| Média da turma Gaming (5509 - 45446, n=105, últimos 2 anos) | |
| Razer Blade 18 RTX 4070 | |
| Gigabyte AERO 16 OLED BSF | |
| Asus TUF Gaming A16 FA617 | |
| Média Intel Core i9-13900H (3655 - 10716, n=25) | |
| Asus ZenBook Pro 16X OLED UX7602ZM-ME115W | |
| MSI CreatorPro Z16P B12UKST | |
| Gigabyte Aero 16 YE5 | |
| AIDA64 / CPU PhotoWorxx | |
| Razer Blade 18 RTX 4070 | |
| Asus ZenBook Pro 16X OLED UX7602ZM-ME115W | |
| Média da turma Gaming (12271 - 89891, n=105, últimos 2 anos) | |
| Gigabyte AERO 16 OLED BSF | |
| MSI CreatorPro Z16P B12UKST | |
| Média Intel Core i9-13900H (10871 - 50488, n=25) | |
| Gigabyte Aero 16 YE5 | |
| Asus TUF Gaming A16 FA617 | |
Desempenho do sistema
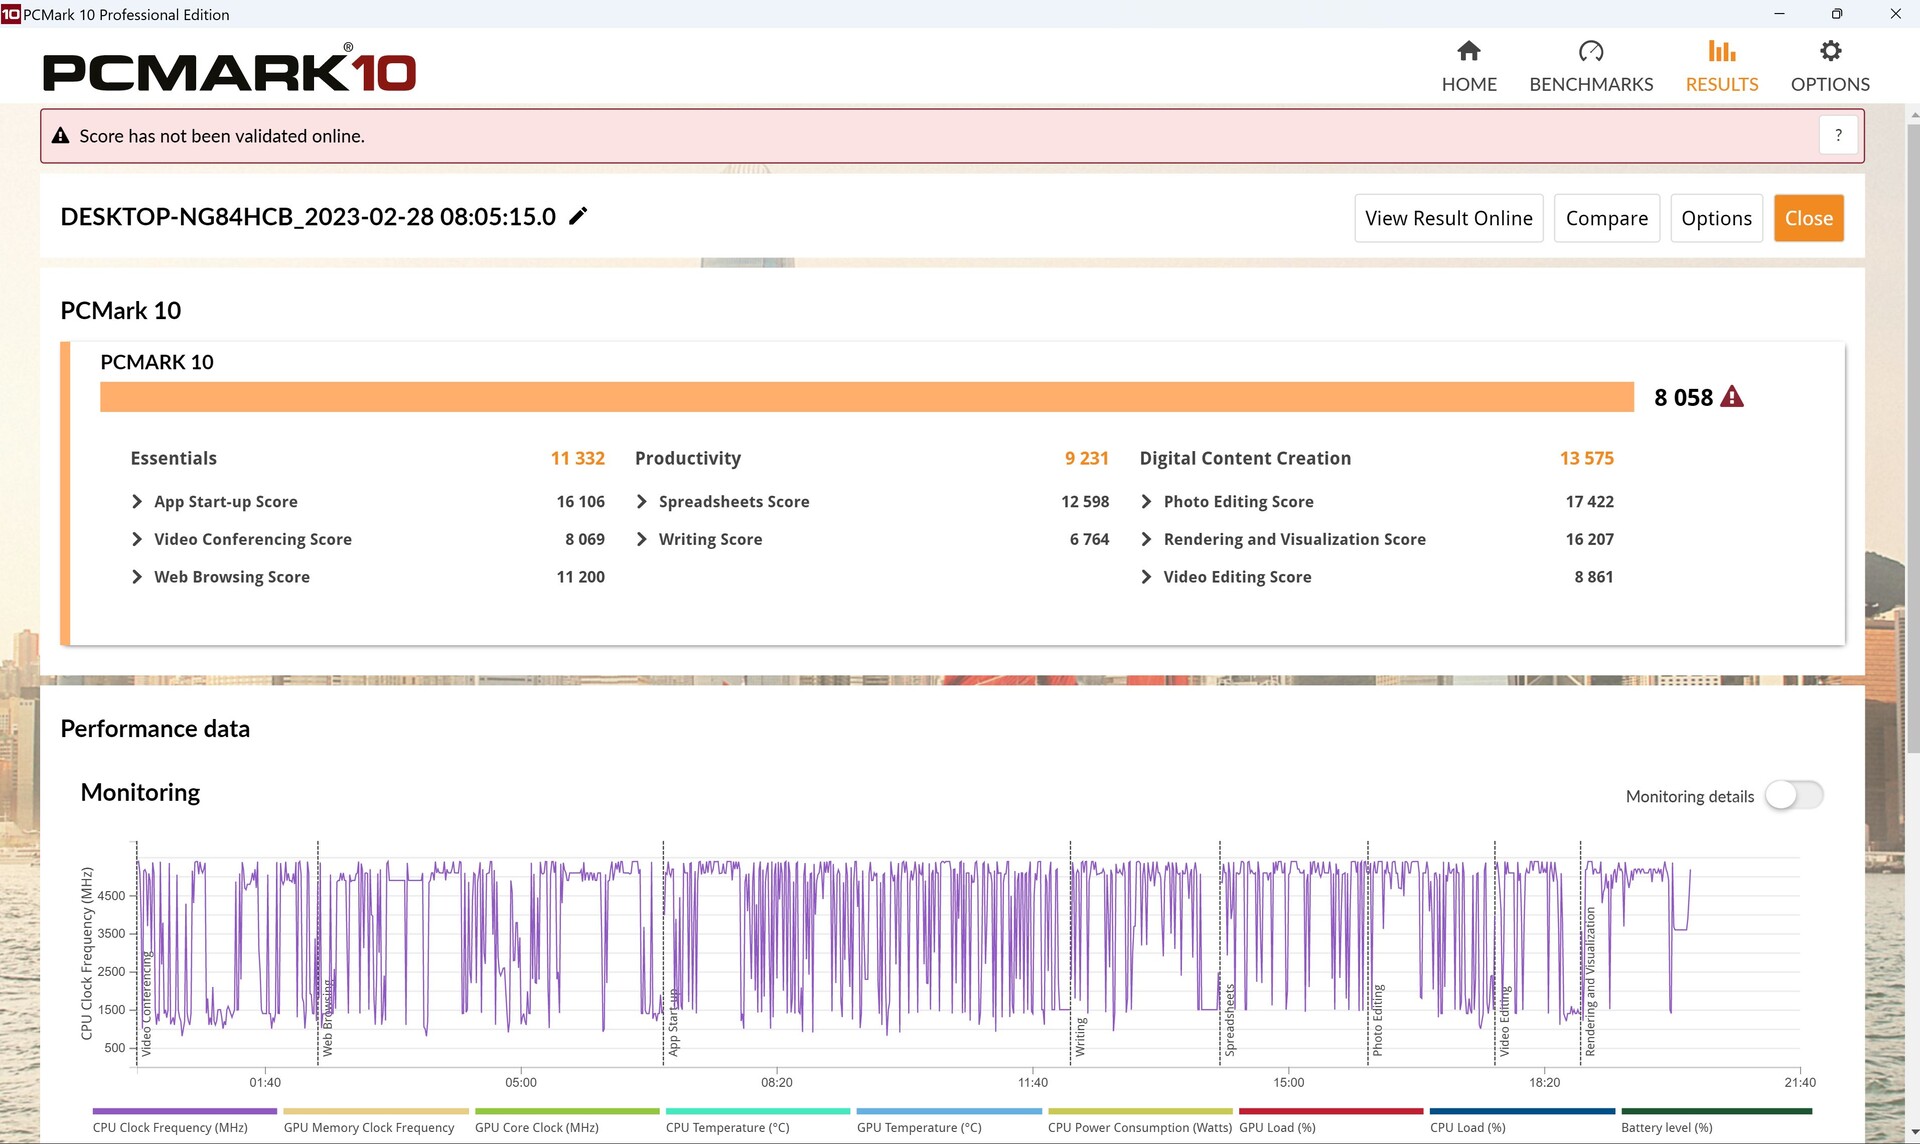
No PCMark 10, nosso Aero troca golpes com os do ano passadoMSI CreatorPro Z16Pinfelizmente, o Aero tem uma pontuação fraca de produtividade, mas se sai muito bem nos outros sub-testes.
CrossMark: Overall | Productivity | Creativity | Responsiveness
| PCMark 10 / Score | |
| Média da turma Gaming (5828 - 12414, n=93, últimos 2 anos) | |
| Gigabyte AERO 16 OLED BSF | |
| Gigabyte Aero 16 YE5 | |
| Média Intel Core i9-13900H, NVIDIA GeForce RTX 4070 Laptop GPU (5855 - 8538, n=8) | |
| Razer Blade 18 RTX 4070 | |
| Asus ZenBook Pro 16X OLED UX7602ZM-ME115W | |
| Asus TUF Gaming A16 FA617 | |
| MSI CreatorPro Z16P B12UKST | |
| PCMark 10 / Essentials | |
| Razer Blade 18 RTX 4070 | |
| Gigabyte AERO 16 OLED BSF | |
| Asus ZenBook Pro 16X OLED UX7602ZM-ME115W | |
| Gigabyte Aero 16 YE5 | |
| Média Intel Core i9-13900H, NVIDIA GeForce RTX 4070 Laptop GPU (8835 - 11940, n=8) | |
| Média da turma Gaming (8810 - 11935, n=97, últimos 2 anos) | |
| Asus TUF Gaming A16 FA617 | |
| MSI CreatorPro Z16P B12UKST | |
| PCMark 10 / Productivity | |
| Média da turma Gaming (6845 - 25323, n=95, últimos 2 anos) | |
| Asus ZenBook Pro 16X OLED UX7602ZM-ME115W | |
| Gigabyte Aero 16 YE5 | |
| Média Intel Core i9-13900H, NVIDIA GeForce RTX 4070 Laptop GPU (7967 - 10991, n=8) | |
| Razer Blade 18 RTX 4070 | |
| MSI CreatorPro Z16P B12UKST | |
| Asus TUF Gaming A16 FA617 | |
| Gigabyte AERO 16 OLED BSF | |
| PCMark 10 / Digital Content Creation | |
| Média da turma Gaming (7602 - 19954, n=95, últimos 2 anos) | |
| Gigabyte AERO 16 OLED BSF | |
| Gigabyte Aero 16 YE5 | |
| Média Intel Core i9-13900H, NVIDIA GeForce RTX 4070 Laptop GPU (7738 - 13575, n=8) | |
| Asus TUF Gaming A16 FA617 | |
| Razer Blade 18 RTX 4070 | |
| Asus ZenBook Pro 16X OLED UX7602ZM-ME115W | |
| MSI CreatorPro Z16P B12UKST | |
| CrossMark / Overall | |
| Razer Blade 18 RTX 4070 | |
| Gigabyte Aero 16 YE5 | |
| Média da turma Gaming (1366 - 2409, n=94, últimos 2 anos) | |
| MSI CreatorPro Z16P B12UKST | |
| Gigabyte AERO 16 OLED BSF | |
| Média Intel Core i9-13900H, NVIDIA GeForce RTX 4070 Laptop GPU (1104 - 1974, n=7) | |
| Asus ZenBook Pro 16X OLED UX7602ZM-ME115W | |
| CrossMark / Productivity | |
| Gigabyte Aero 16 YE5 | |
| Razer Blade 18 RTX 4070 | |
| Média da turma Gaming (1386 - 2254, n=94, últimos 2 anos) | |
| MSI CreatorPro Z16P B12UKST | |
| Gigabyte AERO 16 OLED BSF | |
| Média Intel Core i9-13900H, NVIDIA GeForce RTX 4070 Laptop GPU (1058 - 1914, n=7) | |
| Asus ZenBook Pro 16X OLED UX7602ZM-ME115W | |
| CrossMark / Creativity | |
| Razer Blade 18 RTX 4070 | |
| Média da turma Gaming (1343 - 2786, n=94, últimos 2 anos) | |
| Gigabyte Aero 16 YE5 | |
| MSI CreatorPro Z16P B12UKST | |
| Asus ZenBook Pro 16X OLED UX7602ZM-ME115W | |
| Média Intel Core i9-13900H, NVIDIA GeForce RTX 4070 Laptop GPU (1178 - 2254, n=7) | |
| Gigabyte AERO 16 OLED BSF | |
| CrossMark / Responsiveness | |
| Gigabyte Aero 16 YE5 | |
| Gigabyte AERO 16 OLED BSF | |
| Razer Blade 18 RTX 4070 | |
| MSI CreatorPro Z16P B12UKST | |
| Média da turma Gaming (1226 - 2334, n=94, últimos 2 anos) | |
| Média Intel Core i9-13900H, NVIDIA GeForce RTX 4070 Laptop GPU (1037 - 1952, n=7) | |
| Asus ZenBook Pro 16X OLED UX7602ZM-ME115W | |
| PCMark 10 Score | 8058 pontos | |
Ajuda | ||
| AIDA64 / Memory Copy | |
| Média da turma Gaming (21750 - 129946, n=105, últimos 2 anos) | |
| Asus ZenBook Pro 16X OLED UX7602ZM-ME115W | |
| Gigabyte AERO 16 OLED BSF | |
| MSI CreatorPro Z16P B12UKST | |
| Gigabyte Aero 16 YE5 | |
| Média Intel Core i9-13900H (37448 - 74486, n=25) | |
| MSI Katana 17 B13VFK | |
| Asus TUF Gaming A16 FA617 | |
| AIDA64 / Memory Read | |
| Média da turma Gaming (22956 - 118858, n=105, últimos 2 anos) | |
| Asus ZenBook Pro 16X OLED UX7602ZM-ME115W | |
| Gigabyte AERO 16 OLED BSF | |
| Gigabyte Aero 16 YE5 | |
| MSI CreatorPro Z16P B12UKST | |
| Média Intel Core i9-13900H (41599 - 75433, n=25) | |
| MSI Katana 17 B13VFK | |
| Asus TUF Gaming A16 FA617 | |
| AIDA64 / Memory Write | |
| Média da turma Gaming (22297 - 135096, n=105, últimos 2 anos) | |
| Gigabyte AERO 16 OLED BSF | |
| MSI CreatorPro Z16P B12UKST | |
| Média Intel Core i9-13900H (36152 - 88505, n=25) | |
| Asus ZenBook Pro 16X OLED UX7602ZM-ME115W | |
| Gigabyte Aero 16 YE5 | |
| Asus TUF Gaming A16 FA617 | |
| MSI Katana 17 B13VFK | |
| AIDA64 / Memory Latency | |
| Asus ZenBook Pro 16X OLED UX7602ZM-ME115W | |
| Média da turma Gaming (75.3 - 259, n=105, últimos 2 anos) | |
| MSI Katana 17 B13VFK | |
| MSI CreatorPro Z16P B12UKST | |
| Gigabyte AERO 16 OLED BSF | |
| Gigabyte Aero 16 YE5 | |
| Média Intel Core i9-13900H (75.8 - 102.3, n=25) | |
| Asus TUF Gaming A16 FA617 | |
* ... menor é melhor
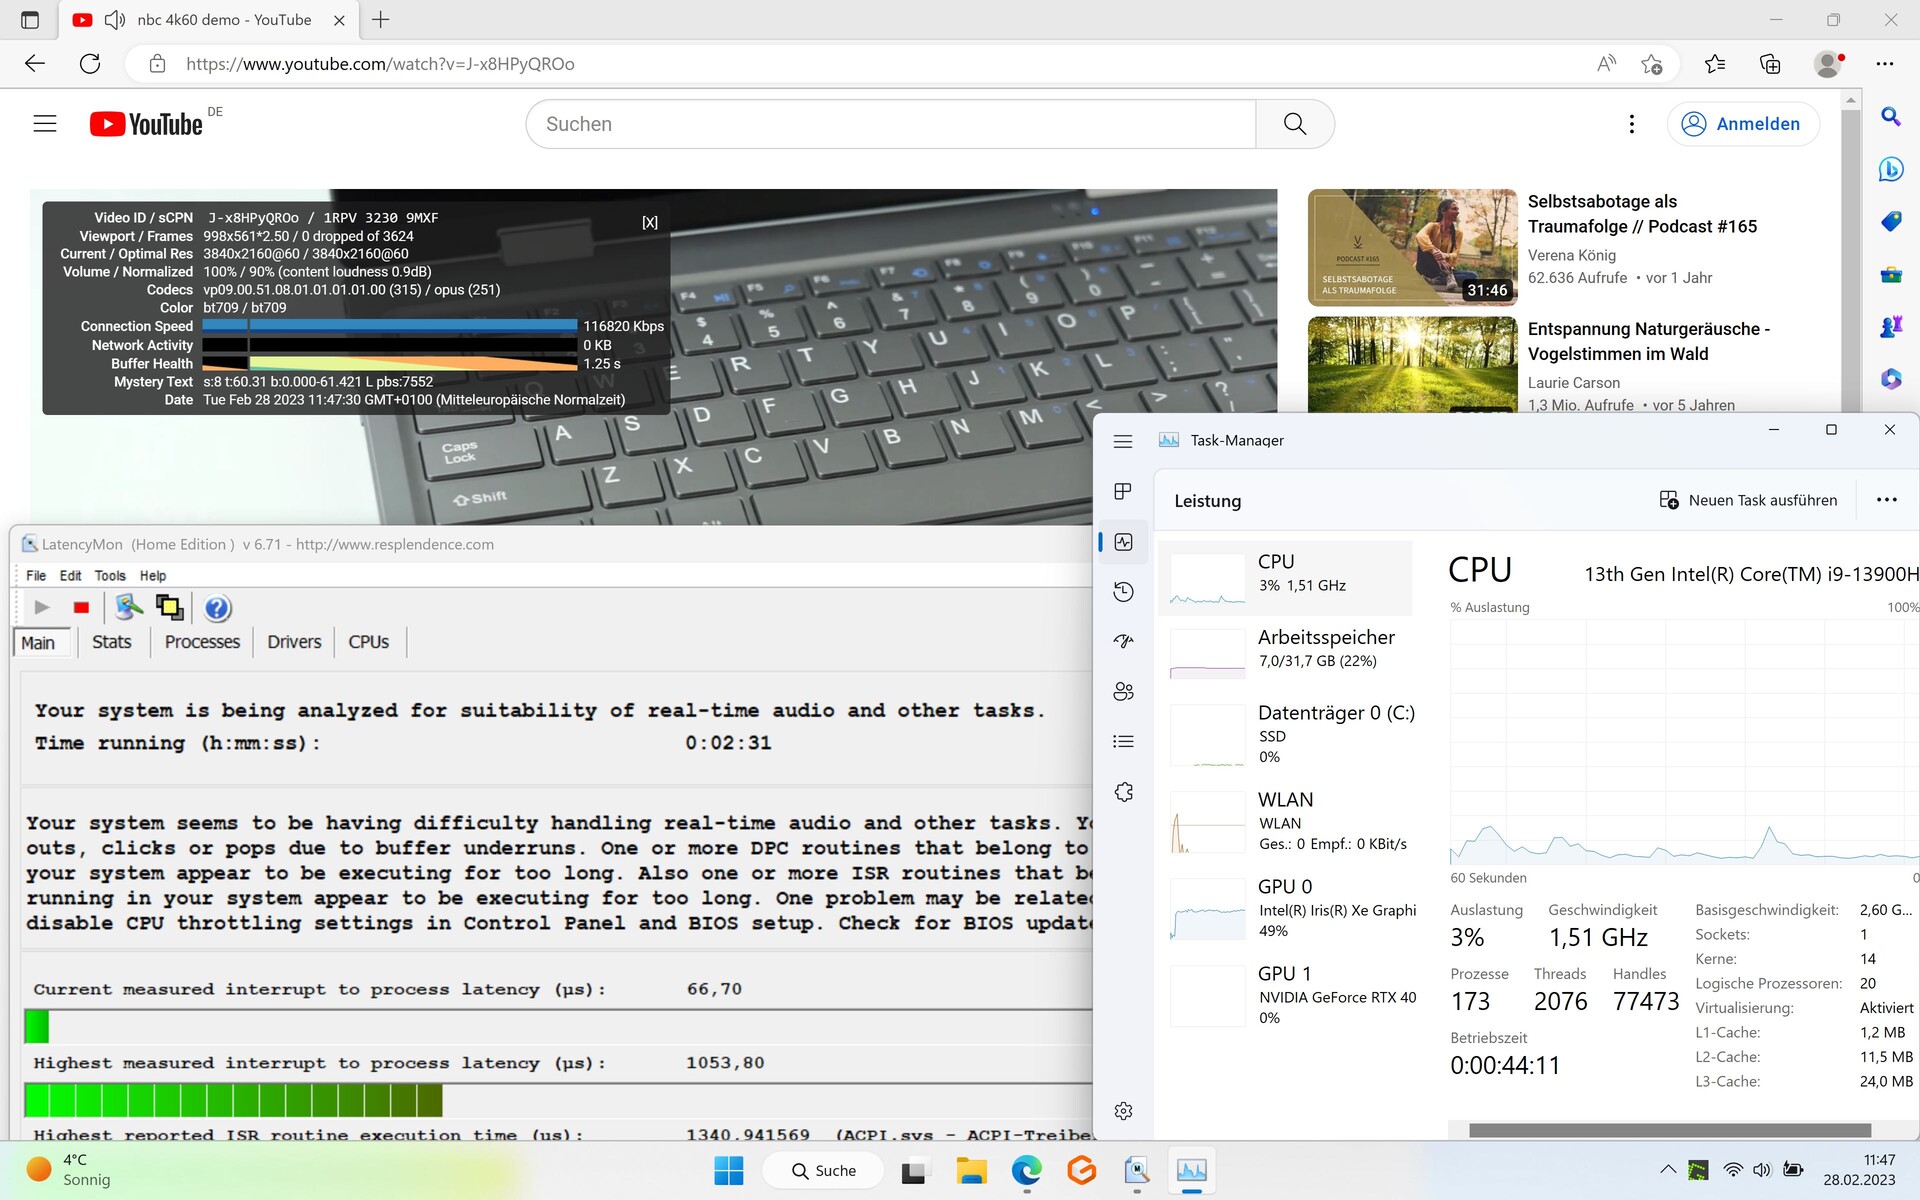
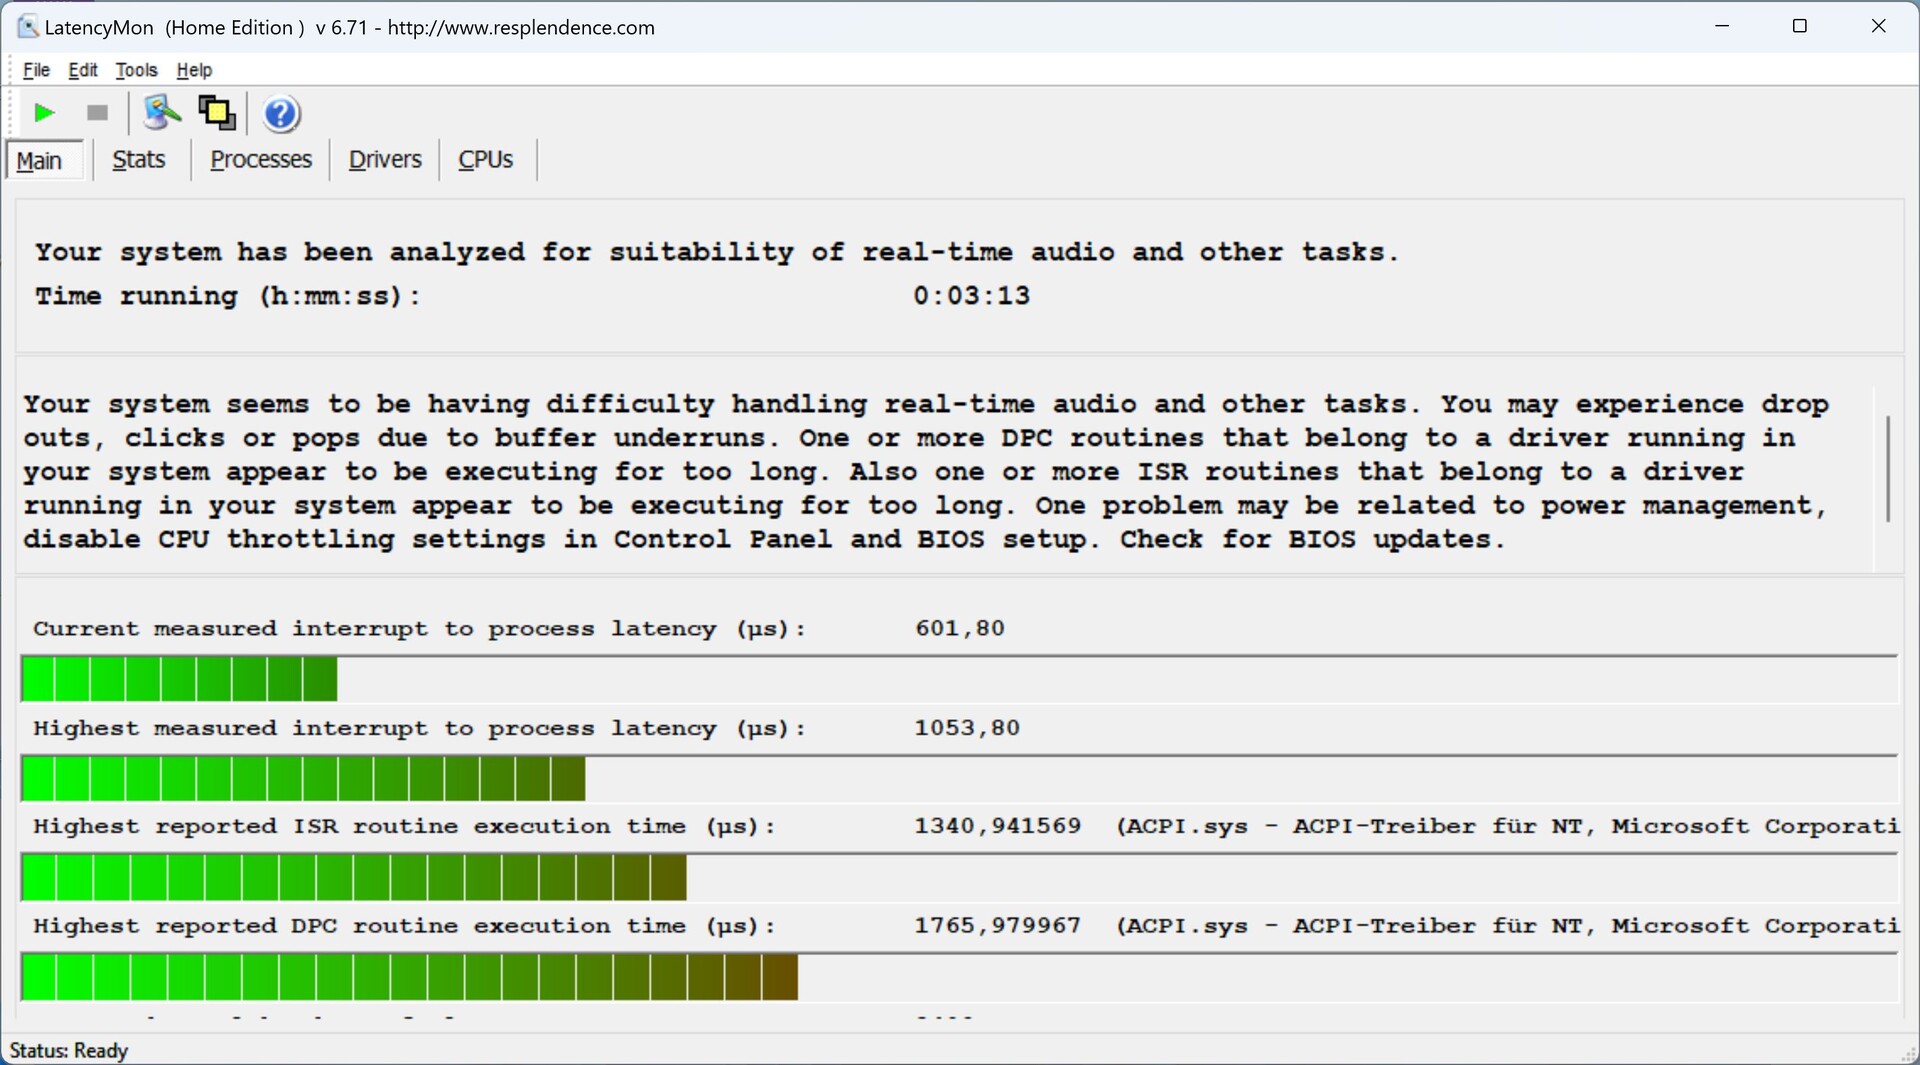
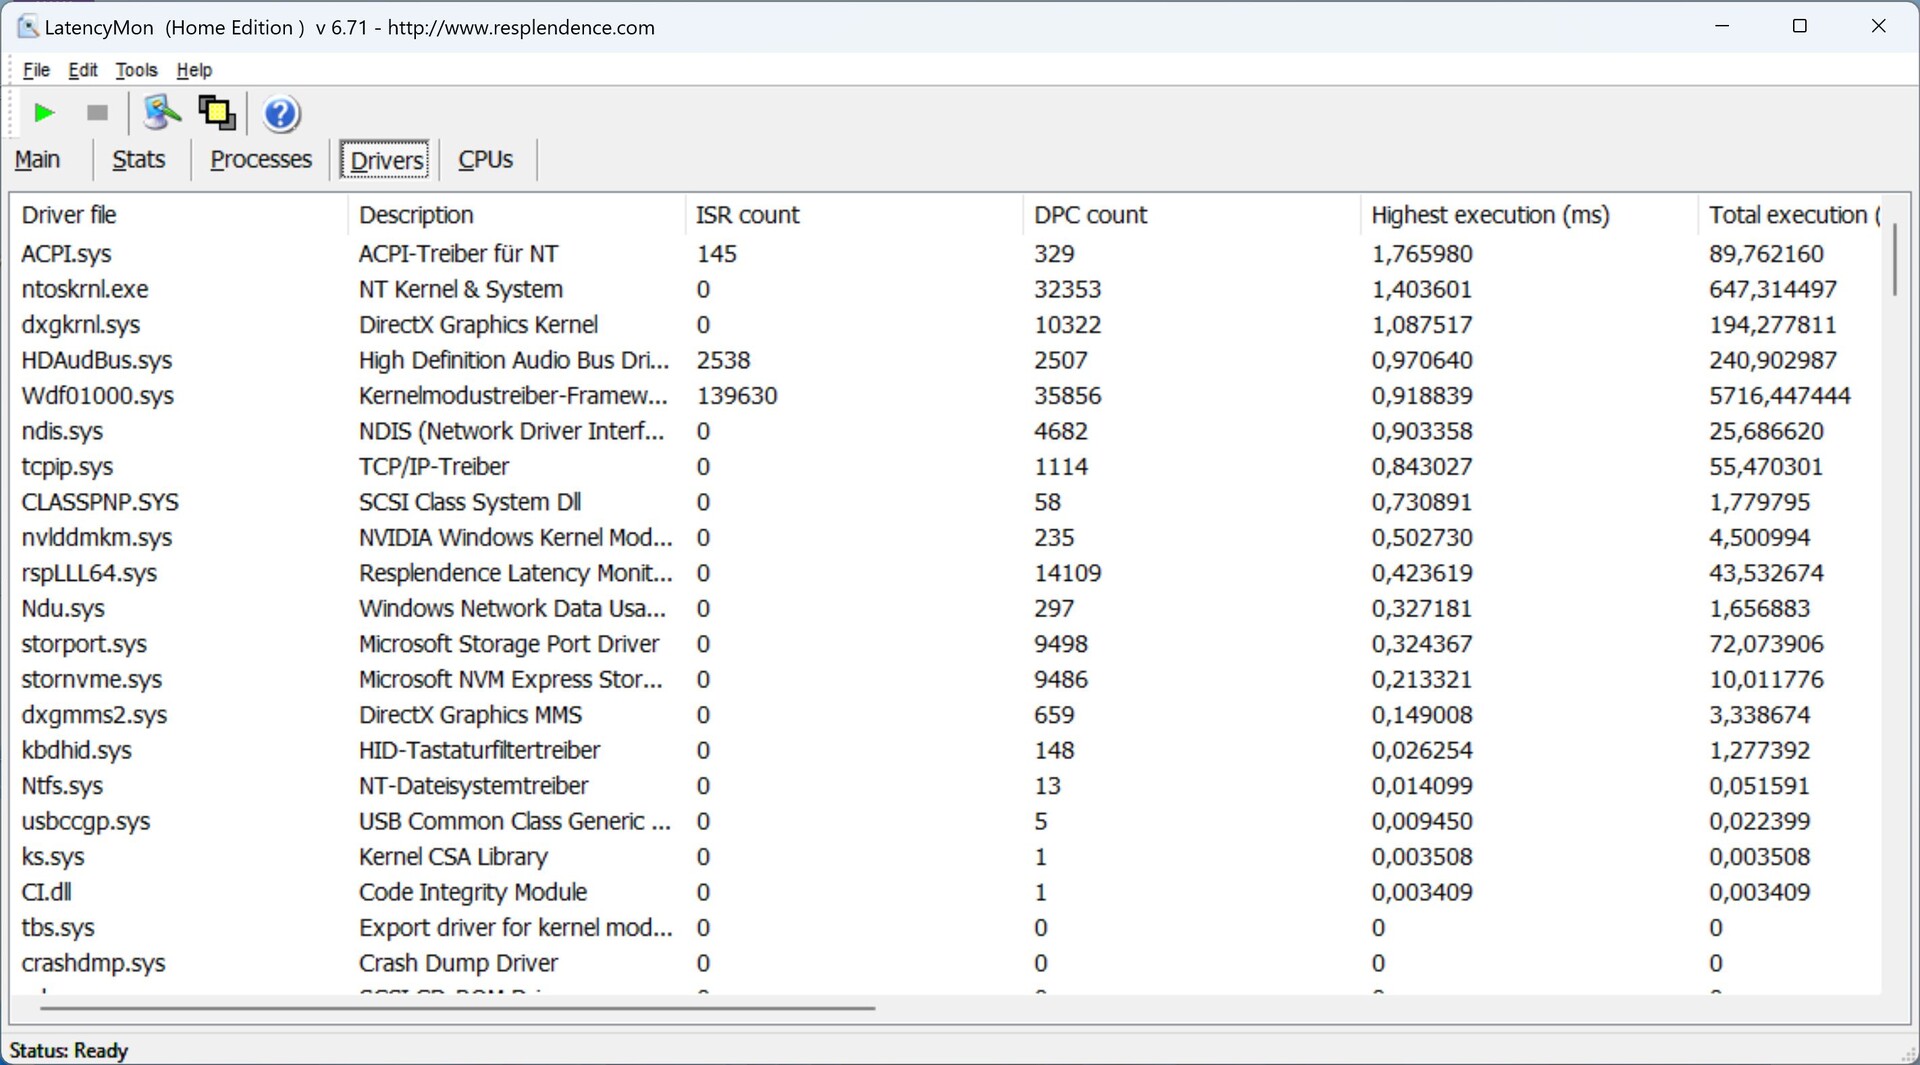
Latência do DPC
Pouco depois de iniciar o LatencyMon, o software detecta as primeiras latências DPC. Estas aumentam ainda mais quando se lança o navegador e se abrem múltiplas abas. Nosso vídeo 4K/60 fps no YouTube, por outro lado, é renderizado suavemente e sem saltar frames.
O Razer Blade 18 tem valores de latência ainda piores do que o nosso Aero.
| DPC Latencies / LatencyMon - interrupt to process latency (max), Web, Youtube, Prime95 | |
| Razer Blade 18 RTX 4070 | |
| Gigabyte AERO 16 OLED BSF | |
| Gigabyte Aero 16 YE5 | |
| MSI CreatorPro Z16P B12UKST | |
| Asus ZenBook Pro 16X OLED UX7602ZM-ME115W | |
| Asus TUF Gaming A16 FA617 | |
* ... menor é melhor
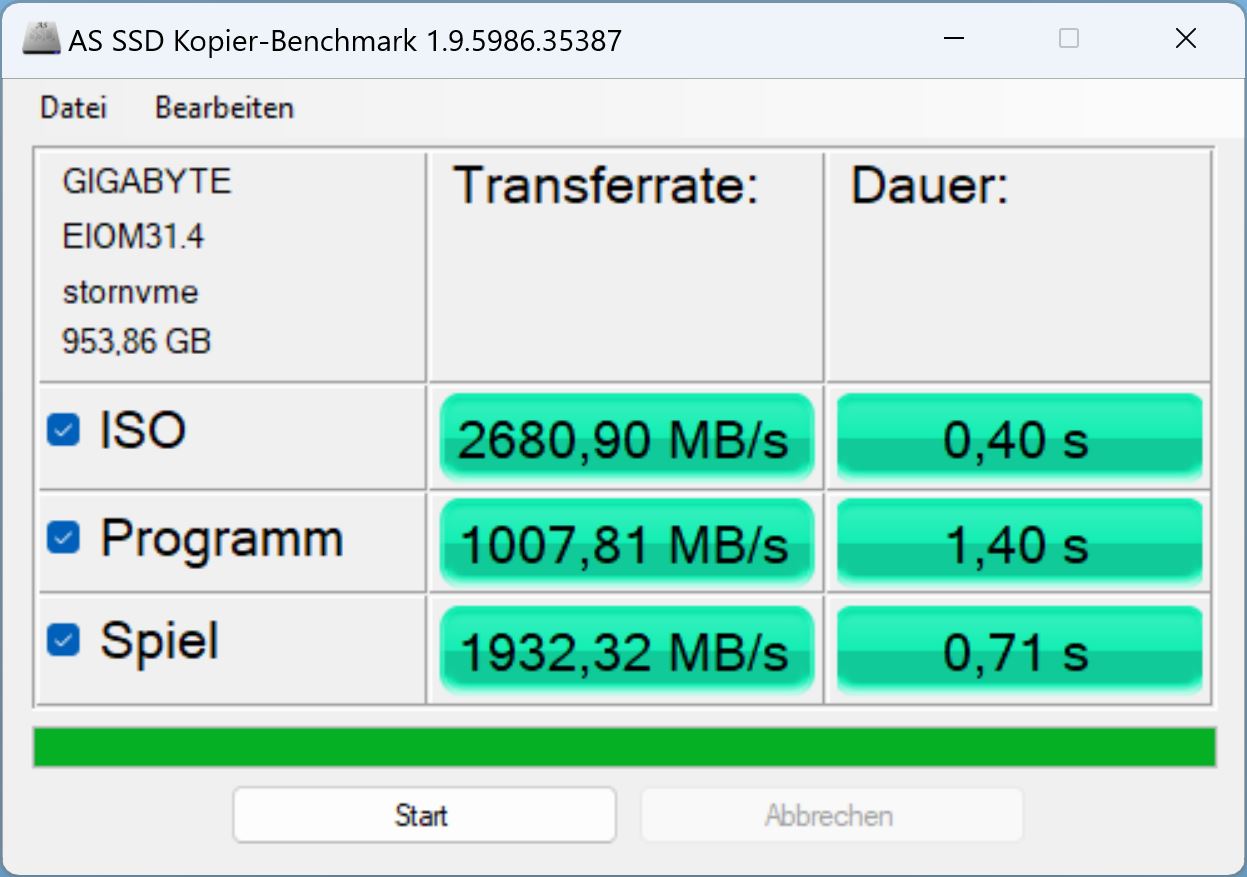
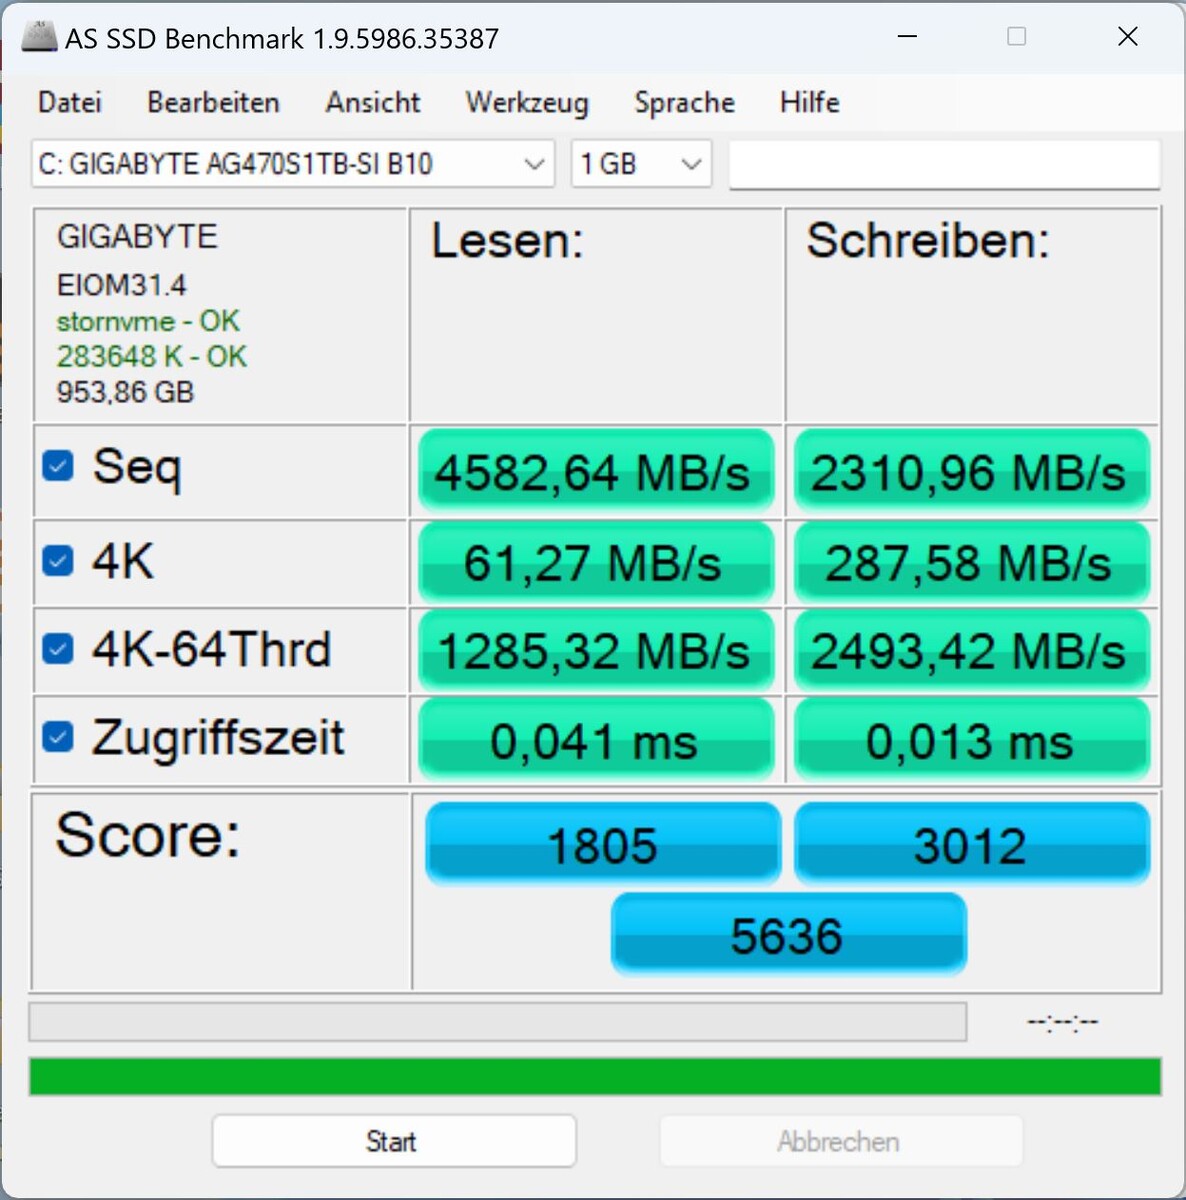
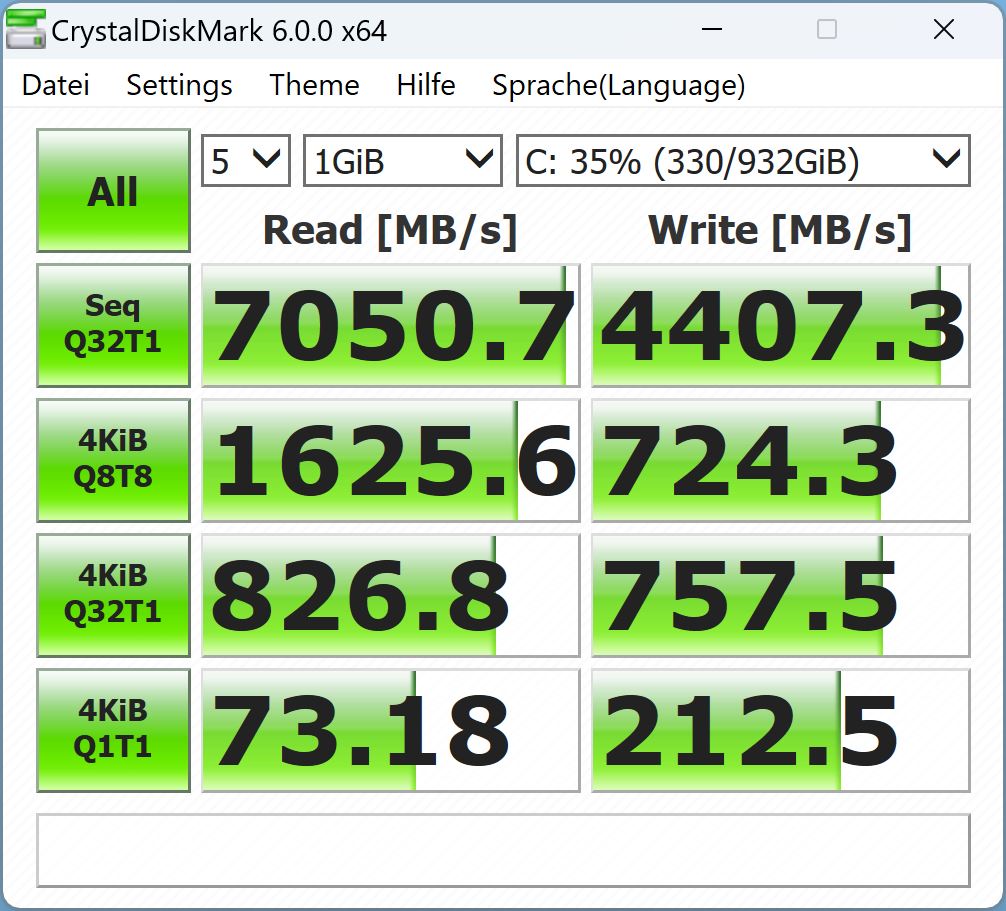
Dispositivo de armazenamento
O fabricante utiliza uma PCIe Gen4 NVMe SSD muito rápida de sua própria empresa. Atualmente está em segundo lugar em nossa melhor lista.
O modelo aqui não atinge seu melhor desempenho, especialmente porque a memória Phison no predecessor (posição 1) é um pouco mais rápida.
Pelo menos o desempenho é relativamente constante, e é bom que uma almofada de resfriamento esteja presa à placa base.

* ... menor é melhor
Sustained Read Performance: DiskSpd Read Loop, Queue Depth 8
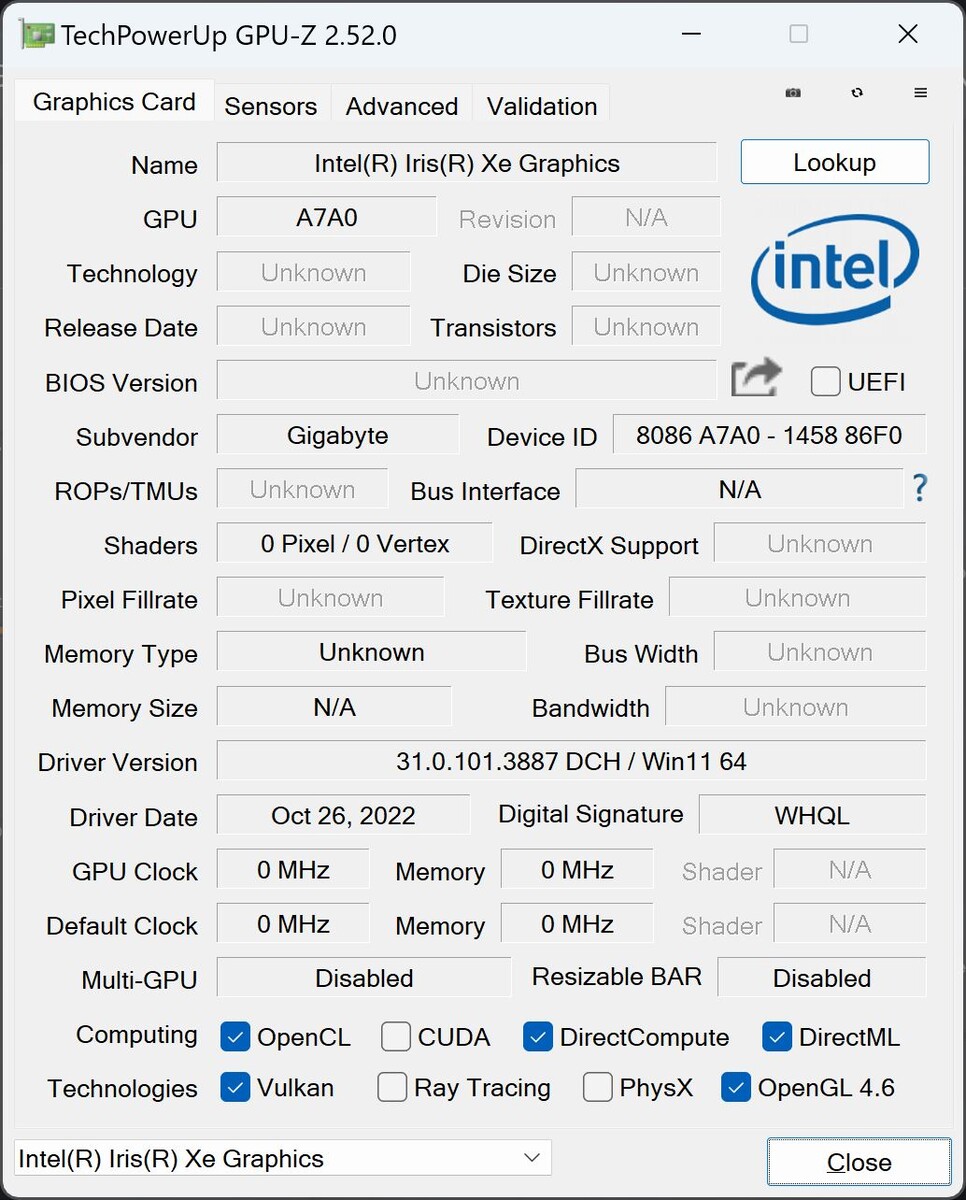
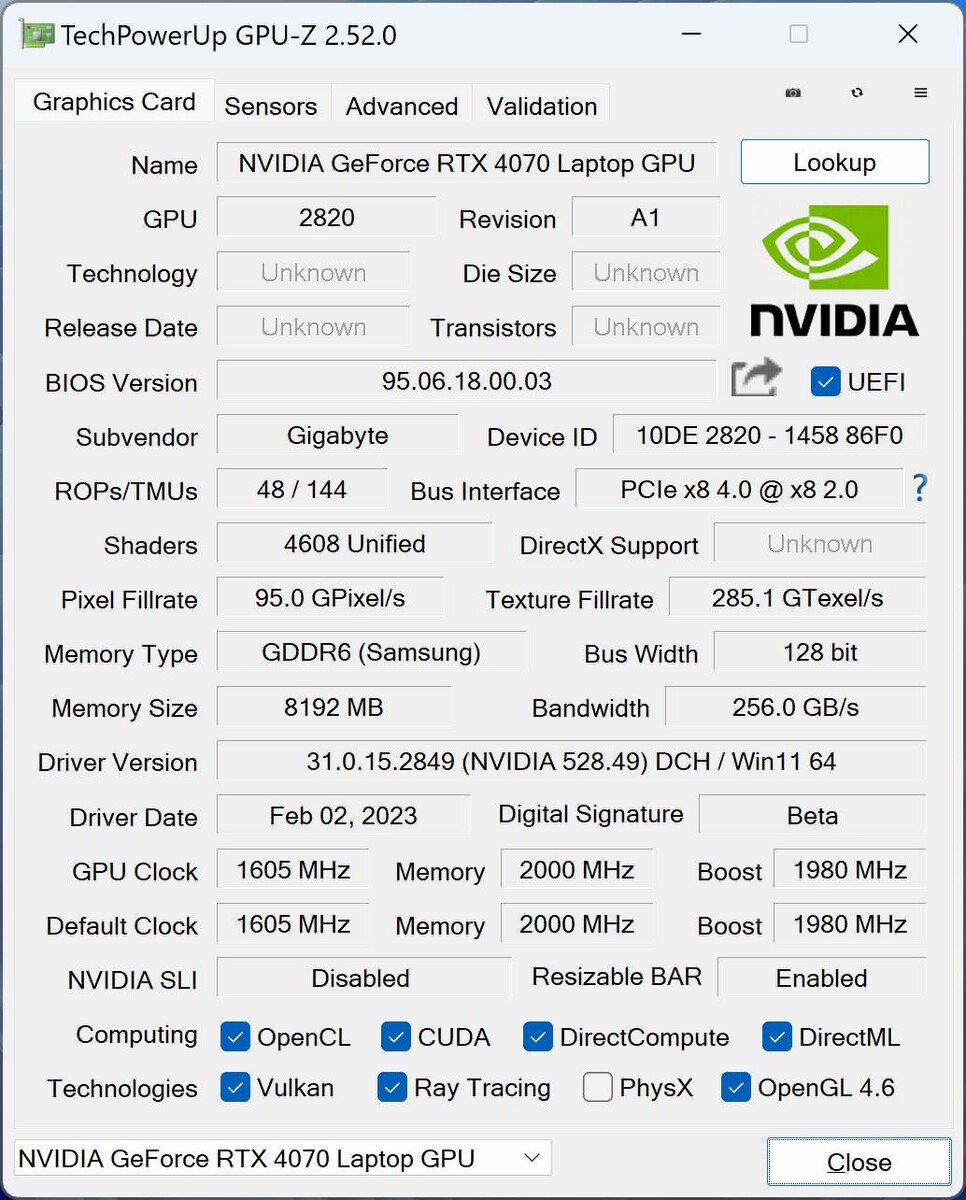
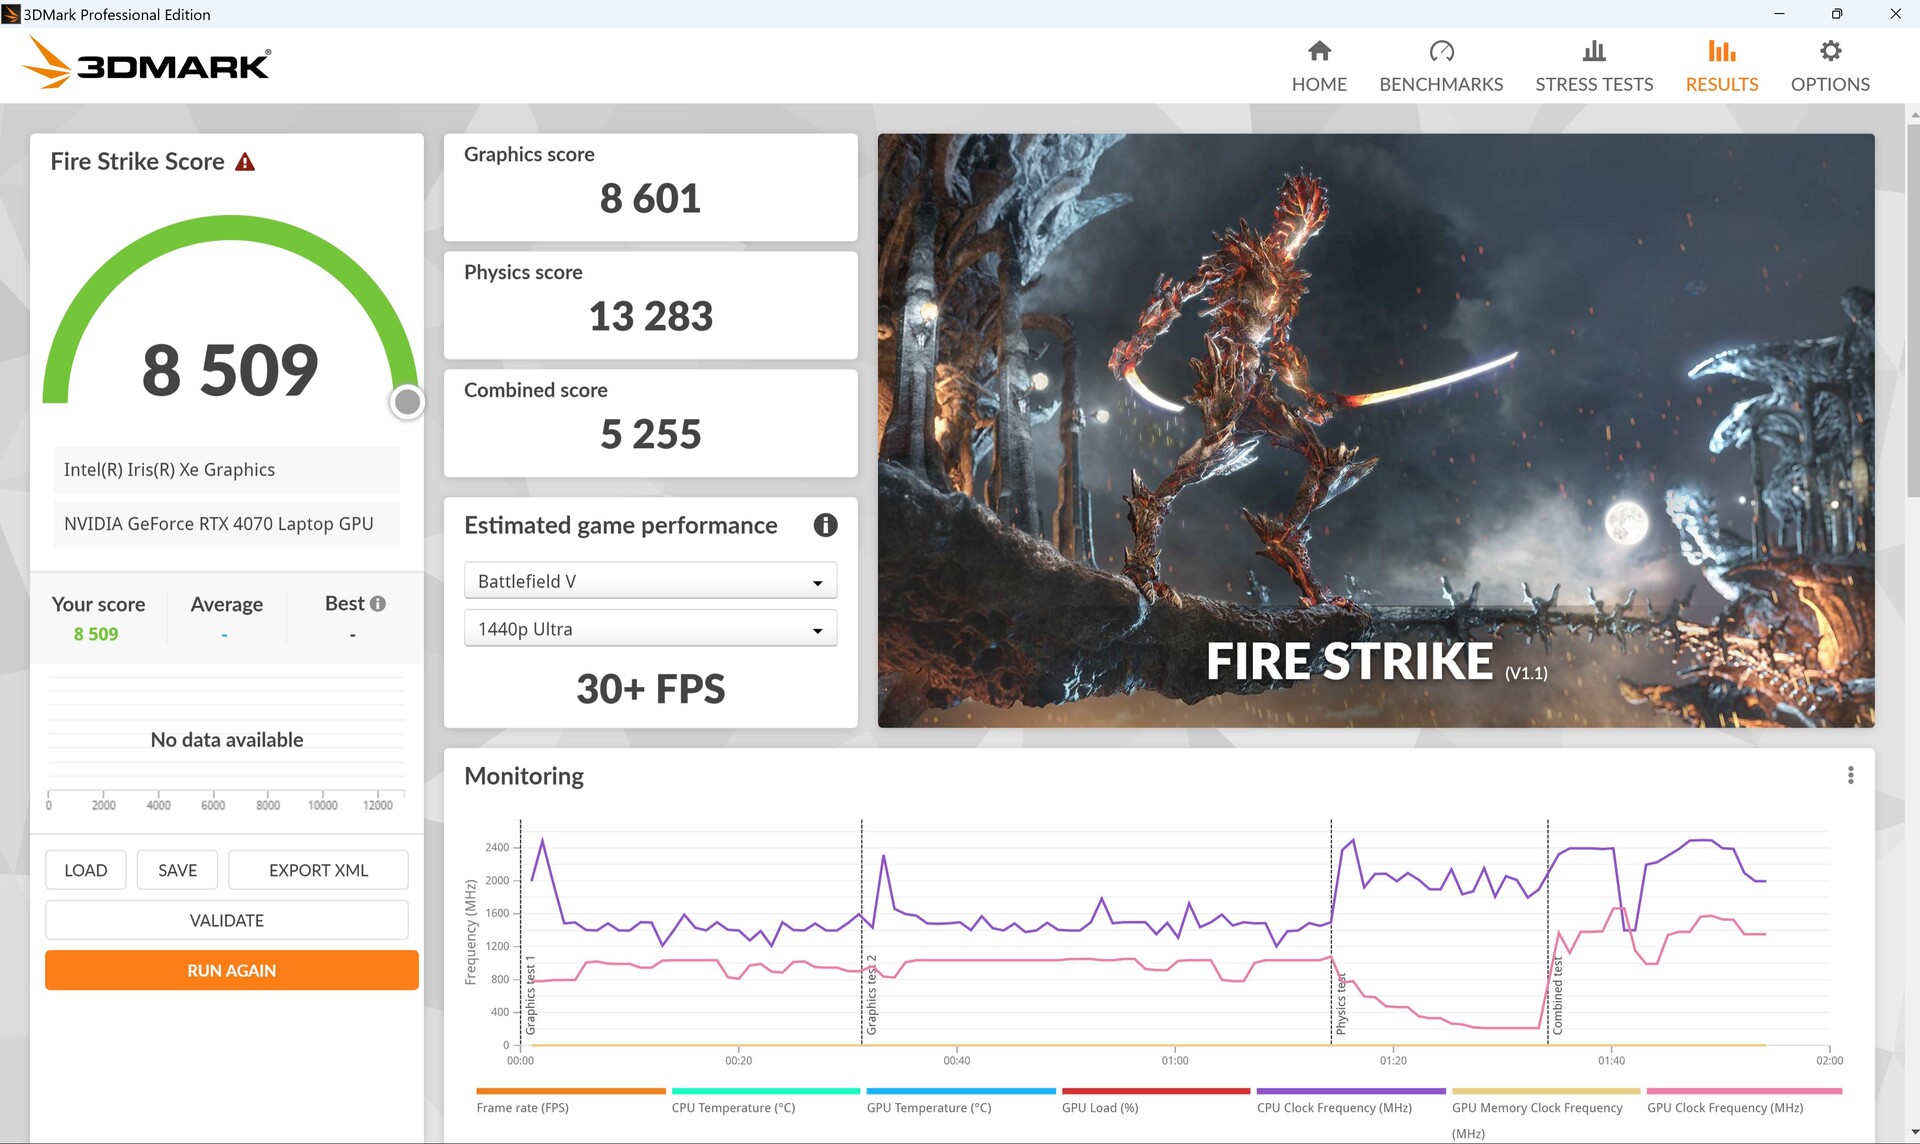
Placa Gráfica
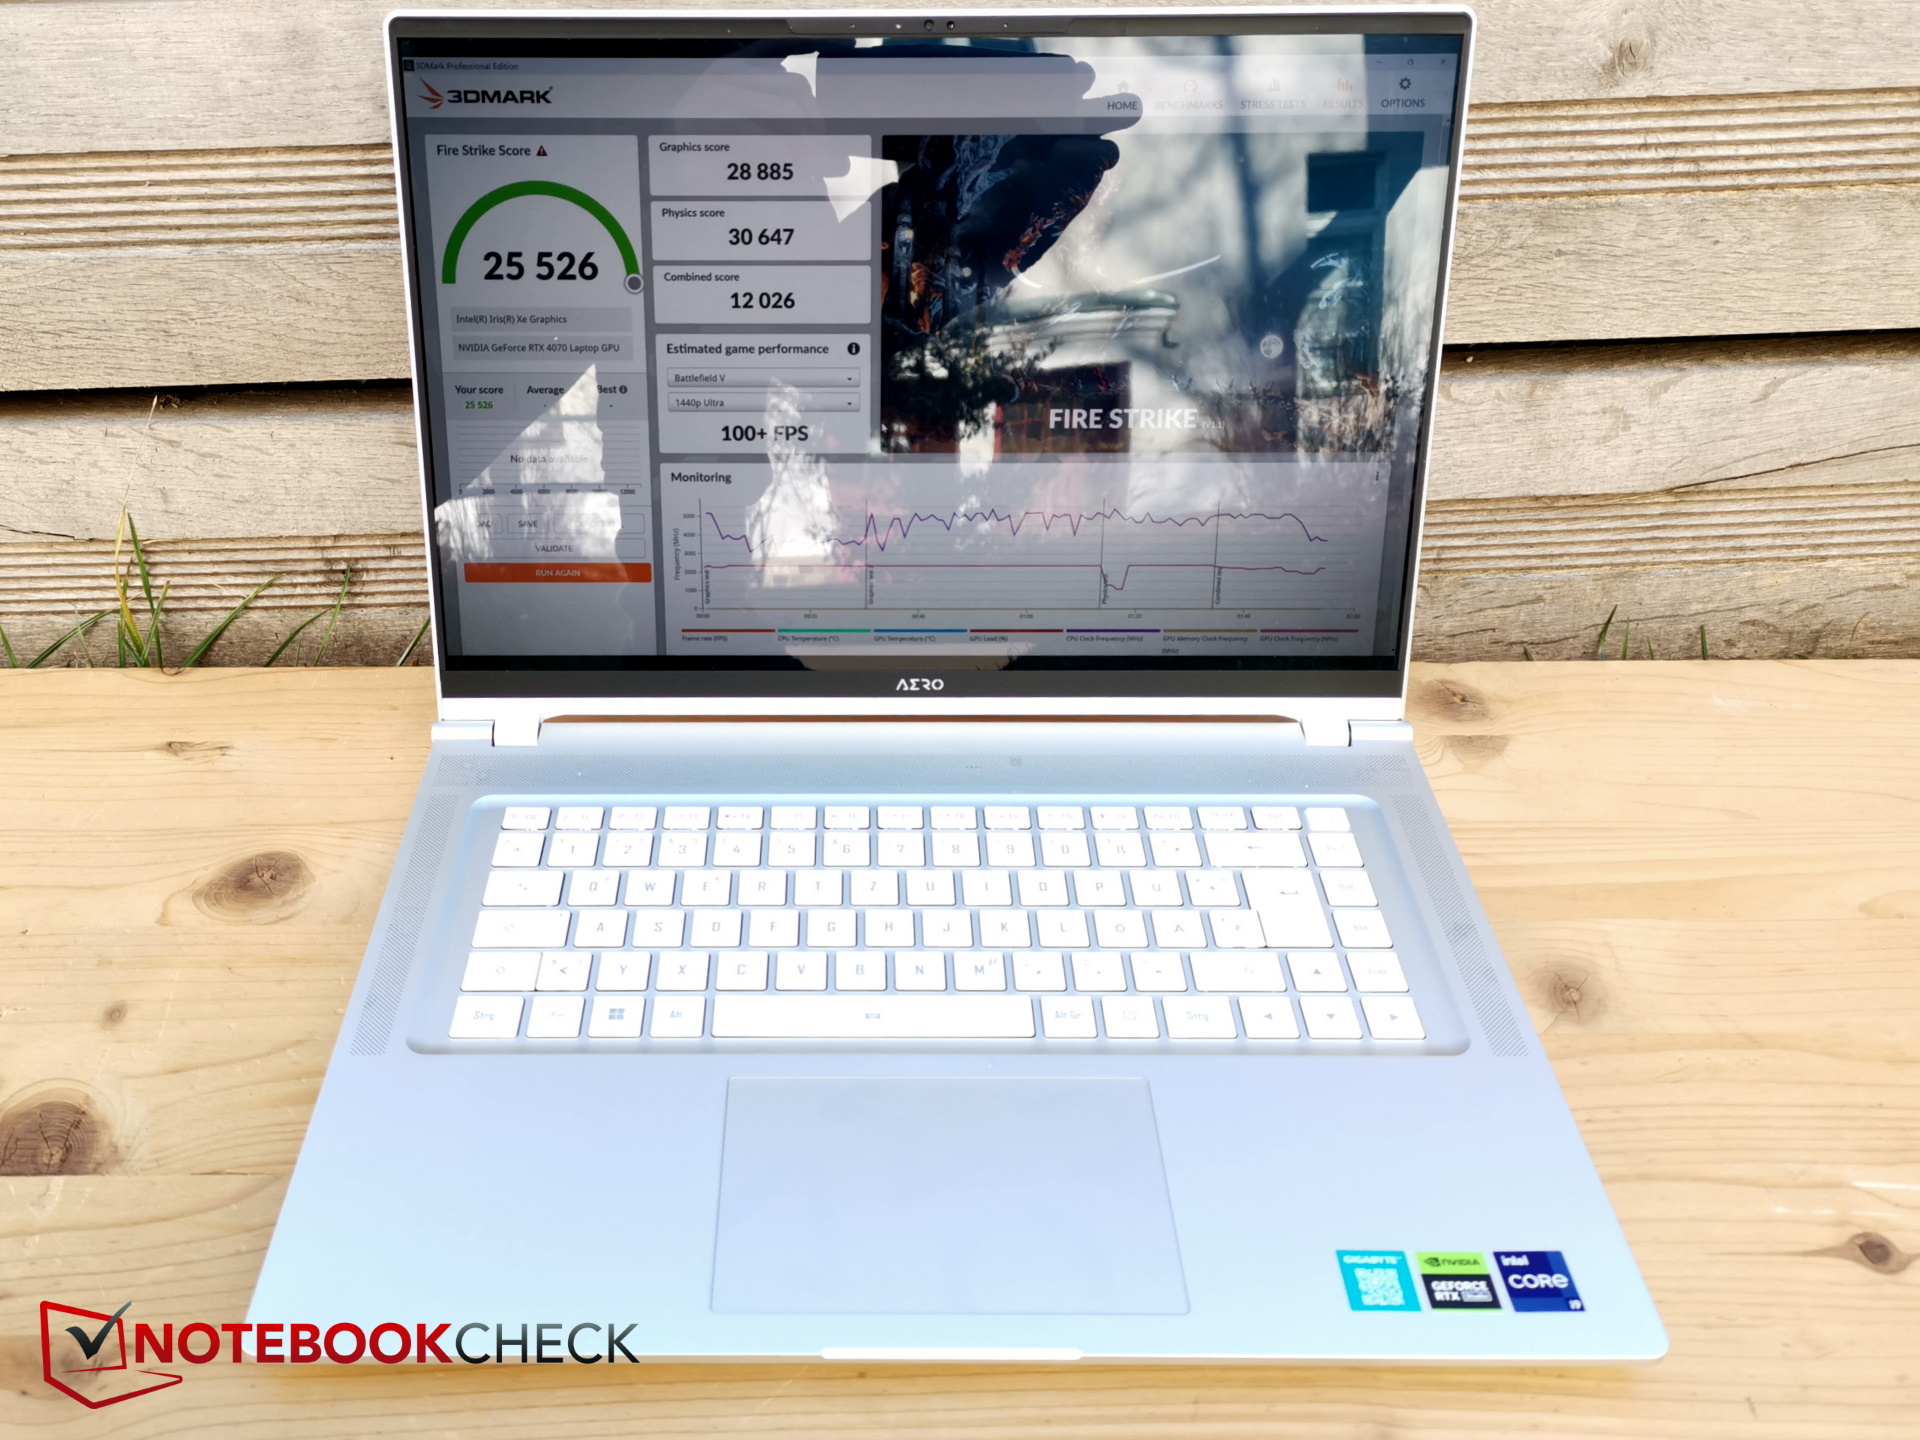
Quando se trata da GPU, você tem a escolha entre oRTX 4060 e RTX 4070; a variante mais potente é instalada em nossa unidade de teste. No Aero fino, normalmente consome cerca de 105 W. O máximo é 115 mais 25 W de Dynamic Boost, mas nosso colega Andreas apontou recentemente em sua revisão do cartão que quase nenhum aumento de desempenho ocorre acima de 100 W para o RTX 4070.
Nos 3DMarks sintéticos, o cartão está no nível esperado, embora não tenhamos muitas outras medidas em nosso banco de dados. Afinal, ela está ocasionalmente à frente dos dispositivos concorrentes com um RTX 3080 Tienquanto o predecessor com seu RTX 3080 Ti também é batido em quase 20%, o CreatorProem 30 por cento. Mesmo a lâmina 18 com a mesma GPU e CPU nominalmente mais rápida está ligeiramente atrás. O Alienware x15 R2 com seu RTX 3080 Ti, por outro lado, está ligeiramente à frente.
Muito desempenho 3D é perdido no Modo Bateria, com a pontuação em Fire Strike caindo em quase 70%!

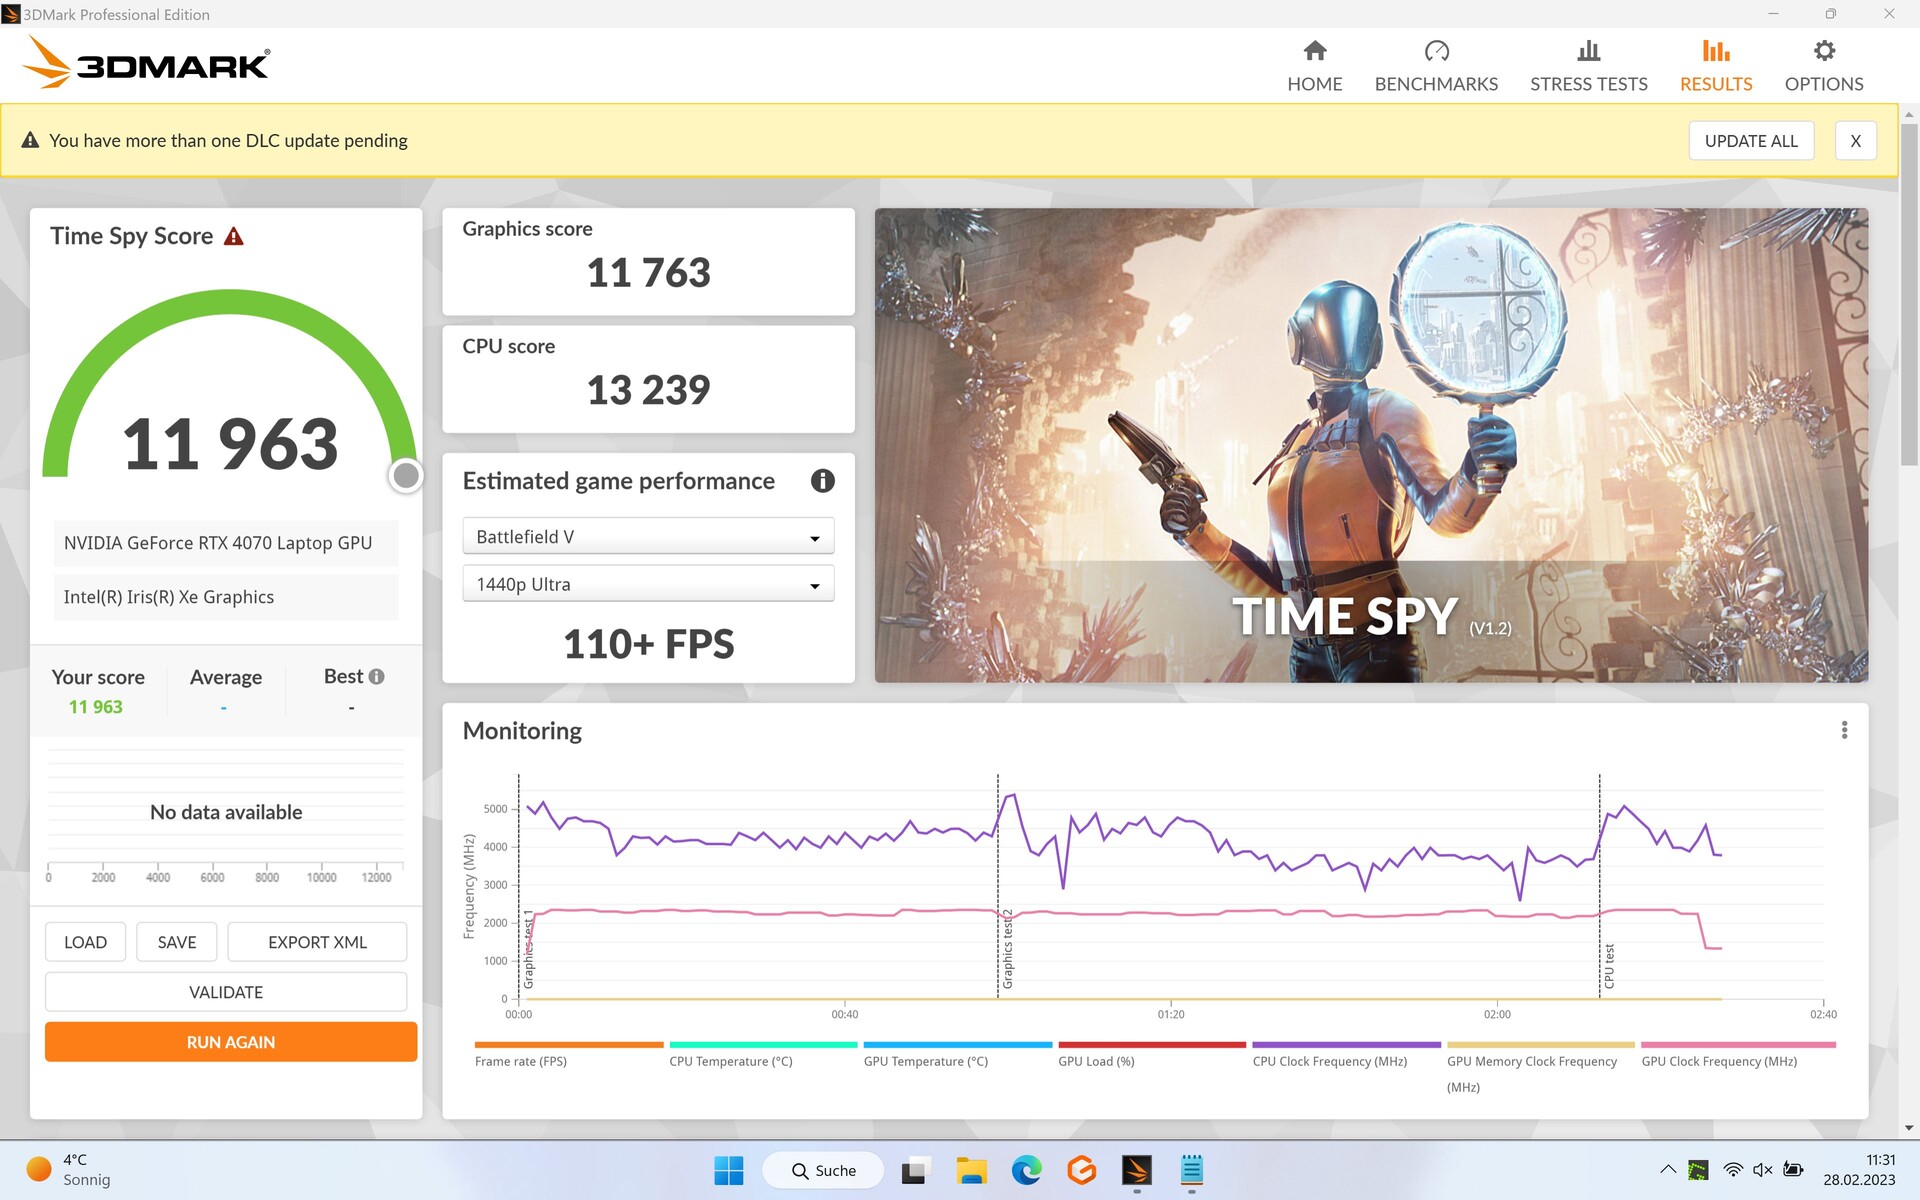
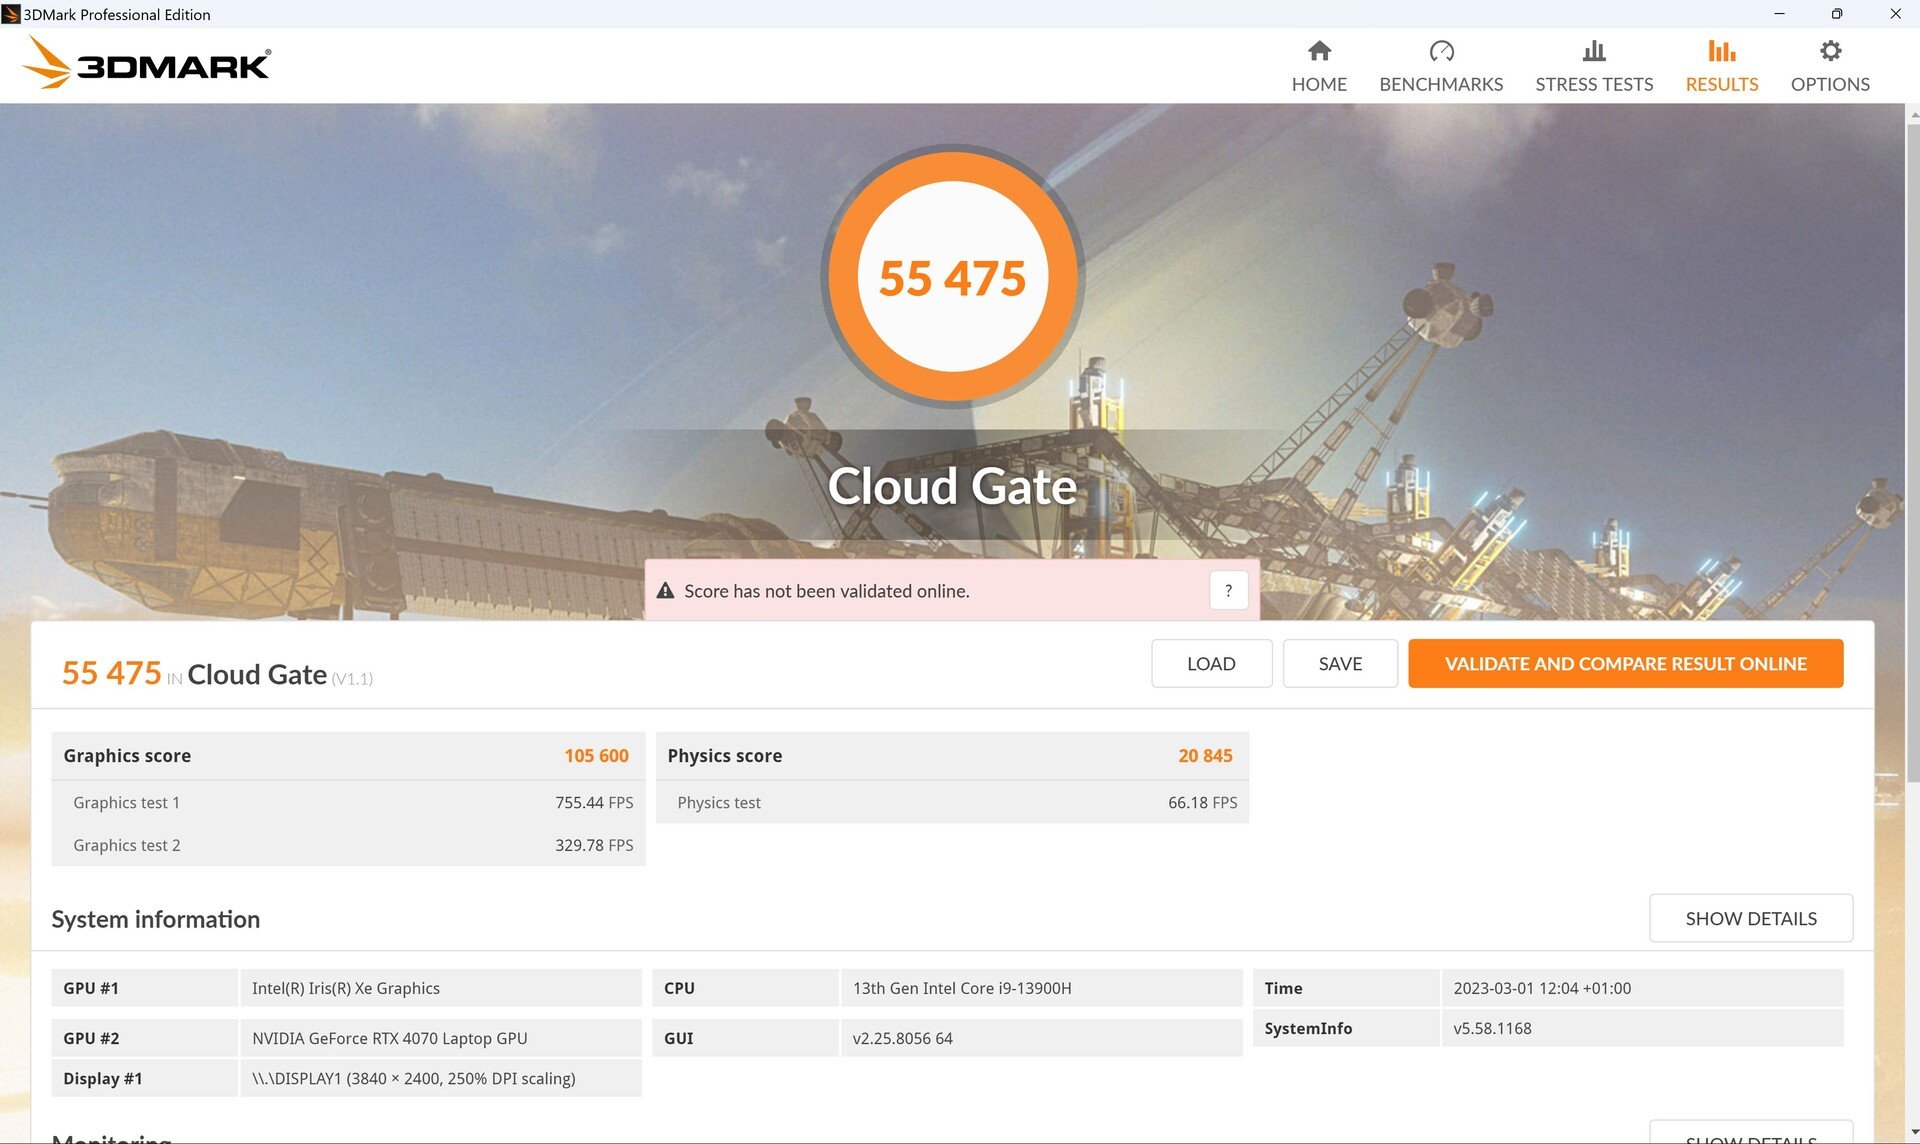
| 3DMark 11 Performance | 33703 pontos | |
| 3DMark Cloud Gate Standard Score | 55475 pontos | |
| 3DMark Fire Strike Score | 25526 pontos | |
| 3DMark Fire Strike Extreme Score | 13175 pontos | |
| 3DMark Time Spy Score | 12029 pontos | |
Ajuda | ||
* ... menor é melhor
Desempenho nos jogos
Nos jogos, o Aero 16 é apenas ultrapassado peloLâmina 18em geral, e somente por causa dos fracos resultados em DOTA 2 Renascer e X-Plane 11.11. O Aero tem até mesmo a vantagem nos jogos pesados de GPU. Isto é interessante porque o RTX 4070é permitido 140 W na Lâmina, mas apenas 105 W no Aero, o que confirma que faz pouco sentido rodar o cartão acima de 100 W no momento.
De modo geral, ele pode lidar com todos os jogos até 2K e às vezes até acima, embora o cartão às vezes fique sem vapor em jogos muito exigentes a 4K.
O desempenho do Ray Tracing, por outro lado, é muito bom. No Cyberpunkt, ele só cai de cerca de 85 a 65 fps com traçado de raio ativado a 1080p.
| The Witcher 3 - 1920x1080 Ultra Graphics & Postprocessing (HBAO+) | |
| Média da turma Gaming (104.7 - 240, n=7, últimos 2 anos) | |
| Gigabyte AERO 16 OLED BSF | |
| Razer Blade 18 RTX 4070 | |
| Gigabyte Aero 16 YE5 | |
| Asus TUF Gaming A16 FA617 | |
| Asus ZenBook Pro 16X OLED UX7602ZM-ME115W | |
| MSI CreatorPro Z16P B12UKST | |
| Final Fantasy XV Benchmark - 1920x1080 High Quality | |
| Média da turma Gaming (41 - 215, n=95, últimos 2 anos) | |
| Gigabyte AERO 16 OLED BSF | |
| Razer Blade 18 RTX 4070 | |
| Gigabyte Aero 16 YE5 | |
| Asus ZenBook Pro 16X OLED UX7602ZM-ME115W | |
| Asus TUF Gaming A16 FA617 | |
| MSI CreatorPro Z16P B12UKST | |
| Dota 2 Reborn - 1920x1080 ultra (3/3) best looking | |
| Razer Blade 18 RTX 4070 | |
| Gigabyte Aero 16 YE5 | |
| Média da turma Gaming (84.8 - 248, n=107, últimos 2 anos) | |
| MSI CreatorPro Z16P B12UKST | |
| Gigabyte AERO 16 OLED BSF | |
| Asus ZenBook Pro 16X OLED UX7602ZM-ME115W | |
| Asus TUF Gaming A16 FA617 | |
O Aero 16 não oferece Advanced Optimus, e o mesmo se aplica ao Modo Sussurro da Nvidia. Entretanto, um interruptor MUX está disponível para que você possa alternar manualmente entre iGPU e dGPU.
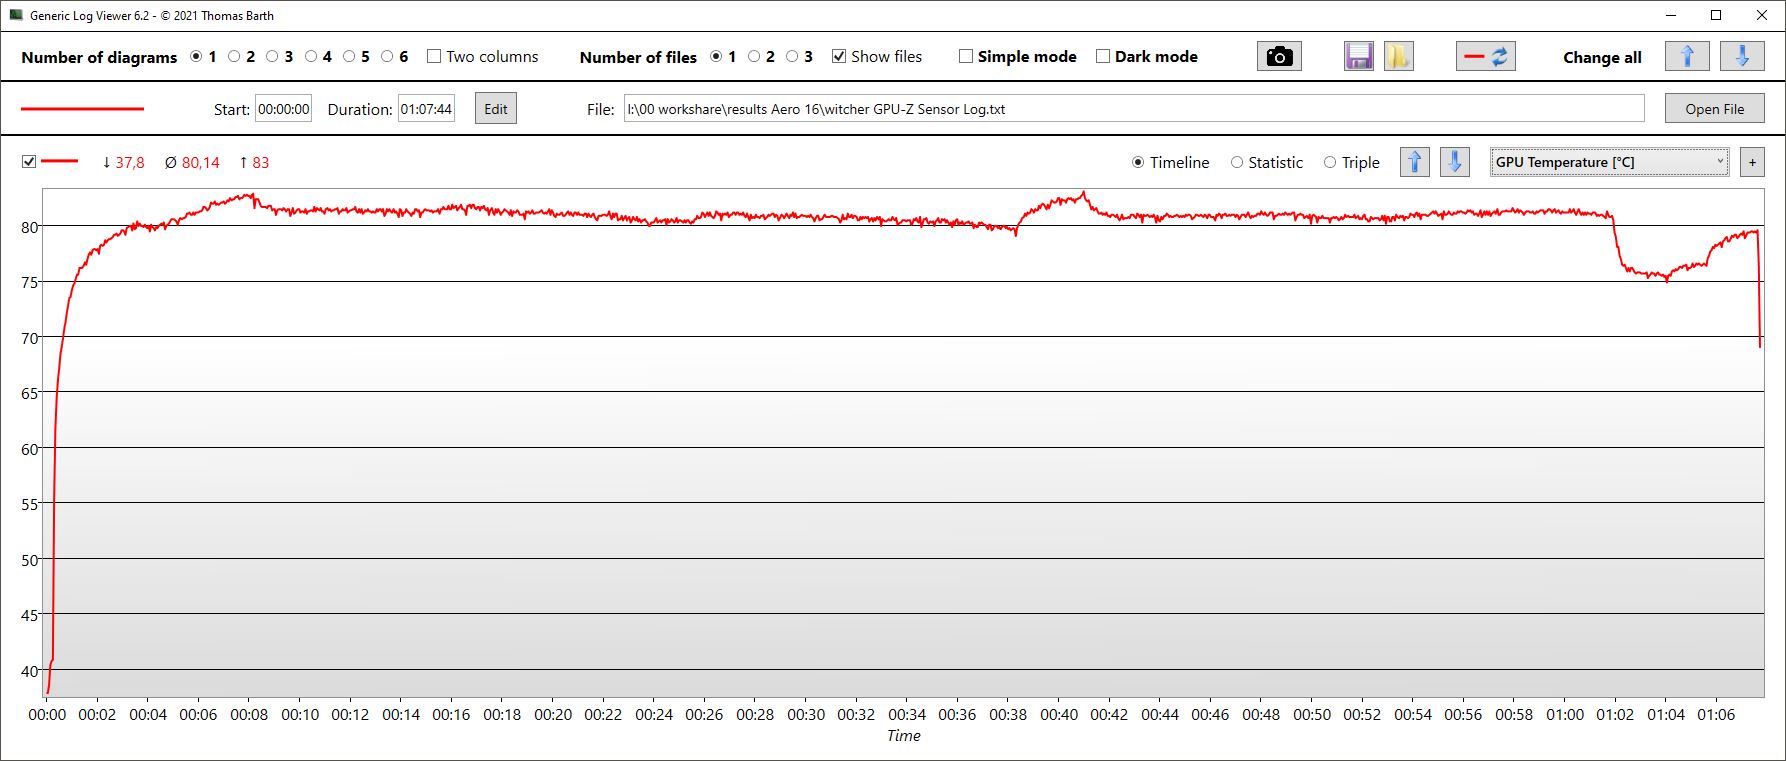
No modo de jogo, a taxa de quadros em Witcher 3 é bastante constante por mais de uma hora e está acima da taxa de umLâmina Razer 18.
O consumo de energia da GPU é quase constante em torno de 105 W, o que significa que tanto o relógio central (2.350 MHz) quanto o relógio de memória (2.000 MHz) também são muito constantes. O cartão aquece até cerca de 80 °C.
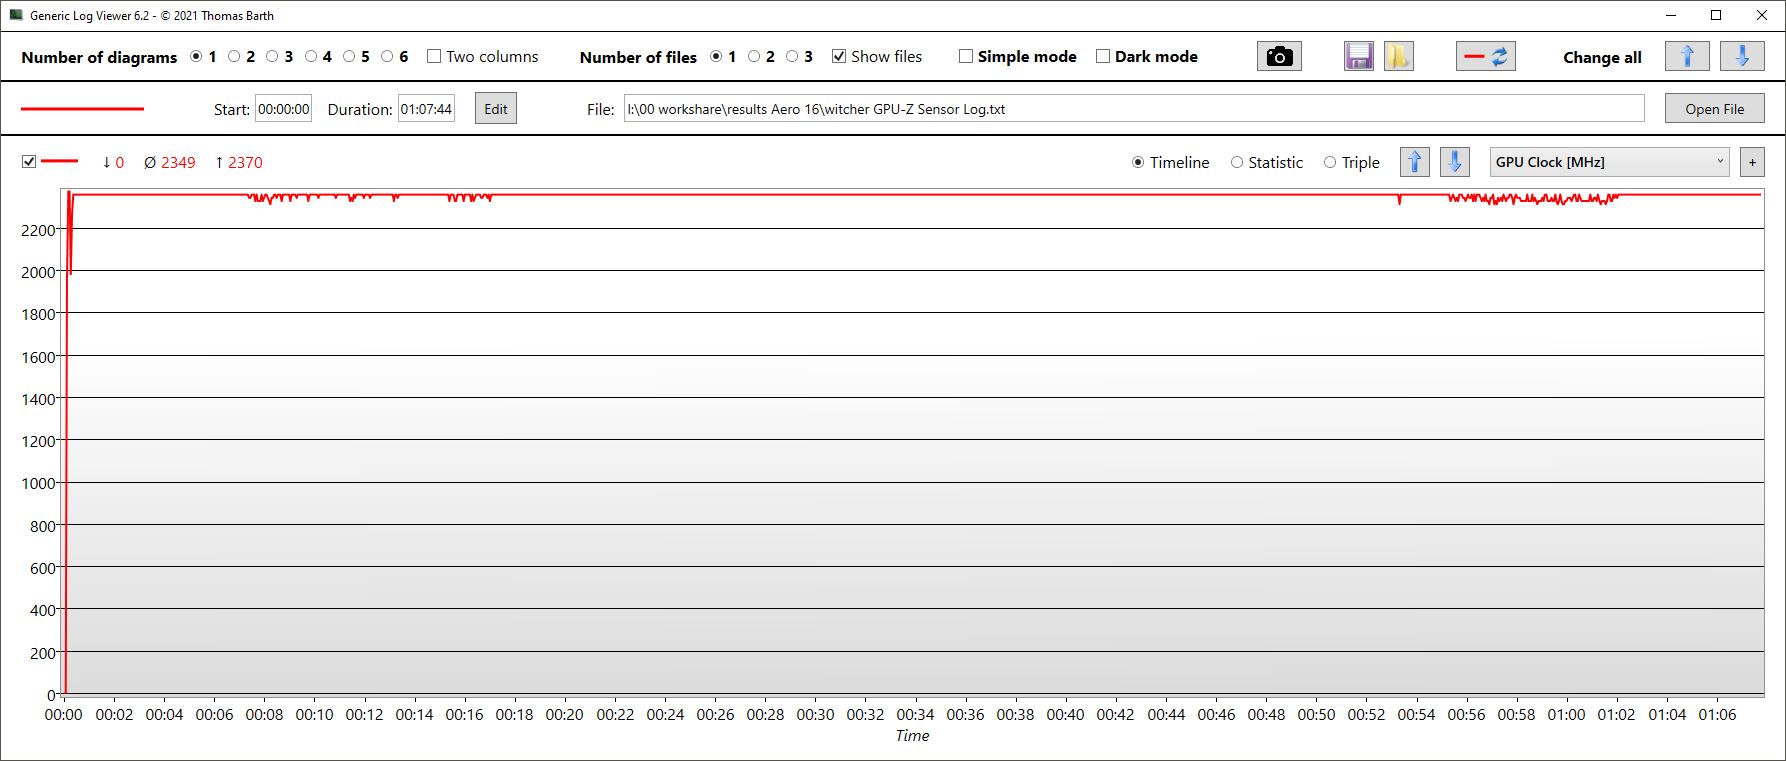
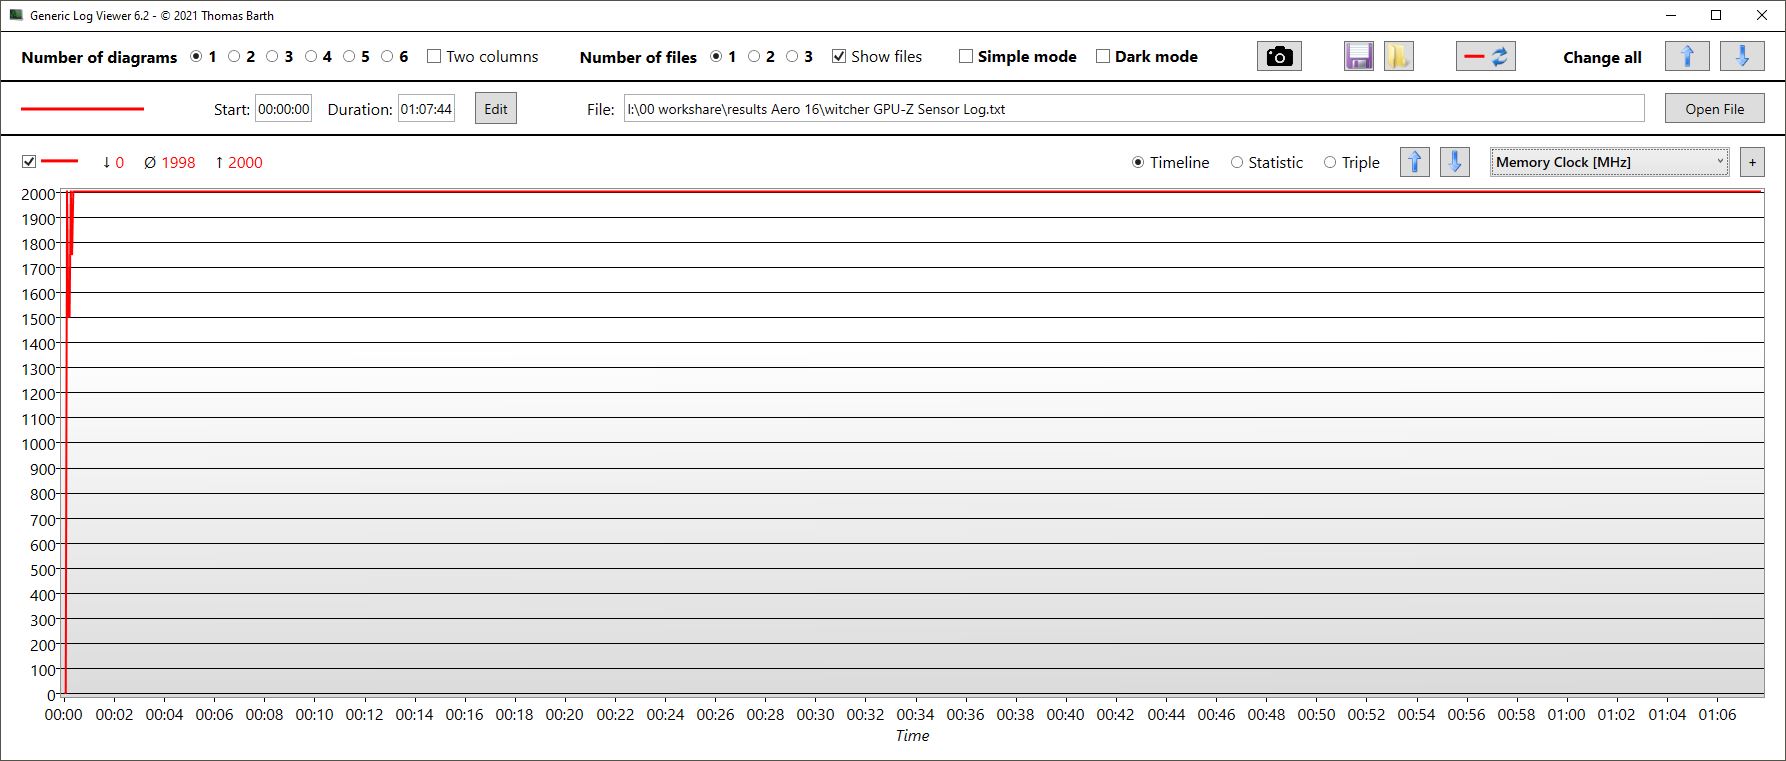
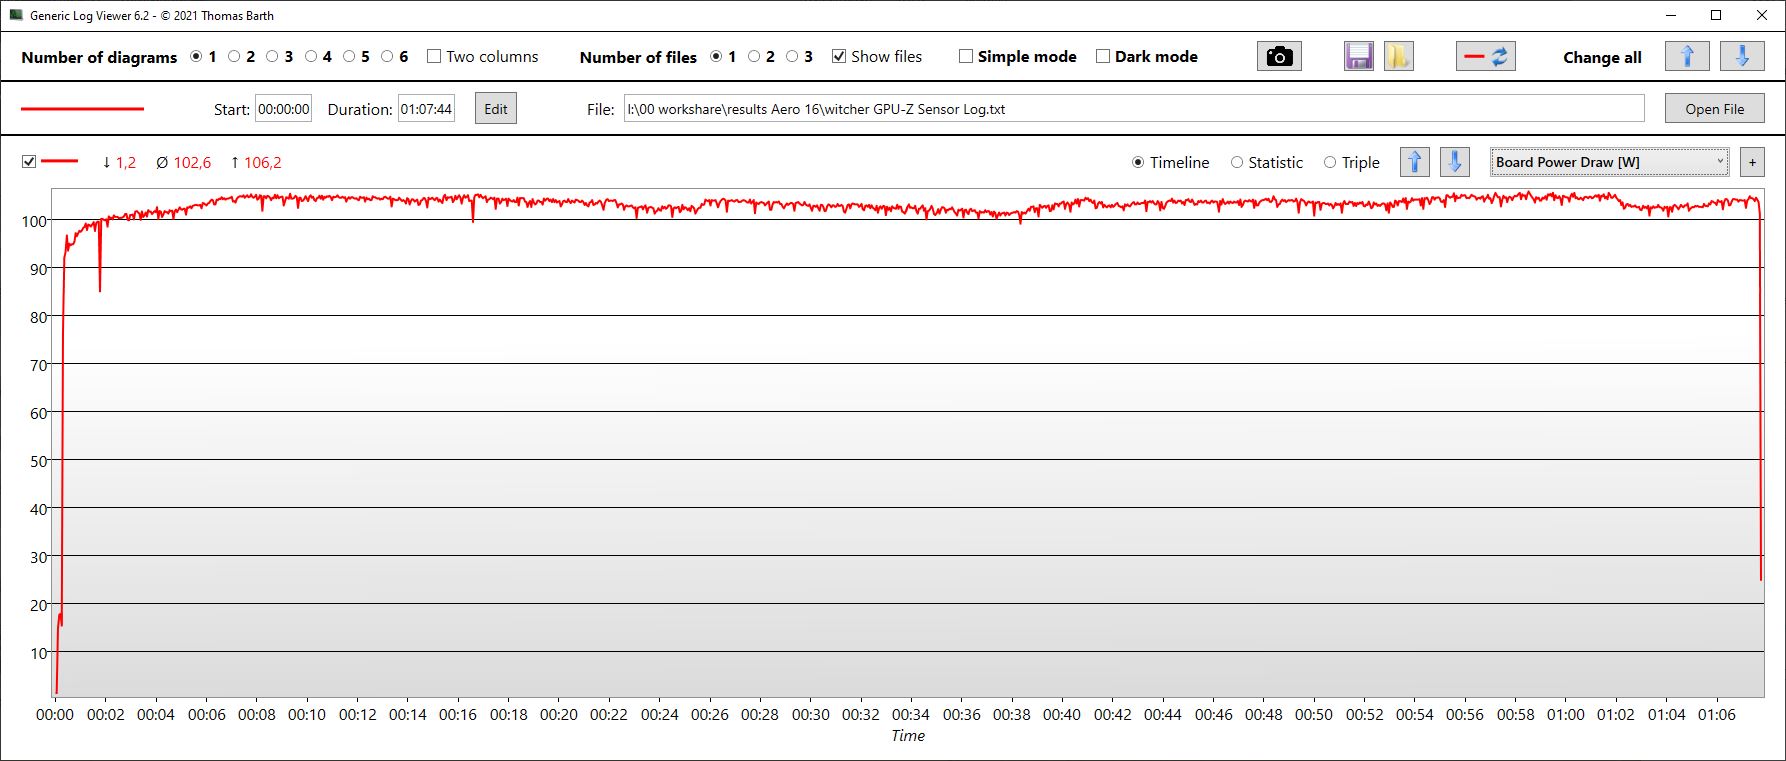
Witcher 3 FPS Chart
| baixo | média | alto | ultra | QHD | 4K | |
|---|---|---|---|---|---|---|
| GTA V (2015) | 185.3 | 186.4 | 183.1 | 123.2 | 90.6 | 75 |
| The Witcher 3 (2015) | 236 | 116 | ||||
| Dota 2 Reborn (2015) | 164.7 | 157 | 150.9 | 144.5 | 128.3 | |
| Final Fantasy XV Benchmark (2018) | 132.3 | 116.2 | 84.7 | 46.1 | ||
| X-Plane 11.11 (2018) | 169.3 | 148 | 115.3 | 98.5 | ||
| Far Cry 5 (2018) | 202 | 168 | 159 | 149 | 115 | 55 |
| Strange Brigade (2018) | 481 | 300 | 237 | 204 | 138.8 | 67.6 |
| Shadow of the Tomb Raider (2018) | 158 | 129 | 70 | |||
| Assassin´s Creed Valhalla (2020) | 106 | 78 | 41 | |||
| Cyberpunk 2077 1.6 (2022) | 84.75 | 53.28 | 19.59 | |||
| F1 22 (2022) | 220 | 214 | 173.8 | 66.6 | 44.3 | 21.5 |
| Call of Duty Modern Warfare 2 2022 (2022) | 101 | 72 | 39 | |||
| Spider-Man Miles Morales (2022) | 90.5 | 68.9 | 40.5 | |||
| The Callisto Protocol (2022) | 78.86 | 59.07 | 32.96 |
Emissões - O Aero 16 permanece bastante frio, mas não silencioso
Ruído
O fino Aero 16 fica bem alto no modo de jogo sob forte estresse. O jogo ou nosso teste de estresse faz com que os fãs girem até 55 dB, o que é mais alto que a concorrência, mas não é surpreendente dado o fator de forma fina.
No Modo Criador, o volume cai dos 55 dB do Modo de Jogo para cerca de 50 dB no teste de estresse. Isto aproxima o Aero da concorrência, que tem um nível de ruído semelhante. Somente o Meeting Mode tenta manter o dispositivo realmente silencioso.
Barulho
| Ocioso |
| 23 / 23 / 33.64 dB |
| Carga |
| 51.49 / 55.24 dB |
 | ||
30 dB silencioso 40 dB(A) audível 50 dB(A) ruidosamente alto |
||
min: | ||
| Gigabyte AERO 16 OLED BSF GeForce RTX 4070 Laptop GPU, i9-13900H, Gigabyte AG470S1TB-SI B10 | Gigabyte Aero 16 YE5 GeForce RTX 3080 Ti Laptop GPU, i9-12900HK, Phison ESR01TBMFCT | Razer Blade 18 RTX 4070 GeForce RTX 4070 Laptop GPU, i9-13950HX, SSSTC CA6-8D1024 | Asus ZenBook Pro 16X OLED UX7602ZM-ME115W GeForce RTX 3060 Laptop GPU, i9-12900H, Samsung PM9A1 MZVL21T0HCLR | Asus TUF Gaming A16 FA617 Radeon RX 7600S, R7 7735HS, Micron 2400 MTFDKBA1T0QFM | MSI CreatorPro Z16P B12UKST RTX A3000 Laptop GPU, i7-12700H, Samsung PM9A1 MZVL21T0HCLR | |
|---|---|---|---|---|---|---|
| Noise | -7% | 8% | -1% | 5% | 4% | |
| desligado / ambiente * (dB) | 23 | 25 -9% | 23.5 -2% | 26 -13% | 24 -4% | 24.1 -5% |
| Idle Minimum * (dB) | 23 | 30 -30% | 23.8 -3% | 26 -13% | 24 -4% | 27.1 -18% |
| Idle Average * (dB) | 23 | 32 -39% | 23.8 -3% | 26 -13% | 25 -9% | 27.1 -18% |
| Idle Maximum * (dB) | 33.64 | 33 2% | 26.8 20% | 26 23% | 28 17% | 27.1 19% |
| Load Average * (dB) | 51.49 | 45 13% | 37.3 28% | 48 7% | 42 18% | 42.9 17% |
| Witcher 3 ultra * (dB) | 55.27 | 50 10% | 48 13% | 50 10% | 44 20% | |
| Load Maximum * (dB) | 55.24 | 52 6% | 53.5 3% | 54.6 1% | 50 9% | 47 15% |
* ... menor é melhor
Temperatura
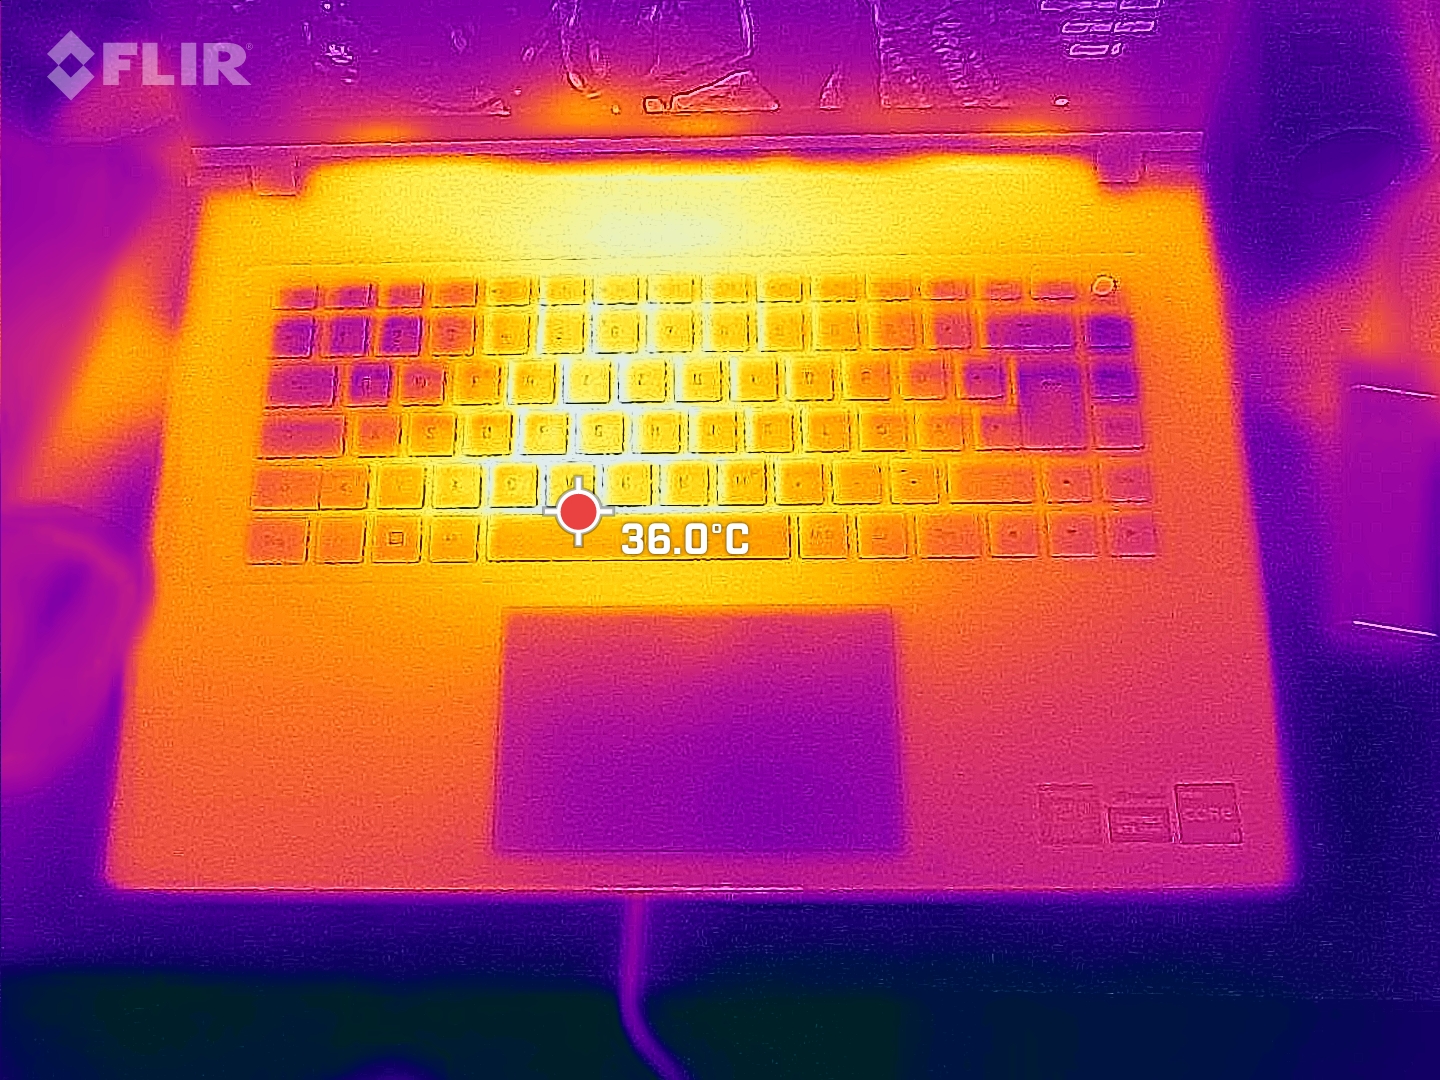
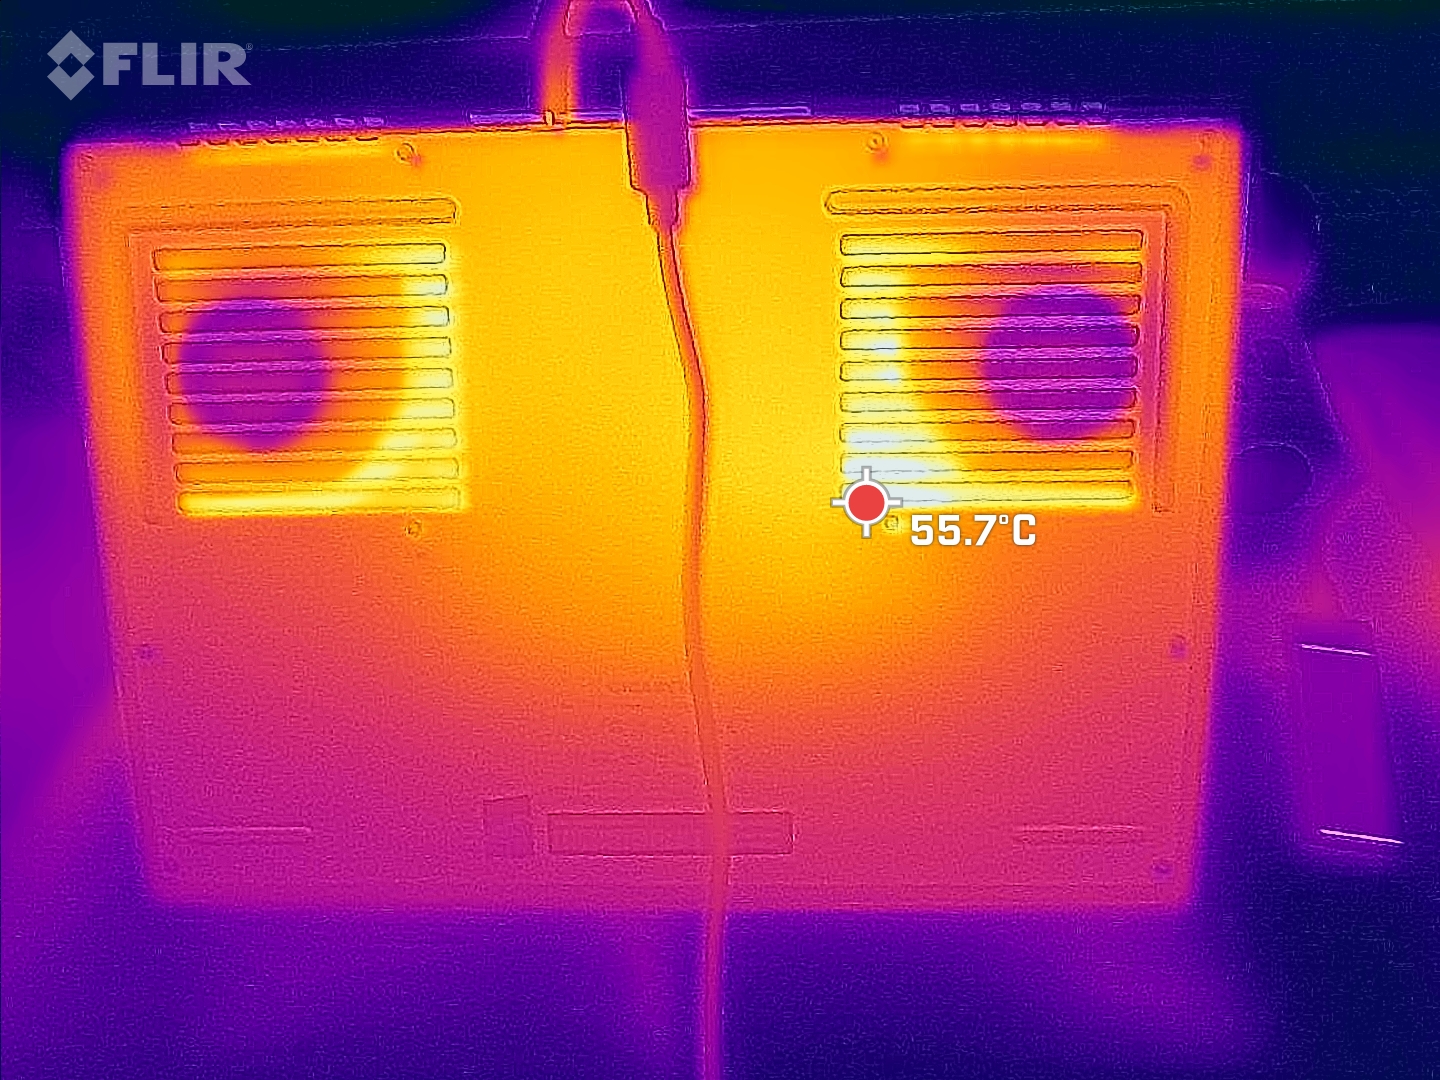
Apesar de seu fino caso, o Aero tem um bom desempenho neste campo. Os ventiladores relativamente altos e a caixa metálica dissipam bem o calor, de modo que os pontos quentes na parte traseira permanecem bem abaixo de 50 °C. O antecessor e vários concorrentes têm um desempenho pior aqui. Os descansos para as palmas das mãos estão sempre dentro de uma faixa confortável.
(±) A temperatura máxima no lado superior é 41 °C / 106 F, em comparação com a média de 40.4 °C / 105 F , variando de 21.2 a 68.8 °C para a classe Gaming.
(-) A parte inferior aquece até um máximo de 47 °C / 117 F, em comparação com a média de 43.2 °C / 110 F
(+) Em uso inativo, a temperatura média para o lado superior é 21.8 °C / 71 F, em comparação com a média do dispositivo de 33.9 °C / ### class_avg_f### F.
(±) Jogando The Witcher 3, a temperatura média para o lado superior é 36.8 °C / 98 F, em comparação com a média do dispositivo de 33.9 °C / ## #class_avg_f### F.
(+) Os apoios para as mãos e o touchpad estão atingindo a temperatura máxima da pele (33 °C / 91.4 F) e, portanto, não estão quentes.
(-) A temperatura média da área do apoio para as mãos de dispositivos semelhantes foi 28.8 °C / 83.8 F (-4.2 °C / -7.6 F).
| Gigabyte AERO 16 OLED BSF Intel Core i9-13900H, NVIDIA GeForce RTX 4070 Laptop GPU | Gigabyte Aero 16 YE5 Intel Core i9-12900HK, NVIDIA GeForce RTX 3080 Ti Laptop GPU | Razer Blade 18 RTX 4070 Intel Core i9-13950HX, NVIDIA GeForce RTX 4070 Laptop GPU | Asus ZenBook Pro 16X OLED UX7602ZM-ME115W Intel Core i9-12900H, NVIDIA GeForce RTX 3060 Laptop GPU | Asus TUF Gaming A16 FA617 AMD Ryzen 7 7735HS, AMD Radeon RX 7600S | MSI CreatorPro Z16P B12UKST Intel Core i7-12700H, NVIDIA RTX A3000 Laptop GPU | |
|---|---|---|---|---|---|---|
| Heat | -31% | -14% | -17% | -45% | -26% | |
| Maximum Upper Side * (°C) | 41 | 49 -20% | 39.2 4% | 32 22% | 54 -32% | 56.3 -37% |
| Maximum Bottom * (°C) | 47 | 55 -17% | 35.6 24% | 41.6 11% | 47 -0% | 68.3 -45% |
| Idle Upper Side * (°C) | 23 | 33 -43% | 31.8 -38% | 32.6 -42% | 40 -74% | 25.2 -10% |
| Idle Bottom * (°C) | 23 | 33 -43% | 33.2 -44% | 36 -57% | 40 -74% | 25.9 -13% |
* ... menor é melhor
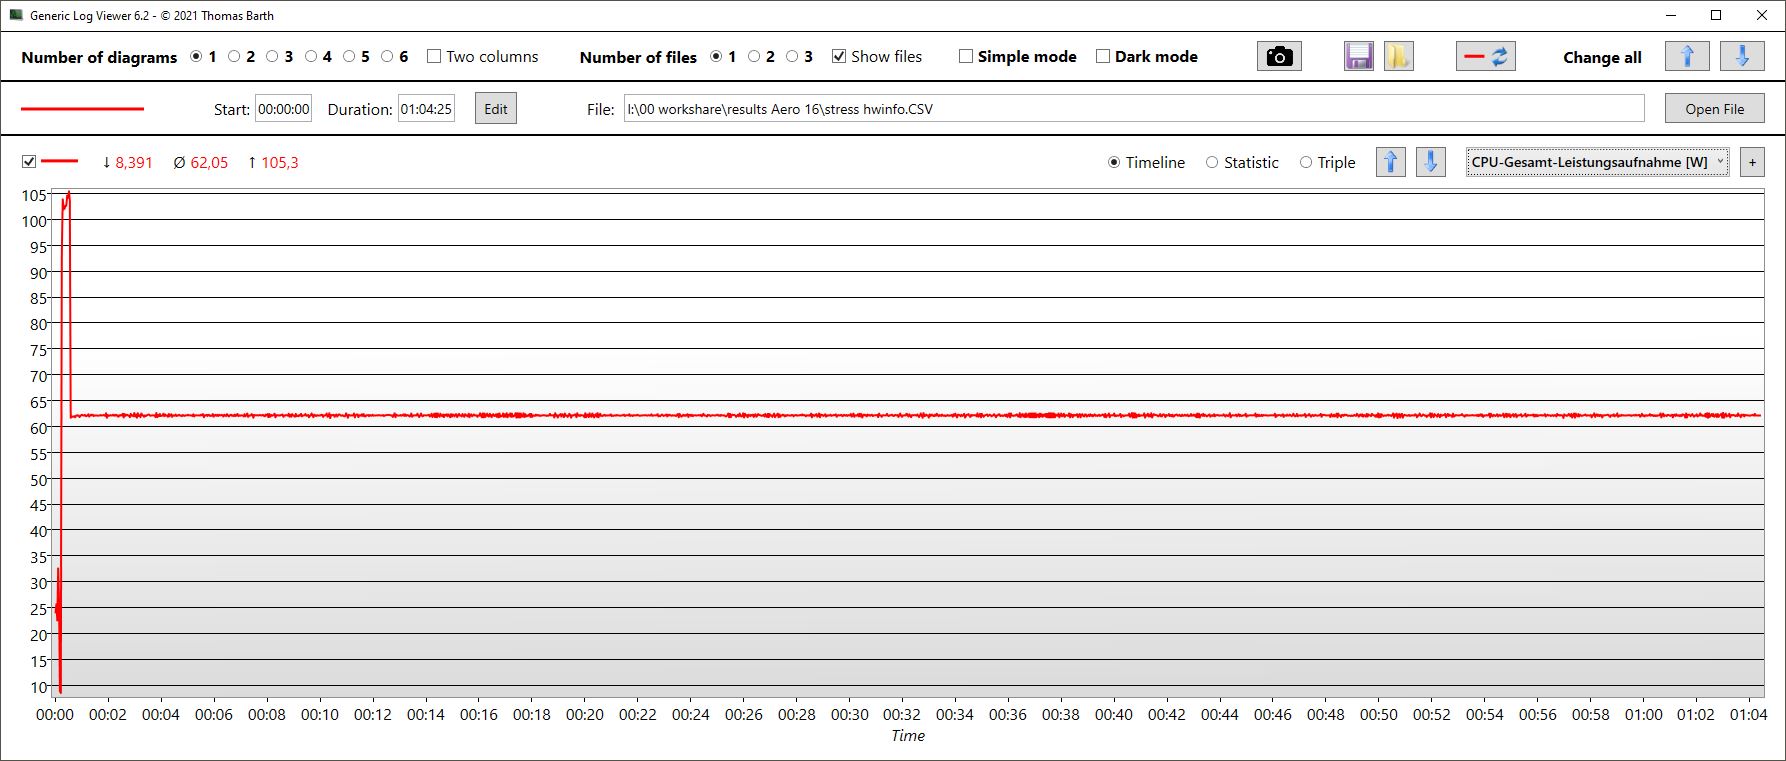
Teste de estresse
Em testes de estresse, a CPU é capaz de consumir 105 W em rajadas curtas antes de cair para uma constante de 62 W após alguns segundos. Ao mesmo tempo, o relógio começa brevemente em 4,1 GHz antes de cair para cerca de 2,9 GHz. No entanto, isto não permanece constante, mas flutua com a temperatura. Quando as temperaturas centrais atingem 90 °C, o relógio é ligeiramente estrangulado, após o que as temperaturas caem novamente. A pouco mais de 80 °C, a velocidade do relógio volta a subir ligeiramente, etc.
O relógio da GPU também flutua continuamente entre 1,7 e 2,4 GHz. Em contraste, o relógio de memória sobe e desce de 2 GHz para 1,75 GHz. A mesma forma de onda é evidente na temperatura da GPU, que flutua aproximadamente entre 70 e 80 °C. O consumo de energia nunca atinge seu máximo no teste de estresse, mas paira apenas em torno de 67 W.
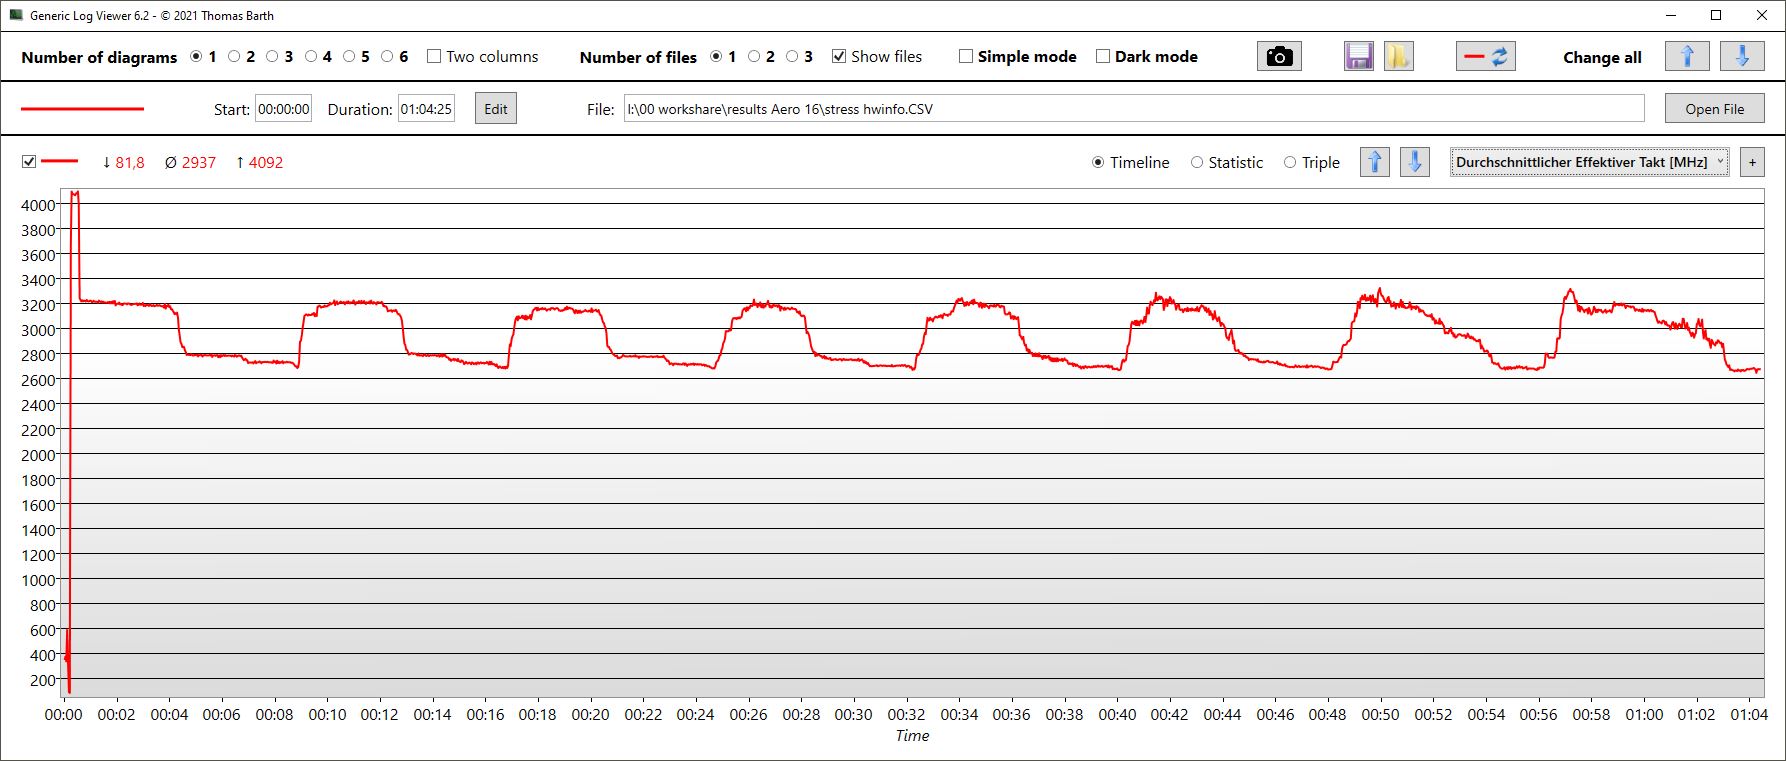
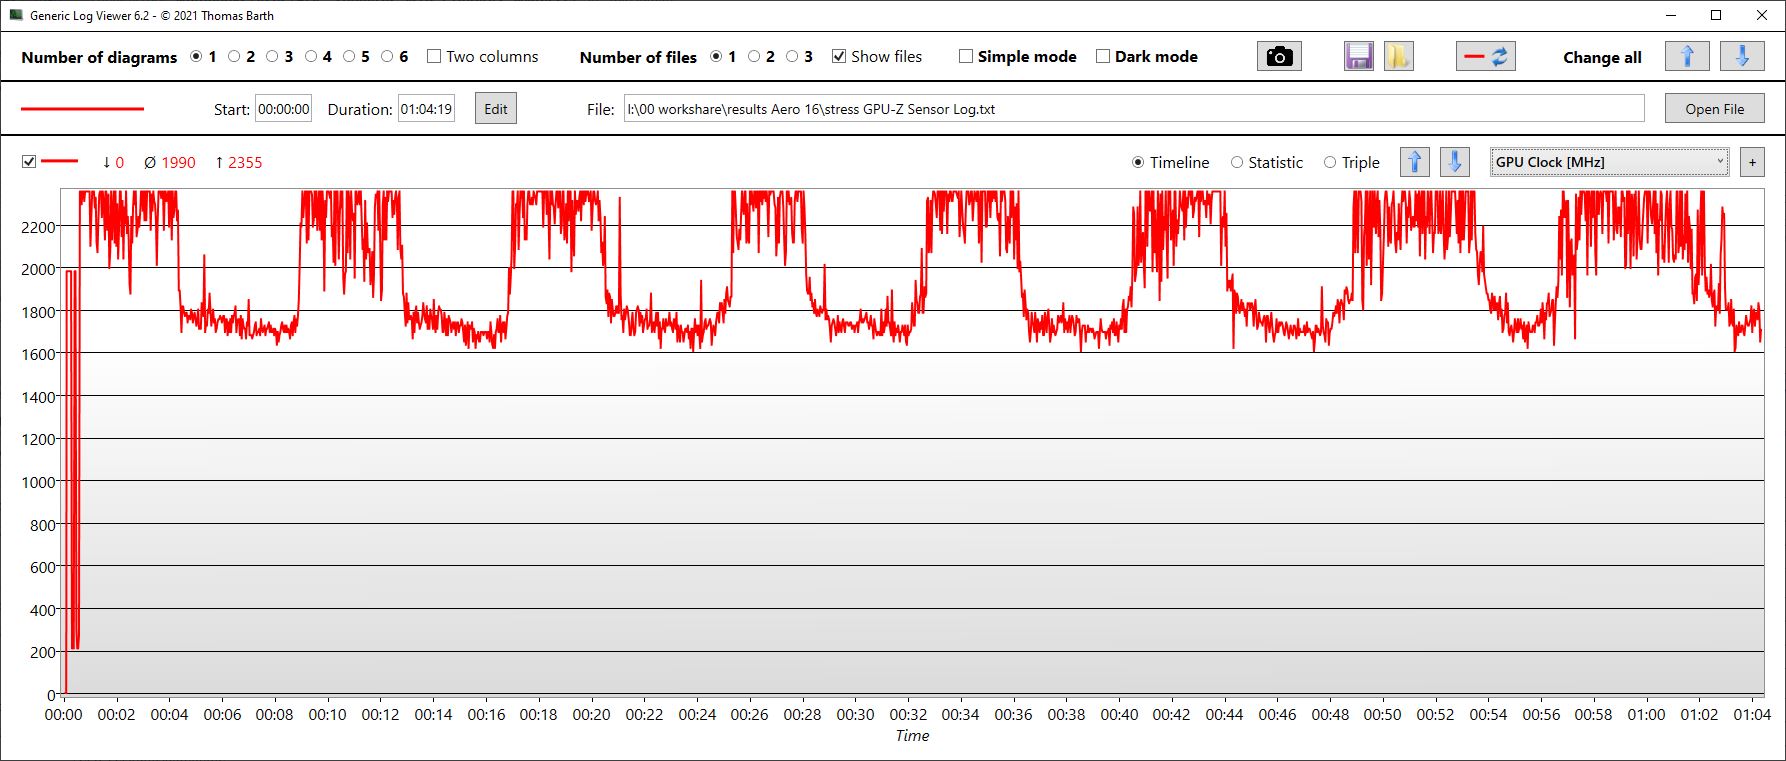
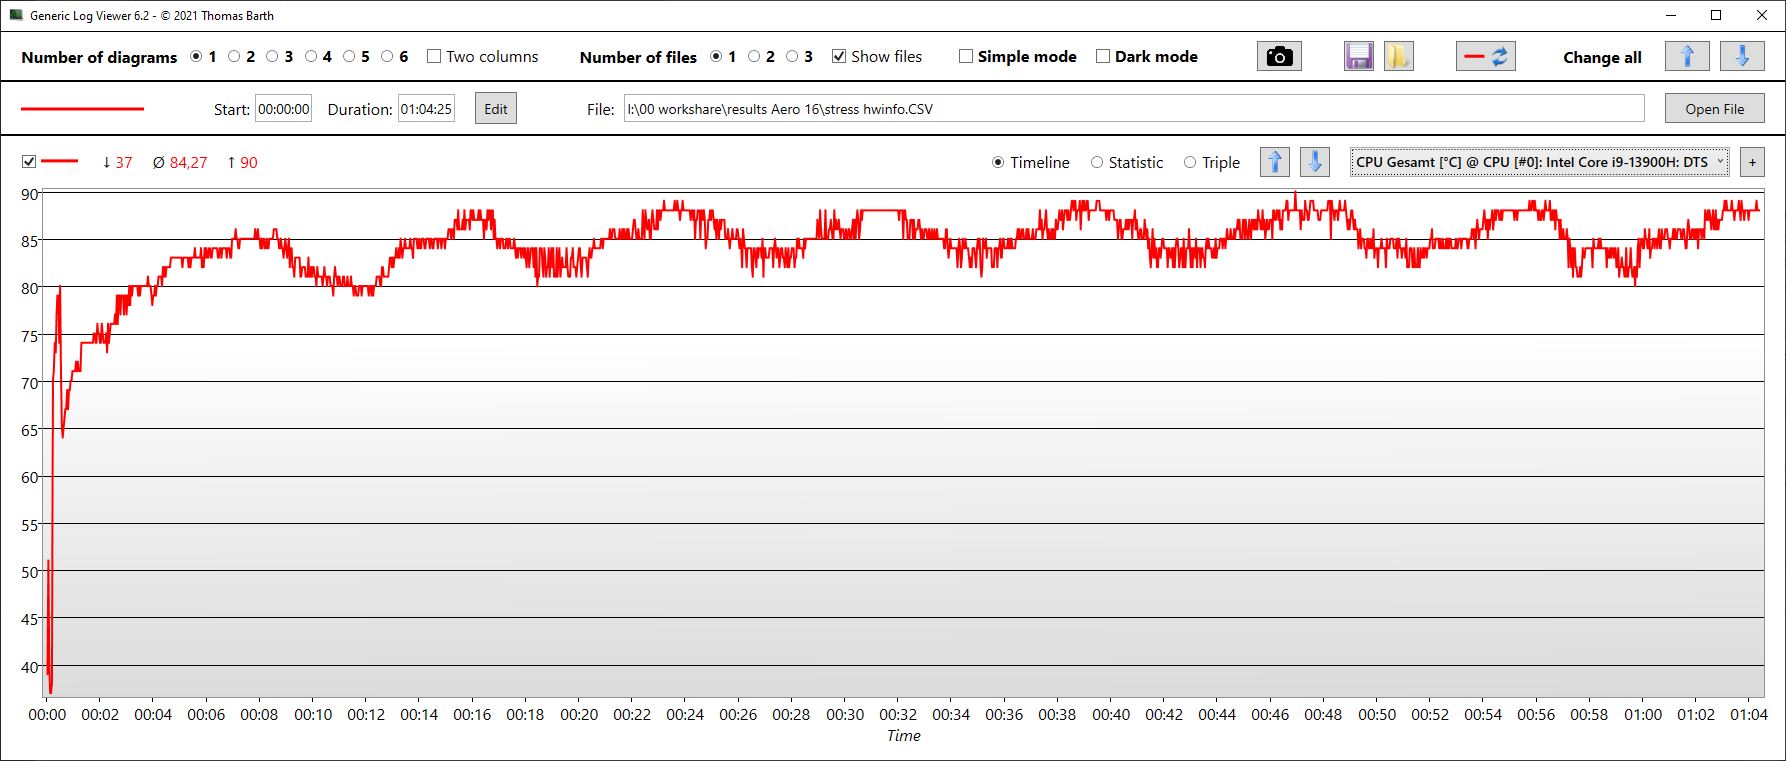
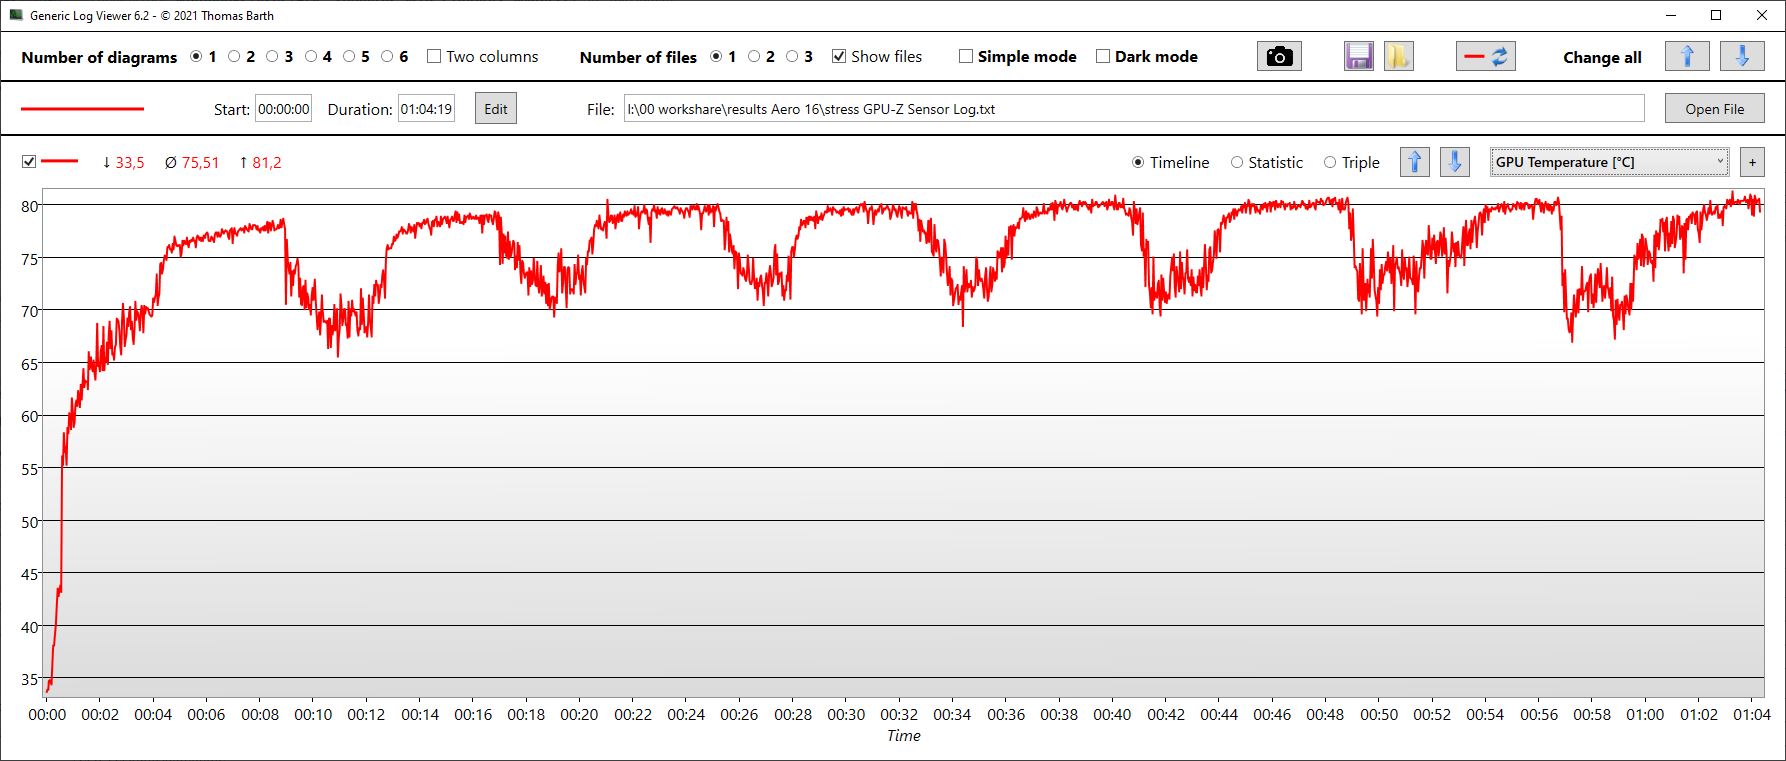

| Relógio CPU (GHz) | Relógio GPU (MHz) | Temperatura média da CPU (°C) | Temperatura média da GPU (°C) | |
| Prime95 + FurMark Stress | 2,9 | 1.990 | 84 | 76 |
| Witcher 3 Estresse | 1,8 | 2.350 | 69 | 80 |
Oradores
A Gigabyte instalou dois alto-falantes estéreo de 2 W cada, o que é geralmente padrão. Infelizmente, os alto-falantes não são realmente convincentes em nenhuma disciplina: eles são razoavelmente altos, mas são incapazes de fornecer médios ou altos bem balanceados.
Além das saídas digitais, o fone de ouvido de 3,5 mm pode ser usado para dispositivos externos.
Gigabyte AERO 16 OLED BSF análise de áudio
(±) | o volume do alto-falante é médio, mas bom (###valor### dB)
Graves 100 - 315Hz
(-) | quase nenhum baixo - em média 15.6% menor que a mediana
(±) | a linearidade dos graves é média (14.3% delta para a frequência anterior)
Médios 400 - 2.000 Hz
(±) | médios mais altos - em média 12.8% maior que a mediana
(-) | médios não são lineares (16.8% delta para frequência anterior)
Altos 2 - 16 kHz
(±) | máximos mais altos - em média 11% maior que a mediana
(-) | os máximos não são lineares (16.3% delta da frequência anterior)
Geral 100 - 16.000 Hz
(-) | o som geral não é linear (48.4% diferença em relação à mediana)
Comparado com a mesma classe
» 100% de todos os dispositivos testados nesta classe foram melhores, 0% semelhantes, 0% piores
» O melhor teve um delta de 6%, a média foi 18%, o pior foi 132%
Comparado com todos os dispositivos testados
» 96% de todos os dispositivos testados foram melhores, 0% semelhantes, 4% piores
» O melhor teve um delta de 4%, a média foi 23%, o pior foi 134%
Asus ZenBook Pro 16X OLED UX7602ZM-ME115W análise de áudio
(+) | os alto-falantes podem tocar relativamente alto (###valor### dB)
Graves 100 - 315Hz
(-) | quase nenhum baixo - em média 16% menor que a mediana
(±) | a linearidade dos graves é média (7.9% delta para a frequência anterior)
Médios 400 - 2.000 Hz
(+) | médios equilibrados - apenas 1.8% longe da mediana
(+) | médios são lineares (3.8% delta para frequência anterior)
Altos 2 - 16 kHz
(±) | máximos mais altos - em média 6.2% maior que a mediana
(+) | os máximos são lineares (2.8% delta da frequência anterior)
Geral 100 - 16.000 Hz
(+) | o som geral é linear (13.3% diferença em relação à mediana)
Comparado com a mesma classe
» 28% de todos os dispositivos testados nesta classe foram melhores, 4% semelhantes, 68% piores
» O melhor teve um delta de 5%, a média foi 17%, o pior foi 45%
Comparado com todos os dispositivos testados
» 14% de todos os dispositivos testados foram melhores, 3% semelhantes, 83% piores
» O melhor teve um delta de 4%, a média foi 23%, o pior foi 134%
Gerenciamento de energia - Eficiente RTX 4070 em Aero 16
Consumo de energia
O consumo de energia é muito bom, especialmente em comparação com a geração anterior. No predecessor, o consumidor faminto de energia RTX 3080 Ti também foi estrangulada a 105 W. Nos benchmarks de jogo, você pode ver que o velho cartão tem um desempenho notavelmente pior ao mesmo tempo em que consome significativamente mais. A nova geração RTX 40x é claramente muito mais eficiente. Mais informações sobre o a eficiência da nova geração RTX 40x pode ser encontrada aqui.
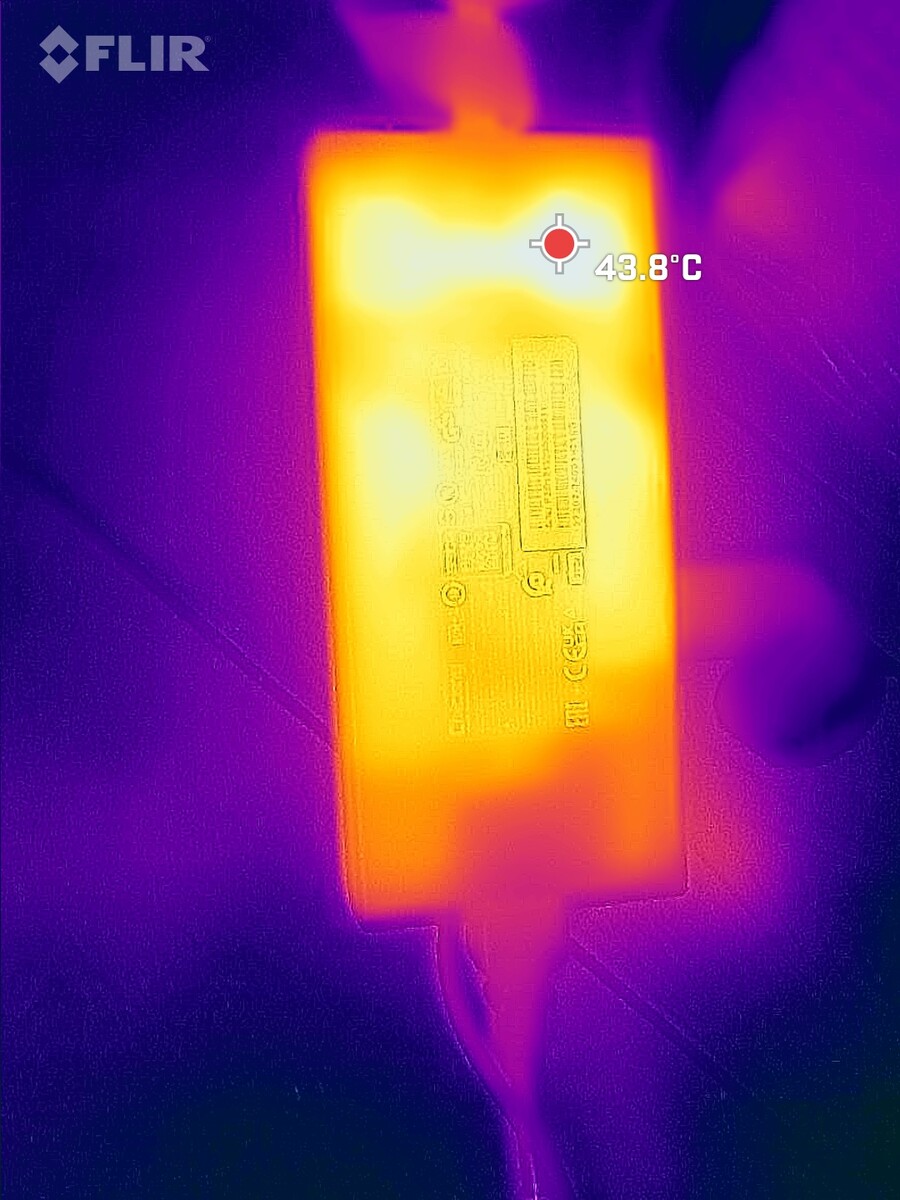
Quando se joga com Witcher 3, o consumo médio é de cerca de 158 W. O fornecimento de energia padrão médio de Chicony é avaliado em 240 W e lida bem com picos de carga de até 192 W em testes de estresse.
| desligado | |
| Ocioso | |
| Carga |
|
Key:
min: | |
| Gigabyte AERO 16 OLED BSF i9-13900H, GeForce RTX 4070 Laptop GPU, Gigabyte AG470S1TB-SI B10, OLED, 3840x2400, 16" | Gigabyte Aero 16 YE5 i9-12900HK, GeForce RTX 3080 Ti Laptop GPU, Phison ESR01TBMFCT, AMOLED, 3840x2400, 16" | Razer Blade 18 RTX 4070 i9-13950HX, GeForce RTX 4070 Laptop GPU, SSSTC CA6-8D1024, IPS, 2560x1600, 18" | Asus ZenBook Pro 16X OLED UX7602ZM-ME115W i9-12900H, GeForce RTX 3060 Laptop GPU, Samsung PM9A1 MZVL21T0HCLR, OLED, 3840x2400, 16" | Asus TUF Gaming A16 FA617 R7 7735HS, Radeon RX 7600S, Micron 2400 MTFDKBA1T0QFM, IPS-Level, 1920x1200, 16" | MSI CreatorPro Z16P B12UKST i7-12700H, RTX A3000 Laptop GPU, Samsung PM9A1 MZVL21T0HCLR, IPS, 2560x1600, 16" | Média NVIDIA GeForce RTX 4070 Laptop GPU | Média da turma Gaming | |
|---|---|---|---|---|---|---|---|---|
| Power Consumption | -64% | -84% | 4% | 14% | 2% | -16% | -24% | |
| Idle Minimum * (Watt) | 11.8 | 26 -120% | 24.5 -108% | 11.1 6% | 8 32% | 10.8 8% | 13.2 ? -12% | 13 ? -10% |
| Idle Average * (Watt) | 16.1 | 30 -86% | 34.1 -112% | 11.4 29% | 11 32% | 16.3 -1% | 18.2 ? -13% | 19 ? -18% |
| Idle Maximum * (Watt) | 17 | 37 -118% | 47.7 -181% | 14.4 15% | 16 6% | 16.9 1% | 24.6 ? -45% | 24.6 ? -45% |
| Load Average * (Watt) | 100.6 | 127 -26% | 140 -39% | 137.4 -37% | 97 4% | 111.7 -11% | 97 ? 4% | 110.7 ? -10% |
| Witcher 3 ultra * (Watt) | 158 | 176 -11% | 202 -28% | 136 14% | 161.5 -2% | 152.1 4% | ||
| Load Maximum * (Watt) | 192 | 236 -23% | 261 -36% | 197 -3% | 168 12% | 177.4 8% | 221 ? -15% | 259 ? -35% |
* ... menor é melhor
Power Consumption Witcher 3 / Stress Test
Power Consumption with an External Monitor
Vida útil da bateria
Os tempos de funcionamento da bateria dependem muito do modo selecionado, e a brilhante tela OLED também drena um pouco de suco. O laptop ainda tem uma bateria de 88 Wh. Devido ao menor consumo geral, é possível obter tempos de funcionamento mais longos com um modo de economia de energia bem escolhido.
Ao assistir a um filme ou navegar na web com brilho reduzido, obtemos pouco menos de 7,5 horas cada um, um bom valor. O Gigabyte ativou automaticamente o modo de economia de energia aqui. Com brilho máximo, o tempo de execução cai para 5,5 horas.
| Gigabyte AERO 16 OLED BSF i9-13900H, GeForce RTX 4070 Laptop GPU, 88 Wh | Alienware x15 R2 P111F i9-12900H, GeForce RTX 3080 Ti Laptop GPU, 87 Wh | MSI Creator Z16P B12UHST i9-12900H, GeForce RTX 3080 Ti Laptop GPU, 90 Wh | Asus ROG Zephyrus Duo 16 GX650RX R9 6900HX, GeForce RTX 3080 Ti Laptop GPU, 90 Wh | Acer Predator Triton 500 SE PT516-52s-70KX i7-12700H, GeForce RTX 3080 Ti Laptop GPU, 99.98 Wh | Gigabyte Aero 16 YE5 i9-12900HK, GeForce RTX 3080 Ti Laptop GPU, 99 Wh | Média da turma Gaming | |
|---|---|---|---|---|---|---|---|
| Duração da bateria | -20% | -35% | -7% | -3% | -13% | -7% | |
| H.264 (h) | 7.4 | 5.8 -22% | 9.3 26% | 8.2 11% | 7.5 1% | 8.32 ? 12% | |
| WiFi v1.3 (h) | 7.5 | 6 -20% | 5.2 -31% | 7.8 4% | 5.7 -24% | 6.4 -15% | 7.11 ? -5% |
| Load (h) | 2.1 | 1 -52% | 1 -52% | 2.2 5% | 1.6 -24% | 1.502 ? -28% | |
| Reader / Idle (h) | 12.5 | 8.9 | 8.27 ? |
Pro
Contra
Veredicto - Um passo mais perto do objetivo

Até agora, os laptops de alto desempenho têm sido frequentemente grandes, barulhentos e quentes, tornando-os adequados tanto para jogadores quanto para criativos, dependendo do design. No futuro, o ideal seria que os laptops fossem silenciosos, frios e, se necessário, pequenos e móveis. O Aero é um bom passo nessa direção, mesmo que a tecnologia atual esteja longe de ser a ideal.
O Aero tem um desempenho melhor do que seu antecessor mais grosso com o RTX 3080 Ti (também apenas 105 W), mas seu eficiente RTX 4070 consome visivelmente menos e permanece mais frio, embora não mais silencioso. Se você estiver procurando discreto, você se beneficiará dos muitos modos de potência e opções de configuração manual no Centro de Controle. Isto permite que você adapte o desempenho e as emissões do Aero à respectiva situação ou ambiente. Como o Aero atual pontua melhor na categoria "Jogos" (88%) do que na categoria "Multimídia" (86%), estamos classificando-o como um notebook de jogos.
Os jogadores podem ficar incomodados com o fato de que o visor OLED, de outra forma grande, só pode operar a 60 Hz. Caso contrário, todos os outros pontos de crítica, tais como os alto-falantes desequilibrados, são relativamente suaves.
O Aero 16 OLED não só tem uma grande tela, mas também é particularmente fino e, graças ao eficiente RTX 4070, também poderoso e, no entanto, comparativamente econômico e fresco.
A concorrência nunca dorme e também está explorando as possibilidades da nova geração RTX 40x. Até agora, revisamos apenas algumas, de modo que as alternativas ainda são raras.
Preço e Disponibilidade
Os compradores interessados podem verificar diretamente através de página oficial de produtos da Gigabyte aqui, onde você clica em Comprar e seleciona sua região e país correspondente a partir da lista suspensa. Você então será encaminhado a uma lista de lojas on-line que podem listar o laptop em seu país.
Nos EUA, por exemplo, a Amazon lista as duas configurações do Gigabyte Aero 16 OLED, ou seja, uma com uma i9-13900H e 32 GB de RAM e a outra com uma i7-13700H e 16 GB de RAM. Ambas são US$2.299,00 e US$2.099,00respectivamente. Naturalmente, isto não é representativo da disponibilidade global, que provavelmente flutuará dependendo de fatores regionais e de transporte.
Os preços são a partir de 12.03.2023 e estão sujeitos a mudanças.
Gigabyte AERO 16 OLED BSF
- 03/13/2023 v7 (old)
Christian Hintze
Transparência
A seleção dos dispositivos a serem analisados é feita pela nossa equipe editorial. A amostra de teste foi fornecida ao autor como empréstimo pelo fabricante ou varejista para fins desta revisão. O credor não teve influência nesta revisão, nem o fabricante recebeu uma cópia desta revisão antes da publicação. Não houve obrigação de publicar esta revisão. Como empresa de mídia independente, a Notebookcheck não está sujeita à autoridade de fabricantes, varejistas ou editores.
É assim que o Notebookcheck está testando
Todos os anos, o Notebookcheck analisa de forma independente centenas de laptops e smartphones usando procedimentos padronizados para garantir que todos os resultados sejam comparáveis. Desenvolvemos continuamente nossos métodos de teste há cerca de 20 anos e definimos padrões da indústria no processo. Em nossos laboratórios de teste, equipamentos de medição de alta qualidade são utilizados por técnicos e editores experientes. Esses testes envolvem um processo de validação em vários estágios. Nosso complexo sistema de classificação é baseado em centenas de medições e benchmarks bem fundamentados, o que mantém a objetividade.Price comparison

