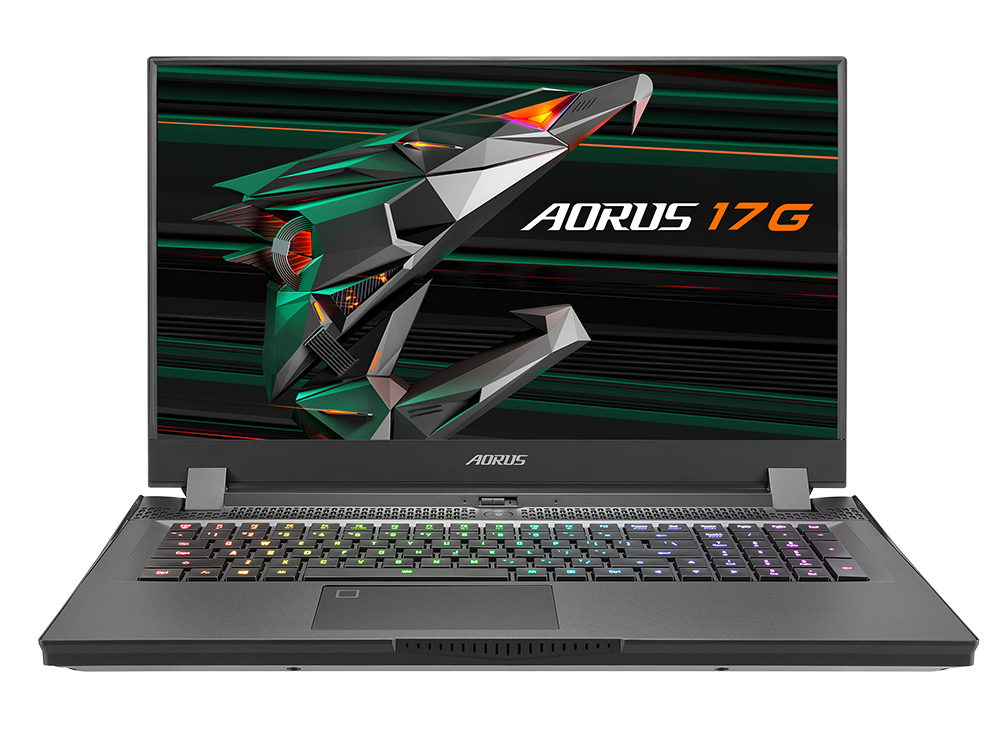
Aorus 17G YD em revisão: Laptop de jogo alto com um bom teclado mecânico

Gigabyte apresenta um laptop de jogo atualizado no formato de 17,3 polegadas com o Aorus 17G YD. Este é o modelo de irmão idêntico doAorus 17G XBque já revisamos. Os concorrentes incluem dispositivos como o Asus Strix Scar 17 G733QSA, oLenovo Legion 7 16ACHg6, oSchenker XMG Neo 17 (Início de 2021), oAlienware m17 R4, e o MSI GE76 Raider 10UH.
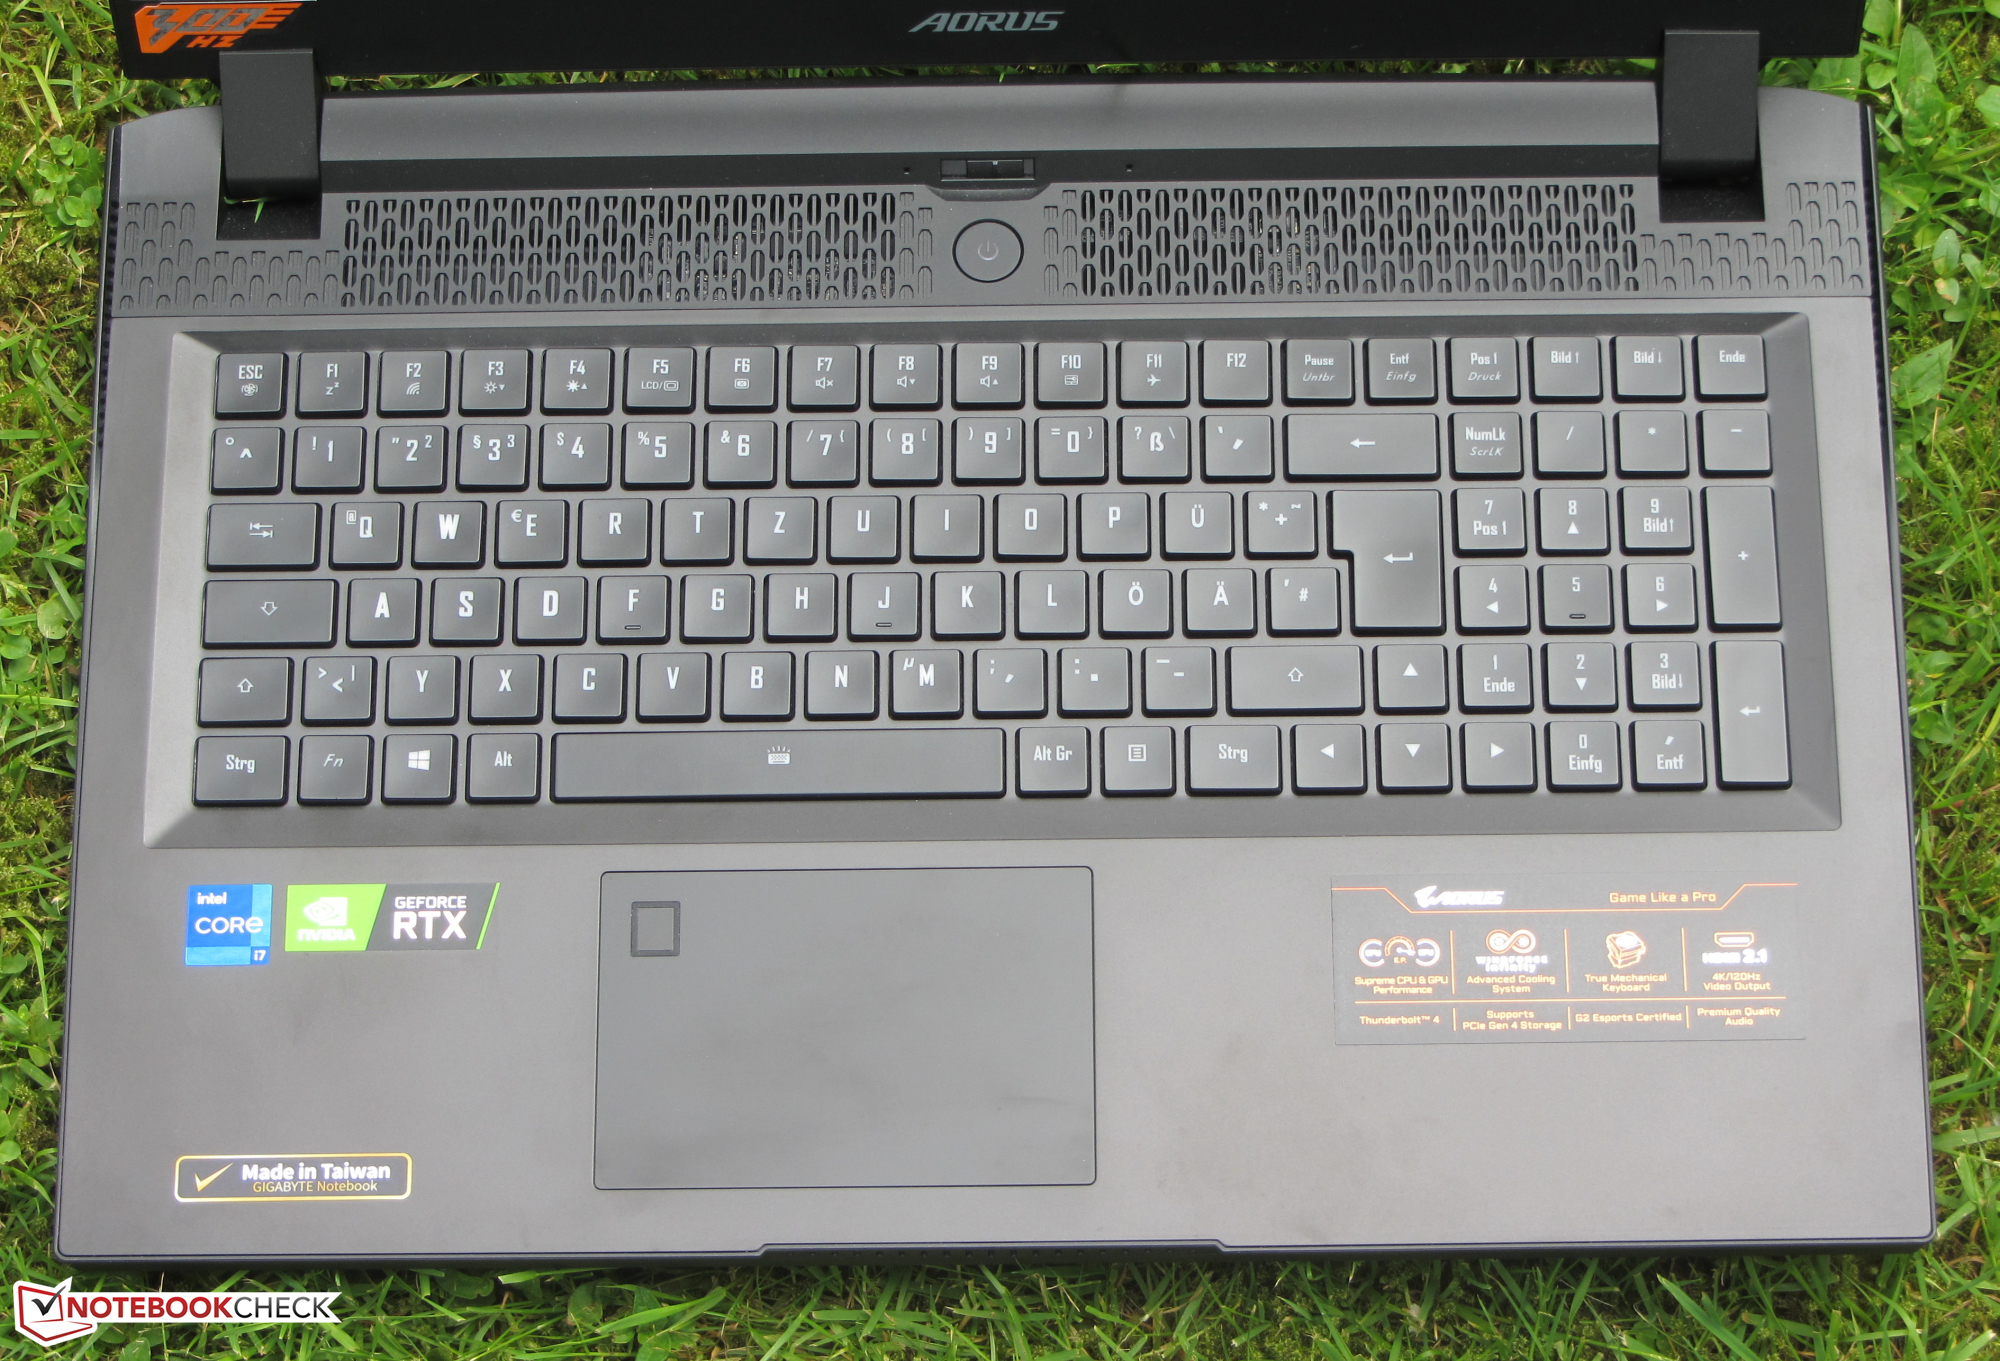
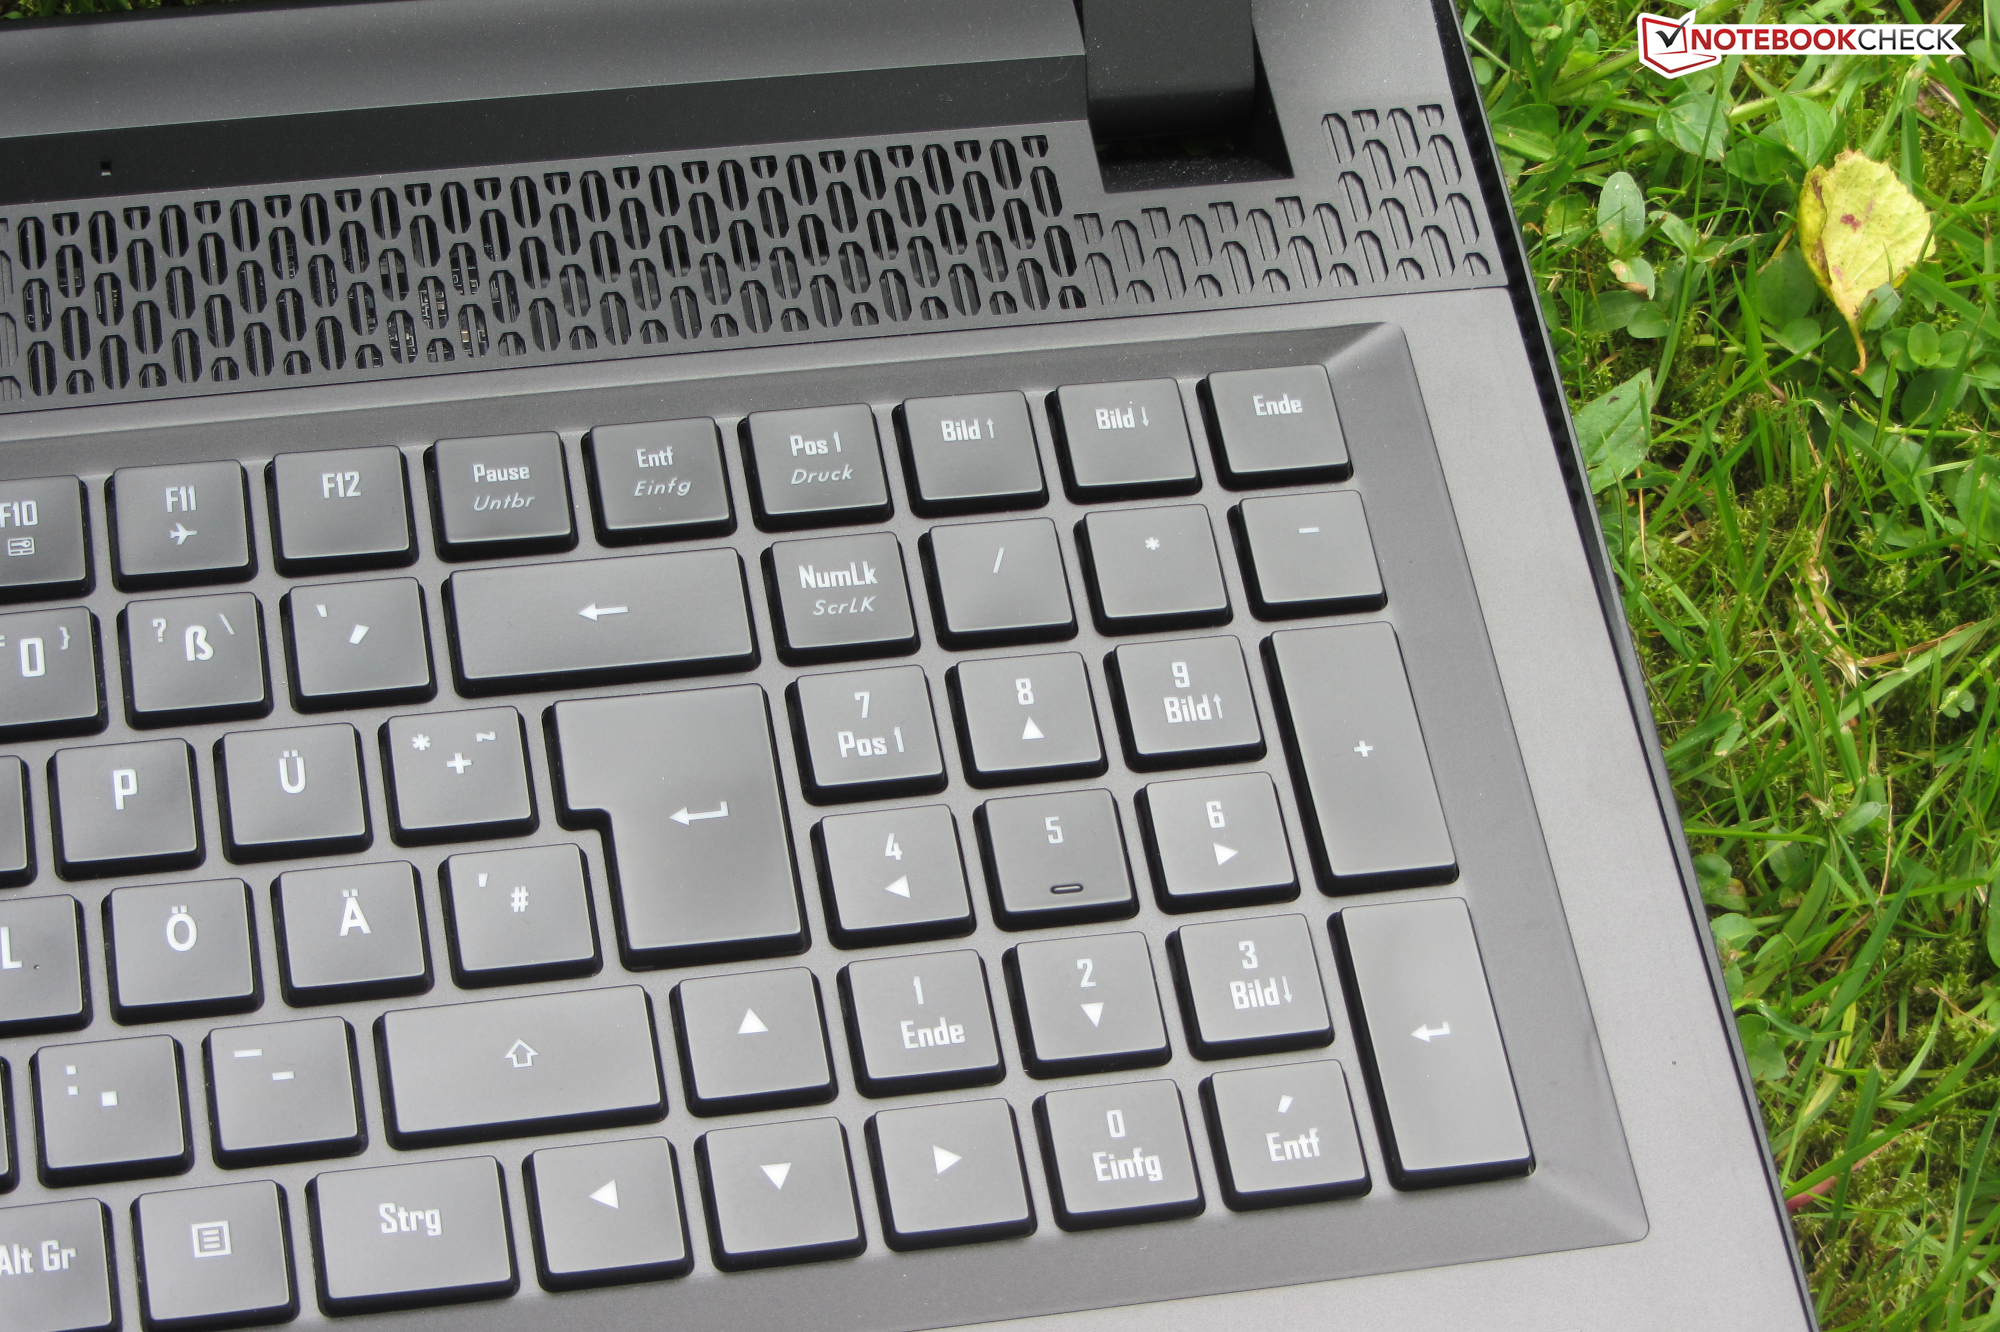
Como os dois modelos Aorus 17G são idênticos na construção, não iremos mais longe no caso, na conectividade, nos dispositivos de entrada e nos alto-falantes. As informações correspondentes podem ser encontradas narevisão do Aorus 17G XB emBreve Análise do Portátil Aorus 17G XB: O teclado mecânico é ótimo .
Possible contenders in comparison
Avaliação | Data | Modelo | Peso | Altura | Size | Resolução | Preço |
|---|---|---|---|---|---|---|---|
| 86 % v7 (old) | 06/2021 | Aorus 17G YD i7-11800H, GeForce RTX 3080 Laptop GPU | 2.8 kg | 26 mm | 17.30" | 1920x1080 | |
| 86.6 % v7 (old) | 05/2021 | Asus Strix Scar 17 G733QSA-XS99 R9 5900HX, GeForce RTX 3080 Laptop GPU | 2.8 kg | 28.3 mm | 17.30" | 1920x1080 | |
| 88.1 % v7 (old) | 06/2021 | Lenovo Legion 7 16ACHg6 R9 5900HX, GeForce RTX 3080 Laptop GPU | 2.5 kg | 23.5 mm | 16.00" | 2560x1600 | |
| 85.1 % v7 (old) | 01/2021 | Schenker XMG Neo 17 (Early 2021, RTX 3070, 5800H) R7 5800H, GeForce RTX 3070 Laptop GPU | 2.5 kg | 27 mm | 17.30" | 2560x1440 | |
| 85.3 % v7 (old) | 04/2021 | Alienware m17 R4 i9-10980HK, GeForce RTX 3080 Laptop GPU | 3 kg | 22 mm | 17.30" | 1920x1080 | |
| 87.1 % v7 (old) | 03/2021 | MSI GE76 Raider 10UH i7-10870H, GeForce RTX 3080 Laptop GPU | 3 kg | 27.4 mm | 17.30" | 1920x1080 |
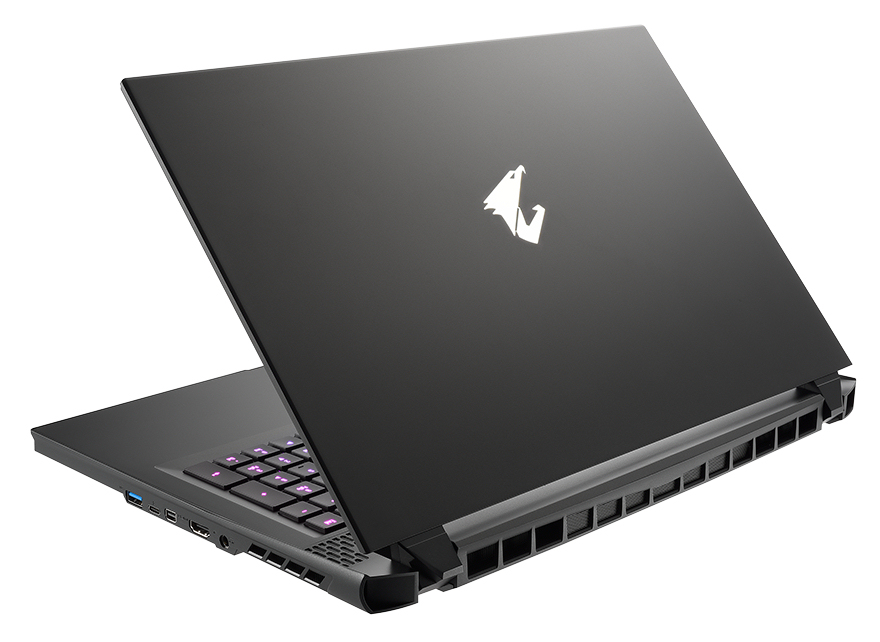

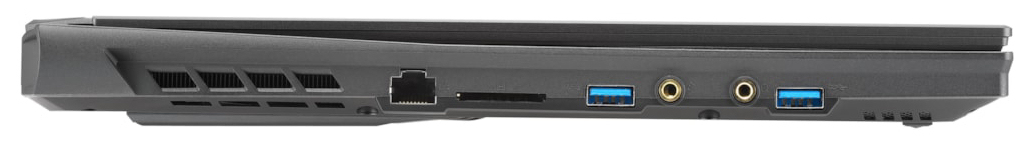
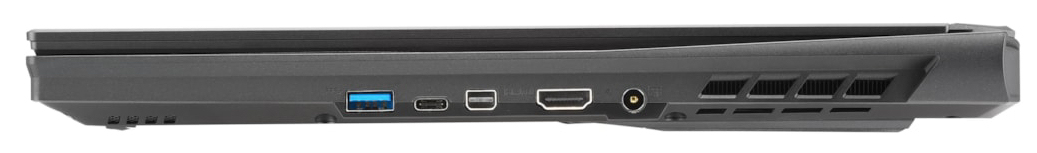
Conectividade - Agora com Thunderbolt 4
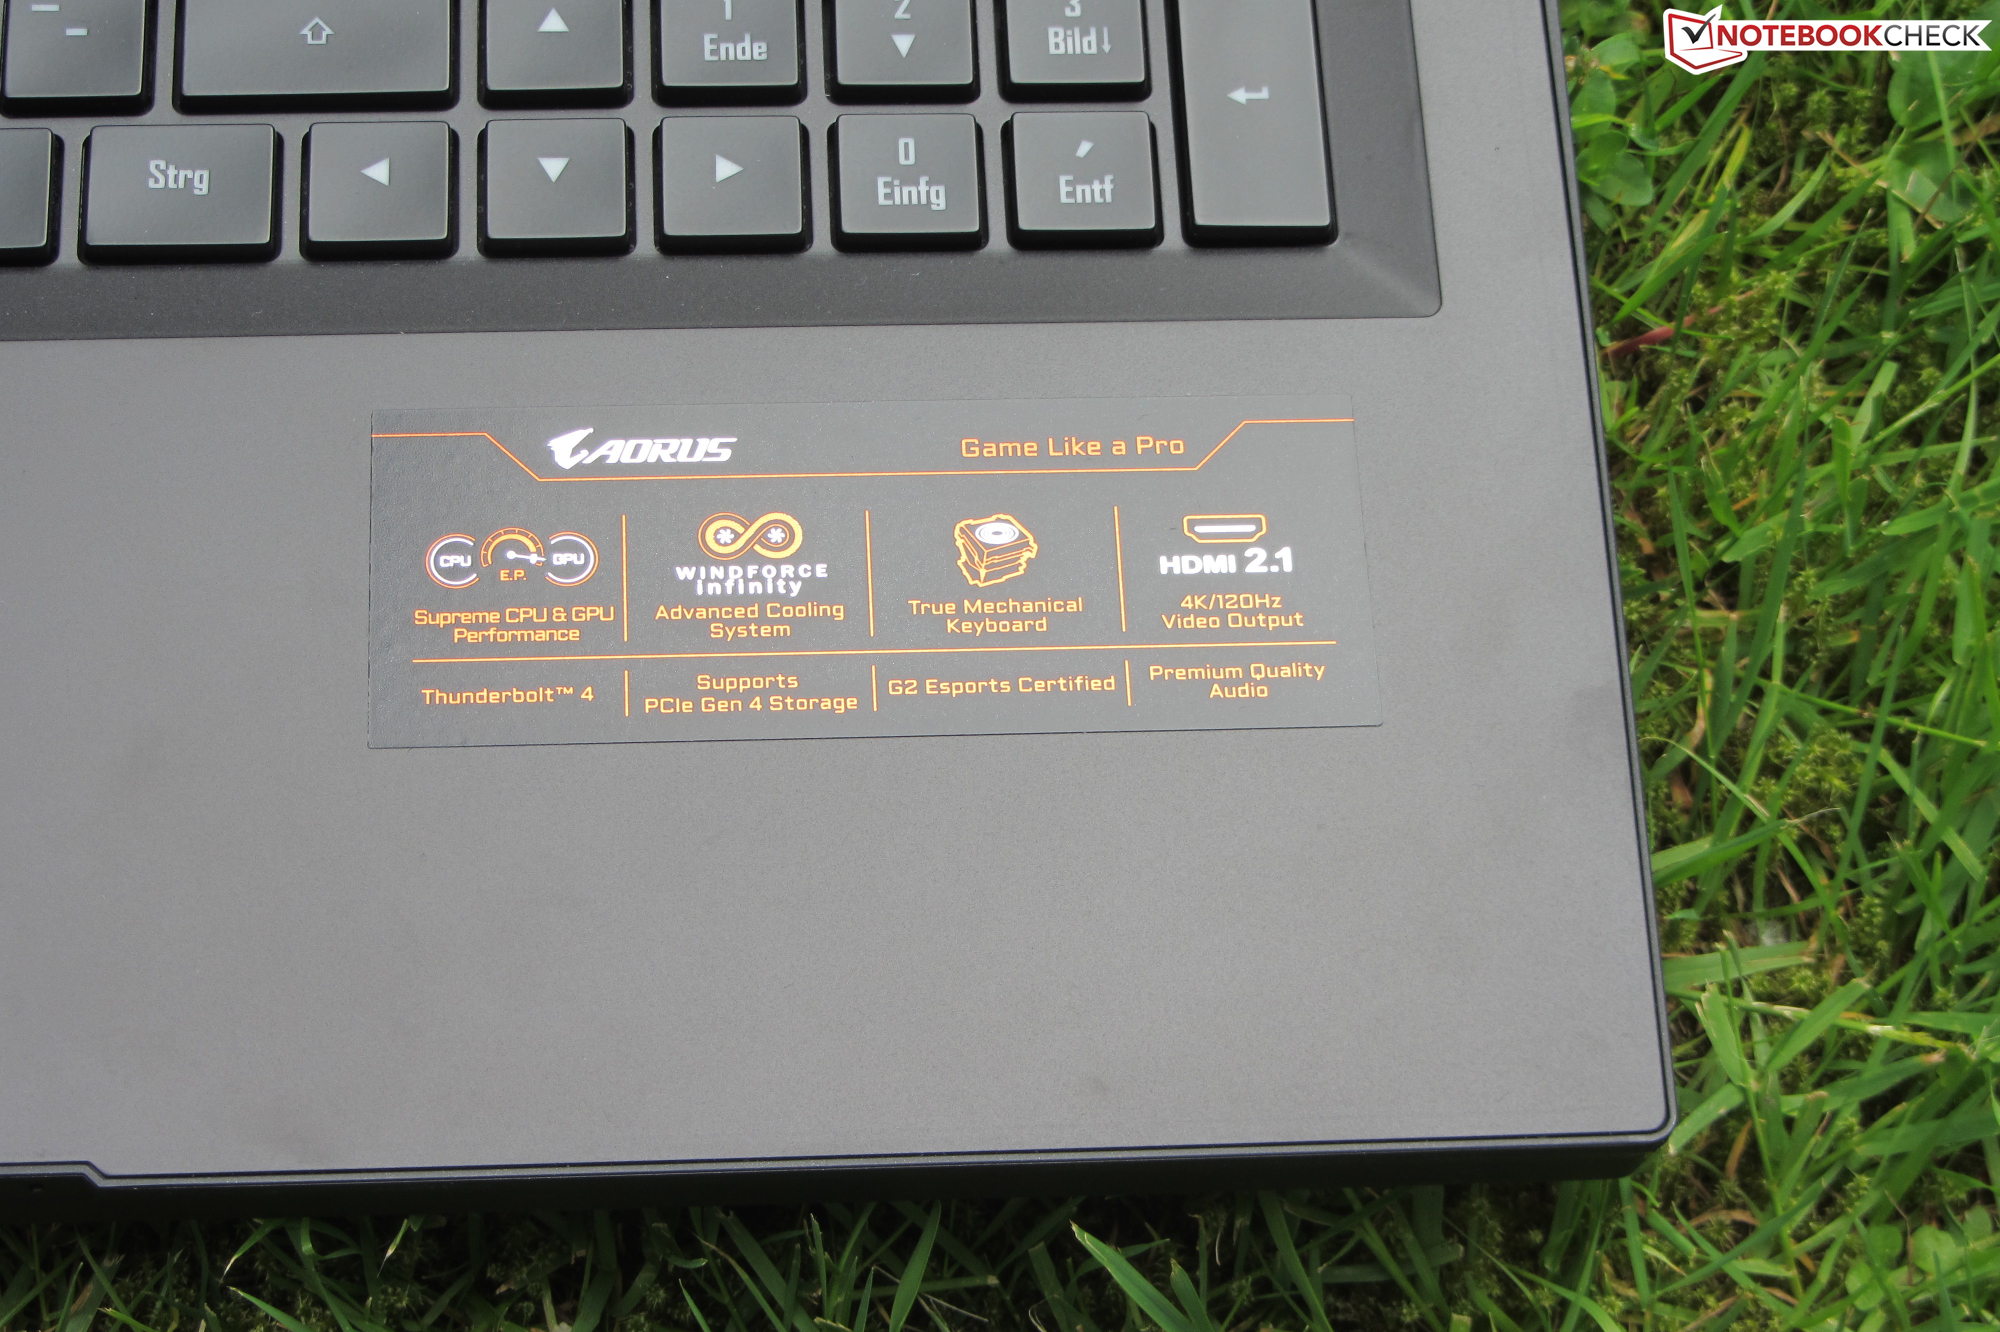
Em comparação com o Aorus 17G XB, o 17G YD recebeu algumas atualizações em termos de portos. A porta HDMI suporta o padrão 2.1 (XB: 2.0), o que permite resoluções e taxas de quadros mais altas. O modelo 17G atual também vem com uma porta Thunderbolt 4 ao invés de uma porta Thunderbolt 3. DisplayPort via USB-C e Power Delivery são suportadas
| SD Card Reader | |
| average JPG Copy Test (av. of 3 runs) | |
| Aorus 17G XB (Toshiba Exceria Pro SDXC 64 GB UHS-II) | |
| MSI GE76 Raider 10UH (Toshiba Exceria Pro SDXC 64 GB UHS-II) | |
| Aorus 17G YD (AV PRO microSD 128 GB V60) | |
| Alienware m17 R4 (AV PRO microSD 128 GB V60) | |
| Média da turma Gaming (20.9 - 210, n=54, últimos 2 anos) | |
| Schenker XMG Neo 17 (Early 2021, RTX 3070, 5800H) (Toshiba Exceria Pro SDXC 64 GB UHS-II) | |
| maximum AS SSD Seq Read Test (1GB) | |
| Aorus 17G XB (Toshiba Exceria Pro SDXC 64 GB UHS-II) | |
| Alienware m17 R4 (AV PRO microSD 128 GB V60) | |
| MSI GE76 Raider 10UH (Toshiba Exceria Pro SDXC 64 GB UHS-II) | |
| Aorus 17G YD (AV PRO microSD 128 GB V60) | |
| Média da turma Gaming (25.5 - 261, n=51, últimos 2 anos) | |
| Schenker XMG Neo 17 (Early 2021, RTX 3070, 5800H) (Toshiba Exceria Pro SDXC 64 GB UHS-II) | |


 GeForce RTX 3070 Laptop GPU, R7 5800H, Samsung SSD 970 EVO Plus 500GB")
 GeForce RTX 3070 Laptop GPU, R7 5800H, Samsung SSD 970 EVO Plus 500GB")


")
")


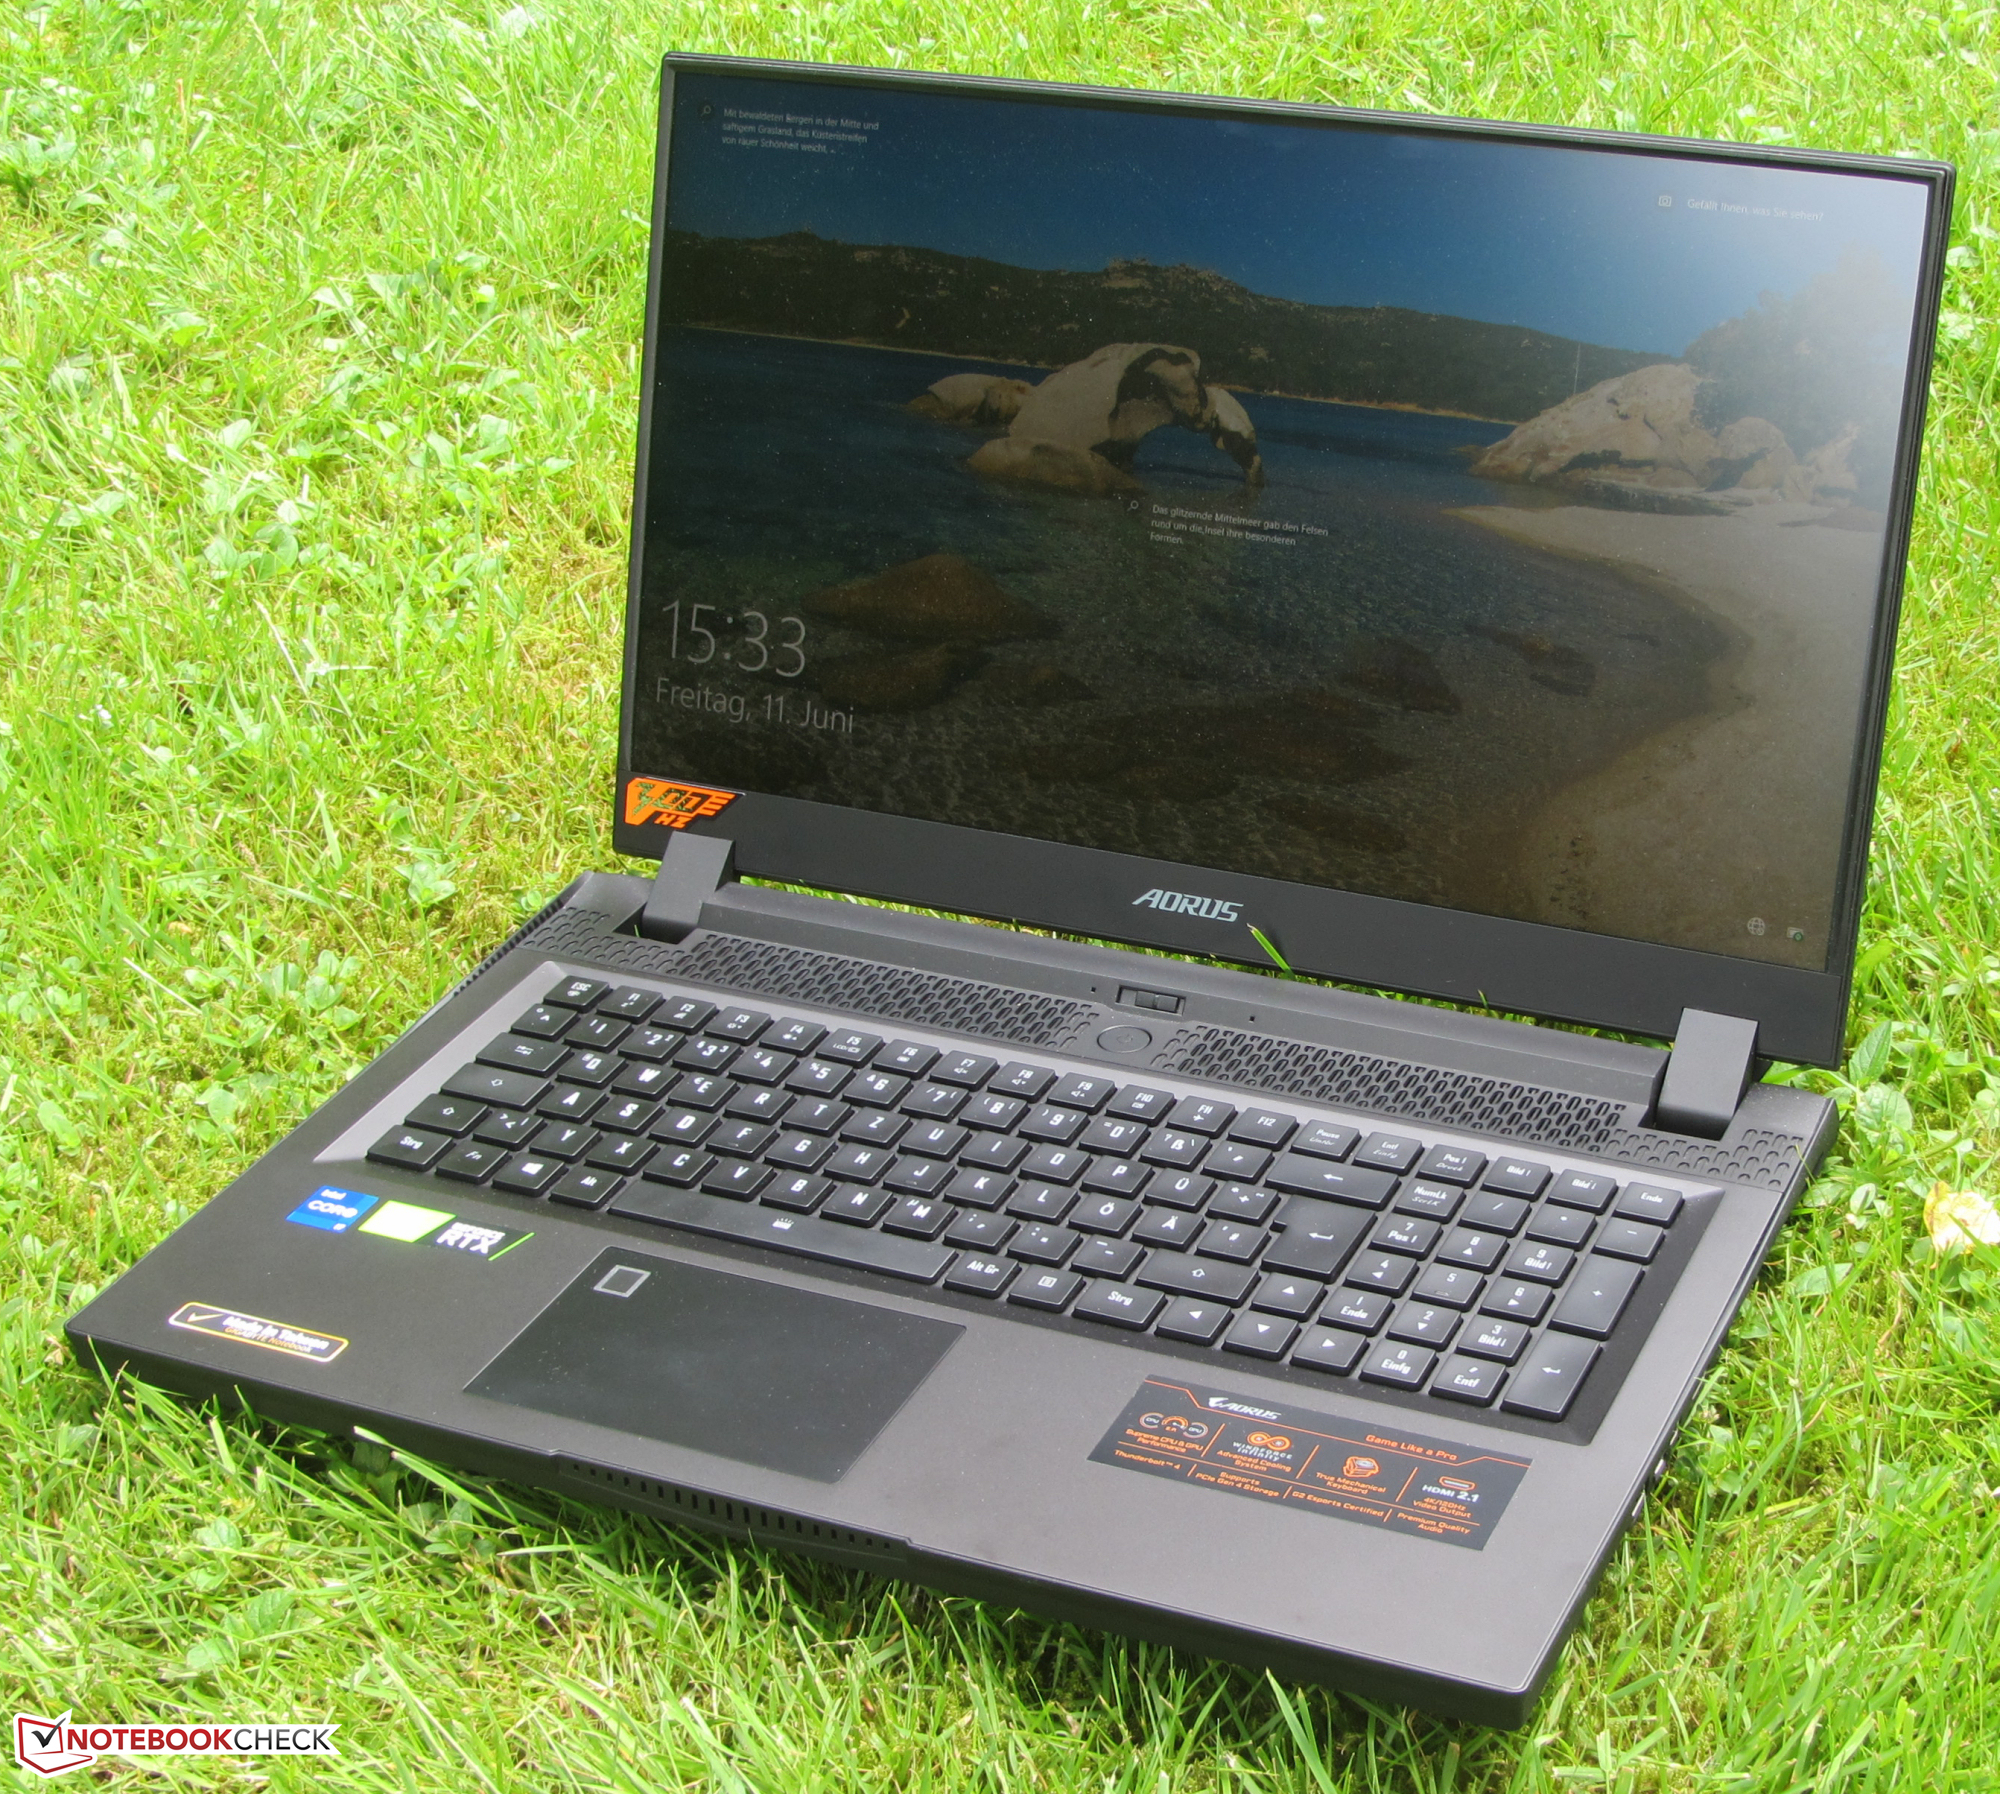
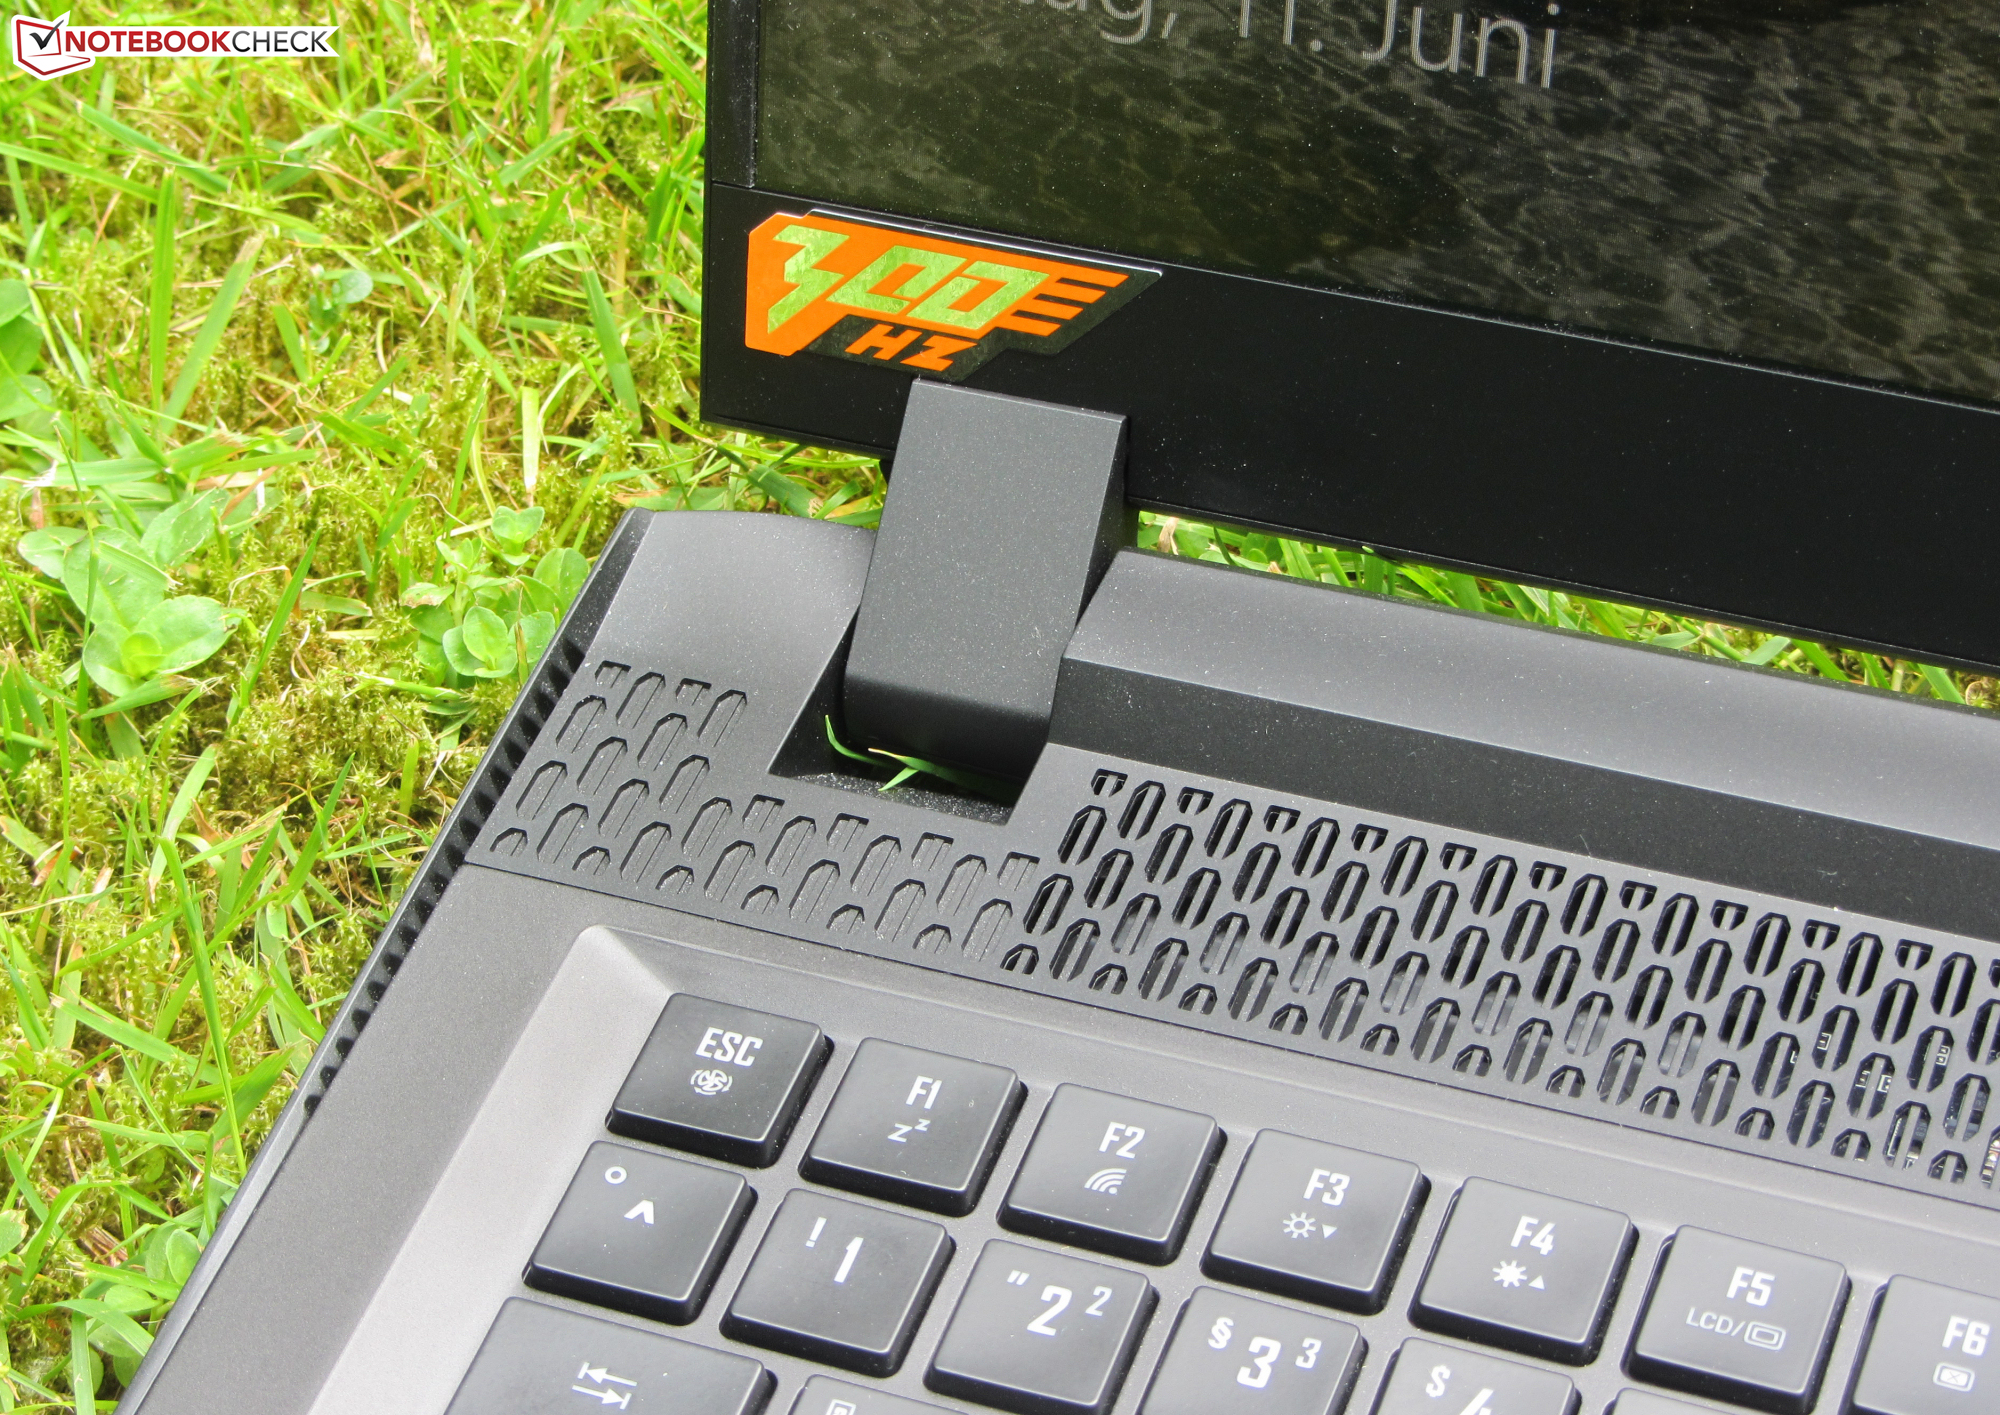
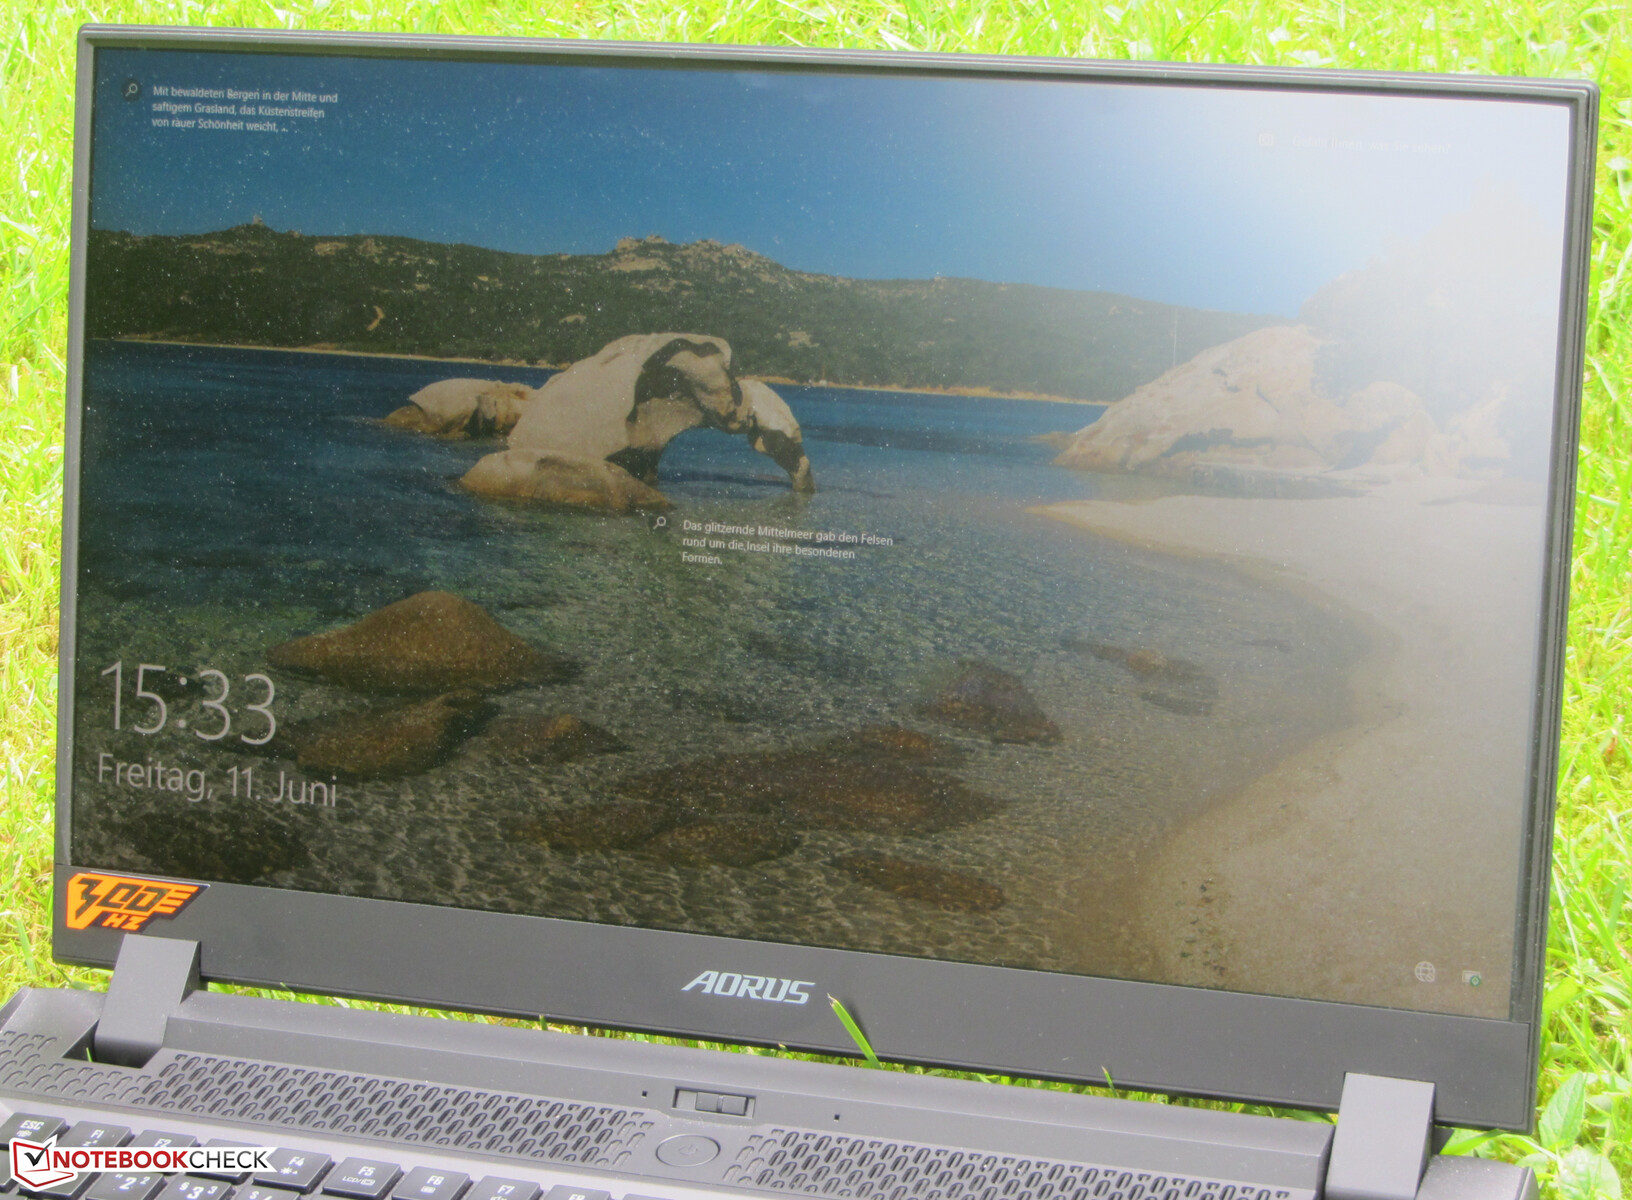
Visor - Painel IPS 300 Hz
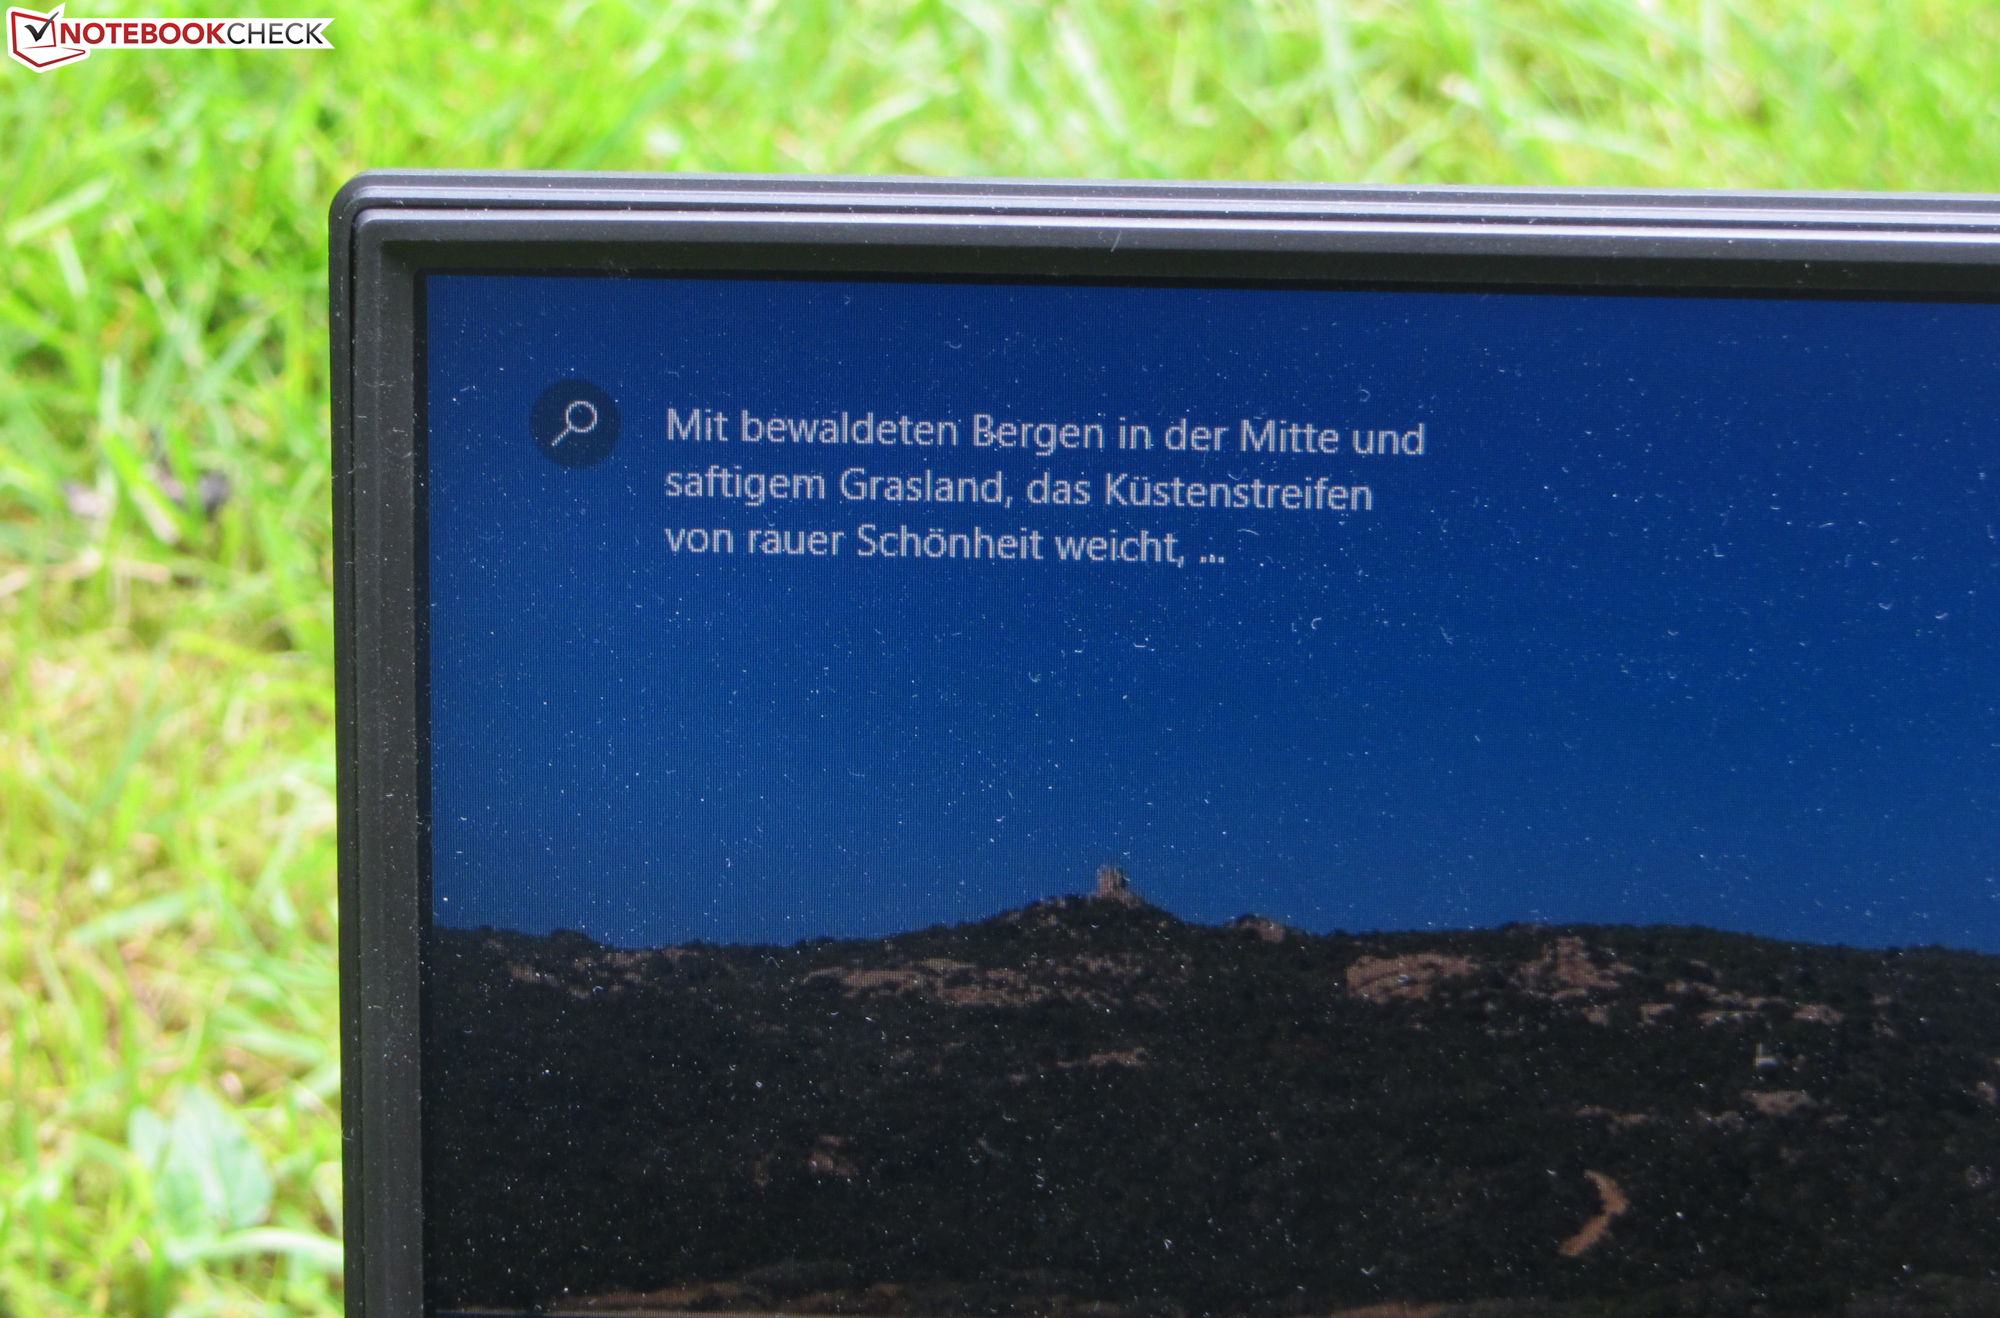
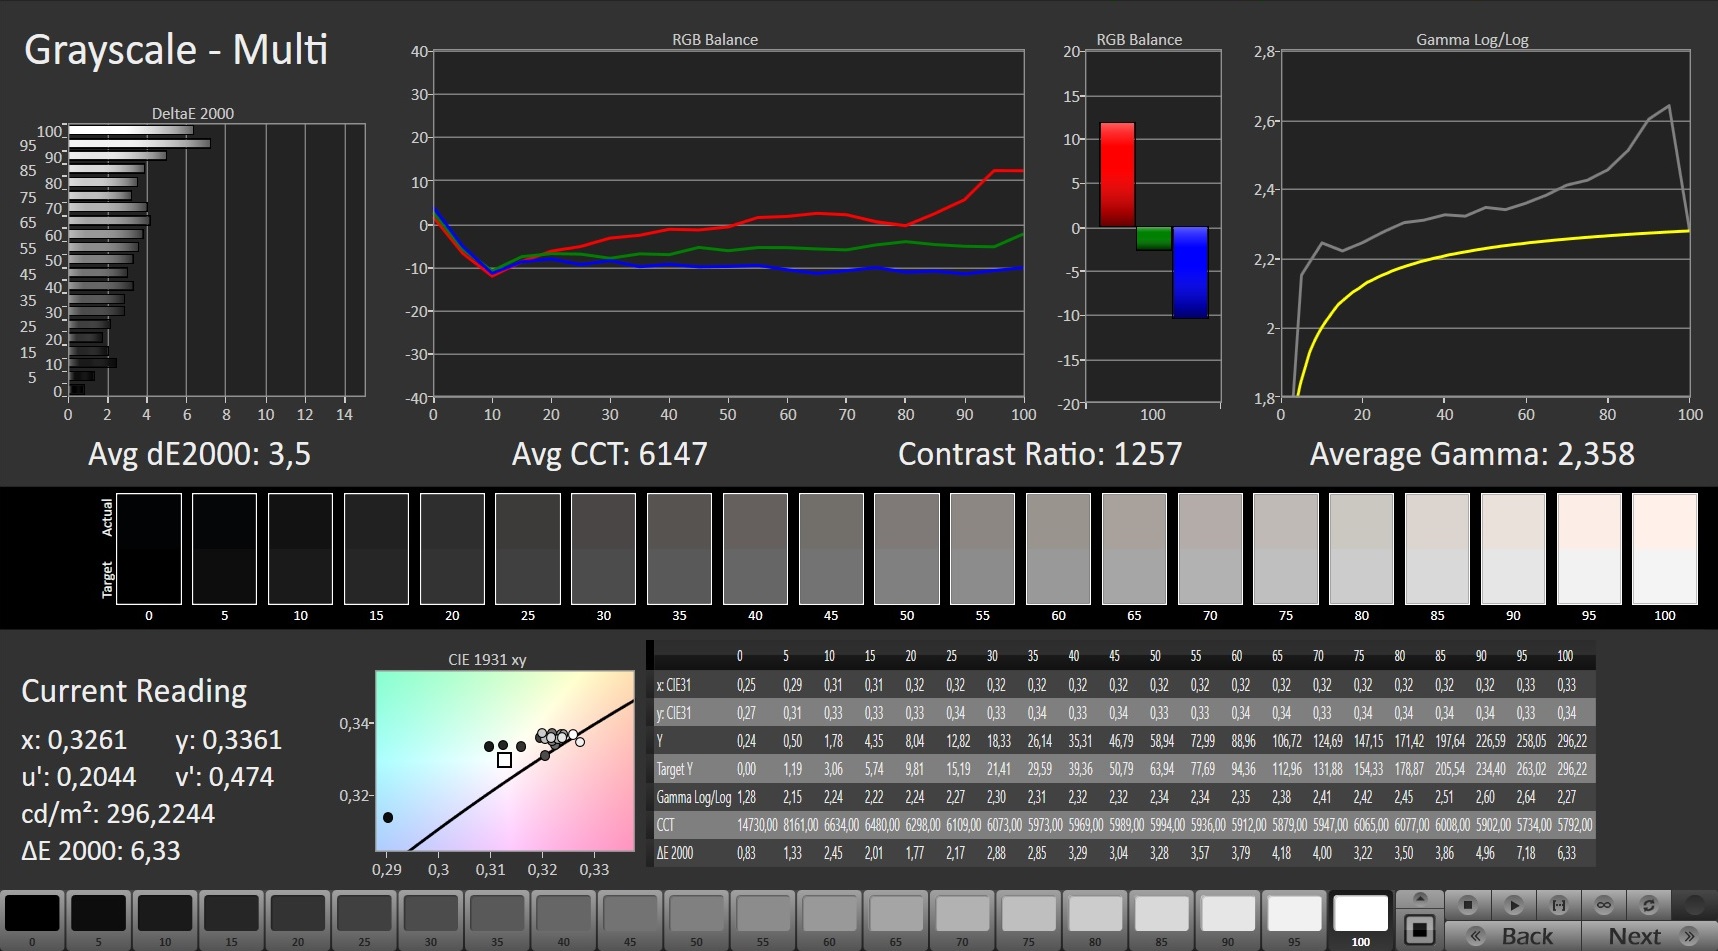
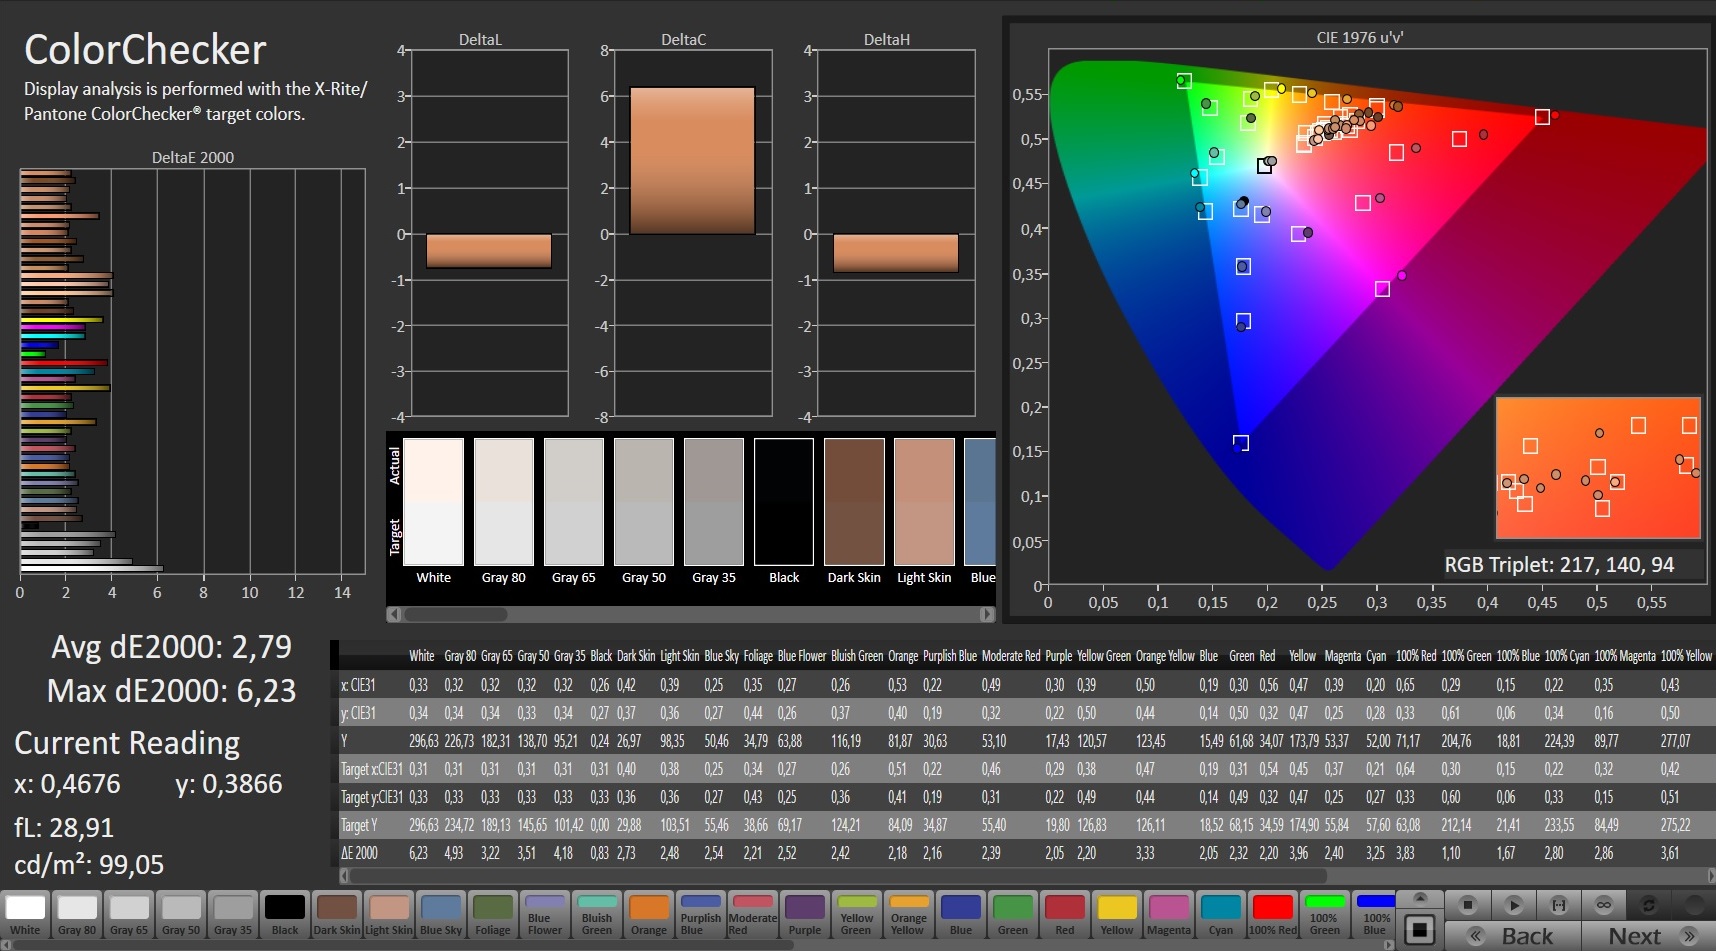
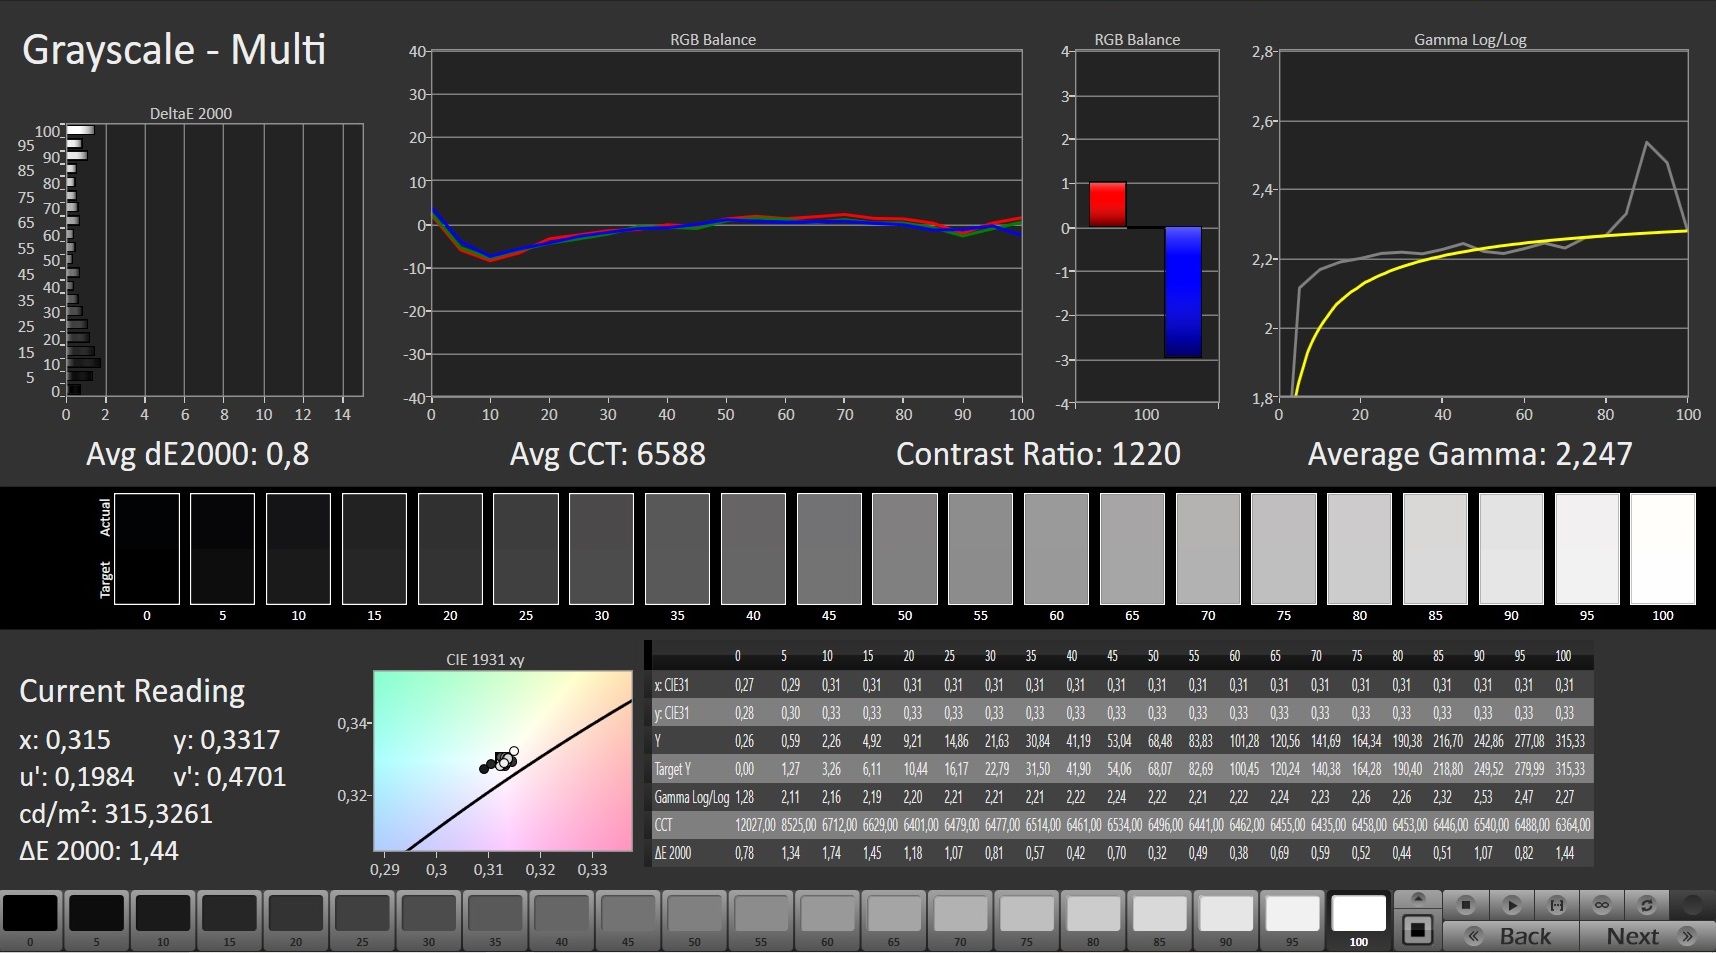
Enquanto o contraste (1.192:1) do visor mate de 17,3 polegadas (1920x1080 pixels) atinge o alvo (> 1.000:1), o brilho médio (282,4 cd/m²) é muito baixo. Consideramos que valores acima de 300 cd/m² são bons. O visor também mostra uma distribuição de brilho desigual. Entretanto, o painel de 300 Hz tem tempos de resposta rápidos e nenhum PWM cintila
| |||||||||||||||||||||||||
iluminação: 73 %
iluminação com acumulador: 286 cd/m²
Contraste: 1192:1 (Preto: 0.24 cd/m²)
ΔE ColorChecker Calman: 2.79 | ∀{0.5-29.43 Ø4.72}
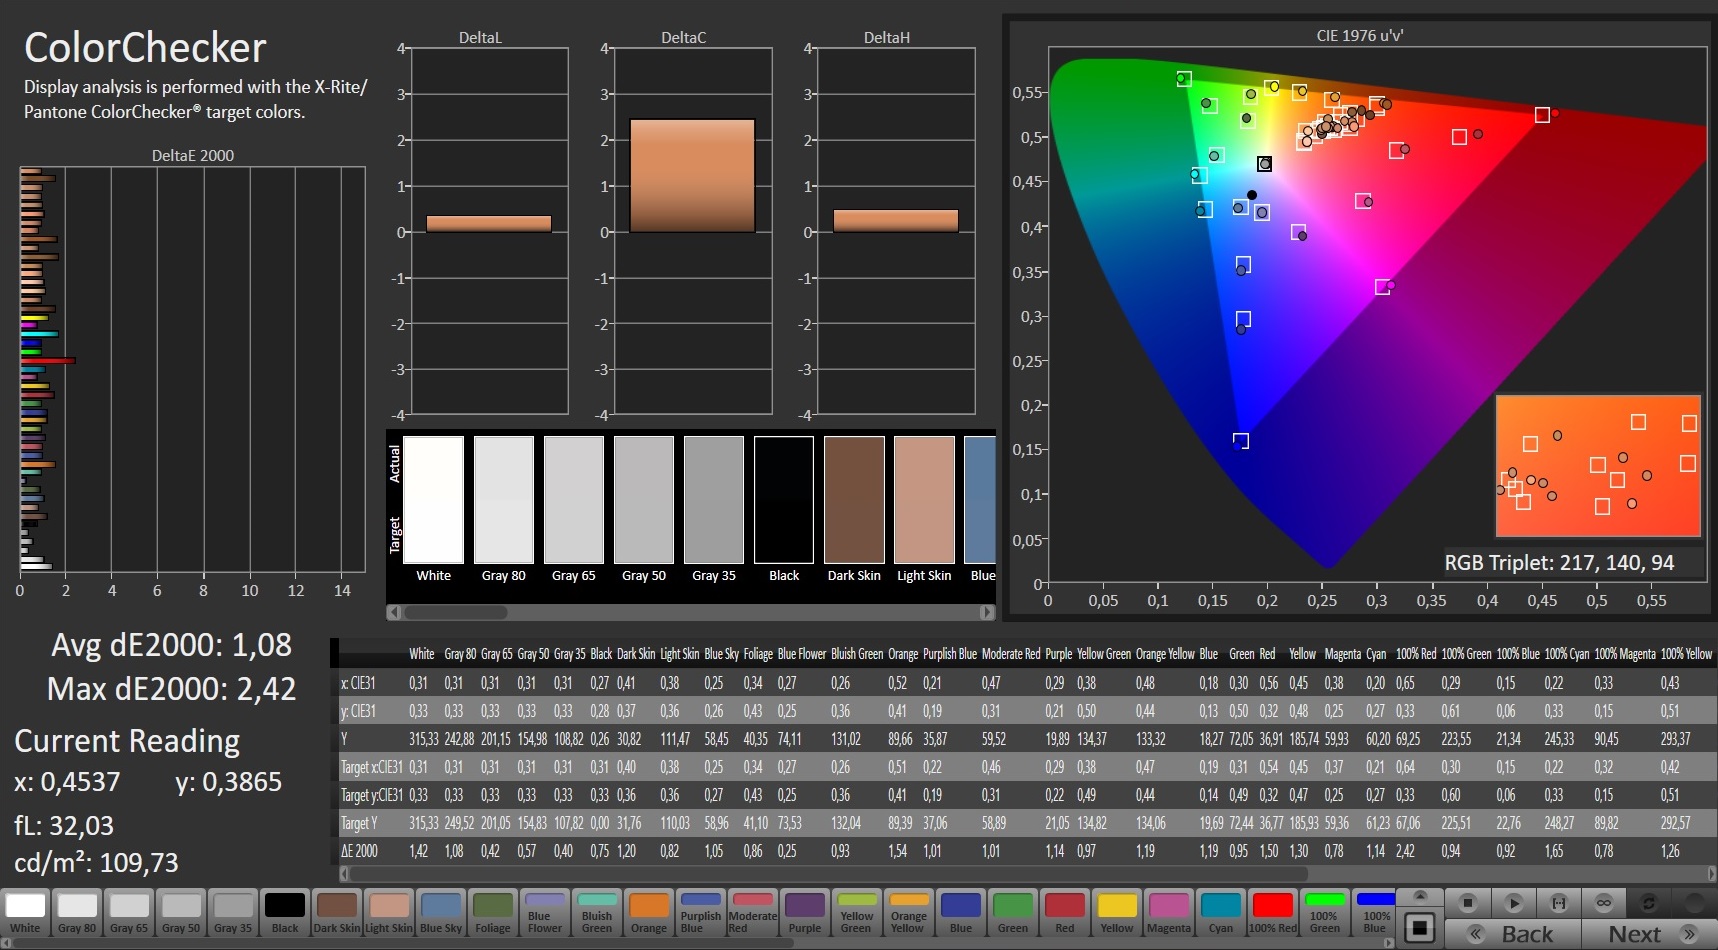
calibrated: 0.82
ΔE Greyscale Calman: 3.5 | ∀{0.09-98 Ø4.97}
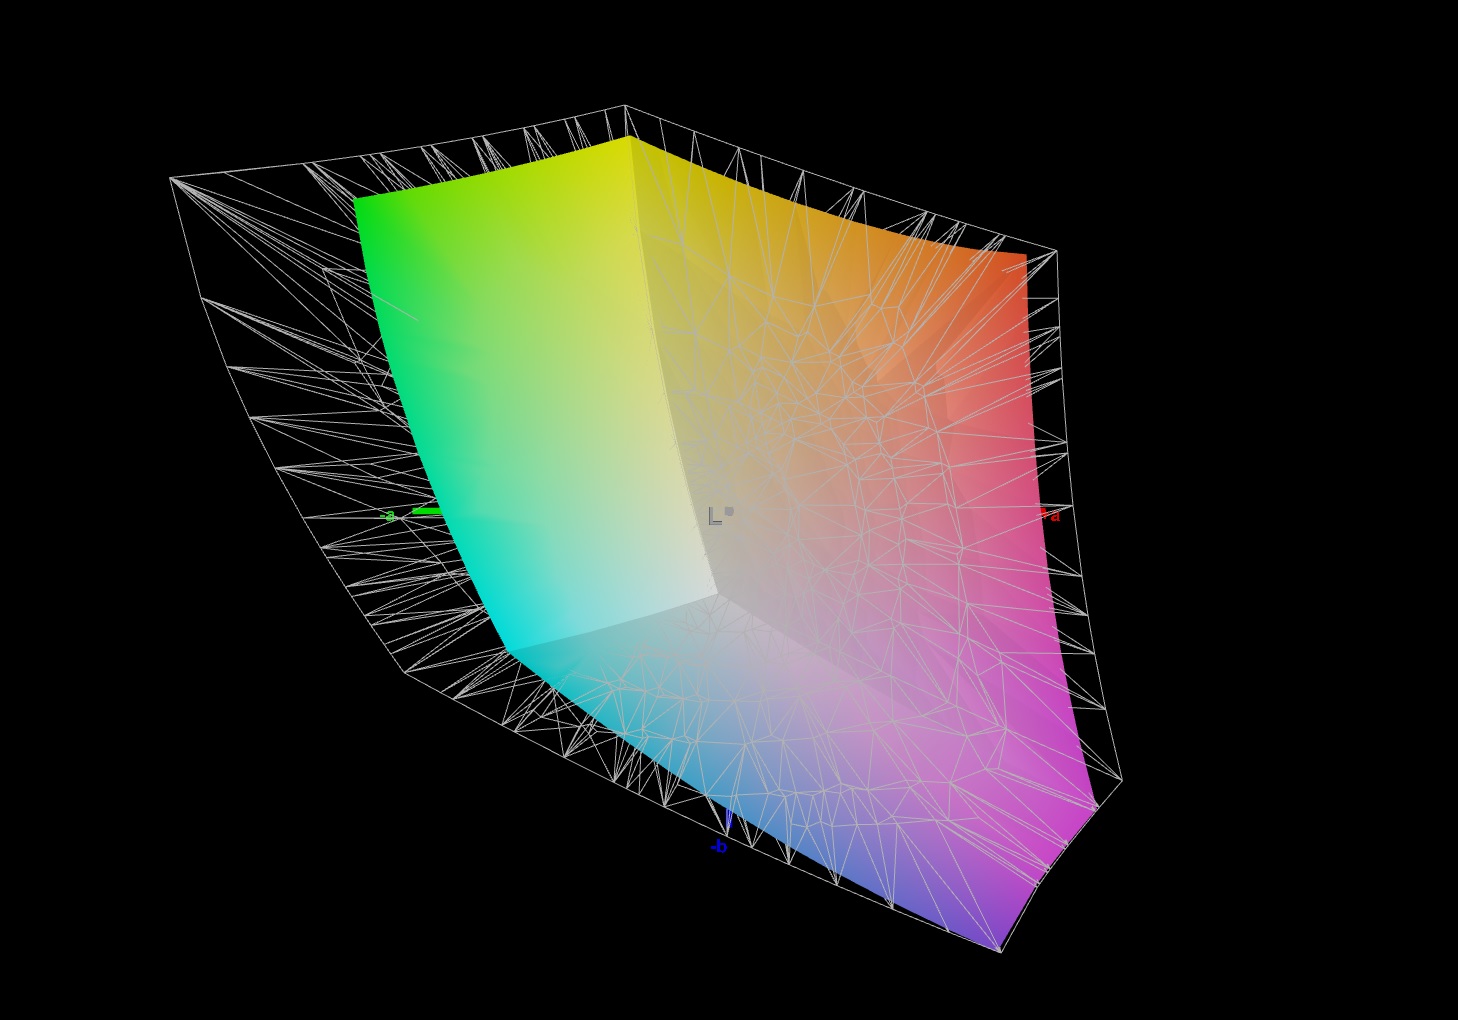
96% sRGB (Argyll 1.6.3 3D)
74% AdobeRGB 1998 (Argyll 1.6.3 3D)
73.7% AdobeRGB 1998 (Argyll 3D)
100% sRGB (Argyll 3D)
72.3% Display P3 (Argyll 3D)
Gamma: 2.358
CCT: 6147 K
| Aorus 17G YD Sharp LQ173M1JW04, IPS, 1920x1080, 17.3" | Asus Strix Scar 17 G733QSA-XS99 AU Optronics B173HAN05.4, IPS, 1920x1080, 17.3" | Lenovo Legion 7 16ACHg6 CSOT T3 MNG007DA1-1, IPS, 2560x1600, 16" | Schenker XMG Neo 17 (Early 2021, RTX 3070, 5800H) BOE NE173QHM-NY2 (BOE0977), IPS, 2560x1440, 17.3" | Aorus 17G XB AU Optronics B173HAN05.0 (AUO509D), IPS, 1920x1080, 17.3" | Alienware m17 R4 AU Optronics AUOEC91, IPS, 1920x1080, 17.3" | MSI GE76 Raider 10UH AU Optronics B173HAN05.1, IPS, 1920x1080, 17.3" | |
|---|---|---|---|---|---|---|---|
| Display | -2% | -2% | -2% | -2% | -2% | -1% | |
| Display P3 Coverage (%) | 72.3 | 71 -2% | 70.3 -3% | 70.5 -2% | 70.6 -2% | 69.8 -3% | 71.8 -1% |
| sRGB Coverage (%) | 100 | 99.4 -1% | 99.4 -1% | 99.5 0% | 97.2 -3% | 99.7 0% | 98.1 -2% |
| AdobeRGB 1998 Coverage (%) | 73.7 | 72.2 -2% | 72.7 -1% | 71.8 -3% | 72.8 -1% | 71.6 -3% | 73.9 0% |
| Response Times | 17% | 14% | -17% | -24% | 2% | -30% | |
| Response Time Grey 50% / Grey 80% * (ms) | 13.6 ? | 6.6 ? 51% | 14 ? -3% | 16.8 ? -24% | 16 ? -18% | 13.2 ? 3% | 20.4 ? -50% |
| Response Time Black / White * (ms) | 9.2 ? | 10.8 ? -17% | 6.4 ? 30% | 10 ? -9% | 12 ? -30% | 9.2 ? -0% | 10 ? -9% |
| PWM Frequency (Hz) | 151500 | ||||||
| Screen | 6% | 21% | 2% | 17% | 21% | -21% | |
| Brightness middle (cd/m²) | 286 | 303.8 6% | 489 71% | 410 43% | 293 2% | 305 7% | 324.6 13% |
| Brightness (cd/m²) | 282 | 292 4% | 469 66% | 381 35% | 285 1% | 301 7% | 312 11% |
| Brightness Distribution (%) | 73 | 85 16% | 92 26% | 88 21% | 95 30% | 93 27% | 87 19% |
| Black Level * (cd/m²) | 0.24 | 0.23 4% | 0.38 -58% | 0.37 -54% | 0.24 -0% | 0.19 21% | 0.28 -17% |
| Contrast (:1) | 1192 | 1321 11% | 1287 8% | 1108 -7% | 1221 2% | 1605 35% | 1159 -3% |
| Colorchecker dE 2000 * | 2.79 | 1.87 33% | 1.45 48% | 2.55 9% | 1.27 54% | 1.31 53% | 3.87 -39% |
| Colorchecker dE 2000 max. * | 6.23 | 3.26 48% | 2.16 65% | 4.33 30% | 2.24 64% | 2.32 63% | 9.35 -50% |
| Colorchecker dE 2000 calibrated * | 0.82 | 1.45 -77% | 1.16 -41% | 1.28 -56% | 1.06 -29% | 0.91 -11% | 1.42 -73% |
| Greyscale dE 2000 * | 3.5 | 2.7 23% | 1.6 54% | 3.4 3% | 1.34 62% | 2.3 34% | 6.5 -86% |
| Gamma | 2.358 93% | 2.26 97% | 2.197 100% | 2.275 97% | 2.38 92% | 2.281 96% | 2.23 99% |
| CCT | 6147 106% | 6436 101% | 6377 102% | 6637 98% | 6542 99% | 6449 101% | 5702 114% |
| Color Space (Percent of AdobeRGB 1998) (%) | 74 | 65.6 -11% | 73 -1% | 72 -3% | 73 -1% | 72 -3% | 66.3 -10% |
| Color Space (Percent of sRGB) (%) | 96 | 99.4 4% | 94 -2% | 95 -1% | 94 -2% | 94 -2% | 98 2% |
| Média Total (Programa/Configurações) | 7% /
6% | 11% /
16% | -6% /
-1% | -3% /
8% | 7% /
14% | -17% /
-18% |
* ... menor é melhor
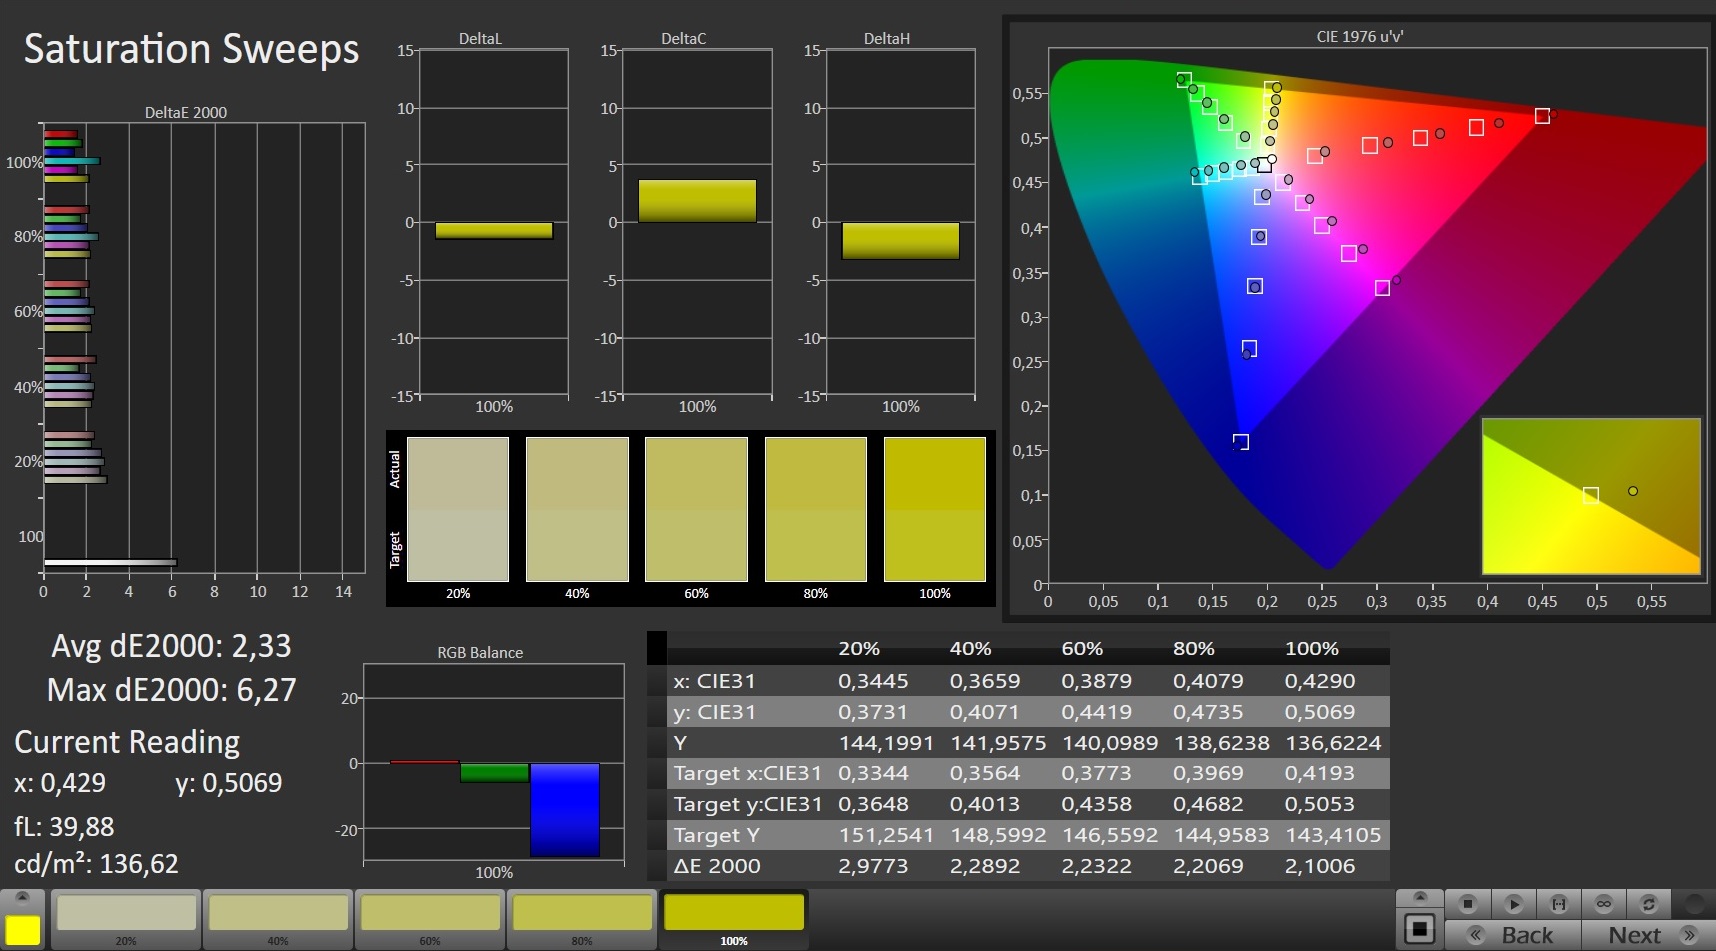
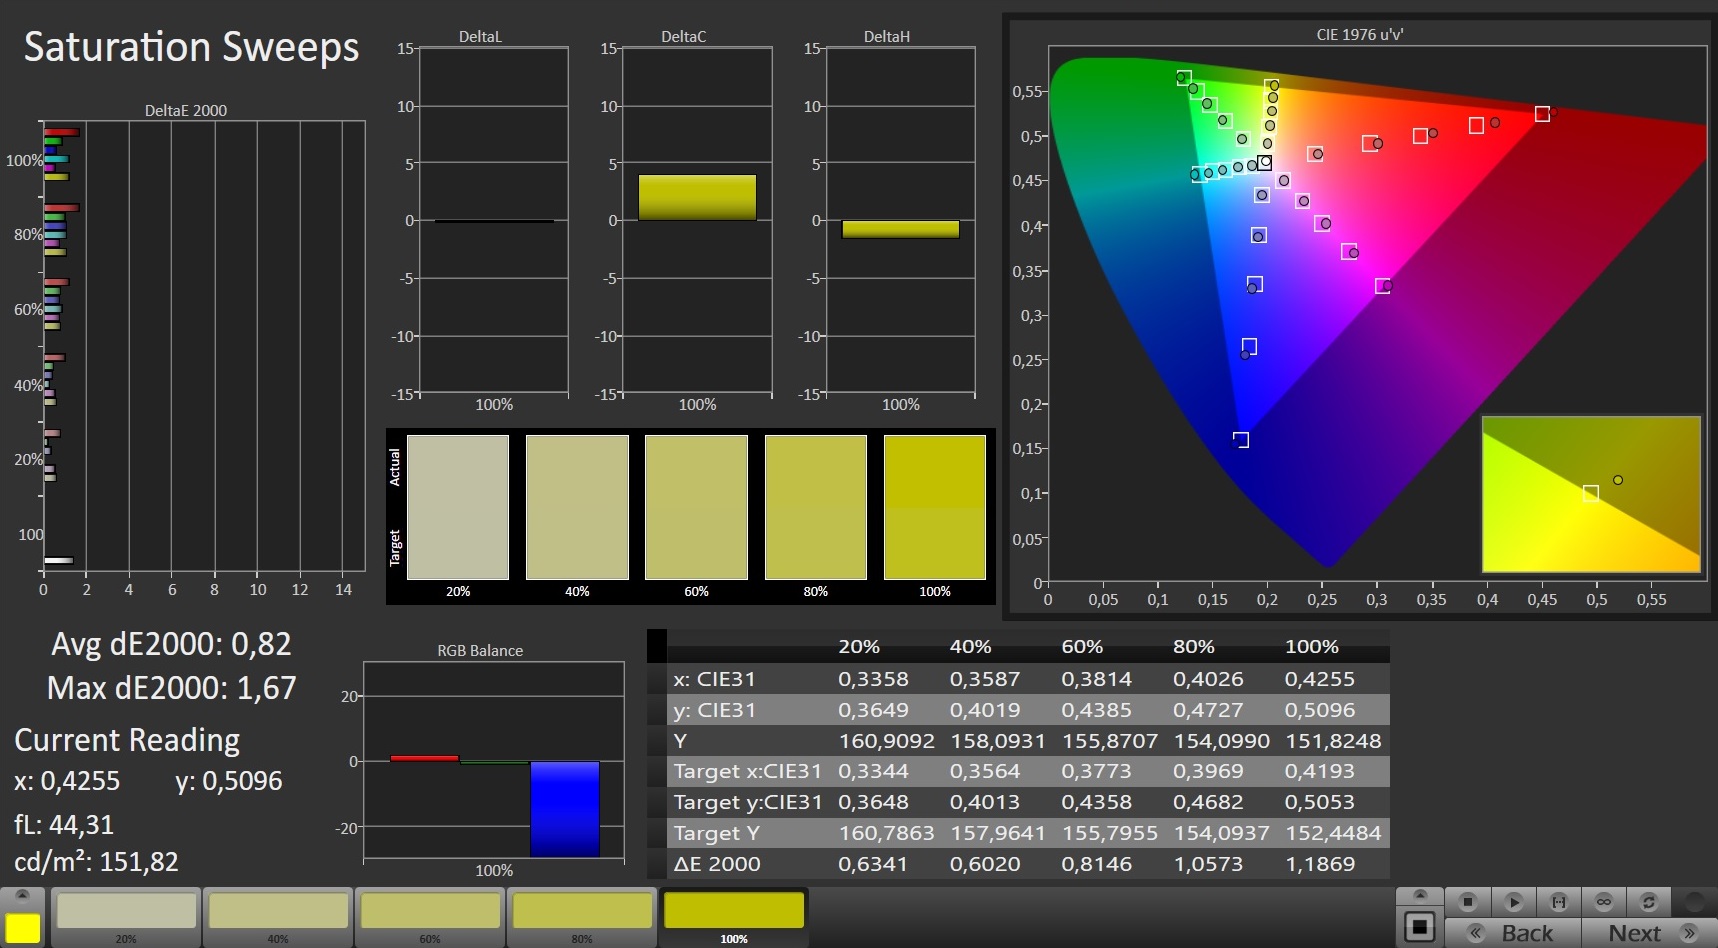
Fora da caixa, o display mostra uma boa reprodução de cores e atende o alvo com um desvio de cor de 2,79 (DeltaE menos de 3). Além disso, não sofre de uma coloração azul. A calibração pode ser usada para alcançar melhorias. O desvio de cor cai para 1,08, e os tons de cinza são representados de forma mais equilibrada. O espaço de cor sRGB é coberto em 100%, enquanto o espaço de cor AdobeRGB é coberto em 74%
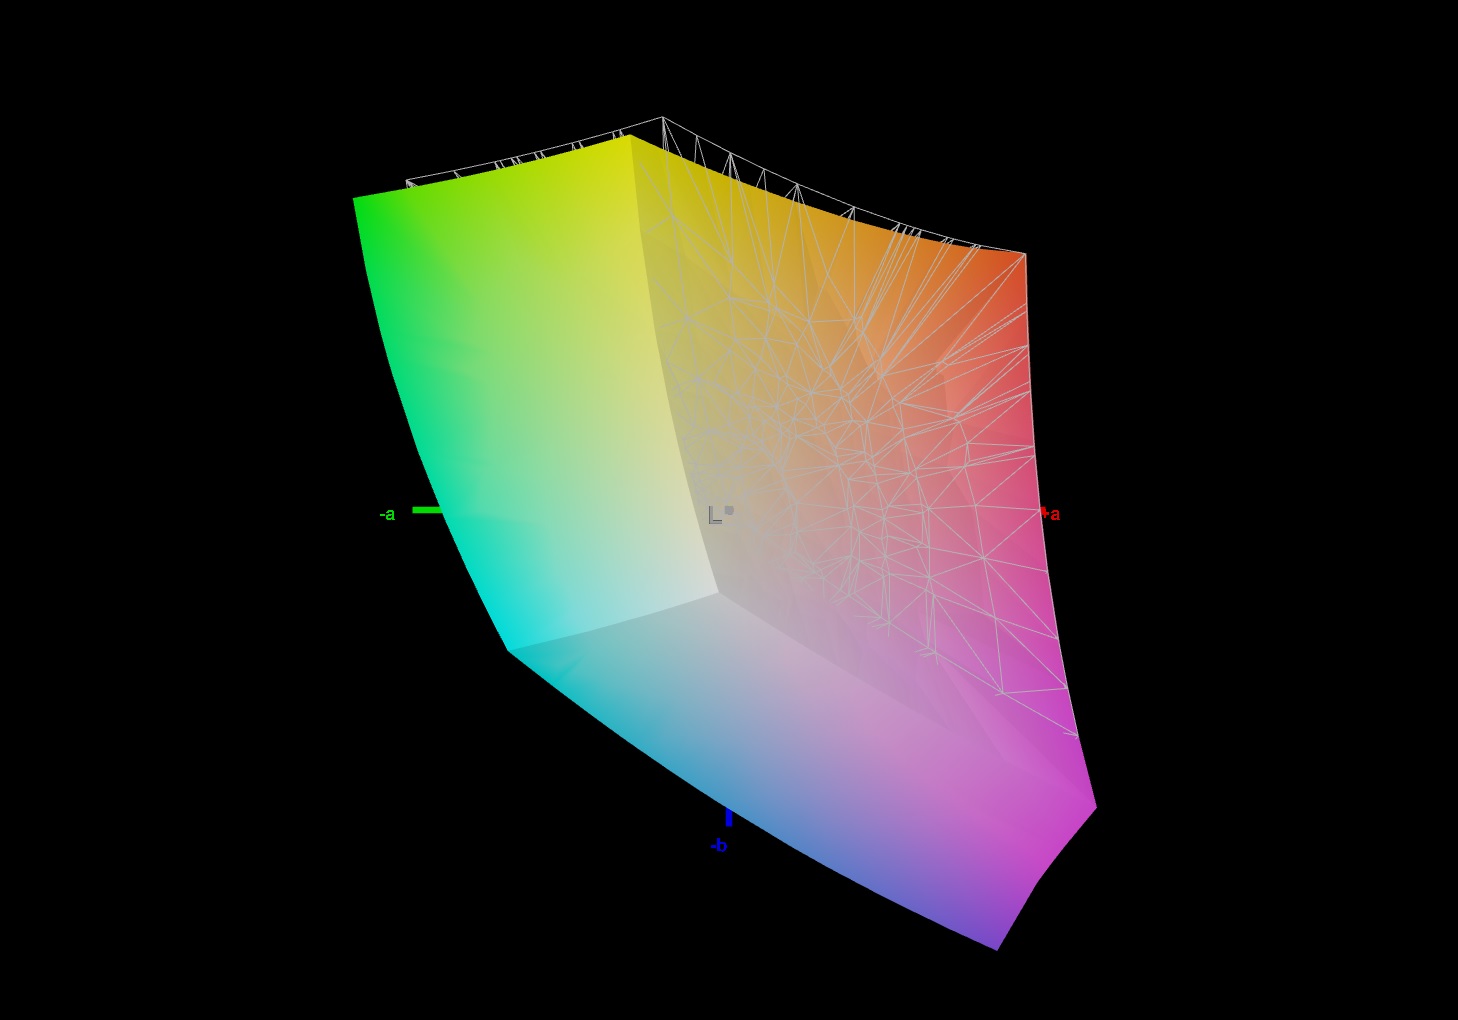
Exibir tempos de resposta
| ↔ Tempo de resposta preto para branco | ||
|---|---|---|
| 9.2 ms ... ascensão ↗ e queda ↘ combinadas | ↗ 5.2 ms ascensão | 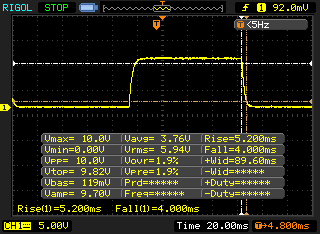 |
| ↘ 4 ms queda | ||
| A tela mostra taxas de resposta rápidas em nossos testes e deve ser adequada para jogos. Em comparação, todos os dispositivos testados variam de 0.1 (mínimo) a 240 (máximo) ms. » 26 % de todos os dispositivos são melhores. Isso significa que o tempo de resposta medido é melhor que a média de todos os dispositivos testados (19.8 ms). | ||
| ↔ Tempo de resposta 50% cinza a 80% cinza | ||
| 13.6 ms ... ascensão ↗ e queda ↘ combinadas | ↗ 6.8 ms ascensão | 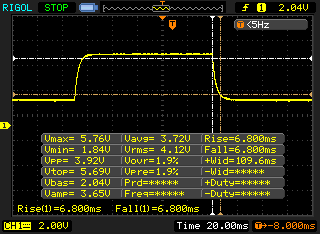 |
| ↘ 6.8 ms queda | ||
| A tela mostra boas taxas de resposta em nossos testes, mas pode ser muito lenta para jogadores competitivos. Em comparação, todos os dispositivos testados variam de 0.165 (mínimo) a 636 (máximo) ms. » 27 % de todos os dispositivos são melhores. Isso significa que o tempo de resposta medido é melhor que a média de todos os dispositivos testados (31 ms). | ||
Cintilação da tela / PWM (modulação por largura de pulso)
| Tela tremeluzindo / PWM não detectado | 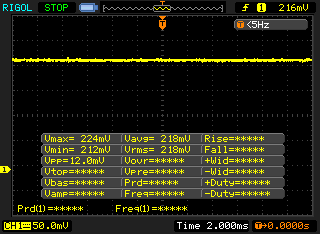 | ||
[pwm_comparison] Em comparação: 52 % de todos os dispositivos testados não usam PWM para escurecer a tela. Se PWM foi detectado, uma média de 7775 (mínimo: 5 - máximo: 343500) Hz foi medida. | |||
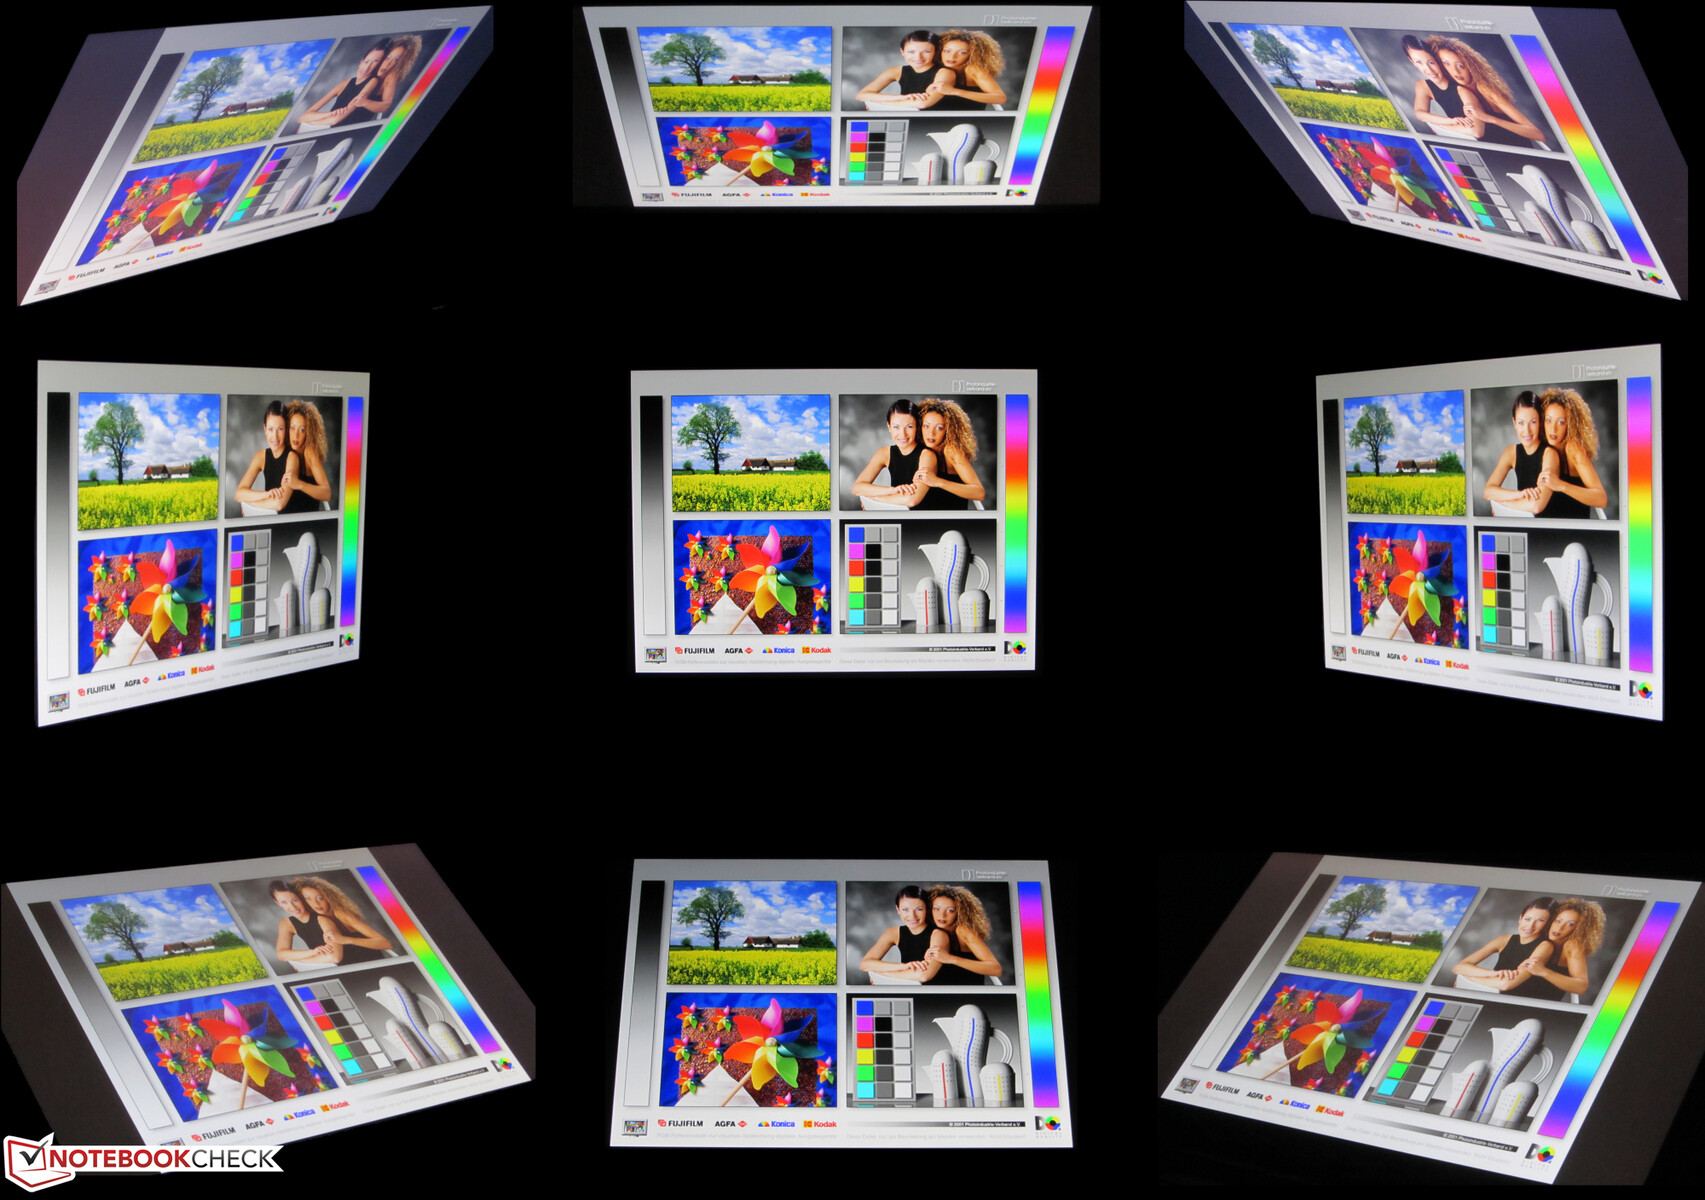
O painel IPS estável em ângulo de visão é legível a partir de qualquer posição. A leitura do conteúdo da tela ao ar livre é possível quando o sol não está muito claro
Desempenho - Tiger Lake encontra a Ampere
Com o Aorus 17G YD, Gigabyte tem um laptop de 17,3 polegadas em sua linha de produtos, o que traz todo jogo moderno suavemente para a tela e também corta uma bela figura em todas as outras áreas de aplicação
Condições de teste
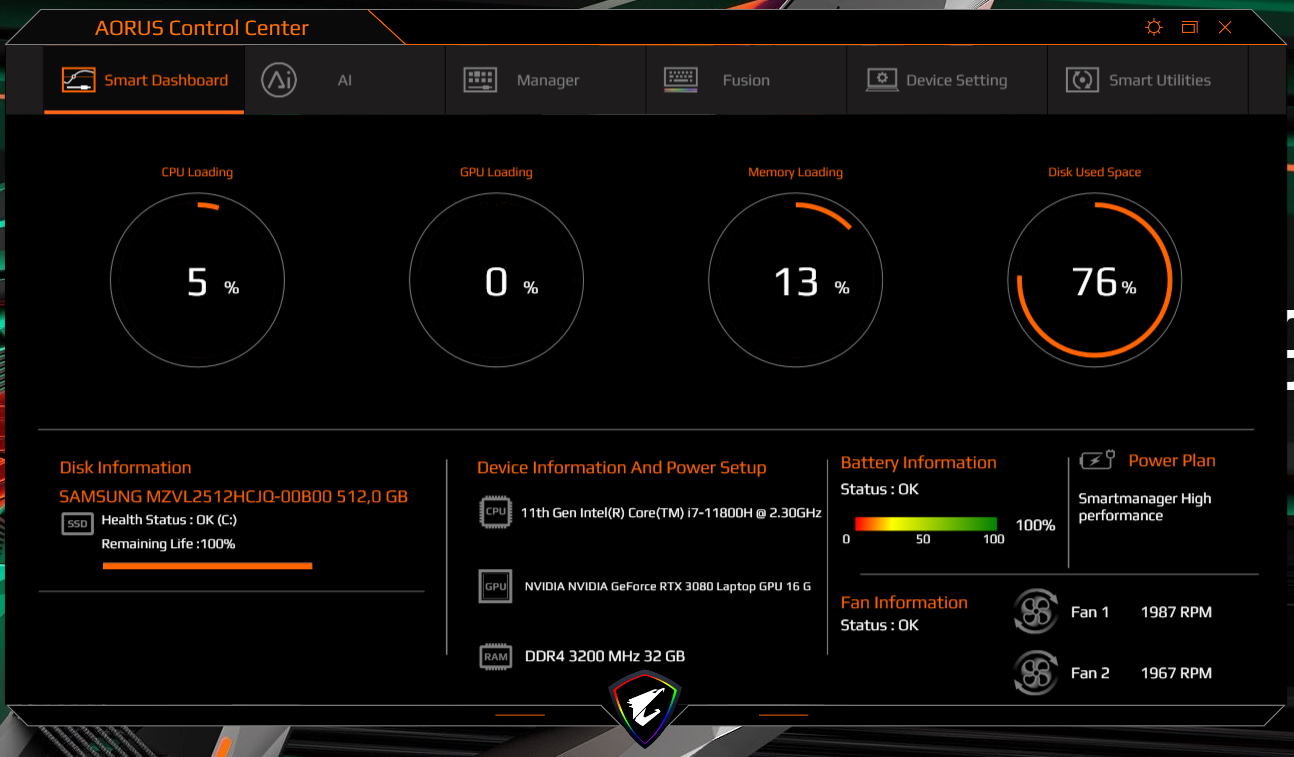
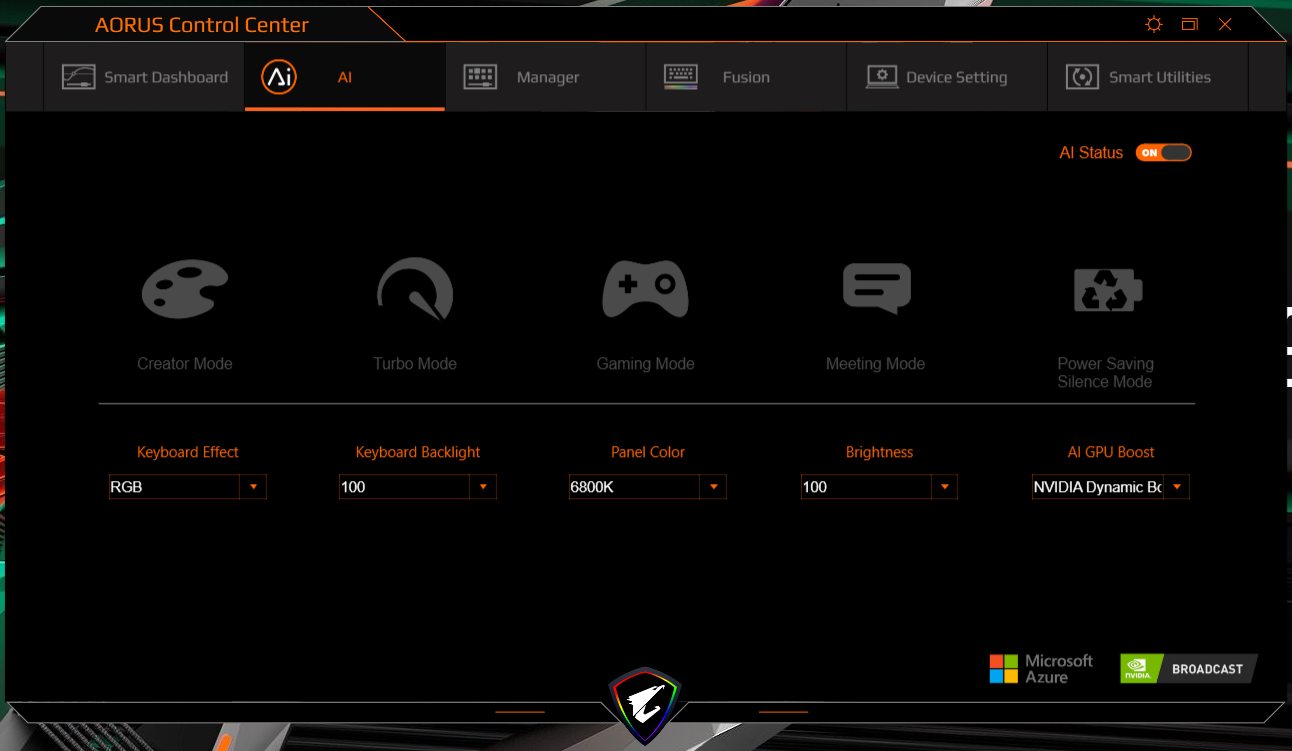
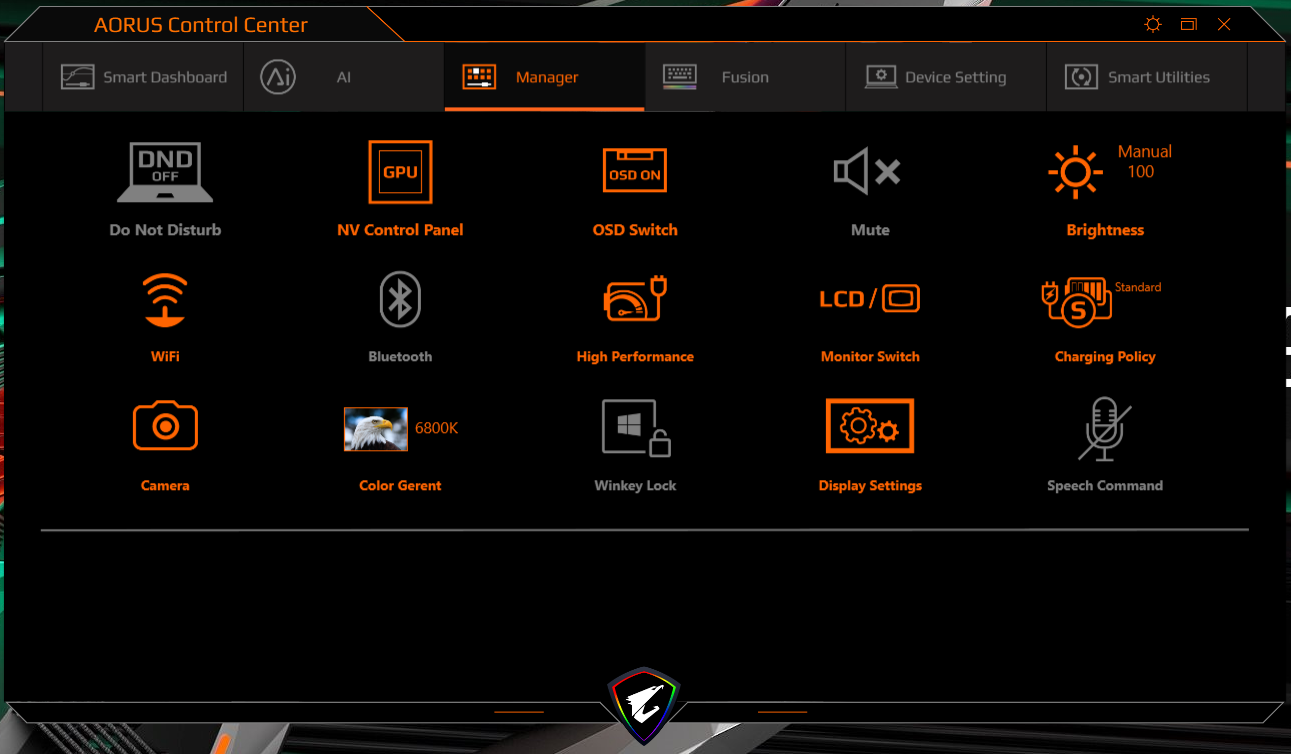
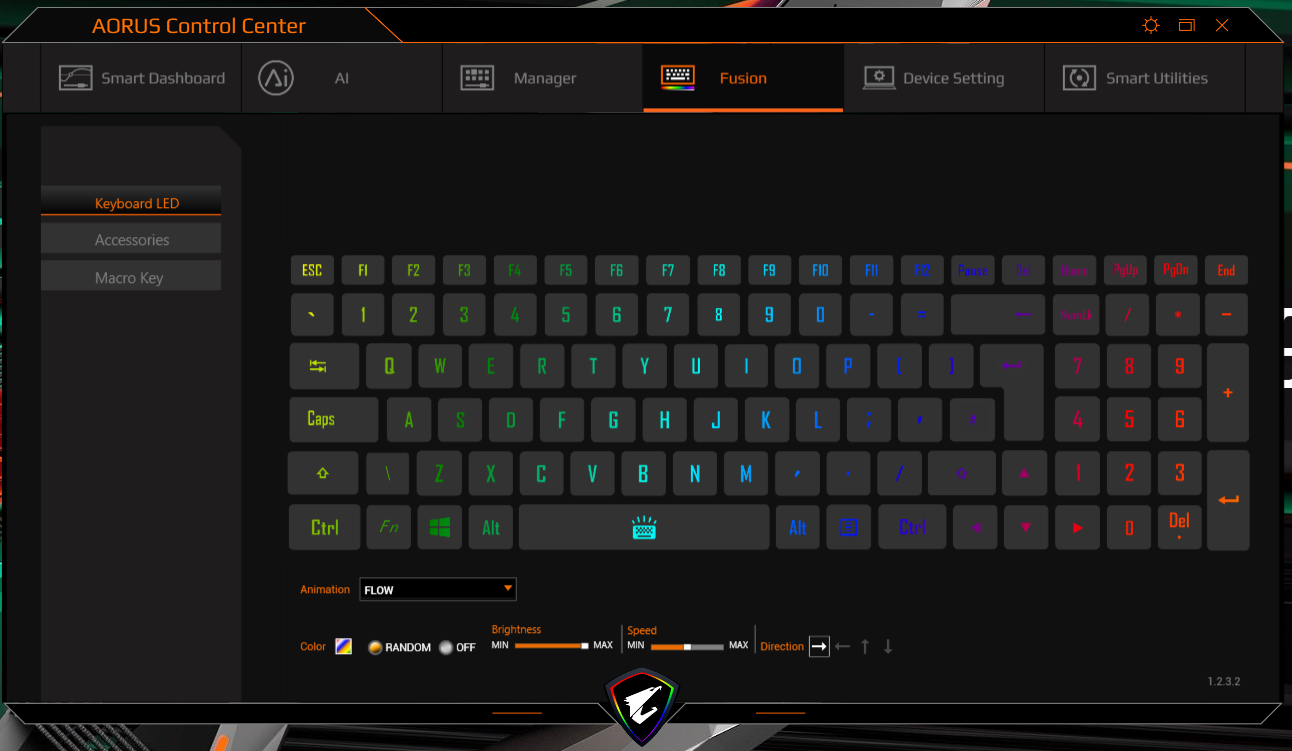
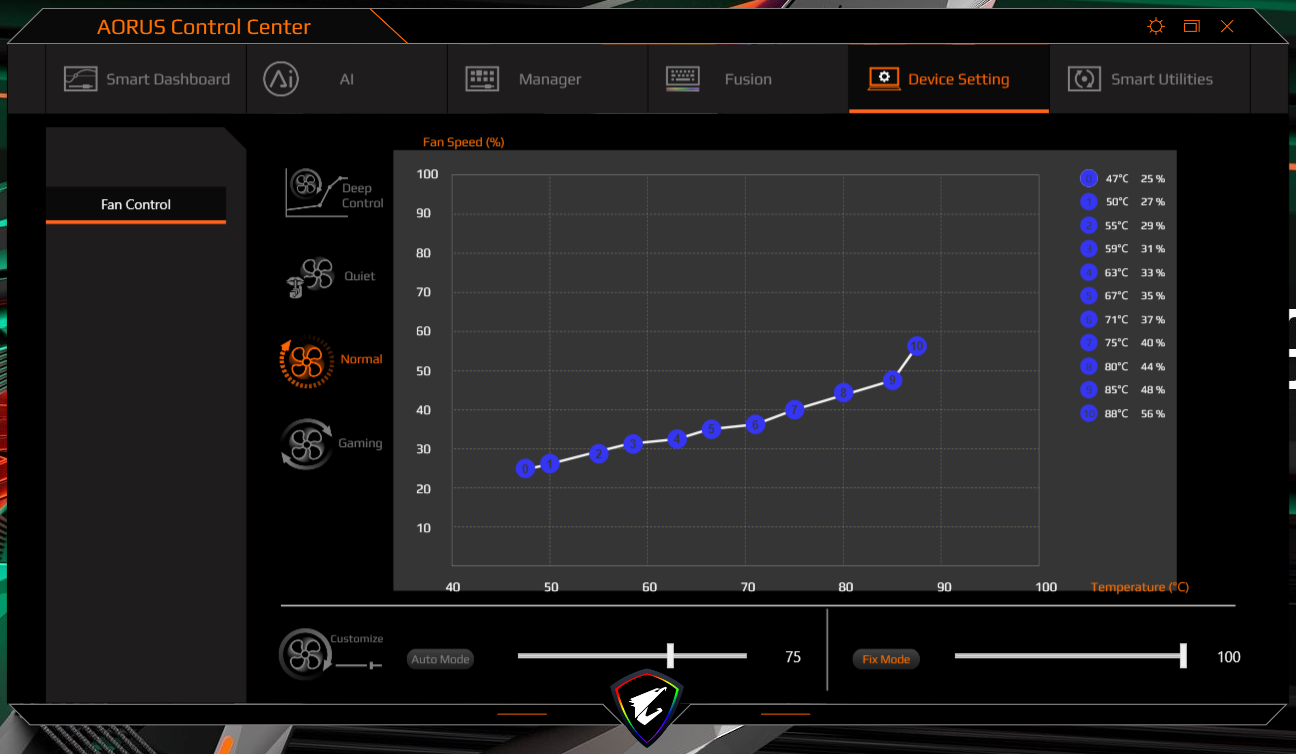
O Centro de Controle Aorus pré-instalado oferece a opção de especificar um perfil energético, entre outras coisas. Usamos aqui a função de IA automática. Como resultado, o próprio Centro de Controle escolhe as configurações apropriadas. Isto não só inclui a potência de computação e overclocking da CPU e da GPU, mas também cobre o brilho da tela, a temperatura da cor e a luz de fundo do teclado.
Alguns benchmarks também foram executados com o perfil "Turbo Mode" ativado. Este último permite que a CPU e a GPU funcionem permanentemente com a máxima performance. Em comparação com a seleção automática do perfil, as diferenças são pequenas. Este perfil não é recomendado para uso prolongado, pois mantém os ventiladores funcionando em plena potência.
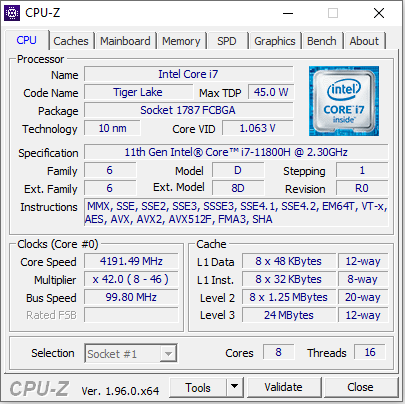
Processador
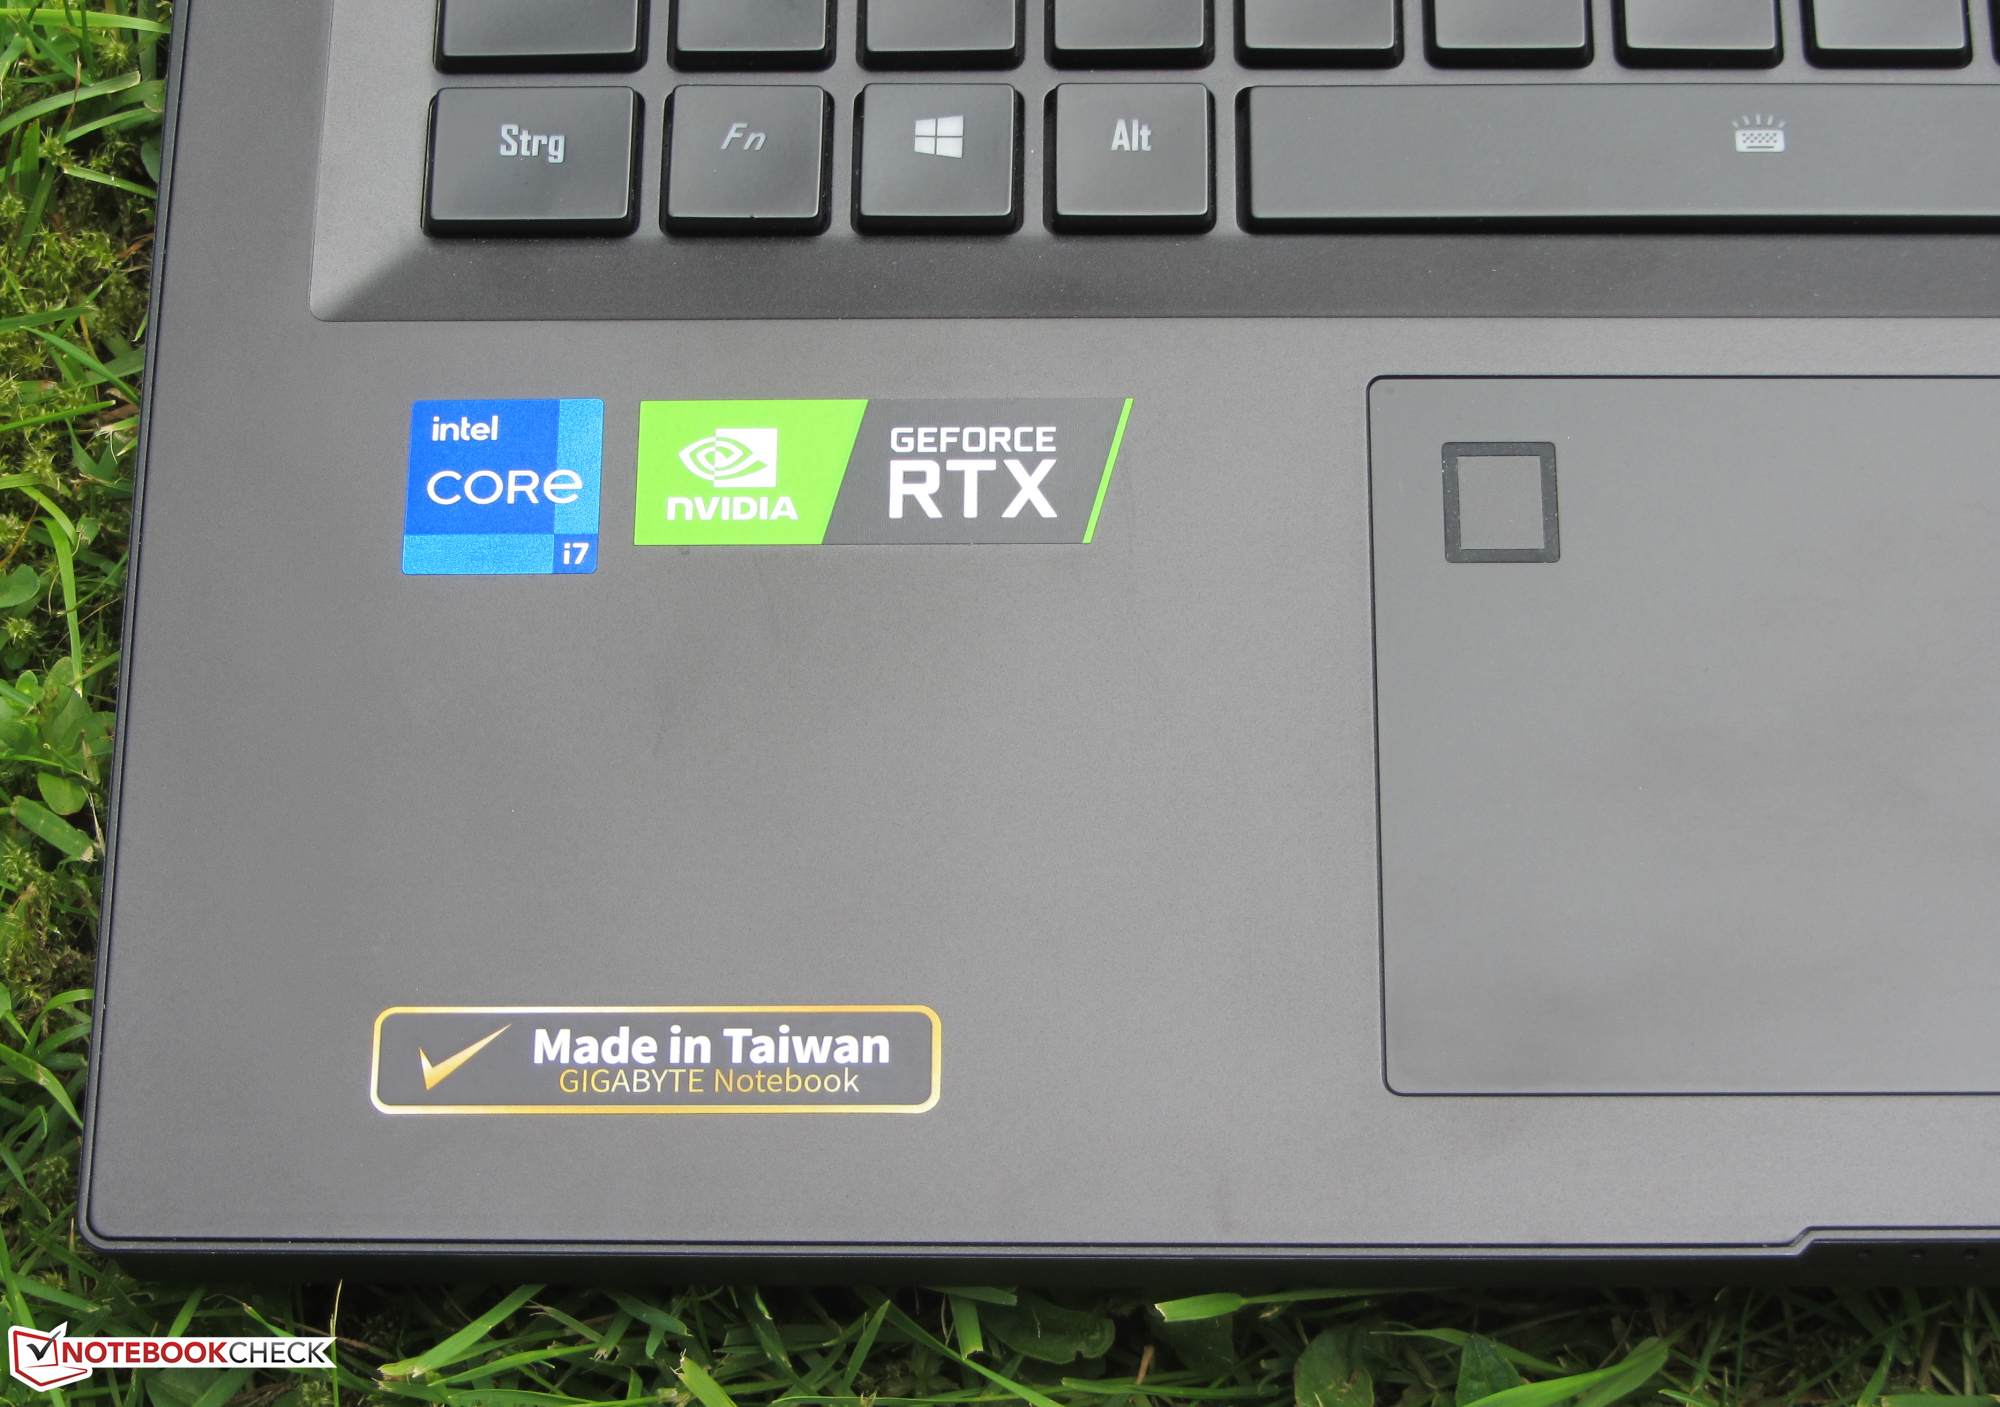
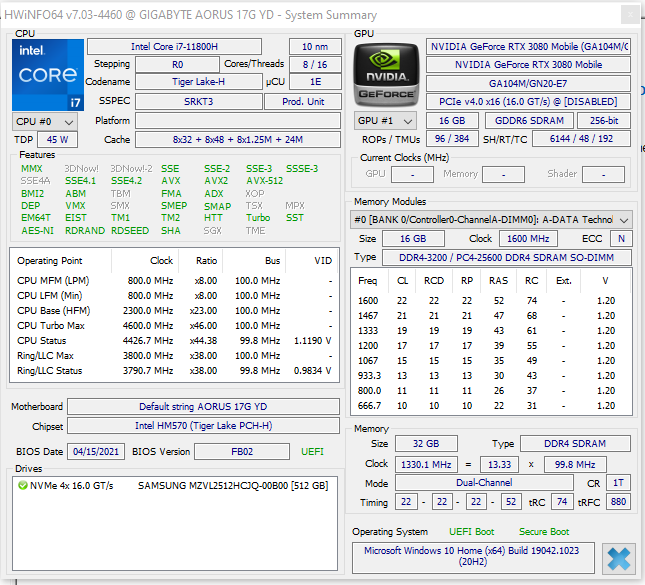
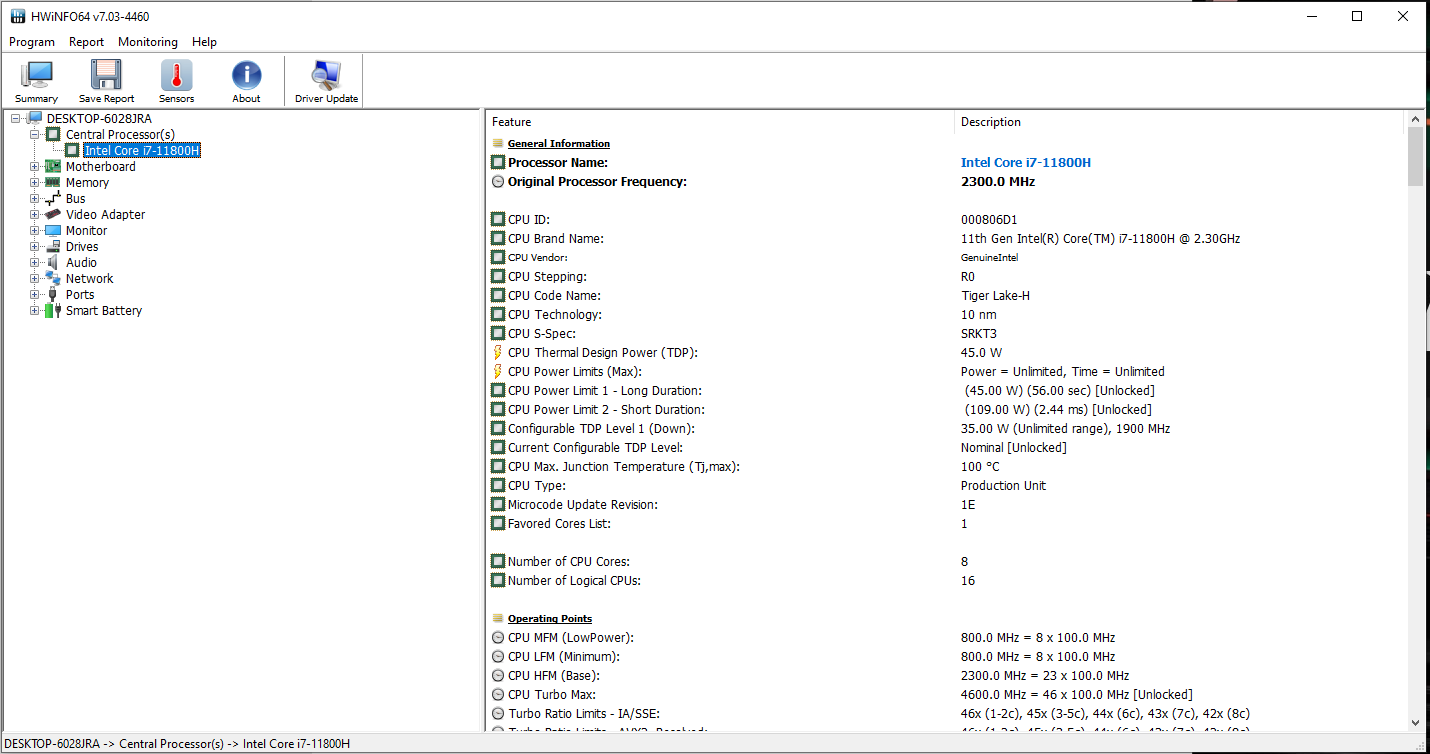
OCore-i7-11800H processadorocta-core (Tiger Lake) funciona a uma velocidade de relógio base de 2,3 GHz. Um aumento para 4,2 GHz (oito núcleos) ou 4,6 GHz (um núcleo) é possível via Turbo. Suporta hiper-Threading (dois fios por núcleo).
Os testes de CPU do benchmark Cinebench R15 são executados em 4,2 GHz (multithread) e 4,2 a 4,5 GHz (single-thread), respectivamente. Em bateria, a CPU funciona em 1,6 a 4,3 GHz (multifios) e 3,2 a 4,5 GHz (mono-fios).
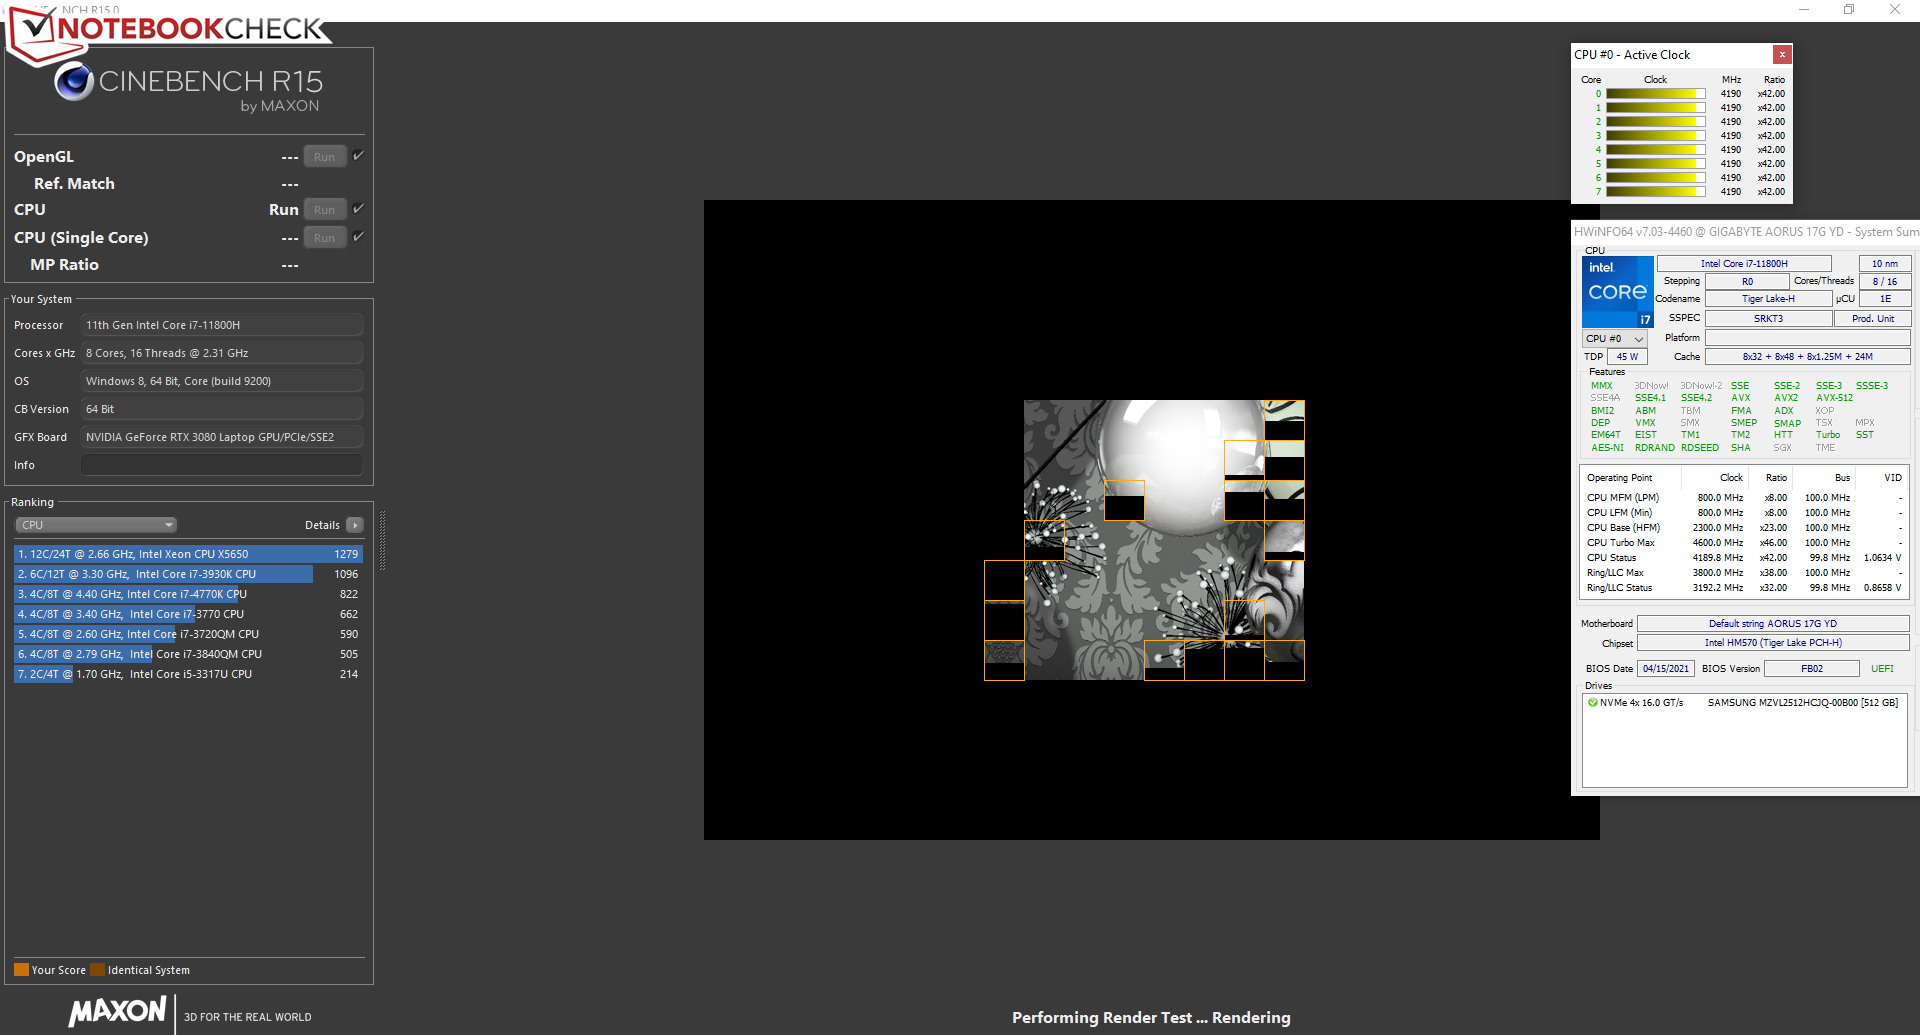
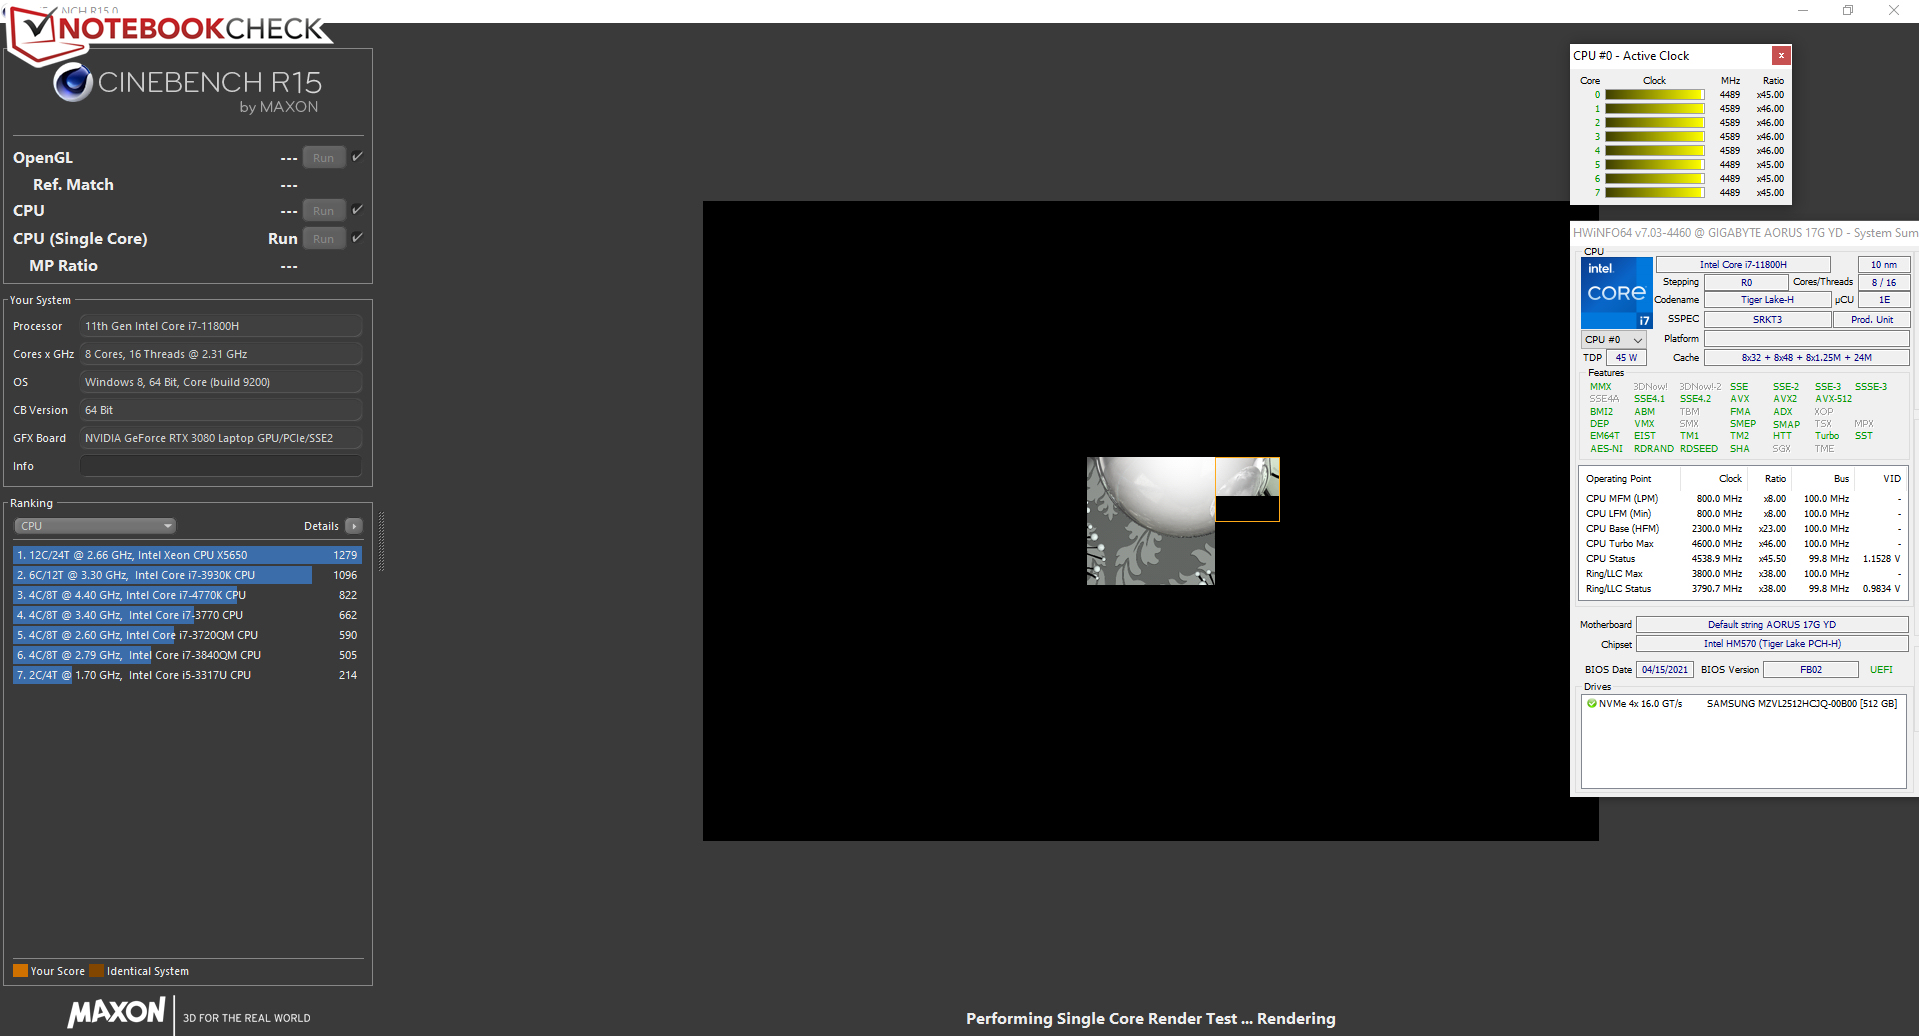
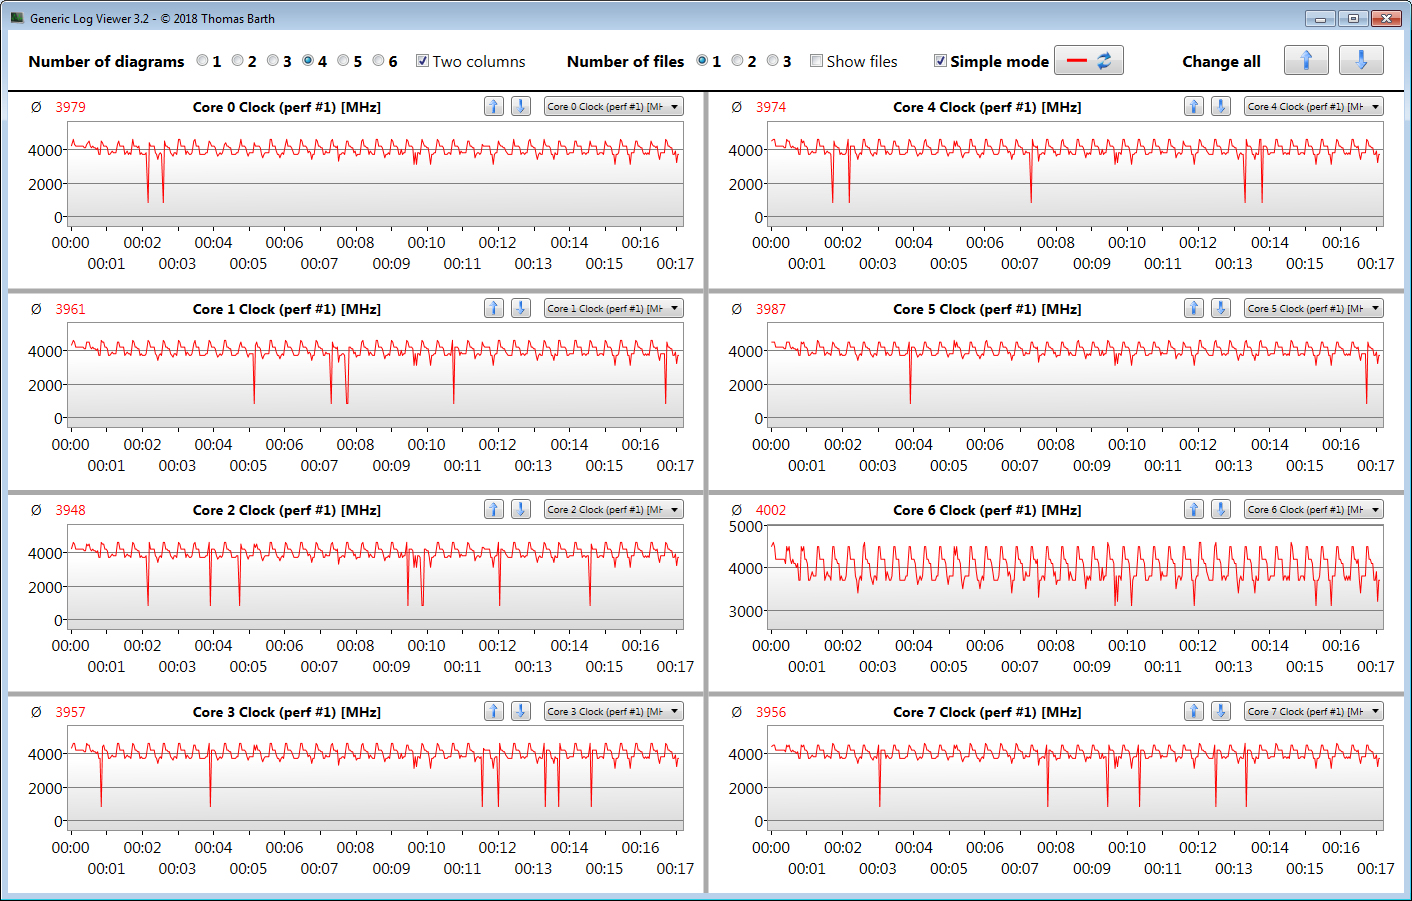
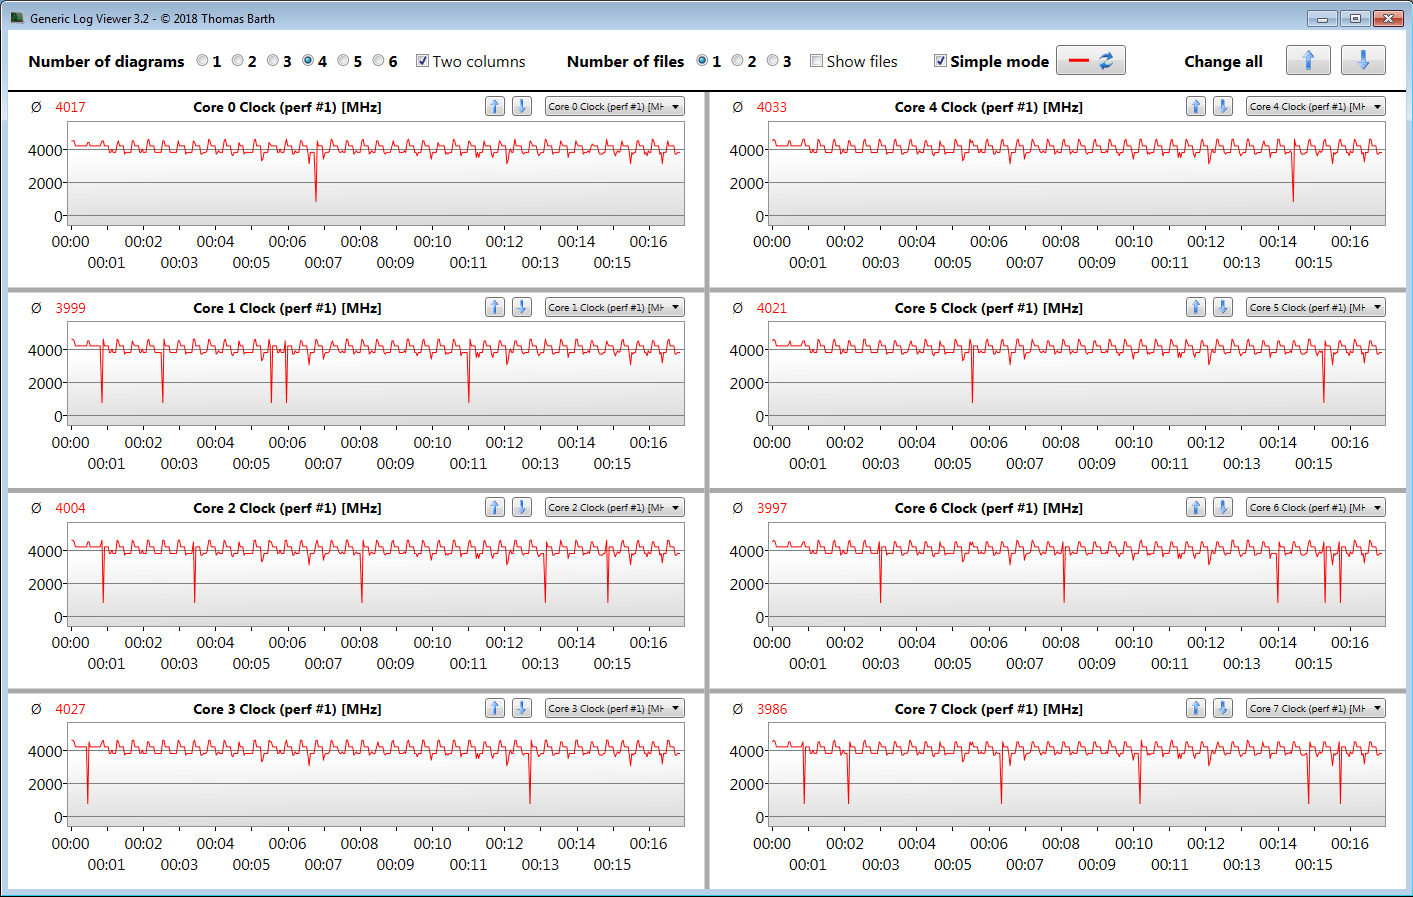
Verificamos se a CPU Turbo também é utilizada de forma consistente quando conectada, executando o teste multithread do benchmark Cinebench R15 em um loop contínuo por pelo menos 30 minutos. O Turbo quase opera em potência máxima.
| HWBOT x265 Benchmark v2.2 - 4k Preset | |
| Média da turma Gaming (11.5 - 44.3, n=109, últimos 2 anos) | |
| Asus Strix Scar 17 G733QSA-XS99 | |
| Lenovo Legion 7 16ACHg6 | |
| Aorus 17G YD (Turbo Mode) | |
| Aorus 17G YD | |
| Schenker XMG Neo 17 (Early 2021, RTX 3070, 5800H) | |
| Alienware m17 R4 | |
| Média Intel Core i7-11800H (7.38 - 17.4, n=46) | |
| MSI GE76 Raider 10UH | |
| Aorus 17G XB | |
| LibreOffice - 20 Documents To PDF | |
| Aorus 17G XB | |
| Alienware m17 R4 | |
| Schenker XMG Neo 17 (Early 2021, RTX 3070, 5800H) | |
| Lenovo Legion 7 16ACHg6 | |
| Média da turma Gaming (19 - 88.8, n=109, últimos 2 anos) | |
| MSI GE76 Raider 10UH | |
| Média Intel Core i7-11800H (38.6 - 59.9, n=45) | |
| Asus Strix Scar 17 G733QSA-XS99 | |
| Aorus 17G YD | |
| Aorus 17G YD (Turbo Mode) | |
* ... menor é melhor
Desempenho do sistema
O sistema funciona bem e sem problemas. Não tivemos nenhum problema, além das altas latências de DPC. O hardware fornece potência computacional mais que suficiente para aplicações que exigem desempenho, como jogos. Isto é acompanhado por bons resultados PCMark
| PCMark 8 Home Score Accelerated v2 | 5265 pontos | |
| PCMark 8 Creative Score Accelerated v2 | 7359 pontos | |
| PCMark 8 Work Score Accelerated v2 | 7104 pontos | |
| PCMark 10 Score | 7073 pontos | |
Ajuda | ||
| PCMark 8 | |
| Home Score Accelerated v2 | |
| Média da turma Gaming (n=1últimos 2 anos) | |
| Aorus 17G YD | |
| Média Intel Core i7-11800H, NVIDIA GeForce RTX 3080 Laptop GPU (3941 - 5640, n=3) | |
| Work Score Accelerated v2 | |
| Aorus 17G YD | |
| Média Intel Core i7-11800H, NVIDIA GeForce RTX 3080 Laptop GPU (4756 - 7104, n=3) | |
| Média da turma Gaming (n=1últimos 2 anos) | |
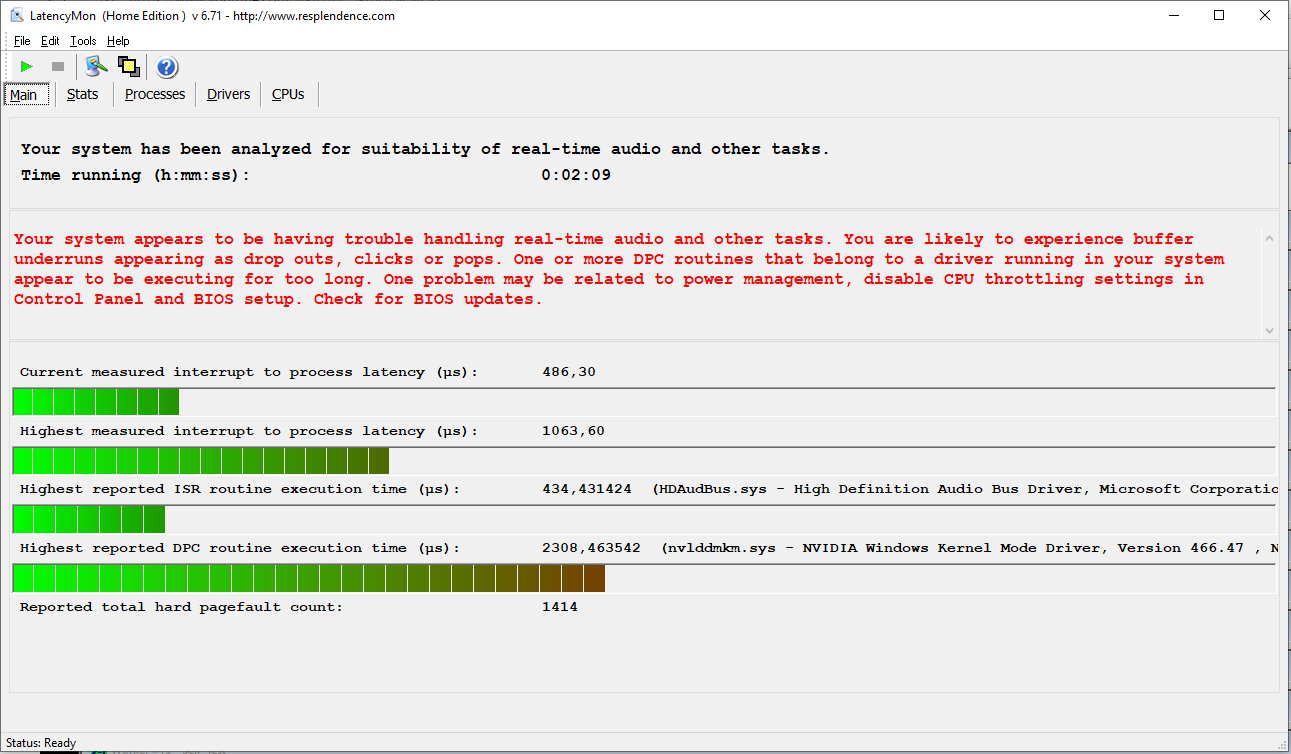
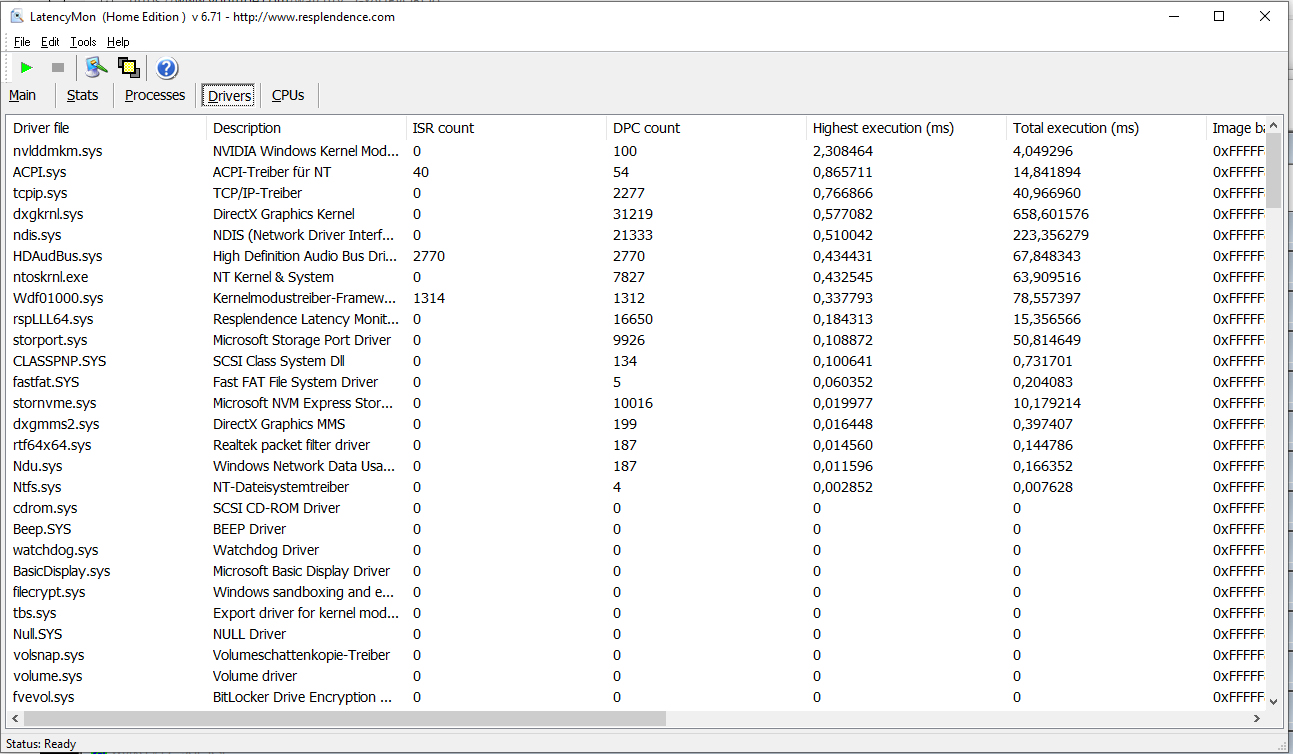
Latências DPC
Nosso teste de monitor de latência padronizado (navegação na web, reprodução de vídeo 4K, Prime95 de alta carga) revelou problemas com latências DPC. O sistema não parece ser adequado para edição de vídeo e áudio em tempo real
| DPC Latencies / LatencyMon - interrupt to process latency (max), Web, Youtube, Prime95 | |
| Aorus 17G XB | |
| Schenker XMG Neo 17 (Early 2021, RTX 3070, 5800H) | |
| MSI GP76 Leopard 10UG | |
| Aorus 17G YD | |
| Asus Strix Scar 17 G733QSA-XS99 | |
| Lenovo Legion 7 16ACHg6 | |
* ... menor é melhor
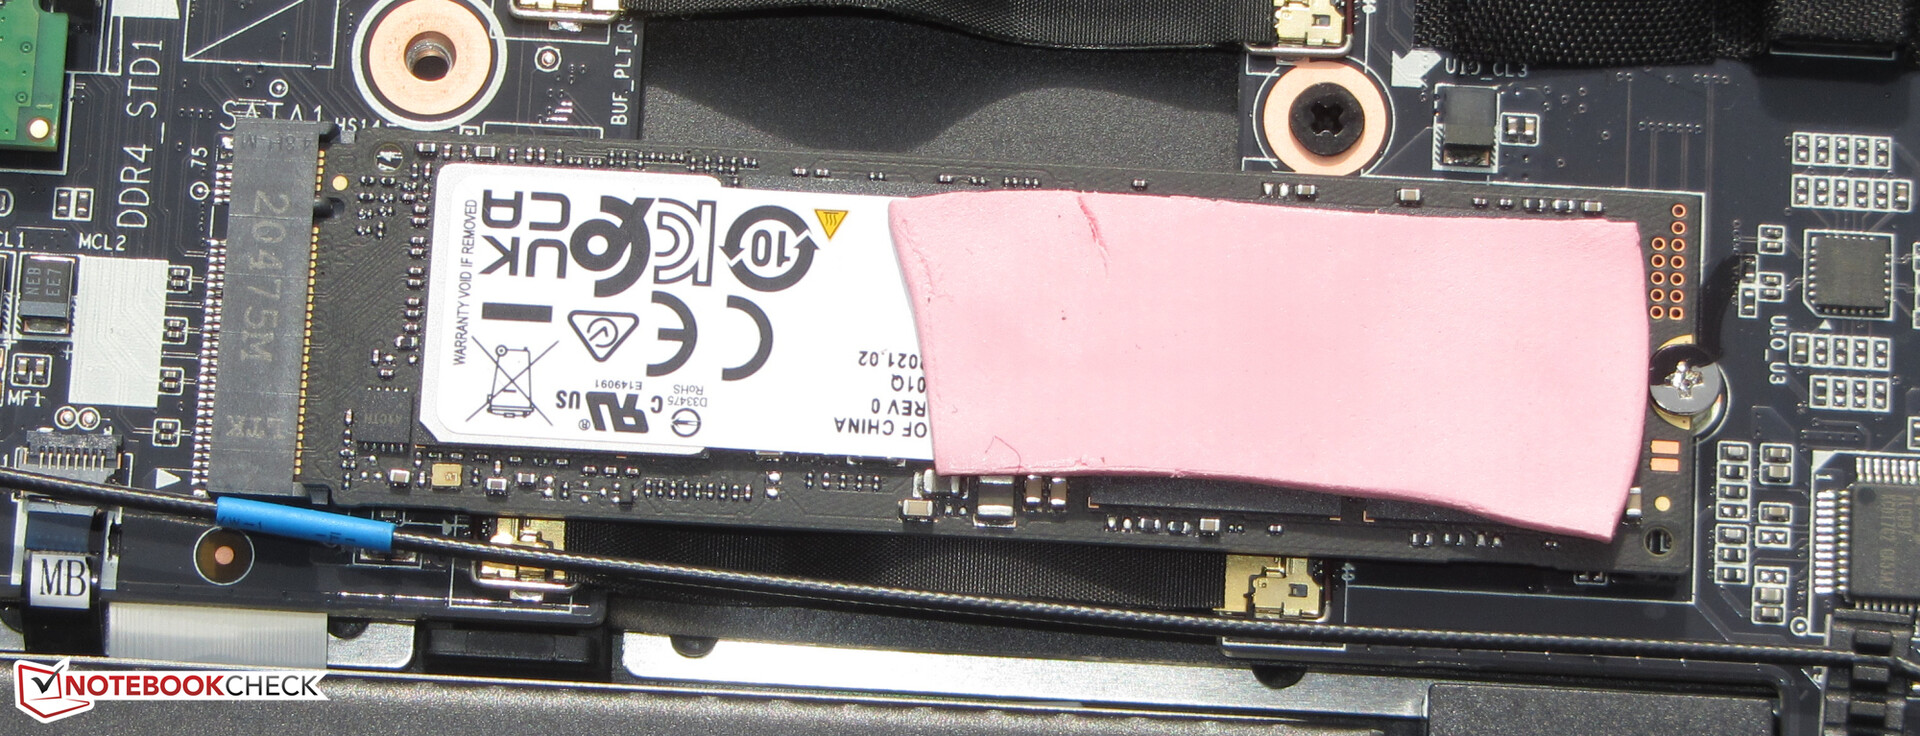
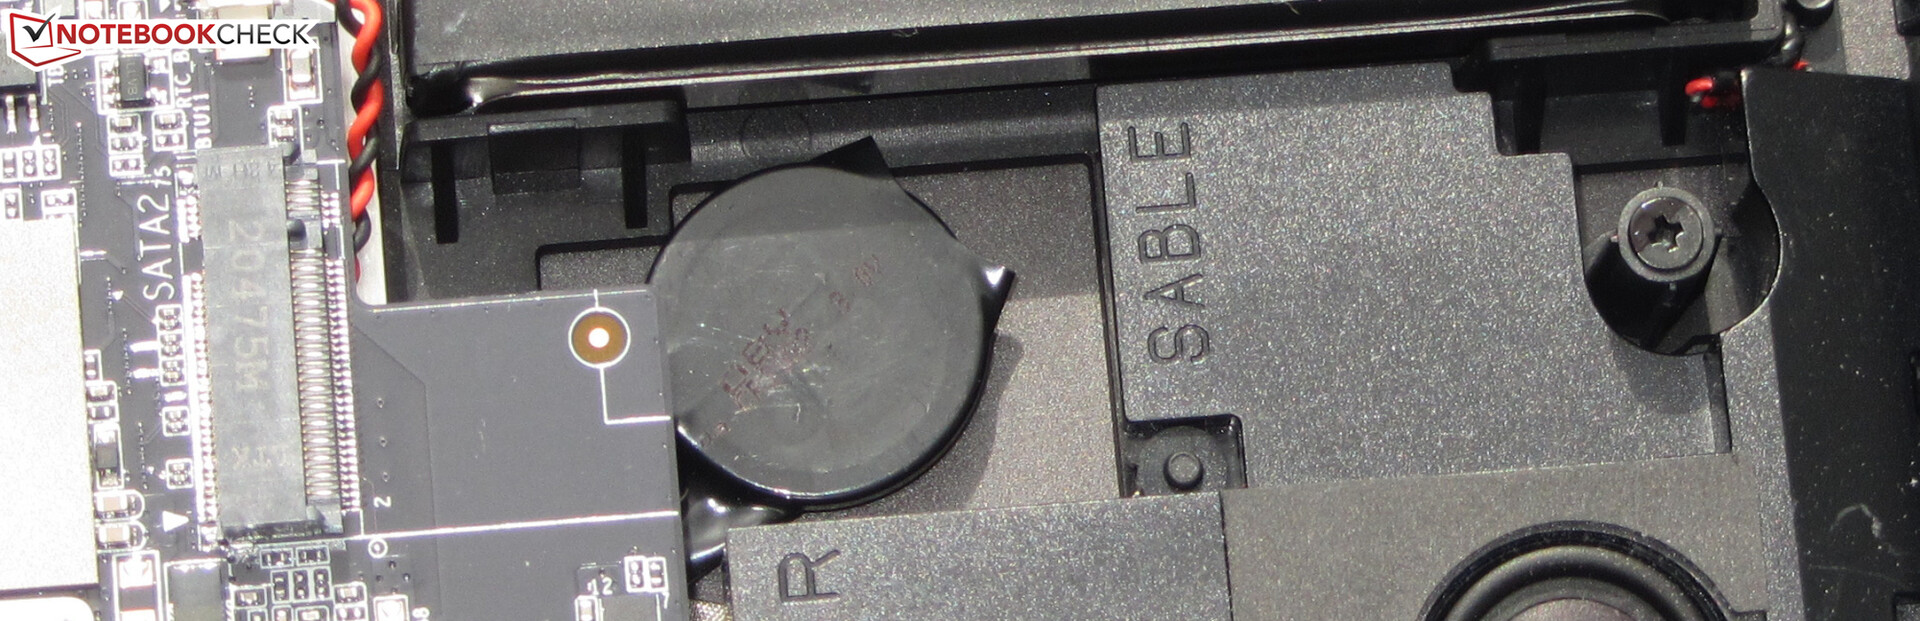
Armazenamento
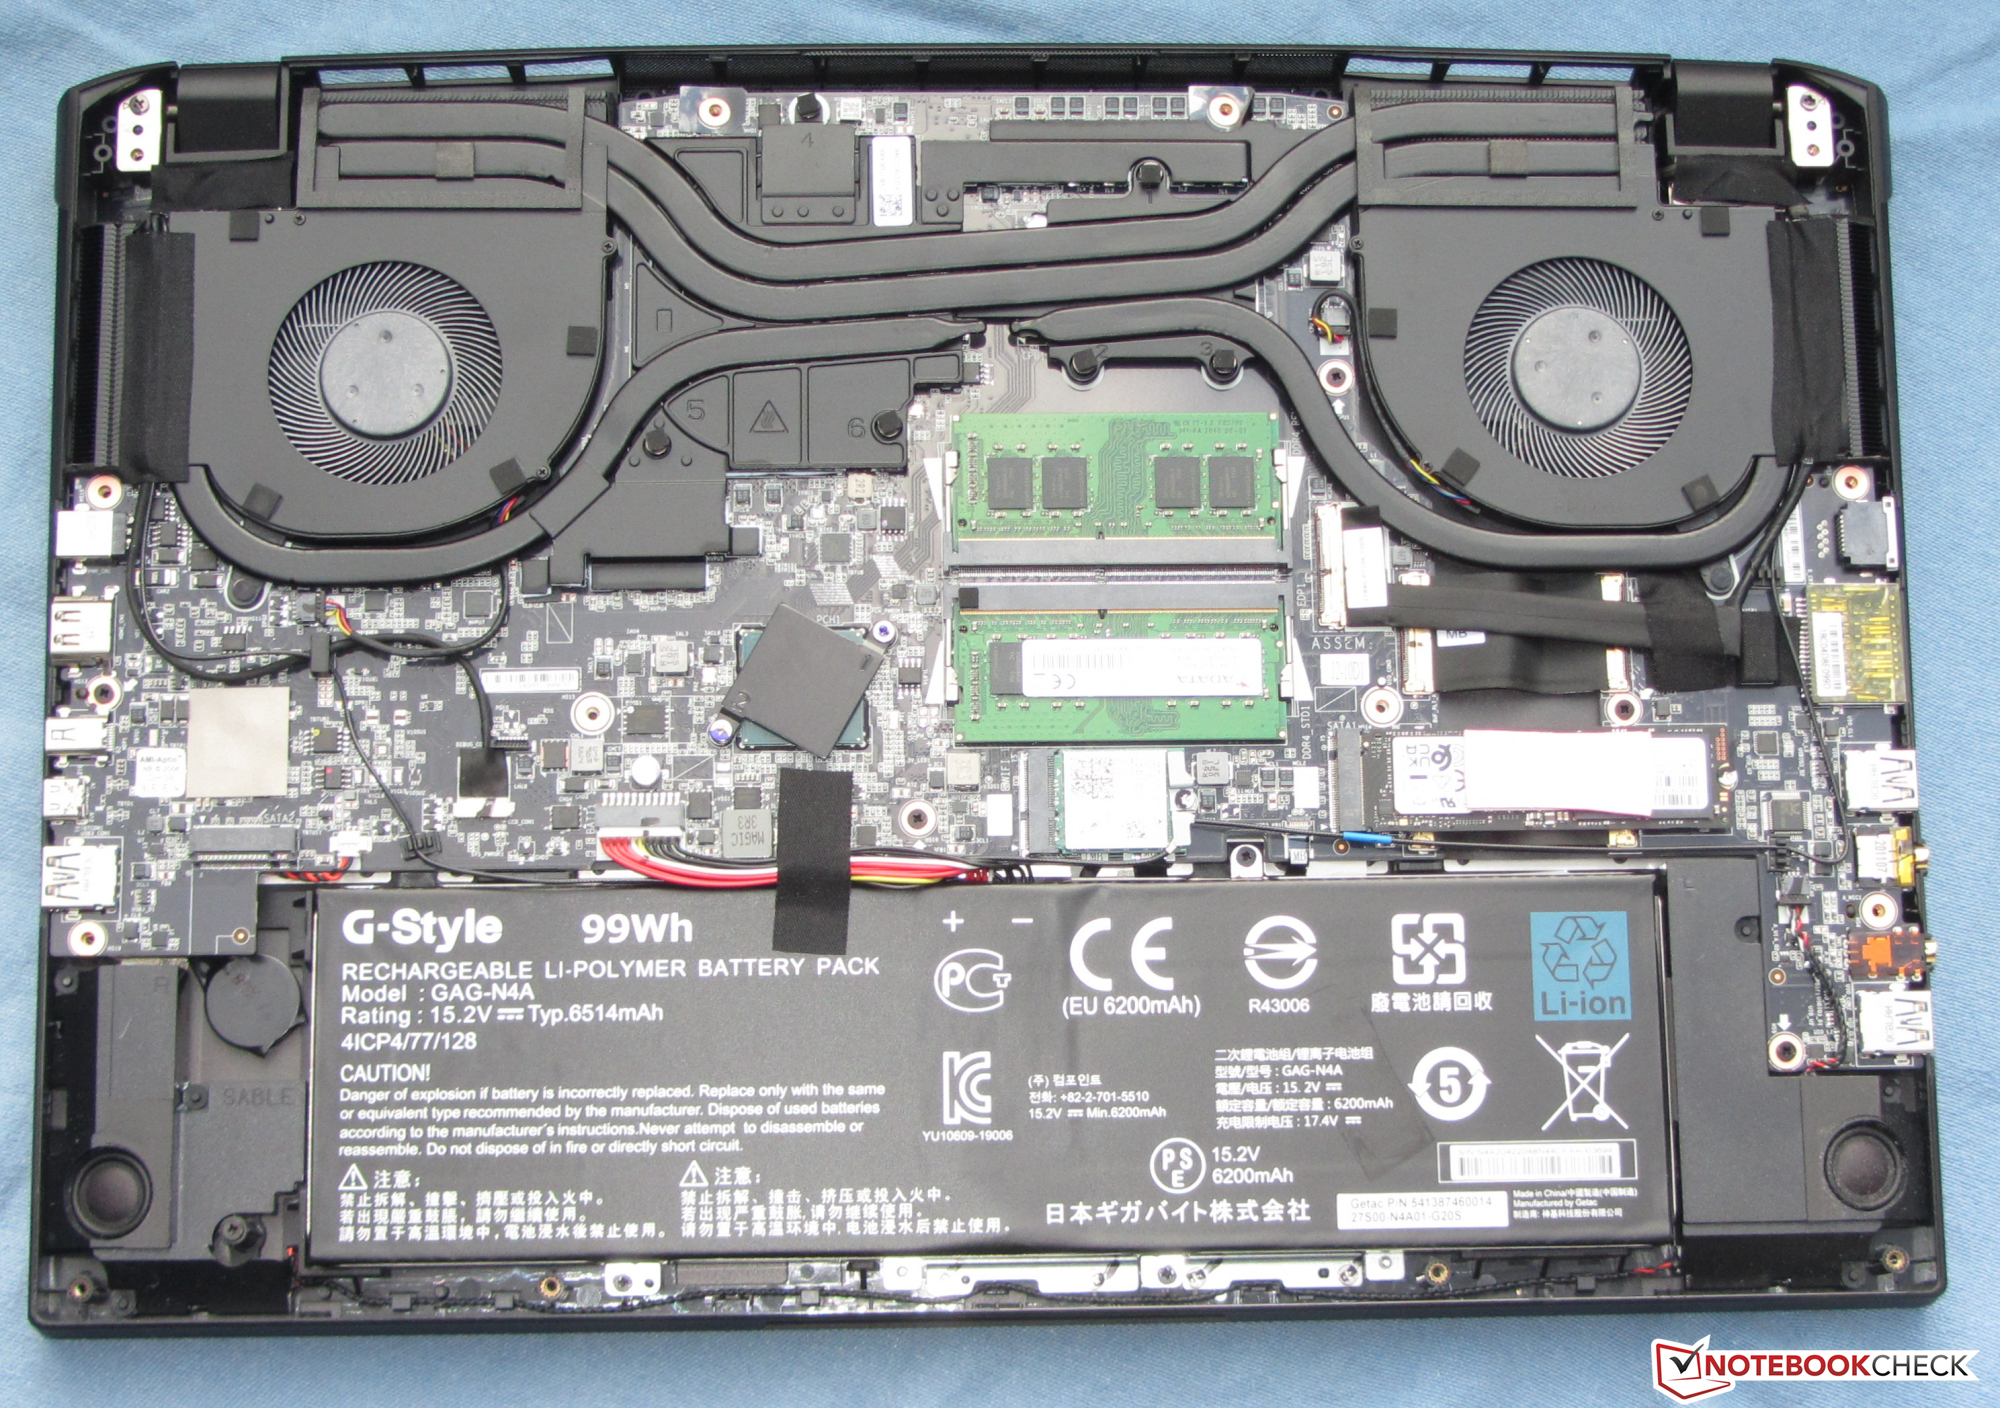
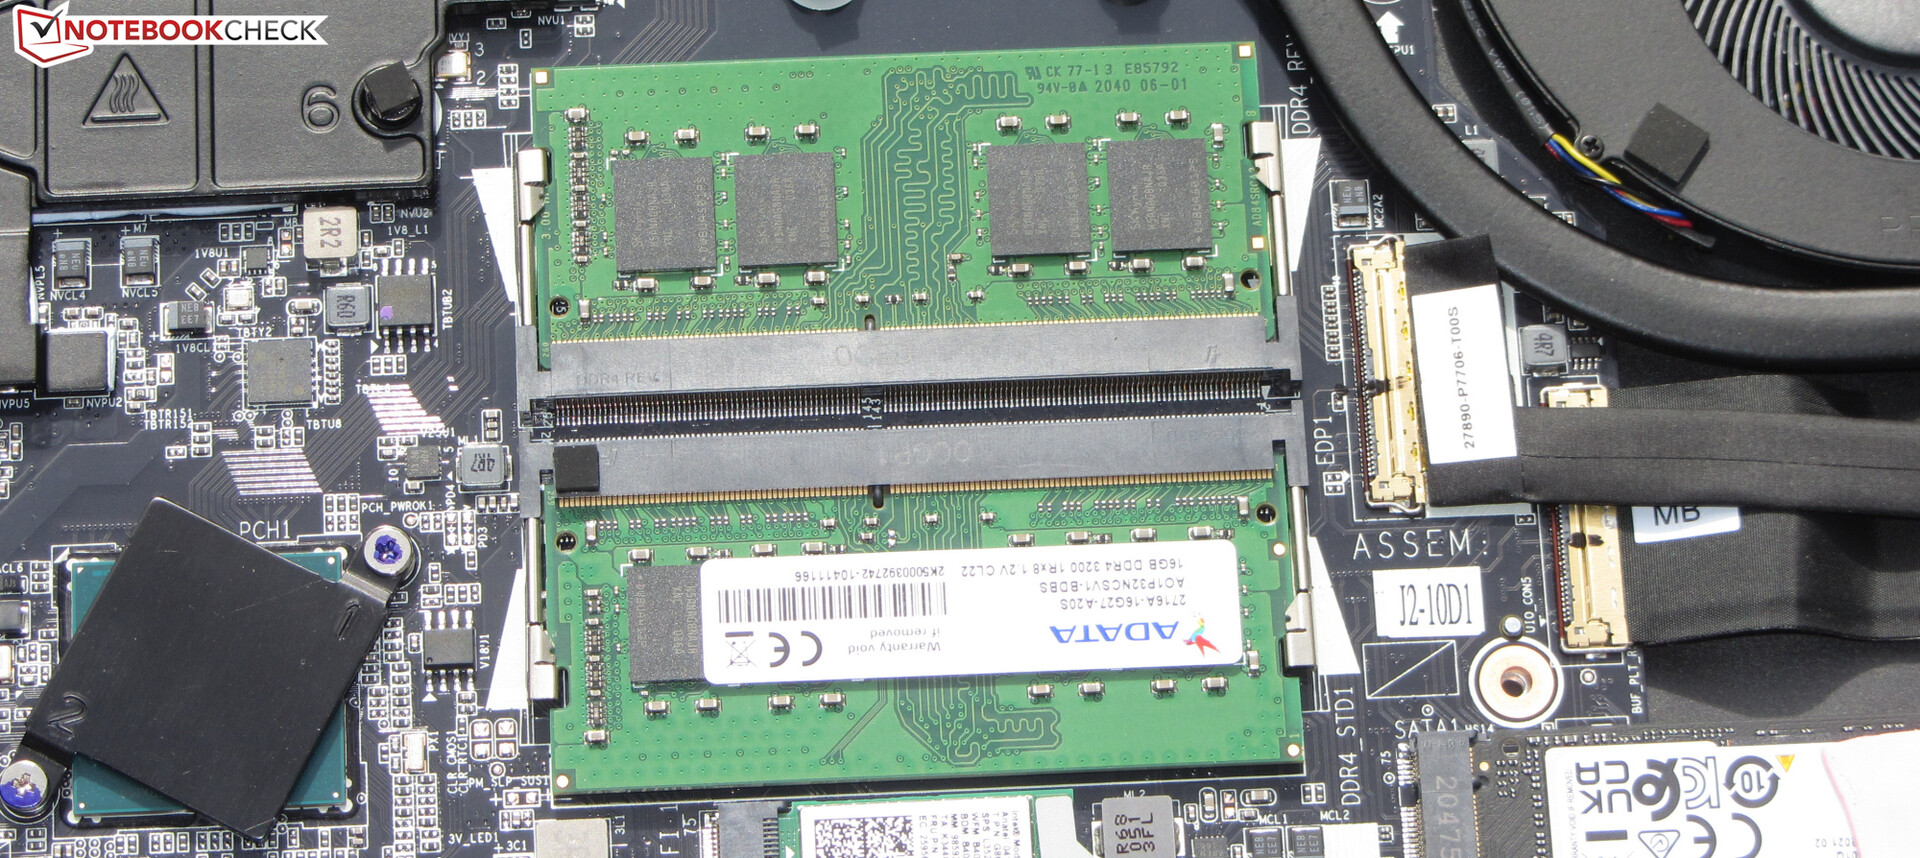
Um SSD NVMe de 512 GB (M.2-2280) da Samsung serve como unidade do sistema, e oferece excelentes taxas de transferência graças a sua conexão PCI Express 4.0. No total, o laptop tem espaço para dois M.2-2280 SSDs (1x PCIe 4.0, 1x PCIe 3.0/SATA). No entanto, o RAID 0/1 não é suportado

| Aorus 17G YD Samsung PM9A1 MZVL2512HCJQ | MSI GP76 Leopard 10UG Kingston OM8PCP3512F-AB | Asus Strix Scar 17 G733QSA-XS99 2x Samsung PM981a MZVLB1T0HBLR (RAID 0) | Lenovo Legion 7 16ACHg6 WDC PC SN730 SDBPNTY-1T00 | Schenker XMG Neo 17 (Early 2021, RTX 3070, 5800H) Samsung SSD 970 EVO Plus 500GB | Aorus 17G XB Samsung SSD PM981a MZVLB512HBJQ | Média Samsung PM9A1 MZVL2512HCJQ | |
|---|---|---|---|---|---|---|---|
| CrystalDiskMark 5.2 / 6 | -50% | 36% | -12% | -4% | -17% | 12% | |
| Write 4K (MB/s) | 227.4 | 143.7 -37% | 235.9 4% | 157.6 -31% | 206.1 -9% | 123.4 -46% | 179.1 ? -21% |
| Read 4K (MB/s) | 91.3 | 45.1 -51% | 48.02 -47% | 48.97 -46% | 53 -42% | 45.02 -51% | 75.6 ? -17% |
| Write Seq (MB/s) | 2241 | 978 -56% | 4822 115% | 2789 24% | 3018 35% | 2526 13% | 3016 ? 35% |
| Read Seq (MB/s) | 4496 | 1163 -74% | 5043 12% | 2494 -45% | 2575 -43% | 2062 -54% | 3350 ? -25% |
| Write 4K Q32T1 (MB/s) | 661 | 519 -21% | 625 -5% | 456.7 -31% | 535 -19% | 497.9 -25% | 459 ? -31% |
| Read 4K Q32T1 (MB/s) | 712 | 302.7 -57% | 392.3 -45% | 575 -19% | 608 -15% | 579 -19% | 554 ? -22% |
| Write Seq Q32T1 (MB/s) | 1540 | 981 -36% | 5350 247% | 3088 101% | 3242 111% | 2982 94% | 4346 ? 182% |
| Read Seq Q32T1 (MB/s) | 6806 | 1983 -71% | 7130 5% | 3388 -50% | 3617 -47% | 3440 -49% | 6346 ? -7% |
| AS SSD | -59% | -9% | -30% | -9% | -25% | -12% | |
| Seq Read (MB/s) | 5150 | 1659 -68% | 4981 -3% | 2944 -43% | 3020 -41% | 1791 -65% | 4656 ? -10% |
| Seq Write (MB/s) | 3920 | 921 -77% | 3050 -22% | 2657 -32% | 2631 -33% | 2193 -44% | 2742 ? -30% |
| 4K Read (MB/s) | 46.6 | 51 9% | 57 22% | 41.86 -10% | 60.3 29% | 50.7 9% | 67 ? 44% |
| 4K Write (MB/s) | 145.8 | 120.1 -18% | 261.3 79% | 111.3 -24% | 171.6 18% | 116.8 -20% | 173.8 ? 19% |
| 4K-64 Read (MB/s) | 2071 | 463.5 -78% | 1205 -42% | 1733 -16% | 1410 -32% | 1525 -26% | 1514 ? -27% |
| 4K-64 Write (MB/s) | 3267 | 909 -72% | 1290 -61% | 2119 -35% | 2324 -29% | 1958 -40% | 2355 ? -28% |
| Access Time Read * (ms) | 0.078 | 0.179 -129% | 0.032 59% | 0.157 -101% | 0.045 42% | 0.07 10% | 0.04867 ? 38% |
| Access Time Write * (ms) | 0.029 | 0.032 -10% | 0.044 -52% | 0.035 -21% | 0.024 17% | 0.032 -10% | 0.03605 ? -24% |
| Score Read (Points) | 2633 | 680 -74% | 1760 -33% | 2070 -21% | 1773 -33% | 1755 -33% | 2047 ? -22% |
| Score Write (Points) | 2805 | 1121 -60% | 1857 -34% | 2496 -11% | 2759 -2% | 2294 -18% | 2778 ? -1% |
| Score Total (Points) | 7716 | 2130 -72% | 4428 -43% | 5607 -27% | 5429 -30% | 4972 -36% | 5812 ? -25% |
| Copy ISO MB/s (MB/s) | 3190 | 3357 5% | 2310 -28% | 2192 ? -31% | |||
| Copy Program MB/s (MB/s) | 987 | 966 -2% | 748 -24% | 629 ? -36% | |||
| Copy Game MB/s (MB/s) | 2096 | 2051 -2% | 1523 -27% | 1393 ? -34% | |||
| Média Total (Programa/Configurações) | -55% /
-55% | 14% /
7% | -21% /
-24% | -7% /
-6% | -21% /
-22% | 0% /
-3% |
* ... menor é melhor
Continuous load read: DiskSpd Read Loop, Queue Depth 8
Placa gráfica
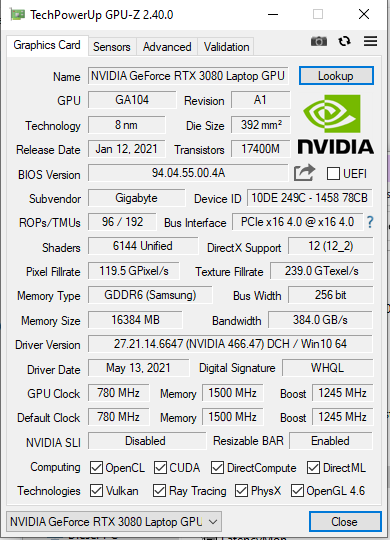
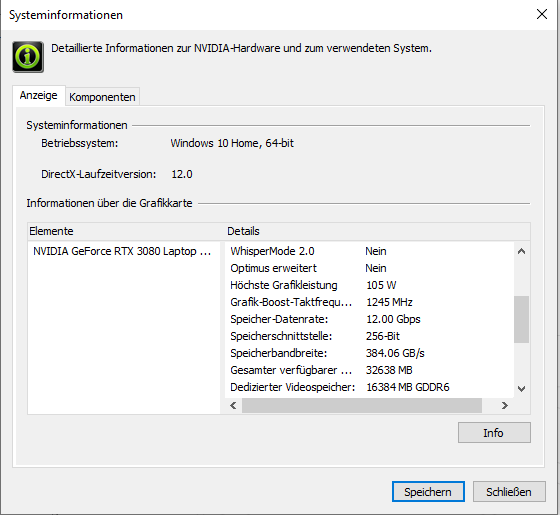
O desempenho real de um núcleo gráfico RTX 3000 depende do TGP máximo que o fabricante do laptop tenha escolhido dentro dos limites definidos pela Nvidia. Com um TGP de 105 watts (90 watts + 15 watts de Dynamic Boost), a Gigabyte continua optando pela faixa inferior de possibilidades no caso dolaptopGeForce RTX 3080GPU instalado aqui (visão geral de todos os laptops RTX 3080 incluindo seus TGPs).
Os resultados do 3DMark estão algures entre a média e abaixo da média em comparação com os laptops RTX 3080 que testamos até agora. Devido ao baixo TGP, o 17G tem que admitir a derrota para oMSI GP76 Leopard 10UGque está equipado com oportátil nominalmente mais fraco GeForce RTX 3070GPU. As limitações técnicas do RTX 3070 em comparação com o RTX 3080 são mais do que compensadas pelo TGP mais alto (140 watts).
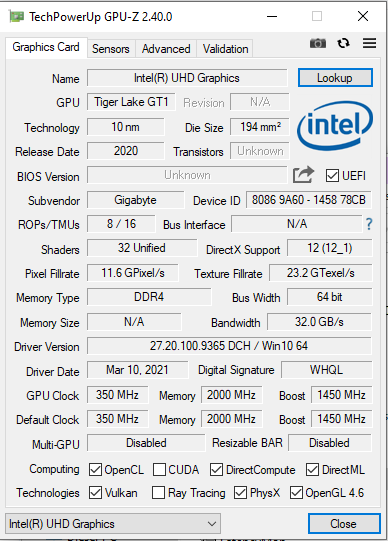
O RTX 3080 pode acessar rapidamente a memória gráfica GDDR6 (16 GB). O UHD Graphics Xe 750GPU que está integrado ao processador está ativo, e o laptop funciona com a solução de comutação gráfica Optimus da Nvidia.
| 3DMark 11 Performance | 28733 pontos | |
| 3DMark Cloud Gate Standard Score | 49494 pontos | |
| 3DMark Fire Strike Score | 22898 pontos | |
| 3DMark Time Spy Score | 10195 pontos | |
Ajuda | ||
Desempenho do jogo
O hardware instalado traz todos os jogos mais recentes suavemente para a tela. Resolução Full HD e nível máximo de qualidade geralmente podem ser selecionados. A GPU também pode lidar com resoluções além do Full HD (um monitor apropriado teria que ser conectado para isso) - com configurações de qualidade reduzida em alguns casos.
Em comparação com os laptops RTX 3080 testados até agora, o 17G tem um desempenho decente e oferece taxas de quadros médias a ligeiramente abaixo da média.
| The Witcher 3 - 1920x1080 Ultra Graphics & Postprocessing (HBAO+) | |
| Média da turma Gaming (95 - 240, n=8, últimos 2 anos) | |
| Lenovo Legion 7 16ACHg6 | |
| MSI GP76 Leopard 10UG | |
| Aorus 17G YD | |
| Asus Strix Scar 17 G733QSA-XS99 | |
| Média NVIDIA GeForce RTX 3080 Laptop GPU (85.1 - 123, n=40) | |
| Schenker XMG Neo 17 (Early 2021, RTX 3070, 5800H) | |
| Aorus 17G XB | |
| Dota 2 Reborn - 1920x1080 ultra (3/3) best looking | |
| Média da turma Gaming (84.8 - 248, n=111, últimos 2 anos) | |
| Aorus 17G YD | |
| Aorus 17G XB | |
| Schenker XMG Neo 17 (Early 2021, RTX 3070, 5800H) | |
| Aorus 17G YD (Turbo Mode) | |
| Média NVIDIA GeForce RTX 3080 Laptop GPU (98 - 156, n=45) | |
| Lenovo Legion 7 16ACHg6 | |
| Asus Strix Scar 17 G733QSA-XS99 | |
| MSI GP76 Leopard 10UG | |
| X-Plane 11.11 - 1920x1080 high (fps_test=3) | |
| Média da turma Gaming (52.1 - 143.5, n=114, últimos 2 anos) | |
| Aorus 17G XB | |
| Média NVIDIA GeForce RTX 3080 Laptop GPU (65.6 - 113, n=44) | |
| Aorus 17G YD (Turbo Mode) | |
| Aorus 17G YD | |
| Lenovo Legion 7 16ACHg6 | |
| MSI GP76 Leopard 10UG | |
| Asus Strix Scar 17 G733QSA-XS99 | |
| Schenker XMG Neo 17 (Early 2021, RTX 3070, 5800H) | |
| Final Fantasy XV Benchmark - 1920x1080 High Quality | |
| Média da turma Gaming (41 - 215, n=100, últimos 2 anos) | |
| Lenovo Legion 7 16ACHg6 (1.3) | |
| Asus Strix Scar 17 G733QSA-XS99 (1.3) | |
| Média NVIDIA GeForce RTX 3080 Laptop GPU (55.5 - 115, n=34) | |
| Aorus 17G YD (1.3, Turbo Mode) | |
| Aorus 17G YD (1.3) | |
| MSI GP76 Leopard 10UG | |
| Strange Brigade - 1920x1080 ultra AA:ultra AF:16 | |
| Média da turma Gaming (76.3 - 456, n=90, últimos 2 anos) | |
| Lenovo Legion 7 16ACHg6 (1.47.22.14 D3D12) | |
| Média NVIDIA GeForce RTX 3080 Laptop GPU (117 - 219, n=34) | |
| Asus Strix Scar 17 G733QSA-XS99 (1.47.22.14 D3D12) | |
| Aorus 17G YD (1.47.22.14 D3D12) | |
| Dirt 5 - 1920x1080 Ultra High Preset | |
| Lenovo Legion 7 16ACHg6 | |
| Aorus 17G YD | |
| Média NVIDIA GeForce RTX 3080 Laptop GPU (52 - 110, n=11) | |
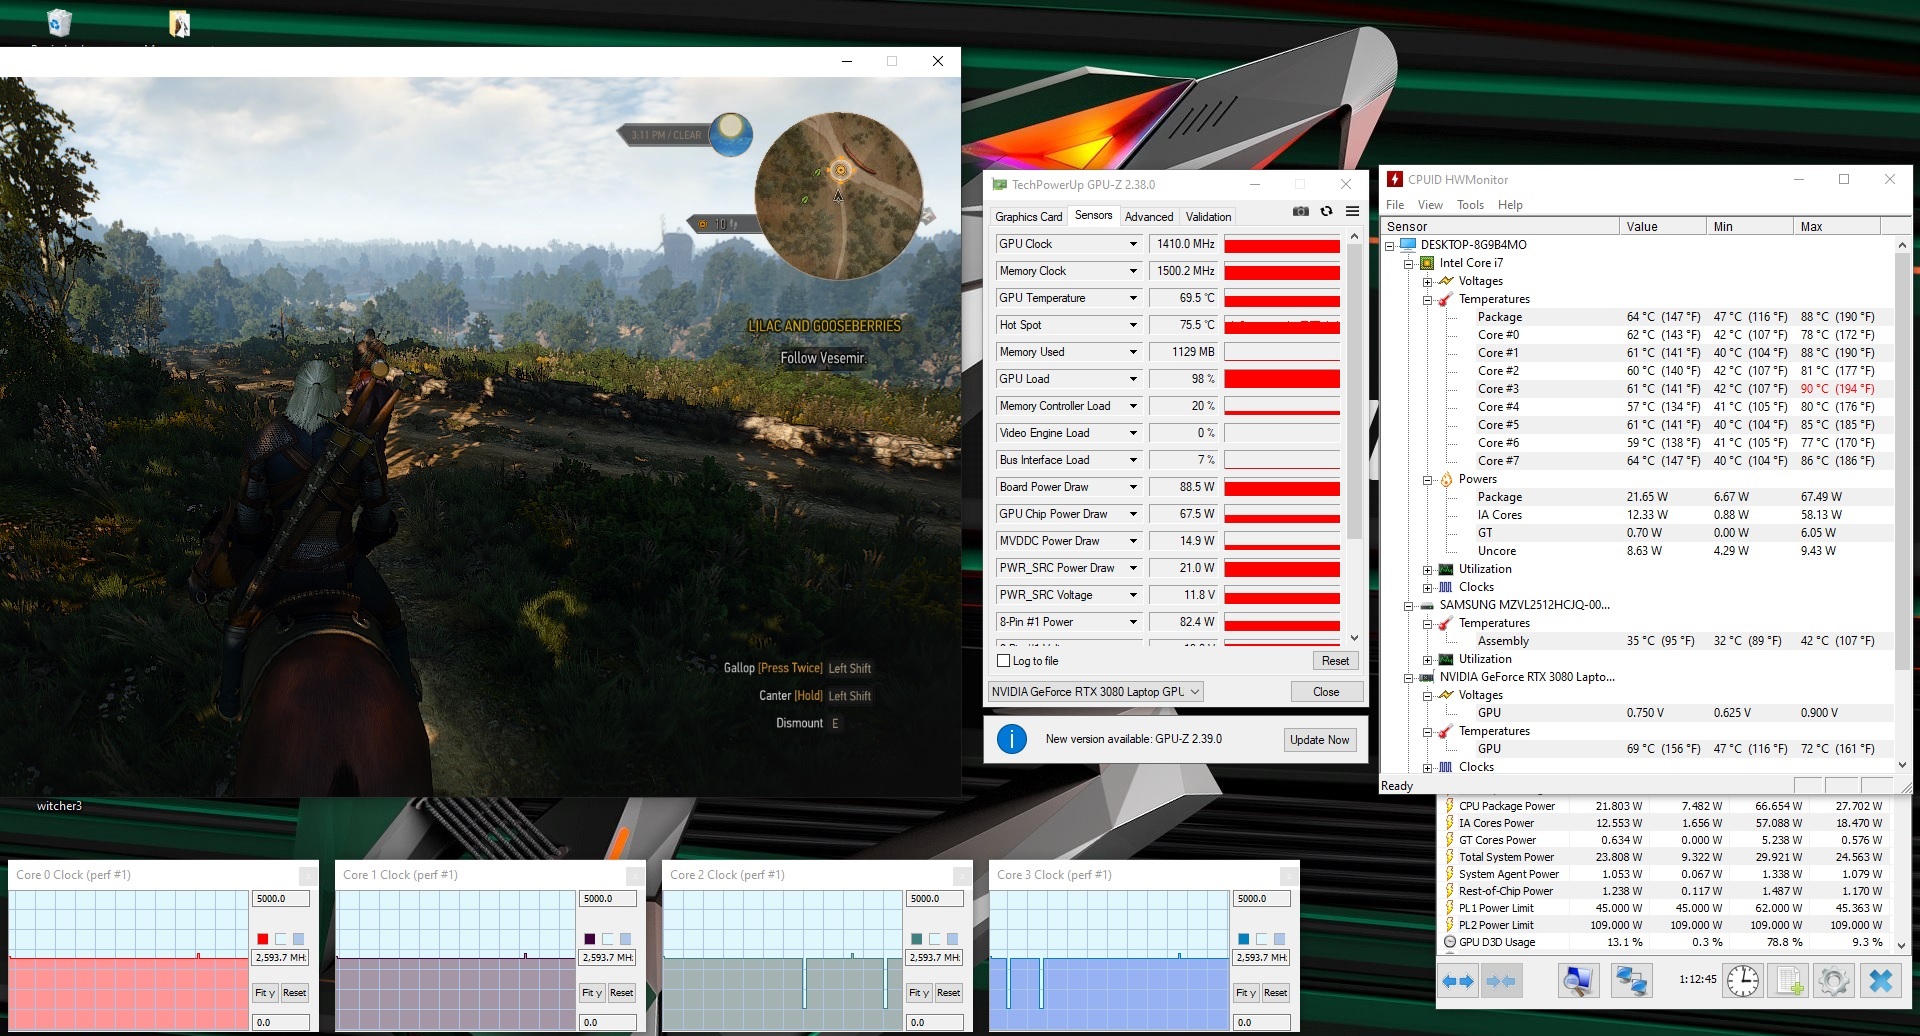
A fim de verificar se as taxas de quadros permanecem em grande parte constantes durante um longo período de tempo, deixamos o jogo O Witcher 3 funcionar por cerca de 60 minutos com resolução Full HD e ajustes de qualidade máxima. O personagem não é movido. Não foi encontrada uma queda nas taxas de quadros
| baixo | média | alto | ultra | |
|---|---|---|---|---|
| GTA V (2015) | 183 | 176 | 158 | 95.7 |
| The Witcher 3 (2015) | 365 | 267 | 183 | 106 |
| Dota 2 Reborn (2015) | 164 | 146 | 139 | 130 |
| Final Fantasy XV Benchmark (2018) | 172 | 123 | 93.8 | |
| X-Plane 11.11 (2018) | 123 | 103 | 82.9 | |
| Far Cry 5 (2018) | 153 | 119 | 115 | 108 |
| Strange Brigade (2018) | 420 | 225 | 184 | 163 |
| Horizon Zero Dawn (2020) | 133 | 119 | 109 | 100 |
| Serious Sam 4 (2020) | 152 | 107 | 93.6 | 85 |
| Dirt 5 (2020) | 178 | 123 | 104 | 87.5 |
| Yakuza Like a Dragon (2020) | 141 | 121 | 117 | 108 |
| Outriders (2021) | 119 | 101 | 110 | 106 |
| Mass Effect Legendary Edition (2021) | 135 | 115 | ||
| Days Gone (2021) | 175 | 139 | 126 | 98.2 |
Emissões - O Aorus laptop fica muito barulhento sob carga
Emissões sonoras
Mesmo em uso ocioso, os ventiladores são claramente audíveis em momentos com níveis de pressão sonora de até 39 dB(A). O ruído é ainda mais alto sob carga com níveis máximos de pressão sonora de 61 dB(A) (teste de estresse) e 52 dB(A)( Witcher 3 teste ), respectivamente. O uso de um fone de ouvido é praticamente inevitável
Barulho
| Ocioso |
| 32 / 33 / 39 dB |
| Carga |
| 43 / 61 dB |
 | ||
30 dB silencioso 40 dB(A) audível 50 dB(A) ruidosamente alto |
||
min: | ||
| Aorus 17G YD i7-11800H, GeForce RTX 3080 Laptop GPU | MSI GP76 Leopard 10UG i7-10750H, GeForce RTX 3070 Laptop GPU | Asus Strix Scar 17 G733QSA-XS99 R9 5900HX, GeForce RTX 3080 Laptop GPU | Lenovo Legion 7 16ACHg6 R9 5900HX, GeForce RTX 3080 Laptop GPU | Schenker XMG Neo 17 (Early 2021, RTX 3070, 5800H) R7 5800H, GeForce RTX 3070 Laptop GPU | Aorus 17G XB i7-10875H, GeForce RTX 2070 Super Max-Q | Média da turma Gaming | |
|---|---|---|---|---|---|---|---|
| Noise | 4% | 18% | 10% | 2% | -3% | 12% | |
| desligado / ambiente * (dB) | 25 | 24 4% | 25 -0% | 26 -4% | 24 4% | 30 -20% | 24.1 ? 4% |
| Idle Minimum * (dB) | 32 | 25 22% | 25.2 21% | 26 19% | 29 9% | 35 -9% | 25.9 ? 19% |
| Idle Average * (dB) | 33 | 32 3% | 25.2 24% | 30 9% | 32 3% | 36 -9% | 27.4 ? 17% |
| Idle Maximum * (dB) | 39 | 34 13% | 25.2 35% | 35 10% | 38 3% | 41 -5% | 29.9 ? 23% |
| Load Average * (dB) | 43 | 54 -26% | 30.7 29% | 40 7% | 49 -14% | 47 -9% | 43 ? -0% |
| Witcher 3 ultra * (dB) | 52 | 51 2% | 51.3 1% | 46 12% | 53 -2% | 48 8% | |
| Load Maximum * (dB) | 61 | 54 11% | 51.3 16% | 50 18% | 55 10% | 49 20% | 54.1 ? 11% |
* ... menor é melhor
Temperatura
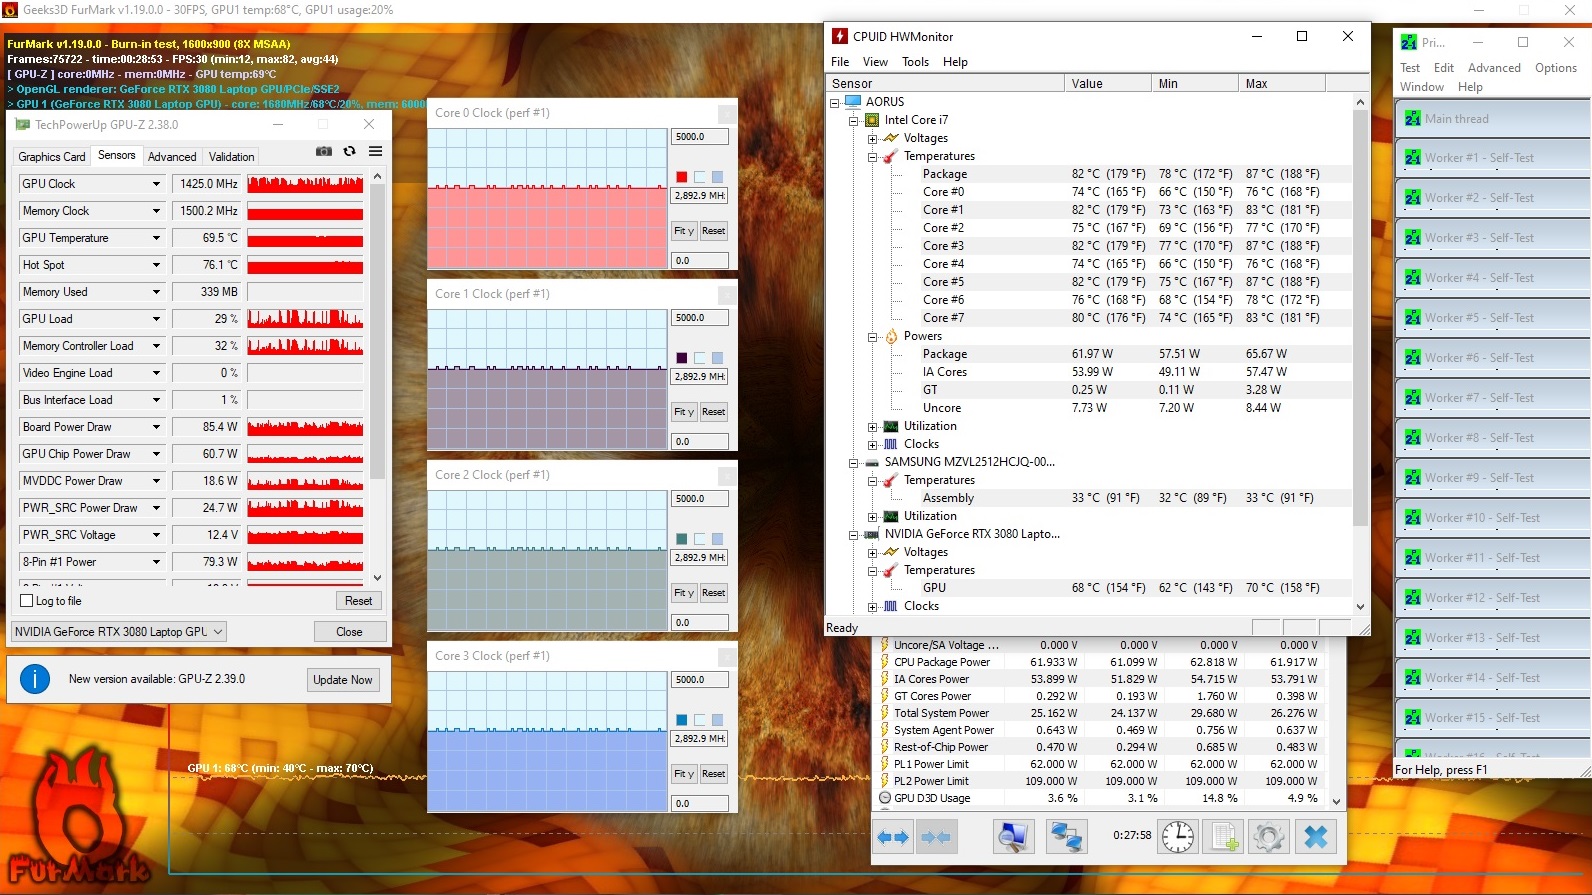
Nosso teste de estresse (Prime95 e FurMark funcionam por pelo menos uma hora) é executado pela CPU e GPU a 2,9 GHz e 1,425 MHz, respectivamente. O teste de estresse representa um cenário extremo. Utilizamos este teste para verificar se o sistema permanece estável sob carga total
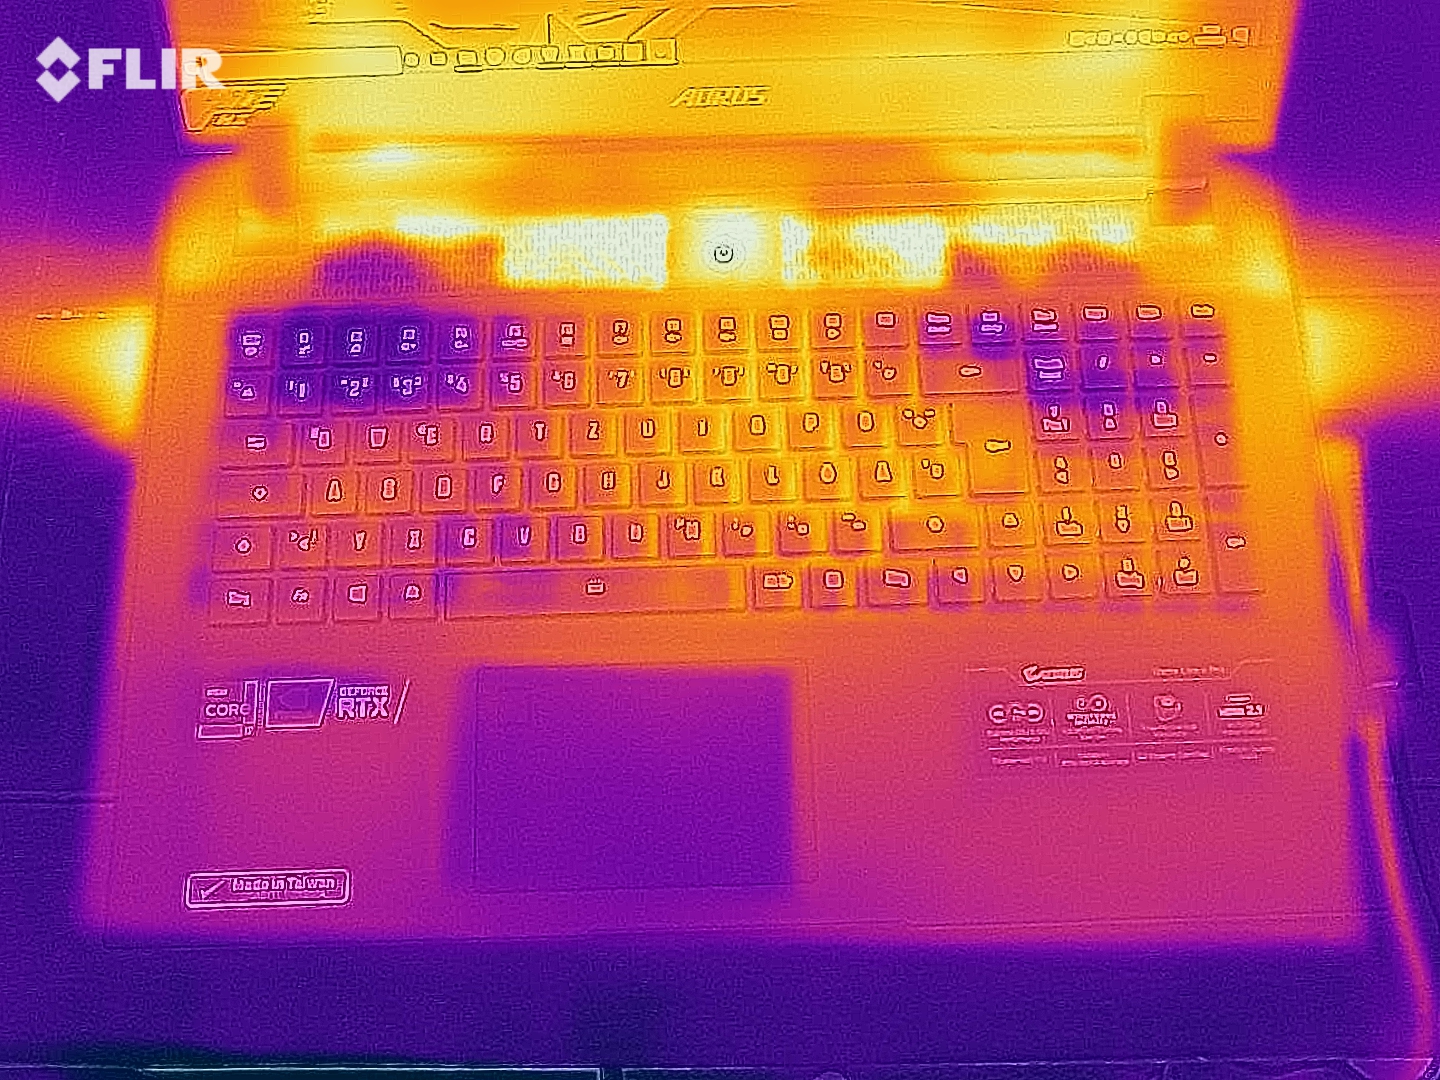
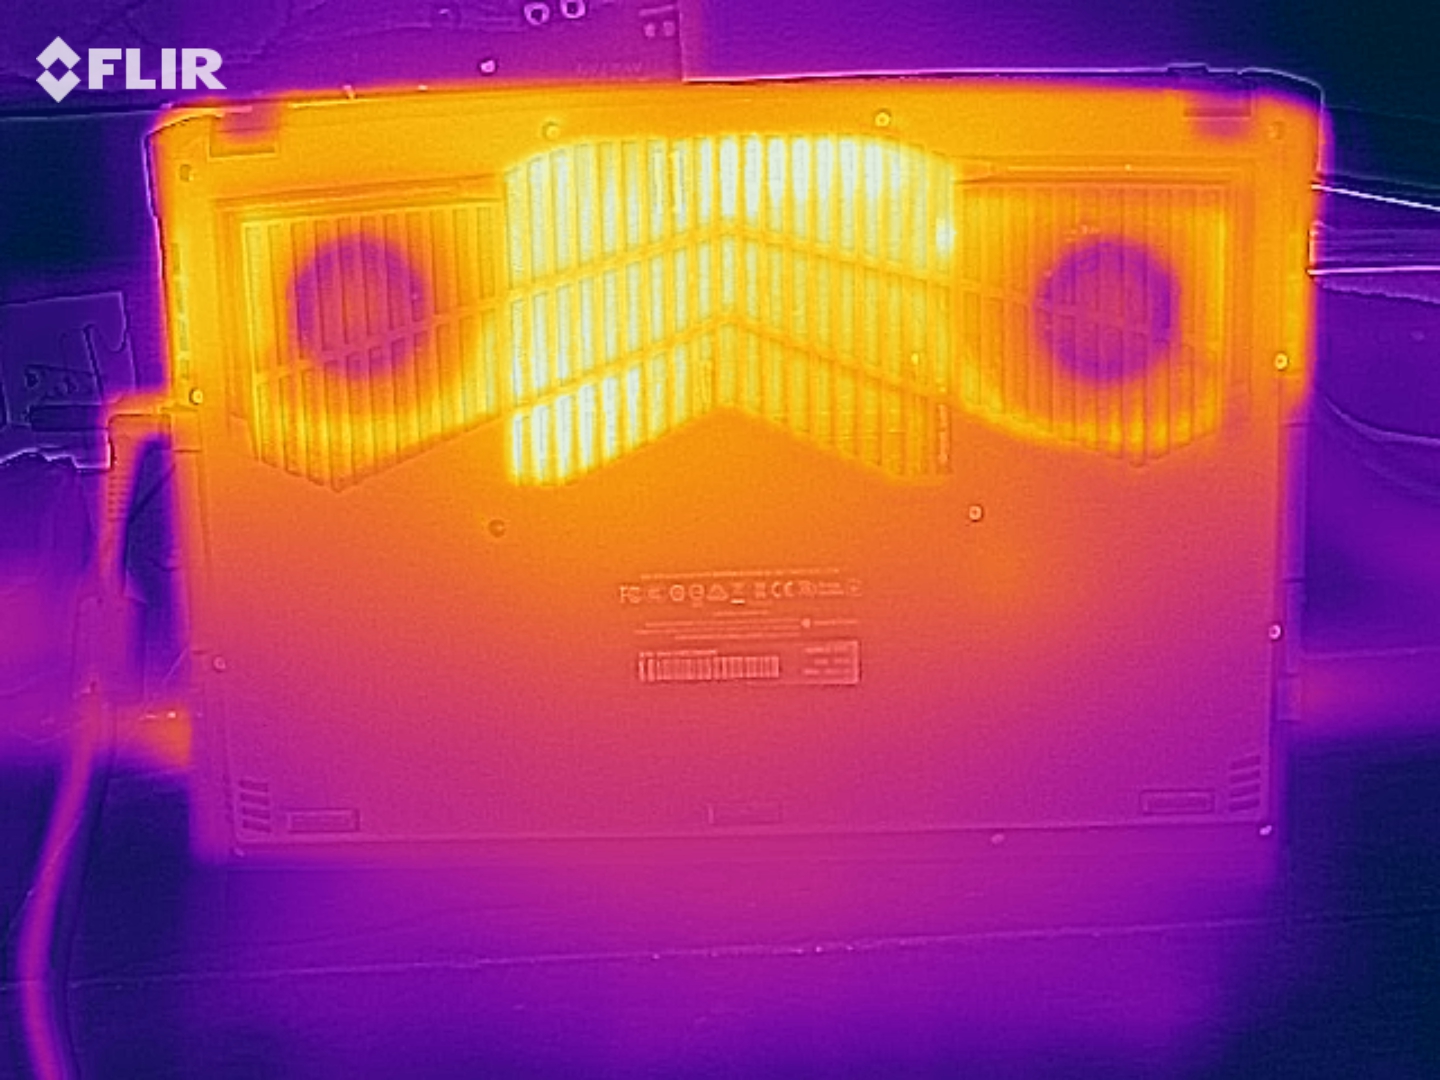
O laptop aquece visivelmente. Durante o teste de estresse, registramos temperaturas na faixa inferior de 50 °C (~122 °F) em vários pontos de medição na parte inferior. O desenvolvimento de calor é ligeiramente maior quando executamos nosso teste The Witcher 3. O dispositivo não deve ser colocado sobre a volta em nenhum dos casos
(+) A temperatura máxima no lado superior é 36 °C / 97 F, em comparação com a média de 40.4 °C / 105 F , variando de 21.2 a 68.8 °C para a classe Gaming.
(-) A parte inferior aquece até um máximo de 52 °C / 126 F, em comparação com a média de 43.2 °C / 110 F
(+) Em uso inativo, a temperatura média para o lado superior é 27.7 °C / 82 F, em comparação com a média do dispositivo de 33.9 °C / ### class_avg_f### F.
(±) Jogando The Witcher 3, a temperatura média para o lado superior é 33 °C / 91 F, em comparação com a média do dispositivo de 33.9 °C / ## #class_avg_f### F.
(+) Os apoios para as mãos e o touchpad são mais frios que a temperatura da pele, com um máximo de 29 °C / 84.2 F e, portanto, são frios ao toque.
(±) A temperatura média da área do apoio para as mãos de dispositivos semelhantes foi 28.8 °C / 83.8 F (-0.2 °C / -0.4 F).
| Aorus 17G YD i7-11800H, GeForce RTX 3080 Laptop GPU | MSI GP76 Leopard 10UG i7-10750H, GeForce RTX 3070 Laptop GPU | Asus Strix Scar 17 G733QSA-XS99 R9 5900HX, GeForce RTX 3080 Laptop GPU | Lenovo Legion 7 16ACHg6 R9 5900HX, GeForce RTX 3080 Laptop GPU | Schenker XMG Neo 17 (Early 2021, RTX 3070, 5800H) R7 5800H, GeForce RTX 3070 Laptop GPU | Aorus 17G XB i7-10875H, GeForce RTX 2070 Super Max-Q | Média da turma Gaming | |
|---|---|---|---|---|---|---|---|
| Heat | -3% | -6% | -21% | -13% | -6% | -7% | |
| Maximum Upper Side * (°C) | 36 | 43 -19% | 40 -11% | 51 -42% | 47 -31% | 48 -33% | 45.1 ? -25% |
| Maximum Bottom * (°C) | 52 | 47 10% | 39.8 23% | 52 -0% | 51 2% | 59 -13% | 48 ? 8% |
| Idle Upper Side * (°C) | 29 | 30 -3% | 34.6 -19% | 37 -28% | 32 -10% | 26 10% | 31.1 ? -7% |
| Idle Bottom * (°C) | 33 | 33 -0% | 38.4 -16% | 38 -15% | 37 -12% | 29 12% | 34.2 ? -4% |
* ... menor é melhor
Oradores
Aorus 17G YD análise de áudio
(+) | os alto-falantes podem tocar relativamente alto (###valor### dB)
Graves 100 - 315Hz
(-) | quase nenhum baixo - em média 31.4% menor que a mediana
(±) | a linearidade dos graves é média (14.2% delta para a frequência anterior)
Médios 400 - 2.000 Hz
(±) | médios mais altos - em média 5.4% maior que a mediana
(±) | a linearidade dos médios é média (7.1% delta para frequência anterior)
Altos 2 - 16 kHz
(+) | agudos equilibrados - apenas 1.4% longe da mediana
(+) | os máximos são lineares (3% delta da frequência anterior)
Geral 100 - 16.000 Hz
(±) | a linearidade do som geral é média (20.6% diferença em relação à mediana)
Comparado com a mesma classe
» 74% de todos os dispositivos testados nesta classe foram melhores, 5% semelhantes, 21% piores
» O melhor teve um delta de 6%, a média foi 18%, o pior foi 132%
Comparado com todos os dispositivos testados
» 55% de todos os dispositivos testados foram melhores, 8% semelhantes, 37% piores
» O melhor teve um delta de 4%, a média foi 24%, o pior foi 134%
Asus Strix Scar 17 G733QSA-XS99 análise de áudio
(±) | o volume do alto-falante é médio, mas bom (###valor### dB)
Graves 100 - 315Hz
(+) | bons graves - apenas 2.1% longe da mediana
(±) | a linearidade dos graves é média (7% delta para a frequência anterior)
Médios 400 - 2.000 Hz
(+) | médios equilibrados - apenas 1.4% longe da mediana
(+) | médios são lineares (4.8% delta para frequência anterior)
Altos 2 - 16 kHz
(±) | máximos mais altos - em média 5.9% maior que a mediana
(±) | a linearidade dos máximos é média (8.7% delta para frequência anterior)
Geral 100 - 16.000 Hz
(+) | o som geral é linear (10.7% diferença em relação à mediana)
Comparado com a mesma classe
» 7% de todos os dispositivos testados nesta classe foram melhores, 2% semelhantes, 91% piores
» O melhor teve um delta de 6%, a média foi 18%, o pior foi 132%
Comparado com todos os dispositivos testados
» 6% de todos os dispositivos testados foram melhores, 2% semelhantes, 93% piores
» O melhor teve um delta de 4%, a média foi 24%, o pior foi 134%
Gerenciamento de energia - A 17G oferece uma vida útil muito decente da bateria
Consumo de energia
Registramos um consumo máximo de energia de 38 watts em uso ocioso - uma taxa bastante alta considerando que a comutação gráfica está habilitada. O teste de estresse e nosso teste Witcher 3permitem que a demanda aumente até 230 watts e uma média de 164 watts, respectivamente. A potência nominal do adaptador de energia é de 230 watts
| desligado | |
| Ocioso | |
| Carga |
|
Key:
min: | |
| Aorus 17G YD i7-11800H, GeForce RTX 3080 Laptop GPU | MSI GP76 Leopard 10UG i7-10750H, GeForce RTX 3070 Laptop GPU | Asus Strix Scar 17 G733QSA-XS99 R9 5900HX, GeForce RTX 3080 Laptop GPU | Lenovo Legion 7 16ACHg6 R9 5900HX, GeForce RTX 3080 Laptop GPU | Schenker XMG Neo 17 (Early 2021, RTX 3070, 5800H) R7 5800H, GeForce RTX 3070 Laptop GPU | Aorus 17G XB i7-10875H, GeForce RTX 2070 Super Max-Q | Média da turma Gaming | |
|---|---|---|---|---|---|---|---|
| Power Consumption | 19% | 18% | -16% | 11% | 4% | 18% | |
| Idle Minimum * (Watt) | 24 | 12 50% | 10.9 55% | 31 -29% | 13 46% | 20 17% | 13.1 ? 45% |
| Idle Average * (Watt) | 26 | 16 38% | 14.7 43% | 33 -27% | 16 38% | 23 12% | 18.8 ? 28% |
| Idle Maximum * (Watt) | 38 | 28 26% | 26.8 29% | 46 -21% | 26 32% | 38 -0% | 24.4 ? 36% |
| Load Average * (Watt) | 101 | 92 9% | 106.7 -6% | 110 -9% | 125 -24% | 105 -4% | 108.5 ? -7% |
| Witcher 3 ultra * (Watt) | 164 | 198 -21% | 192.4 -17% | 180 -10% | 187 -14% | 158 4% | |
| Load Maximum * (Watt) | 230 | 210 9% | 228.4 1% | 235 -2% | 259 -13% | 243 -6% | 254 ? -10% |
* ... menor é melhor
Duração da bateria
O equipamento de 17,3 polegadas atinge tempos de execução de 6:00 horas e 6:10 horas no teste Wi-Fi (acesso a websites usando um roteiro) e teste de vídeo (o curta-metragem Big Buck Bunny
(codificação H.264, Full HD) rodando em loop), respectivamente. Os recursos de economia de energia do laptop são desativados durante ambos os testes, e o brilho da tela é ajustado para cerca de 150 cd/m². Além disso, os módulos sem fio são desabilitados para o teste de vídeo.Os testes de duração da bateria foram realizados sem a opção de perfil automático, suportado por AI, do Centro de Controle. Os perfis de potência padrão foram usados.
| Aorus 17G YD i7-11800H, GeForce RTX 3080 Laptop GPU, 99 Wh | MSI GP76 Leopard 10UG i7-10750H, GeForce RTX 3070 Laptop GPU, 65 Wh | Asus Strix Scar 17 G733QSA-XS99 R9 5900HX, GeForce RTX 3080 Laptop GPU, 90 Wh | Lenovo Legion 7 16ACHg6 R9 5900HX, GeForce RTX 3080 Laptop GPU, 80 Wh | Schenker XMG Neo 17 (Early 2021, RTX 3070, 5800H) R7 5800H, GeForce RTX 3070 Laptop GPU, 62 Wh | Aorus 17G XB i7-10875H, GeForce RTX 2070 Super Max-Q, 94 Wh | Média da turma Gaming | |
|---|---|---|---|---|---|---|---|
| Duração da bateria | -39% | 30% | 4% | -49% | 25% | 10% | |
| Reader / Idle (h) | 9 | 5.6 -38% | 13.3 48% | 8.2 -9% | 4.7 -48% | 10 11% | 8.71 ? -3% |
| H.264 (h) | 6.2 | 6.8 10% | 8.26 ? 33% | ||||
| WiFi v1.3 (h) | 6 | 4.2 -30% | 9.3 55% | 6.8 13% | 3.5 -42% | 7.5 25% | 6.98 ? 16% |
| Load (h) | 1.6 | 0.8 -50% | 1.4 -13% | 1.6 0% | 0.7 -56% | 2.2 38% | 1.47 ? -8% |
Pro
Contra
Veredicto - O Aorus 17G está na vanguarda da tecnologia
O 17G YD não está entre os melhores computadores portáteis RTX 3080 devido a seu TGP relativamente baixo de 105 watts. O desempenho de jogo do dispositivo é a média para um RTX 3080. Para um desempenho máximo,são recomendados concorrentes como aLenovo Legion 7 16ACHg6ou aAlienware m17 R4.
Com o Aorus 17G YD, a Gigabyte fornece um laptop para jogos bem arredondado. Entretanto, o dispositivo gera um alto nível de ruído.
O estrangulamento não é um problema. A CPU e a GPU podem desenvolver seu desempenho de maneira uniforme. No entanto, o dispositivo produz muito ruído sob carga - mais do que muitos concorrentes. A Gigabyte pode ser capaz de melhorar isto com uma atualização da BIOS. O consumo de energia no uso ocioso também é um pouco alto demais.
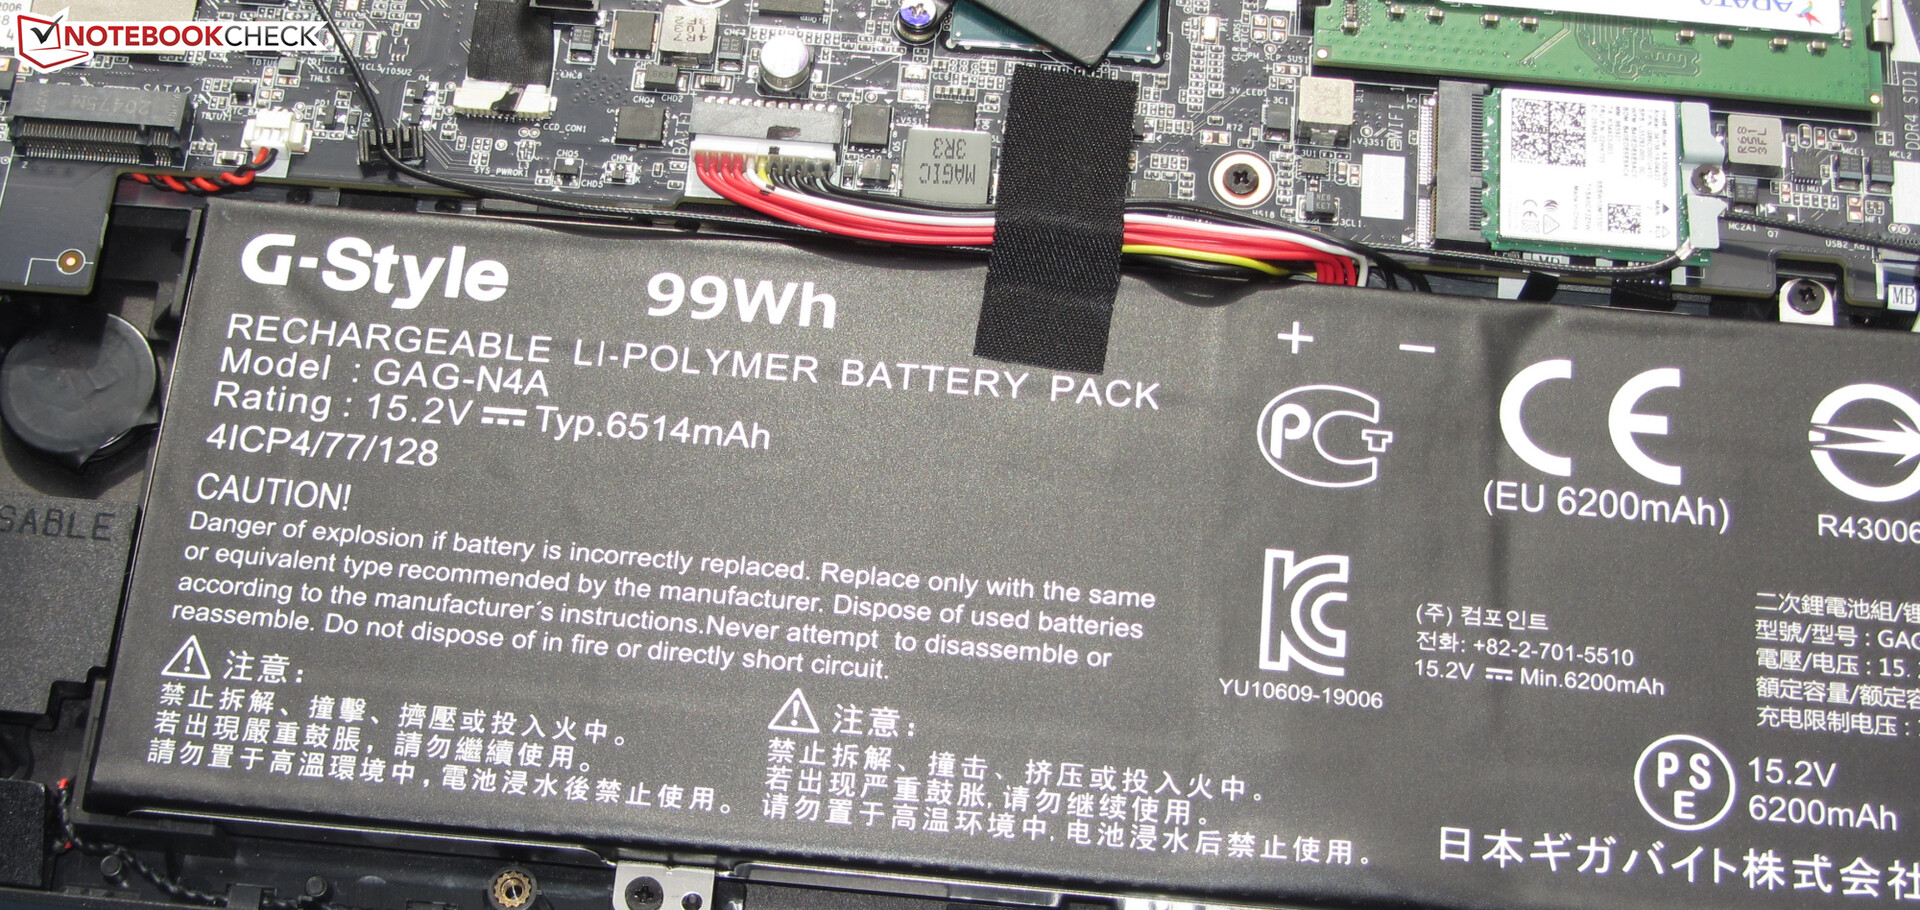
O teclado mecânico (com iluminação RGB) deixou uma boa impressão e será um fator importante para muitos potenciais compradores. Os usuários que nunca usaram este tipo de teclado precisarão se acostumar com a experiência de digitação. A vida útil da bateria é boa, mas fica atrás da modelo de irmão - apesar da bateria ter uma capacidade um pouco maior (94 Wh vs. 99 Wh).
A tela (Full HD, IPS, 300 Hz) oferece ângulos de visão estáveis, bom contraste, superfície fosca, tempos de resposta rápidos, ótima reprodução de cores e boa cobertura de espaço de cor (sRGB: 100%). Entretanto, a luminosidade máxima é muito baixa. Um laptop nesta faixa de preço deveria oferecer mais a este respeito.
Preço e disponibilidade
Aorus 17G YD
- 06/21/2021 v7 (old)
Sascha Mölck
Price comparison

