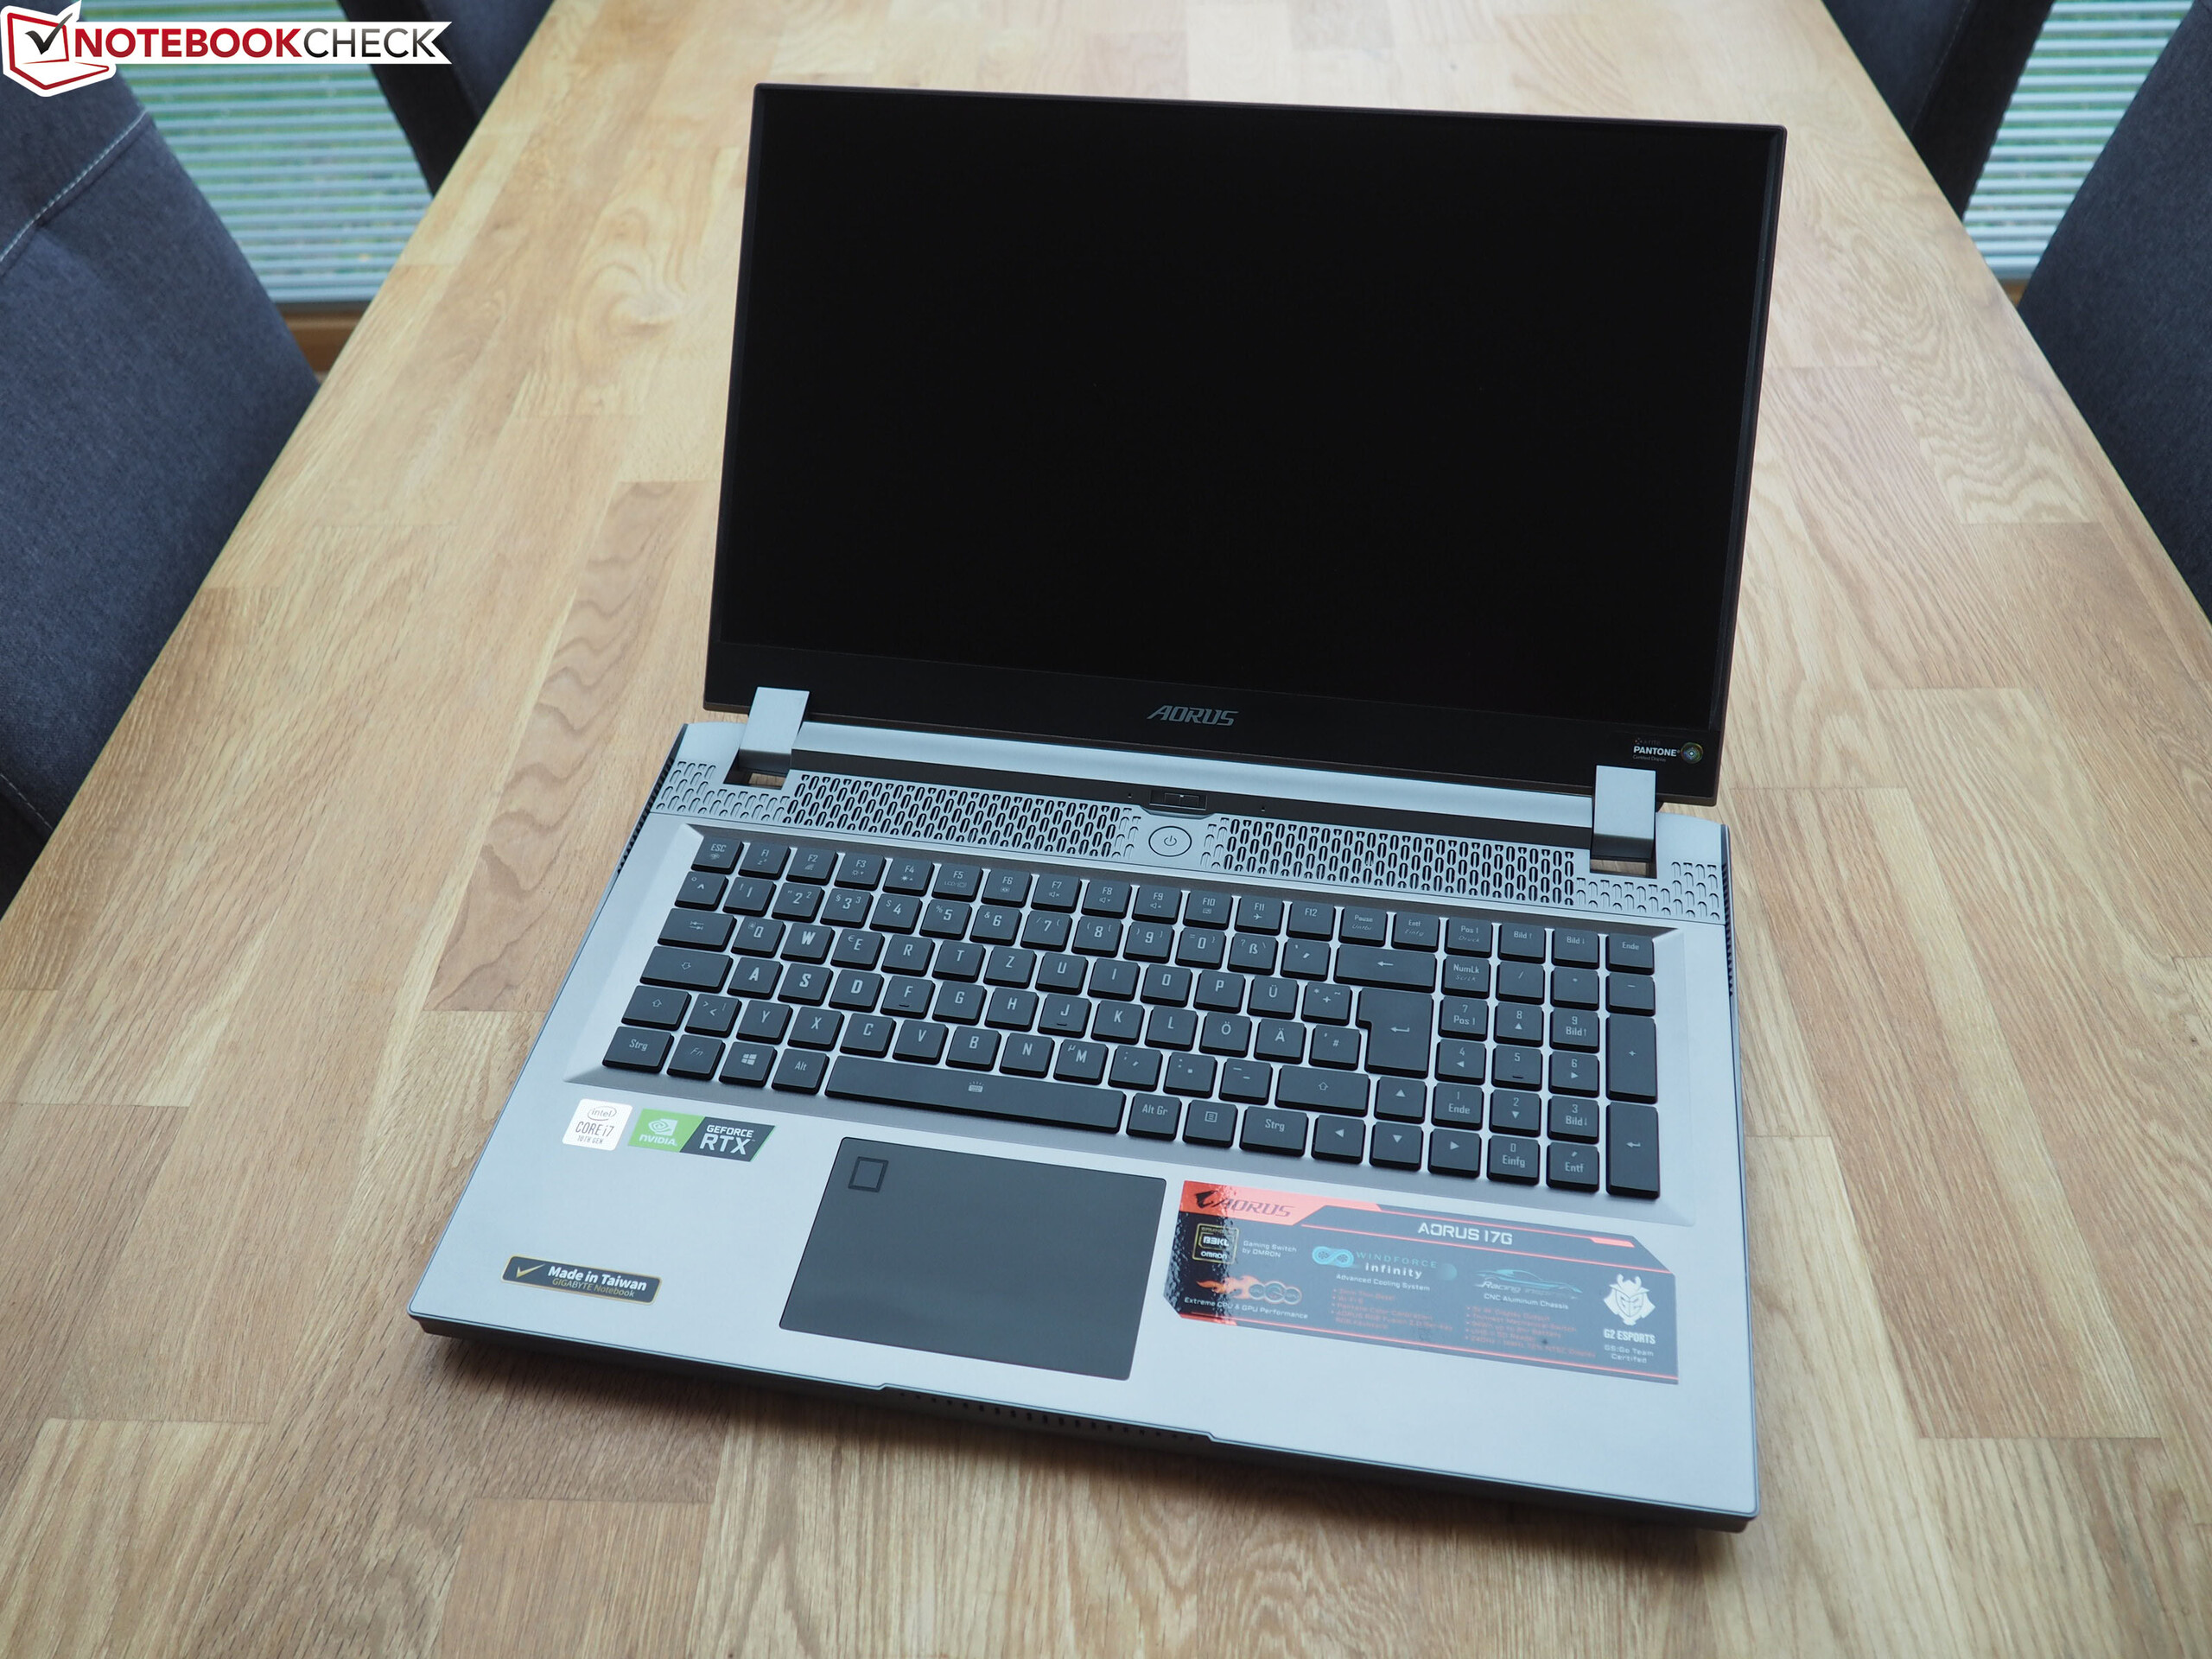
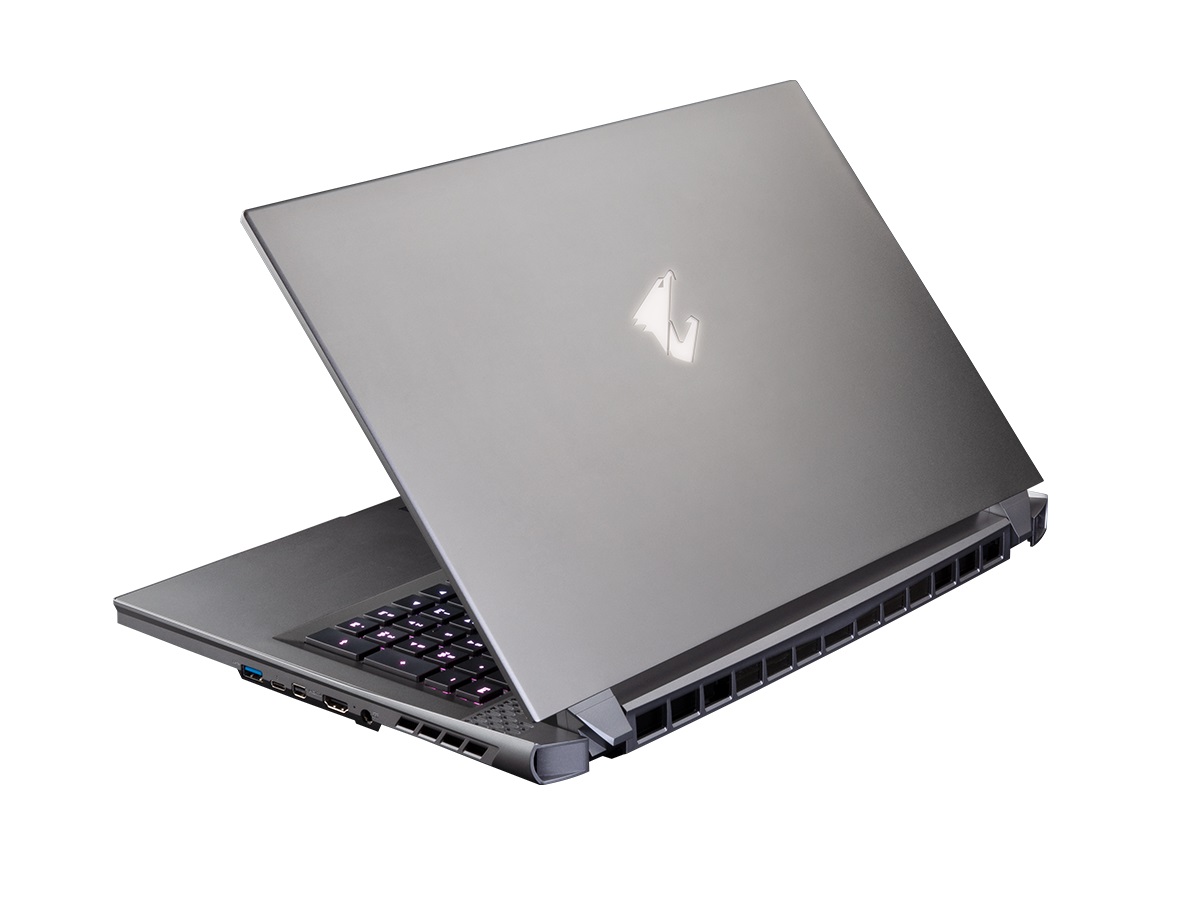
Breve Análise do Portátil Aorus 17G XB: O teclado mecânico é ótimo
Avaliação | Data | Modelo | Peso | Altura | Size | Resolução | Preço |
|---|---|---|---|---|---|---|---|
| 86.5 % v7 (old) | 05/2020 | Aorus 17G XB i7-10875H, GeForce RTX 2070 Super Max-Q | 2.7 kg | 26 mm | 17.30" | 1920x1080 | |
| 87 % v7 (old) | 04/2020 | Gigabyte Aero 17 HDR XB i7-10875H, GeForce RTX 2070 Super Max-Q | 2.7 kg | 21 mm | 17.30" | 3840x2160 | |
| 84.2 % v7 (old) | 03/2020 | Alienware m17 R2 P41E i9-9980HK, GeForce RTX 2080 Max-Q | 2.6 kg | 20.5 mm | 17.30" | 1920x1080 | |
| 84 % v7 (old) | 05/2020 | Lenovo Legion Y740-17IRHg-81UJ001VGE i7-9750H, GeForce RTX 2080 Max-Q | 3 kg | 25.5 mm | 17.30" | 1920x1080 | |
| 87.7 % v7 (old) | 06/2019 | Razer Blade Pro 17 RTX 2080 Max-Q i7-9750H, GeForce RTX 2080 Max-Q | 2.8 kg | 19.9 mm | 17.30" | 1920x1080 | |
| 81.2 % v7 (old) | 12/2019 | Asus ROG Zephyrus S GX701GXR i7-9750H, GeForce RTX 2080 Max-Q | 2.7 kg | 18.7 mm | 17.30" | 1920x1080 |
| SD Card Reader | |
| average JPG Copy Test (av. of 3 runs) | |
| Aorus 17G XB (Toshiba Exceria Pro SDXC 64 GB UHS-II) | |
| Gigabyte Aero 17 HDR XB (Toshiba Exceria Pro SDXC 64 GB UHS-II) | |
| Razer Blade Pro 17 RTX 2080 Max-Q (Toshiba Exceria Pro SDXC 64 GB UHS-II) | |
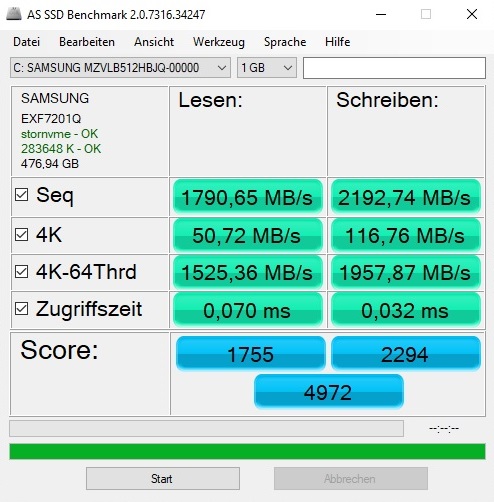
| maximum AS SSD Seq Read Test (1GB) | |
| Aorus 17G XB (Toshiba Exceria Pro SDXC 64 GB UHS-II) | |
| Gigabyte Aero 17 HDR XB (Toshiba Exceria Pro SDXC 64 GB UHS-II) | |
| Razer Blade Pro 17 RTX 2080 Max-Q (Toshiba Exceria Pro SDXC 64 GB UHS-II) | |


| |||||||||||||||||||||||||
iluminação: 95 %
iluminação com acumulador: 293 cd/m²
Contraste: 1221:1 (Preto: 0.24 cd/m²)
ΔE ColorChecker Calman: 1.27 | ∀{0.5-29.43 Ø4.72}
calibrated: 1.06
ΔE Greyscale Calman: 1.34 | ∀{0.09-98 Ø4.97}
94% sRGB (Argyll 1.6.3 3D)
73% AdobeRGB 1998 (Argyll 1.6.3 3D)
72.8% AdobeRGB 1998 (Argyll 3D)
97.2% sRGB (Argyll 3D)
70.6% Display P3 (Argyll 3D)
Gamma: 2.38
CCT: 6542 K
| Aorus 17G XB AU Optronics B173HAN05.0 (AUO509D), IPS, 1920x1080 | Gigabyte Aero 17 HDR XB AUO B173ZAN03.2 (AUO329B), IPS, 3840x2160 | Alienware m17 R2 P41E Chi Mei 173HCE, CMN175F, IPS, 1920x1080 | Lenovo Legion Y740-17IRHg-81UJ001VGE AUO_B173HAN03, IPS, 1920x1080 | Razer Blade Pro 17 RTX 2080 Max-Q AU Optronics B173HAN04.0, IPS, 1920x1080 | Asus ROG Zephyrus S GX701GXR AU Optronics B173HAN05.1, IPS, 1920x1080 | |
|---|---|---|---|---|---|---|
| Display | 21% | 0% | -8% | -12% | -1% | |
| Display P3 Coverage (%) | 70.6 | 86.5 23% | 70.8 0% | 63.8 -10% | 60.6 -14% | 70 -1% |
| sRGB Coverage (%) | 97.2 | 100 3% | 98.5 1% | 92.7 -5% | 89 -8% | 96.6 -1% |
| AdobeRGB 1998 Coverage (%) | 72.8 | 100 37% | 72.2 -1% | 65.3 -10% | 62.1 -15% | 72.3 -1% |
| Response Times | -181% | 1% | 4% | 39% | 51% | |
| Response Time Grey 50% / Grey 80% * (ms) | 16 ? | 55.2 ? -245% | 17.2 ? -8% | 16 ? -0% | 6.8 ? 57% | 5.6 ? 65% |
| Response Time Black / White * (ms) | 12 ? | 26 ? -117% | 10.8 ? 10% | 11 ? 8% | 9.6 ? 20% | 7.6 ? 37% |
| PWM Frequency (Hz) | 26320 ? | |||||
| Screen | 14% | -5% | -76% | -55% | -28% | |
| Brightness middle (cd/m²) | 293 | 487 66% | 384.2 31% | 310 6% | 299.3 2% | 288 -2% |
| Brightness (cd/m²) | 285 | 475 67% | 357 25% | 281 -1% | 294 3% | 276 -3% |
| Brightness Distribution (%) | 95 | 95 0% | 90 -5% | 85 -11% | 94 -1% | 93 -2% |
| Black Level * (cd/m²) | 0.24 | 0.38 -58% | 0.29 -21% | 0.31 -29% | 0.29 -21% | 0.24 -0% |
| Contrast (:1) | 1221 | 1282 5% | 1325 9% | 1000 -18% | 1032 -15% | 1200 -2% |
| Colorchecker dE 2000 * | 1.27 | 1.19 6% | 1.35 -6% | 3.86 -204% | 2.55 -101% | 1.92 -51% |
| Colorchecker dE 2000 max. * | 2.24 | 2.43 -8% | 3.45 -54% | 7.8 -248% | 4.73 -111% | 4.57 -104% |
| Colorchecker dE 2000 calibrated * | 1.06 | 0.5 53% | 1.42 -34% | 2.9 -174% | 1.14 -8% | |
| Greyscale dE 2000 * | 1.34 | 1.45 -8% | 1.2 10% | 4.48 -234% | 3.5 -161% | 3.08 -130% |
| Gamma | 2.38 92% | 2.21 100% | 2.23 99% | 2.5 88% | 2.28 96% | 2.42 91% |
| CCT | 6542 99% | 6557 99% | 6580 99% | 7542 86% | 7101 92% | 7055 92% |
| Color Space (Percent of AdobeRGB 1998) (%) | 73 | 88 21% | 65.5 -10% | 60 -18% | 57 -22% | 65 -11% |
| Color Space (Percent of sRGB) (%) | 94 | 100 6% | 98.5 5% | 93 -1% | 88.7 -6% | 96 2% |
| Média Total (Programa/Configurações) | -49% /
-9% | -1% /
-3% | -27% /
-52% | -9% /
-35% | 7% /
-13% |
* ... menor é melhor
Exibir tempos de resposta
| ↔ Tempo de resposta preto para branco | ||
|---|---|---|
| 12 ms ... ascensão ↗ e queda ↘ combinadas | ↗ 6.8 ms ascensão | 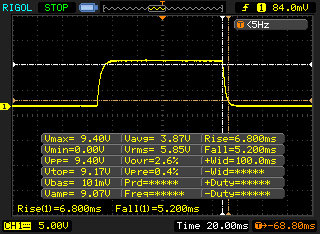 |
| ↘ 5.2 ms queda | ||
| A tela mostra boas taxas de resposta em nossos testes, mas pode ser muito lenta para jogadores competitivos. Em comparação, todos os dispositivos testados variam de 0.1 (mínimo) a 240 (máximo) ms. » 32 % de todos os dispositivos são melhores. Isso significa que o tempo de resposta medido é melhor que a média de todos os dispositivos testados (19.8 ms). | ||
| ↔ Tempo de resposta 50% cinza a 80% cinza | ||
| 16 ms ... ascensão ↗ e queda ↘ combinadas | ↗ 7.6 ms ascensão | 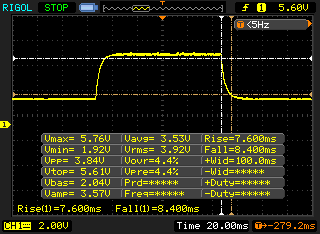 |
| ↘ 8.4 ms queda | ||
| A tela mostra boas taxas de resposta em nossos testes, mas pode ser muito lenta para jogadores competitivos. Em comparação, todos os dispositivos testados variam de 0.165 (mínimo) a 636 (máximo) ms. » 30 % de todos os dispositivos são melhores. Isso significa que o tempo de resposta medido é melhor que a média de todos os dispositivos testados (31 ms). | ||
Cintilação da tela / PWM (modulação por largura de pulso)
| Tela tremeluzindo / PWM não detectado | 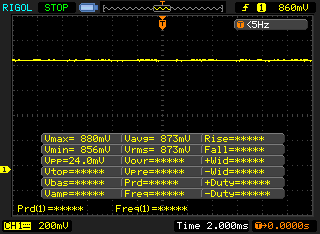 | ||
[pwm_comparison] Em comparação: 52 % de todos os dispositivos testados não usam PWM para escurecer a tela. Se PWM foi detectado, uma média de 7763 (mínimo: 5 - máximo: 343500) Hz foi medida. | |||
| Blender - v2.79 BMW27 CPU | |
| Lenovo Legion Y740-17IRHg-81UJ001VGE | |
| Gigabyte Aero 17 HDR XB | |
| Aorus 17G XB | |
| 7-Zip 18.03 | |
| 7z b 4 -mmt1 | |
| Gigabyte Aero 17 HDR XB | |
| Aorus 17G XB | |
| Lenovo Legion Y740-17IRHg-81UJ001VGE | |
| 7z b 4 | |
| Aorus 17G XB | |
| Gigabyte Aero 17 HDR XB | |
| Lenovo Legion Y740-17IRHg-81UJ001VGE | |
| Geekbench 5.5 | |
| Single-Core | |
| Aorus 17G XB | |
| Gigabyte Aero 17 HDR XB | |
| Lenovo Legion Y740-17IRHg-81UJ001VGE | |
| Multi-Core | |
| Aorus 17G XB | |
| Gigabyte Aero 17 HDR XB | |
| Lenovo Legion Y740-17IRHg-81UJ001VGE | |
| HWBOT x265 Benchmark v2.2 - 4k Preset | |
| Aorus 17G XB | |
| Gigabyte Aero 17 HDR XB | |
| Lenovo Legion Y740-17IRHg-81UJ001VGE | |
| LibreOffice - 20 Documents To PDF | |
| Gigabyte Aero 17 HDR XB | |
| Aorus 17G XB | |
| R Benchmark 2.5 - Overall mean | |
| Lenovo Legion Y740-17IRHg-81UJ001VGE | |
| Aorus 17G XB | |
| Gigabyte Aero 17 HDR XB | |
* ... menor é melhor
| DPC Latencies / LatencyMon - interrupt to process latency (max), Web, Youtube, Prime95 | |
| Aorus 17G XB | |
| Gigabyte Aero 17 HDR XB | |
* ... menor é melhor
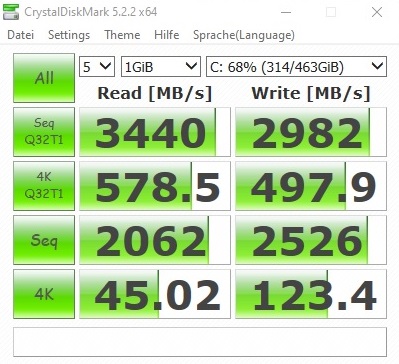
| Aorus 17G XB Samsung SSD PM981a MZVLB512HBJQ | Gigabyte Aero 17 HDR XB Samsung SSD PM981a MZVLB512HBJQ | Alienware m17 R2 P41E 2x SK Hynix PC601 NVMe 512 GB (RAID 0) | Lenovo Legion Y740-17IRHg-81UJ001VGE Samsung SSD PM981 MZVLB1T0HALR | Razer Blade Pro 17 RTX 2080 Max-Q Samsung SSD PM981 MZVLB512HAJQ | Asus ROG Zephyrus S GX701GXR Samsung SSD PM981 MZVLB1T0HALR | |
|---|---|---|---|---|---|---|
| CrystalDiskMark 5.2 / 6 | -2% | -7% | -10% | -28% | -27% | |
| Write 4K (MB/s) | 123.4 | 123.4 0% | 110.6 -10% | 101.2 -18% | 100.7 -18% | 96.1 -22% |
| Read 4K (MB/s) | 45.02 | 45.59 1% | 41.46 -8% | 44.61 -1% | 41.03 -9% | 40.86 -9% |
| Write Seq (MB/s) | 2526 | 2320 -8% | 2378 -6% | 2295 -9% | 1146 -55% | 1317 -48% |
| Read Seq (MB/s) | 2062 | 2013 -2% | 2114 3% | 2174 5% | 1115 -46% | 1030 -50% |
| Write 4K Q32T1 (MB/s) | 497.9 | 489.3 -2% | 445.4 -11% | 401.2 -19% | 384.6 -23% | 350.4 -30% |
| Read 4K Q32T1 (MB/s) | 579 | 559 -3% | 509 -12% | 475.5 -18% | 429.5 -26% | 404.1 -30% |
| Write Seq Q32T1 (MB/s) | 2982 | 2979 0% | 2735 -8% | 2397 -20% | 1859 -38% | 2396 -20% |
| Read Seq Q32T1 (MB/s) | 3440 | 3432 0% | 3206 -7% | 3337 -3% | 3179 -8% | 3194 -7% |

| 3DMark 11 Performance | 23962 pontos | |
| 3DMark Cloud Gate Standard Score | 49917 pontos | |
| 3DMark Fire Strike Score | 18852 pontos | |
| 3DMark Time Spy Score | 7633 pontos | |
Ajuda | ||
| 3DMark 11 - 1280x720 Performance GPU | |
| Razer Blade Pro 17 RTX 2080 Max-Q | |
| Alienware m17 R2 P41E | |
| Asus ROG Zephyrus S GX701GXR | |
| Gigabyte Aero 17 HDR XB | |
| Aorus 17G XB | |
| Lenovo Legion Y740-17IRHg-81UJ001VGE | |
| The Witcher 3 | |
| 1920x1080 High Graphics & Postprocessing (Nvidia HairWorks Off) | |
| Asus ROG Zephyrus S GX701GXR | |
| Razer Blade Pro 17 RTX 2080 Max-Q | |
| Alienware m17 R2 P41E | |
| Lenovo Legion Y740-17IRHg-81UJ001VGE | |
| Gigabyte Aero 17 HDR XB | |
| Aorus 17G XB | |
| 1920x1080 Ultra Graphics & Postprocessing (HBAO+) | |
| Razer Blade Pro 17 RTX 2080 Max-Q | |
| Lenovo Legion Y740-17IRHg-81UJ001VGE | |
| Asus ROG Zephyrus S GX701GXR | |
| Alienware m17 R2 P41E | |
| Gigabyte Aero 17 HDR XB | |
| Aorus 17G XB | |
| baixo | média | alto | ultra | |
|---|---|---|---|---|
| GTA V (2015) | 182 | 177 | 159 | 91.1 |
| The Witcher 3 (2015) | 142 | 73.6 | ||
| Dota 2 Reborn (2015) | 163 | 147 | 138 | 129 |
| X-Plane 11.11 (2018) | 121 | 104 | 87.6 | |
| Shadow of the Tomb Raider (2018) | 110 | 99 | ||
| Battlefield V (2018) | 136 | 126 | ||
| Dirt Rally 2.0 (2019) | 151 | 86.9 | ||
| Rage 2 (2019) | 97.5 | 94.9 | ||
| F1 2019 (2019) | 152 | 141 | ||
| Borderlands 3 (2019) | 77.2 | 58.9 | ||
| GRID 2019 (2019) | 103 | 69.7 | ||
| Call of Duty Modern Warfare 2019 (2019) | 117 | 99.6 | ||
| Gears Tactics (2020) | 109 | 82.2 |
Barulho
| Ocioso |
| 35 / 36 / 41 dB |
| Carga |
| 47 / 49 dB |
 | ||
30 dB silencioso 40 dB(A) audível 50 dB(A) ruidosamente alto |
||
min: | ||
| Aorus 17G XB i7-10875H, GeForce RTX 2070 Super Max-Q | Gigabyte Aero 17 HDR XB i7-10875H, GeForce RTX 2070 Super Max-Q | Alienware m17 R2 P41E i9-9980HK, GeForce RTX 2080 Max-Q | Lenovo Legion Y740-17IRHg-81UJ001VGE i7-9750H, GeForce RTX 2080 Max-Q | Razer Blade Pro 17 RTX 2080 Max-Q i7-9750H, GeForce RTX 2080 Max-Q | Asus ROG Zephyrus S GX701GXR i7-9750H, GeForce RTX 2080 Max-Q | |
|---|---|---|---|---|---|---|
| Noise | -1% | 6% | 14% | 10% | 6% | |
| desligado / ambiente * (dB) | 30 | 30 -0% | 29.1 3% | 30.3 -1% | 28.2 6% | 30 -0% |
| Idle Minimum * (dB) | 35 | 35 -0% | 29.4 16% | 30.3 13% | 28.2 19% | 32 9% |
| Idle Average * (dB) | 36 | 36 -0% | 29.4 18% | 30.3 16% | 28.2 22% | 33 8% |
| Idle Maximum * (dB) | 41 | 38 7% | 31.5 23% | 30.5 26% | 30.8 25% | 34 17% |
| Load Average * (dB) | 47 | 47 -0% | 49.7 -6% | 40.8 13% | 42 11% | 40 15% |
| Witcher 3 ultra * (dB) | 48 | 49 -2% | 49.5 -3% | 40.5 16% | 51 -6% | 49 -2% |
| Load Maximum * (dB) | 49 | 54 -10% | 53.3 -9% | 40.8 17% | 53 -8% | 50 -2% |
* ... menor é melhor
(-) A temperatura máxima no lado superior é 48 °C / 118 F, em comparação com a média de 40.4 °C / 105 F , variando de 21.2 a 68.8 °C para a classe Gaming.
(-) A parte inferior aquece até um máximo de 59 °C / 138 F, em comparação com a média de 43.2 °C / 110 F
(+) Em uso inativo, a temperatura média para o lado superior é 25.1 °C / 77 F, em comparação com a média do dispositivo de 33.9 °C / ### class_avg_f### F.
(±) Jogando The Witcher 3, a temperatura média para o lado superior é 34 °C / 93 F, em comparação com a média do dispositivo de 33.9 °C / ## #class_avg_f### F.
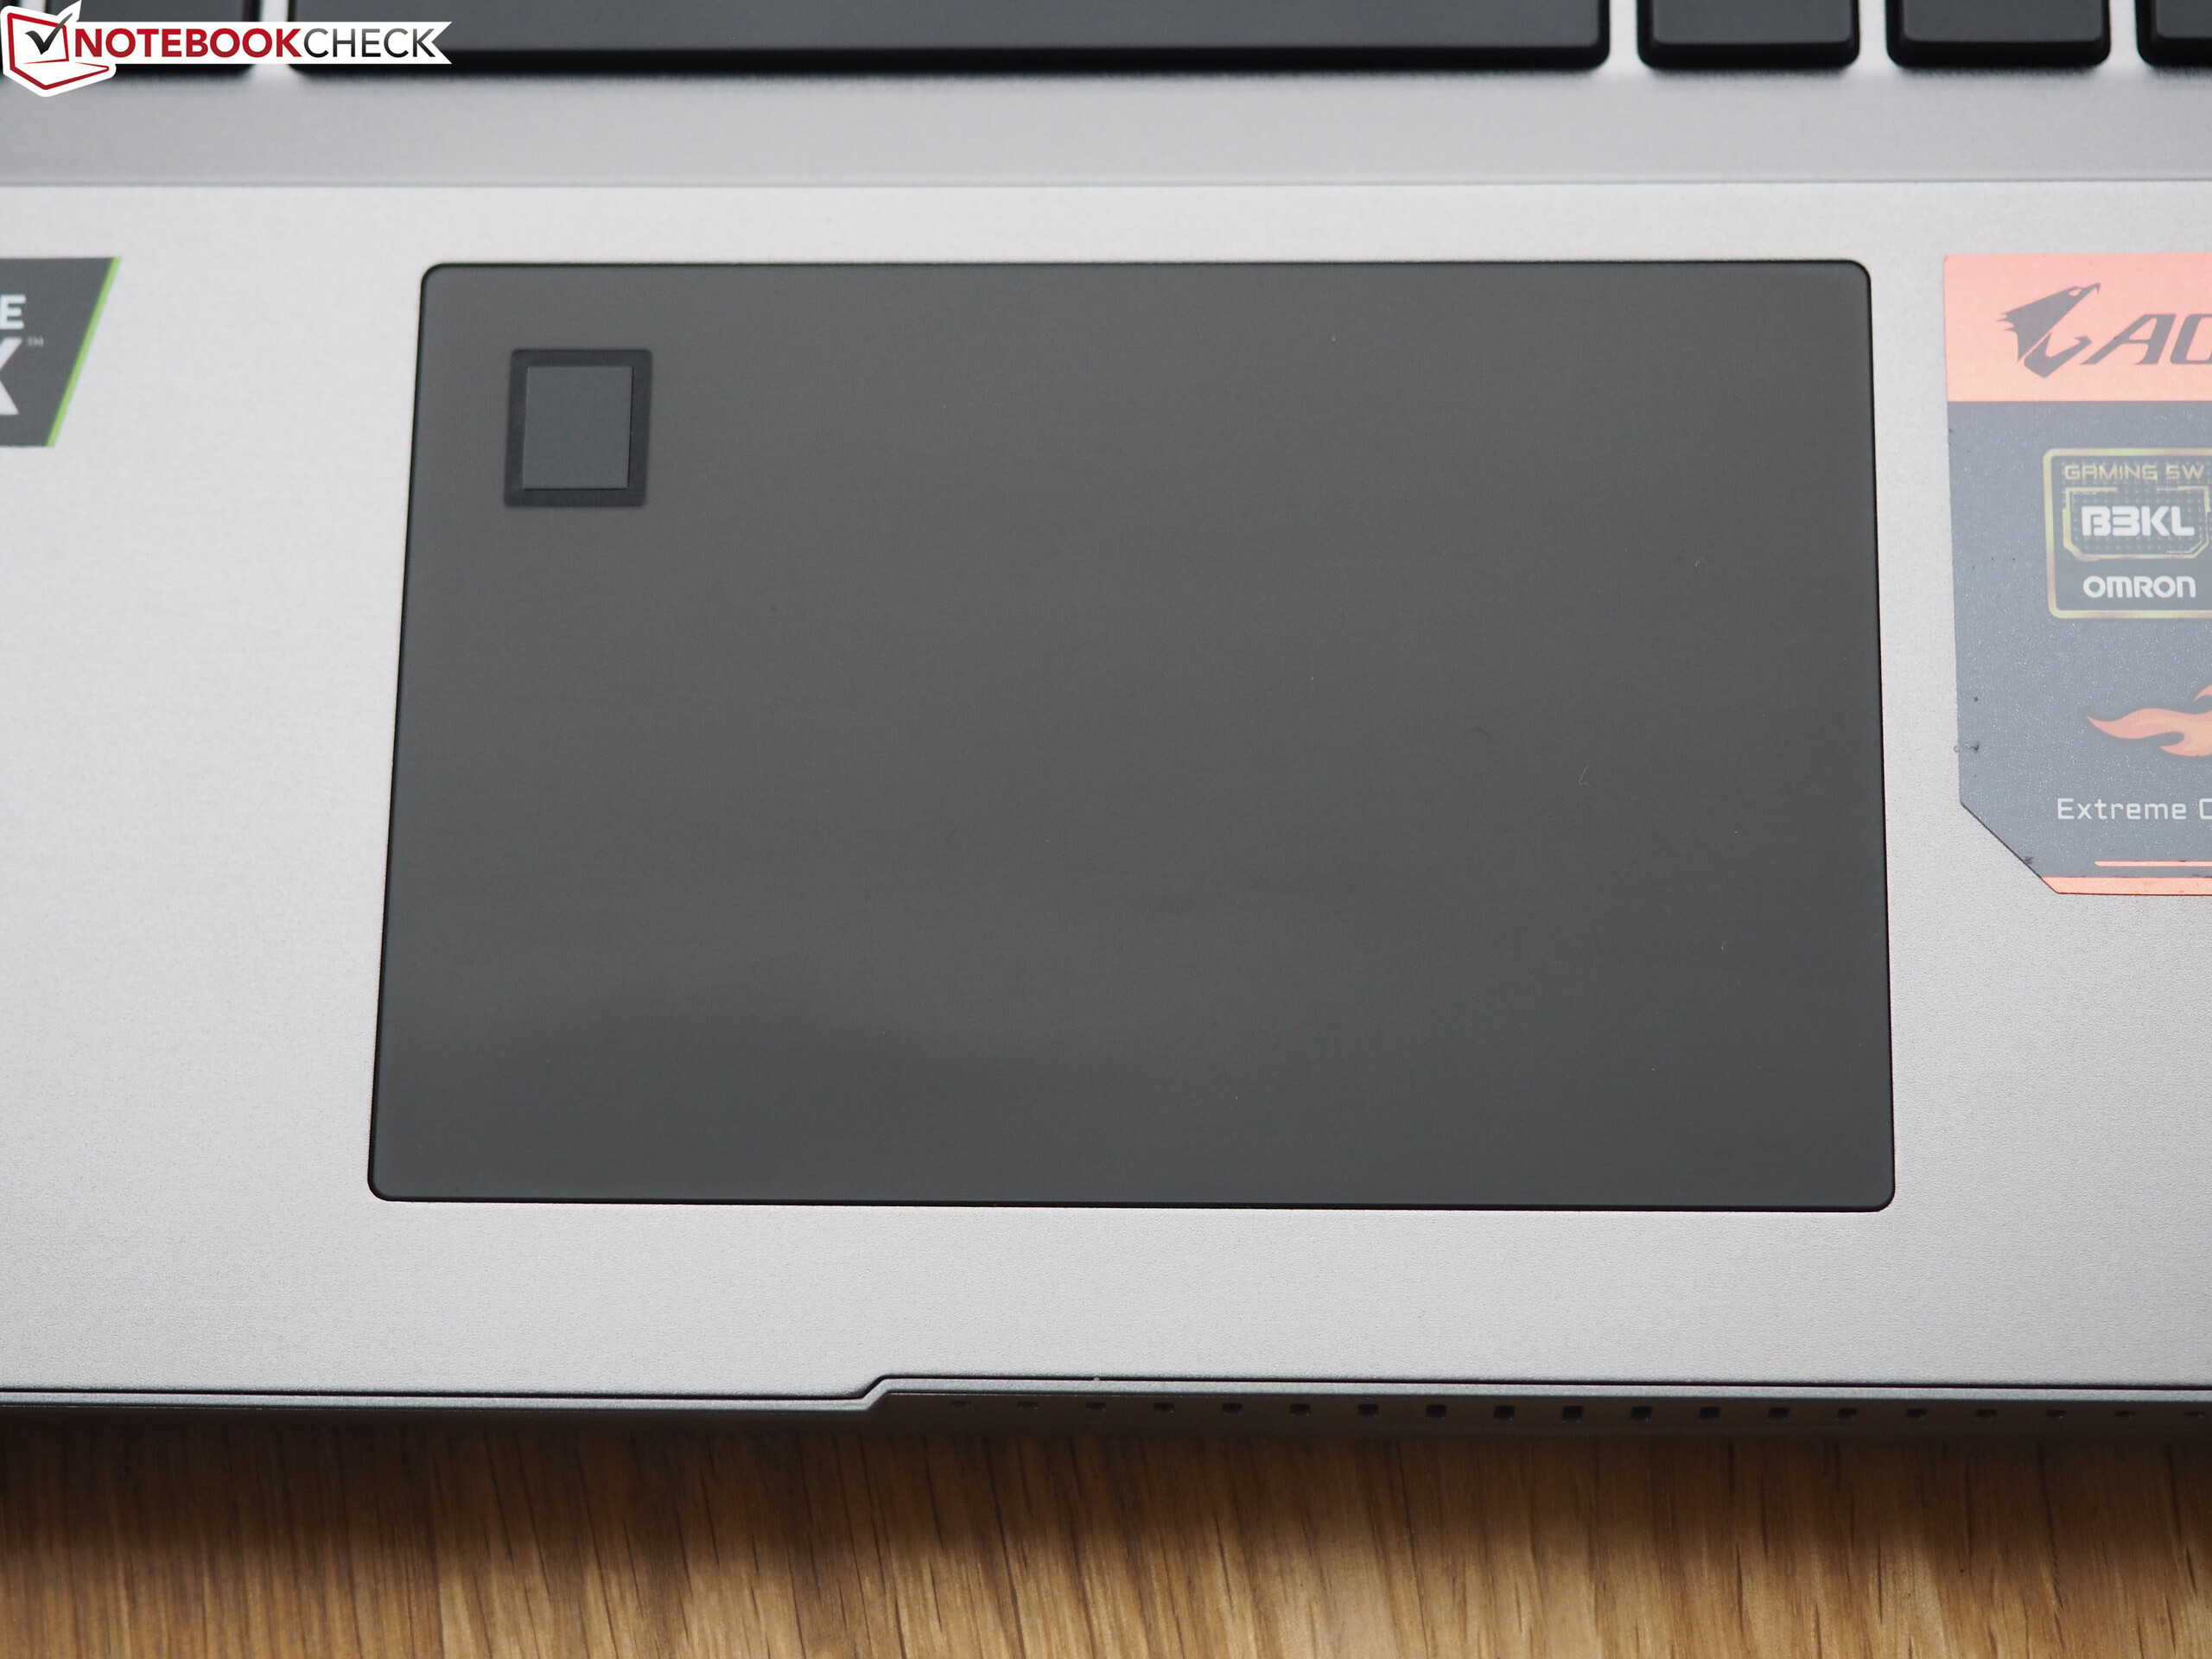
(+) Os apoios para as mãos e o touchpad são mais frios que a temperatura da pele, com um máximo de 30 °C / 86 F e, portanto, são frios ao toque.
(±) A temperatura média da área do apoio para as mãos de dispositivos semelhantes foi 28.8 °C / 83.8 F (-1.2 °C / -2.2 F).
| Aorus 17G XB i7-10875H, GeForce RTX 2070 Super Max-Q | Gigabyte Aero 17 HDR XB i7-10875H, GeForce RTX 2070 Super Max-Q | Alienware m17 R2 P41E i9-9980HK, GeForce RTX 2080 Max-Q | Lenovo Legion Y740-17IRHg-81UJ001VGE i7-9750H, GeForce RTX 2080 Max-Q | Razer Blade Pro 17 RTX 2080 Max-Q i7-9750H, GeForce RTX 2080 Max-Q | Asus ROG Zephyrus S GX701GXR i7-9750H, GeForce RTX 2080 Max-Q | |
|---|---|---|---|---|---|---|
| Heat | -4% | -24% | 1% | 6% | -7% | |
| Maximum Upper Side * (°C) | 48 | 53 -10% | 54.2 -13% | 40.7 15% | 43 10% | 50 -4% |
| Maximum Bottom * (°C) | 59 | 59 -0% | 61.4 -4% | 42.2 28% | 47.2 20% | 47 20% |
| Idle Upper Side * (°C) | 26 | 27 -4% | 37.8 -45% | 31.9 -23% | 27.2 -5% | 33 -27% |
| Idle Bottom * (°C) | 29 | 29 -0% | 38.6 -33% | 33.9 -17% | 30 -3% | 34 -17% |
* ... menor é melhor
Aorus 17G XB análise de áudio
(+) | os alto-falantes podem tocar relativamente alto (###valor### dB)
Graves 100 - 315Hz
(-) | quase nenhum baixo - em média 20.1% menor que a mediana
(±) | a linearidade dos graves é média (10% delta para a frequência anterior)
Médios 400 - 2.000 Hz
(±) | médios mais altos - em média 5.3% maior que a mediana
(±) | a linearidade dos médios é média (7.5% delta para frequência anterior)
Altos 2 - 16 kHz
(+) | agudos equilibrados - apenas 2.7% longe da mediana
(+) | os máximos são lineares (5.7% delta da frequência anterior)
Geral 100 - 16.000 Hz
(±) | a linearidade do som geral é média (16.6% diferença em relação à mediana)
Comparado com a mesma classe
» 43% de todos os dispositivos testados nesta classe foram melhores, 7% semelhantes, 50% piores
» O melhor teve um delta de 6%, a média foi 18%, o pior foi 132%
Comparado com todos os dispositivos testados
» 29% de todos os dispositivos testados foram melhores, 6% semelhantes, 65% piores
» O melhor teve um delta de 4%, a média foi 24%, o pior foi 134%
Gigabyte Aero 17 HDR XB análise de áudio
(+) | os alto-falantes podem tocar relativamente alto (###valor### dB)
Graves 100 - 315Hz
(-) | quase nenhum baixo - em média 18.7% menor que a mediana
(±) | a linearidade dos graves é média (9.5% delta para a frequência anterior)
Médios 400 - 2.000 Hz
(+) | médios equilibrados - apenas 4.6% longe da mediana
(+) | médios são lineares (6.4% delta para frequência anterior)
Altos 2 - 16 kHz
(+) | agudos equilibrados - apenas 4% longe da mediana
(+) | os máximos são lineares (6.1% delta da frequência anterior)
Geral 100 - 16.000 Hz
(±) | a linearidade do som geral é média (15.5% diferença em relação à mediana)
Comparado com a mesma classe
» 35% de todos os dispositivos testados nesta classe foram melhores, 7% semelhantes, 58% piores
» O melhor teve um delta de 6%, a média foi 18%, o pior foi 132%
Comparado com todos os dispositivos testados
» 23% de todos os dispositivos testados foram melhores, 4% semelhantes, 73% piores
» O melhor teve um delta de 4%, a média foi 24%, o pior foi 134%
| desligado | |
| Ocioso | |
| Carga |
|
Key:
min: | |
| Aorus 17G XB i7-10875H, GeForce RTX 2070 Super Max-Q | Gigabyte Aero 17 HDR XB i7-10875H, GeForce RTX 2070 Super Max-Q | Alienware m17 R2 P41E i9-9980HK, GeForce RTX 2080 Max-Q | Lenovo Legion Y740-17IRHg-81UJ001VGE i7-9750H, GeForce RTX 2080 Max-Q | Razer Blade Pro 17 RTX 2080 Max-Q i7-9750H, GeForce RTX 2080 Max-Q | Asus ROG Zephyrus S GX701GXR i7-9750H, GeForce RTX 2080 Max-Q | |
|---|---|---|---|---|---|---|
| Power Consumption | 8% | -35% | 5% | 11% | -11% | |
| Idle Minimum * (Watt) | 20 | 16 20% | 24.7 -23% | 15.7 22% | 16.2 19% | 32 -60% |
| Idle Average * (Watt) | 23 | 19 17% | 35.9 -56% | 26.3 -14% | 20.4 11% | 34 -48% |
| Idle Maximum * (Watt) | 38 | 30 21% | 69.6 -83% | 28 26% | 26.1 31% | 36 5% |
| Load Average * (Watt) | 105 | 109 -4% | 141.8 -35% | 136 -30% | 96.5 8% | 95 10% |
| Witcher 3 ultra * (Watt) | 158 | 167 -6% | 185.8 -18% | 160 -1% | 182.9 -16% | 155 2% |
| Load Maximum * (Watt) | 243 | 246 -1% | 235.4 3% | 177 27% | 214.3 12% | 187 23% |
* ... menor é melhor
| Aorus 17G XB i7-10875H, GeForce RTX 2070 Super Max-Q, 94 Wh | Gigabyte Aero 17 HDR XB i7-10875H, GeForce RTX 2070 Super Max-Q, 94 Wh | Alienware m17 R2 P41E i9-9980HK, GeForce RTX 2080 Max-Q, 76 Wh | Lenovo Legion Y740-17IRHg-81UJ001VGE i7-9750H, GeForce RTX 2080 Max-Q, 76 Wh | Razer Blade Pro 17 RTX 2080 Max-Q i7-9750H, GeForce RTX 2080 Max-Q, 70 Wh | Asus ROG Zephyrus S GX701GXR i7-9750H, GeForce RTX 2080 Max-Q, 76 Wh | |
|---|---|---|---|---|---|---|
| Duração da bateria | -4% | -47% | -56% | -41% | -55% | |
| Reader / Idle (h) | 10 | 9.9 -1% | 7.1 -29% | 3.8 -62% | 4.9 -51% | 4.1 -59% |
| WiFi v1.3 (h) | 7.5 | 6.2 -17% | 4.8 -36% | 3 -60% | 4.7 -37% | 3 -60% |
| Load (h) | 2.2 | 2.3 5% | 0.5 -77% | 1.2 -45% | 1.4 -36% | 1.2 -45% |
| H.264 (h) | 2.8 | 2.8 |
Pro
Contra
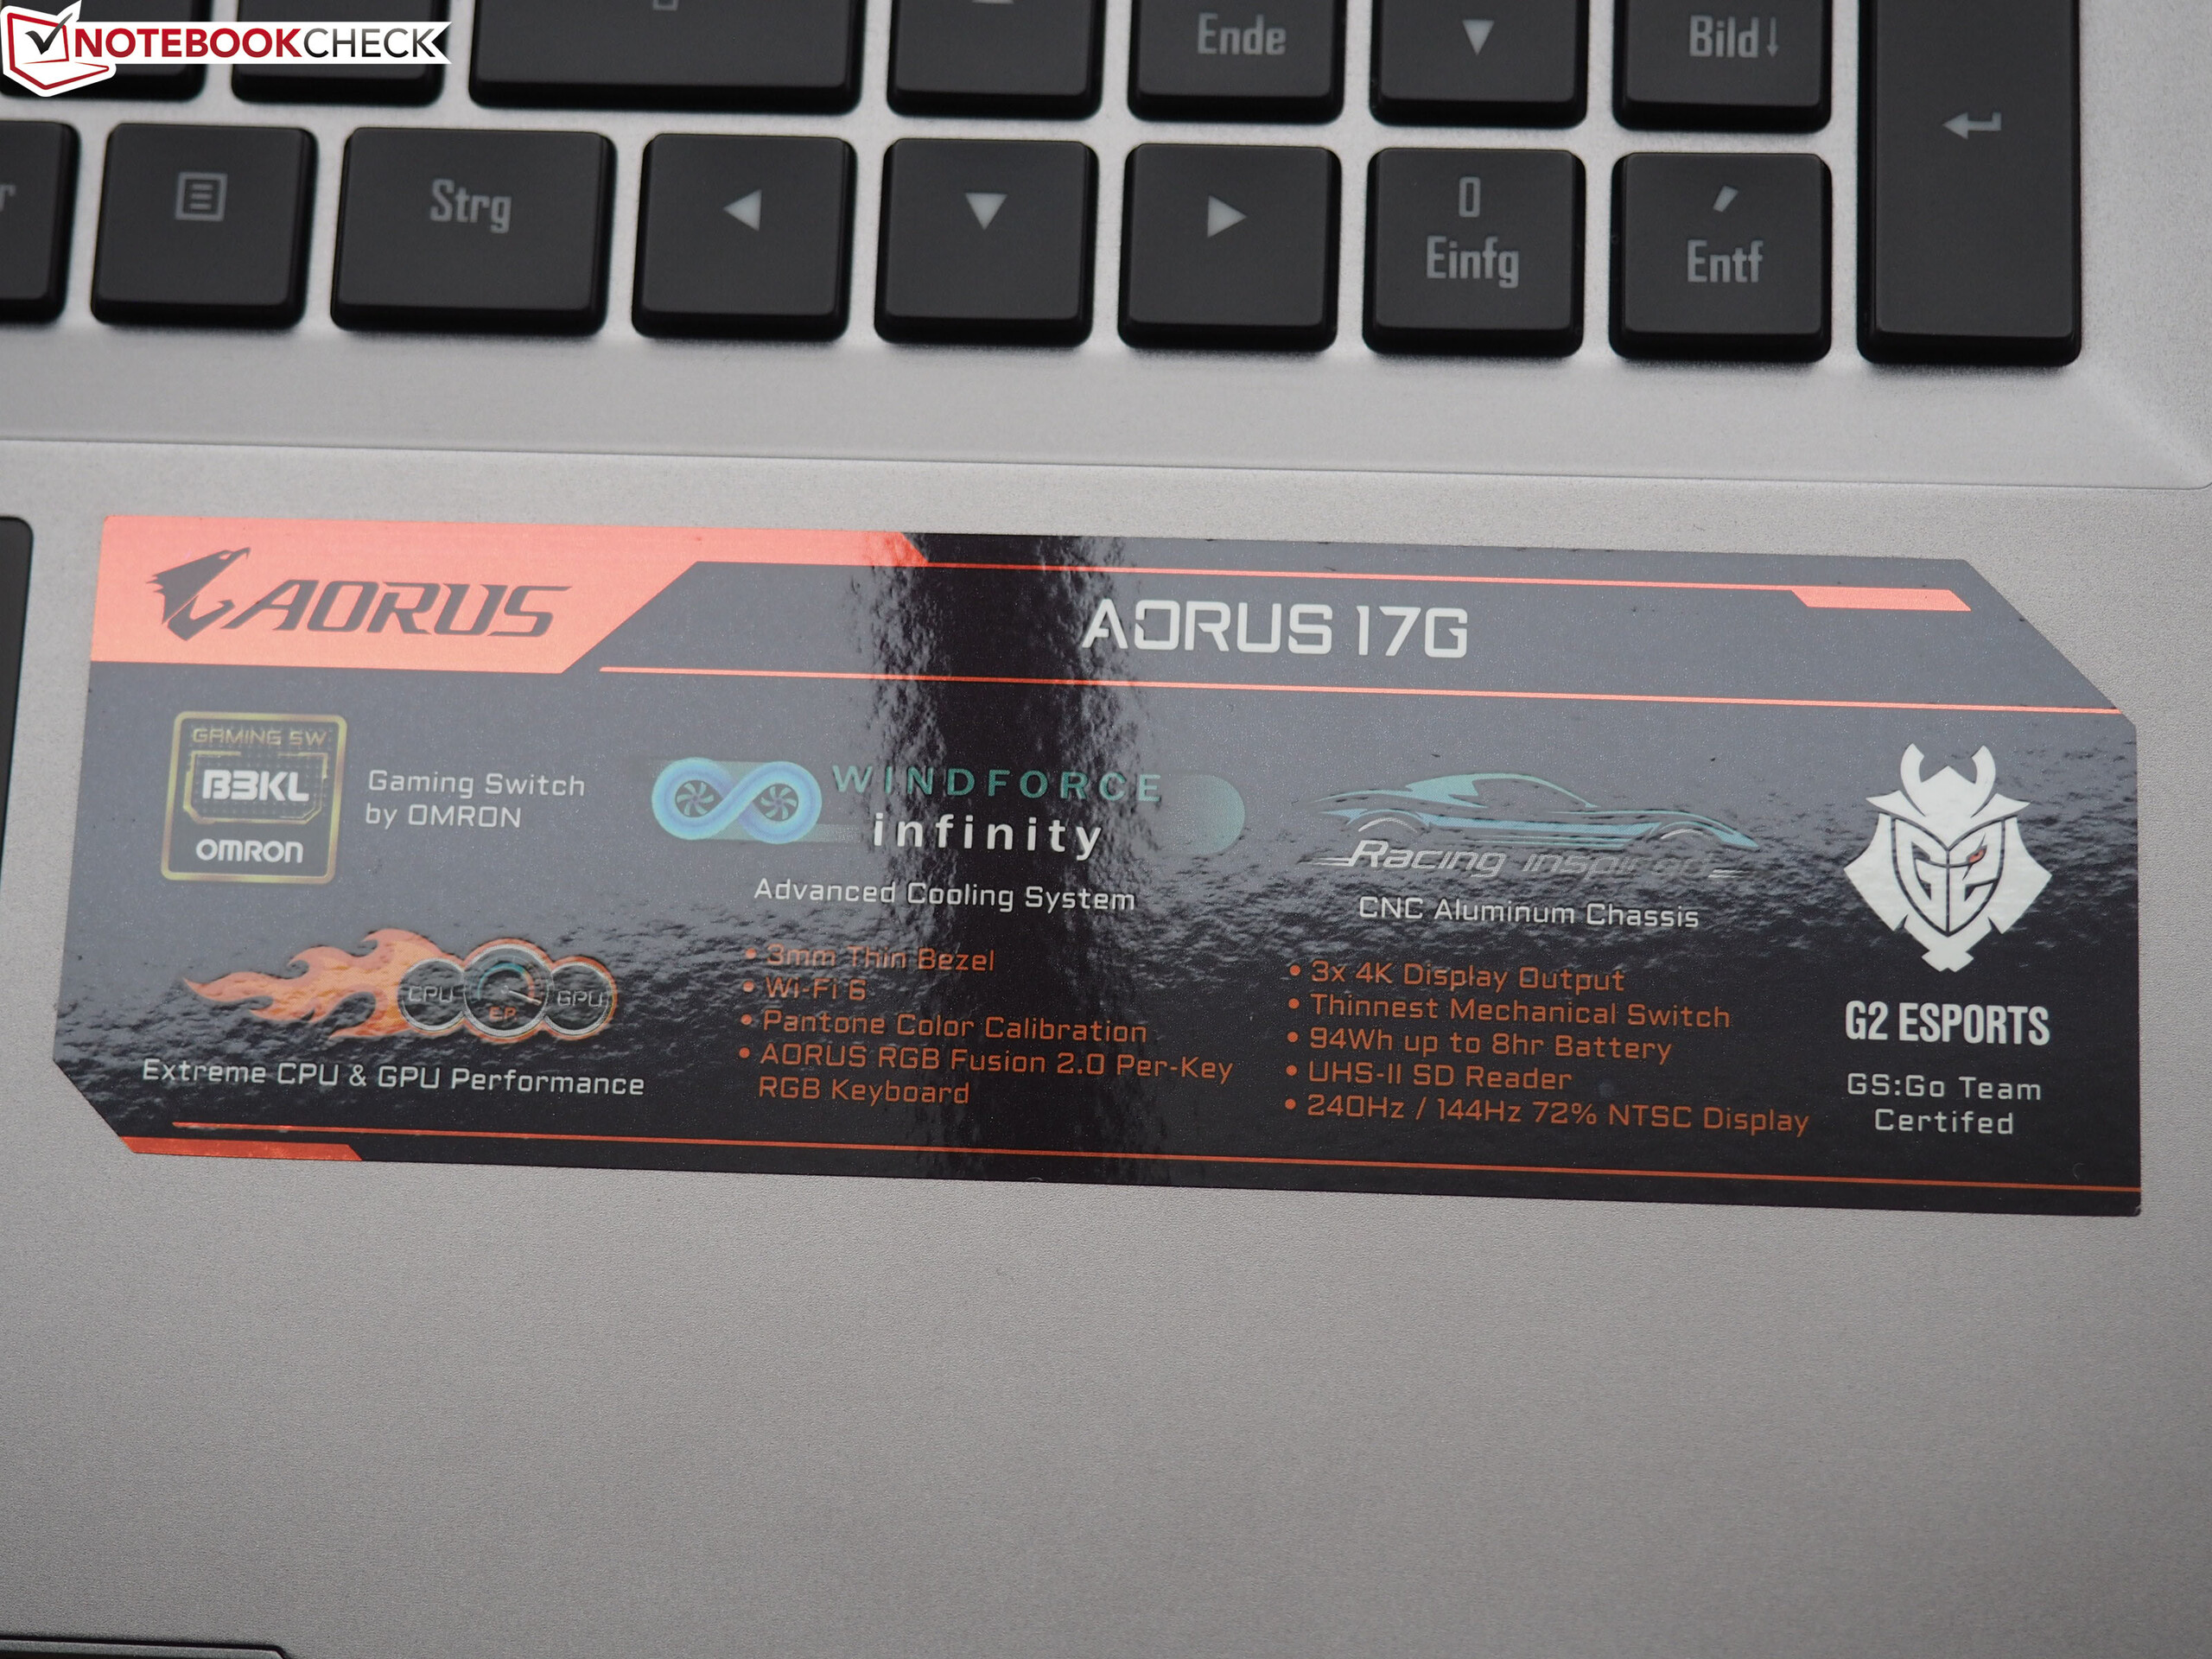
Embora o desempenho da GPU não seja tão notável, o Aorus 17G oferece três características especiais, que tornam o portátil de jogos bastante interessante.
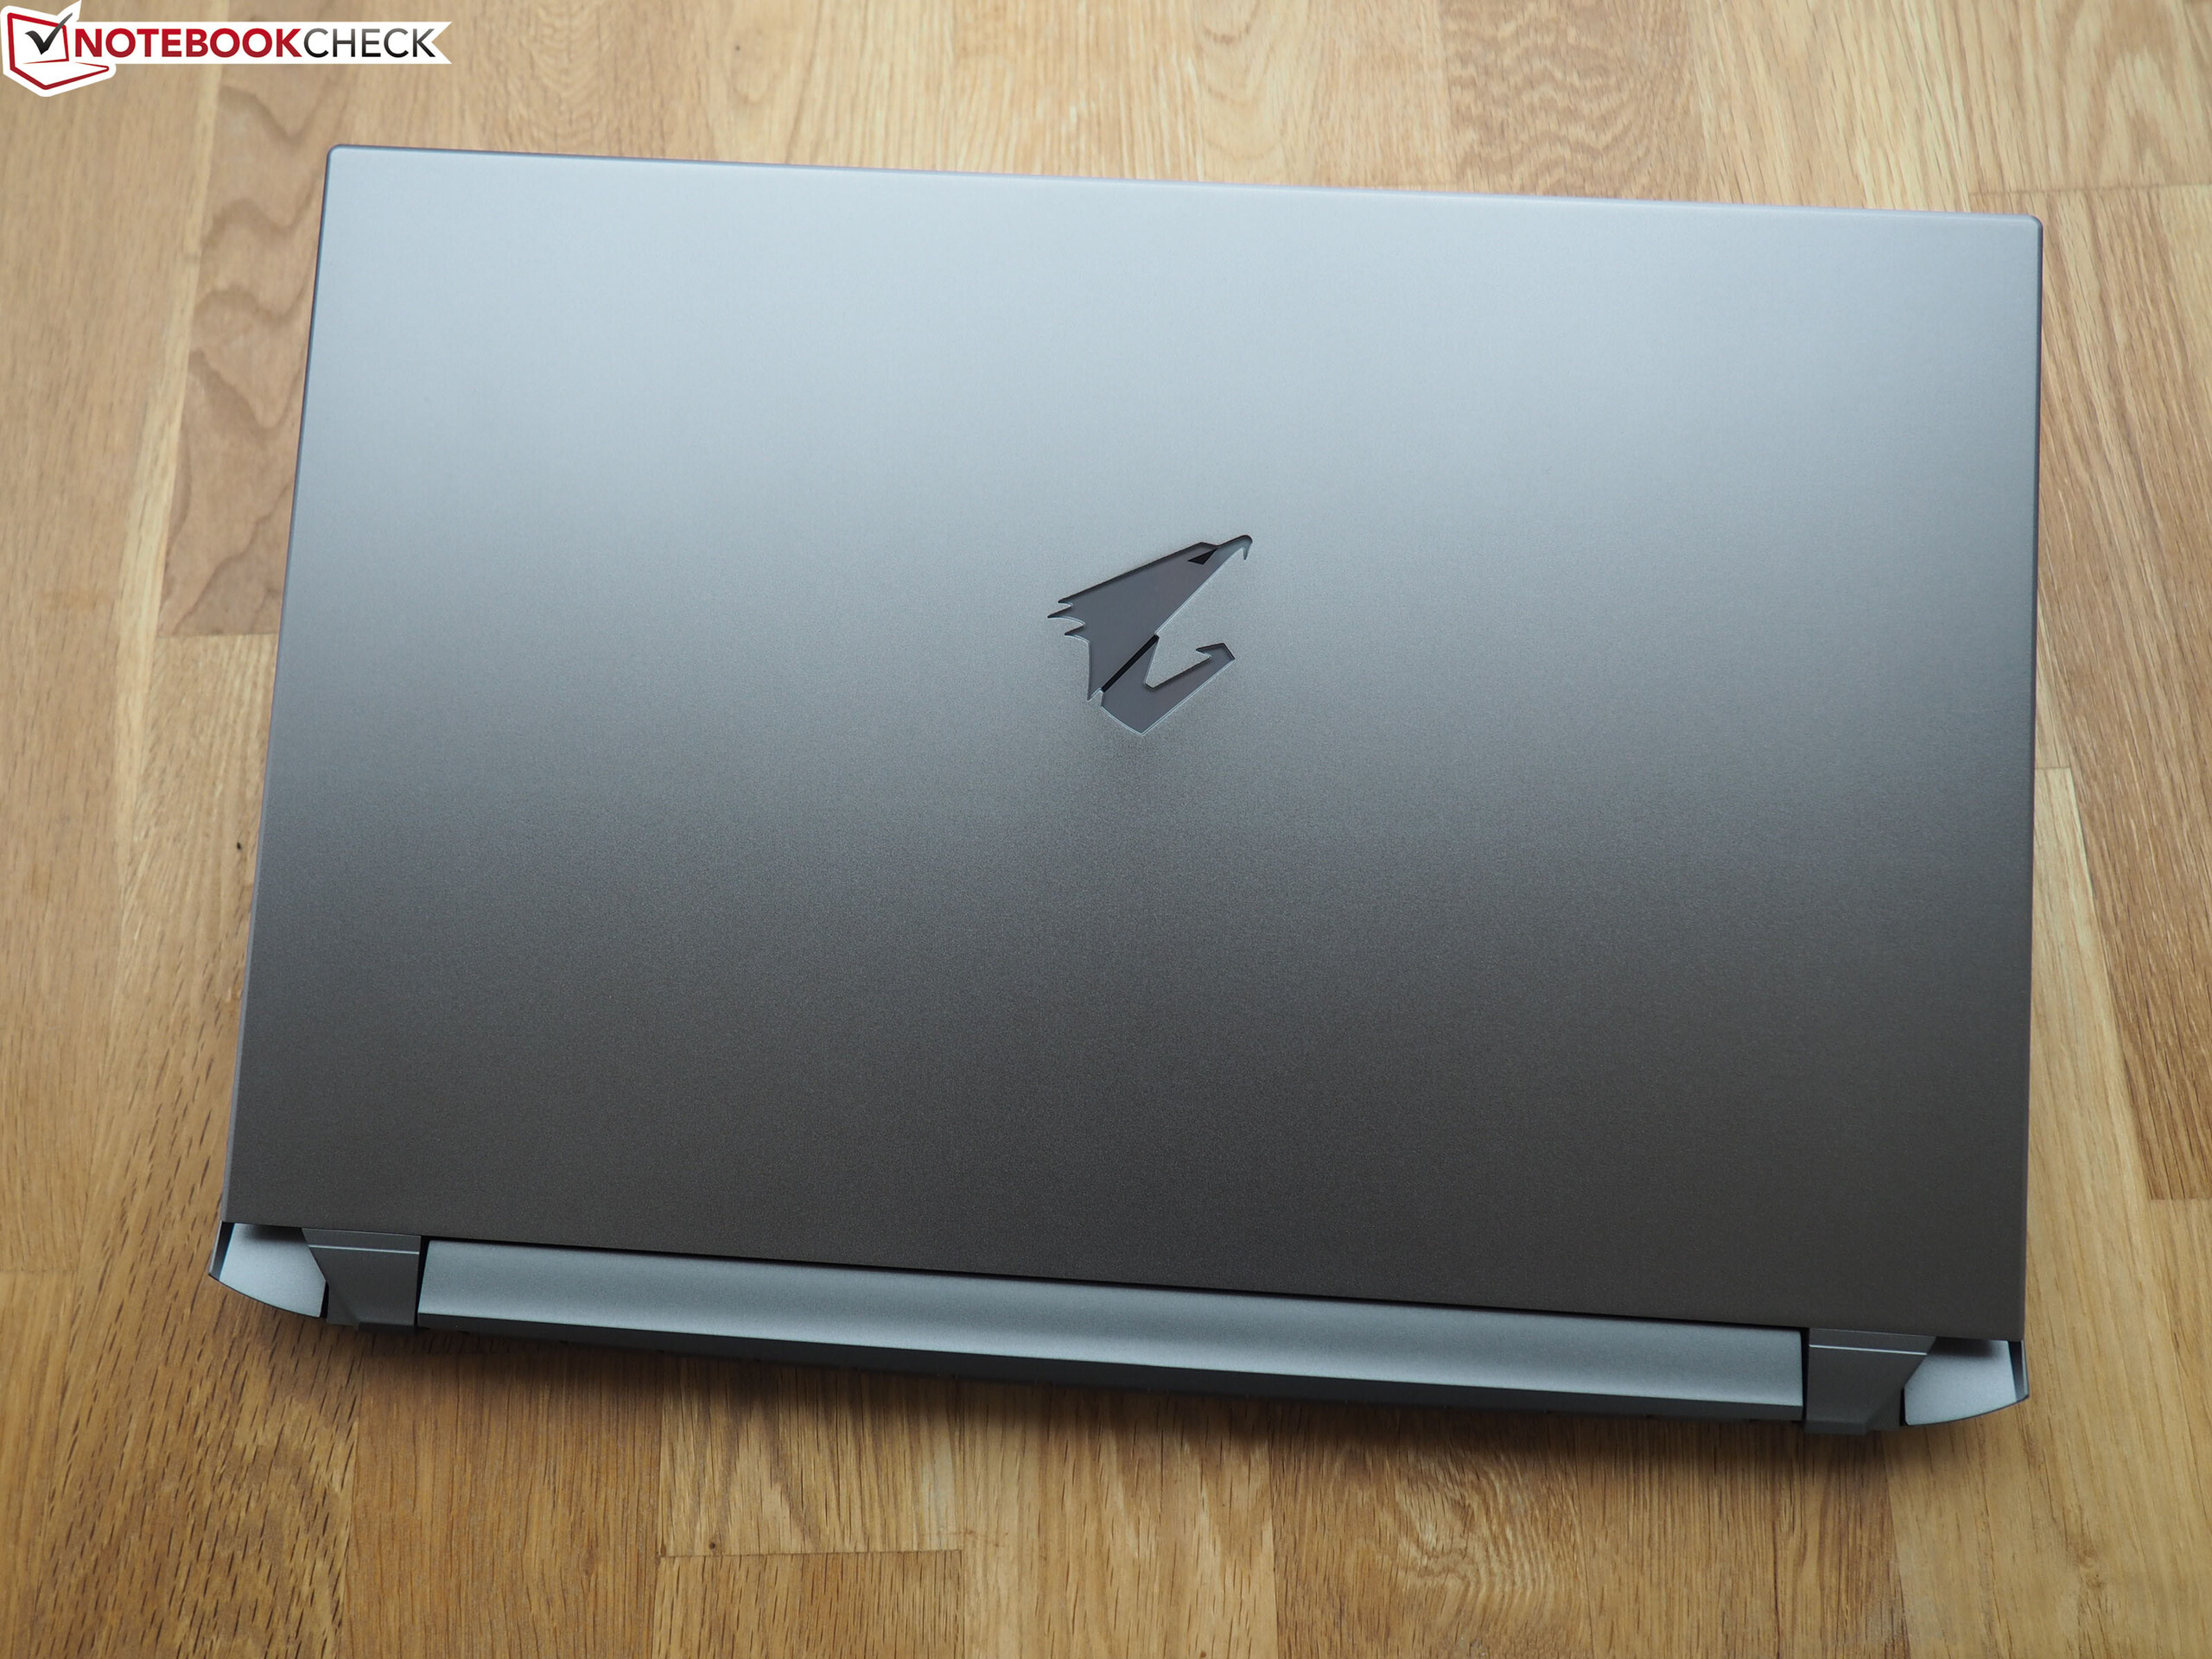
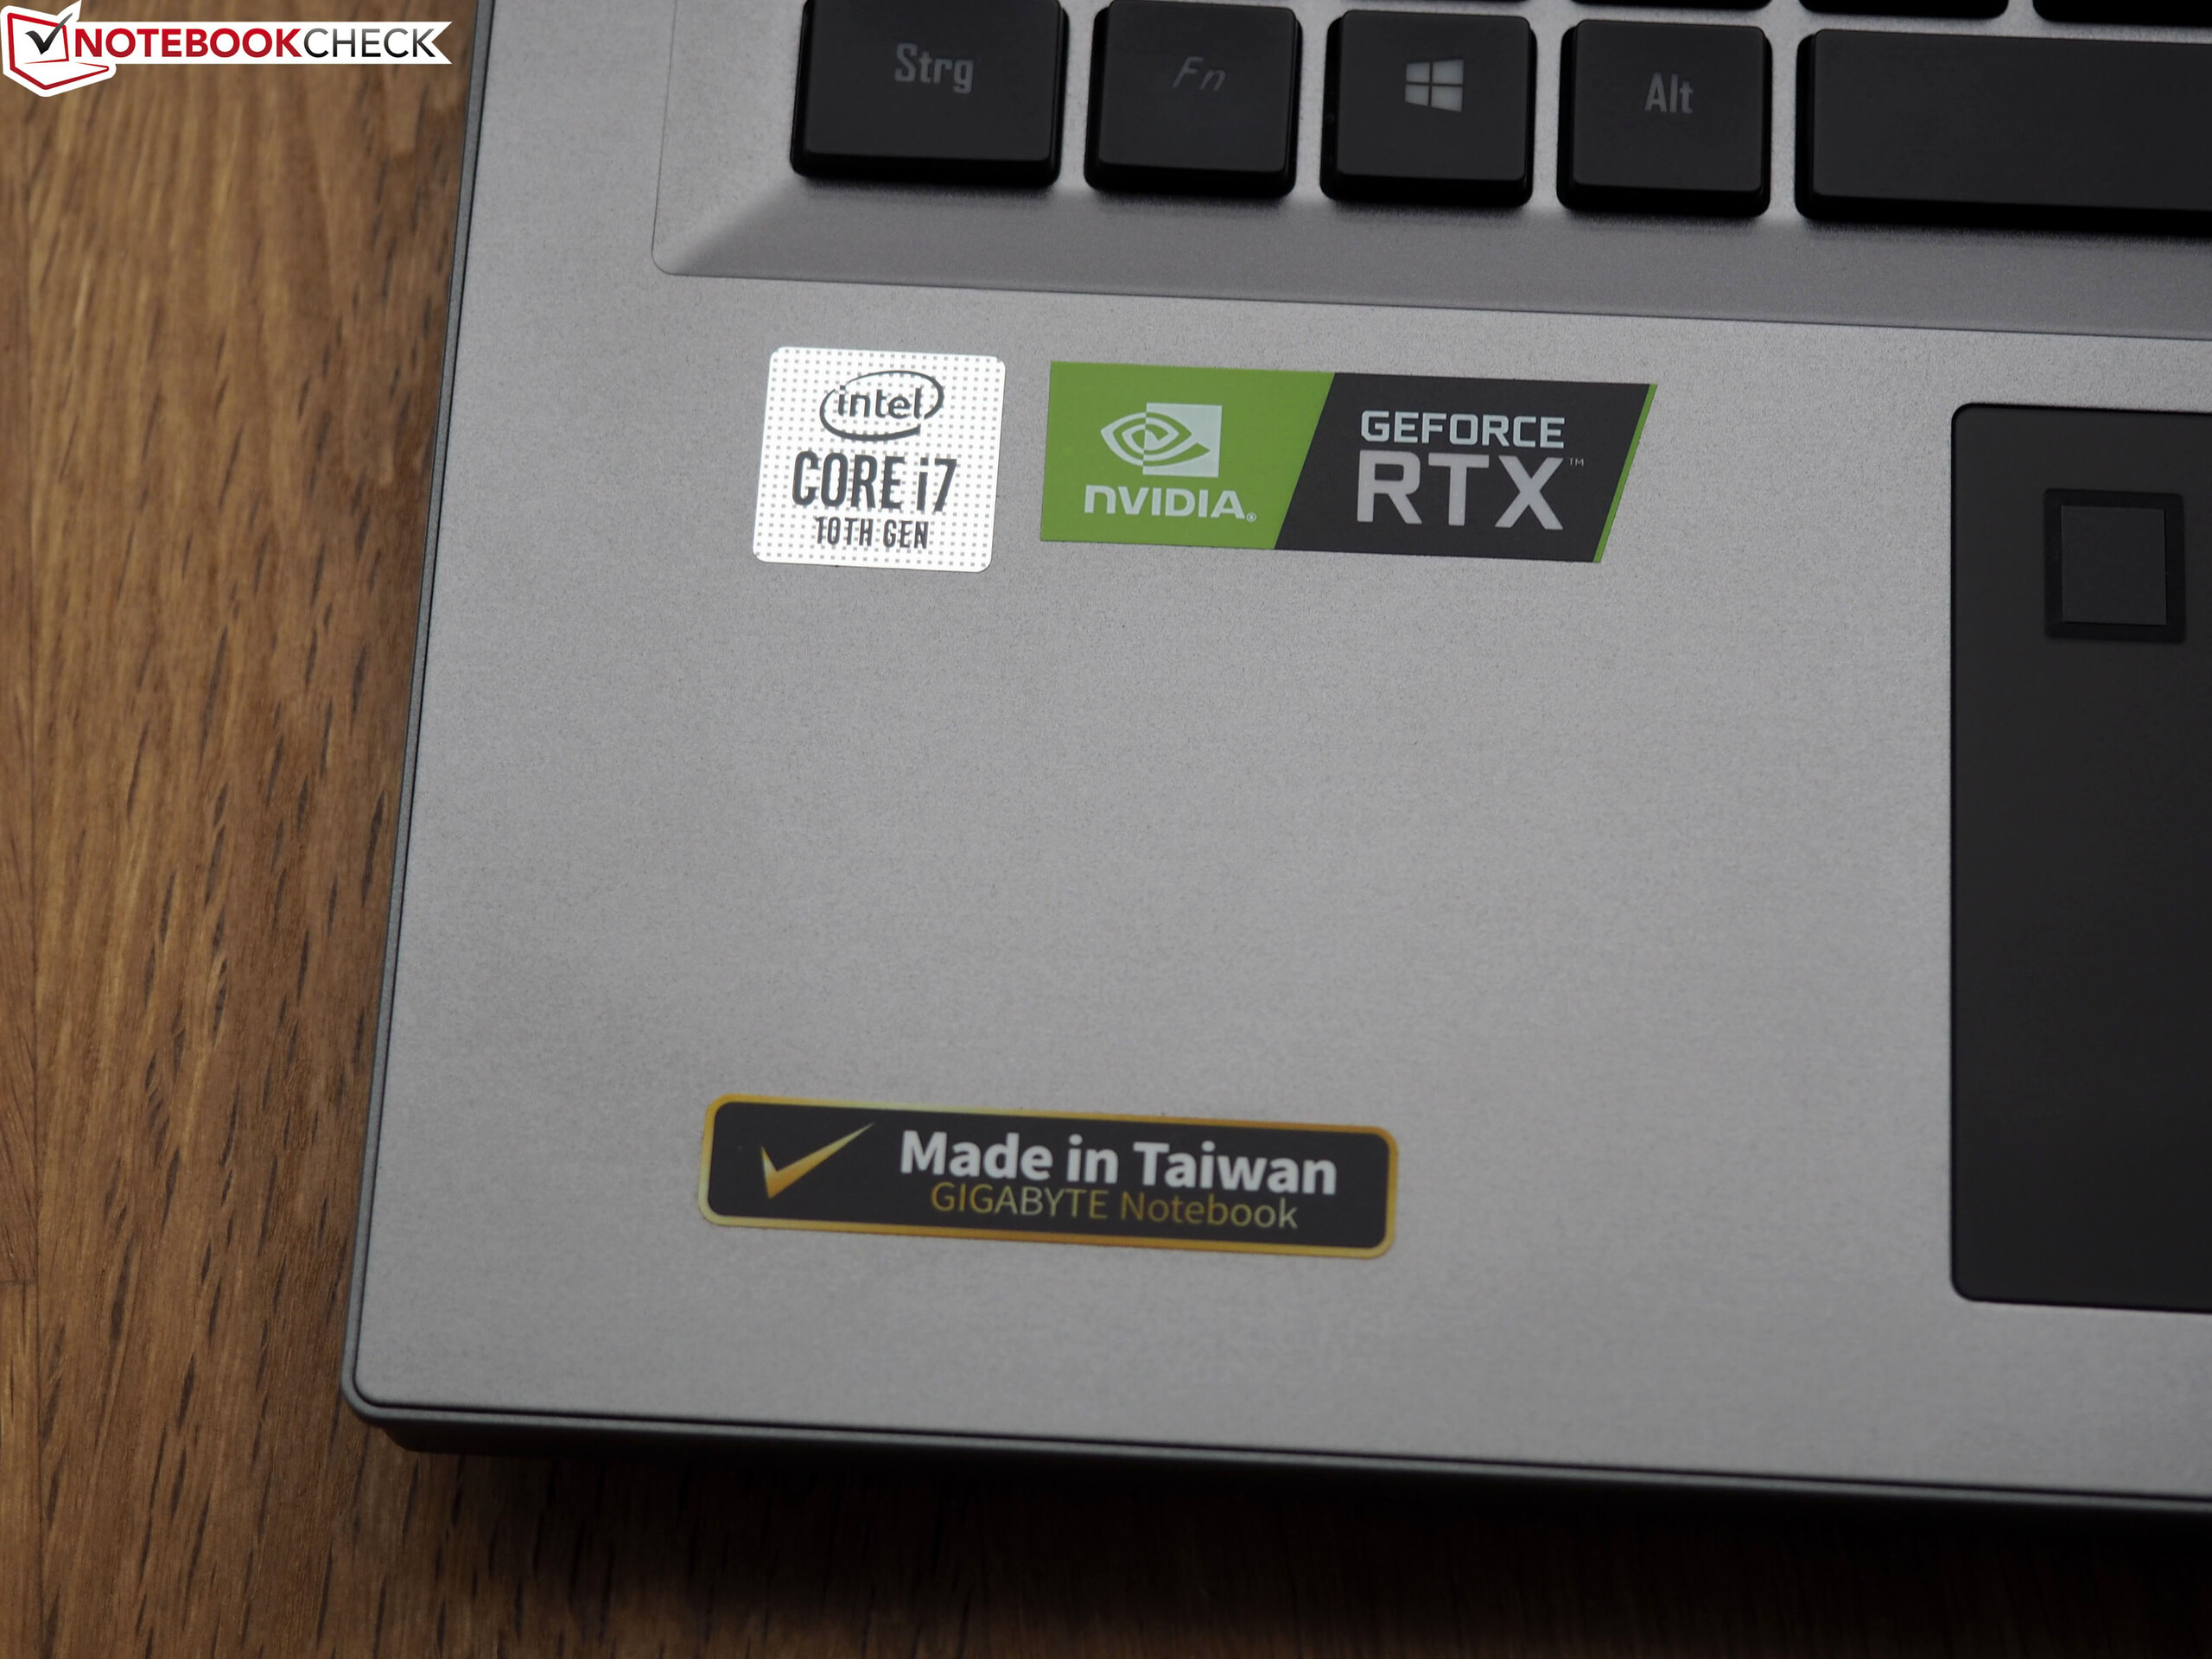
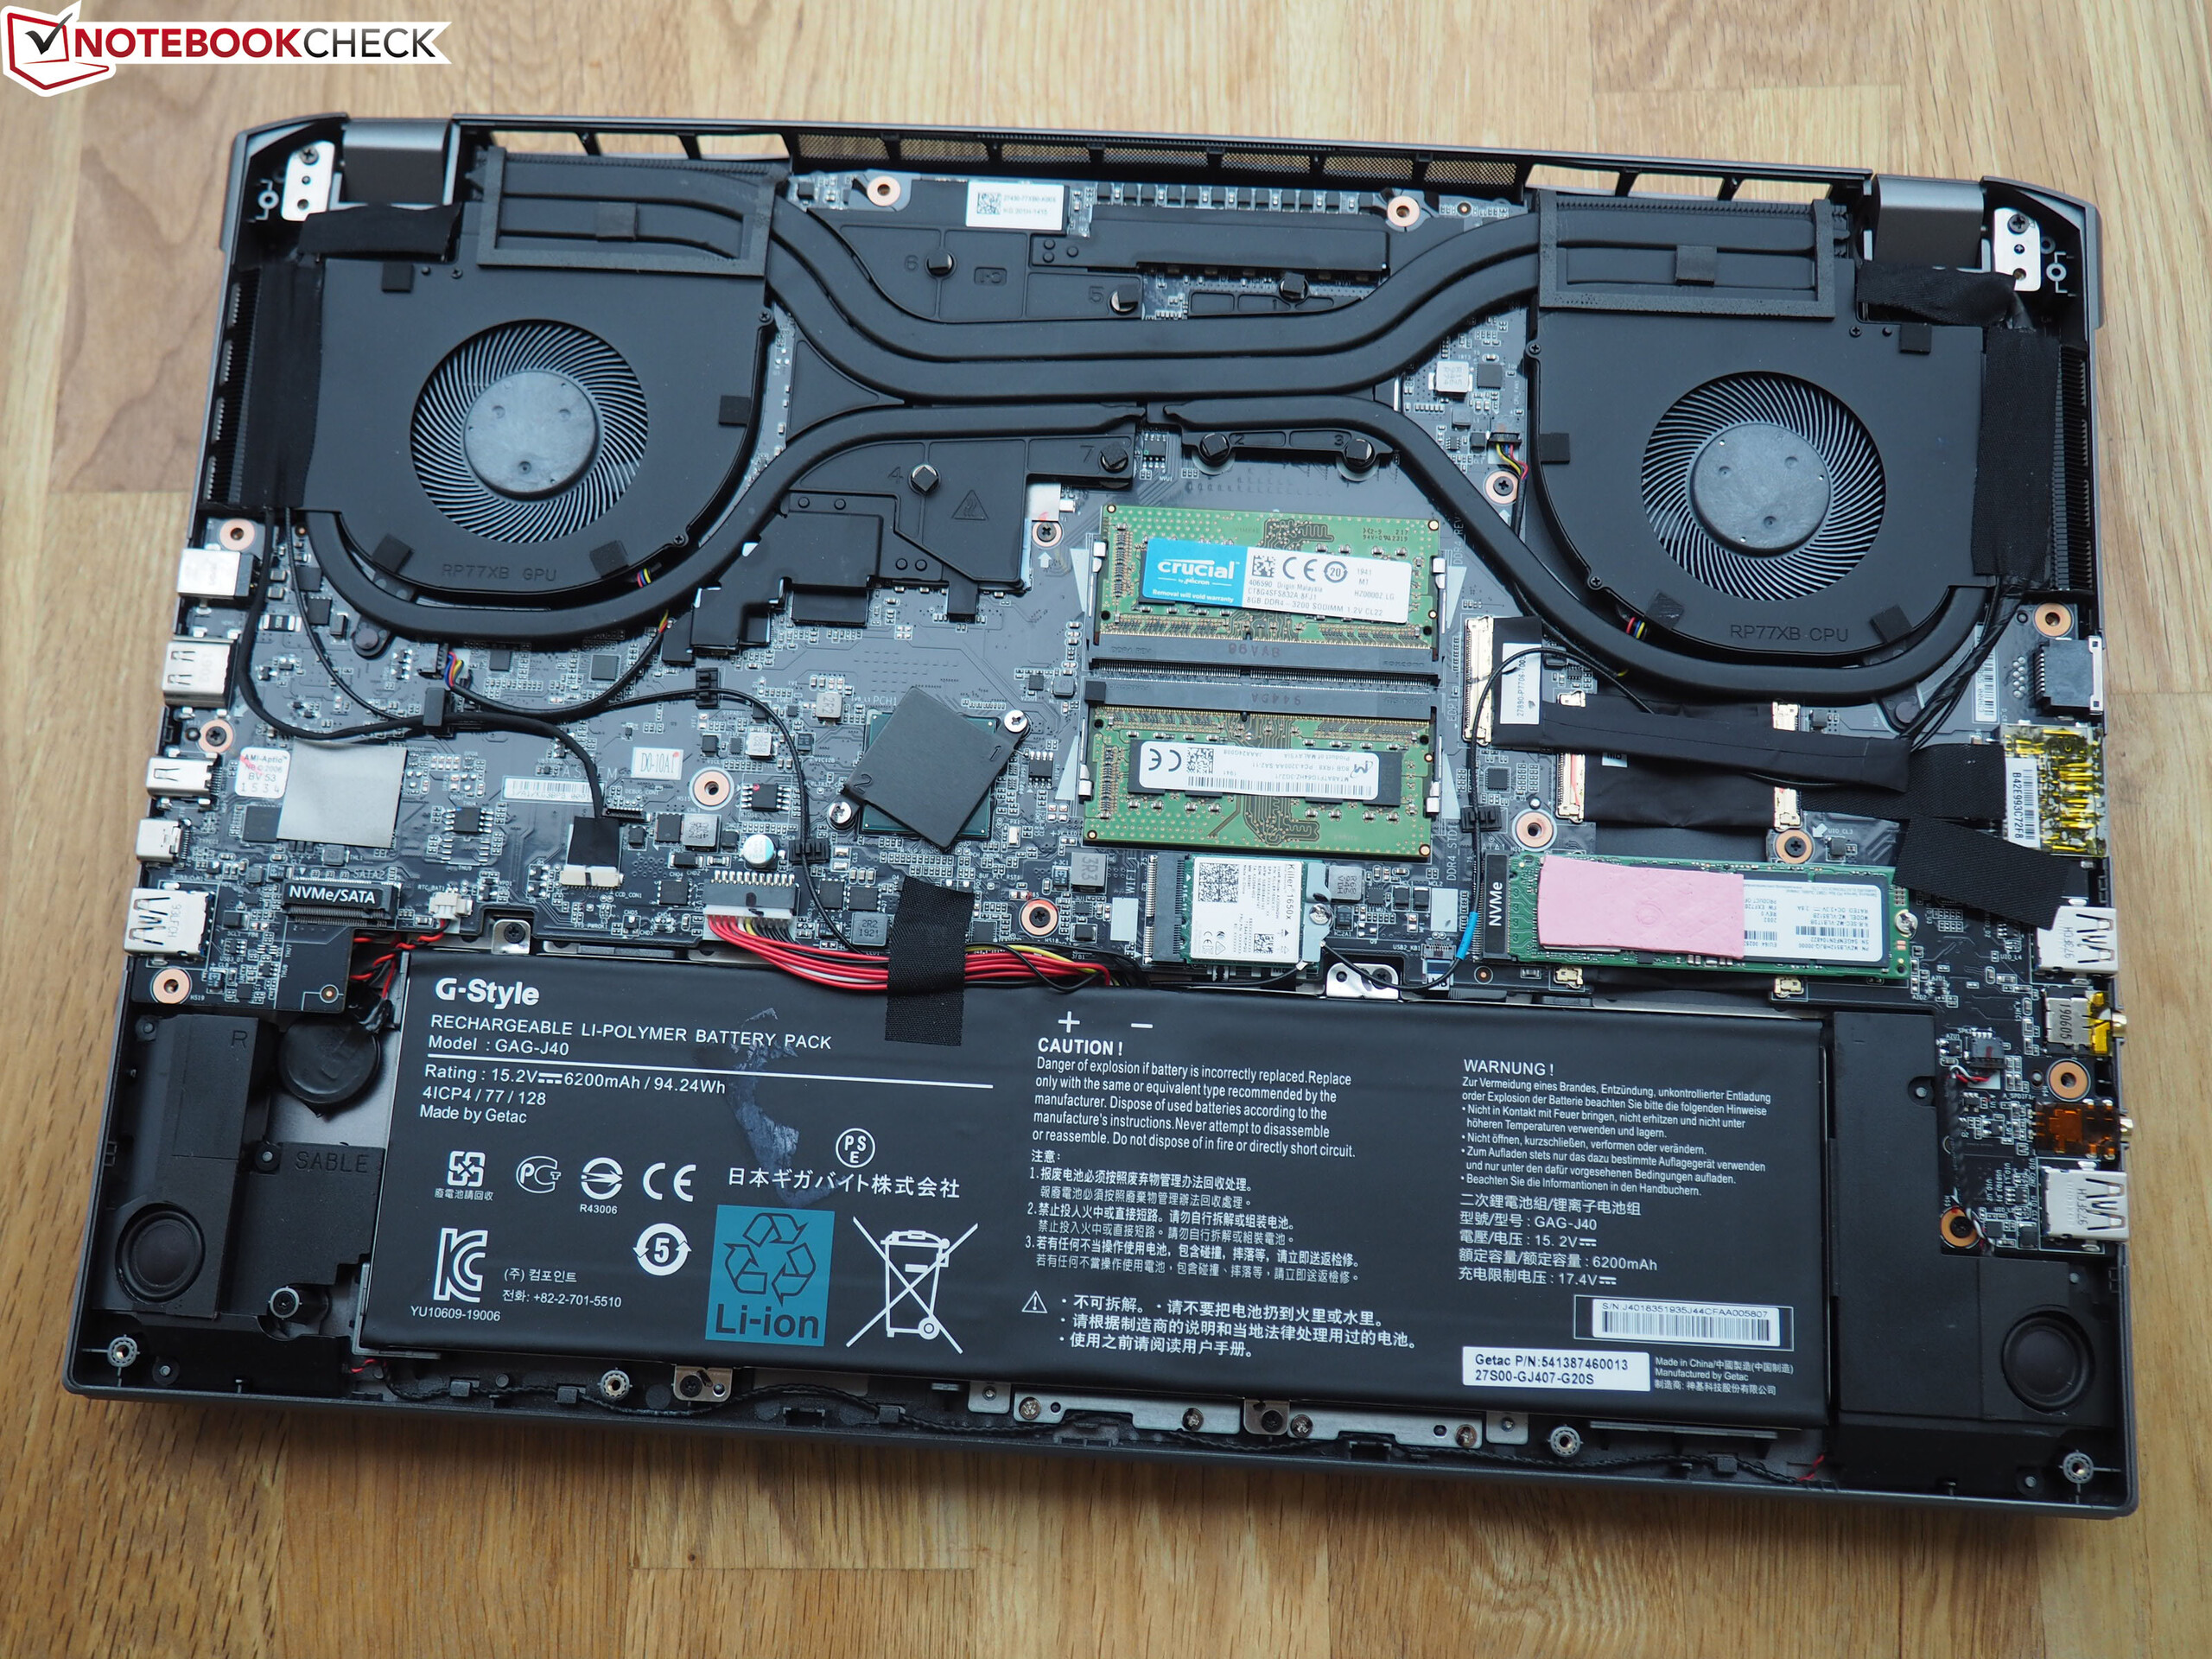
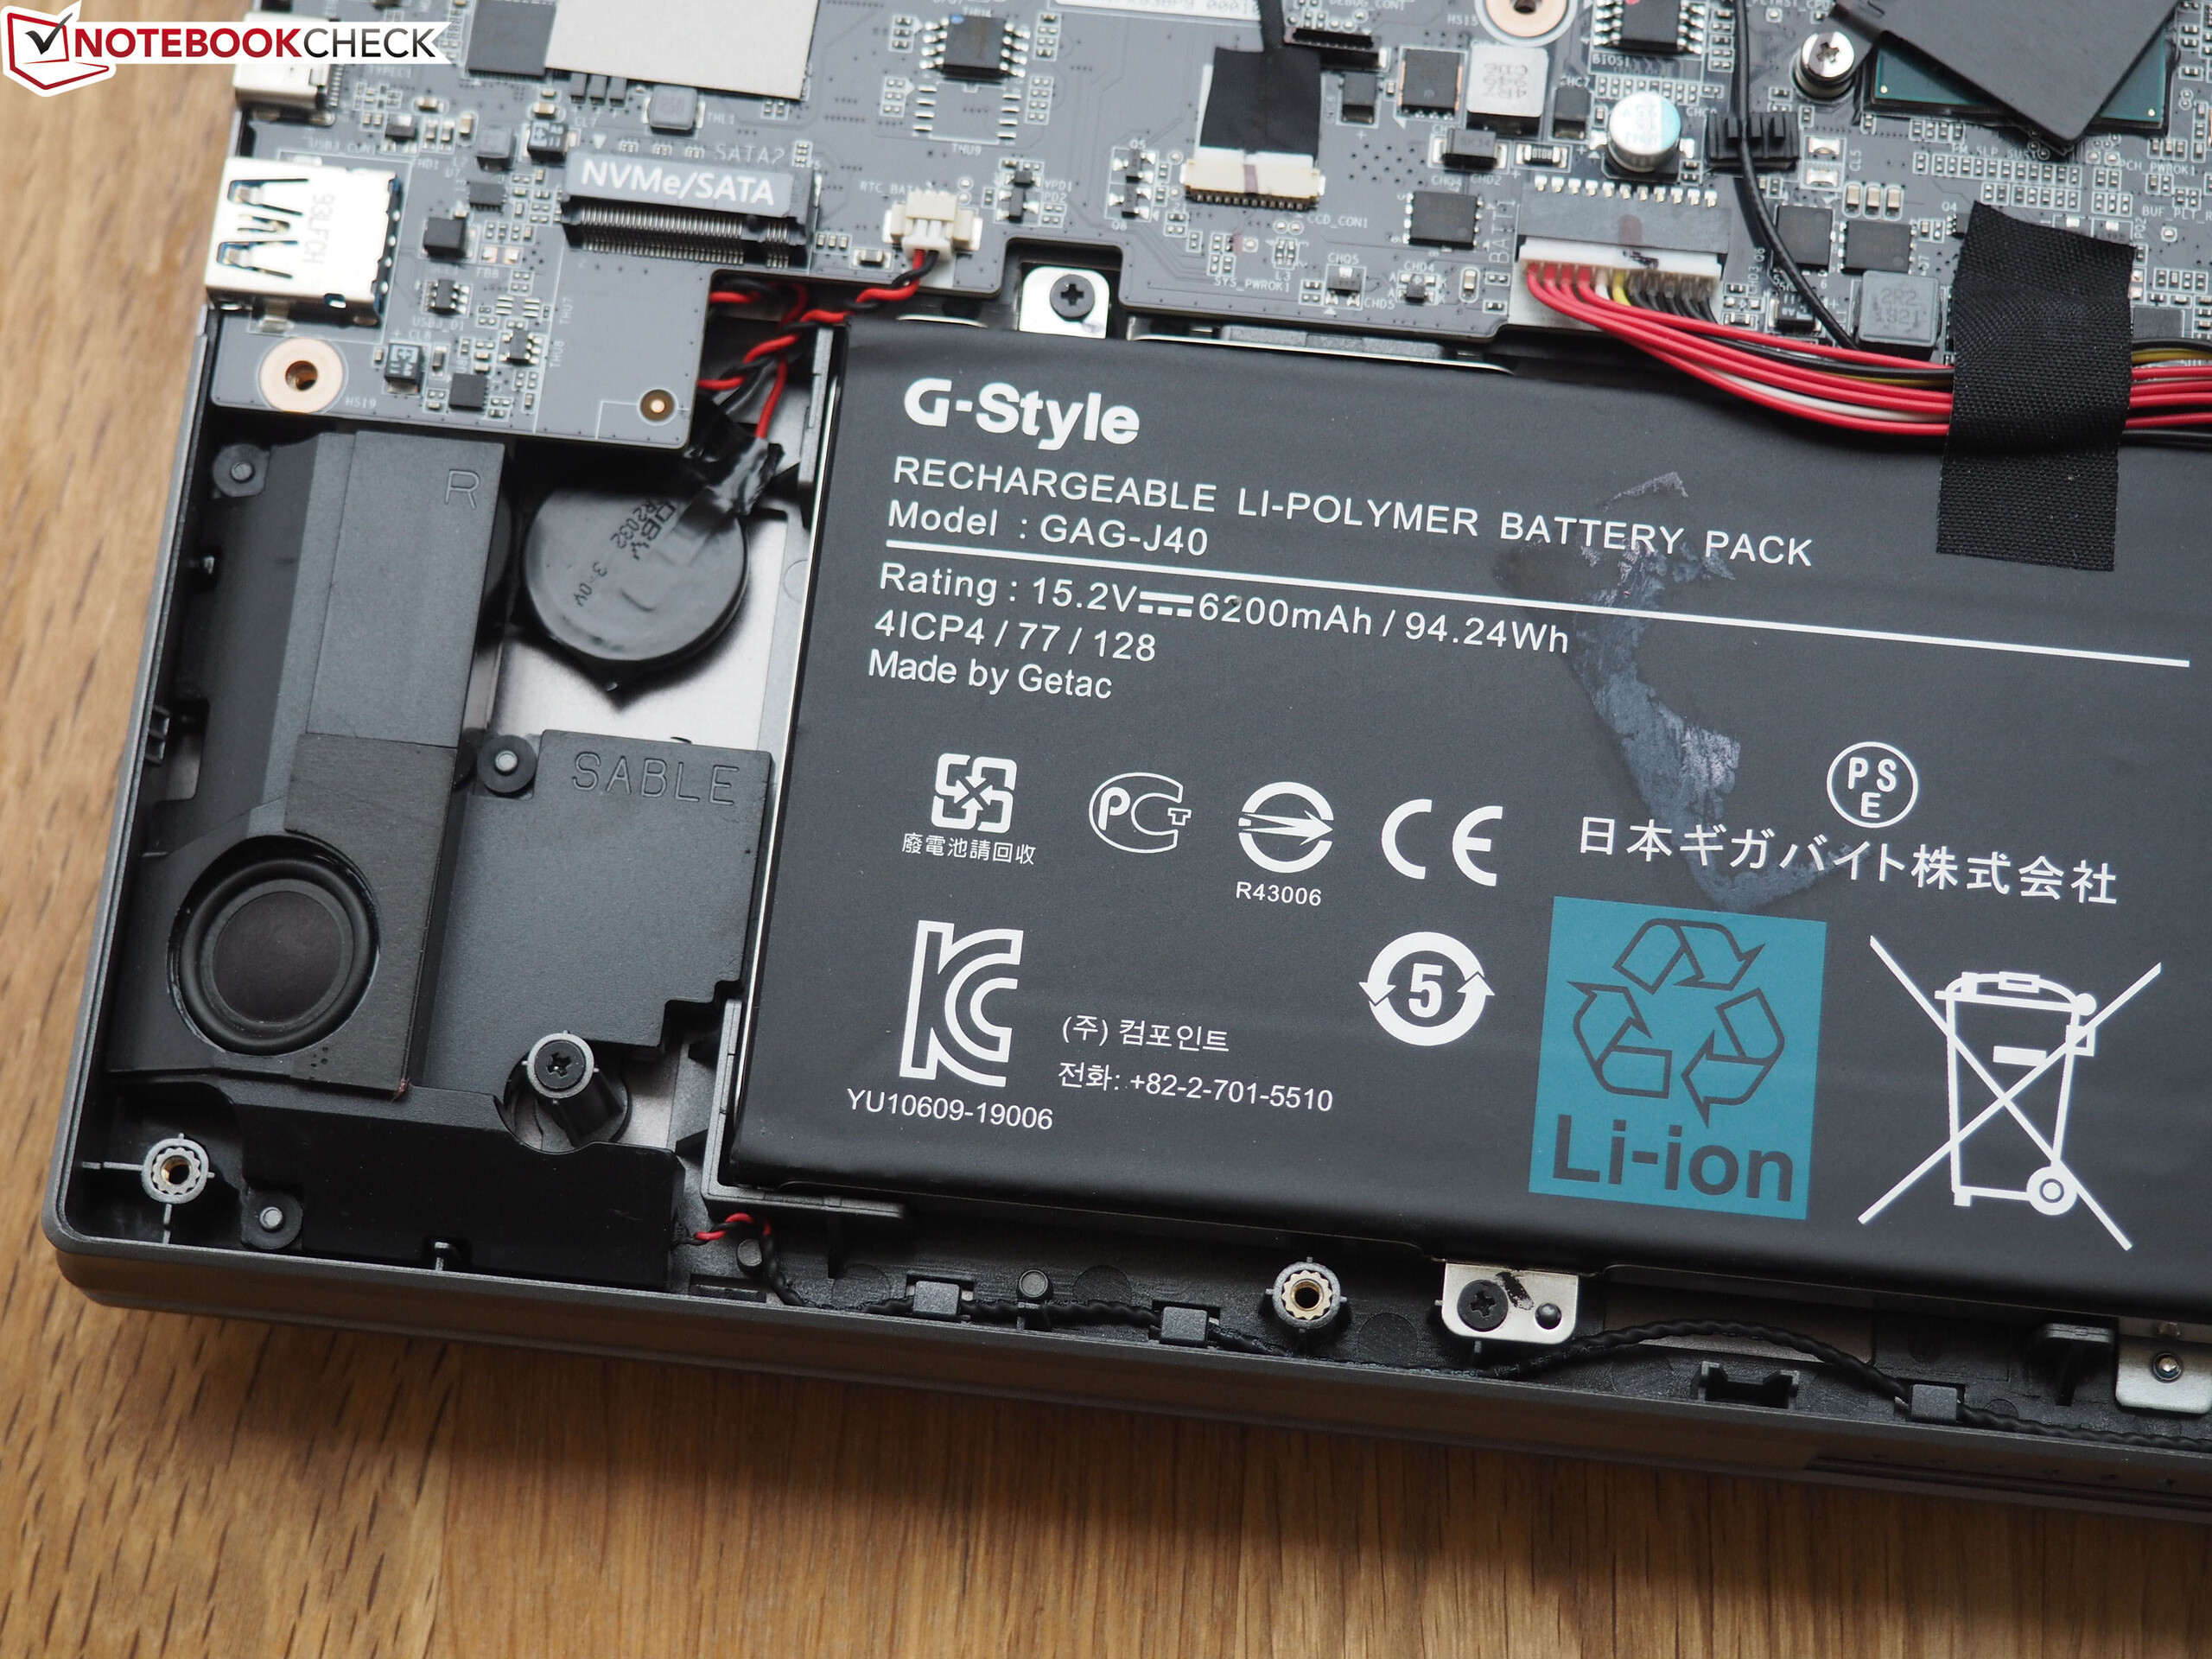
Primeiro está o design. Ao invés de usar um esquema tradicional de cor preta, a Gigabyte oferece um chassi cinza que é muito rígido e parece premium. Outra vantagem é a grande bateria, que garante longos tempos de funcionamento da bateria.
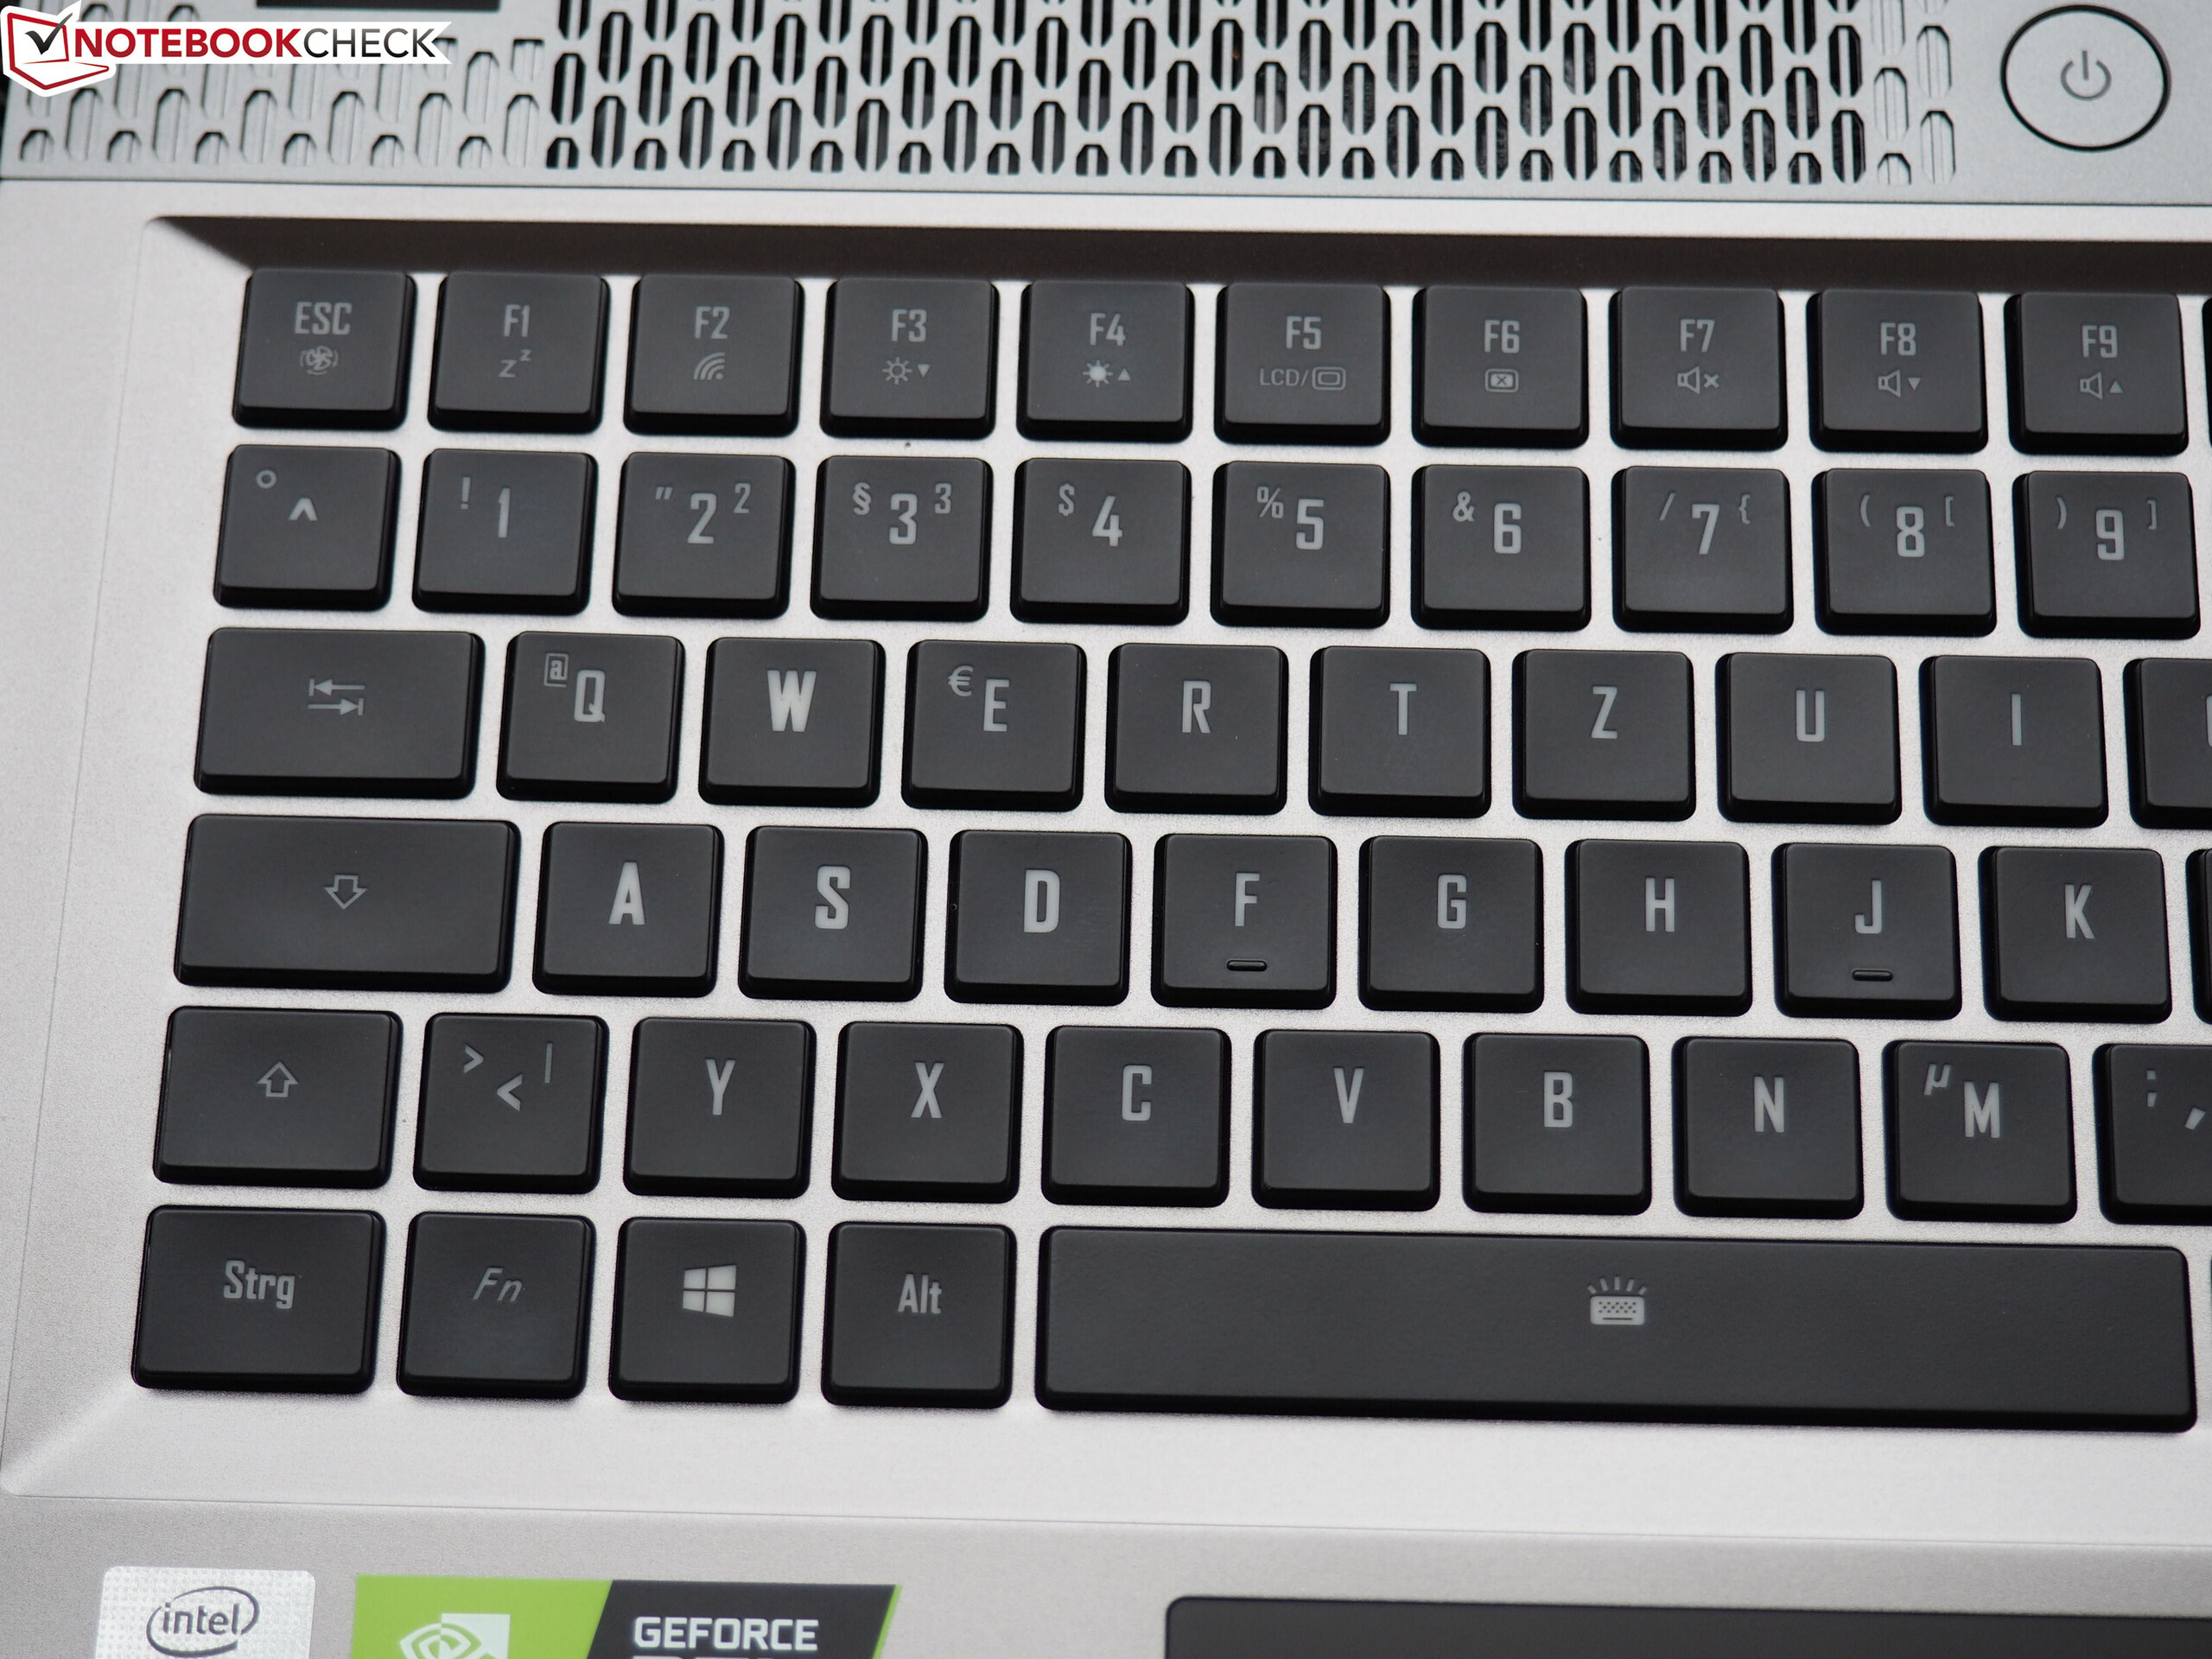
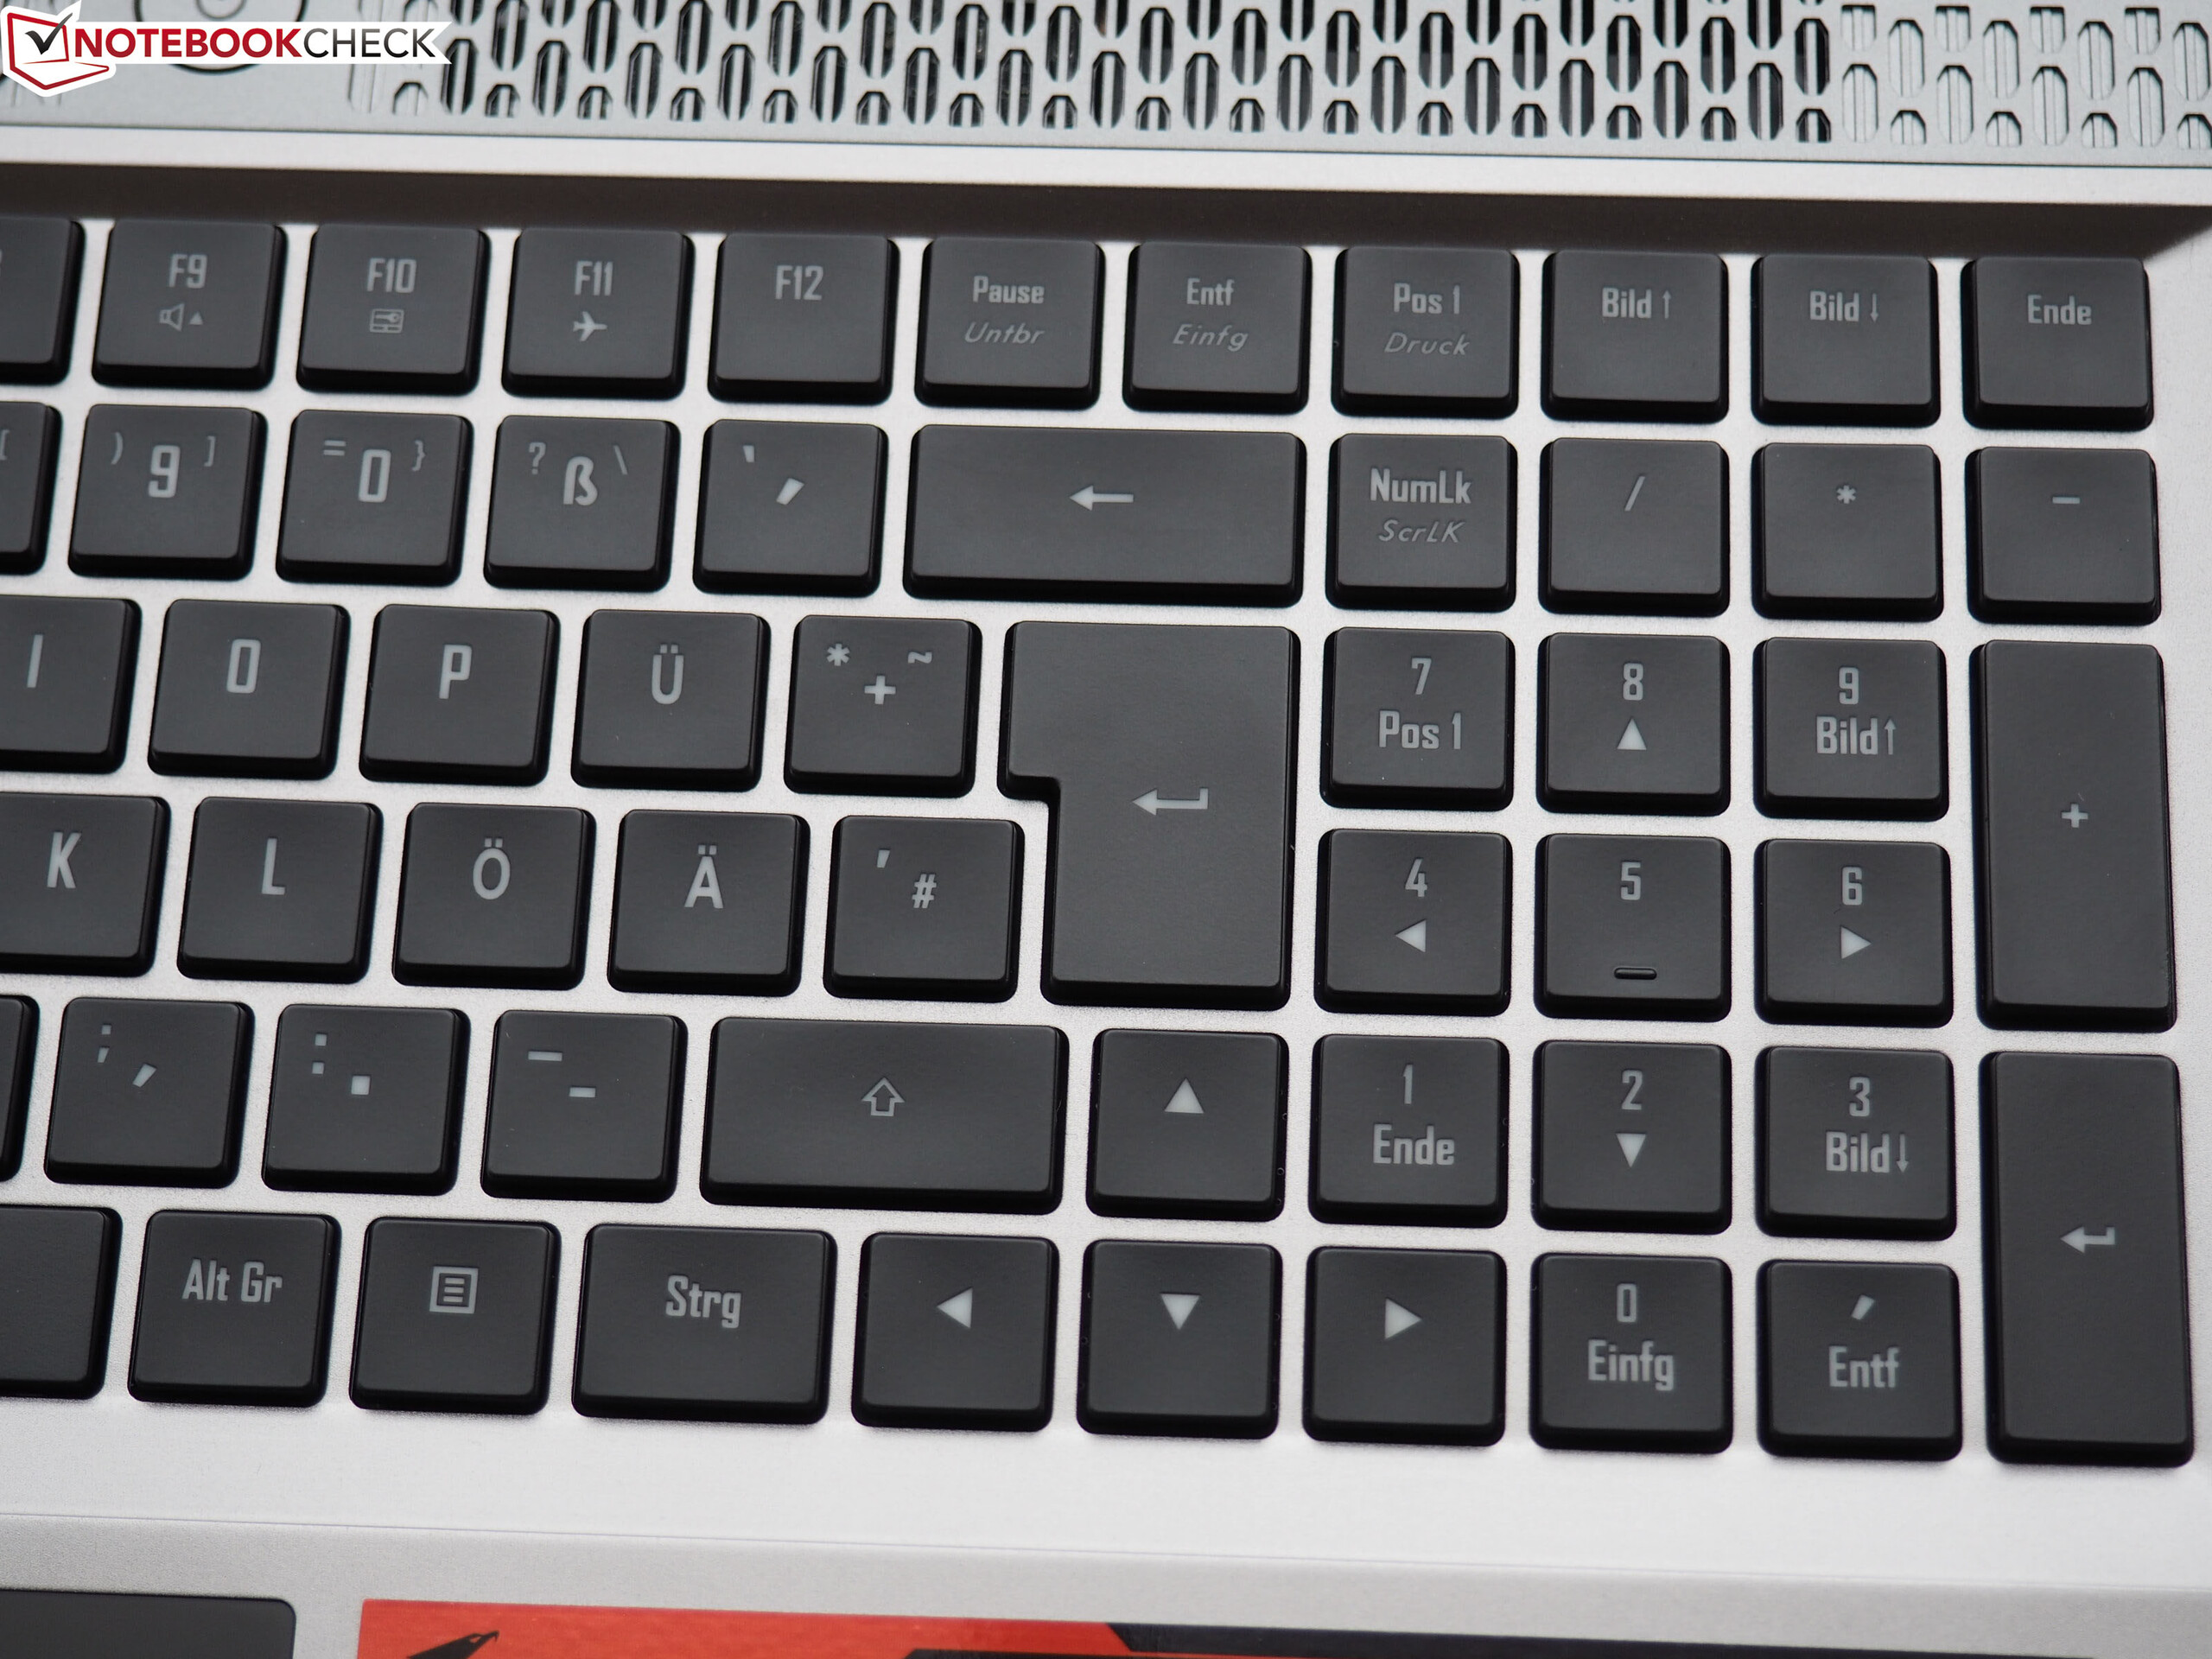
No entanto, o teclado mecânico é o principal recurso especial. Proporciona uma ótima experiência de digitação. Se você conseguir usar o teclado do Aorus 17G, você nunca mais vai querer voltar a usar os teclados tradicionais de portáteis.
Aorus 17G XB
- 05/14/2020 v7 (old)
Florian Glaser
Price comparison