Revisão do laptop Alienware m17 R4: Queimando na atmosfera
O Alienware M17 R4 é o modelo de 17 polegadas da linha de Alienware da Dell. Os laptops com retroiluminação RGB são conhecidos por seu design marcante e, como resultado, ganharam uma certa imagem no mundo dos laptops para jogos. Os dois outros modelos do portfólio da Alienware são a variante de 15 polegadas de nosso dispositivo de teste, que leva o nome de Alienware M15 R4, e o Alienware Area-51M R2. Em contraste com este último, o Alienware M17 R4 ainda é relativamente compacto, na medida em que ainda se pode falar disso quando se trata de um laptop de 17 polegadas nesta classe de desempenho. O Alienware M17 R4 é uma versão atualizada do Alienware M17 R3, que examinamos anteriormente. Na próxima análise, veremos como o estojo fino lida bem com o novo hardware e como a tela de 360 Hz, que é rápida como um relâmpago, se comporta
Possible contenders in comparison
Avaliação | Data | Modelo | Peso | Altura | Size | Resolução | Preço |
|---|---|---|---|---|---|---|---|
| 85.3 % v7 (old) | 04/2021 | Alienware m17 R4 i9-10980HK, GeForce RTX 3080 Laptop GPU | 3 kg | 22 mm | 17.30" | 1920x1080 | |
| 87.1 % v7 (old) | 03/2021 | MSI GE76 Raider 10UH i7-10870H, GeForce RTX 3080 Laptop GPU | 3 kg | 27.4 mm | 17.30" | 1920x1080 | |
| 87.8 % v7 (old) | 02/2021 | Razer Blade Pro 17 2021 (QHD Touch) i7-10875H, GeForce RTX 3080 Laptop GPU | 3 kg | 19.9 mm | 17.30" | 3840x2160 | |
| 87.6 % v7 (old) | 01/2021 | Gigabyte Aero 17 HDR YC i9-10980HK, GeForce RTX 3080 Laptop GPU | 2.8 kg | 21.4 mm | 17.30" | 3840x2160 | |
| 85.1 % v7 (old) | 01/2021 | Schenker XMG Neo 17 (Early 2021, RTX 3070, 5800H) R7 5800H, GeForce RTX 3070 Laptop GPU | 2.5 kg | 27 mm | 17.30" | 2560x1440 | |
| 85.3 % v7 (old) | 09/2020 | Alienware m17 R3 P45E i9-10980HK, GeForce RTX 2080 Super Mobile | 3 kg | 20.7 mm | 17.30" | 1920x1080 |
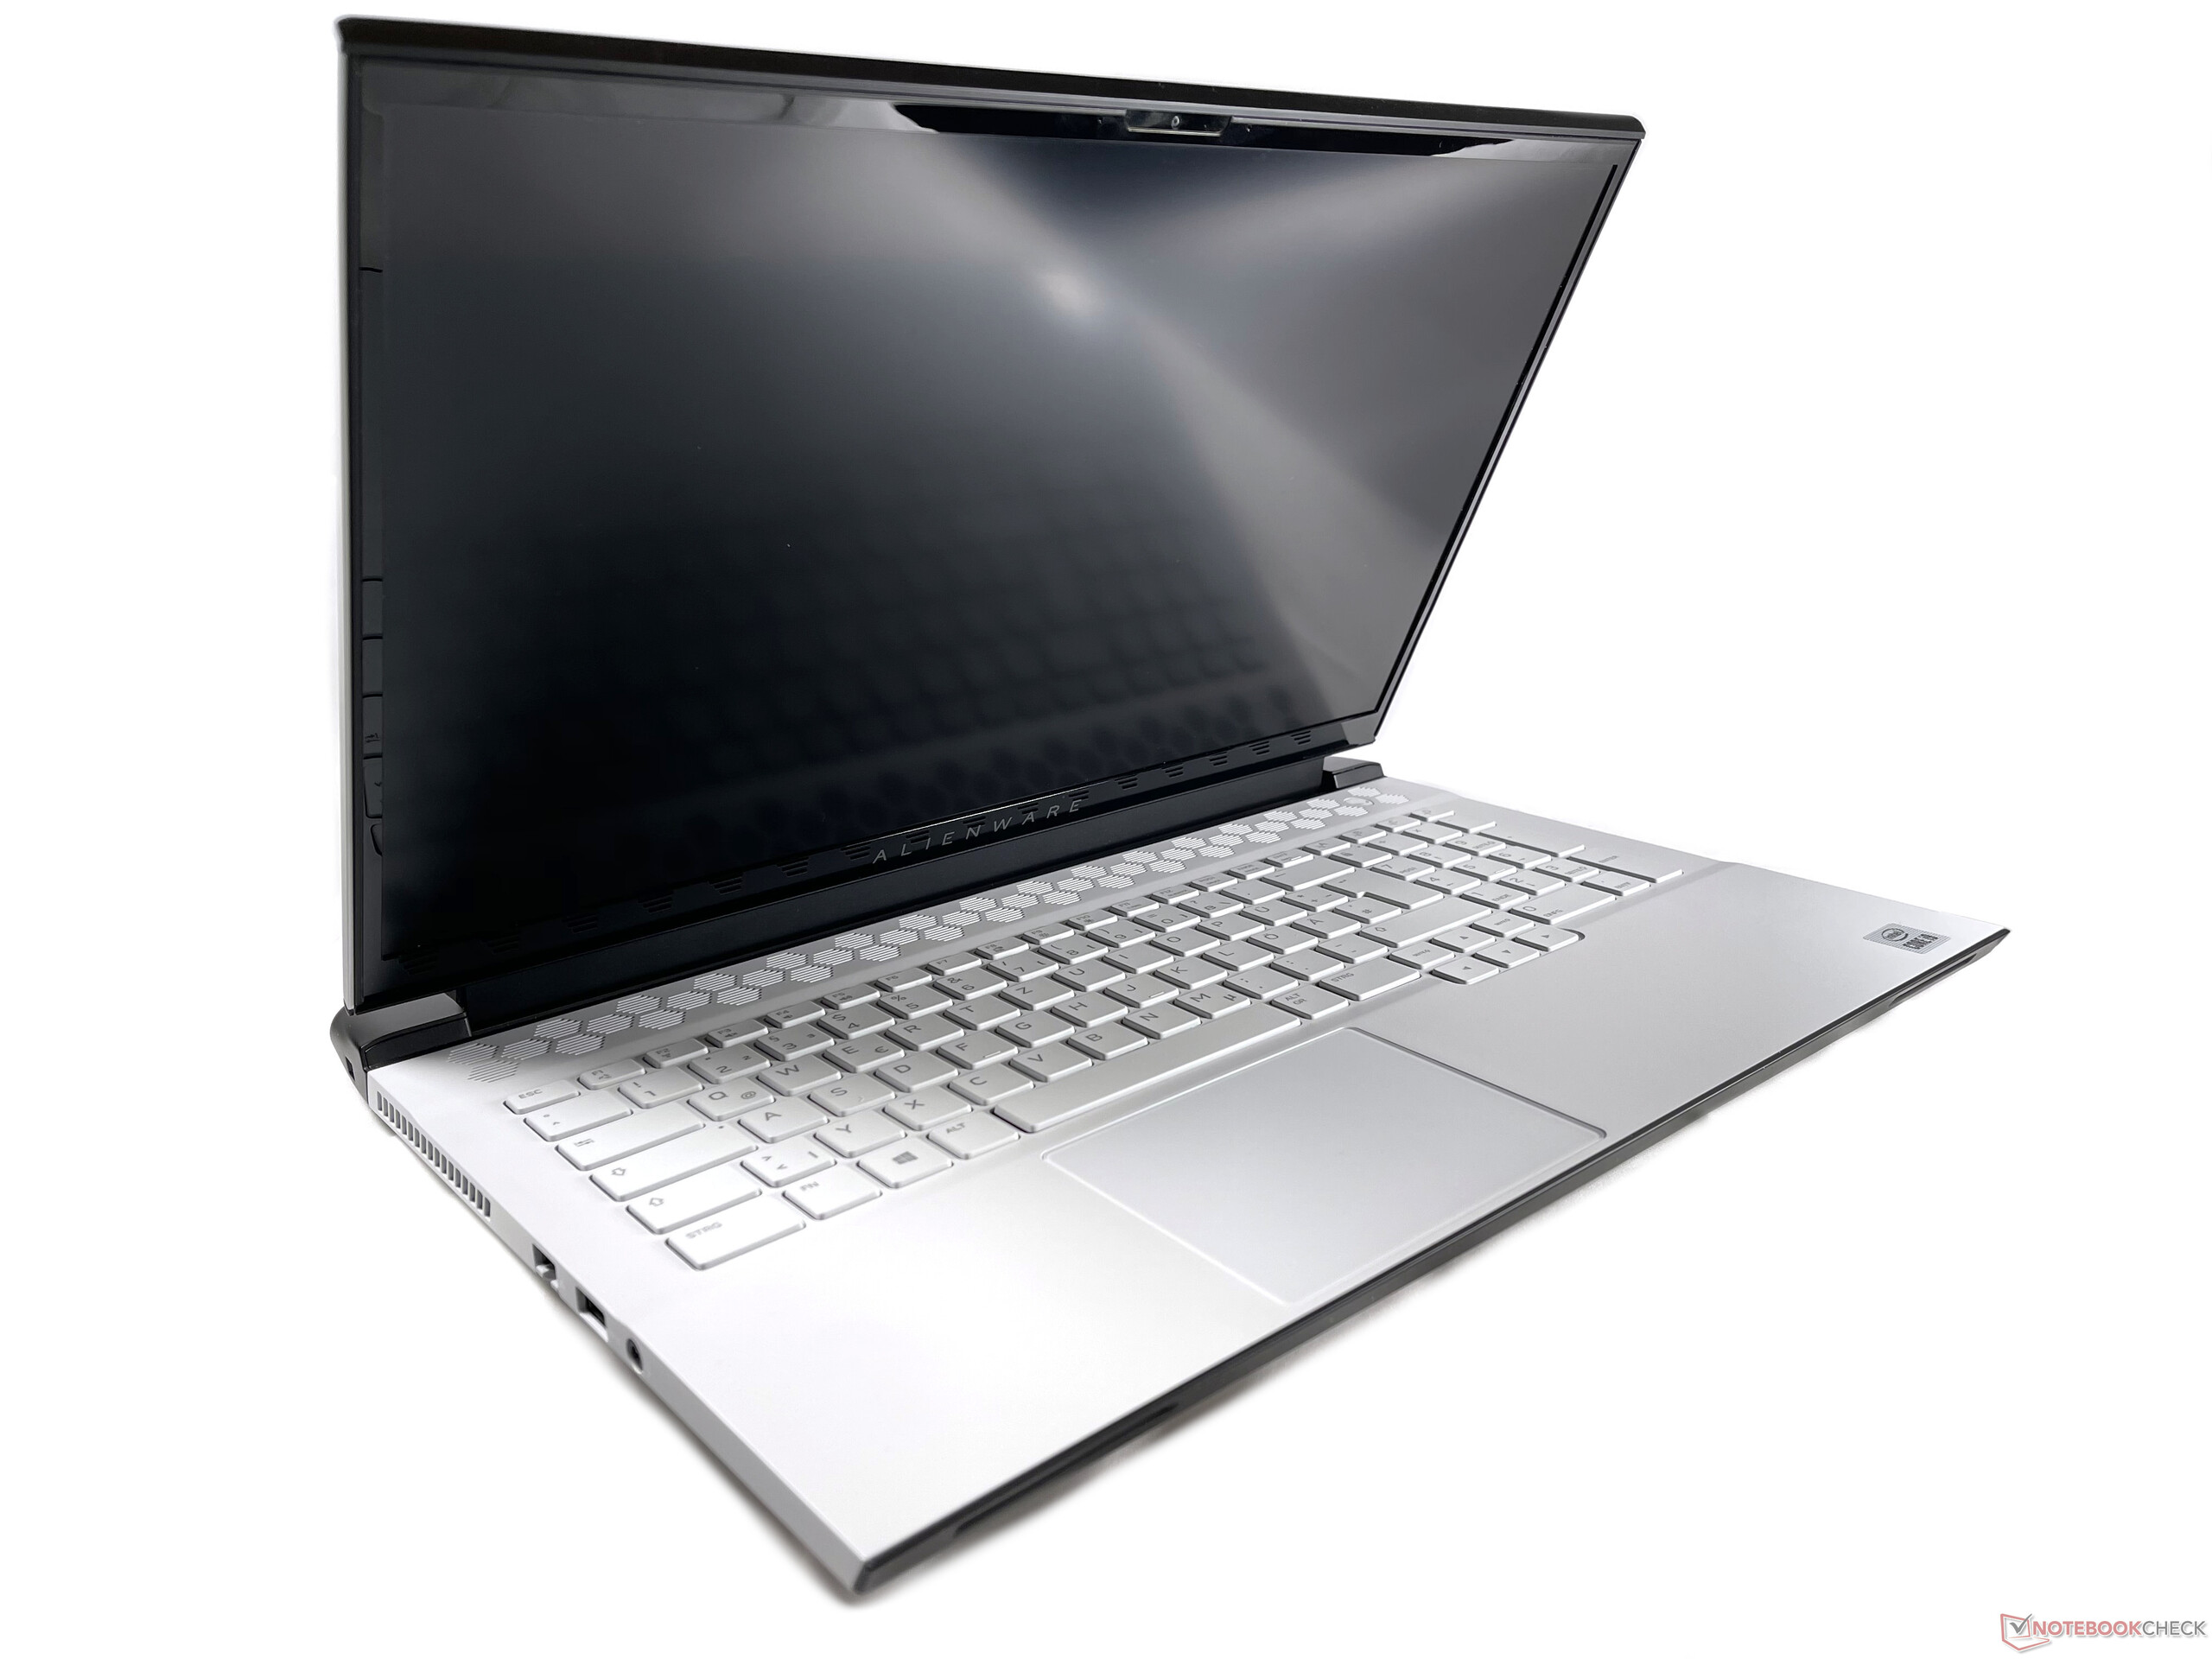
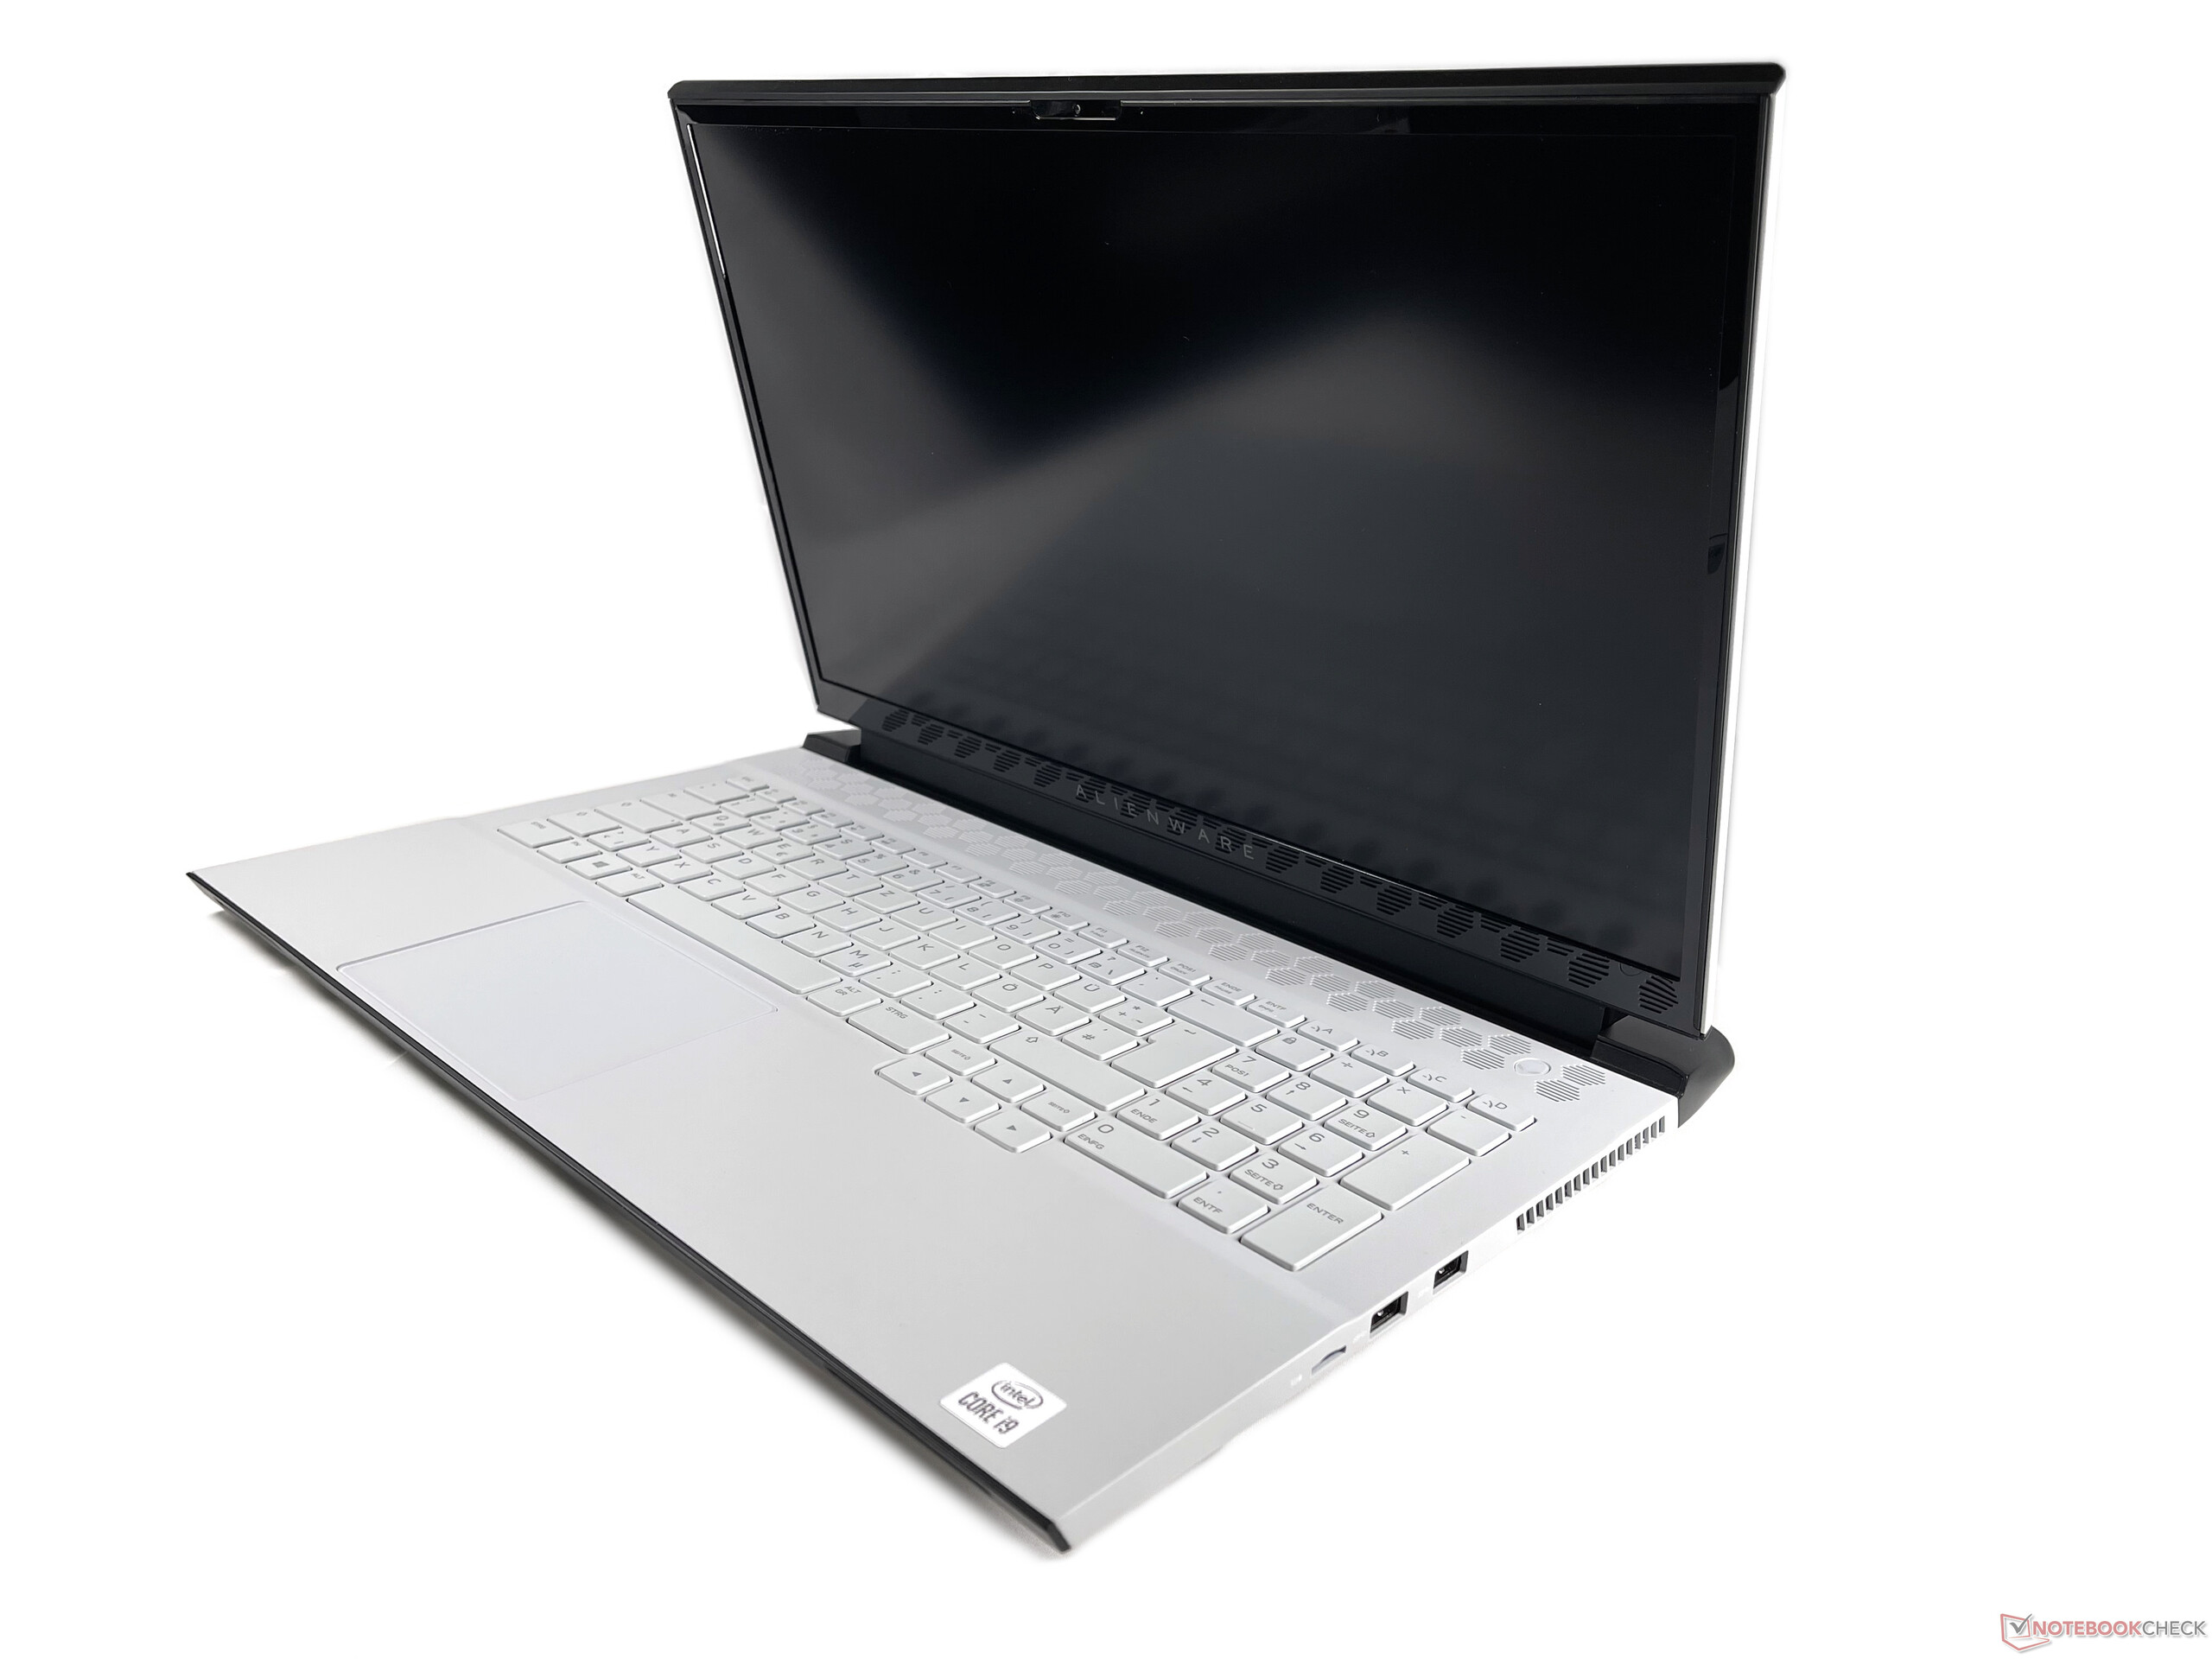
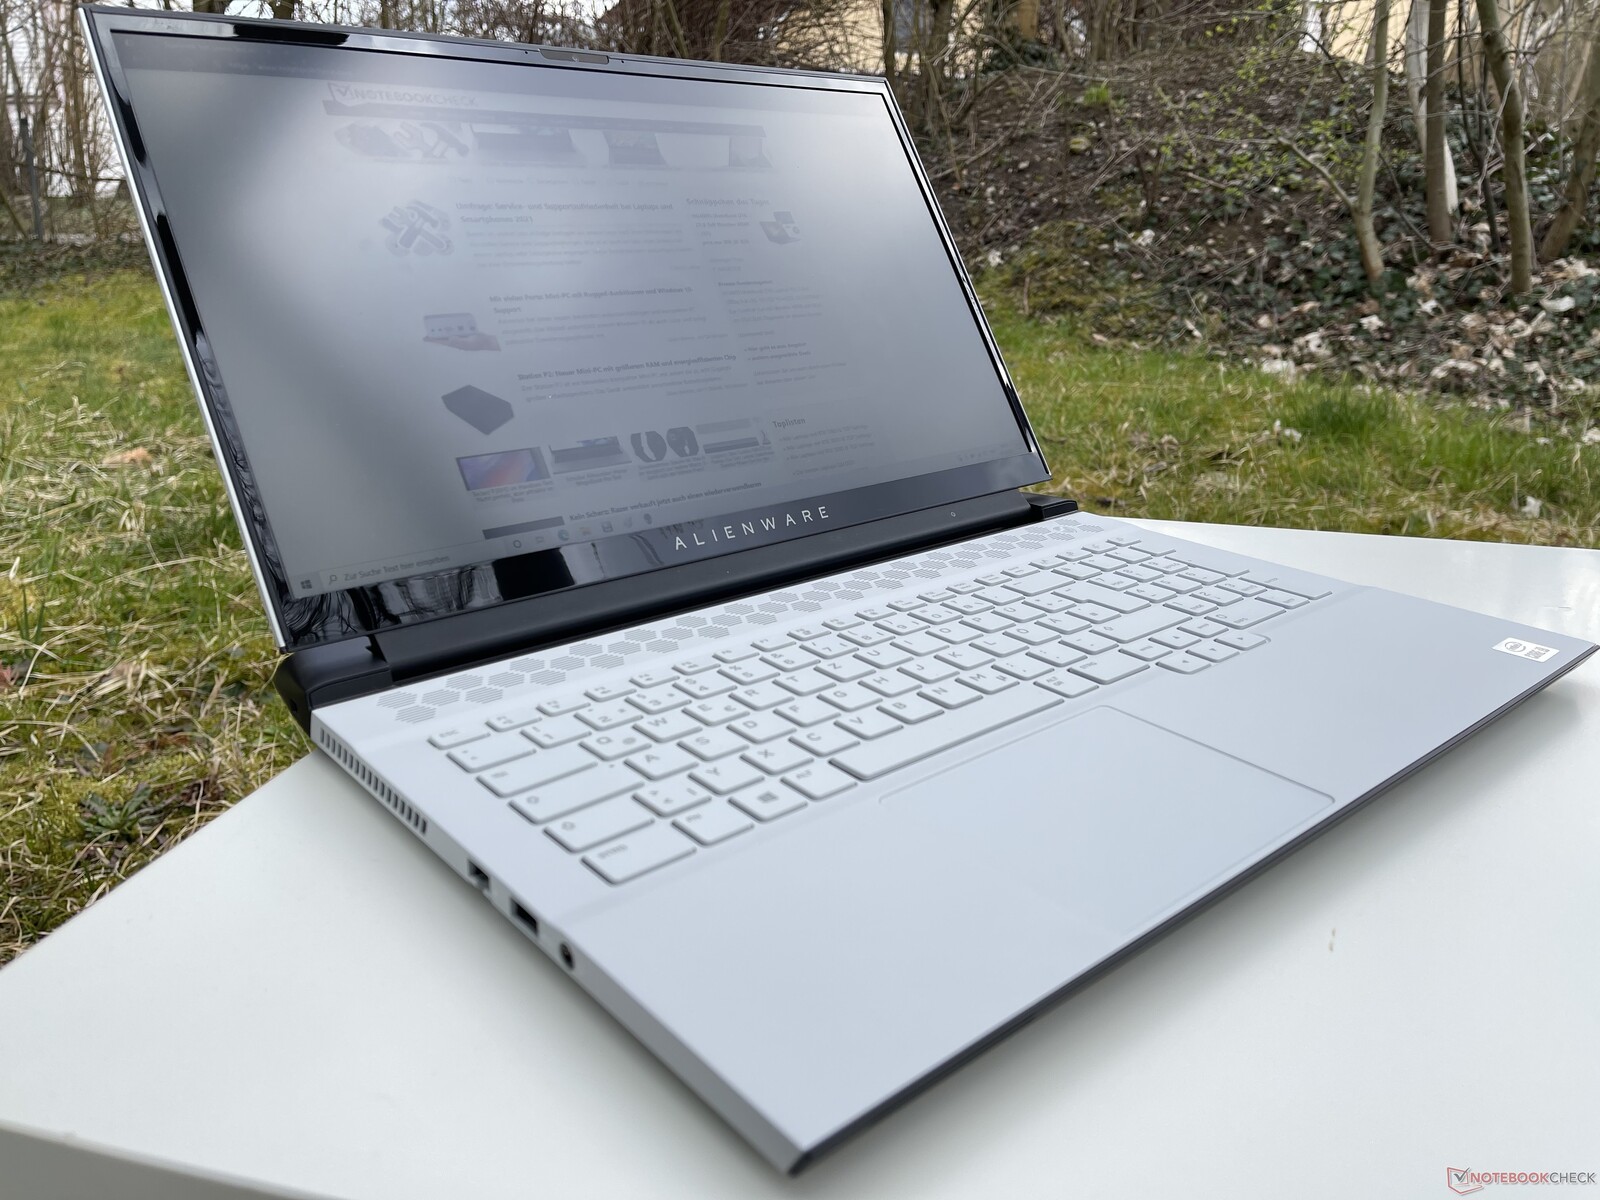
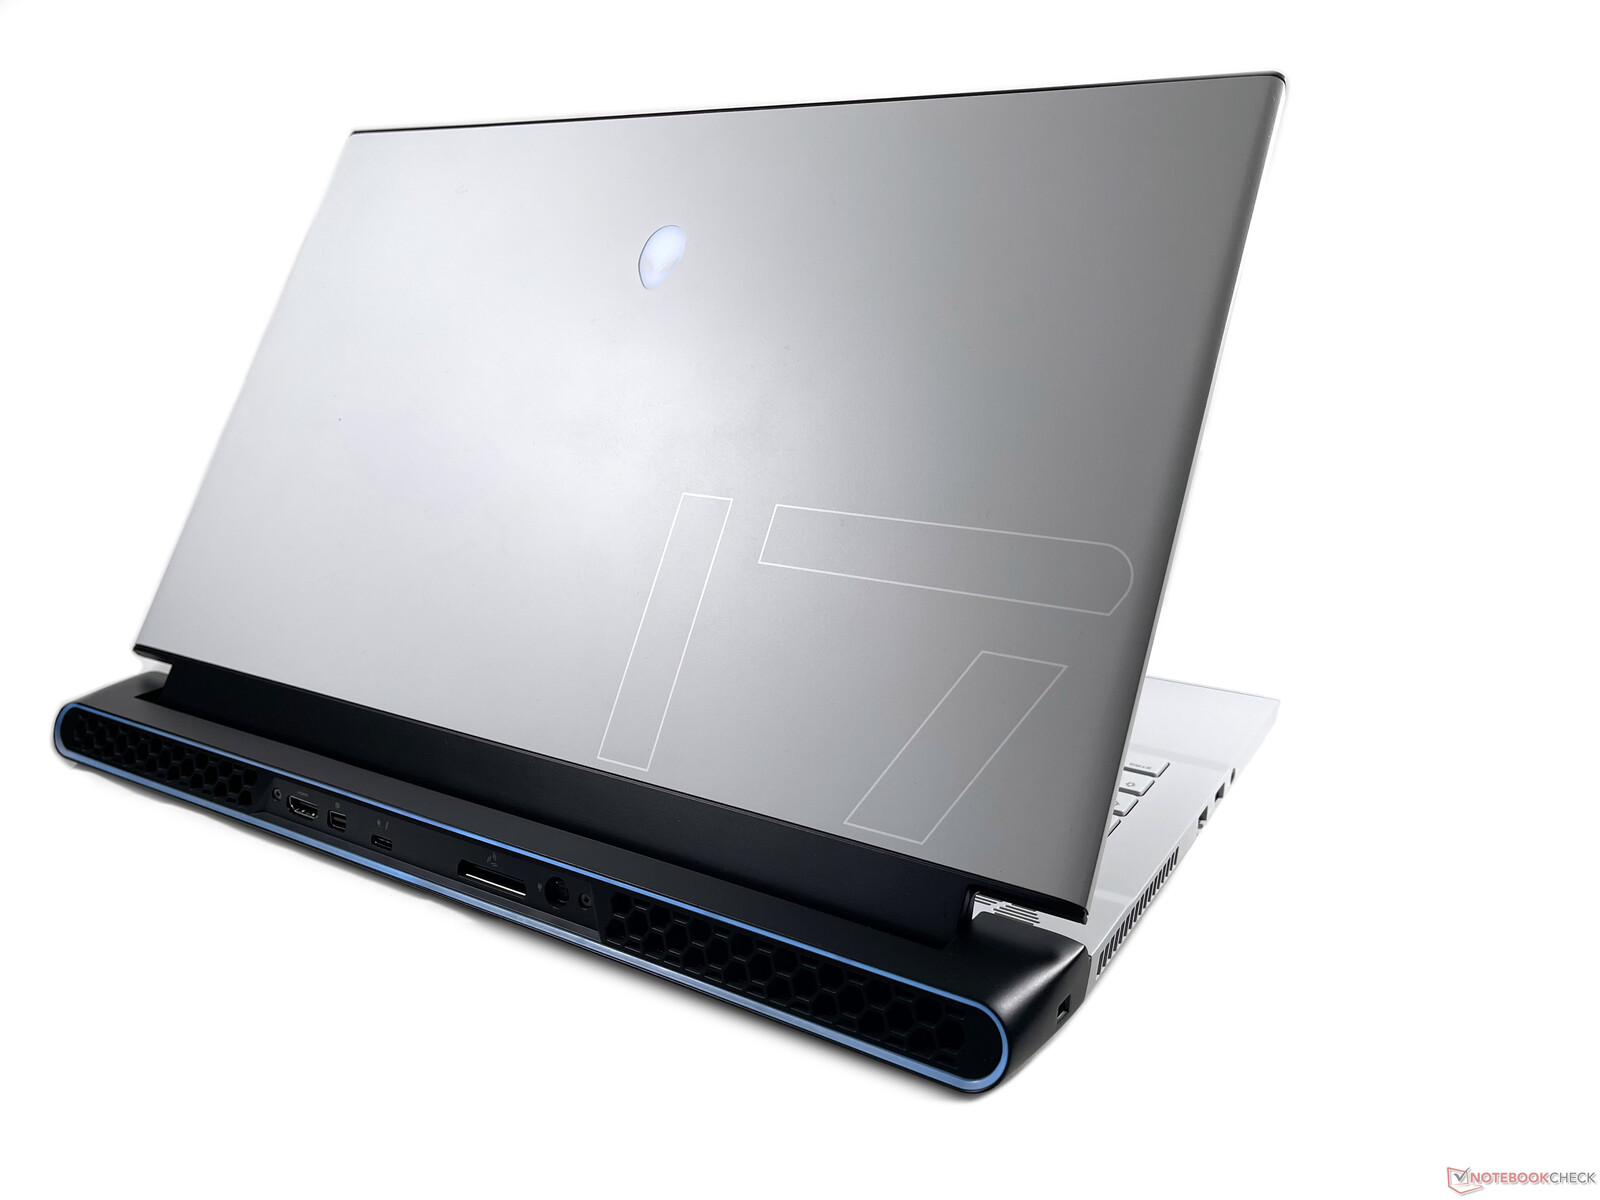
Estojo - Computador portátil alienígena vestido de branco
A caixa é feita de uma liga de magnésio branco com elementos plásticos pretos. As dimensões da abertura são uniformes e a qualidade de construção é muito alta. Isto também é perceptível na alta rigidez da construção. O design não mudou em comparação com o antecessor
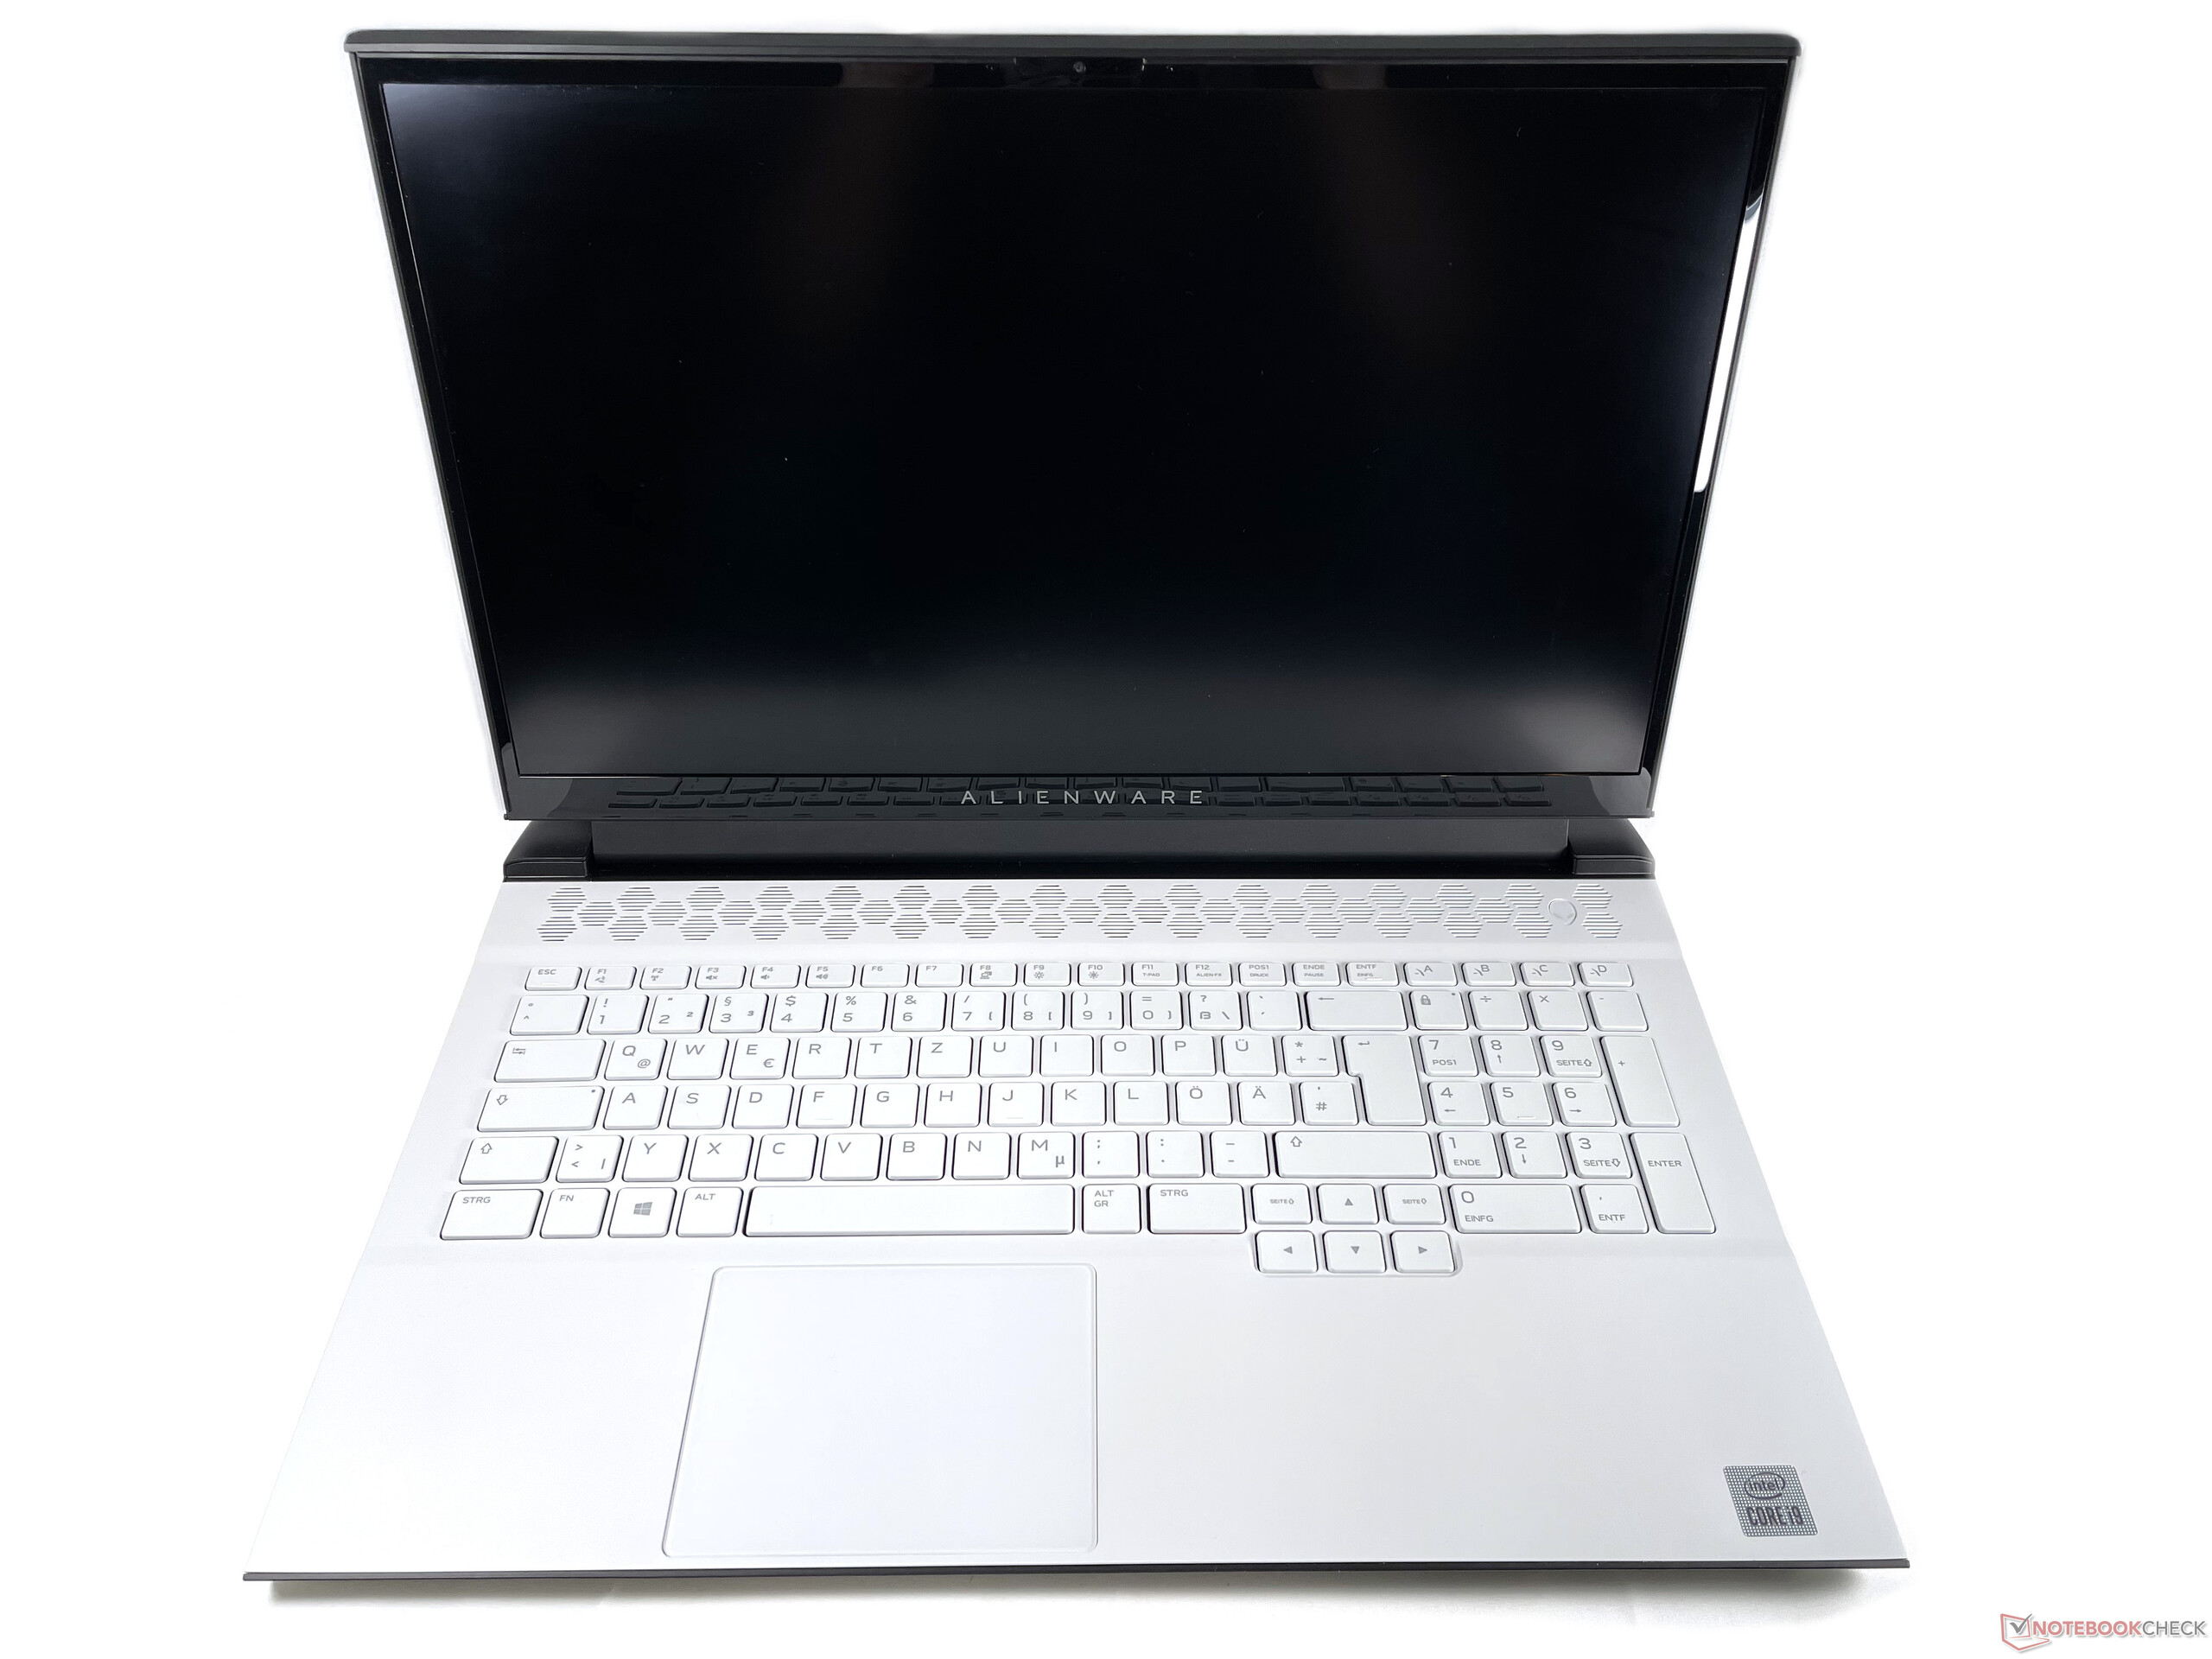

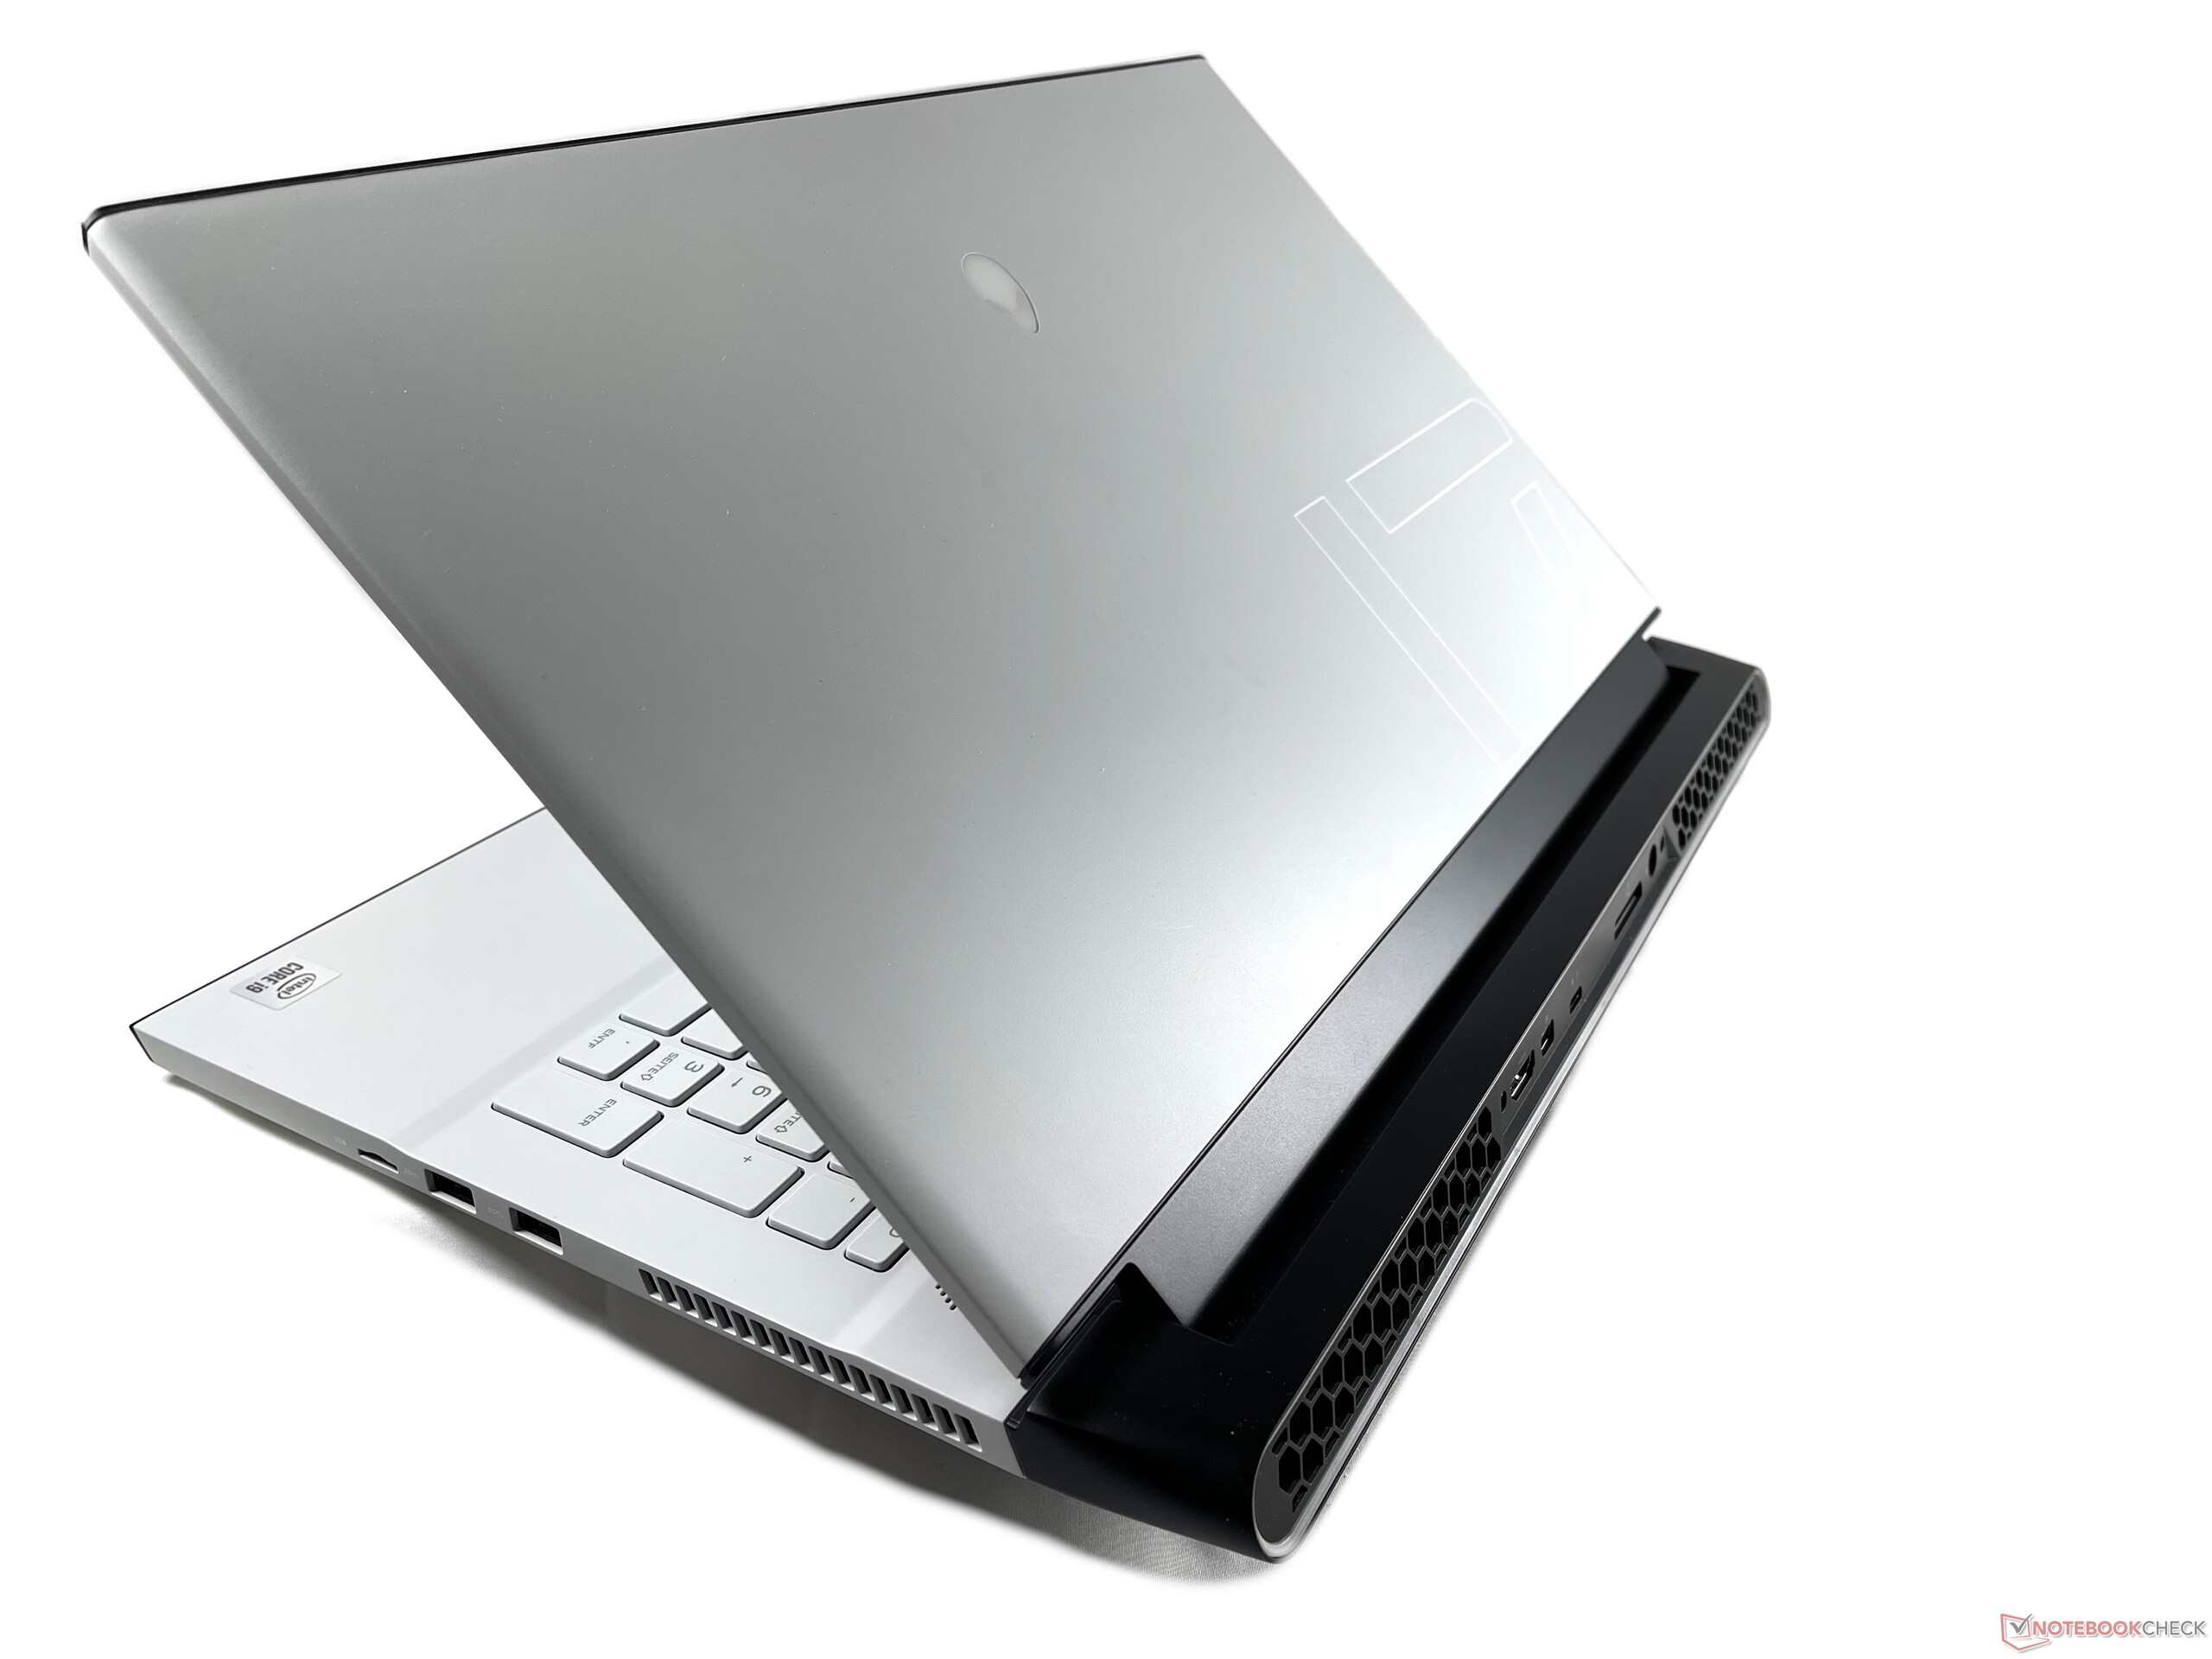
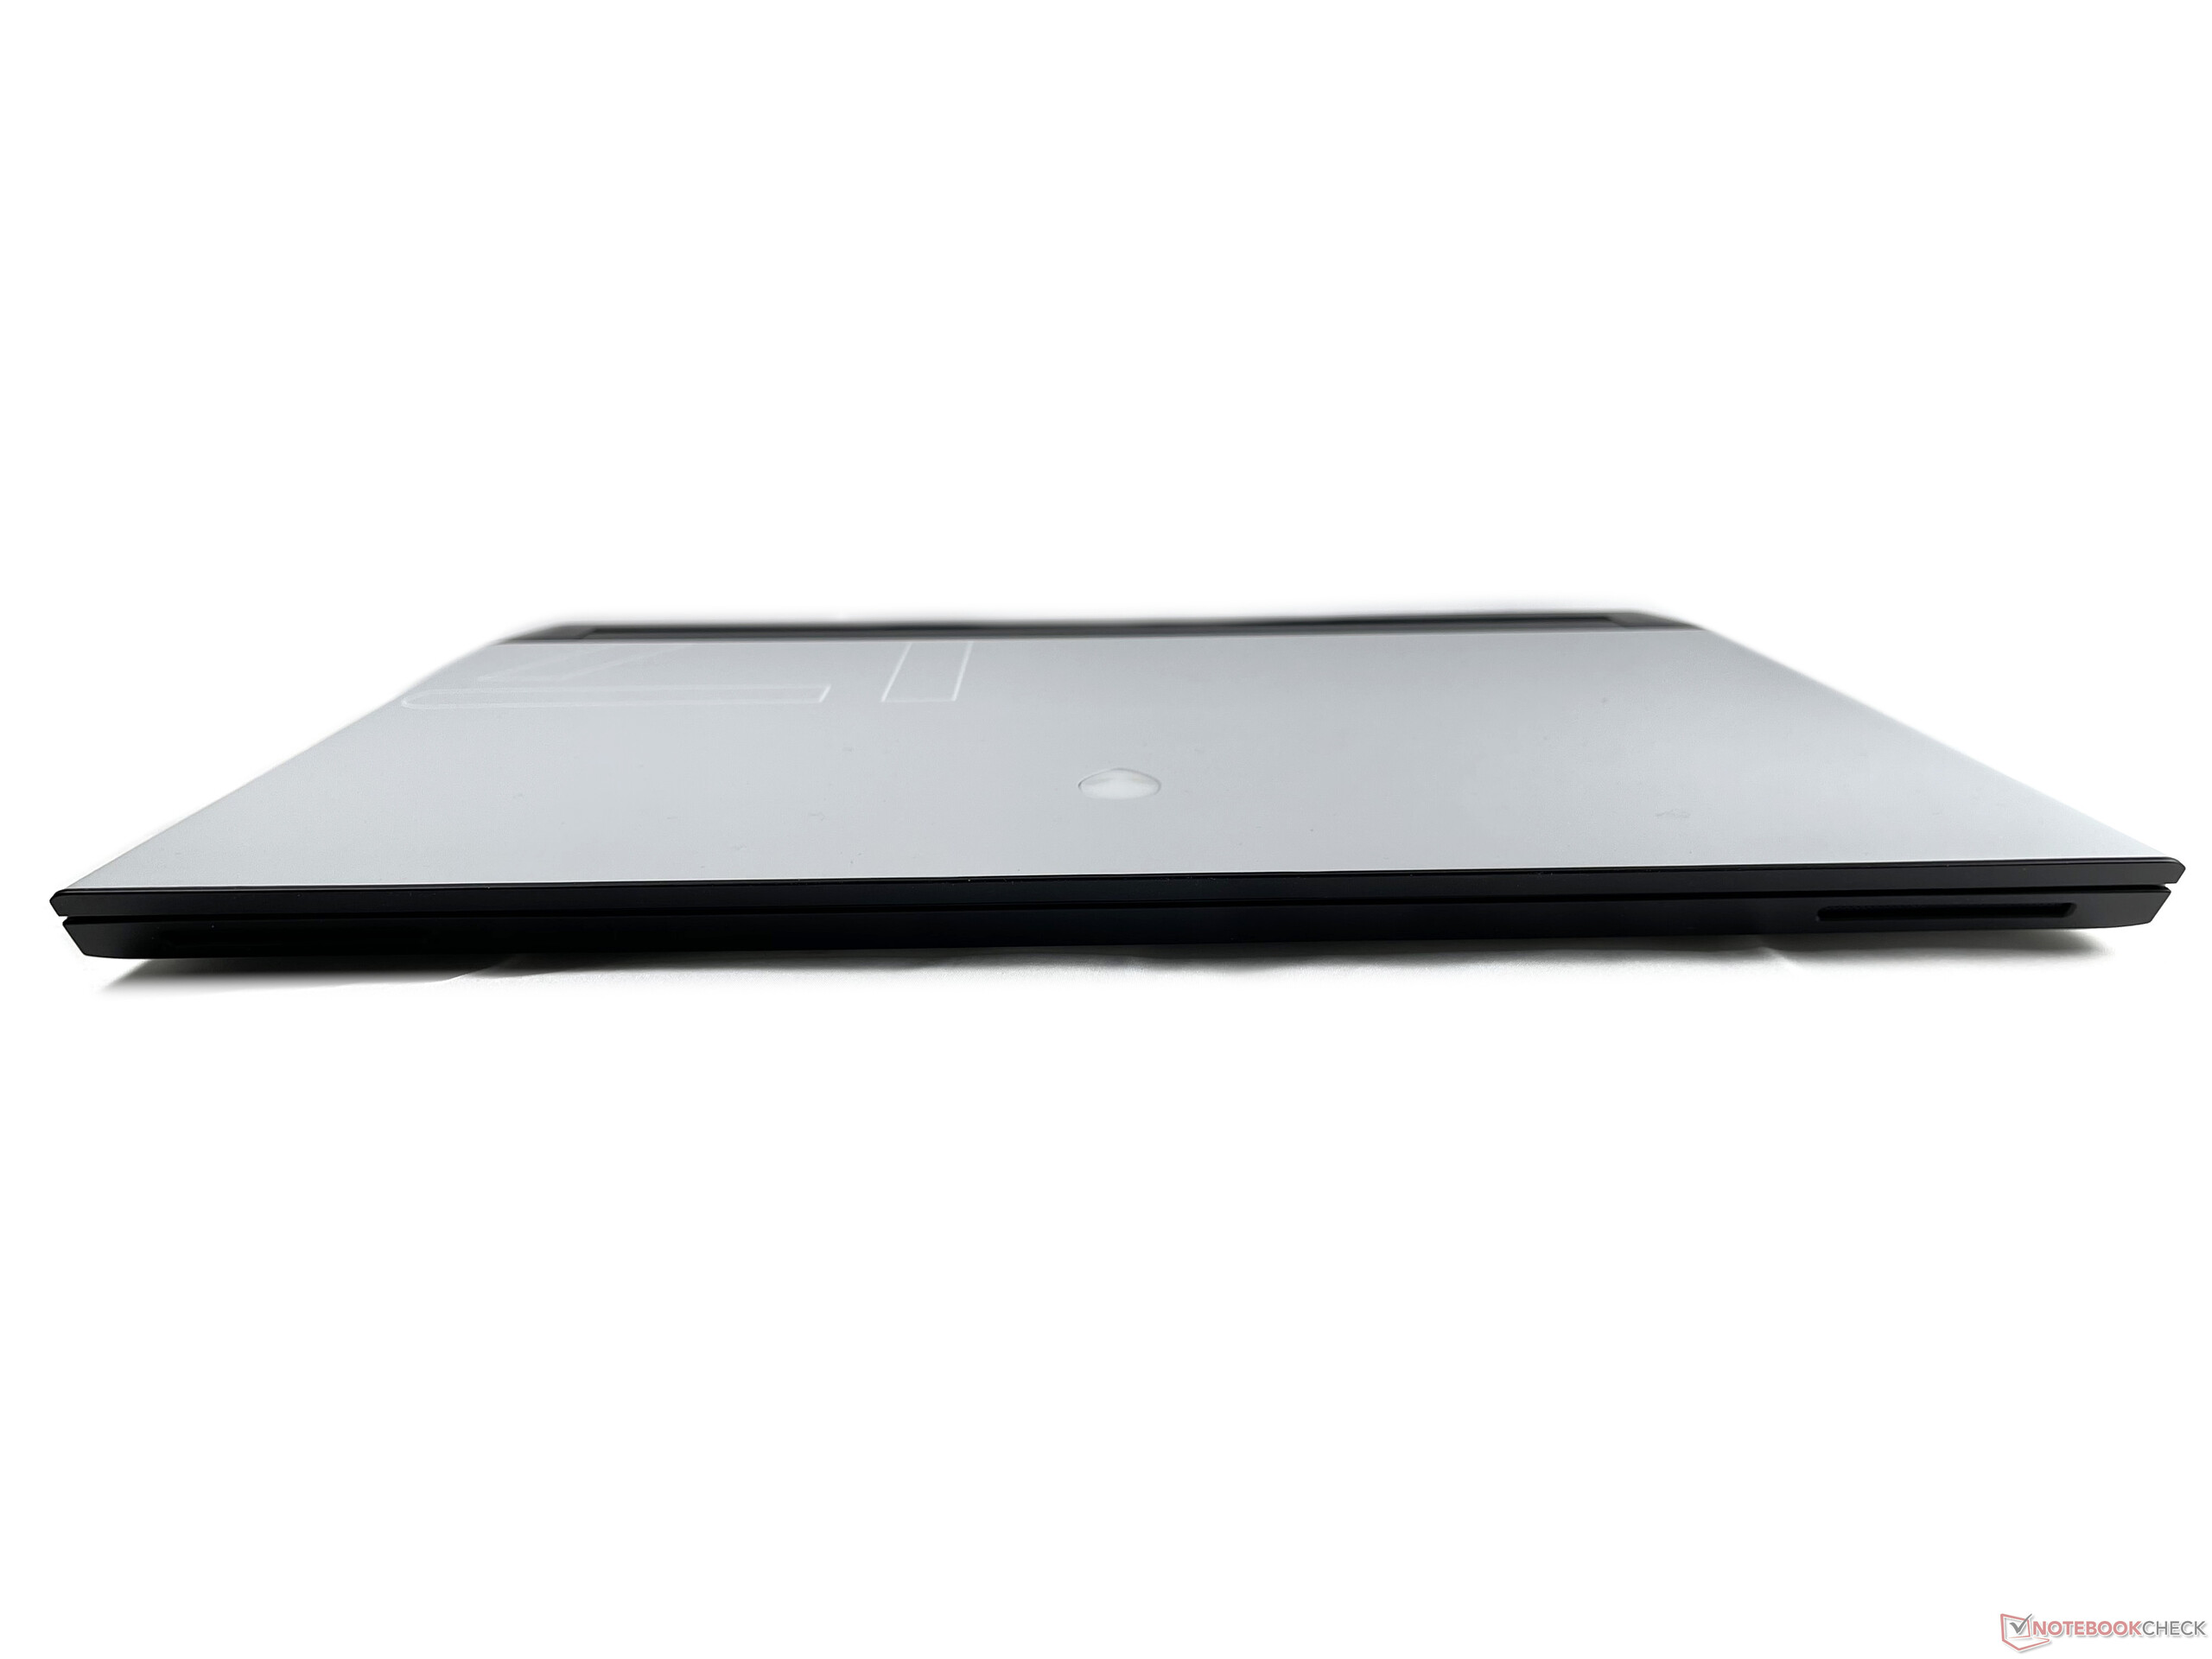
Como as dimensões e o peso do Alienware m17 R4 são praticamente os mesmos do m17 R3, o novo modelo é também um dos grandes e pesados concorrentes da classe de 17 polegadas. Em troca, é um pouco mais fino que o Schenker XMG Neo 17 e oMSI GE76 Raider UH
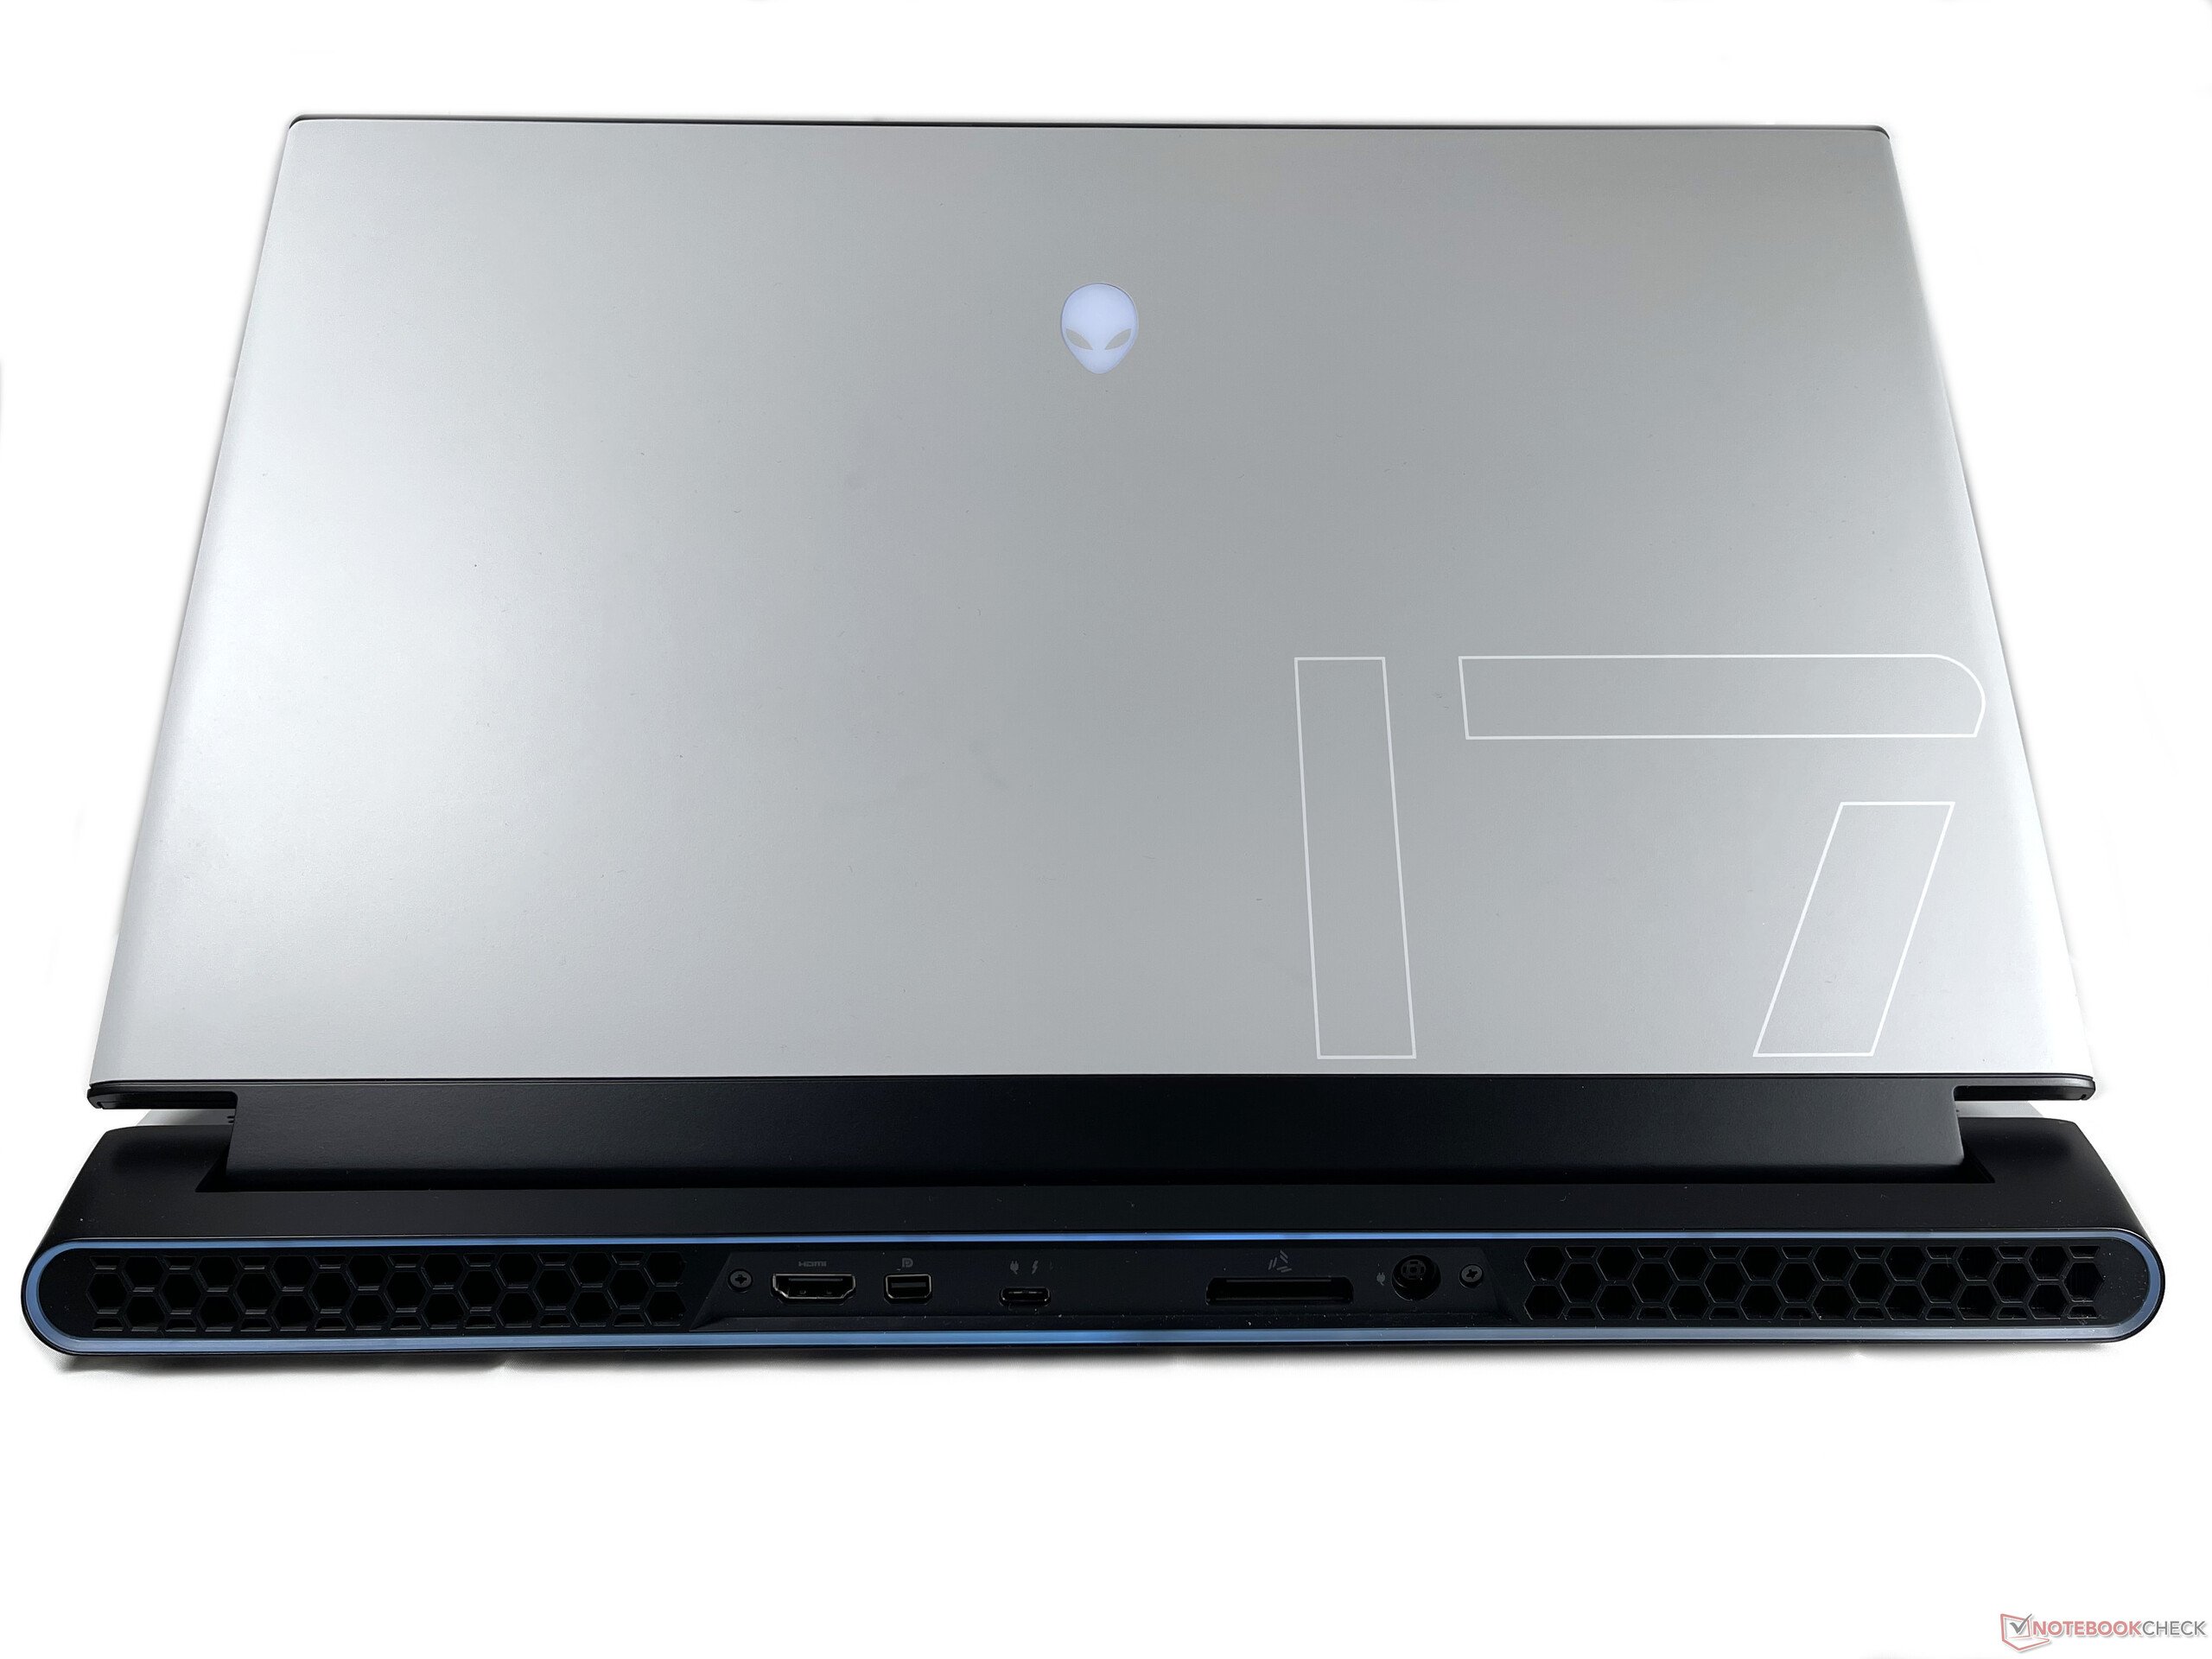
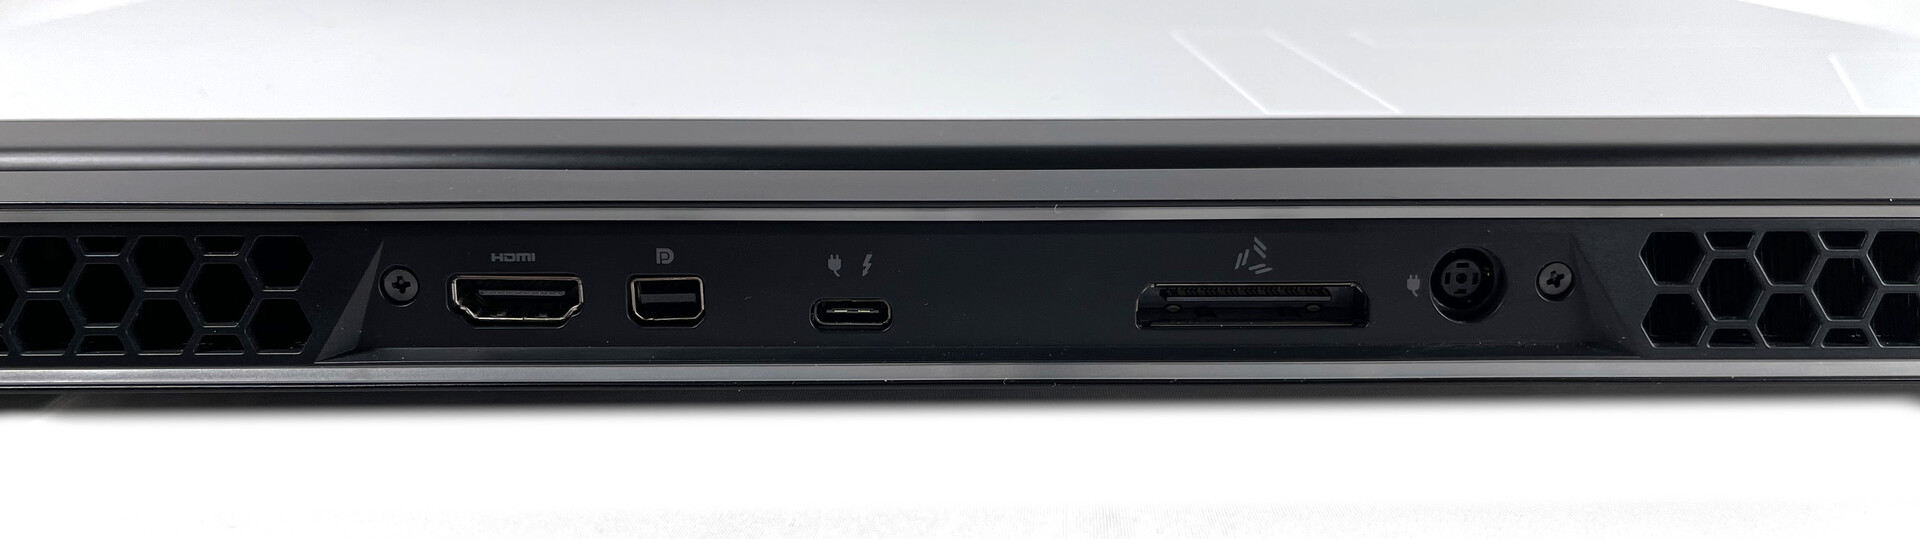
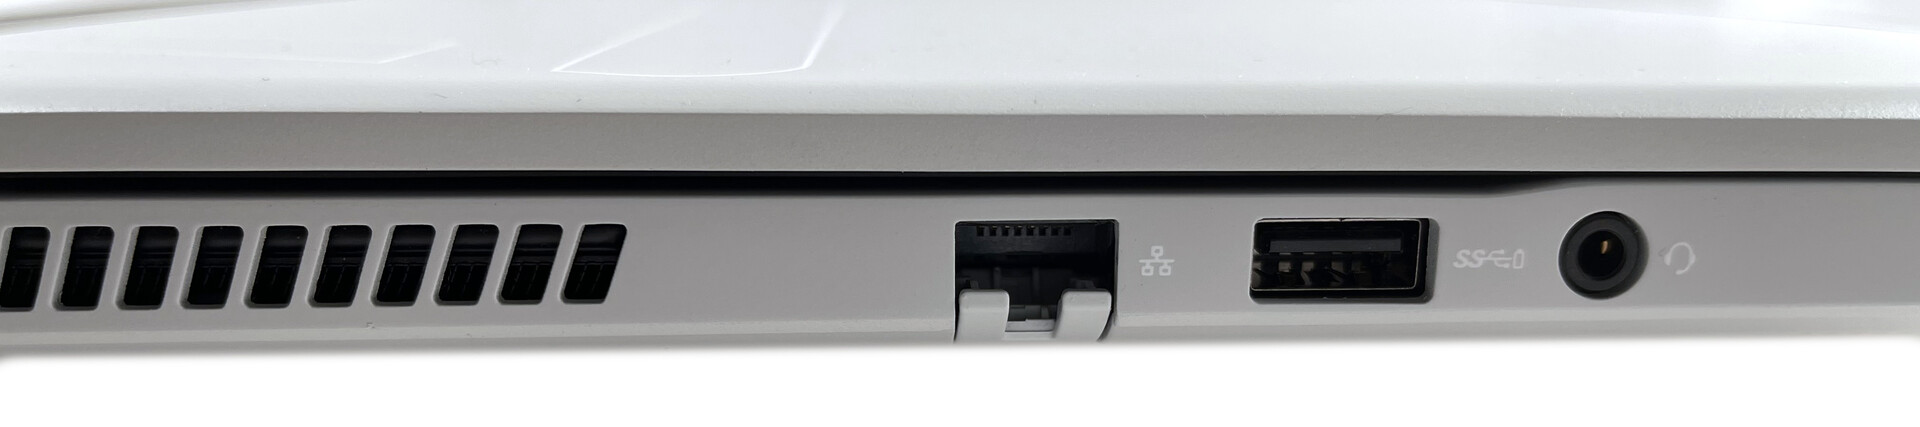
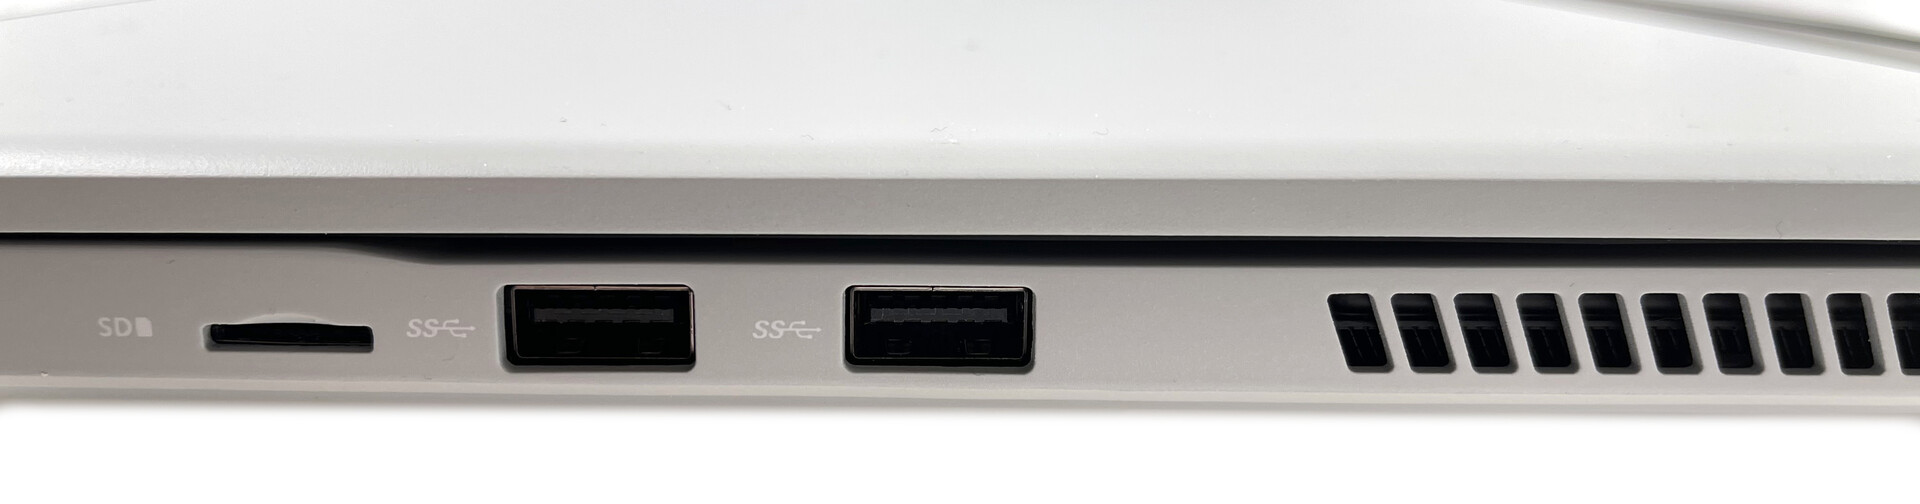
Conectividade - Thunderbolt 3 e 2.5 Gb/s LAN
| SD Card Reader | |
| average JPG Copy Test (av. of 3 runs) | |
| Alienware m17 R3 P45E (Toshiba Exceria Pro M501 UHS-II) | |
| Razer Blade Pro 17 2021 (QHD Touch) (Toshiba Exceria Pro SDXC 64 GB UHS-II) | |
| Gigabyte Aero 17 HDR YC (Toshiba Exceria Pro SDXC 64 GB UHS-II) | |
| MSI GE76 Raider 10UH (Toshiba Exceria Pro SDXC 64 GB UHS-II) | |
| Alienware m17 R4 (AV PRO microSD 128 GB V60) | |
| Média da turma Gaming (20.9 - 210, n=54, últimos 2 anos) | |
| Schenker XMG Neo 17 (Early 2021, RTX 3070, 5800H) (Toshiba Exceria Pro SDXC 64 GB UHS-II) | |
| maximum AS SSD Seq Read Test (1GB) | |
| Alienware m17 R4 (AV PRO microSD 128 GB V60) | |
| Alienware m17 R3 P45E (Toshiba Exceria Pro M501 UHS-II) | |
| Gigabyte Aero 17 HDR YC (Toshiba Exceria Pro SDXC 64 GB UHS-II) | |
| MSI GE76 Raider 10UH (Toshiba Exceria Pro SDXC 64 GB UHS-II) | |
| Razer Blade Pro 17 2021 (QHD Touch) (Toshiba Exceria Pro SDXC 64 GB UHS-II) | |
| Média da turma Gaming (25.5 - 261, n=51, últimos 2 anos) | |
| Schenker XMG Neo 17 (Early 2021, RTX 3070, 5800H) (Toshiba Exceria Pro SDXC 64 GB UHS-II) | |
Comunicação
O módulo Killer AX1650 WLAN baseado em Intel é responsável pela conectividade sem fio e oferece Wi-Fi 6 e Bluetooth 5.1. As velocidades de transferência que medimos estão acima da média do chip WLAN e também acima das do predecessor, que também está equipado com o AX1650
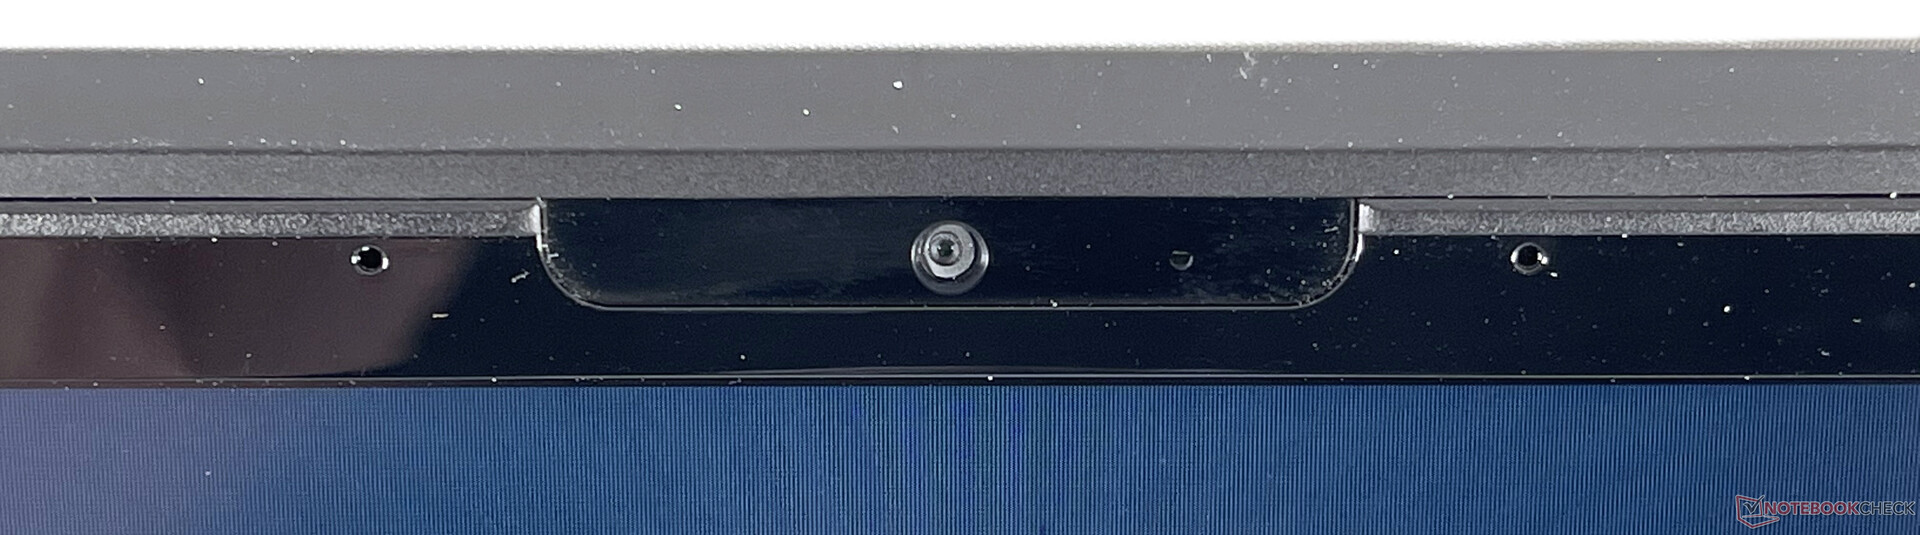
Webcam

")
")
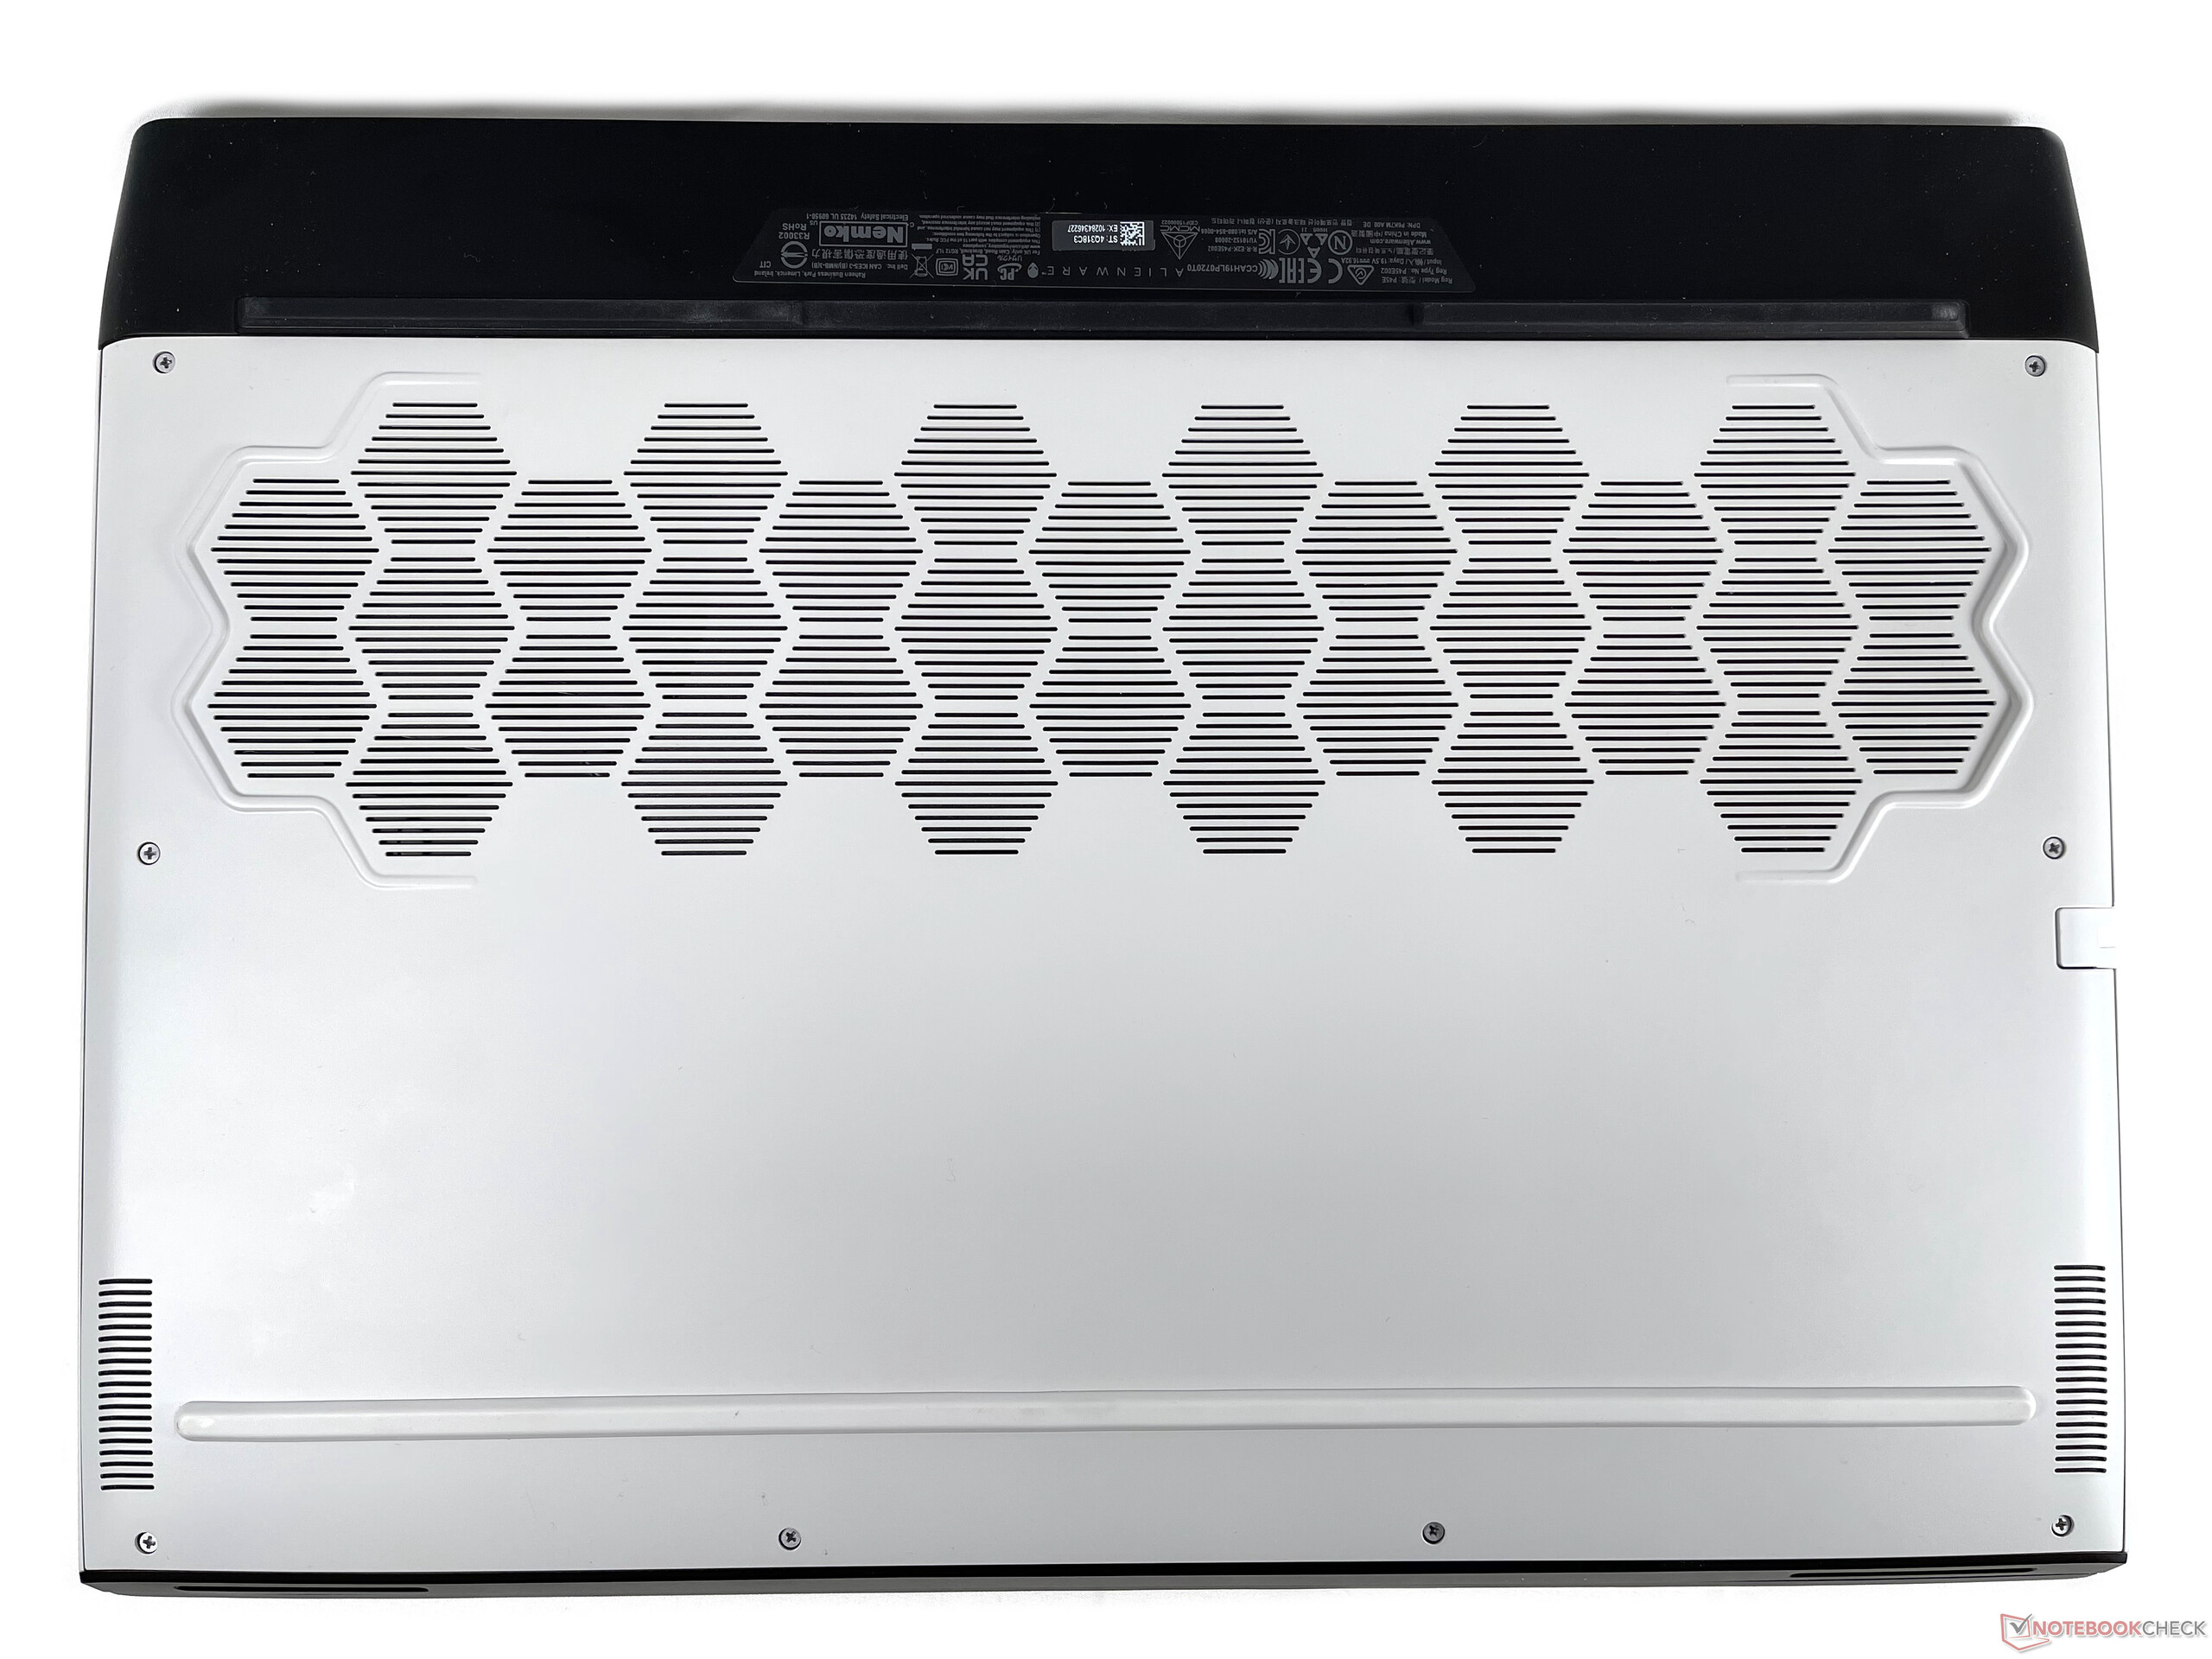
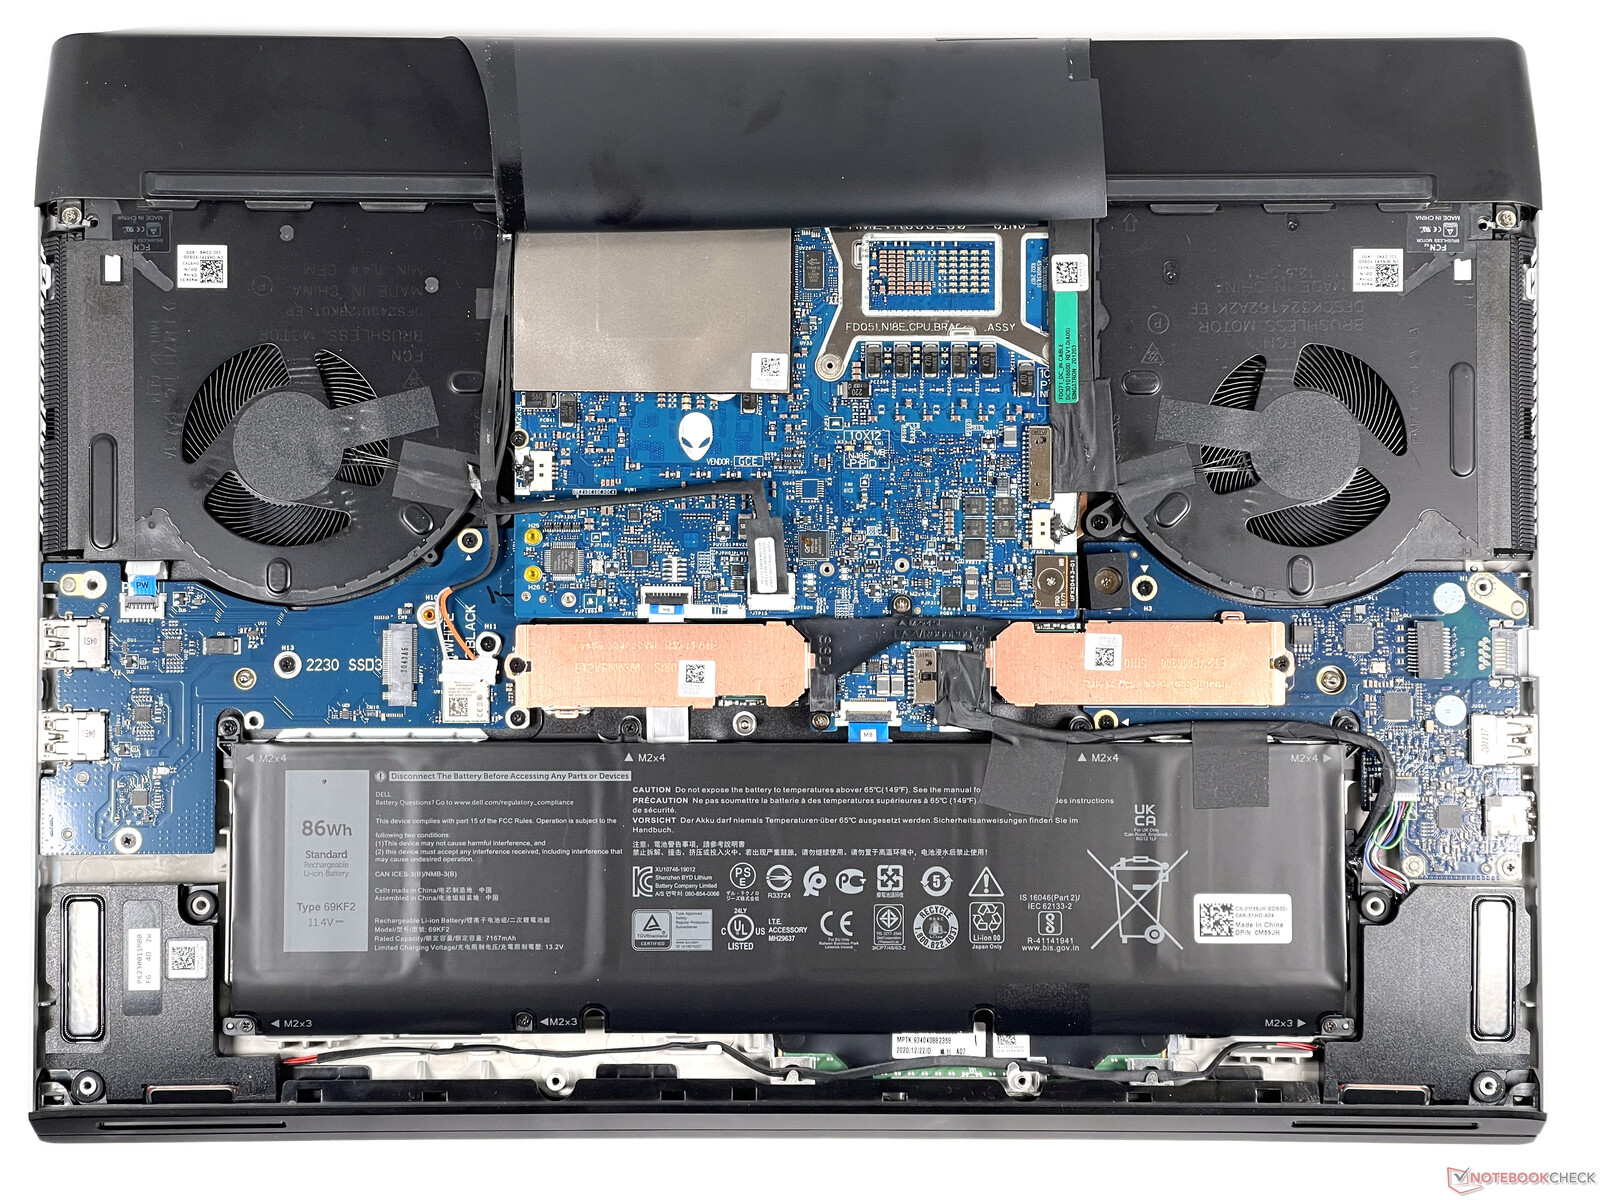
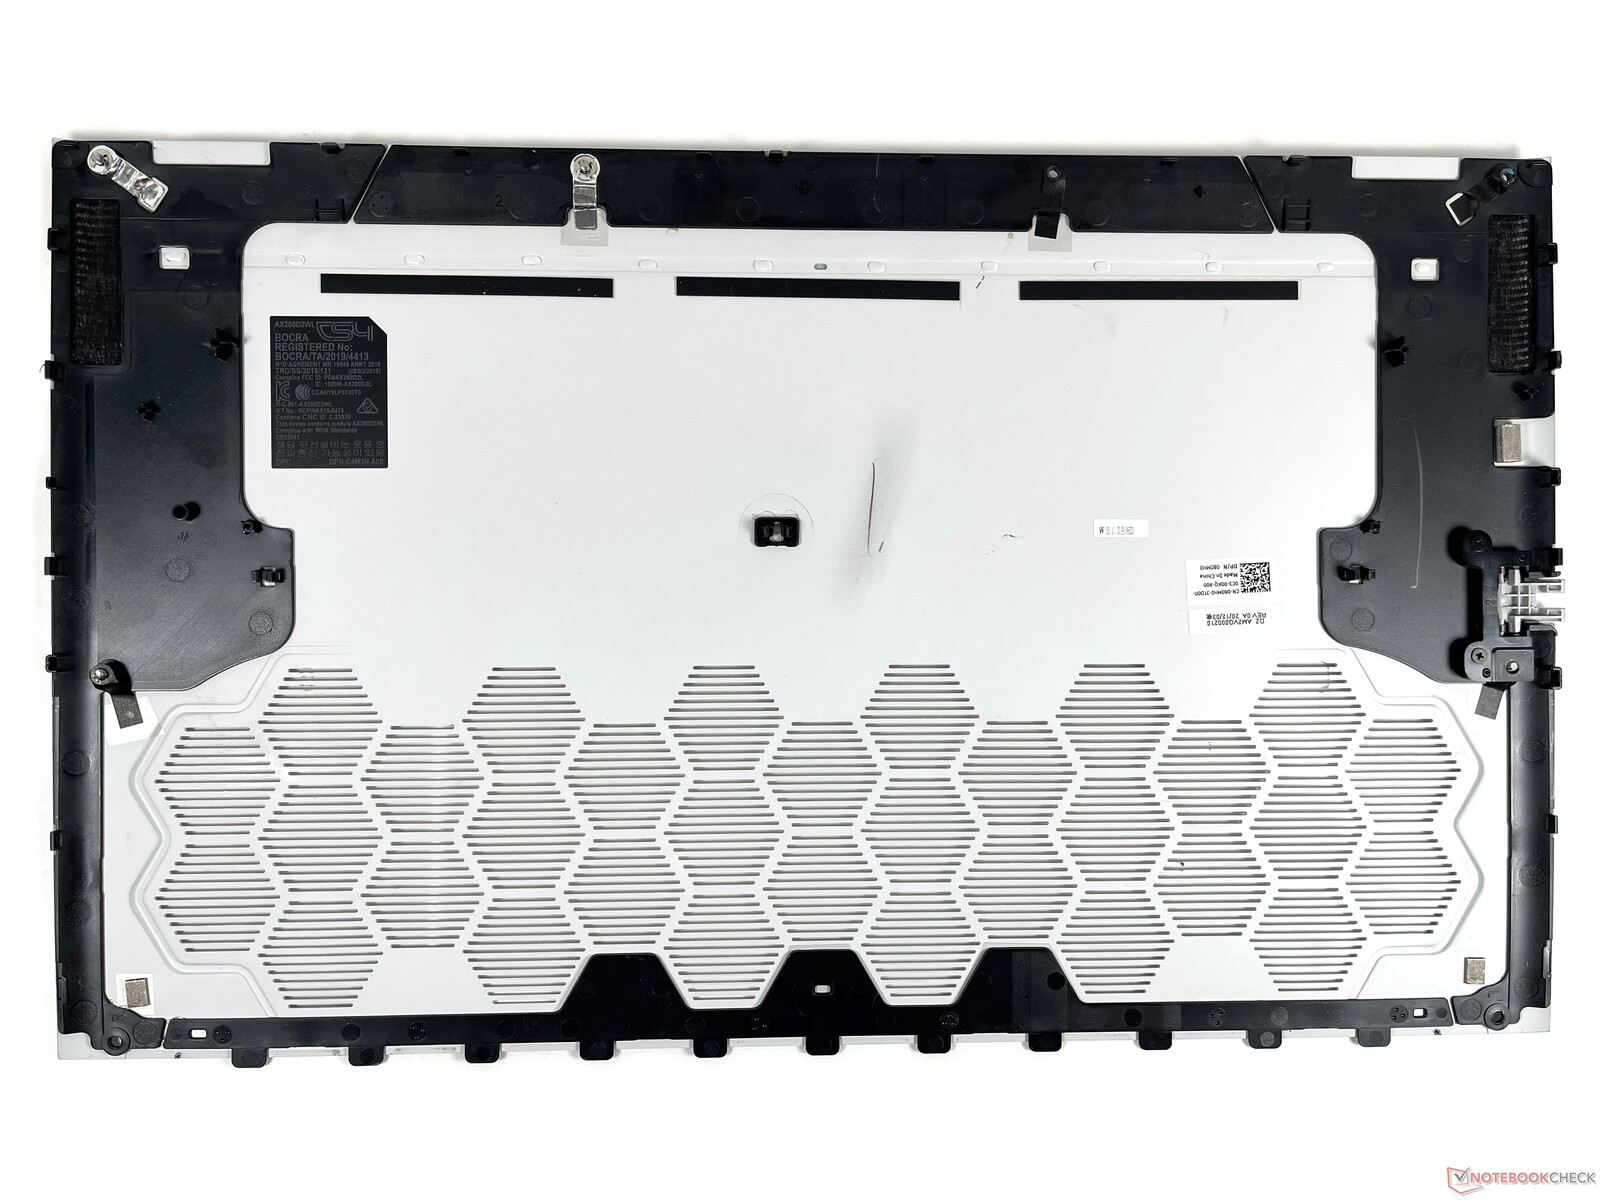
Manutenção
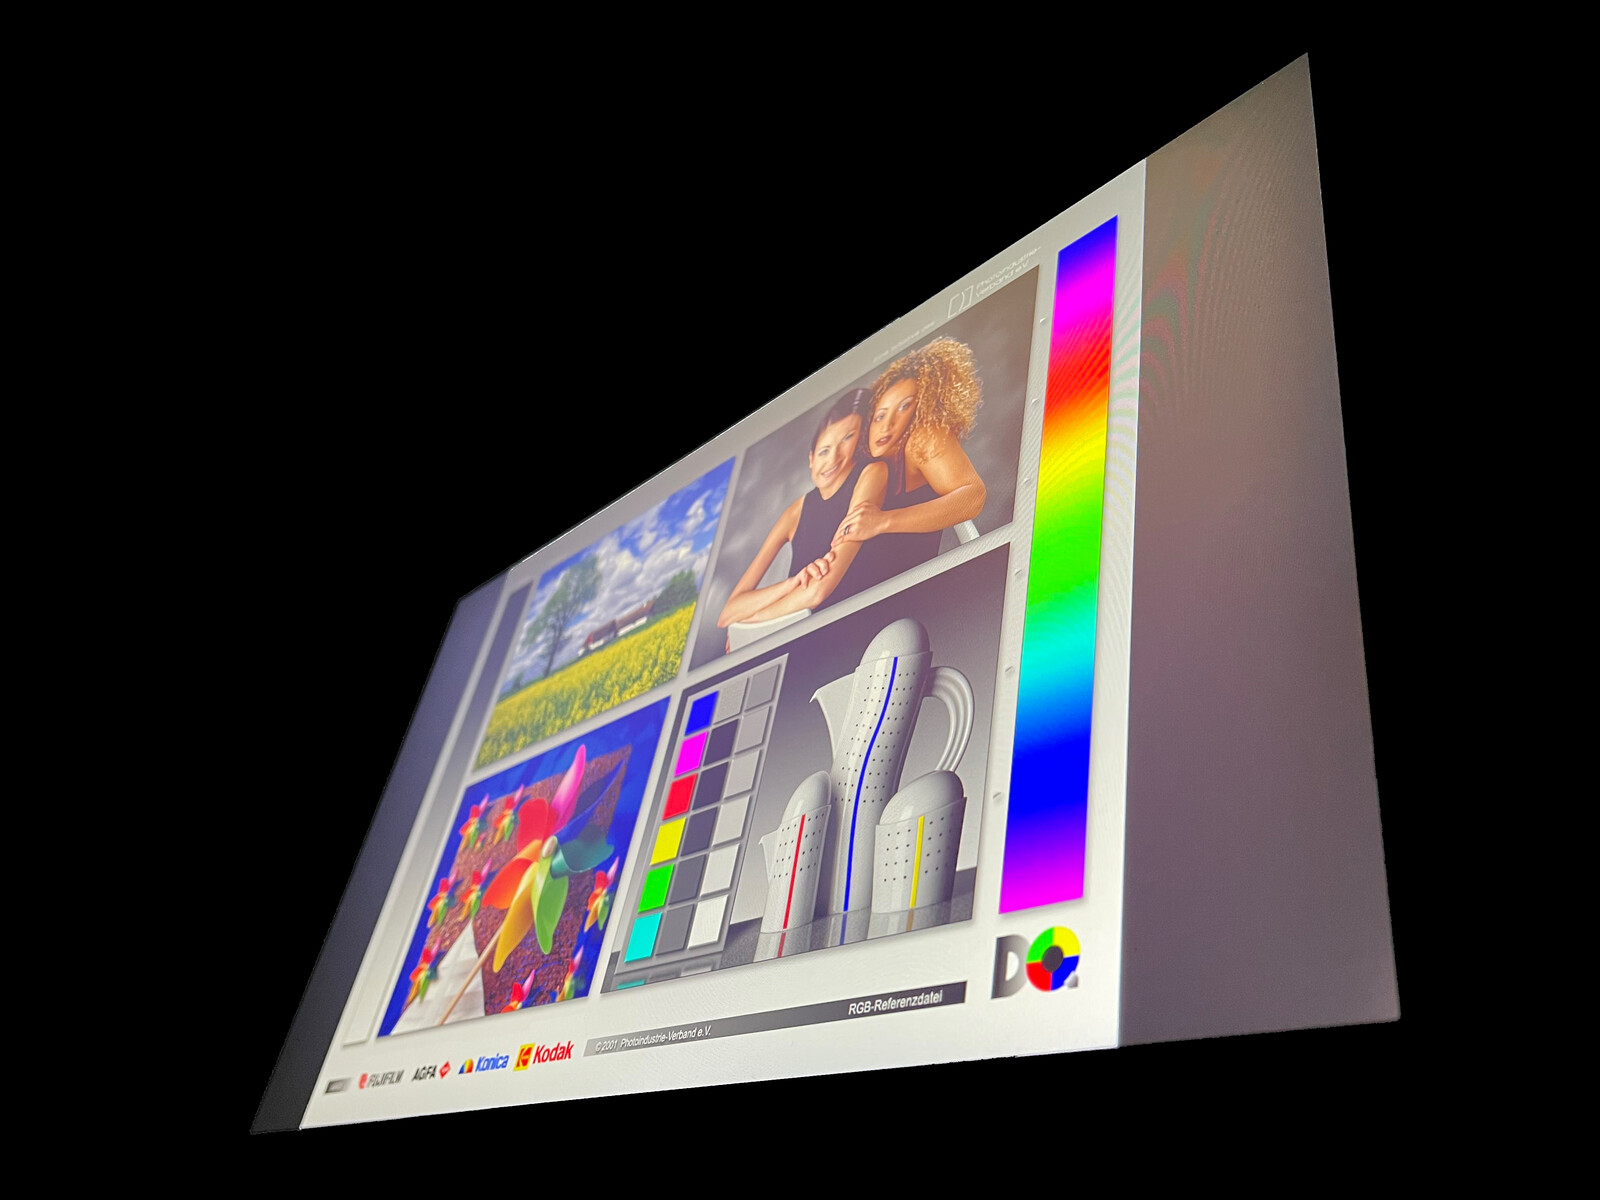
Display - Alienware m17 R4 com display 360 Hz de alto contraste
A tela IPS mate de 17,3 polegadas tem uma resolução nativa de 1920x1080 pixels (Full HD) e uma taxa de atualização de 360 Hz. O painel cobre o espaço de cor sRGB quase completamente e suporta a Nvidia G-Sync. Este último também é válido para a configuração Full HD 144 Hz disponível alternativamente, que cobre 72% do espectro de cores NTSC, de acordo com as especificações do fabricante. Uma variante 4K, onde você troca a alta taxa de atualização por maior resolução, maior brilho, 100% de cobertura do espectro de cores AdobeRGB e rastreamento Tobii eye, também está disponível, mas vem com um preço adicional elevado.
O valor especificado pelo fabricante de 300 cd/m² é alcançado pelo display em nossa medição independente, e embora a diferença seja pequena, a distribuição de brilho de 93% é a mais alta em nosso campo de comparação. Também incluímos o novoAlienware m15 R4na tabela, porque a comparação com os painéis Full HD rápidos faz mais sentido do que a comparação com os painéis 4K do Gigabyte Aero 17 YCou o Razer Blade Pro 17
| |||||||||||||||||||||||||
iluminação: 93 %
iluminação com acumulador: 305 cd/m²
Contraste: 1605:1 (Preto: 0.19 cd/m²)
ΔE ColorChecker Calman: 1.31 | ∀{0.5-29.43 Ø4.71}
calibrated: 0.91
ΔE Greyscale Calman: 2.3 | ∀{0.09-98 Ø4.96}
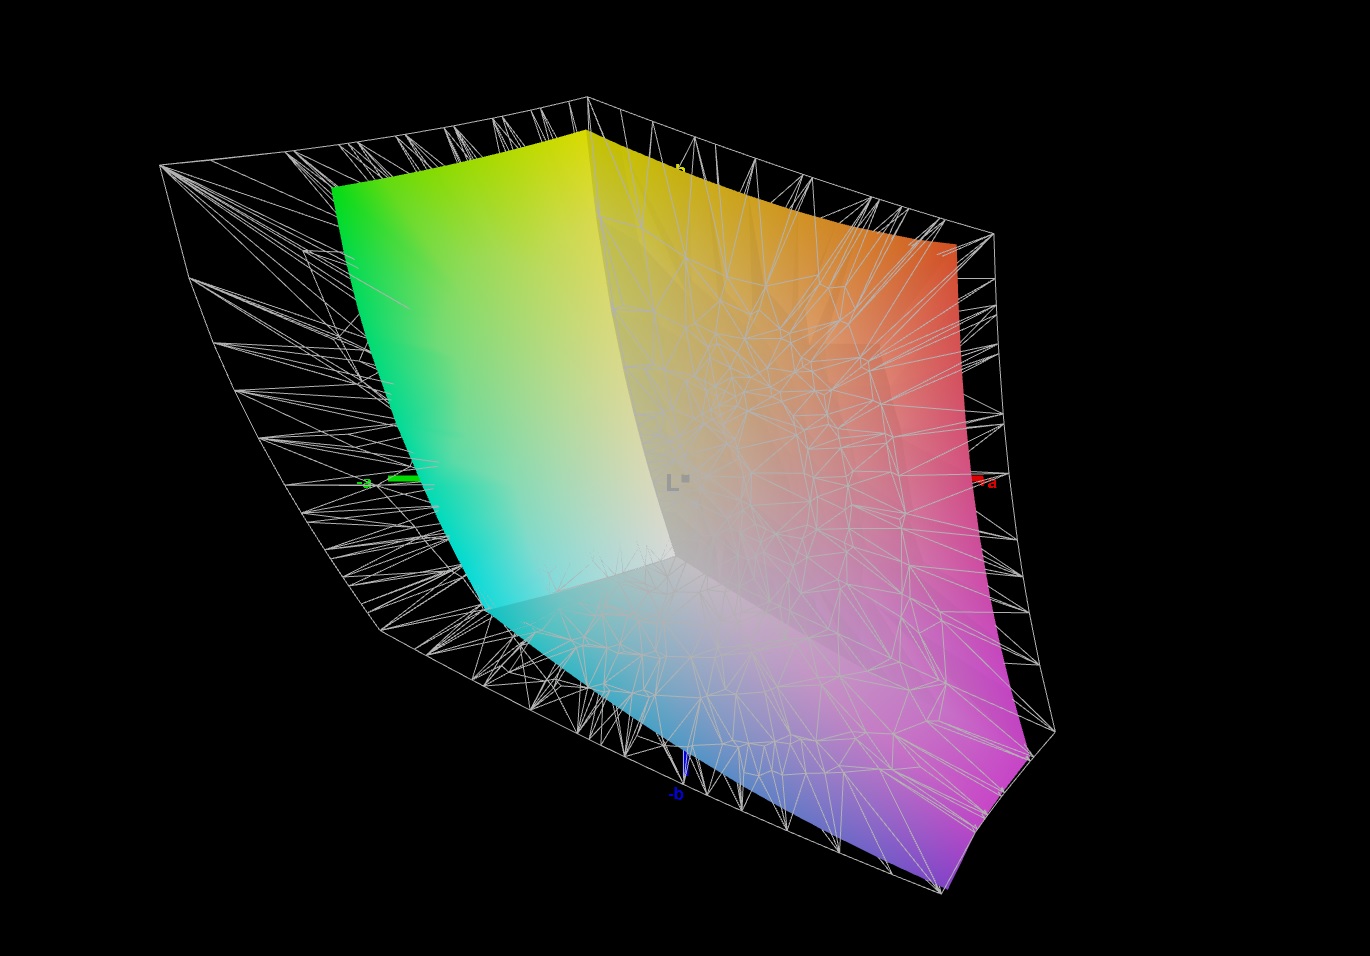
94% sRGB (Argyll 1.6.3 3D)
72% AdobeRGB 1998 (Argyll 1.6.3 3D)
71.6% AdobeRGB 1998 (Argyll 3D)
99.7% sRGB (Argyll 3D)
69.8% Display P3 (Argyll 3D)
Gamma: 2.281
CCT: 6449 K
| Alienware m17 R4 AU Optronics AUOEC91, IPS, 1920x1080, 17.3" | MSI GE76 Raider 10UH AU Optronics B173HAN05.1, IPS, 1920x1080, 17.3" | Schenker XMG Neo 17 (Early 2021, RTX 3070, 5800H) BOE NE173QHM-NY2 (BOE0977), IPS, 2560x1440, 17.3" | Alienware m17 R3 P45E AU Optronics B173HAN, IPS, 1920x1080, 17.3" | Alienware m15 R4 LG Philips LGD066E, IPS, 1920x1080, 15.6" | |
|---|---|---|---|---|---|
| Display | 1% | 0% | -1% | -1% | |
| Display P3 Coverage (%) | 69.8 | 71.8 3% | 70.5 1% | 69.2 -1% | 69.4 -1% |
| sRGB Coverage (%) | 99.7 | 98.1 -2% | 99.5 0% | 97.9 -2% | 99 -1% |
| AdobeRGB 1998 Coverage (%) | 71.6 | 73.9 3% | 71.8 0% | 71.4 0% | 70.5 -2% |
| Response Times | -32% | -18% | -40% | 18% | |
| Response Time Grey 50% / Grey 80% * (ms) | 13.2 ? | 20.4 ? -55% | 16.8 ? -27% | 16.8 ? -27% | 7.4 ? 44% |
| Response Time Black / White * (ms) | 9.2 ? | 10 ? -9% | 10 ? -9% | 14 ? -52% | 10 ? -9% |
| PWM Frequency (Hz) | 151500 | ||||
| Screen | -74% | -31% | -17% | -20% | |
| Brightness middle (cd/m²) | 305 | 324.6 6% | 410 34% | 338.3 11% | 333 9% |
| Brightness (cd/m²) | 301 | 312 4% | 381 27% | 325 8% | 303 1% |
| Brightness Distribution (%) | 93 | 87 -6% | 88 -5% | 91 -2% | 86 -8% |
| Black Level * (cd/m²) | 0.19 | 0.28 -47% | 0.37 -95% | 0.27 -42% | 0.29 -53% |
| Contrast (:1) | 1605 | 1159 -28% | 1108 -31% | 1253 -22% | 1148 -28% |
| Colorchecker dE 2000 * | 1.31 | 3.87 -195% | 2.55 -95% | 1.88 -44% | 1.8 -37% |
| Colorchecker dE 2000 max. * | 2.32 | 9.35 -303% | 4.33 -87% | 3.23 -39% | 4.49 -94% |
| Colorchecker dE 2000 calibrated * | 0.91 | 1.42 -56% | 1.28 -41% | 1.32 -45% | 1.13 -24% |
| Greyscale dE 2000 * | 2.3 | 6.5 -183% | 3.4 -48% | 2.4 -4% | 1.9 17% |
| Gamma | 2.281 96% | 2.23 99% | 2.275 97% | 2.39 92% | 2.265 97% |
| CCT | 6449 101% | 5702 114% | 6637 98% | 6572 99% | 6840 95% |
| Color Space (Percent of AdobeRGB 1998) (%) | 72 | 66.3 -8% | 72 0% | 64.7 -10% | 71 -1% |
| Color Space (Percent of sRGB) (%) | 94 | 98 4% | 95 1% | 97.8 4% | 93 -1% |
| Média Total (Programa/Configurações) | -35% /
-55% | -16% /
-23% | -19% /
-17% | -1% /
-12% |
* ... menor é melhor
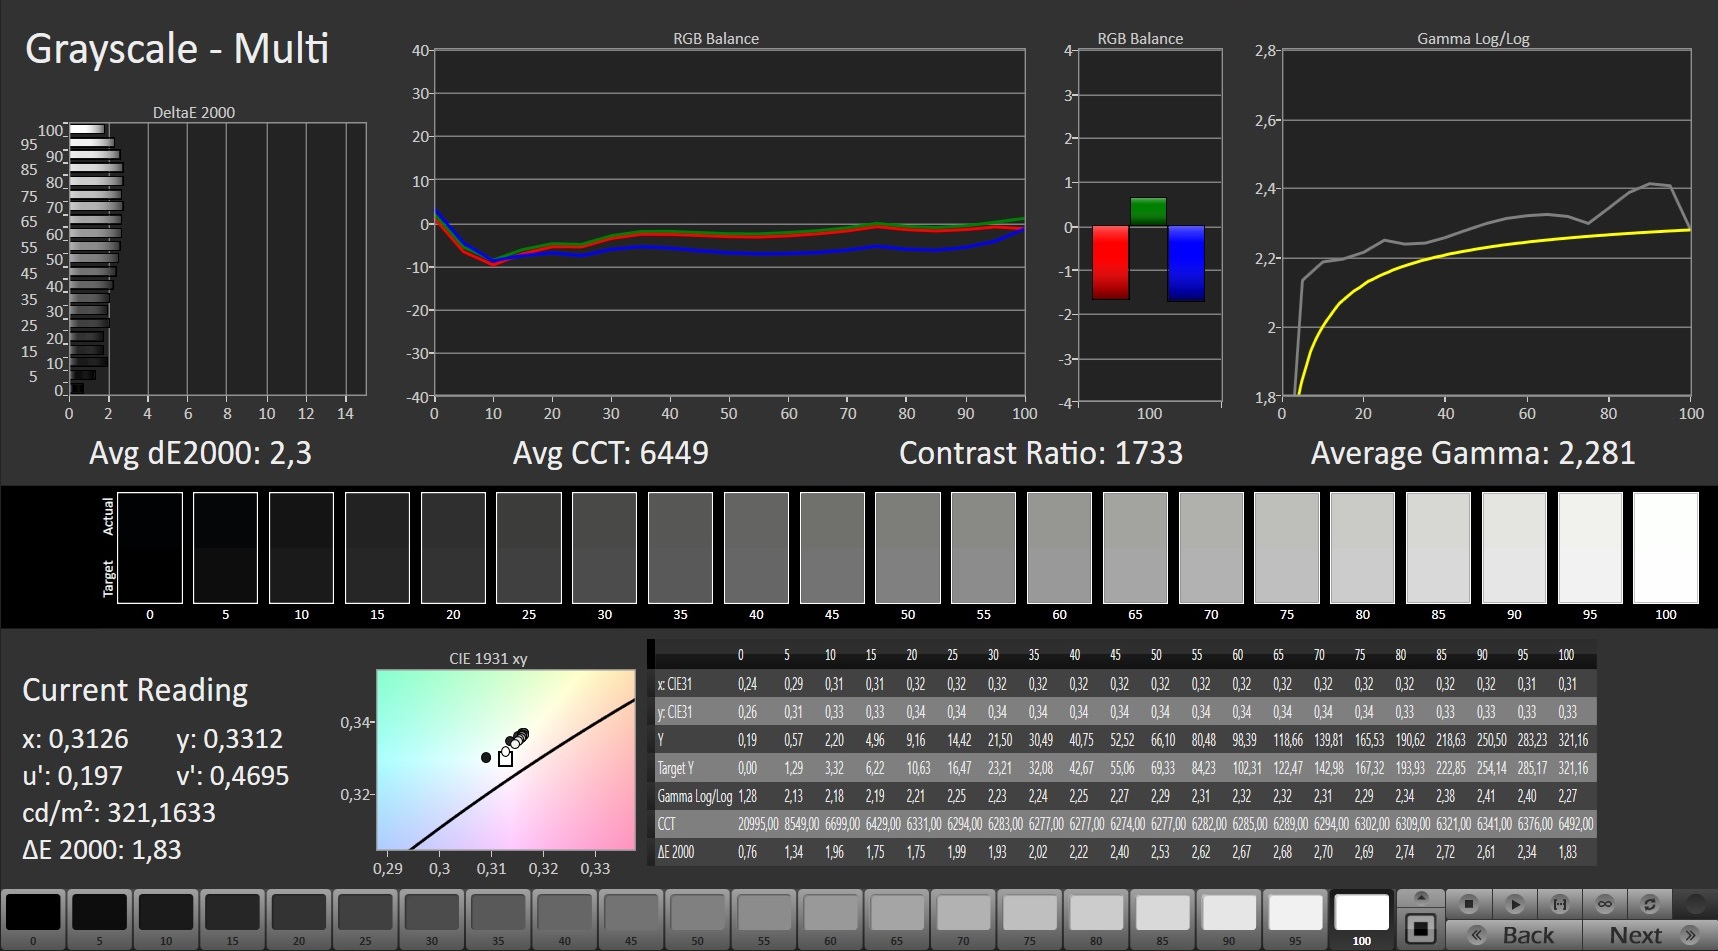
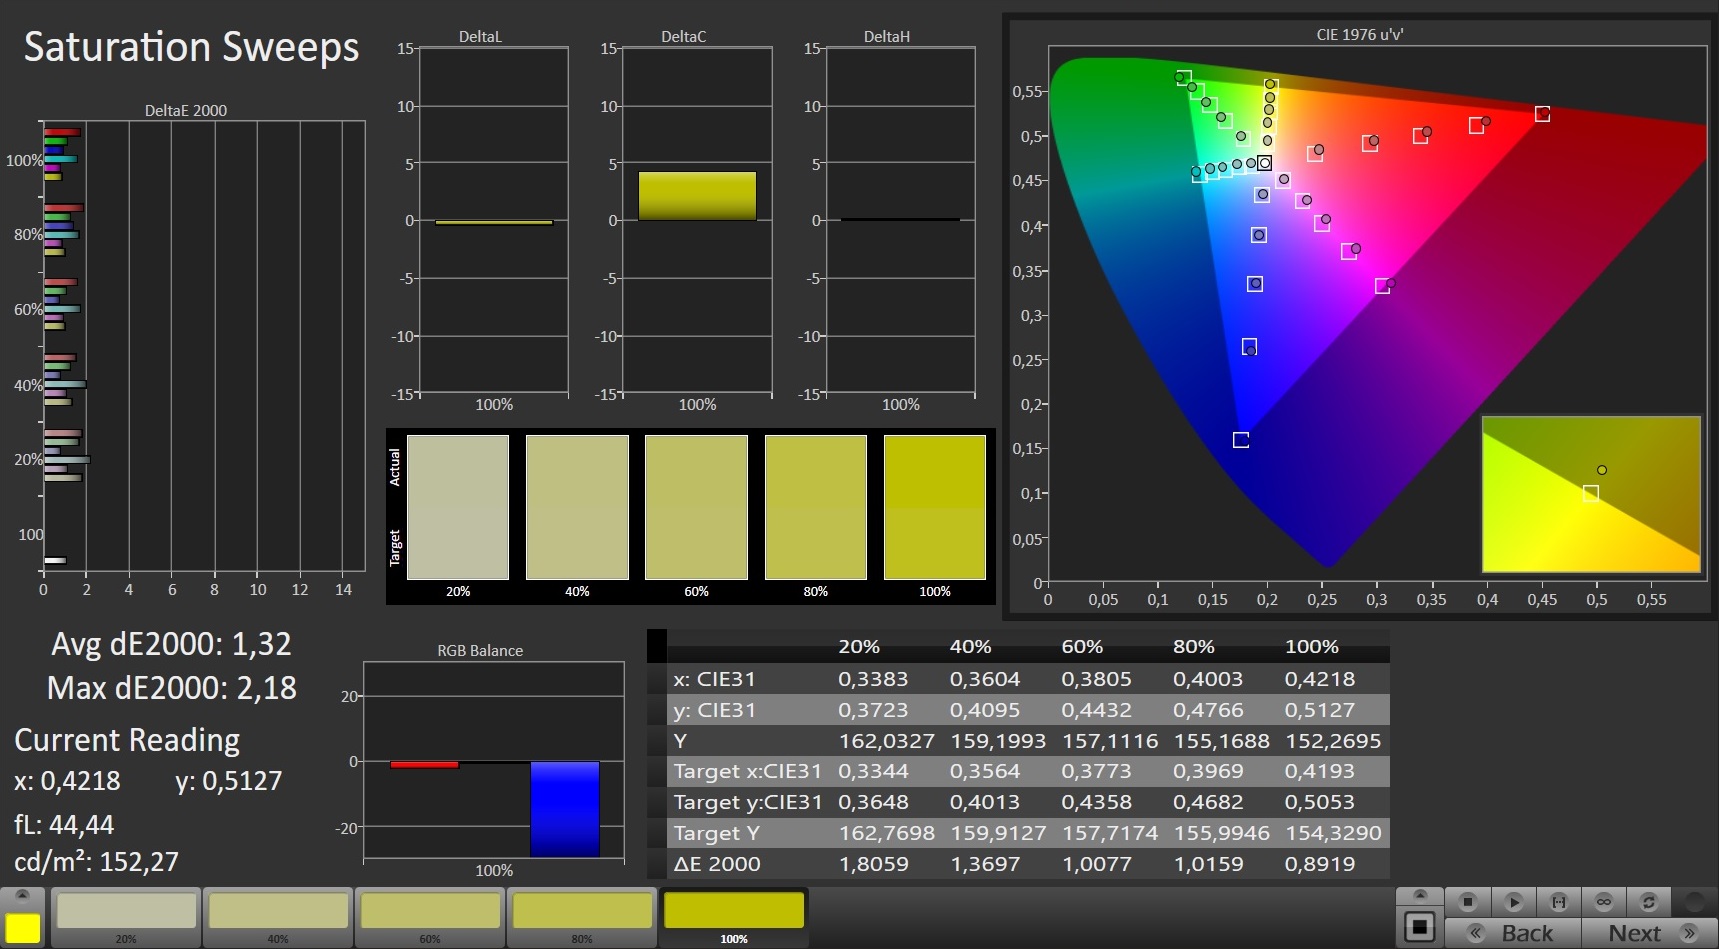
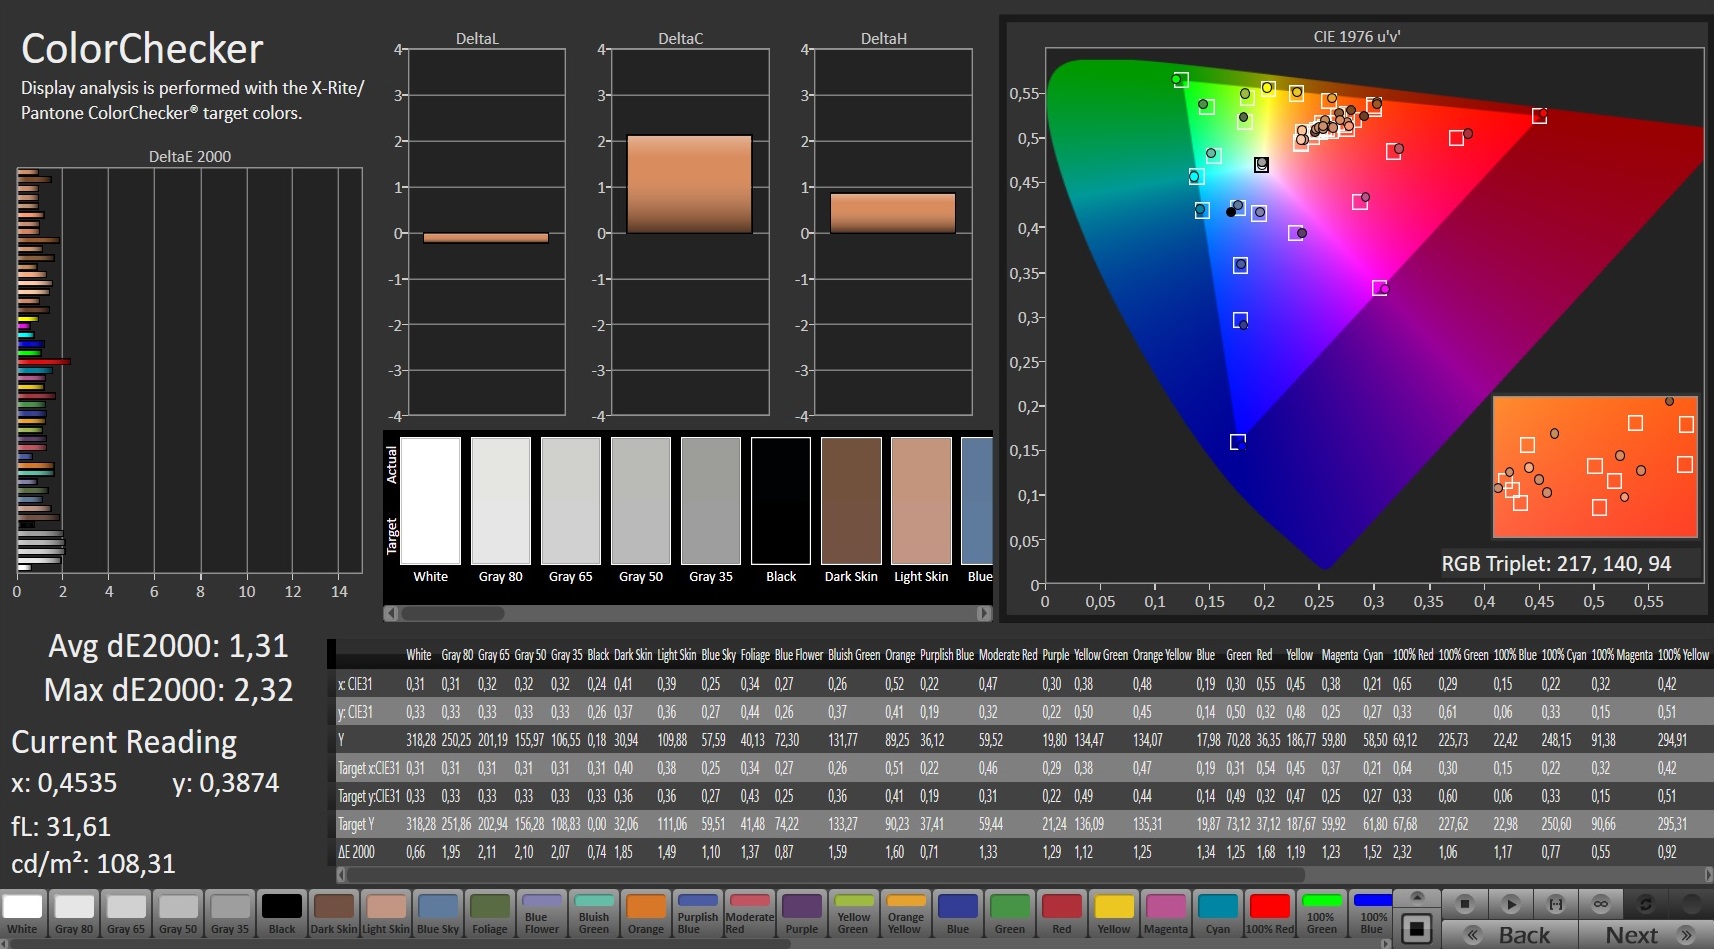
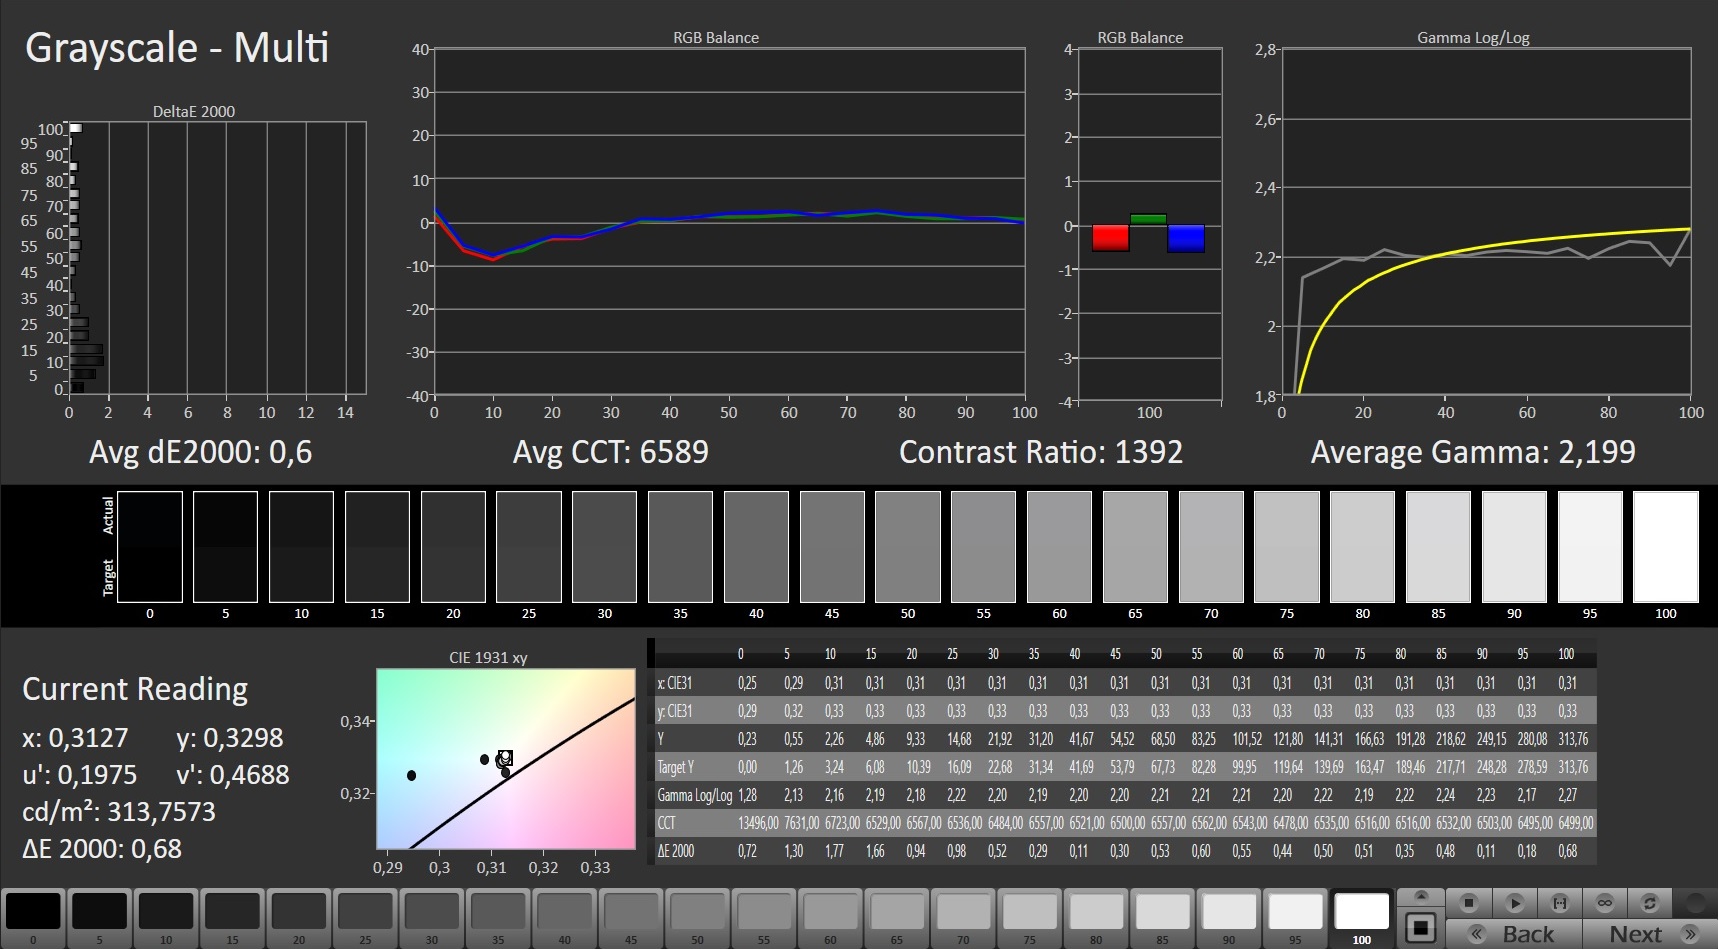
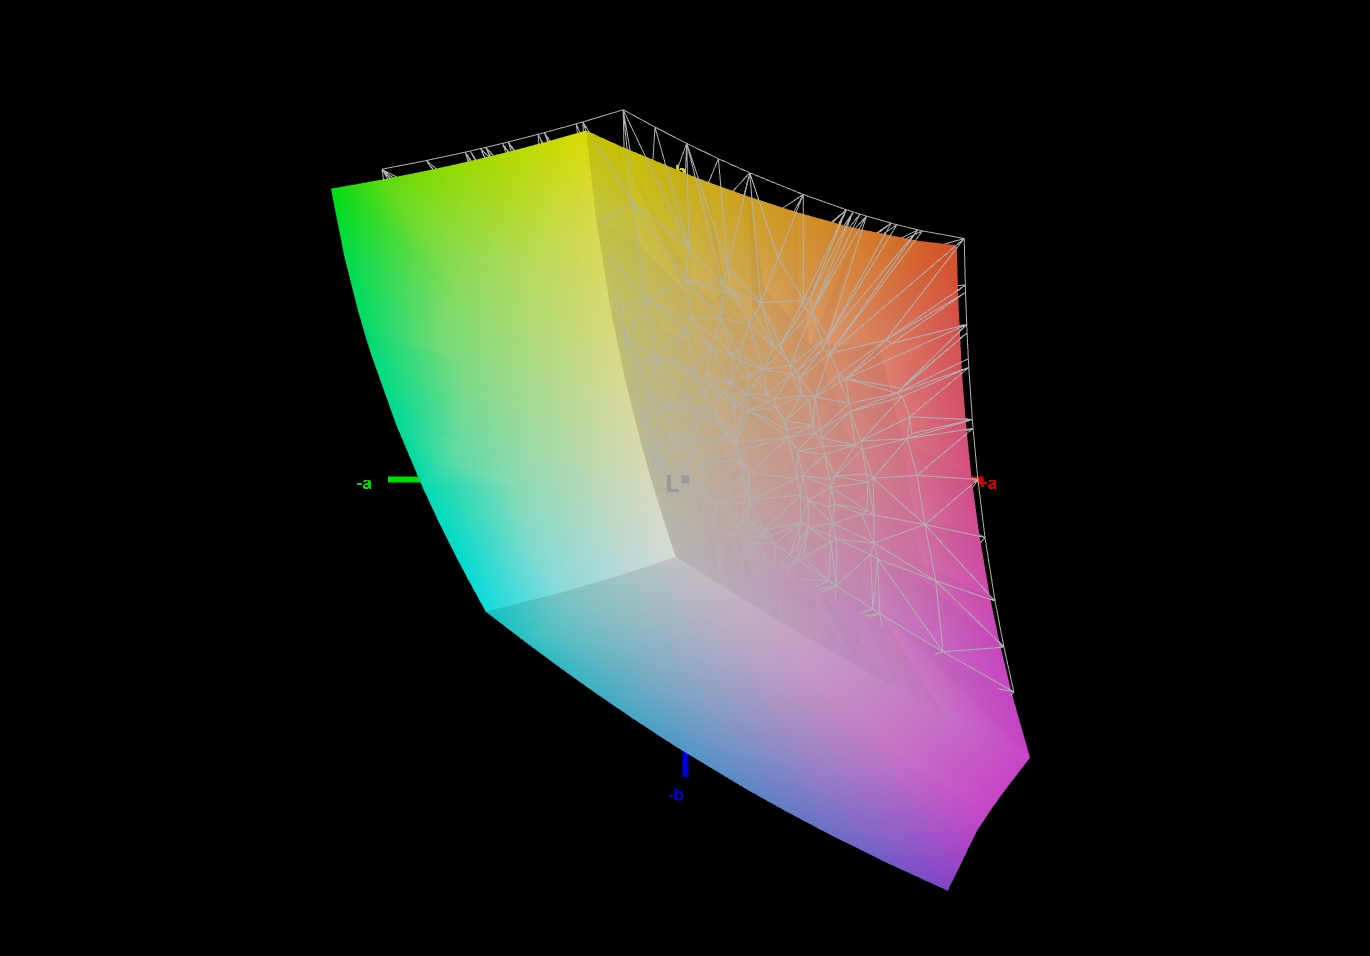
Graças ao nível muito bom de preto de apenas 0,19, o contraste de 1.605:1 é cerca de 30% maior do que nos dispositivos de comparação. O desvio de cor Delta E e os valores de escala de cinza de 1,31 e 2,3 respectivamente são excelentes mesmo antes da calibração, e também estão na faixa ideal (Delta E < 3). De acordo com nossa medição independente, o visor cobre 94% e 72% dos espaços de cor sRGB e AdobeRGB, respectivamente


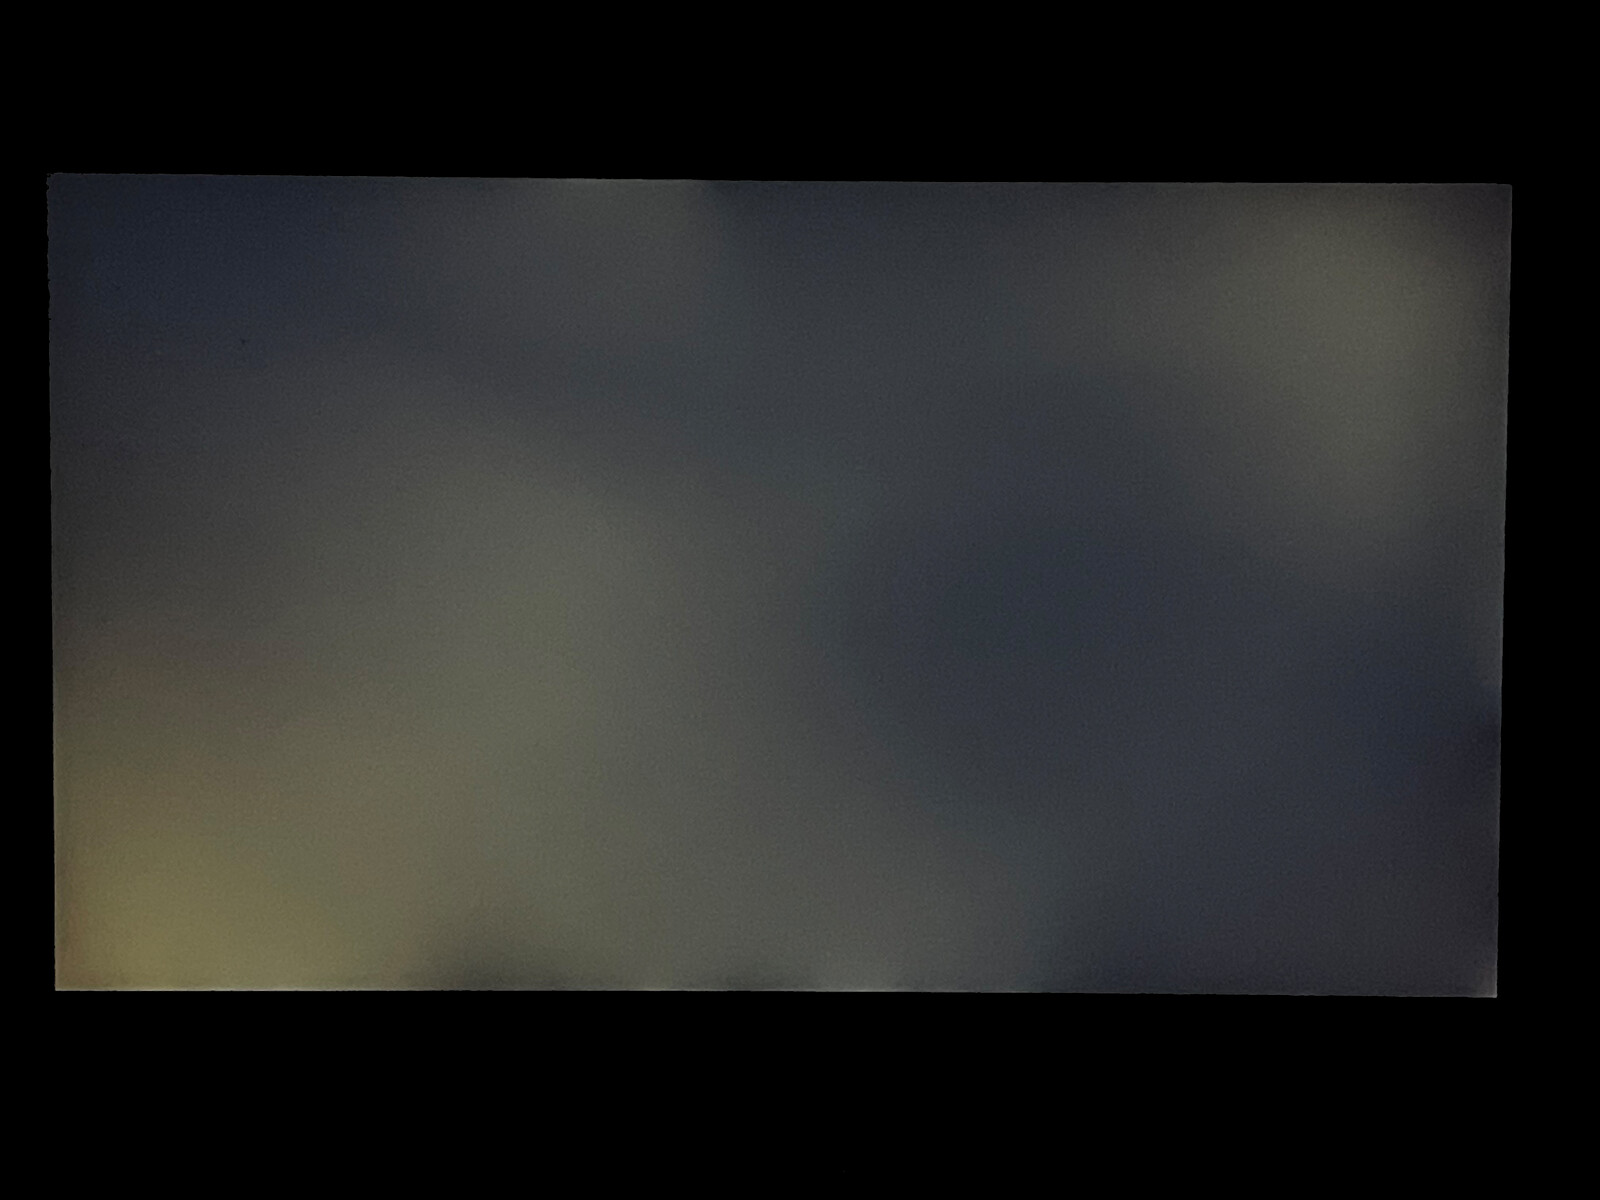
Na maioria das vezes, o brilho é muito baixo para uso externo, mas a camada fosca ajuda a manter o conteúdo da tela legível, pelo menos na sombra ou em condições mais escuras
Exibir tempos de resposta
| ↔ Tempo de resposta preto para branco | ||
|---|---|---|
| 9.2 ms ... ascensão ↗ e queda ↘ combinadas | ↗ 4.8 ms ascensão | 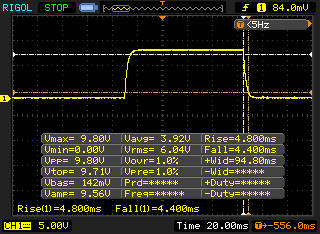 |
| ↘ 4.4 ms queda | ||
| A tela mostra taxas de resposta rápidas em nossos testes e deve ser adequada para jogos. Em comparação, todos os dispositivos testados variam de 0.1 (mínimo) a 240 (máximo) ms. » 26 % de todos os dispositivos são melhores. Isso significa que o tempo de resposta medido é melhor que a média de todos os dispositivos testados (19.8 ms). | ||
| ↔ Tempo de resposta 50% cinza a 80% cinza | ||
| 13.2 ms ... ascensão ↗ e queda ↘ combinadas | ↗ 6.4 ms ascensão | 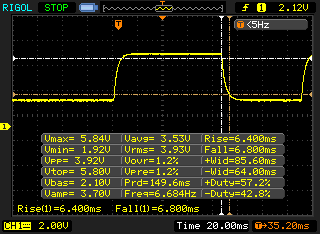 |
| ↘ 6.8 ms queda | ||
| A tela mostra boas taxas de resposta em nossos testes, mas pode ser muito lenta para jogadores competitivos. Em comparação, todos os dispositivos testados variam de 0.165 (mínimo) a 636 (máximo) ms. » 27 % de todos os dispositivos são melhores. Isso significa que o tempo de resposta medido é melhor que a média de todos os dispositivos testados (31 ms). | ||
Cintilação da tela / PWM (modulação por largura de pulso)
| Tela tremeluzindo / PWM não detectado | 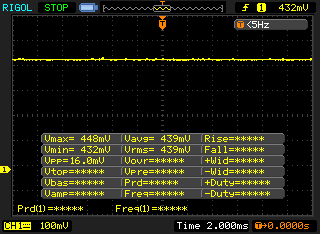 | ||
[pwm_comparison] Em comparação: 52 % de todos os dispositivos testados não usam PWM para escurecer a tela. Se PWM foi detectado, uma média de 7757 (mínimo: 5 - máximo: 343500) Hz foi medida. | |||
Graças à tecnologia IPS subjacente, os ângulos de visão do visor são bons. Mesmo quando se vê de ângulos extremamente íngremes, o contraste e a luminosidade dificilmente mudam
Desempenho - Alienware m17 R4 com alto desempenho de CPU e GPU
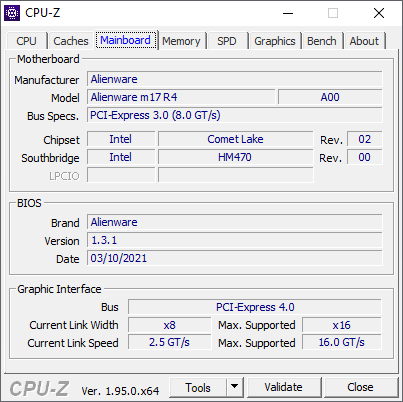
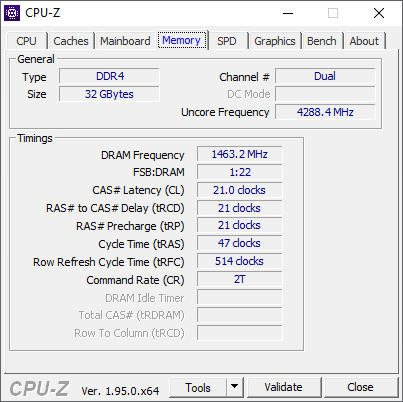
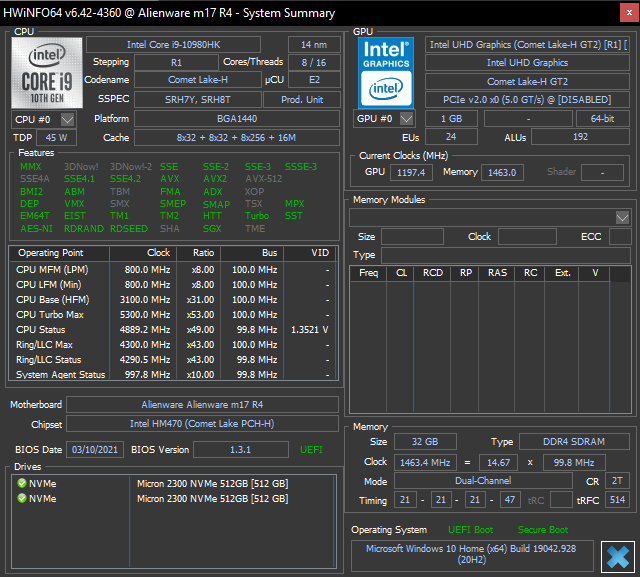
Nossa configuração do Alienware m17 R4 está equipada com umIntel Core i9-10980HKe um mobile Nvidia GeForce RTX 3080. A poderosa dupla é suportada por 32 GB de RAM DDR4 de canal duplo soldado rodando a 2.933 MHz, bem como por dois SSDs NVMe de 512 GB em uma configuração RAID 0. Quanto ao processador, você tem a escolha entre o Core i9 acima mencionado e o Core i7-10870HIntel Core i7-10870H Processor - Benchmarks and Specs. Em nosso teste de loop Cinebench R15, este último é cerca de 9% mais lento do que o processador em nosso modelo de teste. A configuração básica apresenta um Nvidia móvel GeForce RTX 3070, 16 GB de RAM DDR4, e um único SSD de 512 GB
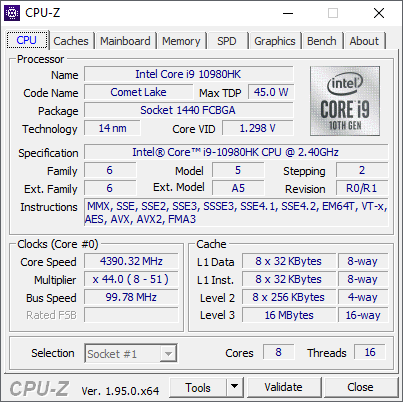
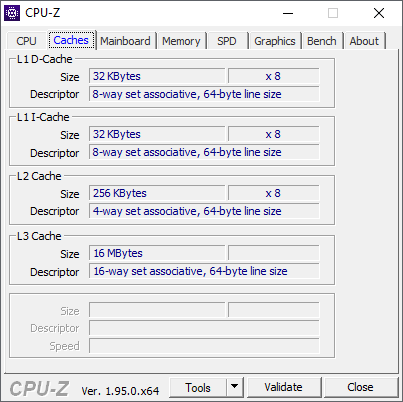
Processador
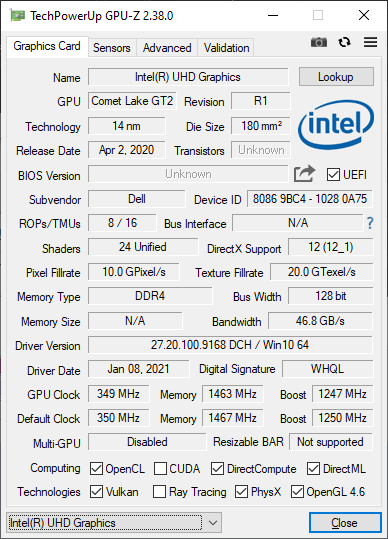
OIntel Core i9-10980HKé um processador octa-core para laptops que também oferece uma GPU integrada. A CPU é baseada na arquitetura do Comet Lake, e também foi utilizada em alguns modelos do predecessor. Os relógios com chip a 2,4-5,2 GHz ou 2,4-5,3 GHz, sendo improvável que 5,3 GHz sejam alcançados na prática, uma vez que a temperatura da CPU não pode exceder 65 °C (~149 °F) para esta taxa de relógio. O "K" no nome indica que a CPU pode teoricamente estar com overclocking. OIntel UHD Graphics 630 integrado ao processador assume o processamento gráfico em cenários de baixa carga, o que economiza energia e reduz o desenvolvimento de calor.
O modo Turbo é usado em grande escala e é mantido de forma constante durante todo o período de teste no teste de loop Cinebench R15. O desempenho da CPU é limitado no modo de bateria: Uma corrida Cinebench R15 produz uma pontuação de cerca de 1.820 quando ligado, enquanto apenas cerca de 1.500 pontos são alcançados com a energia da bateria.
Como com o predecessor, o desempenho da CPU também está em um alto nível em comparação com os rivais da mesma CPU, uma vez que oCore i9-10980HKdesdobra seu desempenho de forma excelente também aqui. Entretanto, o Schenker XMG Neo 17, por exemplo, bate todos os rivais da Intel e também é mais eficiente, apesar de "apenas" estar equipado com oRyzen 7 5800H em vez doAMD Ryzen 9 5900HX.
* ... menor é melhor
Desempenho do sistema
Nos benchmarks PCMark, nosso m17 R4 atinge pontuações ligeiramente acima da média para a combinação CPU-GPU. Em geral, o nível de desempenho do sistema está consequentemente no meio-campo superior, enquanto oSchenker XMG Neo 17é capaz de reivindicar a maioria dos pontos de referência a seu favor. No uso diário, o sistema responde consistentemente às entradas sem atrasos, mas encontramos um pequeno bug de exibição com o Centro de Comando de Alienware
| PCMark 8 Home Score Accelerated v2 | 6224 pontos | |
| PCMark 8 Work Score Accelerated v2 | 5555 pontos | |
| PCMark 10 Score | 6684 pontos | |
Ajuda | ||
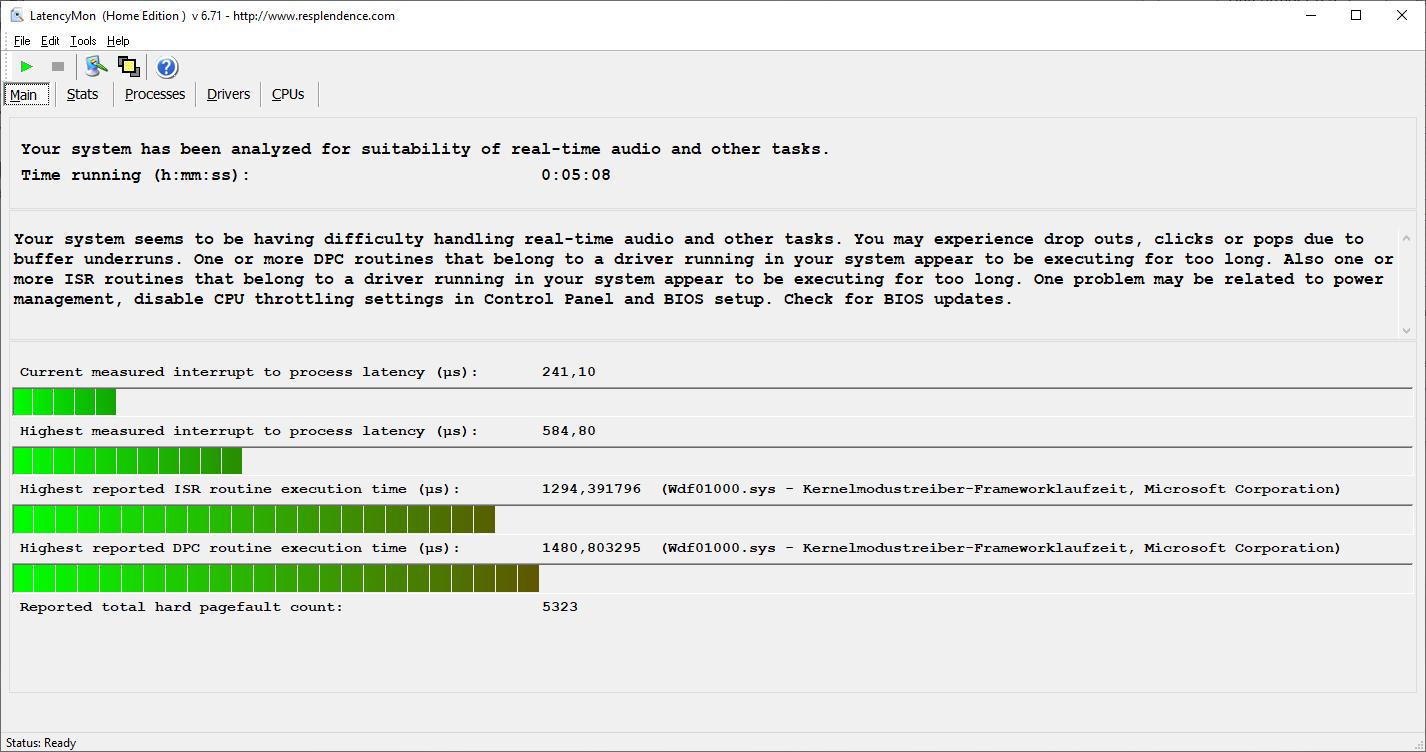
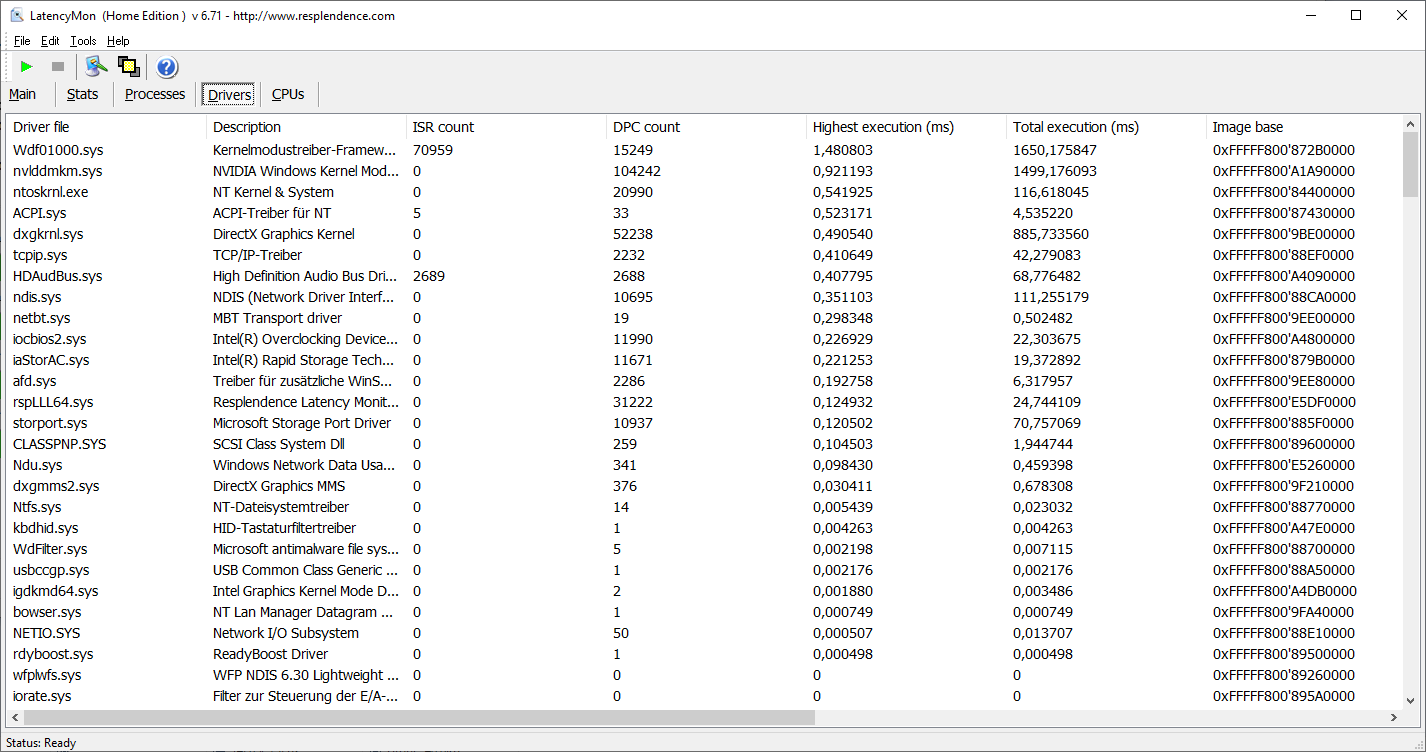
Latências DPC
As latências do DPC são menores do que em todos os outros dispositivos de comparação, mas ainda não são possivelmente adequadas para editar arquivos de vídeo e áudio em tempo real fora da caixa
| DPC Latencies / LatencyMon - interrupt to process latency (max), Web, Youtube, Prime95 | |
| MSI GE76 Raider 10UH | |
| Gigabyte Aero 17 HDR YC | |
| Schenker XMG Neo 17 (Early 2021, RTX 3070, 5800H) | |
| Razer Blade Pro 17 2021 (QHD Touch) | |
| Alienware m17 R3 P45E | |
| Alienware m17 R4 | |
* ... menor é melhor
Armazenamento
Em nosso caso, uma configuração RAID 0 composta de dois SSDs Micron 2300 NVMe serve como solução de armazenamento. O baixo desempenho de escrita 4K é uma conseqüência natural da matriz RAID, mas o desempenho de leitura 4K é parcialmente inferior ao das soluções de acionamento com um único SSD. No entanto, o desempenho tende a ser um pouco mais alto do que com a configuração RAID 0 Micron 2200S do predecessor.
Mais informações podem ser encontradas em nosso artigo de referênciaHDD/SSD Benchmarks.
| Alienware m17 R4 2x Micron 2300 512 GB (RAID 0) | MSI GE76 Raider 10UH WDC PC SN730 SDBPNTY-1T00 | Razer Blade Pro 17 2021 (QHD Touch) Samsung PM981a MZVLB1T0HBLR | Gigabyte Aero 17 HDR YC ESR01TBTLCG-EAC-4 | Schenker XMG Neo 17 (Early 2021, RTX 3070, 5800H) Samsung SSD 970 EVO Plus 500GB | Alienware m17 R3 P45E 2x Micron 2200S 512 GB (RAID 0) | |
|---|---|---|---|---|---|---|
| CrystalDiskMark 5.2 / 6 | 3% | -6% | 5% | 22% | -12% | |
| Write 4K (MB/s) | 93.1 | 157.1 69% | 123.5 33% | 141.2 52% | 206.1 121% | 68 -27% |
| Read 4K (MB/s) | 46.79 | 46.3 -1% | 45.96 -2% | 46.48 -1% | 53 13% | 42.04 -10% |
| Write Seq (MB/s) | 2853 | 2396 -16% | 1861 -35% | 2433 -15% | 3018 6% | 2221 -22% |
| Read Seq (MB/s) | 2556 | 2245 -12% | 1584 -38% | 1742 -32% | 2575 1% | 2202 -14% |
| Write 4K Q32T1 (MB/s) | 475 | 436.1 -8% | 466.4 -2% | 565 19% | 535 13% | 494.5 4% |
| Read 4K Q32T1 (MB/s) | 529 | 524 -1% | 566 7% | 655 24% | 608 15% | 540 2% |
| Write Seq Q32T1 (MB/s) | 3331 | 3086 -7% | 2981 -11% | 3028 -9% | 3242 -3% | 2623 -21% |
| Read Seq Q32T1 (MB/s) | 3319 | 3363 1% | 3260 -2% | 3424 3% | 3617 9% | 3159 -5% |
| AS SSD | 7% | 8% | 38% | 41% | -35% | |
| Seq Read (MB/s) | 2733 | 2967 9% | 2068 -24% | 2674 -2% | 3020 11% | 2060 -25% |
| Seq Write (MB/s) | 2822 | 2604 -8% | 2047 -27% | 2458 -13% | 2631 -7% | 2297 -19% |
| 4K Read (MB/s) | 45.04 | 42.97 -5% | 47.85 6% | 52.1 16% | 60.3 34% | 35.39 -21% |
| 4K Write (MB/s) | 88.4 | 107.8 22% | 87.4 -1% | 113.4 28% | 171.6 94% | 63.1 -29% |
| 4K-64 Read (MB/s) | 1388 | 1684 21% | 1932 39% | 1881 36% | 1410 2% | 1337 -4% |
| 4K-64 Write (MB/s) | 1227 | 2164 76% | 2017 64% | 2849 132% | 2324 89% | 1307 7% |
| Access Time Read * (ms) | 0.079 | 0.116 -47% | 0.055 30% | 0.102 -29% | 0.045 43% | 0.057 28% |
| Access Time Write * (ms) | 0.095 | 0.106 -12% | 0.128 -35% | 0.033 65% | 0.024 75% | 0.411 -333% |
| Score Read (Points) | 1706 | 2023 19% | 2187 28% | 2201 29% | 1773 4% | 1578 -8% |
| Score Write (Points) | 1598 | 2532 58% | 2309 44% | 3208 101% | 2759 73% | 1600 0% |
| Score Total (Points) | 4184 | 5571 33% | 5612 34% | 6524 56% | 5429 30% | 3997 -4% |
| Copy ISO MB/s (MB/s) | 2414 | 2106 -13% | 2400 -1% | 1728 -28% | ||
| Copy Program MB/s (MB/s) | 1030 | 687 -33% | 684 -34% | 727 -29% | ||
| Copy Game MB/s (MB/s) | 1991 | 1590 -20% | 1629 -18% | 1585 -20% | ||
| Média Total (Programa/Configurações) | 5% /
6% | 1% /
3% | 22% /
24% | 32% /
33% | -24% /
-26% |
* ... menor é melhor

Continuous load read: DiskSpd Read Loop, Queue Depth 8
Placa gráfica
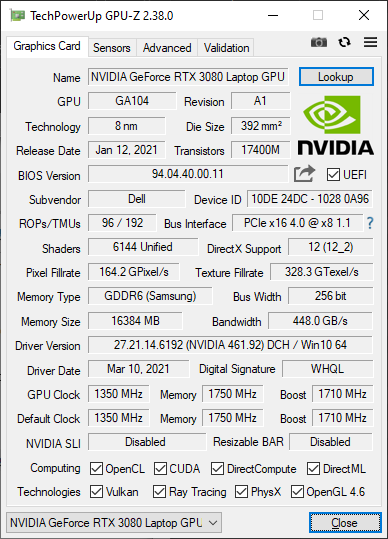
O móvelNvidia GeForce RTX 3080é atualmente a placa gráfica de jogos para laptop mais rápida, e tem acesso a um generoso TDP de 165 watts (incluindo Dynamic Boost) e 16 GB de memória de vídeo. O desempenho gráfico é aproximadamente igual ao de um desktop GeForce RTX 3060 Ti.
Os efeitos do alto orçamento de energia podem ser vistos nos 3DMark benchmarks, que são liderados pelo Alienware m17 R4, sem exceção. Ao mesmo tempo, pode-se ver pelos resultados que o novo modelo mostra uma vantagem de cerca de 20% sobre o m17 R3. As pontuações mostram que o GeForce RTX 3080 pode desencadear seu excelente desempenho no laptop Alienware e já sugere um excelente desempenho em jogos também.
O desempenho gráfico é limitado na potência da bateria. Uma execução do Fire Strike fornece pontuações físicas e gráficas de 18.713 e 6.900, respectivamente, na energia da bateria, enquanto 22.147 e 32.536 são alcançadas quando conectado à tomada.
| 3DMark 11 Performance | 29711 pontos | |
| 3DMark Cloud Gate Standard Score | 57555 pontos | |
| 3DMark Fire Strike Score | 24937 pontos | |
| 3DMark Time Spy Score | 12224 pontos | |
Ajuda | ||
Desempenho do jogo
Nos testes práticos de jogos, nossa amostra de revisão tem um desempenho extremamente bom, e até os jogos mais recentes, como o Cyberpunk 2077, podem ser jogados sem problemas nas mais altas configurações gráficas. Infelizmente, a tela não parece lidar bem com algumas situações, porque a imagem cintila de tempos em tempos.
Mais informações podem ser encontradas em nossa lista de benchmarksComputer Games on Laptop Graphics Cards.
| The Witcher 3 | |
| 1920x1080 High Graphics & Postprocessing (Nvidia HairWorks Off) | |
| Média da turma Gaming (341 - 404, n=2, últimos 2 anos) | |
| MSI GE76 Raider 10UH | |
| Alienware m17 R4 | |
| Razer Blade Pro 17 2021 (QHD Touch) | |
| Média NVIDIA GeForce RTX 3080 Laptop GPU (149 - 242, n=32) | |
| Schenker XMG Neo 17 (Early 2021, RTX 3070, 5800H) | |
| Alienware m17 R3 P45E | |
| Gigabyte Aero 17 HDR YC | |
| 1920x1080 Ultra Graphics & Postprocessing (HBAO+) | |
| Média da turma Gaming (104.7 - 240, n=7, últimos 2 anos) | |
| MSI GE76 Raider 10UH | |
| Alienware m17 R4 | |
| Razer Blade Pro 17 2021 (QHD Touch) | |
| Média NVIDIA GeForce RTX 3080 Laptop GPU (85.1 - 123, n=40) | |
| Schenker XMG Neo 17 (Early 2021, RTX 3070, 5800H) | |
| Alienware m17 R3 P45E | |
| Gigabyte Aero 17 HDR YC | |
Em nosso teste Witcher 3, durante o qual o personagem do jogo não é movido durante todo o período, as taxas de quadros caem ligeiramente várias vezes, o que poderia ser devido à atividade de fundo interferente ou ao estrangulamento térmico
| baixo | média | alto | ultra | |
|---|---|---|---|---|
| GTA V (2015) | 180 | 176 | 160 | 93.9 |
| The Witcher 3 (2015) | 334 | 236 | 211 | 115 |
| Dota 2 Reborn (2015) | 164 | 145 | 140 | 132 |
| Final Fantasy XV Benchmark (2018) | 166 | 139 | 98.2 | |
| X-Plane 11.11 (2018) | 118 | 105 | 88 | |
| Far Cry 5 (2018) | 154 | 135 | 126 | 121 |
| Strange Brigade (2018) | 390 | 287 | 240 | 212 |
| Cyberpunk 2077 1.0 (2020) | 113 | 104 | 92.4 | 80.6 |
Emissões - Temperaturas no limite superior
Emissões sonoras
Os ventiladores podem ser controlados através do software do Centro de Comando Alienware, e se comportam de forma muito dinâmica sob o perfil "Balanceado". Por exemplo, enquanto estão parados ao navegar e trabalhar na área de trabalho, eles giram à velocidade máxima sob carga alta. Eles rapidamente se tornam claramente audíveis quando jogam e depois permanecem neste alto nível de ruído durante todo o jogo. Depois disso, porém, eles normalmente retornam à operação silenciosa após apenas alguns segundos de uso ocioso. Não detectamos nenhum ruído de bobina ou outros ruídos eletrônicos dignos de nota em nosso dispositivo de teste
Barulho
| Ocioso |
| 24 / 25 / 36 dB |
| Carga |
| 45 / 50 dB |
 | ||
30 dB silencioso 40 dB(A) audível 50 dB(A) ruidosamente alto |
||
min: | ||
Temperatura
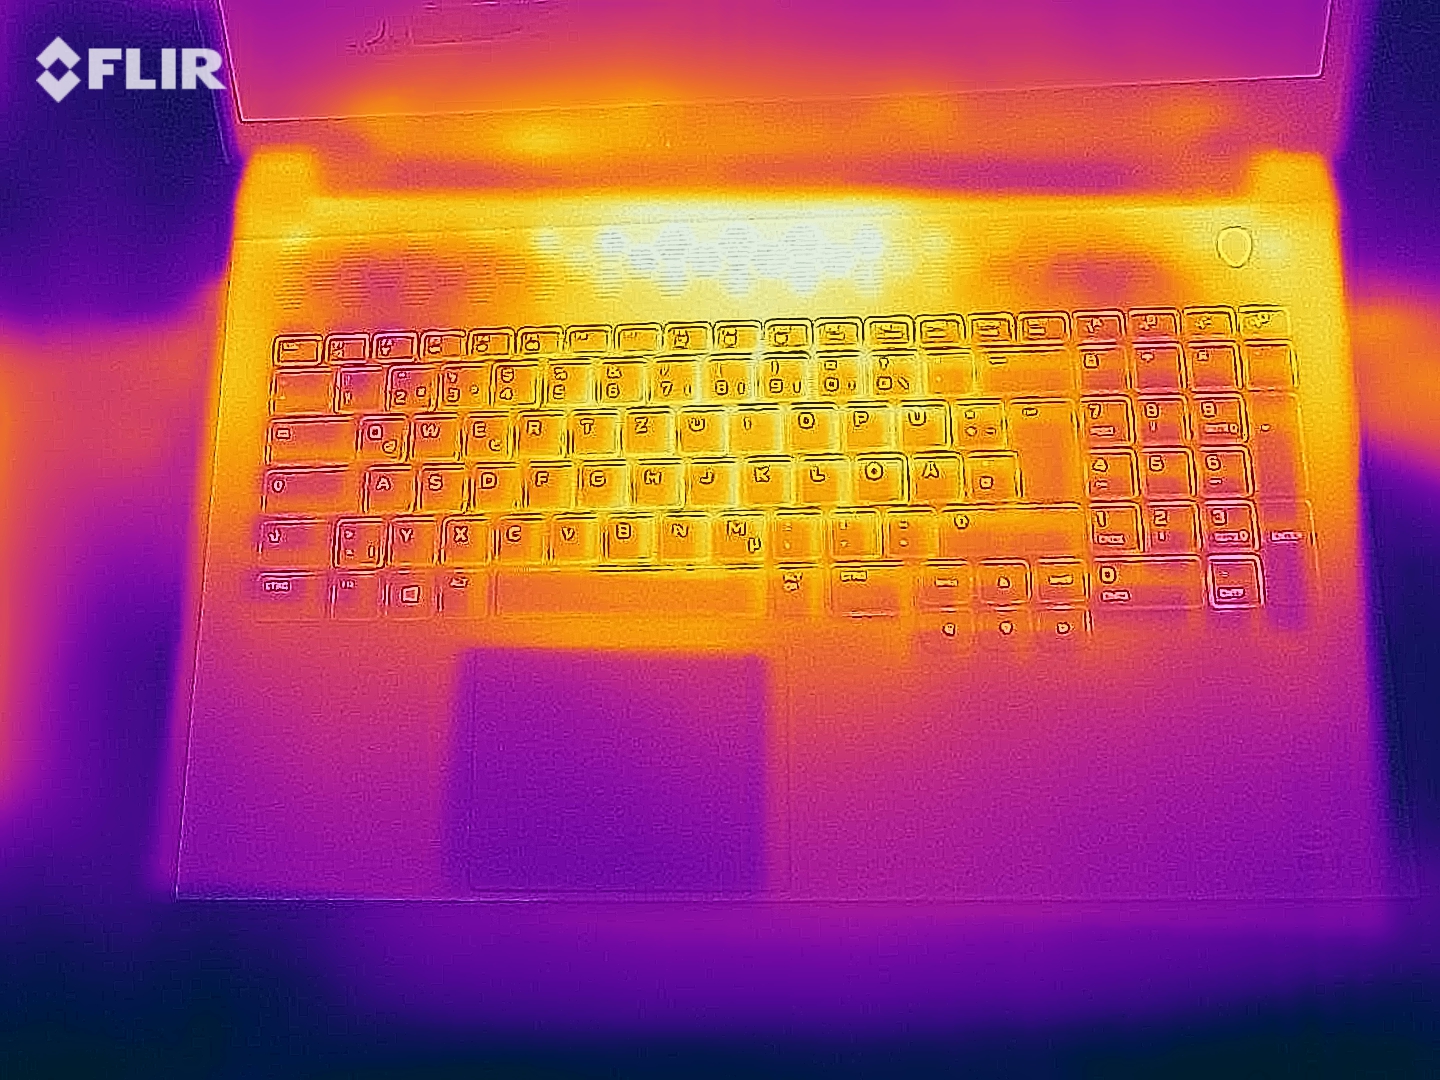
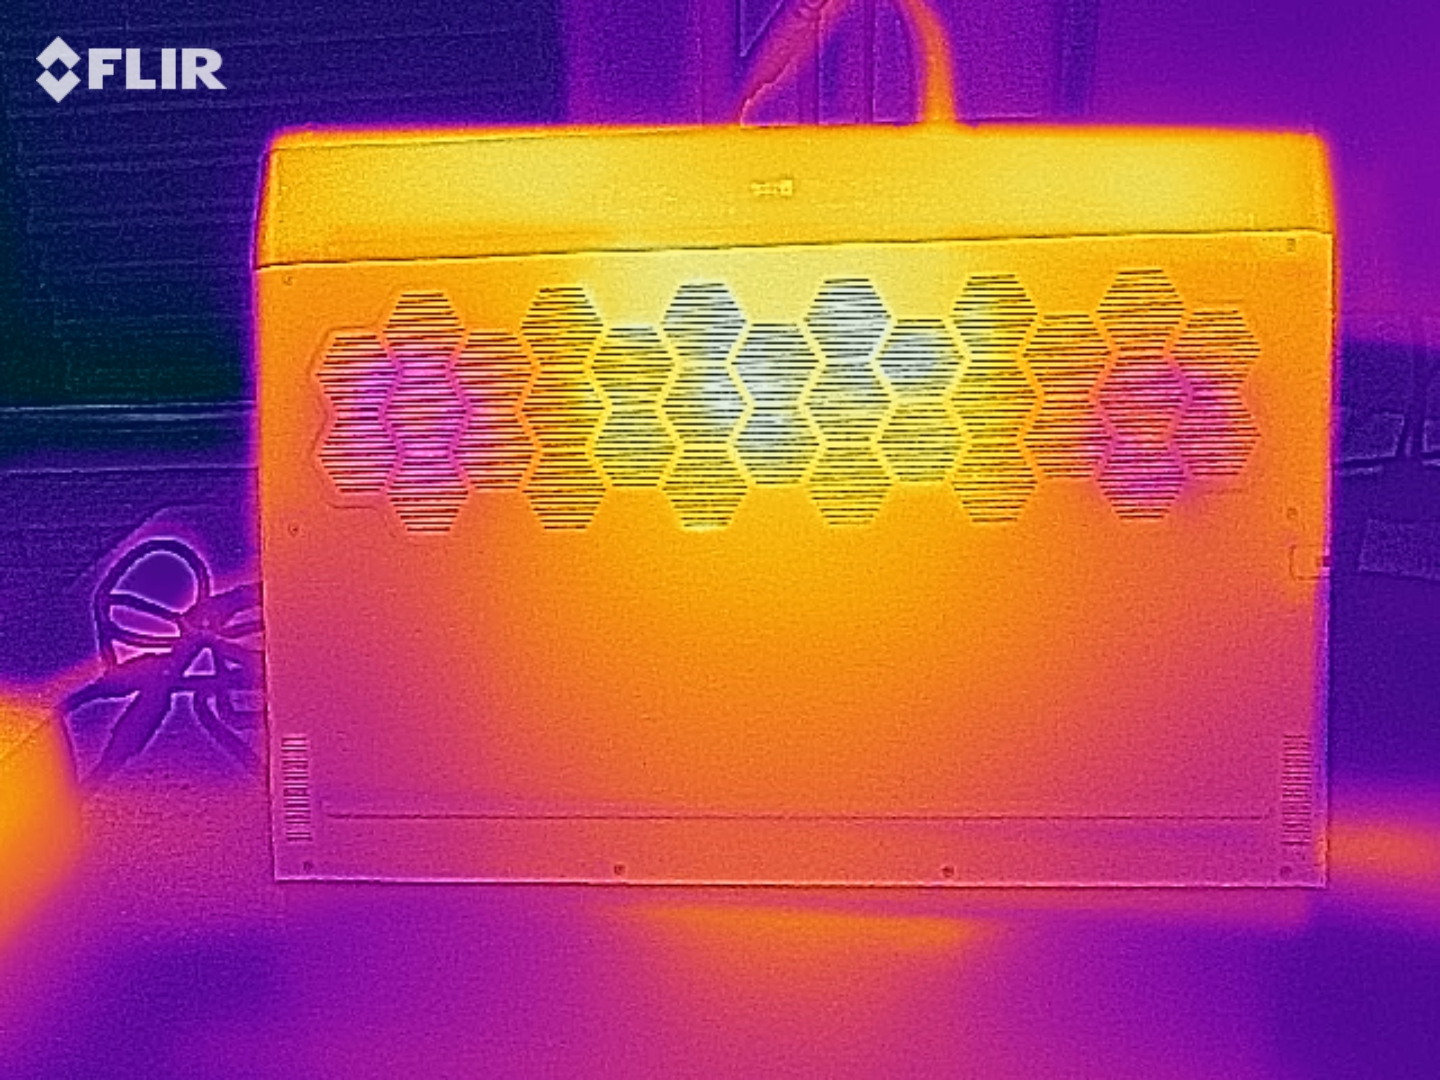
Devido às temperaturas de operação às vezes extremamente altas, certas áreas da superfície também ficam muito quentes. Temperaturas de até 60 °C (~140 °F) e 58 °C (~ 136 °F), respectivamente, são atingidas na área traseira da unidade base enquanto se joga e durante o teste de esforço. Os descansos da palma também ficam especialmente quentes a até 44 °C (~111 °F), o que pode ser desconfortável quando se joga
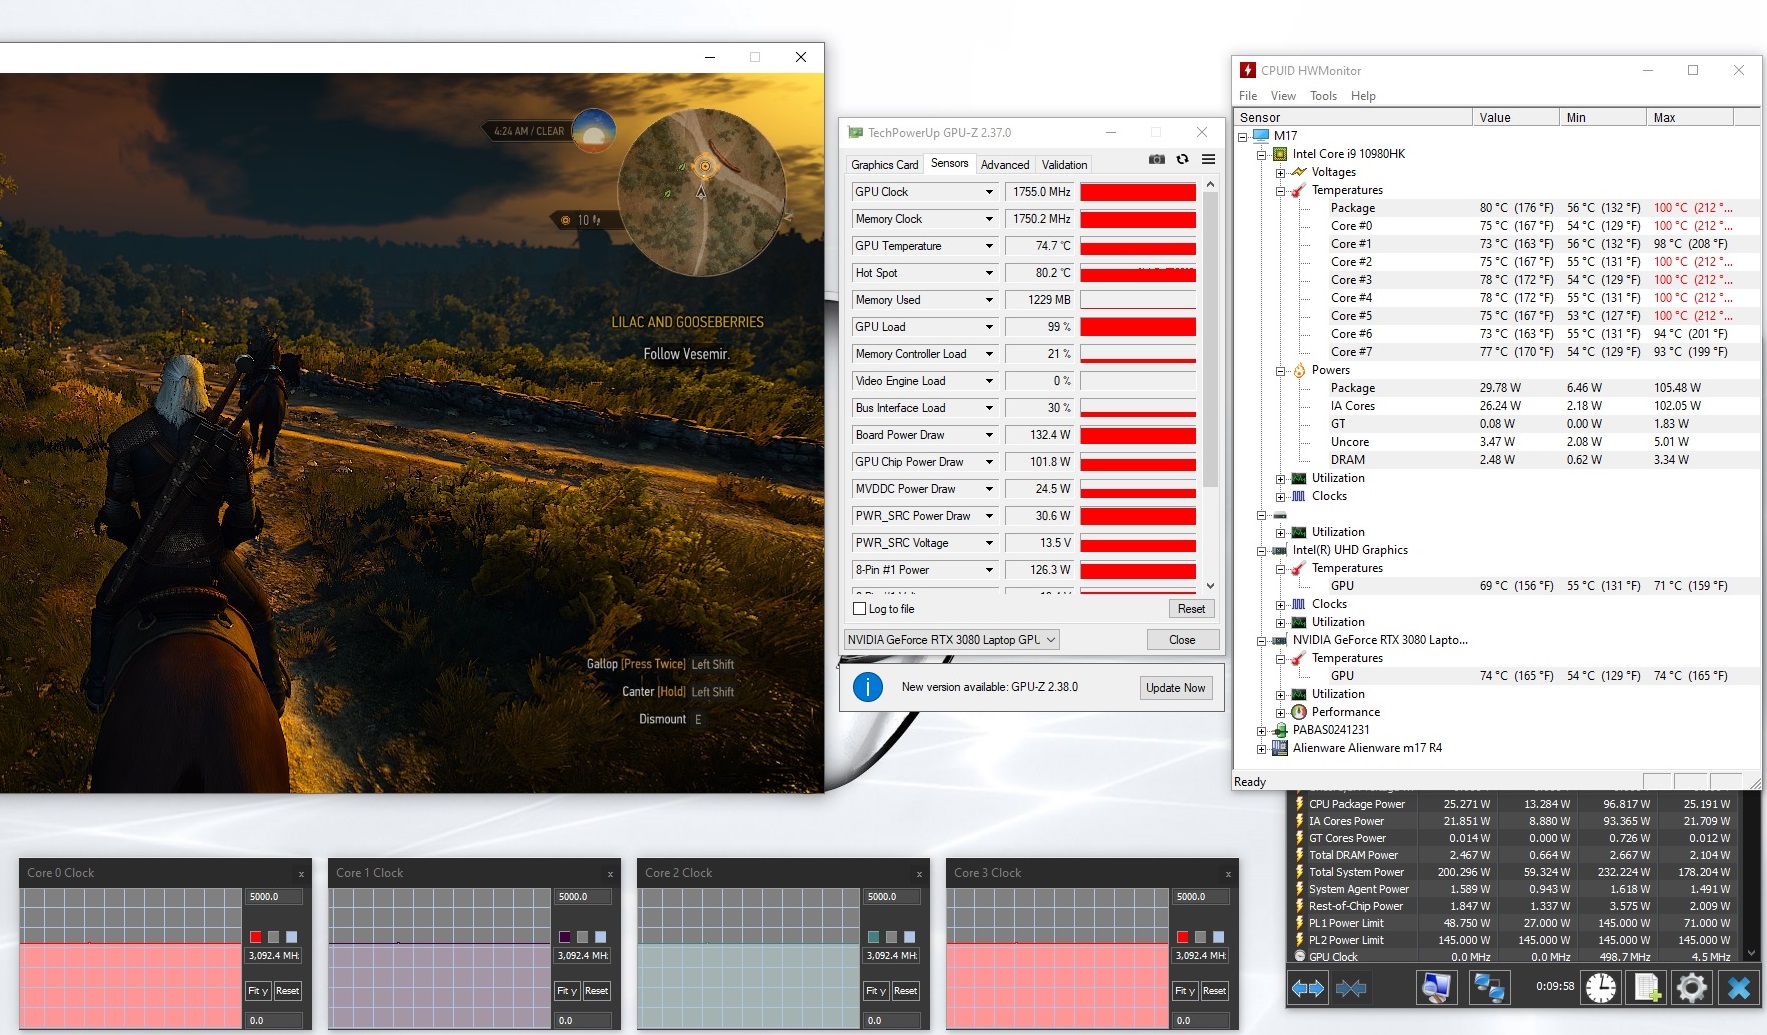
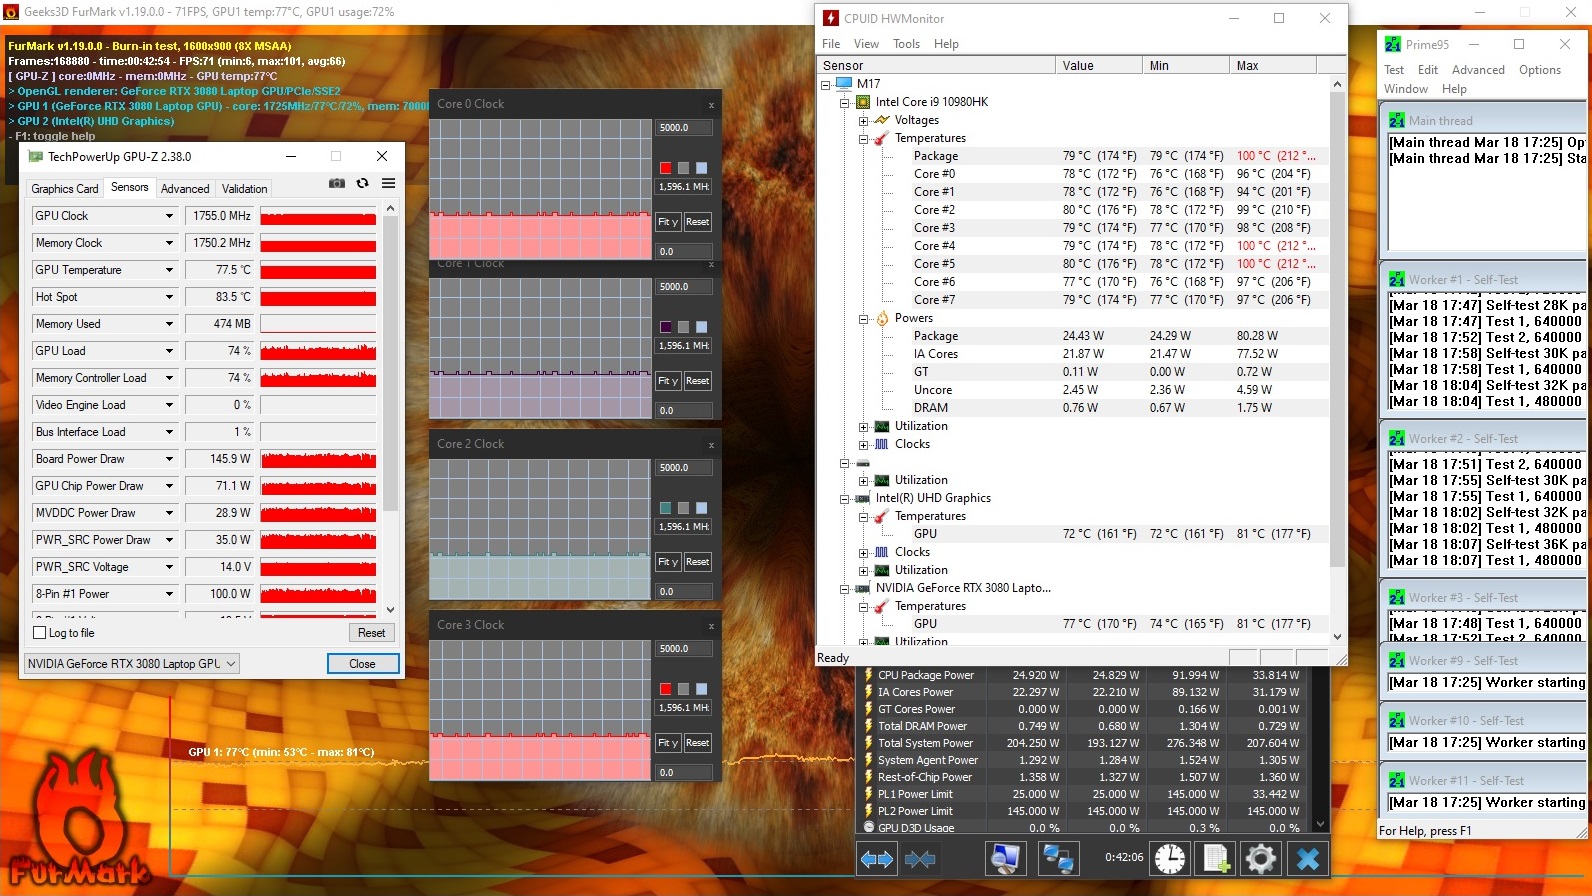
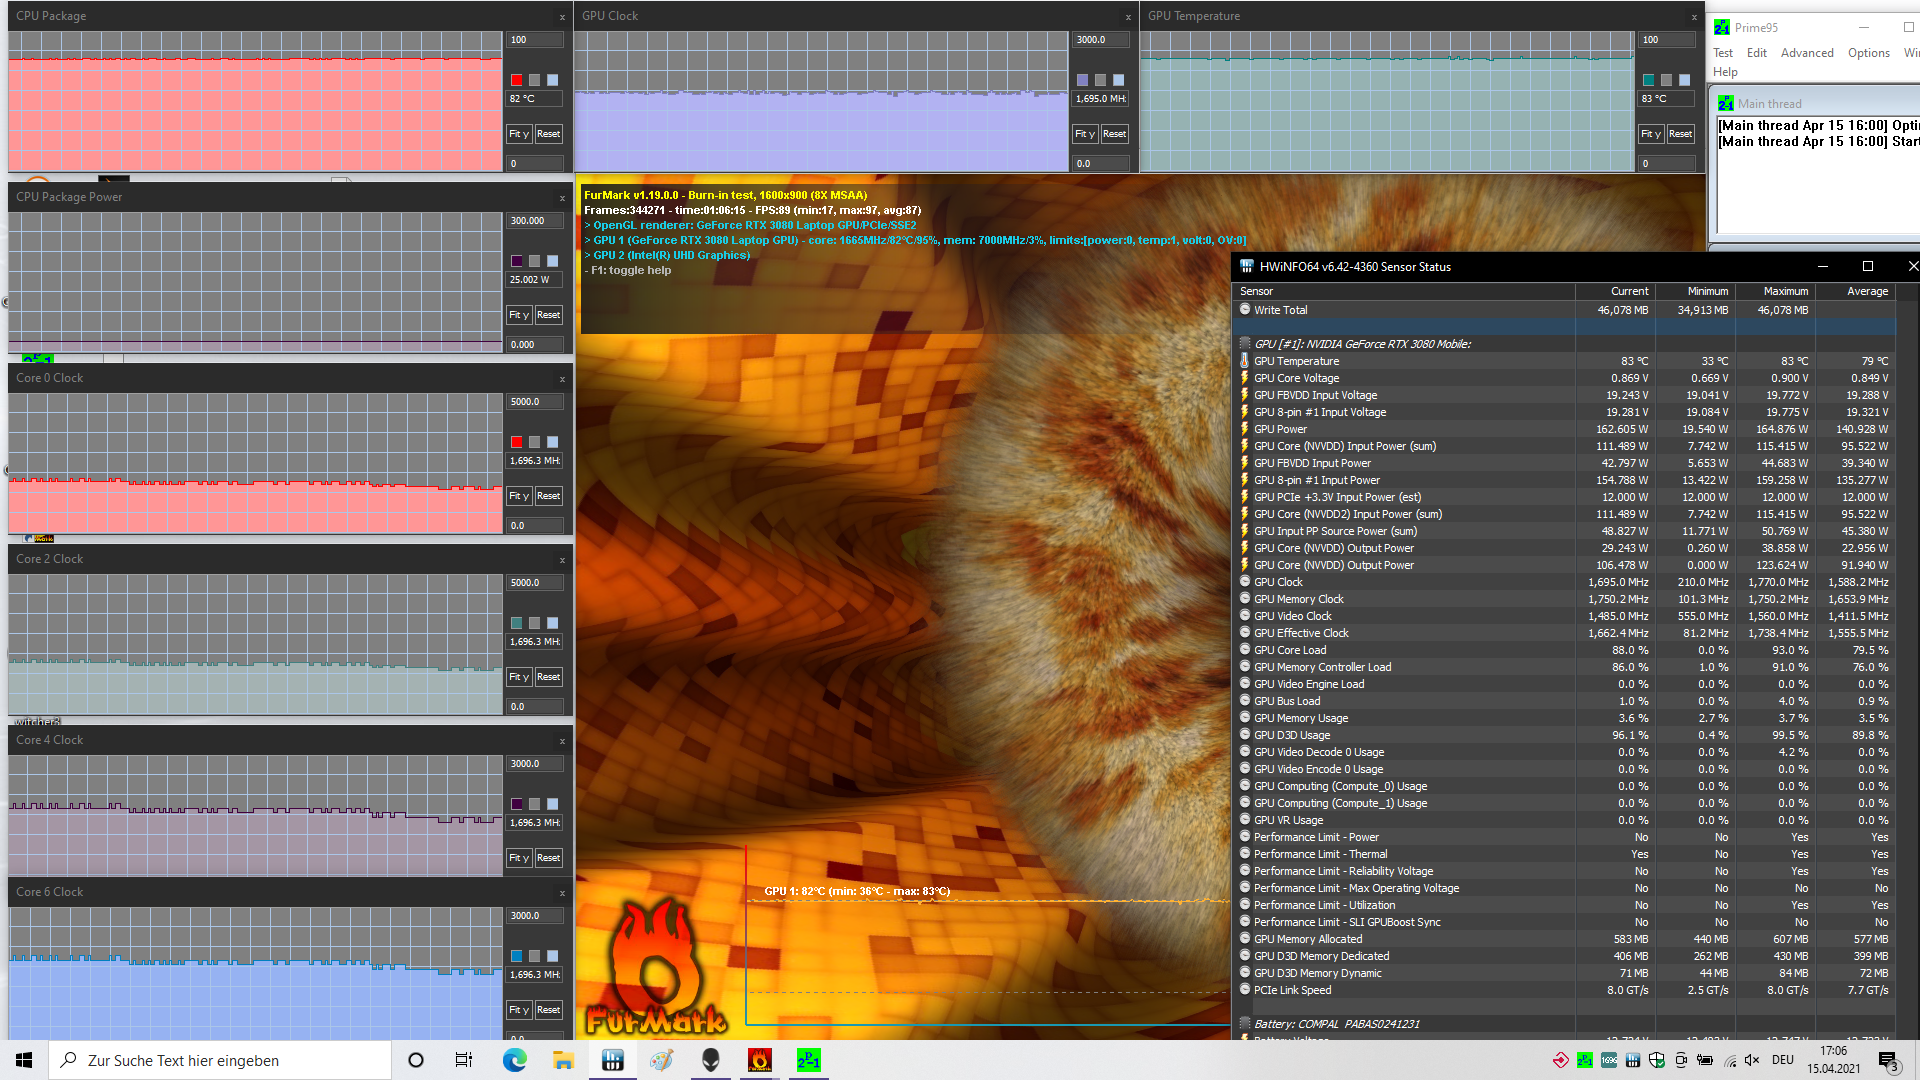
No teste de estresse, a CPU e a GPU inicialmente registram a uma freqüência de 5,1 GHz e 1.755 MHz, respectivamente. A CPU então atinge uma temperatura máxima de 105 °C (~126 °F) e começa a reduzir sua freqüência de clock após um curto período de tempo até finalmente estabilizar-se em torno de 1,7 GHz e uma temperatura de 80 °C (~176 °F). Ao contrário da CPU, a GPU não precisa acelerar, mas reduz sua freqüência de relógio quando atinge 83 °C (~181 °F) e se estabiliza a respeitáveis 1.695 MHz ao longo do tempo. Durante o teste de estresse, foi observada uma tremulação significativa da tela, que poderia ser um sinal de componentes superaquecidos
(-) A temperatura máxima no lado superior é 58 °C / 136 F, em comparação com a média de 40.4 °C / 105 F , variando de 21.2 a 68.8 °C para a classe Gaming.
(-) A parte inferior aquece até um máximo de 46 °C / 115 F, em comparação com a média de 43.2 °C / 110 F
(-) Em uso inativo, a temperatura média para o lado superior é 40.8 °C / 105 F, em comparação com a média do dispositivo de 33.9 °C / ### class_avg_f### F.
(-) Jogando The Witcher 3, a temperatura média para o lado superior é 49.2 °C / 121 F, em comparação com a média do dispositivo de 33.9 °C / ## #class_avg_f### F.
(-) Os apoios para as mãos e o touchpad podem ficar muito quentes ao toque, com um máximo de 44 °C / 111.2 F.
(-) A temperatura média da área do apoio para as mãos de dispositivos semelhantes foi 28.8 °C / 83.8 F (-15.2 °C / -27.4 F).
Alienware m17 R4 análise de áudio
(+) | os alto-falantes podem tocar relativamente alto (###valor### dB)
Graves 100 - 315Hz
(-) | quase nenhum baixo - em média 16.4% menor que a mediana
(±) | a linearidade dos graves é média (8.8% delta para a frequência anterior)
Médios 400 - 2.000 Hz
(+) | médios equilibrados - apenas 4.7% longe da mediana
(+) | médios são lineares (5% delta para frequência anterior)
Altos 2 - 16 kHz
(±) | máximos mais altos - em média 7.7% maior que a mediana
(±) | a linearidade dos máximos é média (7% delta para frequência anterior)
Geral 100 - 16.000 Hz
(±) | a linearidade do som geral é média (16.1% diferença em relação à mediana)
Comparado com a mesma classe
» 39% de todos os dispositivos testados nesta classe foram melhores, 7% semelhantes, 54% piores
» O melhor teve um delta de 6%, a média foi 18%, o pior foi 132%
Comparado com todos os dispositivos testados
» 26% de todos os dispositivos testados foram melhores, 5% semelhantes, 69% piores
» O melhor teve um delta de 4%, a média foi 23%, o pior foi 134%
Razer Blade Pro 17 2021 (QHD Touch) análise de áudio
(+) | os alto-falantes podem tocar relativamente alto (###valor### dB)
Graves 100 - 315Hz
(-) | quase nenhum baixo - em média 19.5% menor que a mediana
(±) | a linearidade dos graves é média (11.2% delta para a frequência anterior)
Médios 400 - 2.000 Hz
(+) | médios equilibrados - apenas 3.4% longe da mediana
(+) | médios são lineares (3.6% delta para frequência anterior)
Altos 2 - 16 kHz
(+) | agudos equilibrados - apenas 2.8% longe da mediana
(+) | os máximos são lineares (5.2% delta da frequência anterior)
Geral 100 - 16.000 Hz
(+) | o som geral é linear (13.6% diferença em relação à mediana)
Comparado com a mesma classe
» 20% de todos os dispositivos testados nesta classe foram melhores, 7% semelhantes, 73% piores
» O melhor teve um delta de 6%, a média foi 18%, o pior foi 132%
Comparado com todos os dispositivos testados
» 15% de todos os dispositivos testados foram melhores, 4% semelhantes, 82% piores
» O melhor teve um delta de 4%, a média foi 23%, o pior foi 134%
Gerenciamento de energia - Laptop alienígena com alto consumo em uso ocioso
Consumo de energia
Mesmo no uso ocioso da mesa, o consumo de energia é muito alto, com uma média de 48 watts. O Schenker XMG Neo 17, por exemplo, requer apenas 16 watts neste cenário. Sob carga máxima, conseguimos medir um consumo máximo temporário de 337 watts; em nosso teste de jogo no mundo real, ele foi de 219 watts. O enorme adaptador de energia de 330 watts tem capacidade suficiente para fornecer energia ao laptop, mesmo sob carga pesada do sistema
| desligado | |
| Ocioso | |
| Carga |
|
Key:
min: | |
| Alienware m17 R4 i9-10980HK, GeForce RTX 3080 Laptop GPU | MSI GE76 Raider 10UH i7-10870H, GeForce RTX 3080 Laptop GPU | Razer Blade Pro 17 2021 (QHD Touch) i7-10875H, GeForce RTX 3080 Laptop GPU | Gigabyte Aero 17 HDR YC i9-10980HK, GeForce RTX 3080 Laptop GPU | Schenker XMG Neo 17 (Early 2021, RTX 3070, 5800H) R7 5800H, GeForce RTX 3070 Laptop GPU | Alienware m17 R3 P45E i9-10980HK, GeForce RTX 2080 Super Mobile | Média da turma Gaming | |
|---|---|---|---|---|---|---|---|
| Power Consumption | 31% | 38% | 38% | 38% | 2% | 44% | |
| Idle Minimum * (Watt) | 42 | 15.5 63% | 15.2 64% | 17 60% | 13 69% | 33.6 20% | 13 ? 69% |
| Idle Average * (Watt) | 48 | 31.3 35% | 20.3 58% | 21 56% | 16 67% | 43.9 9% | 19 ? 60% |
| Idle Maximum * (Watt) | 58 | 31.7 45% | 37.3 36% | 33 43% | 26 55% | 59 -2% | 24.6 ? 58% |
| Load Average * (Watt) | 124 | 93.6 25% | 114.9 7% | 113 9% | 125 -1% | 134.9 -9% | 110.7 ? 11% |
| Witcher 3 ultra * (Watt) | 219 | 233 -6% | 158.4 28% | 157 28% | 187 15% | 242 -11% | |
| Load Maximum * (Watt) | 337 | 260.3 23% | 223.7 34% | 237 30% | 259 23% | 320 5% | 259 ? 23% |
* ... menor é melhor
Duração da bateria
Mesmo para um potente laptop para jogos, a vida útil da bateria é extremamente pobre. Tempos de execução como 2:21 horas em nosso teste Wi-Fi padronizado (250 cd/m² de brilho, roteiro de navegação na web) ou 2:13 horas em nosso teste de vídeo com o curta-metragem Big Buck Bunny não são nenhuma surpresa considerando o alto consumo ocioso. A capacidade da bateria de 86 Wh está no meio-campo, e oRazer Blade Pro 17 consegue tempos de corrida mais altos mesmo com sua bateria menor de 70,5 Wh
| Alienware m17 R4 i9-10980HK, GeForce RTX 3080 Laptop GPU, 86 Wh | MSI GE76 Raider 10UH i7-10870H, GeForce RTX 3080 Laptop GPU, 99.9 Wh | Razer Blade Pro 17 2021 (QHD Touch) i7-10875H, GeForce RTX 3080 Laptop GPU, 70.5 Wh | Gigabyte Aero 17 HDR YC i9-10980HK, GeForce RTX 3080 Laptop GPU, 99 Wh | Schenker XMG Neo 17 (Early 2021, RTX 3070, 5800H) R7 5800H, GeForce RTX 3070 Laptop GPU, 62 Wh | Alienware m17 R3 P45E i9-10980HK, GeForce RTX 2080 Super Mobile, 86 Wh | Média da turma Gaming | |
|---|---|---|---|---|---|---|---|
| Duração da bateria | 103% | 82% | 86% | 2% | -5% | 166% | |
| H.264 (h) | 2.2 | 8.32 ? 278% | |||||
| WiFi v1.3 (h) | 2.4 | 6.3 163% | 5.9 146% | 5.9 146% | 3.5 46% | 3.2 33% | 7.11 ? 196% |
| Load (h) | 1.2 | 1.7 42% | 1.4 17% | 1.5 25% | 0.7 -42% | 0.7 -42% | 1.502 ? 25% |
| Reader / Idle (h) | 8.2 | 9.9 | 10.3 | 4.7 | 3.7 | 8.27 ? |
Pro
Contra
Veredicto - m17 R4 com potencial desperdiçado
A primeira impressão do Alienware m17 R4 é grande. O estojo tem um design elegante que é realçado por muitos LEDs RGB e acompanhado por uma excelente qualidade de construção. O teclado é decente, e o fabricante também não parece ter escamoteado o touchpad. A tela também corta uma bela figura no teste: Ele supera painéis igualmente rápidos com um nível de preto mais baixo e um contraste mais alto.
Nosso principal ponto de crítica são as altas temperaturas de operação, já que a CPU em particular alcança até 105 °C (~221 °F) no teste de estresse. Esta também pode ser a razão para a tela cintilar, o que infelizmente foi observado não apenas durante os testes de estresse, mas também durante os jogos. Além disso, as superfícies ficam mais quentes do que na maioria dos concorrentes, o que reduz o conforto enquanto se joga.
O Alienware m17 R4 oferece um tremendo desempenho gráfico, mas é incapaz de dissipar adequadamente o calor geral do sistema, o que resulta em uma tela cintilante e superfícies muito quentes.
Em vista disto, a escolha de uma CPU Intel também é questionável, pois é menos eficiente e mais difícil de esfriar do que suas atuais equivalentes AMD Ryzen. Entretanto, o desempenho gráfico alcançado pelo móvel GeForce RTX 3080 é notável. Dificilmente qualquer concorrente pode se manter aqui, já que a Dell concede à GPU um TDP particularmente generoso. Taxas de quadros muito altas são alcançadas em jogos modernos, e eles entram por conta própria na tela rápida.
Embora o Alienware m17 R4 ofereça muito boa qualidade de construção e aparência, o alto prêmio comparado aos laptops de jogos com uma melhor relação preço-desempenho não se justifica, em nossa opinião, atualmente. Entretanto, isto poderia mudar rapidamente uma vez que a tela cintilante seja fixa e se o preço for reduzido ou mesmo se uma versão AMD for lançada
Preço e disponibilidade
Você pode encontrar o Alienware m17 R4 em Amazonem várias configurações, tais como as seguintes:
Alienware m17 R4
- 04/17/2021 v7 (old)
Marius Schell
Price comparison

