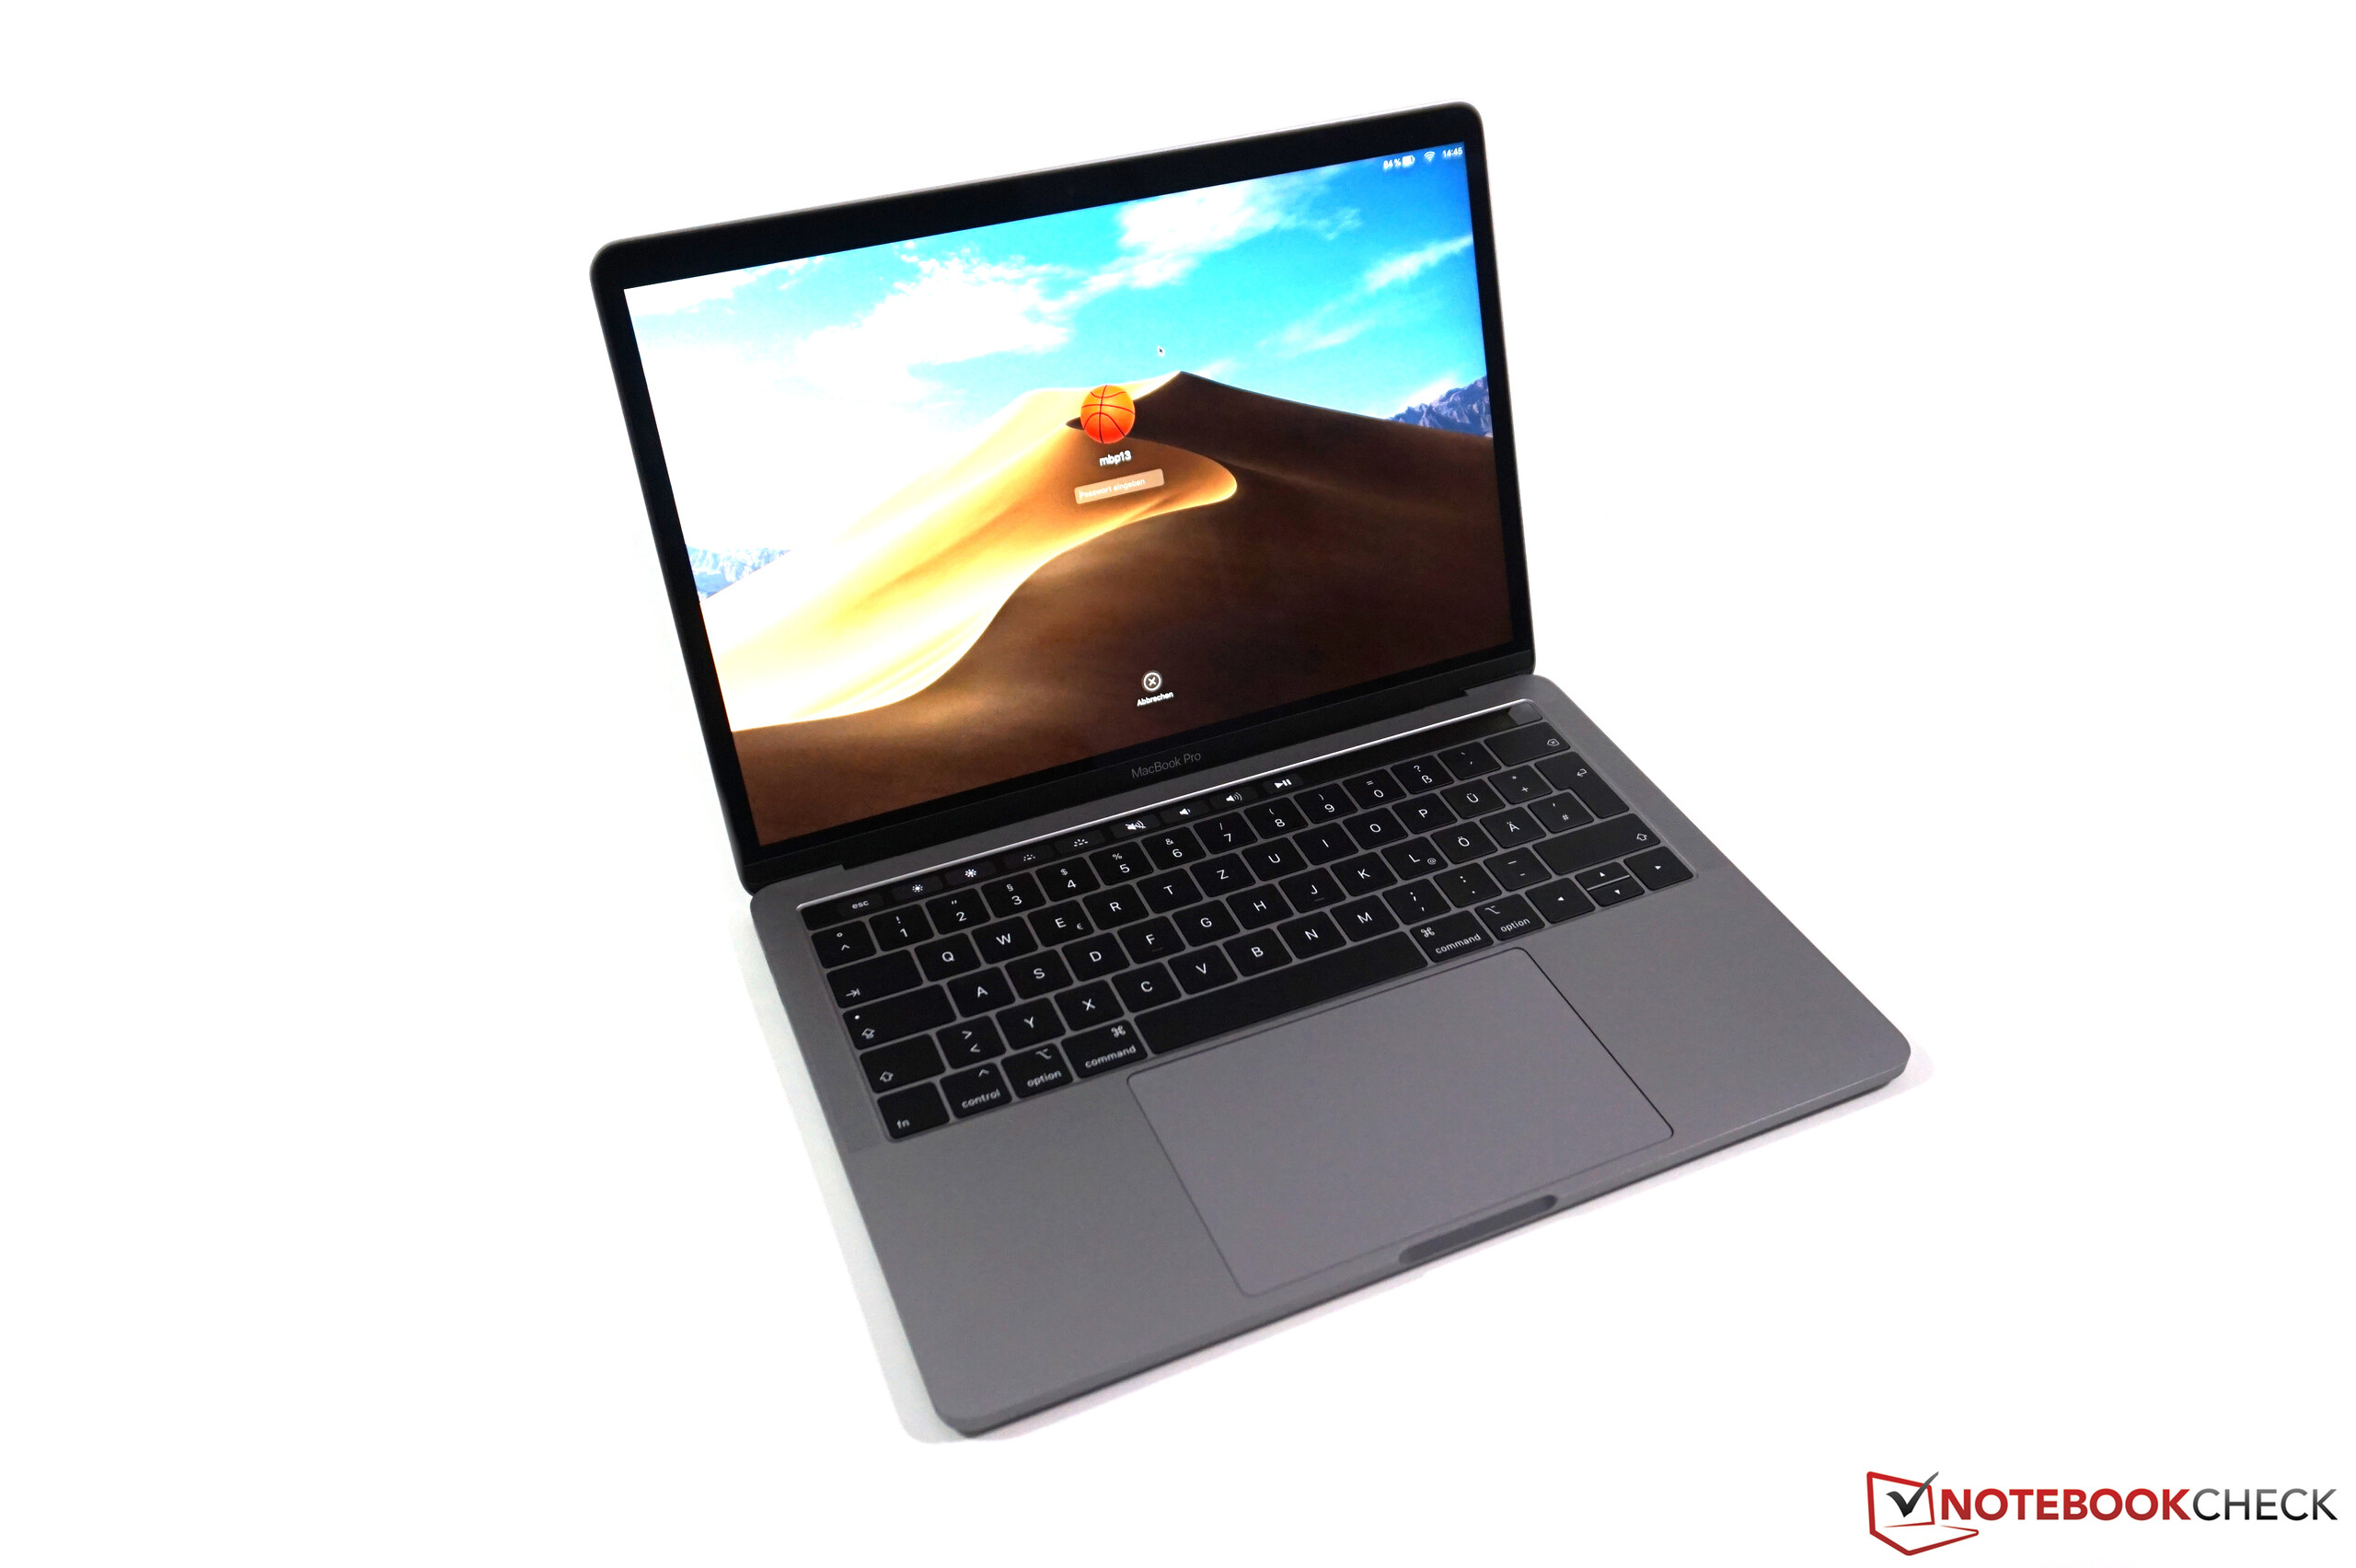
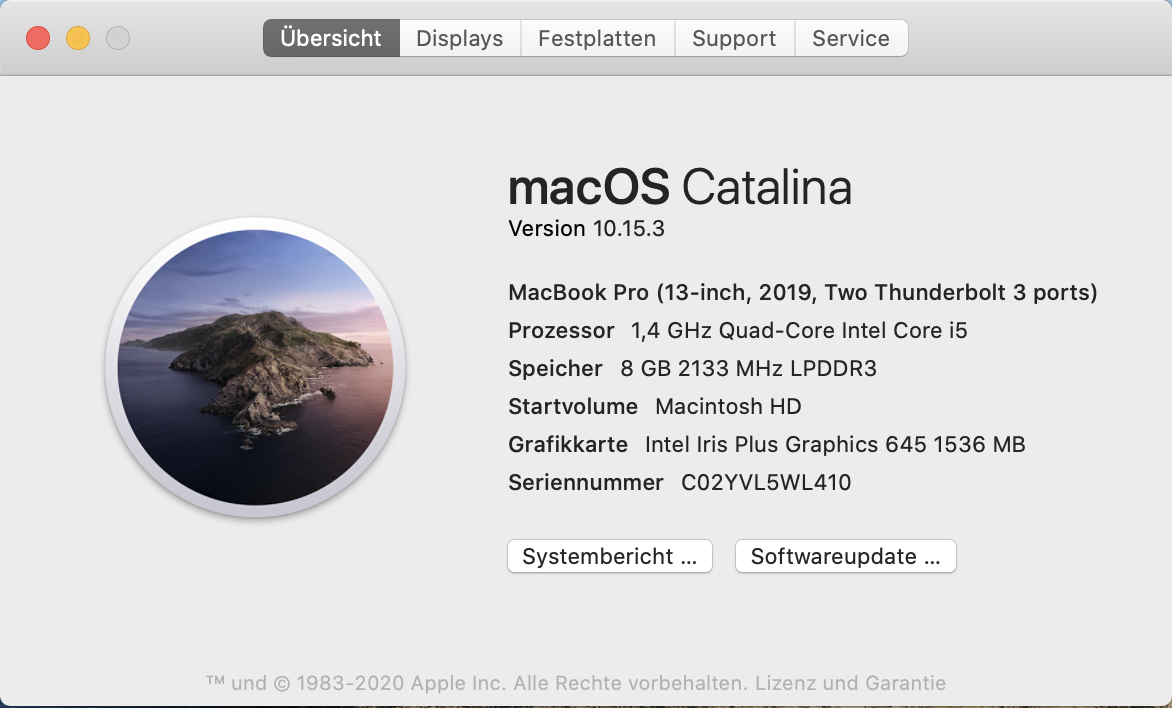
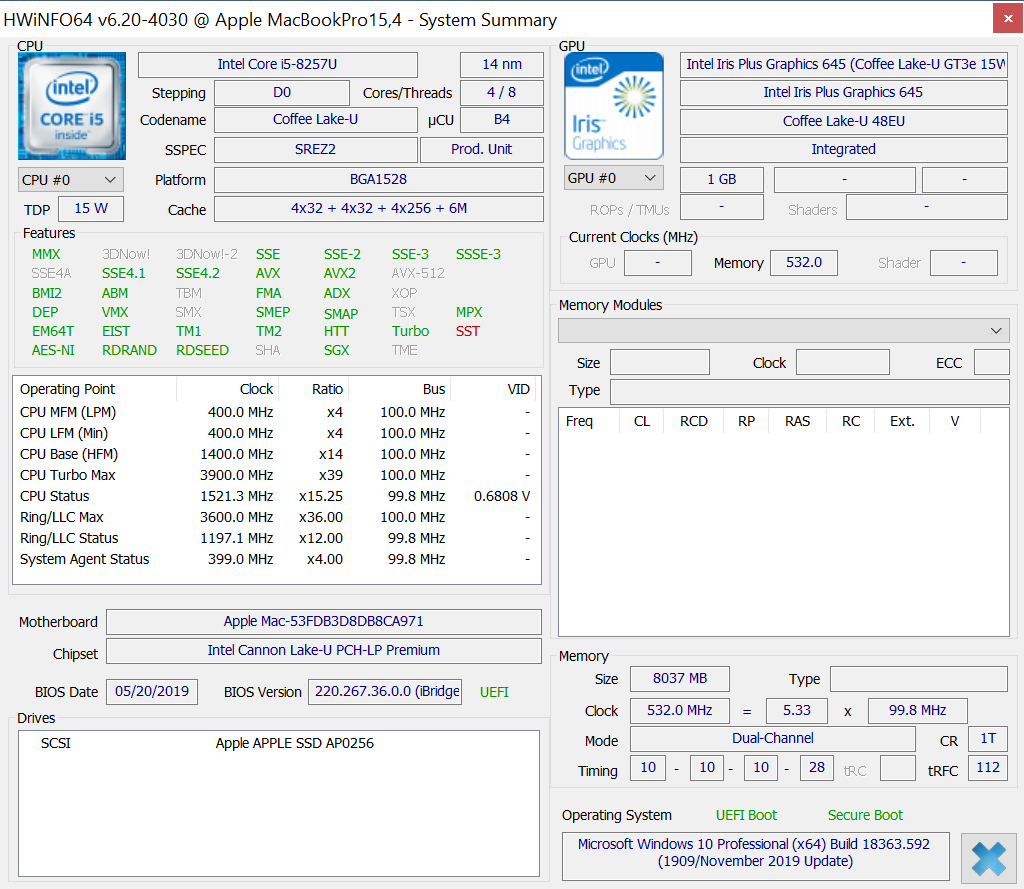
Apple MacBook Pro 13 2019: Em análise o Entry-Level Pro com Touch Bar
Avaliação | Data | Modelo | Peso | Altura | Size | Resolução | Preço |
|---|---|---|---|---|---|---|---|
| 90.6 % v7 (old) | 02/2020 | Apple MacBook Pro 13 2019 2TB3 i5-8257U, Iris Plus Graphics 645 | 1.4 kg | 14.9 mm | 13.30" | 2560x1600 | |
| 90.7 % v7 (old) | 10/2019 | Apple MacBook Pro 13 2019 i5 4TB3 i5-8279U, Iris Plus Graphics 655 | 1.4 kg | 14.9 mm | 13.30" | 2560x1600 | |
| 88.1 % v6 (old) | 07/2017 | Apple MacBook Pro 13 2017 i5-7360U, Iris Plus Graphics 640 | 1.4 kg | 14.9 mm | 13.30" | 2560x1600 | |
| 85.6 % v7 (old) | 08/2019 | Apple Macbook Air 2019 i5-8210Y, UHD Graphics 617 | 1.3 kg | 15.6 mm | 13.30" | 2560x1600 | |
| 87.7 % v6 (old) | 02/2019 | Dell XPS 13 9380 i7 4K i7-8565U, UHD Graphics 620 | 1.2 kg | 11.6 mm | 13.30" | 3840x2160 | |
| 86.3 % v7 (old) | 10/2019 | Razer Blade Stealth i7-1065G7 Iris Plus i7-1065G7, Iris Plus Graphics G7 (Ice Lake 64 EU) | 1.4 kg | 15.3 mm | 13.30" | 1920x1080 | |
| 84.5 % v7 (old) | 08/2019 | HP Envy 13-aq0003ng i7-8565U, GeForce MX250 | 1.2 kg | 14.7 mm | 13.30" | 1920x1080 |
| |||||||||||||||||||||||||
iluminação: 92 %
iluminação com acumulador: 602 cd/m²
Contraste: 1723:1 (Preto: 0.35 cd/m²)
ΔE ColorChecker Calman: 1.7 | ∀{0.5-29.43 Ø4.73}
calibrated: 0.7
ΔE Greyscale Calman: 2.1 | ∀{0.09-98 Ø4.97}
99.4% sRGB (Argyll 1.6.3 3D)
76.7% AdobeRGB 1998 (Argyll 1.6.3 3D)
85.6% AdobeRGB 1998 (Argyll 3D)
99.4% sRGB (Argyll 3D)
96.1% Display P3 (Argyll 3D)
Gamma: 2.18
CCT: 6843 K
| Apple MacBook Pro 13 2019 2TB3 APPA03D, IPS, 2560x1600, 13.3" | Apple MacBook Pro 13 2019 i5 4TB3 APPA03E, IPS, 2560x1600, 13.3" | Apple MacBook Pro 13 2017 APPA033, IPS, 2560x1600, 13.3" | Apple Macbook Air 2019 APPA041, IPS, 2560x1600, 13.3" | Dell XPS 13 9380 i7 4K ID: AUO 282B B133ZAN Dell: 90NTH, IPS, 3840x2160, 13.3" | Razer Blade Stealth i7-1065G7 Iris Plus Sharp LQ133M1JW41, IPS, 1920x1080, 13.3" | HP Envy 13-aq0003ng InfoVision M133NVF3 R2, IPS, 1920x1080, 13.3" | |
|---|---|---|---|---|---|---|---|
| Display | 2% | 2% | -18% | -21% | -18% | -22% | |
| Display P3 Coverage (%) | 96.1 | 98.7 3% | 99.2 3% | 67.4 -30% | 64.8 -33% | 66.2 -31% | 64.4 -33% |
| sRGB Coverage (%) | 99.4 | 100 1% | 99.9 1% | 94.7 -5% | 93.6 -6% | 97.2 -2% | 91.7 -8% |
| AdobeRGB 1998 Coverage (%) | 85.6 | 87.7 2% | 87.1 2% | 69.1 -19% | 65.8 -23% | 67.1 -22% | 65.2 -24% |
| Response Times | 15% | 17% | 16% | -19% | 8% | 35% | |
| Response Time Grey 50% / Grey 80% * (ms) | 50.4 ? | 43.2 ? 14% | 42.8 ? 15% | 42.4 ? 16% | 64.8 ? -29% | 45.2 ? 10% | 31 ? 38% |
| Response Time Black / White * (ms) | 35.2 ? | 29.6 ? 16% | 28.8 ? 18% | 29.6 ? 16% | 38 ? -8% | 33.2 ? 6% | 24 ? 32% |
| PWM Frequency (Hz) | 116300 ? | 111100 ? | 22730 ? | 4000 ? | |||
| Screen | -26% | -6% | -8% | -45% | -5% | -51% | |
| Brightness middle (cd/m²) | 603 | 518 -14% | 588 -2% | 421 -30% | 428.3 -29% | 422.6 -30% | 768 27% |
| Brightness (cd/m²) | 577 | 480 -17% | 561 -3% | 393 -32% | 414 -28% | 404 -30% | 778 35% |
| Brightness Distribution (%) | 92 | 87 -5% | 92 0% | 88 -4% | 88 -4% | 87 -5% | 82 -11% |
| Black Level * (cd/m²) | 0.35 | 0.34 3% | 0.45 -29% | 0.34 3% | 0.27 23% | 0.35 -0% | 0.48 -37% |
| Contrast (:1) | 1723 | 1524 -12% | 1307 -24% | 1238 -28% | 1586 -8% | 1207 -30% | 1600 -7% |
| Colorchecker dE 2000 * | 1.7 | 1.5 12% | 1.7 -0% | 1.5 12% | 2.69 -58% | 1.02 40% | 3.49 -105% |
| Colorchecker dE 2000 max. * | 3.1 | 2.8 10% | 3.5 -13% | 3.8 -23% | 6.19 -100% | 3.06 1% | 7.41 -139% |
| Colorchecker dE 2000 calibrated * | 0.7 | 2.6 -271% | 2.01 -187% | 0.95 -36% | 2.07 -196% | ||
| Greyscale dE 2000 * | 2.1 | 2 5% | 1.9 10% | 1.2 43% | 3.7 -76% | 1 52% | 4.09 -95% |
| Gamma | 2.18 101% | 2.22 99% | 2.33 94% | 2.21 100% | 2.1 105% | 2.21 100% | 2.54 87% |
| CCT | 6843 95% | 6898 94% | 6738 96% | 6694 97% | 6706 97% | 6502 100% | 6452 101% |
| Color Space (Percent of AdobeRGB 1998) (%) | 76.7 | 78.4 2% | 77.92 2% | 61.3 -20% | 60.4 -21% | 62.1 -19% | 60 -22% |
| Color Space (Percent of sRGB) (%) | 99.4 | 99.9 1% | 99.94 1% | 94.6 -5% | 93.5 -6% | 97.1 -2% | 92 -7% |
| Média Total (Programa/Configurações) | -3% /
-16% | 4% /
-1% | -3% /
-7% | -28% /
-37% | -5% /
-6% | -13% /
-35% |
* ... menor é melhor
Exibir tempos de resposta
| ↔ Tempo de resposta preto para branco | ||
|---|---|---|
| 35.2 ms ... ascensão ↗ e queda ↘ combinadas | ↗ 19.6 ms ascensão | 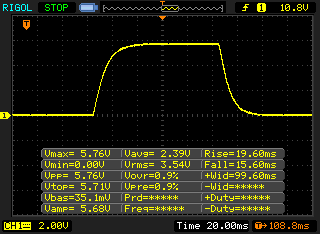 |
| ↘ 15.6 ms queda | ||
| A tela mostra taxas de resposta lentas em nossos testes e será insatisfatória para os jogadores. Em comparação, todos os dispositivos testados variam de 0.1 (mínimo) a 240 (máximo) ms. » 93 % de todos os dispositivos são melhores. Isso significa que o tempo de resposta medido é pior que a média de todos os dispositivos testados (19.9 ms). | ||
| ↔ Tempo de resposta 50% cinza a 80% cinza | ||
| 50.4 ms ... ascensão ↗ e queda ↘ combinadas | ↗ 24.4 ms ascensão | 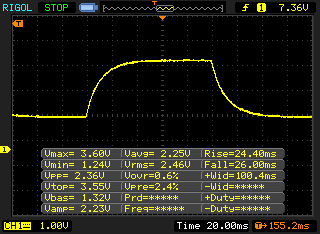 |
| ↘ 26 ms queda | ||
| A tela mostra taxas de resposta lentas em nossos testes e será insatisfatória para os jogadores. Em comparação, todos os dispositivos testados variam de 0.165 (mínimo) a 636 (máximo) ms. » 87 % de todos os dispositivos são melhores. Isso significa que o tempo de resposta medido é pior que a média de todos os dispositivos testados (31.1 ms). | ||
Cintilação da tela / PWM (modulação por largura de pulso)
| Tela tremeluzindo/PWM detectado | 116300 Hz | ≤ 66 % configuração de brilho | 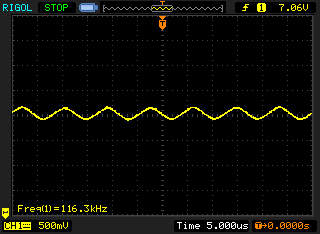 |
A luz de fundo da tela pisca em 116300 Hz (pior caso, por exemplo, utilizando PWM) Cintilação detectada em uma configuração de brilho de 66 % e abaixo. Não deve haver cintilação ou PWM acima desta configuração de brilho. A frequência de 116300 Hz é bastante alta, então a maioria dos usuários sensíveis ao PWM não deve notar nenhuma oscilação. [pwm_comparison] Em comparação: 52 % de todos os dispositivos testados não usam PWM para escurecer a tela. Se PWM foi detectado, uma média de 7798 (mínimo: 5 - máximo: 343500) Hz foi medida. | |||
| PCMark 8 Home Score Accelerated v2 | 3986 pontos | |
| PCMark 8 Creative Score Accelerated v2 | 5589 pontos | |
| PCMark 8 Work Score Accelerated v2 | 4238 pontos | |
| PCMark 10 Score | 3751 pontos | |
Ajuda | ||

| 3DMark 11 Performance | 3238 pontos | |
| 3DMark Fire Strike Score | 1736 pontos | |
| 3DMark Time Spy Score | 624 pontos | |
Ajuda | ||
| baixo | média | alto | ultra | |
|---|---|---|---|---|
| BioShock Infinite (2013) | 104.6 | 60 | 51.6 | 22.1 |
| Dota 2 Reborn (2015) | 76.5 | 57.3 | 29 | 26.9 |
| X-Plane 11.11 (2018) | 37.4 | 26.1 | 22.5 |
Barulho
| Ocioso |
| 29.5 / 29.5 / 29.5 dB |
| Carga |
| 31.1 / 39.3 dB |
 | ||
30 dB silencioso 40 dB(A) audível 50 dB(A) ruidosamente alto |
||
min: | ||
| Apple MacBook Pro 13 2019 2TB3 Iris Plus Graphics 645, i5-8257U, Apple SSD AP0256 | Apple MacBook Pro 13 2019 i5 4TB3 Iris Plus Graphics 655, i5-8279U, Apple SSD AP0512 | Apple MacBook Pro 13 2017 Iris Plus Graphics 640, i5-7360U, Apple SSD AP0128 | Apple Macbook Air 2019 UHD Graphics 617, i5-8210Y, Apple SSD AP0256 | Dell XPS 13 9380 i7 4K UHD Graphics 620, i7-8565U, Samsung SSD PM981 MZVLB512HAJQ | Razer Blade Stealth i7-1065G7 Iris Plus Iris Plus Graphics G7 (Ice Lake 64 EU), i7-1065G7, Samsung SSD PM981 MZVLB256HAHQ | HP Envy 13-aq0003ng GeForce MX250, i7-8565U, Toshiba KBG30ZMV512G | |
|---|---|---|---|---|---|---|---|
| Noise | -1% | -2% | -2% | -4% | -3% | -2% | |
| desligado / ambiente * (dB) | 29.5 | 29 2% | 30.2 -2% | 29.5 -0% | 28.4 4% | 28.3 4% | 30 -2% |
| Idle Minimum * (dB) | 29.5 | 29 2% | 30.2 -2% | 29.5 -0% | 29.4 -0% | 28.3 4% | 30 -2% |
| Idle Average * (dB) | 29.5 | 29 2% | 30.2 -2% | 29.5 -0% | 29.4 -0% | 28.3 4% | 30 -2% |
| Idle Maximum * (dB) | 29.5 | 29 2% | 30.2 -2% | 29.5 -0% | 29.4 -0% | 28.3 4% | 30 -2% |
| Load Average * (dB) | 31.1 | 33.9 -9% | 32.9 -6% | 34 -9% | 34.6 -11% | 33.5 -8% | |
| Load Maximum * (dB) | 39.3 | 41.8 -6% | 39.3 -0% | 41 -4% | 46.8 -19% | 49.4 -26% | 39.5 -1% |
| Witcher 3 ultra * (dB) | 34.5 |
* ... menor é melhor
(±) A temperatura máxima no lado superior é 44.9 °C / 113 F, em comparação com a média de 35.9 °C / 97 F , variando de 21.4 a 59 °C para a classe Subnotebook.
(-) A parte inferior aquece até um máximo de 45.1 °C / 113 F, em comparação com a média de 39.2 °C / 103 F
(+) Em uso inativo, a temperatura média para o lado superior é 24.8 °C / 77 F, em comparação com a média do dispositivo de 30.8 °C / ### class_avg_f### F.
(+) Os apoios para as mãos e o touchpad estão atingindo a temperatura máxima da pele (32.1 °C / 89.8 F) e, portanto, não estão quentes.
(-) A temperatura média da área do apoio para as mãos de dispositivos semelhantes foi 28.2 °C / 82.8 F (-3.9 °C / -7 F).
Apple MacBook Pro 13 2019 2TB3 análise de áudio
(±) | o volume do alto-falante é médio, mas bom (###valor### dB)
Graves 100 - 315Hz
(±) | graves reduzidos - em média 10.7% menor que a mediana
(±) | a linearidade dos graves é média (8.7% delta para a frequência anterior)
Médios 400 - 2.000 Hz
(+) | médios equilibrados - apenas 4.6% longe da mediana
(+) | médios são lineares (3.8% delta para frequência anterior)
Altos 2 - 16 kHz
(+) | agudos equilibrados - apenas 2.3% longe da mediana
(+) | os máximos são lineares (4.7% delta da frequência anterior)
Geral 100 - 16.000 Hz
(±) | a linearidade do som geral é média (15.6% diferença em relação à mediana)
Comparado com a mesma classe
» 36% de todos os dispositivos testados nesta classe foram melhores, 5% semelhantes, 59% piores
» O melhor teve um delta de 5%, a média foi 18%, o pior foi 53%
Comparado com todos os dispositivos testados
» 23% de todos os dispositivos testados foram melhores, 5% semelhantes, 72% piores
» O melhor teve um delta de 4%, a média foi 24%, o pior foi 134%
Apple MacBook Pro 13 2019 i5 4TB3 análise de áudio
(±) | o volume do alto-falante é médio, mas bom (###valor### dB)
Graves 100 - 315Hz
(±) | graves reduzidos - em média 12.8% menor que a mediana
(±) | a linearidade dos graves é média (11.2% delta para a frequência anterior)
Médios 400 - 2.000 Hz
(+) | médios equilibrados - apenas 3.2% longe da mediana
(+) | médios são lineares (4.6% delta para frequência anterior)
Altos 2 - 16 kHz
(+) | agudos equilibrados - apenas 3.4% longe da mediana
(+) | os máximos são lineares (5.3% delta da frequência anterior)
Geral 100 - 16.000 Hz
(+) | o som geral é linear (13.7% diferença em relação à mediana)
Comparado com a mesma classe
» 24% de todos os dispositivos testados nesta classe foram melhores, 5% semelhantes, 71% piores
» O melhor teve um delta de 5%, a média foi 18%, o pior foi 53%
Comparado com todos os dispositivos testados
» 15% de todos os dispositivos testados foram melhores, 4% semelhantes, 81% piores
» O melhor teve um delta de 4%, a média foi 24%, o pior foi 134%
| desligado | |
| Ocioso | |
| Carga |
|
Key:
min: | |
| Apple MacBook Pro 13 2019 2TB3 i5-8257U, Iris Plus Graphics 645, Apple SSD AP0256, IPS, 2560x1600, 13.3" | Apple MacBook Pro 13 2019 i5 4TB3 i5-8279U, Iris Plus Graphics 655, Apple SSD AP0512, IPS, 2560x1600, 13.3" | Apple MacBook Pro 13 2017 i5-7360U, Iris Plus Graphics 640, Apple SSD AP0128, IPS, 2560x1600, 13.3" | Dell XPS 13 9380 i7 4K i7-8565U, UHD Graphics 620, Samsung SSD PM981 MZVLB512HAJQ, IPS, 3840x2160, 13.3" | Razer Blade Stealth i7-1065G7 Iris Plus i7-1065G7, Iris Plus Graphics G7 (Ice Lake 64 EU), Samsung SSD PM981 MZVLB256HAHQ, IPS, 1920x1080, 13.3" | HP Envy 13-aq0003ng i7-8565U, GeForce MX250, Toshiba KBG30ZMV512G, IPS, 1920x1080, 13.3" | Média Intel Iris Plus Graphics 645 | Média da turma Subnotebook | |
|---|---|---|---|---|---|---|---|---|
| Power Consumption | -8% | -5% | -37% | -45% | -32% | -4% | -16% | |
| Idle Minimum * (Watt) | 2.1 | 2.2 -5% | 3.7 -76% | 5.2 -148% | 5.9 -181% | 3.9 -86% | 2.2 ? -5% | 3.78 ? -80% |
| Idle Average * (Watt) | 6.9 | 7.2 -4% | 5.2 25% | 8.6 -25% | 8.1 -17% | 7.8 -13% | 7.4 ? -7% | 6.6 ? 4% |
| Idle Maximum * (Watt) | 7.8 | 8.2 -5% | 7.6 3% | 10.5 -35% | 11.2 -44% | 10.8 -38% | 8.2 ? -5% | 7.93 ? -2% |
| Load Average * (Watt) | 42 | 54 -29% | 41.6 1% | 44.2 -5% | 44.3 -5% | 53 -26% | 44 ? -5% | 41.8 ? -0% |
| Load Maximum * (Watt) | 64.5 | 63.9 1% | 50.5 22% | 47.5 26% | 50.2 22% | 62.7 3% | 64.3 ? -0% | 64.7 ? -0% |
| Witcher 3 ultra * (Watt) | 41.9 |
* ... menor é melhor
| Apple MacBook Pro 13 2019 2TB3 i5-8257U, Iris Plus Graphics 645, 58.2 Wh | Apple MacBook Pro 13 2019 i5 4TB3 i5-8279U, Iris Plus Graphics 655, 58 Wh | Apple MacBook Pro 13 2017 i5-7360U, Iris Plus Graphics 640, 54.5 Wh | Apple Macbook Air 2019 i5-8210Y, UHD Graphics 617, 49.9 Wh | Dell XPS 13 9380 i7 4K i7-8565U, UHD Graphics 620, 52 Wh | Razer Blade Stealth i7-1065G7 Iris Plus i7-1065G7, Iris Plus Graphics G7 (Ice Lake 64 EU), 53.1 Wh | HP Envy 13-aq0003ng i7-8565U, GeForce MX250, 53.2 Wh | Média da turma Subnotebook | |
|---|---|---|---|---|---|---|---|---|
| Battery Runtime | -12% | -12% | -9% | -41% | -25% | -35% | 12% | |
| WiFi Websurfing (h) | 13 | 11.5 -12% | 11.4 -12% | 11.5 -12% | 7.7 -41% | 9.7 -25% | 8.5 -35% | 14 ? 8% |
| WiFi Websurfing max. Brightness (h) | 7.4 | 7 -5% | 8.62 ? 16% |
Pro
Contra
Verdict – Cheaper is better

Após nossas análises dos dois modelos do MacBook Pro 13, nosso veredicto é bem claro: O modelo mais barato é a melhor opção para a maioria dos usuários. A única desvantagem real é a menor quantidade de portas Thunderbolt 3. O desempenho também é um pouco menor, mas somos surpreendidos positivamente pelo MBP 13 menor, para ser honestos. As especificações oficiais da Apple sugerem uma lacuna maior, mas a diferença real é muito pequena e não é perceptível em situações cotidianas.
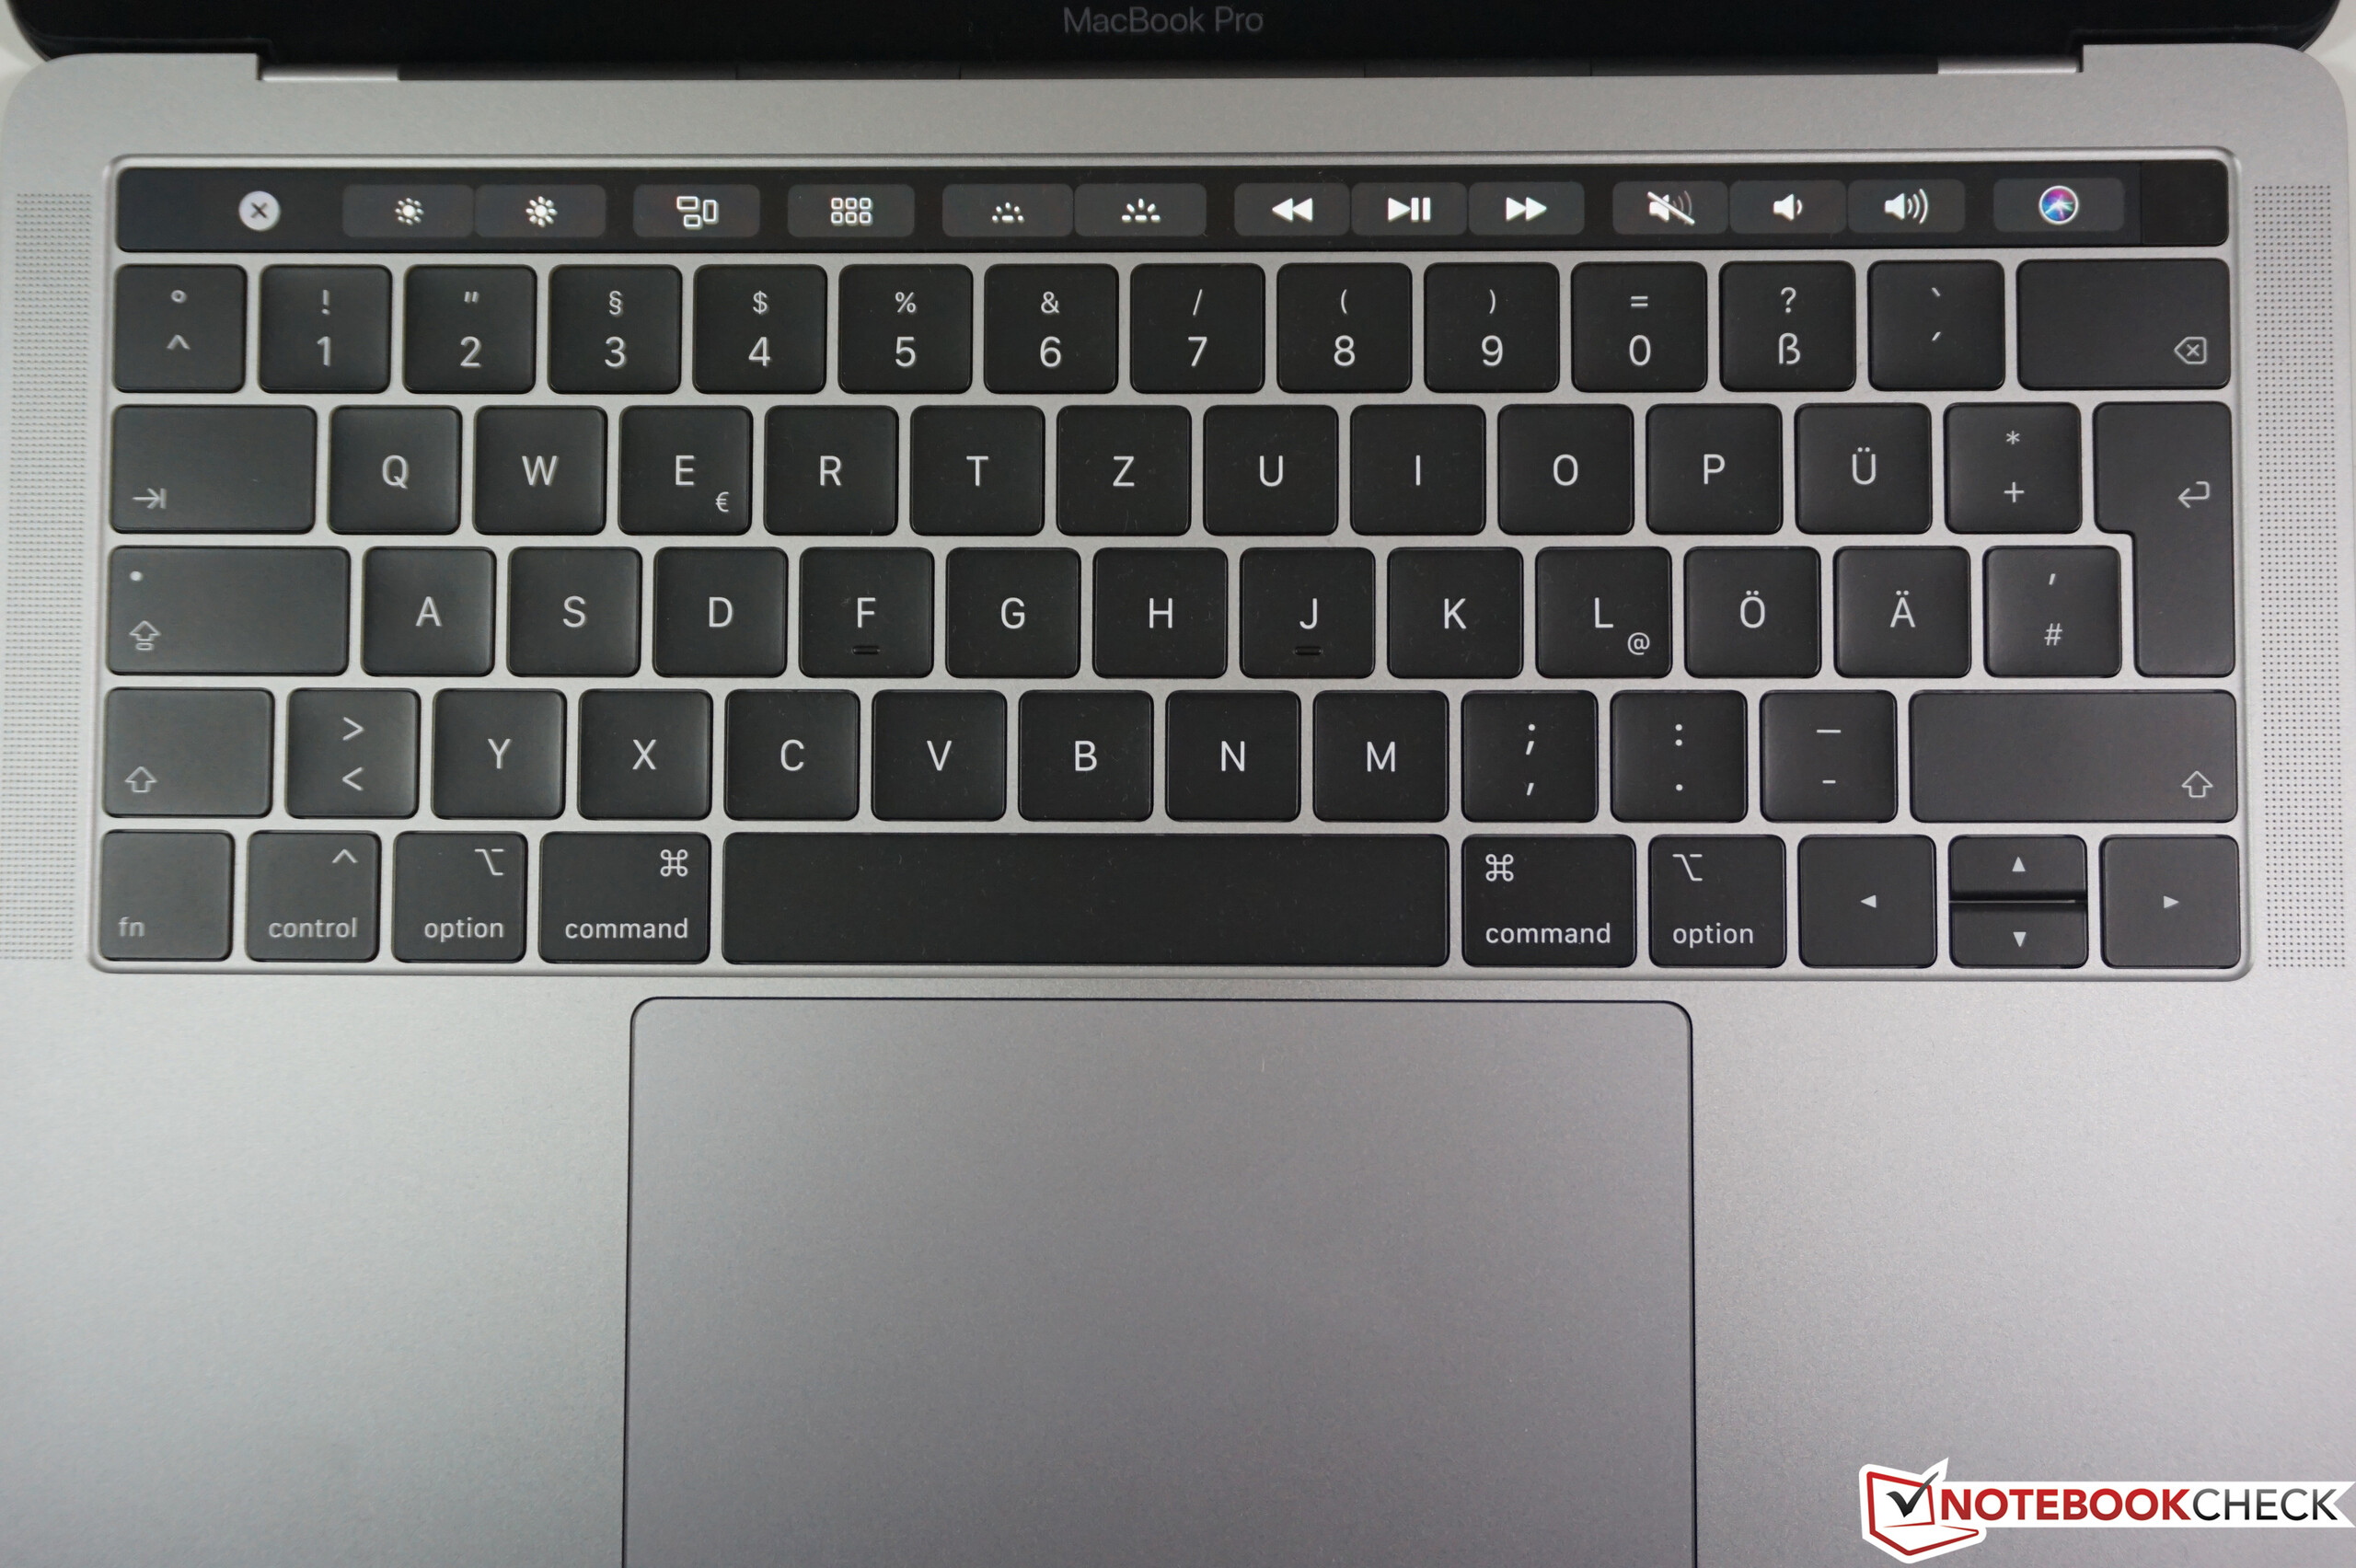
A tela é extremamente boa e, em suma, o MacBook Pro 13 é um ótimo pacote geral. O único problema ainda é o teclado ou os possíveis problemas de confiabilidade, respectivamente. De acordo com a Apple, houve melhorias, mas as más experiências dos anos anteriores não representam um ótimo quadro para a contribuição da Butterfly. Se você precisa de um novo subportátil agora, pode definitivamente adquirir esse modelo, mas os rumores sugerem que o próximo MBP 13 (ou MBP 14) receberá o novo teclado, portanto você pode ter um dispositivo ainda melhor daqui a alguns meses.
O MacBook Pro 13, mais barato, é a melhor escolha na linha da Apple. Quase tão rápido quanto o modelo mais caro e muito mais poderoso que o MacBook Air.
Isso nos deixa com a comparação do MacBook Air levemente mais compacto. O Air é um pouco mais acessível, mas ainda não é uma pechincha por mais de 1.300 Euros. O MacBook Pro 13, por outro lado, é muito mais poderoso e possui uma tela ainda melhor, por isso recomendamos claramente o MacBook Pro 13. Também deve ter um desempenho muito melhor nos próximos anos.
Apple MacBook Pro 13 2019 2TB3
- 02/04/2020 v7 (old)
Andreas Osthoff
Price comparison
