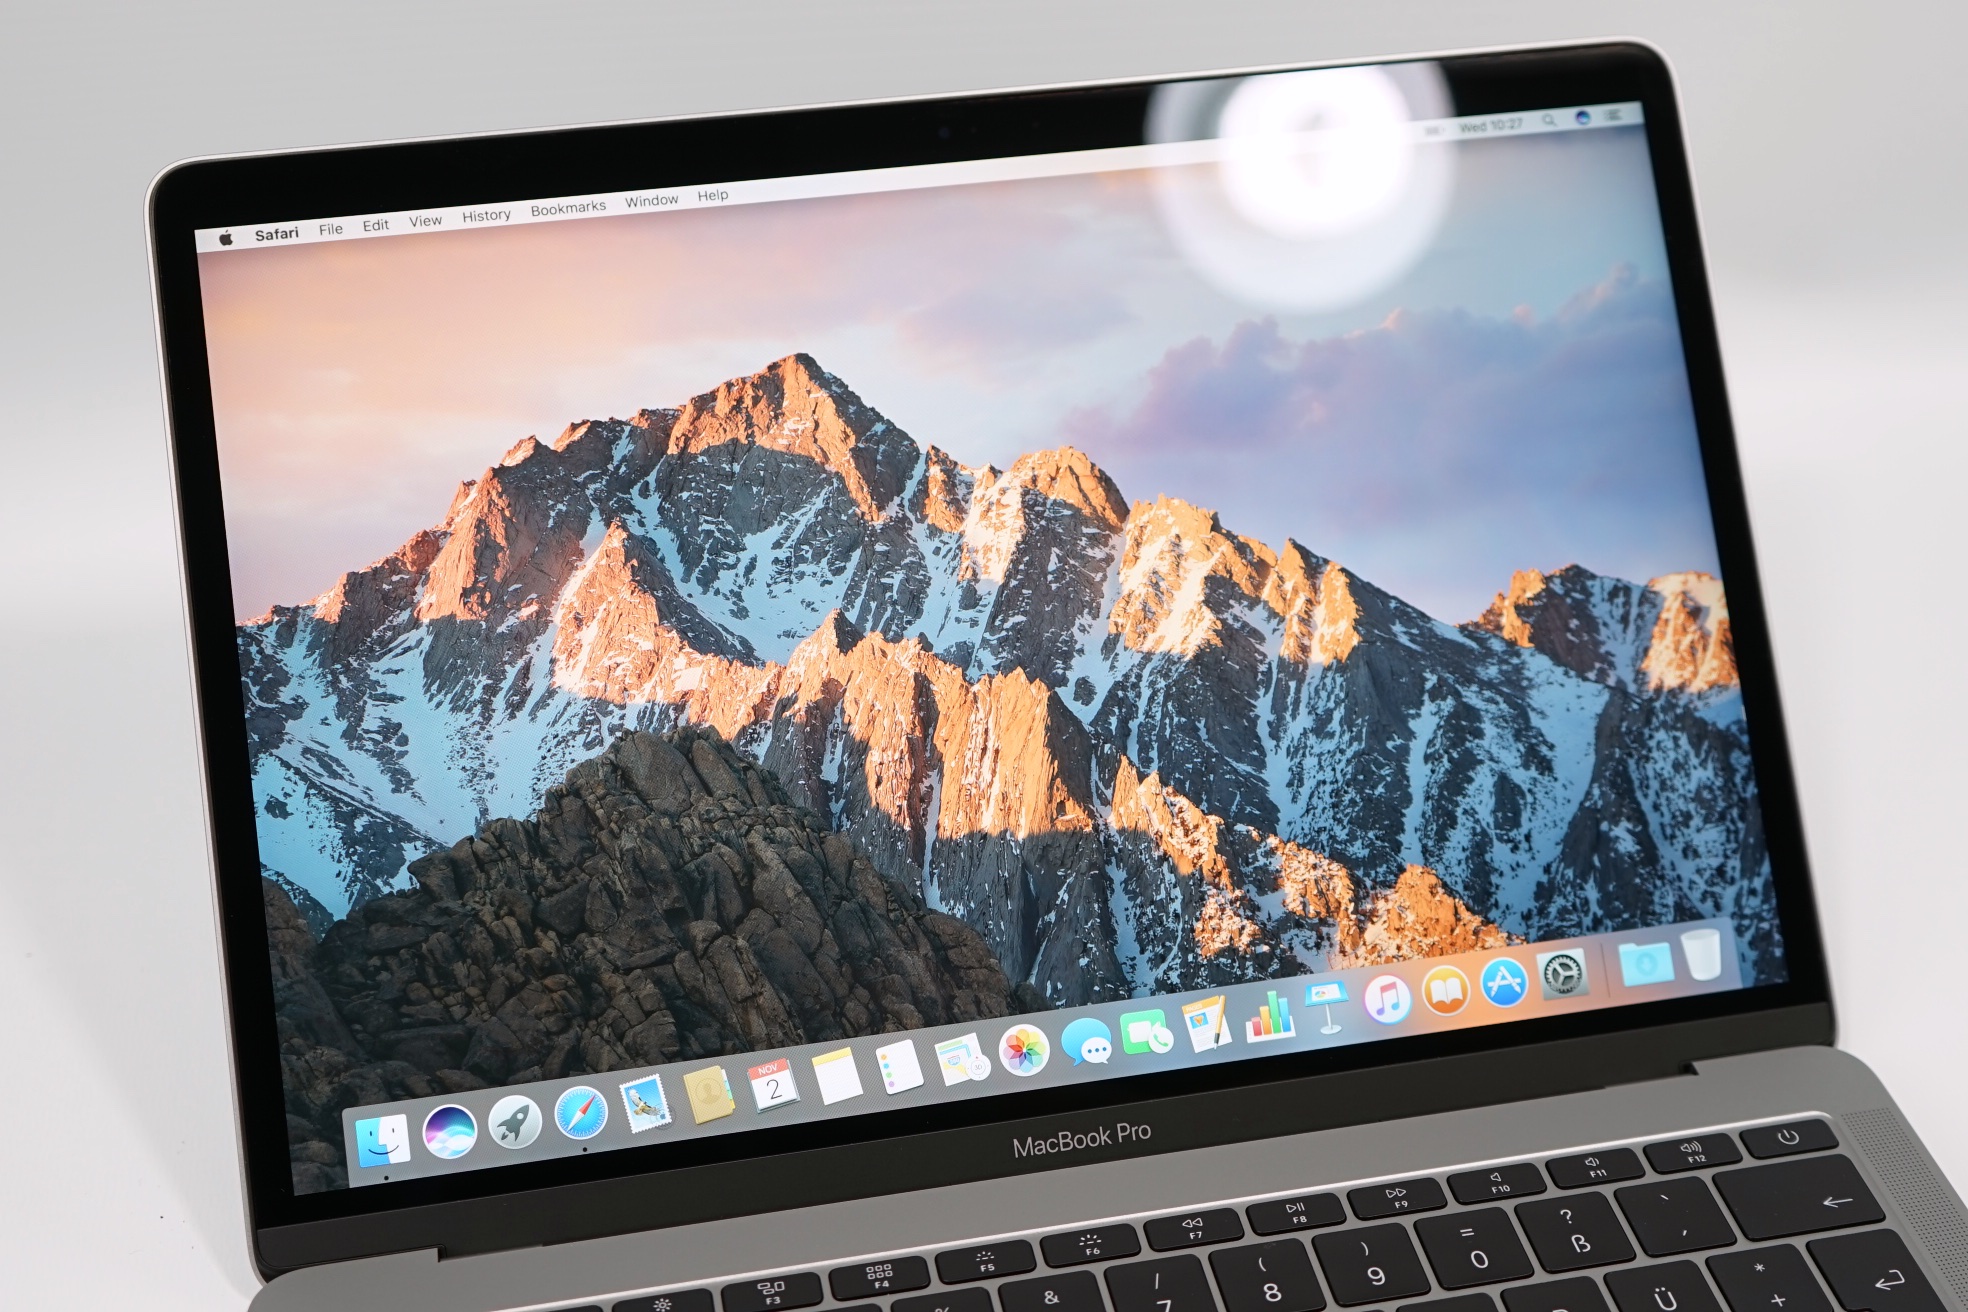
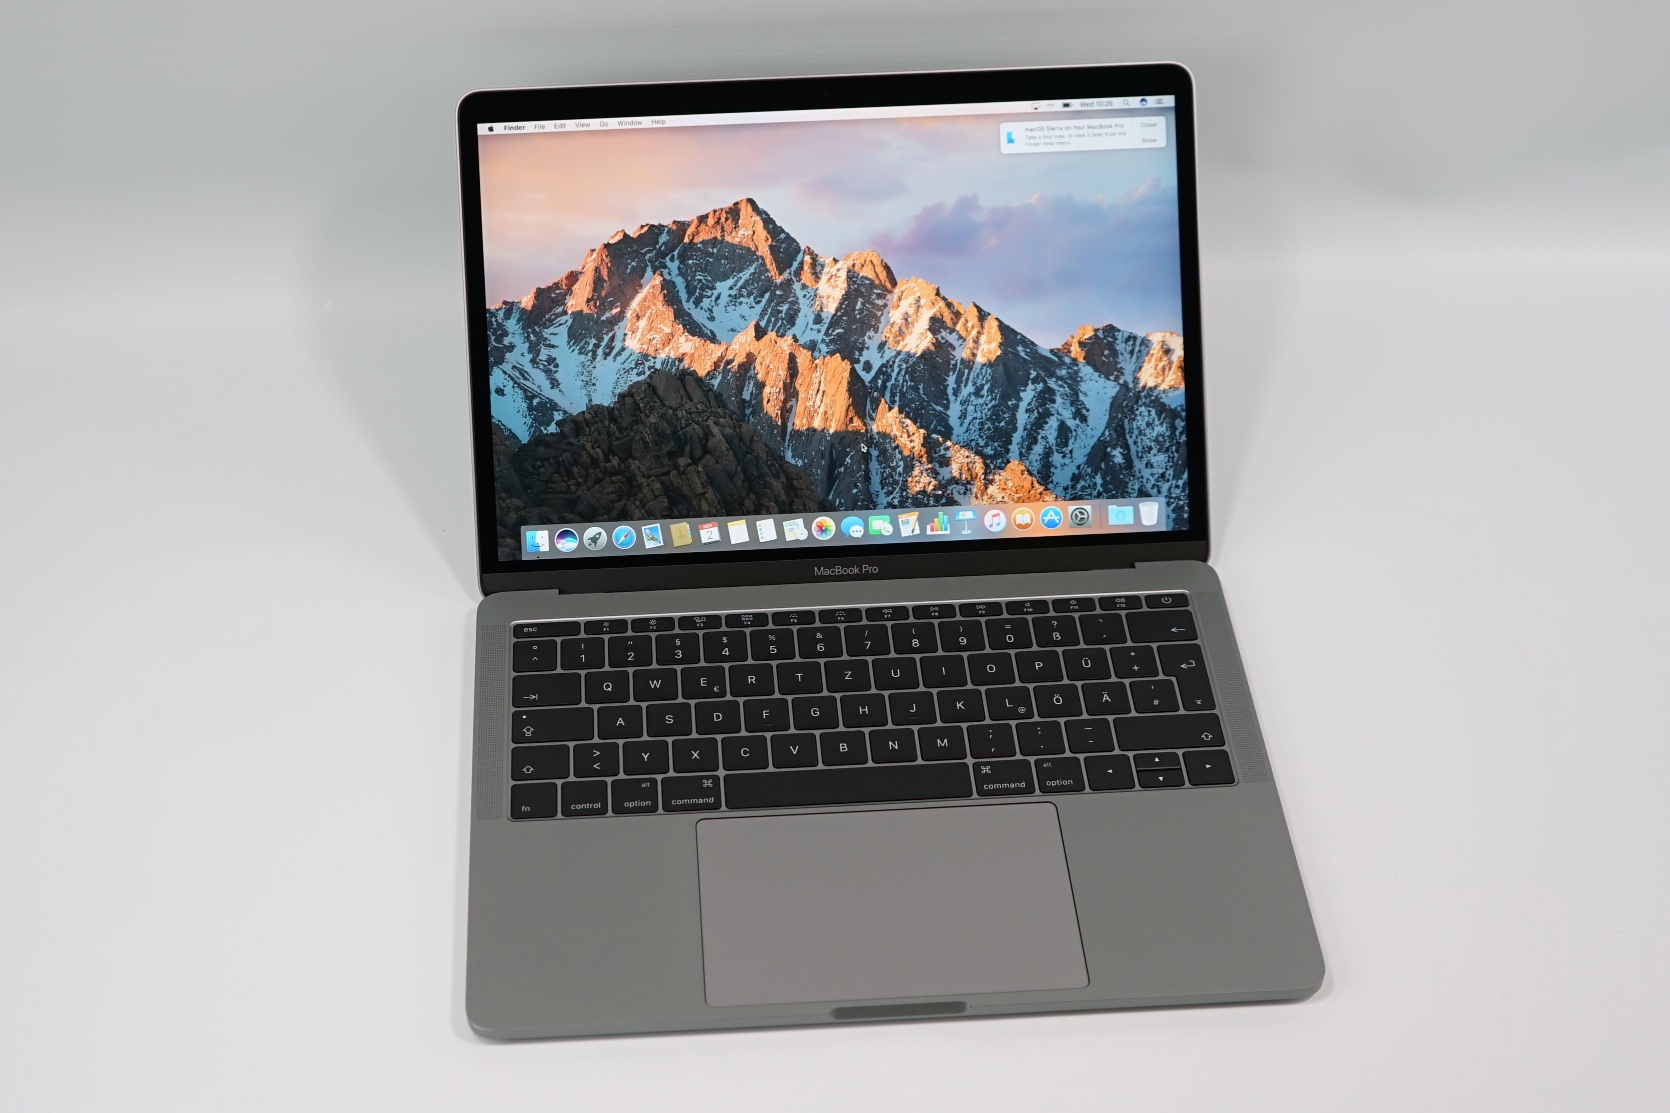
Breve Análise do Apple MacBook Pro 13 (Meados 2017, i5, sem barra táctil)
| |||||||||||||||||||||||||
iluminação: 92 %
iluminação com acumulador: 588 cd/m²
Contraste: 1307:1 (Preto: 0.45 cd/m²)
ΔE ColorChecker Calman: 1.7 | ∀{0.5-29.43 Ø4.71}
ΔE Greyscale Calman: 1.9 | ∀{0.09-98 Ø4.96}
99.94% sRGB (Argyll 1.6.3 3D)
77.92% AdobeRGB 1998 (Argyll 1.6.3 3D)
87.1% AdobeRGB 1998 (Argyll 3D)
99.9% sRGB (Argyll 3D)
99.2% Display P3 (Argyll 3D)
Gamma: 2.33
CCT: 6738 K
| Apple MacBook Pro 13 2017 APPA033, , 2560x1600, 13.3" | Apple MacBook Pro 13 2016 APPA034, , 2560x1600, 13.3" | Apple MacBook Pro 13 2017 Touchbar i5 APPA034, , 2560x1600, 13.3" | Lenovo ThinkPad X1 Carbon 2017-20HR0021GE B140HAN03_1, , 1920x1080, 14" | Razer Blade Stealth QHD i7-7500U Sharp SHP142F (LQ125T1JW02), , 2560x1440, 12.5" | Dell XPS 13 9360 QHD+ i7 Sharp SHP144A, , 3200x1800, 13.3" | |
|---|---|---|---|---|---|---|
| Display | -1% | -1% | -26% | -18% | -25% | |
| Display P3 Coverage (%) | 99.2 | 97.1 -2% | 98.6 -1% | 61.6 -38% | 68.7 -31% | 62.8 -37% |
| sRGB Coverage (%) | 99.9 | 99.8 0% | 100 0% | 87.6 -12% | 95.8 -4% | 89.4 -11% |
| AdobeRGB 1998 Coverage (%) | 87.1 | 86.7 0% | 86.5 -1% | 62.6 -28% | 69.9 -20% | 64.6 -26% |
| Response Times | -45% | -15% | -9% | -1% | -2% | |
| Response Time Grey 50% / Grey 80% * (ms) | 42.8 ? | 47.2 ? -10% | 48 ? -12% | 48 ? -12% | 37 ? 14% | 43.6 ? -2% |
| Response Time Black / White * (ms) | 28.8 ? | 51.6 ? -79% | 33.6 ? -17% | 30.4 ? -6% | 33.4 ? -16% | 29.2 ? -1% |
| PWM Frequency (Hz) | 119000 ? | 200 ? | ||||
| Screen | -3% | 15% | -42% | -48% | -43% | |
| Brightness middle (cd/m²) | 588 | 600 2% | 551 -6% | 278 -53% | 402 -32% | 396.2 -33% |
| Brightness (cd/m²) | 561 | 564 1% | 514 -8% | 271 -52% | 382 -32% | 357 -36% |
| Brightness Distribution (%) | 92 | 89 -3% | 88 -4% | 91 -1% | 88 -4% | 84 -9% |
| Black Level * (cd/m²) | 0.45 | 0.57 -27% | 0.48 -7% | 0.16 64% | 0.45 -0% | 0.266 41% |
| Contrast (:1) | 1307 | 1053 -19% | 1148 -12% | 1738 33% | 893 -32% | 1489 14% |
| Colorchecker dE 2000 * | 1.7 | 1.5 12% | 0.8 53% | 4.5 -165% | 3.6 -112% | 3.9 -129% |
| Colorchecker dE 2000 max. * | 3.5 | 2.9 17% | 1.4 60% | 8.4 -140% | 7.5 -114% | 7.58 -117% |
| Greyscale dE 2000 * | 1.9 | 2 -5% | 1 47% | 3.2 -68% | 4.3 -126% | 4.16 -119% |
| Gamma | 2.33 94% | 2.27 97% | 2.16 102% | 2.02 109% | 2.1 105% | 2.31 95% |
| CCT | 6738 96% | 6855 95% | 6672 97% | 7042 92% | 6572 99% | 6514 100% |
| Color Space (Percent of AdobeRGB 1998) (%) | 77.92 | 77 -1% | 57 -27% | 62.3 -20% | 57.5 -26% | |
| Color Space (Percent of sRGB) (%) | 99.94 | 92 -8% | 87.5 -12% | 95.7 -4% | 88.7 -11% | |
| Média Total (Programa/Configurações) | -16% /
-8% | -0% /
7% | -26% /
-34% | -22% /
-36% | -23% /
-33% |
* ... menor é melhor


Barulho
| Ocioso |
| 30.2 / 30.2 / 30.2 dB |
| Carga |
| 32.9 / 39.3 dB |
 | ||
30 dB silencioso 40 dB(A) audível 50 dB(A) ruidosamente alto |
||
min: | ||
(±) A temperatura máxima no lado superior é 43.5 °C / 110 F, em comparação com a média de 35.9 °C / 97 F , variando de 21.4 a 59 °C para a classe Subnotebook.
(±) A parte inferior aquece até um máximo de 40.6 °C / 105 F, em comparação com a média de 39.2 °C / 103 F
(+) Em uso inativo, a temperatura média para o lado superior é 26.1 °C / 79 F, em comparação com a média do dispositivo de 30.8 °C / ### class_avg_f### F.
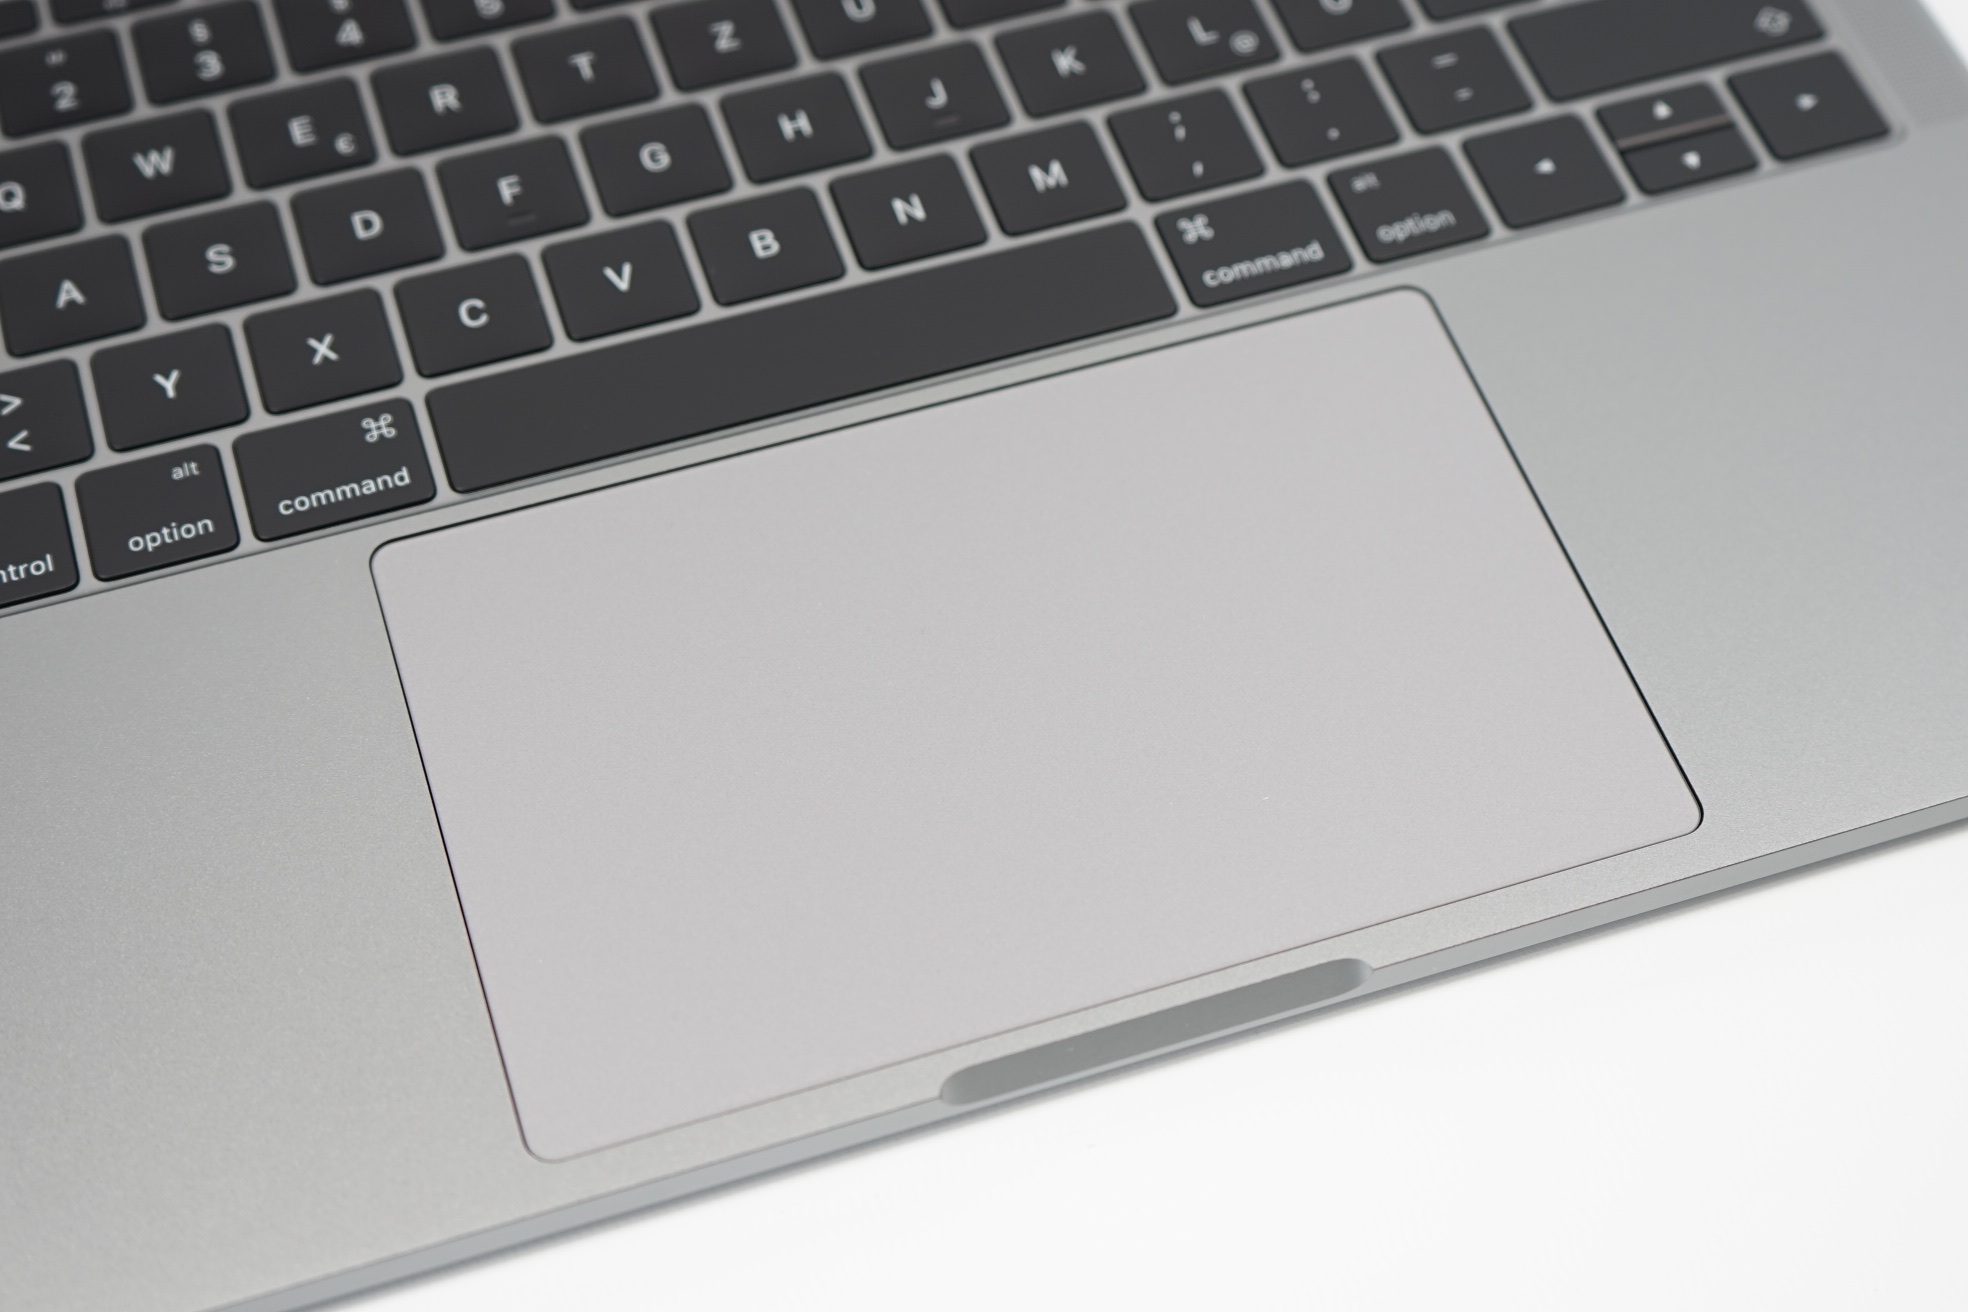
(+) Os apoios para as mãos e o touchpad estão atingindo a temperatura máxima da pele (32.7 °C / 90.9 F) e, portanto, não estão quentes.
(-) A temperatura média da área do apoio para as mãos de dispositivos semelhantes foi 28.2 °C / 82.8 F (-4.5 °C / -8.1 F).
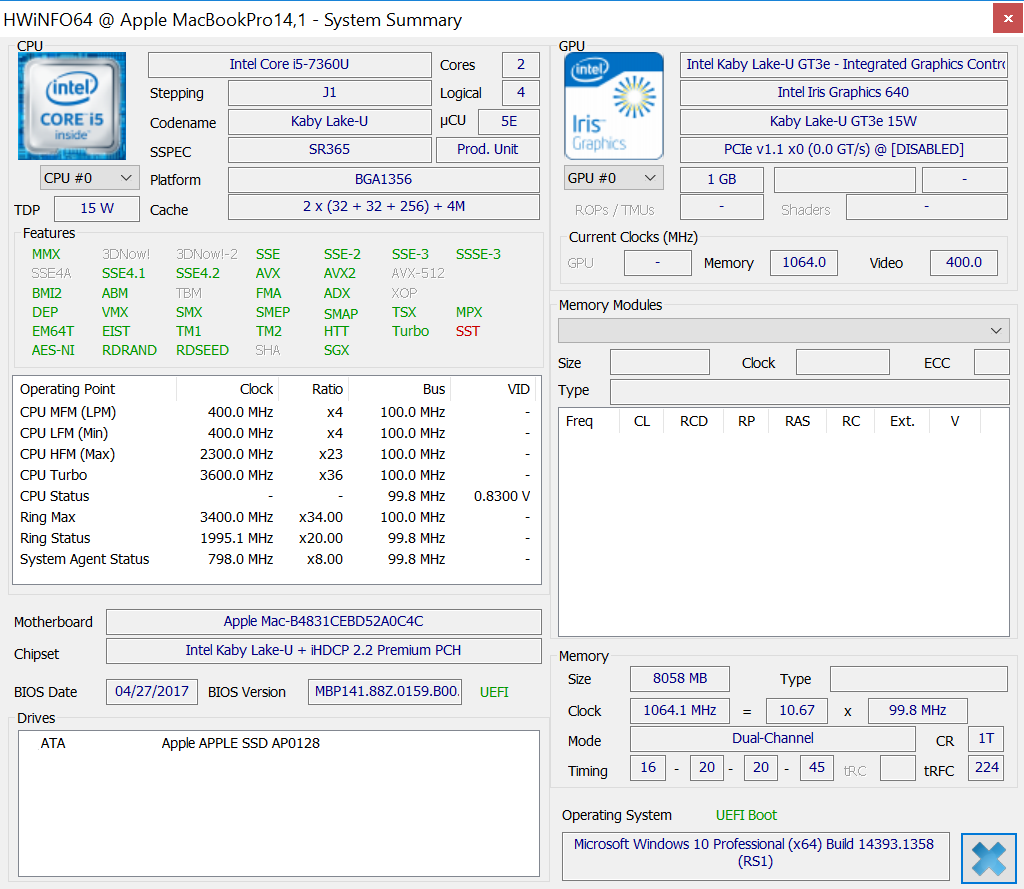
| Apple MacBook Pro 13 2017 i5-7360U, Iris Plus Graphics 640, 54.5 Wh | Apple MacBook Pro 13 2016 6360U, Iris Graphics 540, 54 Wh | Dell XPS 13 9360 QHD+ i7 i7-7500U, HD Graphics 620, 60 Wh | Apple MacBook Pro 13 2017 Touchbar i5 i5-7267U, Iris Plus Graphics 650, 49.2 Wh | Apple MacBook Pro 15 2017 (2.8 GHz, 555) i7-7700HQ, Radeon Pro 555, 76 Wh | Lenovo ThinkPad X1 Carbon 2017-20HR0021GE i5-7200U, HD Graphics 620, 57 Wh | |
|---|---|---|---|---|---|---|
| Duração da bateria | 0% | -25% | -24% | -6% | -20% | |
| WiFi v1.3 (h) | 11.4 | 11.4 0% | 8.6 -25% | 8.7 -24% | 10.7 -6% | 9.1 -20% |
| Witcher 3 ultra (h) | 1.5 |
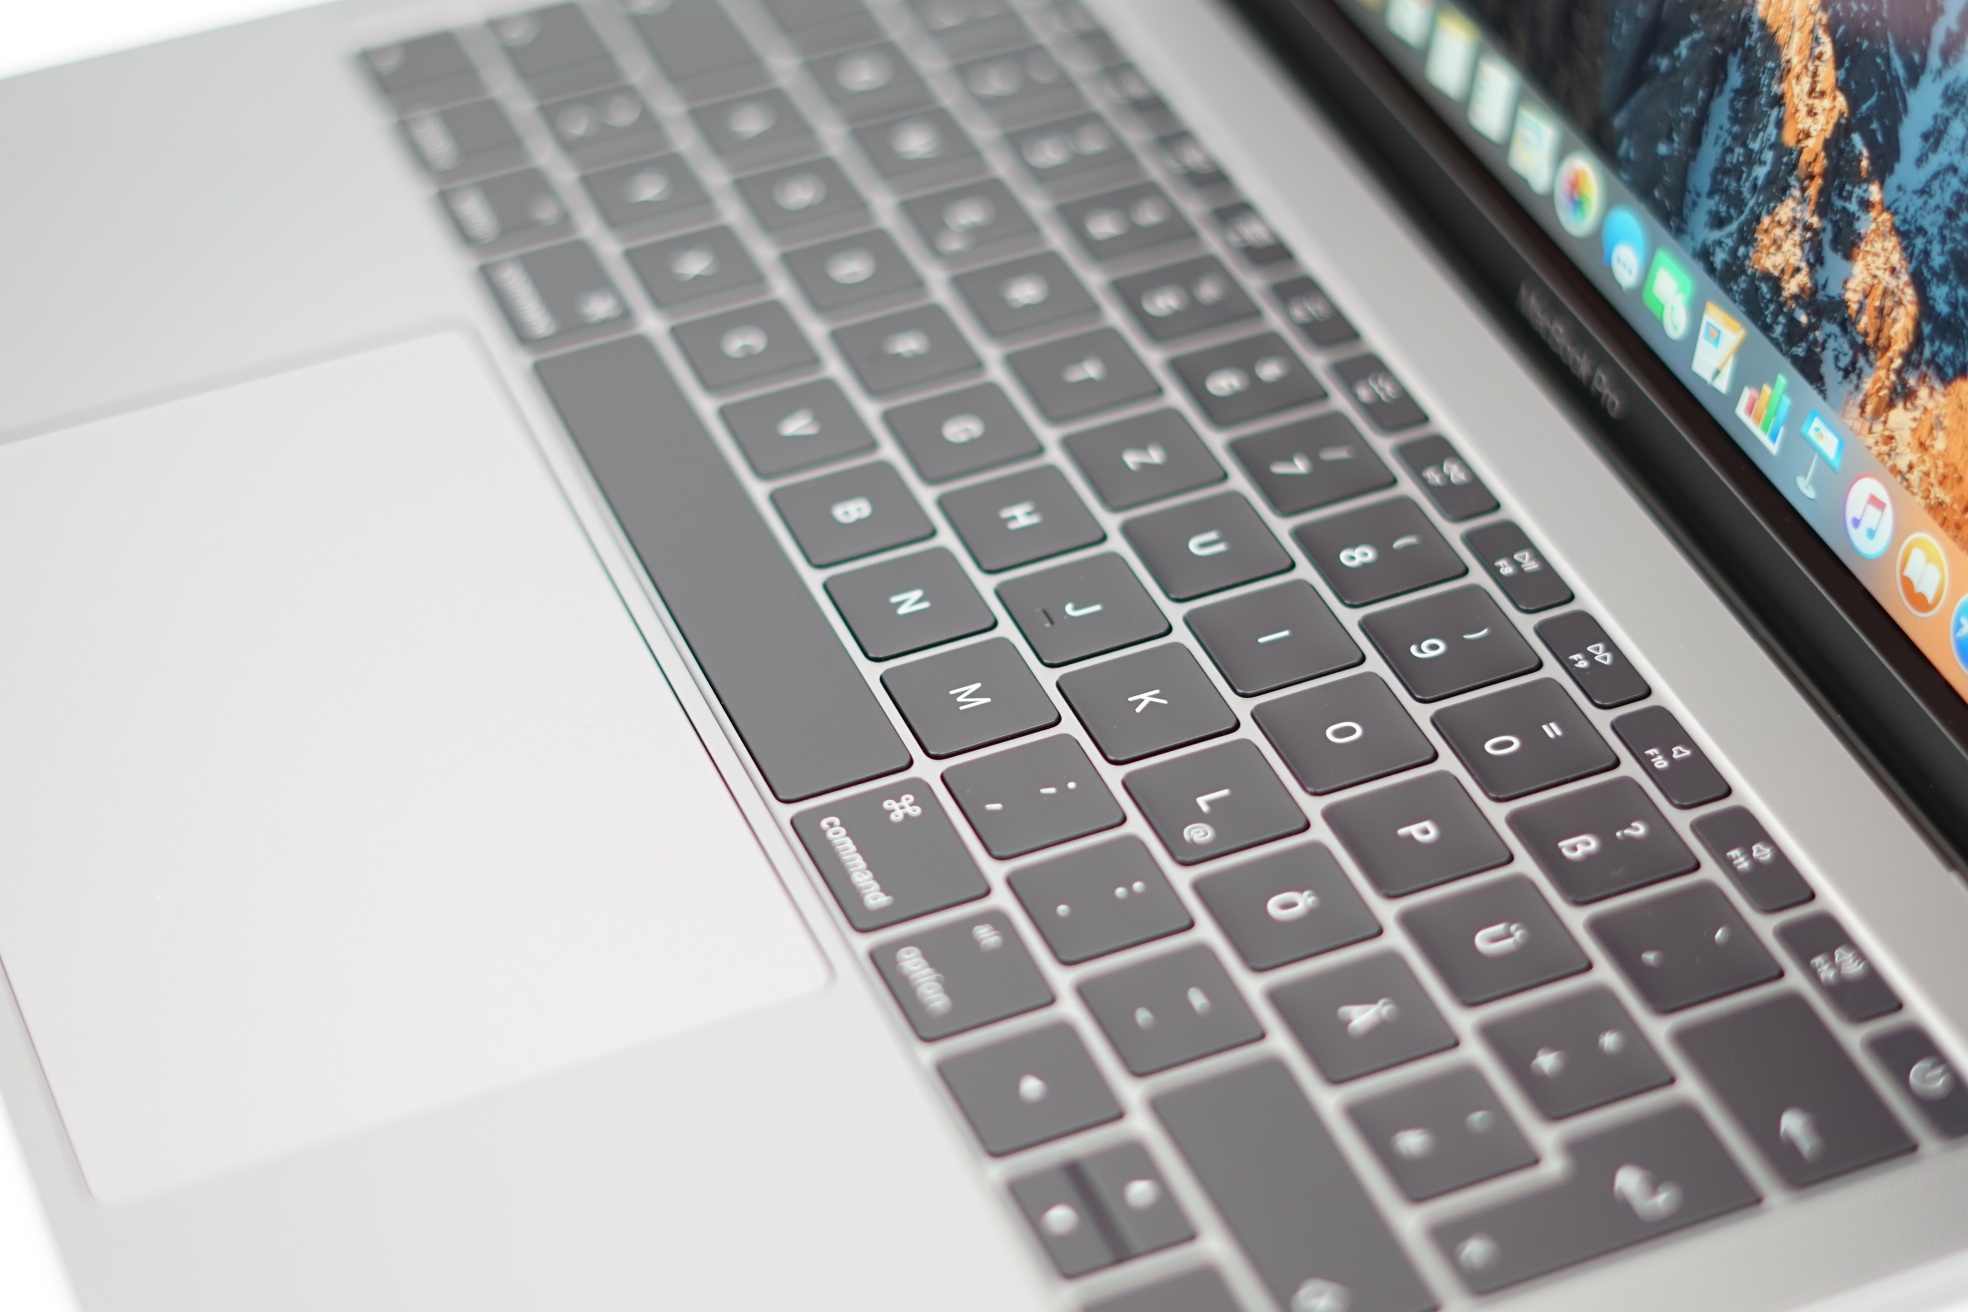
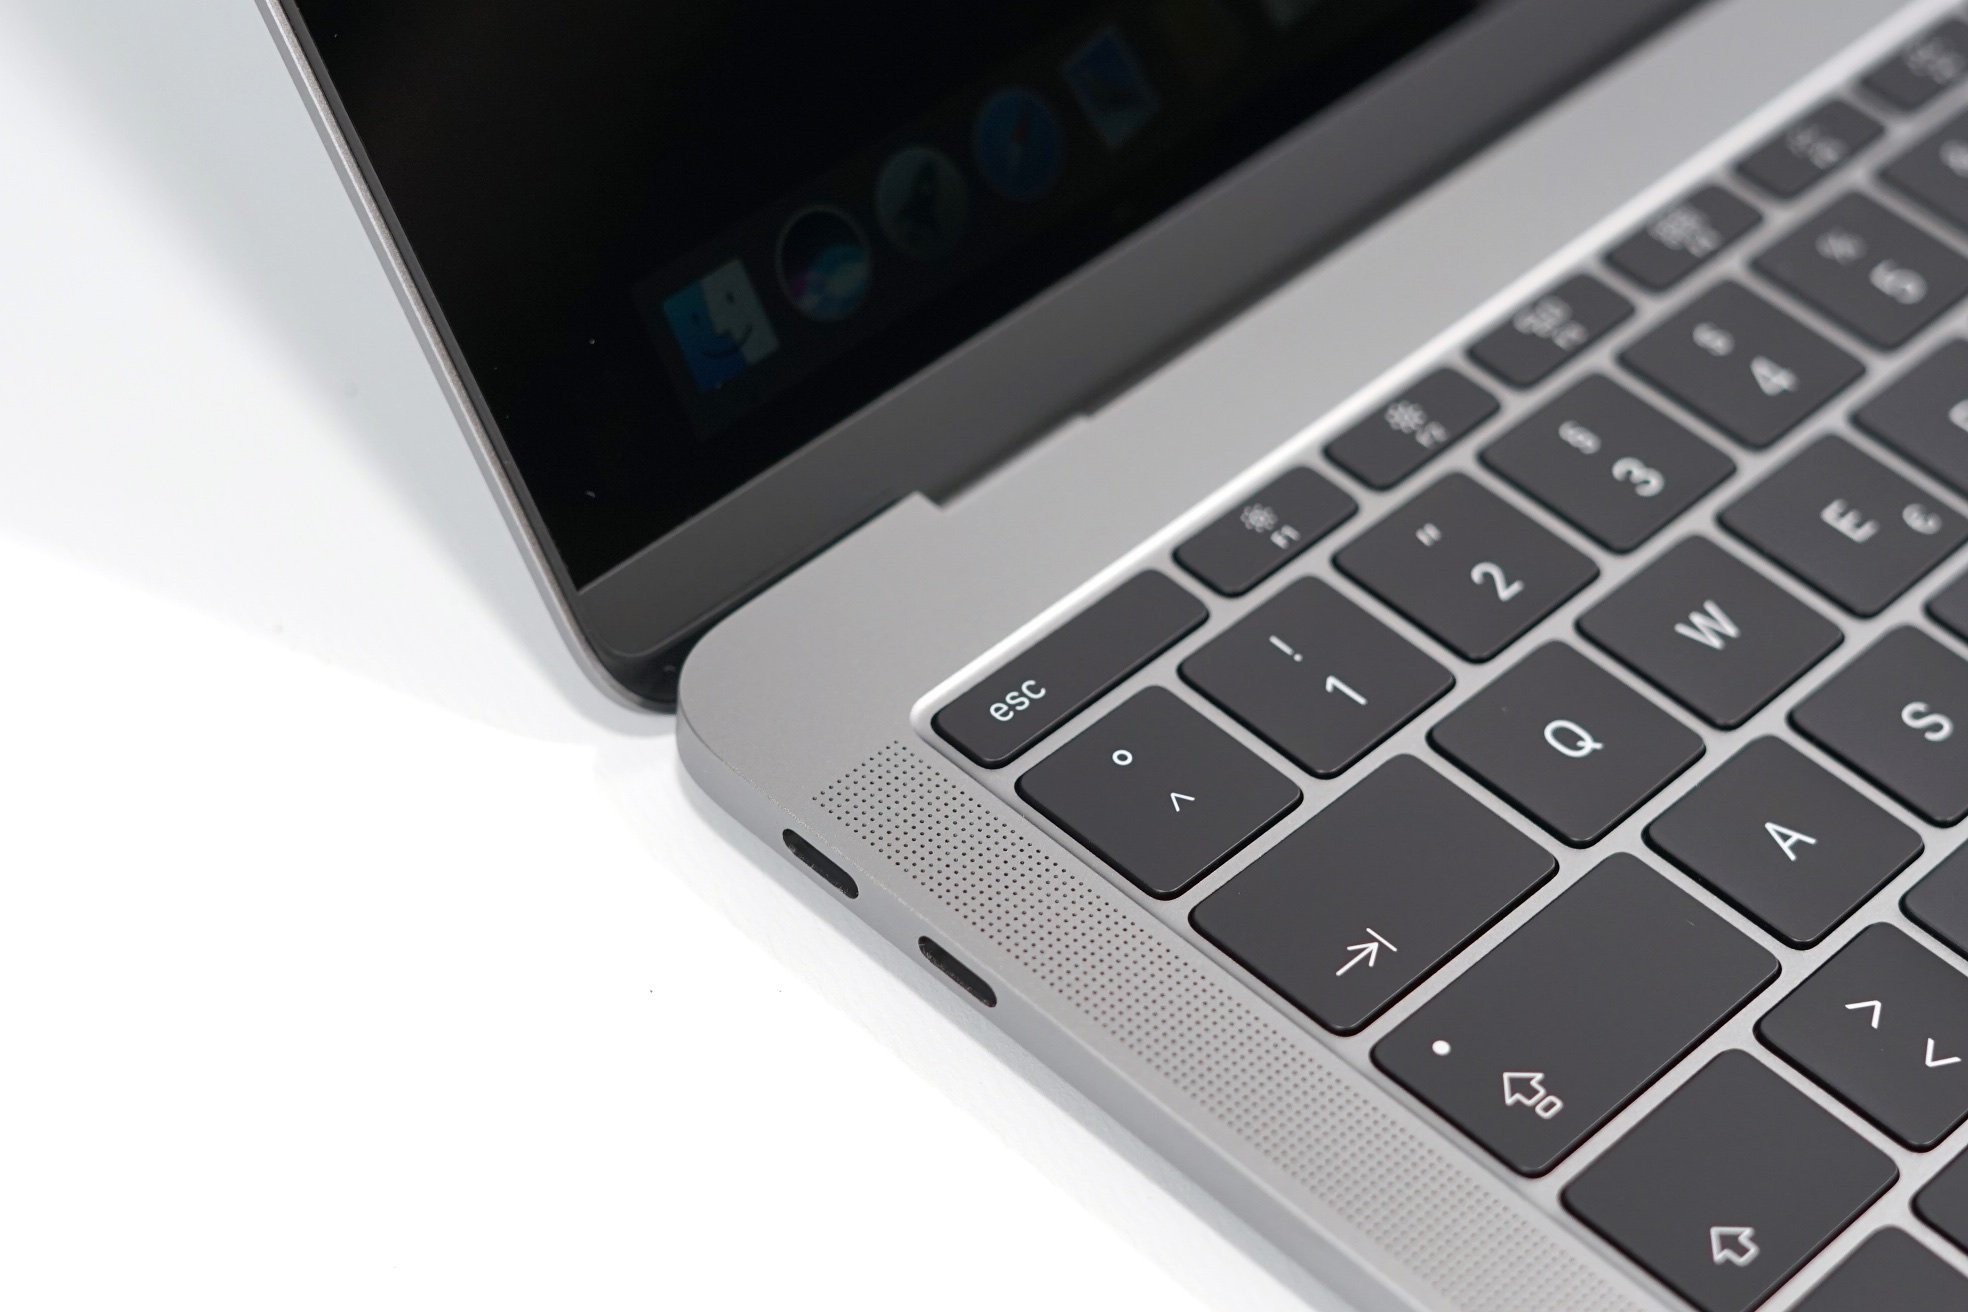
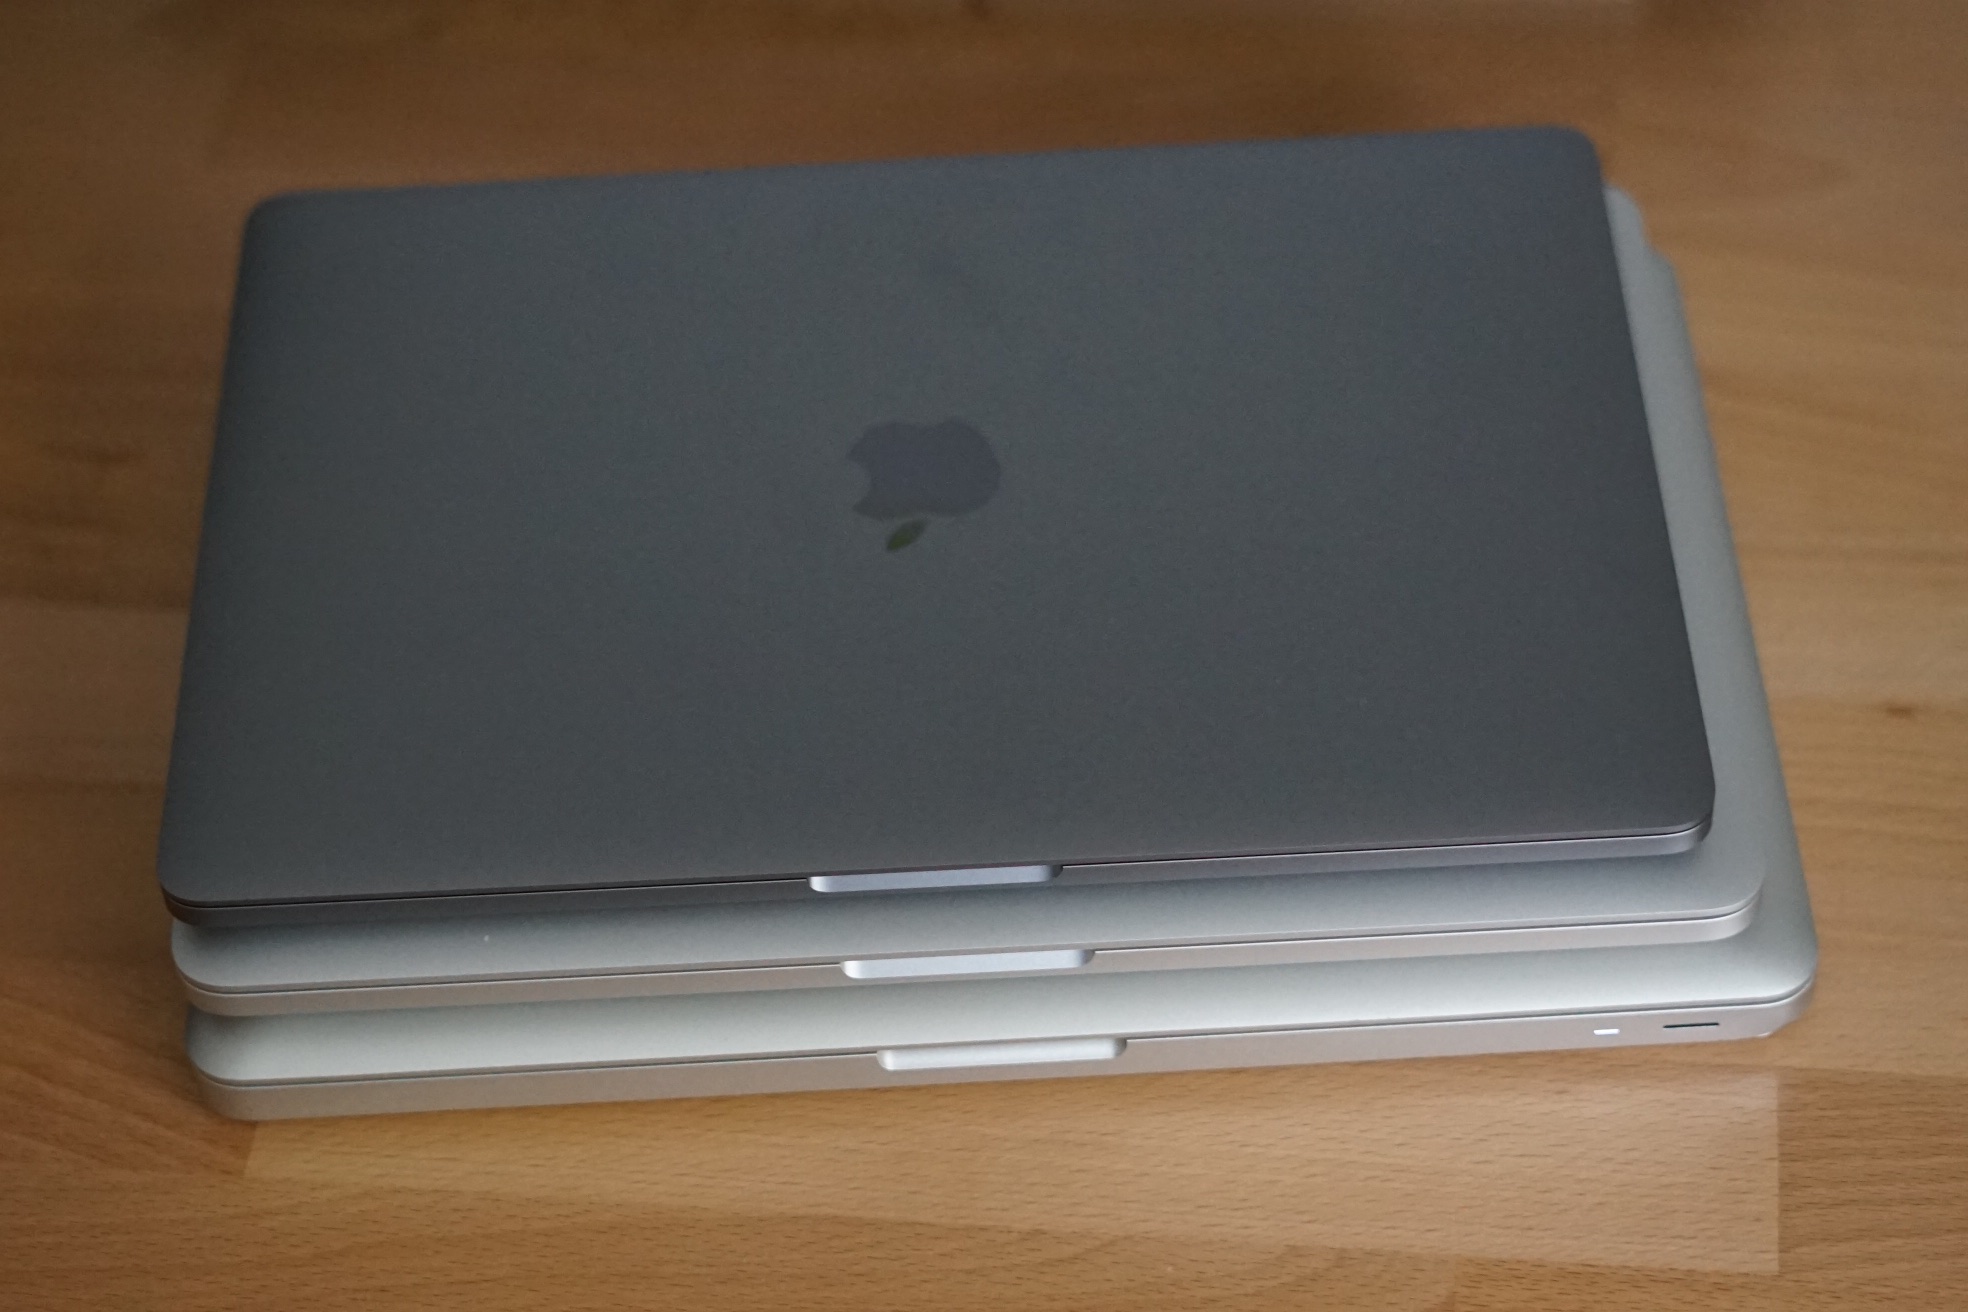
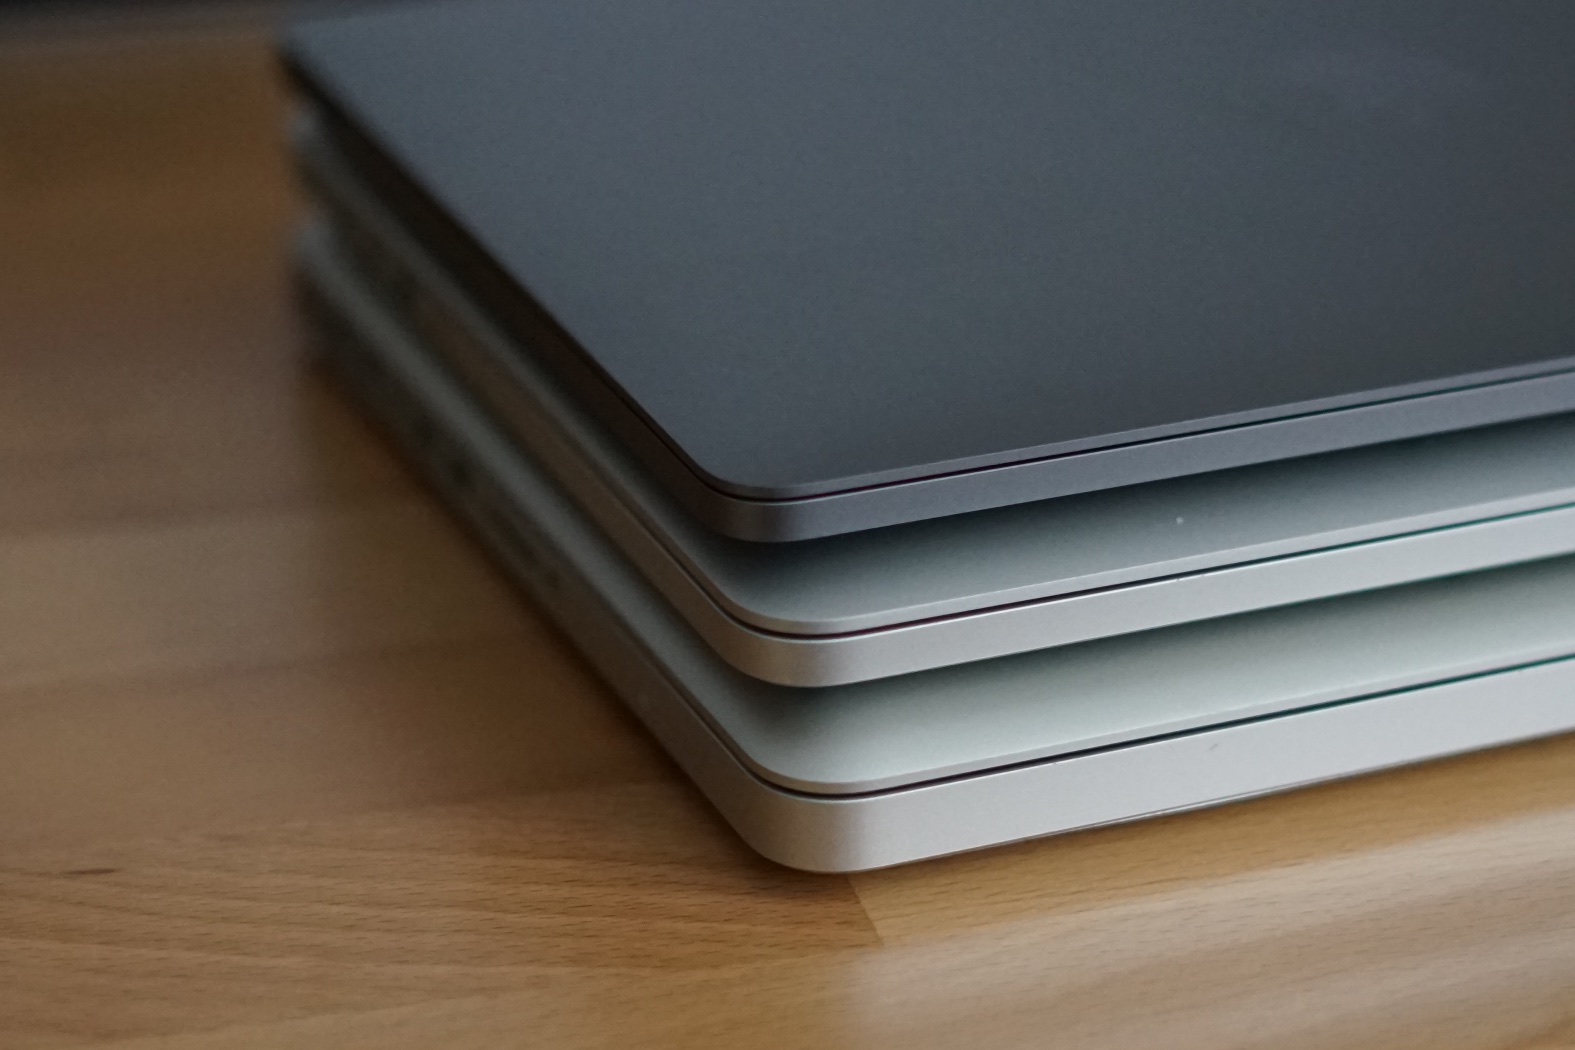
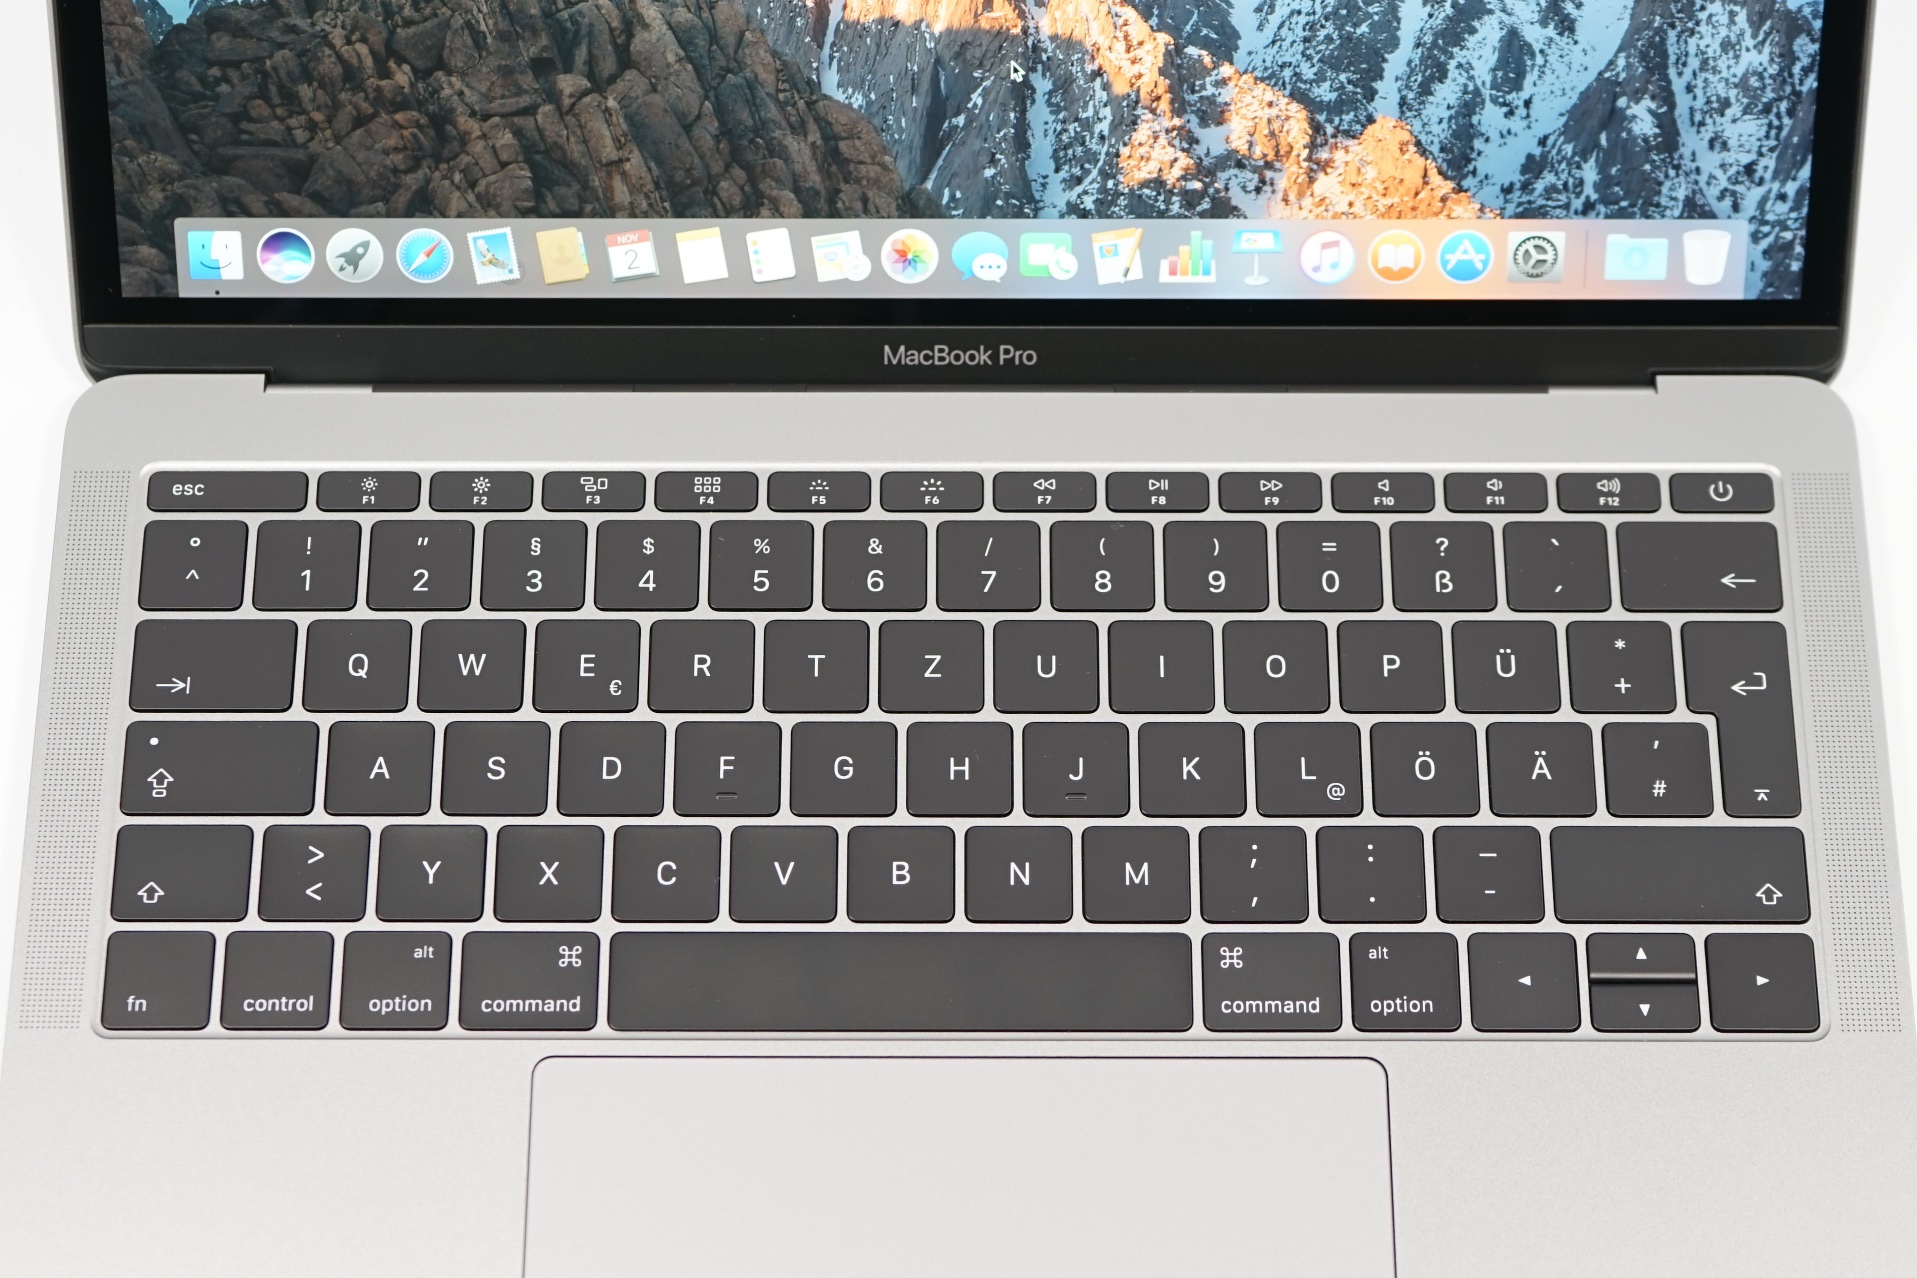
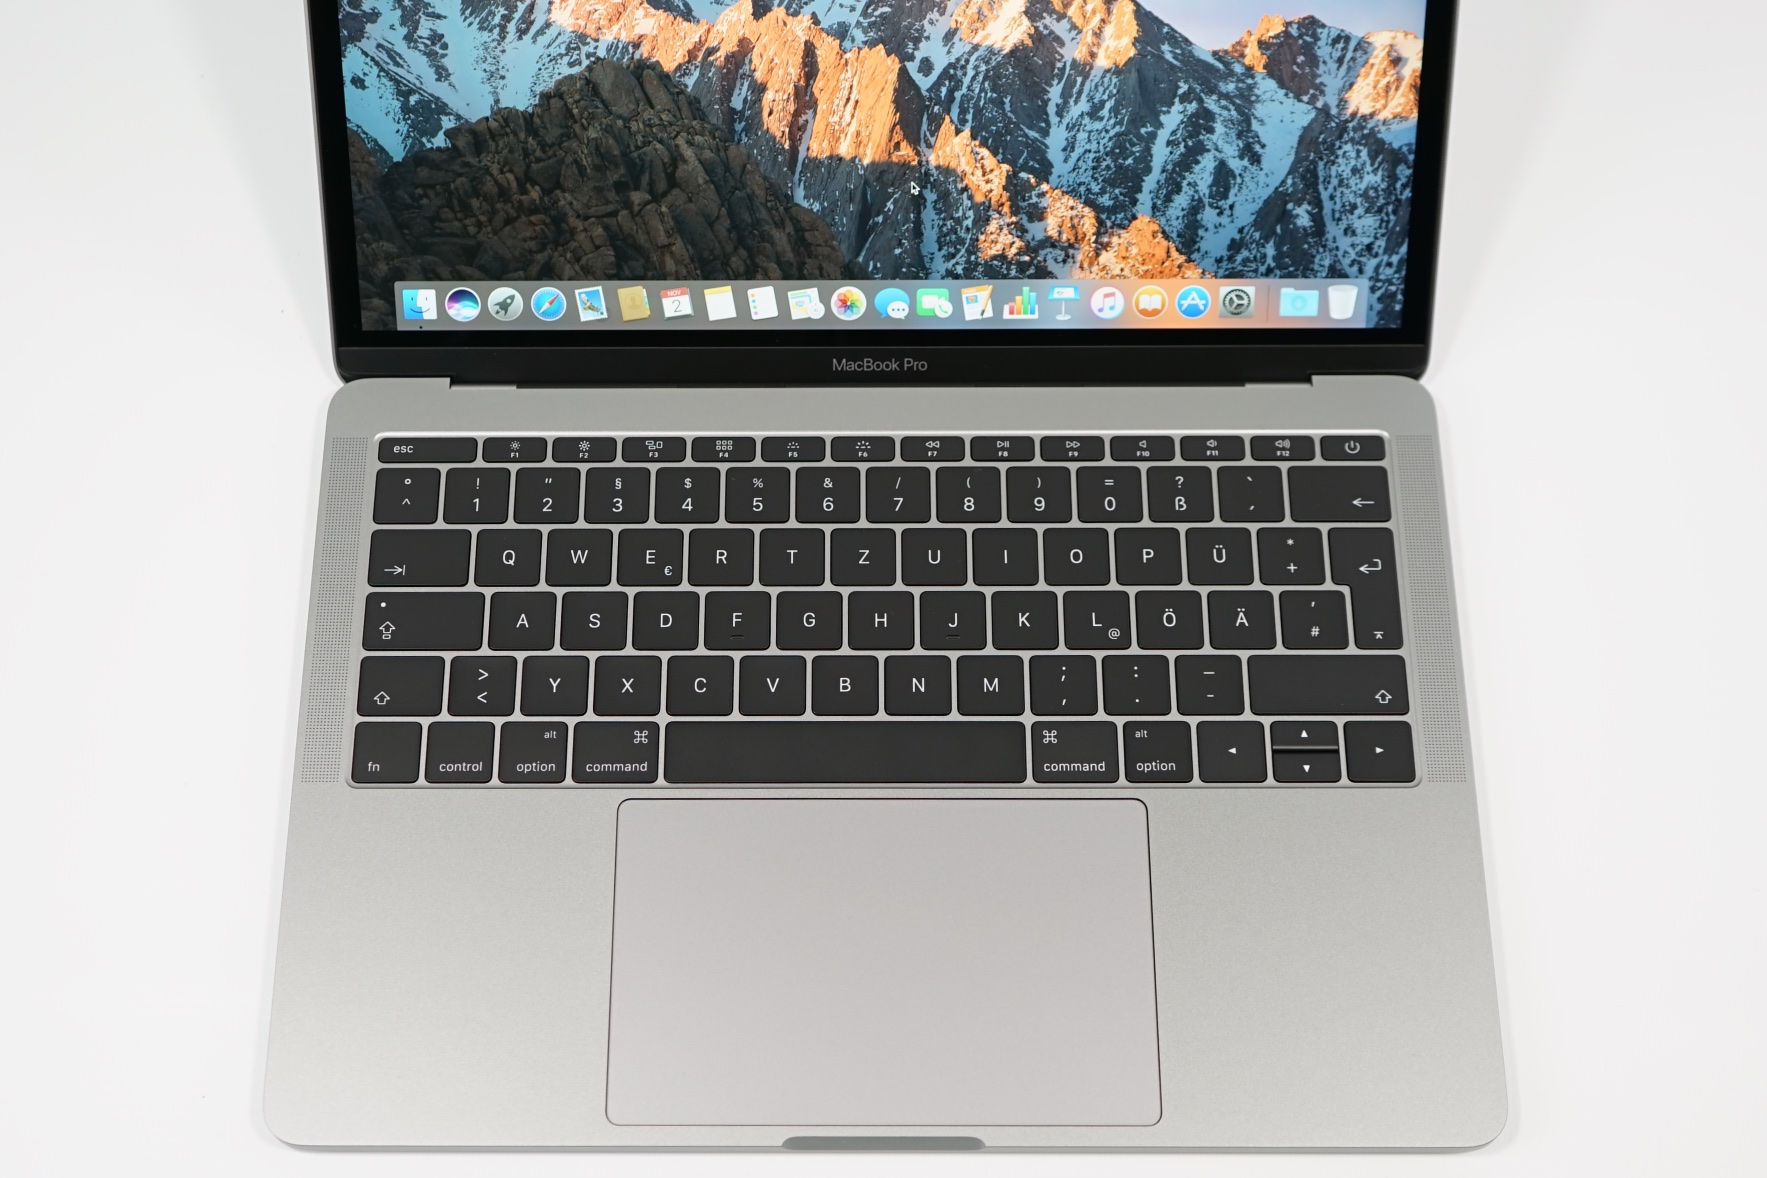
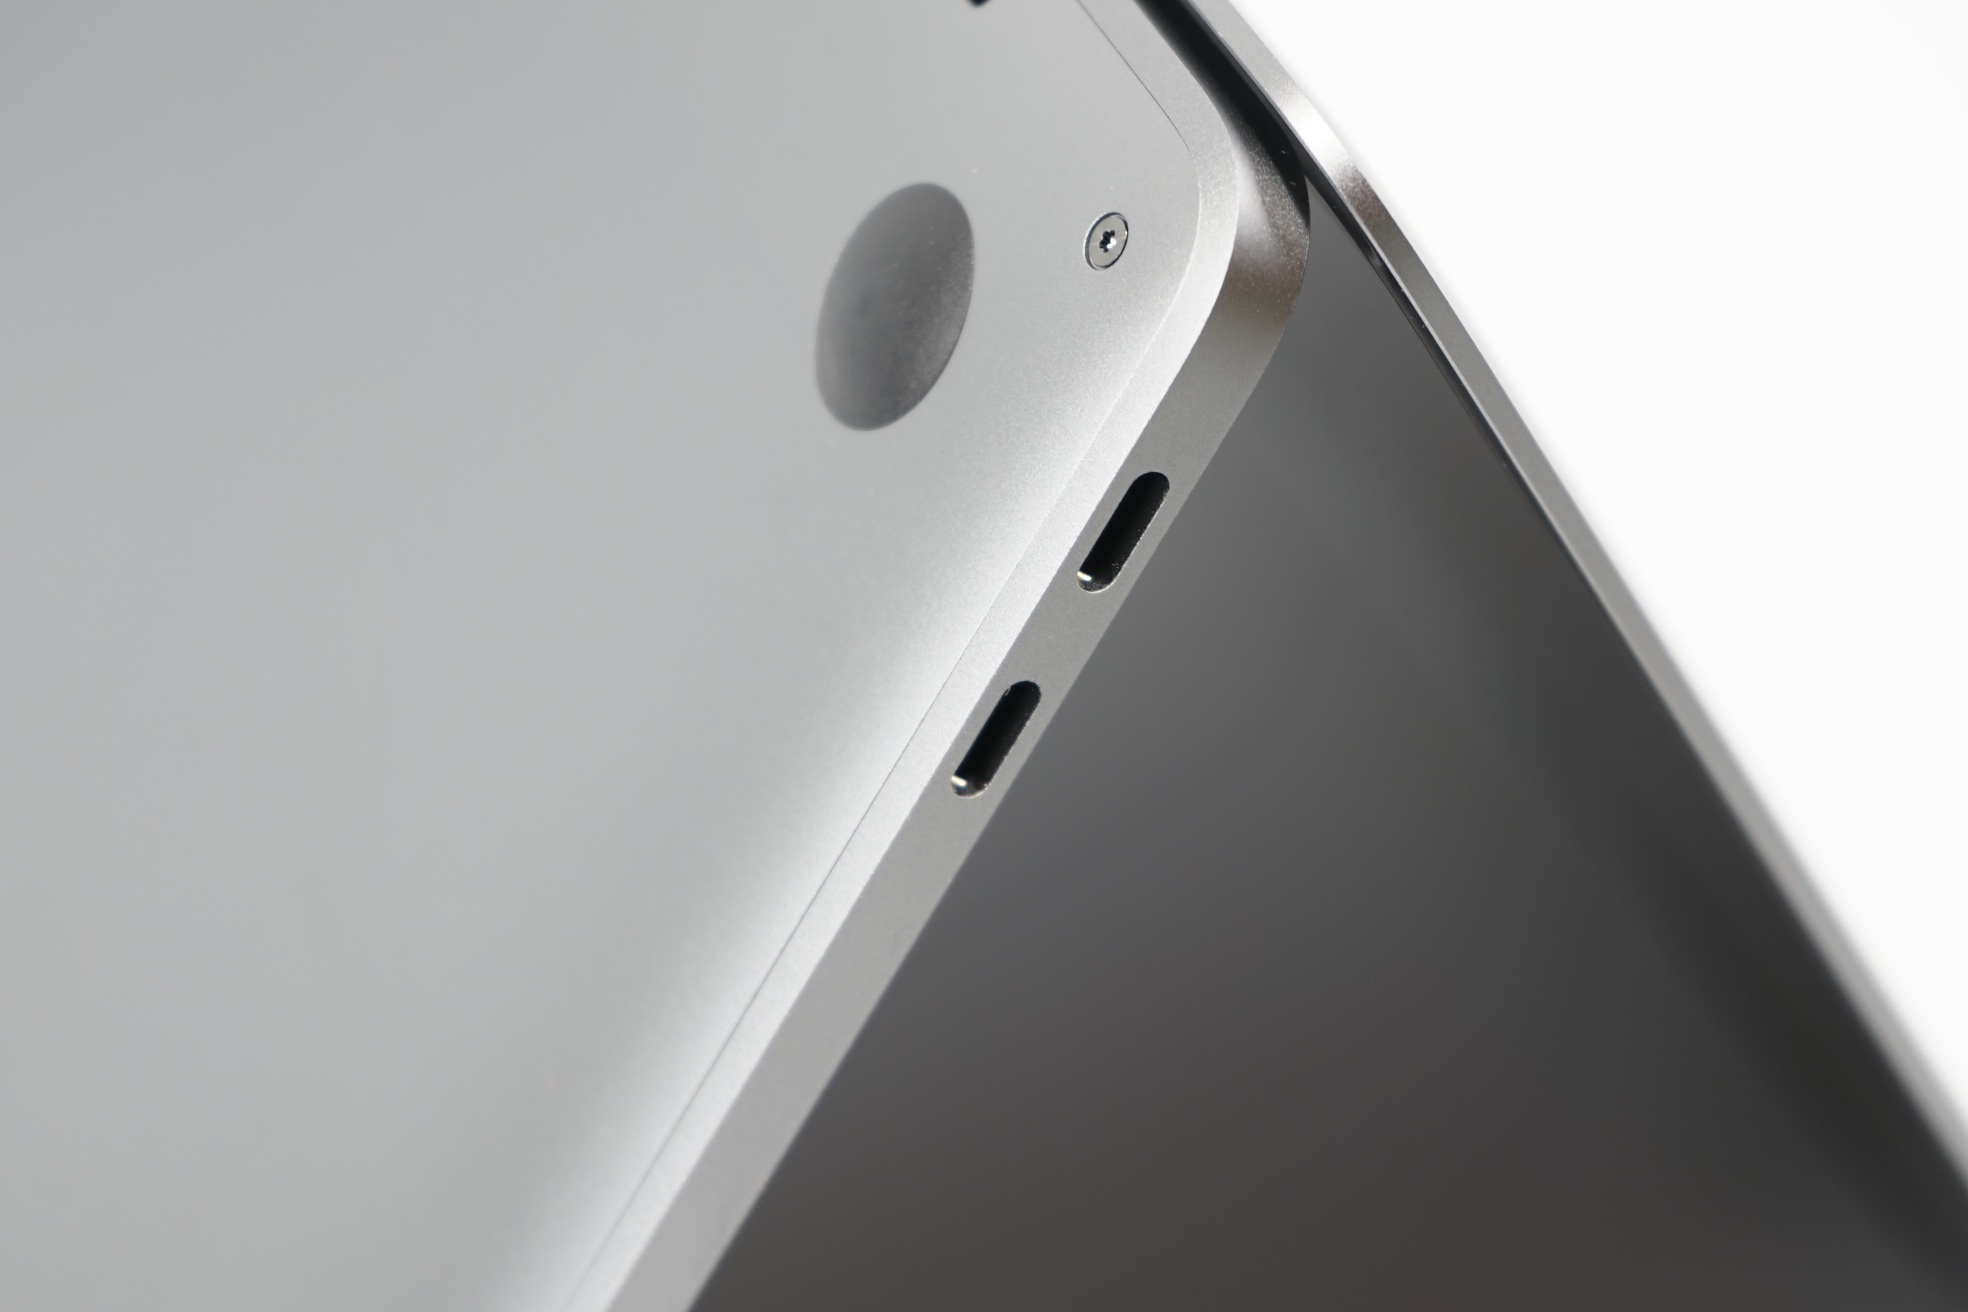
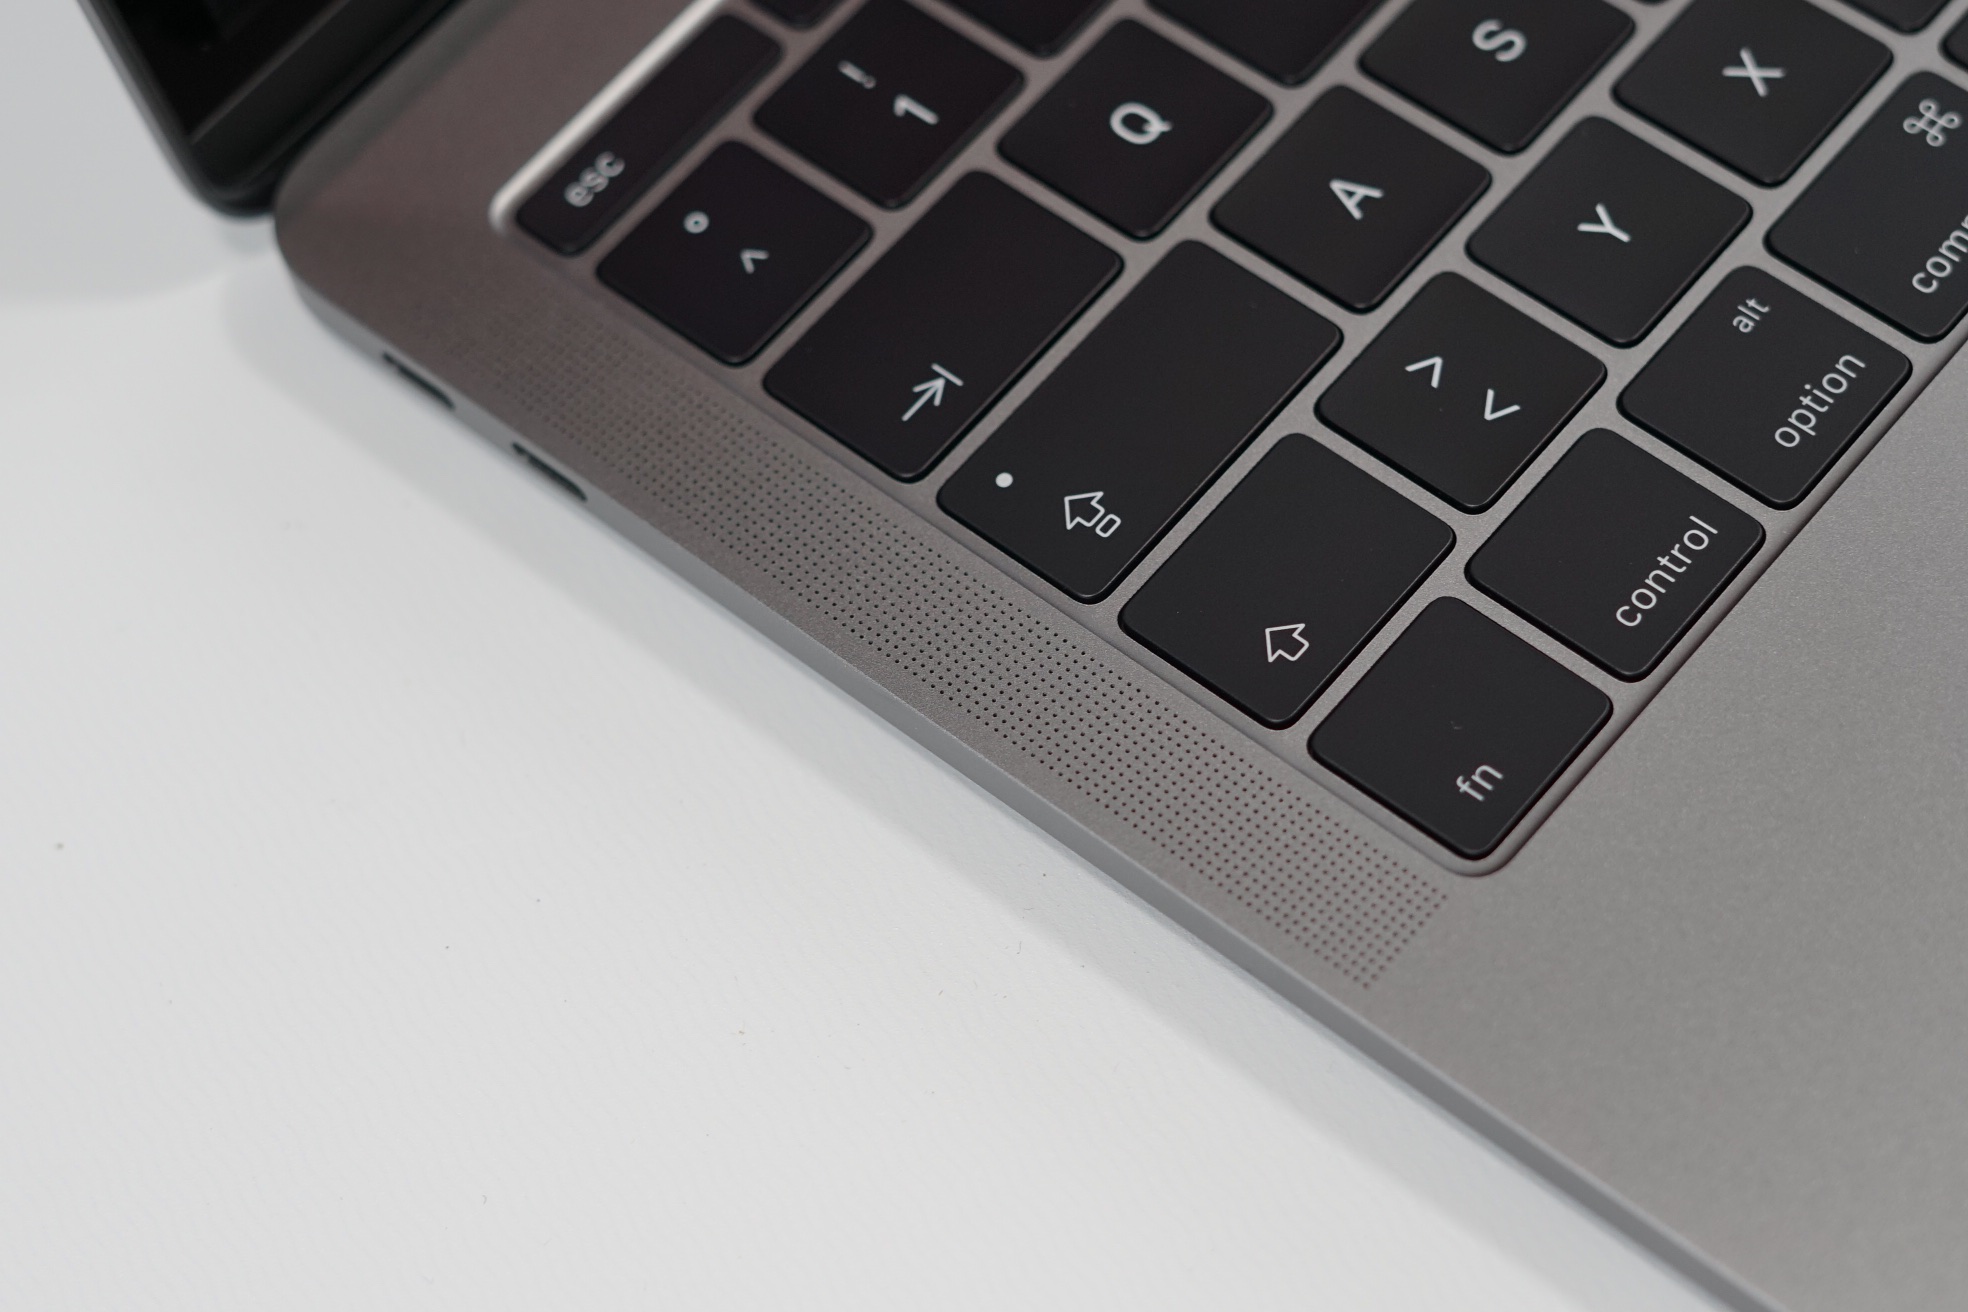
A maior diferença entre os dois modelos MacBook Pro de 13 polegadas da Apple não é apenas a Touch Bar acima do teclado, mas também o resfriamento. O modelo mais caro recebe uma solução superior com duas ventoinhas, enquanto o modelo de teste mais econômico somente recebe um. Isto geralmente não é um problema na prática, onde a ventoinha geralmente está desativada de qualquer maneira, mas você pode ouvir a pequena ventoinha assim que você começa a estressar o aparelho. Nós não gostamos do som agudo, que torna o ruído mais desagradável do que os números sugerem.
Podemos ver uma grande vantagem no tempo de duração Wi-Fi. Também verificaremos o desempenho do MacBook Pro 13 em outros cenários. Como está agora, o modelo mais econômico pode realmente ser a melhor opção para tarefas diárias como navegação na web ou escrever correios.
Price comparison
