Breve Análise do Portátil Apple MacBook Pro 13 2019: Bom desempenho, mas nenhuma inovação real
Avaliação | Data | Modelo | Peso | Altura | Size | Resolução | Preço |
|---|---|---|---|---|---|---|---|
| 90.7 % v7 (old) | 10/2019 | Apple MacBook Pro 13 2019 i5 4TB3 i5-8279U, Iris Plus Graphics 655 | 1.4 kg | 14.9 mm | 13.30" | 2560x1600 | |
| 90.1 % v7 (old) | 07/2019 | Lenovo ThinkPad X1 Carbon 2019-20QE000VGE i7-8665U, UHD Graphics 620 | 1.1 kg | 14.9 mm | 14.00" | 2560x1440 | |
| 87.7 % v6 (old) | 02/2019 | Dell XPS 13 9380 i7 4K i7-8565U, UHD Graphics 620 | 1.2 kg | 11.6 mm | 13.30" | 3840x2160 | |
| 85.6 % v7 (old) | 12/2018 | Razer Blade Stealth i7-8565U i7-8565U, GeForce MX150 | 1.3 kg | 14.8 mm | 13.30" | 1920x1080 | |
| 84.5 % v7 (old) | 08/2019 | HP Envy 13-aq0003ng i7-8565U, GeForce MX250 | 1.2 kg | 14.7 mm | 13.30" | 1920x1080 |
| |||||||||||||||||||||||||
iluminação: 87 %
iluminação com acumulador: 513 cd/m²
Contraste: 1524:1 (Preto: 0.34 cd/m²)
ΔE ColorChecker Calman: 1.5 | ∀{0.5-29.43 Ø4.73}
calibrated: 2.6
ΔE Greyscale Calman: 2 | ∀{0.09-98 Ø4.97}
99.9% sRGB (Argyll 1.6.3 3D)
78.4% AdobeRGB 1998 (Argyll 1.6.3 3D)
87.7% AdobeRGB 1998 (Argyll 3D)
100% sRGB (Argyll 3D)
98.7% Display P3 (Argyll 3D)
Gamma: 2.22
CCT: 6898 K
| Apple MacBook Pro 13 2019 i5 4TB3 APPA03E, , 2560x1600, 13.3" | Apple MacBook Pro 13 2018 Touchbar i5 APPA03E, , 2560x1600, 13.3" | Lenovo ThinkPad X1 Carbon 2019-20QE000VGE LP140QH2-SPD1, , 2560x1440, 14" | Dell XPS 13 9380 i7 4K ID: AUO 282B B133ZAN Dell: 90NTH, , 3840x2160, 13.3" | Razer Blade Stealth i7-8565U Sharp LQ133M1JW41, , 1920x1080, 13.3" | HP Envy 13-aq0003ng InfoVision M133NVF3 R2, , 1920x1080, 13.3" | |
|---|---|---|---|---|---|---|
| Display | 0% | -15% | -22% | -21% | -23% | |
| Display P3 Coverage (%) | 98.7 | 98.5 0% | 72.5 -27% | 64.8 -34% | 65.5 -34% | 64.4 -35% |
| sRGB Coverage (%) | 100 | 99.9 0% | 97.8 -2% | 93.6 -6% | 96.3 -4% | 91.7 -8% |
| AdobeRGB 1998 Coverage (%) | 87.7 | 87.3 0% | 73.8 -16% | 65.8 -25% | 66.3 -24% | 65.2 -26% |
| Response Times | -7% | 21% | -39% | -24% | 24% | |
| Response Time Grey 50% / Grey 80% * (ms) | 43.2 ? | 46 ? -6% | 33.6 ? 22% | 64.8 ? -50% | 57.6 ? -33% | 31 ? 28% |
| Response Time Black / White * (ms) | 29.6 ? | 32 ? -8% | 24 ? 19% | 38 ? -28% | 34 ? -15% | 24 ? 19% |
| PWM Frequency (Hz) | 118000 ? | 22730 ? | 4000 ? | |||
| Screen | 2% | -62% | -27% | 1% | -31% | |
| Brightness middle (cd/m²) | 518 | 519 0% | 338 -35% | 428.3 -17% | 429.8 -17% | 768 48% |
| Brightness (cd/m²) | 480 | 504 5% | 315 -34% | 414 -14% | 403 -16% | 778 62% |
| Brightness Distribution (%) | 87 | 95 9% | 88 1% | 88 1% | 89 2% | 82 -6% |
| Black Level * (cd/m²) | 0.34 | 0.33 3% | 0.43 -26% | 0.27 21% | 0.32 6% | 0.48 -41% |
| Contrast (:1) | 1524 | 1573 3% | 786 -48% | 1586 4% | 1343 -12% | 1600 5% |
| Colorchecker dE 2000 * | 1.5 | 1.4 7% | 4 -167% | 2.69 -79% | 1.08 28% | 3.49 -133% |
| Colorchecker dE 2000 max. * | 2.8 | 2.8 -0% | 7.9 -182% | 6.19 -121% | 3.96 -41% | 7.41 -165% |
| Colorchecker dE 2000 calibrated * | 2.6 | 1.7 35% | 2.01 23% | 1.21 53% | 2.07 20% | |
| Greyscale dE 2000 * | 2 | 2.2 -10% | 6.2 -210% | 3.7 -85% | 1.3 35% | 4.09 -105% |
| Gamma | 2.22 99% | 2.22 99% | 2.13 103% | 2.1 105% | 2.23 99% | 2.54 87% |
| CCT | 6898 94% | 6908 94% | 6787 96% | 6706 97% | 6452 101% | 6452 101% |
| Color Space (Percent of AdobeRGB 1998) (%) | 78.4 | 77.3 -1% | 68.1 -13% | 60.4 -23% | 61.4 -22% | 60 -23% |
| Color Space (Percent of sRGB) (%) | 99.9 | 99.99 0% | 97.8 -2% | 93.5 -6% | 96.3 -4% | 92 -8% |
| Média Total (Programa/Configurações) | -2% /
0% | -19% /
-43% | -29% /
-27% | -15% /
-6% | -10% /
-23% |
* ... menor é melhor
Exibir tempos de resposta
| ↔ Tempo de resposta preto para branco | ||
|---|---|---|
| 29.6 ms ... ascensão ↗ e queda ↘ combinadas | ↗ 15.6 ms ascensão | 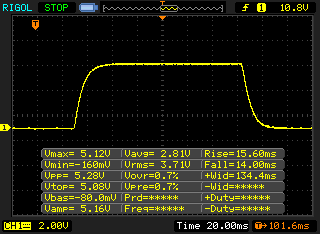 |
| ↘ 14 ms queda | ||
| A tela mostra taxas de resposta relativamente lentas em nossos testes e pode ser muito lenta para os jogadores. Em comparação, todos os dispositivos testados variam de 0.1 (mínimo) a 240 (máximo) ms. » 79 % de todos os dispositivos são melhores. Isso significa que o tempo de resposta medido é pior que a média de todos os dispositivos testados (19.9 ms). | ||
| ↔ Tempo de resposta 50% cinza a 80% cinza | ||
| 43.2 ms ... ascensão ↗ e queda ↘ combinadas | ↗ 22 ms ascensão | 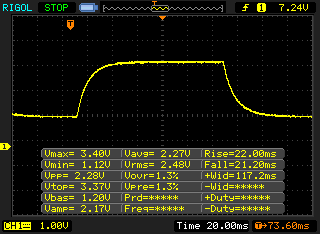 |
| ↘ 21.2 ms queda | ||
| A tela mostra taxas de resposta lentas em nossos testes e será insatisfatória para os jogadores. Em comparação, todos os dispositivos testados variam de 0.165 (mínimo) a 636 (máximo) ms. » 72 % de todos os dispositivos são melhores. Isso significa que o tempo de resposta medido é pior que a média de todos os dispositivos testados (31.1 ms). | ||
Cintilação da tela / PWM (modulação por largura de pulso)
| Tela tremeluzindo / PWM não detectado | 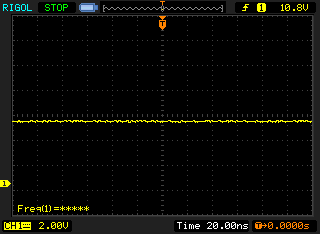 | ||
[pwm_comparison] Em comparação: 52 % de todos os dispositivos testados não usam PWM para escurecer a tela. Se PWM foi detectado, uma média de 7798 (mínimo: 5 - máximo: 343500) Hz foi medida. | |||
| PCMark 8 Home Score Accelerated v2 | 4056 pontos | |
| PCMark 8 Creative Score Accelerated v2 | 5689 pontos | |
| PCMark 8 Work Score Accelerated v2 | 4537 pontos | |
| PCMark 10 Score | 3779 pontos | |
Ajuda | ||

| 3DMark 06 Standard Score | 17176 pontos | |
| 3DMark Ice Storm Standard Score | 57033 pontos | |
| 3DMark Cloud Gate Standard Score | 11806 pontos | |
| 3DMark Fire Strike Score | 1903 pontos | |
| 3DMark Time Spy Score | 705 pontos | |
Ajuda | ||
| baixo | média | alto | ultra | |
|---|---|---|---|---|
| BioShock Infinite (2013) | 78.4 | 54.3 | 49.4 | 15.5 |
| Dota 2 Reborn (2015) | 84 | 63 | 33.3 | 29.9 |
| X-Plane 11.11 (2018) | 42.8 | 29.5 | 25.1 |
Barulho
| Ocioso |
| 29 / 29 / 29 dB |
| Carga |
| 33.9 / 41.8 dB |
 | ||
30 dB silencioso 40 dB(A) audível 50 dB(A) ruidosamente alto |
||
min: | ||
| Apple MacBook Pro 13 2019 i5 4TB3 Iris Plus Graphics 655, i5-8279U, Apple SSD AP0512 | Apple MacBook Pro 13 2018 Touchbar i5 Iris Plus Graphics 655, i5-8259U | Lenovo ThinkPad X1 Carbon 2019-20QE000VGE UHD Graphics 620, i7-8665U, WDC PC SN720 SDAQNTW-512G | Dell XPS 13 9380 i7 4K UHD Graphics 620, i7-8565U, Samsung SSD PM981 MZVLB512HAJQ | Razer Blade Stealth i7-8565U GeForce MX150, i7-8565U, Lite-On CA3-8D256-Q11 | HP Envy 13-aq0003ng GeForce MX250, i7-8565U, Toshiba KBG30ZMV512G | |
|---|---|---|---|---|---|---|
| Noise | -5% | 6% | -3% | -4% | -1% | |
| desligado / ambiente * (dB) | 29 | 29.6 -2% | 28.4 2% | 28.4 2% | 28.4 2% | 30 -3% |
| Idle Minimum * (dB) | 29 | 29.6 -2% | 28.4 2% | 29.4 -1% | 28.5 2% | 30 -3% |
| Idle Average * (dB) | 29 | 29.6 -2% | 28.4 2% | 29.4 -1% | 29 -0% | 30 -3% |
| Idle Maximum * (dB) | 29 | 29.6 -2% | 28.6 1% | 29.4 -1% | 29.1 -0% | 30 -3% |
| Load Average * (dB) | 33.9 | 36.7 -8% | 31.5 7% | 34.6 -2% | 42.8 -26% | |
| Load Maximum * (dB) | 41.8 | 46.7 -12% | 33.1 21% | 46.8 -12% | 41.6 -0% | 39.5 6% |
| Witcher 3 ultra * (dB) | 32.5 | 41.4 |
* ... menor é melhor
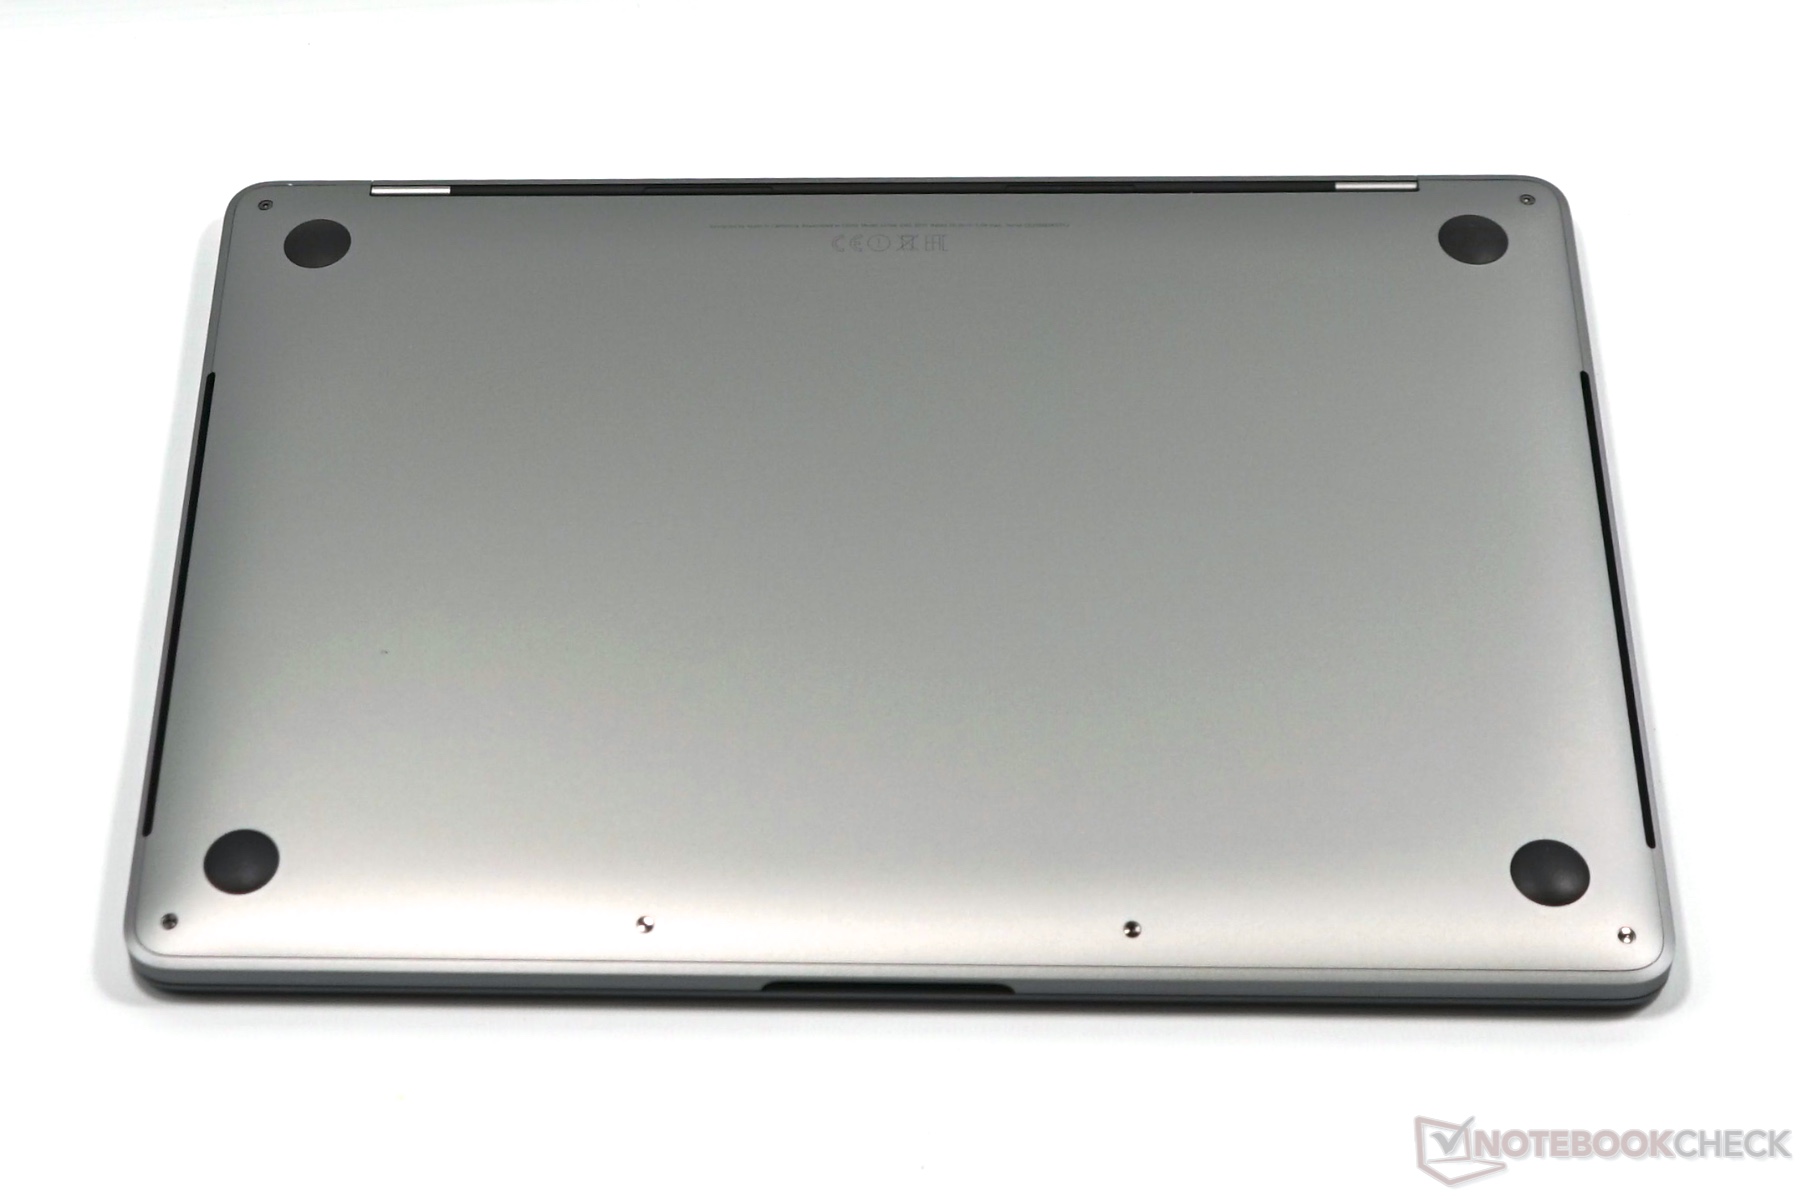
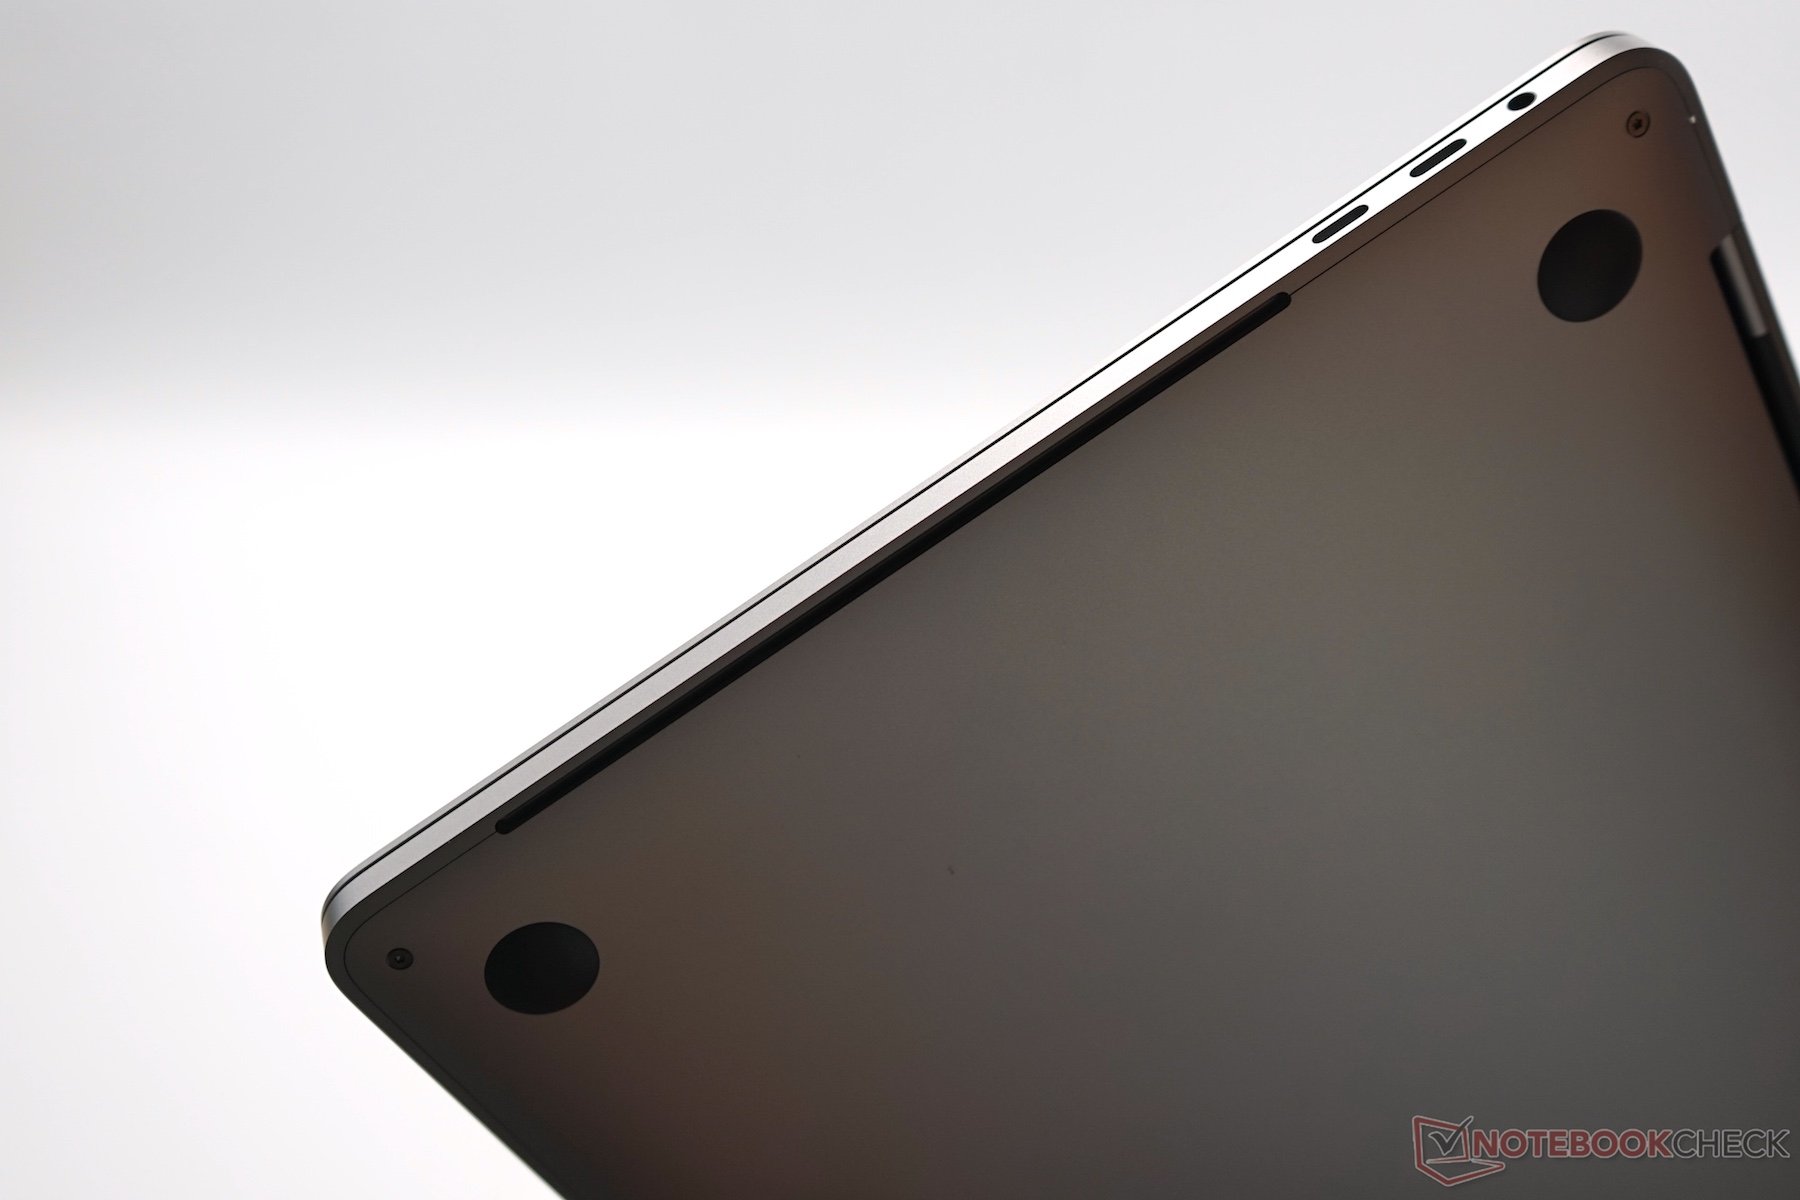
(-) A temperatura máxima no lado superior é 45.7 °C / 114 F, em comparação com a média de 35.9 °C / 97 F , variando de 21.4 a 59 °C para a classe Subnotebook.
(±) A parte inferior aquece até um máximo de 44.2 °C / 112 F, em comparação com a média de 39.2 °C / 103 F
(+) Em uso inativo, a temperatura média para o lado superior é 28.3 °C / 83 F, em comparação com a média do dispositivo de 30.8 °C / ### class_avg_f### F.
(+) Os apoios para as mãos e o touchpad estão atingindo a temperatura máxima da pele (32.5 °C / 90.5 F) e, portanto, não estão quentes.
(-) A temperatura média da área do apoio para as mãos de dispositivos semelhantes foi 28.2 °C / 82.8 F (-4.3 °C / -7.7 F).
Apple MacBook Pro 13 2019 i5 4TB3 análise de áudio
(±) | o volume do alto-falante é médio, mas bom (###valor### dB)
Graves 100 - 315Hz
(±) | graves reduzidos - em média 12.8% menor que a mediana
(±) | a linearidade dos graves é média (11.2% delta para a frequência anterior)
Médios 400 - 2.000 Hz
(+) | médios equilibrados - apenas 3.2% longe da mediana
(+) | médios são lineares (4.6% delta para frequência anterior)
Altos 2 - 16 kHz
(+) | agudos equilibrados - apenas 3.4% longe da mediana
(+) | os máximos são lineares (5.3% delta da frequência anterior)
Geral 100 - 16.000 Hz
(+) | o som geral é linear (13.7% diferença em relação à mediana)
Comparado com a mesma classe
» 24% de todos os dispositivos testados nesta classe foram melhores, 5% semelhantes, 71% piores
» O melhor teve um delta de 5%, a média foi 18%, o pior foi 53%
Comparado com todos os dispositivos testados
» 15% de todos os dispositivos testados foram melhores, 4% semelhantes, 81% piores
» O melhor teve um delta de 4%, a média foi 24%, o pior foi 134%
Lenovo ThinkPad X1 Carbon 2019-20QE000VGE análise de áudio
(±) | o volume do alto-falante é médio, mas bom (###valor### dB)
Graves 100 - 315Hz
(±) | graves reduzidos - em média 11.2% menor que a mediana
(±) | a linearidade dos graves é média (7.1% delta para a frequência anterior)
Médios 400 - 2.000 Hz
(±) | médios mais altos - em média 5.1% maior que a mediana
(+) | médios são lineares (5.4% delta para frequência anterior)
Altos 2 - 16 kHz
(+) | agudos equilibrados - apenas 2.9% longe da mediana
(±) | a linearidade dos máximos é média (9.1% delta para frequência anterior)
Geral 100 - 16.000 Hz
(±) | a linearidade do som geral é média (16.7% diferença em relação à mediana)
Comparado com a mesma classe
» 21% de todos os dispositivos testados nesta classe foram melhores, 8% semelhantes, 71% piores
» O melhor teve um delta de 7%, a média foi 21%, o pior foi 53%
Comparado com todos os dispositivos testados
» 29% de todos os dispositivos testados foram melhores, 7% semelhantes, 64% piores
» O melhor teve um delta de 4%, a média foi 24%, o pior foi 134%
| desligado | |
| Ocioso | |
| Carga |
|
Key:
min: | |
| Apple MacBook Pro 13 2019 i5 4TB3 i5-8279U, Iris Plus Graphics 655, Apple SSD AP0512, IPS, 2560x1600, 13.3" | Apple MacBook Pro 13 2018 Touchbar i5 i5-8259U, Iris Plus Graphics 655, , IPS, 2560x1600, 13.3" | Lenovo ThinkPad X1 Carbon 2019-20QE000VGE i7-8665U, UHD Graphics 620, WDC PC SN720 SDAQNTW-512G, IPS, 2560x1440, 14" | Dell XPS 13 9380 i7 4K i7-8565U, UHD Graphics 620, Samsung SSD PM981 MZVLB512HAJQ, IPS, 3840x2160, 13.3" | Razer Blade Stealth i7-8565U i7-8565U, GeForce MX150, Lite-On CA3-8D256-Q11, IPS, 1920x1080, 13.3" | HP Envy 13-aq0003ng i7-8565U, GeForce MX250, Toshiba KBG30ZMV512G, IPS, 1920x1080, 13.3" | Média Intel Iris Plus Graphics 655 | Média da turma Subnotebook | |
|---|---|---|---|---|---|---|---|---|
| Power Consumption | -15% | -3% | -28% | -52% | -23% | -38% | -8% | |
| Idle Minimum * (Watt) | 2.2 | 2.3 -5% | 3 -36% | 5.2 -136% | 6.7 -205% | 3.9 -77% | 5.96 ? -171% | 3.78 ? -72% |
| Idle Average * (Watt) | 7.2 | 8.7 -21% | 6.3 12% | 8.6 -19% | 8.6 -19% | 7.8 -8% | 8.44 ? -17% | 6.6 ? 8% |
| Idle Maximum * (Watt) | 8.2 | 12.2 -49% | 8.9 -9% | 10.5 -28% | 9.4 -15% | 10.8 -32% | 10.6 ? -29% | 7.93 ? 3% |
| Load Average * (Watt) | 54 | 53.3 1% | 40.8 24% | 44.2 18% | 64.1 -19% | 53 2% | 46.5 ? 14% | 41.8 ? 23% |
| Load Maximum * (Watt) | 63.9 | 64 -0% | 67.5 -6% | 47.5 26% | 64.1 -0% | 62.7 2% | 56.2 ? 12% | 64.7 ? -1% |
| Witcher 3 ultra * (Watt) | 63.7 |
* ... menor é melhor
| Apple MacBook Pro 13 2019 i5 4TB3 i5-8279U, Iris Plus Graphics 655, 58 Wh | Apple MacBook Pro 13 2018 Touchbar i5 i5-8259U, Iris Plus Graphics 655, 58 Wh | Lenovo ThinkPad X1 Carbon 2019-20QE000VGE i7-8665U, UHD Graphics 620, 51 Wh | Dell XPS 13 9380 i7 4K i7-8565U, UHD Graphics 620, 52 Wh | Razer Blade Stealth i7-8565U i7-8565U, GeForce MX150, 53.1 Wh | HP Envy 13-aq0003ng i7-8565U, GeForce MX250, 53.2 Wh | Média da turma Subnotebook | |
|---|---|---|---|---|---|---|---|
| Duração da bateria | -13% | -24% | -33% | -17% | -26% | 27% | |
| H.264 (h) | 12 | 10.9 -9% | 9.8 -18% | 15.8 ? 32% | |||
| WiFi v1.3 (h) | 11.5 | 9.7 -16% | 8.2 -29% | 7.7 -33% | 9.5 -17% | 8.5 -26% | 14 ? 22% |
| Witcher 3 ultra (h) | 1.6 |
Pro
Contra
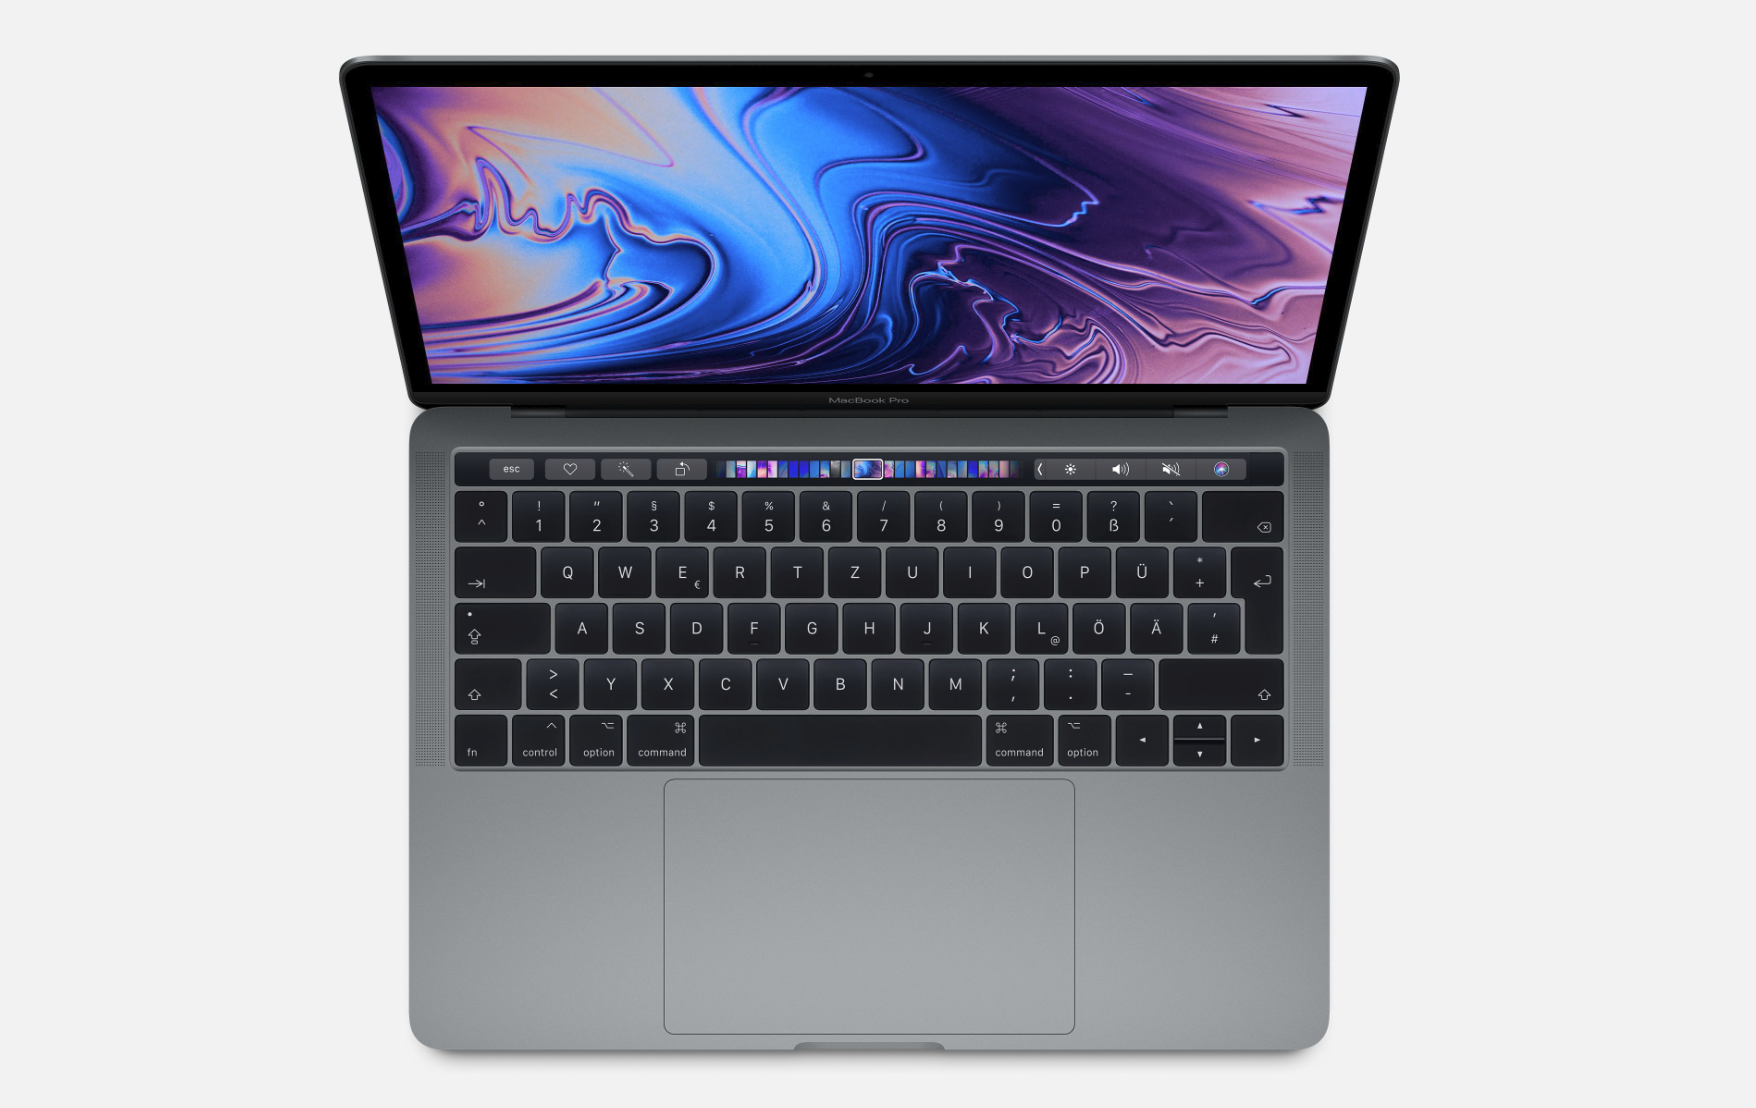
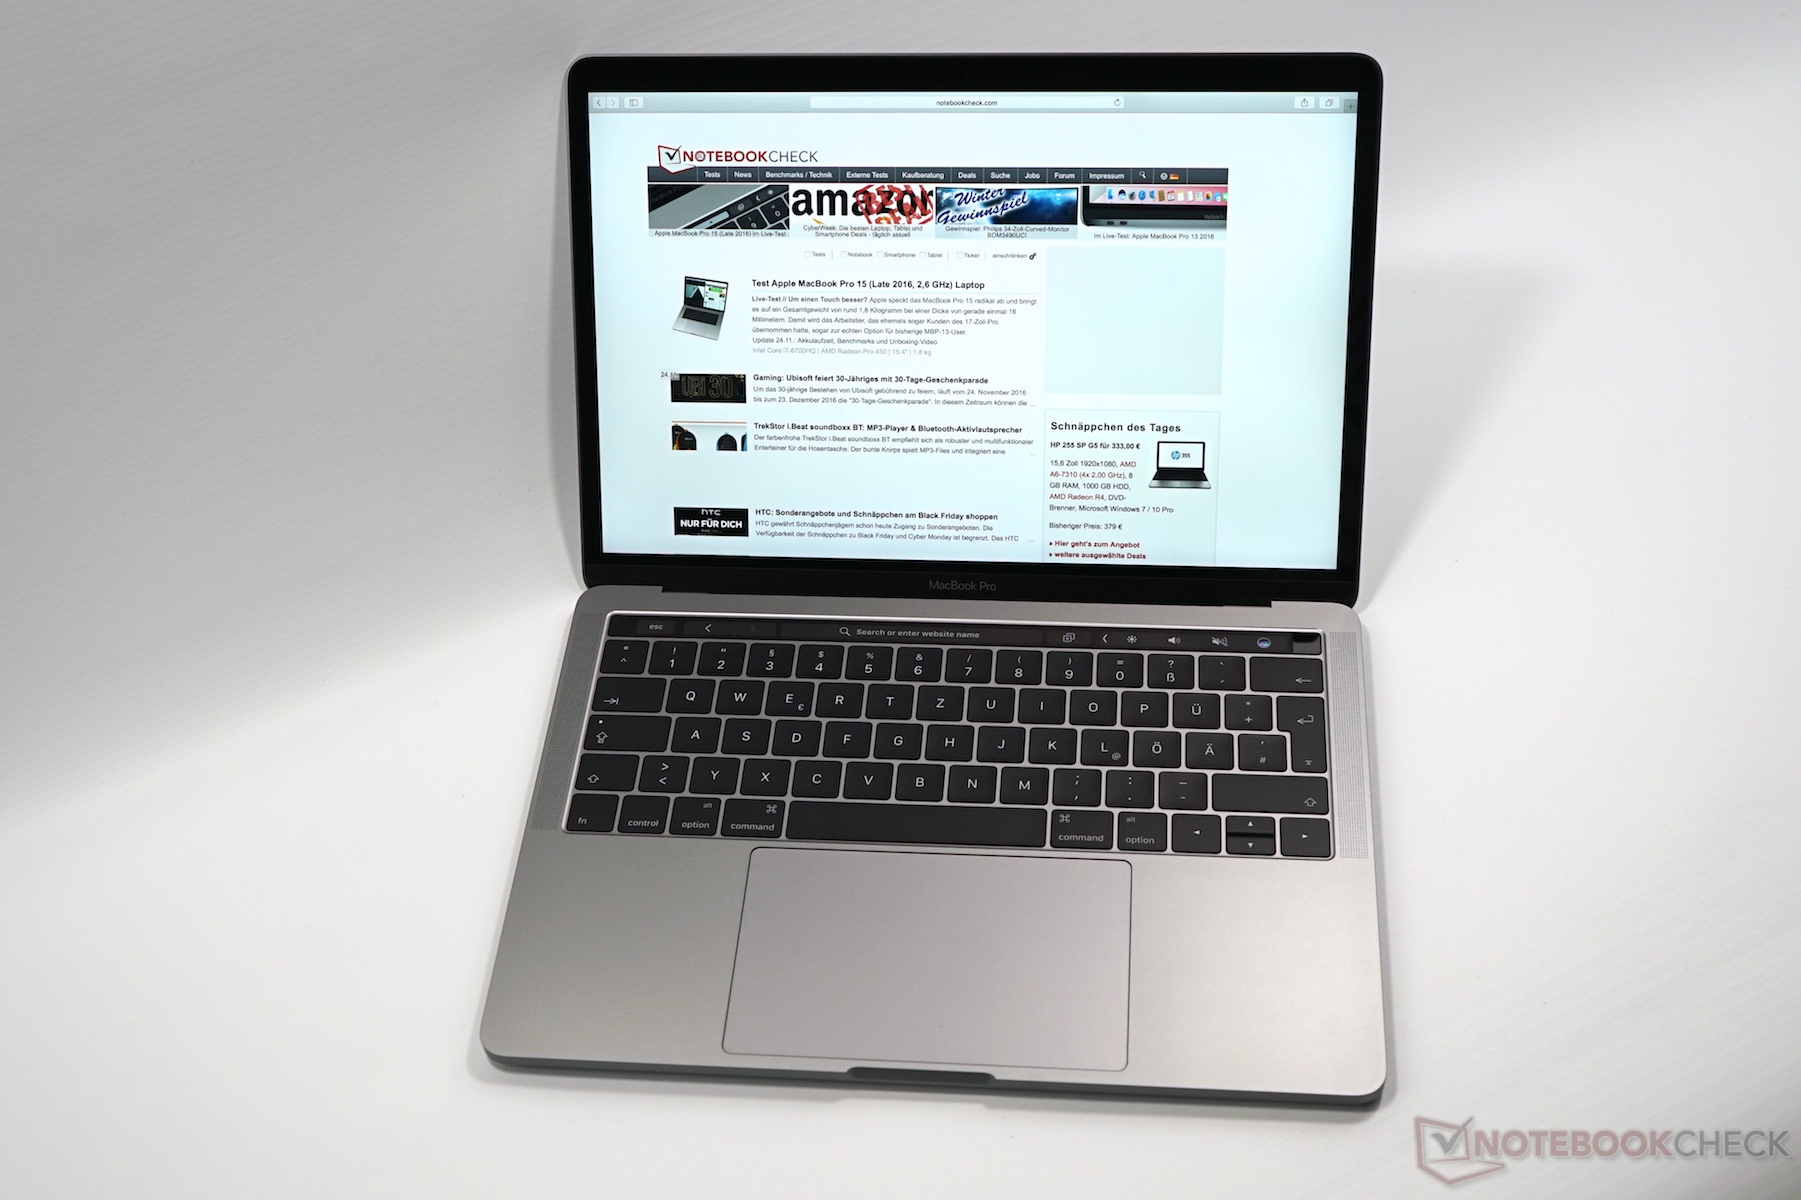
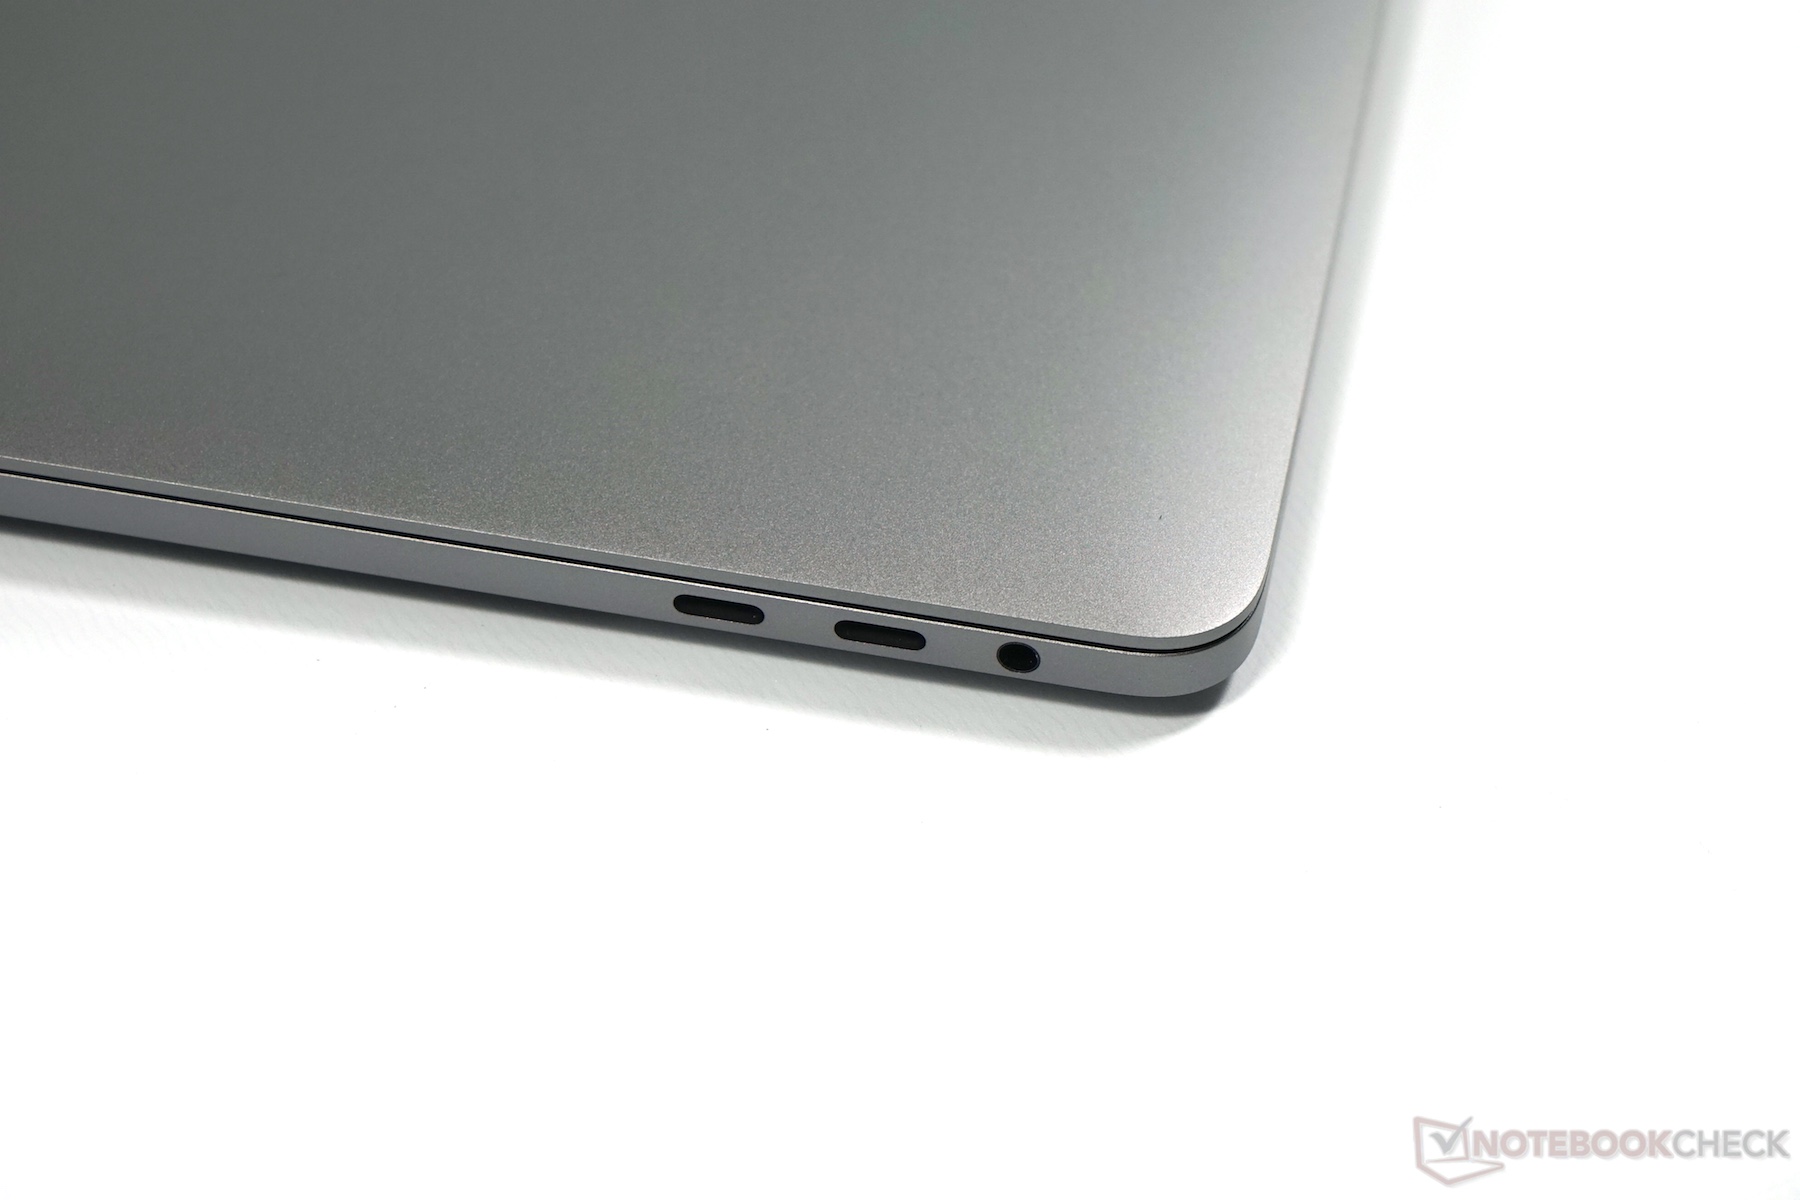
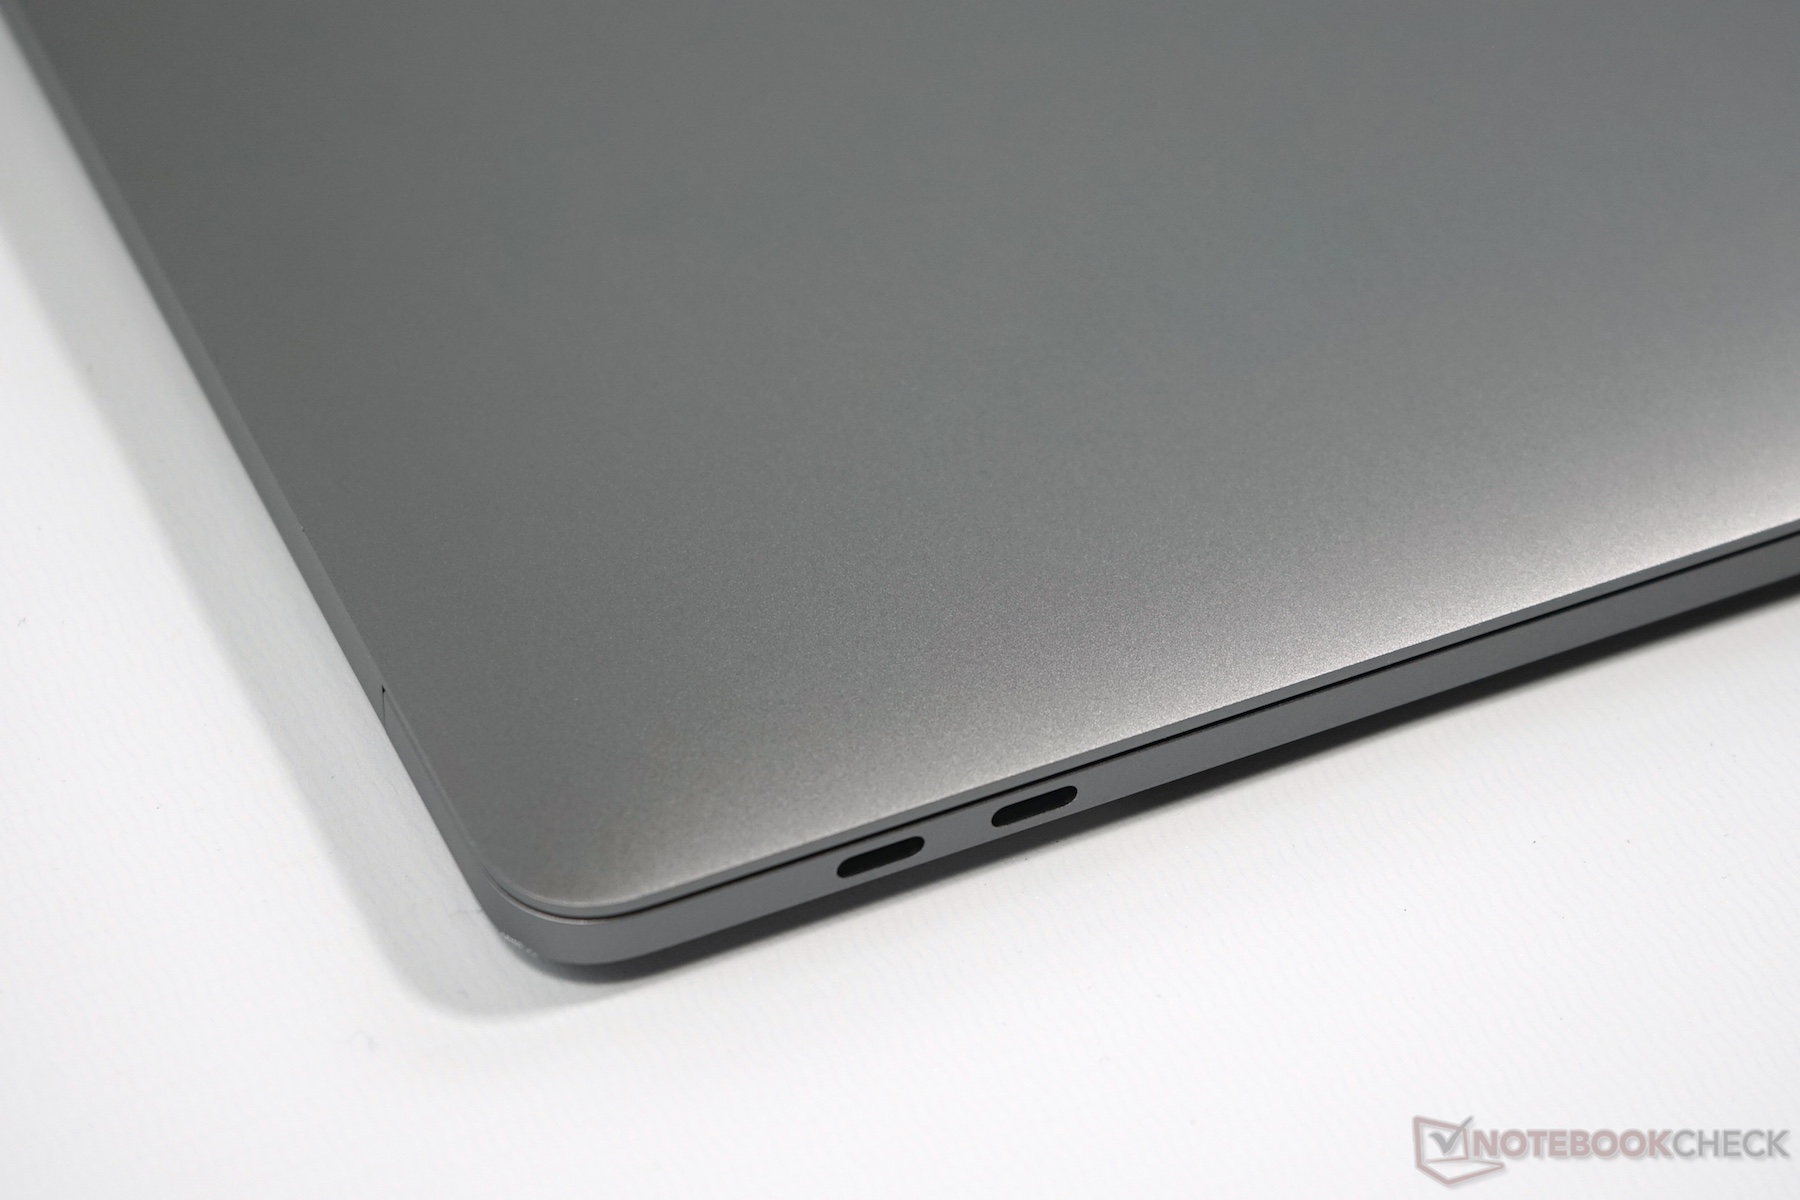
Com o modelo 2019 do MacBook Pro 13 com 4 portas Thunderbolt 3, a Apple fez apenas uma atualização leve do modelo. O foco principal do fabricante este ano foi certamente a atualização do MacBook Pro 13 mais barato (2x TB3), que também foi equipado com a Touch Bar agora.
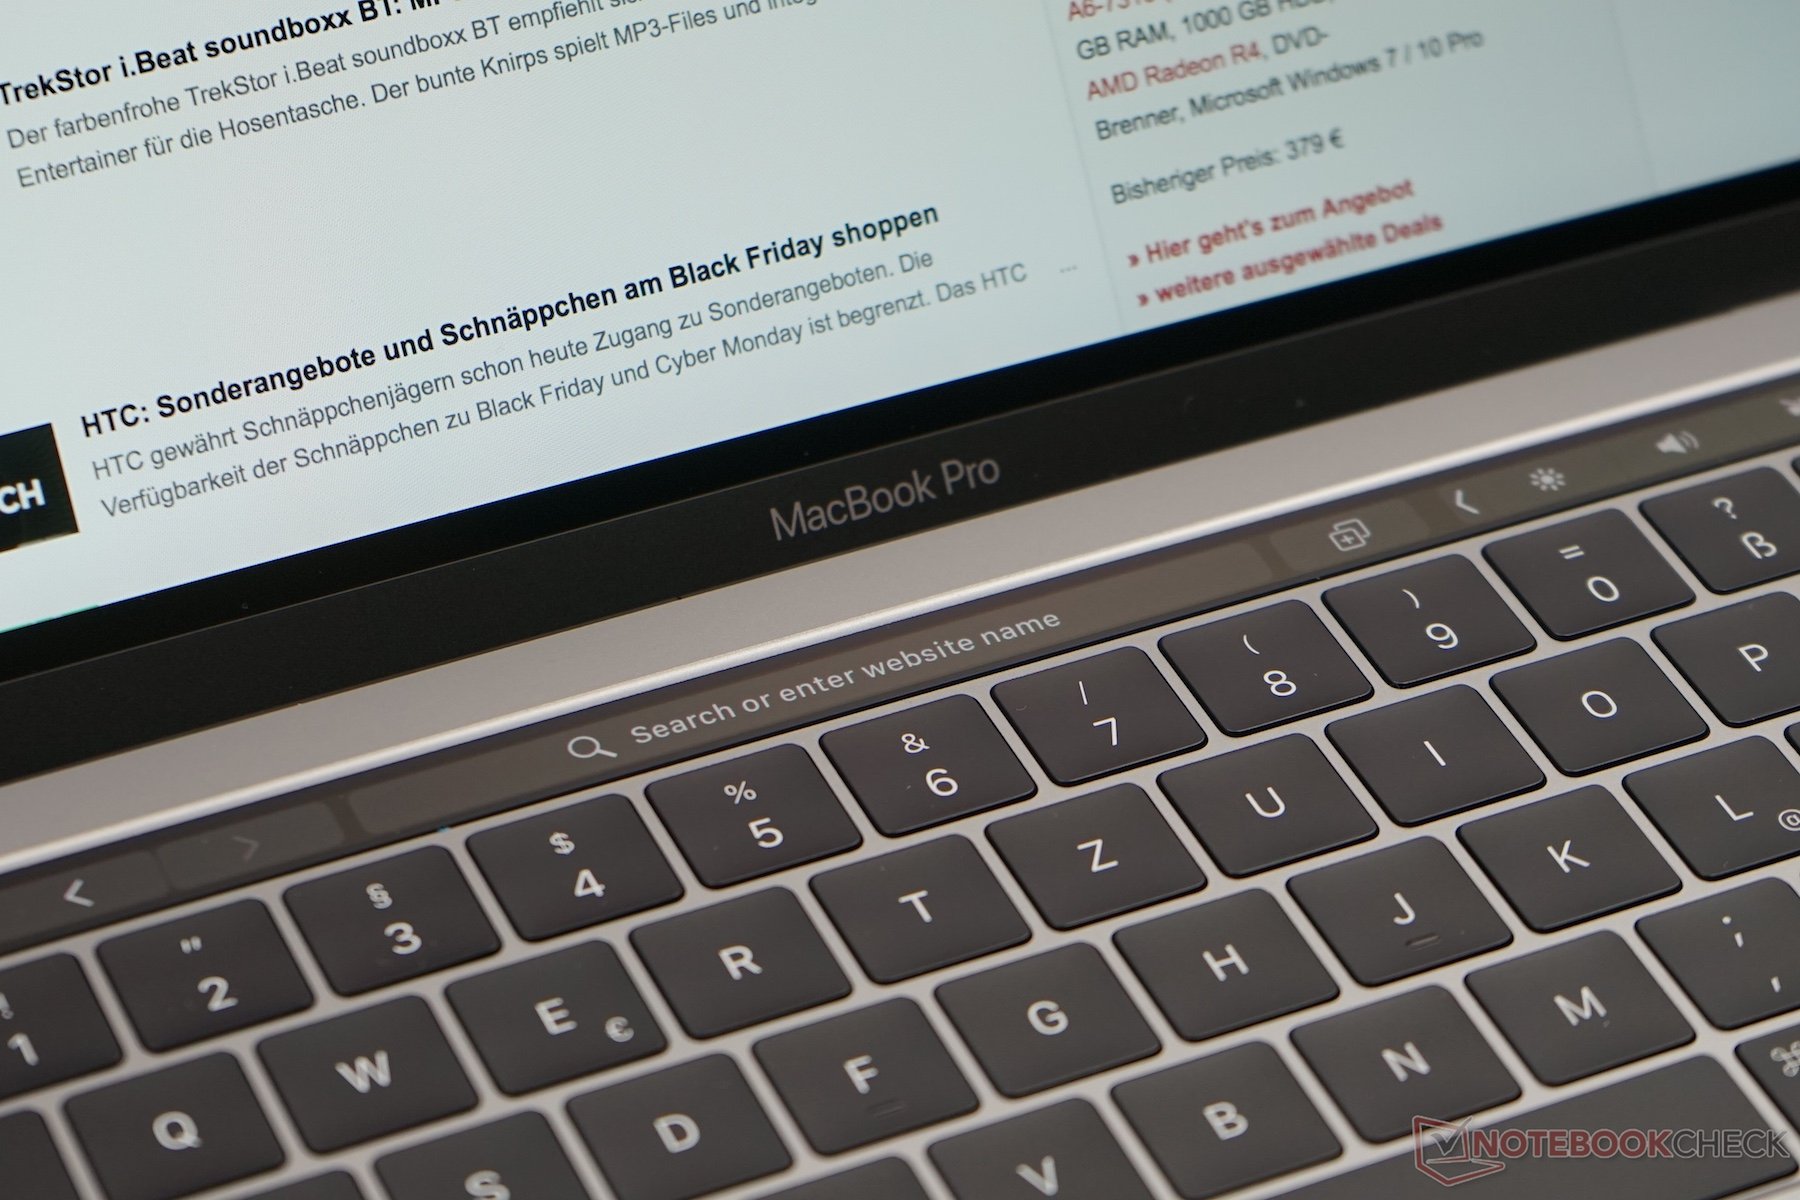
Surpreendentemente para nós, o desempenho da CPU melhorou significativamente, apesar do processador bastante semelhante, e o desempenho não diminui, nem mesmo sob uso intenso contínuo. Isso é raro na categoria de subportáteis. Nada mudou em termos de tela também, mas o painel ainda é um dos melhores do mercado e não precisa temer a comparação com a concorrência. Além disso, também é um dos poucos painéis no formato 16:10.
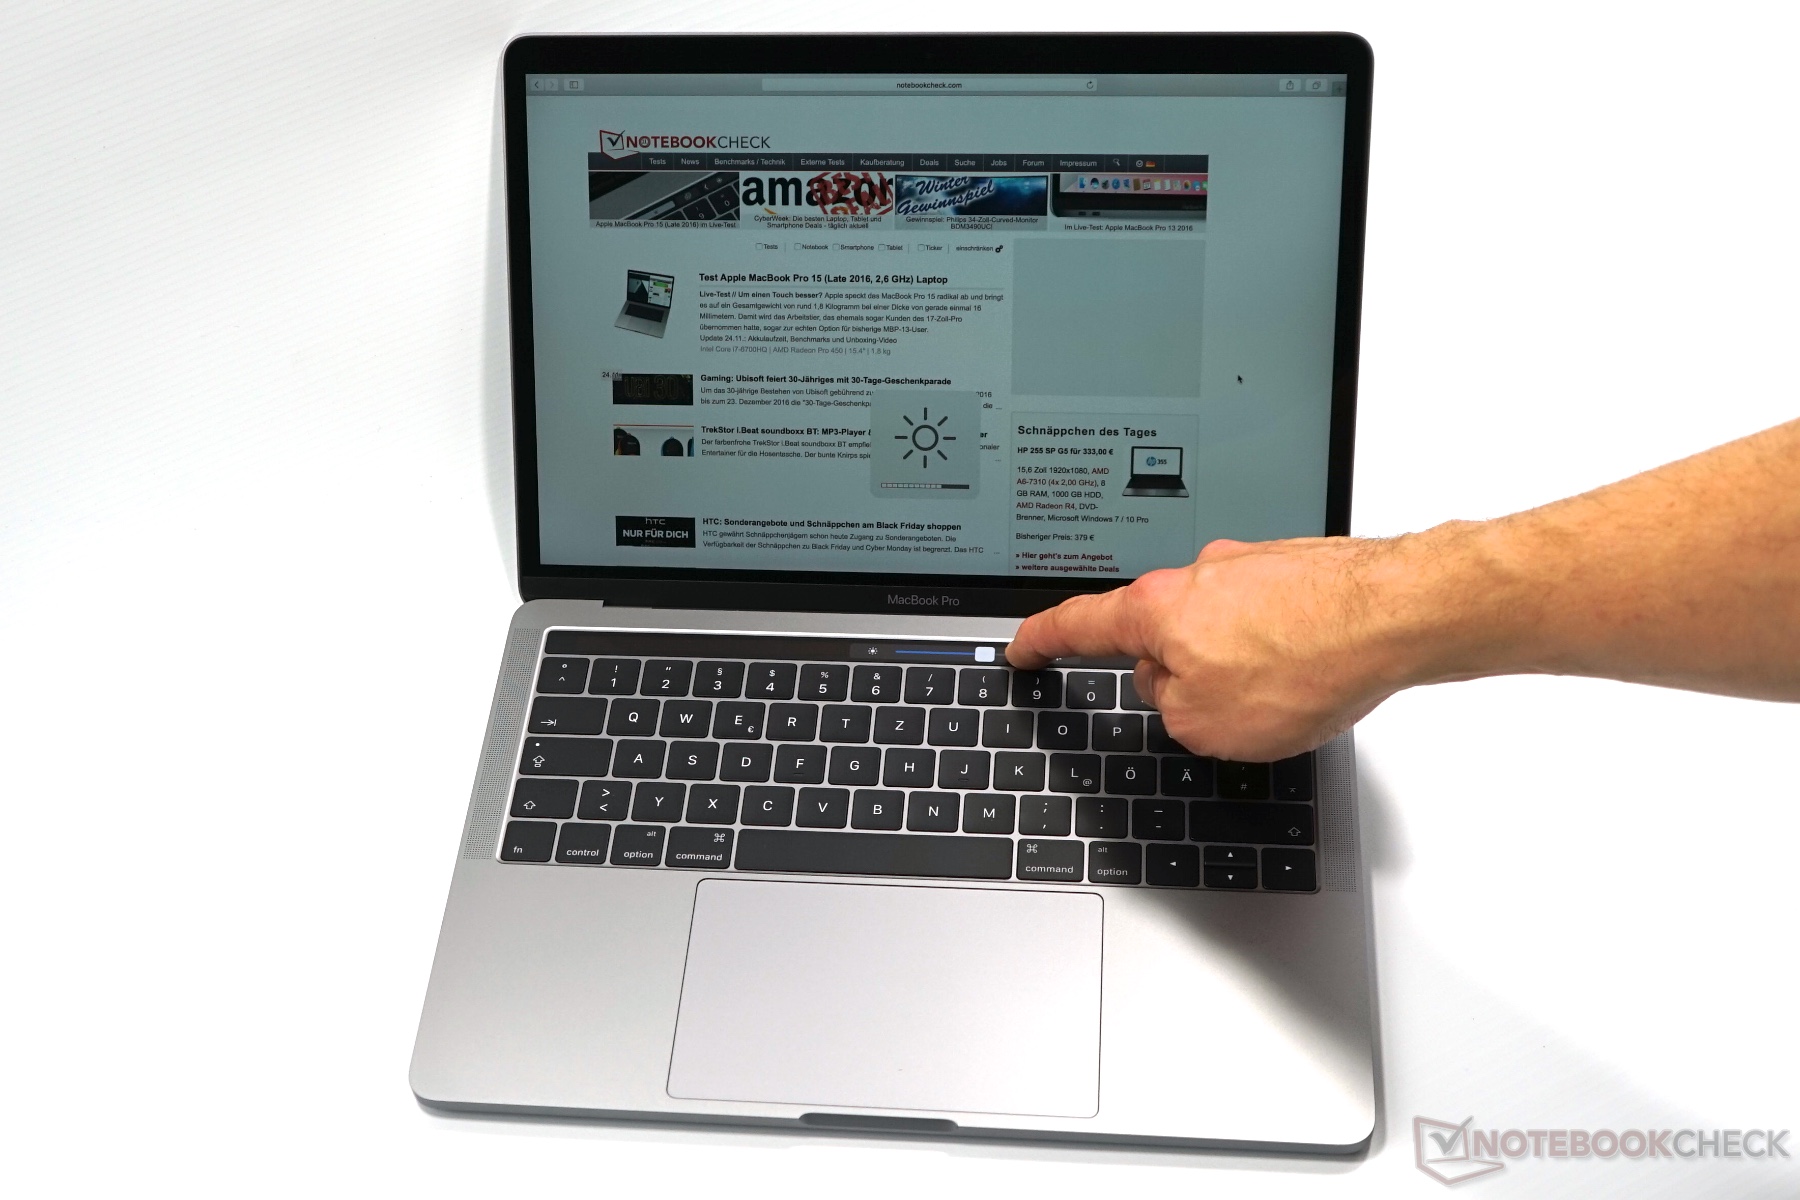
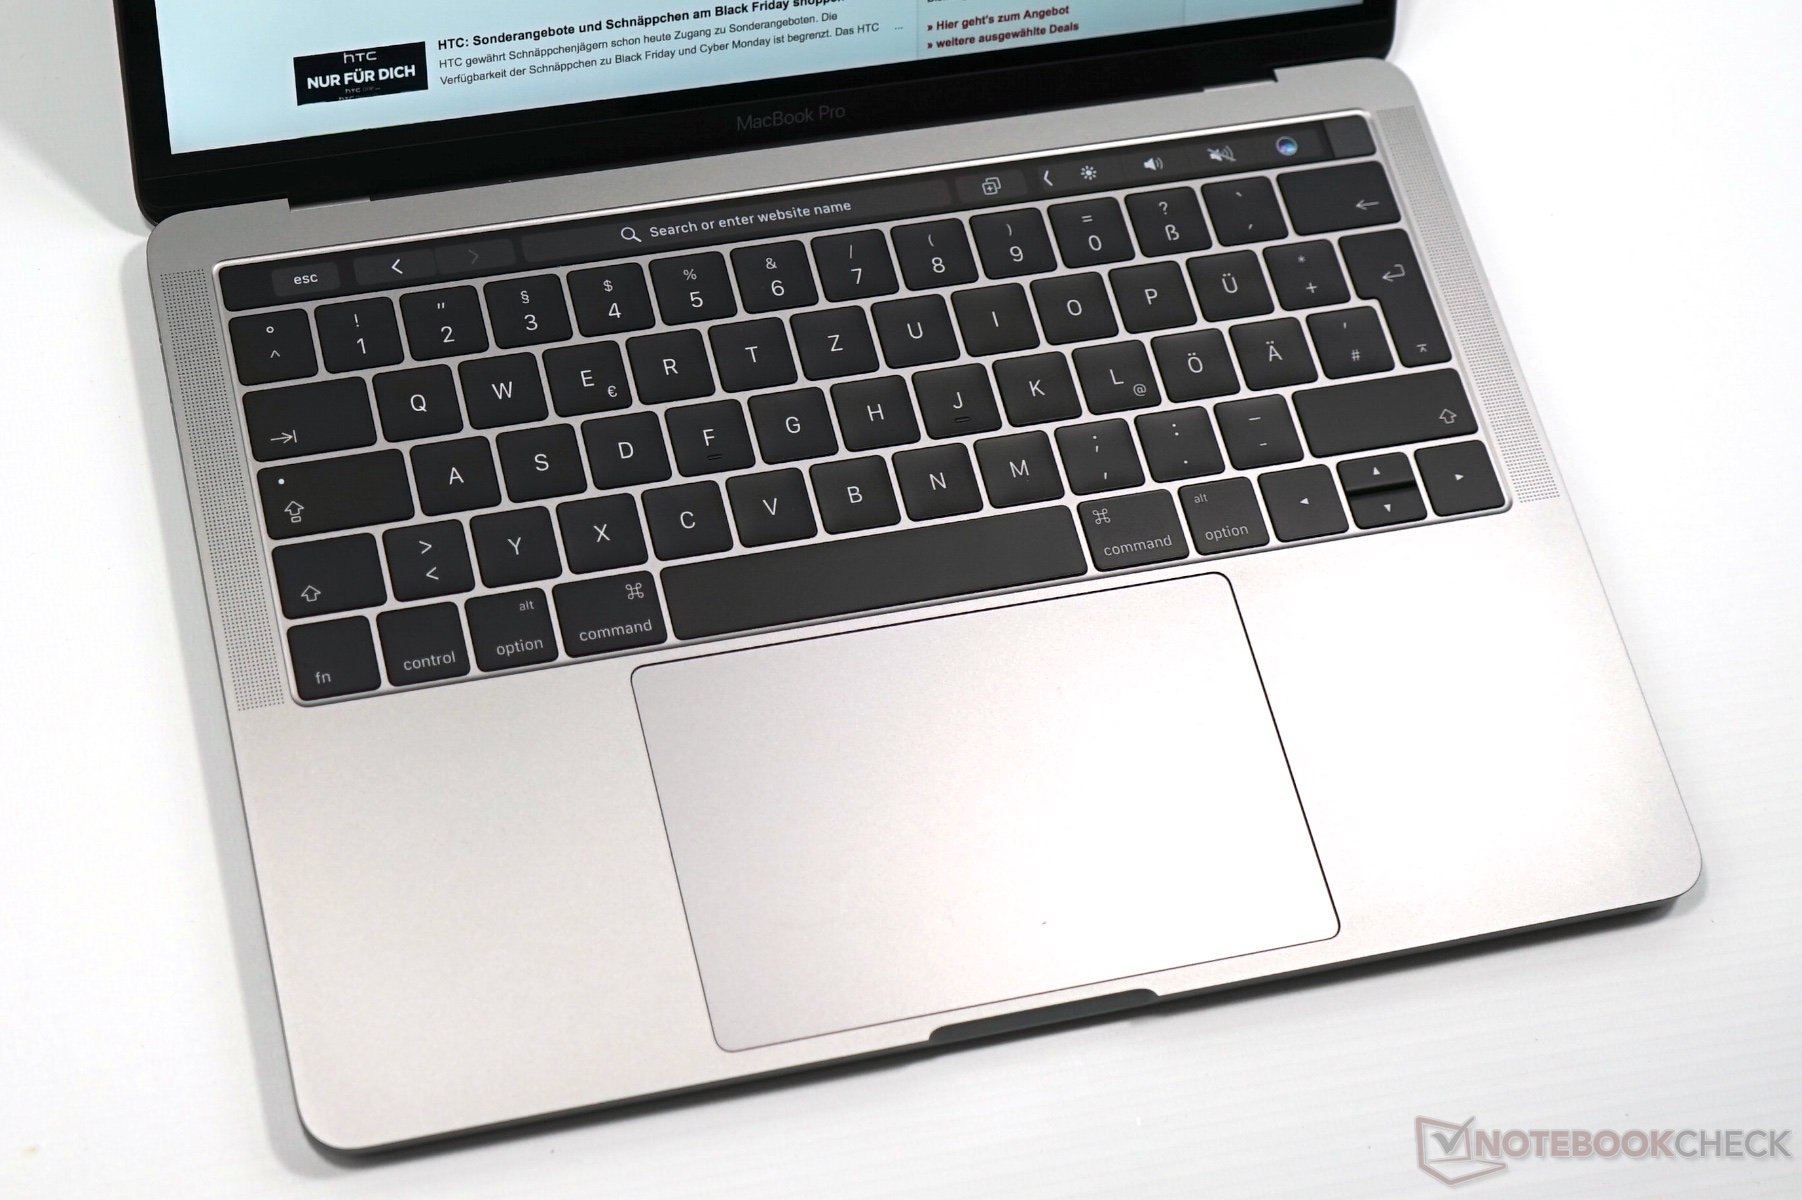
Maior desempenho da CPU e um teclado ligeiramente revisado: As alterações no MacBook Pro 13 de 2019 com 4 portas Thunderbolt são pequenas e, em nenhum caso, justificam uma atualização do modelo do ano passado. No entanto, o MBP 13 ainda é um ótimo subportátil.
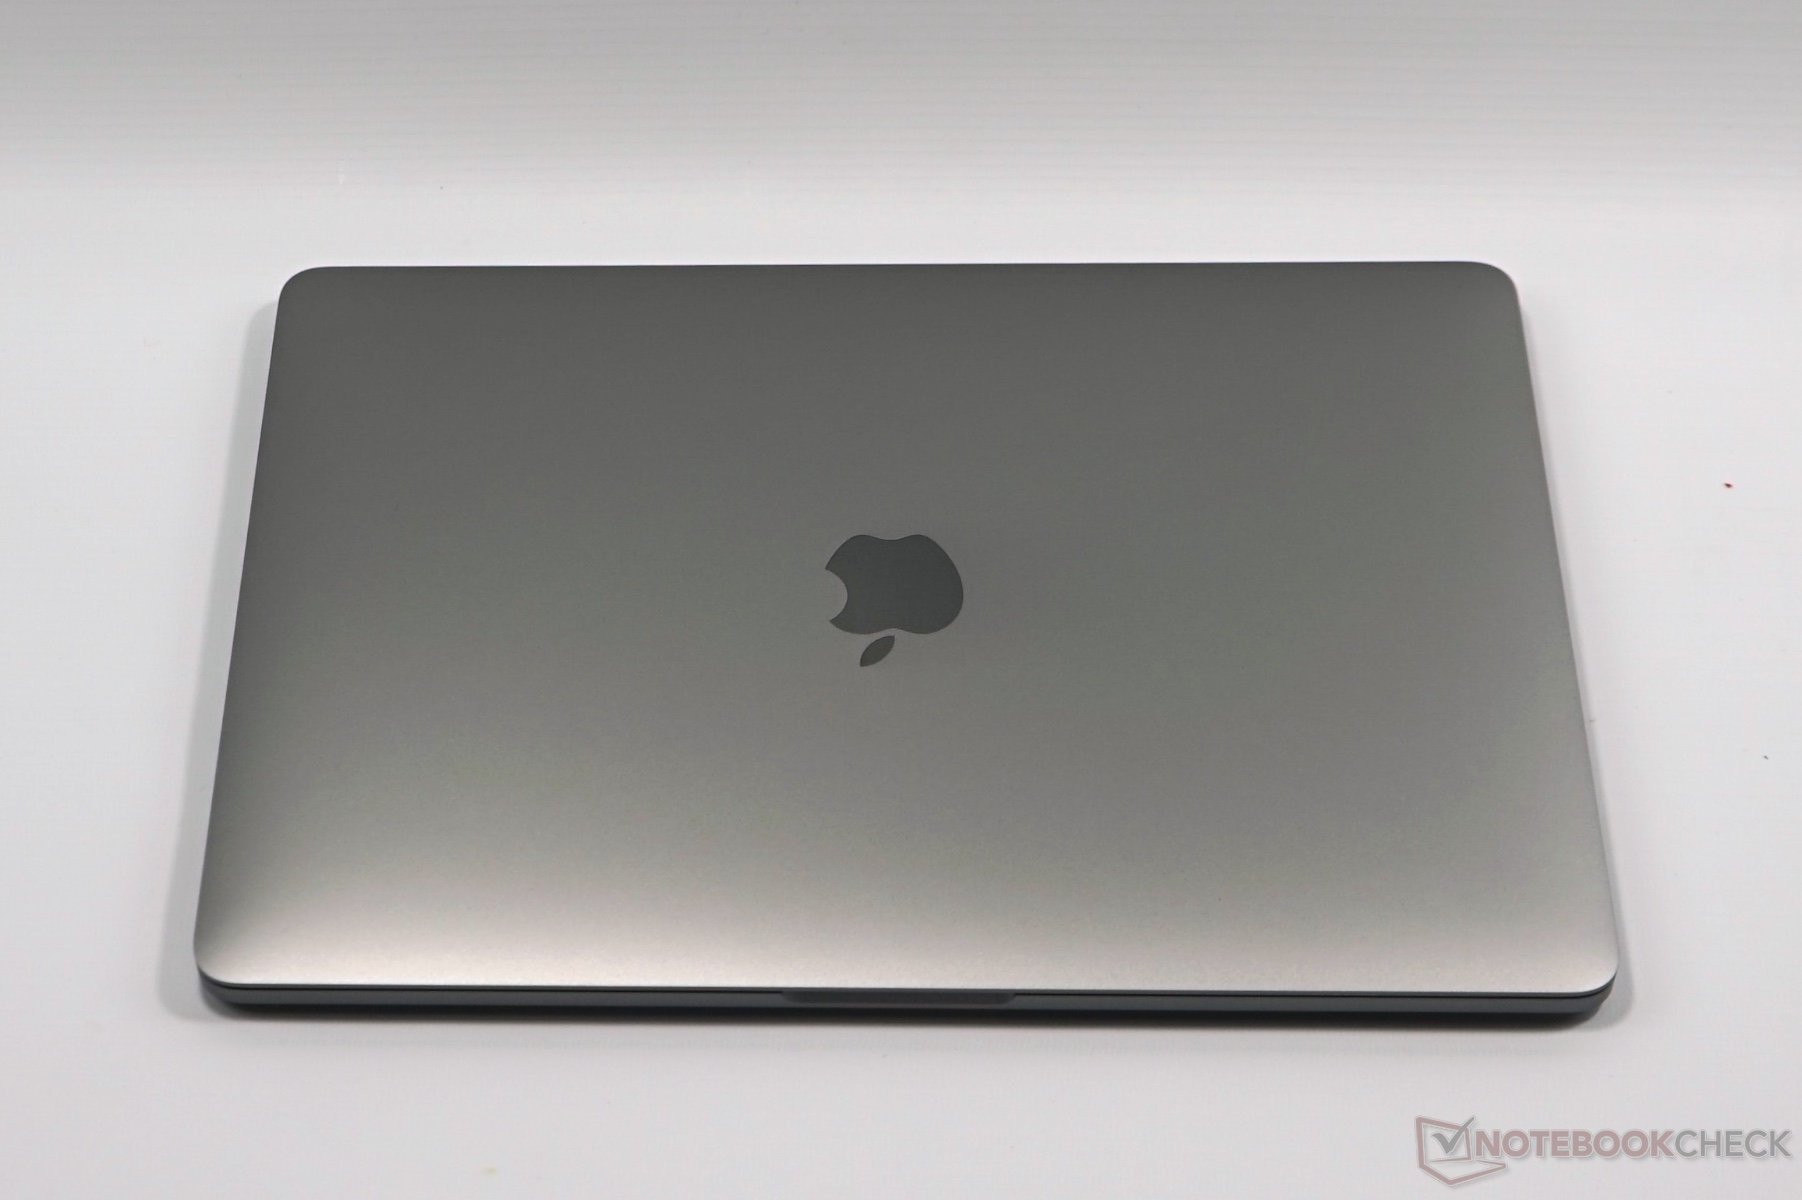
Além das vantagens conhecidas (excelente carcaça, touchpad perfeito, 4x Thunderbolt 3, bateria de longa duração), permanecem as desvantagens do antecessor. As portas Thunderbolt são extremamente versáteis, mas no uso diário você geralmente precisa de adaptadores. Não há leitor de cartão SD, e o teclado ainda é um assunto subjetivo, mas os problemas de confiabilidade dos últimos anos já deixaram um sabor desagradável. Finalmente, ainda há o preço alto e as atualizações de hardware que são geralmente caras. Mas nada disso muda o fato de que a versão 2019 do MacBook Pro 13 também é um ótimo subportátil.
Apple MacBook Pro 13 2019 i5 4TB3
- 10/02/2019 v7 (old)
Andreas Osthoff