Breve Análise do Portátil Dell XPS 13 7390 Core i7-10710U: Mais rápido que o Core i5 XPS 15
Avaliação | Data | Modelo | Peso | Altura | Size | Resolução | Preço |
|---|---|---|---|---|---|---|---|
| 85.9 % v7 (old) | 11/2019 | Dell XPS 13 7390 Core i7-10710U i7-10710U, UHD Graphics 620 | 1.2 kg | 11.6 mm | 13.30" | 3840x2160 | |
| 86.6 % v6 (old) | 05/2019 | Asus ZenBook S13 UX392FN i7-8565U, GeForce MX150 | 1.1 kg | 12.9 mm | 13.90" | 1920x1080 | |
| 82.7 % v7 (old) | 12/2019 | Acer Swift 3 SF314-41-R8HZ R5 3500U, Vega 8 | 1.5 kg | 18 mm | 14.00" | 1920x1080 | |
| 84.1 % v6 (old) | 06/2019 | Lenovo Yoga 530-14ARR-81H9000VGE R7 2700U, Vega 10 | 1.7 kg | 17.6 mm | 14.00" | 1920x1080 | |
| 87.7 % v6 (old) | 02/2019 | Dell XPS 13 9380 i7 4K i7-8565U, UHD Graphics 620 | 1.2 kg | 11.6 mm | 13.30" | 3840x2160 |
| SD Card Reader | |
| average JPG Copy Test (av. of 3 runs) | |
| Dell XPS 13 9380 i7 4K (Toshiba Exceria Pro M501 64 GB UHS-II) | |
| Dell XPS 13 7390 2-in-1 Core i3 (Toshiba Exceria Pro M501 64 GB UHS-II) | |
| Dell XPS 13 7390 Core i7-10710U (Toshiba Exceria Pro M501 64 GB UHS-II) | |
| Dell XPS 13 7390 2-in-1 Core i7 (Toshiba Exceria Pro M501 64 GB UHS-II) | |
| maximum AS SSD Seq Read Test (1GB) | |
| Dell XPS 13 9380 i7 4K (Toshiba Exceria Pro M501 64 GB UHS-II) | |
| Dell XPS 13 7390 2-in-1 Core i3 (Toshiba Exceria Pro M501 64 GB UHS-II) | |
| Dell XPS 13 7390 Core i7-10710U (Toshiba Exceria Pro M501 64 GB UHS-II) | |
| Dell XPS 13 7390 2-in-1 Core i7 (Toshiba Exceria Pro M501 64 GB UHS-II) | |
| |||||||||||||||||||||||||
iluminação: 89 %
iluminação com acumulador: 311.7 cd/m²
Contraste: 1047:1 (Preto: 0.39 cd/m²)
ΔE ColorChecker Calman: 4.6 | ∀{0.5-29.43 Ø4.73}
calibrated: 2.03
ΔE Greyscale Calman: 7.5 | ∀{0.09-98 Ø4.97}
93.5% sRGB (Argyll 1.6.3 3D)
59.5% AdobeRGB 1998 (Argyll 1.6.3 3D)
64.3% AdobeRGB 1998 (Argyll 3D)
93.7% sRGB (Argyll 3D)
63.4% Display P3 (Argyll 3D)
Gamma: 2.12
CCT: 7966 K
| Dell XPS 13 7390 Core i7-10710U AU Optronics B133ZAN, Dell P/N: 90NTH, IPS, 13.3", 3840x2160 | Dell XPS 13 7390 2-in-1 Core i7 Sharp LQ134N1, IPS, 13.4", 1920x1200 | Dell XPS 13 9380 i7 4K ID: AUO 282B B133ZAN Dell: 90NTH, IPS, 13.3", 3840x2160 | Dell XPS 13 9380 2019 ID: AUO 282B B133ZAN Dell: 90NTH, IPS, 13.3", 3840x2160 | Dell XPS 13 9370 i7 UHD ID: Sharp SHP148B, Name: LQ133D1, Dell P/N: 8XDHY, IPS, 13.3", 3840x2160 | Dell XPS 13 i5-8250U ID: Sharp SHP144A, Name: LQ133Z1, IGZO IPS, 13.3", 3200x1800 | |
|---|---|---|---|---|---|---|
| Display | 9% | 1% | 1% | 7% | 0% | |
| Display P3 Coverage (%) | 63.4 | 69.9 10% | 64.8 2% | 64.7 2% | 68.9 9% | 63.9 1% |
| sRGB Coverage (%) | 93.7 | 99.2 6% | 93.6 0% | 93.1 -1% | 98.4 5% | 91.7 -2% |
| AdobeRGB 1998 Coverage (%) | 64.3 | 71.5 11% | 65.8 2% | 65.3 2% | 69.5 8% | 65.7 2% |
| Response Times | 11% | -20% | -10% | -33% | 28% | |
| Response Time Grey 50% / Grey 80% * (ms) | 51.6 ? | 47.6 ? 8% | 64.8 ? -26% | 58 ? -12% | 69.6 ? -35% | 29 ? 44% |
| Response Time Black / White * (ms) | 33.6 ? | 29.2 ? 13% | 38 ? -13% | 36 ? -7% | 44 ? -31% | 30 ? 11% |
| PWM Frequency (Hz) | 2500 ? | 3759 ? | 19500 ? | |||
| Screen | 30% | 21% | 9% | 18% | 1% | |
| Brightness middle (cd/m²) | 408.2 | 549.8 35% | 428.3 5% | 404 -1% | 478.5 17% | 361 -12% |
| Brightness (cd/m²) | 399 | 520 30% | 414 4% | 389 -3% | 466 17% | 303 -24% |
| Brightness Distribution (%) | 89 | 86 -3% | 88 -1% | 85 -4% | 86 -3% | 72 -19% |
| Black Level * (cd/m²) | 0.39 | 0.39 -0% | 0.27 31% | 0.37 5% | 0.43 -10% | 0.33 15% |
| Contrast (:1) | 1047 | 1410 35% | 1586 51% | 1092 4% | 1113 6% | 1094 4% |
| Colorchecker dE 2000 * | 4.6 | 2.12 54% | 2.69 42% | 3.72 19% | 3.09 33% | 5.26 -14% |
| Colorchecker dE 2000 max. * | 11.84 | 3.66 69% | 6.19 48% | 7.38 38% | 5.94 50% | 7.79 34% |
| Colorchecker dE 2000 calibrated * | 2.03 | 1.37 33% | 2.01 1% | 2.06 -1% | 2.06 -1% | |
| Greyscale dE 2000 * | 7.5 | 2.6 65% | 3.7 51% | 4.44 41% | 2.4 68% | 5.69 24% |
| Gamma | 2.12 104% | 2.3 96% | 2.1 105% | 2.34 94% | 2.063 107% | 1.63 135% |
| CCT | 7966 82% | 6884 94% | 6706 97% | 7095 92% | 6883 94% | 6499 100% |
| Color Space (Percent of AdobeRGB 1998) (%) | 59.5 | 65.4 10% | 60.4 2% | 60 1% | 69.47 17% | 59 -1% |
| Color Space (Percent of sRGB) (%) | 93.5 | 99.7 7% | 93.5 0% | 93 -1% | 98.36 5% | 92 -2% |
| Média Total (Programa/Configurações) | 17% /
24% | 1% /
12% | 0% /
5% | -3% /
10% | 10% /
4% |
* ... menor é melhor
Exibir tempos de resposta
| ↔ Tempo de resposta preto para branco | ||
|---|---|---|
| 33.6 ms ... ascensão ↗ e queda ↘ combinadas | ↗ 17.2 ms ascensão | 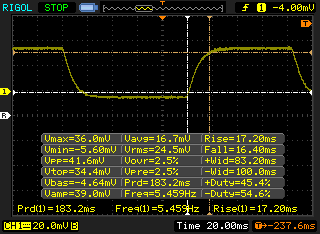 |
| ↘ 16.4 ms queda | ||
| A tela mostra taxas de resposta lentas em nossos testes e será insatisfatória para os jogadores. Em comparação, todos os dispositivos testados variam de 0.1 (mínimo) a 240 (máximo) ms. » 90 % de todos os dispositivos são melhores. Isso significa que o tempo de resposta medido é pior que a média de todos os dispositivos testados (19.9 ms). | ||
| ↔ Tempo de resposta 50% cinza a 80% cinza | ||
| 51.6 ms ... ascensão ↗ e queda ↘ combinadas | ↗ 26.4 ms ascensão | 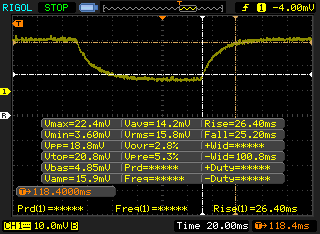 |
| ↘ 25.2 ms queda | ||
| A tela mostra taxas de resposta lentas em nossos testes e será insatisfatória para os jogadores. Em comparação, todos os dispositivos testados variam de 0.165 (mínimo) a 636 (máximo) ms. » 88 % de todos os dispositivos são melhores. Isso significa que o tempo de resposta medido é pior que a média de todos os dispositivos testados (31.1 ms). | ||
Cintilação da tela / PWM (modulação por largura de pulso)
| Tela tremeluzindo / PWM não detectado | 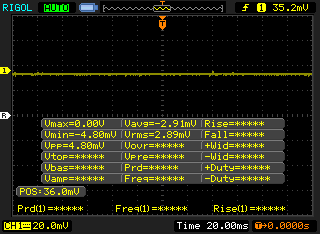 | ||
[pwm_comparison] Em comparação: 52 % de todos os dispositivos testados não usam PWM para escurecer a tela. Se PWM foi detectado, uma média de 7794 (mínimo: 5 - máximo: 343500) Hz foi medida. | |||
* ... menor é melhor
| PCMark 8 Home Score Accelerated v2 | 3442 pontos | |
| PCMark 8 Work Score Accelerated v2 | 4578 pontos | |
| PCMark 10 Score | 4161 pontos | |
Ajuda | ||
| Dell XPS 13 7390 Core i7-10710U SK Hynix PC601 NVMe 512 GB | Dell XPS 13 7390 2-in-1 Core i7 Toshiba BG4 KBG40ZPZ512G | Dell XPS 13 7390 2-in-1 Core i3 Toshiba BG4 KBG40ZPZ256G | Dell XPS 13 9380 i7 4K Samsung SSD PM981 MZVLB512HAJQ | Dell XPS 13 9380 2019 SK hynix PC401 HFS256GD9TNG | Dell XPS 13 9370 i7 UHD Toshiba XG5 KXG50ZNV512G | |
|---|---|---|---|---|---|---|
| AS SSD | -53% | -69% | 44% | -29% | -23% | |
| Seq Read (MB/s) | 1804 | 1801 0% | 1558 -14% | 1981 10% | 2035 13% | 2205 22% |
| Seq Write (MB/s) | 1000 | 1125 13% | 1103 10% | 1473 47% | 658 -34% | 435.8 -56% |
| 4K Read (MB/s) | 45.1 | 39.7 -12% | 37.52 -17% | 53.3 18% | 39.74 -12% | 29.36 -35% |
| 4K Write (MB/s) | 115 | 67 -42% | 59 -49% | 127.4 11% | 105.7 -8% | 107.4 -7% |
| 4K-64 Read (MB/s) | 893 | 1253 40% | 1684 89% | 1179 32% | 461 -48% | 678 -24% |
| 4K-64 Write (MB/s) | 732 | 209 -71% | 198.9 -73% | 2105 188% | 300.1 -59% | 444.8 -39% |
| Access Time Read * (ms) | 0.044 | 0.069 -57% | 0.099 -125% | 0.036 18% | 0.061 -39% | 0.059 -34% |
| Access Time Write * (ms) | 0.095 | 0.625 -558% | 0.722 -660% | 0.029 69% | 0.051 46% | 0.055 42% |
| Score Read (Points) | 1119 | 1472 32% | 1877 68% | 1430 28% | 704 -37% | 926 -17% |
| Score Write (Points) | 947 | 388 -59% | 368 -61% | 2379 151% | 471 -50% | 596 -37% |
| Score Total (Points) | 2608 | 2583 -1% | 3180 22% | 4526 74% | 1479 -43% | 1911 -27% |
| Copy ISO MB/s (MB/s) | 1515 | 1293 -15% | 677 -55% | 1294 -15% | 893 -41% | 585 -61% |
| Copy Program MB/s (MB/s) | 535 | 560 5% | 298.4 -44% | 503 -6% | 287.9 -46% | 570 7% |
| Copy Game MB/s (MB/s) | 1211 | 927 -23% | 496.1 -59% | 1148 -5% | 618 -49% | 503 -58% |
* ... menor é melhor

| 3DMark 06 Standard Score | 14158 pontos | |
| 3DMark 11 Performance | 2228 pontos | |
| 3DMark Ice Storm Standard Score | 62104 pontos | |
| 3DMark Cloud Gate Standard Score | 9916 pontos | |
| 3DMark Fire Strike Score | 1237 pontos | |
| 3DMark Time Spy Score | 491 pontos | |
Ajuda | ||
| baixo | média | alto | ultra | |
|---|---|---|---|---|
| BioShock Infinite (2013) | 85.3 | 42 | 35.8 | 11.2 |
| The Witcher 3 (2015) | 19.7 | |||
| Rocket League (2017) | 76.2 | 36.6 | 23 | |
| Shadow of the Tomb Raider (2018) | 15 |
| Dell XPS 13 7390 Core i7-10710U UHD Graphics 620, i7-10710U, SK Hynix PC601 NVMe 512 GB | Dell XPS 13 7390 2-in-1 Core i7 Iris Plus Graphics G7 (Ice Lake 64 EU), i7-1065G7, Toshiba BG4 KBG40ZPZ512G | Dell XPS 13 7390 2-in-1 Core i3 UHD Graphics G1 (Ice Lake 32 EU), i3-1005G1, Toshiba BG4 KBG40ZPZ256G | Dell XPS 13 9380 i7 4K UHD Graphics 620, i7-8565U, Samsung SSD PM981 MZVLB512HAJQ | Dell XPS 13 9380 2019 UHD Graphics 620, i5-8265U, SK hynix PC401 HFS256GD9TNG | Dell XPS 13 9370 i7 UHD UHD Graphics 620, i5-8550U, Toshiba XG5 KXG50ZNV512G | |
|---|---|---|---|---|---|---|
| Noise | 2% | 2% | -3% | -2% | 2% | |
| desligado / ambiente * (dB) | 28 | 28.1 -0% | 28 -0% | 28.4 -1% | 30.4 -9% | 28 -0% |
| Idle Minimum * (dB) | 28 | 28.1 -0% | 28 -0% | 29.4 -5% | 30.4 -9% | 28 -0% |
| Idle Average * (dB) | 28 | 28.1 -0% | 28 -0% | 29.4 -5% | 30.4 -9% | 28 -0% |
| Idle Maximum * (dB) | 28 | 28.1 -0% | 28 -0% | 29.4 -5% | 30.4 -9% | 28 -0% |
| Load Average * (dB) | 33.7 | 31.7 6% | 31.7 6% | 34.6 -3% | 31.7 6% | 32.5 4% |
| Load Maximum * (dB) | 46.5 | 43.4 7% | 43.5 6% | 46.8 -1% | 38.1 18% | 42.2 9% |
| Witcher 3 ultra * (dB) | 43.4 |
* ... menor é melhor
Barulho
| Ocioso |
| 28 / 28 / 28 dB |
| Carga |
| 33.7 / 46.5 dB |
 | ||
30 dB silencioso 40 dB(A) audível 50 dB(A) ruidosamente alto |
||
min: | ||
(±) A temperatura máxima no lado superior é 44.6 °C / 112 F, em comparação com a média de 35.9 °C / 97 F , variando de 21.4 a 59 °C para a classe Subnotebook.
(-) A parte inferior aquece até um máximo de 49.2 °C / 121 F, em comparação com a média de 39.2 °C / 103 F
(+) Em uso inativo, a temperatura média para o lado superior é 26.6 °C / 80 F, em comparação com a média do dispositivo de 30.8 °C / ### class_avg_f### F.
(+) Os apoios para as mãos e o touchpad são mais frios que a temperatura da pele, com um máximo de 31.4 °C / 88.5 F e, portanto, são frios ao toque.
(-) A temperatura média da área do apoio para as mãos de dispositivos semelhantes foi 28.2 °C / 82.8 F (-3.2 °C / -5.7 F).
| desligado | |
| Ocioso | |
| Carga |
|
Key:
min: | |
| Dell XPS 13 7390 Core i7-10710U i7-10710U, UHD Graphics 620, SK Hynix PC601 NVMe 512 GB, IPS, 3840x2160, 13.3" | Dell XPS 13 7390 2-in-1 Core i7 i7-1065G7, Iris Plus Graphics G7 (Ice Lake 64 EU), Toshiba BG4 KBG40ZPZ512G, IPS, 1920x1200, 13.4" | Dell XPS 13 7390 2-in-1 Core i3 i3-1005G1, UHD Graphics G1 (Ice Lake 32 EU), Toshiba BG4 KBG40ZPZ256G, IPS, 1920x1200, 13.4" | Dell XPS 13 9380 i7 4K i7-8565U, UHD Graphics 620, Samsung SSD PM981 MZVLB512HAJQ, IPS, 3840x2160, 13.3" | Dell XPS 13 9380 2019 i5-8265U, UHD Graphics 620, SK hynix PC401 HFS256GD9TNG, IPS, 3840x2160, 13.3" | Dell XPS 13 9370 i7 UHD i5-8550U, UHD Graphics 620, Toshiba XG5 KXG50ZNV512G, IPS, 3840x2160, 13.3" | |
|---|---|---|---|---|---|---|
| Power Consumption | 20% | 22% | -7% | -2% | -3% | |
| Idle Minimum * (Watt) | 4.7 | 2.6 45% | 3 36% | 5.2 -11% | 4.8 -2% | 5 -6% |
| Idle Average * (Watt) | 8.3 | 5.3 36% | 5.4 35% | 8.6 -4% | 8.6 -4% | 8.3 -0% |
| Idle Maximum * (Watt) | 9 | 7 22% | 7.3 19% | 10.5 -17% | 10.4 -16% | 8.8 2% |
| Load Average * (Watt) | 42 | 43.1 -3% | 33.4 20% | 44.2 -5% | 37.9 10% | 46.4 -10% |
| Load Maximum * (Watt) | 49 | 49 -0% | 48.3 1% | 47.5 3% | 48.5 1% | 48.6 1% |
| Witcher 3 ultra * (Watt) | 43.1 |
* ... menor é melhor
| Dell XPS 13 7390 Core i7-10710U i7-10710U, UHD Graphics 620, 52 Wh | Dell XPS 13 7390 2-in-1 Core i7 i7-1065G7, Iris Plus Graphics G7 (Ice Lake 64 EU), 51 Wh | Dell XPS 13 7390 2-in-1 Core i3 i3-1005G1, UHD Graphics G1 (Ice Lake 32 EU), 51 Wh | Dell XPS 13 9380 i7 4K i7-8565U, UHD Graphics 620, 52 Wh | Dell XPS 13 9380 2019 i5-8265U, UHD Graphics 620, 52 Wh | Dell XPS 13 9370 i7 UHD i5-8550U, UHD Graphics 620, 52 Wh | |
|---|---|---|---|---|---|---|
| Duração da bateria | 7% | 6% | -8% | -1% | -7% | |
| WiFi v1.3 (h) | 8.4 | 9 7% | 8.9 6% | 7.7 -8% | 8.3 -1% | 7.8 -7% |
| Reader / Idle (h) | 35.7 | 17.2 | 13.7 | |||
| Load (h) | 2.2 | 2.4 | 1.8 |
Pro
Contra
Você realmente precisa de um processador hexa-core para um subportátil? Se sua intenção é usar o XPS 13 principalmente para navegação na web, streaming de vídeo, processamento de texto ou outras tarefas leves de escritório para as quais a série foi projetada inicialmente, o Core i7-8565U quad-core mais antigo será suficiente. As pontuações do PCMark 10 estão tão próximas entre o XPS 13 7390 e o XPS 13 9380 que fica difícil justificar o preço mais alto por possuir um XPS 13 de seis núcleos, especialmente porque a maioria dos usuários não sente a diferença durante as cargas de trabalho diárias.
Por outro lado, os usuários avançados que desejam aproveitar os dois núcleos adicionais do Comet Lake-U ficarão felizes em descobrir que o aumento bruto do desempenho de vários threads sobre o Whiskey Lake-U é bastante significativo, mesmo depois de contabilizar as taxas instáveis de velocidade e sustentabilidade máxima limitada do Turbo Boost. Se você roda frequentemente programas que podem se beneficiar de threads adicionais ou deseja conectar estações de acoplamento eGPU ao seu XPS 13, então o SKU Core i7-10710U de seis núcleos vale a pena.
O XPS 13 7390 hexa-core é para usuários avançados que desejam o desempenho de um Core i5 XPS 15 de linha de base em um formato menor de 13,3 polegadas. O sistema é capaz de oferecer desempenho aprimorado sem inconvenientes visíveis à duração da bateria, temperatura da superfície, consumo de energia ou ruído do ventilador.
Dell XPS 13 7390 Core i7-10710U
- 05/15/2020 v7 (old)
Allen Ngo
Price comparison
