Asus ROG Zephyrus S17 revisão de laptop: A caixa do dispositivo de jogo se abre para fornecer mais ar fresco. Legal - mas será seguro?

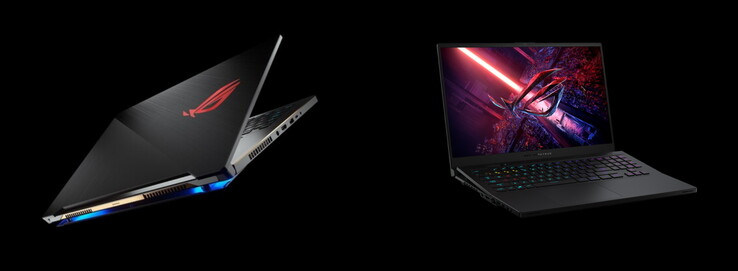
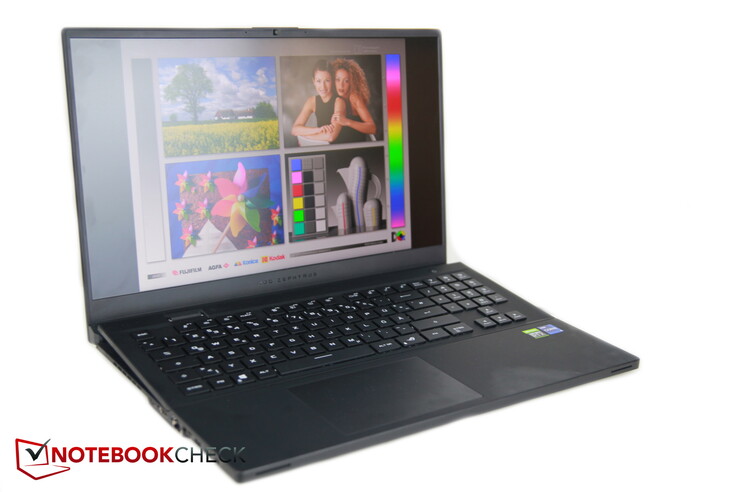
O Zephyrus S17 do ano passado era um dispositivo de jogo bastante incomum de 17 polegadas. Quando aberto, o estojo também se abriu um pouco na parte de baixo, o que supostamente deveria proporcionar um melhor suprimento de ar. A fim de não comprometer a estabilidade, a posição do touchpad e do teclado foi deslocada de forma incomum.
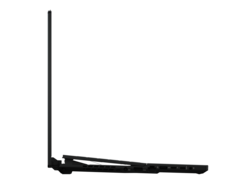
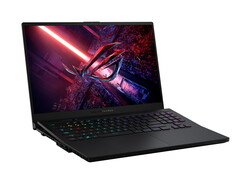
Este ano, a Asus está lançando a nova edição completamente redesenhada do S17. Além das atualizações de hardware (Tiger Lake e RTX 30), o case também foi inteiramente modificado. Mais uma vez, uma lacuna se abre quando se abre o laptop, mas ele não está mais no fundo; em vez disso, o teclado é levantado.
Entre a concorrência, incluímos os dois modelos Gigabyte Aorus 17G e Aero 17 HDR, o Schenker XMG Ultra 17e o MSI GE76 Raider 10UH. Além disso, iremos naturalmente compará-lo com o predecessor.
Os Top 10
» Os Top 10 Portáteis Multimídia
» Os Top 10 Portáteis de Jogos
» Os Top 10 Portáteis Leves para Jogos
» Os Top 10 Portáteis Acessíveis de Escritório/Empresariais
» Os Top 10 Portáteis Premium de Escritório/Empresariais
» Os Top 10 dos Portáteis Workstation
» Os Top 10 Subportáteis
» Os Top 10 Ultrabooks
» Os Top 10 Conversíveis
» Os Top 10 Tablets
» Os Top 10 Smartphones
» A melhores Telas de Portáteis Analisadas Pela Notebookcheck
» Top 10 dos portáteis abaixo dos 500 Euros da Notebookcheck
» Top 10 dos Portáteis abaixo dos 300 Euros
Possible contenders in comparison
Avaliação | Data | Modelo | Peso | Altura | Size | Resolução | Preço |
|---|---|---|---|---|---|---|---|
| 90.1 % v7 (old) | 07/2021 | Asus ROG Zephyrus S17 GX703HSD i9-11900H, GeForce RTX 3080 Laptop GPU | 2.8 kg | 19.9 mm | 17.30" | 2560x1440 | |
| 82.4 % v7 (old) | 08/2020 | Asus Zephyrus S17 GX701LXS i7-10875H, GeForce RTX 2080 Super Max-Q | 2.6 kg | 18.7 mm | 17.30" | 1920x1080 | |
| 86 % v7 (old) | 06/2021 | Aorus 17G YD i7-11800H, GeForce RTX 3080 Laptop GPU | 2.8 kg | 26 mm | 17.30" | 1920x1080 | |
| 88 % v7 (old) | 05/2021 | Gigabyte Aero 17 HDR YD i9-11980HK, GeForce RTX 3080 Laptop GPU | 2.8 kg | 22 mm | 17.30" | 3840x2160 | |
| 84.9 % v7 (old) | 04/2021 | Schenker XMG Ultra 17 Rocket Lake i9-11900K, GeForce RTX 3080 Laptop GPU | 4.7 kg | 43.5 mm | 17.30" | 1920x1080 | |
| 87.1 % v7 (old) | 03/2021 | MSI GE76 Raider 10UH i7-10870H, GeForce RTX 3080 Laptop GPU | 3 kg | 27.4 mm | 17.30" | 1920x1080 |
Estojo - Elevadores para revelar uma lacuna
A caixa preta, que é bastante fina para um equipamento de 17 polegadas, é feita de metal resistente, e a palma da mão repousa sobre o interior é emborrachada.
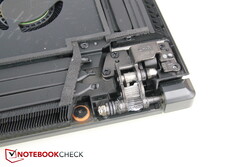
Quando se abre a tampa, as dobradiças robustas levantam simultaneamente a unidade de teclado fino, de modo que uma estreita abertura se abre no estojo. Isto é feito para absorver mais ar e, ao mesmo tempo, também coloca o teclado em uma posição mais ergonômica.
Devido ao metal utilizado, este mecanismo causa uma impressão bastante estável, e mesmo a unidade de teclado não flexiona. Entretanto, ele pode ser ligeiramente movido, o que resulta em ruídos audíveis. Ao mesmo tempo, o pó pode penetrar mais no interior, para não mencionar migalhas e outras partículas de sujeira.
No entanto, não é possível ver nenhum componente eletrônico através do espaço estreito; eles podem ser especialmente cobertos para evitar que a sujeira penetre
O Asus reduziu o comprimento e a largura em alguns milímetros com o redesenho, mas o novo modelo é cerca de 1 mm mais grosso em troca.
A concorrência restante, de 17 polegadas, é um pouco maior e também mais espessa. Portanto, o Zephyrus é um dos dispositivos de jogo mais finos e menores de 17 polegadas. Com menos de 2,8 kg, é também um dos mais leves em comparação direta; os dois modelos Gigabyte têm aproximadamente o mesmo peso
Conectividade - Quantidade generosa de portos, WLAN lento
O S17 tem cinco portas USB 3.2 Gen 2 rápidas. As duas portas USB-C também suportam carregamento via USB, e uma das duas suporta Thunderbolt 4.
A maioria das portas está localizada à esquerda, o que é conveniente para usuários destros. Os cartões SD podem ser inseridos no leitor com um clique, e não sobressaem da caixa - muito bom. Por outro lado, as numerosas portas estão bastante próximas umas das outras à esquerda, mas não devem interferir umas nas outras graças à disposição inteligente de cabos potencialmente grossos ao lado de cabos bastante finos (por exemplo, HDMI ao lado de LAN, USB-A ao lado de USB-C)
Leitor de cartões SD
De acordo com a Asus, o leitor de cartões SD suporta o padrão UHS-II em até 312 MB/s. Em nosso teste de cópia de 1 GB de conteúdo de imagem de nosso microSD AV PRO V60 de 128 GB para a área de trabalho, o leitor atinge um valor de 183 MB/s e, portanto, está em igualdade com a concorrência. A taxa de leitura em AS SSD de 256 MB/s está no topo desta classe
| SD Card Reader | |
| average JPG Copy Test (av. of 3 runs) | |
| Schenker XMG Ultra 17 Rocket Lake | |
| MSI GE76 Raider 10UH (Toshiba Exceria Pro SDXC 64 GB UHS-II) | |
| Aorus 17G YD (AV PRO microSD 128 GB V60) | |
| Gigabyte Aero 17 HDR YD (AV PRO microSD 128 GB V60) | |
| Asus ROG Zephyrus S17 GX703HSD | |
| Média da turma Gaming (20 - 210, n=64, últimos 2 anos) | |
| maximum AS SSD Seq Read Test (1GB) | |
| Asus ROG Zephyrus S17 GX703HSD | |
| Schenker XMG Ultra 17 Rocket Lake (AV PRO microSD 128 GB V60) | |
| MSI GE76 Raider 10UH (Toshiba Exceria Pro SDXC 64 GB UHS-II) | |
| Aorus 17G YD (AV PRO microSD 128 GB V60) | |
| Gigabyte Aero 17 HDR YD (AV PRO microSD 128 GB V60) | |
| Média da turma Gaming (25.5 - 261, n=61, últimos 2 anos) | |
Comunicação
Webcam
Segurança
É desnecessário dizer que o TPM 2.0 é suportado, mas não há espaço para uma fechadura Kensington.
No entanto, há um sensor de impressão digital em retorno que está integrado ao botão de alimentação. Ele pode ser configurado facilmente para login via Windows Olá.
Manutenção
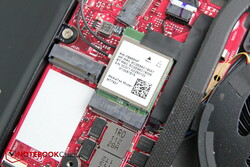
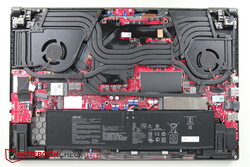
No ano passado, o complicado mecanismo de abertura impediu uma manutenção fácil. Felizmente, este ano é diferente graças ao redesenho: 11 parafusos Torx fixam a tampa inferior, que pode ser removida muito facilmente depois. Abaixo, você finalmente tem acesso simples aos slots SSD (um ocupado), à RAM (um slot substituível, o outro soldado), ao módulo MediaTek WLAN, à bateria, e aos ventiladores - muito bom!
Acessórios e garantia
Além da papelada usual, o Asus não inclui nenhum outro acessório na caixa. O fabricante concede uma garantia de 24 meses
Dispositivos de entrada - Interruptores óptico-mecânicos
Teclado
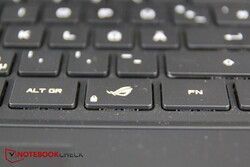
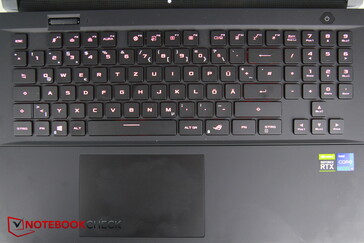
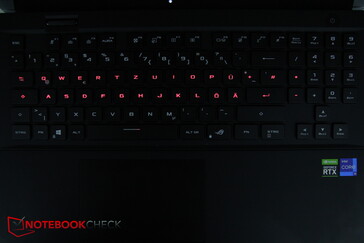
As teclas iluminadas por RGB emitem um ruído de clique claramente perceptível. A viagem parece mais plana do que realmente é (1,9 mm), o que faz com que o teclado se sinta um pouco mole apesar de seus interruptores mecânicos. No entanto, a digitação é bastante rápida, mas não parece particularmente satisfatória. Quando se trata de jogos, porém, as teclas são provavelmente mais adequadas, pois respondem muito rapidamente. Em troca, as teclas WASD iniciam um frenesi de clique adequado em atiradores e afins, devido ao ruído mecânico de acionamento bastante agudo
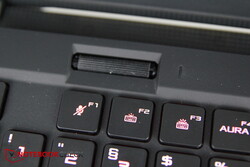
Ao contrário do predecessor, o layout está mais de acordo com o padrão. Apenas o teclado numérico à direita é um pouco menor, e as teclas de seta estão localizadas embaixo, de modo que elas têm espaço extra e, como resultado, são de tamanho normal. A multiroda, uma roda giratória que pode ser configurada individualmente para que várias funções como volume ou brilho possam ser ajustados, está localizada na parte superior esquerda.
As teclas se projetam minimamente acima da base, o que significa que as folgas que resultam podem ser uma porta de entrada para invasões de migalhas. A retroiluminação RGB pode ser ajustada em três níveis de luminosidade.
Touchpad
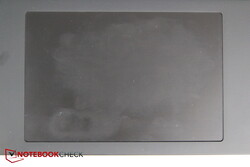
O touchpad se tornou ainda maior, muito grande de fato (~13 x 8,5 cm). No entanto, os botões dedicados do mouse desapareceram como resultado. Há um pequeno espaço entre a superfície do touchpad e a borda da caixa, onde pequenas migalhas podem se acumular rapidamente também.
As propriedades de deslizamento são boas, e o trackpad é preciso mesmo durante movimentos lentos e nos cantos.
Os botões integrados do mouse têm um ponto de pressão muito curto, mas um clique claro de retorno em retorno.
Display - WQHD e muitas características
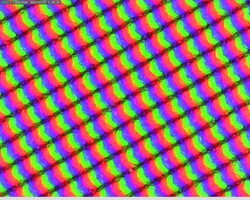
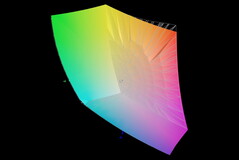
A tela IPS de 17,3 polegadas da BOE está equipada com Adaptive Sync e NVIDIA Advanced Optimus; tem uma resolução WQHD (2560x1440) e suporta 165 Hz. Isto faz com que a imagem pareça visivelmente mais nítida que os modelos Full HD. Alternativamente, um modelo de 144 Hz 4K também deve estar disponível.
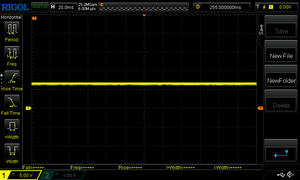
O brilho médio de uma lata aceitável de 288 nits está no mesmo nível do Aorus 17G, enquanto o Aero é muito mais brilhante - o S17 também estaria, se a distribuição de brilho não fosse tão desigual; podemos observar uma diminuição no brilho especialmente em direção ao canto inferior direito. Não notamos nenhum PWM.
Os tempos de resposta são rápidos como deveria ser para um dispositivo de jogo.
| |||||||||||||||||||||||||
iluminação: 72 %
iluminação com acumulador: 296 cd/m²
Contraste: 1073:1 (Preto: 0.3 cd/m²)
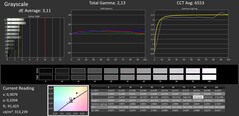
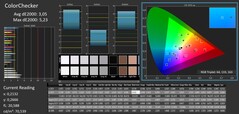
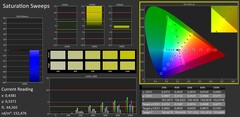
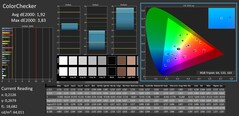
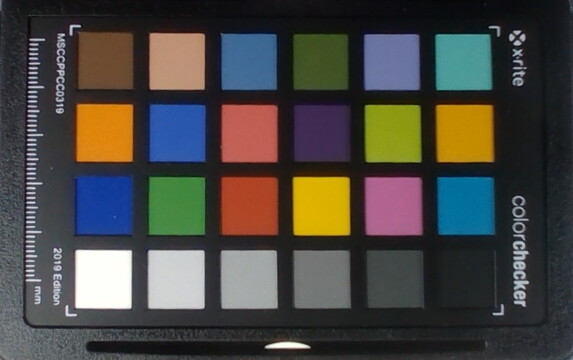
ΔE ColorChecker Calman: 3.05 | ∀{0.5-29.43 Ø4.76}
calibrated: 1.92
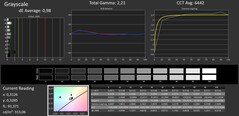
ΔE Greyscale Calman: 3.11 | ∀{0.09-98 Ø5}
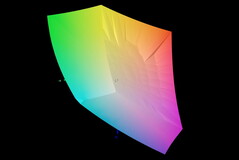
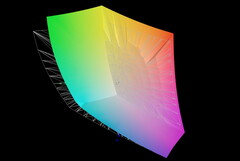
99% sRGB (Argyll 1.6.3 3D)
84% AdobeRGB 1998 (Argyll 1.6.3 3D)
84.4% AdobeRGB 1998 (Argyll 3D)
98.7% sRGB (Argyll 3D)
94.2% Display P3 (Argyll 3D)
Gamma: 2.13
CCT: 6553 K
| Asus ROG Zephyrus S17 GX703HSD BOE099D (BOE CQ NE173QHM-NY3), IPS, 2560x1440, 17.3" | Asus Zephyrus S17 GX701LXS Sharp SHP14DC, IPS, 1920x1080, 17.3" | Aorus 17G YD Sharp LQ173M1JW04, IPS, 1920x1080, 17.3" | Gigabyte Aero 17 HDR YD AU Optronics AUO329B, IPS, 3840x2160, 17.3" | Schenker XMG Ultra 17 Rocket Lake AU Optronics B173HAN05.1, IPS, 1920x1080, 17.3" | MSI GE76 Raider 10UH AU Optronics B173HAN05.1, IPS, 1920x1080, 17.3" | |
|---|---|---|---|---|---|---|
| Display | -11% | -12% | 4% | -14% | -12% | |
| Display P3 Coverage (%) | 94.2 | 73.6 -22% | 72.3 -23% | 86.9 -8% | 69.8 -26% | 71.8 -24% |
| sRGB Coverage (%) | 98.7 | 99.7 1% | 100 1% | 100 1% | 97.2 -2% | 98.1 -1% |
| AdobeRGB 1998 Coverage (%) | 84.4 | 73.7 -13% | 73.7 -13% | 99.6 18% | 72 -15% | 73.9 -12% |
| Response Times | -2% | -99% | -604% | -16% | -175% | |
| Response Time Grey 50% / Grey 80% * (ms) | 4.8 | 5 ? -4% | 13.6 ? -183% | 52 ? -983% | 5.6 ? -17% | 20.4 ? -325% |
| Response Time Black / White * (ms) | 8 | 8 ? -0% | 9.2 ? -15% | 26 ? -225% | 9.2 ? -15% | 10 ? -25% |
| PWM Frequency (Hz) | 151500 | |||||
| Screen | 10% | 3% | 36% | 16% | -15% | |
| Brightness middle (cd/m²) | 322 | 308 -4% | 286 -11% | 488 52% | 306 -5% | 324.6 1% |
| Brightness (cd/m²) | 288 | 310 8% | 282 -2% | 467 62% | 299 4% | 312 8% |
| Brightness Distribution (%) | 72 | 76 6% | 73 1% | 86 19% | 93 29% | 87 21% |
| Black Level * (cd/m²) | 0.3 | 0.34 -13% | 0.24 20% | 0.33 -10% | 0.22 27% | 0.28 7% |
| Contrast (:1) | 1073 | 906 -16% | 1192 11% | 1479 38% | 1391 30% | 1159 8% |
| Colorchecker dE 2000 * | 3.05 | 1.49 51% | 2.79 9% | 1.23 60% | 1.92 37% | 3.87 -27% |
| Colorchecker dE 2000 max. * | 5.23 | 3.97 24% | 6.23 -19% | 2.94 44% | 4.78 9% | 9.35 -79% |
| Colorchecker dE 2000 calibrated * | 1.92 | 0.99 48% | 0.82 57% | 0.77 60% | 1.34 30% | 1.42 26% |
| Greyscale dE 2000 * | 3.11 | 2.3 26% | 3.5 -13% | 1.5 52% | 2 36% | 6.5 -109% |
| Gamma | 2.13 103% | 2.193 100% | 2.358 93% | 2.169 101% | 2.153 102% | 2.23 99% |
| CCT | 6553 99% | 6981 93% | 6147 106% | 6614 98% | 6738 96% | 5702 114% |
| Color Space (Percent of AdobeRGB 1998) (%) | 84 | 74 -12% | 74 -12% | 99 18% | 72 -14% | 66.3 -21% |
| Color Space (Percent of sRGB) (%) | 99 | 96 -3% | 96 -3% | 99 0% | 93 -6% | 98 -1% |
| Média Total (Programa/Configurações) | -1% /
5% | -36% /
-12% | -188% /
-50% | -5% /
6% | -67% /
-35% |
* ... menor é melhor
O contraste e o nível de preto são bons, mas o Aero 4K é obviamente melhor novamente, embora o Schenker Ultra também o seja.
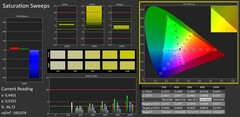
O painel parece estar bem calibrado fora da caixa; os desvios de cor já estão baixos, e podem até ser reduzidos um pouco mais através da calibração manual.
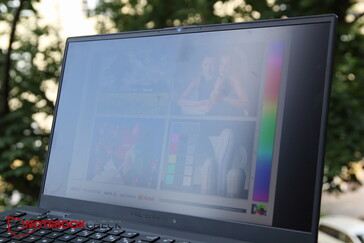
Ao olhar o painel de um ângulo oblíquo, o conteúdo é rapidamente coberto por um véu esbranquiçado. Além disso, o visor poderia ser mais brilhante, de modo que o uso ao ar livre é predominantemente recomendado em áreas à sombra e com vista direta para cima
Exibir tempos de resposta
| ↔ Tempo de resposta preto para branco | ||
|---|---|---|
| 8 ms ... ascensão ↗ e queda ↘ combinadas | ↗ ms ascensão | |
| ↘ ms queda | ||
| A tela mostra taxas de resposta rápidas em nossos testes e deve ser adequada para jogos. Em comparação, todos os dispositivos testados variam de 0.1 (mínimo) a 240 (máximo) ms. » 21 % de todos os dispositivos são melhores. Isso significa que o tempo de resposta medido é melhor que a média de todos os dispositivos testados (20.1 ms). | ||
| ↔ Tempo de resposta 50% cinza a 80% cinza | ||
| 4.8 ms ... ascensão ↗ e queda ↘ combinadas | ↗ ms ascensão | |
| ↘ ms queda | ||
| A tela mostra taxas de resposta muito rápidas em nossos testes e deve ser muito adequada para jogos em ritmo acelerado. Em comparação, todos os dispositivos testados variam de 0.165 (mínimo) a 636 (máximo) ms. » 16 % de todos os dispositivos são melhores. Isso significa que o tempo de resposta medido é melhor que a média de todos os dispositivos testados (31.5 ms). | ||
Cintilação da tela / PWM (modulação por largura de pulso)
| Tela tremeluzindo / PWM não detectado | |||
[pwm_comparison] Em comparação: 53 % de todos os dispositivos testados não usam PWM para escurecer a tela. Se PWM foi detectado, uma média de 8033 (mínimo: 5 - máximo: 343500) Hz foi medida. | |||
Desempenho - Ótimo, mas se deteriora fortemente com a energia da bateria
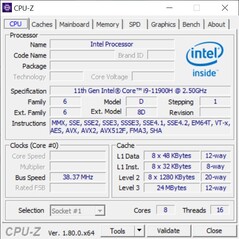
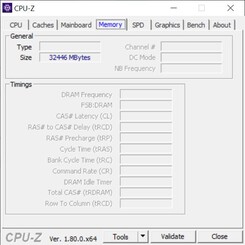
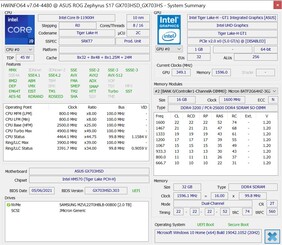
O Zephyrus S17 é equipado com hardware de jogo forte: O Intel Core i9-11900HTiger Lake, o processador NVIDIA GeForce GPU para laptop RTX 3080Os 2 TB de armazenamento SSD, e os 32 GB de RAM em modo de canal duplo, dos quais 16 GB são soldados, deixam pouco a desejar. Além disso, não detectamos nenhum PWM.
No software Asus Armoury Crate, onde todas as configurações de desempenho relevantes estão localizadas ao lado do My Asus, ajustamos o controle deslizante para "Windows" para nossos testes, tornando as configurações do sistema operacional cruciais. Para as medições, usamos o modo High Performance encontrado na barra de tarefas.
Processador
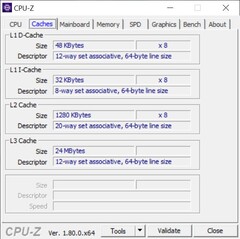
O núcleo Intel i9-11900H é uma CPU de 45 watts de núcleo octa-core com núcleos que regram de 2,5 a 4,9 GHz (4,4 GHz em modo Turbo com todos os núcleos funcionando simultaneamente).
O loop Cinebench R15 revela um desempenho consistentemente alto que supera até mesmo o do Schenker XMG Ultra de forma sustentada, apesar do fato de que a saída deste último é ligeiramente superior. A CPU Comet Lake no antecessor tem um desempenho superior em mais de 30% no teste multithread.
Durante uma única corrida, o TDP flutua constantemente entre 107 watts e 90 watts. Estranhamente, os testes geralmente começam em 90 watts e terminam em 107 watts, enquanto o oposto é geralmente o caso. Nas iterações subseqüentes, no entanto, também há quedas de desempenho curtas durante uma corrida, onde o TDP cai brevemente para 42 watts.
O desempenho da CPU diminui consideravelmente com a energia da bateria. Dos 2.184 pontos iniciais no teste múltiplo Cinebench R15, restam apenas 802 pontos, o que corresponde a uma queda de 63%!
Cinebench R20: CPU (Single Core) | CPU (Multi Core)
Cinebench R15: CPU Single 64Bit | CPU Multi 64Bit
Blender: v2.79 BMW27 CPU
7-Zip 18.03: 7z b 4 -mmt1 | 7z b 4
Geekbench 5.5: Single-Core | Multi-Core
HWBOT x265 Benchmark v2.2: 4k Preset
LibreOffice : 20 Documents To PDF
R Benchmark 2.5: Overall mean
| Cinebench R23 / Single Core | |
| Média da turma Gaming (1136 - 2267, n=135, últimos 2 anos) | |
| Schenker XMG Ultra 17 Rocket Lake | |
| Asus ROG Zephyrus S17 GX703HSD | |
| Média Intel Core i9-11900H (1574 - 1605, n=4) | |
| Aorus 17G YD | |
| MSI GE76 Raider 10UH | |
| Cinebench R23 / Multi Core | |
| Média da turma Gaming (5668 - 40970, n=135, últimos 2 anos) | |
| Schenker XMG Ultra 17 Rocket Lake | |
| Aorus 17G YD | |
| Asus ROG Zephyrus S17 GX703HSD | |
| Média Intel Core i9-11900H (11135 - 13012, n=4) | |
| MSI GE76 Raider 10UH | |
| Cinebench R20 / CPU (Single Core) | |
| Média da turma Gaming (439 - 870, n=134, últimos 2 anos) | |
| Schenker XMG Ultra 17 Rocket Lake | |
| Asus ROG Zephyrus S17 GX703HSD | |
| Média Intel Core i9-11900H (600 - 615, n=5) | |
| Gigabyte Aero 17 HDR YD | |
| Aorus 17G YD | |
| MSI GE76 Raider 10UH | |
| Asus Zephyrus S17 GX701LXS | |
| Cinebench R20 / CPU (Multi Core) | |
| Média da turma Gaming (2179 - 16108, n=134, últimos 2 anos) | |
| Gigabyte Aero 17 HDR YD | |
| Schenker XMG Ultra 17 Rocket Lake | |
| Asus ROG Zephyrus S17 GX703HSD | |
| Aorus 17G YD | |
| Média Intel Core i9-11900H (4324 - 5160, n=5) | |
| MSI GE76 Raider 10UH | |
| Asus Zephyrus S17 GX701LXS | |
| Cinebench R15 / CPU Single 64Bit | |
| Média da turma Gaming (188.8 - 343, n=133, últimos 2 anos) | |
| Schenker XMG Ultra 17 Rocket Lake | |
| Asus ROG Zephyrus S17 GX703HSD | |
| Média Intel Core i9-11900H (236 - 243, n=5) | |
| Gigabyte Aero 17 HDR YD | |
| Aorus 17G YD | |
| Asus Zephyrus S17 GX701LXS | |
| MSI GE76 Raider 10UH | |
| Cinebench R15 / CPU Multi 64Bit | |
| Média da turma Gaming (1537 - 6271, n=134, últimos 2 anos) | |
| Schenker XMG Ultra 17 Rocket Lake | |
| Asus ROG Zephyrus S17 GX703HSD | |
| Aorus 17G YD | |
| Média Intel Core i9-11900H (1770 - 2211, n=5) | |
| Gigabyte Aero 17 HDR YD | |
| MSI GE76 Raider 10UH | |
| Asus Zephyrus S17 GX701LXS | |
| Blender / v2.79 BMW27 CPU | |
| Aorus 17G YD | |
| Asus Zephyrus S17 GX701LXS | |
| MSI GE76 Raider 10UH | |
| Média Intel Core i9-11900H (231 - 270, n=5) | |
| Gigabyte Aero 17 HDR YD | |
| Asus ROG Zephyrus S17 GX703HSD | |
| Schenker XMG Ultra 17 Rocket Lake | |
| Média da turma Gaming (80 - 517, n=130, últimos 2 anos) | |
| 7-Zip 18.03 / 7z b 4 -mmt1 | |
| Média da turma Gaming (4199 - 7508, n=132, últimos 2 anos) | |
| Schenker XMG Ultra 17 Rocket Lake | |
| Asus ROG Zephyrus S17 GX703HSD | |
| Média Intel Core i9-11900H (5582 - 6018, n=5) | |
| Gigabyte Aero 17 HDR YD | |
| Aorus 17G YD | |
| Asus Zephyrus S17 GX701LXS | |
| Asus Zephyrus S17 GX701LXS | |
| MSI GE76 Raider 10UH | |
| 7-Zip 18.03 / 7z b 4 | |
| Média da turma Gaming (23795 - 148086, n=132, últimos 2 anos) | |
| Schenker XMG Ultra 17 Rocket Lake | |
| Asus ROG Zephyrus S17 GX703HSD | |
| Gigabyte Aero 17 HDR YD | |
| Média Intel Core i9-11900H (49486 - 57263, n=5) | |
| Aorus 17G YD | |
| MSI GE76 Raider 10UH | |
| Asus Zephyrus S17 GX701LXS | |
| Asus Zephyrus S17 GX701LXS | |
| Geekbench 5.5 / Single-Core | |
| Média da turma Gaming (986 - 2474, n=132, últimos 2 anos) | |
| Schenker XMG Ultra 17 Rocket Lake | |
| Asus ROG Zephyrus S17 GX703HSD | |
| Média Intel Core i9-11900H (1576 - 1692, n=5) | |
| Gigabyte Aero 17 HDR YD | |
| Aorus 17G YD | |
| Asus Zephyrus S17 GX701LXS | |
| MSI GE76 Raider 10UH | |
| Geekbench 5.5 / Multi-Core | |
| Média da turma Gaming (4557 - 27010, n=132, últimos 2 anos) | |
| Schenker XMG Ultra 17 Rocket Lake | |
| Gigabyte Aero 17 HDR YD | |
| Asus ROG Zephyrus S17 GX703HSD | |
| Aorus 17G YD | |
| Média Intel Core i9-11900H (7725 - 9856, n=5) | |
| MSI GE76 Raider 10UH | |
| Asus Zephyrus S17 GX701LXS | |
| HWBOT x265 Benchmark v2.2 / 4k Preset | |
| Média da turma Gaming (7.7 - 44.3, n=132, últimos 2 anos) | |
| Schenker XMG Ultra 17 Rocket Lake | |
| Asus ROG Zephyrus S17 GX703HSD | |
| Gigabyte Aero 17 HDR YD | |
| Aorus 17G YD | |
| Média Intel Core i9-11900H (13.6 - 16.7, n=5) | |
| MSI GE76 Raider 10UH | |
| Asus Zephyrus S17 GX701LXS | |
| LibreOffice / 20 Documents To PDF | |
| MSI GE76 Raider 10UH | |
| Média da turma Gaming (19 - 88.8, n=132, últimos 2 anos) | |
| Asus Zephyrus S17 GX701LXS | |
| Média Intel Core i9-11900H (40.5 - 49.3, n=5) | |
| Asus ROG Zephyrus S17 GX703HSD | |
| Gigabyte Aero 17 HDR YD | |
| Schenker XMG Ultra 17 Rocket Lake | |
| Aorus 17G YD | |
| R Benchmark 2.5 / Overall mean | |
| MSI GE76 Raider 10UH | |
| Asus Zephyrus S17 GX701LXS | |
| Aorus 17G YD | |
| Gigabyte Aero 17 HDR YD | |
| Média Intel Core i9-11900H (0.52 - 0.544, n=5) | |
| Asus ROG Zephyrus S17 GX703HSD | |
| Schenker XMG Ultra 17 Rocket Lake | |
| Média da turma Gaming (0.3439 - 0.759, n=133, últimos 2 anos) | |
* ... menor é melhor
Desempenho do sistema
O desempenho do sistema é excelente. Embora o XMG Ultra esteja sempre alguns pontos percentuais à frente, nosso Zephyrus geralmente vem em segundo lugar, enquanto o Aero e o Aorus são marginalmente mais lentos.
Houve uma vez uma tela azul durante o teste, quando tentamos executar o 3DMark 06.
| PCMark 10 / Score | |
| Média da turma Gaming (5776 - 10060, n=111, últimos 2 anos) | |
| Schenker XMG Ultra 17 Rocket Lake | |
| Asus ROG Zephyrus S17 GX703HSD | |
| Gigabyte Aero 17 HDR YD | |
| Aorus 17G YD | |
| Média Intel Core i9-11900H, NVIDIA GeForce RTX 3080 Laptop GPU (6822 - 7245, n=2) | |
| MSI GE76 Raider 10UH | |
| Asus Zephyrus S17 GX701LXS | |
| PCMark 10 / Essentials | |
| Schenker XMG Ultra 17 Rocket Lake | |
| Média da turma Gaming (8810 - 12600, n=115, últimos 2 anos) | |
| Asus ROG Zephyrus S17 GX703HSD | |
| Aorus 17G YD | |
| Gigabyte Aero 17 HDR YD | |
| Média Intel Core i9-11900H, NVIDIA GeForce RTX 3080 Laptop GPU (9690 - 10630, n=2) | |
| MSI GE76 Raider 10UH | |
| Asus Zephyrus S17 GX701LXS | |
| PCMark 10 / Productivity | |
| Média da turma Gaming (6662 - 16716, n=113, últimos 2 anos) | |
| Schenker XMG Ultra 17 Rocket Lake | |
| Aorus 17G YD | |
| Asus ROG Zephyrus S17 GX703HSD | |
| Gigabyte Aero 17 HDR YD | |
| Média Intel Core i9-11900H, NVIDIA GeForce RTX 3080 Laptop GPU (8882 - 9182, n=2) | |
| Asus Zephyrus S17 GX701LXS | |
| MSI GE76 Raider 10UH | |
| PCMark 10 / Digital Content Creation | |
| Média da turma Gaming (7440 - 19351, n=113, últimos 2 anos) | |
| Schenker XMG Ultra 17 Rocket Lake | |
| Asus ROG Zephyrus S17 GX703HSD | |
| Gigabyte Aero 17 HDR YD | |
| MSI GE76 Raider 10UH | |
| Média Intel Core i9-11900H, NVIDIA GeForce RTX 3080 Laptop GPU (10014 - 10573, n=2) | |
| Aorus 17G YD | |
| Asus Zephyrus S17 GX701LXS | |
| PCMark 10 Score | 7245 pontos | |
Ajuda | ||
Latências DPC
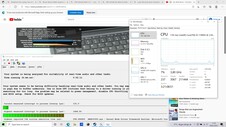
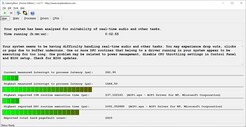
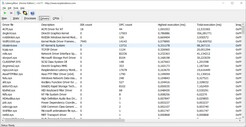
Embora a abertura de várias abas do navegador não cause nenhum problema para o S17, a reprodução de nosso vídeo 4K/60 fps no YouTube, por outro lado, de acordo com a LatencyMon, mesmo que o teste seja completado com 0 quadros descartados. Os problemas são causados pelo driver ACPI.sys, assim como um driver gráfico DirectX e um driver gráfico NVIDIA.
| DPC Latencies / LatencyMon - interrupt to process latency (max), Web, Youtube, Prime95 | |
| MSI GE76 Raider 10UH | |
| Gigabyte Aero 17 HDR YD | |
| Asus ROG Zephyrus S17 GX703HSD | |
| Aorus 17G YD | |
| Schenker XMG Ultra 17 Rocket Lake | |
| Asus Zephyrus S17 GX701LXS | |
* ... menor é melhor
Armazenamento
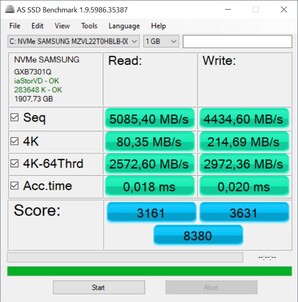
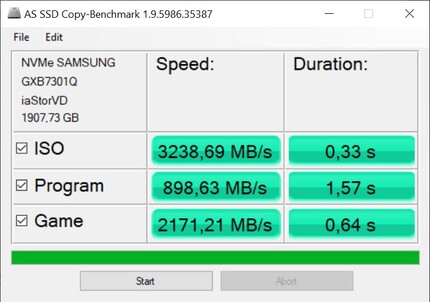
O generoso SSD NVMe de 2 TB da Samsung ocupa o 6º lugar em nosso artigoHDD/SSD Benchmarks, o que o torna um dos modelos mais rápidos disponíveis. Como o SSD no Zephyrus também tem um desempenho 10% acima de sua contraparte média em nosso banco de dados, ele até supera a concorrência com outros modelos Samsung, o que também é bom
| Asus ROG Zephyrus S17 GX703HSD Samsung PM9A1 MZVL22T0HBLB | Asus Zephyrus S17 GX701LXS Samsung PM981a MZVLB1T0HBLR | Aorus 17G YD Samsung PM9A1 MZVL2512HCJQ | Gigabyte Aero 17 HDR YD Samsung PM9A1 MZVL2512HCJQ | Schenker XMG Ultra 17 Rocket Lake Samsung SSD 980 Pro 2TB MZ-V8P2T0 | MSI GE76 Raider 10UH WDC PC SN730 SDBPNTY-1T00 | Média Samsung PM9A1 MZVL22T0HBLB | |
|---|---|---|---|---|---|---|---|
| CrystalDiskMark 5.2 / 6 | -46% | -11% | 2% | 5% | -38% | -9% | |
| Write 4K (MB/s) | 244.2 | 120 -51% | 227.4 -7% | 230.4 -6% | 240 -2% | 157.1 -36% | 215 ? -12% |
| Read 4K (MB/s) | 89.8 | 45.24 -50% | 91.3 2% | 91.6 2% | 87.8 -2% | 46.3 -48% | 78.7 ? -12% |
| Write Seq (MB/s) | 2090 | 2241 | 4216 | 4281 | 2396 | 3657 ? | |
| Read Seq (MB/s) | 2246 | 4496 | 4543 | 4228 | 2245 | 3821 ? | |
| Write 4K Q32T1 (MB/s) | 607 | 392.5 -35% | 661 9% | 667 10% | 696 15% | 436.1 -28% | 572 ? -6% |
| Read 4K Q32T1 (MB/s) | 658 | 348.4 -47% | 712 8% | 728 11% | 778 18% | 524 -20% | 712 ? 8% |
| Write Seq Q32T1 (MB/s) | 5270 | 3015 -43% | 1540 -71% | 5043 -4% | 5195 -1% | 3086 -41% | 5359 ? 2% |
| Read Seq Q32T1 (MB/s) | 7091 | 3445 -51% | 6806 -4% | 6821 -4% | 7099 0% | 3363 -53% | 6846 ? -3% |
| Write 4K Q8T8 (MB/s) | 2270 | 1625 ? -28% | |||||
| Read 4K Q8T8 (MB/s) | 2490 | 2020 ? -19% | |||||
| AS SSD | -70% | -37% | -24% | -22% | -100% | -21% | |
| Seq Read (MB/s) | 5085 | 2744 -46% | 5150 1% | 5438 7% | 5010 -1% | 2967 -42% | 5454 ? 7% |
| Seq Write (MB/s) | 4434 | 1351 -70% | 3920 -12% | 3904 -12% | 3974 -10% | 2604 -41% | 3968 ? -11% |
| 4K Read (MB/s) | 80.3 | 47.24 -41% | 46.6 -42% | 56.2 -30% | 51.9 -35% | 42.97 -46% | 72 ? -10% |
| 4K Write (MB/s) | 214.7 | 109.1 -49% | 145.8 -32% | 165.8 -23% | 156.8 -27% | 107.8 -50% | 195.9 ? -9% |
| 4K-64 Read (MB/s) | 2573 | 1118 -57% | 2071 -20% | 2489 -3% | 2611 1% | 1684 -35% | 1998 ? -22% |
| 4K-64 Write (MB/s) | 2972 | 1926 -35% | 3267 10% | 3480 17% | 3859 30% | 2164 -27% | 2700 ? -9% |
| Access Time Read * (ms) | 0.018 | 0.064 -256% | 0.078 -333% | 0.054 -200% | 0.072 -300% | 0.116 -544% | 0.03461 ? -92% |
| Access Time Write * (ms) | 0.02 | 0.034 -70% | 0.029 -45% | 0.026 -30% | 0.026 -30% | 0.106 -430% | 0.03473 ? -74% |
| Score Read (Points) | 3161 | 1439 -54% | 2633 -17% | 3089 -2% | 3164 0% | 2023 -36% | 2615 ? -17% |
| Score Write (Points) | 3631 | 2170 -40% | 2805 -23% | 4036 11% | 4414 22% | 2532 -30% | 3292 ? -9% |
| Score Total (Points) | 8380 | 4283 -49% | 7716 -8% | 8620 3% | 9134 9% | 5571 -34% | 7177 ? -14% |
| Copy ISO MB/s (MB/s) | 3239 | 3190 -2% | 3424 6% | 2106 -35% | 3150 ? -3% | ||
| Copy Program MB/s (MB/s) | 899 | 987 10% | 1091 21% | 687 -24% | 747 ? -17% | ||
| Copy Game MB/s (MB/s) | 2171 | 2096 -3% | 2365 9% | 1590 -27% | 1803 ? -17% | ||
| Média Total (Programa/Configurações) | -58% /
-61% | -24% /
-29% | -11% /
-15% | -9% /
-14% | -69% /
-81% | -15% /
-17% |
* ... menor é melhor
Continuous load read: DiskSpd Read Loop, Queue Depth 8
Placa gráfica
UmaGPU para laptopRTX 3080pode funcionar com um máximo de 165 watts, mas o Asus "somente" permite 140 watts no S17.
Nos benchmarks sintéticos 3DMark, a GPU no S17 tem um desempenho próximo ao esperado, talvez marginalmente melhor.
Na potência da bateria, o desempenho 3D também cai acentuadamente, mas isto não é incomum para dispositivos de jogos. Em vez de cerca de 38.000 pontos no 3DMark 11, obtemos apenas 16.164 pontos em movimento.
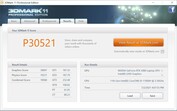
| 3DMark 11 Performance | 30521 pontos | |
| 3DMark Cloud Gate Standard Score | 55536 pontos | |
| 3DMark Fire Strike Score | 24604 pontos | |
| 3DMark Time Spy Score | 11381 pontos | |
Ajuda | ||
Desempenho do jogo
Em Full HD, por exemplo, o Witcher 3 funciona consistentemente a mais de 100 fps mesmo em configurações Ultra, e 76 fps ainda é alcançado na resolução nativa WQHD.
Enquanto o XMG Ultra 17 é mais rápido, o Zephyrus vai frente a frente com o MSI e seu RTX 3080 de 155 watts. O MSI está principalmente à frente no The Witcher 3, mas o S17 é cerca de 5% mais rápido no Far Cry 5.
| Shadow of the Tomb Raider | |
| 1920x1080 Lowest Preset | |
| Schenker XMG Ultra 17 Rocket Lake | |
| Média NVIDIA GeForce RTX 3080 Laptop GPU (117 - 178.7, n=8) | |
| Asus ROG Zephyrus S17 GX703HSD | |
| 1920x1080 Medium Preset | |
| Schenker XMG Ultra 17 Rocket Lake | |
| Asus ROG Zephyrus S17 GX703HSD | |
| Média NVIDIA GeForce RTX 3080 Laptop GPU (81.6 - 164, n=12) | |
| 1920x1080 High Preset AA:SM | |
| Schenker XMG Ultra 17 Rocket Lake | |
| Média da turma Gaming (n=1últimos 2 anos) | |
| Asus ROG Zephyrus S17 GX703HSD | |
| Média NVIDIA GeForce RTX 3080 Laptop GPU (79.4 - 160, n=13) | |
| 1920x1080 Highest Preset AA:T | |
| Média da turma Gaming (131 - 212, n=2, últimos 2 anos) | |
| Schenker XMG Ultra 17 Rocket Lake | |
| Asus ROG Zephyrus S17 GX703HSD | |
| Média NVIDIA GeForce RTX 3080 Laptop GPU (76.6 - 151, n=13) | |
O Zephyrus percorre nosso loop The Witcher 3 durante uma hora com uma taxa de quadros constantemente alta, sem nenhum problema. O estrangulamento não é perceptível durante este período
The Witcher 3 FPS diagram
| baixo | média | alto | ultra | QHD | |
|---|---|---|---|---|---|
| GTA V (2015) | 186 | 181 | 176 | 112 | |
| The Witcher 3 (2015) | 398.5 | 293.2 | 197.1 | 112 | |
| Dota 2 Reborn (2015) | 176 | 82.7 | 148 | 138 | |
| Final Fantasy XV Benchmark (2018) | 144 | ||||
| X-Plane 11.11 (2018) | 142 | 132 | 102 | ||
| Far Cry 5 (2018) | 174 | 139 | 134 | 125 | 103 |
| Strange Brigade (2018) | 471 | 253 | 210 | 186 | |
| Shadow of the Tomb Raider (2018) | 159 | 141 | 138 | 128 | 98 |
Emissões - Silencioso, mas com ruído de fundo
As emissões devem mostrar se a abertura do caso é benéfica: O design incomum mantém o S17 mais silencioso e frio do que outros laptops com o mesmo hardware?
Emissões sonoras
De fato, os ventiladores geralmente permanecem silenciosos em uso ocioso, mesmo no modo High Performance e em pleno brilho. A concorrência é normalmente audivelmente mais alta aqui. Sob carga média, os rivais são apenas ligeiramente mais altos do que o Zephyrus S17, mas nosso modelo de teste permanece significativamente mais silencioso do que a maioria dos concorrentes no The Witcher 3 ou no teste de estresse. Somente o MSI pode acompanhar em termos de ruído em todas as condições - mesmo sem a abertura da caixa, e com desempenho comparável.
Quando o laptop muda do uso ocioso para a carga média, os ventiladores tendem a vibrar. Por exemplo, os ventiladores ainda estão silenciosos no início do 3DMark 06. Devido à carga, eles começam a girar após cerca de um minuto, mas não de maneira uniforme com um leve aumento ao longo do tempo; em vez disso, o número de rotações pulsa irritantemente em um intervalo de vários segundos. Somente depois de um tempo é que os ventiladores finalmente giram constantemente.
O que é realmente irritante, entretanto, é o ruído eletrônico que aflige os usuários do Zephyrus e varia de acordo com a carga aplicada. Na maioria das vezes, isto se manifesta em zumbidos que não são de forma alguma silenciosos; às vezes, são baixos, mas na maioria das vezes, são agudos. Não há zumbido durante o trabalho leve no escritório, e o SSD não parece ser afetado. O ruído irritante sob carga pode ser causado pela placa gráfica.
Barulho
| Ocioso |
| 23 / 23 / 23 dB |
| Carga |
| 41 / 52 dB |
 | ||
30 dB silencioso 40 dB(A) audível 50 dB(A) ruidosamente alto |
||
min: | ||
| Asus ROG Zephyrus S17 GX703HSD GeForce RTX 3080 Laptop GPU, i9-11900H, Samsung PM9A1 MZVL22T0HBLB | Asus Zephyrus S17 GX701LXS GeForce RTX 2080 Super Max-Q, i7-10875H, Samsung PM981a MZVLB1T0HBLR | Aorus 17G YD GeForce RTX 3080 Laptop GPU, i7-11800H, Samsung PM9A1 MZVL2512HCJQ | Gigabyte Aero 17 HDR YD GeForce RTX 3080 Laptop GPU, i9-11980HK, Samsung PM9A1 MZVL2512HCJQ | Schenker XMG Ultra 17 Rocket Lake GeForce RTX 3080 Laptop GPU, i9-11900K, Samsung SSD 980 Pro 2TB MZ-V8P2T0 | MSI GE76 Raider 10UH GeForce RTX 3080 Laptop GPU, i7-10870H, WDC PC SN730 SDBPNTY-1T00 | |
|---|---|---|---|---|---|---|
| Noise | -25% | -28% | -27% | -47% | -4% | |
| desligado / ambiente * (dB) | 23 | 25 -9% | 25 -9% | 25 -9% | 24 -4% | 25.3 -10% |
| Idle Minimum * (dB) | 23 | 32 -39% | 32 -39% | 30 -30% | 30 -30% | 26.1 -13% |
| Idle Average * (dB) | 23 | 35 -52% | 33 -43% | 32 -39% | 31 -35% | 26.1 -13% |
| Idle Maximum * (dB) | 23 | 43 -87% | 39 -70% | 41 -78% | 57 -148% | 26.1 -13% |
| Load Average * (dB) | 41 | 44 -7% | 43 -5% | 43 -5% | 63 -54% | 37.2 9% |
| Witcher 3 ultra * (dB) | 45 | 41 9% | 52 -16% | 51 -13% | 61 -36% | 36.8 18% |
| Load Maximum * (dB) | 52 | 45 13% | 61 -17% | 59 -13% | 63 -21% | 56.9 -9% |
* ... menor é melhor
Temperatura
Então, o S17 é mais frio que a concorrência? Na verdade não! Não é surpreendente que o laptop aqueça um pouco mais que a concorrência em uso ocioso, considerando que os ventiladores estão em sua maioria inativos aqui. Entretanto, o S17 não pode realmente demonstrar suas supostas vantagens de projeto sob carga, mesmo com ventiladores totalmente ativos. Embora os ventiladores permaneçam mais silenciosos do que os da concorrência (exceto o MSI), as temperaturas tendem a ser um pouco mais altas em troca.
No topo, os hotspots estão principalmente em direção ao display, onde o ar quente é emitido. Aqui, a barra de controle LED entre a unidade base e o display aquece até 59 °C (~138 °F). Entretanto, a superfície do teclado permanece mais fria (cerca de 53 °C (~127 °F)). Um máximo de 53 °C (~127 °F) é alcançado na parte inferior, mas isto também não é superado pela concorrência. O descanso da palma da mão já fica visivelmente quente em modo inativo a 30 °C (~86 °F) devido aos ventiladores inativos. Sob carga total, porém, a temperatura nestas áreas é mantida dentro de limites, e a área chave WASD também permanece dentro de uma faixa aceitável.
(-) A temperatura máxima no lado superior é 59 °C / 138 F, em comparação com a média de 40.4 °C / 105 F , variando de 21.2 a 68.8 °C para a classe Gaming.
(-) A parte inferior aquece até um máximo de 53 °C / 127 F, em comparação com a média de 43.3 °C / 110 F
(±) Em uso inativo, a temperatura média para o lado superior é 32.4 °C / 90 F, em comparação com a média do dispositivo de 33.9 °C / ### class_avg_f### F.
(-) Jogando The Witcher 3, a temperatura média para o lado superior é 41.8 °C / 107 F, em comparação com a média do dispositivo de 33.9 °C / ## #class_avg_f### F.
(±) Os apoios para as mãos e o touchpad podem ficar muito quentes ao toque, com um máximo de 39 °C / 102.2 F.
(-) A temperatura média da área do apoio para as mãos de dispositivos semelhantes foi 28.8 °C / 83.8 F (-10.2 °C / -18.4 F).
| Asus ROG Zephyrus S17 GX703HSD GeForce RTX 3080 Laptop GPU, i9-11900H, Samsung PM9A1 MZVL22T0HBLB | Asus Zephyrus S17 GX701LXS GeForce RTX 2080 Super Max-Q, i7-10875H, Samsung PM981a MZVLB1T0HBLR | Aorus 17G YD GeForce RTX 3080 Laptop GPU, i7-11800H, Samsung PM9A1 MZVL2512HCJQ | Gigabyte Aero 17 HDR YD GeForce RTX 3080 Laptop GPU, i9-11980HK, Samsung PM9A1 MZVL2512HCJQ | Schenker XMG Ultra 17 Rocket Lake GeForce RTX 3080 Laptop GPU, i9-11900K, Samsung SSD 980 Pro 2TB MZ-V8P2T0 | MSI GE76 Raider 10UH GeForce RTX 3080 Laptop GPU, i7-10870H, WDC PC SN730 SDBPNTY-1T00 | |
|---|---|---|---|---|---|---|
| Heat | 12% | 16% | 7% | 10% | 11% | |
| Maximum Upper Side * (°C) | 59 | 57 3% | 36 39% | 44 25% | 34 42% | 41 31% |
| Maximum Bottom * (°C) | 53 | 51 4% | 52 2% | 56 -6% | 43 19% | 48.8 8% |
| Idle Upper Side * (°C) | 35 | 28 20% | 29 17% | 32 9% | 38 -9% | 31.8 9% |
| Idle Bottom * (°C) | 35 | 28 20% | 33 6% | 35 -0% | 39 -11% | 36 -3% |
* ... menor é melhor
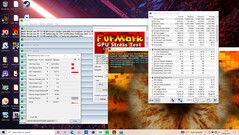
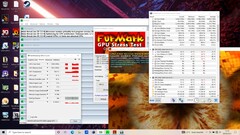
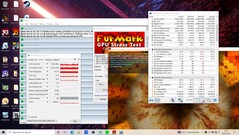
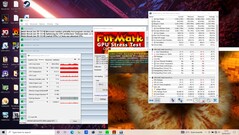
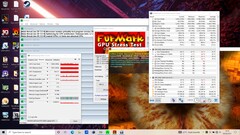
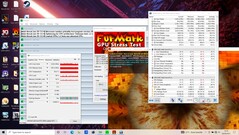
O Zephyrus inicia nosso teste de estresse de uma hora em torno de 4,3 a 4,4 GHz em todos os núcleos, o que corresponde à velocidade máxima do relógio Turbo. Entretanto, as temperaturas do núcleo sobem muito rapidamente até mais de 90 °C (~194 °F), após o que as taxas do relógio são aceleradas e consequentemente diminuem. Ao mesmo tempo, a velocidade do relógio nunca cai abaixo de 3 GHZ, mas oscila na faixa de 3 a 3,6 GHz em seguida.
A velocidade do relógio da GPU flutua ainda mais acentuadamente. Ele começa em torno de 1,7 GHz, mas diminui muito rapidamente e depois oscila extremamente entre 960 MHz e 1,6 GHz.
Oradores
Os alto-falantes da S17 poderiam ser um pouco mais altos, mas de outra forma, porém, eles oferecem médios e triplos bem equilibrados. Além disso, ao contrário da maioria dos outros laptops, os graves estão definitivamente presentes, fazendo com que os alto-falantes soem muito bem e equilibrados de modo geral. Os dispositivos de áudio externos podem ser conectados através da tomada de fones de ouvido
Asus ROG Zephyrus S17 GX703HSD análise de áudio
(±) | o volume do alto-falante é médio, mas bom (###valor### dB)
Graves 100 - 315Hz
(+) | bons graves - apenas 3.6% longe da mediana
(±) | a linearidade dos graves é média (7.3% delta para a frequência anterior)
Médios 400 - 2.000 Hz
(+) | médios equilibrados - apenas 1.1% longe da mediana
(+) | médios são lineares (2.6% delta para frequência anterior)
Altos 2 - 16 kHz
(+) | agudos equilibrados - apenas 3.3% longe da mediana
(+) | os máximos são lineares (4% delta da frequência anterior)
Geral 100 - 16.000 Hz
(+) | o som geral é linear (8.1% diferença em relação à mediana)
Comparado com a mesma classe
» 1% de todos os dispositivos testados nesta classe foram melhores, 1% semelhantes, 98% piores
» O melhor teve um delta de 6%, a média foi 18%, o pior foi 132%
Comparado com todos os dispositivos testados
» 1% de todos os dispositivos testados foram melhores, 1% semelhantes, 98% piores
» O melhor teve um delta de 4%, a média foi 24%, o pior foi 134%
MSI GE76 Raider 10UH análise de áudio
(+) | os alto-falantes podem tocar relativamente alto (###valor### dB)
Graves 100 - 315Hz
(-) | quase nenhum baixo - em média 15.6% menor que a mediana
(±) | a linearidade dos graves é média (10.7% delta para a frequência anterior)
Médios 400 - 2.000 Hz
(+) | médios equilibrados - apenas 3.6% longe da mediana
(+) | médios são lineares (2.7% delta para frequência anterior)
Altos 2 - 16 kHz
(+) | agudos equilibrados - apenas 3.7% longe da mediana
(+) | os máximos são lineares (5.4% delta da frequência anterior)
Geral 100 - 16.000 Hz
(+) | o som geral é linear (12.3% diferença em relação à mediana)
Comparado com a mesma classe
» 13% de todos os dispositivos testados nesta classe foram melhores, 4% semelhantes, 82% piores
» O melhor teve um delta de 6%, a média foi 18%, o pior foi 132%
Comparado com todos os dispositivos testados
» 10% de todos os dispositivos testados foram melhores, 2% semelhantes, 88% piores
» O melhor teve um delta de 4%, a média foi 24%, o pior foi 134%
Gerenciamento de energia - Grande duração da bateria
Consumo de energia
Não há praticamente nenhuma surpresa em termos de consumo de energia, o que está de acordo com a média da classe. Devido à tela de maior resolução, o S17 consome mais do que seu predecessor em uso ocioso, mas isso não é necessariamente o caso sob carga, apesar do hardware mais potente.
Medimos um consumo máximo de 210 watts, que deve ser manuseado facilmente pelo adaptador de energia de 280 watts (~18 x 8,5 x 3,5 cm), bastante volumoso.
| desligado | |
| Ocioso | |
| Carga |
|
Key:
min: | |
| Asus ROG Zephyrus S17 GX703HSD i9-11900H, GeForce RTX 3080 Laptop GPU, Samsung PM9A1 MZVL22T0HBLB, IPS, 2560x1440, 17.3" | Asus Zephyrus S17 GX701LXS i7-10875H, GeForce RTX 2080 Super Max-Q, Samsung PM981a MZVLB1T0HBLR, IPS, 1920x1080, 17.3" | Aorus 17G YD i7-11800H, GeForce RTX 3080 Laptop GPU, Samsung PM9A1 MZVL2512HCJQ, IPS, 1920x1080, 17.3" | Gigabyte Aero 17 HDR YD i9-11980HK, GeForce RTX 3080 Laptop GPU, Samsung PM9A1 MZVL2512HCJQ, IPS, 3840x2160, 17.3" | Schenker XMG Ultra 17 Rocket Lake i9-11900K, GeForce RTX 3080 Laptop GPU, Samsung SSD 980 Pro 2TB MZ-V8P2T0, IPS, 1920x1080, 17.3" | MSI GE76 Raider 10UH i7-10870H, GeForce RTX 3080 Laptop GPU, WDC PC SN730 SDBPNTY-1T00, IPS, 1920x1080, 17.3" | Média NVIDIA GeForce RTX 3080 Laptop GPU | Média da turma Gaming | |
|---|---|---|---|---|---|---|---|---|
| Power Consumption | 17% | -2% | -8% | -105% | -2% | 2% | 12% | |
| Idle Minimum * (Watt) | 21.7 | 10 54% | 24 -11% | 25 -15% | 62 -186% | 15.5 29% | 19.8 ? 9% | 13.8 ? 36% |
| Idle Average * (Watt) | 27 | 16 41% | 26 4% | 28 -4% | 64 -137% | 31.3 -16% | 24.3 ? 10% | 19.6 ? 27% |
| Idle Maximum * (Watt) | 33 | 29 12% | 38 -15% | 40 -21% | 69 -109% | 31.7 4% | 33.3 ? -1% | 25.8 ? 22% |
| Load Average * (Watt) | 108 | 143 -32% | 101 6% | 114 -6% | 183 -69% | 93.6 13% | 108.1 ? -0% | 110.4 ? -2% |
| Witcher 3 ultra * (Watt) | 195 | 146 25% | 164 16% | 176 10% | 297 -52% | 233 -19% | ||
| Load Maximum * (Watt) | 210 | 205 2% | 230 -10% | 236 -12% | 368 -75% | 260.3 -24% | 230 ? -10% | 258 ? -23% |
* ... menor é melhor
Duração da bateria
A bateria no S17 tem uma capacidade de 90 Wh, enquanto a concorrência tem baterias ainda maiores. No entanto, nossa S17 dura mais tempo na maioria dos testes. Dependendo do nível de brilho, ela dura entre 6,5 e 7,5 horas no teste Wi-Fi. O tempo de reprodução de vídeo também pode ser estimado em pouco mais de 7 horas; a competição é pior, sem exceção, aqui
| Asus ROG Zephyrus S17 GX703HSD i9-11900H, GeForce RTX 3080 Laptop GPU, 90 Wh | Asus Zephyrus S17 GX701LXS i7-10875H, GeForce RTX 2080 Super Max-Q, 76 Wh | Aorus 17G YD i7-11800H, GeForce RTX 3080 Laptop GPU, 99 Wh | Gigabyte Aero 17 HDR YD i9-11980HK, GeForce RTX 3080 Laptop GPU, 99 Wh | Schenker XMG Ultra 17 Rocket Lake i9-11900K, GeForce RTX 3080 Laptop GPU, 97 Wh | MSI GE76 Raider 10UH i7-10870H, GeForce RTX 3080 Laptop GPU, 99.9 Wh | Média da turma Gaming | |
|---|---|---|---|---|---|---|---|
| Duração da bateria | -54% | -25% | -41% | -70% | -27% | -12% | |
| H.264 (h) | 7.2 | 6.2 -14% | 1.9 -74% | 7.93 ? 10% | |||
| WiFi v1.3 (h) | 7.5 | 2.8 -63% | 6 -20% | 5.6 -25% | 1.8 -76% | 6.3 -16% | 6.73 ? -10% |
| Witcher 3 ultra (h) | 1 | 0.958 ? -4% | |||||
| Load (h) | 2.7 | 1.5 -44% | 1.6 -41% | 1.2 -56% | 1.1 -59% | 1.7 -37% | 1.472 ? -45% |
| Reader / Idle (h) | 3.5 | 9 | 3 | 8.2 | 9.23 ? |
Pro
Contra
Veredicto - Bom laptop para jogos com futuro incerto
Em conclusão, ainda é difícil avaliar o que a abertura incomum no caso acaba realizando. O Zephyrus é geralmente um pouco mais silencioso do que a concorrência, mas não exatamente mais frio. Por outro lado, há também o aspecto questionável da longevidade, mesmo que a unidade de teclado levantada cause uma impressão muito estável. No entanto, há aqui uma vulnerabilidade adicional.
O Asus tem um laptop de jogo muito bom aqui, mas não podemos realmente decidir se o estojo de levantamento é uma característica legal ou mais uma desvantagem. O Asus também deveria fazer um trabalho melhor com os ruídos incômodos.
Se avaliarmos o desempenho do jogo puro, o ROG Zephyrus não deixa nada a desejar. Tanto a performance da CPU bruta quanto a performance da GPU são incontestáveis. A GPU de 140 watts está ao mesmo nível da GPU de 155 watts no MSI GE76 Raider 10UH.
É somente com a bateria que o desempenho da CPU em particular cai mais do que o esperado. Entretanto, o Asus merece algumas críticas sérias pelo ruído irritante, o comportamento subótimo do ventilador e o módulo WLAN lento.
De outra forma, isto é uma piada, e as impressões positivas prevalecem claramente. Estas incluem o desempenho, a muito boa configuração das portas, a muito boa duração da bateria, a operação relativamente silenciosa, o rápido SSD, e assim por diante
Preço e disponibilidade
Asus ROG Zephyrus S17 GX703HSD
- 07/12/2021 v7 (old)
Christian Hintze


