Acer Predator Helios 300 PH315-53 em revisão: Máquina de jogo rápido com desempenho extra

O Predator Helios é um laptop de 15,6 polegadas para jogos. O dispositivo é alimentado por umNúcleo i7-10750H processador e umGeForce RTX 2060 GPU. Os concorrentes incluem dispositivos como o Dell G5 15 SEoAorus 5 KB, oSchenker XMG Core 15, e oAsus TUF A15 FA506IV
Como o Predador é em grande parte idêntico em construção ao seu predecessor, não iremos mais longe no caso, a conectividade, os dispositivos de entrada, o visor e os alto-falantes - a menos que haja diferenças. As informações correspondentes podem ser encontradas no revisão do Acer Predator Helios 300 PH315-52.
Avaliação | Data | Modelo | Peso | Altura | Size | Resolução | Preço |
|---|---|---|---|---|---|---|---|
| 82.9 % v7 (old) | 11/2020 | Acer Predator Helios 300 PH315-53-77N5 i7-10750H, GeForce RTX 2060 Mobile | 2.5 kg | 22.9 mm | 15.60" | 1920x1080 | |
| 83.7 % v7 (old) | 06/2020 | Dell G5 15 SE 5505 P89F R7 4800H, Radeon RX 5600M | 2.4 kg | 21.6 mm | 15.60" | 1920x1080 | |
| 83.7 % v7 (old) | 10/2020 | Aorus 5 KB i7-10750H, GeForce RTX 2060 Mobile | 2.1 kg | 28 mm | 15.60" | 1920x1080 | |
| 82.1 % v7 (old) | 10/2020 | Schenker XMG Core 15 GK5NR0O R7 4800H, GeForce RTX 2060 Mobile | 2 kg | 19.9 mm | 15.60" | 1920x1080 | |
| 82.7 % v7 (old) | 06/2020 | Asus TUF Gaming A15 FA506IV-HN172 R7 4800H, GeForce RTX 2060 Mobile | 2.2 kg | 24.9 mm | 15.60" | 1920x1080 |
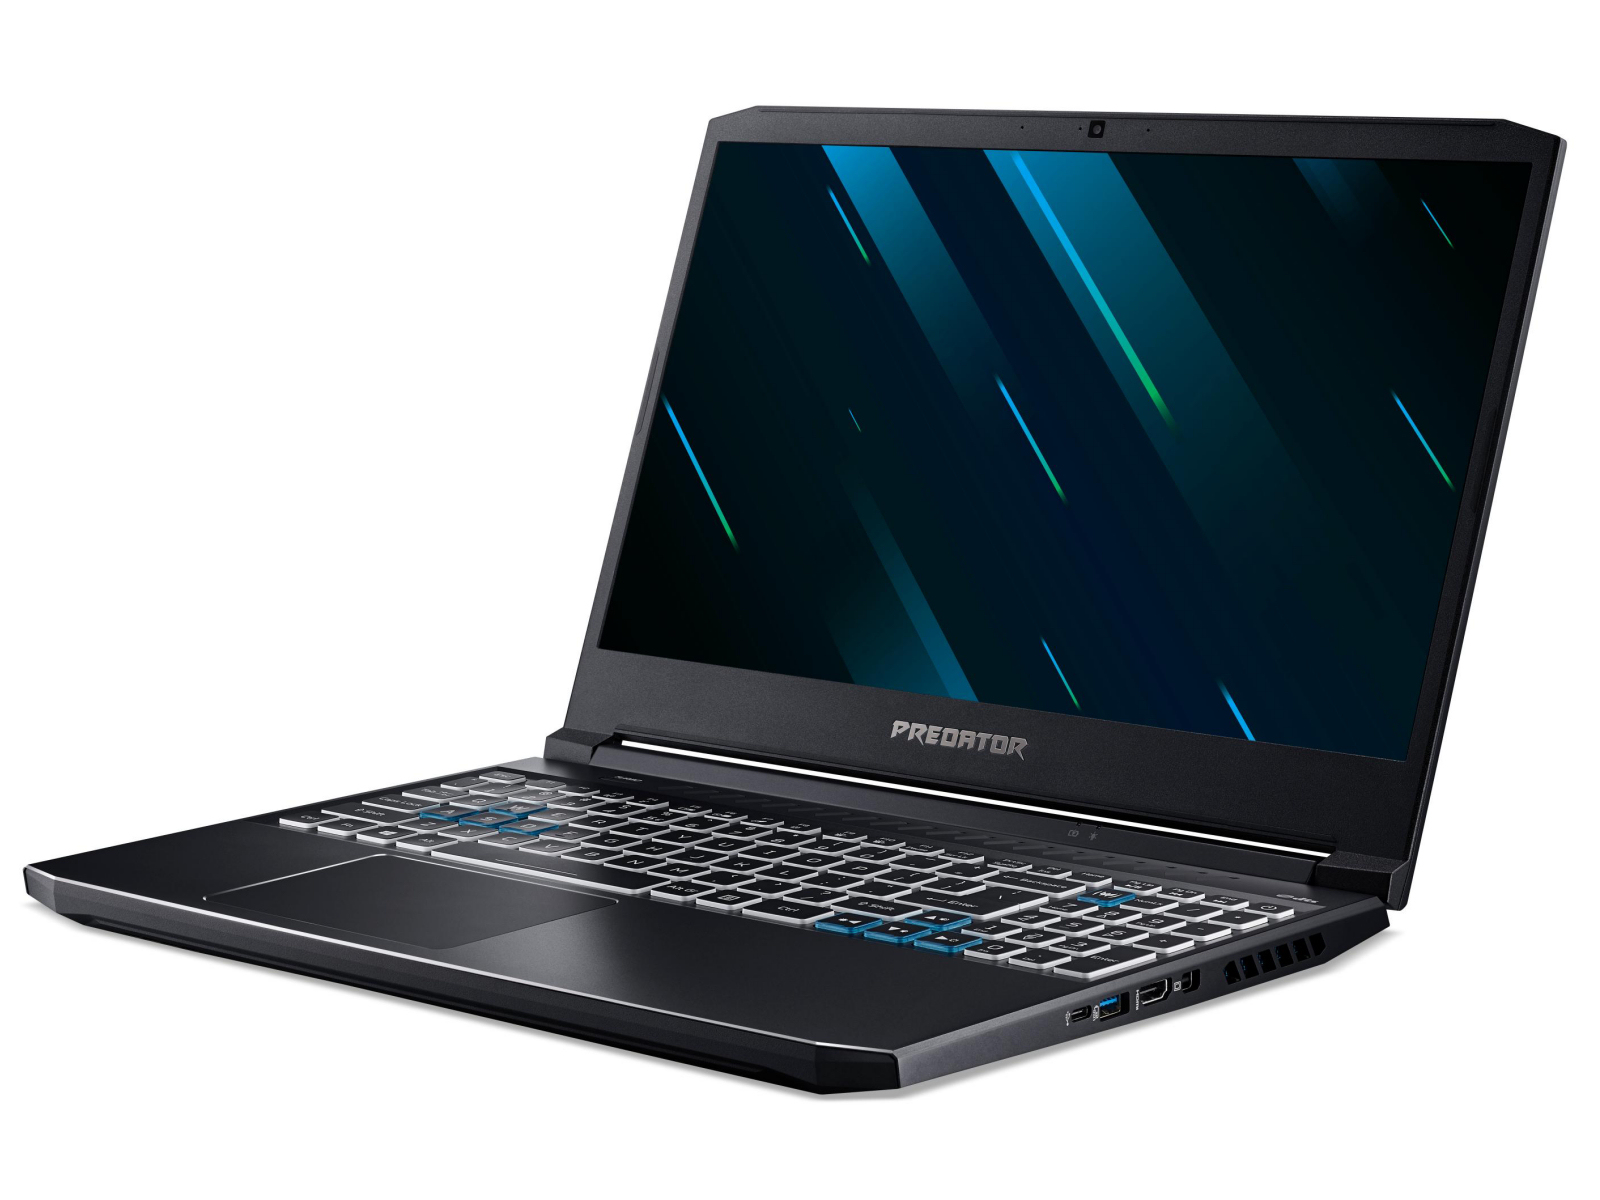
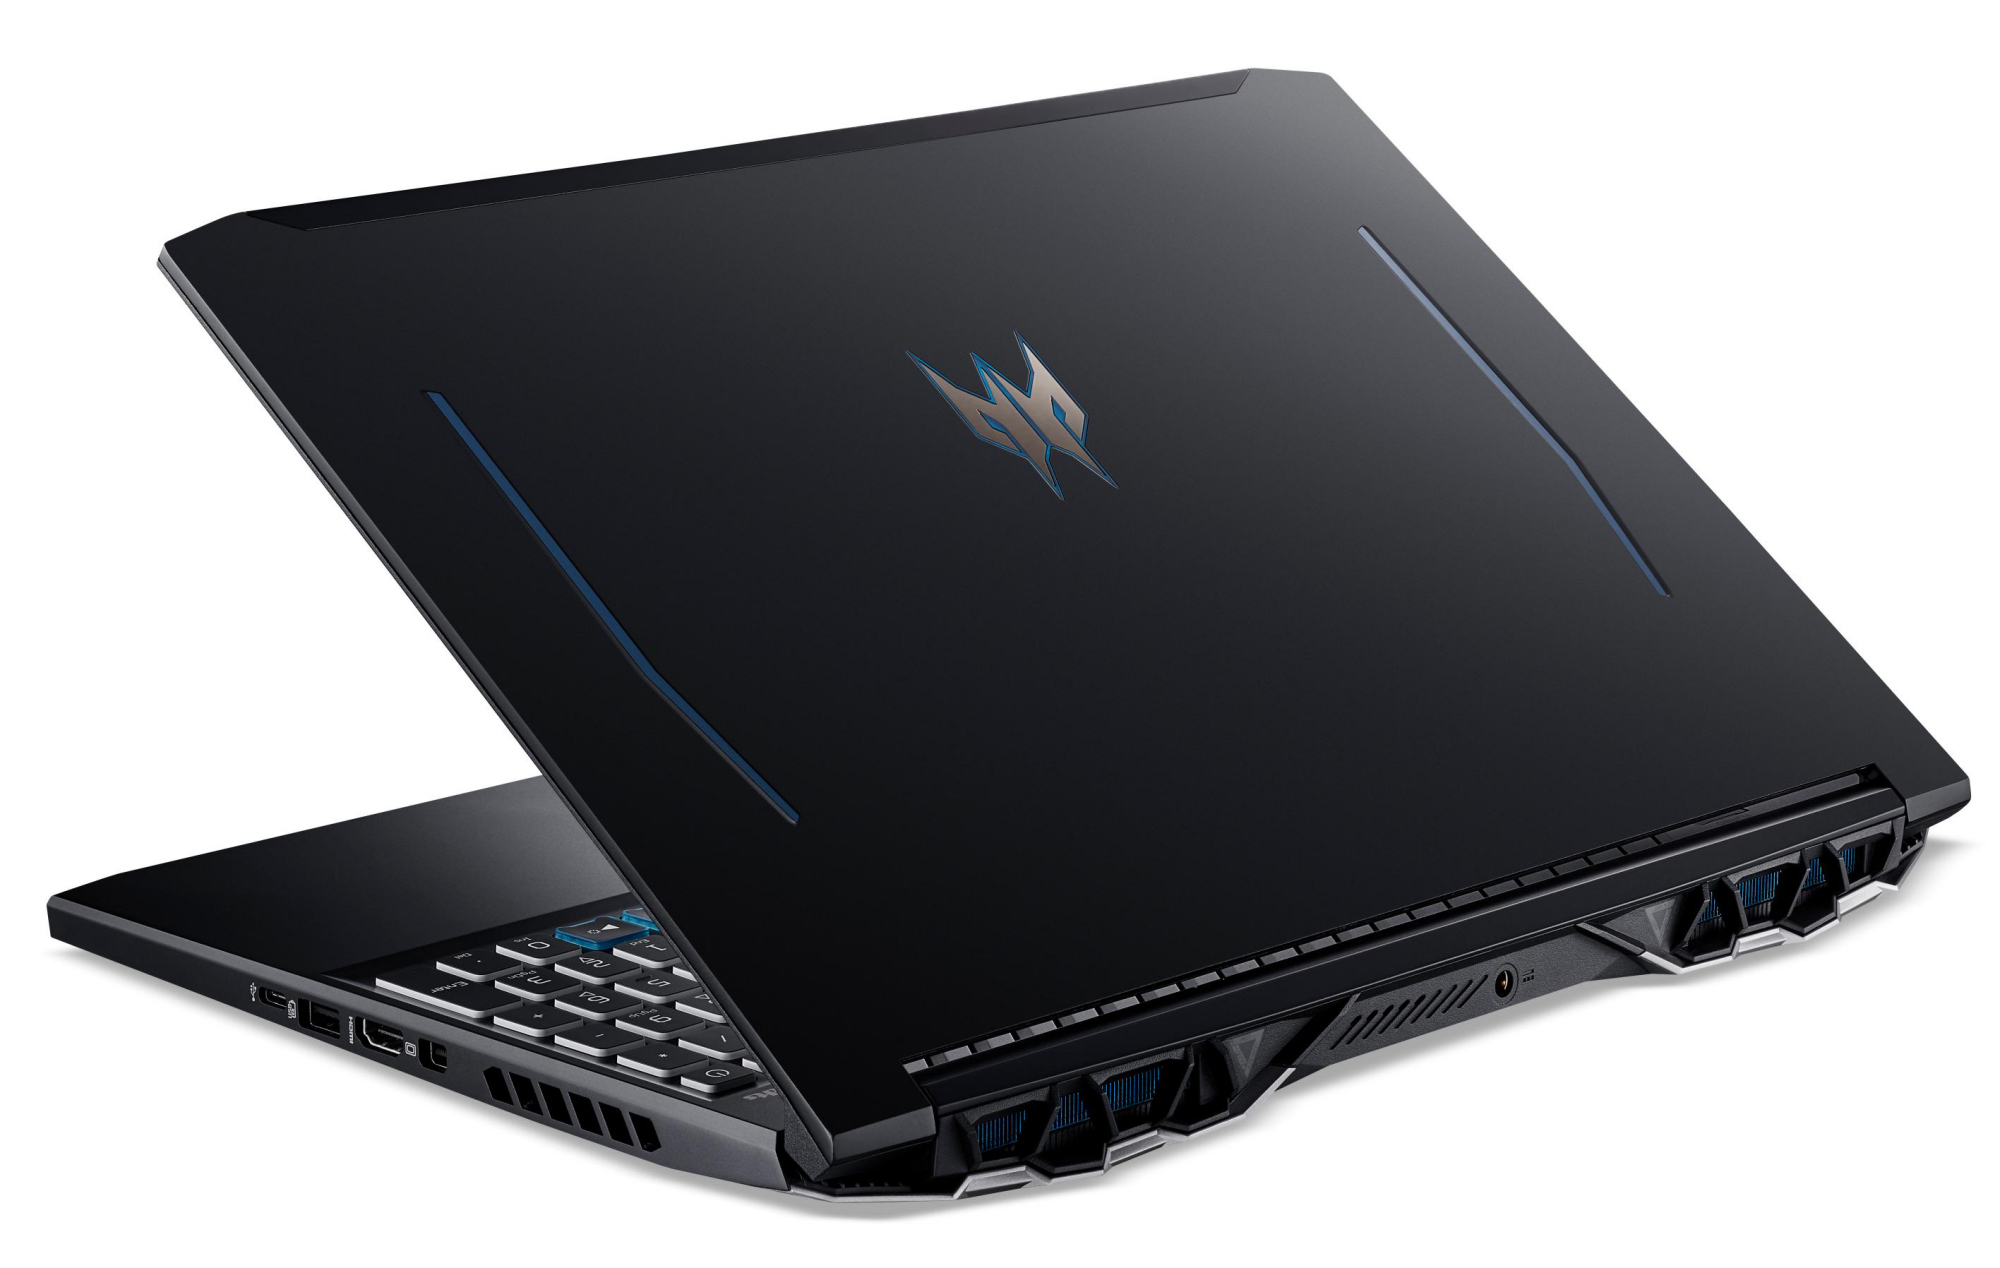
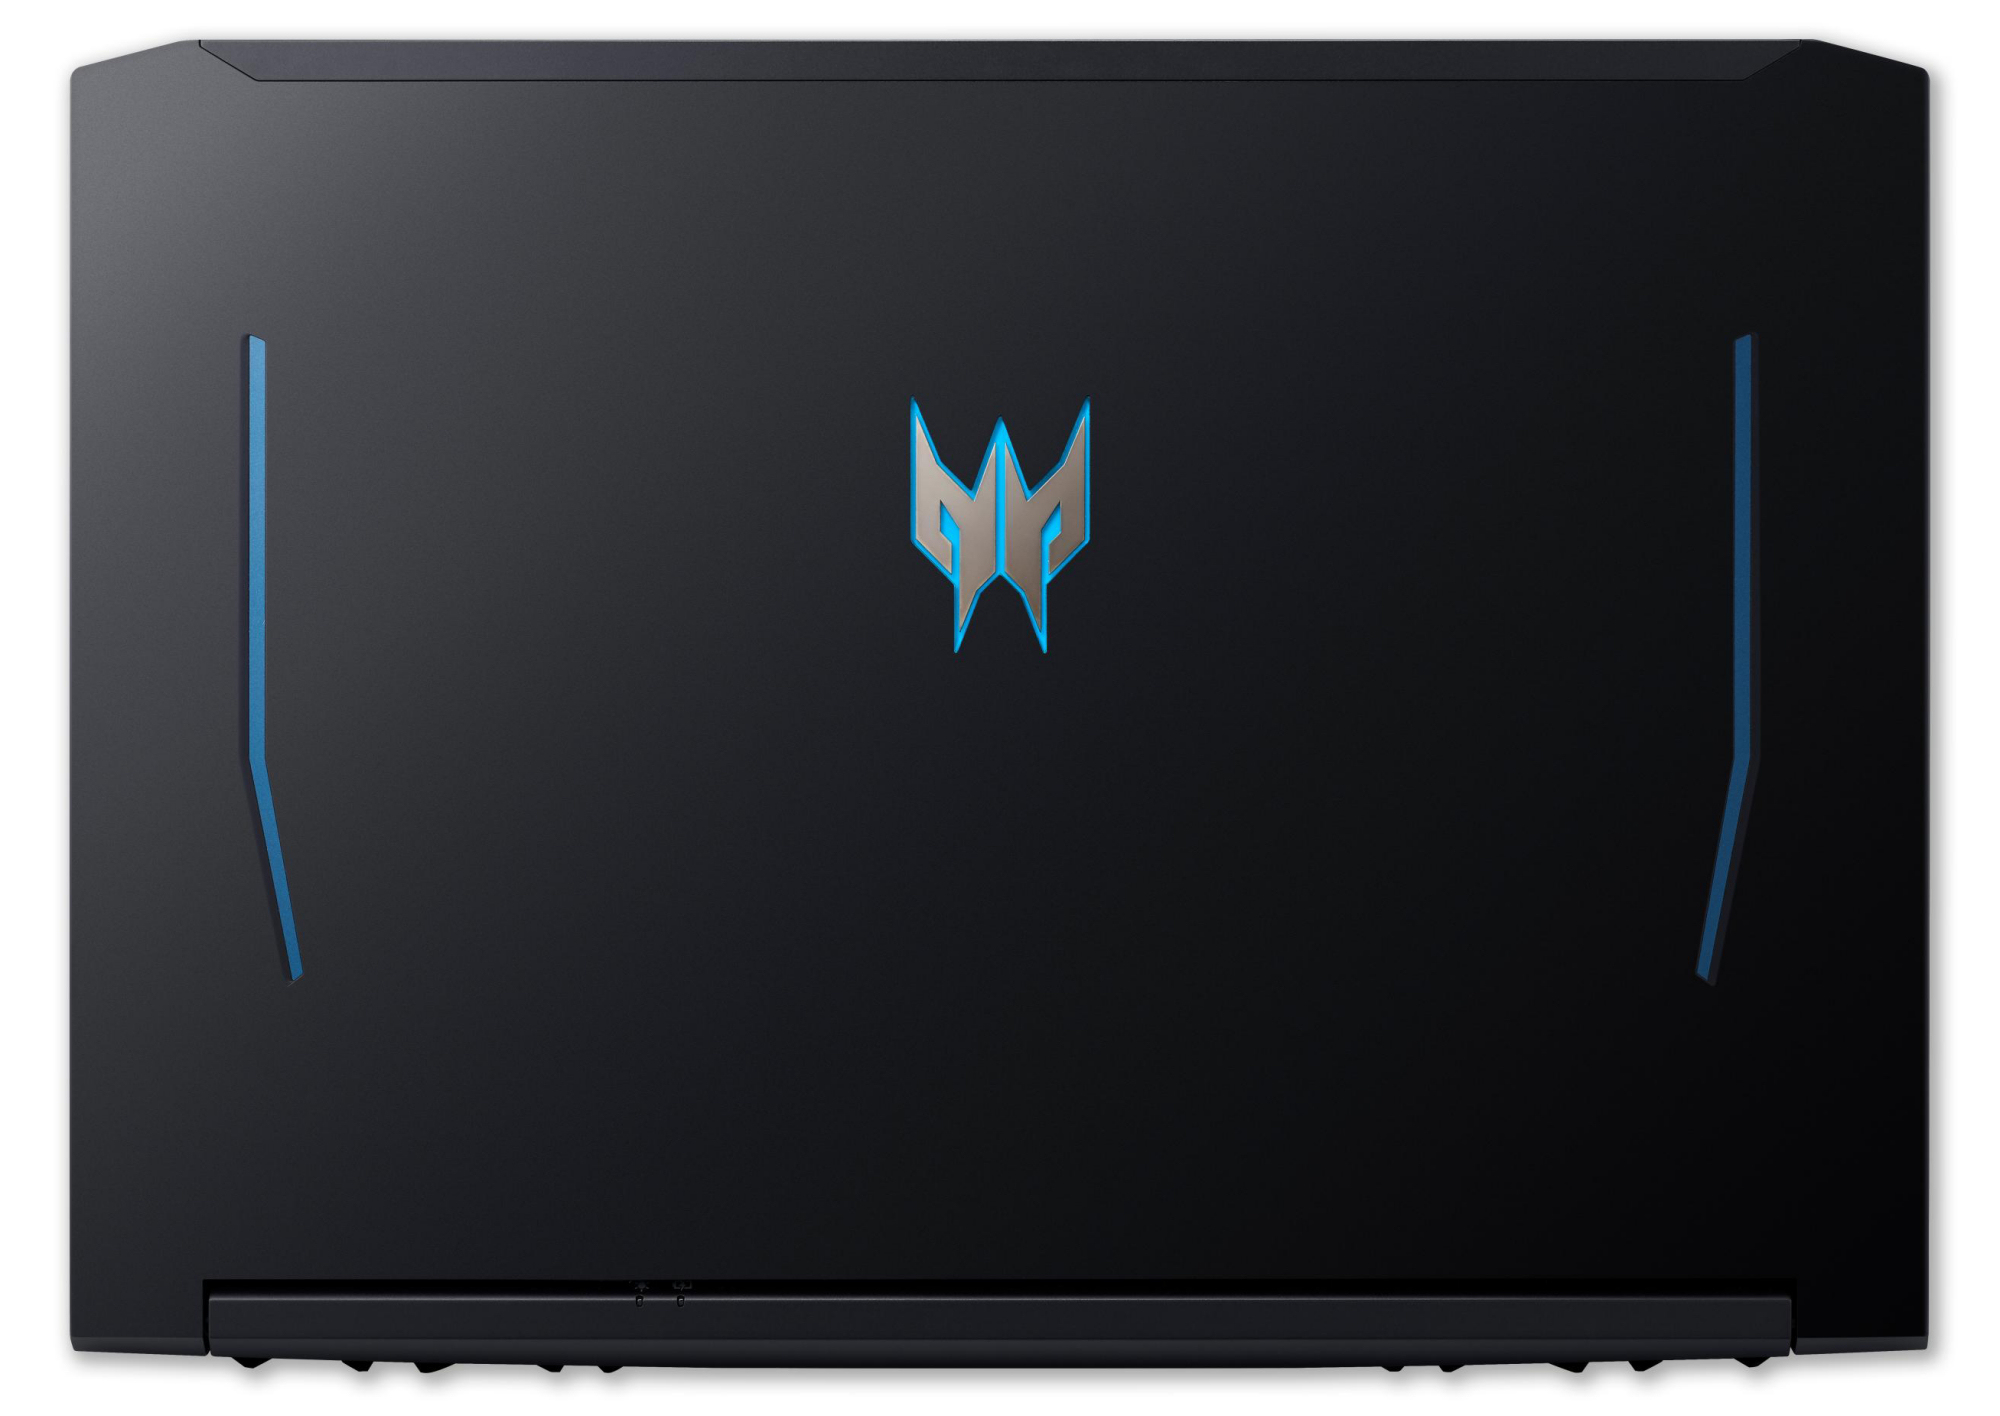
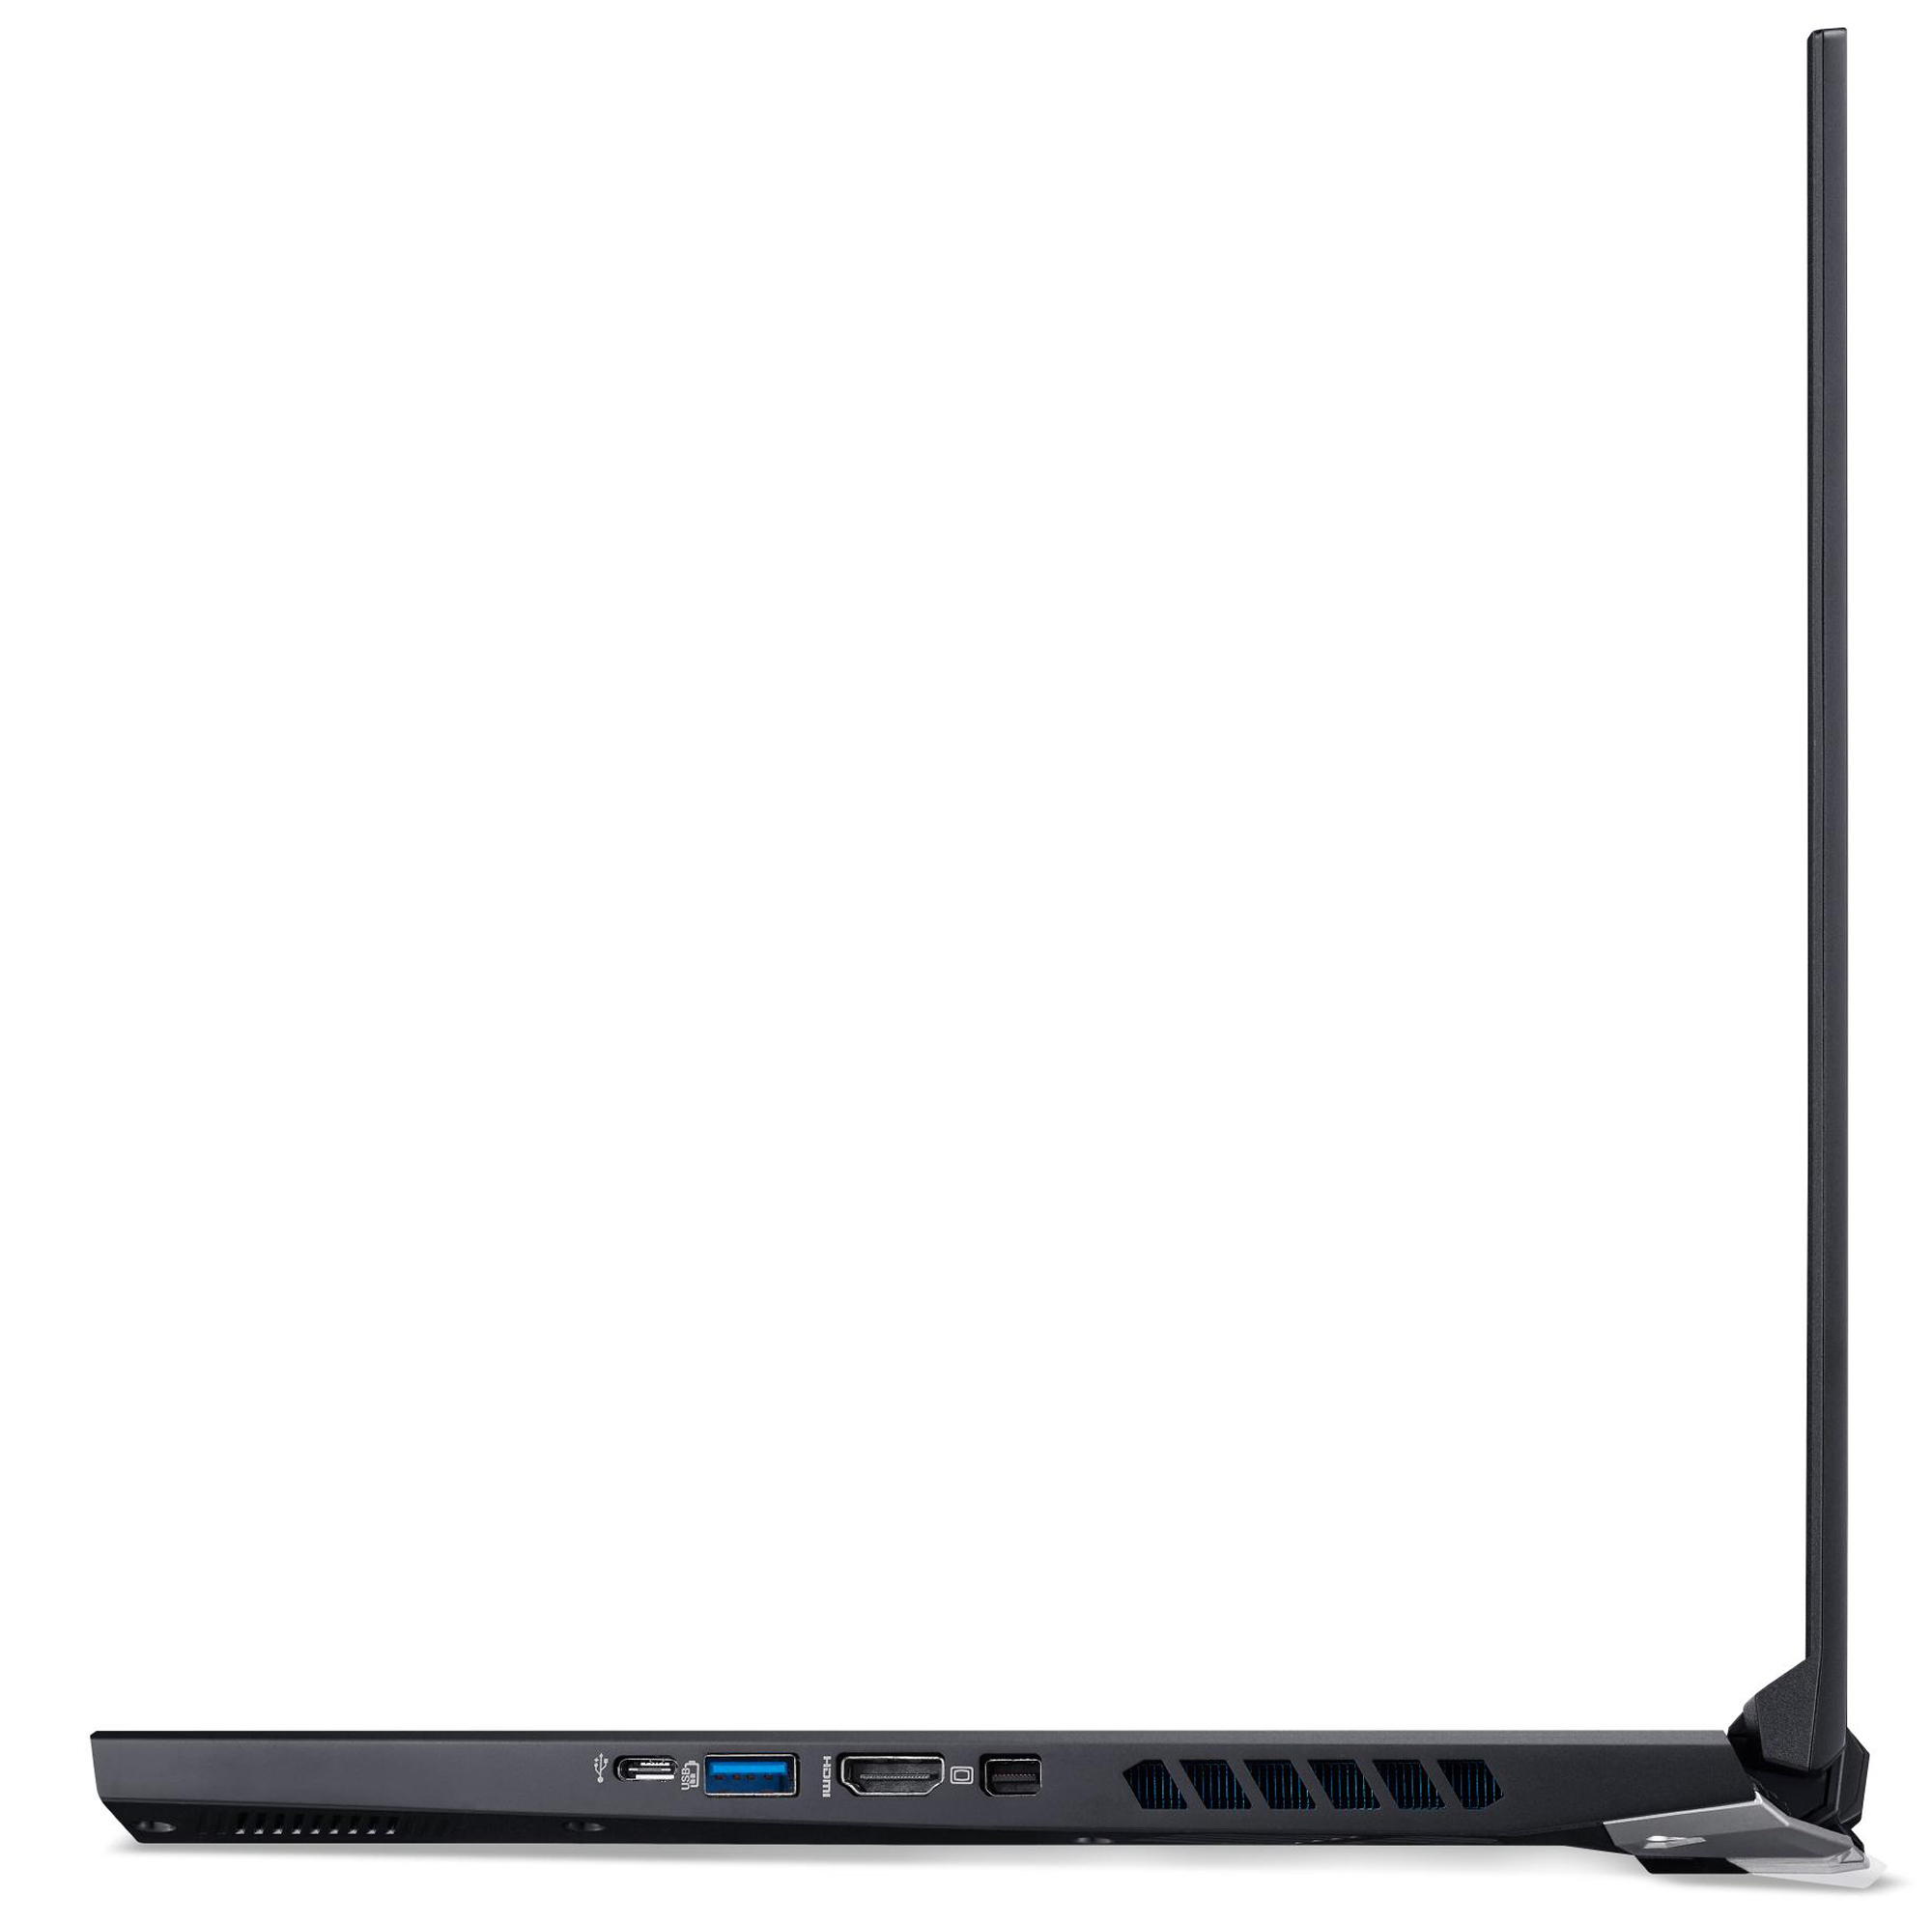
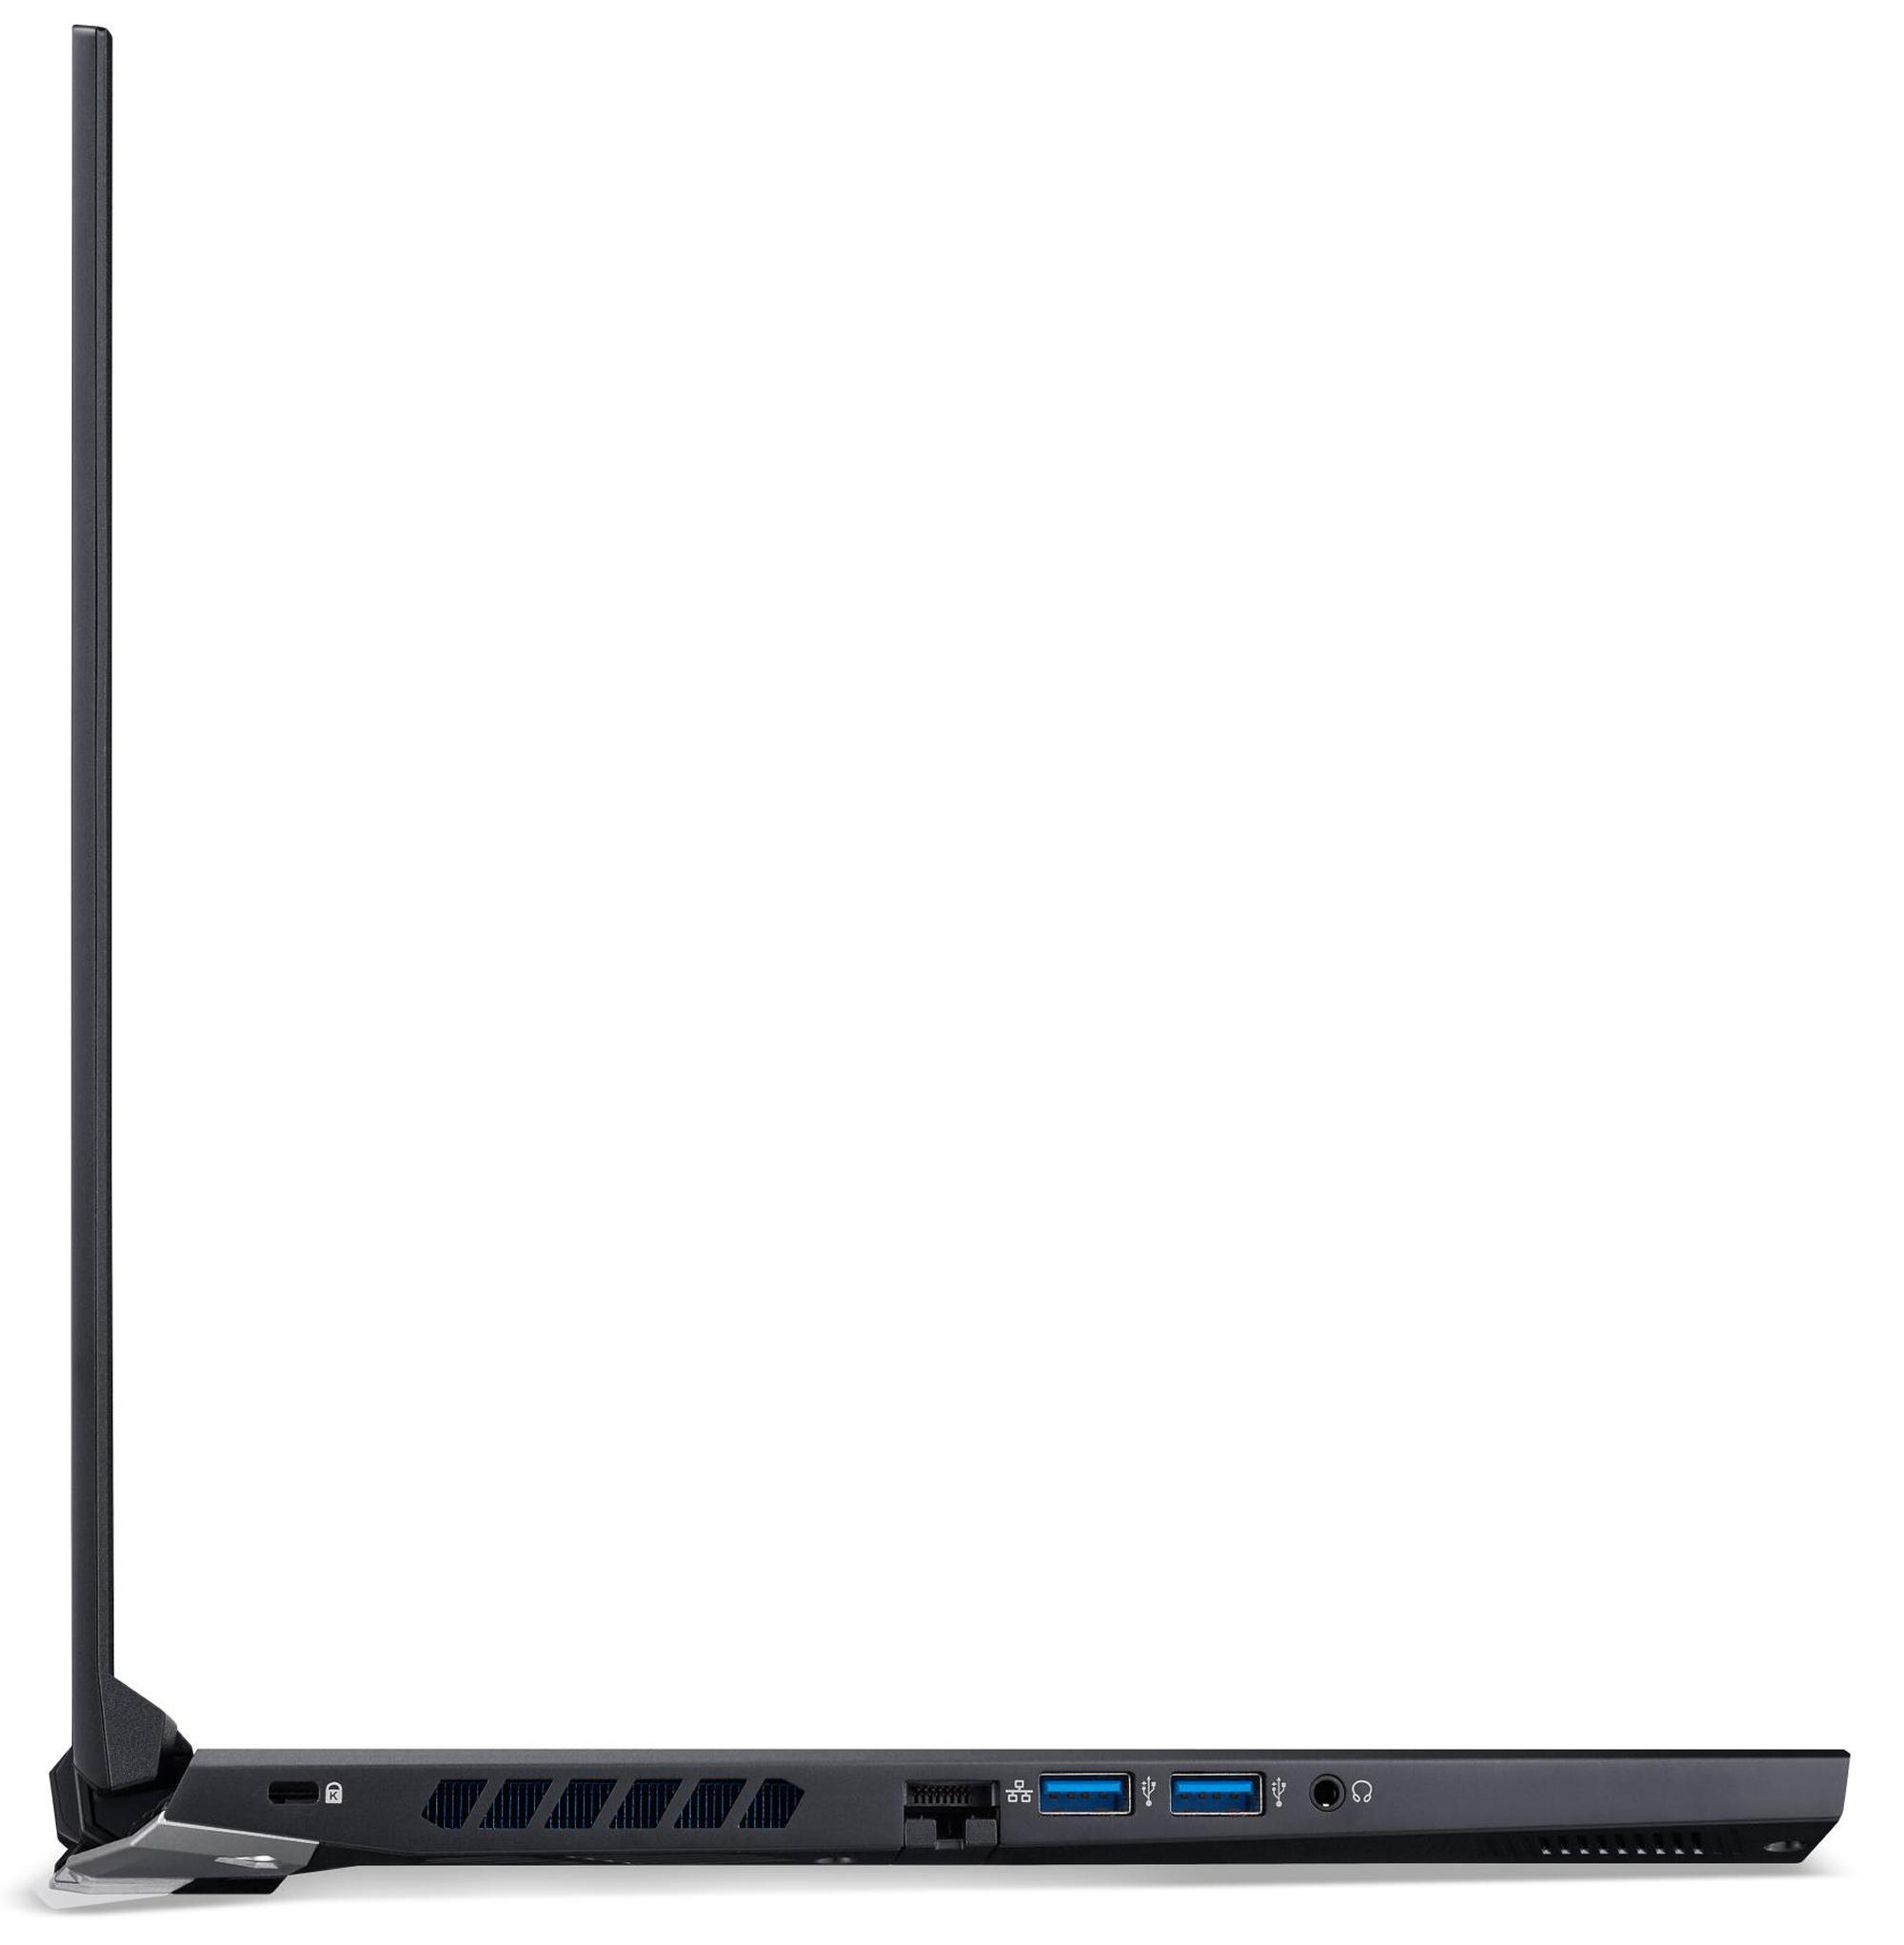
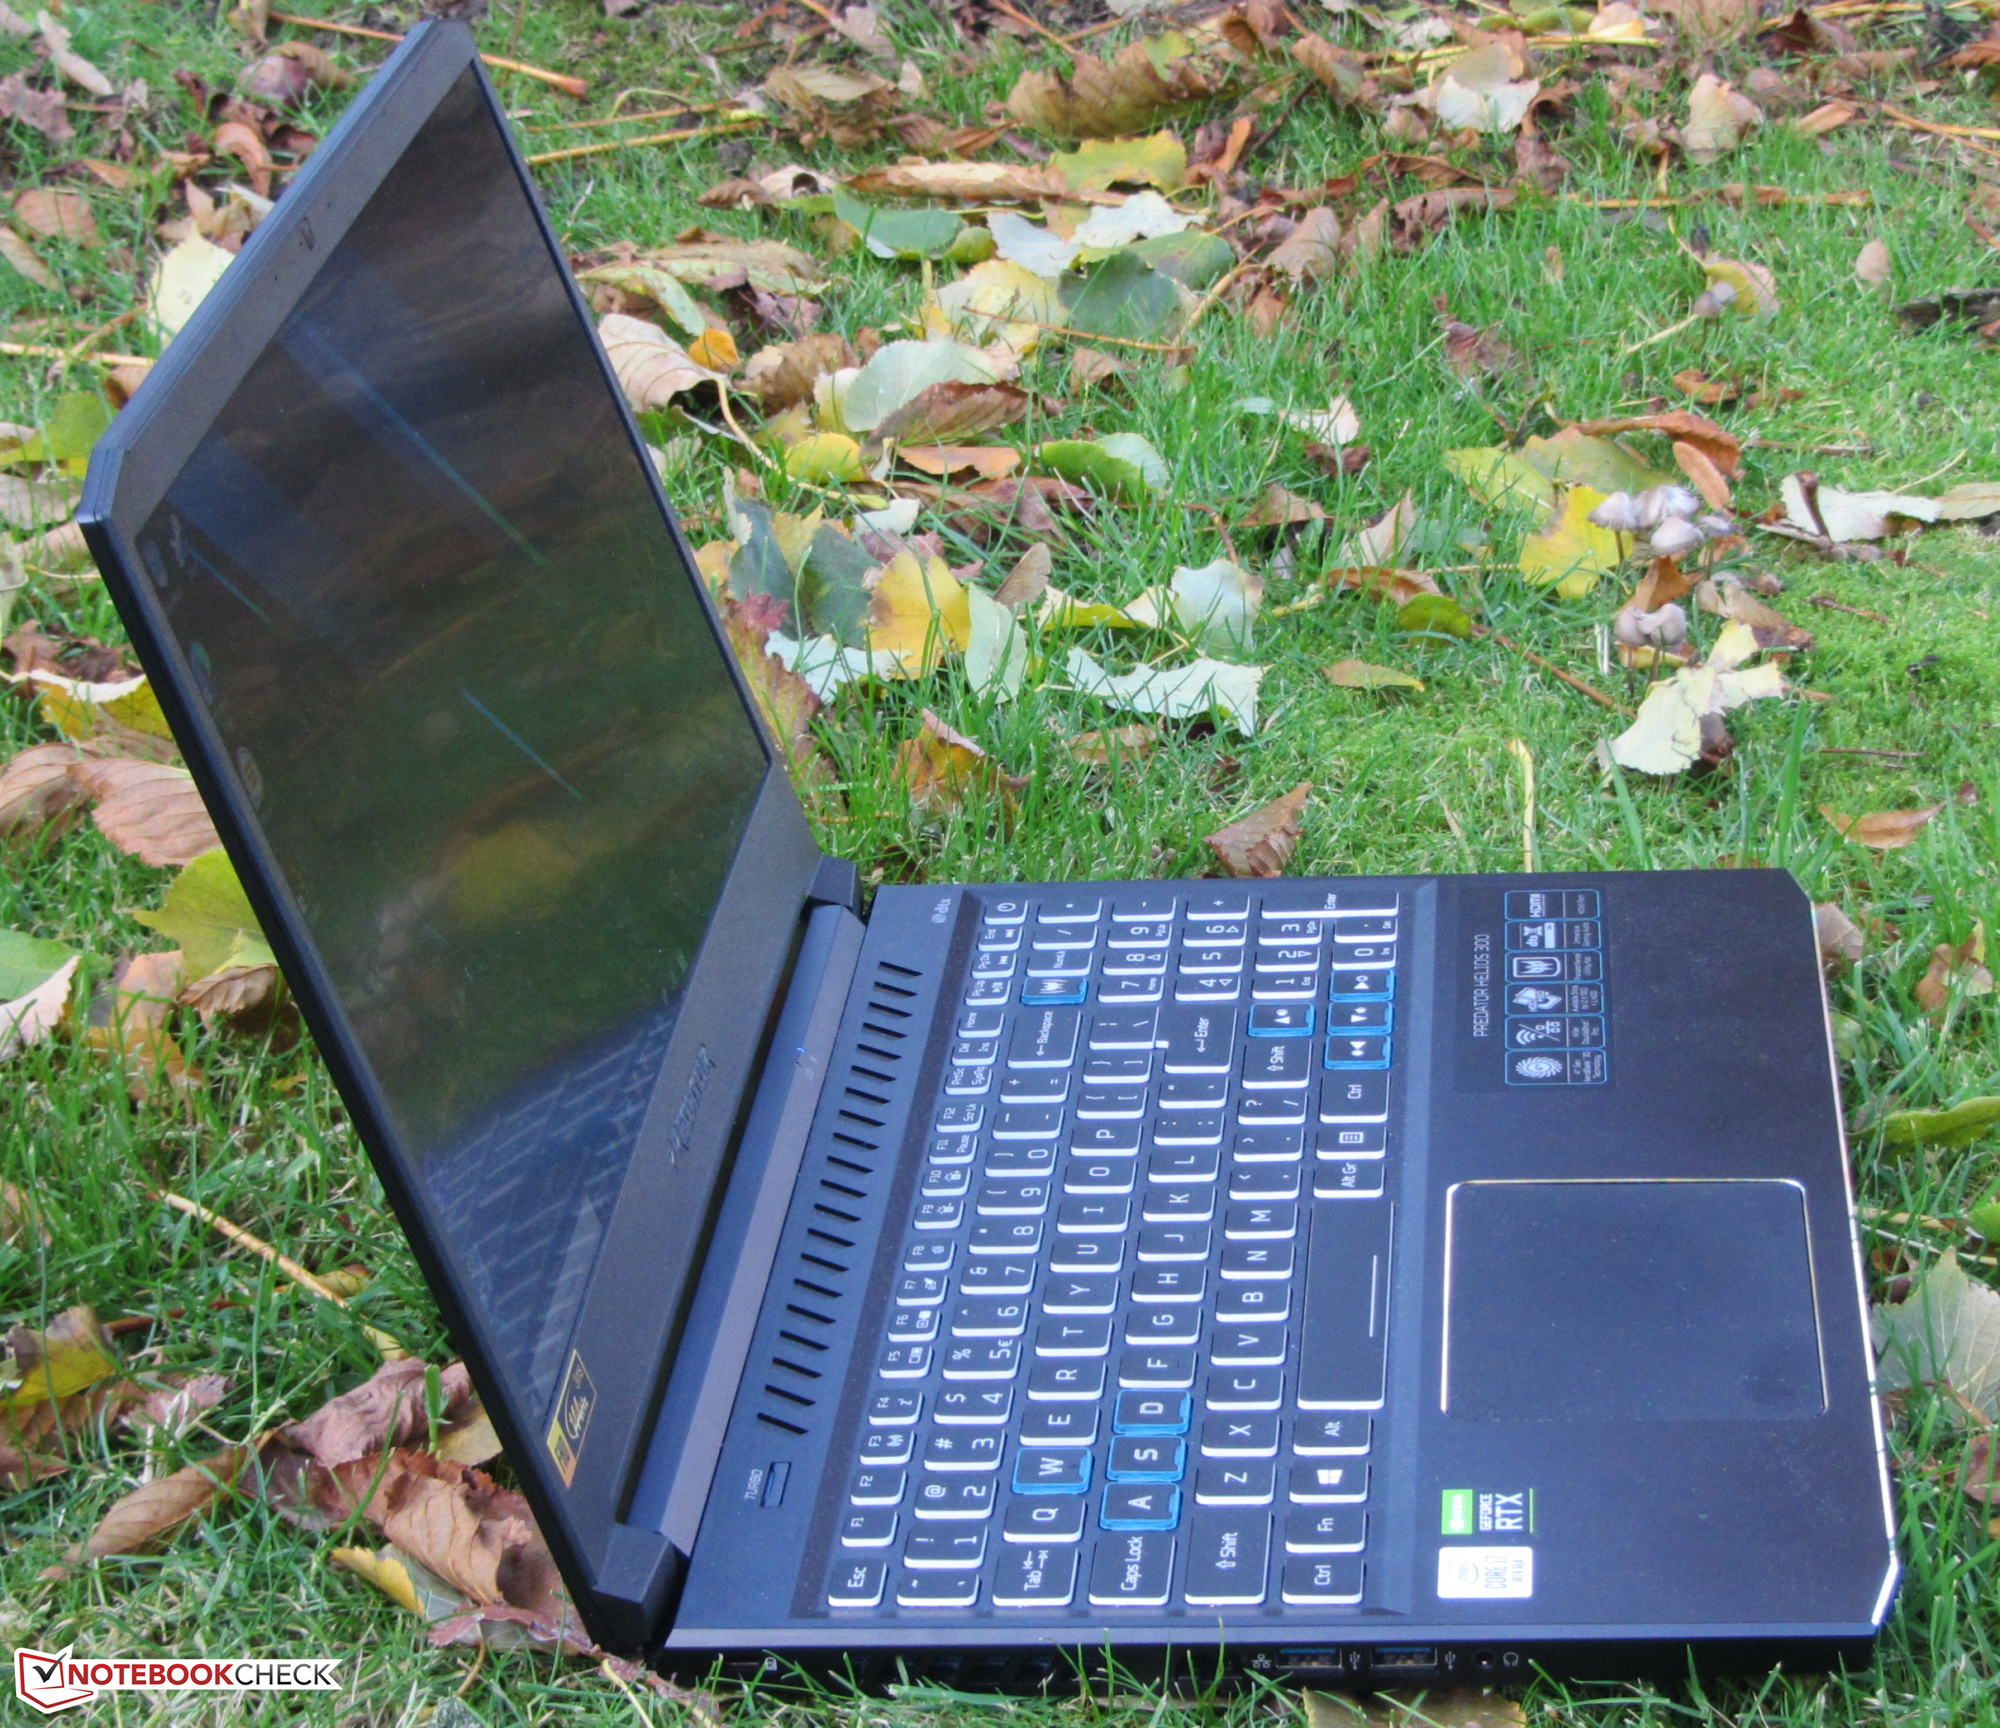
Caso e conectividade - Pequenas mudanças em comparação com o predecessor
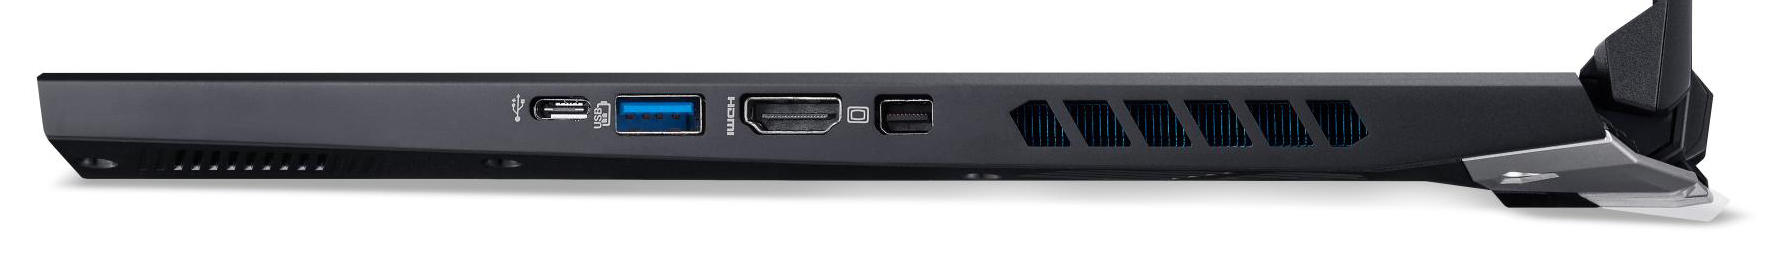
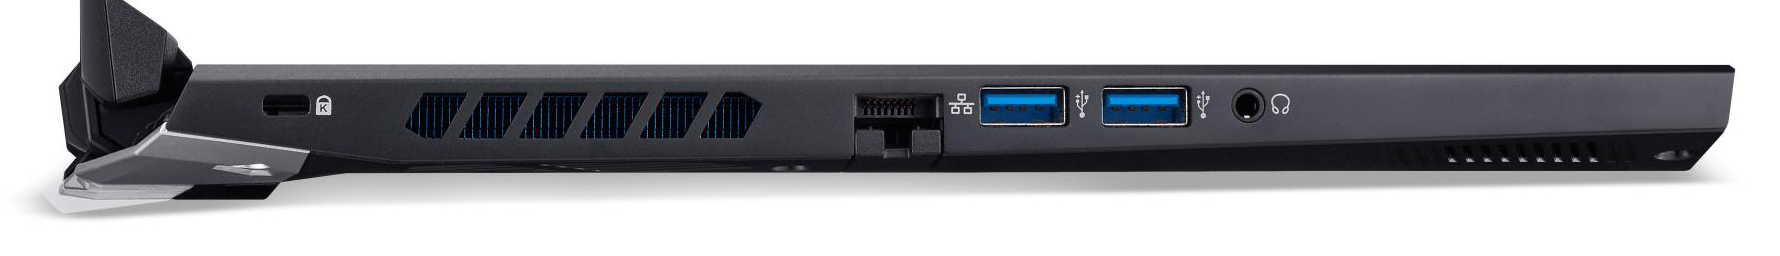
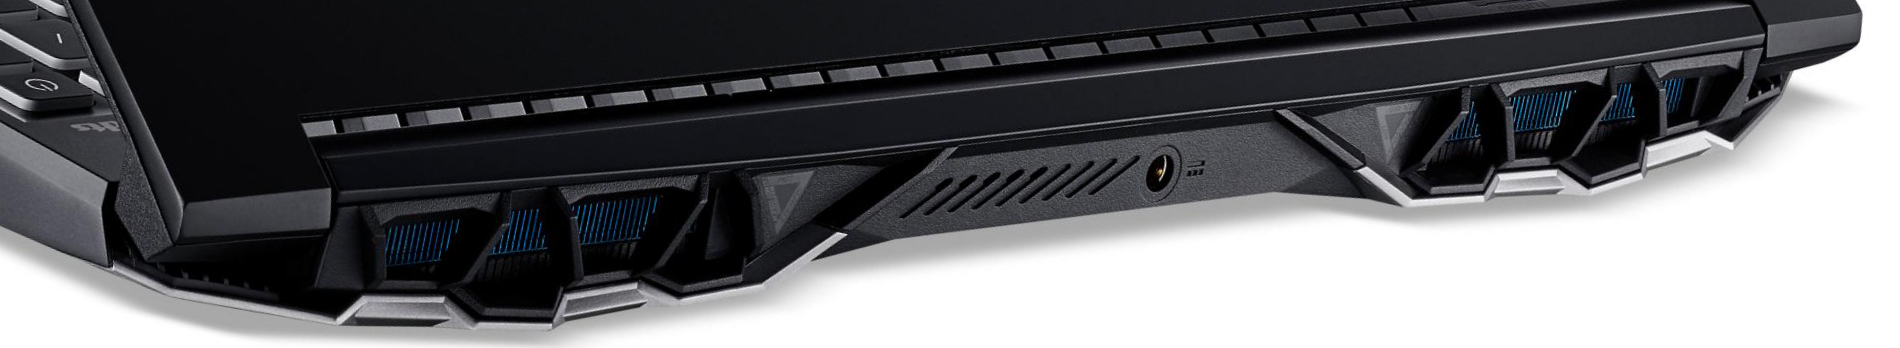
À primeira vista, o caso se assemelha ao de seu predecessor. Mas há diferenças. Por exemplo, o conector de alimentação elétrica foi movido do centro do lado esquerdo para o centro do lado de trás. A saída HDMI e o Mini DisplayPort trocaram de lugar. Além disso, aberturas de ventilação adicionais foram criadas acima do teclado. Além disso, o modelo atual ganhou algum peso. Há uma nova adição em termos de portas também: Ao invés de uma porta USB Type-C 3.2 Gen 1, o modelo atual do Predator tem uma porta USB Type-C 3.2 Gen 2 a bordo


")
")


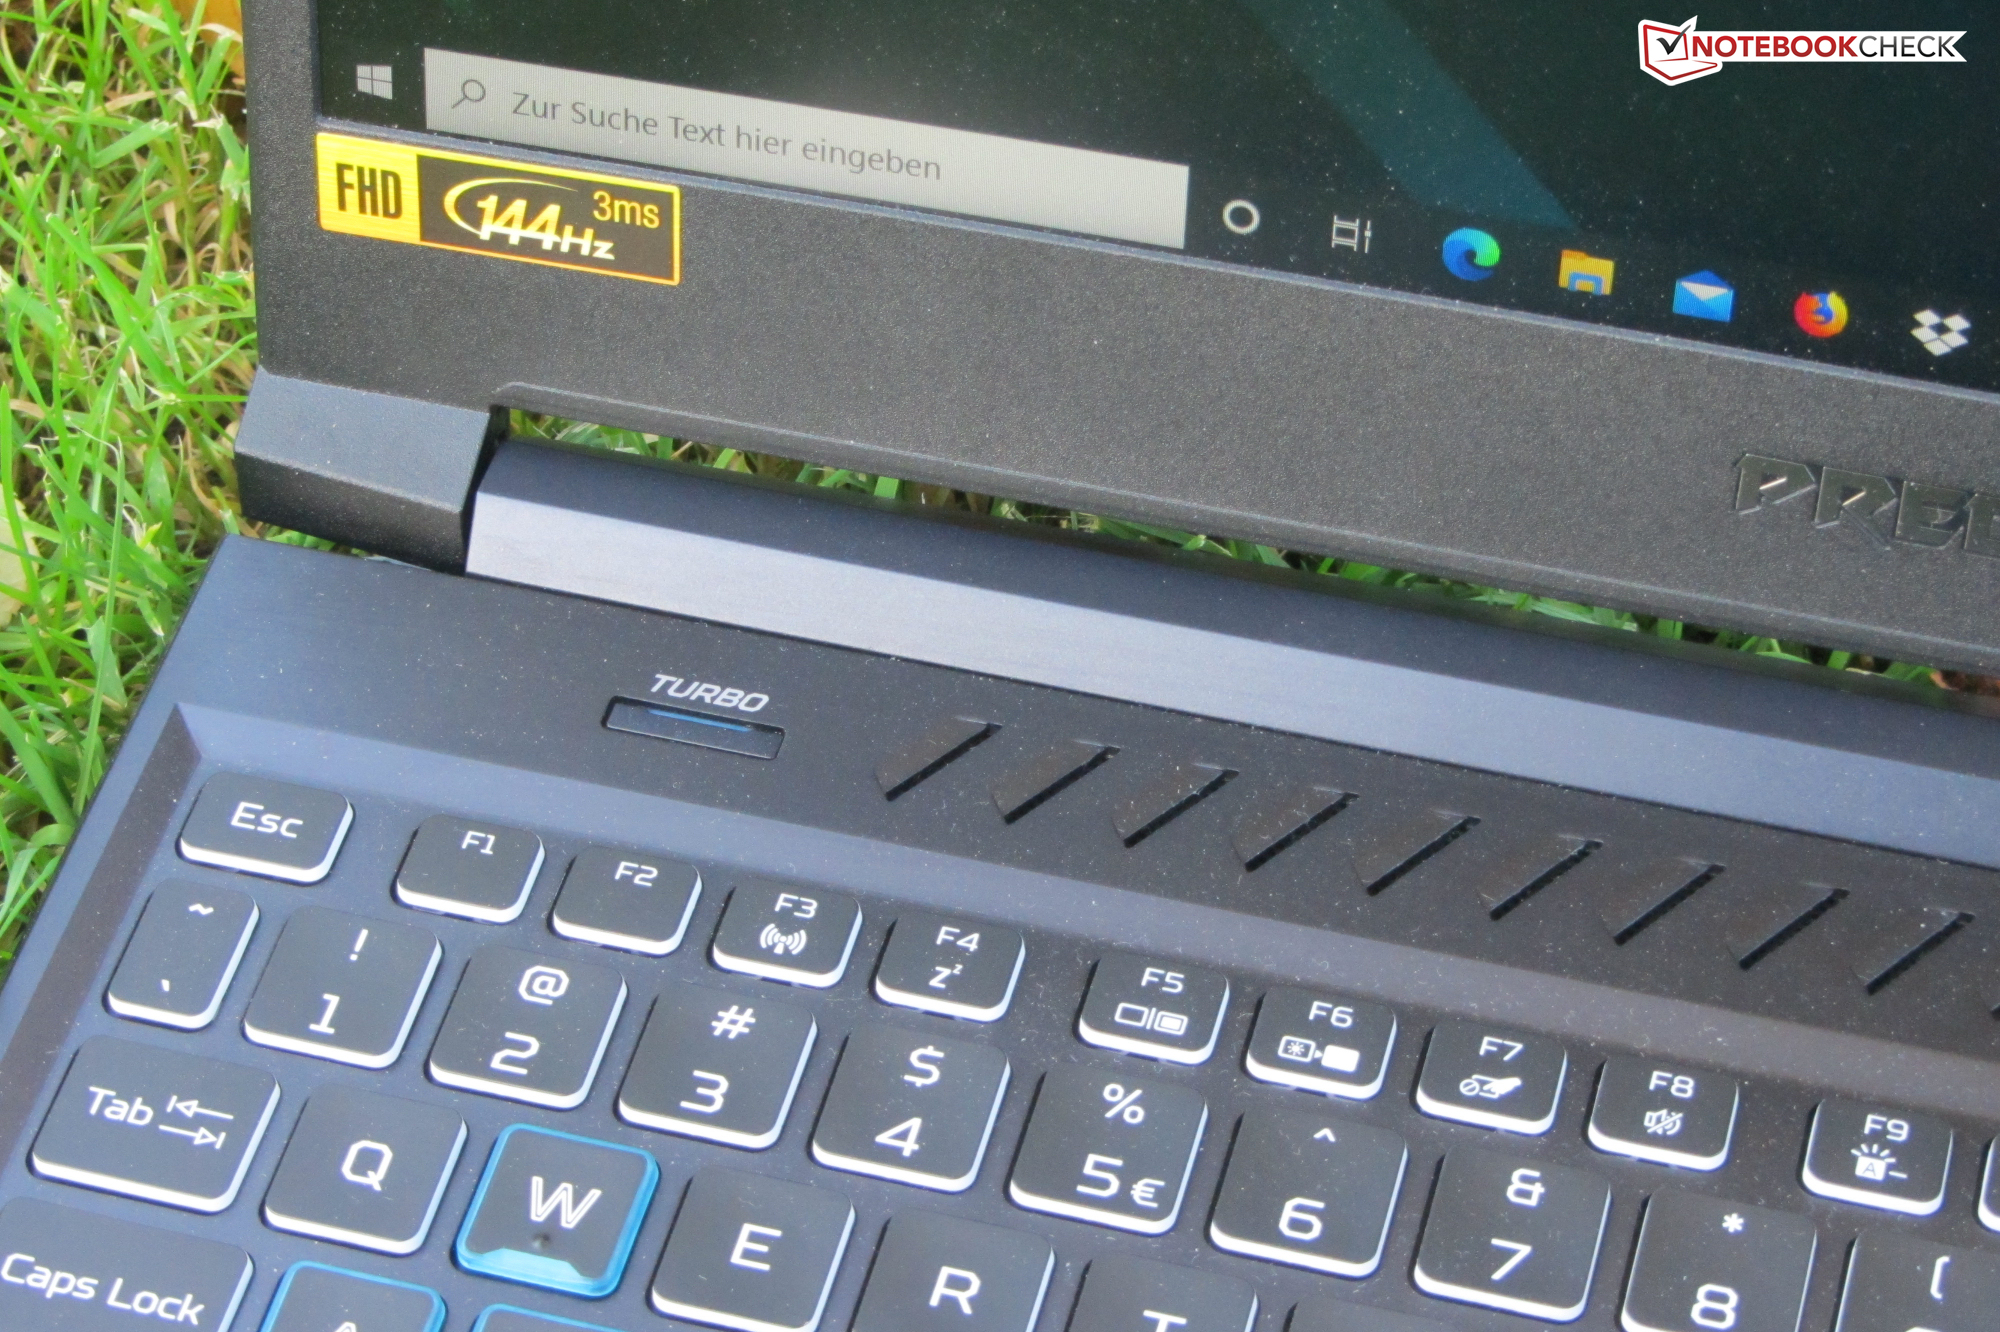
Visor - IPS 144 Hz

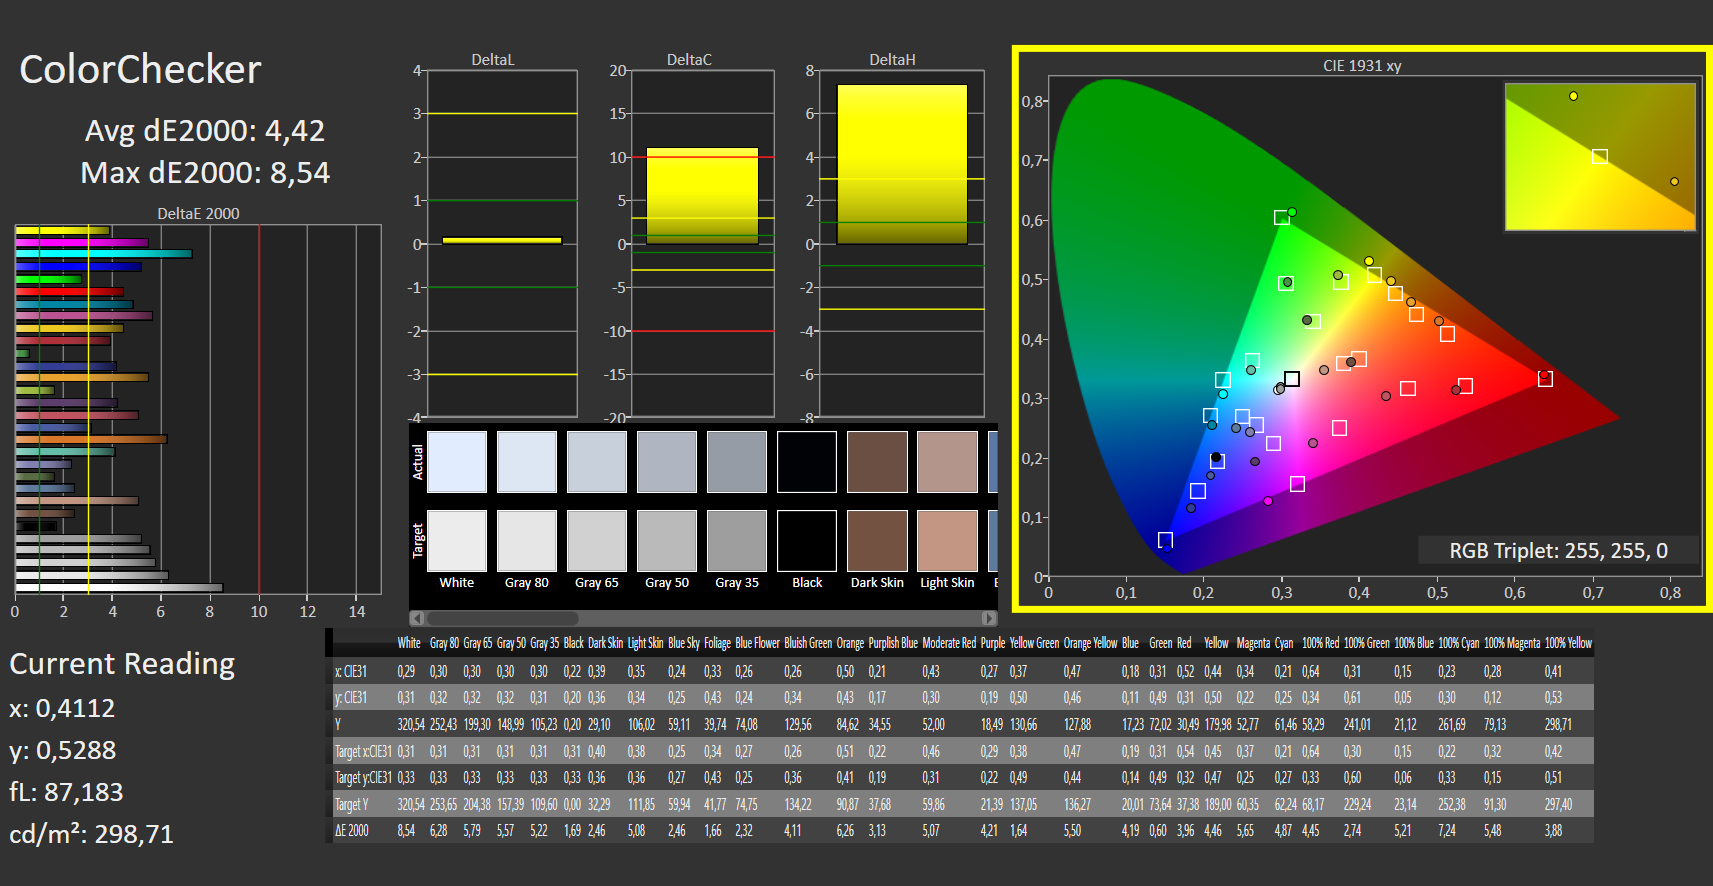
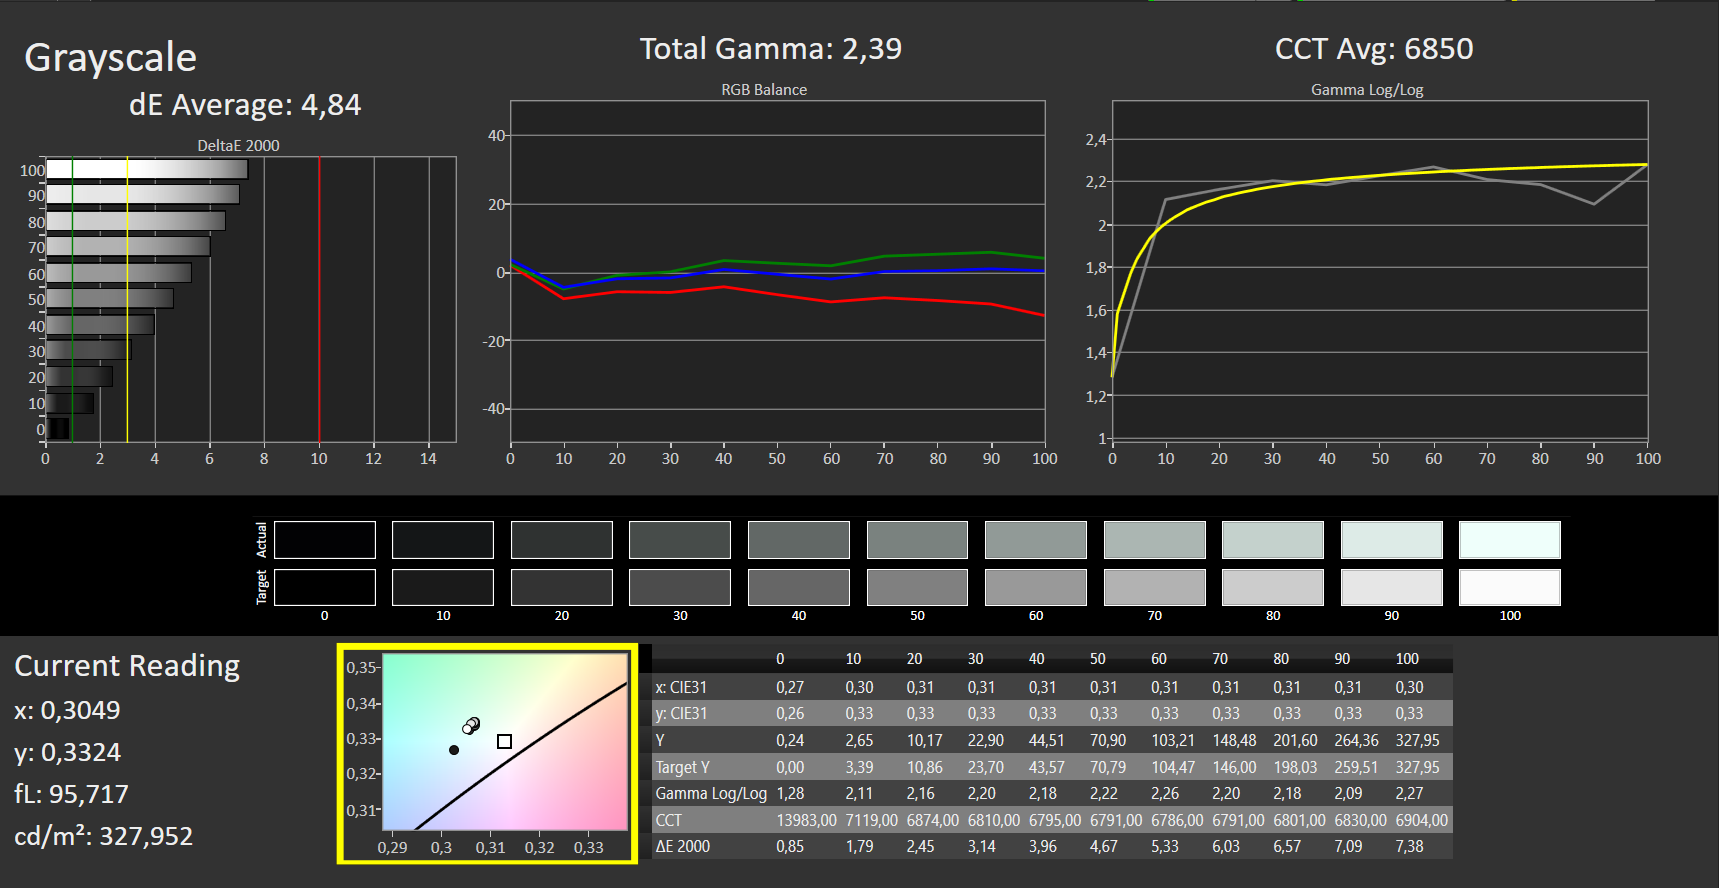
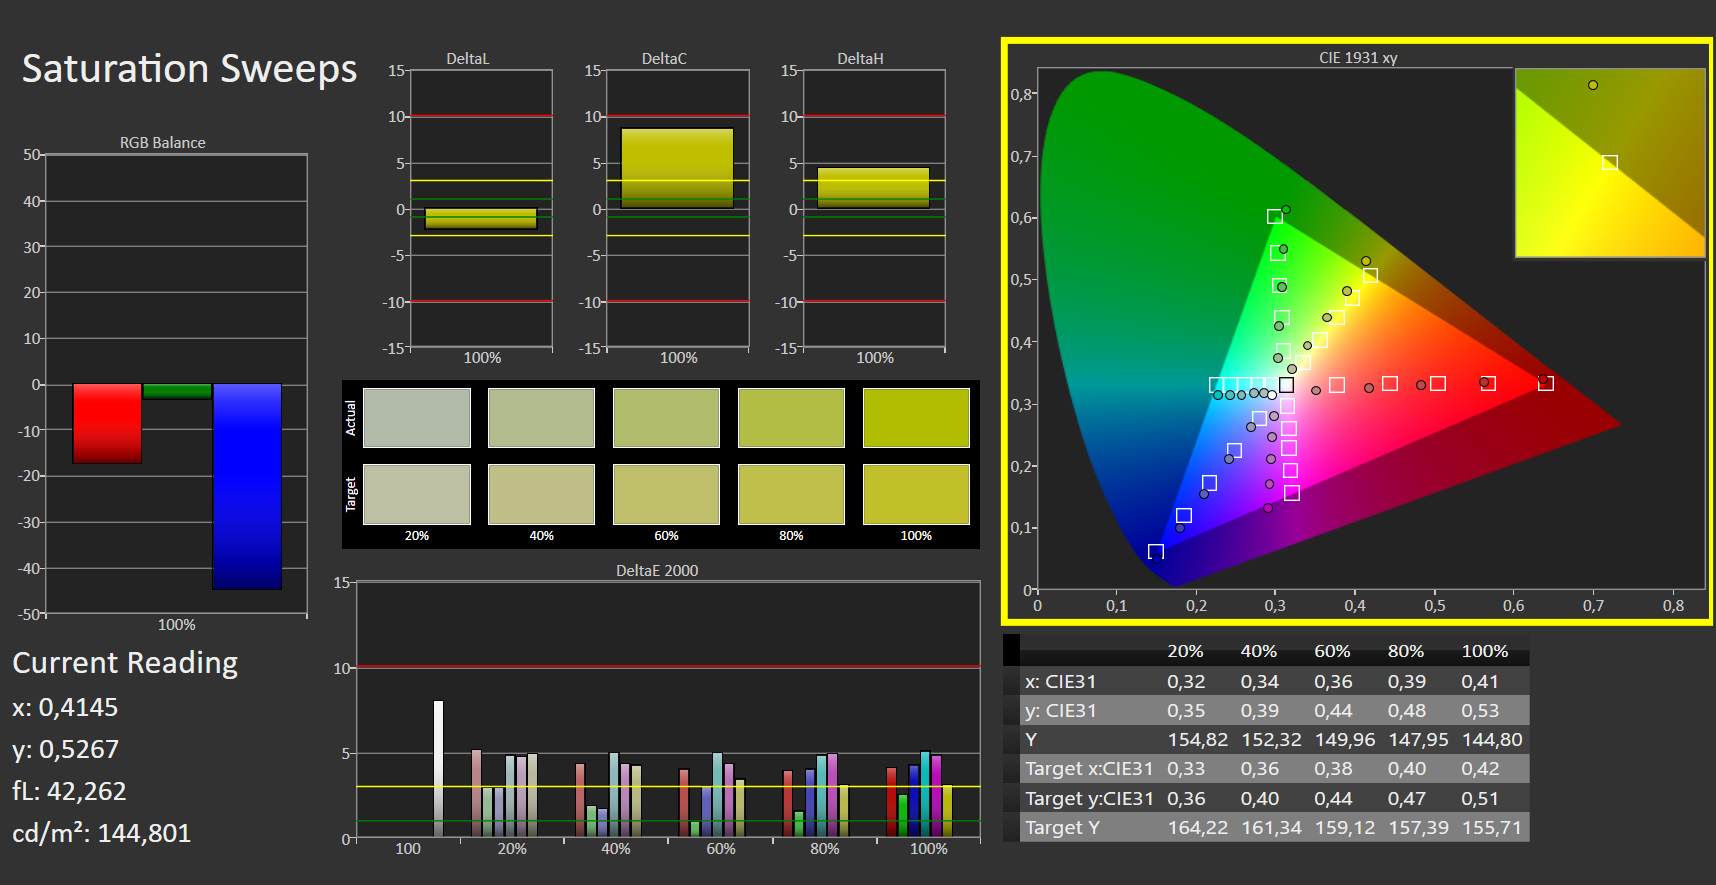
Enquanto o contraste (1.450:1) da tela de 15,6 polegadas (Full HD, IPS) é bom, a luminosidade (294,3 cd/m²) é quase aceitável. Consideramos que valores acima de 300 cd/m² são bons. O painel de 144 Hz utilizado oferece tempos de resposta rápidos e reprodução de cores decentes. Positivo: Não pudemos detectar nenhuma cintilação de PWM.
Este é o mesmo painel que foi usado no modelo anterior
. No entanto, os valores medidos diferem ligeiramente. Esta é uma condição normal. Dois displays idênticos nunca serão 100% consistentes.
| |||||||||||||||||||||||||
iluminação: 83 %
iluminação com acumulador: 254 cd/m²
Contraste: 1450:1 (Preto: 0.22 cd/m²)
ΔE ColorChecker Calman: 4.42 | ∀{0.5-29.43 Ø4.71}
ΔE Greyscale Calman: 4.84 | ∀{0.09-98 Ø4.96}
92% sRGB (Argyll 1.6.3 3D)
60% AdobeRGB 1998 (Argyll 1.6.3 3D)
66.3% AdobeRGB 1998 (Argyll 3D)
92.3% sRGB (Argyll 3D)
65.2% Display P3 (Argyll 3D)
Gamma: 2.39
CCT: 6850 K
| Acer Predator Helios 300 PH315-53-77N5 AU Optronics B156HAN08.2, IPS, 1920x1080, 15.6" | Acer Predator Helios 300 PH315-52-79TY AUO, B156HAN08.2, IPS, 1920x1080, 15.6" | Dell G5 15 SE 5505 P89F BOE NV156FH, WVA, 1920x1080, 15.6" | Aorus 5 KB LG Philips LP156WFG-SPB2 (LGD05E8), IPS, 1920x1080, 15.6" | Schenker XMG Core 15 GK5NR0O LM156LF-1F02, IPS, 1920x1080, 15.6" | Asus TUF Gaming A15 FA506IV-HN172 LM156LF-2F01, IPS, 1920x1080, 15.6" | |
|---|---|---|---|---|---|---|
| Display | -1% | -3% | -1% | 3% | -39% | |
| Display P3 Coverage (%) | 65.2 | 64.1 -2% | 63 -3% | 63.4 -3% | 67.2 3% | 38.92 -40% |
| sRGB Coverage (%) | 92.3 | 93 1% | 90.1 -2% | 92.8 1% | 95.9 4% | 58.5 -37% |
| AdobeRGB 1998 Coverage (%) | 66.3 | 65.7 -1% | 64.1 -3% | 64.8 -2% | 68.5 3% | 40.22 -39% |
| Response Times | 15% | -9% | 7% | 29% | -109% | |
| Response Time Grey 50% / Grey 80% * (ms) | 17 ? | 15 ? 12% | 20.4 ? -20% | 14.4 ? 15% | 9.6 ? 44% | 34 ? -100% |
| Response Time Black / White * (ms) | 11 ? | 9 ? 18% | 10.8 ? 2% | 11.2 ? -2% | 9.6 ? 13% | 24 ? -118% |
| PWM Frequency (Hz) | 198.4 ? | |||||
| Screen | -2% | 0% | 10% | -13% | -17% | |
| Brightness middle (cd/m²) | 319 | 325 2% | 292 -8% | 318 0% | 312 -2% | 280 -12% |
| Brightness (cd/m²) | 294 | 310 5% | 290 -1% | 298 1% | 290 -1% | 254 -14% |
| Brightness Distribution (%) | 83 | 82 -1% | 77 -7% | 87 5% | 87 5% | 88 6% |
| Black Level * (cd/m²) | 0.22 | 0.255 -16% | 0.27 -23% | 0.3 -36% | 0.2 9% | 0.15 32% |
| Contrast (:1) | 1450 | 1275 -12% | 1081 -25% | 1060 -27% | 1560 8% | 1867 29% |
| Colorchecker dE 2000 * | 4.42 | 4.28 3% | 3.99 10% | 2.49 44% | 4.84 -10% | 5.89 -33% |
| Colorchecker dE 2000 max. * | 8.54 | 8.42 1% | 6.11 28% | 5.06 41% | 13.85 -62% | 19 -122% |
| Greyscale dE 2000 * | 4.84 | 5.01 -4% | 3.3 32% | 1.6 67% | 9 -86% | 4.08 16% |
| Gamma | 2.39 92% | 2.6 85% | 2.25 98% | 2.211 100% | 2.105 105% | 2.33 94% |
| CCT | 6850 95% | 7678 85% | 7047 92% | 6714 97% | 8099 80% | 7303 89% |
| Color Space (Percent of AdobeRGB 1998) (%) | 60 | 60 0% | 58.1 -3% | 65 8% | 68 13% | 37 -38% |
| Color Space (Percent of sRGB) (%) | 92 | 93 1% | 89.7 -2% | 89 -3% | 92 0% | 58 -37% |
| Colorchecker dE 2000 calibrated * | 1.45 | 3.02 | 1.53 | 1.77 | 4.79 | |
| Média Total (Programa/Configurações) | 4% /
0% | -4% /
-2% | 5% /
7% | 6% /
-4% | -55% /
-34% |
* ... menor é melhor
Exibir tempos de resposta
| ↔ Tempo de resposta preto para branco | ||
|---|---|---|
| 11 ms ... ascensão ↗ e queda ↘ combinadas | ↗ 6 ms ascensão | 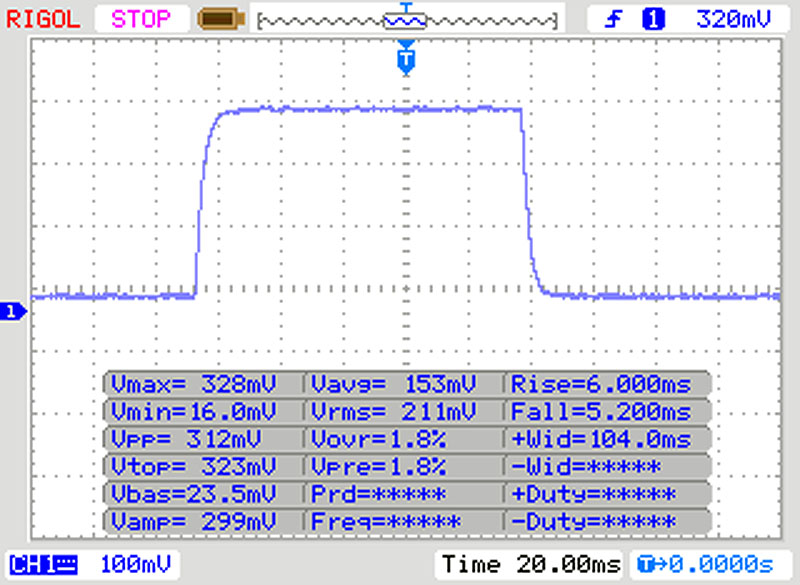 |
| ↘ 5 ms queda | ||
| A tela mostra boas taxas de resposta em nossos testes, mas pode ser muito lenta para jogadores competitivos. Em comparação, todos os dispositivos testados variam de 0.1 (mínimo) a 240 (máximo) ms. » 30 % de todos os dispositivos são melhores. Isso significa que o tempo de resposta medido é melhor que a média de todos os dispositivos testados (19.8 ms). | ||
| ↔ Tempo de resposta 50% cinza a 80% cinza | ||
| 17 ms ... ascensão ↗ e queda ↘ combinadas | ↗ 9 ms ascensão | 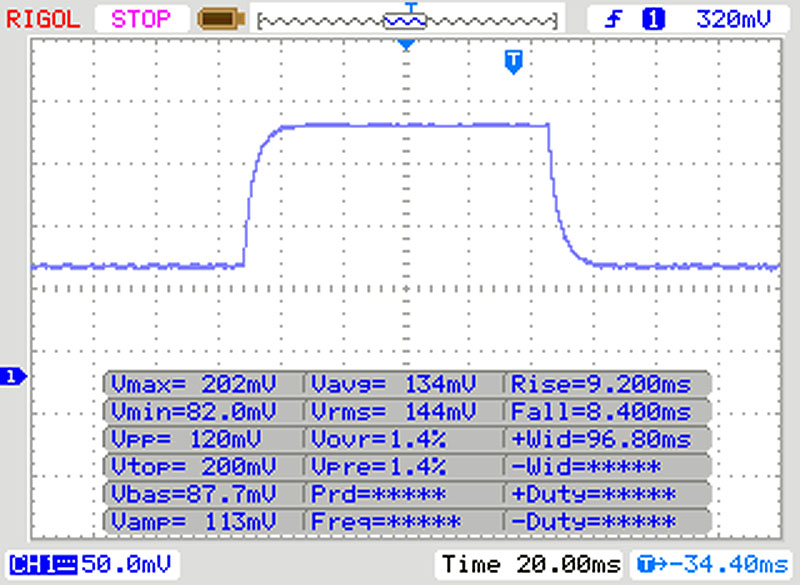 |
| ↘ 8 ms queda | ||
| A tela mostra boas taxas de resposta em nossos testes, mas pode ser muito lenta para jogadores competitivos. Em comparação, todos os dispositivos testados variam de 0.165 (mínimo) a 636 (máximo) ms. » 31 % de todos os dispositivos são melhores. Isso significa que o tempo de resposta medido é melhor que a média de todos os dispositivos testados (31 ms). | ||
Cintilação da tela / PWM (modulação por largura de pulso)
| Tela tremeluzindo / PWM não detectado |  | ||
[pwm_comparison] Em comparação: 52 % de todos os dispositivos testados não usam PWM para escurecer a tela. Se PWM foi detectado, uma média de 7754 (mínimo: 5 - máximo: 343500) Hz foi medida. | |||
Desempenho - Predador com overclocking automático de GPU
Com o Predator Helios 300, a Acer tem um laptop para jogos de 15,6 polegadas em sua linha de produtos, o que traz todo jogo moderno para a tela com suavidade. O preço de nosso dispositivo de teste deve ser aproximadamente entre 1.500 e 1.600 Euros (~$1.744 e ~$1.860). Outras variantes de configuração estão disponíveis. Os preços começam em torno de 1.020 Euros (~$1.186).
Condições de teste
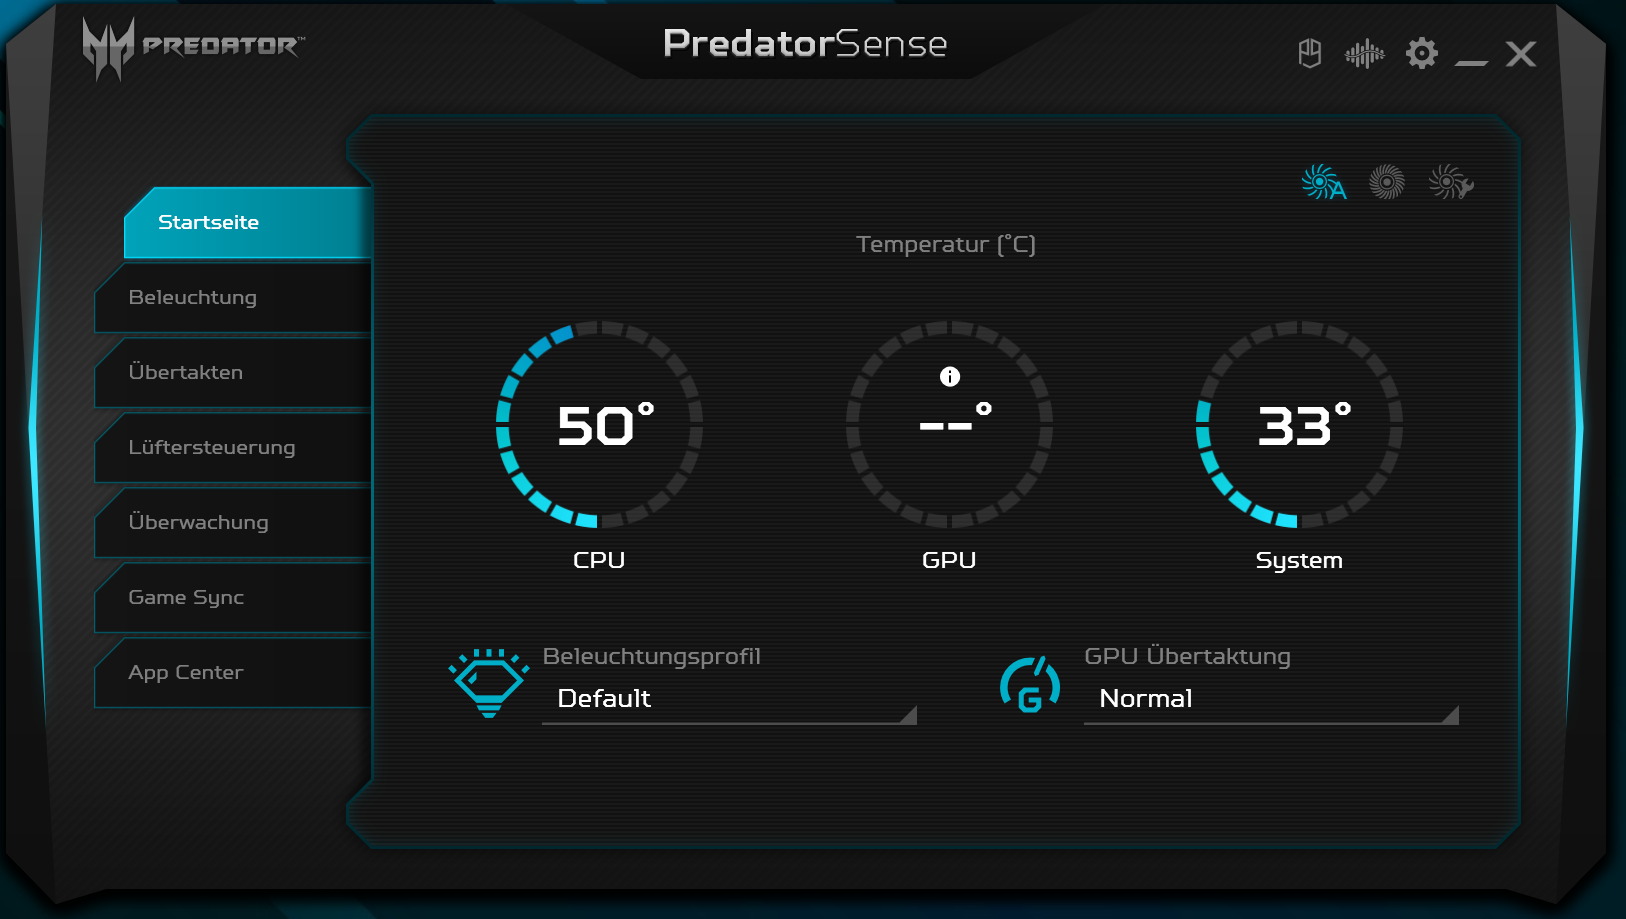
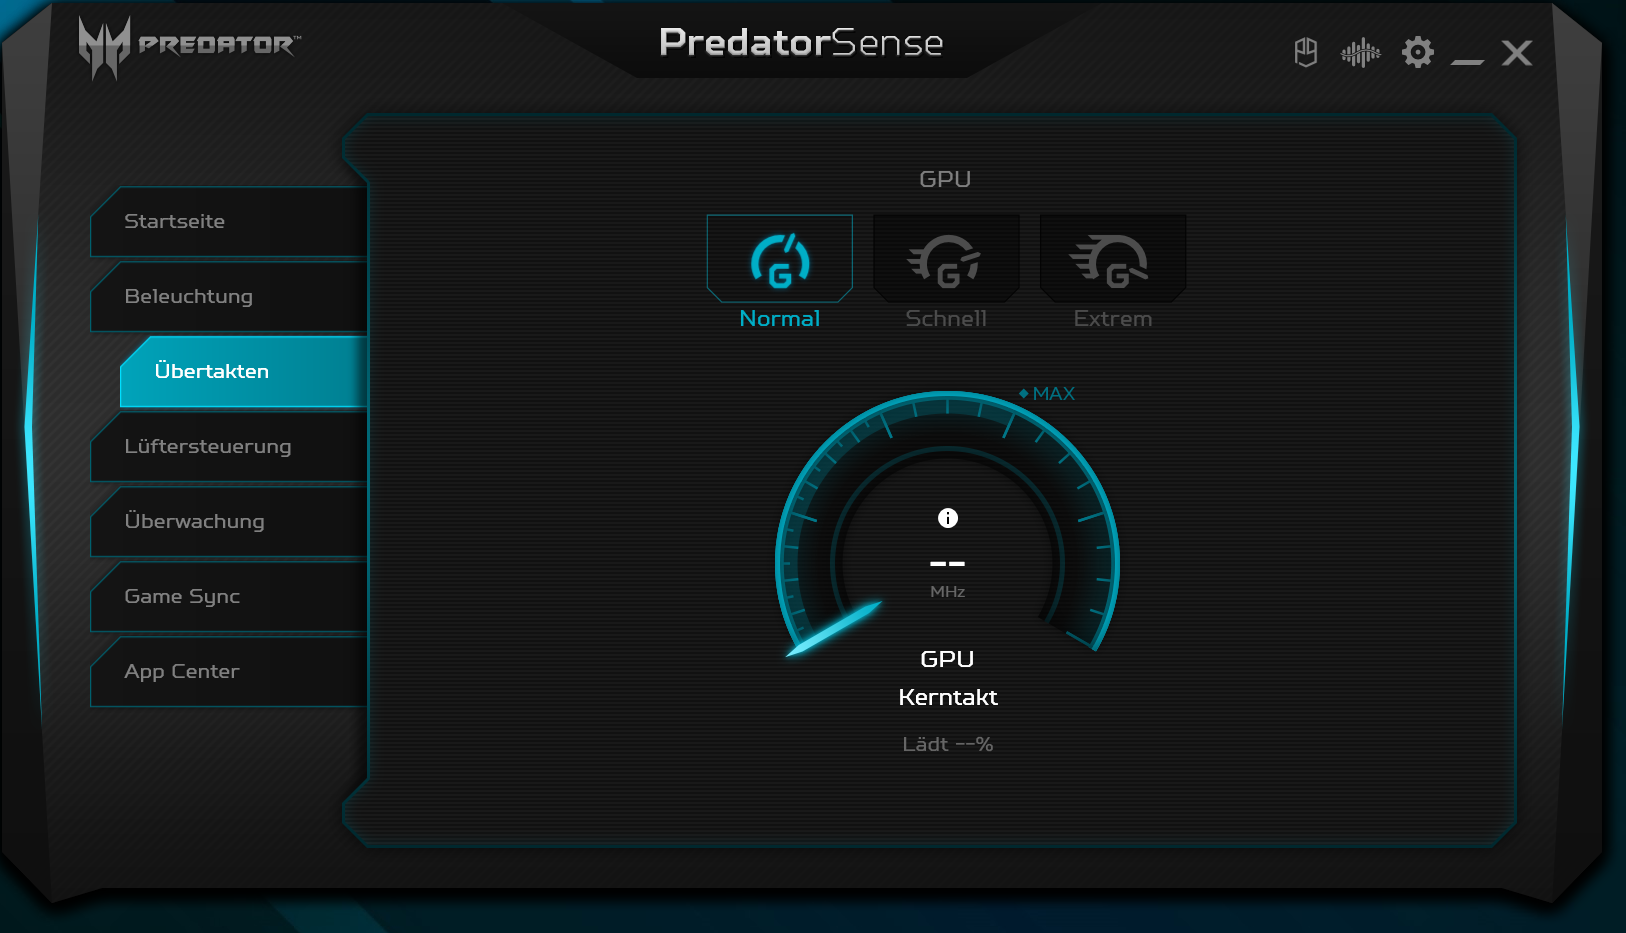
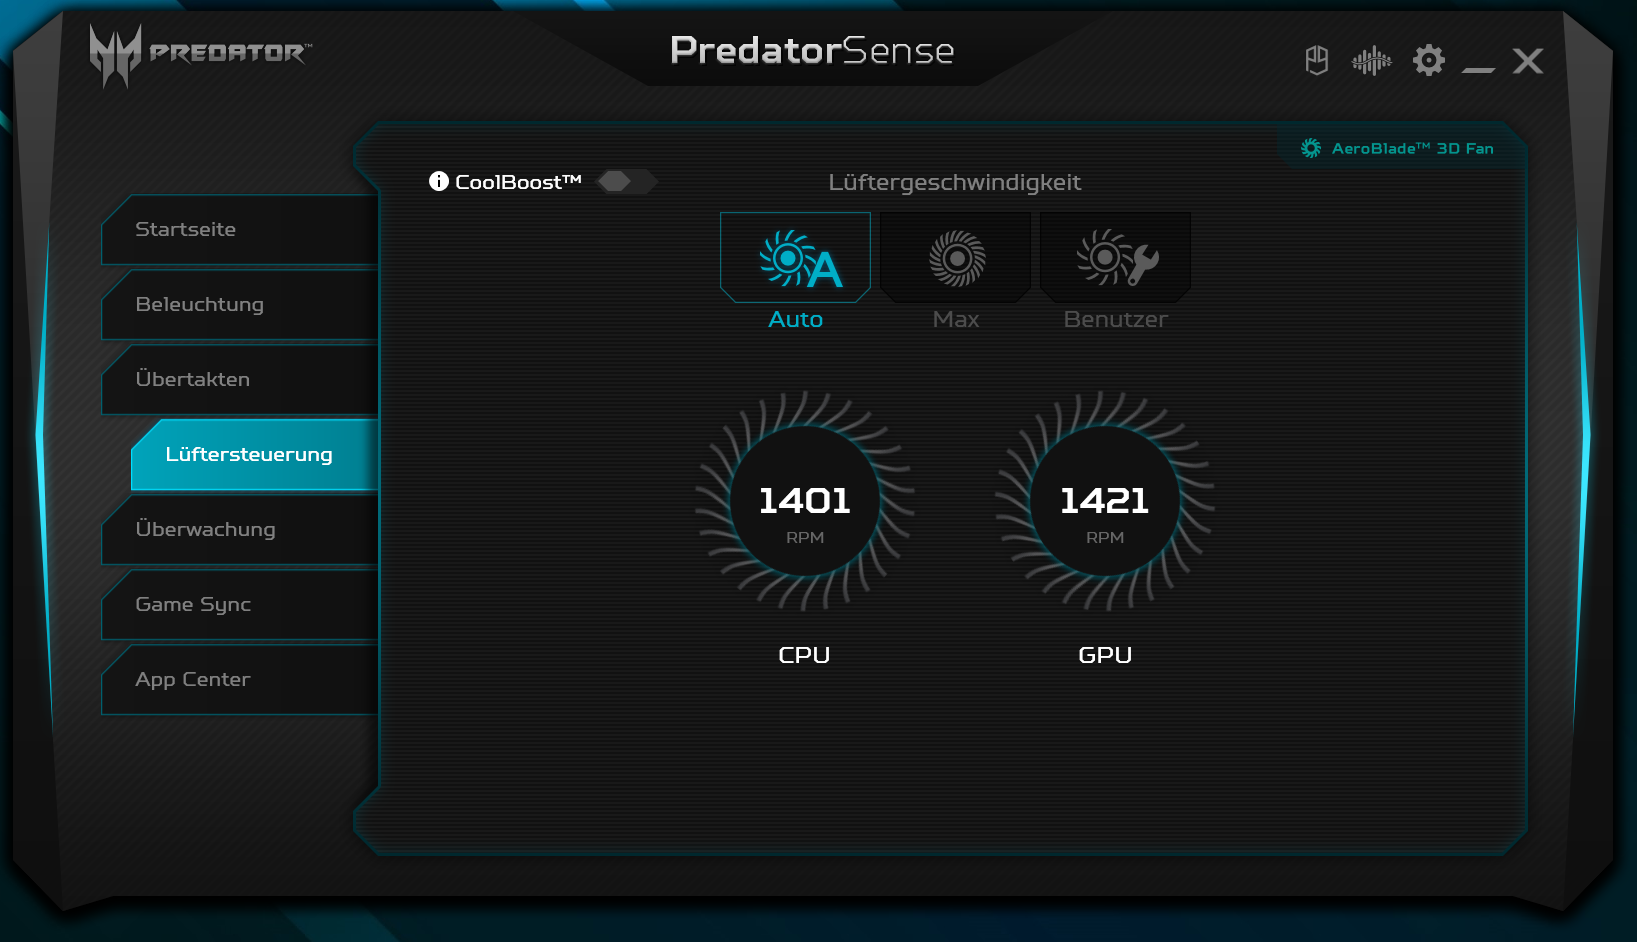
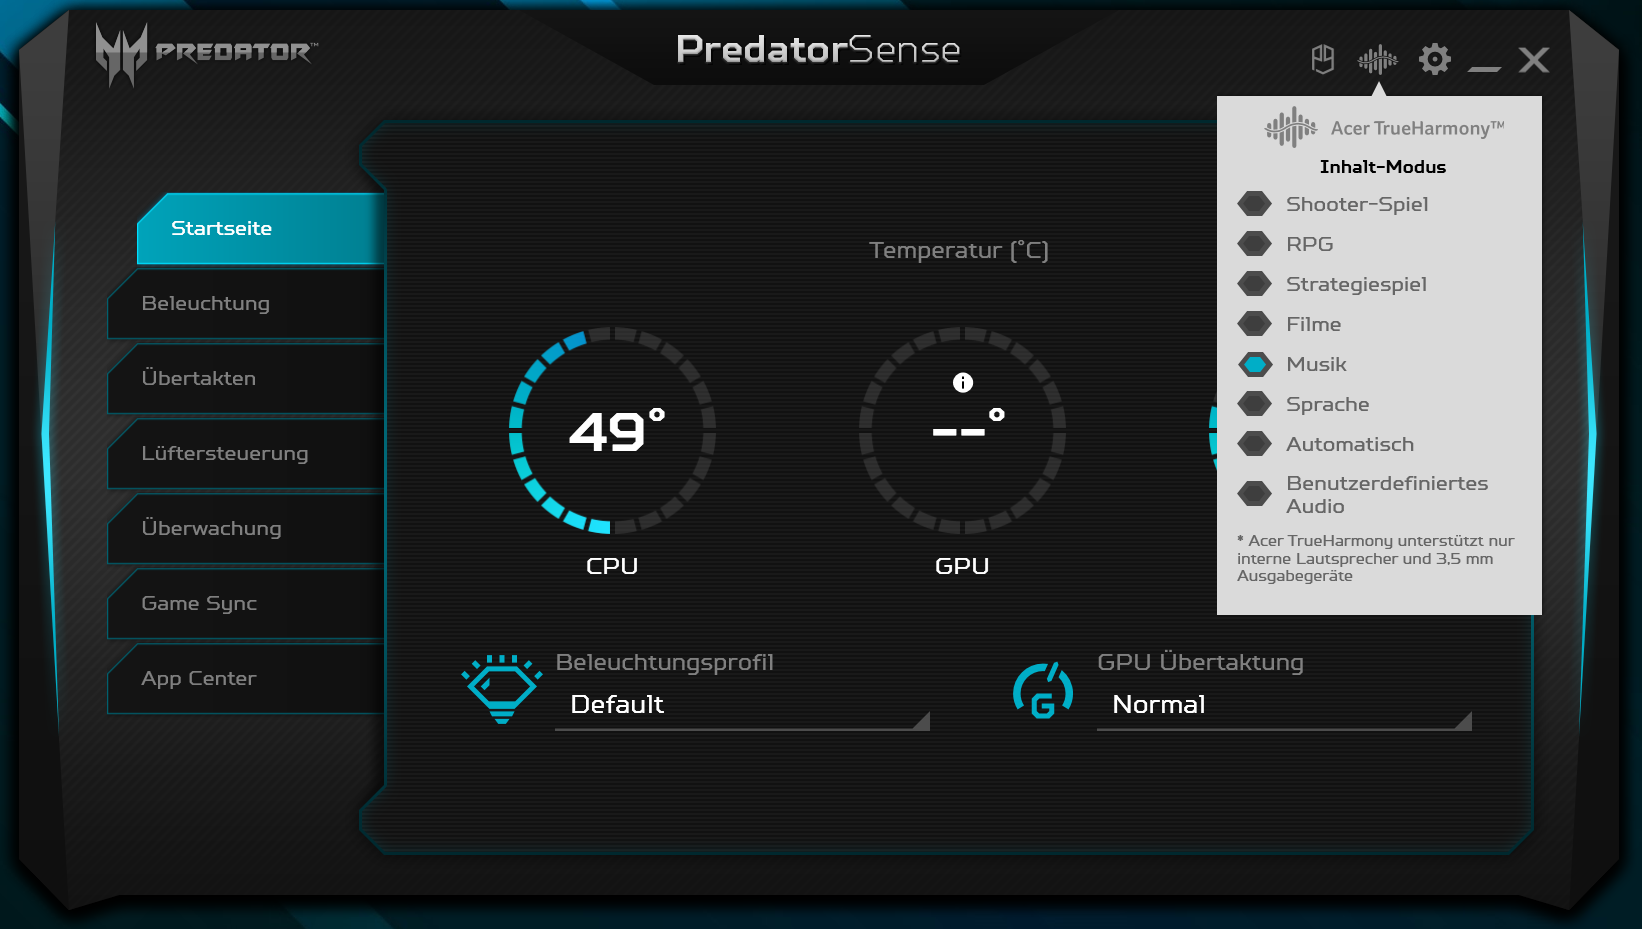
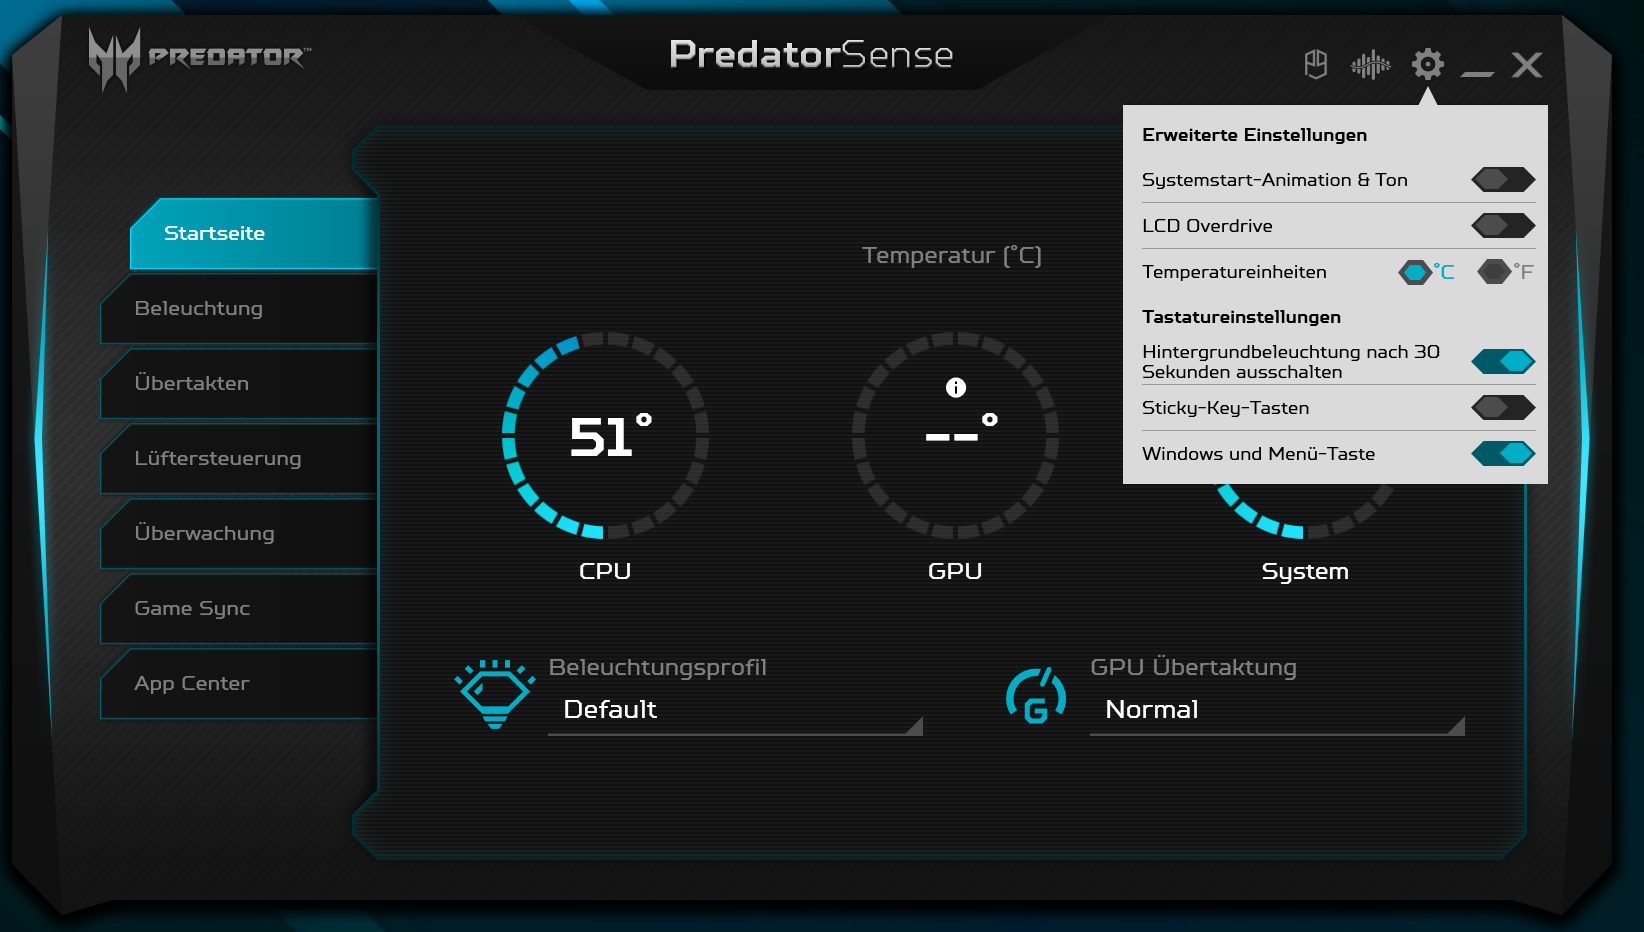
O software Predator Sense pré-instalado permite o ajuste do controle do ventilador e o overclocking automático da GPU. Os perfis da GPU "Normal", "Rápido" e "Extremo" estão disponíveis. Realizamos nosso teste com controle automático do ventilador e sob o perfil "Normal" da GPU. Alguns benchmarks foram executados adicionalmente sob o perfil "Extremo"
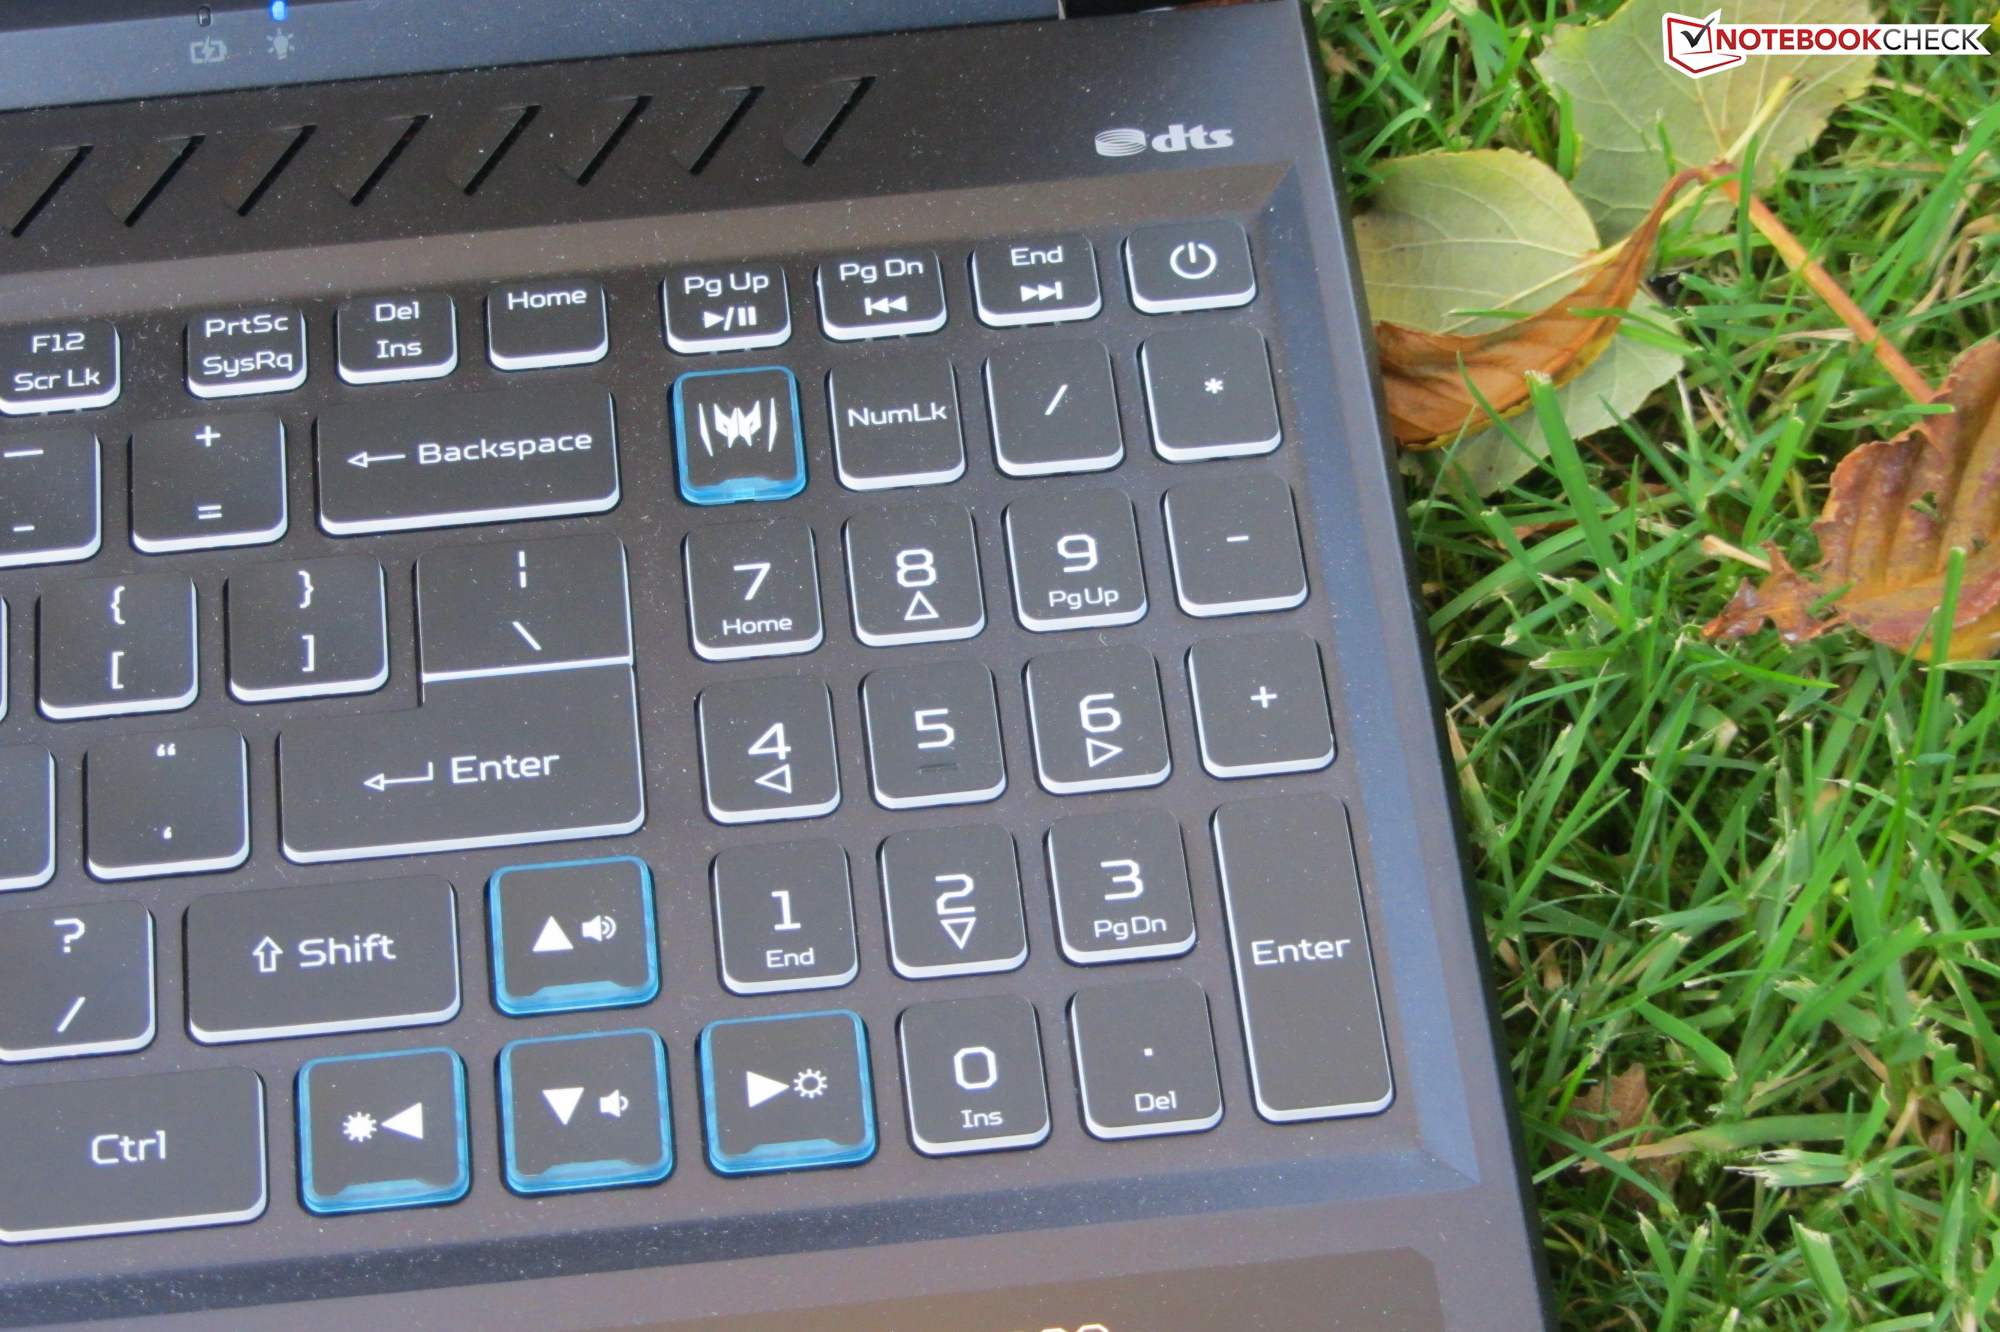
A Acer colocou uma tecla "Turbo" acima do teclado. Se este botão for pressionado, os ventiladores funcionam permanentemente em potência máxima, e o perfil "Extremo" da GPU é ativado.
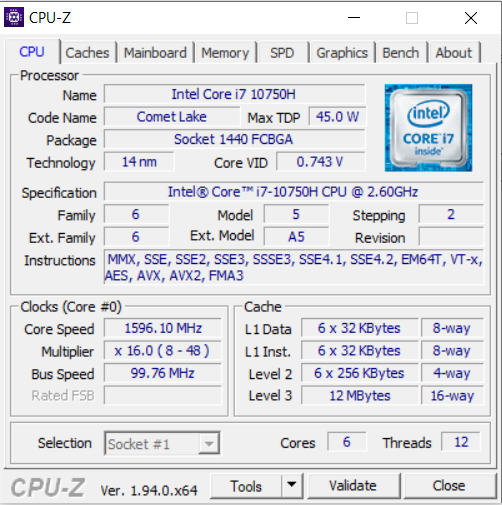
Processador
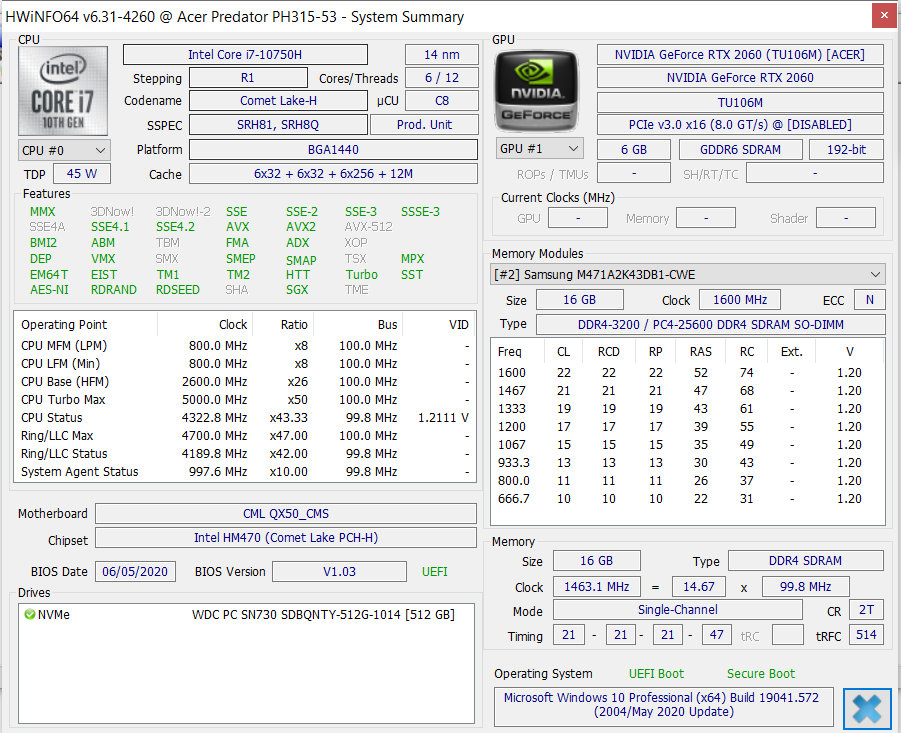
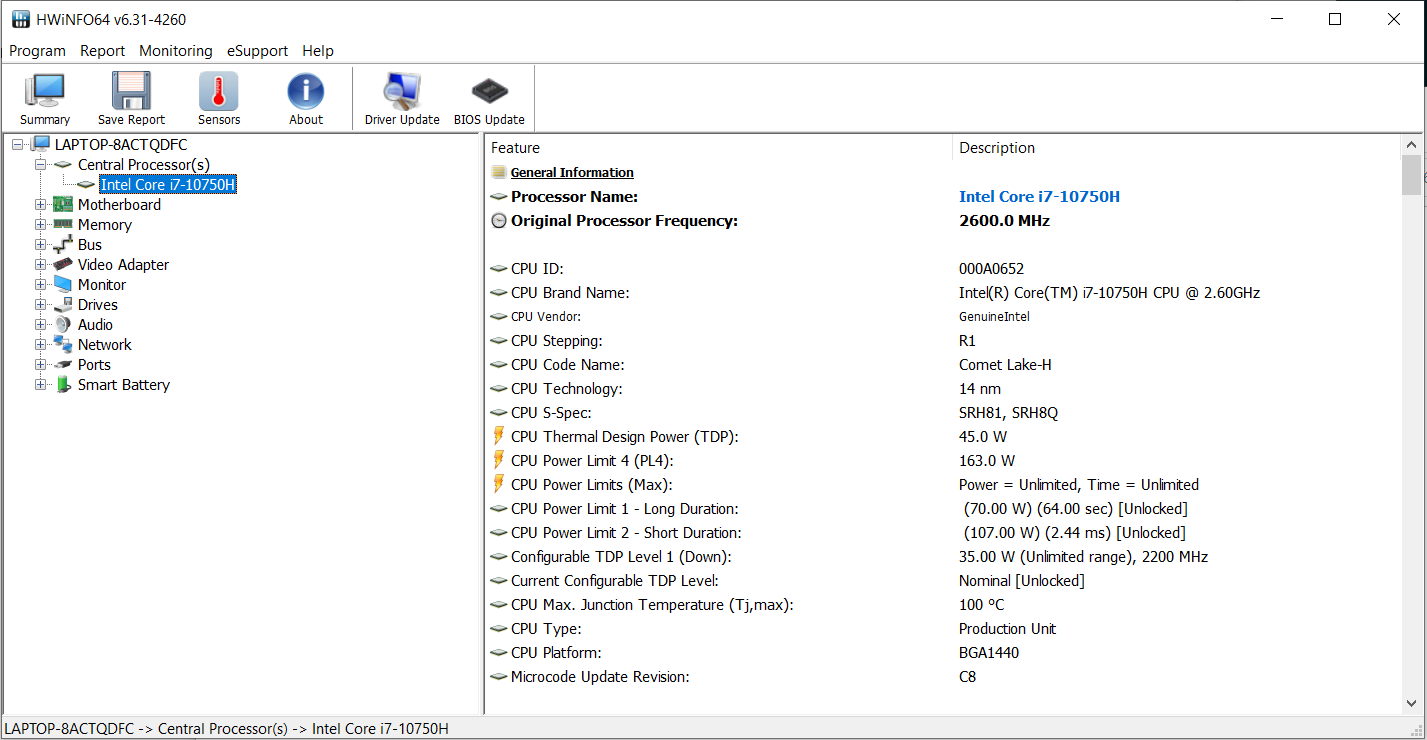
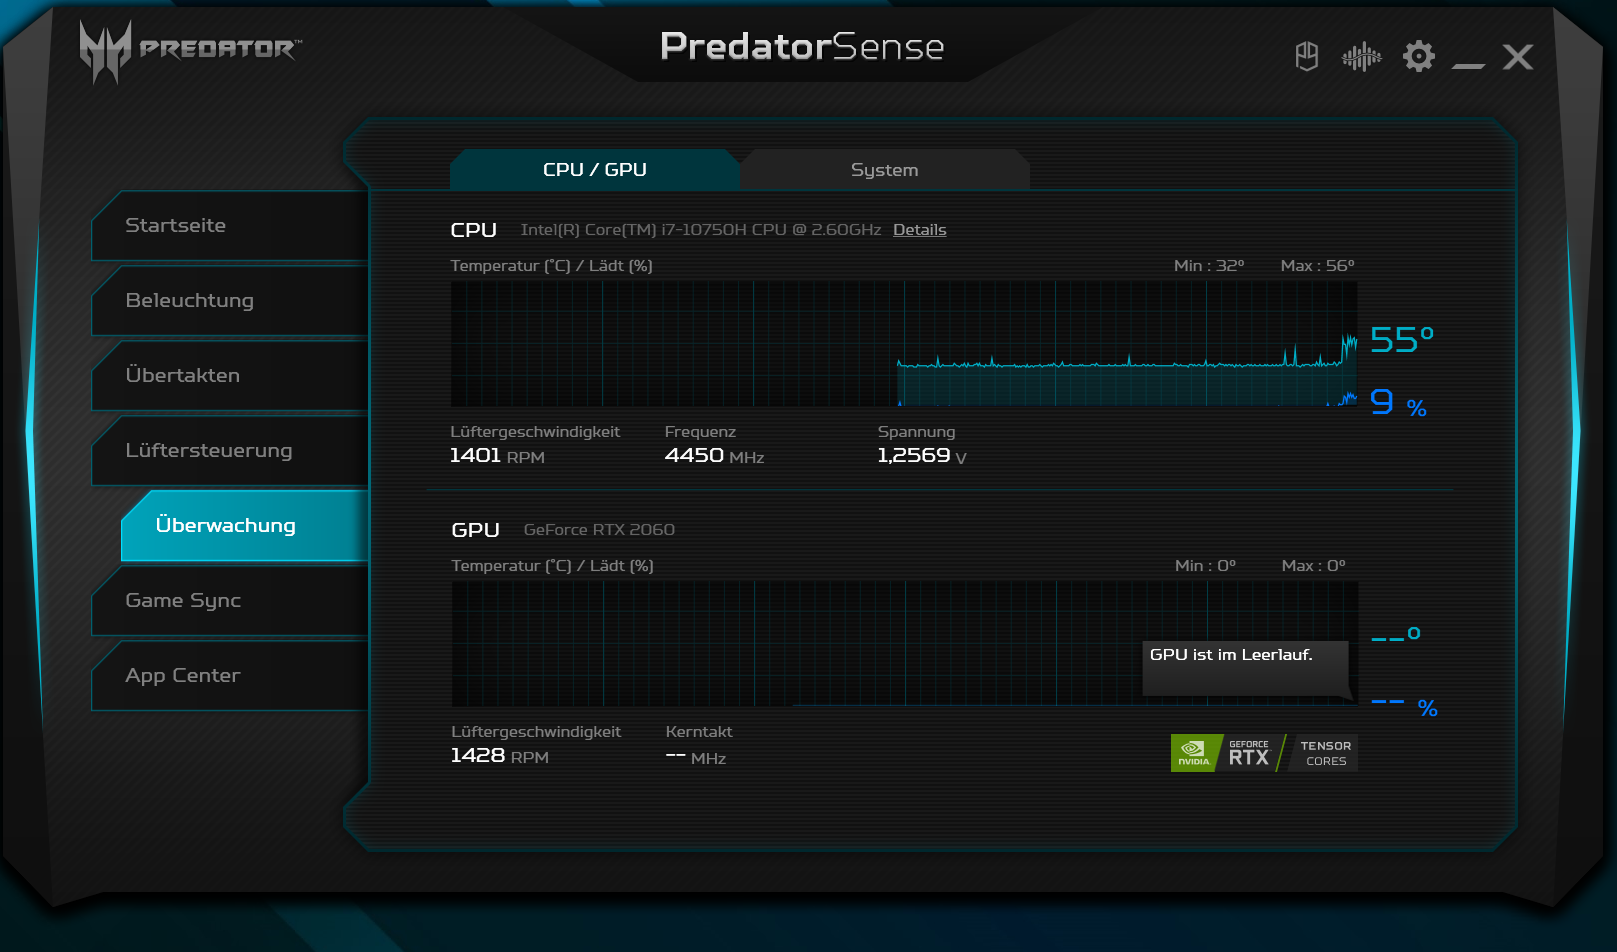
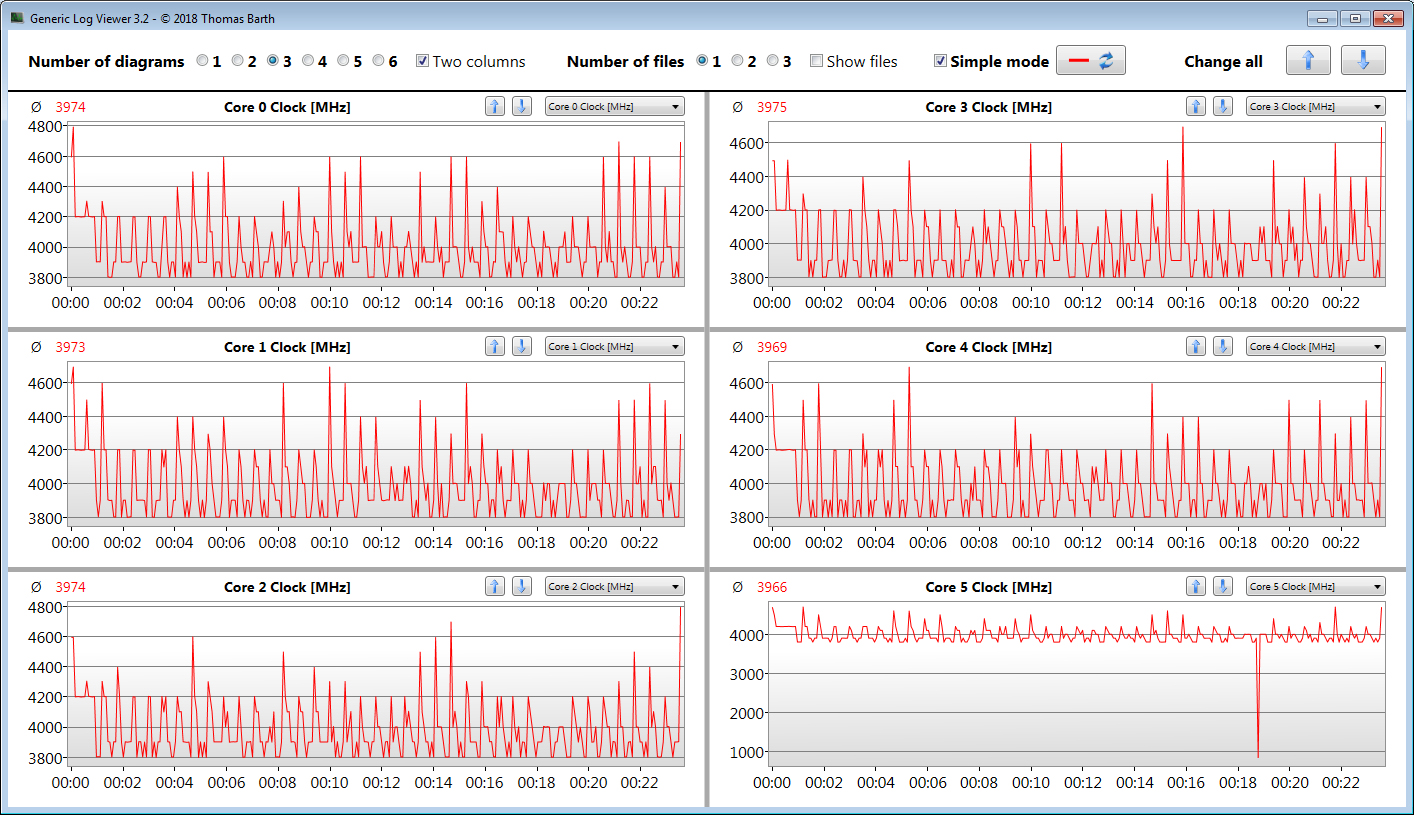
ONúcleo i7-10750H processador hexa-core (Comet Lake) opera a uma velocidade de base de 2,6 GHz. A velocidade do relógio pode ser aumentada para 4,3 GHz (seis núcleos) ou 5 GHz (um núcleo) via Turbo. O Hyper-Threading (dois fios por núcleo) é suportado
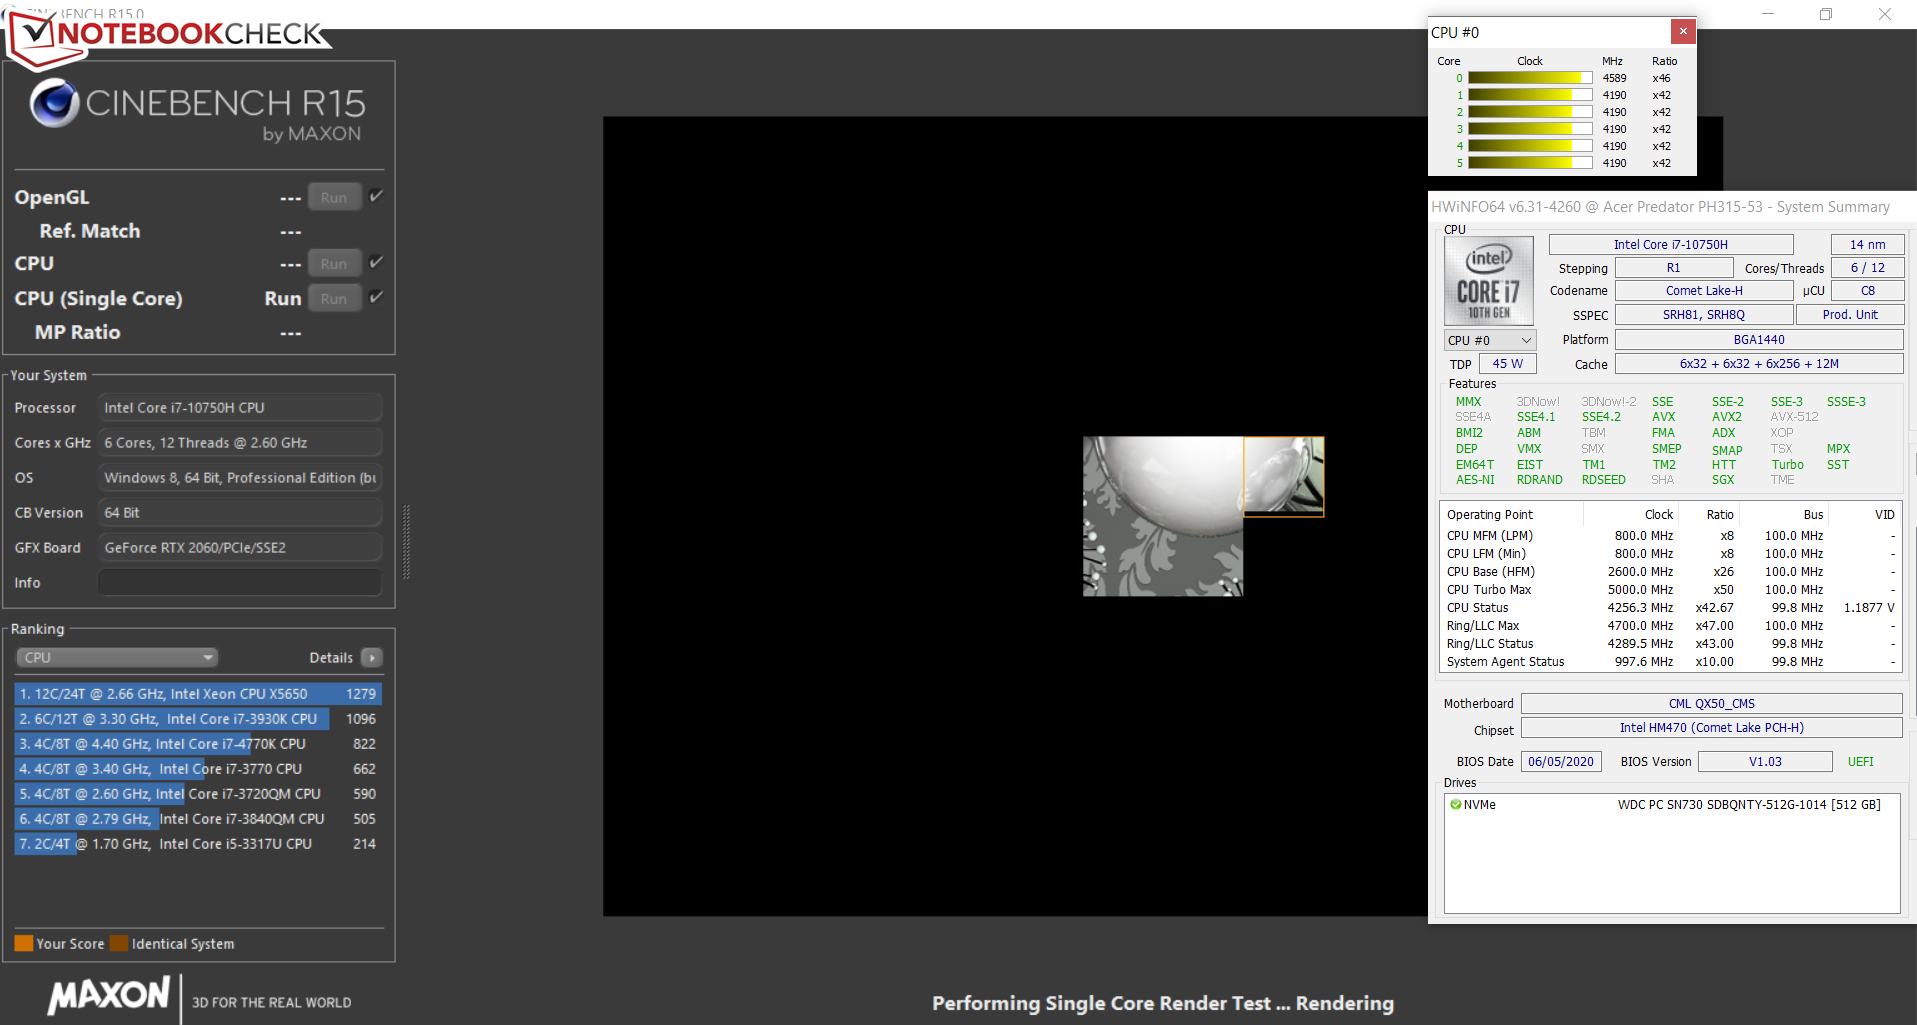
O processador trabalha através dos testes de CPU do benchmark Cinebench R15 em 4,2 GHz (multithread) e 4,2 a 5 GHz (single-thread), respectivamente. Na potência da bateria, as taxas de relógio são de 2,4 a 2,6 GHz (multifios) e 2,4 a 3,2 GHz (mono-fios), respectivamente.
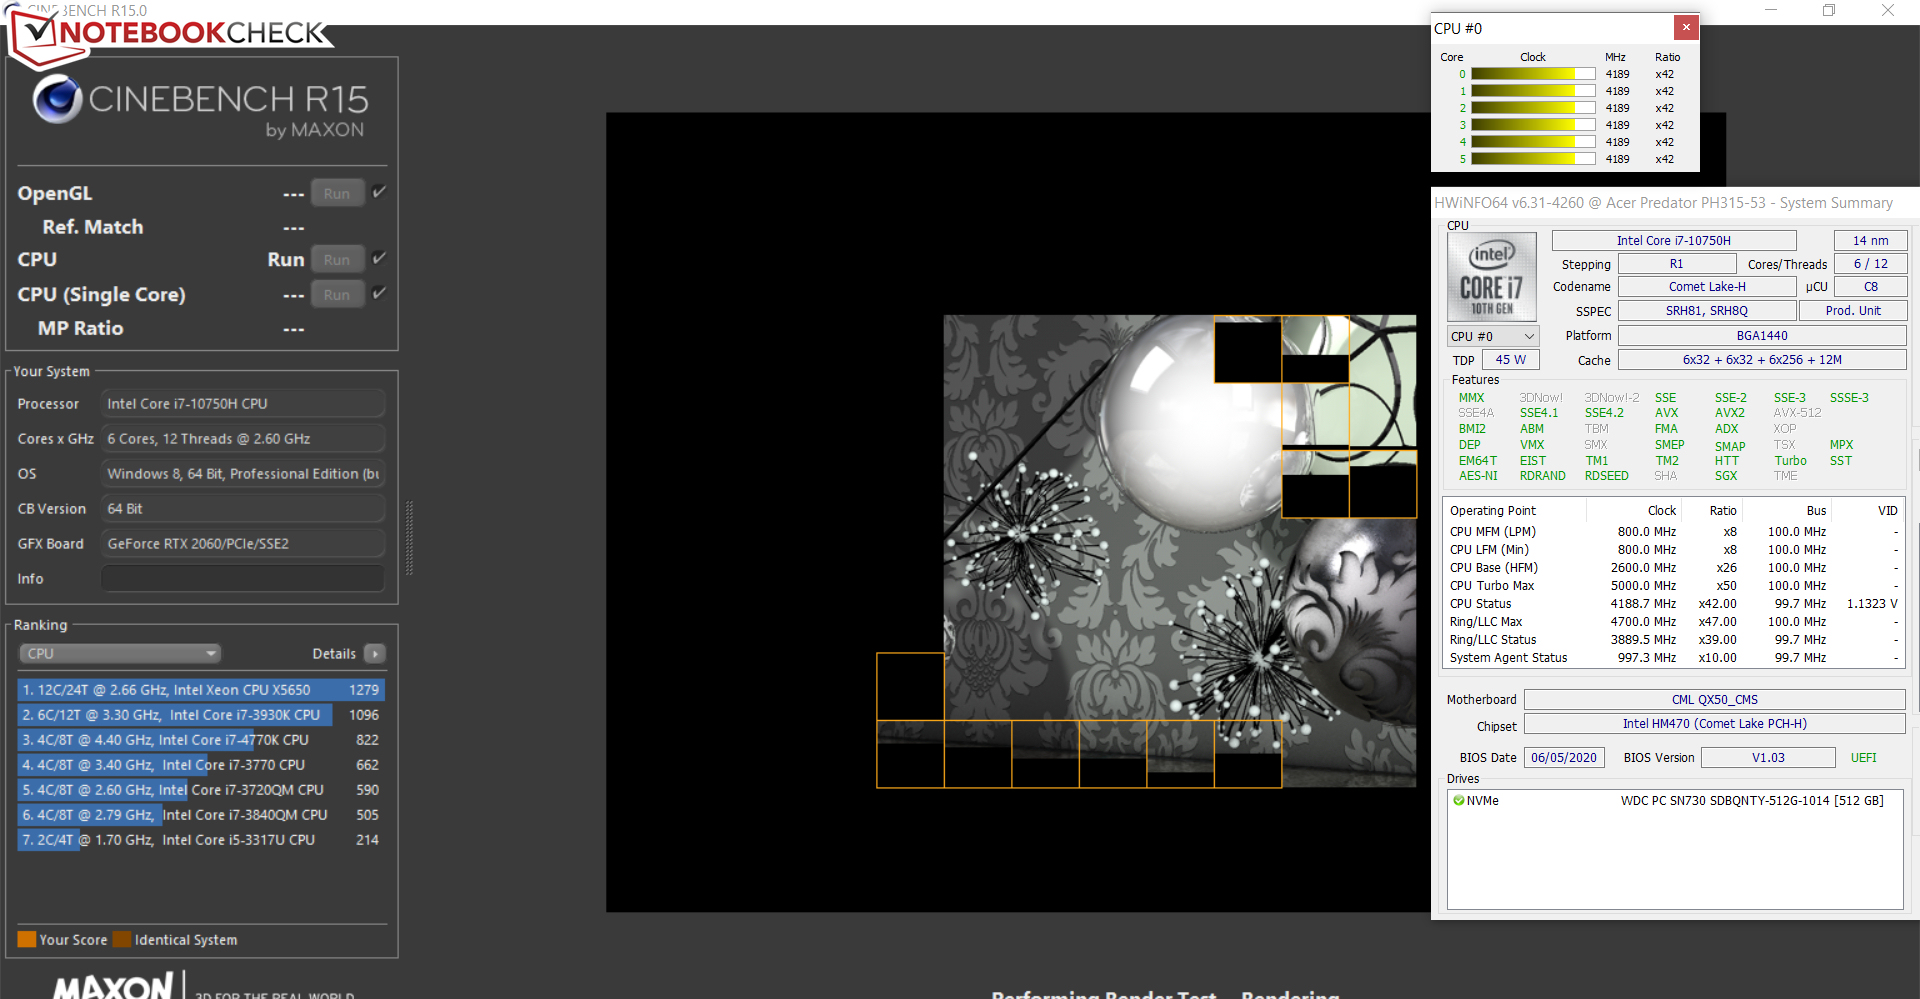
Verificamos se a CPU Turbo é utilizada de forma consistente quando conectada, executando o teste multithread do benchmark Cinebench R15 em um loop contínuo por pelo menos 30 minutos. O Turbo é usado em grande parte
| HWBOT x265 Benchmark v2.2 - 4k Preset | |
| Média da turma Gaming (11.5 - 44.4, n=105, últimos 2 anos) | |
| HP Pavilion Gaming 15-ec1177ng | |
| Dell G5 15 SE 5505 P89F | |
| Schenker XMG Core 15 GK5NR0O | |
| MSI Bravo 15 A4DCR | |
| Asus TUF Gaming A15 FA506IV-HN172 | |
| Acer Predator Helios 300 PH315-53-77N5 | |
| Média Intel Core i7-10750H (5.54 - 11.6, n=43) | |
| Aorus 5 KB | |
| Acer Predator Helios 300 PH315-52-79TY | |
| LibreOffice - 20 Documents To PDF | |
| MSI Bravo 15 A4DCR | |
| Dell G5 15 SE 5505 P89F | |
| HP Pavilion Gaming 15-ec1177ng | |
| Schenker XMG Core 15 GK5NR0O | |
| Acer Predator Helios 300 PH315-53-77N5 | |
| Média Intel Core i7-10750H (43.1 - 99.2, n=43) | |
| Média da turma Gaming (33.2 - 88.8, n=105, últimos 2 anos) | |
| Aorus 5 KB | |
| Asus TUF Gaming A15 FA506IV-HN172 | |
| R Benchmark 2.5 - Overall mean | |
| Média Intel Core i7-10750H (0.578 - 0.708, n=42) | |
| Asus TUF Gaming A15 FA506IV-HN172 | |
| Aorus 5 KB | |
| Acer Predator Helios 300 PH315-53-77N5 | |
| MSI Bravo 15 A4DCR | |
| Schenker XMG Core 15 GK5NR0O | |
| Dell G5 15 SE 5505 P89F | |
| HP Pavilion Gaming 15-ec1177ng | |
| Média da turma Gaming (0.3439 - 0.759, n=106, últimos 2 anos) | |
* ... menor é melhor
Desempenho do sistema
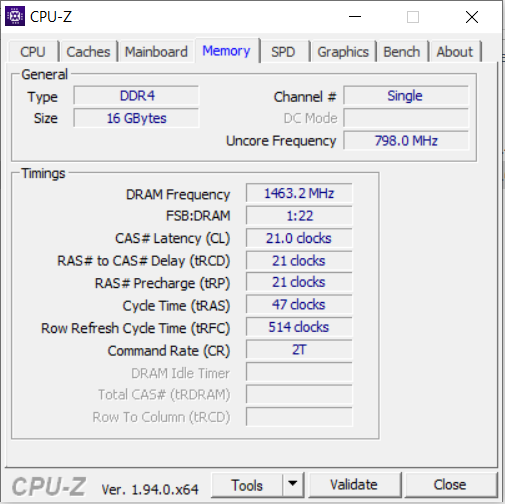
O sistema é rápido e suave. Os resultados do PCMark são bons. O laptop oferece poder de computação suficiente para aplicações que exigem desempenho, tais como jogos, edição de vídeo e processamento de imagens para os próximos anos. Um ligeiro aumento no desempenho poderia ser alcançado ativando o modo de canal duplo. Para este fim, o laptop teria que ser equipado com um segundo módulo de memória.
| PCMark 8 Home Score Accelerated v2 | 4160 pontos | |
| PCMark 8 Creative Score Accelerated v2 | 5899 pontos | |
| PCMark 8 Work Score Accelerated v2 | 5405 pontos | |
| PCMark 10 Score | 5921 pontos | |
Ajuda | ||
Latências DPC
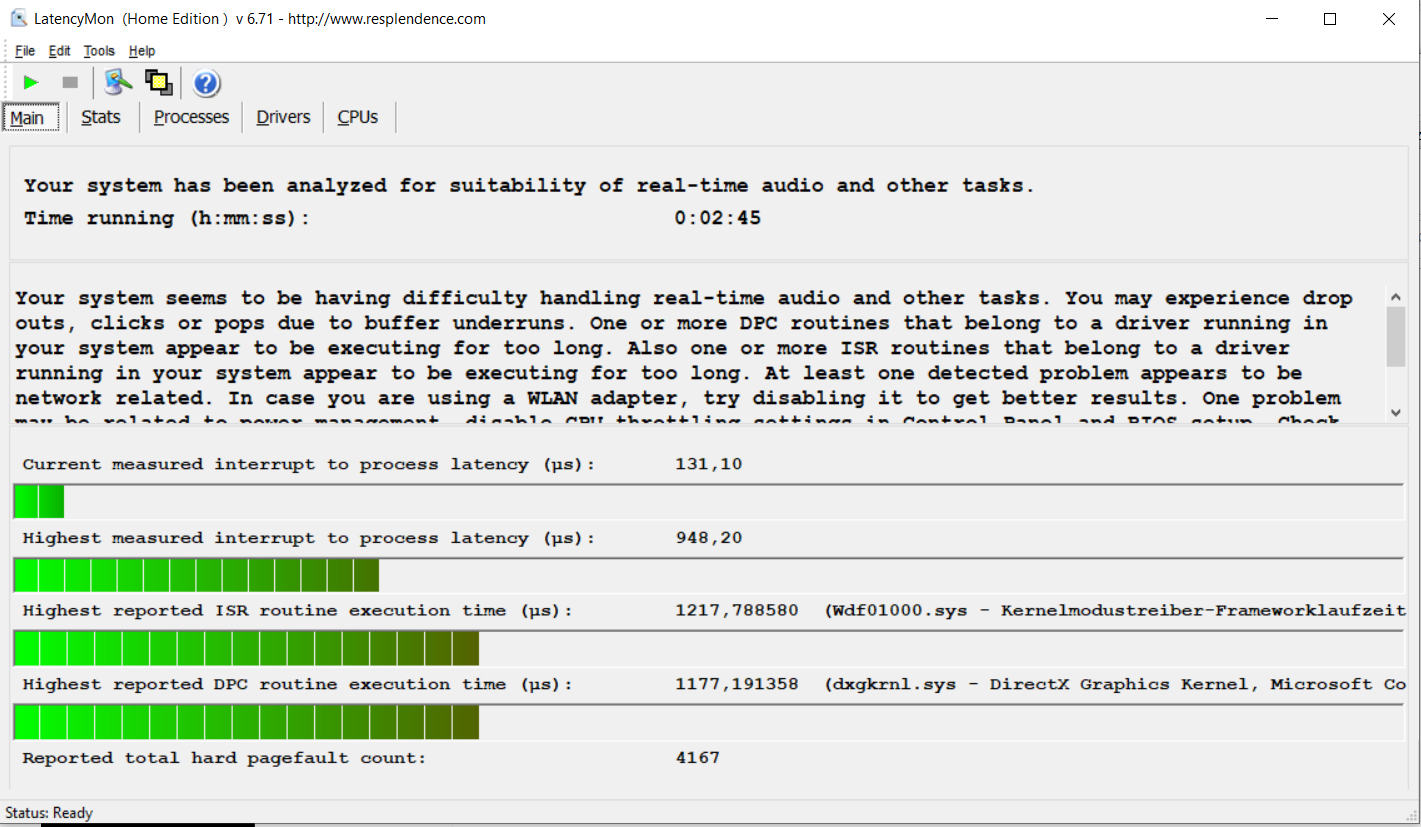
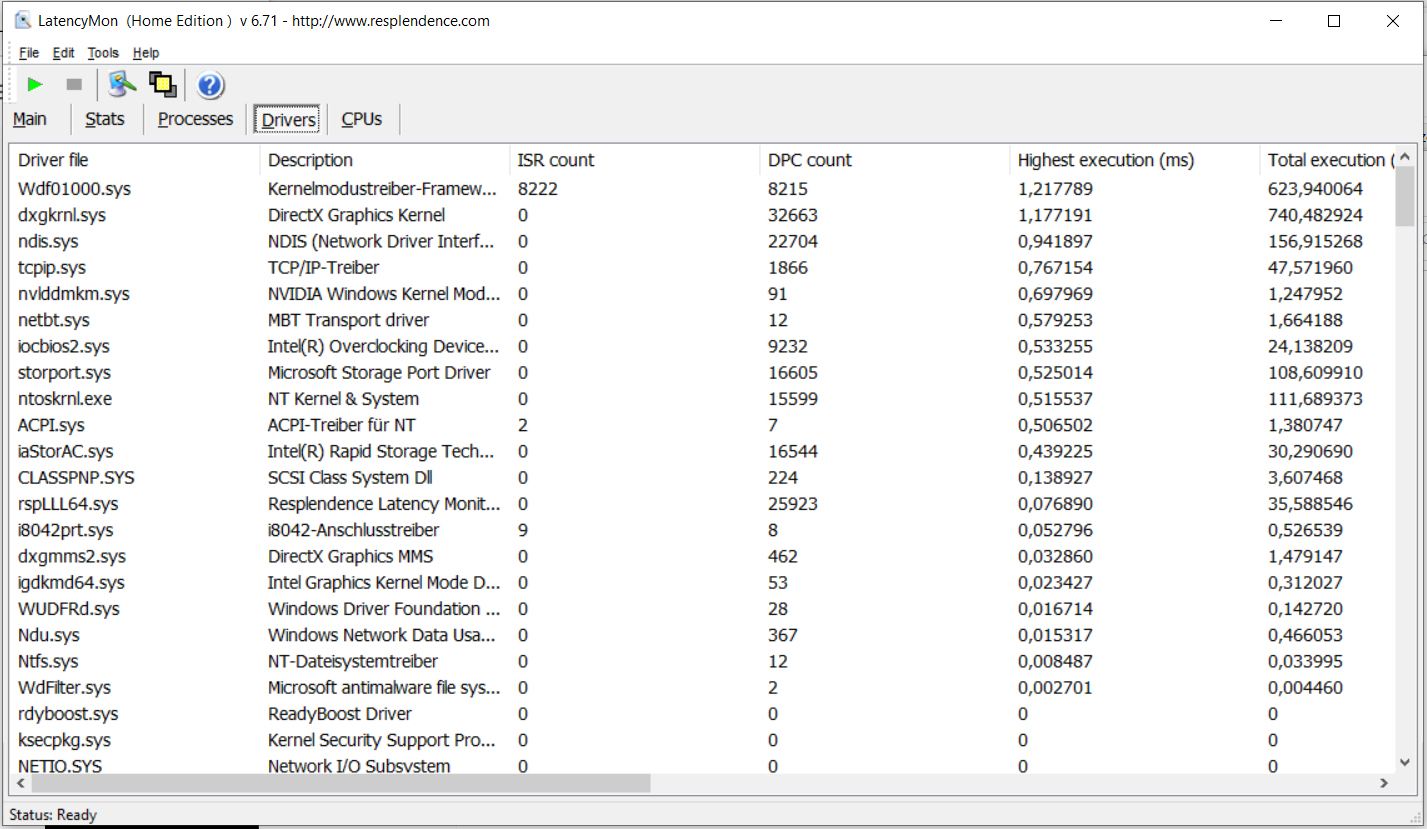
Em nosso teste de monitor de latência padronizado (navegação na web, reprodução de vídeo 4K, Prime95 de alta carga), pudemos observar problemas com as latências DPC. O sistema não parece ser adequado para edição de vídeo e áudio em tempo real
| DPC Latencies / LatencyMon - interrupt to process latency (max), Web, Youtube, Prime95 | |
| Dell G5 15 SE 5505 P89F | |
| Schenker XMG Core 15 GK5NR0O | |
| MSI Bravo 15 A4DCR | |
| Aorus 5 KB | |
| Acer Predator Helios 300 PH315-53-77N5 | |
| Asus TUF Gaming A15 FA506IV-HN172 | |
| HP Pavilion Gaming 15-ec1177ng | |
* ... menor é melhor
Armazenamento
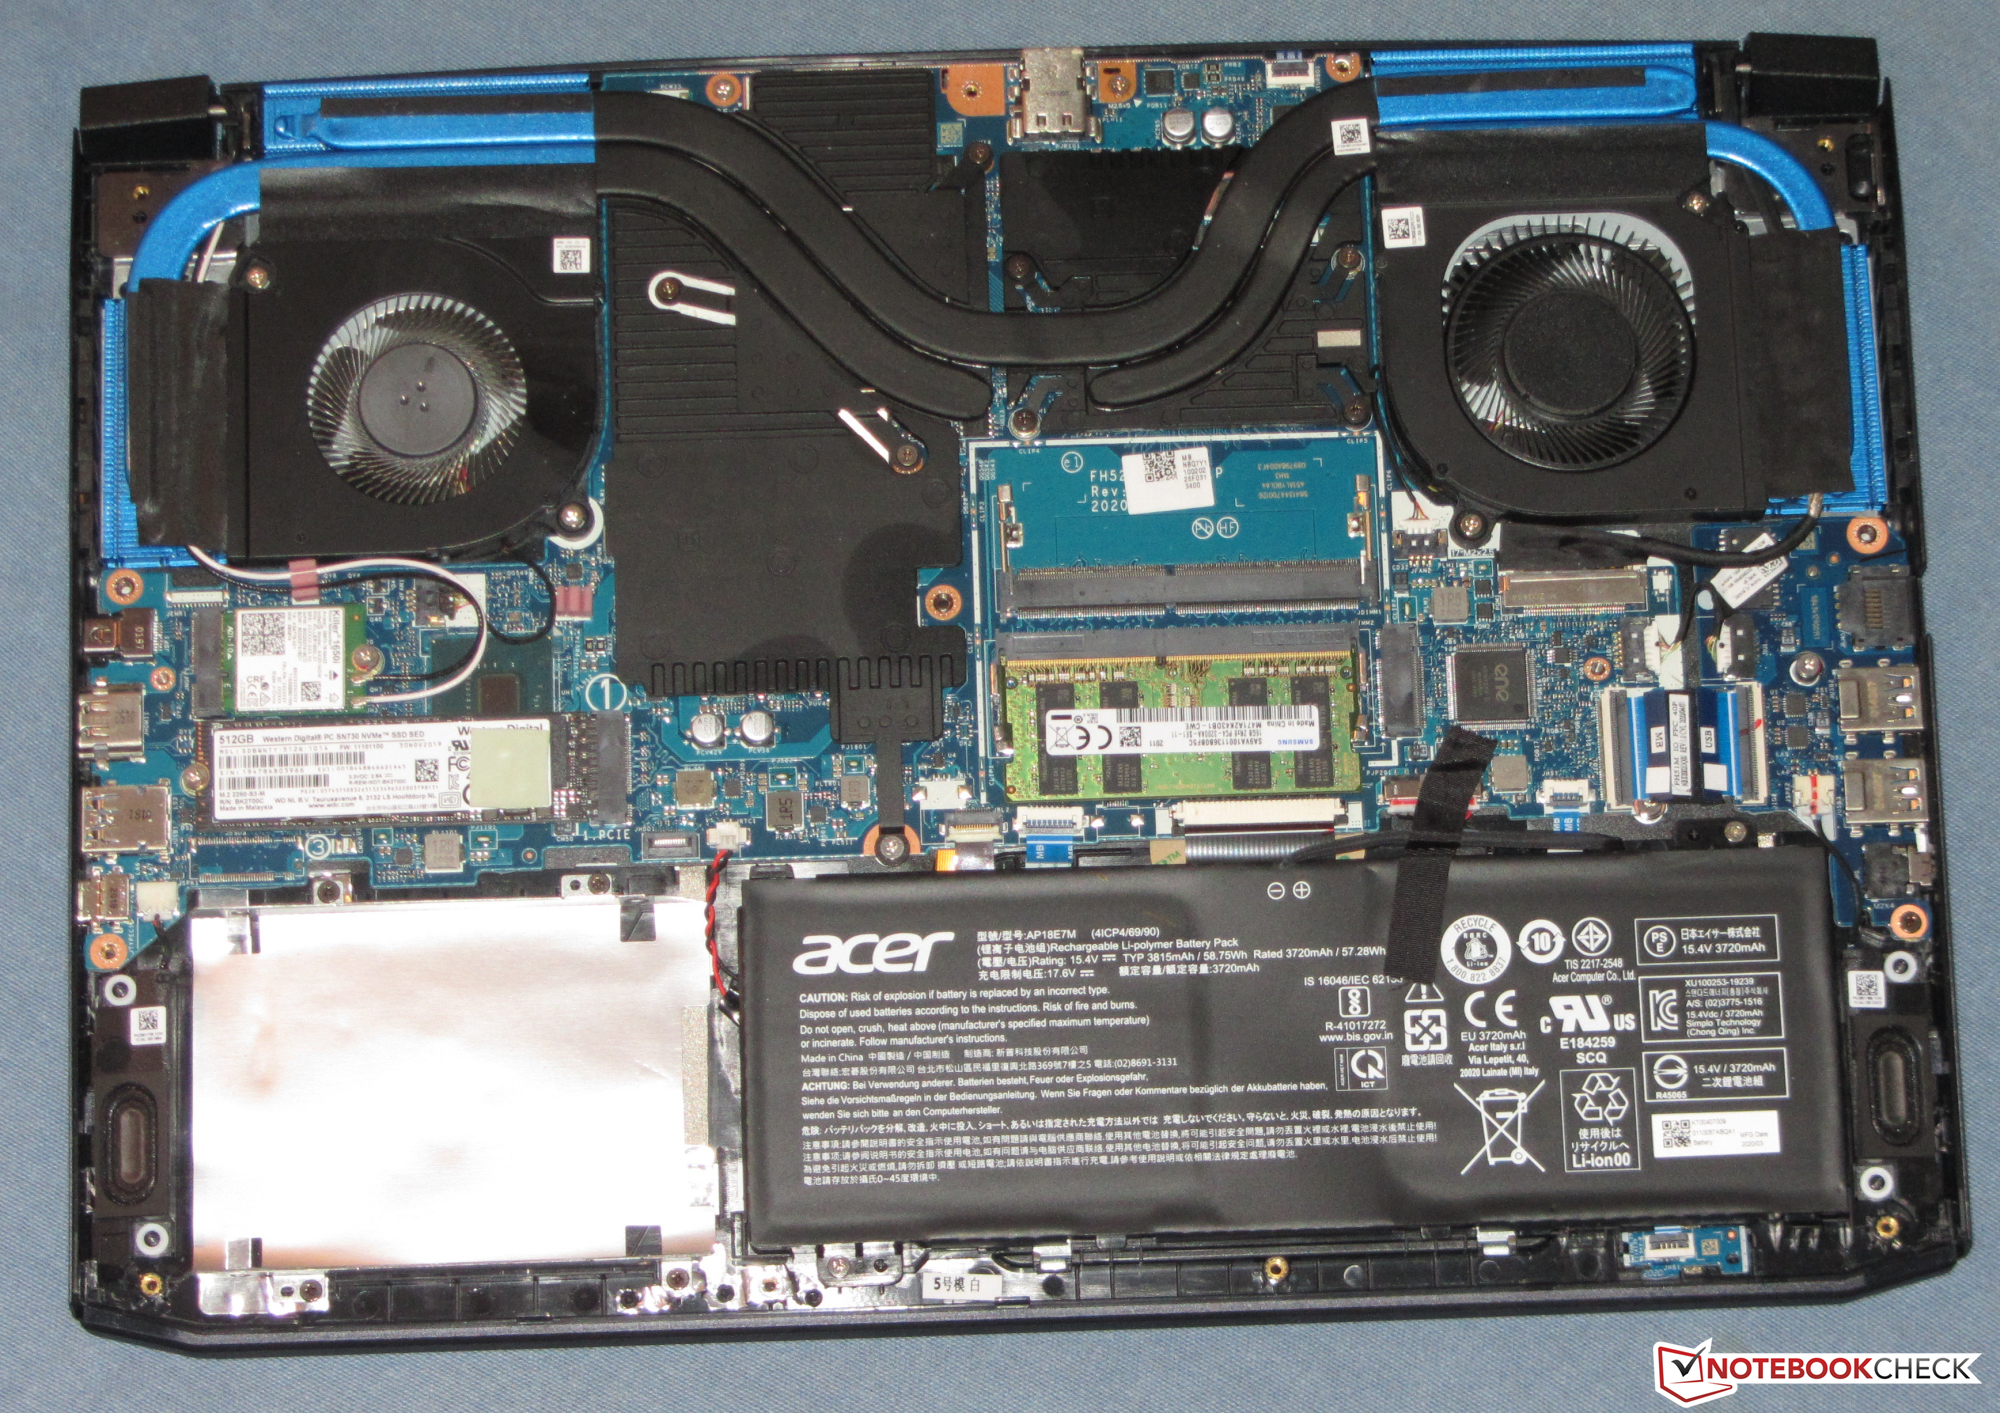
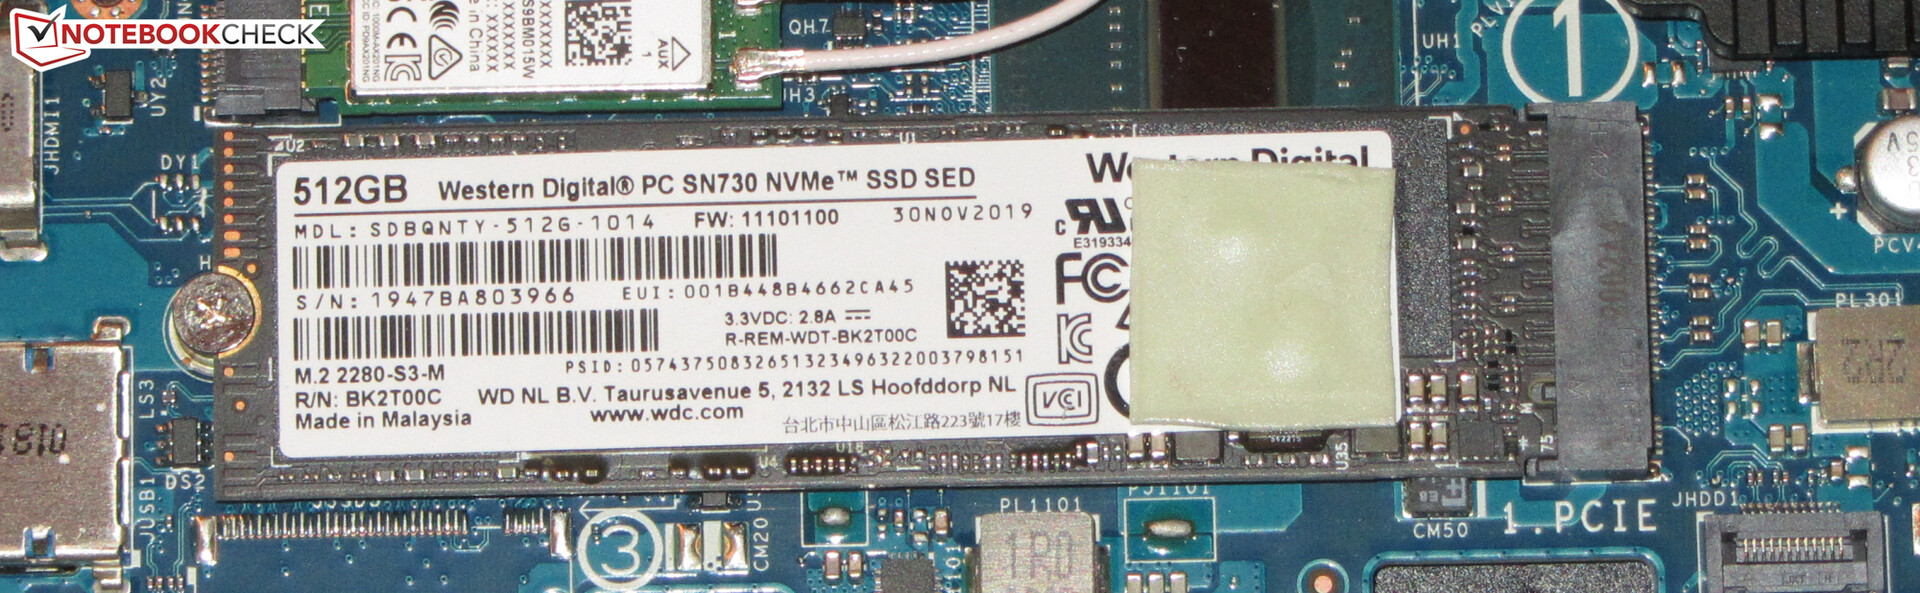
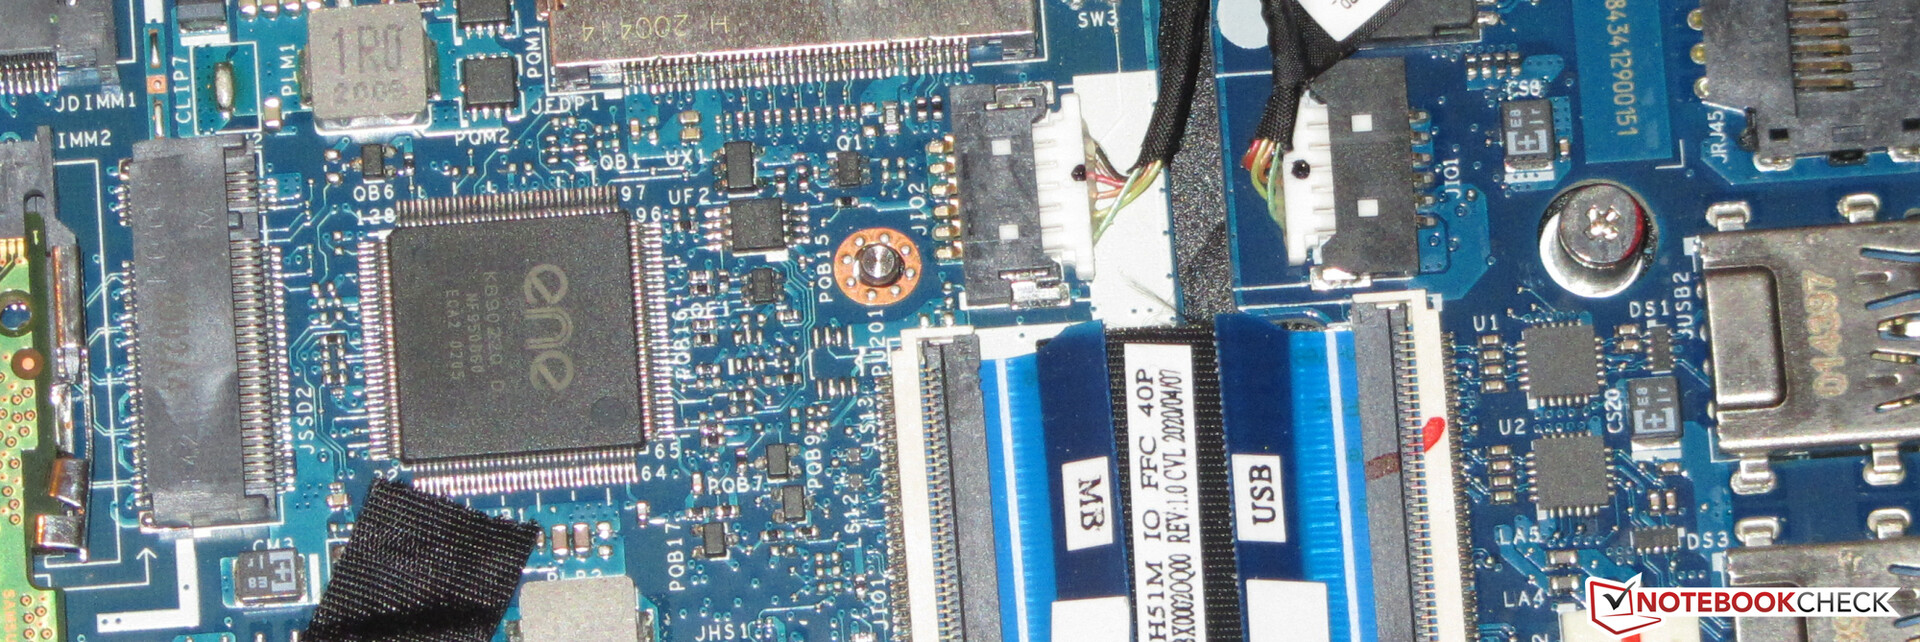
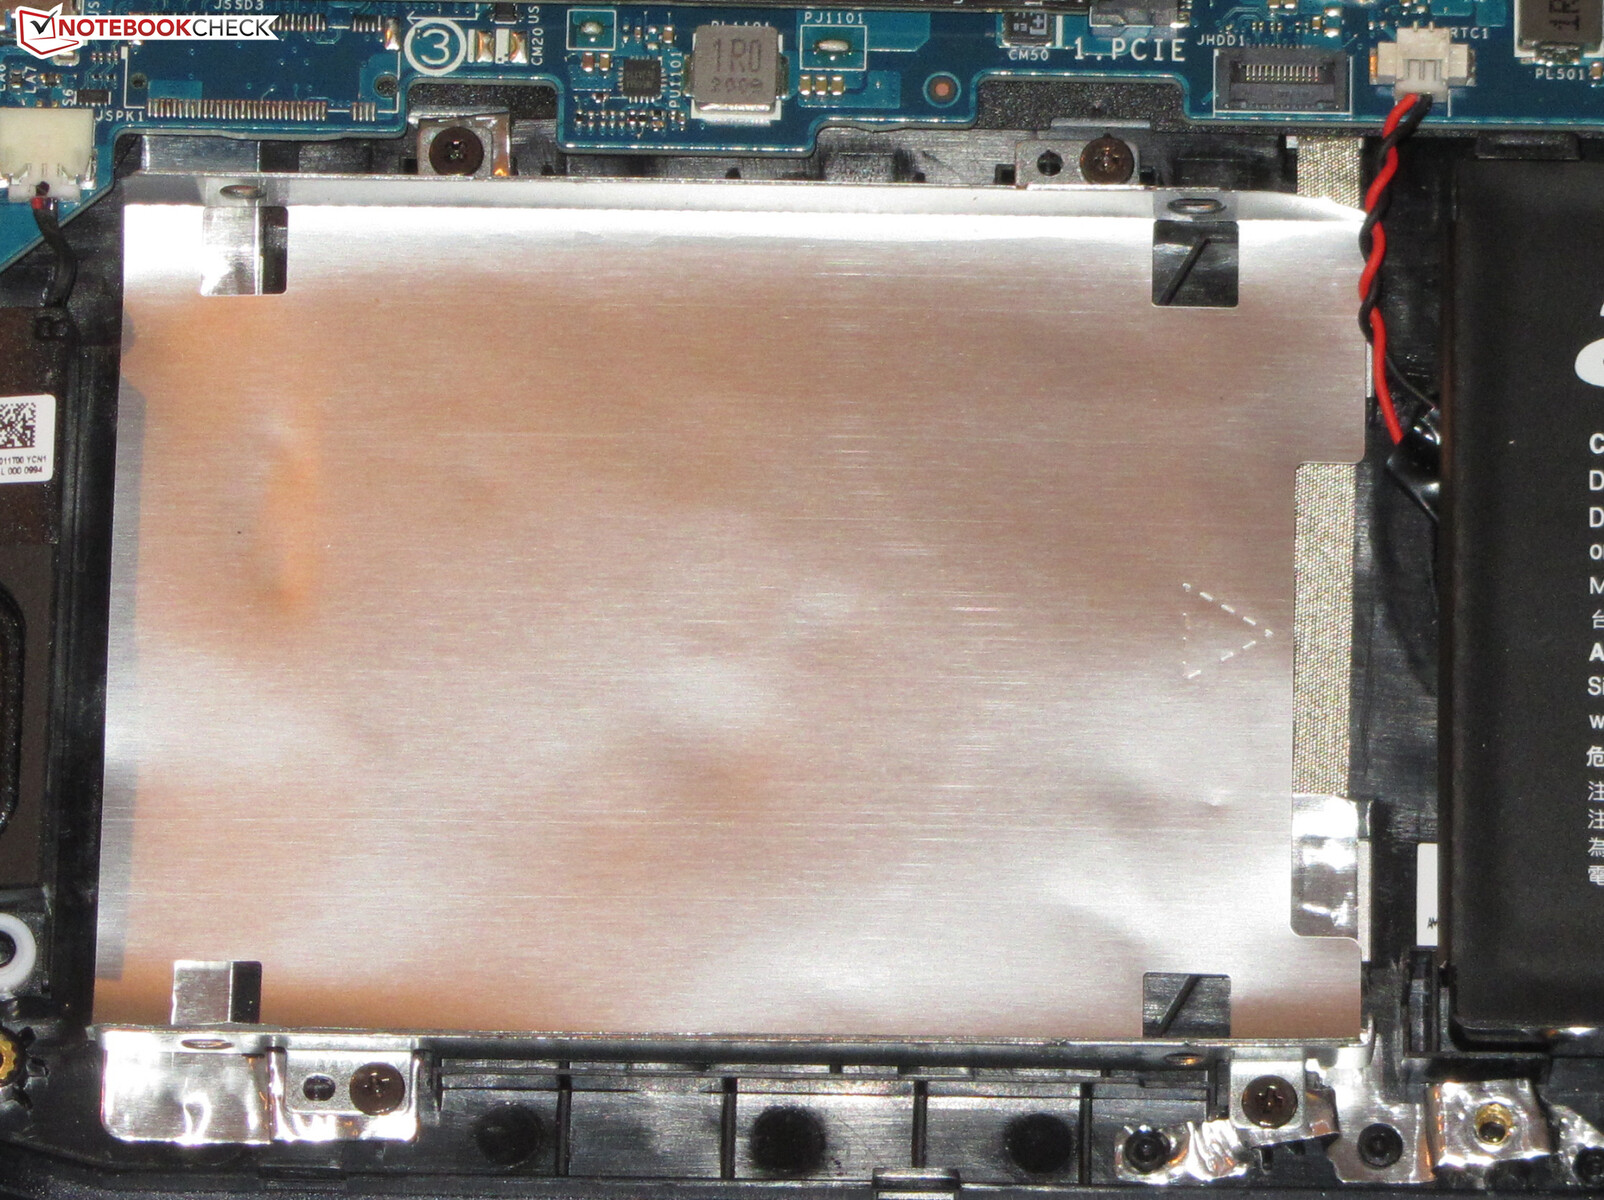
O laptop pode acomodar dois SSDs NVMe no formato M.2 2280, que poderiam formar uma matriz RAID 0, se necessário. Nosso dispositivo de teste está equipado apenas com um SSD NVMe que fornece 512 GB de espaço de armazenamento. As taxas de transferência são boas. Além disso, o Predator ainda tem espaço para um meio de armazenamento de 2,5 polegadas. Nosso dispositivo de teste não pode ser atualizado com esse tipo de drive, porque o slot SATA necessário não está incluído

| Acer Predator Helios 300 PH315-53-77N5 WDC PC SN730 SDBQNTY-512GB | Acer Predator Helios 300 PH315-52-79TY WDC PC SN720 SDAPNTW-512G | Dell G5 15 SE 5505 P89F Samsung PM991 MZ9LQ512HALU | Aorus 5 KB ADATA XPG SX8200 Pro (ASX8200PNP-512GT) | Schenker XMG Core 15 GK5NR0O Samsung SSD 970 EVO Plus 500GB | Asus TUF Gaming A15 FA506IV-HN172 Kingston OM8PCP3512F-AB | Média WDC PC SN730 SDBQNTY-512GB | |
|---|---|---|---|---|---|---|---|
| CrystalDiskMark 5.2 / 6 | -7% | -17% | 11% | 29% | -13% | -2% | |
| Write 4K (MB/s) | 137.5 | 108.7 -21% | 142.1 3% | 162.1 18% | 233 69% | 219.8 60% | 140.9 ? 2% |
| Read 4K (MB/s) | 48.24 | 44.91 -7% | 46.43 -4% | 60.7 26% | 54.5 13% | 50.2 4% | 45.6 ? -5% |
| Write Seq (MB/s) | 2644 | 2424 -8% | 1108 -58% | 2366 -11% | 3050 15% | 979 -63% | 2066 ? -22% |
| Read Seq (MB/s) | 1718 | 1617 -6% | 1622 -6% | 2633 53% | 3042 77% | 1990 16% | 2014 ? 17% |
| Write 4K Q32T1 (MB/s) | 416.6 | 356.9 -14% | 467 12% | 428.2 3% | 520 25% | 516 24% | 472 ? 13% |
| Read 4K Q32T1 (MB/s) | 525 | 557 6% | 525 0% | 582 11% | 546 4% | 298.3 -43% | 453 ? -14% |
| Write Seq Q32T1 (MB/s) | 2705 | 2542 -6% | 1203 -56% | 2480 -8% | 3241 20% | 982 -64% | 2433 ? -10% |
| Read Seq Q32T1 (MB/s) | 3213 | 3218 0% | 2288 -29% | 3121 -3% | 3538 10% | 1907 -41% | 3237 ? 1% |
| Write 4K Q8T8 (MB/s) | 1138 | 981 | |||||
| Read 4K Q8T8 (MB/s) | 1346 | 300.9 | |||||
| AS SSD | 4% | -29% | 0% | 32% | -23% | 3% | |
| Seq Read (MB/s) | 2753 | 2841 3% | 1386 -50% | 2795 2% | 2836 3% | 1682 -39% | 2506 ? -9% |
| Seq Write (MB/s) | 2495 | 2009 -19% | 1234 -51% | 2172 -13% | 2452 -2% | 904 -64% | 1655 ? -34% |
| 4K Read (MB/s) | 38.64 | 39.34 2% | 41.32 7% | 53.3 38% | 60.4 56% | 60.2 56% | 42.2 ? 9% |
| 4K Write (MB/s) | 88.8 | 102.8 16% | 128 44% | 121.3 37% | 190.5 115% | 164.8 86% | 127.5 ? 44% |
| 4K-64 Read (MB/s) | 952 | 1257 32% | 854 -10% | 714 -25% | 1283 35% | 472.5 -50% | 1061 ? 11% |
| 4K-64 Write (MB/s) | 1568 | 1522 -3% | 721 -54% | 1376 -12% | 2298 47% | 845 -46% | 1480 ? -6% |
| Access Time Read * (ms) | 0.086 | 0.098 | 0.049 | 0.034 | 0.087 | 0.1012 ? | |
| Access Time Write * (ms) | 0.044 | 0.036 18% | 0.095 -116% | 0.036 18% | 0.02 55% | 0.02 55% | 0.03833 ? 13% |
| Score Read (Points) | 1266 | 1581 25% | 1034 -18% | 1046 -17% | 1627 29% | 701 -45% | 1354 ? 7% |
| Score Write (Points) | 1906 | 1825 -4% | 973 -49% | 1714 -10% | 2734 43% | 1101 -42% | 1772 ? -7% |
| Score Total (Points) | 3811 | 4175 10% | 2536 -33% | 3279 -14% | 5184 36% | 2143 -44% | 3781 ? -1% |
| Copy ISO MB/s (MB/s) | 2037 | 1446 -29% | 1284 -37% | 2039 0% | 675 -67% | 1903 ? -7% | |
| Copy Program MB/s (MB/s) | 475.6 | 473.4 0% | 401.9 -15% | 438 -8% | 248.4 -48% | 533 ? 12% | |
| Copy Game MB/s (MB/s) | 1018 | 971 -5% | 1013 0% | 1137 12% | 535 -47% | 1074 ? 6% | |
| Média Total (Programa/Configurações) | -2% /
-0% | -23% /
-25% | 6% /
5% | 31% /
31% | -18% /
-19% | 1% /
1% |
* ... menor é melhor
Continuous load read: DiskSpd Read Loop, Queue Depth 8
Placa gráfica
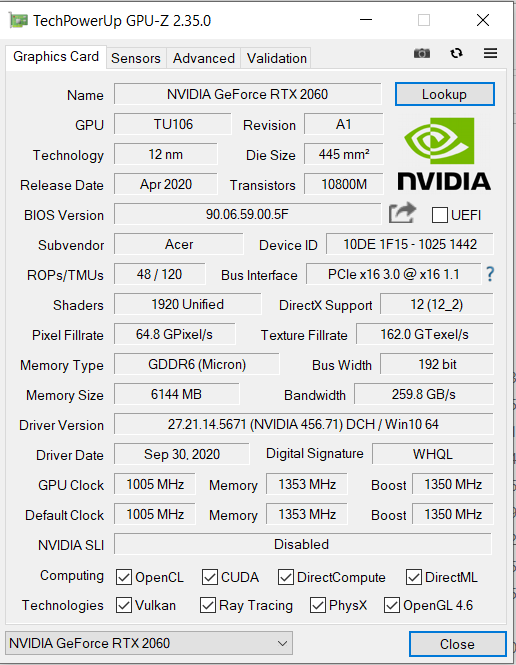
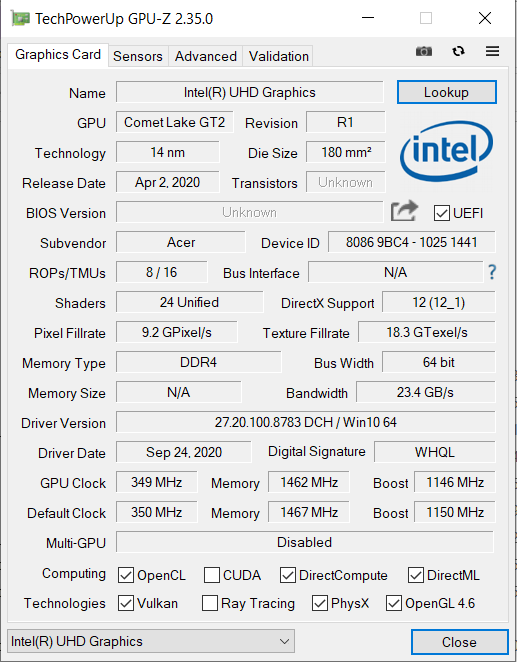
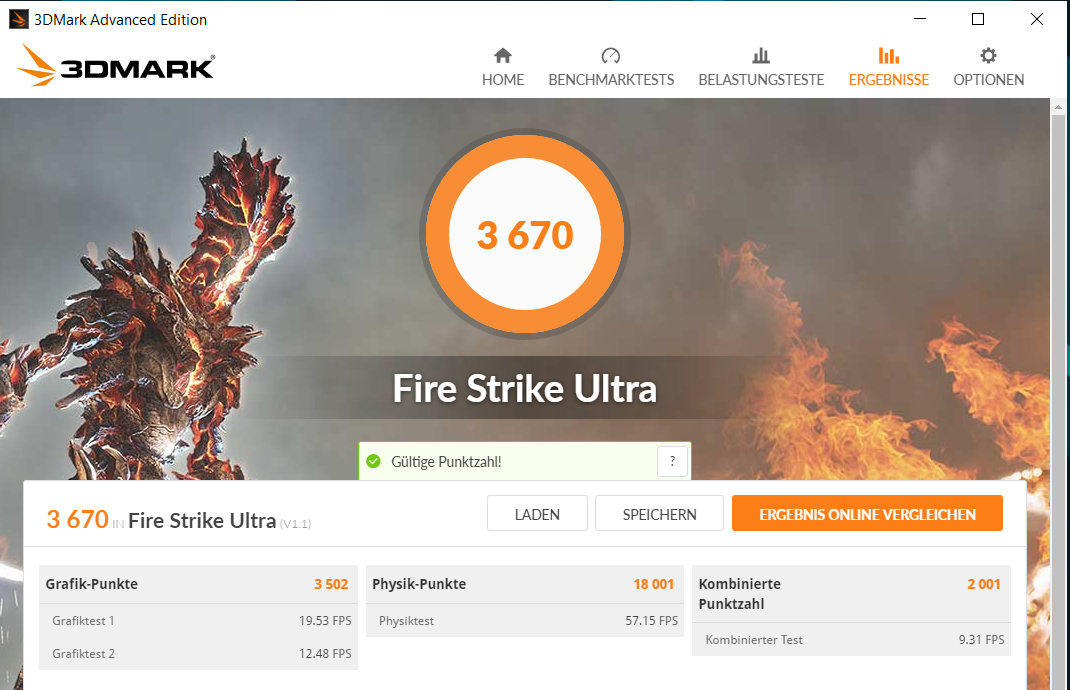
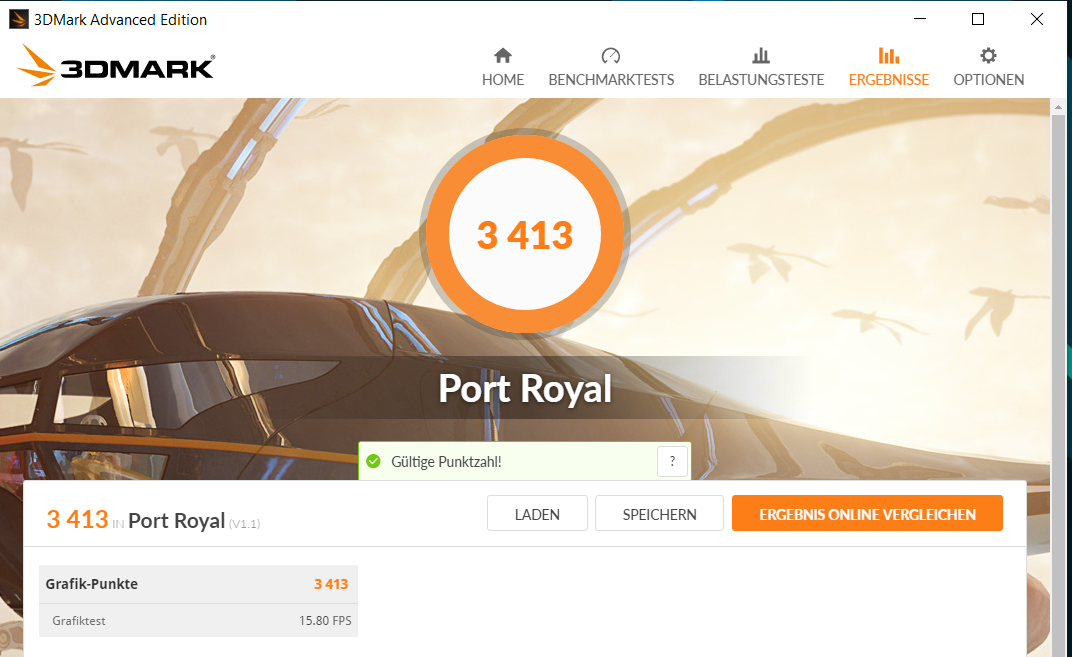
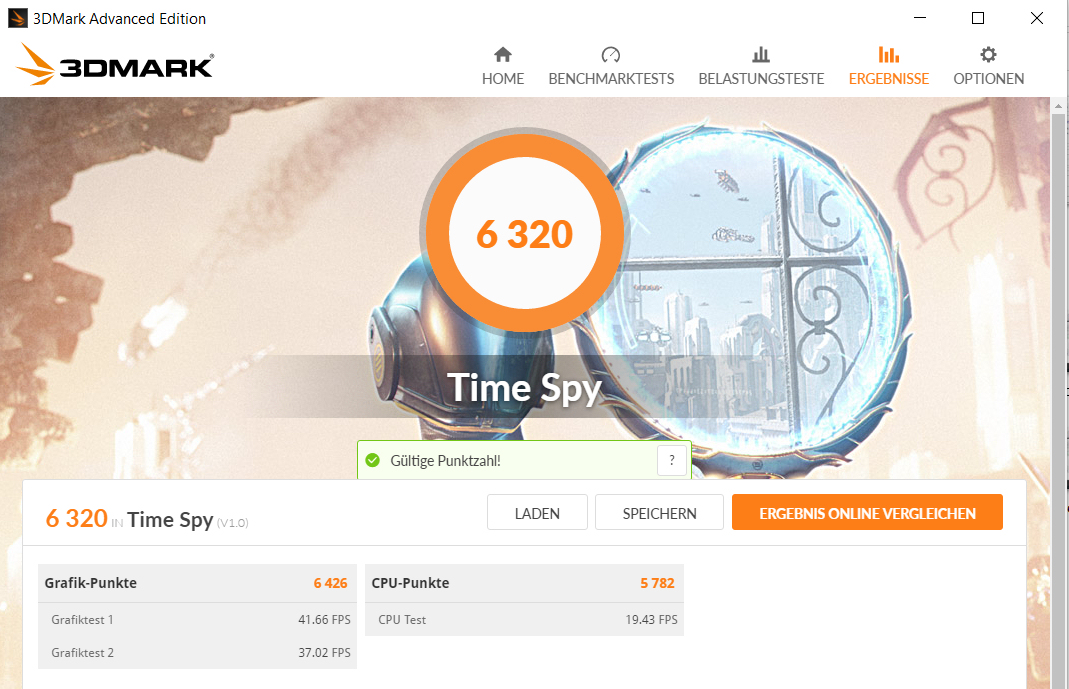
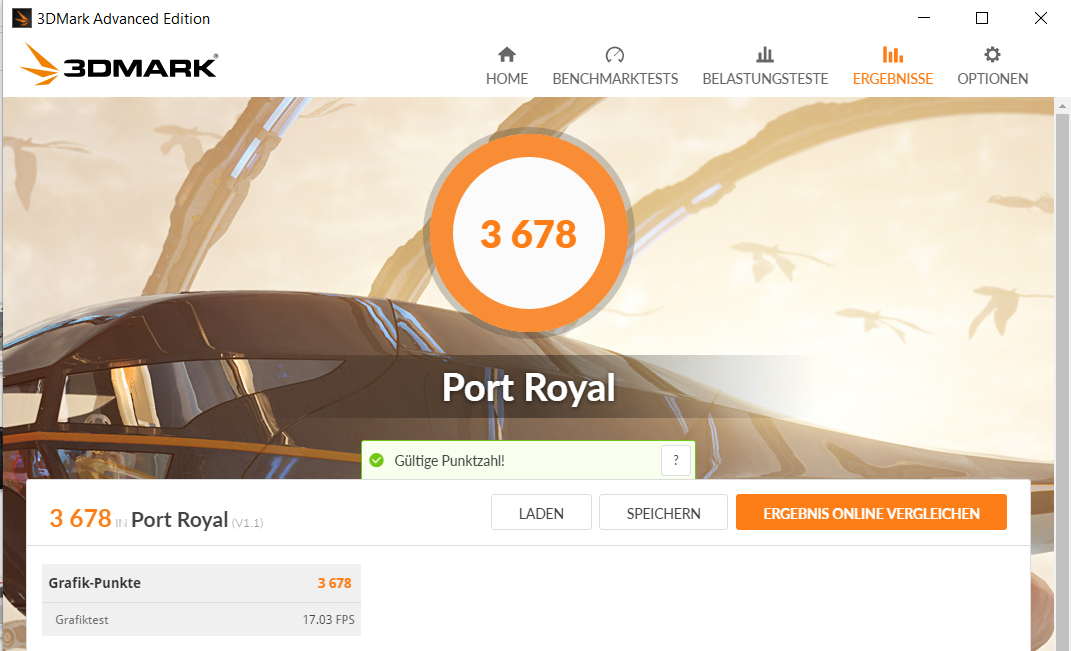
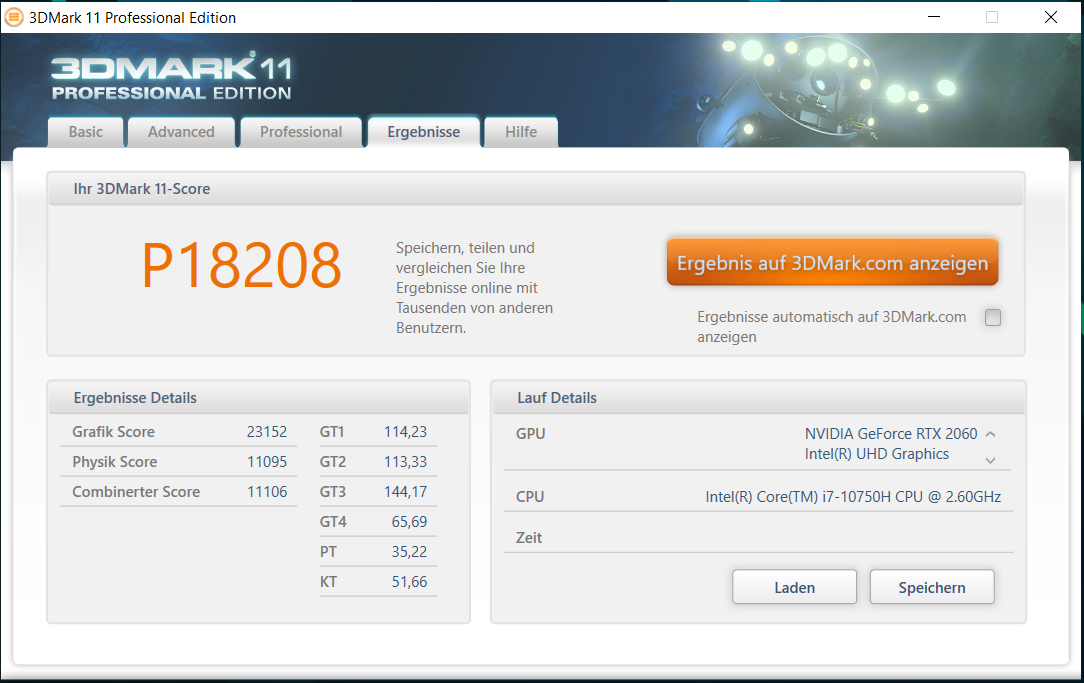
OGeForce RTX 2060 é um modelo de nível básico na classe superior da GPU. Ele pode acessar rapidamente a memória gráfica GDDR6 (6.144 MB). Os resultados nos 3DMark benchmarks estão em um nível normal para a GPU RTX 2060. Além disso, o perfil da GPU "Extreme" Predator Sense só proporciona um ligeiro aumento de desempenho. OGráficos UHD 630 chip que está integrado ao processador está ativo, e o laptop funciona com a solução gráfica de comutação Optimus da Nvidia.
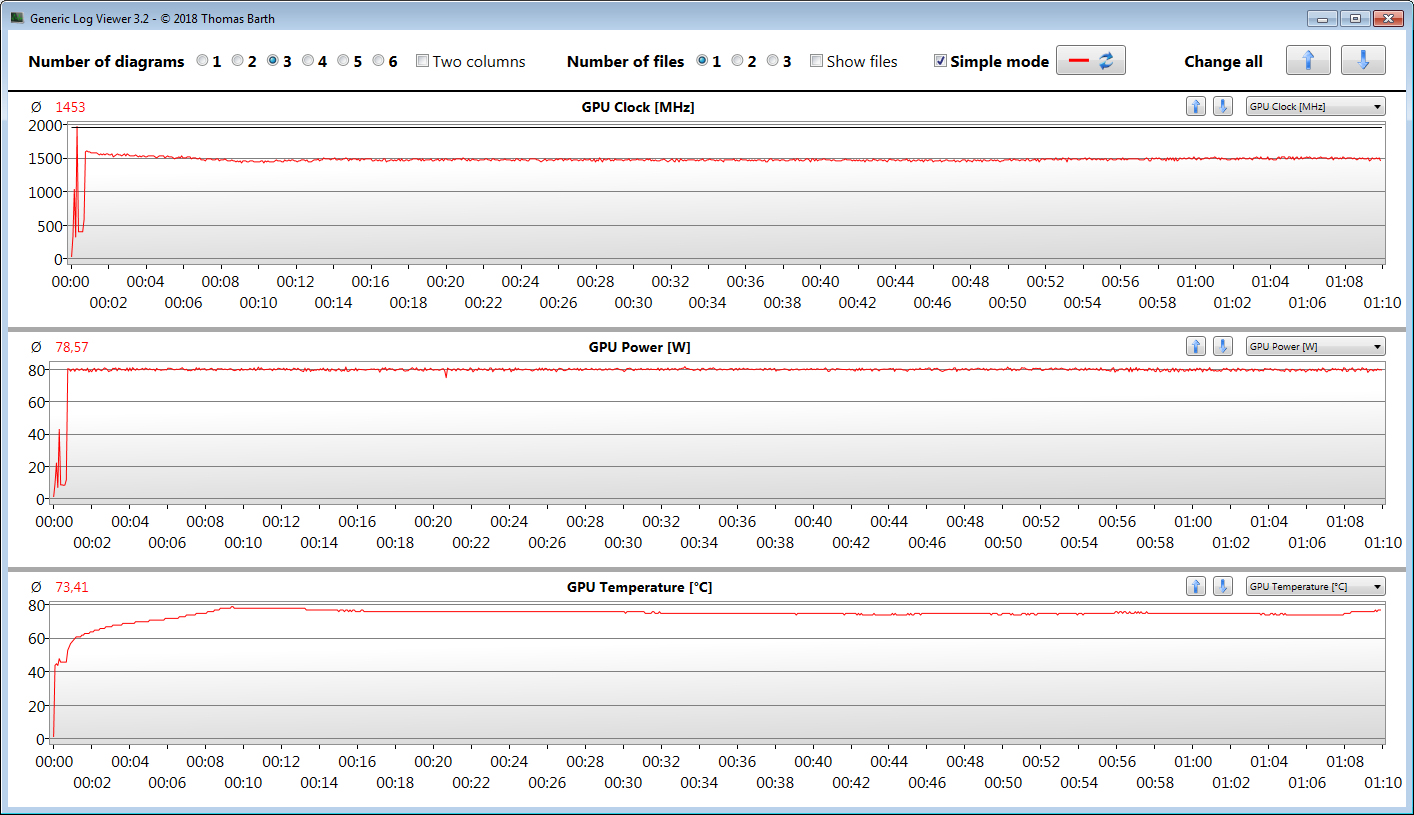
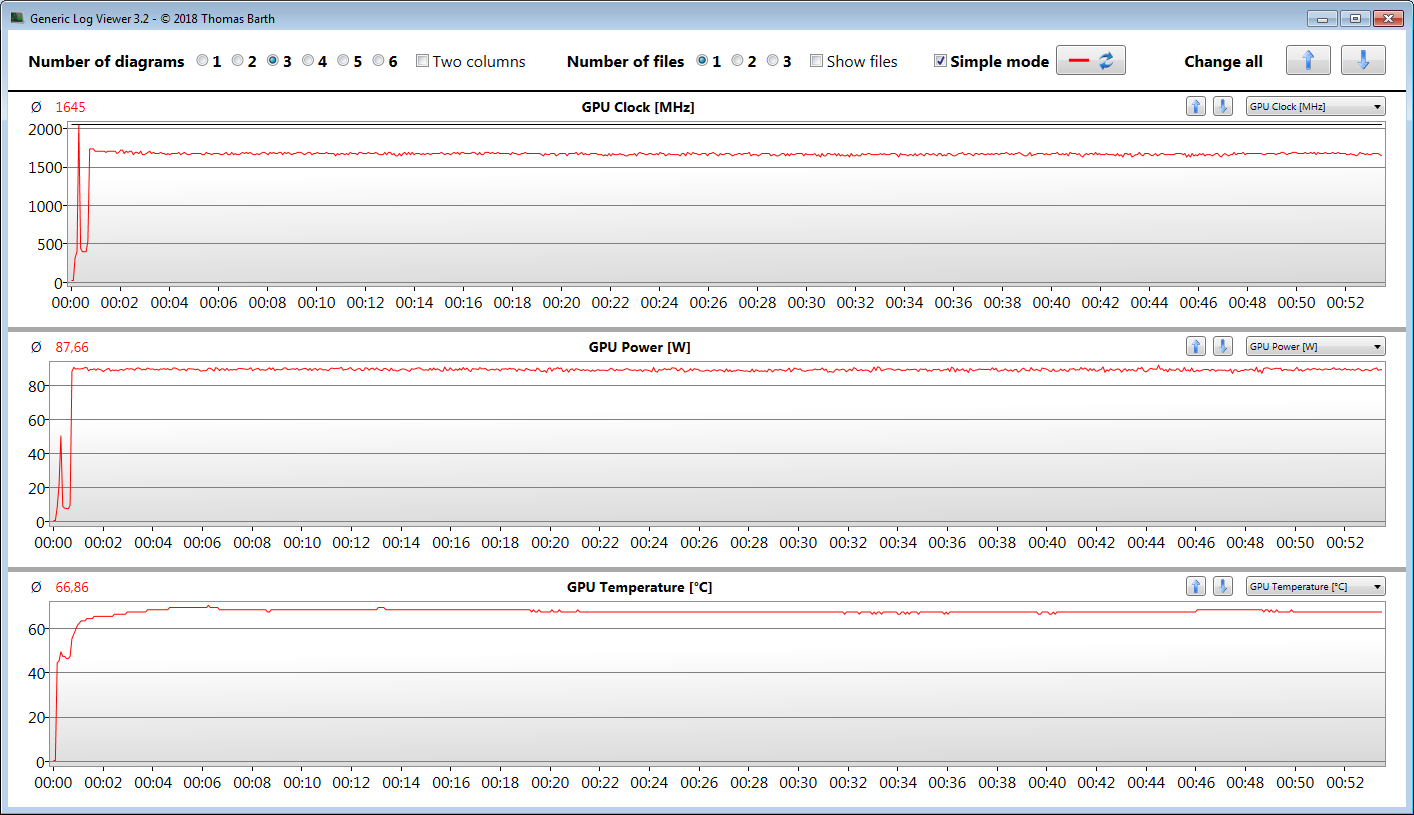
Nvidia especifica uma faixa de relógio entre 1.005 MHz (base) e 1.350 MHz (impulso) para esta GPU DirectX 12. Velocidades mais altas são viáveis se a GPU não atingir um limite especificado de temperatura e/ou energia. O máximo é de 2.032 MHz. Nosso teste
Witcher 3é executado a uma velocidade média de 1.453 MHz e 1.645 MHz (perfil GPU: Extremo), respectivamente.


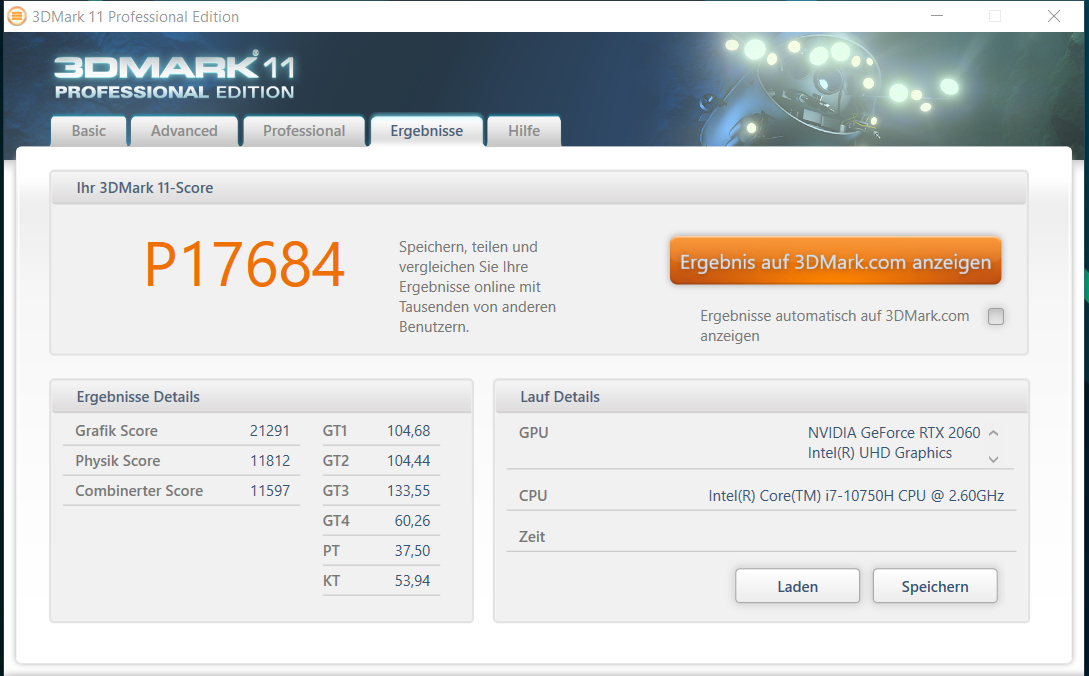
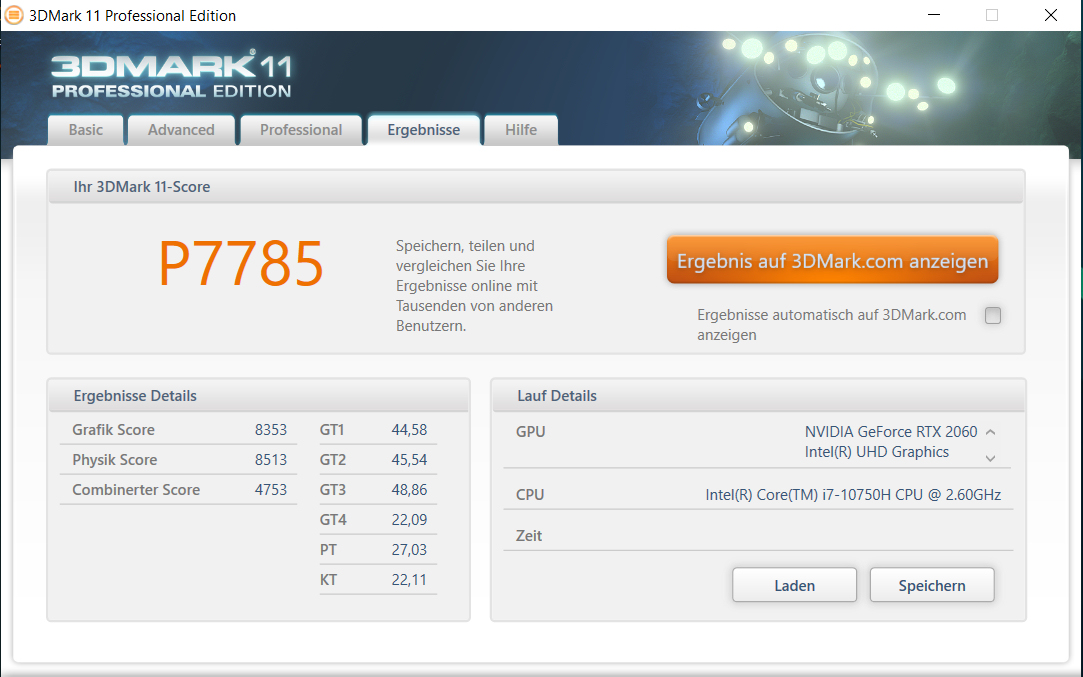
| 3DMark 11 Performance | 17684 pontos | |
| 3DMark Cloud Gate Standard Score | 36435 pontos | |
| 3DMark Fire Strike Score | 14732 pontos | |
| 3DMark Time Spy Score | 6011 pontos | |
Ajuda | ||
| 3DMark 11 - 1280x720 Performance GPU | |
| Média da turma Gaming (21841 - 80022, n=104, últimos 2 anos) | |
| Dell G5 15 SE 5505 P89F | |
| Acer Predator Helios 300 PH315-53-77N5 (Extrem) | |
| Aorus 5 KB | |
| Schenker XMG Core 15 GK5NR0O | |
| Asus TUF Gaming A15 FA506IV-HN172 | |
| Média NVIDIA GeForce RTX 2060 Mobile (19143 - 24662, n=40) | |
| Acer Predator Helios 300 PH315-53-77N5 | |
| Acer Predator Helios 300 PH315-52-79TY | |
| HP Pavilion Gaming 15-ec1177ng | |
| MSI Bravo 15 A4DCR | |
Desempenho do jogo
A combinação CPU-GPU integrada pode trazer todos os jogos mais recentes suavemente para a tela. Resolução Full HD e configurações de alta a máxima qualidade geralmente podem ser selecionadas. Resoluções mais altas (um monitor apropriado teria que ser conectado para isso) requerem uma redução do nível de qualidade. O perfil "Extremo" da GPU produz apenas um leve aumento nas taxas de quadros (ver diagrama comparativo)
A memória de canal único é responsável pelo fato de alguns jogos alcançarem taxas de quadros significativamente menores em configurações baixas do que em laptops comparavelmente equipados. Um segundo módulo de memória (= modo de canal duplo ativo) proporcionaria melhorias.
| The Witcher 3 | |
| 1920x1080 Ultra Graphics & Postprocessing (HBAO+) | |
| Média da turma Gaming (104.7 - 240, n=7, últimos 2 anos) | |
| Acer Predator Helios 300 PH315-53-77N5 (Extrem) | |
| Acer Predator Helios 300 PH317-54-75G8 | |
| Dell G5 15 SE 5505 P89F | |
| Acer Predator Helios 300 PH315-53-77N5 | |
| Aorus 7 KB | |
| Média NVIDIA GeForce RTX 2060 Mobile (50.6 - 74, n=40) | |
| Asus TUF Gaming A15 FA506IV-HN172 | |
| Schenker XMG Core 15 GK5NR0O | |
| Aorus 5 KB | |
| Acer Predator Helios 300 PH315-52-79TY | |
| HP Pavilion Gaming 15-ec1177ng | |
| MSI Bravo 15 A4DCR | |
| 1024x768 Low Graphics & Postprocessing | |
| Média da turma Gaming (447 - 686, n=2, últimos 2 anos) | |
| Acer Predator Helios 300 PH317-54-75G8 | |
| Aorus 7 KB | |
| Dell G5 15 SE 5505 P89F | |
| HP Pavilion Gaming 15-ec1177ng | |
| Média NVIDIA GeForce RTX 2060 Mobile (188.7 - 295, n=27) | |
| Acer Predator Helios 300 PH315-53-77N5 | |
| Schenker XMG Core 15 GK5NR0O | |
| Acer Predator Helios 300 PH315-52-79TY | |
| Asus TUF Gaming A15 FA506IV-HN172 | |
| MSI Bravo 15 A4DCR | |
| Shadow of the Tomb Raider | |
| 1920x1080 Highest Preset AA:T | |
| Média da turma Gaming (96 - 116, n=2, últimos 2 anos) | |
| Acer Predator Helios 300 PH317-54-75G8 | |
| Aorus 7 KB | |
| Acer Predator Helios 300 PH315-53-77N5 (Extrem) | |
| Média NVIDIA GeForce RTX 2060 Mobile (54 - 86, n=22) | |
| Acer Predator Helios 300 PH315-53-77N5 | |
| Dell G5 15 SE 5505 P89F | |
| MSI Bravo 15 A4DCR | |
| 1280x720 Lowest Preset | |
| Dell G5 15 SE 5505 P89F | |
| Aorus 7 KB | |
| Média NVIDIA GeForce RTX 2060 Mobile (88 - 133, n=19) | |
| Acer Predator Helios 300 PH317-54-75G8 | |
| MSI Bravo 15 A4DCR | |
| Acer Predator Helios 300 PH315-53-77N5 | |
| Serious Sam 4 - 1920x1080 Ultra (DX12) AA:2xMS | |
| Acer Predator Helios 300 PH315-53-77N5 (Extrem) | |
| Acer Predator Helios 300 PH317-54-75G8 | |
| Aorus 7 KB | |
| Média NVIDIA GeForce RTX 2060 Mobile (50.3 - 63.3, n=6) | |
| Acer Predator Helios 300 PH315-53-77N5 | |
| Horizon Zero Dawn - 1920x1080 Ultimate Quality | |
| Acer Predator Helios 300 PH317-54-75G8 | |
| Acer Predator Helios 300 PH315-53-77N5 (Extrem) | |
| Média NVIDIA GeForce RTX 2060 Mobile (54 - 67, n=6) | |
| Acer Predator Helios 300 PH315-53-77N5 | |
| Aorus 7 KB | |
| HP Pavilion Gaming 15-ec1177ng | |
| Mafia Definitive Edition - 1920x1080 High Preset | |
| Aorus 7 KB | |
| Média NVIDIA GeForce RTX 2060 Mobile (60.2 - 76.1, n=4) | |
| Acer Predator Helios 300 PH317-54-75G8 | |
| Acer Predator Helios 300 PH315-53-77N5 | |
| Star Wars Squadrons - 1920x1080 Ultra Preset | |
| Média NVIDIA GeForce RTX 2060 Mobile (156.2 - 181, n=3) | |
| Acer Predator Helios 300 PH317-54-75G8 | |
| Acer Predator Helios 300 PH315-53-77N5 | |
A fim de verificar se as taxas de quadros permanecem em grande parte constantes durante um longo período de tempo, deixamos o jogo O Witcher 3 funcionar por cerca de 60 minutos com resolução Full HD e ajustes de qualidade máxima. O personagem não é movido. Uma queda nas taxas de quadros não foi encontrada
| baixo | média | alto | ultra | |
|---|---|---|---|---|
| BioShock Infinite (2013) | 307.3 | 270.5 | 249.6 | 130.9 |
| The Witcher 3 (2015) | 226.4 | 172.4 | 110.7 | 64.8 |
| Shadow of the Tomb Raider (2018) | 88 | 80 | 76 | 71 |
| Doom Eternal (2020) | 171 | 126.9 | 117.9 | 114 |
| Gears Tactics (2020) | 201.6 | 128.5 | 93.4 | 66.5 |
| Horizon Zero Dawn (2020) | 106 | 72 | 67 | 57 |
| Serious Sam 4 (2020) | 113 | 75.7 | 69.9 | 56.6 |
| Mafia Definitive Edition (2020) | 94.3 | 62.5 | 60.2 | |
| Star Wars Squadrons (2020) | 262.1 | 184.5 | 172.8 | 156.2 |
Emissões - O Helios 300 se torna barulhento sob carga
Emissões sonoras
Os ventiladores não fazem muito barulho no uso ocioso. Eles ou ficam parados ou operam em velocidades muito baixas. Isso é tudo sob carga. Desta forma, registramos níveis máximos de pressão sonora de 56 dB(A) (teste de estresse) e 53,1 dB(A) (nosso teste The Witcher 3 ), respectivamente.
Barulho
| Ocioso |
| 25.2 / 25.2 / 25.2 dB |
| Carga |
| 43.5 / 56 dB |
 | ||
30 dB silencioso 40 dB(A) audível 50 dB(A) ruidosamente alto |
||
min: | ||
| Acer Predator Helios 300 PH315-53-77N5 i7-10750H, GeForce RTX 2060 Mobile | Acer Predator Helios 300 PH315-52-79TY i7-9750H, GeForce GTX 1660 Ti Mobile | Dell G5 15 SE 5505 P89F R7 4800H, Radeon RX 5600M | Aorus 5 KB i7-10750H, GeForce RTX 2060 Mobile | Schenker XMG Core 15 GK5NR0O R7 4800H, GeForce RTX 2060 Mobile | Asus TUF Gaming A15 FA506IV-HN172 R7 4800H, GeForce RTX 2060 Mobile | Média NVIDIA GeForce RTX 2060 Mobile | Média da turma Gaming | |
|---|---|---|---|---|---|---|---|---|
| Noise | -8% | 1% | -11% | -4% | -7% | -12% | -4% | |
| desligado / ambiente * (dB) | 25.2 | 30.2 -20% | 28 -11% | 25 1% | 25 1% | 30.2 -20% | 27.9 ? -11% | 24.1 ? 4% |
| Idle Minimum * (dB) | 25.2 | 31 -23% | 28 -11% | 26 -3% | 26 -3% | 30.2 -20% | 29 ? -15% | 26 ? -3% |
| Idle Average * (dB) | 25.2 | 31 -23% | 28 -11% | 30 -19% | 30 -19% | 30.2 -20% | 30 ? -19% | 27.4 ? -9% |
| Idle Maximum * (dB) | 25.2 | 31 -23% | 28 -11% | 34 -35% | 32 -27% | 30.2 -20% | 33 ? -31% | 30.1 ? -19% |
| Load Average * (dB) | 43.5 | 41.5 5% | 28 36% | 53 -22% | 46 -6% | 40 8% | 44 ? -1% | 43.6 ? -0% |
| Witcher 3 ultra * (dB) | 53.1 | 46.7 12% | 50.6 5% | 51 4% | 48 10% | 49 8% | ||
| Load Maximum * (dB) | 56 | 46.9 16% | 50.6 10% | 56 -0% | 48 14% | 49 12% | 51.6 ? 8% | 54.2 ? 3% |
* ... menor é melhor
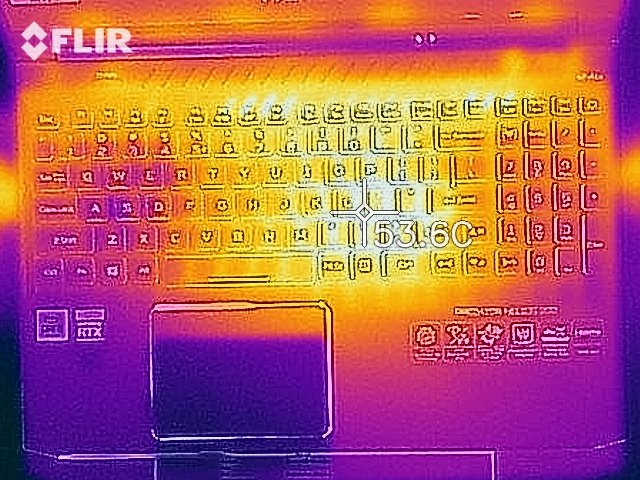
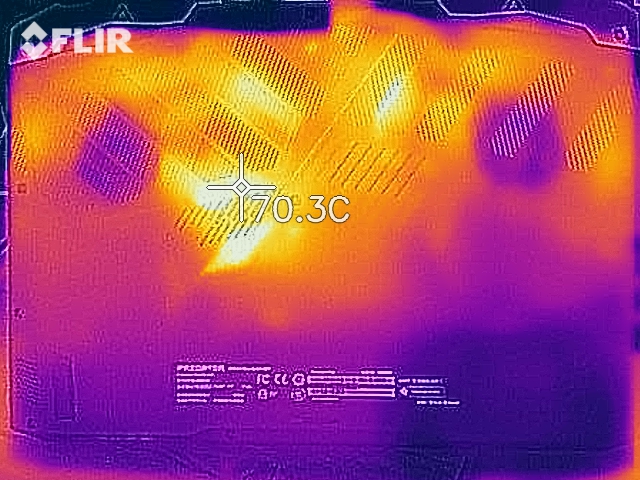
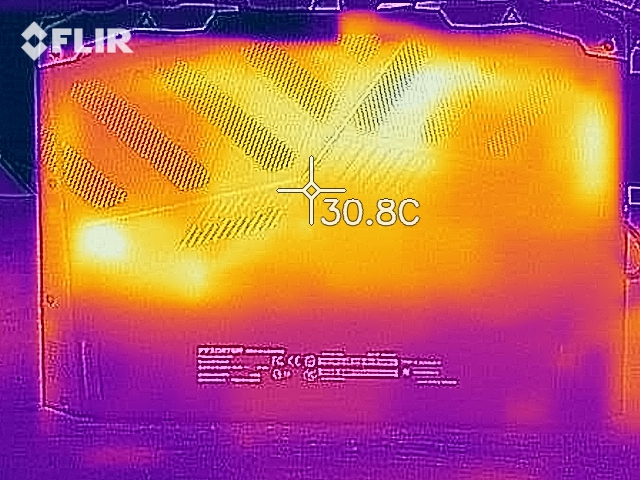
Temperatura
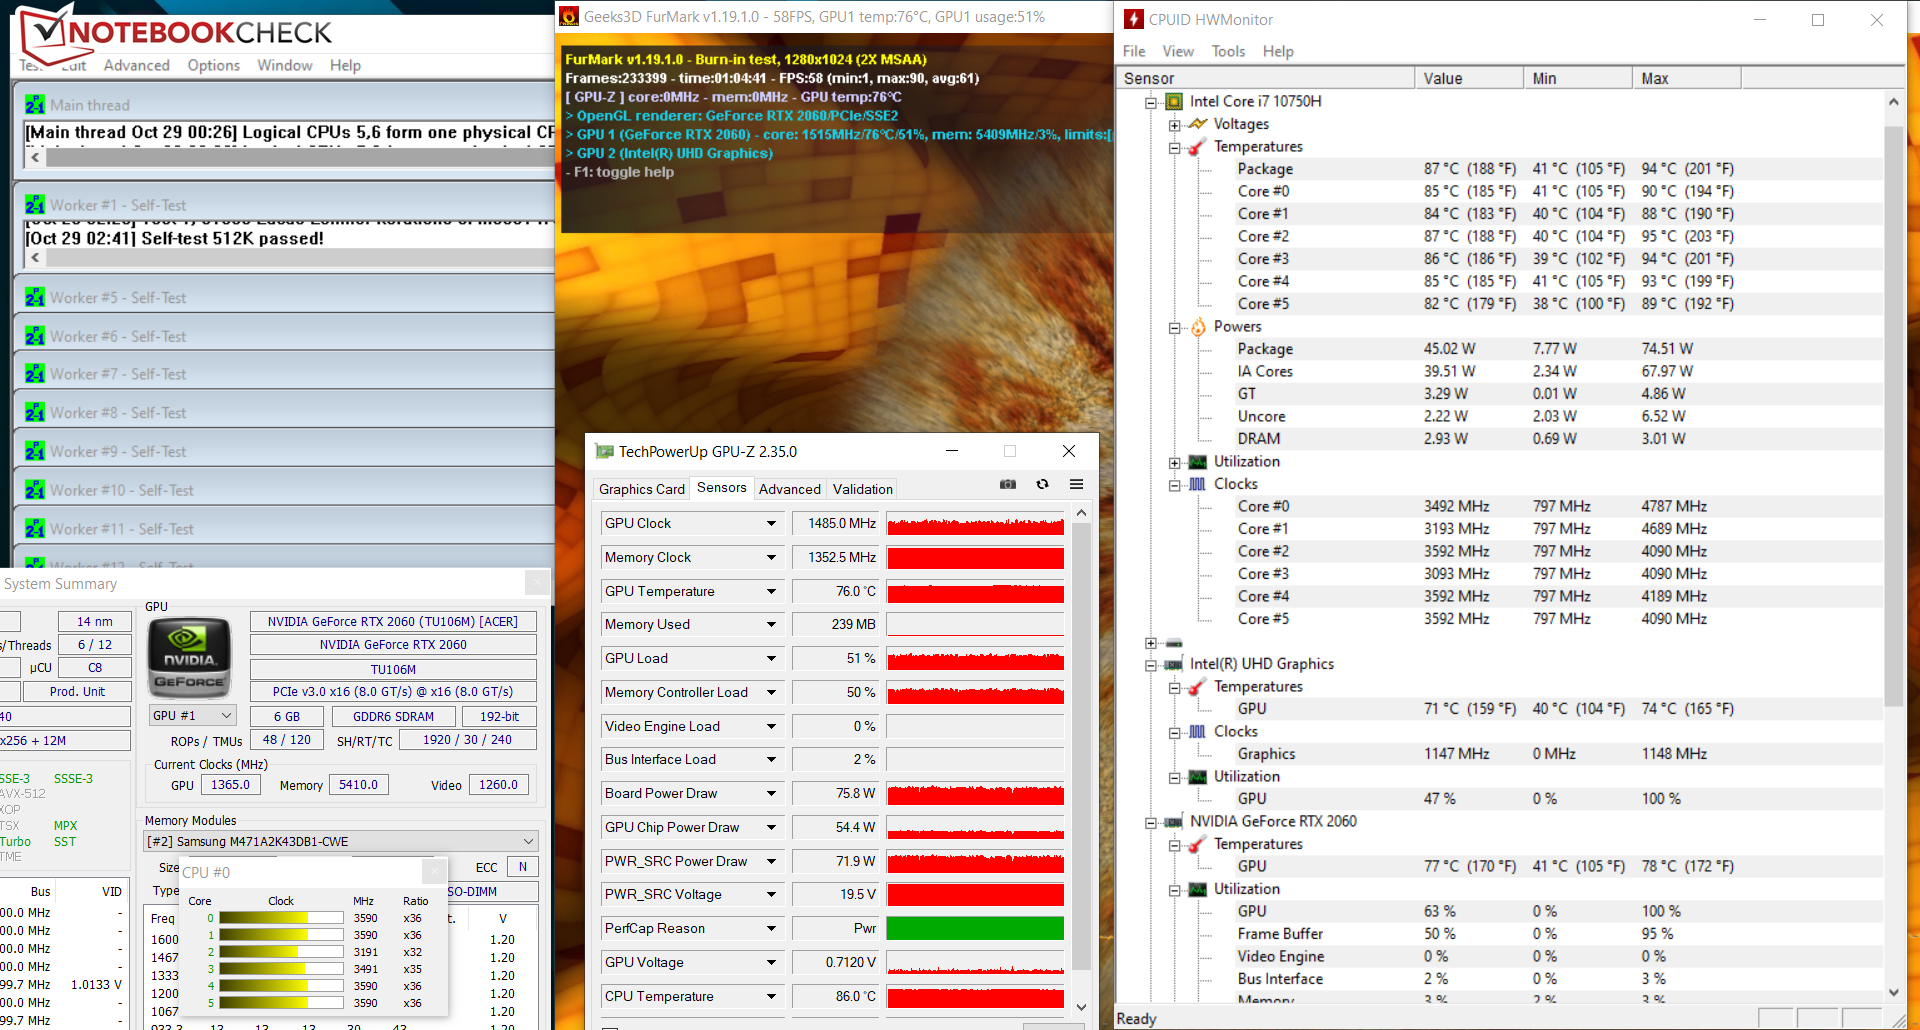
O teste de estresse (Prime95 e FurMark funcionam por pelo menos uma hora) é executado pela CPU e pela GPU em 3 a 3,5 GHz e 1,2 a 1,4 GHz, respectivamente. Na energia da bateria, as taxas de relógio são de 800 MHz (CPU) e 1.380 MHz (GPU). O teste de estresse representa um cenário extremo. Com este teste, verificamos se o sistema permanece estável mesmo sob carga total
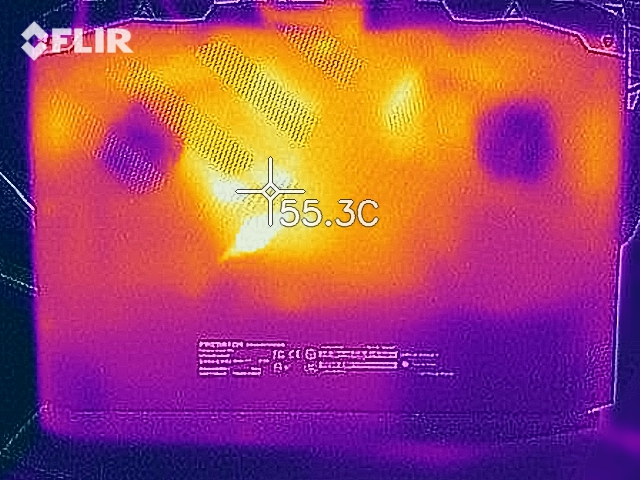
Durante o teste de estresse, registramos temperaturas na faixa de 40-°C (~104°F) em alguns pontos de medição. O desenvolvimento de calor é significativamente menor ao realizar nosso teste The Witcher 3. No uso diário, os valores estão na faixa verde
(±) A temperatura máxima no lado superior é 44.1 °C / 111 F, em comparação com a média de 40.4 °C / 105 F , variando de 21.2 a 68.8 °C para a classe Gaming.
(-) A parte inferior aquece até um máximo de 48 °C / 118 F, em comparação com a média de 43.2 °C / 110 F
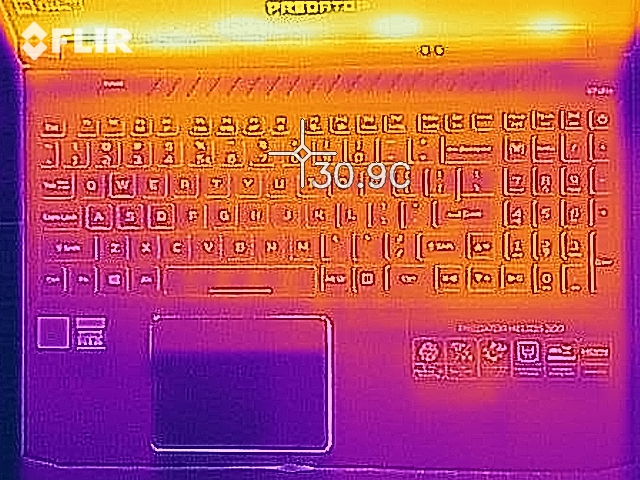
(+) Em uso inativo, a temperatura média para o lado superior é 24.1 °C / 75 F, em comparação com a média do dispositivo de 33.9 °C / ### class_avg_f### F.
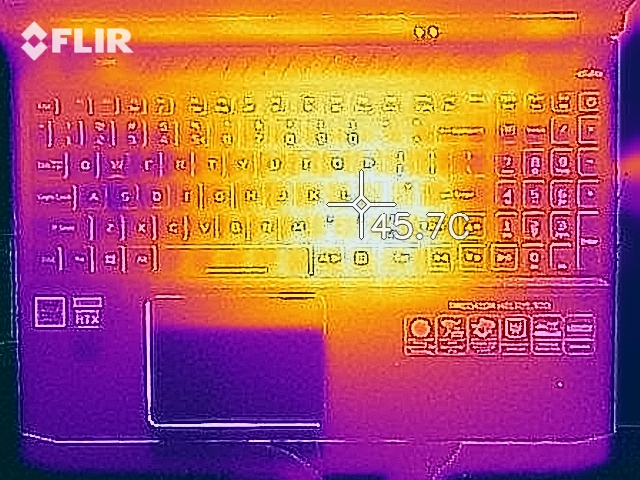
(±) Jogando The Witcher 3, a temperatura média para o lado superior é 33.9 °C / 93 F, em comparação com a média do dispositivo de 33.9 °C / ## #class_avg_f### F.
(+) Os apoios para as mãos e o touchpad são mais frios que a temperatura da pele, com um máximo de 31.9 °C / 89.4 F e, portanto, são frios ao toque.
(-) A temperatura média da área do apoio para as mãos de dispositivos semelhantes foi 28.8 °C / 83.8 F (-3.1 °C / -5.6 F).
| Acer Predator Helios 300 PH315-53-77N5 i7-10750H, GeForce RTX 2060 Mobile | Acer Predator Helios 300 PH315-52-79TY i7-9750H, GeForce GTX 1660 Ti Mobile | Dell G5 15 SE 5505 P89F R7 4800H, Radeon RX 5600M | Aorus 5 KB i7-10750H, GeForce RTX 2060 Mobile | Schenker XMG Core 15 GK5NR0O R7 4800H, GeForce RTX 2060 Mobile | Asus TUF Gaming A15 FA506IV-HN172 R7 4800H, GeForce RTX 2060 Mobile | Média NVIDIA GeForce RTX 2060 Mobile | Média da turma Gaming | |
|---|---|---|---|---|---|---|---|---|
| Heat | -3% | -18% | -19% | -22% | -4% | -17% | -15% | |
| Maximum Upper Side * (°C) | 44.1 | 52 -18% | 53 -20% | 50 -13% | 51 -16% | 42.9 3% | 47.2 ? -7% | 45.2 ? -2% |
| Maximum Bottom * (°C) | 48 | 46.3 4% | 57.6 -20% | 49 -2% | 64 -33% | 49.9 -4% | 52.7 ? -10% | 48.1 ? -0% |
| Idle Upper Side * (°C) | 25.2 | 24.8 2% | 27.4 -9% | 35 -39% | 29 -15% | 27.8 -10% | 31 ? -23% | 31 ? -23% |
| Idle Bottom * (°C) | 25.7 | 25.4 1% | 31 -21% | 31 -21% | 32 -25% | 27 -5% | 32.9 ? -28% | 34.2 ? -33% |
* ... menor é melhor
Oradores
Os alto-falantes estéreo estão localizados na área frontal da parte inferior do dispositivo. Eles produzem um som decente que carece de graves. Para uma melhor experiência sonora, devem ser usados fones de ouvido ou alto-falantes externos.
Acer Predator Helios 300 PH315-53-77N5 análise de áudio
(±) | o volume do alto-falante é médio, mas bom (###valor### dB)
Graves 100 - 315Hz
(-) | quase nenhum baixo - em média 20.9% menor que a mediana
(±) | a linearidade dos graves é média (10.1% delta para a frequência anterior)
Médios 400 - 2.000 Hz
(±) | médios mais altos - em média 5.7% maior que a mediana
(±) | a linearidade dos médios é média (10.3% delta para frequência anterior)
Altos 2 - 16 kHz
(+) | agudos equilibrados - apenas 1.3% longe da mediana
(+) | os máximos são lineares (4.7% delta da frequência anterior)
Geral 100 - 16.000 Hz
(±) | a linearidade do som geral é média (18.2% diferença em relação à mediana)
Comparado com a mesma classe
» 57% de todos os dispositivos testados nesta classe foram melhores, 8% semelhantes, 35% piores
» O melhor teve um delta de 6%, a média foi 18%, o pior foi 132%
Comparado com todos os dispositivos testados
» 39% de todos os dispositivos testados foram melhores, 8% semelhantes, 53% piores
» O melhor teve um delta de 4%, a média foi 23%, o pior foi 134%
Gerenciamento de energia - A vida útil da bateria do PH315 é aceitável
Consumo de energia
No uso inativo, registramos um consumo máximo de energia de 19,8 watts. O teste de estresse e nosso teste Witcher 3permitiram que a demanda aumentasse para 177 watts e 127 watts, respectivamente. A potência do adaptador de energia é de 230 watts.
| desligado | |
| Ocioso | |
| Carga |
|
Key:
min: | |
| Acer Predator Helios 300 PH315-53-77N5 i7-10750H, GeForce RTX 2060 Mobile | Acer Predator Helios 300 PH315-52-79TY i7-9750H, GeForce GTX 1660 Ti Mobile | Dell G5 15 SE 5505 P89F R7 4800H, Radeon RX 5600M | Aorus 5 KB i7-10750H, GeForce RTX 2060 Mobile | Schenker XMG Core 15 GK5NR0O R7 4800H, GeForce RTX 2060 Mobile | Asus TUF Gaming A15 FA506IV-HN172 R7 4800H, GeForce RTX 2060 Mobile | Média NVIDIA GeForce RTX 2060 Mobile | Média da turma Gaming | |
|---|---|---|---|---|---|---|---|---|
| Power Consumption | -115% | -10% | -38% | -54% | -7% | -71% | -93% | |
| Idle Minimum * (Watt) | 2.9 | 17.2 -493% | 6.5 -124% | 8 -176% | 12 -314% | 5.4 -86% | 11.5 ? -297% | 13 ? -348% |
| Idle Average * (Watt) | 13.2 | 22.6 -71% | 10.6 20% | 12 9% | 14 -6% | 10 24% | 16.5 ? -25% | 19 ? -44% |
| Idle Maximum * (Watt) | 19.8 | 25.5 -29% | 11 44% | 21 -6% | 20 -1% | 10.5 47% | 23.7 ? -20% | 24.6 ? -24% |
| Load Average * (Watt) | 105 | 88 16% | 84.1 20% | 128 -22% | 103 2% | 135 -29% | 107.5 ? -2% | 110.7 ? -5% |
| Witcher 3 ultra * (Watt) | 127 | 152.9 -20% | 138 -9% | 125 2% | 144 -13% | |||
| Load Maximum * (Watt) | 177 | 177 -0% | 180.4 -2% | 217 -23% | 193 -9% | 147 17% | 199.7 ? -13% | 259 ? -46% |
* ... menor é melhor
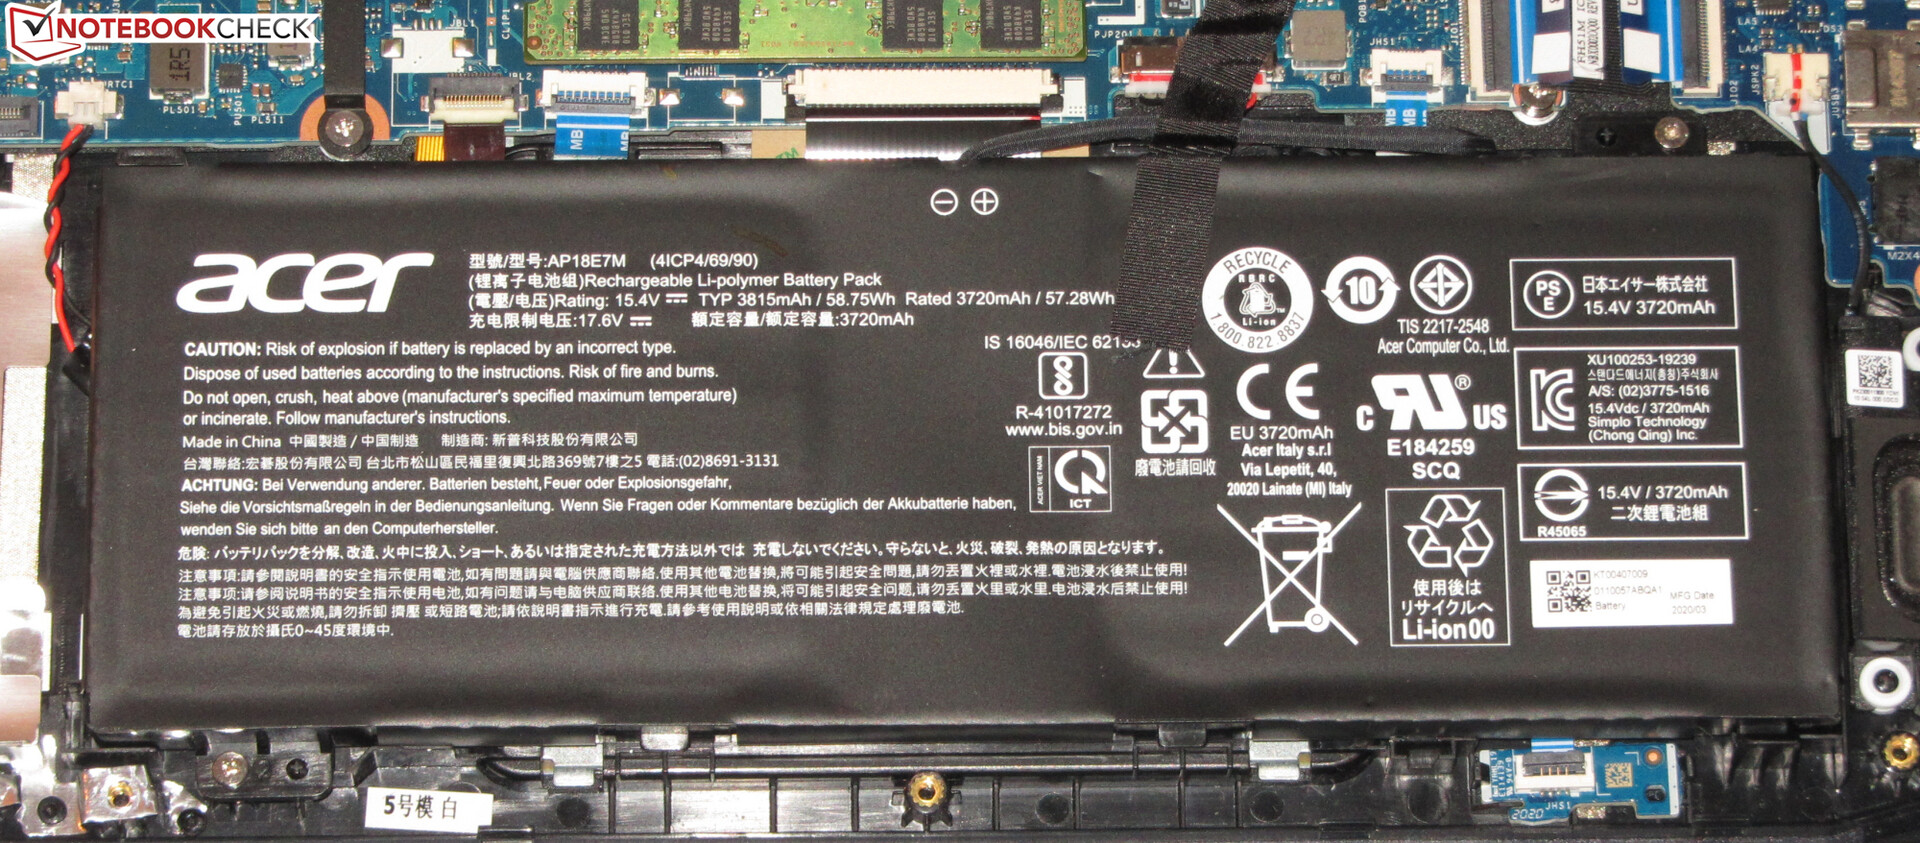
Duração da bateria
O laptop Acer atinge tempos de execução de 4:40 horas e 5:38 horas, respectivamente, em nosso teste WLAN (acessando websites usando um roteiro) e teste de vídeo (o curta-metragem Big Buck Bunny (codificação H.264, Full HD) rodando em loop). Durante ambos os testes, as funções de economia de energia são desativadas e o brilho do display é ajustado para cerca de 150 cd/m². Para realizar o teste de vídeo, os módulos sem fio também são desativados
| Acer Predator Helios 300 PH315-53-77N5 i7-10750H, GeForce RTX 2060 Mobile, 58.7 Wh | Acer Predator Helios 300 PH315-52-79TY i7-9750H, GeForce GTX 1660 Ti Mobile, 58.75 Wh | Dell G5 15 SE 5505 P89F R7 4800H, Radeon RX 5600M, 51 Wh | Aorus 5 KB i7-10750H, GeForce RTX 2060 Mobile, 48.96 Wh | Schenker XMG Core 15 GK5NR0O R7 4800H, GeForce RTX 2060 Mobile, 62 Wh | Asus TUF Gaming A15 FA506IV-HN172 R7 4800H, GeForce RTX 2060 Mobile, 48 Wh | Média da turma Gaming | |
|---|---|---|---|---|---|---|---|
| Duração da bateria | -38% | 8% | -18% | -1% | 7% | 16% | |
| Reader / Idle (h) | 10.4 | 5 -52% | 11.2 8% | 9 -13% | 7.8 -25% | 9.8 -6% | 8.27 ? -20% |
| H.264 (h) | 5.6 | 3.4 -39% | 6.2 11% | 5.4 -4% | 8.32 ? 49% | ||
| WiFi v1.3 (h) | 4.7 | 3.5 -26% | 6.2 32% | 4.8 2% | 5.9 26% | 6.2 32% | 7.11 ? 51% |
| Load (h) | 1.8 | 1.2 -33% | 1.5 -17% | 1 -44% | 1.5 -17% | 1.9 6% | 1.502 ? -17% |
Pro
Contra
Veredicto
O laptop para jogos da Acer traz todos os jogos mais recentes suavemente para a tela, graças aoNúcleo i7-10750H processador e o GeForce RTX 2060núcleo gráfico. Resolução Full HD e configurações de alta a máxima qualidade geralmente podem ser usadas aqui. O desempenho da GPU pode ser aumentado, se necessário
O Acer Predator Helios 300 PH315-53 é um laptop para jogos em grande parte bem redondo que também oferece alguma margem de manobra.
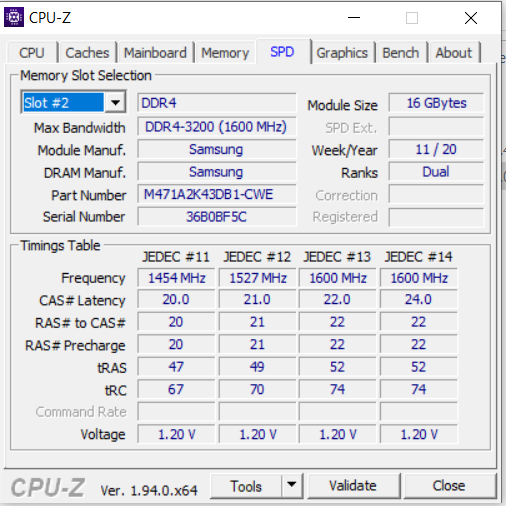
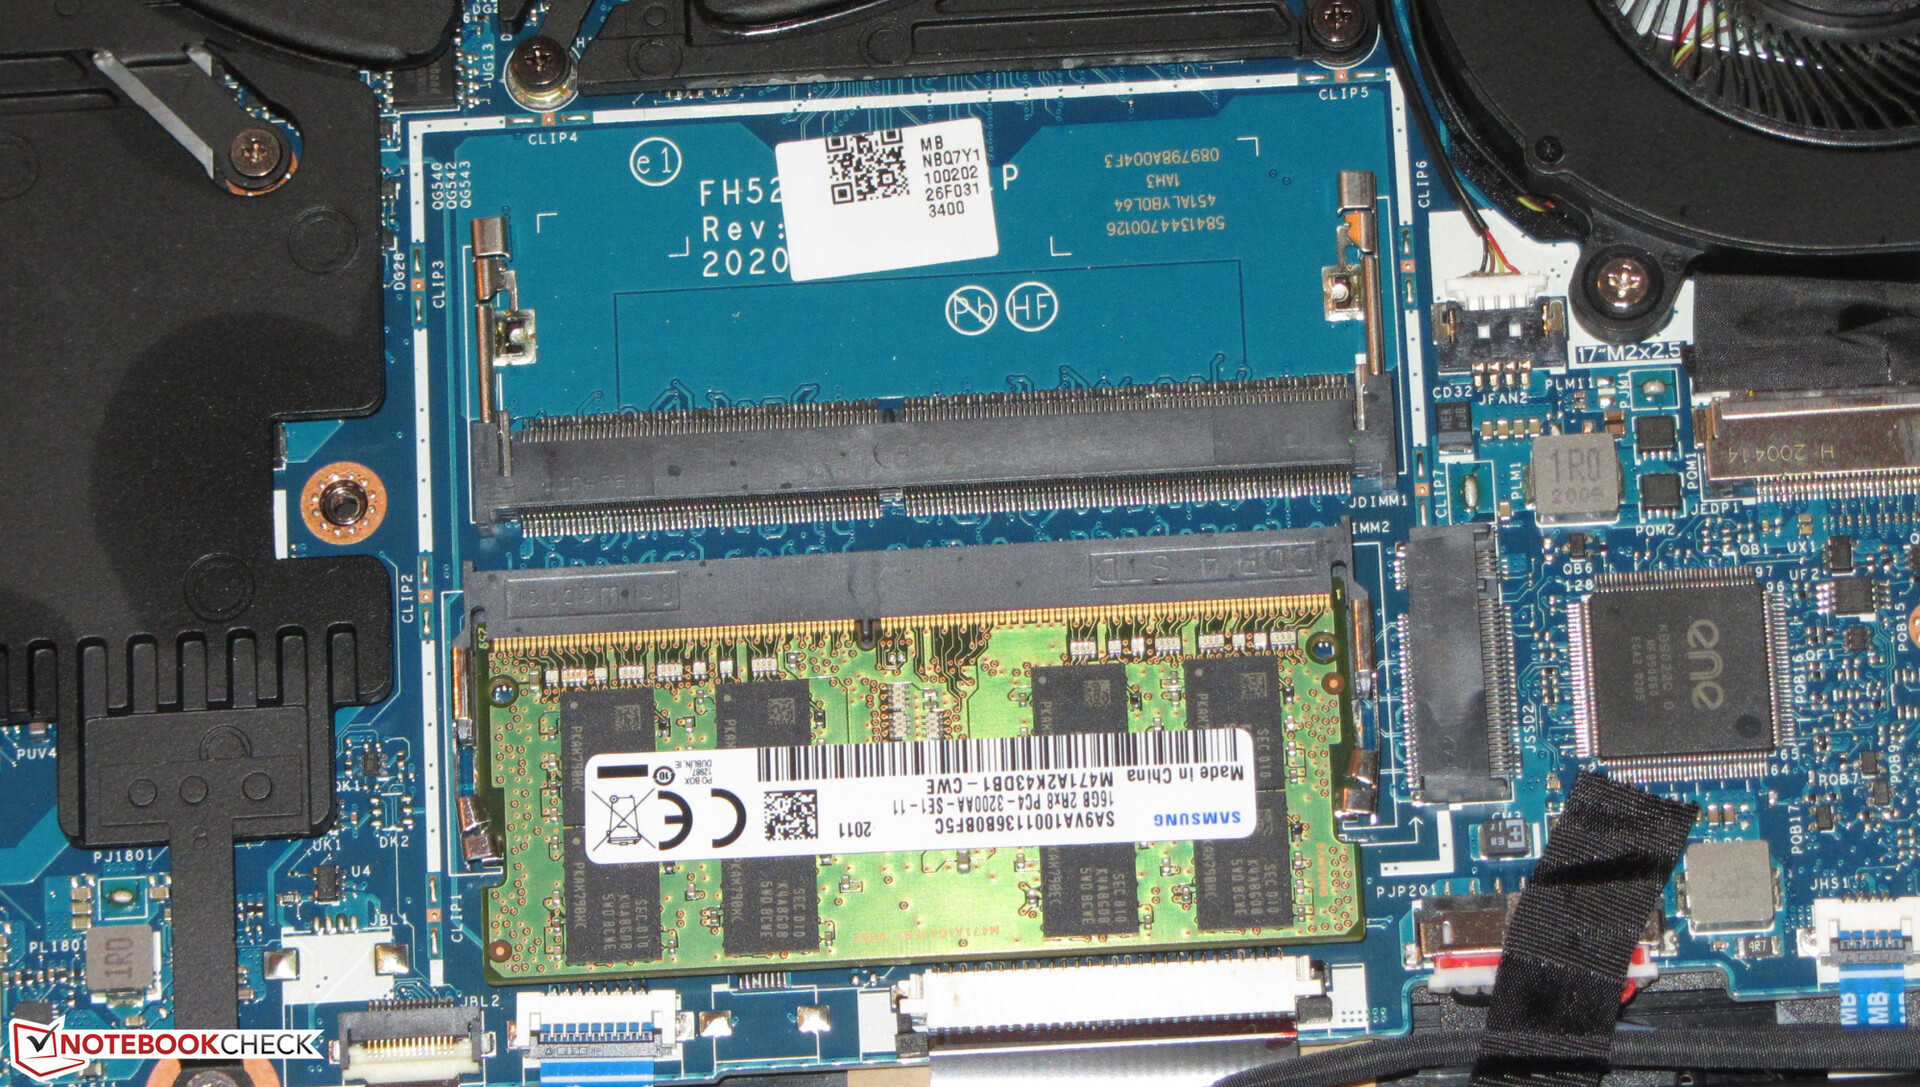
O hardware é suportado por 16 GB de RAM (1x 16 GB, modo monocanal). O laptop pode e deve ser atualizado com um segundo módulo de memória a fim de ativar o modo de duplo canal. Isto causa um leve aumento no desempenho. A capacidade de espaço de armazenamento (512 GB, NVMe SSD) não é muito grande para um laptop para jogos. Um segundo SSD NVMe poderia ser instalado. O Predator também suporta RAID 0
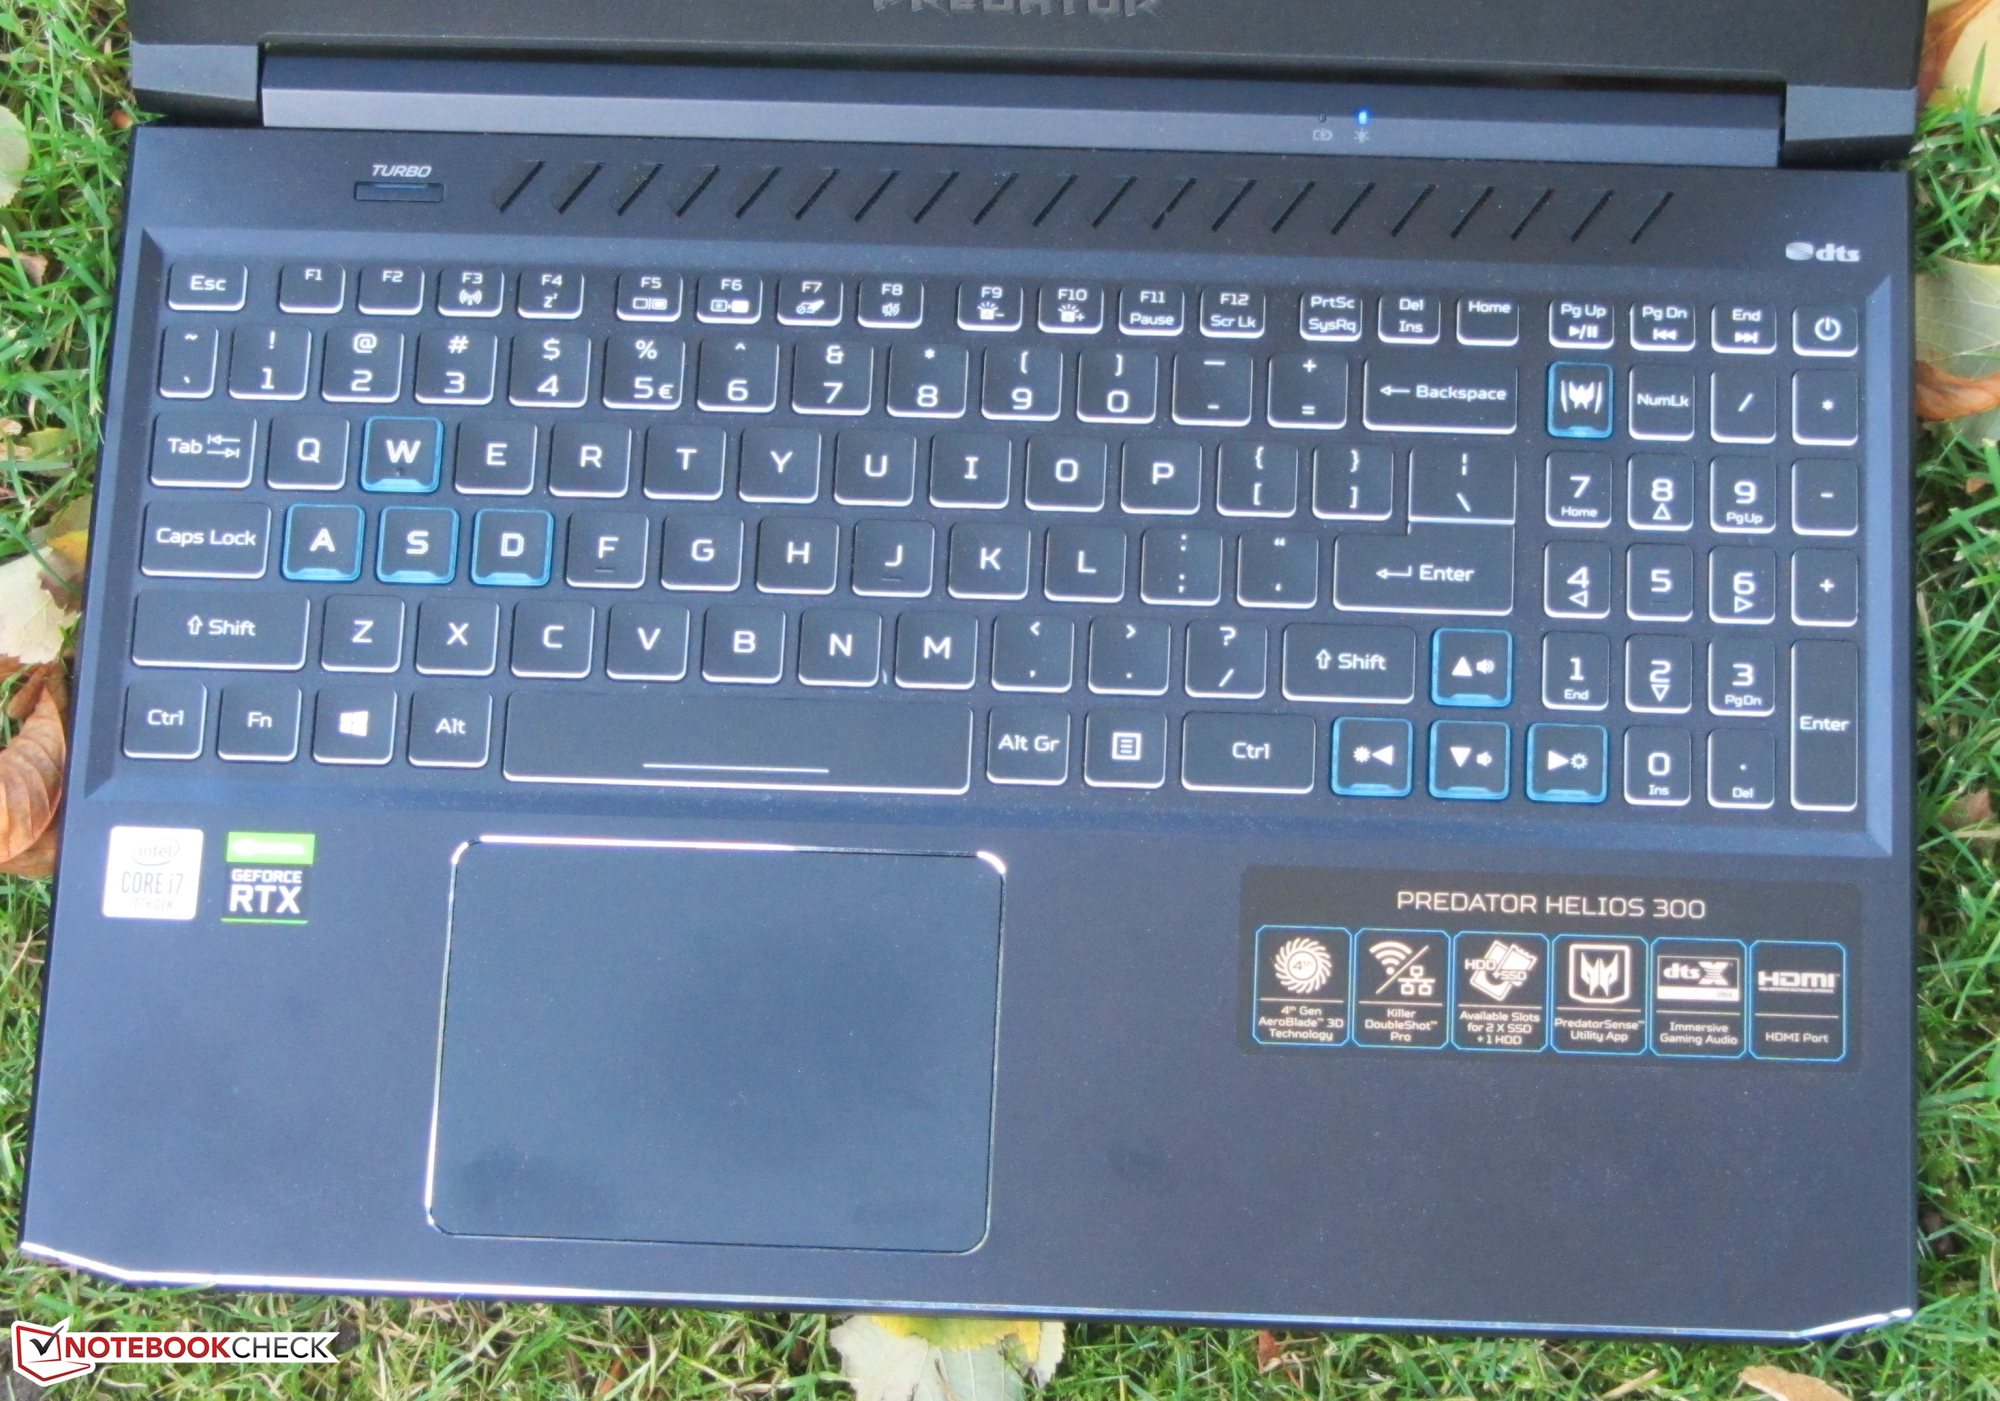
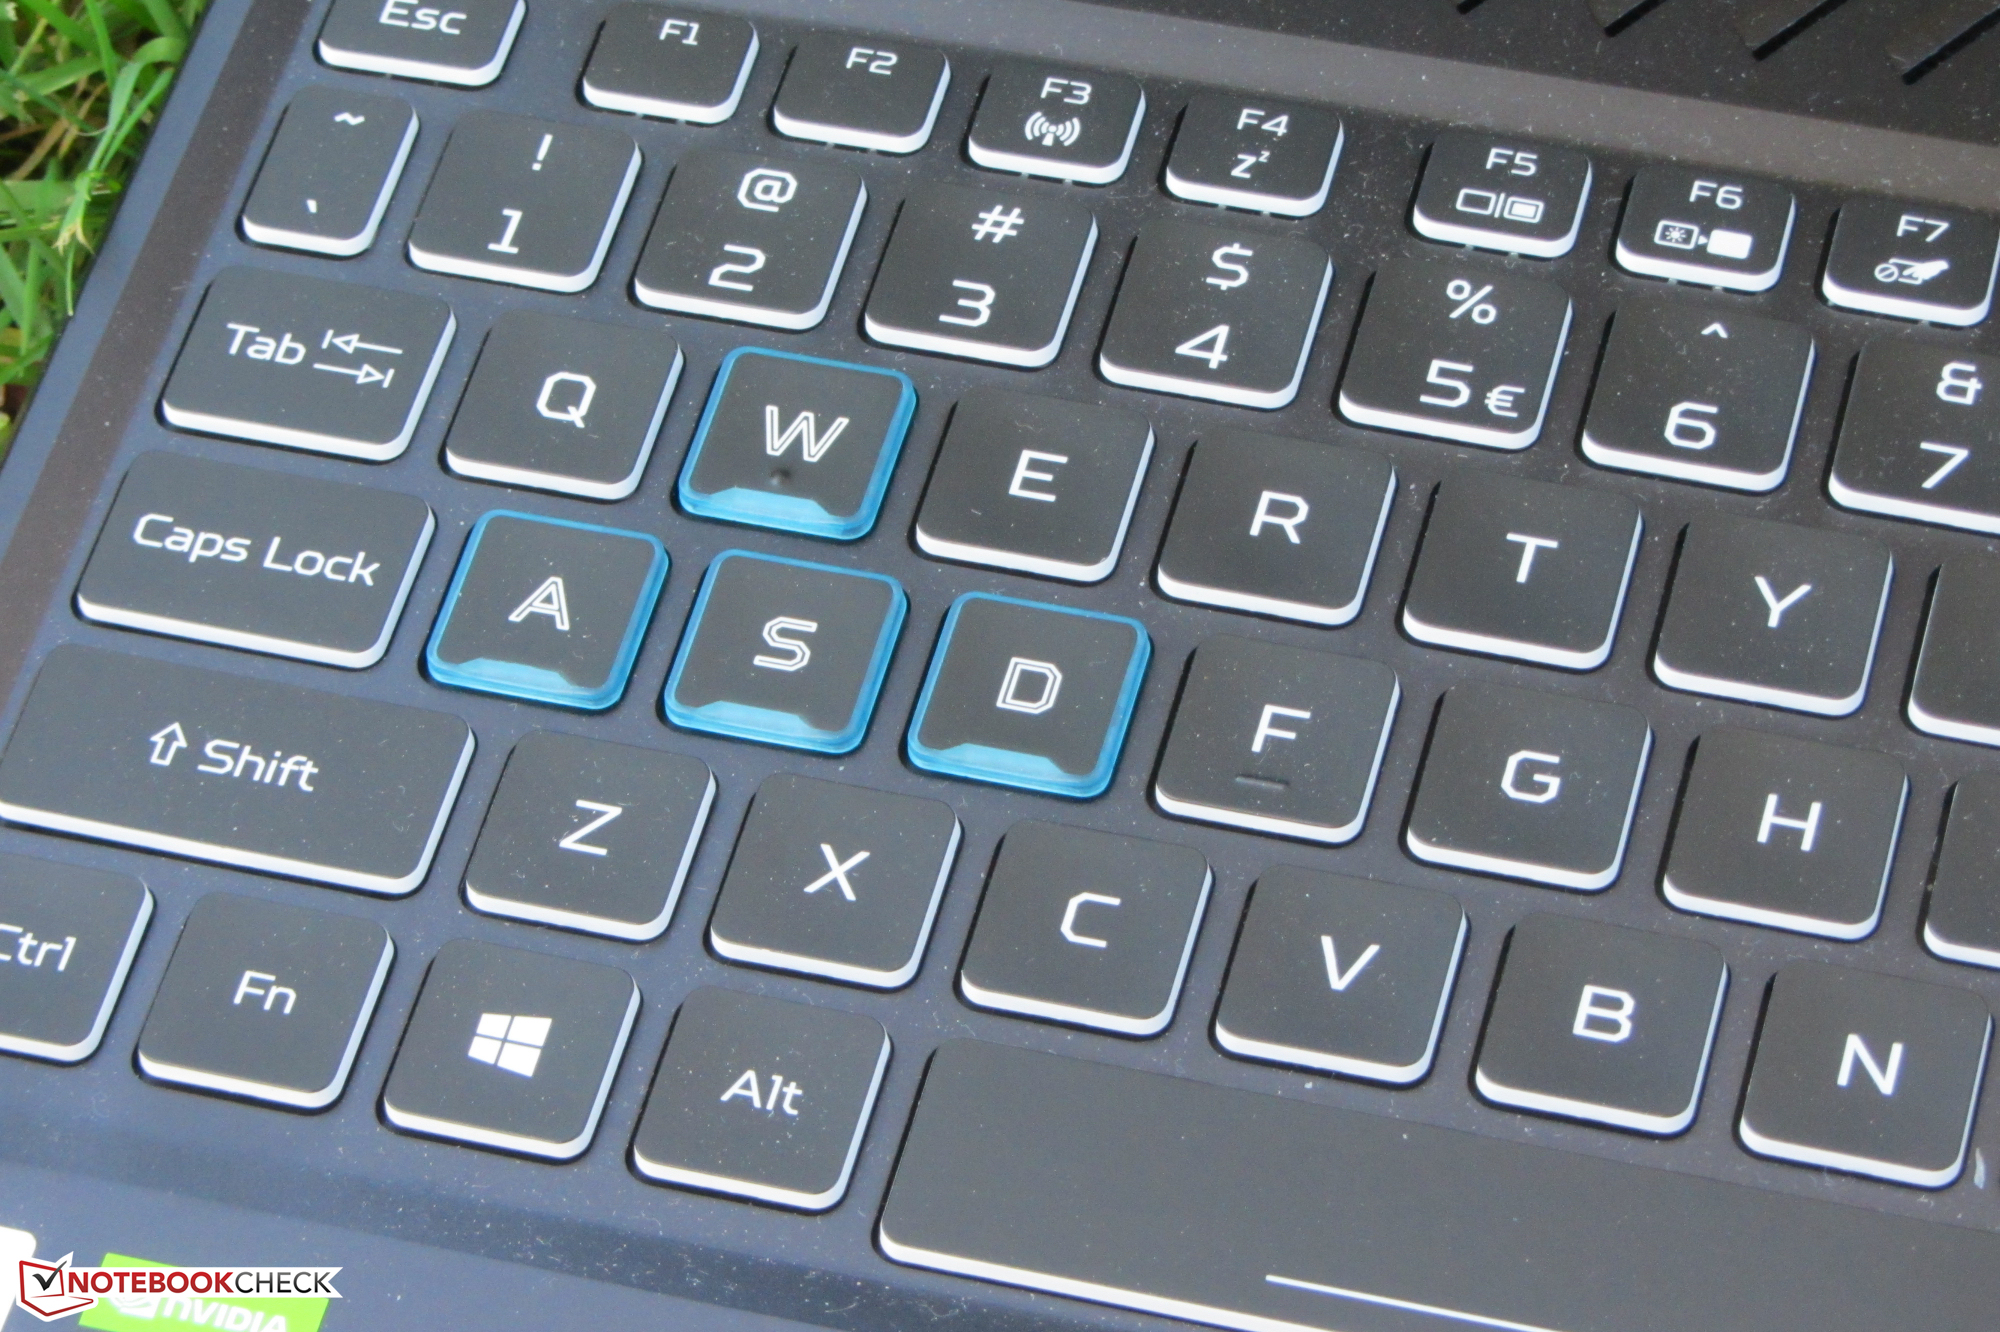
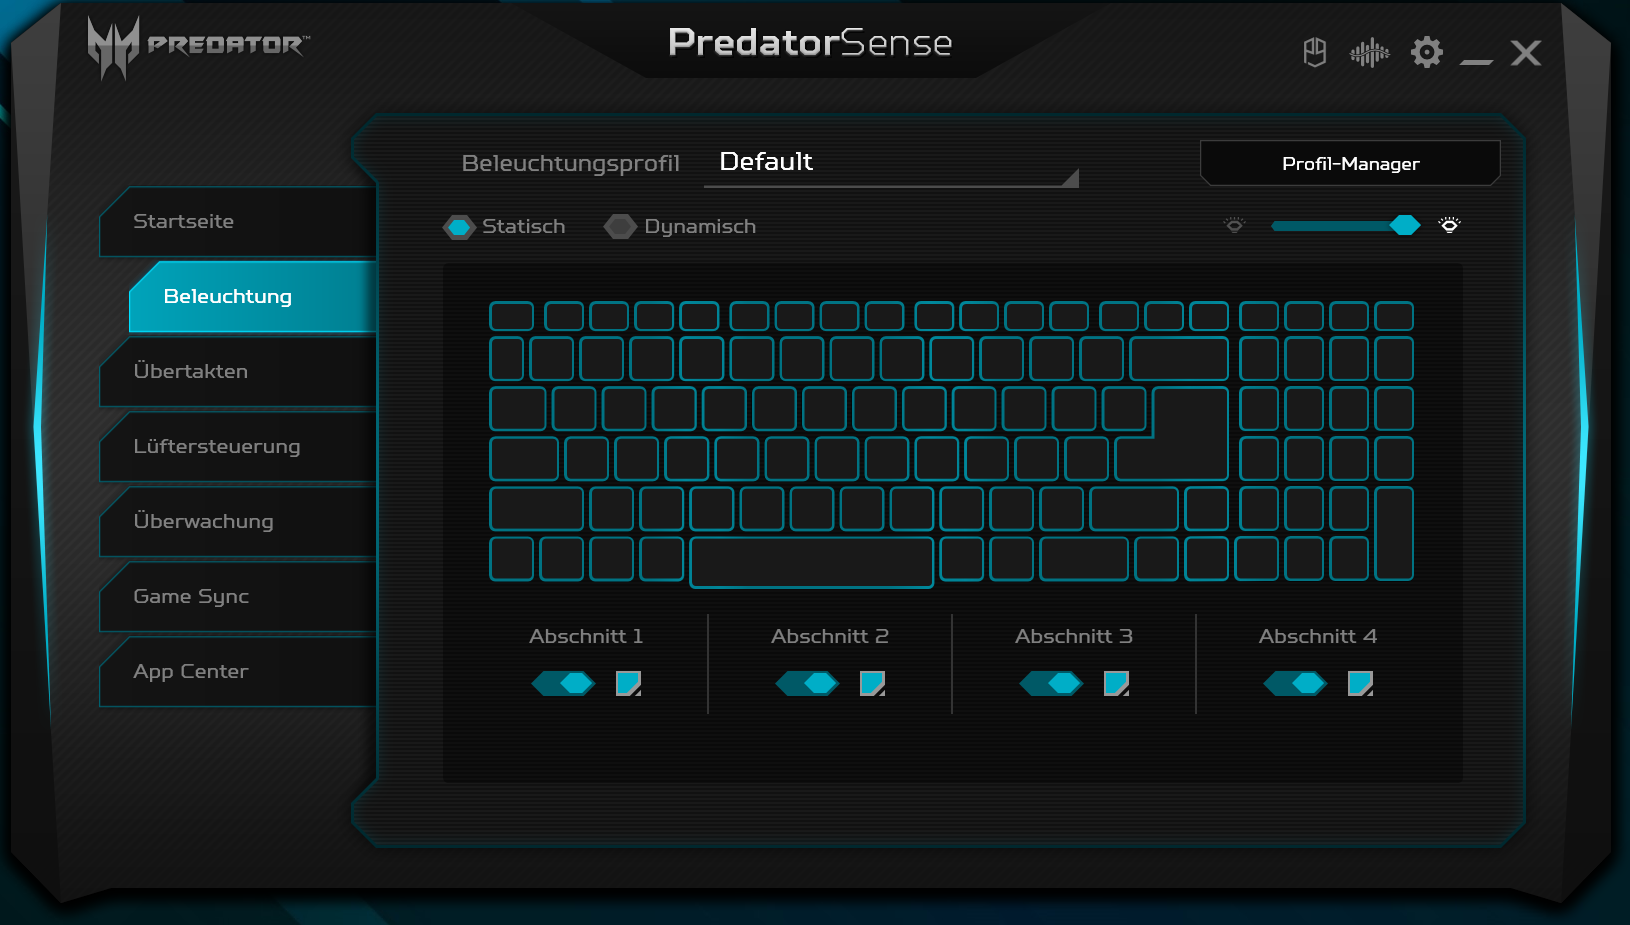
A tela (Full HD, IPS, 144 Hz) oferece ângulos de visualização estáveis, superfície fosca, bom contraste, tempos de resposta rápidos e reprodução decente de cores. O brilho máximo deve ser maior, no entanto. O teclado (retroiluminado) provou ser adequado para o uso diário. A vida útil da bateria é aceitável. Além disso, o Helios não tem uma porta Thunderbolt 3. Há apenas uma porta USB tipo C 3.2 Gen 2, e não suporta nem DisplayPort nem Power Delivery
O Predator causou uma boa impressão em princípio. Entretanto, quando se trata de memória e armazenamento, nossa variante de configuração não está equipada de forma ideal. Pode haver custos de acompanhamento para um segundo módulo de memória ou um segundo SSD NVMe. Se você estiver fundamentalmente interessado no Predator, recomendamos a compra de uma versão mais bem equipada.
Acer Predator Helios 300 PH315-53-77N5
- 10/30/2020 v7 (old)
Sascha Mölck
Price comparison

