Notebookcheck Logo

Revisão do Gigabyte Aero 17 HDR YD laptop: 4K HDR atende a RTX 3080
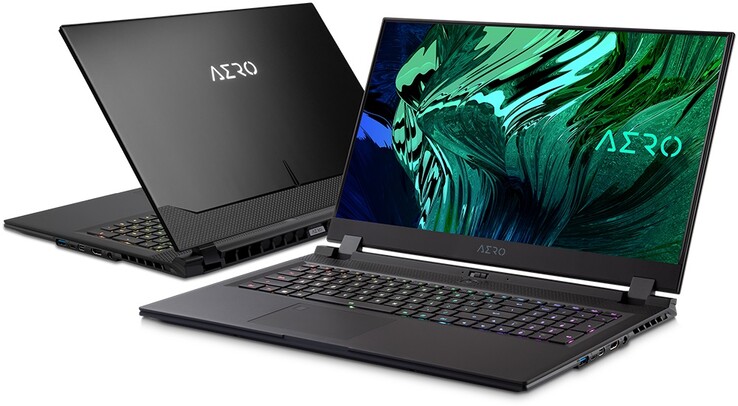
Octa-core Tiger Lake CPU. O Aero 17 HDR YD não só vem com uma tela de 4K compatível com HDR, mas também é executado por um Intel Core i9-11980HK. Nosso teste mostrará o que isto pode fazer em combinação com o RTX 3080 incorporado.
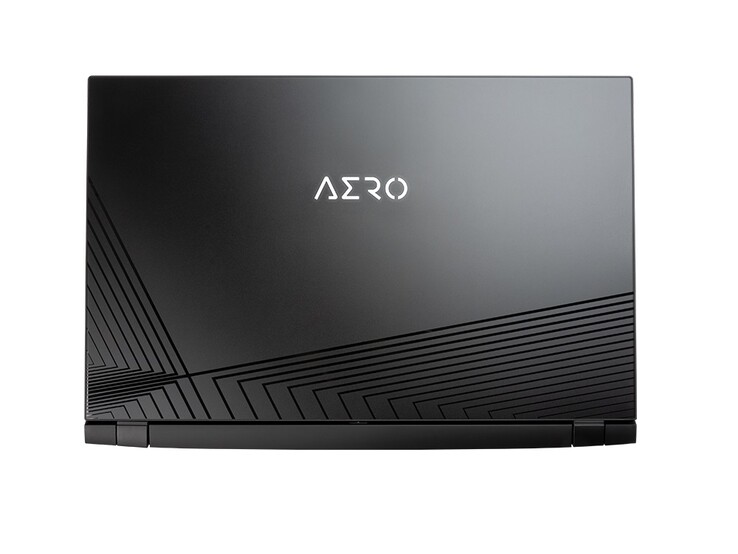
Gigabyte Aero 17 HDR YD

Em comparação com oAero 17 HDR YCtestamos em janeiro, na folha de especificações somente a CPU e a memória de trabalho são alteradas. O Aero 17 HRD YD é executado por um Intel Core i9-11980HKque é acompanhada por 32 GB de memória de trabalho. O sistema é instalado em um SSD de 512 GB da Samsung, e um segundo SSD de 1 TB está disponível para armazenamento de maiores quantidades de dados. Um Nvidia GeForce RTX 3080é responsável pela exibição do conteúdo da imagem.

Esta configuração custa cerca de 3900 Euros (~$4751), e nós a comparamos com os dispositivos concorrentes listados abaixo. Abaixo de cada uma das seções, você também pode adicionar mais cadernos à comparação a partir de nosso banco de dados. Como não mudou muito visualmente ou em termos do equipamento, nos referimos a nossas revisões do Aero 17 XA HDRe Aero 17 HDR YCpara uma descrição mais detalhada destas seções

Gigabyte Aero 17 HDR YD (Aero 17 Serie)
Processador
Intel Core i9-11980HK 8 x 3.3 - 5 GHz, 109 W PL2 / Short Burst, 70 W PL1 / Sustained, Tiger Lake-HK
Placa gráfica
NVIDIA GeForce RTX 3080 Laptop GPU - 16 GB VRAM, Análises do: 1245 MHz, Memoría: 1500 MHz, 105 W TDP, NVIDIA 462.35, Intel UHD Graphics Xe 750 32EUs
Memória
32 GB 
, dual-channel
Pantalha
17.30 polegadas 16:9, 3840 x 2160 pixel 255 PPI, AU Optronics AUO329B, IPS, Brilhante: não, HDR, 60 Hz
placa mãe
Intel HM570
Disco rígido
Samsung PM9A1 MZVL2512HCJQ, 512 GB 
, + 1 TB Phison ESR01TBTLCG-EAC-4
Placa de Som
Intel Tiger Lake-U/Y PCH-LP - cAVS (Audio, Voice, Speech)
Conexões
3 USB 3.0, 1 USB 4.0 40 Gbps, 1 Thunderbolt, USB-C Power Delivery (PD), 1 HDMI, 2 DisplayPort, Conexões Audio: 1x headphone, 1x microphone, Card Reader: SD UHS-II, 1 Leitor de Impressões Digitais
Funcionamento em rede
Realtek RTL8125 2.5GBe Family Ethernet Controller (10/100/1000/2500MBit/s), Intel Wi-Fi 6 AX200 (a/b/g/n = Wi-Fi 4/ac = Wi-Fi 5/ax = Wi-Fi 6/), Bluetooth 5.2
Tamanho
altura x largura x profundidade (em mm): 22 x 396 x 270
Bateria
99 Wh Lítio-Polímero
Sistema Operativo
Microsoft Windows 10 Pro 64 Bit
Camera
Webcam: 0.9 MP, 16:9 (1280x720)
Características adicionais
Alto falantes: 2x 2W, Teclado: chiclet, Iluminação do Teclado: sim, 24 Meses Garantia
peso
2.766 kg, Suprimento de energia: 726 g
Preço
3900 Euro
Note: The manufacturer may use components from different suppliers including display panels, drives or memory sticks with similar specifications.


Possible Competitors for Comparison

Rating
Date
Model
Weight
Height
Size
Resolution
Best Price
88 %
05/2021
Gigabyte Aero 17 HDR YD
i9-11980HK, GeForce RTX 3080 Laptop GPU
2.8 kg22 mm17.30"3840x2160
87.6 %
01/2021
Gigabyte Aero 17 HDR YC
i9-10980HK, GeForce RTX 3080 Laptop GPU
2.8 kg21.4 mm17.30"3840x2160
87.8 %
02/2021
Razer Blade Pro 17 2021 (QHD Touch)
i7-10875H, GeForce RTX 3080 Laptop GPU
3 kg19.9 mm17.30"3840x2160
85.3 %
04/2021
Alienware m17 R4
i9-10980HK, GeForce RTX 3080 Laptop GPU
3 kg22 mm17.30"1920x1080
Gigabyte Aero 17 HDR YD

Size Comparison

399.8 mm 294.3 mm 22 mm 3 kg396 mm 270 mm 22 mm 2.8 kg396 mm 270 mm 21.4 mm 2.8 kg395 mm 260 mm 19.9 mm 3 kg297 mm 210 mm 1 mm 5.7 g

Conexões - O Aero 17 HDR com Thunderbolt 4 e WLAN rápido

Lado esquerdo: 2,5 GBit LAN, leitor de cartões SD UHS-II, 1x USB-A 3.2 Gen1, microfone, fones de ouvido, 1x USB-A 3.2 Gen1
Lado direito: 1x USB-A 3.2 Gen1, 1x Thunderbolt 4, Mini-DisplayPort 1.4, HDMI 2.1, alimentação

Leitor de cartões SD

SD Card Reader
average JPG Copy Test (av. of 3 runs)
Razer Blade Pro 17 2021 (QHD Touch)
  (Toshiba Exceria Pro SDXC 64 GB UHS-II)
199.6 MB/s +8%
Gigabyte Aero 17 HDR YC
  (Toshiba Exceria Pro SDXC 64 GB UHS-II)
194 MB/s +5%
Alienware m17 R4
  (AV PRO microSD 128 GB V60)
190 MB/s +3%
Gigabyte Aero 17 HDR YD
  (AV PRO microSD 128 GB V60)
184 MB/s
Average of class Gaming
  (19 - 202, n=100, last 2 years)
98.4 MB/s -47%
maximum AS SSD Seq Read Test (1GB)
Alienware m17 R4
  (AV PRO microSD 128 GB V60)
239 MB/s +27%
Gigabyte Aero 17 HDR YC
  (Toshiba Exceria Pro SDXC 64 GB UHS-II)
213 MB/s +13%
Razer Blade Pro 17 2021 (QHD Touch)
  (Toshiba Exceria Pro SDXC 64 GB UHS-II)
191.6 MB/s +2%
Gigabyte Aero 17 HDR YD
  (AV PRO microSD 128 GB V60)
188 MB/s
Average of class Gaming
  (25.8 - 269, n=94, last 2 years)
121.3 MB/s -35%

Comunicação

Networking
iperf3 transmit AX12
Gigabyte Aero 17 HDR YD
Intel Wi-Fi 6 AX200
1588 (1508min - 1656max) MBit/s
Alienware m17 R4
Intel Killer Wi-Fi 6 AX1650w
1550 MBit/s -2%
Razer Blade Pro 17 2021 (QHD Touch)
Intel Wi-Fi 6 AX201
1539 (842min - 1691max) MBit/s -3%
Gigabyte Aero 17 HDR YC
Intel Wi-Fi 6 AX200
1190 MBit/s -25%
Average of class Gaming
  (885 - 1412, n=4, last 2 years)
1139 MBit/s -28%
Average Intel Wi-Fi 6 AX200
  (447 - 1645, n=127)
1104 MBit/s -30%
iperf3 receive AX12
Alienware m17 R4
Intel Killer Wi-Fi 6 AX1650w
1600 MBit/s +39%
Razer Blade Pro 17 2021 (QHD Touch)
Intel Wi-Fi 6 AX201
1495 (788min - 1534max) MBit/s +30%
Average of class Gaming
  (881 - 1700, n=4, last 2 years)
1379 MBit/s +20%
Gigabyte Aero 17 HDR YC
Intel Wi-Fi 6 AX200
1340 MBit/s +16%
Average Intel Wi-Fi 6 AX200
  (523 - 1684, n=128)
1191 MBit/s +3%
Gigabyte Aero 17 HDR YD
Intel Wi-Fi 6 AX200
1152 (915min - 1267max) MBit/s
05010015020025030035040045050055060065070075080085090095010001050110011501200125013001350140014501500155016001650Tooltip
Gigabyte Aero 17 HDR YD; iperf3 receive AX12; iperf 3.1.3: Ø1152 (915-1267)
Gigabyte Aero 17 HDR YD; iperf3 transmit AX12; iperf 3.1.3: Ø1588 (1508-1656)

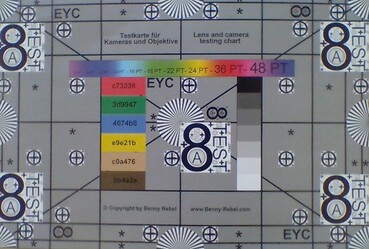
Webcam

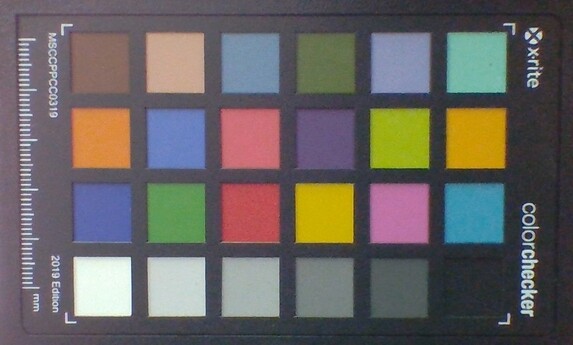
ColorChecker
9.8 ∆E
5.7 ∆E
8.4 ∆E
3.9 ∆E
7.8 ∆E
2.9 ∆E
4 ∆E
14.3 ∆E
6.9 ∆E
9 ∆E
5.3 ∆E
5.4 ∆E
14.6 ∆E
4.1 ∆E
7.9 ∆E
7.3 ∆E
7.9 ∆E
6 ∆E
9 ∆E
6.7 ∆E
6.6 ∆E
6.1 ∆E
5.9 ∆E
4.2 ∆E
ColorChecker Gigabyte Aero 17 HDR YD: 7.06 ∆E min: 2.86 - max: 14.6 ∆E

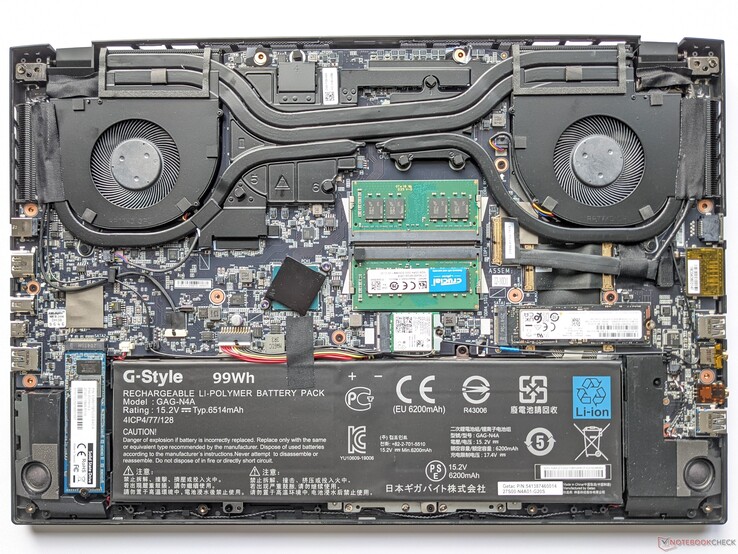
Manutenção

O interior do Gigabyte Aero 17 HDR YD

Dispositivos de entrada - Poderosa iluminação RGB

Você pode encontrar uma descrição detalhada dos dispositivos de entrada na nossa revisão do Gigabyte Aero 17 XA HDR

Gigabyte Aero 17 HDR YD - teclado
Gigabyte Aero 17 HDR YD - ClickPad

Display - Uma imagem muito boa graças ao HDR e 4K

Sangramento da tela
Sangramento da tela

A tela do Aero 17 HDR YD consiste em um painel IPS de 17 polegadas que oferece uma resolução de 3840 x 2160 pixels. Com uma média de 467 cd/m², o brilho máximo é apenas ligeiramente maior do que o do Aero 17 HDR YCe significativamente menor do que no Aero 17 XA HDR. Com 86%, a distribuição de brilho é também a mais baixa em nosso campo de teste.

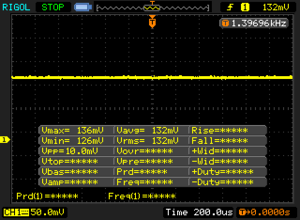
DesdePWMnão é usado para controle de brilho, não deve haver problemas para usuários com olhos sensíveis

493
cd/m²
484
cd/m²
459
cd/m²
481
cd/m²
488
cd/m²
426
cd/m²
475
cd/m²
463
cd/m²
434
cd/m²
Distribuição do brilho
AU Optronics AUO329B tested with X-Rite i1Pro 2
Máximo: 493 cd/m² (Nits) Médio: 467 cd/m² Minimum: 3 cd/m²
iluminação: 86 %
iluminação com acumulador: 488 cd/m²
Contraste: 1479:1 (Preto: 0.33 cd/m²)
ΔE Color 1.23 | 0.5-29.43 Ø5, calibrated: 0.77
ΔE Greyscale 1.5 | 0.57-98 Ø5.3
99% sRGB (Argyll 1.6.3 3D)
99% AdobeRGB 1998 (Argyll 1.6.3 3D)
99.6% AdobeRGB 1998 (Argyll 2.2.0 3D)
100% sRGB (Argyll 2.2.0 3D)
86.9% Display P3 (Argyll 2.2.0 3D)
Gamma: 2.169
Gigabyte Aero 17 HDR YD
AU Optronics AUO329B, IPS, 3840x2160, 17.30
Gigabyte Aero 17 HDR YC
AUO B173ZAN03.2 (AUO329B), IPS-Level, 3840x2160, 17.30
Razer Blade Pro 17 2021 (QHD Touch)
AU Optronics B173ZAN03.3, IPS, 3840x2160, 17.30
Alienware m17 R4
AU Optronics AUOEC91, IPS, 1920x1080, 17.30
Display
0%
1%
-16%
Display P3 Coverage
86.9
87.3
0%
88.6
2%
69.8
-20%
sRGB Coverage
100
100
0%
100
0%
99.7
0%
AdobeRGB 1998 Coverage
99.6
99.9
0%
99.9
0%
71.6
-28%
Response Times
3%
63%
70%
Response Time Grey 50% / Grey 80% *
52 ?(25.2, 26.8)
51.6 ?(25.6, 26)
1%
15.2 ?(7.6, 7.6)
71%
13.2 ?(6.4, 6.8)
75%
Response Time Black / White *
26 ?(10, 16)
24.8 ?(10, 14.8)
5%
12 ?(6, 6)
54%
9.2 ?(4.8, 4.4)
65%
PWM Frequency
Screen
-5%
-157%
-9%
Brightness middle
488
458
-6%
407.2
-17%
305
-37%
Brightness
467
446
-4%
403
-14%
301
-36%
Brightness Distribution
86
92
7%
90
5%
93
8%
Black Level *
0.33
0.37
-12%
0.42
-27%
0.19
42%
Contrast
1479
1238
-16%
970
-34%
1605
9%
Colorchecker dE 2000 *
1.23
1.52
-24%
7.25
-489%
1.31
-7%
Colorchecker dE 2000 max. *
2.94
2.51
15%
12.51
-326%
2.32
21%
Colorchecker dE 2000 calibrated *
0.77
0.66
14%
3.62
-370%
0.91
-18%
Greyscale dE 2000 *
1.5
1.9
-27%
8.1
-440%
2.3
-53%
Gamma
2.169 101%
2.145 103%
2.24 98%
2.281 96%
CCT
6614 98%
6534 99%
5925 110%
6449 101%
Color Space (Percent of AdobeRGB 1998)
99
100
1%
88.1
-11%
72
-27%
Color Space (Percent of sRGB)
99
100
1%
100
1%
94
-5%
Total Average (Program / Settings)
-1% / -3%
-31% / -100%
15% / -1%

* ... smaller is better

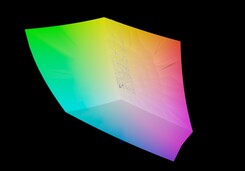
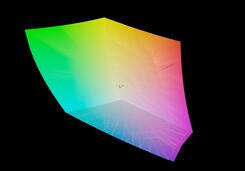
A relação de contraste fica muito boa a 1479:1, e o valor de preto também é apenas ligeiramente elevado a 0,33 cd/m². Além disso, a cobertura do espaço de cor de 99% tanto para os espaços de cor sRGB como para AdobeRGB é excelente. A Gigabyte anuncia a exibição do Aero 17 HDR YD com uma calibração no estado de entrega que foi validada pela Pantone e que pode ser selecionada nos vários modos do Centro de Controle correspondente ao cenário de uso atual.

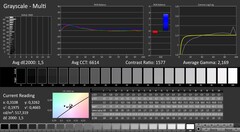
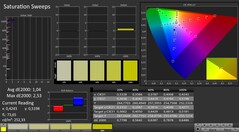
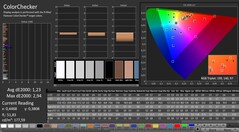
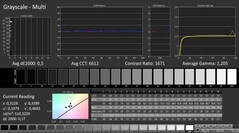
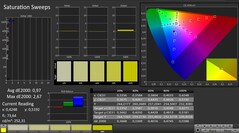
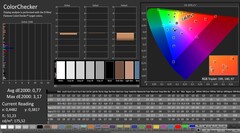
Assim, a análise do CalMAN também mostra um desvio do DeltaE2000 que é correspondentemente baixo. Outra calibração trará apenas uma pequena melhoria de 1,5 para 0,5. Você pode baixar o arquivo ICC correspondente do link no quadro acima, à direita do esquema sobre a distribuição de brilho

CalMAN: Escala de cinza
CalMAN: Saturação
CalMAN: Saturação
CalMAN: ColorChecker
CalMAN: Escala de cinza (calibrada)
CalMAN: Saturação (calibrada)
CalMAN: ColorChecker (calibrado)
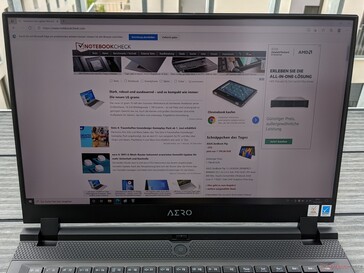
Gigabyte Aero 17 HDR YD ao ar livre em um dia nublado

O brilho da tela do Aero 17 HDR YD é suficiente para mostrar o conteúdo da imagem facilmente legível em dias nublados. Embora a tela mate evite reflexos sob a luz direta do sol, a leitura do conteúdo da tela será então ainda mais difícil

Gigabyte Aero 17 HDR YD vs sRGB (99%)
Grelha subpixel
Grelha subpixel
Gigabyte Aero 17 HDR YD vs AdobeRGB (99%)

Display Response Times

Display response times show how fast the screen is able to change from one color to the next. Slow response times can lead to afterimages and can cause moving objects to appear blurry (ghosting). Gamers of fast-paced 3D titles should pay special attention to fast response times.
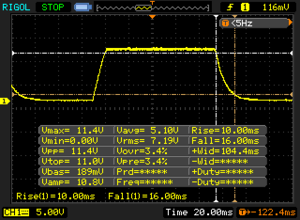
       Response Time Black to White
26 ms ... rise ↗ and fall ↘ combined↗ 10 ms rise
↘ 16 ms fall
The screen shows relatively slow response rates in our tests and may be too slow for gamers.
In comparison, all tested devices range from 0.1 (minimum) to 240 (maximum) ms. » 57 % of all devices are better.
This means that the measured response time is worse than the average of all tested devices (21.5 ms).
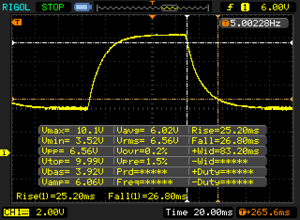
       Response Time 50% Grey to 80% Grey
52 ms ... rise ↗ and fall ↘ combined↗ 25.2 ms rise
↘ 26.8 ms fall
The screen shows slow response rates in our tests and will be unsatisfactory for gamers.
In comparison, all tested devices range from 0.2 (minimum) to 636 (maximum) ms. » 87 % of all devices are better.
This means that the measured response time is worse than the average of all tested devices (33.7 ms).

Screen Flickering / PWM (Pulse-Width Modulation)

To dim the screen, some notebooks will simply cycle the backlight on and off in rapid succession - a method called Pulse Width Modulation (PWM) . This cycling frequency should ideally be undetectable to the human eye. If said frequency is too low, users with sensitive eyes may experience strain or headaches or even notice the flickering altogether.
Screen flickering / PWM not detected

In comparison: 53 % of all tested devices do not use PWM to dim the display. If PWM was detected, an average of 17909 (minimum: 5 - maximum: 3846000) Hz was measured.

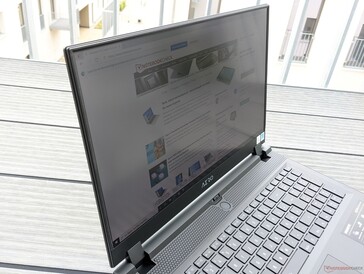
Os ângulos de visão da tela Aero 17 HDR YD são muito estáveis, e o conteúdo pode ser visto de quase qualquer ângulo sem que as cores ou a imagem fiquem distorcidas

Estabilidade dos ângulos de visão

Desempenho - Aumento do desempenho da CPU

Com o Aero 17 HDR YD, Gigabyte tem como alvo os criadores de conteúdo e os jogadores que precisam de um laptop potente com uma tela muito boa. Além da configuração testada aqui, o HDR YD também está disponível com um Intel Core i7-11800He Nvidia GeForce RTX 3080com 8 GB de armazenamento de vídeo. Como "Aero 17 HDR XD", o laptop vem com um Intel Core i7-11800He Nvidia GeForce RTX 3070com 8 GB de armazenamento de vídeo.

Todas as seguintes referências foram executadas com a configuração do sistema "Turbo"

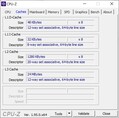
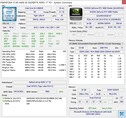
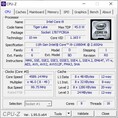
Gigabyte Aero 17 HDR YD - CPUz
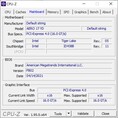
Gigabyte Aero 17 HDR YD - HWInfo
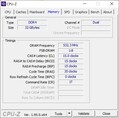
Gigabyte Aero 17 HDR YD - GPUz

Processador

OIntel Core i9-11980HKusado aqui é um processador octa-core, que pode operar em até 16 fios simultaneamente. As velocidades do relógio caem entre 2,6 e 5 GHz, com o TDP configurado desempenhando um papel importante na determinação do desempenho. Gigabyte configurou isto como um PL1 de 70 watts e um PL2 de 109 watts. Com isto, o máximo possível de 65 watts é mesmo ligeiramente excedido, e o Aero 17 HDR YD é capaz de liderar nosso campo de teste nos benchmarks.

Em nosso teste de carga constante Cinebech R15, a CPU também é capaz de manter seu desempenho por um período de tempo mais longo, e é capaz de se recuperar rapidamente de quedas menores de cerca de 9% no desempenho

01052103154205256307358409451050115512601365147015751680178518901995Tooltip
Gigabyte Aero 17 HDR YD Intel Core i9-11980HK: Ø2023 (1924.65-2067.29)
Gigabyte Aero 17 HDR YC Intel Core i9-10980HK: Ø1468 (1385.62-1761.11)
Razer Blade Pro 17 2021 (QHD Touch) Intel Core i7-10875H: Ø1482 (1469.35-1489.04)
Alienware m17 R4 Intel Core i9-10980HK: Ø1833 (1809.95-1853.31)
Cinebench R20
CPU (Single Core)
Average of class Gaming
  (169 - 855, n=227, last 2 years)
698 Points +19%
Average Intel Core i9-11980HK
  (572 - 622, n=7)
593 Points +1%
Gigabyte Aero 17 HDR YD
Intel Core i9-11980HK
585 Points
Gigabyte Aero 17 HDR YC
Intel Core i9-10980HK
507 Points -13%
Alienware m17 R4
Intel Core i9-10980HK
506 Points -14%
Razer Blade Pro 17 2021 (QHD Touch)
Intel Core i7-10875H
490 Points -16%
CPU (Multi Core)
Average of class Gaming
  (930 - 13769, n=227, last 2 years)
7419 Points +41%
Gigabyte Aero 17 HDR YD
Intel Core i9-11980HK
5256 Points
Average Intel Core i9-11980HK
  (3779 - 5256, n=8)
4578 Points -13%
Alienware m17 R4
Intel Core i9-10980HK
4456 Points -15%
Razer Blade Pro 17 2021 (QHD Touch)
Intel Core i7-10875H
3531 Points -33%
Gigabyte Aero 17 HDR YC
Intel Core i9-10980HK
3526 Points -33%
Cinebench R15
CPU Single 64Bit
Average of class Gaming
  (79.2 - 318, n=230, last 2 years)
268 Points +17%
Average Intel Core i9-11980HK
  (224 - 244, n=6)
231 Points 0%
Gigabyte Aero 17 HDR YD
Intel Core i9-11980HK
230 Points
Gigabyte Aero 17 HDR YC
Intel Core i9-10980HK
211 Points -8%
Alienware m17 R4
Intel Core i9-10980HK
209 Points -9%
Razer Blade Pro 17 2021 (QHD Touch)
Intel Core i7-10875H
203 Points -12%
CPU Multi 64Bit
Average of class Gaming
  (400 - 5663, n=231, last 2 years)
3089 Points +49%
Gigabyte Aero 17 HDR YD
Intel Core i9-11980HK
2067 (1924.65min - 2067.29max) Points
Average Intel Core i9-11980HK
  (1696 - 2287, n=7)
2055 Points -1%
Alienware m17 R4
Intel Core i9-10980HK
1853 (1809.95min - 1853.31max) Points -10%
Gigabyte Aero 17 HDR YC
Intel Core i9-10980HK
1761 (1385.62min - 1761.11max) Points -15%
Razer Blade Pro 17 2021 (QHD Touch)
Intel Core i7-10875H
1489 (1469.35min - 1489.04max) Points -28%
Blender - v2.79 BMW27 CPU
Razer Blade Pro 17 2021 (QHD Touch)
Intel Core i7-10875H
302 Seconds * -30%
Gigabyte Aero 17 HDR YC
Intel Core i9-10980HK
299 Seconds * -28%
Average Intel Core i9-11980HK
  (231 - 284, n=4)
257 Seconds * -10%
Alienware m17 R4
Intel Core i9-10980HK
247 Seconds * -6%
Gigabyte Aero 17 HDR YD
Intel Core i9-11980HK
233 Seconds *
Average of class Gaming
  (87 - 1259, n=225, last 2 years)
199.8 Seconds * +14%
7-Zip 18.03
7z b 4 -mmt1
Average of class Gaming
  (2685 - 7581, n=226, last 2 years)
6122 MIPS +8%
Gigabyte Aero 17 HDR YD
Intel Core i9-11980HK
5668 MIPS
Average Intel Core i9-11980HK
  (5428 - 5735, n=5)
5643 MIPS 0%
Alienware m17 R4
Intel Core i9-10980HK
5463 MIPS -4%
Gigabyte Aero 17 HDR YC
Intel Core i9-10980HK
5444 MIPS -4%
Razer Blade Pro 17 2021 (QHD Touch)
Intel Core i7-10875H
5338 MIPS -6%
7z b 4
Average of class Gaming
  (11386 - 140932, n=226, last 2 years)
76978 MIPS +36%
Gigabyte Aero 17 HDR YD
Intel Core i9-11980HK
56759 MIPS
Average Intel Core i9-11980HK
  (45226 - 56759, n=5)
51899 MIPS -9%
Alienware m17 R4
Intel Core i9-10980HK
49275 MIPS -13%
Razer Blade Pro 17 2021 (QHD Touch)
Intel Core i7-10875H
45258 MIPS -20%
Gigabyte Aero 17 HDR YC
Intel Core i9-10980HK
44485 MIPS -22%
Geekbench 5.5
Single-Core
Average of class Gaming
  (158 - 2210, n=231, last 2 years)
1808 Points +12%
Average Intel Core i9-11980HK
  (1561 - 1679, n=5)
1625 Points +1%
Gigabyte Aero 17 HDR YD
Intel Core i9-11980HK
1613 Points
Alienware m17 R4
Intel Core i9-10980HK
1351 Points -16%
Gigabyte Aero 17 HDR YC
Intel Core i9-10980HK
1344 Points -17%
Razer Blade Pro 17 2021 (QHD Touch)
Intel Core i7-10875H
1315 Points -18%
Multi-Core
Average of class Gaming
  (1946 - 22200, n=231, last 2 years)
13567 Points +37%
Gigabyte Aero 17 HDR YD
Intel Core i9-11980HK
9884 Points
Average Intel Core i9-11980HK
  (8786 - 10081, n=5)
9523 Points -4%
Gigabyte Aero 17 HDR YC
Intel Core i9-10980HK
8176 Points -17%
Alienware m17 R4
Intel Core i9-10980HK
8135 Points -18%
Razer Blade Pro 17 2021 (QHD Touch)
Intel Core i7-10875H
8134 Points -18%
HWBOT x265 Benchmark v2.2 - 4k Preset
Average of class Gaming
  (3 - 37.6, n=229, last 2 years)
21.2 fps +34%
Gigabyte Aero 17 HDR YD
Intel Core i9-11980HK
15.8 fps
Average Intel Core i9-11980HK
  (13.1 - 16.3, n=5)
14.9 fps -6%
Alienware m17 R4
Intel Core i9-10980HK
14.3 fps -9%
Razer Blade Pro 17 2021 (QHD Touch)
Intel Core i7-10875H
12.1 fps -23%
Gigabyte Aero 17 HDR YC
Intel Core i9-10980HK
12 fps -24%
LibreOffice - 20 Documents To PDF
Alienware m17 R4
Intel Core i9-10980HK
51.5 s * -25%
Gigabyte Aero 17 HDR YC
Intel Core i9-10980HK
51.4 s * -25%
Average of class Gaming
  (32.8 - 332, n=223, last 2 years)
49.2 s * -20%
Razer Blade Pro 17 2021 (QHD Touch)
Intel Core i7-10875H
45.3 s * -10%
Average Intel Core i9-11980HK
  (40.6 - 47.7, n=5)
43.1 s * -5%
Gigabyte Aero 17 HDR YD
Intel Core i9-11980HK
41.1 s *
R Benchmark 2.5 - Overall mean
Razer Blade Pro 17 2021 (QHD Touch)
Intel Core i7-10875H
0.587 sec * -6%
Alienware m17 R4
Intel Core i9-10980HK
0.574 sec * -4%
Gigabyte Aero 17 HDR YC
Intel Core i9-10980HK
0.561 sec * -2%
Gigabyte Aero 17 HDR YD
Intel Core i9-11980HK
0.552 sec *
Average Intel Core i9-11980HK
  (0.545 - 0.565, n=5)
0.552 sec * -0%
Average of class Gaming
  (0.3609 - 4.47, n=226, last 2 years)
0.4699 sec * +15%

* ... smaller is better

Cinebench R15 CPU Multi 64Bit
2067 Points
Cinebench R15 OpenGL 64Bit
200 fps
Cinebench R15 Ref. Match 64Bit
99.6 %
Cinebench R15 CPU Single 64Bit
230 Points
Ajuda

Desempenho do sistema

No teste PCMark 10 para avaliar o desempenho do sistema, o Gigabyte Aero 17 HDR YD coloca em primeiro lugar em nosso campo de teste. Isto vale tanto para a avaliação geral quanto para todas as disciplinas individuais. Na operação diária, o laptop funciona muito bem sem mostrar nenhuma micro gagueira ou atrasos similares.

Você pode descobrir que desempenho você pode esperar de outros dispositivos em comparação em nosso Lista de referência de CPU

PCMark 10
Score
Average of class Gaming
  (5235 - 9852, n=197, last 2 years)
7580 Points +7%
Gigabyte Aero 17 HDR YD
GeForce RTX 3080 Laptop GPU, i9-11980HK, Samsung PM9A1 MZVL2512HCJQ
7088 Points
Average Intel Core i9-11980HK, NVIDIA GeForce RTX 3080 Laptop GPU
  (6937 - 7088, n=3)
7026 Points -1%
Alienware m17 R4
GeForce RTX 3080 Laptop GPU, i9-10980HK, 2x Micron 2300 512 GB (RAID 0)
6684 Points -6%
Razer Blade Pro 17 2021 (QHD Touch)
GeForce RTX 3080 Laptop GPU, i7-10875H, Samsung PM981a MZVLB1T0HBLR
6531 Points -8%
Gigabyte Aero 17 HDR YC
GeForce RTX 3080 Laptop GPU, i9-10980HK, ESR01TBTLCG-EAC-4
6512 Points -8%
Essentials
Average of class Gaming
  (8300 - 12334, n=196, last 2 years)
10718 Points +5%
Gigabyte Aero 17 HDR YD
GeForce RTX 3080 Laptop GPU, i9-11980HK, Samsung PM9A1 MZVL2512HCJQ
10212 Points
Average Intel Core i9-11980HK, NVIDIA GeForce RTX 3080 Laptop GPU
  (9665 - 10291, n=3)
10056 Points -2%
Razer Blade Pro 17 2021 (QHD Touch)
GeForce RTX 3080 Laptop GPU, i7-10875H, Samsung PM981a MZVLB1T0HBLR
9919 Points -3%
Alienware m17 R4
GeForce RTX 3080 Laptop GPU, i9-10980HK, 2x Micron 2300 512 GB (RAID 0)
9529 Points -7%
Gigabyte Aero 17 HDR YC
GeForce RTX 3080 Laptop GPU, i9-10980HK, ESR01TBTLCG-EAC-4
9312 Points -9%
Productivity
Average of class Gaming
  (6662 - 11833, n=196, last 2 years)
9716 Points +7%
Gigabyte Aero 17 HDR YD
GeForce RTX 3080 Laptop GPU, i9-11980HK, Samsung PM9A1 MZVL2512HCJQ
9098 Points
Average Intel Core i9-11980HK, NVIDIA GeForce RTX 3080 Laptop GPU
  (8934 - 9107, n=3)
9046 Points -1%
Alienware m17 R4
GeForce RTX 3080 Laptop GPU, i9-10980HK, 2x Micron 2300 512 GB (RAID 0)
8798 Points -3%
Gigabyte Aero 17 HDR YC
GeForce RTX 3080 Laptop GPU, i9-10980HK, ESR01TBTLCG-EAC-4
8746 Points -4%
Razer Blade Pro 17 2021 (QHD Touch)
GeForce RTX 3080 Laptop GPU, i7-10875H, Samsung PM981a MZVLB1T0HBLR
8448 Points -7%
Digital Content Creation
Average of class Gaming
  (6462 - 18475, n=196, last 2 years)
11450 Points +10%
Gigabyte Aero 17 HDR YD
GeForce RTX 3080 Laptop GPU, i9-11980HK, Samsung PM9A1 MZVL2512HCJQ
10403 Points
Average Intel Core i9-11980HK, NVIDIA GeForce RTX 3080 Laptop GPU
  (9855 - 10823, n=3)
10360 Points 0%
Alienware m17 R4
GeForce RTX 3080 Laptop GPU, i9-10980HK, 2x Micron 2300 512 GB (RAID 0)
9666 Points -7%
Gigabyte Aero 17 HDR YC
GeForce RTX 3080 Laptop GPU, i9-10980HK, ESR01TBTLCG-EAC-4
9203 Points -12%
Razer Blade Pro 17 2021 (QHD Touch)
GeForce RTX 3080 Laptop GPU, i7-10875H, Samsung PM981a MZVLB1T0HBLR
9021 Points -13%
PCMark 10 Score
7088 pontos
Ajuda

Latências DPC

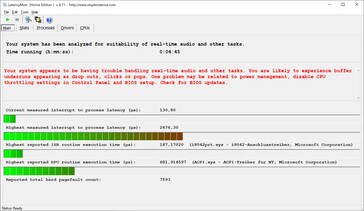
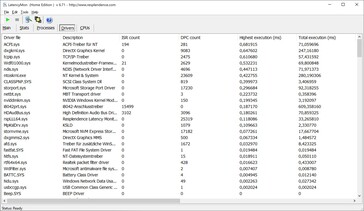
No teste com LatencyMon, o Aero 17 HDR YD mostra latências aumentadas, e portanto não é adequado para aplicações com processamento em tempo real

LatencyMon - Estatísticas
LatencyMon - Motoristas
DPC Latencies / LatencyMon - interrupt to process latency (max), Web, Youtube, Prime95
Gigabyte Aero 17 HDR YC
GeForce RTX 3080 Laptop GPU, i9-10980HK, ESR01TBTLCG-EAC-4
3490 μs * -30%
Gigabyte Aero 17 HDR YD
GeForce RTX 3080 Laptop GPU, i9-11980HK, Samsung PM9A1 MZVL2512HCJQ
2676 μs *
Razer Blade Pro 17 2021 (QHD Touch)
GeForce RTX 3080 Laptop GPU, i7-10875H, Samsung PM981a MZVLB1T0HBLR
1714 μs * +36%
Alienware m17 R4
GeForce RTX 3080 Laptop GPU, i9-10980HK, 2x Micron 2300 512 GB (RAID 0)
585 μs * +78%

* ... smaller is better

Solução de armazenamento

Em nossa configuração de teste, a Gigabyte utiliza um SSD de 512 GB da Samsung que atinge taxas de leitura e escrita muito boas no benchmark de armazenamento. Além disso, há também um SSD de 1 TB, pois também é usado no Aero 17 HDR YC, oferecendo velocidades similares.

Você pode descobrir o desempenho a esperar de outras soluções de armazenamento em nosso Lista de referência HDD/SSD

Gigabyte Aero 17 HDR YD
Samsung PM9A1 MZVL2512HCJQ
Gigabyte Aero 17 HDR YC
ESR01TBTLCG-EAC-4
Razer Blade Pro 17 2021 (QHD Touch)
Samsung PM981a MZVLB1T0HBLR
Alienware m17 R4
2x Micron 2300 512 GB (RAID 0)
Average Samsung PM9A1 MZVL2512HCJQ
 
CrystalDiskMark 5.2 / 6
-38%
-45%
-41%
-20%
Write 4K
230.4
141.2
-39%
123.5
-46%
93.1
-60%
182.8 ?(122.4 - 237, n=30)
-21%
Read 4K
91.6
46.48
-49%
45.96
-50%
46.79
-49%
Write Seq
4216
2433
-42%
1861
-56%
2853
-32%
3119 ?(1056 - 4456, n=21)
-26%
Read Seq
4543
1742
-62%
1584
-65%
2556
-44%
3360 ?(1249 - 4560, n=21)
-26%
Write 4K Q32T1
667
565
-15%
466.4
-30%
475
-29%
464 ?(277 - 710, n=30)
-30%
Read 4K Q32T1
728
655
-10%
566
-22%
529
-27%
566 ?(293 - 940, n=30)
-22%
Write Seq Q32T1
5043
3028
-40%
2981
-41%
3331
-34%
4450 ?(1148 - 5123, n=30)
-12%
Read Seq Q32T1
6821
3424
-50%
3260
-52%
3319
-51%
AS SSD
-33%
-67%
-66%
-18%
Seq Read
5438
2674
-51%
2068
-62%
2733
-50%
4658 ?(2629 - 5546, n=38)
-14%
Seq Write
3904
2458
-37%
2047
-48%
2822
-28%
2766 ?(1108 - 3925, n=38)
-29%
4K Read
56.2
52.1
-7%
47.85
-15%
45.04
-20%
4K Write
165.8
113.4
-32%
87.4
-47%
88.4
-47%
4K-64 Read
2489
1881
-24%
1932
-22%
1388
-44%
1566 ?(533 - 2783, n=38)
-37%
4K-64 Write
3480
2849
-18%
2017
-42%
1227
-65%
2393 ?(1010 - 3480, n=38)
-31%
Access Time Read *
0.054
0.102
-89%
0.055
-2%
0.079
-46%
Access Time Write *
0.026
0.033
-27%
0.128
-392%
0.095
-265%
0.03368 ?(0.02 - 0.076, n=38)
-30%
Score Read
3089
2201
-29%
2187
-29%
1706
-45%
2099 ?(1079 - 3224, n=38)
-32%
Score Write
4036
3208
-21%
2309
-43%
1598
-60%
2819 ?(1258 - 4036, n=38)
-30%
Score Total
8620
6524
-24%
5612
-35%
4184
-51%
5933 ?(3573 - 8620, n=38)
-31%
Total Average (Program / Settings)
-36% / -35%
-56% / -58%
-54% / -55%
-19% / -19%

* ... smaller is better

Samsung PM9A1 MZVL2512HCJQ
CDM 5/6 Read Seq Q32T1: 6821 MB/s
CDM 5/6 Write Seq Q32T1: 5043 MB/s
CDM 5/6 Read 4K Q32T1: 728 MB/s
CDM 5/6 Write 4K Q32T1: 667 MB/s
CDM 5 Read Seq: 4543 MB/s
CDM 5 Write Seq: 4216 MB/s
CDM 5/6 Read 4K: 91.6 MB/s
CDM 5/6 Write 4K: 230.4 MB/s

Constant Performance Reads: DiskSpd Read Loop, Queue Depth 8

No graph data

Placa Gráfica

ONvidia GeForce RTX 3080usada aqui é atualmente uma das mais poderosas placas gráficas em dispositivos móveis. No entanto, o desempenho real depende do TGP configurado, que pode ser de até 165 watts. Gigabyte especifica este valor como 105 watts, resultando em resultados ligeiramente inferiores, mas ainda muito bons, nos 3DMark benchmarks.

NossoLista de padrões de referência GPUmostra como outras placas gráficas se comportam em comparação

3DMark 11 - 1280x720 Performance GPU
Alienware m17 R4
NVIDIA GeForce RTX 3080 Laptop GPU, Intel Core i9-10980HK
43077 Points +20%
Average of class Gaming
  (1029 - 72070, n=230, last 2 years)
40451 Points +13%
Average NVIDIA GeForce RTX 3080 Laptop GPU
  (31288 - 43744, n=39)
38345 Points +7%
Razer Blade Pro 17 2021 (QHD Touch)
NVIDIA GeForce RTX 3080 Laptop GPU, Intel Core i7-10875H
37171 Points +4%
Gigabyte Aero 17 HDR YD
NVIDIA GeForce RTX 3080 Laptop GPU, Intel Core i9-11980HK
35787 Points
3DMark
1280x720 Cloud Gate Standard Graphics
Alienware m17 R4
NVIDIA GeForce RTX 3080 Laptop GPU, Intel Core i9-10980HK
192950 Points +286%
Razer Blade Pro 17 2021 (QHD Touch)
NVIDIA GeForce RTX 3080 Laptop GPU, Intel Core i7-10875H
149262 Points +199%
Average of class Gaming
  (15902 - 193851, n=142, last 2 years)
136246 Points +173%
Average NVIDIA GeForce RTX 3080 Laptop GPU
  (38816 - 192950, n=34)
116550 Points +133%
Gigabyte Aero 17 HDR YC
NVIDIA GeForce RTX 3080 Laptop GPU, Intel Core i9-10980HK
71670 Points +43%
Gigabyte Aero 17 HDR YD
NVIDIA GeForce RTX 3080 Laptop GPU, Intel Core i9-11980HK
49955 Points
1920x1080 Fire Strike Graphics
Alienware m17 R4
NVIDIA GeForce RTX 3080 Laptop GPU, Intel Core i9-10980HK
32366 Points +24%
Average of class Gaming
  (781 - 53059, n=234, last 2 years)
29442 Points +12%
Average NVIDIA GeForce RTX 3080 Laptop GPU
  (16455 - 32366, n=45)
27464 Points +5%
Razer Blade Pro 17 2021 (QHD Touch)
NVIDIA GeForce RTX 3080 Laptop GPU, Intel Core i7-10875H
26486 Points +1%
Gigabyte Aero 17 HDR YD
NVIDIA GeForce RTX 3080 Laptop GPU, Intel Core i9-11980HK
26177 Points
Gigabyte Aero 17 HDR YC
NVIDIA GeForce RTX 3080 Laptop GPU, Intel Core i9-10980HK
25129 Points -4%
2560x1440 Time Spy Graphics
Alienware m17 R4
NVIDIA GeForce RTX 3080 Laptop GPU, Intel Core i9-10980HK
12718 Points +27%
Average of class Gaming
  (224 - 22547, n=232, last 2 years)
12060 Points +21%
Razer Blade Pro 17 2021 (QHD Touch)
NVIDIA GeForce RTX 3080 Laptop GPU, Intel Core i7-10875H
10898 Points +9%
Average NVIDIA GeForce RTX 3080 Laptop GPU
  (6407 - 13210, n=44)
10695 Points +7%
Gigabyte Aero 17 HDR YD
NVIDIA GeForce RTX 3080 Laptop GPU, Intel Core i9-11980HK
9989 Points
Gigabyte Aero 17 HDR YC
NVIDIA GeForce RTX 3080 Laptop GPU, Intel Core i9-10980HK
9646 Points -3%
3DMark 11 Performance
29248 pontos
3DMark Cloud Gate Standard Score
34027 pontos
3DMark Fire Strike Score
22142 pontos
3DMark Time Spy Score
9800 pontos
Ajuda

Desempenho nos jogos

ONvidia GeForce RTX 3080usado aqui é capaz de jogar todos os jogos atuais de forma suave e com altas taxas de quadros. Somente em jogos muito exigentes, as taxas de quadros podem descer para valores abaixo de 30 fps em resolução de 4K e com altos níveis de detalhes.

NossoLista de jogos GPUmostra o desempenho que você pode esperar em vários jogos

The Witcher 3 - 1920x1080 Ultra Graphics & Postprocessing (HBAO+)
Average of class Gaming
  (8.61 - 216, n=225, last 2 years)
116.8 fps +25%
Alienware m17 R4
Intel Core i9-10980HK, NVIDIA GeForce RTX 3080 Laptop GPU
115 (84min) fps +23%
Razer Blade Pro 17 2021 (QHD Touch)
Intel Core i7-10875H, NVIDIA GeForce RTX 3080 Laptop GPU
108.3 (98min - 117max) fps +16%
Average NVIDIA GeForce RTX 3080 Laptop GPU
  (85.1 - 123, n=39)
105.2 fps +13%
Gigabyte Aero 17 HDR YC
Intel Core i9-10980HK, NVIDIA GeForce RTX 3080 Laptop GPU
96.1 (74min) fps +3%
Gigabyte Aero 17 HDR YD
Intel Core i9-11980HK, NVIDIA GeForce RTX 3080 Laptop GPU
93.4 (80min) fps
Final Fantasy XV Benchmark
3840x2160 High Quality
Average of class Gaming
  (32.2 - 94.7, n=67, last 2 years)
62.2 fps +37%
Razer Blade Pro 17 2021 (QHD Touch)
Intel Core i7-10875H, NVIDIA GeForce RTX 3080 Laptop GPU
49.3 fps +9%
Gigabyte Aero 17 HDR YD
Intel Core i9-11980HK, NVIDIA GeForce RTX 3080 Laptop GPU
45.4 fps
Average NVIDIA GeForce RTX 3080 Laptop GPU
  (28.4 - 53.2, n=15)
43.4 fps -4%
2560x1440 High Quality
Average of class Gaming
  (19.8 - 162.9, n=160, last 2 years)
97 fps +28%
Razer Blade Pro 17 2021 (QHD Touch)
Intel Core i7-10875H, NVIDIA GeForce RTX 3080 Laptop GPU
84.3 fps +11%
Average NVIDIA GeForce RTX 3080 Laptop GPU
  (61.6 - 90.3, n=17)
79.4 fps +5%
Gigabyte Aero 17 HDR YD
Intel Core i9-11980HK, NVIDIA GeForce RTX 3080 Laptop GPU
75.9 fps
1920x1080 High Quality
Average of class Gaming
  (9.13 - 194.9, n=225, last 2 years)
111.1 fps +12%
Razer Blade Pro 17 2021 (QHD Touch)
Intel Core i7-10875H, NVIDIA GeForce RTX 3080 Laptop GPU
109 fps +10%
Gigabyte Aero 17 HDR YD
Intel Core i9-11980HK, NVIDIA GeForce RTX 3080 Laptop GPU
99 fps
Average NVIDIA GeForce RTX 3080 Laptop GPU
  (55.5 - 115, n=33)
98.9 fps 0%
Alienware m17 R4
Intel Core i9-10980HK, NVIDIA GeForce RTX 3080 Laptop GPU
98.2 fps -1%
Cyberpunk 2077 1.0
3840x2160 Ultra Preset
Gigabyte Aero 17 HDR YD
Intel Core i9-11980HK, NVIDIA GeForce RTX 3080 Laptop GPU
27.9 fps
Average NVIDIA GeForce RTX 3080 Laptop GPU
  (19.7 - 27.9, n=3)
23 fps -18%
Gigabyte Aero 17 HDR YC
Intel Core i9-10980HK, NVIDIA GeForce RTX 3080 Laptop GPU
21.4 (13.7min, 15.4P0.1, 17.1P1 - 64.3max) fps -23%
2560x1440 Ultra Preset
Average NVIDIA GeForce RTX 3080 Laptop GPU
  (39.8 - 49.7, n=5)
42.9 fps 0%
Gigabyte Aero 17 HDR YD
Intel Core i9-11980HK, NVIDIA GeForce RTX 3080 Laptop GPU
42.8 fps
Gigabyte Aero 17 HDR YC
Intel Core i9-10980HK, NVIDIA GeForce RTX 3080 Laptop GPU
42.3 (14.4min, 15.2P0.1, 17P1 - 107max) fps -1%
1920x1080 Ultra Preset
Alienware m17 R4
Intel Core i9-10980HK, NVIDIA GeForce RTX 3080 Laptop GPU
80.6 (14.3min, 43.6P0.1, 64P1 - 132max) fps +52%
Average NVIDIA GeForce RTX 3080 Laptop GPU
  (52.9 - 84.3, n=9)
69.4 fps +31%
Gigabyte Aero 17 HDR YC
Intel Core i9-10980HK, NVIDIA GeForce RTX 3080 Laptop GPU
60.6 (12.9min, 14.6P0.1, 17P1 - 141max) fps +15%
Gigabyte Aero 17 HDR YD
Intel Core i9-11980HK, NVIDIA GeForce RTX 3080 Laptop GPU
52.9 fps
Dota 2 Reborn
3840x2160 ultra (3/3) best looking
Average of class Gaming
  (14.2 - 205, n=80, last 2 years)
136.5 fps +21%
Razer Blade Pro 17 2021 (QHD Touch)
Intel Core i7-10875H, NVIDIA GeForce RTX 3080 Laptop GPU
128 (107.9min) fps +14%
Gigabyte Aero 17 HDR YD
Intel Core i9-11980HK, NVIDIA GeForce RTX 3080 Laptop GPU
112.6 (96.4min) fps
Average NVIDIA GeForce RTX 3080 Laptop GPU
  (55.2 - 128, n=16)
105.1 fps -7%
Gigabyte Aero 17 HDR YC
Intel Core i9-10980HK, NVIDIA GeForce RTX 3080 Laptop GPU
101 (85.4min) fps -10%
1920x1080 ultra (3/3) best looking
Average of class Gaming
  (26.9 - 220, n=235, last 2 years)
142.4 fps +3%
Gigabyte Aero 17 HDR YD
Intel Core i9-11980HK, NVIDIA GeForce RTX 3080 Laptop GPU
138.4 (119.3min) fps
Razer Blade Pro 17 2021 (QHD Touch)
Intel Core i7-10875H, NVIDIA GeForce RTX 3080 Laptop GPU
134 (115.1min) fps -3%
Alienware m17 R4
Intel Core i9-10980HK, NVIDIA GeForce RTX 3080 Laptop GPU
132 (114.9min) fps -5%
Average NVIDIA GeForce RTX 3080 Laptop GPU
  (98 - 156, n=44)
126.1 fps -9%
Gigabyte Aero 17 HDR YC
Intel Core i9-10980HK, NVIDIA GeForce RTX 3080 Laptop GPU
122 (105.3min) fps -12%
Strange Brigade
3840x2160 ultra AA:ultra AF:16
Average of class Gaming
  (54.5 - 298, n=56, last 2 years)
112.6 fps +46%
Razer Blade Pro 17 2021 (QHD Touch)
Intel Core i7-10875H, NVIDIA GeForce RTX 3080 Laptop GPU
84.1 (69.5min, 72.1P1 - 112max) fps +9%
Average NVIDIA GeForce RTX 3080 Laptop GPU
  (55.9 - 91.7, n=11)
77.6 fps +1%
Gigabyte Aero 17 HDR YD
Intel Core i9-11980HK, NVIDIA GeForce RTX 3080 Laptop GPU
77 (63.2min, 64.3P1 - 103max) fps
2560x1440 ultra AA:ultra AF:16
Average of class Gaming
  (79.8 - 322, n=136, last 2 years)
179.5 fps +39%
Average NVIDIA GeForce RTX 3080 Laptop GPU
  (123 - 165, n=13)
143.4 fps +11%
Razer Blade Pro 17 2021 (QHD Touch)
Intel Core i7-10875H, NVIDIA GeForce RTX 3080 Laptop GPU
143 (80.5min, 115P1 - 249max) fps +11%
Gigabyte Aero 17 HDR YD
Intel Core i9-11980HK, NVIDIA GeForce RTX 3080 Laptop GPU
129 (86.2min, 98.9P1 - 224max) fps
1920x1080 ultra AA:ultra AF:16
Alienware m17 R4
Intel Core i9-10980HK, NVIDIA GeForce RTX 3080 Laptop GPU
212 (79.6min, 151P1 - 362max) fps +23%
Average of class Gaming
  (14.6 - 421, n=223, last 2 years)
206 fps +20%
Razer Blade Pro 17 2021 (QHD Touch)
Intel Core i7-10875H, NVIDIA GeForce RTX 3080 Laptop GPU
197 (81.6min, 149P1 - 298max) fps +15%
Average NVIDIA GeForce RTX 3080 Laptop GPU
  (117 - 219, n=33)
184 fps +7%
Gigabyte Aero 17 HDR YD
Intel Core i9-11980HK, NVIDIA GeForce RTX 3080 Laptop GPU
172 (86min, 125P1 - 285max) fps
GTA V - 1920x1080 Highest Settings possible AA:4xMSAA + FX AF:16x
Average of class Gaming
  (6.38 - 167.7, n=215, last 2 years)
107.1 fps +4%
Gigabyte Aero 17 HDR YD
Intel Core i9-11980HK, NVIDIA GeForce RTX 3080 Laptop GPU
103 (5.99min, 71.4P1 - 221max) fps
Razer Blade Pro 17 2021 (QHD Touch)
Intel Core i7-10875H, NVIDIA GeForce RTX 3080 Laptop GPU
99.5 (5.74min, 71.4P1 - 185max) fps -3%
Average NVIDIA GeForce RTX 3080 Laptop GPU
  (68.6 - 112, n=33)
97.2 fps -6%
Alienware m17 R4
Intel Core i9-10980HK, NVIDIA GeForce RTX 3080 Laptop GPU
93.9 (6.12min, 62.5P1 - 193max) fps -9%
Gigabyte Aero 17 HDR YC
Intel Core i9-10980HK, NVIDIA GeForce RTX 3080 Laptop GPU
90.7 (10.4min, 62.5P1 - 166max) fps -12%

Em nosso teste de carga constante Witcher 3, o Aero 17 HDR YD não mostra nenhuma queda no desempenho. Portanto, você não precisa esperar nenhuma limitação no desempenho do jogo, mesmo depois de períodos mais longos de jogo

05101520253035404550556065707580859095Tooltip
Gigabyte Aero 17 HDR YD GeForce RTX 3080 Laptop GPU, i9-11980HK, Samsung PM9A1 MZVL2512HCJQ; FPS: Ø97.2 (95-100)
baixo média alto ultraQHD4K
GTA V (2015) 185 178 166 103
The Witcher 3 (2015) 93.4
Dota 2 Reborn (2015) 172.8 156.1 145.7 138.4 112.6
Final Fantasy XV Benchmark (2018) 193 127 99 75.9 45.4
X-Plane 11.11 (2018) 129 110 89.3 62.2
Far Cry 5 (2018) 118 96 54
Strange Brigade (2018) 442 236 193 172 129 77
Cyberpunk 2077 1.0 (2020) 74.8 52.9 42.8 27.9

Emissões - É possível uma operação silenciosa

Emissões sonoras

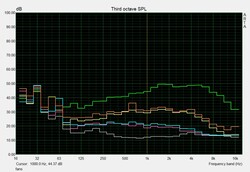
Características do ruído dos ventiladores

Com seus perfis predefinidos no Centro de Comando do Gigabyte, o Aero 17 HDR YD é muito silencioso na operação diária. Ao utilizar aplicativos de escritório e de navegador, os ventiladores raramente se renovam levemente. Mesmo durante os jogos, o laptop será audível, mas não excessivamente alto, dependendo da carga. Entretanto, se você ativar o modo Turbo, os ventiladores funcionarão constantemente na maior velocidade, atingindo níveis de ruído de até 59 dB(A). Embora isto possa ser irritantemente alto, pelo menos seu zumbido é um som uniforme

Barulho

Ocioso
30 / 32 / 41 dB
Carga
43 / 59 dB
  red to green bar
 
 
30 dB
silencioso
40 dB(A)
audível
50 dB(A)
ruidosamente alto
 
min: dark, med: mid, max: light   Earthworks M23R, Arta (15 cm de distância)   environment noise: 25 dB(A)
dB(A) 0102030405060708090Deep BassMiddle BassHigh BassLower RangeMidsHigher MidsLower HighsMid HighsUpper HighsSuper Highs2046.33741.744.640.839.42541.33735.938.335.635.73147.248.644.348.346.445.44033.229.929.731.629.531.65040.630.530.527.524.940.46334.339.531.229.926.834.28026.222.520.922.317.833.510025.92124.918.11535.91252620.523.520.11532.616026.220.924.221.516.734.520028.820.924.621.918.337.425027.921.125.220.715.837.631530.222.928.62214.540.340029.421.928.121.712.440.650029.921.430.22111.940.863036.122.931.120.211.842.880031.321.929.721.111.443.2100030.920.629.318.712.244.4125032.621.631.119.712.647.3160033.221.131.619.112.749.4200032.220.531.219.312.549.325003020.329.418.912.847.6315030.918.330.216.414.448400031.71829.116.415.448.6500028.11626.315.113.848.8630025.314.223.613.913.447.6800021.313.618.613.513.243.81000019.613.516.113.513.141.51250017.313.213.813.312.836.91600019.613.31413.312.131.7SPL42.931.841.230.425.559.1N4.31.63.61.30.713median 29.4median 20.6median 28.1median 19.1median 13.1median 42.8Delta2.92.63.731.45.6hearing rangehide median Fan NoiseGigabyte Aero 17 HDR YD

Temperaturas

Sob carga, as superfícies do Aero 17 HDR YD atingem temperaturas de até 56 °C (133 °F). Os pontos mais quentes estão na parte inferior em direção à parte posterior, mas os descansos da palma permanecerão sempre a temperaturas moderadas. Com isto, você ainda poderá usar o laptop no colo, mas apenas por pouco

O Witcher 3
O Witcher 3
Teste de estresse
Teste de estresse
Carga completa - topo
Carga completa - fundo

Durante nosso teste de carga constante, as temperaturas dentro do laptop Gigabyte sobem até 93 °C (199 °F). A 2,9 GHzdurante este tempo, as velocidades do relógio permanecem acima da velocidade básica do relógio, e de acordo com HWInfo, a CPU funciona de forma estável a 70 watts. O mesmo comportamento é mostrado durante nosso teste de carga constante Witcher 3, com as temperaturas permanecendo ligeiramente mais baixas a um máximo de 80 °C (176 °F). Enquanto operando o laptop sob carga constante, não se deve, portanto, esperar quaisquer limitações devido às temperaturas serem muito altas

 43 °C44 °C44 °C 
 35 °C42 °C40 °C 
 32 °C35 °C35 °C 
Máximo: 44 °C
Médio: 38.9 °C
52 °C56 °C44 °C
52 °C51 °C41 °C
38 °C37 °C35 °C
Máximo: 56 °C
Médio: 45.1 °C
alimentação elétrica  51 °C | Temperatura do quarto 22 °C | Fluke t3000FC (calibrated), Voltcraft IR-900
(-) The average temperature for the upper side under maximal load is 38.9 °C / 102 F, compared to the average of 33.8 °C / 93 F for the devices in the class Gaming.
(±) The maximum temperature on the upper side is 44 °C / 111 F, compared to the average of 40.4 °C / 105 F, ranging from 21.2 to 68.8 °C for the class Gaming.
(-) The bottom heats up to a maximum of 56 °C / 133 F, compared to the average of 43.2 °C / 110 F
(+) In idle usage, the average temperature for the upper side is 29.1 °C / 84 F, compared to the device average of 33.8 °C / 93 F.
(±) Playing The Witcher 3, the average temperature for the upper side is 37.9 °C / 100 F, compared to the device average of 33.8 °C / 93 F.
(+) The palmrests and touchpad are reaching skin temperature as a maximum (35 °C / 95 F) and are therefore not hot.
(-) The average temperature of the palmrest area of similar devices was 28.9 °C / 84 F (-6.1 °C / -11 F).

Oradores

Os alto-falantes do Aero 17 YD produzem um volume bastante alto e um espectro sonoro relativamente amplo que cai acentuadamente abaixo das freqüências de nível médio, no entanto. Embora isto permita reproduzir ocasionalmente o conteúdo de voz, para ouvir música ou jogar jogos, seria preferível alto-falantes externos ou fones de ouvido

dB(A) 0102030405060708090Deep BassMiddle BassHigh BassLower RangeMidsHigher MidsLower HighsMid HighsUpper HighsSuper Highs2040.844.22535.637.73146.449.94029.542.35024.935.46326.834.78017.828.21001525.11251526.816016.727.820018.339.525015.848.231514.555.340012.463.850011.97163011.875.980011.473.3100012.275.3125012.674.3160012.770.2200012.570.3250012.870.5315014.475.2400015.480500013.878.3630013.478.8800013.277.51000013.171.81250012.865.11600012.171SPL25.587.5N0.772.5median 13.1median 71Delta1.410.235.335.132.931.831.83236.535.132.428.93328.936.328.848.32761.52752.924.860.92462.822.763.32269.521.267.82174.82075.919.472.718.97117.770.117.86917.671.817.668.117.671.417.673.717.670.417.571.617.671.617.669.617.459.717.583.630.662.51.5median 69.6median 17.84.72.4hearing rangehide median Pink NoiseGigabyte Aero 17 HDR YDApple MacBook 12 (Early 2016) 1.1 GHz
Frequency diagram (checkboxes can be checked and unchecked to compare devices)
Gigabyte Aero 17 HDR YD audio analysis

(+) | speakers can play relatively loud (88 dB)
Bass 100 - 315 Hz
(-) | nearly no bass - on average 33.9% lower than median
(±) | linearity of bass is average (9.6% delta to prev. frequency)
Mids 400 - 2000 Hz
(+) | balanced mids - only 2.9% away from median
(+) | mids are linear (6.5% delta to prev. frequency)
Highs 2 - 16 kHz
(±) | higher highs - on average 5.1% higher than median
(+) | highs are linear (4.7% delta to prev. frequency)
Overall 100 - 16.000 Hz
(±) | linearity of overall sound is average (19.8% difference to median)
Compared to same class
» 66% of all tested devices in this class were better, 6% similar, 27% worse
» The best had a delta of 6%, average was 18%, worst was 132%
Compared to all devices tested
» 45% of all tested devices were better, 7% similar, 48% worse
» The best had a delta of 4%, average was 25%, worst was 134%

Apple MacBook 12 (Early 2016) 1.1 GHz audio analysis

(+) | speakers can play relatively loud (83.6 dB)
Bass 100 - 315 Hz
(±) | reduced bass - on average 11.3% lower than median
(±) | linearity of bass is average (14.2% delta to prev. frequency)
Mids 400 - 2000 Hz
(+) | balanced mids - only 2.4% away from median
(+) | mids are linear (5.5% delta to prev. frequency)
Highs 2 - 16 kHz
(+) | balanced highs - only 2% away from median
(+) | highs are linear (4.5% delta to prev. frequency)
Overall 100 - 16.000 Hz
(+) | overall sound is linear (10.2% difference to median)
Compared to same class
» 5% of all tested devices in this class were better, 2% similar, 93% worse
» The best had a delta of 5%, average was 19%, worst was 53%
Compared to all devices tested
» 3% of all tested devices were better, 1% similar, 96% worse
» The best had a delta of 4%, average was 25%, worst was 134%

Gerenciamento de energia - A vida útil da bateria caiu um pouco

Consumo de energia

Sob carga, o Aero 17 com o RTX 3080 tem um consumo de energia de até 236 watts. Com isto, ele está no nível de dispositivos comparáveis sob carga, e medimos apenas um consumo de energia um pouco maior do que em outros dispositivos durante a operação ociosa.

A potência de saída da fonte de alimentação incluída é avaliada em 230 watts

Consumo de energia
desligadodarklight 1 / 1.4 Watt
Ociosodarkmidlight 25 / 28 / 40 Watt
Carga midlight 114 / 236 Watt
 color bar
Key: min: dark, med: mid, max: light        Metrahit Energy
Currently we use the Metrahit Energy, a professional single phase power quality and energy measurement digital multimeter, for our measurements. Find out more about it here. All of our test methods can be found here.
Gigabyte Aero 17 HDR YD
i9-11980HK, GeForce RTX 3080 Laptop GPU
Gigabyte Aero 17 HDR YC
i9-10980HK, GeForce RTX 3080 Laptop GPU
Razer Blade Pro 17 2021 (QHD Touch)
i7-10875H, GeForce RTX 3080 Laptop GPU
Alienware m17 R4
i9-10980HK, GeForce RTX 3080 Laptop GPU
Average NVIDIA GeForce RTX 3080 Laptop GPU
 
Average of class Gaming
 
Power Consumption
14%
15%
-43%
12%
21%
Idle Minimum *
25
17
32%
15.2
39%
42
-68%
19.6 ?(8 - 62, n=34)
22%
Idle Average *
28
21
25%
20.3
27%
48
-71%
24.1 ?(11.7 - 64, n=34)
14%
Idle Maximum *
40
33
17%
37.3
7%
58
-45%
33.3 ?(12 - 69, n=34)
17%
Load Average *
114
113
1%
114.9
-1%
124
-9%
Witcher 3 ultra *
176
157
11%
158.4
10%
219
-24%
Load Maximum *
236
237
-0%
223.7
5%
337
-43%

* ... smaller is better

0102030405060708090100110120130140150160170180Tooltip
Gigabyte Aero 17 HDR YD; 1920x1080 The Witcher 3 ultra (external Monitor): Ø166.6 (162-190)
Gigabyte Aero 17 HDR YD; 1280x720 FurMark 1.19 GPU Stress Test (external Monitor): Ø160.9 (158-166)
Gigabyte Aero 17 HDR YD; Cinebench R15 Multi (external Monitor): Ø159.8 (153-167)
Gigabyte Aero 17 HDR YD; Prime95 V2810 Stress (external Monitor): Ø126.3 (120-149)

Vida útil da bateria

Em nosso teste WLAN realista, o Gigabyte Aero 17 HDR YD atinge uma duração de bateria de 5,5 horas. Com isto, sua duração de bateria é cerca de 20 minutos mais curta do que a do Aero 17 HDR YCmodelo predecessor, mas ainda mais longo que o do Alienware m17 R4

Tempo de Execução da Bateria
WiFi Websurfing
5h 34min
Carga (máximo brilho)
1h 10min
Gigabyte Aero 17 HDR YD
i9-11980HK, GeForce RTX 3080 Laptop GPU, 99 Wh
Gigabyte Aero 17 HDR YC
i9-10980HK, GeForce RTX 3080 Laptop GPU, 99 Wh
Razer Blade Pro 17 2021 (QHD Touch)
i7-10875H, GeForce RTX 3080 Laptop GPU, 70.5 Wh
Alienware m17 R4
i9-10980HK, GeForce RTX 3080 Laptop GPU, 86 Wh
Average of class Gaming
 
Battery Runtime
19%
15%
-26%
16%
WiFi v1.3
334
354
6%
356
7%
141
-58%
Load
70
92
31%
86
23%
74
6%

Pro

+ muito bom desempenho do sistema
+ muito bom desempenho em jogos
+ muito boa exibição
+ bons dispositivos de entrada
+ Thunderbolt 4

Contra

- funções secundárias não iluminadas
- posição infeliz da webcam

Veredicto - Um melhor desempenho graças à i9 Tiger Lake

Não só o Aero 17 HDR YD é um laptop muito bom para os jogadores, mas também para os criadores de conteúdo

Com a atualização para o Intel Core i9-11980HK, a Gigabyte melhorou particularmente o desempenho do sistema.

Além disso, o pacote de hardware é arredondado pelo SSD extremamente rápido e 32 GB de memória de trabalho em modo de canal duplo. Em comparação com o predecessor, a vida útil da bateria é reduzida apenas moderadamente, e a tela de 4K também mantém basicamente suas boas qualidades.

Para jogos, oNvidia GeForce RTX 3080 continua sendo a unidade gráfica mais poderosa para laptops que está atualmente disponível. O desempenho 3D é correspondentemente bom, mesmo que o Aero 17 HDR YD esteja apenas no mesmo nível que os concorrentes aqui. Com as configurações de sistema correspondentes, você também pode limitar o nível de ruído, tornando o laptop Gigabyte bem adequado para jogos, mesmo sem fones de ouvido.

Preço e Disponibilidade

Atualmente o Aero 17 HDR YD ainda não está disponível.Avadiretoatualmente a lista como disponível em junho, a partir de US$ 3699.

Gigabyte Aero 17 HDR YD - 05/28/2021 v7
Mike Wobker
Acabamento
87 / 98 → 89%
Teclado
85%
Mouse
81%
Conectividade
71 / 80 → 88%
Peso
58 / 10-66 → 86%
Bateria
67 / 95 → 70%
Pantalha
95%
Desempenho do jogos
98%
Desempenho da aplicação
97%
Temperatura
82 / 95 → 86%
Ruído
60 / 90 → 66%
Audio
76%
Camera
36 / 85 → 42%
Médio
76%
88%
Gaming - Médio equilibrado

Pricecompare

Please share our article, every link counts!
> Análises e revisões de portáteis e celulares > Análises > Análises > Revisão do Gigabyte Aero 17 HDR YD laptop: 4K HDR atende a RTX 3080
Mike Wobker, 2021-05-29 (Update: 2021-05-29)