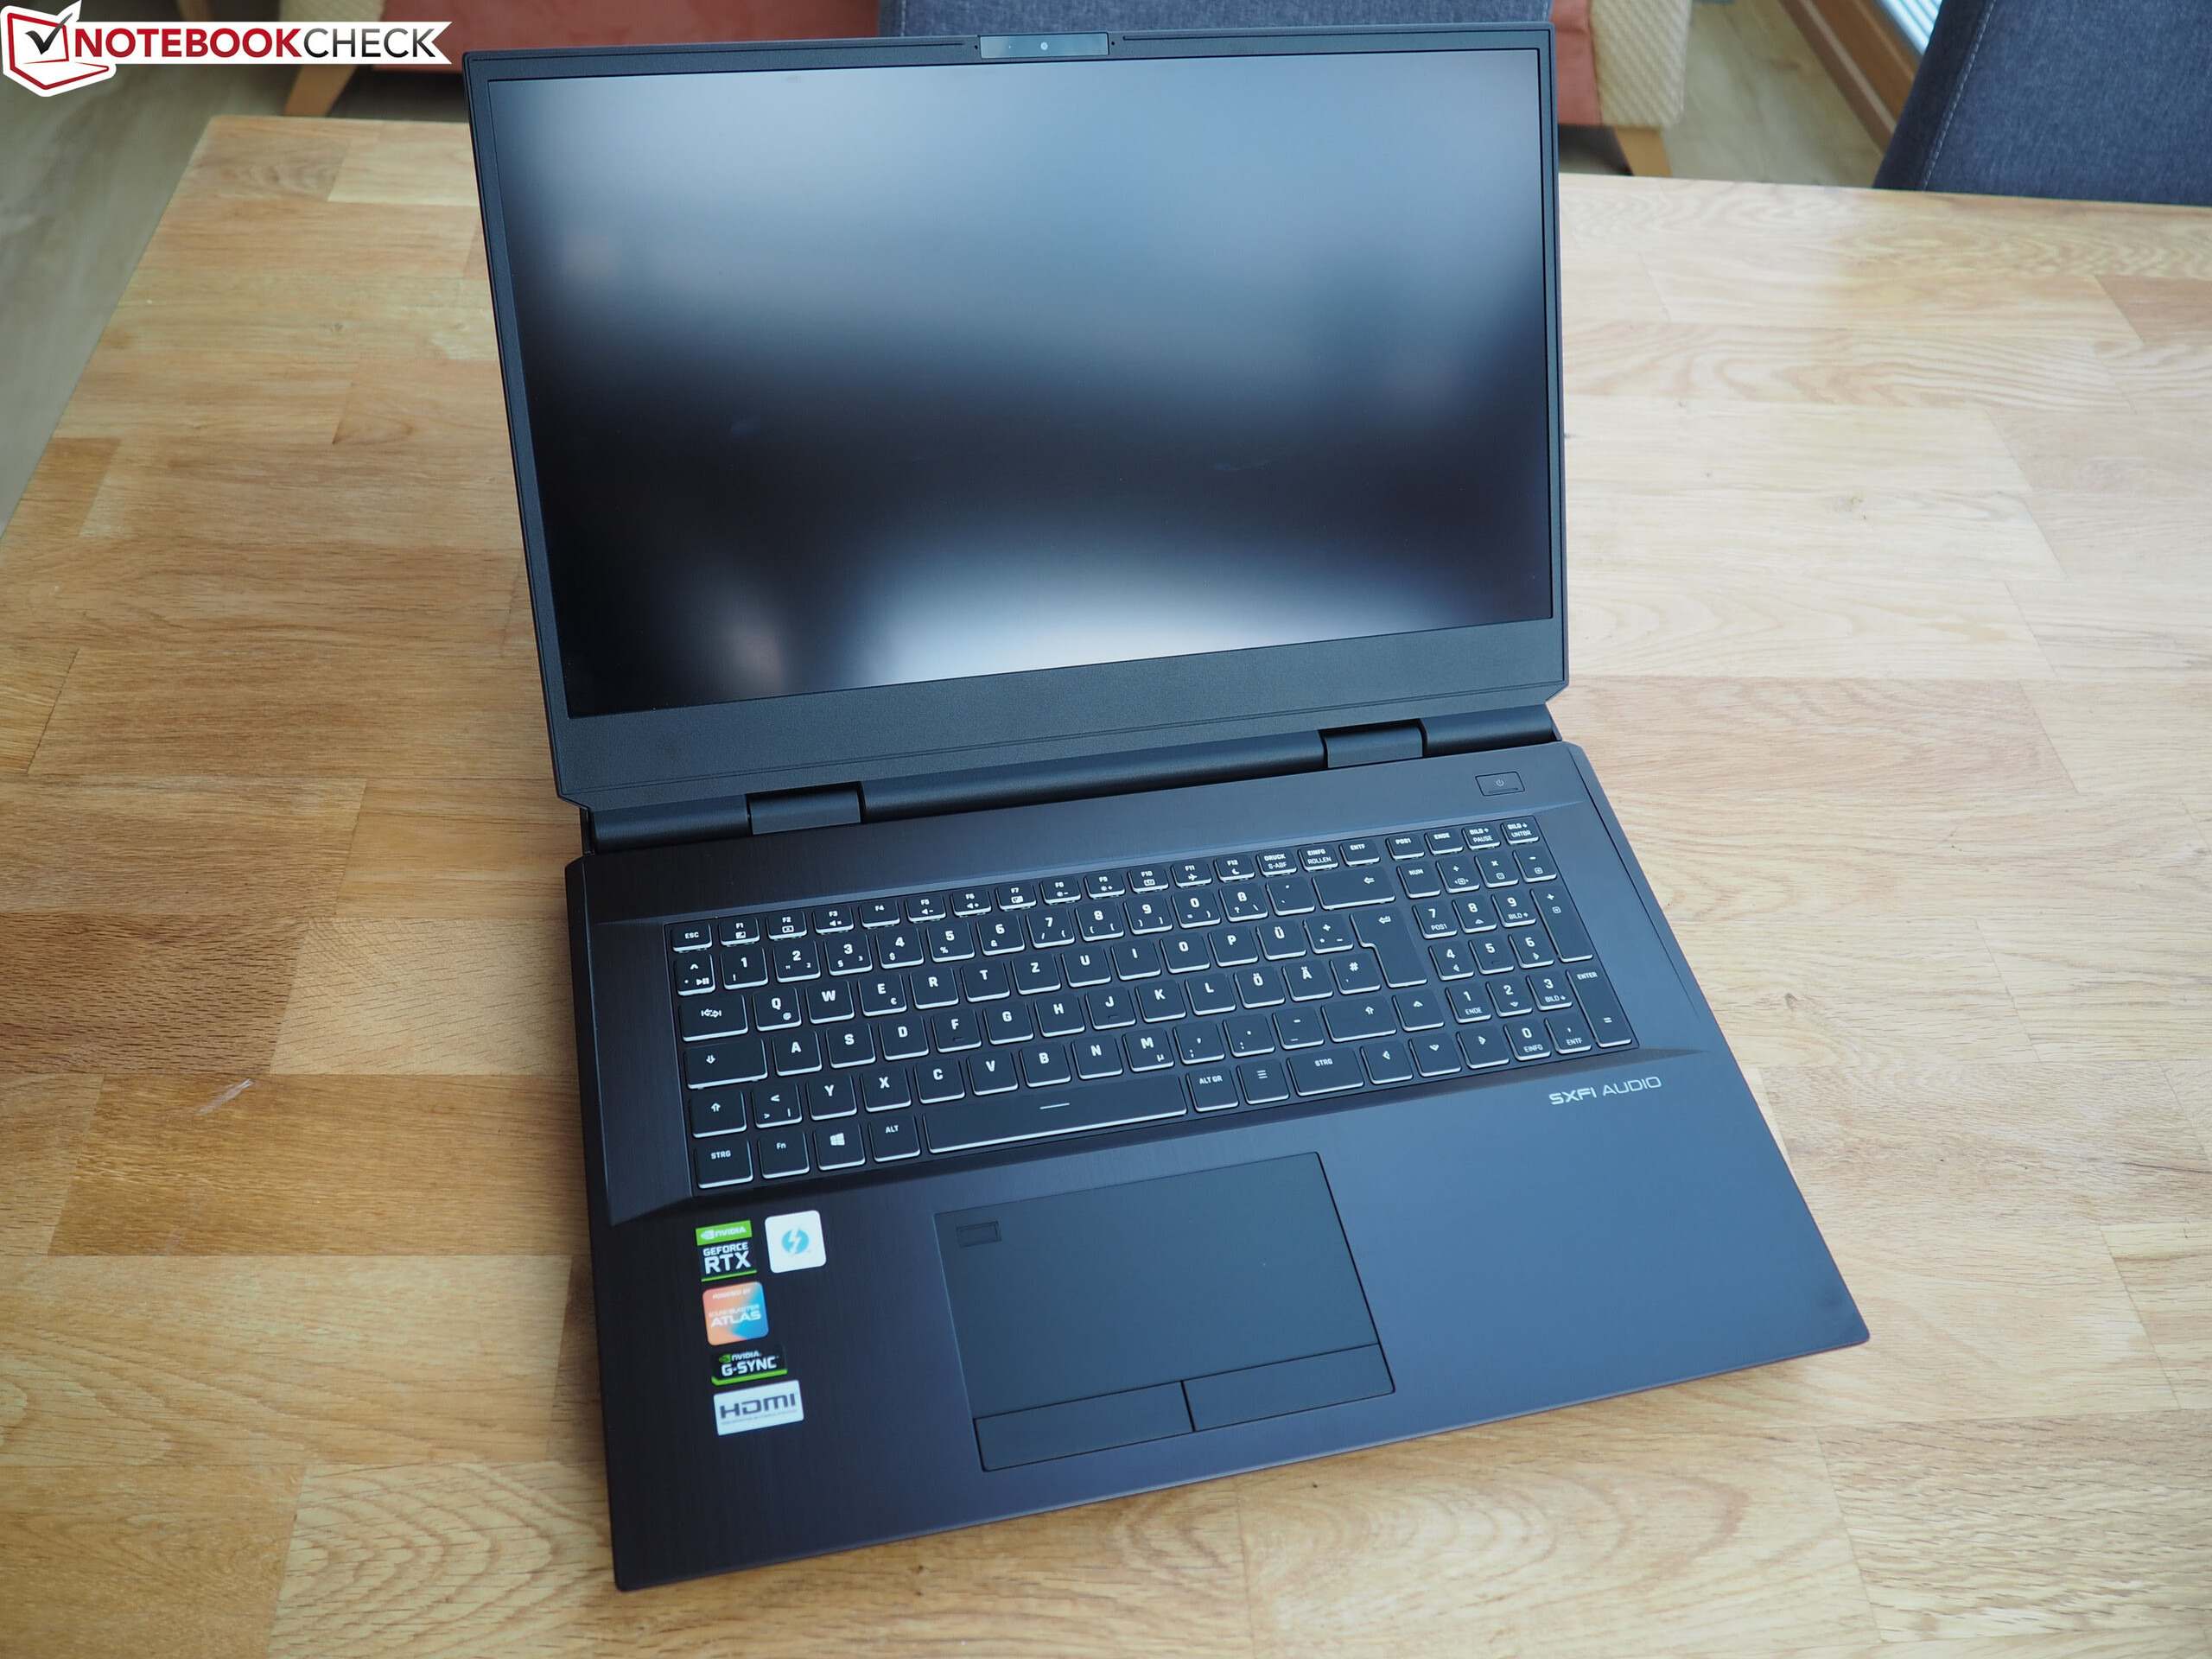
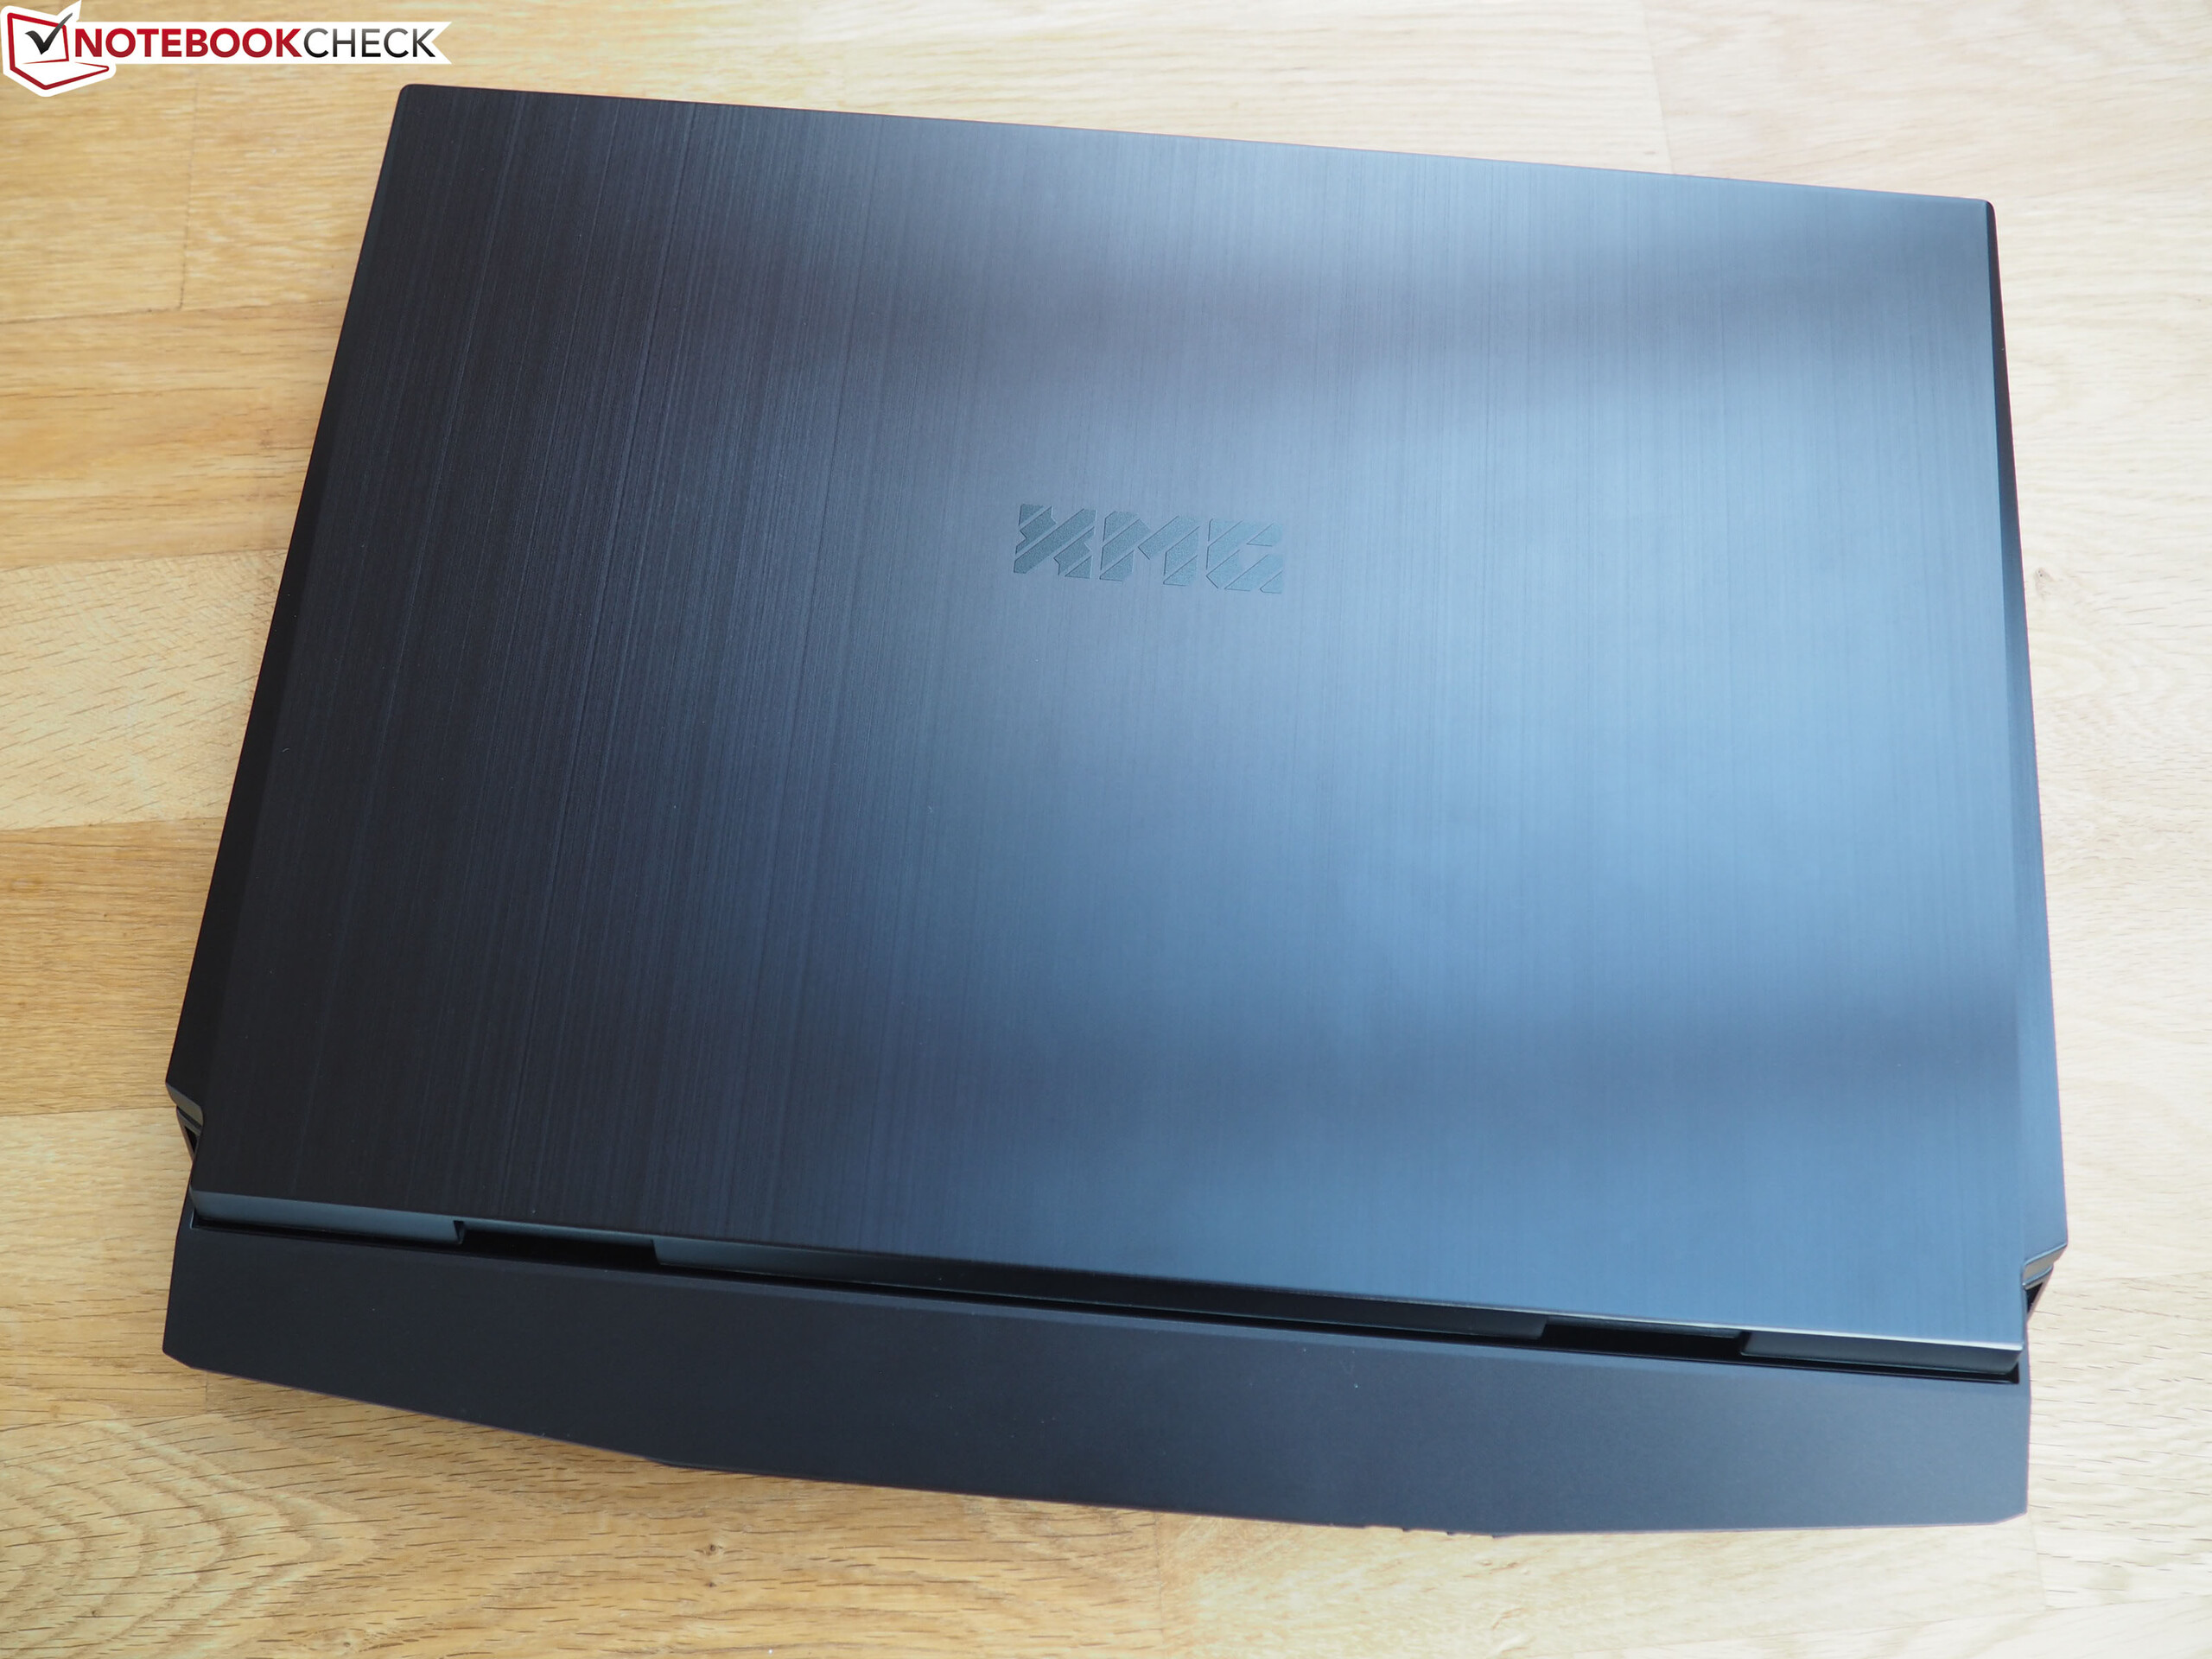
Schenker XMG Ultra 17 (Clevo X170KM-G) em revisão: Casa de força maciça com equipamento exuberante

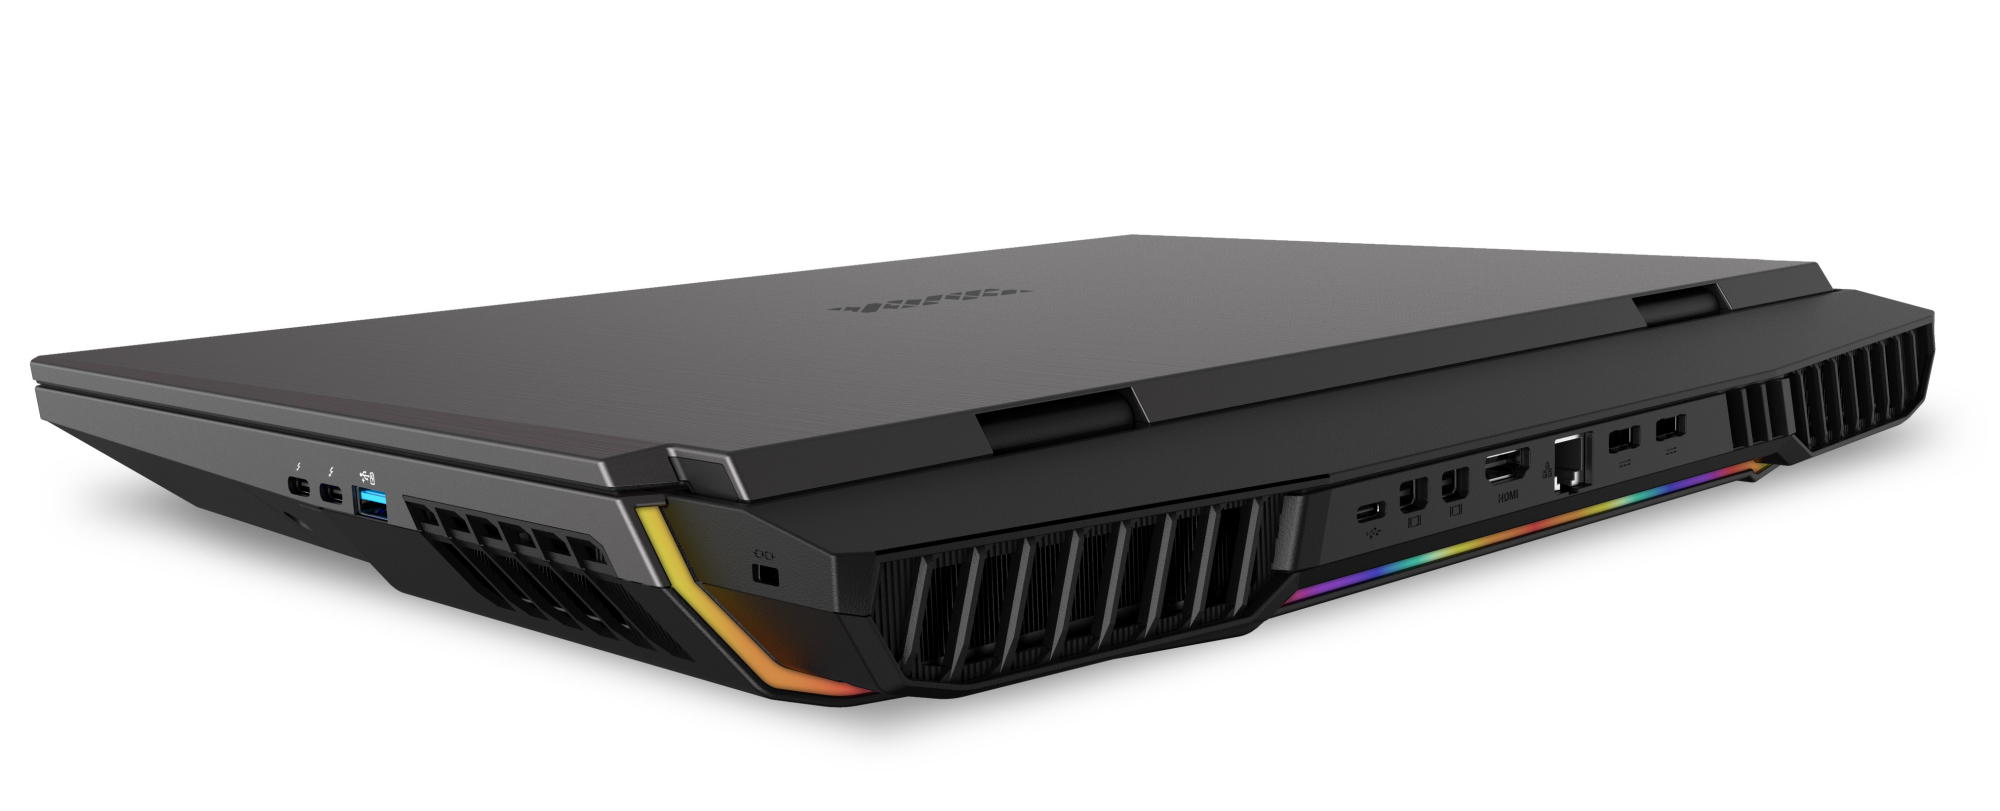
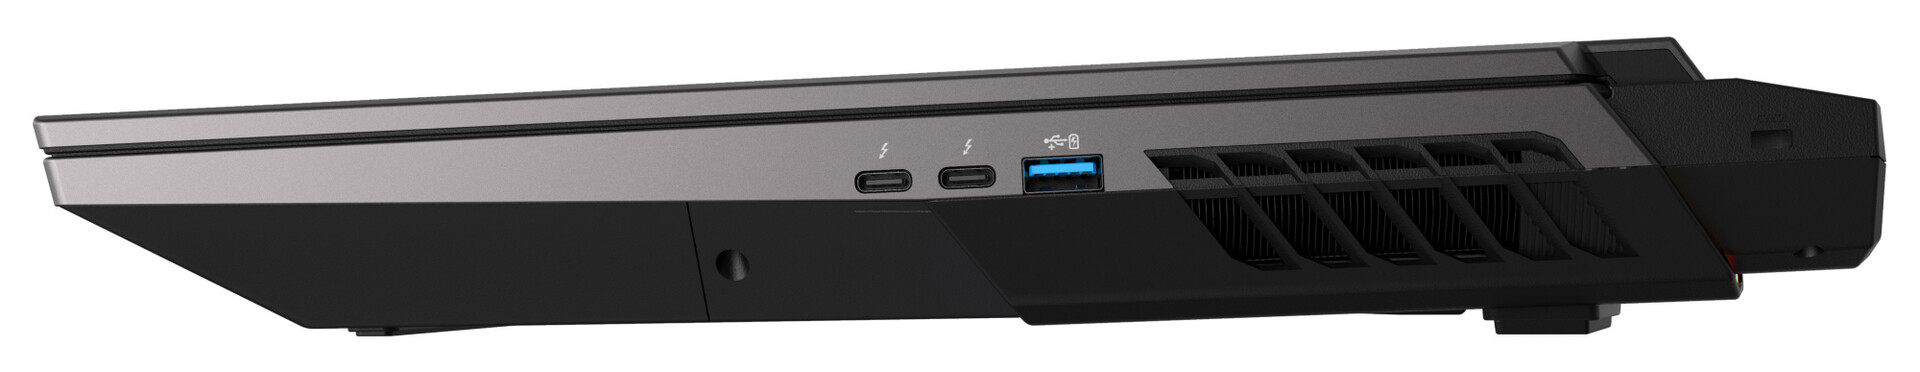
Visualmente, o modelo 2021 do XMG Ultra 17 não mudou em relação ao seuPredecessor. As inovações são encontradas no lado técnico. Os processadores Rocket Lake (CPUs Comet Lake ainda estão disponíveis) e as GPUs Ampere são agora utilizadas. Em vez de um slot Thunderbolt 3, dois slots Thunderbolt 4/USB 4 são usados. Os concorrentes incluem dispositivos como o MSI GT76 Titanium DT 10SGSo Alienware m17 R4 e o Asus Strix Scar 17 G732LXS.
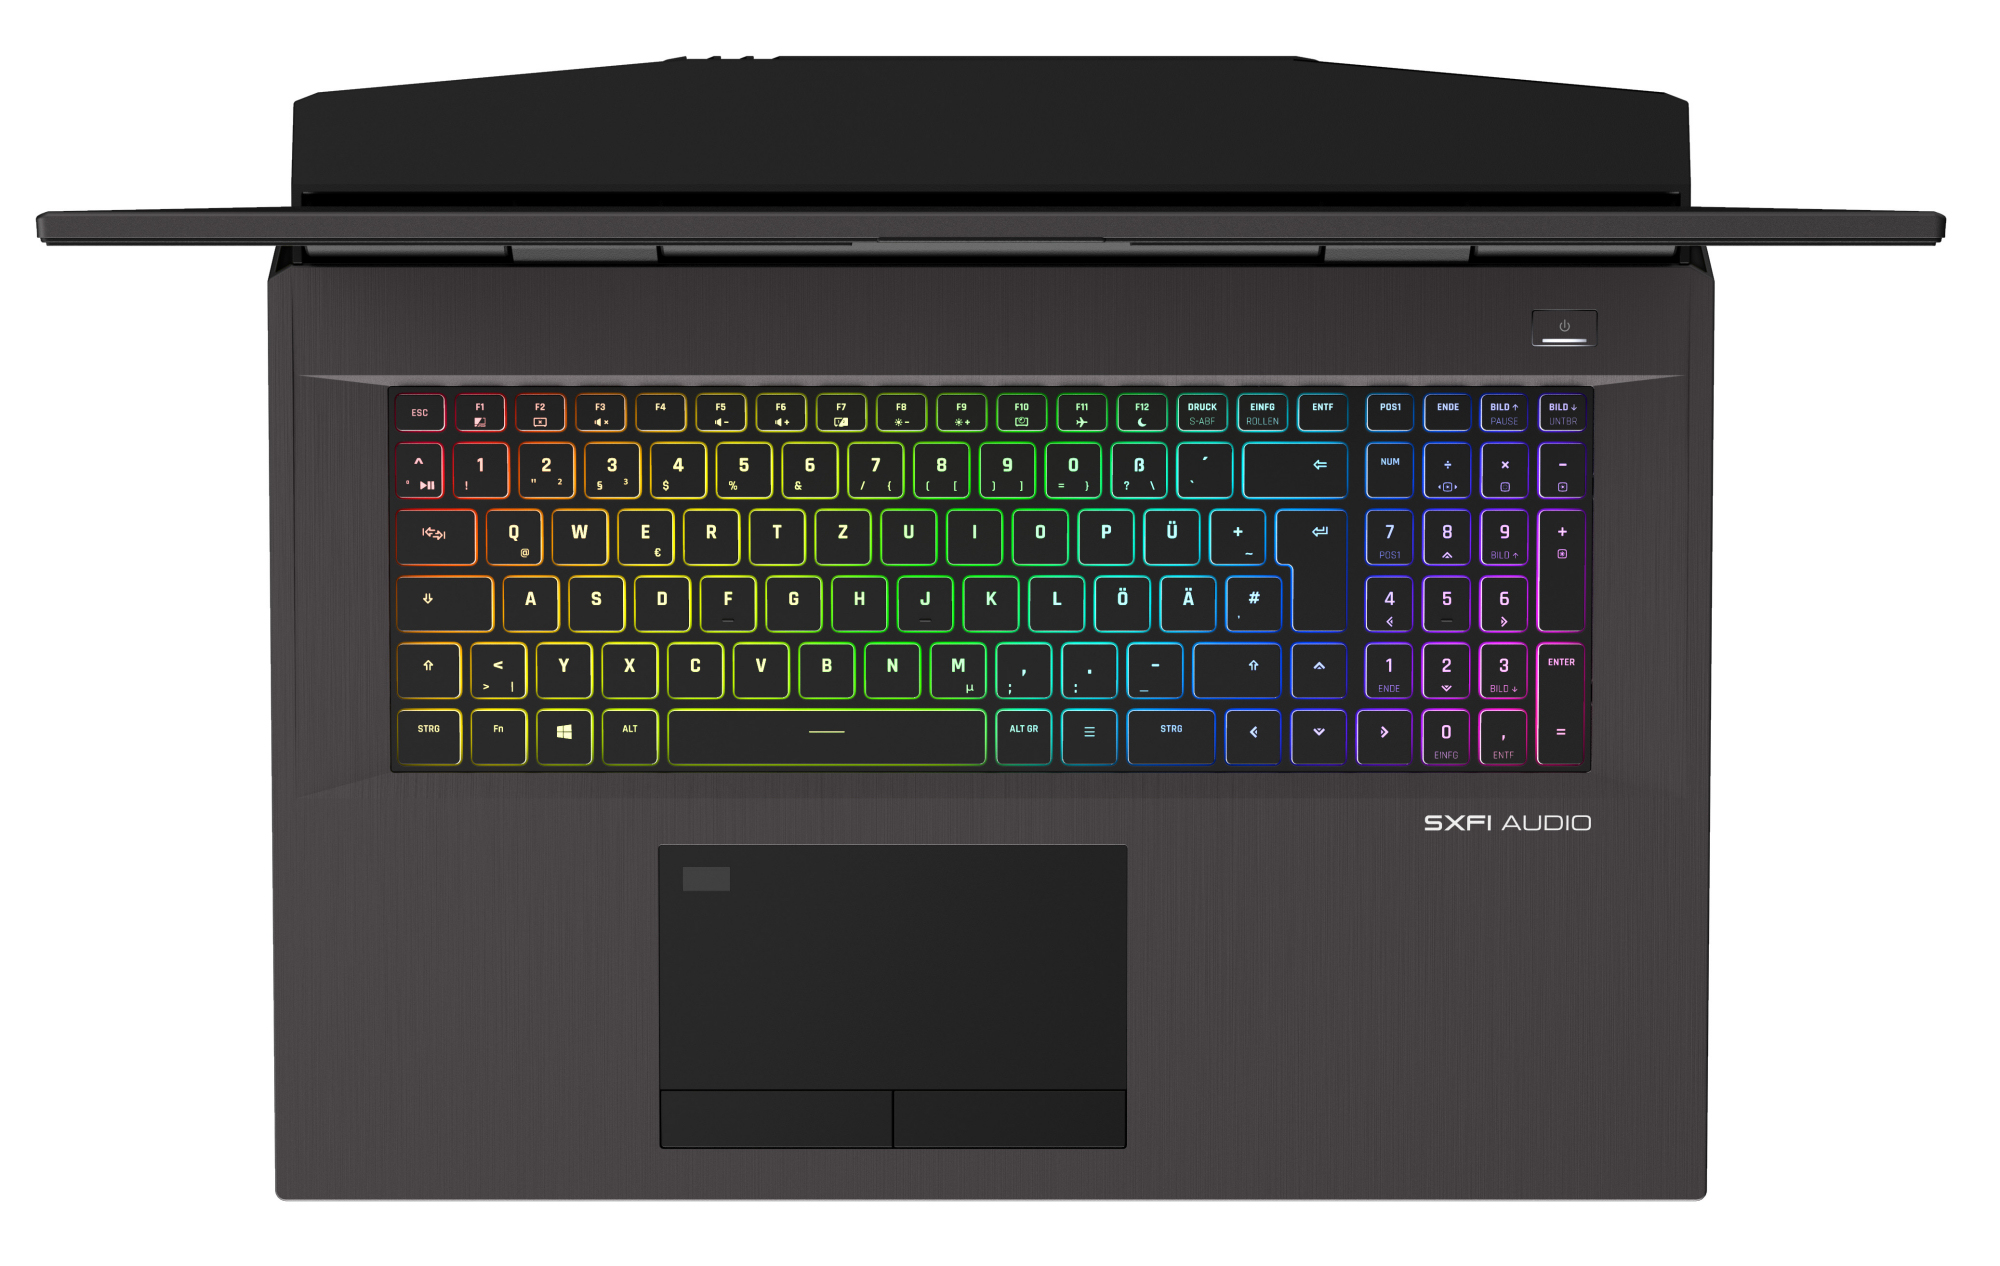
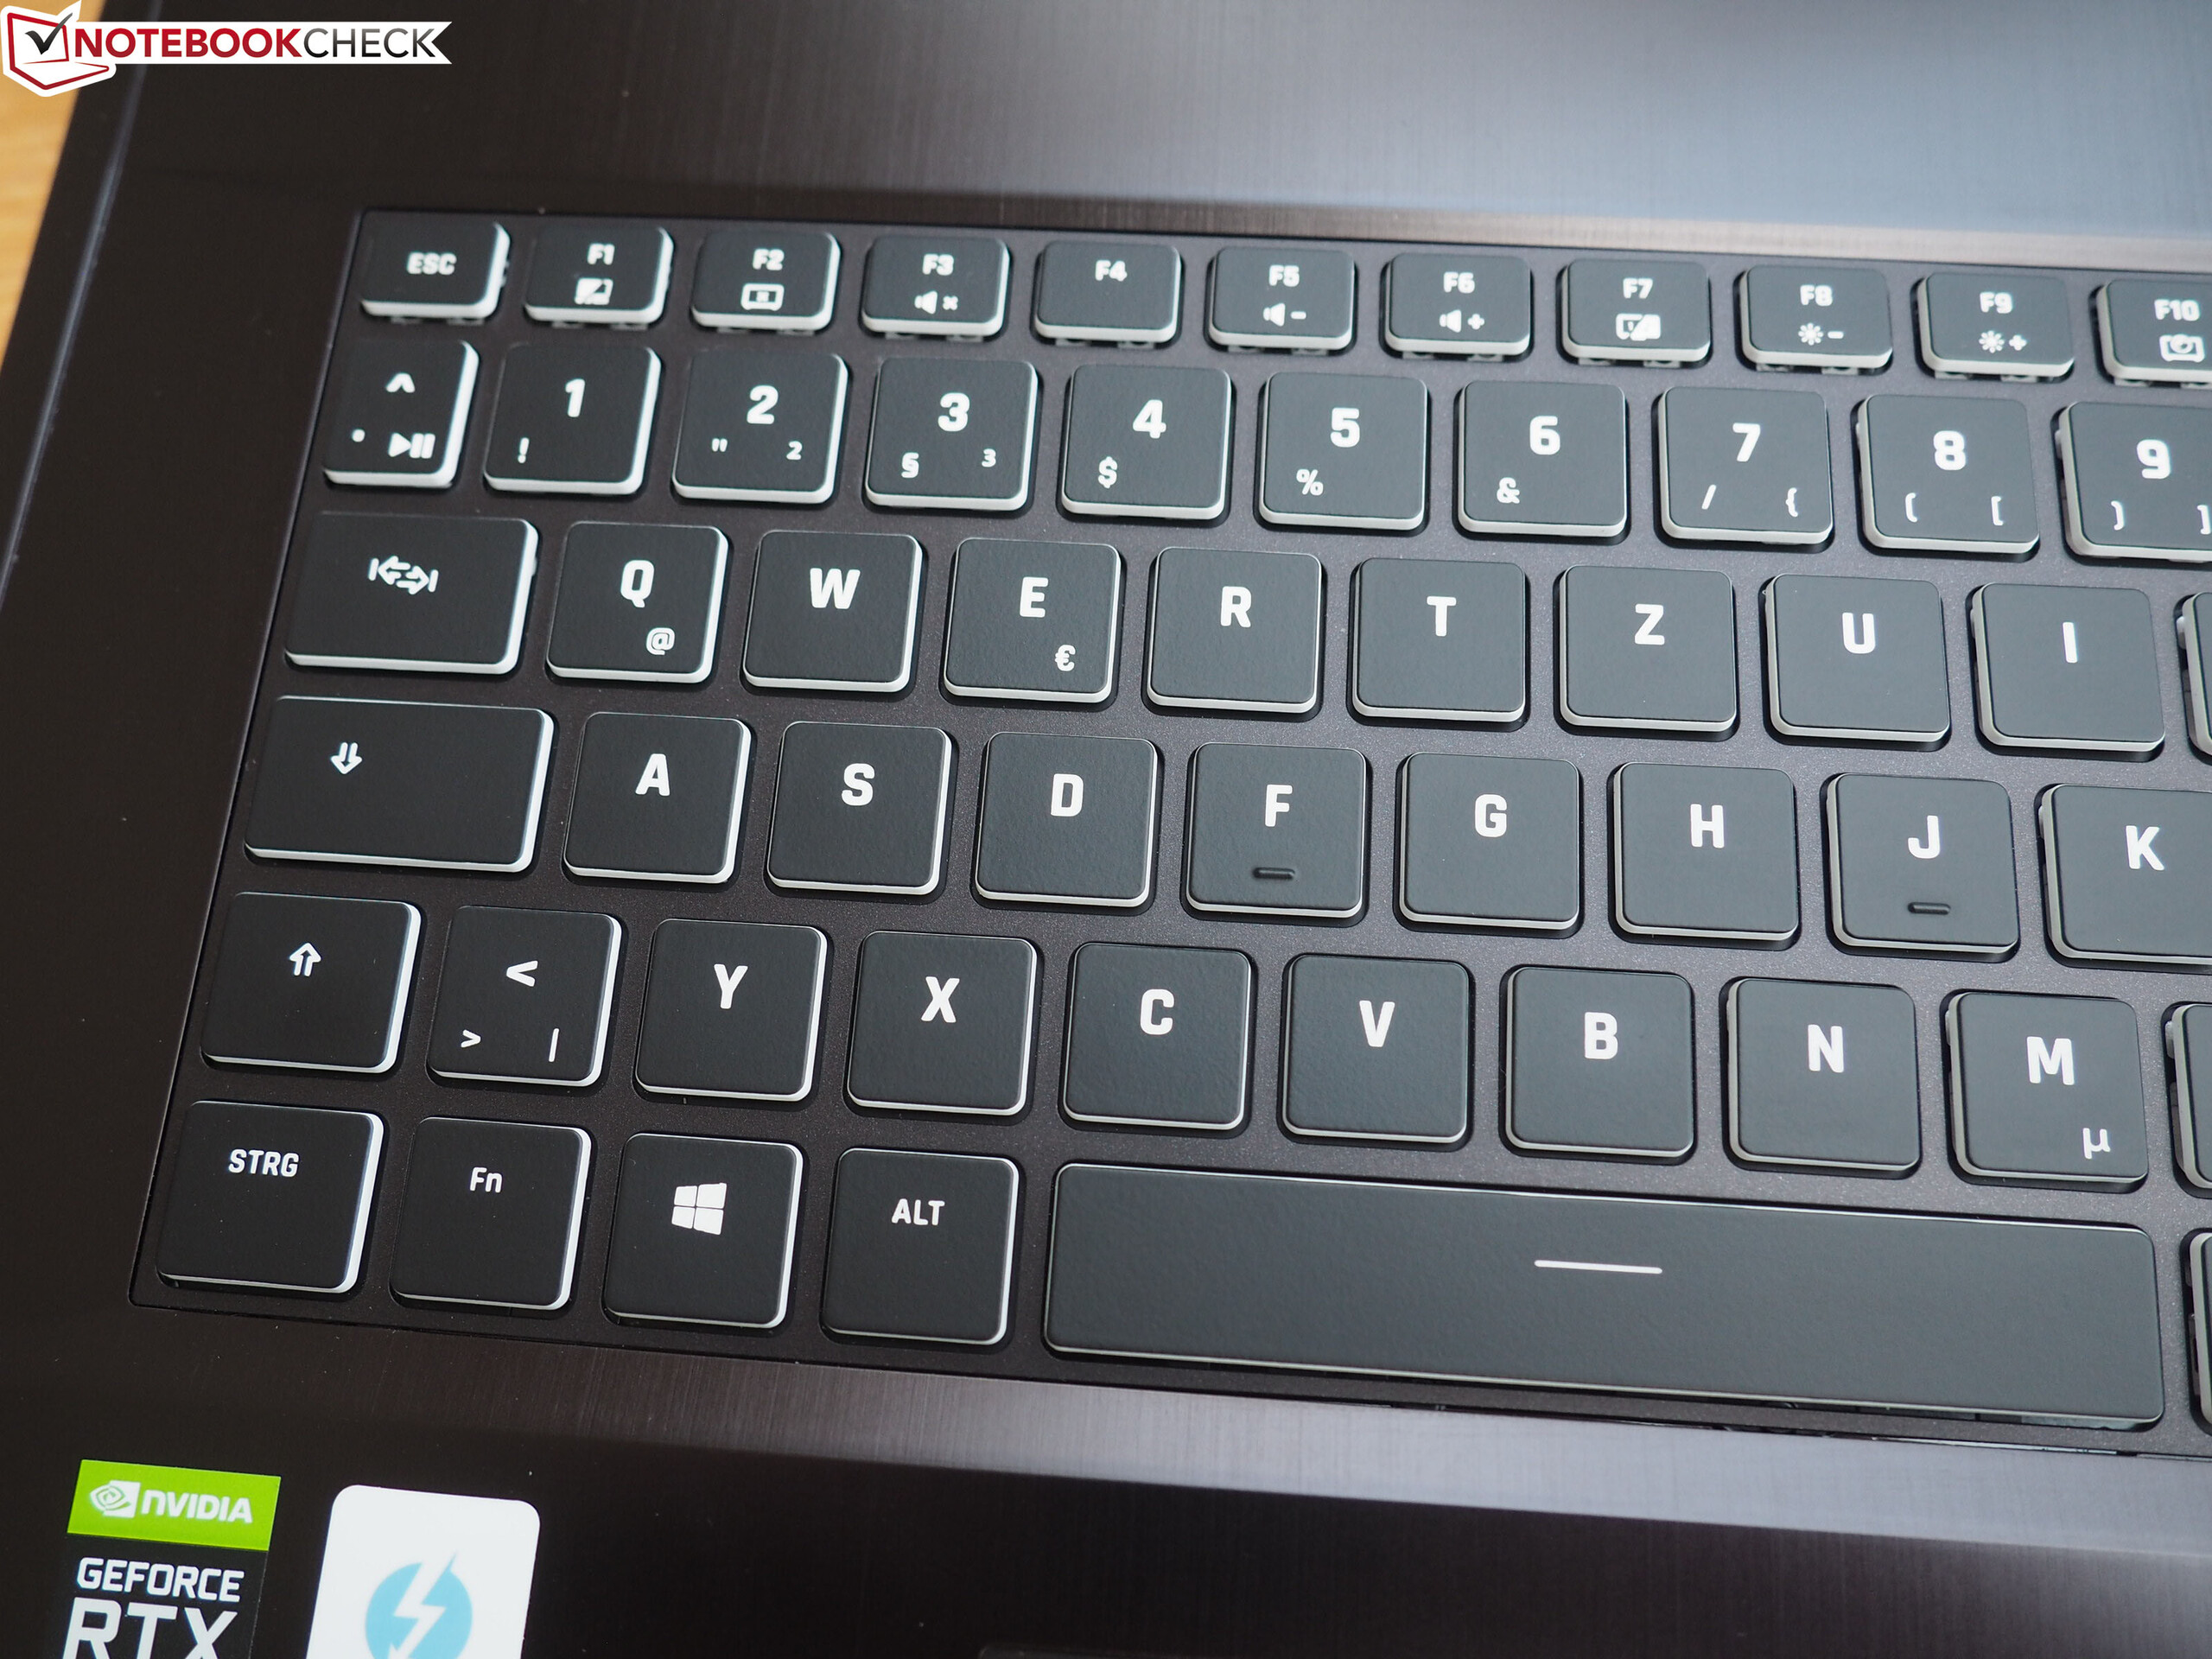
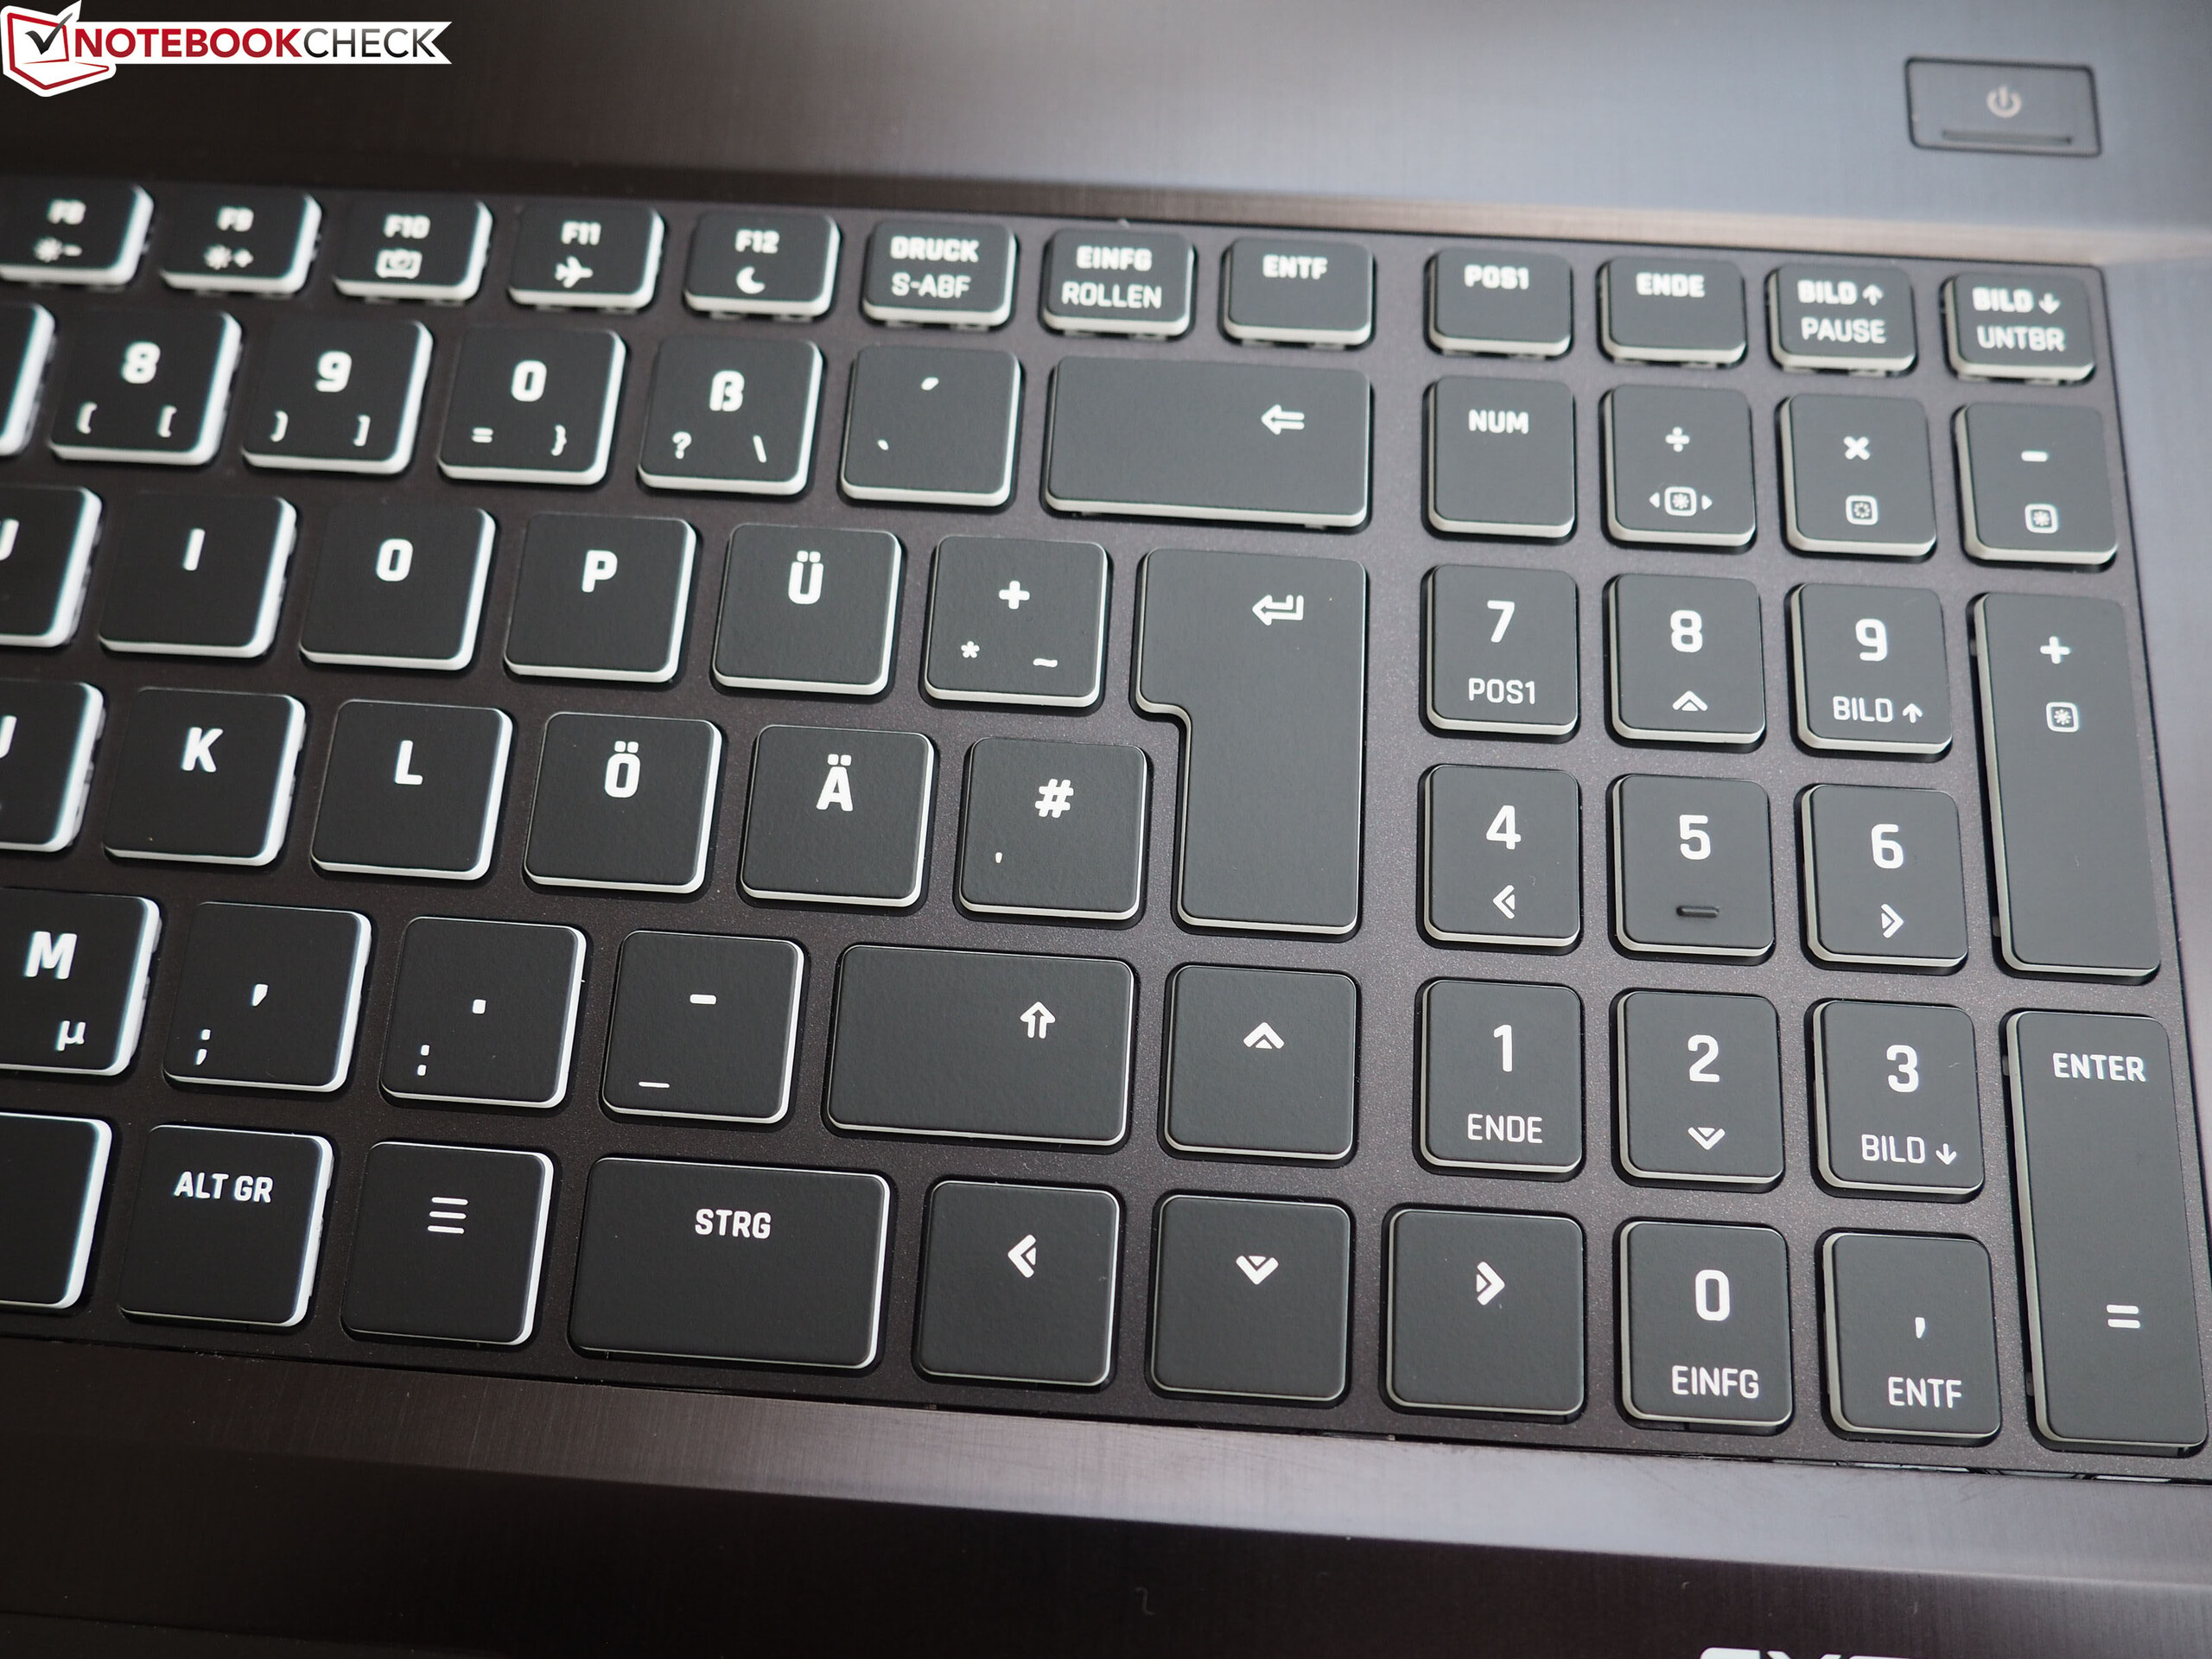
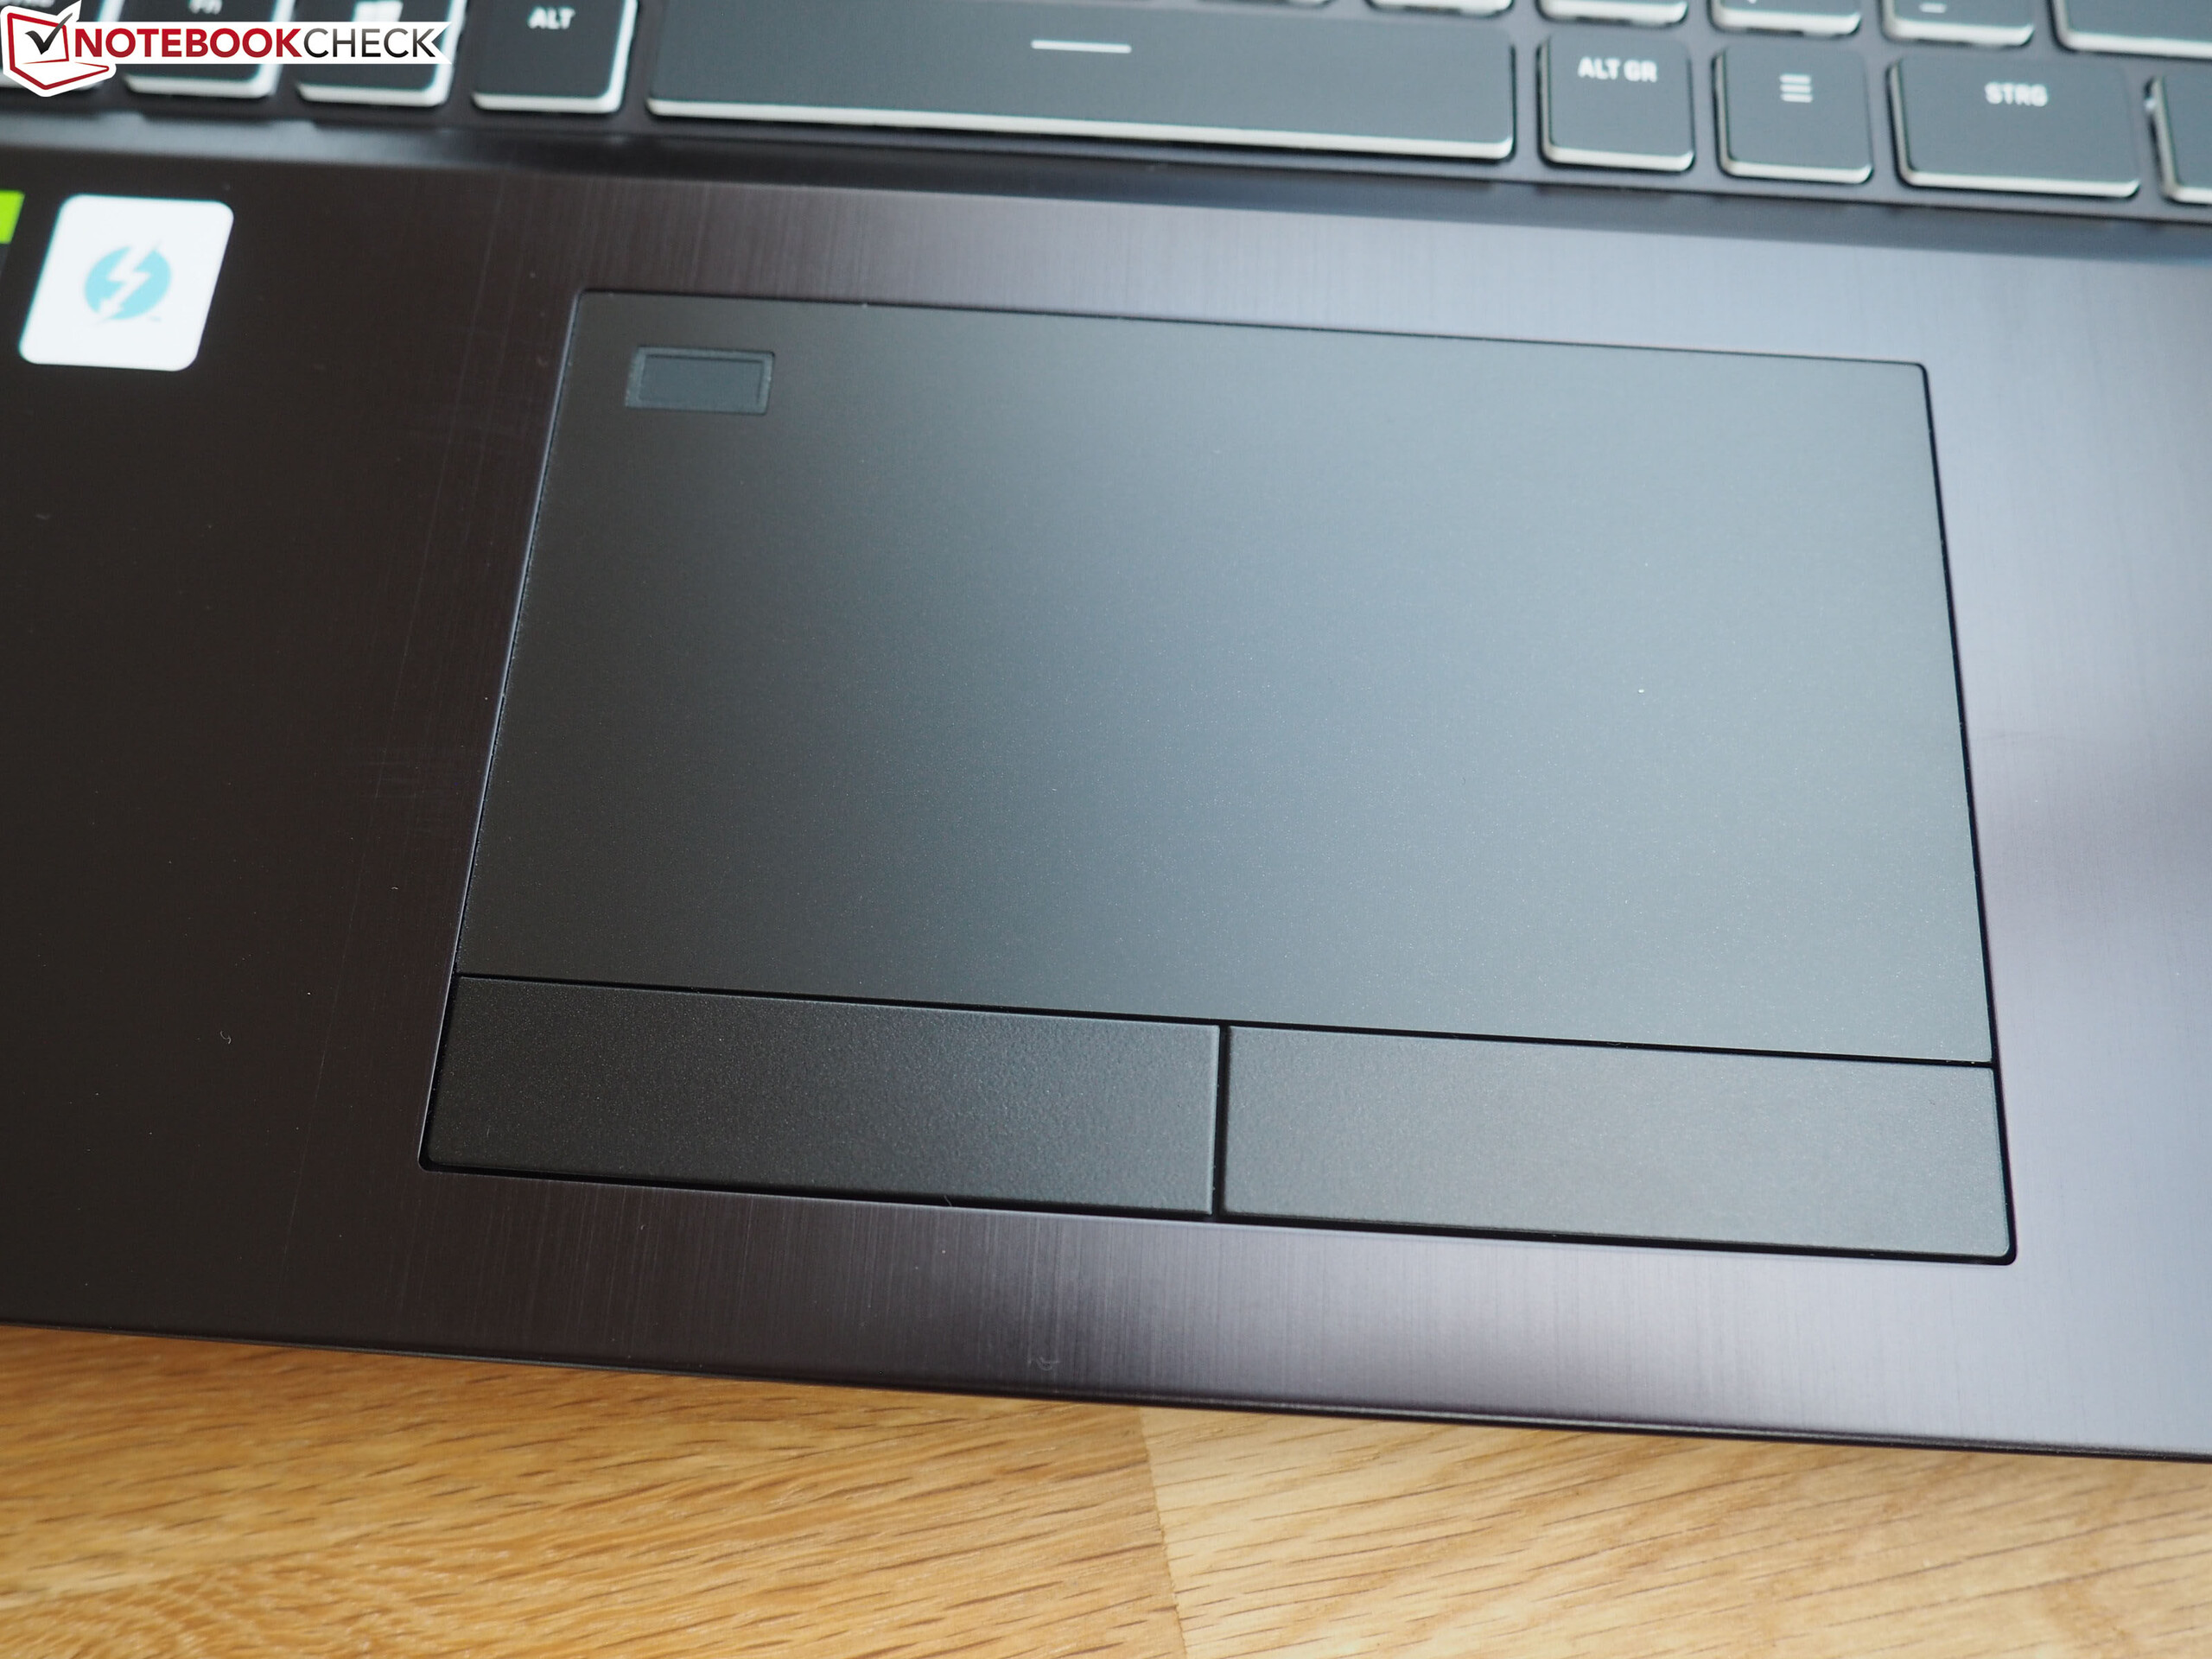
Como o XMG Ultra 17 é idêntico em construção ao modelo 2020, não iremos mais longe no caso, nos equipamentos, nos dispositivos de entrada e nos alto-falantes. As informações correspondentes podem ser encontradas no Revisão do Schenker XMG Ultra 17 (2020).
Possible competitors in comparison
Avaliação | Data | Modelo | Peso | Altura | Size | Resolução |
|---|---|---|---|---|---|---|
| 84.9 % v7 (old) | 04/2021 | Schenker XMG Ultra 17 Rocket Lake i9-11900K, GeForce RTX 3080 Laptop GPU | 4.7 kg | 43.5 mm | 17.30" | 1920x1080 |
| 87.4 % v7 (old) | 10/2020 | MSI GT76 Titan DT 10SGS i9-10900K, GeForce RTX 2080 Super Mobile | 4.2 kg | 42 mm | 17.30" | 3840x2160 |
| 82.7 % v7 (old) | 07/2020 | Asus Strix Scar 17 G732LXS i9-10980HK, GeForce RTX 2080 Super Mobile | 2.9 kg | 26.5 mm | 17.30" | 1920x1080 |
| 85.3 % v7 (old) | 04/2021 | Alienware m17 R4 i9-10980HK, GeForce RTX 3080 Laptop GPU | 3 kg | 22 mm | 17.30" | 1920x1080 |
| SD Card Reader | |
| average JPG Copy Test (av. of 3 runs) | |
| Schenker XMG Ultra 17 Rocket Lake | |
| Schenker XMG Ultra 17 Comet Lake (Toshiba Exceria Pro SDXC 64 GB UHS-II) | |
| Alienware m17 R4 (AV PRO microSD 128 GB V60) | |
| MSI GT76 Titan DT 10SGS (Toshiba Exceria Pro M501 UHS-II) | |
| Média da turma Gaming (20.9 - 210, n=54, últimos 2 anos) | |
| maximum AS SSD Seq Read Test (1GB) | |
| Alienware m17 R4 (AV PRO microSD 128 GB V60) | |
| Schenker XMG Ultra 17 Comet Lake (Toshiba Exceria Pro SDXC 64 GB UHS-II) | |
| Schenker XMG Ultra 17 Rocket Lake (AV PRO microSD 128 GB V60) | |
| MSI GT76 Titan DT 10SGS (Toshiba Exceria Pro M501 UHS-II) | |
| Média da turma Gaming (25.5 - 261, n=51, últimos 2 anos) | |


")
")


")
")


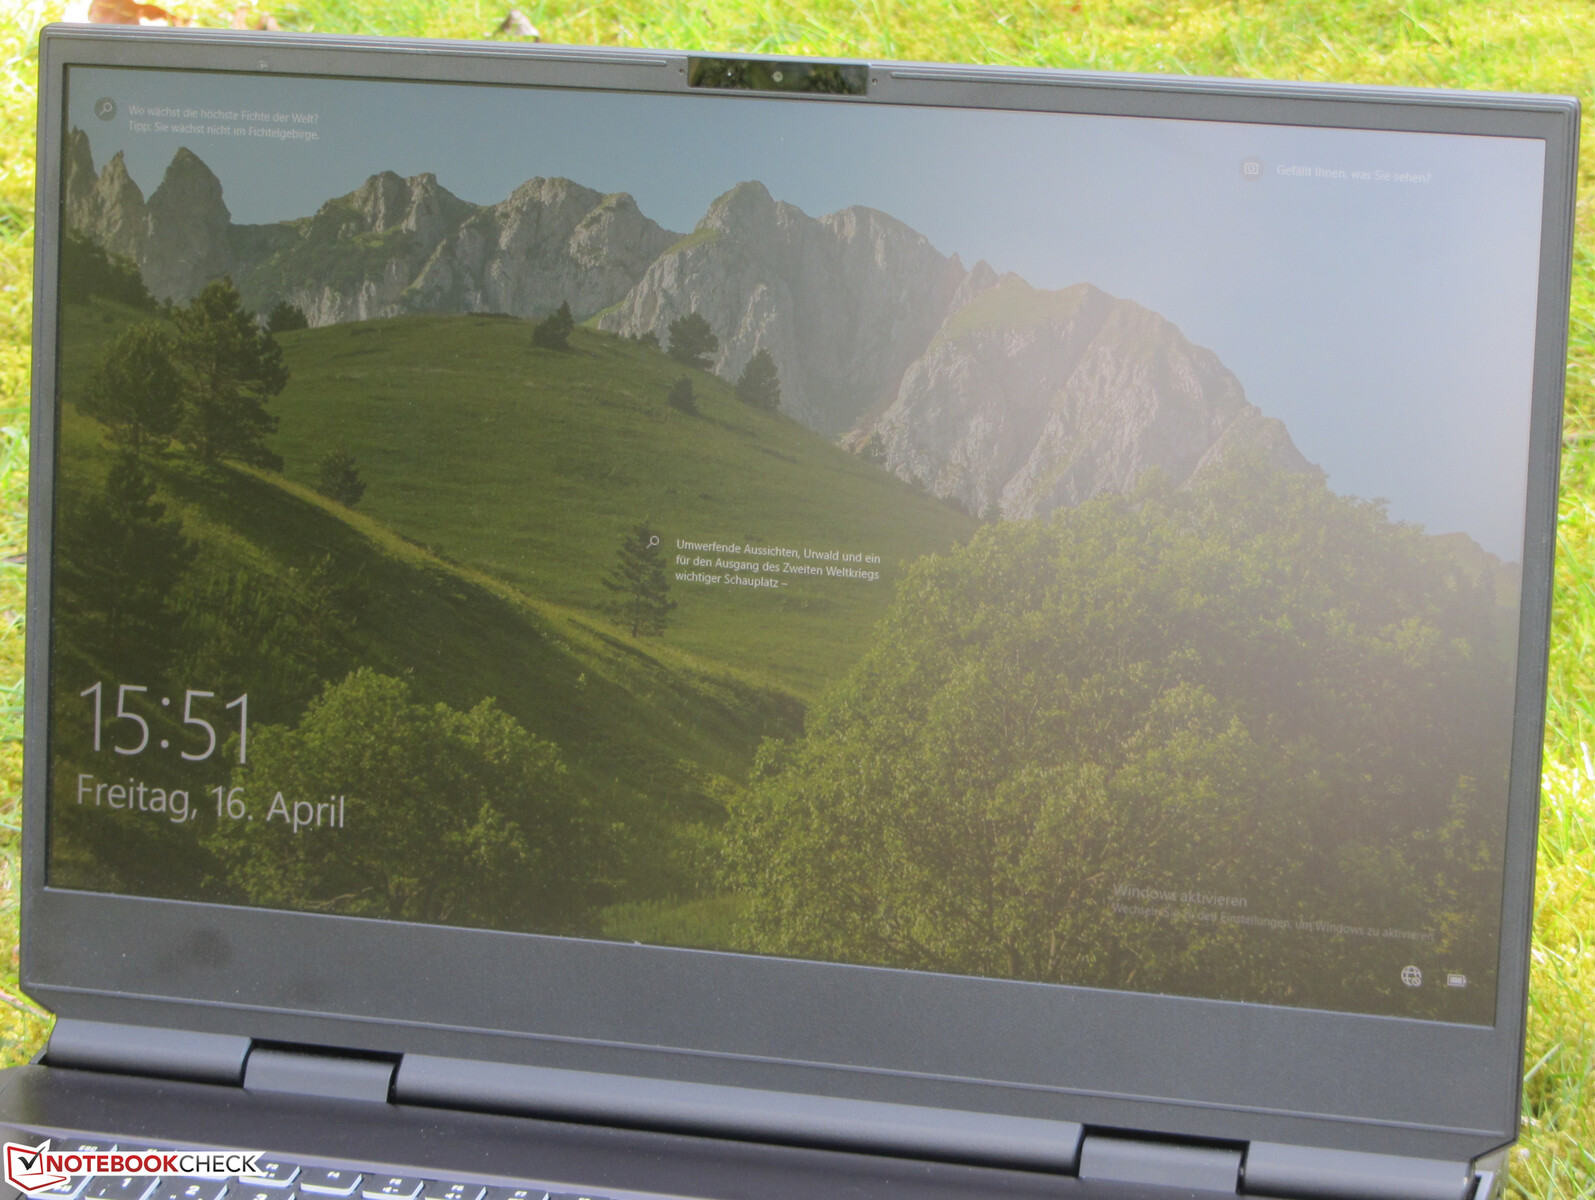
Visor - IPS 300 Hz
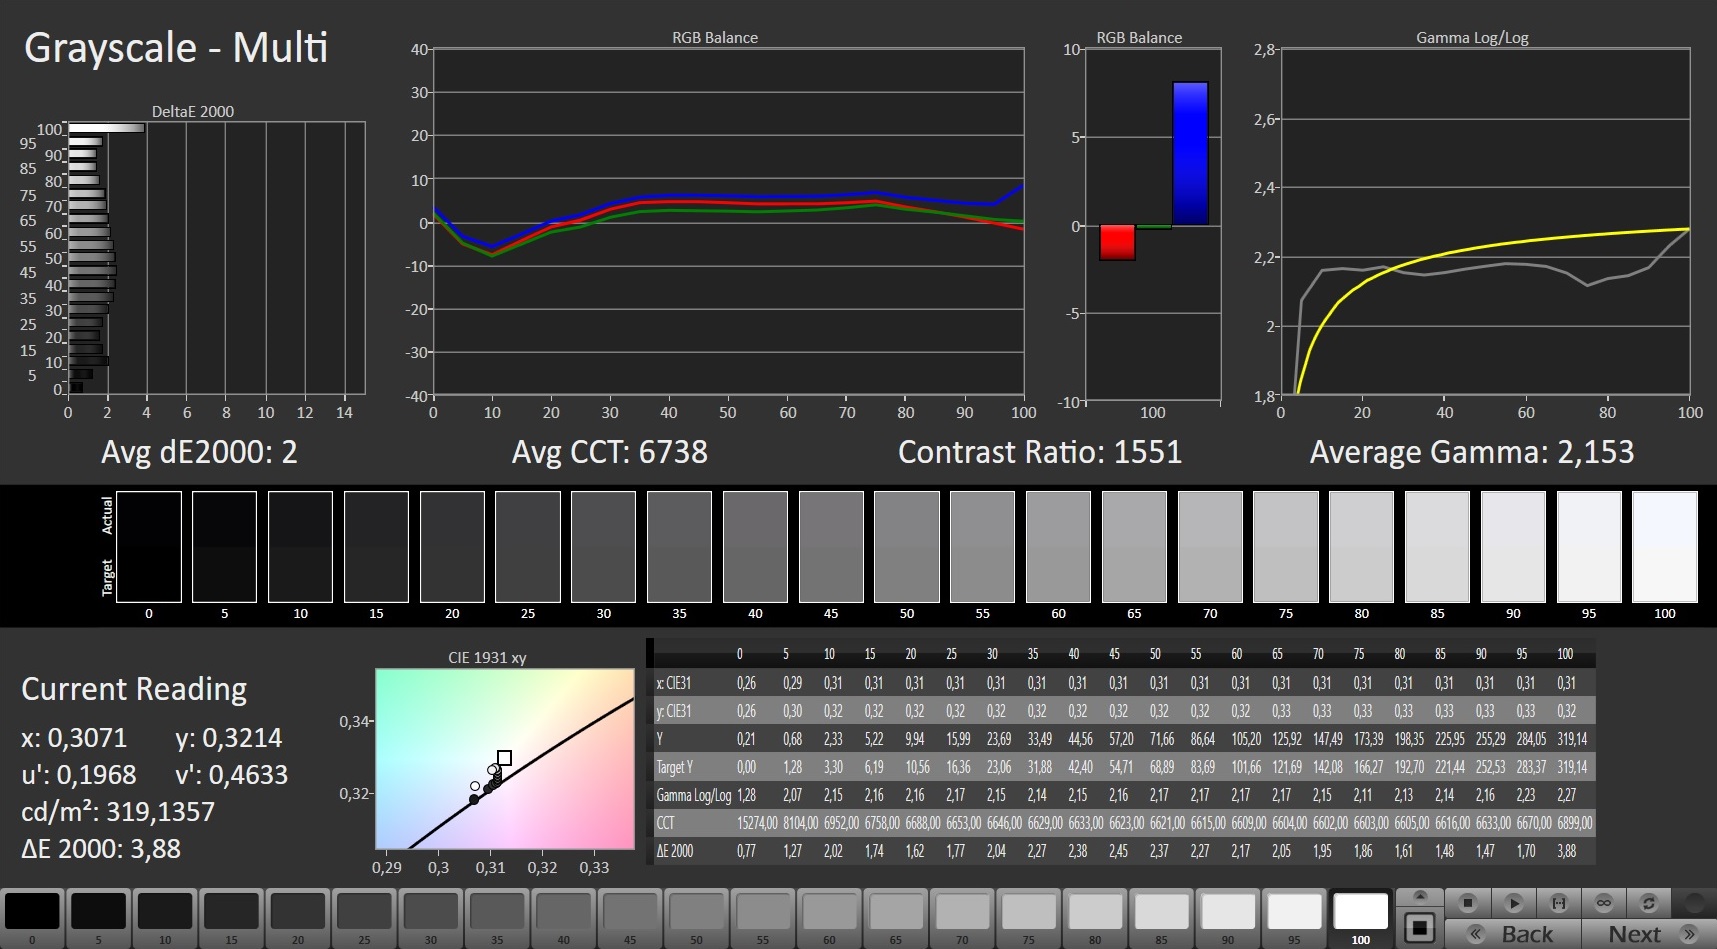
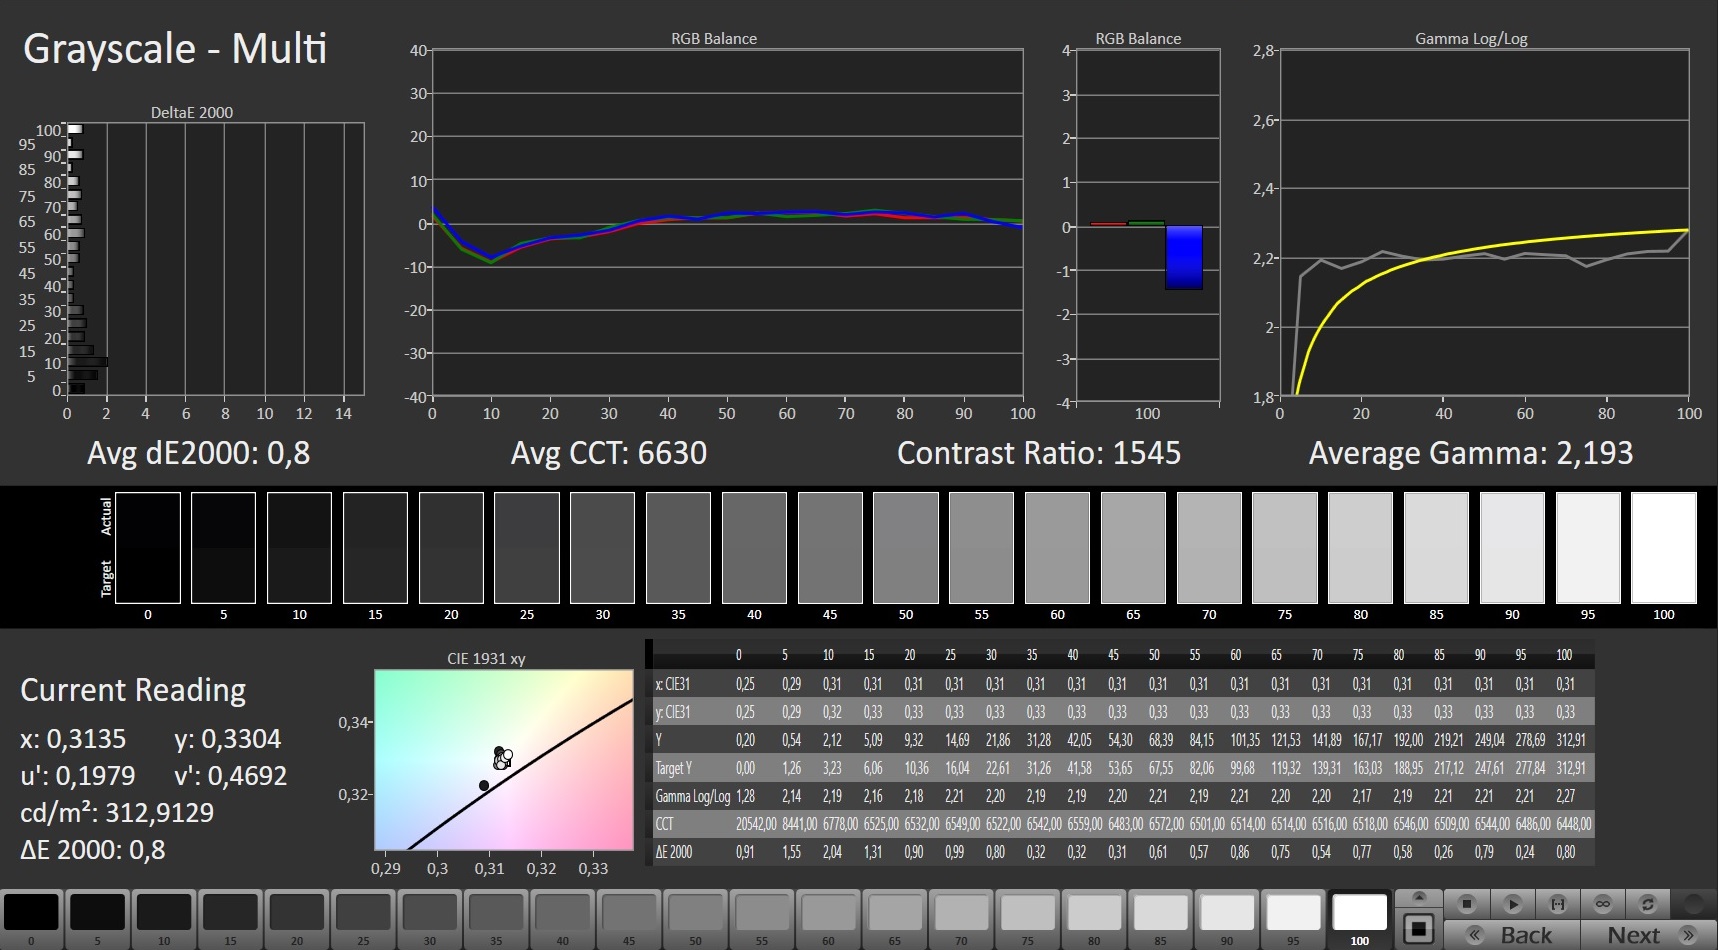
Enquanto a tela mate de 17,3 polegadas (1.920 x 1.080 pixels) proporciona um bom contraste (1.391:1), o brilho (299,3 cd/m²) mal atinge o alvo (> 300 cd/m²). O painel de 300 Hz oferece tempos de resposta curtos e não mostra o PWM cintilando
O display suporta a tecnologia G-Sync da Nvidia. Isto ajusta dinamicamente as taxas de atualização do display e da GPU um ao outro. Isto é para criar a imagem mais suave possível - especialmente em jogos de computador.
| |||||||||||||||||||||||||
iluminação: 93 %
iluminação com acumulador: 306 cd/m²
Contraste: 1391:1 (Preto: 0.22 cd/m²)
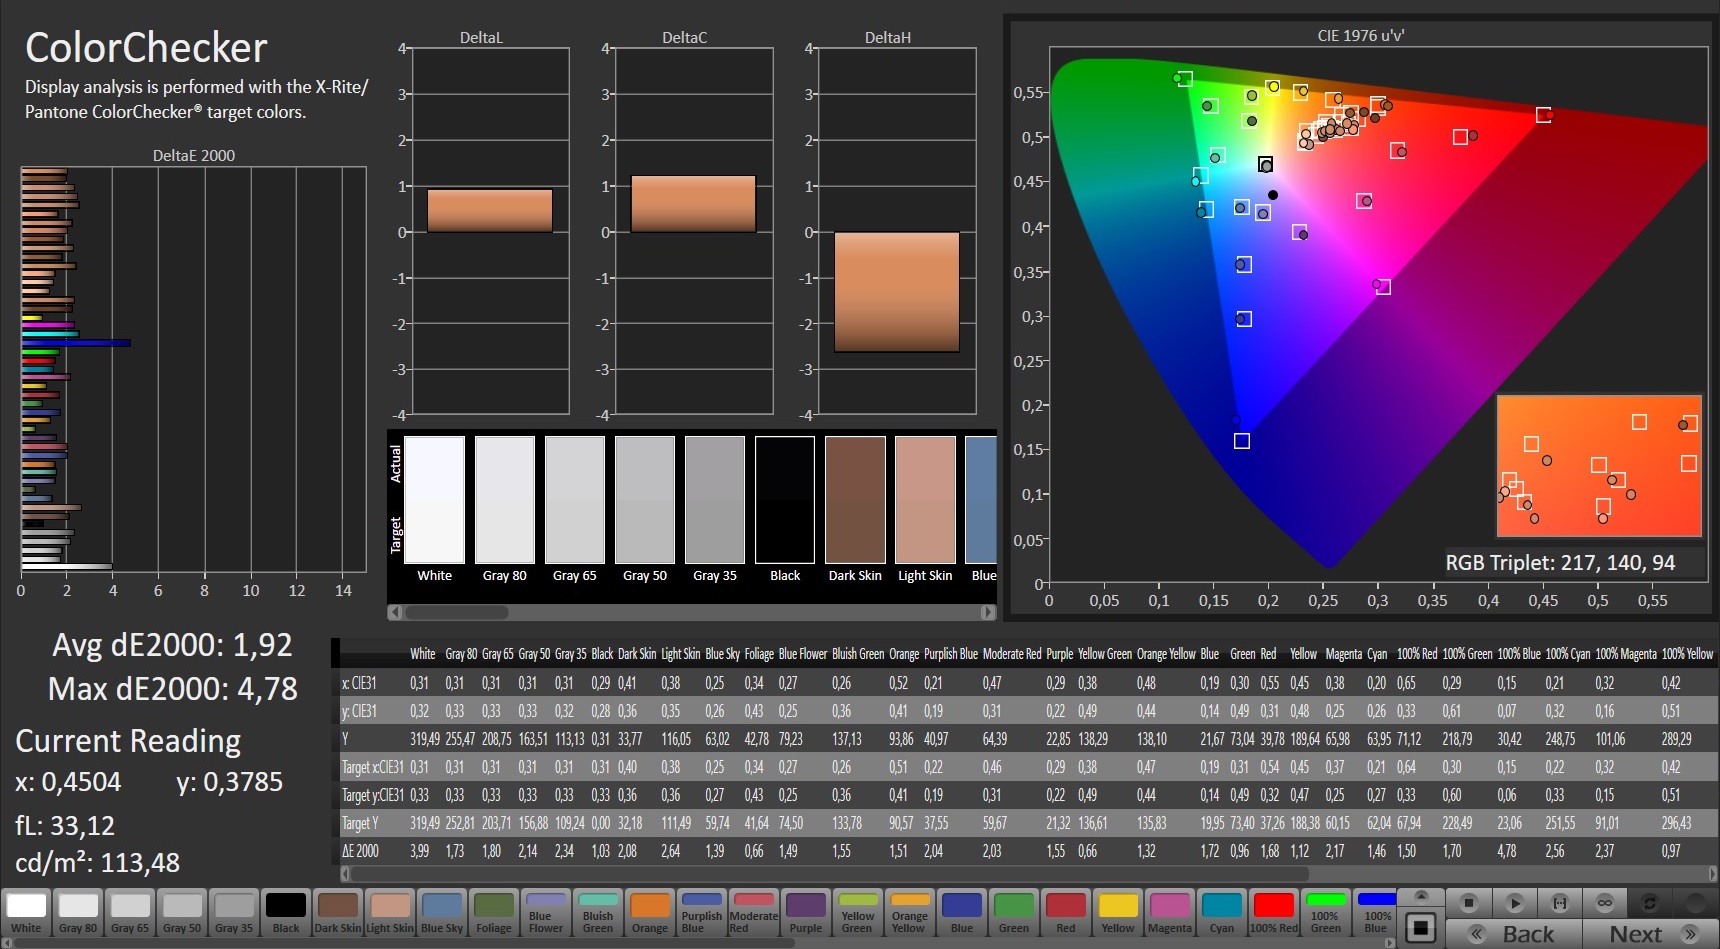
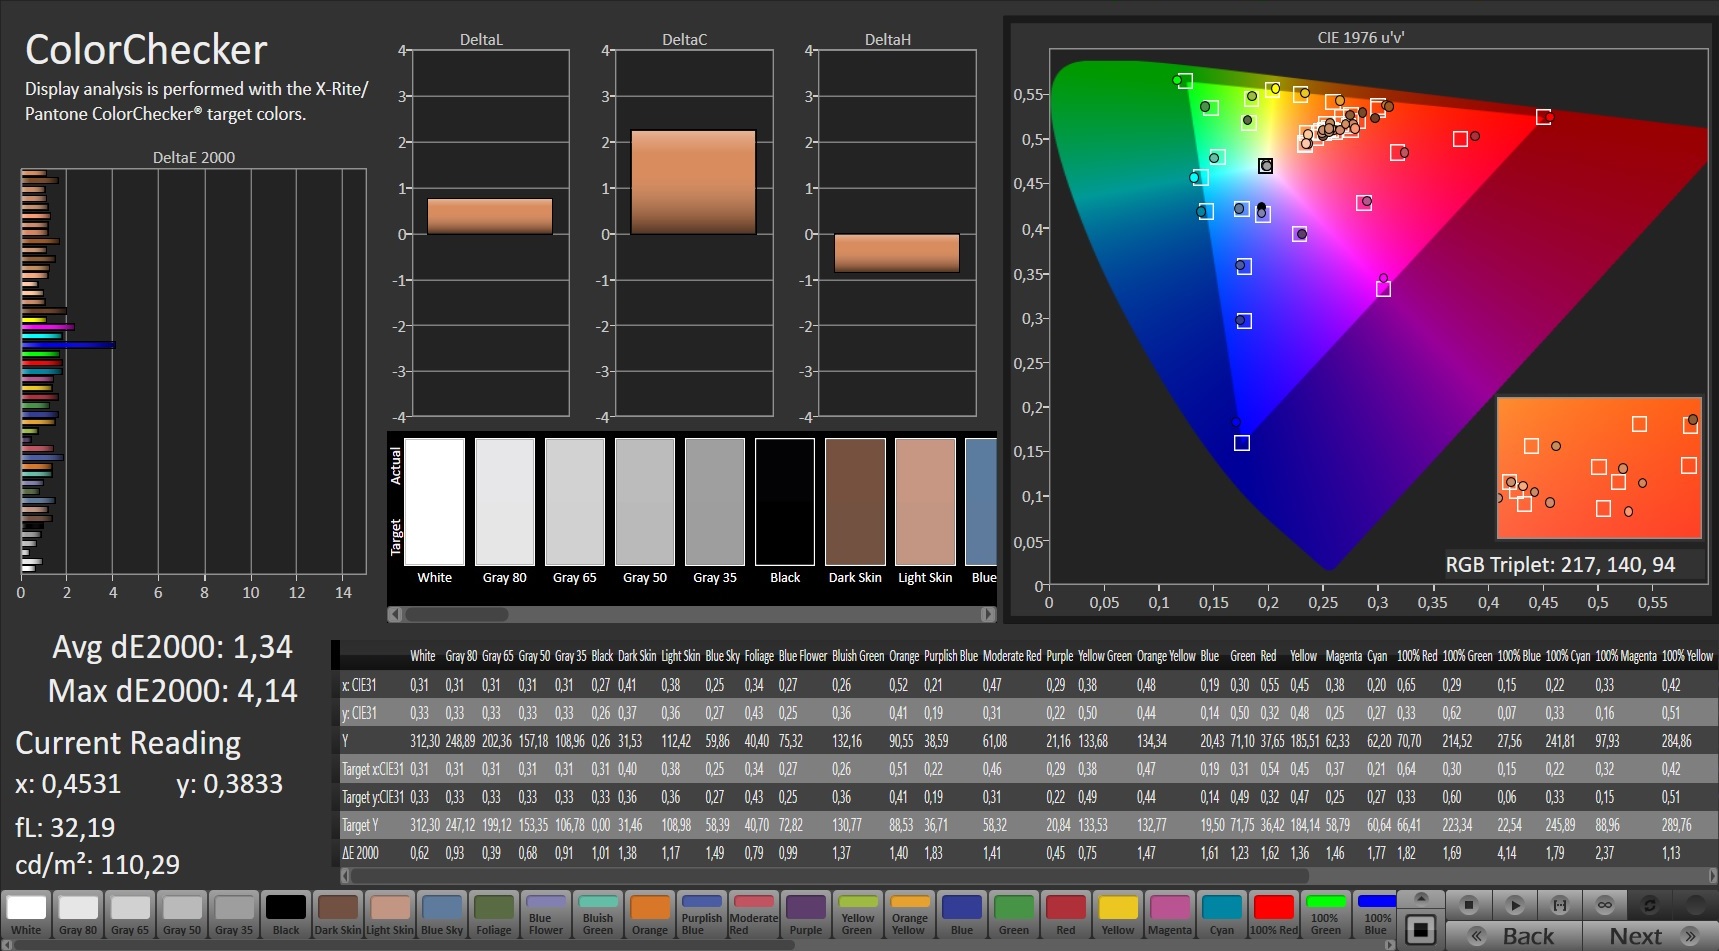
ΔE ColorChecker Calman: 1.92 | ∀{0.5-29.43 Ø4.71}
calibrated: 1.34
ΔE Greyscale Calman: 2 | ∀{0.09-98 Ø4.96}
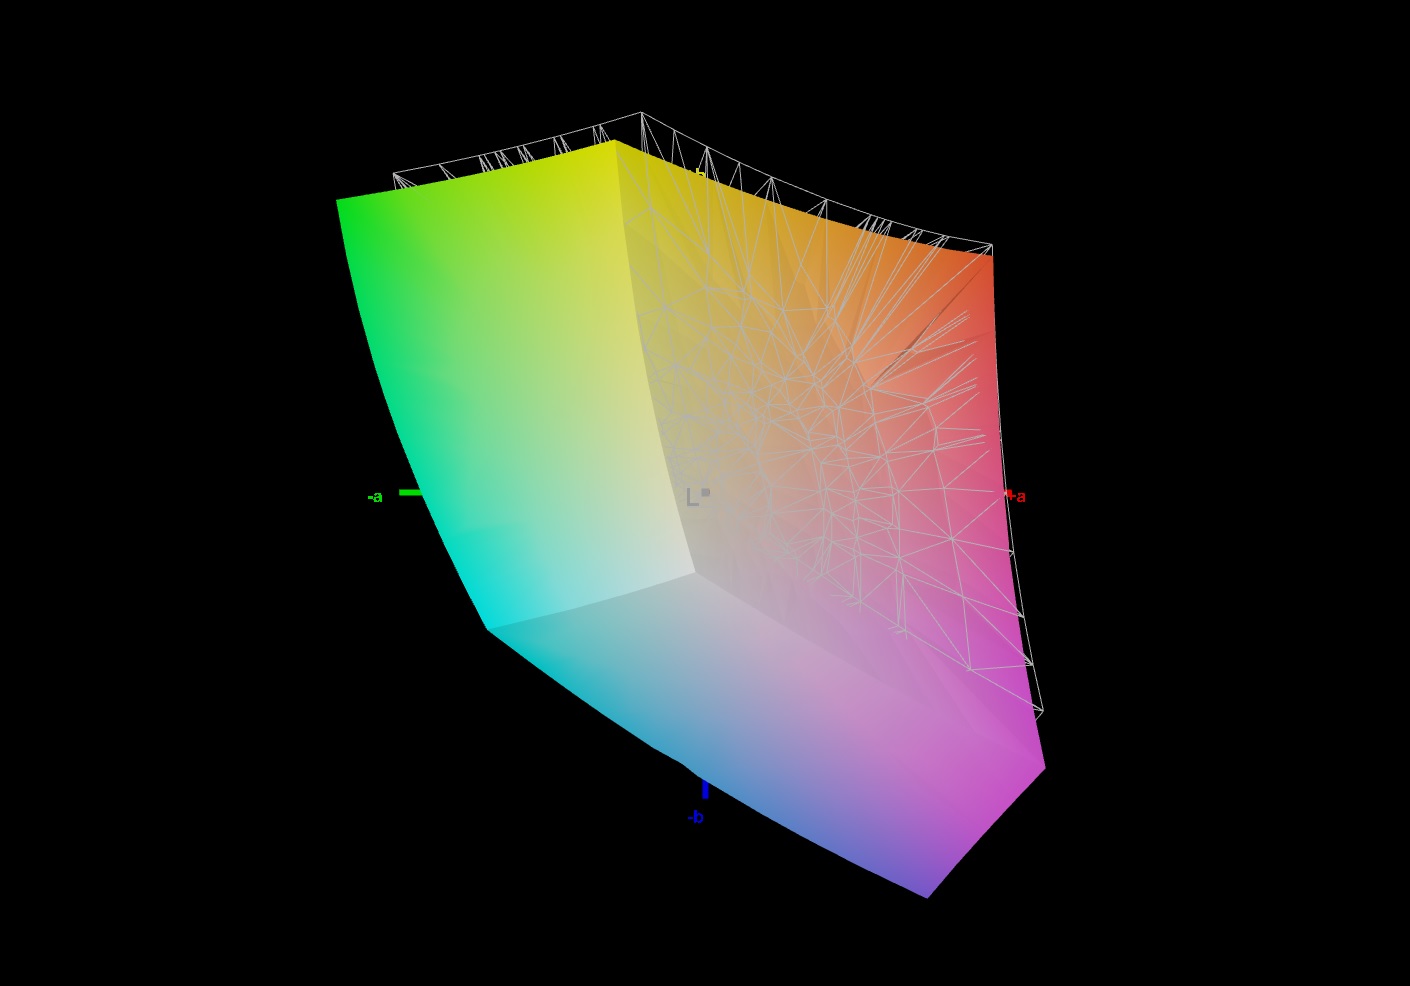
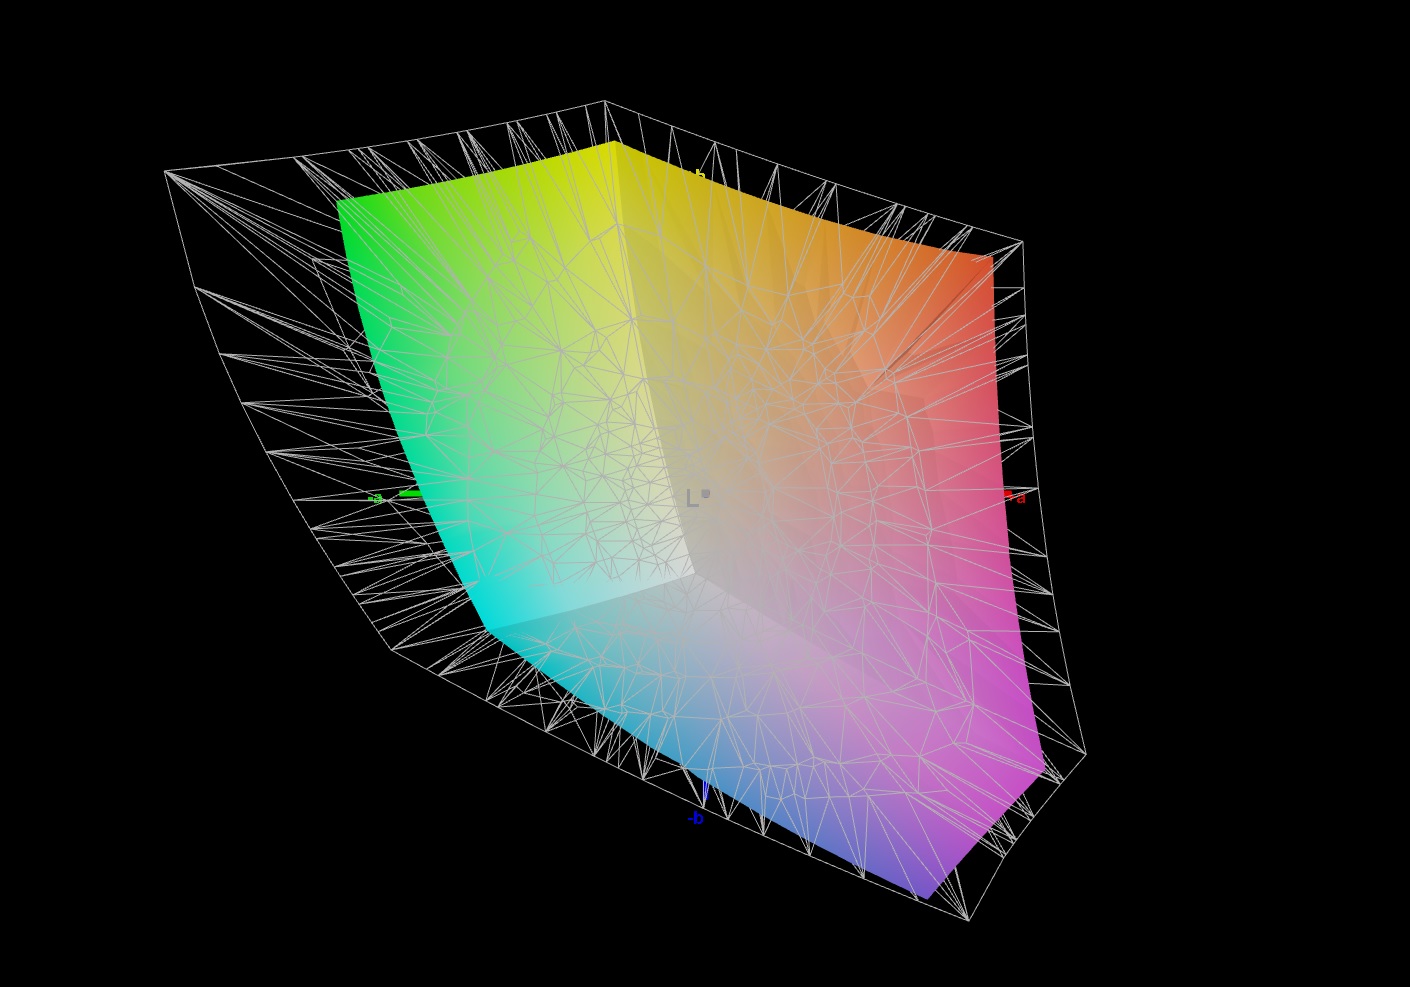
93% sRGB (Argyll 1.6.3 3D)
72% AdobeRGB 1998 (Argyll 1.6.3 3D)
72% AdobeRGB 1998 (Argyll 3D)
97.2% sRGB (Argyll 3D)
69.8% Display P3 (Argyll 3D)
Gamma: 2.153
CCT: 6738 K
| Schenker XMG Ultra 17 Rocket Lake AU Optronics B173HAN05.1, IPS, 1920x1080, 17.3" | MSI GT76 Titan DT 10SGS AU Optronics B173ZAN03.3, IPS, 3840x2160, 17.3" | Asus Strix Scar 17 G732LXS LQ173M1JW03 (SHP14DC), IPS, 1920x1080, 17.3" | Schenker XMG Ultra 17 Comet Lake AUO B173ZAN03.0 (AUO309B), IPS, 3840x2160, 17.3" | Alienware m17 R4 AU Optronics AUOEC91, IPS, 1920x1080, 17.3" | |
|---|---|---|---|---|---|
| Display | 18% | 1% | 19% | 1% | |
| Display P3 Coverage (%) | 69.8 | 82.5 18% | 71 2% | 83 19% | 69.8 0% |
| sRGB Coverage (%) | 97.2 | 98 1% | 99 2% | 99.1 2% | 99.7 3% |
| AdobeRGB 1998 Coverage (%) | 72 | 96.6 34% | 71.6 -1% | 97.9 36% | 71.6 -1% |
| Response Times | -170% | 3% | -468% | -68% | |
| Response Time Grey 50% / Grey 80% * (ms) | 5.6 ? | 23.2 ? -314% | 5.8 ? -4% | 50.4 ? -800% | 13.2 ? -136% |
| Response Time Black / White * (ms) | 9.2 ? | 11.6 ? -26% | 8.4 ? 9% | 21.6 ? -135% | 9.2 ? -0% |
| PWM Frequency (Hz) | |||||
| Screen | -26% | -31% | -38% | 12% | |
| Brightness middle (cd/m²) | 306 | 419.5 37% | 310 1% | 442 44% | 305 0% |
| Brightness (cd/m²) | 299 | 413 38% | 311 4% | 423 41% | 301 1% |
| Brightness Distribution (%) | 93 | 93 0% | 82 -12% | 92 -1% | 93 0% |
| Black Level * (cd/m²) | 0.22 | 0.4 -82% | 0.41 -86% | 0.36 -64% | 0.19 14% |
| Contrast (:1) | 1391 | 1049 -25% | 756 -46% | 1228 -12% | 1605 15% |
| Colorchecker dE 2000 * | 1.92 | 3.4 -77% | 2.41 -26% | 4.38 -128% | 1.31 32% |
| Colorchecker dE 2000 max. * | 4.78 | 7.4 -55% | 8.59 -80% | 10.85 -127% | 2.32 51% |
| Colorchecker dE 2000 calibrated * | 1.34 | 3.28 -145% | 1.13 16% | 0.66 51% | 0.91 32% |
| Greyscale dE 2000 * | 2 | 2 -0% | 4.3 -115% | 7.3 -265% | 2.3 -15% |
| Gamma | 2.153 102% | 2.14 103% | 2.149 102% | 2.17 101% | 2.281 96% |
| CCT | 6738 96% | 6858 95% | 7059 92% | 6906 94% | 6449 101% |
| Color Space (Percent of AdobeRGB 1998) (%) | 72 | 84.6 17% | 72 0% | 98 36% | 72 0% |
| Color Space (Percent of sRGB) (%) | 93 | 97.9 5% | 94 1% | 98 5% | 94 1% |
| Média Total (Programa/Configurações) | -59% /
-36% | -9% /
-21% | -162% /
-81% | -18% /
-0% |
* ... menor é melhor
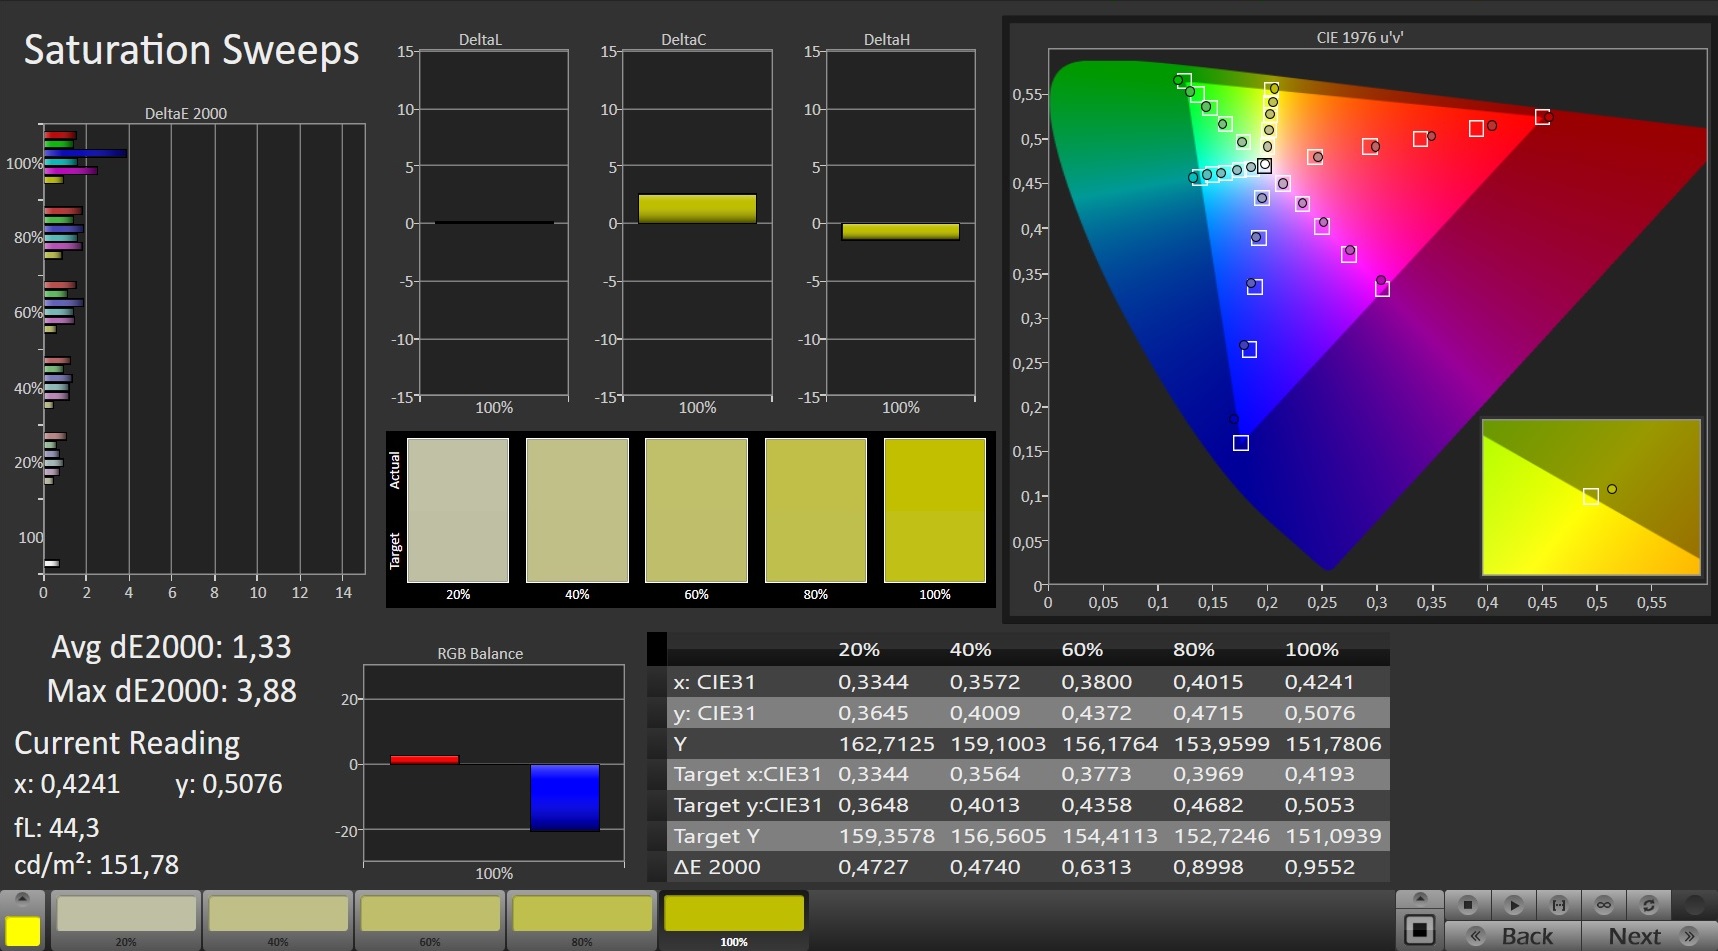
A tela já mostra uma boa reprodução de cores em seu estado de entrega e atinge o alvo com um desvio de pouco menos de 2 (Delta E menos de 3). Ela não sofre de um elenco azul. Uma calibração proporciona melhorias: O desvio de cor cai para 1,34 e os níveis de escala de cinza são exibidos mais equilibrados. A tela não consegue reproduzir completamente os espaços de cor AdobeRGB (72%) e sRGB (93%)

Exibir tempos de resposta
| ↔ Tempo de resposta preto para branco | ||
|---|---|---|
| 9.2 ms ... ascensão ↗ e queda ↘ combinadas | ↗ 4.8 ms ascensão | 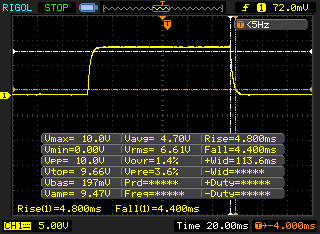 |
| ↘ 4.4 ms queda | ||
| A tela mostra taxas de resposta rápidas em nossos testes e deve ser adequada para jogos. Em comparação, todos os dispositivos testados variam de 0.1 (mínimo) a 240 (máximo) ms. » 26 % de todos os dispositivos são melhores. Isso significa que o tempo de resposta medido é melhor que a média de todos os dispositivos testados (19.8 ms). | ||
| ↔ Tempo de resposta 50% cinza a 80% cinza | ||
| 5.6 ms ... ascensão ↗ e queda ↘ combinadas | ↗ 2.8 ms ascensão | 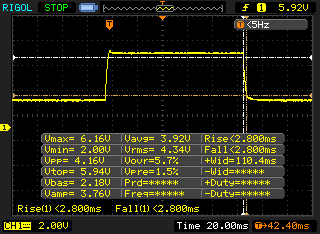 |
| ↘ 2.8 ms queda | ||
| A tela mostra taxas de resposta muito rápidas em nossos testes e deve ser muito adequada para jogos em ritmo acelerado. Em comparação, todos os dispositivos testados variam de 0.165 (mínimo) a 636 (máximo) ms. » 18 % de todos os dispositivos são melhores. Isso significa que o tempo de resposta medido é melhor que a média de todos os dispositivos testados (31 ms). | ||
Cintilação da tela / PWM (modulação por largura de pulso)
| Tela tremeluzindo / PWM não detectado | 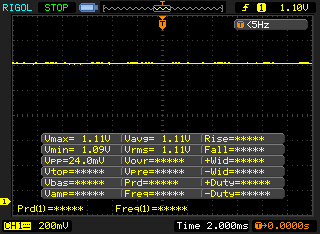 | ||
[pwm_comparison] Em comparação: 52 % de todos os dispositivos testados não usam PWM para escurecer a tela. Se PWM foi detectado, uma média de 7754 (mínimo: 5 - máximo: 343500) Hz foi medida. | |||
O painel IPS estável em ângulo de visão pode ser lido a partir de qualquer posição. É bem possível ler o visor ao ar livre se o sol não estiver muito claro

Desempenho - XMG Ultra 17 permite a troca de CPU e GPU
O notebook de reposição de mesa da Schenker oferece muito poder computacional e funciona de acordo em todas as áreas de aplicação comuns. O dispositivo pode ser configurado de forma muito individual
Condições de teste
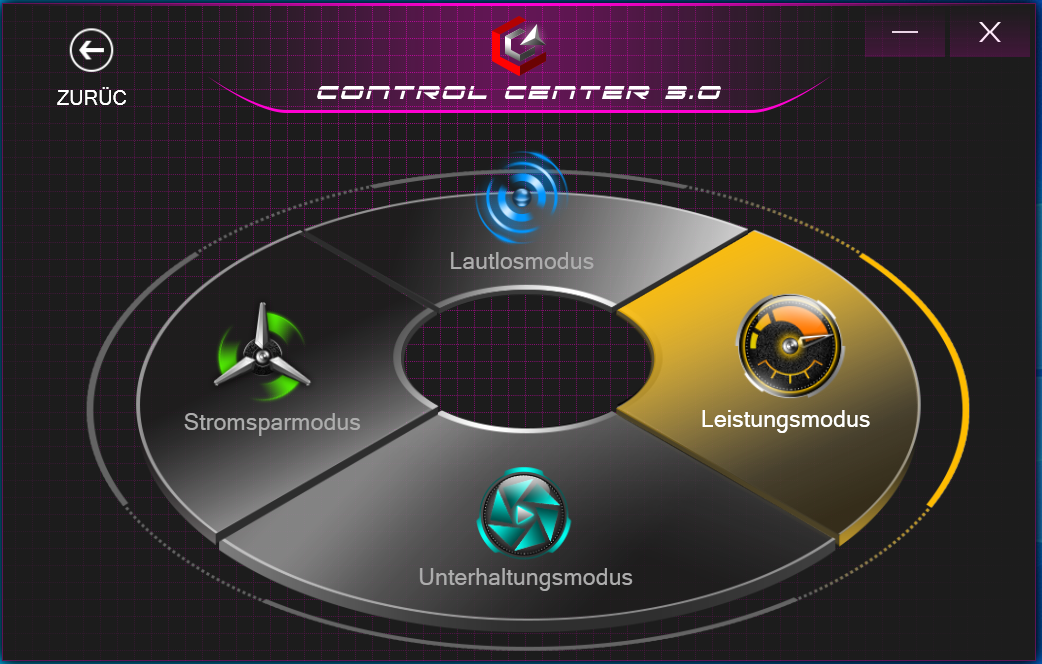
O Centro de Controle pré-instalado permite selecionar um perfil de desempenho, entre outras coisas. Realizamos nossos testes 3D com um perfil "Performance Mode" ativo e controle automático do ventilador. Utilizamos o perfil "Modo de Entretenimento" para os testes de inatividade e bateria.

Processador
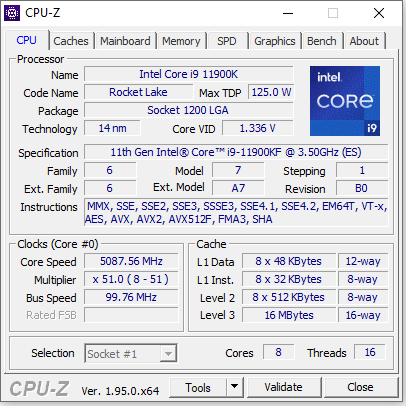
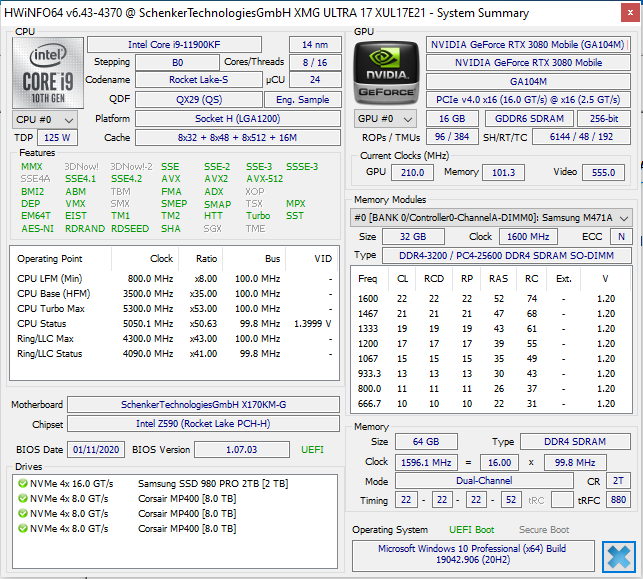
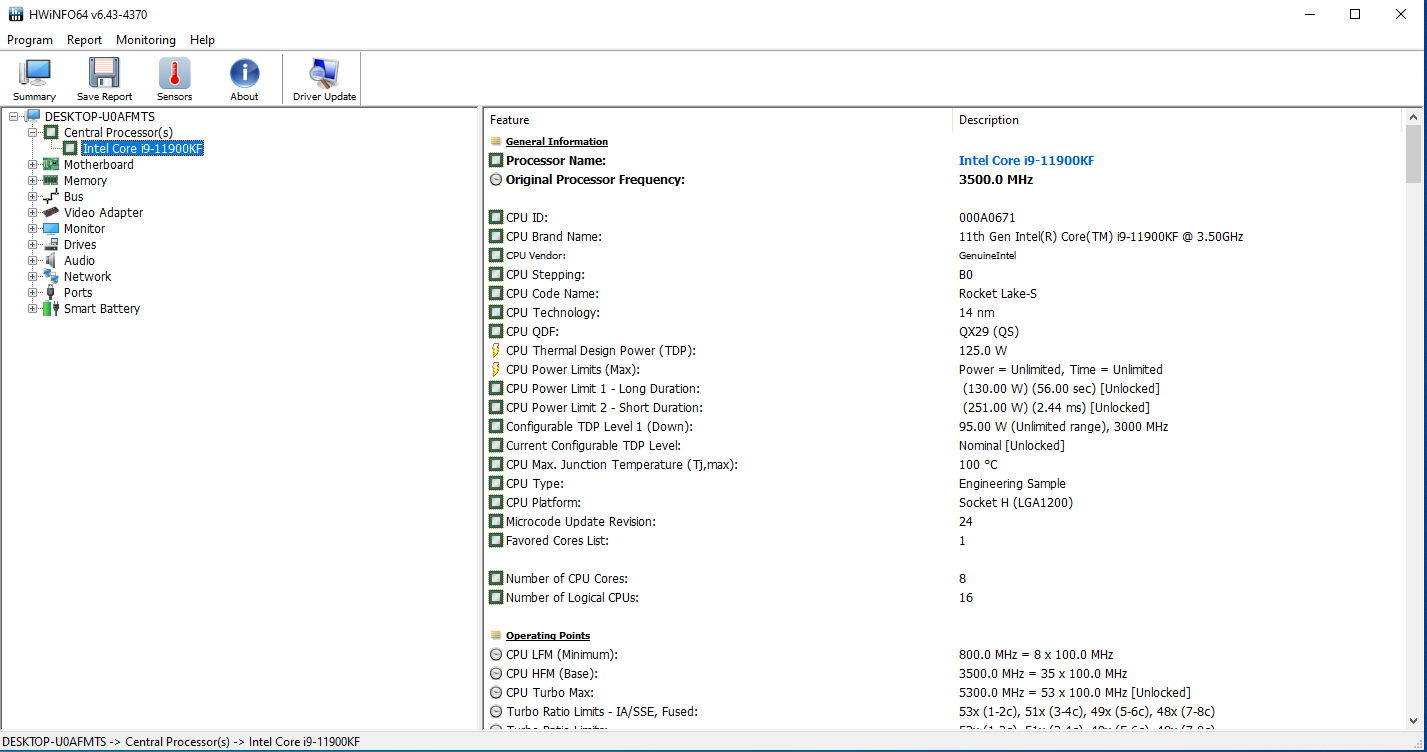
O Core-i9-11900Kprocessador de oito núcleos (Rocket Lake) funciona com um relógio base de 3,5 GHz. O relógio pode ser aumentado para 4,8 GHz (oito núcleos) até 5,3 GHz (um núcleo) via Turbo. O Hyperthreading (dois fios por núcleo) é suportado. Graças ao multiplicador livre, o processador pode ser super-relançado com bastante facilidade. A CPU está em um soquete e, portanto, poderia ser trocada.
Os testes de CPU do benchmark Cinebench R15 são executados com 4,6 a 4,8 GHz (multi-fios) e 4,8 a 5,3 GHz (mono-fios). Em bateria, a CPU funciona em 800 MHz a 4,8 GHz (multifios) ou 3,6 a 5,1 GHz (mono-fios)
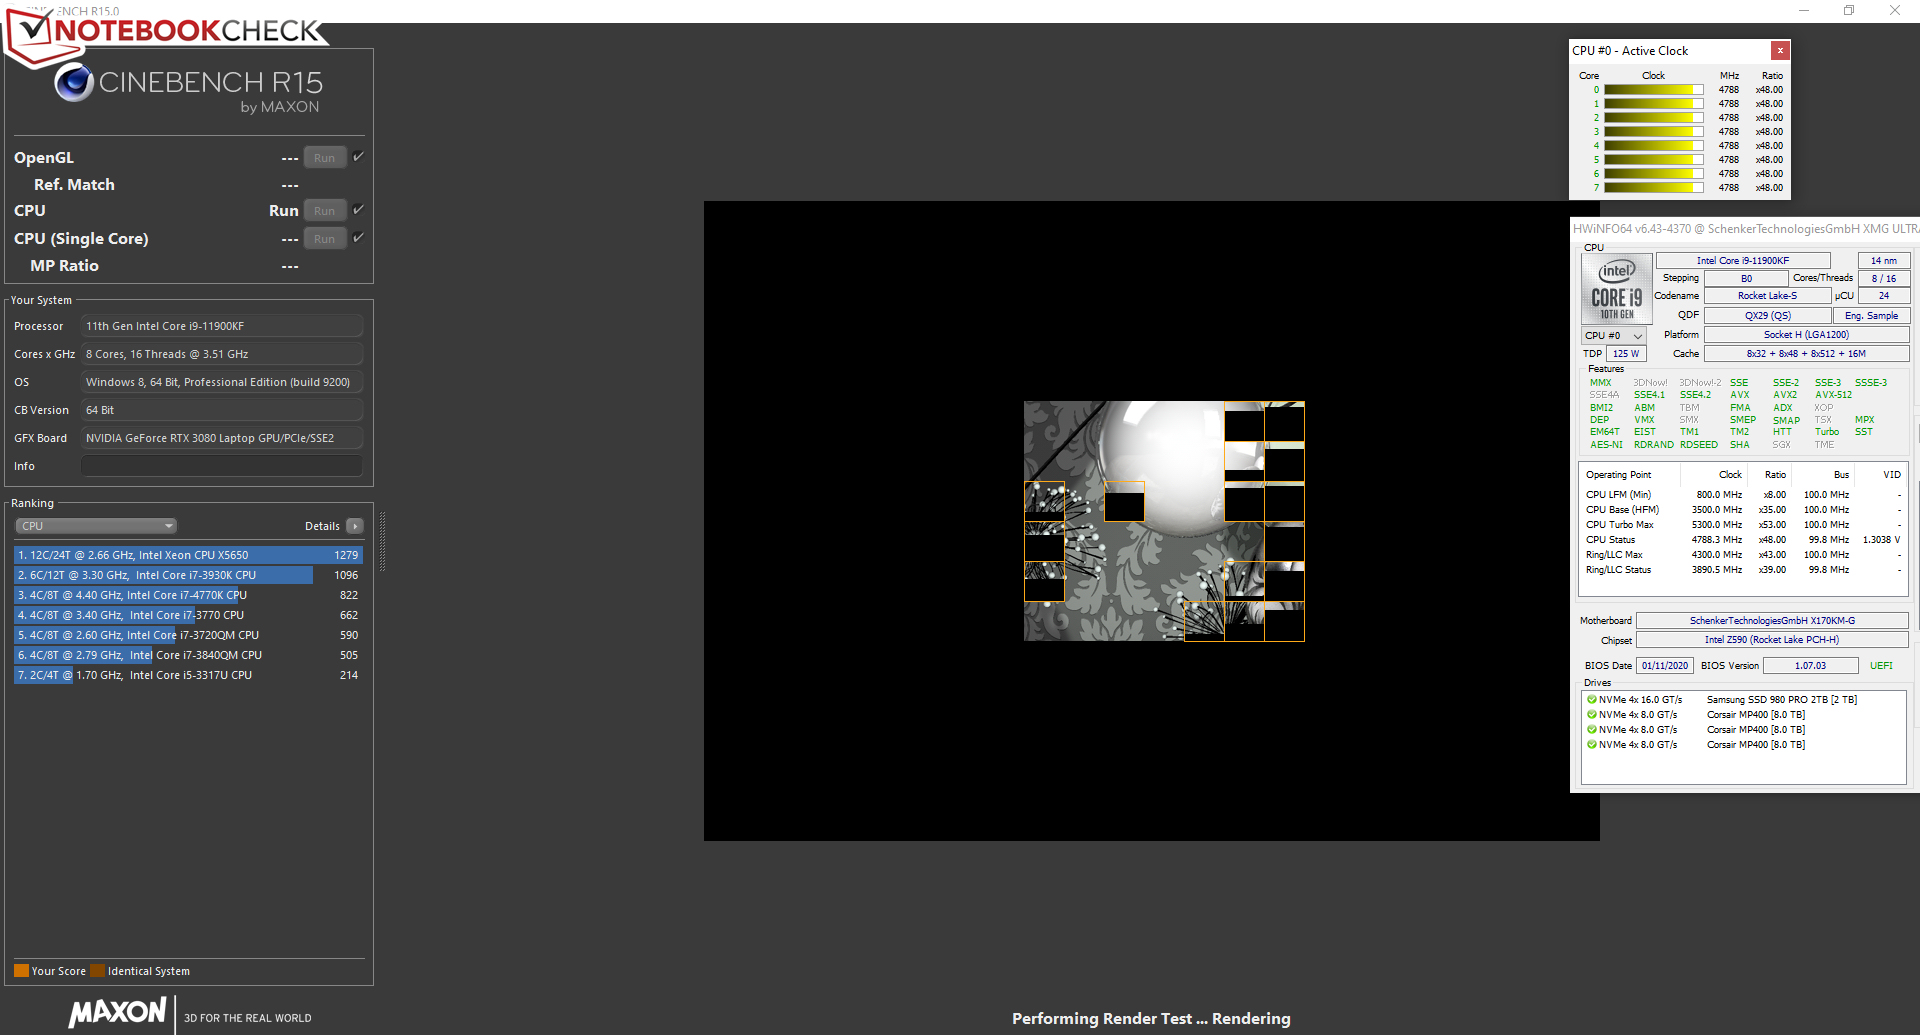
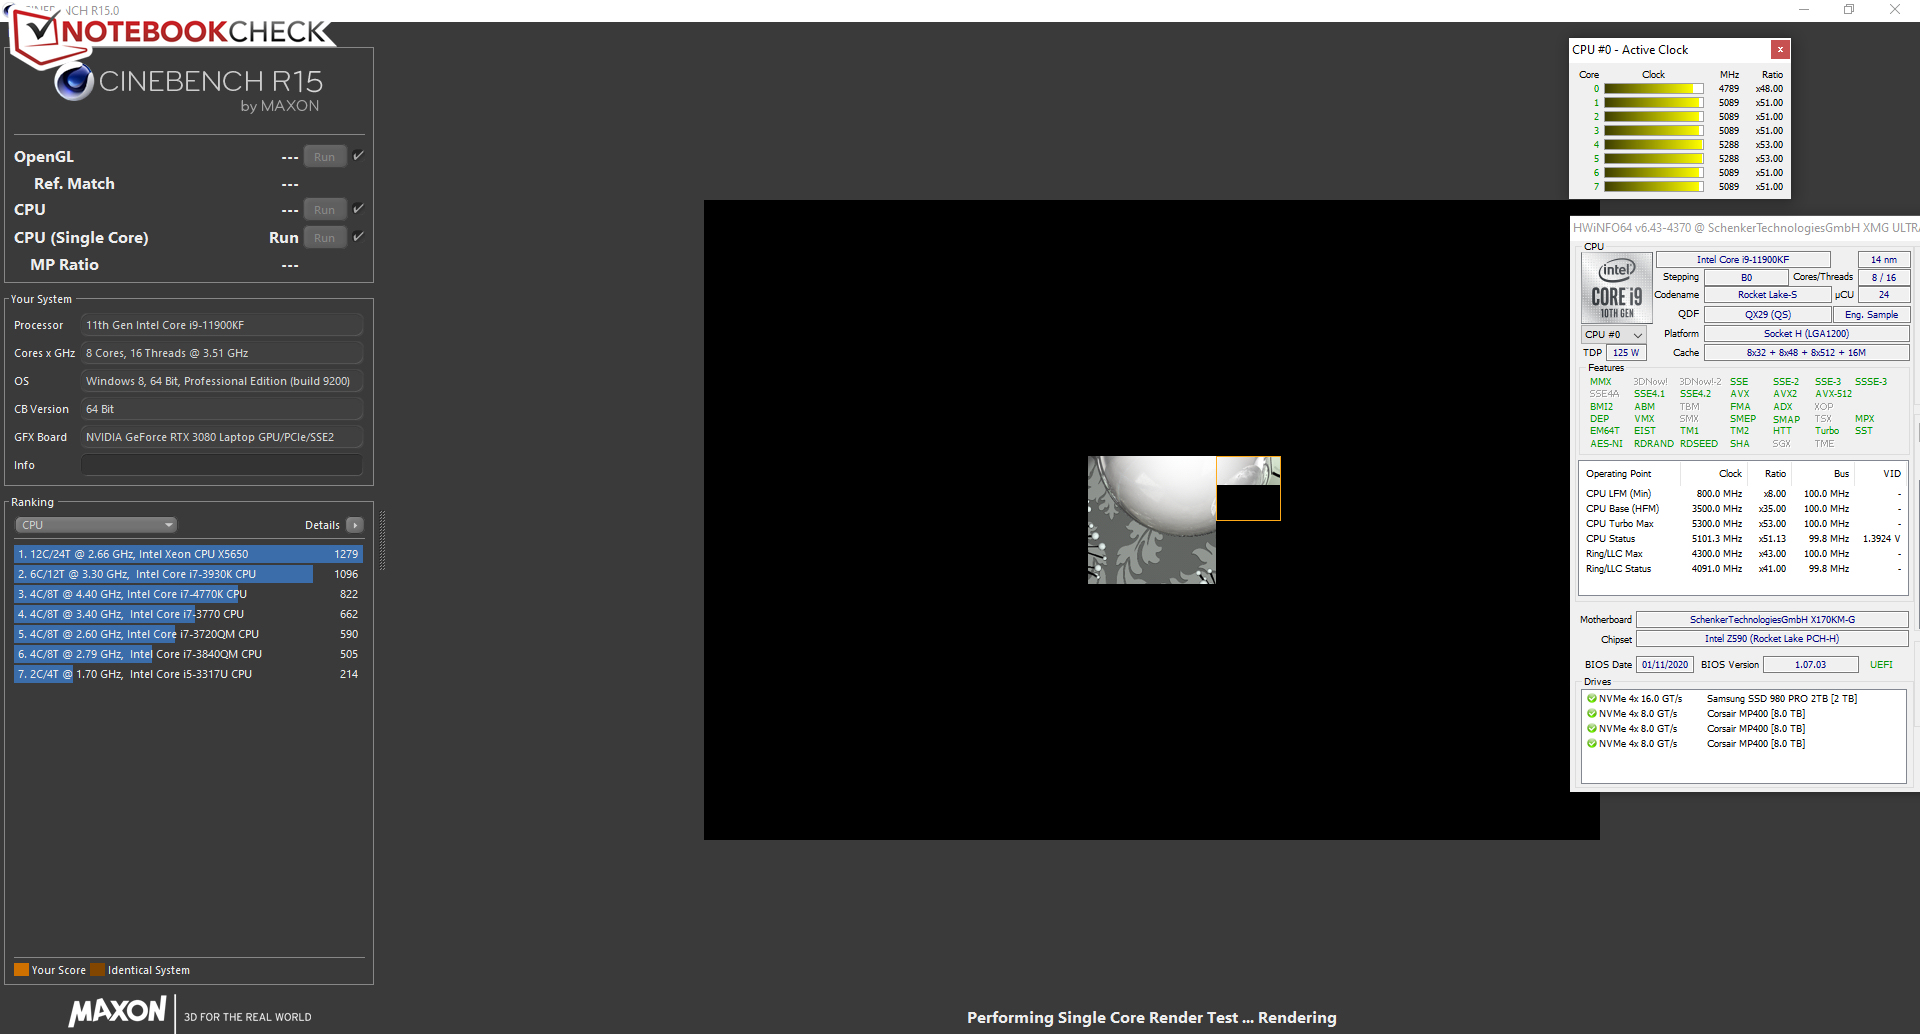
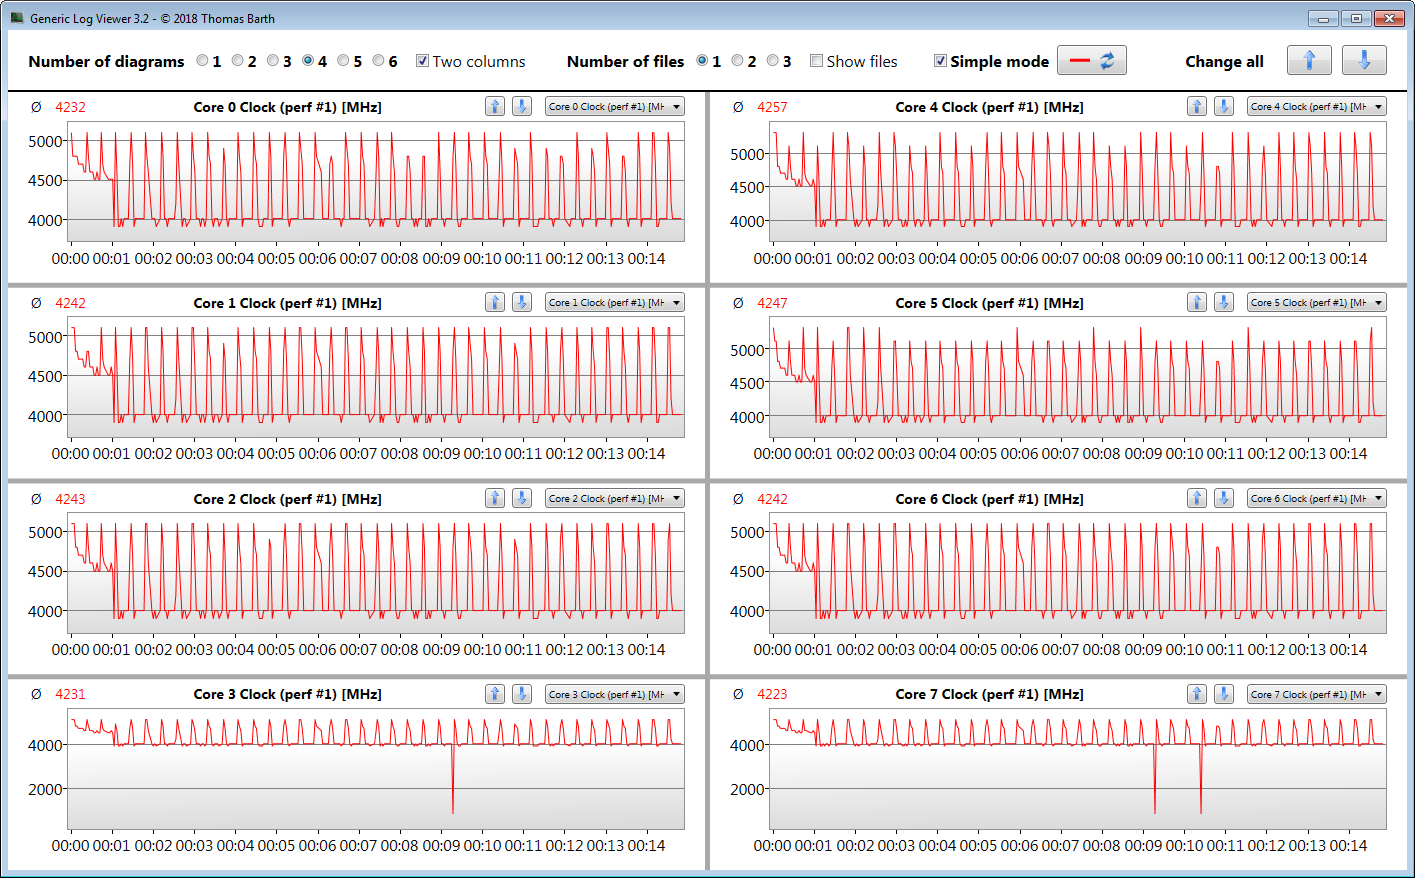
Verificamos se a CPU Turbo também é usada permanentemente na operação de rede elétrica, executando o teste multi-tarefa do benchmark Cinebench R15 em um loop. As altas velocidades são alcançadas no primeiro minuto do teste. Em seguida, o relógio cai para valores em torno de 4 GHz.
O Rocket Lake deixa uma boa impressão. A Intel foi capaz de aumentar significativamente o desempenho por-MHz. Como resultado, a falta de dois núcleos de CPU em comparação com o predecessor do Comet Lake (Core i9-10900K) pode ser compensadaatécerto ponto em aplicações multi-tarefas. O11900Kpode se mostrarem termos dedesempenho derosca única. Ele está à frente de seupredecessor aqui.
* ... menor é melhor
Desempenho do sistema
O fato de não haver falta de poder de computação não deve ser surpreendente, tendo em vista o equipamento de hardware. O laptop é impressionante em todas as áreas de aplicação comuns. Os muito bons resultados do PCMark confirmam isso
| PCMark 8 Home Score Accelerated v2 | 5529 pontos | |
| PCMark 8 Creative Score Accelerated v2 | 7020 pontos | |
| PCMark 8 Work Score Accelerated v2 | 6151 pontos | |
| PCMark 10 Score | 7884 pontos | |
Ajuda | ||
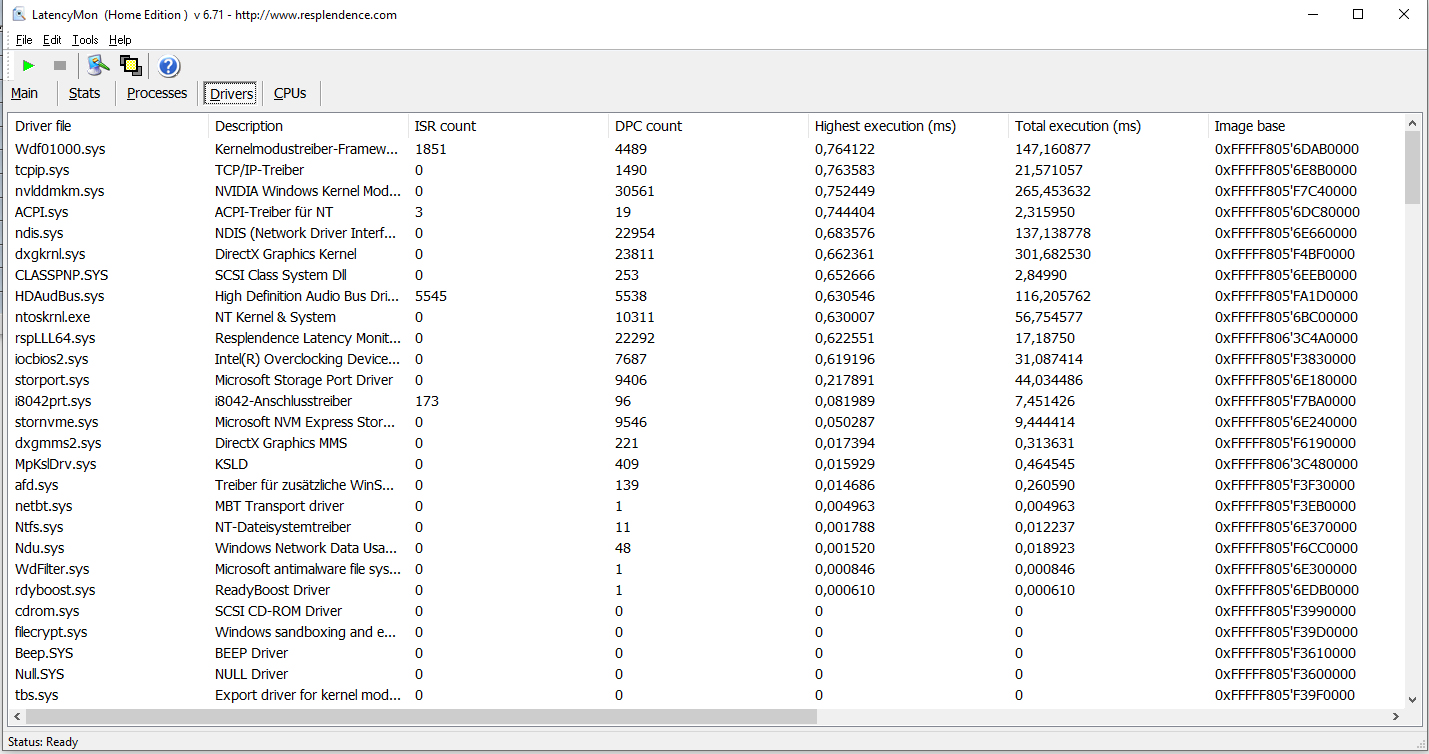
Latências DPC
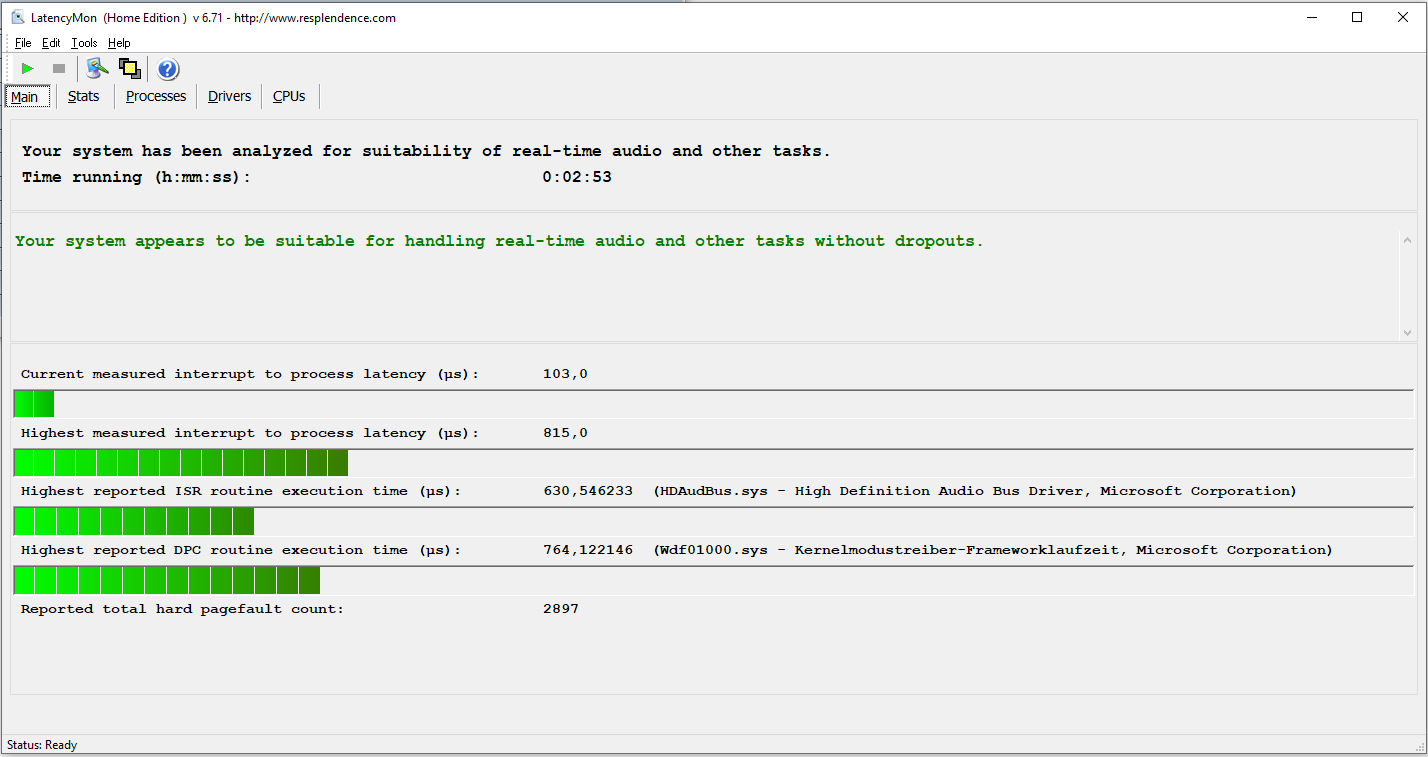
Em nosso teste de monitor de latência padronizado (navegação na web, reprodução de vídeo 4K, Prime95 de alta carga), não observamos nenhuma anormalidade nas latências DPC. O sistema parece ser adequado para edição de vídeo e áudio em tempo real
| DPC Latencies / LatencyMon - interrupt to process latency (max), Web, Youtube, Prime95 | |
| MSI GT76 Titan DT 10SGS | |
| Asus Strix Scar 17 G732LXS | |
| Schenker XMG Ultra 17 Rocket Lake | |
| Alienware m17 R4 | |
| Schenker XMG Ultra 17 Comet Lake | |
* ... menor é melhor
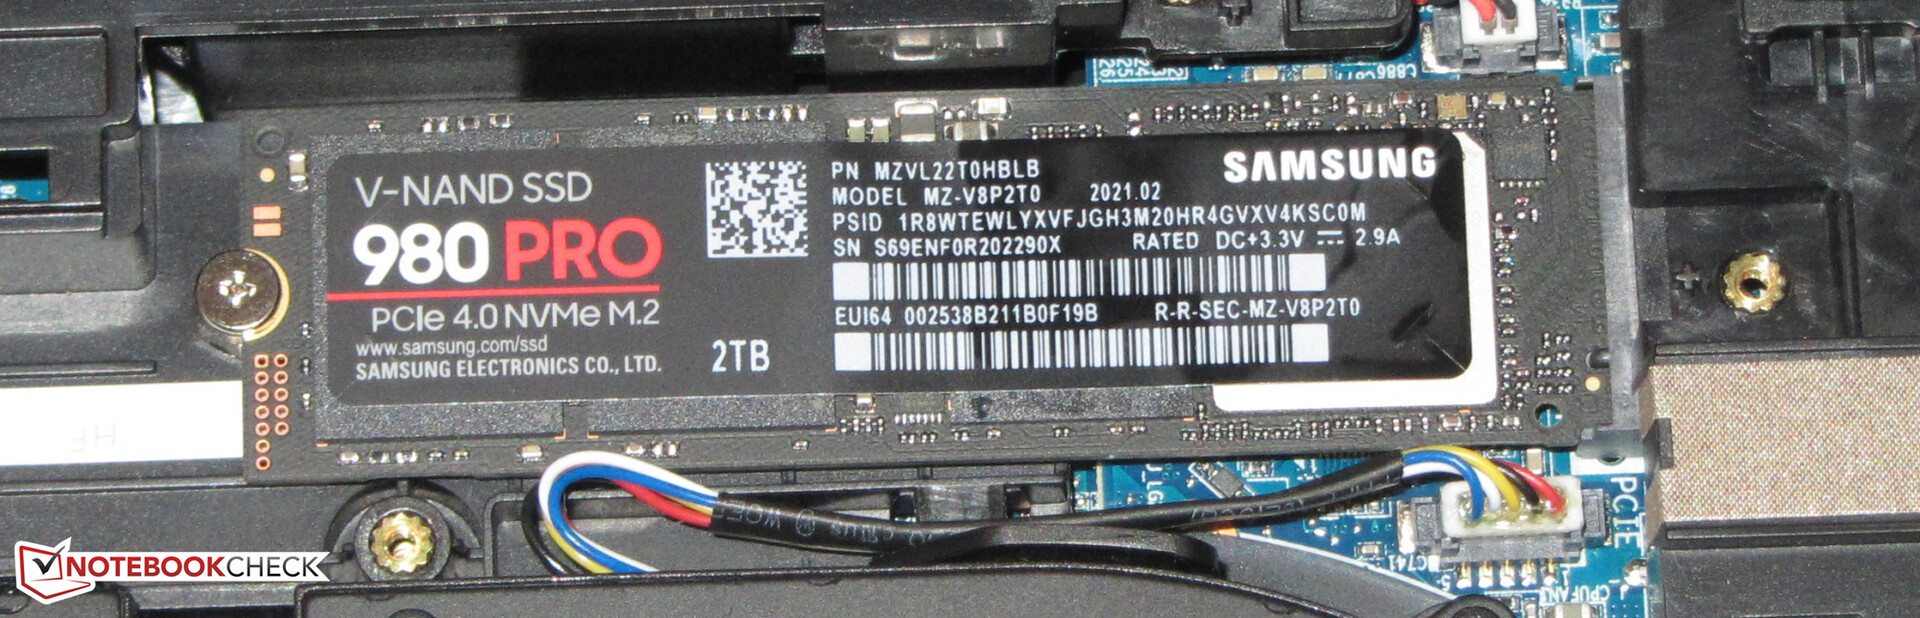
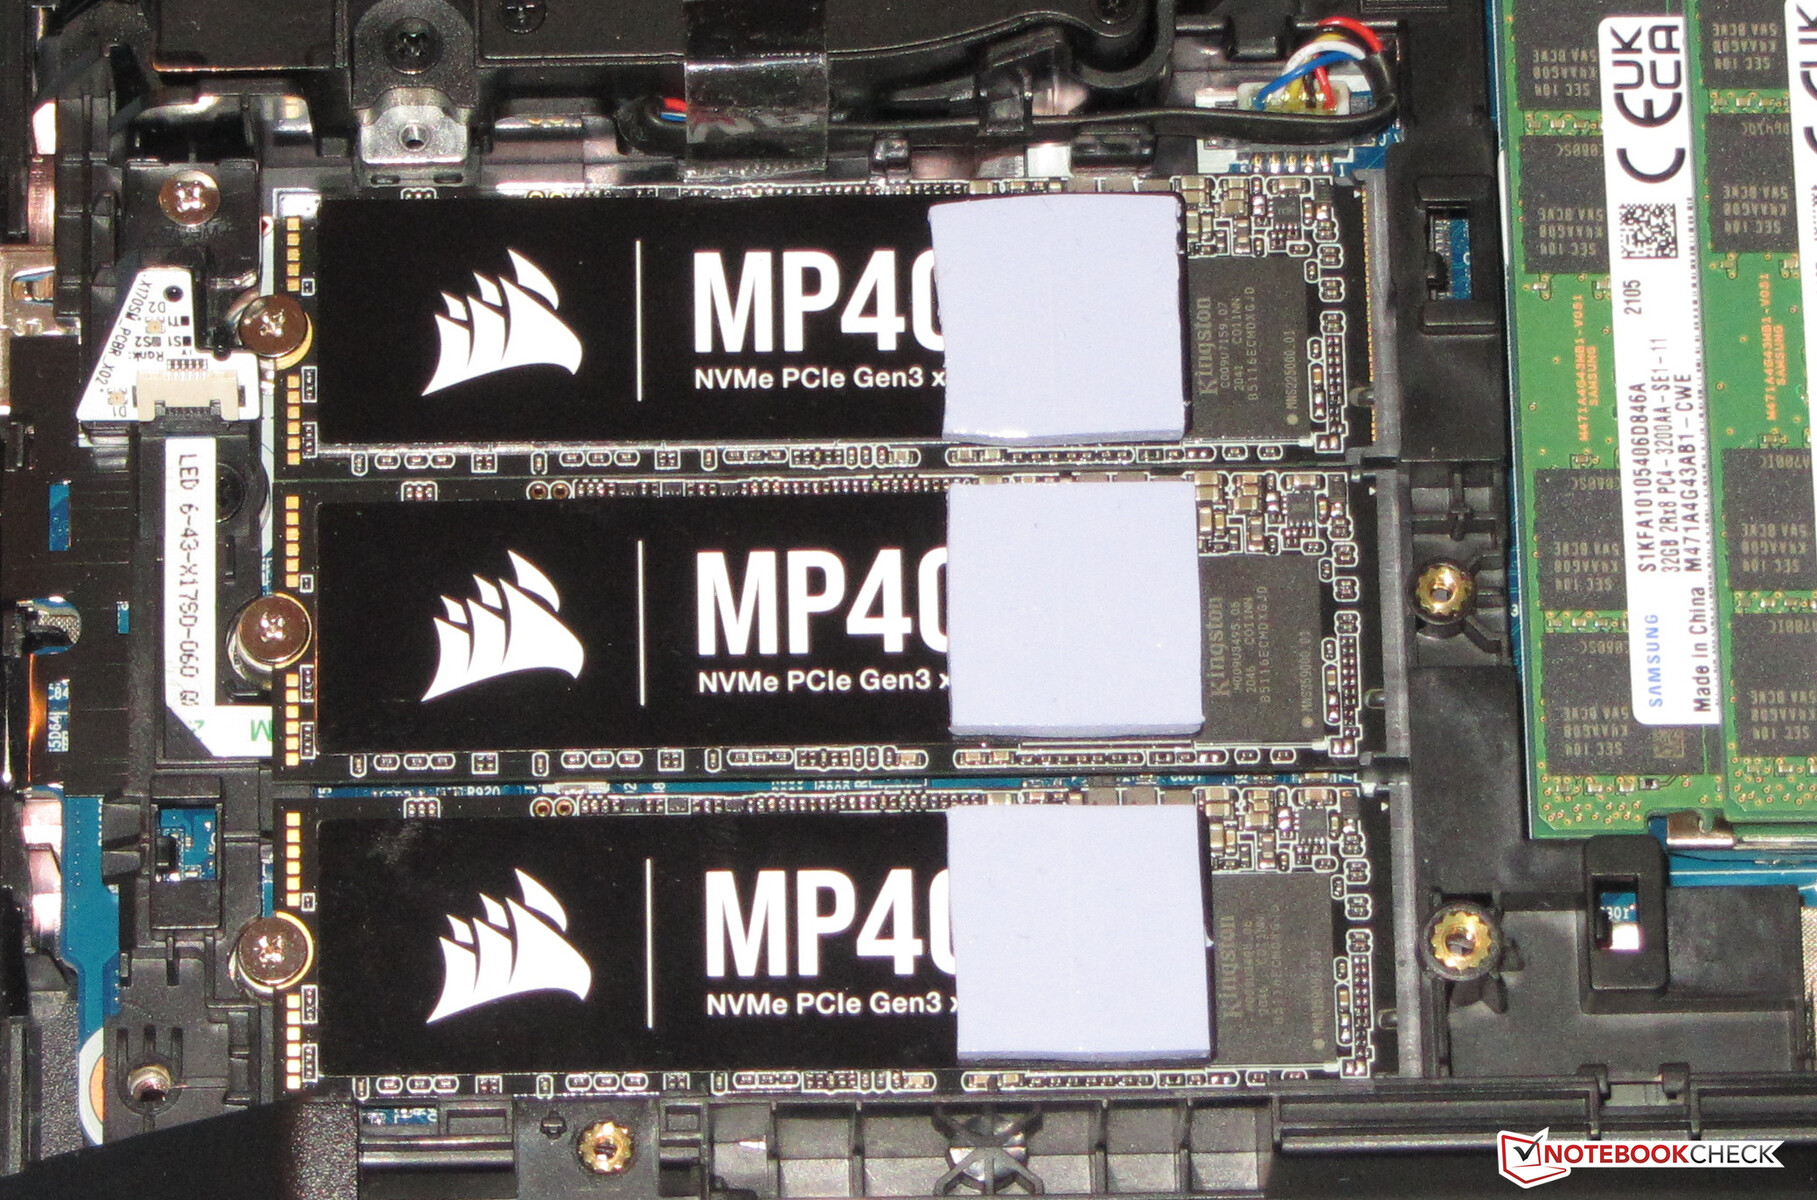
Armazenamento em massa
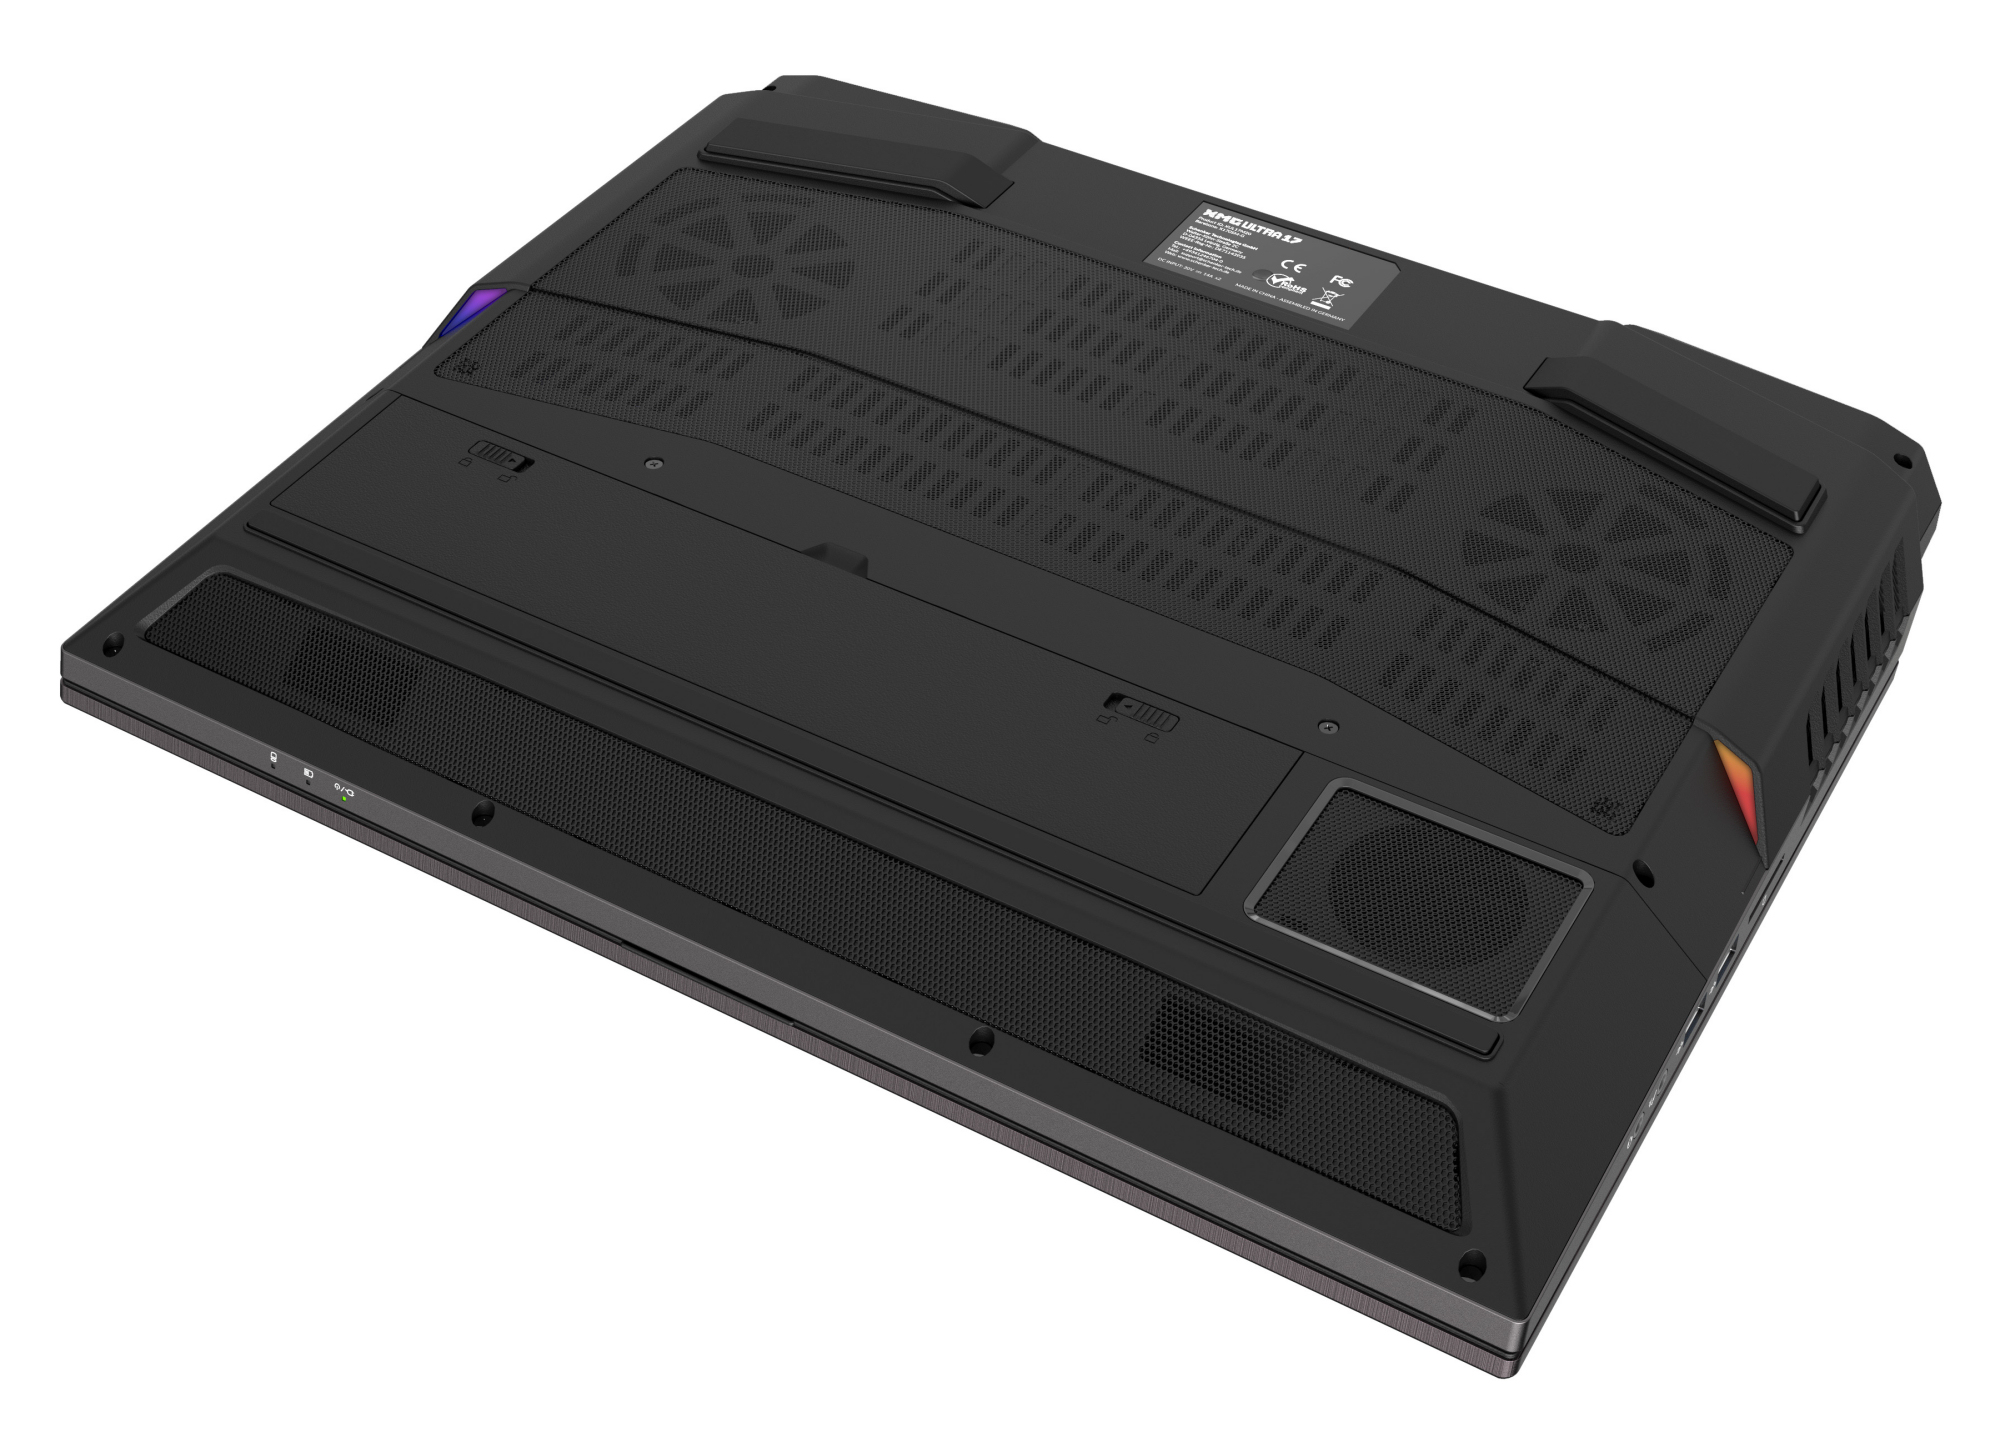
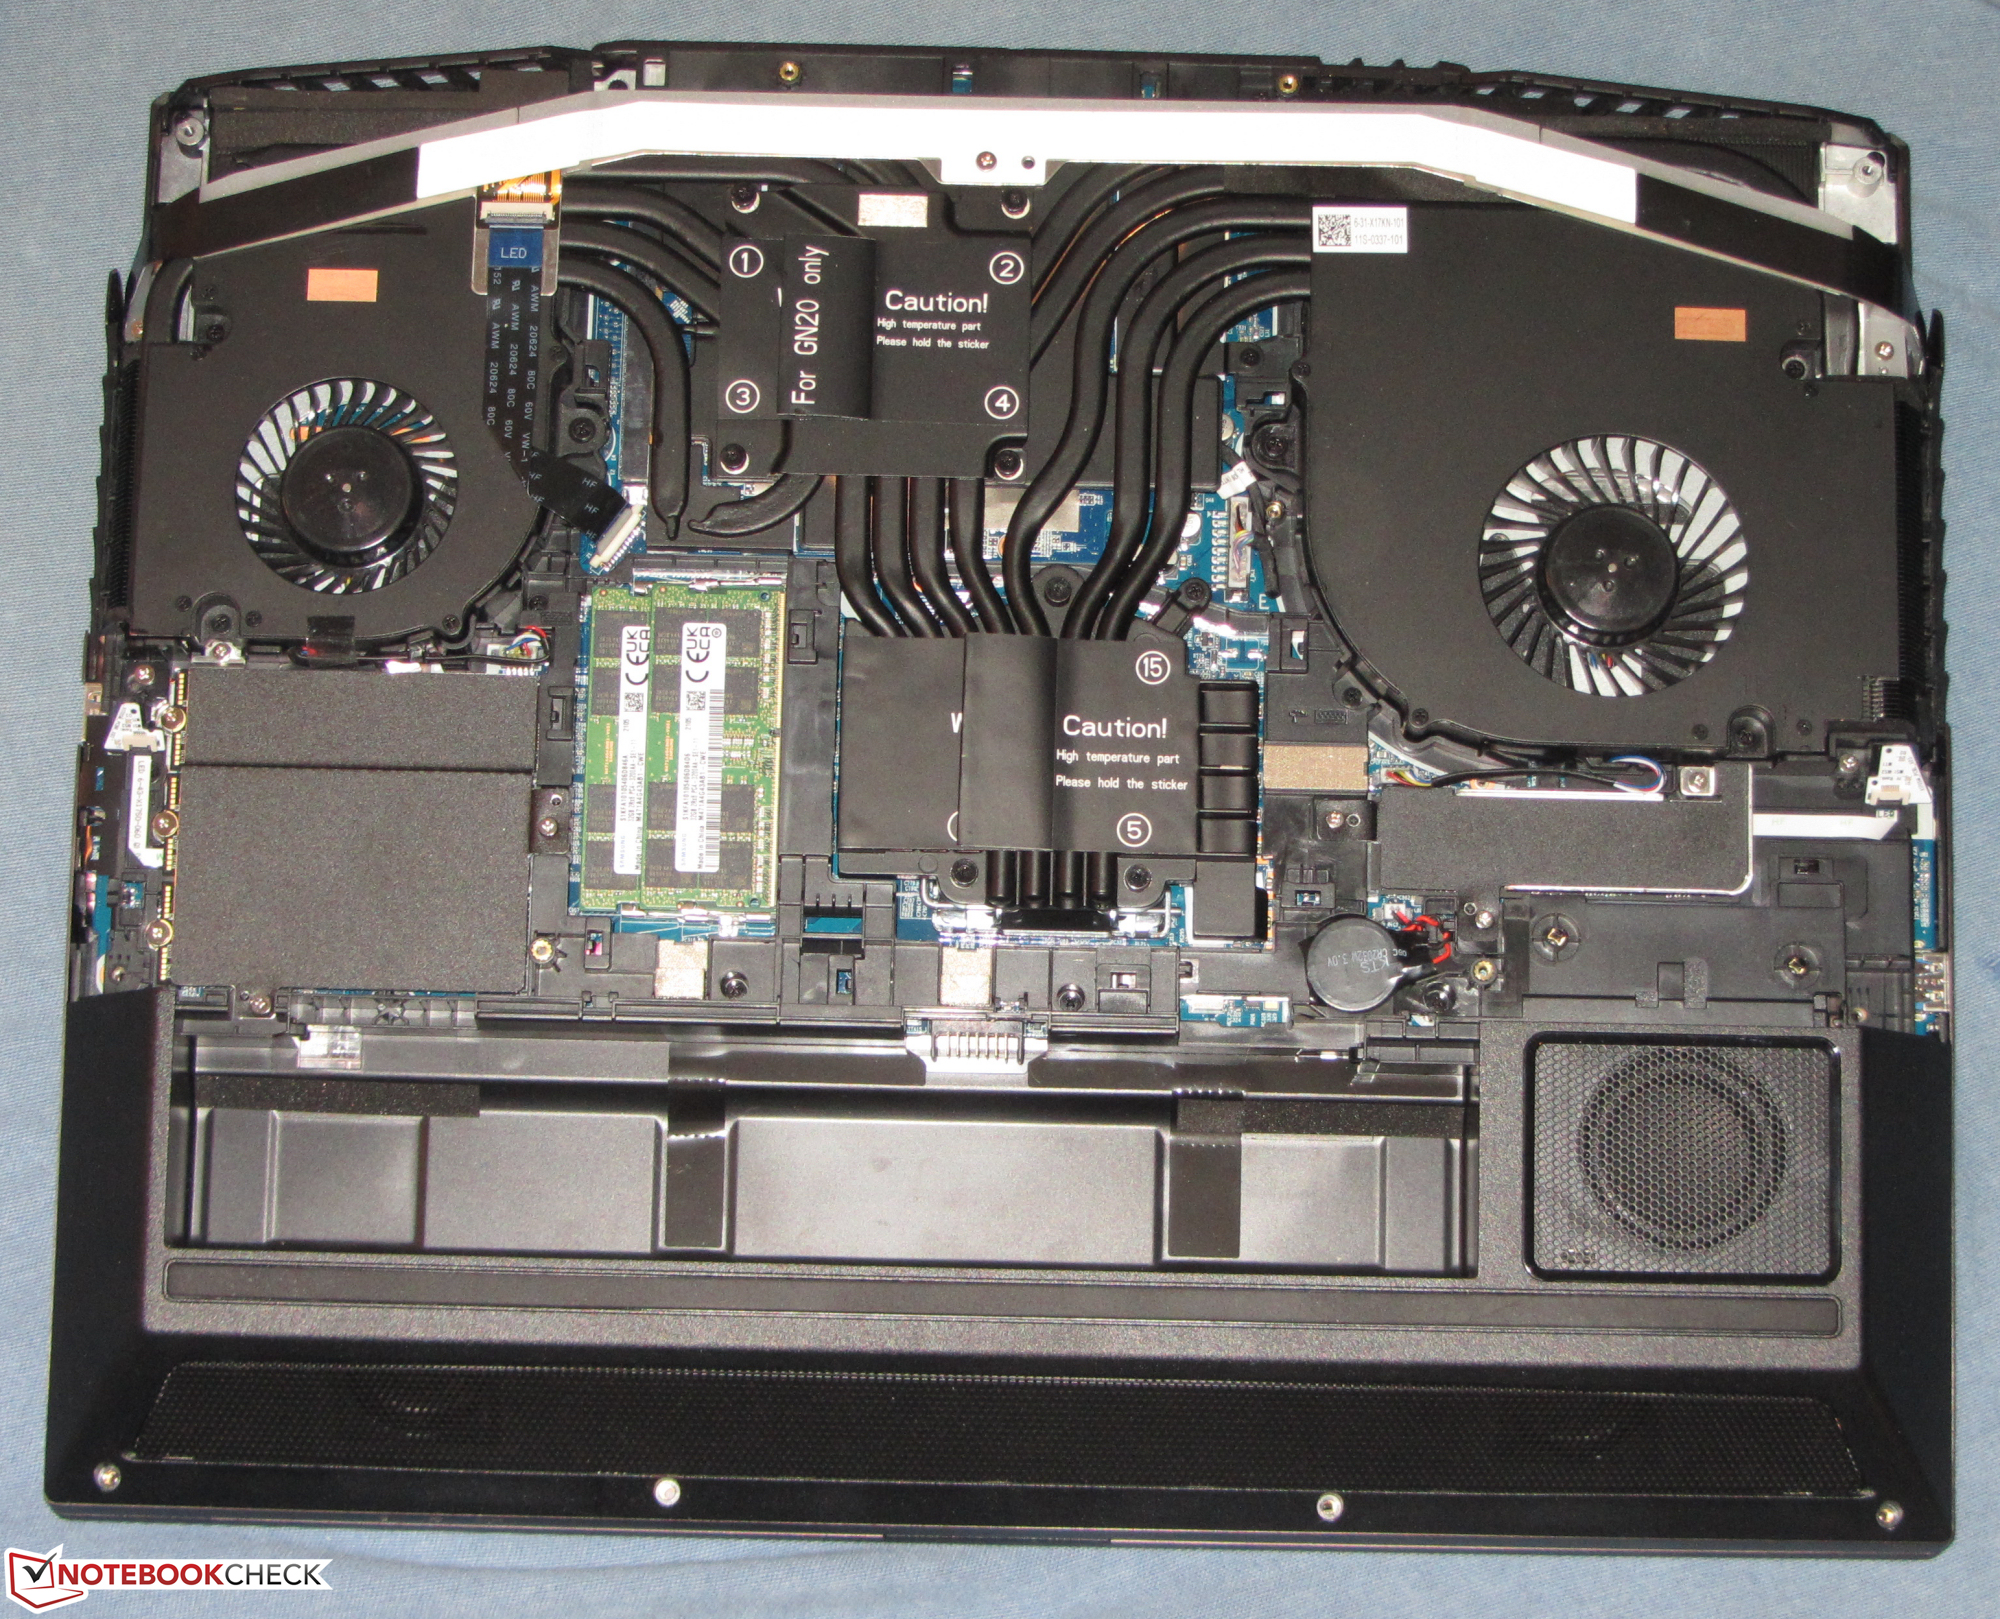
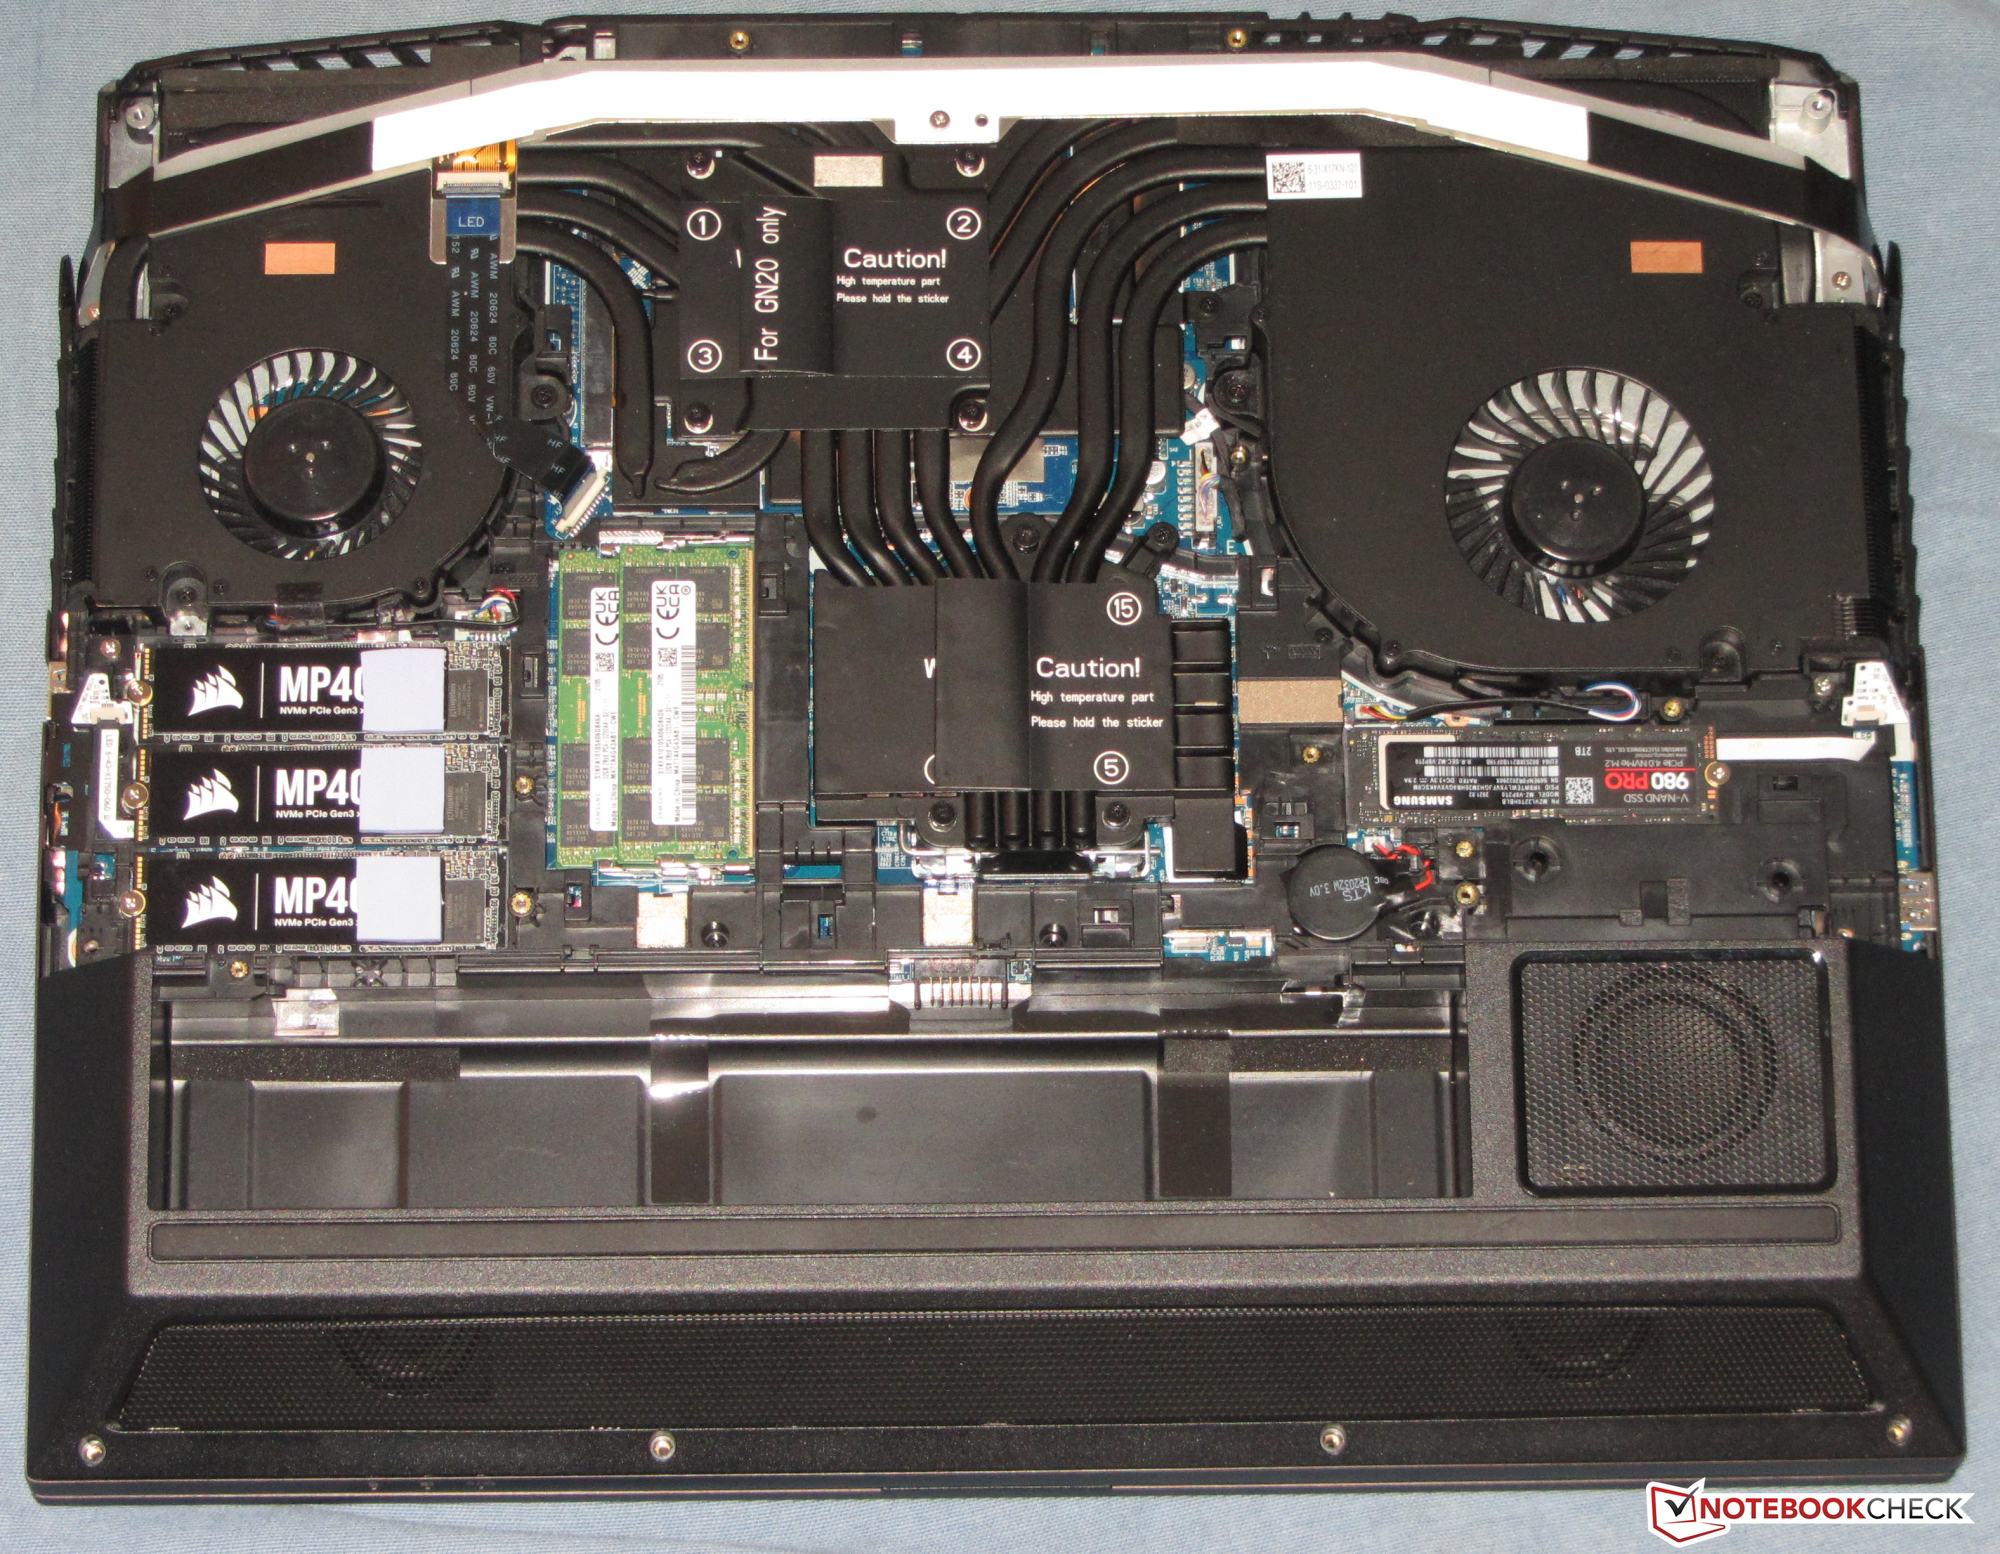
Um SSD NVMe (M.2-2280) da Samsung serve como a unidade do sistema. Ele fornece 2 TB de espaço de armazenamento e oferece excelentes taxas de transferência graças à conexão PCI Express 4. O notebook tem três slots adicionais M.2-2280 que podem ser equipados com NVMe-SSDs (conexão via PCI Express 3.0). Dois dos três slots poderiam, alternativamente, acomodar SSDs SATA. O RAID 0/1/5 é suportado

| Schenker XMG Ultra 17 Rocket Lake Samsung SSD 980 Pro 2TB MZ-V8P2T0 | MSI GT76 Titan DT 10SGS 2x WDC PC SN730 SDBPNTY-1T00 (RAID 0) | Asus Strix Scar 17 G732LXS 2x Intel SSD 660p 1TB SSDPEKNW010T8 (RAID 0) | Schenker XMG Ultra 17 Comet Lake Samsung SSD 970 EVO Plus 2TB | Alienware m17 R4 2x Micron 2300 512 GB (RAID 0) | |
|---|---|---|---|---|---|
| CrystalDiskMark 5.2 / 6 | -42% | -48% | -35% | -42% | |
| Write 4K (MB/s) | 240 | 116.4 -51% | 125.8 -48% | 172 -28% | 93.1 -61% |
| Read 4K (MB/s) | 87.8 | 43.85 -50% | 52.9 -40% | 47.3 -46% | 46.79 -47% |
| Write Seq (MB/s) | 4281 | 2927 -32% | 1795 -58% | 2980 -30% | 2853 -33% |
| Read Seq (MB/s) | 4228 | 1997 -53% | 2315 -45% | 2790 -34% | 2556 -40% |
| Write 4K Q32T1 (MB/s) | 696 | 467.6 -33% | 407.1 -42% | 481.8 -31% | 475 -32% |
| Read 4K Q32T1 (MB/s) | 778 | 538 -31% | 411.9 -47% | 565 -27% | 529 -32% |
| Write Seq Q32T1 (MB/s) | 5195 | 3362 -35% | 2844 -45% | 3295 -37% | 3331 -36% |
| Read Seq Q32T1 (MB/s) | 7099 | 3558 -50% | 3130 -56% | 3550 -50% | 3319 -53% |
| AS SSD | -52% | -54% | -16% | -53% | |
| Seq Read (MB/s) | 5010 | 2406 -52% | 2450 -51% | 2980 -41% | 2733 -45% |
| Seq Write (MB/s) | 3974 | 2867 -28% | 1436 -64% | 2585 -35% | 2822 -29% |
| 4K Read (MB/s) | 51.9 | 41.51 -20% | 49.48 -5% | 52.7 2% | 45.04 -13% |
| 4K Write (MB/s) | 156.8 | 108.8 -31% | 119.4 -24% | 163.1 4% | 88.4 -44% |
| 4K-64 Read (MB/s) | 2611 | 1525 -42% | 1032 -60% | 1954 -25% | 1388 -47% |
| 4K-64 Write (MB/s) | 3859 | 1424 -63% | 1229 -68% | 2347 -39% | 1227 -68% |
| Access Time Read * (ms) | 0.072 | 0.041 43% | 0.145 -101% | 0.039 46% | 0.079 -10% |
| Access Time Write * (ms) | 0.026 | 0.102 -292% | 0.036 -38% | 0.023 12% | 0.095 -265% |
| Score Read (Points) | 3164 | 1807 -43% | 1327 -58% | 2304 -27% | 1706 -46% |
| Score Write (Points) | 4414 | 1819 -59% | 1492 -66% | 2768 -37% | 1598 -64% |
| Score Total (Points) | 9134 | 4573 -50% | 3456 -62% | 6232 -32% | 4184 -54% |
| Copy ISO MB/s (MB/s) | 3424 | 2605 -24% | 2414 -29% | ||
| Copy Program MB/s (MB/s) | 1091 | 651 -40% | 1030 -6% | ||
| Copy Game MB/s (MB/s) | 2365 | 1709 -28% | 1991 -16% | ||
| Média Total (Programa/Configurações) | -47% /
-48% | -51% /
-51% | -26% /
-24% | -48% /
-49% |
* ... menor é melhor
Continuous reading: DiskSpd Read Loop, Queue Depth 8
Placa gráfica
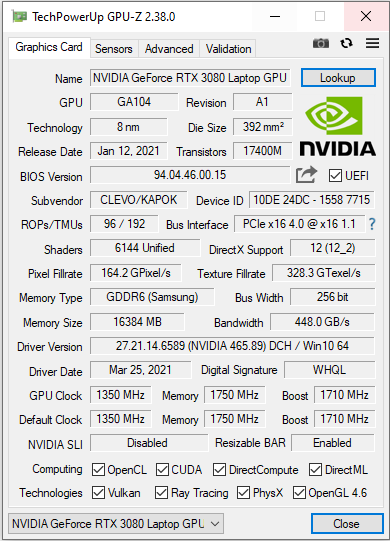
O GeForce RTX-3080 laptopO núcleo gráfico representa a GPU de notebooks maispoderosa atualmenteda Nvidia. Ela pode se basear na rápida memória gráfica GDDR6 (16.384 MB). A GPU e a memória não são permanentemente soldadas à placa-mãe, mas sim colocadas em uma placa plug-in MXM. A troca da placa seria possível. O processador-integrado UHD Graphics Xe-750-32EUs A GPU está desativada à saída da fábrica e o notebook não funciona com a solução gráfica de comutação Optimus da Nvidia.
Os fabricantes de notebooks podem escolher o TGP e, portanto, a potência máxima disponível de um núcleo gráfico RTX-3000, dentro dos limites definidos pela Nvidia (Visão geral de todos os computadores portáteis RTX-3080 incluindo os TGPs) Schenkerescolhe o máximo de 165 watts (150 watts + 15 watts Dynamic Boost). Como resultado, o Ultra17 tem um desempenho muito bom nos testes de GPU e jogos.
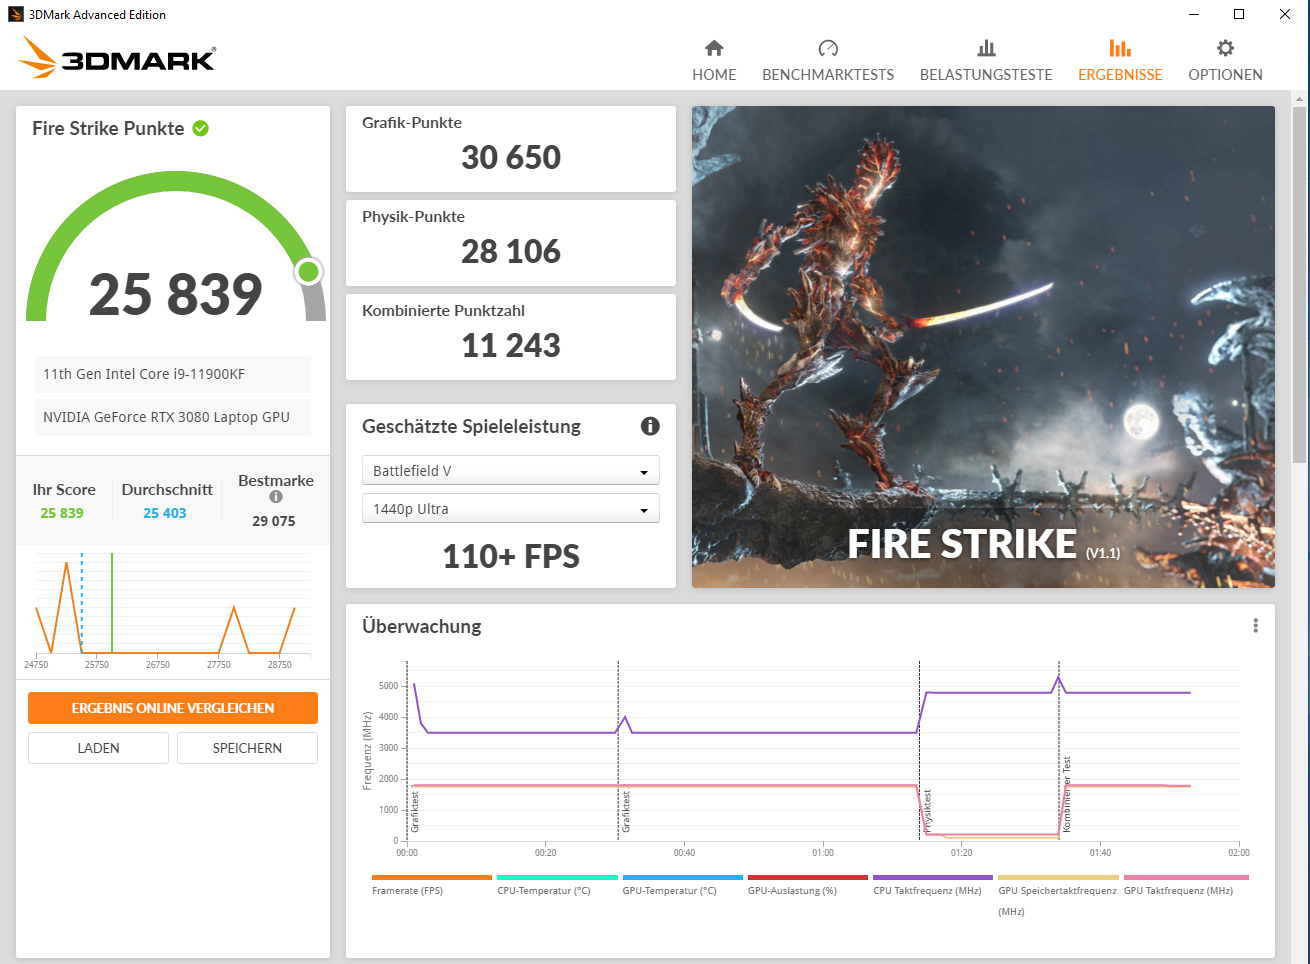
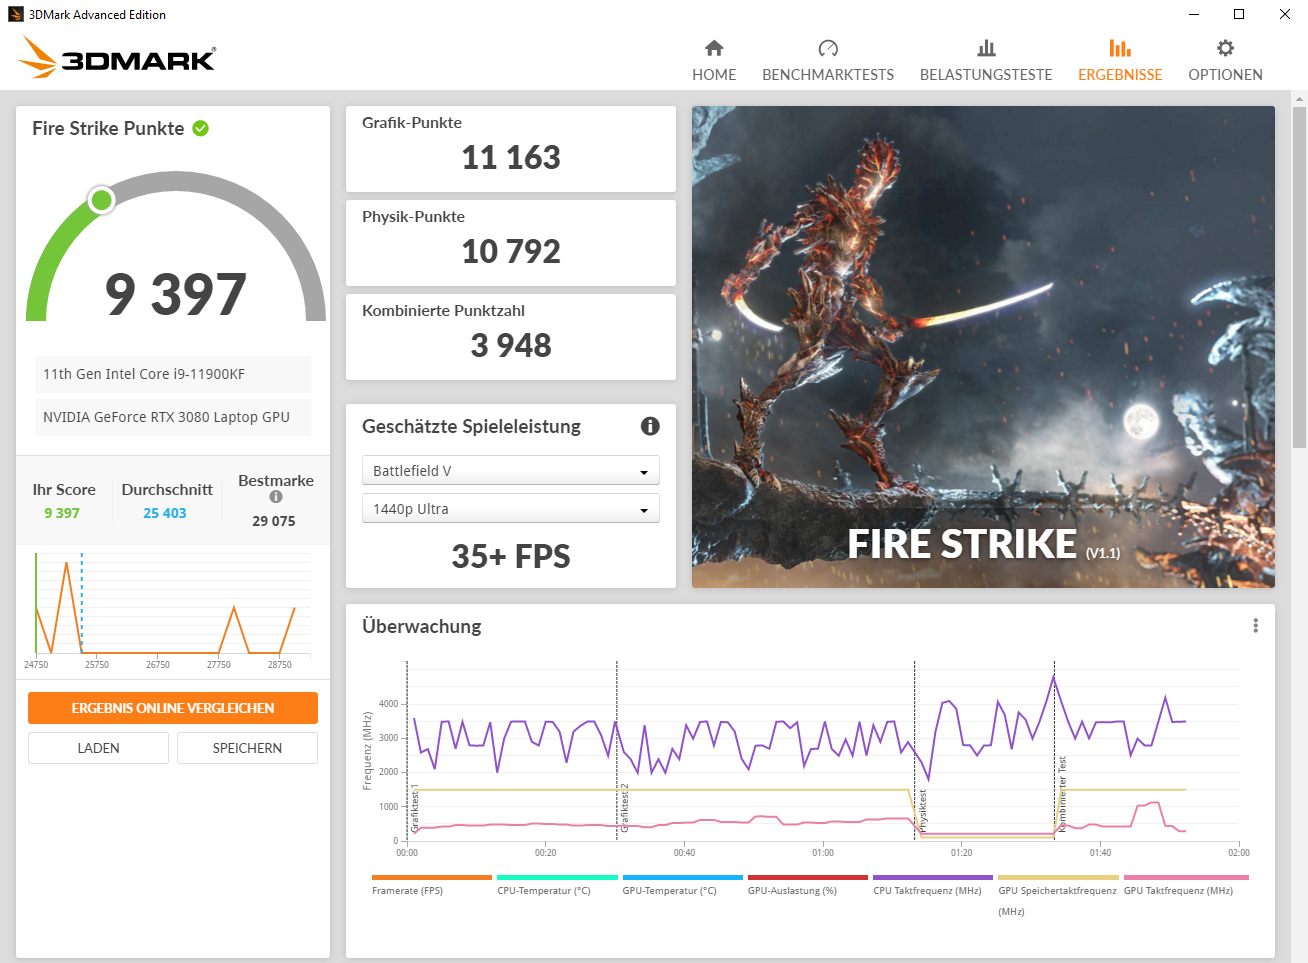
| 3DMark 11 Performance | 32922 pontos | |
| 3DMark Cloud Gate Standard Score | 65479 pontos | |
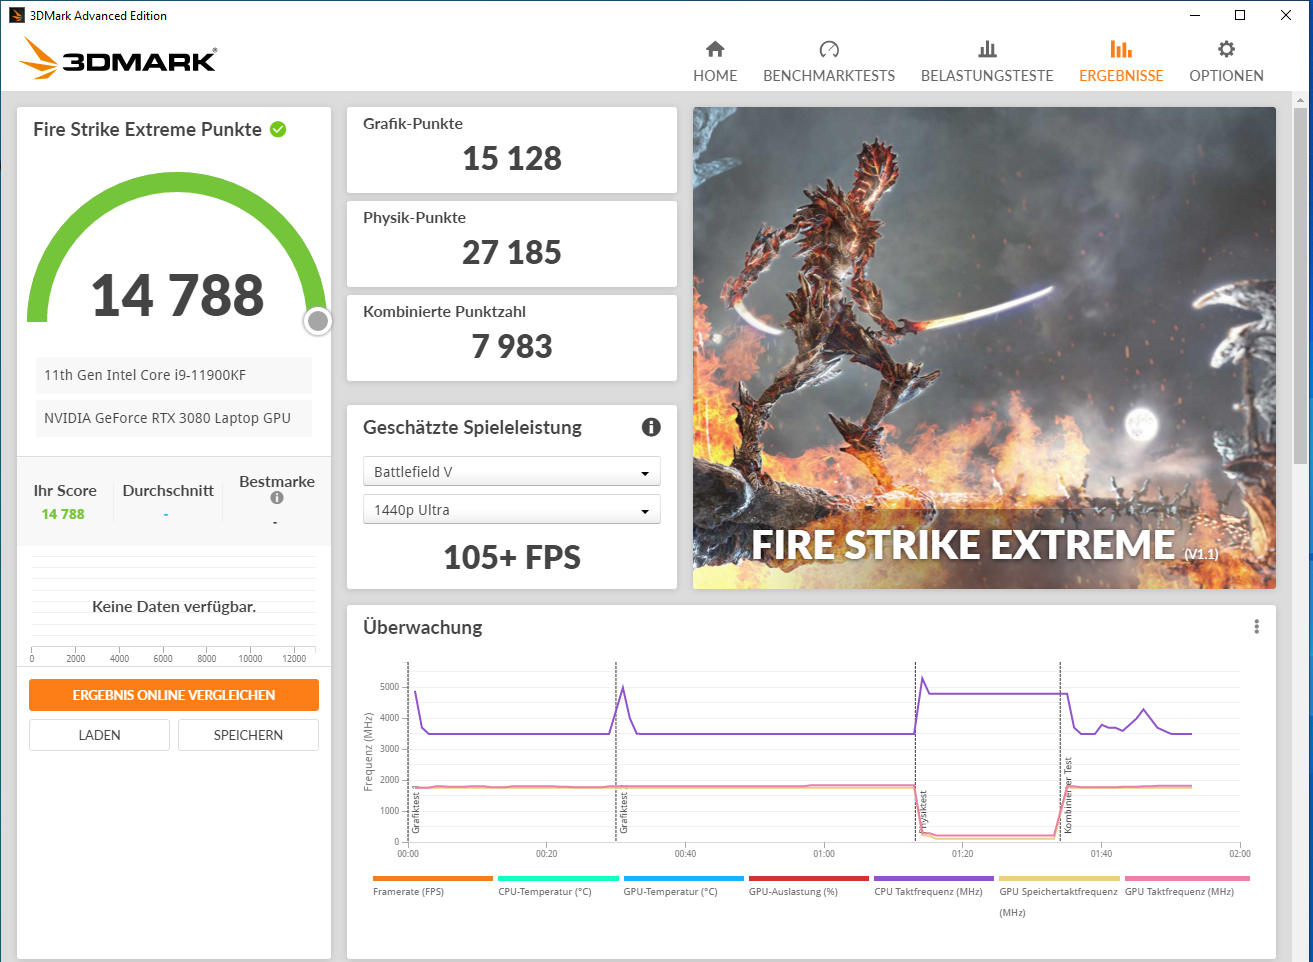
| 3DMark Fire Strike Score | 25839 pontos | |
| 3DMark Fire Strike Extreme Score | 14788 pontos | |
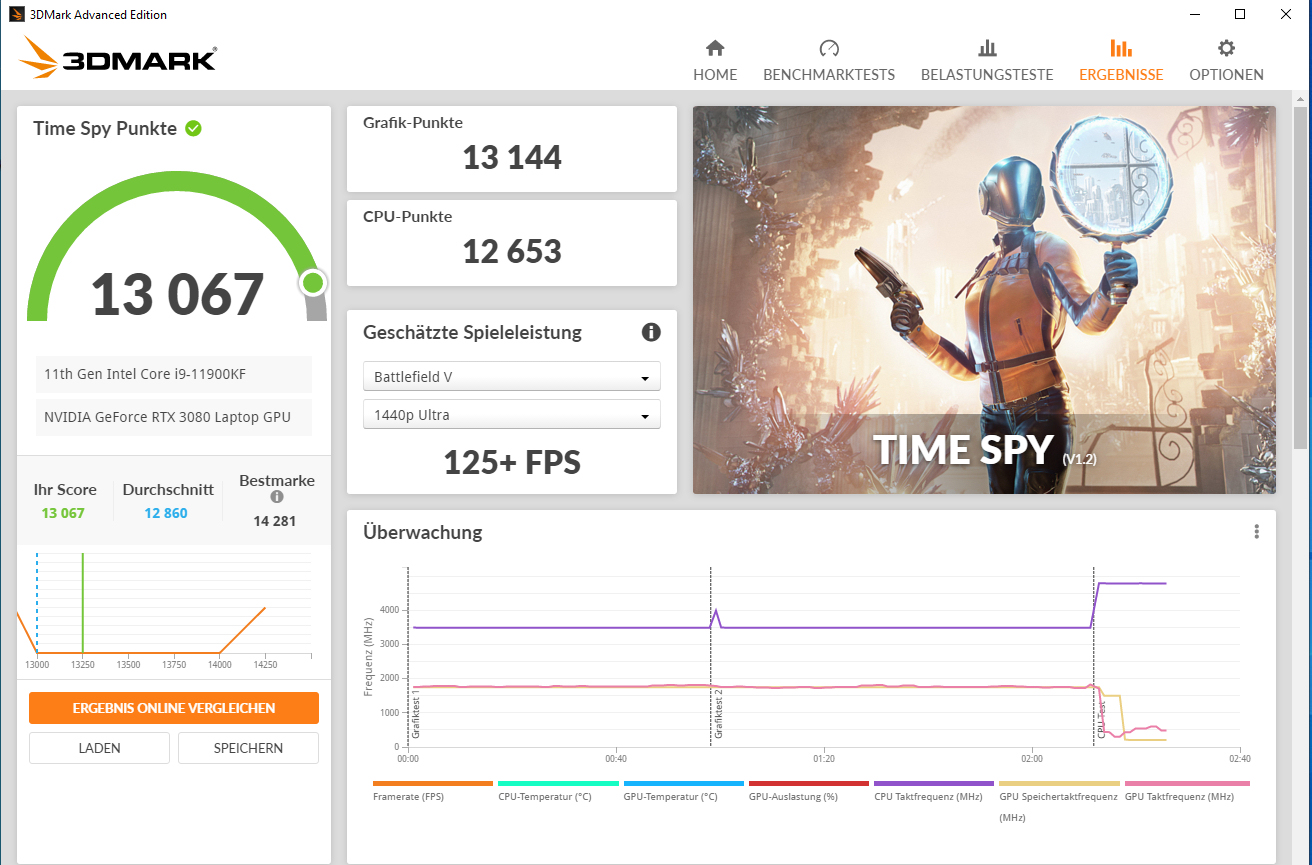
| 3DMark Time Spy Score | 13067 pontos | |
Ajuda | ||
Desempenho do jogo
O computador traz todos os jogos atuais suavemente para a tela. Normalmente, a resolução FHD e as configurações de qualidade máxima podem ser selecionadas. Resoluções mais altas (um monitor correspondente teria que ser conectado para isso) também são tratadas pela GPU
| The Witcher 3 - 1920x1080 Ultra Graphics & Postprocessing (HBAO+) | |
| Média da turma Gaming (104.7 - 240, n=7, últimos 2 anos) | |
| Schenker XMG Ultra 17 Rocket Lake | |
| Alienware m17 R4 | |
| MSI GT76 Titan DT 10SGS | |
| Schenker XMG Ultra 17 Comet Lake | |
| Média NVIDIA GeForce RTX 3080 Laptop GPU (85.1 - 123, n=40) | |
| Asus Strix Scar 17 G732LXS | |
| Far Cry 5 - 1920x1080 Ultra Preset AA:T | |
| Schenker XMG Ultra 17 Rocket Lake | |
| Alienware m17 R4 | |
| Média da turma Gaming (70 - 151, n=6, últimos 2 anos) | |
| Média NVIDIA GeForce RTX 3080 Laptop GPU (75 - 146, n=33) | |
| Shadow of the Tomb Raider - 1920x1080 Highest Preset AA:T | |
| Schenker XMG Ultra 17 Rocket Lake | |
| Schenker XMG Ultra 17 Comet Lake | |
| Asus Strix Scar 17 G732LXS | |
| Média NVIDIA GeForce RTX 3080 Laptop GPU (76.6 - 151, n=13) | |
| Média da turma Gaming (96 - 116, n=2, últimos 2 anos) | |
| Doom Eternal - 1920x1080 Ultra Preset | |
| Schenker XMG Ultra 17 Comet Lake | |
| Asus Strix Scar 17 G732LXS | |
| Schenker XMG Ultra 17 Rocket Lake | |
| Média NVIDIA GeForce RTX 3080 Laptop GPU (163 - 190, n=4) | |
| Serious Sam 4 - 1920x1080 Ultra (DX12) AA:2xMS | |
| Schenker XMG Ultra 17 Rocket Lake | |
| Schenker XMG Ultra 17 Comet Lake | |
| Média NVIDIA GeForce RTX 3080 Laptop GPU (72.6 - 107, n=5) | |
| Cyberpunk 2077 1.0 | |
| 1920x1080 Ultra Preset | |
| Schenker XMG Ultra 17 Rocket Lake | |
| Alienware m17 R4 | |
| Média NVIDIA GeForce RTX 3080 Laptop GPU (52.9 - 84.3, n=9) | |
| 1920x1080 Ray Tracing Ultra Preset (DLSS off) | |
| Schenker XMG Ultra 17 Rocket Lake | |
| Alienware m17 R4 | |
| Média NVIDIA GeForce RTX 3080 Laptop GPU (30.6 - 43.2, n=5) | |
| Watch Dogs Legion | |
| 1920x1080 Ultra Preset (DX12) | |
| Schenker XMG Ultra 17 Rocket Lake | |
| Média NVIDIA GeForce RTX 3080 Laptop GPU (65 - 91.1, n=6) | |
| 1920x1080 Ultra Preset + Ultra Ray Tracing (DX12) | |
| Schenker XMG Ultra 17 Rocket Lake | |
| Média NVIDIA GeForce RTX 3080 Laptop GPU (41 - 61, n=6) | |
| Hitman 3 - 1920x1080 Maximum Settings AF:16x | |
| Schenker XMG Ultra 17 Rocket Lake | |
| Média NVIDIA GeForce RTX 3080 Laptop GPU (129.1 - 201, n=3) | |
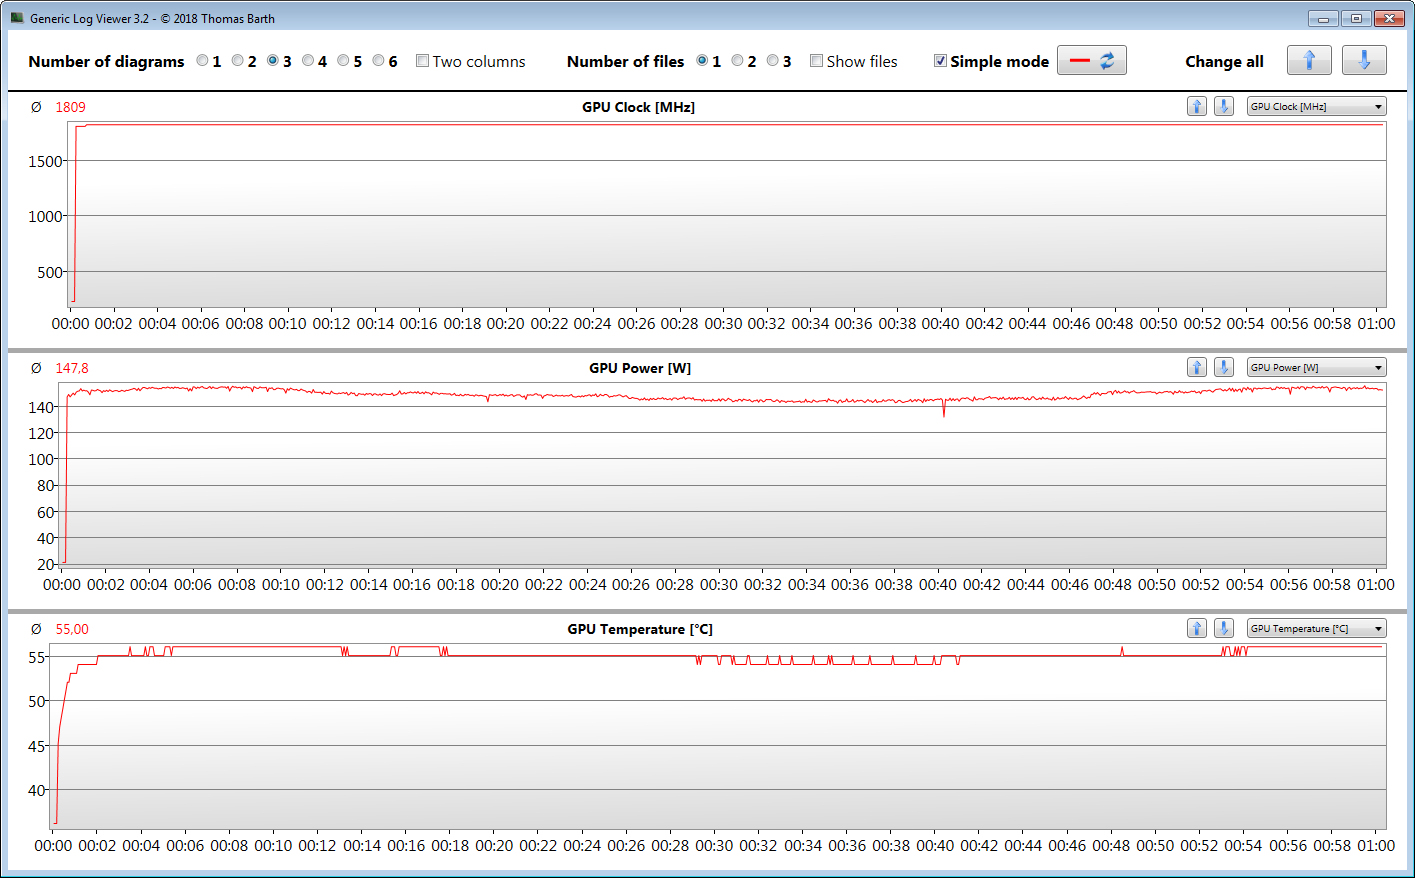
Para verificar se as taxas de quadros permanecem em grande parte constantes durante um período mais longo, executamos o jogo"The Witcher 3" por cerca de 60 minutos com resolução Full HD e ajustes de qualidade máxima. O personagem do jogo não é movido. Uma queda nas taxas de quadros não é notada
| baixo | média | alto | ultra | |
|---|---|---|---|---|
| The Witcher 3 (2015) | 453 | 374 | 242 | 123 |
| Dota 2 Reborn (2015) | 183 | 170 | 161 | 156 |
| X-Plane 11.11 (2018) | 156 | 139 | 113 | |
| Far Cry 5 (2018) | 189 | 162 | 155 | 146 |
| Shadow of the Tomb Raider (2018) | 181 | 164 | 160 | 151 |
| Doom Eternal (2020) | 211 | 199 | 193 | 190 |
| Serious Sam 4 (2020) | 162 | 118 | 111 | 107 |
| Watch Dogs Legion (2020) | 127 | 123 | 110 | 91.1 |
| Dirt 5 (2020) | 110 | 97.1 | 93.3 | 92.4 |
| Immortals Fenyx Rising (2020) | 172 | 125 | 116 | 108 |
| Cyberpunk 2077 1.0 (2020) | 147 | 116 | 96.1 | 84.3 |
| Hitman 3 (2021) | 255.1 | 216.6 | 207.7 | 200.5 |
Emissões - O computador Schenker pode ficar muito barulhento
Emissões sonoras
Quando ociosos e sob carga baixa, os ventiladores geralmente são silenciosos e mal audíveis. No entanto, de vez em quando, eles também se movimentam fortemente durante um curto período em inatividade, atingindo um nível de ruído que é quase o mesmo que sob carga máxima. Em outras palavras: Fica muito barulhento. Com níveis máximos de pressão sonora de 63 dB(A) (teste de estresse) e 61 dB(A) (Witcher 3 teste), dificilmente se pode evitar o uso de um fone de ouvido. Os perfis de energia "Modo Silencioso" e "Modo de Economia de Energia" reduzem o desenvolvimento de ruído - mas às custas da potência de computação.
Barulho
| Ocioso |
| 30 / 31 / 57 dB |
| Carga |
| 63 / 63 dB |
 | ||
30 dB silencioso 40 dB(A) audível 50 dB(A) ruidosamente alto |
||
min: | ||
| Schenker XMG Ultra 17 Rocket Lake i9-11900K, GeForce RTX 3080 Laptop GPU | MSI GT76 Titan DT 10SGS i9-10900K, GeForce RTX 2080 Super Mobile | Asus Strix Scar 17 G732LXS i9-10980HK, GeForce RTX 2080 Super Mobile | Schenker XMG Ultra 17 Comet Lake i9-10900K, GeForce RTX 2080 Super Mobile | Alienware m17 R4 i9-10980HK, GeForce RTX 3080 Laptop GPU | Média da turma Gaming | |
|---|---|---|---|---|---|---|
| Noise | 15% | 4% | 4% | 21% | 20% | |
| desligado / ambiente * (dB) | 24 | 26.4 -10% | 25 -4% | 25 -4% | 24 -0% | 24.1 ? -0% |
| Idle Minimum * (dB) | 30 | 27.5 8% | 33 -10% | 27 10% | 24 20% | 26 ? 13% |
| Idle Average * (dB) | 31 | 27.5 11% | 38 -23% | 32 -3% | 25 19% | 27.4 ? 12% |
| Idle Maximum * (dB) | 57 | 29.8 48% | 45 21% | 57 -0% | 36 37% | 30.1 ? 47% |
| Load Average * (dB) | 63 | 30.9 51% | 54 14% | 56 11% | 45 29% | 43.6 ? 31% |
| Witcher 3 ultra * (dB) | 61 | 60.7 -0% | 50 18% | 55 10% | 47 23% | |
| Load Maximum * (dB) | 63 | 66.6 -6% | 55 13% | 62 2% | 50 21% | 54.2 ? 14% |
* ... menor é melhor
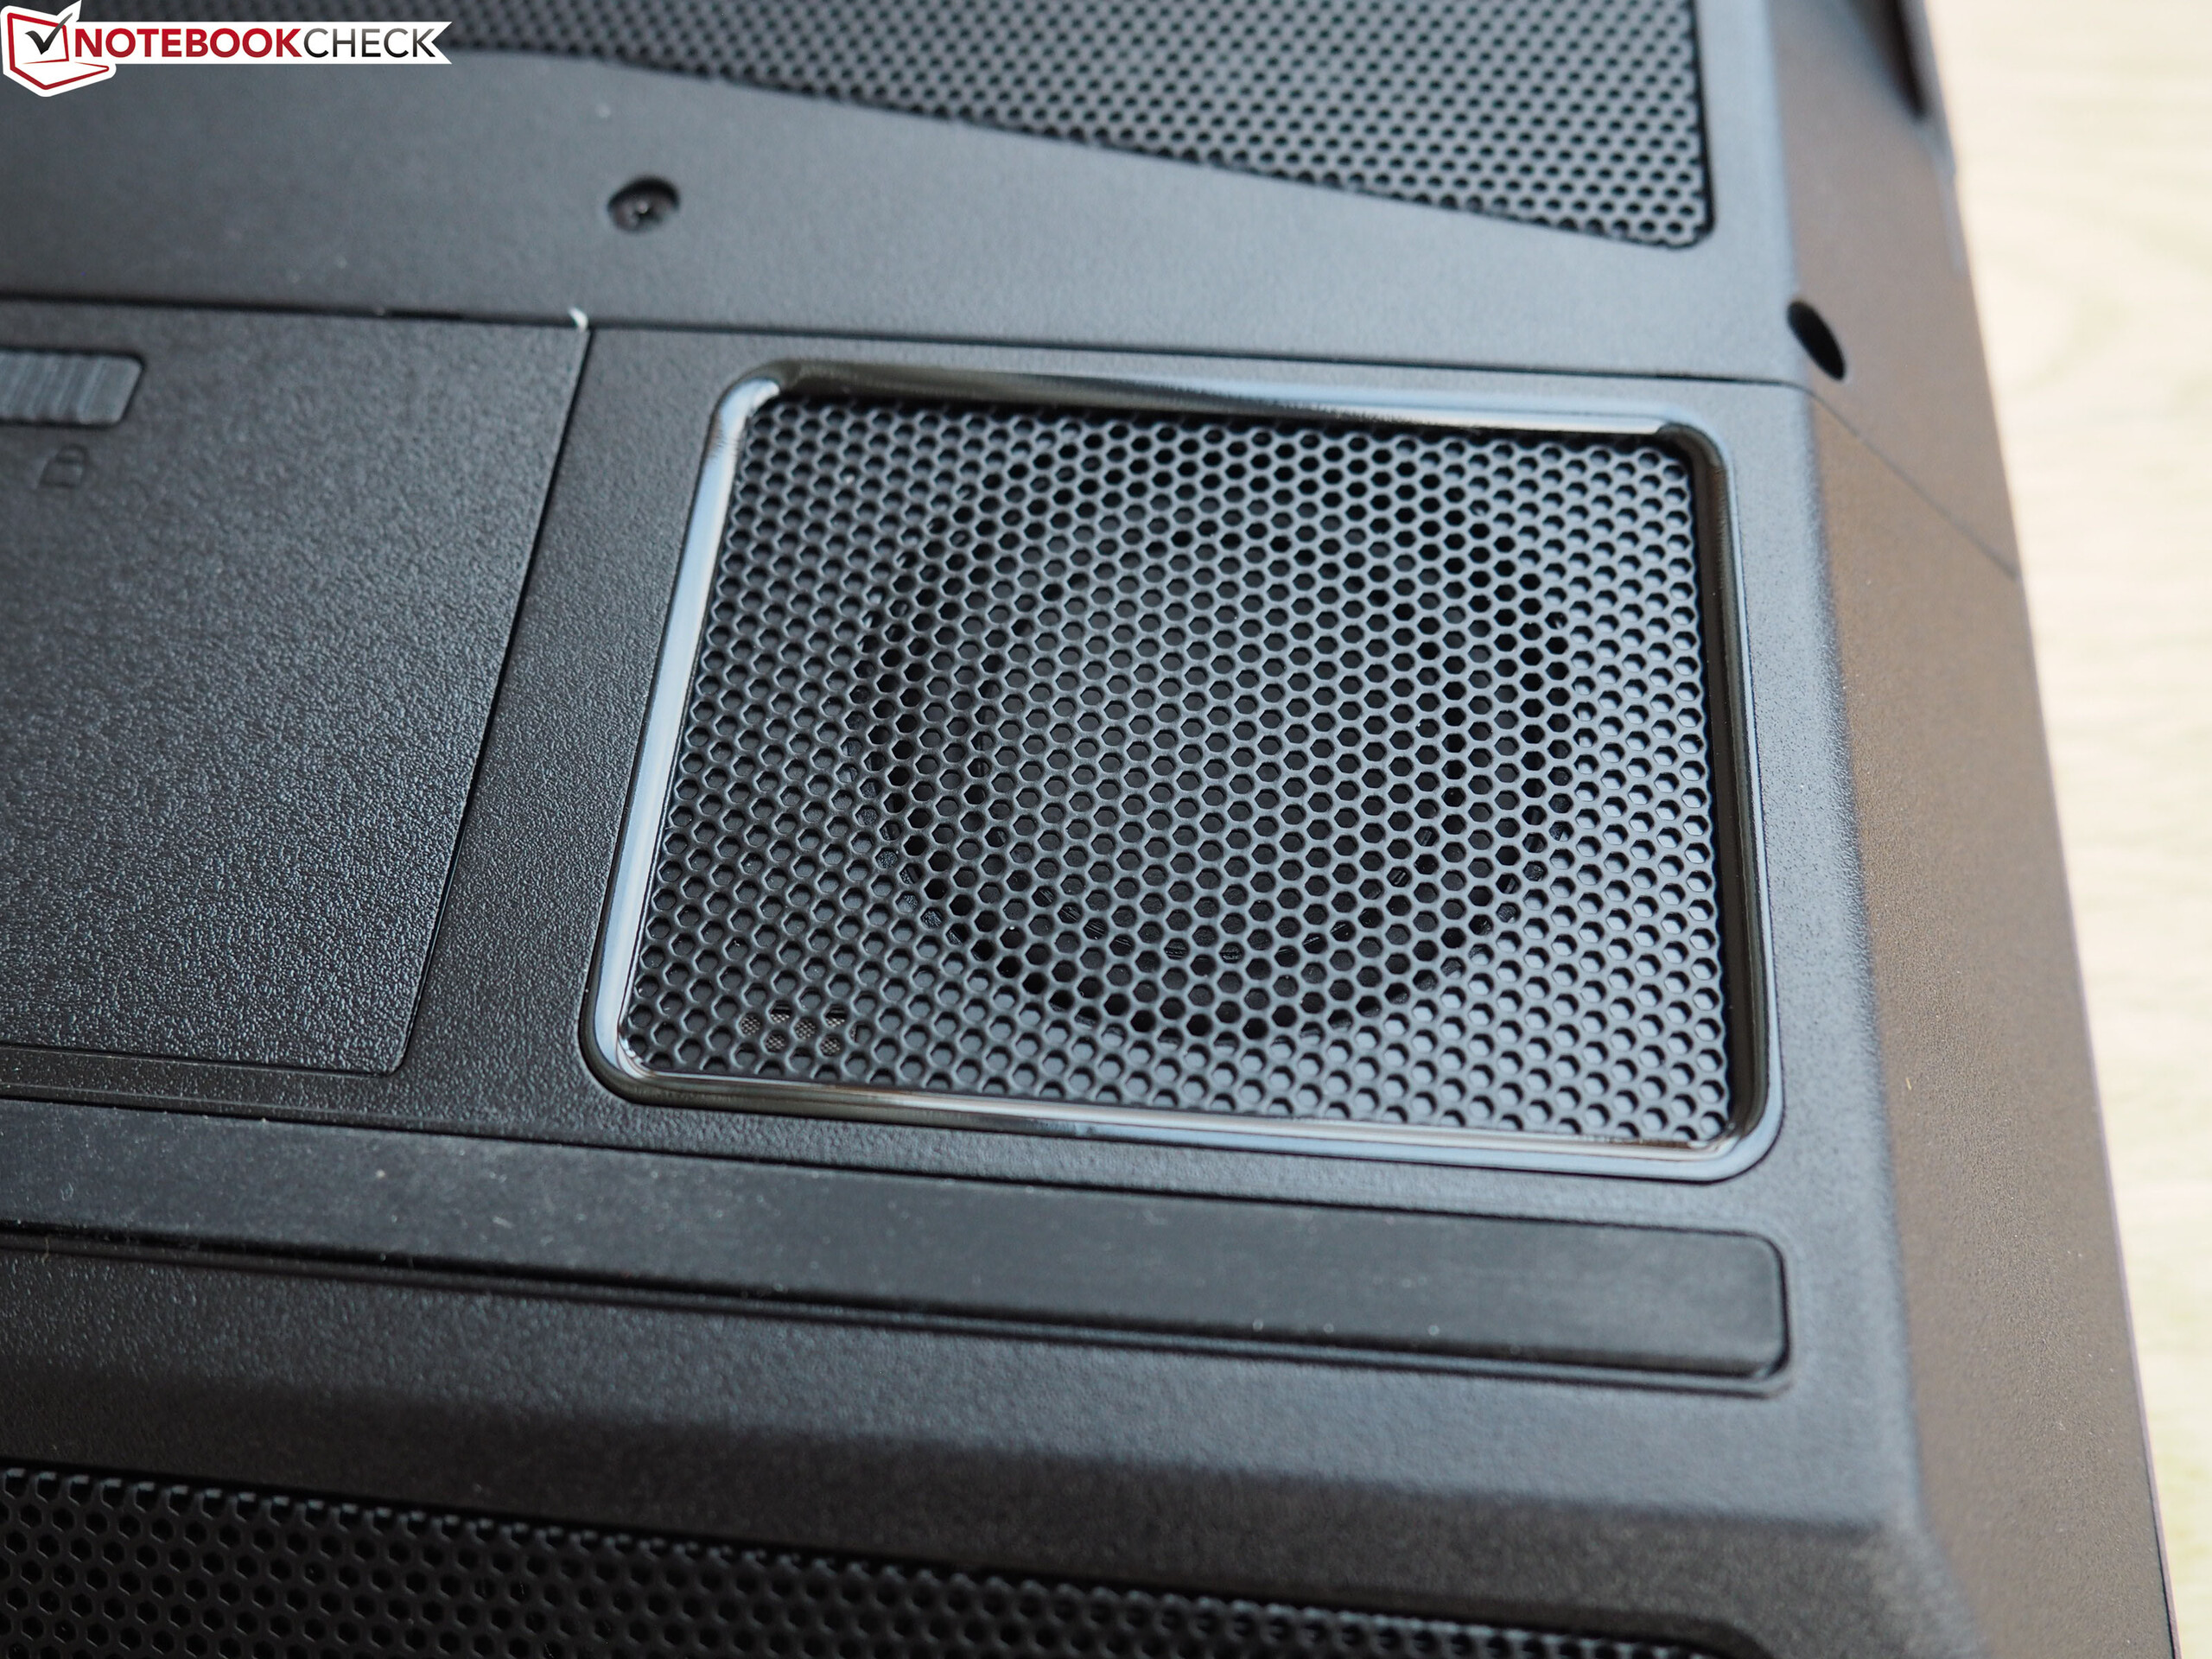
Temperatura
Em nosso teste de estresse (Prime95 e FurMark funcionam por pelo menos uma hora), a CPU e a GPU funcionam a 3,4 GHz e 1.725 MHz, respectivamente. O teste de estresse é um cenário extremo que não ocorre no uso diário. Utilizamos este teste para verificar se o sistema funciona de forma estável mesmo sob carga total
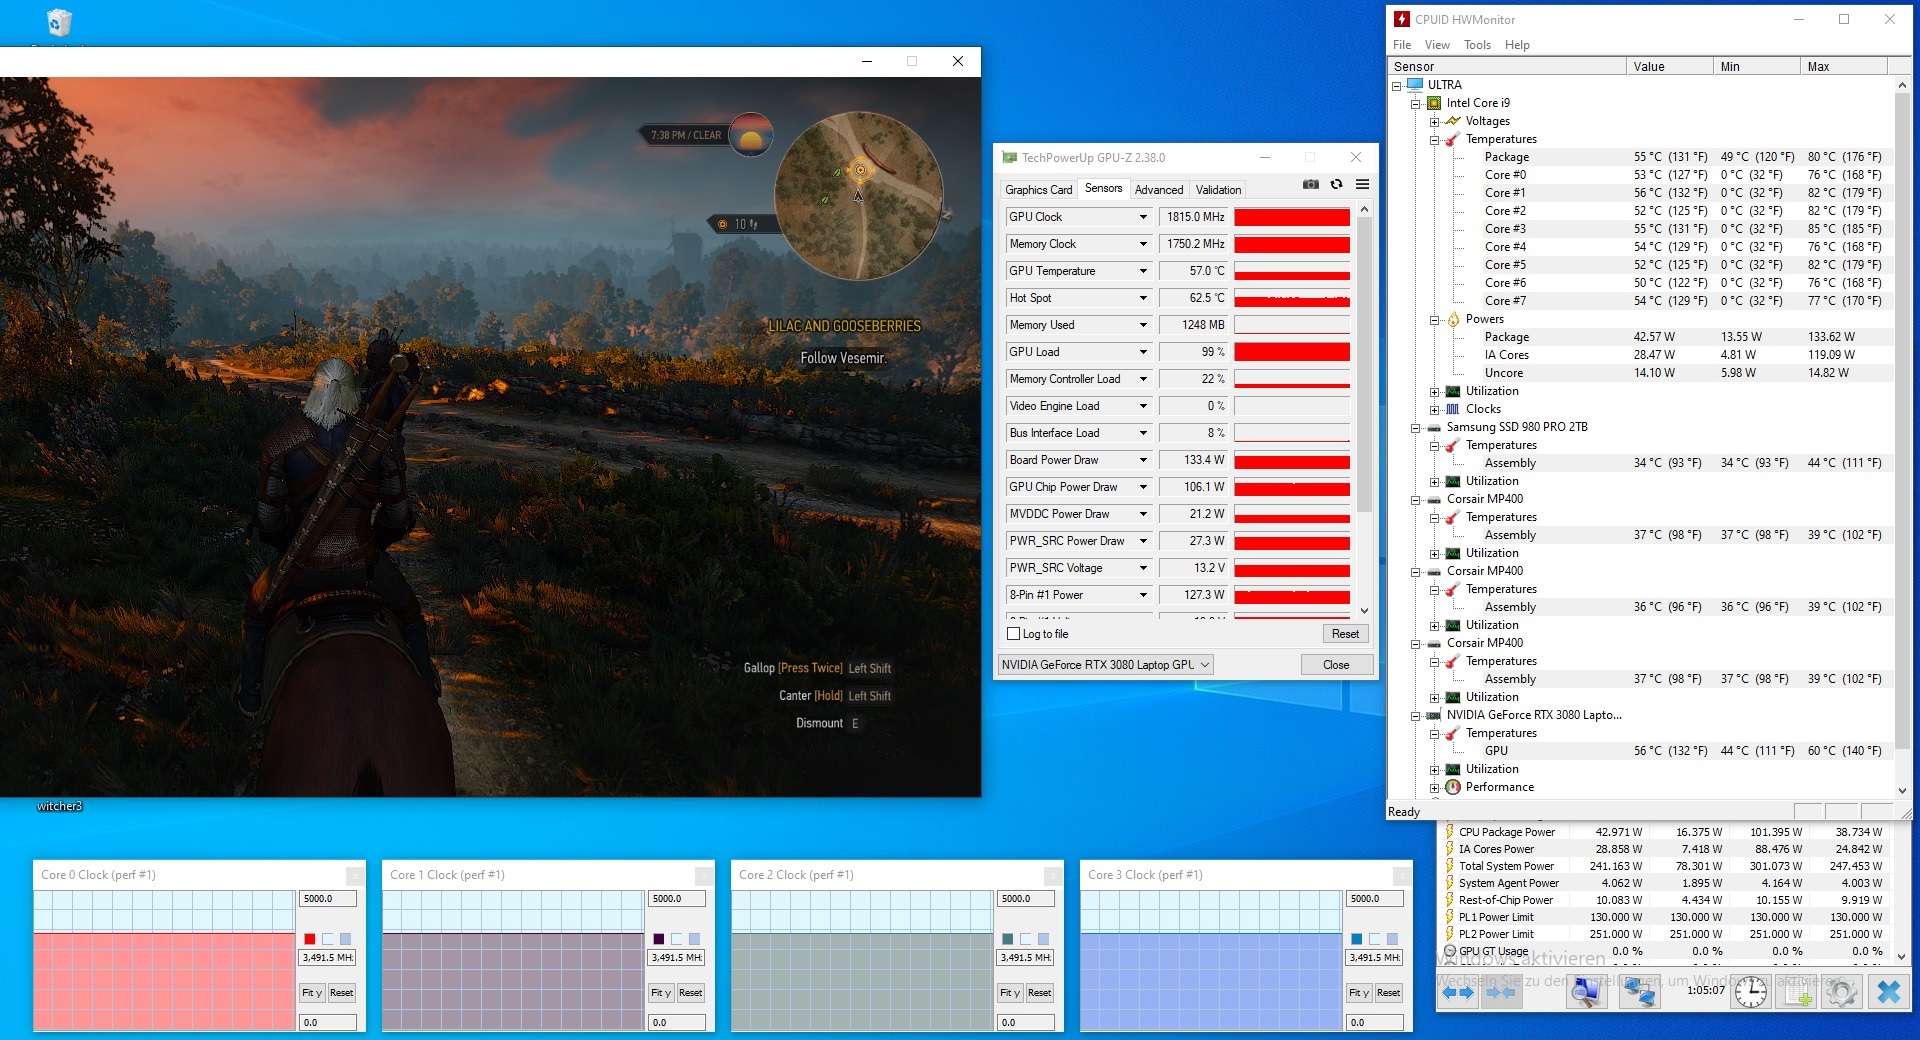
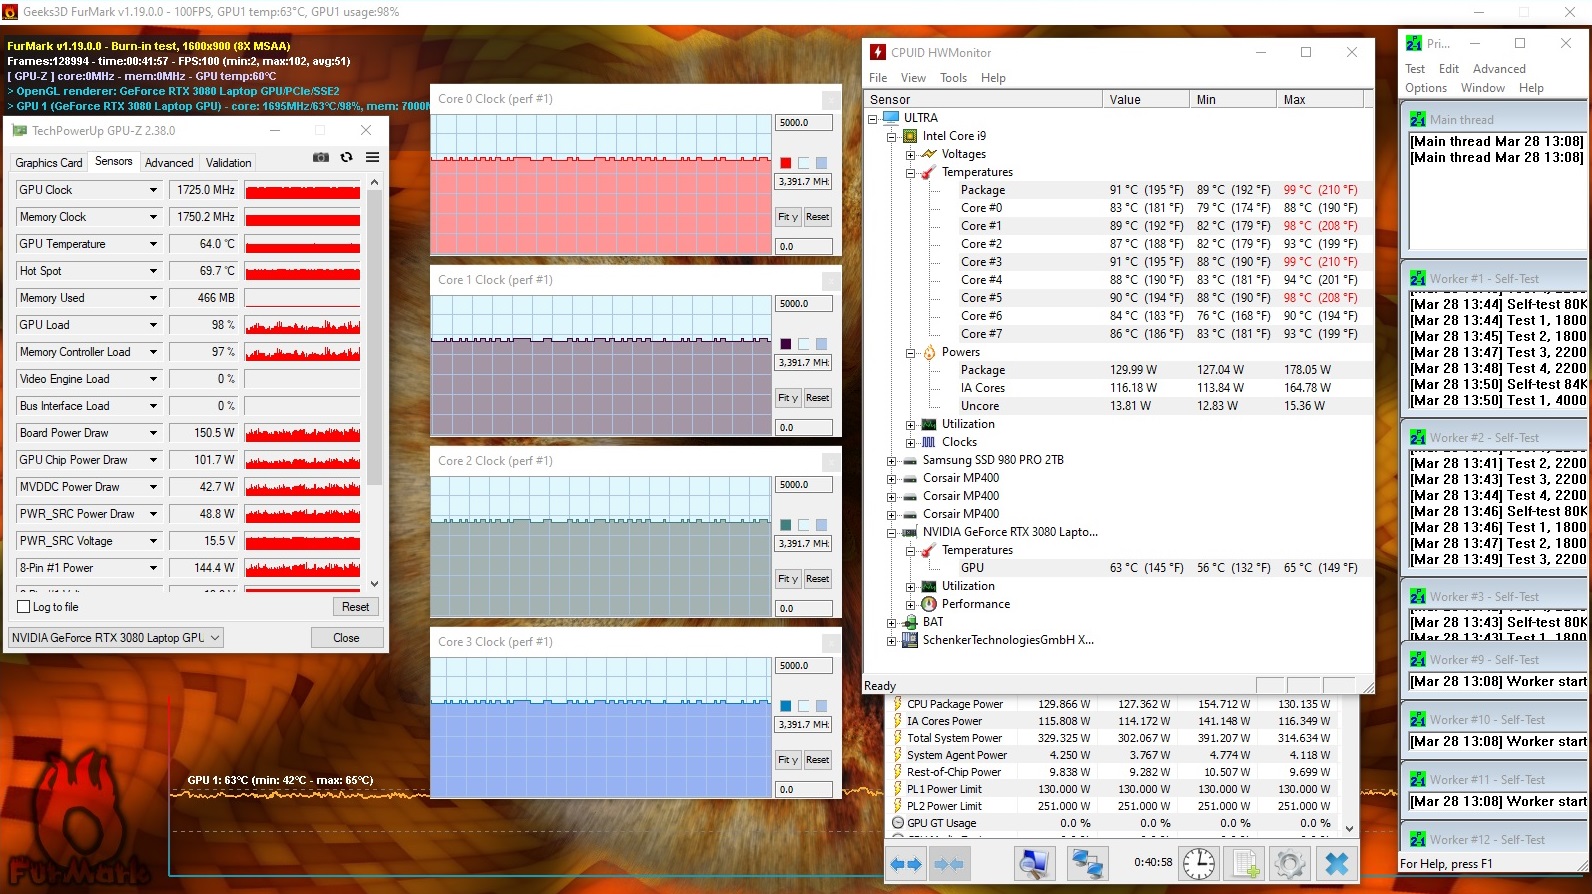
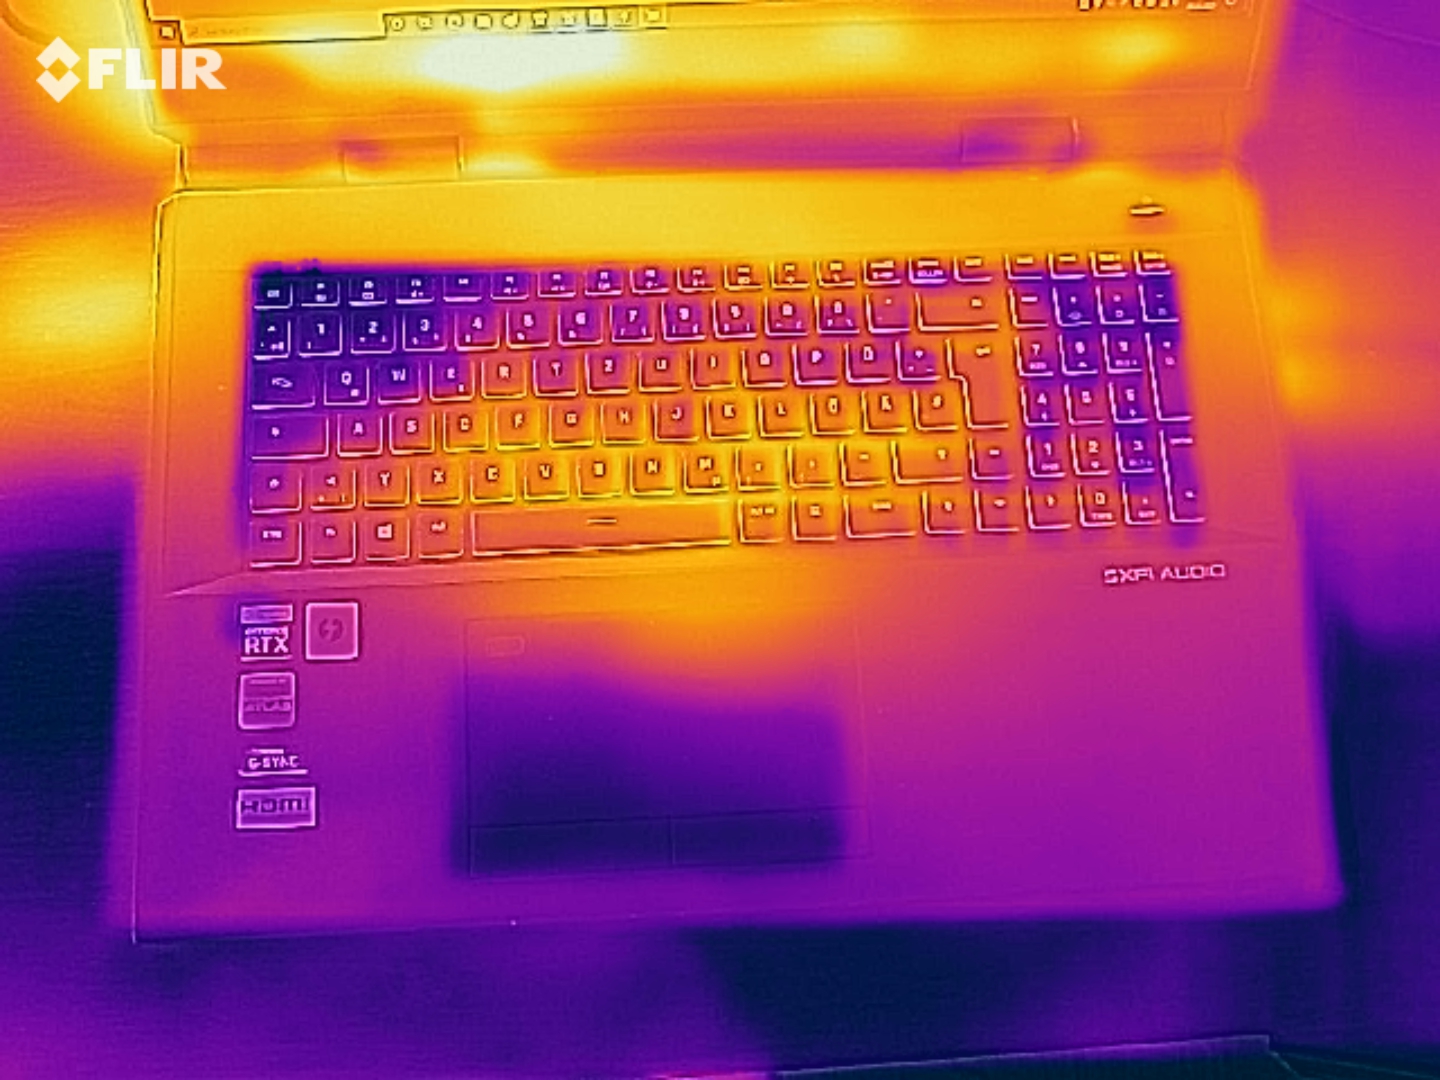
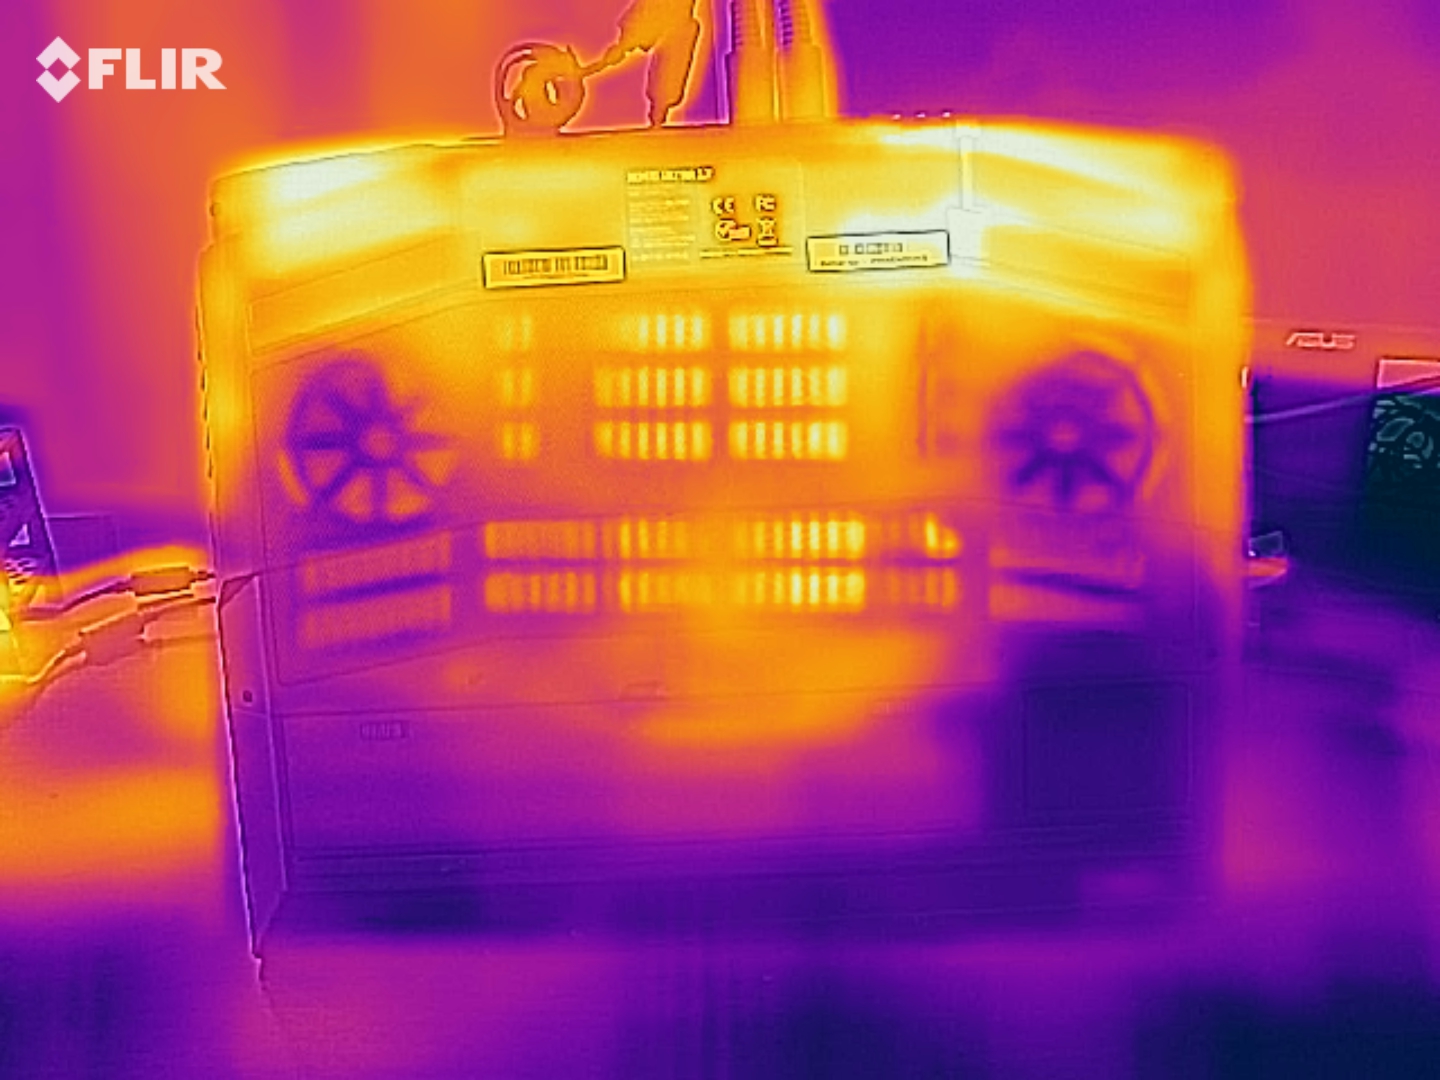
O XMG Ultra não aquece muito. Registramos temperaturas na faixa inferior de 40 graus Celsius (104 graus Fahrenheit) em três pontos de medição durante o teste de estresse. O aquecimento é menor quando realizamos o teste Witcher 3. As temperaturas ociosas às vezes são mais altas do que sob carga porque os ventiladores só funcionam em baixas velocidades
(+) A temperatura máxima no lado superior é 34 °C / 93 F, em comparação com a média de 40.4 °C / 105 F , variando de 21.2 a 68.8 °C para a classe Gaming.
(±) A parte inferior aquece até um máximo de 43 °C / 109 F, em comparação com a média de 43.2 °C / 110 F
(±) Em uso inativo, a temperatura média para o lado superior é 33 °C / 91 F, em comparação com a média do dispositivo de 33.9 °C / ### class_avg_f### F.
(+) Jogando The Witcher 3, a temperatura média para o lado superior é 28.2 °C / 83 F, em comparação com a média do dispositivo de 33.9 °C / ## #class_avg_f### F.
(+) Os apoios para as mãos e o touchpad são mais frios que a temperatura da pele, com um máximo de 30 °C / 86 F e, portanto, são frios ao toque.
(±) A temperatura média da área do apoio para as mãos de dispositivos semelhantes foi 28.8 °C / 83.8 F (-1.2 °C / -2.2 F).
| Schenker XMG Ultra 17 Rocket Lake i9-11900K, GeForce RTX 3080 Laptop GPU | MSI GT76 Titan DT 10SGS i9-10900K, GeForce RTX 2080 Super Mobile | Asus Strix Scar 17 G732LXS i9-10980HK, GeForce RTX 2080 Super Mobile | Schenker XMG Ultra 17 Comet Lake i9-10900K, GeForce RTX 2080 Super Mobile | Alienware m17 R4 i9-10980HK, GeForce RTX 3080 Laptop GPU | Média da turma Gaming | |
|---|---|---|---|---|---|---|
| Heat | 8% | -12% | 1% | -29% | -4% | |
| Maximum Upper Side * (°C) | 34 | 36.4 -7% | 59 -74% | 39 -15% | 58 -71% | 45.2 ? -33% |
| Maximum Bottom * (°C) | 43 | 43 -0% | 52 -21% | 46 -7% | 46 -7% | 48.1 ? -12% |
| Idle Upper Side * (°C) | 38 | 28 26% | 30 21% | 32 16% | 45 -18% | 31 ? 18% |
| Idle Bottom * (°C) | 39 | 33.4 14% | 29 26% | 35 10% | 46 -18% | 34.2 ? 12% |
* ... menor é melhor
Orador
Schenker XMG Ultra 17 Rocket Lake análise de áudio
(+) | os alto-falantes podem tocar relativamente alto (###valor### dB)
Graves 100 - 315Hz
(±) | graves reduzidos - em média 8.1% menor que a mediana
(+) | o baixo é linear (5.9% delta para a frequência anterior)
Médios 400 - 2.000 Hz
(+) | médios equilibrados - apenas 3.4% longe da mediana
(+) | médios são lineares (3.8% delta para frequência anterior)
Altos 2 - 16 kHz
(±) | máximos mais altos - em média 5.2% maior que a mediana
(+) | os máximos são lineares (6.4% delta da frequência anterior)
Geral 100 - 16.000 Hz
(+) | o som geral é linear (10.3% diferença em relação à mediana)
Comparado com a mesma classe
» 6% de todos os dispositivos testados nesta classe foram melhores, 2% semelhantes, 93% piores
» O melhor teve um delta de 6%, a média foi 18%, o pior foi 132%
Comparado com todos os dispositivos testados
» 5% de todos os dispositivos testados foram melhores, 1% semelhantes, 94% piores
» O melhor teve um delta de 4%, a média foi 23%, o pior foi 134%
Gestão de energia - Schenker DTR com um grande apetite por energia
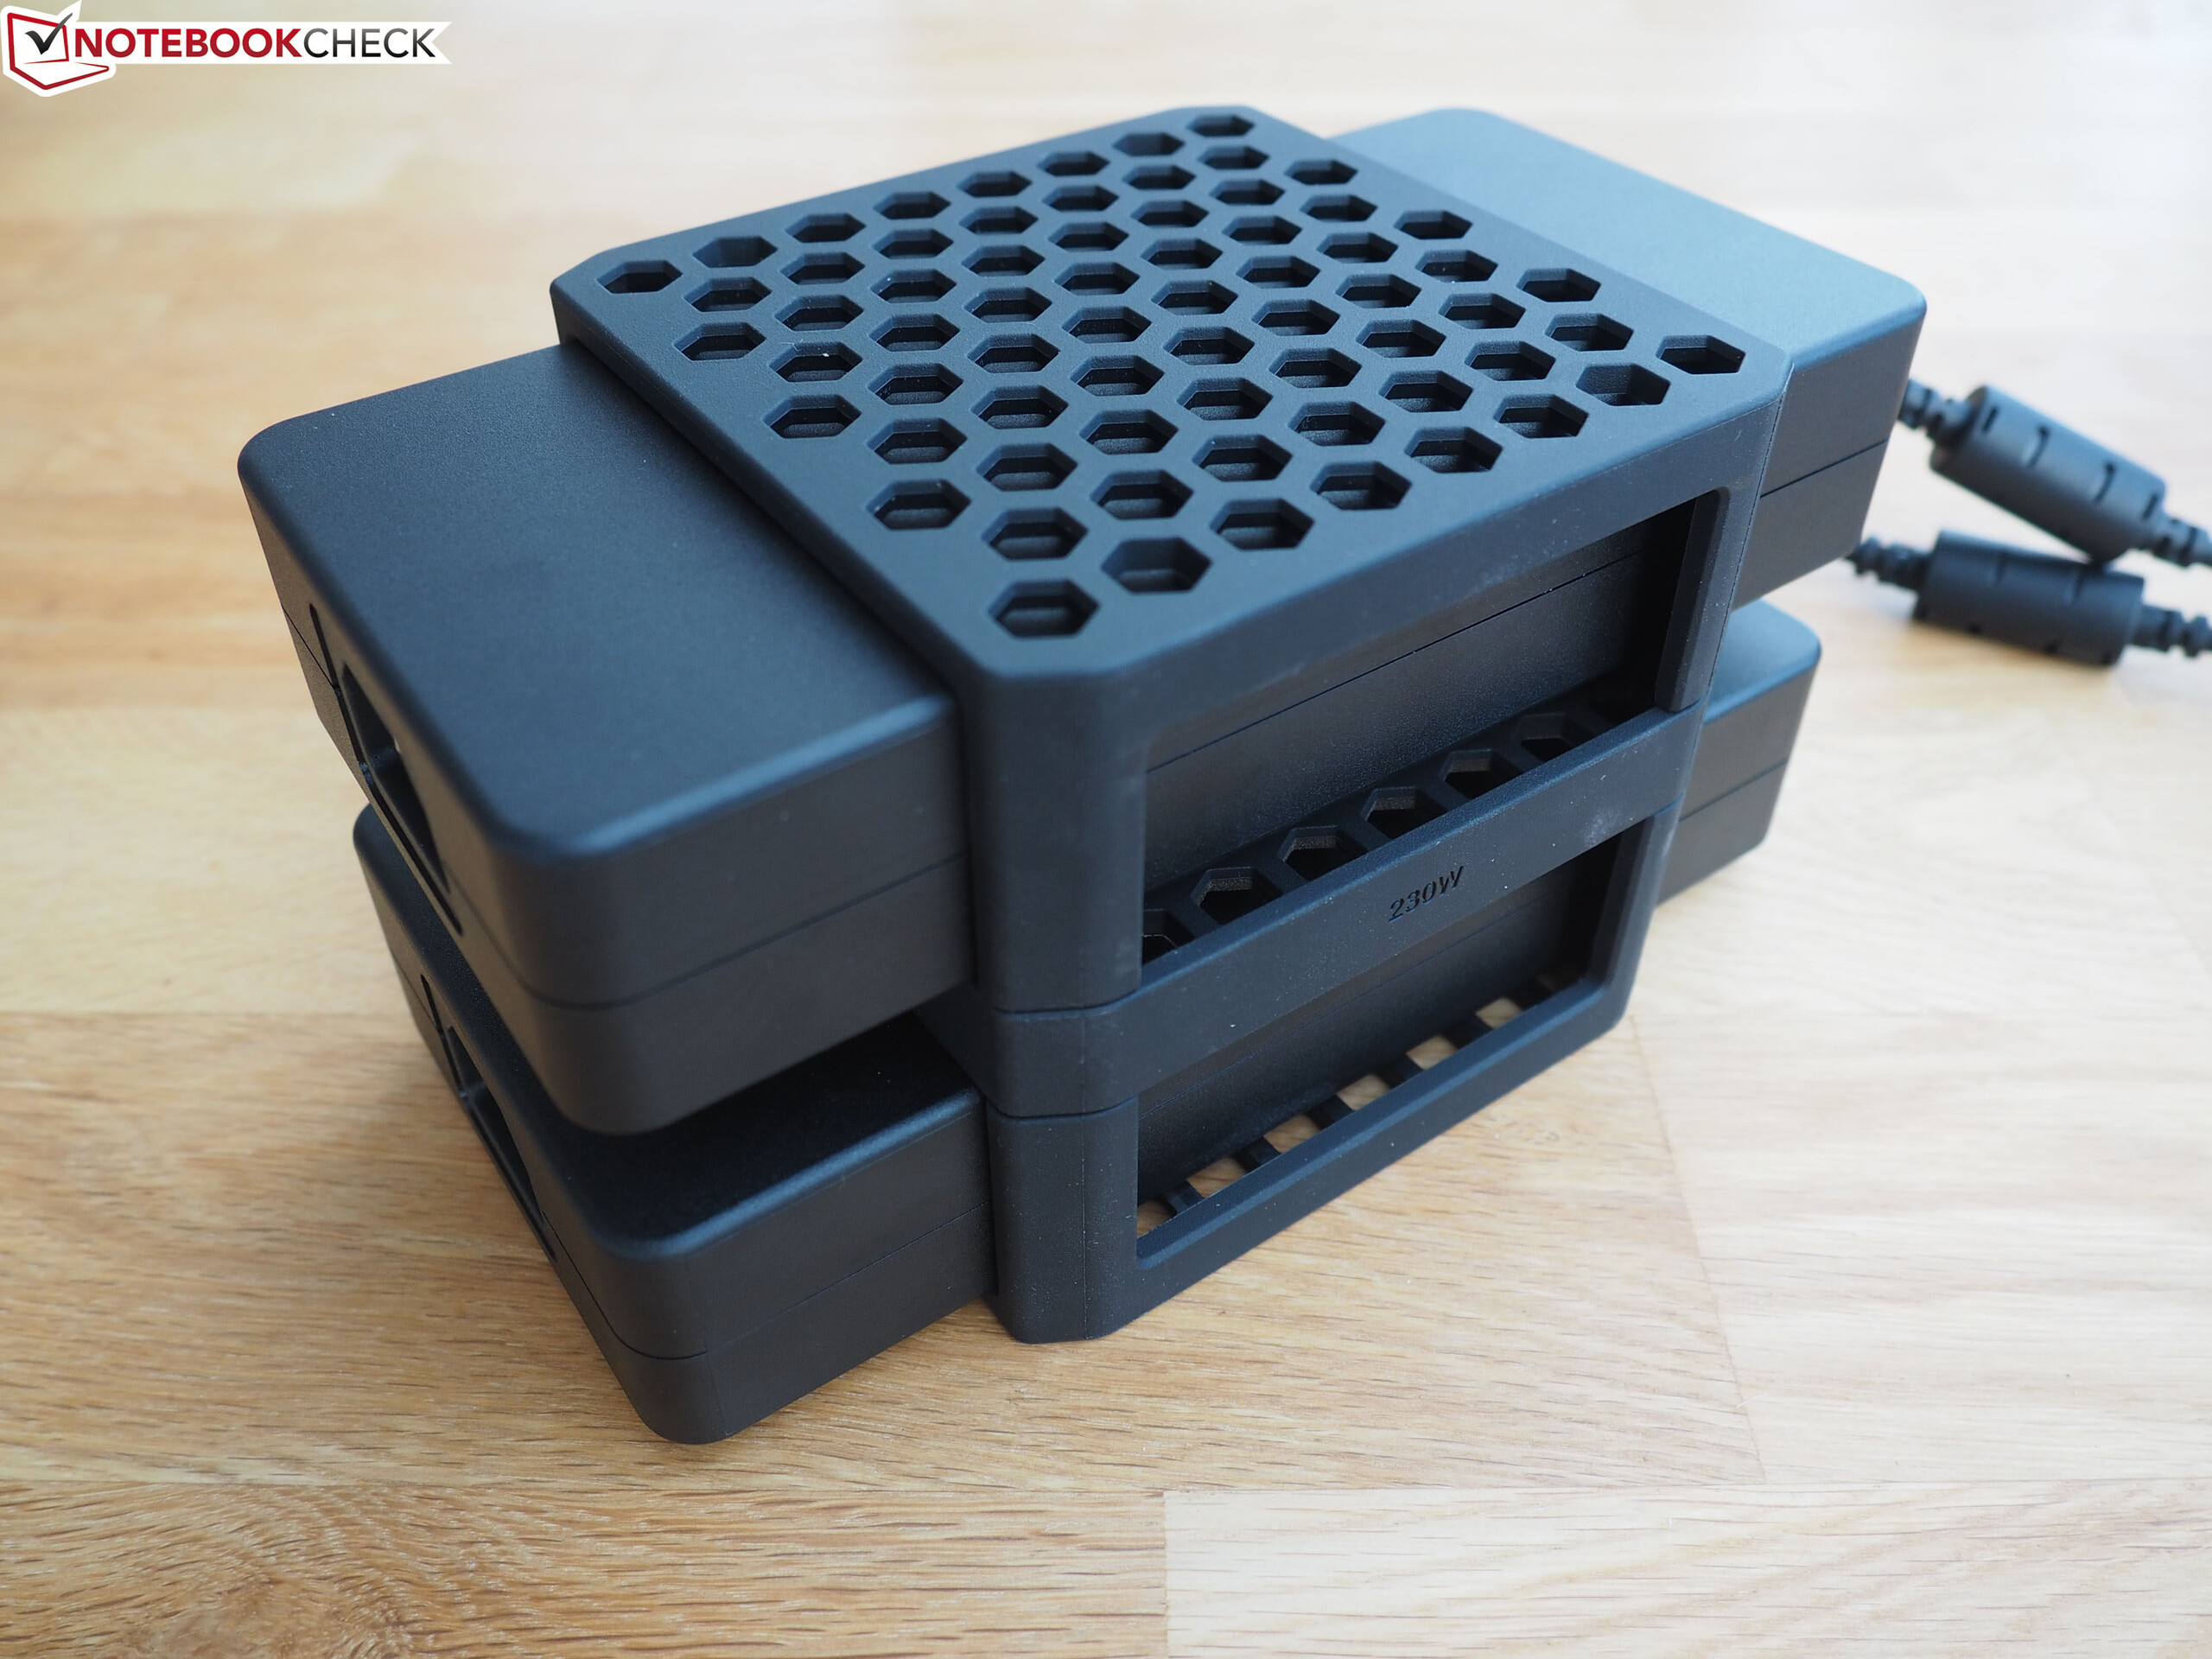
Consumo de energia
Registramos um consumo máximo de energia de 69 watts em modo inativo - um valor que muitos cadernos de escritório não atingem sob carga total. A combinação de uma CPU de alto desempenho e uma GPU permanentemente ativa GeForce é perceptível aqui. O teste de estresse e Witcher 3 teste aumentam a demanda até 368 watts e 297 watts em média, respectivamente. As duas fontes de alimentação fornecem uma potência nominal de 280 watts cada
| desligado | |
| Ocioso | |
| Carga |
|
Key:
min: | |
| Schenker XMG Ultra 17 Rocket Lake i9-11900K, GeForce RTX 3080 Laptop GPU | MSI GT76 Titan DT 10SGS i9-10900K, GeForce RTX 2080 Super Mobile | Asus Strix Scar 17 G732LXS i9-10980HK, GeForce RTX 2080 Super Mobile | Schenker XMG Ultra 17 Comet Lake i9-10900K, GeForce RTX 2080 Super Mobile | Alienware m17 R4 i9-10980HK, GeForce RTX 3080 Laptop GPU | Média da turma Gaming | |
|---|---|---|---|---|---|---|
| Power Consumption | 21% | 39% | 16% | 23% | 57% | |
| Idle Minimum * (Watt) | 62 | 25.9 58% | 16 74% | 34 45% | 42 32% | 13 ? 79% |
| Idle Average * (Watt) | 64 | 38 41% | 25 61% | 40 37% | 48 25% | 19 ? 70% |
| Idle Maximum * (Watt) | 69 | 53.2 23% | 35 49% | 47 32% | 58 16% | 24.6 ? 64% |
| Load Average * (Watt) | 183 | 123.8 32% | 177 3% | 130 29% | 124 32% | 110.7 ? 40% |
| Witcher 3 ultra * (Watt) | 297 | 312.5 -5% | 227 24% | 318 -7% | 219 26% | |
| Load Maximum * (Watt) | 368 | 459.8 -25% | 280 24% | 512 -39% | 337 8% | 259 ? 30% |
* ... menor é melhor
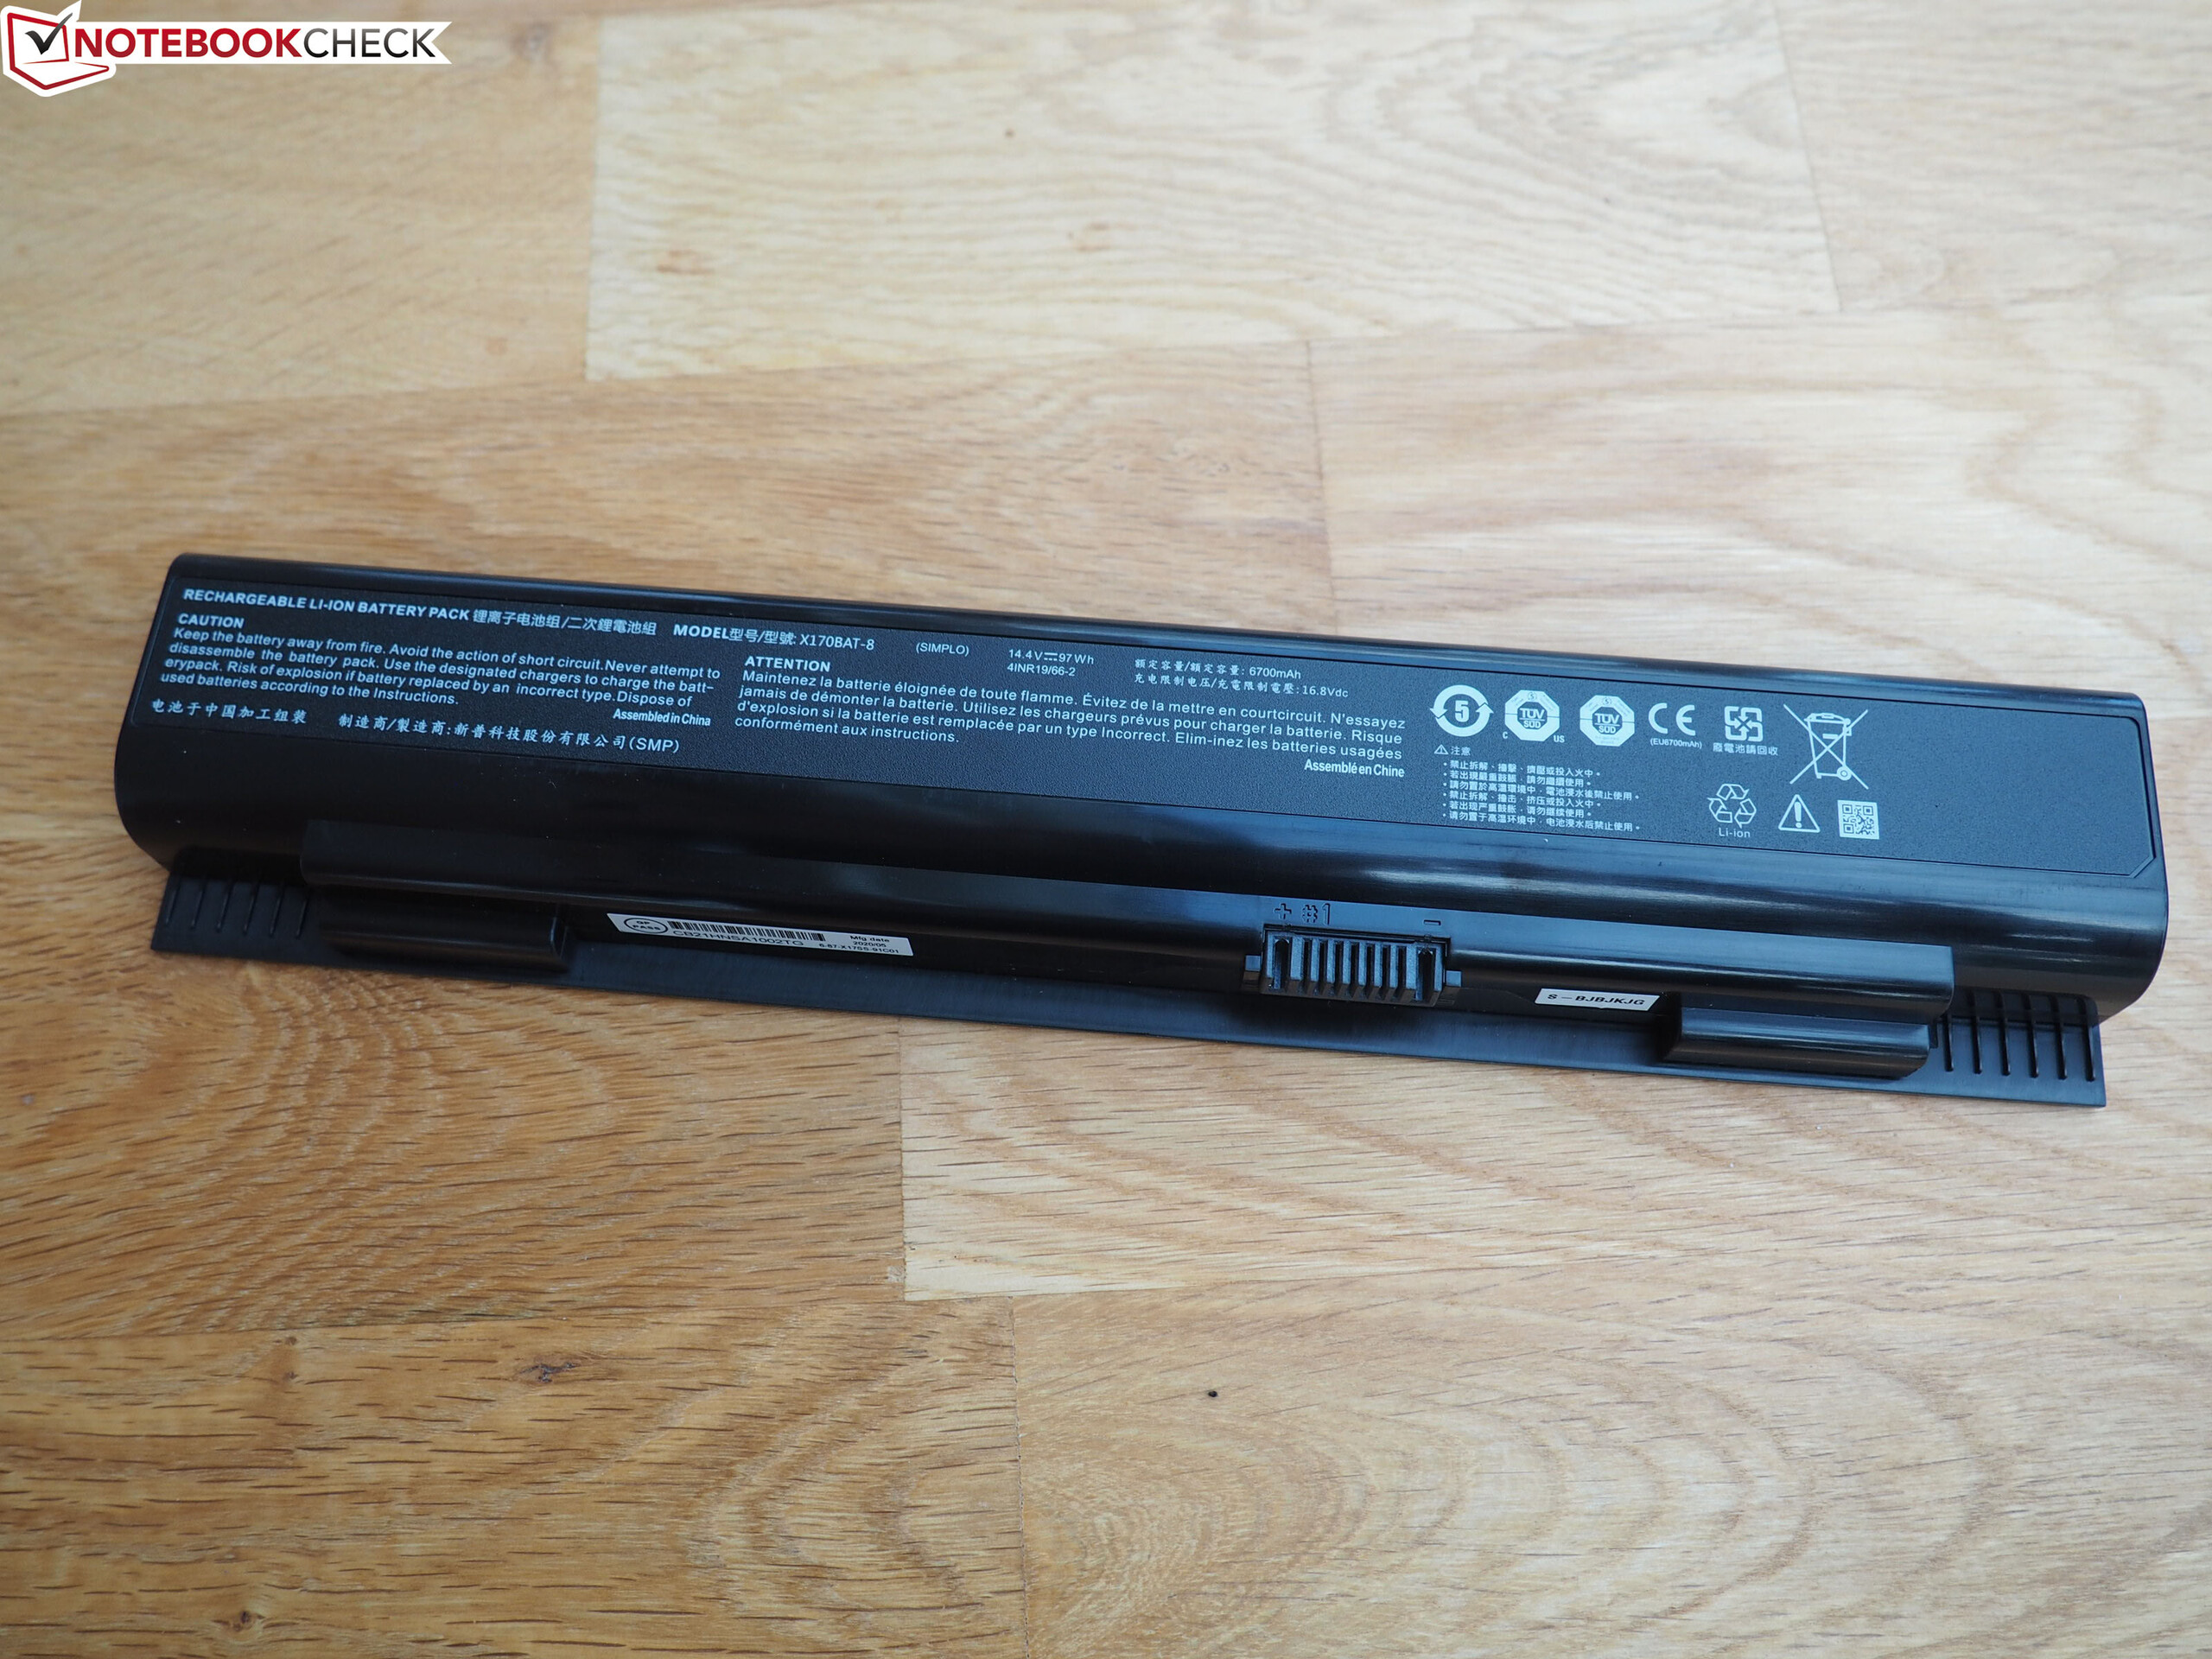
Duração da bateria
A fome desenfreada de energia do hardware significa que mesmo a bateria 97 Wh instalada é apenas boa para tempos de funcionamento miseráveis. O equipamento de 17,3 polegadas atinge tempos de execução de 1:50 h e 1:55 h no teste WLAN (chamando websites através de um roteiro) e teste de vídeo (curta-metragem Big Buck Bunny (codificação H.264, FHD) em loop), respectivamente. A bateria serve mais como fonte de energia de emergência do que como fator de mobilidade em um dispositivo como o Ultra 17.
| Schenker XMG Ultra 17 Rocket Lake i9-11900K, GeForce RTX 3080 Laptop GPU, 97 Wh | MSI GT76 Titan DT 10SGS i9-10900K, GeForce RTX 2080 Super Mobile, 90 Wh | Asus Strix Scar 17 G732LXS i9-10980HK, GeForce RTX 2080 Super Mobile, 66 Wh | Schenker XMG Ultra 17 Comet Lake i9-10900K, GeForce RTX 2080 Super Mobile, 97 Wh | Alienware m17 R4 i9-10980HK, GeForce RTX 3080 Laptop GPU, 86 Wh | Média da turma Gaming | |
|---|---|---|---|---|---|---|
| Duração da bateria | 33% | 166% | 61% | 19% | 212% | |
| Reader / Idle (h) | 3 | 10 233% | 4.9 63% | 8.27 ? 176% | ||
| H.264 (h) | 1.9 | 2.2 16% | 8.32 ? 338% | |||
| WiFi v1.3 (h) | 1.8 | 2.4 33% | 5.9 228% | 3.8 111% | 2.4 33% | 7.11 ? 295% |
| Load (h) | 1.1 | 1.5 36% | 1.2 9% | 1.2 9% | 1.502 ? 37% |
Pro
Contra
Veredicto
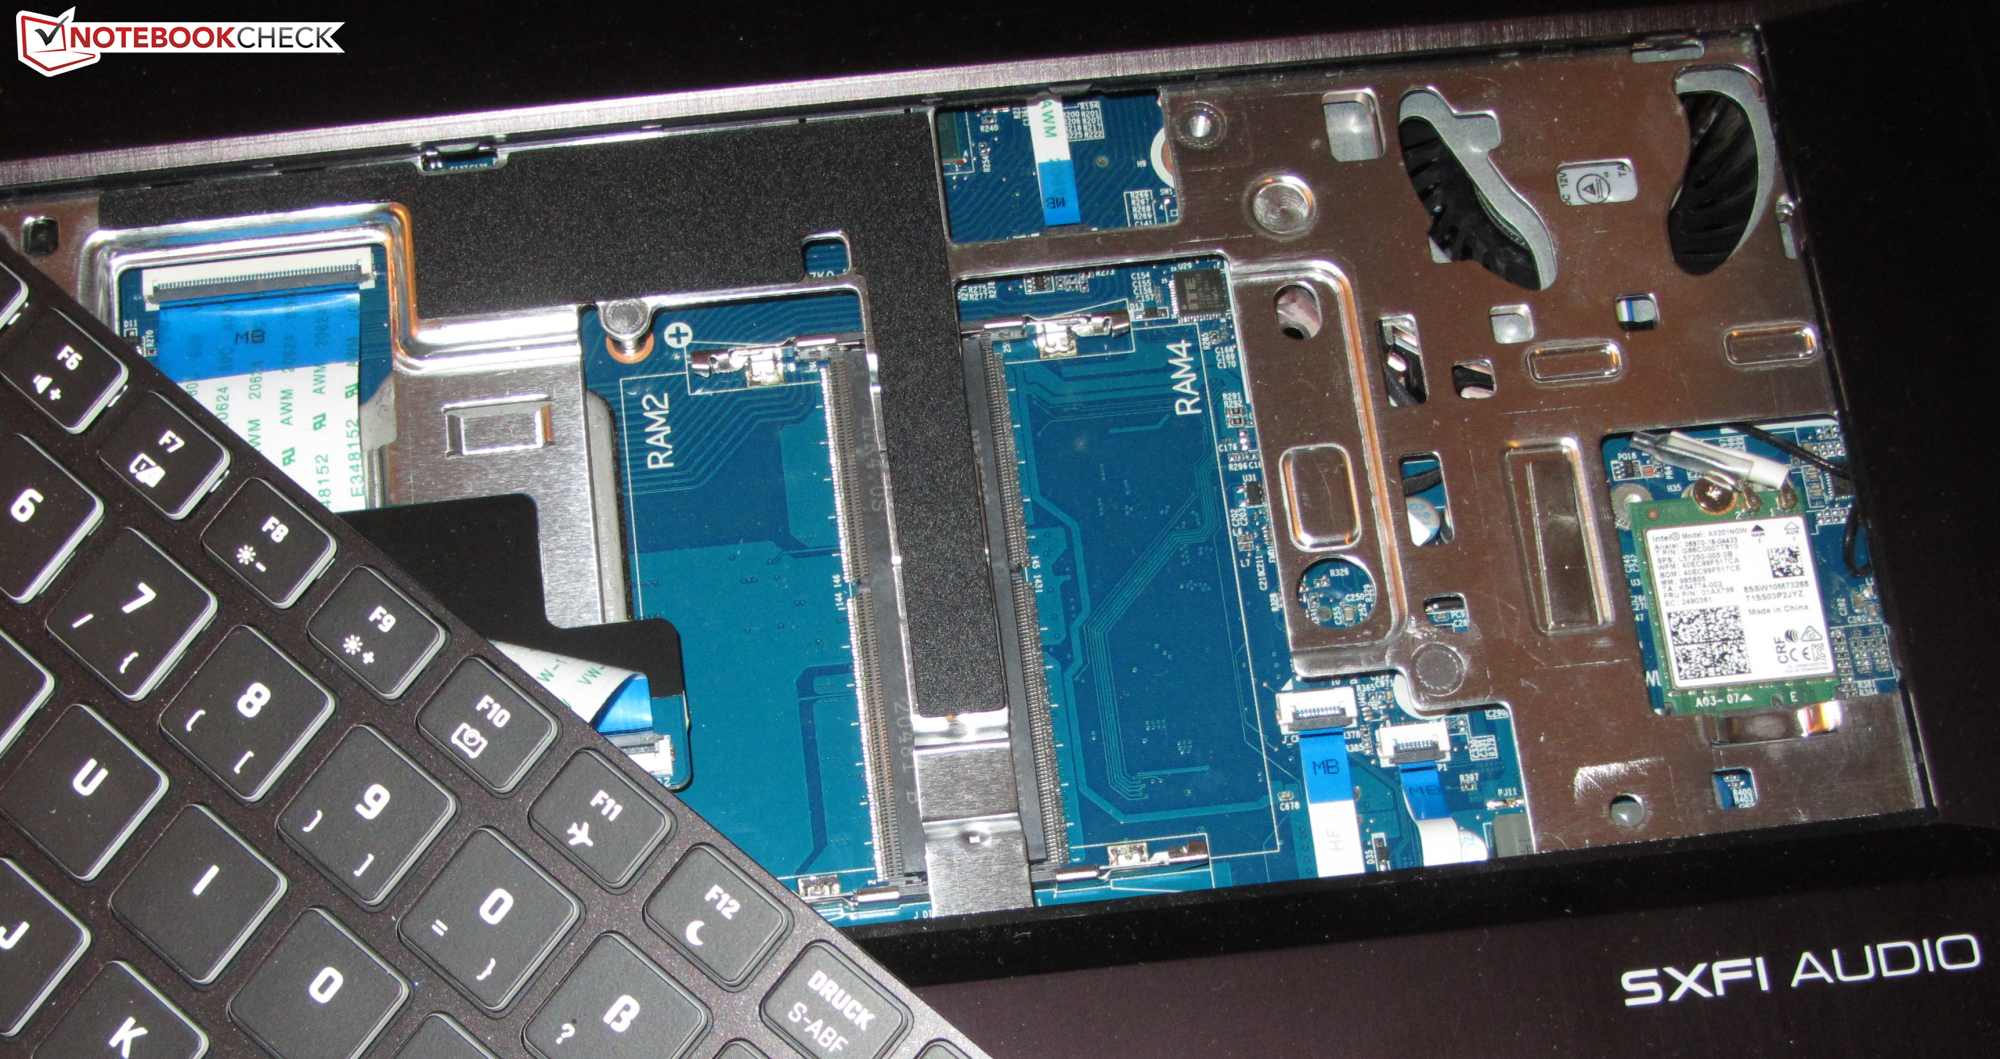
O notebook de substituição maciça da Schenker não compromete em termos de equipamento e potência computacional. Como não só amemória RAM e a mídia de armazenamento, mas também a CPU (socketed) e a GPU (MXM) são intercambiáveis, o notebook pode ser adaptado individualmente de acordo com a necessidade. Há três GPUs (Ampere) e dez CPUs (Comet Lake, Rocket Lake) para escolher.
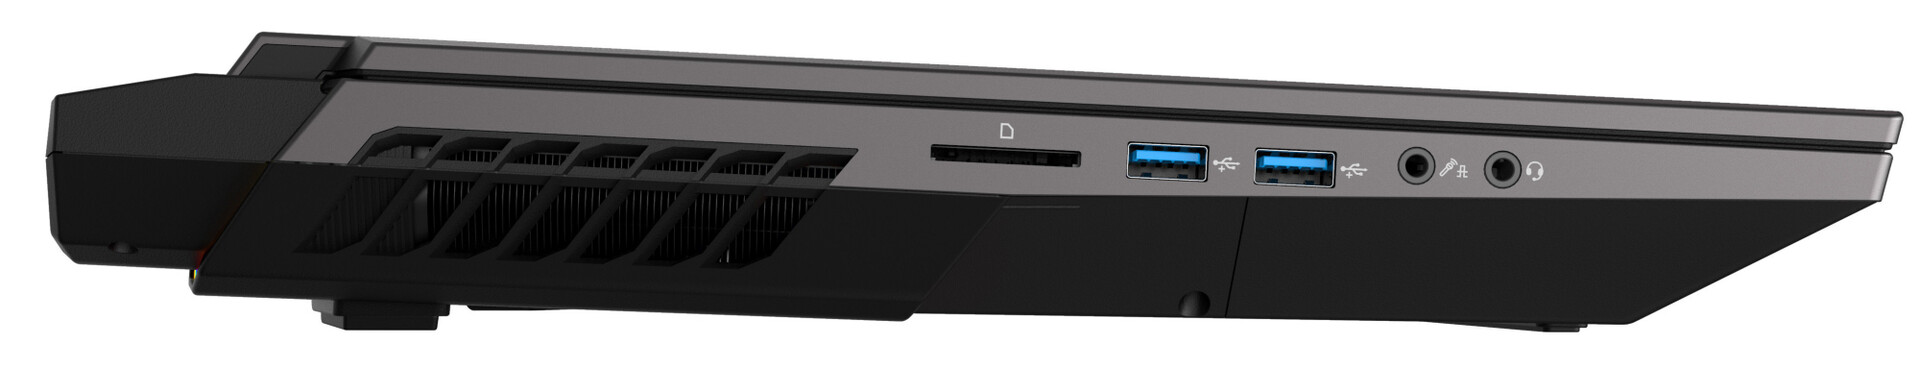
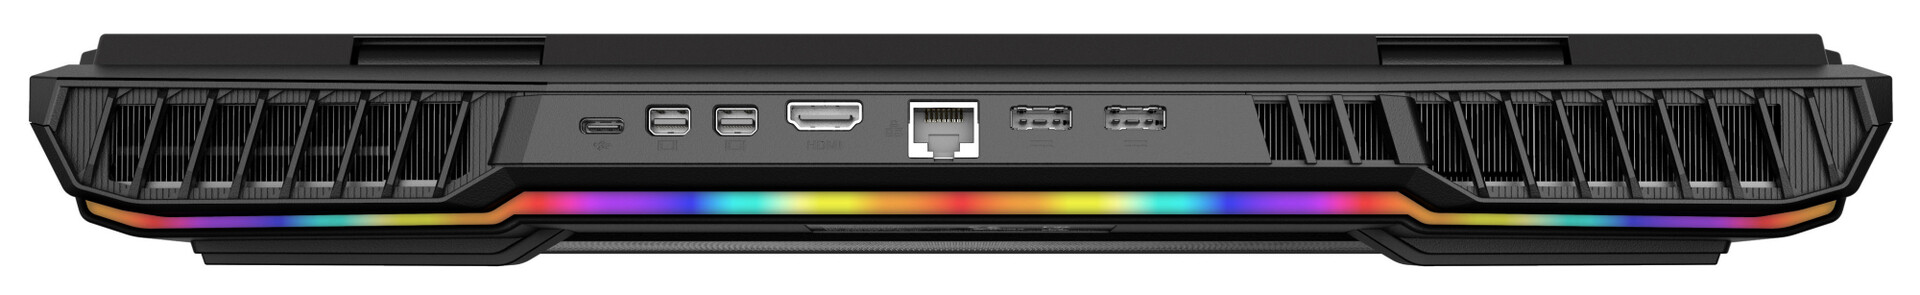
O Schenker XMG Ultra 17 oferece muito poder de computação, numerosas interfaces e muitas opções de expansão.
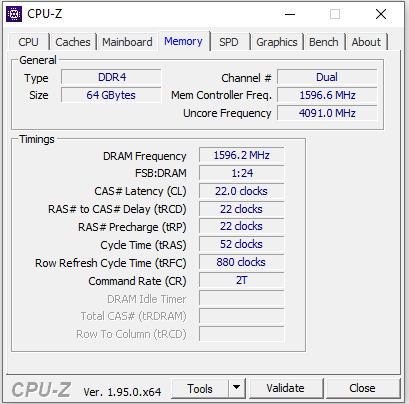
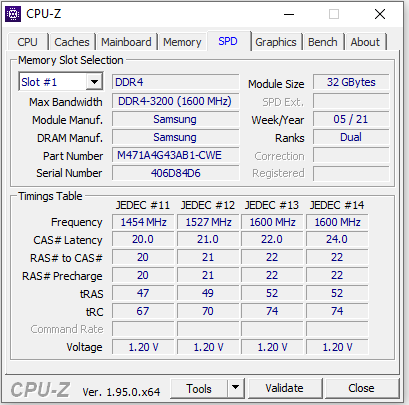
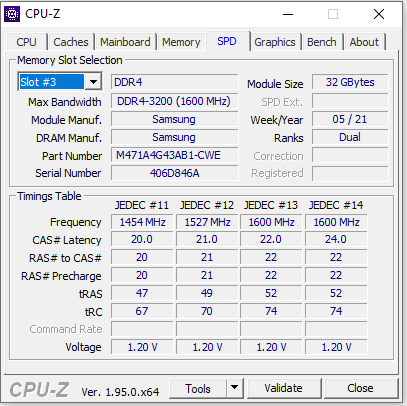
A amostra de revisão que nos é fornecida é muito boa graças à combinação do Core-i9-11900K processador, GeForce RTX-3080 laptop GPU, 64 GB de memória de trabalho (máx. 128 GB) e 4 SSDs NVMe com um total de 26 TB de espaço de armazenamento, o dispositivo de teste fornecido a nós é mais do que equipado para todas as áreas de aplicação comuns. Escritório, Internet, edição de vídeo, processamento de imagens, streaming e jogos são todos tratados sem nenhum problema.
A tecnologia G-Sync da Nvidia garante uma exibição suave da imagem na tela IPS de 300 Hz. Esta última marca com superfície mate, bom contraste, tempos de resposta curtos, ângulos de visão estáveis, ótima reprodução de cores e cobertura decente do espaço de cores. Entretanto, o brilho máximo deve ser um pouco mais alto. Como o dispositivo será usado principalmente em ambientes internos devido à sua baixa mobilidade, ele é aceitável.
Preço e disponibilidade
O Schenker XMG Ultra 17 (2021) pode ser configurado individualmente na loja on-line Schenker. A variante de configuração fornecida a nós está disponível por pouco menos de 9.000 euros (~$10.887). Os modelos de nível básico estão disponíveis por cerca de 2.500 Euros (~$3.024)
Schenker XMG Ultra 17 Rocket Lake
- 04/19/2021 v7 (old)
Sascha Mölck
Price comparison
