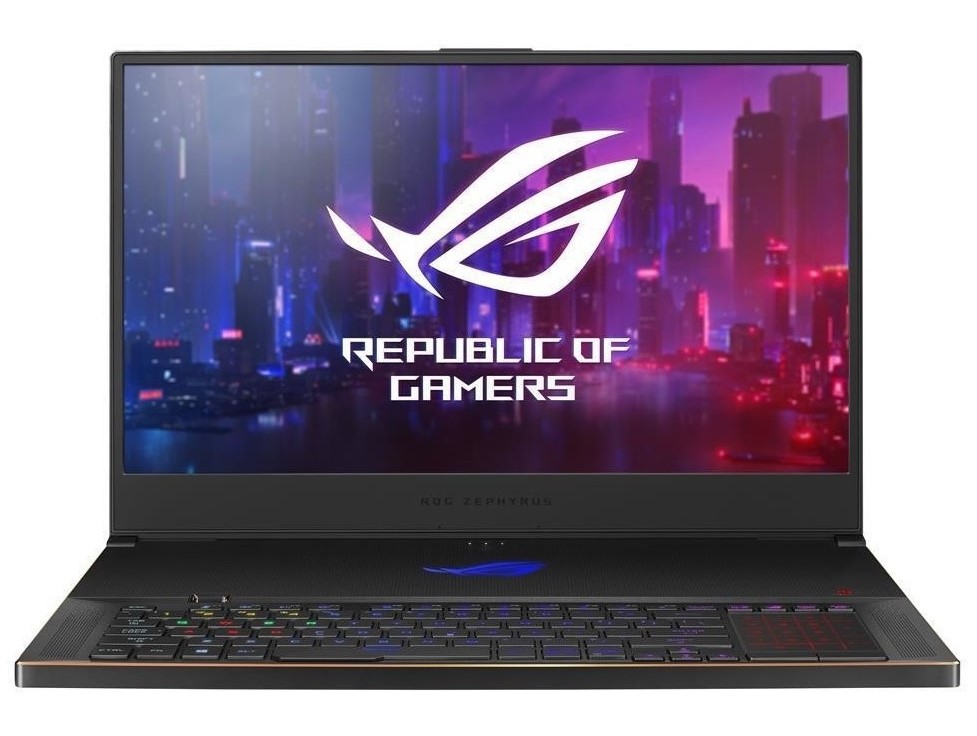
Breve Análise do Portátil Asus ROG Zephyrus S17: Portátil fino e gigante para jogos com Painel de 300 Hz
Avaliação | Data | Modelo | Peso | Altura | Size | Resolução | Preço |
|---|---|---|---|---|---|---|---|
| 82.4 % v7 (old) | 08/2020 | Asus Zephyrus S17 GX701LXS i7-10875H, GeForce RTX 2080 Super Max-Q | 2.6 kg | 18.7 mm | 17.30" | 1920x1080 | |
| 87.4 % v7 (old) | 06/2020 | Razer Blade Pro 17 RTX 2070 Max-Q 300 Hz i7-10875H, GeForce RTX 2070 Max-Q | 2.7 kg | 19.9 mm | 17.30" | 1920x1080 | |
| 83.7 % v7 (old) | 08/2020 | MSI GS75 10SF-609US i7-10875H, GeForce RTX 2070 Max-Q | 2.3 kg | 18.9 mm | 17.30" | 1920x1080 | |
| 84 % v7 (old) | 05/2020 | Lenovo Legion Y740-17IRHg-81UJ001VGE i7-9750H, GeForce RTX 2080 Max-Q | 3 kg | 25.5 mm | 17.30" | 1920x1080 | |
| 84.2 % v7 (old) | 03/2020 | Alienware m17 R2 P41E i9-9980HK, GeForce RTX 2080 Max-Q | 2.6 kg | 20.5 mm | 17.30" | 1920x1080 |
| |||||||||||||||||||||||||
iluminação: 76 %
iluminação com acumulador: 308 cd/m²
Contraste: 906:1 (Preto: 0.34 cd/m²)
ΔE ColorChecker Calman: 1.49 | ∀{0.5-29.43 Ø4.71}
calibrated: 0.99
ΔE Greyscale Calman: 2.3 | ∀{0.09-98 Ø4.96}
96% sRGB (Argyll 1.6.3 3D)
74% AdobeRGB 1998 (Argyll 1.6.3 3D)
73.7% AdobeRGB 1998 (Argyll 3D)
99.7% sRGB (Argyll 3D)
73.6% Display P3 (Argyll 3D)
Gamma: 2.193
CCT: 6981 K
| Asus Zephyrus S17 GX701LXS Sharp SHP14DC, IPS, 1920x1080, 17.3" | Razer Blade Pro 17 RTX 2070 Max-Q 300 Hz Sharp LQ173M1JW02, IPS, 1920x1080, 17.3" | MSI GS75 10SF-609US Sharp LQ173M1JW05, IPS, 1920x1080, 17.3" | Lenovo Legion Y740-17IRHg-81UJ001VGE AUO_B173HAN03, IPS, 1920x1080, 17.3" | Alienware m17 R2 P41E Chi Mei 173HCE, CMN175F, IPS, 1920x1080, 17.3" | |
|---|---|---|---|---|---|
| Display | -1% | 2% | -10% | -2% | |
| Display P3 Coverage (%) | 73.6 | 72.2 -2% | 75.6 3% | 63.8 -13% | 70.8 -4% |
| sRGB Coverage (%) | 99.7 | 98.5 -1% | 99.8 0% | 92.7 -7% | 98.5 -1% |
| AdobeRGB 1998 Coverage (%) | 73.7 | 73 -1% | 75.1 2% | 65.3 -11% | 72.2 -2% |
| Response Times | -16% | 9% | -129% | -140% | |
| Response Time Grey 50% / Grey 80% * (ms) | 5 ? | 5.6 ? -12% | 5 ? -0% | 16 ? -220% | 17.2 ? -244% |
| Response Time Black / White * (ms) | 8 ? | 9.6 ? -20% | 6.6 ? 17% | 11 ? -38% | 10.8 ? -35% |
| PWM Frequency (Hz) | 26320 ? | ||||
| Screen | -59% | -8% | -35% | 13% | |
| Brightness middle (cd/m²) | 308 | 328 6% | 299.4 -3% | 310 1% | 384.2 25% |
| Brightness (cd/m²) | 310 | 329 6% | 299 -4% | 281 -9% | 357 15% |
| Brightness Distribution (%) | 76 | 78 3% | 84 11% | 85 12% | 90 18% |
| Black Level * (cd/m²) | 0.34 | 0.35 -3% | 0.31 9% | 0.31 9% | 0.29 15% |
| Contrast (:1) | 906 | 937 3% | 966 7% | 1000 10% | 1325 46% |
| Colorchecker dE 2000 * | 1.49 | 4.74 -218% | 1.82 -22% | 3.86 -159% | 1.35 9% |
| Colorchecker dE 2000 max. * | 3.97 | 8.99 -126% | 3.91 2% | 7.8 -96% | 3.45 13% |
| Colorchecker dE 2000 calibrated * | 0.99 | 2.12 -114% | 1.59 -61% | 1.42 -43% | |
| Greyscale dE 2000 * | 2.3 | 6.8 -196% | 2.7 -17% | 4.48 -95% | 1.2 48% |
| Gamma | 2.193 100% | 2.2 100% | 2.18 101% | 2.5 88% | 2.23 99% |
| CCT | 6981 93% | 6446 101% | 6837 95% | 7542 86% | 6580 99% |
| Color Space (Percent of AdobeRGB 1998) (%) | 74 | 64.8 -12% | 67.1 -9% | 60 -19% | 65.5 -11% |
| Color Space (Percent of sRGB) (%) | 96 | 98.6 3% | 99.8 4% | 93 -3% | 98.5 3% |
| Média Total (Programa/Configurações) | -25% /
-43% | 1% /
-4% | -58% /
-43% | -43% /
-9% |
* ... menor é melhor
Exibir tempos de resposta
| ↔ Tempo de resposta preto para branco | ||
|---|---|---|
| 8 ms ... ascensão ↗ e queda ↘ combinadas | ↗ 3.6 ms ascensão | 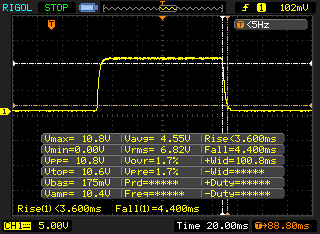 |
| ↘ 4.4 ms queda | ||
| A tela mostra taxas de resposta rápidas em nossos testes e deve ser adequada para jogos. Em comparação, todos os dispositivos testados variam de 0.1 (mínimo) a 240 (máximo) ms. » 22 % de todos os dispositivos são melhores. Isso significa que o tempo de resposta medido é melhor que a média de todos os dispositivos testados (19.8 ms). | ||
| ↔ Tempo de resposta 50% cinza a 80% cinza | ||
| 5 ms ... ascensão ↗ e queda ↘ combinadas | ↗ 2.2 ms ascensão | 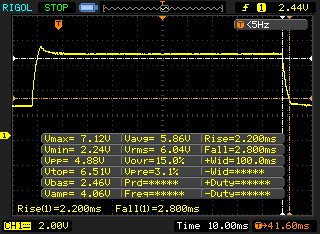 |
| ↘ 2.8 ms queda | ||
| A tela mostra taxas de resposta muito rápidas em nossos testes e deve ser muito adequada para jogos em ritmo acelerado. Em comparação, todos os dispositivos testados variam de 0.165 (mínimo) a 636 (máximo) ms. » 17 % de todos os dispositivos são melhores. Isso significa que o tempo de resposta medido é melhor que a média de todos os dispositivos testados (31 ms). | ||
Cintilação da tela / PWM (modulação por largura de pulso)
| Tela tremeluzindo / PWM não detectado | 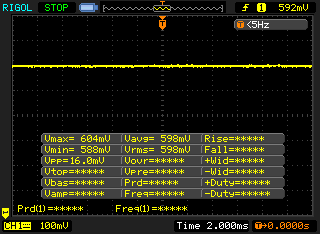 | ||
[pwm_comparison] Em comparação: 52 % de todos os dispositivos testados não usam PWM para escurecer a tela. Se PWM foi detectado, uma média de 7754 (mínimo: 5 - máximo: 343500) Hz foi medida. | |||


* ... menor é melhor
| PCMark 8 Home Score Accelerated v2 | 4666 pontos | |
| PCMark 8 Work Score Accelerated v2 | 6370 pontos | |
| PCMark 10 Score | 5231 pontos | |
Ajuda | ||
| DPC Latencies / LatencyMon - interrupt to process latency (max), Web, Youtube, Prime95 | |
| Razer Blade Pro 17 RTX 2070 Max-Q 300 Hz | |
| Asus Zephyrus S17 GX701LXS | |
| MSI GS75 10SF-609US | |
* ... menor é melhor
| Asus Zephyrus S17 GX701LXS Samsung PM981a MZVLB1T0HBLR | Razer Blade Pro 17 RTX 2070 Max-Q 300 Hz Lite-On CA5-8D512 | MSI GS75 10SF-609US WDC PC SN730 SDBPNTY-512G | Lenovo Legion Y740-17IRHg-81UJ001VGE Samsung SSD PM981 MZVLB1T0HALR | Alienware m17 R2 P41E 2x SK Hynix PC601 NVMe 512 GB (RAID 0) | Média Samsung PM981a MZVLB1T0HBLR | |
|---|---|---|---|---|---|---|
| CrystalDiskMark 5.2 / 6 | 9% | 18% | 1% | 4% | 9% | |
| Write 4K (MB/s) | 120 | 119 -1% | 177.9 48% | 101.2 -16% | 110.6 -8% | 139.7 ? 16% |
| Read 4K (MB/s) | 45.24 | 51.9 15% | 47.42 5% | 44.61 -1% | 41.46 -8% | 49.9 ? 10% |
| Write Seq (MB/s) | 2090 | 2258 8% | 2707 30% | 2295 10% | 2378 14% | 2036 ? -3% |
| Read Seq (MB/s) | 2246 | 2283 2% | 2369 5% | 2174 -3% | 2114 -6% | 2014 ? -10% |
| Write 4K Q32T1 (MB/s) | 392.5 | 491 25% | 427.8 9% | 401.2 2% | 445.4 13% | 461 ? 17% |
| Read 4K Q32T1 (MB/s) | 348.4 | 540 55% | 543 56% | 475.5 36% | 509 46% | 499 ? 43% |
| Write Seq Q32T1 (MB/s) | 3015 | 2253 -25% | 2703 -10% | 2397 -20% | 2735 -9% | 2903 ? -4% |
| Read Seq Q32T1 (MB/s) | 3445 | 3172 -8% | 3387 -2% | 3337 -3% | 3206 -7% | 3479 ? 1% |
| AS SSD | -60% | -13% | 9% | -27% | 13% | |
| Seq Read (MB/s) | 2744 | 2019 -26% | 2327 -15% | 2800 2% | 1938 -29% | 2553 ? -7% |
| Seq Write (MB/s) | 1351 | 1314 -3% | 2479 83% | 2424 79% | 2094 55% | 2084 ? 54% |
| 4K Read (MB/s) | 47.24 | 46.61 -1% | 45.46 -4% | 42.77 -9% | 25.88 -45% | 53.1 ? 12% |
| 4K Write (MB/s) | 109.1 | 90.2 -17% | 157.4 44% | 94.8 -13% | 100.8 -8% | 131.2 ? 20% |
| 4K-64 Read (MB/s) | 1118 | 665 -41% | 1050 -6% | 1406 26% | 1217 9% | 1477 ? 32% |
| 4K-64 Write (MB/s) | 1926 | 813 -58% | 938 -51% | 1697 -12% | 1137 -41% | 1805 ? -6% |
| Access Time Read * (ms) | 0.064 | 0.058 9% | 0.076 -19% | 0.05 22% | 0.051 20% | 0.04983 ? 22% |
| Access Time Write * (ms) | 0.034 | 0.167 -391% | 0.071 -109% | 0.039 -15% | 0.107 -215% | 0.04222 ? -24% |
| Score Read (Points) | 1439 | 913 -37% | 1328 -8% | 1729 20% | 1437 0% | 1786 ? 24% |
| Score Write (Points) | 2170 | 1034 -52% | 1343 -38% | 2034 -6% | 1447 -33% | 2144 ? -1% |
| Score Total (Points) | 4283 | 2392 -44% | 3366 -21% | 4630 8% | 3624 -15% | 4826 ? 13% |
| Média Total (Programa/Configurações) | -26% /
-31% | 3% /
-0% | 5% /
6% | -12% /
-14% | 11% /
11% |
* ... menor é melhor

Constant Performance Reads: DiskSpd Read Loop, Queue Depth 8
| 3DMark 11 Performance | 25058 pontos | |
| 3DMark Cloud Gate Standard Score | 45467 pontos | |
| 3DMark Fire Strike Score | 19929 pontos | |
| 3DMark Time Spy Score | 8883 pontos | |
Ajuda | ||
| The Witcher 3 - 1920x1080 Ultra Graphics & Postprocessing (HBAO+) | |
| Média da turma Gaming (104.7 - 240, n=7, últimos 2 anos) | |
| Média NVIDIA GeForce RTX 2080 Super Max-Q (74.3 - 96, n=11) | |
| Asus Zephyrus S17 GX701LXS | |
| Lenovo Legion Y740-17IRHg-81UJ001VGE | |
| Razer Blade Pro 17 RTX 2070 Max-Q 300 Hz | |
| Alienware m17 R2 P41E | |
| MSI GS75 10SF-609US | |
| Far Cry 5 - 1920x1080 Ultra Preset AA:T | |
| Média da turma Gaming (70 - 151, n=6, últimos 2 anos) | |
| Asus Zephyrus S17 GX701LXS | |
| Média NVIDIA GeForce RTX 2080 Super Max-Q (91 - 110, n=4) | |
| Doom Eternal - 1920x1080 Ultra Preset | |
| Asus Zephyrus S17 GX701LXS | |
| Média NVIDIA GeForce RTX 2080 Super Max-Q (140 - 177.7, n=8) | |
| Final Fantasy XV Benchmark - 1920x1080 High Quality | |
| Média da turma Gaming (41 - 215, n=95, últimos 2 anos) | |
| Média NVIDIA GeForce RTX 2080 Super Max-Q (67 - 80.8, n=2) | |
| Asus Zephyrus S17 GX701LXS | |
| baixo | média | alto | ultra | |
|---|---|---|---|---|
| The Witcher 3 (2015) | 82.6 | |||
| Dota 2 Reborn (2015) | 146.6 | 135.8 | 124.2 | 117.7 |
| Final Fantasy XV Benchmark (2018) | 67 | |||
| X-Plane 11.11 (2018) | 114 | 97.6 | 82.8 | |
| Far Cry 5 (2018) | 101 | |||
| Doom Eternal (2020) | 177.7 |
Barulho
| Ocioso |
| 32 / 35 / 43 dB |
| Carga |
| 44 / 45 dB |
 | ||
30 dB silencioso 40 dB(A) audível 50 dB(A) ruidosamente alto |
||
min: | ||
(-) A temperatura máxima no lado superior é 57 °C / 135 F, em comparação com a média de 40.4 °C / 105 F , variando de 21.2 a 68.8 °C para a classe Gaming.
(-) A parte inferior aquece até um máximo de 51 °C / 124 F, em comparação com a média de 43.2 °C / 110 F
(+) Em uso inativo, a temperatura média para o lado superior é 27.6 °C / 82 F, em comparação com a média do dispositivo de 33.9 °C / ### class_avg_f### F.
(-) Jogando The Witcher 3, a temperatura média para o lado superior é 48.6 °C / 119 F, em comparação com a média do dispositivo de 33.9 °C / ## #class_avg_f### F.
(-) Os apoios para as mãos e o touchpad podem ficar muito quentes ao toque, com um máximo de 40 °C / 104 F.
(-) A temperatura média da área do apoio para as mãos de dispositivos semelhantes foi 28.8 °C / 83.8 F (-11.2 °C / -20.2 F).
Asus Zephyrus S17 GX701LXS análise de áudio
(+) | os alto-falantes podem tocar relativamente alto (###valor### dB)
Graves 100 - 315Hz
(±) | graves reduzidos - em média 8.4% menor que a mediana
(±) | a linearidade dos graves é média (11.6% delta para a frequência anterior)
Médios 400 - 2.000 Hz
(+) | médios equilibrados - apenas 2.2% longe da mediana
(+) | médios são lineares (2.9% delta para frequência anterior)
Altos 2 - 16 kHz
(+) | agudos equilibrados - apenas 4.3% longe da mediana
(+) | os máximos são lineares (4.3% delta da frequência anterior)
Geral 100 - 16.000 Hz
(+) | o som geral é linear (11% diferença em relação à mediana)
Comparado com a mesma classe
» 7% de todos os dispositivos testados nesta classe foram melhores, 3% semelhantes, 89% piores
» O melhor teve um delta de 6%, a média foi 18%, o pior foi 132%
Comparado com todos os dispositivos testados
» 6% de todos os dispositivos testados foram melhores, 2% semelhantes, 92% piores
» O melhor teve um delta de 4%, a média foi 23%, o pior foi 134%
| desligado | |
| Ocioso | |
| Carga |
|
Key:
min: | |
| Asus Zephyrus S17 GX701LXS i7-10875H, GeForce RTX 2080 Super Max-Q | Razer Blade Pro 17 RTX 2070 Max-Q 300 Hz i7-10875H, GeForce RTX 2070 Max-Q | MSI GS75 10SF-609US i7-10875H, GeForce RTX 2070 Max-Q | Lenovo Legion Y740-17IRHg-81UJ001VGE i7-9750H, GeForce RTX 2080 Max-Q | Alienware m17 R2 P41E i9-9980HK, GeForce RTX 2080 Max-Q | Média NVIDIA GeForce RTX 2080 Super Max-Q | Média da turma Gaming | |
|---|---|---|---|---|---|---|---|
| Power Consumption | -25% | -26% | -18% | -75% | -3% | -7% | |
| Idle Minimum * (Watt) | 10 | 19.6 -96% | 19.2 -92% | 15.7 -57% | 24.7 -147% | 12.9 ? -29% | 13 ? -30% |
| Idle Average * (Watt) | 16 | 21.7 -36% | 22.4 -40% | 26.3 -64% | 35.9 -124% | 17.3 ? -8% | 19 ? -19% |
| Idle Maximum * (Watt) | 29 | 36.1 -24% | 34.7 -20% | 28 3% | 69.6 -140% | 26.9 ? 7% | 24.6 ? 15% |
| Load Average * (Watt) | 143 | 115.6 19% | 106.7 25% | 136 5% | 141.8 1% | 123.9 ? 13% | 110.7 ? 23% |
| Witcher 3 ultra * (Watt) | 146 | 157 -8% | 160.5 -10% | 160 -10% | 185.8 -27% | ||
| Load Maximum * (Watt) | 205 | 219.9 -7% | 248.7 -21% | 177 14% | 235.4 -15% | 205 ? -0% | 259 ? -26% |
* ... menor é melhor
| Asus Zephyrus S17 GX701LXS i7-10875H, GeForce RTX 2080 Super Max-Q, 76 Wh | Razer Blade Pro 17 RTX 2070 Max-Q 300 Hz i7-10875H, GeForce RTX 2070 Max-Q, 70 Wh | MSI GS75 10SF-609US i7-10875H, GeForce RTX 2070 Max-Q, 80.25 Wh | Lenovo Legion Y740-17IRHg-81UJ001VGE i7-9750H, GeForce RTX 2080 Max-Q, 76 Wh | Alienware m17 R2 P41E i9-9980HK, GeForce RTX 2080 Max-Q, 76 Wh | Média da turma Gaming | |
|---|---|---|---|---|---|---|
| Duração da bateria | 75% | 131% | -1% | 36% | 97% | |
| Reader / Idle (h) | 3.5 | 8.6 146% | 3.8 9% | 7.1 103% | 8.27 ? 136% | |
| WiFi v1.3 (h) | 2.8 | 4.9 75% | 4.9 75% | 3 7% | 4.8 71% | 7.11 ? 154% |
| Load (h) | 1.5 | 4.1 173% | 1.2 -20% | 0.5 -67% | 1.502 ? 0% |
Pro
Contra
Veredicto - Um portátil moderno para jogos com muito desempenho
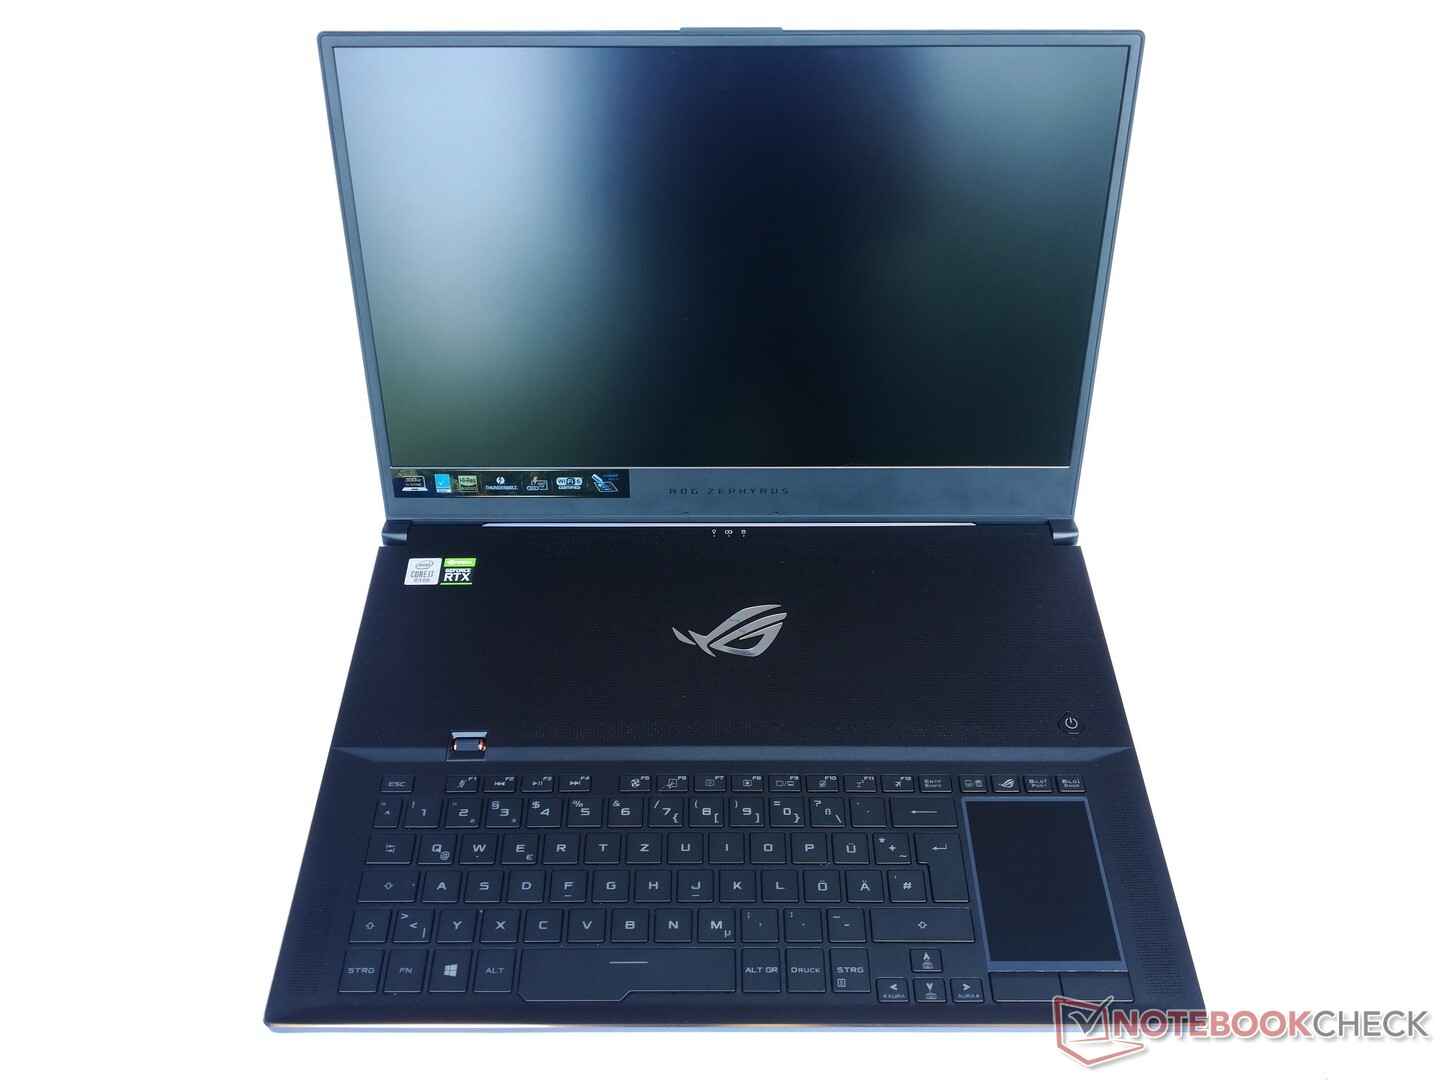
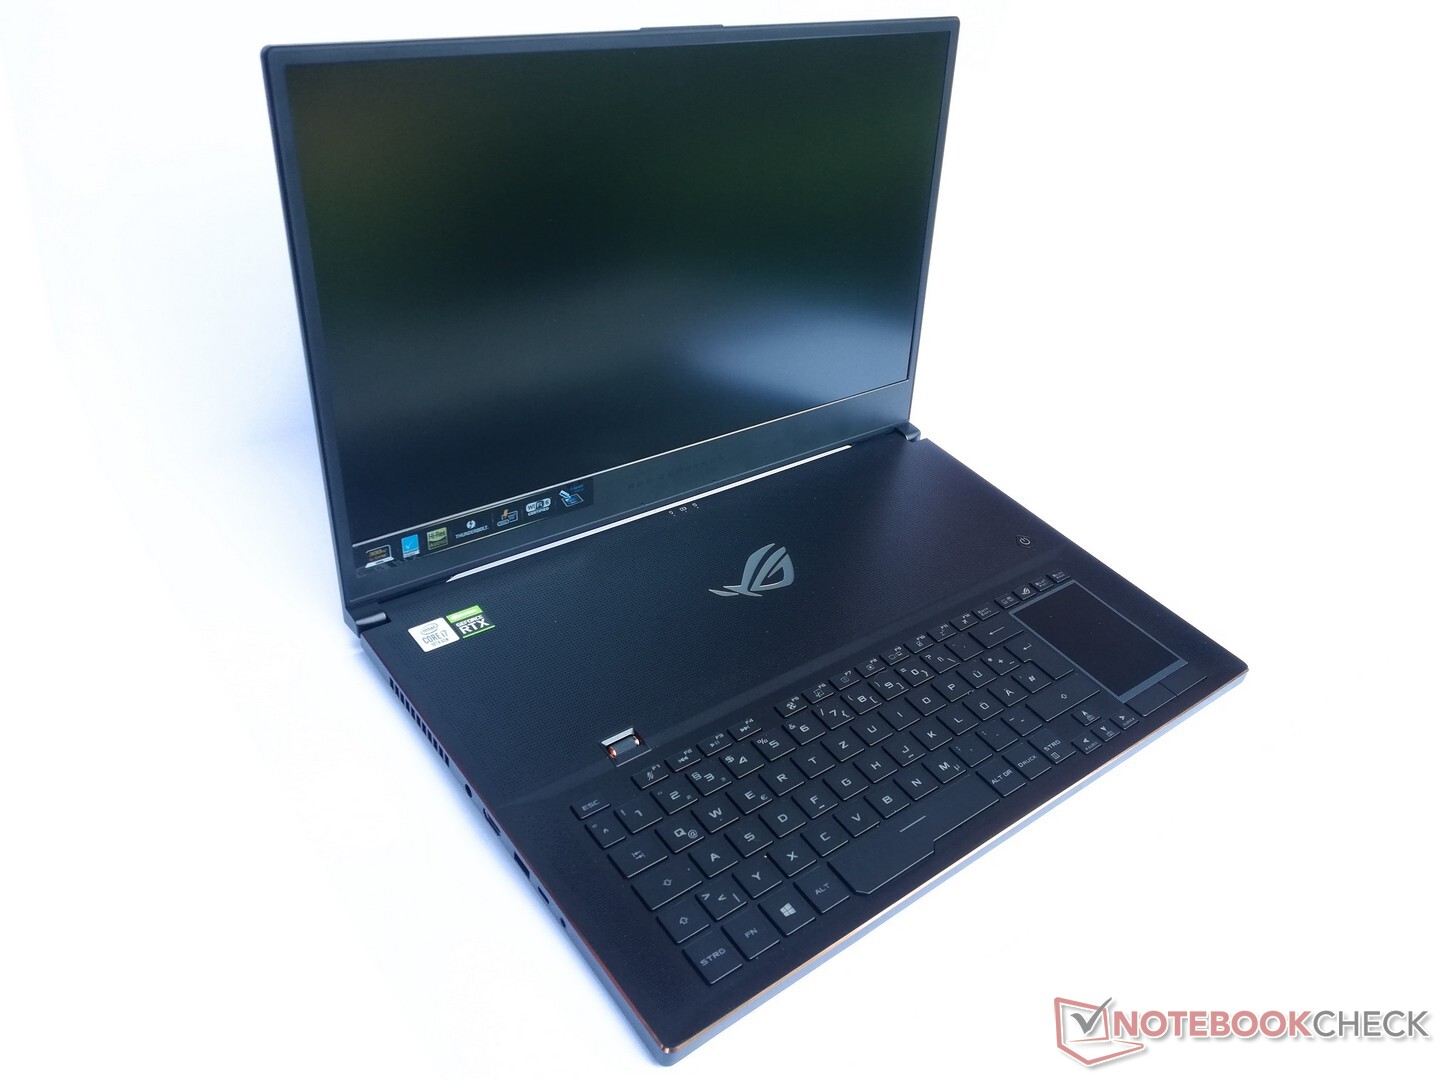
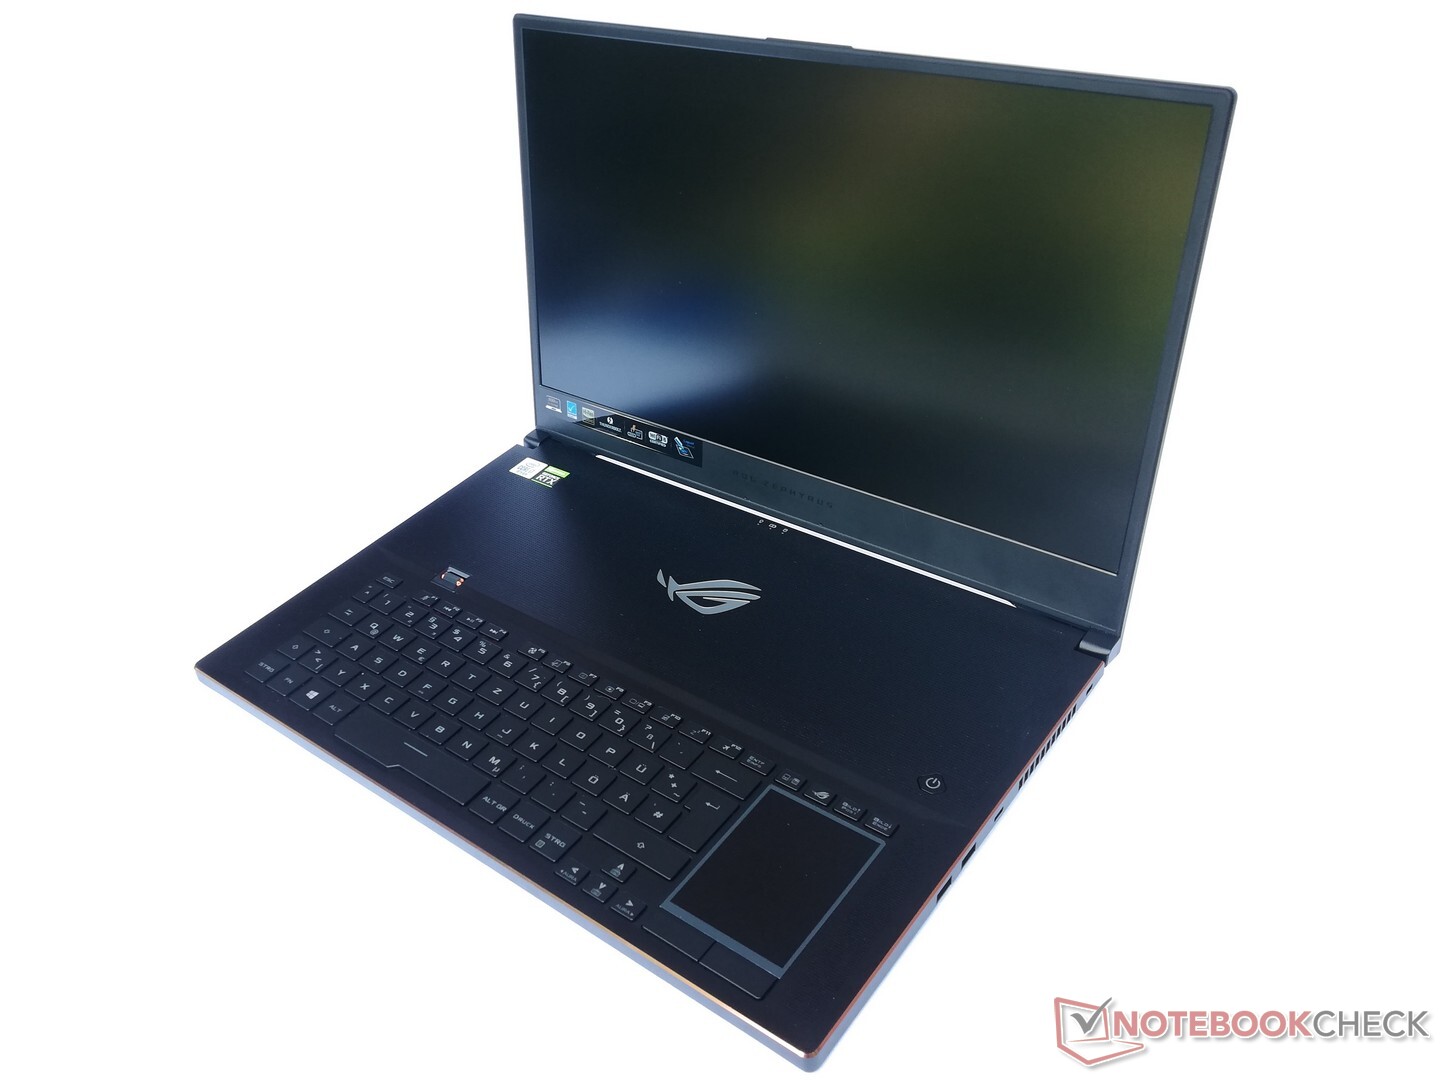
Após a compra do Zephyrus S17 GX701LXS, os usuários não precisam se preocupar com o desempenho do hardware de seu portátil por muito tempo. Isso é completamente suficiente para os jogos atuais, mesmo permitindo que eles sejam jogados no modo "Silencioso" significativamente menos barulhento, onde os ventiladores não soam como uma casa de máquinas. Em nossa opinião, o design de resfriamento da Asus funciona, e não fomos afetados negativamente na operação diária pelo reposicionamento resultante do teclado. No entanto, a leve abertura da parte inferior da carcaça quando a tampa é aberta cria uma impressão muito instável, de forma que gostaríamos de usar o Zephyrus S17 apenas em uma superfície fixa.
O Asus Zephyrus S17 oferece muito desempenho que também pode ser mantido por longos períodos devido ao sistema de resfriamento refinado.
No entanto, aqueles que desejam obter o desempenho máximo de seu Asus Zephyrus S17, mais cedo ou mais tarde, irão querer usar o modo "Turbo". Particularmente durante aplicativos 4K ou VR, os requisitos de desempenho serão significativamente maiores do que para os jogos de resolução Full HD que testamos aqui. Nós nos preocuparíamos menos com o desempenho constante do que com o nível de ruído. Quando os ventiladores aceleram, precisa de fones de ouvido para tudo. Mas como isso não é incomum para um portátil para jogos, o Asus Zephyrus S17 ainda deixa uma boa impressão geral.
Asus Zephyrus S17 GX701LXS
- 08/16/2020 v7 (old)
Mike Wobker
Price comparison
