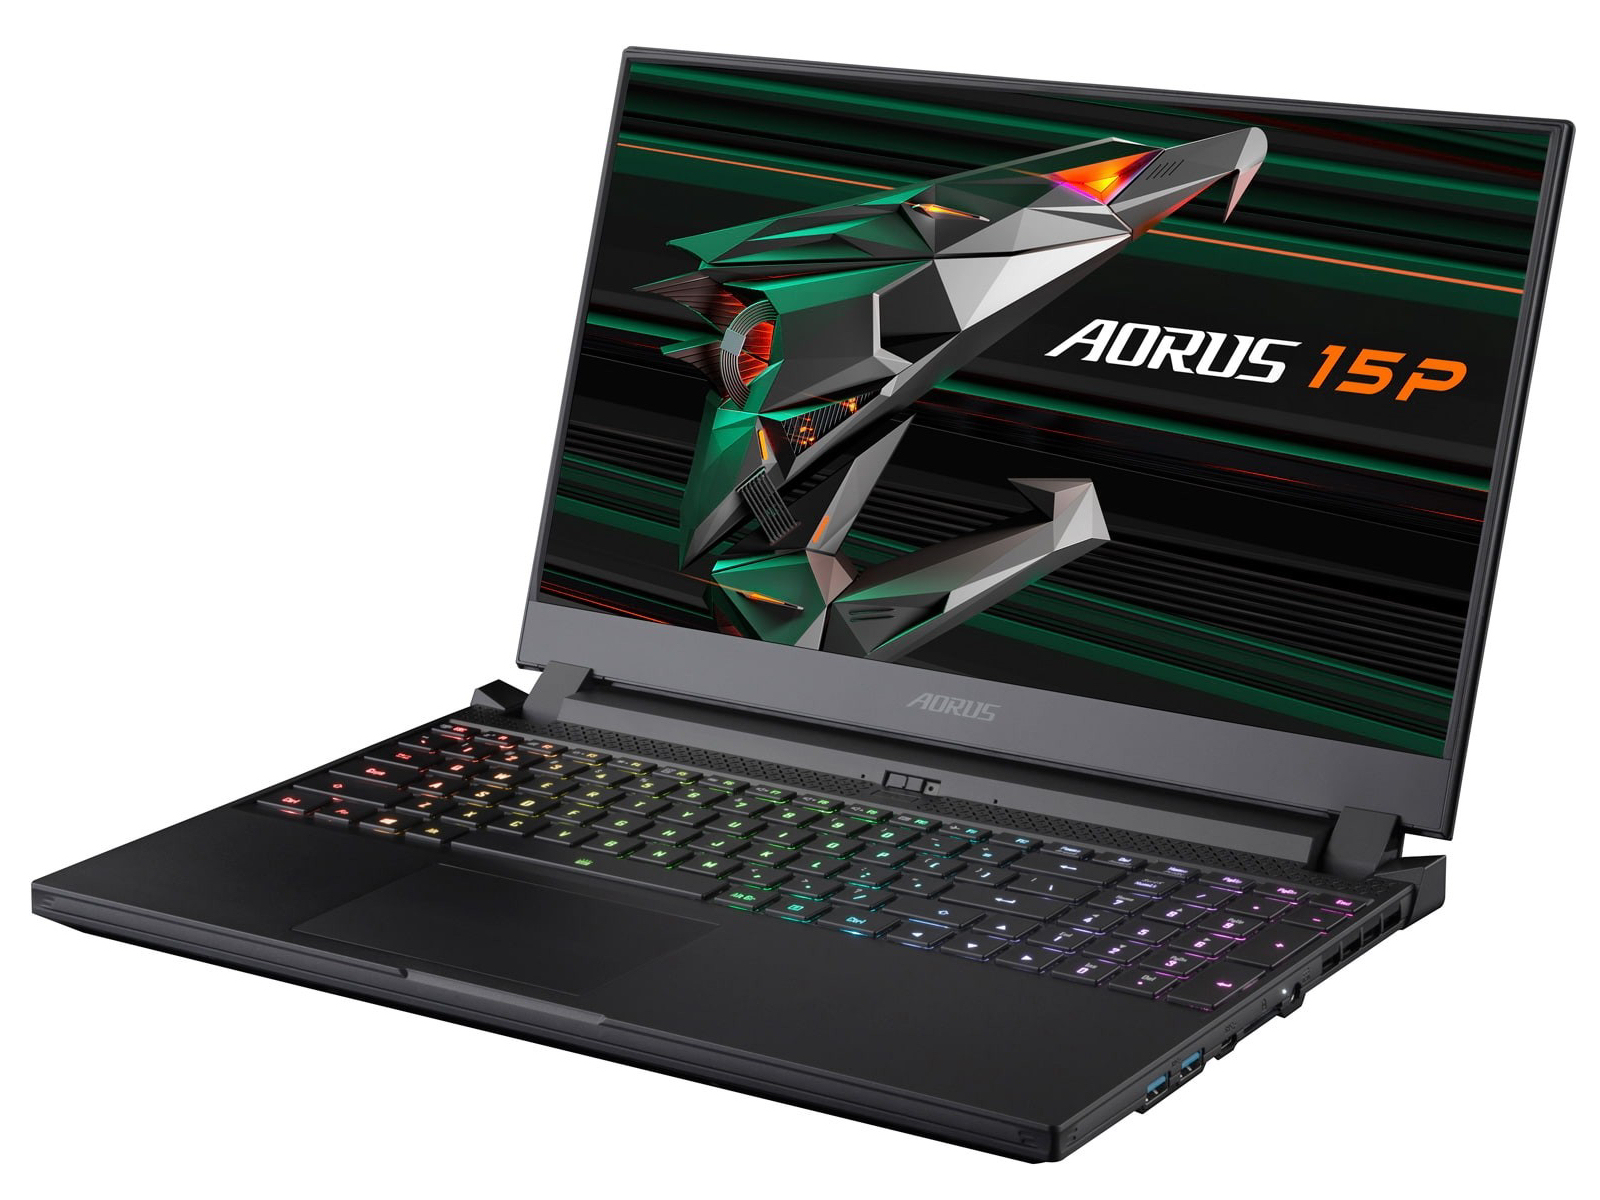
Revisão do Aorus 15P XC Laptop: Muito poder de computação em uma caixa compacta

Gigabyte criou um notebook compacto de 15,6 polegadas que funciona em um octa-core Núcleo i7 10870He um GeForce RTX 3070. O modelo é quase idêntico a seus modelos irmãos Aorus 15G XCe Aorus 15P. Sua concorrência inclui dispositivos tais como oMSI GS66 Stealth 10UGoSchenker XMG Neo 15oAsus TUF Dash F15 FX516PRe o Asus ROG Strix G15 G513QR
Como já revisamos dois modelos com uma construção muito semelhante, não entraremos em detalhes sobre o caso, conectividade, dispositivos de entrada, alto-falantes ou exibição nesta revisão - a menos que observemos quaisquer diferenças. Favor consultar nossas revisões do Aorus 15P WBe Aorus 15G XCpara obter detalhes sobre estes aspectos.
possible competitors in comparison
Avaliação | Data | Modelo | Peso | Altura | Size | Resolução | Preço |
|---|---|---|---|---|---|---|---|
| 86.1 % v7 (old) | 02/2021 | Aorus 15P XC i7-10870H, GeForce RTX 3070 Laptop GPU | 2.2 kg | 27 mm | 15.60" | 1920x1080 | |
| 84 % v7 (old) | 02/2021 | MSI GS66 Stealth 10UG i7-10870H, GeForce RTX 3070 Laptop GPU | 2.1 kg | 19.8 mm | 15.60" | 1920x1080 | |
| 82.4 % v7 (old) | 02/2021 | Asus TUF Dash F15 FX516PR i7-11370H, GeForce RTX 3070 Laptop GPU | 2 kg | 20 mm | 15.60" | 1920x1080 | |
| 85.9 % v7 (old) | 11/2020 | Schenker XMG Neo 15 Comet Lake i7-10875H, GeForce RTX 2070 Super Mobile | 2.2 kg | 23 mm | 15.60" | 1920x1080 | |
| 85 % v7 (old) | 02/2021 | Asus ROG Strix G15 G513QR R9 5900HX, GeForce RTX 3070 Laptop GPU | 2.3 kg | 27.2 mm | 15.60" | 1920x1080 |
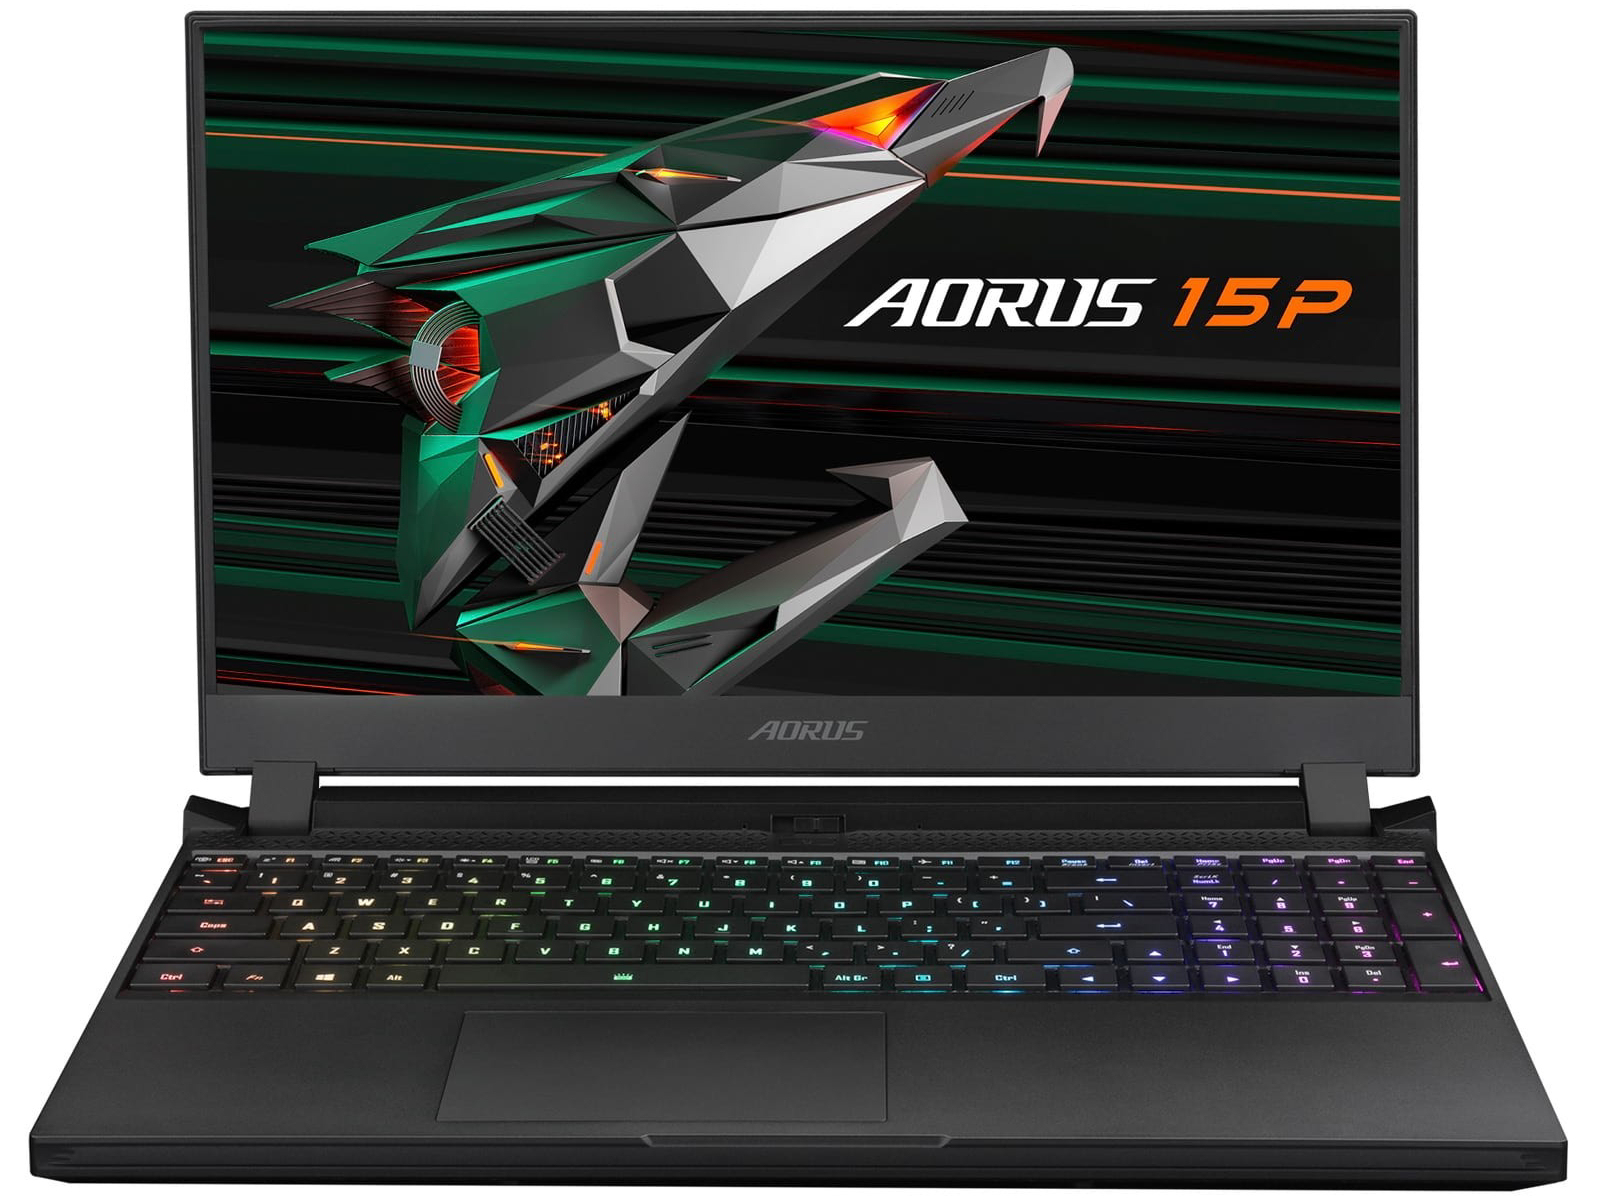
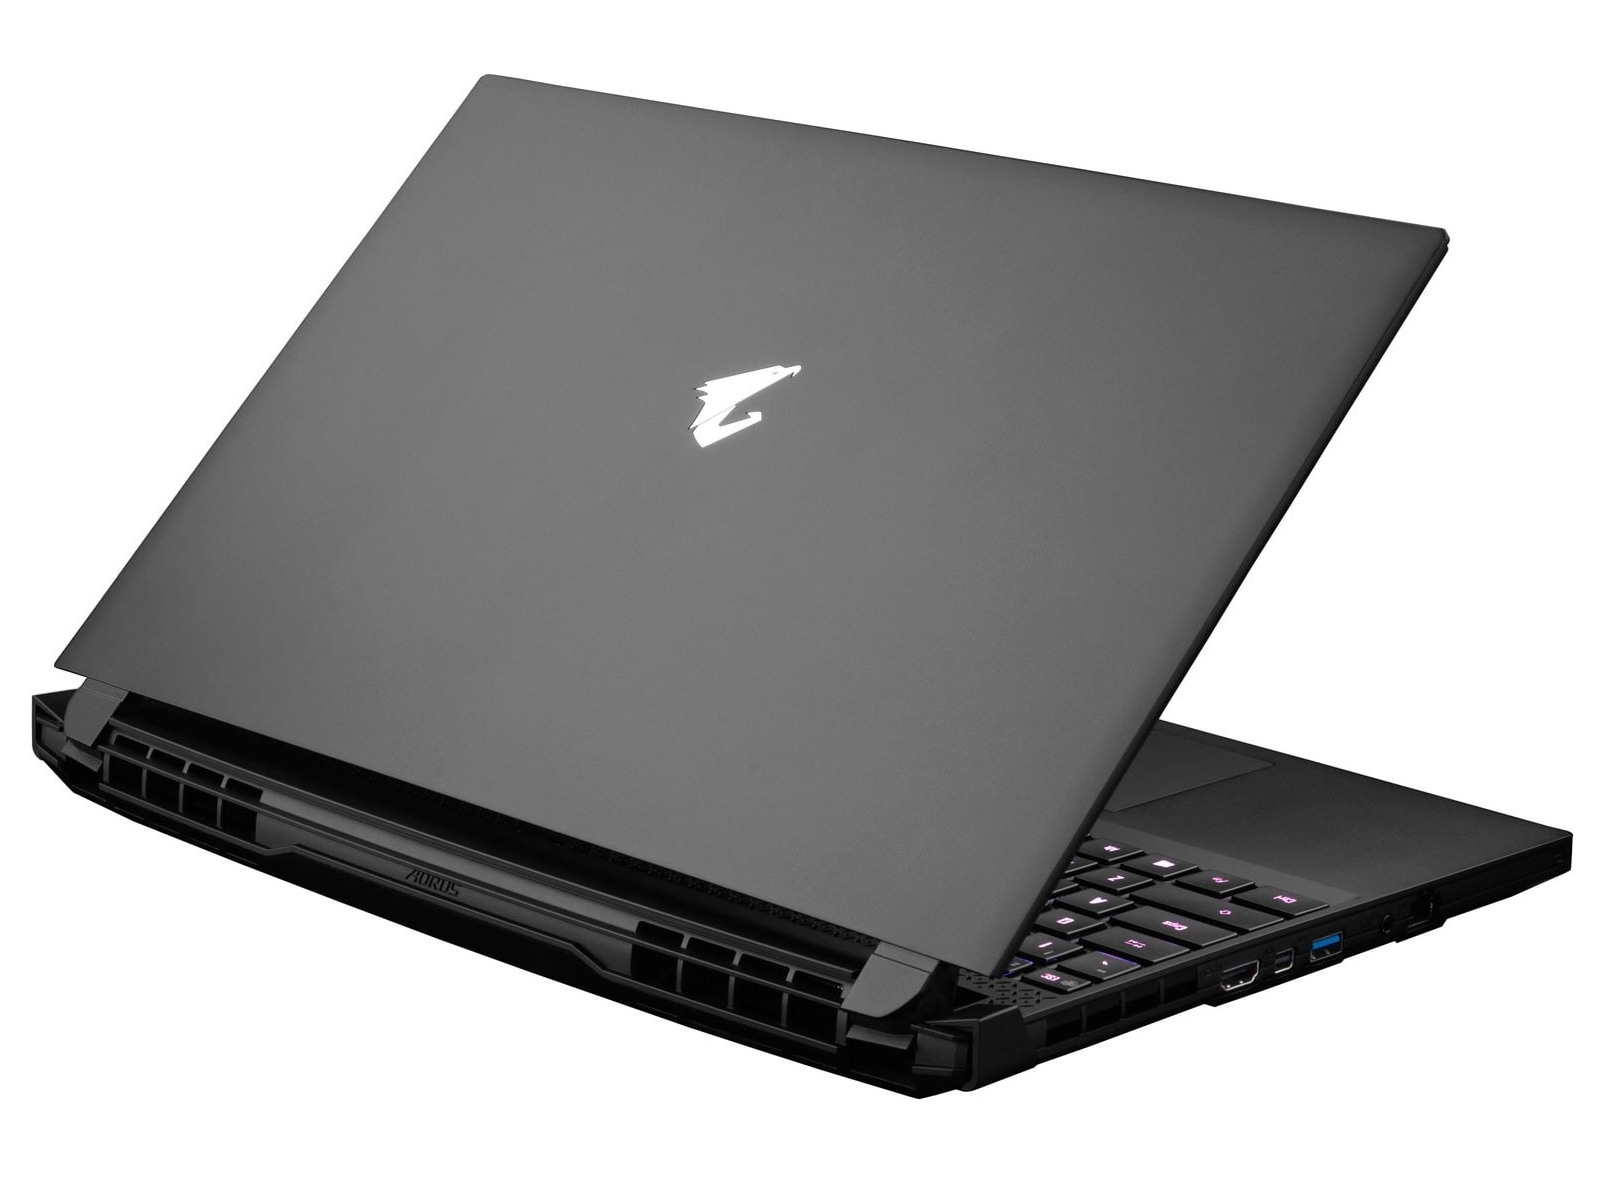
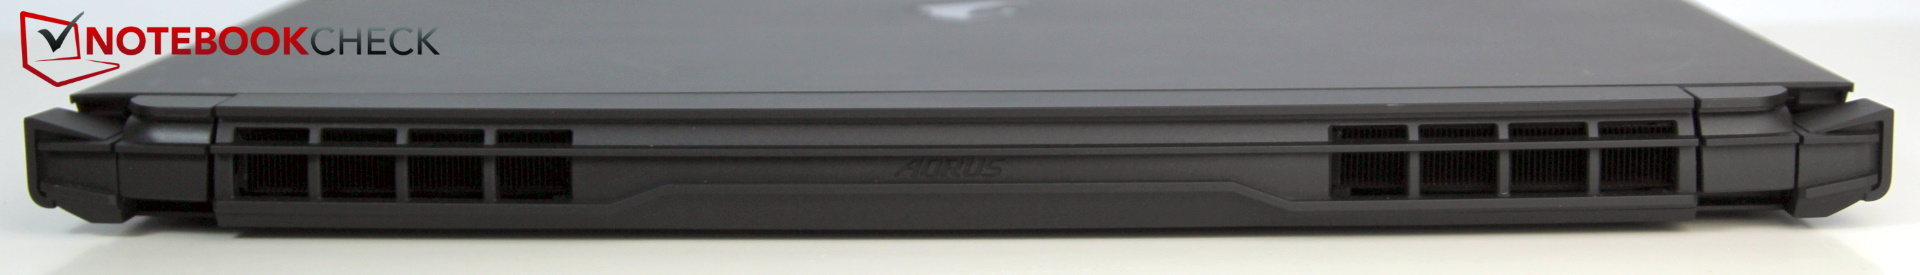
Estojo - 15P XC ligeiramente mais pesado que seus modelos irmãos
O 15P XC, o 15P WBe o15G XCtodos parecem o mesmo à primeira e até mesmo à segunda vista. O case tem o mesmo desenho e posicionamento das portas. Entretanto, há algumas diferenças muito pequenas: O 15P XC é 4 mm mais alto e cerca de 200 gramas mais pesado que seus dois modelos irmãos. A caixa mais grossa do 15P XC pode ser reconhecida pelas ranhuras de ventilação adicionais ao longo da parte traseira

| SD Card Reader | |
| average JPG Copy Test (av. of 3 runs) | |
| Aorus 15P WB (Toshiba Exceria Pro SDXC 64 GB UHS-II) | |
| Aorus 15P XC (Toshiba Exceria Pro SDXC 64 GB UHS-II) | |
| Aorus 15G XC (Toshiba Exceria Pro SDXC 64 GB UHS-II) | |
| Média da turma Gaming (20.9 - 210, n=54, últimos 2 anos) | |
| Schenker XMG Neo 15 Comet Lake (Toshiba Exceria Pro SDXC 64 GB UHS-II) | |
| maximum AS SSD Seq Read Test (1GB) | |
| Aorus 15P WB (Toshiba Exceria Pro SDXC 64 GB UHS-II) | |
| Aorus 15G XC (Toshiba Exceria Pro SDXC 64 GB UHS-II) | |
| Aorus 15P XC (Toshiba Exceria Pro SDXC 64 GB UHS-II) | |
| Média da turma Gaming (25.5 - 261, n=51, últimos 2 anos) | |
| Schenker XMG Neo 15 Comet Lake (Toshiba Exceria Pro SDXC 64 GB UHS-II) | |


")
")


Visor - IPS 240-Hz
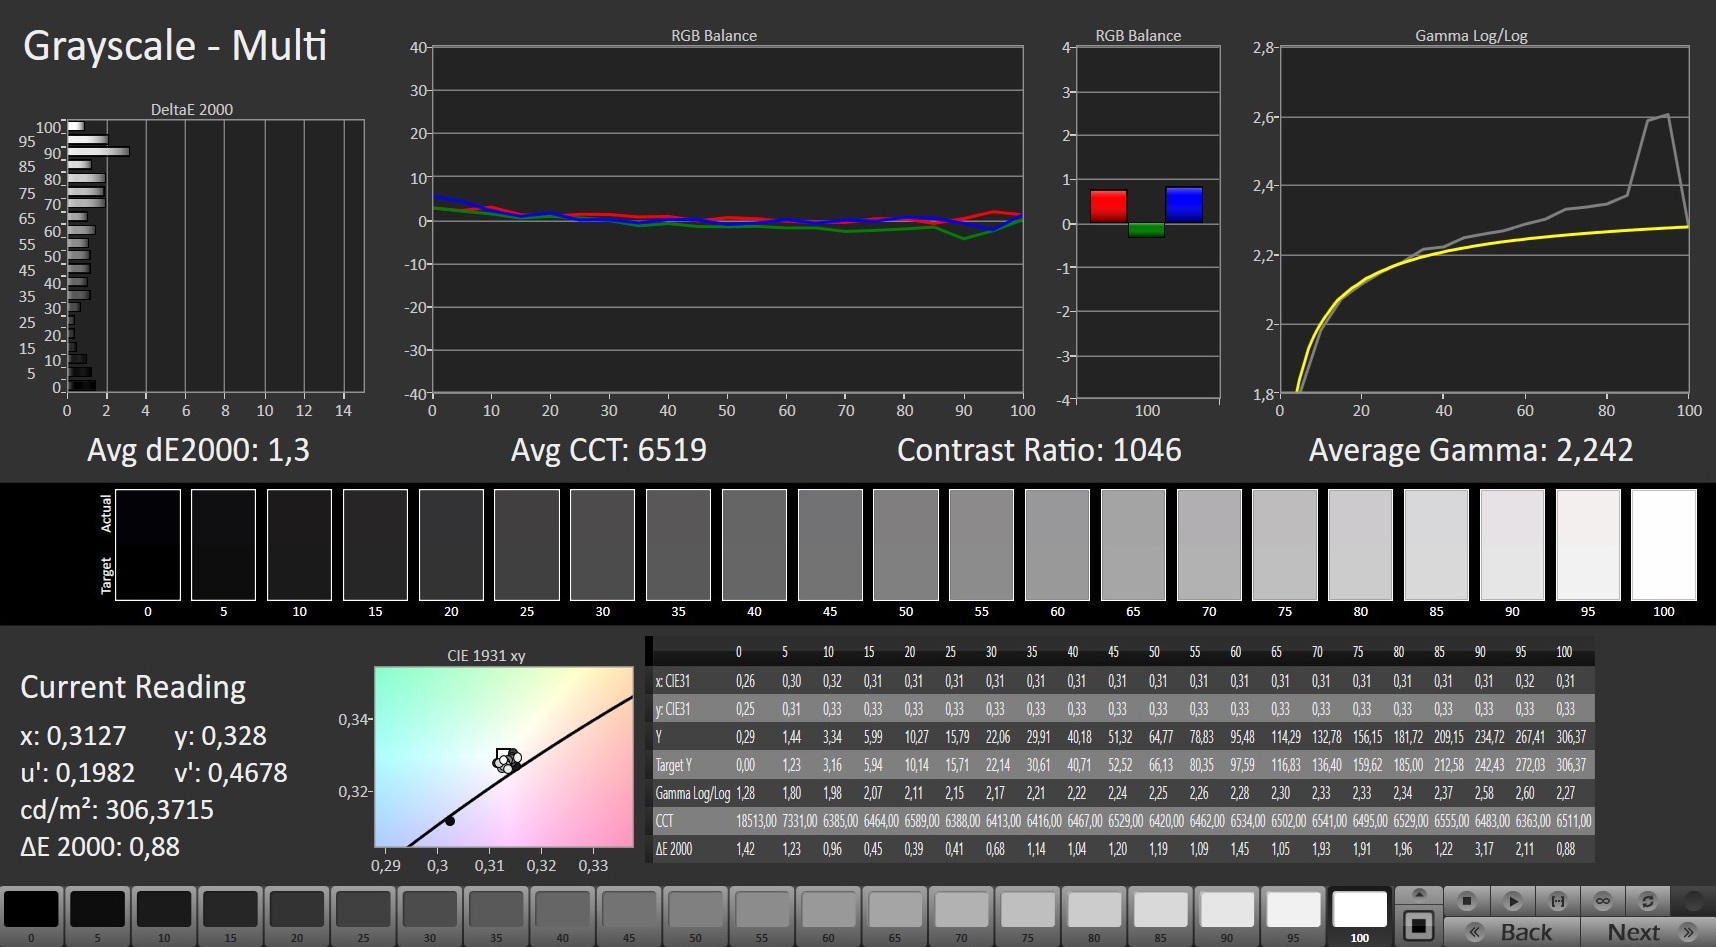
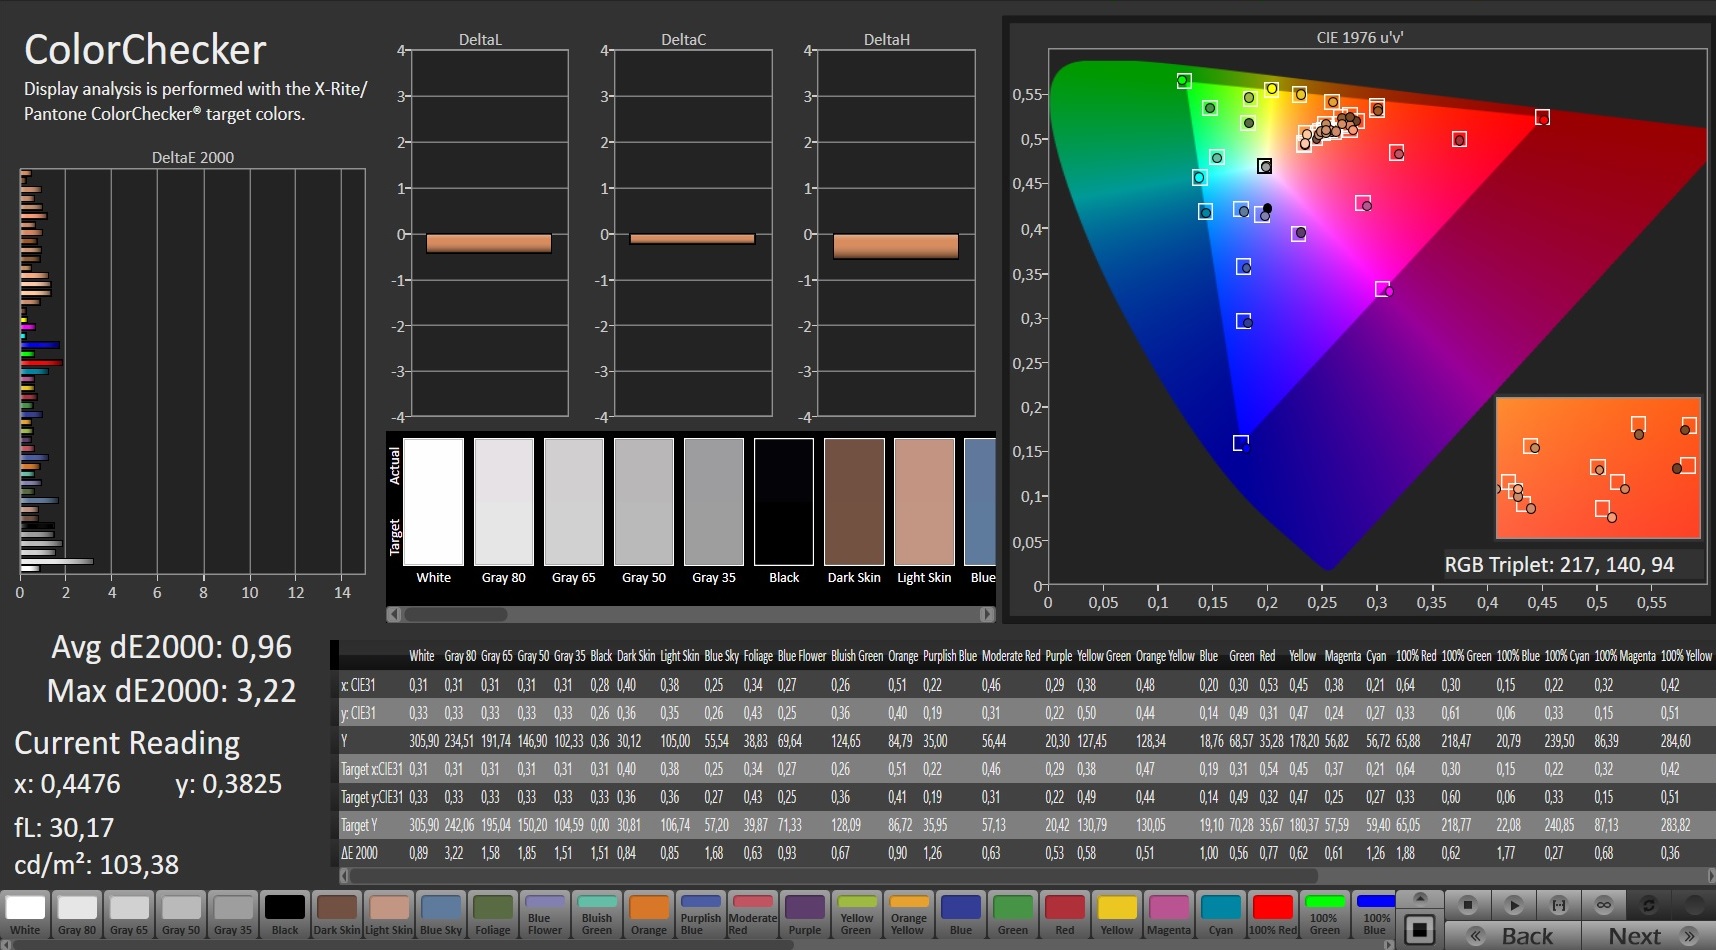
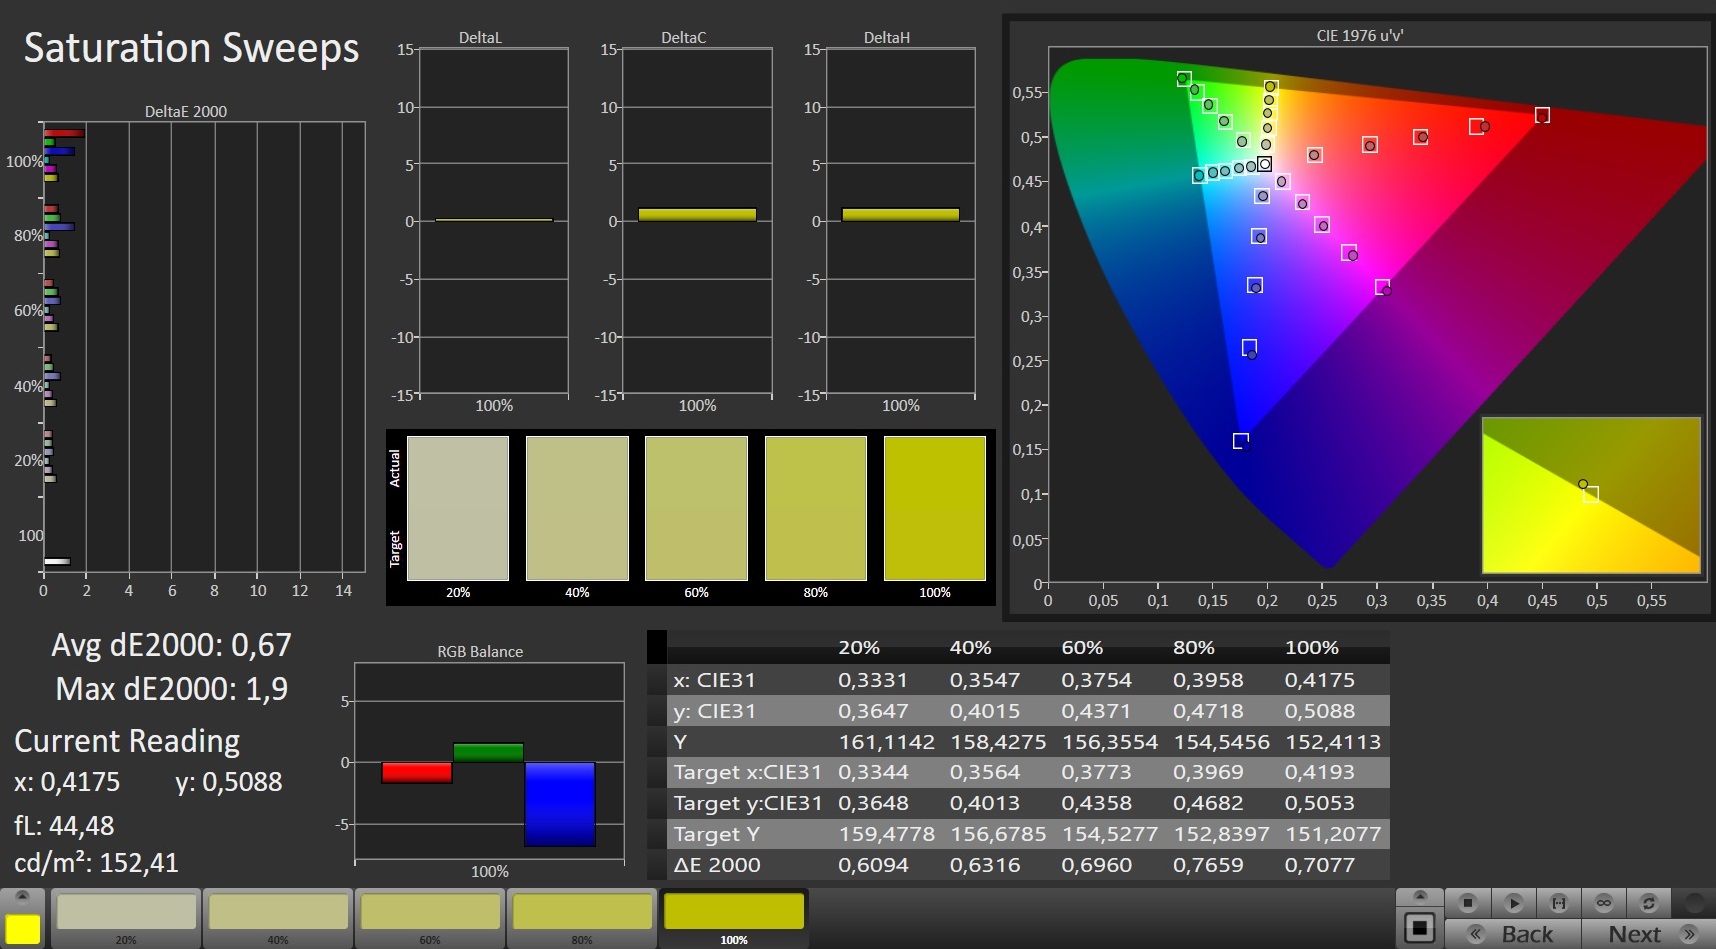
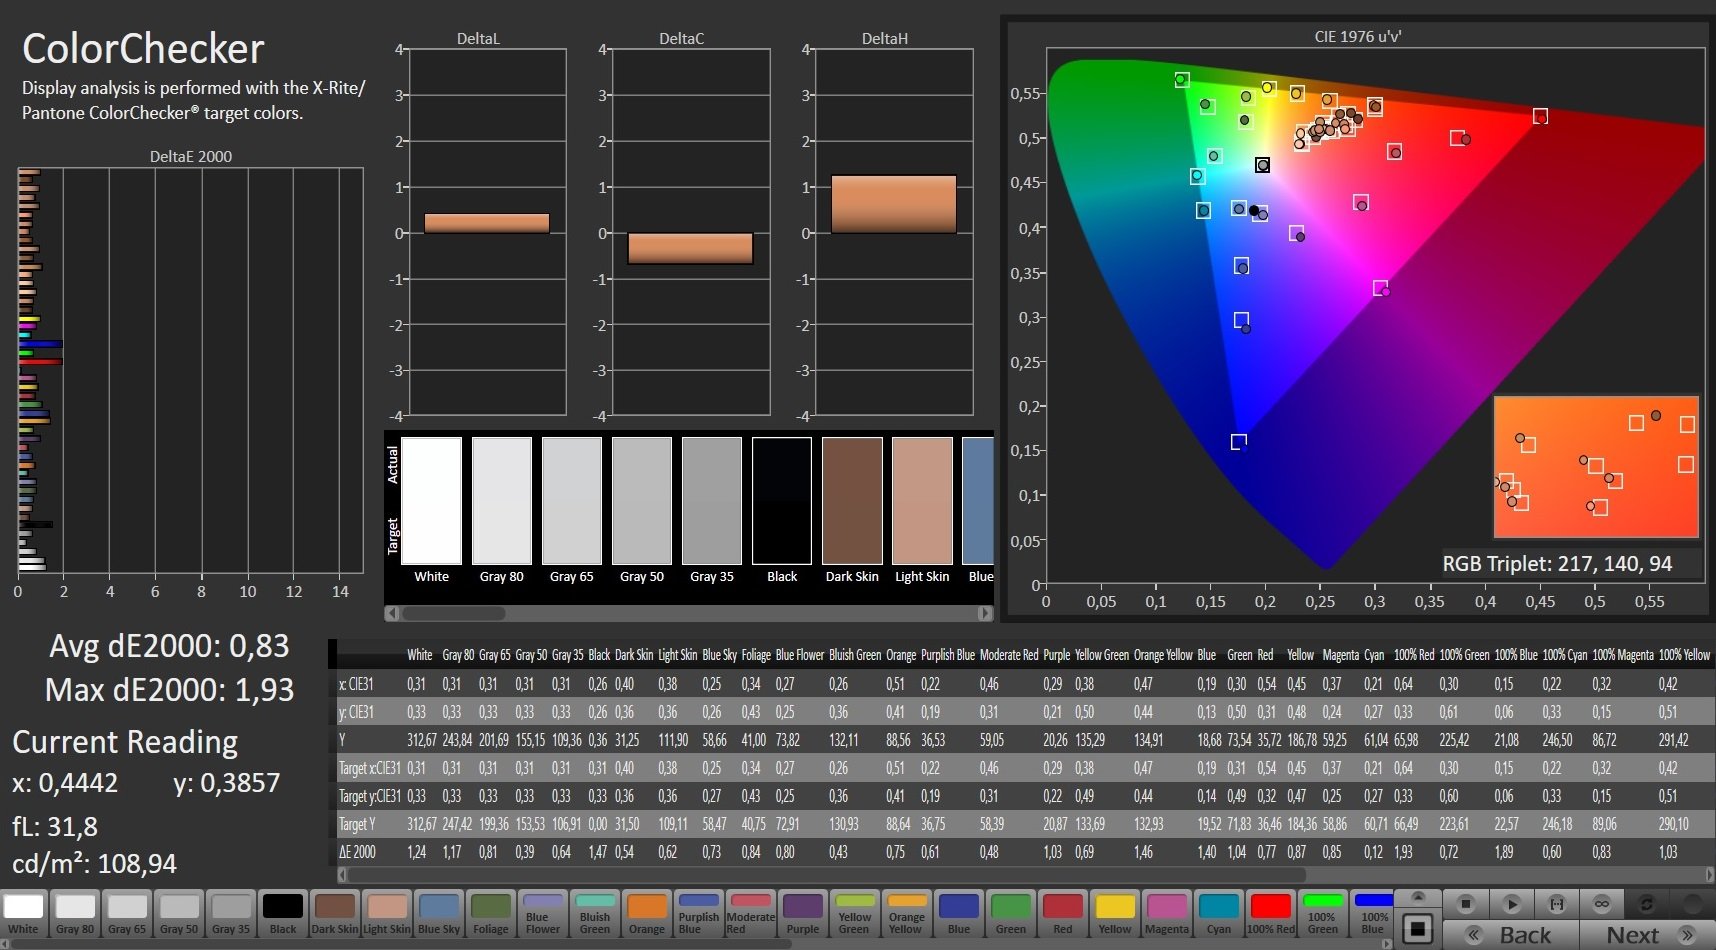
Enquanto a relação de contraste (1028:1) da tela de 15,6 polegadas com ângulos de visão estáveis e altas taxas de resposta (FHD, IPS, 240 Hz) está quase dentro da faixa ideal ( 1000:1), o brilho médio é muito baixo com 278 lêndeas. Consideramos que valores acima de 300 lêndeas são bons. Graças a sua certificação Pantone, o display já oferece grandes cores na fábrica. Infelizmente, o display usa PWM para regular o brilho abaixo de 25% a uma freqüência de 24040 Hz.
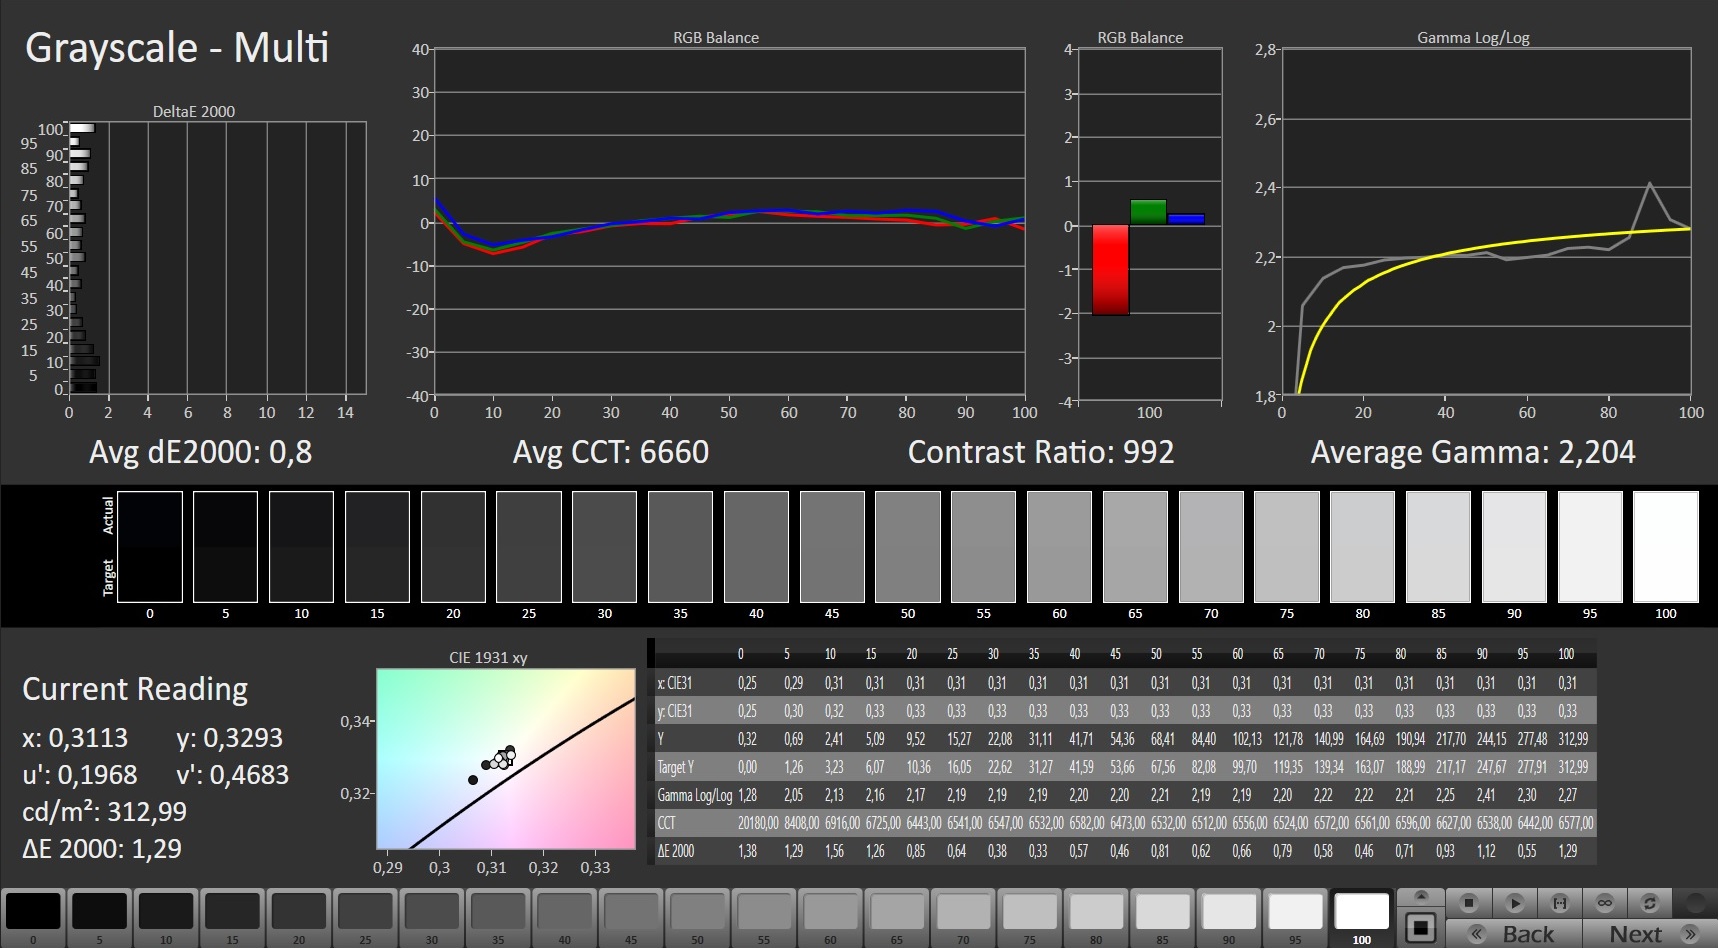
Este é o mesmo painel que noAorus 15G XC. É bastante normal que os resultados sejam ligeiramente diferentes. Duas exibições da mesma construção nunca correspondem a 100%.
| |||||||||||||||||||||||||
iluminação: 88 %
iluminação com acumulador: 298 cd/m²
Contraste: 1028:1 (Preto: 0.29 cd/m²)
ΔE ColorChecker Calman: 0.96 | ∀{0.5-29.43 Ø4.71}
calibrated: 0.83
ΔE Greyscale Calman: 1.3 | ∀{0.09-98 Ø4.96}
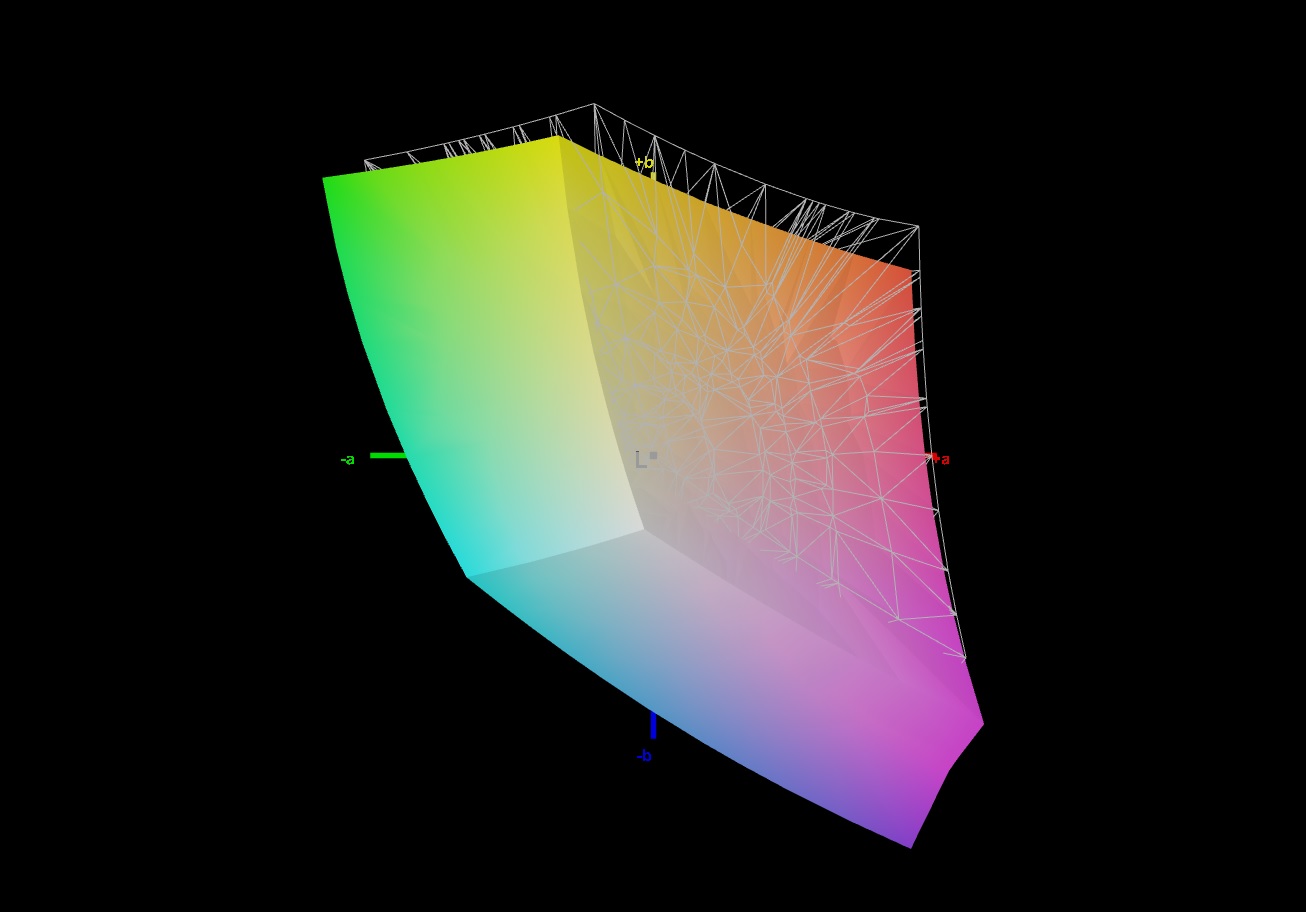
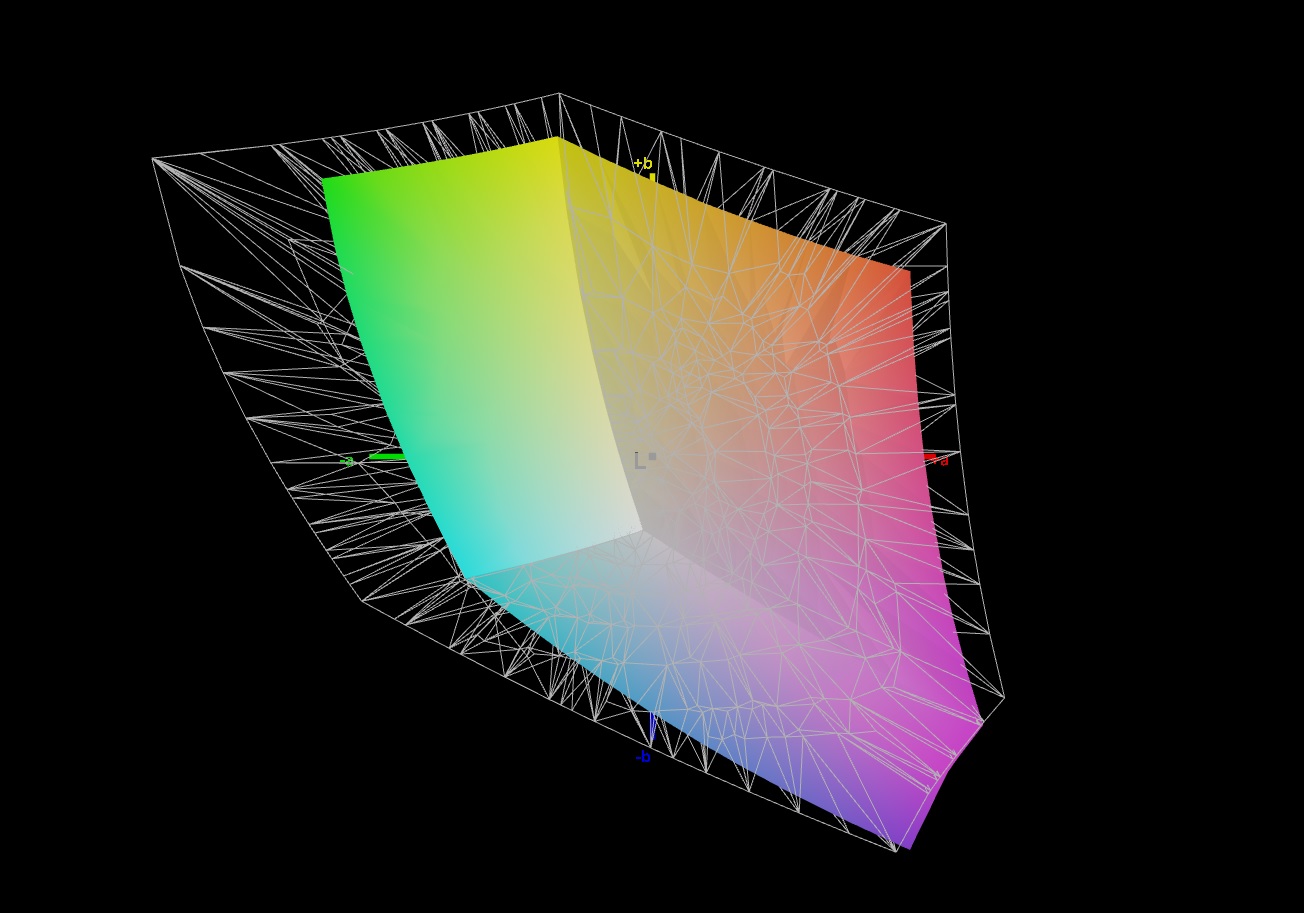
91% sRGB (Argyll 1.6.3 3D)
69% AdobeRGB 1998 (Argyll 1.6.3 3D)
68.6% AdobeRGB 1998 (Argyll 3D)
98.7% sRGB (Argyll 3D)
67.2% Display P3 (Argyll 3D)
Gamma: 2.242
CCT: 6519 K
| Aorus 15P XC Sharp LQ156M1JW03, IPS, 1920x1080, 15.6" | Aorus 15G XC Sharp LQ156M1JW03, IPS, 1920x1080, 15.6" | MSI GS66 Stealth 10UG AU Optronics B156HAN12.0, IPS, 1920x1080, 15.6" | Asus TUF Dash F15 FX516PR LQ156M1JW26 (SHP1532), IPS, 1920x1080, 15.6" | Schenker XMG Neo 15 Comet Lake IPS, 1920x1080, 15.6" | Aorus 15P WB BOE HF NV156FHM-N4G, IPS, 1920x1080, 15.6" | Asus ROG Strix G15 G513QR LQ156M1JW25, IPS, 1920x1080, 15.6" | |
|---|---|---|---|---|---|---|---|
| Display | -2% | 1% | -1% | 1% | -6% | -1% | |
| Display P3 Coverage (%) | 67.2 | 65.6 -2% | 67.7 1% | 66.9 0% | 69.5 3% 67.9 1% | 63 -6% | 67.7 1% |
| sRGB Coverage (%) | 98.7 | 97.5 -1% | 98.4 0% | 98.1 -1% | 99.2 1% 98.7 0% | 91.3 -7% | 94.3 -4% |
| AdobeRGB 1998 Coverage (%) | 68.6 | 67.1 -2% | 69.1 1% | 67.9 -1% | 70.7 3% 68.8 0% | 64.6 -6% | 68.2 -1% |
| Response Times | 7% | -25% | -6% | -22% | 13% | 16% | |
| Response Time Grey 50% / Grey 80% * (ms) | 11.2 ? | 9.6 ? 14% | 14.4 ? -29% | 12 ? -7% | 15.2 ? -36% | 8.8 ? 21% | 8.2 ? 27% |
| Response Time Black / White * (ms) | 9.6 ? | 9.6 ? -0% | 11.6 ? -21% | 10 ? -4% | 10.4 ? -8% | 9.2 ? 4% | 9.2 ? 4% |
| PWM Frequency (Hz) | 24040 ? | 24040 ? | 23580 ? | 23580 ? | |||
| Screen | -3% | -36% | -36% | -46% | -45% | -58% | |
| Brightness middle (cd/m²) | 298 | 288 -3% | 259.5 -13% | 286 -4% | 308 3% | 275 -8% | 308 3% |
| Brightness (cd/m²) | 278 | 270 -3% | 264 -5% | 275 -1% | 284 2% | 268 -4% | 288 4% |
| Brightness Distribution (%) | 88 | 89 1% | 90 2% | 91 3% | 87 -1% | 91 3% | 86 -2% |
| Black Level * (cd/m²) | 0.29 | 0.25 14% | 0.25 14% | 0.25 14% | 0.32 -10% | 0.33 -14% | 0.23 21% |
| Contrast (:1) | 1028 | 1152 12% | 1038 1% | 1144 11% | 963 -6% | 833 -19% | 1339 30% |
| Colorchecker dE 2000 * | 0.96 | 1.19 -24% | 2.52 -163% | 2.43 -153% | 2.45 -155% | 2.72 -183% | 3.28 -242% |
| Colorchecker dE 2000 max. * | 3.22 | 3.79 -18% | 5.55 -72% | 6.33 -97% | 7.74 -140% | 4.45 -38% | 8.51 -164% |
| Colorchecker dE 2000 calibrated * | 0.83 | 0.71 14% | 1.93 -133% | 0.83 -0% | 0.83 -0% | 2.09 -152% | 0.83 -0% |
| Greyscale dE 2000 * | 1.3 | 1.6 -23% | 1.7 -31% | 3.5 -169% | 3.9 -200% | 2.3 -77% | 5 -285% |
| Gamma | 2.242 98% | 2.229 99% | 2.04 108% | 2.32 95% | 2.211 100% | 2.266 97% | 2.057 107% |
| CCT | 6519 100% | 6539 99% | 6414 101% | 7145 91% | 7434 87% | 6933 94% | 7393 88% |
| Color Space (Percent of AdobeRGB 1998) (%) | 69 | 67 -3% | 63.3 -8% | 68 -1% | 69 0% | 65 -6% | 68 -1% |
| Color Space (Percent of sRGB) (%) | 91 | 90 -1% | 98.8 9% | 91 0% | 91 0% | 90 -1% | 90 -1% |
| Média Total (Programa/Configurações) | 1% /
-2% | -20% /
-28% | -14% /
-26% | -22% /
-29% | -13% /
-31% | -14% /
-38% |
* ... menor é melhor

Exibir tempos de resposta
| ↔ Tempo de resposta preto para branco | ||
|---|---|---|
| 9.6 ms ... ascensão ↗ e queda ↘ combinadas | ↗ 5.2 ms ascensão | 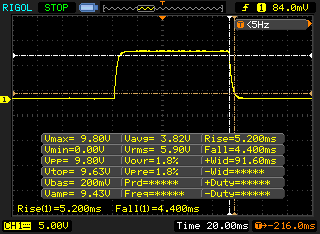 |
| ↘ 4.4 ms queda | ||
| A tela mostra taxas de resposta rápidas em nossos testes e deve ser adequada para jogos. Em comparação, todos os dispositivos testados variam de 0.1 (mínimo) a 240 (máximo) ms. » 26 % de todos os dispositivos são melhores. Isso significa que o tempo de resposta medido é melhor que a média de todos os dispositivos testados (19.8 ms). | ||
| ↔ Tempo de resposta 50% cinza a 80% cinza | ||
| 11.2 ms ... ascensão ↗ e queda ↘ combinadas | ↗ 6 ms ascensão | 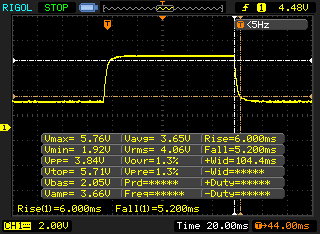 |
| ↘ 5.2 ms queda | ||
| A tela mostra boas taxas de resposta em nossos testes, mas pode ser muito lenta para jogadores competitivos. Em comparação, todos os dispositivos testados variam de 0.165 (mínimo) a 636 (máximo) ms. » 25 % de todos os dispositivos são melhores. Isso significa que o tempo de resposta medido é melhor que a média de todos os dispositivos testados (31 ms). | ||
Cintilação da tela / PWM (modulação por largura de pulso)
| Tela tremeluzindo/PWM detectado | 24040 Hz | ≤ 25 % configuração de brilho | 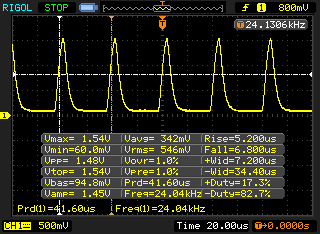 |
A luz de fundo da tela pisca em 24040 Hz (pior caso, por exemplo, utilizando PWM) Cintilação detectada em uma configuração de brilho de 25 % e abaixo. Não deve haver cintilação ou PWM acima desta configuração de brilho. A frequência de 24040 Hz é bastante alta, então a maioria dos usuários sensíveis ao PWM não deve notar nenhuma oscilação. [pwm_comparison] Em comparação: 52 % de todos os dispositivos testados não usam PWM para escurecer a tela. Se PWM foi detectado, uma média de 7757 (mínimo: 5 - máximo: 343500) Hz foi medida. | |||
Desempenho - sem problemas para os próximos anos
O Gigabyte Aorus 15P XC é um caderno para jogos de 15,6 polegadas que pode exibir todos os jogos atuais sem problemas e também faz um bom trabalho em todas as outras áreas de uso.

Condições de teste
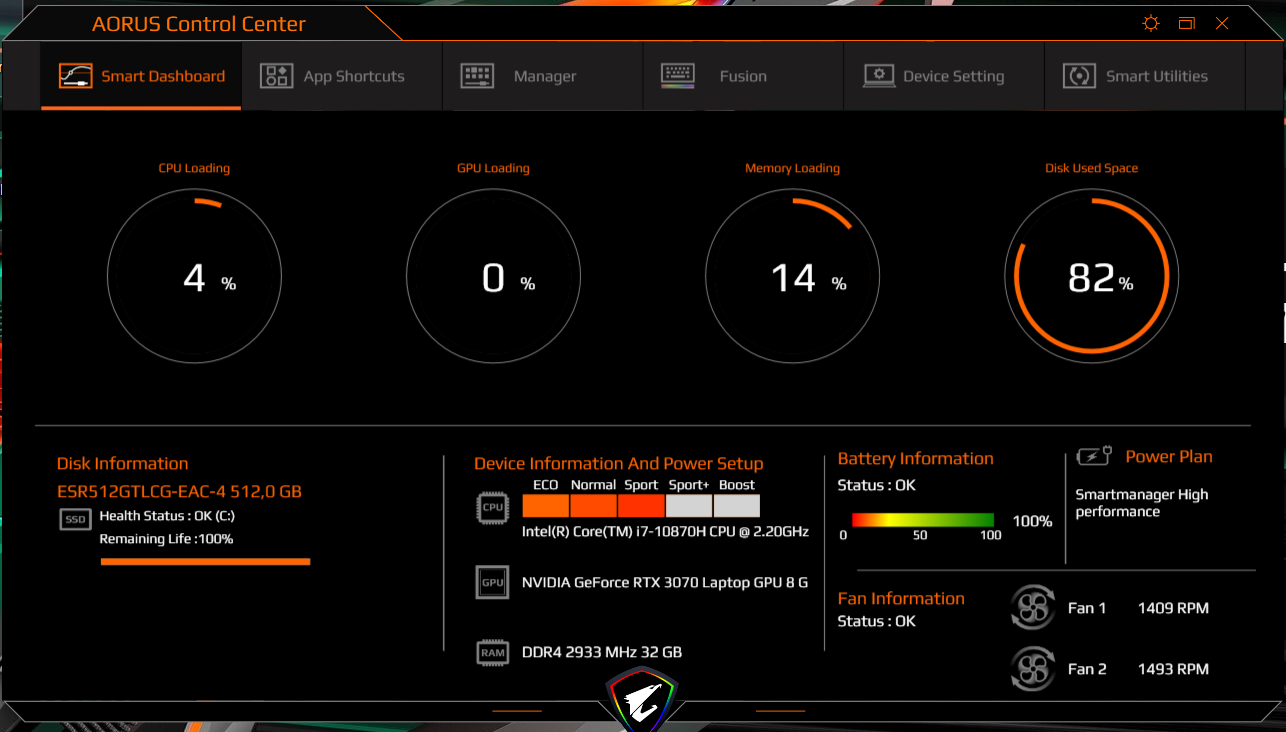
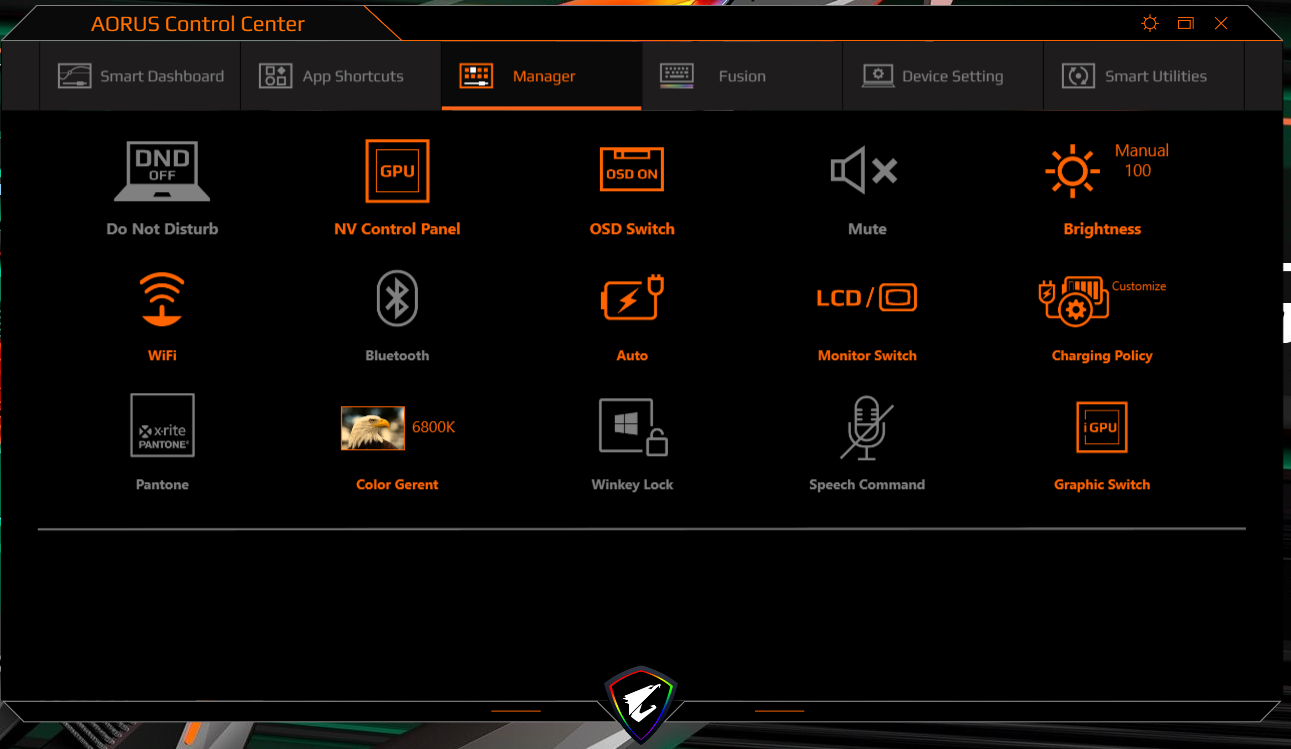
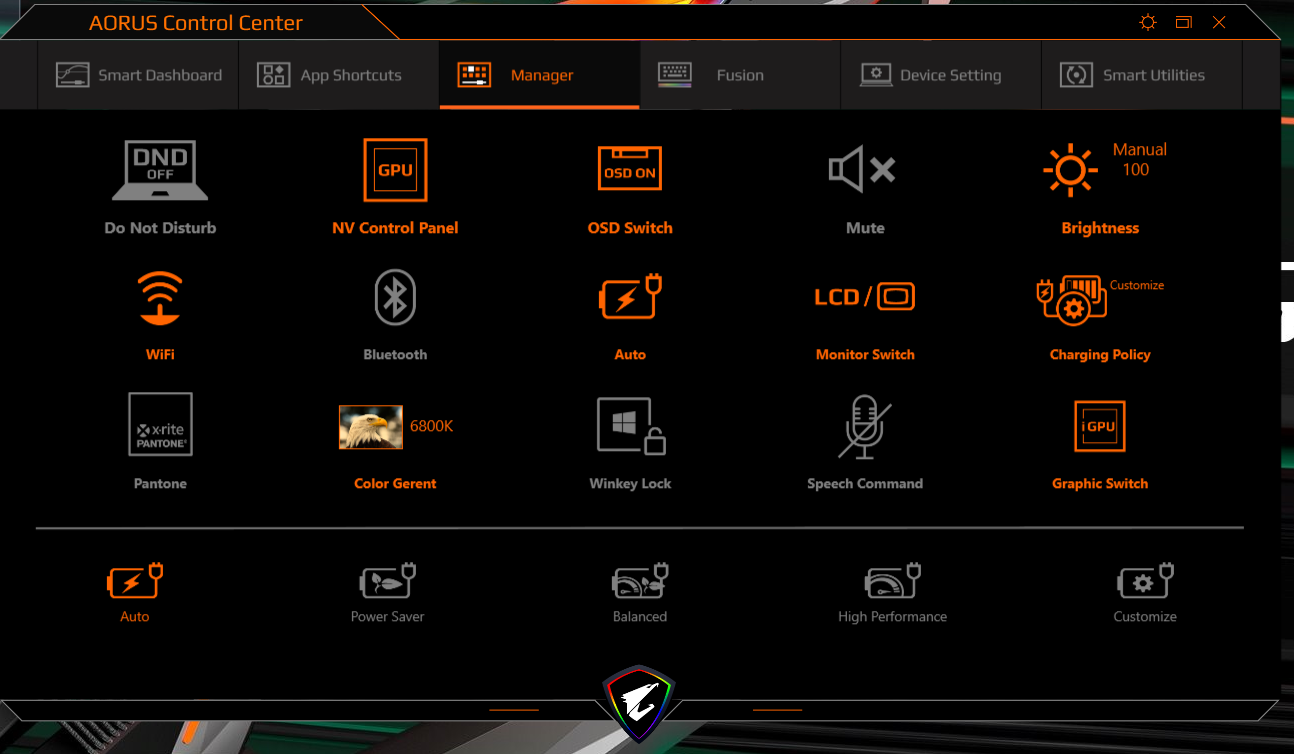
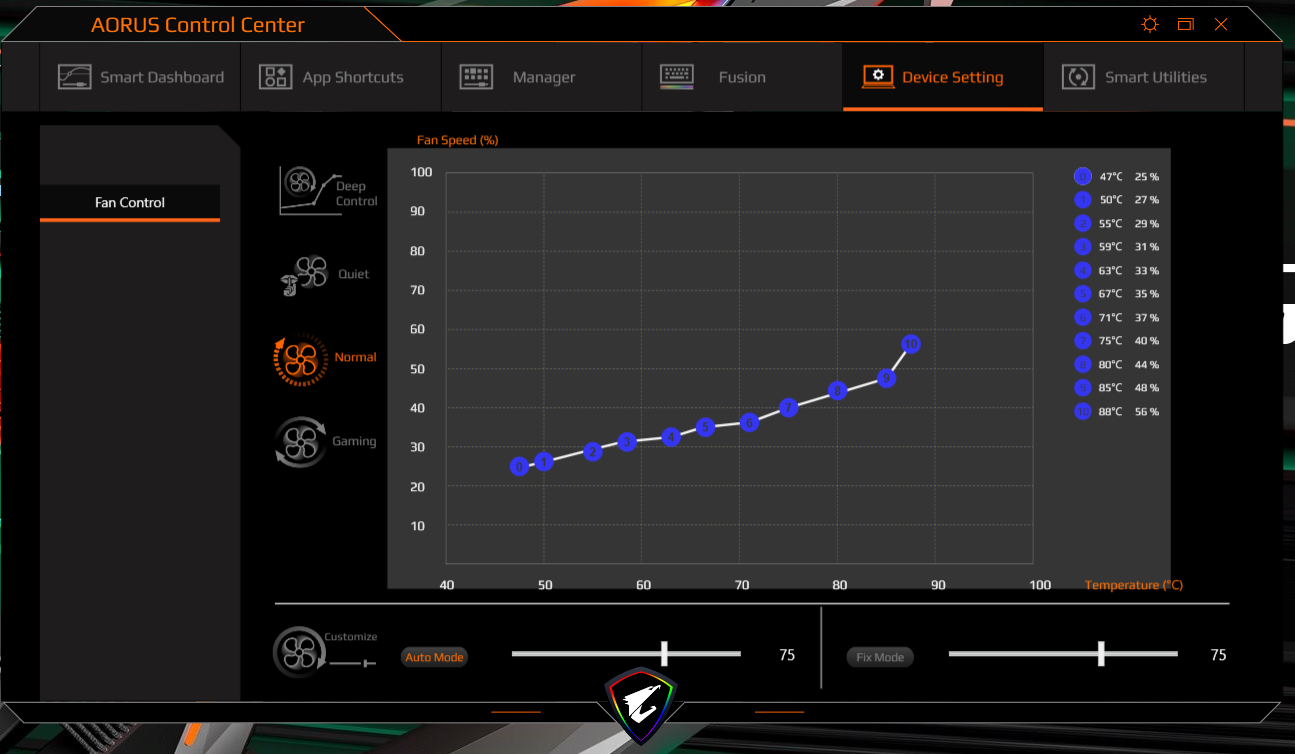
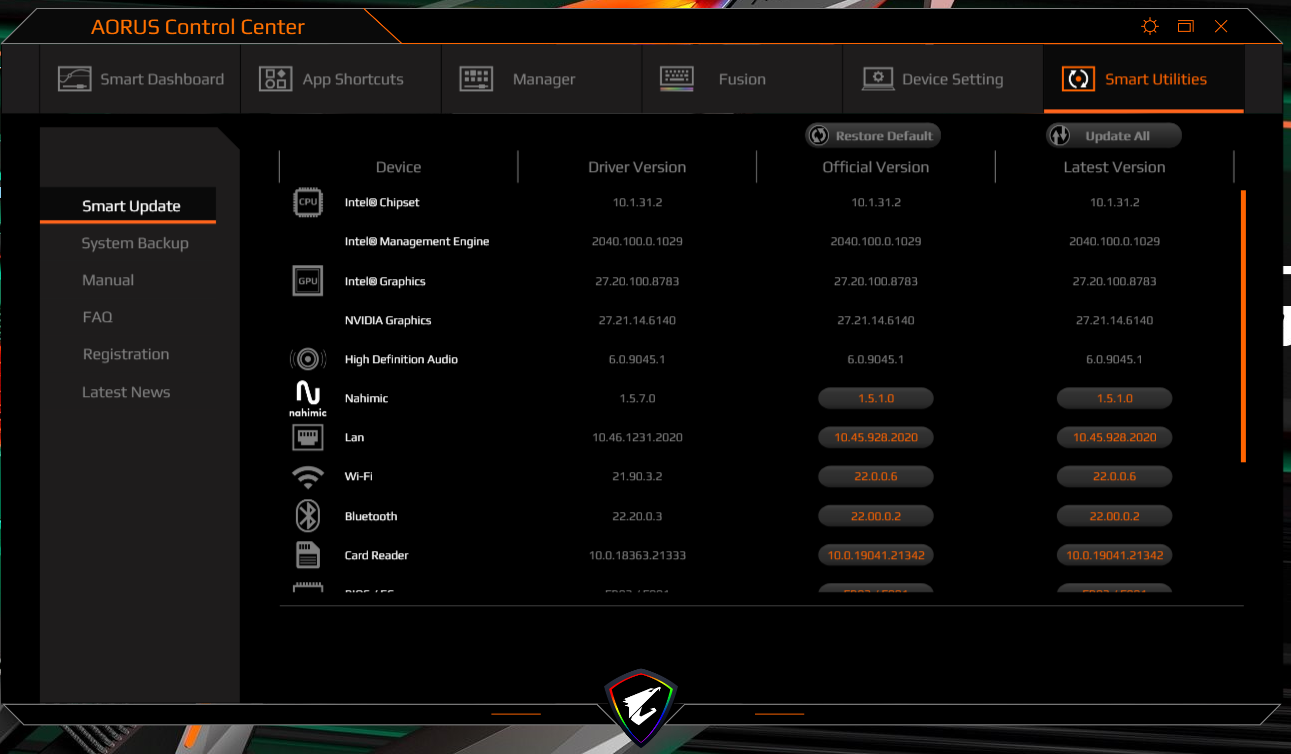
O Centro de Controle Aorus pré-instalado permite aos usuários definir perfis de energia, entre outras coisas. Utilizamos a opção "auto" (com IA ativada) para nossos testes. Isto permite que o Centro de Controle selecione as configurações adequadas por si só. O controle do ventilador foi configurado para "normal".
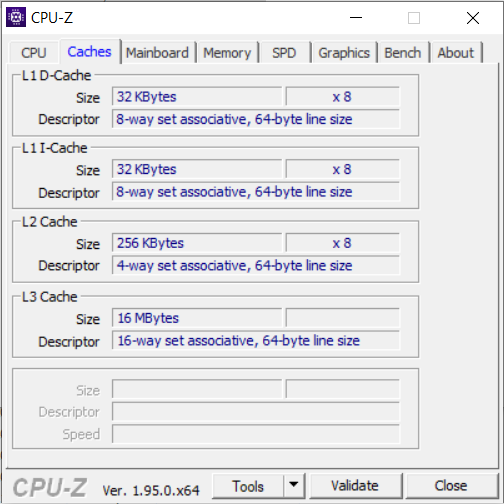
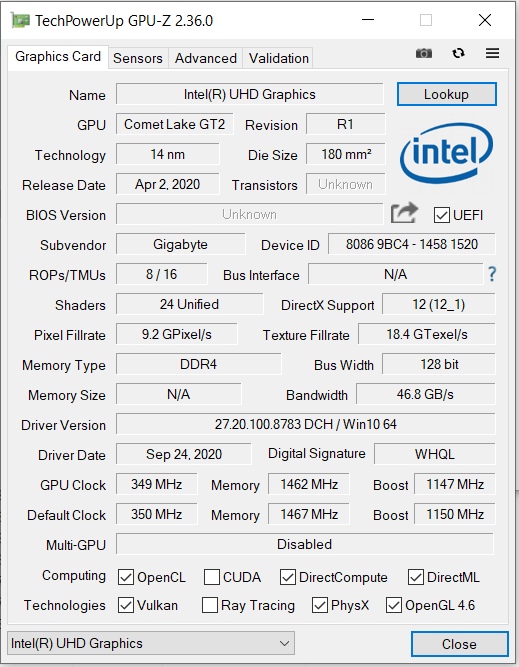
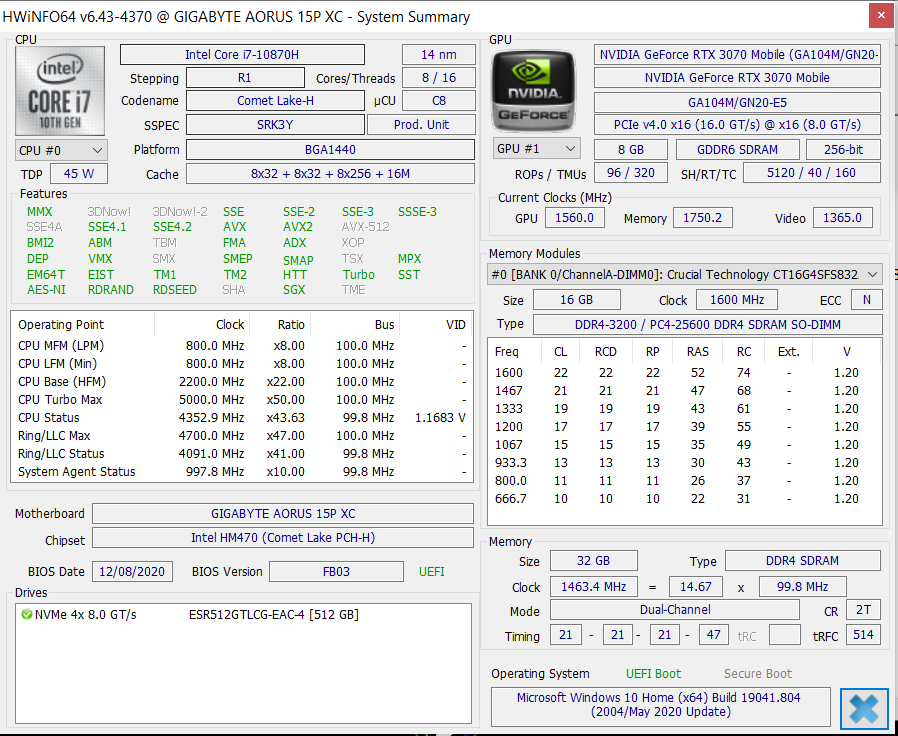
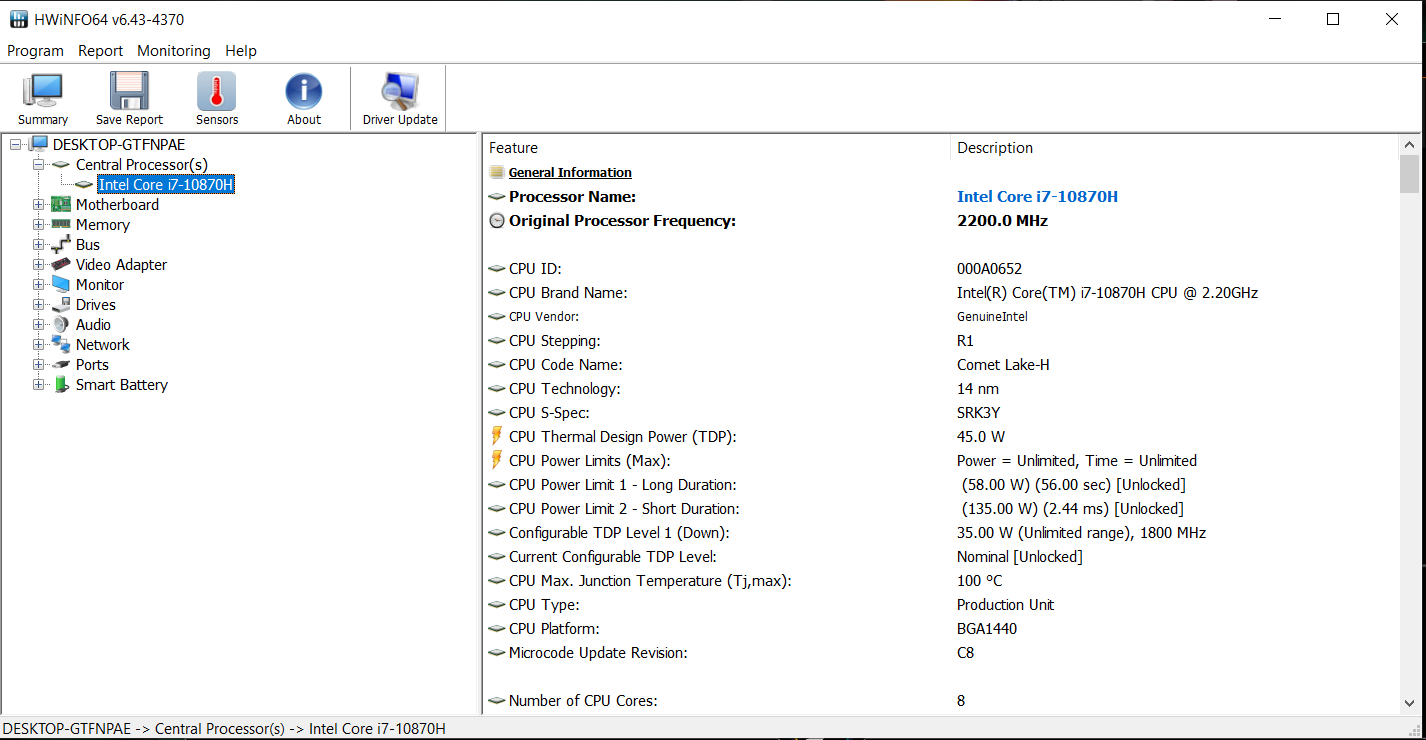
Processador
O octa-core Núcleo i7 10870H(Comet Lake) tem uma taxa de relógio de base de 2,2 GHz que pode ser aumentada para 4,2 GHz (oito núcleos) ou 5 GHz (um núcleo) via Turbo Boost. Ele suporta hyperthreading com dois fios por núcleo
Os testes de CPU dos benchmarks do CineBench R15 são trabalhados em 4 GHz (multifios) e 4 a 4,7 GHz (mono-fios). A CPU reduz sua taxa de clock para 1,7 GHz (multi e mono-fios) quando funcionando com bateria.
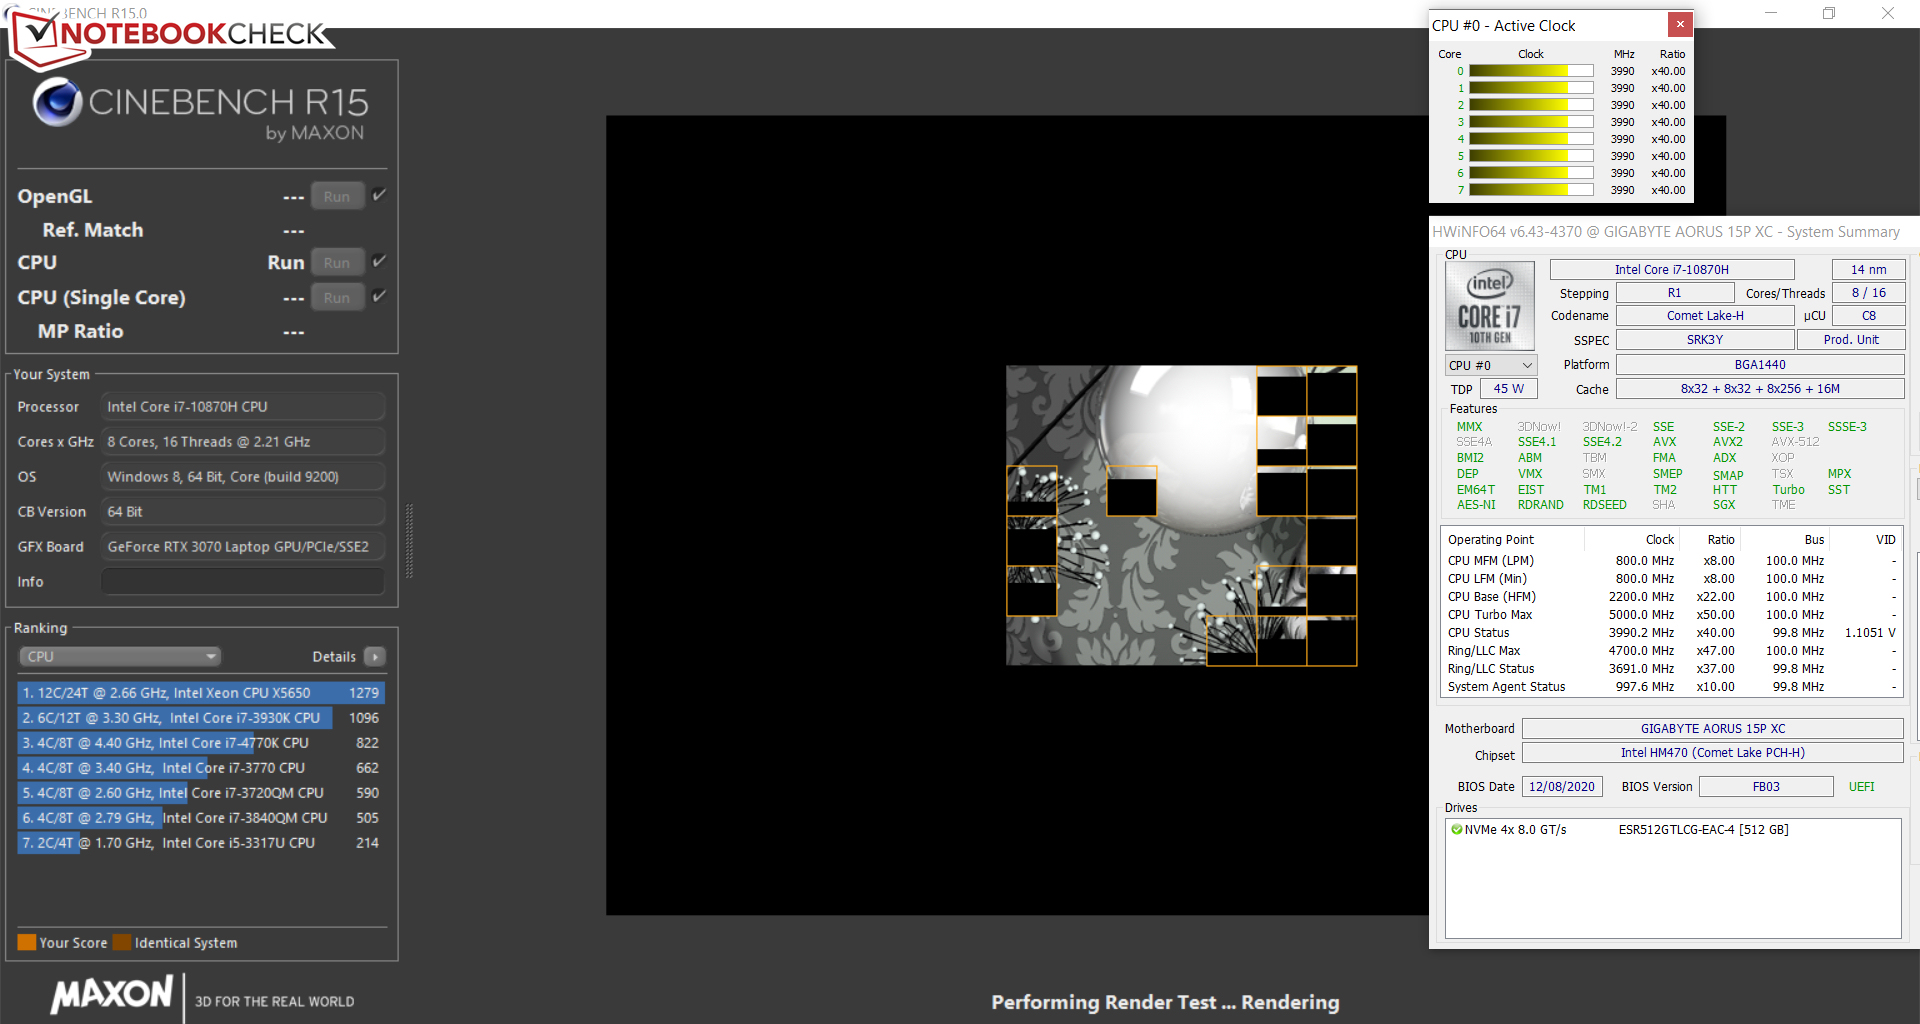
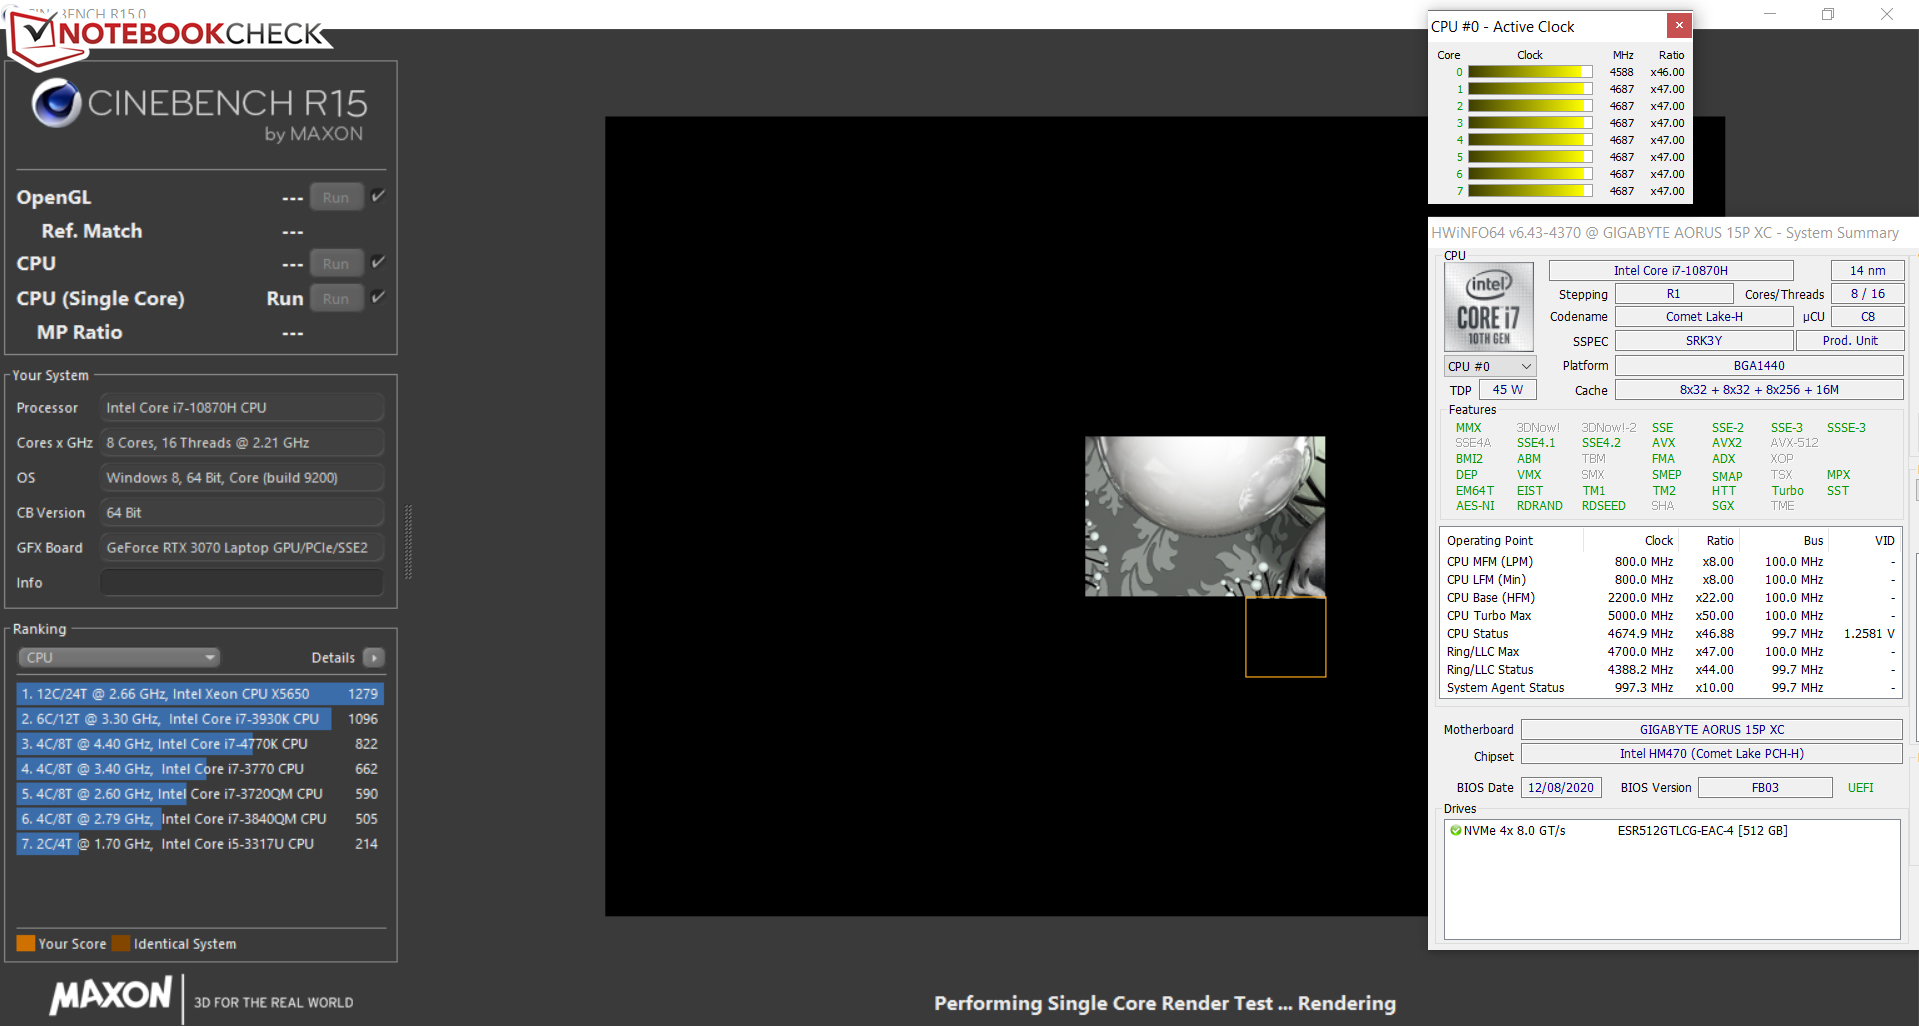
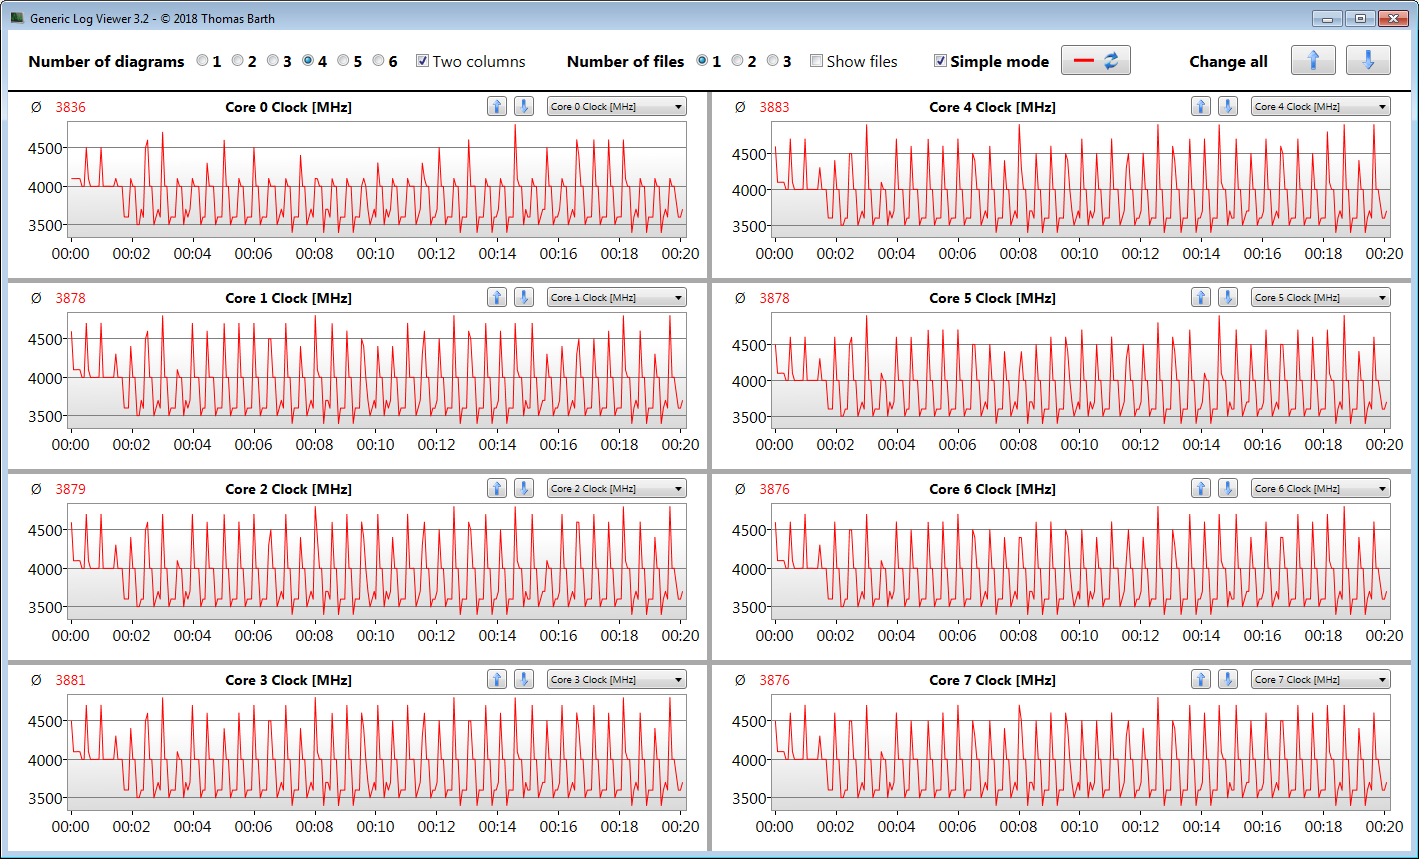
Executamos a versão multi-tarefa do benchmark Cinebench R15 em loop por pelo menos 30 minutos na rede elétrica para descobrir como o turbo CPU se comporta sob carga contínua. A unidade de teste de hoje continua a usar o turbo a um nível elevado.
* ... menor é melhor
Desempenho do sistema
O sistema rápido e suave deve oferecer desempenho suficiente para os próximos anos em todas as áreas de uso - jogos, processamento de imagem, corte de vídeo, uso de escritório e internet. Os resultados dos benchmarks PCMark também são bons.
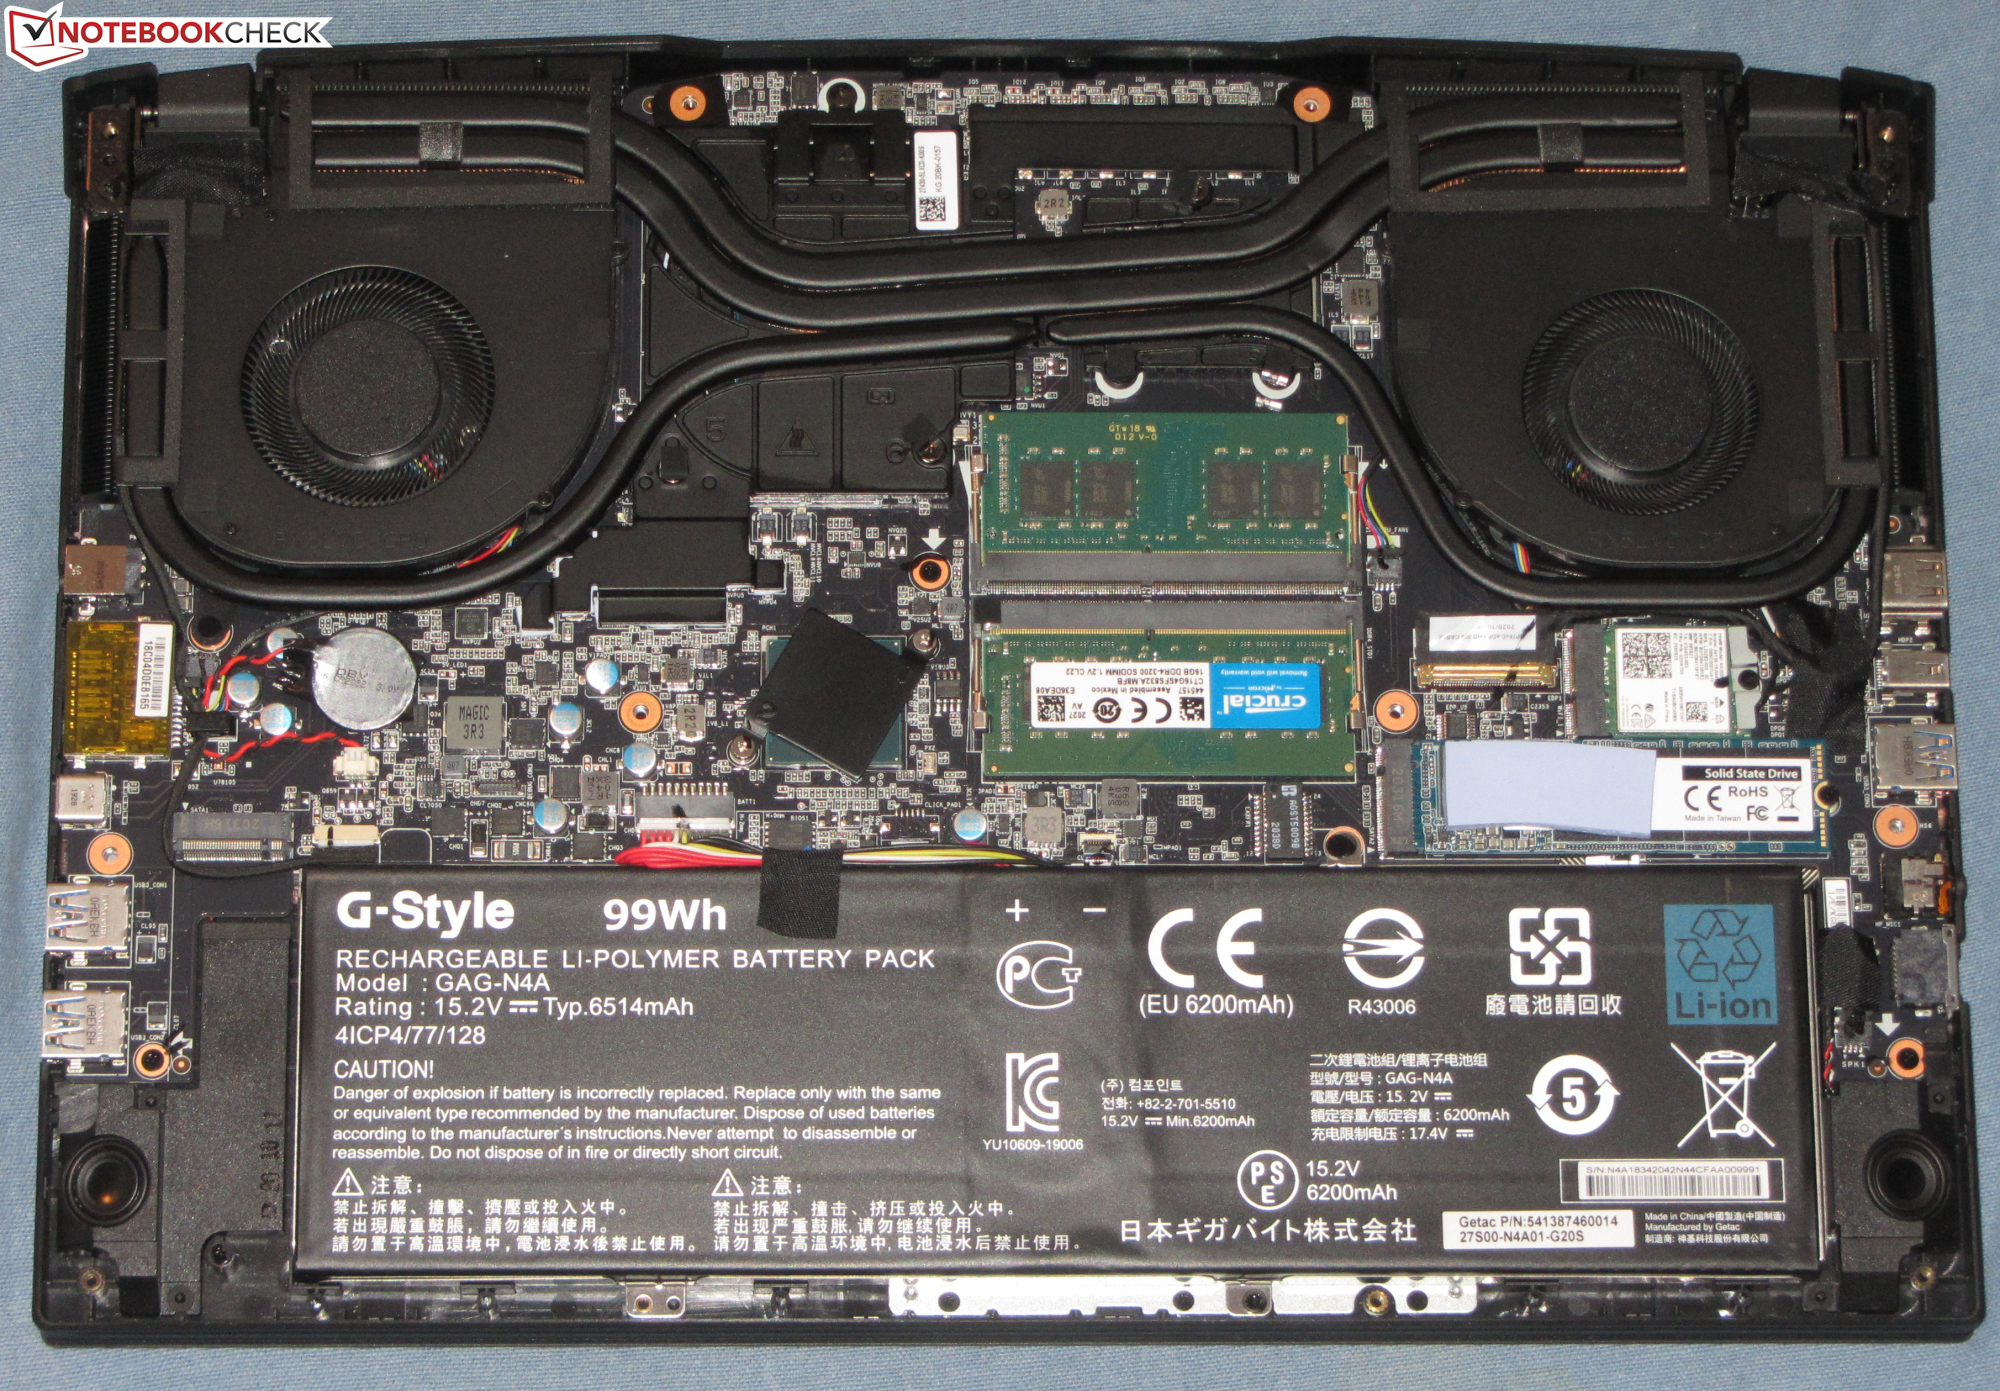
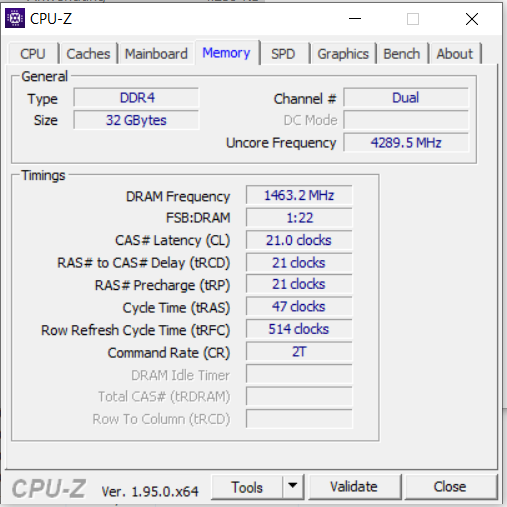
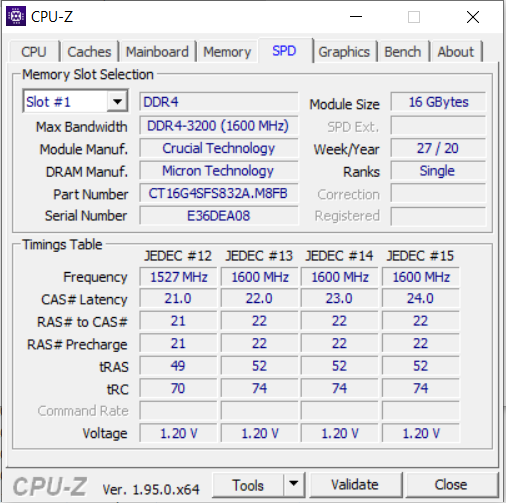
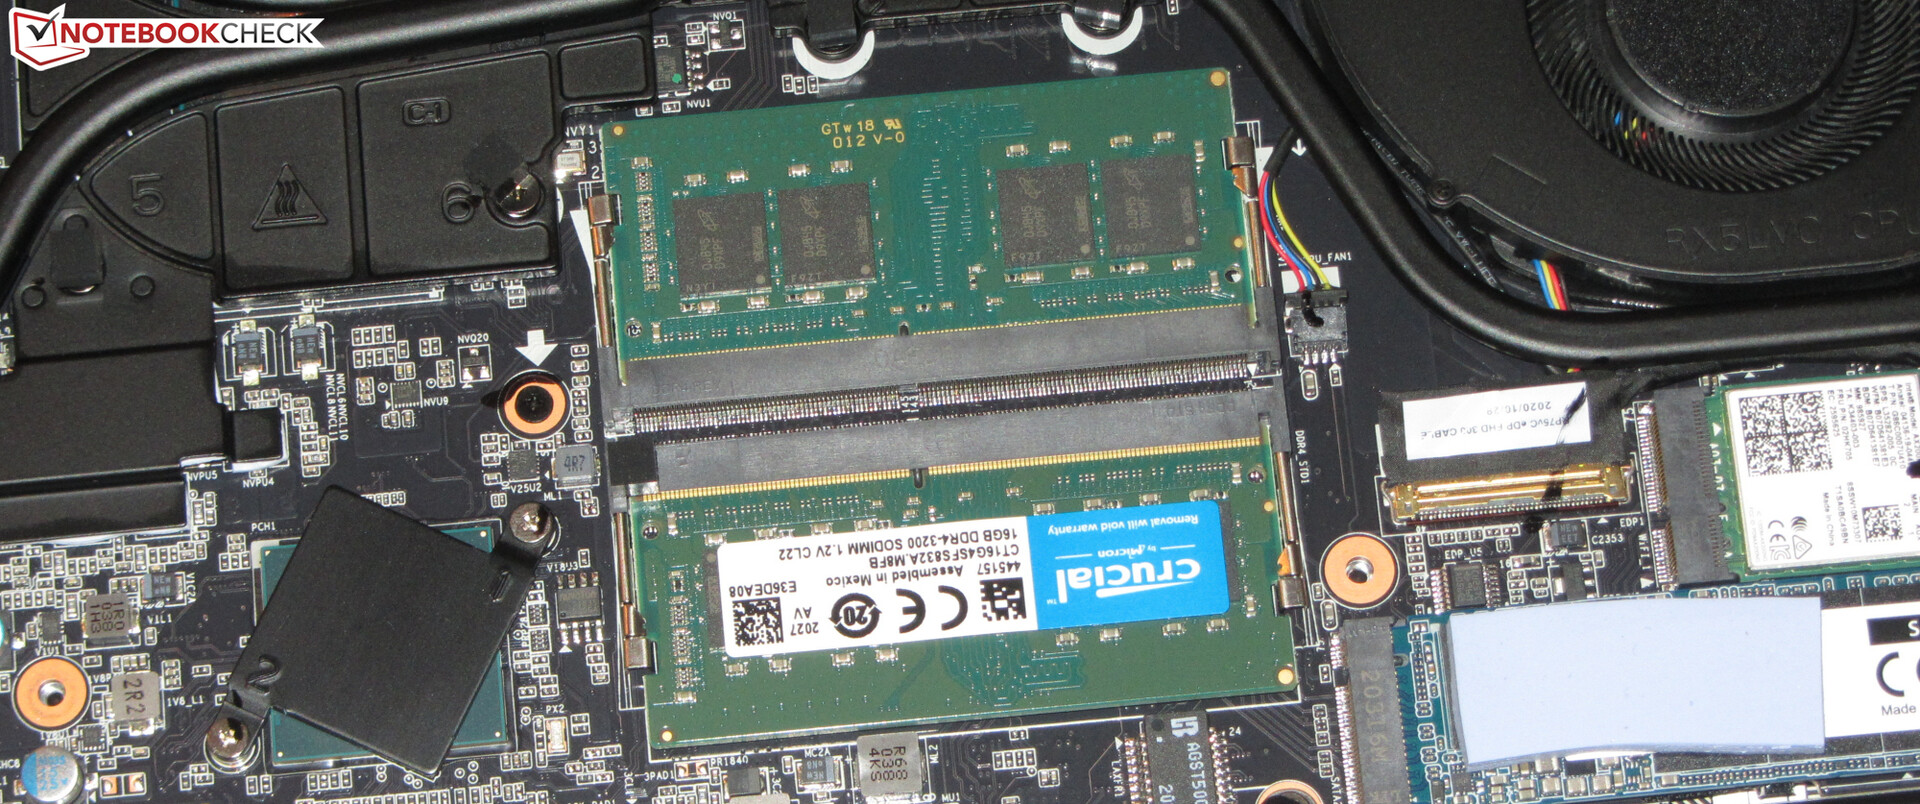
A RAM (DDR4-3200) do notebook de 15,6 polegadas funciona em modo de canal duplo. Os dois bancos de memória estão cada um ocupado por um módulo de 16 GB.
| PCMark 8 Home Score Accelerated v2 | 4486 pontos | |
| PCMark 8 Creative Score Accelerated v2 | 6694 pontos | |
| PCMark 8 Work Score Accelerated v2 | 5970 pontos | |
| PCMark 10 Score | 6463 pontos | |
Ajuda | ||
Latências DPC
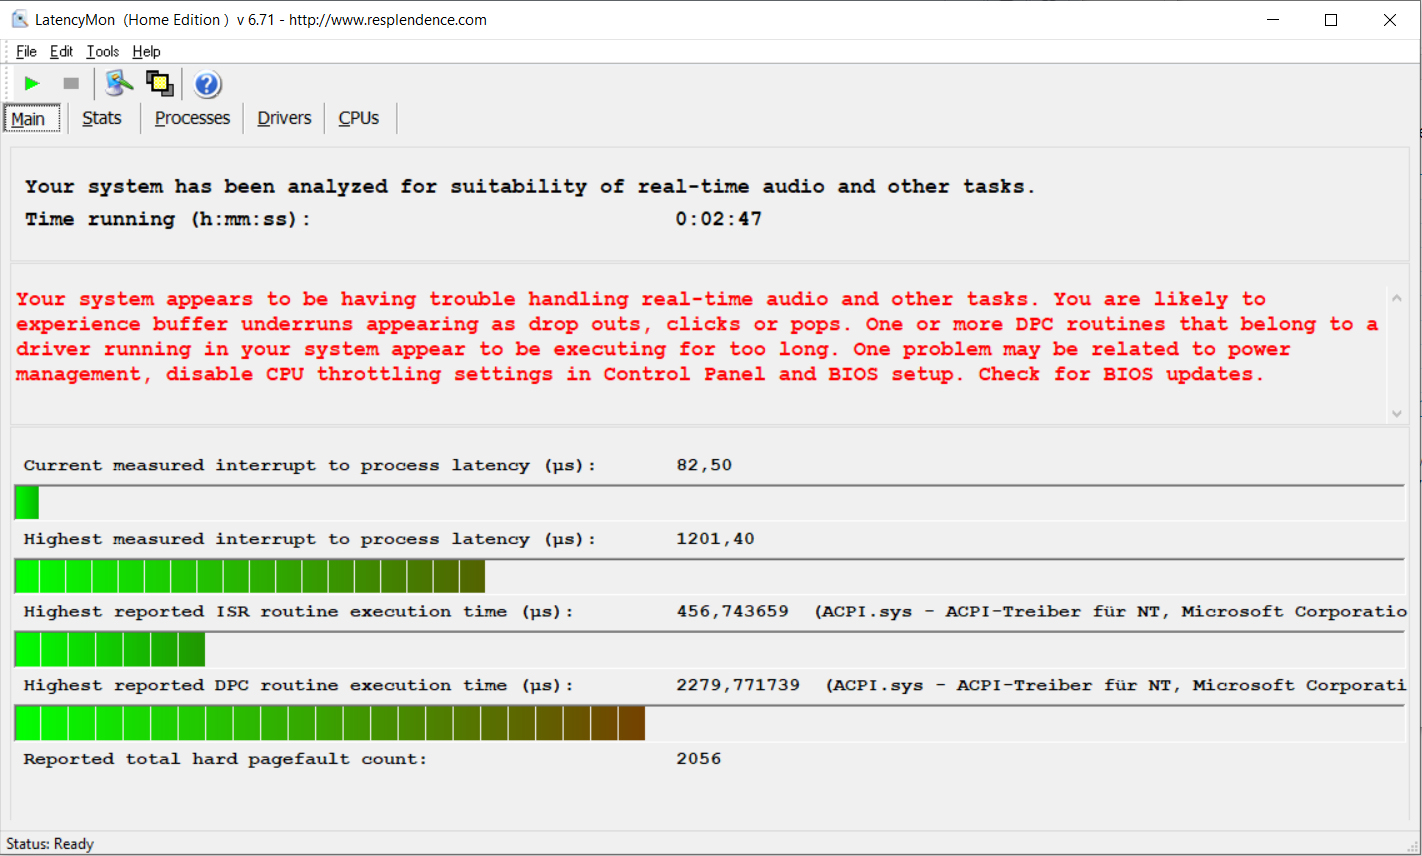
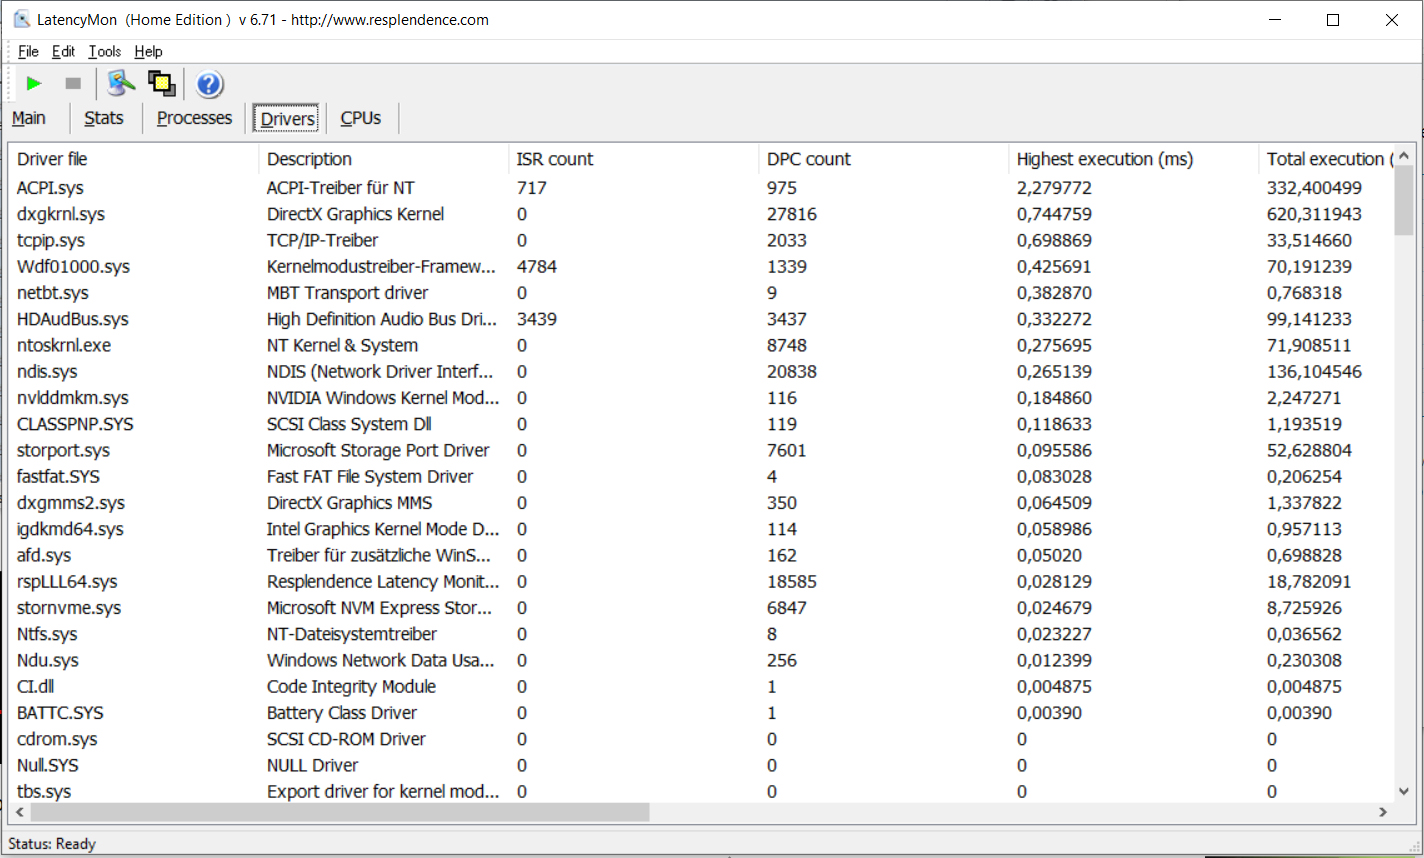
Nosso teste padronizado de Monitor de Latência (navegando na web, transmissão de vídeo 4K, Prime95 High Load) mostrou vários problemas com latências DPC. O sistema não parece ser adequado para edição de vídeo e áudio em tempo real.
| DPC Latencies / LatencyMon - interrupt to process latency (max), Web, Youtube, Prime95 | |
| Aorus 15G XC | |
| Aorus 15P XC | |
| Asus TUF Dash F15 FX516PR | |
| Aorus 15P WB | |
| MSI GS66 Stealth 10UG | |
| Schenker XMG Neo 15 Comet Lake | |
| Asus ROG Strix G15 G513QR | |
* ... menor é melhor
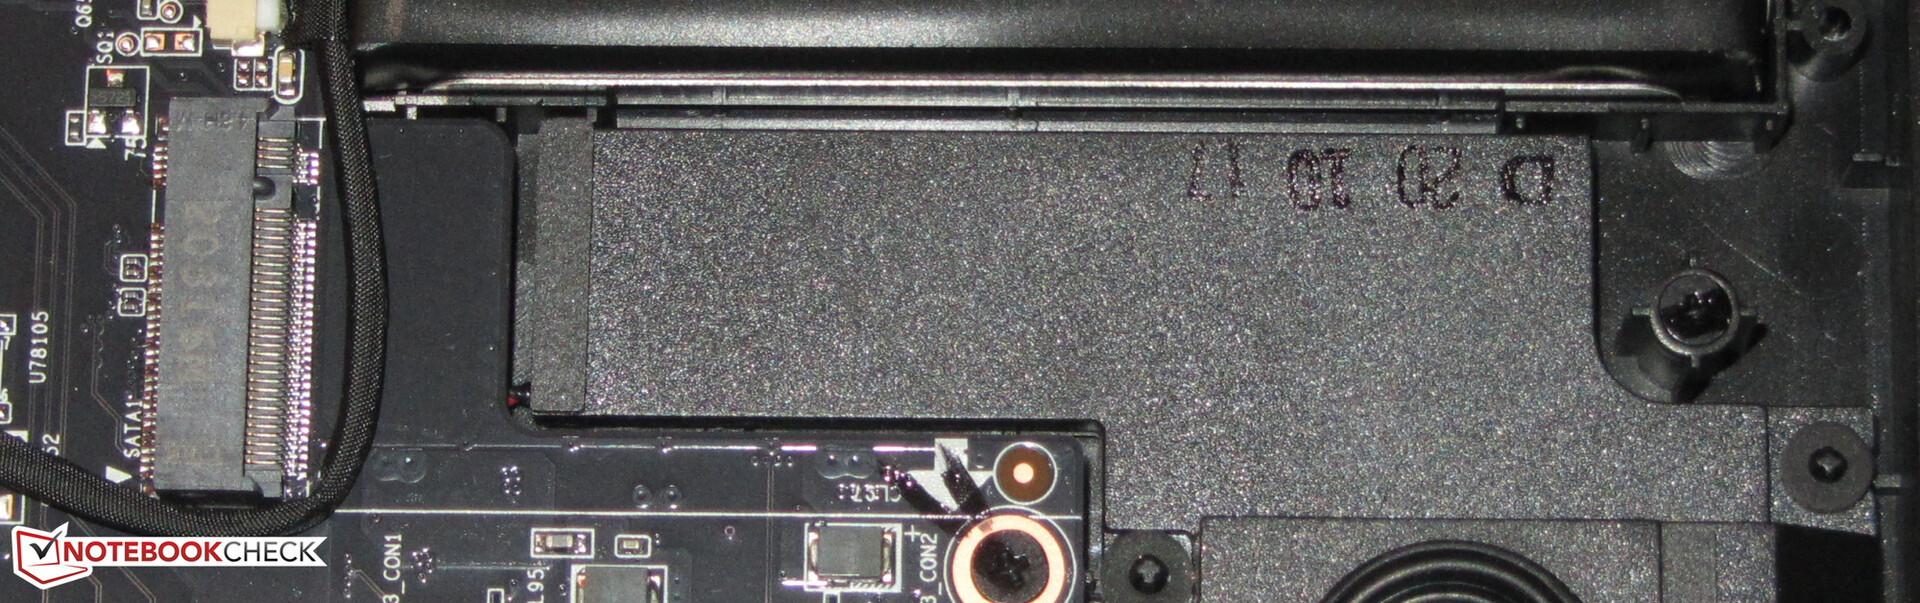
Dispositivos de armazenamento
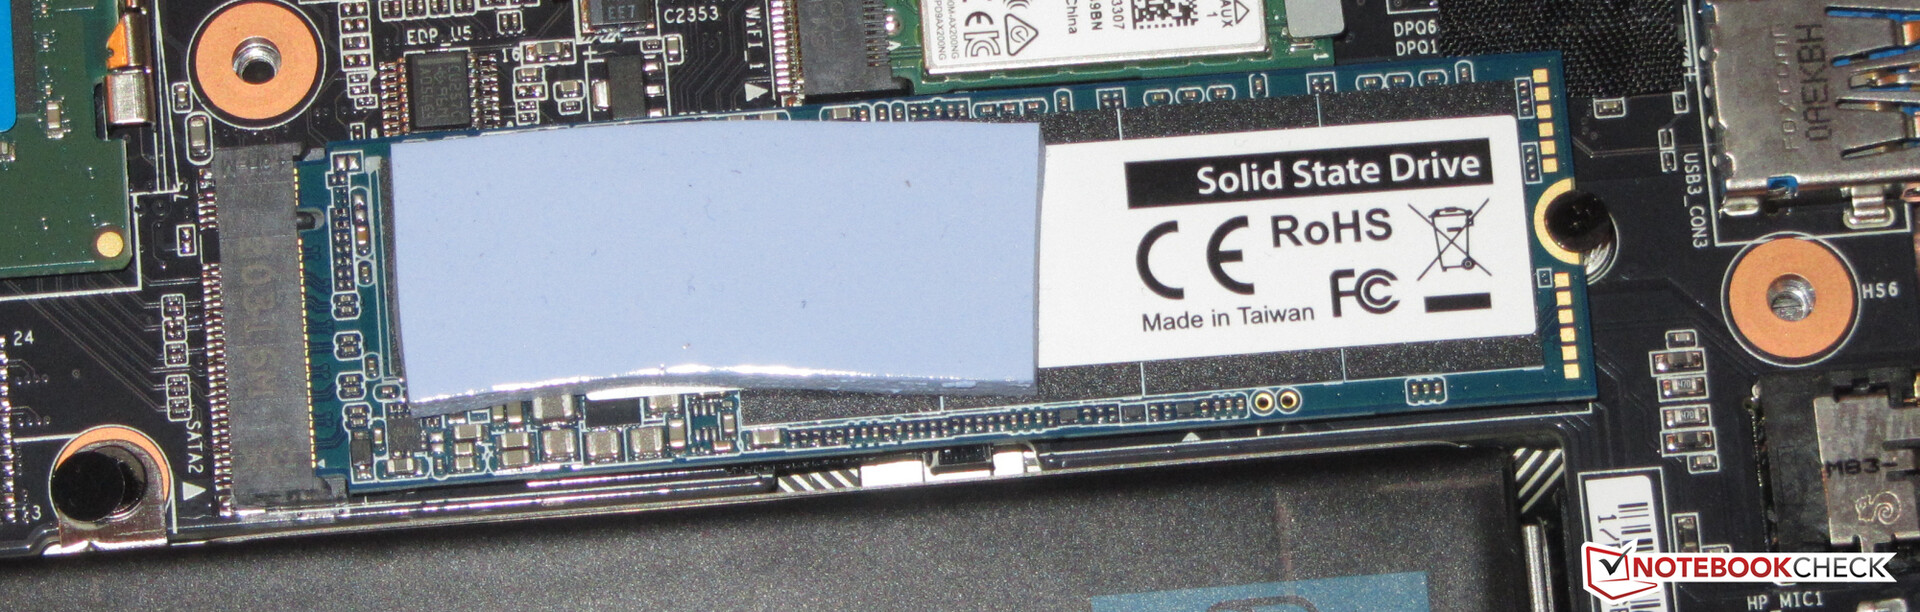
O dispositivo de armazenamento em nossa unidade de teste é um SSD NVMe 512-GB (M.2-2280) da Phison. Ele oferece boas taxas de transferência. O notebook tem outro slot disponível para um M.2 2280 SSD (1x NVMe, 1x NVMe/SATA). Ele não suporta RAID-0/1.

| Aorus 15P XC ESR512GTLCG-EAC-4 | MSI GS66 Stealth 10UG WDC PC SN730 SDBPNTY-1T00 | Asus TUF Dash F15 FX516PR SK Hynix HFM001TD3JX013N | Schenker XMG Neo 15 Comet Lake Samsung SSD 970 EVO Plus 1TB | Aorus 15P WB ADATA XPG SX8200 Pro (ASX8200PNP-512GT) | Aorus 15G XC ESR512GTLCG-EAC-4 | Asus ROG Strix G15 G513QR SK Hynix HFM001TD3JX013N | |
|---|---|---|---|---|---|---|---|
| CrystalDiskMark 5.2 / 6 | 6% | -11% | 22% | 5% | -2% | ||
| Write 4K (MB/s) | 130.2 | 163.1 25% | 129.6 0% | 182.6 40% | 131.7 1% | 137.6 6% | |
| Read 4K (MB/s) | 45.47 | 48.97 8% | 44.71 -2% | 53.5 18% | 55.7 22% | 45.87 1% | |
| Write Seq (MB/s) | 2269 | 2607 15% | 1929 -15% | 3035 34% | 2273 0% | 2304 2% | |
| Read Seq (MB/s) | 1643 | 2316 41% | 2035 24% | 2520 53% | 2533 54% | 1052 -36% | |
| Write 4K Q32T1 (MB/s) | 547 | 338 -38% | 425.9 -22% | 524 -4% | 475.1 -13% | 601 10% | |
| Read 4K Q32T1 (MB/s) | 654 | 475.6 -27% | 433.4 -34% | 617 -6% | 590 -10% | 677 4% | |
| Write Seq Q32T1 (MB/s) | 2512 | 3090 23% | 1390 -45% | 3316 32% | 2373 -6% | 2536 1% | |
| Read Seq Q32T1 (MB/s) | 3382 | 3421 1% | 3505 4% | 3548 5% | 3068 -9% | 3372 0% | |
| AS SSD | -12% | -26% | 19% | -21% | -16% | -0% | |
| Seq Read (MB/s) | 2694 | 2198 -18% | 2671 -1% | 2970 10% | 2241 -17% | 2048 -24% | 2881 7% |
| Seq Write (MB/s) | 2327 | 2596 12% | 1501 -35% | 2559 10% | 2121 -9% | 2403 3% | 1570 -33% |
| 4K Read (MB/s) | 47.77 | 43.81 -8% | 39.65 -17% | 56.6 18% | 52.3 9% | 48.27 1% | 52.4 10% |
| 4K Write (MB/s) | 98.8 | 115.5 17% | 69 -30% | 145 47% | 116.2 18% | 101.6 3% | 124 26% |
| 4K-64 Read (MB/s) | 1746 | 1692 -3% | 1209 -31% | 1938 11% | 713 -59% | 1606 -8% | 1334 -24% |
| 4K-64 Write (MB/s) | 2267 | 2162 -5% | 1650 -27% | 2307 2% | 827 -64% | 1473 -35% | 2189 -3% |
| Access Time Read * (ms) | 0.079 | 0.056 29% | 0.093 -18% | 0.035 56% | 0.054 32% | 0.131 -66% | 0.055 30% |
| Access Time Write * (ms) | 0.039 | 0.098 -151% | 0.055 -41% | 0.025 36% | 0.031 21% | 0.038 3% | 0.03 23% |
| Score Read (Points) | 2063 | 1956 -5% | 1516 -27% | 2291 11% | 989 -52% | 1859 -10% | 1675 -19% |
| Score Write (Points) | 2598 | 2537 -2% | 1869 -28% | 2708 4% | 1155 -56% | 1815 -30% | 2470 -5% |
| Score Total (Points) | 5698 | 5513 -3% | 4105 -28% | 6152 8% | 2659 -53% | 4645 -18% | 4943 -13% |
| Média Total (Programa/Configurações) | -3% /
-5% | -19% /
-20% | 21% /
20% | -8% /
-10% | -9% /
-10% | 0% /
-0% |
* ... menor é melhor
Disk Throttling: DiskSpd Read Loop, Queue Depth 8
Desempenho gráfico
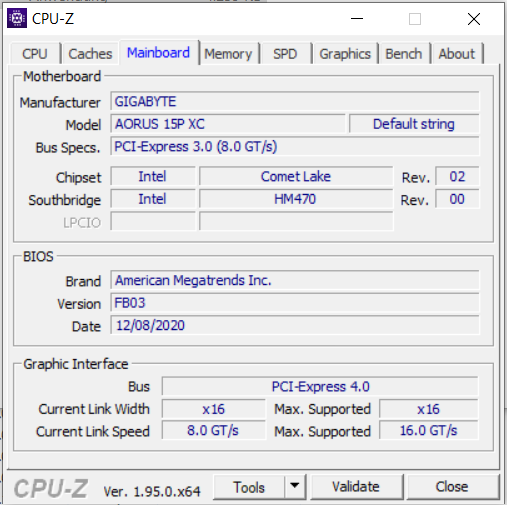
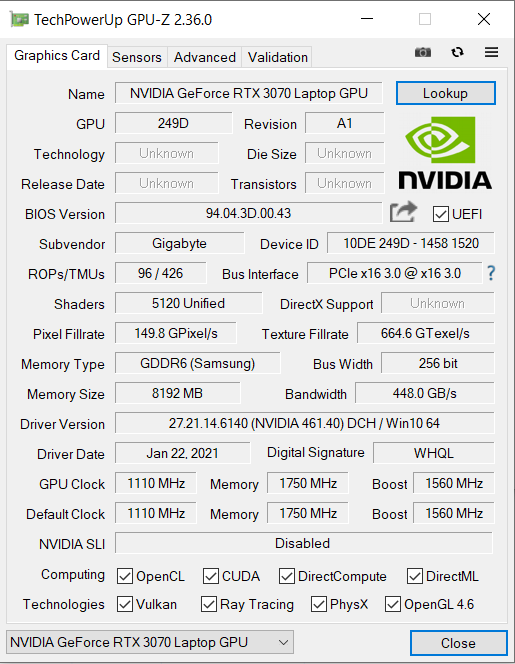
NVIDIA GeForce RTX 3070 Mobile GPU - Benchmarks and SpecsEnquanto oGeForce RTX 3070Laptop está posicionado na parte superior da escala, seu nome por si só não dá nenhuma indicação de seu desempenho real. Os fabricantes podem ajustar individualmente o TGP dentro de uma faixa definida pela Nvidia. Isto é o que realmente decide o nível de desempenho que a GPU terá a oferecer.
O Gigabyte quase que maximiza sua GPU com um TGB de 130 Watt (o máximo estabelecido pela Nvidia é de 140 Watt). O fabricante declarou este valor em seusite global. Nossos testes confirmaram o TGB de 130 Watt.
Como resultado do TGB superior, o 15P atinge resultados de referência significativamente melhores do que seus concorrentes equipados com a mesma GPU, como aMSI GS66 Stealth 10UG(TGP: 95 Watt) e oAsus TUF Dash F15 FX516PR(TGP: 85 Watt). O 15P também pode superar seu modelo irmão com quase a mesma construção, Aorus15G XC, que tem um TGP de 105 Watt. Criamos uma visão geral de todos os computadores portáteis RTX 3070 incluindo seus TGPs.
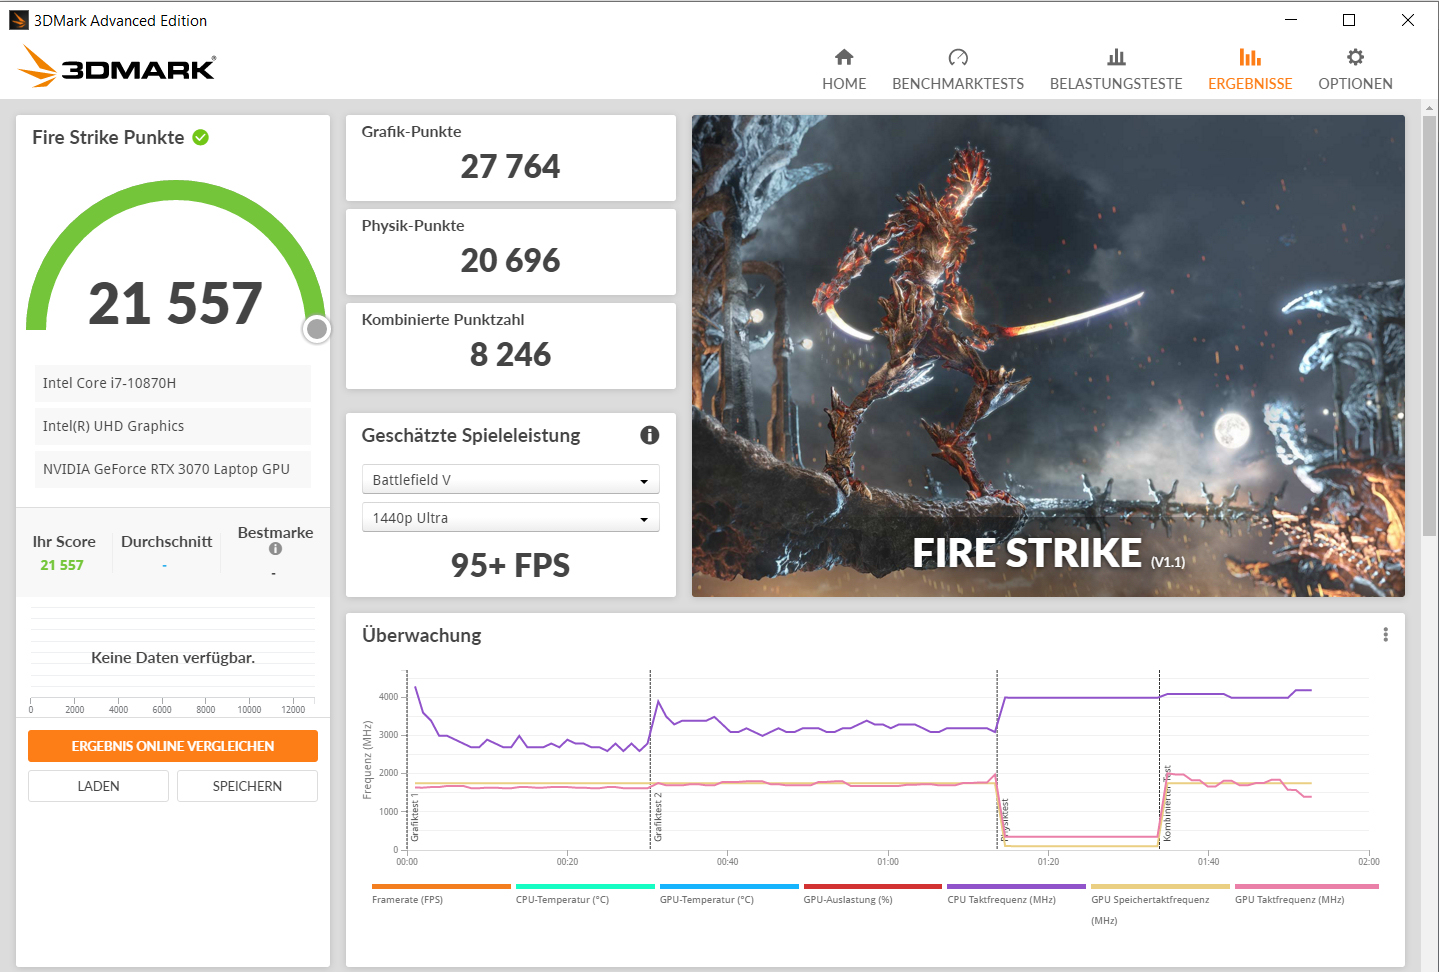

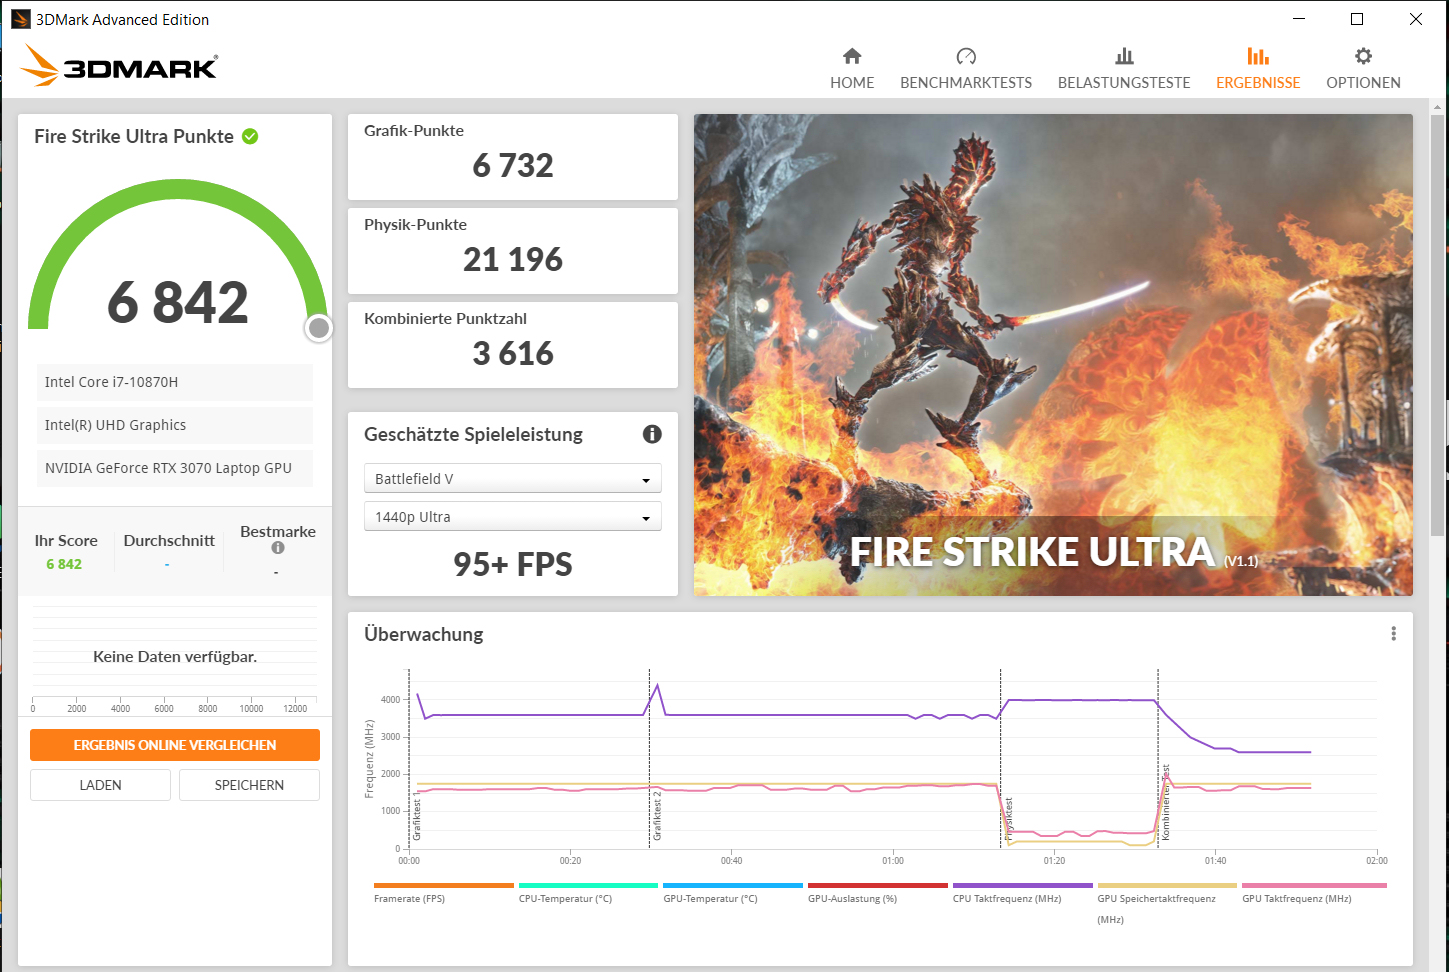
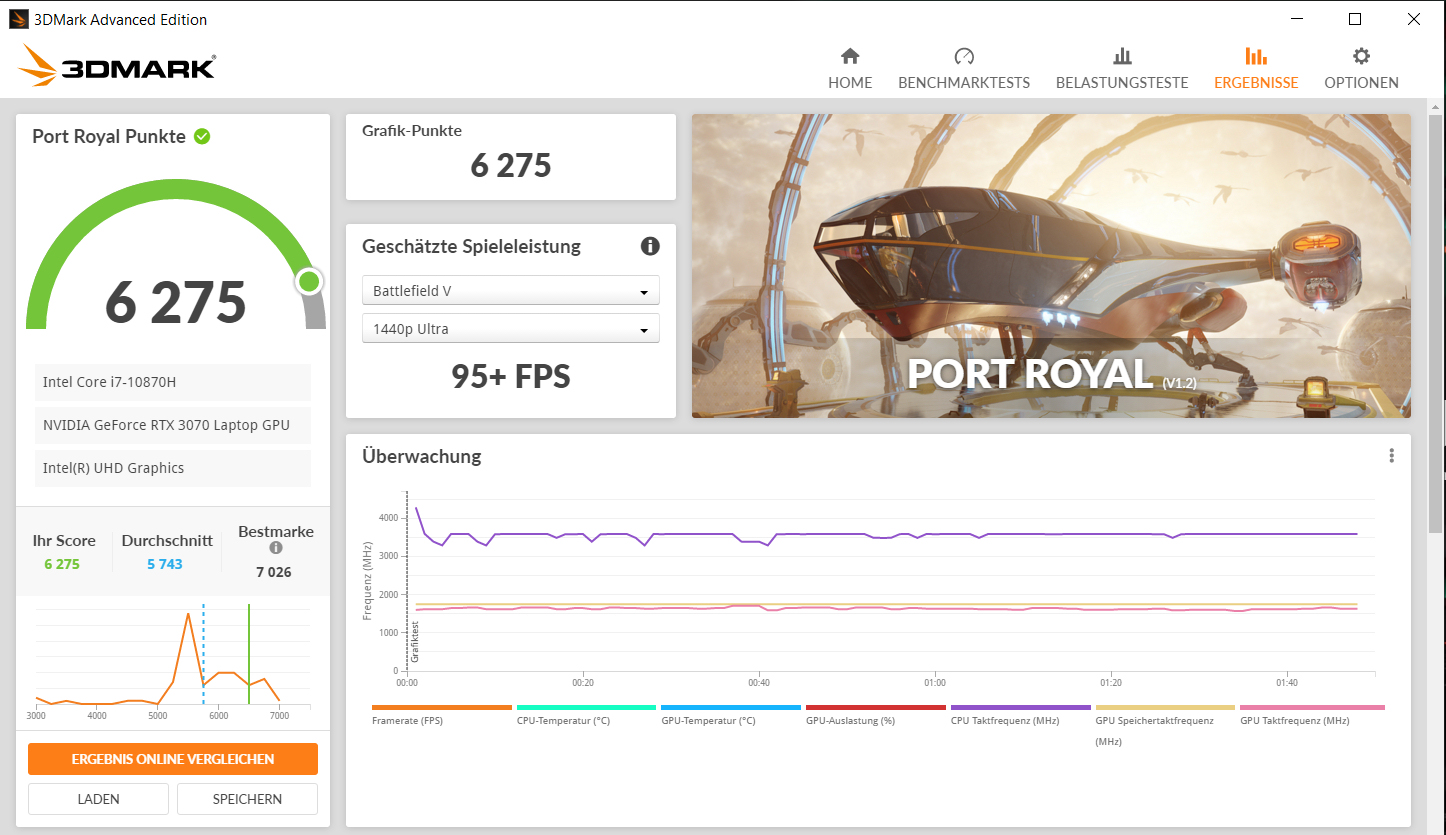
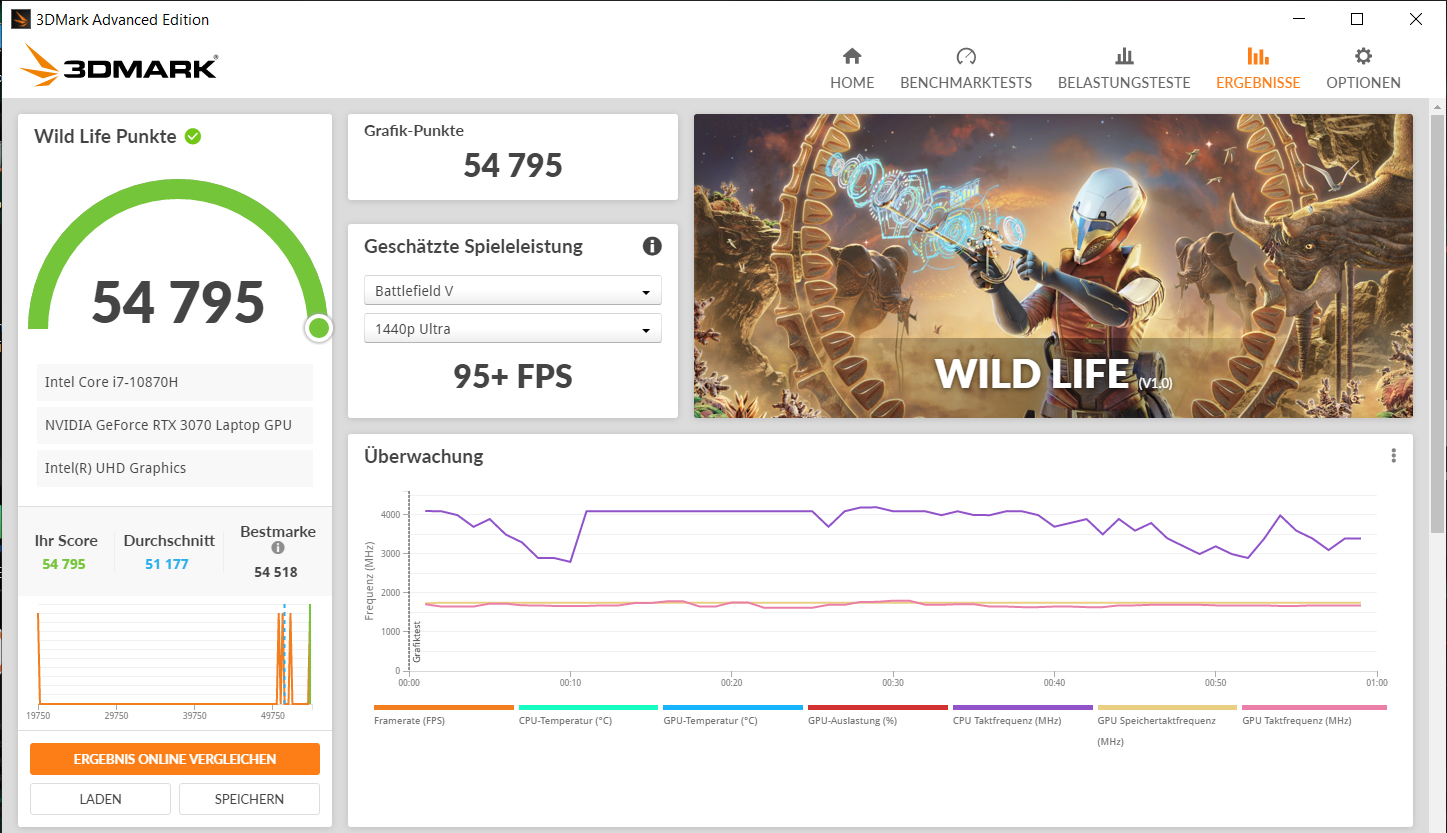
| 3DMark 11 Performance | 27446 pontos | |
| 3DMark Cloud Gate Standard Score | 51836 pontos | |
| 3DMark Fire Strike Score | 21557 pontos | |
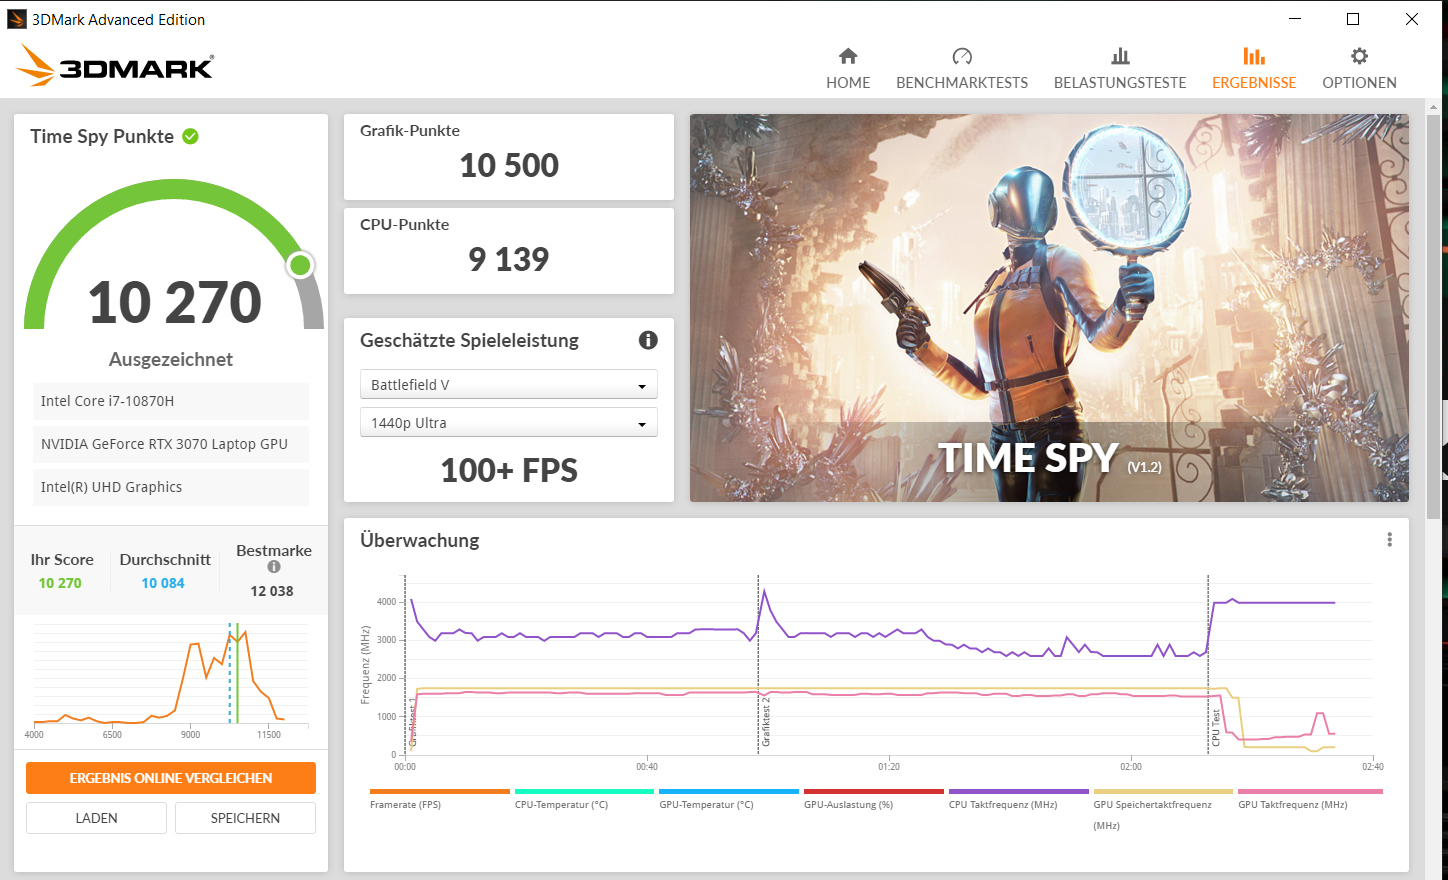
| 3DMark Time Spy Score | 10270 pontos | |
Ajuda | ||
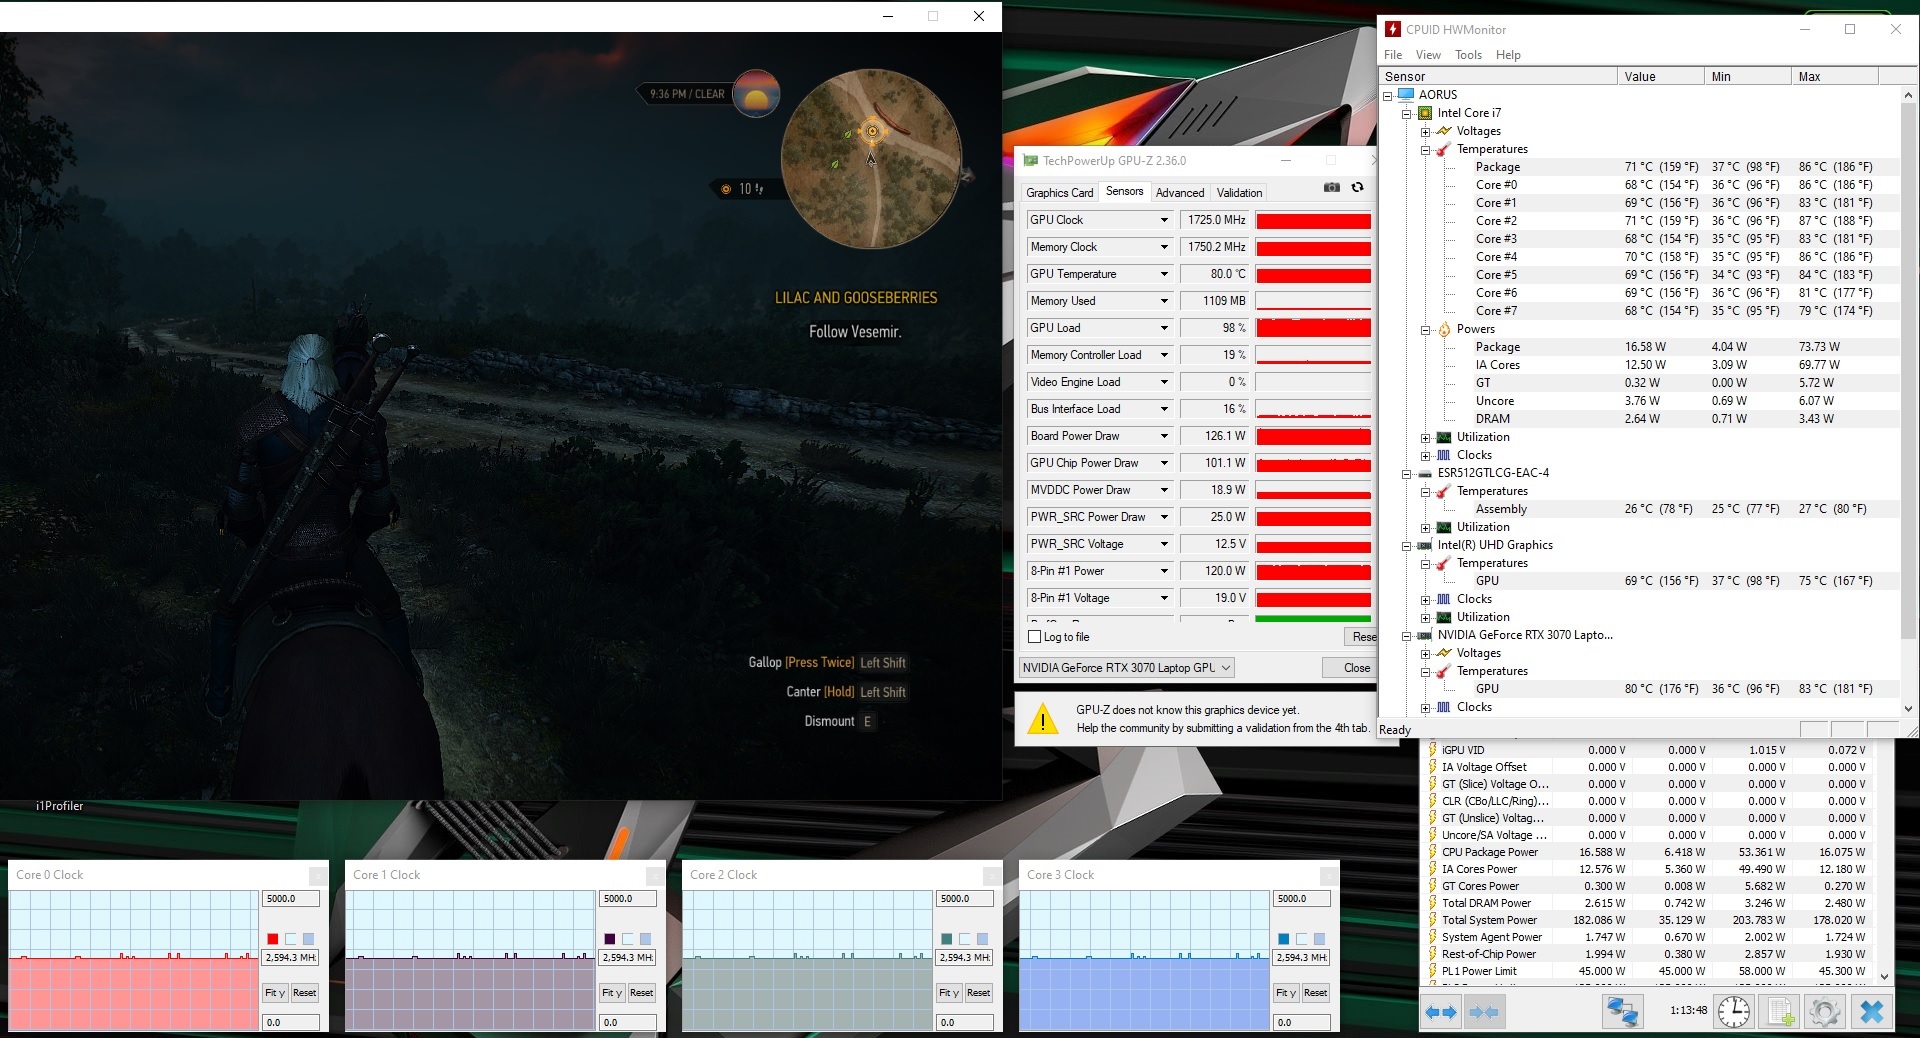
Desempenho nos jogos
O hardware em nossa unidade de teste é capaz de exibir todos os jogos atuais suavemente em resolução Full-HD e configurações de qualidade máxima. Resoluções mais altas (o que exigiria que os usuários conectassem um monitor externo adequado) podem exigir uma redução nas configurações de qualidade.
| The Witcher 3 - 1920x1080 Ultra Graphics & Postprocessing (HBAO+) | |
| Média da turma Gaming (104.7 - 240, n=7, últimos 2 anos) | |
| Aorus 15P XC | |
| Asus ROG Strix G15 G513QR | |
| Aorus 15G XC | |
| Média NVIDIA GeForce RTX 3070 Laptop GPU (34.9 - 109, n=52) | |
| MSI GS66 Stealth 10UG | |
| Schenker XMG Neo 15 Comet Lake | |
| Asus TUF Dash F15 FX516PR | |
| Aorus 15P WB | |
| Far Cry 5 - 1920x1080 Ultra Preset AA:T | |
| Média da turma Gaming (70 - 151, n=6, últimos 2 anos) | |
| Schenker XMG Neo 15 Comet Lake | |
| Média NVIDIA GeForce RTX 3070 Laptop GPU (89 - 140, n=36) | |
| Aorus 15P XC | |
| Aorus 15P WB | |
| Asus ROG Strix G15 G513QR | |
| Watch Dogs Legion - 1920x1080 Ultra Preset (DX12) | |
| Aorus 15P XC | |
| Média NVIDIA GeForce RTX 3070 Laptop GPU (55 - 73, n=7) | |
| Asus TUF Dash F15 FX516PR | |
| Aorus 15P WB | |
| Immortals Fenyx Rising - 1920x1080 Very High Preset | |
| Aorus 15P XC | |
| Média NVIDIA GeForce RTX 3070 Laptop GPU (69 - 94, n=4) | |
| Asus TUF Dash F15 FX516PR | |
| Aorus 15P WB | |
| Serious Sam 4 - 1920x1080 Ultra (DX12) AA:2xMS | |
| Aorus 15P XC | |
| Média NVIDIA GeForce RTX 3070 Laptop GPU (66.4 - 82.1, n=5) | |
| Asus TUF Dash F15 FX516PR | |
| Shadow of the Tomb Raider - 1920x1080 Highest Preset AA:T | |
| Média NVIDIA GeForce RTX 3070 Laptop GPU (86 - 133.7, n=6) | |
| Aorus 15G XC | |
| Aorus 15P XC | |
| Média da turma Gaming (96 - 116, n=2, últimos 2 anos) | |
| Asus TUF Dash F15 FX516PR | |
| F1 2020 - 1920x1080 Ultra High Preset AA:T AF:16x | |
| Média NVIDIA GeForce RTX 3070 Laptop GPU (97 - 173, n=7) | |
| Aorus 15P XC | |
| Asus TUF Dash F15 FX516PR | |
| Cyberpunk 2077 1.0 - 1920x1080 Ultra Preset | |
| Aorus 15P XC | |
| Média NVIDIA GeForce RTX 3070 Laptop GPU (50 - 70.5, n=11) | |
| Asus TUF Dash F15 FX516PR | |
| Aorus 15P WB | |
Nós executamos o jogo "Witcher 3" por cerca de 60 minutos com resolução Full HD e ajustes de qualidade máxima, a fim de descobrir se as taxas de quadros permanecem constantes durante um longo período de tempo. O personagem do jogo não se moveu durante todo este teste. Nós não registramos uma queda nas taxas de quadros.
| baixo | média | alto | ultra | |
|---|---|---|---|---|
| The Witcher 3 (2015) | 672 | 265 | 176 | 101 |
| Dota 2 Reborn (2015) | 128 | 120 | ||
| X-Plane 11.11 (2018) | 111 | 96.3 | 79.5 | |
| Far Cry 5 (2018) | 146 | 119 | 115 | 108 |
| Shadow of the Tomb Raider (2018) | 132 | 111 | 108 | 107 |
| Total War: Three Kingdoms (2019) | 202.3 | 135.6 | 100.7 | 78.9 |
| Red Dead Redemption 2 (2019) | 128 | 108 | 88.4 | 60.7 |
| F1 2020 (2020) | 186 | 157 | 177 | 130 |
| Death Stranding (2020) | 150 | 143 | 137 | 134 |
| Horizon Zero Dawn (2020) | 127 | 99 | 92 | 86 |
| Flight Simulator 2020 (2020) | 59.1 | 41.6 | 42.2 | 38 |
| Serious Sam 4 (2020) | 131 | 98.1 | 91.8 | 82.1 |
| Watch Dogs Legion (2020) | 108 | 104 | 94.7 | 72.3 |
| Assassin´s Creed Valhalla (2020) | 126 | 95 | 84 | 75 |
| Yakuza Like a Dragon (2020) | 134 | 114 | 115 | 106 |
| Immortals Fenyx Rising (2020) | 127 | 112 | 101 | 94 |
| Cyberpunk 2077 1.0 (2020) | 106 | 89.5 | 76.9 | 67.8 |
| Hitman 3 (2021) | 174.4 | 128 | 120.7 | 134.8 |
Emissões - o laptop Aorus aquece significativamente sob carga
Ruído do sistema
Os dois ventiladores funcionam quase que constantemente, mesmo estando ociosos, embora em baixa velocidade. Neste cenário, eles quase nunca são realmente audíveis. Isto muda sob carga. O Aorus 15P pode produzir um nível máximo de ruído de 53 dB(A) (teste de estresse) ou 49 dB(A) (Witcher 3 teste). Recomendamos o uso de um fone de ouvido com estes níveis de ruído.
Barulho
| Ocioso |
| 25 / 29 / 34 dB |
| Carga |
| 44 / 53 dB |
 | ||
30 dB silencioso 40 dB(A) audível 50 dB(A) ruidosamente alto |
||
min: | ||
| Aorus 15P XC i7-10870H, GeForce RTX 3070 Laptop GPU | MSI GS66 Stealth 10UG i7-10870H, GeForce RTX 3070 Laptop GPU | Asus TUF Dash F15 FX516PR i7-11370H, GeForce RTX 3070 Laptop GPU | Schenker XMG Neo 15 Comet Lake i7-10875H, GeForce RTX 2070 Super Mobile | Aorus 15G XC i7-10870H, GeForce RTX 3070 Laptop GPU | Aorus 15P WB i7-10750H, GeForce RTX 2070 Max-Q | Asus ROG Strix G15 G513QR R9 5900HX, GeForce RTX 3070 Laptop GPU | Média da turma Gaming | |
|---|---|---|---|---|---|---|---|---|
| Noise | -10% | -4% | -5% | 0% | 3% | 0% | 2% | |
| desligado / ambiente * (dB) | 24 | 26.2 -9% | 24 -0% | 25 -4% | 25 -4% | 25 -4% | 24 -0% | 24.1 ? -0% |
| Idle Minimum * (dB) | 25 | 34 -36% | 25 -0% | 26 -4% | 29 -16% | 29 -16% | 25 -0% | 26 ? -4% |
| Idle Average * (dB) | 29 | 34 -17% | 30 -3% | 28 3% | 30 -3% | 30 -3% | 31 -7% | 27.4 ? 6% |
| Idle Maximum * (dB) | 34 | 34 -0% | 35 -3% | 33 3% | 31 9% | 31 9% | 33 3% | 30.1 ? 11% |
| Load Average * (dB) | 44 | 47.2 -7% | 53 -20% | 52 -18% | 41 7% | 41 7% | 45 -2% | 43.6 ? 1% |
| Witcher 3 ultra * (dB) | 49 | 46.3 6% | 48 2% | 55 -12% | 47 4% | 43 12% | 48 2% | |
| Load Maximum * (dB) | 53 | 58.2 -10% | 54 -2% | 56 -6% | 51 4% | 45 15% | 50 6% | 54.2 ? -2% |
* ... menor é melhor
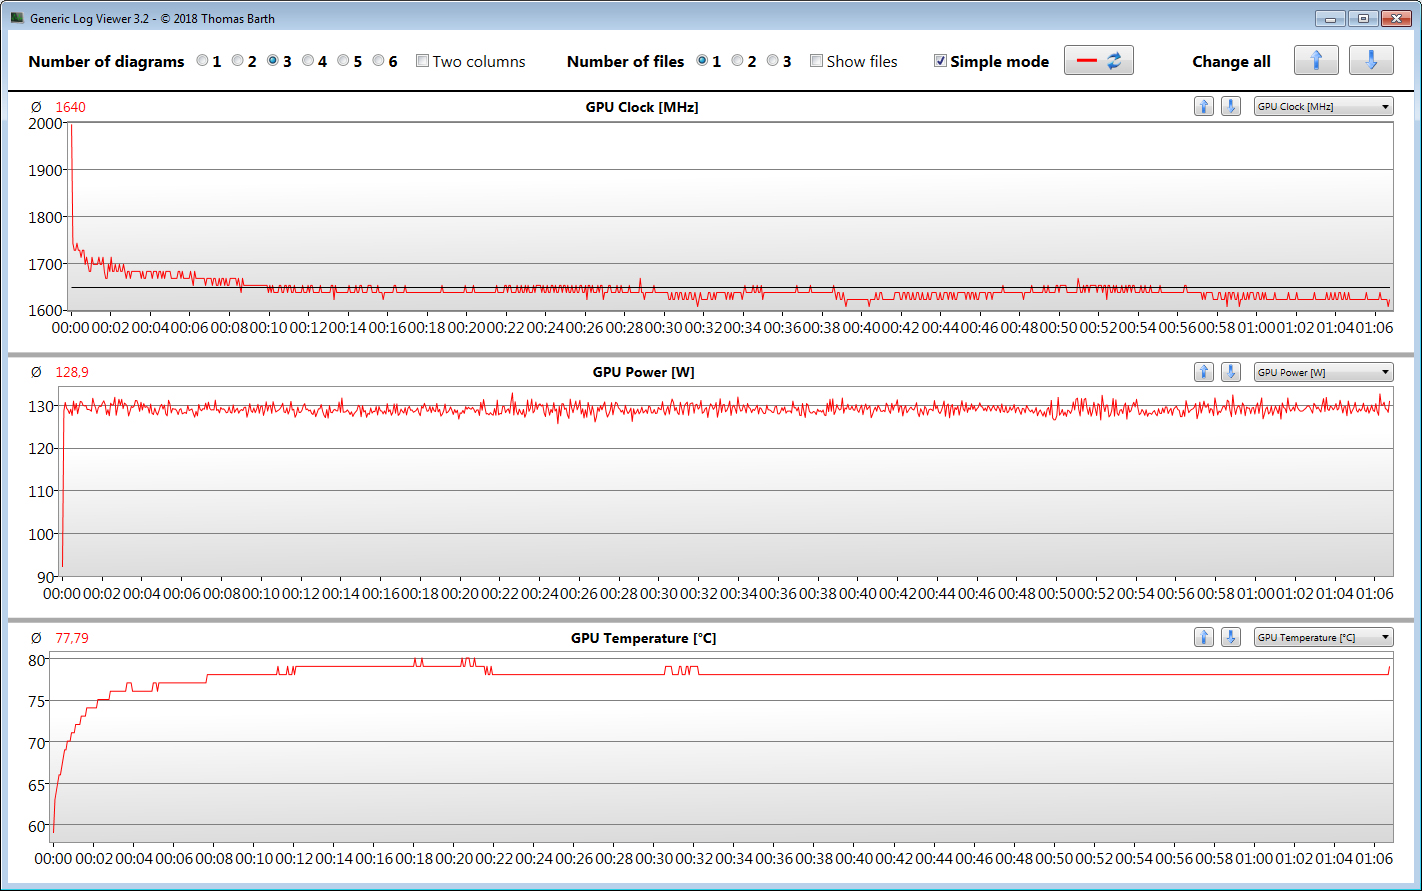
Temperatura
O relógio CPU e GPU a 2,9 GHz e 1275 MHz, respectivamente, durante nosso teste de estresse (Prime 95 e FurMark funcionando por pelo menos uma hora). O teste de estresse representa um cenário extremo que não ocorrerá como tal durante o uso diário. Utilizamos este teste para descobrir se o sistema permanece estável sob carga máxima.
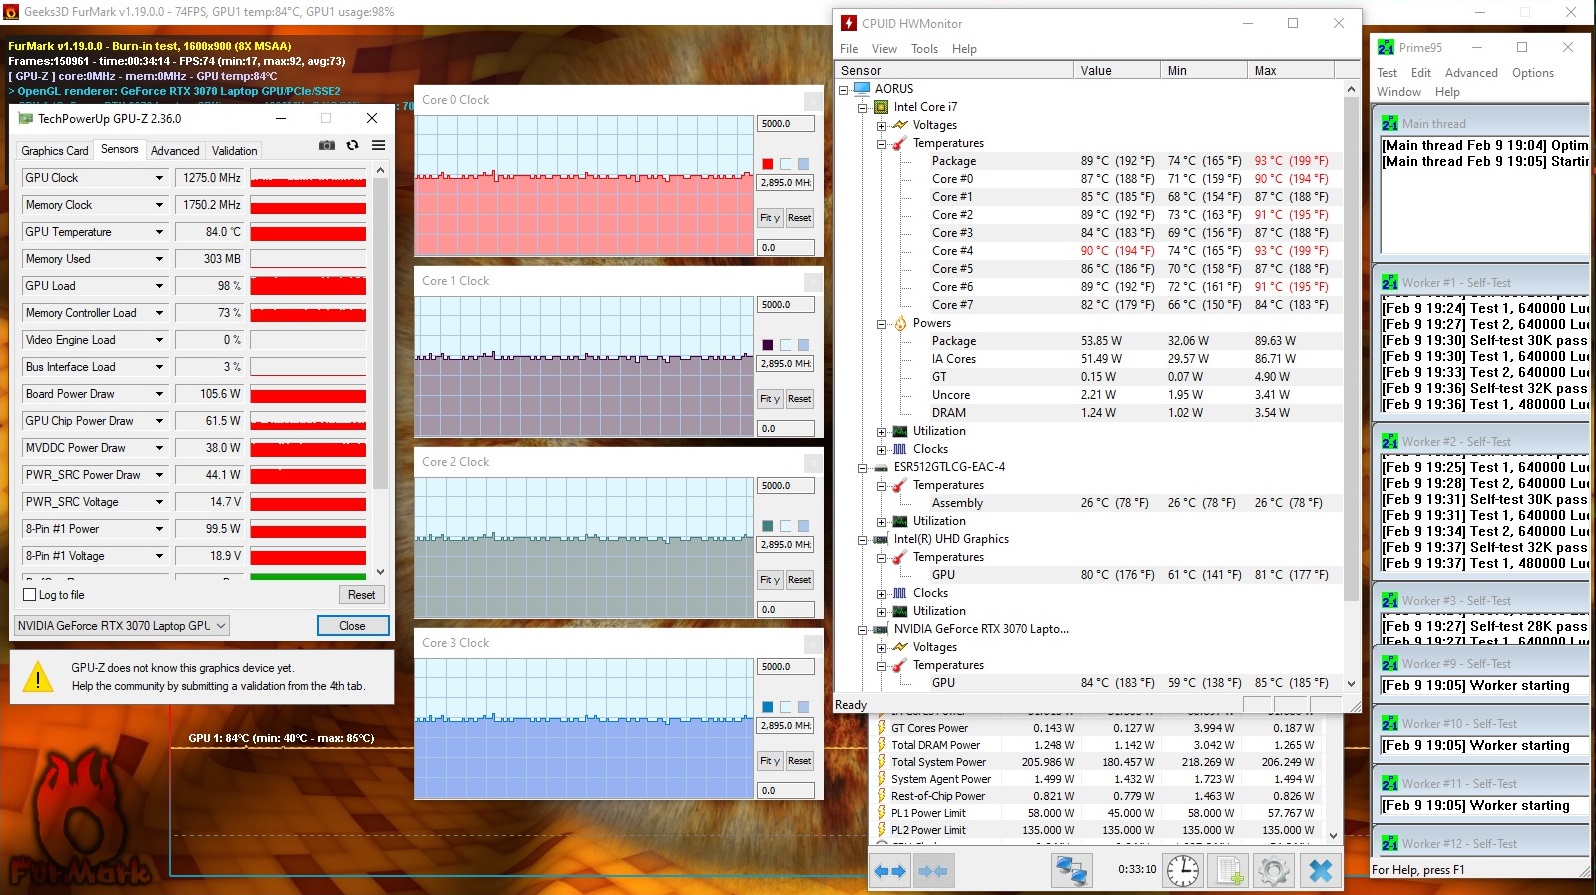
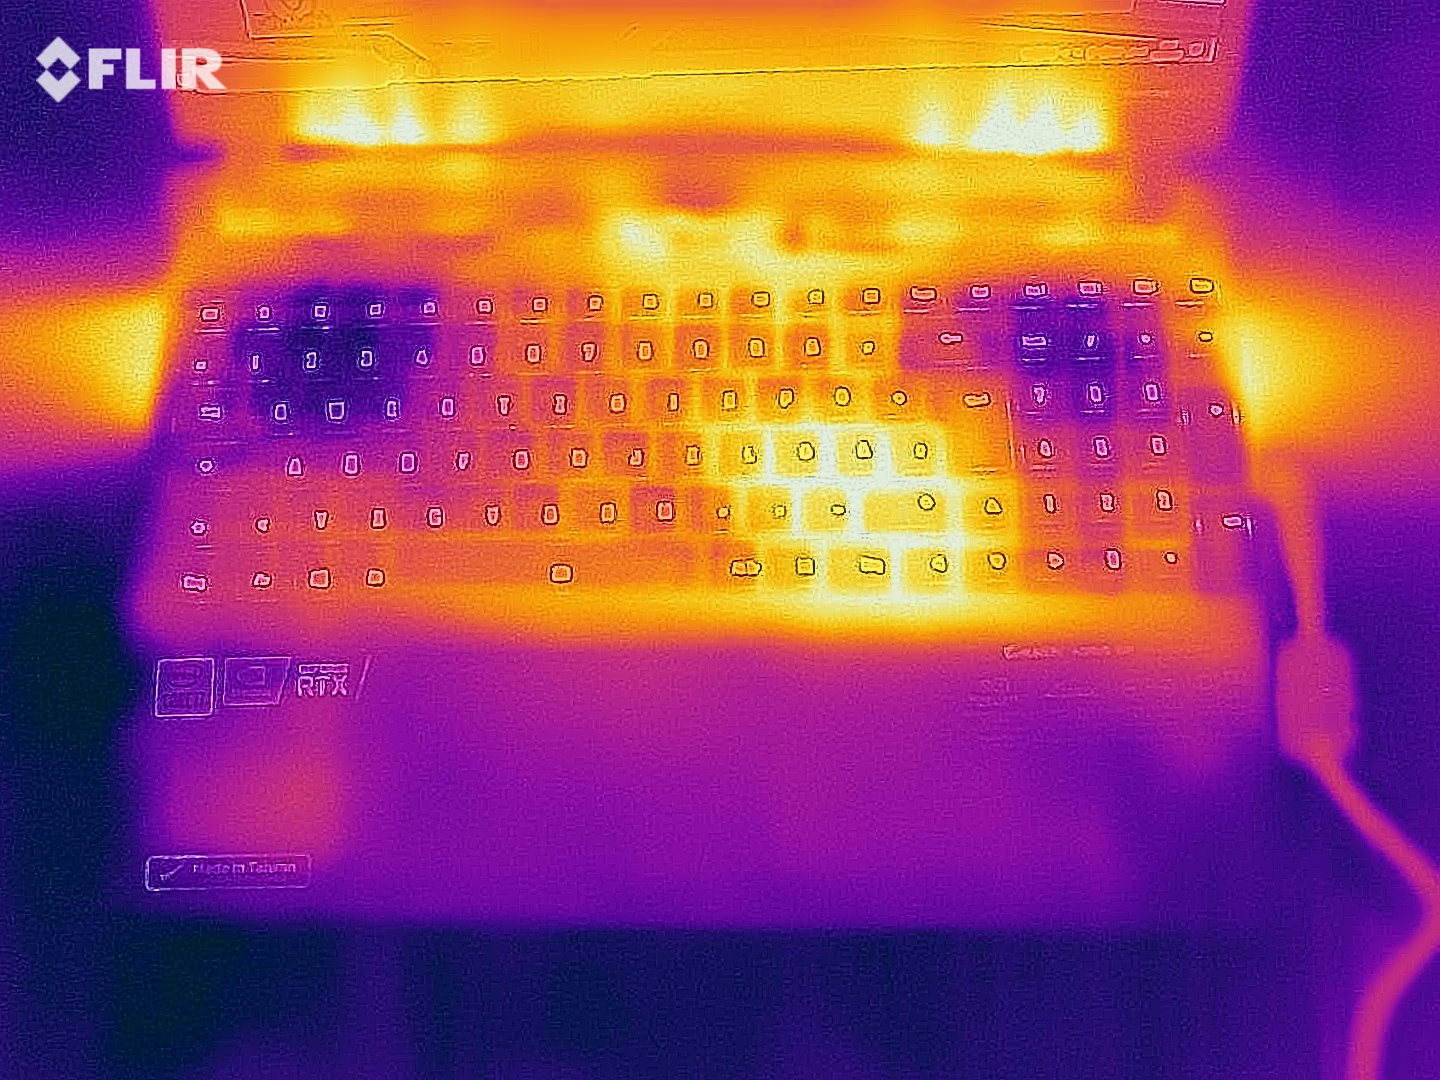
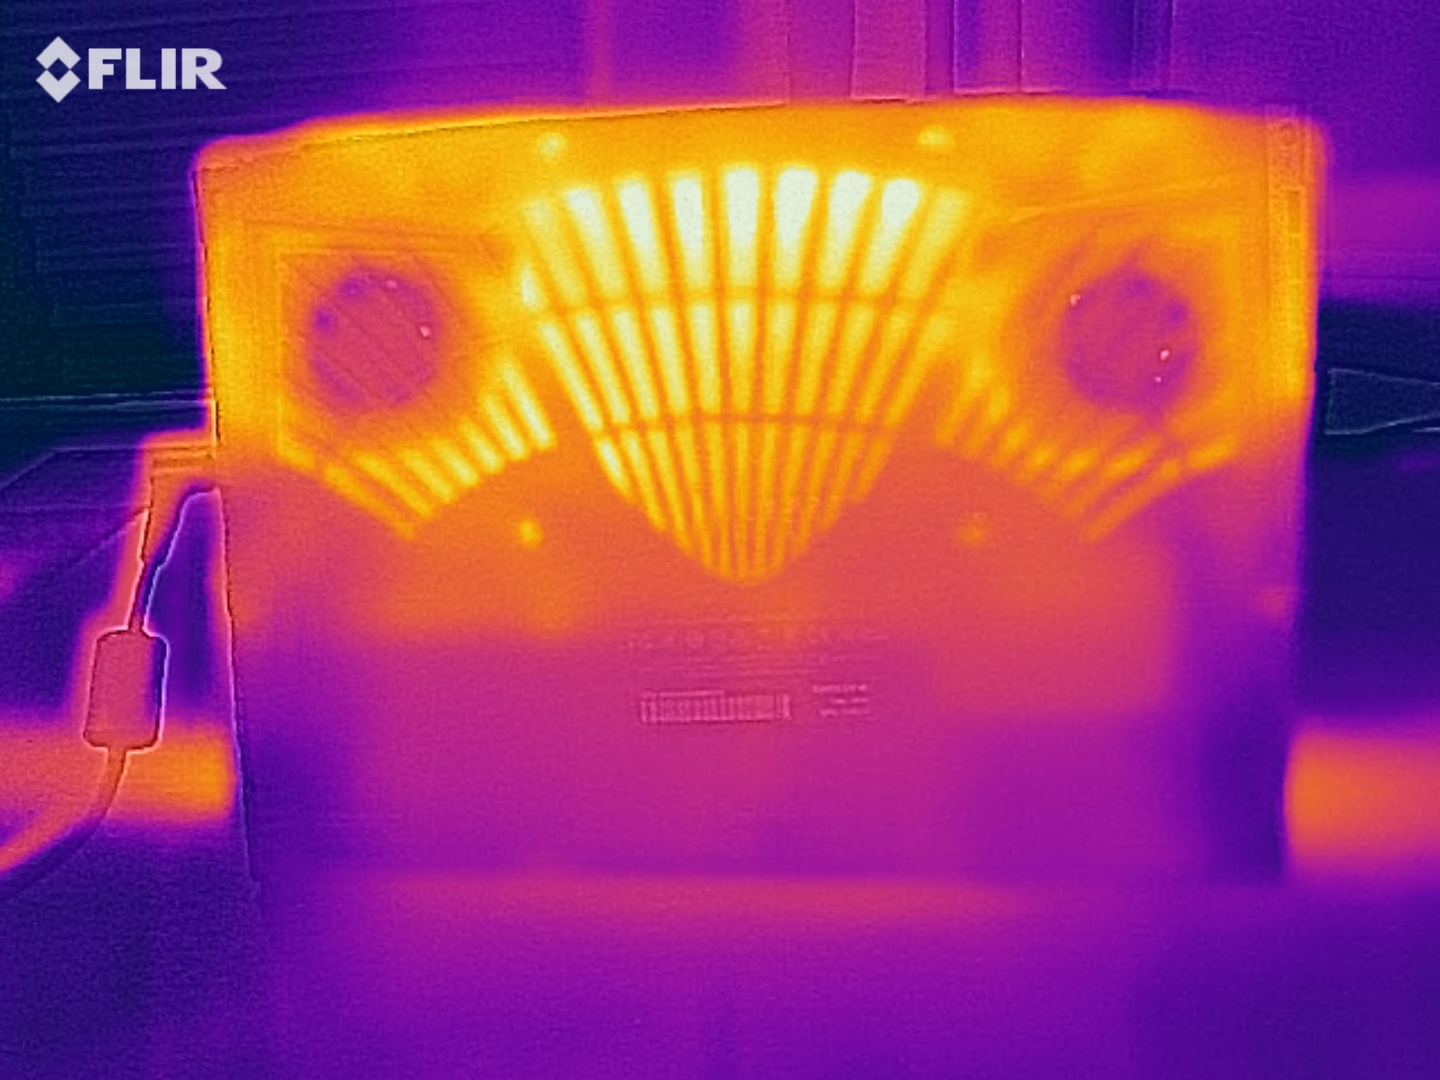
Registramos temperaturas acima de 50 °C em várias áreas do caso. O dispositivo aquece um pouco menos durante o teste Witcher 3. Ainda não recomendamos o uso do dispositivo em seu colo. As temperaturas são aceitáveis durante o uso diário.
(-) A temperatura máxima no lado superior é 47 °C / 117 F, em comparação com a média de 40.4 °C / 105 F , variando de 21.2 a 68.8 °C para a classe Gaming.
(-) A parte inferior aquece até um máximo de 57 °C / 135 F, em comparação com a média de 43.2 °C / 110 F
(+) Em uso inativo, a temperatura média para o lado superior é 24.4 °C / 76 F, em comparação com a média do dispositivo de 33.9 °C / ### class_avg_f### F.
(-) Jogando The Witcher 3, a temperatura média para o lado superior é 39.9 °C / 104 F, em comparação com a média do dispositivo de 33.9 °C / ## #class_avg_f### F.
(+) Os apoios para as mãos e o touchpad estão atingindo a temperatura máxima da pele (34 °C / 93.2 F) e, portanto, não estão quentes.
(-) A temperatura média da área do apoio para as mãos de dispositivos semelhantes foi 28.8 °C / 83.8 F (-5.2 °C / -9.4 F).
| Aorus 15P XC i7-10870H, GeForce RTX 3070 Laptop GPU | MSI GS66 Stealth 10UG i7-10870H, GeForce RTX 3070 Laptop GPU | Asus TUF Dash F15 FX516PR i7-11370H, GeForce RTX 3070 Laptop GPU | Schenker XMG Neo 15 Comet Lake i7-10875H, GeForce RTX 2070 Super Mobile | Aorus 15G XC i7-10870H, GeForce RTX 3070 Laptop GPU | Aorus 15P WB i7-10750H, GeForce RTX 2070 Max-Q | Asus ROG Strix G15 G513QR R9 5900HX, GeForce RTX 3070 Laptop GPU | Média da turma Gaming | |
|---|---|---|---|---|---|---|---|---|
| Heat | -4% | -12% | -15% | -3% | -2% | -7% | -7% | |
| Maximum Upper Side * (°C) | 47 | 40.2 14% | 55 -17% | 46 2% | 45 4% | 47 -0% | 49 -4% | 45.2 ? 4% |
| Maximum Bottom * (°C) | 57 | 45.6 20% | 56 2% | 65 -14% | 61 -7% | 62 -9% | 48 16% | 48.1 ? 16% |
| Idle Upper Side * (°C) | 26 | 28.8 -11% | 29 -12% | 32 -23% | 27 -4% | 26 -0% | 31 -19% | 31 ? -19% |
| Idle Bottom * (°C) | 27 | 37.4 -39% | 32 -19% | 34 -26% | 28 -4% | 27 -0% | 33 -22% | 34.2 ? -27% |
* ... menor é melhor
Oradores
Aorus 15P XC análise de áudio
(+) | os alto-falantes podem tocar relativamente alto (###valor### dB)
Graves 100 - 315Hz
(-) | quase nenhum baixo - em média 20.8% menor que a mediana
(±) | a linearidade dos graves é média (10.8% delta para a frequência anterior)
Médios 400 - 2.000 Hz
(±) | médios mais altos - em média 7.1% maior que a mediana
(+) | médios são lineares (4.9% delta para frequência anterior)
Altos 2 - 16 kHz
(+) | agudos equilibrados - apenas 1.9% longe da mediana
(+) | os máximos são lineares (4.6% delta da frequência anterior)
Geral 100 - 16.000 Hz
(±) | a linearidade do som geral é média (17% diferença em relação à mediana)
Comparado com a mesma classe
» 45% de todos os dispositivos testados nesta classe foram melhores, 12% semelhantes, 43% piores
» O melhor teve um delta de 6%, a média foi 18%, o pior foi 132%
Comparado com todos os dispositivos testados
» 31% de todos os dispositivos testados foram melhores, 8% semelhantes, 61% piores
» O melhor teve um delta de 4%, a média foi 23%, o pior foi 134%
Gerenciamento de energia - boa duração da bateria para um notebook de jogos
Consumo de energia
Medimos um consumo máximo de energia de 33 Watt enquanto ociosos. Isso é um pouco alto demais para nosso gosto. O teste de estresse e o teste Witcher 3 resultam em um consumo de até 256 Watt e uma média de 179 Watt, respectivamente. O MSIGS66Stealth 10UG, equipadocom a mesma combinação de CPU e GPU, é menos exigente devido ao seu TGP mais baixo. Apotência nominal da fonte de alimentação é de 230 Watt
| desligado | |
| Ocioso | |
| Carga |
|
Key:
min: | |
| Aorus 15P XC i7-10870H, GeForce RTX 3070 Laptop GPU | MSI GS66 Stealth 10UG i7-10870H, GeForce RTX 3070 Laptop GPU | Asus TUF Dash F15 FX516PR i7-11370H, GeForce RTX 3070 Laptop GPU | Schenker XMG Neo 15 Comet Lake i7-10875H, GeForce RTX 2070 Super Mobile | Aorus 15G XC i7-10870H, GeForce RTX 3070 Laptop GPU | Aorus 15P WB i7-10750H, GeForce RTX 2070 Max-Q | Asus ROG Strix G15 G513QR R9 5900HX, GeForce RTX 3070 Laptop GPU | Média da turma Gaming | |
|---|---|---|---|---|---|---|---|---|
| Power Consumption | 8% | 30% | -8% | 9% | 13% | 15% | 1% | |
| Idle Minimum * (Watt) | 14 | 12.9 8% | 9 36% | 17 -21% | 13 7% | 13 7% | 4 71% | 13 ? 7% |
| Idle Average * (Watt) | 17 | 15.4 9% | 11 35% | 19 -12% | 16 6% | 15 12% | 9 47% | 19 ? -12% |
| Idle Maximum * (Watt) | 33 | 27.1 18% | 16 52% | 29 12% | 30 9% | 19 42% | 36 -9% | 24.6 ? 25% |
| Load Average * (Watt) | 96 | 98.2 -2% | 107 -11% | 120 -25% | 92 4% | 100 -4% | 130 -35% | 110.7 ? -15% |
| Witcher 3 ultra * (Watt) | 179 | 164.9 8% | 121 32% | 186 -4% | 154 14% | 150 16% | 174 3% | |
| Load Maximum * (Watt) | 256 | 232.9 9% | 162 37% | 250 2% | 223 13% | 249 3% | 227 11% | 259 ? -1% |
* ... menor é melhor
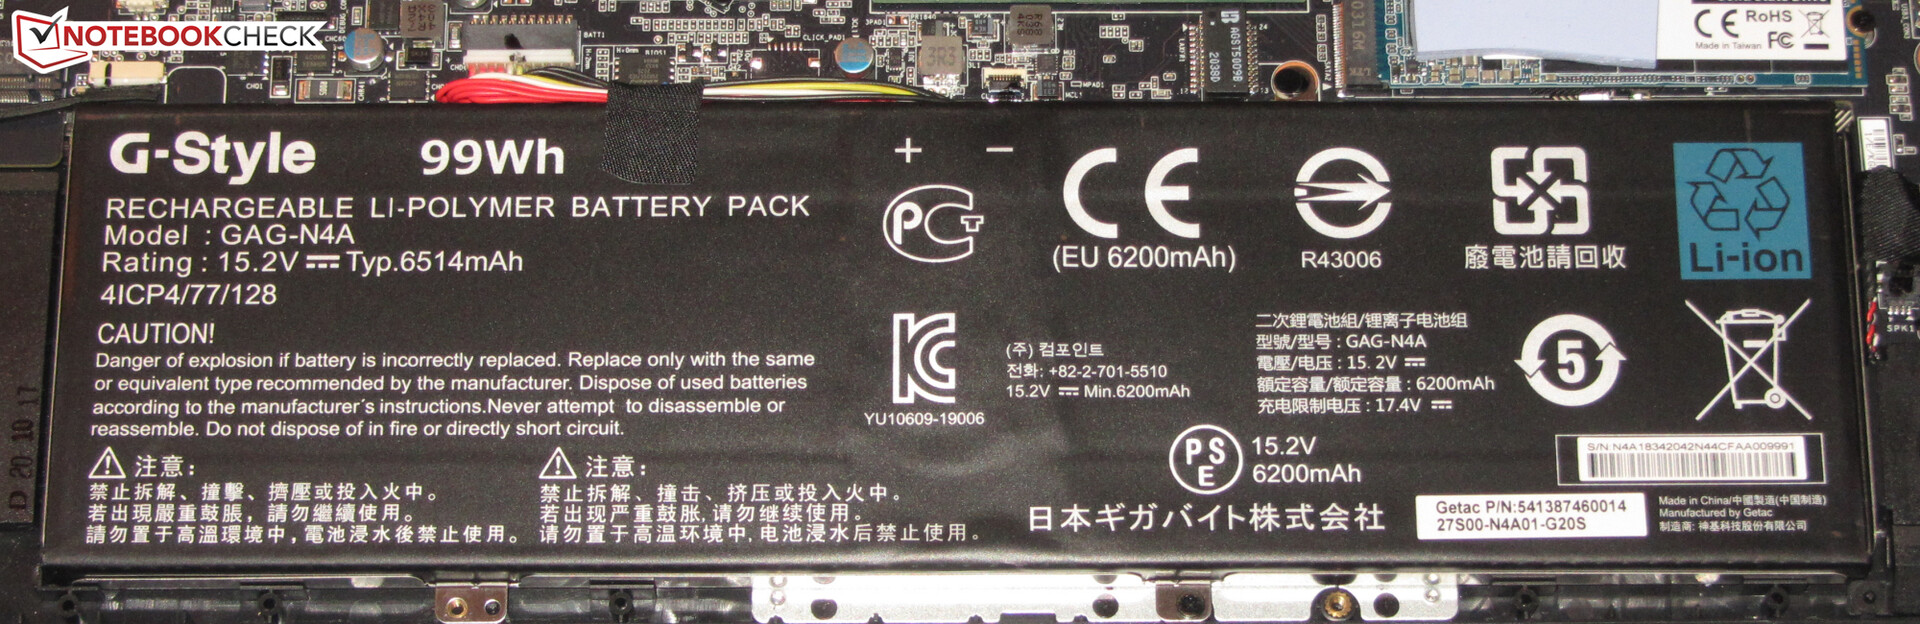
Vida útil da bateria
O Aorus 15P atinge uma duração de bateria de 6:39 ou 6:58 horas em nosso teste Wi-Fi (abertura de sites de acordo com um roteiro) e nosso teste de vídeo (execução do curta-metragem Big Buck Bunny (codec H.264, FHD) em loop), respectivamente. O modo de economia de energia é desativado e o brilho da tela é ajustado para cerca de 150 nits em ambos os testes. Além disso, desligamos os módulos de rede para o teste de vídeo.
| Aorus 15P XC i7-10870H, GeForce RTX 3070 Laptop GPU, 99 Wh | MSI GS66 Stealth 10UG i7-10870H, GeForce RTX 3070 Laptop GPU, 99.9 Wh | Asus TUF Dash F15 FX516PR i7-11370H, GeForce RTX 3070 Laptop GPU, 76 Wh | Schenker XMG Neo 15 Comet Lake i7-10875H, GeForce RTX 2070 Super Mobile, 93 Wh | Aorus 15P WB i7-10750H, GeForce RTX 2070 Max-Q, 94.24 Wh | Aorus 15G XC i7-10870H, GeForce RTX 3070 Laptop GPU, 99 Wh | Asus ROG Strix G15 G513QR R9 5900HX, GeForce RTX 3070 Laptop GPU, 90 Wh | Média da turma Gaming | |
|---|---|---|---|---|---|---|---|---|
| Duração da bateria | 22% | 52% | 12% | 24% | 10% | 39% | 3% | |
| Reader / Idle (h) | 9.5 | 10.8 14% | 16 68% | 11.3 19% | 9.6 1% | 8.27 ? -13% | ||
| H.264 (h) | 7 | 8.1 16% | 6.5 -7% | 13.5 93% | 8.32 ? 19% | |||
| WiFi v1.3 (h) | 6.7 | 7.1 6% | 9.1 36% | 7.5 12% | 7.1 6% | 6.3 -6% | 7.4 10% | 7.11 ? 6% |
| Load (h) | 1.5 | 2.2 47% | 2.3 53% | 2.3 53% | 1.7 13% | 1.502 ? 0% |
Pro
Contra
Veredicto
O 15P XC consegue exibir todos os jogos atuais suavemente graças a suaCPU i7-10870H Core octa-core e suaGPU para notebooksGeForce RTX 3070. Não há compromissos - a Gigabyte definiu o TGP da GPU para 130 Watt, o que significa que ela está quase operando em sua capacidade máxima (140 Watt).
A Gigabyte criou um notebook para jogos bem completo com muito poder de computação - o Aorus 15P XC.
CPU forte, GPU forte, 32 GB de RAM (2x 16 GB, modo de canal duplo, máx. 64 GB) - mas apenas um SSD de 512 GB. A capacidade de armazenamento não é particularmente generosa para um notebook de jogos. Muitos compradores terão que expandir o armazenamento, mais cedo ou mais tarde. Isto não deve representar um grande problema, pois o notebook tem um segundo slot disponível para um SSD NVMe adicional.
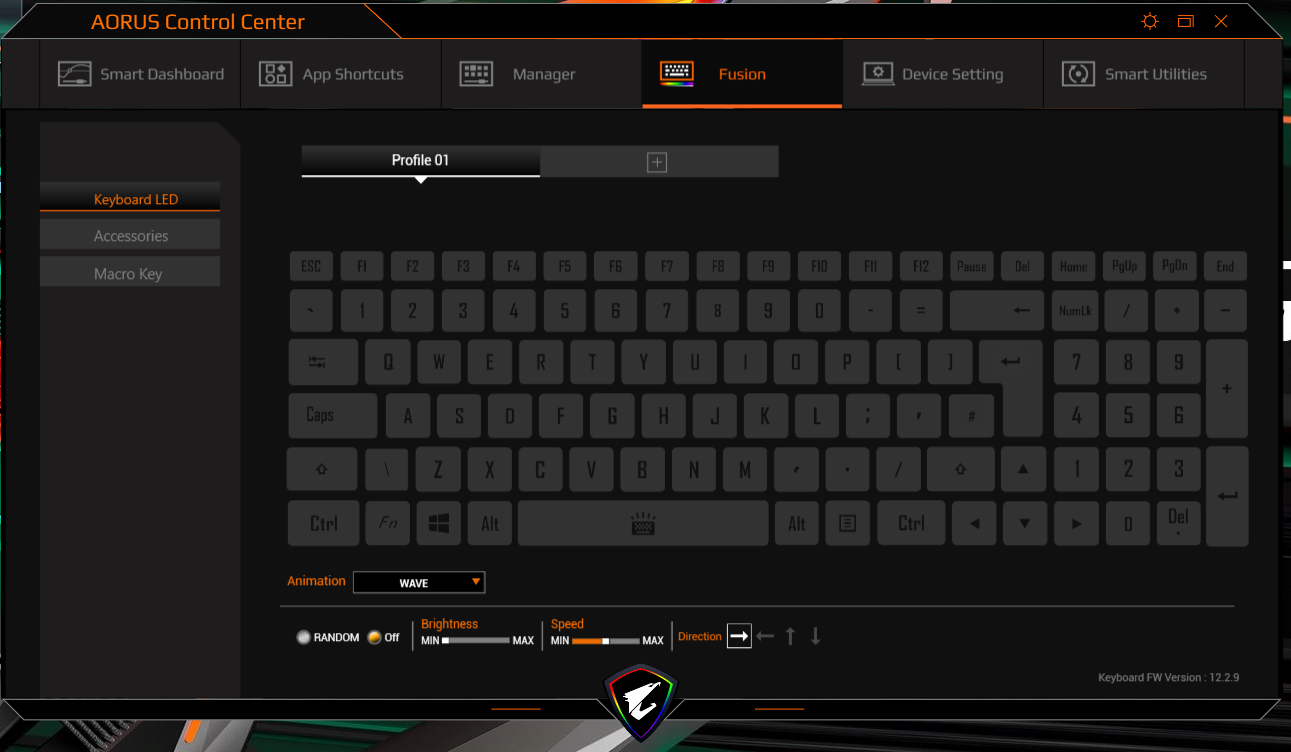
A tela (FHD, IPS, 240 Hz) tem ângulos de visão estáveis, superfície fosca, taxas de resposta curtas, cobertura de espaço de cor decente e - graças à sua certificação Pantone - grande precisão de cor. O brilho máximo é muito baixo, porém, para um notebook nesta faixa de preço em particular. O teclado (RGB backlighting) é adequado para uso diário e a duração da bateria é boa, com uma carga durando cerca de 6 a 7 horas de uso normal.
Preço e Disponibilidade
O Aorus 15P XC ainda não está listado nas principais lojas on-line dos varejistas on-line no momento em que foi escrito. Seu preço atual é de 1.900 euros (~$2.400) na Alemanha.
Aorus 15P XC
- 02/24/2021 v7 (old)
Sascha Mölck
Price comparison

