Notebookcheck Logo

Breve Análise do Análise do Razer Blade 15 Advanced Model (2020): Melhorias de detalhes compensam

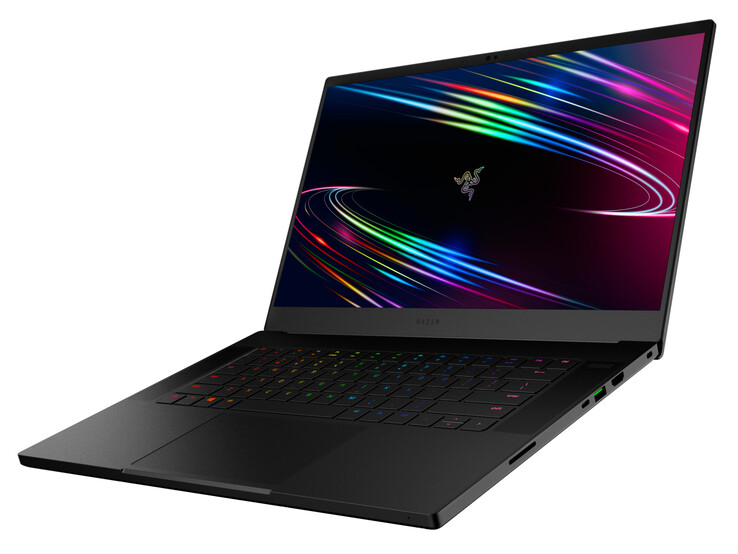
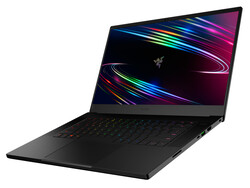
Ajuste fino. O equipamento compacto de 15,6 polegadas da Razer vem com hardware poderoso que roda todos os jogos mais recentes fluentemente na tela Full HD mate (300 Hz, IPS). Há também um SSD NVMe, 16 GB de RAM e uma porta Thunderbolt 3.
Razer Blade 15 RTX 2080 Super Max-Q (Blade 15 RTX Serie)
Processador
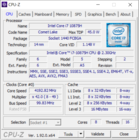
Intel Core i7-10875H 8 x 2.3 - 5.1 GHz, Comet Lake-H
Placa gráfica
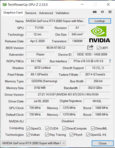
NVIDIA GeForce RTX 2080 Super Max-Q - 8 GB VRAM, Análises do: 1080 MHz, Memoría: 1375 MHz, GDDR6, interface de 256-bits, 27.21.14.5167 (Nvidia 451.67), Optimus
Memória
16 GB 
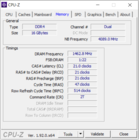
, DDR4 3200, dual-channel, dois slots de memória (ambos ocupados)
Pantalha
15.60 polegadas 16:9, 1920 x 1080 pixel 141 PPI, AU Optronics B156HAN12.0, IPS, Brilhante: não, 300 Hz
placa mãe
Intel HM470
Disco rígido
Samsung PM981a MZVLB1T0HBLR, 1024 GB 
, 883 GB livre
Placa de Som
Realtek ALC298 @ Intel Comet Point PCH - cAVS
Conexões
5 USB 3.1 Gen2, 1 Thunderbolt, 1 HDMI, 2 DisplayPort, 1 Kensington Lock, Conexões Audio: Áudio combinado, Card Reader: SD/SDHC/SDXC, TPM 2.0
Funcionamento em rede
Intel Wi-Fi 6 AX201 (a/b/g/h/n = Wi-Fi 4/ac = Wi-Fi 5/ax = Wi-Fi 6/), Bluetooth 5.1
Tamanho
altura x largura x profundidade (em mm): 17.8 x 355 x 235
Bateria
80 Wh Lítio-Ion
Sistema Operativo
Microsoft Windows 10 Home 64 Bit
Camera
Webcam: HD
Primary Camera: 0.9 MPix
Características adicionais
Alto falantes: Estéreo, Teclado: chiclet, Iluminação do Teclado: sim, MS Office 365 (versão de teste), 12 Meses Garantia
peso
2.2 kg
Preço
3300 Euro
Note: The manufacturer may use components from different suppliers including display panels, drives or memory sticks with similar specifications.


Rating
Date
Model
Weight
Height
Size
Resolution
Best Price
85.9 %
08/2020
Razer Blade 15 RTX 2080 Super Max-Q
i7-10875H, GeForce RTX 2080 Super Max-Q
2.2 kg17.8 mm15.60"1920x1080
81.5 %
04/2019
Asus Zephyrus S GX531GX
i7-8750H, GeForce RTX 2080 Max-Q
2.1 kg15.75 mm15.60"1920x1080
85.8 %
05/2020
Gigabyte Aero 15 OLED XB-8DE51B0SP
i7-10875H, GeForce RTX 2070 Super Max-Q
2.2 kg20 mm15.60"3840x2160
84.6 %
07/2020
MSI GE66 Raider 10SFS
i9-10980HK, GeForce RTX 2070 Super Mobile
2.4 kg23 mm15.60"1920x1080
82.8 %
12/2019
SCHENKER XMG Neo 15 XNE15M19
i7-9750H, GeForce RTX 2070 Max-Q
2.1 kg22 mm15.60"1920x1080

Size comparison

358 mm 267 mm 23 mm 2.4 kg359 mm 243 mm 22 mm 2.1 kg356 mm 250 mm 20 mm 2.2 kg360 mm 268 mm 15.75 mm 2.1 kg355 mm 235 mm 19.9 mm 2.1 kg355 mm 235 mm 17.8 mm 2.2 kg355 mm 235 mm 17.8 mm 2.2 kg297 mm 210 mm 1 mm 5.7 g
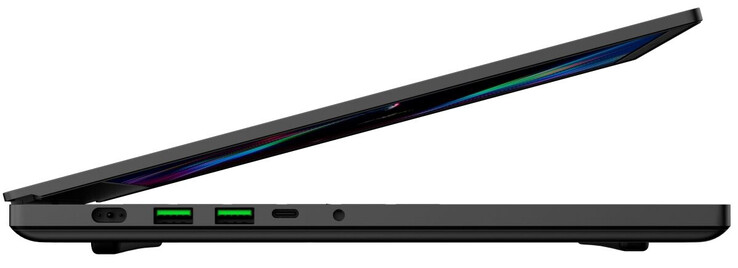
Left side: power supply, 2x USB 3.2 Gen 2 (Type-A), USB 3.2 Gen 2 (Type-C; DisplayPort, Power Delivery), combo audio
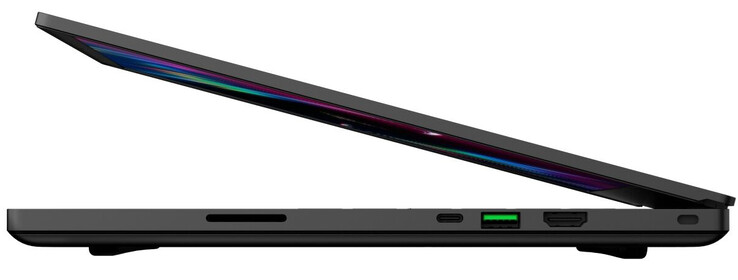
Right side: memory card reader (SD), Thunderbolt 3, USB 3.2 Gen 2 (Type-A), HDMI, cable lock slot
SD Card Reader
average JPG Copy Test (av. of 3 runs)
Gigabyte Aero 15 OLED XB-8DE51B0SP
  (Toshiba Exceria Pro SDXC 64 GB UHS-II)
204 MB/s +3%
Razer Blade 15 RTX 2080 Super Max-Q
  (Toshiba Exceria Pro SDXC 64 GB UHS-II)
198 MB/s
MSI GE66 Raider 10SFS
  (Toshiba Exceria Pro SDXC 64 GB UHS-II)
190 MB/s -4%
Average of class Gaming
  (19 - 202, n=100, last 2 years)
98.4 MB/s -50%
SCHENKER XMG Neo 15 XNE15M19
  (Toshiba Exceria Pro SDXC 64 GB UHS-II)
78 MB/s -61%
maximum AS SSD Seq Read Test (1GB)
Gigabyte Aero 15 OLED XB-8DE51B0SP
  (Toshiba Exceria Pro SDXC 64 GB UHS-II)
243 MB/s +18%
Razer Blade 15 RTX 2080 Super Max-Q
  (Toshiba Exceria Pro SDXC 64 GB UHS-II)
206 MB/s
MSI GE66 Raider 10SFS
  (Toshiba Exceria Pro SDXC 64 GB UHS-II)
202 MB/s -2%
Average of class Gaming
  (25.8 - 269, n=94, last 2 years)
121.3 MB/s -41%
SCHENKER XMG Neo 15 XNE15M19
  (Toshiba Exceria Pro SDXC 64 GB UHS-II)
85 MB/s -59%
Networking
iperf3 transmit AX12
Razer Blade 15 RZ09-0328
Intel Wi-Fi 6 AX201
1622 (1486min - 1748max) MBit/s +17%
Razer Blade 15 RTX 2080 Super Max-Q
Intel Wi-Fi 6 AX201
1386 (1331min - 1568max) MBit/s
Gigabyte Aero 15 OLED XB-8DE51B0SP
Killer Wi-Fi 6 AX1650x Wireless Network Adapter (200NGW)
1310 MBit/s -5%
Average Intel Wi-Fi 6 AX201
  (49.8 - 1775, n=324)
1161 MBit/s -16%
MSI GE66 Raider 10SFS
Killer Wi-Fi 6 AX1650i 160MHz Wireless Network Adapter (201NGW)
1150 MBit/s -17%
SCHENKER XMG Neo 15 XNE15M19
Intel Wireless-AC 9560
1140 MBit/s -18%
Average of class Gaming
  (885 - 1412, n=4, last 2 years)
1139 MBit/s -18%
Razer Blade 15 RTX 2080 Max-Q
Intel Wi-Fi 6 AX200
718 MBit/s -48%
Asus Zephyrus S GX531GX
Intel Wireless-AC 9560
644 MBit/s -54%
iperf3 receive AX12
MSI GE66 Raider 10SFS
Killer Wi-Fi 6 AX1650i 160MHz Wireless Network Adapter (201NGW)
1670 MBit/s +18%
Razer Blade 15 RZ09-0328
Intel Wi-Fi 6 AX201
1522 (1406min - 1631max) MBit/s +7%
Razer Blade 15 RTX 2080 Super Max-Q
Intel Wi-Fi 6 AX201
1419 (1355min - 1443max) MBit/s
Average of class Gaming
  (881 - 1700, n=4, last 2 years)
1379 MBit/s -3%
SCHENKER XMG Neo 15 XNE15M19
Intel Wireless-AC 9560
1360 MBit/s -4%
Average Intel Wi-Fi 6 AX201
  (136 - 1743, n=324)
1261 MBit/s -11%
Gigabyte Aero 15 OLED XB-8DE51B0SP
Killer Wi-Fi 6 AX1650x Wireless Network Adapter (200NGW)
1170 MBit/s -18%
Razer Blade 15 RTX 2080 Max-Q
Intel Wi-Fi 6 AX200
688 MBit/s -52%
Asus Zephyrus S GX531GX
Intel Wireless-AC 9560
661 MBit/s -53%
050100150200250300350400450500550600650700750800850900950100010501100115012001250130013501400145015001550160016501700Tooltip
Razer Blade 15 RTX 2080 Super Max-Q Intel Wi-Fi 6 AX201; iperf3 receive AX12; iperf 3.1.3: Ø1419 (1355-1443)
Razer Blade 15 RZ09-0328 Intel Wi-Fi 6 AX201; iperf3 receive AX12; iperf 3.1.3: Ø1521 (1406-1631)
Razer Blade 15 RTX 2080 Super Max-Q Intel Wi-Fi 6 AX201; iperf3 transmit AX12; iperf 3.1.3: Ø1386 (1331-1568)
Razer Blade 15 RZ09-0328 Intel Wi-Fi 6 AX201; iperf3 transmit AX12; iperf 3.1.3: Ø1622 (1486-1748)
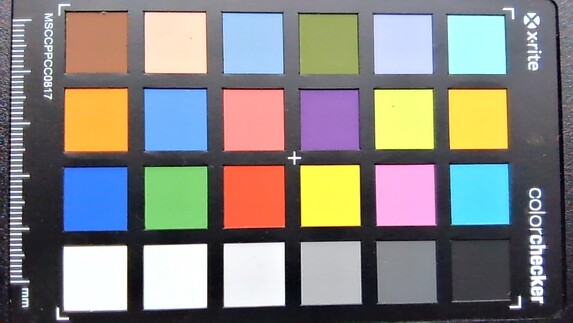
ColorChecker
24 ∆E
20.5 ∆E
25.4 ∆E
24.7 ∆E
25.2 ∆E
17.8 ∆E
18.3 ∆E
31.4 ∆E
20.6 ∆E
24.1 ∆E
18 ∆E
19.4 ∆E
27.9 ∆E
18.7 ∆E
24.1 ∆E
12.9 ∆E
25.6 ∆E
26.6 ∆E
2.7 ∆E
11.9 ∆E
20.6 ∆E
22.5 ∆E
22.9 ∆E
5.3 ∆E
ColorChecker Razer Blade 15 RTX 2080 Super Max-Q: 20.47 ∆E min: 2.75 - max: 31.42 ∆E
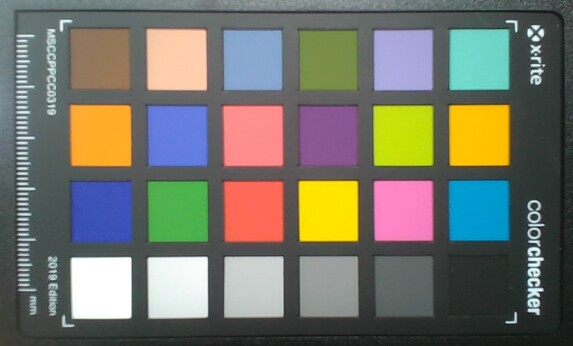
ColorChecker
14.9 ∆E
15.2 ∆E
15.1 ∆E
14.8 ∆E
12.6 ∆E
7.2 ∆E
15.4 ∆E
14.4 ∆E
17.5 ∆E
12.4 ∆E
11.4 ∆E
10 ∆E
8.1 ∆E
9.6 ∆E
22.5 ∆E
6.6 ∆E
17.5 ∆E
11.1 ∆E
2.3 ∆E
10.4 ∆E
13.2 ∆E
12.2 ∆E
8.1 ∆E
5 ∆E
ColorChecker MSI GE66 Raider 10SFS: 11.99 ∆E min: 2.33 - max: 22.54 ∆E
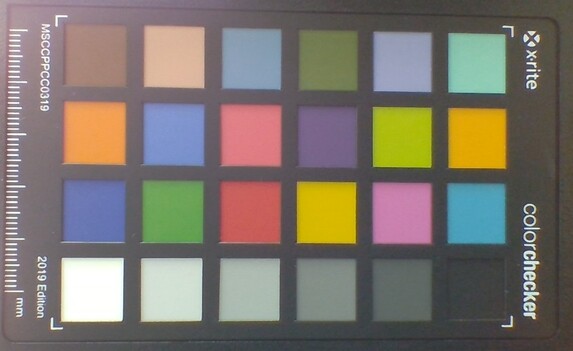
ColorChecker
20.9 ∆E
9.2 ∆E
13.4 ∆E
8.8 ∆E
12.2 ∆E
5.8 ∆E
9.8 ∆E
21.2 ∆E
12 ∆E
13.9 ∆E
5.9 ∆E
3.7 ∆E
19.5 ∆E
7.1 ∆E
11.9 ∆E
3.5 ∆E
11.9 ∆E
11.1 ∆E
3.3 ∆E
9.8 ∆E
10.2 ∆E
9.3 ∆E
8.8 ∆E
3.9 ∆E
ColorChecker Gigabyte Aero 15 OLED XB-8DE51B0SP: 10.3 ∆E min: 3.32 - max: 21.2 ∆E
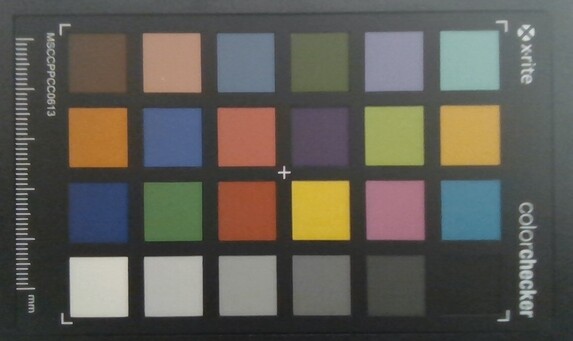
ColorChecker
6.7 ∆E
4.1 ∆E
6.8 ∆E
7.3 ∆E
11 ∆E
11.1 ∆E
8.2 ∆E
6.1 ∆E
10.9 ∆E
11.9 ∆E
9.2 ∆E
7.4 ∆E
8.6 ∆E
12.7 ∆E
10.7 ∆E
6.9 ∆E
13.2 ∆E
6 ∆E
11.2 ∆E
7.5 ∆E
5.1 ∆E
4.3 ∆E
4.5 ∆E
3.6 ∆E
ColorChecker Razer Blade 15 RZ09-0328: 8.13 ∆E min: 3.62 - max: 13.2 ∆E
316
cd/m²
328
cd/m²
310
cd/m²
335
cd/m²
347
cd/m²
331
cd/m²
314
cd/m²
342
cd/m²
327
cd/m²
Distribuição do brilho
AU Optronics B156HAN12.0 tested with X-Rite i1Pro 2
Máximo: 347 cd/m² (Nits) Médio: 327.8 cd/m² Minimum: 16.8 cd/m²
iluminação: 89 %
iluminação com acumulador: 347 cd/m²
Contraste: 1218:1 (Preto: 0.285 cd/m²)
ΔE Color 2.35 | 0.5-29.43 Ø5, calibrated: 1.16
ΔE Greyscale 3.04 | 0.57-98 Ø5.3
99% sRGB (Argyll 1.6.3 3D)
65% AdobeRGB 1998 (Argyll 1.6.3 3D)
71.4% AdobeRGB 1998 (Argyll 2.2.0 3D)
99% sRGB (Argyll 2.2.0 3D)
70.2% Display P3 (Argyll 2.2.0 3D)
Gamma: 2.35
Razer Blade 15 RTX 2080 Super Max-Q
AU Optronics B156HAN12.0, IPS, 1920x1080, 15.60
Razer Blade 15 RTX 2080 Max-Q
Sharp LQ156M1JW03 (SHP14C5), IPS, 1920x1080, 15.60
Asus Zephyrus S GX531GX
AU Optronics B156HAN08.2, IPS, 1920x1080, 15.60
Gigabyte Aero 15 OLED XB-8DE51B0SP
Samsung SDCA029, OLED, 3840x2160, 15.60
MSI GE66 Raider 10SFS
Sharp LQ156M1JW03 (SHP14C5), IPS-Level, 1920x1080, 15.60
SCHENKER XMG Neo 15 XNE15M19
NV156FHM-N4G (BOE084D), IPS, 1920x1080, 15.60
Display
-3%
-7%
27%
-2%
-9%
Display P3 Coverage
70.2
66.9
-5%
65.6
-7%
99.9
42%
68
-3%
64
-9%
sRGB Coverage
99
98.1
-1%
92.2
-7%
100
1%
99
0%
90.3
-9%
AdobeRGB 1998 Coverage
71.4
68.5
-4%
66.9
-6%
98.2
38%
69.8
-2%
65.4
-8%
Response Times
-65%
-12%
72%
-95%
-47%
Response Time Grey 50% / Grey 80% *
6 ?(3, 3)
12.8 ?(6.8, 6)
-113%
7 ?(3.6, 3.4)
-17%
2.2 ?(1, 1.2)
63%
16.4 ?(6.8, 7.6)
-173%
9.6 ?(4.8, 4.8)
-60%
Response Time Black / White *
9 ?(5, 4)
10.4 ?(6, 4.4)
-16%
9.6 ?(4.4, 5.2)
-7%
1.8 ?(1, 0.8)
80%
10.4 ?(6, 4.4)
-16%
12 ?(6.8, 5.2)
-33%
PWM Frequency
23810 ?(10)
60 ?(80)
23580 ?(19)
Screen
0%
-22%
2%
9%
-19%
Brightness middle
347
293
-16%
323.6
-7%
385
11%
291
-16%
313
-10%
Brightness
328
270
-18%
315
-4%
390
19%
278
-15%
295
-10%
Brightness Distribution
89
87
-2%
91
2%
93
4%
91
2%
89
0%
Black Level *
0.285
0.29
-2%
0.29
-2%
0.25
12%
0.3
-5%
Contrast
1218
1010
-17%
1116
-8%
1164
-4%
1043
-14%
Colorchecker dE 2000 *
2.35
1.69
28%
3.31
-41%
2.46
-5%
1.19
49%
3.33
-42%
Colorchecker dE 2000 max. *
4.15
3.37
19%
5.74
-38%
4.01
3%
3.04
27%
6.25
-51%
Colorchecker dE 2000 calibrated *
1.16
1.24
-7%
2.73
-135%
2.6
-124%
1.77
-53%
Greyscale dE 2000 *
3.04
2.3
24%
2.9
5%
1.39
54%
1.9
37%
3.1
-2%
Gamma
2.35 94%
2.3 96%
2.29 96%
2.31 95%
2.216 99%
2.51 88%
CCT
6658 98%
6758 96%
6765 96%
6395 102%
7018 93%
6930 94%
Color Space (Percent of AdobeRGB 1998)
65
63
-3%
59.7
-8%
98
51%
70
8%
59
-9%
Color Space (Percent of sRGB)
99
98.5
-1%
91.8
-7%
100
1%
92
-7%
90
-9%
Total Average (Program / Settings)
-23% / -8%
-14% / -18%
34% / 17%
-29% / -7%
-25% / -20%

* ... smaller is better

Display Response Times

Display response times show how fast the screen is able to change from one color to the next. Slow response times can lead to afterimages and can cause moving objects to appear blurry (ghosting). Gamers of fast-paced 3D titles should pay special attention to fast response times.
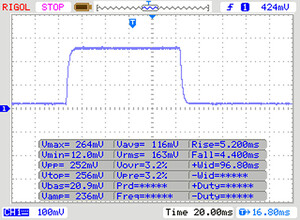
       Response Time Black to White
9 ms ... rise ↗ and fall ↘ combined↗ 5 ms rise
↘ 4 ms fall
The screen shows fast response rates in our tests and should be suited for gaming.
In comparison, all tested devices range from 0.1 (minimum) to 240 (maximum) ms. » 20 % of all devices are better.
This means that the measured response time is better than the average of all tested devices (21.5 ms).
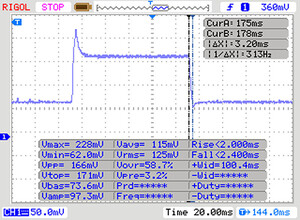
       Response Time 50% Grey to 80% Grey
6 ms ... rise ↗ and fall ↘ combined↗ 3 ms rise
↘ 3 ms fall
The screen shows very fast response rates in our tests and should be very well suited for fast-paced gaming.
In comparison, all tested devices range from 0.2 (minimum) to 636 (maximum) ms. » 13 % of all devices are better.
This means that the measured response time is better than the average of all tested devices (33.7 ms).

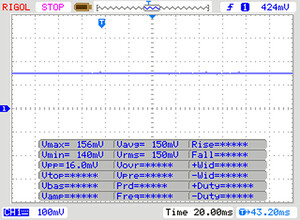
Screen Flickering / PWM (Pulse-Width Modulation)

To dim the screen, some notebooks will simply cycle the backlight on and off in rapid succession - a method called Pulse Width Modulation (PWM) . This cycling frequency should ideally be undetectable to the human eye. If said frequency is too low, users with sensitive eyes may experience strain or headaches or even notice the flickering altogether.
Screen flickering / PWM not detected

In comparison: 53 % of all tested devices do not use PWM to dim the display. If PWM was detected, an average of 17900 (minimum: 5 - maximum: 3846000) Hz was measured.

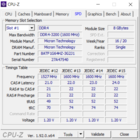
CPU-Z
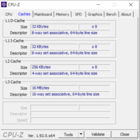
CPU-Z
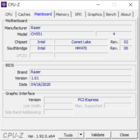
CPU-Z
CPU-Z
CPU-Z
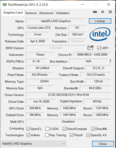
GPU-Z
GPU-Z
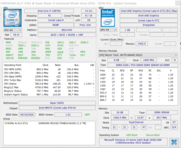
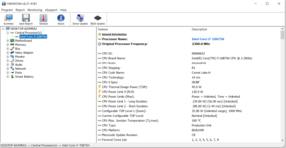
HWiNFO
HWiNFO
 
05010015020025030035040045050055060065070075080085090095010001050110011501200125013001350140014501500155016001650170017501800Tooltip
Razer Blade 15 RTX 2080 Super Max-Q Intel Core i7-10875H, Intel Core i7-10875H: Ø1028 (1017.94-1187.05)
Razer Blade 15 RTX 2080 Super Max-Q Intel Core i7-10875H, Intel Core i7-10875H; Hoch: Ø1211 (1197.82-1369.91)
Razer Blade 15 RTX 2080 Super Max-Q Intel Core i7-10875H, Intel Core i7-10875H; Boost: Ø1343 (1326.08-1451.69)
Asus Zephyrus S GX531GX Intel Core i7-8750H, Intel Core i7-8750H: Ø1072 (986.63-1110.9)
Gigabyte Aero 15 OLED XB-8DE51B0SP Intel Core i7-10875H, Intel Core i7-10875H: Ø1573 (1544.4-1818.6)
MSI GE66 Raider 10SFS Intel Core i9-10980HK, Intel Core i9-10980HK: Ø1610 (1581.15-1708.45)
SCHENKER XMG Neo 15 XNE15M19 Intel Core i7-9750H, Intel Core i7-9750H: Ø1002 (974.71-1181)
Razer Blade 15 RZ09-0328 Intel Core i7-10750H, Intel Core i7-10750H: Ø1069 (1047.18-1166.18)
Razer Blade 15 RTX 2080 Max-Q Intel Core i7-9750H, Intel Core i7-9750H: Ø1056 (1046.13-1175)
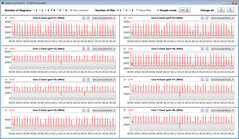
CPU clock speeds while running the CB15 loop
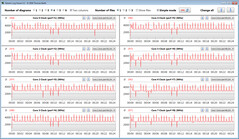
CPU clock speeds while running the CB15 loop ("High")
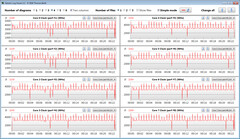
CPU clock speeds while running the CB15 loop ("Boost")
Cinebench R15 CPU Single 64Bit
196 Points
Cinebench R15 CPU Multi 64Bit
1187 Points
Cinebench R15 OpenGL 64Bit
136.9 fps
Cinebench R15 Ref. Match 64Bit
99.6 %
Ajuda
Cinebench R15
CPU Single 64Bit
Average of class Gaming
  (79.2 - 318, n=231, last 2 years)
268 Points +37%
Gigabyte Aero 15 OLED XB-8DE51B0SP
Intel Core i7-10875H
213 Points +9%
MSI GE66 Raider 10SFS
Intel Core i9-10980HK
206 Points +5%
Average Intel Core i7-10875H
  (190 - 220, n=37)
204 Points +4%
Razer Blade 15 RTX 2080 Super Max-Q
Intel Core i7-10875H (Boost)
203 Points +4%
Razer Blade 15 RTX 2080 Super Max-Q
Intel Core i7-10875H (Hoch)
202 Points +3%
Razer Blade 15 RTX 2080 Super Max-Q
Intel Core i7-10875H
196 Points
Razer Blade 15 RZ09-0328
Intel Core i7-10750H
193 Points -2%
SCHENKER XMG Neo 15 XNE15M19
Intel Core i7-9750H
192 Points -2%
Razer Blade 15 RTX 2080 Max-Q
Intel Core i7-9750H
175 Points -11%
Asus Zephyrus S GX531GX
Intel Core i7-8750H
168 Points -14%
CPU Multi 64Bit
Average of class Gaming
  (400 - 5663, n=232, last 2 years)
3090 Points +160%
Gigabyte Aero 15 OLED XB-8DE51B0SP
Intel Core i7-10875H
1818 (1544.4min - 1818.6max) Points +53%
MSI GE66 Raider 10SFS
Intel Core i9-10980HK
1708 (1581.15min - 1708.45max) Points +44%
Average Intel Core i7-10875H
  (1003 - 1833, n=38)
1554 Points +31%
Razer Blade 15 RTX 2080 Super Max-Q
Intel Core i7-10875H (Boost)
1452 Points +22%
Razer Blade 15 RTX 2080 Super Max-Q
Intel Core i7-10875H (Hoch)
1370 Points +15%
Razer Blade 15 RTX 2080 Super Max-Q
Intel Core i7-10875H
1187 Points
SCHENKER XMG Neo 15 XNE15M19
Intel Core i7-9750H
1181 Points -1%
Razer Blade 15 RTX 2080 Max-Q
Intel Core i7-9750H
1175 Points -1%
Razer Blade 15 RZ09-0328
Intel Core i7-10750H
1166 (1047.18min - 1166.18max) Points -2%
Asus Zephyrus S GX531GX
Intel Core i7-8750H
1122 Points -5%
Blender - v2.79 BMW27 CPU
Razer Blade 15 RZ09-0328
Intel Core i7-10750H
423 Seconds * -13%
Razer Blade 15 RTX 2080 Super Max-Q
Intel Core i7-10875H
374.7 Seconds *
Average Intel Core i7-10875H
  (259 - 535, n=30)
327 Seconds * +13%
Gigabyte Aero 15 OLED XB-8DE51B0SP
Intel Core i7-10875H
285 Seconds * +24%
MSI GE66 Raider 10SFS
Intel Core i9-10980HK
278 Seconds * +26%
Average of class Gaming
  (87 - 1259, n=226, last 2 years)
199.5 Seconds * +47%
7-Zip 18.03
7z b 4 -mmt1
Average of class Gaming
  (2685 - 7581, n=227, last 2 years)
6128 MIPS +13%
MSI GE66 Raider 10SFS
Intel Core i9-10980HK
5463 MIPS +1%
Gigabyte Aero 15 OLED XB-8DE51B0SP
Intel Core i7-10875H
5457 MIPS +1%
Razer Blade 15 RTX 2080 Super Max-Q
Intel Core i7-10875H
5423 MIPS
Average Intel Core i7-10875H
  (5071 - 5780, n=31)
5360 MIPS -1%
Razer Blade 15 RZ09-0328
Intel Core i7-10750H
5051 MIPS -7%
7z b 4
Average of class Gaming
  (11386 - 140932, n=227, last 2 years)
77071 MIPS +101%
Gigabyte Aero 15 OLED XB-8DE51B0SP
Intel Core i7-10875H
47170 MIPS +23%
MSI GE66 Raider 10SFS
Intel Core i9-10980HK
46976 MIPS +23%
Average Intel Core i7-10875H
  (29844 - 49562, n=31)
43117 MIPS +13%
Razer Blade 15 RTX 2080 Super Max-Q
Intel Core i7-10875H
38249 MIPS
Razer Blade 15 RZ09-0328
Intel Core i7-10750H
29009 MIPS -24%
Cinebench R20
CPU (Single Core)
Average of class Gaming
  (169 - 855, n=228, last 2 years)
698 Points +46%
Gigabyte Aero 15 OLED XB-8DE51B0SP
Intel Core i7-10875H
511 Points +7%
Average Intel Core i7-10875H
  (430 - 524, n=32)
486 Points +1%
Razer Blade 15 RTX 2080 Super Max-Q
Intel Core i7-10875H
479 Points
MSI GE66 Raider 10SFS
Intel Core i9-10980HK
476 Points -1%
Razer Blade 15 RZ09-0328
Intel Core i7-10750H
470 Points -2%
SCHENKER XMG Neo 15 XNE15M19
Intel Core i7-9750H
434 Points -9%
CPU (Multi Core)
Average of class Gaming
  (930 - 13769, n=228, last 2 years)
7423 Points +160%
MSI GE66 Raider 10SFS
Intel Core i9-10980HK
3843 Points +34%
Gigabyte Aero 15 OLED XB-8DE51B0SP
Intel Core i7-10875H
3801 Points +33%
Average Intel Core i7-10875H
  (1986 - 4176, n=32)
3455 Points +21%
Razer Blade 15 RTX 2080 Super Max-Q
Intel Core i7-10875H
2860 Points
Razer Blade 15 RZ09-0328
Intel Core i7-10750H
2600 Points -9%
SCHENKER XMG Neo 15 XNE15M19
Intel Core i7-9750H
2384 Points -17%
Geekbench 5.5
Single-Core
Average of class Gaming
  (158 - 2210, n=232, last 2 years)
1809 Points +39%
MSI GE66 Raider 10SFS
Intel Core i9-10980HK
1352 Points +4%
Gigabyte Aero 15 OLED XB-8DE51B0SP
Intel Core i7-10875H
1347 Points +4%
Average Intel Core i7-10875H
  (1233 - 1371, n=29)
1304 Points 0%
Razer Blade 15 RTX 2080 Super Max-Q
Intel Core i7-10875H
1300 Points
Razer Blade 15 RZ09-0328
Intel Core i7-10750H
1114 Points -14%
Multi-Core
Average of class Gaming
  (1946 - 22200, n=232, last 2 years)
13583 Points +94%
MSI GE66 Raider 10SFS
Intel Core i9-10980HK
8104 Points +16%
Gigabyte Aero 15 OLED XB-8DE51B0SP
Intel Core i7-10875H
8087 Points +16%
Average Intel Core i7-10875H
  (5715 - 8620, n=29)
7734 Points +11%
Razer Blade 15 RTX 2080 Super Max-Q
Intel Core i7-10875H
6991 Points
Razer Blade 15 RZ09-0328
Intel Core i7-10750H
5242 Points -25%
HWBOT x265 Benchmark v2.2 - 4k Preset
Average of class Gaming
  (3 - 37.6, n=230, last 2 years)
21.2 fps +106%
Gigabyte Aero 15 OLED XB-8DE51B0SP
Intel Core i7-10875H
13 fps +26%
MSI GE66 Raider 10SFS
Intel Core i9-10980HK
13 fps +26%
Average Intel Core i7-10875H
  (7.27 - 14.1, n=27)
11.7 fps +14%
Razer Blade 15 RTX 2080 Super Max-Q
Intel Core i7-10875H
10.3 fps
Razer Blade 15 RZ09-0328
Intel Core i7-10750H
8.074 fps -22%
LibreOffice - 20 Documents To PDF
MSI GE66 Raider 10SFS
Intel Core i9-10980HK
53.4 s * -11%
Razer Blade 15 RZ09-0328
Intel Core i7-10750H
53.2 s * -11%
Gigabyte Aero 15 OLED XB-8DE51B0SP
Intel Core i7-10875H
52.4 s * -9%
Average Intel Core i7-10875H
  (30.2 - 84.3, n=30)
50.3 s * -5%
Average of class Gaming
  (32.8 - 332, n=224, last 2 years)
49.2 s * -3%
Razer Blade 15 RTX 2080 Super Max-Q
Intel Core i7-10875H
47.94 s *
R Benchmark 2.5 - Overall mean
Average Intel Core i7-10875H
  (0.546 - 0.662, n=29)
0.582 sec * -1%
Razer Blade 15 RTX 2080 Super Max-Q
Intel Core i7-10875H
0.579 sec *
MSI GE66 Raider 10SFS
Intel Core i9-10980HK
0.564 sec * +3%
Gigabyte Aero 15 OLED XB-8DE51B0SP
Intel Core i7-10875H
0.547 sec * +6%
Average of class Gaming
  (0.3609 - 4.47, n=227, last 2 years)
0.4694 sec * +19%

* ... smaller is better

PCMark 8 Home Score Accelerated v2
4665 pontos
PCMark 8 Creative Score Accelerated v2
4352 pontos
PCMark 8 Work Score Accelerated v2
6340 pontos
PCMark 10 Score
5093 pontos
Ajuda
PCMark 10
Score
Average of class Gaming
  (5235 - 9852, n=197, last 2 years)
7580 Points +49%
Gigabyte Aero 15 OLED XB-8DE51B0SP
GeForce RTX 2070 Super Max-Q, i7-10875H, Intel Optane Memory H10 with Solid State Storage 32GB + 512GB HBRPEKNX0202A(L/H)
6580 Points +29%
MSI GE66 Raider 10SFS
GeForce RTX 2070 Super Mobile, i9-10980HK, WDC PC SN730 SDBPNTY-1T00
6053 Points +19%
Razer Blade 15 RTX 2080 Max-Q
GeForce RTX 2080 Max-Q, i7-9750H, Samsung SSD PM981 MZVLB512HAJQ
5839 Points +15%
SCHENKER XMG Neo 15 XNE15M19
GeForce RTX 2070 Max-Q, i7-9750H, Seagate FireCuda 510 SSD ZP1000GM30001
5522 Points +8%
Average Intel Core i7-10875H, NVIDIA GeForce RTX 2080 Super Max-Q
  (5093 - 5909, n=4)
5498 Points +8%
Asus Zephyrus S GX531GX
GeForce RTX 2080 Max-Q, i7-8750H, Intel SSD 660p SSDPEKNW512G8
5492 Points +8%
Razer Blade 15 RZ09-0328
GeForce RTX 2070 Max-Q, i7-10750H, Lite-On CA5-8D512
5244 Points +3%
Razer Blade 15 RTX 2080 Super Max-Q
GeForce RTX 2080 Super Max-Q, i7-10875H, Samsung PM981a MZVLB1T0HBLR
5093 Points
Essentials
Average of class Gaming
  (8300 - 12334, n=196, last 2 years)
10718 Points +18%
Gigabyte Aero 15 OLED XB-8DE51B0SP
GeForce RTX 2070 Super Max-Q, i7-10875H, Intel Optane Memory H10 with Solid State Storage 32GB + 512GB HBRPEKNX0202A(L/H)
10458 Points +15%
Razer Blade 15 RZ09-0328
GeForce RTX 2070 Max-Q, i7-10750H, Lite-On CA5-8D512
9993 Points +10%
MSI GE66 Raider 10SFS
GeForce RTX 2070 Super Mobile, i9-10980HK, WDC PC SN730 SDBPNTY-1T00
9813 Points +8%
SCHENKER XMG Neo 15 XNE15M19
GeForce RTX 2070 Max-Q, i7-9750H, Seagate FireCuda 510 SSD ZP1000GM30001
9478 Points +4%
Average Intel Core i7-10875H, NVIDIA GeForce RTX 2080 Super Max-Q
  (9118 - 9599, n=4)
9290 Points +2%
Razer Blade 15 RTX 2080 Super Max-Q
GeForce RTX 2080 Super Max-Q, i7-10875H, Samsung PM981a MZVLB1T0HBLR
9118 Points
Razer Blade 15 RTX 2080 Max-Q
GeForce RTX 2080 Max-Q, i7-9750H, Samsung SSD PM981 MZVLB512HAJQ
9109 Points 0%
Asus Zephyrus S GX531GX
GeForce RTX 2080 Max-Q, i7-8750H, Intel SSD 660p SSDPEKNW512G8
9042 Points -1%
Productivity
Average of class Gaming
  (6662 - 11833, n=196, last 2 years)
9716 Points +17%
Razer Blade 15 RTX 2080 Super Max-Q
GeForce RTX 2080 Super Max-Q, i7-10875H, Samsung PM981a MZVLB1T0HBLR
8285 Points
Razer Blade 15 RTX 2080 Max-Q
GeForce RTX 2080 Max-Q, i7-9750H, Samsung SSD PM981 MZVLB512HAJQ
8200 Points -1%
Gigabyte Aero 15 OLED XB-8DE51B0SP
GeForce RTX 2070 Super Max-Q, i7-10875H, Intel Optane Memory H10 with Solid State Storage 32GB + 512GB HBRPEKNX0202A(L/H)
8200 Points -1%
Average Intel Core i7-10875H, NVIDIA GeForce RTX 2080 Super Max-Q
  (7633 - 8386, n=4)
8106 Points -2%
Razer Blade 15 RZ09-0328
GeForce RTX 2070 Max-Q, i7-10750H, Lite-On CA5-8D512
7954 Points -4%
MSI GE66 Raider 10SFS
GeForce RTX 2070 Super Mobile, i9-10980HK, WDC PC SN730 SDBPNTY-1T00
7641 Points -8%
Asus Zephyrus S GX531GX
GeForce RTX 2080 Max-Q, i7-8750H, Intel SSD 660p SSDPEKNW512G8
7434 Points -10%
SCHENKER XMG Neo 15 XNE15M19
GeForce RTX 2070 Max-Q, i7-9750H, Seagate FireCuda 510 SSD ZP1000GM30001
7000 Points -16%
Digital Content Creation
Average of class Gaming
  (6462 - 18475, n=196, last 2 years)
11450 Points +141%
Gigabyte Aero 15 OLED XB-8DE51B0SP
GeForce RTX 2070 Super Max-Q, i7-10875H, Intel Optane Memory H10 with Solid State Storage 32GB + 512GB HBRPEKNX0202A(L/H)
9017 Points +90%
MSI GE66 Raider 10SFS
GeForce RTX 2070 Super Mobile, i9-10980HK, WDC PC SN730 SDBPNTY-1T00
8029 Points +69%
Razer Blade 15 RTX 2080 Max-Q
GeForce RTX 2080 Max-Q, i7-9750H, Samsung SSD PM981 MZVLB512HAJQ
7236 Points +52%
SCHENKER XMG Neo 15 XNE15M19
GeForce RTX 2070 Max-Q, i7-9750H, Seagate FireCuda 510 SSD ZP1000GM30001
6887 Points +45%
Asus Zephyrus S GX531GX
GeForce RTX 2080 Max-Q, i7-8750H, Intel SSD 660p SSDPEKNW512G8
6690 Points +41%
Average Intel Core i7-10875H, NVIDIA GeForce RTX 2080 Super Max-Q
  (4747 - 7296, n=4)
6074 Points +28%
Razer Blade 15 RZ09-0328
GeForce RTX 2070 Max-Q, i7-10750H, Lite-On CA5-8D512
4926 Points +4%
Razer Blade 15 RTX 2080 Super Max-Q
GeForce RTX 2080 Super Max-Q, i7-10875H, Samsung PM981a MZVLB1T0HBLR
4747 Points
PCMark 8
Home Score Accelerated v2
Average of class Gaming
  (4166 - 6653, n=34, last 2 years)
5222 Points +12%
Razer Blade 15 RTX 2080 Super Max-Q
GeForce RTX 2080 Super Max-Q, i7-10875H, Samsung PM981a MZVLB1T0HBLR
4665 Points
Average Intel Core i7-10875H, NVIDIA GeForce RTX 2080 Super Max-Q
  (4375 - 4666, n=3)
4569 Points -2%
Razer Blade 15 RTX 2080 Max-Q
GeForce RTX 2080 Max-Q, i7-9750H, Samsung SSD PM981 MZVLB512HAJQ
4380 Points -6%
Asus Zephyrus S GX531GX
GeForce RTX 2080 Max-Q, i7-8750H, Intel SSD 660p SSDPEKNW512G8
3979 Points -15%
Razer Blade 15 RZ09-0328
GeForce RTX 2070 Max-Q, i7-10750H, Lite-On CA5-8D512
3696 Points -21%
Work Score Accelerated v2
Razer Blade 15 RTX 2080 Super Max-Q
GeForce RTX 2080 Super Max-Q, i7-10875H, Samsung PM981a MZVLB1T0HBLR
6340 Points
Average Intel Core i7-10875H, NVIDIA GeForce RTX 2080 Super Max-Q
  (5682 - 6370, n=3)
6131 Points -3%
Average of class Gaming
  (4622 - 7085, n=32, last 2 years)
6048 Points -5%
Razer Blade 15 RTX 2080 Max-Q
GeForce RTX 2080 Max-Q, i7-9750H, Samsung SSD PM981 MZVLB512HAJQ
5749 Points -9%
Asus Zephyrus S GX531GX
GeForce RTX 2080 Max-Q, i7-8750H, Intel SSD 660p SSDPEKNW512G8
5289 Points -17%
Razer Blade 15 RZ09-0328
GeForce RTX 2070 Max-Q, i7-10750H, Lite-On CA5-8D512
4705 Points -26%
DPC Latencies / LatencyMon - interrupt to process latency (max), Web, Youtube, Prime95
Gigabyte Aero 15 OLED XB-8DE51B0SP
GeForce RTX 2070 Super Max-Q, i7-10875H, Intel Optane Memory H10 with Solid State Storage 32GB + 512GB HBRPEKNX0202A(L/H)
1877 μs * -139%
MSI GE66 Raider 10SFS
GeForce RTX 2070 Super Mobile, i9-10980HK, WDC PC SN730 SDBPNTY-1T00
935 μs * -19%
Razer Blade 15 RZ09-0328
GeForce RTX 2070 Max-Q, i7-10750H, Lite-On CA5-8D512
905 μs * -15%
Razer Blade 15 RTX 2080 Super Max-Q
GeForce RTX 2080 Super Max-Q, i7-10875H, Samsung PM981a MZVLB1T0HBLR
785 μs *

* ... smaller is better

Samsung PM981a MZVLB1T0HBLR
CDM 5/6 Read Seq Q32T1: 3238 MB/s
CDM 5/6 Write Seq Q32T1: 2984 MB/s
CDM 5/6 Read 4K Q32T1: 569 MB/s
CDM 5/6 Write 4K Q32T1: 510 MB/s
CDM 5 Read Seq: 1949 MB/s
CDM 5 Write Seq: 2180 MB/s
CDM 5/6 Read 4K: 46.98 MB/s
CDM 5/6 Write 4K: 135.7 MB/s
Razer Blade 15 RTX 2080 Super Max-Q
Samsung PM981a MZVLB1T0HBLR
Razer Blade 15 RTX 2080 Max-Q
Samsung SSD PM981 MZVLB512HAJQ
Asus Zephyrus S GX531GX
Intel SSD 660p SSDPEKNW512G8
Gigabyte Aero 15 OLED XB-8DE51B0SP
Intel Optane Memory H10 with Solid State Storage 32GB + 512GB HBRPEKNX0202A(L/H)
MSI GE66 Raider 10SFS
WDC PC SN730 SDBPNTY-1T00
SCHENKER XMG Neo 15 XNE15M19
Seagate FireCuda 510 SSD ZP1000GM30001
Razer Blade 15 RZ09-0328
Lite-On CA5-8D512
Average Samsung PM981a MZVLB1T0HBLR
 
CrystalDiskMark 5.2 / 6
-13%
-41%
0%
6%
-18%
-1%
-2%
Write 4K
135.7
137.2
1%
93.9
-31%
127.4
-6%
158.2
17%
108.7
-20%
118.7
-13%
Read 4K
46.98
46.82
0%
46.29
-1%
147.5
214%
50.7
8%
41.4
-12%
52.4
12%
Write Seq
2180
1221
-44%
974
-55%
485.9
-78%
1790
-18%
1083
-50%
2247
3%
Read Seq
1949
1217
-38%
1425
-27%
1352
-31%
2469
27%
917
-53%
2234
15%
Write 4K Q32T1
510
527
3%
259.4
-49%
476.5
-7%
503
-1%
468.5
-8%
515
1%
461 ?(268 - 656, n=36)
-10%
Read 4K Q32T1
569
614
8%
296.5
-48%
531
-7%
579
2%
530
-7%
584
3%
499 ?(289 - 730, n=36)
-12%
Write Seq Q32T1
2984
1986
-33%
977
-67%
1061
-64%
3102
4%
3057
2%
2235
-25%
Read Seq Q32T1
3238
3234
0%
1666
-49%
2552
-21%
3413
5%
3422
6%
3171
-2%
AS SSD
-4%
-37%
-37%
21%
14%
-24%
5%
Seq Read
1950
1832
-6%
1239
-36%
1200
-38%
2979
53%
2341
20%
2021
4%
Seq Write
2322
1864
-20%
920
-60%
836
-64%
2581
11%
2575
11%
2090
-10%
2084 ?(1248 - 2837, n=37)
-10%
4K Read
45.48
52.1
15%
45.74
1%
65.8
45%
47.33
4%
51
12%
47.71
5%
4K Write
95.4
108.3
14%
95.7
0%
103.8
9%
140
47%
118.6
24%
101.1
6%
131.2 ?(87.4 - 208, n=37)
38%
4K-64 Read
1484
1159
-22%
322
-78%
789
-47%
1710
15%
1637
10%
856
-42%
4K-64 Write
1887
1807
-4%
722
-62%
929
-51%
2188
16%
2442
29%
1041
-45%
Access Time Read *
0.051
0.05
2%
0.073
-43%
0.103
-102%
0.05
2%
0.066
-29%
0.052
-2%
Access Time Write *
0.038
0.034
11%
0.047
-24%
0.045
-18%
0.026
32%
0.028
26%
0.111
-192%
0.04222 ?(0.017 - 0.128, n=37)
-11%
Score Read
1725
1394
-19%
492
-71%
975
-43%
2055
19%
1922
11%
1105
-36%
Score Write
2215
2102
-5%
910
-59%
1117
-50%
2586
17%
2818
27%
1351
-39%
Score Total
4843
4221
-13%
1654
-66%
2594
-46%
5673
17%
5738
18%
3037
-37%
Copy ISO MB/s
1903
2083
9%
1236
-35%
2474
30%
Copy Program MB/s
505
496.5
-2%
703
39%
679
34%
Copy Game MB/s
1113
977
-12%
812
-27%
1037
-7%
Total Average (Program / Settings)
-9% / -7%
-39% / -39%
-19% / -21%
14% / 15%
-2% / 1%
-13% / -15%
2% / 3%

* ... smaller is better

Continuous load read: DiskSpd Read Loop, Queue Depth 8

No graph data
3DMark 11 Performance
20888 pontos
3DMark Cloud Gate Standard Score
32880 pontos
3DMark Fire Strike Score
17148 pontos
3DMark Time Spy Score
7683 pontos
Ajuda
3DMark 11 - 1280x720 Performance GPU
Average of class Gaming
  (1029 - 72070, n=231, last 2 years)
40470 Points +44%
MSI GE66 Raider 10SFS
NVIDIA GeForce RTX 2070 Super Mobile, Intel Core i9-10980HK
30309 Points +7%
Average NVIDIA GeForce RTX 2080 Super Max-Q
  (26292 - 32995, n=10)
29663 Points +5%
Asus Zephyrus S GX531GX
NVIDIA GeForce RTX 2080 Max-Q, Intel Core i7-8750H
28997 Points +3%
Gigabyte Aero 15 OLED XB-8DE51B0SP
NVIDIA GeForce RTX 2070 Super Max-Q, Intel Core i7-10875H
28900 Points +2%
Razer Blade 15 RTX 2080 Super Max-Q
NVIDIA GeForce RTX 2080 Super Max-Q, Intel Core i7-10875H
28200 Points
Razer Blade 15 RTX 2080 Max-Q
NVIDIA GeForce RTX 2080 Max-Q, Intel Core i7-9750H
27762 Points -2%
Razer Blade 15 RZ09-0328
NVIDIA GeForce RTX 2070 Max-Q, Intel Core i7-10750H
23326 Points -17%
SCHENKER XMG Neo 15 XNE15M19
NVIDIA GeForce RTX 2070 Max-Q, Intel Core i7-9750H
21861 Points -22%
3DMark
1280x720 Cloud Gate Standard Graphics
MSI GE66 Raider 10SFS
NVIDIA GeForce RTX 2070 Super Mobile, Intel Core i9-10980HK
141778 Points +11%
Average of class Gaming
  (15902 - 193851, n=142, last 2 years)
136246 Points +7%
Razer Blade 15 RTX 2080 Super Max-Q
NVIDIA GeForce RTX 2080 Super Max-Q, Intel Core i7-10875H
127741 Points
Average NVIDIA GeForce RTX 2080 Super Max-Q
  (101976 - 140750, n=7)
126108 Points -1%
Razer Blade 15 RTX 2080 Max-Q
NVIDIA GeForce RTX 2080 Max-Q, Intel Core i7-9750H
115893 Points -9%
SCHENKER XMG Neo 15 XNE15M19
NVIDIA GeForce RTX 2070 Max-Q, Intel Core i7-9750H
114009 Points -11%
Gigabyte Aero 15 OLED XB-8DE51B0SP
NVIDIA GeForce RTX 2070 Super Max-Q, Intel Core i7-10875H
112791 Points -12%
Asus Zephyrus S GX531GX
NVIDIA GeForce RTX 2080 Max-Q, Intel Core i7-8750H
106350 Points -17%
Razer Blade 15 RZ09-0328
NVIDIA GeForce RTX 2070 Max-Q, Intel Core i7-10750H
59017 Points -54%
1920x1080 Fire Strike Graphics
Average of class Gaming
  (781 - 53059, n=235, last 2 years)
29450 Points +37%
MSI GE66 Raider 10SFS
NVIDIA GeForce RTX 2070 Super Mobile, Intel Core i9-10980HK
22836 Points +6%
Average NVIDIA GeForce RTX 2080 Super Max-Q
  (19655 - 23649, n=10)
21743 Points +1%
Razer Blade 15 RTX 2080 Super Max-Q
NVIDIA GeForce RTX 2080 Super Max-Q, Intel Core i7-10875H
21479 Points
Asus Zephyrus S GX531GX
NVIDIA GeForce RTX 2080 Max-Q, Intel Core i7-8750H
21237 Points -1%
Gigabyte Aero 15 OLED XB-8DE51B0SP
NVIDIA GeForce RTX 2070 Super Max-Q, Intel Core i7-10875H
21121 Points -2%
Razer Blade 15 RTX 2080 Max-Q
NVIDIA GeForce RTX 2080 Max-Q, Intel Core i7-9750H
20718 Points -4%
Razer Blade 15 RZ09-0328
NVIDIA GeForce RTX 2070 Max-Q, Intel Core i7-10750H
18166 Points -15%
SCHENKER XMG Neo 15 XNE15M19
NVIDIA GeForce RTX 2070 Max-Q, Intel Core i7-9750H
17419 Points -19%
2560x1440 Time Spy Graphics
Average of class Gaming
  (224 - 22547, n=233, last 2 years)
12063 Points +55%
MSI GE66 Raider 10SFS
NVIDIA GeForce RTX 2070 Super Mobile, Intel Core i9-10980HK
8328 Points +7%
Average NVIDIA GeForce RTX 2080 Super Max-Q
  (7372 - 8979, n=11)
8210 Points +6%
Asus Zephyrus S GX531GX
NVIDIA GeForce RTX 2080 Max-Q, Intel Core i7-8750H
8171 Points +5%
Razer Blade 15 RTX 2080 Super Max-Q
NVIDIA GeForce RTX 2080 Super Max-Q, Intel Core i7-10875H (GPU: Hoch)
8074 Points +4%
Razer Blade 15 RTX 2080 Max-Q
NVIDIA GeForce RTX 2080 Max-Q, Intel Core i7-9750H
7840 Points +1%
Gigabyte Aero 15 OLED XB-8DE51B0SP
NVIDIA GeForce RTX 2070 Super Max-Q, Intel Core i7-10875H
7829 Points +1%
Razer Blade 15 RTX 2080 Super Max-Q
NVIDIA GeForce RTX 2080 Super Max-Q, Intel Core i7-10875H
7766 Points
Razer Blade 15 RZ09-0328
NVIDIA GeForce RTX 2070 Max-Q, Intel Core i7-10750H
6722 Points -13%
SCHENKER XMG Neo 15 XNE15M19
NVIDIA GeForce RTX 2070 Max-Q, Intel Core i7-9750H
6387 Points -18%
The Witcher 3 - 1920x1080 Ultra Graphics & Postprocessing (HBAO+)
Average of class Gaming
  (8.61 - 216, n=226, last 2 years)
117.1 fps +34%
Razer Blade 15 RTX 2080 Super Max-Q
Intel Core i7-10875H, NVIDIA GeForce RTX 2080 Super Max-Q (GPU: Hoch)
88.6 fps +1%
Razer Blade 15 RTX 2080 Super Max-Q
Intel Core i7-10875H, NVIDIA GeForce RTX 2080 Super Max-Q
87.7 fps
Average NVIDIA GeForce RTX 2080 Super Max-Q
  (74.3 - 96, n=11)
85.3 fps -3%
MSI GE66 Raider 10SFS
Intel Core i9-10980HK, NVIDIA GeForce RTX 2070 Super Mobile
85.1 (71min) fps -3%
Asus Zephyrus S GX531GX
Intel Core i7-8750H, NVIDIA GeForce RTX 2080 Max-Q
80.3 fps -8%
Gigabyte Aero 15 OLED XB-8DE51B0SP
Intel Core i7-10875H, NVIDIA GeForce RTX 2070 Super Max-Q
79.1 (64min) fps -10%
Razer Blade 15 RTX 2080 Max-Q
Intel Core i7-9750H, NVIDIA GeForce RTX 2080 Max-Q
78.3 fps -11%
Razer Blade 15 RZ09-0328
Intel Core i7-10750H, NVIDIA GeForce RTX 2070 Max-Q
61.9 (58min - 69max) fps -29%
SCHENKER XMG Neo 15 XNE15M19
Intel Core i7-9750H, NVIDIA GeForce RTX 2070 Max-Q
60.4 (49min) fps -31%
BioShock Infinite - 1920x1080 Ultra Preset, DX11 (DDOF)
Average NVIDIA GeForce RTX 2080 Super Max-Q
  (170.2 - 181.1, n=4)
174.4 fps +1%
Razer Blade 15 RTX 2080 Super Max-Q
Intel Core i7-10875H, NVIDIA GeForce RTX 2080 Super Max-Q
173 fps
Razer Blade 15 RTX 2080 Max-Q
Intel Core i7-9750H, NVIDIA GeForce RTX 2080 Max-Q
170 fps -2%
Asus Zephyrus S GX531GX
Intel Core i7-8750H, NVIDIA GeForce RTX 2080 Max-Q
166 fps -4%
Shadow of the Tomb Raider - 1920x1080 Highest Preset AA:T
Average of class Gaming
  (27 - 271, n=30, last 2 years)
161.3 fps +73%
MSI GE66 Raider 10SFS
Intel Core i9-10980HK, NVIDIA GeForce RTX 2070 Super Mobile
108 (86min) fps +16%
Gigabyte Aero 15 OLED XB-8DE51B0SP
Intel Core i7-10875H, NVIDIA GeForce RTX 2070 Super Max-Q
100 (77min) fps +8%
Average NVIDIA GeForce RTX 2080 Super Max-Q
  (89 - 106, n=10)
95.8 fps +3%
Razer Blade 15 RTX 2080 Super Max-Q
Intel Core i7-10875H, NVIDIA GeForce RTX 2080 Super Max-Q
93 fps
Razer Blade 15 RTX 2080 Super Max-Q
Intel Core i7-10875H, NVIDIA GeForce RTX 2080 Super Max-Q (GPU: Hoch)
92 fps -1%
Razer Blade 15 RZ09-0328
Intel Core i7-10750H, NVIDIA GeForce RTX 2070 Max-Q
85 fps -9%
Far Cry 5 - 1920x1080 Ultra Preset AA:T
Average of class Gaming
  (14 - 218, n=125, last 2 years)
126.3 fps +39%
Average NVIDIA GeForce RTX 2080 Super Max-Q
  (91 - 110, n=4)
101 fps +11%
Razer Blade 15 RTX 2080 Super Max-Q
Intel Core i7-10875H, NVIDIA GeForce RTX 2080 Super Max-Q
91 fps
Battlefield V - 1920x1080 Ultra Preset
MSI GE66 Raider 10SFS
Intel Core i9-10980HK, NVIDIA GeForce RTX 2070 Super Mobile
141 (109min) fps +29%
Gigabyte Aero 15 OLED XB-8DE51B0SP
Intel Core i7-10875H, NVIDIA GeForce RTX 2070 Super Max-Q
130 (99min) fps +19%
Average NVIDIA GeForce RTX 2080 Super Max-Q
  (109.7 - 125, n=4)
117.9 fps +7%
Razer Blade 15 RTX 2080 Super Max-Q
Intel Core i7-10875H, NVIDIA GeForce RTX 2080 Super Max-Q
109.7 fps
Borderlands 3 - 1920x1080 Badass Overall Quality (DX11)
Average of class Gaming
  (22.4 - 179.7, n=16, last 2 years)
102.2 fps +64%
MSI GE66 Raider 10SFS
Intel Core i9-10980HK, NVIDIA GeForce RTX 2070 Super Mobile
70.6 fps +13%
Average NVIDIA GeForce RTX 2080 Super Max-Q
  (62.5 - 71.6, n=4)
66.4 fps +6%
Gigabyte Aero 15 OLED XB-8DE51B0SP
Intel Core i7-10875H, NVIDIA GeForce RTX 2070 Super Max-Q
64.8 fps +4%
Razer Blade 15 RTX 2080 Super Max-Q
Intel Core i7-10875H, NVIDIA GeForce RTX 2080 Super Max-Q
62.5 fps
Razer Blade 15 RZ09-0328
Intel Core i7-10750H, NVIDIA GeForce RTX 2070 Max-Q
57.3 fps -8%
SCHENKER XMG Neo 15 XNE15M19
Intel Core i7-9750H, NVIDIA GeForce RTX 2070 Max-Q
53 fps -15%
Control - 1920x1080 High Quality Preset (DX11)
Average of class Gaming
  (83.5 - 187, n=6, last 2 years)
147.4 fps +108%
MSI GE66 Raider 10SFS
Intel Core i9-10980HK, NVIDIA GeForce RTX 2070 Super Mobile
80.8 (68min) fps +14%
Average NVIDIA GeForce RTX 2080 Super Max-Q
  (71 - 79.8, n=3)
74 fps +4%
Razer Blade 15 RTX 2080 Super Max-Q
Intel Core i7-10875H, NVIDIA GeForce RTX 2080 Super Max-Q
71 fps
Gigabyte Aero 15 OLED XB-8DE51B0SP
Intel Core i7-10875H, NVIDIA GeForce RTX 2070 Super Max-Q
60.2 (52min) fps -15%
SCHENKER XMG Neo 15 XNE15M19
Intel Core i7-9750H, NVIDIA GeForce RTX 2070 Max-Q
59.3 (52min) fps -16%
Red Dead Redemption 2 - 1920x1080 Maximum Settings
MSI GE66 Raider 10SFS
Intel Core i9-10980HK, NVIDIA GeForce RTX 2070 Super Mobile
47.6 (28min) fps +17%
Average NVIDIA GeForce RTX 2080 Super Max-Q
  (40.6 - 45, n=5)
43 fps +6%
Gigabyte Aero 15 OLED XB-8DE51B0SP
Intel Core i7-10875H, NVIDIA GeForce RTX 2070 Super Max-Q
42.4 (25min) fps +4%
Razer Blade 15 RTX 2080 Super Max-Q
Intel Core i7-10875H, NVIDIA GeForce RTX 2080 Super Max-Q
40.6 fps
Doom Eternal - 1920x1080 Ultra Preset
MSI GE66 Raider 10SFS
Intel Core i9-10980HK, NVIDIA GeForce RTX 2070 Super Mobile
170 (115min) fps +18%
Average NVIDIA GeForce RTX 2080 Super Max-Q
  (140 - 177.7, n=8)
155.7 fps +8%
Razer Blade 15 RTX 2080 Super Max-Q
Intel Core i7-10875H, NVIDIA GeForce RTX 2080 Super Max-Q
144.4 fps
Average of class Gaming
  (22.2 - 189.7, n=5, last 2 years)
130.7 fps -9%
0102030405060708090Tooltip
Razer Blade 15 RTX 2080 Super Max-Q GeForce RTX 2080 Super Max-Q, i7-10875H, Samsung PM981a MZVLB1T0HBLR: Ø74.8 (63-82)
Razer Blade 15 RTX 2080 Super Max-Q GeForce RTX 2080 Super Max-Q, i7-10875H; GPU: Hoch: Ø85.2 (76-91)
Asus Zephyrus S GX531GX GeForce RTX 2080 Max-Q, i7-8750H, Intel SSD 660p SSDPEKNW512G8: Ø72.3 (68-77)
Gigabyte Aero 15 OLED XB-8DE51B0SP GeForce RTX 2070 Super Max-Q, i7-10875H, Intel Optane Memory H10 with Solid State Storage 32GB + 512GB HBRPEKNX0202A(L/H): Ø80.3 (75-84)
MSI GE66 Raider 10SFS GeForce RTX 2070 Super Mobile, i9-10980HK, WDC PC SN730 SDBPNTY-1T00: Ø84.5 (79-90)
SCHENKER XMG Neo 15 XNE15M19 GeForce RTX 2070 Max-Q, i7-9750H, Seagate FireCuda 510 SSD ZP1000GM30001: Ø60.8 (55-68)
Razer Blade 15 RZ09-0328 GeForce RTX 2070 Max-Q, i7-10750H, Lite-On CA5-8D512: Ø62.4 (55-69)
Razer Blade 15 RTX 2080 Max-Q GeForce RTX 2080 Max-Q, i7-9750H, Samsung SSD PM981 MZVLB512HAJQ: Ø72.8 (68-80)
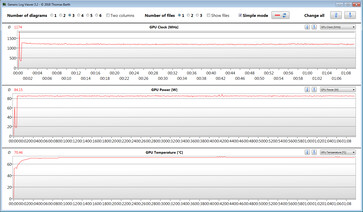
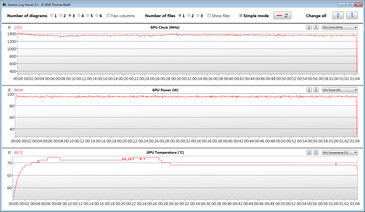
GPU measurements during our The Witcher 3 test
GPU measurements during our The Witcher 3 test (CPU, GPU: "High")
baixo média alto ultra
BioShock Infinite (2013) 347.4 330.2 300.5 173
The Witcher 3 (2015) 308.4 239.9 153.2 87.7
Dota 2 Reborn (2015) 134.3 128.7 117.4 115
X-Plane 11.11 (2018) 109 95.8 80.8
Far Cry 5 (2018) 111 100 96 91
Shadow of the Tomb Raider (2018) 117 104 100 93
Battlefield V (2018) 154.3 124.7 116.2 109.7
Metro Exodus (2019) 131 93.2 70.3 57.2
Total War: Three Kingdoms (2019) 227.8 123.8 83.8 61
Control (2019) 221.7 96.6 71
Borderlands 3 (2019) 128.3 101.6 78.2 62.5
Ghost Recon Breakpoint (2019) 130 95 88 66
Call of Duty Modern Warfare 2019 (2019) 165.5 114.1 96.4 93.8
Star Wars Jedi Fallen Order (2019) 99.5 94.1 88.7
Red Dead Redemption 2 (2019) 113.3 96.5 62.7 40.6
Doom Eternal (2020) 212.2 165.1 147.9 144.4
Gears Tactics (2020) 188.8 171.6 122.2 82.9
F1 2020 (2020) 219 174 150 115
Death Stranding (2020) 139.8 118.7 108.6 104.5

Barulho

Ocioso
30.1 / 30.1 / 30.1 dB
Carga
46.8 / 46 dB
  red to green bar
 
 
30 dB
silencioso
40 dB(A)
audível
50 dB(A)
ruidosamente alto
 
min: dark, med: mid, max: light   Audix TM1, Arta (15 cm de distância)   environment noise: 30.1 dB(A)
dB(A) 0102030405060708090Deep BassMiddle BassHigh BassLower RangeMidsHigher MidsLower HighsMid HighsUpper HighsSuper Highs2032.330.43530.632.32532.831.137.234.232.83134.731.835.436.534.74032.129.639.53332.15029.428.937.232.929.46327.727.427.428.227.78026.927.126.727.326.910027.327.126.424.127.312527.226.225.523.727.216026.526.22323.226.520026.326.422.422.226.325026.82821.821.626.83152930.42120.92940028.728.32019.928.750029.929.419.519.529.963028.828.718.318.428.880032.533.517.917.832.5100032.833.617.617.632.8125034.535.417.217.334.5160035.436.117.217.635.4200037.938.517.217.637.9250035.936.517.317.335.9315037.738.817.417.837.7400033.534.817.617.933.5500031.933.217.717.931.9630026.12717.817.926.1800023.824.717.81823.81000021.12217.817.921.11250019.319.81817.919.31600018.919.218.218.118.9SPL4646.830.130.246N4.95.21.41.44.9median 28.8median 28.7median 17.9median 17.9median 28.8Delta3.84.51.61.43.8hearing rangehide median Fan NoiseRazer Blade 15 RTX 2080 Super Max-Q
Razer Blade 15 RTX 2080 Super Max-Q
i7-10875H, GeForce RTX 2080 Super Max-Q
Razer Blade 15 RTX 2080 Max-Q
i7-9750H, GeForce RTX 2080 Max-Q
Asus Zephyrus S GX531GX
i7-8750H, GeForce RTX 2080 Max-Q
Gigabyte Aero 15 OLED XB-8DE51B0SP
i7-10875H, GeForce RTX 2070 Super Max-Q
MSI GE66 Raider 10SFS
i9-10980HK, GeForce RTX 2070 Super Mobile
SCHENKER XMG Neo 15 XNE15M19
i7-9750H, GeForce RTX 2070 Max-Q
Average NVIDIA GeForce RTX 2080 Super Max-Q
 
Average of class Gaming
 
Noise
8%
-7%
-13%
-15%
-9%
-4%
6%
off / environment *
30.1
28.3
6%
28.7
5%
30
-0%
30
-0%
31
-3%
Idle Minimum *
30.1
28.8
4%
29.8
1%
34
-13%
30
-0%
31
-3%
29.7 ?(24.4 - 33, n=8)
1%
Idle Average *
30.1
28.8
4%
32.4
-8%
36
-20%
35
-16%
34
-13%
30.8 ?(24.4 - 35, n=8)
-2%
Idle Maximum *
30.1
29
4%
38
-26%
41
-36%
44
-46%
37
-23%
35.4 ?(24.4 - 44, n=8)
-18%
Load Average *
46.8
33.5
28%
38.2
18%
48
-3%
53
-13%
47
-0%
47.2 ?(39.5 - 53, n=8)
-1%
Witcher 3 ultra *
48.4
45
7%
56.6
-17%
48
1%
53
-10%
50
-3%
Load Maximum *
46
45.2
2%
56.6
-23%
54
-17%
55
-20%
54
-17%
49.6 ?(45 - 59.4, n=8)
-8%

* ... smaller is better

 47 °C52 °C46 °C 
 39.6 °C47.1 °C42.5 °C 
 40.3 °C41.2 °C38.6 °C 
Máximo: 52 °C
Médio: 43.8 °C
42.9 °C53 °C42.5 °C
40.7 °C48.1 °C41.8 °C
38.6 °C42.6 °C39.9 °C
Máximo: 53 °C
Médio: 39.1 °C
alimentação elétrica  53 °C | Temperatura do quarto 23.9 °C | FIRT 550-Pocket
(-) The average temperature for the upper side under maximal load is 43.8 °C / 111 F, compared to the average of 33.8 °C / 93 F for the devices in the class Gaming.
(-) The maximum temperature on the upper side is 52 °C / 126 F, compared to the average of 40.4 °C / 105 F, ranging from 21.2 to 68.8 °C for the class Gaming.
(-) The bottom heats up to a maximum of 53 °C / 127 F, compared to the average of 43.2 °C / 110 F
(+) In idle usage, the average temperature for the upper side is 28.3 °C / 83 F, compared to the device average of 33.8 °C / 93 F.
(-) Playing The Witcher 3, the average temperature for the upper side is 39.9 °C / 104 F, compared to the device average of 33.8 °C / 93 F.
(-) The palmrests and touchpad can get very hot to the touch with a maximum of 41.2 °C / 106.2 F.
(-) The average temperature of the palmrest area of similar devices was 28.9 °C / 84 F (-12.3 °C / -22.2 F).
Razer Blade 15 RTX 2080 Super Max-Q
i7-10875H, GeForce RTX 2080 Super Max-Q
Razer Blade 15 RTX 2080 Max-Q
i7-9750H, GeForce RTX 2080 Max-Q
Asus Zephyrus S GX531GX
i7-8750H, GeForce RTX 2080 Max-Q
Gigabyte Aero 15 OLED XB-8DE51B0SP
i7-10875H, GeForce RTX 2070 Super Max-Q
MSI GE66 Raider 10SFS
i9-10980HK, GeForce RTX 2070 Super Mobile
SCHENKER XMG Neo 15 XNE15M19
i7-9750H, GeForce RTX 2070 Max-Q
Average NVIDIA GeForce RTX 2080 Super Max-Q
 
Average of class Gaming
 
Heat
4%
3%
1%
-2%
-12%
1%
1%
Maximum Upper Side *
52
47
10%
47
10%
49
6%
49
6%
60
-15%
47.9 ?(35.2 - 57, n=8)
8%
Maximum Bottom *
53
49.2
7%
48.6
8%
61
-15%
52
2%
66
-25%
51.9 ?(32.5 - 62, n=8)
2%
Idle Upper Side *
29.3
28.6
2%
28.8
2%
27
8%
30
-2%
30
-2%
Idle Bottom *
30.2
31.4
-4%
33.2
-10%
29
4%
34
-13%
32
-6%
31 ?(28 - 33, n=8)
-3%

* ... smaller is better

dB(A) 0102030405060708090Deep BassMiddle BassHigh BassLower RangeMidsHigher MidsLower HighsMid HighsUpper HighsSuper Highs2032.130.632.12533.734.233.73130.636.530.64028.23328.25029.332.929.36329.328.229.38032.627.332.610040.224.140.212545.123.745.116046.623.246.620044.622.244.625050.821.650.83155820.95840067.919.967.950067.819.567.863068.618.468.680071.317.871.3100074.917.674.9125071.417.371.4160068.917.668.9200067.517.667.5250062.917.362.9315061.917.861.9400062.617.962.6500063.717.963.7630063.317.963.3800055.91855.91000055.317.955.31250054.817.954.81600052.218.152.2SPL79.930.279.9N45.21.445.2median 62.6median 17.9median 62.6Delta7.91.47.9hearing rangehide median Pink NoiseRazer Blade 15 RTX 2080 Super Max-Q
Frequency diagram (checkboxes can be checked and unchecked to compare devices)
Razer Blade 15 RTX 2080 Super Max-Q audio analysis

(±) | speaker loudness is average but good (74.9 dB)
Bass 100 - 315 Hz
(-) | nearly no bass - on average 15.1% lower than median
(±) | linearity of bass is average (10.9% delta to prev. frequency)
Mids 400 - 2000 Hz
(±) | higher mids - on average 7.2% higher than median
(+) | mids are linear (6.9% delta to prev. frequency)
Highs 2 - 16 kHz
(+) | balanced highs - only 2.4% away from median
(+) | highs are linear (5.1% delta to prev. frequency)
Overall 100 - 16.000 Hz
(±) | linearity of overall sound is average (19.5% difference to median)
Compared to same class
» 65% of all tested devices in this class were better, 7% similar, 28% worse
» The best had a delta of 6%, average was 18%, worst was 132%
Compared to all devices tested
» 43% of all tested devices were better, 7% similar, 50% worse
» The best had a delta of 4%, average was 25%, worst was 134%

Consumo de energia
desligadodarklight 0.4 / 0.6 Watt
Ociosodarkmidlight 10.6 / 13.1 / 15.8 Watt
Carga midlight 131 / 169 Watt
 color bar
Key: min: dark, med: mid, max: light        Metrahit Energy
Currently we use the Metrahit Energy, a professional single phase power quality and energy measurement digital multimeter, for our measurements. Find out more about it here. All of our test methods can be found here.
Razer Blade 15 RTX 2080 Super Max-Q
i7-10875H, GeForce RTX 2080 Super Max-Q
Razer Blade 15 RTX 2080 Max-Q
i7-9750H, GeForce RTX 2080 Max-Q
Asus Zephyrus S GX531GX
i7-8750H, GeForce RTX 2080 Max-Q
Gigabyte Aero 15 OLED XB-8DE51B0SP
i7-10875H, GeForce RTX 2070 Super Max-Q
MSI GE66 Raider 10SFS
i9-10980HK, GeForce RTX 2070 Super Mobile
SCHENKER XMG Neo 15 XNE15M19
i7-9750H, GeForce RTX 2070 Max-Q
Average NVIDIA GeForce RTX 2080 Super Max-Q
 
Average of class Gaming
 
Power Consumption
-12%
-33%
-52%
-17%
-4%
-28%
-36%
Idle Minimum *
10.6
12.5
-18%
16.1
-52%
18
-70%
6
43%
11
-4%
12.9 ?(9 - 23, n=8)
-22%
Idle Average *
13.1
15.3
-17%
20.9
-60%
21
-60%
14
-7%
15
-15%
17.3 ?(12.6 - 30, n=8)
-32%
Idle Maximum *
15.8
20.7
-31%
27
-71%
38
-141%
25
-58%
21
-33%
26.9 ?(15.8 - 42, n=8)
-70%
Load Average *
131
90.2
31%
93.4
29%
113
14%
108
18%
94
28%
123.9 ?(94.8 - 156, n=8)
5%
Witcher 3 ultra *
146
162
-11%
168.2
-15%
149
-2%
195
-34%
143
2%
Load Maximum *
169
209.3
-24%
215.3
-27%
256
-51%
280
-66%
173
-2%
205 ?(169 - 216, n=8)
-21%

* ... smaller is better

Tempo de Execução da Bateria
Ocioso (sem WLAN, min brilho)
8h 42min
WiFi Websurfing (Edge 44)
6h 06min
Big Buck Bunny H.264 1080p
7h 17min
Carga (máximo brilho)
1h 53min
Razer Blade 15 RTX 2080 Super Max-Q
i7-10875H, GeForce RTX 2080 Super Max-Q, 80 Wh
Razer Blade 15 RTX 2080 Max-Q
i7-9750H, GeForce RTX 2080 Max-Q, 80 Wh
Asus Zephyrus S GX531GX
i7-8750H, GeForce RTX 2080 Max-Q, 50 Wh
Gigabyte Aero 15 OLED XB-8DE51B0SP
i7-10875H, GeForce RTX 2070 Super Max-Q, 94.2 Wh
MSI GE66 Raider 10SFS
i9-10980HK, GeForce RTX 2070 Super Mobile, 99.99 Wh
SCHENKER XMG Neo 15 XNE15M19
i7-9750H, GeForce RTX 2070 Max-Q, 62 Wh
Razer Blade 15 RZ09-0328
i7-10750H, GeForce RTX 2070 Max-Q, 65 Wh
Average of class Gaming
 
Battery Runtime
27%
-51%
15%
-7%
-18%
-34%
-7%
Reader / Idle
522
953
83%
518
-1%
454
-13%
439
-16%
H.264
437
WiFi v1.3
366
393
7%
181
-51%
364
-1%
364
-1%
340
-7%
241
-34%
Load
113
102
-10%
166
47%
106
-6%
79
-30%

Pro

+ Tela Full HD mate
+ Painel de 300 Hz
+ Tempos de resposta breves
+ Boa cobertura de espaço de cores
+ Carcaça de metal estável
+ Até 64 GB de memória
+ SSD NVMe
+ Retro iluminação RGB do teclado
+ Wi-Fi 6
+ Excelentes velocidades de transferência WLAN
+ Boa duração da bateria
+ Leitor de cartões de memória muito veloz
+ USB 3.2 Gen 2
+ Thunderbolt 3
+ A bateria pode ser carregada via Thunderbolt 3

Contra

- Sem espaço para dispositivos de armazenamento adicionais
- O teclado precisa melhorar
The Razer Blade 15 Advanced Model (2020). Provided by Razer Europe.

A Razer coloca muito poder de computação em uma carcaça de metal elegante e fina. Graças ao processador Core i7-8550U e à GPU GeForce RTX 2080 Super Max-Q, o portátil consegue lidar com todos os jogos mais recentes. Nenhum compromisso precisa ser feito em termos de configurações de qualidade. Se a GPU em algum ponto não atender mais aos seus requisitos, uma GPU externa pode ser conectada por meio da porta Thunderbolt 3.

Com o Blade 15 Advanced Model (2020), a Razer optou por realizar melhorias detalhadas que compensam.

O 2020 Blade 15 possui tecnologia USB 3.2 Gen 2 e todas as portas USB Tipo A funcionam de acordo com este padrão. Isso também se aplica à porta USB Type-C recém-adicionada (DisplayPort, Power Delivery). Este último substituiu o antigo Mini DisplayPort. Além disso, tanto a porta Thunderbolt 3 quanto a porta USB Type-C 3.2 Gen 2 permitem que você carregue a bateria. Conseguimos acionar um processo de carregamento com um adaptador de energia de 45 watts em cada caso. Usar as duas portas para fornecer energia ao portátil não é possível, já que, no máximo, podem ser transferidos 100 watts de potência.

A tela mate Full HD IPS de 300 Hz também é uma das inovações em comparação com o Modelo predecessor. A tela ganha pontos com ângulos de visão estáveis, brilho suficiente, bom contraste, tempos de resposta rápidos e ótima reprodução de cores. A cobertura do espaço de cores também é agradável.

Razer Blade 15 RTX 2080 Super Max-Q - 08/10/2020 v7
Sascha Mölck
Acabamento
87 / 98 → 88%
Teclado
81%
Mouse
89%
Conectividade
69 / 80 → 86%
Peso
62 / 10-66 → 92%
Bateria
70 / 95 → 74%
Pantalha
89%
Desempenho do jogos
92%
Desempenho da aplicação
88%
Temperatura
81 / 95 → 85%
Ruído
85 / 90 → 94%
Audio
65%
Camera
40 / 85 → 46%
Médio
77%
86%
Gaming - Médio equilibrado

Pricecompare

Please share our article, every link counts!
> Análises e revisões de portáteis e celulares > Análises > Análises > Breve Análise do Análise do Razer Blade 15 Advanced Model (2020): Melhorias de detalhes compensam
Sascha Mölck, 2020-08-18 (Update: 2020-08-22)