Breve Análise do Aorus 7 KB: Portátil para jogos completo com opções de atualização
Avaliação | Data | Modelo | Peso | Altura | Size | Resolução | Preço |
|---|---|---|---|---|---|---|---|
| 81.6 % v7 (old) | 10/2020 | Aorus 7 KB i7-10750H, GeForce RTX 2060 Mobile | 2.5 kg | 29 mm | 17.30" | 1920x1080 | |
| 85.1 % v7 (old) | 07/2020 | MSI GE75 Raider 10SE-008US i7-10750H, GeForce RTX 2060 Mobile | 2.6 kg | 27.5 mm | 17.30" | 1920x1080 | |
| 81.5 % v7 (old) | Nexoc GH7 716IG i7-10750H, GeForce GTX 1660 Ti Mobile | 2.5 kg | 29.5 mm | 17.30" | 1920x1080 | ||
| 80.9 % v7 (old) | 07/2020 | MSI Bravo 17 A4DDR R7 4800H, Radeon RX 5500M | 2.2 kg | 23 mm | 17.30" | 1920x1080 | |
| 82.9 % v7 (old) | 05/2020 | Asus TUF A17 FA706IU-AS76 R7 4800H, GeForce GTX 1660 Ti Mobile | 2.6 kg | 26 mm | 17.30" | 1920x1080 | |
| 83.2 % v7 (old) | 10/2019 | Lenovo Legion Y740-17IRH i7-9750H, GeForce RTX 2060 Mobile | 3 kg | 23 mm | 17.30" | 1920x1080 | |
| 80.6 % v7 (old) | 06/2020 | Acer Nitro 5 AN517-52-77DS i7-10750H, GeForce RTX 2060 Mobile | 2.2 kg | 24.9 mm | 17.30" | 1920x1080 |
| SD Card Reader | |
| average JPG Copy Test (av. of 3 runs) | |
| Média da turma Gaming (20.9 - 210, n=55, últimos 2 anos) | |
| Nexoc GH7 716IG (Toshiba Exceria Pro SDXC 64 GB UHS-II) | |
| Aorus 7 KB (Toshiba Exceria Pro SDXC 64 GB UHS-II) | |
| MSI GE75 Raider 10SE-008US (Toshiba Exceria Pro SDXC 64 GB UHS-II) | |
| maximum AS SSD Seq Read Test (1GB) | |
| Média da turma Gaming (25.5 - 261, n=52, últimos 2 anos) | |
| Nexoc GH7 716IG (Toshiba Exceria Pro SDXC 64 GB UHS-II) | |
| Aorus 7 KB (Toshiba Exceria Pro SDXC 64 GB UHS-II) | |
| MSI GE75 Raider 10SE-008US (Toshiba Exceria Pro SDXC 64 GB UHS-II) | |
| Networking | |
| iperf3 transmit AX12 | |
| MSI GE75 Raider 10SE-008US | |
| Aorus 7 KB | |
| Nexoc GH7 716IG | |
| Média Intel Wi-Fi 6 AX200 (447 - 1645, n=127) | |
| MSI Bravo 17 A4DDR | |
| Lenovo Legion Y740-17IRH | |
| Acer Nitro 5 AN517-52-77DS | |
| Asus TUF A17 FA706IU-AS76 | |
| iperf3 receive AX12 | |
| Aorus 7 KB | |
| Nexoc GH7 716IG | |
| MSI Bravo 17 A4DDR | |
| MSI GE75 Raider 10SE-008US | |
| Média Intel Wi-Fi 6 AX200 (523 - 1684, n=128) | |
| Acer Nitro 5 AN517-52-77DS | |
| Lenovo Legion Y740-17IRH | |
| Asus TUF A17 FA706IU-AS76 | |


")
")
| |||||||||||||||||||||||||
iluminação: 87 %
iluminação com acumulador: 303 cd/m²
Contraste: 977:1 (Preto: 0.31 cd/m²)
ΔE ColorChecker Calman: 2.13 | ∀{0.5-29.43 Ø4.73}
calibrated: 0.7
ΔE Greyscale Calman: 3.4 | ∀{0.09-98 Ø4.97}
90% sRGB (Argyll 1.6.3 3D)
66% AdobeRGB 1998 (Argyll 1.6.3 3D)
65.7% AdobeRGB 1998 (Argyll 3D)
95.6% sRGB (Argyll 3D)
64.7% Display P3 (Argyll 3D)
Gamma: 2.156
CCT: 6850 K
| Aorus 7 KB LG Philips LP173WFG-SPB1, IPS, 1920x1080, 17.3" | MSI GE75 Raider 10SE-008US Chi Mei N173HCE-G33, IPS, 1920x1080, 17.3" | Nexoc GH7 716IG LG Philips LGD0615, IPS, 1920x1080, 17.3" | MSI Bravo 17 A4DDR AU Optronics B173HAN04.7 (AUO479D), IPS, 1920x1080, 17.3" | Asus TUF A17 FA706IU-AS76 BOE NV173FHM-NX1, IPS, 1920x1080, 17.3" | Lenovo Legion Y740-17IRH LG Philips LP173WFG-SPD2 (LGD05E0), IPS, 1920x1080, 17.3" | Acer Nitro 5 AN517-52-77DS AU Optronics B173HAN04.7, IPS, 1920x1080, 17.3" | |
|---|---|---|---|---|---|---|---|
| Display | 2% | 0% | -37% | -37% | 0% | -38% | |
| Display P3 Coverage (%) | 64.7 | 65.6 1% | 64.6 0% | 40.54 -37% | 40.55 -37% | 64.8 0% | 39.47 -39% |
| sRGB Coverage (%) | 95.6 | 98.1 3% | 95.8 0% | 60.1 -37% | 59.7 -38% | 96 0% | 58.9 -38% |
| AdobeRGB 1998 Coverage (%) | 65.7 | 67.8 3% | 65.7 0% | 41.88 -36% | 41.89 -36% | 65.8 0% | 40.77 -38% |
| Response Times | 29% | -1% | -201% | -83% | -13% | -164% | |
| Response Time Grey 50% / Grey 80% * (ms) | 13.6 ? | 6.8 ? 50% | 15.2 ? -12% | 40 ? -194% | 22.4 ? -65% | 14.8 ? -9% | 35 ? -157% |
| Response Time Black / White * (ms) | 9.6 ? | 8.8 ? 8% | 8.6 ? 10% | 29.6 ? -208% | 19.2 ? -100% | 11.2 ? -17% | 26 ? -171% |
| PWM Frequency (Hz) | 25000 ? | ||||||
| Screen | 9% | -16% | -45% | -81% | -10% | -99% | |
| Brightness middle (cd/m²) | 303 | 337.9 12% | 303 0% | 264 -13% | 264.8 -13% | 282 -7% | 263 -13% |
| Brightness (cd/m²) | 278 | 305 10% | 277 0% | 244 -12% | 253 -9% | 261 -6% | 246 -12% |
| Brightness Distribution (%) | 87 | 81 -7% | 86 -1% | 88 1% | 90 3% | 87 0% | 85 -2% |
| Black Level * (cd/m²) | 0.31 | 0.29 6% | 0.25 19% | 0.23 26% | 0.31 -0% | 0.27 13% | 0.47 -52% |
| Contrast (:1) | 977 | 1165 19% | 1212 24% | 1148 18% | 854 -13% | 1044 7% | 560 -43% |
| Colorchecker dE 2000 * | 2.13 | 2.18 -2% | 4.15 -95% | 3.85 -81% | 4.73 -122% | 3.18 -49% | 5.07 -138% |
| Colorchecker dE 2000 max. * | 7.51 | 3.9 48% | 10.52 -40% | 9.13 -22% | 18.89 -152% | 8.39 -12% | 20.5 -173% |
| Colorchecker dE 2000 calibrated * | 0.7 | 0.69 1% | 0.9 -29% | 3.4 -386% | 4.64 -563% | 0.95 -36% | 4.9 -600% |
| Greyscale dE 2000 * | 3.4 | 3.1 9% | 5.38 -58% | 1.95 43% | 1.4 59% | 4.1 -21% | 2.55 25% |
| Gamma | 2.156 102% | 2.07 106% | 2.35 94% | 2.52 87% | 2.16 102% | 2.55 86% | 2.37 93% |
| CCT | 6850 95% | 6882 94% | 7680 85% | 6371 102% | 6641 98% | 7260 90% | 6446 101% |
| Color Space (Percent of AdobeRGB 1998) (%) | 66 | 62 -6% | 61 -8% | 42 -36% | 38.4 -42% | 61 -8% | 37 -44% |
| Color Space (Percent of sRGB) (%) | 90 | 98.2 9% | 96 7% | 60 -33% | 59.3 -34% | 96 7% | 59 -34% |
| Média Total (Programa/Configurações) | 13% /
10% | -6% /
-11% | -94% /
-63% | -67% /
-73% | -8% /
-9% | -100% /
-96% |
* ... menor é melhor
Exibir tempos de resposta
| ↔ Tempo de resposta preto para branco | ||
|---|---|---|
| 9.6 ms ... ascensão ↗ e queda ↘ combinadas | ↗ 5.2 ms ascensão | 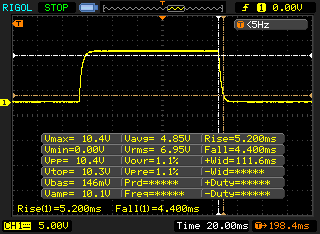 |
| ↘ 4.4 ms queda | ||
| A tela mostra taxas de resposta rápidas em nossos testes e deve ser adequada para jogos. Em comparação, todos os dispositivos testados variam de 0.1 (mínimo) a 240 (máximo) ms. » 26 % de todos os dispositivos são melhores. Isso significa que o tempo de resposta medido é melhor que a média de todos os dispositivos testados (19.9 ms). | ||
| ↔ Tempo de resposta 50% cinza a 80% cinza | ||
| 13.6 ms ... ascensão ↗ e queda ↘ combinadas | ↗ 6.8 ms ascensão | 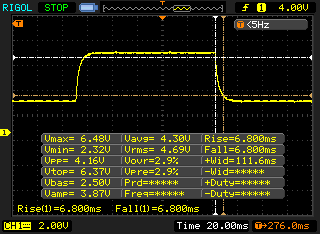 |
| ↘ 6.8 ms queda | ||
| A tela mostra boas taxas de resposta em nossos testes, mas pode ser muito lenta para jogadores competitivos. Em comparação, todos os dispositivos testados variam de 0.165 (mínimo) a 636 (máximo) ms. » 27 % de todos os dispositivos são melhores. Isso significa que o tempo de resposta medido é melhor que a média de todos os dispositivos testados (31.1 ms). | ||
Cintilação da tela / PWM (modulação por largura de pulso)
| Tela tremeluzindo / PWM não detectado | 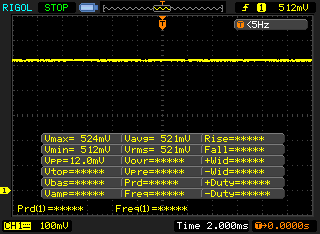 | ||
[pwm_comparison] Em comparação: 52 % de todos os dispositivos testados não usam PWM para escurecer a tela. Se PWM foi detectado, uma média de 7798 (mínimo: 5 - máximo: 343500) Hz foi medida. | |||
| LibreOffice - 20 Documents To PDF | |
| MSI Bravo 17 A4DDR | |
| Asus TUF A17 FA706IU-AS76 | |
| MSI GE75 Raider 10SE-008US | |
| Aorus 7 KB | |
| Média Intel Core i7-10750H (43.1 - 99.2, n=43) | |
| Acer Nitro 5 AN517-52-77DS | |
| Média da turma Gaming (19 - 88.8, n=111, últimos 2 anos) | |
| Nexoc GH7 716IG | |
* ... menor é melhor
| PCMark 8 Home Score Accelerated v2 | 4183 pontos | |
| PCMark 8 Creative Score Accelerated v2 | 4052 pontos | |
| PCMark 8 Work Score Accelerated v2 | 5746 pontos | |
| PCMark 10 Score | 5091 pontos | |
Ajuda | ||
| DPC Latencies / LatencyMon - interrupt to process latency (max), Web, Youtube, Prime95 | |
| Asus TUF A17 FA706IU-AS76 | |
| MSI GE75 Raider 10SE-008US | |
| MSI Bravo 17 A4DDR | |
| Aorus 7 KB | |
| Acer Nitro 5 AN517-52-77DS | |
| Nexoc GH7 716IG | |
* ... menor é melhor

| Aorus 7 KB ADATA XPG SX8200 Pro (ASX8200PNP-512GT) | MSI GE75 Raider 10SE-008US Samsung SSD PM981 MZVLB512HAJQ | Nexoc GH7 716IG Samsung SSD 970 EVO Plus 500GB | MSI Bravo 17 A4DDR Toshiba KBG30ZMV512G | Asus TUF A17 FA706IU-AS76 Intel SSD 660p 1TB SSDPEKNW010T8 | Lenovo Legion Y740-17IRH WDC PC SN520 SDAPMUW-128G | Acer Nitro 5 AN517-52-77DS WDC PC SN530 SDBPNPZ-1T00 | |
|---|---|---|---|---|---|---|---|
| CrystalDiskMark 5.2 / 6 | -9% | 18% | -41% | -13% | -53% | -22% | |
| Write 4K (MB/s) | 158.7 | 139.2 -12% | 201.6 27% | 94.6 -40% | 189.7 20% | 102.7 -35% | 140 -12% |
| Read 4K (MB/s) | 60.5 | 53 -12% | 54.8 -9% | 47.12 -22% | 62.3 3% | 29.12 -52% | 49.04 -19% |
| Write Seq (MB/s) | 2365 | 1950 -18% | 2999 27% | 850 -64% | 1681 -29% | 362.2 -85% | 1963 -17% |
| Read Seq (MB/s) | 2696 | 2328 -14% | 3023 12% | 1157 -57% | 1608 -40% | 1010 -63% | 1455 -46% |
| Write 4K Q32T1 (MB/s) | 418.4 | 408.9 -2% | 545 30% | 277.7 -34% | 468.6 12% | 298.1 -29% | 398.2 -5% |
| Read 4K Q32T1 (MB/s) | 546 | 551 1% | 636 16% | 546 0% | 541 -1% | 349.6 -36% | 461.9 -15% |
| Write Seq Q32T1 (MB/s) | 2471 | 1938 -22% | 3262 32% | 908 -63% | 1770 -28% | 788 -68% | 1969 -20% |
| Read Seq Q32T1 (MB/s) | 3242 | 3467 7% | 3550 10% | 1632 -50% | 1898 -41% | 1490 -54% | 1927 -41% |
| AS SSD | 9% | 51% | -79% | -41% | -80% | -7% | |
| Seq Read (MB/s) | 2844 | 2036 -28% | 3008 6% | 1420 -50% | 1320 -54% | 1339 -53% | 1804 -37% |
| Seq Write (MB/s) | 2240 | 1835 -18% | 2521 13% | 922 -59% | 1539 -31% | 688 -69% | 1922 -14% |
| 4K Read (MB/s) | 53.5 | 60.6 13% | 64.3 20% | 48.51 -9% | 56.3 5% | 23.23 -57% | 38.21 -29% |
| 4K Write (MB/s) | 121.6 | 127.2 5% | 142.5 17% | 116.8 -4% | 158.5 30% | 98.8 -19% | 105 -14% |
| 4K-64 Read (MB/s) | 714 | 1601 124% | 1664 133% | 928 30% | 586 -18% | 300.9 -58% | 976 37% |
| 4K-64 Write (MB/s) | 1221 | 1734 42% | 2447 100% | 345.4 -72% | 820 -33% | 204.6 -83% | 1150 -6% |
| Access Time Read * (ms) | 0.043 | 0.049 -14% | 0.047 -9% | 0.089 -107% | 0.043 -0% | 0.184 -328% | |
| Access Time Write * (ms) | 0.031 | 0.09 -190% | 0.026 16% | 0.189 -510% | 0.113 -265% | 0.037 -19% | 0.045 -45% |
| Score Read (Points) | 1052 | 1865 77% | 2029 93% | 1119 6% | 775 -26% | 458 -56% | 1194 13% |
| Score Write (Points) | 1567 | 2045 31% | 2842 81% | 554 -65% | 1132 -28% | 372 -76% | 1747 11% |
| Score Total (Points) | 3141 | 4863 55% | 5893 88% | 2232 -29% | 2333 -26% | 1038 -67% | 3563 13% |
| Média Total (Programa/Configurações) | 0% /
1% | 35% /
37% | -60% /
-63% | -27% /
-29% | -67% /
-69% | -15% /
-14% |
* ... menor é melhor
Continuous load read: DiskSpd Read Loop, Queue Depth 8
| 3DMark 11 Performance | 18213 pontos | |
| 3DMark Cloud Gate Standard Score | 36217 pontos | |
| 3DMark Fire Strike Score | 14690 pontos | |
| 3DMark Time Spy Score | 6190 pontos | |
Ajuda | ||
| The Witcher 3 - 1920x1080 Ultra Graphics & Postprocessing (HBAO+) | |
| Média da turma Gaming (95 - 240, n=8, últimos 2 anos) | |
| MSI GE75 Raider 10SE-008US | |
| Acer Nitro 5 AN517-52-77DS | |
| Aorus 7 KB | |
| Média NVIDIA GeForce RTX 2060 Mobile (50.6 - 74, n=40) | |
| Lenovo Legion Y740-17IRH | |
| Asus TUF A17 FA706IU-AS76 | |
| Nexoc GH7 716IG | |
| MSI Bravo 17 A4DDR | |
| Shadow of the Tomb Raider - 1920x1080 Highest Preset AA:T | |
| Média da turma Gaming (96 - 116, n=2, últimos 2 anos) | |
| MSI GE75 Raider 10SE-008US | |
| Lenovo Legion Y740-17IRH | |
| Aorus 7 KB | |
| Média NVIDIA GeForce RTX 2060 Mobile (54 - 86, n=22) | |
| Asus TUF A17 FA706IU-AS76 | |
| Acer Nitro 5 AN517-52-77DS | |
| MSI Bravo 17 A4DDR | |
| Doom Eternal - 1920x1080 Ultra Preset | |
| Aorus 7 KB | |
| Média NVIDIA GeForce RTX 2060 Mobile (98.7 - 138, n=10) | |
| Nexoc GH7 716IG | |
| Acer Nitro 5 AN517-52-77DS | |
| MSI Bravo 17 A4DDR | |
| F1 2020 - 1920x1080 Ultra High Preset AA:T AF:16x | |
| Média NVIDIA GeForce RTX 2060 Mobile (93 - 98, n=4) | |
| Aorus 7 KB | |
| Horizon Zero Dawn - 1920x1080 Ultimate Quality | |
| Média NVIDIA GeForce RTX 2060 Mobile (54 - 67, n=6) | |
| Aorus 7 KB | |
| Serious Sam 4 - 1920x1080 Ultra (DX12) AA:2xMS | |
| Aorus 7 KB | |
| Média NVIDIA GeForce RTX 2060 Mobile (50.3 - 63.3, n=6) | |
| Gears Tactics - 1920x1080 Ultra Preset | |
| Média NVIDIA GeForce RTX 2060 Mobile (60.7 - 71.3, n=7) | |
| Aorus 7 KB | |
| Acer Nitro 5 AN517-52-77DS | |
| MSI Bravo 17 A4DDR | |
| Flight Simulator 2020 - 1920x1080 High-End AA:TAA AF:8x | |
| Média NVIDIA GeForce RTX 2060 Mobile (41.8 - 44.7, n=3) | |
| Aorus 7 KB | |
| baixo | média | alto | ultra | |
|---|---|---|---|---|
| BioShock Infinite (2013) | 368.7 | 308.8 | 286.3 | 143.1 |
| The Witcher 3 (2015) | 269.5 | 188.3 | 107.1 | 62.8 |
| Shadow of the Tomb Raider (2018) | 121 | 95 | 86 | 76 |
| Doom Eternal (2020) | 211.1 | 139.6 | 126.2 | 121.8 |
| Gears Tactics (2020) | 235.5 | 150.5 | 97.7 | 64.7 |
| F1 2020 (2020) | 231 | 142 | 126 | 94 |
| Death Stranding (2020) | 148.4 | 99.6 | 91.9 | 88.7 |
| Horizon Zero Dawn (2020) | 128 | 84 | 70 | 54 |
| Flight Simulator 2020 (2020) | 65.5 | 55.7 | 41.8 | 30.9 |
| Serious Sam 4 (2020) | 126 | 80.9 | 74.8 | 58.7 |
| Mafia Definitive Edition (2020) | 128.3 | 77.4 | 71.1 |
Barulho
| Ocioso |
| 31 / 33 / 48 dB |
| Carga |
| 57 / 57 dB |
 | ||
30 dB silencioso 40 dB(A) audível 50 dB(A) ruidosamente alto |
||
min: | ||
| Aorus 7 KB i7-10750H, GeForce RTX 2060 Mobile | MSI GE75 Raider 10SE-008US i7-10750H, GeForce RTX 2060 Mobile | Nexoc GH7 716IG i7-10750H, GeForce GTX 1660 Ti Mobile | MSI Bravo 17 A4DDR R7 4800H, Radeon RX 5500M | Asus TUF A17 FA706IU-AS76 R7 4800H, GeForce GTX 1660 Ti Mobile | Lenovo Legion Y740-17IRH i7-9750H, GeForce RTX 2060 Mobile | Acer Nitro 5 AN517-52-77DS i7-10750H, GeForce RTX 2060 Mobile | |
|---|---|---|---|---|---|---|---|
| Noise | 11% | 7% | 7% | 10% | 6% | 14% | |
| desligado / ambiente * (dB) | 25 | 28.4 -14% | 25 -0% | 30 -20% | 28.7 -15% | 30 -20% | 30.2 -21% |
| Idle Minimum * (dB) | 31 | 30.2 3% | 30 3% | 33 -6% | 28.7 7% | 33 -6% | 30.2 3% |
| Idle Average * (dB) | 33 | 30.2 8% | 31 6% | 34 -3% | 30.5 8% | 34 -3% | 30.2 8% |
| Idle Maximum * (dB) | 48 | 32 33% | 33 31% | 35 27% | 32.5 32% | 35 27% | 30.2 37% |
| Load Average * (dB) | 57 | 33.2 42% | 54 5% | 39 32% | 42.5 25% | 48 16% | 41.5 27% |
| Witcher 3 ultra * (dB) | 55 | 55 -0% | 53 4% | 48 13% | 50.1 9% | 46 16% | 44.5 19% |
| Load Maximum * (dB) | 57 | 55 4% | 57 -0% | 52 9% | 53.4 6% | 49 14% | 44.6 22% |
* ... menor é melhor
(-) A temperatura máxima no lado superior é 48 °C / 118 F, em comparação com a média de 40.4 °C / 105 F , variando de 21.2 a 68.8 °C para a classe Gaming.
(-) A parte inferior aquece até um máximo de 52 °C / 126 F, em comparação com a média de 43.2 °C / 110 F
(±) Em uso inativo, a temperatura média para o lado superior é 32.6 °C / 91 F, em comparação com a média do dispositivo de 33.9 °C / ### class_avg_f### F.
(-) Jogando The Witcher 3, a temperatura média para o lado superior é 41.1 °C / 106 F, em comparação com a média do dispositivo de 33.9 °C / ## #class_avg_f### F.
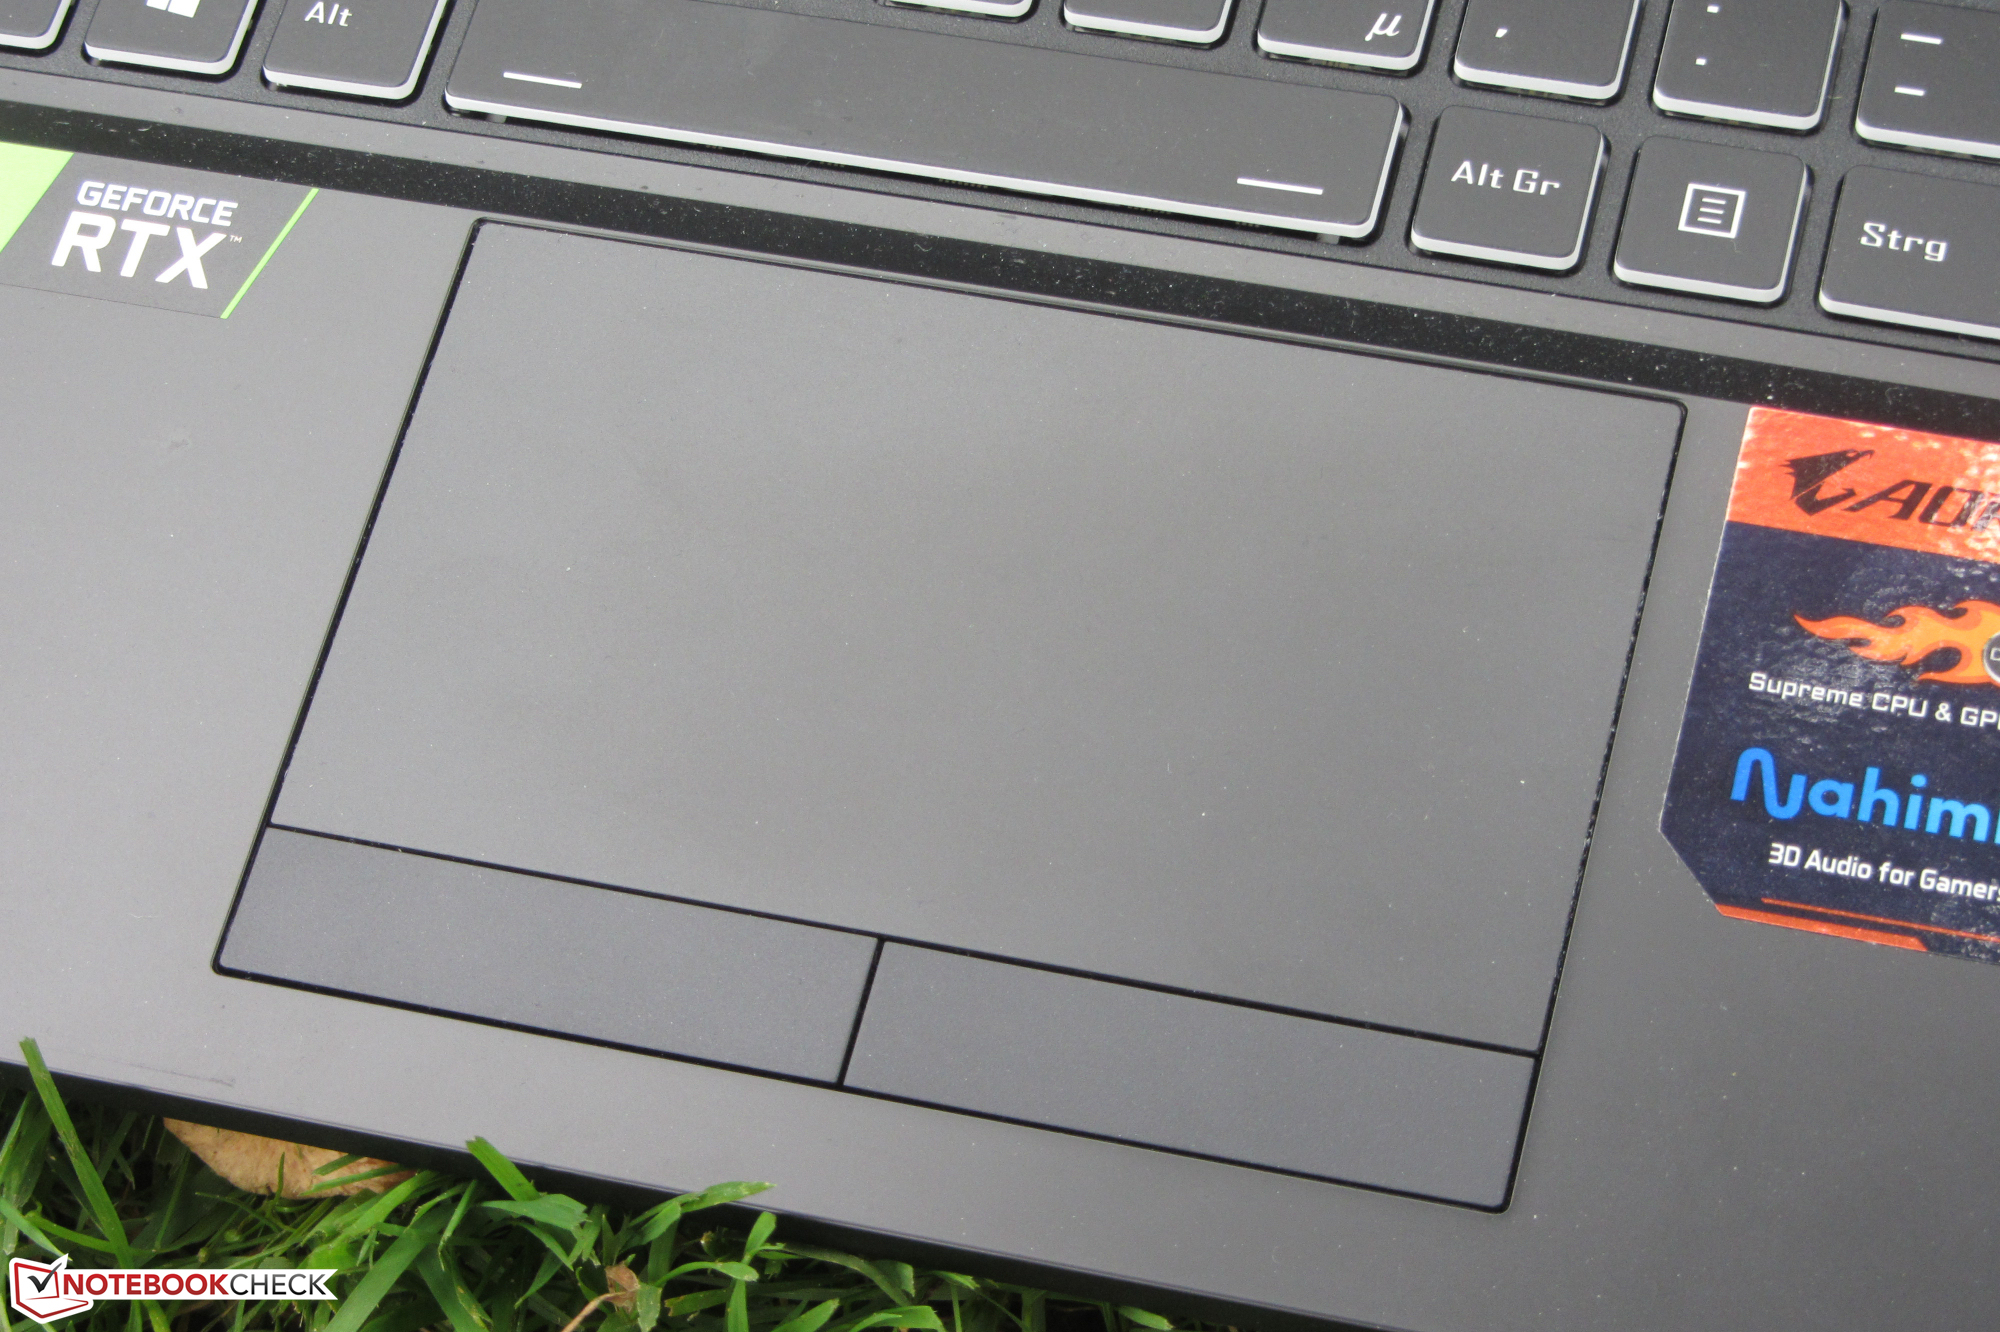
(±) Os apoios para as mãos e o touchpad podem ficar muito quentes ao toque, com um máximo de 36 °C / 96.8 F.
(-) A temperatura média da área do apoio para as mãos de dispositivos semelhantes foi 28.8 °C / 83.8 F (-7.2 °C / -13 F).
| Aorus 7 KB i7-10750H, GeForce RTX 2060 Mobile | MSI GE75 Raider 10SE-008US i7-10750H, GeForce RTX 2060 Mobile | Nexoc GH7 716IG i7-10750H, GeForce GTX 1660 Ti Mobile | MSI Bravo 17 A4DDR R7 4800H, Radeon RX 5500M | Asus TUF A17 FA706IU-AS76 R7 4800H, GeForce GTX 1660 Ti Mobile | Lenovo Legion Y740-17IRH i7-9750H, GeForce RTX 2060 Mobile | Acer Nitro 5 AN517-52-77DS i7-10750H, GeForce RTX 2060 Mobile | |
|---|---|---|---|---|---|---|---|
| Heat | 5% | 9% | 17% | 10% | 12% | 12% | |
| Maximum Upper Side * (°C) | 48 | 44.2 8% | 49 -2% | 48 -0% | 47.6 1% | 43 10% | 50.6 -5% |
| Maximum Bottom * (°C) | 52 | 49 6% | 54 -4% | 50 4% | 50.8 2% | 46 12% | 53.8 -3% |
| Idle Upper Side * (°C) | 37 | 33.6 9% | 29 22% | 25 32% | 33 11% | 31 16% | 26.6 28% |
| Idle Bottom * (°C) | 38 | 39.6 -4% | 30 21% | 26 32% | 29 24% | 34 11% | 27.8 27% |
* ... menor é melhor
Aorus 7 KB análise de áudio
(+) | os alto-falantes podem tocar relativamente alto (###valor### dB)
Graves 100 - 315Hz
(-) | quase nenhum baixo - em média 28.9% menor que a mediana
(±) | a linearidade dos graves é média (13.5% delta para a frequência anterior)
Médios 400 - 2.000 Hz
(+) | médios equilibrados - apenas 3.3% longe da mediana
(+) | médios são lineares (3.8% delta para frequência anterior)
Altos 2 - 16 kHz
(+) | agudos equilibrados - apenas 2.9% longe da mediana
(+) | os máximos são lineares (4.7% delta da frequência anterior)
Geral 100 - 16.000 Hz
(±) | a linearidade do som geral é média (16.9% diferença em relação à mediana)
Comparado com a mesma classe
» 44% de todos os dispositivos testados nesta classe foram melhores, 11% semelhantes, 45% piores
» O melhor teve um delta de 6%, a média foi 18%, o pior foi 132%
Comparado com todos os dispositivos testados
» 30% de todos os dispositivos testados foram melhores, 8% semelhantes, 62% piores
» O melhor teve um delta de 4%, a média foi 24%, o pior foi 134%
| desligado | |
| Ocioso | |
| Carga |
|
Key:
min: | |
| Aorus 7 KB i7-10750H, GeForce RTX 2060 Mobile | MSI GE75 Raider 10SE-008US i7-10750H, GeForce RTX 2060 Mobile | Nexoc GH7 716IG i7-10750H, GeForce GTX 1660 Ti Mobile | MSI Bravo 17 A4DDR R7 4800H, Radeon RX 5500M | Asus TUF A17 FA706IU-AS76 R7 4800H, GeForce GTX 1660 Ti Mobile | Lenovo Legion Y740-17IRH i7-9750H, GeForce RTX 2060 Mobile | Acer Nitro 5 AN517-52-77DS i7-10750H, GeForce RTX 2060 Mobile | |
|---|---|---|---|---|---|---|---|
| Power Consumption | -5% | 26% | 33% | 29% | -1% | 35% | |
| Idle Minimum * (Watt) | 15 | 14.7 2% | 5 67% | 9 40% | 7.4 51% | 20 -33% | 5.4 64% |
| Idle Average * (Watt) | 17 | 20.4 -20% | 10 41% | 10 41% | 10.5 38% | 21 -24% | 9.8 42% |
| Idle Maximum * (Watt) | 22 | 26.9 -22% | 20 9% | 13 41% | 17 23% | 26 -18% | 10.9 50% |
| Load Average * (Watt) | 137 | 93.2 32% | 113 18% | 69 50% | 103.7 24% | 97 29% | 104 24% |
| Witcher 3 ultra * (Watt) | 161 | 185.4 -15% | 132 18% | 128 20% | 128.1 20% | 139 14% | 134.3 17% |
| Load Maximum * (Watt) | 225 | 237.8 -6% | 225 -0% | 214 5% | 183.2 19% | 168 25% | 193 14% |
* ... menor é melhor
| Aorus 7 KB i7-10750H, GeForce RTX 2060 Mobile, 49 Wh | MSI GE75 Raider 10SE-008US i7-10750H, GeForce RTX 2060 Mobile, 65 Wh | Nexoc GH7 716IG i7-10750H, GeForce GTX 1660 Ti Mobile, 48.96 Wh | MSI Bravo 17 A4DDR R7 4800H, Radeon RX 5500M, 51 Wh | Asus TUF A17 FA706IU-AS76 R7 4800H, GeForce GTX 1660 Ti Mobile, 90 Wh | Lenovo Legion Y740-17IRH i7-9750H, GeForce RTX 2060 Mobile, 76 Wh | Acer Nitro 5 AN517-52-77DS i7-10750H, GeForce RTX 2060 Mobile, 57.48 Wh | |
|---|---|---|---|---|---|---|---|
| Duração da bateria | -21% | -11% | 3% | 87% | -15% | 41% | |
| Reader / Idle (h) | 8.6 | 8.9 3% | 7.7 -10% | 9.1 6% | 6.9 -20% | 11 28% | |
| H.264 (h) | 5.6 | 4.3 -23% | 7.3 30% | ||||
| WiFi v1.3 (h) | 4.7 | 3.7 -21% | 4.2 -11% | 5.2 11% | 8.5 81% | 4.3 -9% | 6.6 40% |
| Load (h) | 1.2 | 0.9 -25% | 1.3 8% | 3.3 175% | 1.1 -8% | 2 67% |
Pro
Contra
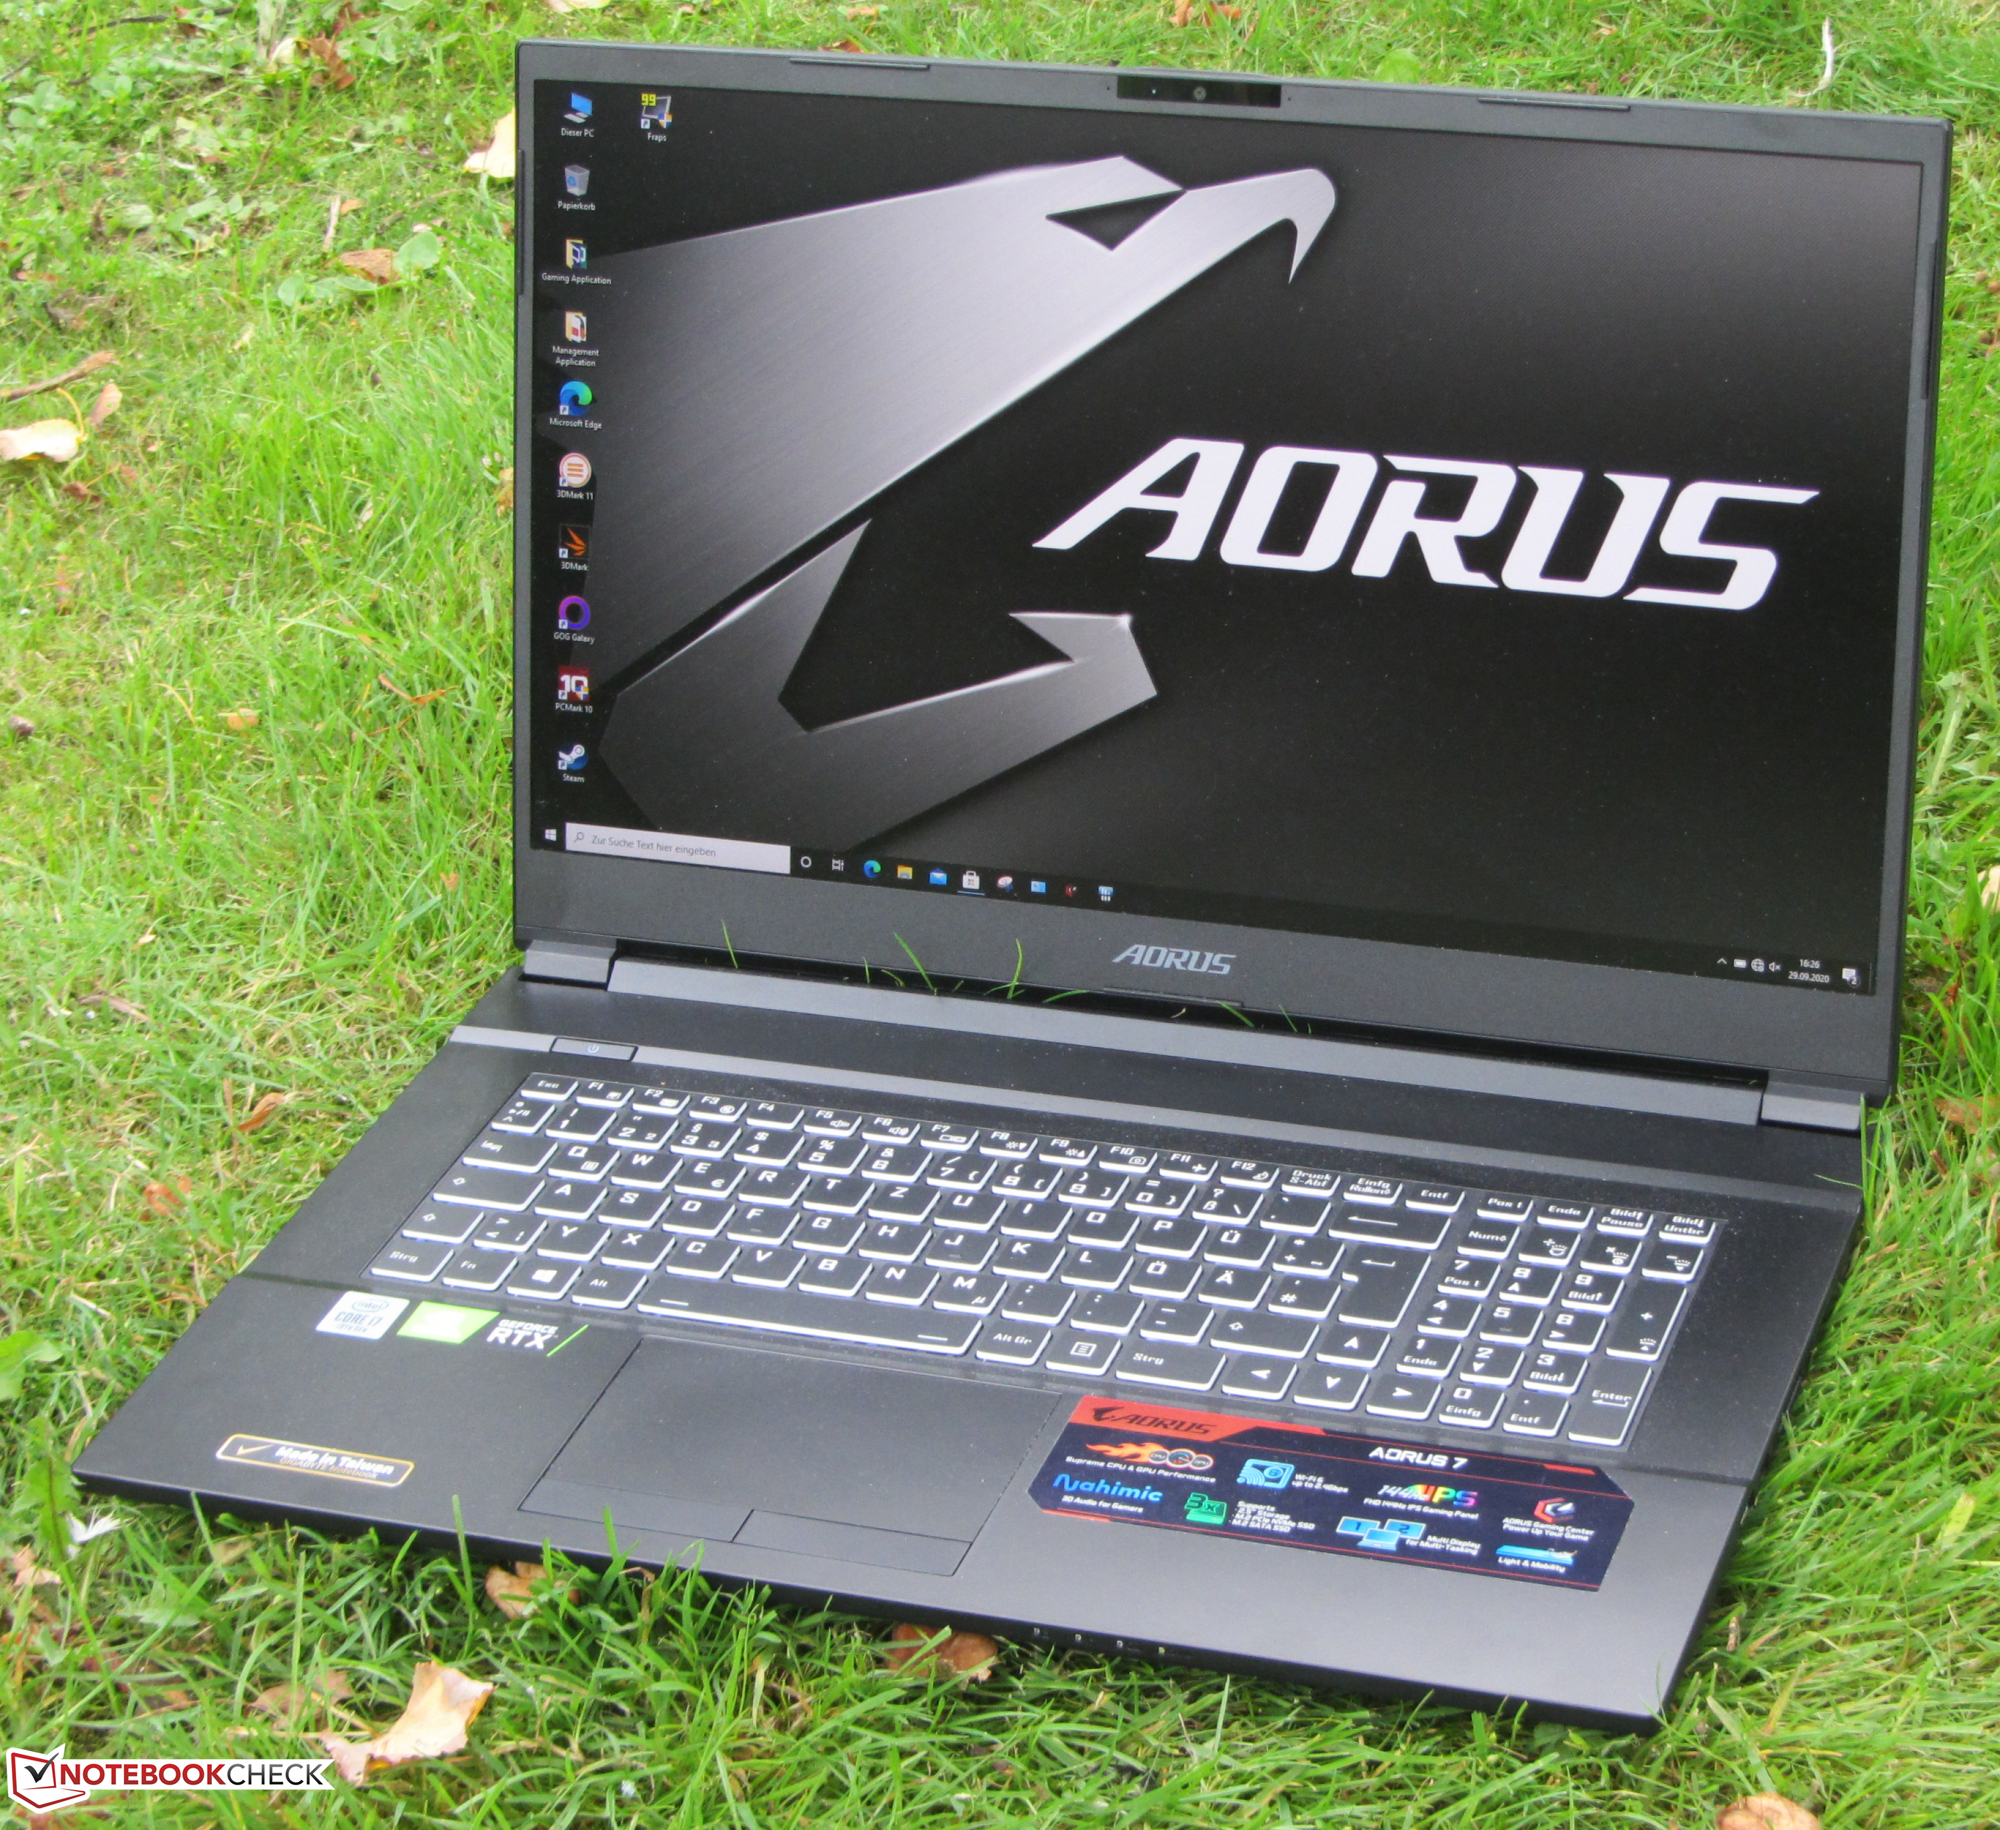
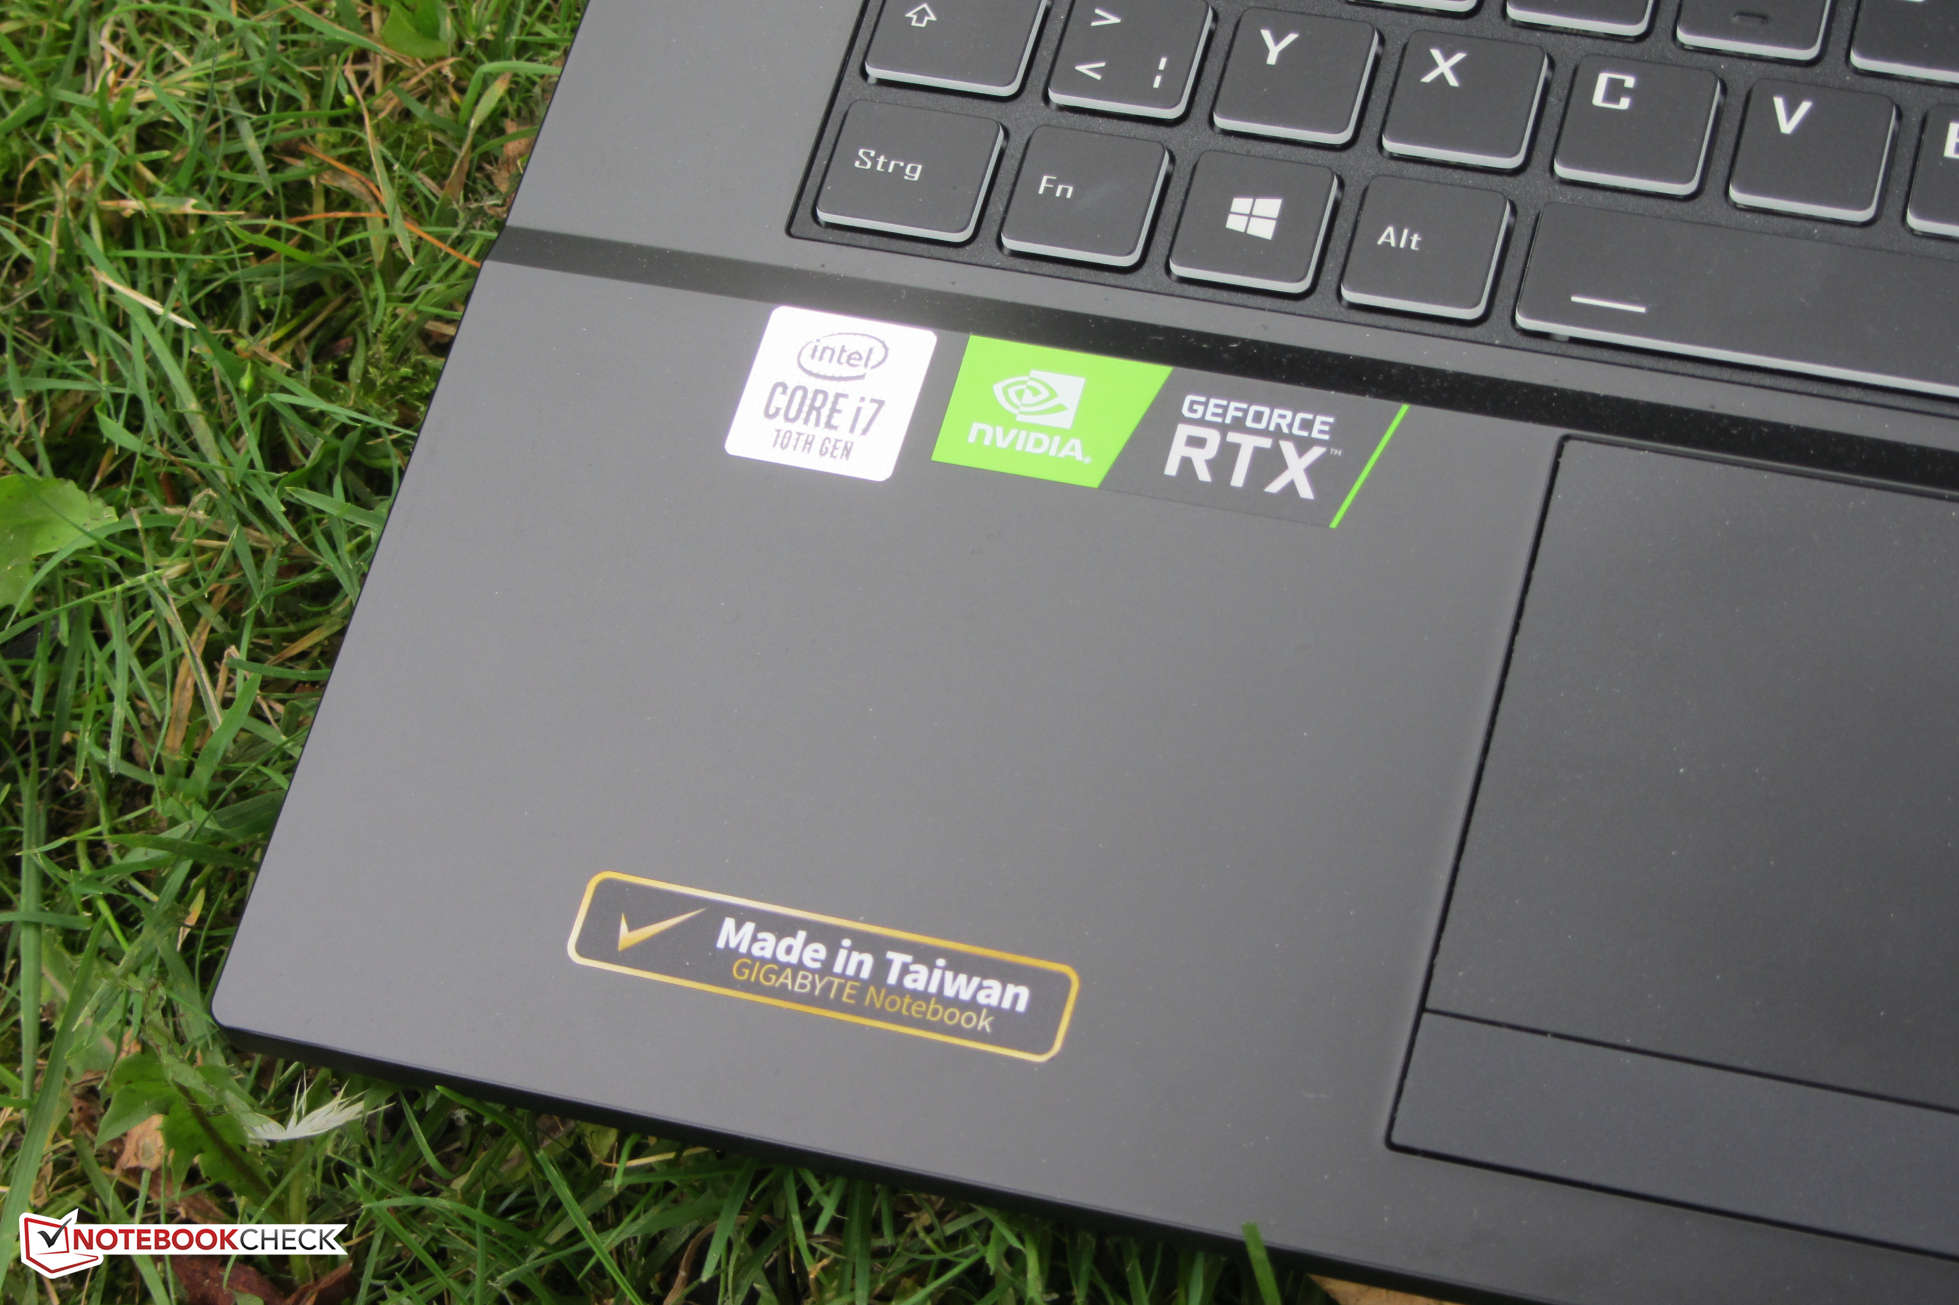
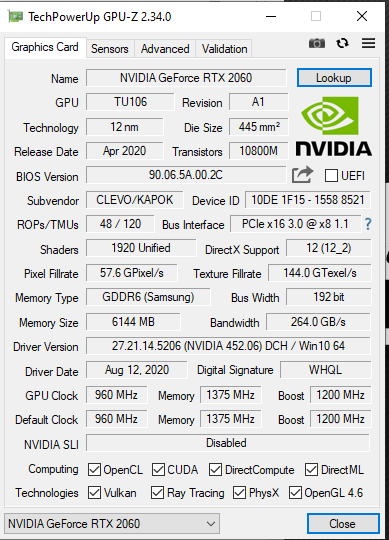
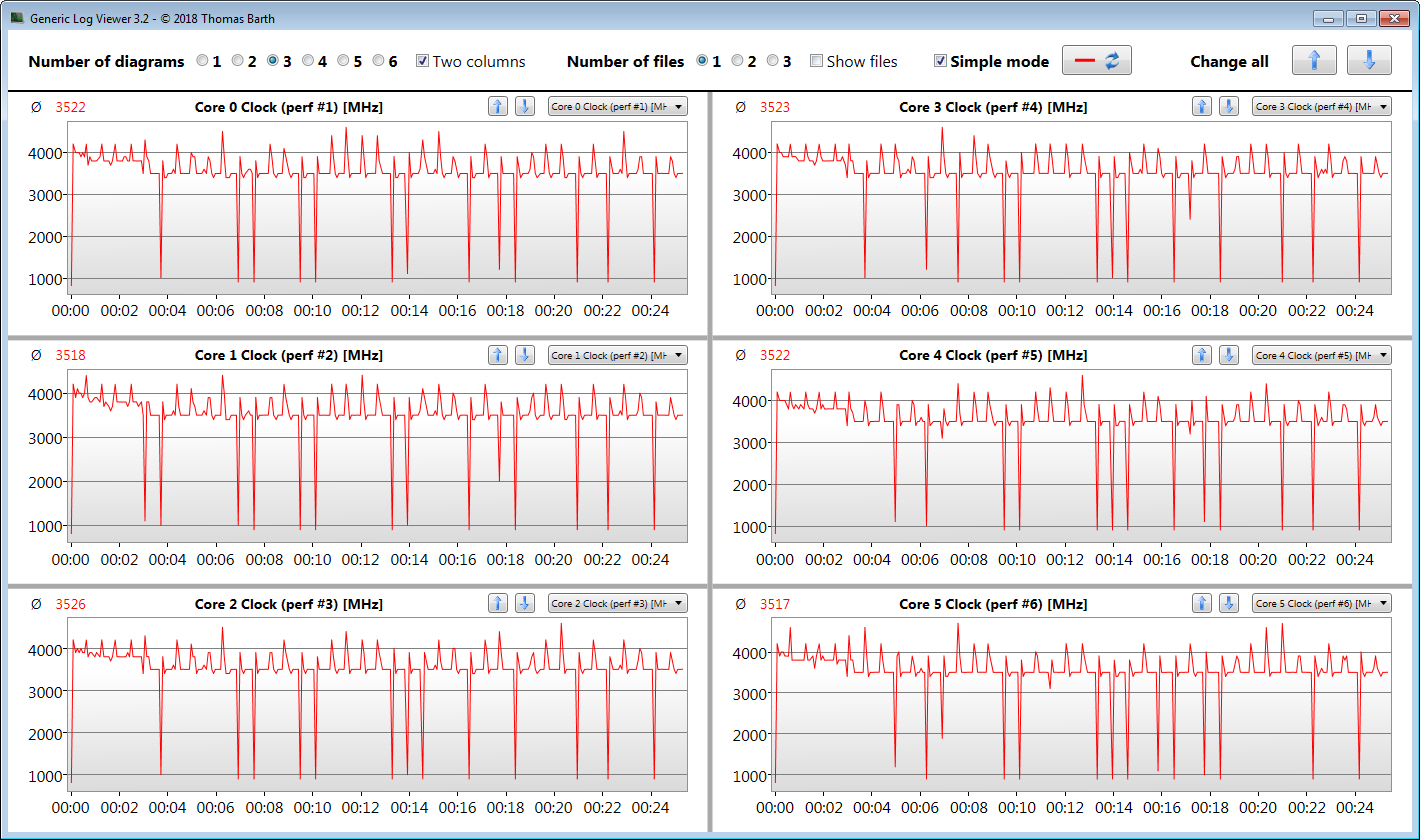
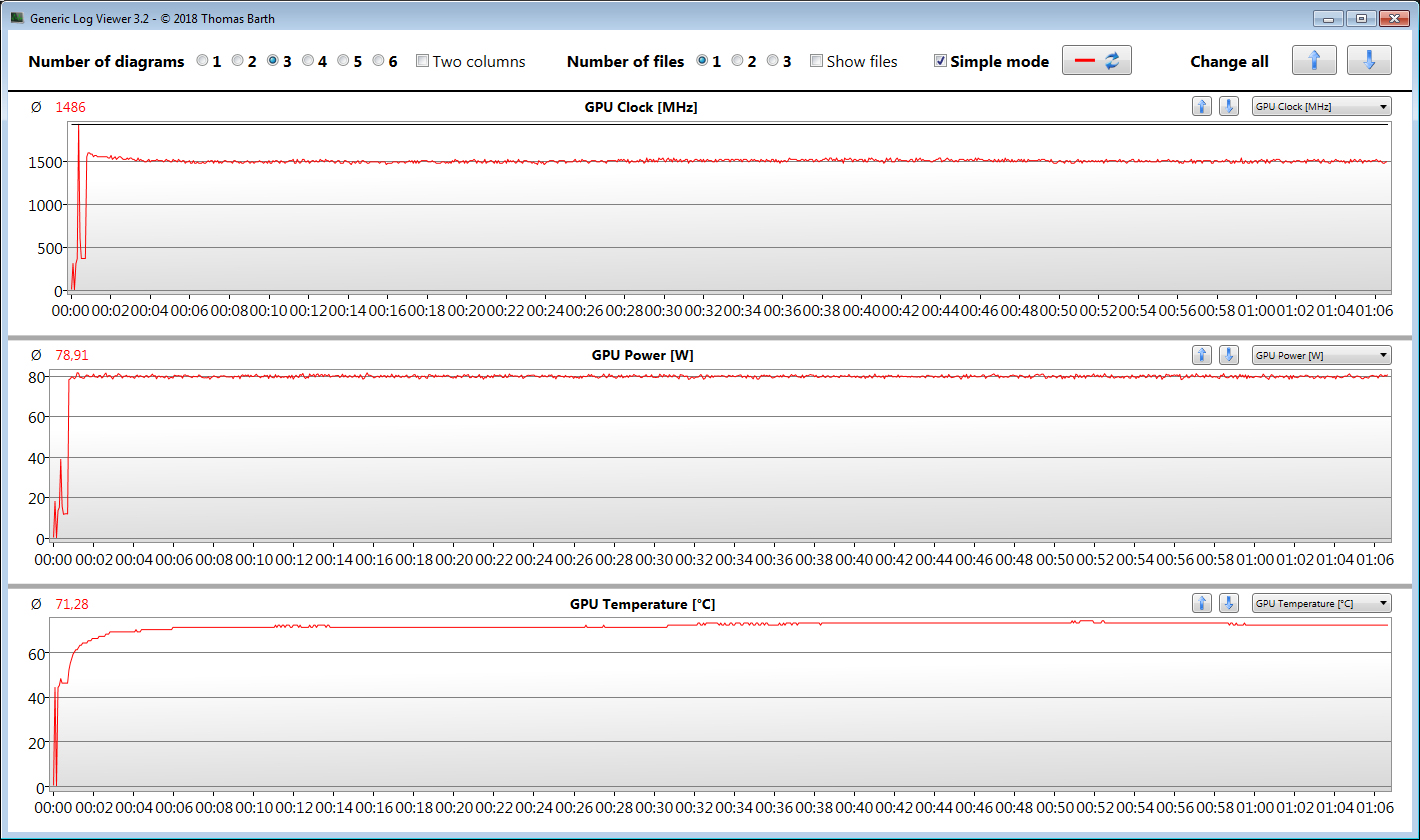
Com o Aorus 7 KB, a Gigabyte tem um portátil para jogos de 17,3 polegadas em sua gama, que faz o que se supõe que faz: Graças ao processador -Sem opções Core i7-10750H e à GPU GeForce RTX 2060, ele roda todos os jogos modernos fluentemente na tela. A carga prolongada não leva a quedas de desempenho.
Com o Aorus 7 KB, a Gigabyte oferece um portátil para jogos completo a um preço razoável.
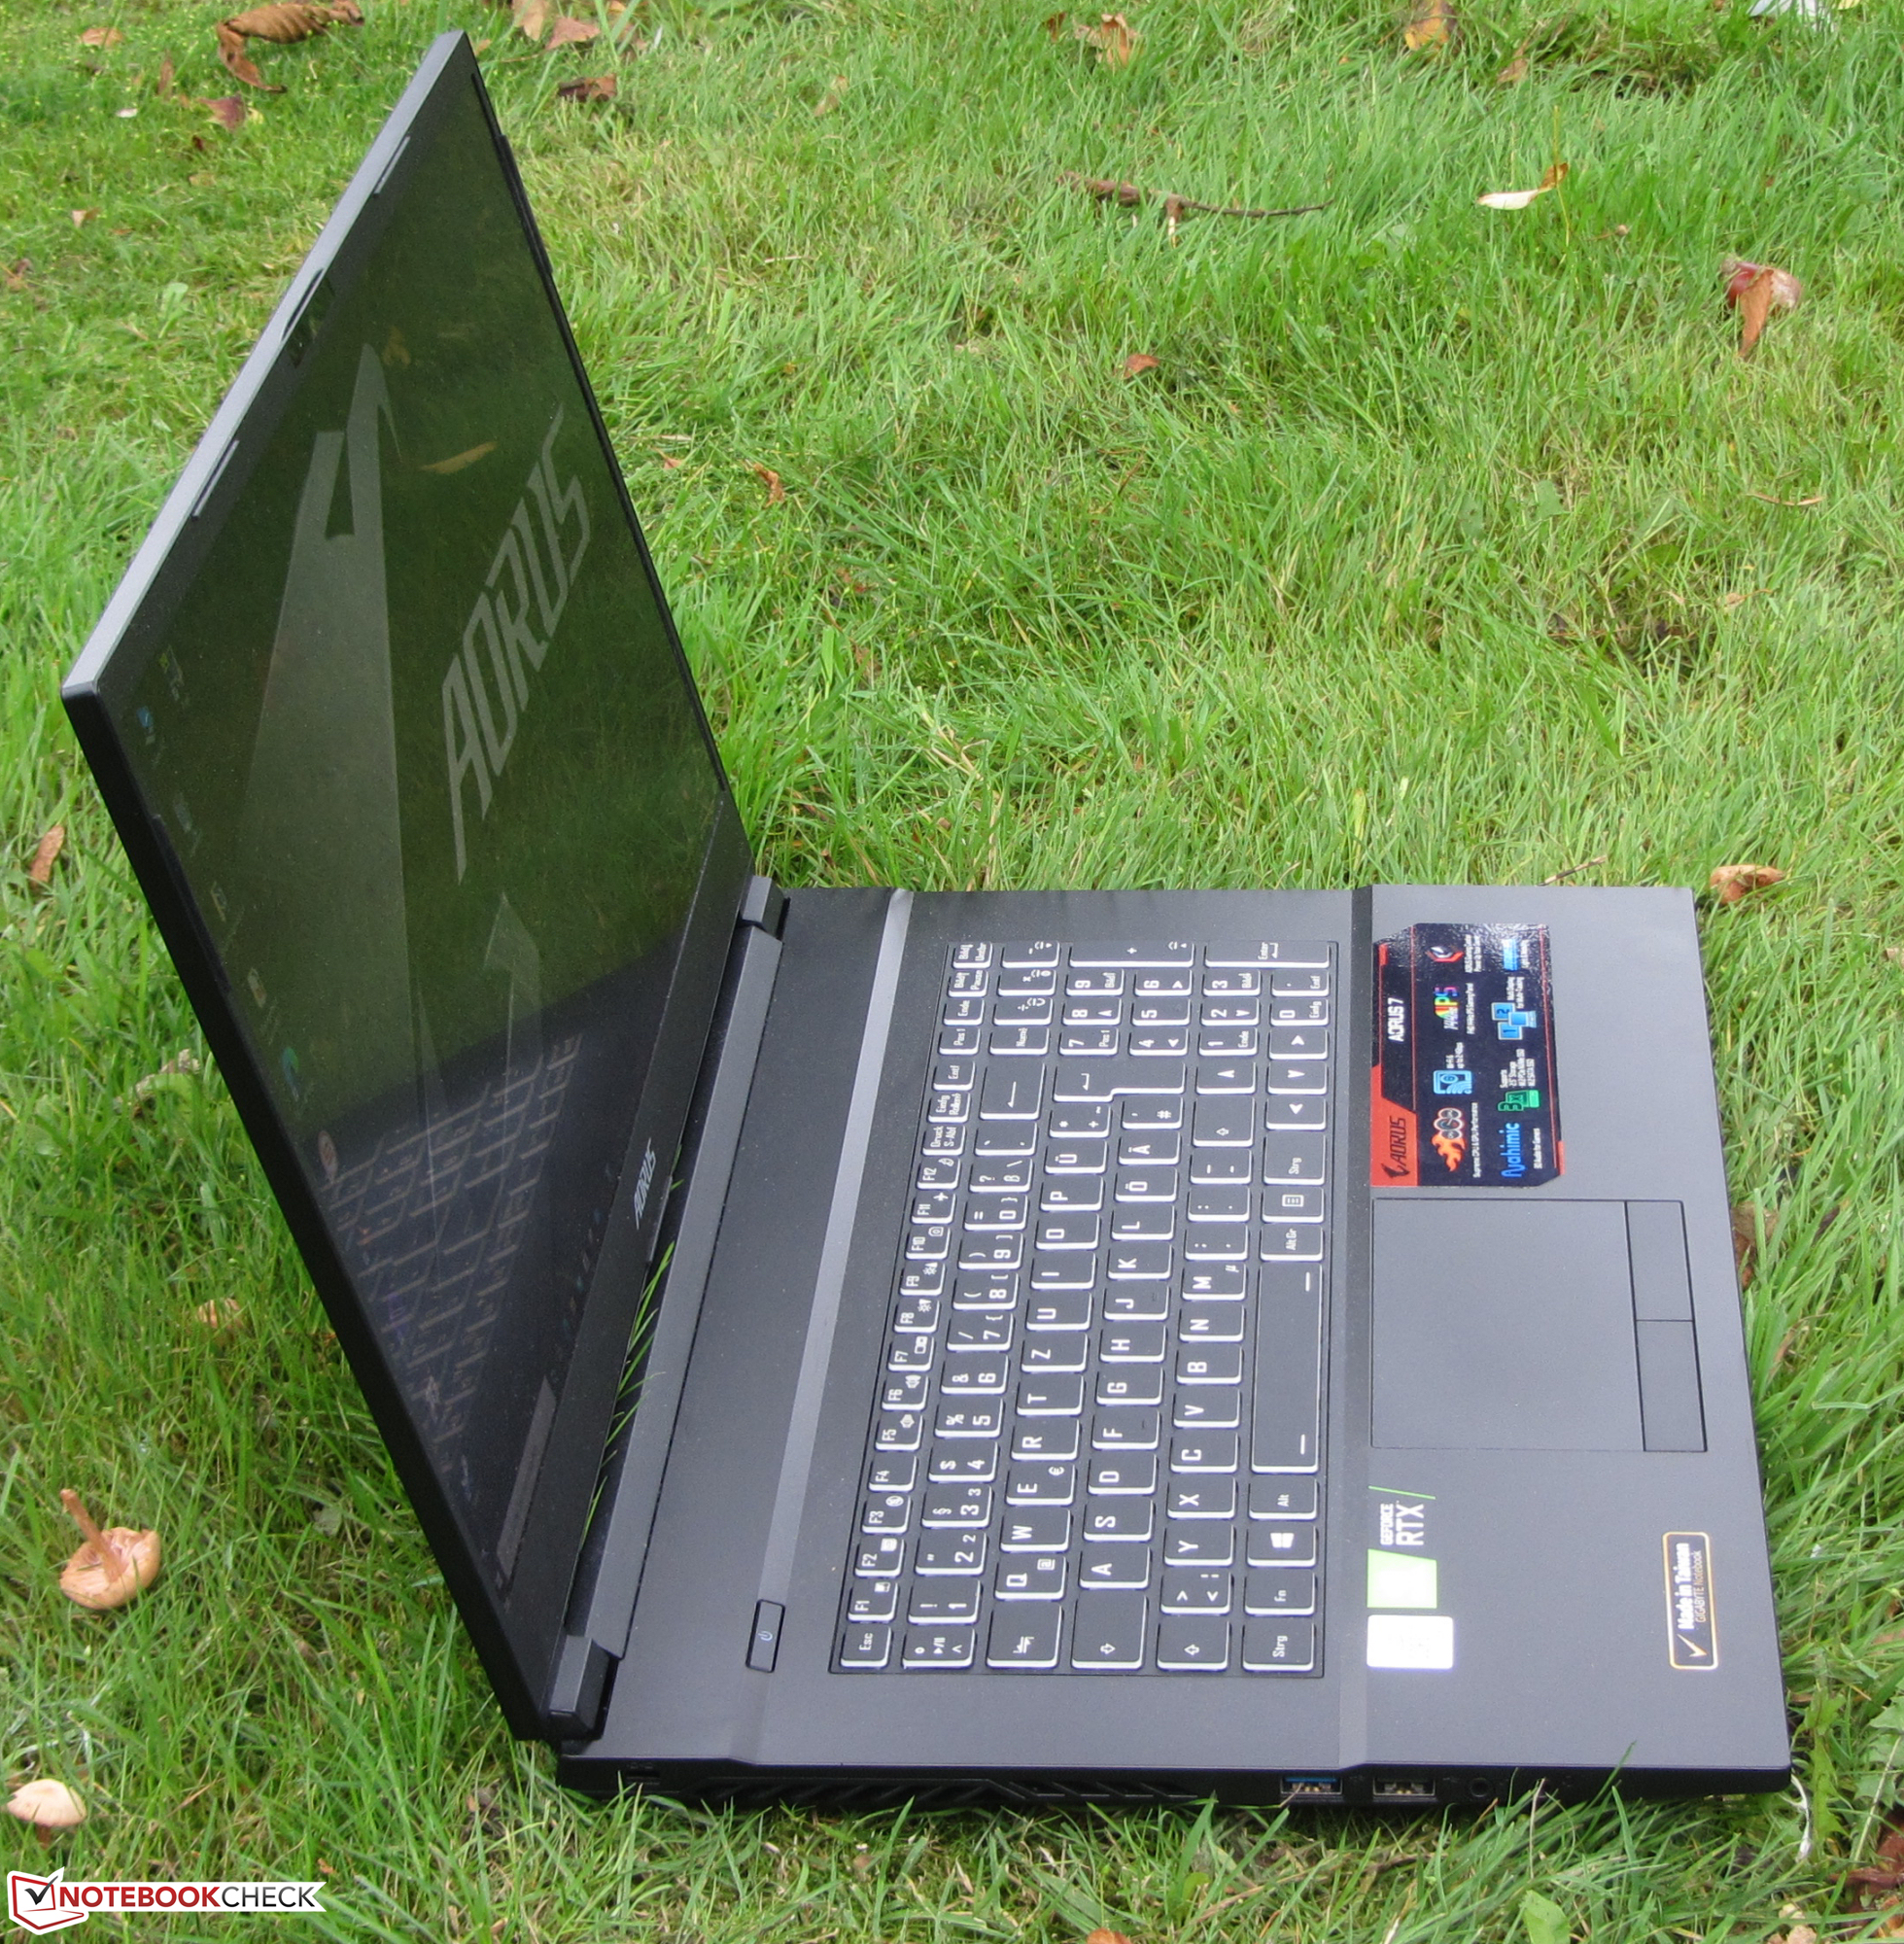
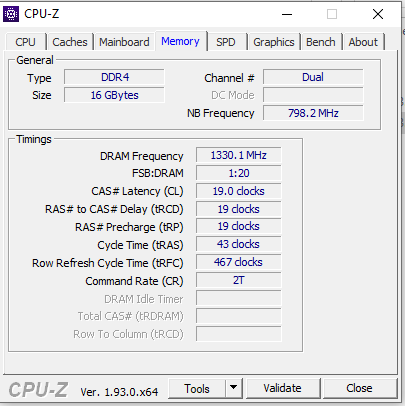
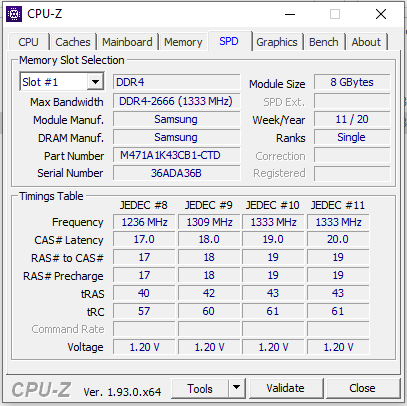
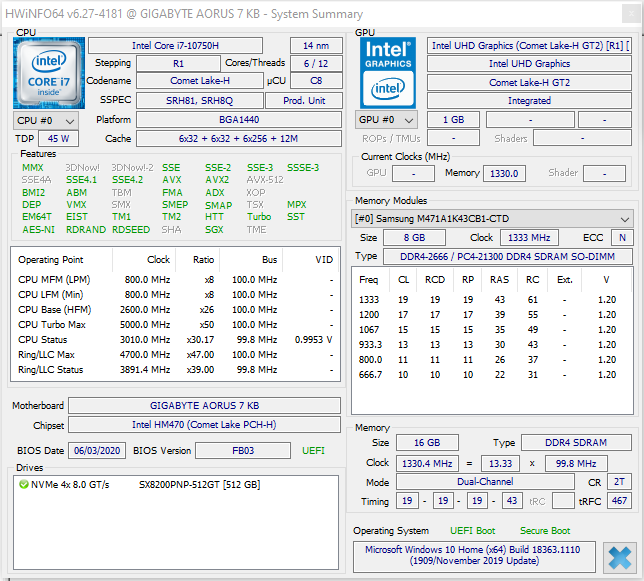
O espaço de armazenamento oferecido pelo veloz SSD NVMe é um pouco apertado para um portátil de jogos, com 512 GB. No entanto, pode ser expandido: O portátil oferece espaço para dois SSDs M.2 2280 (1 NVMe / SATA, 1 NVMe; RAID 0/1) e uma unidade de armazenamento de 2,5 polegadas. Uma expansão de memória (16 GB, modo de canal duplo; 64 GB máx.) Também seria possível. Ambos os procedimentos exigiriam a remoção da tampa inferior.
Considerando o poderoso hardware do portátil, seu desenvolvimento de calor é moderado. No entanto, o dispositivo produz muito ruído. A duração da bateria é boa, mas não é motivo para entusiasmo. A bateria de capacidade relativamente pequena (49 Wh) torna-se perceptível aqui.
A tela Full HD (IPS, 144 Hz) oferece ângulos de visão estáveis, uma superfície fosca, tempos de resposta rápidos, cobertura decente do espaço de cores e excelente reprodução de cores. No entanto, o brilho e contraste máximos deveriam ser maiores.
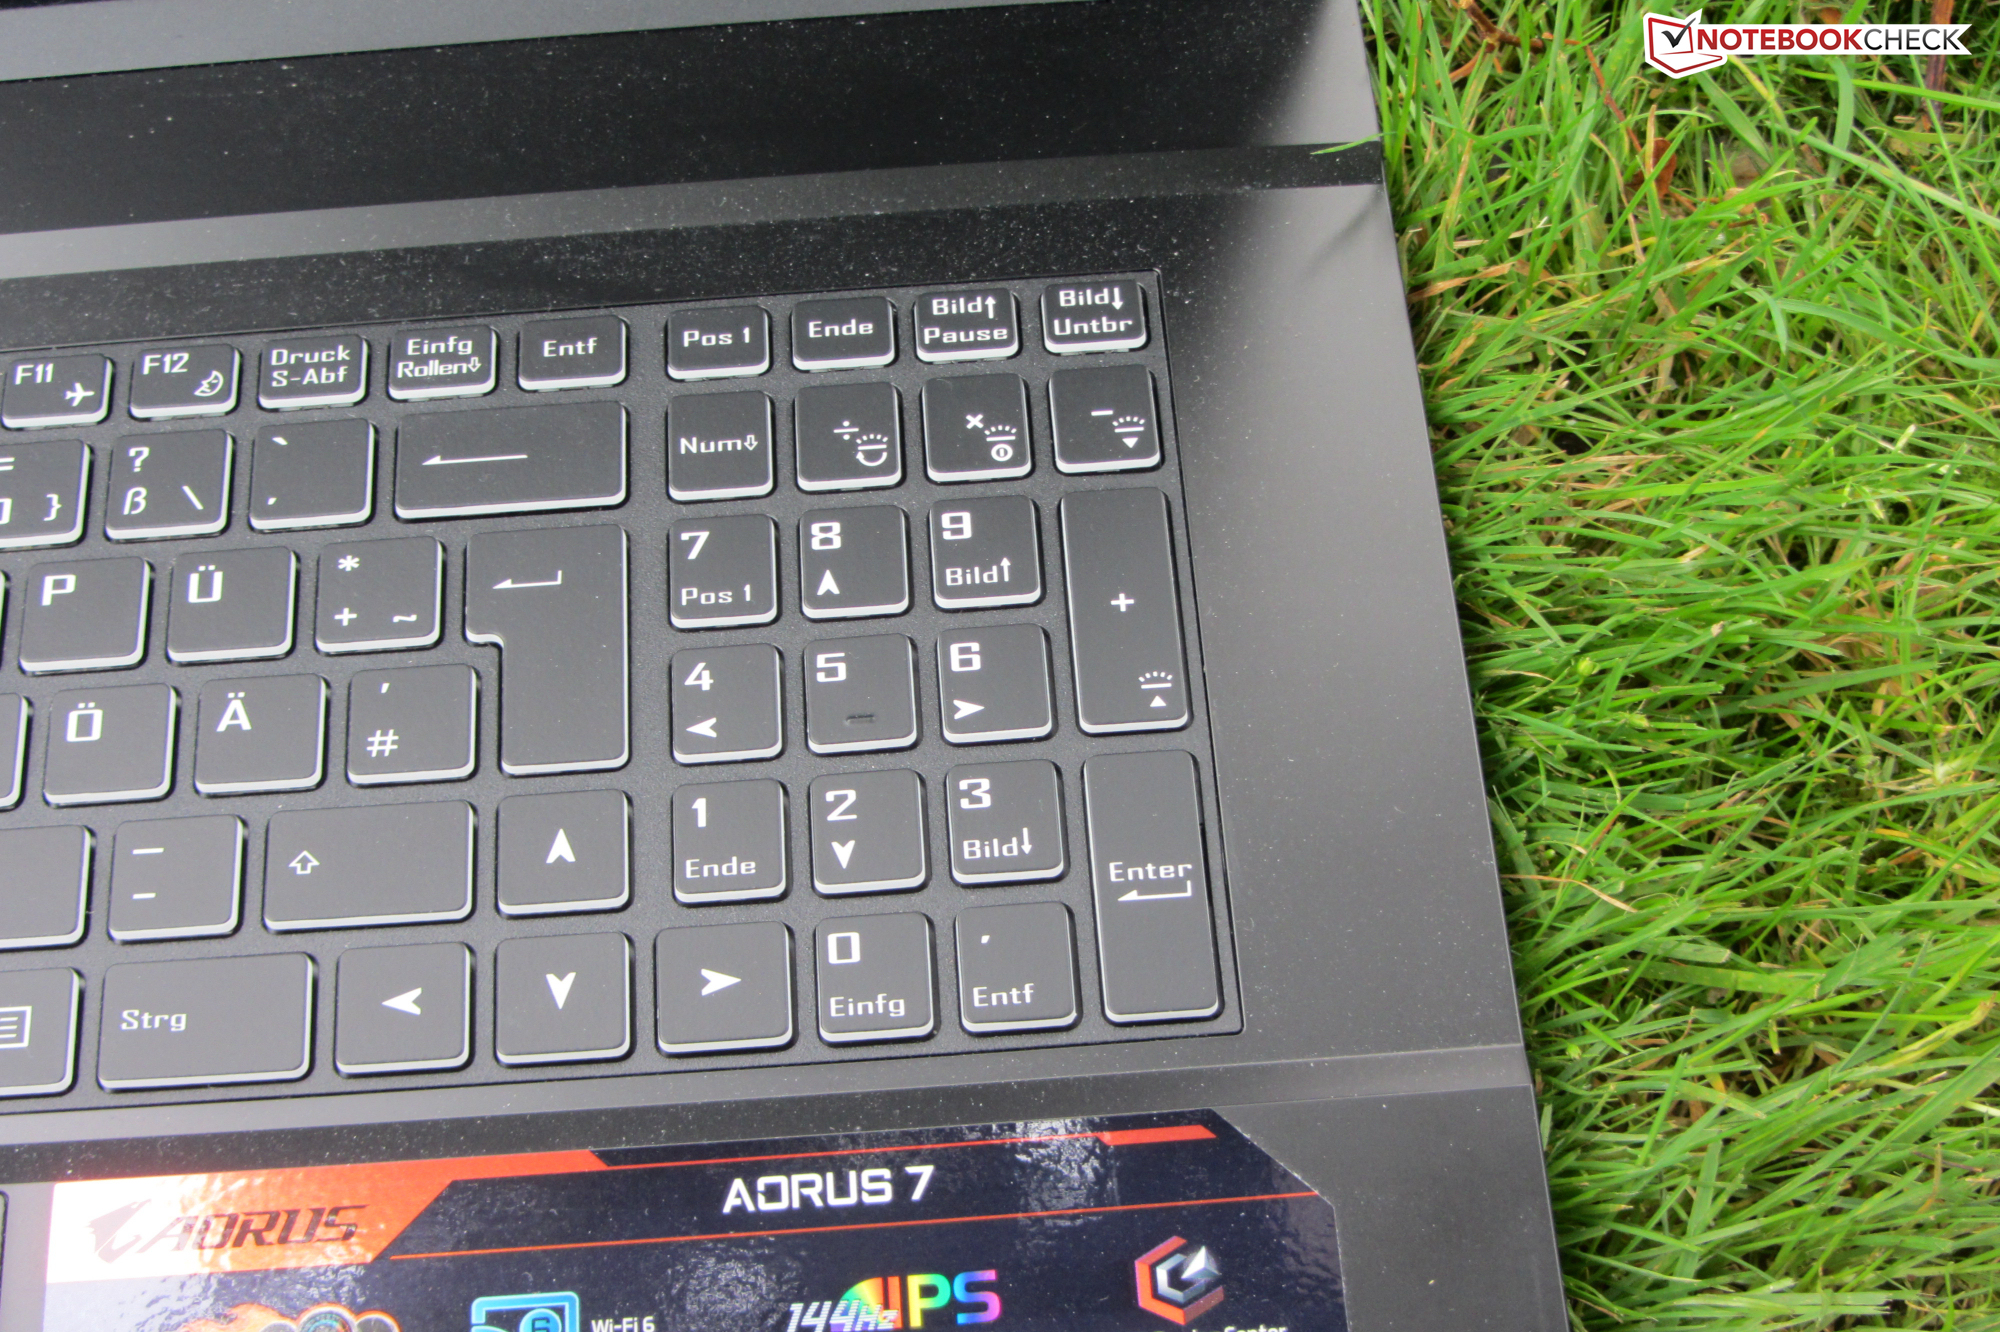
Aorus 7 KB
- 10/06/2020 v7 (old)
Sascha Mölck
Price comparison
