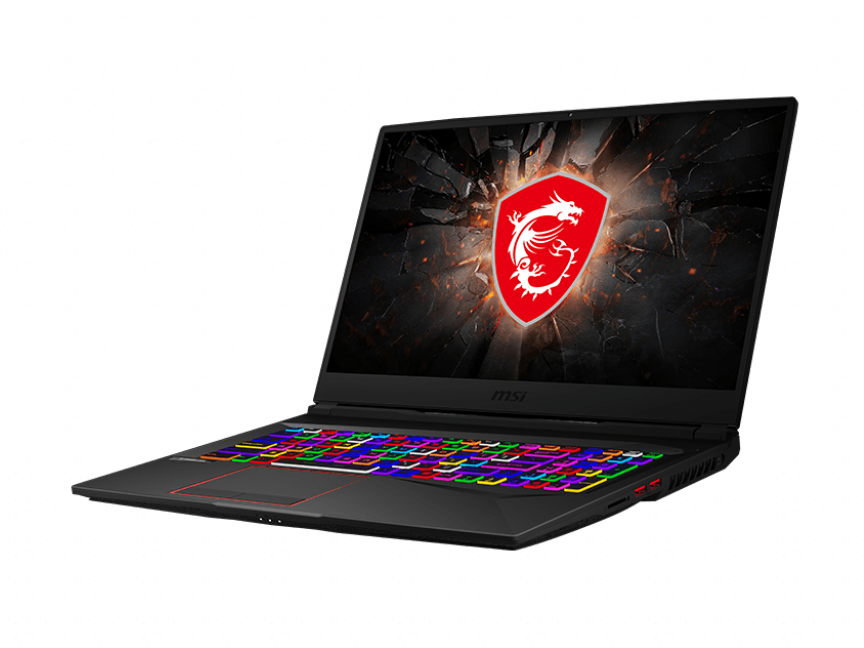
Breve Análise do Portátil MSI GE75 Raider 10SE: Combinação do Core i7 de 10a geração e GeForce RTX
Avaliação | Data | Modelo | Peso | Altura | Size | Resolução | Preço |
|---|---|---|---|---|---|---|---|
| 85.1 % v7 (old) | 07/2020 | MSI GE75 Raider 10SE-008US i7-10750H, GeForce RTX 2060 Mobile | 2.6 kg | 27.5 mm | 17.30" | 1920x1080 | |
| 82.9 % v7 (old) | 07/2019 | MSI GS75 Stealth 9SG i7-9750H, GeForce RTX 2080 Max-Q | 2.3 kg | 18.9 mm | 17.30" | 1920x1080 | |
| 86 % v7 (old) | 09/2019 | Asus Strix Hero III G731GV i7-9750H, GeForce RTX 2060 Mobile | 2.9 kg | 26.2 mm | 17.30" | 1920x1080 | |
| 83.2 % v7 (old) | 10/2019 | Lenovo Legion Y740-17IRH i7-9750H, GeForce RTX 2060 Mobile | 3 kg | 23 mm | 17.30" | 1920x1080 | |
| 89.4 % v6 (old) | 08/2019 | Razer Blade Pro 17 RTX 2060 i7-9750H, GeForce RTX 2060 Mobile | 2.8 kg | 19.9 mm | 17.30" | 1920x1080 | |
| 86.5 % v7 (old) | 05/2020 | Aorus 17G XB i7-10875H, GeForce RTX 2070 Super Max-Q | 2.7 kg | 26 mm | 17.30" | 1920x1080 |
| SD Card Reader | |
| average JPG Copy Test (av. of 3 runs) | |
| Aorus 17G XB (Toshiba Exceria Pro SDXC 64 GB UHS-II) | |
| Gigabyte Aero 17 HDR XB (Toshiba Exceria Pro SDXC 64 GB UHS-II) | |
| Dell XPS 15 9500 Core i7 4K UHD (Toshiba Exceria Pro SDXC 64 GB UHS-II) | |
| Razer Blade Pro 17 RTX 2060 (Toshiba Exceria Pro SDXC 64 GB UHS-II) | |
| MSI GT73VR 7RF-296 (Toshiba Exceria Pro SDXC 64 GB UHS-II) | |
| MSI GE75 Raider 10SE-008US (Toshiba Exceria Pro SDXC 64 GB UHS-II) | |
| maximum AS SSD Seq Read Test (1GB) | |
| Aorus 17G XB (Toshiba Exceria Pro SDXC 64 GB UHS-II) | |
| Gigabyte Aero 17 HDR XB (Toshiba Exceria Pro SDXC 64 GB UHS-II) | |
| MSI GT73VR 7RF-296 (Toshiba Exceria Pro SDXC 64 GB UHS-II) | |
| Razer Blade Pro 17 RTX 2060 (Toshiba Exceria Pro SDXC 64 GB UHS-II) | |
| Dell XPS 15 9500 Core i7 4K UHD (Toshiba Exceria Pro SDXC 64 GB UHS-II) | |
| MSI GE75 Raider 10SE-008US (Toshiba Exceria Pro SDXC 64 GB UHS-II) | |


| |||||||||||||||||||||||||
iluminação: 81 %
iluminação com acumulador: 337.9 cd/m²
Contraste: 1165:1 (Preto: 0.29 cd/m²)
ΔE ColorChecker Calman: 2.18 | ∀{0.5-29.43 Ø4.71}
calibrated: 0.69
ΔE Greyscale Calman: 3.1 | ∀{0.09-98 Ø4.96}
98.2% sRGB (Argyll 1.6.3 3D)
62% AdobeRGB 1998 (Argyll 1.6.3 3D)
67.8% AdobeRGB 1998 (Argyll 3D)
98.1% sRGB (Argyll 3D)
65.6% Display P3 (Argyll 3D)
Gamma: 2.07
CCT: 6882 K
| MSI GE75 Raider 10SE-008US Chi Mei N173HCE-G33, IPS, 17.3", 1920x1080 | MSI GS75 Stealth 9SG Chi Mei N173HCE-G33 (CMN175C), IPS, 17.3", 1920x1080 | Asus Strix Hero III G731GV AU Optronics AUO B173HAN04.0, IPS, 17.3", 1920x1080 | Lenovo Legion Y740-17IRH LG Philips LP173WFG-SPD2 (LGD05E0), IPS, 17.3", 1920x1080 | Razer Blade Pro 17 RTX 2060 AU Optronics B173HAN04.0, IPS, 17.3", 1920x1080 | Aorus 17G XB AU Optronics B173HAN05.0 (AUO509D), IPS, 17.3", 1920x1080 | |
|---|---|---|---|---|---|---|
| Display | -5% | -7% | -2% | -8% | 5% | |
| Display P3 Coverage (%) | 65.6 | 62.6 -5% | 62.9 -4% | 64.8 -1% | 61.1 -7% | 70.6 8% |
| sRGB Coverage (%) | 98.1 | 93.5 -5% | 87.2 -11% | 96 -2% | 89.4 -9% | 97.2 -1% |
| AdobeRGB 1998 Coverage (%) | 67.8 | 64.7 -5% | 63.8 -6% | 65.8 -3% | 62.5 -8% | 72.8 7% |
| Response Times | -10% | -18% | -73% | 0% | -86% | |
| Response Time Grey 50% / Grey 80% * (ms) | 6.8 ? | 7.2 ? -6% | 6.8 ? -0% | 14.8 ? -118% | 6.8 ? -0% | 16 ? -135% |
| Response Time Black / White * (ms) | 8.8 ? | 10 ? -14% | 12 ? -36% | 11.2 ? -27% | 8.8 ? -0% | 12 ? -36% |
| PWM Frequency (Hz) | 25000 ? | 25510 ? | ||||
| Screen | 11% | -52% | -24% | -30% | 11% | |
| Brightness middle (cd/m²) | 337.9 | 366 8% | 312.3 -8% | 282 -17% | 300.4 -11% | 293 -13% |
| Brightness (cd/m²) | 305 | 343 12% | 297 -3% | 261 -14% | 289 -5% | 285 -7% |
| Brightness Distribution (%) | 81 | 91 12% | 91 12% | 87 7% | 93 15% | 95 17% |
| Black Level * (cd/m²) | 0.29 | 0.29 -0% | 0.21 28% | 0.27 7% | 0.32 -10% | 0.24 17% |
| Contrast (:1) | 1165 | 1262 8% | 1487 28% | 1044 -10% | 939 -19% | 1221 5% |
| Colorchecker dE 2000 * | 2.18 | 1.51 31% | 3.6 -65% | 3.18 -46% | 2.32 -6% | 1.27 42% |
| Colorchecker dE 2000 max. * | 3.9 | 3.22 17% | 6.74 -73% | 8.39 -115% | 3.81 2% | 2.24 43% |
| Colorchecker dE 2000 calibrated * | 0.69 | 0.71 -3% | 3.95 -472% | 0.95 -38% | 2.95 -328% | 1.06 -54% |
| Greyscale dE 2000 * | 3.1 | 1.93 38% | 3.1 -0% | 4.1 -32% | 1.5 52% | 1.34 57% |
| Gamma | 2.07 106% | 2.38 92% | 2.26 97% | 2.55 86% | 2.3 96% | 2.38 92% |
| CCT | 6882 94% | 6881 94% | 7002 93% | 7260 90% | 6764 96% | 6542 99% |
| Color Space (Percent of AdobeRGB 1998) (%) | 62 | 60 -3% | 56.6 -9% | 61 -2% | 57.4 -7% | 73 18% |
| Color Space (Percent of sRGB) (%) | 98.2 | 94 -4% | 86.6 -12% | 96 -2% | 89 -9% | 94 -4% |
| Média Total (Programa/Configurações) | -1% /
5% | -26% /
-39% | -33% /
-26% | -13% /
-22% | -23% /
-2% |
* ... menor é melhor
Exibir tempos de resposta
| ↔ Tempo de resposta preto para branco | ||
|---|---|---|
| 8.8 ms ... ascensão ↗ e queda ↘ combinadas | ↗ 4.4 ms ascensão | 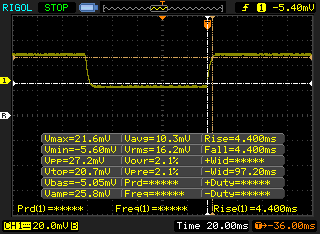 |
| ↘ 4.4 ms queda | ||
| A tela mostra taxas de resposta rápidas em nossos testes e deve ser adequada para jogos. Em comparação, todos os dispositivos testados variam de 0.1 (mínimo) a 240 (máximo) ms. » 25 % de todos os dispositivos são melhores. Isso significa que o tempo de resposta medido é melhor que a média de todos os dispositivos testados (19.8 ms). | ||
| ↔ Tempo de resposta 50% cinza a 80% cinza | ||
| 6.8 ms ... ascensão ↗ e queda ↘ combinadas | ↗ 3.4 ms ascensão | 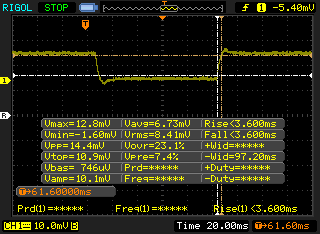 |
| ↘ 3.4 ms queda | ||
| A tela mostra taxas de resposta muito rápidas em nossos testes e deve ser muito adequada para jogos em ritmo acelerado. Em comparação, todos os dispositivos testados variam de 0.165 (mínimo) a 636 (máximo) ms. » 20 % de todos os dispositivos são melhores. Isso significa que o tempo de resposta medido é melhor que a média de todos os dispositivos testados (30.9 ms). | ||
Cintilação da tela / PWM (modulação por largura de pulso)
| Tela tremeluzindo/PWM detectado | 25000 Hz | ≤ 18 % configuração de brilho | 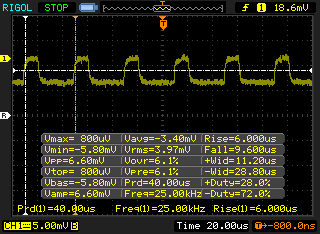 |
A luz de fundo da tela pisca em 25000 Hz (pior caso, por exemplo, utilizando PWM) Cintilação detectada em uma configuração de brilho de 18 % e abaixo. Não deve haver cintilação ou PWM acima desta configuração de brilho. A frequência de 25000 Hz é bastante alta, então a maioria dos usuários sensíveis ao PWM não deve notar nenhuma oscilação. [pwm_comparison] Em comparação: 52 % de todos os dispositivos testados não usam PWM para escurecer a tela. Se PWM foi detectado, uma média de 7744 (mínimo: 5 - máximo: 343500) Hz foi medida. | |||
Cinebench R15: CPU Multi 64Bit | CPU Single 64Bit
Blender: v2.79 BMW27 CPU
7-Zip 18.03: 7z b 4 -mmt1 | 7z b 4
Geekbench 5.5: Single-Core | Multi-Core
HWBOT x265 Benchmark v2.2: 4k Preset
LibreOffice : 20 Documents To PDF
R Benchmark 2.5: Overall mean
| Cinebench R20 / CPU (Multi Core) | |
| MSI Bravo 17 A4DDR | |
| MSI GE66 Raider 10SFS | |
| MSI GE75 9SG | |
| Razer Blade Pro 17 RTX 2070 Max-Q 300 Hz | |
| Acer Nitro 5 AN515-44-R5FT | |
| MSI GE75 Raider 10SE-008US | |
| Média Intel Core i7-10750H (1749 - 3325, n=43) | |
| Lenovo Legion Y740-17IRHg-81UJ001VGE | |
| MSI GE63 Raider 8SG | |
| MSI GF75 Thin 10SCXR | |
| Lenovo Legion Y540-17IRH | |
| Asus ROG Zephyrus G15 GA502DU | |
| Cinebench R20 / CPU (Single Core) | |
| Razer Blade Pro 17 RTX 2070 Max-Q 300 Hz | |
| MSI Bravo 17 A4DDR | |
| MSI GE66 Raider 10SFS | |
| Média Intel Core i7-10750H (431 - 504, n=43) | |
| MSI GE75 Raider 10SE-008US | |
| MSI GE75 9SG | |
| MSI GF75 Thin 10SCXR | |
| Lenovo Legion Y740-17IRHg-81UJ001VGE | |
| Acer Nitro 5 AN515-44-R5FT | |
| Lenovo Legion Y540-17IRH | |
| MSI GE63 Raider 8SG | |
| Asus ROG Zephyrus G15 GA502DU | |
| Cinebench R15 / CPU Multi 64Bit | |
| MSI Bravo 17 A4DDR | |
| MSI GE75 9SG | |
| MSI GE66 Raider 10SFS | |
| Razer Blade Pro 17 RTX 2070 Max-Q 300 Hz | |
| Acer Nitro 5 AN515-44-R5FT | |
| MSI GE75 Raider 10SE-008US | |
| Média Intel Core i7-10750H (804 - 1418, n=50) | |
| Lenovo Legion Y740-17IRHg-81UJ001VGE | |
| MSI GE63 Raider 8SG | |
| Lenovo Legion Y540-17IRH | |
| MSI GF75 Thin 10SCXR | |
| Asus ROG Zephyrus G15 GA502DU | |
| Cinebench R15 / CPU Single 64Bit | |
| MSI GE66 Raider 10SFS | |
| Razer Blade Pro 17 RTX 2070 Max-Q 300 Hz | |
| Média Intel Core i7-10750H (184 - 213, n=45) | |
| MSI GE75 9SG | |
| MSI Bravo 17 A4DDR | |
| MSI GE75 Raider 10SE-008US | |
| MSI GF75 Thin 10SCXR | |
| Acer Nitro 5 AN515-44-R5FT | |
| Lenovo Legion Y740-17IRHg-81UJ001VGE | |
| Lenovo Legion Y540-17IRH | |
| MSI GE63 Raider 8SG | |
| Asus ROG Zephyrus G15 GA502DU | |
| Geekbench 5.5 / Single-Core | |
| MSI GE66 Raider 10SFS | |
| Razer Blade Pro 17 RTX 2070 Max-Q 300 Hz | |
| Média Intel Core i7-10750H (1114 - 1333, n=43) | |
| MSI GE75 Raider 10SE-008US | |
| MSI Bravo 17 A4DDR | |
| MSI GF75 Thin 10SCXR | |
| Lenovo Legion Y740-17IRHg-81UJ001VGE | |
| Acer Nitro 5 AN515-44-R5FT | |
| Geekbench 5.5 / Multi-Core | |
| MSI GE66 Raider 10SFS | |
| MSI Bravo 17 A4DDR | |
| Razer Blade Pro 17 RTX 2070 Max-Q 300 Hz | |
| MSI GE75 Raider 10SE-008US | |
| Média Intel Core i7-10750H (4443 - 6674, n=43) | |
| Lenovo Legion Y740-17IRHg-81UJ001VGE | |
| Acer Nitro 5 AN515-44-R5FT | |
| MSI GF75 Thin 10SCXR | |
| HWBOT x265 Benchmark v2.2 / 4k Preset | |
| MSI Bravo 17 A4DDR | |
| MSI GE66 Raider 10SFS | |
| MSI GE75 9SG | |
| MSI GE75 Raider 10SE-008US | |
| Média Intel Core i7-10750H (5.54 - 11.6, n=43) | |
| Lenovo Legion Y740-17IRHg-81UJ001VGE | |
| Acer Nitro 5 AN515-44-R5FT | |
| MSI GF75 Thin 10SCXR | |
| Asus ROG Zephyrus G15 GA502DU | |
| LibreOffice / 20 Documents To PDF | |
| MSI Bravo 17 A4DDR | |
| Acer Nitro 5 AN515-44-R5FT | |
| MSI GF75 Thin 10SCXR | |
| Razer Blade Pro 17 RTX 2070 Max-Q 300 Hz | |
| MSI GE75 Raider 10SE-008US | |
| MSI GE66 Raider 10SFS | |
| Média Intel Core i7-10750H (43.1 - 99.2, n=43) | |
| R Benchmark 2.5 / Overall mean | |
| Lenovo Legion Y740-17IRHg-81UJ001VGE | |
| MSI GF75 Thin 10SCXR | |
| Acer Nitro 5 AN515-44-R5FT | |
| MSI GE75 Raider 10SE-008US | |
| Média Intel Core i7-10750H (0.578 - 0.708, n=42) | |
| MSI Bravo 17 A4DDR | |
| MSI GE66 Raider 10SFS | |
* ... menor é melhor
| PCMark 8 Home Score Accelerated v2 | 4515 pontos | |
| PCMark 8 Work Score Accelerated v2 | 5928 pontos | |
| PCMark 10 Score | 6268 pontos | |
Ajuda | ||
| DPC Latencies / LatencyMon - interrupt to process latency (max), Web, Youtube, Prime95 | |
| Dell XPS 15 9500 Core i7 4K UHD | |
| Asus Zephyrus G14 GA401IV | |
| MSI GE75 Raider 10SE-008US | |
| Razer Blade Pro 17 RTX 2070 Max-Q 300 Hz | |
* ... menor é melhor
| MSI GE75 Raider 10SE-008US Samsung SSD PM981 MZVLB512HAJQ | MSI GS75 Stealth 9SG 2x Samsung SSD PM981 MZVLB1T0HALR (RAID 0) | Asus Strix Hero III G731GV Intel SSD 660p SSDPEKNW512G8 | Lenovo Legion Y740-17IRH WDC PC SN520 SDAPMUW-128G | Razer Blade Pro 17 RTX 2060 Samsung SSD PM981 MZVLB512HAJQ | Aorus 17G XB Samsung SSD PM981a MZVLB512HBJQ | |
|---|---|---|---|---|---|---|
| AS SSD | 6% | -27% | -60% | 5% | 2% | |
| Seq Read (MB/s) | 2036 | 2855 40% | 940 -54% | 1339 -34% | 1810 -11% | 1791 -12% |
| Seq Write (MB/s) | 1835 | 2687 46% | 921 -50% | 688 -63% | 1797 -2% | 2193 20% |
| 4K Read (MB/s) | 60.6 | 30.31 -50% | 48.05 -21% | 23.23 -62% | 48.43 -20% | 50.7 -16% |
| 4K Write (MB/s) | 127.2 | 96.3 -24% | 104.3 -18% | 98.8 -22% | 106 -17% | 116.8 -8% |
| 4K-64 Read (MB/s) | 1601 | 1460 -9% | 320.1 -80% | 300.9 -81% | 1156 -28% | 1525 -5% |
| 4K-64 Write (MB/s) | 1734 | 1224 -29% | 703 -59% | 204.6 -88% | 1748 1% | 1958 13% |
| Access Time Read * (ms) | 0.049 | 0.054 -10% | 0.079 -61% | 0.184 -276% | 0.057 -16% | 0.07 -43% |
| Access Time Write * (ms) | 0.09 | 0.038 58% | 0.046 49% | 0.037 59% | 0.035 61% | 0.032 64% |
| Score Read (Points) | 1865 | 1776 -5% | 462 -75% | 458 -75% | 1385 -26% | 1755 -6% |
| Score Write (Points) | 2045 | 1589 -22% | 900 -56% | 372 -82% | 2033 -1% | 2294 12% |
| Score Total (Points) | 4863 | 4259 -12% | 1616 -67% | 1038 -79% | 4135 -15% | 4972 2% |
| Copy ISO MB/s (MB/s) | 1900 | 2226 17% | 1416 -25% | 988 -48% | 1984 4% | |
| Copy Program MB/s (MB/s) | 205.5 | 426.4 107% | 569 177% | 327.2 59% | 588 186% | |
| Copy Game MB/s (MB/s) | 1419 | 1152 -19% | 971 -32% | 758 -47% | 835 -41% | |
| CrystalDiskMark 5.2 / 6 | 8% | -27% | -49% | -10% | 9% | |
| Write 4K (MB/s) | 139.2 | 95.5 -31% | 129.3 -7% | 102.7 -26% | 124.1 -11% | 123.4 -11% |
| Read 4K (MB/s) | 53 | 42.59 -20% | 54.4 3% | 29.12 -45% | 44.75 -16% | 45.02 -15% |
| Write Seq (MB/s) | 1950 | 2851 46% | 978 -50% | 362.2 -81% | 1292 -34% | 2526 30% |
| Read Seq (MB/s) | 2328 | 2696 16% | 1447 -38% | 1010 -57% | 1272 -45% | 2062 -11% |
| Write 4K Q32T1 (MB/s) | 408.9 | 402.6 -2% | 476.8 17% | 298.1 -27% | 514 26% | 497.9 22% |
| Read 4K Q32T1 (MB/s) | 551 | 443.9 -19% | 338.1 -39% | 349.6 -37% | 596 8% | 579 5% |
| Write Seq Q32T1 (MB/s) | 1938 | 3420 76% | 982 -49% | 788 -59% | 1892 -2% | 2982 54% |
| Read Seq Q32T1 (MB/s) | 3467 | 3514 1% | 1622 -53% | 1490 -57% | 3209 -7% | 3440 -1% |
| Média Total (Programa/Configurações) | 7% /
7% | -27% /
-27% | -55% /
-56% | -3% /
-0% | 6% /
5% |
* ... menor é melhor

Disk Throttling: DiskSpd Read Loop, Queue Depth 8
| 3DMark 11 | |
| 1280x720 Performance GPU | |
| Schenker XMG Ultra 17 | |
| Eurocom Nightsky RX17 | |
| MSI RTX 2060 Gaming Z 6G | |
| Dell G5 15 SE 5505 P89F | |
| MSI GE75 Raider 10SE-008US | |
| Alienware 17 R5 | |
| Média NVIDIA GeForce RTX 2060 Mobile (19143 - 24662, n=40) | |
| Asus TUF A17 FA706IU-AS76 | |
| Asus Strix GL703VM-DB74 | |
| MSI GF75 Thin 10SCXR | |
| 1280x720 Performance Combined | |
| MSI RTX 2060 Gaming Z 6G | |
| Asus TUF A17 FA706IU-AS76 | |
| MSI GE75 Raider 10SE-008US | |
| Dell G5 15 SE 5505 P89F | |
| Schenker XMG Ultra 17 | |
| Eurocom Nightsky RX17 | |
| Média NVIDIA GeForce RTX 2060 Mobile (1107 - 14726, n=40) | |
| Alienware 17 R5 | |
| MSI GF75 Thin 10SCXR | |
| Asus Strix GL703VM-DB74 | |
| 3DMark 11 Performance | 20404 pontos | |
| 3DMark Cloud Gate Standard Score | 39384 pontos | |
| 3DMark Fire Strike Score | 16312 pontos | |
| 3DMark Time Spy Score | 6788 pontos | |
Ajuda | ||
| Shadow of the Tomb Raider - 1920x1080 Highest Preset AA:T | |
| MSI GE75 9SG | |
| KFA2 GeForce RTX 2060 Super | |
| Aorus 17G XB | |
| Schenker XMG Ultra 17 Coffee Lake Refresh | |
| MSI GE75 Raider 10SE-008US | |
| Média NVIDIA GeForce RTX 2060 Mobile (54 - 86, n=22) | |
| Asus Zephyrus G14 GA401IV | |
| Asus TUF A17 FA706IU-AS76 | |
| HP Omen 15-dc0015ng | |
| MSI GF75 Thin 10SCXR | |
| The Witcher 3 - 1920x1080 Ultra Graphics & Postprocessing (HBAO+) | |
| MSI GE75 9SG | |
| KFA2 GeForce RTX 2060 Super | |
| Aorus 17G XB | |
| MSI GE75 Raider 10SE-008US | |
| Schenker XMG Ultra 17 Coffee Lake Refresh | |
| Média NVIDIA GeForce RTX 2060 Mobile (50.6 - 74, n=40) | |
| Asus Zephyrus G14 GA401IV | |
| Asus TUF A17 FA706IU-AS76 | |
| HP Omen 15-dc0015ng | |
| MSI GF75 Thin 10SCXR | |
| baixo | média | alto | ultra | |
|---|---|---|---|---|
| The Witcher 3 (2015) | 293.5 | 214.9 | 123.9 | 65.9 |
| Dota 2 Reborn (2015) | 149 | 135 | 125 | 118 |
| X-Plane 11.11 (2018) | 103 | 90.6 | 77.2 | |
| Shadow of the Tomb Raider (2018) | 132 | 102 | 97 | 86 |
| MSI GE75 Raider 10SE-008US GeForce RTX 2060 Mobile, i7-10750H, Samsung SSD PM981 MZVLB512HAJQ | MSI GS75 Stealth 9SG GeForce RTX 2080 Max-Q, i7-9750H, 2x Samsung SSD PM981 MZVLB1T0HALR (RAID 0) | Asus Strix Hero III G731GV GeForce RTX 2060 Mobile, i7-9750H, Intel SSD 660p SSDPEKNW512G8 | Lenovo Legion Y740-17IRH GeForce RTX 2060 Mobile, i7-9750H, WDC PC SN520 SDAPMUW-128G | Razer Blade Pro 17 RTX 2060 GeForce RTX 2060 Mobile, i7-9750H, Samsung SSD PM981 MZVLB512HAJQ | Aorus 17G XB GeForce RTX 2070 Super Max-Q, i7-10875H, Samsung SSD PM981a MZVLB512HBJQ | |
|---|---|---|---|---|---|---|
| Noise | -7% | -4% | -8% | 2% | -12% | |
| desligado / ambiente * (dB) | 28.4 | 30 -6% | 28.2 1% | 30 -6% | 28.2 1% | 30 -6% |
| Idle Minimum * (dB) | 30.2 | 31 -3% | 29.5 2% | 33 -9% | 28.2 7% | 35 -16% |
| Idle Average * (dB) | 30.2 | 32 -6% | 30.3 -0% | 34 -13% | 28.2 7% | 36 -19% |
| Idle Maximum * (dB) | 32 | 38 -19% | 31.9 -0% | 35 -9% | 28.2 12% | 41 -28% |
| Load Average * (dB) | 33.2 | 47 -42% | 50.4 -52% | 48 -45% | 43 -30% | 47 -42% |
| Witcher 3 ultra * (dB) | 55 | 48 13% | 50.1 9% | 46 16% | 48.4 12% | 48 13% |
| Load Maximum * (dB) | 55 | 49 11% | 50.1 9% | 49 11% | 53.4 3% | 49 11% |
* ... menor é melhor
Barulho
| Ocioso |
| 30.2 / 30.2 / 32 dB |
| Carga |
| 33.2 / 55 dB |
 | ||
30 dB silencioso 40 dB(A) audível 50 dB(A) ruidosamente alto |
||
min: | ||
(±) A temperatura máxima no lado superior é 44.2 °C / 112 F, em comparação com a média de 40.4 °C / 105 F , variando de 21.2 a 68.8 °C para a classe Gaming.
(-) A parte inferior aquece até um máximo de 49 °C / 120 F, em comparação com a média de 43.2 °C / 110 F
(+) Em uso inativo, a temperatura média para o lado superior é 31.2 °C / 88 F, em comparação com a média do dispositivo de 33.9 °C / ### class_avg_f### F.
(±) Jogando The Witcher 3, a temperatura média para o lado superior é 33.6 °C / 92 F, em comparação com a média do dispositivo de 33.9 °C / ## #class_avg_f### F.
(+) Os apoios para as mãos e o touchpad são mais frios que a temperatura da pele, com um máximo de 29.2 °C / 84.6 F e, portanto, são frios ao toque.
(±) A temperatura média da área do apoio para as mãos de dispositivos semelhantes foi 28.8 °C / 83.8 F (-0.4 °C / -0.8 F).
MSI GE75 Raider 10SE-008US análise de áudio
(+) | os alto-falantes podem tocar relativamente alto (###valor### dB)
Graves 100 - 315Hz
(-) | quase nenhum baixo - em média 20.2% menor que a mediana
(+) | o baixo é linear (2.2% delta para a frequência anterior)
Médios 400 - 2.000 Hz
(±) | médios reduzidos - em média 5.7% menor que a mediana
(+) | médios são lineares (5.9% delta para frequência anterior)
Altos 2 - 16 kHz
(+) | agudos equilibrados - apenas 2.8% longe da mediana
(+) | os máximos são lineares (5% delta da frequência anterior)
Geral 100 - 16.000 Hz
(±) | a linearidade do som geral é média (15.2% diferença em relação à mediana)
Comparado com a mesma classe
» 33% de todos os dispositivos testados nesta classe foram melhores, 6% semelhantes, 61% piores
» O melhor teve um delta de 6%, a média foi 18%, o pior foi 132%
Comparado com todos os dispositivos testados
» 22% de todos os dispositivos testados foram melhores, 4% semelhantes, 74% piores
» O melhor teve um delta de 4%, a média foi 23%, o pior foi 134%
Apple MacBook 12 (Early 2016) 1.1 GHz análise de áudio
(+) | os alto-falantes podem tocar relativamente alto (###valor### dB)
Graves 100 - 315Hz
(±) | graves reduzidos - em média 11.3% menor que a mediana
(±) | a linearidade dos graves é média (14.2% delta para a frequência anterior)
Médios 400 - 2.000 Hz
(+) | médios equilibrados - apenas 2.4% longe da mediana
(+) | médios são lineares (5.5% delta para frequência anterior)
Altos 2 - 16 kHz
(+) | agudos equilibrados - apenas 2% longe da mediana
(+) | os máximos são lineares (4.5% delta da frequência anterior)
Geral 100 - 16.000 Hz
(+) | o som geral é linear (10.2% diferença em relação à mediana)
Comparado com a mesma classe
» 7% de todos os dispositivos testados nesta classe foram melhores, 2% semelhantes, 90% piores
» O melhor teve um delta de 5%, a média foi 18%, o pior foi 53%
Comparado com todos os dispositivos testados
» 5% de todos os dispositivos testados foram melhores, 1% semelhantes, 94% piores
» O melhor teve um delta de 4%, a média foi 23%, o pior foi 134%
| desligado | |
| Ocioso | |
| Carga |
|
Key:
min: | |
| MSI GE75 Raider 10SE-008US i7-10750H, GeForce RTX 2060 Mobile, Samsung SSD PM981 MZVLB512HAJQ, IPS, 1920x1080, 17.3" | MSI GS75 Stealth 9SG i7-9750H, GeForce RTX 2080 Max-Q, 2x Samsung SSD PM981 MZVLB1T0HALR (RAID 0), IPS, 1920x1080, 17.3" | Asus Strix Hero III G731GV i7-9750H, GeForce RTX 2060 Mobile, Intel SSD 660p SSDPEKNW512G8, IPS, 1920x1080, 17.3" | Lenovo Legion Y740-17IRH i7-9750H, GeForce RTX 2060 Mobile, WDC PC SN520 SDAPMUW-128G, IPS, 1920x1080, 17.3" | Razer Blade Pro 17 RTX 2060 i7-9750H, GeForce RTX 2060 Mobile, Samsung SSD PM981 MZVLB512HAJQ, IPS, 1920x1080, 17.3" | Aorus 17G XB i7-10875H, GeForce RTX 2070 Super Max-Q, Samsung SSD PM981a MZVLB512HBJQ, IPS, 1920x1080, 17.3" | |
|---|---|---|---|---|---|---|
| Power Consumption | 8% | -7% | 2% | -1% | -15% | |
| Idle Minimum * (Watt) | 14.7 | 13 12% | 16.2 -10% | 20 -36% | 16 -9% | 20 -36% |
| Idle Average * (Watt) | 20.4 | 17 17% | 24.8 -22% | 21 -3% | 21.7 -6% | 23 -13% |
| Idle Maximum * (Watt) | 26.9 | 25 7% | 28.6 -6% | 26 3% | 26.1 3% | 38 -41% |
| Load Average * (Watt) | 93.2 | 96 -3% | 127.6 -37% | 97 -4% | 105.6 -13% | 105 -13% |
| Witcher 3 ultra * (Watt) | 185.4 | 156 16% | 147.1 21% | 139 25% | 161.8 13% | 158 15% |
| Load Maximum * (Watt) | 237.8 | 239 -1% | 212.7 11% | 168 29% | 225.3 5% | 243 -2% |
* ... menor é melhor
| MSI GE75 Raider 10SE-008US i7-10750H, GeForce RTX 2060 Mobile, 65 Wh | MSI GS75 Stealth 9SG i7-9750H, GeForce RTX 2080 Max-Q, 80.25 Wh | Asus Strix Hero III G731GV i7-9750H, GeForce RTX 2060 Mobile, 66 Wh | Lenovo Legion Y740-17IRH i7-9750H, GeForce RTX 2060 Mobile, 76 Wh | Razer Blade Pro 17 RTX 2060 i7-9750H, GeForce RTX 2060 Mobile, 70 Wh | Aorus 17G XB i7-10875H, GeForce RTX 2070 Super Max-Q, 94 Wh | |
|---|---|---|---|---|---|---|
| Duração da bateria | 62% | 22% | 16% | 22% | 103% | |
| WiFi v1.3 (h) | 3.7 | 6 62% | 4.5 22% | 4.3 16% | 4.5 22% | 7.5 103% |
| Reader / Idle (h) | 7.7 | 6.9 | 10 | |||
| Load (h) | 1.2 | 1.1 | 2.2 |
Pro
Contra
O GE75 10SE enfrenta as mesmas vantagens e desvantagens que os modelos mais antigos de 2018 e 2019. O ruído do ventilador em particular quando os jogos não são mais silenciosos, mas as temperaturas do núcleo são geralmente mais baixas com desempenho geral mais rápido do que outros portáteis para jogos equipados com a mesma CPU ou GPU. Se você quiser obter o máximo do Core i7-10875H ou GeForce RTX 2060, então ele ajuda a combinar com um chassi mais grosso como o GE75, em vez de uma alternativa mais fina.
Após três anos do mesmo design, entretanto, alguns aspectos estão começando a mostrar sua idade. A moldura inferior é relativamente grossa, não há obturador de webcam ou suporte para Thunderbolt 3, e o bleeding irregular da luz de fundo é uma grande chatice. Em vez de ficar mais fino para o inevitável redesenho, gostaríamos de ver uma diminuição no ruído do ventilador, mantendo o mesmo nível de desempenho acima da média. Os usuários com orçamentos mais apertados ainda podem adquirir a série GE75 de 2019 impulsionada pelo Coffee Lake-H com quase o mesmo desempenho em jogos que nosso GE75 impulsionado pelo Comet Lake-H.
A série MSI GE75 tem provado sua versatilidade em três gerações de CPUs Intel série H. O desempenho continua a ser excelente devido à solução de resfriamento eficaz, mas outros aspectos como o ruído do ventilador e outras características físicas poderiam ser melhoradas.
MSI GE75 Raider 10SE-008US
- 07/02/2020 v7 (old)
Allen Ngo
Price comparison
